The diagnosis and recommendation integrated system for dry bean: Determination and validation of...
18
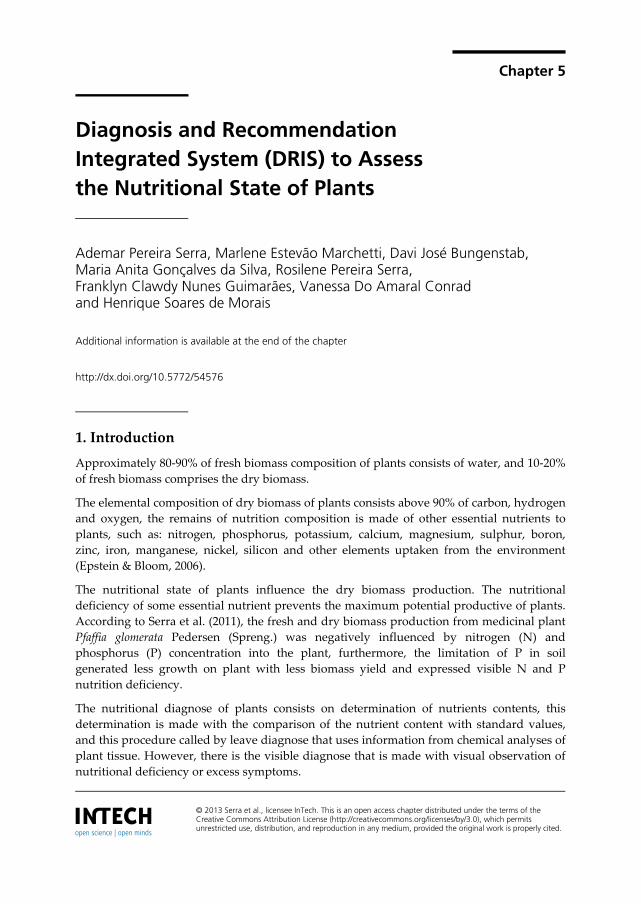
Chapter 5 © 2013 Serra et al., licensee InTech. This is an open access chapter distributed under the terms of the Creative Commons Attribution License (http://creativecommons.org/licenses/by/3.0), which permits unrestricted use, distribution, and reproduction in any medium, provided the original work is properly cited. Diagnosis and Recommendation Integrated System (DRIS) to Assess the Nutritional State of Plants Ademar Pereira Serra, Marlene Estevão Marchetti, Davi José Bungenstab, Maria Anita Gonçalves da Silva, Rosilene Pereira Serra, Franklyn Clawdy Nunes Guimarães, Vanessa Do Amaral Conrad and Henrique Soares de Morais Additional information is available at the end of the chapter http://dx.doi.org/10.5772/54576 1. Introduction Approximately 80-90% of fresh biomass composition of plants consists of water, and 10-20% of fresh biomass comprises the dry biomass. The elemental composition of dry biomass of plants consists above 90% of carbon, hydrogen and oxygen, the remains of nutrition composition is made of other essential nutrients to plants, such as: nitrogen, phosphorus, potassium, calcium, magnesium, sulphur, boron, zinc, iron, manganese, nickel, silicon and other elements uptaken from the environment (Epstein & Bloom, 2006). The nutritional state of plants influence the dry biomass production. The nutritional deficiency of some essential nutrient prevents the maximum potential productive of plants. According to Serra et al. (2011), the fresh and dry biomass production from medicinal plant Pfaffia glomerata Pedersen (Spreng.) was negatively influenced by nitrogen (N) and phosphorus (P) concentration into the plant, furthermore, the limitation of P in soil generated less growth on plant with less biomass yield and expressed visible N and P nutrition deficiency. The nutritional diagnose of plants consists on determination of nutrients contents, this determination is made with the comparison of the nutrient content with standard values, and this procedure called by leave diagnose that uses information from chemical analyses of plant tissue. However, there is the visible diagnose that is made with visual observation of nutritional deficiency or excess symptoms.
-
Upload
independent -
Category
Documents
-
view
1 -
download
0
Transcript of The diagnosis and recommendation integrated system for dry bean: Determination and validation of...
Chapter 5
© 2013 Serra et al., licensee InTech. This is an open access chapter distributed under the terms of the Creative Commons Attribution License (http://creativecommons.org/licenses/by/3.0), which permits unrestricted use, distribution, and reproduction in any medium, provided the original work is properly cited.
Diagnosis and Recommendation Integrated System (DRIS) to Assess the Nutritional State of Plants
Ademar Pereira Serra, Marlene Estevão Marchetti, Davi José Bungenstab, Maria Anita Gonçalves da Silva, Rosilene Pereira Serra, Franklyn Clawdy Nunes Guimarães, Vanessa Do Amaral Conrad and Henrique Soares de Morais
Additional information is available at the end of the chapter
http://dx.doi.org/10.5772/54576
1. Introduction
Approximately 80-90% of fresh biomass composition of plants consists of water, and 10-20% of fresh biomass comprises the dry biomass.
The elemental composition of dry biomass of plants consists above 90% of carbon, hydrogen and oxygen, the remains of nutrition composition is made of other essential nutrients to plants, such as: nitrogen, phosphorus, potassium, calcium, magnesium, sulphur, boron, zinc, iron, manganese, nickel, silicon and other elements uptaken from the environment (Epstein & Bloom, 2006).
The nutritional state of plants influence the dry biomass production. The nutritional deficiency of some essential nutrient prevents the maximum potential productive of plants. According to Serra et al. (2011), the fresh and dry biomass production from medicinal plant Pfaffia glomerata Pedersen (Spreng.) was negatively influenced by nitrogen (N) and phosphorus (P) concentration into the plant, furthermore, the limitation of P in soil generated less growth on plant with less biomass yield and expressed visible N and P nutrition deficiency.
The nutritional diagnose of plants consists on determination of nutrients contents, this determination is made with the comparison of the nutrient content with standard values, and this procedure called by leave diagnose that uses information from chemical analyses of plant tissue. However, there is the visible diagnose that is made with visual observation of nutritional deficiency or excess symptoms.

Biomass Now – Sustainable Growth and Use 130
The visual diagnose can be little practical, because, when the deficiency symptoms show in plants, the plant metabolism has been already damaged and the correction of deficiency can note be taken good benefits on increase of yield or better products quality, besides, the deficiency symptoms is shown in plant when the deficiency is acute (Marshner, 1995).
The tissue analyses has been considered the direct way to evaluation the nutritional state of plants, but, to do this evaluate it is necessary a well specific part from the plant to take this diagnose, this specific part is the leaf tissue that is the most used (Malavolta, 2006; Mourão Filho, 2003; Hallmark & Beverly, 1991; Beaufils, 1973).
The leaf tissue is considered the most important part of the plant where the physiologic activate happens and this tissue shows easily the nutritional disturb. To use the leaf tissue is necessary to have the chemical analyses. Furthermore, to assess the nutritional status there is the need to have leaf standard to sample, this leaf standard depend on the crop that intend to evaluate, but, nowadays there are many information about the most cultivated commercial crops.
The leave diagnose can be a useful tool to assess the nutritional status of plant, but, the procedure to analyse the data must be appropriate. Furthermore, because of natural dynamic of the leaf tissue composition that is strengly influenced by leaf age, maturation stage and interaction among nutrients on uptake and translocation into the plant, if all the damages criteria were not observed the leaf diagnose becomes very difficult to understand and used (Walworth & Sumner, 1987).
The interpretation of nutrients contents in leaf analyses can be made by several methods to assess plant nutritional status. To interpretate results of traditional chemical analyses of plant tissue for the assessment of the nutritional status of plants, the methods of critical level and sufficiency range are used more frequently (Beaufils, 1973; Walworth & Sumner, 1987; Mourão Filho, 2004; Serra et al., 2010a,b; Camacho et a., 2012; Serra et al., 2012).
There are other diagnose systems, such as: Compositional Nutrient Diagnosis (CND) (Parent & Dafir, 1992), plant analysis with standardized scores (PASS) (Baldock & Schulte, 1996), these two methods are less studied then critical level and sufficiency range, but there is CND standard published on Serra et al. (2010a,b) for the West region of Bahia, a state in Brazil and other authors (Parent, 2011; Wairegi and Asten, 2012).
The sufficiency range is the most used method of diagnose, and this method consists on optimum ranges of nutrients concentration to establish the nutritional state of crops, otherwise to use the sufficiency range it is necessary to develop regional calibration that is very expensive.
The Diagnosis and Recommendation Integrated System (DRIS) relate the nutrient contents in dual ratios (N/P, P/N, N/K, K/N...), because of the relation between two nutrients, the problem with the biomass accumulation and reduction of the nutrients concentration in plants with its age is solved (Beaufils, 1973; Walworth & Sumner, 1987; Singh et al., 2000). The use of DRIS on concept of nutritional balance of a plant is becoming an efficient method to assess the nutritional status of plants, this method puts the limitation of nutrients in order of plant demand, enabling the nutritional balance between the nutrient in leaf sample.

Diagnosis and Recommendation Integrated System (DRIS) to Assess the Nutritional State of Plants 131
Because of several factors that can influence nutrient concentration in plants, Jones (1981) suggests that it is necessary to be critical in relation to reliability of DRIS standard, because in this way the use of leaf diagnose method can be well used.
2. Diagnosis and Recommendation Integrated System (DRIS)
The Diagnosis and Recommendation Integrated System (DRIS) was developed by Beaufils in 1973, this method consist in dual relation between a pair of nutrients (N/P, P/N, N/K, K/N...) instead of the use of sufficiency range or critical level that are called univariate methods, because only the individual concentration of the nutrients in leaf tissue is taken into consideration while no information about the nutritional balance is provided. DRIS enables the evaluation of the nutritional balance of a plant, ranking nutrient levels in relative order, from the most deficient to the most excessive.
With the use of dual relation on DRIS, the problem with the effect of concentration or dilution on the nutrients in plants is solved, because, according to Beaufils (1973); Walworth & Sumner (1987) with the growth of leaf tissue, on one hand the concentration of nitrogen, phosphorus, potassium and sulphur decrease in older plants and the concentration of calcium and magnesium increase in older plants on the other hand. When it is used the DRIS method, where the dual ratio is used, the values remain constant, minimizing the effect of biomass accumulation, that is one of the major problem with sufficiency range and critical level method.
It is feasible to find on literature some crops on which DRIS had already been used to assess the nutritional status of plants, such as; pineapple (Sema et al., 2010), cotton (Silva et al., 2009; Serra et al., 2010a,b; Serra et al., 2012), rice (Guindani et al., 2009), potato (Bailey et al., 2009; Ramakrishna et al., 2009), coffee (Nick, 1998), sugarcane (Elwali & Gascho, 1984; Reis Jr & Monnerat, 2002; Maccray et al., 2010), orange (Mourão Filho et al., 2004), apple (Natchigall et al., 2007a,b), mango (Hundal et al., 2005), corn (Reis Jr, 2002; Urricariet et al., 2004), soybean (Urano et al., 2006, 2007), Eucalyptus (Wadt et al., 1998), among other crops.
According to Baldock & Schulte (1996), there are four advantages of DRIS; (1) the scale of interpretation is continuous numeric scale, and easy to use, (2) put the nutrients in order of the most deficiency to the most excessive, (3) identify cases where the yield of plant is been limited by into factor as nutritional status and (4) the Nutritional Balance Index (NBI) give a result of combined effects of nutrients. Nevertheless, the disadvantage of this methodology is that the DRIS index is not independent, because one nutrient concentration can have hard influence on the other DRIS index for one nutrient but this problem can be corrected in parts with a hard selection of the nutrient that will compound the DRIS norms.
3. DRIS norms
To be feasible the use of DRIS to assess the nutritional status of plants, the first step is establish the DRIS norms or standard. The DRIS norms consist on average and standard deviation of dual ratio between nutrients (N/P, P/N, N/K, K/N, etc.) obtained from a crop

Biomass Now – Sustainable Growth and Use 132
reference population (Table 1), but, it is necessary that the crop reference shows high yield (Beaufils, 1973). This method has been followed along the years (Jones, 1981; Alvarez V. & Leite, 1999; Silva et al., 2009; Maccray et al., 2010; Serra et al., 2010a,b; Serra et al., 2012).
The data bank to compose the DRIS norms is formed by the crop yield and chemical analysis of leaf tissue, and this information can be obtained from commercial crop or experimental units. The size of the data bank is not a factor that is directly related to the quality of the DRIS norms (Walworth et al., 1988; Sumner, 1977).
Walworth et al. (1988) observed that, when they used 10 data to establish the DRIS norms, the results obtained were more accurate then the use of a large number of data. What is more important to improve efficiency on DRIS norms is the quality of the data, because it is not accepting the use of sick plants to compose the data bank to establish the DRIS norms.
To make part of the DRIS norms, the rations between nutrients can be selected by the direct form (N/P) or reverse (P/N), but, there is more than one way to change the ratio that is going to compose the DRIS norms. Bataglia et al. (1990) used the entire dual ratio without selecting the direct or reverse form, and other researchers used the transformation by natural log (Beverly, 1987; Urano et al., 2006, 2007; Serra et al., 2010a,b; Serra et al., 2012).
With many ways to select the ratio to compose the DRIS norms there is a necessity to establish the most efficiency way for each crop that results in a better efficiency of the system. Silva et al. (2009) tested the dual ratio selection using the “F” value (Jones, 1981; Letzsch, 1985; Walworth & Sumner, 1987) and “r” value (Nick, 1998) in cotton crop, on his turn, Silva et al. (2009) did not test the criterion of choice the ratio by log transformation or the use of all nutrient ratio as it were made by Alvarez V. & Leite (1999) and Serra et al. (2010a,b).
Results obtained by Serra et al. (2012) showed that the use of “F” value or log transformation in nutrient ratio to define the norms produced different DRIS index, furthermore, when the DRIS index is interpret by Beaufils ranges the difference observed among index was reduced, showed less difference between the two groups of norms.
Following the premises of DRIS proposed by Beaufils (1973), it is feasible to change the dual ratio (A/B or B/A) that is more important to compose the DRIS norms. This way it is expected that the dual ratio from crop with high-yielding (reference population), composed with healthy plants, shows less variation than the population of plants with low-yielding (non-reference population), thus, the relation between variance ratio method, the F value, was defined as the variance ratio of low-yielding (non-reference) and high-yielding population (reference), and the order of the ratio with the highest value was chosen among the variance ratios (Jones, 1981; Letzsch, 1985; Walworth & Sumner, 1987).
The utilization of the relationship between variance ratio method (“F” value) from low-yielding and high-yielding is the most used method to define the DRIS norms. The method “F” value is defined on the data bank divided into two groups (non-reference and reference), and the choice of ratio directly (A/B) or inverse (B/A) defined by relationship between variances from the two populations, in which the ratio chosen will result arises from the following analysis (Jones, 1981; Letzsch, 1985; Walworth & Sumner, 1987):

Diagnosis and Recommendation Integrated System (DRIS) to Assess the Nutritional State of Plants 133
If: − > −
Then: the dual ratio that will make part of the DRIS norms will be A/B, on the another it will be B/A. S2 is the variance of the dual ratio of the reference population and non-reference.
Besides the selection of forward or reverse ratio to compose the DRIS norms, the same principle can be selected with regard to the significance of F value, which can be 1%, 5% or 10% (Wadt, 1999), and feasible to use all dual ratio, which was selected by the largest ratio of variances, without the rigour of significance (Beaufils, 1973; Jones, 1981; Walworth & Sumner, 1987; Serra, 2011).
One can observe on literature that there are not any consensus about which methodology is more efficient to use. Jones (1981) did not select for significance, but he selected by the biggest reason of variances, as well as Raghupathi et al. (2005); Guindani et al. (2009); Sema et al. (2010); Serra et al. (2012). However, Wadt (2005) used the “F” value for the selection of dual ratio with a significance of 10%, excluding from the norms the dual ratio that was with significance above this value.
When selecting the dual ratio by significance of the “F” value, the sum of DRIS indexes does not give a zero value, in this case some nutrients can remain with a larger number of dual ratio than those with fewer ratios. However, Wadt et al. (1999) concludes that the rigour of the selection by the significance of “F” value generates greater efficiency for the diagnosis, in studies made with coffee crop (Coffea canephora Pierre).
Variable Average s Criteria Variable Average s Criteria
r F ADR r F ADR
N/P N/K N/Ca N/Mg N/S N/B
N/Zn N/Cu N/Mn N/Fe P/N P/K P/Ca P/Mg P/S P/B
15,1416 2,2317 1,5598 10,5226 4,5765 0,7503 1,6754 3,9724 1,0587 0,4701 0,0671 0,1500 0,1048 0,7003 0,3080 0,0504
1,8617 0,4022 0,3095 1,8856 2,2252 0,2404 0,3502 2,1953 0,4183 0,1493 0,0087 0,0354 0,0265 0,1316 0,1597 0,0181
X
X X X
X
X
X
X
X X X X X X
X X
X X X X X X X X X X X X X X X X
S/B S/Zn S/Cu S/Mn S/Fe B/N B/P B/K B/Ca B/Mg B/S
B/Zn B/Cu B/Mn B/Fe Zn/N
0,1970 0,4561 1,2012 0,2917 0,1299 1,4916 22,6312 3,3058 2,2463 15,3008 6,3151 2,4320 6,1969 1,5206 0,6875 0,6224
0,1001 0,2180 1,0183 0,1646 0,0691 0,5351 8,8362 1,2388 0,6303 4,6670 3,1483 0,8360 4,6239 0,6858 0,2750 0,1281
X
X X
X
X X
X X X X
X
X X
X
X X X X X X X X X X X X X X X X

Biomass Now – Sustainable Growth and Use 134
Variable Average s Criteria Variable Average s Criteria
r F ADR r F ADR
P/Zn P/Cu P/Mn P/Fe K/N K/P
K/Ca K/Mg K/S K/B
K/Zn K/Cu K/Mn K/Fe Ca/N Ca/P Ca/K
Ca/Mg Ca/S Ca/B
Ca/Zn Ca/Cu Ca/Mn Ca/Fe Mg/N Mg/P Mg/K Mg/Ca Mg/S Mg/B
Mg/Zn Mg/Cu Mg/Mn Mg/Fe
S/N S/P S/K S/Ca S/Mg
0,1117 0,2613 0,0694 0,0316 0,4611 6,9883 0,7088 4,8383 2,0914 0,3446 0,7636 1,7900 0,4861 0,2175 0,6615 10,0208 1,4559 6,9029 2,8917 0,4830 1,0873 2,5864 0,6904 0,3071 0,0980 1,4705 0,2179 0,1516 0,4404 0,0723 0,1626 0,3909 0,0994 0,0464 0,2829 4,2903 0,6233 0,4192 2,8927
0,0251 0,1369 0,0246 0,0112 0,0758 1,4438 0,1301 1,1228 1,0735 0,1226 0,1646 1,0192 0,2024 0,0769 0,1095 2,0527 0,2605 1,3999 1,2685 0,1436 0,2011 1,5065 0,2674 0,0926 0,0173 0,2403 0,0517 0,0351 0,2311 0,0256 0,0387 0,2223 0,0321 0,0165 0,1438 2,2582 0,3228 0,1857 1,3862
X
X X X
X X
X X
X
X
X
X X X
X X X
X X X
X
X X
X X
X X X
X
X X X
X
X X
X X X X X X X X X X X
X X X X X X X X X X X X X X X X X X X X X X X X X X X X X X X X X X X X X X X
Zn/P Zn/K Zn/Ca Zn/Mg Zn/S Zn/B
Zn/Cu Zn/Mn Zn/Fe Cu/N Cu/P Cu/K Cu/Ca Cu/Mg Cu/S Cu/B
Cu/Zn Cu/Mn Cu/Fe Mn/N Mn/P Mn/K Mn/Ca Mn/Mg Mn/S Mn/B
Mn/Zn Mn/Cu Mn/Fe Fe/N Fe/P Fe/K Fe/Ca Fe/Mg Fe/S Fe/B
Fe/Zn Fe/Cu Fe/Mn
9,3606 1,3733 0,9508 6,4829 2,7703 0,4551 2,4792 0,6445 0,2898 0,3491 5,2285 0,7498 0,5274 3,7280 1,6651 0,2730 0,5869 0,3843 0,1679 1,1626 17,1314 2,5865 1,7850 11,6390 5,4646 0,8287 1,9123 4,6606 0,5444 2,3817 36,101 5,3725 3,7003 25,7109 10,9353 1,7883 3,9554 9,4342 2,6114
1,9666 0,3150 0,1766 1,4814 1,4366 0,1419 1,5065 0,2446 0,1007 0,2056 3,1722 0,3941 0,2854 2,4233 1,2996 0,2010 0,3864 0,3414 0,1328 0,6971 9,3481 1,6147 1,0510 5,9153 5,1483 0,4293 1,1921 4,0784 0,3329 0,8848 14,2700 2,5203 1,6352 13,4116 7,3733 0,9809 1,6004 6,2703 1,7679
X X X
X X X
X
X
X X
X X X X
X
X
X
X
X
X
X X X X
X
X X X
X
X X
X
X X
X X X X X X X X X X X X X X X X X X X X X X X X X X X X X X X X X X X X X X X
Data obtained from doctorate thesis of Serra (2011).
Table 1. DRIS norms, following the methodology of “F” values (Jones, 1981; Letzsch, 1985; Walworth & Sumner, 1987), “r” value (Nick, 1998) and all dual ratio (ADR) (Serra, 2011)

Diagnosis and Recommendation Integrated System (DRIS) to Assess the Nutritional State of Plants 135
4. DRIS index
Several changes in the methodology of DRIS indexes calculation were proposed in order to increase the accuracy in the nutritional diagnosis for several crops. The calculation of the functions or standard deviation units can be defined by the methodology originally developed by Beaufils (1973), Jones (1981) or Elwali & Gascho (1984), there are some conflicting results in the literature regarding the effectiveness of each method of calculation. According to Mourão Filho (2004), there is still no clear definition of what would be the best recommendation to calculate the functions or standard deviation units for the DRIS.
According to Serra (2011), the use of the methodology proposed by Jones (1981) when compared with Beaufils (1973) and Elwali & Gascho (1987) showed better efficacy on DRIS index for cotton crop (Gossypium hirsutum r latifolium). The measure of the efficacy used by Serra et al. (2011) was the relation between yield and nutritional balance index (NBI).
Beaufils (1973):
For A/B < a/b;
( = 1 − // ∙ 100 ∙%
f(A/B)=0, for A/B = a/b
For A/B > a/b;
( = /Ba/b − 1 ∙ 100 ∙%
Jones (1981):
( = B − ∙
Elwali & Gascho (1984):
For A/B < a/b-1s
( = 1 − // ∙ 100 ∙%
f(A/B)=0, to the range between a/b-1s to a/b+1s
For A/B > a/b+1s
( = /Ba/b − 1 ∙ 100 ∙%
After defining the functions DRIS, the DRIS index is calculated and for each nutrient a DRIS index is determined, which may have positive or negative values, that represent the arithmetic average of functions in which the nutrient is involved, when the result is negative

Biomass Now – Sustainable Growth and Use 136
(below zero), this means deficiency and when the positive value indicates excess, as proposed by Beaufils (1973):
= ∑ − ∑
n=number of DRIS functions of each dual ratio defined by criteria of chosen of the norms, in that the A nutrient is involved.
The sum of DRIS index in module of the nutrients in a sample diagnosed, generates the nutritional balance index (NBI), in an increasing scale, the higher NBI the greater nutritional imbalance in the plant and consequently low productivity, and the correlation between NBI and yield is considered one measure of the effectiveness of the system DRIS (Beaufils, 1973; Nachtigall & Dechen, 2007b; Guindani et al., 2009).
Mourão Filho (2004) concludes that researches on DRIS are still incipient, therefore, many accurately factors must still be better studied, factors such as the criteria for choosing the reference populations, the combination of methods to be used, so there is a need to more refined studies on these aspects.
5. Nutritional Balance Index (NBI)
When assessing the nutritional status of plants, looking up the nutritional balance of the plant, however, this goal can not be reached when using the traditional methods of nutritional diagnosis, such as the sufficiency range and critical level, because, both of them lead into account only the individual concentrations of nutrients in the plant, with no relationship among these nutrients.
The Diagnosis and Recommendation Integrated System (DRIS) provides the relationship between nutrients through dual ratio (A/B and/or B/A). Thus it is feasible by calculating DRIS index to obtain the nutritional balance (Baldock & Schulte, 1996). In addition to the DRIS index, which may take positive and negative values, there is the nutritional balance index (NBI), which is the sum in modulus of the DRIS indices from a sample and thus the lower the value of the NBI would be more nutritionally balanced in the crop.
Despite of the diagnosis of nutritional status, the DRIS can be a useful tool to indicate situations where yield is limited by other factors than nutritional, however, it does not discriminate the factors that would be limiting the yield. In crops that have low yield and low NBI it is expected that other factors were limiting productivity, not being a limitation by the nutritional status of the plant (Beaufils, 1973).
The Nutritional Balance Index (NBI) was calculated by summing the value in module of the index generated in the sample. This NBI may be useful to indicate the nutritional status of the plant. The higher the NBI, the greater the nutritional imbalance (Beaufils, 1973; Mourão Filho, 2003). The average NBI generates NBIa (Nutritional Balance Index average), according to the formula below:

Diagnosis and Recommendation Integrated System (DRIS) to Assess the Nutritional State of Plants 137
= | | + | | + | | + ⋯+ | | =
Where: n is the number of DRIS index involved in the analysis.
The NBI has been used to prove the effectiveness of the DRIS system in diagnosing the nutritional status of the plant, because the greater the relationship between NBI and yield better the diagnostic system response, to point out the nutritional status of plants (Silveira et al. 2005b) (Figure 1). Guindani et al. (2009) used the NBI to select the reference population to compose DRIS norms relating to the NBI tracks yield and the yield range that had the highest coefficient of determination (R2) was selected as the reference population.
Figure 1. Relationship between the relative dry mass (DM) production of Signal grass and Nutritional Balance Index (NBI) obtained by the method of Jones for combinations of methods choice of ratio order among nutrients (F and R values) in the first growth using the norm of the first growth (a), in the first growth using the general norm (b), in the second growth using the norm of the second growth (c) and in the second growth using the general norm (d) (Silveira et al., 2005b).
6. Interpretation of DRIS index
The interpretation of DRIS index is the identification of nutrients that are limiting the crop yield from the presenting in nutritionally balanced or non-limiting. DRIS index can provide all null values or null values, positive and negative. However, the probability of having all zero values is small, therefore, it is necessary that all dual ratios show the same mean value of the standards. What happens under the conditions of analysis with the DRIS system is the presence of null values, positive and negative (Beaufils, 1973).
Null values mean that the average deviation for a given nutrient, are equidistant and cancelled in the expression of the final value for the DRIS index. It is said therefore that this

Biomass Now – Sustainable Growth and Use 138
nutrient is in a state of nutritional balance (Walworth & Sumner, 1984). After determination of DRIS index is necessary to interpretate these positive and negative values of a particular nutrient, it would be a situation in which the nutrient would be in excess (+) or deficiency (-).
6.1. Interpretation of DRIS index values by the order of the value
The usual method that is used for the interpretation of DRIS index is the ordering of the values of the indices, the ordering is more limiting disabilities by the most limiting excess.
By this method of ordering of the index establish that the lowest DRIS index and negative has been considered the most limiting, the second lowest, the second most limiting disability and until the most limiting excess, which would have the DRIS index greater and positive (Walworth & Sumner 1987; Bataglia & Santos, 1990). These criteria have been used both to evaluate the accuracy of the method (Jones, 1981) and for nutritional surveys, when there is the DRIS as a tool for identifying classes of farms and the distribution of nutritional status (Beaufils, 1973; Eymar et al., 2001; Hundal et al., 2005, Silva et al., 2009; Sema et al., 2010).
6.2. Interpretation of DRIS index by nutrient application potential response
The interpretation of DRIS index for the nutrient application potential response, was originated by Wadt (1996). This method of interpretation consists on grouping five categories of nutrient application potential response (NAPR), by comparing the rates of each nutrient DRIS with the nutrient balance index average (NBIa), which is the arithmetic average of the module of all DRIS index. The NBIa was chosen to be a value that reflects the average of the deviations of each dual ratio relative to the reference value (Wadt, 1996), as seen in Table 2.
The nutrient status of "highest deficiency" represents the situation where there is greater likelihood of positive response with the addition of the nutrient to soil. This positive response should be represented by higher crop yields, or by improving the quality of the agricultural product into a commercially desired degree. In turn, the status of "deficiency" also indicates that it is likely to increase in crop yield with the application of the nutrient, however, this probability is lower than the nutrient with the highest degree of deficiency ("highest deficiency") (Wadt, 1996).
The status "balanced" means that no crop response is expected in relation to the application of the nutrient in soil, there would be no response or a response of the crop "null". The nutrient status of "highest excess" represents the situation where the application of the nutrient may result in negative response on the crop yield, decreased productivity. Finally, the status of "excess" indicates that the addition of nutrients in soil may also result in negative response of the crop and its yield, but that this effect on yield can be controlled by higher nutrient excess (Wadt, 1996).
As recommended by Wadt (1996) the central concept for the addition of the nutrient to soil by the nutrient application potential response is that this increase should be considered as an adjustment in the fertilizer to soil. For example, when it is sure that the nutrient is in a

Diagnosis and Recommendation Integrated System (DRIS) to Assess the Nutritional State of Plants 139
†the NAPR was calculated according to Wadt (1996). ††NBIa = Nutritional Balanced Index average.
Table 2. Criteria to interpret the DRIS index (I DRIS) by nutrient application potential response (NAPR†) (Wadt, 1996).
status of balance and adds it to the crop, it will not result in improved yield, yet, it does not mean that this nutrient should be excluded from the fertilizer recommendation, but that should be kept at fertilization at the same dosages that had been used.
For extraction of nitrogen in the soil, the extractants that have been used do not show a good correlation between the contents extracted by plants with the growth of plants or amount absorbed, and the fertilizer recommendations arising from fertilization of tables that are constructed by means of average curves response generated under field conditions, with data from multiple trials and different locations. Thus, it is expected that the diagnostic system allows adjustments to the amount of each nutrient to be applied, and the interpretation of DRIS index for the nutrient application potential response a useful tool for this purpose.
The nutritional diagnosis would be a complementary tool for the recommendation of the nutritional need of crops, however, it is not feasible to take off the use of soil analysis, because it is essential to check the evolution of soil fertility, and ability to supply nutrients (Wadt, 1996).
Nutricional Criteria Type of nutrient application
potential response
Deficiency
Deficiency-prone
Sufficient
Excess-prone
Excess
I DRIS A < 0,
| I DRIS A | > NBIa †† and IA is
the index of lower value.
I DRIS A < 0 and
| I DRIS A | > NBIa
| I DRIS A | = NBIa
I DRIS A > 0 and
| I DRIS A | > NBIa
I DRIS A > 0,
| I DRIS A | > NBIa and IA is
the index of higher value.
Positive, with higher probability
(p)
Positive, with low probability
(pz)
Null
(z)
Negative, with a low probability (nz)
Negative, with a higher probability
(n)

Biomass Now – Sustainable Growth and Use 140
The use of nutrient application potential response (NAPR) for interpreting the DRIS index is well seen in Brazil, where, Wadt (1996), Dias et al. (2011), Serra et al. (2010a,b) and Serra (2011) (Figure 2) used to interpret the DRIS index in assessing the nutritional status of the cotton crop, Dias et al. (2011) used the NAPR in the cupuaçu crop (Theobroma grandiflorum).
Figure 2. Percentage of plots diagnosed with the method of interpretation of DRIS index named nutrient application potential response (NAPR) (Wadt, 1996): (n) Negative response, with a higher probability; (nz) Negative response, with a low probability; (z) Nula response; (pz) Positive response, with low probability; (p) Positive response, with higher probability. (1) norms with all dual ratio; (2) norms with F value; (3) norms with r value (Serra, 2011).
7. Interpretation of leaf contents by Beaufils ranges
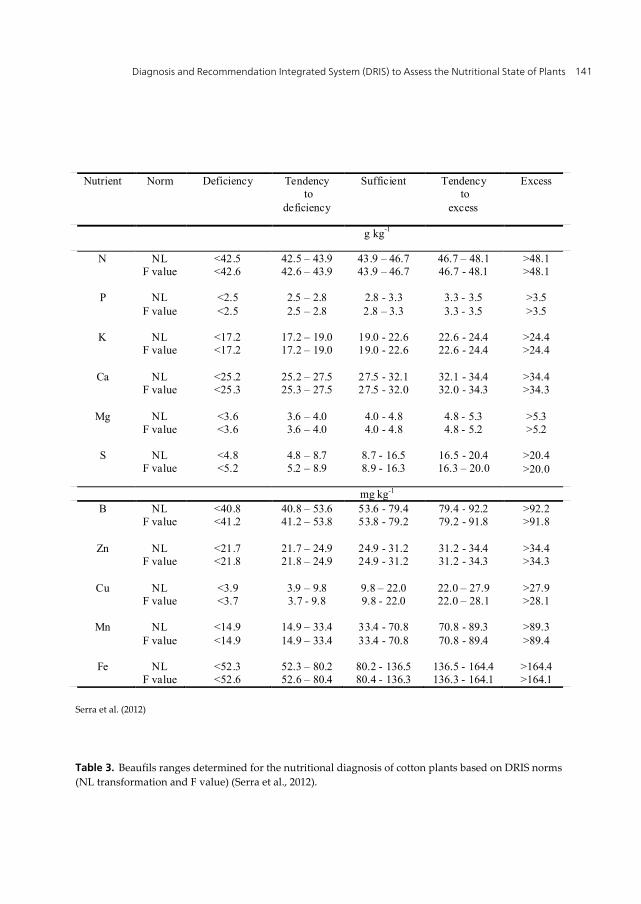
The determination of the Beaufils ranges consists in optimal ranges of nutrients for the assessment of leaf nutrients (Table 3 and 4). This method consists of determining the ranges by means of statistical models of the relationship between leaf concentrations and DRIS index, and, Beaufils (1973) found that from the optimal values of DRIS index were determined intervals of standard deviation of DRIS index for each range of nutritional assessment. Following this criterion, the range that would include the nutrients that would be deficiency was below - 4/3 standard deviation (s); deficiency-prone between - 4/3 to 2/3 s; sufficient between - 2/3 to 2/3 s and a excess-prone 2/3 to 4/3 s; excessive greater than 4/3 s (Table 3).
Thus, it creates the Beaufils ranges, which can be used to interpretate the nutrient concentration in chemical analysis of leaves (Table 3 and 4). As such use, recommended for the specific regions where they were certain, because if extrapolated to other region, it is expected that the results do not follow a favorable response.
Ca FeMnCuZnBSMgKP1 2 31 2 3 1 2 31 2 3 1 2 31 2 31 2 3 1 2 31 2 31 2 31 2 3
N
JONES (1981)
% O
F C
OM
ME
RC
IAL
CO
TT
ON
FIE
LD
S
0
10
20
30
40
50
60
70
80
90
100
ppz z nz n
Diagnosis and Recommendation Integrated System (DRIS) to Assess the Nutritional State of Plants 141
Serra et al. (2012)
Table 3. Beaufils ranges determined for the nutritional diagnosis of cotton plants based on DRIS norms (NL transformation and F value) (Serra et al., 2012).
Nutrient Norm Deficiency Tendency to
deficiency
Sufficient Tendency to
excess
Excess
g kg-1
N P
K
Ca
Mg S
NL F value
NL
F value
NL F value
NL
F value
NL F value
NL
F value
<42.5 <42.6
<2.5 <2.5
<17.2 <17.2
<25.2 <25.3
<3.6 <3.6
<4.8 <5.2
42.5 – 43.9 42.6 – 43.9
2.5 – 2.8 2.5 – 2.8
17.2 – 19.0 17.2 – 19.0
25.2 – 27.5 25.3 – 27.5
3.6 – 4.0 3.6 – 4.0
4.8 – 8.7 5.2 – 8.9
43.9 – 46.7 43.9 – 46.7
2.8 - 3.3 2.8 – 3.3
19.0 - 22.6 19.0 - 22.6
27.5 - 32.1 27.5 - 32.0
4.0 - 4.8 4.0 - 4.8
8.7 - 16.5 8.9 - 16.3
46.7 – 48.1 46.7 - 48.1
3.3 - 3.5 3.3 - 3.5
22.6 - 24.4 22.6 - 24.4
32.1 - 34.4 32.0 - 34.3
4.8 - 5.3 4.8 - 5.2
16.5 - 20.4 16.3 – 20.0
>48.1 >48.1
>3.5 >3.5
>24.4 >24.4
>34.4 >34.3
>5.3 >5.2
>20.4 >20.0
mg kg-1
B
Zn
Cu
Mn
Fe
NLF value
NL
F value
NL F value
NL
F value
NL F value
<40.8<41.2
<21.7 <21.8
<3.9 <3.7
<14.9 <14.9
<52.3 <52.6
40.8 – 53.641.2 – 53.8
21.7 – 24.9 21.8 – 24.9
3.9 – 9.8 3.7 - 9.8
14.9 – 33.4 14.9 – 33.4
52.3 – 80.2 52.6 – 80.4
53.6 - 79.453.8 - 79.2
24.9 - 31.2 24.9 - 31.2
9.8 – 22.0 9.8 - 22.0
33.4 - 70.8 33.4 - 70.8
80.2 - 136.5 80.4 - 136.3
79.4 - 92.279.2 - 91.8
31.2 - 34.4 31.2 - 34.3
22.0 – 27.9 22.0 – 28.1
70.8 - 89.3 70.8 - 89.4
136.5 - 164.4 136.3 - 164.1
>92.2 >91.8
>34.4 >34.3
>27.9 >28.1
>89.3 >89.4
>164.4 >164.1

Biomass Now – Sustainable Growth and Use 142
Serra et al. (2012)
Table 4. Percentage of plots diagnosed by Beaufils ranges as deficient, deficiency-prone, sufficient, excess-prone or excess leaf nutrient contents of cotton, based on the criteria of natural log transformation (NL) and F value (Serra et al., 2012).
8. Conclusion
The DRIS developed by Beaufils (1973) had among its objectives, to correct the problem of correlation with the sampling time of the plant nutrients, and using dual ratio that promote the relationship among. Hence, improving efficacy of plant nutritional diagnosis allows the determination of the evaluation of the nutritional balance.
Nutrient Norm Deficiency Deficiency- prone
Sufficient Excess- prone
Excess
% of plots
N
P
K
Ca
Mg
S
NL F value
NL
F value
NL F value
NL
F value
NL F value
NL
F value
19.44 19.44
7.41 7.41
16.67 16.67
19.44 19.44
12.04 12.04
2.78 7.41
15.74 15.74
19.44 19.44
14.81 14.81
17.59 17.59
9.26 9.26
54.63 50.93
38.89 39.81
45.37 45.37
44.44 44.44
46.30 43.52
31.48 31.48
21.30 20.37
9.26 8.33
12.04 12.04
13.89 13.89
7.41 10.19
18.52 14.81
11.11 2.78
16.67 16.67
15.74 15.74
10.19 10.19
9.26 9.26
28.70 32.41
10.19 18.52
% of plotsB
Zn
Cu
Mn
Fe
NL F value
NL
F value
NL F value
NL
F value
NL F value
13.89 14.81
25.00 25.93
0.00 0.00
0.00 0.00
0.93 0.93
33.33 32.41
25.93 25.00
36.11 37.96
22.22 22.22
37.04 37.04
32.41 32.41
25.93 25.93
42.59 40.74
55.56 55.56
50.00 50.00
9.26 9.26
10.19 8.33
11.11 11.11
11.11 11.11
2.78 2.78
11.11 11.11
12.96 14.81
10.19 10.19
11.11 11.11
9.26 9.26

Diagnosis and Recommendation Integrated System (DRIS) to Assess the Nutritional State of Plants 143
With the advent of Diagnose and Recommendation Integrated System (DRIS) by Beaufils (1973), researchers were setting to this system of nutritional diagnosis in order to increase their efficiency. However, evolution has brought a number of possibilities for calculation of DRIS’ norms and functions, that are needed to be tested to determine the best combination of methodology.
The use of DRIS is still being widely disseminated in the world, DRIS brings results consistently good in assessing the nutritional status of plants, showing the nutritional balance, a fact which is not observed with traditional systems (sufficiency range and critical level).
Author details
Ademar Pereira Serra and Davi José Bungenstab Brazilian Agricultural Research Corporation – Embrapa, Brazil
Marlene Estevão Marchetti, Franklyn Clawdy Nunes Guimarães, Vanessa Do Amaral Conrad and Henrique Soares de Morais Agrarian Science Faculty, Universidade Federal da Grande Dourados – UFGD, Brazil
Maria Anita Gonçalves da Silva Agrarian Science Faculty, Universidade Estadual de Maringá – UEM, Brazil
Rosilene Pereira Serra Federal University of Mato Grosso, Brazil
9. References
Alvarez Venegas, V.H. & Leite, R. de A. (1999). Fundamentos estatísticos das fórmulas usadas para cálculo dos índices DRIS. Boletim Informativo da Sociedade Brasileira de Ciência do Solo. v.24, p.20-25.
Baldock, J.O. & Schulte, E.E. (1996). Plant analysis with standardized scores combines DRIS and sufficiency range approaches for corn. Agronomy Journal. v.88, n.3, p.448-456.
Bailey, J.S.; Ramakrishna, A. & Kirchhof, G. (2009). Na evaluation of nutritional constraints on sweetpotato (Ipomoea batatas) production in the central highlands of Papua New Guinea. Plant and Soil. v.316, p.97–105.
Bataglia, O.C. & Santos, W.R. (1990). Efeito do procedimento de cálculo e da população de referência nos índices do sistema integrado de diagnose e recomendação (DRIS). Revista Brasileira de Ciência do Solo, v.14, p.339-344.
Beaufils, E.R. (1973). Diagnosis and recommendation integrated system (DRIS). A general scheme of experimentation and calibration based on principles developed from research in plant nutrition. South Africa: University of Natal, Pietermaritzburg. 132p. (Soil Science Bulletin, 1).
Beverly, R.B. (1987) Modified DRIS method for simplified nutrient diagnosis of ‘Valencia’ oranges. Journal of plant Nutrition, v.10, p.1401-1408.

Biomass Now – Sustainable Growth and Use 144
Camacho, M.A.; Silveira, M.V.; Camargo, R.A.; Natale, W (2012). Faixas normais de nutrientes pelos métodos ChM, DRIS e CND e nível crítico pelo método de distribuição normal reduzida para laranjeira-pera. Revista Brasileira de Ciência do Solo. v.36, n.1, p. 193-200.
Dias, J.R.M.; Wadt; P.G.S.; Folle, F.A.; Solino, A.J.S.; Delarmelinda, E.A. & Tavella, L.B. (2011) Potencial de resposta à adubação para N, P, K, Ca e Mg em cupuaçueiros avaliados por diferentes normas DRIS. VOL. 41(1), p.77 – 82.
Elwali, A. M. O. & Gascho, G. J. (1984). Soil testing, foliar analysis, and DRIS as guide for sugarcane fertilization. Agronomy Journal, v. 76, p. 466-470.
Epstein, E. & Bloom, A. (2006). Nutrição mineral de plantas: princípios e perspectivas. 2.ed. Londrina: Editora Planta. 401p.
Guindani, R.H.P.; Anghinoni, I.; Nachtigall, G.R. DRIS na avaliação do estado nutricional do arroz irrigado por inundação. Revista Brasileira de Ciências do Solo, v.33, p.109-118, 2009.
Eymar, E.; Cadahía, C. & Africa, S. (2001) Foliar nutrient reference levels obtained in hydroponic cultures as preliminary norms for dris to fertigate conifers', Communications in Soil Science and Plant Analysis, 32:1, p.267-282, 2001.
Hallmark, W.B. & Beverly, R.B. (1991). Review – An update in the use of the Diagnosis and Recommendation Integrated System. Journal of Fertilizer Issues. v.8, p.74-88.
Hundal, H.S.; Singh, D.; Brar, J.S. (2005). Diagnosis and recommendation integrated system for monitoring nutrient status of mango trees in submountainous area of Punjab, India. Communications in Soil Science and Plant Analysis. v.36 (15): 2085-2099.
Jones, C.A. (1981). Proposed modifications of the diagnosis and recommendation integrated system (DRIS) for interpreting plant analyses. Communications in Soil Science and Plant Analysis. v.12, p.785-794.
Letzsch, W.S. (1985). Computer program for selection of norms for use in the diagnosis and recommendation integrated system (DRIS). Communications in Soil Science and Plant Analysis. v.16, p.339–347.
Mccray, J.M.; JI, S., Powell, G.; Montes, G. & Perdomo, R. (2010) Sugarcane Response to DRIS-Based Fertilizer Supplements in Florida. Journal of Plant Nutrition. v.196, p.66–75.
Malavolta, E. Manual de nutrição mineral de plantas. São Paulo, Agronômica Ceres, 2006. 638p.
Marschner, H. (1995) Mineral nutrition of higher plants. 2.ed. San Diego: Academic Press. 889p.
Mourão Filho, F.A.A. & Azevedo, J.C. (2003). DRIS norms for ‘Valencia’ sweet orange on three rootstocks. Pesquisa Agropecuária Brasileira, v.38, p.85-93.
Mourão Filho, F.A.A. . DRIS: Concepts and applications on nutritional diagnosis in fruit crops. Scientia Agricola, Piracicaba, v. 61, n.5, p. 550-560, 2004.
Nachtigall, G.R. & Dechen, A.R. (2007a). DRIS norms for evaluating the nutritional state of apple tree. ScientiaAgricola, v.64, n.3, p.282-287, 2007a.
Nachtigall, G.R. & Dechen, A.R. (2007b). DRIS Use on apple orchard nutritional evaluation in response to potassium fertilization. Communications in Soil Science and Plant Analysis, v.38, n.17, p.2557-2566, 2007b.

Diagnosis and Recommendation Integrated System (DRIS) to Assess the Nutritional State of Plants 145
Nick, J.A. DRIS para cafeeiros podados. Piracicaba:USP/ESALQ, 1998. 86p. (Dissertação - Mestrado).
Parent, L.E. & Dafir, M. (1992). A theoretical concept of compositional nutrient diagnosis. Journal of the American Society for Horticultural Science, v.117, p.239-242.
Parent, L. (2011) Diagnosis of the nutrient compositional Space of fruit crops. Revista Brasileira de Fruticultura, v. 33, n. 1, p. 321-334.
Raghupathi, H. B., Reddy, Y. T. N., Reju, M. Kurian & Bhargava, B. S. (2005). Diagnosis of Nutrient Imbalance in Mango by DRIS and PCA Approaches. Journal of Plant Nutrition, v.27, n.7, p.1131-1148.
Reis Junior, R.A.; Corrêa, J.B.; Carvalho, J.G. & Guimarães, P.T.G. (2002). Diagnose nutricional de cafeeiros da região sul de Minas Gerais: normas DRIS e teores foliares adequados. Revista Brasileira de Ciência Solo, v.26, n.3, p.801-808.
Ramakrishna, A.; Bailey, J.S.; Kirchhof, G. (2009). A preliminary diagnosis and recommendation integrated system (DRIS) model for diagnosing the nutrient status of sweet potato (Ipomoea batatas). Plant and Soil, v.316, p.107–116.
Sema, A.; Maiti, C.S.; Singh, A.K. & Bendangsengla, A. (2010). DRIS nutrient norms for pineapple on alfisols of india. Journal of Plant Nutrition, v.33, n.9, p.1384-1399.
Serra, A.P.; Marchetti, M.E.; Vitorino, A.C.T.; Novelino, J.O. & Camacho, M.A. (2010a). Desenvolvimento de normas DRIS e CND e avaliação do estado nutricional da cultura do algodoeiro. Revista Brasileira de Ciências do Solo, v.34, n.1, p.97-104.
Serra, A.P.; Marchetti, M.E.; Vitorino, A.C.T.; Novelino, J.O.; Camacho, M.A. (2010b). Determinação de faixas normais de nutrientes no algodoeiro pelos métodos CHM, CND e DRIS. Revista Brasileira de Ciência do Solo, v.34, n.1, p.105-113.
Serra, A.P. Normas e funções DRIS para avaliação do estado nutricional do algodoeiro (Gossypium hirsutum r latifolium). Tese de doutorado. Dourados, MS: UFGD, 2011. 200f.
Serra, A.P.; Marchetti, M.E.; Rojas, E.P.; Vitorino, A.C.T. (2012). Beaufils ranges to assess the cotton nutrient status in the southern region of Mato Grosso. Revista Brasileira de Ciência do Solo, v.36, n.1, p. 171-182.
Silva, M.A.C.; Natale, W.; Malheiros, E.B. & Pavinato, A. (2009). Estabelecimento e validação de normas DRIS para a cultura do algodão no centro-oeste do Brasil. Acta Scientiarum Agronomy, v.31, n.1, p.93-99.
Silveira, C.P.; Nachtigall, G.R. & Monteiro, F.A. (2005a). Norms for the diagnosis and recommendation integrated system for signal grass. Scientia Agricola, v.62, n.6, p.513-519.
Silveira, C.P.; Nachtigall, G.R. & Monteiro, F.A. (2005b). Testing and validation of methods for the diagnosis and recommendation integrated system for signal grass. Scientia Agricola, v.62, n.6, p.520-527.
Singh, N.P.; Awasthi, R.P. & Sud, A. (2000). Diagnosis and recommendation integrated system (DRIS) norms for apple (Malus x Domestica Borkh. L. CV. Starking Delicius) in Himachal Pradesh. Indian Journal of Hoticulturae, v.53, n.3, p.196-204.
Sumner, M. E. (1977). Aplication of Beaufils’ diagnostic indices to corn data published in literature irrespective of age and conditions. Plant and Soil, v. 46, p.359-363.

Biomass Now – Sustainable Growth and Use 146
Parent, L (2011). Diagnosis of the nutrient compositional space of fruit crops. Revista Brasileira de Fruticultura, Jaboticabal - SP, v. 33, n. 1, p.321-334.
Urano, E.O.M.; Kurihara, C.H.; Maeda, S.; Vitorino, A.C.T., Gonçalves, M.C.; Marchetti, M.E. (2006). Avaliação do estado nutricional da soja. Pesquisa Agropecuária Brasileira, v.41, n.9, p.1421-1428.
Urano, E.O.M.; Kurihara, C.H.; Maeda, S.; Vitorino, A.C.T., Gonçalves, M.C.; Marchetti, M.E. (2007). Determinação de teores ótimos de nutrientes em soja pelos métodos chance matemática, sistema integrado de diagnose e recomendação e diagnose da composição nutricional. Revista Brasileira de Ciência do Solo, v.31, p.63-72.
Urricariet, S.; Lavado, R.S. & Martín, L. (2004) Corn response to fertilization and SR, DRIS, and PASS interpretation of leaf and grain analysis. Communications in Soil Science and Plant Analysis, v.35, n.3, p.413-425.
Wadt, P.G.S. Os métodos da chance matemática e do sistema integrado de diagnose e recomendação (DRIS) na avaliação do estado nutricional de plantios de eucalipto. Viçosa, MG, Universidade Federal de Viçosa, 1996. 123p. (Tese de Doutorado)
Wadt, P.G.S.; Novais, R.F. De; Alvarez Venegas, V.H.; Fonseca, S.; Barros, N.F. De; Dias, L.E. (1998). Três métodos de cálculo do DRIS para avaliar o potencial de resposta à adubação de árvores de eucalipto. Revista Brasileira de Ciência do Solo, v.22, p.661-666.
Wadt, P.G.S.; Novais, R.F.; Alvarez V., V.H. & Bragança, S.M. (1999). Alternativas de aplicação do "DRIS" à cultura de café Conilon (Coffea canephora Pierre). Scientia Agricola, v.56 n.1. p.188-199.
Wadt, P.G.S. (2005). Relationships between soil class and nutritional status of coffee plantations. R. Bras. Ci. Solo, 29:227-234.
Walworth, J.L. & Sumner, M.E. (1987). The diagnosis and recommendation integrated system (DRIS). Advance in Soil Science, v.6, p.149-188.
Walworth, J. L.; Wooddard, H. J. & Sumner, M. E. (1988). Generation os corn tissue norms from a small, high-yield data base. Communications in Soil Science and Plant Analysis, v.19, n.5, p.563-577.
Waireg, L. W. I. & Van Asten, P. J. A. (2012). norms for multivariate diagnosis of nutrient imbalance in arabica and robusta coffee in the east African highlands. Experimental Agriculture,v.48, p.448-460.