The Determinants of Pharmaceutical Research and Development Investments
38
Contributions to Economic Analysis & Policy Volume 5, Issue 1 2006 Article 28 The Determinants of Pharmaceutical Research and Development Investments Abdulkadir Civan * Michael T. Maloney † * Fatih University, Turkey, [email protected] † Clemson University, [email protected] Copyright c 2006 The Berkeley Electronic Press. All rights reserved.
Transcript of The Determinants of Pharmaceutical Research and Development Investments

Contributions to Economic Analysis &Policy
Volume5, Issue1 2006 Article 28
The Determinants of Pharmaceutical Researchand Development Investments
Abdulkadir Civan∗ Michael T. Maloney†
∗Fatih University, Turkey, [email protected]†Clemson University, [email protected]
Copyright c©2006 The Berkeley Electronic Press. All rights reserved.

The Determinants of Pharmaceutical Researchand Development Investments∗
Abdulkadir Civan and Michael T. Maloney
Abstract
Our maintained hypothesis is that drug development responds to the intensity of consumerdemand. We look at the distribution of drug development by disease and link this to the economicharm caused by disease as measured by mortality. Mortality data represent the net effect of humanfrailty and the efficacy of the existing drugs on the market. If people continue to die from a givencondition then existing drugs are not perfect and there are potential profits from developing a moreeffective compound. We aggregate economic harm worldwide and into three broad regions: theUnited States, other developed countries, and underdeveloped countries. We find that economicharm motivates the distribution of drug development across diseases, but it is economic harm inthe United States alone that matters.
KEYWORDS: patents, intellectual property
∗Civan is Asst. Professor of Economics, Fatih University, Turkey; Maloney is Professor, John E.Walker Department of Economics, Clemson University, 29634-1309. We would like to thank Ray-mond Sauer, Curtis Simon, Robert Tollison, and John Warner for comments and encouragement.The comments of the editor and two anonymous referees were also helpful in improving the paper.

1. INTRODUCTION The drug industry most clearly brings the economic problem of intellectual prop-erty into focus. Intellectual property rights force a tradeoff between consumer surplus from low prices for existing knowledge and the potential consumer sur-plus from the expansion of knowledge. While the complaints about copyright vio-lations in music leave many of us yawning, it is hard to ignore the specter of an elderly person dying because effective drugs are priced out of economic reach. However, giving away existing property to save the elderly could mean that chil-dren born only a few years later are lost because drugs to treat their conditions do not exist.
The issues are not new and have been explored at some length. However, their policy significance is growing. The U.S. Congress is closing in on the passage of legislation to allow the importation of drugs by individual consumers. Several states have begun to import drugs from Canada and elsewhere for their Medicaid patients. Both of these actions effectively reduce the property-rights protection that was previously afforded drug companies selling product in the United States.
This paper offers some evidence that may be useful in terms of the policy de-bate. We attempt to identify the link between demand-side conditions and new drug development. We relate new drug development to the economic harm caused by disease and ask the question, is the economic loss in some countries more im-portant than in others? Put bluntly, do drug companies only respond to demand from the United States? Interestingly, and possibly unfortunately, our answer to the last question is, “yes.”
2. BACKGROUND AND PRIOR RESEARCH Because the U.S. prescription drug market is a $140 billion industry, it is no sur-prise that it is in the spotlight. Several important characteristics separate the pharmaceutical industry from other industries. Not only is it costly to develop the drugs, but governments also require expensive clinical trials before allowing the drugs on the market. These add up to huge fixed costs.
The U.S. pharmaceutical industry spends $30 billion annually on research and development (R&D) projects. Before putting a new drug on the market, compa-nies have to prove that it is both “safe” and “effective.”1 The cost of developing new drugs has increased significantly in recent decades. It has been estimated that a new drug costs approximately $800 million today compared to $400 million in the United States in the early 1990s. R&D costs increased 7.4 percent annually in real terms from the 1980s to the 1990s.2 Part of the reason for the high cost is that most new chemical entities (drug candidates) fail to reach the market. Typically
1 Both terms have extensive regulatory definitions. 2 See, DiMasi et al. (2003).
Contributions to Economic Analysis & Policy
1Civan and Maloney: Pharmaceutical R&D

less than 1 percent of the new chemical compounds examined are used in human testing. Only 20 percent of those compounds finally gain FDA approval.
While the fixed costs are in the hundreds of millions of dollars, the marginal production costs are relatively small. Moreover, unlike some other high-tech or high fixed cost industries, the imitation of the existing drugs is relatively low-tech and cheap. As a result, patent protection is crucial in recouping the cost of drug development.
However, the public perception of the drugs mitigates strong patent protec-tion. Rightly or wrongly, access to pharmaceuticals is seen as a natural right of human beings, so it has been harder for governments to convince their citizens to pay higher prices for the drugs. Thus, governments are reluctant to give strong intellectual property rights to the pharmaceutical companies. Even countries that are otherwise market friendly only recently began granting drug patents. Sweden started to give pharmaceutical patents in 1977, Japan in 1976, Norway in 1992 and Brazil in 1996. Prior to 1995, there were more than 50 countries that did not provide any patent protection to the pharmaceuticals.3
The perception that drugs are not regular commodities leads to the strict price regulation in the pharmaceuticals market present in many countries. Countries that have widespread public health insurance coverage negotiate prices with the pharmaceutical companies. Generally, these negotiations result in much lower prices than found in the United States. Theoretically, if the pharmaceutical com-panies are not happy with the outcome of these negotiations, they have the option not to market their drugs in those countries. However, unlike other goods, the in-ternational treaties give governments the right to waive the patent rights of those companies that do not market drugs in their countries (compulsory licensing). Even if the governments do not use this option, importing drugs from another country is always an option. The U.S. government, which is the most protective of pharmaceutical patents, puts some pressure on pharmaceutical companies to lower their prices. However, many other developed countries’ regulations are much stricter than those in the United States. As a result, new drug prices are much higher in United States than in Canada and European countries.4
3 In 1995 the member countries of World Trade Organization signed a treaty (TRIPS) which
requires all countries to provide strong patent protection to the pharmaceuticals. The treaty gave 10 years to implement the rules to the least developed countries. The latest talks in Doha extended the time period to 2016. Lanjouw and Cockburn (2001) find no significant increase in research for developing country diseases such as malaria and chagas after TRIPS. On theoretical grounds, Chinn and Grossman (1990) and Deardoff (1992) conclude that under most circumstances the de-veloping countries would lose with TRIPS and in some cases world wealth might also decrease because of increased patent protection in developing countries. See also, Diwan and Rodrick (1991), Helpmann (1993), and Scherer (2002) for discussions of various aspects of the issue.
4 There have been a number of studies on international comparisons of drug prices. The Gen-eral Accounting Office’s (1992, 1994) comparisons of drug prices in the United States relative to
2 Vol. 5 [2006], No. 1, Article 28
http://www.bepress.com/bejeap/contributions/vol5/iss1/art28

Because of this, it is not surprising that pharmaceutical companies are accused by the public of charging American consumers significantly higher prices than consumers in other countries including Europe, Canada, and Japan. Arguably, the rest of the world gets the best of the both worlds: lower prices for the existing drugs by regulating the industry and newly innovated drugs paid for by U.S. con-sumers.
On the other hand, the free-riding problem may not be as severe as it seems. There is some evidence that drugs are priced efficiently worldwide. Danzon and Furukawa (2003) find a close relation between drug prices and income across nine developed countries. They argue that this implies efficiency in a Ramsey-pricing sense.5 If true, the price differentials between the United States and other coun-tries may be a signal of economic well-being and regulatory moves to remove them could lower welfare.6
Of course, this argument depends on a number of market structure conditions. First, there is the question of excess profits. On this score, Grabowski, Vernon and DiMasi (2002) find little evidence of excess return. They calculated the rate of return on pharmaceutical investments and found it to be 11.5 percent, while the cost of capital in pharmaceuticals was 11 percent between 1990 and 1994. Evi-dence of price competition within the industry has also been mustered. Lu and Comanor (1998) find that greater therapeutic competition at entry leads to lower
Canada and the UK concluded that U.S. prices were 60 percent higher than the UK and 32 percent higher than Canada. The Minority Staff (1998) estimated that U.S. prices are 102 percent higher than Mexico and 70 percent higher than Canada. See, also, Danzon and Chao (2000) and Danzon and Furukawa (2003) for a good discussion of drug price measurement.
All of these studies use wholesale price as the comparison. For countries other than the United States, this reflects a reasonable estimate of the retail price because drug prices, i.e., the reim-bursement rates paid to pharmacies, are regulated. However, in the United States, the actual prices paid depend on discounts given to government purchasers, health management organizations, and other pharmacy benefit managers, and these are confidential. Nonetheless, the fact that drug re-importation from Canada is a serious policy issue speaks to the fact that U.S. citizens can purchase drugs from Canada at prices that are lower than found at local pharmacies. For instance, Canadapharmacy.com offers Zocor, 10mg, 90 tablets for $168. The retail price in the United States is $216.86. Moreover, Canadapharmacy.com offers a generic not available in the United States at $125 for 112, 90mg pills. While it is true that the price patients pay under drug-benefits programs generally make the option of buying from Canada unattractive, consumers without drug benefits can buy drugs more cheaply from Canada than in the United States.
5 Scherer and Watal (2002) found little evidence of Ramsey pricing for 15 AIDS drugs in 18 low and medium income nations.
6 Danzon and Ketcham (2003) show that removing pricing power by regulation matters. They show that due to policy changes, pharmaceutical companies decided not to introduce some of the newest drugs in New Zealand market. Danzon Wang and Wang (2003) show that price regulation delays new drug launches.
Contributions to Economic Analysis & Policy
3Civan and Maloney: Pharmaceutical R&D

prices in United States.7 Lichtenberg and Philipson (2002) conclude that the effect of competition between patents is at least as large as the effect from generics.8
The question of efficiency is important because there is much anecdotal evi-dence that pharmaceutical products have made our lives both easier and longer, and the economic value of gains in life expectancy is substantial.9 There are also studies showing that the consumption of drugs on an outpatient basis reduces the demand for other health services lowering the overall cost of health care.10
With these thoughts in mind, we propose to take a look at the relation between drug development and the intensity of demand for new drug development around the world. Our basic proposition is that in an efficient drug market, development of new drugs should be driven by demand considerations, and that these demand considerations should operate worldwide. We propose to measure worldwide de-mand by the incidence and losses from diseases that vary in intensity across coun-tries.
Our research runs parallel to that of Acemoglu and Linn (2004). They analyze the effect of potential market size on pharmaceutical innovations using U.S. demographical data. They find a large effect of potential market size (in the United States) on the entry of new drugs. Our research is also based on market size as a driving force in drug development, and consistent with the results of Acemoglu and Linn, we find that market size––especially in the United States––is positively related to drug development.
Our research design and the conclusions are also very similar to Lichtenberg (2005) with a couple of distinct differences. He looks at drugs that have already made it through the development pipeline while we look at drugs still in the pipe-line. Moreover, he uses morbidity data from the World Health Organization (WHO) while we use mortality data. In three different analyses, Lichtenberg finds the same thing that we observe in our data: that is, drug development is positively related to the burden of disease in developed countries but not the burden experi-
7 Ekelund and Persson (2003) do not find the same thing to be true in Sweden. 8 This study looked at quantities, not prices, but the price effect is shown in Cothran (2005).
Bernt et al. (1995) find own-price elasticity estimates between -0.74 and -1.03 for brand-named ulcer drugs based on data from 1977 to 1994. Ellison et al. (1997) found relatively small or insig-nificant cross-price effects between different brand name drugs but substantial cross-price effects between generic substitutes. Wiggins and Maness (2004) have found that for both generic and brand-name firms, there is a significant inverse relation between price and the number of competi-tors, whether those competitors are brand-name or generic producers. Rudholm (2003) found con-trasting results in Sweden.
9 Murphy and Topel (2002) estimate that the gains in life expectancy between 1970 and 1990 in the United States were worth about $2.8 trillion per year in the aggregate, or about $12,000 per person per year. According to their calculations, eliminating deaths from heart disease would gen-erate economic value of $48 trillion and curing cancer would be worth $47 trillion in the United States alone.
10 See Licthtenberg (2001b) and (2004).
4 Vol. 5 [2006], No. 1, Article 28
http://www.bepress.com/bejeap/contributions/vol5/iss1/art28

enced in underdeveloped nations.11 Our results corroborating his are important because the number of drugs in development is a superior measure compared to the number of drugs that have emerged from the development pipeline. Past drug development has (hopefully) affected morbidity and mortality while this endoge-neity issue is not present when the drug pipeline is used as the dependent variable. That is, by relating the burden of disease to drugs that are not yet being used in therapeutic application, we eliminate the possibility of reverse causation.
3. ANALYTICAL FRAMEWORK The demand for a drug depends on the number of potential consumers, on the amount that consumers are willing to pay, and on other market conditions such as the regulatory environment in which the firm operates. To measure the size of the potential market, we use the number of people dying from a given disease. For instance, if there is a significant number of people dying today because of lung cancer, this indicates that there will be many consumers for a newly developed drug to treat lung cancer.
In part, we use mortality because of data availability. We might use changing demographic patterns as Acemoglu and Linn did, but these are unavailable inter-nationally. Morbidity data such as those used by Lichtenberg (2005) were not available to us in disaggregated form when we started this project. They have be-come available and we discuss the results of using these data in Section 6.6 and Appendix B below.
Even so, the use of mortality data is not inappropriate. It is true that the devel-opment of a successful drug for lung cancer will lower the mortality rate due to lung cancer. Once this new drug is in the market the potential profits of new re-search on lung cancer will be lower, but before the new, successful drug enters the market, mortality will be high. In short, if the mortality rate is high for a disease, it means that the existing drugs are not successful and there are potential profits for newly developed compounds.12 As we noted above in reference to Lichtenberg (2005), there may be two-way causality between the mortality rate and drugs al-
11 Litchenberg (2001a) finds that the amount of U.S. government-funded biomedical research
is strongly positively related to premature mortality among white Americans but is unrelated or inversely related to premature mortality among nonwhite Americans, though this result admits several interpretations.
12 Some readers have objected to the use of mortality rates as a measure of demand intensity. They claim that drugs to treat chronic diseases are the most profitable and low mortality rates would indicate a small need for the drug. While it is true that diseases like high blood pressure are chronic, they still kill a lot of people. It is true that weighting mortality rates by age may under-state the importance of such drugs. However, this bias is probably lost in the aggregation. At all events, the bias works against us finding a result.
Contributions to Economic Analysis & Policy
5Civan and Maloney: Pharmaceutical R&D

ready on the market, but drugs in the development pipeline cannot have already affected mortality.
Moreover, our research method further reduces disquiet about potential en-dogeneity. Remember that our concern ultimately is whether the burden of disease differs in its effect on drug development country by country. Even assuming that there is some reverse causality between drug development and mortality, it would only affect the analysis if drug efficacy varied by country, and this does not seem to be the case.
While the number of deaths is a reasonable measure of market size, it alone is a crude measure of demand intensity because it ignores the willingness of con-sumers to pay for a drug. Willingness to pay is a function of a number of different things: the intensity of the disease, the income of the patients, the number and price of similar drugs on the market, and the prices of alternative remedies. In-come can be measured in a straightforward way on a country-by-country basis. Furthermore, we argue that person-years lost due to disease are a proxy for the intensity of the disease. This measure is also available country-by-country.13
Income is unambiguous. Richer people are willing to pay more for treatment because it is worth more both in terms of avoiding lost consumption and lost pro-duction. In addition, we propose that the age of the afflicted population is a meas-ure of the intensity of the disease. Health problems that strike younger people do more economic damage than those that hit older people because mortality in younger people represents a greater loss in productive resources.14
Again, we argue that drug development responds to the intensity of consumer demand as measured by mortality rates across diseases. Mortality data represent the net effect of human frailty and the efficacy of the existing drugs on the mar-ket. The fact that people continue to die from a given condition means that exist-ing drugs are not perfect. There are several reasons why existing drugs are not capable of eliminating a given disease: (a) current drugs are so expensive that not everybody can afford them; (b) current drugs have such significant side effects that not everybody uses them; (c) current drugs are not applicable to everybody. In each case, the mortality rate accounts for the efficacy of current drugs on the market, and it stands as a measure of the demand for new drugs.
It is assumed that marginal productivity of investments in each disease is the same. In other words, we are assuming that the science behind each disease is equally hard, and the probability of finding a drug for equal amount of investment is constant regardless of the medical area. It is assumed that if a drug company devotes $800 million to cancer research, it will introduce one new cancer drug
13 Income measures by age group would be useful but are not available internationally. 14 This is a simplification. Lost productive resources should properly be measured by the lost
human capital. To the extent that younger people are still acquiring human capital, the net cost of mortality over the life cycle probably rises and then falls.
6 Vol. 5 [2006], No. 1, Article 28
http://www.bepress.com/bejeap/contributions/vol5/iss1/art28

into the market; if it decides to invest this $800 million on treatment for heart dis-eases, one new heart drug will be introduced to the market. It is possible that some diseases are harder to target scientifically. However, the data available to us do not make this distinction. Hence, we assume that this effect is impounded in the error term.
Ultimately, we will test the proposition that it is only U.S. demand that mat-ters in drug development. However, a more general version of the same question can be posed, is drug development systematically affected by the regulatory and property-rights structure? For the drug industry, protection of intellectual property extends to regulatory institutions. The average prices of drugs can be low in a country not only due to weak protection of intellectual property rights by the tort system but also due to regulations by the government. As discussed above, many countries regulate the drug prices directly, such as France, or indirectly, such as Germany and the United Kingdom.15 These regulations and negotiations have a similar impact on price levels as does weak patent protection. Unfortunately, there is no index that would enable us to perfectly quantify all of these differences in national policies. Nonetheless, we propose to link a measure of property-rights protection to R&D investment in new drugs.
The maintained hypothesis is that worldwide demand drives the distribution of drug development across disease categories. To test this proposition, we regress drug development across diseases on the worldwide incidence of disease mortal-ity, mortality weighted by the loss of expected life, and mortality weighted by the value of the loss of expected life. In addition, we will add variables that capture the property-rights and regulatory regimes. Finally, we will ask whether drug de-velopment is solely driven by U.S. demand.
4. DESCRIPTION OF THE DATA To test the propositions outlined above, we need the data on the current damages done by each disease and the investment in new drugs to treat each disease. In re-gard to the damages caused by each disease, we use the International Mortality Statistics Dataset. These data consist of annual official cause-of-death statistics categorized in 130 groups of diseases and divided into age percentiles. The data are reported separately for 71 countries.16 Thus, this dataset allows us to estimate the burden of each disease in terms of lives lost and in terms of lost years of life
15 Germany and the UK negotiate with pharmaceutical companies on price levels. If there is
no agreement between the companies and the government on particular drugs, these drugs are ex-cluded from the drugs covered by public insurance.
16 Most of the developed countries are included in the data; however, many developing and underdeveloped countries are not, notably China and India.
Contributions to Economic Analysis & Policy
7Civan and Maloney: Pharmaceutical R&D
on a country-by-country basis. We primarily use the 1997 mortality statistics in order to maximize the number of countries in the sample.17
The cause of death may be proximate or underlying. That is, when a woman dies of bone cancer, it may be that the cancer first appeared there or it may be that breast cancer metastasized to the bones. The WHO standard for classification of mortality is to use the underlying cause of death. So, for instance, breast cancer that metastasizes to the bones and causes death is classified as breast cancer.
Mortality data by disease, age, and country can be linked to income per capita at the national level. This allows us to measure the economic loss caused by each disease. In order to measure the number of years lost because of mortality at a given age we used data on the expected lifetime in each country as reported by the WHO for the year 2002. National income data were taken from per capita statis-tics reported by the World Bank for 2002.
As an alternative to economic loss, health expenditures per capita reported by WHO are used as a measure of the potential profits from new drug development in each country. Healthcare expenditures act as a proxy for drug prices on a coun-try-by-country basis.18
Drug development is measured by the number of drugs in the pipeline. A con-sulting firm, Centerwatch, follows drug companies all over the world and reports on their research and development activities. The data available from Centerwatch not only list the drugs and their therapeutic applications, but also reports their po-sition in the development and marketing approval process. These data were ob-tained for the year 2003.19
Drugs in the pipeline are matched to diseases. The Centerwatch data are bro-ken into many more categories than given in the International Mortality Statistics. In order to match the two sources, it was necessary to ignore some categories and to combine others.20
17 Many countries did not report the mortality data until recently and for others there is a long
lag in their reports. As a consequence, using data from 1997 maximizes the number of countries in the sample. If the 1997 data are not available for a country, either 1996 or 1998 data are employed. Mortality is not expected to change dramatically year to year, so even though mortality data for 1997 are slightly dated relative to other data in the analysis, this should not create a bias.
18 Average prices for newly patented drugs are not publicly available for enough countries in our sample to make direct measurement feasible.
19 Centerwatch sells data and market analysis to industry professionals and potential investors and provides less detailed versions for free to the patients who would like to get informed about clinical trials and investigational drugs. The data have been cited in medical journal publications, e.g., Till, Phillips, and Jadad (2003) and Manheimer and Anderson (2002). We gathered data dur-ing a free three-day trial access.
20 There are some drugs developed for nonfatal diseases such as heart burn or skin diseases. There are many other drugs that are hard to allocate for specific type of diseases such as drugs developed for surgical procedures. Similarly there are some incidences of deaths in the mortality
8 Vol. 5 [2006], No. 1, Article 28
http://www.bepress.com/bejeap/contributions/vol5/iss1/art28

The Centerwatch data are used to create two different variables. The first is the total number of new drugs in the development pipeline. We call this variable Drug-Count and label it K. The second variable measures the total investment represented by drugs in the pipeline. This is called Drug-Investment and is labeled I.
The investment variable is calculated by linking the stage of development to cost estimates reported by other researchers. DiMasi et al., (2003) estimate the cost of each of the three stages of drug development in the United States.21 The development stage of each drug reported by Centerwatch is multiplied by the av-erage U.S. expenditures necessary to reach that stage.22 Both K and I are meas-ured at the disease level. Ki is the total number of drugs in the pipeline that are targeted to treat a given disease, i.23 Ii is the total investment in all drugs aimed at disease i. These variables are the dependent variables used in the analysis.
Different countries provide different levels of patent protection and have dif-ferent price regulations. In order to capture the effects of these policies, we need an index comparable across countries. The best index would be specific to the pharmaceutical industry because sometimes a country’s general property-rights policies do not reflect the specific policy applied to the pharmaceutical industry. However, such an index is not readily available––especially from public sources. As a consequence, we use a more general index created by Heritage Foundation.
The Heritage Foundation’s Freedom Index ranks the countries from 1 to 5 based on their regulation, government intervention, and the level of property-rights protection. Countries that have the most market-friendly policies are given a 1 and the least market friendly ones are given a 5.
data such as homicide and drowning for which new drugs do not represent a likely remedy. These categories are ignored.
21 R&D costs of 68 randomly selected new drugs obtained from a survey of 10 pharmaceutical firms. These data were used to estimate the average pre-tax cost of new drug development. The researchers estimated the mean cost of phase I $15.2 million, phase II $23.5 million and phase III $86.3 million.
22 Where Centerwatch reports that the project is discontinued or that the development stage is unknown it is assumed that the project is in the middle of the approval stage.
Our approach assumes that drug development done in the European Union and Japan costs the same as development done in the United States, which is likely not true since the testing protocols are different.
23 Some drugs are targeted to a number of different diseases. However the drug companies are required to prove the efficacy of the drug for each targeted disease separately. Considering that most of the R&D money goes to efficacy trials, we include these drugs in our dependent variable in each targeted disease without dividing. However for cancer drugs there are number of drugs that are applicable to all types of cancers such as chemotherapy. R&D money of those general cancer drugs are divided into dependent variables of cancers based on their weight.
Contributions to Economic Analysis & Policy
9Civan and Maloney: Pharmaceutical R&D
5. EMPIRICAL METHODOLOGY We are looking for the relation between the amount of drug development and the harm caused by each disease worldwide. The most obvious approach would be to do a panel regression of drug development (Ki or Ii) as the dependent variable on the economic loss caused by each disease in each country. That is, each observa-tion would be a disease, and the economic loss from the disease in each country would be included as separate independent variables. The maintained hypothesis predicts that all coefficients are the same. However, this approach is not possible given the dimensions of the data. Our dataset contains 71 countries and 49 health problems, which makes the full panel approach under identified. As a result, it is necessary to aggregate the data.
There are many ways to aggregate the data. The method that we use reflects the hypotheses in which we are interested. The null hypothesis is that drug com-panies randomly allocate their research and development activities across dis-eases. The alternative hypothesis is that research and development is motivated by potential profits that vary across diseases based on economic loss. Within the al-ternative hypothesis, we are interested in discovering the extent to which intellec-tual property rights and country-specific regulation of the drug industry affects the industry’s allocation of research money. In order to test the null hypothesis against the alternatives, we aggregate the independent variables by summing the number of deaths, the years lost, and the income lost due to each disease across the entire world and across subregions.
Total deaths are simple. Let dij be the number of people in country j who died from disease i. Total deaths by disease i can be identified as:
1
N
i ijj
D d=
=∑ (1)
where N is the number of countries in the world or subregion over which we are aggregating.
Expected years lost because of each disease is somewhat more complicated to express even though it is conceptually simple. Again, we sum across countries. In each country, the age of death is compared to the life expectancy in that country. Table A1 in Appendix A gives life expectancy across the countries in the sample that is used in the calculation of person-years lost. We also discount these lost years at an interest rate that accounts for the social rate of discount.24
24 The interest rates used are 0, 1, 3, and 5 percent. The reported results are based on 1 per-
cent. The choice has no effect on the results.
10 Vol. 5 [2006], No. 1, Article 28
http://www.bepress.com/bejeap/contributions/vol5/iss1/art28

Symbolically, let dijk represent the number of people in country j of age k that died from disease i, and let Tj be life expectancy in country j. Person-years lost to the disease i in country j, Yij, is then:
1 1 (1 )
j jT T kijk
ij tk t
dY
r
−
= =
=+∑∑ (2)
Total person-years lost regionally or worldwide is the sum of Yij over j. That is,
1
N
i ijj
Y Y=
=∑ (3)
If lost person-years are multiplied by per capita income in each country, we
have a measure of the economic loss. Let per capita income in country j be yj. We can then define the regional or worldwide economic loss from disease i as:
1
N
i j ijj
V y Y=
=∑ (4)
We adjust economic loss in country j for the property-rights institutions of that
country. Again, the Heritage Foundation index ranges from a strong property-rights indicator of 1 to weak property rights at 5.25 That is, an index number 5 is given to the least market friendly countries while the most market friendly gov-ernments get 1. If we divide this index into economic loss, we get a weighted measure of economic loss.26 Deaths causing lost years of life and lost income are discounted in countries with weak property-rights institutions.
Let the Heritage Foundation index in country j be Fj. We can then define the property-rights weighted, economic loss from disease i as:
1
/N
i j ij jj
W y Y F=
=∑ (5)
An alternative to economic loss defined in terms of per capita income is to de-
fine the magnitude of potential demand in terms of per capita health expenditures.
25 Heritage Foundation reports the Freedom Index for different categories, such as govern-
ment intervention, regulation, property-rights protection. The results do not change significantly with different categories of indexes. We report the results for the Freedom Index which averages all the categories.
26 Nonlinear weighting of Freedom Index does not change the results.
Contributions to Economic Analysis & Policy
11Civan and Maloney: Pharmaceutical R&D

Per capital health expenditures are a measure of the amount that a resident of country j could be expected to spend each year if that person does not die. If we multiply these expenditures by the lost person-years it gives an approximate upper bound of the amount a drug company might be able to charge for a new life-saving drug. Let hj be per capita health care expenditures in country j. We then have:
1
N
i j ijj
H h Y=
=∑ (6)
Based on these aggregate variables, we can specify several regressions that
test our propositions about the behavior of drug companies. Each of the dependent variables, {Ki, Ii}, can be regressed on each of the independent variables sepa-rately, {Di, Yi, Vi, Wi, Hi}. However, the independent variables cannot all be in-cluded in the same regression because they represent similar aggregations of the cross-country effects. In order to remedy this, we transform them in ways that al-low us to capture the marginal impact of each effect.
Consider what happens if we divide income-weighted lost person-years by lost person-years. This gives us the lost income of the average person killed by disease i. That is, we define a variable called average lost income as:
ii
i
Vv
Y= (7)
Vi represents the lost income weighted by person-years lost to disease i. Yi repre-sents the total person-years lost. The ratio is the weighted average lost per capita income due to disease i. Or, put differently, it is the income of the average victim.
Similarly, define a variable called average property rights as:
ii
i
Vw
W= (8)
Again, Vi represents the lost income weighted by person-years lost to disease i. Wi represents the property-rights adjusted person-year weighted income lost to dis-ease i. The ratio measures the weighted average property-rights protection associ-ated with disease i. We can think of this as the property-rights index of the aver-age victim.
Finally, based on the same methodology we can define the weighted average annual health expenditure for disease i. It is given by:
12 Vol. 5 [2006], No. 1, Article 28
http://www.bepress.com/bejeap/contributions/vol5/iss1/art28
ii
i
Hh
Y= (9)
We can think of this as the annual expected healthcare expenditures for the aver-age victim if that person had survived.
The variables described in equations (7) through (9) help us parse out the marginal impact of economic versus human loss in motivating drug development. However, the issue that we are most keenly interested in is the extent to which drugs are developed to satisfy the U.S. market alone. We investigate this hypothe-sis by aggregating equations (1) through (6) over three subregions: the United States only, the European Union and other developed countries, and the rest of the world, which are the underdeveloped countries.27
Table A2 in Appendix A gives the data and summary statistics for the basic variables used in the analysis. The first part of Table A2 gives worldwide cumula-tive deaths, person-years lost, drug-count, investment, income-weighted years lost, property-rights and income weighted years lost, healthcare expenditure weighted years lost, and the ratio of U.S. deaths to the worldwide total, all by dis-ease. There are 49 diseases. The table is sorted by total deaths. That is the disease with the highest mortality, cerebrovascular disease, comes first; it killed 1.8 mil-lion people in 1997. The bottom of Table A2 gives the mean, median, minimum, maximum, and standard deviation for these variables.
The disease causing the most lost years is the catch-all category for cancers not otherwise defined (NOD). There were 6.74 million person-years lost due to these diseases. Cancer NOD tops out the weighted years lost categories as well. It also has the most new drugs in the pipeline (346) as well as the greatest invest-ment in new drugs ($11 billion).
The median investment is $633 million, which is slightly more than the in-vestment in new stomach cancer drugs. Median income adjusted years lost is $10.6 trillion, which is the value for prostate cancer.
27 The other developed countries are Australia, Austria, Belgium, Canada, Denmark, Finland,
France, Germany, Greece, Iceland, Ireland, Israel, Italy, Japan, Luxemburg, Malta, Netherlands, New Zealand, Norway, Portugal, Singapore, Spain, Sweden, Switzerland, and the UK.
Contributions to Economic Analysis & Policy
13Civan and Maloney: Pharmaceutical R&D

6. RESULTS AND DISCUSSION The results of the analysis are presented in Tables 1 through 4.28 Table 1 presents the results for single-variable regression specifications of new drug development on the various mortality measures. The table gives the estimated elasticities of each effect measured at the mean. The coefficient estimate and t-values are also given in parentheses and brackets, respectively.
6.1. SIMPLE WORLDWIDE AGGREGATE EFFECTS The results in Table 1 for the two different dependent variables, drug count
and drug investment, are nearly identical and follow the expected pattern. Drug development by disease is positively associated with worldwide total deaths due to each disease. However, deaths alone are a crude measure of demand intensity and the effect is not statistically significant at conventional levels.
Weighting deaths by lost years improves the predictive power of the model. The R2
nearly doubles. The elasticity is almost 0.5; this says that doubling person-years lost increases drug development by 50 percent.
Another way to interpret these coefficients is to note that they imply that the marginal drug on the market comes in response to a median value of 8571 lives lost, or 69,791 person-years lost, or $1 trillion income-adjusted years lost. From the healthcare-expenditure-adjusted years lost estimates, we can say that an upper bound on the market size necessary to bring a new drug into the market is $101 billion calculated at the median.
Weighting years-lost by income, property rights, or healthcare expenditures further improves the fit of the model, but differences among these effects are slight.29 The estimated elasticity is approximately the same as found using years lost. Based on these regressions, it appears that drug development is a worldwide phenomenon based on the total economic loss from each disease.
28 The negative binomial econometric technique is used in all regressions. The negative bino-
mial model is used because of the discrete nature of the dependent variables. Even though our In-vestment variable is not purely discrete, it is created by multiplying constants with discrete values, thus using Negative binomial is still appropriate.
29 The R2s of the various regressions in Table 1 paint a straightforward picture. Even so, we perform some tests of goodness-of-fit. Arguably, the regression of drug count on Vi is a nested test of the regression of drug count on Yi because Vi is Yi times per capita income raised to the expo-nent of, alternatively, zero or one. Using this logic, the likelihood ratio test statistic is 4.52, which is significant at the .04 level. Similarly, the nested test of Hi compared to Yi returns a test statistic of 5.19, significant at the .03 level. The nested test of Wi compared to Vi returns a test statistic of .75, which fails to reject the null that weighting income adjusted years lost by the freedom index adds no explanatory power. Comparisons of the models including Yi and Wi with those including Hi represent nonnested tests. We postpone these nonnested tests to the results reported in Table 2.
14 Vol. 5 [2006], No. 1, Article 28
http://www.bepress.com/bejeap/contributions/vol5/iss1/art28
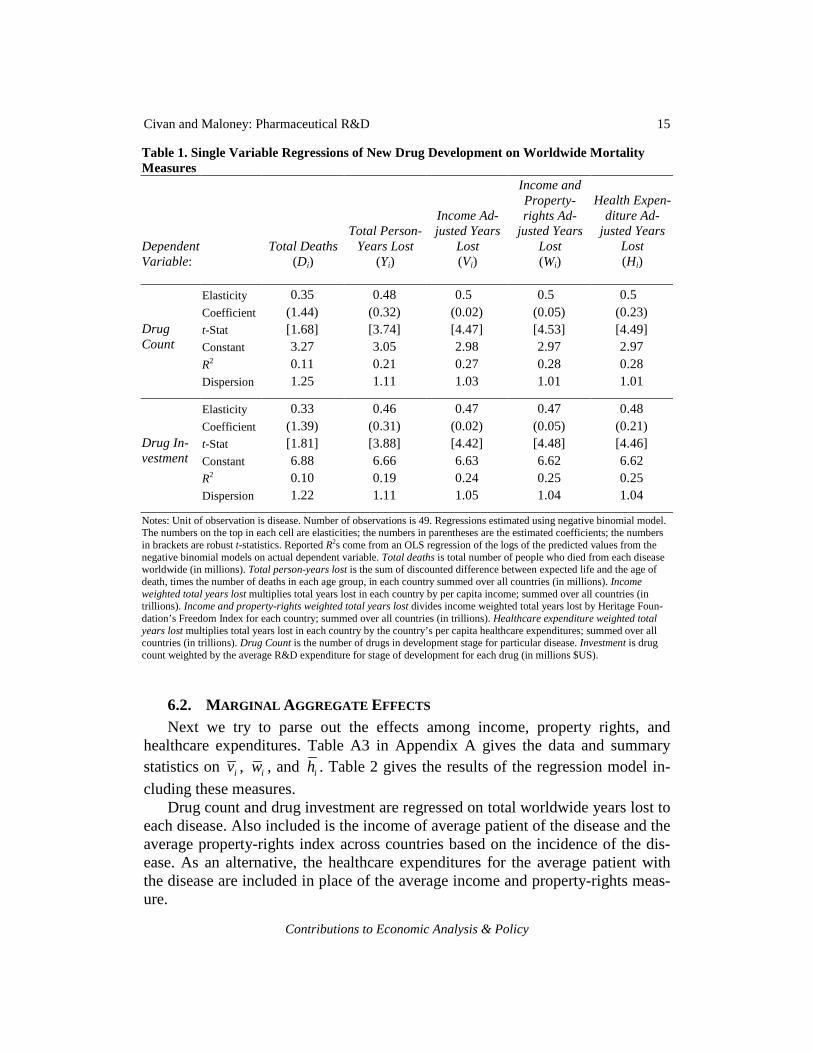
Table 1. Single Variable Regressions of New Drug Development on Worldwide Mortality Measures
Dependent Variable:
Total Deaths (Di)
Total Person-Years Lost
(Yi)
Income Ad-justed Years
Lost (Vi)
Income and Property-rights Ad-
justed Years Lost (Wi)
Health Expen-diture Ad-
justed Years Lost (Hi)
Elasticity 0.35 0.48 0.5 0.5 0.5 Coefficient (1.44) (0.32) (0.02) (0.05) (0.23) t-Stat [1.68] [3.74] [4.47] [4.53] [4.49] Constant 3.27 3.05 2.98 2.97 2.97 R2 0.11 0.21 0.27 0.28 0.28
Drug Count
Dispersion 1.25 1.11 1.03 1.01 1.01
Elasticity 0.33 0.46 0.47 0.47 0.48 Coefficient (1.39) (0.31) (0.02) (0.05) (0.21) t-Stat [1.81] [3.88] [4.42] [4.48] [4.46] Constant 6.88 6.66 6.63 6.62 6.62 R2 0.10 0.19 0.24 0.25 0.25
Drug In-vestment
Dispersion 1.22 1.11 1.05 1.04 1.04 Notes: Unit of observation is disease. Number of observations is 49. Regressions estimated using negative binomial model. The numbers on the top in each cell are elasticities; the numbers in parentheses are the estimated coefficients; the numbers in brackets are robust t-statistics. Reported R2s come from an OLS regression of the logs of the predicted values from the negative binomial models on actual dependent variable. Total deaths is total number of people who died from each disease worldwide (in millions). Total person-years lost is the sum of discounted difference between expected life and the age of death, times the number of deaths in each age group, in each country summed over all countries (in millions). Income weighted total years lost multiplies total years lost in each country by per capita income; summed over all countries (in trillions). Income and property-rights weighted total years lost divides income weighted total years lost by Heritage Foun-dation’s Freedom Index for each country; summed over all countries (in trillions). Healthcare expenditure weighted total years lost multiplies total years lost in each country by the country’s per capita healthcare expenditures; summed over all countries (in trillions). Drug Count is the number of drugs in development stage for particular disease. Investment is drug count weighted by the average R&D expenditure for stage of development for each drug (in millions $US).
6.2. MARGINAL AGGREGATE EFFECTS Next we try to parse out the effects among income, property rights, and
healthcare expenditures. Table A3 in Appendix A gives the data and summary statistics on iv , iw , and ih . Table 2 gives the results of the regression model in-
cluding these measures. Drug count and drug investment are regressed on total worldwide years lost to
each disease. Also included is the income of average patient of the disease and the average property-rights index across countries based on the incidence of the dis-ease. As an alternative, the healthcare expenditures for the average patient with the disease are included in place of the average income and property-rights meas-ure.
Contributions to Economic Analysis & Policy
15Civan and Maloney: Pharmaceutical R&D

Table 2. Isolating Demand Effects in New Drug Development
Dependent Variables & Specifications Drug Count Drug Investment Independent Variables: (a) (b) (c) (d)
Total Person-Years Lost (Yi) 0.30
(0.20) [2.73]
0.29 (0.20) [2.69]
0.29
(0.20) [2.76]
0.29 (0.19) [2.73]
Income ( )iv 1.44
(0.10) [3.63]
1.04
(0.08) [3.03]
Property Rights ( )iw -3.05
(-1.28) [-2.35]
-4.51
(-1.90) [-3.57]
Healthcare Expenditures ( )ih 1.92
(1.50) [6.99]
1.77
(1.39) [6.48]
Constant (4.55) [2.82]
(1.02) [3.20]
(10.07) [6.61]
(4.85) [16.47]
R2 0.49 0.50 0.48 0.41 Dispersion 0.63 0.61 0.72 0.73 Notes: Observations are by disease; there are 49 observations. The numbers on the top in each cell are elasticities. The numbers in parentheses are the coefficients estimated by negative binomial model. The numbers in brackets are the robust t-statistics of coefficients. Reported R2s come from an OLS regres-sion of the logs of the predicted values of the negative binomial models on actual dependent variable. Person-Years Lost is the worldwide total difference between life expectancy and age of death. Income is the per capita income of the average victim worldwide. Healthcare Expenditures is the per capita annual expenditures on healthcare for the average victim worldwide. Property Rights is the Heritage Foundation Freedom Index for the average victim of the disease worldwide.
The results support the general argument that drug companies are motivated
by demand-side factors. Average income is positive and statistically significant. Also, note that the elasticity of the effect of years lost is the same in all specifica-tions. This implies that the model is fundamentally stable. Lost person-years drive the demand for drugs. On top of this, other factors have marginal effects.
However, the results also imply that the political and regulatory environment affects drug research. The property-rights variable has the correct sign and is sta-tistically significant: as the Heritage Foundation index moves toward stronger property-rights institutions (i.e., from 5 toward 1), drug development increases.
The alternative to income and property rights that we use to capture the poten-tial economic value of lost person-years to drug companies is the average health-care expenditures. This value is highly statistically significant. Healthcare expen-
16 Vol. 5 [2006], No. 1, Article 28
http://www.bepress.com/bejeap/contributions/vol5/iss1/art28

ditures are a direct measure of what is at stake for new drug development, and they represent a proxy for the actual drug prices on a country-by-country basis. The healthcare-expenditure variable appears to be a substitute for the income and property-rights specification.
We perform a nonnested J-test of the alternative specifications: (a) versus (b) and (c) versus (d) (see Green 2000, p. 302). The predicted values of (a) are in-cluded in (b) and vice versa. The same tests are performed for (c) and (d). Based on these tests neither specification can be declared superior. The tests accept the null in all cases; i.e., the predicted values from model (a) when included in (b) are statistically insignificant. The same is true for predicted (b) included in model (a), and similarly for the tests run on models (c) and (d).
6.3. U.S. EFFECT Next, we disaggregate the incidence of disease in order to measure the relative
importance of demand around the world. We show regressions that control for the disease impacts in three broad regions of the world: the United States, the Euro-pean Union and other developed countries, and the rest of the world comprised of underdeveloped countries. First, we repeat the specifications shown in Table 1 disaggregating the independent variables into these three groups.
These regressions are shown in Table 3. The results are clear. Table 3 shows that the U.S. alone drives drug development. As in Table 1, person-years lost are a more powerful predictor than lives alone. However, in Table 3, economically weighting person-years lost does not add to the predictive power of the model. This is because person-years lost in the United States drive the result. Since there is no variation in income, property rights, or healthcare expenditures across dis-eases in the construction of these various effects for the United States alone, they add nothing to predictive power. However, these variables do have variation for the other two regional aggregations. If the rest of the world mattered in determin-ing drug development, it should show up more powerfully when disease incidence is weighted by income or healthcare, but it does not.
The results say that as person-years lost in the United States go up by 10 per-cent, drug development goes up by around 7 percent. Drug development is not related to mortality in other developed countries on net, and as person-years lost go up in the underdeveloped countries, drug development goes down.
The negative sign and statistical significance in the drug-count regressions on person-years lost in underdeveloped countries represents a striking result. Not only does the incidence of disease in underdeveloped countries not encourage drug development, it actually discourages it.
Contributions to Economic Analysis & Policy
17Civan and Maloney: Pharmaceutical R&D
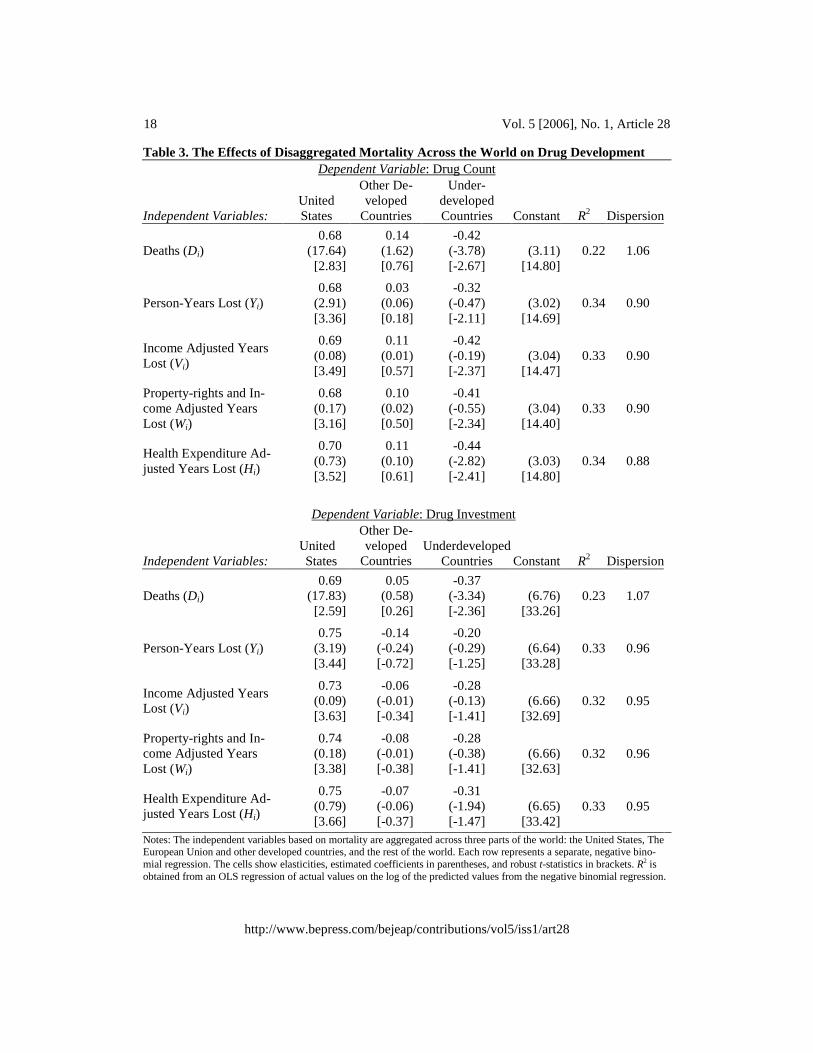
Table 3. The Effects of Disaggregated Mortality Across the World on Drug Development Dependent Variable: Drug Count
Independent Variables: United States
Other De-veloped
Countries
Under-developed Countries Constant R2 Dispersion
Deaths (Di) 0.68
(17.64) [2.83]
0.14 (1.62) [0.76]
-0.42 (-3.78) [-2.67]
(3.11)
[14.80] 0.22 1.06
Person-Years Lost (Yi) 0.68
(2.91) [3.36]
0.03 (0.06) [0.18]
-0.32 (-0.47) [-2.11]
(3.02)
[14.69] 0.34 0.90
Income Adjusted Years Lost (Vi)
0.69 (0.08) [3.49]
0.11 (0.01) [0.57]
-0.42 (-0.19) [-2.37]
(3.04)
[14.47] 0.33 0.90
Property-rights and In-come Adjusted Years Lost (Wi)
0.68 (0.17) [3.16]
0.10 (0.02) [0.50]
-0.41 (-0.55) [-2.34]
(3.04)
[14.40] 0.33 0.90
Health Expenditure Ad-justed Years Lost (Hi)
0.70 (0.73) [3.52]
0.11 (0.10) [0.61]
-0.44 (-2.82) [-2.41]
(3.03)
[14.80] 0.34 0.88
Dependent Variable: Drug Investment
Independent Variables: United States
Other De-veloped
Countries Underdeveloped
Countries Constant R2 Dispersion
Deaths (Di) 0.69
(17.83) [2.59]
0.05 (0.58) [0.26]
-0.37 (-3.34) [-2.36]
(6.76)
[33.26] 0.23 1.07
Person-Years Lost (Yi) 0.75
(3.19) [3.44]
-0.14 (-0.24) [-0.72]
-0.20 (-0.29) [-1.25]
(6.64)
[33.28] 0.33 0.96
Income Adjusted Years Lost (Vi)
0.73 (0.09) [3.63]
-0.06 (-0.01) [-0.34]
-0.28 (-0.13) [-1.41]
(6.66)
[32.69] 0.32 0.95
Property-rights and In-come Adjusted Years Lost (Wi)
0.74 (0.18) [3.38]
-0.08 (-0.01) [-0.38]
-0.28 (-0.38) [-1.41]
(6.66)
[32.63] 0.32 0.96
Health Expenditure Ad-justed Years Lost (Hi)
0.75 (0.79) [3.66]
-0.07 (-0.06) [-0.37]
-0.31 (-1.94) [-1.47]
(6.65)
[33.42] 0.33 0.95
Notes: The independent variables based on mortality are aggregated across three parts of the world: the United States, The European Union and other developed countries, and the rest of the world. Each row represents a separate, negative bino-mial regression. The cells show elasticities, estimated coefficients in parentheses, and robust t-statistics in brackets. R2 is obtained from an OLS regression of actual values on the log of the predicted values from the negative binomial regression.
18 Vol. 5 [2006], No. 1, Article 28
http://www.bepress.com/bejeap/contributions/vol5/iss1/art28

6.4. EXPLAINING THE NEGATIVE SIGN The negative relation between the incidence of disease and drug development
that we see in Table 3 for the underdeveloped countries is a perverse effect and begs an explanation. Two have been offered by Danzon (2004):
[G]overnments in countries with relatively high prices have been increasingly attempting to reduce their own drug expenditures by taking advantage of lower prices in other countries. Two strategies are employed to that end. The first re-lies on cross-national price comparisons as a benchmark for regulating domestic prices. ... The second strategy is to permit wholesalers to import drugs purchased abroad at lower prices. Such parallel importing is growing in Europe and threatens to expand significantly, as traditionally low-priced countries join the European Un-ion. [p. 1]
Our result is consistent with either or both of these explanations. The implication is that the prices of drugs in countries that have negotiated drug prices or coun-tries that allow wholesale importation are pushed down by low prices in other countries. Thus, if pharmaceutical companies develop drugs whose principal mar-kets are countries with low prices, such as the underdeveloped countries, they will be forced to sell these drugs at low prices worldwide, and hence will be unable to recover their costs.
6.5. DISSECTING THE NEGATIVE EFFECTS To further investigate the negative effect of mortality in the rest of the world
on drug development, we re-estimate the regressions shown in Table 2 with the independent variables disaggregated in similar form to Table 3. Table 4 shows drug count and drug investment regressed on person-years lost in the United States, person-years lost in other developed countries, and person-years lost in underdeveloped countries along with average income, average property rights, and average healthcare expenditures in other developed countries and in the rest of the world. The income, property right, and healthcare variables for the United States are omitted because they are collinear with years lost in the United States.30
Person-years lost in the United States are the baseline; we are searching for the impacts of income, property rights, and healthcare expenditures in other de-veloped and underdeveloped countries. So, for instance, Table 3 says that lost person-years in developed countries have no impact on drug development. Table 4 separates this out into income and property-rights factors.
30 Substituting healthcare expenditures for income and property rights reduces predictive
power substantially. This suggests that the healthcare-expenditure effect found in Table 2 is a U.S. phenomenon.
Contributions to Economic Analysis & Policy
19Civan and Maloney: Pharmaceutical R&D

Table 4. Isolating Disaggregated Demand Effects
Specifications & Dependent Variables Drug Count Drug Investment
Independent Variables: (a) (b) (c) (d)
Total Person-Years Lost in the United States (Yi)
0.98 (4.21) [3.52]
0.88 (3.79) [2.88]
1.08
(4.63) [3.69]
0.98 (4.21) [3.06]
Total Person-Years Lost in Developed Countries* (Yi)
-0.34 (-0.61) [-1.65]
-0.14 (-0.24) [-0.56]
-0.49
(-0.88) [-2.24]
-0.31 (-0.55) [-1.20]
Income in Developed Countries* ( )iv 7.49
(0.32) [2.97]
8.23
(0.35) [3.50]
Property Rights in Developed Countries* ( )iw
-6.70 (-2.85) [-1.70]
-6.96
(-2.97) [-2.00]
Healthcare Expenditures In Developed Countries* ( )ih
3.14 (1.62) [1.29]
3.78
(1.96) [1.62]
Total Person-Years Lost in Under-developed Countries (Yi)
-0.27 (-0.40) [-2.08]
-0.37 (-0.54) [-2.19]
-0.21
(-0.31) [-1.49]
-0.28 (-0.41) [-1.59]
Income in Underdeveloped Countries ( )iv
-0.54 (-0.16) [-0.85]
-0.54
(-0.16) [-0.85]
Property Rights in Underdeveloped Countries ( )iw
-17.80 (-5.82) [-3.01]
-15.36 (-5.03) [-2.83]
Healthcare Expenditures in Underdevel-oped Countries ( )ih
0.09 (0.40) [0.13]
-0.17
(-0.72) [-0.24]
Constant (20.46) [3.37]
(-0.21) [-0.01]
(21.19) [3.75]
(3.02) [1.25]
R2 0.44 0.34 0.42 0.33 Dispersion 0.69 0.88 0.76 0.92 Notes: Observations are by disease; there are 49 observations. The numbers on the top in each cell are elasticities. The numbers in parentheses are the coefficients estimated by negative binomial model. The numbers in brackets are the robust t-statistics of coefficients. Reported R2s come from an OLS regression of the log of the predicted values of the negative binomial models on actual dependent variable. Person-Years Lost is the worldwide total difference between life expec-tancy and age of death. Income is the per capita income of the average victim worldwide. Healthcare Expenditures is the per capita annual expenditures on healthcare for the average victim worldwide. Property Rights is the Heritage Foundation Freedom Index for the average victim of the disease worldwide. (*) Developed Countries excludes the United States.
20 Vol. 5 [2006], No. 1, Article 28
http://www.bepress.com/bejeap/contributions/vol5/iss1/art28

6.5.1. DEVELOPED COUNTRIES For developed countries, the statistically significant coefficients on income
and marginally significant coefficients on property rights in Table 4 both have the correct sign. That is, as income increases and property rights become stronger, more drugs are developed to meet the needs of the population. However, these impacts are offset by the negative sign on person-years lost.
Thus, we conclude that within the subsample of developed countries, those with low income and unfavorable property-rights institutions actually discourage drug development while those with high income and favorable property-rights institutions encourage drug development by an offsetting amount. That is, devel-oped countries with high income and reasonable property-rights institutions are paying relatively high and relatively efficient prices for drugs. Alternatively, de-veloped countries with low income and poor property-rights protection are paying drug prices that are inefficiently low, so low in fact that they actually discourage drug development in diseases that affect their populations the most.
The perverse result that we see on net in the underdeveloped world shows up even in the developed world for some countries. In the subsample of developed countries, the estimated perverse impact from some countries is consistent with Danzon’s speculation in her second point above––cross shipment from countries with low prices to countries with high prices.
6.5.2. UNDERDEVELOPED COUNTRIES In underdeveloped countries, the negative net effect shown in Table 3 is
shown to be almost totally a property-rights effect. The estimated impact for the property-rights variable is over three times as large for these countries as for de-veloped countries in specification (a).
Overall, the conclusion is that the net negative impact of underdeveloped countries on drug development comes from the countries with the worst property-rights institutions. The implication is that drug prices in these countries are so low that drug companies avoid developing drugs that focus on diseases primarily prevalent in these countries because the research costs cannot be recovered, even from sales in the rest of the world.
Recognize that our data and methodology do not allow us to estimate the ef-fect of disease and drug development on a country-by-countries basis. The zero impact that we see as an aggregate phenomenon across the developed countries is odd and the negative impact we see across the underdeveloped countries is para-doxical. Table 4 is one attempt to flesh this out, but it is only suggestive.
6.6. OTHER CONSIDERATIONS The reader should keep in mind that the dataset does not include all the coun-
tries in the world but only 71 of them. One might consider how the inclusion of
Contributions to Economic Analysis & Policy
21Civan and Maloney: Pharmaceutical R&D

the data of the other countries would affect the results. Table 1 lists the countries for which the mortality data are available. As expected, most of the developed countries' mortality data are available, while much of the less developed countries' data are not available. Nonetheless, to the extent that the less developed countries are represented in an unbiased fashion, the estimated elasticities should be unbi-ased.
There are a number of limitations of the data that may weaken the results. Mortality data only give information about the deceased. It is clear that this is not a perfect proxy for the economic years lost due to the disease. Arguably, the mor-bidity data used by Litchenberg (2005) would be better. Those data come from a 2002 WHO study: "Global Burden of Disease [GBD]” (See Mathers et al., 2003). In the GBD project WHO estimated the damages caused by 156 health problems in terms of healthy person-years lost (DALY). Since all illnesses do not affect the life quality on the same level, the researchers in the WHO study weight each health problem by combining expert opinions with survey answers. They attempt to proxy the economic damages caused by each disease. WHO also released mor-tality data along with the DALY estimates as part of the GBD.
When we began this project the WHO data were only available in interna-tional region aggregations. The country by country data have now been released, and we applied our methodology to these data. However, we have found serious data discrepancies that lower our level of confidence that our model can employ these data in their current form. We discuss these issues in Appendix B; our opin-ion is that the WHO GBD data are not suitable at this time to give an informative corroborative test of our findings.
There are other limitations in our methodology. One is that charitable founda-tions, international organizations, many governments, and universities are active in pharmaceutical research and development investments and also purchase exist-ing treatments from pharmaceutical companies. These organizations and founda-tions create extra demand that is not perfectly accounted for in our data for the drugs that are particularly effective in underdeveloped countries.31 Our data do account for the lost lives and years to which these organizations no doubt respond, but weighting years by income in the underdeveloped countries potentially under-states the demand from charitable organizations for drugs to be used in these countries. This is a potential explanation for the negative sign on income for un-derdeveloped countries in Table 4.
Another factor omitted from our analysis is that countries differ on the proc-esses of drug approval in terms of requirements of time, money, and probability of getting the approval. This is clearly going to affect the investment decisions. If Canadian drug approval is much cheaper and takes less time than U.S. approval,
31 In a similar vein, the charitable contributions by pharmaceutical companies in terms of cheap or free drugs to developing countries for tax or public relations reasons is not accounted for.
22 Vol. 5 [2006], No. 1, Article 28
http://www.bepress.com/bejeap/contributions/vol5/iss1/art28
ceteris paribus, companies are going to invest more on Canadian diseases than U.S. diseases. Neither do we account for the size of the drug industry in each country. In a public choice framework, countries with large domestic drug indus-tries are more likely to have policies favorable to the industry.
Finally, the index of market friendliness of countries (the Heritage Foundation index) is far more general than we would like it to be. Even though the United States, Canada, and France have very similar Heritage index numbers, their na-tional drug policies significantly differ.
All of these problems contribute to some extent to the prediction error of the regressions. In spite of this, none appear to create a bias, so the conclusions drawn from the estimates stand.
7. CONCLUSIONS Our research implies that research in the drug industry is driven almost exclu-sively by demand from the United States. Even though drug companies market drugs worldwide and collect a significant portion of total industry revenues from this source, this has almost no impact in motivating drug research.32 The distribu-tion of drug development across diseases is systematically linked to the incidence and harm caused by these diseases in the United States and not on net in other countries. Indeed, there is evidence that demand in some countries actually has a negative effect in motivating drug development. The transmission mechanism of this perverse effect is cross-country importation policies and the pricing formulas of some countries that are based on the lowest price at which the drug is sold worldwide. These policies make it unprofitable to develop drugs to treat diseases where most sales will be in low-price countries.
Our conclusions are striking and somewhat troublesome. The troublesome as-pect is that there is no straightforward policy implication. Because drug develop-ment is so strongly influenced by the United States demand, changes in the drug-pricing regime in the United States could significantly reduce the amount of drug development. Our results show that much of the rest of the world is free-riding on drug development induced by the high prices paid by U.S. consumers, but stop-ping the free-riding by forcing drug prices down in the United States to match other countries may also stop the drug development.33 It is not obvious that this will improve welfare.
32 IMS Health (2004) reports that pharmaceutical companies’ revenue from the United States
between May 2003 and May 2004 was $168 billion while the combined sales in Canada, Ger-many, France, Italy, UK, Spain, Japan, Australia, New Zealand, Mexico, Argentina, and Brazil was $162 billion at the same period.
33 To say that much of the rest of the world is free-riding on U.S. consumers is true, but rec-ognize that this comes at a cost in the sense that drug companies do not focus their research on diseases that are most important in these countries.
Contributions to Economic Analysis & Policy
23Civan and Maloney: Pharmaceutical R&D

APPENDIX A Table A1. Countries Included in Mortality Data
Country Life Expectancy Country Life Expectancy Albania 70 Kyrgyzstan 65 Argentina 75 Latvia 70 Armenia 70 Lithuania 72 Australia 80 Luxembourg 79 Austria 80 Malta 78 Azerbaijan 66 Mauritius 72 Belarus 68 Mexico 74 Belgium 78 Netherlands 79 Belize 70 New Zealand 79 Brazil 69 Nicaragua 70 Bulgaria 72 Norway 79 Canada 80 Panama 75 Chile 77 Paraguay 72 Colombia 72 Peru 70 Costa Rica 77 Poland 75 Croatia 75 Portugal 77 Cuba 77 Republic of Korea 76 Czech Republic 76 Republic of Moldova 68 Denmark 77 Romania 71 Dominican Republic 68 Russian Federation 65 Ecuador 71 Singapore 80 El Salvador 70 Slovakia 74 Estonia 71 Slovenia 77 Finland 78 South Africa 51 France 80 Spain 80 Georgia 72 Sweden 80 Germany 79 Switzerland 81 Greece 78 Tajikistan 64 Hungary 73 Macedonia 72 Iceland 80 Turkmenistan 67 Ireland 77 Ukraine 67 Israel 80 United Kingdom 78 Italy 80 United States 77 Japan 82 Uruguay 75 Kazakhstan 64 Uzbekistan 68 Kuwait 76 Venezuela 74
24 Vol. 5 [2006], No. 1, Article 28
http://www.bepress.com/bejeap/contributions/vol5/iss1/art28

Table A2. Mortality Measures and New Drug Development by Disease
Cause of Death
Total Deaths
(Di)
Total Person-Years Lost
(Yi)
Income Adjusted
Years Lost
(Vi)
Income and Property-rights Ad-
justed Years
Lost
(Wi)
Healthcare Expenditure
Adjusted
Years Lost
(Hi)
Ratio U.S. to Total
Deaths Drug Count
Drug Investment
Cerebrovascular disease 1.8 6.3 94.26 39.04 8.19 0.00 10 290
Other ischemic heart diseases 1.71 4.86 71.89 33.43 6.9 0.02 69 2879
Diseases of pulmonary circulation and other forms of heart disease
1.08 5.7 101.02 44.96 9.9 0.01 57 2726
Acute myocardial infarction 1 6.09 107.12 48.91 10.03 0.03 20 830
Malignant neoplasm of other sites 0.75 6.74 126.53 56.88 11.81 0.09 346 11233
Malignant neoplasm of trachea, bronchus, and lung
0.61 5.01 105.99 48.3 10.1 0.00 150 4701
Pneumonia 0.51 4.32 40 16.25 3.42 0.18 30 1786
Embolism thrombosis and other diseases of arteries, arterioles, and capillaries
0.42 1.12 19.65 8.94 1.85 0.37 59 2330
Other diseases of the respiratory system
0.39 2.2 37.15 16.84 3.59 0.21 28 1056
Malignant neoplasm of colon 0.32 2.19 46.61 20.5 4.21 0.01 108 3019
Diabetes mellitus 0.32 2.06 33.03 14.87 3.14 0.00 93 3686
Bronchitis chronic and unspecified emphysema and asthma
0.31 1.32 20.35 8.99 1.86 0.04 48 2389
Malignant neoplasm of stomach 0.26 2.04 34.26 13.29 2.73 0.12 23 624
Contributions to Economic Analysis & Policy
25Civan and Maloney: Pharmaceutical R&D

Table A2. Mortality Measures and New Drug Development by Disease
Cause of Death
Total Deaths
(Di)
Total Person-Years Lost
(Yi)
Income Adjusted
Years Lost
(Vi)
Income and Property-rights Ad-
justed Years
Lost
(Wi)
Healthcare Expenditure
Adjusted
Years Lost
(Hi)
Ratio U.S. to Total
Deaths Drug Count
Drug Investment
Hypertensive disease 0.24 1.08 15.76 7.21 1.58 0.14 26 1474
Chronic liver disease and cirrhosis 0.22 3.16 49.04 21.4 4.46 0.05 15 499
Malignant neoplasm of breast 0.21 2.24 43.85 20.14 4.2 0.18 104 3847
Malignant neoplasm of prostate 0.15 0.5 10.63 4.85 1.01 0.06 107 3131
Nephritis nephritic syndrome and nephritis
0.15 1.06 13.04 5.43 1.16 0.25 4 140
Other malignant neoplasm of lym-phatic and haemopoietic tissue
0.13 1.29 25.66 11.72 2.43 0.20 117 3461
Leukemia 0.1 1.27 20.25 8.95 1.86 0.09 51 1898
Tuberculosis of respiratory system 0.1 1.45 5.34 1.85 0.39 0.23 3 125
Malignant neoplasm of liver 0.09 0.96 21.46 7.98 1.67 0.18 27 892
Malignant neoplasm of esophagus 0.08 0.67 13.86 5.96 1.24 0.18 11 327
Benign neoplasm other and un-specified neoplasm
0.06 0.61 10.41 4.43 0.92 0.21 18 696
Malignant neoplasm of bladder 0.06 0.33 6.96 3.15 0.64 0.28 17 474
Ulcer of stomach and duodenum 0.06 0.36 4.3 1.82 0.36 0.12 8 502
Malignant neoplasm of lip oral cavity and pharynx
0.06 0.71 12.13 5.33 1.13 0.20 1 18
26 Vol. 5 [2006], No. 1, Article 28
http://www.bepress.com/bejeap/contributions/vol5/iss1/art28

Table A2. Mortality Measures and New Drug Development by Disease
Cause of Death
Total Deaths
(Di)
Total Person-Years Lost
(Yi)
Income Adjusted
Years Lost
(Vi)
Income and Property-rights Ad-
justed Years
Lost
(Wi)
Healthcare Expenditure
Adjusted
Years Lost
(Hi)
Ratio U.S. to Total
Deaths Drug Count
Drug Investment
HIV disease 0.05 1.32 25.09 12.1 2.64 0.34 101 3478
Other endocrine and metabolic diseases
0.05 0.61 11.99 5.58 1.18 0.16 92 3708
Malignant neoplasm of cervix uteri 0.05 0.6 7.62 3.34 0.69 0.30 22 511
Other intestinal infectious diseases 0.05 1.61 5.39 1.88 0.44 0.24 7 140
Other viral diseases 0.03 0.5 8.09 3.47 0.73 0.06 83 3581
Anemia 0.03 0.31 3.36 1.43 0.3 0.18 10 352
Other diseases of blood and blood-forming organs
0.02 0.23 3.67 1.61 0.34 0.21 25 1316
Epilepsy 0.02 0.54 5.39 2.33 0.46 0.15 23 947
Infections of kidney 0.02 0.12 0.74 0.29 0.06 0.21 1 86
Multiple sclerosis 0.01 0.16 3.04 1.45 0.3 0.09 27 937
Influenza 0.01 0.08 0.81 0.33 0.07 0.11 12 517
Other bacterial diseases 0.01 0.07 0.96 0.42 0.09 0.18 9 350
Hyperplasia of prostate 0.01 0.01 0.11 0.05 0.01 0.17 7 345
Other arthropod-borne diseases 0.01 0.08 0.27 0.09 0.03 0.08 2 47
Other diseases of circulatory sys-tem
0.01 0.12 1.95 0.86 0.19 0.08 1 24
Contributions to Economic Analysis & Policy
27Civan and Maloney: Pharmaceutical R&D

Table A2. Mortality Measures and New Drug Development by Disease
Cause of Death
Total Deaths
(Di)
Total Person-Years Lost
(Yi)
Income Adjusted
Years Lost
(Vi)
Income and Property-rights Ad-
justed Years
Lost
(Wi)
Healthcare Expenditure
Adjusted
Years Lost
(Hi)
Ratio U.S. to Total
Deaths Drug Count
Drug Investment
Sexually transmitted diseases 0 0.04 0.15 0.06 0.01 0.29 18 633
Malaria 0 0.03 0.12 0.05 0.01 0.09 11 439
Meningococcal infection 0 0.14 1.24 0.57 0.11 0.09 8 368
Typhoid and paratyphoid fever 0 0.02 0.05 0.02 0 0.12 3 71
Tetanus 0 0.01 0.06 0.02 0 0.17 3 259
Whooping cough 0 0.01 0.07 0.03 0.01 0.04 2 173
Appendicitis 0 0.06 0.5 0.22 0.05 0.06 1 86
Mean 0.24 1.48 23.90 10.56 2.21 0.14 41.18 1497.98
Standard Deviation 0.40 1.87 32.64 14.61 3.06 0.09 58.78 1946.11
Median 0.06 0.67 10.63 4.85 1.01 0.14 20.00 633.00
Max 1.80 6.74 126.53 56.88 11.81 0.37 346.00 11233.00
Min 0.00 0.01 0.05 0.02 0.00 0.00 1.00 18.00
Notes: Total deaths: Total number of people who died from each disease worldwide (in millions). Total person-years lost: The sum of discounted difference between expected life and the age of death, times the number of deaths in each age group, in each country, summed over all countries (in millions). Income weighted total years lost: Multiplies total years lost in each country by per capita income, summed over all countries (in trillions). Income and property-rights weighted total years lost: Divides income weighted total years lost by Heritage Foundation’s Freedom Index for each country, summed over all countries (in trillions). Healthcare expenditure weighted total years lost: Multiplies total years lost in each country by the country’s per capita healthcare expenditures, summed over all countries (in trillions). Drug Count: Number of drugs in development stage for particular disease. Investment: Drug count weighted by the average R&D expenditure for stage of development for each drug (in millions $US).
28 Vol. 5 [2006], No. 1, Article 28
http://www.bepress.com/bejeap/contributions/vol5/iss1/art28

Table A3. Summary Statistics of Average Patients by Disease
Cause of Death ( )iv ( )ih ( )iw
Typhoid and paratyphoid fever 2.30 0.13 2.89 Other intestinal infectious diseases 3.36 0.27 2.87 Tuberculosis of respiratory system 3.70 0.27 2.88 Whooping cough 6.35 0.54 2.49 Meningococcal infection 8.97 0.83 2.17 Tetanus 4.17 0.35 2.84 Other bacterial diseases 14.23 1.33 2.28 HIV disease 19.07 2.01 2.07 Other viral diseases 16.25 1.46 2.34 Malaria 3.96 0.40 2.61 Other arthropod-borne diseases 3.39 0.41 2.91 Sexually transmitted diseases 3.42 0.33 2.66 Malignant neoplasm of lip, oral cavity, and pharynx 17.19 1.60 2.28 Malignant neoplasm of oesophagus 20.64 1.84 2.32 Malignant neoplasm of stomach 16.75 1.33 2.58 Malignant neoplasm of colon 21.33 1.92 2.27 Malignant neoplasm of liver 22.45 1.74 2.69 Malignant neoplasm of trachea, bronchus, and lung 21.15 2.02 2.19 Malignant neoplasm of breast 19.60 1.88 2.18 Malignant neoplasm of cervix uteri 12.60 1.14 2.28 Malignant neoplasm of prostate 21.36 2.02 2.19 Malignant neoplasm of bladder 20.80 1.92 2.21 Malignant neoplasm of other sites 18.77 1.75 2.22 Leukemia 16.00 1.47 2.26 Other malignant neoplasms of lymphatic and haemopoietic
tissue 19.95 1.89 2.19 Benign neoplasm other and unspecified neoplasm 17.06 1.51 2.35 Diabetes mellitus 16.03 1.52 2.22 Other endocrine and metabolic diseases 19.66 1.94 2.15 Anaemias 10.74 0.98 2.35 Other diseases of blood and blood-forming organs 15.95 1.49 2.28 Multiple sclerosis 19.27 1.89 2.09 Epilepsy 9.97 0.85 2.31 Hypertensive disease 14.64 1.47 2.19 Acute myocardial infarction 17.58 1.65 2.19 Other ischemic heart diseases 14.79 1.42 2.15 Diseases of pulmonary circulation and other forms of heart
disease 17.71 1.74 2.25 Cerebrovascular disease 14.95 1.30 2.41 Embolism thrombosis and other diseases of arteries, arterioles,
and capillaries 17.56 1.65 2.20 Other diseases of the circulatory system 16.35 1.60 2.27 Pneumonia 9.26 0.79 2.46 Influenza 9.95 0.83 2.44 Bronchitis chronic and unspecified emphysema and asthma 15.37 1.41 2.26 Other diseases of the respiratory system 16.89 1.63 2.21
Contributions to Economic Analysis & Policy
29Civan and Maloney: Pharmaceutical R&D

Table A3. Summary Statistics of Average Patients by Disease
Cause of Death ( )iv ( )ih ( )iw
Ulcer of stomach and duodenum 11.88 1.01 2.36 Appendicitis 8.65 0.78 2.31 Chronic liver disease and cirrhosis 15.50 1.41 2.29 Nephritis nephrotic syndrome and nephrosis 12.30 1.09 2.40 Infections of kidney 6.28 0.51 2.50 Hyperplasia of prostate 11.34 0.95 2.37 Mean 13.83 1.27 2.37 Standard deviation 5.83 0.56 0.22 Median 15.50 1.42 2.28 Max 22.45 2.02 2.91 Min 2.30 0.13 2.07
Notes: Income ( )i
v is the per capita income of the average victim worldwide. Healthcare Expenditures ( )i
h is the per
capita annual expenditures on healthcare for the average victim worldwide. Property Rights ( )i
w is the Heritage Founda-
tion Freedom Index for the average victim of the disease worldwide. All in $1000.
30 Vol. 5 [2006], No. 1, Article 28
http://www.bepress.com/bejeap/contributions/vol5/iss1/art28

APPENDIX B The following are two tables reporting the results of applying our methodology to the 2002 WHO Global Burden of Disease data. In the mortality data released in the GBD, WHO reports total deaths and age-adjusted deaths. The methodology that they use to get age-adjusted deaths appears very similar to ours. They say, “The years of life lost (YLL) basically correspond to the number of deaths multi-plied by the standard life expectancy at the age of at which death occurs.”34 How-ever, when we correlate total deaths and age-adjusted deaths in the United States using the GBD data, we get a correlation coefficient of .995. There is almost no difference. The same correlation for our data yields a correlation coefficient of .933.35 This is not a huge difference, but it appears to us that the WHO age-adjustment method is different from ours. Recall from Table 1, our results are largely driven by age-adjusting the 1997 mortality data. So this is a substantive issue.
When we use the GBD data, our results are replicated in qualitative form in the mortality dataset. Table 4a below mirrors Table 4 in the text. The results are the same but the goodness of fit and significance levels are lower. Using the DALY data, which measure morbidity in addition to mortality, the basic relation between the economic harm from disease and drug development shows up. Table 2a below shows the regression of drug counts and drug development investment on DALY and income, property rights, and health care expenditures per lost man year due to disease aggregated across the entire world. The results are very similar to those reported in Table 2 in the text except that the goodness of fit is substan-tially lower. However, when we try to separate the DALY effects by region, we find nothing.
Our efforts with the GBD data raise questions and we are pursuing this re-search. Interested readers can get updates on our results at our web sites and are welcome to query us for additional information on these curious findings (as well as anything else). But our opinion is that the WHO GBD data are not suitable at this time to give an informative corroborative test of our findings.
34 From the notes page of the spreadsheet containing the data available from:
<www3.who.int/whosis/menu.cfm?path=whosis,burden,burden_estimates,burden_estimates_2002N,burden_estimates_2002N_2002Rev_country&language=English> on April 11, 2006.
35 These correlations are for the 25 diseases for which there is a perfect match between the GBD mortality data and the 1997 mortality tables. When we look at all the disease categories in the GBD data, the correlation for the United States is .999; however, the correlation for the sum of all countries is .942, which is more like the correlation in our data. This same set of correlations for the morbidity data are .98 for the United States and .86 for world-wide aggregates. It appears that the age adjustment is in error for some, but not all countries, and in particular for the United States.
Contributions to Economic Analysis & Policy
31Civan and Maloney: Pharmaceutical R&D
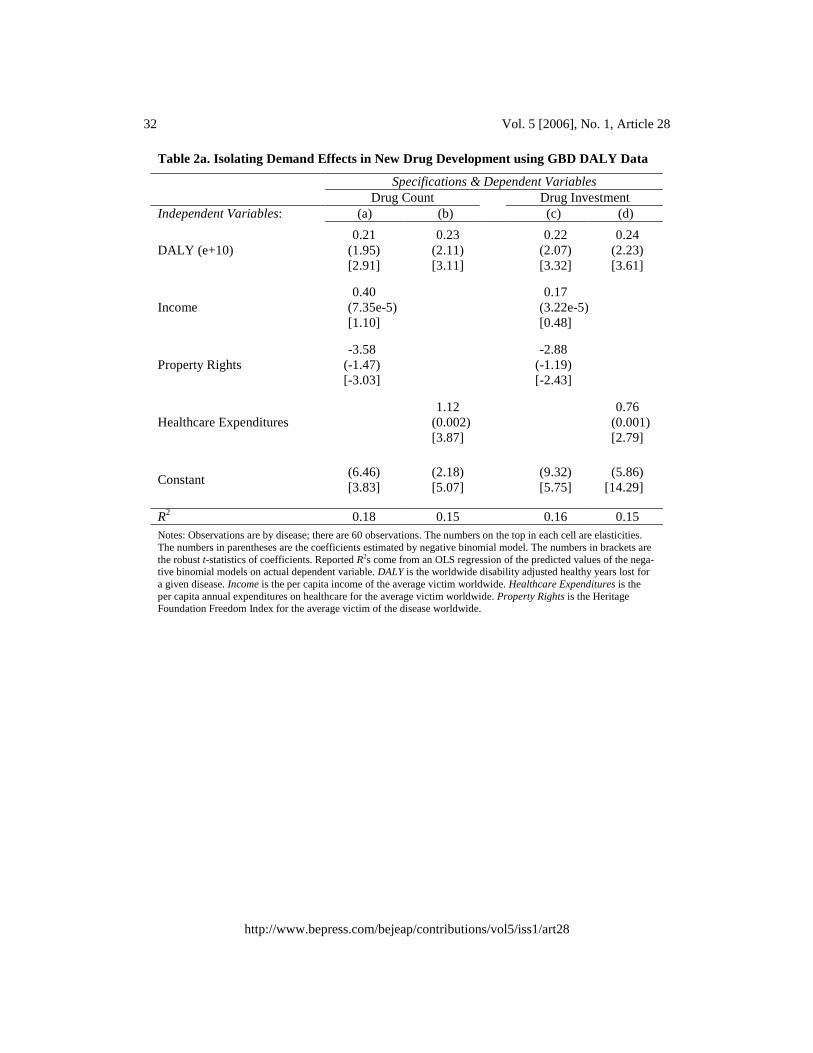
Table 2a. Isolating Demand Effects in New Drug Development using GBD DALY Data
Specifications & Dependent Variables Drug Count Drug Investment Independent Variables: (a) (b) (c) (d)
DALY (e+10) 0.21
(1.95) [2.91]
0.23 (2.11) [3.11]
0.22
(2.07) [3.32]
0.24 (2.23) [3.61]
Income 0.40
(7.35e-5) [1.10]
0.17
(3.22e-5)[0.48]
Property Rights -3.58
(-1.47) [-3.03]
-2.88
(-1.19) [-2.43]
Healthcare Expenditures 1.12
(0.002) [3.87]
0.76
(0.001) [2.79]
Constant (6.46) [3.83]
(2.18) [5.07]
(9.32) [5.75]
(5.86) [14.29]
R2 0.18 0.15 0.16 0.15 Notes: Observations are by disease; there are 60 observations. The numbers on the top in each cell are elasticities. The numbers in parentheses are the coefficients estimated by negative binomial model. The numbers in brackets are the robust t-statistics of coefficients. Reported R2s come from an OLS regression of the predicted values of the nega-tive binomial models on actual dependent variable. DALY is the worldwide disability adjusted healthy years lost for a given disease. Income is the per capita income of the average victim worldwide. Healthcare Expenditures is the per capita annual expenditures on healthcare for the average victim worldwide. Property Rights is the Heritage Foundation Freedom Index for the average victim of the disease worldwide.
32 Vol. 5 [2006], No. 1, Article 28
http://www.bepress.com/bejeap/contributions/vol5/iss1/art28

Table 4a. Isolating Disaggregated Demand Effects using GBD Mortality Data
Specifications & Dependent Variables Drug Count Drug Investment Independent Variables: (a) (b) (c) (d)
Mortality in the United States 0.25
(0.01) [1.48]
0.22 (8.85e-3) [1.44]
0.17
(7.15e-3) [1.12]
0.19 (7.70e-3) [1.22]
Mortality Developed Countries* 0.05
(1.08e-3) [0.21]
-0.04 (-2.05e-3) [-0.34]
-0.06
(-1.29e-3) [-0.28]
-0.18 (-4.47e-3) [-0.79]
Income in Developed Countries* 1.33
(4.48e-5) [1.11]
0.61
(2.04e-5) [0.69]
Property Rights in Developed Coun-tries*
3.20 (1.45) [0.73]
2.87
(1.30) [0.70]
Healthcare Expenditures In Devel-oped Countries*
2.63
(1.14e-3) [1.87]
1.78
(7.70e-4) [1.47]
Mortality in Underdeveloped Coun-tries
-0.11 (-1.31e-4) [-1.09]
-0.05 (-6.57e-5) [-0.41]
0.04
(4.92e-5) [0.53]
0.07 (8.34e-5) [0.61]
Income in Underdeveloped Countries -0.45
(-2.81e-4) [-0.57]
-0.51
(-3.20e-4) [-0.76]
Property Rights in Underdeveloped Countries
-17.22 (-5.41) [-3.74]
-15.22 (-4.79) [-3.74]
Healthcare Expenditures in Underde-veloped Countries
0.40
(1.76e-3) [0.63]
0.16
(7.12e-4) [0.29]
Constant (16.73) [2.10]
(0.77) [0.57]
(19.17) [2.66]
(5.13) [4.48]
R2 0.30 0.17 0.25 0.07 Notes: Observations are by disease; there are 56 observations. The numbers on the top in each cell are elasticities. The numbers in parentheses are the coefficients estimated by negative binomial model. The numbers in brackets are the ro-bust t-statistics of coefficients. Reported R2s come from an OLS regression of the predicted values of the negative bino-mial models on actual dependent variable. Income is the per capita income of the average victim worldwide. Healthcare Expenditures is the per capita annual expenditures on healthcare for the average victim worldwide. Property Rights is the Heritage Foundation Freedom Index for the average victim of the disease worldwide. (*) Developed Countries excludes the United States.
Contributions to Economic Analysis & Policy
33Civan and Maloney: Pharmaceutical R&D

REFERENCES
Acemoglu, D., and Linn, J., 2004, “Market Size in Innovation: Theory and Evi-dence From The Pharmaceutical Industry, The Quarterly Journal of Econom-ics, 119(3) August, 1049-1090
Bernt, E.R., Bui, L., Reiley, D.R. and Urban, G.L., 1995, "Information, Market-ing, and Pricing in the US Antiulcer Drug Market," American Economic Re-view, 85(2) May, 100-105.
Chin J., Grossman, G., 1990, "Intellectual Property Rights and North-South Trade," in The Political Economy of International Trade: Essays in Honor of Robert E. Baldwin, Jones, R., and Krueger, A., eds., (Cambridge: Basil Blackwell) 90-108.
Cothran, C.B., 2005, "Prescription Drug Prices Based on Demand Intensity," un-published Master's thesis, John E. Walker Department of Economics, Clem-son University.
Danzon, P.M., 1997, “Price Discrimination for Pharmaceuticals: Welfare Effects in the US and the EU,” International Journal of the Economics of Business, 4(3) November, 301-321.
_______, 2004, “Parallel Trade and Comparative Pricing of Medicines: Poor Choice for Patients?” PfizerForum.com: A World of Ideas on Public Policy. <www.pfizerforum.com/english/danzon.shtml>.
_______, Chao, L., 2000, "Cross-National Price Differences for Pharmaceuticals: How Large and Why?" Journal of Health Economics, 19(2) March, 159-195.
_______, Kethcam, J., 2003, "Reference Pricing of Pharmaceuticals for Medicare: Evidence from Germany, The Netherlands and New Zealand," National Bu-reau of Economic Research Working Paper No. 10007, September (Cam-bridge MA: NBER).
_______, Wang, R., and Wang L, 2003, “The Impact of Price Regulation on the Launch Delay of New Drugs- Evidence from Twenty-Five Major Markets in the 1990s”. National Bureau of Economic Research Working Paper No. 9874, July (Cambridge MA: NBER).
_______, and Furukawa, M.F., 2003, "Prices and Availability of Pharmaceuticals: Evidence from Nine Countries," Health Affairs Web Exclusive, October 29, <http://content.healthaffairs.org/cgi/content/full/hlthaff.w3.521v1/DC1>.
Deardoff A.V., 1992, "Welfare Effects of World Patent Protection," Economica, 59(233) February, 33-51.
DiMasi, J.A., Hansen, R.W., and Grabowski, H.G., 2003, "The Price of Innova-tion: New Estimates of Drug Development Costs," Journal of Health Econom-ics, 22(2) March, 151-85.
34 Vol. 5 [2006], No. 1, Article 28
http://www.bepress.com/bejeap/contributions/vol5/iss1/art28

Diwan, I., and Rodrik, D., 1991, "Patents, Appropriate Technology and North-South Trade," Journal of International Economics, 30(1-2) February, 27-47.
Ekelund, M., and Persson, B., 2003, "Pharmaceutical Pricing in a Regulated Mar-ket," The Review of Economics and Statistics, 85(2) May, 298-306.
Ellison, S. F., Cockburn, I., Griliches, Z, and Hausman, J., 1997, "Characteristics of Demand for Pharmaceutical Products: An Examination of Four Cepha-losporins," RAND Journal of Economics, 28(3) Autumn, 426-446.
Grabowski, H.G., Vernon, J., and DiMasi, J.A., 2002, "Returns on Research and Development for 1990s New Drug Introductions," Pharmacoeconomics, 20(15) Supp. 3, 11-29.
Green, W.H., 2000, Econometric Analysis, 4th ed. (Upper Saddle River NJ: Pren-tice Hall).
Helpman, E., 1993, "Innovation, Imitation and Intellectual Property Rights," Econometrica, 61(6) November, 1247- 1280.
IMS Retail Drug Monitor 2004, 2004 (August), <www.imshealth.com/vgn/images/portal/cit_40000873/58/22/52756740IMS_DRUGMON_MAY04.pdf>.
Lanjouw, J.O., and Cockburn, I.M., 2001, "New Pills for Poor People? Empirical Evidence after GATT," World Development, 29(2) February, 265-289.
Lichtenberg, F., 2001a, “The Allocation of Publicly Funded Biomedical Re-search,” in Medical Care Output and Productivity, Studies in Income and Wealth, Volume 62, ed. by Ernst Berndt and David Cutler (Chicago: Univer-sity of Chicago Press), 565-89.
_______, 2001b, "The Benefits and Costs of Newer Drugs: Evidence from the 1996 Medical Expenditure Panel Survey," National Bureau of Economic Re-search Working Paper No. 8147(Cambridge MA: NBER) March.
_______, Philipson, J. P., 2002, "The Dual Effects of Intellectual Property Regu-lations: -Within and Between- Patent Competition in the US Pharmaceutical Industry," National Bureau of Economic Research Working Paper No. 9303(Cambridge MA: NBER) October.
_______, 2004, "The Expanding Pharmaceutical Arsenal in the War on Cancer," National Bureau of Economic Research Working Paper No. 10328 (Cam-bridge MA: NBER) February.
_______, 2005, "Pharmaceutical innovation and the burden of disease in develop-ing and developed countries," Journal of Medicine and Philosophy 30(6), De-cember 2005.
Lu, Z.J., Comanor, W.S., 1998, “Strategic Pricing of New Pharmaceuticals," Re-view of Economics and Statistics, 80(1) February, 108-118.
Contributions to Economic Analysis & Policy
35Civan and Maloney: Pharmaceutical R&D
Manheimer, E., and Anderson, D., 2002, "Survey of public information about on-going clinical trials funded by industry: evaluation of completeness and acces-sibility," British Medical Journal 325 (7363) September, 528-531.
Mathers, C.D., Bernard, C., Iburg, K., Inoue, M., Ma Fat, D., Shibuya, K., Stein, C., and Tomijima, N., 2003, "The Global Burden of Disease in 2002: data sources, methods and results." Geneva, World Health Organization (GPE Dis-cussion Paper No. 54). Available at <www.who.int/evidence>.
Murphy, K.M., Topel, R.H., 2003, "The Economic Value of Medical Research," in Measuring the Gains from Medical research: An Economic Approach,” Murphy and Topel, eds., (Chicago: University of Chicago Press).
Rudholm, N., 2003, "Competition and Substitutability in the Swedish Pharmaceu-ticals Market," Applied Economics, 35(14) September, 1609-1617.
Scherer, F.M., 2002, "A Note on Global Welfare in Pharmaceutical Patenting," Federal Reserve Bank of Philadelphia Working Paper No 03-11.
Scherer, F.M., and Watal, J., 2002, "Post-TRIPS Options for Access to Patented Medicines in Developing Nations." WHO Hosjbor Conference Background Paper.
Till, J.E., Phillips, R.A., and Jadad, A.R., 2003, "Finding Canadian cancer clinical trials on the Internet: an exploratory evaluation of online resources," Cana-dian Medical Association Journal, 168 (9) April, 1127-1129.
U.S. General Accounting Office, 1992, "Prescription Drugs: Companies Typically Charge More in the United States than in Canada." GAO-HRD-92-110. Wash-ington, D.C.
U.S. General Accounting Office, 1994, "Prescription Drugs: Companies Typically Charge More in the United States than in the United Kingdom." GAO/HEHS-94-29. Washington, D.C.
U.S. House of Representatives, Committee on Government Reform and Over-sight, Minority Staff Report, 1998, Prescription Drug Pricing in the 1st Con-gressional District in Maine: An International Price Comparison, October 24.
Wiggins, N., and Maness, R., 2004, "Price Competition in Pharmaceuticals: The Case of Anti-Infectives," Economic Inquiry, 42(2) April, 247-263.
36 Vol. 5 [2006], No. 1, Article 28
http://www.bepress.com/bejeap/contributions/vol5/iss1/art28