The Dahuiyeh (Zarand) earthquake of 2005 February 22 in central Iran: reactivation of an...
12
Geophys. J. Int. (2006) 164, 137–148 doi: 10.1111/j.1365-246X.2005.02839.x GJI Seismology The Dahuiyeh (Zarand) earthquake of 2005 February 22 in central Iran: reactivation of an intramountain reverse fault M. Talebian, 1 J. Biggs, 3 M. Bolourchi, 1 A. Copley, 2 A. Ghassemi, 1 M. Ghorashi, 1 J. Hollingsworth, 2 J. Jackson, 2 E. Nissen, 3 B. Oveisi, 1 B. Parsons, 3 K. Priestley 2 and A. Saiidi 1 1 Geological Survey of Iran, PO Box 13185-1494, Tehran, Iran 2 COMET, Bullard Laboratories, Madingley Road, Cambridge, CB3 0EZ, UK. E-mail: [email protected] 3 COMET, Department of Earth Sciences, Parks Road, Oxford, OX1 3PR, UK Accepted 2005 October 10. Received 2005 October 6; in original form 2005 July 14 SUMMARY We used seismic body waves, radar interferometry and field investigation to examine the source processes of the destructive earthquake of 2005 February 22 near Zarand, in south–central Iran. The earthquake ruptured an intramountain reverse fault, striking E–W and dipping north at ∼60 ◦ to a depth of about 10 km. It produced a series of coseismic scarps with up to 1 m vertical displacement over a total distance of ∼13 km, continuous for 7 km. The line of the coseismic ruptures followed a known geological fault of unknown, but probably pre-Late Cenozoic, age and involved bedding-plane slip where the scarps were continuous at the surface. However, any signs of earlier coseismic ruptures along this fault had been obliterated by the time of the 2005 earthquake, probably by land sliding and weathering, so that the fault could not reasonably have been identified as active beforehand. The 2005 fault is at an oblique angle to the range- bounding Kuh Banan strike-slip fault, and may represent a splay from that fault, related to its southern termination. Other intramountain reverse faulting earthquakes have occurred in Iran, but this is the first to have produced a clear, mapped surface rupture, and to have been studied with InSAR. Faults of this type represent a serious seismic hazard in Iran and are difficult to assess, because their geomorphological expression is much less clear than the range-bounding reverse faults, which are more common and have been better studied. Key words: active tectonics, earthquake source parameters, faulting, Iran, radar interfero- metry, seismology. 1 INTRODUCTION On 2005 February 22 an earthquake of M w 6.4 struck a region of south–central Iran near Zarand, about 60 km north of the city of Kerman, the provincial capital (Fig. 1). The earthquake occurred at 05:55 am local time, in winter, so many people were indoors, and casualties were high in the villages affected, with approximately 500 killed in Dahuiyeh and Hotkan (Fig. 2) This paper is concerned with the coseismic faulting in the earthquake, and its tectonic and seismic hazard implications. These are interesting, for two main reasons. First, this earthquake is the most recent in a series of destructive earthquakes in Kerman province (Table 1), starting with one of M w 5.8 in 1977 less than 30 km from the 2005 Dahuiyeh epicentre. The series continued with substantial earthquakes in 1981 ( M w 6.6, 7.2) and 1998 ( M w 6.6) SE of Kerman on the Gowk fault system (Berberian et al. 1984, 2001), followed by the devastating earth- quake ( M w 6.3) at Bam in 2003 (Talebian et al. 2004), about 280 km SE of the 2005 Dahuiyeh earthquake discussed here. The sys- tem of faults responsible for these earlier earthquakes is a roughly N–S to NW–SE striking zone of right-lateral strike-slip faults that probably accommodates <5 mm yr −1 of right-lateral shear between central Iran and the Lut desert (Fig. 1; see Walker & Jackson 2002, 2004). For reasons that are not clear, it appears that this fault system is going through a period of substantial seismic activity; much more so than the equivalent N–S right-lateral strike-slip system on the east side of the Lut, which accommodates a faster (∼10–15 mm yr −1 ) shear between the Lut and Afghanistan (Walker & Jackson 2004), yet which has had relatively few earthquakes over the last 100 yr. Iran has a long-documented historical record of earthquakes, and apparent episodic bursts of activity in the fault zones bounding the relatively rigid desert interior has been noticed before (Ambraseys & Melville 1982; Berberian & Yeats 1999). The implications for major cities, such as Kerman, within these zones, are substantial. Second, the 2005 Dahuiyeh earthquake involved reverse faulting, unlike the strike-slip faulting responsible for the earlier recent earth- quakes in this zone mentioned above. Reverse-faulting earthquakes C 2005 The Authors 137 Journal compilation C 2005 RAS
Transcript of The Dahuiyeh (Zarand) earthquake of 2005 February 22 in central Iran: reactivation of an...

Geophys. J. Int. (2006) 164, 137–148 doi: 10.1111/j.1365-246X.2005.02839.x
GJI
Sei
smol
ogy
The Dahuiyeh (Zarand) earthquake of 2005 February 22 in centralIran: reactivation of an intramountain reverse fault
M. Talebian,1 J. Biggs,3 M. Bolourchi,1 A. Copley,2 A. Ghassemi,1 M. Ghorashi,1
J. Hollingsworth,2 J. Jackson,2 E. Nissen,3 B. Oveisi,1 B. Parsons,3 K. Priestley2
and A. Saiidi11Geological Survey of Iran, PO Box 13185-1494, Tehran, Iran2COMET, Bullard Laboratories, Madingley Road, Cambridge, CB3 0EZ, UK. E-mail: [email protected], Department of Earth Sciences, Parks Road, Oxford, OX1 3PR, UK
Accepted 2005 October 10. Received 2005 October 6; in original form 2005 July 14
S U M M A R YWe used seismic body waves, radar interferometry and field investigation to examine the sourceprocesses of the destructive earthquake of 2005 February 22 near Zarand, in south–central Iran.The earthquake ruptured an intramountain reverse fault, striking E–W and dipping north at∼60◦ to a depth of about 10 km. It produced a series of coseismic scarps with up to 1 m verticaldisplacement over a total distance of ∼13 km, continuous for 7 km. The line of the coseismicruptures followed a known geological fault of unknown, but probably pre-Late Cenozoic, ageand involved bedding-plane slip where the scarps were continuous at the surface. However, anysigns of earlier coseismic ruptures along this fault had been obliterated by the time of the 2005earthquake, probably by land sliding and weathering, so that the fault could not reasonablyhave been identified as active beforehand. The 2005 fault is at an oblique angle to the range-bounding Kuh Banan strike-slip fault, and may represent a splay from that fault, related to itssouthern termination. Other intramountain reverse faulting earthquakes have occurred in Iran,but this is the first to have produced a clear, mapped surface rupture, and to have been studiedwith InSAR. Faults of this type represent a serious seismic hazard in Iran and are difficult toassess, because their geomorphological expression is much less clear than the range-boundingreverse faults, which are more common and have been better studied.
Key words: active tectonics, earthquake source parameters, faulting, Iran, radar interfero-metry, seismology.
1 I N T RO D U C T I O N
On 2005 February 22 an earthquake of M w 6.4 struck a region ofsouth–central Iran near Zarand, about 60 km north of the city ofKerman, the provincial capital (Fig. 1). The earthquake occurred at05:55 am local time, in winter, so many people were indoors, andcasualties were high in the villages affected, with approximately 500killed in Dahuiyeh and Hotkan (Fig. 2) This paper is concerned withthe coseismic faulting in the earthquake, and its tectonic and seismichazard implications. These are interesting, for two main reasons.
First, this earthquake is the most recent in a series of destructiveearthquakes in Kerman province (Table 1), starting with one of M w
5.8 in 1977 less than 30 km from the 2005 Dahuiyeh epicentre.The series continued with substantial earthquakes in 1981 (M w 6.6,7.2) and 1998 (M w 6.6) SE of Kerman on the Gowk fault system(Berberian et al. 1984, 2001), followed by the devastating earth-quake (M w 6.3) at Bam in 2003 (Talebian et al. 2004), about 280km SE of the 2005 Dahuiyeh earthquake discussed here. The sys-
tem of faults responsible for these earlier earthquakes is a roughlyN–S to NW–SE striking zone of right-lateral strike-slip faults thatprobably accommodates <5 mm yr−1 of right-lateral shear betweencentral Iran and the Lut desert (Fig. 1; see Walker & Jackson 2002,2004). For reasons that are not clear, it appears that this fault systemis going through a period of substantial seismic activity; much moreso than the equivalent N–S right-lateral strike-slip system on the eastside of the Lut, which accommodates a faster (∼10–15 mm yr−1)shear between the Lut and Afghanistan (Walker & Jackson 2004),yet which has had relatively few earthquakes over the last 100 yr.Iran has a long-documented historical record of earthquakes, andapparent episodic bursts of activity in the fault zones bounding therelatively rigid desert interior has been noticed before (Ambraseys& Melville 1982; Berberian & Yeats 1999). The implications formajor cities, such as Kerman, within these zones, are substantial.
Second, the 2005 Dahuiyeh earthquake involved reverse faulting,unlike the strike-slip faulting responsible for the earlier recent earth-quakes in this zone mentioned above. Reverse-faulting earthquakes
C© 2005 The Authors 137Journal compilation C© 2005 RAS

138 M. Talebian et al.
KBF
Figure 1. (a) Location map of Iran. The 2005 Dahuiyeh earthquake epicentre is marked by a large blue circle. Red circles are other earthquakes of M w ≥ 5.3on the fault system bounding the west side of the Lut desert since 1977 (see Table 1), discussed in the text. Solid lines are active faults. The box outlines thearea in Fig. 1(b), and K is Kerman. The arrow at the bottom is the convergence direction between Arabia and Eurasia at this longitude (Vernant et al. 2004).(b) Detailed map of the Zarand region. Focal mechanisms are for earthquakes in Table 1; blue circles are their instrumental epicentres. Solid black lines areactive faults, and the thick red line is the continuous part of the 2005 coseismic surface ruptures. The red box outlines the area in Fig. 6. KBF is the Kuh BananFault, BT is Bob Tangol, GI is Gisk, D is Dahuiyeh, H is Hotkan and GA is Gorchuiyeh. Topography is from the SRTM 90 m database. The white line runningfrom north of BT to south of GI is the section of the KBF that ruptured in 1977.
are common in central and eastern Iran, and several devastatingones have occurred in modern times, such as the 1968 Ferdows,1978 Tabas, 1994 Sefidabeh and 2004 Changureh earthquakes. Allof these involved blind reverse faults along the edge of range frontsbordering the desert, and have surface geomorphological expres-sions that are clear (Walker et al. 2003, 2005; Berberian et al.2000), even if they were not recognized at the time. By contrast,the reverse fault responsible for the 2005 Dahuiyeh earthquake waswithin a mountainous region, not along its edge, and at a high angleto the range front. Its location, and its identification for seismic haz-ard estimation, are far less obvious than for range-bounding faults.Its tectonic significance, and its implications for hazard assessment,both require serious attention.
2 T E C T O N I C A N D G E O L O G I C A LS E T T I N G
The most striking geomorphological feature of the general epicen-tral region is the NW–SE range front forming a well-defined abruptNE edge to the Zarand plain (Figs 1 and 2). This edge is definedby the Kuh Banan fault, which separates deformed Palaeozoic andMesozoic sediments in the mountainous region to the east fromthe flat alluvial plain of Zarand. The Kuh Banan fault can be seento dip east in the region of Bob-Tangol (Fig. 1) and has a reverse(or thrust) component to its displacement, which must be respon-sible for its associated topography. However, its most recent senseof motion seems to have been largely strike-slip, seen in the focalmechanism of the 1977 December 19 Bob-Tangol (or Gisk) earth-quake (Fig. 1b, Table 1), which ruptured between 10 and 20 km ofthe Kuh Banan fault trace north of Zarand (Fig. 1b, Berberian et al.1979; Ambraseys & Melville 1982). Our field observations of clearright-lateral offsets of Late Quaternary drainage systems near Gisk,
and a clear fault trace across an embayment south of Gisk, near30◦49′N 56◦40′E, which has very little associated topography, alsoattest to recent strike-slip motion with little reverse component.
The Kuh Banan fault becomes less distinct south of 30◦45′N,where it seems to bend to the east to join a series of E–W scarpsnear Gorchuiyeh (30◦41′N 56◦49′E) that are clearly the remnants ofreverse-fault ruptures, upthrown to the north (Fig. 1). Young faultscarps with a NW–SE trend, upthrown to the NE, are seen againsouth of Chatrud, considerably closer to Kerman.
The 2005 Dahuiyeh earthquake did not rupture the Kuh Bananfault, but occurred on an E–W reverse fault within the mountainousregion to the east (Fig. 2). As we show below, it had a northwarddip of 60◦–65◦, which is steep even for reverse faults. Its epicentreis about 10–15 km west of an earlier, smaller (M w 5.3) earthquakeon 1984 August 6 that damaged the village of Hur (Fig. 1b) andwhich also had a reverse-fault mechanism. In the east of this 1984–2005 epicentral region the rocks consist mostly of Triassic–Jurassicsediments, principally shales, sandstones and some limestones. Inthe west, adjacent to the Kuh Banan range front, the sediments areof Cambrian to Devonian age, dominated by sandstones, with someevaporite-rich units.
3 E A RT H Q UA K E S O U RC EPA R A M E T E R S
3.1 Data sources
An aim of this paper is to present what is known of the source pa-rameters of the 2005 earthquake. We have three principal sources ofinformation, from teleseismic seismology, coseismic ruptures ob-served at the surface, and radar interferometry (InSAR). Together,they form a coherent picture of the general features of the coseismicfaulting.
C© 2005 The Authors, GJI, 164, 137–148
Journal compilation C© 2005 RAS

The 2005 Dahuiyeh (Iran) earthquake 139
Figure 2. (a) Detail adapted from the Geological Survey of Iran map, 1:250 000 scale, for Rafsanjan (GSI 1992). The coseismic rupture in the 2005 Dahuiyehearthquake follows the highlighted yellow line, which can be seen to follow a geological fault marked on the map (red line). Dashed black lines are roads. C isCambrian, OS is Ordovician–Silurian, D is Devonian, TR is Triassic and J is Jurassic. (b) Shaded topography from the SRTM 90 m data set of the same region.The coseismic rupture in the 2005 Dahuiyeh earthquake is marked by the red line, continuous where observed as a scarp in the field and dotted where we inferthe rupture to have been blind and not to have broken the surface (see text). (c) Detail from a LANDSAT TM scene of the same area. The 2005 coseismicrupture is marked as in (b) above. The red circle is the 2005 epicentre given in Table 1. The white arrows mark the NE–SW fault at the eastern end of the 2005coseismic ruptures, referred to in the text.
3.2 Teleseismic bodywave modelling
The 2005 earthquake was widely recorded by stations of the GlobalDigital Seismic Network (GDSN), and the fault parameters of itscentroid are well determined by long-period P and SH body waves.We first convolved the digital broad-band records from stations in the
teleseismic distance range of 30◦–90◦ with a filter that reproduces thebandwidth of the old WWSSN 15–100 long-period instruments. Atthese wavelengths the source appears as a point source in space (thecentroid) with a finite rupture time, and the resulting seismogramsare sensitive to the source parameters of the centroid while relativelyinsensitive to the details of geological structure. We then used the
C© 2005 The Authors, GJI, 164, 137–148
Journal compilation C© 2005 RAS

140 M. Talebian et al.
Figure 2. (Continued.)
Table 1. Summary of epicentral and source parameters for the earthquakes shown in Fig. 1. Latitude, longitude and origin time are from the relocations ofEngdahl et al. (1998) or subsequent updates to their catalogue. Centroid depth (km), moment, strike, dip and rake are all determined from long-period P andSH waveforms using the method described here (Fig. 3). The last column lists the reference for waveform analysis: B93 is Baker (1993); B01 is Berberian et al.(2001); T04 is Talebian et al. (2004).
Date Time Lat. Long. Depth Moment (N m) M w Strike Dip Rake Ref.
1977 December 19 23:34:33.0 30.911 56.413 7 6.6 × 10¹⁷ 5.8 58 82 36 B931981 June 11 07:24:24.8 29.858 57.686 20 9.5 × 10¹⁸ 6.6 169 52 156 B011981 July 28 17:22:24.1 29.976 57.767 18 3.7 × 10¹⁹ 7.0 177 69 184 B01
1984 August 6 11:14:35.1 30.801 57.171 11 1.1 × 10¹⁷ 5.3 279 35 86 B931998 Mar 14 19:40:29.6 30.126 57.585 5 9.1 × 10¹⁸ 6.6 156 54 195 B01
2003 December 26 01:56:54.0 28.953 58.267 6 7.6 × 10¹⁸ 6.5 357 88 194 T042005 February 22 02:25:22.1 30.774 56.736 7 4.8 × 10¹⁸ 6.4 270 60 104 here
MT5 version (Zwick et al. 1994) of McCaffrey & Abers’s (1988)and McCaffrey et al.’s (1991) algorithm, which inverts the P and SHwaveform data to obtain the strike, dip, rake, centroid depth, seismicmoment and the source time function (STF), which is parametrizedby a series of isosceles triangle elements of half-duration τ s. Wealways constrained the source to be a double couple. The method andapproach we used are described in detail elsewhere (e.g. Nabelek1984; McCaffrey & Nabelek 1987; Molnar & Lyon-Caen 1989;Taymaz et al. 1991) and are too routine to justify detailed repetitionhere.
The observed and synthetic seismograms for the ‘best’ minimum-misfit source parameters found by the inversion process are shownin Fig. 3. Nodal planes for both P and SH are well determined by thewide azimuth distribution of the recording stations, and the wave-forms show a relatively simple pulse, typical of a shallow reverse-faulting earthquake, with STF of 7–9 s duration. It is clear fromthe surface and InSAR observations that the nodal plane dippingnorth is the fault plane, which has a strike of 270◦, a dip of 60◦
and a rake of 104◦. The centroid depth is 7 km and the moment is4.8 × 1018 N m (M w 6.4). To investigate the uncertainties in theseparameters, we carried out a number of tests, in which the parameterunder investigation was held fixed at various values either side of
the ‘best-fit’ value, while the other parameters we allowed to vary, tominimize the misfit. In this way, we were able to see how much theparameters can be changed before there is a substantial deteriorationin the fit between observed and synthetic seismograms. This, too, isnow a routine procedure (see Molnar & Lyon-Caen 1989; Taymazet al. 1991). We estimate the uncertainties to be ±10◦ in strike, ±5◦
in dip, ±15◦ in rake, ±3 km in depth and ±20 per cent in moment.Baker (1993), using the same method and procedure on digi-
tized P and SH waves of the old WWSSN network, investigated the1984 August 6 Hur earthquake, 10–15 km to the east of the 2005Dahuiyeh event. The mechanism he obtained is shown in Table 1, andis similar in orientation (though with a somewhat shallower dip tothe north-dipping nodal plane) and depth to that of the 2005 earth-quake, though it was less widely recorded, with correspondinglylarger errors estimated for strike (±25◦) and dip (±10◦), thoughsimilar errors in rake and depth.
3.3 Surface faulting, geological structureand geomorphology
The 2005 earthquake produced a series of coseismic ground rupturesrunning E–W over a distance of ∼13 km. Within a few hours of the
C© 2005 The Authors, GJI, 164, 137–148
Journal compilation C© 2005 RAS

The 2005 Dahuiyeh (Iran) earthquake 141
Figure 3. P and SH waveforms for 2005 February 22 Dahuiyeh earthquake. The event header shows the strike, dip, rake, centroid depth and scalar seismicmoment (in N m) of the minimum misfit solution. The top focal sphere shows the lower hemisphere stereographic projection of the P waveform nodal planes,and the positions of the seismic stations used in the modelling routine. The lower focal sphere shows the SH nodal planes. Capital letters next to the stationcodes correspond to the position on the focal sphere. These are ordered clockwise by azimuth, starting at north. The solid lines are the observed waveforms,and the dashed lines are the synthetics. The inversion window is marked by vertical lines on each waveform. The source time function (STF) is shown, alongwith the timescale for the waveforms. The amplitude scales for the waveforms are shown below each focal sphere. The P and T axes within the P waveformfocal sphere are shown by a solid and an open circle respectively.
C© 2005 The Authors, GJI, 164, 137–148
Journal compilation C© 2005 RAS

142 M. Talebian et al.
Figure 4. (a) View north of the coseismic rupture cutting the Darbidkhun-Hotkan road (see Fig. 2a) at 30◦46.993′N 56◦49.075′E. This picture was taken 1day after the earthquake, by which time the scarp had been smoothed by bulldozer. The vertical offset is 105 cm. (b) View S from the air of the same localityas (a) on the eastern side of the road, showing a series of parallel open fissures caused by the collapse of the overhanging hanging wall.
earthquake, the part of these ruptures that crossed the road betweenDarbidkhun and Hotkan (Fig. 2a) had been noticed (Fig. 4). In thislocality the scarp that formed was about 105 cm high, upthrownto the north (Fig. 4a). In general, it was associated with a series ofparallel open fissures on the upthrown side (Fig. 4b), representingthe collapse of the hanging wall. The scarp formed in well-beddedTriassic–Jurassic shales and sandstones, with a uniform orientationof strike 280◦ and dip 70◦N; essentially parallel to the orientationof the fault plane determined from the teleseismic waveform mod-elling. In this place, it was clear that the fault surface was parallelto the bedding, at least close to the surface.
Over the next 2 days, the surface rupture was followed in the field,and it became clear that the scarp at the road (Fig. 4) was part of acontinuous E–W rupture that could be traced for 7 km westward fromits eastern termination at 30◦46.737′N 56◦52.469′E. Throughout thissection, the fault was parallel to the bedding in the Triassic–Jurassicsediments, which varied very little, typically with a dip of 60◦–70◦N.The scarp itself approximately followed the south-facing base of anE–W ridge (Fig. 2b). Occasionally it crossed the north-facing slopeof a side gully, reversing the local slope (Fig. 5a), and in severalplaces it crossed incised streams (Fig. 5d), in which the northwarddip of the fault was clearly visible. The general morphology of thescarp revealed that the overhanging hanging wall had collapsed toleave an open fissure (Fig. 5b), sometimes several metres behindwhere the reverse fault itself reached the surface (Fig. 5c).
Two characteristics of this continuous fault rupture are notewor-thy. Firstly, it followed precisely a known fault within the Triassic–Jurassic succession, that was marked on the existing geological maps(Geological Survey of Iran 1992, 1995). The orientation of this pre-existing fault, and its association with the surrounding folding andgeological structure, suggest that it originated with an earlier, pre-Late-Cenozoic phase of deformation, perhaps with a different slipvector, and with a substantial offset. Secondly, there was very littleevidence in the local geomorphology for previous recent movementon this fault. Only at one place (30◦46.72′N 56◦5.18′E), where therupture crossed an incised N–S flowing stream, was there a hint of anearlier uplifted stream terrace that ended at the fault scarp; but eventhis was equivocal. The reason for this lack of evidence for earlierearthquake-generated scarps is probably because the topography issteep, the rocks are weak, easily eroded shales and sandstones, and
the winter rain and snow-melt are capable of removing such scarpsquickly. This fault would have been very difficult to identify as activebefore the earthquake occurred.
The eastern limit of this continuous fault trace coincided withknown geological fault striking NE–SW, that is clearly visible inthe topography, satellite image and on the geological map (markedby white arrows in Fig. 2c). To the SE of this oblique fault, theTriassic–Jurassic rocks form a large fold with a steeply plungingaxis, and bedding becomes strongly oblique to the coseismic rupturesurface. The main road continues east, and crosses the projectedline of the fault in several places, but showed no sign of surfacerupture.
At the western end of the continuous trace (30◦47.098′N56◦48.478′E), the projected fault again enters a region where theTriassic–Jurassic rocks are severely contorted into a series of foldswith almost-vertical axes. A thorough search in this area failed tofind evidence of surface rupture, until a point ∼5.5 km west of theend of the continuous trace, at 30◦47.027′N 56◦45.082′E, where aconvincing linear scarp about 300 m long was found (Figs 2, 5e andf). At this place the scarp is in Triassic limestones and runs along anorth-facing slope of an E–W valley, thus reversing the local slopewith its upward throw to the north of ∼100 cm. The location of thisscarp, precisely along-strike from that in the west, and its sense ofthrow in the opposite sense to the local slope, make its coseismictectonic origin very likely. As we show in the next section, that inter-pretation is also consistent with the InSAR interpretation. The scarpin Figs 5(e) and (f) runs westward into the bottom of a major E–Wriver valley, which itself follows the trace of a known geologicalfault. On its north side are lower Cambrian (Desu Formation) redbeds with abundant gypsum, striking 090◦ and dipping uniformly45◦N. On the south side are limestones and shales of Devonian agewith quite variable dips, generally towards the south at ∼45◦. In thenext section we show it is very likely that the coseismic rupture fol-lowed the geological fault in the river bed, and was thus subparallelto the bedding in the Cambrian rocks on the north side. Althoughwe found evidence for some bedding-plane slip in those Cambrianrocks near the valley floor, we found no evidence of a continuousfault trace in the valley floor itself.
In summary, the observed surface ruptures have several im-portant characteristics. They were observed only where the local
C© 2005 The Authors, GJI, 164, 137–148
Journal compilation C© 2005 RAS

The 2005 Dahuiyeh (Iran) earthquake 143
Figure 5. Field photos of the surface ruptures in the 2005 Dahuiyeh earthquake. (a) View east along the scarp at 30◦46.819′N 56◦51.667′E, where the faultcrosses a dirt track (foreground), then a stream and runs up a snow-covered north-facing slope. The fault is upthrown ∼60 cm on the north (left), thus reversingthe local snow-covered slope. (b) View north of the scarp where it crosses a minor stream at 30◦46.838′N 56◦51.520′E. The overhanging hanging wall hascollapsed to form a vertical open fissure. The vertical offset (white arrow) is ∼100 cm. (c) View east where the scarp runs behind an abandoned village at30◦46.950′N 56◦49.505′E, with vertical offset ∼50 cm. Again, the hanging wall has collapsed to leave a vertical fissure. The fault continues east to throughthe saddle in the skyline. (d) View north of the fault crossing a gully at 30◦46.959′N 56◦49.642′E, with vertical offset (white arrow) ∼60 cm. Here the fault isclearly parallel to the bedding in the Triassic–Jurassic sandstones and shales, and dips at 60◦N. (e) View NW of the fault at 30◦47.027′N 56◦45.082′ E. Thevertical offset (white arrow) is ∼100 cm, up on the north (right) side, thus reversing the local slope. The person is standing at the foot of the scarp. (f) View westabout 50 m west of (e), showing the scarp (dotted line) offsetting the local slope with the downhill side upthrown. The fault descends the slope to the valley,where we infer it continued along the line of the river (dashed line), which is a reverse fault dipping N (right). The red rocks dipping N in the background arethe Cambrian rocks of the Desu Formation.
bedding was uniform, planar and subparallel to the orientation of therupture plane determined seismologically. In those places, the rup-ture surface clearly followed the bedding, at least near the surface.The InSAR data discussed below show that the rupture almost cer-tainly extended at depth over the entire distance from its easternmost
surface expression to Kuh Banan fault in the west. However, wherethe rocks at the surface were folded, with bedding oblique to therupture plane, then the fault was ‘blind’, and did not reach the sur-face itself. In those places the surface expression of the fault waspresumably coseismic warping or folding.
C© 2005 The Authors, GJI, 164, 137–148
Journal compilation C© 2005 RAS

144 M. Talebian et al.
Table 2. Summary of Envisat data used to produce interferograms. The incidence angle is measured relative to the vertical. The firstimage of each pair was acquired on Date 1, and the second on Date 2, separated by �t days. The perpendicular baseline between theorbits in each pass is B ⊥ m.
Track Incidence angle Azimuth Date 1 Date 2 �t (days) B⊥ (m)
Ascending 285 41◦ 349.2◦ 2004/09/19 2005/03/13 175 75Descending 435 23◦ 190.7◦ 2005/02/17 2005/03/24 35 61
3.4 SAR Interferometry
We used Envisat ASAR data and the JPL/Caltech ROI PAC software(Rosen et al. 2004) to construct two interferograms spanning theearthquake, one from an ascending track in acquisition mode IS6(centre-scene incidence angle 41◦), and one from a descending trackin the more usual IS2 mode (incidence angle 23◦). Precise orbitsprovided by ESA were used but no further orbital adjustments weremade. The topographic phase contribution was removed using thethree-arcsec (90 m) SRTM DEM (with voids left unfilled) and theinterferograms cleaned using a power spectrum filter (Goldstein &Werner 1998). Acquisition data are given in Table 2 and the observedwrapped interferograms are shown in Figs 6(a) and (b).
Perpendicular baselines are small (≤75 m) and the correlation isgenerally good for both interferograms, with the exception of a fewareas. The ascending track interferogram, which spans the wholewinter, suffers from temporal decorrelation in a band crossing theSW of the interferogram (corresponding to a vegetated area of theZarand plain) and in patches over high ground in the NW (mostlikely due to snow). However, the most significant decorrelation,which is present in both interferograms, is an ∼ 18 × 8 km patchclose to the faulting itself. This decorrelation is partly a result of thesteep terrain, and possibly snow, in this mountainous area. However,some other steep, elevated parts of the interferograms are coherentand so coseismic ground shaking and land sliding are probably alsocontributing factors.
Maximum line-of-sight displacements are ∼20 cm (7 fringes)towards the satellite and ∼20 cm away from the satellite for theascending interferogram, and ∼40 cm (14 fringes) towards and∼45 cm (16 fringes) away from the satellite for the descending in-terferogram. The area to the north of the central decorrelated patchshows displacements towards the satellite in both interferograms,and the area south of the patch shows displacements away fromthe satellite in both interferograms. The ascending interferogramhas an eastward pointing line-of-sight vector, while the descendinginterferogram has a westward pointing line-of-sight vector; E–Wmotions would, therefore, cause oppositely signed displacementsin one interferogram compared to the other. Since this is not thecase, it follows that the line-of-sight displacements are dominatedby vertical motions. This in turn helps explain why the descendinginterferogram contains more fringes than the ascending one: withits steeper incidence angle, the descending interferogram is moresensitive to vertical motions. Taken together, the interferograms aretherefore consistent with uplift on the north side of a roughly E–Wfault, and subsidence to the south of it.
In spite of the decorrelated central region, it is clear from bothinterferogram pairs that the northern and southern fringe lobes joinat points close to the west and east ends of the observed surfaceruptures (black dots). This in turn indicates that the causative faultis of similar length to the ruptures observed in the field. In theascending interferogram, there are also fringes showing negativeline-of-sight displacement at 30◦49′N 56◦32′E. These correspondwith a vegetated area in the town of Zarand and we suspect it to
be the result of subsidence, perhaps due to ground-water pumping,during the ∼6 month period spanned by the interferogram. Thisfeature is absent from the descending interferogram, presumablybecause of its much shorter (35 days) timespan.
To model the interferometric data, we first resampled the inter-ferograms using a quadtree algorithm (e.g. Jonsson et al. 2002),reducing them from ∼2–3 million to ∼1000 points each. We theninverted these data using a downhill simplex algorithm with Monte-Carlo restarts (Wright et al. 1999), to solve for uniform slip on asingle, rectangular fault in an elastic half-space (Okada 1985). Thefault location, length and top and bottom depths, strike, dip, rake,and slip, were all free to vary in the inversion.
The best-fit solution (Table 3, Figs 6c and d) shows almost purereverse faulting on a steep, north-dipping fault plane extending from9.6 km depth to the surface. Errors were estimated by inverting 100data sets perturbed by realistic correlated noise (Wright et al. 2005).The best-fit parameters are close to those of the focal mechanismobtained by P and SH-waveform inversion (the equivalent ‘centroiddepth’ for the InSAR model is ∼4.7 km), and differences in theorientation between the two are within the allowable errors in thetwo inversions.
The simple one-fault model fits the data well to a first order (Figs6e and f), especially in the eastern part of the fault zone. The cal-culated fault does not project to the surface at precisely the loca-tions where surface ruptures were observed in the field (Figs 6c andd), though the disagreement is everywhere less than 0.6 km. Sincethe field observations indicate that the fault reached the surface byfollowing bedding planes, where they happened to be favourablyoriented locally, we doubt whether the disagreement is significant.Nonetheless, residuals in Figs 6(e) and (f) include three fringes westof the modelled fault (for the ascending track), and the same num-ber to the south and north of the fault (for the descending track). Akinked fault, with a change in strike at some point along its length,might account for some of these residual fringes, but such an elab-oration cannot at present be directly supported by field evidence.
In conclusion, a consistent first-order picture of coseismic rup-ture surface is revealed by the seismology, InSAR and field data.The best-fit solutions of the seismological and InSAR models differsignificantly only for moment, the InSAR estimate being 38 per centhigher than the seismological estimate. The assumption of uniformslip in the InSAR model may account for some of this difference.Another possibility is that since the second pass of the interferogrampairs was 2 weeks and 1 month after the earthquake, the InSAR anal-ysis involves some afterslip. Using the fault length of 12.6 km basedon InSAR, the seismic moment and centroid depth yield an averageslip of 0.8 m, compared with the 1.6 m from the InSAR model.
4 DA M A G E , C A S UA LT I E S A N DE P I C E N T R A L L O C AT I O N
The two villages most affected by the 2005 earthquake wereDahuiyeh, at the western end of the coseismic surface faulting, andHotkan, about 7 km north of the central part of the fault ruptures
C© 2005 The Authors, GJI, 164, 137–148
Journal compilation C© 2005 RAS
The 2005 Dahuiyeh (Iran) earthquake 145
30o 4
0’30
o 5
0’
los (i=23o)
10 km
los displace-ment (cm)
surface ruptures
+1.4
-1.4
0
b56o
40’
los
10 km
los displace-ment (cm)
surface ruptures
+1.4
-1.4
0
56o
50’ 57o
00’
a
(i=41o)
los
10 km
los displace-ment (cm)
surface rupturesmodel fault
+1.4
-1.4
0
c
(i=41o)
30o 4
0’30
o 5
0’
los (i=23o)
10 km
los displace-ment (cm)
surface rupturesmodel fault
+1.4
-1.4
0
d
56o 40’
30o 4
0’30
o 5
0’
los (i=23o)
10 km
los displace-ment (cm)
surface rupturesmodel fault
+1.4
-1.4
0
56o 50’ 57o 00’
f
56o 40’
los
10 km
los displace-ment (cm)
surface rupturesmodel fault
+1.4
-1.4
0
56o 50’ 57o 00’
e
(i=41o)
56o 40’ 56o 50’ 57o 00’
30o
40’
30o
50’
30o
40’
30o
50’
30o
40’
30o
50’
Figure 6. Radar interferograms, in all cases shown wrapped, with one fringe representing a 28 mm line-of-sight change between the ground and the satellite(see Table 2 for acquisition parameters). In each case the inset with arrows shows the satellite track and line-of-sight (los) directions, with inclination to thedownward vertical (i) in degrees. White areas are incoherent. (a) ascending and (b) descending radar interferograms. The black box in (a) marks the areacovered in Fig. 2. The positions of the observed coseismic surface ruptures are marked by the line of black dots in the decorrelated area in the middle of thefringe patterns. (c) and (d) are synthetic interferograms calculated for the ascending (c) and descending (d) orbits, using the fault parameters in Table 3. Thethin solid line is the projection to the surface of the fault used to calculate the synthetics. (e) and (f) are the residuals left by subtracting observed and syntheticinterferograms in the ascending (e) and descending (f) cases.
C© 2005 The Authors, GJI, 164, 137–148
Journal compilation C© 2005 RAS
146 M. Talebian et al.
Table 3. Fault plane parameters from the inversion of interferometric and seismic data. The average slip for the seismological solution is calculated assumingthe fault length of 12.5 km from the InSAR analysis, and the centroid depth of 7 km (i.e. total fault depth of 14 km). The depth of the seismological model isthe centroid depth, whereas in the InSAR model the depth is to the base of the fault.
Data inverted Strike Dip Rake Slip Depth Length Moment (N m)
InSAR interferograms 266 ± 1◦ 67 ± 2◦ 105 ± 2◦ 1.7 ± 0.1 m 9.3 ± 0.3 km 12.5 ± 0.2 km 6.7 ± 0.2 × 10¹⁸
P and SH body waves 270 ± 10◦ 60 ± 5◦ 104 ± 5◦ (0.8 m) (7.0 ± 3 km) – 4.9 ± 1.0 × 10¹⁸
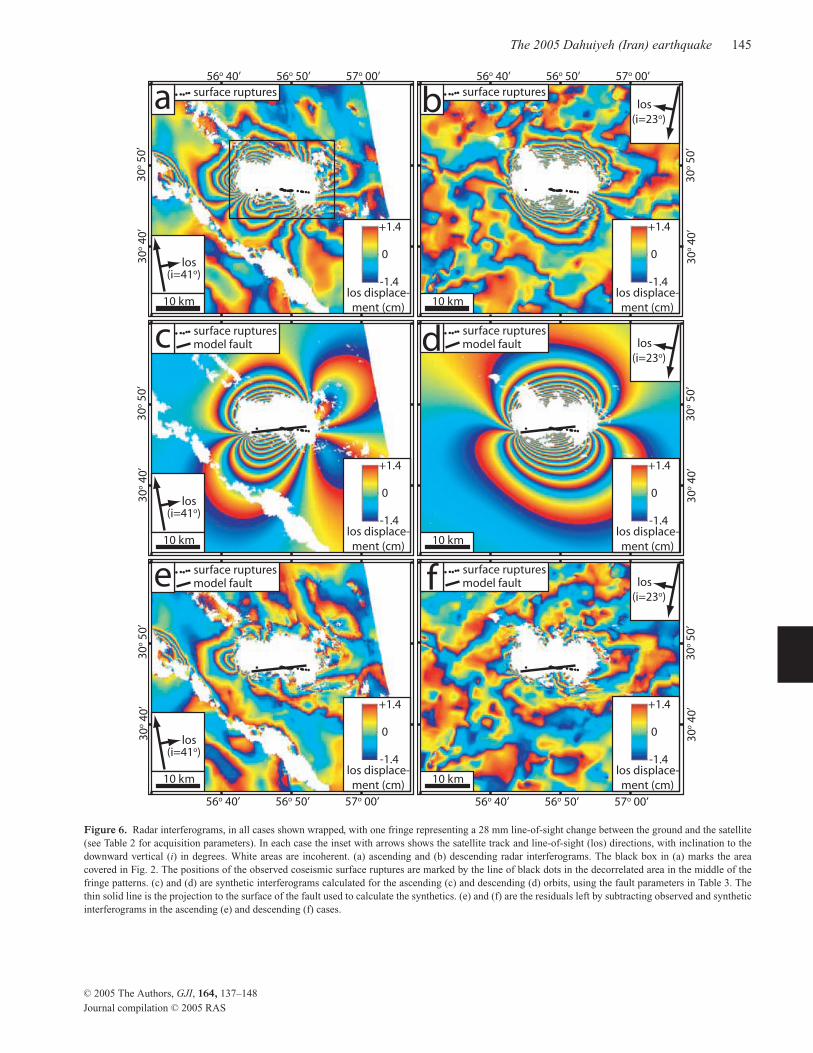
Figure 7. (a) View west over Dahuiyeh. Old Dahuiyeh is almost totally destroyed in the foreground. In the background, on the Zarand plain, is the moremodern settlement of new Dahuiyeh, resettled before the earthquake and considerably less damaged. (b) View west along the ridge of Hotkan. The village iscompletely destroyed, with hardly a building left standing. Only a few door and window frames remain identifiable.
(Fig. 2a). About 150 and 300 people were killed in each place,respectively. Some damage was sustained by other villages alongthe Kuh Banan range front, but the mountainous region to the eastis relatively sparsely inhabited. The small hamlet of Darbidkhun(Fig. 2a) suffered considerable damage, but with few casualties.The old village of Dahuiyeh, situated at the range front, was largelyconstructed from traditional sun-dried mud brick, and was almosttotally destroyed, with only a few modern buildings surviving with-out collapse (Fig. 7a). Casualties would have been far worse, hadnot the majority of the population already moved to a new locationa few km west in the Zarand plain, before the earthquake. The newDahuiyeh is constructed largely of modern materials, and relativelyfew buildings collapsed.
Hotkan is situated on a high ridge above a fertile valley in themountains, and was completely destroyed (Fig. 7b), with hardly anybuildings surviving. Construction was largely of stone-rubble walls,which collapsed, failing to support heavy roofs of timber coveredwith clay.
There is some interest in the damage distribution from the per-spective of epicentral location error. The best current instrumen-tal epicentre location, courtesy of R. Engdahl (personal commu-nication, 2005 June 13) and based largely on arrival time data atregional-distance stations in Iran, is close to Dahuiyeh, just southof the observed line of surface ruptures (Fig. 1b; Table 1). The trueepicentre must lie north of this line. If the fault has a constant dipof 60◦N, it projects to a depth of ∼12 km beneath Hotkan, which isclose to the base of the fault inferred from InSAR data (Table 3). If,as is often the case (Mori et al. 1195), the earthquake nucleated nearthe base of the seismogenic zone, we would expect the epicentre tohave a latitude rather similar to that of Hotkan, that is, to be shiftedabout 5–10 km north of that in Table 1 and Fig. 1(b).
5 D I S C U S S I O N
In one respect, the fact that the fault responsible for the 2005Dahuiyeh earthquake was a reverse fault is unremarkable. The prin-cipal style of deformation within Iran is shortening, to accommo-date convergence between Arabia and Eurasia, and reverse-faultingearthquakes are common. However, the association of the 2005earthquake fault with the adjacent Kuh Banan strike-slip fault isworth considering, because the 2005 earthquake reverse fault waswithin the mountains at a high angle to the range front, and not alongthe range front itself, which is a far more common occurrence.
Large intracontinental strike-slip faults, such as the Kuh Bananfault, differ from transform faults in the oceans, in that they seem toend, or terminate, rather than simply connect with another part of acontinuous plate boundary. Much recent attention has been directedtowards these terminations, which in many cases involve the strike-slip fault ending in a dip-slip fault with an oblique trend, whosedisplacement dies away with distance from the end of the strike-slipfault. Examples have been described from Mongolia (Bayasgalanet al. 1999), northern Tibet (Meyer et al. 1998) and Iran (Berberianet al. 2000), all of which involve reverse-fault terminations, andfrom Greece (Goldsworthy et al. 2002), where the strike-slip faultsend in normal faulting. In all these places, the function of thesedip-slip faults is probably to allow the strike-slip fault to terminatein rotations about a vertical axis.
In the context above, the oblique angle between the 2005Dahuiyeh earthquake rupture and the Kuh Banan strike-slip fault,looks familiar. However, it is not likely that the Kuh Banan faultactually terminates in the south at Dahuiyeh. The range front con-tinues another 15 km to the south, though with less geomorpholog-ical evidence for recent faulting than farther north, to the latitude of
C© 2005 The Authors, GJI, 164, 137–148
Journal compilation C© 2005 RAS

The 2005 Dahuiyeh (Iran) earthquake 147
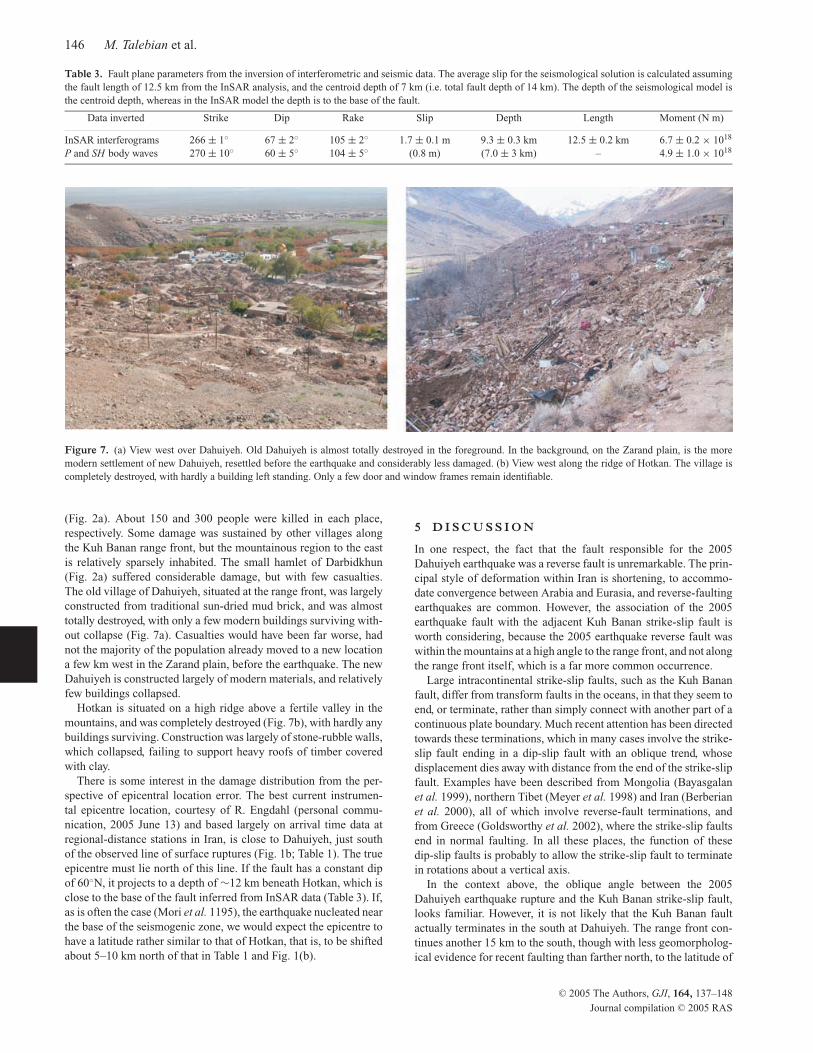
Gorchuiyeh (Fig. 1b), where it then bends east into what is clearly athrust or reverse fault, with uplifted and abandoned modern fan sur-faces indicating recent movement. The Dahuiyeh earthquake reversefault seems to be a splay coming off the Kuh Banan fault before its ac-tual termination. This behaviour has also been observed elsewhere,and a good example is the faulting associated with the great Gobi-Altai earthquake (M w∼8), described by Baljinnyam et al. (1993)and Bayasgalan et al. (1999) and summarized in Fig. 8. The maincoseismic rupture in 1957 involved left-lateral strike-slip along theranges of Ih Bogd and Baga Bogd, but coseismic reverse (or thrust)faulting was also observed at Toromhon and at the eastern end ofBaga Bogd. The Toromhon fault was a substantial thrust (or reverse)fault splaying off the main left-lateral faulting and clearly absorbedsome of the strike-slip offset, which was greater west of Toromhonand smaller to the east. Both Toromhon and Baga Bogd reversefaults died out to the south, and so does the reverse fault at theeast end of Arts Bogd, which did not rupture in 1957. The situationat the southern end of Kuh Banan is rather similar (Fig. 8). If theDahuiyeh reverse fault absorbs some of the strike-slip motion, thatmay account for why the Kuh Banan range front shows less clearevidence for Holocene offsets between Dahuiyeh and Gorchuiyeh.Other than the observation that the 2005 coseismic ruptures did notcontinue east of the oblique structure marked by white arrows inFig. 2(c), we have no evidence that the displacement on the 2005Dahuiyeh reverse fault decreases away from the Kuh Banan fault. Itis also unclear whether the 1986 Hur earthquake, further to the east(Fig. 1b) was on the same, or a related, structure at depth.
Thus the 2005 earthquake fault may have a tectonic functionthat is understandable, at least in principle. However, the fault hasa brutal lesson to teach in terms of seismic hazard assessment, assuch intramountain reverse faults are much more difficult to assess asactive than the ones that bound range fronts. Reverse fault splays atan oblique angle to strike-slip faults are common in Iran (e.g. Walker& Jackson 2004), and many are marked on geological maps. Wesuspect that, like the 2005 Dahuiyeh earthquake fault, their locationwithin the mountains, where erosion and land sliding remove traces
Gobi-Altay 1957
Kuh Banan
50 km
50 km Zarand
D G
Ih BogdBaga Bogd
Toromhon
Arts Bogd
N
N
Figure 8. A comparison between the fault pattern in the region of the 1957Gobi-Altai earthquake (M w∼8) in Mongolia (top) and the Kuh Banan andDahuiyeh system of faults in Iran (bottom). Note the different scales. For easeof comparison, the two fault systems are drawn parallel: in fact the Gobi-Altay fault trends E–W, while the Kuh Banan fault trends NNW–SSE. The1957 ruptures in Mongolia followed the northern sides of Ih Bogd and BagaBogd mountains, ending in reverse faults that also moved (black triangles)at the eastern end of each segment. The Artz Bogd segment, which alsoends in a reverse fault (white triangles) did not move in 1957. The 2005Dahuiyeh (D) reverse fault is marked by black triangles, and the reversefault at Gorchuiyeh (G) is marked by white triangles.
of recent activity, and the unlikelihood of them cutting large areasof Quaternary deposits, may make their seismic potential difficultto assess and easy to miss.
6 C O N C L U S I O N S
From the seismotectonic and seismic hazard points of view, the im-portant feature of the 2005 Dahuiyeh earthquake was that it occurredon an intramountain reverse fault. Most reverse-faulting earthquakesin Iran occur on faults that bound the range fronts, and are easily rec-ognizable in the geomorphology. By contrast, the 2005 earthquakeoccurred on a fault which, although known and mapped in the geol-ogy, could not reasonably have been identified as active beforehand,as any signs of its previous seismogenic activity had been obscuredby weathering and land sliding. Other intramountain reverse faultearthquakes are known to have occurred in Iran before, such as the1984 Hur earthquake nearby, but the 2005 event was the first weknow of that produced a clear, mapped surface rupture, and couldalso be studied by InSAR. The 2005 earthquake fault occurred closeto the Kuh Banan strike-slip fault, which follows a range front, but atan oblique angle to it, and has several characteristics of reverse faultsplays that come off other strike-slip faults, both in Iran and else-where. These reverse fault splays are probably related to the way thestrike-slip faults terminate, and may indicate rotations about verticalaxes.
A C K N O W L E D G M E N T S
We thank Manuel Berberian for information about the 1984 Hurearthquake, Bob Engdahl for quickly making available his recal-culated epicentre for the 2005 Dahuiyeh earthquake and BrianEmmerson for help with the seismic data. We are grateful to E.Fielding and V. Regard for constructive reviews. We thank M. T.Korehei, M. Ghassemi and M. Hoseini for providing the facilitiesand support of the Geological Survey of Iran, and A. Rashidi for helpin the field. This work was supported by an NERC grant to COMET(http://comet.nerc.ac.uk). Cambridge Earth Sciences contribution8251.
R E F E R E N C E S
Ambraseys, N.N. & Melville, C.P., 1982. A history of Persian earthquakes,Cambridge University Press, UK, p. 219.
Baker, C., 1993. The active seismicity and tectonics of Iran, PhD thesis,(unpublished), University of Cambridge, p. 228.
Baljinnyam, I. et al., 1993. Ruptures of major earthquakes and active defor-mation in Mongolia and its surroundings, Geol. Soc. Am. Memoir, 181,p. 62.
Bayasgalan, A., Jackson, J., Ritz, J.F. & Carretier, S., 1999. Field examples ofstrike-slip fault terminations in Mongolia, and their tectonic significance,Tectonics, 18, 394–411.
Berberian, M. & Yeats, R.S., 1999. Patterns of historical earthquakes rupturein the Iranian plateau, Bull. seism. Soc. Am., 89, 120–139.
Berberian, M., Asudeh, I. & Arshadi, S., 1979. Surface rupture and mecha-nism of the Bob-Tangol (southeastern Iran) earthquake of 19 December1977, Earth planet. Sci. Lett., 42, 456–462.
Berberian, M., Jackson, J.A., Qorashi, M. & Kadjar, M.H., 1984. Field andteleseismic observations of the 1981 Golbaf-Sirch earthquakes in SE Iran,Geophys. J. R. astr. Soc., 77, 809–838.
Berberian, M., Jackson, J.A., Qorashi, M., Talebian, M., Khatib, M.M. &Priestley, K., 2000. The 1994 Sefidabeh earthquakes in eastern Iran: blindthrusting and bedding-plane slip on a growing anticline, and active tec-tonics of the Sistan suture zone, Geophys. J. Int., 142, 283–299.
Berberian, M. et al., 2001. The March 14 1998 Fandoqa earthquake (M w
6.6) in Kerman province, SE Iran: re-rupture of the 1981 Sirch earthquake
C© 2005 The Authors, GJI, 164, 137–148
Journal compilation C© 2005 RAS

148 M. Talebian et al.
fault, triggering of slip on adjacent thrusts, and the active tectonics of theGowk fault zone, Geophys. J. Int., 146, 371–398.
Engdahl, E.R., van der Hilst, R. & Buland, R., 1998. Global teleseismicearthquake relocation with improved travel times and procedures for depthdetermination, Bull. seism. Soc. Am., 3, 722–743.
Geological Survey of Iran, 1992. Geological Map of Rafsanjan, 1:250,000scale.
Geological Survey of Iran, 1995. Geological Map of Zarand, 1:100,000 scale.Goldstein, R.M. & Werner, C.L., 1998. Radar interferogram filtering for
geophysical applications, Geophys. Res. Lett., 25, 4035–4038.Goldsworthy, M., Jackson, J. & Haines A.J., 2002. The continuity of active
fault systems in Greece, Geophys. J. Int., 148, 596–618.Jonsson, S., Zebker, H., Segall, P. & Amelung, F., 2002. Fault slip distribution
of the M w 7.2 Hector mine earthquake estimated from satellite radar andGPS measurements, Bull. seism. Soc. Am., 92, 1377–1389.
McCaffrey, R. & Abers, J., 1988. SYN3: a program for inversion of teleseis-mic body wave form on microcomputers, Air Force Geophysical Labora-tory Technical Report, AFGL-TR-88-0099, Hanscomb Air Force Base,Massachusetts.
McCaffrey, R. & Nabelek, J., 1987. Earthquakes, gravity, and the origin ofthe Bali Basin: an example of a nascent continental fold-and-thrust belt,J. geophys. Res., 92, 441–460.
McCaffrey, R., Zwick, P. & Abers, G., 1991, SYN4 Program, IASPEI Soft-ware Library, 3, 81–166.
Meyer, B., Tapponnier, P., Bourjot, L., Metivier, F., Gaudemer, Y., Peltzer,G., Shunmin, G. & Zhitai, C., 1998. Crustal thickening in Gansu-Qinghai,lithospheric mantle subduction, and oblique, strike-slip controlled growthof the Tibet plateau, Geophys. J. Int., 135, 1–47.
Molnar, P. & Lyon-Caen, H., 1989. Fault plane solutions of earthquakes andactive tectonics of the Tibetan Plateau and its margin, Geophys. J. Int., 99,123–153.
Mori, J., Wald, D.J. & Wesson, R.I., 1195. Overlapping fault planes of the1971 San Fernando and 1994 Northridge, California earthquakes, Geo-phys. Res. Lett., 22, 1033–1036.
Nabelek, J., 1984. Determination of earthquake source parameters from in-version of body waves, PhD thesis, MIT, Cambridge, Massachusetts.
Okada, Y., 1985. Surface deformation due to shear and tensile faults in ahalf-space, Bull. seism. Soc. Am., 75, 1135–1154.
Rosen, P.A., Hensley, S., Peltzer, G. & Simons, M., 2004. Updated RepeatOrbit Interferometry package released. EOS, Trans. Am. geophys. Un., 85,35.
Talebian, M. et al., 2004. The 2003 Bam (Iran) earthquake: rupture of a blindstrike-slip fault, Geophys. Res. Lett., 31, L11611.
Taymaz, T., Jackson, J. & McKenzie, D., 1991. Active tectonics of the northand central Aegean Sea, Geophys. J. Int., 106, 433–490.
Vernant, Ph. et al., 2004. Contemporary crustal deformation and plate kine-matics in Middle East constrained by GPS measurements in Iran andnorthern Oman, Geophys. J. Int., 157, 381–398.
Walker, R. & Jackson, J., 2002. Offset and evaluation of the Gowk Fault,S.E. Iran: a major intra-continental strike-slip system, J. Struct. Geol., 24,1677–1698.
Walker, R. & Jackson, J., 2004. Active tectonics and Late Tertiary straindistribution in central and eastern Iran. Tectonics, 23, TC5010.
Walker, R., Jackson, J. & Baker, C., 2003. Thrust faulting in eastern Iran:source parameters and surface deformation of the 1978 Tabas and 1968Ferdows earthquake sequences, Geophys. J. Int., 152, 749–765.
Walker, R., Bergman, E., Jackson, J., Ghorashi, M. & Talebian, M., 2005.The 22 June 2002 Changureh (Avaj) earthquake in Qazvin province, NWIran: epicentral re-location, source parameters, surface deformation andgeomorphology, Geophys. J. Int., 160, 707–720.
Wright, T.J., Parsons, B.E., Jackson, J.A., Haynes, M., Fielding, E.J., Eng-land, P.C. & Clarke, P.J., 1999. Source parameters of the 1 October 1995Dinar (Turkey) earthquake from SAR interferometry and seismic body-wave modelling, Earth planet. Sci. Lett., 172, 23–37.
Wright, T.J., Parsons, B.E. & Lu, Z., 2004. Towards mapping surface defor-mation in three dimensions using InSAR, Geophys. Res. Lett., 31, L01607.
Wright, T.J., Clarke, P. & Funning, G., 2005. Realistic errors for modelsderived from InSAR data, J. geophys. Res., submitted.
Zwick, P., McCaffrey, R. & Abers, G., 1994, MT5 Program, IASPEI SoftwareLibrary, 4.
A P P E N D I X
The 2005 surface ruptures occurred in high mountainous countryin material that makes preservation of the scarps, even for a shorttime, extremely unlikely. We, therefore, include in this Appendixa list (Table A1) of the precise GPS-determined locations of somepositions on the scarps that we visited in the field in 2005 February–April. This will enable anyone interested in visiting these locations,for example to carry out palaeoseismological trenching investiga-tions, to find their exact position. The sites are listed in order, fromeast to west.
Table A1. GPS locations (in degrees, minutes, seconds) of sites visited onthe 2005 coseismic fault scarps. The vertical offset on the scarp(s), where itcould be estimated is given by V , in cm.
Longitude Latitude Comments
◦ ′ ′′ ◦ ′ ′′
56 52 28.3 30 46 44.5 V = 50 cm, cuts old road in bend56 52 05.2 30 46 47.1 V = 40 cm, cuts dirt track56 51 40.4 30 46 48.6 V = 60 cm, cuts mining road and
stream to east;possibly two terraces in the streamabove the fault.
56 51 31.2 30 46 50.3 V = 100 cm56 51 25.0 30 46 51.1 V = 50 cm, strike = 275, dip =
80◦N56 50 56.2 30 46 54.8 V = 50 cm, strike = 27556 50 10.3 30 46 57.5 on slope down to a river56 50 01.1 30 46 58.3 distributed cracking56 50 06.6 30 46 57.4 V = 40 cm, on a saddle between
valleys56 50 04.0 30 46 57.1 V = 30 cm56 49 58.9 30 46 57.9 V = 30 cm56 49 53.4 30 46 58.0 V = 30 cm56 49 51.2 30 46 58.1 V = 30 cm56 49 46.4 30 46 57.1 next to abandoned village56 49 34.3 30 46 57.1 V = 60 cm, crosses stream, dip
= 60◦N56 49 31.9 30 46 56.756 49 13.8 30 46 58.1 V = 40 cm,56 49 04.8 30 46 58.9 V = 105 cm, dip = 70, cuts
tarmac roadDarbidkhun-Hotkan
56 49 03.6 30 46 59.856 49 00.8 30 46 59.656 48 58.5 30 47 00.5 V = 80 cm, cuts small stream56 48 55.8 30 47 01.256 48 52.9 30 47 01.8 V = 100 cm56 48 49.5 30 47 03.9 50 cm wide fault zone56 48 47.9 30 47 02.4 V = 40+ cm, strike = 28056 48 43.2 30 47 04.8 50 cm wide fault zone, strike =
230, evidence of right-lateraloffset
56 48 41.6 30 47 06.1 2 m wide fault zone, strike = 24056 48 40.1 30 47 08.8 minor cracks56 48 28.7 30 47 05.956 45 04.9 30 47 01.6 V = 100, in limestone, reversing
local slope, strike = 260
C© 2005 The Authors, GJI, 164, 137–148
Journal compilation C© 2005 RAS