
Prokaryotic cells: structural organisation of the cytoskeleton ...
The cytoskeleton, a structure that is susceptible to thetoxic mechanism activated by palytoxins in humanexcitable cellsM. Carmen Louzao1, Isabel R. Ares1, Mercedes R. Vieytes2, Iago Valverde3, Juan M. Vieites3,Takeshi Yasumoto4 and Luis M. Botana1
1 Departamento de Farmacologia, Facultad de Veterinaria, Universidad de Santiago de Compostela, Lugo, Spain
2 Departamento de Fisiologia Animal, Facultad de Veterinaria, Universidad de Santiago de Compostela, Lugo, Spain
3 ANFACO-CECOPESCA, Campus Universitario de Vigo, Vigo, Pontevedra, Spain
4 Japan Food Research Laboratories, Tama Laboratory, Tokyo, Japan
Palytoxin is an extremely toxic product that was first
isolated from the zoanthid Palythoa toxica [1]. This
toxin is a large, water-soluble polyalcohol with a wide
distribution in algae, crabs, herbivorous fish, and the
surgeonfish. Palytoxin enters the food chain and causes
a fatal type of poisoning named clupeotoxism [2,3].
This compound is highly toxic for mammals, with an
LD50 of 33 ngÆkg)1 when administered intravenously
in dogs [4]. Ostreocins are not well-known congeners
of the palytoxin found in Ostreopsis siamensis [5,6].
Likewise, almost nothing is known about a still
unnamed toxin produced by Ostreopsis ovata that may
be related to ostreocins and palytoxins [5].
The putative palytoxin receptor is the Na+ ⁄K+-
ATPase. The membrane enzyme Na+ ⁄K+-ATPase
uses ATP hydrolysis to pump 2 K+ and 3 Na+ in
Keywords
actin cytoskeleton; laser-scanning
cytometry; membrane potential;
ostreocin-D; palytoxin
Correspondence
L. M. Botana, Departamento de
Farmacologia, Facultad de Veterinaria,
27002 Lugo, Spain
Fax ⁄ Tel: +34 982 252 242
E-mail: [email protected]
(Received 31 October 2006, revised 7
February 2007, accepted 14 February 2007)
doi:10.1111/j.1742-4658.2007.05743.x
Palytoxin is a marine toxin responsible for a fatal type of poisoning in
humans named clupeotoxism, with symptoms such as neurologic distur-
bances. It is believed that it binds to the Na+ ⁄K+-ATPase from the extra-
cellular side and modifies cytosolic ions; nevertheless, its effects on internal
cell structures, such as the cytoskeleton, which might be affected by these
initial events, have not been fully elucidated. Likewise, ostreocin-D, an
analog of palytoxin, has been only recently found, and its action on excit-
able cells is therefore unknown. Therefore, our aim was to investigate the
modifications of ion fluxes associated with palytoxin and ostreocin-D activ-
ities, and their effects on an essential cytoskeletal component, the actin
system. We used human neuroblastoma cells and fluorescent dyes
to detect changes in membrane potential, intracellular Ca2+ concentration,
cell detachment, and actin filaments. Fluorescence values were obtained
with spectrofluorymetry, laser-scanning cytometry, and confocal micro-
scopy; the last of these was also used for recording images. Palytoxin and
ostreocin-D modified membrane permeability as a first step, triggering
depolarization and increasing Ca2+ influx. The substantial loss of filamen-
tous actin, and the morphologic alterations elicited by both toxins, are
possibly secondary to their action on ion channels. The decrease in poly-
merized actin seemed to be Ca2+-independent; however, this ion could be
related to actin cytoskeletal organization. Palytoxin and ostreocin-D alter
the ion fluxes, targeting pathways that involve the cytoskeletal dynamics of
human excitable cells.
Abbreviations
bis-oxonol, bis-(1,3-diethylthiobarbituric acid) trimethine oxonol; F-actin, filamentous actin; LSC, laser-scanning cytometry.
FEBS Journal 274 (2007) 1991–2004 ª 2007 The Authors Journal compilation ª 2007 FEBS 1991
opposite directions, thereby creating an ionic
asymmetry that is responsible for the electrochemical
potential difference of Na+ and K+ across the cell
membrane [7]. The marine toxin appears to bind to the
Na+ ⁄K+-ATPase from the extracellular side and elicit
a nonselective cation leak pathway, possibly by dis-
rupting the strict coupling between the pump’s inner
and outer gates, allowing them to both be open [8,9].
Several studies have shown that the palytoxin-induced
channel permits the passage of cations such as Na+
and K+ but not Ca2+ [10–12]. Ouabain, a well-known
inhibitor of the sodium pump, hampers the fluxes
evoked by palytoxin [13] and seems to induce detach-
ment of cells [14]. Likewise, the phenomena of cell–
matrix and cell–cell adhesion have been related to
filamentous actin (F-actin) [15,16].
Until now, the effects of palytoxins on the actin
cytoskeleton of nerve cells, which comprise one of its
main targets in mammals, have not been evaluated.
The ability of excitable cells to generate all-or-none
action potentials in response to depolarizing stimuli is
well known. There are some reports describing the
membrane depolarization induced by palytoxin in
neuronal cells [17–19]. However, surprisingly, this
membrane potential and the increase in intracellular
Na+ and further Ca2+ movements has never been
linked with a possible effect of palytoxin on the cyto-
architecture of excitable cells. On the basis of previous
information, the specific aim of this work was to
investigate and relate the effects of palytoxins (a) on
ion fluxes (shown as changes in membrane potential or
alterations in intracellular Ca2+) and (b) on actin cyto-
skeletal dynamics, morphology and cell attachment, by
using human neuroblastoma cells. Herein, we present
new findings on the mode in which both compounds
induce toxicity in a neuronal model. Knowledge of the
key points involved in the cellular damage is funda-
mental for establishing functional parameters with
practical application in the design and development of
in vitro detection techniques for seafood control pro-
grams. This information is very useful, as it forms the
basis for developing biotoxin detection methods that
could provide an alternative to animal testing.
Results
In this study, we determined the electrophysiologic
consequences of palytoxin action in excitable cells. We
have previously developed an assay to detect changes
in membrane potential by using the sensitive dye
bis-(1,3-diethylthiobarbituric acid) trimethine oxonol
(bis-oxonol) [20]. The negative charge of bis-oxonol
prevents its accumulation in the mitochondria, and
therefore the probe only indicates changes in mem-
brane potential [21]. Process conditions such as con-
centration of dye were taken from our previous studies
[20,22,23]. The dye was allowed to equilibrate with the
cells for 15–20 min before any experiment was begun.
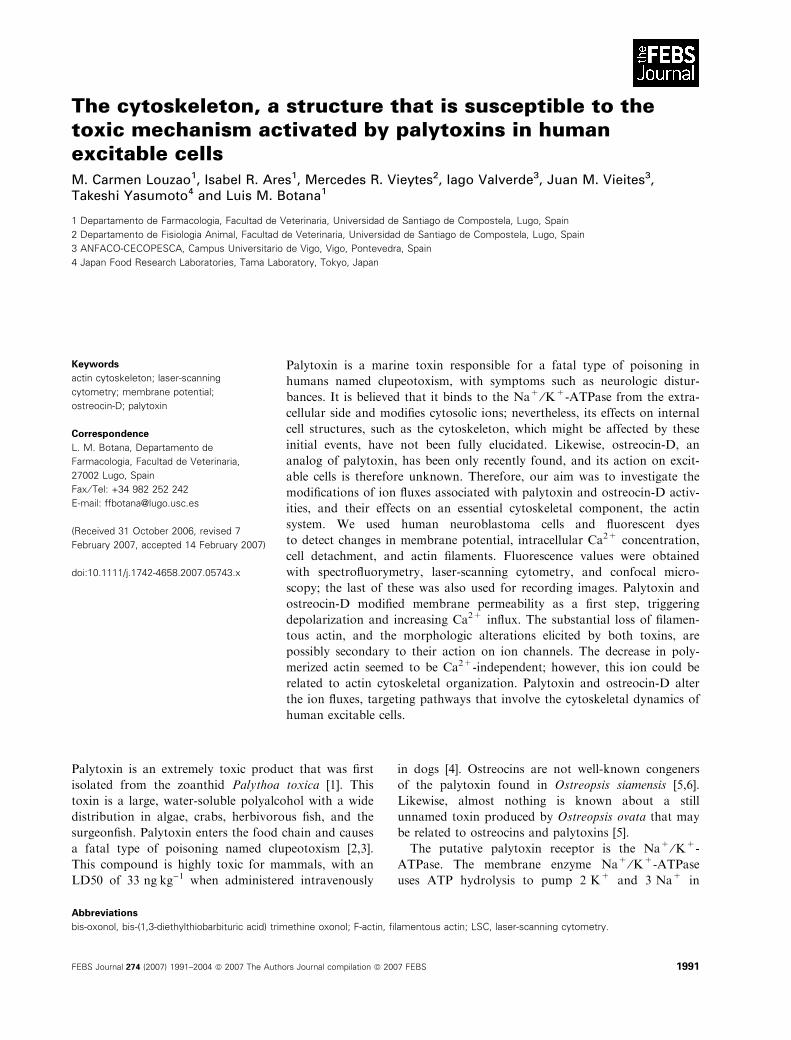
Downward and upward deflections of the fluorescence
tracings represent hyperpolarization and depolari-
zation, respectively. Figure 1 shows that 75 nm
palytoxin or ostreocin-D induced depolarization in
neuroblastoma cells.
The next step was to investigate whether, together
with this depolarization, there was an increase in cyto-
solic Ca2+. It is known that the use of dual indicators
to study intracellular Ca2+ minimizes the contribution
of artefactual changes to the fluorescent signal that are
not related to variations in Ca2+ [24,25]. Taking into
account this fact, we used a combination of Fluo-3
and Fura red to perform this kind of assay. The Fluo-3
and Fura red fluorescence intensities are increased and
reduced, respectively, when the intracellular free Ca2+
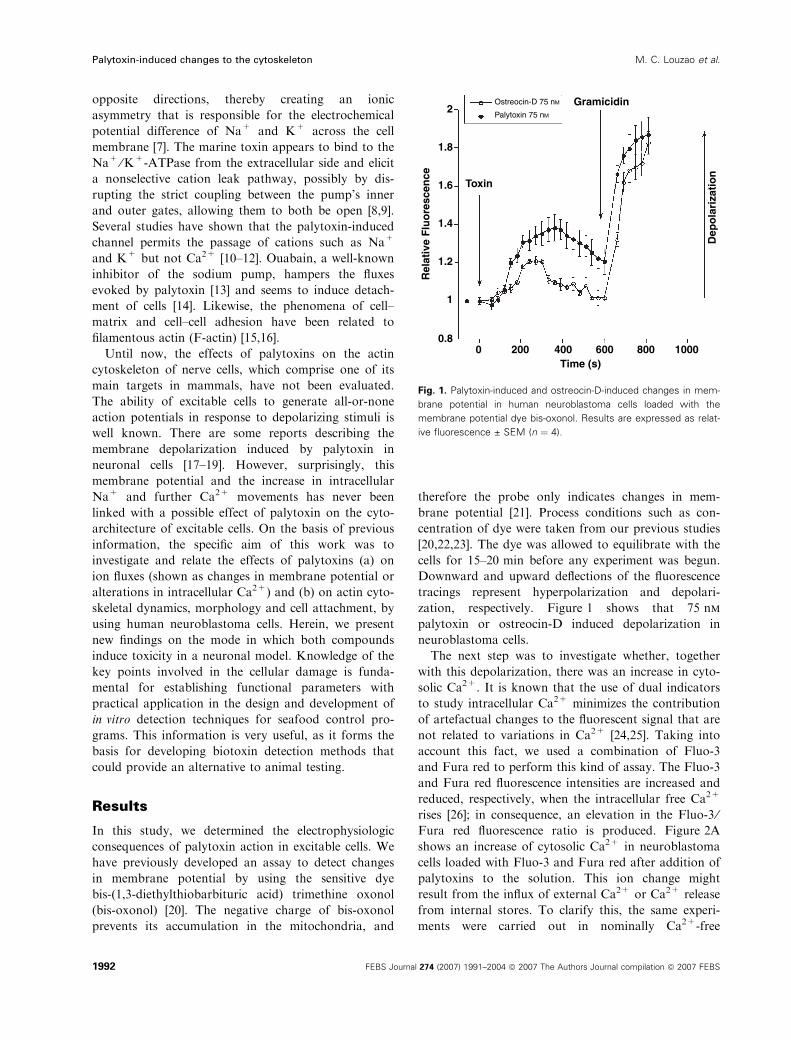
rises [26]; in consequence, an elevation in the Fluo-3 ⁄Fura red fluorescence ratio is produced. Figure 2A
shows an increase of cytosolic Ca2+ in neuroblastoma
cells loaded with Fluo-3 and Fura red after addition of
palytoxins to the solution. This ion change might
result from the influx of external Ca2+ or Ca2+ release
from internal stores. To clarify this, the same experi-
ments were carried out in nominally Ca2+-free
1
1.2
1.4
1.6 Toxin
GramicidinOstreocin-D 75 nM
Palytoxin 75 nM
1.8
2
0.80 200 400
Time (s)
Dep
ola
riza
tio
n
Rel
ativ
e F
luo
resc
ence
600 800 1000
Fig. 1. Palytoxin-induced and ostreocin-D-induced changes in mem-
brane potential in human neuroblastoma cells loaded with the
membrane potential dye bis-oxonol. Results are expressed as relat-
ive fluorescence ± SEM (n ¼ 4).
Palytoxin-induced changes to the cytoskeleton M. C. Louzao et al.
1992 FEBS Journal 274 (2007) 1991–2004 ª 2007 The Authors Journal compilation ª 2007 FEBS
medium, and we found that neither palytoxin nor ost-
reocin-D modified the cation concentration within
neuroblastoma cells (Fig. 2B). These results suggest
that toxins induce an extracellular Ca2+ influx.
Modifications of intracellular Ca2+ levels could be
associated with cytotoxic effects. In order to examine
whether palytoxin affected the attachment of cells to
the extracellular matrix, we determined, by additional
fluorimetric microplate assays, the percentage of paly-
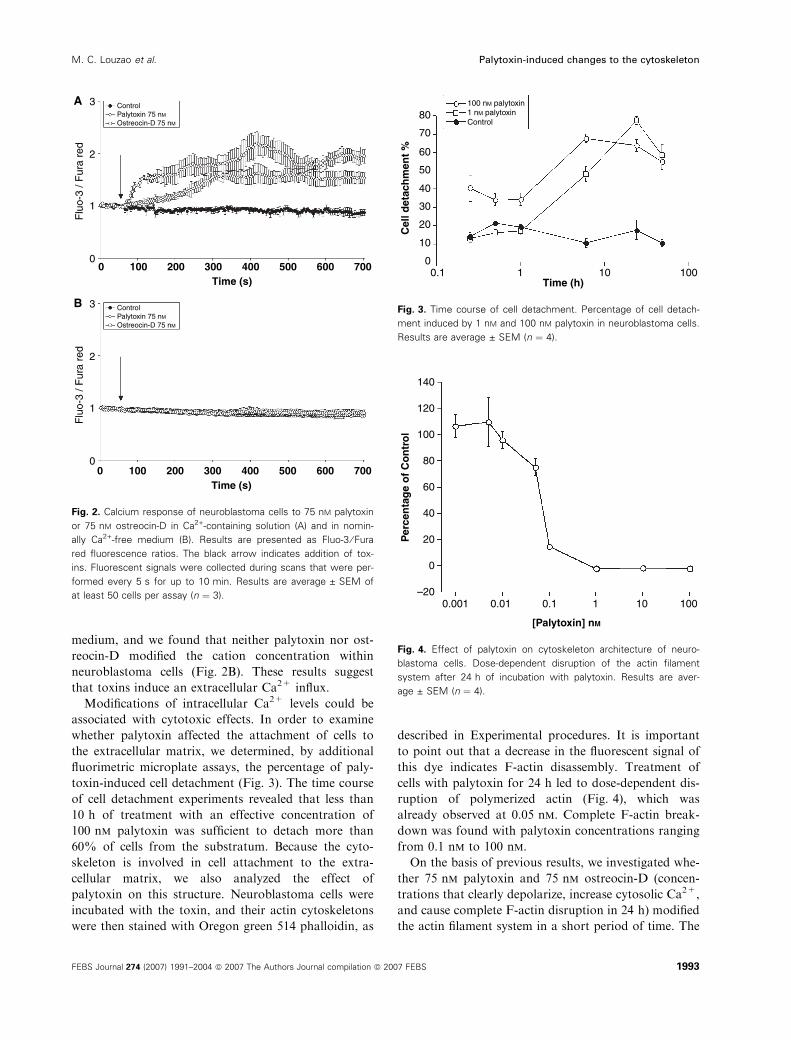
toxin-induced cell detachment (Fig. 3). The time course
of cell detachment experiments revealed that less than
10 h of treatment with an effective concentration of
100 nm palytoxin was sufficient to detach more than
60% of cells from the substratum. Because the cyto-
skeleton is involved in cell attachment to the extra-
cellular matrix, we also analyzed the effect of
palytoxin on this structure. Neuroblastoma cells were
incubated with the toxin, and their actin cytoskeletons
were then stained with Oregon green 514 phalloidin, as
described in Experimental procedures. It is important
to point out that a decrease in the fluorescent signal of
this dye indicates F-actin disassembly. Treatment of
cells with palytoxin for 24 h led to dose-dependent dis-
ruption of polymerized actin (Fig. 4), which was
already observed at 0.05 nm. Complete F-actin break-
down was found with palytoxin concentrations ranging
from 0.1 nm to 100 nm.
On the basis of previous results, we investigated whe-
ther 75 nm palytoxin and 75 nm ostreocin-D (concen-
trations that clearly depolarize, increase cytosolic Ca2+,
and cause complete F-actin disruption in 24 h) modified
the actin filament system in a short period of time. The
0 100
A
B
Flu
o-3
/ Fur
a re
dF
luo-
3 / F
ura
red
200 300 400Time (s)
600500 700
0 100 200 300 400Time (s)
600500 700
Ostreocin-D 75 nM
Control3
2
1
0
3
2
1
0
Palytoxin 75 nM
Ostreocin-D 75 nM
ControlPalytoxin 75 nM
Fig. 2. Calcium response of neuroblastoma cells to 75 nM palytoxin
or 75 nM ostreocin-D in Ca2+-containing solution (A) and in nomin-
ally Ca2+-free medium (B). Results are presented as Fluo-3 ⁄ Fura
red fluorescence ratios. The black arrow indicates addition of tox-
ins. Fluorescent signals were collected during scans that were per-
formed every 5 s for up to 10 min. Results are average ± SEM of
at least 50 cells per assay (n ¼ 3).
100 nM palytoxin1 nM palytoxin80
70
60
50
40
30
20
10
00.1 1 10 100
Control
Time (h)
Cel
l det
ach
men
t %
Fig. 3. Time course of cell detachment. Percentage of cell detach-
ment induced by 1 nM and 100 nM palytoxin in neuroblastoma cells.
Results are average ± SEM (n ¼ 4).
0.10.010.001 1 10 100
[Palytoxin] nM
80
100
120
140
60
40
20
–20
0
Per
cen
tag
e o
f C
on
tro
l
Fig. 4. Effect of palytoxin on cytoskeleton architecture of neuro-
blastoma cells. Dose-dependent disruption of the actin filament
system after 24 h of incubation with palytoxin. Results are aver-
age ± SEM (n ¼ 4).
M. C. Louzao et al. Palytoxin-induced changes to the cytoskeleton
FEBS Journal 274 (2007) 1991–2004 ª 2007 The Authors Journal compilation ª 2007 FEBS 1993
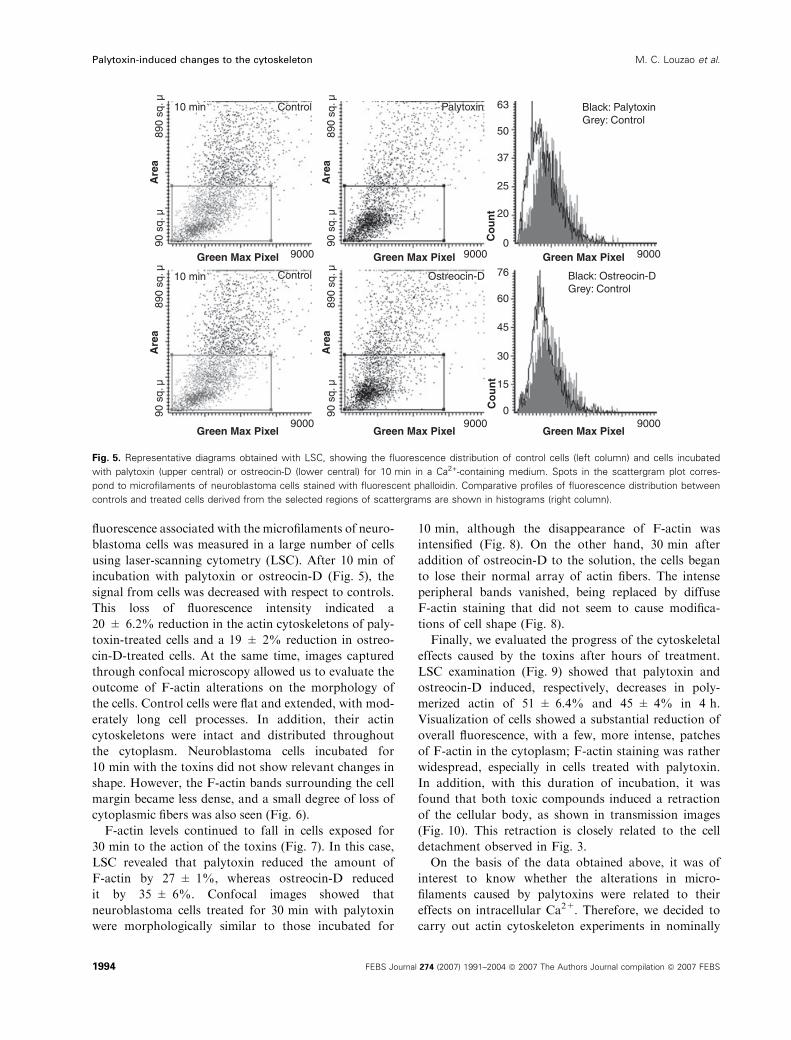
fluorescence associated with the microfilaments of neuro-
blastoma cells was measured in a large number of cells
using laser-scanning cytometry (LSC). After 10 min of
incubation with palytoxin or ostreocin-D (Fig. 5), the
signal from cells was decreased with respect to controls.
This loss of fluorescence intensity indicated a
20 ± 6.2% reduction in the actin cytoskeletons of paly-
toxin-treated cells and a 19 ± 2% reduction in ostreo-
cin-D-treated cells. At the same time, images captured
through confocal microscopy allowed us to evaluate the
outcome of F-actin alterations on the morphology of
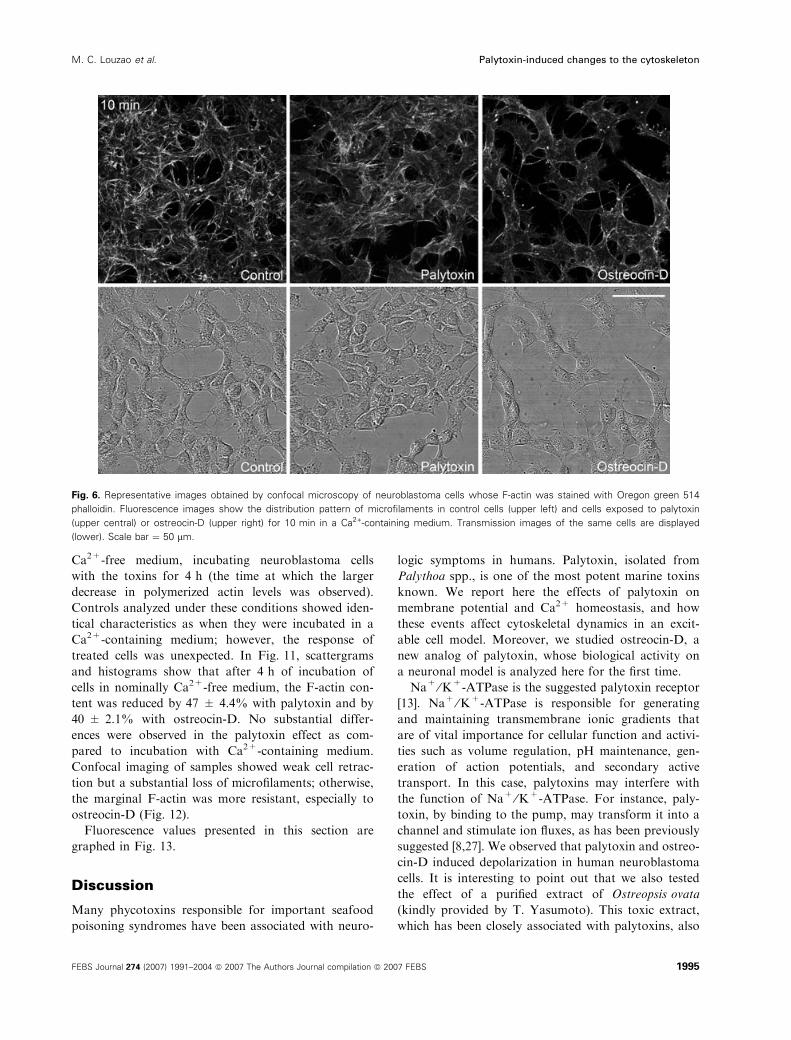
the cells. Control cells were flat and extended, with mod-
erately long cell processes. In addition, their actin
cytoskeletons were intact and distributed throughout
the cytoplasm. Neuroblastoma cells incubated for
10 min with the toxins did not show relevant changes in
shape. However, the F-actin bands surrounding the cell
margin became less dense, and a small degree of loss of
cytoplasmic fibers was also seen (Fig. 6).
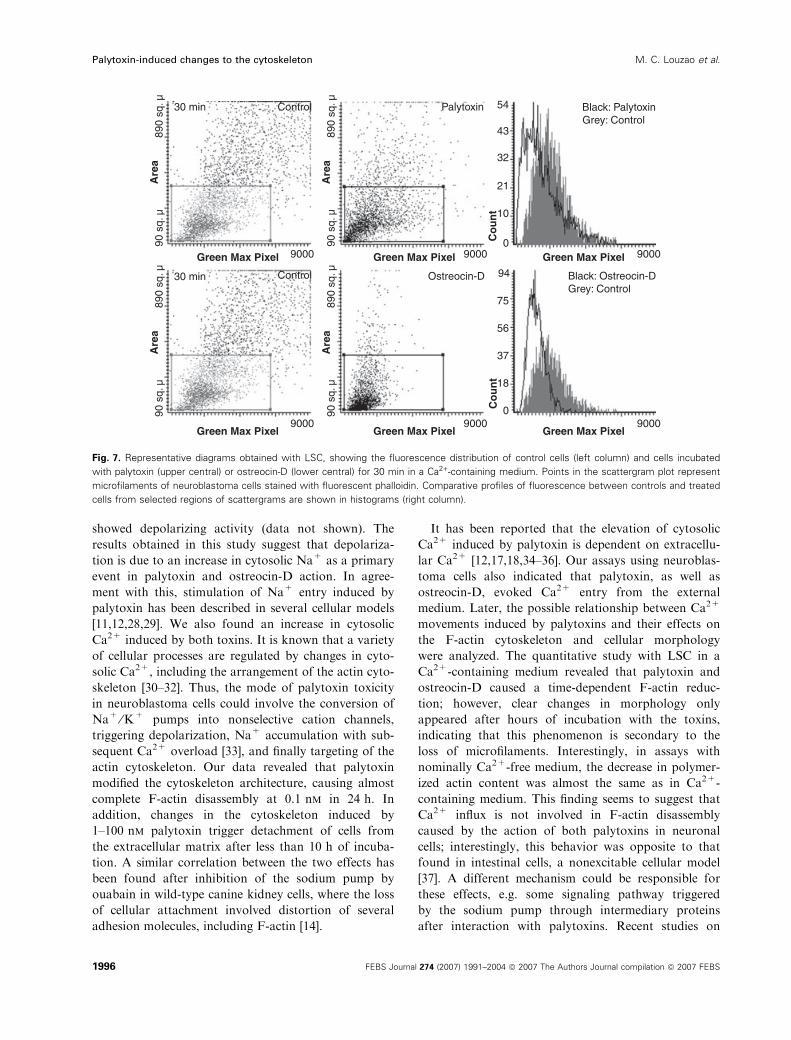
F-actin levels continued to fall in cells exposed for
30 min to the action of the toxins (Fig. 7). In this case,
LSC revealed that palytoxin reduced the amount of
F-actin by 27 ± 1%, whereas ostreocin-D reduced
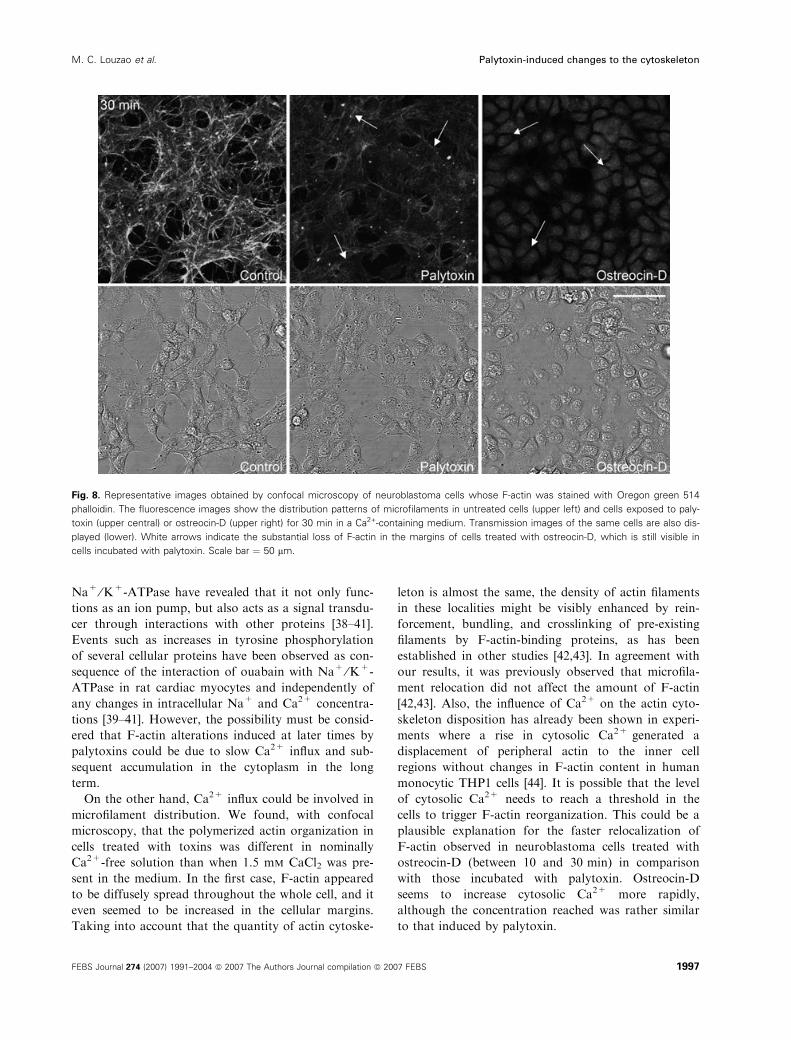
it by 35 ± 6%. Confocal images showed that
neuroblastoma cells treated for 30 min with palytoxin
were morphologically similar to those incubated for
10 min, although the disappearance of F-actin was
intensified (Fig. 8). On the other hand, 30 min after
addition of ostreocin-D to the solution, the cells began
to lose their normal array of actin fibers. The intense
peripheral bands vanished, being replaced by diffuse
F-actin staining that did not seem to cause modifica-
tions of cell shape (Fig. 8).
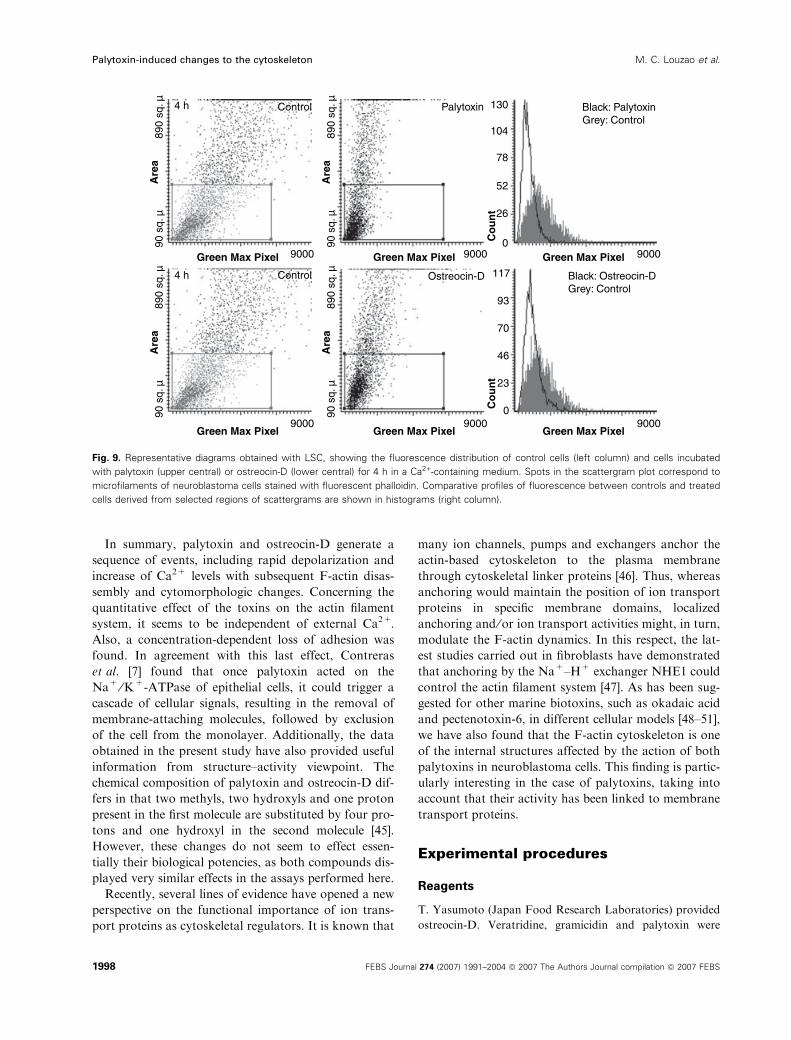
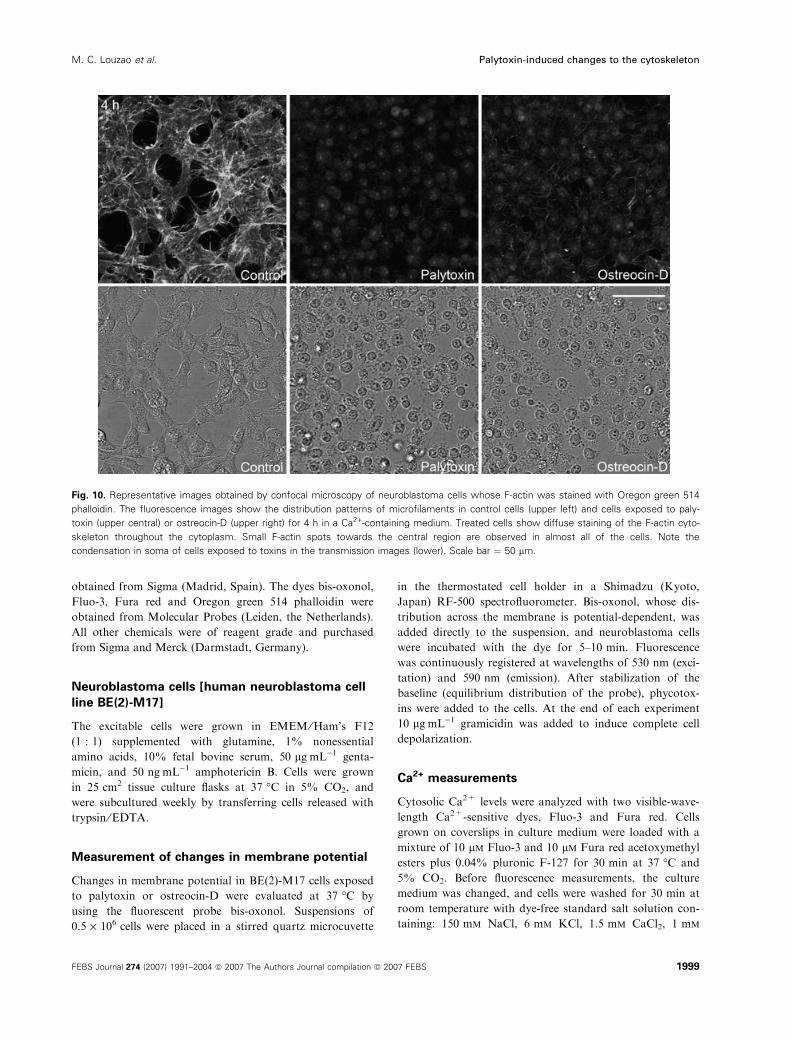
Finally, we evaluated the progress of the cytoskeletal
effects caused by the toxins after hours of treatment.
LSC examination (Fig. 9) showed that palytoxin and
ostreocin-D induced, respectively, decreases in poly-
merized actin of 51 ± 6.4% and 45 ± 4% in 4 h.
Visualization of cells showed a substantial reduction of
overall fluorescence, with a few, more intense, patches
of F-actin in the cytoplasm; F-actin staining was rather
widespread, especially in cells treated with palytoxin.
In addition, with this duration of incubation, it was
found that both toxic compounds induced a retraction
of the cellular body, as shown in transmission images
(Fig. 10). This retraction is closely related to the cell
detachment observed in Fig. 3.
On the basis of the data obtained above, it was of
interest to know whether the alterations in micro-
filaments caused by palytoxins were related to their
effects on intracellular Ca2+. Therefore, we decided to
carry out actin cytoskeleton experiments in nominally
10 min
10 min
Control
Control
Green Max Pixel Green Max Pixel Green Max Pixel
Co
un
t
Green Max Pixel
90 s
q. µ
Are
a89
0 sq
. µ
90 s
q. µ
9000 9000 9000
9000 9000
63
50
37
25
0
20
Co
un
t
76
60
45
30
0
15
9000
Are
a89
0 sq
. µ
90 s
q. µ
Are
a89
0 sq
. µ
90 s
q. µ
Are
a89
0 sq
. µ
Green Max Pixel Green Max Pixel
Palytoxin Black: Palytoxin Grey: Control
Black: Ostreocin-D Grey: Control
Ostreocin-D
Fig. 5. Representative diagrams obtained with LSC, showing the fluorescence distribution of control cells (left column) and cells incubated
with palytoxin (upper central) or ostreocin-D (lower central) for 10 min in a Ca2+-containing medium. Spots in the scattergram plot corres-
pond to microfilaments of neuroblastoma cells stained with fluorescent phalloidin. Comparative profiles of fluorescence distribution between
controls and treated cells derived from the selected regions of scattergrams are shown in histograms (right column).
Palytoxin-induced changes to the cytoskeleton M. C. Louzao et al.
1994 FEBS Journal 274 (2007) 1991–2004 ª 2007 The Authors Journal compilation ª 2007 FEBS
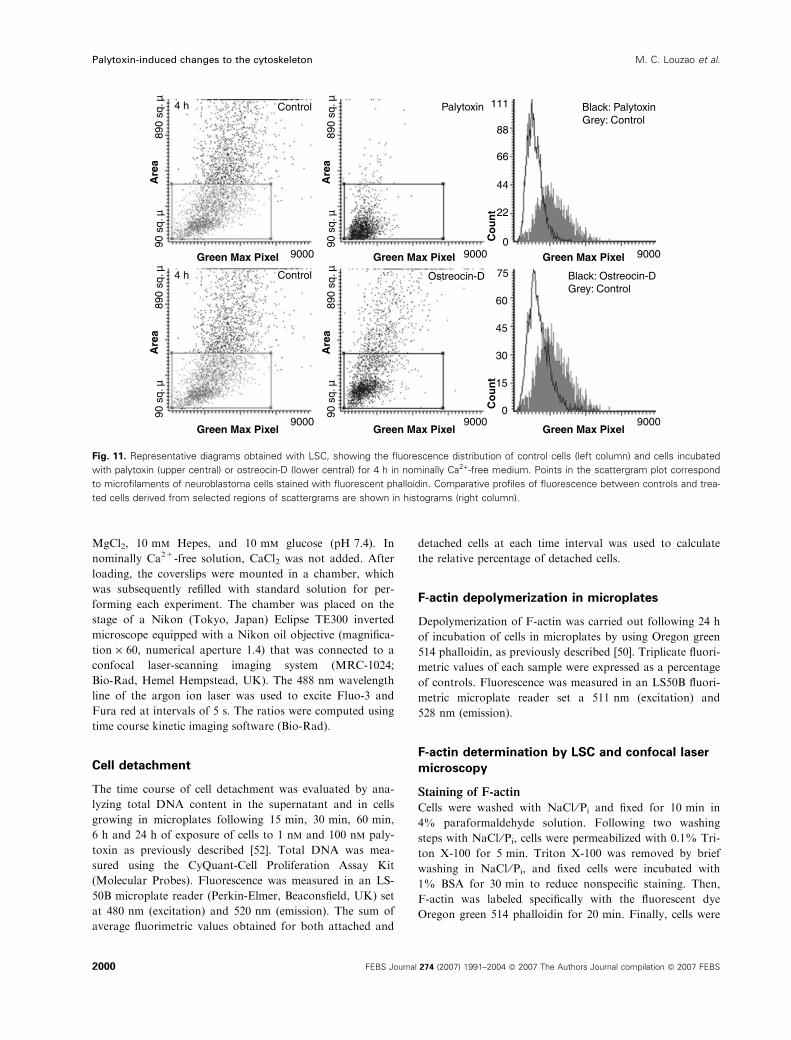
Ca2+-free medium, incubating neuroblastoma cells
with the toxins for 4 h (the time at which the larger
decrease in polymerized actin levels was observed).
Controls analyzed under these conditions showed iden-
tical characteristics as when they were incubated in a
Ca2+-containing medium; however, the response of
treated cells was unexpected. In Fig. 11, scattergrams
and histograms show that after 4 h of incubation of
cells in nominally Ca2+-free medium, the F-actin con-
tent was reduced by 47 ± 4.4% with palytoxin and by
40 ± 2.1% with ostreocin-D. No substantial differ-
ences were observed in the palytoxin effect as com-
pared to incubation with Ca2+-containing medium.
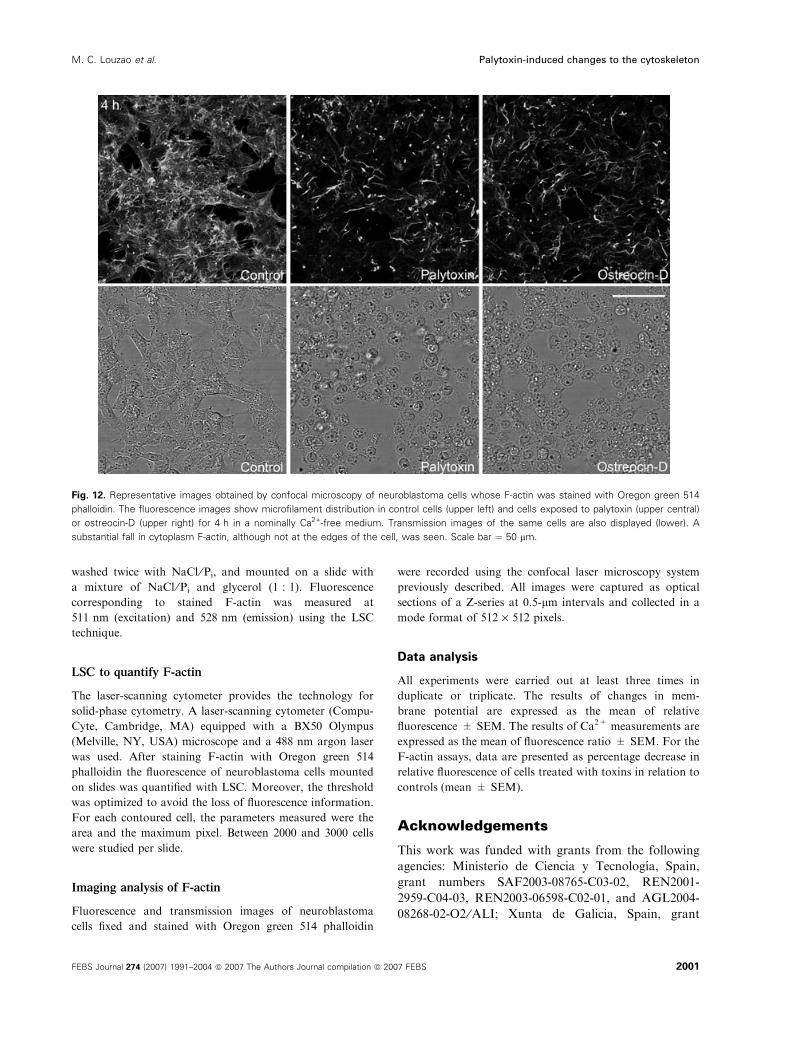
Confocal imaging of samples showed weak cell retrac-
tion but a substantial loss of microfilaments; otherwise,
the marginal F-actin was more resistant, especially to
ostreocin-D (Fig. 12).
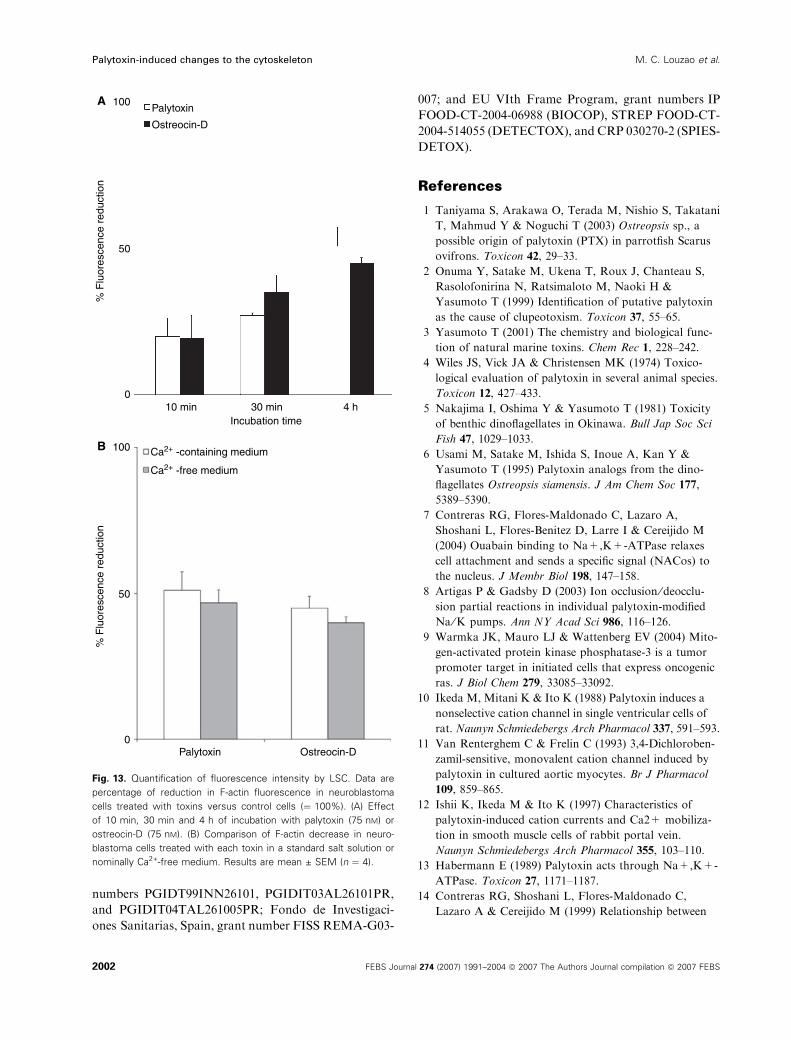
Fluorescence values presented in this section are
graphed in Fig. 13.
Discussion
Many phycotoxins responsible for important seafood
poisoning syndromes have been associated with neuro-
logic symptoms in humans. Palytoxin, isolated from
Palythoa spp., is one of the most potent marine toxins
known. We report here the effects of palytoxin on
membrane potential and Ca2+ homeostasis, and how
these events affect cytoskeletal dynamics in an excit-
able cell model. Moreover, we studied ostreocin-D, a
new analog of palytoxin, whose biological activity on
a neuronal model is analyzed here for the first time.
Na+ ⁄K+-ATPase is the suggested palytoxin receptor
[13]. Na+ ⁄K+-ATPase is responsible for generating
and maintaining transmembrane ionic gradients that
are of vital importance for cellular function and activi-
ties such as volume regulation, pH maintenance, gen-
eration of action potentials, and secondary active
transport. In this case, palytoxins may interfere with
the function of Na+ ⁄K+-ATPase. For instance, paly-
toxin, by binding to the pump, may transform it into a
channel and stimulate ion fluxes, as has been previously
suggested [8,27]. We observed that palytoxin and ostreo-
cin-D induced depolarization in human neuroblastoma
cells. It is interesting to point out that we also tested
the effect of a purified extract of Ostreopsis ovata
(kindly provided by T. Yasumoto). This toxic extract,
which has been closely associated with palytoxins, also
Fig. 6. Representative images obtained by confocal microscopy of neuroblastoma cells whose F-actin was stained with Oregon green 514
phalloidin. Fluorescence images show the distribution pattern of microfilaments in control cells (upper left) and cells exposed to palytoxin
(upper central) or ostreocin-D (upper right) for 10 min in a Ca2+-containing medium. Transmission images of the same cells are displayed
(lower). Scale bar ¼ 50 lm.
M. C. Louzao et al. Palytoxin-induced changes to the cytoskeleton
FEBS Journal 274 (2007) 1991–2004 ª 2007 The Authors Journal compilation ª 2007 FEBS 1995
showed depolarizing activity (data not shown). The
results obtained in this study suggest that depolariza-
tion is due to an increase in cytosolic Na+ as a primary
event in palytoxin and ostreocin-D action. In agree-
ment with this, stimulation of Na+ entry induced by
palytoxin has been described in several cellular models
[11,12,28,29]. We also found an increase in cytosolic
Ca2+ induced by both toxins. It is known that a variety
of cellular processes are regulated by changes in cyto-
solic Ca2+, including the arrangement of the actin cyto-
skeleton [30–32]. Thus, the mode of palytoxin toxicity
in neuroblastoma cells could involve the conversion of
Na+ ⁄K+ pumps into nonselective cation channels,
triggering depolarization, Na+ accumulation with sub-
sequent Ca2+ overload [33], and finally targeting of the
actin cytoskeleton. Our data revealed that palytoxin
modified the cytoskeleton architecture, causing almost
complete F-actin disassembly at 0.1 nm in 24 h. In
addition, changes in the cytoskeleton induced by
1–100 nm palytoxin trigger detachment of cells from
the extracellular matrix after less than 10 h of incuba-
tion. A similar correlation between the two effects has
been found after inhibition of the sodium pump by
ouabain in wild-type canine kidney cells, where the loss
of cellular attachment involved distortion of several
adhesion molecules, including F-actin [14].
It has been reported that the elevation of cytosolic
Ca2+ induced by palytoxin is dependent on extracellu-
lar Ca2+ [12,17,18,34–36]. Our assays using neuroblas-
toma cells also indicated that palytoxin, as well as
ostreocin-D, evoked Ca2+ entry from the external
medium. Later, the possible relationship between Ca2+
movements induced by palytoxins and their effects on
the F-actin cytoskeleton and cellular morphology
were analyzed. The quantitative study with LSC in a
Ca2+-containing medium revealed that palytoxin and
ostreocin-D caused a time-dependent F-actin reduc-
tion; however, clear changes in morphology only
appeared after hours of incubation with the toxins,
indicating that this phenomenon is secondary to the
loss of microfilaments. Interestingly, in assays with
nominally Ca2+-free medium, the decrease in polymer-
ized actin content was almost the same as in Ca2+-
containing medium. This finding seems to suggest that
Ca2+ influx is not involved in F-actin disassembly
caused by the action of both palytoxins in neuronal
cells; interestingly, this behavior was opposite to that
found in intestinal cells, a nonexcitable cellular model
[37]. A different mechanism could be responsible for
these effects, e.g. some signaling pathway triggered
by the sodium pump through intermediary proteins
after interaction with palytoxins. Recent studies on
30 min
30 min
Control
Control
Green Max Pixel Green Max Pixel Green Max Pixel
Co
un
t
Green Max Pixel
90 s
q. µ
Are
a89
0 sq
. µ
90 s
q. µ
9000 9000 9000
9000 9000
54
43
32
21
0
10
Co
un
t
94
75
56
37
0
18
9000
Are
a89
0 sq
. µ
90 s
q. µ
Are
a89
0 sq
. µ
90 s
q. µ
Are
a89
0 sq
. µ
Green Max Pixel Green Max Pixel
Palytoxin Black: Palytoxin Grey: Control
Black: Ostreocin-D Grey: Control
Ostreocin-D
Fig. 7. Representative diagrams obtained with LSC, showing the fluorescence distribution of control cells (left column) and cells incubated
with palytoxin (upper central) or ostreocin-D (lower central) for 30 min in a Ca2+-containing medium. Points in the scattergram plot represent
microfilaments of neuroblastoma cells stained with fluorescent phalloidin. Comparative profiles of fluorescence between controls and treated
cells from selected regions of scattergrams are shown in histograms (right column).
Palytoxin-induced changes to the cytoskeleton M. C. Louzao et al.
1996 FEBS Journal 274 (2007) 1991–2004 ª 2007 The Authors Journal compilation ª 2007 FEBS
Na+ ⁄K+-ATPase have revealed that it not only func-
tions as an ion pump, but also acts as a signal transdu-
cer through interactions with other proteins [38–41].
Events such as increases in tyrosine phosphorylation
of several cellular proteins have been observed as con-
sequence of the interaction of ouabain with Na+ ⁄K+-
ATPase in rat cardiac myocytes and independently of
any changes in intracellular Na+ and Ca2+ concentra-
tions [39–41]. However, the possibility must be consid-
ered that F-actin alterations induced at later times by
palytoxins could be due to slow Ca2+ influx and sub-
sequent accumulation in the cytoplasm in the long
term.
On the other hand, Ca2+ influx could be involved in
microfilament distribution. We found, with confocal
microscopy, that the polymerized actin organization in
cells treated with toxins was different in nominally
Ca2+-free solution than when 1.5 mm CaCl2 was pre-
sent in the medium. In the first case, F-actin appeared
to be diffusely spread throughout the whole cell, and it
even seemed to be increased in the cellular margins.
Taking into account that the quantity of actin cytoske-
leton is almost the same, the density of actin filaments
in these localities might be visibly enhanced by rein-
forcement, bundling, and crosslinking of pre-existing
filaments by F-actin-binding proteins, as has been
established in other studies [42,43]. In agreement with
our results, it was previously observed that microfila-
ment relocation did not affect the amount of F-actin
[42,43]. Also, the influence of Ca2+ on the actin cyto-
skeleton disposition has already been shown in experi-
ments where a rise in cytosolic Ca2+ generated a
displacement of peripheral actin to the inner cell
regions without changes in F-actin content in human
monocytic THP1 cells [44]. It is possible that the level
of cytosolic Ca2+ needs to reach a threshold in the
cells to trigger F-actin reorganization. This could be a
plausible explanation for the faster relocalization of
F-actin observed in neuroblastoma cells treated with
ostreocin-D (between 10 and 30 min) in comparison
with those incubated with palytoxin. Ostreocin-D
seems to increase cytosolic Ca2+ more rapidly,
although the concentration reached was rather similar
to that induced by palytoxin.
Fig. 8. Representative images obtained by confocal microscopy of neuroblastoma cells whose F-actin was stained with Oregon green 514
phalloidin. The fluorescence images show the distribution patterns of microfilaments in untreated cells (upper left) and cells exposed to paly-
toxin (upper central) or ostreocin-D (upper right) for 30 min in a Ca2+-containing medium. Transmission images of the same cells are also dis-
played (lower). White arrows indicate the substantial loss of F-actin in the margins of cells treated with ostreocin-D, which is still visible in
cells incubated with palytoxin. Scale bar ¼ 50 lm.
M. C. Louzao et al. Palytoxin-induced changes to the cytoskeleton
FEBS Journal 274 (2007) 1991–2004 ª 2007 The Authors Journal compilation ª 2007 FEBS 1997
In summary, palytoxin and ostreocin-D generate a
sequence of events, including rapid depolarization and
increase of Ca2+ levels with subsequent F-actin disas-
sembly and cytomorphologic changes. Concerning the
quantitative effect of the toxins on the actin filament
system, it seems to be independent of external Ca2+.
Also, a concentration-dependent loss of adhesion was
found. In agreement with this last effect, Contreras
et al. [7] found that once palytoxin acted on the
Na+ ⁄K+-ATPase of epithelial cells, it could trigger a
cascade of cellular signals, resulting in the removal of
membrane-attaching molecules, followed by exclusion
of the cell from the monolayer. Additionally, the data
obtained in the present study have also provided useful
information from structure–activity viewpoint. The
chemical composition of palytoxin and ostreocin-D dif-
fers in that two methyls, two hydroxyls and one proton
present in the first molecule are substituted by four pro-
tons and one hydroxyl in the second molecule [45].
However, these changes do not seem to effect essen-
tially their biological potencies, as both compounds dis-
played very similar effects in the assays performed here.
Recently, several lines of evidence have opened a new
perspective on the functional importance of ion trans-
port proteins as cytoskeletal regulators. It is known that
many ion channels, pumps and exchangers anchor the
actin-based cytoskeleton to the plasma membrane
through cytoskeletal linker proteins [46]. Thus, whereas
anchoring would maintain the position of ion transport
proteins in specific membrane domains, localized
anchoring and ⁄or ion transport activities might, in turn,
modulate the F-actin dynamics. In this respect, the lat-
est studies carried out in fibroblasts have demonstrated
that anchoring by the Na+–H+ exchanger NHE1 could
control the actin filament system [47]. As has been sug-
gested for other marine biotoxins, such as okadaic acid
and pectenotoxin-6, in different cellular models [48–51],
we have also found that the F-actin cytoskeleton is one
of the internal structures affected by the action of both
palytoxins in neuroblastoma cells. This finding is partic-
ularly interesting in the case of palytoxins, taking into
account that their activity has been linked to membrane
transport proteins.
Experimental procedures
Reagents
T. Yasumoto (Japan Food Research Laboratories) provided
ostreocin-D. Veratridine, gramicidin and palytoxin were
4 h
4 h
Control
Control
Green Max Pixel Green Max Pixel Green Max Pixel
Co
un
t
Green Max Pixel
90 s
q. µ
Are
a89
0 sq
. µ
90 s
q. µ
9000 9000 9000
9000 9000
130
104
78
52
0
26
Co
un
t
117
93
70
46
0
23
9000
Are
a89
0 sq
. µ
90 s
q. µ
Are
a89
0 sq
. µ
90 s
q. µ
Are
a89
0 sq
. µ
Green Max Pixel Green Max Pixel
Palytoxin Black: PalytoxinGrey: Control
Black: Ostreocin-DGrey: Control
Ostreocin-D
Fig. 9. Representative diagrams obtained with LSC, showing the fluorescence distribution of control cells (left column) and cells incubated
with palytoxin (upper central) or ostreocin-D (lower central) for 4 h in a Ca2+-containing medium. Spots in the scattergram plot correspond to
microfilaments of neuroblastoma cells stained with fluorescent phalloidin. Comparative profiles of fluorescence between controls and treated
cells derived from selected regions of scattergrams are shown in histograms (right column).
Palytoxin-induced changes to the cytoskeleton M. C. Louzao et al.
1998 FEBS Journal 274 (2007) 1991–2004 ª 2007 The Authors Journal compilation ª 2007 FEBS
obtained from Sigma (Madrid, Spain). The dyes bis-oxonol,
Fluo-3, Fura red and Oregon green 514 phalloidin were
obtained from Molecular Probes (Leiden, the Netherlands).
All other chemicals were of reagent grade and purchased
from Sigma and Merck (Darmstadt, Germany).
Neuroblastoma cells [human neuroblastoma cell
line BE(2)-M17]
The excitable cells were grown in EMEM ⁄Ham’s F12
(1 : 1) supplemented with glutamine, 1% nonessential
amino acids, 10% fetal bovine serum, 50 lgÆmL)1 genta-
micin, and 50 ngÆmL)1 amphotericin B. Cells were grown
in 25 cm2 tissue culture flasks at 37 �C in 5% CO2, and
were subcultured weekly by transferring cells released with
trypsin ⁄EDTA.
Measurement of changes in membrane potential
Changes in membrane potential in BE(2)-M17 cells exposed
to palytoxin or ostreocin-D were evaluated at 37 �C by
using the fluorescent probe bis-oxonol. Suspensions of
0.5 · 106 cells were placed in a stirred quartz microcuvette
in the thermostated cell holder in a Shimadzu (Kyoto,
Japan) RF-500 spectrofluorometer. Bis-oxonol, whose dis-
tribution across the membrane is potential-dependent, was
added directly to the suspension, and neuroblastoma cells
were incubated with the dye for 5–10 min. Fluorescence
was continuously registered at wavelengths of 530 nm (exci-
tation) and 590 nm (emission). After stabilization of the
baseline (equilibrium distribution of the probe), phycotox-
ins were added to the cells. At the end of each experiment
10 lgÆmL)1 gramicidin was added to induce complete cell
depolarization.
Ca2+ measurements
Cytosolic Ca2+ levels were analyzed with two visible-wave-
length Ca2+-sensitive dyes, Fluo-3 and Fura red. Cells
grown on coverslips in culture medium were loaded with a
mixture of 10 lm Fluo-3 and 10 lm Fura red acetoxymethyl
esters plus 0.04% pluronic F-127 for 30 min at 37 �C and
5% CO2. Before fluorescence measurements, the culture
medium was changed, and cells were washed for 30 min at
room temperature with dye-free standard salt solution con-
taining: 150 mm NaCl, 6 mm KCl, 1.5 mm CaCl2, 1 mm
Fig. 10. Representative images obtained by confocal microscopy of neuroblastoma cells whose F-actin was stained with Oregon green 514
phalloidin. The fluorescence images show the distribution patterns of microfilaments in control cells (upper left) and cells exposed to paly-
toxin (upper central) or ostreocin-D (upper right) for 4 h in a Ca2+-containing medium. Treated cells show diffuse staining of the F-actin cyto-
skeleton throughout the cytoplasm. Small F-actin spots towards the central region are observed in almost all of the cells. Note the
condensation in soma of cells exposed to toxins in the transmission images (lower). Scale bar ¼ 50 lm.
M. C. Louzao et al. Palytoxin-induced changes to the cytoskeleton
FEBS Journal 274 (2007) 1991–2004 ª 2007 The Authors Journal compilation ª 2007 FEBS 1999
MgCl2, 10 mm Hepes, and 10 mm glucose (pH 7.4). In
nominally Ca2+-free solution, CaCl2 was not added. After
loading, the coverslips were mounted in a chamber, which
was subsequently refilled with standard solution for per-
forming each experiment. The chamber was placed on the
stage of a Nikon (Tokyo, Japan) Eclipse TE300 inverted
microscope equipped with a Nikon oil objective (magnifica-
tion · 60, numerical aperture 1.4) that was connected to a
confocal laser-scanning imaging system (MRC-1024;
Bio-Rad, Hemel Hempstead, UK). The 488 nm wavelength
line of the argon ion laser was used to excite Fluo-3 and
Fura red at intervals of 5 s. The ratios were computed using
time course kinetic imaging software (Bio-Rad).
Cell detachment
The time course of cell detachment was evaluated by ana-
lyzing total DNA content in the supernatant and in cells
growing in microplates following 15 min, 30 min, 60 min,
6 h and 24 h of exposure of cells to 1 nm and 100 nm paly-
toxin as previously described [52]. Total DNA was mea-
sured using the CyQuant-Cell Proliferation Assay Kit
(Molecular Probes). Fluorescence was measured in an LS-
50B microplate reader (Perkin-Elmer, Beaconsfield, UK) set
at 480 nm (excitation) and 520 nm (emission). The sum of
average fluorimetric values obtained for both attached and
detached cells at each time interval was used to calculate
the relative percentage of detached cells.
F-actin depolymerization in microplates
Depolymerization of F-actin was carried out following 24 h
of incubation of cells in microplates by using Oregon green
514 phalloidin, as previously described [50]. Triplicate fluori-
metric values of each sample were expressed as a percentage
of controls. Fluorescence was measured in an LS50B fluori-
metric microplate reader set a 511 nm (excitation) and
528 nm (emission).
F-actin determination by LSC and confocal laser
microscopy
Staining of F-actin
Cells were washed with NaCl ⁄Pi and fixed for 10 min in
4% paraformaldehyde solution. Following two washing
steps with NaCl ⁄Pi, cells were permeabilized with 0.1% Tri-
ton X-100 for 5 min. Triton X-100 was removed by brief
washing in NaCl ⁄Pi, and fixed cells were incubated with
1% BSA for 30 min to reduce nonspecific staining. Then,
F-actin was labeled specifically with the fluorescent dye
Oregon green 514 phalloidin for 20 min. Finally, cells were
4 h
4 h
Control
Control
Green Max Pixel Green Max Pixel Green Max Pixel
Co
un
t
Green Max Pixel
90 s
q. µ
Are
a89
0 sq
. µ
90 s
q. µ
9000 9000 9000
9000 9000
111
88
66
44
0
22
Co
un
t
75
60
45
30
0
15
9000
Are
a89
0 sq
. µ
90 s
q. µ
Are
a89
0 sq
. µ
90 s
q. µ
Are
a89
0 sq
. µ
Green Max Pixel Green Max Pixel
Palytoxin Black: PalytoxinGrey: Control
Black: Ostreocin-DGrey: Control
Ostreocin-D
Fig. 11. Representative diagrams obtained with LSC, showing the fluorescence distribution of control cells (left column) and cells incubated
with palytoxin (upper central) or ostreocin-D (lower central) for 4 h in nominally Ca2+-free medium. Points in the scattergram plot correspond
to microfilaments of neuroblastoma cells stained with fluorescent phalloidin. Comparative profiles of fluorescence between controls and trea-
ted cells derived from selected regions of scattergrams are shown in histograms (right column).
Palytoxin-induced changes to the cytoskeleton M. C. Louzao et al.
2000 FEBS Journal 274 (2007) 1991–2004 ª 2007 The Authors Journal compilation ª 2007 FEBS
washed twice with NaCl ⁄Pi, and mounted on a slide with
a mixture of NaCl ⁄Pi and glycerol (1 : 1). Fluorescence
corresponding to stained F-actin was measured at
511 nm (excitation) and 528 nm (emission) using the LSC
technique.
LSC to quantify F-actin
The laser-scanning cytometer provides the technology for
solid-phase cytometry. A laser-scanning cytometer (Compu-
Cyte, Cambridge, MA) equipped with a BX50 Olympus
(Melville, NY, USA) microscope and a 488 nm argon laser
was used. After staining F-actin with Oregon green 514
phalloidin the fluorescence of neuroblastoma cells mounted
on slides was quantified with LSC. Moreover, the threshold
was optimized to avoid the loss of fluorescence information.
For each contoured cell, the parameters measured were the
area and the maximum pixel. Between 2000 and 3000 cells
were studied per slide.
Imaging analysis of F-actin
Fluorescence and transmission images of neuroblastoma
cells fixed and stained with Oregon green 514 phalloidin
were recorded using the confocal laser microscopy system
previously described. All images were captured as optical
sections of a Z-series at 0.5-lm intervals and collected in a
mode format of 512 · 512 pixels.
Data analysis
All experiments were carried out at least three times in
duplicate or triplicate. The results of changes in mem-
brane potential are expressed as the mean of relative
fluorescence ± SEM. The results of Ca2+ measurements are
expressed as the mean of fluorescence ratio ± SEM. For the
F-actin assays, data are presented as percentage decrease in
relative fluorescence of cells treated with toxins in relation to
controls (mean ± SEM).
Acknowledgements
This work was funded with grants from the following
agencies: Ministerio de Ciencia y Tecnologı́a, Spain,
grant numbers SAF2003-08765-C03-02, REN2001-
2959-C04-03, REN2003-06598-C02-01, and AGL2004-
08268-02-O2 ⁄ALI; Xunta de Galicia, Spain, grant
Fig. 12. Representative images obtained by confocal microscopy of neuroblastoma cells whose F-actin was stained with Oregon green 514
phalloidin. The fluorescence images show microfilament distribution in control cells (upper left) and cells exposed to palytoxin (upper central)
or ostreocin-D (upper right) for 4 h in a nominally Ca2+-free medium. Transmission images of the same cells are also displayed (lower). A
substantial fall in cytoplasm F-actin, although not at the edges of the cell, was seen. Scale bar ¼ 50 lm.
M. C. Louzao et al. Palytoxin-induced changes to the cytoskeleton
FEBS Journal 274 (2007) 1991–2004 ª 2007 The Authors Journal compilation ª 2007 FEBS 2001
numbers PGIDT99INN26101, PGIDIT03AL26101PR,
and PGIDIT04TAL261005PR; Fondo de Investigaci-
ones Sanitarias, Spain, grant number FISS REMA-G03-
007; and EU VIth Frame Program, grant numbers IP
FOOD-CT-2004-06988 (BIOCOP), STREP FOOD-CT-
2004-514055 (DETECTOX), and CRP 030270-2 (SPIES-
DETOX).
References
1 Taniyama S, Arakawa O, Terada M, Nishio S, Takatani
T, Mahmud Y & Noguchi T (2003) Ostreopsis sp., a
possible origin of palytoxin (PTX) in parrotfish Scarus
ovifrons. Toxicon 42, 29–33.
2 Onuma Y, Satake M, Ukena T, Roux J, Chanteau S,
Rasolofonirina N, Ratsimaloto M, Naoki H &
Yasumoto T (1999) Identification of putative palytoxin
as the cause of clupeotoxism. Toxicon 37, 55–65.
3 Yasumoto T (2001) The chemistry and biological func-
tion of natural marine toxins. Chem Rec 1, 228–242.
4 Wiles JS, Vick JA & Christensen MK (1974) Toxico-
logical evaluation of palytoxin in several animal species.
Toxicon 12, 427–433.
5 Nakajima I, Oshima Y & Yasumoto T (1981) Toxicity
of benthic dinoflagellates in Okinawa. Bull Jap Soc Sci
Fish 47, 1029–1033.
6 Usami M, Satake M, Ishida S, Inoue A, Kan Y &
Yasumoto T (1995) Palytoxin analogs from the dino-
flagellates Ostreopsis siamensis. J Am Chem Soc 177,
5389–5390.
7 Contreras RG, Flores-Maldonado C, Lazaro A,
Shoshani L, Flores-Benitez D, Larre I & Cereijido M
(2004) Ouabain binding to Na+,K+-ATPase relaxes
cell attachment and sends a specific signal (NACos) to
the nucleus. J Membr Biol 198, 147–158.
8 Artigas P & Gadsby D (2003) Ion occlusion ⁄ deocclu-sion partial reactions in individual palytoxin-modified
Na ⁄K pumps. Ann NY Acad Sci 986, 116–126.
9 Warmka JK, Mauro LJ & Wattenberg EV (2004) Mito-
gen-activated protein kinase phosphatase-3 is a tumor
promoter target in initiated cells that express oncogenic
ras. J Biol Chem 279, 33085–33092.
10 Ikeda M, Mitani K & Ito K (1988) Palytoxin induces a
nonselective cation channel in single ventricular cells of
rat. Naunyn Schmiedebergs Arch Pharmacol 337, 591–593.
11 Van Renterghem C & Frelin C (1993) 3,4-Dichloroben-
zamil-sensitive, monovalent cation channel induced by
palytoxin in cultured aortic myocytes. Br J Pharmacol
109, 859–865.
12 Ishii K, Ikeda M & Ito K (1997) Characteristics of
palytoxin-induced cation currents and Ca2+ mobiliza-
tion in smooth muscle cells of rabbit portal vein.
Naunyn Schmiedebergs Arch Pharmacol 355, 103–110.
13 Habermann E (1989) Palytoxin acts through Na+,K+-
ATPase. Toxicon 27, 1171–1187.
14 Contreras RG, Shoshani L, Flores-Maldonado C,
Lazaro A & Cereijido M (1999) Relationship between
Ostreocin-D
10 min0
50
100
30 min 4 hIncubation time
Ca2+ -containing medium
Ca2+ -free medium
% F
luor
esce
nce
redu
ctio
n
0
50
100
% F
luor
esce
nce
redu
ctio
nPalytoxin
A
B
Ostreocin-DPalytoxin
Fig. 13. Quantification of fluorescence intensity by LSC. Data are
percentage of reduction in F-actin fluorescence in neuroblastoma
cells treated with toxins versus control cells (¼ 100%). (A) Effect
of 10 min, 30 min and 4 h of incubation with palytoxin (75 nM) or
ostreocin-D (75 nM). (B) Comparison of F-actin decrease in neuro-
blastoma cells treated with each toxin in a standard salt solution or
nominally Ca2+-free medium. Results are mean ± SEM (n ¼ 4).
Palytoxin-induced changes to the cytoskeleton M. C. Louzao et al.
2002 FEBS Journal 274 (2007) 1991–2004 ª 2007 The Authors Journal compilation ª 2007 FEBS
Na(+),K(+)-ATPase and cell attachment. J Cell Sci
112, 4223–4232.
15 Gumbiner BM (1996) Cell adhesion: the molecular basis
of tissue architecture and morphogenesis. Cell 84, 345–
357.
16 Chen H, Bernstein BW & Bamburg JR (2000) Regula-
ting actin-filament dynamics in vivo. Trends Biochem
Sci 25, 19–23.
17 Tatsumi M, Takahashi M & Ohizumi Y (1984) Mechan-
ism of palytoxin-induced [3H]norepinephrine release
from a rat pheochromocytoma cell line. Mol Pharmacol
25, 379–383.
18 Satoh E & Nakazato Y (1991) Mode of action of paly-
toxin on the release of acetylcholine from rat cerebro-
cortical synaptosomes. J Neurochem 57, 1276–1280.
19 Ishii K, Ito KM, Uemura D & Ito K (1997) Possible
mechanism of palytoxin-induced Ca++ mobilization in
porcine coronary artery. J Pharmacol Exp Ther 281,
1077–1084.
20 Louzao MC, Vieytes MR, Baptista de Sousa JMV,
Leira F & Botana LM (2001) A fluorimetric method
based on changes in membrane potential for screening
paralytic shellfish toxins in mussels. Anal Biochem 289,
246–250.
21 Mohr FC & Fewtrell C (1987) IgE receptor-mediated
depolarization of rat basophilic leukemia cells measured
with the fluorescent probe bis-oxonol. J Immunol 138,
1564–1570.
22 Louzao MC, Vieytes MR, Cabado AG, Baptista de
Sousa JMV & Botana LM (2003) A fluorimetric micro-
plate assay for detection and quantitation of toxins
causing paralytic shellfish poisoning. Chem Res Toxicol
16, 433–438.
23 Louzao MC, Vieytes MR, Yasumoto T & Botana LM
(2004) Detection of sodium channel activators by a
rapid fluorimetric microplate assay. Chem Res Toxicol
17, 572–578.
24 Lipp P & Niggli E (1993) Ratiometric confocal Ca(2+)-
measurements with visible wavelength indicators in iso-
lated cardiac myocytes. Cell Calcium 14, 359–372.
25 Yip KP & Marsh DJ (1996) [Ca2+]i in rat afferent
arteriole during constriction measured with confocal
fluorescence microscopy. Am J Physiol Renal Physiol
271, F1004–F1011.
26 Budel S, Schuster A, Stergiopoulos N, Meister JJ & Beny
JL (2001) Role of smooth muscle cells on endothelial cell
cytosolic free calcium in porcine coronary arteries. Am J
Physiol Heart Circ Physiol 281, H1156–H1162.
27 Guennoun S & Horisberger JD (2000) Structure of the
5th transmembrane segment of the Na,K-ATPase alpha
subunit: a cysteine-scanning mutagenesis study. FEBS
Lett 482, 144–148.
28 Yoshizumi M, Houchi H, Ishimura Y, Masuda Y,
Morita K & Oka M (1991) Mechanism of palytoxin-
induced Na+ influx into cultured bovine adrenal chrom-
affin cells: possible involvement of Na+ ⁄H+ exchange
system. Neurosci Lett 130, 103–106.
29 Monroe JJ & Tashjian AH Jr (1995) Actions of
palytoxin on Na+ and Ca2+ homeostasis in human
osteoblast-like Saos-2 cells. Am J Physiol Cell Physiol
269, 582–589.
30 Lankford KL & Letourneau PC (1989) Evidence that cal-
cium may control neurite outgrowth by regulating the
stability of actin filaments. J Cell Biol 109, 1229–1243.
31 Yin HL & Stossel TP (1979) Control of cytoplasmic
actin gel–sol transformation by gelsolin, a calcium-
dependent regulatory protein. Nature 281, 583–586.
32 Puius YA, Mahoney NM & Almo SC (1998) The mod-
ular structure of actin-regulatory proteins. Curr Opin
Cell Biol 10, 23–34.
33 Kockskamper J, Ahmmed G, Zima A, Sheehan K,
Glitsch H & Blatter L (2004) Palytoxin disrupts cardiac
excitation–contraction coupling through interactions
with P-type ion pumps. Am J Physiol Cell Physiol 287,
C527–C538.
34 Frelin C & Van Renterghem C (1995) Palytoxin. Recent
electrophysiological and pharmacological evidence for
several mechanisms of action. Gen Pharmacol 26, 33–37.
35 Amano K, Sato K, Hori M, Ozaki H & Karaki H
(1997) Palytoxin-induced increase in endothelial Ca2+
concentration in the rabbit aortic valve. Naunyn Sch-
miedebergs Arch Pharmacol 355, 751–758.
36 Satoh E, Ishii T & Nishimura M (2003) Palytoxin-
induced increase in cytosolic-free Ca(2+) in mouse
spleen cells. Eur J Pharmacol 465, 9–13.
37 Ares IR, Louzao MC, Vieytes MR, Yasumoto T &
Botana LM (2005) Actin cytoskeleton of rabbit intest-
inal cells is a target for potent marine phycotoxins.
J Exp Biol 208, 4345–4354.
38 Kometiani P, Li J, Gnudi L, Kahn BB, Askari A &
Xie Z (1998) Multiple signal transduction pathways link
Na+-K+-ATPase to growth-related genes in cardiac
myocytes: the roles of ras and mitogen-activated protein
kinases. J Biol Chem 273, 15249–15256.
39 Haas M, Askari A & Xie Z (2000) Involvement of Src
and epidermal growth factor receptor in the signal
transducing function of Na+-K+-ATPase. J Biol Chem
275, 27832–27837.
40 Liu J, Tian J, Haas M, Shapiro JI, Askari A & Xie Z
(2000) Ouabain interaction with cardiac Na1–K1-
ATPase initiates signal cascades independent of changes
in intracellular Na+ and Ca2+ concentrations. J Biol
Chem 275, 27838–27844.
41 Xie Z & Askari A (2002) Na+ ⁄K+-ATPase as a signal
transducer. Eur J Biochem 269, 2434–2439.
42 Fiorentini C, Matarrese P, Fattorossi A & Donelli G
(1996) Okadaic acid induces changes in the organization
of F-actin in intestinal cells. Toxicon 34, 937–945.
43 McCormack SA, Ray RM, Blanner PM & Johnson LR
(1999) Polyamine depletion alters the relationship of
M. C. Louzao et al. Palytoxin-induced changes to the cytoskeleton
FEBS Journal 274 (2007) 1991–2004 ª 2007 The Authors Journal compilation ª 2007 FEBS 2003
F-actin, G-actin, and thymosin beta4 in migrating
IEC-6 cells. Am J Physiol Cell Physiol 276, C459–C468.
44 Richelme F, Benoliel AM & Bongrand P (2000)
Dynamic study of cell mechanical and structural
responses to rapid changes of calcium level. Cell Motil
Cytoskeleton 45, 93–105.
45 Ukena T, Satake M, Usami M, Oshima Y, Fujita T,
Naoki H & Yasumoto T (2002) Structural confirmation
of ostreocin-D by application of negative-ion fast-atom
bombardment collision-induced dissociation tandem
mass spectrometric methods. Rapid Commun Mass Spec-
trom 16, 2387–2393.
46 Denker SP & Barber DL (2002) Ion transport proteins
anchor and regulate the cytoskeleton. Curr Opin Cell
Biol 14, 214–220.
47 Denker SP, Huang DC, Orlowski J, Furthmayr H &
Barber DL (2000) Direct binding of the Na–H exchan-
ger NHE1 to ERM proteins regulates the cortical cyto-
skeleton and cell shape independently of H(+)
translocation. Mol Cell 6, 1425–1436.
48 Spector I, Braet F, Shochet N & Bubb M (1999) New
anti-actin drugs in the study of the organization and
function of the actin cytoskeleton. Microsc Res Tech 47,
18–37.
49 Leira F, Alvarez C, Vieites JM, Vieytes MR & Botana
LM (2001) Study of cytoskeletal changes induced by
okadaic acid in BE(2)-M17 cells by means of a quantita-
tive fluorimetric microplate assay. Toxicol Vitro 15,
277–282.
50 Leira F, Cabado A, Vieytes M, Roman Y, Alfonso A,
Botana L, Yasumoto T, Malaguti C & Rossini G (2002)
Characterization of F-actin depolymerization as a major
toxic event induced by pectenotoxin-6 in neuroblastoma
cells. Biochem Pharmacol 63, 1979–1988.
51 Cabado AG, Leira F, Vieytes M, Vieites J & Botana L
(2004) Cytoskeletal disruption is the key factor that trig-
gers apoptosis in okadaic acid-treated neuroblastoma
cells. Arch Toxicol 78, 74–85.
52 Cabado AG, Leira F, Vieites JM, Vieytes MR &
Botana LM (2003) Caspase-8 activation iniciates
okadaic acid-induced apoptosis in neuroblastoma. In
Proceedings of the 4th International Conference on
Molluscan Shellfish Safety (Villalba A, Reguera B,
Romalde JL & Beiras R, eds), pp. 107–117. Consellerı́a
de Pesca e Asuntos Marı́timos da Xunta de Galicia and
IOC of UNESCO, Santiago de Compostela.
Palytoxin-induced changes to the cytoskeleton M. C. Louzao et al.
2004 FEBS Journal 274 (2007) 1991–2004 ª 2007 The Authors Journal compilation ª 2007 FEBS
Copyright © 2022 FDOKUMEN