The cost of debt capital revisited
33
ORIGINAL RESEARCH The cost of debt capital revisited Rainer Baule 1 Received: 5 March 2017 / Accepted: 10 August 2018 Ó The Author(s) 2018 Abstract We propose a method to estimate the cost of debt in a continuous-time framework with an infinite time horizon. The approach builds on the class of well- known earnings before interest and taxes (EBIT)-based models. It extends other approaches based on option-pricing theory with a finite one-period horizon. The model is capable of splitting the observed yield spread of a corporate bond into the risk premium, which adds to the expected return of bondholders, and the default premium, which accounts for expected losses. The model can easily be calibrated for non-public firms, since most of its input parameters are readily observable, while the output, the model-implied cost of debt, proves to be very insensitive with respect to the remaining non-observable parameters, the EBIT growth rate, and the bank- ruptcy costs of the firm. We demonstrate the applicability of the cost of debt to calculate an approximate weighted average cost of capital for the purpose of firm and project valuation, and its usage and limitations. Keywords Cost of capital Cost of debt EBIT-based model WACC Yield spread 1 Introduction Cost of capital is one of the central issues in corporate finance. For a company’s management, the cost of capital is an important benchmark for capital budgeting and performance measurement. For external investors, the cost of capital is the appropriate discount rate for future cash flows to determine the value of a company. & Rainer Baule [email protected] 1 University of Hagen, Universita ¨tsstraße 41, 58097 Hagen, Germany 123 Business Research https://doi.org/10.1007/s40685-018-0070-6
-
Upload
khangminh22 -
Category
Documents
-
view
2 -
download
0
Transcript of The cost of debt capital revisited

ORIGINAL RESEARCH
The cost of debt capital revisited
Rainer Baule1
Received: 5 March 2017 /Accepted: 10 August 2018
� The Author(s) 2018
Abstract We propose a method to estimate the cost of debt in a continuous-time
framework with an infinite time horizon. The approach builds on the class of well-
known earnings before interest and taxes (EBIT)-based models. It extends other
approaches based on option-pricing theory with a finite one-period horizon. The
model is capable of splitting the observed yield spread of a corporate bond into the
risk premium, which adds to the expected return of bondholders, and the default
premium, which accounts for expected losses. The model can easily be calibrated
for non-public firms, since most of its input parameters are readily observable, while
the output, the model-implied cost of debt, proves to be very insensitive with respect
to the remaining non-observable parameters, the EBIT growth rate, and the bank-
ruptcy costs of the firm. We demonstrate the applicability of the cost of debt to
calculate an approximate weighted average cost of capital for the purpose of firm
and project valuation, and its usage and limitations.
Keywords Cost of capital � Cost of debt � EBIT-based model � WACC �Yield spread
1 Introduction
Cost of capital is one of the central issues in corporate finance. For a company’s
management, the cost of capital is an important benchmark for capital budgeting
and performance measurement. For external investors, the cost of capital is the
appropriate discount rate for future cash flows to determine the value of a company.
& Rainer Baule
1 University of Hagen, Universitatsstraße 41, 58097 Hagen, Germany
123
Business Research
https://doi.org/10.1007/s40685-018-0070-6

Estimating this key figure comes down to estimating its components, cost of equity,
and cost of debt.
While there is a large amount of literature concentrating on the estimation of the
cost of equity (for a recent overview, see, for example, Da et al. (2012)), a little
attention has been focused on the cost of debt. It is common practice to simply use the
yield to maturity of the company’s debt securities as an approximation.1 However,
using the yield to maturity neglects the risk of default, and is, therefore, only a
reasonable approximation when default risk is small. Instead, cost of capital, defined
as opportunity costs, is the required expected return to capital suppliers, as described,
for example, in the textbook of Brealey et al. (2016). While the cost of equity is the
expected return to stockholders, the cost of debt is the expected return to bondholders.
When the debt is risky, meaning, when there is a non-zero probability of default, the
expected return is not identical to the yield to maturity of corporate debt securities,
because the risk of possible loss in the event of a default lowers the expected return.
In this paper, we take a closer look at how the cost of debt is estimated for a
defaultable firm. We consider a situation in which the decision maker—either
internally for capital budgeting, etc. or externally for firm valuation—has already
carried out a reasonable estimation for the cost of equity. He or she additionally needs
an estimation for the cost of debt. We take the yield to maturity of corporate debt as
given and show how the actual cost of debt can be calculated as a value between the
risk-free interest rate and this yield to maturity. As an input, the approach requires a
current value of the fair corporate interest rate, either from a publicly traded debt
instrument or, for example, from recent conditions of a fair bank loan.
In particular, during the past financial crisis, it became obvious that the yield to
maturity is not a good choice when default risk is large. The very large yields
observed for many companies reflect the increased probability of default, especially
in cases where the yield exceeds the cost of equity. Basically, an expected return can
be calculated based on a given yield to maturity when the probability of default and
the expected recovery rate are given. In the general case, for multi-period or
continuous-time settings, time-dependent (marginal) probabilities of default or
hazard rates are required to calculate the actually expected return and thus the cost
of capital.2 However, estimations of default probabilities are difficult to obtain and
suffer from a large estimation error.
As an alternative, the expected return on debt could be calculated analogously to
the common approach of calculating the expected return on equity, using the capital
asset pricing model (CAPM). According to the CAPM, the expected return on any
security is determined by its systematic risk, measured by the beta coefficient. To
reasonably estimate the beta of corporate debt, a reliable and stable time series of
bond values is required. Unfortunately, many bonds are not exchange-traded at all,
and for those that are, trading volume is often so low that observed bond quotes are
not accurate. Thus, this approach is only feasible for a small number of companies
with outstanding bonds that are frequently traded.
1 See, for example, the textbooks of Damodaran (2012) and Ross et al. (2016). Often, the
recommendation of this approximation is restricted to firms with low default risk.2 See, among others, Schonbucher (2003) for an overview of default risk modeling.
Business Research
123

Hsia (1981) demonstrates the consistency of the CAPM with option-pricing
theory. On this basis, Hsia (1991) suggests calculating the cost of capital in an
option-pricing framework.3Cooper and Davydenko (2007) pick up this idea and
propose a method of calculating the expected return on a debt security based on the
Merton (1974) model.4 They use the model to split the observed yield spread of a
bond; specifically, the difference between the bond’s yield to maturity and the
corresponding default-free rate, into two components: the default premium
(expected default effect), which reflects the probability of default, and the risk
premium (expected excess return), which reflects the bondholders’ surplus on the
expected return for bearing additional risk compared to a risk-free bond. The actual
cost of debt is the risk-free rate plus the second component, the risk premium.
The great advantage of this approach is that the Merton model is not needed to
estimate the absolute yield spread, which is already known as an input parameter.
Instead, the model is applied to calculate the relative proportion of the default
premium and the risk premium. The approach proves to be very robust with respect
to the debt-to-equity ratio and the equity premium, but it is less robust with respect
to equity volatility. This is not a serious concern when the equity volatility can be
estimated from stock-price time series. For the purpose of capital budgeting, goal-
setting, performance measurement, etc. in an exchange-traded company, the
approach is easily applicable. However, for the purpose of firm valuation, an equity
value, as well as its volatility, is not available, as it is the very objective of the
valuation process to calculate this value.
As a second drawback, the approach proves to be theoretically incompatible to the
analysis of long-term valuation problems—either internally, such as for capital
budgeting of long-term projects, or externally, for firmvaluation. TheMertonmodel is a
single-periodmodel bynature, so any conjunction of theMertonmodel andmulti-period
capital budgeting, or firm valuation techniques, suffers from a kind of incompatibility.
In this paper, we propose a method to calculate the cost of debt capital which is
theoretically compatible with long-term applications, and which can be used for
firm valuation, as well as in cases where the equity value and its volatility are not
known a priori. Our approach is based on a structural asset-value model, like the
Merton model. However, we do not follow Merton’s restrictive assumption of
modeling debt as a single zero bond with finite maturity. Instead, debt is modeled as
a perpetual bond which pays a continuous coupon. This approach is compatible with
the common method of discounted cash flows for firm valuation, where an infinite
time horizon is considered. Furthermore, our approach has the advantage of no debt
maturity being necessary as a model parameter. The approach basically builds on
the model of Leland (1994). In Goldstein et al. (2001), we do not model the asset
value directly, but instead consider the flow of earnings as the source of firm value.
Within a structural model, the cost of debt can be deduced from the yield spread
based on market risk aversion. When risk aversion is zero, the total yield spread
refers to the default premium; the risk premium is zero, and the cost of debt equals
3 The approach has found its way into the popular textbook of Copeland et al. (2005).4 The Merton model is also applied by Husmann and Schmidt (2008), who derive the ‘‘incremental
borrowing rate’’ according to International Financial Reporting Standards (IFRS 36).
Business Research
123

the risk-free rate. When risk aversion is greater than zero, the model can be used to
split the yield spread into the default premium and the risk premium: using risk-
neutral valuation, the debt value is the sum of expected payments to bondholders
under the risk-neutral measure, discounted by the risk-free rate. On the other hand,
given the expectation of payments under the physical measure, the expected return
to bondholders is defined by that discount rate which gives the current debt value
when applied to expected payments. This expected return must be larger than the
risk-free rate, but smaller than the yield to maturity. The relative proportion of
default premium (yield to maturity minus expected return) and risk premium
(expected return minus risk-free rate) depends on the difference between the
physical and the risk-neutral measure, hence the market risk aversion.
Basically, the approach outlined in the present paper tries to give decision makers
a tool for estimating the cost of debt (as the missing component when the cost of
equity is given) based on parameters which are either observable or which do not
have a large impact on the estimate. Instead of directly calculating the cost of capital
for the total firm, it is very common in practice to estimate the cost of equity and the
cost of debt separately. Such an approach allows us to place the actual cost of debt
between the two polar values: the risk-free rate and the yield to maturity of
corporate debt.
In Sect. 2 of this paper, we describe the approach in more detail. Based on the
structural asset-value model, we show how to calculate the cost of capital (debt and
equity) within this framework. Section 3 demonstrates how the model is calibrated to
input data and provides a quantitative analysis of the model results for a typical
investment grade and for a typical highly leveraged company. Furthermore, the
aspects of the calibration and potential bond covenants are discussed. Section 5 gives
attention to the application of the model for the valuation of a firm or projects within
the firm. We show the applicability of the textbook formula of the weighted average
cost of capital (WACC) for instantaneous returns, but demonstrate its inconsistencies
for long-term returns. As a use case, we apply the model for a situation in which the
WACC is valid (because of exogenous financing with constant leverage) and analyze
the approximation error of the cost of debt calculated within the model for a situation
which deviates in the financing assumption. Section 6 is the conclusion.
2 Firm valuation in continuous time and the cost of capital
2.1 Model setup
The basis of our model is earnings before interest and taxes (EBIT). In contrast to
classical firm valuationmethods based on free cash flows after taxes, such an approach
allows us to treat all claimants to EBIT consistently, namely the government (taxes),
bondholders (interest), and shareholders (dividends).5 The model is very similar to
5 As a further difference, we consider earnings instead of cash flow. The difference is the net effect of
depreciation, which lowers earnings but not cash flow, and capital expenditure, which lowers cash flow
but not earnings, and changes in net working capital. We assume that these effects add up to zero; in other
words, depreciation equals capital expenditure and net working capital is kept constant.
Business Research
123

Goldstein et al. (2001).6 EBIT is assumed to follow a continuous stochastic process.
To bemore precise, the EBIT flowX grows on average at a growth rate g and is subject
to random fluctuations, modeled by a geometric Brownian motion with variance rate
r,7
dX
X¼ g dt þ r dW ; ð1Þ
where dW is the differential of a Wiener process. In contrast to accounting practice,
EBIT is not a discrete figure which is calculated periodically, but is rather modeled
as a continuous flow. This means that the flow of an infinitesimal time interval dt is
given by X dt. In the case of an all-equity firm, this EBIT flow is distributed by a
fraction s, the corporate tax rate, to the government, and the rest to shareholders.8
In the general case, the company has issued a certain amount of debt. To be
compatible with the firm valuation approach, we need a debt structure that is not
redeemed after one period, as it is in the Merton model. In line with Leland (1994)
and Goldstein et al. (2001), we consider a perpetual coupon bond. The bond pays
continuous interests i with respect to face value F; thus, the bondholders receive
continuous payments at a rate i F as long as the firm is not bankrupt. The remainder
of the EBIT flow is distributed among the government and shareholders, as above,
i.e., the government receives taxes at a rate sðX � i FÞ and the rest goes to
shareholders. The total claim to the EBIT flow will be called the asset value in the
following. This asset value is the sum of the claims of shareholders (E), bondholders
(D), and the government (G), along with the present value of bankruptcy costs
(BC).9
Using risk-neutral valuation, the asset value is given by (see Goldstein et al.
2001)10
A ¼ EQ
Z 1
0
e�rt Xt dt ¼Z 1
0
e�rt X0 ect dt ¼ X0
r � c; ð2Þ
where c is the risk-neutral drift of the EBIT flow. The relation between the actual
drift, g, and the risk-neutral drift, c, depends on market risk aversion. In line with
Goldstein et al. (2001), we model market risk using the continuous-time capital
asset pricing model (Merton 1973), considering the dynamics of the asset value
A. As r and c are constant, A follows the same geometric Brownian motion as X:
6 There are, however, some differences. In contrast to the Goldstein et al. (2001) approach, we do not
model a dynamic capital structure. Furthermore, we refrain from modeling personal taxes raised on
payments to investors.7 Thus, EBIT cannot become negative. As a consequence, there is no bankruptcy risk for an all-equity
firm. The approach of modeling EBIT as a geometric Brownian motion has become standard in the
literature, see, for example, Hackbarth et al. (2007), Strebulaev (2007), Purnanandam (2008), and
Riis Flor (2008).8 We assume that, in line with Goldstein et al. (2001), the total EBIT flow is immediately distributed
among the claimants.9 In this sense, the asset value is a gross value, as bankruptcy costs are also covered, although there are no
direct claimants to this part of the asset value.10 Expectation under the risk-neutral measure is denoted EQ in the following, while expectation under the
physical measure is simply denoted E.
Business Research
123

dA
A¼ g dt þ r dW : ð3Þ
On the other hand, we can write the asset dynamics using an expected (instanta-
neous) asset return, l, and the asset payout rate. As the total EBIT flow is imme-
diately paid out to the claimants, the payout rate on asset value equals X / A. Thus
dA
A¼ l� X
A
� �dt þ r dW ¼
�l� ðr � cÞ
�dt þ r dW ; ð4Þ
using (2). Based on the continuous-time CAPM, the expected instantaneous asset
return is given by the instantaneous security market line:
l ¼ r þ ðlM � rÞ CovðrA; rMÞVarðrMÞ
¼ r þ h q r; ð5Þ
where h is the market price of risk, defined as the market excess return per one unit
of market risk:
h ¼ lM � r
rM; ð6Þ
and q is the (instantaneous) correlation between asset return, rA, and market return,
rM .
From the identity of (3) and (4), using the security market line (5), it follows
g ¼ r þ h q r� ðr � cÞ ¼ cþ h q r: ð7Þ
The difference between actual and risk-neutral EBIT drift is given by the product of
the market price of risk and the systematic part of EBIT volatility. As indicated in
the introduction, and as we discussed in greater detail below, this difference is also
crucial for splitting the yield spread into the default premium and the risk premium,
and thus for estimating the cost of debt.
We now model default risk. When the EBIT flow falls below the claim of the
bondholders, i F, the company does not necessarily default, as shareholders can opt
to infuse payments to avoid bankruptcy. Goldstein et al. (2001) show that it is
optimal for shareholders to do so as long as the asset value does not fall below a
threshold B, which is specified below. In this case, the remaining asset value (which
is identical to the threshold B) goes to bondholders. However, bankruptcy costs
occur, and the bondholders receive only a fraction 1� a of the remaining asset
value.11
The bankruptcy threshold B is given by (see Goldstein et al. 2001)
11 Goldstein et al. (2001) assume that bondholders have to pay taxes in the event of a default, so they
only receive ð1� sÞ ð1� aÞ of the remaining asset value. As such an approach introduces some additional
complexity (for example, Eq. (13) will no longer hold), we assume that government has no claim in the
event of a default, in line with the classical Leland (1994) model and some more recent approaches such
as Glover (2016).
Business Research
123
B ¼ kðc; r; rÞ1þ kðc; r; rÞ �
i
rF ð8Þ
with
kðc; r; rÞ ¼c� r2=2þ
ffiffiffiffiffiffiffiffiffiffiffiffiffiffiffiffiffiffiffiffiffiffiffiffiffiffiffiffiffiffiffiffiffiffiffiffiffiffiffiffiðc� r2=2Þ2 þ 2 r r2
q
r2:
ð9Þ
In the following, we determine the value of the different claims, in particular, the
value of debt, the value of equity, the present value of taxes (government’s claim),
and the present value of bankruptcy costs. The debt value is the sum of discounted
interest payments until a potential bankruptcy date t� plus the present value of the
recovery payment at default.12 Using risk-neutral valuation techniques, the debt
value is given by (see Leland 1994 and Goldstein et al. 2001)
D ¼EQ
Z t�
0
i F e�rt dt þ ð1� aÞB e�rt�� �
¼EQ � i F
re�rtt
�
0þ ð1� aÞB e�rt�
� �
¼ i
rF ð1� gÞ þ ð1� aÞB g;
ð10Þ
where g is the present value of receiving 1 at bankruptcy:
g ¼ EQ e�rt� �
¼ B
A
� �kðc;r;rÞ: ð11Þ
The present value of bankruptcy costs is given by
BC ¼ EQ aB e�rt� �
¼ aB g: ð12Þ
The remaining asset value after bankruptcy costs and the claim of bondholders is
distributed among the government and shareholders:
E ¼ð1� sÞðA� BC � DÞ;G ¼sðA� BC � DÞ:
ð13Þ
For the following derivation of the cost of capital, we note that, using the definitions
in (2), (10), and (12):
A� BC � D ¼ X0
r � c� i
rF ð1� gÞ � B g: ð14Þ
2.2 The cost of capital
Once we know the current values of debt and equity, we can use the expected
payments under the physical measure to calculate the cost of capital. The cost of
12 As the company does not necessarily default at all, t� can be infinite.
Business Research
123

debt cD is the expected internal rate of return to bondholders. Therefore, we can
again use the expectation of payments as in (10), but, using the physical instead of
the risk-neutral measure, and discounting payments by the expected return on
debt—the cost of debt cD—to obtain the current debt value:
D ¼ E
Z t�
0
i F e�cDt dt þ ð1� aÞB e�cDt�
� �: ð15Þ
This equation implicitly defines the cost of debt cD. It is worth noting that the cost of
debt is considered for a time horizon either until bankruptcy or to infinity. Calcu-
lating the cost of debt over a finite time horizon could yield different results. Instead
of considering time-varying cost of capital, we refer to cost of capital as an average
value over an unlimited time horizon.
Basically, the right-hand side of Eq. (15) is nothing else than the debt value in
Eq. (10), with expectation taken under the physical measure and the discount factor
cD instead of r. Therefore, to solve the integral, we can simply use Eq. (10), with creplaced by g and r by cD:
D ¼ i
cDF 1� B
A
� �kðg;cD;rÞ !
þ ð1� aÞB B
A
� �kðg;cD;rÞ: ð16Þ
This equation can easily be solved iteratively for cD.13
The cost of equity is determined analogously. The expected flow to shareholders
at time t equals E½ð1� sÞðXt � i FÞ�, where expectations of the random EBIT flow
Xt are taken under the physical measure. However, payments are only received until
a potential bankruptcy at time t�. Accordingly, the cost of equity, cE, is implicitly
given by
E ¼ E
Z t�
0
ð1� sÞðXt � i FÞ e�cEt dt: ð17Þ
Again, we can use Eq. (13) together with (14), with c replaced by g and r by cE:
E ¼ ð1� sÞ X0
cE � g� i
cEF 1� B
A
� �kðg;cE ;rÞ !
� BB
A
� �kðg;cE ;rÞ" #
: ð18Þ
Analogously to the cost of debt, this equation can be solved iteratively for cE.
3 Model application and analysis
3.1 Input parameters and sensitivity analysis
Having derived an expression for the cost of debt capital in the model framework,
this section analyzes the applicability of the model in terms of input requirements,
calibration, and outcome sensitivity. We have two general types of applications in
13 For the calibration of the model in Sect. 3, we will use D ¼ F as an identifying assumption.
Business Research
123

mind: internal applications, for capital budgeting, performance measurement, etc.,
and external applications, for firm valuation.
According to (10), the model value of debt depends on the following input
parameters:
– current level of EBIT flow, X0,
– EBIT growth rate, g,
– face value of debt, F,
– interest rate on corporate debt, i,
– bankruptcy costs, a,– corporate tax rate, s,– risk-free interest rate, r,
– market price of risk, h,– correlation between asset returns and market returns, q, and– EBIT and asset volatility, r.
We can divide the parameters into two groups: some are readily observable, while
the others have to be estimated. Belonging to the first group are the company-
specific parameters X0, F, i, and s, and the risk-free rate r. The current level of EBITflow can be taken from the latest financial report.14 The same is true for the face
value of debt, while the interest rate is the nominal interest rate that the company
pays for its long-term debt. The corporate tax rate can also be deduced from the
financial report, by relating paid taxes to earnings before taxes. The risk-free rate is
the yield of long-term government bonds.
Within the second group, the EBIT growth rate has to be estimated.15 While this
is a standard requirement in firm valuation (e.g., Damodaran 2012), an estimation
suffers from considerable potential errors. In addition, it is not easy to estimate the
bankruptcy costs. Approaches could be based on historical recovery rates of
comparable companies. Furthermore, we have the market price of risk, based on the
market risk premium, as a global parameter. While accepted as one of the most
important figures in finance, there is considerable controversy about its value.16 In
addition, the correlation between asset returns and market returns has to be
estimated. For listed companies, the stock-price time series can be used.
Alternatively, average sector correlations can be applied. Within our calibration
analysis in Sect. 3.2, we put a special emphasis on the model behavior with respect
to the uncertain input parameters g, a, h, and q.Finally, the EBIT and asset volatility is left as an input parameter. In contrast to
Cooper and Davydenko (2007), we do not attempt to estimate this value directly.
While estimates could be based on stock-price volatility for listed companies, this
would be difficult for private companies. Instead, we imply a value for volatility
based on other input data. As an identifying assumption, we suppose that the debt of
the firm trades at par, in other words, that the paid corporate interest rate reflects
14 In practical applications, an average value over a few preceding years could be more appropriate.15 In the Gordon growth model, the EBIT growth rate is constant over time.16 See Welch (2017) for an overview.
Business Research
123

current market conditions.17 This means that the debt value D equals its face value
F.18 As we know the debt value according to this assumption, we can use the model
equation for the debt value (10) to obtain an implied volatility which yields this
value. In the appendix, we can derive an expression for the unknown asset volatility
r:
1� ri
1� ð1�aÞ kðc;r;rÞ1þkðc;r;rÞ
¼ kðc; r; rÞ i Fðr � gþ qh rÞð1þ kðc; r; rÞÞ r X0
� �kðc;r;rÞ: ð19Þ
This equation can be solved iteratively for r.Figure 1 shows the cost of debt for a typical company dependent on the market
price of risk h. The parameters are: current EBIT flow X0 ¼ 5, EBIT growth rate
g ¼ 1%, face value of debt F ¼ 30, bankruptcy costs a ¼ 50%, tax rate s ¼ 30%,
risk-free rate r ¼ 3%, and correlation q ¼ 0:6. The corporate interest rate varies
from 4 to 7%. The graphs show the relative growth of the risk premium with
respect to the total yield spread when the market price of risk increases. When the
market price of risk is low, the major part of the yield spread refers to the default
premium, which compensates for lower expected returns. The actual expected
return is only a little above the risk-free rate, although the nominal interest rate
might be considerably larger. This means that bondholders receive only a small
premium as an add-on to the risk-free rate for bearing substantial default risk. For
high values of the market price of risk on the other hand, the major part of the
yield spread refers to the risk premium. Although the actual default risk might be
low, bondholders receive large compensation for bearing that risk. For instance, at
a market price of risk of h ¼ 0:6, the expected return for bondholders (and thus,
the cost of debt) with an interest rate of 4% is 3.97%. This means that, for bearing
the risk of an expected loss of only 0.03%, they receive a risk premium above the
risk-free rate of 0.97%.
Figure 2 shows the cost of debt with a fixed market price of risk h ¼ 0:25dependent on the corporate interest rate. The model is re-calibrated for each value of
the interest rate, so that the debt value equals par value. Accordingly, the volatility
parameter changes along the x-axis. The figure thus displays the cost of debt for
different levels of the interest rate under the assumption that D ¼ F.
The cost of debt increases concavely with the interest rate. While, for smaller
interest rate values, the major part of the yield spread reflects the risk premium, for
larger interest rates, the relative share of the expected default premium gains in
importance. The concave shape of the graph is explained by the asymmetric
distribution of bond returns. Within the (continuous) CAPM framework, the risk
premium is driven by the covariance of bond returns and market returns. This
covariance increases with the default risk, and thus, with the paid interest rate, but,
17 Thus, the calibration requires knowledge of the current fair corporate interest rate (for debt issued at
par value). In practice, when the company has several layers of debt raised at different times, one can use
the latest negotiated interest rate as the best market proxy for a fair corporate interest rate.18 We will discuss this assumption in greater detail in Sect. 3.3 and with respect to the empirical
application in Sect. 4.
Business Research
123

3.0%
3.5%
4.0%
4.5%
5.0%
5.5%
6.0%
6.5%
7.0%
0.0 0.1 0.2 0.3 0.4 0.5 0.6
Market Price of Risk
Cost
of D
ebt
i = 7%
i = 6%
i = 5%
i = 4%
Fig. 1 Cost of debt with respect to market price of risk. The basic parameters are initial EBIT flowX0 ¼ 5, EBIT growth rate g ¼ 1%, relative bankruptcy costs a ¼ 50%, corporate tax rate s ¼ 30%, risk-free interest rate r ¼ 3%, and correlation q ¼ 0:6. The model is calibrated (by means of volatility), so thatthe debt value equals its face value D ¼ F ¼ 30. The four lines refer to four different levels of thecorporate interest rate, ranging from i ¼ 4% to i ¼ 7%
3.0%
3.5%
4.0%
4.5%
5.0%
5.5%
6.0%
6.5%
7.0%
3.0% 3.5% 4.0% 4.5% 5.0% 5.5% 6.0% 6.5% 7.0%
Cos
t of D
ebt
Corporate Interest Rate
Fig. 2 Cost of debt with respect to the corporate interest rate. The basic parameters are initial EBIT flowX0 ¼ 5, EBIT growth rate g ¼ 1%, relative bankruptcy costs a ¼ 50%, corporate tax rate s ¼ 30%, risk-free interest rate r ¼ 3%, market price of risk h ¼ 0:25, and correlation q ¼ 0:6. The model is calibrated(by means of volatility), so that the debt value equals its face value D ¼ F ¼ 30. The light straight line, asa benchmark, is the identity cD ¼ i. Accordingly, the dark line divides the yield spread i� r into the riskpremium (below) and the default premium (above)
Business Research
123

because the asymmetry of the distribution becomes less pronounced with increasing
default risk, the increase of covariance is concave.19
Table 1 provides a sensitivity analysis of the model with respect to the key input
variables. Two different settings are considered: a typical investment-grade firm
(debt-to-equity ratio 0.4) and a highly leveraged firm (debt-to-equity ratio 2.0). In
both cases, the EBIT growth rate is 1%, the corporate tax rate is 30%, bankruptcy
costs are 50%, the risk-free interest rate is 3%, the market price of risk is 0.25, and
the correlation is 0.6. In the base case, the investment-grade firm pays an interest
rate of 4%, and the highly leveraged firm pays an interest rate of 7%. These
parameters are consistent with asset volatilities of 21.8 and 28.1%, respectively. For
the investment-grade firm, about 70% of the yield spread represent the risk
premium. The cost of debt capital thus equals 3.7%. For the highly leveraged firm, a
smaller proportion of less than 50% of the overall yield spread refers to the risk
premium. This observation is in line with Fig. 2, which shows a concave increase in
the cost of debt with the corporate interest rate.
The table reports the fair corporate interest rate (for debt at par value) together
with the cost of debt when the input parameters are changed. Parallel to variations in
the corporate interest rate, the cost of debt varies with respect to changes in the
parameters. For example, when the level of EBIT flow falls, the bankruptcy
threshold comes closer and default risk increases, so the fair corporate interest rate
must rise. However, the relative proportion a of the risk premium with respect to the
yield spread stays within a quite narrow range, 63%–73% for the investment-grade
firm and 37–52% for the highly leveraged firm.
These results are fairly in line with the figures reported by Cooper and
Davydenko (2007) based on the Merton (1974) model. Their relative proportions of
the risk premium are about 80% for the investment-grade firm and about 40% for
the highly leveraged one.20 However, as their model is calibrated differently, the
results are not directly comparable.
3.2 Calibration analysis
In addition to a sensitivity analysis, for a practical application, the impact of
parameter misestimations on the model calibration is of interest. For example, the
EBIT growth rate is not directly observable. If we retain the assumption that the
corporate interest is known and debt trades at par, a given parameter set transfers
19 This concave increase of the covariance with default risk can be explained in a stylized one-period
setting. In this setting, the bond return rD is �1 in case of default, and it is þi otherwise; default risk is
totally systematic and linked to the market return rM . Without loss of generality, the distribution of rM is
standard normal. Thus, default occurs if rM\N�1ðpÞ, where p is the default probability and N is the
standard normal distribution. The covariance of bond returns and market returns is then given by
CovðrM ; rDÞ ¼ �Z N�1ðpÞ
�1x dNðxÞ þ i
Z 1
N�1ðpÞx dNðxÞ ¼ / N�1ðpÞ
� ð1þ iÞ;
where / is the normal density function. As can easily be verified, this covariance increases concavely
with p.20 Berg (2010) reports very similar figures based on the Merton model, calibrated to real-world data.
Business Research
123

Table
1Sensitivityanalysisofthecostofdebtforatypical
investm
ent-gradefirm
(leftpart)andatypical
highly
leveraged
firm
(rightpart)
Investm
ent-gradefirm
Highly
leveraged
firm
X0
g (%)
r (%)
a (%)
s (%)
r (%)
i (%)
c D (%)
a (%)
X0
g (%)
r (%)
a (%)
s (%)
r (%)
i (%)
c D (%)
a (%)
51.0
21.8
50
30
3.0
4.00
3.69
69
51.0
28.1
50
30
3.0
7.00
4.88
47
44.21
3.80
66
410.05
5.60
37
63.86
3.61
71
66.15
4.61
51
0.5
4.19
3.78
66
0.5
7.83
5.11
44
1.5
3.81
3.59
73
1.5
6.34
4.68
50
20
3.77
3.56
73
25
5.89
4.51
52
25
4.46
3.92
63
30
7.82
5.12
44
40
3.93
3.64
69
40
6.54
4.70
48
60
4.06
3.73
69
60
7.62
5.12
46
25
4.00
3.69
69
25
7.00
4.88
47
35
4.00
3.69
69
35
7.00
4.88
47
2.5
3.48
3.19
70
2.5
6.08
4.28
50
3.5
4.52
4.19
68
3.5
8.05
5.52
45
Thebasic
param
etersaretheinitialEBIT
flowX0¼
5,EBIT
growth
rate
g¼
1%,volatility
r¼
21:8%
(left)andr¼
28:1%
(right),relativebankruptcycostsa¼
50%,
corporate
taxrate
s¼
30%,risk-freeinterest
rate
r¼
3%,market
price
ofrisk
h¼
0:25,andcorrelationq¼
0:6.Themodel
iscalibratedbymeansofthecorporate
interestrate,so
thatthedebtvalueequalsitsface
valueD¼
F¼
20(left)orD¼
F¼
40(right).Theoutputcolumnsshowthecorporateinterestratei,thecostofdebtc D
,
andtherelativeproportionaoftherisk
premium
withrespectto
theyield
spread.Thesensitivityanalysischanges
oneofthesixinputparam
eters,whiletheremaining
param
etersarekeptconstant
Business Research
123

into an implied value of the asset volatility. Such a calibration acknowledges that
the model does not perfectly reflect reality, but sets the input parameters consistent
to observable data—in particular, the corporate interest rate.21
The calibration analysis in Table 2 shows the impact of parameter misestimations
on the calculated cost of debt, if the model is re-calibrated in the described way that
it is still consistent with the given corporate interest rate. This re-calibration
involves a new estimation of the asset volatility. It is implicitly assumed that there is
no ‘‘true’’ volatility to be inferred, but the implied asset volatility is the best fit to the
observable corporate interest rate. For example, lines 1 and 2 tell us that (for the
investment-grade firm) both combinations of the unobservable parameters
g ¼ 1:0%, r ¼ 21:8% and g ¼ 0:5%, r ¼ 20:4% lead to the same model output
in terms of D ¼ F when the corporate interest rate is i ¼ 4%.
As shown in the table, the calculated cost of debt is very insensitive to such
different model calibrations with respect to the unobservable parameters EBIT
growth rate and bankruptcy costs.22 Shifting these parameters by 0.5 or 10
percentage points, respectively, leads to a change of as little as 1–5 base points in
the cost of debt. Naturally, the cost of debt, in particular the relative proportion of
the risk premium, is most sensitive to the market price of risk (and also to the
correlation), as demonstrated in Fig. 1.
Therefore, the market price of risk is a key input to the model, as it is prone to
estimation errors, and the model output is relatively sensitive with respect to this
parameter. As an alternative to a direct input of the market price of risk, we consider
in the following an implied calculation based on an available estimate of the second
component of the cost of capital, the cost of equity. The reasoning is that most
applications focus on an accurate estimate of the cost of equity and give a little
attention to the cost of debt. We, therefore, analyze how an existing estimate of the
cost of equity can be used to calibrate the model and consistently obtain an estimate
for the cost of debt without explicitly estimating the market price of risk.
The idea is simply to calibrate the model by choosing a value for the market price
of risk, so that the cost of equity calculated according to (18) equals the externally
given value. As the external estimate for the cost of equity also depends on the
market price of risk, we cannot expect to eliminate the associated estimation error.
However, we can use the model to obtain a consistent value for the cost of debt
when the external value for the cost of equity is considered reliable.
According to (5), it is not the market price of risk h alone, but instead its product
with the correlation q which determines the expected asset return. We can,
21 In a way, such a calibration is quite analogous to the ‘‘practitioners Black–Scholes approach’’ (An and
Suo 2009) to option pricing: although practitioners know that the assumptions of the Black–Scholes
model do not hold, they, nonetheless, use the model by estimating the implied volatilities from traded
options data and calculating prices for non-traded, but similar options and other derivatives with these
implied volatilities.22 Note that the Goldstein et al. (2001)’s assumption that bondholders have to pay taxes upon default is
equivalent to increased bankruptcy costs. Our deviation obviously has a negligible impact on the resulting
cost of debt, which would increase from 3.69% to 3.70%. For the highly leveraged firm, the value would
be 4.95% instead of 4.88%.
Business Research
123

therefore, also refrain from estimating q and iteratively calculate an implied value
for the product qh, as follows:
– Given starting values qh0; qh1.– For each iteration j
– Calculate an implied asset volatility rj according to (19).
– Calculate model values for the bankruptcy threshold B, the asset value A,
and the equity value E.
– Calculate a value for the cost of equity cE by iteratively solving (18).
– Calculate a new estimate for the correlation-adjusted market price of risk
using regula falsi:
qhjþ1 ¼ qhj � cjE � cE
cj�1E � c
jE
ðqhj�1 � qhjÞ:
Table 3 summarizes the results of an analysis when the model is calibrated based on
a given value for the cost of equity. Again, we consider an investment-grade firm
and a highly leveraged firm. The externally given cost of equity for the investment-
grade firm is assumed to be 7%, that of the highly leveraged firm 9%, well in line
with the basic settings of Table 2. The results are similar; however, the model output
is now more sensitive. With respect to the unobservable parameters, EBIT growth
rate, and bankruptcy costs, the sensitivity is now twice as large, although it is still
quite small in absolute terms. A change in g of 0.5 percentage points or a change in
a of 10 percentage points leads to a change of 2–10 base points in the cost of debt.
Table 2 Calibration analysis of the model for a typical investment-grade firm (left part) and a typical
highly leveraged firm (right part)
Investment-grade firm Highly leveraged firm
g
(%)
a(%)
h(%)
q(%)
r(%)
cD(%)
a
(%)
g
(%)
a(%)
h(%)
q(%)
r(%)
cD(%)
a
(%)
1.00.5 20.4 3.68 68 0.5 26.3 4.87 47
1.5 23.3 3.69 69 1.5 29.9 4.89 47
40 22.3 3.68 68 40 29.4 4.84 46
60 21.3 3.70 70 60 26.8 4.93 48
0.20 23.9 3.60 60 0.20 31.5 4.59 40
0.30 20.1 3.76 76 0.30 25.3 5.15 54
0.5 23.5 3.61 61 0.5 30.9 4.64 41
0.7 20.3 3.75 75 0.7 25.7 5.11 53
The basic parameters are the initial EBIT flow X0 ¼ 5, EBIT growth rate g ¼ 1%, relative bankruptcy
costs a ¼ 50%, corporate tax rate s ¼ 30%, market price of risk h ¼ 0:25, correlation q ¼ 0:6, risk-freerate r ¼ 3%, and corporate interest rate i ¼ 4% (left) and i ¼ 7% (right). The model is calibrated (by
means of volatility), so that the debt value equals its face value D ¼ F ¼ 20 (left) or D ¼ F ¼ 40 (right).
The output columns show the implied volatility r, the cost of debt cD, and the relative proportion a of the
risk premium with respect to the yield spread. The calibration analysis changes one of the four uncertain
input parameters and re-calibrates the model using a new implied volatility, so that D ¼ F holds
Business Research
123
3.3 The identifying assumption
The calibration of the model depends on the identifying assumption that debt trades
at par, i.e., its value D equals the face value F. If this is not the case, the calibration
is biased. For example, if the EBIT value X and in parallel the asset value A drops,
default risk and thus the value of g in Eq. (11) becomes higher, so the debt value
(10) shrinks. New potential debtholders will anticipate the actual default risk after a
change in the EBIT flow, so they will adjust their required interest rates accordingly.
The true cost of debt will, therefore, be higher if D\F.
This pattern of a decreasing cost of debt with respect to its relative value is shown
in Fig. 3 for the highly leveraged firm (solid line). For example, if the debt value
drops to 80% of its original value (equivalent to a drop in the EBIT flow from 5 to
3.36), the cost of debt rises from 4.88% to 5.33%.
The dashed line depicts the resulting cost-of-debt estimate if the model was
erroneously applied with the original volatility value (here, 28.1%) under the false
assumption that D ¼ F holds. If actually D\F, that is, the default probability is
higher, then the cost-of-debt estimate needs to be low to produce a debt value equal
to the face value. Thus, the estimation procedure underestimates the cost of debt in
the case that D\F; counter to economic intuition, the cost of debt decreases with
increasing default probability.
However, this is not the way the model should actually be applied. Instead, a drop
in the EBIT flow leads to a re-calibration of volatility. Therefore, to produce a debt
value equal to the face value if actually D\F (higher default probability), not the
cost-of-debt estimate, but the volatility estimate is adjusted (here, it drops to
Table 3 Calibration analysis of the model, calibrated to an externally given cost of equity, for a typical
investment-grade firm (left part) and a typical highly leveraged firm (right part)
Investment-grade firm Highly leveraged firm
g
(%)
a(%)
cE(%)
r(%)
cD(%)
a
(%)
g
(%)
a(%)
cE(%)
r(%)
cD(%)
a
(%)
1.0 50 7 21.4 3.71 71 1.0 50 9 28.5 4.85 46
0.5 19.3 3.73 73 0.5 26.2 4.88 47
1.5 23.4 3.69 69 1.5 30.8 4.82 45
40 22.2 3.68 68 40 30.4 4.75 44
60 20.6 3.73 73 60 26.5 4.96 49
6 25.1 3.54 54 8 31.9 4.55 39
8 17.8 3.85 85 10 25.5 5.13 53
The basic parameters are the initial EBIT flow X0 ¼ 5, EBIT growth rate g ¼ 1%, relative bankruptcy
costs a ¼ 50%, corporate tax rate s ¼ 30%, risk-free rate r ¼ 3%, and corporate interest rate i ¼ 4% (left)
and i ¼ 7% (right). The model is calibrated by means of market price of risk and volatility, so that the
cost of equity is cE ¼ 7% (left) or cE ¼ 9% (right) and the debt value equals its face value D ¼ F ¼ 20
(left) or D ¼ F ¼ 40 (right). The output columns show the implied volatility r, the cost of debt cD, andthe relative proportion a of the risk premium with respect to the yield spread. The calibration analysis
changes one of the three uncertain input parameters, and re-calibrates the model using new values for the
market price of risk and implied volatility, so that the cost of equity remains unchanged and further
D ¼ F holds
Business Research
123
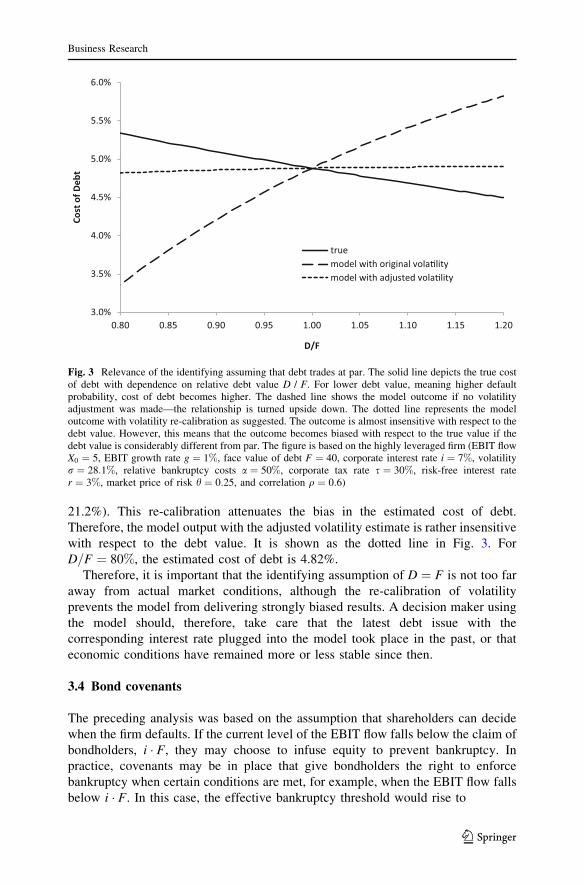
21.2%). This re-calibration attenuates the bias in the estimated cost of debt.
Therefore, the model output with the adjusted volatility estimate is rather insensitive
with respect to the debt value. It is shown as the dotted line in Fig. 3. For
D=F ¼ 80%, the estimated cost of debt is 4.82%.
Therefore, it is important that the identifying assumption of D ¼ F is not too far
away from actual market conditions, although the re-calibration of volatility
prevents the model from delivering strongly biased results. A decision maker using
the model should, therefore, take care that the latest debt issue with the
corresponding interest rate plugged into the model took place in the past, or that
economic conditions have remained more or less stable since then.
3.4 Bond covenants
The preceding analysis was based on the assumption that shareholders can decide
when the firm defaults. If the current level of the EBIT flow falls below the claim of
bondholders, i � F, they may choose to infuse equity to prevent bankruptcy. In
practice, covenants may be in place that give bondholders the right to enforce
bankruptcy when certain conditions are met, for example, when the EBIT flow falls
below i � F. In this case, the effective bankruptcy threshold would rise to
3.0%
3.5%
4.0%
4.5%
5.0%
5.5%
6.0%
0.80 0.85 0.90 0.95 1.00 1.05 1.10 1.15 1.20
Cost
of D
ebt
D/F
truemodel with original vola�litymodel with adjusted vola�lity
Fig. 3 Relevance of the identifying assuming that debt trades at par. The solid line depicts the true costof debt with dependence on relative debt value D / F. For lower debt value, meaning higher defaultprobability, cost of debt becomes higher. The dashed line shows the model outcome if no volatilityadjustment was made—the relationship is turned upside down. The dotted line represents the modeloutcome with volatility re-calibration as suggested. The outcome is almost insensitive with respect to thedebt value. However, this means that the outcome becomes biased with respect to the true value if thedebt value is considerably different from par. The figure is based on the highly leveraged firm (EBIT flowX0 ¼ 5, EBIT growth rate g ¼ 1%, face value of debt F ¼ 40, corporate interest rate i ¼ 7%, volatilityr ¼ 28:1%, relative bankruptcy costs a ¼ 50%, corporate tax rate s ¼ 30%, risk-free interest rater ¼ 3%, market price of risk h ¼ 0:25, and correlation q ¼ 0:6)
Business Research
123

B ¼ i � Fr � c
; ð20Þ
given the relation between EBIT flow and asset value according to Eq. (2).
In this section, we analyze the impact of such covenants on the cost of debt. A
high bankruptcy threshold enforces an earlier redemption of debt. However, this is
only beneficial for bondholders if bankruptcy costs are sufficiently low. Otherwise,
they get an early redemption with high probability, but the redemption amount may
be quite low. Whether a bond covenant, given by a bankruptcy threshold, provides
an additional value to bondholders, therefore, crucially depends on the bankruptcy
costs a.Figure 4 shows the cost of debt in dependence on the bankruptcy costs, when a
debt-service bond covenant is in place (dashed lines), together with the base case
without covenant (solid lines). The two lines represent the exemplary firms
(investment-grade firm with F ¼ 20 and i ¼ 4%; highly leveraged firm with F ¼ 40
and i ¼ 7%). The figure reveals that a covenant reduces the cost of debt only for
smaller levels of bankruptcy costs, while it increases it for larger levels. This
observation is in line with the finding of Leland (1994) that debt being protected by
a similar covenant in his model ceteris paribus exhibits a lower value than
unprotected debt when bankruptcy costs are high.
Not surprisingly, the effect is least pronounced for the investment-grade firm. For
this firm, the probability that a default event occurs or the covenant becomes
effective is quite low, so the covenant has no great impact on the cost of debt. For
the highly leveraged firm in contrast, the impact is large. When bankruptcy costs are
high, the covenant triggers the early default with low redemption and destroys
bondholder value, resulting in higher costs of debt. When bankruptcy costs are low,
the redemption amount in the case of default is close to the face value of debt, so
bondholders bear a little risk, moving the cost of debt closer to the risk-free rate.
4 Empirical application
In this section, we demonstrate the application of the model for real-world data. It is
not intended to provide a full-blown empirical analysis. Rather, the purpose is to
showcase the usability of the model and the reasonability of its outcome when
applied to empirical data. The major strength of the model is its low requirement of
input data and hence its applicability also for non-public firms. However, the model
should yield reasonable results, also for public firms, that are in line with those of
other techniques applicable in these cases.
For this purpose, we consider large public-traded companies, which also have
issued corporate bonds. Bond data can be used to infer the corporate interest rate. In
particular, we consider US corporate issuers of jumbo bonds with an outstanding
amount of at least one billion dollars and a remaining time to maturity exceeding 15
years as of September 2017. Distant maturities are required to approximate the
model assumption of perpetuate debt. After eliminating issuers with currently
negative EBIT values, we are left with a total number of 38 companies. For those
Business Research
123

companies with several bonds that meet the criteria, we take that one with the larger
time to maturity. All bond data are retrieved from Thomson Reuters Eikon.
The observable bond price theoretically allows for a deviation of the assumption
that corporate debt trades at par, i.e., D ¼ F. However, the considered bond will not
be the only layer of debt of the respective company, so a generalization of the bond
price to the total debt is questionable. We, therefore, consider two alternative
identifying assumptions:
1. The observed bond is of negligible size compared to total debt, and all
remaining debts consist of a single layer with a single interest rate and trades at
par. This is the known assumption D ¼ F. In this case, the fair corporate
interest rate i equals the yield to maturity of the bond, because it is the rate that
a bond investor accepts under the current market conditions.23
2. The whole debt is identical to the bond. Under that assumption, the corporate
interest rate equals the bond coupon rate and the debt value equals the face
value times the bond price. It is straightforward to calibrate the model under
this alternative identifying assumption.
3.0%
3.5%
4.0%
4.5%
5.0%
5.5%
6.0%
6.5%
7.0%
0% 10% 20% 30% 40% 50% 60% 70% 80% 90% 100%
Cost
of D
ebt
Bankruptcy Costs
without covenant
with covenant
F = 40; i = 7%
F = 20; i = 4%
Fig. 4 Influence of a bond covenant based on debt-service coverage. The dashed lines show the cost ofdebt with dependence on relative bankruptcy costs when a bond covenant is in place; the solid lines showthe respective values without a covenant. Two cases are considered: an investment-grade firm (F ¼ 20,i ¼ 4%) and a highly leveraged firm (F ¼ 40, i ¼ 7%). The remaining parameters are the initial EBITflow X0 ¼ 5, EBIT growth rate g ¼ 1%, corporate tax rate s ¼ 30%, risk-free interest rate r ¼ 3%,market price of risk h ¼ 0:25, and correlation q ¼ 0:6. Only when bankruptcy costs are low, a bondcovenant is actually beneficial for bondholders. Otherwise, an early default triggered by the covenantdestroys value because of bankruptcy costs
23 There might be slight deviations because of the coupon effect, but these deviations are small, in
general.
Business Research
123

The remaining model input data are calculated as follows:
– The current level of EBIT flow, X0, and the face value of debt, F, are taken from
the latest annual report.
– The corporate tax rate, s, is calculated as an average from the latest three
financial reports.
– The risk-free interest rate, r, is taken from the US treasury yield curve with a
maturity matching that of the bond.
– The correlation between asset returns and market returns, q, is calculated from
2-year historical time series of the company stock price and the S&P 500 index.
For the unobservable parameters, we take the same values as in the previous section,
that is, the EBIT growth rate g ¼ 1%, bankruptcy costs a ¼ 50%, and the market
price of risk h ¼ 0:25.
The results are shown in Table 4, where cð1ÞD and c
ð2ÞD refer to the two alternative
identifying assumptions. As a benchmark, cost of debt estimates based on historical
default rates for the respective rating class are also given.24 Although there are some
deviations, the results of the methods are fairly in line. On average, cost-of-debt
estimates based on historical default rates are about 20 basis points larger than those
calculated with the model under Assumption 1, whereas average values almost
coincide under Assumption 2. This is, however, not a proof that Assumption 2 is
actually correct. First, there are deviations both upwards and downwards. Second,
there are further calibration issues—as discussed in Sect. 3.2, cost of debt increases
when the unobservable market price of risk is increased, and the observed yield
spreads might also be influenced by other factors such as liquidity risk, which are
not captured by the model. All in all, the empirical results tend to be reasonable and
can be seen as a justification for the applicability of the model.
5 WACC and firm valuation
5.1 Instantaneous returns
Cost of debt and cost of equity are the components of the overall cost of capital for
the company. In theory and practice, the ‘‘weighted average cost of capital’’
(WACC) as a value-weighted average, incorporating the tax shield of debt
financing, is in widespread use. In this section, we calculate this figure within our
model framework.
In doing so, we distinguish between the long-term average cost of capital, as
considered so far, and the instantaneous cost of capital. As discussed, for most
applications, such as capital budgeting, long-term project analysis, or firm valuation,
24 Default rates are based on Moody’s statistics 1983–2013 provided by Ou (2014). The corresponding
cost of debt estimate is the internal rate of return of expected payments of a fictitious 20-years-to-maturity
bond and a (notional) yield to maturity of the actual corporate bond. For simplicity, recovery rates are
assumed to be zero.
Business Research
123

Table 4 Results of an empirical application
Company EBIT Debt YTM
(%)cð1ÞD
(%)
i
(%)cð2ÞD
(%)
Rating cðRÞD
(%)
21st Century Fox 5.9 33.1 4.33 3.61 6.15 3.86 Baa1 3.94
AbbVie 9.2 61.5 4.10 3.40 4.40 3.43 Baa2 3.45
Altria 21.8 33.1 4.10 3.34 5.38 3.44 A3 3.65
Anthem 5.3 40.1 4.16 3.51 4.65 3.58 Baa2 3.51
Apple 62.8 193.4 3.89 3.52 4.75 3.89 Aa1 3.85
Cisco 13.1 59.4 3.78 3.46 5.90 3.82 A1 3.48
Comcast 17.4 122.9 4.00 3.56 6.50 3.95 A3 3.55
Duke Energy 5.7 91.7 3.80 3.03 6.40 3.18 A1 3.50
Ford 8.7 199.0 4.94 3.82 4.75 3.83 Baa2 4.29
General Electric 14.1 282.8 3.78 3.47 4.13 3.53 A1 3.47
General Motors 12.1 142.5 5.19 3.99 6.25 4.08 Baa3 4.33
Home Depot 13.5 38.5 3.70 3.33 5.88 3.72 A2 3.26
HP 4.0 32.6 5.49 4.09 6.00 4.13 Baa2 4.84
IBM 13.1 93.9 3.99 3.55 4.00 3.55 A1 3.69
Intel 13.7 46.2 3.78 3.50 4.80 3.70 A1 3.47
Kinder Morgan 2.9 41.2 5.26 3.80 6.95 3.90 Baa3 4.40
Kraft Heinz 6.2 62.9 4.58 3.68 5.00 3.73 Baa3 3.72
Lockheed Martin 5.1 39.6 3.96 3.38 4.07 3.40 Baa1 3.57
Merck & Co 5.3 55.1 3.64 3.36 4.15 3.45 A1 3.34
Microsoft 25.4 168.7 3.68 3.44 4.50 3.62 Aaa 3.67
Oracle 13.3 79.6 3.80 3.48 6.50 3.93 A1 3.50
Pepsico 9.6 62.9 3.82 3.39 7.00 3.92 A1 3.52
Pfizer 9.5 110.0 3.74 3.37 7.20 3.78 A1 3.43
Pacific Gas & El. 2.3 46.5 3.60 2.94 6.05 3.13 A2 3.16
Phillips 1.1 27.9 4.36 3.64 5.88 – A3 3.91
Procter & Gamble 13.7 64.6 3.29 3.07 5.55 3.49 Aa3 3.09
Roche 0.1 0.4 3.82 3.19 7.00 3.46 A1 3.51
Southern Copper 1.5 6.6 4.90 3.87 6.75 4.07 Baa2 4.25
Target 4.9 26.5 3.94 3.18 4.00 3.18 A2 3.50
Time Warner 6.9 41.6 4.84 3.68 6.10 3.79 Baa2 4.20
Transocean 1.3 10.8 8.77 4.46 6.80 4.39 B1 4.20
UPS 5.5 39.4 3.72 3.40 6.20 3.83 A1 3.42
United Technol. 8.3 58.4 4.03 3.59 6.13 3.93 A3 3.58
Valero Energy 3.6 25.3 4.69 3.71 6.63 3.93 Baa2 4.04
Viacom 2.5 18.0 5.39 3.81 6.88 4.02 Baa3 4.53
Wal-Mart 25.3 118.3 3.75 3.15 7.55 3.51 Aa2 3.57
Walt Disney 14.3 44.7 3.84 3.49 4.13 3.55 A2 3.40
Business Research
123

a long-term time horizon is required. The cost of debt and cost of equity derived and
analyzed in the preceding sections fulfill this requirement. Equations (16), (18) are
based on the discounting of all cash flows to capital suppliers until the time of
bankruptcy, or until infinity if no bankruptcy occurs.
For shorter time horizons, expected returns can be different. In the following, we
consider the expected instantaneous returns over an infinitesimally short-time
horizon. As will become clear, in contrast to the long-term cost of debt and equity,
we can derive the well-known WACC formula for the instantaneous costs.25
The expected returns over an infinitesimally short-time horizon can be deduced
based on the continuous-time CAPM. The security market line holds for any
security, hence, in particular also for the expected (instantaneous) equity return and
the expected (instantaneous) debt return:26
lE ¼ r þ h q rE ð21Þ
and
lD ¼ r þ h q rD: ð22Þ
For the variance rates,27
rYr
¼ oY
oA� AY
ð23Þ
holds, where Y is the value of an arbitrary claim on the asset value—in particular,
debt D or equity E. The derivatives of E and D with respect to A are given by the
following (see the appendix):
Table 4 continued
Company EBIT Debt YTM
(%)cð1ÞD
(%)
i
(%)cð2ÞD
(%)
Rating cðRÞD
(%)
Williams Partners 1.0 23.1 4.89 3.52 6.30 – Baa3 4.03
The sample consists of 38 major US issuers of long-term bonds. EBIT and Debt are give in billion US
dollars. For the model calibration, g ¼ 1%, a ¼ 50%, and h ¼ 0:25 are applied, as in the theoretical
analysis. cð1ÞD is the cost of debt based on the assumption that the average corporate interest rate equals the
bond yield to maturity, YTM, and the debt value equals its face value. cð2ÞD is the cost of debt based on the
assumption that all debt is structured as the considered bond, that is, the corporate interest rate equals the
bond coupon i, and the debt value equals its face value times the bond price. (In cases denoted with -, the
calibration failed.) The last column shows an alternative estimated cost of debt based on historical default
rates for the specific rating class of the respective issuer
25 Instantaneous costs of capital have been studied in different contexts, for example by Loffler (2004) or
Grinblatt and Liu (2008). The recovery of the classical WACC formula is, however, special to the setup
of our model.26 Equity and asset value are driven by the same risk factor, and hence, the instantaneous correlations
with the market factor are identical.27 This relation follows from Ito’s Lemma. See, e.g., Black and Scholes (1973).
Business Research
123

oE
oA¼ ð1� sÞ 1þ B
A
� �kðc;r;rÞþ1" #
ð24Þ
and
oD
oA¼ ð1þ a kðc; r; rÞÞ B
A
� �kðc;r;rÞþ1
: ð25Þ
According to the foundations of the model, the EBIT flow, plus the change in asset
value, are distributed among the bondholder, shareholder, and government clai-
mants, and the bankruptcy costs:
X þ dA
dt¼ dD
dtþ dE
dtþ dG
dtþ dBC
dt: ð26Þ
In the following, we ignore bankruptcy costs to keep things in line with the standard
approaches.28 Taking expectations yields
A l ¼ D lD þ ðE þ GÞ lE; ð27Þ
where lD and lE denote the instantaneous returns on debt and equity, respectively.
As the shareholders and government share claims on the identical remainder A� D,
their instantaneous returns are identical.29 Inserting E þ G ¼ E=ð1� sÞ (accordingto (13)) and A ¼ Dþ E=ð1� sÞ yields
Dþ E
1� s
� �l ¼ D lD þ E
1� slE: ð28Þ
The WACC is defined as the expected return on firm value, V ¼ Dþ E, after taxes,
with taxes applied to the total EBIT without the tax shield of debt financing. The
expected cash flow after taxes is A l ð1� sÞ. Hence, the instantaneous WACC,
lWACC, is given by
V lWACC ¼ A l ð1� sÞ ¼ Dþ E
1� s
� �l ð1� sÞ ¼ DlDð1� sÞ þ E lE: ð29Þ
This yields the textbook formula for the instantaneous WACC:
lWACC ¼ E
VlE þ ð1� sÞD
VlD: ð30Þ
5.2 Long-term returns
The reason why the textbook formula is valid for an infinitesimally small time
horizon is related to the financing policy of the firm. Miles and Ezzell (1980) have
28 This assumption is easily modeled by letting a ¼ 0. In the appendix, we show how to incorporate non-
zero bankruptcy costs. This involves calculating an instantaneous return on bankruptcy costs, which is
analogous to the instantaneous returns on debt and equity, as shown below.29 Note that this identity would be violated if government had a claim on bondholders in the event of a
default.
Business Research
123

shown that the textbook WACC is valid for all time horizons if the unleveraged cost
of capital, the cost of debt, the tax rate, and the leverage of the firm are all constant.
Brennan (2003) and Gamba et al. (2008) extend the analysis in several aspects, in
particular with regard to personal taxes. They derive conditions that are necessary
and sufficient for the discounted cash flow approach using the textbook WACC to
be correct. The crucial point is the leverage ratio kept constant by the firm, as an
exogenously given financing policy. For an infinitesimally small time horizon, the
leverage ratio is constant by nature, so the consistency of the instantaneous WACC
derived in the previous section is in line with these results. However, for longer time
horizons, the leverage ratio may vary in the Goldstein et al. (2001) model. We
cannot, therefore, expect the textbook formula to hold for the long-term cost of debt,
cD, and the long-term cost of equity, cE.
The actual weighted average cost of capital for the firm, cV , is defined as the
expected long-term return on firm value after taxes—analogous to the instantaneous
case:
V ¼E
Z 1
0
ð1� sÞXt e�cV t dt ¼
Z 1
0
ð1� sÞX0 eðg�cV Þt dt ¼ ð1� sÞ X0
cV � gð31Þ
) cV ¼ gþ ð1� sÞX0
V: ð32Þ
The value of this actual WACC differs from the textbook WACC:
cWACC ¼ E
VcE þ ð1� sÞD
VcD: ð33Þ
Figure 5 shows the actual WACC and the textbook WACC in dependence on the
leverage for a typical model setup with initial EBIT flow X0 ¼ 5, EBIT growth rate
g ¼ 1%, EBIT volatility r ¼ 20%, corporate tax rate s ¼ 30%, market price of risk
h ¼ 0:25, and correlation q ¼ 0:6. The interest rate is chosen, so that the value of
debt equals its respective face value, which varies at the x-axis. In this setting, total
asset value equals 100.
The dotted lines show the textbook WACC, while the solid lines refer to the
actual WACC. The grey pair of lines ignore bankruptcy costs (a ¼ 0%), and the
dark pair of lines incorporate bankruptcy costs with a ¼ 50%.
Without bankruptcy costs, the tax shield of debt financing leads to a
monotonically negative relationship between leverage and the cost of capital,
both for the actual WACC and the textbook formula. The textbook WACC when
bankruptcy costs exist (solid grey line) also decreases monotonically—because it
simply ignores bankruptcy costs.30 The actual WACC in the presence of
bankruptcy costs, however, reaches a minimum at a certain leverage and starts to
increase again for high values of leverage. This shape is a representation of the
well-known trade-off theory. For small levels of leverage, the tax shield of debt
financing leads to a decrease in the cost of capital with increasing leverage.
Increasing leverage, on the other hand, leads to increasing bankruptcy costs. At a
30 It is different to the textbook WACC without bankruptcy costs because of the model calibration: with
bankruptcy costs, debt is worth less and requires a higher interest rate, which increases the WACC.
Business Research
123

certain level of leverage, the trade-off between the positive effect of the tax shield
and the negative effect of bankruptcy costs is optimal. For yet higher levels of
leverage, the negative effect of bankruptcy costs starts to dominate, and the cost
of capital increases again.
Comparing the actual WACC with the textbook WACC, the textbook formula
overestimates the actual WACC for small levels of leverage, and underestimates it
for higher levels of leverage. As Miles and Ezzell (1980) point out, the textbook
formula assumes a constant level of leverage over time. In our model, however, an
initially high level of leverage decreases over time, on average (in terms of
expectations), as a positive development of the EBIT flow strengthens the equity
value more than it does the debt value. Hence, the textbook formula puts too
much weight on the cost of debt, and as the cost of debt is smaller than the cost of
equity, it underestimates the actual WACC. On the other hand, an initially low
level of leverage increases over time (on average). The reason is that while a
positive development of the EBIT flow can further decrease an initially very low
leverage only marginally, a negative development of the EBIT flow can
substantially increase the leverage. Hence, the textbook formula puts too much
weight on the cost of equity, and, as it is larger than the cost of debt,
overestimates the actual WACC.
4.4%
4.6%
4.8%
5.0%
5.2%
5.4%
5.6%
5.8%
6.0%
6.2%
0 10 20 30 40 50 60
Notional Debt
WAC
Cactual WACC with bankruptcy costs
actual WACC without bankruptcy costs
textbook WACC with bankruptcy costs
textbook WACC without bankruptcy costs
Fig. 5 Actual and textbook WACC. The basic parameters are the initial EBIT flow X0 ¼ 5, EBIT growthrate g ¼ 1%, corporate tax rate s ¼ 30%, market price of risk h ¼ 0:25, correlation q ¼ 0:6, and volatilityr ¼ 20%. The model is calibrated (by means of nominal interest rate), so that the debt value equals itsface value, which varies at the x-axis. Total asset value is 100. The dark black lines represent relativebankruptcy costs a ¼ 50%, while the light grey lines represent no bankruptcy costs (a ¼ 0). The solidlines refer to the actual WACC; the dashed lines refer to the ‘‘textbook WACC’’. Note that the ‘‘textbookWACC with bankruptcy costs’’ actually ignores the existence of these costs and is, therefore,monotonically decreasing
Business Research
123

5.3 Adjusted net present value and the tax shield
If the cost of debt calculated as in Sect. 3 is not well suited to estimate the weighted
cost of capital within the model, one may ask what it is good for. As the leverage in
the Goldstein et al. (2001) model is not constant, using the WACC method is not
recommended at all within its scope. Instead, for the purpose of firm valuation, an
adjusted net present value approach would be appropriate. With the value of the
unlevered firm, V0 ¼ ð1� sÞA, the value of the levered firm reads
V ¼ E þ D
¼ ð1� sÞ ðA� D� BCÞ þ D
¼ V0 þ sD� ð1� sÞBC;ð34Þ
where sD represents the tax shield.
As the tax shield is directly related to the cash flows to bondholders, the cost of
debt might be useful to approximate its value. However, if the cost of debt is
obtained based on the identifying assumption as above, its value would be given by
its face value F. If we drop this assumption and take a value for the cost of debt as
given, Eq. (10) gives us an indication for its usefulness to approximate the value of
the tax shield: while the value of debt is composed of interest payments and the final
payment in the event of a bankruptcy, only the former enters the value of the tax
shield. Therefore, the approximation is good if either default risk is low or
bankruptcy costs are high. It always underestimates the true value, because the cost
of debt is too high as a discount rate. Nonetheless, the approximation might be
useful in some cases.
However, by dropping the identifying assumption of debt trading at par, the EBIT
volatility is needed as an additional input parameter. Furthermore, the value of the
tax shield is not sufficient to apply the adjusted net present value approach, as the
value of bankruptcy costs is also needed. One might argue that, if the model
parameters are known, one could directly calculate the value of the tax shield and of
bankruptcy costs without using the cost of debt within the model. Hence, the scope
for an application lies outside the model. The following subsection demonstrates
how the cost of debt—calculated within the model—can be useful as an
approximation when the framework of the model is left.
5.4 Firm valuation outside the model
As mentioned in the introduction, a main application of calculating the cost of debt
within the presented framework could be a situation in which the cost of equity is
already given. In this subsection, we consider a firm that maintains an exogenous
financing strategy, keeping the initial leverage ratio constant. We assume that the
firm has already carried out a reasonable estimate for the cost of equity. According
to the constant-leverage strategy, using the WACC to value the firm or a project of
the firm is adequate. To calculate the WACC, the cost of debt must be estimated.
For this, the firm uses the approach presented in this paper, although the model
deviates from its actual policy, as the model assumes a financing policy with a time-
Business Research
123

varying leverage ratio. In the following, we analyze whether the cost of debt thus
derived is a reasonable approximation in this situation.31
The true cost of debt is calculated within a simulation study. The company has
issued a perpetual bond which pays interest at a fixed rate i, as assumed in the
model. The EBIT flow is modeled according to Eq. (1) on a yearly basis, which
gives new values for debt and equity at the end of each period. If the EBIT and thus
the asset value fall, the debt ratio increases. To retain the initial leverage ratio, the
firm redeems part of the debt.32 Conversely, if the asset value rises, the firm takes on
new debt at a coupon rate according to fair market conditions. The firm defaults if
the asset value breaches the initial bankruptcy threshold B.33
By repeating the simulation many times (we run 50,000 paths, each until either
bankruptcy or a final date T ¼ 100 is reached), we obtain a flow of expected
payments to bondholders (including interests, redemptions, and new debt issues) for
the successive periods. The actual cost of debt is the internal rate of return of this
payment flow.
We analyze this ‘‘true’’ cost of debt compared to the approximate cost of debt
obtained by the model. The base data for the firm are the same as in Sect. 3, where
the corporate interest rate varies between 3 and 7%. Figure 6 shows the results. For
corporate interest rates up to about 5.5%, the deviations are fairly small, remaining
below 0.2%. For higher rates, deviations can become larger—at a corporate interest
rate of 7%, the model gives a cost of debt of 4.9%, whereas the true value is 5.5%.
The reason for this underestimation of the actual cost of debt lies in the financing
policy: a high initial corporate interest rate goes hand in hand with a high initial
leverage ratio and thus a high level of default risk. The constant-leverage policy
reduces the effects of default risk for bondholders, as parts of the outstanding debt
are redeemed in full when the bankruptcy threshold approaches. These early
redemptions increase the expected return for bondholders and thus the cost of debt.
Nonetheless, using the cost of debt obtained by the model seems to be a reasonable
approximation in most cases.
The constant-leverage policy makes the WACC method an appropriate choice for
the valuation of the firm or single projects of the firm. To analyze the effect of the
approximation on the final outcome, the value of a cash flow, we consider a
perpetual flow of 1 in each period to be discounted with the WACC. The perspective
is thus internal, looking at a new project within the firm. The value of a different
cash flow is easily obtained by a simple scaling. As argued, we take the cost of
31 Shortly speaking, the firm uses a biased model to estimate the cost of debt to be plugged into the
correct WACC formula. As a second use case, one could also think of a firm with time-varying leverage
consistent with the model, so it would calculate the correct cost of debt, but then to plugged into a biased
WACC formula.32 This redemption can be seen as a repurchase at market value. The market value is calculated at each
simulation step based on the current conditions, assuming an infinite time horizon and the bankruptcy
threshold B. Note that such a redemption policy at market value (in contrast to a call option at a fixed
price) has no impact on the actual value of the bond.33 As Gamba et al. (2008) point out, a continuous maintenance of a constant debt ratio would leave the
firm without default risk, as it would have redeemed all the debt before bankruptcy was reached.
Therefore, default must be modeled by an exogenous threshold, which we assume to be the ex-ante
optimal threshold B.
Business Research
123

3.0%
3.5%
4.0%
4.5%
5.0%
5.5%
6.0%
6.5%
7.0%
3.0% 3.5% 4.0% 4.5% 5.0% 5.5% 6.0% 6.5% 7.0%
Cost
of D
ebt
Corporate Interest Rate
true value (constant leverage)approximate value (model with �me-varying leverage)
10
12
14
16
18
20
22
24
26
28
30
3.0% 3.5% 4.0% 4.5% 5.0% 5.5% 6.0% 6.5% 7.0%
Valu
e of
Cas
h Fl
ows
Corporate Interest Rate
true cost of debt (constant leverage)
approximate cost of debt (model with �me-varying leverage)
benchmark cost of debt (corporate interest rate)
Fig. 6 Cost of debt obtained by the model compared to the actual cost of debt when an constant-leveragepolicy is conducted (upper graph) and resulting cash flow valuations (lower graph). The actual cost ofdebt is obtained by simulating the EBIT flow, where the debt ratio is re-adjusted in each period to retainits initial value. The lower graph show the results of a WACC-based valuation of a perpetual cash flow of1, where the cost of equity is externally given. As a benchmark, also the value obtained by theapproximation cost of debt = corporate interest rate is displayed. The basic parameters are the initial EBITflow X0 ¼ 5, EBIT growth rate g ¼ 1%, relative bankruptcy costs a ¼ 50%, corporate tax rate s ¼ 30%,risk-free interest rate r ¼ 3%, market price of risk h ¼ 0:25, and correlation q ¼ 0:6. The model iscalibrated (by means of volatility), so that the debt value equals its face value D ¼ F ¼ 30
Business Research
123

equity as given—without loss of generality, we use the value obtained by the model.
Here, the textbook formula is directly applicable to calculate the WACC, once with
the actual cost of debt and once with the cost of debt obtained by the model. The
lower graph of Fig. 6 shows the resulting value of the perpetuity. Differences remain
rather small—even in the extreme cases of very high corporate interest rates, they
are below 5%. As a benchmark, the graph also displays the resulting values when
the corporate interest rate itself is used as an approximation for the cost of debt, as
sometimes recommended. With deviations of up to 15%, this approximation is
considerably worse.
6 Conclusion
The cost of debt is an essential component of the cost of capital, which is a central
figure in a number of applications, such as capital budgeting, performance
measurement, and firm valuation. Using the yield to maturity of corporate debt is an
inappropriate choice in the presence of substantial default risk. The expected return
to bondholders, rather than the yield to maturity, is a correct value for the cost of
debt. The expected return lies between the risk-free rate and the yield to maturity. It
is the risk-free rate, plus the risk premium, which compensates the bondholders for
bearing default risk. The relative proportion of the risk premium with respect to the
total yield spread depends on the market price of risk.
We propose an EBIT-based model which allows a calculation of the cost of debt.
The benefits of the model are the theoretical compatibility with multi-period
applications and the applicability for private companies. We derive expressions for
the cost of debt and the cost of equity which can be solved iteratively.
The model can easily be calibrated to input data that are readily observable or can
be reasonably estimated. The unobservable parameters, EBIT growth rate and
bankruptcy costs, prove to have a little impact on the model output. The most
crucial parameter is the market price of risk. Instead of explicitly estimating this
global parameter, one can alternatively calibrate the model to reflect an externally
given cost of equity. With this approach, the model can be used to estimate the cost
of debt relative to the cost of equity. However, it is assumed that the fair corporate
interest rate for debt trading at par is known or can be reasonably estimated.
A decision maker who already has an estimation for the cost of equity can thus
use the model to estimate the cost of debt. In a case where firm and project valuation
with the weighted average cost of capital (WACC) is applicable (that is, under
exogenous financing with constant leverage), the cost of debt obtained with the
model can be used as a reasonable approximation, although the model actually
assumes a time-varying leverage.
It can be shown that the textbook formula for the WACC is valid for an
instantaneous time horizon with the additional condition that there are no
bankruptcy costs. This is not surprising, as the financing condition, a constant-
leverage ratio, is fulfilled by nature for an instantaneous horizon. For longer
horizons, however, the actual cost of overall capital can substantially differ from the
textbook WACC, as the debt-to-equity ratio is not constant in the model.
Business Research
123

Acknowledgements The author thanks the editor and two anonymous referees for valuable comments
and suggestions. He furthermore thanks Olaf Korn for fruitful discussions, as well as Florian Borchard for
capable research assistance.
Open Access This article is distributed under the terms of the Creative Commons Attribution 4.0
International License (http://creativecommons.org/licenses/by/4.0/), which permits unrestricted use, dis-
tribution, and reproduction in any medium, provided you give appropriate credit to the original author(s)
and the source, provide a link to the Creative Commons license, and indicate if changes were made.
Appendix
Implied asset volatility
Given the current debt value D, we can use (10) to calculate an implied value for g:
g ¼irF � D
irF � ð1� aÞB : ð35Þ
Inserting D ¼ F and the threshold B according to its definition (8) yields an
expression for g with the yet unknown asset volatility r:
g ¼irF � F
irF � ð1� aÞ kðc;r;rÞ
1þkðc;r;rÞirF¼
1� ri
1� ð1�aÞ kðc;r;rÞ1þkðc;r;rÞ
: ð36Þ
We can now use the definition (11) of g to iteratively calculate an implied value for
the asset volatility:
g ¼ B
A
� �kðc;r;rÞ¼ kðc; r; rÞ i Fðr � gþ h rÞ
ð1þ kðc; r;rÞÞ r X
� �kðc;r;rÞ: ð37Þ
Derivatives with respect to asset value
To calculate the derivatives of equity and debt value with respect to asset value, we
first need the derivative of g:
ogoA
¼ o
oA
B
A
� �k
¼ �kB�1 B
A
� �kþ1
; ð38Þ
where, for simplicity of notation, k ¼ kðc; r; rÞ.Regarding the equity value, we can write (13) explicitly to obtain
E ¼ð1� sÞ A� aB g� i
rFð1� gÞ þ ð1� aÞB g
� �� �
¼ð1� sÞ Aþ i
rF � B
� �g� i
rF
� �:
ð39Þ
It follows
Business Research
123

oE
oA¼ð1� sÞ 1� i
rF � B
� �kB�1 B
A
� �kþ1" #
¼ð1� sÞ 1� i
rF ð1þ kÞ r
i F� k
� �B
A
� �kþ1" #
¼ð1� sÞ 1� B
A
� �kþ1" #
;
ð40Þ
using the definition B ¼ k1þk
irF (8).
Regarding the debt value, deriving Eq. (10) yields
oD
oA¼� ð1� aÞB� i
rF
� �kB�1 B
A
� �kþ1
¼� ð1� aÞ k� i
rFð1þ kÞ r
i F
� �B
A
� �kþ1
¼ð1þ a kÞ B
A
� �kþ1
:
ð41Þ
Instantaneous WACC with bankruptcy costs
In Sect. 5.1, we have derived the textbook formula for the instantaneous WACC
when bankruptcy costs are zero. In the general case, Eq. (27) becomes
Al ¼ D lD þ ðE þ GÞ lE þ BC lBC; ð42Þ
where lBC is the instantaneous return on bankruptcy costs, that is, the expected
instantaneous drift of their value. It is calculated analogously to the drifts of debt
and equity in the intertemporal CAPM as
lBC ¼ r þ h q rBC ð43Þ
with
rBC ¼ r � oBCoA
� A
BCð44Þ
according to (23). The partial derivative is derived similar to oD=oA as
oBC
oA¼ �a k
B
A
� �kþ1
: ð45Þ
(Note that, technically, rBC becomes negative.)
With bankruptcy costs, the expected return on firm value after taxes is A l ð1�sÞ � BC lBC ð1� sÞ (as expected, bankruptcy costs also decrease the expected tax
payments). Hence, the instantaneous WACC is given by
Business Research
123

V lWACC ¼ A l ð1� sÞ � BC lBC ð1� sÞ ¼ DlDð1� sÞ þ E lE � BC lBC ð1� sÞ:ð46Þ
The textbook formula for the instantaneous WACC must, therefore, be extended by
a component for bankruptcy costs:
lWACC ¼ E
VlE þ ð1� sÞ D
VlD � BC
VlBC
� �: ð47Þ
To illustrate the effect, we consider the highly leveraged firm (see Sect. 3) with bank-
ruptcy costs a ¼ 50%. Here, we have lE ¼ 8:90%, lD ¼ 4:37%, and lBC ¼ 1:97%.
The true instantaneous WACC calculated with Eq. (47) is lWACC ¼ 5:51%, whereas
the textbook formula, ignoring bankruptcy costs, yields 5:64%.
References
An, Y., and W. Suo. 2009. An empirical comparison of option-pricing models in hedging exotic options.
Financial Management 38: 889–914.
Berg, T. 2010. From actual to risk-neutral default probabilities: Merton and beyond. Journal of Credit
Risk 6 (1): 55–86.
Black, F., and M. Scholes. 1973. The pricing of options and corporate liabilities. Journal of Political
Economy 81: 637–654.
Brealey, R.A., S.C. Myers, and F. Allen. 2016. Principles of corporate finance, 12th ed. Singapore:
McGraw-Hill.
Brennan, M.J. 2003. Corporate investment policy. In Handbook of the Economics of Finance, ed. G.M.
Constantinides, M. Harris, and R.M. Stulz, 167–214. Amsterdam: Elsevier.
Cooper, I.A., and S.A. Davydenko. 2007. Estimating the cost of risky debt. Journal of Applied Corporate
Finance 19: 90–95.
Copeland, T.E., J.F. Weston, and K. Shastri. 2005. Financial theory and corporate policy, 4th ed. Boston:
Pearson.
Da, Z., R.J. Guo, and R. Jagannathan. 2012. CAPM for estimating the cost of equity capital: Interpreting
the empirical evidence. Journal of Financial Economics 103: 204–220.
Damodaran, A. 2012. Investment valuation, 4th ed. New York: Wiley.
Gamba, A., G.A. Sick, and C.A. Leon. 2008. Investment under uncertainty, debt and taxes. Economic
Notes 37 (1): 31–58.
Glover, B. 2016. The expected cost of default. Journal of Financial Economics 119: 284–299.
Goldstein, R., N. Ju, and H.E. Leland. 2001. An EBIT-based model of dynamic capital structure. Journal
of Business 74: 483–512.
Grinblatt, M., and J. Liu. 2008. Debt policy, corporate taxes, and discount rates. Journal of Economic
Theory 141: 225–254.
Hackbarth, D., C.A. Hennessy, and H.E. Leland. 2007. Can the trade-off theory explain debt structure?
Review of Financial Studies 20: 1389–1428.
Hsia, C.C. 1981. Coherence of the modern theories of finance. Financial Review 16: 27–42.
Hsia, C.C. 1991. Estimating a firm’s cost of capital: An option pricing approach. Journal of Business
Finance & Accounting 18: 281–287.
Husmann, S., and M. Schmidt. 2008. The discount rate: A note on IAS 36. Accounting in Europe 5 (1):
49–62.
Leland, H.E. 1994. Corporate debt value, bond covenants, and optimal capital structure. Journal of
Finance 49: 1213–1252.
Loffler, A. 2004. Zwei Anmerkungen zu WACC. Zeitschrift fur Betriebswirtschaft 74: 933–942.
Merton, R.C. 1973. An intertemporal capital asset pricing model. Econometrica 41: 867–887.
Merton, R.C. 1974. On the pricing of corporate debt: The risk structure of interest rates. Journal of
Finance 29: 449–470.
Business Research
123

Miles, J.A., and J.R. Ezzell. 1980. The weighted average cost of capital, perfect capital markets, and
project life: A clarification. Journal of Financial and Quantitative Analysis 15: 719–730.
Ou, S. 2014. Annual default study: Corporate default and recovery rates, 1920–2013, moody’s Investors
Service
Purnanandam, A. 2008. Financial distress and corporate risk management: Theory and evidence. Journal
of Financial Economics 87: 706–739.
Riis Flor, C. 2008. Capital structure and assets: Effects of an implicit collateral. European Financial
Management 14: 347–373.
Ross, S.A., R.W. Westerfield, J.F. Jaffe, and B.D. Jordan. 2016. Modern financial management, 11th ed.
New York: McGraw-Hill.
Schonbucher, P.J. 2003. Credit derivatives pricing models: Models, pricing and implementation.
Chichester: Wiley.
Strebulaev, I.A. 2007. Do tests of capital structure theory mean what they say? Journal of Finance 62:
1747–1787.
Welch, I. 2017. Corporate finance. Los Angeles
Business Research
123