The Clinical Neurophysiology Primer
537
The Clinical Neurophysiology Primer The Clinical Neurophysiology Primer Edited by Andrew S. Blum, MD, PhD Seward B. Rutkove, MD Edited by Andrew S. Blum, MD, PhD Seward B. Rutkove, MD
-
Upload
khangminh22 -
Category
Documents
-
view
1 -
download
0
Transcript of The Clinical Neurophysiology Primer

TheClinicalNeurophysiologyPrimer
TheClinicalNeurophysiologyPrimerEdited by
Andrew S. Blum, MD, PhD
Seward B. Rutkove, MD
Edited by
Andrew S. Blum, MD, PhD
Seward B. Rutkove, MD
BlumRutkove
The Clinical Neurophysiology Primer
The Clinical Neurophysiology Primer
The Clinical Neurophysiology PrimerEdited by
Andrew S. Blum, MD, PhDComprehensive Epilepsy Program, Department of Neurology, Rhode Island Hospital, Brown Medical School, Providence, RI
and
Seward B. Rutkove, MDDepartment of Neurology, Beth Israel Deaconess Medical Center, Boston, MA
THE CLINICAL NEUROPHYSIOLOGY PRIMERISBN-13: 978-0-89603-996-4E-ISBN-13: 978-1-59745-271-7humanapress.com
I Basic Considerations. Basic Electronics in ClinicalNeurophysiology. Basic Neurophysiology and the CorticalBasis of EEG. Ions, Membrane Potentials, and Myelin. Intro-duction to Volume Conduction. II Electroencephalography.The Normal EEG in an Adult. Activation of the EEG. NormalVariant EEG Patterns. Epileptiform Abnormalities. Focal andGeneralized Slowing, Coma, and Brain Death. NormalPediatric EEG. Pediatric EEG Abnormalities. III NerveConduction Studies and Electromyography. Neurophysiol-ogy of Nerve Conduction Studies. Technical, Physiological, andAnatomic Considerations in Nerve Conduction Studies.Introduction to the Needle Electrode Examination.Mononeuropathies of the Upper and Lower Extremity.Electrophysiology of Polyneuropathy. Radiculopathy and
• Normal EEG results in adult andpediatric populations
• Technical, physiological, and anatomicalconsiderations for nerve conduction studies
• Detailed introduction to the needleelectrode examination
The Clinical Neurophysiology Primer presents a broad yet focused treatment of central topics in the field of clinicalneurophysiology. This volume was inspired by the clinical neurophysiology lecture series at Beth Israel Deaconess MedicalCenter and Rhode Island Hospital, where faculty and trainees at these renowned teaching hospitals participate in a lectureseries over the course of the academic year. Much like the lecture series, The Clinical Neurophysiology Primer is designed toacquaint trainees with the essential elements of clinical neurophysiology.
Each chapter in this four-part volume is written by leading and respected clinical neurophysiologists. Part I presents introduc-tory considerations such as basic electronics, basic CNS physiology, and volume conduction for clinical neurophysiology. PartsII and III attend to all aspects of electroencephalography (EEG) and electromyography (EMG), respectively. In Part IV, topics infields related to clinical neurophysiology are emphasized, including autonomic testing, evoked potentials, sleep studies, andtheir applications. Fellows engaged in neurophysiology training, those pursuing more focused training in those areas, andneurology residents will all find this volume to be an indispensable reference. A standalone CD-ROM version of this title is alsoavailable (ISBN: 978-1-934115-09-1).
Motor Neuron Disorders. Electrophysiology of Brachial andLumbosacral Plexopathies. Evaluation of the Cranial Nerves.Electrophysiology of Myopathy: Approach to the Patient WithMyopathy in the EMG Laboratory. Neurophysiology ofNeuromuscular Transmission and Its Disorders. Pediatric NerveConduction Studies and EMG. IV Autonomic Testing, EvokedPotentials, and Sleep. Polysomnography and Sleep Disor-ders. Autonomic Nervous System Testing. Visual EvokedPotentials. Brainstem Auditory Evoked Potentials. Somatosen-sory Evoked Potentials. Transcranial Magnetic Stimulation.Index.
• Considerations for cranial nerve evaluation
• Polysomnography and sleep disorders
• Visual, brainstem, auditory, andsomatosensory evoked potentials
FEATURES
CONTENTS
BlumRutkove

THE CLINICAL NEUROPHYSIOLOGY PRIMER


THE
CLINICAL NEUROPHYSIOLOGY
PRIMER
Edited by
ANDREW S. BLUM, MD, PhD
Comprehensive Epilepsy ProgramDepartment of Neurology
Rhode Island Hospital, Brown Medical SchoolProvidence, RI
SEWARD B. RUTKOVE, MD
Department of NeurologyBeth Israel Deaconess Medical Center
Boston, MA

© 2007 Humana Press Inc.999 Riverview Drive, Suite 208Totowa, New Jersey 07512
humanapress.com
All rights reserved. No part of this book may be reproduced, stored in a retrieval system, or transmitted in any form or by anymeans, electronic, mechanical, photocopying, microfilming, recording, or otherwise without written permission from thePublisher. All articles, comments, opinions, conclusions, or recommendations are those of the author(s), and do not necessarilyreflect the views of the publisher.
Due diligence has been taken by the publishers, editors, and authors of this book to assure the accuracy of the informationpublished and to describe generally accepted practices. The contributors herein have carefully checked to ensure that the drugselections and dosages set forth in this text are accurate and in accord with the standards accepted at the time of publication.Notwithstanding, as new research, changes in government regulations, and knowledge from clinical experience relating to drugtherapy and drug reactions constantly occurs, the reader is advised to check the product information provided by the manufac-turer of each drug for any change in dosages or for additional warnings and contraindications. This is of utmost importancewhen the recommended drug herein is a new or infrequently used drug. It is the responsibility of the treating physician todetermine dosages and treatment strategies for individual patients. Further it is the responsibility of the health care provider toascertain the Food and Drug Administration status of each drug or device used in their clinical practice. The publisher, editors,and authors are not responsible for errors or omissions or for any consequences from the application of the information presentedin this book and make no warranty, express or implied, with respect to the contents in this publication.
Cover design by Karen Schulz
Cover illustration: (Foreground) Needle EMG, positive sharp wave (Fig. 4, Chapter 14; see complete caption and discussionon pp. 233–234). (Background) Epileptiform abnormalities, three-Hertz EEG of generalized spike-and-slow wave activity(Fig. 10, Chapter 8; see complete caption on p. 114 and discussion on p. 112).
For additional copies, pricing for bulk purchases, and/or information about other Humana titles, contact Humana at the aboveaddress or at any of the following numbers: Tel.: 973-256-1699; Fax: 973-256-8341; E-mail: [email protected] or visitour website at www.humanapress.com
The opinions expressed herein are the views of the authors and may not necessarily reflect the official policy of the NationalInstitute on Drug Abuse or any other parts of the US Department of Health and Human Services. The US Government does notendorse or favor any specific commercial product or company. Trade, proprietary, or company names appearing in thispublication are used only because they are considered essential in the context of the studies reported herein.
This publication is printed on acid-free paper. ∞
ANSI Z39.48-1984 (American National Standards Institute) Permanence of Paper for Printed Library Materials.
Photocopy Authorization Policy:
Authorization to photocopy items for internal or personal use, or the internal or personal use of specific clients, is granted byHumana Press Inc., provided that the base fee of US $30.00 per copy, plus US $00.30 per page, is paid directly to the CopyrightClearance Center at 222 Rosewood Drive, Danvers, MA 01923. For those organizations that have been granted a photocopylicense from the CCC, a separate system of payment has been arranged and is acceptable to Humana Press Inc. The fee codefor users of the Transactional Reporting Service is: [978-0-89603-996-4/07 $30.00].
Printed in the United States of America. 10 9 8 7 6 5 4 3 2 1
eISBN 978-1-59745-271-7
Library of Congress Cataloging-in-Publication Data
Essentials of clinical neurophysiology / edited by Andrew S. Blum,Seward B. Rutkove. p. ; cm. Includes bibliographical references and index. ISBN 0-89603-996-X (alk. paper) 1. Electroencephalography. 2. Electromyography. 3. Neurophysiology. 4. Nervous system--Diseases--Diagnosis. I. Blum, Andrew S. II. Rutkove, Seward B. [DNLM: 1. Nervous System Physiology. 2. Electroencephalography. 3. Electromyography. 4.Electrophysiology. 5. Nervous System Diseases--diagnosis. WL 102 E776 2007] RC386.6.E43E87 2007 616.8'047547--dc22
2006014475

v
PREFACE
With the growth of combined clinical neurophysiology fellowship training programs and theircorresponding “pan-physiology” board examinations, there has been an increased need foreducational materials that span the range of clinical neurophysiology topics. The ClinicalNeurophysiology Primer aims to meet this need by providing a broad and intentionally basic treatmentof the most central topics within clinical neurophysiology.
The Clinical Neurophysiology Primer initially took shape within the clinical neurophysiologysections at Beth Israel Deaconess Medical Center and Rhode Island Hospital, as an outgrowth of theirfellowships’ didactic lecture series. Faculty and trainees at these and affiliated teaching hospitalsparticipate in a series of lectures over the course of the academic year designed to acquaint traineeswith the elements of clinical neurophysiology, supplementing their clinical experiences. We hope that thisprimer will prove valuable to others as a companion book intended for clinical neurophysiology fellowsand neurology residents, to be used in conjunction with such a program of lectures.
The Clinical Neurophysiology Primer is divided into four parts. The first addresses backgroundtopics integral to, and shared by, all the disciplines within clinical neurophysiology. These treat suchtopics as basic electronics and the neural basis for the central and peripheral electrical potentials thatwe study in the laboratory. Part II addresses the most central topics pertinent to the application andanalysis of electroencephalography. Part III tackles similar key topics pivotal to understandingneuromuscular disease pathophysiology and correlates found with nerve conduction studies andelectromyography. The last part covers topics in related fields of clinical neurophysiology: autonomictesting, evoked potentials, sleep studies, and their applications. The primer is multiauthored. Many ofthe contributing authors are faculty, or were trainees, at our fellowship programs. Inevitably othercontributors also joined the effort. Each chapter has appended references or bibliographies thatprovide the reader with additional sources of information to expand upon the introductory materialscovered here. Chapter lengths also vary considerably in size, in part related to the breadth of thematerial incorporated. Finally, each chapter ends with a set of questions and answers to aid trainees ingauging their mastery of the materials.
We hope this primer will fulfill its intended role as a starting point for fellows engaged in clinicalneurophysiology training, for those pursuing more focused training in areas within clinicalneurophysiology, and for neurology residents aiming to acquire a basic understanding of thesedisciplines.
Andrew S. Blum, MD, PhD
Seward B. Rutkove, MD


vii
CONTENTS
Preface .................................................................................................................................................. vContributors ....................................................................................................................................... ix
I Basic Considerations
1 Basic Electronics in Clinical Neurophysiology ................................................................. 3Christopher M. Sinclair, Mason C. Gasper, and Andrew S. Blum
2 Basic Neurophysiology and the Cortical Basis of EEG .................................................. 19Gregory L. Holmes and Roustem Khazipov
3 Ions, Membrane Potentials, and Myelin ........................................................................... 35Devanand Jillapalli and Jeremy M. Shefner
4 Introduction to Volume Conduction ................................................................................. 43Seward B. Rutkove
II Electroencephalography
5 The Normal EEG in an Adult ............................................................................................. 57Donald L. Schomer
6 Activation of the EEG ........................................................................................................... 73Barbara A. Dworetzky, Edward B. Bromfield, and Nanon E. Winslow
7 Normal Variant EEG Patterns ............................................................................................ 83Richard L. Cervone and Andrew S. Blum
8 Epileptiform Abnormalities .............................................................................................. 101Bernard S. Chang and Frank W. Drislane
9 Focal and Generalized Slowing, Coma, and Brain Death ........................................... 127Edward M. Donnelly and Andrew S. Blum
10 Normal Pediatric EEG ........................................................................................................ 141Ann M. Bergin and Blaise F. D. Bourgeois
11 Pediatric EEG Abnormalities ............................................................................................ 179James J. Riviello, Jr.
III Nerve Conduction Studies and Electromyography
12 Neurophysiology of Nerve Conduction Studies .......................................................... 207James B. Caress, Gregory J. Esper, and Seward B. Rutkove
13 Technical, Physiological, and Anatomic Considerationsin Nerve Conduction Studies ....................................................................................... 217
James B. Caress

viii Contents
14 Introduction to the Needle Electrode Examination ...................................................... 229Gregory J. Esper and Seward B. Rutkove
15 Mononeuropathies of the Upper and Lower Extremity .............................................. 251Kevin R. Scott and Milind J. Kothari
16 Electrophysiology of Polyneuropathy ............................................................................ 275Annabel K. Wang and Seward B. Rutkove
17 Radiculopathy and Motor Neuron Disorders ............................................................... 289Juan A. Acosta and Elizabeth M. Raynor
18 Electrophysiology of Brachial and Lumbosacral Plexopathies .................................. 299Juan A. Acosta and Elizabeth M. Raynor
19 Evaluation of the Cranial Nerves ..................................................................................... 313George Sachs
20 Electrophysiology of Myopathy: Approach to the PatientWith Myopathy in the EMG Laboratory ......................................................................... 325
Nithi S. Anand and David Chad
21 Neurophysiology of Neuromuscular Transmission and Its Disorders .................... 353James M. Gilchrist
22 Pediatric Nerve Conduction Studies and EMG ............................................................ 369Peter B. Kang
IV Autonomic Testing, Evoked Potentials, and Sleep
23 Polysomnography and Sleep Disorders ......................................................................... 393Jean K. Matheson, Randip Singh, and Andreja Packard
24 Autonomic Nervous System Testing............................................................................... 447Frederick K. Nahm and Roy Freeman
25 Visual Evoked Potentials ................................................................................................... 461Frank W. Drislane
26 Brainstem Auditory Evoked Potentials .......................................................................... 475Jacob R. Berger and Andrew S. Blum
27 Somatosensory Evoked Potentials ................................................................................... 485Jacob R. Berger and Andrew S. Blum
28 Transcranial Magnetic Stimulation ................................................................................. 499Masahito Kobayashi and Alvaro Pascual-Leone
Index ................................................................................................................................................. 517

CONTRIBUTORS
ix
JUAN A. ACOSTA, MD • Department of Neurology, Beth Israel Deaconess Medical Center,Harvard Medical School, Boston, MA
NITHI S. ANAND, MD, MPH • Department of Neurology, University of Massachusetts Medical Center,Worcester, MA
JACOB R. BERGER, MD • Comprehensive Epilepsy Program, Department of Neurology,Rhode Island Hospital, Brown Medical School, Providence, RI
ANN M. BERGIN, MB, MRCP • Division of Epilepsy and Clinical Neurophysiology,Department of Neurology, Children’s Hospital, Harvard Medical School,Boston, MA
ANDREW S. BLUM, MD, PHD • Comprehensive Epilepsy Program, Department of Neurology,Rhode Island Hospital, Brown Medical School, Providence, RI
BLAISE F. D. BOURGEOIS, MD • Division of Epilepsy and Clinical Neurophysiology,Department of Neurology, Children’s Hospital, Harvard Medical School, Boston, MA
EDWARD B. BROMFIELD, MD • Department of Neurology, Brigham and Women’s Hospital,Harvard Medical School, Boston, MA
JAMES B. CARESS, MD • Department of Neurology, Wake Forest University School of Medicine,Winston Salem, NC
RICHARD L. CERVONE, MD • Comprehensive Epilepsy Program, Department of Neurology,Rhode Island Hospital, Brown Medical School, Providence, RI
DAVID CHAD, MD • Department of Neurology,University of Massachusetts Medical Center,Worcester, MA
BERNARD S. CHANG, MD • Comprehensive Epilepsy Center, Department of Neurology,Beth Israel Deaconess Medical Center, Harvard Medical School, Boston, MA
EDWARD M. DONNELLY, MD • Comprehensive Epilepsy Program, Department of Neurology,Rhode Island Hospital, Brown Medical School, Providence, RI
FRANK W. DRISLANE, MD • Comprehensive Epilepsy Center, Department of Neurology,Beth Israel Deaconess Medical Center, Harvard Medical School, Boston, MA
BARBARA A. DWORETZKY, MD • Department of Neurology, Brigham and Women’s Hospital,Harvard Medical School, Boston, MA
GREGORY J. ESPER, MD • Department of Neurology, Emory University School of Medicine,Atlanta, GA
ROY FREEMAN, MD • Department of Neurology, Beth Israel Deaconess Medical Center,Harvard Medical School, Boston, MA
MASON C. GASPER, DO, MPH • Comprehensive Epilepsy Program, Department of Neurology,Rhode Island Hospital, Brown Medical School, Providence, RI
JAMES M. GILCHRIST, MD • Department of Neurology, Rhode Island Hospital, Brown Medical School,Providence, RI
GREGORY L. HOLMES, MD • Section of Neurology, Neuroscience Center at Dartmouth,Dartmouth Medical School, Lebanon, NH
DEVANAND JILLAPALLI, MD • Department of Neurology, SUNY Upstate Medical University,Syracuse, NY

x Contributors
PETER B. KANG, MD • Department of Neurology, Children’s Hospital, Boston, MA
ROUSTEM KHAZIPOV, MD, PHD • Institut de Neurobiologie de la Méditerranée, Marseilles,France
MASAHITO KOBAYASHI, MD • Department of Neurosurgery, Keio University School of Medicine,Tokyo, Japan
MILIND J. KOTHARI, MD • Department of Neurology, Penn State Hershey Medical Center,Hershey, PA
JEAN K. MATHESON, MD • Department of Neurology, Beth Israel Deaconess Medical Center,Harvard Medical School, Boston, MA
FREDERICK K. NAHM, MD, PHD • Yale New Haven Health Systems, Greenwich, CT
ANDREJA PACKARD, MD, PHD • Department of Neurology, Boston University Medical Center,Boston, MA
ALVARO PASCUAL-LEONE, MD, PHD • Department of Neurology, Beth Israel Deaconess MedicalCenter, Harvard Medical School, Boston, MA
ELIZABETH M. RAYNOR, MD • Department of Neurology, Beth Israel Deaconess Medical Center,Harvard Medical School, Boston, MA
JAMES J. RIVIELLO, JR., MD • Division of Epilepsy and Clinical Neurophysiology,Department of Neurology, Children’s Hospital, Harvard Medical School,Boston, MA
SEWARD B. RUTKOVE, MD • Department of Neurology, Beth Israel Deaconess Medical Center,Harvard Medical School, Boston, MA
GEORGE SACHS, MD, PHD • Department of Neurology, Rhode Island Hospital, Brown University,Providence, RI
DONALD L. SCHOMER, MD, PHD • Comprehensive Epilepsy Center, Department of Neurology,Beth Israel Deaconess Medical Center, Harvard Medical School, Boston, MA
KEVIN R. SCOTT, MD • Department of Neurology, Penn State Hershey Medical Center,Hershey, PA
JEREMY M. SHEFNER, MD, PHD • Department of Neurology, SUNY Upstate Medical University,Syracuse, NY
CHRISTOPHER M. SINCLAIR, MD • Comprehensive Epilepsy Program, Department of Neurology,Rhode Island Hospital, Brown Medical School, Providence, RI
RANDIP SINGH, MD • Department of Neurology, Beth Israel Deaconess Medical Center,Harvard Medical School, Boston, MA
ANNABEL K. WANG, MD • Department of Neurology, Mount Sinai School of Medicine,New York, NY
NANON E. WINSLOW, REEGT • Department of Neurology, Brigham and Women’s Hospital,Harvard Medical School, Boston, MA

IBASIC CONSIDERATIONS
01_Blum 4/11/07 8:29 AM Page 1

01_Blum 4/11/07 8:29 AM Page 2

1Basic Electronics in Clinical Neurophysiology
Christopher M. Sinclair, Mason C. Gasper, and Andrew S. Blum
SummaryA basic understanding of simple electronics is vital for the student of clinical neurophysiology to
better understand how we begin to analyze neurobiological systems. The elements of basic circuitshave relevant and tangible application to the way in which we model the behavior of neural systems inthe laboratory. This chapter helps to define and assemble these varied circuit elements for the student.This base of understanding is then used to illustrate how simple electronic circuits can filter andamplify biological data. The composition and behavior of commonly used electrodes are discussed, asare the varied montages we use to record and/or display the measured data, as in an EEG. Attention isdevoted to digital signal analysis because modern clinical neurophysiology increasingly relies on digitalsampling for ease of data analysis and storage. Lastly, electrical safety issues are considered, particu-larly as they apply to the clinical neurophysiology arena.
Key Words: Amplifier; circuit element; digital conversion; electrical safety; electrode; electronicfilter; montage.
1. GENERAL PRINCIPLES
An understanding of the nature of electricity and the behavior of charged particles beginswith one fundamental principle—like charges repel and opposite charges attract. If a collec-tion of charges, whether positive or negative, are unevenly distributed, there is an inherentdrive for those charges to redistribute to achieve electrical neutrality. This drive may be con-sidered the electrical potential.
The MKS (meter-kilogram-second) unit of energy (E) is the joule (J). One joule is defined asthe energy required to accelerate a 1-kg mass by 1 m/s2 over a distance of 1 m. The unit of charge(Q) is the coulomb (C). One coulomb is defined as 6.24 × 10¹⁸ individual units of charge, wherea single electron carries one unit of negative charge. Separated charges (that have not achievedelectrical neutrality) are a form of stored or potential energy, and this energy will be expended asthe charge separation is neutralized. In the MKS system, 1 J of energy is needed to separate 1 Cof charge against an electrical potential of 1 V. Stated more concisely, 1 J = 1 V × 1 C.
2. CURRENT
The flow of electrons in response to an existing or applied electrical potential, or voltage,is known as current. Current (I) is simply some quantity of charge (Q) moving in some quan-tity of time (t). Mathematically, this is expressed as:
I = Q/t
From: The Clinical Neurophysiology PrimerEdited by: A. S. Blum and S. B. Rutkove © Humana Press Inc., Totowa, NJ
3
01_Blum 4/11/07 8:29 AM Page 3

where I is the current in amperes (A), Q is the quantity of charge in coulombs, and t is thetime in seconds required for the transfer of charge. The current must travel through a mediumthat consists of other particles, and this medium may interfere with the efficient flow ofcharge; it presents resistance (R) to that flow. Thus, the current is not only affected by theapplied potential but also by the amount of resistance in the conducting medium. Variousmedia conduct electricity with variable efficiency. Metals conduct very well because of theirabundant free electrons and, thus, are termed conductors. Conversely, materials that lack freeelectrons to facilitate the flow of charge resist this flow, and are known as insulators.Although the flow of electricity is achieved through the movement of electrons, current isconventionally described to flow from the positive pole to the negative pole. Thus, the direc-tion of current refers to the movement of positive rather than negative charge. Current mayconsist of other forms of charge apart from electrons. Current may also be conveyed by ions(regardless of charge polarity) in a tissue or solution, as is the case in the conduction of muscleor nerve potentials.
3. CIRCUIT ELEMENTS
3.1. Resistors
Under everyday conditions, current meets with some resistance to flow, much as frictionopposes the movement of an object over a surface. Some energy or force is expended in over-coming this resistance. The voltage (or potential) difference across a given resistance isknown as the voltage “drop,” and the relationship between these parameters and the resultantcurrent is given by Ohm’s law:
V = IR
The unit of resistance is the ohm (Ω), which is defined as the resistance (R) that will dis-sipate 1 J of energy when a current of 1 A flows through it for a period of 1 s. Practicallyspeaking, resistors are made from materials that do not easily allow the free movement ofelectrons, such as carbon. Very high resistance materials that are the most restrictive towardthe movement of electrons, such as air, rubber, or glass, make the best insulators. The greaterthe distance that current must traverse through a resistive material, the more resistance to flowthere will be. It is, thus, useful to alter the length of a resistive material to vary the currentflow. As given by Ohm’s law, resistance and current vary inversely with one another (R = V/I).Therefore, a reduction in the length of a resistive medium by half will lead to a doubling ofthe current. The potentiometer (voltmeter) uses this principle by providing a way to vary thelength of a resistor (and thereby vary the current flow) to advantage.
Resistance in the acquisition of a biological test, such as an EEG, does not only derivefrom the material of the wiring in use. Resistance derives from any material through whichcurrent must pass. For example, resistive elements in the EEG include not just the electrodewiring but also the scalp–electrode interface and the internal circuitry of the machine.Resistance is provided by anything that lies between the positively charged terminal of a circuit (the cathode) and the negatively charged terminal (the anode). If the resistance is infi-nitely large, then the current becomes infinitely small (or ceases). This produces a circuit thatis “open.” Circuit breakers act in this way to ensure the safety of an electrical system. If resist-ance is reduced to a miniscule value, this permits a relatively large current, and is deemed a“short circuit.” Any resistance between the anode and cathode that allows current to flow butis neither infinitely large nor extremely small is a “closed circuit.”
4 Sinclair, Gasper, and Blum
01_Blum 4/11/07 8:29 AM Page 4

Each element in a circuit contributes its own resistance. If multiple resistive elements existin a succession along a circuit, they are said to be in series (Fig. 1A). If they are configuredto allow current to travel in multiple alternate paths, they are said to be in parallel (Fig. 1B).Because the series configuration fractionates the total voltage across each of the resistive ele-ments, it is also known as a voltage divider. Addition of these resistive elements creates aresistor of greater length that is equivalent to the sum of all the component resistances.Therefore, the equivalent resistance (Req) for a series circuit may be obtained by summing theindividual resistances in the circuit as such:
Req = R1 + R2 + R3
By contrast, a parallel circuit will allow current to fractionate and travel any of a numberof paths, and, therefore, is known as a current divider. The several routes that the current maytravel effectively reduces the total resistance to flow to less than that of any of the componentresistances in the circuit. This is represented by the following relationship:
1/Req = 1/R1 + 1/R2 + 1/R3
In considering a complete circuit, there are two other applicable laws. Kirchoff’s currentlaw states that the sum of current flowing into and out of any circuit node must be zero.Kirchoff’s voltage law states that the sum of all voltage steps (voltage sources and drops)around a complete circuit must be zero.
3.2. Capacitors
A capacitor is a device that permits the storage of charge. It consists of two parallel con-ducting plates closely apposed to one another but separated by a small distance and an inter-posed insulating material, the dielectric. The gap between the plates provides a large resistanceto the flow of current from plate to plate. As such, when a potential is applied across a circuitcontaining a capacitor, positive charge will accumulate on the positive plate, attracting nega-tive charge to the opposite plate. Current flows between the plates via the circuit withoutcharge actually crossing the dielectric gap between the plates. The accumulation of separatedcharge creates a potential difference across the plates that eventually balances the potentialapplied across the circuit, and current flow then ceases. Several factors affect the magnitude ofcharge, or capacitance, that may be stored by a capacitor. This is proportional to the size of
Basic Electronics in Clinical Neurophysiology 5
Fig. 1. This figure contrasts the organization of a series circuit (A) and a parallel circuit (B). In aseries circuit, equal current must flow through each resistor in turn. Therefore, the resistors functionas a voltage divider. The resistance, Rcomb, is given by R1 + R2 + R3. The parallel circuit functions asa current divider, with equal voltage across each resistor. The combined resistance is given by 1/Rcomb =1/R1 + 1/R2 + 1/R3.
01_Blum 4/11/07 8:29 AM Page 5

the plates of the capacitor, inversely proportional to the distance between those plates, and isaffected by the dielectric material between the plates. The MKS unit for capacitance is thefarad (F). A farad will store 1 C of charge on the plates of a capacitor with an applied poten-tial difference of 1 V. This is mathematically expressed as:
C = Q/V
where C is the capacitance in farads, Q is the charge in coulombs, and V is the voltage in voltsacross the plates. In practice, most circuits use capacitance on the order of microfarads orpicofarads.
If you differentiate both sides of the above capacitance equation with respect to time andrearrange the result, you obtain the following relation:
I = C × dV/dt
or current is equal to capacitance multiplied by the change in voltage with respect to time.Thus, if the voltage is unchanging (dV/dt = 0), then current flow becomes zero. This is thecase with a direct current (DC) circuit, wherein current flows directly between the anode andcathode with an invariant voltage. Once the potential difference between the plates of thecapacitor has equaled that applied constant voltage, current flow ceases. Conversely, a con-tinually varying potential will be able to maintain current flow across a circuit that includessuch a capacitive element. This is the effect produced by alternating current (AC) that, as thename implies, is constantly oscillating between two alternating poles. (AC will be describedin more detail later.) Thus, a capacitor will pass AC flow but will block DC flow. This imped-ing effect of the capacitor is known as capacitive reactance and is defined as follows:
XC = 1/(2πƒC)
where XC is in ohms, ƒ is the frequency of the current in hertz, and C is in farads. One cansee that as the frequency of the current approaches zero (as in DC), the capacitive reactance(resistance to flow) becomes infinitely large.
Capacitance is crucial to any system that can maintain separated charge and, thereby, storepotential energy for use in doing work. The lipid bilayer membrane of nerve tissue is a superbcapacitor, which both permits and restricts the flow of ionic currents. It is these intermittentfluctuations in biological currents that ultimately produce the potentials of interest in clinicalneurophysiology, such as in EEG. However, other sources of biological capacitance can alsointerfere with these signals, such as the capacitive resistance in the cerebrospinal fluid, skull,and scalp. As the equation for XC predicts, these will affect differing neuronal frequencies todifferent degrees. For example, 3 Hz activities through 2 µF of capacitance will have an XC = 1/[2 · 3.14 · 3 Hz · (2 × 10_6) F] = 26.5 kΩ, which is much larger than the 4.4 kΩ reac-tance seen by 18-Hz beta frequencies. This illustrates how much more capacitive reactancethere is to low frequencies vs higher frequencies with scalp recordings.
Multiple capacitors in a circuit interact in a manner that is opposite to the behavior of resis-tors. When arranged in parallel, there is an additive effect as such:
Ceq = C1 + C2 + C3
and when arranged in series, the equivalent capacitance is less than any of the individual val-ues, as such:
1/Ceq = 1/C1 + 1/C2 + 1/C3
6 Sinclair, Gasper, and Blum
01_Blum 4/11/07 8:29 AM Page 6

3.3. Inductors
An inductor consists of a continuous coil of wire called a solenoid. Current flowing in thiscoil generates a magnetic field whose axis passes through the coil (with directionality dic-tated by the right hand rule). Because of the equivalence of electricity and magnetism (i.e.,Maxwell’s equations), this magnetic field can induce an electromotive force (emf, ε) in anearby conductor, if the magnetic field is variable over time. The magnetic field can vary ifthe current flow in the coil varies. The relationship of this emf to the current is:
ε = – L × dI/dt,
where L is a constant called the inductance of the device. The negative sign in the equation indi-cates that the changing current (dI) induces an emf that opposes that change. The unit of inductance(L) is the henry (H). The inductance of a solenoid is proportional to the number of turns in the coil.
A changing current (i.e., AC) passing through a coil will generate a changing magnetic fieldthat passes through its core. If a second coil of wire is wrapped around a nearby section of thiscore, the changing magnetic field will generate a reciprocal emf and current in the second coil.One can tap this feature to step voltage from one value to another, as in a transformer (Fig. 2).Because inductance (L) depends on the number of turns (N) in the coils, if the number of turnsin the first coil (N1) is greater than in the second coil (N2), then the inductance will decreasein the second coil. From the above equation, if L decreases, then dI/dt will increase propor-tionately. The induced emf (or voltage) in circuit two will decrease in proportion to the dropin inductance. Therefore, voltage varies directly with L and current varies inversely with L,whereas the total energy (power) in the system is conserved. As current steps up, voltage stepsdown. These vary according to the ratio L1/L2, which is directly related to N1/N2.
Inductance is similar to resistance in that it poses an impediment to the motion of chargegenerated by another source. For example, an AC source, with its associated emf, providinga current through a circuit with an inductor, will be opposed by the emf generated by thatinductor. The inductor’s emf is, in effect, subtracted from that of the circuit to determine thenet potential. This property is known as the inductive reactance (XL), which is:
XL = 2πƒL
where XL is in ohms and the frequency (ƒ) is in Hz.
Basic Electronics in Clinical Neurophysiology 7
Fig. 2. This figure illustrates a transformer, which is based on the principle of induction. An alter-nating current (AC) with voltage, V1, is applied to an inducer, represented by the coil with N1 turns.Another coil with N2 turns shares the same rod. AC flowing through the coil induces a magnetic fieldthat then induces a reciprocal electrical field (voltage) in the second coil. The ratio of coil loops deter-mines the change in voltage in the second circuit; fewer turns leads to a proportionately reduced volt-age in the second circuit.
01_Blum 4/11/07 8:29 AM Page 7

4. POWER
Energy is simply charge moving across some potential energy gradient (E = QV). Power isthe rate of transfer of this energy, or mathematically:
P = E/t
A useful permutation of power for use in electrical circuits is as follows:
P = Q·V/t = (Q/t)·V = IV
where I is the current and V is the voltage. The SI unit of power is the watt (W), which isequivalent to 1 J/s (energy per time).
Recall the previous transformer discussion. As the voltage climbs, the current drops pro-portionally, and the product of these (the power) will remain constant. Of course, this is anideal, and a transformer in the real world will lose something in the transfer (albeit not much).Their typical efficiency is on the order of 90 to 99%. The intensity of power (β) is often represented as a ratio with a second power level on a normalized, logarithmic scale with unitsin decibels. The decibel ratio of two power levels is:
β = 10log(P2/P1)
5. ALTERNATING CURRENT
AC has very useful properties, particularly in circuits involving capacitors and inductors.In the previous treatment of inductors, we saw that a current generated in a coil around amagnetic material could induce a magnetic flux that, in turn, would result in an emf (volt-age) across the circuit. An AC generator operates on a similar principle with a minor differ-ence. That is, a magnetic field across a rotating wire will cause a changing field in that wirethat will, in turn, induce an alternating emf and current in the wire.
The wire is part of a circuit that must be rotated by some external energy source. Practicalexamples of this are wind, falling water at a hydroelectric plant, or burning coal. The resultingrotation will produce a sinusoidal flow of AC with a characteristic amplitude and frequency.
As is apparent from the sinusoidal nature of AC, the average current over any given com-plete cycle is zero. The quantity of current delivered, however, relates to the amplitude of thesine wave. Because AC is only at its maximum amplitude for an instant, it will not producethe same heating effect as an equivalent DC, nor will it produce an equivalent current. It willinstead produce an effect that is similar to a DC of lesser quantity. The effective current in anAC circuit across a resistor is given by the root mean square (rms) value. This can be shownto be Irms = Im/√2 = 0.707Im, where Im is the maximum amplitude and Irms is the effectiveequivalent to DC. The direction of this current makes no difference in the power of the sys-tem because P = IV, which is equivalent to I2R.
6. IMPEDANCE
Impedance (Z) is the term used for the combined effects of resistance along with capaci-tive and inductive reactance in an RC circuit (a circuit that includes a resistor and capacitorin series) passing AC current:
Z = [R2 + (XC _ XL)2]1/2
8 Sinclair, Gasper, and Blum
01_Blum 4/11/07 8:29 AM Page 8

The inductive reactance is subtracted from the capacitive reactance because they have oppo-site phase. In an AC circuit, Ohm’s law takes the form V = IZ, where Z is the term for resist-ance in this type of circuit. This is analogous to Ohm’s law as applied to DC circuits (V = IR).
7. TIME CONSTANTS
With this understanding of basic circuit elements, we can now examine how simple cir-cuits behave and permit basic electronic filtering of waveform data. An RC circuit is shownin Fig. 3A. When voltage is applied to the circuit, current flows across the resistor and beginsto accumulate on the capacitor. As the capacitor becomes fully charged, it accrues a voltagethat opposes further flow of current through the circuit. If the power source is turned off, thecapacitor discharges in the opposite direction of current flow as it charged.
The charging (and discharging) behavior of a capacitor over time is exponential. Its kinet-ics are described using a time constant, τ, which is that time required for the capacitor toreach approx 63% of its charge. This is 1 – 1/e, where e is the base of the natural logarithm(~2.718). This time is independent of the applied voltage, but rather depends on the resistorand capacitor combination. In an RC circuit, the time constant can be calculated as:
τ = R × C
A larger resistor permits less current to flow to fill the capacitor, thereby prolonging the timeconstant of an RC circuit. Similarly, a larger capacitor takes longer to charge, thus, prolonging τ.
8. FILTERS
Let us return to the RC circuit and apply a voltage square wave pulse (Fig. 3B). At the outset, the voltage change is seen across the resistor, but there is a lag in the appearance of
Basic Electronics in Clinical Neurophysiology 9
Fig. 3. This figure depicts a simple resistance/capacitance (RC) circuit. In (A), VR is the voltage dropacross the resistor and VC is the voltage drop across the capacitor. In (B), the behavior of such a circuitin response to an applied square wave pulse (Vapplied) is illustrated. The voltage across the capacitor, VC,gradually builds as charge accrues on the capacitor. This process follows a logarithmic function and hasa time course shown in VC. Eventually, VC opposes the flow of current in the circuit. When the appliedvoltage is zero at the end of the pulse, the capacitor discharges in a reciprocal fashion. By contrast, VR ismaximal at the onset of the applied pulse, but as the capacitor charges and opposes the source voltage,current flow decreases and then stops; VR then reaches zero because current, I, becomes 0 (V = IR). Notethat VR and I behave similarly because they are directly proportional to one another. In this way, VCbehaves as a high-frequency (low-pass) filter, whereas VR behaves as a low-frequency (high-pass) filter.
01_Blum 4/11/07 8:29 AM Page 9

voltage across the capacitor. At steady state (with no current flow after the capacitor is fullycharged), there is no measurable voltage drop across the resistor and there is maximal volt-age across the capacitor. The sum of the voltages across these elements always equals theinput voltage. Thus, the voltage output across the resistor is very sensitive to sudden changesin input voltage (high frequencies) but insensitive to relatively unchanging voltage (low fre-quencies); the opposite is true of the capacitor. Therefore, these circuit elements form thebasis of high- and low-frequency electronic filters of variable input waveforms (as we recordin EMG and EEG). That is, the resistive element serves as a low-frequency filter, and thecapacitive element serves as a high-frequency filter.
The low-frequency (or high-pass) filter is helpful in EEG, for instance, in blunting slow DCpotentials that are of lesser interest. A shorter time constant makes for a more stringent low-frequency filter (higher cutoff frequency). The relationship between τ and the low-frequencyfilter is given by:
Fcutoff = 1/(2πτ) ≈ 0.16/τ,
where Fcutoff is that frequency above which greater than 70% of the input amplitudes will pass. The high-frequency (low-pass) filter is based on the capacitive element and is useful in
EEG, to attenuate undesired frequencies that may stem from muscle activity near the scalpleads. The cutoff frequency is defined similarly as in the low-frequency filter. The combina-tion of the low- and high-frequency filters defines the operative bandwidth in use. This is therange of input frequencies that will be allowed through for further analysis.
With such RC circuit-based filters (e.g., as in older analog EEG machines), input data is notfiltered in an all-or-none fashion, but rather there is a roll-off in the restriction of input frequen-cies above and below the low- and high-frequency filter settings (Fig. 4). By combining suchcircuits, one can obtain filters that are more specific, such as the 60-Hz “notch” filter, whichmore dramatically blunts 60-Hz inputs, a common source of artifact in typical recording envi-ronments because of ambient electrical noise. This discussion notwithstanding, modern digitalEEGs filter input data using different methodologies than described, with much steeper fre-quency response characteristics than available with simple RC circuits. It is important to notethat overly stringent filtering can distort the output data, for instance, making waveforms seemless sharp than in reality. This can become clinically relevant to the interpretation of the data,for instance, in the recognition of subtle notched morphologies on EEG.
9. AMPLIFIERS
Amplifiers are electronic devices that serve to multiply an input signal by a constant. Thisamplification factor is called gain and is related to the ratio, Vout/Vin. It is common to expressgain in decibels as 20 × log10(Vout/Vin). The dynamic range of an amplifier refers to the volt-age range over which the amplifier behaves linearly. The sensitivity control on an EEGmachine helps to modify the dynamic range of the amplifier. Sensitivity is expressed asmicrovolts per millimeter and refers to the size of the deflection on the paper or screen thatrepresents this voltage. Typical sensitivity settings for EEG are 7 µV/mm. Increasing theamplifier gain requires lowering the sensitivity; they are inversely related. EEG amplifiershave multiple circuit elements that include voltage regulators, filters, and calibration circuits,among other elements.
The heart of the EEG machine is the differential amplifier. The difference between theinput voltages from two electrodes relative to a reference electrode (ideally close to the
10 Sinclair, Gasper, and Blum
01_Blum 4/11/07 8:29 AM Page 10

recording leads) is amplified and serves as output. This method serves to subtract commonartifactual noise that may be contaminating both input electrodes. One example is ambient60-Hz noise from the local recording environment. This subtraction of common noise iscalled common mode rejection. The capacity of an amplifier to perform common mode rejec-tion is described by the common mode rejection ratio, which is equal to the common signalvoltage divided by the nonamplified output voltage.
The common mode rejection ratio for many amplifiers in modern EEG devices is 10,000.In a differential amplifier, by convention, if input 1 is negative with respect to input 2, thenthe pen deflection is upward. If input 1 is positive with respect to input 2, then the deflectionis downward.
10. ELECTRODES
The above principles can now be applied to the acquisition of neurophysiological data.This begins with the electrode and the interface between the subject and the electrode.Electrodes connect the patient to the circuits of the neurophysiological recorder. They serveto detect and conduct electrical potentials from the patient to the machine. They are metallic,and an electrolyte paste is used to help conduct current and reduce movement artifacts.Electrodes may be nonreversible (polarized) or reversible (nonpolarized). Polarized elec-trodes are prone to develop significant capacitance, and this may interfere with the faithfultransmission of underlying biological signals (the electrode behaves like a low-frequency fil-ter). Reversible electrodes, such as those of silver chloride, are preferred for common neuro-physiological applications. Polarization is avoided because the chloride ion is common toboth the electrode and the electrolyte. Other metals can be used, such as gold or platinum, butmay be costly.
Because the electrode–electrolyte interface resembles a simple RC circuit, it is important forthe electrode impedance to be as low as possible, typically less than 5 kΩ, for scalp electrodes.
Basic Electronics in Clinical Neurophysiology 11
Fig. 4. Frequency response of filters. This figure shows the percentage of input voltage that isallowed as a function of frequency in relation to applied filters based on analog resistance/capacitance(RC) circuits with various time constants, τ. Such filters exhibit a “roll off” in their attenuation ofinput frequencies. As τ shortens, the curves for both the high- and low-pass filters are shifted towardhigher frequencies. The cutoff frequency is inversely related to τ. For a given filter circuit, it is thefrequency above which approx 70% (0.16/τ) of the input amplitudes will pass through for analysis.The notch filter is designed to specifically filter out 60-Hz inputs, because these are frequently arti-factual in origin.
01_Blum 4/11/07 8:29 AM Page 11
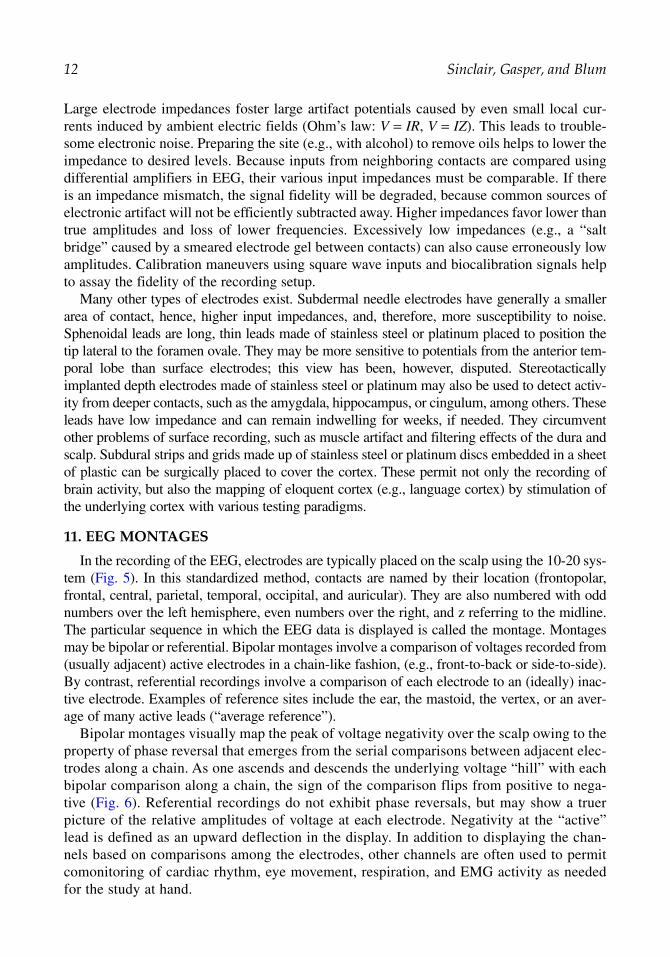
Large electrode impedances foster large artifact potentials caused by even small local cur-rents induced by ambient electric fields (Ohm’s law: V = IR, V = IZ). This leads to trouble-some electronic noise. Preparing the site (e.g., with alcohol) to remove oils helps to lower theimpedance to desired levels. Because inputs from neighboring contacts are compared usingdifferential amplifiers in EEG, their various input impedances must be comparable. If thereis an impedance mismatch, the signal fidelity will be degraded, because common sources ofelectronic artifact will not be efficiently subtracted away. Higher impedances favor lower thantrue amplitudes and loss of lower frequencies. Excessively low impedances (e.g., a “saltbridge” caused by a smeared electrode gel between contacts) can also cause erroneously lowamplitudes. Calibration maneuvers using square wave inputs and biocalibration signals helpto assay the fidelity of the recording setup.
Many other types of electrodes exist. Subdermal needle electrodes have generally a smallerarea of contact, hence, higher input impedances, and, therefore, more susceptibility to noise.Sphenoidal leads are long, thin leads made of stainless steel or platinum placed to position thetip lateral to the foramen ovale. They may be more sensitive to potentials from the anterior tem-poral lobe than surface electrodes; this view has been, however, disputed. Stereotacticallyimplanted depth electrodes made of stainless steel or platinum may also be used to detect activ-ity from deeper contacts, such as the amygdala, hippocampus, or cingulum, among others. Theseleads have low impedance and can remain indwelling for weeks, if needed. They circumventother problems of surface recording, such as muscle artifact and filtering effects of the dura andscalp. Subdural strips and grids made up of stainless steel or platinum discs embedded in a sheetof plastic can be surgically placed to cover the cortex. These permit not only the recording ofbrain activity, but also the mapping of eloquent cortex (e.g., language cortex) by stimulation ofthe underlying cortex with various testing paradigms.
11. EEG MONTAGES
In the recording of the EEG, electrodes are typically placed on the scalp using the 10-20 sys-tem (Fig. 5). In this standardized method, contacts are named by their location (frontopolar,frontal, central, parietal, temporal, occipital, and auricular). They are also numbered with oddnumbers over the left hemisphere, even numbers over the right, and z referring to the midline.The particular sequence in which the EEG data is displayed is called the montage. Montagesmay be bipolar or referential. Bipolar montages involve a comparison of voltages recorded from(usually adjacent) active electrodes in a chain-like fashion, (e.g., front-to-back or side-to-side).By contrast, referential recordings involve a comparison of each electrode to an (ideally) inac-tive electrode. Examples of reference sites include the ear, the mastoid, the vertex, or an aver-age of many active leads (“average reference”).
Bipolar montages visually map the peak of voltage negativity over the scalp owing to theproperty of phase reversal that emerges from the serial comparisons between adjacent elec-trodes along a chain. As one ascends and descends the underlying voltage “hill” with eachbipolar comparison along a chain, the sign of the comparison flips from positive to nega-tive (Fig. 6). Referential recordings do not exhibit phase reversals, but may show a truerpicture of the relative amplitudes of voltage at each electrode. Negativity at the “active”lead is defined as an upward deflection in the display. In addition to displaying the chan-nels based on comparisons among the electrodes, other channels are often used to permitcomonitoring of cardiac rhythm, eye movement, respiration, and EMG activity as neededfor the study at hand.
12 Sinclair, Gasper, and Blum
01_Blum 4/11/07 8:29 AM Page 12

Basic Electronics in Clinical Neurophysiology 13
Fig. 5. The International 10-20 system of electrode placement. This figure depicts an overhead viewof the most commonly used array of standardized electrodes in EEG. Odd numbers refer to the left, evennumbers to the right. Electrodes are named according to location: F, frontal; C, central; P, parietal; T,temporal; Fp, frontopolar; O, occipital; and A, auricular. Sphenoidal leads (Sp) and supplemental temporal (T1, T2) leads are not shown.
Fig. 6. Bipolar EEG recordings and phase reversal. A hypothetical region of scalp negativity is illus-trated topologically, as a voltage “hill” (A). The higher the hill, the greater the negative field potentialat that point along the anterior–posterior axis, with electrode A most anterior, and electrode E mostposterior. The hill peaks at C. In (B), the waveforms derived from bipolar comparisons between adja-cent electrodes are illustrated, as in a bipolar recording. By convention, if contact 1 is more negativethan contact 2, the deflection is upward. Because these comparisons are performed serially along theanterior–posterior axis, the difference between adjacent channels flips polarity as one traverses thepeak of the hill. The flip in polarity leads to the highly visible phase reversal on a bipolar tracing,denoted by the star in (b). The shared contact of the phase reversal maps the voltage peak, electrode Cin this case.
01_Blum 4/11/07 8:29 AM Page 13

12. DIGITAL SIGNAL ANALYSIS
As elsewhere in our lives, the digital revolution has become firmly entrenched within thearena of clinical neurophysiology. Increasingly, our neurophysiological recording systems andour displays of recorded waveforms are based on computers. This affords numerous advan-tages, such as the reformatting of EEG data into different montages, refiltering data, and/orapplying spike and seizure detection systems to accrued data sets. Storage and sharing of datais simpler; no longer are rooms dedicated to the storage of reams of paper tracings.
Computers require that data be digitized. However, the input waveforms that we strive tofaithfully record occur in an analog universe. Analog refers to continuous data with respect totime and with respect to value. In EEG, the scalp voltages we record are generated continuouslyover time and with a continuous range of amplitudes. Digital, on the other hand, refers to theintermittent sampling of data. Measurements are sampled at discrete moments and amplitudesare assigned to nearest discrete values. The degree of fidelity with which the digitally sampleddata resembles the original analog data depends on how finely it is sampled, that is, how manydiscrete steps there are along the time (x) axis and the amplitude (y) axis (Fig. 7).
Analog signals are first amplified, then filtered, then subjected to digital conversion. Theanalog-to-digital converter (ADC) is at the core of the generation of digital signals. The ADCsamples the continuous data and assigns a binary code to represent the voltage at that momentin time. Many modern recorders have a sampling rate of 256-Hz per channel. The totalthroughput refers to the number of channels times the sampling rate. For a 21-channel EEG,this leads to a throughput of 5276 samples/s. One can have a sampling system race throughall of these in sequence, or parallel samplers can analyze each channel singly.
14 Sinclair, Gasper, and Blum
Fig. 7. Analog vs digital. The upper curve depicts an analog signal with variable amplitude overtime. Digitization relies on using discrete intervals along both the x- and y-axes and making samplingmeasurements of the analog signal at discrete time intervals and assigning discrete amplitude values.The ability of a digitized output signal to faithfully resemble its analog input depends on the finenessof these discrete steps (resolution) along these axes. Sampling at greater than twice the Nyquist fre-quency ensures an adequate degree of digital sampling to minimize aliasing.
01_Blum 4/11/07 8:29 AM Page 14

It is important to have an adequate sampling rate to avoid undue distortion of the inputwaveforms. The Nyquist frequency is the highest input frequency component of interest to berecorded. To avoid distortion, the sampling rate should be greater than twice the Nyquist fre-quency. If one samples at less than twice the Nyquist frequency, aliasing will occur. Aliasingrefers to the artifactual creation of low frequencies in ADC, by undersampling high-frequencyinputs. The alias frequency is mathematically defined as the sampling frequency minus theNyquist frequency.
In addition, another means to deter such ADC artifact is to apply a high-frequency filter tothe input data to cut off undesirable high-frequency elements.
The dynamic range of a recording system refers to the range of measurable values, fromhighest to lowest; in EEG, this refers to the recordable voltage range. The dynamic range isthe log10(Vh/Vl). The resolution of a digital recording system depends on the range of record-able values divided by the number of digitally assignable increments. This, in turn, dependson the number of available digital bits in the recording system. With n-bit data, one has 2n possible values; for a 12-bit EEG recording system, this is 212 = 4096 available voltageincrements. This can be regarded as plus or minus 2048 units, 0 to 2047. The availabledynamic range available is log10(2047/1) = 2.8. Obviously, more bits lead to finer resolution.
In an analog system, values at the extremes may be clipped because of inadequacies in therecording or display capacity. Generally, digital systems afford better dynamic range, andmuch less risk of loss of information at the extremes of the recordable range. Although digi-tal recording systems typically have very good resolution and dynamic range, our ability todisplay this data depends on the digital resolution of our monitors. When the monitor’s reso-lution becomes limiting, we can improve our viewing resolution by restricting our analysis toa subset of the data.
As can be seen, digitization of neurophysiological data affords numerous advantages toprevious analog methods. For instance, digitization has improved our EEG analysis by per-mitting switching the viewing montage, permitting the adjustment of filters and sensitivitysettings post hoc, improving the dynamic range and preservation of data at the extremes ofthe recording range, lowering the cost for data storage and data sharing, and facilitating therecall of previous data for comparison. In the arena of long-term video EEG monitoring,digitization has been a tremendous boon. It is now simpler to integrate the video and EEGdata stream, easier to locate events of interest, and simpler to store the data over time.Computerized methods now exist to apply search techniques to automate the detection ofspikes and seizures within a digital data set. Algorithms exist and are being perfected to allowfor frequency analysis of data (Fourier transformation—spectral analysis), current sourcemapping, and real-time seizure detection and even seizure prediction technology that mayone day revolutionize the treatment of epilepsy.
13. ELECTRICAL SAFETY
Electrodiagnostic procedures are extremely safe, however, injuries can occur and mayinclude pain, dermal burns, seizure, and ventricular fibrillation. A current of 1 mA at 60 Hzapplied to dry skin is the threshold for pain sensation. Lethal current injury causing ventric-ular fibrillation exceeds 100 to 300 mA. Be aware of low-resistance pathways between exter-nal current sources and the heart (e.g., indwelling cardiac catheters), because currents lessthan 100 mA can cause serious cardiac arrhythmias under such circumstances. Following afew simple rules will minimize the risk of injury while recording an EEG or EMG.
Basic Electronics in Clinical Neurophysiology 15
01_Blum 4/11/07 8:29 AM Page 15

High-risk populations among those undergoing EEG evaluation include neonates andpatients with intravascular catheters or instruments. Lower risk populations include non-neonates without implanted medical instrumentation and bystanders who are near instrumen-tation, possibly in contact with an electrical device.
The overriding safety issue in recording an EEG is the risk of exposing the patient to cur-rent. The amount of current is the most important predictor of electrical injury. A secondaryconcern, especially with older EEG equipment in which small sparks are generated when thepower switch is activated, is prevention of flammable gas explosion.
To reduce the risk of patient exposure to current, proper grounding must be ensured. Theelectrical circuit in EEG consists of a current provided by the “hot” contact in a wall outlet,which travels through the EEG machine and returns to the outlet’s neutral contact. Excesscurrent can accrue from various sources that escape this circuit (i.e., a short circuit within theinstrument that directs current to the covering of the EEG machine). This potentially danger-ous leaked current can fortunately be shunted to the ground contact, which is the path of low-est resistance. However, should ground failure occur, the leak current may flow preferentiallythrough a low-resistance pathway, which may include the patient.
In intensive care units or surgical operating rooms, multiple machines may often be attachedto a patient and may lead to the use of multiple grounds. A ground loop may be formed if eachof these several grounds has a slightly different potential, allowing excess current to flow fromthe higher resistant ground to the lower resistant ground. This may be hazardous if this groundloop includes a nearby person or the patient. A simple rule to avoid this hazard is to connectthe patient to only one common ground that serves all of the devices in use.
Basic requirements for proper grounding include:
1. EEG equipment should always be connected to a three-pronged wall receptacle, never a two-pronged plug. Three-pronged plugs include a black “hot” connector, a white neutral connector,and a green ground connector. The ground is absent in two-pronged plugs. The black connectorhas AC current at 110 V. The neutral connector is the reference for the “hot” line but is not necessarily at 0 V. The ground is the building ground connection.
2. A working fuse within the machine to break the circuit, should high current travel through theground, alleviating a potential safety risk to the patient.
3. Adequate power outlets for patient-related equipment, typically marked by a green dot, indicat-ing a higher standard of safety.
4. Regular evaluation and testing of equipment. Equipment and plug grounds must be periodicallytested with an ohmmeter, which should show a resistance of less than 0.1 ohms when assessingthe drop in current from cover to ground connector.
5. Ensure that the ground plug is firmly in place in the socket.6. Connect all devices into the same outlet using a grounding bar. This will ensure a common low
resistance ground pathway for all stray currents. In the case of multiple devices in use, placinga ground on the patient may actually increase the danger of electrical shock. Because anotherpurpose of the ground in EEG and EMG is to reduce ambient 60-Hz interference, avoidance ofmultiple grounds will actually improve the quality of the recording.
Excessive current that requires shunting arises typically because of a short circuit withinthe equipment or a leakage current. Leakage currents from stray conductive and stray induc-tive sources mainly arise from the power cable. The cable contains three wires covered byinsulation, which creates a type of capacitor in which currents can flow between wires (from“hot” to the others). Longer cords create greater capacitance, with a larger potential for cur-rent leak (up to 70 µA) into the instrument.
16 Sinclair, Gasper, and Blum
01_Blum 4/11/07 8:29 AM Page 16

Unwanted inductive current is a less significant source of current leak than cable capaci-tance. Inductive currents are generated by the magnetic field surrounding a wire that createscurrent in other wires. This may arise when wires are coiled. Steps to avoid generation ofexcessive currents are:
1. Power cords are rated in capacitance per foot and selected by instrument manufacturers to ensureminimal leakage.
2. Extension cords should never be used. A leakage current produced by adding a 6-foot powerextension cord will range from a minimum of 7 mA to 60 mA.
3. Keep wires from excessive coiling.
SUGGESTED READING
American EEG Society. Guidelines in EEG. J Clin Neurophysiol 1986;3:1–147.American EEG Society. Guidelines for standard electrode position nomenclature. J Clin
Neurophysiol 1991;8:200–202.Hughes JR. EEG in Clinical Practice. Butterworth-Heinemann, Boston, MA, 1994.Laks MM, Berson A. Electrical safety measures for physicians using electromedical equipment. Sem
Neurol 1995;15:311–316.Litt B, Fisher RS. EEG engineering principles. In: Current Practice of Clinical Electroencephalography,
2nd ed. (Daly DD, Pedley TA, eds.) Raven, New York, NY, 1990.Misulis KE. Basic electronics for clinical neurophysiology. J Clin Neurophysiol 1989;6:41–74.Misulis KE, Head TC. Essentials of Clinical Neurophysiology, 3rd edition. Butterworth-Heinemann,
Boston, MA, 2003.Niedermeyer E, Lopes da Silva FH, eds. Electroencephalography: Basic Principles, Clinical Applications
and Related Fields, 3rd ed. Williams and Wilkins, Baltimore, MD, 1993.Seaba P. Electrical safety. Am J EEG Tech 1980;20:1–13.
REVIEW QUESTIONS
1. In a simple circuit with a single resistor, if the applied voltage is 10 V, and the resistance is 5 Ω,what is the current?
2. In a series circuit with two resistive elements, R1 and R2, what is the derived combined resist-ance in the circuit?
3. In a parallel circuit with two resistors, R1 and R2, what is the resultant combined resistance inthe circuit?
4. How does the resistance to current flow attributable to a capacitor (capacitive reactance) relateto the frequency of the AC?
5. In a transformer with a coil (N1) of 20 turns and an applied voltage of 100 V, what will be theresultant voltage in its associated secondary circuit if its coil (N2) has only 5 turns?
6. What is impedance?7. In an RC circuit, what is its derived time constant? What is a time constant?8. Which element in an RC circuit behaves as a low-pass (high-frequency) filter?9. What is the Nyquist frequency? If the Nyquist frequency for EEG is considered to be 100 Hz,
what should the sampling frequency be to avoid aliasing?10. What is a ground loop?
REVIEW ANSWERS
1. Using Ohm’s law, V = IR, the derived current is 2 A. 2. The combined resistance in a series circuit is Rcomb = R1 + R2.3. This is a current divider. The resultant combined resistance is 1/Rcomb = 1/R1 + 1/R2.4. Capacitive reactance is inversely related to the applied frequency of AC.
Basic Electronics in Clinical Neurophysiology 17
01_Blum 4/11/07 8:29 AM Page 17

5. In a transformer, the ratio of the coil number defines the step-down or step-up relationships. In thisinstance, N1/N2 = 20/5 = 4. Therefore, the induced voltage will be 1/4 of the original voltage,or 100 V/4 = 25 V.
6. Impedance is the combined resistances to current flow in a circuit passing AC. It may includenot only resistance from a resistor, but also capacitive and inductive reactances.
7. The time constant, τ, of a circuit with resistance R and capacitance C is defined by: τ = R × C.The time constant, τ, refers to the time needed for a capacitor in an RC circuit to reach 63% (1 – 1/e) of its full charge.
8. The voltage reading across the capacitor in an RC circuit behaves as the high-frequency filter.Adjustment of this element may serve to help filter out higher-frequency artifact, such as EMGactivity in the recording of an EEG.
9. The Nyquist frequency is the highest input frequency that is deemed desirable to detect. If theNyquist frequency is 100 Hz, then the sampling frequency should be at least 200 Hz to avoidaliasing.
10. A ground loop occurs when multiple grounds are applied to a subject because of various electri-cal devices, such as in an intensive care unit setting. If these various grounds are not identical involtage, an electrical pathway can exist that includes the patient, through which stray currentsmay travel, thus, endangering the patient. A common ground can avoid this hazard.
18 Sinclair, Gasper, and Blum
01_Blum 4/11/07 8:29 AM Page 18

2Basic Neurophysiology and the Cortical Basis of EEG
Gregory L. Holmes and Roustem Khazipov
SummaryClinical neurophysiological studies are based on the recording of both spontaneous electrical activity,
as with the EEG, or with stimulated responses, such as evoked potentials. The electrical signaling withinthese neuronal circuits is responsible for both the spontaneous and evoked electrical activity that is rou-tinely measured in the clinical neurophysiology laboratory. This chapter will review some of the basicconcepts of neuronal signaling that are important to the understanding of clinical neurophysiology.
Key Words: Action potential; dipole; ion channel; membrane potential; neurotransmission; paroxysmaldepolarization shift; postsynaptic potential.
1. INTRODUCTION
The human brain contains more than 100 billion neurons, the majority of which have theability to influence many other neurons. It is through this communication process, termed sig-naling, that electrical activity is generated, resulting in the human EEG.
The cells of the nervous system can be divided into two major categories: neurons and neu-roglial cells. Although neurons come in many shapes and sizes, the major components ofmost neurons are the dendrites, which receive information; the cell body, which processes andintegrates the information; and the axon, which conducts signals to other brain regions.Neuroglia, often referred to as glia, do not participate directly in electrical signaling, althoughthey are critical in maintaining support of the neurons. The three major categories of glialcells are the astrocytes, which maintain the correct metabolic milieu for neuronal signaling;oligodendrocytes, which myelinate neurons; and microglia, which serve as the brain’smacrophages and assist in brain recovery from injury.
Neurons are organized into neuronal ensembles of circuits that process specific kinds ofinformation. Neurons that carry information into the circuit are termed afferent neurons,whereas neurons signaling information away from the circuit are referred to as efferent neu-rons. Nerve cells that only participate in the local aspects of a circuit are called interneurons.Processing circuits are combined to form systems that server broader function, such as mem-ory, vision, or hearing.
Clinical neurophysiological studies are based on the recording of both spontaneous electri-cal activity, as with the EEG, or with stimulated responses, such as evoked potentials. The elec-trical signaling within these neuronal circuits is responsible for both the spontaneous andevoked electrical activity that is routinely measured in the clinical neurophysiology laboratory.
From: The Clinical Neurophysiology PrimerEdited by: A. S. Blum and S. B. Rutkove © Humana Press Inc., Totowa, NJ
19
02_Holmes 4/11/07 8:51 AM Page 19

This chapter will review some of the basic concepts of neuronal signaling that are importantto the understanding of clinical neurophysiology.
2. BASIS OF BRAIN ELECTRICAL ACTIVITY
2.1. Membrane Polarity
All neurons and glia have lipid bilayer membranes separating the delicate internalmachinery of the cell from the external environment. The neuronal membrane is an excel-lent insulator and separates different concentration of ions inside the cell from those outsidethe cell. The activity of ion channels is fundamental to signaling in the nervous system. Themovement of ions that carry electrical charge through ion channels results in voltagechanges across the membrane.
Electrical potentials are generated across the membranes of neurons because there are dif-ferences in the concentration of specific ions across the membrane, and the membrane isselectively permeable to ion flow. Movement of ions across membranes occurs through ionchannels, which are proteins that transverse the neuronal membrane and allow certain ions tocross in the direction of their concentration gradient. Whereas Na+ and Cl
_are more concen-
trated outside the cell, K+ and organic anions, consisting of amino acids and proteins, aremore concentrated inside the cell. Na+ and Cl
_ions, therefore, tend to flow into the cell along
this concentration gradient, whereas K+ ions tend to flow outward. Because of their size, largeorganic anions are unable to move out of the intracellular compartment.
Ion flow is not only determined by ionic concentration gradients, but also is dependent onthe selective permeability of ion channels (often referred to as the channel’s conductance),as well as electrical forces that arise from the membrane potential. Ultimately, in the restingstate, ion flow ceases when concentration dependent forces are offset by opposing electricalforces based on the voltage across the membrane, the resting membrane potential. Becauseof the selective permeability of ion channels and the unequal distribution of anions andcations inside and outside of the neuron, there arises a potential difference across the neu-ronal membrane. The charge separation gives rise to a difference of electrical potential, orvoltage, across the membrane, called the membrane potential. The membrane potential, Vm,is defined as
Vm = Vin – Vout
where Vin is the potential on the inside of the cell and Vout the potential on the outside. At rest,the membrane potential is called the resting membrane potential. The outside of the cell is byconvention defined as zero and the resting membrane potential is, therefore, equal to the volt-age inside the cell. In neurons, the usual range is –60 mV to –70 mV.
Ions are, thus, subject to two forces driving them across the membrane: a chemical driv-ing force that depends on the concentration gradient across the membrane and an electricaldriving force that depends on the electrical potential across the membrane. Ions flow fromhigh-concentration areas to low-concentration areas (chemical driving force); ions flow toareas of opposite charge, like charges repel, unlike charges attract (electrical driving force).The net electrochemical driving force is determined by the electrical potential differenceacross the membrane and the concentration gradient of the ions selective for the channel.
To illustrate these physiological features, the flow of K+ ions will be considered (Fig. 1).Because K+ ions are highly concentrated inside the cell, K+ ions tend to diffuse from inside tooutside the cell down their chemical concentration gradient. Because of this ionic flow, the
20 Holmes and Khazipov
02_Holmes 4/11/07 8:51 AM Page 20

outside of the membrane accumulates a slight positive charge and the inside a slight negativecharge. As K+ ions accumulate outside the cell, there grows a counteracting electrostatic forceopposing further K+ efflux, because the positive charges repel each other. Once K+ diffusionhas proceeded to a certain point, a potential develops across the membrane at which the elec-trical force driving K+ ions into the cell exactly balances the chemical force driving K+ ionsout of the cell, that is, the outward movement of K+ (driven by its concentration gradient) isequal to the inward movement of K+ (driven by the electrical potential difference across themembrane). This potential is called the potassium equilibrium potential, EK.
The equilibrium potential for any ion X can be calculated from the Nernst equation:
EX = RT/zF × ln([X]o/[X]i)
where R is the gas constant, T the temperature, z the valence of the ion, F the Faraday con-stant, and [X] the concentrations of the ion inside (i) and outside (o) of the cell. Because RT/Fequals 25 mV at 25°C, z is +1 for K+, and the concentrations of K+ outside and inside theaxon are 20 mM and 400 mM, respectively, the Nernst equation for K+ in the squid axon canbe rewritten as:
EK = 58
1
20
400log
[ ]
[ ]
mVmV≈ −75
Basic Neurophysiology and the Cortical Basis of EEG 21
Fig. 1. K+ channel. In neurons, K+ has a higher concentration inside neurons than outside (A).Because of the concentration differences, K+ diffuses from inside the cell to the outside. With K+ out-flow, the inside of the cell becomes even more negative, because the K+ ion is carrying a positivecharge. At some point, a steady state is reached, in which the electrical and chemical driving forcesare equal and opposite, and there is a balance between K+ entering and leaving the cell (B). Modifiedfrom Kandel et al., 2000, with permission.
02_Holmes 4/11/07 8:51 AM Page 21
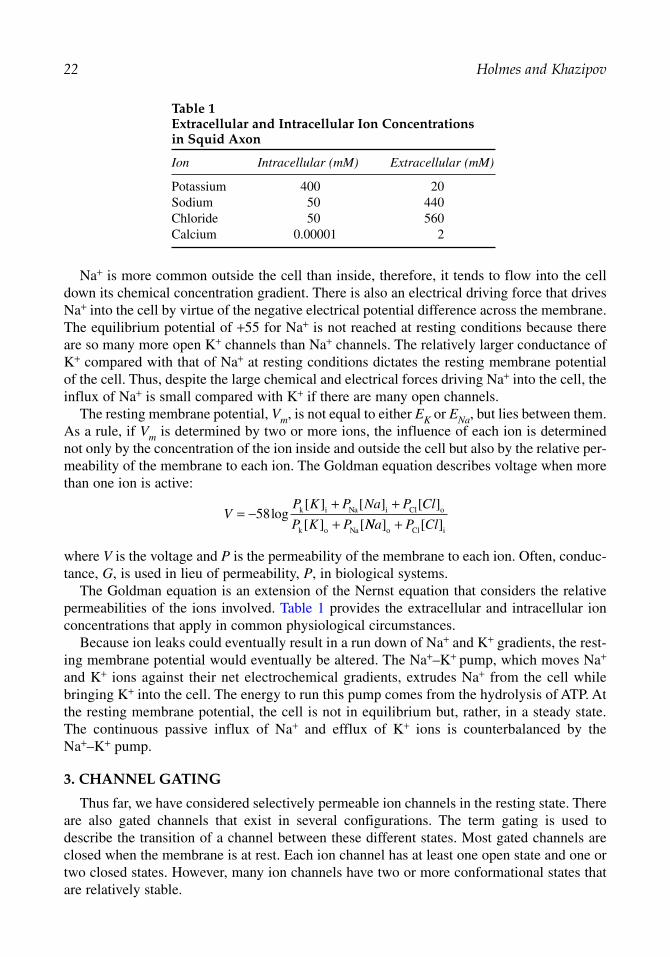
Na+ is more common outside the cell than inside, therefore, it tends to flow into the celldown its chemical concentration gradient. There is also an electrical driving force that drivesNa+ into the cell by virtue of the negative electrical potential difference across the membrane.The equilibrium potential of +55 for Na+ is not reached at resting conditions because thereare so many more open K+ channels than Na+ channels. The relatively larger conductance ofK+ compared with that of Na+ at resting conditions dictates the resting membrane potentialof the cell. Thus, despite the large chemical and electrical forces driving Na+ into the cell, theinflux of Na+ is small compared with K+ if there are many open channels.
The resting membrane potential, Vm, is not equal to either EK or ENa, but lies between them.As a rule, if Vm is determined by two or more ions, the influence of each ion is determinednot only by the concentration of the ion inside and outside the cell but also by the relative per-meability of the membrane to each ion. The Goldman equation describes voltage when morethan one ion is active:
where V is the voltage and P is the permeability of the membrane to each ion. Often, conduc-tance, G, is used in lieu of permeability, P, in biological systems.
The Goldman equation is an extension of the Nernst equation that considers the relativepermeabilities of the ions involved. Table 1 provides the extracellular and intracellular ionconcentrations that apply in common physiological circumstances.
Because ion leaks could eventually result in a run down of Na+ and K+ gradients, the rest-ing membrane potential would eventually be altered. The Na+–K+ pump, which moves Na+
and K+ ions against their net electrochemical gradients, extrudes Na+ from the cell whilebringing K+ into the cell. The energy to run this pump comes from the hydrolysis of ATP. Atthe resting membrane potential, the cell is not in equilibrium but, rather, in a steady state.The continuous passive influx of Na+ and efflux of K+ ions is counterbalanced by theNa+–K+ pump.
3. CHANNEL GATING
Thus far, we have considered selectively permeable ion channels in the resting state. Thereare also gated channels that exist in several configurations. The term gating is used todescribe the transition of a channel between these different states. Most gated channels areclosed when the membrane is at rest. Each ion channel has at least one open state and one ortwo closed states. However, many ion channels have two or more conformational states thatare relatively stable.
VP K P Na P Cl
P K P= −
+ ++
58log[ ] [ ] [ ]
[ ] [k i Na i Cl o
k o Na NNa P Cl] [ ]o Cl i+
22 Holmes and Khazipov
Table 1Extracellular and Intracellular Ion Concentrations in Squid Axon
Ion Intracellular (mM) Extracellular (mM)
Potassium 400 20Sodium 50 440Chloride 50 560Calcium 0.00001 2
02_Holmes 4/11/07 8:51 AM Page 22

Three regulatory mechanisms determine whether a channel remains open. In voltage-gatedchannels, the voltage across the membrane determines whether a conformational change inthe membrane occurs that may open the channel. In ligand-mediated channels, the ligandbinds to the channel, either at an extracellular site, as with neurotransmitters, such as gluta-mate or γ-aminobutyric acid (GABA), or at an intracellular site, as with certain cytoplas-mic compounds, such as Ca2+ and nucleotides. Ligand binding causes a conformationalchange that causes the channel to open. Finally, ligands can also activate cellular signal-ing cascades that can covalently modify a channel through phosphorylation (see the dis-cussion of metabotropic receptors in Subheading 7.). This covalent modification alsoinfluences channel behavior.
4. ACTION POTENTIAL
For a neuron to transmit information, it must generate an electrical current, termed anaction potential. Development of the action potential requires an electrical or chemical stim-ulus, which alters ion flow into the cell.
The electrical current that flows into and out of the cell is carried by ions, both positivelycharged (cations) and negatively charged (anions). The direction of current flow is conven-tionally defined as the direction of net movement of positive charge. Cations move in thedirection of the electrical current, whereas anions move in the opposite direction.Depending on the exact nature of transmembrane ionic flow, the charge separation acrossthe resting membrane is disturbed, altering the polarity of the membrane. A reduction ofcharge separation results in a less negative membrane potential and is termed depolariza-tion, whereas an increase in charge separation leading to a more negative membrane potentialis called hyperpolarization.
When the membrane potential reaches a threshold (~–55 to –60 mV), the voltage-gatedNa+ channels open rapidly. The influx of Na+ makes the interior of the cell more positive thanbefore. This sudden marked increase in depolarization causes still more voltage-gated Na+
channels to open, resulting in further acceleration of the depolarization. This positive feedforward cycle initiates an action potential and is responsible for its all-or-none character.Once initiated, the action potential behaves independently of its stimulus. Because the Na+
conductance becomes so transiently large relative to other ionic conductances, the membranepotential approaches the equilibrium potential for Na+ (+60 mV) during an action potential.Depolarization during the action potential is very large, but very brief, lasting only 1 ms.These features of the action potential allow neuronal signaling with high fidelity at a veryhigh rate (up to hundreds of action potentials per second). Termination of the action potentialis caused by rapid inactivation of Na+ channels and delayed opening of voltage-gated K+
channels. The delayed increase in K+ efflux, combined with a decrease in Na+ influx, pro-duces a net efflux of positive charge from the cell, which continues until the cell has repolar-ized. Indeed, after an action potential, there is a brief hyperpolarization, during which timethe cell is more refractory to immediate depolarization, before reestablishing the restingmembrane voltage. Figure 2 demonstrates the sequential opening of voltage-gated Na+ andK+ channels during the action potential.
During the action potential, Na+ channels undergo transitions among three differentstates: resting, activated, or inactivated. On depolarization, the channel goes from the rest-ing (closed) state to the activated (open) state (Fig. 3). If the depolarization is brief, thechannels go directly back to the resting state on repolarization. If the depolarization is
Basic Neurophysiology and the Cortical Basis of EEG 23
02_Holmes 4/11/07 8:51 AM Page 23

maintained, the channels go from the open state to the inactivated closed state. Once thechannel is inactivated, it cannot be opened by further depolarization. Channel inactivationcan be reversed only by repolarization of the membrane to its negative resting potential,which allows the channel to switch from the inactivated to the resting state. Each Na+
channel has two kinds of gates that must operate in conjunction for the channel to conductNa+ ions. An activation gate closes when the membrane is at its negative resting potentialand is rapidly opened by depolarization; an inactivation gate is open at the resting poten-tial and closes slowly in response to depolarization. The channel conducts ions only forthe brief period during a depolarization when both gates are open. Repolarization reversesthe two processes; closing the activation gate rapidly and opening the inactivation gatemore slowly. After the channel has returned to the resting state, it can again be reactivatedby further depolarization.
After an action potential, the Na+ channels are inactivated and the K+ channels are acti-vated for a brief period of time. These transitory events make it more difficult for anotheraction potential to be generated quickly. This refractory period limits the number of action
24 Holmes and Khazipov
Fig. 2. Openings of channels during the action potential. The influx of Na+ makes the interior ofthe cell more positive than before, increasing the degree of depolarization, which causes still morevoltage-gated Na+ channels to open, resulting in further acceleration of the depolarization. The posi-tive feedback cycle initiates the action potential and is responsible for its all-or-none character.However, with the depolarization there is a greater electrical driving force on the K+ ions and K+ flowoutward. The increase in K+ efflux combined with a decrease in Na+ influx results in an efflux of pos-itive charge from the cell, which continues until the cell has repolarized to its resting membrane poten-tial. Modified from Kandel et al., 2000 with permission.
02_Holmes 4/11/07 8:51 AM Page 24

potentials that a given nerve cell can produce per unit time. This phenomenon also explainswhy action potentials do not reverberate up and down the neuronal membrane.
Very small depolarizations do not trigger an action potential because they do not open a largeenough number of Na+ channels and increase the driving force on K+ ions, favoring repolariza-tion, as the depolarized membrane potential is further from EK. Action potential threshold occurswhen the inward Na+ current just exceeds K+ outflow. The net inward current produces an activedepolarization, which initiates further Na+ channel opening and generation of the action potential.
Extracellular electrodes can detect action potentials from individual neurons only if thesize of the electrode is comparable to the size of the cell (tens of micrometers) and if theelectrode is very close to the cell soma, where the action potential is generated. The ampli-tude of the extracellularly recorded action potential is small, on the order of tens of micro-volts, and the duration is less than a millisecond. With conventional EEG electrodes, theaction potentials from individual neurons are too small to be detected. However, whenmany neurons fire action potentials simultaneously, which can occur, for instance, inepileptic patients, their summated action potentials can be detected in EEG recordings as a“population spike.”
Basic Neurophysiology and the Cortical Basis of EEG 25
Fig. 3. Voltage-gated Na+ channel. In the resting condition (A) the activation gate (black bar) isclosed and the inactivation gate (ball and chain) is open. No Na+ flows because of the closed activa-tion gate. With depolarization of the membrane, there is a conformational change of the channel andthe activation gate opens (B). Na+ flow then occurs. This is followed by inactivation by closure of theinactivation gate (C), prohibiting the further flow of Na+ ions. With repolarization of the membrane,the inactivation gate opens and the activation gate closes and the channel is ready for another cycle(A). Modified from Kandel et al., 2000, with permission.
02_Holmes 4/11/07 8:51 AM Page 25
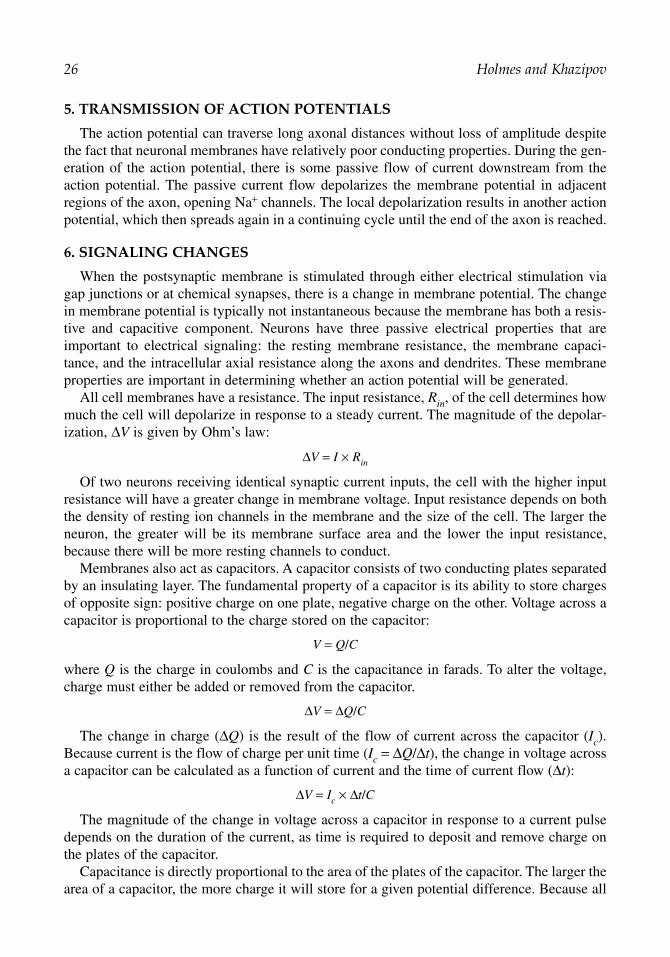
5. TRANSMISSION OF ACTION POTENTIALS
The action potential can traverse long axonal distances without loss of amplitude despitethe fact that neuronal membranes have relatively poor conducting properties. During the gen-eration of the action potential, there is some passive flow of current downstream from theaction potential. The passive current flow depolarizes the membrane potential in adjacentregions of the axon, opening Na+ channels. The local depolarization results in another actionpotential, which then spreads again in a continuing cycle until the end of the axon is reached.
6. SIGNALING CHANGES
When the postsynaptic membrane is stimulated through either electrical stimulation viagap junctions or at chemical synapses, there is a change in membrane potential. The changein membrane potential is typically not instantaneous because the membrane has both a resis-tive and capacitive component. Neurons have three passive electrical properties that areimportant to electrical signaling: the resting membrane resistance, the membrane capaci-tance, and the intracellular axial resistance along the axons and dendrites. These membraneproperties are important in determining whether an action potential will be generated.
All cell membranes have a resistance. The input resistance, Rin, of the cell determines howmuch the cell will depolarize in response to a steady current. The magnitude of the depolar-ization, ∆V is given by Ohm’s law:
∆V = I × Rin
Of two neurons receiving identical synaptic current inputs, the cell with the higher inputresistance will have a greater change in membrane voltage. Input resistance depends on boththe density of resting ion channels in the membrane and the size of the cell. The larger theneuron, the greater will be its membrane surface area and the lower the input resistance,because there will be more resting channels to conduct.
Membranes also act as capacitors. A capacitor consists of two conducting plates separatedby an insulating layer. The fundamental property of a capacitor is its ability to store chargesof opposite sign: positive charge on one plate, negative charge on the other. Voltage across acapacitor is proportional to the charge stored on the capacitor:
V = Q/C
where Q is the charge in coulombs and C is the capacitance in farads. To alter the voltage,charge must either be added or removed from the capacitor.
∆V = ∆Q/C
The change in charge (∆Q) is the result of the flow of current across the capacitor (Ic).Because current is the flow of charge per unit time (Ic = ∆Q/∆t), the change in voltage acrossa capacitor can be calculated as a function of current and the time of current flow (∆t):
∆V = Ic × ∆t/C
The magnitude of the change in voltage across a capacitor in response to a current pulsedepends on the duration of the current, as time is required to deposit and remove charge onthe plates of the capacitor.
Capacitance is directly proportional to the area of the plates of the capacitor. The larger thearea of a capacitor, the more charge it will store for a given potential difference. Because all
26 Holmes and Khazipov
02_Holmes 4/11/07 8:51 AM Page 26

biological membranes are composed of lipid bilayers with similar insulating properties,membrane capacitance increases with the size of the cell. More charge, and, therefore, cur-rent, is required to produce the same change in membrane potential in a larger neuron than ina smaller one. The capacitance of the membrane has the effect of reducing the rate at whichthe membrane potential changes in response to a current pulse. If the membrane had onlyresistive properties, a step pulse of outward current passed across it would change the mem-brane potential instantaneously. Biological membranes have both capacitive and resistiveproperties in parallel.
7. CELL-TO-CELL COMMUNICATION
Through either neurotransmitter release at chemical synapses or current flow through gapjunctions, ligand-gated or voltage-gated channels open and elicit postsynaptic potentials.Postsynaptic potentials alter the probability that an action potential will be produced in thepostsynaptic cell. If there is depolarization of the membrane, the potential is termed an exci-tatory postsynaptic potentials (EPSP), whereas, if there is hyperpolarization, the potential iscalled an inhibitory postsynaptic potential (IPSP). EPSPs bring the membrane potentialcloser to threshold for action potential generation, whereas IPSPs keep the membrane poten-tial more negative than the threshold potential. In chemical synapses, whether the event is anEPSP or IPSP depends on the neurotransmitter released and the type of postsynaptic recep-tor activated. In the cerebral cortex, approx 90% of neurons (principal neurons) synthesizeand release glutamate, the principal CNS excitatory neurotransmitter. The remaining neu-ronal populations (interneurons) release GABA, the principal inhibitory neurotransmitter ofthe cortex.
Direct electrical transmission from one cell to another occurs through gap junctions. Gapjunctions consist of hexameric complexes formed by the close juxtaposition of pores consist-ing of proteins called connexons that span the neuronal membrane. The pore of a gap junc-tion is larger than the pores of voltage-gated ion channels and can, therefore, transfer largersubstances between cells, including intracellular metabolites. Electrical transmission acrossgap junctions occurs rapidly because passive current flow across the gap junction is virtuallyinstantaneous. Gap junctions seem to have an important role in the synchronization of neu-ron firing, particularly in interneuronal networks.
Chemical synapses have a wider spacing between cells, termed the synaptic cleft, andoperate through release of neurotransmitter stored in vesicles. The neurotransmitter diffusesfrom the presynaptic membrane to the postsynaptic membrane. Neurotransmitter releaseoccurs when an action potential reaches the presynaptic terminal and initiates the opening ofvoltage-gated Ca2+ channels. This permits a rapid influx of Ca2+ into the presynaptic termi-nal. Elevation of intracellular Ca2+ causes synaptic vesicles to fuse with the plasma mem-brane of the presynaptic neuron. There are a number of calcium-binding proteins thatparticipate in the cascade of events that lead to neurotransmitter release. The fusion of thevesicular and neuronal membranes allows release of the neurotransmitter. Figure 4 illustratesthe process of neurotransmitter release.
Excitatory synaptic transmission is mediated by glutamate acting on target postsynapticneurons via three types of ionotropic receptors, named after their selective agonists (α-amino-3-hydroxy-5-methylisoxazole-4-proprionic acid [AMPA], kainic acid [KA], and N-methyl-D-aspartate [NMDA]). Although all types of glutamate receptors respond to glutamate, they haveindividual characteristics. The AMPA receptor responds rapidly to glutamate with opening of
Basic Neurophysiology and the Cortical Basis of EEG 27
02_Holmes 4/11/07 8:51 AM Page 27

channels permeable to Na+ and K+, resulting in depolarization. One synapse contains tens ofAMPA receptors on the postsynaptic membrane, and current summation leads to an EPSP ofapprox 1 mV. As a result, simultaneous activation of several excitatory synapses is necessaryto sufficiently activate a postsynaptic neuron to action potential threshold. Kainate receptorsare similar to AMPA receptors but have slower kinetics. The third type of glutamateionotropic receptor—the NMDA receptor—may not directly participate in information processing but seems to play a critical role in synaptic plasticity. The NMDA channel hascharacteristics of both a ligand-activated and voltage-sensitive channel. At resting potential,Mg2+ sits in the channel, blocking the flow of ions. Only with depolarization of the membraneis Mg2+ displaced and Na+ and Ca2+ ions able to cross the channel. The high permeability ofthe NMDA receptor to Ca2+ underlies its role in synaptic plasticity, such as long-term poten-tiation of synaptic strength, which is hypothesized to participate in learning and memory.
GABA is the principal inhibitory transmitter of the brain. Inhibitory synapses made byinterneurons and using GABA as their transmitter use two types of receptors, GABAA andGABAB receptors. GABAA receptors are ligand-gated ion channels, whereas GABABreceptors are metabotropic receptors (see next paragraph). GABAA receptors are inhibitorybecause their associated ion channels are permeable to Cl
_. Because the reversal potential
for Cl_ is more negative than the threshold for neuronal firing, Cl_
flow hinders action
28 Holmes and Khazipov
Fig. 4. Synaptic neurotransmission. An action potential travels down the axon until it reaches thesynapse. The depolarization causes voltage-gated Ca2+ channels to open. The influx of Ca2+ results inhigh concentrations of Ca2+ near the active zone (A). This triggers fusion of vesicles with neurotrans-mitter to the presynaptic cell membrane and emptying of the vesicles into the synaptic cleft (B). Theneurotransmitter crosses to the postsynaptic membrane and results in depolarization of the membraneif it is an excitatory neurotransmitter. With glutamate release, there is binding of the ligand to post-synaptic receptors (AMPA, KA, or NMDA) with subsequent inflow of Na+ ions. Modified fromKandel et al., 2000 with permission.
02_Holmes 4/11/07 8:51 AM Page 28

potential generation. Activation of GABAB receptors results in opening of K+ channelsthat also inhibits the postsynaptic cell. In the spinal cord, GABA and glycine act asinhibitory transmitters.
Metabotropic receptors differ from ionotropic receptors in that they affect ion channelsvia the activation of G proteins. All metabotropic receptors are part of a superfamily of Gprotein-coupled receptors. In certain cases, the activation of G proteins by metabotropicreceptors allows binding of activated G protein subunits directly to ion channels (this mech-anism, for instance, operates in GABAB receptor-mediated opening of K+ channels). In othercases, metabotropic receptors can be coupled to ionic channels via second messengers, suchas cAMP or cGMP. Metabotropic receptors can also couple to intracellular effectorenzymes. Activation of protein kinases can then phosphorylate ion channels or other pro-teins closely associated with ion channels, thereby altering channel function.
There are five biogenic amine neurotransmitters: three catecholamines, norepinephrine,epinephrine, and dopamine; and histamine and serotonin. Dopamine plays a role in controlof body movements, and norepinephrine and serotonin in the modulation of sleep and wake-fulness. The role of epinephrine and serotonin is less clear.
Acetylcholine is concentrated in two major CNS loci, the forebrain nuclear complex andthe cholinergic nuclei of the brainstem tegmentum. Although not yet fully understood, it isknown that acetylcholine is in involved in pain and chemosensory pathways as well as mem-ory. Interestingly, autosomal dominant nocturnal frontal lobe epilepsy has been linked tochromosome 20q13.2 and a mutation in the gene CHRNA4 encoding the α4-subunit of a neu-ronal nicotinic acetylcholine receptor. Nicotinic cholinoreceptors are enriched in interneuronsand deficiency in the excitation of these inhibitory cells possibly underlies the enhancedexcitability thought to be operant in epilepsy.
8. PHYSIOLOGICAL BASIS OF THE EEG
The EEG represents a set of field potentials recorded by multiple electrodes on the surfaceof the scalp. The electrical activity of the EEG is an attenuated measure of the extracellularcurrent flow from the summated activity of many neurons. The surface EEG predominatelyreflects the activity of cortical neurons close to the EEG electrodes. Deeper structures, suchas the hippocampus, thalamus, or brainstem, do not contribute directly to the surface EEG.However, transmission of electrical impulses from distant sites has substantial effects on thesurface EEG. For example, thalamocortical connections are critical in the synchronization ofelectrical activity, such as sleep spindles. Oscillatory EEG patterns arise because of pacemaker cells, in which membrane voltage fluctuates spontaneously, or because of thereciprocal interaction of excitatory and inhibitory neurons in circuit loops. The human EEGshows activity over the range of 1 to 30 Hz, with amplitudes in the range of 20 to 300 µV.
The waveforms recorded by the surface electrodes depend on the orientation and distanceof the electrical source with respect to the recording electrode. To understand how the EEGis obtained, it is useful to examine a single pyramidal neuron situated in layer 5 of the cor-tex, with its apical dendritic arbor above, although it is clear that EEG activity derives fromthousands of such neurons functioning within networks.
Figure 5 shows such a single neuron with current flowing into the dendrite at the site of gen-eration of an EPSP, creating a current sink. Current flow must complete a loop and, therefore,this generates a source somewhere along the dendrites or cell body. The size of the voltagechange created by the EPSP is predicted by Ohm’s law, V = IR. The Rm (membrane resistance)
Basic Neurophysiology and the Cortical Basis of EEG 29
02_Holmes 4/11/07 8:51 AM Page 29

is much larger than the extracellular fluid and, therefore, the corresponding voltage recordedby an intracellular electrode is larger, and opposite in polarity to an extracellular electrodepositioned near the current sink. At the site of generation of an EPSP, the extracellular elec-trode detects current (positive ions) flowing away from the electrode into the cytoplasm as anegative voltage change, whereas the intracellular electrode detects a positive change in voltage caused by the influx of Na+ ions. An extracellular electrode near the source has anopposite deflection. The direction of voltage change is determined by location in regards to thesink and source. In Fig. 5, note the differences in pen deflection depending on whether the extracellular electrode is near the source or sink.
If instead of an apical (layer 2/3) EPSP, we examine the instance of a basal IPSP, close tothe soma of such a pyramidal neuron, the current flow loops and derived extracellular andintracellular recordings turn out to be identical to those described above for the superficialEPSP. In both cases (a superficial EPSP or a basal IPSP), a dipole is created with separationof charge oriented vertically in the cortex, with extracellular negativity in more superficiallaminae, and extracellular positivity in deeper laminae.
Now consider how these extracellular field potentials will behave when recorded from thescalp. It is fortunate that the cortex is organized as a sheet just under the scalp, with an
30 Holmes and Khazipov
Fig. 5. Current flow in a cortical neuron. See text. Modified from Kandel et al., 2000 with permission.
02_Holmes 4/11/07 8:51 AM Page 30

intrinsic columnar organization. It is these pivotal features that afford our ability to obtain auseful EEG signal. The highly organized columns of pyramidal neurons are arranged just so,with cell bodies in deeper laminae, and dendritic arbors extending upward to laminae that aremore superficial. Excitatory afferent fibers innervate the superficial layer 2/3 dendrites,whereas inhibitory contacts favor the deeper cell bodies below. When such EPSPs are generated because of the coordinated excitation of numerous afferent inputs into layer 2/3dendrites, broad regions of the cortex coordinately generate transient dipoles that lead tomeasurable extracellular voltage negativity, as recorded by scalp electrodes.
Figure 6 illustrates these anatomic and physiological properties. In Fig. 6, there are afferentinputs into either the apical dendrites (A) or cell body (B). In both cases, the afferent stimulilead to depolarization (sink) with current flow into the cell body. This results in negativityextracellularly. The current flow in A results in a source in the apical dendrites, whereas, in B,the source is located at the soma. The examples thereby lead to two vertically oriented dipolesof opposing polarity. Surface EEG electrodes will detect the extracellular electrical fields generated closer to the cortical surface (i.e., the superficial laminae), and there will be lessinfluence from activity occurring at the cell body. Therefore, the deflection of the pen is oppo-site in the two conditions. Again, as stated above, a deep IPSP will generate a similar scalpelectrical field as will a superficial EPSP—both lead to scalp negativity.
Because of these geometric reasons, only vertically oriented dipoles are detectable withscalp electrodes. Thus, only those portions of the underlying cortical sheet that are parallel tothe scalp are detectable with EEG electrodes. Portions of the cortex that run down the sulci,oriented orthogonal to the scalp, generate radially oriented dipoles, which are not well seenby scalp EEG technique. Magnetoencephalography may be able to detect such radial dipoleswith much greater facility, however.
Basic Neurophysiology and the Cortical Basis of EEG 31
Fig. 6. Polarity of the surface EEG depends on the location of the synaptic activity within thecortex. See text. Modified from Kandel et al., 2000 with permission.
02_Holmes 4/11/07 8:51 AM Page 31

It follows that EEG detects the summed extracellular electrical field potentials from aswath of underlying cortex. It has been estimated that each EEG electrode “sees” the summedactivity of roughly 6 cm2 of underlying cortex. We obtain cogent signals because there is asignificant amount of synchrony underlying the behavior of thousands of cortical neurons.This synchrony may be physiological, as seen in the alpha rhythm over the posterior chan-nels. However, when the cortex becomes excessively synchronized, we may detect patholog-ical EEG morphologies, termed spikes and sharp waves.
Such epileptiform features represent the summed activity of numerous rapidly firing neu-rons, which have been depolarized to threshold in a coordinated and excessively synchro-nized fashion. A wave of cortical excitation, termed the paroxysmal depolarization shift(PDS) is thought to be responsible for this broad and synchronous cortical excitation. ThePDS is sufficiently strong to bring a large collection of neurons synchronously to threshold,generating a rapid and synchronized bursting of action potentials that “ride” atop the moresustained PDS potential. It is thought that PDS waves are followed by strong wavesof hyperpolarization, perhaps recruited by inhibitory interneurons in the involved circuits.These pathological waves of cortical excitation and subsequent inhibition affecting broadregions of excessively synchronized cortex are thought to underlie the spikes, sharp waves,and sharp and slow wave complexes we recognize as pathological correlates in routineEEG interpretation.
REVIEW QUESTIONS
1. What is responsible for voltage potentials across neuronal membranes?2. What forces govern ionic flow through neuronal channels?3. Which ion is most important for determining the resting membrane potential? Why?4. What are the two main mechanisms that permit gating of channel opening?5. What is the main channel that, in a feed-forward fashion, leads to the rapid depolarization intrin-
sic to the action potential? Which ion facilitates repolarization?6. As neuronal size increases, does depolarization require more or less current flow across the
membrane?7. What are the two types of subthreshold changes to membrane voltage that occur secondary to
afferent input?8. What are the three main types of glutamate receptors? How are they defined and how do they
differ?9. What are the main geometric and physiological properties of the cortex that permit the record-
ing of the EEG signal?10. What is the term for the wave of cortical depolarization that can support rapid and excessively
synchronized (pathological) spiking of large collections of neurons?
REVIEW ANSWERS
1. Different concentrations of ionic species across the neuronal membrane and differential perme-ability to ionic flow across the membrane are the determinants of the membrane potential. TheGoldmann equation represents this relationship mathematically.
2. Two forces govern ionic flow across channels, a chemical driving force defined by concentra-tion gradients, and an electrical driving force determined by the membrane potential.
3. The resting membrane potential is principally influenced by the reversal potential for K+. It hasthe highest permeability at resting conditions and, therefore, contributes the most in theGoldmann equation to the determination of the resting membrane potential.
4. Ligand-gated and voltage-gated channels represent two mechanisms for controlling the openingof gated channels.
32 Holmes and Khazipov
02_Holmes 4/11/07 8:51 AM Page 32

5. The voltage-gated Na+ channel is the principal ionic conductance that underlies the upstroke ofthe action potential. The K+ ion facilitates repolarization.
6. As neuronal size grows, more current is required to achieve a similar level of depolarization,because the larger neuron has larger membrane surface area, which leads to higher capacitance.
7. The two main types of subthreshold stimuli are EPSPs and IPSPs.8. AMPA, KA, and NMDA receptors are three distinct subtypes of glutamate receptors. AMPA and
KA receptors are ligand-gated ionic channels, permeable to Na+ and K+. KA receptors haveslower kinetics and differential binding properties with specific agonists. NMDA receptors haveboth ionotropic and metabotropic properties and are important in synaptic plasticity. NMDAreceptors also affects Ca2+ translocation across the membrane.
9. The two main features of the cortex that permit EEG acquisition are its sheet-like organizationparallel to the scalp (in large part), as well as its columnar organization, which leads to the gen-eration of orthogonal electrical dipoles in the cortex, detectable by scalp EEG electrodes.
10. The paroxysmal depolarization shift is the term for the pathological wave of cortical excitationthat leads to rapid and synchronized regional spiking detectable by EEG as epileptiform activity.
SUGGESTED READING
Armstrong CM, Bezanilla F. Inactivation of the sodium channel II. Gating current experiments. J GenPhysiol 1977;70:567–590.
Catterall WA. Structure and function of voltage-sensitive ion channels. Science 1988;242:50–61.Friedman LK, Sperber EF, Moshe SL, Bennett MV, Zukin RS. Developmental regulation of gluta-
mate and GABAA receptor gene expression in rat hippocampus following kainite-induced statusepilepticus. Dev Neurosci 1997;19:529–542.
Furshpan EJ, Potter DD. Transmission at the giant motor synapses of the crayfish. J Physiol1959;145:289–325.
Goldman DE. Potential, impedance, and rectification in membranes. J Gen Physiol 1943;27:37–60.Hodgkin AL, Huxley AF. A quantitative description of membrane current and its application to
conduction and excitation in nerve. J Physiol 1952;117:500–544.Hodgkin AL, Katz B. The effect of sodium ions on the electrical activity of the giant axon of the
squid. J Physiol 1949;108:37–77.Jessell TM, Kandel ER. Synaptic transmission: a bi-directional and a self-modifiable form of cell-cell
communication. Cell 1993;72(Suppl):1–30.Kandel ER, Schwartz JH, Jessell TM. Principles of Neural Science. 4th ed. McGraw-Hill, New York,
NY, 2000.Unwin N. Neurotransmitter action: opening of ligand-gated ion channels. Cell 1993;72(Suppl):31–41.Woodhull AM. Ionic blockage of sodium channels in nerve. J Gen Physiol 1973;61:687–708.
Basic Neurophysiology and the Cortical Basis of EEG 33
02_Holmes 4/11/07 8:51 AM Page 33

02_Holmes 4/11/07 8:51 AM Page 34

3Ions, Membrane Potentials, and Myelin
Devanand Jillapalli and Jeremy M. Shefner
SummaryThe neuron is uniquely suited for the transmission of electrical impulses. The neuronal membrane
itself allows for charge separation; depending on the permeability of the membrane to a given type ofion, that ion will distribute across the membrane, producing a resting membrane potential, described bythe Nernst equation. However, via the sodium–potassium (Na–K) pump, an active electrochemical gra-dient is maintained across the cell membrane, the magnitude of which can be calculated by knowing therelative concentrations of all the relevant ions, both in the intracellular fluid (ICF) and extracellular fluid(ECF), via the Goldman–Hodgkin–Katz equation. The development of action potentials are dependenton the presence of voltage-gated sodium channels, which open when the membrane itself is partiallydepolarized through mechanical, electrical, or chemical means. The initiation of an action potential cre-ates a spreading area of voltage change, causing additional nearby channels to open, ultimately leading tothe propagation of the action potential down the entire length of the axon. Myelin dramatically speedsthe process of neuronal depolarization by producing salutatory conduction. Together, with the complexset of processes at the neuromuscular junction, neural transmission is effectively achieved.
Key Words: Action potential; ion; myelin; resting membrane potential; sodium–potassium pump;voltage gated.
1. INTRODUCTION
In the clinical neurophysiology laboratory, a variety of electrical signals are recorded fromsubjects. Understanding the underlying neurophysiology governing these electrical signals isvery important if one is to correctly identify, record, and interpret the signals. In this chapter,we will first review the role of the semipermeable cell membrane; intracellular fluid (ICF)and extracellular fluid (ECF) compartments; and the concentration, charge, and permeabilityof the important ions in the generation of potential difference across the cell membrane.Later, we will see how local changes in the resting membrane potential of excitable cells caninitiate propagation of the current to form the basis of communication from nerve to nerve andfrom nerve to muscle. This chapter repeats some of the information in chapter 2; however,additional information relevant to peripheral nerves is also included.
2. CELL MEMBRANE, ICF, AND ECF
The cell membrane separates the ICF from the ECF, and helps to maintain critical dif-ferences in ionic concentrations between the two fluid spaces. Of the electrically importantion species, sodium concentration is approximately 12 times greater in the ECF than in
From: The Clinical Neurophysiology PrimerEdited by: A. S. Blum and S. B. Rutkove © Humana Press Inc., Totowa, NJ
35
03_Jillapalli 4/11/07 8:52 AM Page 35

the ICF, whereas chloride concentration is approx 25 times greater in the ECF than theICF. Potassium, however, is approx 35 times more abundant in the ICF than in the ECF.The ICF also contains proteins, organic phosphates, nucleic acids, and so on, which atphysiological pH have a net negative charge. Because the cell membrane is a bilipid layer,it is quite permeable to lipid soluble substances, while acting as an effective barrier againstmany water-soluble particles. However, the cell membrane also contains specialized proteinmolecules, which act to selectively transport or allow passage of certain water-solubleparticles. It is through these transport and channel proteins that movement of water-solubleions and molecules occurs in and out of the cell. The mechanisms by which this move-ment occurs are passive transport and active transport.
2.1. Passive Transport
Passive transport is defined by movement that does not require the expenditure of energy. Twomain forces contribute to passive movement of particles across the membrane—concentrationgradient and electrical charge. All other factors being equal, particles will tend to move in sucha manner that their concentration is equal throughout a given space. Thus, if a membrane is permeable to a certain particle, and that particle is more highly concentrated on one side of themembrane than the other side, diffusion forces will cause a net movement of particles toward theside with the lower concentration. Physiologically, this movement occurs through the transportproteins in the membrane. Thus, all other factors being equal, sodium ions will move from theECF into the ICF, because there is a higher concentration of these ions in the ECF. Similarly,potassium ions tend to diffuse out of the cell, because their concentration is much higher in theICF. If diffusion is the only force determining particle movement, the amount of particle move-ment will be determined by the magnitude of the concentration gradient, and by the extent towhich the membrane is permeable to that particle. Along the cell membrane, permeability isdetermined by properties of the transport proteins, with selectivity based on the electrical andmechanical (diameter and shape) properties of the transport protein and the particle to be trans-ported. Not all water-soluble ions and molecules move simply down the concentration gradientunaided. Some ions and molecules require a carrier to shuttle them across the cell membranedown the concentration gradient, referred to as facilitated diffusion.
The other major force that determines passive movement of particles across the nervemembrane is electrical charge. The particles of interest to us are all charged; potassium,sodium, and calcium are present as positively charged ions, whereas chloride carries a nega-tive charge. Therefore, if particles move across the membrane according to concentration gra-dients, they carry with them either a net positivity or negativity. Because like charges repeleach other, a buildup of either positive or negative charge will tend to inhibit the further trans-port of like charges.
2.2. Active Transport
In contrast to passive diffusion, active transport of substances across the cell mem-brane requires the expenditure of energy, usually in the form of high-energy phosphatebonds, such as ATP. Active transport involves the transport of ions in a direction notdetermined by concentration or electrical gradients. For example, positively chargedsodium ions passively tend to move into the cell along both electrical and concentrationgradients. However, active transport supports the movement of such ions in the oppositedirection, against the passive forces. Both sodium and potassium ions are transported
36 Jillapalli and Shefner
03_Jillapalli 4/11/07 8:52 AM Page 36

actively across the membrane, via a single mechanism called the sodium–potassium(Na–K) pump.
2.3. The Na–K Pump
The Na–K pump is present in all living cells. It is a complex protein with two subunits—theα- and β-subunits. Because the role of Na–K pump is to move ions against a concentrationgradient, the sodium receptor sites for this pump are located inside the cell membrane (wherethe sodium concentration is lower), whereas the potassium receptor sites on the pump arelocated outside the cell membrane (where the potassium concentration is lower). There arethree sodium-binding sites and two potassium-binding sites in any Na–K pump. Thus, forevery three sodium ions sent out of the cell, two potassium ions are brought inside.
3. THE RESTING MEMBRANE POTENTIAL
We have seen in the preceding paragraphs that the net diffusion of ions occurs down the concentration and electrical gradients. If a membrane were completely and equally permeableto all particles, diffusion would be allowed to proceed unchecked, and the various concentrationdifferences across the cell membrane would eventually become equalized. However, in biologicalsystems, both active transport and selective membrane permeability prevent such equalization.The resting membrane potential for a cell membrane is a product of the gradients that exist forsingle ion species, in combination with energy-requiring processes, such as active transport.
3.1. The Nernst Potential
In a hypothetical situation, let us assume that the cell membrane is permeable to only onesingle ion, which then tends to diffuse through the cell membrane along its gradient. With ionmovement, there will be an accumulation of charge; this charge will tend to oppose further diffusion of like-charged particles with the force of opposition increasing as more ions travelacross the membrane. At some point, the diffusion force responsible for ion movement alongthe concentration gradient will exactly equal the electrical opposing force. The potential differenceat which this equalization of forces occurs is called the Nernst potential for that ion. For singlycharged ions at 37°C, the formula to calculate this potential (in millivolts) is: 61 × log10(concentration of the ion outside divided by the concentration of the ion inside). Because theconcentration of different ions is different across the cell membrane, one can see that the Nerstpotential will be different for each ion. Using this formula, we can calculate the potential difference across the cell membrane for potassium and sodium ions as examples. For potassium,the Nernst potential is approximately –94 mV, with the negativity inside the cell membrane,whereas it is +61 mV for sodium. The effect that each ion species will have in determining theglobal resting membrane potential for a membrane is determined by the membrane permeabilityto than ion. Thus, if a membrane is completely impermeable to an ion, it will have no effect onthe membrane potential of the cell, no matter what its Nernst potential might be.
3.2. Goldman–Hodgkin–Katz Equation
This equation objectifies the point made in the preceding paragraph, and suggests that theoverall resting membrane potential for a biological membrane is a combination of the Nernstpotentials for all permeable ion species inhabiting the perimembrane area, scaled by theirrespective permeabilities. At rest, the membrane is most permeable to chloride and, hence,
Ions, Membrane Potentials, and Myelin 37
03_Jillapalli 4/11/07 8:52 AM Page 37

the overall resting membrane potential is closest to the Nernst potential for chloride, atapproximately –60 mV.
3.3. The Role of the Na–K Pump
The Goldman-Hogkin-Katz equation makes no inference regarding equilibrium. It simplystates what the transmembrane potential will be given to the membrane conductances and relative concentrations of different ions at a given point in time. As an equilibrium state doesnot exist, without active intervention the concentrations of various ions will change, accordingto either their concentration or diffusion gradient. The concentrations discussed above arekept constant, however, but the activity of an energy requiring Na-K pump. The Na–K pumptakes out three sodium ions for every two potassium ions it brings inside the cell, leaving anet deficit of positive charges (or net excess of negative charges) inside the cell; this also con-tributes to the electrical difference or gradient across the cell membrane, with the negativityinside the membrane and positivity outside.
In summary, the resting membrane potential of cells is largely determined by the passivediffusion of the ions through channel proteins in the cell membrane, according to both con-centration and electrical gradients. The membrane is most permeable to chloride, so this ioncontributes most to the resting membrane potential as a whole. In addition, the electrogenicNa–K pump, on a smaller but sustained scale, contributes to this resting membrane potential.As a result, the resting membrane potential in large nerve fiber is approx –60 mV, with thenegativity inside the cell membrane. The resting membrane potential provides the substrateon which neural communication is based but by itself is not responsible for signal transmission.Information transfer requires the presence of a regenerative process, the action potential,which can transmit a signal over long distances without decay.
4. MEMBRANE ACTION POTENTIALS
Nerve and muscle action potentials occur as a result of sudden changes in permeability ofspecific ion channels, in response to local perturbations in the voltage of membrane potential.The channels involved are known to be voltage dependent; that is, permeability changes aredependent on changes in membrane potentials. Although voltage-dependent ion channelsdepend on changes in membrane potential to initiate permeability changes, once thosechanges occur, they revert back to baseline permeability levels quickly and irrespective ofmembrane potential. Thus, although an action potential needs a membrane potential changefor its initiation, its termination occurs because of processes intrinsic to the channels them-selves. Action potentials are, therefore, extremely brief, usually in the order of approx 1 ms.Action potentials are always all-or-none responses, because the voltage-dependent changesdiscussed either occur completely or not at all. To understand these action potentials, we willdiscuss what happens during depolarization and repolarization.
The process of action potential generation was first studied in unmyelinated axons ofinvertebrates. Such axons have both voltage-gated potassium and sodium channels. If a localarea of membrane is briefly depolarized (i.e., rendered more positive) by approx 15 mV,a conformational change occurs in both ion channels, such that both become briefly muchmore permeable. Because of the high concentration of extracellular sodium, as well as thenegativity of the intracellular space, sodium will rush into the cell through the open sodiumchannels. However, after approx 1 ms, the sodium channels revert to their resting, nearlyclosed, state. The effect of sodium influx is to render the local area of intracellular space
38 Jillapalli and Shefner
03_Jillapalli 4/11/07 8:52 AM Page 38

briefly depolarized. In contrast to sodium channels, potassium channels open more slowly andclose more slowly. Therefore, relatively long after the sodium channels have reverted to theirbaseline closed state, potassium channels remain open, allowing positively charged ions toleave and restoring the baseline negativity within the axon. These changes in the sodium andpotassium conductance during an action potential are illustrated in Fig. 1. In myelinated axons,however, changes in potassium conductance do not seem to contribute to the repolarizationprocess.
Local changes in myelinated or unmyelinated axons are unimportant in themselves,unless a mechanism exists for them to propagate along the axon. This mechanism is discussed next.
5. PROPAGATION OF THE ACTION POTENTIAL
The consequence of an action potential occurring in a local area of membrane is to depolar-ize that area. Local current spreading from that area depolarizes the surrounding resting mem-brane to an extent greater than necessary to cause neighboring voltage-gated sodium andpotassium channels to open, resulting in the changes in sodium and potassium conductance thatthen produce the action potentials in these neighboring areas. This wave of depolarization occursin a continuous fashion in unmyelinated fibers. The rate at which action potentials traverse anunmyelinated axon is determined by both the total amounts of ions traversing the membrane (ion flux), as well as the resistance to current flow within the axon. Both of these factors are afunction of axon diameter; the larger the axon, the more ions flow into it, and the easier it is for current to flow along it. The relationship between fiber size and conduction velocity in nonmyeli-nated axons is nonlinear, which implies that very large unmyelinated axons would be necessaryto provide conduction velocities required for normal vertebrate function. Furthermore, such largeunmyelinated axons are not only impractical but also would be inefficient in signal transmissionbecause of the large transmembrane capacitance and low transmembrane resistance and the needfor higher energy expenditure. Myelinated axons, however, provide the correct combination ofefficiency in signal conduction and energy conservation, as discussed next.
Ions, Membrane Potentials, and Myelin 39
Fig. 1. The conductance of the sodium ions (gNa) and potassium ions (gK) in the action potential(Hodgkin–Huxley model, 1952), illustrating the rapid opening and closing of the sodium channelsand, in contrast, the slower opening and delayed closure of the potassium channels.
03_Jillapalli 4/11/07 8:52 AM Page 39

5.1. Myelin and Salutatory Conduction
The myelin sheath is a specialized structure existing within Schwann cells; it is a highlyeffective insulating material, wrapping around the axon in concentric spirals. Schwann cells arepresent every 1 to 2 mm along the axon. At the junction of contiguous Schwann cells are thenodes of Ranvier, an area that is devoid of myelin. In contrast to unmyelinated axons, sodiumand potassium channels are not evenly dispersed along the axon surface. Sodium channels arefound in the highest concentration at the nodes of Ranvier and are not usually found in betweenthese nodes under the myelin. In contrast, potassium channels are found underneath the myelinsheath. Depolarization in myelinated axons, therefore, can occur only at nodal regions, wheresodium channels reside. Once a nodal area has been depolarized, a potential difference existsbetween it and the next contiguous nodal area, resulting in longitudinal flow of current. The difference between longitudinal current flow in the unmyelinated axons and myelinated axonsis that, in the latter, instead of spreading to the immediate contiguous membrane, spread occursfrom one node to the next node. However, because these nodes are separated by 1 to 2 mm, theaction potential transmission seems to jump from one node to the next in a discontinuous fash-ion, termed saltatory conduction. Myelin allows this form of conduction by reducing membranecapacitance and increasing transmembrane resistance, so that the stimulus decay is not significantby the time it reaches the next node. Saltatory conduction significantly increases speed of actionpotential propagation (~70 m/s in large myelinated fibers). Myelinated axons, thus, combineefficiency in signal conduction and energy conservation.
SUGGESTED READING
Armstrong CM. Voltage-dependent ion channels and their gating. Physiol Rev 1992;72:S5–S12.Hodgkin AL. Huxley AF. A quantitative description of membrane current and its application to con-
duction and excitation in nerve. J Physiol 1952;117:500–544.Hubbard JI. Microphysiology of vertebrate neuromuscular transmission. Physiol Rev 1973;53:674–715. Preston DC, Shapiro BE. Electromyography and neuromuscular disorders. Butterworth-Heinemann,
Boston, MA, 1998.Waxman SG, Bennett MVL. Relative conduction velocities of small myelinated and non-myelinated
fibers in the central nervous system. Nat New Bio 1972;238:217–219.
REVIEW QUESTIONS (CHOOSE THE BEST ANSWER FROM THE ALTERNATIVES)
1. During depolarization of the cell membrane, the movement of sodium ions from the ECF intothe ICF uses which of the following physiological mechanisms?A. Active transport.B. Active transport through voltage-gated sodium channel.C. Facilitated diffusion.D. Passive transport through voltage-gated sodium channel.
2. The potential difference across the cell membrane on the inside of the cell is:A. Positive at the peak of sodium influx during an action potential.B. Negative at the peak of sodium influx during an action potential.C. Positive during the resting state of the membrane potential.D. Independent of the action potential.E. None of the above.
3. The role of the Na–K pump is:A. Passive transport of either sodium or potassium ions.B. Passive transport of sodium and potassium ions.
40 Jillapalli and Shefner
03_Jillapalli 4/11/07 8:52 AM Page 40

C. Maintenance of the resting membrane potential by active transport of sodium and potassium ions.D. Maintenance of the resting membrane potential by passive transport of sodium and potassium ions.E. Relies on the transformation of ADP to AMP for energy.
4. The resting membrane potential of a neuron is approximately:A. +60 µV.B. –30 mV.C. –60 µV.D. –90 mV.E. None of the above.
5. The closure of the sodium channels during an action potential is caused by:A. Changes in the membrane voltage.B. Changes in the potassium conductance.C. Spontaneous closure independent of membrane voltage changes.D. Changes in calcium conductance.E. Local electrical currents adjacent to the channels.
6. The process of repolarization in a nerve fiber is brought about by which of the following:A. Increased potassium conductance in the myelinated fiber.B. Decreased sodium conductance in the unmyelinated fiber.C. Increased potassium conductance in the unmyelinated fiber.D. Increased calcium conductance in the myelinated fiber.E. A and C.
7. Which of the following properties in a nerve fiber results in a faster conduction velocity? A. High transmembrane capacitance, low transmembrane resistance, and large fiber diameter.B. Low transmembrane capacitance, high transmembrane resistance, and large fiber diameter.C. Low transmembrane capacitance, low transmembrane resistance, and small fiber diameter.D. High transmembrane capacitance, high transmembrane resistance, and small fiber diameter.
8. Which of the following statements concerning chloride ions and channels is most accurate?A. They have no role in establishing the resting membrane potential; only potassium and sodium
contribute.B. At rest, they distribute passively across the cell membrane.C. The opening of chloride channels helps in repolarization of the neuronal membrane.D. Chloride is necessary for the action of the Na–K pump.
9. The membrane permeability of which of the following ions contribute the most in the genesis ofthe resting membrane potential?A. Sodium and potassium.B. Potassium and calcium.C. Chloride and potassium.D. Sodium and chloride.E. Sodium, chloride, and potassium contribute equally.
10. Which of the following statements concerning saltatory conduction is false?A. It occurs only in myelinated nerves.B. It relies on high internodal resistance and low capacitance.C. It requires the opening of potassium channels in the internodal membrane.D. It may fail if internodal myelin thickness is reduced.E. The greater the internodal distance, the faster the conduction velocity will be, up to the point
that conduction fails.
REVIEW ANSWERS
1. The correct answer is D. Although it is true that sodium ions move passively into the cell alongthe concentration gradient during depolarization, such movement occurs through the voltage-gated sodium channels after they are first opened.
Ions, Membrane Potentials, and Myelin 41
03_Jillapalli 4/11/07 8:52 AM Page 41

2. The correct answer is A. The membrane potential is negative on the inside of the cell membraneat rest. However, at the peak of the sodium influx during an action potential, there is reversal ofpolarity, resulting in positivity on the inside of the membrane.
3. The correct answer is C. The Na–K pump actively transports three sodium ions for every twopotassium ions against their respective concentration gradient. This unequal transport of posi-tive charges helps maintain the potential difference across the cell membrane in a sustainedmanner.
4. The correct answer is E. None the above. The correct resting membrane for a neuron is approx–60 mV; for a muscle fiber it is closer to –90 mV.
5. The correct answer is C. Sodium channels open during an action potential because of changesin the membrane potential. However, the closure of the sodium channels occurs spontaneouslybecause of processes intrinsic to the channels and independent of membrane voltage changes.
6. The correct answer is C. In unmyelinated nerve fibers, increased potassium conductance playsan important role in the process of repolarization. However, in myelinated axons, changes inpotassium conductance do not seem to significantly contribute to the repolarization process.
7. The correct answer is B. Low transmembrane capacitance, high transmembrane resistance, andlarge fiber diameter is the correct choice.
8. The correct answer is B. At rest, chloride is distributed passively across the cell membrane. In fact, chloride channels remain open at rest, helping to stabilize the membrane potential.
9. The correct answer is C. The membrane is most permeable to potassium and chloride ions, sothat these ions contribute the most in the genesis of the resting membrane potential.
10. The correct answer is C. Opening of potassium channels in the internodal membrane is notrequired for saltatory conduction to occur. All of the other statements are true.
42 Jillapalli and Shefner
03_Jillapalli 4/11/07 8:52 AM Page 42

4Introduction to Volume Conduction
Seward B. Rutkove
SummaryThe term “volume conduction” refers to the complex effects of measuring electrical potentials a
distance from their source generators. Near-field potentials refer to those recorded in relative closeproximity to the detector, whereas far-field potentials refer to those recorded at a considerable distance,as is most commonly the case in evoked potentials. A relative straightforward model of volume conduc-tion can be worked through to assist in better understanding how volume conduction effects can impactthe shape of a recorded neuronal potential. In fact, all motor and sensory nerve conduction waveformsare substantially impacted by volume conductive effects. The recording setup of sensory studies (i.e.,whether they are bipolar or referential) also impacts the size and morphology of the recorded signals.In addition, the compound motor action potential actually represents a composite of both near- andfar-field activity. The morphology of both spontaneous discharges and the motor unit potentialsthemselves evaluated during needle EMG are, in part, caused by the complex effects of volume conduction.
Key Words: Bipolar; far-field; fibrillation potential; near-field; positive sharp wave; source generator;referential; volume conduction.
1. WHAT IS VOLUME CONDUCTION? WHY IS IT RELEVANT?
Volume conduction is the term used to describe the effects of recording electrical potentialsat a distance from their source generator. In other words, the recording electrodes are not indirect contact with the nerve or muscle; there is a medium of some sort separating the two. Intruth, volume conduction plays a role in almost all clinical neurophysiological recordings, bothcentral and peripheral, because recording electrodes are never placed in direct contact with thenerve cells generating the signal. There are some occasional examples in which volume con-duction plays only a minor role because the amount of nonexcitable tissue between the depo-larizing neuron and the recording electrodes is quite small. One example of this would benear-nerve nerve conduction studies, in which a needle electrode is placed in very close vicin-ity to the nerve of interest. Even so, electrical signals can take short cuts through ionic mediaand, therefore, distant activity can be detected.
Two terms are worth being familiar with immediately: far-field potentials and near-fieldpotentials, and volume conduction theory plays into both. A near-field potential is one thatis obtained with the recording electrode in relatively close proximity to the source of the signal(the generator), although, again, not in direct contact with it. Bipolar recording arrangements asdiscussed below in Section 3 are generally used to study exclude these potentials. Exampleswould include standard needle EMG, digital sensory conduction studies, motor studies, and
From: The Clinical Neurophysiology PrimerEdited by: A. S. Blum and S. B. Rutkove © Humana Press Inc., Totowa, NJ
43
04_Rutkove 4/11/07 8:54 AM Page 43

standard electroencephalography. Far-field potentials, in contrast, are generated at a dis-tance from the recording electrodes. These potentials are most critical in somatosensoryevoked potentials (SSEPs), in which electrodes on the scalp can pick up electrical activ-ity occurring in the brainstem. Referential recordings (again, discussed in Section 3,below) detect these potentials more easily. However, far-field potentials also play a role inother aspects of clinical neurophysiology, and even standard motor studies can be “con-taminated” by far-field effects, as described below in Section 4.2.
To become more familiar with the effects of volume conduction, it is helpful to first reviewseveral examples. In the sections that follow, we will then deal with the underlying theory andcome back to an explanation regarding why the observed phenomena occur.
Example 1: A motor response recorded from the motor point of abductor pollicis brevis producesa negative first phase; however, a motor response recorded off the motor point will produce aninitial positive phase followed by a negative phase.Example 2: An antidromic sensory response recorded from the sural or radial nerve usually hasa small positive phase before the main negative phase; antidromic sensory responses from theulnar and median nerves, on the other hand, have a major negative phase without the precedingpositive phase.Example 3: Fibrillation potentials and positive sharp waves, which are morphologically quite“dissimilar,” are both generated by the single muscle fibers.Example 4: The P9 potential observed on upper extremity SSEPs can be observed simultane-ously at multiple recording sites.
2. WORKING MODEL OF VOLUME CONDUCTION
There are two basic models that have been used to explain the observed phenomena of volume conduction. The first involves the use of a waveform moving down a nerve sitting ina medium. The second relies upon the concepts of what is called “solid-angle geometry.”Although both models are relatively straightforward, because our goal here is merely to pro-vide a basic understanding of volume conduction, we will omit the discussion on the solid-angle geometry model, which can be obtained in the suggested reading.
Figure 1 demonstrates the depolarization of an axon moving from left to right and whatwill be observed depending on the exact location of the recording electrodes, both in termsof distance from the nerve (Levels 1, 2, and 3) and location along the nerve relative to thedepolarizing wave front (Ovals A, B, and C). For purposes of discussion, it is easier to envi-sion the waveform remaining stationery and the electrode moving from left to right across thediagram. In A, the waves of depolarization are initially moving away from the current sourceas they fan out in the medium, slightly against the direction of electrode movement (mostobvious toward the extreme left side of A). By convention, this will produce a downwarddeflection on the oscilloscope. As we move through A, however, the current lines begin tomove in the same direction as the electrode movement and the tracing on the oscilloscopebegins to move upward. At the “O” line (the equipotential point), there is no net current flowacross the electrode, and the oscilloscope tracing returns to baseline. In B, current flow is nowtoward the sink, in the same direction as the moving recording electrode, producing furtherupward movement of the tracing producing the rising peak of the main negative spike. In C,the current abruptly switches direction as we cross the point of maximal depolarization.Current again now moves in the opposite direction of the electrode and the oscilloscopeshows a downward movement (but it now has to start at the apex of the negative peak, not atbaseline, so it remains in negative territory). After crossing the equipotential line again, we
44 Rutkove
04_Rutkove 4/11/07 8:54 AM Page 44

Volume Conduction 45
Fig. 1. A model of the effects of volume conduction on a recorded neuron or muscle potential. Fordiscussion purposes, it is simpler to imagine the depolarization frozen in time and the electrodeslowly being moved through positions A to D. Levels 1, 2, and 3 simply represent what would be seendepending on the proximity of the recording electrode to the nerve. Focusing on a single level (e.g.,level 2) is simplest. By convention, if current lines are traveling opposite the direction of electrodemovement, this will produce a downward deflection on the oscilloscope; if traveling in the samedirection, it will produce a upward deflection. In A, the lines of current fanning out beyond the elec-trode source are initially traveling opposite the electrode movement, producing a downward (positivedeflection), but then gradually start to travel in the same direction as the electrode, returning thedeflection back to baseline, as the electrode “arrives at” the “zero” or equipotential line. In B, the cur-rent continues to travel in the same direction as the electrode movement and the oscilloscope tracesan upward (negative) potential. As the electrode crosses the current sink (where the actually depolar-ization of the neuron is occurring), the lines of current abruptly change direction and the oscilloscopepotential begins to move downward in C. This downward movement continues past the equipotentialline and into D. However, within D, the fanning out of current lines gradually begins to move in thesame direction as the electrode, producing an upward deflection on the oscilloscope and returning thetracing to baseline. Note that the potential is asymmetric, reflecting the fact that neuronal repolariza-tion is a slower process with less dense current lines.
04_Rutkove 4/11/07 8:54 AM Page 45

enter D, where the current continues to flow in the direction opposite electrode movement initially, and the oscilloscope traces out the trailing positive peak. However, at some pointin D, the fanning out current lines begin to move in relatively the same direction as the elec-trode, and the tracing moves up and returns to zero as the current reaches undetectable levels. It is also worth noting that the repolarization of the axon is a slower process than thedepolarization (note how the lines of current flow are more densely packed on the left sidethan the right side of the diagram), leading to a sharper initial positive peak as compared withthe final positive peak. When closer to the axon (the different levels), the peaks appearsharper than when further away from it.
It is worth considering what a potential would look like in the absence of a volume con-ductor. Using the same model, the major difference would be that no initial positivity norfinal positivity would be identified, because the current would not fan out from the sourcegenerator. This would leave a monophasic negative spike (Fig. 2). This spike would have someasymmetry, however, given the fact that repolarization is slower than depolarization. In summary,the middle negative phase of a recorded potential will be present with or without volume conduction, but the end positivities are purely a consequence of volume conduction.
3. TWO OTHER CONCEPTS RELEVANT TO VOLUME CONDUCTION THEORY
All recordings in clinical neurophysiology are differential recordings, in that the electricalactivity under one electrode (the “active” electrode or E1) is compared with that under theother electrode (the “reference” or “inactive” electrode, called E2). The final waveformobtained is a combination of what the E1 and the E2 electrodes are sensing; in mathematicalterms, this would be described as E1 – E2. Hence, whatever E2 is “seeing” needs to be sub-tracted from E1.
Two terms are used to describe the two types of differential recordings: “referential” and“bipolar.” Referential recordings refers to E2 being placed on a relatively electrically inactivestructure, such as the earlobe in EEG recordings, or a bony prominence in EMG recordings.Bipolar recordings are those in which both E1 and E2 are being placed in relative proximityto electrical tissue, such as an antidromic digital sensory response stimulating the wrist andrecording from the finger. For better or worse, although we like to think of E2 as electricallysilent in referential recordings, in fact, far-field potentials can be recorded under this electrode,which can contribute substantially to the recorded waveforms. This issue will be discussed infurther detail below in Section 4.2.
46 Rutkove
Fig. 2. A monophasic potential produced by a neuronal recording in the complete absence of vol-ume conduction. Because there is no fanning out of current lines observed in Fig. 1, the initial andfinal positivities do not occur, leaving only the negative, slightly asymmetric monophasic negativepotential.
04_Rutkove 4/11/07 8:54 AM Page 46

“Standing waves” (also called “virtual dipoles”) may be produced when a depolarizationof a nerve traverses from one body segment to another, for example, from arm to shoulder orhand to finger. The mechanism of this is complex, but likely is caused by several differenteffects, including a change in the anatomic uniformity of the volume conductor, extracellularresistivity, a change in the anatomic orientation of the propagating potential, or the abrupt ter-mination of excitable tissue. Although this plays a role in both nerve conduction studies andall evoked potentials, the issue is most relevant in SSEPs.
4. VOLUME CONDUCTION AND ITS ROLE IN SPECIFIC TESTS
4.1. Sensory Nerve Conduction Studies
Let us begin our discussion by looking at a standard antidromic median sensory studyrecording from digit 3, a form of “bipolar study,” in that both E1 and E2 are in proximity tothe potential generators (the digital nerves of the middle finger). Figure 3A shows the stan-dard recorded response. Note that there is an initial negativity and a final positivity. In Fig. 3B,the reference electrode is moved to digit 5, essentially changing the biopolar arrangement toa referential recording arrangement, where E2 is picking up no electrical activity. An initial positivity now appears on the recorded waveform, because of the approaching wavefront, as described in Fig. 1. The reason that it was not visible with both electrodes on digit3 is that both were sensing it simultaneously and, hence, it was subtracted out by the differ-ential recording. With the reference electrode on digit 5, only the active electrode on digit 3senses it and, thus, it appears. Note also that the amplitude of the negative peak is slightlyhigher. In Fig. 3C, the contribution of E2 is clarified by keeping it as the reference electrodeand placing E1 on digit 5. What is seen is essentially an upside-down version of that seen in Fig.3B, with an initial negativity and slightly lower amplitude at the now “upside down” negativepeak. The amplitude is slightly reduced because the digit 3 electrode is very distal and theunderlying electrical potential is smaller. The initial negativity seen here normally counterbal-ances the positivity of E1 (seen in Fig. 3B) in the bipolar recording (A), producing the flatbaseline leading up to the major negativity. In Fig. 3D, the waveforms seen in Fig. 3B and 3Care digitally added, to produce approximately what is observed in Fig. 3A.
Thus, antidromic median and ulnar bipolar sensory studies typically do not demonstrate aninitial positivity because they are truly bipolar and the approaching wave front is sensedsimultaneously by both electrodes and is cancelled out. However, in standard antidromicradial sensory studies (recording from the snuff box) and antidromic sural sensory studies(recording from the ankle) a small positivity is typically identified. This likely reflects the factthat E1 and E2 are seeing slightly different environments and that the potentials are not trulybipolar with incomplete cancellation of the approaching wave front.
4.2. Motor Studies
In motor studies, there is generally no initial positivity on the compound motor actionpotential, similar to that observed on bipolar digital sensory studies. However, the reason whythis occurs is different. Rather than the wave front being sensed by both electrodes and can-celing, in this situation, the depolarization of the muscle fibers is actually originating directlybeneath the active electrode, E1, and, hence, there is no approaching wave front. This can bedemonstrated by moving E1 slightly off the motor point, which will then create a small positivity in front of the major negative phase.
Volume Conduction 47
04_Rutkove 4/11/07 8:54 AM Page 47

Regardless, the negative peak amplitude that is being measured is still very much a productof what the two electrodes are sensing. It is appealing to think that the active electrode is sensing the depolarization of the muscle and the inactive is seeing a flat line. This is actuallypretty much the case for standard median and peroneal motor conduction studies, in whichonly a small subset of muscles on the hand or foot are depolarizing. However, this is defi-nitely not true in ulnar and tibial motor studies, in which the majority of the muscles in thehand and foot are all depolarizing, essentially “electrifying” the entire structure. This wasdemonstrated by Kincaid et al., in a study in which the authors evaluated what the referenceelectrode was actually seeing in different parts of the hand (Figs. 4 and 5). In these studies,the active electrode was placed on different parts of the hand and the reference electrode wasmoved to the opposite side of the body so that E2 could be viewed as a true reference. As canbe seen, nearly the entire hand is “electrified” when the ulnar nerve is stimulated (Fig. 4) andvolume-conducted waveforms can be picked up all over the hand (even on the tips of the fin-gers); hence, there really is no inactive site for this muscle. When stimulating the mediannerve, however, virtually no activity is picked up in any location, except in the region of thethenar eminence (Fig. 5). Similar results are also found by evaluating the tibial and peronealnerves in the feet; the tibial nerve analogous to the ulnar and the peroneal nerve is analogousto the median.
48 Rutkove
Fig. 3. Median digit 3 sensory studies. Comparisons are made between the standard bipolararrangement (A) and other arrangements to better understand how the standard potential is generated.In A, the active electrode “A” and the reference electrode “R” are both placed on digit 3 to obtain thestandard bipolar recording. In B, the reference electrode is moved to digit 5 to produce a true “refer-ential recording.” Note how an initial positivity is observed (because of the approaching wavefront)and the peak-to-peak amplitude is higher than the baseline-to-peak observed in A. In C, the referenceelectrode is maintained on digit 3, but the active electrode “A” is moved away. This reveals what isbeing recorded by the reference electrode alone: a small initial negativity and larger second positivity.In D, the responses from B and C are digitally added, giving approximately what is observed in A.
04_Rutkove 4/11/07 8:54 AM Page 48

Hence, when performing a standard ulnar motor study, the ultimate configuration of themotor response is a composite of what E1 and E2 are sensing. The large positivity that issensed over the fifth metacarpal–phalangeal joint is subtracted from the response detecteddirectly over the hypothenar muscles. Subtracting this positivity will cause it to become anegativity, leading to the characteristic “double-humped” ulnar motor potential (Fig. 6). Thesame exercise for the median nerve, on the other hand, produces essentially no change in theamplitude/configuration of the motor response because the E2 activity is negligible.
4.3. EMG4.3.1. Fibrillation Potentials and Positive Sharp Waves
Fibrillation potentials and positive sharp waves are both produced by the electrical depo-larization of single muscle fibers. However, they have dramatically different morphologies,as illustrated in Figs. 3 and 4, Chapter 14. They appear so dissimilar because of volume conduction effects. Fibrillation potentials are thought to represent the depolarization of a single muscle fiber observed from a short distance by the needle electrode. Hence, the reasonfor its triphasic nature is very similar to a sensory nerve conduction study, with an approaching
Volume Conduction 49
Fig. 4. Volume-conducted potentials recorded from various parts of the hand with stimulation ofthe ulnar nerve. Note how potentials can be recorded from nearly the entire hand, even the tips of thefingers. From Kincaid et al., 1993 with permission.
Fig. 5. Volume conducted potentials recorded from the hand with stimulation of the median nerve.Note how potentials can only be recorded in the vicinity of the thenar eminence, where the median-innervated muscles reside. From Kincaid et al., 1993 with permission.
04_Rutkove 4/11/07 8:54 AM Page 49

wave front causing the initial positivity, the major negative spike being induced by the depo-larization traveling underneath the electrode, and the trailing positivity caused by the depart-ing wavefront. This is in contrast with a positive sharp wave, in which it is proposed thatneedle is in actual contact with the fiber being recorded. The mechanical deformation of themyocyte membrane by the needle is thought to partially depolarize the cell. Hence, theapproaching wave front produces an initial positivity and then the negativity begins to develop,but essentially aborts as it comes into contact with the depolarized area of muscle membrane.Although these are only models and the real phenomenon is likely more complex, they arehelpful in understanding how two different waveforms can be produced by a single generator.
4.3.2. End-Plate Spikes
These potentials are similar to fibrillation potentials in that they represent the depolariza-tion of a single muscle fiber. However, they are different in that needle movement at the endplate induces the firing of the muscle fiber and, hence, the action potential is generated imme-diately beneath the needle. Accordingly, unlike fibrillation potentials, they are usually biphasic—with an initial negativity followed by a positivity. The fact that these potentials are generatedimmediately beneath the needle is similar to a motor conduction study, in which the depolar-ization of the muscle fibers begins under the surface electrode.
4.3.3. Motor Unit Potentials
When in close proximity to the muscle fibers of a single motor unit, the motor unit poten-tial will have higher amplitude and, when more distant, the amplitude will decrease and thegeneral sharpness of this waveform will decrease. The duration tends to be more immune tothese volume conduction and tissue filtering effects, with it being relatively consistent regard-less of the distance the needle electrode is placed from the motor unit potential being recorded.Hence, the single most useful parameter when evaluating a motor unit is its duration.
4.4. Somatosensory Evoked Potentials
Somatosensory potentials are usually recorded in a bipolar fashion with both recordingelectrodes placed near the generator source (e.g., spinal cord or scalp). This approachmeasures near-field potentials. However, by widely spacing the recording electrodes, earlywaveforms in the form of far-field potentials can also be observed. Although initially
50 Rutkove
Fig. 6. Approximate digital addition of the ulnar motor response recorded from the hypothenareminence and that recorded from the fifth MCP joint, leading to the typical “double-humped” ulnarmotor response.
04_Rutkove 4/11/07 8:54 AM Page 50

thought to be due to a specific neuronal generator of some form, such as ganglia or indi-vidual neurons, it was recognized by Jun Kimura and others that these waveforms wereactually being caused by a waveform traveling from one body segment into another, the so-called standing waves or virtual dipoles noted above in Section 3. These waveforms havealso been called “junctional” or “boundary” potentials. The most prominent and most care-fully studied of these is the P9 potential obtained with stimulation of the median nerve. Itis thought that this is caused by the intersection of the arm with the trunk. Similar “virtualdipoles” can be demonstrated in standard digital sensory nerve conduction studies, if per-formed in a referential fashion; however, these are usually irrelevant when performed in astandard bipolar manner.
SUGGESTED READING
Dumitru D, Delisa JA. AAEM Minimonograph #10: Volume Conduction. Muscle Nerve1991;14:605–624.
Frith RW, Benstead TJ, Daube JR. Stationary waves recorded at the shoulder after median nerve stimu-lation. Neurology 1986;36:1458–1464.
Kimura J, Kimura A, Ishida T, et al. What determines the latency and amplitude of stationary peaksin far-field recordings? Ann Neurol 1986;19(5):479–486.
Kincaid JC, Brashear A, Markand ON. The influence of the reference electrode on CMAP configu-ration. Muscle Nerve 1993;16(4):392–396.
Lagerlund TD. Volume conduction. In: Daube J, ed. Clinical Neurophysiology. Oxford UniversityPress, New York, NY, 2002, pp. 28–36.
REVIEW QUESTIONS
1. What causes the initial positivity of a normal median compound motor action potential when theactive electrode is not placed over the motor point of the abductor pollicis brevis muscle?A. Depolarization of distant muscles.B. A retreating wavefront.C. An approaching wavefront.D. A stationary wavefront.E. None of the above.
2. End-plate spikes lack an initial positivity because:A. The depolarization initiates immediately beneath the needle.B. They are not generated by muscle fibers.C. The axon initiates the depolarization.D. The wavefront is forced to abruptly stop by the presence of the needle.E. The depolarization involves only the proximal portion of the muscle fiber.
3. In the volume conduction model described, which of the following is true?A. The depolarizing wavefront produces current lines that fan out away from the current sink.B. There is symmetry between the depolarizing and repolarizing regions of the nerve.C. Inward current produces a negative deflection on the oscilloscope regardless of the location
of the electrodes.D. The rise time of the observed potential is independent of distance from the axon.E. Electrons are moving in the direction opposite current flow.
4. Which of the following statements regarding positive sharp waves and fibrillation potentials is true?A. Positive waves represent an action potential traveling down a large muscle fiber; fibrillation
potentials represent an action potential traveling down a small muscle fiber.B. Fibrillation potentials are recorded when the needle is in contact with a muscle fiber.C. Fibrillation potentials are induced by movement of the needle against the muscle fiber.D. Positive sharp waves result from an aborted muscle fiber depolarization.E. Fibrillation potentials initiate immediately beneath the recording needle electrode.
Volume Conduction 51
04_Rutkove 4/11/07 8:54 AM Page 51

5. Which of the following SSEP peaks is caused by a virtual dipole?A. P9.B. P22.C. N13.D. N5.E. N20.
6. An initial positivity can be observed on median antidromic digit 2 sensory recordings by doingwhich of the following?A. Moving the active electrode to digit 5.B. Moving the reference electrode to digit 5.C. Moving both electrodes to digit 5.D. Moving the recording electrodes more closely together.E. B and D are both correct.
7. Which of the following statements concerning the reference electrode in a motor recording is mostaccurate?A. It is electrically inactive.B. It detects electrical activity from nondepolarizing muscles.C. Although electrical active, it usually does not contribute substantially to the recorded wave-
form with median nerve studies.D. Although electrical active, it usually does not contribute substantially to the recorded wave-
form with tibial nerve studies.E. Placing it over a bone ensures that no distant muscle activity is detected.
8. In the absence of a volume conductor, a triphasic wave (e.g., a fibrillation potential) wouldappear as which of the following?A. A biphasic wave with a prominent initial positive peak.B. A triphasic wave.C. A negative monophasic wave.D. A biphasic wave with a prominent trailing positive peak.E. An inverted triphasic wave.
9. Which of the following is most likely to have an initial positivity under normal recording conditions?A. An antidromic digit 3 median sensory response.B. An antidromic digit 5 ulnar sensory response.C. An antidromic sural response recorded at the ankle.D. A tibial motor response.E. A peroneal motor response.
10. An example of a far-field potential is:A. A median motor response with the recording electrode over abductor pollicis brevis.B. A sural sensory response recorded at the ankle.C. Ulnar motor activity detected at the tip of digit 5.D. The N14 peak, generated by the medial lemniscus, on upper extremity SSEPs detected on
scalp recordings.E. C and D are both correct.
REVIEW ANSWERS
1. The correct answer is C. The approaching wavefront causes the initial positivity. Although thedepolarization of distant muscles can also cause this phenomenon, this is unlikely to be the casehere. A retreating wavefront contributes to the final positivity. Stationary wave fronts are gener-ally not observed in median motor responses.
2. The correct answer is A. In most circumstances, end-plate spikes are generated by the needle tipdirectly causing a depolarization of the end plate, with the depolarization then traveling away
52 Rutkove
04_Rutkove 4/11/07 8:54 AM Page 52

from the point of contact with the muscle. Hence, an initial negativity is followed by a final positivity.The axon does not initiate the depolarization. The abrupt ending of a muscle fiber depolarizationcaused by the presence of a needle causes a positive sharp wave, not end-plate spikes.
3. The correct answer is A. The fanning out of the current lines through the medium is essentiallywhat causes volume conduction-related effects. There is asymmetry between the depolarizingand repolarizing regions of the nerve because repolarization is a slower process than depolariza-tion. The inward current may produce a negative or positive deflection depending on where therecording electrode is relative to the depolarization. The rise time of the potential increases thefurther the electrode moves from the nerve. Electrons do not move freely through solution—ions do.
4. The correct answer is D. Positive sharp waves result when a muscle fiber depolarization abruptlyaborts as it travels down the muscle fiber, likely because the needle is in contact with the musclefiber. Although the amplitude of fibrillation potentials and positive sharp waves is related tomuscle fiber size, at least to some extent, size does not result in different morphologies of therecorded waveform. Fibrillation potentials are generally thought to be identified when the nee-dle is not in contact with the muscle fiber. Fibrillation potentials can initiate anywhere relativeto the needle electrode.
5. The correct answer is P9. This one is thought to be cause by the change in conduction as thepotential crosses from the arm into the trunk.
6. The correct answer is B. By moving the reference electrode to digit 5, the approaching wave-front on the median nerve, which causes the initial positivity, will only be seen by the active elec-trode and, hence, will appear. Normally, it would be detected by both electrodes and, therefore,cancelled out. Moving the electrodes closer together would decrease the amplitude of therecorded response but would do little else.
7. The correct answer is C. In median and peroneal motor recordings, the reference electrode gen-erally detects very little electrical activity. The reference electrode is “active” in that it is helpingto produce the differential recording and, if a muscle is not depolarizing, there is no electricalactivity to record. In tibial recordings, the reference electrode detects considerable volume-conducted electrical activity. Although we would like to think that placing the electrode over thebone ensures that no distant muscle activity will be detected, this is not true.
8. The correct answer is C. Without volume conduction, the arriving and departing waveformswould not be detected and the triphasic wave would become a monophasic, somewhat asymmetricnegative peak, as shown in Fig. 2. The asymmetry is because the rate of repolarization is slowerthan the rate of depolarization. None of the other answers is valid.
9. The correct answer is C. Sural and radial sensory responses can be thought of more as “referential”than as “bipolar” because both electrodes are not oriented identically in relation to the nerve,allowing the initial positivity to appear. In standard digit 3 and digit 5 recordings, there is no positivitybecause they are bipolar recordings and the approaching waveform is seen simultaneously byboth electrodes and cancelled out. Motor responses usually do not have initial positivitiesbecause the active electrode is placed immediately above the motor point, where the depolariza-tion of the muscle fibers begins. Hence, there is no approaching waveform to cause the positivity.
10. The correct answer is E. In both cases, the electrical activity is being recorded at a distance ratherthan in the immediate proximity of the generator. In the other two examples, the recording elec-trodes are placed as close to the generator as possible.
Volume Conduction 53
04_Rutkove 4/11/07 8:54 AM Page 53

04_Rutkove 4/11/07 8:54 AM Page 54

IIELECTROENCEPHALOGRAPHY
05_Schomer.qxd 4/11/07 8:55 AM Page 55

05_Schomer.qxd 4/11/07 8:55 AM Page 56

5The Normal EEG in an Adult
Donald L. Schomer
SummaryWhen an experienced electroencephalographer sits down to review an EEG, whether obtained on a
pen/ink-based analog machine or from the cathode ray tube screen of a digital device, a number ofmental integrations take place seamlessly. This chapter addresses the “normal” EEG observed in peo-ple older than 18 yr of age. Topics to be covered include the normal waking background rhythm (alpharhythm); beta activity; mu, theta, and lambda waves; activation effects on the EEG; and features of nor-mal sleep.
Key Words: Awake and sleep EEG; normal EEG; routine EEG.
1. INTRODUCTION
When an experienced electroencephalographer sits down to review an EEG, whetherobtained on a pen/ink-based analog machine or off of a cathode ray tube screen from a digi-tal device, a number of mental integrations take place seamlessly. This chapter examines the“normal” EEG observed in people older than 18 yr of age.
2. RECORDING PRINCIPALS
EEG recording electrodes are glued onto the scalp in an orderly fashion according to anagreed on measured placement, referred to as either the International 10-20 or 10-10 system(1). The electrodes are plugged into a head-box, which allows the technician to record ineither a bipolar or a referential fashion. The former is a system in which adjacent electrodesare connected to a differential amplifier. The latter is a system in which each electrode is con-nected to a differential amplifier and compared with a common electrode. The differentialamplifier has two inputs (G1 and G2), and amplifies the difference in voltage at the two inputsites. The output is then charted onto a graph in the case of an analog-based EEG machine,so that the difference in voltage is graphed against time. In the case of a computer-based sys-tem, the inputs are digitized and the amplifier registers the voltage differences and stores itas a digital signal for display on a cathode ray tube. In either case, the viewed information isessentially the same.
There are certain basic rules that are followed by the technician to ensure high quality andreproducible results. There are strict guidelines related to the placement of the electrodes sothat the same electrodes end up in the same spots, regardless of which technician appliesthem. The electrodes need to be tested for impedance and maintained below 5000 Ω. Theelectrodes, when recording in a bipolar montage, are connected in straight lines going from
From: The Clinical Neurophysiology PrimerEdited by: A. S. Blum and S. B. Rutkove © Humana Press Inc., Totowa, NJ
57
05_Schomer.qxd 4/11/07 8:55 AM Page 57

front to back and from left to right. Displays of the output tend to follow similar rules, andthe left side of the head is usually displayed above the right side.
There is also a polarity convention that all manufacturers of EEG equipment follow.Originally, when all of the device outputs were graphic pens, the convention was that if theG1 input was more negative than the G2 input, the pen deflection was upward. It follows thateither a negative event at G1 or a positive event at G2 would have led to an upward deflec-tion. A positive event at G1 or a negative event at G2 leads to a downward deflection. Theserules still apply to digital recording devices, but there are obviously no pen deflections, sim-ply movement of the signal off of the baseline. By connecting electrodes in linear arrays, onecan graph fields and electrical polarity of given potentials over time (2).
3. THE AWAKE AND RESTING STATE
After the electrodes are attached, the montage selected and the machine calibrated, thetechnician is ready to record. Recordings are done for between 20 min (minimum) and sev-eral hours in selected circumstances. The patient is recorded initially in the awake restingstate, with eyes open, and recorded again with eyes closed. Unless there is a specific reasonto the contrary, part of the recording session should be performed with the patient hyperven-tilating and receiving intermittent photic stimulation. The patient may also be allowed to fallasleep and, therefore, EEG can be recorded during sleep induction and sequencing into thevarious stages of sleep.
4. THE ALPHA RHYTHM
When electroencephalographers sit down to review a normal study, they are usually drawnfirst to the prominent background alpha rhythm. As with all repeating rhythms, it is mostimportant to note the frequency and the location of the activity, its amplitude, and its reactivity.The alpha rhythm oscillation is between 8 and 13 Hz and is most prominent over the moreposterior aspects of the head. Its amplitude or voltage in a bipolar (P4–O2) derivation is any-where from 15 to 65 µV. This is reactive or responsive to mental activity and to eye openingor closure. The rhythm is partially or completely blocked by mental activity or by eye open-ing (3). Likewise, it is enhanced by relaxation and by eye closure (Fig. 1).
For healthy adults, there is a bell-shaped distribution curve for the alpha frequency, center-ing around 10.0 Hz. The frequency is significantly affected by cerebral blood flow and may varyby up to 2 Hz in any individual, based on flow changes. It normally does not vary by more than1 Hz during the course of the record and shows very little change during long time spans.Although it has been reported that the alpha rhythm may slow by 1 Hz every 10 yr after the ageof 50 yr, in more recent studies that controlled for subtle disease states, such changes did notappear. In a few healthy subjects (<2%), no apparent alpha rhythm can be seen. In a few moresubjects (<7%), a very low-voltage alpha rhythm is observed. Because recordings are bipolar,one can improve on alpha detections by increasing the inter-electrode distances. When this isdone, the finding of an absent alpha rhythm is actually quite low. The frequency may also varyslightly in relationship to the menstrual cycle, where it is faster by up to 0.3 Hz during thefollicular phase. This variation is probably below the level that can be visually recognized.
The alpha rhythm is most prominent over the posterior aspects of the head. In some indi-viduals, it is overwhelmingly occipital in its distribution. In approximately one-third ofhealthy adults, the alpha rhythm is widely distributed and incorporates parietal and posteriortemporal regions.
58 Schomer
05_Schomer.qxd 4/11/07 8:55 AM Page 58

59
Fig. 1. This recording shows the presence of a normal alpha rhythm present over the posterior head regions. Note how the alpha rhythmattenuates just before a spontaneous eye opening marked by the eye movement artifact noted over the frontal electrodes, approximatelymidway through the recording.
05_Schomer.qxd 4/11/07 8:55 AM Page 59

There may be a side-to-side amplitude asymmetry, noted in approx 60% of people, inwhich the right side tends to be of slightly higher amplitude. The left side may be morepredominant in left handed individuals. The difference in amplitude between the twohemispheres is not more than 50%. If it is more than that, it is almost always related to anidentifiable abnormality. The skull can act as an amplitude attenuator and, therefore, asone ages and as one’s skull thickens, the amplitude of the alpha rhythm tends to diminish.
The state of the eyes is important to the alpha rhythm. The alpha rhythm is the rhythm of theawake, resting, eyes-closed individual. In most people, the alpha rhythm will be blocked orsignificantly attenuated when the eyes are open (Fig. 1). Similarly, mental effort, such as doingsimple math, likewise blocks alpha rhythm in approximately three-fourths of healthy subjects.
5. BETA ACTIVITY
Beta activity (>13 Hz) is defined by three relatively distinct frequency bands: 18 to 25 Hzactivity, which is the most frequently encountered; 14 to 17 Hz activity, which is less com-mon; and the still rarer, greater than 25 Hz activity. The first two frequencies are seen com-monly over the frontal regions and become more prominent as the subject gets drowsy. Thesetwo beta rhythms are usually of low voltage (<25 µV). It can be markedly increased by theuse of some drugs, most notably the benzodiazepines and barbiturates. However, in thosecircumstances, it is felt that the rhythm is a provoked cortical rhythm and not a normal one.A good review of beta activity is in the textbook on EEG by Niedermeyer (4).
6. MU RHYTHM
The mu rhythm is a centrally located rhythm with a frequency of 8 to 10 Hz. It is thought tobe the resting rhythm of the pre- and post-Rolandic cortex. It is more commonly noted in theyounger adult population, in whom it is detected in up to 20% of people younger than 30 yr ofage. The likelihood of finding it decreases with increasing age. It is reactive to motor program-ming. It is seen during times of relaxation and can be affected by the state of the eyes. Whenseen, the technician often asks the patient to make a fist contralateral to the side in which therhythm has been observed. This movement or even the thought of this movement blocks therhythm. The mu rhythm may appear quite asymmetrically, although that is not of any patholog-ical significance, except for the possibility that there may a skull defect on the side of thisrhythm (breach effect) (Fig. 2).
7. THETA RHYTHM
Theta activity is defined as activity between 4 and 7 Hz. Although theta activity is often asign of disease or of sleep onset, it may also be seen as part of a normal awake EEG. Althoughsome intermittent low-voltage theta activity is seen over the frontal–central regions in healthypeople while resting and awake, this is usually not a well-developed nor regular rhythm. Undera circumstance in which the subject is performing some moderately difficult mental task, suchas spelling or mathematics, one can occasionally see a well-developed theta rhythm in thefrontal midline region (3). A small amount of left temporal theta activity during wakefulnessis also expected as a normal factor in aging, starting around the age of 50 yr (3).
8. LAMBDA WAVE
Occasionally, ones sees occipital positive sharp slow waves in the record of a patient whois lying quietly in bed awake. These waves may be quite asymmetric and raise the possibility
60 Schomer
05_Schomer.qxd 4/11/07 8:55 AM Page 60

61
Fig. 2. This tracing shows the presence of a sharp-appearing 11-Hz rhythm present over the right central region thatabruptly stops associated with an eye movement. This rhythm also blocks with movement of the right hand and is classicfor the mu rhythm.
05_Schomer.qxd 4/11/07 8:55 AM Page 61

of a focal abnormality. The normal lambda wave is identified by doing a few simple maneu-vers. The wave is felt to represent occipital lobe activity in a person who is actively readingor scanning the room. Often the subjects have their eyes open and are looking carefully at theceiling tiles. The technician will have the patient reproduce the maneuver that they felt causedthe waves to appear in the first place. They will then have the patient close their eyes, whichwill block the normal lambda wave but usually not have an effect on the abnormal activity.They will then have them open their eyes and look at a plain piece of paper, which also blocksthe normal lambda wave but will not effect the epileptiform discharges, which are most oftenmistaken for a lambda wave (3).
9. RESPONSE TO HYPERVENTILATION
Hyperventilation is a method of “activating” the EEG. It may bring out focal or gener-alized slowing in cases of structural disease or of more diffuse encephalopathic disorders.It also can bring out interictal epileptic discharges or trigger more overt symptomaticseizures. It should not be performed in the very elderly patient or in someone suspected ofhaving any intracranial mass lesions or a recent transient ischemic event/stroke. In the adultpopulation, it is normal to hyperventilate the patient for 3 to 5 min. The technician usuallytries to, at minimum, double the base breathing rate, and to have the subject exhale moredeeply than usual. This act causes the subject to exhale excessive amounts of CO2 andbecome hypocapnic. The hypocapnia causes mild cerebral vessel vasoconstriction and,hence, mild cerebral hypoxia. The hypoxia and the hypocapnia together potentially canproduce changes that may signal a disorder. One additional variable that must be consid-ered is the blood glucose level at the time of this test. If the response is one of significantgeneralized slow wave activity, the technician often will give the patient a glass of orangejuice and wait 10 to 15 min and repeat the exercise. If the slowing is still present, it takeson significance as a potential abnormality. The normal response in a healthy adult is to haveno slow wave or epileptiform activity brought out by this maneuver. It is normal to some-times see a patient exhibit greater alpha activity as a result of hyperventilating than theyhad otherwise shown.
10. RESPONSE TO INTERMITTENT PHOTIC STIMULATION
Similar to hyperventilation, intermittent photic stimulation is performed to “activate” theEEG. Photic stimulation is performed by using a commercial stroboscopic stimulator placedapprox 1 m from the patient’s eyes. They are asked to keep their eyes closed and look straightahead while the ambient room lighting is turned down. The test is performed by alternatingflashes varying from 1 to 35 Hz and lasting for 10 s and interrupted by 10 to 30 s with no stim-ulation. The variables that need to be controlled for are the distance from the subject to thestrobe, the luminance of the strobe, direction of gaze, and level of consciousness. The mostcommon abnormal activation is to produce epileptic activity in relationship to the photic stim-ulation. In healthy people, one may see any level of “driving.” This phenomena appears in theoccipital leads and is the result of a “flash” visual evoked response. Therefore, the backgroundrhythm gets linked to the timing of the photic stimulator (Fig. 3). The first response appearsshortly after the stimulator goes on (<100 ms) and stops when the stimulator shuts off. It ismore likely to occur around the baseline background frequency (±2–4 Hz). One may also seewhat is referred to as a photomyogenic response as a normal variant. In this condition, wide-spread muscle twitching appears, which is timed to the stimulator. This reaction is felt to
62 Schomer
05_Schomer.qxd 4/11/07 8:55 AM Page 62

The Normal EEG in an Adult 63
Fig. 3. Midway through this 20-s portion of a routine EEG is the 10-s period of intermittent photicstimulation noted by the artifact on the last channel. The frequency of the photic stimulator is eightflashes per second. There is a prominent evoked response noted over the occipital leads at the samefrequency. This is a normal reaction.
05_Schomer.qxd 4/11/07 8:55 AM Page 63

represent a heightened brainstem-mediated reflex reaction to the photic stimulator. Additionalenhanced levels of photic driving reactions are recognized and defined in a review byWaltz et al. (5).
11. SLEEP
Many patients will come to an EEG lab and immediately fall asleep. Others may come withthat in mind and never attain even a minimum level of drowsiness. For an electroencephalo-grapher, sleep is useful to observe for several reasons. Similar to hyperventilation andphotic stimulation, it may bring out latent abnormalities. There are some disorders, suchas juvenile myoclonic epilepsy, in which waking up from sleep may be the only time onesees the markers for this disorder. In many EEG laboratories, the technician tries to get atleast some sleep on every study. In other labs, the staff are asked to have the subject stayawake for significant portions of the night before the test to try to assure that the patient willfall asleep easily.
Four stages of non-rapid eye movement sleep are described next. Seldom does a subject getbeyond Stage III during routine testing, but all stages are noted as they happen in a healthy per-son. Chiappa and Santamaria’s book on drowsiness is an excellent dissertation on the subject (6).
12. DROWSINESS OR STAGE I
The first suggestion that a patient is going to sleep is that there is a sudden drop in the volt-age of their background alpha rhythm, followed by intermittent theta activity noted over themore posterior head regions (Fig. 4). This presleep or twilight state is usually followed byearly Stage II. However, patients may alternate back and forth from awake resting to drowsi-ness for extended periods of time. In the healthy elderly patient, they may skip this state com-pletely and go into Stage III or IV. Other healthy elderly patients may spend most of theirsleep time in drowsiness and Stage II of sleep and have very little of the later stages noted.
Vertex sharp waves may begin to be seen in deeper stages of drowsiness, Stage Ib sleep.Vertex sharp waves are centered around the CZ electrode, with maximum voltage noted in theadjacent electrodes (C3 and C4). The wave may have complex morphology and consist ofseveral phases. The initial phase is usually a surface negative biphasic sharp wave followedby a high-voltage surface negative slow wave, lasting up to 400 ms in duration.
13. STAGE II
This stage’s onset is identified by the appearance of spindles. They are frontal–centrallypredominant waves that occur as a cluster lasting for one to several seconds in duration. Thespindle frequency is between 11 and 15 Hz and, in healthy adults, they are bilateral and syn-chronous in their appearance, with an amplitude up to 30 µV. Spindles may appear by them-selves or following a vertex wave. In that latter situation, the wave is called a “K complex”(Fig. 5). Vertex waves are increasingly prevalent in Stage II sleep, and often persist in deeperstages as well. During the progression into deeper aspects of Stage II, the background rhythmcontinues to slow into the slower theta ranges, and high voltage generalized and frontallypredominant delta slow waves are noted (<4 Hz).
During Stage II of sleep, occipital predominant high-voltage sharp slow waves are occa-sionally noted. These waves look like the lambda waves described in Section 8. These arereferred to as either lambdoid waves or posterior occipital sharp transients of sleep. The phys-iological basis for posterior occipital sharp transients of sleep is probably very similar to
64 Schomer
05_Schomer.qxd 4/11/07 8:55 AM Page 64

65
Fig. 4. Approximately half-way through this record, the alpha rhythm gradually fades and is replaced by slower theta frequency activity.There are no eye movement artifacts and this pattern evolved into Stage II sleep. Therefore, this tracing shows the transition from wakefulnessto sleep, i.e., drowsiness.
05_Schomer.qxd 4/11/07 8:55 AM Page 65

lambda waves. Their relation to visual dreams remains contested. Occasionally, these wavesmay extend into Stage III of sleep.
14. STAGE III
Occasionally a patient may go on to Stage III sleep. In this phase, there are still vertexwaves, spindles, and K-complexes, but they occur less frequently and seem to be over-whelmed by the more prominent delta wave activity (<4 Hz). This slow wave activity iswidespread but has a frontal and central predominance. It should be the most frequentlynoted rhythm and should be present for 20 to 50% of the record (Fig. 6). Stage III and thelater Stage IV of sleep are most often associated with increases in the interictal dischargesof temporal lobe epilepsy.
66 Schomer
Fig. 5. This record, approximately half-way through, shows classic frontal–centrally predominant fastbursts of “spindle” activity followed by a centrally predominant high-voltage slow sharp wave, vertexwave. This complex is also referred to as a “K-complex,” and is one of the hallmarks of Stage II sleep.
05_Schomer.qxd 4/11/07 8:55 AM Page 66

67
Fig. 6. As a subject progresses into Stage III sleep, as shown here, the background slows into the delta frequency range and is pres-ent approx 40% of the time.
05_Schomer.qxd 4/11/07 8:55 AM Page 67

68
Fig. 7. When the background is more than 50% delta activity, the subject is considered to be in Stage IV of sleep, as noted on thisportion of the record.
05_Schomer.qxd 4/11/07 8:55 AM Page 68

69
Fig. 8. Rapid eye movement sleep follows Stage IV in the sequencing of sleep. As noted here, the background is a low-voltage fastrhythm, as is seen in the wakeful state, but is also associated with lateral eye movements with a frequency of approx 1 Hz. These eyemovements are seen over the lateral temporal leads, where they are out of phase with each other from side to side.
05_Schomer.qxd 4/11/07 8:55 AM Page 69

15. STAGE IV
Stage IV also has rudimentary vertex waves, spindles, and K-complexes, but shows furtherslowing and a more persistent delta-frequency background. In this stage, most (>50%) of thetime of the recording is associated with continuously appearing delta activity (Fig. 7). Thisstage is only rarely achieved in the routine EEG recording.
16. REM
In sleep laboratories, the REM stage is divided into tonic and phasic components based onthe simultaneous recording of other physiological parameters not routinely monitored duringEEG acquisitions (7). The other recordings include respiration effort and pulse oximetry, andchin and leg EMG activity. From a strictly EEG perspective, the background rhythm returnsto what seems to be a drowsy or wakeful state, with low-voltage theta and alpha frequencyactivity, and with large, slow lateral eye movements (Fig. 8). This stage of sleep is also rarelyencountered in routine EEG. When it is, perhaps ideally, the time from onset of drowsinessto the time of onset of REM should be measured. If it is short (<10 min), then the subjectmight consider a formal sleep lab referral to rule out narcolepsy.
REVIEW QUESTIONS
1. What system ensures consistent EEG recording technique? What is the upper limit of electrodeimpedance that is tolerated in EEG acquisition?
2. An upward deflection on an EEG conventionally indicates a negative or positive event?3. What is the lower limit of normal for the waking posterior background rhythm in an adult
patient? What are its characteristics?4. What defines an abnormal degree of asymmetry in alpha amplitude?5. What medications lead to excess beta activity? Can beta activity be a normal finding?6. What maneuver may demonstrate reactivity of the mu rhythm?7. What patients should not be asked to perform hyperventilation?8. Are photic driving responses normal? What is the most characteristic frequency of photic driving?9. What is the defining EEG feature of Stage II sleep?
10. What differentiates Stage III from Stage IV sleep?
REVIEW ANSWERS
1. The International 10-20 system ensures that electrodes are applied in a systematic fashion bythe technologist to each patient. Electrode impedances are kept at 5000 Ω or less to minimizeelectrode-related artifact.
2. An upward deflection reflects a surface negative event. 3. The lower limit of normal for the adult waking posterior rhythm (the alpha rhythm) is 8 Hz.
It is most prominently seen in the posterior channels and exhibits physiologic reactivity, specifi-cally attenuating with eye opening or other mental tasks.
4. The alpha amplitude is said to be abnormally asymmetric if there is a greater than 50% discrep-ancy between the hemispheres. Particularly in right-handed people, the right side is usually ofhigher amplitude.
5. Benzodiazepines and barbiturates are most often associated with excessive beta activity. Betaactivity can be a normal finding, and may be state dependent, because it is more often noted indrowsy tracings, especially in frontal channels.
6. Planning a movement with the contralateral hand or executing such a movement (e.g., make afist) will attenuate the mu rhythm.
70 Schomer
05_Schomer.qxd 4/11/07 8:55 AM Page 70

7. Hyperventilation should be avoided in the very elderly, in those suspected of an intracranial masslesion, or in those with recent cerebral ischemia.
8. Photic driving responses are a normal phenomenon. However, their absence is common and isnot pathological. When present, they should be fairly symmetrically evident. They are mostcommon at close to the patient’s alpha frequency.
9. Spindles are the defining element of Stage II sleep. Vertex waves are also abundant, as areK-complexes. Vertex waves may be seen in isolation in deeply drowsy (Stage Ib) subjects.
10. Stage III sleep entails delta activity involving 20 to 50% of the tracing, whereas Stage IV sleepexhibits greater than 50% delta activity.
REFERENCES
1. Nuwer MR. Recording electrode site nomenclature. J Clin Neurophysiol 1987;4:121–133.2. Niedermeyer E. The EEG signal: polarity and field determination. In: Niedermeyer E, Lopes da
Silva F, eds. Electroencephalography: Basic principles, Clinical Applications and Related Fields,4th ed. Williams and Wilkins, Philadelphia, PA, 1999, pp. 143–148.
3. Kellaway P. Orderly approach to visual analysis: elements of the normal EEG and their charac-teristics in children and adults. In: Ebersole JS, Pedley TA, eds. Current Practice of ClinicalElectroencephalography, 3rd ed. Lippincott Williams and Wilkins, Philadelphia, PA, 2003,pp. 100–159.
4. Niedermeyer E. The normal EEG of the waking adult. In: Niedermeyer E, Lopes da Silva F, eds.Electroencephalography: Basic principles, Clinical Applications and Related Fields, 4th ed.Williams and Wilkins, Philadelphia, PA, 1999, pp. 149–173.
5. Waltz S, Christen H-J, Doose H. The different patterns of the photoparoxysmal response:a genetic study. Electroencephal Clin Neurophysiol 1992;83:138–145.
6. Santamaria J, Chiappa KE. The EEG of Drowsiness. Demos Publications, New York, NY, 1987.7. Niedermeyer E. Sleep and EEG. In: Niedermeyer E, Lopes da Silva F, eds. Electroencephalography:
Basic principles, Clinical Applications and Related Fields, 4th ed. Williams and Wilkins, Philadelphia,PA, 1999, pp. 174–188.
The Normal EEG in an Adult 71
05_Schomer.qxd 4/11/07 8:55 AM Page 71

05_Schomer.qxd 4/11/07 8:55 AM Page 72

From: The Clinical Neurophysiology PrimerEdited by: A. S. Blum and S. B. Rutkove © Humana Press Inc., Totowa, NJ
73
6Activation of the EEG
Barbara A. Dworetzky, Edward B. Bromfield, and Nanon E. Winslow
SummaryVarious procedures are commonly used in the recording of the EEG in an effort to increase the diag-
nostic yield of the test. Common methods, such as hyperventilation (HV), photic stimulation, and sleepdeprivation, referred to collectively as activation techniques, are traditionally used toward this end. Lesscommon techniques, such as withdrawal of antiepileptic medications, use of specific triggers reportedby the patient, and other idiosyncratic methods can be tried as well. This chapter will review methodsof activation of the EEG, including HV, photic stimulation, and sleep deprivation. Historical back-ground, physiological mechanisms, standard techniques, and clinical significance will also be reviewed.
Key Words: Hyperventilation; photic stimulation; photic driving; photoparoxysmal response; reflexepilepsy; sleep deprivation.
1. INTRODUCTION
Even in patients with a definite diagnosis of epilepsy, the first EEG will be normal 50% ofthe time. It is a common and accepted practice to arrange for additional EEGs if the first oneis nondiagnostic, because three studies increase the sensitivity of detecting an abnormality toapprox 90%. The EEG technologist is trained to use certain techniques to increase the likeli-hood that an abnormality will emerge during the 20- to 30-min sampling of brain activity thatis obtained during a routine EEG. Common methods, such as hyperventilation (HV), photicstimulation, and sleep deprivation, referred to collectively as activation techniques, are tradi-tionally used if an EEG would otherwise be interpreted as normal or “nonspecific.” Less com-mon techniques, such as withdrawal of antiepileptic medications, use of specific triggersreported by the patient, and other idiosyncratic methods can be tried as well. This chapterreviews methods of activation of the EEG, including HV, photic stimulation, and sleep dep-rivation. Historical background, physiological mechanisms, standard techniques, and clinicalsignificance will also be reviewed.
2. HYPERVENTILATION
2.1. Background
Activation of seizures by HV was first reported in 1924, even before the discovery of the EEG.This technique became widely used in the diagnosis of absence seizures. HV responses can varywidely depending on age of patient and the amount of individual effort put forth. Common HV
06_Dworetzky 4/11/07 8:57 AM Page 73

responses in adults include no EEG change or mild slowing temporally, frontally, or diffusely. Inyounger individuals, in contrast, responses can be particularly dramatic, with extremely highvoltage synchronous delta waves in bursts or runs. This can be further exaggerated if it has beenmany hours since the person has eaten a meal (relative hypoglycemia) (Fig. 1). Unless there aredefinitive spikes embedded within the synchronous delta activity or the record fails to return tobaseline within 1 to 2 min of verified completion of over-breathing, the response should be inter-preted as negative, because there is large variation in the normal response. Consistent focal fea-tures, whether epileptiform or not, are interpreted as abnormal.
2.2. Mechanism
With HV, there is a rise in PaO2 and a drop in PaCO2. To compensate for the resultanthypocapnia, the cerebral blood vessels constrict. The mechanism of the EEG response to HV isnot yet understood, but several theories are reviewed by Takahashi. These include inadequatecompensatory vasoconstriction, cerebral hypoperfusion as a result of vasoconstriction, increasedneuronal excitability from respiratory alkalosis, synchronous activity of the thalamocortical pro-jections that are enhanced by hypocapnia, and decreased activity of the mesencephalic reticularformation. The more dramatic changes noted in children suggest that immature autoregulationmay explain the HV response, or that HV slowing is independent of cerebral blood flow.Whatever the true mechanism, HV is an accepted, standard technique for activation of the EEG.
74 Dworetzky, Bromfield, and Winslow
Fig. 1. (A) Start hyperventilation (HV) in an adult. (Continued)
06_Dworetzky 4/11/07 8:57 AM Page 74

Activation of the EEG 75
Fig. 1. (B) End HV 3 min later with marked bilateral slowing.
2.3. Technique
When there are no epileptiform discharges uncovered during a routine EEG, the HV proce-dure is explained to the patient. Those with severe cardiac or pulmonary disease, uncontrolledhypertension, or a recent vascular event, such as myocardial infarction, stroke, or transientischemic attack, should not be exposed to this procedure, because hypocapnia and alkalosismay cause vasospasm or decrease cerebral perfusion. To begin the procedure, the technologistinstructs the patient to breathe deeply and rapidly for 3 min. Patients are usually lying flat dur-ing a routine EEG, although it has been noted that the effects are enhanced by an upright pos-ture, possibly because of the relative cerebral hypoperfusion. Patients should be told that theymight experience symptoms of lightheadedness and tingling, particularly around the mouthand fingertips, although they can be reassured that this is reversible. As mentioned, the timesince the last meal should be documented, because low glucose may enhance the response. TheEEG is usually recorded on a bipolar montage with the patient’s eyes closed, and should berun on the same montage, at least 1 min before starting the hyperventilating and continued forup to 3 min afterward, documenting the effort that the patient puts forth.
Syncope may lead to prolonged post-HV slowing, and patients with the rare vascular dis-ease known as Moyamoya can have a delayed “re-buildup” referring to high-voltage diffuseslowing, which can occur even after HV is completed. Longer duration of HV (up to 6 min)
06_Dworetzky 4/11/07 8:57 AM Page 75

was shown by Adams and Luders to have a higher yield than 6 h of continuous EEG moni-toring, justifying continuation of this technique when no epileptiform discharges are noted at3 min, particularly in patients with absence seizures. Occasionally, patients become mildlyconfused and have difficulty discontinuing the procedure and may require gentle remindersto stop. If this is ineffective, rebreathing CO2 with a paper bag or oxygen mask placed overthe mouth can be useful. For the pediatric population, it is helpful to have children blow at apinwheel, although for the very youngest, HV may be captured during the all too commonperiods of sobbing in the EEG laboratory. HV should be discontinued if repetitive dischargesor seizures are elicited.
2.4. Clinical Significance
HV can enhance subtle but significant abnormalities, rendering insignificant onesunchanged or diminished. Additionally, it can be used as an induction technique fornonepileptic seizures. Previous studies have shown that, in patients with partial seizures anda normal baseline EEG, focal interictal discharges were elicited in 6 to 9% of patients usingHV, whereas, in children with absence epilepsy, generalized spike and wave activity appearedin 80% of cases. A recent study by Holmes et al. however, suggested that even in knownepilepsy patients, seizures were elicited by HV in less than 0.5%.
76 Dworetzky, Bromfield, and Winslow
Fig. 2. (A) Symmetric photic driving with 12-Hz stimulation frequency. (Continued)
06_Dworetzky 4/11/07 8:57 AM Page 76

3. PHOTIC STIMULATION
3.1. Background
Photic stimulation is performed in most EEG laboratories for nearly all patients referredfor routine EEG. The earliest roots of this activation procedure may be traced back at least toancient Greece, where descriptions of the potter’s wheel to screen people who might haveseizures were documented. Bright lights were noted to cause epileptic seizures at the turn ofthe 20th century. Intermittent photic stimulation (IPS) with a constant light source was usedby 1934, and activation of epileptic discharges by using a strobe technique was soon reported.Clinical description of young patients’ producing pleasurable feelings by waving their handsin front of a source of light was subsequently reported.
3.2. Mechanism
Physiologically, the photic response is a repetitive visual potential evoked by flash, as theresponse occurs in a specific time relationship to the light stimulus. Photic driving refers to thistime-locked activity generated by visual cortex and seen at the back of the head (Fig. 2A).Certain stimulus frequencies more readily elicit responses, usually those between 4 and 30 Hz.Analysis at slower frequencies reveals that the actual response is of positive polarity and
Activation of the EEG 77
Fig. 2. (B) Photic driving “harmonic” response, intermittent photic stimulation at 7-Hz stimulation,14-Hz driving.
06_Dworetzky 4/11/07 8:57 AM Page 77

follows the stimulus by approx 100 ms. There is a wide range in amplitude of normal responses.When they are of particularly high amplitude, one might recognize a “harmonic,” or multiple,of the presented stimulus frequency. For example, a double harmonic response occurs at twicethe stimulus frequency (Fig. 2B) and a half harmonic occurs at half the stimulus frequency.
3.3. Technique
Most EEG machines are preprogrammed with the ability to present successive stimulustrains at particular frequencies. Standard techniques for photic stimulation include presenting thestrobe light stimuli at a measured distance of 20 to 30 cm with the patient’s eyes closed.Trains should begin at 1 or 3 Hz, and be presented for 4 to 10 s, with at least 4 s between eachtrain, up to 30 Hz. Subjects may have trouble tolerating these visually presented stimulidirectly, and often find it helpful to close their eyes.
3.4. Clinical Significance
Photic driving is considered normal unless there is dramatic voltage asymmetry or unilateralabsence of the response (not just caused by varying harmonics), or if epileptiform dischargesare elicited. The presence of a dramatic, high-amplitude driving response may indicate hyper-autonomic responsiveness, such as is seen in alcohol withdrawal, hyperthyroidism, or migrain-ous disorders. Prominent driving, however, is not considered abnormal, even in the absence ofsuch clinical correlates. Repetitive contractions of the frontalis muscle synchronized to the lightflash at a delay of 50 to 60 ms, known as photomyoclonus, was first described by Gastaut, andthis phenomenon does not clearly correlate with epilepsy or other neurological disease. Suchmuscle activity can be differentiated from cortical discharges by its suppression with eye open-ing, and anterior rather than posterior or generalized location. These twitches are always exactlytime-locked and do not outlast the stimulus.
The phenomenon of photomyoclonus, similar to an exaggerated driving response, is nor-mal, although, again, perhaps more associated with hyperautonomic states. Photoparoxysmalresponse (PPR), formerly known as photoconvulsive response, occurs when IPS generatebilaterally synchronous and usually generalized epileptiform discharges, which may outlastthe stimulus by several seconds, or indeed even cause a seizure (Fig. 3). Photic-inducedseizures are most commonly myoclonic although absence or tonic–clonic seizures can occur.Discharges are often generalized but more pronounced in frontal leads, and are more likelyinduced at middle stimulus frequencies (15–20 Hz) or with stimuli presented on eye closurewhile the patient is awake and alert. The presence of PPR is more likely to indicate idiopathicgeneralized epilepsy rather than partial epilepsy. This response can be a genetic trait,although it is rarely seen in patients without any history of seizures. Photic stimulation shouldbe discontinued in the presence of polyspike and wave discharges.
Artifacts identified during photic stimulation can mimic PPR, particularly the electroreti-nal response (generated by retinal ganglion cells), and photoelectric effect (from photochem-ical response of the silver electrodes). Occipital spikes can be elicited with photic stimulationin progressive myoclonus epilepsy, such as that seen in infantile ceroid lipofuscinosis.
4. SLEEP DEPRIVATION
4.1. Background and Clinical Significance
The association of epileptic seizures and sleep has been recognized since at least the 19thcentury. Gowers, as cited by Chokroverty, found that 21% of patients had seizures exclusivelyduring the night, especially during transitions into and out of sleep, as well as 1 to 2 h after
78 Dworetzky, Bromfield, and Winslow
06_Dworetzky 4/11/07 8:57 AM Page 78

awakening. With the introduction of the EEG, epileptic discharges during sleep were discov-ered. An increase in discharges during sleep has been a longstanding observation amongpatients with grand mal seizures. Sleep deprivation has been demonstrated to increase the yieldof epileptiform findings even in the absence of sleep production, and may be more activatingthan sedated sleep; a more recent study of Degen et al., however, did not confirm significantdifferences in activation of epileptiform activity in patients with and without complete sleepdeprivation. Even more recent studies of Malow et al. have shown that slow wave sleep is mostlikely to include spikes, whereas rapid eye movement (REM) sleep is the least likely to includedischarges, even less than waking. Klein et al. found that sleep was more activating than HVfor patients with definite interictal epileptiform discharges. Glick’s recent review of the effectsof sleep deprivation on EEG concluded that there is a prominent activating effect of light sleepon the EEG, but no evidence of an overall increase in discharge rate after sleep deprivation inwaking or other sleep states. Regarding specificity of sleep recording, activity that is “sharpappearing” but seen only during wakefulness and not in sleep is less likely to be “epileptiform”than discharges that continue or increase during sleep.
4.2. Mechanism
Neuronal synchronization is the underlying basis for epileptiform discharges and ictal events.Non-REM sleep, mediated by thalamocortical input, is a time of increased synchronization
Activation of the EEG 79
Fig. 3. Photoconvulsive response in an 11-yr-old girl with spells of unresponsiveness, aggravatedby bright lights.
06_Dworetzky 4/11/07 8:57 AM Page 79

when seizures occur in susceptible patients, and focal discharges tend to demonstrate a broaderfield. This lies in contradistinction to REM sleep, in which there is relative desynchronizationof the EEG, and epileptiform discharges or seizures are rare.
4.3. Technique
In many laboratories, partial rather than complete sleep deprivation is used because itis less onerous for patients, less likely to precipitate seizures, and probably just as useful.We tell patients to cut down to half of their usual sleep amount, and to stay awake and notdrink any caffeine in the morning before the EEG study is performed, to increase the like-lihood of sleep. Technologists become adept at making the room quiet and warm, andcoaxing the patient gently to sleep despite being in a laboratory setting. A second EEGordered with sleep or sleep deprivation can increase the yield. Generally, conscious seda-tion, such as with chloral hydrate administration, is no longer offered, because special cer-tification and staffing are required and make this problematic. However, conscioussedation is still used in some pediatric facilities in which a sleep EEG may be the onlyway to obtain an artifact-free tracing.
5. DRUG OR DRUG WITHDRAWAL
Drugs, or the withdrawal of drugs, can precipitate seizures. Historically, pentylenetetrazol(Metrazol) was introduced to bring on convulsive seizures for electroconvulsive shock ther-apy in the 1930s and 1940s. It was later abandoned because of many restrictions on its use.Antiepileptic drug withdrawal is often used during inpatient long-term video EEG monitor-ing for both diagnostic and therapeutic reasons. Contrary to many patients’ understanding,however, drug withdrawal is rarely used in the EEG laboratory outside of the long-term mon-itoring setting, because the likelihood of seeing interictal discharges, especially focal dis-charges, is not greatly affected by most antiepileptic drugs (and the risk of seizure is high).In the long-term monitoring setting, concerns raised that medication withdrawal wouldchange the nature of the typical seizures and negate the usefulness for localization has dissi-pated with studies indicating that seizures may more likely generalize, but clinical seizuresemiology and electrographic onset are not significantly altered.
6. OTHER METHODS
Additional idiosyncratic activation methods may be justified in patients with “reflexepilepsy” associated with specific stimuli or activities, such as reading or listening to specificmusic. Patients with psychogenic nonepileptic seizures may perceive similar relationships,and appropriate methods may also induce these spells and establish the correct diagnosis.
The importance of making a definitive diagnosis of epilepsy cannot be overstated.Although extended recording on either an ambulatory or inpatient basis may have thehighest yield, this testing is not appropriate for patients with infrequent spells or thosewhose interictal discharges can be identified using the simpler and less expensive tech-niques outlined here. The more intensive techniques, however, are preferable to a “thera-peutic trial,” which may lead to prolonged, inappropriate use of potentially toxicmedications, not to mention the associated stigma and activity restrictions. In some cir-cumstances, it may be useful to proceed directly to ambulatory EEG after an initial studythat includes HV, photic stimulation, and sleep and sleep deprivation is negative, ratherthan repeating the routine EEG.
80 Dworetzky, Bromfield, and Winslow
06_Dworetzky 4/11/07 8:57 AM Page 80

SUGGESTED READING
Adams D, Luders H. Hyperventilation and 6-hour EEG recording in evaluation of absence seizures.Neurology 1981;31:1175–1177.
Ajmone-Marsan C. Pentylenetetrazol: historical notes and comments on its electroencephalographicactivation properties. In: Luders H, Noachtar S, ed. Epileptic Seizures: Pathophysiology andClinical Semiology. Churchill Livingstone, Philadelphia, PA, 2000, pp. 563–569.
Benbadis SR Johnson K, Anthony K, Caines G, et al. Induction of psychogenic nonepileptic seizureswithout placebo. Neurology 2000;55(12):1904–1905.
Chokroverty S, Quinto C. Sleep and epilepsy. In: Chokroverty S, ed. Sleep Disorders Medicine, 2nd ed.Butterworth Heinemann, Woburn, MA, 1999, pp. 697–727.
Degen R, Degen HE, Reker M. Sleep EEG with or without sleep deprivation? Does sleep deprivationactivate more epileptic activity in patients suffering from different types of epilepsy? Eur Neurol1987;26(1):51–59.
Doose H, Waltz S. Photosensitivity: genetics and clinical significance. Neuropediatrics1993;24:249–255.
Drury I. Activation of seizures by hyperventilation. In: Luders H, Noachtar S, ed. Epileptic Seizures:Pathophysiology and Clinical Semiology. Churchill Livingstone, Philadelphia, PA, 2000,pp. 575–579.
Gastaut H. Effects des stimulations physiques sur l’EEG de l’ homme. Electroencephalogr ClinNeurophysiol Supp. 1949;2:69–82.
Glick T. The sleep-deprived electroencephalogram: evidence and practice. Arch Neurol 2002;59(8):1235–1239.
Holmes M, Dewaraja A, Vanhatalo S. Does hyperventilation elicit epileptic seizures? Epilepsia2004;45(6):618–620.
Klein K, Knake S, Hamer HM, Ziegler A, Oertel WH, Rosenow F. Sleep but not hyperventilationincreases the sensitivity of the EEG in patients with temporal lobe epilepsy. Epilepsy Res2003;56(1):43–49.
Malow B, Selwa L, Ross D, Aldrich M. Lateralizing value of interictal spikes on overnight sleep-EEGstudies in temporal lobe epilepsy. Epilepsia 1999;40(11):1587–1592.
Misulis K. Essentials of Clinical Neurophysiology. Butterworth-Heinemann, Woburn, MA, 1993.Patel V, Maulsby R. How hyperventilation alters the electroencephalogram: a review of controversial
viewpoints emphasizing neurophysiological mechanisms. J Clin Neurophysiol 1987;4:101–120.Rosenow F, Luders H. Hearing-induced seizures. In: Luders H, Noachtar S, eds. Epileptic Seizures:
Pathophysiology and Clinical Semiology. Churchill Livingstone, Philadelphia, PA, 2000, pp. 580–584.Rosenow F, Luders H. Startle-induced seizures. In: Luders H, Noachtar S, eds. Epileptic Seizures:
Pathophysiology and Clinical Semiology. Churchill Livingstone, Philadelphia, PA, 2000, pp.585–592.
Takahashi T. Activation Methods. In: Niedermeyer E, Lopes Da Silva F, eds. Electroencephalography:Basic Principles, Clinical Applications, and Related Fields, 4th ed. Lippincott Williams &Wilkins, Philadelphia, PA, 1999, pp. 261–284.
Wolf P. Activation of seizures by reading and praxis. In: Luders H, Noachtar S, eds. EpilepticSeizures: Pathophysiology and Clinical Semiology. Churchill Livingstone, Philadelphia, PA,2000, pp. 609–614.
REVIEW QUESTIONS
1. What is the value of HV to the EEG?2. In what way does hypoglycemia influence the effect of HV on the EEG?3. Who should not undergo HV?4. What is the physiological basis for photic driving response?5. When are photic driving responses abnormal?6. What are PPRs and what do they signify?
Activation of the EEG 81
06_Dworetzky 4/11/07 8:57 AM Page 81

7. What is photomyoclonus? Is it considered pathological?8. What is the photoelectric (photocell) effect?9. What additional activation methods can be used in the inpatient setting to improve the yield of
monitoring?10. Which sleep stage is least apt to activate epileptiform features?
REVIEW ANSWERS
1. HV is helpful in that it may accentuate focal or epileptiform abnormalities in the EEG. It has anespecially high yield in the evaluation of patients with 3-Hz spike wave abnormalities associatedwith absence epilepsy.
2. Hypoglycemia tends to accentuate the effect of HV on the EEG. 3. Patients with recent or unstable CNS or cardiac ischemia, cardiopulmonary compromise,
or uncontrolled hypertension should not undergo HV.4. Photic driving responses are derived from visual evoked potential responses in the visual cortex.5. Photic driving responses are abnormal if there are dramatic hemispheric voltage asymmetries or
frankly unilateral responses. The affected hemisphere does not generate a response. Otherwise,photic driving responses are considered to be normal (epileptiform activities are also abnormalwhen elicited, but these are termed PPRs). Some investigators think that prominent photic driv-ing responses, including at high stimulus frequencies, may be a marker of hyperautonomicstates, but this phenomenon is insufficiently specific to be deemed pathological.
6. PPRs are denoted by epileptiform discharges generated in the context of IPS, sometimes contin-uing after the completion of the photic train. They signify an underlying epileptic process that isphotically sensitive. They are usually encountered in association with generalized epilepsies,although they may also be seen in focal occipital epilepsies.
7. Photomyoclonus refers to entrained contraction of the frontalis muscle in the context of IPS. It is considered a normal phenomenon.
8. The photoelectric effect refers to an electrode-derived artifact caused by a photochemical reac-tion from the silver electrode in response to light stimulation itself. It may be improved (and ver-ified) by shielding the involved lead from the direct illumination of the strobe source.
9. Other methods of EEG activation during inpatient long-term monitoring include sleep depriva-tion, anticonvulsant withdrawal, and occasionally exposure to stimuli in the context of reflexepilepsies (e.g., reading or writing epilepsies).
10. REM sleep is not conducive to epileptiform activity because it is a more desynchronized pattern.Non-REM stages are much more productive of epileptiform features.
82 Dworetzky, Bromfield, and Winslow
06_Dworetzky 4/11/07 8:57 AM Page 82

7Normal Variant EEG Patterns
Richard L. Cervone and Andrew S. Blum
SummaryThe object of this chapter is to familiarize the reader with a number of commonly encountered
normal variants of brain-derived EEG activity. The term “normal variant pattern” refers to those rhythmsor waveforms that have features reminiscent of either interictal or ictal EEG abnormalities. However,these patterns have been found in a substantial proportion of tracings from healthy subjects and, therefore,are not currently thought to represent pathological entities. It is, therefore, vital that such patterns beappropriately recognized by the EEG reader as normal variants and not erroneously confused for patho-logical patterns. This chapter addresses four main categories of variant EEG activity:
1. Rhythmic patterns.2. Epileptiform patterns.3. Lambda and lambdoids.4. Age-related variants.
EEG artifacts derived from sources other than brain-derived activity will not be reviewed.
Key Words: Benign; EEG; epileptiform; rhythm; variant.
1. RHYTHMIC VARIANT PATTERNS
There are six main types of rhythmic variant EEG patterns:
1. Alpha variant.2. Mu rhythm.3. Rhythmic temporal theta burst of drowsiness (“psychomotor variant”).4. Subclinical rhythmic electrographic (theta) discharges in adults (SREDA).5. Midline theta rhythm.6. Frontal arousal rhythm (FAR).
1.1. Alpha Variant
This pattern was described first by Goodwin in 1947. There are two types of alpha variants,“slow” and “fast.” The slow (subharmonic) alpha variant appears as an abrupt rhythm usuallyat half the frequency of the patient’s more typical waking background rhythm, and often ofgreater voltage (Fig. 1). The fast (harmonic) alpha variant may appear as a notched or bifur-cated form of the patient’s usual waking background rhythm, so that a superimposed harmonicrhythm of twice the alpha frequency occurs. Alpha variants are blocked with eye opening andexhibit a posterior predominance, just as with normal alpha rhythms. Alpha variants vary intheir prevalence within a subject’s tracing, alternating with periods of normal-appearing alpha
From: The Clinical Neurophysiology PrimerEdited by: A. S. Blum and S. B. Rutkove © Humana Press Inc., Totowa, NJ
83
07_Blum 4/11/07 8:59 AM Page 83

84
Fig. 1. Slow alpha. This subject is 46 yr of age. Note how the posterior background rhythm shifts from abilateral 11-Hz rhythm earlier in the figure to a somewhat notched biposterior 5- to 6-Hz rhythm late in thefigure.
07_Blum 4/11/07 8:59 AM Page 84

Normal Variant EEG Patterns 85
activity. Alpha variants have been regarded as a physiological variation of the more familiarposterior background alpha activity, and do not predict increased convulsive tendency.
1.2. Mu Rhythm
Numerous terms have been applied to the mu rhythm, including arcade, comb, and wicketrhythms, owing to its morphology. Individual waveforms have an arciform morphology. Thisoccurs in waking over the central regions, especially the C3, Cz, and C4 contacts (Fig. 2). It isclosely associated with the sensorimotor cortex, hence the term “mu,” for motor. Mu exhibitsa frequency in the alpha range, typically at 9 to 11 Hz. Niedermeyer observed this rhythm inapprox 14% of adolescents’ EEG tracings, and less often in younger children and the elderly.Similar to the alpha activity of the occipital cortex, it exhibits physiological reactivity. Itattenuates with contralateral limb movement or just planned movement of the contralaterallimb. With direct cortical recording methods, a 20-Hz beta activity may be observed from thesensorimotor cortex, with similar reactivity. Thus, the scalp-recorded mu is likely a subhar-monic of this underlying rhythm.
Mu is usually observed bilaterally with shifting predominance; it may, however, be asym-metrical and asynchronous. Mu activity is augmented in the setting of a focal skull breach.This could, for instance, explain some instances of highly lateralized mu rhythms. Exclusivelylateralized mu should raise a suspicion of an abnormality in the hemisphere lacking mu activity.Sometimes, focal mu activity in the setting of a bony defect of the skull may be so sharp andof higher voltage as to falsely mimic an epileptogenic focus.
1.3. Rhythmic Temporal Theta Bursts of Drowsiness (“Psychomotor Variant”)
Gibbs et al. called this pattern the “psychomotor variant” because it was thought to representa temporal lobe or psychomotor seizure. This concept has been more recently discarded becausethis pattern is observed in asymptomatic healthy individuals and exhibits poor correlation withpatients with true temporal lobe or psychomotor seizures. This pattern has also been called“rhythmic mid-temporal discharges” describing its character, location, and frequency.
This pattern may be present in waking or early drowsiness and usually in tracings of adultsand adolescents. It wanes with deepening sleep. As its name implies, this particular patternis found in the mid-temporal head regions, but can spread parasagittally. It is comprised of5- to 7-Hz rhythms in bursts or trains lasting often longer than 10 s and sometimes beyond aminute (Fig. 3). This variant rhythm can exhibit variable morphologies, but is often sharplycontoured. It is usually monomorphic; it does not evolve significantly in frequency or amplitude,as occurs in most ictal patterns. Rhythmic mid-temporal discharges can occur bilaterally orindependently with shifting hemispheric predominance. This pattern is uncommon; its inci-dence is approx 0.5%, according to Gibbs et al.
1.4. Subclinical Rhythmic Electrographic Discharges in Adults
This variant pattern involves sharply contoured 5- to 7-Hz activities with a wide distribution,mainly over temporo-parietal derivations. It is usually bilateral, but can be asymmetricallydisposed. SREDA can appear as repetitive monophasic sharp waves or as a single dischargefollowed seconds later by sharp waves that gradually accelerate to form a sustained, rhythmictrain of theta activity. This may last from 20 s to several minutes, usually 40 to 80 s. Becauseof its duration and evolution, SREDA can easily be misinterpreted as an ictal pattern, evenby experienced readers. Nevertheless, SREDA has not been shown to have any consistent
07_Blum 4/11/07 8:59 AM Page 85

86
Fig. 2. Mu. This subject is 27 yr old. Note the prominent mu rhythm over the C3 contact. This blocks efficientlywhen the subject is asked to make a fist with the contralateral hand, as indicated.
07_Blum 4/11/07 8:59 AM Page 86

87
Fig. 3. Psychomotor variant. The subject is 20 yr of age. Note the run of monomorphic sharply contoured thetaactivity lasting 2 to 3 s over the left temporal channels.
07_Blum 4/11/07 8:59 AM Page 87

correlation with seizures. SREDA is more typically seen in older adults, and more commonat rest, drowsiness, or during hyperventilation.
1.5. Midline Theta Rhythm
The midline theta rhythm is most prominent at Cz but may spread to nearby contacts. This5- to 7-Hz frequency exhibits either a smooth, arc-shaped (mu-like) or spiky appearance. Theduration is variable and it tends to wax and wane. It is more common in wakeful and drowsystates and reacts variably to limb movements, alerting, and/or eye opening. This rhythm isnow regarded to be a nonspecific variant, although it once was considered a marker of anunderlying epileptic tendency.
1.6. Frontal Arousal Rhythm
FAR involves trains of 7- to 10-Hz activities in the frontal head regions. These rhythmsmay be notched and may last up to 20 s. FAR has been described as an uncommon rhythmthat appears during sleep-to-wake transitions, especially in children. FAR disappears once thesubject is fully awake. This pattern was, at one time, associated with children with minimalcerebral dysfunction, but this specific association has been subsequently doubted. This patternis still considered to be a nonspecific finding without pathological significance.
2. EPILEPTIFORM VARIANT PATTERNS
There are 4 major types of epileptiform variant patterns:
1. 14- and 6-Hz positive bursts.2. Small sharp spikes (benign epileptiform transients of sleep [BETS]).3. 6-Hz spike and wave (phantom spike and wave).4. Wicket spikes.
2.1. Fourteen- and 6-Hz Positive Bursts
Previously called “14- and 6-Hz positive spikes” or “ctenoids,” these variants occur as burstsof rhythmic arched waves, similar to sleep spindles, with a smooth negative component and aspike-like positive component (Fig. 4). As the name implies, these trains occur at 14 and 6 Hz.The bursts last only 0.5 to 1 s. Such bursts are best captured on referential montages (becauseof the greater interelectrode distances). They are maximal at the posterior temporal head regionsand usually occur independently from bilateral hemispheres with shifting predominance. This variant appears in 10 to 58% of healthy subjects, but is influenced by age, montage, andduration of drowsiness and sleep. This pattern is more prevalent in children and adolescents.
2.2. Small Sharp Spikes/BETS
As these names imply, small sharp spikes or BETS are low in amplitude (~50 µV) andbrief (~50 ms). Their morphology can be monophasic or diphasic. When diphasic, the ascendinglimb is quite abrupt and the descending limb slightly less so. They may exhibit a subtlefollowing slow wave. BETS are isolated and sporadic. They appear during drowsiness andlight sleep in adults. They are usually unilateral but can appear independently (and rarelysynchronously) from bilateral regions (Fig. 5). On a transverse montage, their field oftenillustrates a transverse oblique dipole (opposite polarities across the opposing hemispheres),an atypical finding in bona fide epileptiform discharges. Other distinguishing features
88 Cervone and Blum
07_Blum 4/11/07 8:59 AM Page 88

between BETS and epileptiform activity are that BETS do not run in trains, distort the back-ground, or coexist with rhythmic slowing, and BETS diminish with deepening sleep, whereasepileptiform discharges worsen with deeper sleep stages. White et al. reported the incidenceof BETS to be comparable in healthy subjects (24%) as in symptomatic patients (20%). Thus,BETS seem unrelated to the diagnosis of epilepsy.
Normal Variant EEG Patterns 89
Fig. 4. Fourteen- and 6-Hz positive bursts. Note the bursts of spiky morphologies with surface pos-itivity, here seen bilaterally with shifting laterality. They are best detected with long distance referen-tial montages. Reprinted from Goldensohn et al., 1999 with permission.
07_Blum 4/11/07 8:59 AM Page 89

90
Fig. 5. Benign epileptiform transients of sleep (BETS). This tracing is from a 45-yr-old subject. Note the diminutiveand very sharp diphasic transient seen broadly across the left temporal channels with spread to the left parasagittal chainof electrodes in the context of early sleep.
07_Blum 4/11/07 8:59 AM Page 90

Normal Variant EEG Patterns 91
2.3. Six-Hertz Spike and Wave (“Phantom” Spike and Wave)
These rhythms have a frequency ranging from 5- to 7-Hz. They occur in brief bursts last-ing 1 to 2 s, rarely up to 3 to 4 s. The spike component can be difficult to recognize becauseit is not only very brief but also of very low amplitude and, thus, has a fleeting quality. Thissubtle characteristic has given rise to the pithy term, “phantom” spike and wave. By contrast,its slow-wave component is broader in duration, higher in amplitude, and more widespreadin distribution.
This pattern appears in waking or drowsiness in adolescents and adults. However, it is absentfrom slow-wave sleep. Silverman reported its overall incidence to be 2.5%. It usually has adiffuse, bilaterally synchronous distribution. At times, it is asymmetric or more regional.
Phantom spike and wave can appear quite similar to the 6-Hz positive spike burst.Infrequently, a transition may be seen on the same subject’s EEG between these two types ofvariants. This pattern is thought by most to represent a benign finding. However, its morphol-ogy may be easily confused with an epileptiform pattern. Its failure to persist into slow wavesleep and its monomorphic quality permit its distinction from bona fide epileptiform discharges.
2.4. Wicket Spikes
This variant pattern appears as single spike-like waves or as intermittent trains of arc-likemonophasic waves at 6- to 11-Hz (Fig. 6). Amplitudes range from 60 to 200 µV. Wicketspikes commonly appear from temporal channels and can be bilateral and synchronous orwith shifting predominance. They occur mainly in drowsiness and light sleep in adults olderthan 30 yr of age.
When wicket spikes occur in isolation, they may be mistaken for an epileptiform dis-charge. Several features help differentiate isolated wicket spikes from pathological spikes. Asimilar morphology of the isolated wicket spike to those in a later train or cluster argues forthe variant pattern and against an epileptiform discharge. The absence of a following slow-wave argues for the variant and against an epileptiform discharge. An unchanged backgroundalso argues more for the variant and against an epileptiform event.
3. LAMBDA AND LAMBDOIDS
3.1. Lambda
Lambda waves are sharp monophasic or biphasic waveforms that resemble the Greekletter lambda. They have a duration of 160 to 250 ms, an amplitude of 20 to 50 µV, and usu-ally appear over bi-occipital leads, although occasionally may be unilateral (Fig. 7). Lambdawaves depend on rapid saccadic eye movements with eyes open. This variant pattern isusually generated when the patient scans a complex patterned design in a well-illuminatedroom, for instance, dotted ceiling tiles in the laboratory. They block by staring at a feature-less white surface or by closing the eyes. They are much more common in children 2 to 15 yrof age than in adults.
Slow lambda of youth, also known as shut-eye waves and posterior slow wave transientsassociated with eye movements, are associated with eye blinks in children. They appear overoccipital channels as single, broad monophasic or diphasic, mainly surface negative waves.These morphologies last 200 to 400 ms and have an amplitude of 100 to 200 µV. They maybe asymmetric. They are usually found in children younger than 10 yr of age.
07_Blum 4/11/07 8:59 AM Page 91

3.2. Lambdoids
Lambdoids, also called positive occipital sharp transients of sleep (POSTS) have a check-mark (biphasic) morphology with initial surface positivity and often appear in trains up to 4to 5 Hz (Fig. 8). POSTS are usually synchronous but can be asymmetric in size. There aremost commonly seen between 15 and 35 yr of age, and usually in light sleep. They mayappear before the alpha rhythm completely evaporates in drowsiness. POSTS are a com-monly encountered variant pattern on routine EEGs.
Slow lambdoids of youth, also known as cone-shaped waves or O-waves, are high voltage,diphasic slow transients seen over the occipital contacts and frequently with the occipitaldelta activity in deeper sleep states (Fig. 9). As the name implies, they are cone-shaped. Theycan be seen up to 5 yr of age.
92 Cervone and Blum
Fig. 6. Wicket spikes. Wicket spikes are often seen over temporal channels in drowsy or sleeprecordings in adults. Reprinted from Goldensohn et al., 1999 with permission.
07_Blum 4/11/07 8:59 AM Page 92

93
Fig. 7. Lambda. This is from a 42-yr-old subject. Note the bilateral triangular-shaped morphologies over the occipitalderivations evident with eyes open in waking.
07_Blum 4/11/07 8:59 AM Page 93

94
07_Blum 4/11/07 8:59 AM Page 94

95
Fig. 8. Positive occipital sharp transients of sleep (POSTS). These derive from a drowsy 26-yr-old subject. (A) IllustratesPOSTS occurring in a biposterior train at 2 to 4 Hz. In this anterior–posterior bipolar montage, POSTS have a check-markappearance. The initial deflection is surface positive. This is better demonstrated in (B), which illustrates the same fragmentreformatted in an average-reference montage. Note the frequent positive waveforms over the bi-occipital contacts.
07_Blum 4/11/07 8:59 AM Page 95
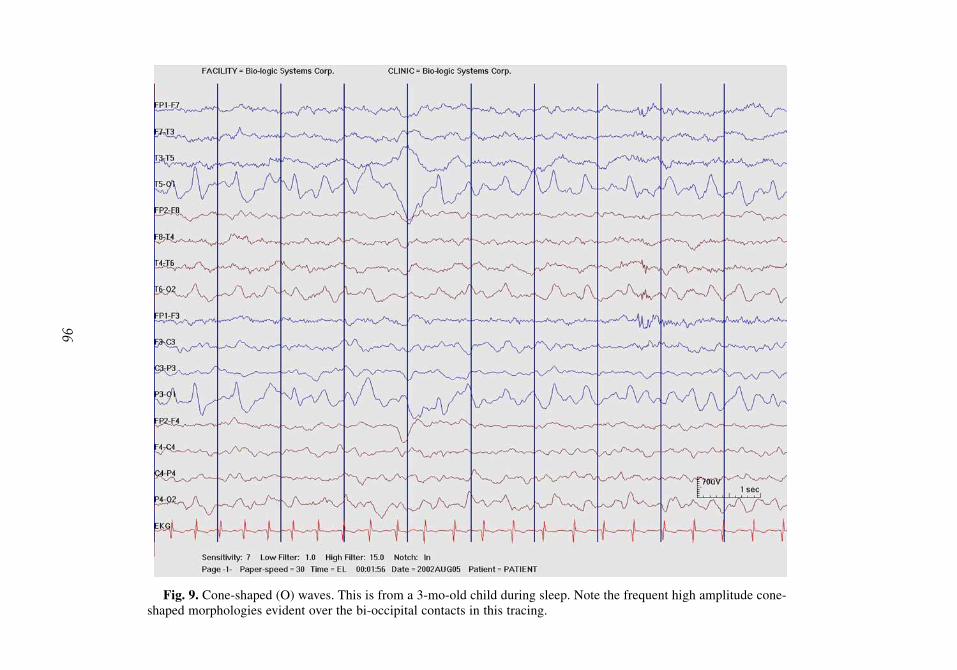
96
Fig. 9. Cone-shaped (O) waves. This is from a 3-mo-old child during sleep. Note the frequent high amplitude cone-shaped morphologies evident over the bi-occipital contacts in this tracing.
07_Blum 4/11/07 8:59 AM Page 96

97
Fig. 10. Posterior slow waves of youth (youth waves). This is from the tracing of an 11-yr-old girl. Note the complexwaveforms seen over the biposterior contacts. They illustrate the fused waveforms involving a delta waveform with asuperimposed or “fused” alpha rhythm on top.
07_Blum 4/11/07 8:59 AM Page 97

98 Cervone and Blum
4. AGE-DEPENDENT VARIANTS
Posterior slow waves of youth, also called youth waves, posterior fused transients, and sailwaves, are triangular, 2- to 4-Hz waveforms that coexist with other waking backgroundrhythms (Fig. 10). They commonly form a complex that consists of the slow delta componentwith superimposed and following faster rhythms of the waking background rhythm, hence theterm “fused.” They are best seen over the posterior head regions in waking. These waves areoccasionally asymmetric. These waveforms behave just like normal waking backgroundrhythms in that they block with eye opening, increase with hyperventilation, and disappearin drowsiness. Youth waves usually appear between the ages of 8 to 20 yr, maximally inearly adolescence.
Hyperventilation-induced slowing refers to a build-up of diffuse theta and delta activitiesin response to hyperventilation for several minutes during the EEG. This build-up may beabrupt or gradual and is often rhythmic and of high amplitude (up to 500 µV); it shouldresolve within 1 min after cessation of the patient’s hyperventilation effort. This slowing ismore prominent posteriorly in children and more anteriorly in young adults. This phenome-non is highly age dependent. It is extremely common in children and adolescents, becomingless common in young adults and thought by many to be uncommon after the age of 30 yr.As such, many laboratories regard this finding as a nonspecific abnormality in tracings ofthose older than 30 yr of age. Focal slowing or epileptiform activity evoked during hyperven-tilation is, however, pathological in nature.
Temporal theta in the elderly is a commonly encountered age-dependent pattern. This is a4- to 5-Hz activity involving temporal channels and is thought by some to represent a subhar-monic of the 8- to 10-Hz background rhythm common in the elderly. However, this rhythm isdistinct from the alpha rhythm in that it persists with eye opening and even into drowsi-ness and light sleep. Hyperventilation augments this pattern’s voltage and persistence.Temporal theta in the elderly usually occurs as very brief fragments lasting only two to threewaves, rarely more than seven. Some have observed them to be more prevalent over the lefthemisphere. Their significance remains controversial. Some regard these waveforms as normalvariants but others have suggested that they may signify underlying vascular insufficiency,possibly subclinical in nature. Low-voltage intermittent temporal theta activity in asympto-matic elderly individuals has been estimated to occur with an incidence of approx 35%.
SUGGESTED READING
Arenas AM, Brenner RP, Reynolds CF III. Temporal slowing in the elderly revisited. Am J EEGTechnol 1986;26:105–114.
Gibbs FA, Rich CL, Gibbs EL. Psychomotor variant type of seizure discharge. Neurology (Minneap)1963;13:991–998.
Goldensohn ES, Legatt AD, Koszer S, Wolf SM. Goldensohn’s EEG Interpretation: Problems ofOverreading and Underreading, 2nd ed. Futura Publishing, Armonk, NY, 1999.
Goodwin, JE. The significance of alpha variants in the EEG, and their relationship to an epileptiformsyndrome. Am J Psychiatry 1947;104:369–379.
Netchine S, Lairy GC. The EEG and psychology of the child. In: Handbook of Electro-encephalography and Clinical Neurophysiology, Vol. 6: The Normal EEG Throughout Life. Part B:The Evolution of the EEG From Birth to Adulthood (Lairy GC, ed). Elsevier Scientific, Amsterdam,Holland, 1975, pp. 69–104
Niedermeyer E, Lopes da Silva FH, eds. Electroencephalography: Basic Principles, ClinicalApplicatons and Related Fields, 3rd ed. Williams and Wilkins, Baltimore, MD, 1993.
07_Blum 4/11/07 8:59 AM Page 98
Pedley TA. EEG patterns that mimic epileptiform discharges but have no association with seizures.In: Current Clinical Neurophysiology: Update on EEG and Evoked Potentials, (Henry CE, ed.).Elsevier/North Holland, New York, NY, 1980, pp. 307–336.
Silverman D. Phantom spike-waves and the fourteen and six per second positive spike pattern: aconsideration of their relationship. Electroencephalogr Clin Neurophysiol 1967;22: 207–213.
Westmoreland BF. Normal and benign EEG patterns. Am J EEG Technol 1982;22:3–31.Westmoreland BF. Chapter 8: Benign EEG variants and patterns of uncertain clinical significance. In:
Current Principles and Practice of Clinical Electroencephalography, 2nd ed., (Daly DD, Pedley TA,eds.). Lippincott-Raven, Philadelphia, PA and New York, NY, 1997, pp. 243–251.
White JC, Langston JW, Pedley TA. Benign epileptiform transients of sleep: clarification of the smallsharp spike controversy. Neurology 1977;27:1061–1068.
REVIEW QUESTIONS
1. Alpha variant may:A. Be a subharmonic (slow) frequency of normal alpha.B. Be a harmonic (fast) frequency of normal alpha.C. Block with eye opening.D. Be sporadic, intermingling with normal alpha or may predominate.E. All the above.
2. Mu has features that may include:A. Predominantly found at the C3 and/or C4 contacts.B. An arciform appearance.C. Blocking with contralateral upper extremity use or planned use.D. More common in adults vs children.E. All of the above.
3. Which one of the following statements concerning the psychomotor variant pattern is false?A. It is also known as rhythmic temporal theta bursts of drowsiness.B. It is typically seen in patients with temporal lobe (“Psychomotor”) epilepsy.C. It usually exhibits a 5- to 7-Hz frequency. D. It usually occurs in restful wakefulness or in drowsiness.E. None of the above is false.
4. The 14- and 6-Hz positive bursts (14- and 6-Hz positive spikes or ctenoids) are best des-cribed as:A. More common in children and adolescents, declining in prevalence with advancing age.B. Maximal over the posterior temporal regions, especially on referential montage.C. Similar in morphology to sleep spindles with a sharp, spike-like positive component and a
smooth, rounded negative phase.D. Exhibiting a brief duration of 0.5 to 1 s.E. All of the above.
5. BETS (small sharp spikes) typically:A. Have an amplitude of 50 µV and a duration of 50 ms.B. May be monophasic or diphasic with an abrupt ascent and a steep descent.C. May include a diminutive following slow wave.D. Appear in isolation, not in trains.E. All of the above.
6. Which of the following statements regarding phantom spike and wave are true?A. It persists into slow-wave sleep.B. This pattern often presents in lengthy trains up to 40 to 80 s.C. It resembles the 6-Hz positive spike burst variant, and both may coexist in the same tracing.D. The pattern is fleeting or “phantom-like,” in that it may be easily blocked by eye opening.E. All of the above.
Normal Variant EEG Patterns 99
07_Blum 4/11/07 8:59 AM Page 99

100 Cervone and Blum
7. Lambda waves can be:A. Seen only with the eyes open.B. Seen when the patient scans a complex pattern and block when looking at a featureless object.C. Seen in the posterior (occipital) head regions.D. More common in children rather than adults.E. All of the above.
8. POSTS are:A. Usually seen in light sleep and typically just before the alpha rhythm disappears.B. Seen over a wide age range, including children to the elderly.C. Demonstrate a check-mark morphology.D. Usually synchronous over the occipital regions, but may show asymmetric amplitudes.E. All of the above.
9. Posterior slow waves of youth (youth waves):A. Block with eye opening.B. Accompany the posterior alpha rhythm.C. Typically increase with hyperventilation and decrease in drowsiness.D. Are triangular-contoured, with a frequency of 2 to 4 Hz.E. All of the above.
10. Temporal theta in the elderly:A. Is usually at 4 to 5 Hz .B. Typically occurs in brief runs of two to three waves, rarely greater than six to seven waves.C. Persists despite eye opening and despite drowsiness or light sleep.D. Is more common over the left hemisphere and may represent asymptomatic or subclinical
cerebrovascular insufficiency in the elderly.E. All of the above.
REVIEW ANSWERS
1. The correct answer is E.2. The correct answer is E.3. The correct answer is B.4. The correct answer is E.5. The correct answer is E.6. The correct answer is C.7. The correct answer is E.8. The correct answer is E.9. The correct answer is E.
10. The correct answer is E.
07_Blum 4/11/07 8:59 AM Page 100

8Epileptiform Abnormalities
Bernard S. Chang and Frank W. Drislane
SummaryDespite the advances in neuroimaging technology in recent decades, the EEG is still the cornerstone
of diagnostic testing for patients with epilepsy, and it remains the best real-time assessment of cerebralphysiological function available. For patients with suspected seizure disorders, the routine EEG is usedby clinicians to identify the presence of interictal epileptiform discharges that serve as a marker forepilepsy, and more prolonged ambulatory or inpatient EEG monitoring is used to record completeseizures. This chapter reviews interictal epileptiform abnormalities, ictal patterns observed in associa-tion with seizures, and periodic epileptiform discharge patterns.
Key Words: Epileptiform; ictal; interictal; periodic; polyspike; sharp wave; spike.
1. INTRODUCTION
Despite the advances in neuroimaging technology in recent decades, the EEG is still thecornerstone of diagnostic testing for patients with epilepsy, and it remains the best real-timeassessment of cerebral physiological function available. For patients with suspected seizuredisorders, the routine EEG is used by clinicians to identify the presence of interictal epilep-tiform discharges that serve as a marker for epilepsy, and more-prolonged ambulatory orinpatient EEG monitoring is used to record complete seizures. This chapter reviews interic-tal epileptiform abnormalities, ictal patterns observed in association with seizures, and peri-odic epileptiform discharge patterns.
2. INTERICTAL EPILEPTIFORM ABNORMALITIES
2.1. Spikes and Sharp Waves2.1.1. Description
Spikes and sharp waves are sharply contoured waveforms that are distinct from the EEGbackground and usually have a negative polarity (Fig. 1). They can be of any voltage and canoccur either singly or in repetitive runs with varying frequencies. They can be focal or gener-alized in distribution. Spikes, by definition, have a duration shorter than 70 ms, whereas sharpwaves have a duration between 70 ms and 200 ms. These discharges classically have an asym-metric appearance, with the initial deflection characterized by a sharper slope than the returnto baseline. They may be observed as isolated waveforms or they can be followed by a slowwave. Although similar deflections with a positive polarity are sometimes referred to as “posi-tive spikes,” nearly all epileptiform discharges of clinical interest are of negative polarity.
From: The Clinical Neurophysiology PrimerEdited by: A. S. Blum and S. B. Rutkove © Humana Press Inc., Totowa, NJ
101
08_Chang 4/11/07 9:02 AM Page 101

102
Fig. 1. Sharp waves. Note the run of sharp wave discharges evident over the anterior left temporal channels, withphase reversal at F7.
08_Chang 4/11/07 9:02 AM Page 102

Epileptiform Abnormalities 103
2.1.2. Physiological Basis and Significance
A spike is thought to be generated by the synchronous depolarization of thousands of cor-tical neurons located within an area of at least 6 cm2. Sharp waves are thought by some toresult from the synchronous activation of either a smaller pool of neurons or a pool of neu-rons further from the recording electrode, such as below the cortical surface. However, mostelectroencephalographers consider spikes and sharp waves to have the same physiologicalsignificance: they are interictal epileptiform discharges that serve as markers for epileptoge-nesis, either focal or generalized, and are suggestive of an underlying propensity towardseizures. They are observed only rarely in healthy individuals.
2.1.3. The Spike-and-Slow-Wave Complex
This term refers to the occurrence of a spike followed immediately by a slow wave, whichcan be of varying frequency and amplitude, and is usually distinct from the underlying back-ground (Fig. 2). Sharp-and-slow wave complexes include a sharp wave as the initial wave-form, rather than a spike. The following slow wave in these discharges may representinhibition and subsequent hyperpolarization of cortical neurons that follows the initial syn-chronous depolarization. Spike-and-slow wave complexes are strongly suggestive of anunderlying epileptic disorder.
2.1.4. Polyspikes
These are discharges characterized by multiple spikes observed in rapid succession, typi-cally at frequencies of 10 Hz or faster (Fig. 3). They may be followed by a slow wave.Polyspikes may be observed in many generalized seizure disorders, particularly those inwhich myoclonus is a feature, and at times may occur in temporal association with a clini-cally noted myoclonic jerk.
2.1.5. Differential Diagnosis
Because of the clinical and physiological significance of spikes and sharp waves, it isimportant to recognize the features that distinguish them from other similar waveforms.Many of these are also discussed in Chapter 7, on normal EEG variants.
2.1.6. Vertex Waves
Vertex waves are broad, sharply contoured waveforms of negative polarity that are typi-cally central in location and observed mostly during Stage II sleep (Fig. 4). Individual vertexwaves can appear more prominently over one hemisphere, as long as they are not persistentlyunilateral. Because sleep can be associated with an exacerbation of epileptiform activity, dis-tinguishing central spikes from vertex waves may be difficult in certain cases. However, avertex wave usually has a symmetric morphology, whereas the initial deflection of a spike isusually steeper than the return to baseline.
2.1.7. Wicket Spikes
Wicket spikes are sharp negative-polarity waveforms that can be of high amplitude and aretypically observed in the temporal regions of older adults (Fig. 5). Most commonly, they ariseout of a high-amplitude background that is already somewhat sharp in morphology. They areof uncertain clinical significance but do not seem to suggest an underlying epileptic disorder.
2.1.8. Small Sharp Spikes, or Benign Epileptiform Transients of Sleep
Small sharp spikes, or benign epileptiform transients of sleep (BETS), are low-amplitude,short-duration waveforms that are symmetrically biphasic. As their name suggests, they are
08_Chang 4/11/07 9:02 AM Page 103

104
Fig. 2. Spike and slow wave. Note the characteristic spike followed by a slow wave, in this instance distributed bi-anteriorly at close to 4 Hz. Spikes may sometimes seem to be “buried” by the slow wave component, giving rise toa notched appearance, as seen in portions of this burst.
08_Chang 4/11/07 9:02 AM Page 104

105
Fig. 3. Polyspike and slow wave. A bi-anterior burst of polyspikes appear, followed by a prominent slow wave. Theseare more commonly observed in generalized epilepsies, but are not unique to such.
08_Chang 4/11/07 9:02 AM Page 105

106
Fig. 4. Waveforms with epileptiform appearance: vertex waves. Vertex waves are typically central in location andare observed mostly during Stage II sleep. Here, vertex waves appear in a clustered fashion, with phase reversal aboutthe vertex channels, as illustrated in this transverse montage.
08_Chang 4/11/07 9:02 AM Page 106

Epileptiform Abnormalities 107
Fig. 5. Waveforms with epileptiform appearance: wicket spikes. Wicket spikes are of uncertainclinical significance but are typically observed in temporal channels in older adults. FromGoldensohn et al., 1999 with permission.
observed during sleep, and are most common over the temporal regions, although they can bemore widespread, unilateral or bilateral, and can have a horizontal dipole distribution. Theyare usually a normal EEG variant of no known clinical significance.
2.1.9. Rhythmic Midtemporal Theta Bursts, or Psychomotor Variant
Rhythmic midtemporal theta bursts, or psychomotor variant, are sharp in morphology andoccur classically at a 6-Hz frequency. A characteristic feature is the notched appearance ofthe waveforms (Fig. 6). They most commonly occur in the temporal regions of young adultsduring sleep. They are a normal EEG variant of no clinical significance.
08_Chang 4/11/07 9:02 AM Page 107

108
Fig. 6. Waveforms with epileptiform appearance: rhythmic midtemporal theta bursts. This pattern is also known as the“psychomotor variant.” Note the run of unchanging 5-Hz activity over the left temporal channels lasting 3 s in this trac-ing. The patient is drowsy, as is commonly the case for this pattern. This pattern is no longer considered pathological.
08_Chang 4/11/07 9:02 AM Page 108

Epileptiform Abnormalities 109
Fig. 7. Waveforms with epileptiform appearance: 14-and-6 Hz positive bursts. Fourteen- and 6-Hzpositive bursts are seen with shifting laterality in this tracing. They are downward deflections, verysharply contoured, broadly distributed, and best seen with long-distance referential recording tech-nique. They are a normal variant pattern. From Goldensohn et al., 1999 with permission.
2.1.10. Fourteen- and 6-Hz Positive Bursts
Fourteen- and 6-Hz positive bursts are distinguished from epileptiform spikes by their posi-tive polarity and their characteristic mixture of 14-Hz and 6-Hz frequencies (Fig. 7). Theyusually occur in the recordings of adolescents and young adults during sleep, and are bestobserved using montages with long interelectrode distances or ear references. Although, in
08_Chang 4/11/07 9:02 AM Page 109

the past, electroencephalographers have associated 14- and 6-Hz positive bursts with a vari-ety of neurological abnormalities, they are now thought to be a normal variant.
2.1.11. Occipital Spikes of Blindness
Occipital spikes of blindness can be observed in patients with acquired visual loss in child-hood. They are epileptiform in appearance and often quite narrow but are not thought to suggestan underlying seizure disorder.
2.1.12. Six-Hertz Spike-and-Wave, or “Phantom” Spike-and-Wave
Six-Hertz spike-and-wave, or “phantom” spike-and-wave, is a discharge characterized byrepetitive spike-and-slow wave complexes occurring at a 6-Hz frequency, with the spikebeing of very low amplitude compared with the following slow wave. It is typically observedin a generalized distribution but may be posteriorly predominant. Six-Hertz spike-and-waveis not thought to be associated with clinical seizures.
2.1.13. Sharply Contoured Artifact
Finally, sharply contoured artifact can also be confused for true spikes and sharp waves.ECG artifact is frequently sharp in morphology and is identified by a clear temporal associ-ation with the QRS complex on the cardiac rhythm strip. Muscle artifact can be quite sharpbut is usually of an extremely fast frequency that distinguishes it from cerebrally generatedactivity. Electrode dysfunction or “pop” artifact can also be initially confused for epileptiformactivity. However, this artifact characteristically lacks the appropriate field expected in abrain-derived discharge. It is also often much steeper at the outset than bona fide epileptiformdischarges, with an exponential decay.
2.2. Epileptiform Discharges by Location
Spikes and sharp waves from several brain regions deserve particular mention because oftheir special significance or the frequency with which they are observed.
2.2.1. Temporal Spikes
The majority of partial seizures in adults stem from the temporal lobes, and, thus, temporalspikes and sharp waves are the most frequently observed focal interictal discharges (Fig. 1).There is a large literature on the significance of interictal temporal discharges in helping todetermine the laterality of temporal lobe seizure onset, and synchronous bitemporal dischargesor even unilateral discharges from the side contralateral to ictal onset can be observed, presum-ably because the two mesial temporal lobes are so intimately connected. Extra electrodes arefrequently used to provide more coverage of temporal areas: “true anterior temporal” scalpelectrodes are placed by some laboratories (referred to as T7 and T8 in American ClinicalNeurophysiology Society nomenclature), whereas many use sphenoidal needle electrodes,which are inserted several centimeters deep to the surface below the zygomatic arch bilater-ally and record from near the mesial temporal lobes.
2.2.2. Centrotemporal (or “Rolandic”) Spikes
These are characteristic of the childhood syndrome of benign epilepsy with centrotem-poral spikes (Rolandic epilepsy) and are observed over the centrotemporal region eitherunilaterally or bilaterally (Fig. 8). These are typically high-amplitude biphasic or, lessoften, polyphasic spikes or sharp waves, with a following slow wave. In patients with thissyndrome, these discharges can occur quite frequently, particularly during sleep. Often the
110 Chang and Drislane
08_Chang 4/11/07 9:02 AM Page 110

111
Fig. 8. Centrotemporal (“Rolandic”) spikes. This bipolar tracing is from a 5-yr-old boy with a history of spells ofconvulsive activity involving the left arm. Note the frequent high-amplitude sharp and slow waves appearing independ-ently from bicentral channels with some spread to involve the temporal channels as well, better seen on the right.These discharges are often sleep activated.
08_Chang 4/11/07 9:02 AM Page 111

112 Chang and Drislane
distribution suggests a horizontal dipole (i.e., a phase reversal in a referential recording or twosimultaneous phase reversals of opposite polarity in a bipolar recording), although this is notinvariable (Fig. 9). The clinical syndrome consists of simple partial seizures of the face,sometimes affecting speech or swallowing functions, and occasional generalized tonic–clonic(GTC) seizures. The syndrome is considered benign, in that underlying structural lesions arerarely observed (despite the clear focality of the discharges) and seizures do not usually per-sist beyond childhood. Rolandic epilepsy is thought to be inherited in an autosomal dominantfashion with incomplete penetrance, such that the characteristic EEG discharges can beobserved in some children without clinical seizures.
2.2.3. Occipital Spikes
These are observed in a syndrome analogous to, but less well-defined than, Rolandicepilepsy, called benign childhood epilepsy with occipital paroxysms. The occipital dischargesin this syndrome attenuate with eye opening. Importantly, these patients’ seizures, which arecharacterized by visual hallucinations and headache, are not typically photosensitive, and theEEG does not show an abnormal response to intermittent photic stimulation. As noted above,occipital spikes in patients with acquired blindness do not necessarily imply an underlyingtendency toward seizures.
2.2.4. Frontal Sharp Waves
These can be a normal EEG finding in neonates between 28 and 42 wk conceptional ageand, in this age group, do not necessarily imply an epileptic disorder, as long as there is nopersistent unilaterality. They are also termed encoches frontales, because of their classic“check-mark” appearance.
2.2.5. Generalized Spikes
In adults, generalized epileptiform discharges often have a bifrontal predominance, some-times to such an extent that the sharp or spike morphology is only truly observed frontallyand not in more posterior regions. Most electroencephalographers consider these bifrontallypredominant discharges to be manifestations of generalized epileptogenesis, however.
Generalized spikes are typically suggestive of an underlying generalized epilepsy. Asnoted above, a bifrontal predominance is common. In most idiopathic generalized epilepsies,spike-and-slow wave complexes are observed, sometimes repeating at frequencies that arecharacteristic of particular epilepsy syndromes. For example, interictal runs of generalizedspike-and-slow wave discharges recurring three times per second are most strongly associatedwith childhood or juvenile absence epilepsy (Fig. 10), whereas faster generalized discharges(four to six per second) are typically observed with the syndrome of juvenile myoclonicepilepsy (Fig. 11). “Slow” (less than three per second) generalized spike-and-slow wave discharges (Fig. 12) are an interictal pattern observed in Lennox–Gastaut syndrome, a child-hood disorder characterized by multiple seizure types and developmental delay.
Occasionally in patients with partial epilepsy, a physiologically focal epileptiform dischargecan spread so rapidly to involve the entire brain that, on visual analysis of the EEG, it seemsgeneralized in onset, a phenomenon called secondary bilateral synchrony.
2.3. Activation Procedures and Precipitants
The two commonly used activation procedures during a routine EEG, hyperventilation andintermittent photic stimulation, can increase the chance of detecting interictal epileptiform
08_Chang 4/11/07 9:02 AM Page 112
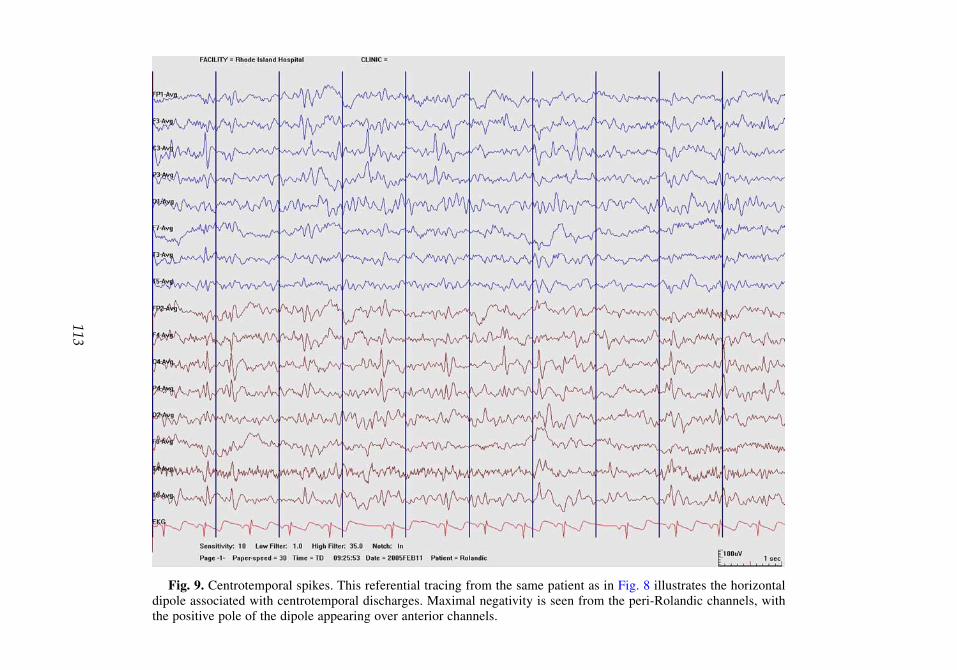
113
Fig. 9. Centrotemporal spikes. This referential tracing from the same patient as in Fig. 8 illustrates the horizontaldipole associated with centrotemporal discharges. Maximal negativity is seen from the peri-Rolandic channels, withthe positive pole of the dipole appearing over anterior channels.
08_Chang 4/11/07 9:02 AM Page 113

114
Fig. 10. Three-Hertz generalized spike-and-slow wave activity. This tracing derives from a 12-yr-old girl with staringspells and a positive family history. Note that this 8-s burst of bilaterally synchronous 3-Hz spike and wave activity arisesduring hyperventilation. The subject does not respond to the cue until the cessation of the spike and wave activity. Theburst is maximal over bi-anterior channels.
08_Chang 4/11/07 9:02 AM Page 114

115
Fig. 11. Fast spike-and-wave activity. This tracing is from a 17-yr-old girl with juvenile myoclonic epilepsy. Notethe synchronous, bi-anterior spike and wave activity at 4 to 5 Hz.
08_Chang 4/11/07 9:02 AM Page 115

116
Fig. 12. “Slow” spike-and-slow wave activity. This tracing is from a 36-yr-old man with Lennox–Gastaut Syndrome(LGS). In this case, there is a run of 2- to 21⁄2-Hz synchronous bi-anteriorly predominant sharp and slow wave activitylasting 7 s. Such activity, when prolonged, may appear during atypical absence seizures common to patients with LGS.
08_Chang 4/11/07 9:02 AM Page 116

discharges in susceptible patients. Hyperventilation can bring out both focal and generalizeddischarges, although it is most useful in eliciting the three-per-second spike-and-slow wavepattern observed with absence seizures. Intermittent photic stimulation usually triggersgeneralized discharges in patients with photosensitive generalized epilepsies.
Drowsiness and sleep are also precipitants of epileptiform discharges. For this reason, routineEEGs in patients with suspected seizure disorders are often performed after sleep deprivation,to maximize the chances of recording an adequate period of sleep. The various stages of non-REM sleep, in particular, seem to be associated with increased epileptiform activity. Somepatients may only have epileptiform discharges during sleep.
2.4. Clinical Interpretation of Epileptiform Abnormalities
The identification and characterization of interictal epileptiform discharges are usefulclinically in several ways. First, their mere presence can help to confirm the diagnosis in apatient in whom a seizure disorder is suspected. However, their limitation in this regard mustbe understood: only approx 50% of patients with known epilepsy have interictal dischargeson their first routine EEG. This number increases to 70% or greater with repeat studies.However, patients with mesial temporal lobe seizures may not have visible discharges ifonly standard scalp electrodes are used, and frontal lobe seizure patients also have a lowincidence of interictal discharges. Elderly epilepsy patients have a lower incidence ofinterictal discharges than do younger patients. Finally, approx 1% of patients who do nothave clinical seizures may have epileptiform discharges on their EEGs. In summary, then,although the finding of interictal epileptiform discharges is fairly specific for the diagnosisof epilepsy, a single EEG is not an exquisitely sensitive test for epilepsy, particularly in certainsituations or populations.
Interictal discharges can be critical, however, in the characterization of a patient’s epilepsysyndrome. For some patients, it is not possible on clinical grounds alone to determine whetherseizures are partial or generalized in onset, and some syndromes have characteristic interictalEEG discharges that form part of their definition.
Thirdly, a clinician may wish to assess the frequency of interictal discharges in a knownepilepsy patient, if there is a question of worsening seizures or frequent subclinical seizures,for example (surprisingly, however, frequent discharges do not necessarily correlate withfrequent seizures in many cases). In addition, patients with epilepsy who have unexplainedcognitive dysfunction or sleep disturbances may sometimes have very frequent interictal dis-charges during sleep, although the causal relationship between these discharges and theirsymptoms is not completely understood.
3. ICTAL PATTERNS
3.1. Introduction
Ictal patterns are those that are observed on EEG during clinical seizures. Although, intu-itively, one might expect that a seizure should appear electrographically to be a monotonousrepetition of multiple interictal epileptiform discharges in a row, this is not usually the case.Instead, the patterns during both focal- and generalized-onset seizures may have their ownunique morphology and evolution, and, in some cases, a good correlation can be madebetween clinical seizure phenomenology and ictal EEG pattern.
Epileptiform Abnormalities 117
08_Chang 4/11/07 9:02 AM Page 117

3.2. Generalized Ictal Patterns3.2.1. The Evolving Discharge of a GTC Seizure
The onset of a GTC seizure on EEG is typically characterized by the rapid (>10 per second)repetition of generalized spikes and polyspikes. These spikes usually increase in amplitude anddecrease in frequency during the first 10 to 20 s of a GTC seizure, corresponding to the tonicphase observed clinically. As the clonic phase ensues, bursts of generalized high-amplitudespike-and-slow wave or polyspike discharges may be observed coinciding temporally with theclonic jerks of the extremities, with a low-voltage suppressed background observed in betweenthe jerks. A gradual tapering of the frequency of the bursts is usually noted as the clonic jerksslow toward the end of the clinical seizure. Postictally, the background is suppressed, followedeventually by widespread delta-frequency slowing. It should be noted that, in most GTCseizures, much of the scalp EEG tracing from onset of tonic stiffening through the phase ofclonic jerking is usually obscured by widespread muscle artifact. The actual epileptiformdischarges may only partially be observed through the artifact, if at all.
3.2.2. Three-Per-Second Spike-and-Slow Wave Discharges
The classic EEG during an absence seizure demonstrates generalized spike-and-slow wavedischarges repeating at a frequency of three per second (Fig. 10). These seizures may lastonly for a few seconds at a time and may occur tens or hundreds of times a day. Patients usu-ally stare unresponsively during them, and may have minor automatisms. As described ear-lier, briefer interictal runs of the three-per-second pattern may be observed at other times,without any concomitant interruption in the patient’s awareness.
3.2.3. Slow Spike-and-Wave Discharges
Prolonged runs of generalized spike-and-slow wave discharges repeating at a “slow” fre-quency (less than three per second; Fig. 12) are the pattern usually observed in associationwith atypical absence seizures, one of the seizure types observed in Lennox–Gastaut syn-drome. During these seizures, patients stare but may also have complex automatisms. Asmentioned before, patients with Lennox–Gastaut syndrome usually have briefer bursts ofslow spike-and-wave discharges as an interictal pattern as well, without accompanying clin-ical manifestations.
3.2.4. Polyspike Discharges
Polyspikes (Fig. 3) are the cardinal feature of myoclonic seizures, such as those observedin the syndrome of juvenile myoclonic epilepsy. However, their presence is not universal, andrepetitive polyspike discharges can be observed as an ictal pattern in association with othergeneralized seizure types as well. Sometimes the polyspike discharges on EEG coincide tem-porally with the frequency of clinical myoclonic jerks.
3.2.5. Electrodecremental Pattern
This ictal pattern is observed primarily with three seizure types: infantile spasms, tonicseizures, and atonic seizures. The EEG demonstrates a sudden widespread drop in amplitude,resulting in a low-voltage fast rhythm that persists for at least a few seconds. This decrementmay be preceded by a high-voltage generalized slow wave. Infantile spasms, which are char-acterized by repeated episodes of flexion of the trunk and arms in jackknife-like movements,are usually associated with mental retardation, either cryptogenic or from a known etiology,such as tuberous sclerosis. In these cases, the interictal EEG may demonstrate hypsarrhyth-mia, an extremely high-voltage slow chaotic background with multifocal spikes. Tonic and
118 Chang and Drislane
08_Chang 4/11/07 9:02 AM Page 118

Epileptiform Abnormalities 119
atonic seizures can also manifest on EEG with an electrodecremental pattern, and are mostcommonly observed in Lennox–Gastaut syndrome.
3.3. Focal Ictal Patterns
Ictal EEG patterns observed in association with partial-onset seizures come in manyforms. As a general rule, it is the rhythmicity and evolution of an EEG pattern that suggestto an electroencephalographer that a focal pattern of activity is ictal in nature, more than anyother features. Here, we discuss briefly some of the commonly recognized focal ictal pat-terns. It should be noted that with all partial-onset seizures, secondary generalization to atonic–clonic seizure is usually associated with an evolution of the ictal EEG pattern fromlocalized activity to one typical for a GTC seizure, as described in Section 3.2.1.
3.3.1. Rhythmic Theta
Focal seizures, including many of temporal lobe origin, often begin with a focal area ofrhythmic theta activity, which is often not sharp in morphology initially (Fig. 13). The thetaactivity may be quite localized in appearance, but will typically undergo an evolution in whichthe amplitude becomes higher, the frequency may become faster or slower, and the morphologymay become sharper. In brief seizures, this may be the entire ictal pattern, with the rhythmicactivity either ending abruptly or, more commonly, gradually waning with decreased amplitudeand slower frequency. In longer seizures, this pattern may spread to adjacent channels as theclinical symptoms progress. Occasionally, localized rhythmic artifact confined to a small num-ber of electrodes may be difficult to distinguish from an ictal pattern. In these cases, it is usefulto remember that electrographic seizures typically display an evolving pattern, whereas rhyth-mic artifact may appear monotonous, and that rhythmic activity localized to a single electrodeis more likely to be artifact than a seizure, except possibly in neonatal recordings.
3.3.2. Rhythmic Beta
Another electrographic pattern of focal seizure onset involves the appearance of rhythmicbeta activity (Fig. 14). This can evolve to a pattern of slower frequencies and sharper morpholo-gies. Although rhythmic beta activity is uncommonly observed in scalp ictal recordings, it is fre-quently observed in ictal recordings obtained with intracranial electrodes, because the removalof the filtering effect of the skull allows higher frequencies to be observed more readily.
3.3.3. Repetitive Spikes and Sharp Waves
At times focal seizures begin with repetitive, rhythmic spikes and sharp waves that appearsimilar to the patient’s interictal epileptiform discharges. In these cases, what distinguishes aperiod of EEG activity as representing an ictal pattern rather than just frequent interictal dis-charges is the prominent rhythmicity of the discharges, their increased frequency comparedwith interictal discharges, and the overall evolution of their appearance and resolution.
A particular pattern of rhythmic triangular sharp waves has been described at the onset ofsome focal seizures; these sharp waves may be quite different from the patient’s usual inter-ictal discharges. This pattern of seizure onset is commonly observed in ictal recordings fromthe hippocampus using intracranial electrodes.
4. PERIODIC EPILEPTIFORM DISCHARGES
4.1. Introduction
Periodic discharges, as their name implies, are those that recur at regular intervals. In gen-eral, the term is used to refer to discharges that appear on the order of every second to every
08_Chang 4/11/07 9:02 AM Page 119

120
Fig. 13. Rhythmic theta. This tracing is from a 54-yr-old woman with refractory right temporal lobe epilepsy. Thisdepicts an evolving electrographic seizure involving rhythmic and sharply contoured theta activity over right tempo-ral channels, acquired during a complex partial seizure recorded during long-term monitoring.
08_Chang 4/11/07 9:02 AM Page 120

121
Fig. 14. Rhythmic beta. This tracing is from a 12-mo-old girl with infantile spasms. This particular page illustrates asudden burst of left hemispheric rhythmic beta activity at 13 to 14 Hz for 6 s, associated with sudden dystonic arm move-ments. The burst of rhythmic beta activity begins with a sudden high-amplitude sharp wave discharge, maximal at T3.
08_Chang 4/11/07 9:02 AM Page 121

122 Chang and Drislane
several seconds, but not fast enough to be considered ongoing seizure activity. In someinstances, periodic discharges on EEG are so characteristic of particular clinical diagnoses asto be nearly pathognomonic, whereas, in other cases, periodic discharges may be the nonspe-cific result of a variety of cerebral insults.
4.2. Patterns of Periodic Discharges4.2.1. Periodic Generalized Sharp Waves With One-Per-Second Frequency
This pattern is the characteristic EEG finding in Creutzfeldt–Jakob Disease (CJD), a progressive spongiform encephalopathy caused by prions that leads to dementia andmyoclonus, among other features (Fig. 15). More than 90% of all CJD patients will demon-strate this finding on EEG by the time the disease is advanced, but in the first few weeks ormonths the periodic discharges may be unilateral, not as prominent, or not present at all.They typically occur on a background that is slow and disorganized, and such an encephalo-pathic background may be the only EEG sign early in the disease course. New variant CJDdoes not seem to be associated with these periodic discharges.
4.2.2. Periodic Generalized Sharp Complexes Occurring Every 5 to 20 s
Subacute sclerosing panencephalitis, a late sequela of childhood measles infection, is char-acterized by these periodic EEG discharges that are separated by relatively long intervals. Anoteworthy feature is that clinically observed myoclonic jerks, which are a prominent sign ofthe disease, can occur in temporal association with these generalized complexes, which areusually of very high voltage and occur on a slow, disorganized background.
4.2.3. Periodic Lateralized Epileptiform Discharges
These are aptly named unilateral sharply contoured waveforms that recur at a regular fre-quency, usually every one to few seconds. The waveform appearance is commonly that of abroad, high-voltage sharp wave, sharp-and-slow wave complex, or sharply contoured triphasicwave (Fig. 16). The intervening background on the side of the discharges is abnormal, oftenslow, and of low voltage. Most commonly, periodic lateralized epileptiform discharges(PLEDs) are observed in the setting of an acute or subacute structural lesion of the cerebralhemisphere, often large and destructive in nature. Thus, stroke (both ischemic and hemor-rhagic), tumor, abscess, and encephalitis are among the common etiologies. In general,PLEDs are not thought to represent ongoing ictal activity, although a high percentage ofpatients with PLEDs have seizures at other times. Sometimes PLEDs are observed in latestatus epilepticus or during a recovery phase after status epilepticus, and less commonly apattern of PLEDs may increase in frequency and evolve into clear ictal activity. PLEDs canpersist for days to weeks after a cerebral insult, although their amplitude and frequencyusually decrease during that period of time. Periodic epileptiform discharges occurringindependently over the two cerebral hemispheres have been termed bilateral independentPLEDs; their presence sometimes suggests CNS infection.
The occurrence of PLEDs that are predominantly over the temporal regions suggests thediagnosis of herpes simplex encephalitis, a hemorrhagic infection caused by herpes simplexvirus that has a predilection for the orbitofrontal and temporal regions and can rapidly leadto encephalopathy, seizures, coma, and death. Because of the fulminant nature of this disor-der, the appearance of any periodic discharges over the temporal regions should immediatelyraise suspicion for this diagnosis in the appropriate clinical setting.
08_Chang 4/11/07 9:02 AM Page 122

123
Fig. 15. Periodic generalized sharp waves in Creutzfeldt–Jakob disease. This tracing derives from a 68-yr-old manwith a rapidly progressive dementia and myoclonus. The EEG demonstrates continuous, high-amplitude, periodicsharp waves at 1 to 1.5 Hz that are bilateral, although maximal over the left hemisphere. The technologist noted occa-sional clinical myoclonic jerking of the limbs during this acquisition.
08_Chang 4/11/07 9:02 AM Page 123

124
Fig. 16. Periodic lateralized epileptiform discharges (PLEDs). PLEDs are regularly recurring sharply contoured wave-forms seen unilaterally. This sample is from a 66-yr-old man after resection of a parafalcine meningioma complicated byintracranial hemorrhage. There are fairly monotonous, recurrent sharp wave discharges from the left frontal region at 1.4 Hz.
08_Chang 4/11/07 9:02 AM Page 124
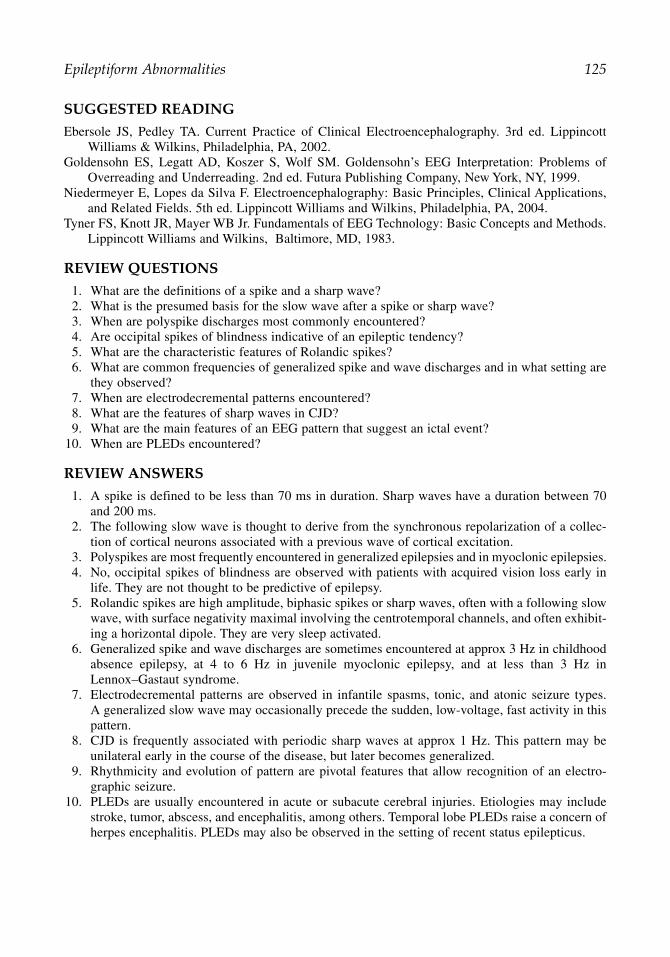
SUGGESTED READING
Ebersole JS, Pedley TA. Current Practice of Clinical Electroencephalography. 3rd ed. LippincottWilliams & Wilkins, Philadelphia, PA, 2002.
Goldensohn ES, Legatt AD, Koszer S, Wolf SM. Goldensohn’s EEG Interpretation: Problems ofOverreading and Underreading. 2nd ed. Futura Publishing Company, New York, NY, 1999.
Niedermeyer E, Lopes da Silva F. Electroencephalography: Basic Principles, Clinical Applications,and Related Fields. 5th ed. Lippincott Williams and Wilkins, Philadelphia, PA, 2004.
Tyner FS, Knott JR, Mayer WB Jr. Fundamentals of EEG Technology: Basic Concepts and Methods.Lippincott Williams and Wilkins, Baltimore, MD, 1983.
REVIEW QUESTIONS
1. What are the definitions of a spike and a sharp wave?2. What is the presumed basis for the slow wave after a spike or sharp wave?3. When are polyspike discharges most commonly encountered?4. Are occipital spikes of blindness indicative of an epileptic tendency?5. What are the characteristic features of Rolandic spikes?6. What are common frequencies of generalized spike and wave discharges and in what setting are
they observed?7. When are electrodecremental patterns encountered?8. What are the features of sharp waves in CJD?9. What are the main features of an EEG pattern that suggest an ictal event?
10. When are PLEDs encountered?
REVIEW ANSWERS
1. A spike is defined to be less than 70 ms in duration. Sharp waves have a duration between 70and 200 ms.
2. The following slow wave is thought to derive from the synchronous repolarization of a collec-tion of cortical neurons associated with a previous wave of cortical excitation.
3. Polyspikes are most frequently encountered in generalized epilepsies and in myoclonic epilepsies.4. No, occipital spikes of blindness are observed with patients with acquired vision loss early in
life. They are not thought to be predictive of epilepsy.5. Rolandic spikes are high amplitude, biphasic spikes or sharp waves, often with a following slow
wave, with surface negativity maximal involving the centrotemporal channels, and often exhibit-ing a horizontal dipole. They are very sleep activated.
6. Generalized spike and wave discharges are sometimes encountered at approx 3 Hz in childhoodabsence epilepsy, at 4 to 6 Hz in juvenile myoclonic epilepsy, and at less than 3 Hz inLennox–Gastaut syndrome.
7. Electrodecremental patterns are observed in infantile spasms, tonic, and atonic seizure types. A generalized slow wave may occasionally precede the sudden, low-voltage, fast activity in thispattern.
8. CJD is frequently associated with periodic sharp waves at approx 1 Hz. This pattern may beunilateral early in the course of the disease, but later becomes generalized.
9. Rhythmicity and evolution of pattern are pivotal features that allow recognition of an electro-graphic seizure.
10. PLEDs are usually encountered in acute or subacute cerebral injuries. Etiologies may includestroke, tumor, abscess, and encephalitis, among others. Temporal lobe PLEDs raise a concern ofherpes encephalitis. PLEDs may also be observed in the setting of recent status epilepticus.
Epileptiform Abnormalities 125
08_Chang 4/11/07 9:02 AM Page 125

08_Chang 4/11/07 9:02 AM Page 126

9Focal and Generalized Slowing, Coma,
and Brain Death
Edward M. Donnelly and Andrew S. Blum
SummaryThis chapter addresses the related topics of focal and generalized slowing, coma, and brain death.
These EEG abnormalities are encountered in a wide range of clinical situations of variable severity.Focal and generalized slowing are both common and highly nonspecific findings in the EEG laboratory.Despite their lack of etiological specificity, EEG slowing and related patterns often bear importantimplications for both the location of CNS abnormalities and/or the prognosis for neurological recovery.
Key Words: Burst suppression; continuous; delta; diffuse; electrocerebral inactivity; focal; intermit-tent; theta; triphasic wave.
1. FOCAL SLOWING
Focal slowing in the EEG suggests an underlying abnormality but is of nonspecific etiol-ogy. It may reflect structural (i.e., tumor or infarct) or functional (i.e., postictal or migraine)abnormalities. There exist two spectra of severity, one pertaining to frequency, with slowerrhythms representing more severe lesions, and one pertaining to persistence, with continuousslowing a more significant abnormality than intermittent slowing. An interhemispheric frequencydifference of less than 1 Hz is not considered significant.
Continuous slowing in the EEG, whether focal or generalized, tends to take the appearanceof either rhythmic monomorphic or arrhythmic polymorphic waveforms. These patterns oftenhave differing significance. Continuous focal arrhythmic polymorphic slowing (Fig. 1) usuallysuggests some type of structural lesion in the underlying subcortical white matter. Abscesses,ischemic strokes, tumors, contusions, and so on, all may produce this pattern. The mechanismfor this form of slowing may reflect disordered intracortical connectivity. Even transientfunctional disturbances, such as migraine and the postictal state, can be responsible. Thisillustrates the value of follow-up EEGs looking for evolution or resolution of any focal slowingthat may be present. Rarely, focal slowing (and even focal seizures) can suggest toxic–metabolicdisturbances, especially in hypoglycemic and hyperglycemic states. Continuous focalrhythmic monomorphic slowing, by contrast, is more commonly associated with underlyinggray matter lesions. Note that focal cortical lesions are more likely to produce focal voltageattenuation or epileptiform abnormalities rather than focal slowing. Focal rhythmicmonomorphic slow activity can also be intermittent. This is a less common pattern. The mannerof appearance should be considered. Recurrent bursts of paroxysmal focal slowing may raise
From: The Clinical Neurophysiology PrimerEdited by: A. S. Blum and S. B. Rutkove © Humana Press Inc., Totowa, NJ
127
09_Donnelly 4/11/07 9:03 AM Page 127

128
Fig. 1. Continuous focal arrhythmic polymorphic slowing. This EEG is from a 36-yr-old man with a right frontalbrain tumor. Note the continuous polymorphic theta and delta activities involving the right hemispheric channels withrelatively preserved normal rhythms over the left.
09_Donnelly 4/11/07 9:03 AM Page 128
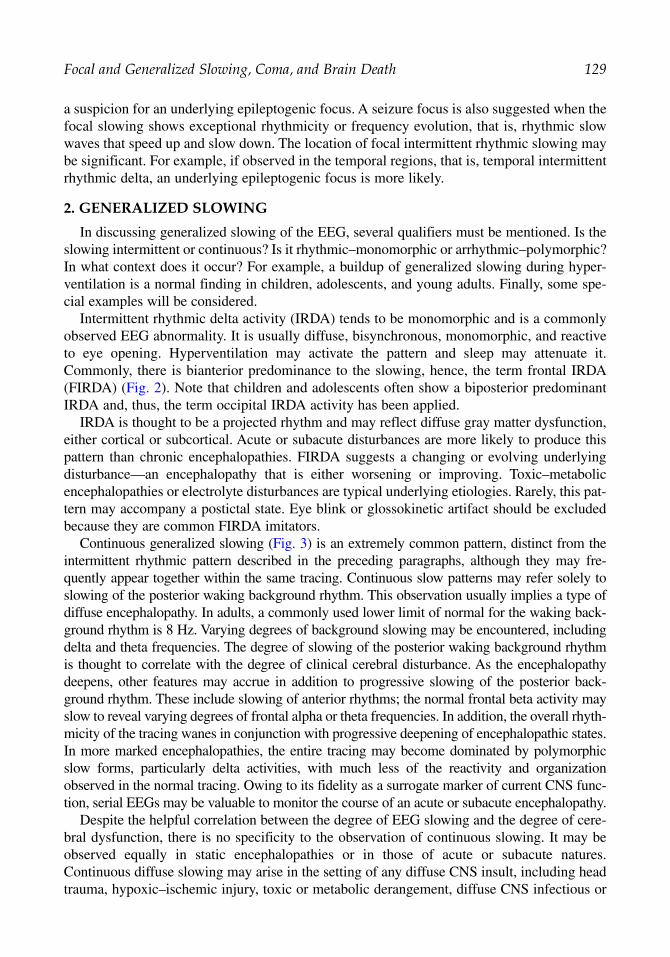
a suspicion for an underlying epileptogenic focus. A seizure focus is also suggested when thefocal slowing shows exceptional rhythmicity or frequency evolution, that is, rhythmic slowwaves that speed up and slow down. The location of focal intermittent rhythmic slowing maybe significant. For example, if observed in the temporal regions, that is, temporal intermittentrhythmic delta, an underlying epileptogenic focus is more likely.
2. GENERALIZED SLOWING
In discussing generalized slowing of the EEG, several qualifiers must be mentioned. Is theslowing intermittent or continuous? Is it rhythmic–monomorphic or arrhythmic–polymorphic?In what context does it occur? For example, a buildup of generalized slowing during hyper-ventilation is a normal finding in children, adolescents, and young adults. Finally, some spe-cial examples will be considered.
Intermittent rhythmic delta activity (IRDA) tends to be monomorphic and is a commonlyobserved EEG abnormality. It is usually diffuse, bisynchronous, monomorphic, and reactiveto eye opening. Hyperventilation may activate the pattern and sleep may attenuate it.Commonly, there is bianterior predominance to the slowing, hence, the term frontal IRDA(FIRDA) (Fig. 2). Note that children and adolescents often show a biposterior predominantIRDA and, thus, the term occipital IRDA activity has been applied.
IRDA is thought to be a projected rhythm and may reflect diffuse gray matter dysfunction,either cortical or subcortical. Acute or subacute disturbances are more likely to produce thispattern than chronic encephalopathies. FIRDA suggests a changing or evolving underlyingdisturbance—an encephalopathy that is either worsening or improving. Toxic–metabolicencephalopathies or electrolyte disturbances are typical underlying etiologies. Rarely, this pat-tern may accompany a postictal state. Eye blink or glossokinetic artifact should be excludedbecause they are common FIRDA imitators.
Continuous generalized slowing (Fig. 3) is an extremely common pattern, distinct from theintermittent rhythmic pattern described in the preceding paragraphs, although they may fre-quently appear together within the same tracing. Continuous slow patterns may refer solely toslowing of the posterior waking background rhythm. This observation usually implies a type ofdiffuse encephalopathy. In adults, a commonly used lower limit of normal for the waking back-ground rhythm is 8 Hz. Varying degrees of background slowing may be encountered, includingdelta and theta frequencies. The degree of slowing of the posterior waking background rhythmis thought to correlate with the degree of clinical cerebral disturbance. As the encephalopathydeepens, other features may accrue in addition to progressive slowing of the posterior back-ground rhythm. These include slowing of anterior rhythms; the normal frontal beta activity mayslow to reveal varying degrees of frontal alpha or theta frequencies. In addition, the overall rhyth-micity of the tracing wanes in conjunction with progressive deepening of encephalopathic states.In more marked encephalopathies, the entire tracing may become dominated by polymorphicslow forms, particularly delta activities, with much less of the reactivity and organizationobserved in the normal tracing. Owing to its fidelity as a surrogate marker of current CNS func-tion, serial EEGs may be valuable to monitor the course of an acute or subacute encephalopathy.
Despite the helpful correlation between the degree of EEG slowing and the degree of cere-bral dysfunction, there is no specificity to the observation of continuous slowing. It may beobserved equally in static encephalopathies or in those of acute or subacute natures.Continuous diffuse slowing may arise in the setting of any diffuse CNS insult, including headtrauma, hypoxic–ischemic injury, toxic or metabolic derangement, diffuse CNS infectious or
Focal and Generalized Slowing, Coma, and Brain Death 129
09_Donnelly 4/11/07 9:03 AM Page 129

130
Fig. 2. Frontal intermittent rhythmic delta activity. This tracing is from an 83-yr-old woman with dementia, normalpressure hydrocephalus, and syncope. Note the bursts of rhythmic delta activity with bi-anterior predominance. Thereis also slowing of posterior background rhythms.
09_Donnelly 4/11/07 9:03 AM Page 130

131
Fig. 3. Continuous generalized slowing. This is from a 73-yr-old man with a several year history of memory lossand recently increased confusion. Note the slightly irregular, continuous, 5- to 6-Hz activity evident biposteriorly aswell as more diffusely in this tracing.
09_Donnelly 4/11/07 9:03 AM Page 131

132 Donnelly and Blum
neoplastic processes, dementing illnesses, and even in multifocal conditions, such as multifo-cal, bihemispheric vascular insults. Indeed, because EEG offers relatively poor spatial resolu-tion, as vascular events accrue in the CNS, the tracing may lose its focal/multifocal quality andmay appear diffusely slow. Likewise, focal abnormalities may have less distinctive EEG signatures amid the diffuse slowing caused by an encephalopathy; focal details are lost. It isalso important to remember that generalized slowing is a normal feature of the drowsy or sleeptracing. One must take stock of the patient’s state when interpreting whether the observedslowing is pathological or merely reflective of state.
Triphasic waves (Fig. 4) represent a special type of generalized continuous slowing. Thekey features that distinguish triphasic waves from other forms of slowing include their typicaltriphasic morphology and a phase lag. The waves themselves are usually medium- to high-voltageslow waves occurring at a frequency of 1.5 to 2.5 Hz. They typically occur in a bilaterally sym-metric, bisynchronous fashion. Although they may wax and wane somewhat in amplitude andfrequency during the recording, they tend to exhibit a somewhat monotonous appearance.Triphasic waves usually show a phase lag of 25 to 140 ms across the anterior–posterior axis. Thisphase lag is more commonly observed in an anterior-to-posterior direction than vice versa.
Triphasic waves suggest a toxic–metabolic encephalopathy, most commonly a hepaticencephalopathy. However, this pattern is not specific for hepatic encephalopathy. Triphasicwaves can also be observed in other metabolic disorders, such as uremia, hyperthyroidism,hypercalcemia, hypoglycemia, hyponatremia, and lithium intoxication. Alzheimer’s diseaseand other dementias; prion diseases; structural pathologies, such as stroke and subduralhematoma; and cerebral carcinomatosis can also demonstrate this pattern. Triphasic wavesmay be quite difficult to differentiate from triphasic-appearing epileptiform morphologies,blunted sharp and slow wave complexes. This is even more problematic because both mayequally occur in similar clinical settings, such as in uremic encephalopathy.
3. COMA
Coma refers to a clinical state in which a person exhibits a decreased level of conscious-ness with eyes closed and no purposeful responses to applied stimuli. Just as in milderencephalopathic conditions, the depth of the coma is paralleled by helpful EEG findings. Inlighter forms of coma, the EEG may show some responsivity to stimuli with higher voltageand more prominent slowing. As the coma deepens, a blocking type response ensues, inwhich stimuli produce a voltage drop and attenuation of background activity. Finally, indeeper coma, the EEG becomes unreactive to patient stimulation.
Causes of coma are many and may include toxic–metabolic or hypoxic–ischemicencephalopathies as well as supratentorial or infratentorial structural pathologies. The EEGin coma may show several possible patterns, some of which can help identify etiology andsome of which may have prognostic implications.
When coma is caused by nonconvulsive status epilepticus (Fig. 5), the EEG can beextremely helpful because it not only quickly establishes etiology, but may also permit assess-ment of subsequent anticonvulsant treatment efficacy. In no other instance is the specificity ofthe EEG in coma higher than in nonconvulsive status epilepticus. Keep in mind, however, thatalthough the EEG may identify the cause of coma as an epileptic encephalopathy, there maybe an as yet unidentified disturbance acting as a precipitant, for instance, hypoxic–ischemicencephalopathy, uremia, stroke, and so on. The EEG provides an immediate assessment oftreatment efficacy in abolishing the epileptiform activity.
09_Donnelly 4/11/07 9:03 AM Page 132

133
Fig. 4. Triphasic waves. This is derived from the EEG of a 46-yr-old man with hepatic encephalopathy. Note thebi-anteriorly predominant waveforms with triphasic morphology. There are no clear phase reversals or embeddedsharp elements, and a subtle phase lag is evident along the anterior–posterior axis of the tracing.
09_Donnelly 4/11/07 9:03 AM Page 133

134
Fig. 5. Nonconvulsive status epilepticus. This tracing is from a 13-yr-old boy with absence epilepsy and a new prolongedconfusional state. Note the incessant, bisynchronous, very high amplitude 3-Hz spike-and-wave pattern. The patient wasquite confused, but could repeat if reminded to do so. This indicates absence status epilepticus.
09_Donnelly 4/11/07 9:03 AM Page 134

Focal slowing in the EEG of a comatose patient may suggest a structural cause, such as asupratentorial structural lesion. Such lesions often produce coma in the setting of various cere-bral herniation syndromes via mechanical compression of pontomesencephalic tegmentalzones important in “alerting” the cortex and permitting wakefulness.
Generalized burst suppression (Fig. 6) is another common EEG pattern observed in coma.The bursts occur in a quasi-periodic fashion and may contain admixed sharp and/or spike andslow waves. Myoclonic jerks can accompany the bursting. Asynchronous bursting may reflectdisordered interhemispheric cortical connectivity. Asymmetric burst voltage often signifiesasymmetric cortical injury and/or raises the suspicion of a breach effect or an overlying fluidcollection. The quasi-periodic bursts and suppressive intervals vary in duration with the depthof the coma. As the coma deepens, the bursts of activity become shorter and more infrequentand the suppressive intervals widen. This pattern reflects an exceptionally profound level ofdepressed consciousness. It is often observed during induction of general anesthesia. It is alsothe desired EEG pattern during administration of barbiturate therapy for refractory statusepilepticus or to help control increased intracranial pressure after traumatic brain injury.Burst suppression suggests a poor prognosis, depending on the etiology. In the setting of atoxin- or medication-induced coma, the prognosis may be far better than in hypoxic–ischemicinjury or trauma, in which burst suppression patterns may suggest a poor outcome.
Monotonous monorhythmic patterns can also be observed in the EEG of a comatose patient.Persistent, diffuse 8- to 12-Hz activity in a comatose patient is known as alpha coma (Fig. 7).This pattern, at first glance, may resemble normal background activity. However, the 8- to 12-Hzactivity appears diffusely, not over posterior head regions, as in the normal waking backgroundrhythm. Additionally, the pattern is completely unreactive to exogenous stimuli. Typical precip-itants of alpha coma include brainstem lesions and hypoxic–ischemic mechanisms. It may alsobe observed as an ante mortem pattern as the patient progresses from burst suppression to electrocerebral inactivity (ECI). Alpha coma is, thus, thought to imply a very poor prognosis,particularly in the setting of anoxic injury. However, rare case reports have shown neurologicalrecovery from this EEG pattern. Beta coma, theta coma, and delta coma are less common unre-active monomorphic EEG patterns whose prognostic significance is less clear.
Comatose patients can exhibit an EEG that seems to show features of normal sleep.Spindles, vertex waves, and K-complexes can be observed with cyclic variability. The EEGis distinguishable from normal sleep, however, because the patient is unarousable and theEEG does not react to applied stimuli. This pattern is sometimes referred to as spindle coma.These features associated with the EEG of sleep may disappear as the coma deepens.
Cheyne–Stokes respirations in a comatose patient may have a specific EEG correlate. Analternating pattern consisting of low-voltage irregular periods followed by higher-voltageslowing mirrors the respiratory rhythm changes. The cyclic alternating pattern may representthe effects of a cortical release phenomenon on the pacemaker function of the brainstemarousal system.
4. BRAIN DEATH
Brain death is a clinical diagnosis made when there is no evidence of brainstem function onsuccessive neurological exams. Protocols for declaring brain death vary among institutions andaccording to the age of the patient. The EEG is one of several tests that can help confirm thediagnosis. Complete absence of brain-derived rhythms, ECI (Fig. 8), can help confirm the clin-ical diagnosis of brain death. Electrocardiogram and respirator derived artifacts are often all that
Focal and Generalized Slowing, Coma, and Brain Death 135
09_Donnelly 4/11/07 9:03 AM Page 135

136
Fig. 6. Burst suppression. This 49-yr-old woman was recorded while undergoing induction with general anesthesia forvascular surgery. Bursts of bilaterally synchronous, higher amplitude mixed frequencies occur lasting 1 to 2 s, punctuatedby periods of relative attenuation lasting 3 to 4 s.
09_Donnelly 4/11/07 9:03 AM Page 136

137
Fig. 7. Alpha coma. This recording is of a 59-yr-old man on a respirator in the medical intensive care unit, partly sedated,in coma. He was unreactive to noxious stimulation. Note the diffuse and fairly continuous 9- to 9.5-Hz activities, with rever-sal of the usual anterior–posterior voltage gradient. This activity failed to vary with attempts to arouse the patient.
09_Donnelly 4/11/07 9:03 AM Page 137

138
Fig. 8. Electrocerebral inactivity. This record is from a 66-yr-old man after a cardiopulmonary arrest. Note that thesensitivity is at 2 µV/mm and “double distance” electrode comparisons are in use. The record is dominated by ampli-fied ECG-derived artifact. No convincing brain-derived rhythms are seen.
09_Donnelly 4/11/07 9:03 AM Page 138

are observed in ECI. Several technical requirements must be met to ensure the validity of thefinding. The American Electroencephalographic Society has published technical criteria thatmust be met before an EEG can be considered to fulfill ECI (Table 1).
One technicality deserving special mention is the diagnosis of brain death in infants andchildren. Persistence of the EEG ECI pattern must be documented in these age groups. For infantsyounger than 2 mo of age, two EEGs showing ECI must be obtained, separated by 48 h. Forinfants between 2 and 12 mo of age, the two EEGs showing ECI must be separated by 24 h.Of course, administration of sedative–hypnotic medications, for instance, barbiturates andbenzodiazepines, negates the ability of the EEG to speak to brain death because the observedfindings could be attributed to reversible, medication-induced effects. Variable requirementsexist for the duration of time necessary since the last administration of sedative medicationbefore the EEG can support the diagnosis of brain death. Other potential confounders of ECImust be excluded, such as hypothermia, hypotension, and severe electrolyte and glucoseabnormalities, among others.
SUGGESTED READING
Bennett DR, Hughes JR, Korein J, Merlis JK, Suter C. Atlas of Electroencephalography in Coma andCerebral Death: EEG at the Bedside or in the Intensive Care Unit. Raven, New York, NY, 1976.
Daly DD, Pedley TA. Current Practice of Clinical Electroencephalography, 2nd ed. Raven, New York,NY, 1990.
Lüders HO, Noachtar S. Atlas and Classification of Electroencephalography, 1st ed. WB Saunders,Philadelphia, PA, 2000.
Niedermeyer E. Electroencephalography: Basic Principles, Clinical Applications and Related Fields,5th ed. Williams and Wilkins, Baltimore, MD, 2004.
Spehlman R. EEG Primer, 2nd ed. Elsevier, Amsterdam, Holland, 1991.
REVIEW QUESTIONS
1. What are the two main characteristics of slowing? What is their significance?2. What is the significance of focal, arrhythmic polymorphic slowing?3. What is the significance of focal, rhythmic monomorphic slowing?4. What is IRDA and when is it encountered?5. What are triphasic waves and when are they most commonly encountered?6. How does the reactivity of an EEG in coma speak to the depth of coma?
Focal and Generalized Slowing, Coma, and Brain Death 139
Table 1EEG Criteria for Electrocerebral Inactivity
1. A minimum of eight scalp electrodes should be used2. Interelectrode impedances should be less than 10,000 Ω but more than 100 Ω3. The integrity of the entire recording system must be verified4. Interelectrode distances should be at least 10 cm5. The sensitivity should be at least 2 µV/mm for at least 30 min of recording6. Appropriate filter settings should be used7. Additional monitoring techniques should be used when necessary8. There should be no EEG reactivity to afferent stimulation9. The recording should be made by a qualified technician10. A repeat EEG should be performed if there is doubt regarding the presence of electrocerebral
inactivity
09_Donnelly 4/11/07 9:03 AM Page 139

7. How is the EEG beneficial in epileptic stupor, that is, nonconvulsive status epilepticus?8. What do burst suppression patterns signify?9. When is alpha coma encountered and what is its significance?
10. What are some technical criteria for recording ECI?
REVIEW ANSWERS
1. The frequency of the observed slowing and its persistence are two important characteristics. Ingeneral, the slower the recorded rhythms, the more severe the lesion. Additionally, in general,the more persistent the slowing, the more severe the process.
2. Focal, arrhythmic polymorphic slowing usually implies a focal subcortical white matter lesion.However, it is nonspecific to etiology.
3. Focal, rhythmic monomorphic slowing usually suggests a lesion of the underlying gray matter.However, when such a pattern becomes notably repetitively paroxysmal and burst-like, oneshould also entertain the possibility of a focal epileptic process.
4. IRDA usually signifies an acute or subacute process leading to diffuse cortical or subcorticalgray matter dysfunction. It is usually bianteriorly predominant, that is, FIRDA, but may be pos-teriorly maximal in childhood and adolescence, that is, occipital IRDA.
5. Triphasic waves are broad waveforms with characteristic triphasic morphology. They are usuallydiffusely represented and bilaterally synchronous, at 1.5 to 2.5 Hz. Often, they exhibit a helpfulphase lag across the anterior–posterior axis. They mainly occur in metabolic encephalopathies,usually in hepatic insufficiency, but are not exclusive to hepatic disease states.
6. As comatose states become deeper, the EEG becomes progressively less reactive to environmen-tal stimuli. Lighter comas may still show some reactivity, even when this is clinically unapparent.
7. The EEG is critical to making the diagnosis of nonconvulsive status epilepticus. It is also invalu-able in assessing the progress of therapeutic interventions in this setting.
8. Burst suppression is observed in many comatose states. As the periods of voltage suppressionbecome longer, the coma becomes deeper. This pattern may be iatrogenic as in general anesthe-sia or in barbiturate coma for status epilepticus, among others. Thus, it may have a good prog-nosis in intoxications, but may carry a poor prognosis in other etiologies, for instance,hypoxic–ischemic insults.
9. Alpha coma is denoted by widespread alpha activity that is unreactive to applied stimuli. Itimplies a poor prognosis in most instances, although when associated with medication relatedcoma, recovery may occur.
10. The criteria for ECI include a minimum of eight leads, 10-cm interelectrode distances or greater,sensitivity set to 2 µV/mm for at least 30 min of recording, among others (Table 1). In children,a repeat tracing may be necessary.
140 Donnelly and Blum
09_Donnelly 4/11/07 9:03 AM Page 140

10Normal Pediatric EEG
Ann M. Bergin and Blaise F. D. Bourgeois
SummaryThis chapter provides an overview of the developmental changes in the pediatric EEG from early
prematurity through adolescence. The early development of recognizable sleep–wake cycles in thepremature infant, the changes that occur around term and the maturation of the EEG in the awake,drowsy, and sleep states are described. Changes in response to routine activation procedures are alsodescribed. Figures are provided throughout the text. Discussion of common variant patterns observedin childhood is also provided.
Key Words: Child; development; EEG; normal variant; sleep–wake cycles.
1. INTRODUCTION
From the first detectable EEG tracings in the extremely premature infant, to the matureEEG of the 18-yr-old subject, the pediatric EEG undergoes enormous changes in parallel withthe great increase in size and complexity of the brain and its connections. Characteristic pat-terns of activity are observed at various stages during normal development. These patternsemerge, wax, and wane during a broadly predictable time span. Their persistence beyond theexpected period may be an indicator of dysmaturity or injury. Recognition of the normaldevelopmental progression and deviation from normal patterns is essential for identifying,understanding, and predicting recovery from injury.
2. NEONATAL PERIOD
The patterns observed in the neonatal EEG and the significance attributed to them dependson the conceptional maturity of the infant. Therefore, to evaluate the neonatal EEG, the readermust know the conceptional age of the infant (duration in weeks since last menstrualperiod/beginning of pregnancy), in addition to the postnatal age. Patterns observed alsodepend on the infant’s state of arousal, and this should also be noted. The EEG patterns areevaluated in light of these conditions.
2.1. Premature Infants2.1.1. Less Than 29 Wk
The most striking feature of the early premature EEG is the discontinuity of activity.Bursts of high-voltage, predominantly delta activity, mixed with other frequencies and sharpwaves, are interspersed with periods of low-voltage quiescent recordings. Interburst intervals
From: The Clinical Neurophysiology PrimerEdited by: A. S. Blum and S. B. Rutkove © Humana Press Inc., Totowa, NJ
141
10_Bergin 4/11/07 9:05 AM Page 141

142 Bergin and Bourgeois
may be prolonged, up to 90 s or more, whereas active bursts are generally shorter, but maylast up to 1 min. This pattern is described as trace discontinu (Fig. 1). At this early stage, thereis virtually complete synchrony between the hemispheres. The EEG is invariant with clinicalsleep or wakefulness, or with stimulation. The bursts of activity are predominant in theparasagittal and occipital areas, with relative inactivity in the temporal areas. Specific gesta-tional features observed at this stage may include monomorphic occipital theta or delta activity,occurring in bursts lasting up to 5 or 6 s, sharp theta in the occiput of premature infants(STOP) (Fig. 2), and delta brushes (beta–delta complexes) initially confined to the Rolandicand occipital areas.
2.1.2. Twenty-Nine to 32 Wk
At this age, the EEG remains for the most part discontinuous, although the average dura-tion of the interburst interval decreases (maximum ~60 s). Previously synchronous bursts ofactivity are now commonly asynchronous. This will persist, especially in quiet sleep (QS),until term and briefly beyond, during trace alterant. Brief periods of continuous activity cor-relate with active sleep (AS; rapid eye movement [REM] sleep) and irregular respirations, theearliest phase of differentiation of sleep–wake cycles. Specific gestational features includedelta brushes that are more prominent in Rolandic, occipital, and parietal areas (Fig. 3).Bursts of higher voltage, sharply contoured theta activity become more common in the mid-temporal regions (temporal theta bursts).
2.1.3. Thirty-Three to 36 Wk
At this stage, cyclic state changes between wakefulness, AS and QS become more easilydefined, and the relationship between these electrical states and the attendant respiratory(irregular respiration in waking and AS; regular in QS) and musculoskeletal (clonic chinmovements in QS; REM in AS) patterns become more consistent. The EEG background isa more continuous mix of theta and delta activity in waking and AS, with continuingcycling through periods of trace discontinu. The infant now responds to stimulation withdiffuse attenuation of background activity (Fig. 4). Temporal theta bursts give way briefly(33–34 wk) to temporal alpha bursts before largely disappearing by 34 to 35 wk. Deltabrushes persist and become more clearly associated with QS (Fig. 5). Sharp waves occurpredominantly in central and temporal areas. Positive temporal sharp waves may occursingly or in runs, unilaterally or synchronously in both hemispheres. Toward 36 to 37 wk,frontal sharp waves (encoches frontales; Fig. 6), sometimes associated with rhythmicfrontal delta activity (Fig. 7), become more prominent, and sharp waves in other areas wanein frequency.
2.2. Term Infants
Sleep–wake cycles are now fully developed. The waking record is a continuous mixture offrequencies. Infants at this stage move directly from waking into AS, characterized by twopatterns of activity (mixed-frequency AS [Fig. 8], and low-voltage irregular sleep [Fig. 9]),both associated with irregular respiratory pattern and REM. QS is associated with two pat-terns on EEG, trace alternant (Fig. 10), which persists to 46 wk conceptional age, and withhigh-voltage slow pattern (Fig. 11), both of which are associated with regular respiratory pat-tern and absence of eye movements. Frontal and temporal sharp transients persist, observedpredominantly in QS, but wane by 44 wk conceptional age. Interhemispheric synchrony iscomplete in waking and virtually complete in sleep.
10_Bergin 4/11/07 9:05 AM Page 142

143
Fig. 1. Twenty-six weeks gestation. Trace discontinu. LE-RF, left eyelid to reference; RE-RF, right eyelid to reference;Chn-RF, chin to reference; LF, low frequency filter; HF, high frequency filter; Rsp, respiration.
10_Bergin 4/11/07 9:05 AM Page 143

Fig. 2. Twenty-seven weeks gestation. Sharp theta in the occiput of premature infants (STOP).
144
10_Bergin 4/11/07 9:05 AM Page 144

Fig. 3. Thirty weeks gestation. Delta brushes, prominent in the parietal areas. LUE, left under eye; RAE, right above eye;RESP, respiration.
145
10_Bergin 4/11/07 9:05 AM Page 145

Fig. 4. Thirty-four weeks gestation. Startle, producing arousal with diffuse attenuation of background. LOC, left outer canthus;ROC, right outer canthus; Resp, respiration.
146
10_Bergin 4/11/07 9:05 AM Page 146

Fig. 5. Thirty-four weeks gestation. Occipital delta and delta brushes. RESP, respiration; LUE, left under eye; RAE, right above eye.
147
10_Bergin 4/11/07 9:05 AM Page 147

Fig. 6. Thirty-six weeks gestation. Frontal sharp waves (encoches frontales).
148
10_Bergin 4/11/07 9:05 AM Page 148

Fig. 7. Thirty-six weeks gestation. Frontal sharp waves and rhythmic frontal delta.
149
10_Bergin 4/11/07 9:05 AM Page 149

Fig. 8. Term. Active sleep, mixed-frequency pattern (note irregular respirations). RESP, respiration; LUE, left under eye; RAE,right above eye.
150
10_Bergin 4/11/07 9:05 AM Page 150

Fig. 9. Term. Active sleep, low-voltage irregular pattern. RESP, respiration; LUE, left under eye; RAE, right above eye.
151
10_Bergin 4/11/07 9:05 AM Page 151

Fig. 10. Term. Quiet sleep, trace alternant pattern. RESP, respiration; LUE, left under eye; RAE, right above eye.
152
10_Bergin 4/11/07 9:05 AM Page 152

Fig. 11. Term. Quiet sleep, high-voltage slow pattern. Rsp, respiration; LF, low frequency filter; HF, high frequencyfilter; LE-RF, left eye to reference; RE-RF, right eye to reference; Chn-RF, chin to reference.
153
10_Bergin 4/11/07 9:05 AM Page 153

2.2.1. Infancy (<1 Yr)
With the end of the neonatal period (after 6-8 wk of age), trace alternant and frontal sharpwaves are no longer observed in the healthy infant. In the awake state, an early, often poorlysustained, poorly reactive posterior dominant rhythm of three per second is first observed at3 mo of age, and often increases to four per second at 4 mo (Fig. 12). Reactivity to eye clo-sure emerges quickly. The posterior dominant rhythm may be up to 6 to 7 Hz by 12 mo ofage (Fig. 13). The voltage of the dominant rhythm varies from 30 to 40 µV, up to 100 µV orhigher in the first year. The waking background activity is dominated by delta frequenciesthroughout the first year, but there is a steady increase in the amount of theta activity present.Central theta activity of 4 to 5 Hz may be observed as early as 3 mo (Fig. 14), is usual by 6 mo, and faster (?) rhythms up to 8 Hz are observed in the central/Rolandic areas by 12 mo.Activation by photic stimulation is most likely to produce a driving response in the lowertheta frequencies.
After the first to second month, infants move from wakefulness into QS (Fig. 15),instead of directly into AS. The drowsy pattern is characterized by nonspecific slowingand increase in amplitude in the first 6 mo. Thereafter, drowsiness is manifest by anincrease in diffuse, highly synchronous and rhythmic, theta activity (hypnagogic hyper-synchrony). Sleep spindles develop by 3 mo of age, although fragmentary forms may beobserved shortly after term (Fig. 16). Spindles in infancy are typically comb-like, withrounded positive and a sharper negative component. They increase to a maximum dura-tion (up to 10 s) at approx 6 mo of age, and are maximal in the central and parietal areas,rather than at the midline, at this age. They are commonly asynchronous. Vertex wavesappear between 3 and 5 mo. They are broader, and less sharply contoured than later inchildhood.
2.2.2. Early Childhood (>1 to 3 Yr)
The posterior dominant rhythm increases in frequency from 6 to 7 Hz in the second year to7 to 8 Hz in the third year, and the blocking response to eye opening is now robust (Fig. 17).As in adults, the dominant rhythm may be of greater amplitude in the nondominant hemi-sphere. The difference should not be greater than 50%. In the waking background, delta activityremains prominent and may be observed diffusely or shifting in position throughout therecord. There is a relative increase in the amount of theta activity, and this is visually the moststriking frequency at this age. Throughout childhood, waking theta activity is prominent, oftenshifting in prominence from side to side. Children of this age are usually unable to cooperatewith hyperventilation, but occasionally sobbing may induce diffuse slowing caused by ahyperventilation effect (Fig. 18). Occipital driving response to photic stimulation is still morelikely at slower stimulation rates.
With drowsiness, diffuse, high-voltage, rhythmic theta (3–5 Hz) appears, mainly in theparasagittal areas. It is typically continuous, but may appear as discrete bursts in some chil-dren. It is often also present at arousal (hypnagogic and hypnopompic hypersynchrony)(Fig. 19). As the child progresses into sleep, diffuse irregular slow activity (1–3 Hz) develops,mixed with medium voltage theta activity. Slow activity has a maximal amplitude in theoccipital leads (Fig. 20). Vertex sharp waves appear, which are now of higher voltage andmore sharply contoured than previously. Runs of vertex sharp waves may occur (Fig. 21).Spindles, usually 12 to 14 Hz, may have a wider field, and are mostly synchronous by 2 yrof age.
154 Bergin and Bourgeois
10_Bergin 4/11/07 9:05 AM Page 154

Fig. 12. Four months. Four per second posterior rhythm; LF, low frequency filter; HF, high frequency filter.
155
10_Bergin 4/11/07 9:05 AM Page 155

Fig. 13. Twelve months. Six per second reactive posterior dominant rhythm; LUE, left under eye; RAE, right above eye.
156
10_Bergin 4/11/07 9:05 AM Page 156

Fig. 14. Four and a half months. Five per second central activity, four per second posterior rhythm; LF, low frequencyfilter; HF, high frequency filter.
157
10_Bergin 4/11/07 9:05 AM Page 157

Fig. 15. One month. Quiet sleep. RESP, respiration; LUE, left under eye; RAE, right above eye.
158
10_Bergin 4/11/07 9:05 AM Page 158
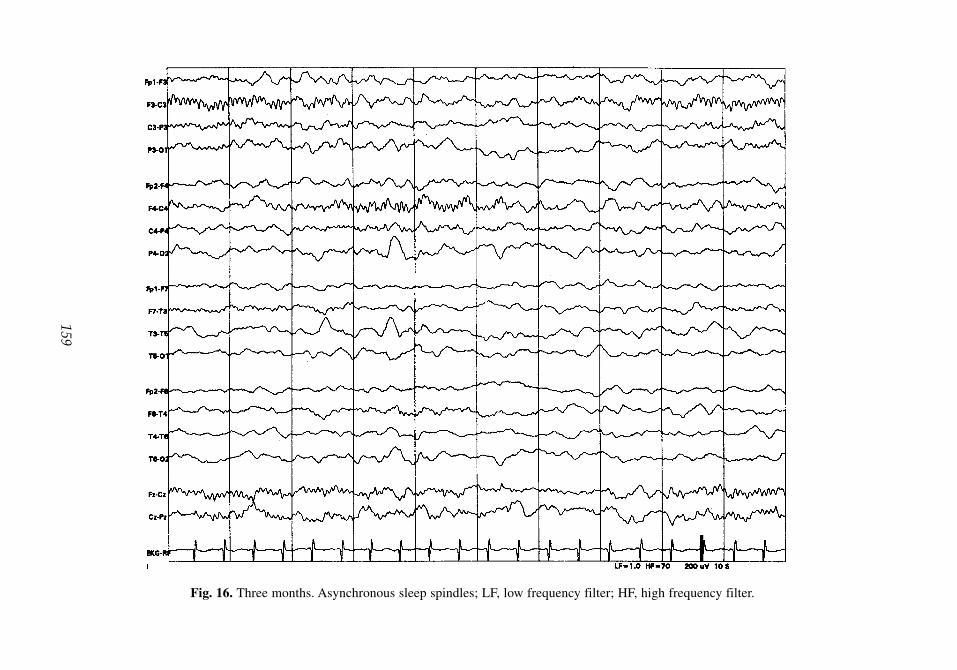
Fig. 16. Three months. Asynchronous sleep spindles; LF, low frequency filter; HF, high frequency filter.
159
10_Bergin 4/11/07 9:05 AM Page 159

Fig. 17. Three years. Reactive posterior dominant rhythm in the alpha range (8/s); LUE, left under eye; RAE, right above eye.
160
10_Bergin 4/11/07 9:05 AM Page 160

Fig. 18. Three years. Sobbing produces hyperventilation effect; LUE, left under eye; RAE, right above eye.
161
10_Bergin 4/11/07 9:05 AM Page 161

Fig. 19. Three years. Hypnagogic hypersynchrony with drowsiness; LUE, left under eye; RAE, right above eye.
162
10_Bergin 4/11/07 9:05 AM Page 162

Fig. 20. Three years. Sleep—spindles with frontal maximum, delta with posterior maximum; LUE, left under eye; RAE, rightabove eye.
163
10_Bergin 4/11/07 9:05 AM Page 163

Fig. 21. Three years. Sleep—V wave and run of V waves (transverse montage). Fourteen per second spindle with vertex maximum; LUE,left under eye; RAE, right above eye.
164
10_Bergin 4/11/07 9:05 AM Page 164

Normal Pediatric EEG 165
2.2.3. Preschool Age (>3 to 6 Yr)
At this age, the posterior basic rhythm consistently reaches alpha frequency. It is still of highamplitude, often greater than 100 µV. Throughout early childhood, low voltage background(<30 µV) is abnormal. Posterior slow waves of youth emerge at this age (Fig. 22). These are1.5- to 3-Hz waves, maximal in the occipital region. They are intermixed with posterior alpha,and, at times, fused slow waves can resemble occipital sharp waves, although lacking typi-cal morphology and after-coming slow wave. Posterior slow waves, in common with the pos-terior dominant rhythm, block with eye opening. This pattern persists throughout childhoodand adolescence, disappearing in young adulthood. Rolandic mu rhythm may be apparent atthis stage, often shifting from side to side. Children can now cooperate with hyperventilation.Hyperventilation produces prominent diffuse slowing to 3 to 5 Hz, which may be more apparenton the left initially, although becoming symmetrical (Fig. 23). This response is enhanced byfasting. It may persist beyond apparent cessation of hyperventilation if the child continues tobreathe deeply. Intermittent photic stimulation is still associated with a driving response atstimulation rates less than 8 Hz.
Drowsiness is often still associated with hypersynchrony, as described in Section 2.2.2.Vertex waves are increasingly sharply contoured. Spindles are now maximal in the midline,at 14 Hz, decreasing to 10 Hz with deeper sleep. Sleep-related slowing is still maximum inamplitude posteriorly. Positive occipital sharp transients of sleep (POSTS) are not yet expected,and, if present, are poorly formed. Frontal arousal rhythm in the theta range may be observed,but is more common later.
2.2.4. Late Childhood (>6 to 12 Yr)
Posterior dominant rhythm reaches 10 Hz by 10 yr of age, and reaches its maximumamplitude before that age. Posterior slow waves are prominent, and may be asymmetric,with higher amplitude on the right, as with the posterior dominant rhythm. Medium volt-age semi-rhythmic frontal theta activity may be observed in healthy children at this age,and may persist into young adulthood (Fig. 24). There is increasing prominence of the murhythm (up to 15–16 yr) (Fig. 25). Lambda waves may be observed posteriorly with saccadic eye movements in response to patterned visual stimulus. Hyperventilation stillproduces high-voltage slowing (1.5–4 Hz). Intermittent photic stimulation now stimulatesdriving at 6 to 16 Hz.
Hypnagogic hypersynchrony is disappearing, and is rare after the age of 6 yr. The drowsypattern at this age is gradual alpha dropout, with increasing amounts of theta and delta activity.Vertex sharp waves are still prominent, with large amplitude, and may have asymmetric fieldover the midline. Spindles are now disposed anteriorly over the frontal midline, and typicallylast less than 1 s. Fully developed POSTS are observed for the first time (Fig. 26), and othersleep patterns, such as 14- and/or 6-Hz positive sharp waves are more common.
2.2.5. Adolescence (>12 to 18 Yr)
At this age, the EEG begins to resemble the adult EEG more closely, as the amount ofunderlying delta activity wanes completely (Fig. 27). The amplitude of the posterior domi-nant rhythm also declines gradually, although it remains higher than in adults throughout thisperiod in many children. The mu rhythm reaches its maximum prominence at 15 to 16 yr,waning thereafter. Hyperventilation-related slowing is less pronounced, and the response tointermittent photic stimulation is mature, with a driving response occurring over the range 6- to 20-Hz stimulation.
10_Bergin 4/11/07 9:05 AM Page 165

Fig. 22. Six years. Posterior slow waves of youth; LUE, left under eye; RAE, right above eye.
166
10_Bergin 4/11/07 9:05 AM Page 166

Fig. 23. Six years. Hyperventilation—diffuse slowing; LUE, left under eye; RAE, right above eye.
167
10_Bergin 4/11/07 9:05 AM Page 167

Fig. 24. Nine years. Frontal theta. PHO-STM, photic stimulation; LUE, left under eye; RAE, right above eye.
168
10_Bergin 4/11/07 9:05 AM Page 168

Fig. 25. Twelve years. Mu rhythm on right, responds to movement of left hand; LUE, left under eye; RAE, right above eye.
169
10_Bergin 4/11/07 9:05 AM Page 169

Fig. 26. Twelve years. Sleep—positive occipital sharp transients of sleep; LUE, left under eye; RAE, right above eye.
170
10_Bergin 4/11/07 9:05 AM Page 170

Fig. 27. Sixteen years. Awake EEG, little delta activity remains; LUE, left under eye; RAE, right above eye.
171
10_Bergin 4/11/07 9:05 AM Page 171

The drowsy pattern is now mature, with alpha dropout, and replacement with a low-voltage mixture of slow and fast activity. Prominent V waves remain, still sharper in con-tour than in adulthood, but less so than earlier in childhood. Spindles are mature. POSTSare abundant and mature. They may occur in semiregular runs and resemble an occipitalrhythm. Fourteen- and/or 6-Hz positive sharp waves are not uncommon in sleep.
3. NORMAL VARIANT PATTERNS
3.1. Phantom Spike Wave (Six Per Second Spike Wave Complex)
This pattern looks like a miniature version of the typical three per second spike wave oftypical absence. The spike component is often unimpressive (hence, the “phantom spike”designation). Although it may be diffuse, at times the distribution of this phenomenon andthe state in which it occurs allow discrimination of two forms. It occurs in waking, at rel-atively higher amplitude and the anterior head regions in male subjects (Fig. 28), and, infemale subjects, is typically occipital, of lower amplitude, and occurs in drowsiness. Thedischarge usually lasts 1 to 2 s, but may persist longer. It is usually symmetrical, but mayhave a lateral predominance. This pattern is present in adolescence and adulthood. Unlikemore pathological spike wave patterns, it tends to disappear as sleep deepens. Althoughhere described as a normal variant, the status of phantom spike wave as denoting increasedrisk of seizure has been controversial, particularly the anterior/frontal form, which someauthors consider more likely to be associated with other epileptiform findings and withepileptic seizures.
3.2. Fourteen- and 6-Hz Positive Spikes (Fig. 29)
This benign pattern is first observed in early childhood, achieves maximum frequency inthe adolescent age group, and wanes thereafter. It is observed in drowsiness and sleep, has abroad field, but is usually maximum in the posterior temporal area. At times, the 14-Hz or the6-Hz component may predominate. The 14-Hz component may be observed more frequentlyin middle childhood or adolescence, the 6-Hz pattern in younger children and young adults.The discharge may last 1 to 2 s. It often occurs independently on both sides. Because theamplitude is low, it is best observed with referential montages, which, in general, use longerinterelectrode distances.
3.3. Rhythmic Temporal Theta Bursts of Drowsiness (Psychomotor Variant) (Fig. 30)
This is a rare pattern. It is observed in adolescents and adults. It occurs in drowsiness, and,similar to other benign patterns, disappears as sleep supervenes. It may occur bilaterally orindependently. It begins with rhythmic sharply contoured, often notched or flat-topped thetawaves in the mid-temporal area. The amplitude and field increase, but there is no evolutionin frequency or of waveform. These last features help distinguish this pattern from trueseizure. This pattern is no longer thought to denote increased risk of seizure or epilepsy.
3.4. Alpha Variant Patterns3.4.1. Slow Alpha Variant
This is most likely the result of the superimposition of two alpha rhythms producing thesudden appearance of a notched posterior rhythm at half the previous frequency. Similar tothe individual’s usual alpha frequency, it is blocked by eye opening. This change may occurin trains during normal alpha activity. It may be more likely to occur in drowsiness.
172 Bergin and Bourgeois
10_Bergin 4/11/07 9:05 AM Page 172

Fig. 28. Fourteen years. Phantom spike wave, “waking, at relatively higher amplitude and the anterior head regions in males” vari-ant (see text). Note Fp1 and F3 electrodes (average referential montage).
173
10_Bergin 4/11/07 9:05 AM Page 173

Fig. 29. Thirteen years. Fourteen- and 6-Hz positive spikes. Note P7 and P8 electrodes (average referential montage).
174
10_Bergin 4/11/07 9:05 AM Page 174

Fig. 30. Seventeen years. Rhythmic temporal theta bursts of drowsiness (“psychomotor variant”); LUE, left under eye; RAE,right above eye.
175
10_Bergin 4/11/07 9:05 AM Page 175
3.4.2. Fast Alpha Variant
This typically occurs on first eye closure, when a beta-range activity occurs in theposterior regions, which attenuates with eye opening. This is usually replaced within asecond or two by the individual’s usual alpha frequency. This fast occipital activity hasbeen described as the “squeak” phenomenon. Both the slow and fast alpha variants arenormal physiological phenomena.
SUGGESTED READING
Blume WT, Kaibara M. Atlas of Pediatric Electroencephalography, 2nd ed. Lippincott-Raven,Philadelphia, PA, 1999.
Daly DD, Pedley TA. Current Practice of Clinical Electroencephalography. 2nd ed. Lippincott-Raven,Philadelphia, PA, 1997.
Neidermeyer E. Maturation of the EEG: development of waking and sleep patterns. In:Electroencephalography. Basic Principles, Clinical Applications and Related Fields, 4th ed.(Neidermeyer E, Lopes da Silva F, eds). Williams & Wilkins, Baltimore, MD, 1999.
Scher MS. Electroencephalography of the newborn: normal and abnormal features. In: Electroence-phalography. Basic Principles, Clinical Applications and Related Fields, 4th ed. (Neidermeyer E,Lopes da Silva F, eds). Williams & Wilkins, Baltimore, MD, 1999.
REVIEW QUESTIONS
1. To accurately assess the preterm EEG, all of the following facts must be known except:A. Chronological age.B. Conceptional age.C. Physiological data (EKG, respirations, etc.).D. State of infant (awake, asleep).E. Time of last feed.
2. Which of the following statements is true regarding the EEG in premature infants?A. EEG response to stimulation is typically observed as early as 26 wk.B. The EEG of the 30-wk premature infant is mostly synchronous.C. Cyclic state changes begin to correlate with changes in respiratory rate, heart rate, and eye
movements at 34 to 35 wk.D. Frontal sharp waves are always abnormal at 36 wk.E. At 36 wk the infant responds to stimulation with high voltage synchronous activity.
3. At term:A. Reactive posterior dominant activity is observed with eye closure.B. Discontinuity of EEG is no longer present in any state.C. Asynchrony of EEG is no longer present in any state.D. Frontal sharp waves are normal in the first month.E. Infants fall directly from waking into QS.
4. The posterior dominant rhythm in childhood:A. Is poorly reactive to eye closure throughout early childhood.B. Rarely reaches alpha frequency before 8 yr.C. May exhibit voltage of greater than 100 µV in the first year.D. Should never by asymmetrical.E. Is commonly of low voltage (<30 µV).
5. As the EEG matures through childhood:A. Theta activity is unusual in the first year.B. Delta activity predominates in the first year.C. Frontal theta activity is never normal.D. Theta activity is synchronous throughout childhood.
176 Bergin and Bourgeois
10_Bergin 4/11/07 9:05 AM Page 176

6. The following are true of sleep spindles except:A. They are first observed at 3 mo of age.B. They may be prolonged up to 10 s in the first year of life.C. They are synchronous at 2 yr.D. They remain comb-shaped until adolescence.E. They are central and parietal in infancy and frontal midline by late childhood.
7. In childhood, during sleep:A. Vertex waves are first observed at 1 mo of age.B. Slow activity in sleep is maximal in the frontal area.C. Vertex sharp waves may be asymmetrical.D. POSTs are normally observed early childhood.E. Hypnagogic and hypnopompic hypersynchrony remain common in adolescence.
8. Activation procedures:A. There is no response to photic stimulation before 2 yr of age.B. Younger children demonstrate a driving response at higher flash frequencies than older age
groups.C. Slowing associated with hyperventilation may be initially asymmetrical.D. High-voltage slowing with hyperventilation is exacerbated by hyperglycemia.
9. Normal variants:A. The slow alpha variant is more likely to be associated with pathology than the fast alpha variant.B. Alpha variant patterns are alpha patterns observed in posterior head regions in sleep.C. Phantom spike wave pattern occurring in the occipital areas is more likely to be abnormal
than that occurring in the frontal areas.D. Fourteen- and/or 6-Hz positive sharp waves are high-amplitude phenomena, usually in the
posterior temporal area.E. Rhythmic temporal theta bursts are distinguished from seizure by the absence of change in
frequency and waveform.10. In pediatric EEG:
A. Lambda waves are occipital sleep phenomena related to REM movements.B. Mu activity is blocked by movement of the contralateral hand.C. Posterior slow waves of youth, unlike posterior dominant activity, do not block with eye
opening.D. Delta brushes are occasionally observed after the first year.
REVIEW ANSWERS
1. The correct answer is E.2. The correct answer is C.3. The correct answer is D.4. The correct answer is C.5. The correct answer is B.6. The correct answer is D.7. The correct answer is C.8. The correct answer is C.9. The correct answer is E.
10. The correct answer is B.
Normal Pediatric EEG 177
10_Bergin 4/11/07 9:05 AM Page 177

10_Bergin 4/11/07 9:05 AM Page 178

11Pediatric EEG Abnormalities
James J. Riviello, Jr.
SummaryEEG is an important tool in pediatric neurology and EEG abnormalities occur in many different dis-
orders. EEG abnormalities are nonspecific and do not make a specific diagnosis. However, the EEG isespecially useful in the diagnosis, differential diagnosis, classification, and management of seizuresand epileptic syndromes. Once the diagnosis of epilepsy is established, specific EEG patterns help todefine specific epileptic syndromes.
Key Words: EEG; EEG and epileptic syndromes; pediatric EEG; pediatric EEG abnormalities; pedi-atric EEG patterns.
1. INTRODUCTION
EEG is an important tool in pediatric neurology. EEG abnormalities occur in all categoriesof neurological disorders. These abnormalities are useful for lateralizing and localizing a neu-rological process, but are nonspecific and do not make a specific diagnosis. Epileptiform activ-ity, described as an EEG waveform recorded in a proportion of those suffering from anepileptic disorder, may occur in conditions other than epilepsy. Therefore, the presence ofovert epileptiform features suggests, but is not absolutely diagnostic of epilepsy. For example,in a sample of children referred for EEG who had spikes, Kellaway reported a location-dependent incidence of epilepsy, ranging from 38 to 91% (central the lowest, temporal thehighest).
EEG interpretation starts with an assessment of the EEG background, which refers to theentire EEG. This starts with whether the background is continuous or symmetric. It is impor-tant to know the child’s age, and, if a newborn, the conceptual age rather than the legal age,because background continuity decreases with a decreasing conceptual age. The most prema-ture infants have a very discontinuous background, and may even have prolonged periods ofelectrocerebral inactivity, called trace discontinu. Even in infants and older children, specificwaveforms, such as the posterior rhythm, have a developmental appearance. Next, evaluatethe overall symmetry from side to side, and then look for the presence of generalized or focalabnormalities, such as slowing or epileptiform activity. If an actual seizure occurs during theEEG, it is called an ictal EEG. The majority of EEGs do not record actual seizures; these arecalled interictal EEGs.
The EEG is especially useful in the evaluation and management of seizures, epilepsy, andthe epilepsy syndromes. A recent practice parameter on evaluating a first nonfebrile seizurein children recommended routine EEG. EEG findings may help to differentiate an epileptic
From: The Clinical Neurophysiology PrimerEdited by: A. S. Blum and S. B. Rutkove © Humana Press Inc., Totowa, NJ
179
11_Riviello 4/11/07 9:07 AM Page 179

from a nonepileptic event. Many paroxysmal disorders in childhood mimic epilepsy, but donot have an epileptic mechanism. These are called nonepileptic paroxysmal events. Althoughnonepileptic paroxysmal events typically have a normal interictal EEG, the EEG may changeat the time of the event. With syncope, slowing and even electrocerebral inactivity may occurat the time of the event. It is especially important to include cardiac disorders in the differen-tial diagnosis, because arrhythmias, such as the prolonged QT syndrome, may present with a“seizure.” However, a normal EEG does not exclude the diagnosis of epilepsy, and an abnor-mal EEG does not, in itself, establish a diagnosis of epilepsy. In a longitudinal study of 3726normal children, aged 6 to 13 yr, Cavazutti et al. reported that 3.5% had epileptiform patterns.The EEG is “diagnostic” of a seizure only when actual clinical manifestations occur at thetime of the electrographic discharge; if not, this finding is only very suggestive of epilepsy.
With a definite diagnosis of epilepsy, EEG helps to classify seizure type or the associatedepileptic syndrome. For example, with a generalized tonic–clonic seizure (GTCS), a focalinterictal EEG suggests a focal onset. EEG monitoring is also useful in the presurgical eval-uation of refractory epilepsy, because identifying the location of the seizure focus is a veryimportant part of the presurgical evaluation.
There are epileptic disorders associated with EEG epileptiform activity, such asLandau–Kleffner syndrome (LKS) or continuous spike waves of sleep (CSWS), that may notalways be associated with overt clinical seizures but have cognitive dysfunction with cognitiveor language regression. These specific disorders typically have sleep-activated epileptiformactivity, with regression related to the duration of this EEG activity. The entity transient cog-nitive impairment refers to altered cognitive function associated with epileptiform activity,although it may take specific computerized testing to detect. EEG is used in both the diagnosisand treatment of these disorders, because the treatment goal is both clinical and electrographicimprovement.
EEG is also used to exclude epilepsy in disorders that mimic epilepsy, such as the variouschildhood migraine syndromes, attention deficit disorders, or other psychiatric disorders. Theincidence of paroxysmal abnormalities in headaches and migraines varies from 9 to 30%. Ina recent study by Richer et al. in children with ADHD, epileptiform activity occurred in 6.1%of 347 EEGs. However, only 3 of 21 children with epileptiform activity developed a seizuredisorder. In the era before modern neuroimaging, EEG was used in the diagnostic evaluationfor brain tumors. However, practice parameters for headache no longer recommend routineEEG. Certain EEG findings may also be associated with specific metabolic or genetic disor-ders. For example, a “comb-like” central rhythm has been observed in neonates with maple-syrup-urine disease, and bifrontal slow spike-and-wave discharges have been reported in thering 20 chromosome syndrome.
The International League Against Epilepsy system for seizure classification, theInternational Classification of Epileptic Seizures (ICES), starts with seizure type, whetherfocal or generalized, and then classifies the epileptic syndrome. There is also an unclassifiedcategory that includes neonatal seizures. An epileptic syndrome refers to a complex of signsand symptoms that define a unique epilepsy (Table 1), and is useful for choosing antiepilepticdrug (AED) treatment and for predicting prognosis. Etiology is also included in epilepsy clas-sification, whether symptomatic, cryptogenic, or idiopathic, and either generalized or focal.
Epileptic syndromes are divided into benign or malignant, depending on the expected out-come. In general, the “idiopathic” epilepsies are analogous to the benign epileptic syndromes,and the “symptomatic” epilepsies are analogous to the malignant epileptic syndromes.
180 Riviello
11_Riviello 4/11/07 9:07 AM Page 180

Pediatric EEG Abnormalities 181
Benign syndromes are those in which seizures are successfully treated with AEDs, require noother specific treatment, or may even remit without sequelae. Malignant syndromes generallyare resistant to treatment and have a poor prognosis. However, not every “benign” epilepticsyndrome is associated with a normal outcome, and not every “malignant” epileptic syndromehas a poor outcome. For example, a small number of children with benign familial neonatalseizures will have developmental problems and persistent seizures, some children withabsence epilepsy can have learning difficulties, and photosensitive epilepsy can occasionallybe severe. The term catastrophic epilepsy is used for the malignant epileptic syndromes.
2. SPECIFIC EEG ABNORMALITIES
The ICES starts with determining whether the seizure onset is focal or generalized. A pro-posed new classification will instead focus on seizure semiology. Specific seizure semiologycan be identified from temporal, frontal, parietal, and occipital regions. Within each, furthersubdivision is possible. Clinical manifestations by location are similar in both adult and child-hood epilepsy.
3. SPECIFIC EPILEPTIC SYNDROMES
In contrast to seizure location and the resultant clinical manifestations, differences exist inthe occurrence of epileptic syndromes in adult and pediatric epileptology. Most specificepileptic syndromes begin in childhood and may continue into adulthood. We shall start withthe benign epileptic syndromes and then the malignant syndromes. Descriptions of theepileptic syndromes come from the ICES. Additional points within each syndrome are specif-ically referenced. The following specific epileptic syndromes are those associated with specific EEG findings.
Table 1Features Used to Classify Epileptic Syndromes
Seizure Type(s)Partial onset
Simple, complex, secondarily generalizedGeneralized onset
Absence, tonic, tonic-clonic, atonic, myoclonicSpecific
Spasms, gelastic, othersCluster of Signs and Symptoms Customarily Occurring TogetherAge of onsetEtiologyAnatomyPrecipitating factorsSeverity: prognosis, benign or malignantEEG, both ictal and interictalDuration of epilepsyAssociated clinical featuresChronicityDiurnal and circadian cycling
11_Riviello 4/11/07 9:07 AM Page 181

3.1. Benign Epileptic Syndromes3.1.1. Febrile Seizures
The conventional wisdom regarding the EEG in benign febrile seizures is that the EEG shouldbe normal, whereas, in a child with epilepsy, the EEG will be abnormal, with epileptiform fea-tures. The ICES considers febrile seizures a situation-related seizure: the situation being the ill-ness with fever. However, there may not be such a clear distinction. Alvarez and Lombrosoreported hypnagogic paroxysmal spike wave activity (minimal epileptiform features, sharp wavesembedded into hyperventilation, or hypnagogic hypersynchrony) occurring with a higher inci-dence in children with febrile seizures. This is similar to epileptiform activity admixed into ver-tex waves and sleep spindles, called dyshormia by Niedermeyer (Fig. 1). Dyshormia refers to anabnormal paroxysmal arousal features during sleep. These features may indicate a lower seizurethreshold and explains why they occur in both the normal population and in those with epilepsy.
The recent practice parameter (1999) on benign febrile seizures does not require an EEGfor evaluating a benign febrile seizure. This is defined as a short (<15 min) GTCS withoutsignificant postictal depression, in a child with a nonfocal neurological examination withouta family history of epilepsy.
3.1.2. Benign Myoclonic Epilepsy in Infancy
This disorder is characterized by brief bursts of generalized myoclonus that begin in other-wise normal children during the first 2 yr of life. There is often a family history of epilepsy.EEG shows brief bursts of generalized spike waves during early sleep. No other seizures occurat onset, but GTCS may occur during adolescence and developmental delay may be present.
3.1.3. Childhood Absence Epilepsy
The peak age of onset of childhood absence epilepsy is from 6 to 7 yr. The seizures con-sist of an abrupt cessation of ongoing activity, with a change of facial expression and a blankgaze. The duration is short, rarely lasting longer than 30 s, there is no preceding aura or sub-sequent postictal depression, and there may be frequent automatisms. Seizures may be acti-vated by hyperventilation and photic stimulation.
Absence seizures are divided into typical absence and atypical absence seizures. Typicalabsence seizures are classified as simple or complex; a simple absence has a sudden onsetwithout motor activity; complex absences have associated motor activity or autonomic activ-ity. The atypical absence seizure has a less clearly defined onset or cessation, so that it maybe difficult to identify the beginning or the end of the seizure without EEG. Atypical absenceseizures may have more pronounced tone changes, a longer duration, and are typically asso-ciated with other seizure types and mental retardation.
Penry et al. studied 374 absence seizures with video EEG in 48 patients; a simple absenceoccurred in only 9% of patients; automatisms occurred in at least one episode in 88% ofpatients, clonic components occurred in 41% of patients, and seizures lasted less than 20 s induration in 85% of patients.
Automatisms may be perseverative or de novo, and autonomic abnormalities may consistof pupillary dilatation, pallor, flushing, salivation, or incontinence.
The EEG in a typical absence seizure shows a symmetric 3-Hz generalized spike-and-wave discharge, which has a faster frequency at the beginning and a slower frequency at theend (Fig. 2). The atypical absence has a frequency between 1.5 and 2.5 Hz (usually slower),may be asymmetric, and usually has a slow background.
182 Riviello
11_Riviello 4/11/07 9:07 AM Page 182

Pediatric EEG Abnormalities 183
A pattern reported in children is hyperventilation-induced high-amplitude rhythmic slow-ing (HIHARS), in which altered awareness may occur with HIHARS on EEG. Clinically, eyeopening and eyelid flutter occur more frequently in absence seizures, whereas fidgeting, smil-ing, and yawning occurred more frequently with HIHARS. Arrest of activity, staring, and oraland manual automatisms were observed in both groups. A similar pattern has been describedin adults. These two disorders emphasize the importance of clinical observation by the EEGtechnologist during the study.
3.1.4. Intermittent Rhythmic Delta Activity
Intermittent rhythmic delta activity (IRDA) consists of rhythmic, sinusoidal, delta activity,which may be notched and even have low amplitude admixed spikes. IRDA may be general-ized or have an age-dependent specific location: an occipital location (OIRDA) is more com-mon in children (Fig. 3), whereas a frontal location is more common in older children andadults. Although IRDA itself is nonspecific for etiology, it typically occurs in disorders asso-ciated with acute altered awareness. In children, OIRDA is seen most commonly in epilepsy,especially generalized absence epilepsy. In our study of IRDA in children, 80% had epilepsyand the majority had absence epilepsy. This was referred to as posterior paroxysmal activityby Holmes et al. OIRDA occurs usually as an interictal pattern, but may be an ictal pattern;we have seen OIRDA evolve into a 3-Hz spike-and-wave discharge.
3.1.5. Juvenile Absence Epilepsy
The onset is around puberty, but the seizures may be less frequent than in the childhoodabsence syndrome. GTCS and myoclonic seizures may occur and the EEG shows a fastspike-and-wave discharge, similar to that seen in juvenile myoclonic epilepsy (JME). Theremay also be electrographic discharges that are more prolonged, with less altered awareness.
3.1.6. Juvenile Myoclonic Epilepsy
JME of Janz is characterized by mild myoclonic, generalized tonic–clonic, sometimesclonic–tonic–clonic seizures, and absence seizures. The onset is typically around puberty.JME is also referred to as impulsive petit mal.
The myoclonic seizures are usually mild to moderate in intensity, may involve the entireextremity, rather than isolated muscles, and generally are bilateral. These occur after awak-ening and are aggravated by fatigue, sleep deprivation, or alcohol. The patient may dropobjects or fall. Myoclonic status epilepticus has occurred. GTCS are frequent. Delgado-Escueta et al. reported that GTCS occurred in 41 of 43 patients, and Asconape and Penryreported GTCS in 83% of patients. Myoclonic jerks usually precede the GTCS and mayevolve into a GTCS. GTCS usually occur shortly after awakening. Absence seizures occurredin 40% in the series of Delgado-Escueta et al. These usually occur in association with GTCS,and most commonly occur shortly after awakening.
The EEG in JME is characterized interictally by a fast spike-and-wave discharge, 3.5- to 6-Hz spike-and-wave and polyspike-and-wave complexes (Fig. 4). Ten- to 16-Hz rapid spikeswith slow waves occur with myoclonic seizures, photosensitivity is common, and abnormalitiesmay occur in sleep.
3.1.7. Epilepsy With GTCS on Awakening
GTCS occur exclusively or predominantly shortly after awakening. The onset is usuallyin the second decade. Absence or myoclonic seizures may occur. The EEG shows the fast
11_Riviello 4/11/07 9:07 AM Page 183

184
11_Riviello 4/11/07 9:07 AM Page 184

185
Fig. 1. Dyshormia. Six-year-old girl with childhood absence epilepsy. Note the spike component embedded with a vertex wave (A) and withinspindles (B) during sleep.
11_Riviello 4/11/07 9:07 AM Page 185

186
Fig. 2. Absence epilepsy. Twelve-year-old girl with seizures denoted by staring and a family history of seizure.Note the 3-Hz spike-and-wave pattern with responsiveness after its cessation.
11_Riviello 4/11/07 9:07 AM Page 186

187
Fig. 3. OIRDA. Eight-year-old girl with childhood absence epilepsy. Note the high amplitude, notched, 3- to 3.5-Hz occipital activity thatattenuates with eye opening.
11_Riviello 4/11/07 9:07 AM Page 187

188
Fig. 4. Juvenile myoclonic epilepsy (JME). Seventeen-year-old girl with JME. Note the generalized fast spike-and-wave discharge at approx 4 Hz.
11_Riviello 4/11/07 9:07 AM Page 188

spike-and-wave discharge, similar to JME. Photosensitivity may also occur. This syndromemay represent JME without myoclonus.
3.1.8. Benign Focal Epilepsy of Childhood
This disorder is also called benign childhood partial seizures. There are different clinicalsyndromes, which depend on discharge location, centro–temporal (Rolandic, benignRolandic epilepsy [BRE], or benign childhood epilepsy with centrotemporal spikes), occipi-tal, or frontal. The centro–temporal location is the most common, followed by the occipitallocation. BRE is a common epileptic syndrome, occurring in 16 to 24% of childhood epilep-sies. In Iceland, the incidence of BRE is 4.7 in 100,000 people. Although considered a benignsyndrome, cognitive dysfunction may occur.
The centro–temporal location, or BRE, has an age of onset of 3 to 13 yr, with a peak at 9 to10 yr, and recovery occurs before the ages of 15 to 16 yr. According to Lerman, the seizurefrequency is low, 13% may have just one seizure, 66% have infrequent seizures, and 21% havefrequent seizures. The typical seizure characteristics consist of oral–buccal–lingual paresthe-sias, speech arrest, preservation of consciousness, sialorrhea, and tonic or clonic facial move-ments. The seizures are nocturnal in 50% of patients, occur in both the waking and sleep statesin 15% of patients, and the waking state in only 10 to 20% of patients. Status epilepticus israre. The prognosis is excellent, seizures are usually well-controlled, and the seizure fre-quency, recurrence, and duration are similar in treated and untreated children. Lerman andKivity reported EEG normalization by adulthood in all patients. Lombroso referred to these as“sylvian” seizures, given the location of the discharges near the Sylvian fissure.
The EEG in BRE has distinctive, high-amplitude, diphasic spikes or sharp waves with aprominent slow wave, in the midtemporal (T3, T4) and central (C3, C4) regions (Fig. 5).However, when additional scalp electrodes are placed, maximum negativity was in the cen-tral region, either in a “high” (C3, C4) or “low” (C5, C6) location. Marked sleep activationoccurs, and a horizontal dipole is present. There is a common misconception that the pres-ence of a horizontal dipole is pathognomonic of a benign focal epilepsy. Similar findingshave been reported in different pathological processes, including tumors. Massa et al. identi-fied the following EEG characteristics as predictive of a “complicated” course: intermittentslow wave focus, multiple, asynchronous spike wave foci, spike wave clusters, generalized 3-Hz spike wave discharges, discharges with positive or negative myoclonia, or abundanceof interictal abnormalities during waking or sleep.
There are now two defined occipital epilepsy syndromes in children, also called childhoodepilepsy with occipital spikes or childhood epilepsy with occipital paroxysms: the early onsetform (Panayiotopoulos type) and the late-onset (Gastaut type). Panayiotopoulos estimatesthat the early onset form comprises approx 6% of childhood epilepsies. The typical age ofonset is 2 to 12 yr, with a median onset of 5 yr. The typical seizure consists of autonomic andbehavioral disturbances, with vomiting, eye deviation, and altered awareness. Headaches andvomiting may occur, with migraines in the differential. The late-onset type consists of visualseizures with elementary visual hallucinations, which may evolve to a feeling of ocular move-ments or pain, eye deviation, ictal blindness, or focal or secondarily generalized seizures. Thetypical age of onset is 3 to 16 yr, with a mean age of 8 yr. Migraine is in the differential diag-nosis. Neuropsychological dysfunction is also seen in these two disorders. On EEG, the giantspikes typical for benign occipital epilepsy are similar morphologically to those seen in BRE(Fig. 6). These occur with closed eyes, or have “fixation-off” sensitivity; fixation-off refers toblocking central vision or closing the eyes.
Pediatric EEG Abnormalities 189
11_Riviello 4/11/07 9:07 AM Page 189
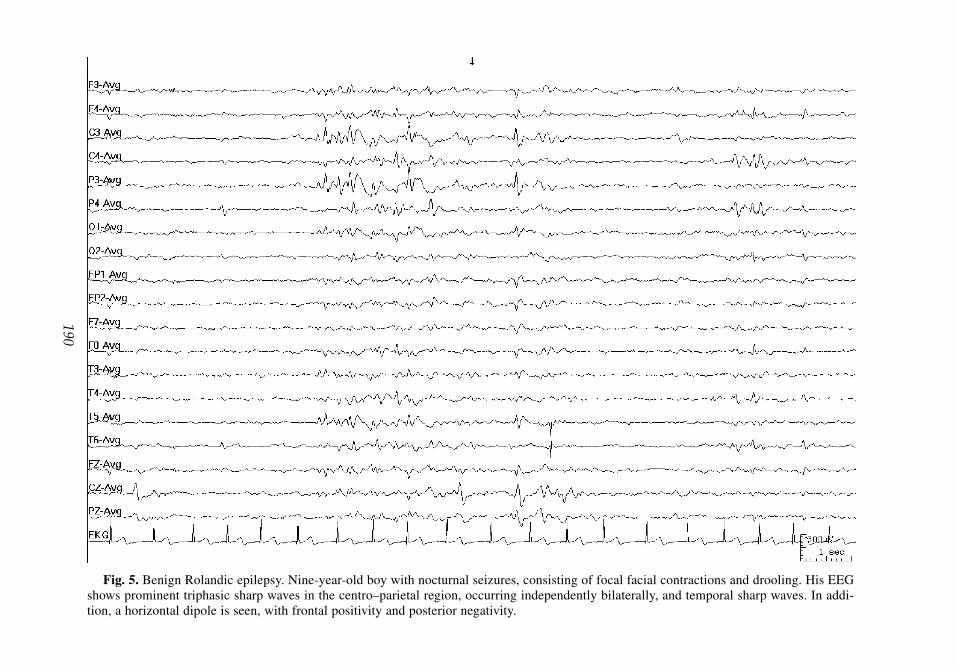
190
Fig. 5. Benign Rolandic epilepsy. Nine-year-old boy with nocturnal seizures, consisting of focal facial contractions and drooling. His EEGshows prominent triphasic sharp waves in the centro–parietal region, occurring independently bilaterally, and temporal sharp waves. In addi-tion, a horizontal dipole is seen, with frontal positivity and posterior negativity.
11_Riviello 4/11/07 9:07 AM Page 190
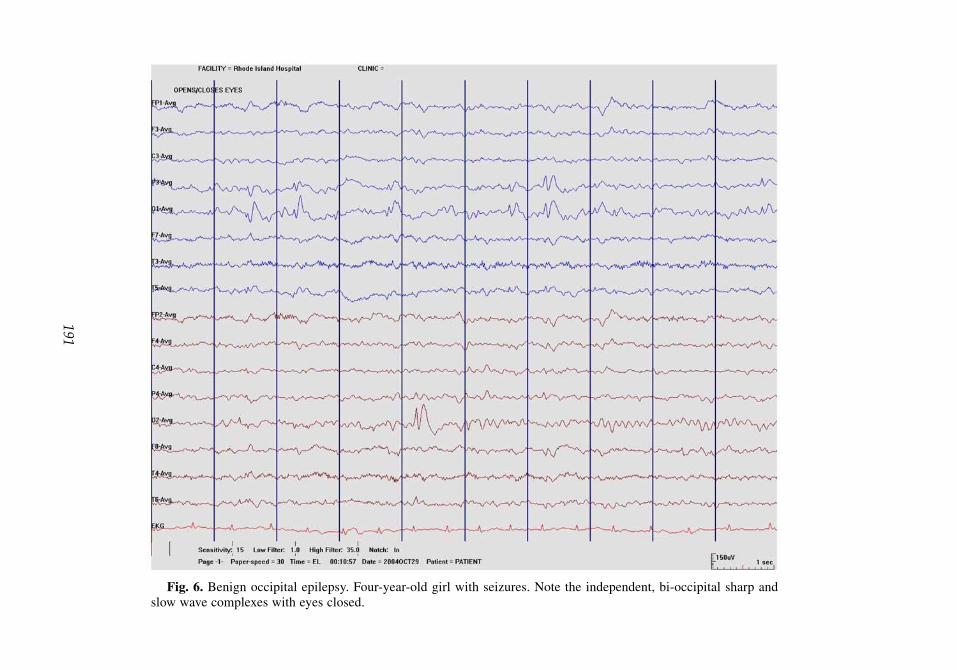
191
Fig. 6. Benign occipital epilepsy. Four-year-old girl with seizures. Note the independent, bi-occipital sharp andslow wave complexes with eyes closed.
11_Riviello 4/11/07 9:07 AM Page 191

192 Riviello
With a frontal location, seizures are infrequent in the waking state, are characterized bystaring, with automatisms or version, and may generalize during sleep. The EEG shows thetypical, repetitive frontal sharp waves with the characteristic “benign” morphology.
3.2. Malignant Epileptic Syndromes
The malignant epilepsy syndromes include disorders most likely associated with a poorprognosis. The EEG findings typical in these disorders include background discontinuity,burst suppression (BS), hypsarrhythmia, electrodecremental events, beta bursts, and the gen-eralized paroxysmal fast activity.
3.2.1. Neonatal Seizures
There is no specific EEG pattern present in neonatal seizures. Neonatal seizures are clas-sified by Volpe essentially using the semiology of the clinical seizure (Table 2).
Mizrahi et al. found that certain seizure types have a close association with an electro-graphic seizure, such as focal clonic seizures, whereas other seizure types, such as subtleseizures, may not have as high an association with an electrographic seizure (referred to ashaving an electrographic signature). These are referred to as clinical seizures with a consis-tent electrocortical signature or clinical seizures without a consistent electrocortical signa-ture. There are also electrographic seizures without clinical seizure activity.
The background activity is very important for prognosis. Rose and Lombroso reported agood outcome with a normal EEG background in 86% of patients. A poor prognosis wasassociated with an abnormal background, especially the BS or low-voltage invariant patterns,or electrocerebral inactivity. The burst-suppression pattern is the most extreme manifestationof background discontinuity and is measured by the interburst interval (IBI). However,neonatal EEG may have features suggestive of dysmaturity, such as an increased duration ofthe IBI. Hahn et al. studied the duration of the IBI in normal premature infants and found acorrelation with the duration of the IBI with the gestational age. Neonatal seizures do not allfit under malignant epileptic syndromes, but these set the stage for the malignant neonatalepileptic syndromes.
Table 2Neonatal Seizures: Classification System of Volpe
Electrographic Seizure
Clinical Seizure Common Uncommon
Subtle +Clonic
Focal +Multifocal +
TonicFocal +Generalized +
MyoclonicFocal, multifocal +Generalized +
11_Riviello 4/11/07 9:07 AM Page 192

3.2.2. Neonatal Myoclonic Encephalopathy
Neonatal myoclonic encephalopathy (NME) is also known as early myoclonicencephalopathy. The onset is typically within the neonatal period, but before 3 mo of age. Theseizures are characterized by partial or fragmentary myoclonus, massive myoclonias, andtonic spasms developing later. EEG consists of complex bursts of spikes and sharp waves,with periods of discontinuity; and the burst-suppression pattern, which may later evolve intoa hypsarrhythmia pattern. All patients with NME are severely retarded and there is a highmortality during the first year of life. The metabolic disorder nonketotic hyperglycinemianeeds to be excluded in this group.
3.2.3. Early Infantile Epileptic Encephalopathy
Early infantile epileptic encephalopathy with suppression bursts is also known asOhtahara’s Syndrome. The onset is within the first few months of age, typically with tonicseizures (spasms), focal seizures, and a burst-suppression EEG. The prognosis is similar tothat of NME, and these patients may evolve into infantile spasms (IS; West Syndrome).
3.2.4. Severe Myoclonic Seizures of Infancy
In Severe myoclonic seizures of infancy, there is typically a family history of epilepsy orfebrile seizures, no antecedent neurological history, and seizures beginning in the first yearof life with generalized or unilateral febrile clonic seizures, with myoclonic seizures typicallyoccurring between 1 and 4 yr of age. Focal seizures may also occur. The febrile seizures tendto be long and recurrent. EEG shows generalized spike waves and polyspike waves, earlyphotosensitivity, and focal abnormalities. Psychomotor retardation occurs, usually beginningin the second year of life, with ataxia and interictal myoclonus. Seizures are typically veryresistant to treatment.
The EEG may be normal at the time of the initial febrile seizures, but when the myoclonusstarts, generalized spike-and-wave or polyspike-and-wave discharges occur. It may be diffi-cult early on to differentiate the benign from the malignant syndrome, although febrileseizures do not typically occur in the benign form, in which seizures respond well to valproicacid and psychomotor retardation is absent.
3.2.5. Infantile Spasms (West Syndrome)
IS is an epileptic syndrome characterized by the triad of myoclonic or tonic seizures, hyp-sarrhythmia, and mental retardation. This is also called West Syndrome. IS is considered anage-dependent malignant epileptic syndrome, with a peak onset between 4 and 7 mo andalways before 12 mo of age.
IS is divided into idiopathic, symptomatic, and cryptogenic forms. Symptomatic refers toIS secondary to a known neurological insult; cryptogenic refers to a suspected, but not defi-nitely identified neurological insult; idiopathic is used when no specific insult has been iden-tified. The prognosis is worse if the spasms are either symptomatic or cryptogenic.
Clinical manifestations include brief head nods, with quick extension and flexion move-ments of the trunk, arms, and legs, occurring in clusters and during transitions from sleepingto awaking. These are also described as flexor, extensor, or mixed. The actual spasms mayresolve, but other seizure types occur later. The prognosis depends on the etiology.
Evaluation includes neuroimaging to exclude anatomic lesions, but other disorders, espe-cially metabolic and infectious, need to be excluded. Focal spasms may occur secondary tofocal lesions, such as tumor, stroke, or focal cortical dysplasia. Treatment is with steroids or
Pediatric EEG Abnormalities 193
11_Riviello 4/11/07 9:07 AM Page 193

194 Riviello
standard anticonvulsant medications. Adrenocorticotropic hormone has been considered thedrug of choice by many, although benzodiazepines, especially nitrazepam, and valproic acid,and now vigabatrin have been used. Vigabatrin may be especially effective if spasms arecaused by tuberous sclerosis, and recent studies show a similar efficacy between vigabatrinand ACTH, with a lower incidence of acute side effects from vigabatrin. However, vigabatrinhas been associated with retinal dysfunction, and visual field defects have been reported.Vigabatrin has not yet been released in the United States because of the retinal dysfunction.
If a focal lesion is responsible, then resection may be curative. Even in the absence of afrank mass lesion, surgery may be performed on refractory cases if an epileptogenic focus hasbeen identified. Most of these cases result from focal cortical dysplasias. Functional neu-roimaging, especially positron emission tomography scan, have been used to localize theepileptogenic region.
The classic interictal EEG finding is the hypsarrhythmia pattern, which consists of a high-voltage, disorganized background with multifocal spike and sharp waves. This pattern may firstoccur during non-rapid eye movement sleep and may disappear during rapid eye movement(active sleep) sleep or the waking state. The typical ictal pattern is the electrodecremental event,in which a generalized spike or sharp wave is followed by a flattening of EEG activity (Fig. 7).
Hrachovy et al. described the variations of the pattern: increased interhemispheric syn-chronization, asymmetrical hypsarrhythmia, hypsarrhythmia with a consistent focus ofabnormal discharge, hypsarrhythmia with episodes of attenuation, and hypsarrhythmia com-prising primarily high-voltage slow activity with little sharp-wave or spike activity. From ourdepartment, Kramer et al. studied the hypsarrhythmia variant patterns: electrodecrementaldischarges, absence of normal sleep activity, relative normalization, hemihypsarrhythmia,BS, occipital hypsarrhythmia, interhemispheric asymmetry, and interhemispheric synchro-nization, and devised a scoring system. The variant patterns occurred in 69% of 53 consecu-tive EEGs. A better prognosis was not related to the presence of any one variant pattern, butwas associated with faster background activity (<75% delta), a lower total hypsarrhythmiascore (≤10), and with absence of electrodecremental discharges on the pre-ACTH EEG.
3.2.6. Lennox–Gastaut Syndrome
Lennox–Gastaut Syndrome (LGS) is a severe, mixed seizure disorder, with tonic, atonic,and myoclonic seizures, mental retardation, and a slow spike-and-wave pattern on the EEG.This is a typical example of what has been termed an “epileptic encephalopathy.” The major-ity of children with LGS have frequent intractable seizures, starting between 1 to 8 yr.
Tonic seizures are a major component of LGS, and criteria that are more restrictive forLGS require tonic seizures for the diagnosis. Tonic seizures are typically sleep activated andrepetitive, although long-term monitoring may be needed to discover these. Benzodiazepinesmay induce tonic status epilepticus in LGS.
The EEG hallmark of LGS is the slow spike-and-wave discharge (1.5–2.5 Hz) superim-posed on a slow background (Fig. 8). Bursts of fast rhythms occur during sleep (Fig. 9).These discharges may be frequent, and may be very sleep activated.
LGS is typically resistant to therapy with standard AEDs. Alternative therapies, such ascorticosteroid therapy, the ketogenic diet, or vagal nerve stimulation, may be helpful.
3.2.7. Atypical Partial Benign Epilepsy of Childhood
Aicardi and Chevrie described the atypical partial benign epilepsy of childhood syndrome,which has some features of BRE; nocturnal focal seizures and focal EEG abnormalities, with
11_Riviello 4/11/07 9:07 AM Page 194

195
Fig. 7. Infantile spasms (IS). Seven-month-old child with IS. Note the high-amplitude, disorganized slow activity with multi-focal spikes with an electrodecremental response. This sort of electrodecremental event may be associated with a clinical spasm.
11_Riviello 4/11/07 9:07 AM Page 195

196
Fig. 8. Slow spike and wave of Lennox–Gastaut syndrome (LGS). Thirty-six-year-old man with LGS. Note thebilaterally synchronous 1.5- to 2-Hz spike-and-wave discharges.
11_Riviello 4/11/07 9:07 AM Page 196

197
Fig. 9. Slow spike and wave with fast activity in sleep. Eleven-year-old girl with LGS. Her EEG shows slow spike-and-wavedischarges, interrupted by a generalized burst of beta activity. Some of these beta bursts may be associated with tonic seizures.
11_Riviello 4/11/07 9:07 AM Page 197

198 Riviello
initial seizures similar to BRE, but then evolving into periodic atonic seizures, with briefabsences and GTCS. Atonic episodes correlate with the slow wave discharges on EEG. TheEEG can be very sleep activated, similar to that seen in electrical status epilepticus of sleep(ESES), and time periods with marked sleep activation correlate with atonic seizures andintellectual regression. This fluctuates with the EEG findings. This disorder has been referredto as “pseudo-LGS,” because EEG findings are similar to those of LGS.
3.2.8. Multiple Independent Spike Syndrome
Multiple independent spikes are defined as three or more independent spike foci, with atleast one originating in both the right and left hemispheres. It is related to hypsarrhythmia andthe slow spike-and-wave pattern seen in LGS. Background slowing and sleep-activated dis-charges are common, and similar to IS, increased synchrony may occur during sleep.
3.2.9. Epilepsy With Myoclonic–Astatic Seizures
Myoclonic astatic epilepsy is also called Doose Syndrome. Onset is typically between 7 moand 6 yr of age. The seizures consist primarily of generalized myoclonic, astatic, ormyoclonic–astatic seizures, short absences, and mostly GTCS, typically without tonic seizuresor drop attacks. However, tonic seizures may occur in cases with a poor outcome. There aregeneralized spike-and-wave patterns on EEG with the background activity characterized by a4- to 7-Hz rhythm with a parietal accentuation (Fig. 10). There is a high incidence of seizuresor EEG abnormalities in relatives. Before the onset of the seizures, which may start as febrileseizures, development is normal. Valproic acid and ethosuximide are the drugs of choice. Theprognosis is variable, some having a spontaneous remission.
3.2.10. Eyelid Myoclonia With Absences (Jeavons Syndrome)
Eyelid myoclonia with absences consists of eyelid myoclonia and absences, which mayoccur independently. The eyelid myoclonia typically occurs immediately after eye closureand is associated with brief bilateral spike-and-wave activity (Fig. 11). Eyelid myoclonialooks like rapid blinking, with upward eye deviation, and is more frequent in bright light anddoes not occur in the dark. However, eyelid myoclonia occurs in other idiopathic generalizedepilepsies, especially with photosensitive generalized epilepsy, and has been reported in fam-ily members without seizures. These were called paroxysmal eyelid movements by Camfieldet al. The frequency may help to differentiate these: the eyelid flutter with an absence seizurehas a frequency of 3 Hz, eyelid myoclonia has a frequency of 4 to 6 Hz, and paroxysmal eye-lid movements have a frequency of 10 Hz.
3.2.11. Photosensitive Epilepsy (A Reflex Epilepsy)
Photosensitive epilepsy is a specific reflex epilepsy, which refers to the induction of aseizure associated with a discharge of spikes or spike and slow waves with photic stimulation(referred to in the EEG laboratory as intermittent photic stimulation). The term photoparox-ysmal is used if there is only an electrographic discharge, whereas photoconvulsive is used ifthere is an actual clinical event associated with the discharge. Photosensitive seizures are usu-ally associated with idiopathic generalized epilepsy, but may also occur with focal or symp-tomatic epilepsies. Seizures may be self-induced, and this may be difficult to treat. Avoidanceof precipitating stimuli may be important (e.g., polarized sunglasses).
3.2.12. LKS (Acquired Epileptic Aphasia)
LKS is a rare epileptic syndrome characterized by language regression and an abnormalEEG. Language regression usually begins in those older than 4 yr and may first manifest as
11_Riviello 4/11/07 9:07 AM Page 198

199
Fig. 10. Myoclonic astatic epilepsy (Doose syndrome). Five-year-old boy with generalized tonic–clonic seizures and myoclonic–astatic seizures. Note the generalized spike-and-wave discharge, with a frontal predominance, with a background of 6 Hz.
11_Riviello 4/11/07 9:07 AM Page 199

200
Fig. 11. Eyelid myoclonia with absences (Jeavons syndrome). Twelve-year-old girl with eyelid myoclonia associated with absence seizures anda rare, generalized tonic–clonic seizure, responsive to valproic acid. Note the generalized polyspikes induced by eye closure.
11_Riviello 4/11/07 9:07 AM Page 200

201
Fig. 12. Landau-Kleffner syndrome (LKS). Four-year-old girl with LKS. Language regression occurred at 3 yr of age. Notethe generalized, high-amplitude, slow spike-and-wave discharge during sleep, representing electrical status epilepticus of sleep.
11_Riviello 4/11/07 9:07 AM Page 201

202 Riviello
an apparent word deafness, called a “verbal auditory agnosia.” Seizures and behavior dis-turbances, particularly hyperactivity, each occur in approximately two-thirds of childrenwith LKS.
The EEG in LKS shows bilateral, multifocal spikes and spike-and-wave discharges, occur-ring usually in the posterior regions, especially the temporal region, with a marked activationduring sleep (Fig. 12). However, discharges occur in many locations, and may even be gen-eralized. Some authorities require the presence of ESES to make the diagnosis.
3.2.13. Epilepsy With CSWS
CSWS is an epileptic syndrome characterized by continuous spike and waves during slowwave sleep. This has also been called ESES. CSWS consists of a sleep-activated EEG patternwith paroxysmal features present during 85% of slow wave sleep, and is divided into sympto-matic and cryptogenic groups, determined by whether normal neurological or psychomotordevelopment was present before the onset of the CSWS. Seizures are common but may not befrequent. Regression occurs in a more global manner, rather than predominantly the languageregression seen in LKS. The sleep activated EEG may also occur in LKS, and some requirethe presence of CSWS for making the diagnosis of LKS. Guilhoto and Morrell reported that amore focal EEG pattern is associated with language regression, whereas, if the EEG pattern ismore generalized, the regression is more global, and not predominantly in language skills.
LKS and CSWS have similar treatments: anticonvulsants are used for seizures and corti-costeroids are used for the language or neurobehavioral difficulties. Valproic acid, the benzo-diazepines, and ethosuximide have been the most successful anticonvulsants, and there is datasuggesting that carbamazepine may worsen the EEG. Steroids may have a better therapeuticefficacy than standard AEDs for the aphasia in LKS.
It is important to distinguish a sleep-activated EEG pattern from the epileptic syndromes ofLKS and CSWS. The EEG could show the pattern of marked sleep activation but the patientneed not have the specific epileptic syndromes with either language or global regression.
SUGGESTED READING
@Refs:Alvarez N, Lombroso CT, Medina C, Cantlon B. Paroxysmal spike and wave activity indrowsiness in young children: its relationship to febrile convulsions. Electroencephalogr ClinNeurophysiol 1983;56:406–413.
Aicardi J, Chevrie JJ. Atypical benign partial epilepsy of childhood. Dev Med Child Neurol1982;24:281–292.
Asconape J, Penry JK. Some clinical and EEG aspects of benign juvenile myoclonic epilepsy:Epilepsia 1984;25:108–114.
Astradsson A, Olafsson E, Ludvigsson P, Bjorgvinsson H, Hauser WA. Rolandic epilepsy: an inci-dence study in Iceland. Epilepsia 1998;39:884–886.
Camfield CS, Camfield PR, Sadler M, et al. Paroxysmal eyelid movements: a confusing feature ofgeneralized photosensitive epilepsy. Neurology 2004;63:40–42.
Cavazzuti GB, Cappella L, Nalin A. Longitudinal study of epileptiform EEG patterns in normal chil-dren. Epilepsia 1980;21:43–55.
Delgado-Escueta AV, Enrile-Bacsal F. Juvenile myoclonic epilepsy of Janz. Neurology 1984;34:285–294.Guilhoto LMFF, Morrell F. Electrophysiological differences between Landau–Kleffner Syndrome
and other conditions showing the CSWS electrical pattern. Epilepsia 1994;35(Suppl 8):126.Hahn JS, Monyer H, Tharp BR. Interburst interval measurements in the EEGs of premature infants
with normal neurological outcome. Electroencephalogr Clin Neurophysiol 1989;73:410–418.
11_Riviello 4/11/07 9:07 AM Page 202

Pediatric EEG Abnormalities 203
Hirtz D, Ashwal S, Berg A etal. Practice parameter: evaluating a first nonfebrile seizure in children:report of the quality standards subcommittee of the American Academy of Neurology, The ChildNeurology Society, and The American Epilepsy Society. Neurology 2000;55:616–623.
Holmes GL, McKeever M, Adamson M. Absence seizures in children: clinical and electroencephalo-graphic features. Ann Neurol 1987;21:268–273.
Hrachovy RA, Frost JD Jr, Kellaway P. Hypsarrhythmia: variations on the theme. Epilepsia1984;25:317–325.
Kellaway P. The incidence, significance, and natural history of spike foci in children. In: CurrentClinical Neurophysiology. Update on EEG and Evoked Potentials (Henry CE, ed).Elsevier/North Holland, New York, NY, 1980, pp. 151–175.
Kotagal P. Multifocal independent Spike syndrome: relationship to hypsarrhythmia and the slowspike-wave (Lennox–Gastaut) syndrome. Clin Electroencephalogr 1995;26:23–29.
Kramer U, Sue WC, Mikati MA. Hypsarrhythmia: frequency of variant patterns and correlation withetiology and outcome. Neurology 1997;48:197–203.
Lerman P. Benign partial epilepsy with centro-temporal spikes. Epileptic syndromes in infancy, child-hood and adolescence, 2nd ed. (Roger J, Bureau M, Dravet C, et al., eds). John Libbey andCompany, London, UK 1992, pp. 189–200.
Legarda S, Jayakar P, Duchowny M, Alvarez L, Resnick T. Benign rolandic epilepsy: high central andlow central subgroups. Epilepsia 1994;35:1125–1129.
Lerman P, Kivity S. Benign focal epilepsy of childhood. A follow-up study of 100 recovered patients.Arch Neurol 1975;23:261–264.
Lewis DW, Ashwal S, Dahl G, et al. The Quality Standards Subcommittee of the American Academyof Neurology; The Practice Committee of the Child Neurology Society. Practice parameter: eval-uation of children and adolescents with recurrent headaches: report of the Quality StandardsSubcommittee of the American Academy of Neurology and the Practice Committee of the ChildNeurology Society. Neurology 2002;59:490–498.
Lombroso CT. Sylvian seizures and mid temporal spike foci in children. Arch Neurol 1967;17:52 59.Lum LM, Connolly MB, Farrell K Wong PK. Hyperventilation-induced high-amplitude rhythmic
slowing with altered awareness: a video-EEG comparison with absence seizures. Epilepsia2002;43:1372–1378.
Massa R, de Saint Martin A, Carcangiu R, et al. EEG criteria predictive of a complicated evolutionin idiopathic rolandic epilepsy. Neurology 2001;57:1071–1079.
Mizrahi EM, Kellaway P. Characterization and classification of neonatal seizures. Neurology1987;37:1837–1844.
Niedermeyer E. Primary (idiopathic) generalized epilepsy and underlying mechanisms. ClinElectroencephalogr 1996;27:1–21
Panayiotopoulos CP. Benign childhood epileptic syndromes with occipital spikes: new classificationproposed by the International League Against Epilepsy. J Child Neurol 2000;15:548–552.
Penry JK, Porter RJ, Dreifuss RE. Simultaneous recording of absence seizures with video tape andelectroencephalography. A study of 374 seizures in 48 patients. Brain 1975;98:427–440.
Proposal for Revised Classification of Epilepsies and Epileptic Syndromes, Epilepsia 1989;30:389–399.Practice parameter: long-term treatment of the child with simple febrile seizures. American Academy pf
Pediatrics. Committee on Quality Improvement, Subcommittee on Febrile Seizures. Pediatrics1999;103:1307–1309.
Richer LP, Shevell MI, Rosenblatt BR. Epileptiform abnormalities in children with attention-deficit-hyperactivity disorder. Pediatr Neurol 2002;26:125–129.
Rose AL, Lombroso CT. A study of clinical, pathological, and electroencephalographic features in137 full-term babies with a long-term follow-up. Pediatrics 1970;45:404 425.
Volpe JJ. Neurology of the Newborn, 3rd ed. WB Saunders Co., Philadelphia, PA, 1995, pp. 172–207.Wirrell EC, Camfield PR, Gordon KE, Dooley JM, Camfield CS. Benign rolandic epilepsy: atypical
features are very common. J Child Neurol 1995;10:455–458
11_Riviello 4/11/07 9:07 AM Page 203

204 Riviello
REVIEW QUESTIONS
1. Do epileptiform abnormalities oblige the diagnosis of epilepsy?2. What is dyshormia?3. What is the distinction between simple and complex typical absence seizures?4. What is the distinction between typical and atypical absence seizures?5. What is the significance of OIRDA?6. What is the characteristic EEG finding in JME?7. What are features of the two benign occipital epilepsies of childhood?8. What defines the syndrome of IS (West Syndrome)? What are its classical interictal and ictal
EEG findings?9. What defines LGS? What is the EEG of LGS?
10. What features are common to both LKS and CSWS?
REVIEW ANSWERS
1. No, epileptiform abnormalities may be seen in as many as 3.5% of healthy children. Therefore,epilepsy is a clinical diagnosis, supported by appropriate EEG findings.
2. Dyshormia is an abnormal paroxysmal feature intermixed with normal sleep elements in theEEG. Epileptiform features embedded within vertex waves, for example, represents dyshormia.It has been suggested to indicate the possibility of a lower than normal seizure threshold.
3. Simple absence seizures lack associated motor phenomena. Complex absence seizures haveassociated motor or autonomic elements.
4. Typical absence seizures have a sudden onset and offset and tend to be briefer. Their EEG illus-trates a 3-Hz generalized spike-and-wave pattern. Atypical absence seizures have less clearlydefined beginning and end, more change in tone, tend to last longer, and often are in the com-pany of mental retardation and other seizure types. Their EEG typically has a slower frequencyof 1.5 to 2.5 Hz, is more apt to be asymmetric, and usually has a slow background.
5. OIRDA is a childhood pattern of paroxysmal rhythmic delta activity, sometimes with admixednotched or spike elements. It is a nonspecific pattern, but seems to occur with great frequencyin children with epilepsy, mostly absence epilepsy. However, it can be seen in other scenariosand need not be an epileptic finding.
6. JME is associated with a fast spike-and-wave pattern, 3.5- to 6-Hz spike-and-wave or polyspike-and-wave complexes. Photosensitivity occurs quite frequently.
7. The early form of benign occipital epilepsy involves children ages 2 to 12 yr having seizures involv-ing vomiting, eye deviation, and altered awareness. The later type (age 3–16 yr) has visual seizureswith visual hallucinations, feeling of ocular movement or pain, eye deviation, ictal blindness, andfocal or generalized seizures. Both show giant spikes with morphologies resembling those of BRE.
8. IS is defined by a triad of myoclonic or tonic seizures, hypsarrhythmia, and mental retardation.The classic interictal finding is the hypsarrhythmia pattern involving high voltage and a disor-ganized background with multifocal spike and sharp waves. It is usually sleep activated. Theclassic ictal finding is the electrodecremental pattern with an initial generalized spike or sharpwave, then a diffuse attenuation of the EEG of variable duration.
9. LGS is a disorder characterized by mixed seizure types, mental retardation, and a slow (1.5–2.5 Hz)spike-and-wave pattern on EEG. Background slowing is typical. It is commonly a highly refractoryepilepsy. Tonic seizures and interictal epileptiform discharges are both sleep-activated features in LGS.
10. Both LKS and CSWS are uncommon epilepsies with profound sleep activation. In both, thesleep EEG may become dominated by epileptiform activity, even to the level of ESES (>85% ofslow wave sleep with paroxysmal features). In LKS, the discharges are thought to be morebitemporal and/or biparietal, whereas in CSWS discharges are more diffusely seen. Seizuresaccompany both syndromes, but the more devastating clinical problems are language regression(in LKS) and global behavioral regression (in CSWS). Treatments involve anticonvulsants andoften corticosteroids for both.
11_Riviello 4/11/07 9:07 AM Page 204

IIINERVE CONDUCTION STUDIES
AND ELECTROMYOGRAPHY
12_Caress 4/11/07 10:33 PM Page 205

12_Caress 4/11/07 10:33 PM Page 206

12Neurophysiology of Nerve Conduction Studies
James B. Caress, Gregory J. Esper, and Seward B. Rutkove
SummaryThe methodology for performing standard nerve conduction studies has been established by iden-
tifying the most helpful and consistent physiological data obtainable while being constrained by avariety of technical and practical limitations. Nerve stimulation occurs underneath the negativelycharged anode of the applied stimulator and simultaneous hyperpolarization of the nerve occursbeneath the positively charged cathode. Referential or bipolar recording techniques are used for alltypes of measurements. Sensory conduction studies can be performed either antidromically or ortho-dromically, although, for technical reasons, the former are usually preferred; the recorded sensorynerve action potential is made up of the simultaneous depolarization of all of the cutaneous sensoryaxons. In motor studies, the compound motor action potential is recorded from the motor point of themuscle of interest and represents the depolarization of the underlying muscle fibers rather than thenerve itself and is, thus, of considerably greater amplitude and duration. F-waves and H-reflexes rep-resent the two most commonly evaluated forms of late responses and assist with assessing the entirelength of the neurons, from spinal cord to distal muscle.
Key Words: Compound motor action potential; depolarization; late responses; nerve conduction study;sensory nerve action potential; stimulation.
1. PHYSIOLOGY OF STIMULATIONStimulators used in routine nerve conduction studies (NCS) have a cathode and an anode
and are, therefore, bipolar. The cathode is negatively charged, whereas the anode is positivelycharged. The depolarization of axons occurs under the cathode because the negativity in theregion of the cathode leads to a reduction in the potential difference between the inside andthe outside of the cell (the inside of the cell is relatively negative at baseline). On the otherhand, the extracellular environment under the anode is positively charged, leading to hyper-polarization of the underlying axons.
Much of the current supplied by the stimulator travels in the very low resistance extracel-lular space because current follows the path of least resistance. The cross-sectional resistanceof an axon will determine whether some of that current will enter and depolarize the nerve.Cross-sectional resistance is reduced as diameter of the axon increases, resulting in a greaterarea in which current can flow. The result relevant to NCS is that large axons will depolarizewith relatively less stimulus current than smaller axons. Hence, with low stimulus intensities,large axons will be preferentially stimulated.
From: The Clinical Neurophysiology PrimerEdited by: A. S. Blum and S. B. Rutkove © Humana Press Inc., Totowa, NJ
207
12_Caress 4/11/07 10:33 PM Page 207

2. MEASUREMENT OF SENSORY POTENTIALS IN NCSWaveforms that are displayed during sensory NCS reflect the passage of current beneath
surface electrodes that are at least a few millimeters distant from the current generators (thatis, the depolarizing axons). Routine studies usually use a bipolar recording technique inwhich both the active and reference electrodes lie above the nerve. The potential measuredby the active electrode is compared with that measured by the reference electrode, and bothare compared with a ground electrode lying elsewhere on the patient. The reference electrodemakes an important contribution to the observed compound sensory nerve action potential(SNAP) (Fig. 1). The nerve current is not directly measured in NCS but overlying loops ofcurrent in the soft tissue reflect the actual action potentials. This situation is referred to as volume conduction and is further described in Chapter 4.
Temporal dispersion refers to the phenomenon that, as a sensory conduction study is per-formed over longer and longer segments of nerve, the recorded SNAP loses its sharpness(high amplitude and short duration) and becomes a broader, lower-amplitude potential. Thisoccurs normally in any sensory NCS because individual sensory axons conduct at slightlydifferent rates and because these slight differences are magnified when a NCS is performedover a large segment of nerve. In diseased states, such as polyneuropathies, temporal disper-sion can be enhanced (abnormal temporal dispersion). Because sensory NCS are especiallyvulnerable to the effects of temporal dispersion in both health and disease, sensory studies areusually performed over shorter segments of nerve than motor studies, which tend to be lesssusceptible to these effects (described in Section 3).
Sensory responses can be recorded with an orthodromic or an antidromic technique. In ortho-dromic studies, the recording electrodes are proximal to the stimulation site, and, in antidromicstudies, stimulation is proximal to the recording position. In the hands, ring electrodes are usedaround the fingers to stimulate (orthodromic) or record (antidromic). Although orthodromic
208 Caress, Esper, and Rutkove
Fig. 1. A median sensory nerve action potential recorded from digit 2. The digitally averagedwaveform is on top.
12_Caress 4/11/07 10:33 PM Page 208

responses reflect more accurately the physiology of sensory responses via afferent conduc-tion, upper extremity orthodromic responses are usually considerably smaller than antidromicresponses.
3. MEASUREMENT OF MOTOR POTENTIALS IN NCSThe active electrode is placed over the motor point of the muscle, where the majority of
the motor axons synapse with the end plates of the muscle fibers. Rather than measuring acompound nerve action potential, the summation of the muscle fiber action potentials ismeasured. This is called the compound motor action potential (CMAP) (Fig. 2). In this case,there is no leading edge of a dipole to cause an initial downward deflection, because the depo-larization initiates directly beneath the recording electrode. The influx of Na+ at the muscleend plates generates extracellular negativity that is displayed as an abrupt upward deflectionfrom the baseline. The waveform returns to the baseline as the resting membrane potential ofthe muscle fibers is reestablished. The distal latency is the time at which the depolarizationof the fastest nerve fiber is recorded; this response is routinely recorded but does not directlymeasure the conduction velocity, as is the case with sensory recordings. This is because ofthe additional time it takes for acetylcholine to traverse the synapse, to attach to receptors,and to generate muscle fiber action potentials. Conduction velocity is calculated only in theproximal segments of nerve, by subtracting the distal latency and distance from the valuesobtained with proximal stimulation. However, by establishing normal values for distal laten-cies for specific distances, meaning can be given to the measurement that can assist in theevaluation of a variety nerve disorders, including distal compression neuropathies, such ascarpal tunnel syndrome (median neuropathy at the wrist).
One point that is frequently overlooked is that the recorded CMAP does not reflect mus-cle contraction. The CMAP is a purely electrical signal from the summation of muscle fiberaction potentials, which occurs well before the actual contraction of the muscle takes place.
Nerve Conduction Studies 209
Fig. 2. A median compound muscle action potential. Recordings made with wrist and elbow stim-ulating APB, abductor pollicis brevis.
12_Caress 4/11/07 10:33 PM Page 209

The visible muscle contraction requires Ca2+ release cross-linking of actin and myosin fibers(so-called excitation–contraction coupling), which occurs much more slowly and is not meas-ured in routine NCS. Also, as in sensory NCS, the reference electrode is not electrically inac-tive, and it contributes to the waveform, even though it is often placed over a bone, a regiongenerally considered electrically silent. This is particularly clear during ulnar or tibial motorNCS, where the waveform characteristically exhibits a double-peaked negative phase. Thesecond peak results from activity recorded at the reference electrode.
Similar to sensory responses, normal temporal dispersion of the responses does occurbecause smaller motor neurons will conduct at slower velocities than larger, causing therecorded CMAP to spread out (increase in duration and decrease in amplitude) the longer thesegment of nerve studied. However, the effects are not nearly as dramatic as those observedin sensory studies, because the duration of the CMAP is much larger than of the SNAP (~6 times longer). Hence, small increases in duration are not be readily apparent, and theamplitude of the response generally declines only modestly with increasing distance.
4. NEUROPHYSIOLOGY OF THE LATE RESPONSES
4.1. F-WavesThe “F” stands for foot, because these responses were first recorded from intrinsic foot mus-
cles. On stimulation of a single motor axon, the wave of depolarization will travel distally to berecorded as part of the CMAP, or “M-wave,” but also will travel proximally to its anterior horncell (AHC). Retrograde depolarization of AHCs will result in regeneration of an action potentialat the axon hillock in a small subset of neurons (~5–10%), which then travels back down themotor axon to the innervated muscle, recorded at the electrodes as the F-wave (Fig. 3). Although,for theoretical reasons, it is desirable to reverse the polarity of the stimulator, placing the anodedistally and cathode proximally to avoid “anodal block,” this remains more of a theoreticalrather than a practical consideration. F-waves are easily generated with the cathode in the dis-tal position. At the level of the spinal cord, no synapse is involved, and an F-wave from a sin-gle axon has the same morphology and almost identical latency each time. However, a singleaxon will not generate an F-wave with each successive depolarization. The probability that anF-wave will be generated from any neuron is dependent on the variable excitability of the AHCmembrane that can be increased with reinforcement maneuvers (clenching teeth or making atight fist) and decreased by sleep and anesthesia. F-waves may be absent in sleeping, sedated,or comatose persons, and should not be interpreted as a sign of peripheral nervous system dis-ease in these patients. During NCS, supramaximal stimulation of the peripheral nerve ensuresthat all motor axons capable of generating an F-wave are depolarized each time. Under normalconditions, several axons generate an F-wave, and the summation of these responses isrecorded. The varying probability that a single axon will produce an F-wave results in varia-tion of the morphology and latency of the summated F-waves. In severe neuropathic condi-tions, when only one axon capable of generating an F-wave is surviving, it is recorded as an“all or none” response without variability. Also under neuropathic conditions, unusually highamplitude F-waves may be recorded because of reinnervation of the motor units.
At least 10 F-waves are usually collected for analysis. The minimum F-wave latency is theparameter measured in most labs, but reflects only the fastest motor axon contributing to theF-wave; this value may be spared in pathological situations and, importantly, in acquireddemyelinating neuropathies. Mean or median F-wave latencies provide better informationconcerning the proximal sections of the nerves in diseased states. However, most EMG
210 Caress, Esper, and Rutkove
12_Caress 4/11/07 10:33 PM Page 210

laboratories do not have normal values from which to interpret abnormalities in theseparameters. Other F-wave parameters that may also be useful include chronodispersion andpersistence. Chronodispersion is a measure of the range of minimum latencies and is normallyless than 5 ms. This range can be exceeded in demyelinating neuropathies or radiculopathies.Persistence is a measure of the frequency of obtaining an F-wave after supramaximal stimulus,and varies for different motor nerves. Persistence is 80 to 100% for most nerves, but peronealF-waves may be difficult to elicit, even in healthy persons.
F-wave minimum latency is dependent on limb length, and nomograms are used to judgeabnormality. If a height-adjusted table is not available, the appropriate F-wave latency cor-rected for height (±2.5 ms) can be estimated using the formula:
F-estimate (ms) = [2 × F distance (mm)/CV (m/s)] + distal latency (ms) + 1 ms
where F distance is from the stimulus site to the C7 spinal process (median, ulnar) or thexiphoid process (peroneal, tibial), and CV is the conduction velocity. The addition of 1 msallows for the central conduction delay. F-estimates can also be useful for identifying proxi-mal pathology in the proximal segments of a nerve. Because the calculation of the estimaterelies on the conduction velocity, which is obtained distally, proximal pathology will createa longer measured F-wave latency than would be anticipated by the F-estimate calculation.
Because F-waves probe the proximal portions of nerves, it seems reasonable that theyshould be useful in studying the plexus and nerve roots, which otherwise can only be directlystimulated using special techniques. Unfortunately, F-waves do have limitations for commonpathology, such as structural radiculopathies, for several reasons. For example, the standardmedian and ulnar motor NCS evaluate only the C8 and T1 roots, which are not commonlydamaged in structural radiculopathies, C5, C6, and C7 radiculopathies being much morecommon. Further, the shared root innervation (C8, T1) of abductor digiti quinti and abductorpollicis brevis muscles means that, in the setting of a completely transected C8 root, the F-wave latency may still be normal because of sparing of the T1 root. F-waves are likely tobe more useful in detecting radiculopathies affecting the lower extremities, where standard
Nerve Conduction Studies 211
Fig. 3. F-responses recorded from the tibial nerve; the bottom tracing shows the superimposed data.
12_Caress 4/11/07 10:33 PM Page 211

peroneal and tibial motor conduction studies evaluate L5 and S1 derived neurons. Finally,because the F-response is a pure motor phenomenon, radiculopathies affecting only the sen-sory root cannot be detected (although this also remains a limitation of needle EMG).
Recall that the F-wave evaluates the proximal and distal segments of the nerve because ittravels to the root level and then back to the distal muscle to be recorded. This implies thatF-waves may be prolonged in distal entrapment neuropathies and polyneuropathies; thus,abnormal F-waves are not specific for proximal nerve pathology.
F-waves have their greatest usefulness in the setting of demyelinating radiculoneu-ropathies, especially Guillain–Barré Syndrome (GBS). Early GBS is frequently characterizedby prominent involvement of the spinal roots. In these cases, the distal motor nerve segmentsmay be electrophysiologically normal despite clinical weakness and areflexia caused bydemyelination at the root level. F-wave minimum latency is commonly prolonged, and per-sistence can be severely reduced or absent in this setting; this suggests demyelination withconduction block in the proximal segments of the nerves. The combination of a normal dis-tal CMAP and absent F-waves is highly specific for proximal demyelination. F-wave laten-cies are most prolonged 3 to 5 wk after the onset of GBS, secondary to further demyelinationthroughout the length of the nerve.
4.2. H-Reflex“H” stands for Hoffman, after the investigator who first recorded the late response in 1918.
The H-reflex is often said to be the NCS parallel of the clinical ankle tendon reflex, but thetwo tests are probably not evaluating the exact same group of nerve fibers. The tibial nerve isstimulated in the popliteal fossa, with the cathode proximal to the anode, and the response isrecorded with the active electrode overlying the belly of the soleus muscle and the referenceelectrode placed at the calcaneal tendon. As with F-waves, the “reversed” cathode–anode ori-entation avoids the possibility of anodal block. The nerve is stimulated with a long-duration(1 ms) pulse rather than the short-duration pulse commonly used in routine NCS (0.05–0.2 ms)because the longer pulse is more effective at selectively stimulating the type 1A sensoryfibers from muscle spindle organs that initiate the response.
In clinical practice, the H-reflex in adults is generally mostly recorded from the soleus;however, it is also readily obtainable form flexor carpi radialis with medial nerve stimulation,but is generally not performed because it provides little additional information over conven-tional EMG. However, in children and in diseased states, H-reflexes may also be elicitablefrom many other nerves and muscles.
The H-reflex is best studied by generating a recruitment curve, accomplished by graduallyincreasing stimulus intensities such that the variability of the H-reflex can be measured (Fig. 4).At very low stimulus intensities, no response can be elicited. At slightly higher intensity, asmall H-reflex can be seen without the M-wave. This occurs because the type 1A fibers arebeing stimulated without direct depolarization of the adjacent alpha motor neurons. The 1Afibers conduct the stimulus to the spinal cord, where a monosynaptic reflex occurs, as it doeswith the clinical ankle jerk, where the afferent volley is initiated by the Golgi tendon organs.From the spinal cord, the response travels orthodromically down the motor neuron to thesoleus, where the triphasic H-wave is recorded. With further increasing stimulation, the H-reflex continues to grow in amplitude as more and more 1A afferents are stimulated. Then,as motor fibers are directly depolarized, an M-wave begins to appear. The H-reflex thenbegins to decline in amplitude with increasing stimulus intensity caused by collision with the
212 Caress, Esper, and Rutkove
12_Caress 4/11/07 10:33 PM Page 212

antidromic impulse being conducted along the motor neurons. Eventually, the H-reflex iscompletely abolished, as a supramaximal motor response is elicited and antidromic motorresponses collide with all the descending motor input arriving via the sensory pathways. Atthis point, any late responses recorded will be F-waves only.
The minimum onset latency (usually 25–34 ms) is the only routinely measured aspect ofthe H-reflex and, similar to the F-wave, is dependent on the height of the subject and theintegrity of the nerves. Comparing the affected and unaffected leg reflexes is more useful thananalysis of a unilateral response, and most laboratories consider up to a 1.5 ms difference asnormal. Also, comparing bilateral H-reflex amplitudes can be informative, as can comparingthe ratio of the H-reflex amplitude with the M-wave amplitude. The ratio may reflect thedegree of AHC excitability. The ratio usually increases in upper motor neuron lesions and canbe used to evaluate spasticity. Amplitude can be measured as long as care is taken to movethe recording electrodes to ensure optimum positioning.
The H-reflex suffers from a lack of specificity for similar reasons as outlined for F-waves.The absolute latency is increased in polyneuropathies (axonal and demyelinating), or thereflex may be absent. Comparison of the healthy and diseased legs may be useful for diag-nosing S1 radiculopathies.
4.3. A-WavesThe A-wave (Fig. 5) is another late response; however, it is only prominent in pathologi-
cal states. It can be distinguished from F-waves by its invariable latency and morphology witheach stimulus. The A-wave latency is typically shorter than the F-wave but can be longer. A-waves can be seen in the setting of any neuropathic process, but are quite common inpolyneuropathies and radiculopathies.
Nerve Conduction Studies 213
Fig. 4. H-reflex recruitment. Note how the potential comes in initially before the M-wave, maximizesjust as the M-wave appears, and then gradually decreases in size as the M-wave becomes supramaxi-mal. Once the M-wave is supramaximal, the only recorded late responses will be the F-waves. The bot-tom tracing shows the superimposed data.
12_Caress 4/11/07 10:33 PM Page 213

A number of potential explanations have been suggested for the occurrence of A-waves.One possibility is that an abnormal axon may give off a branch proximally. Stimulation of thenerve may result in antidromic excitation of the branch, leading to a descending orthodromicdepolarization. This would essentially represent a so-called “axon reflex.” Another possibilityis that ephaptic transmission is occurring between the axons proximally because of abnormal(crosstalk) demyelination. An impulse can then travel antidromically up one neuron andorthodromically down another, exciting the muscle at a constant latency.
SUGGESTED READINGAlbers JW, Donofrio PD, McGonagle TK. Sequential electrodiagnostic abnormalities in acute inflam-
matory demyelinating polyradiculoneuropathy. Muscle Nerve 1985;8:528–539.Dumitru D. Physiologic basis of potentials recorded in electromyography. Muscle Nerve 2000;
23:1667–1685.Fraser JL, Olney RK. The relative diagnostic sensitivity of different F-wave parameters in various
polyneuropathies. Muscle Nerve 1992;15:912–918.Kincaid JC, Brasher A, Markand ON. The influence of the reference electrode on CMAP configura-
tion. Muscle Nerve 1993;16:392–396.Preston DC, Shapiro BE. Electromyography and Neuromuscular Disorders. Butterworth-Heinemann,
Boston, MA, 2000.Roth G. Clinical Motor Electroneurography: Evoked Responses Beyond the M-Wave Eectopic
Activity. Elsevier, Amsterdam, Holland, 2000.
REVIEW QUESTIONS
1. Which of the following statements concerning temporal dispersion is true?A. Abnormal temporal dispersion is typically observed only in sensory nerves.B. Normal temporal dispersion is independent of the length of nerve being studied.C. Abnormal temporal dispersion is the hallmark of axonal polyneuropathies.D. Abnormal temporal dispersion is usually accompanied by a drop in response amplitude.E. Marked abnormal temporal dispersion is typically seen in the median nerve of patients with
carpal tunnel syndrome.
214 Caress, Esper, and Rutkove
Fig. 5. An example of A-wave (arrow), obtained while evaluating ulnar F-waves.
12_Caress 4/11/07 10:33 PM Page 214

2. Which of the following comments is true regarding nerve stimulation?A. Nerve depolarization typically occurs beneath the anode.B. Little of the applied electrical current typically flows through the extracellular space.C. Large and small nerve fibers have an equal propensity toward initiating an action potential with
stimulation.D. Anodal black can theoretically interfere with the acquisition of F wave data.E. Standard nerve conduction study techniques rely on the use of submaximal stimulation.
3. Which of the following statements concerning the F-estimate is true?A. The F-estimate can assist in identifying the presence of a distal neuropathic process.B. The F-estimate is useful only in lower extremity studies where the F-waves are longer.C. In a patient with an isolated L5 radiculopathy, but otherwise a normal nerve conduction study,
the F-estimate would likely provide a value of shorter latency than the measured F-waves.D. The distal latency is not used to help calculate the F-estimate.E. The F-estimate is likely to be elevated falsely in patients with axonal polyneuropathies.
4. The following statements concerning sensory nerve conduction studies are true, EXCEPT:A. They can be performed orthodromically or antidromically.B. They are more susceptible to normal temporal dispersion than motor studies.C. They rely on depolarization of the nerve beneath the anode.D. They rely on measurements from both the E1 and E2 electrodes in reference to the ground.E. They preferentially stimulate larger diameter nerve fibers at low stimulus intensities.
5. Motor nerve conduction studies:A. Require that E2 be replaced over the belly of the muscle and E1 be placed at a relatively inac-
tive site.B. Result in waveforms that are the summation of muscle fiber action potentials.C. Allow nerve conduction velocity to be measured with distal stimulation.D. Are representative of muscle contraction.E. Are typically performed in the antidromic fashion.
6. F waves are:A. Late responses measured during sensory nerve conduction studies.B. Indicative of pathology at the root level only.C. Typically less than 31–32 ms in latency in the upper extremities and less than 56 ms in latency
in the lower extremities.D. Independent of height.E. Of identical morphology with each stimulus.
7. A patient with Guillain Barré Syndrome, or acute inflammatory demyelinating polyneuropathy,might be expected to have:A. Prolonged distal latencies.B. Conduction velocity slowing.C. Abnormal temporal dispersion.D. Prolonged F wave latencies.E. All of the above.
8. The tibial H-reflex:A. Is electrophysiologically similar to the ankle reflex.B. Represents the contraction of gastrocnemius.C. Represents the contraction of the soleus.D. May be abnormal in an L5 radiculopathy.E. Is independent of height.
9. Sensory conduction studies are typically abnormal in:A. Myopathy.B. Compressive radiculopathies.C. Polyneuropathy.D. Myasthenia gravis.E. All of the above.
10. A patient with a decreased median nerve sensory response amplitude, prolonged median nerve Fwave latency, and prolonged median nerve motor distal latency may have:
Nerve Conduction Studies 215
12_Caress 4/11/07 10:33 PM Page 215

A. Median neuropathy at the wrist.B. Generalized polyneuropathy.C. Generalized myopathy.D. C8-T1 radiculopathy from herniated disc.E. A and B.
REVIEW ANSWERS
1. Answer: D. Abnormal temporal dispersion is usually accompanied by a drop in response amplitude.Normal temporal dispersion is very dependent on the length of the neuron. Abnormal temporal dis-persion is the hall mark of demyelinating polyneuropathies and can be observed easily in motorconduction studies. It is not typically seen in patients with carpal tunnel syndrome.
2. Answer: D. Anodal block can theoretically interfere with the acquisition of F wave data, although thisis usually not a practical concern. All the other statements are false. Nerve depolarization occursbeneath the cathode, most of the electrical current travels through the extracellular space, large diam-eter nerve fibers have the greater propensity toward action potential generation, and standard nerveconduction studies are supramaximal stimuli.
3. Answer C: In an isolated L5 radiculopathy, a peroneal F-estimatate would likely provide a shorter valuethan the actual F-waves, since the F-estimate would be calculated from the relatively unaffected distallatency and conduction velocity. F-estimates are most helpful in identifying the presence of a superim-posed proximal process on a distal, can be performed in both the arms and legs, includes the distallatency and will not be adversely affected by the presence of an axonal neuropathy.
4. Answer: C. The nerve is depolarized beneath the cathode, not the anode. All the other statements aretrue.
5. Answer: B. The CMAP is the summation of all the muscle fiber action potentials. E1 is placed over themuscle belly, not E2. Nerve conduction velocity cannot be measured with distal stimulation alone. Themuscle contraction is not being measured in standard motor conduction studies. Motor conduction stud-ies cannot be performed antidromically since the muscle depolarization is being measured.
6. Answer: C. They are typically less than 31–32 ms in latency in the upper extremities and less than56 ms in latency in the lower extremities. F waves are the late responses of motor, not sensory, nerveconduction studies. While prolonged F wave latencies are possibly indicative of pathology at spe-cific root levels only, they can also be prolonged in focal compressive neuropathies (e.g. carpal tun-nel syndrome) or generalized polyneuropathies. They are dependent on height, as taller people willhave longer F wave latencies (increased distance for the action potential to travel).
7. Answer: E. All the statements are true.8. Answer: A. The tibial H-reflex results from stimulation of Ia afferent tibial nerve fibers, which
synapse in the spinal cord, travel back down the tibial nerve, and cause depolarization of the soleusmuscle. It is therefore electrically similar to the ankle reflex (although not identical). It does not rep-resent the actual contraction of a muscle, but rather the summed muscle fiber potentials of therecorded muscle. As the neurophysiologic equivalent of the ankle reflex, it may be abnormal in anS1 radiculopathy but not L5 radiculopathy. The H-reflex latency varies with different height: thelatency is longer in people of taller stature, just like F-waves.
9. Answer: C. Sensory studies are typically abnormal in most, but not all, polyneuropathies. Inmyopathies, the motor responses can be normal or reduced. In compressive radiculopathies, the dor-sal root ganglion, which houses the pseudounipolar sensory cell bodies, lies outside of the zone ofcompression. Because sensory nerves do not have a neuromuscular junction, sensory responses willbe normal in myasthenia gravis.
10. Answer: E. These findings can be seen in both focal compressive lesions of the median nerve at thewrist and generalized polyneuropathy. Sensory responses in a generalized should not be abnormal inmyopathy. In addition, the sensory responses should not be abnormal in a C8-T1 radiculopathy fortwo reasons: 1) the sensory component of the median nerve is derived from the C6-7 dermatomesand 2) sensory responses are typically normal in compressive radiculopathies.
216 Caress, Esper, and Rutkove
12_Caress 4/11/07 10:33 PM Page 216

13Technical, Physiological and Anatomic Considerations
in Nerve Conduction Studies
James B. Caress
SummaryNerve conduction studies and their interpretation are subject to a variety of factors. First, technical
factors including submaximal stimulation, environmental electrical noise, inaccurate placement of therecording electrodes, and stimulus artifact can substantially interfere with accurate recording of nerveand muscle responses. Second, physiological factors, such as the effects of body height and age, cancause profound variation in all nerve conduction parameters, and studies require interpretation keep-ing these individual variations in mind. Another physiological factor is temperature, in which coolingcan produce a variety of changes, including slowing of conduction velocity and increase of responseamplitude. Anatomic factors are also important, the most common being the Martin–Gruber anasto-mosis, usually presenting with a reduction in response amplitude with proximal stimulation of theulnar nerve, and the second most common being the presence of an accessory peroneal nerve. Payingconstant attention to all of these details is a critical element to the accurate performance and interpre-tation of nerve conduction studies.
Key Words: Conduction velocity; distal latency; Martin–Gruber anastomosis; nerve conduction study;stimulation; temperature.
1. INTRODUCTION
Nerve conduction studies (NCS) are considerably more technically demanding than EMG.Correct interpretation of NCS data is dependent on re-creating the conditions that prevailedwhen the normal data tables were generated. This means that close attention to temperatureand electrode placement are crucial. Physiological potentials are tiny in comparison withambient electrical noise and must be amplified many times for evaluation. Artifacts may besimilarly amplified and need to be recognized and minimized.
2. SKIN PREPARATION
Good skin preparation is vital to performing NCS. The skin acts as a barrier to the meas-urement of electrical signals of interest and the effect of this barrier can be minimized byapplication of conductive gel that provides a low-resistance pathway to the electrode. Thickor edematous skin adds additional distance between the recording electrodes and the signalgenerator (i.e., the nerve or muscle), resulting in lower amplitudes. When the skin is callused,there may be different amounts of resistance to measuring the charge over the skin betweenthe active and reference recording electrodes. Impedance is the term used to describe resistance
From: The Clinical Neurophysiology PrimerEdited by: A. S. Blum and S. B. Rutkove © Humana Press Inc., Totowa, NJ
217
13_Caress 4/11/07 10:33 PM Page 217

to current flow in NCS. The impedance of recording electrodes must be similar, or ambientelectrical noise will appear different at the electrodes. When this occurs, 60-Hz artifact or abroad stimulus artifact may obscure the waveforms. Skin lotions or perspiration can providea conductive medium from the stimulator to the recording electrodes and can also result in abroad stimulus artifact. Soap and water cleansing is usually effective, but alcohol and acetonemay be used to obtain a clean surface.
3. STIMULUS ARTIFACT
Spread of excess current along the skin and deeper tissues results in a stimulus artifact.Modern instruments use a variety of technical mechanisms to minimize this, but, even so,stimulus artifact can obscure potentials with very short latencies, especially palm-to-fingersor palm-to-wrist recordings. Reducing stimulus duration and intensity can reduce stimulusartifact, but it is imperative to obtain supramaximal responses. Placing the ground electrodebetween the stimulating and recording electrodes can reduce stimulus artifact by providing alow-impedance pathway for excess current to flow through. Rotating the anode of the stimu-lator while leaving the cathode in place can minimize the stimulus artifact. Increasing the dis-tance between stimulating and recording electrodes or decreasing the distance between theactive and reference recording electrodes will reduce stimulus artifact at the cost of lengthen-ing the latency and, possibly, reducing the amplitude of the waveforms.
4. RECORDING ELECTRODES
Recording electrodes used in routine NCS include disc electrodes, ring electrodes, and barelectrodes that connect two discs at a fixed distance. Disc electrodes are commonly used torecord motor potentials and nondigital sensory potentials. The discs are connected to separatewires that allow the distance between the active and reference electrode to be altered. Standardinterelectrode distance is 3 to 4 cm, but there are occasions when adjustments must be madebecause of anatomic or physiological conditions. Any variation from standard positioning canchange the characteristics of the recorded potentials, therefore, understanding the underlyingelectrophysiology is helpful in interpreting the data when alterations are necessary.
NCS and EMG electrodes record all potentials using a differential amplifier system thatmagnifies differences between the active and reference electrodes at each point in time.Identical signals appearing simultaneously at both electrodes undergo common mode rejec-tion and are not displayed in the waveform. This is an ideal situation to minimize noise, butcan also reduce physiological potentials.
In sensory NCS, the active and reference recording electrodes are placed linearly along thecourse of the nerve, approx 3 cm apart. It is optimal for the traveling depolarized zone to passcompletely under the active electrode before beginning to pass under the reference electrode,because this maximizes the displayed amplitude. Interelectrode differences of less than 3 cmmay result in reduction of the amplitude. Increasing interelectrode difference beyond 3 to 4cm does not increase the amplitude further and improves the chance of introducing electricalnoise that may appear different at the two points. When the interelectrode distance is neces-sarily altered (as occurs with an amputation of a distal phalanx or to avoid bandages or sim-ilar obstacles), these concepts need to be kept in mind because normal values depend onspecific interelectrode distances. Amplitudes vary inversely with the recording electrode’sdistance from the nerve, thus, it is advisable to take steps to minimize edema, particularly
218 Caress
13_Caress 4/11/07 10:33 PM Page 218

Technical Factors 219
when recording from the sural, superficial peroneal, and radial nerves with disc electrodes.Placement of subdermal monopolar needle electrodes can circumvent this problem.
In motor NCS, recording electrodes are placed in the “belly-tendon” arrangement. Theactive electrode is placed directly over the spot where most of the axons terminate in the neu-romuscular junction, called the motor point. When the nerve is stimulated, proper placementover the motor point will result in an initial negative (upwards) deflection from the baseline.If the electrode is not over the motor point, depolarization adjacent to the electrode results ina “positive dip” with an initially positive deflection. This downward deflection is a volume-conducted response akin to the positive deflection at the onset of a triphasic sensory wave-form. If a positive dip is noted, the active electrode should be moved until an initial negativedeflection is observed. On occasion, repositioning the electrodes cannot correct a positive dipbecause of unusual anatomy (particularly tibial motor potentials) or because of severe neuro-muscular pathology.
The reference electrode is placed distally over a tendinous region. Older texts have statedthat the reference electrode is electrically inactive or “indifferent” and, thus, some practition-ers may be unaware that the reference electrode makes important contributions to the meas-ured motor potential. This is most apparent with ulnar motor studies recording from abductordigiti quinti (ADQ). The ulnar motor waveform characteristically exhibits a double-peakedmorphology in its negative phase, and the second peak is usually of higher amplitude. In anelegant study, Kincaid et al. demonstrated that the reference electrode generates the secondpeak. When the reference electrode was moved to the contralateral index finger, the secondpeak was not recorded. In median nerve studies, the contribution of the reference electrodehas a more subtle impact. The effect of the reference electrode should be kept in mind whendouble-peaked waveforms appear in unusual situations or when inclusion of the second peakwould produce seemingly inaccurate results.
5. VIRTUAL CATHODE
A tenet of NCS is that depolarization occurs directly under the cathode of the stimulator but,with overzealous attempts to maximize the amplitude of potentials, excess current traveling inthe overlying superficial tissues may result in depolarization distal to the cathode. When thisoccurs, the cathode is “virtually” in a different place than its actual anatomic location. This canbe readily observed by keeping the stimulator in place and increasing the intensity beyondmaximal values (see Fig. 1). The amplitude stays relatively stable but the distal latency isshortened. The erroneously short latency may mask pathological slowing. Virtual cathode caneasily occur when the nerve is quite deep to the stimulator. For example, during ulnar motorNCS at the below-elbow site, the deep location of the nerve results in high-intensity stimula-tion to elicit the supramaximal response. Depending on the anatomy of the individual person,some fibers distal to the stimulator may be stimulated to achieve a maximal response. Theresult is an inaccurately fast forearm velocity. If this is combined with correctly performedabove-elbow stimulation, an artifactual relative slowing across the elbow is created.
6. ANODAL BLOCK
When depolarization under the cathode occurs, there is also hyperpolarization of the nervebeneath the anode. The hyperpolarization is without significance in NCS unless the cathodeand anode are inadvertently reversed. When this happens, depolarization occurs 2 to 3 cmproximal to the point that has been marked for depolarization, resulting in apparent prolonged
13_Caress 4/11/07 10:33 PM Page 219

distal latencies, and the area of hyperpolarization may block some of the impulses comingfrom the proximal depolarized zone (anodal block).
Reversing the orientation of the stimulator (cathode proximal) is routinely used to avoidanodal block during F-wave measurements. However, a distal compound motor action poten-tial (CMAP) is still generated despite the hyperpolarized zone, although there may be a sub-tle reduction in amplitude that goes unnoticed. The corollary is that F-waves are readilyobtained even if the operator fails to reverse the position of the stimulator.
7. AVERAGING
Computerized software has made the “average” key on NCS machines a routine fixture,but it continues to be used relatively sparingly in clinical practice. All physiological wave-forms recorded during NCS are contaminated by noise (ambient electrical fields, EKG arti-fact, etc.). The differential amplifier and proper use of filters attenuate most of this noise sothat the averaging is only needed for recording very small amplitude potentials (sensory andmixed nerve potentials) in the microvolt range. By averaging repeated stimuli of identicalintensity, noise is reduced, resulting in a flatter baseline and a more clearly defined physio-logical waveform. Mathematically, averaging potentials increases the signal-to-noise ratio bya factor equal to square root of the number of potentials averaged. During routine NCS onhealthy individuals, the signal is evident above the noise, tempting the operator to omit averaging the potential. However, averaging will improve identification of the onset latencyand provide a more accurate and reproducible waveform. The value of averaging becomesmore apparent when it used to define potentials not evident on initial inspection because of
220 Caress
Fig. 1. Virtual cathode. From top to bottom, the first waveform shows a slightly submaximal motorresponse. The second stimulus produces a maximal response. The third stimulus is of 25% higherintensity and generates a supramaximal response that is unchanged in amplitude or latency. A furtherincrease in stimulus intensity produces a response that is of slightly faster latency without a changein amplitude (virtual cathode). The virtual cathode effect is demonstrated again in the bottom tracingafter another increase in intensity.
13_Caress 4/11/07 10:33 PM Page 220

surrounding noise. For example, consider a sural sensory potential that is 1 µV in amplitudebut cannot be identified because the baseline “rumble” is 2 µV (signal-to-noise ratio of 1:2).Without averaging, the sural potential would be erroneously recorded as absent. If the poten-tial is averaged four times (square root of 4 = 2), the signal-to-noise ratio is increased to 2:2(or 1:1). If the potential is averaged 16 times, this increases the signal-to-noise ratio to 4:2(2:1), and the potential will become visible above the noise.
8. PHYSIOLOGICAL FACTORS
Physiological factors, including age and height but particularly temperature, can signifi-cantly influence NCS responses. The effects of temperature on NCS can be explained bysodium channel physiology.
8.1. Temperature
Diminishing temperature results in slower opening and closing of the Na+ channel porebut, because closing time is relatively more affected, the net result is that cooler tempera-tures produce a net increase in the total time the Na+ channel remains open. The sloweropening time causes delay in regeneration of the action potential at each node of Ranvierand results in prolonged distal latencies and slower conduction velocities. The net increasein sodium channel open time results in a longer duration action potential and, as more Na+
ions enter the intracellular space, a larger amplitude potential is produced. Warmingbeyond the physiological range reverses this pattern and can result in faster conductionvelocities and reduced amplitude. Studies attempting to document these changes in duringroutine NCS conditions have produced variable results because of differences in how cool-ing was applied. However, in clinical practice, the important effects of cold temperature inroutine NCS are longer distal latencies, slower conduction velocities, and higher ampli-tudes (see Fig. 2). This pattern of findings can mimic demyelination, resulting in erroneousdiagnoses of median or ulnar neuropathy at the wrist, and demyelinating polyneuropathies.Cooling also results in reduced decrement on repetitive stimulation and can mask the diag-nosis of myasthenia gravis.
Skin temperatures between 32°C and 36°C are standard for NCS, but typical ambient skintemperature is between 28°C and 32°C. Therefore, the limbs of most patients need to bewarmed before testing if standard tables of normal values are to be used. Conduction veloc-ity increases by 1.5 to 2 m/s per 1°C as skin temperature increases throughout the physiolog-ical range. If adequate warming is not possible, correction factors using this data can be usedprovided there is understanding that these equations do not correct for amplitude changes,and, importantly, that these correction factors may be inaccurate in diseased nerves.
8.2. Age
Peripheral nerve myelination begins at approximately the 15th week of gestation and con-tinues through 3 to 5 yr of age. Therefore, for children younger than the age of 5 yr, specialtables are required to evaluate NCS data. In term infants, the latency and conduction velocity values are approximately half those recorded in adults, and premature infants haveeven slower conduction velocities; at the beginning of the third trimester, velocities are one-third of those measured in term infants.
NCS parameters are fairly stable from age 5 yr through 40 yr, and then there is a tendencytowards slower latencies and velocities with lower amplitudes. In the healthy older
Technical Factors 221
13_Caress 4/11/07 10:33 PM Page 221

population older than age 60 yr, upper extremity NCS latencies are relatively unchangedwhen compared with younger adult populations. Between the ages of 60 to 90 yr, median,radial, and ulnar sensory amplitudes fall slightly. Lower extremity latencies tend to increaseand velocities tend to decrease compared with younger adults. Lower extremity motor andsensory amplitudes decrease throughout middle age, and the trend continues in the elderly.The thought that sural sensory responses may be absent in the elderly is widely circulated,but one study found recordable sural potentials in 98% of individuals older than age 60 yr,and superficial peroneal sensory responses in 90% of the same group.
Studies on the effect of age on NCS parameters consistently show that amplitude is moreaffected by this process than is velocity. Possible explanations for the changes in NCS withaging include “normal” axon loss caused by neuronal senescence, higher prevalence ofasymptomatic, generalized neuropathy, increased lower extremity edema, and a higher preva-lence of subclinical entrapment neuropathies.
8.3. Height
As opposed to the effects of aging, increasing height influences latencies and velocitiesmore than amplitude. The effect is particularly evident in the lower extremities, and, in gen-eral, increasing height results in longer distal latencies, slower conduction velocities, andslightly reduced amplitude. The effect of height may not cause collected data to deviate fromcommonly used normal ranges except for very tall or very short individuals. Unusually fastvelocities and latencies are not usually given consideration because the values are consideredsupernormal rather than pathological, however, in very short persons, latencies at the upperend of commonly used “normal” ranges may be pathological if not adjusted for height.
222 Caress
Fig. 2. The effect of warming. (A) At ambient temperature, the median sensory response is of longerlatency, higher amplitude and longer duration than the same response (B) after the hand has beenwarmed.
13_Caress 4/11/07 10:33 PM Page 222

Similarly, very tall people may seem to have mild generalized slowing of NCS parametersthat does not reflect demyelination or other pathology. It is easy to see that, at the extremesof height, mild neuropathic processes could be overlooked or mistakenly identified.
One theory purported to explain the effect of height on NCS is that, in taller people, theaxons are more tapered and smaller in diameter in the distal segments than in people of com-mon height. Another proposed explanation is that the distal segments are relatively coolerdespite attempts at adequate warming.
9. ANATOMIC VARIATIONS
9.1. Martin–Gruber Anastomosis
The Martin–Gruber anastomosis (MGA) is a common anatomic variant of peripheral nervepathways in the forearm. It involves primarily motor fibers that cross over from the mediannerve in the proximal forearm to the ulnar nerve at the wrist. Although the MGA is identifi-able in up to 30% of people, many instances of MGA do not affect the interpretation of theNCS data and, thus, are not identified. The MGA can be inherited in an autosomal dominantpattern and can be unilateral or bilateral. In the MGA, the course of the ulnar fibers from theplexus is altered, such that a portion of the ulnar fibers descends with the median nerve to theelbow. These fibers branch off the median nerve in the forearm (often via fibers from the ante-rior interosseous nerve) to join the ulnar nerve proximal to the wrist. The intrinsic hand mus-cles are innervated by the “usual” nerve (unlike the “all-ulnar hand”); it is only the pathwaythat particular ulnar fibers take to get to the wrist that is anomalous. There are three types ofMGA to consider, but combinations of the types may occur and generally make the anomalyeasier to recognize.
Type I: Crossover fibers innervate the ADQ. When the crossover involves the ADQ, themedian studies appear normal, but ulnar stimulation at the wrist (recording from ADQ) pro-duces a much higher-amplitude waveform than on stimulation below the elbow. The drop inamplitude may exceed the 10 to 20% reduction that is expected over this distance because ofnormal phase cancellation and temporal dispersion. The type I MGA can be confirmed byrecording from ADQ while stimulating the median nerve at the elbow and demonstrating aninitially negative (upward) waveform that is similar in amplitude to the “drop” seen betweenthe distal and proximal ulnar stimulation sites. If the MGA goes unrecognized in this situa-tion, conduction block of the ulnar nerve in the forearm may be erroneously diagnosed. Theclinical situation and EMG results may alert the diagnostician to investigate the possibility ofMGA rather than conduction block, but, in cases in which demyelinating neuropathy is clin-ically suspected, the possibility of MGA may be overlooked.
Type II: Crossover fibers innervate the first dorsal interosseous (FDI). This is the mostcommon type of MGA. Ulnar NCS recording from the FDI can be used to evaluate lesionsof the deep palmar branch or to investigate ulnar neuropathy at the elbow. The pattern ofamplitude change is similar to that seen in type I and can mimic a conduction block of theulnar nerve in the forearm. As with type I, type II MGA is proven by stimulating the mediannerve at the wrist and elbow, and noting a higher amplitude response from the proximal sitewhile still recording from FDI. During routine median motor studies, recording from APB, atype II MGA is often suggested by a slightly enlarged or altered median CMAP appearancewith elbow stimulation when compared with the CMAP obtained at the wrist. Because NCSrecording from FDI are not routinely performed in most labs, type II MGA is often detectedin the setting of carpal tunnel syndrome (CTS) (see next paragraph).
Technical Factors 223
13_Caress 4/11/07 10:33 PM Page 223

In cases of CTS with prolonged distal motor Type III: Crossover fibers innervate thenareminence muscles that have ulnar innervation (adductor pollicis and/or flexor pollicis bre-vis–deep head). Type III MGA is recognized during median motor NCS by an increase inamplitude at the proximal site. Submaximal wrist stimulation or co-stimulation of the ulnarnerve from the antecubital fossa produces a similar pattern and should be initially investi-gated. The MGA is confirmed by stimulating the ulnar nerve at the wrist (still recordingfrom the thenar eminence over the abductor pollicis brevis) and then at the elbow. In per-sons with and without MGA, wrist stimulation produces a waveform with an initial positivedeflection caused by volume conduction from ulnar innervated muscles thenar eminence. Inindividuals without MGA, stimulation of the ulnar nerve at the elbow, produces a waveformof similar appearance without much reduction of amplitude, but, in those with MGA, stim-ulation at the elbow results in a much lower amplitude than at the wrist, often with alteredmorphology.
In cases of CTS with prolonged distal motor latencies, type II and type III MGA are easierto detect, because median stimulation at the elbow produces a positive deflection before theCMAP, which was not observed with wrist stimulation. The delay through the carpal tunnelprevents the abductor pollicis brevis muscle from depolarizing before the muscles inner-vated by the crossover fibers. The initial volume-conducted response from the crossovermuscles results in the “positive dip.” If the onset latency is marked at the beginning of the“positive dip,” the median forearm conduction velocity will be erroneously fast and usuallynonphysiological (>80 m/s). An accurate velocity cannot be measured because the takeofffor the “true” median CMAP is lost in the positive deflection. This pattern is so distinctivethat the diagnosis of CTS plus MGA can be made by inspection of the median waveformswithout determining the type of MGA. Distal and proximal ulnar nerve stimulation record-ing from the thenar eminence and FDI, as described in this section, will differentiatebetween type II and type III MGA (Fig. 3). Ulnar studies recording from ADQ are unaf-fected in this situation.
In the setting of ulnar neuropathy at the elbow or proximal median neuropathy, seriouserrors in EMG interpretation are easily made if the MGA is unrecognized during NCS.Sparing of the certain ulnar muscles innervated by crossover fibers in ulnar neuropathy at theelbow produces patterns that may mimic a lesion of the deep palmar branch. Similarly, alesion of the proximal median nerve affecting crossover fibers could produce a pattern sug-gesting C8 radiculopathy on EMG, because abnormalities may be identified in both median-and ulnar-innervated hand muscles.
9.2. Accessory Peroneal Branch to Extensor Digitorum Brevis
The extensor digitorum brevis (EDB), the recording location for peroneal motor NCS, isusually exclusively innervated by the deep branch of the peroneal nerve. In 13 to 22% of peo-ple, a branch of the superficial peroneal nerve traveling behind the lateral malleolus inner-vates the lateral portion of the EDB. The anomalous innervation is recognized when proximalperoneal stimulation produces a higher amplitude CMAP than that obtained by stimulation atthe ankle. Submaximal stimulation at the ankle or co-stimulation of the tibial nerve in thepopliteal fossa may cause a similar pattern, and should be considered initially. The presenceof an accessory peroneal branch is confirmed by low-intensity stimulation behind the lateralmalleolus and demonstrating a CMAP with an initial negative deflection. Rarely, the EDB iscompletely supplied by the accessory branch.
224 Caress
13_Caress 4/11/07 10:33 PM Page 224
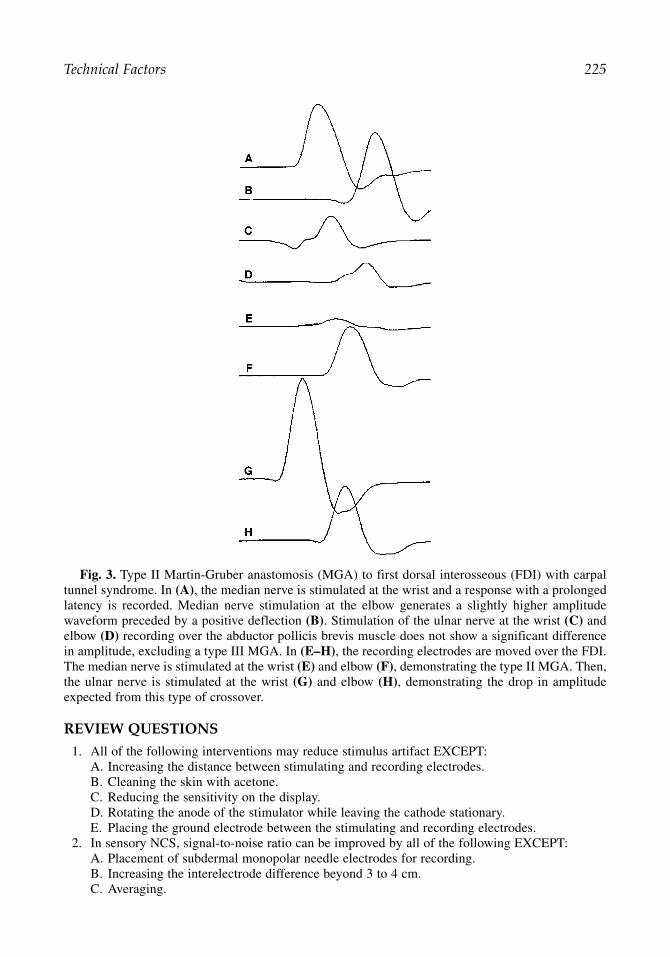
REVIEW QUESTIONS
1. All of the following interventions may reduce stimulus artifact EXCEPT:A. Increasing the distance between stimulating and recording electrodes.B. Cleaning the skin with acetone.C. Reducing the sensitivity on the display.D. Rotating the anode of the stimulator while leaving the cathode stationary.E. Placing the ground electrode between the stimulating and recording electrodes.
2. In sensory NCS, signal-to-noise ratio can be improved by all of the following EXCEPT:A. Placement of subdermal monopolar needle electrodes for recording.B. Increasing the interelectrode difference beyond 3 to 4 cm.C. Averaging.
Technical Factors 225
Fig. 3. Type II Martin-Gruber anastomosis (MGA) to first dorsal interosseous (FDI) with carpaltunnel syndrome. In (A), the median nerve is stimulated at the wrist and a response with a prolongedlatency is recorded. Median nerve stimulation at the elbow generates a slightly higher amplitudewaveform preceded by a positive deflection (B). Stimulation of the ulnar nerve at the wrist (C) andelbow (D) recording over the abductor pollicis brevis muscle does not show a significant differencein amplitude, excluding a type III MGA. In (E–H), the recording electrodes are moved over the FDI.The median nerve is stimulated at the wrist (E) and elbow (F), demonstrating the type II MGA. Then,the ulnar nerve is stimulated at the wrist (G) and elbow (H), demonstrating the drop in amplitudeexpected from this type of crossover.
13_Caress 4/11/07 10:33 PM Page 225

D. Cleaning the skin with alcohol.E. Decreasing the distance between the stimulating and recording electrodes.
3. All of the following can cause a “positive dip” on routine NCS EXCEPT:A. Co-stimulation.B. Improper recording electrode placement.C. MGA.D. MGA with CTS.E. Submaximal stimulation.
4. Virtual cathode commonly occurs during:A. Stimulation at intensity above supramaximal.B. Submaximal stimulation.C. MGA.D. Axonal neuropathy.E. Improper recording electrode placement.
5. Virtual cathode can result in all of the following EXCEPT:A. An erroneously short latency.B. An erroneously fast conduction velocity.C. Significantly higher amplitudes.D. Loss of sensitivity to entrapment neuropathy distal to the stimulation point.E. More patient discomfort.
6. If the signal-to-noise ratio is 1:4, how many times would the potential need to be averaged toproduce a signal-to-noise ratio of 2:1?A. 64.B. 4.C. 128.D. 16.E. 2.
7. During NCS, inadequate warming of a limb will have the most marked effect on:A. Amplitude.B. Distal latency.C. Proximal conduction velocity.D. Decrement.E. Duration.
8. In the MGA:A. Some muscles in the thenar eminence that are typically innervated by the median nerve are
innervated by the ulnar nerve.B. The proximal median amplitude is always higher than the distal median amplitude.C. A pseudoconduction block of the ulnar nerve in the forearm may occur.D. The sensory potential recording from digit two has contributions from the median and
ulnar nerves.E. Individuals who have this variant may have relative protection from median neuropathy at
the wrist.9. In accessory peroneal nerve branch to the EDB:
A. Responses may mimic a conduction block in the calf.B. Responses may mimic a conduction block across the fibular head.C. Anamolous innervation is by stimulating behind the lateral malleolus.D. Anamolous innervation is when the bulk of the EDB is reduced.E. The accessory branch involves only sensory fibers.
10. After recording of the motor CMAP, if the stimulator is not “turned around” with the cathodewhere the anode had been, the F-waves will:A. Be absent because of anodal block.B. Have a longer latency.C. Will show more chronodispersion.
226 Caress
13_Caress 4/11/07 10:33 PM Page 226
D. Have a shorter latency.E. Be reduced in amplitude.
REVIEW ANSWERS
1. The correct answer is C. Reducing the sensitivity on the display does not change the degree ofstimulus artifact relative to the recorded potential of interest.
2. The correct answer is B. Increasing the interelectrode difference beyond 3 to 4 cm does not resultin higher amplitude signals. Reducing the distance between the stimulator and recording elec-trodes will result in higher amplitudes.
3. The correct answer is C. When recording over the thenar eminence and stimulating the mediannerve at the elbow, a positive dip is not usually seen unless there is concomitant CTS slowingdown the action potentials as they enter the hand.
4. The correct answer is A. Virtual cathode occurs when stimulation intensity is sufficient to depo-larize the nerve distal to the location of the stimulating cathode.
5. The correct answer is C. Virtual cathode is unlikely to have an appreciable effect on the ampli-tude of the response. The most noticeable effect is a shorter latency, resulting in faster conduc-tion velocities and erroneously fast velocities across entrapment point immediately distal to thestimulation point.
6. The correct answer is A. The square root of the number of stimuli is the factor that improves thesignal-to-noise ratio. In this case, the square root of 64 is eight times the given signal-to-noiseratio of 1:4 = 8:4 = 2:1.
7. The correct answer is B. Inadequate warming of a limb usually produces a marked effect on dis-tal latency because the distal parts of the limb tend to be the coldest. Expected lesser effectsinclude increased amplitude, decrease proximal conduction velocity, decreased decrement (ifpresent), and increased duration of the response.
8. The correct answer is C. An MGA involving the ADQ would be expected to produce a drop inamplitude when comparing the distal site with the proximal site. This will have an appearanceof conduction block in the forearm and not across the elbow.
9. The correct answer is C. The accessory branch of the peroneal nerve to the EDB is confirmedby stimulating behind the lateral malleolus. This anatomic variant is suspected when the ampli-tude at the below fibular head site is higher than the amplitude recorded at the ankle. Therefore,it does not mimic a conduction block.
10. The correct answer is B. When F-waves are recorded with the stimulator in position for routinemotor studies, there is a risk that some potential F-waves will be blocked under the anode.However, F-waves are typically recordable with the cathode distal to the anode, although theyhave a slightly longer latency than if the cathode and anode positions had been reversed.
REFERENCES
1. Kincaid JC, Brasher A, Markand ON. The influence of the reference electrode on CMAP config-uration. Muscle Nerve 1993;16:392–396.
2. Hodgkin AL, Katz B. The effect of temperature on the electrical activity of the giant axon of thesquid. J Physiol (Lond) 1949;109:240–249.
3. Rutkove SB. The effects of temperature in neuromuscular electrophysiology. Muscle Nerve2001;24:867–882.
4. Rivner MH, Swift TR, Malik K. Influence of age and height on nerve conduction. Muscle Nerve2001;24:1134–1141.
5. Falco FJE, Hennessey WJ, Braddom RL, Goldberg G. Standardized nerve conduction studies inthe upper limb of the healthy elderly. Am J Phys Med Rehabil 1992;71:263–271.
6. Falco FJE, Hennessey WJ, Goldberg G, Braddom RL. Standardized nerve conduction studies inthe lower limb of the healthy elderly. Am J Phys Med Rehabil 1994;73:168–174.
7. Preston DC, Shapiro BE. Electromyography and Neuromuscular Disorders. Butterworth–Heinemann, Boston, MA, 1998.
Technical Factors 227
13_Caress 4/11/07 10:33 PM Page 227

13_Caress 4/11/07 10:33 PM Page 228

14Introduction to the Needle Electrode Examination
Gregory J. Esper and Seward B. Rutkove
SummaryNeedle EMG remains an important part of the evaluation of the peripheral nervous system and can
assist substantially in characterizing a variety of disease states. The needle electrode examination generally consists of three parts: evaluation of spontaneous activity, evaluation of motor unit potentialmorphology, and evaluation of motor unit potential recruitment. Abnormal spontaneous activityincludes the commonly observed fibrillation potential and positive sharp wave and the less frequentmyotonic, myokymic, neuromyotonic, and complex repetitive discharges. Neurogenic disease producesprolonged duration and increased amplitude of motor unit potentials with reduced recruitment, whereasmyopathic disease generally produces low-amplitude, short-duration motor unit potentials, with normalor early recruitment. An understanding of the basic mechanisms of these disease changes can greatlyaid in the interpretation of EMG data. Finally, the distribution of abnormalities across muscles can alsoaid in diagnosis, especially in the assessment of radiculopathy and plexopathies.
Key Words: Fibrillation potential; motor unit potential; motor unit recruitment; myotonic discharge;needle electromyography; positive sharp wave.
1. INTRODUCTION
Needle electromyography (EMG) complements nerve conduction studies and serves a crit-ical role in the evaluation of both muscle and nerve diseases. With experience, needle EMG canbe rapidly performed and interpreted. However, to the uninitiated, the procedure can seem verycomplicated and the interpretation of the waveforms arbitrary. In this chapter, we provide abackground for a general understanding of how needle EMG is performed and interpreted, butleave its detailed application to specific disorders for discussion in other chapters of this text.
2. BASIC CONCEPTS
2.1. The Needle Electrode
There are several different types of needle electrodes. The monopolar needle electrode pro-vides referential recordings. The needle is Teflon covered, except for the tip, which isexposed and where electrical activity is recorded; these signals are compared with thoserecorded from the surface via a separated electrode placed on the skin at a distance from themuscle. Although monopolar needle electrodes continue to be widely used, concentric nee-dle electrodes have become the favored choice among most electromyographers. With thistype of electrode, a barrel that surrounds the active needle electrode serves as the reference,allowing the recorded signal from the active needle electrode to be compared with that of the
From: The Clinical Neurophysiology PrimerEdited by: A. S. Blum and S. B. Rutkove © Humana Press Inc., Totowa, NJ
229
14_Rukove 4/11/07 9:12 AM Page 229

barrel, without requiring a separate surface electrode (see Fig. 1). An insulating material sep-arates these two surfaces. Because the placement of the reference electrode is practicallyadjacent to the active site, motor unit potentials (MUPs) using a concentric needle tend to besmaller in duration and amplitude than those same MUPs measured with a monopolar electrode.
2.2. The Oscilloscope
Waveforms representing MUPs are visually displayed on the oscilloscope in real time, andboth qualitative and quantitative assessments can be made of MUPs. Qualitative visual analysis of the MUPs on the oscilloscope allows the real-time assessment of the duration,amplitude, and number of phases of each waveform, along with the recruitment ratio (dis-cussed in more detail in Section 7 below). MUP morphology determination can be also beconfirmed by a more accurate, but usually more time consuming, quantitative assessment ofwaveforms, which are analyzed by available software. Standard EMG is generally performedin a qualitative fashion, because an experienced electromyographer can often assess abnor-malities rapidly and accurately; quantitation of MUP morphology is usually reserved for sub-tle processes (e.g., a mild myopathy) and research purposes.
2.3. The Loudspeaker/Amplifier
Listening to the electrical activity can tell the electromyographer a great deal regarding thecondition of the muscle. Musical concepts apply in this regard: the volume (loud vs soft) of
230 Esper and Rutkove
Fig. 1. A simple drawing of a concentric needle electrode.
14_Rukove 4/11/07 9:12 AM Page 230

a given element tells you about its amplitude, the pitch (high vs low) tells you about the dura-tion of the potential, and the timbre (quality of the sound) tells you about its phases. Otherelectrical discharges, such as myotonia, neuromyotonia, and complex repetitive discharges(CRDs) have characteristic sounds that are helpful in determining the type of disease present.Similar to the visual interpretation of waveforms, the auditory interpretation gradually devel-ops with time and experience. These issues are discussed in further detail below, in the sec-tion on the evaluation of voluntary activity.
3. THE PROCESS
Needle EMG evaluates the electrical activity of muscle, through which neuropathic ormyopathic processes can be identified and characterized. The needle electrode examination(NEE) generally consists of three distinct parts: evaluation of spontaneous activity, evaluationof MUP morphology, and evaluation of activation and recruitment.
3.1. Evaluation of Spontaneous Activity
The first part of the NEE is the evaluation of spontaneous activity—the activity that ispresent when the muscle is completely relaxed. When a needle electrode is inserted into anelectrically active tissue, an initial burst of electrical activity from the depolarizing musclefibers is to be expected. These bursts generally last no longer than approx 0.5 s (500 ms).With every movement of the needle electrode, a similar burst of electrical activity will begenerated. However, when the movement ceases, the electrical activity should end and onlyelectrical silence should normally be identified. This is what is described as “normal spon-taneous activity.”
A relaxed, normal muscle should be electrically silent; the exception to this rule occurswhen the needle comes into close proximity to the end-plate region of the muscle.Intermittent bursts of sharp spike activity, called “end-plate spikes,” might be observed. Theyare generally easy to recognize because they have a sputtering quality, are biphasic, and usu-ally have an initial negativity (see Fig. 2). Another helpful hint is the sound of “end-platenoise”—a very high-frequency hissing sound attributed to the depolarization of the end-platevia the release of individual quanta of acetylcholine. Often end-plate spikes will be seensuperimposed on a very irregular baseline (also visible in Fig. 2), the irregular baseline beingcaused by these individual quanta of acetylcholine. When the needle is near the end-plate,patients generally note an abrupt increase in discomfort. Movement of the needle a short dis-tance away generally relieves the pain, the spontaneous discharges abruptly stop, and themuscle returns to its usual quiet state.
In most pathological states, spontaneous activity increases. In both neuropathic andmyopathic diseases, the resting potential of the muscle fibers is elevated (is less negative)because of changes in the ion conductances, and the muscle fibers, thus, are more excitable.The most minor increase in spontaneous activity might be an increase in the length of aneedle-induced discharge (i.e., it lasts longer than 500 ms). A number of abnormal sponta-neous potentials can be observed with the muscle at rest. These potentials can be dividedinto two groups: those generated by the depolarization of a single muscle fiber and thosegenerated by the depolarization of a motor neuron. It should also be noted that in somecases (mainly chronic myopathies), spontaneous activity can actually decrease because ofthe loss of myocytes.
Needle Electrode Examination 231
14_Rukove 4/11/07 9:12 AM Page 231

232 Esper and Rutkove
Fig. 2. End-plate spikes. Notice that the end-plate spike waveforms have an initial negativity. Theirregular baseline is observed as part of “end-plate noise” and represents the electrical equivalent ofindividual quanta of acetylcholine exciting receptors in the end plate.
4. SPONTANEOUS POTENTIALS GENERATED BY SINGLE MUSCLE FIBERS
4.1. Fibrillation Potentials
A fibrillation potential represents the electrical activity generated by the depolarization ofa single muscle fiber and is depicted in Fig. 3. These potentials are typically triphasic, withan initial small positivity, followed by a large negative spike, and ending with another smallpositive spike. Generally, these potentials are thought of as being recorded by the needle elec-trode a short distance from the spontaneously depolarizing muscle fiber. The triphasic mor-phology of this potential is explained by the principles of volume conduction (see Chapter 4).The first phase represents the distant approach of the depolarization toward the needle; thelarge negative spike is caused by the transit of the depolarization in the immediate vicinity ofthe needle, and the final positive phase is caused by the potential receding into the distance.Fibrillation potentials may not always have this classic morphology, especially because theshape depends on the exact position of the needle in relationship to the muscle. They gener-ally have an amplitude of 20 to 200 µV, are 1 to 5 ms in duration, and fire at a rate of 0.5 to15 per second. The classic view of fibrillation potentials is that they fire in a very regular,clock-like pattern, with the depolarization occurring consistently. However, many fibrillationpotentials, if observed for a long enough time, will slow down until they eventually stop.
Fig. 3. Fibrillation potential. Note the triphasic character (an initial positive phase followed by anegative phase followed again by a positive phase).
14_Rukove 4/11/07 9:12 AM Page 232

The change in frequency can be quite prolonged, moving from a rate of two per second toone every 2 s during a period of 30 to 40 s. Fibrillation potentials can fire substantially slowerthan motor units (discussed below), often reaching firing frequencies of 0.5 Hz. Alternatively,MUPs generally cannot fire more slowly than approx 4 to 5 Hz and do so slightly irregularly.Hence, the slow, regular, steady “tick” of a fibrillation potential can usually help in its iden-tification. This becomes more difficult if the screen is filled with multiple fibrillation poten-tials with different morphologies and firing frequencies, such that the individually firingpotentials can no longer be identified. Some have described this sound as “frying bacon,”which, although helpful, may be a little misleading. In situations in which there are many fib-rillation potentials occurring at once, the presence of positive sharp waves (PSWs) (describedbelow in Section 4.2.) can also help confirm the identity of these waves. Alternatively, sim-ply waiting for the electrical activity to decrease until only a couple of potentials are presentcan help in accurately assessing these waveforms.
Although fibrillation potentials are undoubtedly caused by the partial depolarization of themuscle membrane, their significance is rather nonspecific. They are typically found in anynerve disease in which there is axonal injury causing muscle fibers to lose their innervation(i.e., states of denervation). As reinnervation proceeds after injury, a given muscle fiber willhave its resting membrane potential restored, and the spontaneous depolarization will cease.For this reason, fibrillation potentials are generally considered evidence of subacute injury.However, in any condition in which reinnervation is incomplete and muscle fibers remaindenervated, the resting membrane potential will be abnormally elevated, and spontaneousdepolarization of the muscle fiber is to be expected. The prototypic illness in which this isobserved is remote poliomyelitis, in which reinnervation of all the muscle fibers does notoccur. Although the disease may have occurred decades earlier, fibrillation potentials willpersist in the fibers that have not been reinnervated. Fibrillation potentials are also commonlyobserved in most muscle diseases. The reasons for this are debated and are explored more inChapter 20. However, the most likely explanations are:
1. The muscle disease is accompanied by some distal neuronal injury.2. The muscle disease itself is causing splitting of muscle fibers (leaving a partial muscle fiber no
longer attached to the part receiving innervation).3. That the disease itself is affecting the resting potential of the muscle membrane.
The morphology of fibrillation potentials is one aspect of disease that is not commonlyevaluated. Nonetheless, noting the size of fibrillation potentials can be helpful. Small fibril-lation potentials are commonly observed in muscle diseases and chronic neurogenic states(e.g., old polio). The reasons for this likely relate to morphological and physiological changesin both of these types of disease states. In muscle disease, split or atrophic muscle fibers sim-ply will be smaller, and there will be fewer Na+ channels activated to produce a given fibril-lation potential. Hence, the amplitude of the spike will be smaller. A similar argument holdsfor chronic neurogenic disease, in which a reduction in the amplitude of the response is likelycaused by a reduction in the number of active Na+ channels or decreased function of theNa+–K+ ATPase. One possible mechanism through which this may occur is via downregula-tion of protein synthesis induced by the longstanding absence of innervation.
4.2. Positive Sharp Waves
Similar to fibrillation potentials, PSWs (Fig. 4) represent the depolarization of single musclefibers; however, their morphology is quite distinct. Unlike fibrillation potentials, they are
Needle Electrode Examination 233
14_Rukove 4/11/07 9:12 AM Page 233

biphasic with an initial sharp positivity, followed by a more prolonged negativity. The firingpattern is also more variable than that of a fibrillation potential. Although they can be clock-like and similar to a fibrillation potential, one can also observe a rapid run of PSWs that grad-ually slows down until it stops.
The mechanism underlying the generation of PSWs has been debated. The most widelyaccepted explanation for PSWs is that they represent a discharge of a single muscle fiber inwhich the discharge is abruptly aborted. The proposed pathophysiology is that the needle elec-trode is in contact with the spontaneously depolarizing muscle fiber. Like a fibrillation poten-tial, the distantly approaching depolarization produces an initial positivity. The depolarizationapproaches the needle and the negativity commences. However, because the needle is in con-tact with the membrane itself, the depolarization abruptly ends near the electrode because themechanical presence of the needle against the membrane causes the membrane to becomeresistant to the depolarization, resulting in a prolonged dying out of the negative phase.
PSWs, similar to fibrillation potentials, can occur in neurogenic and myopathic disease.However, PSWs are perhaps slightly more sensitive but less specific for the presence of mus-cle or nerve disease. This is possibly because PSWs can be triggered by the mechanical actionof the needle touching the muscle fiber. There are several examples of this. First, in patientswith recent onset neurogenic injury, short runs of PSWs may be observed in the muscle beforefibrillation potentials actually develop. Second, PSWs can often be found in the intrinsic footmuscles and in the lumbosacral paraspinal muscles of otherwise healthy individuals. In thesegroups, fibrillation potentials tend to be much less common. Third, PSWs can be diffuselypresent in muscles of people who are otherwise healthy. This syndrome, which has beentermed “EMG disease,” may represent a channelopathy in which the muscle membrane ismildly depolarized at baseline and, hence, more easily irritated by needle movement.
4.3. Myotonic Discharges
Similar to fibrillation potentials and PSWs, myotonic discharges represent the repetitivespontaneous depolarization of single muscle fibers and are the electrical equivalent of clinicalmyotonia. However, the character of the myotonic discharge is different from that of either afibrillation potential or PSW, because the frequency and amplitude of the discharge waxes andwanes over time (Fig. 5). Although the specific mechanism underlying the variation in theseparameters is controversial, the individual waveforms that make up the discharges will have theappearance of either a fibrillation potential or a PSW that is changing in size over time. A “classic”myotonic discharge will generally start at a low frequency, gradually speed up, and then
234 Esper and Rutkove
Fig. 4. Positive sharp wave. The initial sharp positivity is followed by a broad negative wave thatslowly fades away.
14_Rukove 4/11/07 9:12 AM Page 234

gradually slow down before it stops. The amplitude may similarly increase and decrease duringthis cycle. The sound over the loudspeaker is most accurately described as similar to that of arevving motorcycle engine. However, many myotonic discharges may be observed that do nothave the initial speeding up and only demonstrate a gradual reduction in frequency and ampli-tude as the discharge slows down, giving a “dive-bomber” sound to the discharge. Strictlyspeaking, these may be difficult to separate from a short run of PSWs. Nonetheless, usually afterassessing spontaneous activity for some time in a patient with these partial myotonic discharges,a few with a clear initial waxing of frequency and amplitude will also be found.
Myotonic discharges are helpful because they reduce the differential diagnosis of a patientpresenting with symptoms of muscle disease. The list of disorders that are characterized bydiffusely prominent myotonic discharges is relatively limited and includes myotonia con-genita, the myotonic dystrophies (types 1 and 2), paramyotonia congenital/hyperkalemicparalysis, drug-induced myotonia (observed with colchicine, chloroquine, and with somecholesterol-lowering drugs). However, occasional myotonic discharges can also be present inpatients with many other muscle diseases, including inflammatory myopathies, acid maltasedeficiency (discharges are observed most prominently in the paraspinal muscles), myotubu-lar myopathy, and occasionally even in patients with neurogenic disease. It should be notedthat, in some situations, muscle cooling can enhance the number of myotonic discharges, andapplying ice to the skin overlying a muscle can sometimes be helpful.
4.4. Complex Repetitive Discharges
CRDs are unlike the other three types of muscle fiber discharge, because they represent thedepolarization of a group of muscle fibers rather than a single fiber firing repetitively.Understanding the EMG appearance and sound of a CRD is best achieved by first learningthe pathological mechanism that underlies these unusual discharges. The initial denervationof muscle fiber is subsequently followed by reinnervation of that muscle fiber by the axon ofa neighboring muscle fiber. If a denervating process continues, that group of muscle fibersmay subsequently lose axonal contact, leaving a group of denervated muscle fibers of the sametype adjacent to one another. The initial depolarization of a denervated, individual muscle fibermay then initiate the depolarization of its neighboring fiber, which, in turn, can initiate firing in adjacent fiber. This type of linked electrical depolarization is termed ephaptic
Needle Electrode Examination 235
Fig. 5. A myotonic discharge; note the slow decrease in frequency and amplitude of the potential.In this example, a clear “revving” up of the potential is not obvious.
14_Rukove 4/11/07 9:12 AM Page 235

transmission: abnormal electrical transmission of signals that are not part of normal function.The ensuing discharge is complex because it involves multiple muscle fibers; the depolariza-tions can then become reentrant when the fiber that initiated the discharge becomes depolarizedagain (see Fig. 6). This reentrant mechanism allows the discharge to continue repetitively forsome time. CRDs can become more complex when additional reentrant circuits are added orremoved (see Fig. 6). A needle movement causing the first fiber to depolarize may initiate aCRD. On the other hand, CRDs may simply be present without requiring direct contact to a muscle fiber by a needle. Occasionally a “complex-fibrillation potential” may be identified: asingle repetitively depolarizing muscle fiber that has several other fibers electrically linked to it.Such a potential will not be a classic CRD because it is not caused by a reentrant mechanism.
Thus, based on an understanding of this pathophysiology, the EMG appearance of aCRD can be easily understood. CRDs appear as multiphasic waves (Fig. 7) that canabruptly change morphology when additional loops of muscle fibers join in or drop out.The multiphasic appearance is caused by the depolarizing fibers associated with the reentrant
236 Esper and Rutkove
Fig. 6. Complex repetitive discharge pathophysiology. The starred fiber is the pacemaker. Note theadditional reentrant loop, shown in a circle.
Fig. 7. A complex repetitive discharge.
14_Rukove 4/11/07 9:12 AM Page 236

circuit. CRDs have a machine-like sound and can also abruptly stop if a fiber in this circuitfails to depolarize.
5. SPONTANEOUS POTENTIALS GENERATED BY MOTOR NEURONS
5.1. Fasciculation Potential
Fasciculation potentials (Fig. 8) result from the spontaneous depolarization of a motor neu-ron and its associated muscle fibers. The morphology of a fasciculation potential is that of aMUP. Fasciculation potentials are substantially larger than fibrillation potentials, arepolyphasic, and fire erratically. Fasciculation potentials will appear only intermittently. Infact, one of the best ways for identifying a fasciculation potential is to simply place the nee-dle into the muscle of interest and for the examiner to remove his/her hand from the needleand simply wait 30 s or longer to see whether a fasciculation potential occurs.
The mechanism underlying a fasciculation potential is that of a reduced threshold fordepolarization of the motor neuron. The reduced threshold can be caused by neurogenic dis-ease or can be related to reduced concentration of a serum ion (most notably calcium) lead-ing to intermittent depolarizations of the motor neuron. In addition, potassium channels areimportant membrane stabilizers; if these channels become dysfunctional, spontaneous depo-larization of the motor neuron will occur, potentially leading to fasciculation potentials.
Not surprisingly, the clinical significance of fasciculation potentials is not specific.Although fasciculation potentials commonly occur in severe neurogenic diseases, includingmotor neuron disease, occasional fasciculation potentials can also occur normally in manyindividuals. In fact, patients are frequently referred to physicians for evaluation of clinicalfasciculations that are often benign—that is, there is no associated neurogenic disease.Fasciculation potentials can be part of the “cramp-fasciculation” syndrome, a disorder ofmild nerve hyperexcitability in which patients experience intermittent cramping (usually
Needle Electrode Examination 237
Fig. 8. A fasciculation potential.
14_Rukove 4/11/07 9:12 AM Page 237

more pronounced in the legs than arms) in association with symptomatic muscle twitching(fasciculations). Clinically, such benign fasciculations can be discriminated from the “malig-nant” fasciculations of amyotrophic lateral sclerosis by their character. Benign fasciculationstend to affect one muscle at a time and cause the muscle to fire frequently; malignant fascic-ulations tend to affect multiple muscles simultaneously throughout the body. Malignant fas-ciculation potentials tend to be larger, in part because the motor units that are activated witheach depolarization have already undergone substantial reinnervation.
5.2. Doublets/Triplets/Multiplets
These discharges are grouped fasciculations that fire irregularly and may be observed inpatients with peripheral nerve hyperexcitability. They most commonly occur in situations ofreduced ion concentrations (again, most notably calcium). At one moment a doublet (two fas-ciculation potentials in a row from the same motor unit), then a triplet, and yet later a singlefasciculation potential might be identified. These grouped fasciculations have a firing fre-quency of 0.1 to 10 Hz.
5.3. Myokymic Discharge
A myokymic discharge (Fig. 9) represents another form of repetitive fasciculation poten-tial, but this time the repetitive depolarization is more “hard wired” than in a doublet ortriplet. A disease state within the axon causes a grouped repetitive discharge. There are essen-tially two firing frequencies of interest in myokymic discharges. The intergroup firing rate isoften very slow, with each group appearing once every 2 to 3 s; the intragroup firing rate issubstantially higher, with a rate of 50 to 150 Hz. The morphology of these individual wave-forms is that of a grouped, repetitive MUP. The MUP itself is usually polyphasic and largesuggesting neurogenic injury (see discussion of MUPs in Section 7). The sound of myokymicdischarges has been described as “marching soldiers,” although the gaps in between theappearance of each group would make a description of “marching soldiers starting and stop-ping frequently” more accurate. Multiple myokymic discharges can also occur simultane-ously, complicating the electrophysiological interpretation.
238 Esper and Rutkove
Fig. 9. A myokymic discharge.
14_Rukove 4/11/07 9:12 AM Page 238

Myokymic discharges represent the electrical equivalent of clinical myokymia (the bag ofworms appearance of muscle). These discharges are most commonly associated withdemyelinating lesions that affect the exiting motor axons from the spinal cord or brainstem,and are also observed after radiation injury to nerves. However, these discharges can beobserved uncommonly in any neurogenic disease.
5.4. Neuromyotonic Discharge
Neuromyotonic discharges (Fig. 10) are the most rarely observed of any discharge. Theyhave a characteristic “ping” sound to them, reflecting their very rapid rate of firing (up to 300Hz), with a rapid decrescendo, lasting less than a second in duration. Visually, a neuromy-otonic discharge appears on the oscilloscope as a high-frequency waveform of rapidlydecreasing amplitude before it stops, similar to a tornado lying on its side. Unlike a myotonicdischarge, a “revving up” is not observed. Although these discharges may seem to have somesimilarities to a myotonic discharge, there are two obvious differences: first, these dischargesare considerably larger than myotonic discharges because they represent the entire motor unitand not just a single muscle fiber. Second, the firing rate is much faster and the duration ofthe entire discharge is very short. These discharges can be observed very rarely in any neu-rogenic disorder, but are most commonly associated with axonal potassium channelopathies(e.g., Isaac’s syndrome). Dysfunction in the potassium channel leads to an elevated restingpotential and subsequent instability of the cell membrane, such that recurrent spontaneousdepolarizations of the membrane occur.
5.5. Cramp Discharge
Cramp discharges are most commonly observed as an involuntary discharge that is pro-duced during a muscle contraction. For example, while asking a patient to contract a musclewith an inserted needle electrode, the patient may suddenly complain that their muscle is verypainful and they are getting a cramp. What may be observed on the oscilloscope is a repetitive,rapidly firing (40–60 Hz) single motor unit or group of motor units that stops as the muscle isstretched out. Cramp discharges can be very difficult to distinguish from activity produced bya normal contraction, except that the patient will complain of pain and that, in some situations,a single motor unit will fire very frequently for a short time, before a more normal recruitmentpattern is re-established.
Needle Electrode Examination 239
Fig. 10. A neuromyotonic discharge.
14_Rukove 4/11/07 9:12 AM Page 239

6. EVALUATION OF VOLUNTARY MOTOR ACTIVITY
After evaluating spontaneous activity, the electromyographer studies the morphology andfiring characteristics of the MUPs while asking the patient to voluntarily activate the muscle.The morphology of the motor unit can most clearly separate neurogenic from myopathic dis-ease while also adding substantial information concerning the severity and chronicity of thedisorder. The firing pattern of the MUPs is also critical to identify because it enhances theinterpretation of the MUP morphology. Although evaluation of the motor units can be quan-tified by using one of several techniques, most EMG laboratories rely on qualitative assess-ment and grading by the electromyographer performing the study. Although seeminglyarbitrary to the casual observer, an experienced electromyographer uses a number of devel-oped skills, both visual and auditory, to interpret the condition of the motor units.
7. BASIC MUP PARAMETERS
7.1. Duration
The duration of the motor unit is perhaps its most important characteristic (Fig. 11). Theduration reflects how dispersed the motor unit is in time and space and is the least affectedby proximity of the needle electrode to the motor unit being recorded. Generally, short-durationmotor units are commonly observed in myopathic conditions, whereas long-duration motorunits are observed in neurogenic disorders. In any muscle, motor unit size will vary within adistribution of durations; however, some muscles (e.g., those of the quadriceps or triceps)have longer-duration units than those of others (e.g., iliopsoas and biceps). Duration of theMUP is also age-dependent, because larger motor units are observed more prominently inolder people, due to the normal drop out of motor neurons in the spinal cord with advanc-ing age. Although normal values for this parameter have been painstakingly obtained for
240 Esper and Rutkove
Fig. 11. A motor unit potential with five phases.
14_Rukove 4/11/07 9:12 AM Page 240

people of different ages, with experience, one can learn to be comfortable identifying what isprobably normal for someone and what is not. To give a sense of these changes, a normalMUP from biceps femoris in a 20-yr-old patient is approx 11 ms in duration, whereas a nor-mal MUP from the vastus lateralis of an 80-yr-old patient is approx 16 ms. From an auditorystandpoint, longer-duration MUPs have a lower pitched, “thuddy” sound, consistent with thefact that the prolonged duration equates to a longer wavelength and, thus, a lower frequency.Short-duration MUPs are higher pitched and have a “tinny” quality to them.
7.2. Amplitude
The amplitude of a MUP (Fig. 11) is much more subject to variation than duration, and itis strongly dependent on the distance of the needle from the motor unit. One way of deter-mining how close the needle is to a given motor unit is to evaluate the rise time of the motorunit—that is, the time it takes for the first phase of the potential to reach its maximum afterthe initial departure from baseline. By freezing the oscilloscope screen, the rise time can beeasily evaluated visually and should be generally less than approx 500 µs for the needle to beconsidered in close proximity to the motor unit. Nonetheless, with small movements of a nee-dle in close proximity to the muscle, the amplitude will vary considerably. Even so, inpatients with neurogenic disorders, the absolute highest amplitude motor units will be dis-tinctly higher than those from a healthy patient. For example, a patient with a chronic neuro-genic disorder could have amplitudes for a single motor unit reaching 10 mV or more,whereas in a healthy individual, MUPs may not reach above 3 mV.
Amplitude equates to volume when listening to the EMG activity. Hence, for a given vol-ume setting on the EMG, a higher-amplitude motor unit will sound louder than a lower-ampli-tude motor unit will. Because chronic neurogenic disease produces both a prolongation induration and increase in amplitude, loud, low-pitched motor units are commonly observed in neurogenic disease. Quiet, high-pitched, “crackling” motor units are commonly observed inmyopathic conditions.
7.3. Phases
A phase is an individual “peak” or “trough” of the motor unit and can be calculated as thenumber of baseline crossings minus 1 (Fig. 11). Phases are differentiated from turns or ser-rations, in that a turn is a peak or trough, whether or not it involves a baseline crossing. Mostmotor units usually consist of four phases or less, although some units with more phases willbe observed approx 5% of the time. Electrically, a phase can be thought of as the electricalsignature of one or more muscle fibers that make up the overall motor unit, which are in rel-atively close proximity to one another.
Polyphasia is defined as an excess of motor units with five or more phases, and it is a com-mon occurrence in both myopathic and neuropathic neuromuscular conditions. Phases willincrease if the conduction velocity in the terminal nerve twigs to individual muscle fibers isslowed (leading also to a longer-duration MUP) and if the MUP is spread out over a largerarea of the muscle because of reinnervation. In a muscle undergoing reinnervation, polypha-sia is usually most apparent relatively early to midway through the recovery process, andgradually decreases as time passes (discussed in more detail below in Section 8). Injury to thedistal axon is also common in myopathies, and may also contribute to the polyphasia in thesedisorders; however, the fact that each muscle fiber’s depolarization time shortens can lead to
Needle Electrode Examination 241
14_Rukove 4/11/07 9:12 AM Page 241

a decrease in the normal “bundling” of individual muscle fiber potentials into a single phaseand cause the potential to appear polyphasic.
From an auditory standpoint, the number of phases affects the timbre of the sound—thequality that allows one to distinguish, for instance, a violin from a flute. The timbre of a soundis dependent on the overtones in a sound. MUPs, however, have a very limited range of over-tones; polyphasic MUP will sound like a “ratchet” produced by the higher frequenciesembedded within it.
7.4. Recruitment
Recruitment refers to the orderly participation of MUPs that occurs with a muscle contrac-tion. When an individual is asked to just barely contract a muscle, a single MUP will beginto fire at a rate of approx 4 to 5 Hz. As the patient is asked to push harder, the motor unit willreach approx 10 Hz in firing frequency before the next motor unit begins to fire. People referto this as the rule of 5s: When two units are firing, the fastest is firing at 10 Hz; when threeunits are firing, the fastest is firing at a normal frequency of 15 Hz. However, this rule doesnot hold perfectly well for all muscles. In the cranial nerve musculature, a more rapid firingrate is often observed with a single unit normally firing at up to 15 Hz.
As more motor units join into the contraction, the screen gradually fills up with motorunits, such that individual units can no longer be observed. This is what is called a “full inter-ference pattern.” In neurogenic disease, this pattern is disturbed, such that a single motor unitwill fire more quickly to achieve sufficient force, essentially trying to make up for its absentbrethren. Hence, in cases of severe neurogenic disease in which only a single motor unit ispresent, that MUP may be found to fire at rates of 30 to 40 Hz without other accompanyingMUPs. In cases of less-profound axon loss, several individual motor units will fire at 15 to20 Hz each, more rapidly than observed normally, producing a “picket fence” appearance tothe EMG activity rather than the full interference pattern normally generated.
In myopathic disease, the “rule of 5s” still holds; however, MUPs fill the screen so rapidlythat they make such an orderly appearance of MUPs impossible to observe. This has beendescribed as “early recruitment,” but perhaps should more accurately be called “compressedrecruitment” or “condensed recruitment.” Because the muscle fiber itself is disrupted andunable to contribute adequately to the force required to contract a muscle, more muscle fibersmust be recruited earlier than normal. Thus, in severe myopathies, a barely contracting mus-cle may produce the firing of many MUPs at once, leading to a full interference pattern,something that is usually only observed with high force levels.
7.5. Activation
Activation describes the CNS drive that produces a contraction. Activation can be reducedif there is a true CNS lesion, such as an infarction or area of demyelination, or if the patientis simply not trying hard to contract the muscle, perhaps because of pain in the limb. Theoscilloscope screen in patients with reduced activation demonstrates motor units that preservethe 5:1 ratio; however, a full interference pattern is never achieved. Rather, a couple of normal-appearing motor units will fire slowly and inconsistently. Perhaps, with encouragement, thisfiring pattern will improve momentarily before lapsing.
The presence of reduced activation, although implying the presence of a CNS lesion orsimply poor effort, does not exclude the presence of superimposed peripheral neurogenic ormyopathic disease. For example, patients with severe sensory ataxia, such as one due to a
242 Esper and Rutkove
14_Rukove 4/11/07 9:12 AM Page 242

sensory neuronopathy, may have difficulty moving their limbs simply secondary to impaired sensory feedback, leading to reduced activation. Similarly, patients with amyotrophic lateral sclerosis often have a combination of central and peripheral motor neuron loss, lead-ing to a picture of reduced activation superimposed on reduced recruitment and MUPenlargement.
8. UNDERSTANDING THE TIME COURSE OF DEVELOPMENT OF MUP ABNORMALITIES
8.1. Neurogenic Disorders
Let us take a situation in which axonal injury occurs to a nerve such that some, but not all ofit, will regrow and eventually reinnervate a muscle it controls. For simplicity, this muscle is nor-mally only innervated by three neurons. Figure 12A shows the initial state with a healthy muscleand nerve, with individual muscle fibers having a checkerboard pattern of innervation from threedifferent motor neurons. Figure 12B shows the injured nerve and the associated denervated mus-cle shortly after the injury. The motor neuron has its basement membrane intact and can regrow,whereas the other two do not, and cannot regrow. The nerve is now not connected, and if a nee-dle were placed in the muscle, marked spontaneous activity would be observed (as shown), butno MUPs would be identified. Figure 12C shows early reinnervation. Only one of the three axonsin the nerve has managed to grow back, and it has attached to only three muscle fibers. If an EMGwere performed at this stage, one motor unit would appear, but it would be made up of only threemuscles and would be recruited very rapidly because there are no other motor neurons to assist.This unusual situation of a low-amplitude, short-duration motor unit with reduced recruitment iscalled a “nascent” MUP (a MUP in the process of being born). Gradually more muscle fibers willbe added to the motor unit, including muscle fibers that are more distant that were not normallypart of the initial unit. These developing nerve twigs are poorly myelinated (dotted lines) and arelong and, hence, the resulting potential is demonstrated in Fig. 12D—polyphasic with low ampli-tude but long duration. In this example, there is a single satellite potential attached to the end ofMUP; this potential represents the firing of a distant recently reinnervated muscle fiber. Therecruitment remains reduced, because there are no other associated motor units able to con-tribute to the muscle contraction. Finally, in Fig. 12E, reinnervation is complete. The terminalnerve twigs are well-myelinated and a new, single, large motor unit has formed, now doing thework of nearly three motor units (not all of the fibers were successfully reinnervated in this exam-ple). This MUP has a larger amplitude, longer-duration, and, perhaps, some mild polyphasia;recruitment remains reduced. Should all of the fibers be successfully reinnervated, spontaneousactivity will also normalize and no fibrillation potentials or PSWs will be identified.
In summary, not all neurogenic disorders are the same, and the appearance of the MUP willdepend on the severity of the lesion, when in the course of recovery the neurophysiologicalstudy is being completed, and the relative success of reinnervation. Of course, if no reinner-vation occurs (as does happen in some severe nerve injuries), than no MUPs will be identi-fied and fibrillation potentials will persist in the muscle indefinitely.
8.2. Myopathic Disorders
Myopathic disorders also produce changing characteristics on needle EMG over time.Acute and subacute myopathies generally are identified by short-duration, low-amplitudeMUPs, usually accompanied by fibrillation potentials and PSWs. The spontaneous activityitself is often of low amplitude (small fibrillation potentials). The reason for the MUP
Needle Electrode Examination 243
14_Rukove 4/11/07 9:12 AM Page 243

244 Esper and Rutkove
14_Rukove 4/11/07 9:12 AM Page 244

Needle Electrode Examination 245
Fig. 12. Motor unit remodeling with nerve injury. See text for details.
14_Rukove 4/11/07 9:12 AM Page 245

changes is demonstrated in Fig. 13A and B, which shows a MUP before and after a myo-pathic process has begun. Several processes likely contribute to the development of smallmotor units, including destruction of muscle fibers associated with a given motor unit, trun-cation of muscle fibers leading to smaller individual muscle fiber action potentials, anddestruction of intramuscular nerve twigs by inflammation. Ischemia and other pathologicalprocesses may also play a role. The result, however, is that the number of individual motorunits is preserved, but their amplitude and duration are markedly reduced. In addition to thesechanges, the force-generating capacity of a single motor unit will also decrease, making itnecessary to recruit additional motor units earlier than normal to produce even small move-ments of the extremity. Hence, short-duration, low-amplitude motor units with “early”recruitment—many motor units participating to produce small degrees of force—are seen insubacute or ongoing myopathy, as detailed above in Section 7.4.
As a myopathic condition persists and there is ongoing destruction of muscle fibers andsome motor nerve terminals are lost, a gradual degree of reinnervation occurs, such thatmotor neurons sprout twigs to still-functioning individual muscle fibers. In time, the previousclear myopathic picture may become more and more clouded by the presence of some occa-sional large motor units. In some situations, the myopathic motor units become almost impos-sible to find as they are replaced by a few, usually very polyphasic, high-amplitude,long-duration units. If there are muscle fibers or segments of muscle fiber that remain with-out reinnervation, then ongoing denervation will persist.
Muscle diseases are either hereditary or acquired. Hereditary muscle diseases, includingthe muscular dystrophies, can show a more chronic pattern of large MUPs mixed with short-duration, low-amplitude, polyphasic MUPs. This reflects the chronicity of the diseaseprocess, which, in adult cases, is longstanding. Acquired muscles diseases, especially inflam-matory myopathies such as dermatomyositis or polymyositis, typically have short-duration,low-amplitude MUPs with prominent denervating features. In contrast to there inflammatorymyopathies, inclusion body myositis, an acquired long-standing disease, characteristicallyhas a mixture of large and small MUPs and prominent fibrillation potentials and positivesharp waves.
9. LIMITATIONS AND FINER ASPECTS OF NEEDLE EMG
Needle EMG, although providing valuable insights into a patient’s peripheral pathology,has a number of limitations that are important to identify. Similarly, these limitations gohand-in-hand with several often misunderstood aspects of the procedure.
9.1. Needle Placement and MUP Morphology
Whereas we would like to think of an individual MUP as the electrical signal of a singlemotor unit, in fact, a single MUP is actually the electrical signature of a single motor unit asrecorded by a needle electrode in a specific position relative to that motor unit. In other words,the orientation and distance of the needle to an individual motor unit determines the exact con-figuration of the MUP. Small movements of the needle may turn a polyphasic motor unit intoone with normal phases; amplitude will also fluctuate. At least one study has demonstrated thatMUPs will appear smaller when evaluated with the needle inserted toward the periphery of amuscle then when inserted more deeply into it. Duration of a given MUP usually is the moststable characteristic, is less dependent on needle position, and should be considered theparameter of choice to evaluate.
246 Esper and Rutkove
14_Rukove 4/11/07 9:12 AM Page 246

Needle Electrode Examination 247
Fig. 13. Motor unit remodeling in myopathy. See text for details. MUP, motor unit potential.
14_Rukove 4/11/07 9:12 AM Page 247

9.2. Sampling Error
When a needle is inserted in a muscle, only a small area of the muscle is evaluated. Hence,for mild lesions, needle examination in one area of the muscle might show results differentfrom another area. In some situations, in which the findings are very subtle, examining severaldifferent parts of a muscle can be helpful in establishing the overall condition of that muscle.
9.3. Age-Dependent Changes
As noted, MUPs will gradually enlarge as a person ages, and most people who undergoEMG who are in their 80s will demonstrate MUPs that are relatively large compared withthose of younger people. Whether this represents true disease or whether it is merely a con-sequence of aging, caused by normal motor neuron loss, is never clear in an individualpatient. This situation is analogous to finding degenerative changes on imaging of thespine of asymptomatic elderly individuals. Such “abnormalities” may not be meaningful.Ultimately, how to interpret mild degrees of MUP enlargement in a given elderly individualis really up to the discretion of the electromyographer.
9.4. Weakness in the Setting of a Normal EMG
It must be recalled that although EMG is very useful test, it does not evaluate all aspects ofthe muscle. It only evaluates the electrical activity of the muscle fiber—that produced by thedepolarization of the muscle fiber membrane. Although strength depends on this being normal,it also depends on normal release of Ca2+ into the sarcoplasm and normal function of actin andmyosin, as well as other associated proteins, to produce a muscle contraction. Strength alsodepends on having an intact connection between the muscle and bone (i.e., the presence of anintact tendon). Another cause of milder degrees of weakness in the setting of relatively normalEMG is mildly reduced activation or recruitment that is simply difficult to observe on the oscil-loscope screen. Patients with subtle weakness, in the 4+ to 5–range, may have relativelynormal-appearing EMG studies. This is especially true in mild myopathies, in which subtlechanges in MUP morphology may not be readily observed and in which computer-assistedtechniques at quantifying the results may be helpful.
SUGGESTED READING
Brown WF, Bolton CF, eds. Clinical Electromyography. Butterworths, Boston, MA, 1987.Daube JR. AAEM minimonograph 11: needle examination in clinical electromyography. Muscle
Nerve 1991;14:685–670Daube JR. Assessing the Motor Unit With Needle Electromyography. In: Clinical Neurophysiology
(Daube JR, ed.). FA Davis, Philadelphia, PA, 1996, pp. 257–265.Kimura J, ed. Electrodiagnosis in Diseases of Nerve and Muscle. FA Davis, Philadelphia, PA, 1983.Bonner FJ Jr, DevlescHoward AB. AAEM minimonograph #45: the early development of elec-
tromyography. Muscle Nerve 1995;18:825–833.
REVIEW QUESTIONS
1. Which of the following statements is true?A. PSWs are unrelated to fibrillation potentials. B. PSWs are produced by groups of muscle fibers, whereas fibrillation potentials are produced
by individual muscle fibers. C. PSWs are a more specific abnormality than fibrillation potentials.D. PSWs are uncommon in most muscle disorders.E. None of the above.
248 Esper and Rutkove
14_Rukove 4/11/07 9:12 AM Page 248

2. Recruitment will be reduced in which of the following conditions?A. Subacute myopathy.B. Chronic myopathy.C. Acute Guillain–Barré syndrome.D. Myasthenia gravis.E. B and C.
3. Which of the following is not generated by nerve?A. CRD.B. Cramp potential.C. Doublet.D. Fasciculation.E. Myokymic discharge.
4. In distinguishing a neuromyotonic discharge from myotonic discharge, which of the followingis true?A. A neuromyotonic discharge has a faster firing frequency than a myotonic discharge.B. A myotonic discharge has a larger amplitude than a neuromyotonic discharge.C. A true neuromyotonic discharge has a “revving” up phase (increasing frequency), whereas a
myotonic discharge does not.D. A neuromyotonic discharge may have the form of a PSW.E. Myotonic discharges are a characteristic finding in Isaac’s syndrome.
5. Which of the following characteristics is most important in evaluating a MUP?A. Amplitude.B. Duration.C. Phases.D. Turns.E. Activation.
6. Abnormalities in activation on needle EMG can be observed in which of the following?A. Stroke.B. Spinal cord injury.C. Sensory neuronopathy.D. Depression.E. All of the above.
7. Which of the following statements concerning motor unit recruitment is FALSE?A. Recruitment of motor units usually proceeds from smaller to larger motor units.B. Recruitment can be difficult to judge in someone with poor activation.C. In neurogenic disorders, recruitment of the second motor unit may be delayed and not occur
until the first motor unit is firing at rates of 20 to 30 Hz.D. Early recruitment of MUPs, as occurs in myopathies, indicates that MUPs fire at unusually
low frequencies.E. In patients with chronic neurogenic injury, enlargement of MUP size is accompanied by a
reduction in recruitment.8. Which statement is FALSE concerning the sounds of needle EMG?
A. A myotonic discharge sounds like a motorcycle revving its engine. B. Polyphasia will give a MUP a ratchety timbre.C. A sputtering sound is often associated with end-plate spikes.D. Fasciculation potentials “tick” in a clock-like fashion.E. “Marching soldiers” suggests a myokymic discharge.
9. Which of the following statements is true?A. MUP duration and amplitude generally increase with increasing age.B. A single MUP can have a great many morphologies, depending on the orientation of the nee-
dle relative to the motor unit.C. Chronic myopathies may have substantial numbers of larger MUPs.
Needle Electrode Examination 249
14_Rukove 4/11/07 9:12 AM Page 249

D. Fibrillation potentials are commonly present in myopathic conditions.E. All of the above.
10. Which of the following discharges would cease in a patient exposed to curare (a blocker of themuscle end-plate acetylcholine receptor)?A. CRD.B. Myotonic discharge.C. Positive wave.D. Fasciculation.E. None of the above.
REVIEW ANSWERS
1. The correct answer is E. None of the above. PSWs are depolarizing single muscle fibers, just likefibrillation potentials, but are more nonspecific and can be found variably in many muscle dis-orders.
2. The correct answer is E. In both Guillain–Barré syndrome and chronic myopathies, recruitmentmay be reduced, whereas in myasthenia gravis and subacute myopathy, recruitment will benormal or early.
3. The correct answer is A. A CRD is caused by a reentrant path in a group of muscle fibers,without any nerve involvement. All of the other potentials described are induced by neuronaldischarges.
4. The correct answer is A. Neuromyotonic discharges have the fastest firing frequency of anyspontaneous waveform, reaching rates of up to 300 per second. Because myotonic discharges arecaused by the depolarization of a single muscle fiber, they cannot be polyphasic and they aresmaller than neuromyotonic discharges, which are motor unit discharges. Only myotonicdischarges “rev up.” Because they are motor units, neuromyotonic discharges can never have themorphology of a PSW.
5. The correct answer is B. The single most important MUP characteristic is the duration, becauseit is the least likely to be affected by electrode positioning.
6. The correct answer is E. Any condition that may reduce the overall descending drive to recruitmotor units will lead to reduced activation. These conditions can be organic (stroke and spinalcord injury), behavioral (depression, malingering), or caused by reduced sensory feedback (sen-sory loss caused by sensory neuronopathy).
7. The correct answer is D. In myopathies, motor unit recruitment is not truly early, but rather is“compressed,” in that many motor units are activated quickly, because each motor unit generatessubstantially less force than normal. MUPs never fire more slowly than approx 4 to 5 Hz. All ofthe other answers are true.
8. The correct answer is D. Fasciculation potentials occur irregularly; fibrillation potentials, onother hand, can tick like a clock. All of the other answers are correct.
9. The correct answer is E. All of the answers are correct.10. The correct answer is D. A fasciculation potential is the only discharge that is neuronally gener-
ated and, hence, requires the activation of the muscle end plate.
250 Esper and Rutkove
14_Rukove 4/11/07 9:12 AM Page 250

15Mononeuropathies of the Upper and Lower Extremity
Kevin R. Scott and Milind J. Kothari
SummaryNerves of both the upper and lower extremities are frequently injured for a variety of reasons. In the
arms, median neuropathy at the wrist is by far the most common disorder; ulnar neuropathy also occurswith a relatively high frequency. Other mononeuropathies affecting the upper extremities, includinganterior and posterior interosseous neuropathies, and musculocutaneous neuropathies, are very infre-quent. In the legs, peroneal neuropathy at the fibular neck and lateral femoral cutaneous neuropathyare the most common disorders, and other focal neuropathies, such as tibial neuropathy at the ankle(tarsal tunnel syndrome) are often sought but rarely identified. Although all mononeuropathies can bepreliminarily diagnosed by history and clinical examination, neurophysiological testing provides a keycomponent to confirming the diagnosis and assisting with treatment planning.
Key Words: Carpal tunnel syndrome; median neuropath; meralgia paresthetic; peroneal neuropathy;radial neuropathy; tarsal tunnel syndrome; tibial neuropathy; ulnar neuropathy.
1. INTRODUCTION
Focal compression mononeuropathies of the upper and lower extremities are commonlyencountered in clinical practice. These neuropathies serve as a major source of referrals to aneurophysiology laboratory. In this chapter, common entrapments of the upper and lowerlimbs will be discussed and correlated with the electrophysiological findings.
2. MEDIAN NEUROPATHY
The median nerve can be compressed at various levels; the most common site being at thewrist. This neuropathy is the most common entrapment neuropathy affecting the upperextremity.
2.1. Anatomy
The median nerve arises from the medial and lateral cords of the brachial plexus. Thelateral cord is made up of C6–C7 fibers, and supplies median sensory fibers to the thenareminence, thumb, index, and middle fingers, as well as, the majority of motor fibers to theproximal median-innervated forearm muscles. The medial cord is made up of C8–T1 fibers,and supplies the majority of motor fibers to the distal median-innervated muscles of the fore-arm and hand, as well as sensory fibers to the lateral half of the ring finger.
After the medial and lateral cords join, the median nerve courses distally, along the medial sideof the humerus. No muscular branches are given off during its course through the proximal arm.
From: The Clinical Neurophysiology PrimerEdited by: A. S. Blum and S. B. Rutkove © Humana Press Inc., Totowa, NJ
251
15_Kothari 4/11/07 9:13 AM Page 251

The nerve then enters the region of the antecubital fossa, where it lies medial to the bicepstendon and brachial artery. At this point, the median nerve pierces the pronator teres muscle,providing branches to innervate this muscle, as well as the flexor carpi radialis, palmaris longus,and flexor digitorum superficialis muscles of the forearm. Posteriorly, the median nerve givesoff the anterior interosseous nerve (AIN), which innervates the flexor pollicis longus, flexordigitorum profundus (to digits 2 and 3), and the pronator quadratus muscles. The AIN providesno cutaneous sensory innervation, but does supply sensation to the interosseous membrane andwrist joint.
Proximal to the wrist, in the distal portion of the forearm, the median nerve gives off thepalmar sensory cutaneous nerve, which provides sensation over the thenar eminence. Themedian nerve, itself, along with the nine flexor tendons of the hand, continues through thecarpal tunnel formed by the transverse carpal ligament and carpal bones. After passing intothe palm, the nerve divides into sensory and motor trunks. The sensory trunk divides further,providing digital sensory nerves to innervate the first three fingers and lateral portion of thefourth. The motor trunk gives off the recurrent thenar branch, which supplies the muscles ofthe thenar eminence, including the opponens pollicis, the abductor pollicis brevis (APB), andthe superficial potion of the flexor pollicis brevis muscles, before continuing distally and sup-plying the first and second lumbricals.
2.2. Clinical Features of Median Nerve Dysfunction2.2.1. Median Neuropathy at the Wrist (Carpal Tunnel Syndrome)
This is the most common entrapment neuropathy affecting the upper extremity. Patients maypresent with a variety of signs and symptoms, including weakness and sensory disturbances.The most common complaint is that of pain and paresthesias. Pain is usually localized to thewrist and fingers, but may radiate to the forearm, arm, or even the shoulder. Certain patientsmay report a diffuse aching sensation involving the entire arm. Sensory disturbances usuallyinvolve the lateral three fingers. However, patients may report paresthesias involving the entirehand or even in regions supplied by the ulnar nerve. It is very important to note that sensationover the thenar eminence will be spared in carpal tunnel syndrome (CTS). This region is sup-plied by the palmar cutaneous branch, which arises proximal to the carpal tunnel. Patients usu-ally report an increase in symptoms during activities that cause the hand to be placed in eithera flexed or extended posture (typing, driving, holding a telephone, reading a newspaper). Ahallmark of CTS is nocturnal paresthesias. Patients frequently awaken from sleep to shake theirhands. This is likely secondary to nerve ischemia resulting from a persistent flexed or extendedposture of the wrist. Late in the course, there may be frank weakness of thumb abduction andopposition with atrophy over the thenar eminence. Activities requiring fine motor dexterity maybe impaired (buttoning shirts, writing, dropping utensils, and opening jars). Provocative testing(Tinel’s and Phalen’s) may be helpful. The clinician must be aware of the sensitivity and speci-ficity issues. In CTS, a Tinel’s sign may be present in approximately half of the cases. Of impor-tance is that normal people may also exhibit a false-positive Tinel’s sign.
2.2.1.1. DIFFERENTIAL DIAGNOSIS OF CTS
Many peripheral or central nervous system lesions may produce symptoms similar to CTS.In evaluating the patient with CTS, the clinician must consider a proximal median nervelesion, a lesion affecting the brachial plexus, a cervical radiculopathy, and even stroke. Theexamination can be helpful in excluding these conditions. With lesions that are more proximal,
252 Scott and Kothari
15_Kothari 4/11/07 9:13 AM Page 252

patients should have weakness involving the proximal muscles and may also have reflexabnormalities.
There is a long list of potential conditions that may lead to the development of CTS(Table 1). CTS may be the result of repetitive use injuries or wrist trauma. Inflammatory orinfectious causes may include connective tissue disease, sarcoid, lyme, tuberculosis, or com-pression as the result of a septic joint. Metabolic causes, such as diabetes, hypothyroidism, oracromegaly, lead to gains in weight or tissue edema that may lead to compression within thetunnel. Less common causes include a variety of different tumors, such as lipoma, schwan-noma, neurofibroma, or ganglion cysts; or congenital disorders, such as anomalous muscles,congenitally small tunnel, or persistent median artery.
2.2.1.2. ELECTROPHYSIOLOGY IN CTS
When performing electrodiagnostic studies, limb temperature must be controlled andadequately maintained. The pathophysiology in CTS is usually that of demyelination, whichmay be associated with secondary axonal degeneration. In patients with typical CTS, themedian distal motor and sensory latencies are prolonged, whereas the ulnar studies arenormal. However, there is a small group (10–25%) of patients, in whom these routine nerveconduction studies are normal. In this group, comparison studies should be performed andmay demonstrate abnormalities of the median nerve.
Routine nerve conduction studies evaluating for CTS should include:
1. Median motor study—stimulating at the wrist and elbow; recording from the APB muscle.2. Ulnar motor study—stimulating at the wrist, below elbow, and above elbow sites; recording
from the abductor digiti minimi muscle.3. Ulnar and median F-responses.
Mononeuropathies 253
Table 1Potential Causes of Median Mononeuropathy at the Wrist (Carpal Tunnel Syndrome)a
1. Inflammatory/infectiousA. Connective tissue disease (e.g., rheumatoid arthritis or lupus)B. SarcoidosisC. LymeD. Tuberculosis E. Complications of septic arthritis
2. Traumatic/overuseA. Repetitive use injuriesB. Wrist or hand trauma
3. Metabolic/endocrineA. Diabetes mellitusB. HypothyroidismC. PregnancyD. Acromegaly
4. CongenitalA. Congenitally small carpal tunnelB. Anomalous musclesC. Persistent median artery
5. IdiopathicaFrom ref. 1.
15_Kothari 4/11/07 9:13 AM Page 253

4. Median sensory study—stimulating at the wrist; recording from the index finger.5. Ulnar sensory study—stimulating at the wrist; recording from the fifth digit.
If routine nerve conduction studies are normal, comparison studies are used to evaluatefor compression by comparing median nerve to ulnar nerve function. Three frequently usedcomparison studies are:
1. Median vs ulnar palm-to-wrist mixed nerve latencies.2. Median vs ulnar wrist-to-digit 4 sensory latencies.3. Median (second lumbrical) vs ulnar (interosseous) distal motor latencies.
In each case, identical distances are used between the stimulating and recording electrodesfor the median and ulnar nerves. These sensitive comparison studies are considered abnormalif differences between the median and ulnar latencies exceed 0.4 to 0.5 ms. Other studies havealso been described, including inching across the wrist, median vs radial comparison study tothe thumb, median vs ulnar F-wave minimal latency difference, and wrist-to-palm vs wrist-to-digit 2 sensory latency. These latter studies are less frequently used in most laboratories.
Needle examination is usually performed in the patient being evaluated for CTS. The APBmuscle and at least two proximal C6–C7 muscles, that is, extensor digitorum communis,pronator teres, and flexor carpi radialis, should be sampled to exclude a C6–C7 radiculopathy.If the APB muscle is abnormal:
1. At least two other lower trunk/C8–T1 muscles, for example, first dorsal interosseous or exten-sor indicis proprius, should be examined to exclude a C8–T1 radiculopathy, lower trunk brachialplexopathy, or polyneuropathy.
2. At least two proximal, median nerve-innervated muscles, for example, flexor carpi radialis,pronator teres, or flexor pollicis longus, should be sampled to exclude a proximal median neu-ropathy in the forearm.
2.2.1.3. TREATMENT
The conservative management of CTS involves withdrawal of provoking factors, use of aneutral wrist splint, and local corticosteroid injections. If this approach fails, surgical decom-pression may be necessary. Surgery usually provides benefit in 85 to 90% of patients.
2.2.2. Proximal Median Neuropathy
There are several syndromes involving proximal median nerve dysfunction. These includeentrapments at different locations, such as:
1. The ligament of Struthers.2. The lacertus fibrosus.3. The heads of the pronator teres muscle.4. The sublimis bridge of the flexor digitorum sublimis muscle.
Patients with proximal median neuropathy will usually present with complaints of pain in thearm and forearm, paresthesias in the distribution of the median nerve, and weakness. The dis-tinguishing feature on sensory examination is that the thenar eminence is involved in thesecases, whereas it is spared in CTS. Patients will also demonstrate weakness of proximalmedian-innervated muscles (flexor digitorum sublimis, flexor carpi radialis, and/or pronatorteres). However, the pronator teres may be spared in pronator syndrome. Pronation/supinationtype movements may aggravate the symptoms. The sole finding of increased pain on provoca-tive testing is unreliable. A Tinel’s sign may be present in approx 50% of cases.
254 Scott and Kothari
15_Kothari 4/11/07 9:13 AM Page 254

The electrodiagnostic study is quite helpful in these patients. The median sensory study isusually abnormal. The median motor study may show slowing of the forearm conductionvelocity. There may also be a drop in the amplitude proximally as compared with the distalsite. The needle examination will demonstrate abnormalities in median-innervated musclesinvolving the wrist and forearm. Thus, if testing for a proximal median neuropathy, at leasttwo proximal muscles should be examined. It is also important to remember that, in a lesionat the level of the pronator teres, the pronator teres muscle itself may be spared. MRI or ultra-sound may be useful to visualize the nerve.
2.2.3. Anterior Interosseous Neuropathy (AIN)
The AIN is the largest branch of the median nerve and originates just distal to the pronatorteres in the forearm. The nerve has no cutaneous sensory fibers, thus, patients will not experi-ence cutaneous sensory symptoms. The nerve supplies three muscles: the flexor pollicis longus,the flexor digitorum profundus subserving digits 2 and 3, and the pronator quadratus. To testthe pronator quadratus muscle, the elbow should be flexed to avoid the effect of the pronatorteres. Involvement of the AIN is easily tested by having the patient perform the “OK” sign.Patients with AIN injury will be unable to flex the distal phalanges of the thumb and forefin-ger. Instead of forming a normal circular “OK” sign, these patients maintain an extended posi-tion at the distal interphalangeal joints and form a pincer-type grasp. The electrodiagnosticstudy will usually demonstrate normal nerve conduction studies. The needle examinationshould demonstrate abnormalities in muscles supplied by the AIN, and is critical in makingthis diagnosis. Patients may present with AIN as a manifestation of an autoimmune brachialplexopathy. Treatment usually involves conservative measures, although, occasionally, surgi-cal intervention is warranted.
3. ULNAR NEUROPATHY
3.1. Anatomy
The ulnar nerve is derived from the C8–T1 nerve roots. Nearly all ulnar nerve fiberstravel through the lower trunk and medial cord of the brachial plexus. As the ulnar nervedescends through the medial arm, it provides no branches until it reaches the elbow. Here,muscular branches to the flexor carpi ulnaris and flexor digitorum profundus (subservingdigits 4 and 5) arise. The nerve then descends to the wrist. Proximal to the wrist, the dor-sal ulnar cutaneous sensory branch exits, and just before entering Guyon’s canal, the nervegives off the palmar cutaneous sensory branch, providing sensation over the hypothenararea. The nerve then enters Guyon’s canal and provides sensation to the volar fifth andmedial fourth digits, as well as motor innervation to the hypothenar muscles, palmar anddorsal interossei, third and fourth lumbricals, adductor pollicis, and deep head of the flexorpollicis brevis muscles.
3.2. Clinical Features of Ulnar Nerve Dysfunction3.2.1. Ulnar Neuropathy at the Elbow
This neuropathy is the second most common entrapment neuropathy. Typical symptomsinclude numbness and tingling in the distribution of the ulnar nerve. Some patients mayreport elbow pain that radiates into the ulnar aspect of the hand. In some cases, only sensorysymptoms are present. Impaired cutaneous sensation in the volar fingertips is the most
Mononeuropathies 255
15_Kothari 4/11/07 9:13 AM Page 255

common sensory deficit. Sensory loss in the ulnar palm is less frequent. An early motor signmay be an inability to adduct the fifth digit (Wartenberg’s sign). In more involved cases, therewill be weakness of handgrip and atrophy of the intrinsic hand muscles. Weakness of the firstdorsal interosseous muscle (84%) is more frequent than weakness of the abductor digiti quintimuscle (76%). Weakness of the flexor digitorum profundus and flexor carpi ulnaris muscleoccurs in 56% and 20% of patients, respectively. In severe cases, clawing of digits 4 and 5can develop. Deep tendon reflexes are usually preserved in this focal neuropathy. Variousprovocative maneuvers have been described to increase the diagnostic yield. These include aTinel’s sign at the elbow, sustained manual pressure over the cubital tunnel, sustained elbowflexion, and flexion combined with manual pressure. Combined flexion with manual pressureover the cubital tunnel has been reported to have the highest sensitivity (91%). The differen-tial diagnosis in a patient suspected of an ulnar neuropathy at the elbow includes a lowertrunk or medial cord brachial plexopathy, a C8–T1 radiculopathy, or an ulnar neuropathy atsome location other than the elbow. Some common causes of ulnar neuropathy at the elboware listed in Table 2.
3.2.1.1. ELECTROPHYSIOLOGY
As with other mononeuropathies, the electrodiagnostic study should localize the abnormali-ties to a specific nerve, in this case, the ulnar nerve. The ulnar motor study should demonstrateevidence of focal demyelination across the elbow, characterized by either focal slowing or con-duction block. When performing the ulnar motor study, elbow position is crucial. The flexedelbow position should be used, and has been shown to be more sensitive than testing in theextended position. In certain cases, inching across the elbow can be performed to demonstratea focal area of demyelination. Recording over the first dorsal interosseous muscle may beslightly more sensitive than recording over the abductor digiti quinti muscle.
Evaluation of the ulnar nerve with nerve conduction studies should include the routinestudies described in Table 3. Should routine nerve conduction studies not localize the lesion,additional techniques may be helpful to consider. These may include:
256 Scott and Kothari
Table 2Common Causes of Ulnar Neuropathy at the Elbowa
1. Old fracture with joint deformity2. Recent elbow trauma without fracture3. Habitual leaning on elbow4. Occupational repetitive flexion/extension5. Congenital variations of HUA architecture
A. Absent HUA with nerve prolapseB. Hypertrophy of retinaculumC. Anconeus epitrochlearis muscle
6. Diabetes mellitus7. Hereditary neuropathy with liability to pressure palsies8. Rheumatoid arthritis9. Iatrogenic
A. Malpositioning during surgeryB. Nerve infarction during transposition
10. Amyotrophic lateral sclerosisaHUA, humeroulnar aponeurotic arcade.
15_Kothari 4/11/07 9:13 AM Page 256

1. Repeating the ulnar motor study; recording from the first dorsal interosseous muscle.2. Ulnar motor study using inching across the elbow segment.3. Sensory or mixed-nerve studies across the elbow.4. Comparing the dorsal ulnar cutaneous sensory responses between the affected and asymptomatic
contralateral limb.5. Comparing the medial antebrachial cutaneous sensory response between affected and asympto-
matic sides if there is reason to suspect a brachial plexopathy.
In most cases, the lesion is at the elbow; however, lesions at the wrist or more proximallocations (brachial plexus or root) should be excluded by the electrodiagnostic study.
3.2.1.2. TREATMENT
The treatment of patients with ulnar neuropathy at the elbow may consist of conservativeor surgical measures. Nonoperative management should include avoidance of pressure on theelbow and/or prolonged elbow flexion, and use of an elbow splint. In certain cases, steroidinjections into the cubital tunnel may be helpful. In patients who have significant or progres-sive neurological deficits, surgical decompression is recommended. There are a number ofprocedures used; however, which procedure is most effective remains controversial.
3.2.2. Ulnar Neuropathy at the Wrist
Entrapment of the ulnar nerve at the wrist is rare compared with compression at the elbow.The common site of entrapment occurs within the Canal of Guyon. Five different syndromes
Mononeuropathies 257
Table 3Electrodiagnostic Evaluation of Ulnar Neuropathy at the Elbowa
Nerve conduction studies
1. Ulnar nerve studiesA. Ulnar motor study, stimulating at the wrist, below elbow, and above elbow sites; recording
from the abductor digiti minimi muscleB. Ulnar F-responsesC. Ulnar sensory study stimulating at the wrist; recording from the fifth digit
2. Median nerve studiesA. Median motor study stimulating at the wrist and below elbow sites; recording from the
abductor pollicis brevis muscleB. Median F-responsesC. Median sensory study stimulating at the wrist; recording from the first digit
EMG
1. RoutineA. At least one ulnar-innervated muscle distal to the wrist (e.g., first dorsal interosseous and
abductor digiti minimi)B. Two ulnar-innervated muscles of the forearm (e.g., FDP and FCU)
2. If testing of any of the routine muscles is abnormal, then additional needle examination shouldinclude:A. At least two non-ulnar, lower trunk, C8–T1 muscles (e.g., APB, FPL, and EIP)B. C8 and T1 paraspinal muscles
aFDP, flexor digitorum profounder; FCU, flexor carpi ulnaris; APB, abductor pollicis brevis; FPL, flexor pol-licis longus; EIP, extensor indicis proprius; ECU, extensor carpi ulnaris; EDC, extensor digitorum communis;ECR extensor carpi radialis; FCR, flexor carpi radialis; PT, pronator teres
From ref. 1.
15_Kothari 4/11/07 9:13 AM Page 257

have been described with entrapment in this region (Table 4). Patients may present with sen-sory and/or motor involvement confined to the distal ulnar nerve distribution. They may havesensory loss, paresthesias, or pain in the region supplied by the distal ulnar sensory branch.The region supplied by the dorsal ulnar cutaneous sensory branch may be spared. Motordeficits are limited to the muscles of the hand with sparing of the proximal ulnar-innervatedmuscles. Examination may demonstrate weakness with atrophy or fasciculations in the intrinsichand muscles. A Tinel’s sign may be present over Guyon’s canal.
The electrophysiology in this entrapment is often complex. Table 5 outlines a protocolwhen testing for an ulnar nerve lesion at the wrist. Table 6 summarizes typical electrodiag-nostic findings in each of the various syndromes. MRI may be useful in detecting structuralabnormalities that may compress the ulnar nerve in Guyon’s canal. A variety of differentcauses have been described. A ganglion cyst or traumatic wrist injury account for the major-ity of cases. In cases in which a structural lesion is identified, surgical removal is recom-mended. In certain cases, surgical exploration may be considered even if MRI fails to identifya lesion.
4. RADIAL NEUROPATHY
4.1. Anatomy
The radial nerve receives fibers from all three trunks of the brachial plexus (C5–T1 roots).The posterior divisions of the three trunks unite to form the posterior cord, which gives off theradial nerve. The radial nerve exits the lateral wall of the axilla, and travels distally through theproximal arm, just medial to the humerus. Proximally, three sensory nerves: the posterior cuta-neous nerve of the arm, the lower lateral cutaneous nerve of the arm, and the posteriorcutaneous nerve of the forearm, join the radial nerve, providing cutaneous sensation over the
258 Scott and Kothari
Table 4Clinical Syndromes Produced by Ulnar Nerve Compression Within the Canal of Guyona
1. Combined motor and sensory syndrome (Type 1)A lesion at the proximal portion of the canal may involve both motor and sensory divisions.Weakness of all ulnar innervated hand muscles and loss of sensation over the palmar fifth andmedial fourth fingers occurs. Cutaneous sensation over the hypothenar and dorsomedial surfacesof the hand should be spared.
2. Pure sensory syndrome (Type 2)Clinically, there is loss of sensation over the palmar surface of the fifth and medial fourth fingers.Sensation is spared over the hypothenar eminence. Motor fibers are not affected. There is noweakness associated with this lesion.
3. Pure motor syndromesA. Lesion affecting the deep palmar and hypothenar motor branches (Type 3)
This lesion affects the motor trunk proximal to the takeoff of the hypothenar branches. As aresult, all ulnar innervated muscles of the hand are involved. Because the sensory branch isnot affected, sensation is spared.
B. Lesion affecting the deep palmar motor branch only (Type 4)Clinically, there is weakness of lumbricals 1 and 2, as well as ulnar-innervated muscles ofthe thenar eminence. This type of lesion spares the muscles of the hypothenar eminence.
C. Lesion affecting only the distal deep palmar motor branch (Type 5)This type of lesion occurs just proximal to the branches innervating the adductor pollicis andfirst dorsal interosseous muscles, resulting in weakness of these muscles.
aFrom refs. 1 and 16.
15_Kothari 4/11/07 9:13 AM Page 258

Mononeuropathies 259
Table 5Electrodiagnostic Evaluation of Ulnar Neuropathy at the Wrista
Nerve conduction studies
1. Ulnar nerve studiesA. Ulnar motor study stimulating at the wrist, below elbow, and above elbow sites; recording
from the abductor digiti minimi muscleB. Ulnar motor study (bilateral) stimulating at the wrist; recording from the first dorsal
interosseous muscleC. Ulnar F-responsesD. Ulnar sensory study stimulating at the wrist; recording from digit 5E. Dorsal ulnar cutaneous sensory study stimulating forearm; recording from the dorsolateral hand
2. Median nerve studiesA. Median motor study stimulating at the wrist and elbow sites; recording from the abductor
pollicis brevis muscleB. Median F-responses
3. Ulnar–median comparison studiesLumbrical (2nd)–interosseous (first palmar) comparison study
EMG
1. RoutineA. One deep palmar motor muscle (e.g., first dorsal interosseous)B. One hypothenar branch muscle (e.g., abductor digiti minimi)C. Two forearm muscles (e.g., FCU and FDP)
2. If testing of any of the routine muscles is abnormal, then additional needle examination shouldinclude:A. At least two nonulnar, lower trunk, C8–T1 muscles (e.g., APB, FPL, and EIP)B. C8 and T1 paraspinal muscles
aFDP, flexor digitorum profounder; FCU, flexor carpi ulnaris; APB, abductor pollicis brevis; FPL, flexor pol-licis longus; EIP, extensor indicis proprius; ECU, extensor carpi ulnaris; EDC, extensor digitorum communis;ECR extensor carpi radialis; FCR, flexor carpi radialis; PT, pronator teres
From ref. 1.
Table 6Nerve Conduction Study Findings in Ulnar Neuropathy at the Wrista
1. Combined motor and sensory syndrome (Type 1)Decreased ulnar sensory amplitude. Decreased ulnar motor amplitude with prolonged distallatency. EMG shows denervation of all intrinsic hand muscles.
2. Pure sensory syndrome (Type 2)Decreased ulnar sensory amplitude. Ulnar motor study will be normal. EMG is normal.
3. Pure motor syndromesA. Lesion affecting the deep palmar and hypothenar motor branches (Type 3)
Ulnar sensory response is normal. Ulnar motor amplitude is decreased with prolonged dis-tal latency. EMG shows denervation of all intrinsic hand muscles.
B. Lesion affecting the deep palmar motor branch only (Type 4)Ulnar sensory response is normal. Ulnar motor amplitude is decreased with prolonged dis-tal latency when recording from the first dorsal interosseous muscle. EMG shows denerva-tion of the first dorsal interosseous muscle with sparing of the hypothenar muscles.
C. Lesion affecting only the distal deep palmar motor branch (Type 5)Ulnar sensory response is normal. Ulnar motor amplitude is decreased with prolonged dis-tal latency when recording from the first dorsal interosseous muscle. EMG shows denerva-tion of the first dorsal interosseous muscle with sparing of the hypothenar muscles.
aFrom ref. 17.
15_Kothari 4/11/07 9:13 AM Page 259

posterolateral portions of the arm and a small strip along the middle posterior aspect of theforearm. Muscular branches are provided next to the long, lateral, and medial triceps muscles,as well as the anconeus muscle. Moving distally, the radial nerve wraps around the humerus,traveling in the spiral groove, before giving off additional branches to the supinator, long headof the extensor carpi radialis, and brachioradialis muscles. A few centimeters distal to the lateral epicondyle, the radial nerve divides into the superficial radial sensory nerve and theposterior interosseous nerve. The superficial radial sensory nerve travels distally along theradius providing cutaneous sensation over the dorsolateral hand and proximal portions of thedorsal aspect of the thumb, index, middle, and ring fingers. The posterior interosseous nervetravels through the supinator muscle passing under the arcade of Frohse. The posteriorinterosseous nerve supplies muscular branches to the short head extensor carpi radialis, exten-sor digitorum communis, extensor carpi ulnaris, abductor pollicis longus, extensor indicis pro-prius, extensor pollicis longus, and extensor pollicis brevis muscles.
4.1.1. Radial Neuropathy at the Axilla
This entrapment results from prolonged compression of the nerve as it courses through theaxilla. A common presentation is the patient on crutches, who uses them incorrectly, thereby,applying prolonged pressure to the axilla. Because the lesion occurs proximal to muscularbranches supplying the triceps muscle group, the clinical presentation is similar to radial neu-ropathy at the spiral groove, with the addition of triceps muscle weakness. Additionally, sensorydisturbance extending into the posterior arm and forearm caused by compression of the posteriorcutaneous sensory nerves of the forearm and arm is commonly seen.
4.1.2. Radial Neuropathy at the Spiral Groove
This is the most common site of compression of the radial nerve. This commonly occurswhen a person has draped an arm over a chair or bench during deep sleep or intoxication(“Saturday Night Palsy”). Other cases may occur after strenuous muscular effort or fracture ofthe humerus. Patients with this particular entrapment typically present with wrist and fingerdrop in combination with decreased sensation over the posterolateral hand in the distribution ofthe superficial radial sensory nerve. Patients typically have weakness of supination and elbowflexion. However, elbow extension (triceps muscle) will be spared.
4.1.3. Posterior Interosseous Neuropathy
In this condition, patients also present with wrist drop. However, there are several distinctfeatures of this particular entrapment that distinguish it from lesions at the spiral groove. In aposterior interosseous neuropathy (PIN), there is sparing of radial-innervated muscles proximalto the takeoff of the posterior interosseous nerve (triceps, anconeus, brachioradialis, and longhead of the extensor carpi radialis muscles). Entrapment usually occurs at the Arcade of Frohse.When the patient extends the wrist, they may do so weakly, and with radial deviation; thisoccurs because the extensor carpi ulnaris is weak but the extensor carpi radialis is preserved.These patients typically do not experience cutaneous sensory deficits. Patients, however, maycomplain of forearm pain, which results from dysfunction of the deep sensory fibers of theposterior interosseous nerve that supplies the interosseous membrane and joint capsule.
4.1.4. Superficial Radial Sensory Neuropathy
In the forearm, the superficial radial sensory nerve travels subcutaneously next to theradius. Its superficial location makes it quite susceptible to compression. Sensory distur-bances occur over the dorsolateral surface of the hand, and dorsal, proximal, portions of the
260 Scott and Kothari
15_Kothari 4/11/07 9:13 AM Page 260

fingers. Various objects, such as tight fitting bands, watches, bracelets, or handcuffs may leadto a superficial radial neuropathy. Because this is a pure sensory neuropathy, these patientsdo not develop weakness.
4.1.4.1. DIFFERENTIAL DIAGNOSIS OF WRIST DROP
The differential diagnosis of a wrist drop should include the various radial nerve lesionsthat have been discussed. In addition, lesions that are more proximal, such as a posterior cordbrachial plexopathy, a C7–C8 radiculopathy, or even a central lesion, should be considered.A careful clinical examination can be invaluable in localizing the lesion causing wrist drop.
4.1.4.2. ELECTROPHYSIOLOGY
The electrodiagnostic study should identify the presence of a radial neuropathy and properlylocalize the level of dysfunction. The radial motor study should be performed and comparedwith the contralateral side. A protocol outlining electrodiagnostic recommendations forevaluating radial neuropathy is outlined in Table 7.
Needle examination should focus on localizing the lesion level. Typically, one shouldexamine at least: two PIN-innervated muscles (e.g., extensor indicis proprius, extensor carpiulnaris, and extensor digitorum communis muscles); two radial-innervated muscles that areproximal to the PIN but distal to the spiral groove (e.g., long head of extensor carpi radialis
Mononeuropathies 261
Table 7Electrodiagnostic Evaluation for Evaluating Radial Neuropathya
Nerve conduction studies
1. Radial nerve studiesA. Radial motor study stimulating at the forearm, elbow, below spiral groove, and above spiral
groove sites; recording from extensor indicis proprius muscleB. Superficial radial sensory study. Stimulating at the forearm; recording over the extensor ten-
dons of the thumb. Bilateral studies are recommended2. Median nerve studies
A. Median motor study stimulating at the wrist and below elbow sites; recording from theabductor pollicis brevis muscle
B. Median sensory study stimulating at the wrist; recording from the first digitC. Median F-responses
3. Ulnar nerve studiesA. Ulnar motor study, stimulating at the wrist, below elbow, and above elbow sites; recording
from the abductor digiti minimi muscleB. Ulnar F-responsesC. Ulnar sensory study stimulating at the wrist; recording from the fifth digit
EMG
1. At least two PIN-innervated muscles (e.g., EIP, ECU, and EDC)2. At least two radial-innervated muscles proximal to the PIN, but distal to the spiral groove
(e.g., brachioradialis and long-head ECR)3. At least one radial-innervated muscle proximal to the spiral groove (e.g., triceps)4. At least one nonradial, posterior cord-innervated muscle (e.g., deltoid)5. At least two nonradial C7-innervated muscles (e.g., FCR, PT, FPL, and cervical paraspinal muscles)
aPIN, posterior interosseous neuropathy; EIP, extensor indicis proprius; ECU, extensor carpi ulnaris; EDC,extensor digitorum communis; ECR, extensor carpi radialis; FCR, flexor carpi radialis; PT, pronator teres; FPL,flexor pollicis longus.
From ref. 1.
15_Kothari 4/11/07 9:13 AM Page 261

and brachioradialis); two nonradial nerve, C7-innervated muscles (e.g., pronator teres, flexorpollicis longus, flexor carpi radialis, and cervical paraspinal muscles); one radial-innervatedmuscle proximal to the spiral groove (e.g., triceps muscle); and one nonradial, posterior cord-innervated muscle (e.g., deltoid). Table 8 summarizes the different electrophysiologicalabnormalities that are encountered in the various radial nerve lesions discussed.
4.2. Other Focal Mononeuropathies of the Upper Extremity4.2.1. Suprascapular Neuropathy
This entrapment most commonly occurs at the suprascapular notch, under the transversescapular ligament. Less frequently, the nerve can be entrapped distally at the spinoglenoidnotch. The most common symptom is shoulder pain. Shoulder pain is typically deep and bor-ing, and occurs along the superior aspect of the scapula, with radiation into the shoulder. Thepain may be exacerbated by adduction of the extended arm.
Patients may demonstrate weakness of shoulder abduction (supraspinatus) and externalrotation (infraspinatus). Atrophy may be present in cases that are more severe. If the nerve isentrapped distally at the spinoglenoid notch, the deficit is limited to the infraspinatus muscleonly. In this case, pain is usually absent because the deep sensory fibers to the shoulder jointarise proximal to the lesion.
Various conditions that should be excluded include C5–C6 radiculopathy, upper trunkbrachial plexopathy, rotator cuff injury, and other orthopedic conditions of the shoulder.
262 Scott and Kothari
Table 8Electrodiagnostic Findings in Radial Neuropathya
1. Posterior interosseous neuropathyA. Nerve conduction studies—superficial radial sensory response is normal. Radial motor study
may show low-amplitude response (if axonal) or conduction block at the elbow (if demyeli-nating)
B. EMG—denervation in the extensor indicis proprius, extensor digitorum communis, and exten-sor carpi ulnaris muscles
2. Radial neuropathy at the spiral grooveA. Nerve conduction studies—superficial radial sensory response is low (if axonal). Radial
motor study may show low-amplitude response (if axonal) or conduction block at the spiralgroove (if demyelinating)
B. EMG—denervation as in PIN plus long head extensor carpi radialis, brachioradialis, andsupinator muscles
3. Radial neuropathy at the axillaA. Nerve conduction studies—superficial radial sensory response is low (if axonal). Radial
motor study may show low-amplitude response (if axonal)B. EMG—denervation as in spiral groove, plus triceps muscle
4. Posterior cord brachial plexopathyA. Nerve conduction studies—superficial radial sensory response is low (if axonal). Radial
motor study may show low-amplitude response (if axonal)B. EMG—denervation as in axilla, plus deltoid, and latissimus dorsi muscles
5. C7 RadiculopathyA. Nerve conduction studies—radial motor study may show low-amplitude response (if axonal)B. EMG—denervation as in axilla, plus flexor carpi radialis and cervical paraspinal muscles, but
sparing the brachioradialis and supinator musclesaPIN, posterior interosseous neuropathy; From ref. 1.
15_Kothari 4/11/07 9:13 AM Page 262

In rare cases, a focal suprascapular neuropathy may be the primary manifestation of a morediffuse autoimmune-mediated brachial plexopathy (neuralgic amyotrophy).
Electrodiagnostic studies should identify the involvement of suprascapular-innervatedmuscles, and exclude other causes. Routine nerve conduction studies of the upper extremityshould be normal. Motor studies of the suprascapular nerve can be performed, but requirecareful technique, and, therefore, are not commonly performed. Compound muscle actionpotentials may be recorded using a monopolar needle electrode placed in the spinatii muscleswhile stimulating over Erb’s point. Needle examination is very useful, and will help identifyabnormalities limited to the spinatii muscles, thus, supporting the diagnosis of suprascapularneuropathy. An MRI of the shoulder is usually recommended to exclude a ganglion cyst caus-ing compression of the nerve.
4.2.2. Axillary Neuropathy
This neuropathy typically occurs in the setting of trauma (dislocation of the shoulder orfracture of the humerus). Clinically, patients have a well-demarcated “patch” of numbnessalong the lateral aspect of the shoulder, and will have weakness of shoulder abduction(deltoid) and external rotation (teres minor). Differential diagnosis is similar to that of asuprascapular neuropathy. Routine nerve conduction studies are, again, normal. Motor studyof the axillary nerve can be performed but, again, requires careful technique and experience.The needle examination usually demonstrates abnormalities in the deltoid and teres minormuscles only.
4.2.3. Long Thoracic Neuropathy
The long thoracic nerve arises directly from the C5, C6, and C7 nerve roots proximal tothe brachial plexus. The nerve supplies the serratus anterior muscle exclusively. Most com-monly, this neuropathy is seen in patients with neuralgic amyotrophy. Dysfunction of the longthoracic nerve can result from traumatic injuries that cause widespread damage to multiplecervical nerve roots. Isolated cases of long thoracic neuropathy, although rare, are observed.Patients will exhibit scapular winging with their arms outstretched. Electrodiagnostic studiesshould be performed to determine if a more widespread process exists.
4.2.4. Musculocutaneous Neuropathy
An isolated musculocutaneous neuropathy is rare. Most commonly, it occurs as part of awidespread traumatic lesion involving the shoulder and arm. Patients will have weakness ofelbow flexion, sensory loss over the lateral forearm (lateral antebrachial cutaneous nerve),and an absent biceps reflex. The electrodiagnostic study should localize the lesion to thisnerve, and exclude a brachial plexopathy or cervical radiculopathy. The lateral antebrachialcutaneous sensory study should be abnormal as compared with the contralateral side. Motorstudy of the musculocutaneous nerve can be performed, but careful technical skill is requiredto ensure accuracy of the result. Needle examination should demonstrate abnormalities in thebiceps, brachialis, and coracobrachialis muscles.
4.2.5. Spinal Accessory Neuropathy
Isolated lesions of this nerve occur in the region of the posterior cervical triangle and result inisolated weakness of the trapezius muscle. Stretch injuries may occur, but usually this neuropa-thy results after local surgical procedures. Patients may have shoulder drop caused by weaknessof the trapezius muscle. If the lesion is more proximal, there may be weakness of the sternoclei-domastoid muscle as well. The needle examination provides the greatest usefulness with this
Mononeuropathies 263
15_Kothari 4/11/07 9:13 AM Page 263

type of entrapment syndrome. Routine nerve conduction studies of the upper extremity shouldbe normal. A careful needle examination should exclude brachial plexus dysfunction.
5. PERONEAL NEUROPATHY
Peroneal neuropathy is the most common focal neuropathy affecting the lower extremity. It isa common cause of foot drop, and, most often, is compressed at the level of the fibular head.
5.1. Anatomy
The peroneal nerve fibers are derived from the L4–S1 nerve roots. These fibers travelthrough the lumbosacral plexus, and continue on through the sciatic nerve. Within the sciaticnerve, fibers of the common peroneal nerve run separately from tibial nerve fibers. The com-mon peroneal nerve first gives off the lateral cutaneous nerve of the calf. Near the fibularneck, the common peroneal nerve divides into its terminal branches, the superficial and deepperoneal nerves.
The superficial peroneal nerve courses distally along the fibula. It provides muscularbranches to the peroneus longus and peroneus brevis muscles, controlling ankle eversion. Thenerve then divides into the medial and lateral cutaneous branches, which provide sensationover the distal anterolateral calf, dorsum of the foot, and dorsum of the first three to four toes,sparing a small wedge-shaped area over the webspace between the medial two toes.
The deep peroneal nerve travels distally along the anteromedial aspect of the tibia, andmediates dorsiflexion of the ankle and toes. Proximal to the ankle, it provides muscularbranches to the tibialis anterior, extensor digitorum longus, extensor hallucis longus, andperoneus tertius muscles. After crossing the ankle, muscular branches are supplied to theextensor digitorum brevis and first dorsal interosseous pedis. A small cutaneous sensorybranch, the dorsal digital cutaneous nerve, arises distally and provides sensation over thewebspace between the first two toes.
5.2. Clinical Features of Peroneal Nerve Dysfunction5.2.1. Peroneal Neuropathy at the Fibular Head
Patients with a peroneal neuropathy at the fibular head have a characteristic clinicalpresentation. Many cases occur postoperatively and are thought to occur because of patientpositioning that resulted in prolonged compression of the nerve. Other factors that maypredispose patients to peroneal neuropathies at the fibular head include trauma resulting infracture of the fibula or knee dislocation, weight loss, frequent leg crossing, prolonged hos-pitalization in an ICU setting, diabetes mellitus, preexisting polyneuropathy, and compres-sion caused by braces, casts, or splints.
Involvement of the superficial peroneal nerve results in weakness of foot eversion, as wellas sensory disturbance in the mid- and lower-lateral calf and over the dorsum of the foot.Involvement of the deep peroneal fibers results in weakness of toe and ankle dorsiflexion (footdrop). Ankle inversion and toe flexion are spared, because the tibial nerve mediates these func-tions. Foot drop may be partial or complete, and, in some instances, may develop during aperiod of days or weeks. In most cases, the lesion is unilateral, but, in 10% of patients, bilat-eral lesions may be present. In exclusively deep peroneal neuropathies, which are much lessfrequent than common peroneal neuropathies, sensory disturbances are lacking (except forsensory loss in the first web space), and ankle eversion is normal. The clinical examinationshould help localize the lesion and identify whether a more proximal lesion is present.
264 Scott and Kothari
15_Kothari 4/11/07 9:13 AM Page 264

5.2.1.1. ELECTROPHYSIOLOGY
Electrodiagnostic studies are extremely useful in the evaluation of patients who present withfoot drop. The differential diagnosis of foot drop includes peroneal neuropathy at the fibularhead, deep peroneal neuropathy, sciatic neuropathy primarily or exclusively involving peronealfibers, lumbar plexopathy, L5 radiculopathy, motor neuron disease, or a cortical lesion.Electrodiagnostic study can establish the diagnosis of peroneal mononeuropathy, or suggest oneof these more proximal causes. In addition, the study may not only establish the site (fibular head,thigh, or deep peroneal nerve) of the lesion, but assist in making prognostic judgements.
Peroneal motor studies recording over the extensor digitorum brevis and tibialis anteriormuscles should be performed. A protocol for this neuropathy is outlined in Table 9. Needleexamination of the short head of the biceps is crucial in identifying lesions at the fibular neck(should be normal) or more proximal causes (if abnormal).
6. FEMORAL NEUROPATHY
6.1. Anatomy
The femoral nerve is derived from the lumbar plexus, originating from the posterior divi-sions of the L2, L3, and L4 nerve roots. The nerve provides motor branches to the psoas andiliacus muscles before traveling underneath the inguinal ligament. Subsequently, the nervedivides into motor and sensory branches. Motor branches supply the sartorius, pectineus, andthe four heads of the quadriceps muscles. Sensory branches supply sensation to the medialthigh (medial cutaneous nerve of the thigh), anterior thigh (intermediate cutaneous nerve ofthe thigh), and medial calf (saphenous nerve).
Mononeuropathies 265
Table 9Recommended Electrodiagnostic Evaluation of Peroneal Neuropathya
Nerve conduction studies
1. Peroneal nerveA. Peroneal motor study stimulating at the ankle, below fibular neck, and popliteal fossa;
recording from the extensor digitorum brevis muscle. If there is evidence of focalslowing/conduction block, this study should be repeated stimulating at the fibular neck andpopliteal fossa; recording from the tibialis anterior muscle
B. Peroneal F-responsesC. Superficial peroneal sensory study stimulating over the lateral calf; recording from the ankle
2. Tibial nerveA. Tibial motor study stimulating at the ankle and popliteal fossa; recording from the abductor
hallucis muscleB. Tibial F-responses
3. Sural nerve sensory study
EMG
1. Two deep peroneal-innervated muscles (e.g., tibialis anterior and extensor hallucis longus)2. At least one superficial peroneal-innervated muscle (e.g., peroneus longus and peroneus brevis)3. Two tibial-innervated muscles (e.g., tibialis posterior, medial gastrocnemius, and flexor digito-
rum longus)4. Short head of the biceps femoris
aFrom ref. 1.
15_Kothari 4/11/07 9:13 AM Page 265

6.2. Clinical Features of Femoral Nerve Dysfunction
Patients with a femoral neuropathy usually complain of leg weakness when walking(because of buckling of the knee) and frequent falls. Numbness and paresthesias may bereported in the anterior thigh or medial calf. Examination may demonstrate weakness of thequadriceps muscles and an absent knee jerk reflex. Atrophy may or may not be present. Hipadduction should be normal, because this is mediated by the obturator nerve. If there is weak-ness of hip flexion, the lesion localizes proximal to the inguinal ligament. Sensory examina-tion should demonstrate abnormalities in the anteromedial thigh and medial calf.
6.3. Electrophysiology
Electrodiagnostic studies are very helpful in identifying a femoral neuropathy and also indetermining prognosis. Nerve conduction studies of the femoral nerve can be performed andshould be compared with the contralateral side. Table 10 outlines a protocol for evaluating asuspected femoral neuropathy. The needle examination is often more useful than the femoralmotor study.
6.4. Other Diagnostic Studies
Imaging of the pelvis with either CT or MRI should be performed to exclude a retroperitonealhematoma. Often, lumbar spine imaging studies are also performed to exclude a possible rootlesion. Laboratory studies should exclude diabetes and vasculitic disorders.
266 Scott and Kothari
Table 10Electrodiagnostic Evaluation of a Femoral Neuropathy
Nerve conduction studies
1. Femoral nerveA. Femoral motor study stimulating at the below inguinal ligament site; recording from the rec-
tus femoris. Comparison with the asymptomatic side is necessary.B. Saphenous sensory study stimulating the medial calf; recording from the medial ankle.
Comparison with the asymptomatic side is necessary.2. Peroneal nerve
A. Peroneal motor study stimulating at the ankle, below fibular neck, and popliteal fossa;recording from the extensor digitorum brevis muscle
B. Peroneal F-responses3. Tibial nerve
A. Tibial motor study stimulating at the ankle and popliteal fossa; recording from the abductorhallucis muscle
B. Tibial F-responses4. Sural nerve sensory study
EMG
1. Iliopsoas and at least two quadriceps muscles (e.g., vastus lateralis and vastus medialis)2. At least one obturator-innervated muscle (e.g., adductor longus)3. L2–L4 paraspinal muscles4. At least two nonfemoral muscles to exclude a polyneuropathy (e.g., tibialis anterior, medial
gastrocnemius, and biceps femoris)
15_Kothari 4/11/07 9:13 AM Page 266

7. SCIATIC NEUROPATHY
7.1. Anatomy
The sciatic nerve derives its supply from the L4–S2 nerve roots. The nerve arises from thelumbosacral plexus, and exits the pelvis through the greater sciatic foramen before travelingunder the piriformis muscle. The nerve itself consists of two distinct trunks, the lateral trunk(peroneal) and medial trunk (tibial). Branches originating in the proximal thigh arise predom-inantly from the tibial division. The tibial division supplies the hamstring muscles, with theexception of the short head of the biceps femoris, which receives its supply from the peronealdivision. All muscles below the knee receive innervation from the sciatic nerve through oneof its two divisions (peroneal or tibial). Afferent sensory input from the leg also travels in thesciatic nerve, except for that region supplied by the saphenous nerve.
7.2. Clinical Features of Sciatic Nerve Dysfunction
Weakness, numbness, and paresthesias in the lower extremity are common symptoms ofsciatic neuropathy. A flail foot is commonly seen with this condition. Weakness of knee flex-ion and impairment of all ankle and toe movements will be present. Sensory loss may beappreciated in various areas over the posterior calf, ankle, and sole of the foot. Sciaticneuropathy may arise from a myriad of causes, including compression during surgery orcoma, tumors (compression or direct nerve invasion), vascular abnormalities, fibromuscularbands, mononeuritis multiplex, piriformis compression, and traumatic injuries arising fromgunshot or knife wounds or injections.
7.3. Electrophysiology
The electrodiagnostic evaluation should confirm a sciatic neuropathy and exclude otherconditions that mimic this lesion. The nerve conduction studies/needle examination thatshould be performed are summarized in Table 11.
7.4. Other Diagnostic Studies
Imaging studies, especially MRI, are often very helpful in identifying a structural lesion,if present. Angiography may be indicated if an arterial aneurysm or iliac artery thrombosis isa possible cause.
8. TIBIAL NEUROPATHY
8.1. Anatomy
The tibial nerve descends to the level of the medial malleolus before coursing under theflexor retinaculum on the medial side of the ankle. The distal tibial nerve then divides intothree or four terminal branches. The medial and lateral calcaneal sensory nerves are purelysensory, and supply sensation to the heel of the foot. The medial and lateral plantar nervescontain both motor and sensory fibers that supply the medial and lateral sole, respectively.
8.2. Clinical Features of Tibial Nerve Dysfunction at the Ankle (Tarsal TunnelSyndrome)
The most frequent symptom in patients with tarsal tunnel syndrome (TTS) is peri-malleolar pain. Ankle and sole pain is often described as burning, and is often worse with
Mononeuropathies 267
15_Kothari 4/11/07 9:13 AM Page 267

268 Scott and Kothari
Table 11Electrodiagnostic Evaluation for Sciatic Neuropathya
Nerve conduction studies
1. Peroneal nerveA. Peroneal motor study stimulating at the ankle, below fibular neck, and popliteal fossa;
recording from the extensor digitorum brevis muscle. If there is evidence of focalslowing/conduction block, this study should be repeated stimulating at the fibular neck andpopliteal fossa; recording from the tibialis anterior muscle
B. Peroneal F-responsesC. Superficial peroneal sensory study stimulating the lateral calf; recording from the ankle
2. Tibial nerveA. Tibial motor study stimulating at the ankle and popliteal fossa; recording from the abductor
hallucis muscleB. Tibial F-responses
3. Sural nerve sensory study4. H-reflex (bilateral studies are necessary)
EMG
1. Two peroneal-innervated muscles (e.g., tibialis anterior and extensor hallucis longus)2. At least one superficial peroneal-innervated muscle (e.g., peroneus longus and peroneus brevis)3. Two tibial-innervated muscles (e.g., tibialis posterior and medial gastrocnemius)4. Short and long heads of the biceps femoris5. At least one superior and one inferior gluteal-innervated muscle6. L5–S1 paraspinal muscles7. At least two nonsciatic, non-L5–S1 innervated muscles to exclude more widespread processes
(e.g., vastus lateralis, iliopsoas, and adductor longus)aFrom ref. 1.
weight bearing or at night. Patients usually do not describe weakness. Some patients mayexhibit a positive Tinel’s sign over the ankle. Differential diagnosis of TTS should includelocal trauma, proximal tibial neuropathy, mild polyneuropathy, or S1 radiculopathy.
8.3. Electrophysiology
When performing electrodiagnostic studies in these cases, it is helpful to perform aside-to-side comparison, particularly in the patient with unilateral complaints. Those patientswith bilateral complaints may be more difficult to assess. A recommended electrodiagnosticprotocol is provided in Table 12. The needle examination can be problematic because theexamination may be uncomfortable to the patient. Needle examination is further complicateby the presence of nonspecific abnormalities that are often present in the intrinsic footmuscles of normal individuals.
9. CONCLUSION
We reviewed the most common entrapment neuropathies that practicing neurologists arelikely to see in clinical practice. A good history, physical examination, and neurologicalexamination are essential to guiding one’s diagnostic evaluation, and ultimately, in assessingeach patient’s prognosis and treatment options.
15_Kothari 4/11/07 9:13 AM Page 268

Mononeuropathies 269
Table 12Electrodiagnostic Protocol to Evaluate for Tarsal Tunnel Syndrome
Nerve conduction studies
1. Peroneal nerveA. Peroneal motor study stimulating at the ankle, below fibular neck, and popliteal fossa;
recording from the extensor digitorum brevis muscleB. Peroneal F-responses
2. Tibial nerveA. Tibial motor study stimulating at the ankle and popliteal fossa; recording from the abductor
hallucis muscle.B. Tibial F-responsesC. Medial and lateral plantar motor and sensory studies
3. Sural nerve sensory study4. H-reflex (bilateral studies are necessary)
EMG
1. One peroneal-innervated muscle (e.g., tibialis anterior and extensor hallucis longus)2. At least two tibial-innervated muscles distal to the tarsal tunnel (e.g., abductor hallucis and
abductor digiti minimi)3. At least two tibial-innervated muscles proximal to the tarsal tunnel (e.g., tibialis posterior and
medial gastrocnemius)4. If any muscle proximal to the tarsal tunnel is abnormal, additional muscles may need to be sam-
pled to exclude more proximal causes (e.g., sciatic neuropathy, polyneuropathy, or lumbosacralplexopathy)
REVIEW QUESTIONS
1. Which of the following would not be an expected clinical finding in a patient with medianmononeuropathy at the wrist?A. Paresthesias involving the first three fingers (and possible the lateral fourth) of the hand.B. Numbness involving the first three fingers of the hand and thenar eminence.C. Weakness of thumb abduction.D. Worsening of symptoms at night.E. Reproduction of pain and paresthesias with forced flexion of the wrist.
2. Which of the following is not a potential site of entrapment of the median nerve?A. Wrist.B. Ligament of Struthers.C. Guyon’s canal.D. Sublimis bridge.E. Lacertus fibrosus.
3. Common clinical findings suggesting ulnar nerve entrapment at the elbow include all of thefollowing EXCEPT:A. Numbness involving the fourth and fifth fingers of the hand.B. Weakness of the hand.C. Pain at the elbow that radiates along the medial aspect of the forearm.D. Loss of deep tendon reflexes in the arm.E. Pain with percussion of the area over the cubital tunnel.
4. One easy clinical finding that can help to exclude ulnar nerve compression at the wrist as comparedto a more proximal lesion (elbow, brachial plexus, or nerve roots) would be:
15_Kothari 4/11/07 9:13 AM Page 269

A. Sensory deficits involving the palmar aspect of the fourth and fifth fingers.B. Atrophy of the hypothenar and intrinsic hand muscles.C. Sensory deficit involving the dorsomedial aspect of the hand.D. Weakness of wrist flexion.E. C and D are correct.
5. Which of the following would not be an expected finding with a radial neuropathy at the spiralgroove?A. Wrist drop.B. Weakness of finger extension.C. Weakness of elbow flexion.D. Numbness over the dorsolateral hand.E. Weakness of elbow extension.
6. A lesion of the posterior interosseous nerve would cause all of the following EXCEPT:A. Weakness of wrist extension (possibly with radial deviation).B. Numbness of the dorsolateral hand.C. Forearm pain.D. Weakness of finger extension.E. Sparing of elbow flexion and extension.
7. Compression of the peroneal nerve at the fibular head is the most common entrapment neu-ropathy of the lower extremity. Clinical findings that would suggest this diagnosis include all ofthe following EXCEPT:A. Weakness of foot dorsiflexion.B. Weakness of foot inversion.C. Weakness of foot eversion.D. Numbness over the lateral calf and dorsum of the foot.E. Tinel’s sign at the fibular head.
8. In localizing a peroneal lesion to the fibular head, EMG study of which muscle is essential?A. Peroneus longus.B. Tibialis anterior.C. Short head of biceps femoris.D. Extensor hallucis longus.
9. Compression of the femoral nerve at the inguinal ligament can result in which of the following:A. Weakness of knee flexion.B. Weakness of hip adduction.C. Weakness of hip flexion.D. Sensory disturbance over the anteromedial thigh and medial calf.
10. Which of the following is consistent with tarsal tunnel syndrome (TTS)?A. Sensory loss over the dorsum of the foot.B. A Tinel’s sign in the region of the medial malleolus.C. Weakness of foot plantar flexion.D. Ankle jerk loss on the affected side.E. All of the above.
REVIEW ANSWERS
1. The correct answer is B. Patients presenting with symptoms suggestive of a median mononeu-ropathy at the wrist often describe paresthesias involving the first three fingers and lateralfourth finger, with numbness that is often worse at night. In fact, patients may report beingawakened from sleep by wrist/hand pain, requiring them to “shake-out” their hands or run themunder water. Because the median nerve innervates the APB muscle, weakness of thumb oppo-sition may be present, as well as atrophy of the thenar eminence, in more advanced cases.Asking the patient to hold the wrists in a flexed position for approx 1 min is known as Phalen’s
270 Scott and Kothari
15_Kothari 4/11/07 9:13 AM Page 270

maneuver, and although not 100% sensitive and specific, may be a useful test to confirm one’sclinical suspicion of CTS. One would not expect numbness to extend to the thenar eminence inCTS, because the palmar cutaneous sensory branch, which arises proximal to the carpal tunneland would be spared in an entrapment neuropathy at the wrist, innervates this area. Involvementof the thenar eminence or extending proximal to the wrist would suggest a more proximalmedian nerve injury.
2. The correct answer is C. The median nerve can potentially be entrapped at six different sitesalong its course through the arm. The ligament of Struthers refers to a fibrous band that mayarise from the medial humerus and inserts on the medial epicondyle. The lacertus fibrosus arisesfrom the biceps tendon and inserts on the forearm flexor muscles. The median nerve can also becompressed as it pierces the pronator teres muscle, and as it passes under the fibrous sublimisbridge of the flexor digitorum sublimis muscle. In addition, a branch of the median nerve, theAIN, can be compromised as it travels through the forearm. Isolated involvement of the AINmay occur in cases of brachial plexitis (Parsonage–Turner syndrome). Finally, the median nervecan be compressed at the wrist for a variety of reasons. Guyon’s canal is a small anatomictunnel through which the ulnar nerve passes through the wrist to innervate the hand and is not asite of median nerve entrapment.
3. The correct answer is D. Compromise of the ulnar nerve as it passes through the cubital tunnel isthe second most common type of entrapment neuropathy after CTS. Patients may report pain thatradiates into the ulnar forearm and hand. In some cases, only sensory symptoms may be present,manifesting as sensory loss primarily involving the fourth and fifth fingers. An early motor signmay be an inability to adduct the fifth finger (Wartenberg’s sign) causing patients to report fre-quently “catching” of the finger when placing their hands in their pockets. Patients may developatrophy and weakness of intrinsic hand muscle strength. Various provocative maneuvers, such aspercussion (Tinel’s sign) or sustained manual pressure over the cubital tunnel, can be helpful inconfirming one’s clinical suspicion. Because the ulnar nerve arises from the C8–T1 nerve roots andtravels through the lower trunk and medial cord of the brachial plexus, none of the deep tendonreflexes commonly tested in the arm (biceps, triceps, or brachioradialis) should be affected.
4. The correct answer is E. Ulnar nerve entrapment at the wrist can present in a variety of ways.Commonly, some combination of sensory deficit involving the fourth and fifth fingers withweakness of the hypothenar and intrinsic hand muscles is present. Sensory loss over the dorsalaspect of the hand would not be a finding consistent with ulnar neuropathy at the wrist. Thedorsomedial aspect of the hand is primarily innervated by the dorsal ulnar sensory cutaneousnerve, which is a sensory component of the ulnar nerve, but arises 6 to 8 cm proximal to the wristand would not be involved in an entrapment neuropathy at the wrist. Similarly, weakness of thewrist flexors would indicate a more proximal lesion.
5. The correct answer is E. Radial neuropathy at the spiral groove commonly results from traumato the proximal arm or from prolonged compression of the nerve that can occur when a patientfalls asleep with the arm draped over the edge of a chair or bathtub. Weakness of wrist andfinger extension, as well as elbow flexion, are all findings consistent with a lesion of the radialnerve at the spiral groove because these muscles are all innervated distal to the groove. A lesionat the spiral groove would also be expected to affect the function of the radial sensory nerve ofthe forearm, leading to numbness over the dorsal aspect of the lateral hand. Because the tricepsare innervated proximal to the groove, elbow extension would be spared.
6. The correct answer is B. The posterior interosseous nerve is primarily a motor branch of theradial nerve that innervates most of the wrist and finger extensors. Because the extensor carpiradialis (long head) arises proximal to the PIN, the wrist may deviate radially with attemptedextension. Elbow flexion and extension (brachioradialis and triceps) are both innervated proxi-mally to the takeoff of the PIN and are, thus, spared. Forearm pain is common because the PINprovides some sensation to the deep interosseous membrane of the forearm; however, no cuta-neous sensory branches arise from it. One should reconsider the diagnosis of PIN entrapment ifcutaneous sensation is impaired.
Mononeuropathies 271
15_Kothari 4/11/07 9:13 AM Page 271

7. The correct answer is B. Weakness of foot inversion would not be an expected finding becausethis action is primarily mediated by the tibialis posterior muscle, which is innervated by thetibial nerve. This muscle is critical in determining whether foot drop is solely a peroneal nerveproblem or a more proximal sciatic neuropathy or L5 root lesion. The other signs are all consis-tent with a peroneal neuropathy localizing to the fibular head involving both the superficial anddeep branches.
8. The correct answer is C. The short head of the biceps femoris is the only muscle that is inner-vated by the peroneal nerve proximal to the fibular head and is, thus, critical to localizing a per-oneal lesion to the fibular neck. The short head of biceps femoris should be normal in acompressive lesion of the peroneal nerve at the fibular head. The peroneus longus, tibialis anterior,and extensor hallucis longus are all peroneal innervated muscles distal to the fibular head andwould be expected to be abnormal on EMG examination.
9. The correct answer is D. Weakness of knee flexion is a sciatic nerve mediated movement.Likewise, weakness of hip adduction, although also suggesting involvement of the L2–L4 nerveroots, is mediated by the obturator nerve. Hip flexion is mediated by the iliopsoas muscle group;however, this muscle group arises proximal to the inguinal ligament and would be expected tobe spared. The medial and intermediate cutaneous nerve of the thigh and the saphenous nerves,all of which arise from the femoral nerve and would be affected in compression at the level ofthe inguinal ligament, mediate sensory disturbance over the anterior and medial aspect of thedistal thigh as well as the medial calf. Weight gain, preexisting obesity, pregnancy, and thewearing of tight work belts may predispose to this type of injury.
10. The correct answer is B. A Tinel’s sign over the tibial nerve in the region of the medial malleolusis relatively common. In TTS, sensory loss is relatively confined to the plantar aspect of the foot,not the dorsum. There is no associated weakness of foot plantar flexion, and the ankle jerkshould be preserved.
SUGGESTED READING
Bradshaw DY, Shefner JM. Ulnar neuropathy at the elbow. Neurol Clin 1999;17(3):447–461.Busis NA. Femoral and obturator neuropathies. Neurol Clin 1999;17(3):633–653.Campbell WW, Pridgeon RM, Sahni SK. Short segment incremental studies in the evaluation of
ulnar neuropathy at the elbow. Muscle Nerve 1992;15:1050–1054.Carlson N, Logigian EL. Radial neuropathy. Neurol Clin 1999;17(3):499–523.Clarke AM, Stanley D. Prediction of the outcome 24 hours after carpal tunnel decompression. J Hand
Surg (Br) 1993;18:180–181.Fricker R, Fuhr P, Pippert H, et al. Acute median nerve compression at the distal forearm caused by
a thrombosed aneurysm of an epineural vessel: case report. Neurosurgery 1996; 38(1):194–196.Goslin KL, Krivickas LS. Proximal neuropathies of the upper extremity. Neurol Clin 1999;
17(3):525–548.Gross PT, Tolomeo EA. Proximal median neuropathies. Neurol Clin 1999;17(3):425–445.Katirji B. Peroneal Neuropathy. Neurol Clin 1999;17(3):567–591.Katirji MB, Wilbourn AJ. Common peroneal mononeuropathy: a clinical and electrophysiologic
study of 116 lesions. Neurology 1988;38:1723–1728.Kothari MJ, Preston DC. Comparison of the flexed and extended elbow positions in localizing ulnar
neuropathy at the elbow. Muscle Nerve 1995;18:336–340.Kothari MJ, Heistand M, Rutkove SB. Three ulnar nerve conduction studies in patients with ulnar
neuropathy at the elbow. Arch Phys Med Rehabil 1998;79:87–89.Kothari MJ. Ulnar neuropathy at the wrist. Neurol Clin 1999;17(3):463–476.Kuntzer T, van Melle G, Regli F. Clinical and prognostic features in unilateral femoral neuropathies.
Muscle Nerve 1997;20:205.Novak CB, Lee GW, MacKinnon SE, et al. Provocative testing for cubital tunnel syndrome. J Hand
Surg 1994;19A:817–820.
272 Scott and Kothari
15_Kothari 4/11/07 9:13 AM Page 272

Oh SJ, Meyer RD. Entrapment neuropathies of the tibial (posterior tibial) nerve. Neurol Clin1999;17(3):593–615.
Preston DC. Distal median neuropathies. Neurol Clin 1999;17(3):407–424.Preston DC, Logigian EL. Lumbrical and interossei recording in carpal tunnel syndrome. Muscle
Nerve 1992;15:1253–1257.Rennels GD, Ochoa J. Neuralgic amyotrophy manifesting as anterior interosseous nerve palsy.
Muscle Nerve 1980;3:160–164.Preston DC, Ross MH, Kothari MJ, et al. The median-ulnar latency difference studies are compara-
ble in mild carpal tunnel syndrome. Muscle Nerve 1994;17:1469–1471.Preston DC, Shapiro BE. Electromyography and Neuromuscular Disorders: Clinical-Electrophysiologic
Correlations. Butterworth-Heinemann, Boston, MA, 1998.Shea JD, McClain EJ. Ulnar-nerve compression syndrome at and below the wrist. J Bone Joint Surg
1969;51A:1095–1103.Stewart JD. The variable clinical manifestations of ulnar neuropathies at the elbow. J Neurol
Neurosurg Psychiatry 1987;50:252–258.Wu JS, Morris JD, Hogan GR. Ulnar neuropathy at the wrist. Case report and review of the literature.
Arch Phys Med Rehabil 1985;66:785–788.Yuen EC, Olney RK, So YT. Sciatic neuropathy: clinical and prognostic features in 73 patients.
Neurology 1994;44:1669–1674.Yuen EC, So YT. Sciatic neuropathy. Neurol Clin 1999;17(3):617–631.
Mononeuropathies 273
15_Kothari 4/11/07 9:13 AM Page 273

15_Kothari 4/11/07 9:13 AM Page 274

16Electrophysiology of Polyneuropathy
Annabel K. Wang and Seward B. Rutkove
SummaryAs a class, polyneuropathies are some of the most commonly presented disorders to a neuromuscu-
lar clinician. Polyneuropathies generally are of one of two forms, axonal or demyelinating. This clas-sification is often helpful in identification of potential causes. Axonal polyneuropathies are mostcommonly associated with diabetes, alcohol, or toxins, including side effects of medication.Demyelinating polyneuropathies, as a whole, are much less common and can be acute or chronic, andidiopathic or associated with a monoclonal gammopathy. Finally, hereditary neuropathies, includingthe various forms of Charcot–Marie–Tooth disease, have similar but somewhat distinct characteristicscompared with acquired forms of polyneuropathy. Nerve conduction studies, and, to some extent,needle eletromyography (EMG), can assist with the evaluation of polyneuropathies, and can help toshorten the differential diagnosis regarding potential causes.
Key Words: Axonal polyneuropathy; Charcot–Marie–Tooth; demyelinating polyneuropathy; diabeticpolyneuropathy; Guillain–Barré Syndrome; polyneuropathy.
1. INTRODUCTION
Electrophysiological testing serves a critical role in the evaluation of polyneuropathies(PNs). In conjunction with the information obtained from the neurological history and exam-ination, electrophysiology can be used to assist in isolating a specific diagnosis. Testing can(1) help identify whether the PN involves sensory or motor fibers; (2) determine whether theunderlying pathophysiology is predominantly demyelinating, axonal, or mixed (demyelinat-ing and axonal); (3) establish duration and severity of the PN. Importantly, the combinationof nerve conduction studies and needle eletromyography (EMG) can also be used to evaluatesuperimposed problems, such as polyradiculopathy or focal mononeuropathies, which maypotentially contribute to the patient’s neuropathic symptoms.
2. NERVE CONDUCTION STUDIES
In the evaluation of PNs, routine motor and sensory nerve conduction studies are performed,usually starting with the lower extremities. If asymmetry is suggested by history or examina-tion, the more-affected limb is evaluated first, followed by the contralateral lower extremity.Nerve conduction studies of the upper extremities can provide additional information regardingthe pathophysiology of PN (e.g., demyelinating features), especially if the lower extremitymotor and sensory responses are markedly reduced in amplitude or unobtainable. Evaluationof both the lower and upper extremities can also provide information regarding whether the
From: The Clinical Neurophysiology PrimerEdited by: A. S. Blum and S. B. Rutkove © Humana Press Inc., Totowa, NJ
275
16_Wang 4/11/07 10:34 PM Page 275

disorder could be caused by multiple individual mononeuropathies (confluent mononeuropathymultiplex) rather than true PN.
When studying the lower extremity, tibial and peroneal motor studies with F-waves areperformed. The tibial nerve is recorded from the abductor hallucis brevis, with electrical stimu-lation at the ankle and popliteal fossa. The peroneal nerve is recorded from the extensordigitorum brevis, with electrical stimulation at the ankle and below and above the fibular headsites. If the response from extensor digitorum brevis is unobtainable, recording from tibialisanterior may help to differentiate between demyelinating and axonal lesions in the peronealnerve. Sural sensory studies are usually performed antidromically, recording at the ankle,with electrical stimulation at the calf. Although other distal nerves of the lower extremitiescan also be studied (e.g., the plantar nerves), such methods are more difficult to perform andinterpret, in part because of substantial variation in normal values among individuals of dif-ferent ages. In fact, in older individuals, absent plantar sensory responses are often consid-ered a normal finding.
In the upper extremity, median and ulnar motor studies with F-waves are performed, aswell as sensory studies. Radial sensory study, with electrical stimulation in the forearm andrecording from the anatomical snuffbox, can also be informative, because the superficialradial nerve is generally not affected by entrapment or compression. Comparing the ampli-tude of the superficial radial sensory response with the amplitude of the sural nerve can alsobe helpful in identifying early axonal PN, especially in individuals with “borderline normal”sural amplitudes.
Additional studies can also be performed, including H-reflex testing. H-reflex latenciescan be abnormal early, in patients with both axonal and demyelinating PNs. Blink reflex stud-ies are also occasionally helpful, especially in patients with early acute demyelinating PN(Guillain–Barré syndrome [GBS]).
While performing nerve conduction studies, careful temperature monitoring is of parti-cular importance. Decreased temperature of the distal limbs may lead to the erroneousconclusion that a demyelinating PN is present because of reductions in conduction velocityand prolongation of distal latencies. These effects are discussed in more detail in Chapter 13.
3. NEEDLE EMG
Needle EMG in the evaluation of PN is helpful for several reasons. First, needle exami-nation of lower extremity muscles can assist in establishing the presence of motor axonalinjury by identifying the presence of a gradient of abnormality. In this situation, the distalmuscles (e.g., extensor hallucis longs) are most severely affected, with proximal muscles(e.g., tibialis anterior and gastrocnemius) showing more minor changes, and muscles that areeven more proximal (e.g., vastus lateralis) appearing entirely normal. Comparing the sever-ity of distal reinnervation between the two legs can also be helpful in some situations. Forexample, symmetric reinnervation restricted to extensor hallucis longus may be present.Second, needle examination is helpful to evaluate for superimposed processes, most notablylumbosacral radiculopathy that may be contributing to a patient’s clinical picture. In fact, ina proportion of elderly individuals referred for symptoms of PN (distal sensory loss), themajor pathology identified is polyradiculopathy, often related to lumbar stenosis. Third, inpatients with acute demyelinating PNs, reduced recruitment of motor unit potentials is oneof the first abnormalities observed, and is often present before nerve conduction abnormal-ities develop.
276 Wang and Rutkove
16_Wang 4/11/07 10:34 PM Page 276
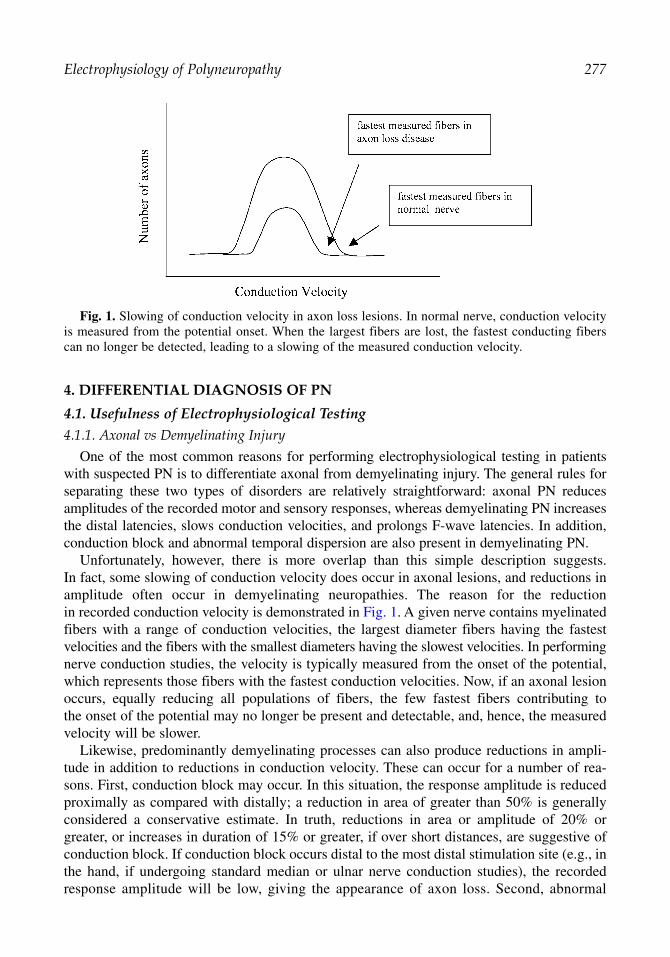
4. DIFFERENTIAL DIAGNOSIS OF PN
4.1. Usefulness of Electrophysiological Testing4.1.1. Axonal vs Demyelinating Injury
One of the most common reasons for performing electrophysiological testing in patientswith suspected PN is to differentiate axonal from demyelinating injury. The general rules forseparating these two types of disorders are relatively straightforward: axonal PN reducesamplitudes of the recorded motor and sensory responses, whereas demyelinating PN increasesthe distal latencies, slows conduction velocities, and prolongs F-wave latencies. In addition,conduction block and abnormal temporal dispersion are also present in demyelinating PN.
Unfortunately, however, there is more overlap than this simple description suggests.In fact, some slowing of conduction velocity does occur in axonal lesions, and reductions inamplitude often occur in demyelinating neuropathies. The reason for the reductionin recorded conduction velocity is demonstrated in Fig. 1. A given nerve contains myelinatedfibers with a range of conduction velocities, the largest diameter fibers having the fastestvelocities and the fibers with the smallest diameters having the slowest velocities. In performingnerve conduction studies, the velocity is typically measured from the onset of the potential,which represents those fibers with the fastest conduction velocities. Now, if an axonal lesionoccurs, equally reducing all populations of fibers, the few fastest fibers contributing tothe onset of the potential may no longer be present and detectable, and, hence, the measuredvelocity will be slower.
Likewise, predominantly demyelinating processes can also produce reductions in ampli-tude in addition to reductions in conduction velocity. These can occur for a number of rea-sons. First, conduction block may occur. In this situation, the response amplitude is reducedproximally as compared with distally; a reduction in area of greater than 50% is generallyconsidered a conservative estimate. In truth, reductions in area or amplitude of 20% orgreater, or increases in duration of 15% or greater, if over short distances, are suggestive ofconduction block. If conduction block occurs distal to the most distal stimulation site (e.g., inthe hand, if undergoing standard median or ulnar nerve conduction studies), the recordedresponse amplitude will be low, giving the appearance of axon loss. Second, abnormal
Electrophysiology of Polyneuropathy 277
Fig. 1. Slowing of conduction velocity in axon loss lesions. In normal nerve, conduction velocityis measured from the potential onset. When the largest fibers are lost, the fastest conducting fiberscan no longer be detected, leading to a slowing of the measured conduction velocity.
16_Wang 4/11/07 10:34 PM Page 277

temporal dispersion of recorded compound motor action potentials can also reduce the ampli-tude of the recorded response. The duration of the response is prolonged, and the amplitudedrops, so that the area remains relatively constant. Third, and perhaps most commonly, reduc-tions in amplitude occur because there is secondary axonal loss with many demyelinatingprocesses. Hence, many demyelinating lesions are not purely demyelinating, but, rather, are“mixed” (demyelinating and axonal).
Several attempts have been made to develop criteria to separate demyelinating from axonalprocesses (Tables 1 and 2). Unfortunately, these criteria have substantial limitations becausethey were developed mainly for research purposes and for specific disorders, such as acuteinflammatory demyelinating polyradiculoneuropathy (AIDP; also known as GBS) or chronicinflammatory demyelinating polyradiculoneuropathy (CIDP). CIDP has stricter criteria thanAIDP because the longstanding nature of the disorder leads to more substantial axonal injury.
Needle EMG does not serve a major role in differentiating acute axonal from demyelinat-ing disorders. In acute demyelinating disorders, reduced recruitment will be present oftendiffusely, whereas, in acute axonal neuropathies, abnormalities may be restricted to nerve
278 Wang and Rutkove
Table 1Criteria for Acute Inflammatory Demyelinating Polyradiculoneuropathy
At least three of the following in motor nerves:
>50% NL CMAP <50% NL CMAP
CVb <90% LLN <80% LLNDLa >115% ULN >125% ULNF-waveb >125% ULN —Ratiob <0.70 —
Abbreviations: CMAP, compound motor amplitude potential; CV, conduction velocity; DL, distal latency; F-wave, F-wave latency; LLN, lower limit of normal; NL, normal; ratio, proximal/distal CMAP area ratio; ULN,upper limit of normal.
aMore than two nerves.bMore than one nerve. Modified from ref. 2.
Table 2Criteria for CIDP
At least three of four in motor nerves:
1. Reduction in nerve conduction velocity in at least two nerves (see chart)2. Partial conduction block in at least one nerve3. Prolonged distal latencies in at least two nerves (see chart)4. Absent F-waves or prolonged F-waves in at least two nerves (see chart)
>80% NL CMAP <80% NL CMAP
CVa <80% LLN <70% LLNDLa >125% ULN >150% ULNF-wavesa >120% ULN >150% ULN
Abbreviations: CMAP, compound motor amplitude potential; CV, conductionvelocity; DL, distal latency; F-wave, F-wave latency; LLN, lower limit of normal;NL, normal; ULN, upper limit of normal.
Modified from ref. 1.aMore than two nerves.
16_Wang 4/11/07 10:34 PM Page 278

segments that are more distal or individual nerves, as occurs in monoeuropathy multiplex.Fibrillation potentials often develop in both types of PN and, hence, are not clearly helpful inestablishing the diagnosis. Myokymic discharges often occur early in AIDP, and these poten-tials, if present, can also be helpful in the diagnosis.
4.1.2. Acquired vs Inherited Demyelinating PNs
Nerve conduction studies are also valuable in differentiating whether a demyelinatingprocess is acquired or inherited. Although the clinical history may make such a distinctioninconsequential (e.g., the abrupt onset of numbness and tingling and generalized weaknesswould make Charcot–Marie–Tooth disease an unlikely consideration), certain features in theelectrophysiology may help guide the clinician. In hereditary illnesses, demyelination tendsto be distinctly uniform, with the same abnormally slow conduction velocity in all upperextremity nerves. Conduction block is not present and although some abnormal temporaldispersion may occur, the waveforms themselves have a relatively normal morphology. Thisis demonstrated in Fig. 2, which represents typical motor conduction studies for a patient withCharcot–Marie–Tooth disease IA. Although the motor responses seem normal, the latency is
Electrophysiology of Polyneuropathy 279
Fig. 2. Typical motor conduction studies in a patient with Charcot–Marie–Tooth IA. Although thewaveform morphology appears normal, there is a marked prolongation of distal latency and severeslowing of conduction velocity.
Right Median Motor-Nerve Conduction Study
Latency Amplitude Area Distance CVSegment (ms) (mV) (ms*mV) (cm) (m/s)
APB-wrist 9.8 9.2 32.4 7.8 22.2Wrist-elbow 20.8 9.2 33.6 24.5
APB, abductor pollicis brevis; CV, conduction velocity.
16_Wang 4/11/07 10:34 PM Page 279
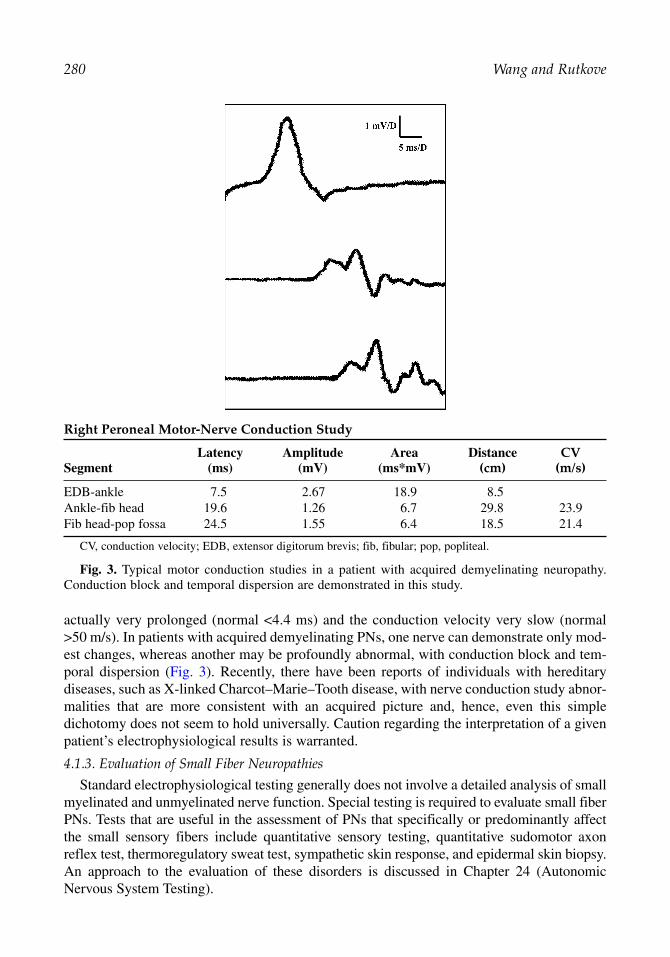
actually very prolonged (normal <4.4 ms) and the conduction velocity very slow (normal>50 m/s). In patients with acquired demyelinating PNs, one nerve can demonstrate only mod-est changes, whereas another may be profoundly abnormal, with conduction block and tem-poral dispersion (Fig. 3). Recently, there have been reports of individuals with hereditarydiseases, such as X-linked Charcot–Marie–Tooth disease, with nerve conduction study abnor-malities that are more consistent with an acquired picture and, hence, even this simpledichotomy does not seem to hold universally. Caution regarding the interpretation of a givenpatient’s electrophysiological results is warranted.
4.1.3. Evaluation of Small Fiber Neuropathies
Standard electrophysiological testing generally does not involve a detailed analysis of smallmyelinated and unmyelinated nerve function. Special testing is required to evaluate small fiberPNs. Tests that are useful in the assessment of PNs that specifically or predominantly affectthe small sensory fibers include quantitative sensory testing, quantitative sudomotor axonreflex test, thermoregulatory sweat test, sympathetic skin response, and epidermal skin biopsy.An approach to the evaluation of these disorders is discussed in Chapter 24 (AutonomicNervous System Testing).
280 Wang and Rutkove
Fig. 3. Typical motor conduction studies in a patient with acquired demyelinating neuropathy.Conduction block and temporal dispersion are demonstrated in this study.
Right Peroneal Motor-Nerve Conduction Study
Latency Amplitude Area Distance CVSegment (ms) (mV) (ms*mV) (cm) (m/s)
EDB-ankle 7.5 2.67 18.9 8.5Ankle-fib head 19.6 1.26 6.7 29.8 23.9Fib head-pop fossa 24.5 1.55 6.4 18.5 21.4
CV, conduction velocity; EDB, extensor digitorum brevis; fib, fibular; pop, popliteal.
16_Wang 4/11/07 10:34 PM Page 280

5. DIFFERENTIAL DIAGNOSIS OF PNS
5.1. Motor PNs
Pure motor PNs are uncommon (in fact, many have some sensory component), and canbe axonal or demyelinating in nature. One example of an acute axonal motor PN is theaxonal form of GBS, or acute motor axonal neuropathy. Lead neuropathy can occur acutelyor chronically, and is predominantly motor in nature. Multifocal motor neuropathy with con-duction block is a chronic and demyelinating neuropathy that is often associated with highganglioside (GM1) antibody titers, but generally presents as multiple mononeuropathies,rather than a confluent motor neuropathic process.
5.2. Sensory PNs
Pure sensory PNs can be either acute or chronic and are usually axonal in nature. ManyPNs that seem to be predominantly sensory at the time of presentation are also found to havea motor component on electrophysiological testing. However, true sensory neuropathiesoccur, including early in diabetes mellitus, and are often related to chemotherapeutic medica-tions, such as thalidomide and cis-platinum.
Isolated small fiber sensory PNs represent an important subset of pure sensory neuropathies.Key features include hyperesthesia, allodynia with loss of pinprick sensation, as well as symp-toms of autonomic dysfunction, including orthostatic hypotension, decreased sweating, andbladder/gastrointestinal symptoms. Large fiber modalities, including vibration and joint posi-tion sense, along with deep tendon reflexes are preserved, although some limited involvementof these may also be identified. As noted, routine sensory nerve conduction studies are normal.The small fiber PNs have a number of causes and can be associated with systemic disorders(diabetes and amyloidosis), with inherited disorders (familial amyloidosis, hereditary sensoryand autonomic neuropathy, Fabry’s Disease, and Tangier’s Disease), with infectious etiologies(e.g., HIV), with toxins (alcohol, chemotherapy, or antiretroviral), or can be idiopathic in nature.
Sensory neuronopathies are disorders that present with pure sensory loss and pain and oftenseem similar to PNs clinically, except that the sensory loss may be patchier and involve proximalas well as distal areas at the time of presentation. Symptoms within the trigeminal nerve territoryoccur often as well. In these disorders, sensory neuron cell bodies within the dorsal root gangliadegenerate, so that “neuronopathies” rather than “axonopathies” are the problem. However, froman electrophysiological perspective, the isolated reduction in sensory responses can make it verydifficult to differentiate a sensory neuronopathy from a classic PN. However, the time course,clinical involvement of the trigeminal territory, lack of a clear distal-to-proximal gradient of abnor-malities (that is, sensory potentials in the arms are as abnormal as those in the legs), and someasymmetry to the responses can suggest a non-PN entity. Testing of the blink reflex can also behelpful in identifying trigeminal nerve dysfunction. The most common causes of sensory neu-ronopathy include paraneoplastic disorders (associated with the antibody to Hu), vitamin B6(pyridoxinel) as less as 200 toxicity—usually in doses mg/d, and Sjogren’s syndrome.
5.3. Acute Sensorimotor PNs5.3.1. Acute Demyelinating Sensorimotor PNs
The prototypic acute demyelinating sensorimotor PN is GBS (or AIDP). Onset is usually2 to 4 wk after a viral infection or other predisposing factor, such as childbirth or surgery.Although the initial symptoms usually include prominent weakness and sensory loss, the
Electrophysiology of Polyneuropathy 281
16_Wang 4/11/07 10:34 PM Page 281

282 Wang and Rutkove
examination can be remarkably variable. Weakness and sensory loss are usually distally pre-dominant, but, in some cases, the weakness may be more proximal and the asymmetries ofweakness can be substantial. CSF generally reveals a normal cell count with an elevated pro-tein level (so-called albuminocytological dissociation). Cranial and autonomic nerve func-tion can also be involved, often to a dramatic extent. Electrophysiological testing can usuallybe very helpful in identifing the disorder, although the typical features of demyelination andconduction block may take a week or longer to become apparent. Early abnormalities mayinclude only absent or delayed F-responses, prolonged distal latencies, and, most impor-tantly, reduced motor unit potential recruitment on needle EMG.
Other causes of acute demyelinating PNs are uncommon, but include diphtheria and expo-sure to n-hexane.
5.3.2. Acute Axonal Sensorimotor PNs
Acute axonal PNs are generally rare, but can represent a form of GBS, known as acutemotor sensory axonal neuropathy. Acute motor axonal neuropathy mainly affects motorfibers. Nerve biopsies reveal virtually no demyelinating features, only severe axonal pathol-ogy. Other causes of acute axonal sensorimotor PNs include toxin exposure (e.g., heavy met-als and organic solvents) and porphyria. However, most axonal sensorimotor PNs tend to besubacute to chronic in nature.
5.4. Chronic Sensorimotor PNs5.4.1. Chronic Demyelinating PNs
CIDP is the most common acquired demyelinating disorder. CIDP can occur in isolationor in association with a monoclonal gammopathy or other disorders, such as HIV. Hereditarydemyelinating PNs, including the various forms of Charcot–Marie–Tooth disease, are alsoincluded in this category. Patients with diabetes mellitus can also develop a form of diabeticPN that may have a substantial “demyelinating” component, although the conduction velocityslowing is more likely caused by ion channel abnormalities and Na–K ATPase dysfunctionthan demyelination.
5.4.2. Chronic Axonal PNs
Most chronic sensorimotor PNs are predominantly axonal in nature, and the list of causesis lengthy, including diabetes mellitus, vitamin B12 deficiency, as well as other metabolic,infectious, toxic, and inherited disorders. A brief list is included in Table 3.
5.5. Multiple Mononeuropathies
In patients presenting with an acute or subacute course of asymmetric sensory loss andweakness, the diagnosis of mononeuropathy multiplex should be considered. This group ofdisorders usually has a course distinct from that of standard PNs, in that lesions seem toinvolve individual nerve territories rather than a length-dependent process. However, as thedisease progresses, confluent sensory loss and weakness can develop, making it difficult todiscern individual nerve lesions. There is a similarity to the clinical picture of sensoryneuronopathy (e.g., related to Sjogren’s or paraneoplastic disorder), because both disorderspresent with a patchy pattern of painful sensory complaints. There is no weakness in sensoryneuronopathy, a feature essentially required to make a diagnosis of mononeuropathy multi-plex. The most common nerves involved include the sciatic nerve, usually in the mid-thighregion, and the median and ulnar nerves, usually just proximal to the elbow. The nerve
16_Wang 4/11/07 10:34 PM Page 282

Electrophysiology of Polyneuropathy 283
Table 3Differential Diagnosis of PNs
1. Motor (acute and chronic)A. Axonal Guillain–Barré syndrome (acute motor axonal neuropathy)B. LeadC. Multifocal motor neuropathy with conduction block
2. Sensory A. Acute axonal
Paraneoplastic sensory neuronopathyPostinfectious inflammatory sensory polyganglionopathyPyridoxine (B6) toxicitySjogren’s syndrome
B. Chronic axonalCis-platinum toxicityHereditary and sensory autonomic neuropathiesMonoclonal protein-associated neuropathyParaneoplastic sensory neuronopathySpinocerebellar ataxias (including Friedreich’s ataxia)SyphilisThalidomideVitamin E deficiency
C. Small fiber (acute or chronic)Amyloidosis (inherited and acquired)DiabetesFabry’s DiseaseHereditary and sensory autonomic neuropathiesHIV (AIDS)IdiopathicPorphyriaTangier’s diseaseToxins
AlcoholChemotherapyAntiretroviral
3. Multiple mononeuropathies (acute or chronic)DiabetesHereditary tendency to pressure palsyHIVHypothyroidLeprosyLymeLymphomatoid granulomatosisMultifocal mononeuropathy with conduction blockNeurofibromatosisParaneoplasticPerineuromaSarcoidosisVasculitis
4. SensorimotorA. Acute demyelinating
Guillain–Barré syndrome
(Continued)
16_Wang 4/11/07 10:34 PM Page 283

284 Wang and Rutkove
Table 3 (Continued)
DiphtheriaHIV variant of Guillain–Barré syndrome Tick paralysisToxic
AmiodaronePerhexilineGlue-sniffing (n-hexane)
B. Acute axonalCritical illness PNPorphyriaToxic
ArsenicOrganophosphatesThallium
VasculitisC. Chronic demyelinating (uniform)
Hereditary motor sensory neuropathy type I (Charcot–Marie–Tooth disease IA)Hereditary motor sensory neuropathy type III (Dejerine Sottas)Hereditary motor sensory neuropathy type IV (Refsum’s disease)Cockayne’s diseaseKrabbe’s globoid leukodystrophyMetachromatic leukodystrophy
D. Chronic demyelinating (nonuniform)Anti-myelin associated glycoproteinChronic inflammatory demyelinating polyradiculoneuropathyHereditary tendency to pressure palsyMonoclonal protein-associated neuropathyn-hexaneOsteosclerotic myelomaPerhexiline toxicityX-linked Charcot–Marie–Tooth disease Waldenstom’s macroglobulinemia
E. Chronic axonalAmyloidosisConnective tissue disease DiabetesHereditary motor sensory neuropathy type II (Charcot–Marie–Tooth disease 2)HIVIdiopathicLymeParaneoplasticSarcoidosisSyphilisToxic
ArsenicAlcoholPaclitaxelVincristine
Thiamine deficiencyThyroidVasculitisVitamin B12 deficiency
16_Wang 4/11/07 10:34 PM Page 284

Electrophysiology of Polyneuropathy 285
involvement is generally not at a site of compression but, rather, at a site of more tenuousblood supply or watershed region. Mononeuropathy multiplex is usually related to one of thevasculitic disorders, including polyarteritis nodosa, Churg–Strauss, Wegener’s granulomato-sis, hypersensitivity vasculitis, hepatitis C with cryoglobulinemia, HIV, or one of the connec-tive tissue disorders. However, multiple mononeuropathies can also occur at sites ofcompression in patients with underlying PNs, diabetes, and hypothyroidism, as well as inindividuals with a hereditary disposition to pressure palsies. It is worth making a distinctionbetween multiple mononeuropathies and mononeuritis multiplex (of the vasculitic kind),because of the distinctly different clinical implications.
SUGGESTED READING
Ad Hoc Subcommittee of the American Academy of Neurology AIDS Task Force. Research criteriafor diagnosis of chronic inflammatory demyelinating polyneuropathy (CIDP). Neurology1991;41:617–618.
Albers JW, Kelly JJ Jr. Acquired inflammatory demyelinating polyneuropathies: clinical and electro-diagnostic features. Muscle Nerve 1989;12:435–451.
Auger RG, Windebank AJ, Lucchinetti CF, Chalk CH. Role of the blink reflex in the evaluation ofsensory neuronopathy. Neurology 1999;53:407–408.
Chalk CH. Acquired peripheral neuropathy. In: Acquired Neuromuscular Diseases, Vol. 15 (PourmandR, ed.). WB Saunders, Philadelphia, PA, 1997, pp. 501–528.
Donofrio PD, Albers JW. AAEM minimonograph #34: polyneuropathies: classification by nerveconduction studies and electromyography. Muscle Nerve 1990;13:889–903.
England JD, Gronseth GS, Franklin G, et al. Distal symmetric polyneuropathy:a definition for clini-cal research. Neurology 2005;64(2):199–207.
Kimura J. Electrodiagnosis in Diseases of Nerve and Muscle: Principles and Practice, OxfordUniversity Press, Oxford, 2001.
Lewis RA, Sumner AJ, Shy ME. Electrophysiological features of inherited demyelinating neu-ropathies: a reappraisal in the era of molecular diagnosis. Muscle Nerve 2000;23:1472–1487.
Mendell JR, Kissel JT, Cornblath JR. Diagnosis and Management of Peripheral Nerve Disorders.University Press, Oxford, England, 2001.
Stewart JD, Low PA, Fealey RD. Distal small fiber neuropathy: results of tests of sweating and auto-nomic cardiovascular reflexes. Muscle Nerve 1992;15(6):661–665.
REVIEW QUESTIONS
1. What is the role of electrophysiology in the evaluation of PNs?A. Identify nerve fiber type.B. Determine pathophysiology.C. Establish chronicity.D. Ascertain severity.E. All of the above.
2. Reduced temperature of the limbs:A. Falsely elevates sensory nerve potential amplitudes.B. Falsely reduces sensory nerve potential amplitudes.C. Falsely increases of conduction velocity.D. Falsely reduces sensory nerve potential durations.E. Has no effect on nerve conduction studies.
3. A practical definition for partial conduction block over a short distance would include which ofthe following:A. Drop in amplitude of greater than 20% and a greater than 15% increase in duration.B. Drop in amplitude of greater than 50% and a less than 15% increase in duration.C. Drop in amplitude of greater than 50% and a greater than 15% increase in duration without
temporal dispersion.
16_Wang 4/11/07 10:34 PM Page 285

D. Drop in amplitude of greater than 20% and a less than 15% increase in duration.E. Drop in amplitude of greater than 20% and a greater than 50% increase in duration.
4. Needle EMG at the onset of symptoms in a demyelinating PN typically reveals:A. Fibrillation potentials.B. Neuromyotonic discharges.C. Reduced recruitment.D. Fasciculations.E. Positive sharp waves.
5. Tests that evaluate small nerve fiber function include all of the following EXCEPT:A. Quantitative sudomotor axon reflex test.B. Sympathetic skin response.C. Quantitative sensory testing.D. Epidermal skin biopsy.E. Standard nerve conduction studies.
6. Which feature on needle EMG best characterizes chronicity?A. Fasciculations.B. Reduced recruitment.C. Polyphasia.D. Enlarged motor unit potential amplitudes.E. Positive sharp waves.
7. Which of the following is characteristic of nonuniform demyelination?A. Charcot–Marie–Tooth disease I.B. Charcot–Marie–Tooth disease II.C. Charcot–Marie–Tooth disease III.D. X-linked Charcot–Marie–Tooth disease.E. Pyridoxine deficiency.
8. All of the following have predominantly sensory symptoms and signs EXCEPT:A. Paraneoplastic syndrome.B. Vitamin B6 deficiency.C. Sjogren’s syndrome.D. Lead exposure.E. Cis-platinum.
9. What feature is not observed in pure small fiber PNs?A. Allodynia.B. Loss of pinprick sensation.C. Absent reflexes.D. Normal nerve conduction studies.E. Hyperesthesia.
10. Which of the following is not a criterion for CIDP (CMAP > 80%)?A. Decreased conduction velocity at less than 70% of the lower limit of normal.B. Distal latency greater than 125% of the upper limit of normal.C. Prolonged F-waves greater than 120% of the upper limit of normal.D. Absent F-waves.E. Partial conduction block.
REVIEW ANSWERS
1. The correct answer is E. Nerve conduction studies are helpful in determining whether the PN isaxonal, demyelinating, or mixed. Needle EMG provided information regarding reinnervation ofmotor unit potentials or the chronicity of the disorder. Both nerve conduction studies and needleEMG ascertains the severity of the PN.
286 Wang and Rutkove
16_Wang 4/11/07 10:34 PM Page 286

2. The correct answer is A. For every 1°C decrease in temperature, the distal latency increasesby 0.2 ms and the conduction velocity decreases between 1.5 and 2.5 m/s. The amplitudealso increases, due to prolonged opening of the sodium channels.
3. The correct answer is D. In normal patients, the typical drop in amplitude is less than 20% andthe increase in duration is less than 15% across a short segment of nerve (e.g., less than 10 cm).Thus, any greater drop of amplitude and duration is suggestive of conduction block.
4. The correct answer is C. Reduced recruitment is one of the earliest abnormalities observed indemyelinating PN. Demyelinative changes on nerve conduction studies can lag behind by morethan 1 wk. PSWs and fibrillation potentials typically develop 1–2 weeks after onset. Neuromyo-tonic discharges are not typically seen.
5. The correct answer is E. All of the other tests are used to evaluate small nerve fiber function.Nerve conduction studies evaluate the fastest and largest diameter nerve fibers.
6. The correct answer is D. Reduced recruitment and positive sharp waves can occur in acute PN.Fasciculations represent damage to the motor neuron or axon. Polyphasic motor unit potentialscan be observed with subacute lesions. Enlarged motor unit potentials are a result of reinnerva-tion, which typically requires substantial time to develop.
7. The correct answer is D. Charcot–Marie–Tooth disease I and Charcot–Marie–Tooth disease III(Dejerine-Sottas) are examples of uniform demyelination. Patients with Charcot–Marie–Tooth IIhave an axonal PN, whereas pyridoxine (vitamin B6) deficiency typically presents as a sensoryneuronopathy.
8. The correct answer is D. Lead typically causes a predominantly motor neuropathy and can oftenpresent with a wrist drop. All of the others cause mainly sensory dysfunction.
9. The correct answer is C. Signs of large fiber dysfunction including absent vibration anddepressed reflexes, are typically not observed in small fiber PN.
10. The correct answer is E. See criteria in Table 2.
Electrophysiology of Polyneuropathy 287
16_Wang 4/11/07 10:34 PM Page 287

16_Wang 4/11/07 10:34 PM Page 288

17Radiculopathy and Motor Neuron Disorders
Juan A. Acosta and Elizabeth M. Raynor
SummaryAlthough radiculopathies and motor neuron disorders have vastly different underlying mechanisms
and clinical presentations, the electrodiagnostic examination for these disorders demonstrate remark-able similarities. In all of these conditions, the electrophysiological examination reflects motor neuroninjury with virtually no involvement of sensory neurons, even in the face of substantial sensory symp-toms, as may occur in radiculopathy. The needle examination is a critical part of electrophysiologicaltesting, helping to define the extent and severity of the abnormality, often more effectively than is pos-sible with nerve conduction studies alone. Late responses, including F-waves and the H-reflexes, canalso assist in the diagnosis of radiculopathy to some extent. The electrodiagnostic evaluation of motorneuron disease requires special consideration and care.
Key Words: Amyotrophic lateral sclerosis; F-wave; motor neuron disease; myotome; needle elec-tromyography; radiculopathy.
1. INTRODUCTION
The electrodiagnostic (EDX) examination has an established role in the evaluation ofradiculopathy and motor neuron disorders (MNDs). An extension of the neurological exami-nation, the EDX examination must always be interpreted in the proper clinical context.Radiculopathy results from injury to nerve roots producing sensory and/or motor symptomsand signs in the distribution of the corresponding dermatomes and/or myotomes. On the otherhand, MNDs are characterized by injury and loss of the anterior horn cell, affecting onlymotor fibers. Although radiculopathies and MNDs are clinically dissimilar, their electrophys-iological features are alike, because, in both, the nerve injury occurs proximal to the dorsalroot ganglion (DRG). For this reason, they will be discussed together. The fact thatpolyradiculopathy and MNDs are often indistinguishable from an electrophysiological per-spective, yet have dissimilar symptoms and clinical course, underscores the importance ofclinical context in assessing EDX findings.
In evaluating radiculopathy, EDX studies are useful in determining the functional conse-quence of a given structural lesion. They specifically are used to delineate the distribution ofthe affected muscles, localize the level, and establish the chronicity and extent of the prob-lem. Although EDX studies are generally sensitive and specific, a normal EMG result in theface of signs and symptoms consistent with radiculopathy does not exclude this diagnosis.
In evaluating MND, EDX studies are used to establish objective evidence of lower motorneuron degeneration in multiple body segments and are an essential diagnostic procedure inthe workup of these disorders.
From: The Clinical Neurophysiology PrimerEdited by: A. S. Blum and S. B. Rutkove © Humana Press Inc., Totowa, NJ
289
17_Raynor 4/11/07 10:34 PM Page 289

2. ANATOMIC CONSIDERATIONS
Thirty-one pairs of spinal nerves are formed from dorsal and ventral roots (8 cervical,12 thoracic, 5 lumbar, 5 sacral, and 1 coccygeal). Ventral roots arise from motor neurons inthe anterior and lateral gray columns of the spinal cord. Dorsal roots extend proximally fromsensory neurons in the DRG, which lie within the neural foramen (outside the spinal canal).Ventral and dorsal roots join together just distal to the DRG, forming a spinal nerve; on exit-ing the foramen, the nerve divides into dorsal and ventral rami. The dorsal rami supply theparaspinal muscles and skin overlying the paraspinous region; ventral rami form the plexus,which branches into the individual peripheral nerves that supply the upper and lower limb andthe sacral region.
The muscles supplied by a single spinal segment constitute a myotome; the skin regionsupplied by a single spinal segment is a dermatome. There is significant variability in indi-vidual myotomal and dermatomal representation for a particular muscle or skin region. Eachmuscle receives innervation from multiple contiguous nerve roots, and each dermatome over-laps extensively with neighboring dermatomes.
3. PHYSIOLOGICAL CONSIDERATIONS
3.1. Radiculopathies
The majority of radiculopathies result from nerve root compression, either from disc her-niation or as a consequence of spondylotic arthropathy; inflammatory and immunologicallesions are less common. The most commonly involved roots are L5 and S1, and C6 and C7(see Table 1 for a list of radiculopathies and associated symptoms and signs). These lesionsmay affect nerve roots by causing axonal degeneration, focal demyelination, or both. Theelectrophysiological findings in a patient are determined by the degree to which each of thesepathophysiological processes occurs. Regardless of the underlying cause, injury to the rootsoccurs at a location that is proximal to the DRG. This is a critical point in terms of establish-ing the electrophysiological pattern of abnormalities, and allows differentiation of radicularlesions from those distal to the DRG. Notably, only a portion of the nerve roots fibers areinjured in the majority of cases of radiculopathy, an important factor with regard to the pat-tern of abnormalities observed on EDX testing. The most commonly used EDX test forradiculopathies, the needle examination of muscle, is used to identify the extent and severityof motor axonal injury in a patient, which is a reflection of the nerve root fiber injury.
3.2. Motor Neuron Disorders
Amyotrophic lateral sclerosis (ALS) is the most common of the MND evaluated in theEMG laboratory. ALS is characterized by upper and lower motor neuron degeneration involv-ing multiple body regions (i.e., cranial, cervical, thoracic, and lumbosacral). The loss ofmotor neurons usually begins in one area, is asymmetrical, and later becomes evident in otherareas. The clinical and electrophysiological findings are dependent on the body segmentinvolved and the severity of involvement. Whereas recognition of upper motor neuroninvolvement depends on clinical signs, routine EDX studies are of major help in identifyinglower motor neuron abnormalities, even before they are clinically recognizable.
A single motor neuron innervates a group of muscles fibers; the motor unit is comprised ofthe motor neuron, its axon, and all of the muscle fibers innervated by it. The innervation ratiois the number of muscle fibers innervated by a single motor neuron. In ALS, degeneration
290 Acosta and Raynor
17_Raynor 4/11/07 10:34 PM Page 290

of anterior horn cells leads to loss of motor neurons and denervation of muscle fibers that arepart of these motor units; nearby, unaffected axons attempt to reinnervate denervated musclefibers, increasing the innervation ratio in surviving motor neurons. These pathophysiologicalevents are associated with active denervation/chronic reinnervation changes observed onEMG examination, as well as reduced recruitment related to loss of motor units. EDX abnor-malities are frequently observed in muscles that are not clinically involved in this disease.Similarly, in polio, another MND, chronic reinnervation and reduced motor unit recruitmentis generally more widespread than the clinical examination alone would suggest.
4. ELECTRODIAGNOSIS
4.1. Sensory Nerve Conduction Studies
Sensory nerve conduction study (SNCS) results are nearly always normal in radiculopathyas well as MND. The sensory nerve action potential (SNAP) amplitude is normal even whenpatients have clinical sensory loss because the lesion occurs proximal to the DRG (i.e.,
Radiculopathy 291
Table 1Neurological Examination Findings in Monoradiculopathies
Root Sensory loss Motor abnormalities/ Deep tendon reflexlevel Pain (paresthesias) weakness abnormalities
C5 Pain lateral shoulder Shoulder Deltoid, supraspinatus, Biceps reflexand infraspinatus
C6 Neck radiating to Radial side of the Brachioradialis, flexor Biceps reflexthe arm arm to thumb carpi radialis, biceps
C7 Neck to the fingers Between second Triceps, wrist extensors Triceps reflexand fourth finger
C8–T1 Neck to the fingers Ulnar aspect of hand All hand intrinsics, Noneand/or forearm flexor digitorum
profundusL1 Inguinal region Inguinal region None NoneL2 Groin, anterior thigh Anterolateral thigh Iliopsoas NoneL3 Anterior thigh to Medial thigh Quadriceps, iliopsoas, Knee jerk
knee, anterior leg and knee hip adductorsL4 Medial foreleg Medial lower leg Tibialis anterior, Knee jerk
quadriceps, hip adductors
L5 Lateral thigh and Lateral lower leg, Toe extensors, ankle None, unless S1lower leg, dorsum foot, dorsiflexor, everter and involveddorsum foot great toe inverter, hip abductors
S1 Posterior thigh, Sole, lateral foot and Toe flexors, gastrocnemii, Ankle jerkcalf, heel ankle, lateral two hamstrings, gluteus
toes maximusS2–S4 Medial buttocks Medial buttocks, None, unless Bulbocavernosus,
perineal, perianal S1–S2 involved anal winkregion Ankle jerk if S1
involved
17_Raynor 4/11/07 10:34 PM Page 291

is preganglionic) and the peripheral sensory axons are intact. This is the most useful pieceof information for differentiating radiculopathies from lesions involving the plexus or indi-vidual peripheral nerves. The most common, albeit rare, exception to this rule is involvementof the L5 DRG with L5 radiculopathy caused by a far lateral disc herniation. In MND, thesensory study results are normal because the disorder affects only motor neurons.
There are two essential points that are mostly relevant to radiculopathy with associatedsensory symptoms. First, it is most helpful to compare the SNAP from the symptomatic limbwith the corresponding SNAP in the contralateral uninvolved limb (with reduction in ampli-tude of ≥50% considered abnormal) rather than relying purely on reference values for theamplitudes; this is even more essential if there is coexistent polyneuropathy. Second, in eval-uating radiculopathy, it is important to attempt recordings from nerves most closely repre-senting the clinically affected dermatome (e.g., superficial peroneal recording for suspectedL5 lesions or sural recording for S1 lesions).
4.2. Motor Nerve Conduction Studies
Motor nerve conduction study (MNCS) results are frequently normal in radiculopathy, forseveral reasons. Myotomal overlap of root innervation to individual muscles makes it likelythat, from each muscle, a significant number of uninvolved nerve roots will contribute tomaintenance of a normal compound muscle action potential (CMAP); additionally, only afraction of nerve root fibers are injured in most cases of compressive radiculopathy. If a nerveroot lesion causes focal segmental demyelination, the CMAP, which is recorded distal to thelesion, will also be normal. In an injury that is characterized by significant axonal loss, therewill be distal axonal degeneration that may result in reduced CMAP amplitude. If degenera-tion of a large number of motor axons occurs, conduction velocity may be decreased and dis-tal latency prolonged, because of loss of the fast-conducting axons, although, generally, thisis mild. All CMAP abnormalities reflect the degree of axon loss and, therefore, are morelikely to occur with severe lesions. As with sensory studies, a CMAP should be recorded froma muscle in the clinically relevant myotomes, if possible. This is readily achievable in thelegs, where the most common radiculopathies affect L5 and S1 nerve fibers, but less relevantin the arms, where the most common nerve roots involved, C6 and C7, are not generally eval-uated with motor nerve conduction studies.
In MND, CMAP may be normal or amplitudes may be reduced in proportion to the lossof motor units. As with radiculopathy, changes in conduction velocity and/or distal latencyare generally mild. However, thorough nerve conduction studies are extremely important foridentifying peripheral neuropathies that may mimic ALS clinically, such as multifocal motorneuropathy with conduction block. In this disorder, evidence of conduction block is identi-fied, often in unusual segments of nerve (e.g., not at standard compression sites). Despite theprominent conduction block and often some associated axon loss of motor studies, sensorystudy results are normal or nearly normal. Sometimes the block can be difficult to identify,prompting the electromyographer to pursue proximal testing of nerves, including root stimu-lation using needle electrodes.
4.3. Late Responses 4.3.1. F-Responses
These late responses are produced by antidromic activation of a subpopulation of motorneurons and are useful because they provide an assessment of proximal motor pathways.
292 Acosta and Raynor
17_Raynor 4/11/07 10:34 PM Page 292

However, F-responses also reflect conduction along the distal motor pathway and may beprolonged if axonal loss or demyelination along any portion of the motor nerve has occurred.Unfortunately, the sensitivity of F-responses in radiculopathy seems low. This may bebecause F-responses are mediated by more than one nerve root (i.e., L5/S1). It may also bebecause nerve root injury in most radiculopathies is partial, leaving a reasonable number ofmotor axons intact, resulting in a normal minimal F-latency. For this reason, a prolongedminimum–maximum latency range (chronodispersion) or evaluating mean F-latency arelikely to be more sensitive indicators of radiculopathy. Nevertheless, F-responses also have alow specificity, because axon loss or demyelination anywhere along the entire length of themotor fiber being studied may prolong the F-latency.
In MND, F-responses are generally of normal latency until marked axon loss has occurred,in which case, they are usually only mildly prolonged. Their main usefulness in evaluation ofthese disorders is in excluding polyneuropathies that may produce a clinical syndrome indis-tinguishable from ALS, particularly those characterized by proximal conduction abnormali-ties, such as the multifocal motor neuropathy with conduction block, discussed above.
4.3.2. H-Reflexes
H-reflexes are useful in the evaluation of radiculopathy because they assess both motor andsensory pathways involving the nerve root; however, standard studies evaluate only the S1 rootlevel, a major limitation. H-reflex latency is the most useful parameter to measure. Ipsilateralprolongation (>2 ms longer than the contralateral, uninvolved side) or absence of the H-reflexis observed in unilateral S1 radiculopathy. In bilateral lesions, the reflexes may be prolongedor absent bilaterally. One advantage of the H-reflex over needle EMG is that it becomes abnor-mal immediately after compression injury of the nerve root, although it remains abnormalthereafter. There are important disadvantages of the H-reflex, including the lack of specificity.They may be abnormal with any lesion that causes depression of the ankle jerks and are gen-erally absent in patients with polyneuropathy. Although uncommonly attempted, an H-reflexcan usually be obtained from the flexor carpi radialis in healthy individuals; abnormalities inthis response may, thus, be helpful in identifying a C6–C7 radiculopathy.
4.3.3. Needle EMG
Needle EMG is overall the most useful procedure in the electrodiagnosis of radiculopathy.Needle EMG is a sensitive tool for demonstrating axonal loss in motor fibers secondary tonerve root injury; however, EMG is insensitive for demonstrating purely demyelinating lesionsunless severe enough to produce substantial reductions in motor unit potential recruitment.The needle EMG in suspected radiculopathies must be extensive and, at the very least, severalmuscles must be examined. Timing of the EMG in relation to the injury must be consideredwhen analyzing EDX data. Denervation (i.e., fibrillation potentials and positive sharp waves)is expected to develop in paraspinal muscles within 7 to 10 d of a root injury; in the proximallimbs in 2 to 3 wk, and in the distal limbs in 3 to 6 wk, although such abnormalities are oftenobserved sooner. Reinnervation changes generally develop in involved muscles in a similarfashion as the denervation changes (i.e., proceeding distally from the point of injury); usually,these changes take 3 to 6 mo to develop after the acute injury. The evaluation of at least fiveto seven muscles of the involved extremity, including the paraspinals, is generally required toadequately screen for radiculopathy (Table 2). It is important to verify that muscles in adjacentmyotomes are normal, to localize a radiculopathy to a particular level; it is usually not possi-ble to be more precise than to indicate two adjacent root levels of involvement (e.g., C6–C7).
Radiculopathy 293
17_Raynor 4/11/07 10:34 PM Page 293

Characteristic needle EMG findings in radiculopathy include ongoing denervation and/orchronic reinnervation in limb muscles sharing the same root (myotome) distribution butinnervated by different peripheral nerves, as well as ongoing denervation in paraspinal mus-cles. Abnormalities should be sought in distal and proximal limb muscles, although some-times only distal muscles will be affected. Compromised muscles initially show reducedrecruitment followed by fibrillation potentials and/or positive sharp waves, and, in chroniccases, high-amplitude, long-duration motor unit potentials. Understanding of the time frame
294 Acosta and Raynor
Table 2Nerves and Spinal Root Supply of Representative Muscles Commonly Tested During Needle Evaluation of Radiculopathya
Nerve Muscle Root
Brachial PlexusSpinal accessory nerve Trapezius C3–C4Dorsal scapular nerve Rhomboid major/minor C4–C5Suprascapular nerve Supraspinatus C5–C6
Infraspinatus C5–C6Axillary nerve Deltoid C5–C6Musculocutaneous nerve Biceps brachii C5–C6Median nerve Pronator teres C6–C7
Flexor carpi radialis C6–C7Flexor pollicis longus C6–C7Abductor pollicis brevis C8–T1
Ulnar nerve Flexor carpi ulnaris C7–C8–T1FDP IV–V C7–C8First dorsal interosseous C8–T1Abductor digiti quinti C8–T1
Radial nerve Triceps C6–C7–C8Brachioradialis C5–C6Extensor carpi radialis C5–C6
Posterior interosseous nerve Extensor digitorum communis C7–C8Extensor indicis proprius C8
Lumbosacral plexusSuperior gluteal nerve Gluteus maximus L5–S1Inferior gluteal nerve Gluteus medius L5–S1
Tensor fasciae latae L5–S1Femoral nerve Iliopsoas L2–L3
Quadriceps L2–L3–L4Obturator nerve Adductor longus L3–L4Sciatic nerve Hamstrings L5–S1–S2Tibial nerve Gastrocnemius and soleus S1–S2
Tibialis posterior L5–S1Superficial peroneal nerve Peroneus longus L5–S1Deep peroneal nerve Tibialis anterior L4–L5
Extensor hallucis longus L4–L5aFDP IV–V, flexor digitorum profundus of the fourth and fifth digits.
17_Raynor 4/11/07 10:34 PM Page 294

for development of these EMG abnormalities in relationship to the clinical nerve root injuryis important in interpretation of the findings (see preceding paragraphs).
The presence of denervation in paraspinal muscles is an important localizing finding indi-cating axonal loss in the dorsal rami (i.e., at nerve root level). However, there are severalpoints regarding the paraspinal muscle examination that require further discussion:
1. Paraspinal muscles may be normal in cases of clear-cut radiculopathy.2. Ongoing denervation, particularly isolated positive sharp waves, may be observed in paraspinal
muscles in healthy subjects, particularly those older than the age of 50 yr. Generally, however,abundant denervation changes are not observed in healthy subjects.
3. Paraspinal denervation changes are not specific for compressive radiculopathy and may beobserved in inflammatory myopathy and MND, and may be persistent after posterior laminec-tomy procedures.
4. There is considerable overlap of paraspinal muscle innervation from the dorsal rami; thus, thefinding of paraspinal abnormalities at a particular level does not localize the radiculopathy to thatlevel, only limb muscle abnormalities should be used for this purpose. Conversely, paraspinalmuscles may require sampling at several adjacent levels for abnormalities to be detected (e.g.,examine C6 and C8 paraspinals if C7 paraspinals are normal in a C7 radiculopathy).
In generalized MND, the needle EMG is of critical importance for demonstrating evidenceof widespread lower motor neuron degeneration. The findings include ongoing denervationin the form of fibrillation potential, as well as fasciculation potentials, in addition to chronicreinnervation changes. These abnormalities are frequently present in a myotomal distribu-tion (therefore, are identical to polyradiculopathy), but the characteristic that differentiatesMNDs from radiculopathy is the finding of abnormalities in multiple body segments: cra-nial, cervical (either arm and associated paraspinal musculature), thoracic, and lumbar(either leg and associated paraspinal musculature). The evaluation in MND should befocused at demonstrating abnormalities involving more than one nerve as well as more thanone root level of abnormality in the various segments with the least discomfort to the patient.This may be possible by examination of only two or three carefully chosen muscles in eachof these regions. The finding of fasciculation potentials, although characteristic of MND, isnot specific and may also occur with radiculopathy or disorders of peripheral nerve hyper-excitability (e.g., cramp-fasciculation syndrome).
5. SUMMARY OF EDX FINDINGS IN RADICULOPATHY
5.1. Nerve Conduction Studies1. Sensory: usually normal even if clinical sensory loss is present, an important differenti-
ating feature from nerve and plexus lesions. Care should be taken to record from clini-cally relevant sensory nerves and to compare with the contralateral side if appropriate.
2. Motor: usually normal even in the presence of weakness. CMAP may be decreased withlesions causing severe axon loss, particularly if multiple, adjacent nerve roots areaffected.
5.2. Needle EMG
Overall, needle EMG is the most useful EDX test for evaluating radiculopathy. Timing ofthe study in relation to symptom onset is very important for interpreting EMG findings.Ongoing denervation takes an average of 2 to 3 wk to develop in affected limb muscles;chronic reinnervation changes take 3 to 6 mo to develop. Paraspinal denervation is useful,although nonspecific, and may be absent in nearly half of all lesions.
Radiculopathy 295
17_Raynor 4/11/07 10:34 PM Page 295

6. SUMMARY OF EDX FINDINGS IN MND
6.1. Nerve Conduction Studies
SNCSs: normal.MNCS: reduced CMAP amplitudes may be observed in muscles experiencing severe
axonal loss. In less-involved muscles, CMAP amplitudes may be normal.
6.2. Needle EMG
Ongoing denervation and chronic reinnervation are present in varying degrees in differ-ent areas, reflecting abnormalities in multiple nerve and root distributions. The presence offasciculation potentials should be sought; although they are characteristic of the disorder,fasciculation potentials may be absent in MND and are not specific to MND. Abnormalitiesshould be sought in the most clinically affected body regions, but at least three body regionsmust be examined, and abnormalities demonstrated in muscles innervated by differentperipheral nerves and nerve roots.
SUGGESTED READING
Aminoff MJ. Electrophysiological evaluation of root and spinal cord disease. Semin Neurol 2002;22:197–204.
Raynor EM, Kleiner-Fisman G, Nardin R. Lumbosacral and thoracic radiculopathies. In:Neuromuscular Disorders in Clinical Practice (Katirji B, Kaminski H, Preston D, Ruff R, Shapiro B,eds.). Butterworth-Heinemann, Boston, MA 2002.
Stewart JD. The lower cervical spinal nerves. In: Focal Peripheral Neuropathies (Stewart JD, ed.).Raven Press, New York, NY, 1993; pp. 93–109.
REVIEW QUESTIONS
1. The best single sensory study to differentiate L5 radiculopathy vs lumbosacral plexopathy is:A. Sural nerve.B. Saphenous nerve.C. Superficial peroneal nerve.D. Lateral femoral cutaneous nerve.E. None of the above.
2. The sensitivity of F-responses in radiculopathy is generally considered low because:A. F-responses are rarely performed.B. F-responses are mediated by more than one root.C. Nerve injury in radiculopathy is partial.D. B and C.E. None of the above.
3. The most useful procedure in evaluation of radiculopathy is:A. F-responses.B. H-reflexes.C. Motor nerve conduction studies.D. Needle examination.E. A and B.
4. The finding of fibrillation potentials in paraspinal muscles:A. Clearly localizes the affected root.B. Is typical of plexopathy.C. Suggests radiculopathy but does not localize the root involved.D. Indicate chronic disease.E. None of the above.
296 Acosta and Raynor
17_Raynor 4/11/07 10:34 PM Page 296

5. Sensory studies in MND show:A. Reduced conduction velocity.B. Reduced amplitude.C. Prolonged distal latency.D. Abnormal morphology.E. Normal morphology.
6. Chronic reinnervation on needle examination is characterized by:A. Fibrillation potentials.B. Positive sharp waves.C. Short duration motor unit potentials.D. Long duration motor unit potentials.E. Nascent motor unit potentials.
7. A 42-yr-old man presents with pain in his lower back radiating down to his toes. You suspect anS1 radiculopathy. Which study will be more likely to be abnormal?A. Needle exam of the tibialis anterior.B. H-reflex latency.C. Peroneal motor response.D. Sural sensory amplitude.E. None of the above.
8. The following pair of muscles is innervated primarily by the S1 root:A. Tibialis posterior and gastrocnemius.B. Gastrocnemius and gluteus maximus.C. Tibialis anterior and peroneus longus.D. Quadriceps and hamstring.E. Long head biceps femoris and extensor digitorum brevis.
9. A pure, subacute L5 radiculopathy is more likely to show fibrillation potentials in the followingmuscles:A. Obturator and tibialis anterior.B. Vastus lateralis and peroneus longus.C. Gastrocnemius and tibialis anterior.D. Tibialis anterior and tibialis posterior.E. Gluteus maximus and foot intrinsics.
10. The best way to differentiate ALS from a severe ongoing and chronic polyradiculopathy is:A. The presence of fasciculation potentials in paraspinal muscles.B. The absence of motor unit potentials in abductor pollicis brevis.C. The clinical history and neurological exam.D. Needle examination of upper and lower extremities.E. MRI of the entire spine.
REVIEW ANSWERS
1. The correct answer is C. Sensory nerves tend to be affected in plexopathy and spared in radicu-lopathy. The saphenous nerve will be abnormal if the L4 plexus is involved and the sural nervewill be abnormal if the S1 branches of the plexus are compromised.
2. The correct answer is D. The sensitivity of F-responses in radiculopathy seems low. This may bebecause F-responses are mediated by more than one nerve root (i.e., L5/S1). It may also bebecause nerve root injury in most radiculopathies is partial, leaving a reasonable number ofmotor axons intact, resulting in a normal minimal F-latency.
3. The correct answer is D. Needle exam is the most useful EDX study to evaluate radiculopathies.4. The correct answer is C. The finding of paraspinal abnormalities at a particular level dose not local-
ize the radiculopathy to that level, only the limb abnormalities should be used for this purpose.5. The correct answer is E. Sensory nerve conduction studies are normal in MND.
Radiculopathy 297
17_Raynor 4/11/07 10:34 PM Page 297

6. The correct answer is D. Long duration, large amplitude, and polyphasic motor units are sign ofchronic reinnervation.
7. The correct answer is B. H-reflexes are useful in the evaluation of radiculopathy because theyassess both motor and sensory pathways involving the nerve root; standard studies evaluate onlythe S1 root level, which is the root involved in this patient.
8. The correct answer is B. 9. The correct answer is D. Tibialis anterior and tibialis posterior are primarily L5 muscles
(although tibialis anterior has a substantial contribution from L4 as well). 10. The correct answer is C. ALS and a severe ongoing and chronic polyradiculopathy look almost
the same on EDX studies and sometimes can be challenging for diagnosis. The history will befundamental. MND is painless and does not have associated sensory symptoms. Therefore, clin-ical history and examination will be the first step in defining the underlying pathology.
298 Acosta and Raynor
17_Raynor 4/11/07 10:34 PM Page 298

18Electrophysiology of Brachial and Lumbosacral
Plexopathies
Juan A. Acosta and Elizabeth M. Raynor
SummaryBrachial and lumbosacral plexopathies represent a heterogeneous group of disorders including trau-
matic injury as well as infiltrating and inflammatory lesions. The anatomy of both regions is complex, cre-ating challenges in their evaluation; electrophysiological testing is a key tool in the assessment ofplexopathies. Accurate electrodiagnosis requires a comfortable knowledge of the relevant plexus anatomyand applicable nerve conduction techniques, as well as recognition of the underlying pathophysiologicalprocesses affecting these regions. The sensory nerve conduction studies are used to differentiate lesions ofthe plexus from radiculopathies, which they may closely resemble clinically and electrophysiologically.Motor nerve conduction studies, late responses, and needle EMG, in conjunction with the sensory studies,allow precise localization and often provide clues to the underlying pathophysiology of a given lesion.
Key Words: Brachial plexopathy; lumbosacral plexitis; lumbosacral plexopathy; Partonage–Turnersyndrome; radiation plexopathy.
1. INTRODUCTION
Accurate electrodiagnosis of plexopathies requires a fundamental understanding of the com-plex regional anatomy. As in other disorders, the electrodiagnostic study represents an extensionof the neurological examination. Plexus lesions may cause motor, sensory, and/or sympatheticdisturbances and may be indistinguishable from lesions involving multiple nerves or nerve rootsbased on physical examination alone. In addition to providing information regarding the local-ization, extent, pathophysiology, and severity of a given lesion, the electrodiagnostic study maybe useful in determining the etiology and/or prognosis in some cases, and is, therefore, a criticaltool in the evaluation of suspected lesions of the lumbosacral and brachial plexus.
Lesions of the brachial plexus are more common than those involving the lumbosacralplexus for several reasons: the brachial plexus is relatively superficially located, and is closelyrelated to the bony structures of the shoulder and neck that are freely mobile (making it sus-ceptible to trauma); it is also closely related to major blood vessels, the apex of the lung andlymph nodes draining the lung and breast (making it susceptible to metastatic lesions).
2. BRACHIAL PLEXOPATHY
2.1. Brachial Plexus Anatomy
The brachial plexus is formed from the ventral roots of C5 through T1 (Fig. 1). It has threetrunks (upper, middle, and lower), three cords (medial, lateral, and posterior), and a number of
From: The Clinical Neuropysiology PrimerEdited by: A. S. Blum and S. B. Rutkove © Humana Press Inc., Totowa, NJ
299
18_Raynor 4/11/07 9:45 AM Page 299

terminal nerves, the most substantial being the median, ulnar, and radial nerves. The ventral ramiof C5 and C6 merge to form the upper trunk, C7 ventral ramus forms the middle trunk andC8-T1ventral rami join to form the lower trunk. The anterior divisions of the upper and mid-dle trunks form the lateral cord; the anterior division of the lower trunk forms the medialcord; and posterior divisions from all three trunks form the posterior cord. Terminal branchesfrom the cords are responsible for the motor and sensory innervation of the upper extremityand shoulder girdle. These terminal branches include the musculocutaneous nerve (lateralcord), median nerve (lateral and medial cord), ulnar nerve (medial cord), and radial and axil-lary nerves (posterior cord). Several smaller nerves also arise directly from the plexus.
Useful points to remember are:
• The long thoracic nerve (C5,6,7) and dorsal scapular nerve (C5,6) arise directly from the nerveroots and therefore their involvement implies a very proximal lesion, usually of the roots them-selves.
• The most likely differential diagnostic consideration for an upper trunk or lateral cord brachialplexus lesion is a C5-6 radiculopathy; for a lower trunk or medial cord lesion is a C8-T1radiculopathy and for a middle trunk lesion is a C7 radiculopathy.
• The lateral cord contribution to the median nerve is mainly sensory and derived from C5 and C6ventral rami through the upper trunk.
• The medial cord contribution to the median nerve is mainly motor and originates from C8 andT1 ventral rami through the lower trunk.
300 Acosta and Raynor
Fig. 1. Anatomy of the brachial plexus, showing the eventual destinations of all root components.Ext, external; extn, extension.
18_Raynor 4/11/07 9:45 AM Page 300

2.2. Pathophysiology
Brachial plexopathies present with a variety of clinical syndromes depending on theanatomical part of the plexus involved. In terms of frequency, the upper trunk is the mostoften involved, likely due to its superficial location, with trauma being the most frequentcause. Less common but potentially more serious (due to the incidence of infiltrating tumorsin this region) are lesions of the lower trunk; isolated middle trunk lesions are rare.Regardless of etiology or the portion of the plexus involved, axonal loss is the underlyingpathophysiology in the majority of brachial plexus lesions.
3. ELECTRODIAGNOSIS: BRACHIAL PLEXOPATHIES
3.1. Motor Nerve Conduction Studies
Motor nerve conduction studies (MNCS) are useful mostly for demonstrating significantaxonal loss in motor fibers. However, routine MNCS will be abnormal in plexopathy only ifthe nerve under study is derived from the involved trunk or cord of the brachial plexus. Thus,routine MNCS of the median and ulnar nerves provide information relevant only to the lowertrunk/medial cord and C8-T1 nerve roots. Unusual conduction studies may be performed forthe evaluation of other plexus lesions; for example, information regarding the upper trunk/lateralcord and C5-6 roots may be obtained from MNCS of the musculocutaneous nerve, recordingfrom the biceps brachii. These studies are technically more difficult than routine MNCS andthe range of response amplitudes is large; a good rule of thumb when performing these orother technically difficult or unusual studies is to obtain results from the uninvolved contralat-eral limb and compare the responses for significant asymmetries in amplitude (>50% reduc-tion considered abnormal).
MNCS are often normal in plexopathies but a reduced CMAP amplitude, often associated withmild conduction slowing (due to loss of fast conducting axons) may be observed when axonal lossis significant. Side-to-side comparisons of amplitude are sometimes useful in demonstrating moresubtle abnormalities, with a 50% reduction compared to the uninvolved side considered abnormal.MNCS are important for identifying the presence of mononeuropathies that could complicate thediagnosis or clinically mimic brachial plexopathy, such as ulnar neuropathy at the elbow.
3.2. Sensory Nerve Conduction Studies
Sensory nerve conduction studies are essential in the assessment of plexopathies. In con-trast to radiculopathies, in which sensory studies are invariably normal, sensory nerve actionpotentials (SNAP) amplitudes are abnormally reduced in plexopathies as the sensory fibersare injured distal to the dorsal root ganglia.
As with MNCS, amplitude is the most important parameter for demonstrating axonal lossand side to side comparison is important for demonstrating subtle abnormalities. Reductionin SNAP amplitude of 50% or more compared to the contralateral, uninvolved nerve is con-sidered abnormal, even if the absolute value of the SNAP amplitude falls within the normalrange. Most important is that the sensory nerve from which the recording is made shouldreflect the clinically involved dermatome. The choice of which sensory studies to perform inevaluating suspected brachial plexopathy depends on a directed physical examination todetermine suspected anatomical level of involvement based on careful mapping of sensoryloss, in conjunction with reflex changes and muscle weakness.
Plexopathy 301
18_Raynor 4/11/07 9:45 AM Page 301

The upper extremity nerves most commonly evaluated are the median, ulnar, superficialradial, and lateral antebrachial cutaneous (LAC) nerves; medial antebrachial cutaneous(MAC) nerves are examined less frequently. Relevant sensory nerves for evaluating suspectedupper trunk lesions include median (recorded from digits 2 and 1), superficial radial(recorded from snuffbox or digit 1), and LAC. For suspected upper trunk brachial plexo-pathies, LAC and median SNAPs recorded from digit1 are more sensitive for detectingabnormalities than routine median recordings from digit two or superficial radial recordingsfrom the snuffbox. This is due to the contribution from middle trunk fibers to median nervesinnervating digit 2 and superficial radial nerves innervating the snuffbox. Radial SNAPs canhelp differentiate upper trunk from lateral cord lesions, as in the latter the radial SNAP shouldbe preserved.
For evaluation of suspected lower trunk lesions, the MAC and ulnar nerves are the relevantnerves to study. Both the MAC and the ulnar SNAP are derived from the lower trunk andmedial cord. In general, the ulnar SNAP is at least as sensitive as the MAC recording in theidentification of lower trunk brachial plexus lesions; however, MAC recordings may be help-ful in cases where an ulnar neuropathy is present and a superimposed lower trunk or medialcord lesion must be ruled out. The MAC as well as the LAC are best performed on a contralat-eral asymptomatic limb to allow side to side comparison with the involved limb.
3.3. F-Responses
As in evaluation of radiculopathies, late responses are complementary to the routine con-duction studies but do not increase diagnostic sensitivity in most cases as these lesions arepredominantly axonal. In addition, the F-responses are non-localizing as F-response latencyprolongation may occur from a lesion anywhere from cervical spine to the hand. Like MNCS,F responses are generally only recorded from the motor fibers of the median and ulnar nerves,allowing evaluation of only the lower trunk and C8-T1 nerve roots.
3.4. Needle Electromyography
Needle Electromyography (EMG) is an essential tool for electrodiagnosis of suspectedbrachial plexus lesions as there is no restriction to the anatomic level and extent of the plexuswhich can be examined by needle EMG, as opposed to nerve conduction studies. In additionto demonstrating the extent of a given lesion, it is useful in documenting the severity of thelesion, including the presence or absence of axonal continuity to a particular muscle (funda-mental in determining prognosis). As in radiculopathy, EMG may demonstrate axonal loss inmuscles that appear clinically normal. Conversely, EMG may be used to later demonstrateevidence of reinnervation before it can be identified by physical examination.
Generally, extensive EMG study is required to evaluate suspected brachial plexus lesions asmuscles innervated by the relevant trunks, cords, and nerves should be examined. Additionally,the presence of paraspinal muscles abnormalities should be sought in order to rule out associatednerve root injury, particularly in cases of trauma where nerve root avulsion may be a consid-eration. The aim of the EMG is to demonstrate involvement of multiple muscles innervated by a common brachial plexus structure(s) but different nerves. Muscles outside of the area ofsuspected brachial plexus involvement that are innervated by these nerves should be examined,in addition to paraspinal muscles, with the expectation that these are uninvolved, thus rulingout radiculopathy or multiple mononeuropathies as the cause for a given clinical syndrome.Table 1 outlines an electrodiagnostic approach to suspected brachial plexus lesions.
302 Acosta and Raynor
18_Raynor 4/11/07 9:45 AM Page 302

Table 1Electrophysiological Patterns of Brachial and Lumbosacral Plexopathies
Plexopathy SNAP CMAP F-response Needle exam Others
Upper trunk LAC abnormal Median and ulnar Normal Abnormal: (C5 innervated) Rhomboids, serratusMedian, radial D1 normal deltoid, biceps anterior and
+/– abnormal supraspinatus, infraspinatus cervical paraspinal Partially involved: muscles normal
triceps, brachioradialispronator teresflexor carpi radialis
Lower trunk Ulnar abnormal Ulnar and median May be Abnormal: (C8-T1 innervated Pronator teres,(neurogenic MAC abnormal +/- reduced (related abnormal median, ulnar, and radial) triceps, biceps,thoracic outlet to axon loss) abductor pollicis brevis, first and C8-T1 syndrome) dorsal interosseous, extensor paraspinals normal
indicis propius
Middle trunk Median abnormal Normal Normal Abnormal: (C7 innervated)Radial +/- abnormal triceps
pronator teresflexor carpi radialis
Lateral cord LAC abnormal Normal Normal Abnormal: bicepsMedian D1, D2 pronator teres
abnormal flexor carpi radialis
Medial cord Ulnar abnormal Median and ulnar +/- abnormal Abnormal C8-T1 muscles Radial innervated C8MAC abnormal +/- reduced (related to (median, and ulnar) muscles (extensor
axon loss) Abductor pollicis brevis, indicis proprius,first dorsal interosseous digitorum
communis) normal
(Continued)
303
18_Raynor 4/11/07 9:45 AM Page 303
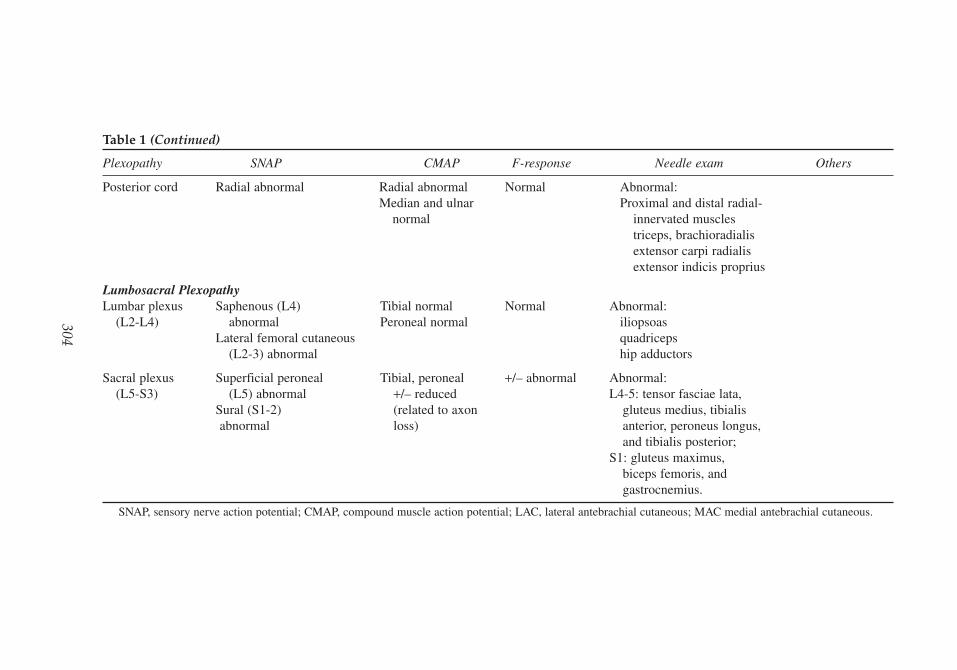
Table 1 (Continued)
Plexopathy SNAP CMAP F-response Needle exam Others
Posterior cord Radial abnormal Radial abnormal Normal Abnormal:Median and ulnar Proximal and distal radial-
normal innervated musclestriceps, brachioradialisextensor carpi radialisextensor indicis proprius
Lumbosacral PlexopathyLumbar plexus Saphenous (L4) Tibial normal Normal Abnormal:
(L2-L4) abnormal Peroneal normal iliopsoasLateral femoral cutaneous quadriceps
(L2-3) abnormal hip adductors
Sacral plexus Superficial peroneal Tibial, peroneal +/– abnormal Abnormal:(L5-S3) (L5) abnormal +/– reduced L4-5: tensor fasciae lata,
Sural (S1-2) (related to axon gluteus medius, tibialis abnormal loss) anterior, peroneus longus,
and tibialis posterior;S1: gluteus maximus,
biceps femoris, and gastrocnemius.
SNAP, sensory nerve action potential; CMAP, compound muscle action potential; LAC, lateral antebrachial cutaneous; MAC medial antebrachial cutaneous.
304
18_Raynor 4/11/07 9:45 AM Page 304

As in all axonal injury involving motor fibers, the earliest finding on needle exam isdecreased motor unit recruitment (immediate) followed by denervation (i.e., fibrillationpotentials, positive sharp waves) within the first 3 wk or so. Reinnervation changes (long-duration, high-amplitude, and polyphasic motor unit potentials) are expected in involvedmuscles within 3–6 mo after the acute injury. In cases where axonal continuity cannot bedemonstrated initially (i.e., lesions characterized by complete denervation in some muscles),serial electrodiagnostic studies may be used to search for any evidence of recovery so that, incases where no reinnervation is occurring, decisions may be made regarding surgical explo-ration or nerve grafting.
4. SPECIFIC DISORDERS OF THE BRACHIAL PLEXUS
Brachial plexopathies are most commonly caused by trauma, including closed tractioninjuries as well as penetrating trauma and dislocation of the humerus. The position of thearm and head is important in determining susceptibility of the brachial plexus structuresduring a closed injury: with the arm down at the side, a force causing excessive shoulderdepression will be transmitted to the upper trunk (C5-6 roots), whereas with the arm over-head, force applied to the axilla is transmitted to the lower trunk (C8-T1 roots). Iatrogenicbrachial plexopathies are not uncommon; for example, lower trunk plexopathies can beencountered as a complication of median sternotomy procedures. Obstetric paralysis mayoccur in newborns following difficult vaginal deliveries; upper trunk lesions (Erb’s palsy)are more common than isolated lower trunk lesions (Klumpke’s palsy). Infiltrating tumorsand other masses, including those in the apex of the lung, can also cause severe, usuallyvery painful, plexopathies.
Neuralgic amyotrophy goes by many names, including idiopathic brachial neuritis andParsonage-Turner syndrome. This immune-mediated disorder has a characteristic clinical andelectrodiagnostic pattern which is distinctly different from structural lesions involving thebrachial plexus. Rather than an upper trunk brachial plexopathy, the electrodiagnostic patternin neuralgic amyotrophy is one of multifocal peripheral nerve involvement, with a predilec-tion for motor nerves innervated by the upper trunk, as well as the anterior interosseous nerve,long thoracic nerve, and proximal median nerve. Often there are minimal sensory abnormal-ities on both the physical examination and the sensory nerve conduction studies may be nor-mal, in contrast to structural lesions of the brachial plexus.
Radiation plexopathy is a rare complication of radiation therapy. It is usually seen as a late sequelae, years after treatment, most often in women receiving axillary irradiation for breast cancer. Either the upper or lower trunk may be involved; the absence of paindifferentiates this from recurrent tumor. If present, myokymic discharges may be identifiedon EMG and are a useful diagnostic feature distinguishing radiation plexopathy frommetastatic tumor.
True neurogenic thoracic outlet syndrome (TOS) is a rare disorder, distinct from the morecommonly diagnosed symptomatic TOS, in which pain is a prominent feature, without focalneurological symptoms. In neurogenic TOS a fibrous band compresses the proximal aspectof the lower trunk of the brachial plexus, producing a clinical picture of intermittent pares-thesias progressing to intrinsic hand weakness and atrophy with sensory loss in the medialforearm and hand. Electrodiagnostic studies in neurogenic TOS demonstrate a lower trunkbrachial plexopathy.
Plexopathy 305
18_Raynor 4/11/07 9:45 AM Page 305

5. LUMBOSACRAL PLEXOPATHY
5.1. Lumbosacral Plexus Anatomy
The lumbosacral plexus may best be considered as two distinct plexuses, the lumbar andthe sacral (Fig. 2). The lumbar plexus is derived from L1-L4 nerve roots and gives rise to twomajor nerves: the femoral nerve (L2-L4) that innervates the quadriceps muscle and the skinof the anterior thigh and medial lower leg, and the obturator nerve (L2-L4) innervating thethigh adductor muscles and the skin of the medial thigh. Branches to the iliopsoas musclearise directly from the plexus, traveling alongside the femoral nerve. The lumbar plexus alsogives rise to several sensory nerves: the iliohypogastric (L1) supplying the anterior and lat-eral lower abdominal wall, the ilioinguinal (L1) to the upper medial thigh and root of thepenis or labium majus, the genitofemoral nerve (L1-L2) to the upper anterior thigh and scro-tum, and the lateral cutaneous nerve of the thigh (L2-L3) to the lateral thigh.
The sacral plexus derives from L4 through S4 nerve roots and gives rise to the largest nerveof the plexus, the sciatic nerve. The sciatic nerve supplies the hamstring muscles and all themuscles below the knee through its two branches: the peroneal and tibial nerves. The supe-rior and inferior gluteal nerves arise from the sacral plexus proximal to the sciatic nerve andsupply the gluteus muscles.
5.2. Pathophysiology
The lumbosacral plexus is well protected by the pelvis, making it less susceptible to trau-matic injury than the brachial plexus. It is, however, a favored site for involvement in diabetes,in contrast to the brachial plexus, which is rarely affected by diabetic amyotrophy. The LSP can
306 Acosta and Raynor
Fig. 2. Schematic of anatomy of the lumbosacral plexus.
18_Raynor 4/11/07 9:45 AM Page 306

be also affected by malignant invasion, radiation, retroperitoneal hematoma, and less frequentlyby trauma. As in the brachial plexus, the lesions that can be identified on electrophysiologicaltesting are largely axonal in nature and occur distal to the dorsal root ganglion, as opposed toradiculopathies. Hence, as with brachial plexopathy, sensory NCS abnormalities are typical andhelp differentiate lumbosacral plexopathy from radiculopathy.
6. ELECTRODIAGNOSIS: LUMBOSACRAL PLEXOPATHIES
Several principles of electrodiagnosis in lumbosacral plexopathy are similar to thosedescribed in the evaluation of brachial plexus lesions. The anatomy of the lumbosacral plexusis more straightforward; again, considering lumbar and sacral plexus separately is helpful. Ingeneral, lesions tend to affect either one but rarely both the lumbar and sacral plexus. In casesof lumbar plexopathy, the patient generally presents with quadriceps weakness and the dif-ferential diagnostic considerations are femoral neuropathy versus high lumbar radiculopathy(L2-3). The involvement of obturator-innervated muscles localizes a lesion outside of thefemoral nerve territory; to distinguish lumbosacral plexopathy from radiculopathy, the saphe-nous SNCS should be performed and paraspinal EMG is important.
A patient with a lesion of the sacral plexus will often present with foot drop (inability to dor-siflex the foot) or a flail foot (inability to dorsiflex or plantar flex the foot), and the differentialdiagnostic considerations include peroneal neuropathy, sciatic neuropathy, and lumbosacralradiculopathy. Weakness outside of the ankle dorsiflexors and foot evertors (involving tibial-innervated muscles such as tibialis posterior and gastrocnemius) indicates a lesion proximal tothe peroneal nerve while weakness of gluteal muscles indicates a lesion proximal to the sciaticnerve, involving either plexus or nerve roots.
6.1. Motor Nerve Conduction Studies
Routine MNCS of the peroneal and tibial nerves evaluate only the sacral plexus. Aslumbosacral plexopathies may superficially resemble peroneal neuropathy, it is important to exclude focal lesions of this nerve, most commonly occuring at the fibular neck. Thisincludes peroneal MNCS recording tibialis anterior if no CMAP is obtainable from extensordigitorum brevis.
Because of their proximal location, the muscles innervated by the lumbar plexus are tech-nically difficult to evaluate with MNCS. A CMAP may be recorded from quadriceps, stimu-lating femoral nerve at the level of the inguinal ligament. Side-to-side comparison is the mostreliable means of obtaining a relative normal value for amplitude. While this may be helpfulin demonstrating axonal loss, one can obtain evidence for this from the needle EMG of thequadriceps; thus, femoral MNCS is not commonly performed in the evaluation of lumbarplexus lesions.
6.2. Sensory Nerve Conduction Studies
As in brachial plexopathy, SNCS are a key tool in the assessment of lumbosacral plexuslesions; however, there are important issues which complicate both the performance and theinterpretation of SNCS in the lower extremities. First, it is technically difficult and almostimpossible to elicit responses from some of the nerves arising from the lumbar plexus, suchas the iliohypogastric, genitofemoral, and ilioinguinal nerves. While sensory responses fromthe lateral femoral cutaneous and saphenous nerves can be obtained, it is often with signifi-cant difficulty, even in normal subjects; as previously emphasized, side-to-side comparison is
Plexopathy 307
18_Raynor 4/11/07 9:45 AM Page 307

necessary. Sensory responses representing sacral plexus dermatomes (i.e., superficial per-oneal and sural) are more easily obtainable and extremely helpful in the evaluation of sacralplexus lesions.
Another complicating issue which frequently influences the electrodiagnostic evaluationof this region is the presence of underlying polyneuropathy, a common finding in the popu-lation of patients seen in the EMG laboratory. Abnormalities due to polyneuropathy willaffect SNCS most significantly; in some cases, SNAPs are absent, significantly hinderinglesion localization. However, when milder polyneuropathy is present, the finding of an asym-metrically reduced SNAP in the involved lower extremity is a useful, localizing finding.
6.3. F-Responses
As in brachial plexopathy, late responses may provide information about proximal conduc-tion in the tibial and peroneal nerves; however, abnormalities are not specific for localization tothe plexus. Still, F-response abnormalities may be an early finding in lumbosacral plexopathy.
6.4. Needle EMG
EMG is one of the most important electrodiagnostic tests in the evaluation of lumbosacralplexopathy. As in the upper extremity, a plexus lesion will produce abnormalities in multiplenerve and root territories, largely sparing related paraspinal muscles. Therefore, muscles fromdifferent myotomes supplied by different peripheral nerves need to be evaluated, and the sam-pling should include those innervated by both the lumbar and sacral plexus. When evaluatingthe lumbar plexus it is useful to examine muscles innervated by the femoral nerve and obtu-rator nerves, as well as the iliopsoas and the high lumbar paraspinal muscles (Table 1).Lumbar plexus lesions are differentiated from femoral neuropathy by the presence of EMGabnormalities in the obturator-innervated adductor longus muscle, in addition to the quadri-ceps. The finding of abnormalities restricted to the iliopsoas and quadriceps is considered evi-dence of a femoral neuropathy, because the nerves innervating these muscles run in very closeproximity one another, even though, strictly speaking, the branch to iliopsoas comes directlyfrom the lumbosacral plexus rather than the femoral nerve.
In the evaluation of the sacral plexus, the electromyographer examines muscles innervated byperoneal and tibial divisions of the sciatic nerve in multiple myotomes both below and above theknee, followed by gluteal-innervated muscles, and followed finally by lower paraspinal muscles.For example, to distinguish between peroneal neuropathy and more proximal lesions causingfoot drop, i.e., sciatic neuropathy or lumbosacral plexopathy, EMG abnormalities are sought inthe short head of the biceps femoris (peroneal division of the sciatic nerve, above the knee) inaddition to the tibial-innervated tibialis posterior. Additional abnormalities in gluteal-innervatedmuscles then help localize the lesion to the sacral plexus, proximal to the sciatic nerve.
7. SPECIFIC DISORDERS OF THE LUMBOSACRAL PLEXUS
Diabetic amyotrophy is the most common lesion affecting the lumbosacral plexus. The exactlocalization of this disorder remains subject to considerable controversy; electrodiagnostically,it is most consistent with an asymmetric, radiculoneuropathy affecting high lumbar regions.Clinically, however, its appearance most closely resembles that of a lumbosacral plexopathy.
Patients typically present with severe thigh pain, followed by weakness and wastinginvolving quadriceps and hip adductors/abductors. Sensory abnormalities are clinically less
308 Acosta and Raynor
18_Raynor 4/11/07 9:45 AM Page 308

prominent. Careful electrophysiological examination will nearly always demonstrateinvolvement outside of the femoral and lumbar plexus region, with abnormalities in sensoryand motor branches of peroneal and tibial nerves, frequently accompanied by abnormalitiesin the paraspinal muscles. The quadriceps, iliopsoas, adductors, and glutei are often mostprominently affected. The presence of fibrillation potentials in the paraspinal muscles cer-tainly brings into the question the exact localization of the disorder; despite this, for simplic-ity, most electromyographers continue to think of diabetic amyotrophy as a form ofplexopathy. The electrodiagnostic evaluation is more helpful than physical examination fordemonstrating abnormalities outside of a single myotome or nerve territory, and the wide-spread nature of this lesion often differentiates it from structural lesions involving the nerveroots or plexus. In cases where uncertainty remains, appropriate imaging studies are helpfulin establishing diagnosis.
Idiopathic lumbosacral plexitis is another uncommon disorder that often affects elderlymen and is associated with considerable pain, weakness, and sensory loss of the involved leg.Like idiopathic brachial neuritis, its cause is unknown, and the physiology is mainly axonalin nature. Unlike brachial neuritis, however, this disorder has a tendency toward recurrenceand persistence with prominent pain. Electrodiagnostic studies reveal abnormalities in tibialand peroneal nerves and in the saphenous, sural, and superficial peroneal sensory nerves.Abnormalities on EMG correspond with areas of weakness. Unlike diabetic amyotrophy, dis-tal involvement of the leg and sensory disturbances are common.
Other specific disorders include radiation plexopathy, compression (for example, due to anexpanding mass or hematoma in the retroperitoneum), and trauma, (including pelvic fracturesand difficult obstetrical delivery).
FURTHER READING
Eisen AA. The electrodiagnosis of plexopathies. In: Clinical Electromyography. Eds. Brown WF,Bolton CF. Butterworth-Heinemann, Boston 1993: pp. 211–225.
Ferrante MA, Wilbourn AJ. Electrodiagnostic approach to the patient with suspected brachial plex-opathy. Neurol Clin 2000;20:423–450.
Rutkove SB, Sax TW. Lumbosacral plexopathies. In: Neuromuscular Disorders in Clinical Practice.Eds. Katirji B, Kaminski H, Preston D, Ruff R, Shapiro B. Butterworth-Heinemann, Boston 2002.
QUESTIONS
1. The presence of fibrillation potentials in the paraspinal muscles is most consistent withA. Median neuropathy at the wristB. Upper trunk brachial plexopathyC. Crush injury to the posterior cordD. RadiculopathyE. None of the above
2. Electromyography of the rhomboid major muscle is important to evaluate for:A. Long thoracic neuropathyB. Lower trunk brachial plexopathyC. Medial cord brachial plexopathyD. C5 radiculopathyE. C8-T1 radiculopathy
3. A 38-year-old carpenter comes to the EMG lab for evaluation of right hand weakness and pares-thesias in the 4th and 5th digits. On examination you find normal reflexes, mild sensory loss over
Plexopathy 309
18_Raynor 4/11/07 9:45 AM Page 309

digit 5 and hand intrinsic muscle weakness. In addition to ulnar neuropathy, what else is in yourdifferential diagnosis?A. Upper trunk brachial plexopathyB. Posterior cord brachial plexopathyC. Lower trunk brachial plexopathyD. C8-T1 radiculopathyE. C and D
4. Which of the following tests would be most helpful to further localize the lesion in the previous patient?A. Median sensory response recorded from digit 3B. Musculocutaneous motor studyC. Medial antebrachial cutaneous sensory studyD. Lateral antebrachial cutaneous sensory studyE. Needle electromyography of the deltoid muscle
5. Which of the following is commonly seen in brachial neuritis?A. Winging of the scapula due to trapezius weaknessB. Weakness in muscles innervated by the anterior interosseous nerveC. Deltoid weaknessD. A radial neuropathy like pictureE. Diffuse plexopathy with weakness of muscles whose fibers traverse the lower, middle, and
upper trunks of the plexus6. Which of the following is not commonly seen in diabetic amyotrophy?
A. Prominent weakness of foot plantar flexionB. Weakness of hip flexionC. Fibrillation potentials in iliopsoas, adductor longus, and quadriceps musclesD. Reduced deep tendon reflex at the kneeE. Fibrillation potentials in the paraspinal muscles
7. Which of the following statements is not true regarding brachial plexopathies?A. Medial cord plexopathies may clinically look similar to C8-T1 radiculopathiesB. Involvement of triceps would be anticipated in a lateral cord plexopathyC. Sensory loss involving the lateral aspect of the forearm would be expected in right upper
trunk plexopathy.D. Weakness of serratus anterior would be atypical in a lateral cord plexopathyE. In a lower trunk plexopathy, the ulnar sensory response amplitude may be reduced
8. Which of the following is correct?A. Traumatic plexopathies are much more common in the upper extremities than the lowerB. The lower extremity proximal sensory nerves are difficult to test electrophysiologicallyC. In both brachial and lumbosacral plexopathies, F-wave latencies may be prolongedD. Both idiopathic brachial neuritis and lumbosacral plexitis are accompanied by prominent painE. All of the above
9. Which of the following pairs is incorrect?A. C5 nerve root/upper trunkB. C7 nerve root/middle trunkC. L3 nerve root/sciatic nerveD. Posterior cord of brachial plexus—radial nerveE. All are correct
10. Which of the following statements is incorrect?A. Median F responses can be helpful in the diagnosis of an upper trunk plexopathyB. Peroneal F responses may assist in the diagnosis of a lumbosacral plexopathyC. Median motor response amplitude may be reduced in true neurogenic thoracic outlet syndromeD. Ulnar sensory response from digit 5 is likely to be normal in vascular thoracic outlet syndrome
310 Acosta and Raynor
18_Raynor 4/11/07 9:45 AM Page 310
ANSWERS
1. Answer: D. The presence of fibrillation potentials in the paraspinal muscles is more consistent withradiculopathy. This is an important finding used to differentiate a plexopathy from a radiculopathy.
2. Answer: D. The dorsal scapular nerve which takes off directly from the C5 motor nerve root beforejoining the upper trunk of the brachial plexus innervates the rhomboid muscle. Abnormalities seenin the rhomboid muscle generally support a C5 radiculopathy over a plexopathy although a veryproximal upper trunk plexopathy could potentially produce abnormalities in this muscle as well.
3. Answer: E. The distribution of weakness and sensory findings are consistent with either a lowertrunk/medial cord brachial plexopathy or a C8-T1 radiculopathy.
4. Answer: C. Abnormalities in this sensory nerve will indicate that the problem is at the level ofthe lower trunk or medial cord and will rule out C8 and T1 roots. In addition, the medial ante-brachial cutaneous sensory study will be normal in isolated ulnar neuropathy.
5. Answer: B. Weakness of anterior interosseous muscles is commonly seen in brachial neuritis.Winging of the scapula is usually seen in brachial neuritis due to weakness of serratus anterior.The other clinical pictures would be distinctly atypical for brachial neuritis.
6. Answer: A. Prominent foot flexion weakness would be distinctly uncommon in diabetic amy-otrophy. All of the other items are commonly seen in this disorder.
7. Answer: B. Nerve fibers to triceps leave the upper, middle, and lower trunks to form the poste-rior cord, from which the radial nerve arises; fibers destined for the radial nerve do not travelthrough the lateral cord. All of the other statements are correct.
8. Answer: E. All the statements are correct.9. Answer: C. The L3 nerve root provides fibers that are enter the obturator and femoral nerves;
the sciatic nerve fibers are derived from the L4-S2 roots.10. Answer: A. Median F responses evaluate only the C8-T1 roots, the lower trunk, and the medial
cord. While the sensory fibers from the median nerve traverse other areas of the plexus, themotor fibers from which the F waves are obtained are restricted to these regions.
Plexopathy 311
18_Raynor 4/11/07 9:45 AM Page 311

18_Raynor 4/11/07 9:45 AM Page 312

19Evaluation of the Cranial Nerves
George Sachs
SummaryElectrophysiological testing of the cranial nerves remains an important and perhaps under utilized
area of neurophysiological evaluation. Motor responses from individual branches of the facial nervecan be obtained to assist in the diagnosis and prognosis of facial neuropathies. In blink reflex testing,the first division of the trigeminal nerve is stimulated and responses from the orbicularis oculi areobtained. This form of testing can be used for a variety of purposes including helping to localize dis-orders of the Vth and VIIth cranial nerves, assisting in the evaluation of Guillain–Barré syndrome, andeven in the assessment of brainstem disorders. It is also useful in the assessment of hemifacial spasm.The masseter reflex and master silent period can also be assessed when clinically indicated. Althoughless commonly pursued, other cranial nerves can also be evaluated electrophysiologically, includingthe XIth and XIIth cranial nerves. Assessment of these cranial nerves can be important in assessingother diseases, including amyotrophic lateral sclerosis.
Key Words: Bell’s palsy; blink reflex; facial neuropathy; hemifacial spasm; trigeminal neuropathy.
1. INTRODUCTION
Although clinical neurophysiological techniques can be applied to nearly all cranial nerves,this chapter will focus on those readily studied in standard EMG laboratories. Evoked poten-tial studies of the optic and auditory nerves are discussed in Chapters 25 and 26, and only briefmention will be made of specialized techniques applied to extraocular and laryngeal muscles.Standard nerve conduction studies and EMG can assess the facial, trigeminal, spinal accessory,and hypoglossal nerves and the muscles they innervate. However, a few general caveats applyto the study of these cranial nerves. First, normal values for conduction studies are not as well-established as those for limb nerves and, therefore, side-to-side comparisons become particu-larly important. Second, the short or inaccessible extracranial course of some nerves prohibitsdirect assessment of conduction velocity. In such cases, reflex studies and latency measure-ments provide the next best option. Finally, EMG of cranial muscles requires a delicateapproach and familiarity with specific motor unit potential (MUP) characteristics.
2. CONDUCTION STUDIES
2.1. Facial Nerve2.1.1. Relevant Anatomy
Of all cranial nerves, the facial nerve (Fig. 1) is the one most frequently studied in EMGlabs. It emerges from the pons, coursing across the cerebello-pontine angle to the internal
From: The Clinical Neurophysiology PrimerEdited by: A. S. Blum and S. B. Rutkove © Humana Press Inc., Totowa, NJ
313
19_Sachs 4/11/07 10:35 PM Page 313

acoustic meatus, where it enters the facial canal in the petrous bone. Branches given offwithin the petrous bone innervate the stapedius muscle, salivary, and lacrimal glands as wellas taste buds on the anterior tongue. Soon after it exits the skull through the stylomastoidforamen, the nerve sends small branches to the digastric, stylohyoid, and occipital scalp mus-cles. The main nerve trunk courses through the parotid gland and then divides into fivebranches innervating facial muscles:
1. The temporal branch supplying the frontalis. 2. The zygomatic branch supplying the orbicularis oculi and nasalis. 3. The buccal branch supplying the orbicularis oris. 4. The mandibular branch supplying the mentalis.5. The cervical branch supplying the platysma.
2.1.2. Conduction Studies
Motor conduction studies can be performed for any of the facial muscles mentioned inSubheading 2.1.1. Percutaneous stimulation underneath the ear at the tip of the mastoidprocess excites all five facial branches. A more distal site, just anterior to the tragus,stimulates the zygomatic and temporal branches. The nasalis muscle is a particularlyattractive recording site because it tends to produce a compound muscle action potential(CMAP) with a sharp initial negative deflection. Motor conduction studies to the orbic-ularis oculi are convenient because the same recording site is shared with the blinkreflex. However, flat circular muscles, such as the orbicularis oculi and oris may produceCMAPs that are more dispersed, with initial positive deflections. Furthermore, artifactfrom direct co-stimulation of the masseter is more likely to complicate recording fromthese muscles. Facial muscles normally produce CMAPs with amplitudes rangingbetween 2 and 4 mA, although a value less than 50% of the normal contralateral is themost widely accepted criterion for abnormality.
314 Sachs
Fig. 1. Major branches of the facial nerve and muscles that they innervate.
19_Sachs 4/11/07 10:35 PM Page 314

2.2. Trigeminal Nerve 2.2.1. Relevant Anatomy
Unlike the facial nerve, the trigeminal nerve contains a large number of somatosensoryafferent fibers in addition to motor axons. Primary neurons relaying pain/temperature andtouch modalities reside within the gasserian ganglion. Their distal axons leave the ganglion inthe three sensory divisions: ophthalmic (V1), maxillary (V2), or mandibular (V3). Proximalaxons of touch fibers project to the principal trigeminal nucleus of the pons, whereas pain/tem-perature fibers send their proximal axons to the spinal trigeminal nuclei (extending from thepons to the cervical spinal cord). The cell bodies of trigeminal muscle spindle afferents arethought to occupy the mesencephalic trigeminal nucleus. This nucleus extends rostrally to thelevel of the colliculi, serving as a relay center for proprioceptive reflexes.
Motor fibers of the trigeminal nerve originate from their nucleus in the mid pons. Theypass through Meckel’s cave at the tip of the petrous bone and then under the Gasserian gang-lion to emerge from the skull via the foramen ovale. The motor fibers join the mandibulardivision of the nerve to supply the masticatory muscles (masseter, temporalis, and pterygoids)as well as palatal, mylohyoid, and the anterior belly of the digastric muscle.
2.2.2. Conduction Studies
The trigeminal nerve’s extracranial course is not suitable for the performance of motorconduction studies. Branches to masticatory muscles originate from the mandibular divisionsoon after its exit from the foramen ovale and take short, deep trajectories to their targets.Many sensory branches are also inaccessible, but orthodromic sensory conduction studies ofthe supraorbital nerve have been described. Stimulation at the upper forehead elicits a sen-sory nerve action potential recordable at the supraorbital notch. The latency of this responseis usually shorter than 1 ms, which makes it prone to distortion from stimulus artifact.
2.2.3. Blink Reflex
Reflex studies provide an alternative method of assessing sensory conduction in thetrigeminal nerve. Of these, the blink reflex is the most commonly used. It represents the elec-trophysiological correlate of the glabellar tap reflex. The technique involves recordingresponses bilaterally from orbicularis oculi after electrical stimulation of the supraorbitaltrigeminal branch. This produces two separate responses. The earlier response (termed R1)appears with a latency of 8 to 13 ms and is normally limited to the ipsilateral orbicularis oculi.Appearing later, and bilaterally, is the R2 response. It is temporally more dispersed, with anormal onset latency ranging from 24 to 41 ms. R2 responses recorded contralateral to stim-ulation have a slightly longer average latency, but the side-to-side latency difference for anysingle stimulation should not exceed 5 ms.
Paired stimuli at 3 to 5 ms intervals will, at times, evoke an R1 response when single stim-uli fail. The blink reflex can also be elicited by a mechanical glabellar tap delivered using areflex hammer with a microswitch to trigger the trace. This technique stimulates both sides,leading to bilateral R1 responses with slightly longer latencies than those evoked electrically.Electrical stimulation of the infraorbital or mental nerves often elicits blink responses, whichcan assess sensory transmission through these branches.
Blink reflexes can delineate pathology in the trigeminal nerve, the facial nerve, and brainstempathways connecting trigeminal and facial nuclei (Fig. 2). Interpretation requires comparison
Cranial Nerves 315
19_Sachs 4/11/07 10:35 PM Page 315
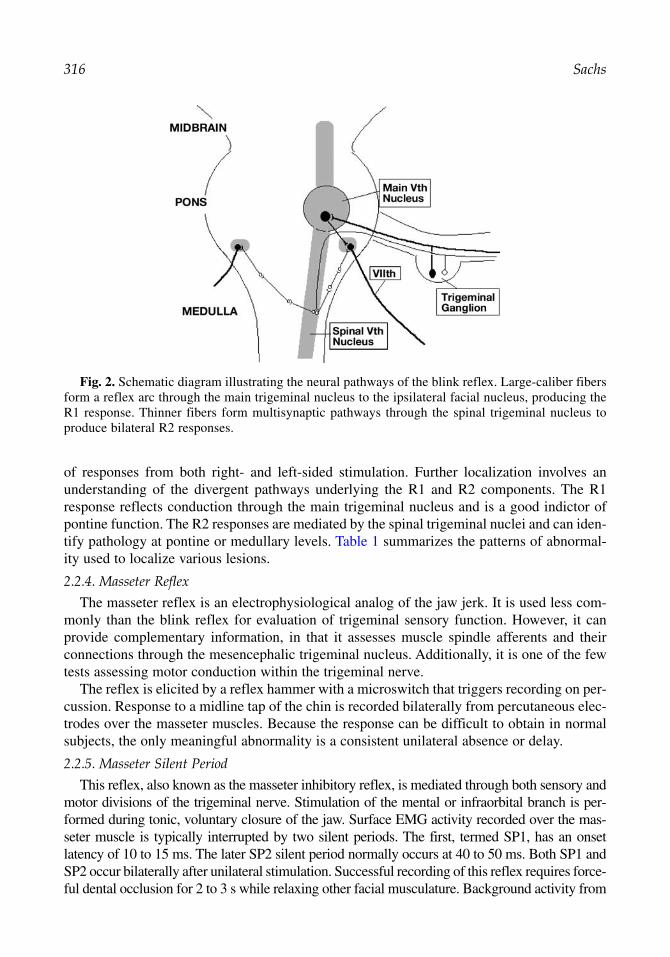
of responses from both right- and left-sided stimulation. Further localization involves anunderstanding of the divergent pathways underlying the R1 and R2 components. The R1response reflects conduction through the main trigeminal nucleus and is a good indictor ofpontine function. The R2 responses are mediated by the spinal trigeminal nuclei and can iden-tify pathology at pontine or medullary levels. Table 1 summarizes the patterns of abnormal-ity used to localize various lesions.
2.2.4. Masseter Reflex
The masseter reflex is an electrophysiological analog of the jaw jerk. It is used less com-monly than the blink reflex for evaluation of trigeminal sensory function. However, it canprovide complementary information, in that it assesses muscle spindle afferents and theirconnections through the mesencephalic trigeminal nucleus. Additionally, it is one of the fewtests assessing motor conduction within the trigeminal nerve.
The reflex is elicited by a reflex hammer with a microswitch that triggers recording on per-cussion. Response to a midline tap of the chin is recorded bilaterally from percutaneous elec-trodes over the masseter muscles. Because the response can be difficult to obtain in normalsubjects, the only meaningful abnormality is a consistent unilateral absence or delay.
2.2.5. Masseter Silent Period
This reflex, also known as the masseter inhibitory reflex, is mediated through both sensory andmotor divisions of the trigeminal nerve. Stimulation of the mental or infraorbital branch is per-formed during tonic, voluntary closure of the jaw. Surface EMG activity recorded over the mas-seter muscle is typically interrupted by two silent periods. The first, termed SP1, has an onsetlatency of 10 to 15 ms. The later SP2 silent period normally occurs at 40 to 50 ms. Both SP1 andSP2 occur bilaterally after unilateral stimulation. Successful recording of this reflex requires force-ful dental occlusion for 2 to 3 s while relaxing other facial musculature. Background activity from
316 Sachs
Fig. 2. Schematic diagram illustrating the neural pathways of the blink reflex. Large-caliber fibersform a reflex arc through the main trigeminal nucleus to the ipsilateral facial nucleus, producing theR1 response. Thinner fibers form multisynaptic pathways through the spinal trigeminal nucleus toproduce bilateral R2 responses.
19_Sachs 4/11/07 10:35 PM Page 316

surrounding muscles may mask the silent periods and, if this is the case, recording the EMGactivity with a concentric needle in the masseter may prove more successful.
The SP1 silent period likely reflects conduction through the sensory trigeminal branch toinhibitory interneurons projecting bilaterally to the motor trigeminal nucleus. This arc lieswithin the midpontine level. The SP2 is mediated through the spinal trigeminal nucleus andinvolves upper medullary as well as pontine levels. Similar to the masseter (jaw jerk) reflex,the masseter inhibitory reflex provides an assessment of both trigeminal sensory and motorconduction, but it supplies complementary information regarding smaller caliber sensoryfibers and pontomedullary connections that are more caudal.
2.3. Spinal Accessory Nerve2.3.1. Relevant Anatomy
This largely motor nerve emerges from the brainstem and cervical spine as a long, lineararray of rootlets. The spinal portion of the nerve ascends through the foramen magnum tomerge with the cranial portion and then exits the skull through the jugular foramen. Coursingdown the neck between the carotid artery and jugular vein to innervate the sternocleidomas-toid, the nerve penetrates that muscle before traversing the posterior triangle of the neck. Itthen terminates by innervating the trapezius. Communications from cervical roots C3 and C4join the spinal accessory nerve along its distal course. These innervate the trapezius to a vari-able degree. The lower portion of the trapezius more commonly receives direct innervationfrom the C3 and C4 roots, but cervical innervation of the entire trapezius has been reported.
2.3.2. Conduction Studies
Motor conduction studies of the spinal accessory nerve most often evaluate the distal seg-ment innervating the trapezius. The nerve is stimulated percutaneously at the posterior bor-der of the sternocleidomastoid muscle, with CMAP recorded from the upper portion of thetrapezius. Conduction studies assessing portions of the nerve that are more proximal can be
Cranial Nerves 317
Table 1Interpretation of Blink Reflex Studies
R supraorbital stim L supraorbital stim
Record R1 R2 R1 R2
Normal Right nl nl nlLeft nl nl nl
R CN VII lesion Right Ab Ab AbLeft nl nl nl
R CN V lesion Right Ab Ab nlLeft Ab nl nl
R pons lesion Right Ab ± ±Left ± nl nl
R medulla lesion Right nl Ab nlLeft Ab nl nl
Expected blink reflex results for trigeminal and facial neuropathies as well as brainstem lesions. R, right; stim,stimulus; L, left; nl, normal; CN, cranial nerve; ab, abnormal or absent; ±, possibly abnormal depending on pre-cise location of lesion within the pons.
19_Sachs 4/11/07 10:35 PM Page 317

performed. These involve stimulation anterior to the mastoid process with recording via nee-dle electrodes in the sternocleidomastoid and trapezius.
2.4. Hypoglossal Nerve2.4.1. Relevant Anatomy
The hypoglossal nerve derives from 10 to 15 rootlets exiting the ventral medulla. Theseform two bundles that pass through the hypoglossal canal and merge into a single nerve onleaving the skull. The nerve descends toward the angle of the mandible, receiving communi-cations from C1 and C2 ventral rami and giving off a branch to the ansa cervicalis that sup-plies the infrahyoid muscles. The hypoglossal nerve proper turns medially past the hyoidbone and divides into branches supplying the extrinsic (styloglossus, hypoglossus, genioglos-sus, and geniohyoid) muscles as well as the intrinsic muscles of the tongue.
2.4.2. Conduction Studies
Hypoglossal nerve stimulation is achieved with a bipolar surface electrode, placing thecathode 1 cm medial to the inner aspect of the mandible, at a point one-third the distance fromthe angle to the apex. CMAPs are recorded from the surface of the tongue using disc elec-trodes affixed to a bite bar or tongue depressor. The electrodes are placed along the midline,with the active electrode 1 cm behind the incisors and the reference electrode 2 cm more pos-terior. The amplitude of the CMAP may be variable because of tongue movement, but laten-cies are reportedly quite stable. As with other cranial nerve conduction studies, clearasymmetries on bilateral stimulation provide the most convincing abnormalities.
2.5. Recurrent Laryngeal Nerve2.5.1. Relevant Anatomy
This branch of the vagus nerve originates at the base of the neck and takes a different prox-imal course on the two sides. On the left, it loops under the aortic arch. On the right, it loopsunder the subclavian artery before ascending to the larynx in the sulcus between the tracheaand esophagus. All laryngeal muscles except the cricothyroid receive innervation from therecurrent laryngeal nerve.
2.5.2. Conduction Studies
Conduction studies of this nerve require specialized techniques. Recording from laryngealmuscles is most often accomplished with a concentric needle placed under laryngoscopicguidance. Needle electrodes are used to stimulate two sites: the descending vagus trunk at theposterior border of the sternocleidomastoid and the recurrent laryngeal branch lateral to thetrachea. Conduction velocity can be estimated using measurements of nerve length betweenthese two sites, derived from cadavers.
3. EMG
The needle exam of cranial musculature involves largely the same principles and techniqueused in studying limb muscles. However, a few points deserve special attention. Becausefacial muscles are small and located in sensitive areas, many examiners prefer to use very thinrecording needles (0.3-mm diameter or 30-gauge concentric needles, often referred to as“facial needles”). Their impedance is higher than standard concentric needles, raising theamplitude of both signal and noise. Other signal characteristics, most importantly the dura-tion and complexity of MUPs, are not altered by the use of facial needles.
318 Sachs
19_Sachs 4/11/07 10:35 PM Page 318

In general, motor units in cranial muscles tend to be brief and of low amplitude, makingassessment of myopathies difficult. Relaxation of cranial muscles may be hard to achieve butis most important for detection of fibrillation potentials, which can be confused with smallbrief motor units. Furthermore, activity from surrounding muscles may contaminate therecording unless selective activation of a given muscle is attempted on a background of com-plete relaxation. This is particularly relevant to examination of the orbicularis oris and orbic-ularis oculi, thin muscles in close proximity to the masseter. Every effort should be made torelax the jaw when recording from these muscles.
The cranial muscles most commonly studied by EMG include the temporalis and masseterfor the trigeminal nerve; the frontalis, orbicularis oculi, and orbicularis oris for the facialnerve; the trapezius and sternocleidomastoid for the spinal accessory nerve; and the tonguefor the hypoglossal nerve. One approach to hypoglossal muscles involves needle insertionthrough the surface of the tongue while holding it protruded with a gauze pad. An alternativeis to assess the genioglossus through the under surface of the chin, 2 cm back from the men-tal apex. With either approach, it is important to allow the tongue to settle back within thefloor of the mouth to achieve relaxation, which can often be very difficult to accomplish.
EMG of extraocular muscles is performed rarely and is usually carried out by ophthalmol-ogists familiar with the details of the anatomy. The approach is through the eyelid, sometimeswith the use of a topical anesthetic. Assessment for spontaneous activity is difficult becauseextraocular muscles maintain some baseline motor unit activation even in primary position.
4. CLINICAL CORRELATIONS
4.1. Bell’s Palsy—Initial Evaluation
The diagnosis of Bell’s Palsy is usually obvious from its clinical features. Electrodiagnosticstudies serve mainly to quantify the severity and determine prognosis. Assessing the relativecontribution of demyelinating and axonal components is crucial to prognosis. BecauseWallerian degeneration does not fully develop until 5 to 8 d after axonal injury, motor conduc-tion studies provide accurate prognostic data only after that time. CMAP amplitude is the mostuseful prognostic parameter. If the CMAP amplitude is less than 10% of that on the healthyside, maximum recovery will be delayed 6 to 12 mo, usually leaving moderate-to-severe weak-ness. If the amplitude is 10 to 30% of the healthy side, recovery may take 2 to 8 mo, with mild-to-moderate residua. If the CMAP amplitude is greater than 30% of normal, there is usuallyfull recovery within 2 mo. CMAP amplitude is most accurate in predicting a good prognosis,and less accurate in those patients with greater than 90% loss of amplitude, because a substan-tial number (up to 47%) will still have a good recovery. The CMAP amplitude method is oflimited use in bilateral facial neuropathies.
The blink reflex does not add much to prognosis in Bell’s palsy. Although it evaluates con-duction along the entire nerve, its assessment of axonal degeneration offers little beyonddirect facial nerve studies and is limited by the same time constraints. Absence of the R1component within 2 wk of onset indicates a 45% chance of satisfactory recovery, comparedwith 94% in patients with normal R1. A prolonged R1 latency only reduces the chances ofsatisfactory recovery to 87%.
Needle EMG will show abnormalities in motor unit recruitment from the outset of Bell’spalsy, but this finding does not help differentiate demyelinating from axonal lesions and, con-sequently, has little prognostic usefulness. However, the presence of even a few voluntaryMUPs in a patient with complete clinical paralysis indicates the nerve remains in continuity
Cranial Nerves 319
19_Sachs 4/11/07 10:35 PM Page 319
and is consistent with a better prognosis than those patients with no MUPs. This findingneeds to be interpreted cautiously in the orbicularis oris because there may be some degreeof crossed innervation in this midline muscle. Fibrillation potentials and positive sharp wavesindicate the presence of axonal degeneration but are difficult to quantify and do not necessar-ily imply poor recovery. They usually do not appear earlier than 1 to 2 wk after onset and maynot be observed for up to 3 wk.
4.2. Bell’s Palsy—Later Studies
Regeneration after Bell’s palsy can lead to a number of electrophysiological changes. Findingson needle exam include low-amplitude, polyphasic MUPs typical of newly regenerated motorunits (nascent motor unit potentials). In addition to abnormal volitional recruitment, these motorunits may also generate spontaneous discharges, either single or grouped (myokymic). This pre-sumably reflects a hyperexcitable state of facial motor neurons or their axons.
Synkinetic movements often develop after regeneration of the facial nerve, manifesting asjaw winking and other clinical phenomena. An electrophysiological counterpart can beobserved in the blink reflex, in which supraorbital nerve stimulation elicits R1 and R2responses not only from the orbicularis oculi but also from the orbicularis oris, platysma, orother lower facial muscles. A combination of aberrant axonal branching, ephaptic transmis-sion between axons, and neuronal hyperexcitability underlies these synkinetic discharges.
4.3. Hemifacial Spasm
This unilateral paroxysmal contraction of facial muscles may follow Bell’s palsy or occurwith a mass compressing the facial nerve, but, in most instances, hemifacial spasm ariseswithout a clear cause. Surgical exploration often reveals an arterial loop impinging the nervein such “idiopathic” cases. EMG activity during spasm shows bursts of MUP firing at ratesof 80 to 150 Hz. Brief bursts often repeat at rates of 5 to 20 per second but prolonged tonicdischarges also occur. During voluntary blinking, synkinetic discharges appear in orbicularisoris or other facial muscles normally not involved in blinking. The synkinesis of idiopathichemifacial spasm may vary from moment to moment, unlike the constant synkinesis observedafter Bell’s palsy.
Nerve conduction and reflex studies reveal abnormal responses in cases of hemifacialspasm. Blink reflexes demonstrate synkinetic R1 and R2 responses in muscles such as theorbicularis oris (that is, those not normally activated by supraorbital nerve stimulation), thatare more variable than those observed after Bell’s palsy. Motor conduction studies with selec-tive stimulation of individual facial nerve branches will evoke CMAPs from muscles suppliedby other divisions. This may reflect either ephaptic transmission or hyperexcitability of facialneurons. Hyperexcitability may also manifest as after-discharges following CMAP.
4.4. Trigeminal Neuralgia/Neuropathy
Neuralgia is the most common affliction of the trigeminal nerve. It manifests as paroxysmalpain within one or more branches, affecting (in order of decreasing frequency) the maxillary,mandibular, and ophthalmic divisions. Although a sensation of mild residual numbness can per-sist in the affected area, the neurological exam shows no deficit. Trigeminal neuralgia compli-cates many cases of multiple sclerosis; however, it most often occurs in isolation. Surgicalexploration of such idiopathic cases frequently reveals a vascular loop contacting proximal por-tions of the nerve.
320 Sachs
19_Sachs 4/11/07 10:35 PM Page 320

Electrophysiological evaluation is normal in cases of trigeminal neuralgia, except for rareprolongation of the R1 component of the blink reflex. Other abnormalities in reflex studiesor EMG of trigeminal muscles argue for the alternative diagnosis of trigeminal neuropathy.Trigeminal neuropathy with evidence of denervation on EMG often reflects a neoplastic ortraumatic etiology.
Pure sensory trigeminal neuropathy occurs in patients with connective tissue disorders(sensory neuronopthy). These cases show abnormalities in R1 and R2 components of theblink reflex as well as abnormal masseter silent periods. The sensory trigeminal neuropathycomplicating Sjogren’s syndrome produces blink reflex and silent period abnormalities, butspares proprioceptive neurons within the mesencephalic nucleus and consequently the mas-seter (jaw jerk) reflex remains normal, because these neurons are located within the centralnervous system.
4.5. Spinal Accessory Neuropathy
The most common causes of spinal accessory neuropathies are surgical trauma and tumors,but occasionally they occur without clear etiology. Many of these spontaneous cases appearakin to brachial neuritis, likely involving disimmune mechanisms. Motor nerve conductionstudies and EMG confirm the diagnosis and localization, with assessment of the sternoclei-domastoid important in determining the proximal extent of pathology. On the whole, electro-physiology is less helpful in prognosis than it is for cases of facial neuropathy. The amplitudeof trapezius CMAPs on early conduction studies does not predict outcome well. Cases withvery low initial CMAP amplitudes and marked denervation on EMG can recover surprisinglywell. In part, this may reflect compensatory reinnervation directly from cervical roots.
4.6. ALS
EMG of cranial muscles plays an important role in the diagnosis of ALS. Detection of den-ervation outside the cervical and lumbar regions becomes particularly significant in patientswith extensive spondylosis or other spinal pathology that could confound denervation identi-fied in appendicular muscles. EMG abnormalities can be observed well before clinical evi-dence of weakness in facial or bulbar muscles. Fibrillations and positive waves provide themost definitive evidence of denervation but may be difficult to recognize. Reported studies ofcranial muscles in ALS have found fibrillations (in order of decreasing frequency) in thetongue, facial nerve muscles, and trigeminal nerve muscles. Evidence of reinnervation(increased MUP duration and amplitude) is less definitive but more common. Quantitativeanalysis of MUP parameters has revealed abnormalities in up to 60% of cranial nerve mus-cles in ALS patients without bulbar signs or symptoms.
SUGGESTED READING
Ongerboer de Visser BW, Cruccu G. Chapter 3: Neurophysiologic examination of the trigeminal,facial, hypoglossal, and spinal accessory nerves in cranial neuropathies and brain stem disorders.In: Clinical Electromyography, 2nd ed. (Brown WF, Bolton CF, eds.). Butterworth Heinemann,Boston, MA, 1993, pp. 63–64.
Kimura J. Chapter 16: The blink reflex. In: Electrodiagnosis in Diseases of Nerve and Muscle:Principles and Practice, 2nd ed. FA Davis, Philadelphia, PA, 1989, pp. 307–331.
Preston DC, Shapiro BE. Chapter 5: The blink reflex. In: Electromyography and NeuromuscularDisorders: Clinical–Electrophysiologic Correlations. Butterworth-Heinemann, Boston, MA,1998, pp. 57–62.
Cranial Nerves 321
19_Sachs 4/11/07 10:35 PM Page 321

REVIEW QUESTIONS
1. Poor prognosis in Bell’s palsy is indicated by:A. Ipsilateral R1 on the blink reflex prolonged by 10%.B. Reduced motor unit recruitment in frontalis.C. Nasalis CMAP amplitude less than 10% of contralateral.D. A and C.
2. Which is least likely to be observed with hemifacial spasm:A. R1 response from orbicularis oris on blink reflex.B. Denervation in the masseter.C. Response in frontalis from stimulation of the zygomatic branch.D. After-discharges on conduction studies.
3. On the blink reflex testing, stimulation of the left supraorbital nerve produces abnormal R2 responsesin orbicularis oculi bilaterally. All other responses are normal. The lesion is most likely in:A. The left trigeminal nerve.B. The left pons.C. The left medulla.D. The right medulla.
4. With the blink reflex, R1 response from the ipsilateral mentalis is observed with:A. Aberrant regeneration after Bell’s palsy.B. Medullary lesions.C. Hemifacial spasm.D. A and C.
5. Which is least likely to be observed with the trigeminal neuropathy of Sjogren’s syndrome:A. Denervation in the masseter.B. Abnormal blink reflex.C. Abnormal masseter silent period.D. Normal masseter (jaw jerk) reflex.
6. Compared with larger concentric EMG needles, facial (30 gauge) concentric needles:A. Increase MUP duration.B. Increase MUP amplitude.C. Increase MUP polyphasia.D. Increase MUP firing rate.
7. Synkinesis of facial muscles after Bell’s palsy reflects:A. Aberrant branching of axons.B. Hyperexcitability within the Gasserian ganglion.C. Ephaptic transmission.D. A and C.
8. Which is least likely to occur with a compressing mass in the jugular foramen:A. Denervation in the sternocleidomastoid.B. Denervation in the geniohyoid.C. Denervation in the trapezius.D. Scapular winging.
9. Common electrodiagnostic findings in idiopathic trigeminal neuralgia include:A. Denervation in the temporalis.B. Denervation in the masseter.C. Absent R1 and R2 responses of the blink reflex.D. None of the above.
10. In patients with ALS:A. Denervation is observed more often in temporalis than in the tongue.B. Denervation is observed more often in the mentalis than the tongue.C. Cranial EMG abnormalities are observed in patients without bulbar symptoms.D. There is often early recruitment of motor units in cranial muscles.
322 Sachs
19_Sachs 4/11/07 10:35 PM Page 322
REVIEW ANSWERS
1. The correct answer is C. If the CMAP amplitude is less than 10% of the contralateral facial mus-cles, there is almost always severe axonal degeneration, affording a poor prognosis in Bell’spalsy. Delay of R1 response has little prognostic value because slowing of conduction does notcause significant weakness. Reduced motor unit recruitment does not necessarily imply axonaldamage. It may reflect conduction block, which is reversible.
2. The correct answer is B. The masseter is supplied by the trigeminal nerve and should not beaffected by this disorder of the facial nerve. Answers A and C describe lateral spread of responseamong facial muscles. This is common in hemifacial spasm and may reflect ephaptic transmis-sion or hyperexcitability within the facial nucleus. After discharges, another manifestation ofhyperexcitability, can be observed after CMAPs in motor conduction studies of the facial nervein cases of hemifacial spasm.
3. The correct answer is C. R2 responses are mediated through the spinal trigeminal tract andnuclei in the medulla. The pathway leading to the contralateral R2 response crosses at the levelof the medulla. Although trigeminal nerve and pontine lesions can affect the R2 response, theywould most likely also affect the R1 response. A lesion in the right medulla would not disruptthe pathway mediating the ipsilateral R2 from left-sided stimulation.
4. The correct answer is D. R1 responses are normally restricted to the orbicularis oculi. An R1response from the mentalis represents a synkinetic response, which can be observed after regen-eration in Bell’s palsy or in hemifacial spasm. A medullary lesion is too caudal to affect the path-way underlying the R1 response.
5. The correct answer is A. The trigeminal neuropathy observed in Sjogren’s syndrome (and othercollagen vascular disorders) is purely sensory. Sparing of the masseter reflex is characteristic ofSjogren’s syndrome. The cell bodies of 1A afferents involved in this reflex reside in the mesen-cephalic nucleus, which may be less susceptible to immune attack than other trigeminal sensoryneurons within the Gasserian ganglion.
6. The correct answer is B. Facial EMG needles are thinner than standard EMG needles and, there-fore, have a higher impedance. This increases the amplitude of recorded signals but does notaffect other motor unit action potential features.
7. The correct answer is D. Both aberrant branching of regenerated axons and ephaptic transmis-sion between axons cause synkinesis in Bell’s palsy. Hyperexcitability in the Gasserian ganglionshould not affect facial nerve muscles, nor should it occur in Bell’s palsy.
8. The correct answer is B. Compression at the jugular foramen should injure spinal accessorynerve fibers destined for both the sternocleidomastoid and trapezius. Trapezius weakness causesone form of scapular winging. The geniohyoid is supplied by the hypoglossal nerve, whichleaves the skull through the hypoglossal canal. Although skull base tumors will frequently com-press both cranial nerves XI and XII, a “jugular foramen syndrome” spares the latter.
9. The correct answer is D. Idiopathic trigeminal neuralgia very rarely prolongs R1 latency in theblink reflex, but is not associated with any other electrodiagnostic abnormalities.
10. The correct answer is C. Evidence of ongoing denervation and reinnervation in cranial muscles isfrequently observed in ALS patients without bulbar signs or symptoms. EMG abnormalities arefound in the tongue, facial muscles, and trigeminal muscles, in order of decreasing frequency.
Cranial Nerves 323
19_Sachs 4/11/07 10:35 PM Page 323

19_Sachs 4/11/07 10:35 PM Page 324

20Electrophysiology of Myopathy
Approach to the Patient With Myopathy in the EMG Laboratory
Nithi S. Anand and David Chad
SummaryThe myopathic disorders represent a heterogeneous group of diseases with a variety of causes.
Although electrodiagnostic testing rarely allows an entirely specific diagnosis to be made, suchtesting can be extremely helpful in first confirming the presence of myopathy and therefore helpingto appropriately categorize it. Standard motor nerve conduction studies generally do not demon-strate substantial abnormalities, except occasional reductions in compound motor potential ampli-tude in severe cases or where predominantly distal disease is present. Needle EMG remains themost important part of neurophysiological examination. In most myopathic conditions, sponta-neous activity is increased, although it is most prominently increased in inflammatory or necrotizingmyopathic processes. The presence of myotonic discharges can be very helpful in limiting the dif-ferential diagnosis. Complex repetitive discharges, which are present in myopathic conditions, arenonspecific. Motor unit potentials in myopathy are generally of low-amplitude and short duration,except in very chronic conditions, in which the motor unit potentials can actually become of longduration and high amplitude. Finally, it is critical to remember that an entirely normal EMG doesnot exclude the presence of myopathy.
Key Words: Dermatomyositis; fibrillation potential; myopathy; myositis; myotonic discharge; myotonicdystrophy; polymyositis.
1. INTRODUCTION
The term myopathy is used to denote diseases of the striated muscle. Diseases of muscleare common in neurological practice, and EMG has an important role in their diagnosis andmanagement. We suggest that most patient encounters in the EMG laboratory start with abrief history. This is performed to ascertain the mode of onset, progression, pattern of mus-cle involvement, and to inquire about relevant medical history, including medications (e.g.,statin drugs, coumadin). The history is followed by a focused neurological examination toidentify the weak muscle groups and confirm the pattern of muscle involvement. In gen-eral, the pattern of muscle involvement in myopathy is proximal more than distal, althoughthere are exceptions to this general rule. In this context, it is useful to have in mind a clas-sification of muscle diseases (Table 1). It is worth remembering that lesions in other partsof the nervous system, such as watershed cerebral infarctions, motor neuron diseases, neu-romuscular junction (NMJ) disorders, and motor neuropathies might mimic the clinicalpicture of myopathy. It is also useful to remember key clinical findings of common
From: The Clinical Neurophysiology PrimerEdited by: A. S. Blum and S. B. Rutkove © Humana Press Inc., Totowa, NJ
325
20_Chad 4/11/07 9:54 AM Page 325
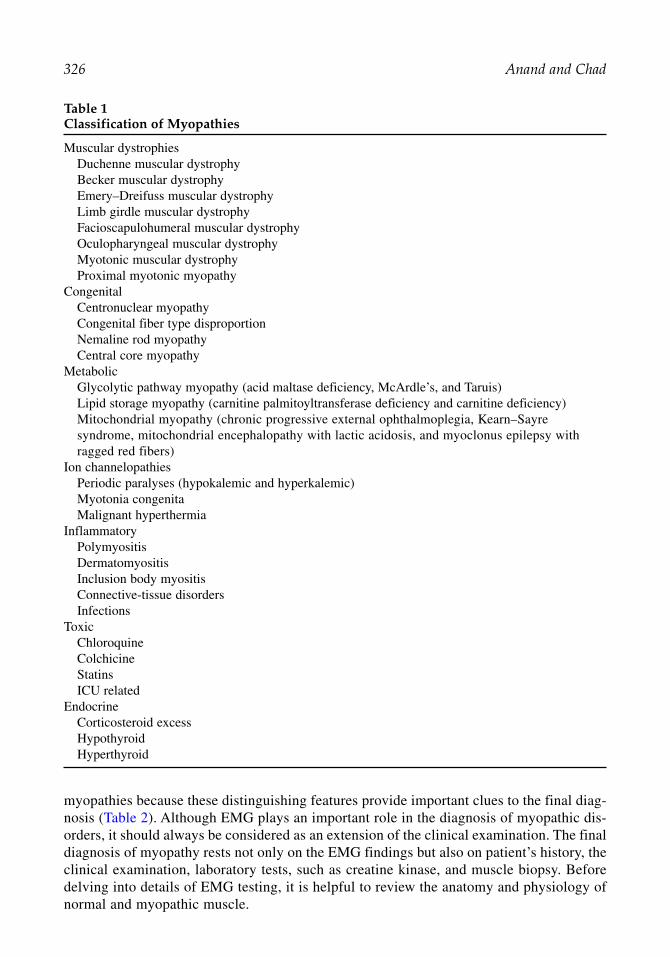
326 Anand and Chad
myopathies because these distinguishing features provide important clues to the final diag-nosis (Table 2). Although EMG plays an important role in the diagnosis of myopathic dis-orders, it should always be considered as an extension of the clinical examination. The finaldiagnosis of myopathy rests not only on the EMG findings but also on patient’s history, theclinical examination, laboratory tests, such as creatine kinase, and muscle biopsy. Beforedelving into details of EMG testing, it is helpful to review the anatomy and physiology ofnormal and myopathic muscle.
Table 1Classification of Myopathies
Muscular dystrophiesDuchenne muscular dystrophy Becker muscular dystrophy Emery–Dreifuss muscular dystrophy Limb girdle muscular dystrophy Facioscapulohumeral muscular dystrophy Oculopharyngeal muscular dystrophy Myotonic muscular dystrophy Proximal myotonic myopathy
CongenitalCentronuclear myopathyCongenital fiber type disproportionNemaline rod myopathyCentral core myopathy
MetabolicGlycolytic pathway myopathy (acid maltase deficiency, McArdle’s, and Taruis)Lipid storage myopathy (carnitine palmitoyltransferase deficiency and carnitine deficiency)Mitochondrial myopathy (chronic progressive external ophthalmoplegia, Kearn–Sayresyndrome, mitochondrial encephalopathy with lactic acidosis, and myoclonus epilepsy withragged red fibers)
Ion channelopathiesPeriodic paralyses (hypokalemic and hyperkalemic)Myotonia congenitaMalignant hyperthermia
InflammatoryPolymyositisDermatomyositisInclusion body myositisConnective-tissue disordersInfections
ToxicChloroquineColchicineStatinsICU related
EndocrineCorticosteroid excessHypothyroidHyperthyroid
20_Chad 4/11/07 9:54 AM Page 326
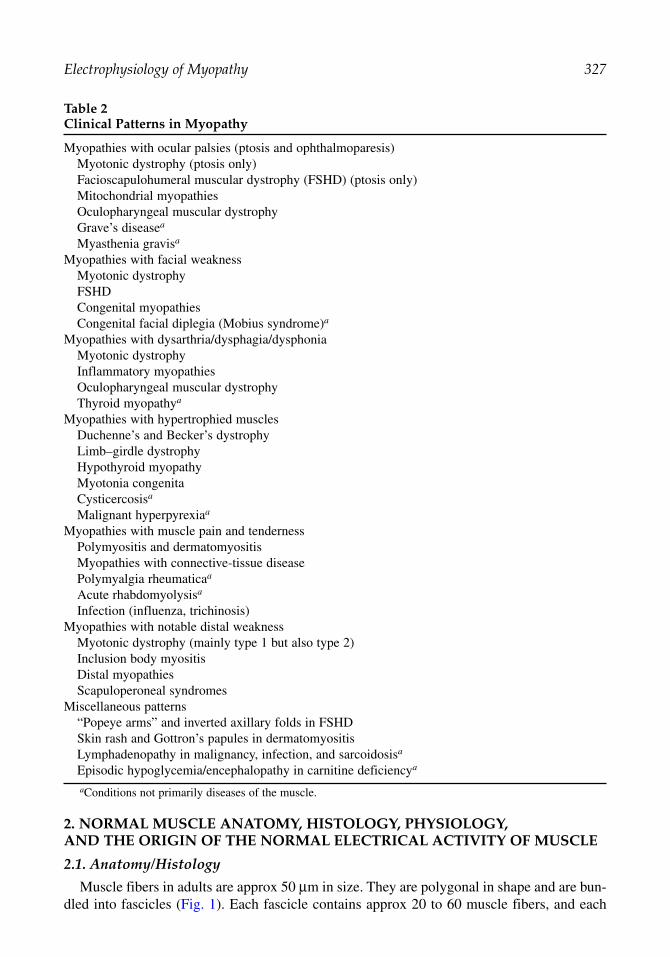
Electrophysiology of Myopathy 327
2. NORMAL MUSCLE ANATOMY, HISTOLOGY, PHYSIOLOGY, AND THE ORIGIN OF THE NORMAL ELECTRICAL ACTIVITY OF MUSCLE
2.1. Anatomy/Histology
Muscle fibers in adults are approx 50 µm in size. They are polygonal in shape and are bun-dled into fascicles (Fig. 1). Each fascicle contains approx 20 to 60 muscle fibers, and each
Table 2Clinical Patterns in Myopathy
Myopathies with ocular palsies (ptosis and ophthalmoparesis)Myotonic dystrophy (ptosis only)Facioscapulohumeral muscular dystrophy (FSHD) (ptosis only)Mitochondrial myopathiesOculopharyngeal muscular dystrophyGrave’s diseasea
Myasthenia gravisa
Myopathies with facial weaknessMyotonic dystrophyFSHDCongenital myopathiesCongenital facial diplegia (Mobius syndrome)a
Myopathies with dysarthria/dysphagia/dysphoniaMyotonic dystrophyInflammatory myopathiesOculopharyngeal muscular dystrophyThyroid myopathya
Myopathies with hypertrophied musclesDuchenne’s and Becker’s dystrophyLimb–girdle dystrophyHypothyroid myopathyMyotonia congenitaCysticercosisa
Malignant hyperpyrexiaa
Myopathies with muscle pain and tendernessPolymyositis and dermatomyositisMyopathies with connective-tissue diseasePolymyalgia rheumaticaa
Acute rhabdomyolysisa
Infection (influenza, trichinosis)Myopathies with notable distal weakness
Myotonic dystrophy (mainly type 1 but also type 2)Inclusion body myositisDistal myopathiesScapuloperoneal syndromes
Miscellaneous patterns“Popeye arms” and inverted axillary folds in FSHD Skin rash and Gottron’s papules in dermatomyositis Lymphadenopathy in malignancy, infection, and sarcoidosisa
Episodic hypoglycemia/encephalopathy in carnitine deficiencya
aConditions not primarily diseases of the muscle.
20_Chad 4/11/07 9:54 AM Page 327

328 Anand and Chad
muscle fiber consists of 50 to 100 myofibrils (Fig. 2). The myofibrils are divided into sarcom-eres, which are the smallest contractile units. The sarcomere is that portion of the myofibrilthat extends from Z band to Z band (Fig. 3). The sarcomere consists of two filaments, thethick (myosin) filaments alternating with the thin (actin) filaments. The four major contrac-tile proteins that are present in a myofilament are actin, myosin, troponin, and tropomyosin.The T tubules (Fig. 2) are located near the junction of the A and I bands and transmit the ini-tial depolarization at the motor end plate. They are opposed on each side by the terminal cis-terns of the sarcoplasmic reticulum. The terminal cisterns act as the storage space for calciumions. This sarcoplasmic reticulum-T tubule-sarcoplasmic reticulum complex is called the“triad” and is responsible for converting electrical signals (membrane action potentials) tochemical signals (calcium release).
In a normal muscle, the muscle fibers are organized into functional groups called motorunits. The term “motor unit,” first used by Liddell and Sherrington in 1929, refers to a singlelower motor neuron and the muscle fibers it innervates. One motor neuron innervates multi-ple muscle fibers, but each muscle fiber is innervated by only one motor neuron. The averagenumber of muscle fibers in a motor unit determines the innervation ratio of the muscle. Thisratio varies greatly from one muscle to another and is related to the degree of dexterityrequired of that muscle. For instance, the innervation ratio of the external ocular muscles isapprox 10 muscle fibers to 1 motor neuron, that of intrinsic hand muscles is approx 100 mus-cle fibers to 1 motor neuron, and that of gastrocnemius is approx 2000 muscle fibers to 1 motor neuron. The muscle fibers belonging to a motor unit are typically distributed widely,reaching over as many as 100 fascicles. They are randomly distributed over a circular or oval
Fig. 1. Schematic diagram of the connective tissue sheaths of muscle. Muscle fibers are bundled intofascicles bordered by perimysial connective tissue. From DeGirolami and Smith, 1982 with permission.
20_Chad 4/11/07 9:54 AM Page 328

Electrophysiology of Myopathy 329
region that can reach approx 20 to 30% of the muscle’s cross sectional area, with an averagediameter of 5 to 10 mm. In general, there is a mosaic pattern of as many as 20 to 50 overlap-ping motor units in the same muscle, although a slightly higher density of muscle fibersbelonging to the same motor unit is observed at the center of the motor unit.
2.2. Physiology
Muscle contraction occurs as a result of a series of steps. The process starts with an actionpotential traveling along the motor nerve axon and reaching the axon terminal (Fig. 4). This(presynaptic) depolarization opens voltage-gated calcium channels, which increases calciumconductance and leads to release of acetylcholine (ACh) into the synaptic cleft. The AChreceptors (ligand-gated channels) at the postsynaptic membrane bind to this ACh, resulting inan end-plate potential, which, when reaching threshold, triggers opening of the adjacent mus-cle fiber voltage-gated sodium channels (Fig. 4). This ionic flow induces a voltage change,producing an action potential that initiates the excitation-contraction coupling.
With this outline in mind, let us now consider each step in more detail. In the resting state,small fluctuations in membrane potentials occur at the end-plate region called miniature end-plate potentials. The miniature end-plate potentials are produced by the spontaneous releaseof quanta of ACh from the motor nerve ending that are not sufficient to produce an action
Fig. 2. Structure of a single muscle fiber cut both horizontally and longitudinally. Individual myofib-rils are surrounded and separated by sarcoplasmic reticulum. T tubules are continuous with extracellularfluid and interdigitate with sarcoplasmic reticulum. Note the regular association of T tubule with sar-coplasmic reticulum to form membranous triads. Note the location of myonuclei at the periphery of themuscle fiber and the presence of many mitochondria. From Westmoreland et al., 1994 with permission.
20_Chad 4/11/07 9:54 AM Page 329

330 Anand and Chad
potential. An action potential is generated if this end-plate potential reaches sufficient ampli-tude. Postsynaptic depolarization causes the action potential to travel along the muscle fiberin both directions at a velocity of approx 4 m/s and to come in contact with the terminal cis-ternae of the sarcoplasmic reticulum, thus, gaining entry into the contractile apparatus.
The T tubules transmit this action potential inward, penetrating the triad complex (sar-coplasmic reticulum-T tubule-sarcoplasmic reticulum complex). This results in a signaltransduction through ryanodine receptors releasing calcium ions. The calcium ions then bindto the troponin subunits, causing a conformational change in the tropomyosin and the actinhelix configuration. Sliding of the thin actin filaments over the thick myosin filaments pro-duces muscle contraction. The shortening of the sarcomeres and the I band during contrac-tion is not caused by any change in the absolute length of the filaments but rather by thesliding of the filaments themselves. Contraction ceases when calcium is removed from thesarcoplasmic reticulum by active transport.
2.3. EMG Correlates of Normal Muscle Physiology
In muscle at rest, the advancing needle records discharges described as insertional activityand the stationary needle electrode records discharges described as spontaneous activity.When the muscle is voluntarily activated, the needle electrode records groups of individualmotor unit action potentials (MUAPs).
Fig. 3. Organization of protein filaments in a myofibril. (A) Longitudinal section through onesarcomere (Z disc to Z disc) showing the overlap of actin and myosin. (B) Cross section through theA band, where the thin actin filaments interdigitate with the thick myosin filaments in a hexagonalformation. (C) Location of specific proteins in the sarcomere. From Westmoreland et al., 1994 withpermission.
20_Chad 4/11/07 9:54 AM Page 330

Electrophysiology of Myopathy 331
2.3.1. Insertional Activity
In normal muscle, the act of inserting the needle electrode generally evokes only a briefdischarge that lasts a little longer than the actual movement of the needle.
2.3.2. Spontaneous Activity
Physiological spontaneous activity is usually restricted to the end-plate regions, observedas end-plate noise and spikes. A more prolonged discharge can occur when the needle elec-trode is in the end-plate zone (Fig. 5).
2.3.3. Motor Unit Action Potential
The standard concentric needle electrode used in EMG practice has an active recordingsurface of approx 150 × 600 µm. This recording surface captures activity of muscle fibers that
Fig. 4. The binding of acetylcholine (ACh) at transmitter-gated channels opens channels perme-able to both Na+ and K+. The flow of these ions into and out of the cell depolarizes the cell mem-brane, producing the end-plate potential. This depolarization opens neighboring voltage-gated Na+
channels. To elicit an action potential, the depolarization produced by the end-plate potential mustopen sufficient Na+ channels to reach the threshold for initiating the action potential. From Kandel et al.,1995 with permission.
20_Chad 4/11/07 9:54 AM Page 331

332 Anand and Chad
are located within a 10-mm diameter. The electrical activity of a motor unit recorded by aneedle electrode represents the summation of action potentials of muscle fibers that are fir-ing near the electrode. Approximately 8 to 20 muscle fibers belonging to the same motor unitcontribute to the recorded MUAP. It is important to appreciate that the MUAP represents thesummated activity of some muscle fibers in a motor unit but not activity of all fibers of amotor unit. Type I muscle fibers are primarily responsible for the generation of the MUAPbecause low-threshold small motor neurons are preferentially activated on initial minimalvoluntary contraction.
Normally, there is some variation of size and form of the MUAPs in a single muscle andof the average size and form of action potential in different muscles. The morphology of theMUAPs is influenced by a number of technical and physiological factors, such as type of nee-dle electrode used, patient’s age, muscle temperature, and so on. In general, MUAP durationis shorter in proximal than in distal muscles and their size is larger in adults than in children.MUAPs recorded in normal muscles of the extremities are commonly diphasic or triphasicwaves, and they produce a thumping or knocking sound over the loudspeaker.
A variety of parameters define the MUAP (Fig. 6). The amplitude is primarily derivedfrom the muscle fiber action potentials of the motor unit residing within 500 µm of theactive recording surface and usually measures between 100 µV and 2 mV. It is influencedby the number and diameter of fibers involved, proximity of the needle electrode to motorunits, and the synchronicity of their action potentials. The rise time is measured from the ini-tial positive peak to the subsequent negative peak, and is an indicator of the distancebetween the recording tip of the electrode and the depolarizing muscle fibers. The rise timeshould be less than 500 µs before a MUAP is accepted as a genuine near-field MUAP. A short rise time is characterized by a sharp, crisp sound. If the MUAP is associated with adull sound, the electrode should be adjusted until MUAPs with sharp and crisp sounds aredetected. The amplitude and rise time are inversely proportional to the distance between theelectrode and the muscle fibers.
The duration of the MUAP depends on the depolarization of many muscle fibers that areboth away from and close to the tip of the needle. It best reflects the number of muscle fibers
Fig. 5. Normal spontaneous activity in the end-plate region. Electrical activity recorded from themuscle at rest after insertional activity has subsided, and there is no voluntary muscle contraction.From Daube, 1991 with permission.
20_Chad 4/11/07 9:54 AM Page 332

Electrophysiology of Myopathy 333
in a motor unit, and typically measures approx 5 to 15 ms. It is the time from the initialdeflection away from the baseline to its final return to the baseline. It varies with the muscletested, patient’s age, and the muscle temperature. The initial deflection reflects the arrival ofthe fastest muscle fiber action potential and, thus, the arrival time of various action potentialsdetermine the final duration of that particular MUAP. Factors that influence the arrival timeof various action potentials include length of individual terminal nerve branches, the distanceof individual NMJs from the recording electrode, the diameter of individual muscle fibers,and the conduction velocity along individual muscle fibers (Fig. 7). Thus, unlike the ampli-tude, the duration of the MUAP is significantly affected by the distant muscle fibers. Thenumber of phases in the MUAP depends on the synchrony of depolarization of the musclefibers, that is, the extent to which the muscle fibers within a motor unit fire at the same time.MUAPs with more than four phases are called polyphasic. Polyphasia may be observed nor-mally, and up to 12% polyphasic MUAPs has been described in normal muscles.
2.3.4. Recruitment in Normal Muscle
Motor unit recruitment refers to the successive activation of the same and additional motorunits with increasing strength of voluntary muscle contraction. The Henneman size principlerefers to the orderly successive activation of motor units during an increasing voluntary mus-cle activation, with the activation of small, weak (type 1) motor units first in an early contrac-tion, and the sequential addition of larger, stronger (type 2) motor units to provide a smoothincrease in muscle power. Recruitment frequency refers to the firing rate of a MUAP when adifferent MUAP appears during gradually increasing voluntary muscle contraction.Recruitment interval refers to the time elapsed between consecutive discharges of a MUAPwhen a different MUAP first appears during gradually increasing muscle contraction.
Fig. 6. A schematic motor unit potential with characteristics that can be measured. The motor unitpotential (also known as the motor unit action potential) is the compound action potential of a singlemotor unit whose muscle fibers lie within the recording range of an electrode. From Daube, 1991with permission.
20_Chad 4/11/07 9:54 AM Page 333

334 Anand and Chad
In the EMG laboratory, motor unit recruitment is commonly assessed with the rule of fives.Let us consider a situation in which the first motor unit begins to fire at 5 Hz. A new MUAPis recruited when the first motor unit reaches a firing frequency of 10 Hz. Subsequent newmotor units are added as the previous motor units reach their maximal firing frequency. Forinstance, if the MUAPs are firing at 25 Hz, there should be at least five different MUAPs onthe EMG monitor. If the ratio exceeds six, this indicates that few motor units are present andthose are firing rapidly, at more than the usual frequency of 5 Hz. Each muscle also has acharacteristic maximal MUAP recruitment frequency. For instance, the facial muscles havehigh maximal recruitment frequencies (20–30 Hz) in contrast to the extremity muscles, whichhave maximal recruitment frequencies in the 10- to 12-Hz range.
The other commonly used term for recruitment in the EMG laboratory is interference pat-tern. A full interference pattern implies that no individual MUAP can be clearly identified. Inhealthy individuals, one would expect a full interference pattern on voluntary muscle contrac-tion. A reduced interference pattern is one in which some of the individual MUAPs may beidentified, whereas other individual MUAPs cannot be identified because of superimpositionof waveforms. The importance of early or increased recruitment observed in myopathy willbe discussed in Section 3.2.4. If documenting recruitment pattern or the interference pattern,it is important to specify the force of muscle contraction associated with that pattern.
3. MYOPATHIC MUSCLE: HISTOPATHOLOGY AND THE ORIGIN OF ABNORMAL ELECTRICAL ACTIVITY DETECTED BY EMG
3.1. Histopathology
Myopathic states result in a variety of structural alterations in the muscle. Muscle fiberatrophy is typically produced by denervation, although it can be observed in the late stagesof severe myopathies (Fig. 8). Muscle fiber hypertrophy (Fig. 8) is observed in chronicmuscle diseases, notably in the muscular dystrophies and in other longstanding disorders(e.g., hypothyroid myopathy). Muscle fiber necrosis results in disruption and fragmentation
Fig. 7. Schematic representation of motor unit action potential generation and recording by a con-centric needle electrode. Individual muscle fiber action potentials numbered one through six arrive atthe recording electrode at different times, depending on factors such as terminal nerve branch length,distance between the muscle fiber’s neuromuscular junction and the recording electrode, diameter ofthe individual muscle fiber, and the conduction velocity of muscle fiber action potentials along indi-vidual muscle fibers. From Ball 1985 with permission.
20_Chad 4/11/07 9:54 AM Page 334

Electrophysiology of Myopathy 335
of the sarcoplasm and loss of normal cross striations (Fig. 9). Regenerating fibers stain darkblue with hematoxylin stain because of their increased RNA content. Segmental necrosismay result in separation of a portion of a muscle fiber from the NMJ, resulting in denerva-tion of the detached portion of the muscle fiber. Interstitial mononuclear cell infiltrates(Fig. 10) are important markers for inflammatory muscle disease, such as polymyositis.Vacuolar degeneration may be observed in a number of myopathies, including glycogenand lipid storage disorders, IBM (Fig. 11), and hypokalemic periodic paralysis. By electronmicroscopy, the vacuoles may contain normal or abnormal material and fluid. Variousstructural changes may be observed with congenital myopathies, such as nemaline rodmyopathy, centronuclear myopathy (Fig. 12), and central core disease. Additionally, mito-chondrial abnormalities (Fig. 13) are observed in a variety of myopathies, including theKearns-Sayre syndrome.
3.2. EMG Correlates of Myopathic Muscle3.2.1. Insertional Activity in Myopathic Muscle
A marked reduction of insertional activity occurs if muscle fibers are severely atrophied orreplaced by fibrous tissue or fat, or if they become unexcitable, for example, during severeparalysis in familial periodic paralysis. An increase in insertional activity is the first EMGclue to the presence of abnormal spontaneous potentials in the muscle (Fig. 14).
3.2.2. Spontaneous Activity in Myopathic Muscle
The general rule of thumb is that any spontaneous potential with an initial positive deflec-tion should be regarded as abnormal. It is also important to pause and allow sufficient time
Fig. 8. Chronic myopathic changes (Emery–Dreifuss muscular dystrophy). Cross-section demon-strating pronounced variation in muscle fiber size with enlarged (hypertrophic) and small (atrophic)fibers. Additionally, there are prominent internalized myonuclei, fiber splitting (arrows), and an excessof connective tissue. This increase in fiber size variation compared with healthy muscle contributesto the temporal dispersion of muscle fiber action potentials arriving at the recording electrode and,hence, to the polyphasic MUAP of myopathic disorders [see Fig. 7]. By creating two fibers from one,fiber splitting has the effect of increasing MUAP amplitude. H&E stain.
20_Chad 4/11/07 9:54 AM Page 335

336 Anand and Chad
(≥1–2 s) between each needle electrode advancement to look for abnormal spontaneouspotentials. The four abnormal spontaneous potentials to look for in a patient with myopathycomprise: fibrillation potentials, positive sharp waves (PSWs), myotonic potentials, and com-plex repetitive discharges (CRDs).
Fibrillation potentials are the most common abnormal insertional/spontaneous activityobserved in myopathies. They seem to arise spontaneously from either a single muscle fiberor a few muscle fibers and are not associated with visible contractions. They are biphasic ortriphasic waves with an initial positive deflection (Fig. 15). They are usually 1 to 2 ms induration and less than 100 µV in amplitude. They are identified by their regular frequency,with a typical sound on the loudspeaker that is likened to “raindrops on tin roof.” PSW, as thename implies, are biphasic waves with an initial PSW followed by a long negative wave. Theyare usually 30 ms in duration, with amplitudes of 50 µV to 1 mV. They are regular in fre-quency and are identified by their “dull thud” or “ticking of clock” sounds on the loud-speaker. Fibrillation potentials in myopathic disorders were described as early as 1949 by
Fig. 9. Muscle fiber necrosis. Longitudinal section showing a necrotic muscle fiber segment(arrows) with disruption/fragmentation of the sarcoplasm and loss of normal cross striations.Myonuclei (arrowheads), with prominent nucleoli of a regenerating muscle fiber (open arrowheads)are also noted. Such a pathological state may be associated with fibrillation potential activity becausestill healthy muscle fiber segments may have become separated from the muscle end-plate region bysegmental fiber necrosis. H&E stain.
20_Chad 4/11/07 9:54 AM Page 336

Electrophysiology of Myopathy 337
Kugelberg. They are thought to result from segmental necrosis of muscle fibers, in which thenecrosis leaves a distal muscle fiber segment separated from the part carrying the motor plate.Both fibrillation potentials and PSWs have the same clinical significance and can be observedwith both neurogenic and myopathic disorders. However, when observed in excess in a myo-pathic illness, the muscle biopsy almost always shows some necrotizing features.
Myotonic discharges are the second most common abnormal insertional/spontaneousactivity observed in myopathies. They are the EMG hallmark of myotonia and are often asso-ciated with clinical myotonia. When observed diffusely on needle examination, the patient isconsidered to have a myotonic disorder unless proven otherwise. They are generated by single
Fig. 10. Mononuclear cell infiltration and excessive muscle fiber size variation in inflammatorymyopathy. The inflammation surrounds small vessels (*) and spills out into the endomysium to sur-round some muscle fibers. H&E stain.
Fig. 11. Vacuolated muscle fiber in the setting of inclusion body myositis. The vacuoles are linedor “rimmed” with granular material. H&E stain.
20_Chad 4/11/07 9:54 AM Page 337

338 Anand and Chad
muscle fibers and can occur either spontaneously, by stimulation of the nerves supplying therecorded muscle, by voluntary MUAP activation, or by mechanical stimulation. Cold isthought to enhance myotonic discharges in most conditions; the one exception to this rule isparamyotonia congenita, in which prolonged cooling will lead to complete electrical silenceof the muscle. The frequency of their discharge ranges between 15 and 150 Hz, and theiramplitude ranges between 10 µV and 1 mV. Their waxing and waning amplitudes and the“dive-bomber sound” on the loudspeaker are characteristic (Fig. 16). Although the precise
Fig. 12. Centronuclear myopathy. Instead of their normal peripheral location, muscle nuclei arelocated in the central regions of the muscle fibers. H&E stain.
Fig. 13. Mitochondrial myopathy in the context of Kearns-Sayre syndrome. Note the accumula-tion of darkly staining material in the subsarcolemmal regions that prove by electron microscopy tobe abnormal mitochondria. H&E stain.
20_Chad 4/11/07 9:54 AM Page 338

Electrophysiology of Myopathy 339
mechanism of myotonia is unclear, it is thought to be secondary to a defect in ion channelson the muscle membrane (the chloride channel in myotonia congenita, and the sodium chan-nel in paramyotonia and hyperkalemic periodic paralysis).
CRDs are repetitive discharges of polyphasic or serrated action potentials characterized bytheir uniform frequency, shape, and amplitude, with abrupt onset, cessation, or change in con-figuration (Fig. 17). In contrast to myotonic discharges, CRDs do not wax and wane in ampli-tude or frequency. Formerly referred to as “bizarre high-frequency waves” or the confusing
Fig. 14. Insertion activity. Top, normal insertion activity. Bottom, increased insertion activity.From Daube, 1991 with permission.
Fig. 15. Fibrillation potentials. Top, spike form. Center, positive waveform. Bottom, developmentof a positive wave form (serial photographs taken after insertion of needle electrode). From Daube,1991 with permission.
20_Chad 4/11/07 9:54 AM Page 339

340 Anand and Chad
term “pseudomyotonic discharges,” they are indicative of a hyperirritable muscle membranewith a group of muscle fibers firing in near synchrony. CRDs are observed in both neurogenicand myopathic disorders. Their presence is suggestive of a more chronic or longstandingprocess. They may be found in patients with muscular dystrophy, hyperkalemic periodicparalysis, glycogen storage disorders, and hypothyroid myopathy, but also in chronic dener-vating diseases.
Clinically, fasciculations are visible muscle twitches and they represent the spontaneouscontractions of a group of muscle fibers belonging to a single motor unit. The electrical activ-ity associated with the twitch is called a fasciculation potential, and it has the configurationof a MUAP. Although fasciculation potentials generally arise in the wake of an underlyingneurogenic process, rarely, they are observed in myopathies, such as thyrotoxic myopathyand inclusion body myositis (IBM). Even in such rare instances, an underlying neurogeniccomponent may be the cause of fasciculations. Likewise, myokymic potentials are not usuallyobserved in diseases of the muscle in the absence of a coexisting or underlying neurogenicprocess. In fact, the presence of fasciculations or myokymia should prompt the clinician torethink the diagnosis of a primary muscle disease.
3.2.3. MUAP Changes in Myopathic Muscle
In myopathy, there is a reduction in the average number of functional muscle fibers permotor unit. Some of the fibers within a motor unit may be nonfunctional because of musclefiber necrosis and, hence, the electrode may be less likely to record activity from distantfibers. The initial and terminal portions of the MUP are not recorded, thereby producingshort-duration MUAPs. The shortening does not depend on the type of myopathy but isgreater in patients with weakness that is more advanced, and is more likely to be found in
Fig. 16. Myotonic discharge. Note that the potentials wax and wane in amplitude and frequency.From Daube, 1991 with permission.
Fig. 17. Complex repetitive discharges. These are the action potentials of groups of muscle fibersdischarging in near synchrony at high rates. Note that they are characterized by abrupt onset and ces-sation. From Daube, 1991 with permission.
20_Chad 4/11/07 9:54 AM Page 340

Electrophysiology of Myopathy 341
proximal than distal muscles. If the number of active fibers lying close to the electrode is alsoreduced, the mean amplitude of the potentials may also be diminished because of loss of con-tributions of fibers that have disappeared. In adult limb muscles, MUAPs of shorter than 6 msare considered to be short in duration. Short-duration MUAPs are usually also low in ampli-tude (<500 µV) and recruited early (see below) (an inappropriately large number of MUAPsin the face of a weak voluntary muscle contraction). Thus, small-amplitude, short-duration(SASD) MUAPs are the EMG hallmarks of myopathy (Fig. 18). There are likened to “news-paper rubbing between two fingers” on the loudspeaker. These potentials (SASDs) are oftenreferred to as “myopathic.” As discussed below, it is important to remember that the so-called“myopathic” potentials are not diagnostic of myopathy and can be observed with a numberof other conditions.
In chronic or end-stage myopathies, some MUAPs may be increased rather than decreasedin amplitude and duration. These alterations in MUAP appearance, observed mostly in necro-tizing myopathies (Fig. 9), probably result from reinnervation of previously denervated mus-cle fiber segments by secondary collateral sprouts, fiber splitting, and from the increase innumbers of hypertrophic fibers (Fig. 8). An additional point to keep in mind is that in severe,
Fig. 18. Normal and abnormal motor unit action potential (MUAP) configurations. (A) NormalMUAPs. (B) Myopathic MUAPs. Short-duration, low-to-moderate amplitude, “spikey” and polypha-sic MUAPs. The reduced number of muscle fibers per motor unit leads to a MUAP that is shorter induration and lower in amplitude than normal. Because of the increased variation in size of remainingmuscle fibers, there is less synchronous firing of individual muscle fibers, leading to increasedpolyphasia. (C) Large-amplitude, long-duration (including satellite potentials), polyphasic MUAPs,as observed in neurogenic disorders. Time marker, 10 ms; voltage marker, 200 µV. From Brombergand Albers, 1988 with permission.
20_Chad 4/11/07 9:54 AM Page 341

342 Anand and Chad
end-stage disease, the process of recruitment (see next section) may actually be reduced (Fig. 19) rather than early or increased because the extensive loss of muscle fibers leads tothe functional equivalent of a loss of motor units.
3.2.4. Recruitment Pattern in Myopathic Muscle
In myopathic disorders, individual muscle fibers drop out of the motor unit without affect-ing the integrity of the motor unit’s connection with the central nervous system. Accordingly,the number of functional motor units remains unaltered until an advanced stage of the dis-ease. Because each motor unit contains fewer functioning muscle fibers, it generates lessforce than normal. As a result, more motor units than normal are required to generate a cer-tain level of force; this phenomenon is called early recruitment (Fig. 19). Hence, in myo-pathic diseases, an inappropriately large number of MUAPs is firing in the face of musclecontractions that generate only weak force. In this situation, the interference pattern remainsfull (but compared with normal, the amplitude is reduced because the pattern is generated bySASD MUAPs). Because activation, a central nervous system process—the ability to firemotor units faster—is unaffected in myopathy, the ratio of firing frequency to number ofMUAPs will typically be less than normal (<5).
3.2.5. Clinical Significance and Differential Diagnosis of “Myopathic” MUAPs
Overall, just as fibrillation potentials are indicative of the disease activity, MUAP changesare indicative of disease severity. Of the various MUAP alterations, an increased proportionof polyphasic MUAP is often reported to be the earliest recognizable change withmyopathies. Decreased MUAP duration and early recruitment are considered the most reliable
Fig. 19. Pattern of motor unit action potential (MUAP) recruitment at low levels of muscle force.(A) Normal recruitment with 3 MUAPs recruited. (B) Myopathy (myositis). Early recruitment withmany short duration polyphasic MUAPs despite low level of force. Because each motor unit containsfewer muscle fibers, it generates less force than normal. To develop a given level of force, anincreased number of MUAPs is required compared with normal. (C) Decreased recruitment with onlyone high-amplitude MUAP firing rapidly, as observed in neurogenic disorders. Time marker, 10 ms;voltage marker, 200 µV. From Bromberg and Albers, 1988 with permission.
20_Chad 4/11/07 9:54 AM Page 342

Electrophysiology of Myopathy 343
changes. Decreased MUAP amplitude is considered least reliable, because it is dependent onvarious needle electrode factors.
In addition to myopathies, short-duration MUAPs can also be observed in NMJ disorderssuch as myasthenia gravis, Lambert-Eaton myasthenic syndrome (LEMS), and botulism (Fig. 20). In these cases, the “myopathic” MUAP occur because of the failure of action poten-tial generation secondary to a defect in the NMJ. SASD MUAPs may also be observed withnascent motor units after denervation and reinnervation. However, nascent MUAPs revealmarkedly reduced recruitment in contrast to the early recruitment observed in myopathies.
4. THE WORKUP FOR MYOPATHY
4.1. Advantages of Electrodiagnosis
EMG provides a much wider source of sampling than other diagnostic procedures, such asmuscle biopsy. EMG also helps enormously in the differential diagnosis of weakness, distin-guishing myopathic disorders from diseases of peripheral nerve/anterior horn cell or NMJ.For example, IBM and amyotrophic lateral sclerosis may share clinical features of asymmet-ric muscle atrophy and weakness, but the former would be more likely to demonstrate SASDMUAPs and early recruitment. EMG is also useful in identifying certain electrophysiologicalabnormalities, such as myotonic discharges, that may not have a clinical counterpart, therebyproviding an important clue for the diagnostic process. In addition, EMG findings may pro-vide important information that helps in the selection of a muscle for biopsy. For example, amuscle involved by an inflammatory myopathy might be expected to reveal needle electrodefindings of fibrillation potentials and SASD MUAPs. Finally, EMG findings may be the onlyobjective evidence of motor unit dysfunction and is especially useful in the early stages of adisease or if the disease is mild. For example, early in the course of an inflammatory myopathy,
Fig. 20. Differential diagnosis of the short duration MUAP. Schematic representation of the motorunit and specific targets of disease processes that lead to failure to generate muscle fiber action poten-tials. From Ferrante and Wilbourn, 2000 with permission.
20_Chad 4/11/07 9:54 AM Page 343

344 Anand and Chad
when weakness is minimal and limited, fibrillation potential activity might be mild but wide-spread, including paraspinal muscles.
4.2. Limitations of Electrodiagnosis
The findings of EMG are not diagnostic of any one illness. No waveforms are pathogno-monic of a specific disease. The EMG findings are diverse; some disorders, such as congen-ital or endocrine myopathies, do not produce extensive EMG changes (probably because theymainly affect the contractile properties of the muscle fibers without modifying their electri-cal activity), whereas others, such as inflammatory myopathy, may produce striking findings.The EMG appearance may differ depending on the stages of the disease. A coexisting neuro-genic disorder also limits the usefulness of the EMG. Therefore, before arriving at a specificdiagnosis, EMG results should be integrated with the clinical findings.
4.3. Planning the EMG Study
Just before the EMG examination we explain the purpose of the EMG and the procedureitself to the patient. We tailor testing conditions to patient’s comfort, ensuring that the roomtemperature is warm and the patient appropriately clothed. Once the clinical impression of amyopathy is confirmed, it is reasonable to proceed with the first of the two-part EMG, thenerve conduction study (NCS) (Table 3). It is a common practice to perform the NCS beforethe needle examination.
4.3.1. Nerve Conduction Studies in Myopathy
4.3.1.1. NERVE CONDUCTION STUDIES
Because most myopathies tend to be characterized by proximal more than distal muscleinvolvement, the results of routine motor studies recording from distal small muscles are usu-ally normal, unless the myopathy is severe. Proximal and intermediate muscles (deltoid, biceps,and tibialis anterior) certainly may be evaluated, and some reductions in compound muscleaction potentials (CMAPs) may be found more readily in those muscles. The reduction inCMAP amplitude is explained by the fact that the CMAP is a summation of individual muscle
Table 3Recommended Electrodiagnostic Studies for the Patient With a Suspected Myopathya
Recommended nerve conduction studies for myopathy:At least one motor and one sensory conduction, with corresponding F-wave from the arm (e.g., median
sensory and motor, median F-wave)At least one motor and one sensory conduction, with corresponding F-wave from the leg (e.g., sural
sensory and tibial motor, tibial F-wave) (if generalized decrease in CMAP, proceed with workup for neuromuscular junction disorders)
Recommended needle electrode examination for myopathy (perform examination on muscles on one side of the body, leaving the other side for muscle biopsy, if needed):At least two proximal and two distal muscles in the lower extremity (e.g., tibialis anterior, gastrocnemius,
vastus lateralis, and iliopsoas)At least two proximal and two distal muscles in the upper extremity (e.g., first dorsal interosseus, flexor
carpi radialis, biceps, and deltoid)At least one paraspinal muscle aAdapted from Preston and Shapiro.
20_Chad 4/11/07 9:54 AM Page 344

Electrophysiology of Myopathy 345
action potentials. More importantly, a generalized reduction in the CMAP amplitudes shouldalert the electromyographer to the possibility of disorders involving either the presynapticportion of the NMJ, motor polyradiculopathies, or motor neuron diseases. It is then essential toperform repetitive nerve stimulation (RNS) testing and postactivation facilitation testing to lookfor LEMS. Another reason to perform RNS in the workup of a myopathy is that myastheniagravis may simulate myopathy in some patients if it presents with proximal muscle weaknesswithout symptomatic cranial nerve signs.
Late responses, such as H-reflexes and F-waves, are usually normal in myopathies. Theymay be rarely reduced if the recorded muscles are severely affected. Sensory NCS results aregenerally normal in myopathy and when attenuated or absent suggest a coexisting neuropa-thy that may be part of a systemic disease.
4.3.1.2. REPETITIVE NERVE STIMULATIONS
RNS are generally expected to be normal in disease of the muscle alone. The usefulness ofRNS in myopathies is mainly to differentiate myopathies from diseases such as myastheniagravis, especially when it presents with proximal muscle weakness alone without any ocularor bulbar symptoms, or LEMS. A few points regarding RNS in myopathies are worth noting:
• A decremental response may be observed with the myotonic disorders. However, it is moreprominent, with repetition rates of 5 Hz, rather than the usual 2-Hz repetition rate.
• An incremental response may be observed during attacks of periodic paralysis (where a low-amplitude CMAP increases with repetitive rates of 10 Hz).
• Both decremental and incremental responses have been reported with polymyositis.• Decremental responses have also been noted with myophosphorylase deficiency (McArdle’s
disease).
4.3.2. Needle Electrode Examination in Myopathy
The NCS is followed by the needle electrode examination (NEE). Here, a monopolar orconcentric bipolar needle is inserted into selected muscles to assess the insertional activity,spontaneous activity, and the motor unit morphology on voluntary activity. Certain key pointsare worth remembering during the needle examination, taking inflammatory muscle diseaseas an example. In this regard, we find the approach of Dr. Wilbourn very useful. The mostproximal muscles, such as iliacus, glutei, and paraspinal muscles, are the ones most likely toshow abnormalities, rather than biceps, deltoid, and the vasti. Certain mid-limb muscles, par-ticularly brachioradialis and tibialis anterior, more often show abnormalities than musclesthat are more proximal, such as the vasti. In addition, whenever possible, the needle exami-nation should be confined to one side of the body, leaving the other for a muscle biopsy, ifneeded. It is important to avoid any needle-induced muscle fiber trauma that could potentiallyinfluence the muscle biopsy results.
4.3.3. Single-Fiber EMG in Myopathy
Single-fiber EMG is not commonly pursued in the evaluation of myopathy. However,abnormal jitter and blocking will be identified because these findings are the result of non-specific damage to the end terminal.
5. PUTTING IT ALL TOGETHER
Now that we have an understanding of the muscle physiology in myopathy and its electricalcorrelates, it is time to make the final diagnosis. Again, as we mentioned in Section 1., EMG is
20_Chad 4/11/07 9:54 AM Page 345

346 Anand and Chad
only one part of the puzzle. We have to blend the clinical history and physical examinationfindings with the EMG results to arrive at a final diagnosis.
Although the examiner is generally expected to wear the “electromyographer hat” duringthe study, taking care not to be biased with the available clinical information, the final reportshould be formulated after considering all of the technical factors and the inherent subjectivenature of analyzing the MUAPs on the EMG monitor. Some caveats are worth rememberingwhen interpreting abnormal EMG findings in a patient with suspected myopathy.
• Small MUAPs in the early stages of reinnervation after severe denervation may be misinter-preted as caused by myopathy.
• Individual MUAPs may have a normal or even high amplitude in patients with mild myopathies orin clinically unaffected muscles from patients with myopathy; for instance, if the needle electrodeis close to normal or hypertrophic muscle fibers (as a compensatory reaction in early stages).
• EMG mainly reflects activity of type I fibers (diseases of the adrenal or pituitary glands as wellas steroid-related myopathy show type 2 atrophy without degenerative change).
• The spike duration may sometimes seem extremely prolonged because of late satellite potentials. (InDuchenne’s dystrophy, polyphasic MUAPs with prolonged spike duration are rather typical (Fig. 6).
It is also important to remember that although EMG is useful in the diagnosis of myopathies,there are a number of diseases of muscle that may present as challenges to the electromyographer(Table 4). Metabolic and endocrine myopathies may not have abnormal EMG findings.
Table 4Electrodiagnostic Clues to the Diagnosis of Specific Myopathies
Myopathies that may present with normal EMGMetabolic myopathiesEndocrine myopathiesHypokalemic periodic paralysis (in between attacks)Myopathy with fiber type disproportion
Myopathies that may present with fibrillation potentials onlyInflammatory myopathies Chloroquine myopathyAcute rhabdomyolysis
Myopathies that may present with myotoniaMyotonic dystrophy
Myotonia congenita (MUAPs normal)Proximal myotonic myopathyParamyotonia congenitaColchicine myopathyAcid maltase DeficiencyHyperkalemic periodic paralysis (in between attacks)Centronuclear myopathy
Myopathies with denervating features (fibrillation potentials and positive sharp waves)Inflammatory myopathies Muscular dystrophiesCongenital myopathiesMetabolic myopathiesToxic myopathies Infectious myopathy
20_Chad 4/11/07 9:54 AM Page 346

Electrophysiology of Myopathy 347
Fibrillation potentials may be the only abnormal findings in the early stages of necrotizingmyopathies, such as inflammatory myopathies. Likewise, myotonic discharges may be theonly abnormal EMG finding in a number of myotonic myopathies.
6. EMG IN SELECTED MYOPATHIES
Before concluding, we highlight a few important features (and EMG caveats) of someimportant groups of muscle diseases. Inflammatory myopathies are important because someare eminently treatable. EMG plays a critical role not only in their diagnosis but also formonitoring the activity of the disease and its response to treatment. Although IBM is notresponsive to immunosuppressive therapies, unlike polymyositis and dermatomyositis, it isconsidered here because it may simulate motor neuron disease clinically, and EMG plays anessential roll in establishing the correct diagnosis. Certain myopathies with myotonia areoften missed clinically because of the absence of clinical myotonia. Endocrine and congen-ital myopathies may have a normal EMG and it is important for the electromyographer tobe aware of these possibilities.
6.1. Polymyositis/Dermatomyositis• Characterized by abundant fibrillation potentials and PSW, CRD, and MUAPs of short duration
and low amplitude.• Serial EMG studies during treatment showing a reduction in fibrillation potential activity is con-
sidered a marker of disease improvement (Fig. 21).
6.2. Inclusion Body Myositis• A mixed pattern of high-amplitude, long-duration MUAPs and SASD MUAPs accompanied by
abnormal spontaneous activity is highly suggestive of this condition.• Approximately 15 to 30% of patients with IBM may have an associated axonal neuropathy.
Fig. 21. The cycle of needle electrode examination changes that can be observed during the variousstages of a reversible necrotizing myopathy, such as polymyositis. Fibs, fibrillation potentials; MUPs,motor unit potential. From Wilbourn, 1993 with permission.
20_Chad 4/11/07 9:54 AM Page 347

348 Anand and Chad
6.3. Myotonic Myopathies• Myotonic discharges on needle examination is characteristic.• Myotonic discharges may be restricted to paraspinal muscles in patients with adult-onset acid mal-
tase deficiency and to intrinsic hand muscles in asymptomatic patients with myotonic dystrophy.• MUAP changes may be more prominent in distal muscles than in proximal muscles. Hence,
several distal limb muscles must be assessed in addition to proximal muscles.
6.4. Acute Illness/ICU Myopathy• Generalized low-amplitude or absent CMAPs and normal sensory nerve action potentials on NCS.• Widespread fibrillation potentials on NEE (this is found variably).• “Myopathic MUAPs” if voluntary activity possible.• RNS necessary to exclude NMJ disorders.• Post-tetanic facilitation (for LEMS) unreliable because muscles too weak.
6.5. Endocrine Myopathies• Fasciculation potentials and myokymic discharges may be the only spontaneous activity in
hyperthyroidism.• Hyperkalemic periodic paralysis may be associated with increased fibrillation potentials (myotonic
discharges and CRDs are found between attacks).• EMG in familial hypokalemic periodic paralysis is often normal between attacks.• Steroid myopathy is a misnomer, because, in the absence of denervation, steroids do not cause
histological signs of myopathy but, rather, a selective atrophy of type 2 muscle fibers.
6.6. Congenital Myopathies• A normal EMG does not exclude a congenital myopathy.• Scant fibrillation potentials and short-duration MUAPs are observed. • Among all congenital myopathies, centronuclear myopathy has the most prominent changes in spon-
taneous activity (fibrillations, PSW, CRD, and myotonia), sometimes mimicking myotonic dystrophy.
SUGGESTED READING
Aminoff MJ. Electromyography in Clinical Practice, 3rd ed. Churchill Livingstone, New York,NY, 1998.
Ball RD. Basics of needle electromyography. An AAEE Workshop. AAEM, 1985, Rochester, MN.Bromberg MD, Albers JW. Electromyography in idiopathic myositis. Mt Sinai J Med 1988;55(6):
459–464.Daube JR. AAEM minimonograph #11: needle examination in electromyography. Muscle Nerve
1991;14:685–700.Daube JR. Electrodiagnosis of muscle disorders. In: Myology (Engel AG, Franzini-Armstrong C, eds.).
McGraw-Hill, New York, NY, 1994.DeGirolami U, Smith TW. Pathology of skeletal muscle. Am J Pathol 1982;107:235–276.Dumitru D. Myopathies. In: Electrodiagnostic Medicine (Dumitru D, ed). Hanley and Belfus,
Philadelphia, PA 1994.Ferrante MA, Wilbourn AJ. In: Comprehensive Clinical Neurophysiology (Levin K, Luders H, eds.).
WB Saunders, Philadelphia, PA, 2000, pp. 268–280.Kandel ER, Schwartz JH, Jessell TM. Essentials of Neural Science and Behavior. Appleton and
Lange, Stamford, CT, 1995, pp. 212.Katirji B. Electromyography in Clinical Practice. St. Louis, Mosby, 1998.Kimura J. Electrodiagnosis in Diseases of Nerve and Muscle: Principles and Practice. Oxford
University Press, New York, NY, 2001. WB Saunders, Philadelphia, 19.Oh SJ. Principles of Electromyography. Williams and Wilkins, Baltimore, MD, 1998.
20_Chad 4/11/07 9:54 AM Page 348

Electrophysiology of Myopathy 349
Phillips LH, Litchy WJ, Auger RG, et al. AAEM Glossary of terms in electrodiagnostic medicine.Muscle Nerve 2001;Suppl 10.
Preston DC, Shapiro BE. Electromyography and Neuromuscular Disorders. Clinical–ElectrophysiologicalCorrelations. Butterworth-Heinemann, Boston, MA, 1998.
Westmoreland BE, Benarroch EE, Daube JR, Reagan TJ, Sandok BA. Medical Neurosciences. AnApproach to Anatomy, Pathology and Physiology by Systems and Levels. Little Brown and Co.,Boston, MA, 1994, pp. 353.
Wilbourn AJ. The electrodiagnostic examination with myopathies. J Clin Neurophysiol 1993; 10:132–148.
REVIEW QUESTIONS
1. Which one of the following structures comprises the essential contractile unit of a muscle fiber?A. Sarcomere.B. Myosin.C. Actin.D. Myofibril.
2. All of the following statements regarding the motor unit are true except:A. One motor unit innervates multiple muscle fibers.B. Each muscle fiber is innervated by only one motor unit.C. Muscle fibers belonging to a motor unit are contiguous.D. The innervation ratio varies with each muscle.
3. Essential steps involved in the process of muscle contraction include all of the following except:A. Depolarization induced opening of voltage gated calcium channels.B. Signal transduction of ryanodine receptors.C. Sliding of actin and myosin filaments.D. Decrease in absolute length of thick and thin filaments.
4. Which one of the following statements regarding the MUAP is false:A. MUAP amplitude depends on number and size of the muscle fibers closest to the recording
electrode.B. The presence of any polyphasic MUAPs is generally indicative of an underlying pathological
process.C. Duration depends both on fibers close to and away from the recording electrode.D. Rise time should ideally be shorter than 500 µs.
5. Match the following:A. Fibrillation potentials i. Waxing and waning amplitudesB. Myotonic discharges ii. “Raindrops on roof”C. Complex repetitive discharges iii. Thyrotoxic myopathyD. Fasciculation potentials iv. Normally found in Iliacus
6. EMG findings most consistent with the diagnosis of myopathy are:A. Absent motor responses on NCS, fibrillation potentials, and SASD MUAPs.B. Fibrillation potentials, fasciculation potentials, and large-duration MUAPs.C. Fibrillation potentials, complex repetitive potentials, and SASD MUAPs. D. Normal EMG.
7. All statements regarding NEE findings in myopathy are true EXCEPT:A. Decreased MUAP amplitude is the most reliable finding.B. MUAP findings indicate disease severity.C. Increased or early recruitment is characteristic.D. Fibrillation potentials indicate disease activity.
8. A generalized reduction in CMAP amplitudes in NCS may indicate all EXCEPT:A. Presynaptic defect of the NMJ. B. Motor polyradiculopathies.C. Motor neuron disease.D. Myopathy in early stages.
20_Chad 4/11/07 9:54 AM Page 349

350 Anand and Chad
9. Myopathies that may present with “denervating features” on EMG include all EXCEPT:A. Inflammatory myopathies.B. Muscular dystrophies.C. Corticosteroid myopathy.D. Toxic myopathies.
10. All of the following myopathies may present with myotonic discharges EXCEPT:A. Myotonia congenita.B. The myopathy of intensive care.C. Colchicine myopathy.D. Paramyotonia congenita.
REVIEW ANSWERS
1. The correct answer is A. The sarcomere is the smallest contractile unit in a myofibril. It extendsfrom Z band to Z band. The sarcomere consists of two filaments, the thick (myosin) filamentsalternating with the thin (actin) filaments. The four major contractile proteins that are present ina myofilament are actin, myosin, troponin, and tropomyosin.
2. The correct answer is C. The term “motor unit” refers to a single lower motor neuron and themuscle fibers it innervates. One motor neuron innervates multiple muscle fibers but each mus-cle fiber is innervated by only one motor neuron. The muscle fibers belonging to a motor unitare typically distributed widely, extending over as many as 100 fascicles. Muscle fibers are ran-domly distributed over a circular or oval region that can reach approx 20 to 30% of the muscle’scross-sectional area, with an average diameter of 5 to 10 mm.
3. The correct answer is D. Sliding of the thin actin filaments over the thick myosin filaments pro-duces muscle contraction. The shortening of the sarcomeres and the I band during contraction isnot caused by any change in the absolute length of the filaments but rather by the sliding of thefilaments themselves.
4. The correct answer is B. MUAPs with more than four phases are referred to as polyphasic. Upto 12% of recorded MUAPs in normal muscles are polyphasic.
5. The audio-amplified correlate of fibrillation potentials have been likened to the sound of “raindropson a tin roof.” Complex repetitive potentials may be found in the iliacus muscle of healthy individ-uals and, hence, should not be considered abnormal if restricted to that muscle. Fasciculations maybe observed in thyrotoxic myopathy. Electrical myotonia (waxing and waning of discharges) ischaracteristically observed in myotonic myopathies.
6. The correct answer is C. Fibrillation potentials are usually observed in necrotizing myopathies.SASD MUAPs are not specific for myopathies (they are also observed in neurogenic disordersand diseases of the NMJ). Motor responses on NCS are expected to be normal in diseases ofmuscle, unless it is end-stage disease. Although CRDs are nonspecific, they may occur inmyopathies. The EMG may be normal in some myopathies—those that are endocrine or meta-bolic in nature.
7. The correct answer is A. Just as fibrillation potentials are indicative of disease activity, MUAPchanges are indicative of disease severity. Of the various MUAP alterations, an increased pro-portion of polyphasic MUAP is often reported to be the earliest recognizable change withmyopathies. Decreased MUAP duration and early or increased recruitment are considered themost reliable changes. Decreased MUAP amplitude is considered the least reliable, because it isdependent on various needle electrode factors.
8. The correct answer is D. A generalized reduction in the CMAP amplitudes should alert the elec-tromyographer to the possibility of disorders involving either the presynaptic portion of theNMJ, motor polyradiculopathies, or motor neuron diseases. Early stage myopathies generally donot present such an EMG profile.
9. The correct answer is C. “Denervating features” on EMG generally refer to a mixture of high-amplitude, long-duration MUAPs accompanied by abnormal spontaneous activity. Inflammatory
20_Chad 4/11/07 9:54 AM Page 350

Electrophysiology of Myopathy 351
myopathies, IBM, muscular dystrophies, and toxic myopathies may all produce such an EMGpicture. Corticosteroids usually produce a rather selective atrophy of type 2 muscle fibers and donot cause denervation.
10. The correct answer is B. Myotonic discharges are characterized by the waxing and waning ofamplitude and frequency on EMG. These discharges are found in myopathies with defects in thesarcolemma. They are not observed in the myopathy of intensive care, a disorder characterizedby loss of myosin filaments with sparing of the sarcolemmal membrane.
20_Chad 4/11/07 9:54 AM Page 351

20_Chad 4/11/07 9:54 AM Page 352

21Neurophysiology of Neuromuscular Transmission
and Its Disorders
James M. Gilchrist
SummaryDespite several antibody tests being available for the assessment of disorders of neuromuscular
transmission, electrophysiological testing of the neuromuscular junction remains a very important partof clinical practice. The neuromuscular junction is a complex structure and an understanding of itsanatomy and physiology can assist in better understanding the value of electrodiagnostic testing. Themost common disorders include myasthenia gravis, Lambert–Eaton myasthenic syndrome, and botu-lism, and are usually readily identified using several electrophysiological techniques including slow(2–3 Hz) and fast (20- to 50-Hz stimulation). Single-fiber needle EMG remains an additional power-ful and sensitive test for patients with disorders that are more mild, in whom repetitive stimulation test-ing is negative or indeterminate.
Key Words: Botulism; Lambert–Eaton myasthenic syndrome; myasthenia gravis; neuromuscularjunction; repetitive nerve stimulation.
1. NEUROPHYSIOLOGY OF NEUROMUSCULAR TRANSMISSION
1.1. Anatomy of the Terminal End-Plate Region
The physiology of the neuromuscular junction (NMJ) derives from the anatomy of the ter-minal axon and motor end plate, also referred to as the presynaptic and postsynaptic regions(Fig. 1). Motor nerve fibers end in an arborization of fine intramuscular twigs ending at theterminal bouton. The motor twigs are myelinated until the very terminus, with a Schwann cellcovering all but the synaptic interface. The terminal axon is separated from the motor end-plateregion of the muscle fiber by an extracellular space approx 70-nm wide, called the primarysynaptic cleft. On the far side of this cleft, in the motor end-plate region, are a series of invagi-nations of the muscle membrane, which are called the secondary synaptic clefts. These junc-tional folds are unique to NMJs.
The terminal axon membrane contains voltage-gated calcium channels (VGCC) of the P/Qtype, which are arranged in active zones in a semigeometric array. Within the terminal axon,synaptic vesicles containing acetylcholine collect at the active zones (Fig. 1). Acetylcholineis synthesized from choline and acetate in the cytoplasm by the enzyme choline acetyltrans-ferase. Acetylcholine enters the synaptic vesicles using the vesicular acetylcholine trans-porter, which also exports the acetylcholine during exocytosis. Choline is actively transportedby an energy-dependent reuptake mechanism.
From: The Clinical Neurophysiology PrimerEdited by: A. S. Blum and S. B. Rutkove © Humana Press Inc., Totowa, NJ
353
21_Gilchrist 4/11/07 9:56 AM Page 353

The primary synaptic cleft is divided by a basal lamina, a loosely organized, porous bound-ary containing acetylcholinesterase, which catabolizes acetylcholine as it diffuses across theprimary synaptic cleft. Approximately 50% of the acetylcholine released from the presynap-tic membrane is catabolized before it reaches the postsynaptic membrane.
The most important components of the postsynaptic membrane are the acetylcholinereceptors. These receptors are of the nicotinic type, and contain a ligand-activated cationchannel. At the base of the secondary clefts are voltage-gated sodium channels, essential fortransmitting any action potential along the muscle membrane. Acetylcholine receptors aremanufactured by membrane-bound ribosomes in the cytoplasm and then inserted in the post-synaptic membrane. There are approx 10,000 receptors per square micrometer at the termi-nal and upper areas of the secondary clefts. Each adult acetylcholine receptor (Fig. 2) is atetramer containing 2 α-subunits, and one each of the β-, δ-, and ε-subunits. Fetal acetyl-choline receptors substitute a γ-subunit for the ε-subunit. Of note, ocular muscles, which dif-fer from other skeletal muscles in a number of ways, have an enriched population offetal-type receptors. The half-life for adult acetylcholine receptors is 8 to 11 d. Ligand sitesfor acetylcholine are located on each of the α-subunits, and both most be engaged to activatethe receptor channel. The main immunogenic region (MIR) is also located on each α-subunit,but separate from the ligand-binding site. After acetylcholine dissociates from the receptor, itis catabolized by acetylcholinesterase. Application of agents that inhibit the activity of acetyl-cholinesterase will prolong the activity of acetylcholine at the postsynaptic receptors.
354 Gilchrist
Fig. 1. A cartoon of a neuromuscular junction (NMJ). The synaptic vesicles contain acetyl-choline. The active zones contain voltage-gated calcium channels, and part of the apparatus neces-sary for exocytosis. The basal lamina in the primary synaptic cleft contains acetylcholinesterase.Voltage-gated sodium channels necessary for propagation of the action potential generated at theneuromuscular junction are in the muscle fiber membrane, including the depths of the secondarysynaptic clefts.
21_Gilchrist 4/11/07 9:56 AM Page 354

1.2. Presynaptic Physiology of Neuromuscular Transmission
The motor nerve action potential generated in the cell body is transmitted to the terminalaxon membrane. As it traverses the presynaptic membrane, it activates the VGCCs, which open,allowing the movement of calcium into the terminal axon. The influx of calcium activatescalmodulin-dependent protein kinase II, which binds with synapsin I, resulting in the dockingof the synaptic vesicle with the terminal membrane. Release of the acetylcholine by exocytosisinvolves a complicated interaction of many proteins, including synaptobrevin, syntaxin, andSNAP-25. The synaptic membrane remains part of the axonal membrane and is recycled.
Acetylcholine-containing vesicles are organized into at least two pools. The immediatelyavailable pool is the smallest and consists of those vesicles actually lined up at the activezones for release. During a series of axonal depolarizations, such as when attempting to contracta muscle, the immediately available store will become depleted, and fewer synaptic vesicleswill be released. The second pool is considerably larger than the immediately available store
Neuromuscular Transmission 355
Fig. 2. A cartoon of the acetylcholine receptor, showing a transverse section, a top view, and adeconstructed view of the α-subunit. MIR, the main immunogenic region of the receptor; ACh, theligand-binding site for acetylcholine. From Engel AG, 1999 with permission.
21_Gilchrist 4/11/07 9:56 AM Page 355

and is called the mobilization or reserve pool. During the course of a few seconds,it will replenish the immediately available pool.
The influx of calcium via the VGCCs is by passive diffusion. In contrast, calcium egress isby active transport and takes longer. During a sustained series of action potentials, the calciumconcentration in the terminal axon will continue to increase and facilitate release of synapticvesicles, partially countering the effects of depletion of the immediately available pool.
1.3. Postsynaptic Electrophysiology of Neuromuscular Transmission
The acetylcholine molecules passively diffuse across the primary synaptic cleft. Those thatescape catabolism bind with acetylcholine receptors on the postsynaptic membrane. The acti-vated receptors undergo a conformational change, allowing sodium to enter the cell andpotassium to leave. This causes a small depolarization of the immediately adjacent musclemembrane. Release of single synaptic vesicles from the presynaptic membrane causes areproducible level of depolarization, approx 1 mV, called a miniature end-plate potential(MEPP). This is the basis for the quantal theory of neuromuscular transmission (NMT).Because many synaptic vesicles are released with each depolarization of the terminal axonmembrane, many MEPPs are produced. The MEPPs summate temporally and spatially toform an end-plate potential (EPP). If this EPP is sufficient to depolarize the membrane tothreshold, an action potential is generated, which is then propagated along the muscle mem-brane by voltage-gated sodium channels in the sarcolemmal membrane, eventually resultingin muscle fiber contraction, the defining purpose of NMT.
An important concept is that of the safety factor. The EPP normally produced after eachaction potential activation of the presynaptic membrane is approximately four times that nec-essary to reach threshold. It is calculated by the formula m = n × p, where m is the quantal ofthe EPP, and n is the percentage of vesicles released from the immediately available pool,which is determined by p, the probability of release. This excessive EPP derives from the abun-dance of acetylcholine released presynaptically and of acetylcholine receptors postsynapti-cally. Thus, even with the normally encountered depletion of the immediately available poolof acetylcholine-containing synaptic vesicles during a rapid train of motor nerve action poten-tials, the safety factor always provides successful NMT in the healthy NMJ. When healthymuscle fatigues, it is not because of failure of NMT but, rather, because of muscle metabolicissues, such as lactic acid buildup and failure of energy pathways. However, in the abnormalNMJ, if either the amount of acetylcholine released or the number of acetylcholine receptorsdeclines, the safety factor will begin to fall as the size of the EPP falls. If the EPP safety fac-tor falls below 1, that is, that needed to just reach threshold for action potential generation, thenNMT will fail. This is the basis for fatigable weakness in disorders of postsynaptic NMT, suchas myasthenia gravis (MG). As the number of receptors falls, the EPP also decreases. In manyNMJs, the safety factor will fall below 1, and that muscle fiber will be, in essence, denervated.In many other fibers, the safety factor will hover just at or above 1, and initially, there will besuccessful NMT. However, during a train of motor nerve action potentials, the normal deple-tion of the immediately available store of acetylcholine-containing synaptic vesicles will resultin a decrease in acetylcholine reaching the decreased number of receptors on the postsynapticmembrane. This will cause the safety factor to fall below 1, and NMT will fail, the muscle fiberwill not contract, and the muscle will weaken.
The safety factor is also important in understanding incremental strength during sustainedeffort in disorders of presynaptic NMJ. In these disorders, there are abundant postsynaptic
356 Gilchrist
21_Gilchrist 4/11/07 9:56 AM Page 356
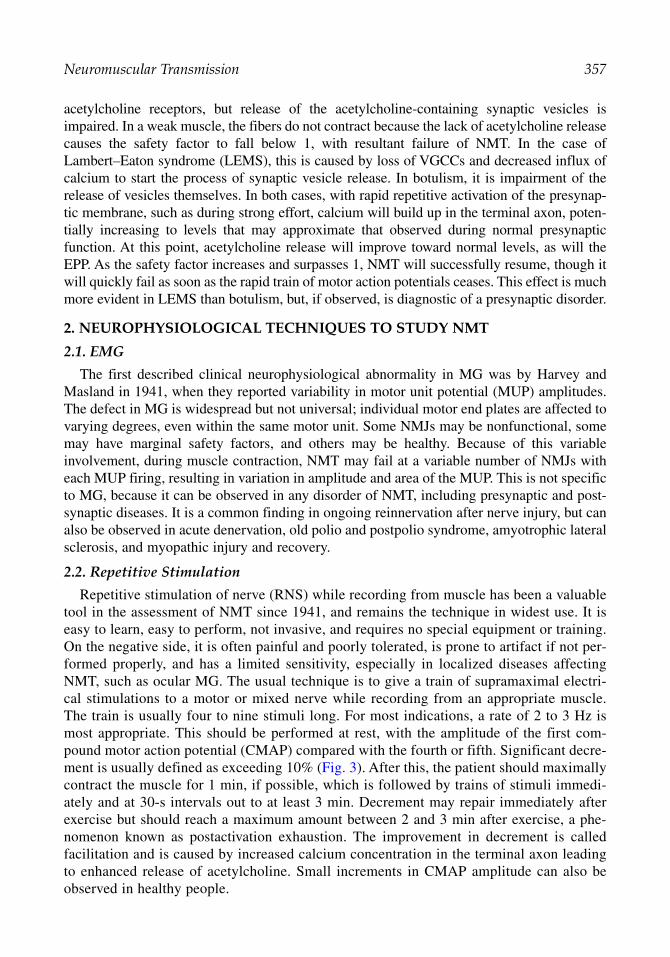
acetylcholine receptors, but release of the acetylcholine-containing synaptic vesicles isimpaired. In a weak muscle, the fibers do not contract because the lack of acetylcholine releasecauses the safety factor to fall below 1, with resultant failure of NMT. In the case ofLambert–Eaton syndrome (LEMS), this is caused by loss of VGCCs and decreased influx ofcalcium to start the process of synaptic vesicle release. In botulism, it is impairment of therelease of vesicles themselves. In both cases, with rapid repetitive activation of the presynap-tic membrane, such as during strong effort, calcium will build up in the terminal axon, poten-tially increasing to levels that may approximate that observed during normal presynapticfunction. At this point, acetylcholine release will improve toward normal levels, as will theEPP. As the safety factor increases and surpasses 1, NMT will successfully resume, though itwill quickly fail as soon as the rapid train of motor action potentials ceases. This effect is muchmore evident in LEMS than botulism, but, if observed, is diagnostic of a presynaptic disorder.
2. NEUROPHYSIOLOGICAL TECHNIQUES TO STUDY NMT
2.1. EMG
The first described clinical neurophysiological abnormality in MG was by Harvey andMasland in 1941, when they reported variability in motor unit potential (MUP) amplitudes.The defect in MG is widespread but not universal; individual motor end plates are affected tovarying degrees, even within the same motor unit. Some NMJs may be nonfunctional, somemay have marginal safety factors, and others may be healthy. Because of this variableinvolvement, during muscle contraction, NMT may fail at a variable number of NMJs witheach MUP firing, resulting in variation in amplitude and area of the MUP. This is not specificto MG, because it can be observed in any disorder of NMT, including presynaptic and post-synaptic diseases. It is a common finding in ongoing reinnervation after nerve injury, but canalso be observed in acute denervation, old polio and postpolio syndrome, amyotrophic lateralsclerosis, and myopathic injury and recovery.
2.2. Repetitive Stimulation
Repetitive stimulation of nerve (RNS) while recording from muscle has been a valuabletool in the assessment of NMT since 1941, and remains the technique in widest use. It iseasy to learn, easy to perform, not invasive, and requires no special equipment or training.On the negative side, it is often painful and poorly tolerated, is prone to artifact if not per-formed properly, and has a limited sensitivity, especially in localized diseases affectingNMT, such as ocular MG. The usual technique is to give a train of supramaximal electri-cal stimulations to a motor or mixed nerve while recording from an appropriate muscle.The train is usually four to nine stimuli long. For most indications, a rate of 2 to 3 Hz ismost appropriate. This should be performed at rest, with the amplitude of the first com-pound motor action potential (CMAP) compared with the fourth or fifth. Significant decre-ment is usually defined as exceeding 10% (Fig. 3). After this, the patient should maximallycontract the muscle for 1 min, if possible, which is followed by trains of stimuli immedi-ately and at 30-s intervals out to at least 3 min. Decrement may repair immediately afterexercise but should reach a maximum amount between 2 and 3 min after exercise, a phe-nomenon known as postactivation exhaustion. The improvement in decrement is calledfacilitation and is caused by increased calcium concentration in the terminal axon leadingto enhanced release of acetylcholine. Small increments in CMAP amplitude can also beobserved in healthy people.
Neuromuscular Transmission 357
21_Gilchrist 4/11/07 9:56 AM Page 357

There are several caveats worth noting regarding RNS:
1. Two- to 5-Hz stimulation is preferred if looking for decrement. One-hertz stimulation is usuallytoo slow to produce decrement, and rates faster than 5 Hz may produce facilitation of theresponse, masking any decrement.
2. Maximal voluntary contraction for 10 to 60 s (depending on the strength of the patient) followedby a supramaximal nerve stimulus is the preferred method for looking for increment. In patientswho cannot cooperate, or are too weak to voluntarily contract the muscle, rapid stimulation up to 50 Hz can be performed but this is exquisitely painful and should not be performed formore than 10 s unless the patient is deeply comatose.
3. Proximal muscles are more likely to show decrement in MG than are distal muscles, but proximalmuscles are more prone to technical artifact and are more painful.
4. Decrement disappears as muscle temperature drops, therefore, a cool limb can result in failureto elicit decrement even if there is a defect in NMT. This is a greater problem with distalmuscles, which should be warmed to at least 32°C. On the other hand, warming a limb abovestandard temperature may enhance a mild decrement.
5. In healthy individuals, CMAPs can increase up to approx 40% in amplitude simply because ofthe phenomenon of pseudofacilitation. Hence, increments of greater than 40% should be consi-dered abnormal, although most patients with LEMS have considerably greater increments, in therange of 100 to 400% (see below).
6. Stimulation site and intensity must remain constant throughout the test because decreases inintensity may mimic decrement.
7. A healthy NMJ should have no decrement, but, because of the technical limitations of RNS,a decrement of up to 10% is within normal limits.
There have been several studies of the sensitivity of RNS in MG and LEMS, includingcomparisons to other techniques. In summary, RNS in MG is more likely to be abnormalin generalized disease than in ocular MG, is marginally more sensitive than measurementof acetylcholine receptor antibodies, is less sensitive than single-fiber EMG (SFEMG) atall levels of disease, and the diagnostic yield increases as more muscles are studied. Theyield for a distal muscle RNS in generalized disease is 40% and approaches 70% for aproximal muscle.
NMT is an energy-dependent activity and ischemia will affect it adversely. This is the basisfor an uncommonly used procedure, called double-step repetitive stimulation. This method
358 Gilchrist
Fig. 3. Repetitive stimulation in a patient with myasthenia gravis demonstrating typical U-shapeddecrement: maximal by the third or fourth stimulation in the train of nine, with return toward normalby the ninth stimulation. Decrement, calculated by comparing the fourth evoked response amplitudeto that of the first, exceeds 65%.
21_Gilchrist 4/11/07 9:56 AM Page 358

requires near-nerve needle stimulation of the ulnar nerve at the wrist at 3 Hz for 4 min whilerecording from the abductor digiti quinti muscle, measuring decrement, then repeating the 4 min of 3-Hz stimulation with a sphygmomanometer inflated above systolic blood pressure,measuring decrement after the cuff is deflated. This technique has been shown to increasesensitivity in MG comparable to proximal muscle RNS, but still lags considerably behindSFEMG.
Eaton and Lambert first described RNS in LEMS in 1956. At a low rate of stimulation,these patients will have decrement indistinguishable from MG. At high rates of stimulation,or after maximal voluntary activation of the muscle, there will be an increment in theresponse reaching and exceeding 100% in most patients (Fig. 4). This facilitation of theCMAP is not unique to LEMS, and up to 90% CMAP facilitation has been reported in MG.However, increase in the CMAP by 100% should be considered diagnostic of a presynapticdefect. A recent large study of LEMS found 98% of patients had decrement with 3-Hz stimu-lation, 88% of patients had CMAP potentiation greater than 100% in at least one muscle, butonly 39% had potentiation greater than 100% in all three muscles studied.
2.3. Single-Fiber EMG
SFEMG is the selective recording of a limited number of single muscle fiber action poten-tials from one motor unit in vivo. This requires a needle electrode with different specifica-tions from a concentric or monopolar needle electrode, and SFEMG needle electrodes havea dramatically smaller recording area than either. A SFEMG recording surface is 25 µm indiameter, with an effective recording area of 300 µm3, as compared with a concentric needle
Neuromuscular Transmission 359
Fig. 4. Repetitive stimulation in a patient with Lambert–Eaton myasthenia syndrome. Pre-exerciseshows a very small CMAP with decrement at low rates of stimulation. When repeated after exercise,the CMAP amplitude has increased by several hundred fold but decrement persists. The bottom traceis at 50 Hz stimulation and shows initial decrement followed by dramatic increment in CMAP ampli-tude. From Maselli R, 1998.
21_Gilchrist 4/11/07 9:56 AM Page 359

electrode, which records from approx 1 cm3. A smaller electrode emphasizes the amplitudedifference between close and distant fiber potentials. A smaller recording surface will alsorestrict the number of recordable muscle fiber potentials. In addition, muscle fiber poten-tials adjacent to the recording electrode will have high amplitudes and short duration, andrelatively more high-frequency components compared with more distant potentials. Byusing a high-pass filter of 500 Hz, much of the amplitude of distant muscle fiber poten-tials will be attenuated while preserving that of the nearby potentials. This allows singlemuscle fiber potentials to be selectively studied while the rest of the MUP is effectivelydampened to nil.
By counting the number of single muscle fiber potentials observed with each MUP firing,the number of muscle fibers from that MUP within the small recording territory of theSFEMG needle electrode can be determined. For the most part, this should be one or two.Sampling 20 different sites in a muscle allows calculation an average number of single mus-cle fiber potentials per recording site. This is called the fiber density. In conditions with lossof random distribution of MUP muscle fibers, such as reinnervation, fiber density willincrease. Specific disorders that can increase fiber density include anterior horn cell diseases,such as spinal muscular atrophy, polio, postpolio muscular atrophy, and amyotrophic lateralsclerosis; and any peripheral or cranial neuropathy with axonal loss, specifically, thosecaused by diabetes, alcohol, uremia, toxins, amyloidosis, Guillain–Barré syndrome, chronicdemyelinating inflammatory polyneuropathy, and multiorgan failure. The only study to com-pare etiologies found that alcoholic polyneuropathy produced higher fiber densities than diduremic or diabetic neuropathy, despite (or because of) better nerve conduction velocities. Avariety of muscle disorders will also have increased fiber densities, especially as the diseaseprogresses and chronic disability ensues, including muscular dystrophies, inflammatorymyopathies, mitochondrial myopathies, and congenital myopathies.
In those instances in which two or more fiber potentials from a single MUP are recorded,an interpotential interval (IPI) can be calculated. By recording multiple consecutive firings ofthe muscle fiber potentials, the difference between consecutive IPIs can be calculated. Thevariation amongst these consecutive IPIs is called jitter. Jitter is most accurately determinedby calculating a mean consecutive difference using the formula:
Mean consecutive difference = [(IPI1 − IPI2) + … + (IPIn−1 − IPIn)]/(n−1)
Jitter is thought to derive from variation in the time in takes the NMJ EPP to reach thresh-old for action potential generation at the postsynaptic membrane. In disorders with disturbedNMT, there will be an increased variation in the time taken to attain an EPP capable of reach-ing threshold. This will lead to increased jitter (Fig. 5). Therefore, abnormal jitter is an indi-cator of abnormal NMT.
In those instances in which an EPP fails to reach threshold for action potential gener-ation, one of the muscle fiber potentials in the pair will be absent. This is called impulseblockade (Fig. 5). It is another indicator of abnormal NMT, usually indicating a moresevere disturbance than increased jitter alone. Impulse blocking, often referred to simplyas blocking, is usually intermittent, with the affected fiber potential appearing and disap-pearing in an unpredictable pattern. Blocking is uncommonly observed with jitter lessthan 100 µs.
Increase jitter, and even blocking, are not specific to MG or LEMS, and can be observedin any disorder of NMT. It is an early finding in any neuropathy with axonal loss, including
360 Gilchrist
21_Gilchrist 4/11/07 9:56 AM Page 360

acute transection. Wallerian degeneration after nerve fiber transection transpires over 11 to14 d, and sensory nerve action potentials become unobtainable below the transection by 11 d. However, CMAPs are lost within 7 d of nerve transection, because NMT fails beforethe nerve fiber becomes inexcitable. Increased jitter will be observed in anterior horn cell dis-orders, acute and chronic peripheral neuropathies, and myopathies. It is a reflection of acutedenervation and subsequent failure of NMT, as the nerve terminus degenerates, and reinner-vation, as the nerve terminus regenerates and the NMJ matures. In muscle disease, jitter indi-cates degeneration of motor end plates caused by myofiber degeneration as well as myofiberregeneration with immature motor end plates. However, it is in the primary disorders of NMTthat SFEMG jitter studies are most useful.
SFEMG has been used in the diagnosis of MG since at least 1971. Since then, there havebeen numerous studies of the sensitivity of SFEMG in diagnosing MG, and comparisons toother diagnostic techniques. The largest series of SFEMG studies in MG reported the resultsof 788 patients. Results of SFEMG of the extensor digitorum communis muscle was abnor-mal in 85% of all patients with MG at the time of initial examination. If the extensor digito-rum communis muscle was healthy, and a second muscle was studied, 85% of those patientshad abnormal jitter studies. Thus, if two muscles were studied when the first was normal,results of SFEMG for jitter analysis were abnormal in 98% of all patients with MG. This farexceeds the sensitivity of all other diagnostic tests for MG, as further illustrated by severalcomparative studies, which, in one study, found SFEMG to be the most sensitive, at 92%(testing a single muscle); with RNS at 77% (testing multiple muscles) and acetylcholinereceptor antibody testing at 73%. SFEMG was sensitive regardless of whether disease wasgeneralized or ocular; the yield was higher than 90%, even in ocular disease, if more than onemuscle was studied.
Neuromuscular Transmission 361
Fig. 5. Single-fiber EMG examination for jitter in normal and abnormal motor end plates. (A)Superimposed and (B) serial traces indicating (from left to right) normal jitter, increased jitter with-out impulse blocking, and increased jitter as well as blocking.
21_Gilchrist 4/11/07 9:56 AM Page 361
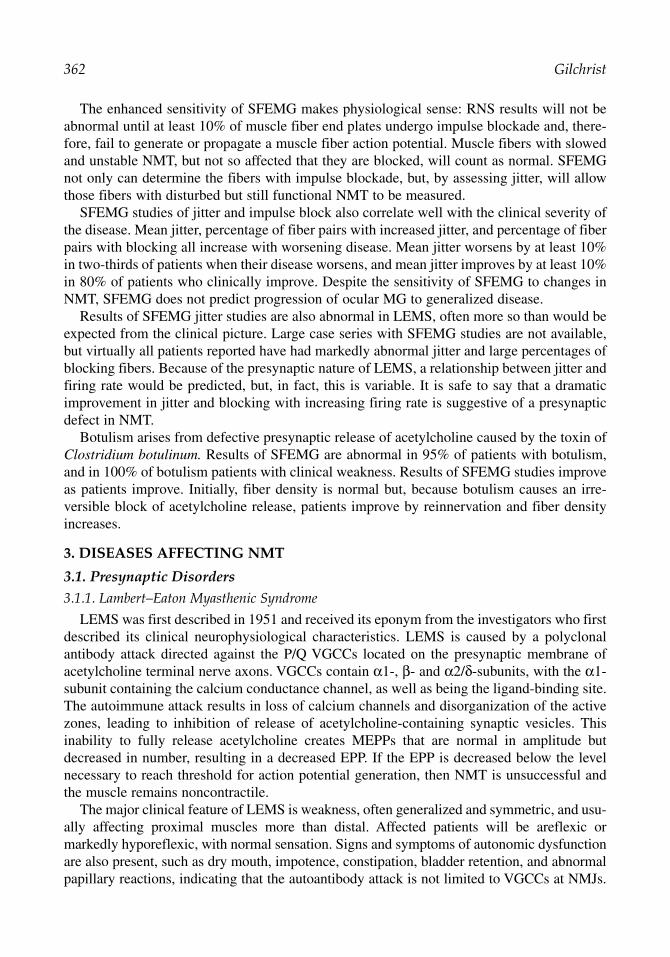
The enhanced sensitivity of SFEMG makes physiological sense: RNS results will not beabnormal until at least 10% of muscle fiber end plates undergo impulse blockade and, there-fore, fail to generate or propagate a muscle fiber action potential. Muscle fibers with slowedand unstable NMT, but not so affected that they are blocked, will count as normal. SFEMGnot only can determine the fibers with impulse blockade, but, by assessing jitter, will allowthose fibers with disturbed but still functional NMT to be measured.
SFEMG studies of jitter and impulse block also correlate well with the clinical severity ofthe disease. Mean jitter, percentage of fiber pairs with increased jitter, and percentage of fiberpairs with blocking all increase with worsening disease. Mean jitter worsens by at least 10%in two-thirds of patients when their disease worsens, and mean jitter improves by at least 10%in 80% of patients who clinically improve. Despite the sensitivity of SFEMG to changes inNMT, SFEMG does not predict progression of ocular MG to generalized disease.
Results of SFEMG jitter studies are also abnormal in LEMS, often more so than would beexpected from the clinical picture. Large case series with SFEMG studies are not available,but virtually all patients reported have had markedly abnormal jitter and large percentages ofblocking fibers. Because of the presynaptic nature of LEMS, a relationship between jitter andfiring rate would be predicted, but, in fact, this is variable. It is safe to say that a dramaticimprovement in jitter and blocking with increasing firing rate is suggestive of a presynapticdefect in NMT.
Botulism arises from defective presynaptic release of acetylcholine caused by the toxin ofClostridium botulinum. Results of SFEMG are abnormal in 95% of patients with botulism,and in 100% of botulism patients with clinical weakness. Results of SFEMG studies improveas patients improve. Initially, fiber density is normal but, because botulism causes an irre-versible block of acetylcholine release, patients improve by reinnervation and fiber densityincreases.
3. DISEASES AFFECTING NMT
3.1. Presynaptic Disorders3.1.1. Lambert–Eaton Myasthenic Syndrome
LEMS was first described in 1951 and received its eponym from the investigators who firstdescribed its clinical neurophysiological characteristics. LEMS is caused by a polyclonalantibody attack directed against the P/Q VGCCs located on the presynaptic membrane ofacetylcholine terminal nerve axons. VGCCs contain α1-, β- and α2/δ-subunits, with the α1-subunit containing the calcium conductance channel, as well as being the ligand-binding site.The autoimmune attack results in loss of calcium channels and disorganization of the activezones, leading to inhibition of release of acetylcholine-containing synaptic vesicles. Thisinability to fully release acetylcholine creates MEPPs that are normal in amplitude butdecreased in number, resulting in a decreased EPP. If the EPP is decreased below the levelnecessary to reach threshold for action potential generation, then NMT is unsuccessful andthe muscle remains noncontractile.
The major clinical feature of LEMS is weakness, often generalized and symmetric, and usu-ally affecting proximal muscles more than distal. Affected patients will be areflexic ormarkedly hyporeflexic, with normal sensation. Signs and symptoms of autonomic dysfunctionare also present, such as dry mouth, impotence, constipation, bladder retention, and abnormalpapillary reactions, indicating that the autoantibody attack is not limited to VGCCs at NMJs.
362 Gilchrist
21_Gilchrist 4/11/07 9:56 AM Page 362

Unlike MG, oculomotor function is uncommon and the onset is usually insidious, althoughacute presentations, including respiratory crisis, are reported. The most striking clinical featureis the improvement in muscle contraction and strength with continued effort. Muscles thatwere too weak to resist gravity will become nearly normal with sustained effort and reflexesthat at first are absent, will steadily improve to normal with repetitive striking of the tendon.All such improvements prove transient and disappear rapidly with cessation of effort. Thisfacilitation with sustained effort is pathognomonic of a presynaptic disorder of NMT.
Unlike MG, the typical patient with LEMS is male and older, often in the fifth or sixthdecade of life. This is likely because 50% of LEMS patients have a paraneoplastic syndrome,often associated with a small cell carcinoma of the lung. The 50% of patients without an asso-ciated carcinoma are younger, but again with a strong male preponderance. The clinical char-acteristics do not differ between the cancer and noncancer groups. Survival is determined bythe underlying cancer in those patients with one, but is not otherwise shortened.
The diagnosis is never made without a high index of suspicion. Antibodies against the P-type VGCC are found in up to 85% of patients, but the diagnosis is most frequently madein the EMG laboratory. Any patient with small CMAP amplitudes and normal conductionvelocities but normal sensory nerve action potential studies should be considered a possiblecase of LEMS. To screen for LEMS, the muscle being recorded should then be exercised for10 to 30 s, depending on how weak it is, and an immediate supramaximal stimulus adminis-tered. If there is no increment in the CMAP amplitude, a presynaptic defect is not present. Ifthere is more than a 40% increment, a presynaptic defect becomes a strong possibility, and,if the increment exceeds 100%, a presynaptic defect is definite. Any such finding should beconfirmed in other muscles by a similar method. Repetitive stimulation (Fig. 4) will showdecrement at low rates of stimulation before exercise, with immediate increase in CMAPamplitude and repair of decrement after exercise, and return to decrement after 2 to 3 min. Athigh rates of stimulation, which are not recommended in the conscious patient because ofgreat discomfort, there will be a dramatic facilitation of the CMAP amplitude. SFEMG willshow increased jitter, impulse blockade, and, in some fibers, a decrease in jitter when thereis an increase in firing rate.
In patients with cancer, treatment is obviously directed at the cancer, which will often pro-vide improvement and even remission. Symptomatic treatments may also provide clinical ben-efit. Guanidine enhances release of synaptic vesicles and was shown to be effective, but hadsevere side effects and is no longer available. Pyridostigmine enhances the amplitude ofMEPPs, much as it does in MG, and can provide some benefit. The most effective symptomatictreatment comes from the aminopyridines, which inhibit voltage-gated potassium conductance,lengthening the action potential and prolonging calcium conductance into the terminal axon; 4-aminopyridine is effective but crosses the blood–brain barrier and causes seizures, tremors,and anxiety; 3,4-diaminopyridine has been found to be much safer because it is less capable ofcrossing the blood–brain barrier and more potent in enhancing release of acetylcholine. Theindustrial solvent, 3,4-diaminopyridine, is available by the barrel for that purpose, but notapproved by the Food and Drug Administration except for individual compassionate use.
3.1.2. Botulism
Botulism is caused by the neurotoxin secreted by the anaerobic bacteria Clostridium botu-linum and takes three forms, food-borne, wound, and infantile. Food-borne is the most commonworldwide, but in the United States, infantile botulism is most common. The toxin consists of
Neuromuscular Transmission 363
21_Gilchrist 4/11/07 9:56 AM Page 363

a heavy and a light chain, and enters the terminal motor axon via receptor-mediated endocyto-sis. Inside the axon, the light chain interferes with proteins involved in fusion of the synapticvesicle with the terminal membrane, including synaptobrevin (part of the synaptic vesicle mem-brane), SNAP-25, and syntaxin (both part of the presynaptic membrane). The effect on thenerve terminal is irreversible and, if severe enough, results in denervation of the myofiber.Recovery in those cases is prolonged, because it requires nerve regeneration and reinnervation.
Infantile botulism occurs between 2 wk and 6 mo of age, and presents as hypotonia, con-stipation, poor feeding, and dyspnea during the course of hours or days. Food-borne botulismaffects older children and adults and begins abruptly, with diplopia, ptosis, dysphagia, limbweakness, and respiratory compromise. External ophthalmoplegia, papillary paralysis, are-flexia or hyporeflexia, and limb weakness are found on examination. Respiratory failure canlead to death, but supportive care and use of botulism antitoxin provide for a good prognosis.
The diagnosis should be suspected clinically and can be made by documenting the presenceof botulinum toxin. The diagnosis is usually confirmed using electrodiagnosis. CMAPs arealways small at rest. Facilitation greater than 100% is observed in 90% of patients but requiresa more sustained effort or a longer period of high-rate stimulation. Repetitive stimulation willshow a decrement if the CMAP is not too low for decrement to be accurately measured.Routine EMG will often reveal fibrillations and positive waves, with a myopathic recruitmentpattern consisting of small, brief, polyphasic MUPs that are early recruited to a full interfer-ence pattern. SFEMG will show increased jitter and blocking, which may inversely correlatewith MUP firing rate. Fiber density will increase as reinnervation proceeds.
3.2. Postsynaptic Disorders of NMT3.2.1. Myasthenia Gravis
MG is an autoimmune disorder in which polyclonal antibodies are directed against the nico-tinic acetylcholine receptor of skeletal muscle. This results in degradation of the NMJ, with sim-plification of the secondary synaptic clefts, loss of acetylcholine receptors, and failure of NMT.The loss of receptors results in a MEPP that has decreased amplitude, leading to a decreasedEPP. The clinical hallmark of the disease is fatigable weakness, usually after repetitive action,causing intermittent symptoms, such as ptosis, diplopia, dysphagia, dysarthria, and facial andlimb muscle weakness. Respiratory compromise can occur in severe cases. The disease has abimodal peak incidence, affecting older men and young women of childbearing age.
Although the clinical history and examination are often typical and highly suggestive, con-firmation of the diagnosis rests on pharmacological, immunological, and electrodiagnosticgrounds. Edrophonium (Tensilon) administered intravenously will quickly but briefly reversethe signs of MG and serves as a good bedside test. Assay for the presence of serum acetyl-choline receptor antibodies is very specific for MG, and is abnormal in 70 to 90% of cases.Sensitivity is lower in patients with only ocular signs.
Electrodiagnostic methods most useful in the diagnosis of MG are RNS and SFEMG. Theresults of RNS are most likely to be abnormal in patients with generalized disease, and whentesting proximal muscles, but even then sensitivity is only in the 70% range if multiple mus-cles are tested. Decrement is most likely with low rates of stimulation, 3 to 5 Hz, after aperiod of maximal muscle contraction. In patients with decrement at rest, exercise willincrease the amount of decrement. At high rates of stimulation, facilitation of the CMAP maymask decrement. The decrement tends to be maximal by the fourth stimulus in a train andoften will repair by the ninth. This U-shaped decrement is common in MG but not specific.
364 Gilchrist
21_Gilchrist 4/11/07 9:56 AM Page 364

SFEMG remains the most sensitive test for dysfunction of NMT and the most sensitivediagnostic test for MG, reaching a 98% yield if two muscles are tested when the first is nor-mal. This is true for ocular as well as generalized disease. SFEMG is also useful in the man-agement of MG because it is a faithful and sensitive indicator of the status of NMT, unlikereceptor antibody assay and RNS.
Treatment may address symptoms only or may be curative. Anticholinesterases can be usedto briefly abate or improve symptoms attributable to MG, but will not affect the underlyingimmunological dysfunction. These drugs work by inhibiting the breakdown of acetylcholine,the neurotransmitter released by terminal motor nerve fibers. Edrophonium, neostigmine, andpyridostigmine (Mestinon) are all anticholinesterases, the latter most commonly used becauseof its longer duration of action (2–4 h) and lesser muscarinic side effects. Mestinon is com-monly used by itself in mild cases and in conjunction with immune suppression in moresevere cases. Side effects include diaphoresis, hypersalivation, diarrhea, nausea, abdominalcramping, bradycardia, and fasciculations. Intravenous dosages of pyridostigmine and neostig-mine are 1/30 of the oral dose for both drugs.
Suppression of the immune system attack on the acetylcholine receptor is indicated when thedisease is generalized, involves vital functions, such as ventilation or swallowing, or is notamenable to symptomatic treatment alone. Various treatments can be used, including corticos-teroids, immune suppressants, such as azathioprine, mycophenylate, mofetil and cyclosporine,plasmapheresis, intravenous human immunoglobulin, and thymectomy. Corticosteroids cancause worsening of symptoms at initiation of therapy and patients must be carefully watchedearly on, preferably as inpatients. This worsening can be limited by starting patients on very lowdoses, with a slow titration upward in dose, although this delays clinical benefit. Plasmapheresisis indicated in the severely compromised patient, in the patient refractory to other treatmentmodalities, and in the patient in whom an immediate response is required.
Thymomas are present in 10 to 15% of patients with MG, and MG occurs in 30% of patientswith thymomas. Thymic hyperplasia is present in another 70% of patients with MG. The thy-mus gland is the likely site for initial sensitization to the acetylcholine receptor. Removal ofthymic tissue increases remission rate from 15 to 30%, and results in significant clinicalimprovement in two-thirds of patients, although the improvement may take up to 5 yr.
3.2.2. Congenital Myasthenic Syndromes
Congenital myasthenic syndromes are genetic disorders affecting components of the NMJimportant in the normal function of NMT. The first clinical description was in 1937, but therealization that they were not related to MG occurred only after the autoimmune nature of MGwas defined in the 1970s. Many such syndromes have now been defined either by their physi-ology, their clinical manifestations, or their ultrastructural characteristics, affecting presynaptic,synaptic, and postsynaptic function. Postsynaptic syndromes account for 76% of cases, withend-plate acetylcholinesterase deficiency accounting for 13% of cases and presynaptic syn-dromes, 8%. There is neither the space nor the inclination to detail each of the syndromes, buta notation of the actual defect usually suffices to illustrate why there is a problem (Table 1).
Onset of symptoms may be in the neonatal period, childhood, or adulthood. The hallmarkof all is fatigable weakness, that is, increasing weakness with continued exertion. This caninvolve ocular, bulbar, limb, and respiratory muscles. Antibodies to acetylcholine receptorsare always absent, by definition. The Tensilon test is variably useful depending on the defect,and obviously not useful in end-plate acetylcholinesterase deficiency. A decremental
Neuromuscular Transmission 365
21_Gilchrist 4/11/07 9:56 AM Page 365
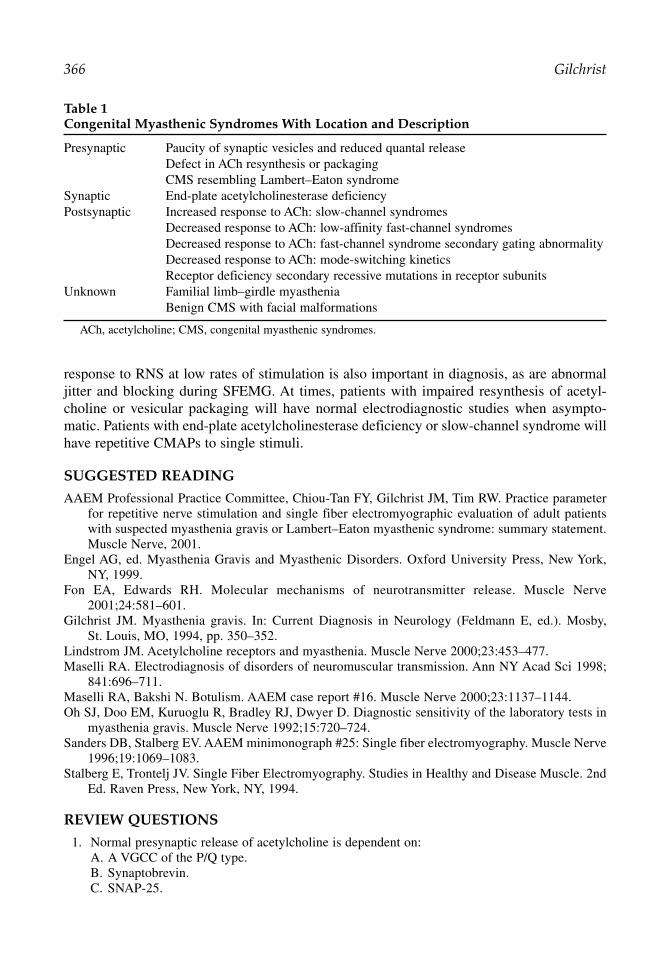
response to RNS at low rates of stimulation is also important in diagnosis, as are abnormaljitter and blocking during SFEMG. At times, patients with impaired resynthesis of acetyl-choline or vesicular packaging will have normal electrodiagnostic studies when asympto-matic. Patients with end-plate acetylcholinesterase deficiency or slow-channel syndrome willhave repetitive CMAPs to single stimuli.
SUGGESTED READING
AAEM Professional Practice Committee, Chiou-Tan FY, Gilchrist JM, Tim RW. Practice parameterfor repetitive nerve stimulation and single fiber electromyographic evaluation of adult patientswith suspected myasthenia gravis or Lambert–Eaton myasthenic syndrome: summary statement.Muscle Nerve, 2001.
Engel AG, ed. Myasthenia Gravis and Myasthenic Disorders. Oxford University Press, New York,NY, 1999.
Fon EA, Edwards RH. Molecular mechanisms of neurotransmitter release. Muscle Nerve2001;24:581–601.
Gilchrist JM. Myasthenia gravis. In: Current Diagnosis in Neurology (Feldmann E, ed.). Mosby,St. Louis, MO, 1994, pp. 350–352.
Lindstrom JM. Acetylcholine receptors and myasthenia. Muscle Nerve 2000;23:453–477.Maselli RA. Electrodiagnosis of disorders of neuromuscular transmission. Ann NY Acad Sci 1998;
841:696–711.Maselli RA, Bakshi N. Botulism. AAEM case report #16. Muscle Nerve 2000;23:1137–1144. Oh SJ, Doo EM, Kuruoglu R, Bradley RJ, Dwyer D. Diagnostic sensitivity of the laboratory tests in
myasthenia gravis. Muscle Nerve 1992;15:720–724.Sanders DB, Stalberg EV. AAEM minimonograph #25: Single fiber electromyography. Muscle Nerve
1996;19:1069–1083.Stalberg E, Trontelj JV. Single Fiber Electromyography. Studies in Healthy and Disease Muscle. 2nd
Ed. Raven Press, New York, NY, 1994.
REVIEW QUESTIONS
1. Normal presynaptic release of acetylcholine is dependent on:A. A VGCC of the P/Q type.B. Synaptobrevin.C. SNAP-25.
366 Gilchrist
Table 1Congenital Myasthenic Syndromes With Location and Description
Presynaptic Paucity of synaptic vesicles and reduced quantal releaseDefect in ACh resynthesis or packagingCMS resembling Lambert–Eaton syndrome
Synaptic End-plate acetylcholinesterase deficiencyPostsynaptic Increased response to ACh: slow-channel syndromes
Decreased response to ACh: low-affinity fast-channel syndromesDecreased response to ACh: fast-channel syndrome secondary gating abnormalityDecreased response to ACh: mode-switching kineticsReceptor deficiency secondary recessive mutations in receptor subunits
Unknown Familial limb–girdle myasthenia Benign CMS with facial malformations
ACh, acetylcholine; CMS, congenital myasthenic syndromes.
21_Gilchrist 4/11/07 9:56 AM Page 366

D. Vesicular acetylcholine transporter.E. All of the above.
2. The immediately available pool of acetylcholine vesicles is:A. Rapidly depleted by a train of presynaptic action potentials.B. Mobilized to replenish the active zones.C. Expanded in proportion to the postsynaptic depolarization.D. Held constant by the vesicular acetylcholine transporter.E. Irrelevant to the normal function of NMT.
3. NMT safety factor:A. Is equal to the number of receptor activations necessary to reach threshold for action poten-
tial activation.B. Is not a factor in normal NMT.C. Refers to the EPP in excess of that necessary to reach threshold for action potential activation.D. Fails frequently during exercise in healthy people.E. Is determined solely by the number of available acetylcholine receptors.
4. Lambert–Eaton syndrome:A. Is a postsynaptic disorder of VGCCs.B. Is caused by a defect in acetylcholine vesicle release.C. Is not readily diagnosed by repetitive nerve stimulation.D. Improves with continued exercise.E. Is less likely than botulism to show changes with continued exercise.
5. EMG:A. Is irrelevant to the examination of disorders of NMT.B. Will show MUP variation only with strong contractions.C. Will show abnormalities of motor unit variation that are specific to MG.D. Will show denervation potentials in most cases of LEMS.E. Can reveal MUP amplitude variation suggestive of defective NMT.
6. Repetitive nerve stimulation:A. Is the most sensitive test for disorders of NMT.B. Is best performed at high rates of stimulation.C. Should be performed both before and after a period of maximum voluntary muscle contraction.D. Most commonly shows facilitation 2 to 3 min after exercise.E. Does not require impulse blockade to be abnormal.
7. SFEMG:A. Is usually performed with a low filter of 20 Hz, using a concentric needle electrode.B. Performed by axonal stimulation allows the examiner to determine fiber density.C. Is a sensitive measure of NMT safety factor.D. Can differentiate presynaptic from postsynaptic disorders.E. Is abnormal only in primary disorders of NMT.
8. The clinical characteristics of LEMS:A. Are indistinguishable at the bedside from MG.B. Often involve oculomotor function.C. Always indicate an underlying lung cancer of the small cell type.D. Include areflexia and autonomic dysfunction.E. Are obvious and rarely missed.
9. Botulism:A. Is caused by a toxin directed against acetylcholinesterase in the basal laminar matrix of the
primary synaptic cleft.B. Is a presynaptic disorder of the VGCCs.C. Does not show abnormalities on repetitive nerve stimulation.D. Will reveal facilitation after exercise.E. Does not involve oculomotor function.
Neuromuscular Transmission 367
21_Gilchrist 4/11/07 9:56 AM Page 367

10. MG:A. Is characterized by fatigable weakness.B. Shows maximal decrement by the fourth stimulus in a train.C. Does not require SFEMG for diagnosis.D. Is characterized by a MEPP of decreased amplitude.E. All of the above.
REVIEW ANSWERS
1. The correct answer is E. VGCCs, synaptobrevin, SNAP-25, and vesicular acetylcholine trans-porter all participate in the release of acetylcholine from the presynaptic terminal.
2. The correct answer is A. The immediate pool is rapidly depleted by a train of presynaptic actionpotentials and is not expanded in proportion to the postsynaptic depolarization. The mobiliza-tion or reserve pool is mobilized to replenish the immediate pool. The immediate pool is not heldconstant by the acetylcholine transporter and is, in fact, very relevant to normal NMT.
3. The correct answer is C. The NMT safety factor refers to the EPP in excess of that necessary toreach threshold. It is not the number of receptor activations needed to reach threshold and it is amajor factor in normal NMT. However, it does not fail during exercise in healthy people (therecontinues to be some safety factor normally present even after intense exercise and rapid ratesof stimulation). It is determined, in part, by the number of acetylcholine receptors as well as theamount acetylcholine in the NMJ.
4. The correct answer is D. LEMS improves with repeated exercise. It is a presynaptic disorder ofVGCC, it is not caused by a defect in acetylcholine release, it is readily diagnosed by repetitivenerve stimulation (with a decrement at slow rates of stimulation and an increment with highrates), and is more likely than botulism to show improvements with continued exercise.
5. The correct answer is E. EMG will show unstable MUPs with varying amplitude in patients withdefective NMT of any cause and are not necessarily dependent on the strength of contraction(hence, EMG is not irrelevant to examination of disorders of NMT, but there are no abnormali-ties specific to any one disorder). Denervation potentials would be distinctly uncommon inLEMS (although they are relatively common in botulism).
6. The correct answer is C. To elicit abnormalities on repetitive stimulation, it should be performed bothbefore and after a period of maximum voluntary muscle contraction. It is not the most sensitive test(SFEMG is). It should be performed at slow rates for postsynaptic disorders and rapid rates for presy-naptic disorders. Facilitation should occur immediately after exercise (after exercise exhaustion usu-ally is maximal at 2–3 min after exercise). It does require impulse blockade to be abnormal.
7. The correct answer is C. SFEMG provides an excellent measure of the safety factor of NMT. Itis usually performed with a single-fiber electrode (not a concentric needle electrode) with a low-frequency filter set to approx 2 kHz. Axonal stimulation is not necessary to determine fiber den-sity. It cannot differentiate presynaptic from postsynaptic disorders. It is a nonspecific findingand can be abnormally elevated in almost any form of neuromuscular disease.
8. The correct answer is D. Areflexia and autonomic dysfunction are usually associated withLEMS. LEMS and MG usually are quite distinct, although, in some rare cases, they can looksimilar. Oculomotor function is rarely if ever involved in LEMS. It is not always associated withsmall cell carcinoma of the lung (it can occur as an independent autoimmune disorder). LEMScan be difficult to diagnosis and the disorder can be overlooked.
9. The correct answer is D. Botulism usually demonstrates facilitation after exercise, although insevere cases facilitation may not occur. It is not caused by antibodies directed against acetyl-cholinesterase or the VGCCs, but rather against the proteins involved in fusion of the synapticvesicle with the terminal membrane. Abnormalities on repetitive stimulation are to be expectedand involvement of oculomotor function is quite common.
10. The correct answer is E. All of the choices are typically observed in MG.
368 Gilchrist
21_Gilchrist 4/11/07 9:56 AM Page 368

22Pediatric Nerve Conduction Studies and EMG
Peter B. Kang
SummaryA variety of neuromuscular conditions affect children, ranging from severe, usually fatal disorders,
such as spinal muscular atrophy type I (Werdnig–Hoffman syndrome) to relatively mild problems, suchas benign congenital hypotonia. The evaluation of children in the EMG laboratory requires special carebecause of the discomfort of the tests. Moreover, other considerations, such as slower baseline nerveconduction velocities and conditions that generally do not present in adulthood, such as congenitalmyasthenic syndromes, can make the pediatric neurophysiological examination especially challenging.This chapter reviews both the common pediatric neuromuscular conditions and their assessment in theEMG laboratory.
Key Words: Electromyography; Guillain–Barré syndrome; hereditary neuropathies; pediatrics; rootavulsion; spinal muscular atrophy.
1. INTRODUCTION
EMG is a useful diagnostic tool in children suspected of having acquired or inheritedneuromuscular disease and complements the advances in molecular genetic testing duringthe past decade. The technical limitations of performing EMG in children require that theelectromyographer be selective in deciding how to approach the study. In evaluating forgeneralized processes, examination of one or two extremities is often adequate to narrowthe differential diagnosis or, in some cases, suggest a specific disorder. EMG may be usedto evaluate hypotonia in infants, assess the severity and localization of perinatal brachialplexus injuries, and distinguish between different possible causes of gait difficulties inolder children. In children, EMG may contribute to the diagnosis of many disorders,including spinal muscular atrophy (SMA), brachial plexus injury, hereditary polyneuropathy,acquired polyneuropathy, disorders of neuromuscular transmission, myopathy, musculardystrophy, and myotonic disorders.
2. TECHNICAL ISSUES
2.1. General Approach
Electrodiagnostic studies are highly dependent on technique in adults, but are even moredependent on technique in children. Infants and toddlers do not understand the purpose of thestudy, have a limited tolerance for discomfort, and often squirm and withdraw during testing.In selected cases, sedation or general anesthesia is required to obtain adequate data. Topicalanesthetic creams are used in some pediatric EMG laboratories, which can help reduce pain,
From: The Clinical Neurophysiology PrimerEdited by: A. S. Blum and S. B. Rutkove © Humana Press Inc., Totowa, NJ
369
22_Kang 4/11/07 10:35 PM Page 369

but they require that the electromyographer either guess which sites are most likely candi-dates for needle EMG before the nerve conduction studies, or impose a stressful half-hourwait between the nerve conduction studies and needle EMG on the patient. Despite theselimitations, it is usually possible to perform a successful and informative study.
As in adults, a brief history and focused physical examination is critical in directing the testsperformed, especially because they may be terminated prematurely. If the child is old enoughto understand the procedure, it is important to explain it to the child as well as the parent. It issometimes possible to convince younger children that the EMG machine is a “tickling” machinefor nerve conduction studies—the power of suggestion being quite effective. Infants may bemore comfortable sitting in a parent’s lap on the examination table or in a chair. Pacifiers andtoys are often effective in calming infants and toddlers. Even school-age children and adoles-cents may feel more comfortable if a parent sits or stands near them during the study.
2.2. Nerve Conduction Studies
The temperature of the extremity during nerve conduction studies is as important in chil-dren as in adults. An excessively cold extremity will yield falsely slow conduction velocitiesand increased amplitudes. Upper extremity skin temperatures, measured at first dorsalinterosseous, should be at least 32°C. Lower extremity skin temperatures, measured at lowergastrocnemius, should be at least 30°C. Warming may be achieved with the use of towelsdampened with hot water and wrapped around the distal extremity for approx 5 min. Caremust be taken not to overheat the towels; a child’s skin is more delicate than that of an adult,and is more susceptible to scalding injury. It is also important to wring out the towel beforeapplying to the skin and to dry the skin after warming; a wet extremity will rapidly cool.Some electromyographers use disposable hot packs that produce heat via a chemical reaction.If used in children, these packs should be wrapped in towels to prevent burns, for they maybecome very hot. The temperature should be measured again after warming to confirm that itis in the acceptable range.
Surface active and reference recording electrodes may need to be trimmed or even cut inhalf for infants. Full-sized ground electrodes should be used whenever possible, however,because their placement is more flexible. Pediatric stimulators with small cathodes and anodesare useful for this age group. Standard adult distal distances cannot be used in infants andyoung children because of the small size of the extremities involved; thus, evaluation ofmotor distal latencies must take the patient’s age into account (see Table 1). The initial stim-ulation should always be less than 10 mA. It can be very reassuring to a child when the firststimulation is barely perceptible.
Questions of generalized processes, such as polyneuropathies and myopathies, are commonin pediatric EMG laboratories. Limited patient tolerance often makes it practical to performonly a motor and sensory study in an upper and lower extremity. In such cases, the electromyo-grapher may perform median motor and sensory studies in an upper extremity, and peronealmotor and a sural or medial plantar (depending on the age) sensory study in a lower extremity.In a child who is uncooperative or anxious, it may be best to perform the sensory studies first,because those require less stimulation intensity and are, thus, better tolerated.
The median motor study is performed as in an adult, with the E1 recording electrodeplaced over the abductor pollicis brevis and stimulation occurring at the wrist and cubital
370 Kang
22_Kang 4/11/07 10:35 PM Page 370

Pediatric EMG 371
Table 1Motor Nerve Conduction Studies, Suggested Values
Age A (mV) CV (m/s) DL (ms)
Median nervePreterm (33–39 wk) — ≥18 —0–1 mo ≥2.5 ≥20 ≤3.51–6 mo ≥3.5 ≥25 ≤3.07–12 mo ≥2.5 ≥30 ≤3.01–2 yr ≥3.5 ≥35 ≤2.52–3 yr — ≥40 ≤2.53–4 yr — ≥45 ≤2.54+ yr — ≥50 ≤3.0Adult ≥4.0 ≥50 ≤4.0
Ulnar nervePreterm (33–39 wk) — ≥18 ≤3.30–1 mo ≥1.5 ≥20 ≤3.01–6 mo ≥2.5 ≥25 ≤3.37–12 mo ≥3.0 ≥35 ≤2.51–2 yr ≥2.5 ≥40 ≤2.52–3 yr — ≥40 —3–4 yr — ≥45 —4+ yr — ≥50 —Adult ≥6.0 ≥50 ≤3.3
Peroneal nerve0–1 mo ≥1.5 ≥20 ≤3.01–6 mo ≥1.5 ≥25 ≤2.57–12 mo ≥2.0 ≥30 ≤3.51–2 yr ≥1.5 ≥35 ≤3.52–3 yr — ≥40 —3–4 yr — ≥40 —4+ yr — ≥40 —Adult ≥2.0 ≥40 ≤6.5
Tibial nervePreterm (33–36 wk) — ≥14 —Preterm (37–39 wk) — ≥18 —0–1 mo — ≥20 ≤4.51–6 mo — ≥20 ≤4.07–12 mo — ≥25 ≤3.51–2 yr — ≥30 ≤3.02–3 yr — ≥35 ≤4.03–4 yr — ≥40 ≤4.04–6 yr — ≥40 ≤4.56+ yr — ≥40 ≤5.0Adult ≥4.0 ≥40 ≤5.8
A, suggested amplitude; CV, suggested conduction velocity; DL, suggested distallatency; —, data not available.
aAdapted from refs. 1, 2, 4–6, 23–25.
22_Kang 4/11/07 10:35 PM Page 371
fossa. The peroneal motor study is performed as in an adult, with the E1 recording electrodeplaced over the extensor digitorum brevis and stimulation occurring at the ankle, fibular head,and popliteal fossa. Recording of tibialis anterior may be used when no response or a verysmall response is obtained from extensor digitorum brevis. One of the proximal stimulationsites may be omitted in children, unless, of course, there is a question of a peroneal neuropa-thy at the fibular head, such neuropathy being quite rare in children.
In infants, the most difficult aspect of the median antidromic sensory study involves theplacement of the active and reference electrodes. The active electrode may be placed on thesecond digit and the reference on the third, or the electrodes can be cut in half and both placedon the second or third digit. If this is unsuccessful, ring electrodes may be used instead. Thestimulation site is, as usual, at the wrist. In neonates and some infants, surface recordings ofsural nerve sensory action potentials are often obscured by artifact caused by high skinimpedance and short interelectrode distances. In this age group, the most technically reliablesensory study to obtain in the lower extremity is the orthodromic medial plantar study, recordingthe tibial nerve at the ankle and stimulating the medial plantar region of the sole.
Full-term newborns typically have nerve conduction velocities that are approximately halfthose expected in an adult. Nerve conduction velocities increase steadily during the first 3 to5 yr of life, because of growth in axon diameter and thickening of myelin. Thus, adult nerveconduction values cannot be reliably expected until 3 to 5 yr of age, although some children’sresponses reach those values earlier. Normal amplitudes are also diminished in children com-pared with adults, especially in the first year of life. In a child younger than 3 to 5 yr, it isimportant to consult age-matched reference values in interpreting the results of nerve conduc-tion studies. Tables 1 and 2 list suggested normal values adapted and summarized from pub-lished data on surface recordings, and also include adult normal values for comparison. Moststudies seeking to establish normal values in children focus on motor nerve conduction studies,thus, Table 1 is more comprehensive than Table 2.
Elicitation of late responses may produce significant discomfort in a child, and should notbe performed unless they can help answer a specific question, for example, when Guillain–Barré syndrome is a possible diagnosis. If a number of late response studies are necessary,sedation or anesthesia should be considered. Despite incomplete myelination, short statureresults in F-response latencies that are shorter in children than in adults. Age-matched normalvalues, such as the ones listed in Table 3 should be used. H-reflexes may be obtained in theupper as well as the lower extremities in the first year of life, but are rarely necessary in thepediatric population.
2.3. Needle EMG
For the needle examination, a 30-gauge, 25-mm disposable concentric needle (the small-est commercially available) is almost always the best choice. School-age children often askif “it will hurt.” One can reply that it will “pinch” or say that it will be like a blood draw, whileavoiding the term “needle.” The needle itself can be described as a “microphone.” Older chil-dren and adolescents may often be examined as thoroughly as adults, but it is still advisableto examine the fewest muscles necessary to answer the question at hand. These patientssometimes reach a limit of tolerance unexpectedly during the needle examination and becomeupset with little warning.
Except in cases of neonatal brachial plexus injury or trauma, extensive root screens arerarely required in children. In many cases, the question revolves around a generalized process,
372 Kang
22_Kang 4/11/07 10:35 PM Page 372

therefore, a limited needle examination often yields the necessary data. In infants and tod-dlers, poor cooperation often makes it impossible to evaluate both insertional activity and vol-untary activity in the same muscle. In the upper extremities, insertional activity is most easilyobserved in triceps and first dorsal interosseous, whereas motor unit activity is better assessedin biceps and flexor carpi radialis. In the lower extremities, medial gastrocnemius and vastuslateralis are better for insertional activity, whereas tibialis anterior and iliopsoas are preferredfor motor unit potential (MUP) analysis.
As in adults, if there is a question of a polyneuropathy, it is important to examine distalmuscles, although it is rarely necessary to study intrinsic foot muscles in young children.Children with possible myopathy should have several proximal muscles evaluated, but oneextremity (preferably lower) should be spared so that histological examination of a musclebiopsy performed at a later time will be free of potential artifacts from needle injury.
Pediatric EMG 373
Table 2Sensory Nerve Action Potentials, Suggested Values
Age A (mV) CV (m/s)
Median nerve (antidromic)0–1 mo ≥5 ≥251–6 mo ≥10 ≥357–12 mo ≥15 ≥301–2 yr ≥15 ≥402–3 yr — —3–4 yr — —4+ yr — —Adult ≥20 ≥50
Sural nerve (antidromic)0–1 mo ≥6 ≥201–6 mo ≥6 ≥207–12 mo ≥6 ≥251–2 yr ≥6 ≥302–3 yr ≥6 ≥353–4 yr ≥6 ≥404+ yr ≥6 ≥40Adult ≥6 ≥40
Medial plantar nerve orthodromic in children0–1 mo ≥10 —1–6 mo ≥15 ≥357–12 mo ≥15 ≥351–2 yr ≥15 ≥352–4 yr — —4+ yr — —Adult (antidromic) ≥2 ≥35
A, suggested amplitude; CV, suggested conduction velocity; —, data notavailable. Sural sensory responses may be obscured by subcutaneous tissuein neonates and infants; medial plantar studies may be more accurate in thisage group.
aAdapted from refs. 1–3, 6, 25.
22_Kang 4/11/07 10:35 PM Page 373

3. COMMON REFERRALS TO THE PEDIATRIC EMG LABORATORY
Deciding whether to request or perform an EMG in a particular case is sometimes diffi-cult, because the number of available diagnostic modalities has increased dramatically inrecent years. Genetic testing is available for many neuropathies and muscular dystrophies,and may make EMG unnecessary in certain patients. However, there are many children with
374 Kang
Table 3F-Wave Responses, Suggested Values
Age Latency (ms)
Median nerve0–1 mo ≤201–6 mo ≤207–12 mo ≤211–2 yr ≤212–4 yr ≤214–6 yr ≤236–14 yr ≤29Adult ≤31
Ulnar nerve0–1 mo —1–6 mo ≤177–12 mo ≤171–2 yr ≤172–4 yr —4–6 yr —6–14 yr —Adult ≤32
Peroneal nerve0–1 mo ≤261–6 mo ≤277–12 mo ≤291–2 yr ≤302–4 yr ≤344–6 yr ≤366–14 yr ≤43Adult ≤56
Tibial nerve0–1 mo —1–6 mo —7–12 mo ≤241–2 yr ≤262–4 yr —4–6 yr —6–14 yr —Adult ≤56
—, data not available. aAdapted from refs. 1, 3, 25, 26.
22_Kang 4/11/07 10:35 PM Page 374

acquired conditions and unusual presentations of inherited disorders in whom EMG is anessential test, and the volume of EMG referrals, in our experience, has remained steady.
The differential diagnosis of hypotonia in infancy and early childhood is vast, andincludes a number of peripheral nervous system processes. However, it is important toremember that the majority of cases of infant hypotonia arise from central causes. An exten-sive peripheral nervous system evaluation should be pursued only if supported by the his-tory and examination. Peripheral nervous system lesions may localize to the anterior horncell, peripheral nerve, neuromuscular junction, or muscle. If a congenital myopathy or mus-cular dystrophy lies in the differential diagnosis, it is often useful to obtain a set of muscleenzymes (creatine kinase, aldolase, alanine aminotransferase, aspartate aminotransferase,and lactate dehydrogenase) before requesting or performing an EMG or muscle biopsy. It isimportant to remember that muscle enzymes may be artifactually elevated immediately afterneedle EMG is performed. A significant elevation of one or more enzymes (the elevatedenzymes should include either creatine kinase or aldolase, because these are the ones thatare most specific to muscle) will justify a muscle biopsy as the next step. Mild abnormali-ties or normal levels of these enzymes do not always exclude a congenital myopathy; inthose cases, an EMG may be helpful in directing further studies. The precise sensitivity ofEMG in the evaluation of the hypotonic infant is unclear. One study reported an 80% over-all sensitivity for the correct diagnosis, whereas another recorded a 65% sensitivity for SMAand 10% for myopathy.
A neonate with a birth injury to the brachial plexus may present with a weak or flaccidupper extremity. It is rare for alternative diagnoses to be plausible, therefore, the question forthe electromyographer usually revolves around issues of severity and prognosis. Except in themost severe cases, an EMG is most helpful after the first few months of life, when the pres-ence or absence of chronic reinnervation and axonal continuity may best be assessed.
Toddlers and older children may present with delayed motor milestones or difficulty walk-ing. As in the evaluation of hypotonia, the differential diagnosis is broad, and may includealmost any segment of the peripheral nervous system. Proximal weakness, often detected bythe presence of Gowers sign, Trendelenburg gait, or both, typically suggests the possibility ofDuchenne, Becker, or limb–girdle muscular dystrophy. If such a patient has significantly ele-vated muscle enzyme levels, either molecular genetic testing or muscle biopsy will yield adiagnosis in most cases. When such an evaluation is unrevealing, an EMG may be useful inassessing the child for a neuropathic process, such as SMA type III (also known asKugelberg–Welander disease). SMA type III may resemble a muscular dystrophy with aproximal distribution of weakness and a mild elevation of the creatine kinase level.
Abrupt onset gait difficulty may be caused by acute inflammatory demyelinating polyneu-ropathy (AIDP; Guillain–Barré syndrome), an inflammatory myopathy, tick paralysis, spinalcord conditions (mass lesion or transverse myelitis), or central causes. Although poliomyelitis,fortunately, has almost been eradicated in much of the world, West Nile virus has also beenfound to produce a similar syndrome of acute motor paralysis. A detailed skin and scalp exam-ination is important in such acutely weak children, because tick paralysis is readily cured byremoving the tick. Because ataxia is often observed in AIDP, it may be difficult in some casesto distinguish between that condition and other causes of ataxia, such as acute cerebellitis. Ifa particular diagnosis cannot be supported by other findings, such as areflexia, cytoalbumino-logical dissociation, rash, elevated creatine kinase level, or nerve root enhancement on MRIimaging of the spine, EMG may be helpful in distinguishing between the possibilities.
Pediatric EMG 375
22_Kang 4/11/07 10:35 PM Page 375

Chronic gait difficulty associated with areflexia, sensory loss, pes cavus, distal weakness,or a combination of these suggests the presence of an isolated inherited polyneuropathy, suchas Charcot–Marie–Tooth (CMT) disease, also called hereditary motor sensory neuropathy. Insome instances, a demyelinating polyneuropathy may be associated with a more generalizedneurodegenerative disorder, such as metachromatic leukodystrophy, especially if there is anassociated cognitive decline.
4. IMPORTANT FINDINGS IN THE PEDIATRIC EMG LABORATORY
4.1. Motor Neuron Disease
Because of the development of the polio vaccine, SMA has become the dominant anteriorhorn cell disease affecting children in developed countries. The onset of the most commonvariant, type I (Werdnig–Hoffman disease), is typically in the first 6 mo of life. The infantspresent with hypotonia, weakness, and delayed motor milestones. Mothers may reportdecreased fetal movements. Examination is notable for areflexia or hyporeflexia, hypotonia,weakness, and preserved extraocular movements. Tongue fasciculations may sometimes beobserved, but are not a reliable finding, especially in young infants, and the lack of tonguefasciculations should never be used to exclude SMA. These children never sit independentlyand never walk. The majority do not survive the second year of life.
The onset of SMA type II is typically from 6 to 18 mo, with some cases beginning as earlyas the neonatal period. These children often present with motor delays. They eventually sitindependently but never walk, and survive only to adolescence or early adulthood. The gaitdifficulties that are often the first signs of SMA type III usually begin after 18 mo. Thesepatients walk independently for most of their lives. Life expectancy is normal in most casesof SMA type III, although some patients require wheelchair assistance as adults.
SMA is caused by a deletion in the survival motor neuron (SMN) gene on chromosome 5q13.Until this discovery, EMG and muscle biopsy were the principal means of confirming the diag-nosis during life. Genetic testing for deletions in SMN is now readily available, but EMG is stillhelpful in many cases, especially if the presentation is mild or otherwise unusual, or if an infantdevelops respiratory failure before the results of genetic testing become available.
As in adult motor neuron disease, it is critical to document normal sensory responses onnerve conduction studies; if these are abnormal, the diagnosis should remain in serious doubt.Compound motor action potential (CMAP) amplitudes are often diminished in SMA type I,but may be minimally reduced or normal in SMA types II and III. During the needle exami-nation, at least three limbs should be studied. Cranial muscles may be substituted for one limb,especially if tongue fasciculations are observed. Examination of paraspinal muscles is not gen-erally helpful and should be avoided. Both ongoing denervation and chronic reinnervation maybe observed. In adults, chronic reinnervation should be demonstrated in most muscles of atleast three limbs to meet criteria for motor neuron disease, but in children it is not always pos-sible to do this extensive a needle examination, and any findings should be confirmed bygenetic testing. Fasciculation potentials are observed more rarely in SMA as compared withamyotrophic lateral sclerosis, and the MUP abnormalities are generally symmetrical in SMA.
4.2. Sensory Neuropathy and Neuronopathy
It is rare to find an isolated sensory neuropathy or sensory neuronopathy in childhood. Ininfants, the sural and superficial peroneal sensory responses are often difficult to record.Thus, in children of that age, the medial plantar sensory responses and upper extremity
376 Kang
22_Kang 4/11/07 10:35 PM Page 376

sensory responses must be checked before concluding that the patient has a true loss of sen-sory responses. Age-specific normal values must be used in children younger than 3 to 5 yr.
If a true sensory neuropathy or sensory neuronopathy is present, the most likely causes areFriedreich’s ataxia and the hereditary sensory and autonomic neuropathies. Because genetictesting for the triplet-repeat expansion in Friedreich’s ataxia is available, patients with thetypical clinical presentation are often diagnosed without the assistance of an EMG.Associated findings include ataxia, absent lower extremity reflexes, extensor plantarresponses, thinning of the spinal cord on spine MRI, normal brain MRI early in the course,onset before 20 yr, pes cavus, dysarthria, distal sensory loss, optic atrophy, diabetes, andcardiomyopathy.
4.3. Brachial Plexus
Brachial plexus injuries in children most commonly occur at birth, as a result of shoulderdystocia (difficulty in extracting the shoulder from the birth canal). Risk factors includedifficult delivery and large birthweight. As might be expected from the mechanism of injury,upper plexus injuries (Erb’s palsy) predominate. Lower brachial plexus lesions (Klumpke’spalsy) and total plexus injuries (Erb-Klumpke paralysis) are less common. The neonate willhave flaccid weakness of one upper extremity.
The history and examination are, in most cases, diagnostic of perinatal brachial plexusinjury. A careful examination will suggest the root levels involved. In upper plexus lesions, theposture known as the “waiter’s tip” is usually found, consisting of arm adduction, elbow exten-sion, forearm pronation, and wrist flexion. In lower plexus lesions, wrist and finger flexors andintrinsic hand muscles are weak. A Horner’s syndrome is typically present. A combination ofthese findings or complete upper extremity paralysis suggests total plexus involvement.
Initial management includes gentle immobilization of the affected extremity against theabdomen and range of motion exercises, preferably under the direction of a trained physicaltherapist. In almost all cases, observation and conservative management are recommendeduntil 3 to 6 mo of age. If there is no improvement at that point, evaluation for possible micro-surgical repair may be indicated, including EMG and MRI.
In this setting, the purpose of performing an EMG study is to determine the localizationand severity of the injury. The severity is largely dependent on the localization, becausediscontinuity of the axon, most commonly caused by avulsion of the nerve root, is associatedwith a much poorer prognosis than “stretching” of the brachial plexus structures.
If brachial plexus injury and root avulsion were mutually exclusive conditions, the studywould be relatively simple, because, in the former condition, sensory responses would beabsent, whereas, in the latter, they would be preserved. However, in many cases, the twolesions coexist, making abnormal sensory nerve action potentials (SNAPs) less reassuringthan they would be under other circumstances.
The needle study is the key to determining prognosis. Because examination of the cervi-cal paraspinal muscle is impractical in most infants, the presence of MUPs on needle EMGat various root levels confirms continuity of the axon and, thus, the likelihood of at least par-tial recovery of function. This assessment can only be made several months after birth, afterreinnervation has begun to occur, because a premature examination may yield an inaccuratelygrim prognosis.
Precise localization among the root, trunk, division, cord, and nerve structures requiresthe evaluation of a large number of muscles, but unless the infant is anesthetized, this is
Pediatric EMG 377
22_Kang 4/11/07 10:35 PM Page 377

not usually possible. Thus, because of the high likelihood that the study will be terminatedprematurely, the choice of muscles is critical. If an infant has a typical upper plexus pres-entation, the deltoid, biceps, and triceps muscles should be studied first. Comparing del-toid and biceps can help distinguish between root and plexus involvement; both muscleswill be abnormal when a C5–C6 root lesion is present, but only one may be abnormal inlesions of the brachial plexus. Unfortunately, examination of the rhomboids and serratusanterior is rarely practical in infants, limiting the precision of localization within thebrachial plexus.
When a Horner’s syndrome or other signs of lower plexus involvement are present, adistal muscle, such as the first dorsal interosseous, should be among the first musclesexamined. Depending on the clinical picture and the tolerance of the patient, other mus-cles that may be studied include the supraspinatus, extensor digitorum communis, flexordigitorum superficialis, and abductor digiti quinti. If the triceps has been successfullyexamined, needle EMG of extensor digitorum communis may not be necessary. As formedian-innervated nerve muscles, examination of the flexor digitorum superficialis isusually more informative than that of abductor pollicis brevis, because the infant is morelikely to activate the former.
Muscle activation in infants is often fleeting. For flexor muscles, tickling or gentle pinch-ing of the fingers and hand may stimulate withdrawal when the needle itself fails to inducethis response. The infant is less likely to activate extensor muscles under these circum-stances. It is sometimes difficult to decide how long to examine a muscle, especially if thechild is crying and it seems that the time remaining in the study is rapidly diminishing.When no MUPs are present, tickling or pinching to activate muscle contractions should beperformed at least once for each major level (C5–C6, C7, and C8–T1), and preferably inmultiple muscles. Because a decision whether or not to perform surgery may hinge partlyon the study results, any examination that is too truncated to be reliable should be repeatedunder anesthesia.
4.4. Polyneuropathies
AIDP (Guillain–Barré syndrome) may occur at almost any age in childhood, from 1 moto adulthood. The classic clinical presentation is the same as in adults, with an acute onsetof ascending paralysis, areflexia, and cytoalbuminological dissociation in the cerebrospinalfluid, with protein values often ranging from 80 to 200. An EMG may be very helpful inconfirming or casting doubt on the diagnosis. The use of spine MRI with gadoliniumenhancement to detect nerve root enhancement is also becoming more widespread. The ini-tial symptoms may be atypical in some patients, consisting primarily of numbness, pares-thesias, or pain.
Nerve conduction studies are most useful in the evaluation of possible AIDP. In the clas-sic demyelinating form of AIDP, the diagnostic findings are temporal dispersion and con-duction block in the setting of slow conduction velocities and prolonged distal latencies. Thecriteria for these findings are generally the same in children as in adults: at least 15% pro-longation of CMAP duration on proximal vs distal stimulation for temporal dispersion, atleast 50% diminution of CMAP amplitude on proximal vs distal stimulation for partial con-duction block, and an absent CMAP on proximal stimulation for complete conduction block.The presence of temporal dispersion excludes partial or complete conduction block. Anothercriterion for nonuniform slowing suggesting an acquired demyelinating process is a significant
378 Kang
22_Kang 4/11/07 10:35 PM Page 378

disparity in nerve conduction velocities between different nerves, usually at least 10 m/s dif-ference within the upper or lower extremities, and at least 15 m/s difference between anupper and a lower extremity. The usual adult standards stipulating the number of nervesinvolved may not always be practical to apply in children, because the study may be termi-nated early. Evidence for axonal loss may be present, but unless severe, this is usually a sec-ondary phenomenon.
In some early or mild cases, temporal dispersion, conduction block, and conduction velo-city slowing may not be present. Prolonged or absent F-responses and H-reflexes may beearly signs of AIDP, as may be reduced recruitment on an otherwise normal needle EMGstudy. If tolerated, F-waves should be performed on several nerves in multiple extremities. H-reflexes are extremely uncomfortable, especially for a child, and, thus, should be avoided.These early electrophysiological signs of AIDP may be subtle and nonspecific; if the diagnosiscannot clearly be supported by other data, a repeat study later in the course may provide moredefinite evidence.
The less common, primarily axonal form of Guillain–Barré, known as acute motor axonalneuropathy, was first recognized in China, and most commonly occurs there, but has alsobeen described in the United States, Europe, and other parts of Asia. In adults, the prognosisis clearly worse in axonal variants. Children with acute motor axonal neuropathy have aworse course acutely (many require assisted ventilation) and recover more slowly than thosewith AIDP, but the long-term prognosis is generally good if they survive the acute phase.Conduction velocities are normal or mildly slow. There is evidence for axonal loss both onnerve conduction studies and needle EMG.
A generalized sensorimotor polyneuropathy in the setting of long-standing symptoms maybe caused by chronic inflammatory demyelinating polyradiculoneuropathy (CIDP) or an inher-ited polyneuropathy, such as CMT (also known as hereditary sensory and motor neuropathy),metachromatic leukodystrophy, Cockayne syndrome, Pelizaeus-Merzbacher disease, oradrenomyeloneuropathy. An EMG can determine whether a polyneuropathy is present, andmay, in some cases, help distinguish between acquired and genetic causes. Traditionally,signs of nonuniform slowing of nerve conduction, such as temporal dispersion, conductionblock, and significant disparities in nerve conduction velocities between different nerves haveindicated the presence of an acquired polyneuropathy, whereas uniform slowing has beenassociated with an inherited polyneuropathy. However, numerous reports have demonstratednonuniform slowing in some instances of inherited polyneuropathies, including metachro-matic leukodystrophy, hereditary neuropathy with liability to pressure palsies, the X-linkedvariant of CMT (CMTX), and adrenomyeloneuropathy.
Children with CIDP generally have manifestations of motor delay or impairment. Theweakness may show a distal predominance or may be diffusely distributed. Other findingsinclude sensory loss in some patients, normal cranial nerve function, and hyporeflexia or are-flexia. CIDP may develop at any age, and has even been reported to be present at birth.
The electrophysiological findings in CIDP are similar to those in fully developed AIDP.Nerve conduction velocities may be as slow as 2.3 m/s. Temporal dispersion and conductionblock are classic findings. Needle EMG reveals evidence for secondary axonal loss. Thechronicity or relapsing nature of the course distinguishes CIDP from AIDP. It is sometimes dif-ficult to confirm CIDP based on electrophysiology alone, especially in light of the exceptionsto the uniform vs nonuniform slowing rule that have recently been described. Palpable enlargednerves and pes cavus may be present in CIDP as well as in CMT. Elevated protein in cerebrospinal fluid
Pediatric EMG 379
22_Kang 4/11/07 10:35 PM Page 379

is found in CIDP, but also in inherited disorders such as metachromatic leukodystrophy andCMT. The absence of cognitive involvement, MRI abnormalities, and long-tract signs is sug-gestive of CIDP rather than an inherited leukodystrophy, but nerve biopsy is still required to dis-pel remaining doubts, especially if there is a question of CMT.
CMT type I is the most common inherited polyneuropathy. It is characterized by a predom-inantly demyelinating pattern on EMG, with nerve conduction velocities typically in theteens. The pattern of inheritance is autosomal dominant. Initial symptoms may include distallower extremity weakness and wasting, with slow progression over several decades.Hyporeflexia, palpable enlarged nerves, pes cavus, distal weakness and wasting, and distalsensory loss are classic physical findings.
Primary axonal loss is found in CMT type II. Nerve conduction velocities are normal ormildly slow. Onset is typically in early adulthood, and the course is mild. Inheritance is usu-ally autosomal dominant, although autosomal recessive kindreds with moderately slow nerveconduction velocities have been described.
CMTX is characterized by primary axonal loss combined with secondary demyelination.The most prominent EMG findings are reduced CMAP and SNAP amplitudes, but nerve con-duction velocities are moderately slow, which helps distinguish CMTX from CMT type IIelectrophysiologically, and there may be heterogeneity of conduction parameters, includingconduction block, giving it an “acquired” appearance. Heterozygote females have mild symp-toms, whereas affected males have the full spectrum of manifestations, including pes cavus,distal muscle weakness and atrophy, and distal sensory loss.
Type III (Dejerine–Sottas disease) is associated with severe demyelination. EMGdemonstrates profound slowing of nerve conduction velocities, typically in the single digits,with temporal dispersion of CMAPs. Onset may occur anytime between birth and 2 yr.Delayed motor milestones, weakness, areflexia, and hypotonia typically occur. Elevatedcerebrospinal fluid protein may be present. Palpably enlarged nerves are a classic butinconsistent finding.
4.5. Mononeuropathies
Mononeuropathies are rare in children compared with adults. Median neuropathies at thewrist may be associated with idiopathic carpal tunnel syndrome, but may also occur in thesetting of acute trauma, chronic trauma via sports, mucopolysaccharidosis (Hurler/Scheie,Hunter, and Maroteux–Lamy), mucolipidosis (types II or III), or scleroderma. In somecases, the median neuropathy may be the first specific finding that indicates a systemic con-dition. Thus, the possibility of a mucopolysaccharidosis or mucolipidosis should always beconsidered if a child is diagnosed with a distal median neuropathy. Proximal median neu-ropathies seem to occur at least as often as median neuropathies at the wrist, and are typi-cally caused by trauma, such as a fracture of the humerus or a laceration. The classic clinicalpicture of a median neuropathy occurs in some of these patients but is not universal. A care-ful needle EMG is important in cases of median neuropathy to investigate the possibility ofa proximal lesion.
An isolated ulnar neuropathy may occur at the level of the elbow, forearm, wrist, or hand.It is most commonly caused by trauma, including fracture in the supracondylar area or fore-arm, laceration anywhere along the course of the nerve, acute compression during surgery,and chronic compression during activity (e.g., pressure from bicycle handlebars and wheel-chair armrests). Cubital tunnel syndrome occurs occasionally. Because direct trauma is more
380 Kang
22_Kang 4/11/07 10:35 PM Page 380

common in children than compression, axonal pathophysiology is correspondingly observedmore often in these patients.
In contrast to median and ulnar mononeuropathies, radial neuropathy may be observed atany age, from newborns to 17-yr-old children, and generally has a good prognosis. Becauseof the location of the radial nerve, it is susceptible to prenatal or perinatal intrauterine com-pression. Other causes of compression and entrapment, as well as direct trauma from frac-tures and lacerations have also been identified. Weakness of extensor muscles and wristdropare the most common signs. Radial sensory nerve conduction studies should be performedin such cases. If normal values are not available for children younger than 3 to 5 yr and thesymptoms are unilateral, a study in the contralateral arm may be used for comparison.Radial motor studies are difficult because of the technical challenges in young children andtheir limited tolerance for the strong stimuli that may be required. The needle EMG studyis critical to localize the lesion. With adequate sedation or anesthesia, detailed needleexamination is possible even in neonates. Unless symptoms progress or there is evidencefor entrapment, surgical exploration is generally unnecessary, and most patients may bemanaged conservatively.
Peroneal neuropathy is the most common lower extremity mononeuropathy. It may becaused by direct trauma during sports activities, compression from casts and other devicesattached to the leg, or entrapment from fibrous bands. Patients whose lesions were predomi-nantly demyelinating had a better outcome than those with significant axonal loss, as indi-cated by a low-amplitude or absent peroneal CMAP.
4.6. Neuromuscular Junction
Disorders of neuromuscular transmission are caused by impaired transmission of acetyl-choline across the neuromuscular junction. In children, the most common causes of these dis-orders are myasthenia gravis (of which there are three types: neonatal, congenital, andjuvenile) and botulism. Lambert–Easton myasthenic syndrome is rare in this age group.
In neonatal myasthenia gravis, maternal antibodies to the acetylcholine receptor cross theplacenta and enter the fetal circulation. This occurs in 12% of infants born to mothers withsymptomatic or quiescent autoimmune myasthenia gravis. Soon after birth, an affectedneonate develops respiratory distress, feeding difficulties, and weakness. In one-third ofcases, ventilatory support and nasogastric tube feedings are required until the baby clears theantibodies from the circulation, which usually takes several weeks. Oral pyridostigmine maybe helpful in severe cases.
Congenital myasthenic syndrome is caused by genetic mutations affecting the neuromus-cular junction. The most common mutations are in genes coding for the acetylcholine recep-tor, but presynaptic lesions may also occur. The inheritance is usually autosomal recessive.These patients do not have antibodies to the acetylcholine receptor. Onset is typically in thefirst year. Compared with juvenile myasthenia gravis, there are fewer fluctuations in weak-ness and more prominent ocular features. Episodes of apnea may be present in some subtypessuch as choline acetyltransferase deficiency and rapsyn deficiency. Cholinesterase inhibitorsmay alleviate symptoms, but immune modulating therapies are ineffective, as would beexpected from the pathophysiology.
Juvenile myasthenia gravis has the same autoimmune origins as adult myasthenia gravis,but the onset is during childhood or adolescence. Symptoms such as ophthalmoplegia, ptosis(bilateral or unilateral), orbicularis oculi or facial weakness, dysphagia, dysarthria, and dyspnea
Pediatric EMG 381
22_Kang 4/11/07 10:35 PM Page 381

in a fluctuating pattern may suggest the diagnosis. Isolated generalized weakness may pres-ent a challenge, because the differential diagnosis is broad. The evaluation is essentially thesame as in adult myasthenia gravis. Diagnosis may be made through acetylcholine receptorantibody testing, EMG, the edrophonium test, or a combination of these. Once the diagnosisis confirmed, a chest CT study should be performed, although the incidence of thymomais lower in children than in adults. Symptomatic therapy with acetylcholinesterase inhibitorsand immune modulating medications may be used, as in adults. Medications known to exac-erbate myasthenia gravis should be avoided.
The most common form of botulism in childhood is infant botulism, caused by ingestionof Clostridium botulinum spores from the soil. Endemic states include Pennsylvania, Utah,and California. Botulinum toxin inhibits the release of acetylcholine from the presynaptic ter-minal. Infants typically present with the acute onset of constipation, extremity weakness, bul-bar weakness, sluggish pupillary responses, and oculomotor palsies. Reflexes may be eitherpreserved or diminished. Because the infants ingest spores rather than preformed toxin as inadult botulism, the illness is caused by low levels of subacute toxin production rather than anoverwhelming single dose. Thus, stool samples rather than blood samples should be sent forbotulinum toxin testing in patients suspected of having infant botulism.
Routine nerve conduction studies are an important component of an evaluation for disor-ders of neuromuscular transmission. Not only must a generalized polyneuropathy beexcluded, but certain findings may be suggestive of particular neuromuscular transmissiondefects, such as low-amplitude CMAPs in presynaptic disorders and repetitive CMAPs onsingle supramaximal stimulation in slow channel syndrome (a form of congenital myasthenicsyndrome). During repetitive stimulation, the accessory nerve should be the first one studied,unless there is focal or maximal weakness in the distribution of another nerve, such as theulnar or median nerve. Accessory nerve studies are more sensitive than ulnar studies, and inchildren, the study may need to be terminated at any time because of patient discomfort. Ininfants, repetitive nerve stimulation should only be performed with the patient under sedationor anesthesia.
In postsynaptic disorders, such as neonatal, juvenile, or postsynaptic congenital myas-thenia, the characteristic finding on low-frequency (2–3 Hz) repetitive stimulation is agreater than 10% decrement in the CMAP amplitude. The nadir typically occurs at thefourth or fifth stimulus. If the nadir occurs earlier or later, the decrement is most likely arti-factual. In presynaptic disorders, such as botulism and the presynaptic forms of congenitalmyasthenia, low-frequency repetitive stimulation may also produce a decremental response,but it is not observed as consistently as in postsynaptic disorders. The more sensitive testin suspected disorders of presynaptic transmission is high-frequency repetitive stimulationat 20 to 50 Hz, which yields an incremental response in nearly all such patients. This pat-tern may also be observed occasionally in patients with severe postsynaptic defects. Thethreshold for determining abnormal facilitation of the CMAP amplitude on high fre-quency repetitive stimulation is typically considered a 100% increment. On the rare occa-sion when an older child is suspected of having a presynaptic disorder, such as adultbotulism or Lambert–Eaton myasthenic syndrome, a single supramaximal stimulus pre-and then again post- 10 seconds of maximal contraction of the muscle being tested maysubstitute for high-frequency repetitive stimulation. Because high-frequency stimulation iseven more uncomfortable than low-frequency stimulation, this procedure is generally per-formed under anesthesia in any age group.
382 Kang
22_Kang 4/11/07 10:35 PM Page 382

Abnormalities in at least two nerves should be identified before diagnosing a child with adisorder of neuromuscular transmission. This may be difficult in a child who is uncomfort-able or uncooperative. Single-fiber EMG, a technique used often in adults, is impractical inmost children. If the study is technically inadequate, other diagnostic modalities (acetyl-choline receptor antibody levels and edrophonium testing) may be considered, or the studymay be repeated under anesthesia.
Low-amplitude, short-duration MUPs suggestive of a myopathy are often observed on nee-dle EMG in patients with disorders of neuromuscular transmission. Fibrillation potentials maybe observed in cases of botulism and severe cases of autoimmune myasthenia gravis. Someinvestigators have found neurogenic findings in patients with botulism, which may be explainedby the functional denervation that can occur in this disorder. In a child with myopathic EMGfindings of unclear etiology, it is important to consider the possibility of a disorder of neuro-muscular transmission and, if indicated, perform repetitive stimulation studies.
4.7. Muscle
Before the discovery of dystrophin and the subsequent development of genetic testing forDuchenne and Becker muscular dystrophy, EMGs were commonly used in the diagnosticevaluation of boys who had gait difficulties. The question of possible myopathy or musculardystrophy does still arise in the pediatric EMG laboratory, but the patients who are referredoften have atypical presentations or rare conditions. Congenital myopathies include centronu-clear myopathy, nemaline myopathy, and central core disease. Muscular dystrophies includecongenital muscular dystrophy, Emery–Dreifuss dystrophy, facioscapulohumeral musculardystrophy, limb–girdle muscular dystrophy, Duchenne muscular dystrophy, and Becker mus-cular dystrophy. Children may also present with symptoms suggestive of a metabolic myopa-thy, categorized as glycogenosis or fatty acid oxidation disorder. Mitochondrial myopathiesare also considered a form of metabolic myopathy. Glycogenoses include acid maltase defi-ciency (glycogenosis type II, Pompe’s disease), myophosphorylase deficiency (glycogenosistype V, McArdle’s disease), and phosphofructokinase deficiency (glycogenosis type VII).Inflammatory myopathies include dermatomyositis and polymyositis.
The evaluation of a possible primary muscle disorder in the EMG laboratory can be diffi-cult. Because normal MUPs are smaller in infants and children than in adults, the threshold fordefining a unit as myopathic is different. In infants, MUPs are typically biphasic, with dura-tions of 1 to 4 ms and amplitudes less than 100 µV. In addition, inconsistent muscle activationin some children may make it difficult to detect short-duration MUPs and early recruitmentwith confidence. When in doubt, it is always more prudent to conclude that the results of astudy are normal rather than overemphasize potentially false positive findings. The EMGreport should indicate that normal study results do not exclude a myopathic process.
In cases of possible myopathy or muscular dystrophy, it is important to examine proximalmuscles and any other muscles that are weak. Iliopsoas should be studied whenever possible—in infants and younger children, it is crucial to locate the femoral pulse and ensure that theneedle is not placed in the femoral artery. If the patient is so agitated that this cannot be guar-anteed, it is advisable to defer study of that muscle. Other proximal muscles in the upper andlower extremities should also be studied.
In many cases of noninflammatory myopathy and muscular dystrophy, needle EMG willdemonstrate low-amplitude, short-duration MUPs, sometimes accompanied by fibrillationpotentials and positive sharp waves. These findings may also be observed in disorders of
Pediatric EMG 383
22_Kang 4/11/07 10:35 PM Page 383
neuromuscular transmission. Abnormal spontaneous activity will typically be more promi-nent in cases of inflammatory myopathy. Early recruitment, in which multiple MUPs are acti-vated despite minimal force generation, is another sign of myopathy, but is very difficult toassess in infants and children. Myopathic findings do not generally help to distinguishbetween the various myopathic disorders, unless there is very prominent spontaneous activ-ity, myotonia, or both.
A myotonic discharge is a distinct finding of abnormal spontaneous activity that may bestbe described as a series of rapidly firing fibrillation potentials or positive sharp waves, withfluctuating amplitude and frequency and a duration of 2 to 20 s. The fluctuations produce asound that has been described as resembling that of a “dive bomber,” but the sound of amotorcycle engine may be a better analogy. Myotonic discharges are often elicited with smallinsertions of the EMG needle. These discharges may be missed, however, especially in chil-dren, if the needle EMG study is technically limited or only performed on a few muscles. Theabsence of myotonic discharges on a needle EMG study does not entirely exclude that entity.
Classically, myotonic discharges are associated with myotonic dystrophy, myotonia con-genita, paramyotonia congenita, and hyperkalemic periodic paralysis. However, because it is, ina sense, a severe manifestation of positive sharp waves and fibrillation potentials, it may also beobserved in some myopathic disorders not caused by channelopathies, such as acid maltasedeficiency, centronuclear myopathy, polymyositis, and dermatomyositis.
4.8. Myotonic Disorders
There are four classic primary myotonic disorders: myotonic dystrophy, myotonia con-genita, paramyotonia congenita, and hyperkalemic periodic paralysis. There are two types ofmyotonic dystrophy (type 1 and type 2). Type 1 is the most common form in childhood; type 2is mainly an adult disorder. Onset of symptoms of type 1 myotonic dystrophy is in late child-hood or adolescence; there is, however, a variant that is symptomatic at birth. A fully devel-oped case of myotonic dystrophy has many distinctive features, including frontal balding,temporal wasting, distal weakness, and myotonia on examination. The neonatal variant maypresent with arthrogryposis multiplex congenita. These patients are often diagnosed directlyby DNA testing. However, the findings may be more subtle early in the course, therefore, anEMG may be helpful in those cases. Routine motor and sensory nerve conduction studies areusually normal, although some reports demonstrate mild slowing of conduction velocities.Repetitive stimulation produces CMAP decrements. Needle EMG reveals, in addition tomyotonic discharges, other abnormal spontaneous activity, and short-duration, low-amplitudeMUPs, demonstrative of an underlying myopathic process.
There are autosomal dominant (Thomsen’s disease) and recessive (Becker’s disease) vari-ants of myotonia congenita, which is caused by mutations in the chloride channel. Musclestiffness may be present at rest, but is relieved on activity. Muscle hypertrophy occurs in bothdisorders. Motor strength is normal in Thomsen’s disease, but weakness typically occurs inBecker’s disease. Routine motor and sensory nerve conduction studies are normal, but repe-titive stimulation and short exercise will lead to CMAP decrements. Needle EMG demons-trates myotonic discharges, but there are usually no other abnormal findings.
Paramyotonia congenita and hyperkalemic periodic paralysis are both caused by mutationsin the sodium channel. Signs of paramyotonia congenita are often present in infancy. Theremay be delayed eye opening after sneezing. In later years, the child may experience stiffen-ing of the extremities, weakness, and falling with activity. This pattern of “paradoxical”
384 Kang
22_Kang 4/11/07 10:35 PM Page 384

myotonia with activity is the reverse of what is typically found in other myotonic disorders,leading to the name paramyotonia. Symptoms may also be triggered by cold weather. Eatinghard-to-chew or cold foods, such as bagels or ice cream, may trigger dysphagia. The resultsof standard motor and sensory nerve conduction studies are normal. The response to repeti-tive stimulation or exercise is normal in most cases, but some patients may develop CMAPdecrements, especially with cooling of the extremity. Myotonic discharges and other abnor-mal spontaneous activity may be accentuated by briefly cooling the extremity before needleEMG. There may be electrical silence on needle EMG during an episode.
ACKNOWLEDGMENT
The author thanks Basil T. Darras, M.D., for helpful comments on the manuscript.
REVIEW QUESTIONS
1. You are attempting to perform a sural sensory nerve conduction study in a 6-mo-old infant,but despite several attempts cannot record a reproducible SNAP. The best course at this pointis to:A. Move on to the next patient.B. Record a superficial peroneal sensory response.C. Record a saphenous sensory response.D. Record a medial plantar sensory response.E. Proceed to the motor studies.
2. You are performing nerve conduction studies and EMG on a full term neonate with hypotoniaand hyporeflexia. The upper extremity nerve conduction study results are as follows:
Distal latency Amplitude Velocity
Median motor 2.3 ms 3.1 mV 27 m/sMedian sensory 14 µV 30 m/s
You conclude that:A. The study is normal so far.B. The patient has a demyelinating neuropathy.C. The patient has an axonal neuropathy.D. The patient could have either a motor neuron disorder or a myopathy.E. Electrode placement is deficient.
3. Nerve conduction velocities are different in infants and children compared with adults mainlybecause of:A. The shorter distances between electrodes.B. Persistence of fetal isoforms of ion channels in the axons.C. Incomplete myelination of axons.D. Smaller surface area of electrodes used in infants and children.E. Differences in axon diameters.
4. While performing needle EMG in infants:A. It is almost always possible to record information on both spontaneous activity and voluntary
activity from each muscle.B. Insertional activity is best recorded in extensor muscles, whereas voluntary units are best
observed in flexor muscles.C. Fibrillation potentials and positive sharp waves may often be regarded as normal findings.D. It is important to examine all relevant muscles despite the patient’s level of discomfort.E. Needle placement is often incorrect because the infant cannot follow directions.
Pediatric EMG 385
22_Kang 4/11/07 10:35 PM Page 385

5. A 4-mo-old full term infant whose birthweight was 9 lb, 11 oz has a flaccid, pronated left upperextremity with flexed fingers. He becomes agitated during nerve conduction studies and youanticipate that he will only tolerate needle EMG on one muscle. Which muscle would youchoose?A. Biceps.B. Triceps.C. Flexor digitorum superficialis.D. First dorsal interosseous.E. Abductor pollicis brevis.
6. A 10-yr-old girl has had difficulty walking with frequent falls for 4 yr, and is slowly worsening.On examination, she has proximal weakness with a Gowers sign. Her serum creatine kinase levelis normal. Nerve conduction studies reveal low-amplitude CMAPs and normal SNAPs, and nee-dle EMG demonstrates large motor units with significantly decreased recruitment. The next stepin the evaluation should be:A. Muscle biopsy.B. Genetic testing for PMP22 duplication.C. Genetic testing for Duchenne muscular dystrophy deletion.D. Genetic testing for SMN deletion.E. Lumbar puncture for protein level.
7. A 15-yr-old boy is teased in school for lifting his legs up high “like a robot” when he walks. Hismother reports that he has always walked this way, but that his symptoms have been worsening.He has calf atrophy, high arches, and foot drop on examination, with loss of vibration sensationand proprioception in his toes. His mother also has high arches and uses a cane, and says that“stumbling” runs on her side of the family. Based on the subtype of his suspected disease that ismost common in the general population, the most likely findings on nerve conduction studieswill be:A. Mildly slow conduction velocities, in the 35 to 40 m/s range.B. Low amplitude CMAPs.C. Low amplitude SNAPs.D. Conduction block.E. Markedly slow conduction velocities, in the 20 to 30 m/s range.
8. An 18-yr-old woman with a long history of diabetes has developed progressive difficulty walk-ing and numbness in her toes during the past 5 yr. She was initially thought to have diabetic neu-ropathy and was referred with that presumptive diagnosis, but when you examine her beforenerve conduction studies and EMG, you find that she has marked dysarthria, absent lowerextremity reflexes, and extensor plantar responses. What electrophysiological findings wouldyou expect?A. Low-amplitude motor and sensory responses.B. Low-amplitude or absent sensory responses.C. Markedly slow conduction velocities.D. Myopathic motor units on needle EMG.E. Temporal dispersion.
9. A 12-yr-old girl is referred for numbness in her fingers. She has markedly prolonged medianmotor distal latencies, abnormal median SNAPs, and evidence for active denervation andchronic reinnervation at the abductor pollicis brevis. The remainder of her electrodiagnosticexamination is normal, but you notice during the study that she has a large-appearing head withcoarse facial features, short hands and fingers, and a protruding abdomen. She wears hearingaids and sometimes has difficulty understanding your directions during the study. Her parentstell you that previous doctors have just said that she is “different.” If you were to include a clin-ical correlation in your report, you would say:A. That median neuropathies are quite common in childhood.B. She might have CMT disease.
386 Kang
22_Kang 4/11/07 10:35 PM Page 386

C. It may be helpful to send urine for mucopolysaccharides.D. A chromosome analysis may be indicated.E. She should have serum amino acids and urine organic acids checked.
10. You are in practice in Pennsylvania when you are asked to perform nerve conduction studies andEMG on an inpatient at your local hospital, a 4-mo-old infant boy with an acute onset of weak-ness and hypotonia. On examination, he is intubated and quite flaccid, with ophthalmoparesis,sluggish pupillary responses, and hyporeflexia. His mother tells you that the first sign of diffi-culty was constipation 4 d ago. His father is not present because he is a foreman on a crew break-ing ground for the new hospital outpatient building across the street. The highest yield studieson nerve conduction studies and EMG will be:A. Median and peroneal motor studies.B. Sensory studies.C. 2- to 3-Hz repetitive stimulation.D. 20- to 50-Hz repetitive stimulation.E. Needle EMG.
REVIEW ANSWERS
1. The correct answer is D. The medial plantar sensory response is often easier to obtain than thesural sensory response in infants, in part, because of the substantial amount of subcutaneous tissue over the sural nerve at that age.
2. The correct answer is A. Nerve conduction studies and EMG normal values in infants and children differ markedly from those in adults, but follow a consistent age-dependent pattern. Ageneral rule of thumb is that nerve conduction velocities in newborns are half those of adults.
3. The correct answer is C. Myelination of axons continues after birth, often not reaching maturityuntil the third to fifth year of life. Smaller axon diameters in infants and children also slow con-duction velocities to some extent, but have a more modest effect than incomplete myelination.
4. The correct answer is B. An infant’s typical reflexive response to a painful stimulus is withdrawalof the extremity, thus, needle insertion in an extensor muscle will usually result in relaxation of thatmuscle, whereas insertion in a flexor muscle will lead to activation. Fibrillation potentials and pos-itive sharp waves are abnormal findings in infants, just as in adults. The needle study in an infant isoften abbreviated compared with an equivalent study in an adult. It is unnecessary to subject aninfant to excessive discomfort, and the electromyographer must carefully triage the muscles studied.In the hands of a skilled electromyographer, needle placement is almost always correct. Anatomicallandmarks are critical in infant studies, and larger muscles are studied whenever possible.
5. The correct answer is A. The infant most likely has an Erb’s palsy affecting the upper trunk ofthe brachial plexus caused by traction on the neck and shoulders during a difficult delivery,which can be deduced from the large birthweight and clinical presentation. Thus, a muscle inner-vated by the upper trunk of the brachial plexus would be ideal if only one muscle can be stud-ied. The biceps, innervated by the musculocutaneous nerve, lateral cord, upper trunk, andC5–C6, is ideal. The other options all indicate muscles innervated by lower portions of thebrachial plexus. The deltoid is another upper trunk muscle frequently studied in this setting, butis less likely than the biceps to be activated by an uncooperative infant. At the age of 4 mo, themost likely abnormal finding is chronic reinnervation rather than active denervation, making thebiceps a better choice. If the infant were 1-mo old, the deltoid might be preferable. In an infantwho tolerates the study well, as full a root/plexus screen as possible should be performed,because the extent and severity of injury can vary significantly.
6. The correct answer is D. This patient most likely has SMA type III (Kugelberg–Welander disease), with the proximal weakness, normal creatine kinase levels, and evidence for motor neuron disease on electrophysiological studies. In almost all cases, the patient will have ahomozygous deletion in exon 7, exon 8, or both, of the SMN gene. A muscle biopsy shoulddemonstrate fiber type grouping suggesting a neurogenic lesion, but is more invasive than
Pediatric EMG 387
22_Kang 4/11/07 10:35 PM Page 387

genetic testing on blood lymphocytes and does not reveal a molecular diagnosis. The patientdoes not fit the picture of hereditary motor and sensory neuropathy (CMT), which is associatedwith distal weakness, sensory loss, and a duplication in the PMP22 gene. This presentation isalso not consistent with Duchenne or Becker muscular dystrophy, nor with an inflammatorydemyelinating polyneuropathy, which is associated with elevations in cerebrospinal fluid pro-tein. If this patient were a severely hypotonic infant with the same creatine kinase levels andelectrodiagnostic results, she would most likely have SMA type I (Werdnig–Hoffman disease).
7. The correct answer is E. This patient most likely has CMT disease. Type 1, a demyelinatingform, is most common and statistically would be most likely in this patient without furtherdemographic information, especially with the history of autosomal dominant inheritance.Conduction velocities are markedly slow in most cases. Amplitudes are typically normal in thisform, although they can be markedly abnormal in type 2, the axonal form, of CMT. Evidence formultifocal slowing, such as conduction block, is classically found with acquired polyneu-ropathies, although multifocal slowing in inherited polyneuropathies, including some forms ofCMT, does occur.
8. The correct answer is B. This patient seems to have Friedreich’s ataxia, which is often associ-ated with diabetes and cardiomyopathy. Onset occurs before age 20 yr. A sensory neuronopathy,with severe reduction in sensory response amplitudes is common, and preserved CMAPs andconduction velocities help distinguish it from CMT.
9. The correct answer is C. This girl most likely has Hurler disease, a mucopolysaccharidosis. Aurine screen for mucopolysaccharides is indicated, followed by or concurrent with blood lyso-somal enzyme testing. Median neuropathies, including carpal tunnel syndrome, are exceedinglyrare in children in the absence of a systemic underlying condition. Assuming that she has nolower extremity symptoms, this presentation is inconsistent with CMT. Chromosome analysis,an amino acid panel, and an organic acid panel would not diagnose Hurler disease.
10. The correct answer is D. Pennsylvania, along with Utah and California, are states with high inci-dences of infant botulism, because of the presence of botulinum spores in the soil. A parent ofan affected infant typically works in construction or is otherwise in close and frequent contactwith newly disrupted soil. Constipation is a frequent early sign. The most important studies toperform are high-frequency repetitive stimulation studies at 20 to 50 Hz, which should yield anincremental response. It is important to perform such studies with the patient under anesthesia,because the studies are quite painful. Because this infant is already intubated, this should not bedifficult. There may also be a decrement on low-frequency repetitive stimulation, but this find-ing may not always be present. Other electrodiagnostic studies, including routine nerve conduc-tion studies and needle EMG, abnormalities such as diminished CMAP amplitudes will yieldnormal results or nonspecific abnormalities.
SUGGESTED READING
Baer RD, Johnson EW. Motor nerve conduction velocities in normal children. Arch Phys MedRehabil. 1965;46:698-704.
Cornblath DR, Sladky JT, Sumner AJ. Clinical electrophysiology of infantile botulism. MuscleNerve. 1983;6:448-452.
Cruz Martinez A, Perez Conde MC, Ferrer MT. Motor conduction velocity and H-reflex in infancyand childhood: 1.-study in newborns, twins and small-for-dates. Electromyogr ClinNeurophysiol. 1977;17:493-505.
Darras BT, Jones HR. Diagnosis of pediatric neuromuscular disorders in the era of DNA analysis.Pediatr Neurol. 2000;23:289-300.
Deymeer F, Jones HR, Jr. Pediatric median mononeuropathies: a clinical and electromyographicstudy. Muscle Nerve. 1994;17:755-762.
Escolar DM, Jones HR, Jr. Pediatric radial mononeuropathies: a clinical and electromyographic studyof sixteen children with review of the literature. Muscle Nerve. 1996;19:876-883.
388 Kang
22_Kang 4/11/07 10:35 PM Page 388

Felice KJ, Royden Jones H, Jr. Pediatric ulnar mononeuropathy: report of 21 electromyography-documented cases and review of the literature. J Child Neurol. 1996;11:116–120.
Gamstorp I. Normal Conduction Velocity of Ulnar, Median and Peroneal Nerves in Infancy,Childhood and Adolescence. Acta Paediatr. 1963;14:SUPPL146:168–176.
Jones HR, Jr., Bolton CF, Harper CM, Jr. Pediatric Clinical Electromyography. Philadelphia-NewYork: Lippincott-Raven, 1996:1–36.
Jones HR, Jr., Felice KJ, Gross PT. Pediatric peroneal mononeuropathy: a clinical and electromyo-graphic study. Muscle Nerve. 1993;16:1167–1173.
Jones HR, Jr. Guillain-Barre syndrome in children. Curr Opin Pediatr. 1995;7:663–668. Kang PB, Finkel RS. Myasthenia gravis. In: Burg FD, Ingelfinger JR, Polin RA, Gershon AA, eds.
Current Pediatric Therapy. Philadelphia: Saunders Elsevier, 2006;1028–1033. Martinez AC, Ferrer MT, Conde MC, Bernacer M. Motor conduction velocity and H-reflex in infancy
and childhood. II. -Intra and extrauterine maturation of the nerve fibres. Development of theperipheral nerve from 1 month to 11 years of age. Electromyogr Clin Neurophysiol. 1978; 18:11–27.
Miller RG, Gutmann L, Lewis RA, Sumner AJ. Acquired versus familial demyelinative neuropathiesin children. Muscle Nerve. 1985;8:205–210.
Miller RG, Kuntz NL. Nerve conduction studies in infants and children. J Child Neurol. 1986;1:19–26.
Namba T, Brown SB, Grob D. Neonatal myasthenia gravis: report of two cases and review of the literature. Pediatrics. 1970;45:488–504.
Nicolas G, Maisonobe T, Le Forestier N et al. Proposed revised electrophysiological criteria forchronic inflammatory demyelinating polyradiculoneuropathy. Muscle Nerve. 2002;25:26–30.
Packer RJ, Brown MJ, Berman PH. The diagnostic value of electromyography in infantile hypotonia.Am J Dis Child. 1982;136:1057–1059.
Parano E, Uncini A, De Vivo DC, Lovelace RE. Electrophysiologic correlates of peripheral nervoussystem maturation in infancy and childhood. J Child Neurol. 1993;8:336–338.
Preston DC, Shapiro BE. Electromyography and Neuromuscular Disorders. 2nd ed. Boston:Butterworth-Heinemann, 2005;704.
Russell JW, Afifi AK, Ross MA. Predictive value of electromyography in diagnosis and prognosis ofthe hypotonic infant. J Child Neurol. 1992;7:387–391.
Sladky JT. Neuropathy in childhood. Semin Neurol. 1987;7:67–75.Sladky JT, Brown MJ, Berman PH. Chronic inflammatory demyelinating polyneuropathy of infancy:
a corticosteroid-responsive disorder. Ann Neurol. 1986;20:76–81.Streib EW. AAEE minimonograph #27: differential diagnosis of myotonic syndromes. Muscle Nerve.
1987;10:603–615.Swoboda KJ, Edelbol-Eeg-Olofsson K, Harmon RL, et al. Pediatric electromyography. In: Jones HR,
Jr., De Vivo DC, Darras BT, eds. Neuromuscular Disorders of Infancy, Childhood, andAdolescence: a clinician's approach. Boston: Butterworth-Heinemann, 2003;35–74.
Zerres K, Rudnik-Schoneborn S. Natural history in proximal spinal muscular atrophy. Clinical analy-sis of 445 patients and suggestions for a modification of existing classifications. Arch Neurol.1995;52:518–523.
Pediatric EMG 389
22_Kang 4/11/07 10:35 PM Page 389

22_Kang 4/11/07 10:35 PM Page 390

IVAUTONOMIC TESTING, EVOKED POTENTIALS,
AND SLEEP
23_Matheson 4/11/07 10:36 PM Page 391

23_Matheson 4/11/07 10:36 PM Page 392

23Polysomnography and Sleep Disorders
Jean K. Matheson, Randip Singh, and Andreja Packard
SummaryThe classification of sleep disorders is based both on clinical and neurophysiological criteria and is
undergoing constant refinement. Sleep disorders can be caused by either a primary disorder of a mech-anism controlling sleep or inadequate function of an end organ, such as the upper airways and lungs.Understanding the physiology and pattern of normal sleep is an important foundation for interpretingthe clinical symptoms, signs, and neurophysiological abnormalities observed in patients with sleep dis-orders. The term polysomnography refers to the simultaneous recording of multiple sleep parameters,including a limited electroencephalogram, respiratory parameters, chest excursion, limb movements,and the electrocardiogram. Polysomnography is important for assessing a variety of sleep disturbances,including disorders such as sleep-related breathing disorders (including obstructive sleep apnea), rapideye movement behavior disorder, and periodic movements of sleep. The multiple sleep latency test andmaintenance of wakefulness test are studies that are especially useful in the evaluation of narcolepsyand other hypersomnias.
Key Words: Multiple sleep latency test; narcolepsy; obstructive sleep apnea; periodic movements ofsleep; polysomnography; sleep.
1. INTRODUCTION
The understanding of sleep disorders and the development of sleep disorders medicine asa discipline has depended on the ability to simultaneously measure and record multiple physiological parameters during sleep. The term “polysomnography” was introduced in theearly 1970s to describe both the recording and the interpretation of these variables. The tech-nique of polysomnographic recording evolved from EEG with critical modifications thatallowed researchers to correlate changes in EEG with changes in other physiological systems.In the late 1930s, Alfred L. Loomis, E. Newton Harvey, and Garret Hobart (1) introduced theconcept of recording electroencephalographic activity continuously through the night and, indoing so, identified five sleep stages. In 1953, Eugene Aserinsky, working in NathanielKleitman’s laboratory at the University of Chicago, added electrodes to record the eye move-ments he had observed through the lids of sleeping subjects. By waking subjects duringintense periods of rapid eye movement (REM), these researchers discovered that the REMswere associated with dreaming and, thus, discovered REM sleep (2). Soon thereafter, WilliamDement, working in the same laboratory, established that REM alternated with non-REM(NREM) sleep in cycles of approx 90 min (3). Later, after research showed that REM wasassociated with loss of muscle tone (REM sleep atonia), surface EMG electrodes on the chin
From: The Clinical Neurophysiology PrimerEdited by: A. S. Blum and S. B. Rutkove © Humana Press Inc., Totowa, NJ
393
23_Matheson 4/11/07 10:36 PM Page 393

were added to the EEG and the electro-oculogram (EOG) recordings to better define the REMsleep state. A committee of early sleep researchers refined the rules for recording and scoringsleep stages in 1968. The product of that effort, known as the “Rechtschaffen and Kales cri-teria” (R and K criteria) remains the international “gold-standard” in the field (4). In the pro-gression of the development of the polysomnogram (PSG), the pivotal discovery of sleepapnea in the 1960s resulted in the addition of simultaneous respiratory and cardiac monitor-ing. Both REMs and apneas are evident with direct observation but were not appreciated asimportant until studied with neurophysiological techniques. It is now difficult to understandhow these obvious human behaviors could have been ignored for so long; there are perhapsno better examples of clinical neurophysiology amplifying human observation.
This chapter will focus on the standardized techniques used to measure sleep-related phys-iological parameters and their practical application to the diagnosis of specific sleep disorders.
2. CLINICAL ASSESSMENT OF SLEEP DISORDERS
A sleep disorder generally occurs for one of two reasons. It may represent a primary dis-order of a mechanism controlling sleep or failure of a specific end organ, such as the upperairways and lungs. As in all of clinical medicine, testing must be ordered and interpretedwithin the context of the patient’s clinical presentation, with a clear understanding of thequestions to be answered and the inherent limitations of the study proposed. Most patientspresent with complaints of excessive daytime sleepiness, difficulty initiating or maintainingsleep, or some sort of unpleasant event that occurs during sleep. Detailed medical and sleephistories with careful attention to underlying medical and psychiatric illness, daytime sche-dules, lifestyle issues, medications, and drug use are prerequisites for the intelligent analysisof the problem and planning of the appropriate testing. A complete physical examinationshould always be obtained before referral for study. Sleep logs, which document dailysleep–wake behaviors, may be valuable tools that complement both the office history and theinterpretation of the objective data acquired in the sleep laboratory.
2.1. Classification of Sleep Disorders
The American Academy of Sleep Medicine (AASM) has established a classification ofsleep disorders, the “International Classification of Sleep Disorders,” 2nd ed. (ICSD-2) (5).A summary of this classification is given in Table 1.
A detailed discussion of these disorders is outside the scope of this chapter. Later subheadingswill discuss the sleep disorders that are best suited to analysis by neurophysiological testing.
3. OVERVIEW OF SLEEP
REM sleep, sometimes called paradoxical sleep or dreaming sleep, and NREM sleep arethe two sleep states. NREM and REM sleep alternate in recurring cycles of approx 90 min.
NREM sleep is divided into four stages (stages 1–4), which represent progressive deepen-ing of sleep. Stage 1 sleep is characterized by the gradual disappearance of the alpha rhythmof quiet wakefulness, which is replaced by theta activity and some fast activity. The emer-gence of sleep spindles and K-complexes establishes the onset of stage 2 sleep. Stage 3 andstage 4 sleep are defined by the presence of high-voltage slow activity. Stage 3 and stage 4sleep are often described together as slow-wave sleep or delta sleep.
The normal young adult descends in an orderly progression through the four NREMstages. Slow-wave sleep appears approx 30 to 40 min after sleep onset. The first REM period
394 Matheson, Singh, and Packard
23_Matheson 4/11/07 10:36 PM Page 394

follows this slow-wave sleep, approx 70 to 90 min after sleep onset. The PSG during REMsleep shows dramatic changes. A sudden loss of EMG activity occurs in the chin muscles,which is indicative of generalized skeletal muscle atonia. REMs occur in phasic bursts andthe EEG shows mixed frequencies similar to waking and stage 1 sleep, sometimes with acharacteristic sawtooth pattern.
The first REM period is short, lasting approx 10 min. The end of the first REM periodcompletes the first sleep cycle. Thereafter, NREM sleep continues to alternate with REMsleep; the healthy adult goes through 4 to 6 cycles. Slow-wave sleep is concentrated in thefirst third of the night, whereas REM sleep episodes become progressively longer later in thenight. Slow-wave sleep is prominent in adolescence and decreases significantly with age,whereas REM sleep duration tends to remain stable throughout adulthood. Newborns, how-ever, demonstrate up to 50% REM sleep.
REM and NREM sleep differ physiologically. REM sleep is characterized by both phasic andtonic changes in physiology. The drop in baseline EMG correlates with a tonic change. REMscorrelate with phasic changes. Tonic physiological changes also include impaired thermoregu-lation, reduction in ventilatory chemosensitivity, hypotension, bradycardia, increased cerebralblood flow, and intracranial pressure, increased respiratory rate, and penile erection. Phasicchanges include vasoconstriction, increased blood pressure, tachycardia, and further increasesin cerebral blood flow and respiratory rate. During NREM sleep, the physiological state is morestable, with an overall reduction in blood pressure, heart rate, cardiac output, and respiratoryrate. One characteristic feature of NREM, slow-wave sleep is the secretion of growth hormone.
The control of sleep onset, duration, and stage changes is poorly understood. It is thoughtthat there are two sleep drives, one homeostatic and the other circadian. The homeostaticdrive increases with the duration of wakefulness, whereas the circadian signals are controlledby the suprachiasmatic nucleus of the hypothalamus. Recent evidence has shown that neu-rons of the ventrolateral preoptic nucleus of the hypothalamus are sleep active and sleep pro-moting, confirming old observations that lesions in this area induce insomnia. These neuronsexpress the inhibitory transmitters, galanin and GABA, and innervate wake-promoting areas,including the hypocretin (also known as orexin) containing neurons of the posterolateralhypothalamus, histaminergic neurons of the tuberomammillary nucleus, the serotonergic dor-sal raphe, norepinephrine containing neurons of the locus ceruleus, and the cholinergic neu-rons of the dorsal midbrain and pons. In turn, monoaminergic wake-promoting areas inhibitthe ventrolateral preoptic nucleus, thereby resulting in reciprocal inhibition that self-reinforces
Sleep Disorders 395
Table 1International Classification of Sleep Disorders-2: Diagnostic Categories
I InsomniasII Sleep-related breathing disordersIII Hypersomnias of central origin not due to a circadian rhythm sleep
disorder, sleep-related breathing disorder, or other cause of disturbednocturnal sleep
IV Circadian rhythm sleep disordersV ParasomniasVI Sleep-related movement disordersVII Isolated symptoms, apparently normal variants, and unresolved issuesVIII Other sleep disorders
23_Matheson 4/11/07 10:36 PM Page 395

stable periods of sleep and wake. In this model, homeostatic and circadian drives are hypoth-esized to shift the balance between states by still unknown mechanisms. Adenosine that accu-mulates during wakefulness, the effect of which is antagonized by caffeine, may be one of thefactors that signals the homeostatic drive to sleep. Neurons critical for generating REM sleepare found in the lateral pons and adjacent midbrain, including the cholinergic cells of thepedunculopontine and lateral dorsal tegmental nuclei. These neurons are inhibited by norep-inephrine, serotonin, and histamine. Hypocretin-1 cells in the posterolateral hypothalamusstimulate aminergic cells and, thus, also contribute to the inhibition of REM sleep whilesimultaneously promoting wakefulness. Loss of hypocretin-1-containing cells is now knownto underlie the pathophysiology of narcolepsy (see Section 6.2.1.) (see Espana and Scammellfor a recent review of sleep neurobiology; ref. 6).
Some disorders are exacerbated by or occur only during certain sleep stages. Sleepwalking,for example, occurs with arousal from slow-wave sleep. Epileptic seizures tend to be facili-tated by NREM sleep but inhibited by REM sleep. Obstructive sleep apnea (OSA) is typicallyworse in REM sleep because of REM atonia and alteration of respiratory chemosensitivity.
Because of this changing physiological template, a careful neurophysiological study ofsleep is useful in understanding a wide variety of disease processes.
4. POLYSOMNOGRAPHY
Polysomnography is the term applied to the simultaneous and continuous measurement ofmultiple physiological parameters during sleep. In practice, the term PSG has come to meana specific type of polysomnographic study in which measurements allow for:
1. The identification of sleep stage.2. Monitoring of cardiopulmonary function.3. Monitoring of body movements during sleep.
This study is typically obtained at night in a sleep laboratory for the purpose of identifying,as best as possible given the novel environment, the patient’s typical sleep and its associatedpathologies. The AASM has developed guidelines for the indication for polysomnography (7).These indications include:
1. Suspicion of sleep-related breathing disorders.2. Treatment and followup of sleep-related breathing disorders.3. In combination with the MSLT for suspected narcolepsy.4. Evaluation of sleep-related behaviors that are violent, potentially injurious, or do not respond to
conventional therapy.5. To assist in the diagnosis of paroxysmal arousals that are suggestive of seizure disorder (with
additional video and EEG).6. Evaluation of sleep-related movement disorders.
Many experienced clinicians also obtain PSGs in the evaluation of insomnia, circadianrhythm disorders, nocturnal angina, arrhythmia, hypertension, gastroesophageal reflux, andheadache, because these entities are commonly exacerbated by coexisting sleep disorders thatmay not be evident on clinical grounds.
Standard PSG measurements in current clinical practice include (see Table 2):
1. EEG (C4–A1 and/or C3–A2).2. Eye movement recording (EOG).3. EMG of chin (surface).
396 Matheson, Singh, and Packard
23_Matheson 4/11/07 10:36 PM Page 396

4. Respiratory effort (chest and abdomen).5. Airflow (nasal/oral).6. Oxygen saturation (pulse oximetry).7. EKG (one lead).8. EMG (surface) of anterior tibialis muscles.9. Body position.
Other measurements may be performed as dictated by the clinical question. Video moni-toring and additional EEG electrodes are commonly added for the question of nocturnalseizure disorder (Video EEG–PSG), whereas continuous blood pressure monitoring, peniletumescence recordings, and gastroesophageal pH measurements are only rarely performedin clinical situations. PSGs performed in the sleep laboratory are termed “attended” PSGs,which indicates that a technician is available throughout the study who may intervene toassure quality or to initiate therapies, such as the application of positive pressure for thetreatment of sleep apnea. Full polysomnography is available at the bedside or for at-hometesting, and although of high quality, is not generally accepted as equal in reliability toattended studies.
Four-channel studies geared for screening of respiratory cardiorespiratory abnormalitiesbut lacking reliable methods of identifying whether the patient is awake or asleep, are poorlyvalidated against formal polysomnography. However, these may have some usefulness whenfull polysomnographic study is not available.
Sleep Disorders 397
Table 2Parameters Recorded in Standard PSG, MSLT, and MWT
Parameters recorded
PSG EEG (C4–A1, C3–A2)Additional EEG if indicated EOGEMG (chin)AirflowRespiratory effortO2 saturation est. (SpO2)EKGEMG limb, anterior tibialis muscles;
extensor digitorum muscles when indicated
Body positionEsophageal pH (rarely)
MSLT and MWT EEG (C4–A1, C3–A2)EEG (O1–A1, O2–A2)EOGEMG (chin)EKGOptional: respiratory monitoring
EOG, electro-oculogram; MWT, maintenance of wakefulness test;MSLT, multiple sleep latency test; PSG, polysomnogram; SpO2, pulseoximetry.
23_Matheson 4/11/07 10:36 PM Page 397

Polysomnographic techniques with fewer recording channels are also applied to two othersleep laboratory tests: the multiple sleep latency test (MSLT) and the maintenance of wake-fulness test (MWT). The MSLT measures the tendency to fall asleep during the day andscreens for the occurrence of inappropriate daytime episodes of REM sleep. The MWT meas-ures the ability to stay awake in multiple daytime naps.
4.1. The PSG4.1.1. Sleep Stage Scoring/Sleep Architecture
Sleep stage “scoring” or “staging” refers to the lengthy process of identifying sleep stagesrecorded on the PSG. Identification of sleep stages requires the simultaneous assessment ofthree channels of the PSG: EEG, EOG, and chin EMG. The continuously recorded EEG is,by convention, analyzed in 30-s intervals, known as epochs. Sleep stages are identified or“scored” using the R and K criteria outlined in Section 4.1.1.1. (see Table 3). Because oneepoch can show features of more than one sleep stage, the sleep stage that occupies more than50% of the 30-s interval is assigned to that epoch. Although stage scoring can be performedin a limited fashion by computer, the accuracy is poor and most laboratories rely on visualscoring by trained sleep technicians.
Sleep architecture refers to the distribution and temporal sequence of sleep stages (Table 4),which contribute to a quantitative understanding of the night’s sleep. Most analyses alsoinclude a hypnogram, a graphic display of sleep stages on a time line throughout the nightthat assists in the qualitative assessment of sleep. Hypnograms and sleep architecture para-meters are produced by computer analysis of the visually derived data. Figure 1 shows repre-sentative hypnograms across ages. Table 5 shows ranges of normative values for sleep stagesin adults. Architecture and stage distribution are influenced by commonly used medications.A summary of some of these medication effects is given in Table 6.
4.1.1.1. SLEEP STAGES: TECHNIQUE AND SCORING RULES
“A Manual of Standardized Terminology, Techniques and Scoring System for Sleep Stagesof Human Subjects,” edited by Rechtschaffen and Kales, is the internationally accepted stan-dard for sleep staging (R and K criteria) (4). Although those who intend to master sleep scor-ing need to study the manual directly, the following text and Table 3 provide useful summariesabstracted directly from the R and K manual.
4.1.1.1.1. Technical Requirements for Scoring
4.1.1.1.1.1. EEG A single EEG channel is used for the purposes of scoring sleep stages.The acceptable derivations are C4 or C3 (International 10–20 System) referred to the oppositeear or mastoid; two channels are recorded with one used as a backup for technical problemsduring the night. This sleep derivation tends to confuse electroencephalographers who do nottypically record using an opposite side reference. The opposite side derivation was chosen tomaximize inter-electrode distance. Because the amplitude of the EEG waveform is dependenton inter-electrode distance, and because amplitude is included in the criteria for stages 3 and4 sleep (see below), the convention has remained. Filtering also influences the amplitude ofthe waveform. Traditional EEG recording uses a low filter frequency of 1 Hz, but the EEG of sleep studies is filtered at a low-frequency setting of 0.3 Hz to maximize amplitude oflower-frequency waves. A 1-Hz low-frequency filter reduces the amplitude of a 1-Hz signal by20%. Using an incorrect low-frequency filter will, therefore, result in underscoring of stages 3 and 4 sleep. The high-frequency settings are typically the same for traditional EEG and
398 Matheson, Singh, and Packard
23_Matheson 4/11/07 10:36 PM Page 398

399
Table 3Outline of Scoring Criteria According to “R and K” Manual
Stage/state Electroencephalogram (EEG) Electrooculogram (EOG) Electromyogram (EMG)
Relaxed wakefulness Eyes closed: rhythmic alpha Voluntary control; REMs or none; Tonic activity, relatively high;(8–13 cps); prominent in occipital; blinks; slow eye movements voluntary movementattenuates with attention when drowsy (SEMs) when
Eyes open: relatively low voltage drowsymixed frequency
Non-rapid eye movement sleep (NREM)Stage 1 Relatively low voltage, mixed frequency SEMs Tonic activity, may be a slight
May be theta (3–7cps) activity with decrease from wakinggreater amplitude
Vertex sharp wavesSynchronous high voltage theta
bursts in childrenStage 2 Background: relatively low voltage, Occasionally SEMs near Tonic activity, low level
mixed frequency sleep onsetSleep spindles: waxing, waning,
12–14 cps (>0.5 s)K-complex: negative sharp wave
followed by slower positive component (0.5 s); spindles may ride on Ks; Ks maximal in vertex; spontaneous or in response to sound
(Continued)
23_Matheson 4/11/07 10:36 PM Page 399

400
Table 3 (Continued)
Stage/state Electroencephalogram (EEG) Electrooculogram (EOG) Electromyogram (EMG)
Stage 3 ≥20%, ≤50% high amplitude (>75 µV), None, picks up EEG Tonic activity, low levelslow frequency (≤2 cps); maximal in frontal
Stage 4 >50% high amplitude, slow None, picks up EEG Tonic activity, low levelfrequency
Rapid eye movement Relatively low voltage mixed frequency Phasic REMs Tonic suppression; phasic sleep (REM) Saw tooth waves twitches
Theta activitySlow alpha
Movement time Obscured Obscured Very high activity
Reprinted from Carskadon MA, Monitoring and staging human sleep. In: Kryger, MH, Roth, T, Dement WC, Rechtschaffen A, eds., Principles and Practice ofSleep Medicine, 4th ed., p.1364, 2005, with permission from Elsevier.
23_Matheson 4/11/07 10:36 PM Page 400

polysomnography and are set at 70 Hz. Central lead placements are used because sleep-spe-cific EEG waveforms (K-complexes, spindles, vertex waves, high-voltage slow activity, andsawtooth waves, see Section 4.1.1.1.2.) tend to be maximal in these areas. The posterior pre-dominant alpha rhythm of the relaxed wakeful state is adequately, but not ideally, observed inthe central leads. To better visualize the alpha rhythm, many laboratories add occipital chan-nels, but R and K scoring rules are nonetheless based on the central derivations.
Most laboratories now use digital recording techniques that allow for manipulation ofmontages, time base, filter settings, and channel sensitivity. The EEG sampling rate should beat least 200 Hz and the monitor display should also allow appropriate resolution of the waveforms.
4.1.1.1.1.2. Eye Movement Recording Eye movement recording is necessary for the identi-fication of REM sleep. Slow eye movements are characteristic of the onset of stage 1 sleep andaid in the identification of that sleep stage. Two channels are devoted to the EOG. StandardEEG electrodes are applied 1 cm above and lateral to the outer canthus of one eye and 1 cmbelow and lateral to the outer canthus of the other eye (E1 and E2, also called ROC and LOC).
The R and K manual recommends using the same ear or mastoid as a reference electrode forboth channels, but, in usual practice, the eye electrodes are referred to the opposite ear or mas-toid. As a result of the eye’s natural dipole (cornea positive), vertical or lateral eye movementsare identified as out-of-phase deflections on the two channels. This arrangement makes eyemovements easily distinguishable from frontal EEG activity inadvertently picked up by theEOG electrodes. Frontal EEG activity will appear as in- phase activity. Typical filter settings are0.3 Hz and 15 Hz, which allow for good resolution of both slow and fast eye movements.
4.1.1.1.1.3. Chin EMG EMG activity can be easily recorded from surface EEG-type elec-trodes applied to muscles on and under the chin. The EMG activity so measured is an indicationof muscle activity, which is called “muscle tone” in the sleep literature. Analysis of chin muscle
Sleep Disorders 401
Table 4Sleep Variables
Variable Abbreviation Definition
Time in bed TIB The time from lights out until the subject chooses to end the studySleep period SPT TIB minus time awake after lights out before sleep onset, and
time minus time in bed after awakening in the morningTotal sleep TST Total time the subject actually slept. This is SPT minus any
time time awake during the nightSleep SE TST/TIB. Often reported as a percentage. This is an important
efficiency measure of sleep qualityindex
Percentage This may be reported as either a percentage of the SPT or the TST.of each The usual convention is to report percentage of SPT stage with stage W included as a sleep stage
Sleep-onset SL Time from lights out until the onset of sleep. Sleep onset is latency usually defined as the onset to the first epoch of any sleep
stage. Sometimes reported as latency to stage 2Number of Records the number of times the subject returns to stage W
awakenings after sleep onsetNumber of Records the number of EEG arousals
arousals
23_Matheson 4/11/07 10:36 PM Page 401

tone is necessary to identify normal and abnormal REM sleep. In the normal condition, REMsleep is characterized by a well-sustained, typically sudden, drop in tone with some intermit-tent phasic activity. The activity in the chin electrode is used in the formal staging of REMsleep discussed in Section 4.1.1.1.2.8. Three electrodes are placed, one on the chin and two onthe muscles under the chin, one on each side. Only two electrodes are used, referred to eachother, but if one fails because of movement, the third is available without waking the patient.Surface EMG electrodes are filtered to remove slow artifacts and allow the high-frequencymuscle activity to be observed. A low-frequency setting of 10 Hz and a high-frequency settingof 70 Hz are commonly used.
402 Matheson, Singh, and Packard
Fig. 1. Normal sleep cycles. Rapid eye movement (REM) sleep (darkened area) occurs cyclicallythroughout the night at intervals of approximately 90 min in all age groups. REM sleep shows littlevariation in the different age groups, whereas stage 4 sleep decreases with age. In addition, the elderlyhave frequent awakenings and a marked increase in total wake time. From ref. 17 with permission.
23_Matheson 4/11/07 10:36 PM Page 402

403
Table 5 Normative Values for Sleep Stages in Adults
Sleepstages 20–29 yr 30–39 yr 40–49 yr 50–59 yr 60–69 yr
%SPT Males Females Males Females Males Females Males Females Males Females
Wake 1.26 ± 1.08 0.53 ± 0.49 1.47 ± 1.94 1.84 ± 3.97 6.29 ± 5.56 1.63 ± 1.30 4.33 ± 2.33 4.95 ± 6.48 7.73 ± 6.02 8.93 ± 8.471 4.44 ± 1.62 4.18 ± 2.39 5.71 ± 3.43 4.17 ± 1.65 7.56 ± 3.03 5.64 ± 2.00 7.56 ± 3.94 4.85 ± 2.20 9.73 ± 3.97 7.69 ± 4.122 45.54 ± 5.17 52.37 ± 5.89 56.89 ± 7.36 53.77 ± 7.73 54.75 ± 11.14 54.01 ± 8.55 61.71 ± 10.30 57.80 ± 6.50 56.79 ± 8.76 54.78 ± 8.593 and 4 20.76 ± 4.78 17.69 ± 6.73 12.46 ± 5.58 14.00 ± 7.26 8.54 ± 6.84 12.05 ± 8.31 4.92 ± 7.70 10.63 ± 6.07 2.66 ± 5.05 7.17 ± 6.81REM 28.00 ± 5.66 25.23 ± 3.63 23.47 ± 3.86 26.22 ± 5.27 22.85 ± 4.00 26.67 ± 4.10 21.48 ± 4.01 21.77 ± 3.26 23.09 ± 3.59 21.43 ± 4.04
REM, rapid eye movement sleep.Abstracted from ref. 16.
23_Matheson 4/11/07 10:36 PM Page 403

4.1.1.1.2. Sleep Stage Scoring Rules
A summary of sleep stage scoring rules abstracted from the R and K manual is abstractedbelow and in Table 3.
4.1.1.1.2.1. Stage W Stage W (Fig. 2) refers to the waking state. Wakefulness is char-acterized by a low-voltage mixed-frequency EEG and/or the alpha rhythm. A posteriorlypredominant rhythm in the alpha frequency (8–13 Hz), which attenuates with eye opening,is characteristic of the relaxed wakeful state with the eyes closed. This rhythm is generallyreferred to as the alpha rhythm, but is sometimes referred to as the Berger rhythm by elec-troencephalographers. In disease states (e.g., encephalopathy or hypothyroidism), the alpharhythm may not reach the alpha frequency, an example of why it is important to not con-fuse the term “alpha rhythm” with the term “alpha frequency.” When the eyes are open,low-voltage mixed-frequency rhythms are observed. Wake is usually also accompanied bythe REMs of normal exploratory visual behavior, associated with high chin tone.
4.1.1.1.2.2. Movement Time Movement time is a scoring term applied to epochs that areobscured by movement artifact for more than 50% of the 30-s epoch, and occur before or
404 Matheson, Singh, and Packard
Table 6Medication Effects on the Polysomnogram
Medication SWS REM Miscellaneous
TCAs ⇔ ⇓SSRIs/SNRIs ⇔ ⇓ Venlafaxine is a 5HT and NE uptake inhibitor SSRIs and
SNRIs ⇑ Non-REM slow eye movementsTrazodone ⇔ ⇓Nefazadone ⇔ ⇑Bupropion ⇔ ⇑ NE and DA uptake inhibitorMirtazapine ⇔ ⇔MAOIs ⇔ ⇓Lithium ? ⇓BZDs ⇓ ⇔ ⇑ Spindle activity and stage 2Zolpidem ⇔ ⇔Dopaminergic drugs ? ? Mixed resultsAnticonvulsants Minimal data
Phenytoin ⇑ ?Barbiturates ⇓ ⇓ ⇑ Spindle activityCarbamazepine ⇑ ⇓Tiagabine ⇑ ⇔Gabapentin ⇑ ⇔
Lipophilic beta-blockers ⇓ ⇓Clonidine ? ⇓Opioids ⇓ ⇓ Can ⇓ respiratory driveAmphetamines ⇔ ⇓Caffeine ⇓ ? Adenosine antagonist; adenosine ⇑ SWSAlcohol (acute) ? ⇓ After ETOH metabolism there is a REM rebound Alcohol (chronic) ⇓ ⇓Sodium oxybate ⇑ ⇑⇓ Approved for cataplexy and excessive sleepiness
23_Matheson 4/11/07 10:36 PM Page 404

405
Fig. 2. Wake. The posterior dominant alpha rhythm block with eye opening. Fast eye movements typical of wakefulness are notedas rapid out-of-phase deflections. (30-s epoch)
23_Matheson 4/11/07 10:36 PM Page 405

after scorable sleep epochs. Movement time is not quantitated as either sleep or wake, butscored as a separate category.
4.1.1.1.2.3. Movement Arousal Movement arousal is a term used in the R and K manualthat applies primarily to sleep stage scoring criteria. A movement arousal is defined as “anyincrease in EMG on any channel, which is accompanied by a change in pattern on any addi-tional channel.”
4.1.1.1.2.4. EEG Arousal Intrusions during sleep that seem to cause a disturbance withlightening of sleep, but without full awakening are termed “EEG arousals.” A formal defini-tion of EEG arousal has been generated by The Atlas Taskforce of the American SleepDisorders Association (8) and is not in the R and K manual. An EEG arousal is defined as:“An abrupt shift in EEG frequency which may include theta, alpha, and/or frequencies greaterthan 16 Hz, but not spindles, subject to the following rules and conditions:
1. The subject must be asleep for at least 10 s before an arousal can be scored.2. Minimum interval of sleep between two arousals is 10 s.3. The EEG frequency shift must be 3 s or greater in duration.4. Arousals do not require increases in chin EMG in NREM sleep.5. Arousals require increased chin EMG in REM sleep.6. EMG changes alone are not sufficient for scoring an arousal.7. K-complexes and delta waves are not scored as arousals unless they occur within a frequency
shift as described above. 8. Blocking artifact is not an arousal unless accompanied by the EEG frequency shift.9. Three seconds of alpha frequency activity during sleep is not scored as an arousal unless there
has been a 10-s period free of alpha10. Transitions from one sleep stage to another are not in themselves arousals.” (8)
4.1.1.1.2.5. Stage 1 Subjects typically descend from stage W to stage 1 sleep (Fig. 3). Thisstage is defined by the presence of a relatively low-voltage mixed-frequency EEG with a pre-dominance of slower activity in the 3- to 7-Hz range. Sharp negative centrally predominantwaves called vertex waves may be observed. Faster-frequency activity of 12 to 14 Hz mayoccur. At sleep onset, stage one is identified by the drop out of the alpha rhythm that predom-inates in the relaxed state before sleep. When greater than 50% of a 30-s epoch shows theslower activity of stage 1 sleep, the epoch is scored as stage 1. Slow, rolling eye movementsthat help the scorer identify the transition to sleep frequently accompany this stage. Stage 1sleep may also appear intermittently throughout the night, often in response to a disturbanceand is, thus, considered a “light” sleep stage. An increase in stage 1 sleep is, thus, one impor-tant measure of sleep disruption. This stage is frequently not perceived by the subject as sleep,particularly early in the night.
4.1.1.1.2.6. Stage 2 Stage 2 sleep (Fig. 4) is defined by the appearance of K-complexesand or sleep spindles, each lasting at least 0.5 s, in the absence of slow activity sufficient tomeet the scoring requirements of stage 3 or 4 sleep (see Section 4.1.1.1.2.7.). A sleep spindleis a series of 12- to 14-Hz waves with a fusiform morphology. The K-complex in the R andK criteria is defined differently than that definition accepted by the EEG community. The K-complex in R and K is defined as “EEG wave form having a well-delineated negative sharpwave which is immediately followed by a positive component. Waves of 12 to 14 cps may ormay not constitute a part of the complex” (4). In the EEG literature, a K-complex refers to a vertex sharp wave accompanied by a sleep spindle. There is no amplitude criterion for a K-complex. As soon as either a spindle or K-complex of 0.5-s duration appears, stage 2 is
406 Matheson, Singh, and Packard
23_Matheson 4/11/07 10:36 PM Page 406

407
Fig. 3. Stage 1. Slow roving eye movements occur and the posterior dominant alpha rhythm comprises less than 50% of the epoch.(30-s epoch)
Fig. 4. Stage 2. This is a typical epoch of stage 2 demonstrating sleep spindles and a K-complex. This stage is defined by the presenceof either K-complexes or spindles, each lasting at least 0.5 s in duration. (30-s epoch)
23_Matheson 4/11/07 10:36 PM Page 407

408 Matheson, Singh, and Packard
established. K-complexes and spindles appear intermittently. To score uneventful intervalsbetween the appearance of these transients, the “3-min rule” is applied: “If less than 3 min ofrecord which would ordinarily meet the requirements for stage 1 intervene between sleepspindles and/or K-complexes, these intervening epochs are to be scored stage 2, if there is noindication of movement arousal or pronounced increase in muscle tone during the interval inquestion” (4). Stage 2 is the most abundant and easily identified sleep stage.
4.1.1.1.2.7. Stages 3 and 4 Stages 3 and 4 are characterized by the presence of high-voltage slow activity. The slow waves that define these stages must be 2 Hz or less and >75 µVin amplitude. If slow waves meeting these criteria are observed for at least 20% but not morethan 50% of the epoch, that epoch is scored as stage 3 (Fig. 5). Stage 4 sleep (Fig. 6) is char-acterized by the same high-voltage slow waves for more than 50% of the epoch. Stages 3 and4 sleep are commonly referred to as “delta sleep” or “slow-wave sleep.” The terminology differences between the EEG and the sleep literature are again notable. A delta wave in sleepterminology is high-amplitude and 2 Hz or less, whereas a delta wave in EEG terminology is3 Hz or less. It is worth pointing out, again, that slow-wave filters can distort the amplitude ofthe waveform. If a standard EEG filtering of 1 Hz is applied, the amplitude of waves of 1 Hzwill be reduced by 20%.
4.1.1.1.2.8. Stage REM Scoring of REM sleep (Fig. 7) is more complicated than theother sleep stages. In REM, tonic and phasic physiological changes are reflected in EEG,EOG, and EMG; characteristic changes in all three leads are required to identify the stage.REM sleep is defined by a low-voltage mixed-frequency EEG, episodic REMs, and chinEMG activity that is at the lowest level recorded during the study. The drop in EMG activityis a hallmark of normal REM sleep and correlates with generalized skeletal muscle atonia(REM atonia). Sawtooth waves, a notched theta-frequency waveform evident in frontal andvertex areas, are often observed in association with eye movements. Although saw-toothwaves are unique to REM and aid identification of the stage, they are neither sufficient nornecessary for REM stage scoring.
Alpha activity in REM is usually faster than in stage 1 but slower than in wakefulness.Spindles occasionally appear in REM sleep, but any period less than 3 min between two spin-dles is scored as stage 2 sleep if no eye movements or movement arousals are observed in thatinterval (if movement arousals occur the stage reverts to stage 1, assuming other criteria forthat stage are met). Difficulties in determining the precise beginning and end of the REMstage arise because:
1. EEG, EOG, and EMG do not typically change simultaneously.2. REMs are episodic events.
Epochs are scored as REM from the point of EMG amplitude decrease, providing thatREMs occur in subsequent epochs before the reappearance of spindles, K-complexes or amovement arousal. If one of these events occurs in the interval between the drop in tone andthe first eye movement, REM is scored from that event forward, assuming that EMG is stillat the REM stage level (i.e., the lowest level of the record). Epochs that are contiguous withstage REM epochs with low-voltage mixed-frequency EEG activity are scored as REM, if theEMG remains at the REM stage level and there is no movement arousal, regardless ofwhether REMs are present on the EOG in that epoch. A detailed explanation of REM rules isavailable in the R and K manual.
23_Matheson 4/11/07 10:36 PM Page 408

409
Fig. 5. Stage 3. This stage requires at least 20% and not more than 50% of the epoch to demonstrate activity ≤2 Hz with an ampli-tude >75 mV.
Fig. 6. Stage 4. This stage requires more than 50% of the epoch to demonstrate activity ≤2 Hz with an amplitude >75 mV.
23_Matheson 4/11/07 10:36 PM Page 409

410
Fig. 7. Rapid eye movements. Rapid eye movements are observed with the tonic EMG level recorded at the lowest level during thestudy. Occasionally, sawtooth waves and phasic increases in EMG activity occur. (30-s epoch)
23_Matheson 4/11/07 10:36 PM Page 410

4.1.2. Respiratory Measures
The recording of airflow, respiratory effort, and oxygen saturation allows for the determi-nation of abnormal breathing patterns during sleep. These abnormalities underlie the sleep-related breathing disorders. A variety of abnormal breathing events exist, including: apnea, acomplete cessation of airflow; hypopnea, a reduction in airflow; and respiratory effort-relatedarousal (RERA), an EEG arousal induced by respiratory effort but not meeting criteria for anapnea or hypopnea. Surprisingly, there has been a lack of uniform definition of these events,based in large part on differing recording methodologies. Current definitions that have themost widespread clinical use are based on guidelines provided by the Medicare Administrationand endorsed by position statements by the AASM; these will be detailed in Sections 4.1.2.2.2.and 4.1.2.2.1. The definition and interpretation of abnormal respiratory events varies widely inpractice and in publications. When interpreting the summary report of a PSG, it is essentialthat the clinician is aware of the laboratory’s working definitions.
4.1.2.1. METHODOLOGY OF RECORDING RESPIRATORY MEASURES
4.1.2.1.1. Airflow
Pneumotachographs are the gold-standard for the measure of airflow. Flow is measuredacross a resistor by a differential manometer. Pneumotachographs generally require a cum-bersome mask that is leak-free and seals both mouth and nose. This technique is used inresearch laboratories but not in routine diagnostic clinical studies. Positive-pressure machinesmay have built in pneumotachographs, however, that assist in determining flow during theapplication of pressure in therapeutic studies.
Thermistors or thermocouples placed at both the nose and the mouth are the most com-monly used devices for measuring airflow during PSGs. These devices identify the differ-ences in temperature of inspired and expired air, resulting in an easily measured signal.Because change in temperature is not dependent on the volume of air moved, thermistors andthermocouples are sensitive to any airflow, but cannot measure airflow volumes. They havethe advantage of measuring airflow at mouth and nose simultaneously, but have the disadvan-tage of overestimating airflow and underestimating abnormalities.
Nasal pressure transducers are used in many laboratories to assess airflow. These devicesare more sensitive than thermistors or thermocouples to subtle changes in flow consistentwith obstruction. The pressure transducer is inserted into a nasal cannula. The pressure trac-ing obtained is a direct function of flow. The shape of the signal reflects the airflow limita-tion that is observed in partial or complete obstruction of the airway and is an indirectmeasure of airway resistance. Flattening of the inspiratory signal and/or amplitude reductionindicates limitation of airflow (Fig. 8). The device overestimates decreased airflow when thepatient breathes through the mouth. As a result, it is generally recommended that nasal pres-sure transducers are used with a thermistor or thermocouple.
Respiratory inductance plethysmography (RIP) is a technique used to measure changes involume of the chest and abdomen. These volume changes can provide a measure of tidal vol-ume. Bands around the chest and abdomen incorporate coils that expand and contract duringbreathing. Changes in length of the bands induce changes in the oscillating frequency of thecircuit. An output signal can be calibrated for volumes in the abdominal and chest compart-ments. To accurately measure airflow, the system must be carefully calibrated in supine andupright positions. Calibration in obese patients is difficult. Most often, the system is not cal-ibrated and is used as a qualitative measure of chest and abdominal effort.
Sleep Disorders 411
23_Matheson 4/11/07 10:36 PM Page 411

412
Fig. 8. RERA. Airflow limitation on the nasal air pressure transducer (NAF) is associated with an EEG arousal and steady oximetryreadings. This epoch also demonstrates an arousal. (30-s epoch)
23_Matheson 4/11/07 10:36 PM Page 412

4.1.2.1.2. Respiratory Effort
Intra-esophageal pressure measurement, which reflects pressure changes in the intratho-racic compartment, is the gold-standard for measurement of chest effort. Increased airwayresistance results in increased negative pressures. A manometer is inserted in the esophagusthrough a pediatric feeding tube that remains in place for the duration of the study. The dis-comfort and inconvenience of inserting the manometer make this a technique that is used inonly a few centers.
RIP, when uncalibrated, provides a qualitative measurement of movement of the chest andabdomen with respiration.
Stain gauges and piezoelectric bands both also provide qualitative measure of the move-ment of chest and abdomen. One band is placed around the chest and the other around theabdomen. Piezoelectric bands are the most commonly used instruments for these measure-ments because of ease of use and low cost, but reliability is less than with RIP.
Intercostal EMG is a simple technique in which standard EEG electrodes are applied to anintercostal space close to the diaphragm. Respiratory effort is evident with a surface EMGrecording, similar to the chin EMG. These recordings are a useful second measure of respi-ratory effort, but are prone to failure in obese patients.
4.1.2.1.3. Oxygen Saturation
Pulse oximetry is a noninvasive method of monitoring the percentage of hemoglobin thatis saturated with oxygen. The pulse oximeter consists of a probe attached to the patient’s fin-ger or ear lobe. A source of light originates from the probe at two wavelengths. By calculat-ing the absorption at the two wavelengths, the processor can estimate the proportion ofhemoglobin that is oxygenated.
4.1.2.2. TYPES OF RESPIRATORY EVENTS
4.1.2.2.1. Apnea
An apnea is defined as the absence of airflow for at least 10 s. There are three types:
1. Obstructive apnea (Fig. 9): absence of airflow for at least 10 s with evidence of persistent respi-ratory effort.
2. Central apnea (Fig. 10): absence of airflow for 10 s without evidence of any of respiratory effort. 3. Mixed apnea (Fig. 11): absence of airflow for 10 s with initial absence of effort followed by a
return of respiratory effort before resumption of airflow.
4.1.2.2.2. Hypopnea
The term hypopnea refers to a decrease in airflow (Fig. 12). There have been many defini-tions of this event proposed. The current clinical definition that is recognized by Medicareand endorsed by the AASM is as follows: “Hypopnea in adult patients is defined as an abnor-mal respiratory event lasting at least 10 s with at least a 30% reduction in thoracoabdominalmovement or airflow as compared to baseline, and with at least a 4% oxygen desaturation.”Hypopneas can be associated with airway obstruction or a centrally mediated reduction inrespiratory effort. In clinical practice, it is difficult to distinguish obstructive hypopneas fromcentral hypopneas unless an esophageal pressure monitor is used. Because most effort andairflow monitors are not quantitative, there is debate regarding whether the criterion of 30%reduction in these measures is practical.
Sleep Disorders 413
23_Matheson 4/11/07 10:36 PM Page 413

414
Fig. 9. Obstructive sleep apnea. Each apnea demonstrates persistent thoracoabdominal effort and is associated with airflow obstruc-tion lasting at least 10 s. The epoch also reveals cyclic drops in oxygen saturation and respiratory-induced limb movements, which arenot required for scoring apneas. (2-min window)
23_Matheson 4/11/07 10:36 PM Page 414

415
Fig. 10. Central sleep apnea. Each apnea is characterized by an absence of airflow and thoracoabdominal effort for at least 10 s.Desaturations are seen with the events but are not required. (2-min window)
23_Matheson 4/11/07 10:36 PM Page 415

416
Fig. 11. Mixed apnea. This recording exhibits three apneas. The second is termed a mixed apnea because the event starts as a cen-tral event and evolves into an obstructive apnea. Mixed apneas often occur in association with obstructive and central apneas. In thiscase, an obstructive apnea precedes the event and a central apnea follows it. (2-min window)
23_Matheson 4/11/07 10:36 PM Page 416

417
Fig. 12. Hypopnea. This is an example of recurrent “Medicare hypopneas.” Medicare requires at least a 30% reduction in airflow orthoracoabdominal movement, lasting at least 10 s, with a drop in oxygen saturation of at least 4%. (2-min window)
23_Matheson 4/11/07 10:36 PM Page 417

4.1.2.2.3. Respiratory Effort-Related Arousal
When airway resistance increases, oxygen saturation and tidal volume may stay the sameas respiratory effort increases to overcome the obstruction. The result of increased respiratoryeffort may be an arousal that disturbs sleep. These abnormalities are termed RERAs (Fig. 8)(7). Evidence of increased respiratory effort in association with arousal is best evidenced byan esophageal manometer, but that technique is rarely available. Pressure transducers can showevidence of flow limitation before arousal. Changes in breathing patterns before arousal mayalso be correlated with increased airway resistance. The event should last 10 s. RERAs are notscored in all laboratories; some laboratories refer to these events as hypopneas or “hypopneasnot meeting Medicare criteria.”
4.1.2.3. QUANTIFICATION OF RESPIRATORY ABNORMALITY
1. Apnea hypopnea index (AHI): the apnea hypopnea index is calculated by adding the total num-ber of apneas and hypopneas and dividing by the number of hours of sleep. When used with thedefinitions above, the index is useful as a standardized measure that reflects severity of sleep-dis-ordered breathing.
2. Respiratory disturbance index (RDI): all respiratory events scored are added together anddivided by the number of hours of sleep to generate the RDI. The RDI is not a standard meas-ure because different laboratories measure respiratory events differently. If a laboratory meas-ures RERAs, for example, they will be reflected in the RDI.
3. Oxygen saturation: laboratories typically report several measure of oxygen saturation, includinglowest saturation, baseline saturation, and percent time at various levels of saturation.
4.1.2.3.1. EKG
A single channel EKG is recorded. There is no standard lead placement. Some laborato-ries use a modified Lead II (right shoulder, left leg), most use a precordial lead.
Recording EKG allows for continuous review of cardiac rhythm during the night. Cardiacabnormalities often correlate with respiratory abnormalities and sleep stages. Respiratoryobstruction may result in periods of vagally mediated cardiac slowing followed by sympatheti-cally induced increased rates with arousal. Hypoxia and increased sympathetic drive duringarousal can exacerbate arrhythmia. REM sleep may be associated with prominent autonomicchanges reflected in the rhythm strip.
4.1.3. Limb EMG
Surface EMG recording of the limbs allows for analysis of movement disorders and move-ment arousals during sleep. Usually only the anterior tibialis muscles of both legs are studied,but recordings may also be obtained from the arms (extensor digitorum muscles). The anteriortibialis muscles are studied because they have a good correlation with the movements observedin periodic limb movement disorder (PLMD; Subheading 6.4.1.), a disorder that exists withand without the complaint of restless legs (Subheading 6.4.2.). Leg movements may alsoaccompany respiratory events or other sources of arousal. Periodic leg movements, by defini-tion, occur in periodic sequences, whereas other leg movements may not be periodic.
4.1.3.1. TECHNIQUES FOR RECORDING LIMB MOVEMENTS
Two surface electrodes are placed on the bellies of the anterior tibialis muscles of both legsand each recorded in a bipolar fashion. A high-frequency filter of at least 128 Hz is recom-mended. The surface EMG obtained is calibrated while the patient is awake with a 30°dorsiflexion and plantar flexion of the great toe without resistance. Activity during sleep iscompared with this biological calibration.
418 Matheson, Singh, and Packard
23_Matheson 4/11/07 10:36 PM Page 418

4.1.3.2. TECHNIQUES FOR SCORING AND REPORTING LIMB MOVEMENTS
The AASM has established the following scoring guidelines (10):
1. Leg movement: a burst of anterior tibialis activity with a duration of 0.5 to 5 s and with anamplitude of at least 25% of the calibration movements.
2. Periodic leg movement sequence is defined as four or more leg movements separated by between5 s and 90 s. These should be scored during both sleep and wake. Periodic leg movements dur-ing wakefulness are suggestive of restless legs syndrome (RLS) and correlate with periodic limbmovements during sleep (PLMS) (Fig. 13).
3. Leg movement with arousal: to assess the impact of the events on sleep, leg movements thatcause arousal are counted. The arousal must not follow leg movement onset by more than 3 s.
Leg movements associated with respiratory events are counted and classified as respiratoryrelated.
Leg movements are reported in terms of both an absolute number as well as indices ofevents per hour of sleep with and without arousal. Leg movements within sequences (andtherefore periodic) should be distinguished from leg movements not within sequences.
4.1.4. Body Position
Body position sensors allow correlation of respiratory abnormalities with position.Severity of sleep-disordered breathing may vary significantly with position.
4.1.5. Video EEG–PSG
Because only a limited EEG montage is used for the analysis of sleep stage in a standardPSG, extended EEG montages are necessary to attempt to identify epileptic activity duringsleep. These studies are usually obtained in patients who complain of unusual nocturnalevents that could represent seizure activity. Video monitoring helps characterize the behavi-oral components of the disorder in relationship to the neurophysiological findings. Res-piratory monitoring may identify respiratory precipitants to seizure activity that would havebeen overlooked in routine or extended EEG analysis. The number of channels recorded isdependent on the capability of the recording equipment; a full EEG is optimal. A commoneight-channel EEG recording added to the routine PSG includes includes: F7–T3, T3–T5,T5–O1, F8–T4, T4–T6, T6–O2, F3–C3, and F4–C4.
4.1.6. Interpretation of the PSG
Polysomnographic interpretation requires both an independent analysis of the componentmeasurements and an overall synthesis of how these variables interact with each other.
Most reports include a quantitative report of sleep architecture, respiratory measures,EKG, limb movements, and a limited description of EEG. Diagnostic requirements for spe-cific disorders using these measures are described in Tables 7 to 11.
Qualitative interpretation of the PSG is also important, and relies on the polysomnogra-pher’s ability to identify patterns of interaction between variables that vary from the norm andmay be disease specific. A summary of statistics does not replace an epoch-by-epoch reviewof the record. Interpretation is dependent on the clinical context, making it important that theclinician approaches the process of reading a sleep study with an understanding of thepatient’s medical background and the specific questions posed. For example, an arousal fromslow-wave sleep may be an insignificant polysomnographic finding, and subtle periods ofdecreased airflow are also common. In the context of a patient who presents with episodes ofsudden fear and panic during sleep, however, the presence of a sudden arousal from slow-wave
Sleep Disorders 419
23_Matheson 4/11/07 10:36 PM Page 419

420
Fig. 13. Periodic limb movements during sleep. The limb movements in this case occur bilaterally and are independent of respira-tory instability. The morphology is easily identified by its periodicity. (2-min window)
23_Matheson 4/11/07 10:36 PM Page 420

421
Table 7Central Sleep Apnea
Disorder Clinical criteria Polysomnographic criteria Other requirements Other features
Primary central At least one of the following: Five or more central apneas The disorder is not better PaCO2 low normal <40sleep apnea • Excessive daytime sleepiness per hour of sleep explained by another cur- during wakefulness
• Frequent arousals and rent sleep disorder, another O2 desaturation is awakenings during sleep or medical or neurological usually mildinsomnia complaints disorder, medication use, Sleep is fragmented by
• Awakening short of breath or substance use disorder. respiratory eventsCheynes Stokes No symptoms are required At least 10 central apneas and The disorder occurs in Oxygen desaturations
breathing Patients often report symptoms hypopneas per hour of sleep association with a serious usually not less pattern of sleep disruption, insomnia, in which the hypopnea has a medical illness, such as than 80%.
excessive daytime sleepiness, crescendo–decrescendo pattern heart failure, stroke, Distinguished from or awakening short of breath. of tidal volume accompanied or renal failure. hypoventilation
by frequent arousals from The disorder is not better syndromes by PaCO2sleep and derangement of explained by another <45sleep architecture current sleep disorder, Sleep is fragmented.
another medical or Arousals are frequently neurological disorder, associated with medication use, or crescendo breathing.substance use disorder. Attenuated by REM sleep
(Continued)
23_Matheson 4/11/07 10:36 PM Page 421

422
Table 7 (Continued)
Disorder Clinical criteria Polysomnographic criteria Other requirements Other features
High-altitude Recent ascent to altitude Recurrent central apneas, >5/hr, None Sleep is fragmented.periodic of at least 4000 m with cycle length 12–34 s, Attenuated by REMbreathing primarily in NREM
Central sleep The patient has been taking Five or more central apneas or The disorder is not better May complicate other apnea due a long-acting opioid periodic breathing (10 or explained by another sleep-related breathing to drug or for at least 2 mo. more central apneas or current sleep disorder or disorderssubstance hypopneas per hour of sleep medical or neurological
with crescendo–descrescendo disorder.pattern and arousals)
Primary sleep No requirements Prolonged central respiratory The disorder is not better Exacerbated by REM sleepapnea of pauses of 20 s or more in explained by another Findings may not infancy duration, or shorter episodes current sleep disorder, occur nightly; (apnea of with obstructive or mixed medical or neurological polysomnographic prematurity, features with clinical disorder, or medication. study may be normal. <37 wk; compromise (e.g., bradycardia, Additional EEG and apnea of hypoxemia, cyanosis, or esophageal pH employedinfancy >37 wk) hypotonia) frequently.
Abstracted from ref. 5, with permission.
23_Matheson 4/11/07 10:36 PM Page 422

423
Table 8Obstructive Sleep Apnea
Disorder Clinical criteria Polysomnographic criteria Other requirements Other features
Obstructive At least one of the following: With clinical criteria noted: The disorder is not In this definition of sleep apnea theresleep apnea • The patient complains of Five or more apneas, better explained is no requirement that respiratory
unintentional sleep episodes hypopneas or RERAs by another current events are associated with oxygenduring wakefulness, daytime per hour of sleep with sleep disorder, desaturation.sleepiness, unrefreshing sleep, evidence of respiratory another medical The Medicare-approved criteria forfatigue, or insomnia effort during all or a or neurological obstructive sleep apnea justifying
• The patient wakes with breath portion of each medication use, treatment with positive pressure areholding, gasping, or choking respiratory event or substance different than the diagnostic criteria
• The bed partner reports Without clinical criteria use disorder. established by the International loud snoring, breathing noted: Classification of Sleep Disorders-2.interruptions, or both during Fifteen or more Medicare does not recognize the patient’s sleep apneas, hypopneas, or RERAs. Hypopneas by Medicare
RERAs per hour of criteria require ≥4% desaturation sleep with evidence of and ≥30% decrease in respiratory respiratory effort during effort or airflow. Using these all or a portion of each criteria, positive pressure will be respiratory event covered under Medicare in adult
patients if (1) the AHI is ≥15 or (2) the AHI is ≥5 and ≤14 with documented symptoms of excessive daytime sleepiness,impaired cognition, mood disorders, or insomnia; or documented hypertension,ischemic heart disease or history of stroke.
Abstracted from ref. 5 with permission.
23_Matheson 4/11/07 10:36 PM Page 423

424
Table 9Sleep-Related Hypoventilation/Hypoxemic Syndromes
Disorder Clinical criteria Polysomnographic criteria Other requirements Other features
Sleep-related Symptoms not Episodes of shallow breathing No primary lung diseases, Carbon dioxide levels nonobstructive required longer than 10 s in duration skeletal malformations, or show an increase alveolar Patients often report associated with arterial oxygen peripheral neuromuscular during episodes of hypoventilation symptoms of sleep desaturation and either frequent disorders that affect hypoventilation. syndrome disruption, insomnia, arousals from sleep or ventilation are present Daytime blood gases
or excessive daytime brady-tachycardia The disorder is not better may be normal or sleepiness explained by another cur- abnormal.
rent sleep disorder, anothermedical or neurologicaldisorder, medication use,or substance use disorder.
Congenital Patient exhibits shallow Polysomnographic monitoring Hypoventilation is worse Rare disorder, recentlycentral breathing or cyanosis during sleep demonstrates during sleep than associated with alveolar and apnea of severe hypercapnia and during wakefulness. mutations of hypoventilation perinatal onset hypoxia, predominantly Rebreathing ventilatory PHOX2B genesyndrome during sleep without apnea response to hypoxia
or hypercapnia is absent or diminished.
The disorder is not better explained by another cur-rent sleep disorder, anothermedical or neurological medication use, orsubstance use disorder.
Sleep-related Lung parenchymal disease Polysomnography or sleeping The disorder is not better PaCO2 is not routinely hypoventilation/ or pulmonary vascular arterial blood gas shows at explained by another cur- measured during PSG.hypoxemia due disease is present and least one of the following: rent sleep disorder, another End tidal CO2 is measuredto pulmonary believed to be the • Sp O2 during sleep medical or neurological in some laboratories.parenchymal or primary cause of <90% for more than 5 min disorder, medication use,vascular pathology hypoxemia with a nadir of at least 85% or substance use disorder.
• More than 30% of total sleeptime at an SpO2 <90%
23_Matheson 4/11/07 10:36 PM Page 424

425
• Sleeping PaCO2 that is abnormally high or disproportionatelyincreased relative to levelsduring wakefulness
Sleep-related Lower airways obstructive Polysomnography or sleeping The disorder is not better PaCO2 is not routinely hypoventilation/ disease is present and arterial blood gas shows at explained by another measured during PSG.hypoxemia is believed to be the least one of the following: current sleep disorder, End tidal CO2 is sometimesdue to primary cause of • SpO2 during sleep of <90% another medical or measured in some lower airways the hypoxemia. for >5 min with neurological disorder, laboratories.obstruction a nadir of at least 85% medication use, or
• More than 30% of total sleep substance use disorder.time at an SpO2 <90%
• Sleeping PaCO2 that is abnormally high or disproportionately increasedrelative to levels during wakefulness.
Sleep-related A neuromuscular or chest Polysomnography or sleeping The disorder is not better Exacerbated by REM sleephypoventilation/ wall disorder is present arterial blood gas shows at explained by another because of muscle atoniahypoxemia and believed to be the least one of the following: current sleep disorder, Present in a wide variety ofdue to primary cause of • SpO2 during sleep of <90% another medical or disorders that impair chestneuromuscular hypoxemia. for more than 5 min with neurological disorder, wall function including and chest wall a nadir of at least 85% medication use, or obesity, kyphoscoliosis,disorders • More than 30% of total sleep substance use disorder. and any disorder causing
time at an SpO2 <90% muscular weakness, such • Sleeping PaCO2 that is as the muscular
abnormally high or dystrophies, ALS, and disproportionately increased myastheniarelative to levels during Exacerbated by disorders wakefulness. that also reduce
chemosensitivity, such as myotonic dystrophy
SpO2, saturation by pulse oximetry; PSG, polysomnogram; REM, rapid eye movement sleep; ALS, amyotrophic lateral sclerosis. Abstracted from ref. 5, with permission.
23_Matheson 4/11/07 10:36 PM Page 425

426
Table 10Narcolepsy and Idiopathic Hypersomnia
Disorder Clinical criteria Polysomnographic criteria Other requirements Other features
Narcolepsy with Complaint of excessive If cataplexy is clinically unequivocal, CSF hypocretin-1 levels less CSF hypocretin may becataplexy daytime sleepiness or CSF hypocretin fulfills criteria than 110 pg/mL or 1/3 considered as alternative
occurring almost daily noted, polysomnographic study normal mean control can to PSG/MSLT if clinicalfor at least 3 mo with PSG and MSLT are replace PSG and MSLT. situation warrants.
A definite history of recommended but not required as At the time of PSG/MSLT, PSG often shows other cataplexy, defined as confirmatory evidence. patients must be free of abnormalities including sudden and transient Full night PSG with minimum of medications that influence some sleep-disordered episodes of loss of 6 h sleep on night preceding sleep 5 half-lives of breathing, leg movements,muscle tone triggered MSLT longest acting metabolite. fragmented sleep andby strong emotions, Confirmatory MSLT must Prior to PSG/MSLT sleep– REM behavior disordermost reliably, laughing demonstrate: mean sleep latency wake cycle should be Clinical correlation is
≤8 min with minimum of 2 standardized for at least required to determineSOREMPs. 7 d, confirmed by sleep whether these
logs or actigraphy. abnormalities areThe disorder is not better primary or secondary.
explained by another Many patients cannotcurrent sleep disorder, undergo a valid MSLTanother medical or because sleep-influencingneurological disorder, medications, especiallymedication use, or antidepressants, cannotsubstance use disorder. be discontinued. MSLT
in this situation may bemisleading.
23_Matheson 4/11/07 10:36 PM Page 426
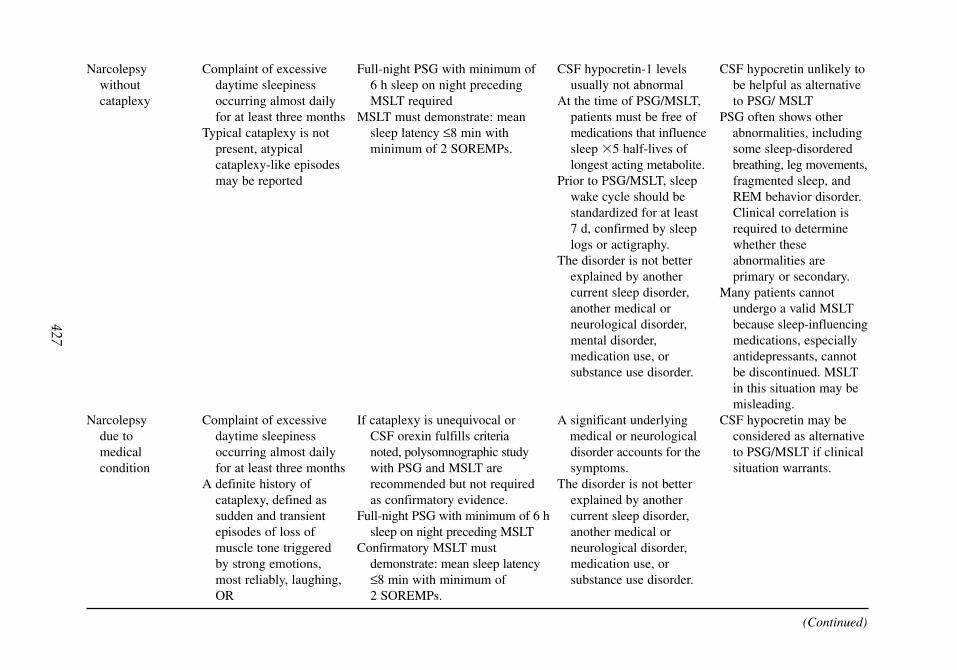
427
Narcolepsy Complaint of excessive Full-night PSG with minimum of CSF hypocretin-1 levels CSF hypocretin unlikely to without daytime sleepiness 6 h sleep on night preceding usually not abnormal be helpful as alternative cataplexy occurring almost daily MSLT required At the time of PSG/MSLT, to PSG/ MSLT
for at least three months MSLT must demonstrate: mean patients must be free of PSG often shows other Typical cataplexy is not sleep latency ≤8 min with medications that influence abnormalities, including
present, atypical minimum of 2 SOREMPs. sleep 5 half-lives of some sleep-disordered cataplexy-like episodes longest acting metabolite. breathing, leg movements,may be reported Prior to PSG/MSLT, sleep fragmented sleep, and
wake cycle should be REM behavior disorder. standardized for at least Clinical correlation is 7 d, confirmed by sleep required to determine logs or actigraphy. whether these
The disorder is not better abnormalities are explained by another primary or secondary.current sleep disorder, Many patients cannot another medical or undergo a valid MSLT neurological disorder, because sleep-influencingmental disorder, medications, especially medication use, or antidepressants, cannot substance use disorder. be discontinued. MSLT
in this situation may be misleading.
Narcolepsy Complaint of excessive If cataplexy is unequivocal or A significant underlying CSF hypocretin may be due to daytime sleepiness CSF orexin fulfills criteria medical or neurological considered as alternative medical occurring almost daily noted, polysomnographic study disorder accounts for the to PSG/MSLT if clinical condition for at least three months with PSG and MSLT are symptoms. situation warrants.
A definite history of recommended but not required The disorder is not better cataplexy, defined as as confirmatory evidence. explained by another sudden and transient Full-night PSG with minimum of 6 h current sleep disorder,episodes of loss of sleep on night preceding MSLT another medical ormuscle tone triggered Confirmatory MSLT must neurological disorder,by strong emotions, demonstrate: mean sleep latency medication use, ormost reliably, laughing, ≤8 min with minimum of substance use disorder.OR 2 SOREMPs.
(Continued)
23_Matheson 4/11/07 10:36 PM Page 427

428
Table 10 (Continued)
Disorder Clinical criteria Polysomnographic criteria Other requirements Other features
hypocretin-1 levels in CSF ≤110 pg/mL or 1/3 of normal mean control values
Idiopathic The patient has a complaint PSG demonstrates no other The disorder is not better Waking patient is typically hypersomnia of excessive daytime sleep disorder. explained by another difficult.with long sleepiness occurring PSG sleep latency is short and current sleep disorder, MSLT not always performed sleep time almost daily for at sleep duration is ≥10 h. another medical or because of difficulty both
least 3 mo. If MSLT performed, sleep latency neurological disorder, waking patient at the end Prolonged nocturnal is <8 min with fewer than mental disorder, of naps and keeping
sleep, >10 h 2 SOREMPs. medication use, or patient awake between napsdocumented by substance use disorder. PSG analysis of subtle interviews, actigraphy respiratory events often or, sleep logs identifies patients with
Waking patient is difficult sleep-disorderedin the morning or at the breathing as alternative end of naps. diagnosis.
Idiopathic The patient has a complaint Nocturnal PSG demonstrates a The disorder is not better PSG analysis of subtle hypersomnia of excessive daytime major sleep period that is explained by another respiratory events often without long sleepiness occurring normal in duration current sleep disorder, identifies patients with sleep time almost daily for at (>6 h but <10 h). another medical or sleep-disordered
least 3 mo. PSG has excluded other causes neurological disorder, breathing as an alternativeThe patient has normal of daytime sleepiness. mental disorder, diagnosis.
nocturnal sleep (>6 h MSLT after overnight PSG medication use, orbut <10 h), documented demonstrates a mean sleep substance use disorder.by interviews, latency of <8 min and actigraphy, or sleep logs. fewer than 2 SOREMPs.
CSF, cerebrospinal fluid, MSLT, multiple sleep latency test; PSG, polysomnogram; SREMPs, sleep-onset REM periods; REM, rapid eye movement sleep.Abstracted from ref. 5, with permission.
23_Matheson 4/11/07 10:36 PM Page 428

429
Table 11REM Behavior Disorder and Disorders of Arousal From NREM
Disorder Clinical criteria Polysomnographic criteria Other requirements Other features
REM behavior At least one of the Presence of REM sleep without Absence of EEG Video recording and disorder (RBD) following: atonia: the EMG finding of epileptiform activity additional EMG limb
• Sleep-related injurious, excessive amounts of sustained during REM sleep leads (arms) are helpful.potentially injurious, intermittent elevation of unless RBD can be Often associated with and or disruptive behaviors submental EMG tone or distinguished from may precede parkinsonian by history excessive phasic submental concurrent REM sleep syndromes
• Abnormal REM behaviors or limb EMG twitching related seizure disorder. Patients often report that documented during The disorder is not better behaviors were consistent polysomnographic explained by another with complex dream monitoring current sleep disorder, mentation.
another medical orneurological disorder,mental disorder,medication use, or substance use disorder.
Disorders of Characterized by confused None required The disorder is not better Typically emerge in the first arousal from behaviors emerging from Sudden spontaneous arousals explained by another third of the night when NREM NREM (typically slow- from slow wave sleep may be current sleep disorder, slow-wave sleep is
wave sleep) sleep noted with or without another medical or prominentincluding ambulation, behavioral correlate. neurological disorder, Familial tendency, may be routine, or inappropriate Polysomnogram useful to mental disorder, precipitated by another behaviors, or identify contributing causes medication use, or cause of arousal such as manifestations of terror, of arousal substance use disorder. sleep-disordered breathingtypically associated with or leg movementspartial or complete Differential diagnosis amnesia for the episode includes seizure disorder
and REM behavior disorder.
REM, rapid eye movement sleep; NREM, non-REM sleep.Abstracted from ref. 5, with permission.
23_Matheson 4/11/07 10:36 PM Page 429

sleep with evidence of preceding subtle airflow limitation, would suggest that sleep-disorderedbreathing was contributing to the manifestation of a disorder of arousal from NREM sleep.Ultimately, the interpretation of these qualitative features is dependent on the experience ofthe interpreting clinician.
4.2. The MSLT
The MSLT is a limited-montage polysomnographic study that evaluates subjects in a seriesof opportunities to nap during the day. It is a validated objective measure of the ability ortendency to fall asleep, and allows an opportunity to assess the presence of abnormal sleep-onset REM periods. The AASM published new practice guidelines for the clinical use of theMSLT in 2005 (11).
4.2.1. Indications for the MSLT
As described in the current practice parameters, the MSLT is indicated for:
“1. The evaluation of patients with suspected narcolepsy to confirm the diagnosis.2. The MSLT may be indicated as part of the evaluation of patients with suspected idiopathic
hypersomnia to help differentiate idiopathic hypersomnia from narcolepsy.”
The study is always preceded by a full-night PSG during the subject’s usual sleep period.Total sleep time on this study must be at least 6 h.
4.2.2. Techniques of the MSLT
The montage for the MSLT includes scoring channels (EEG, chin EMG, and EOG) andEKG. Occipital leads (O1–A1, O2–A2) are added to better identify the drop out of alpha activ-ity characteristic of sleep onset (Table 2). Occasionally, limited respiratory channels are added.
The standard MSLT provides five opportunities to nap at 2-h intervals. The study starts 1.5to 3 h after termination of nocturnal PSG. The patient is studied in a dark quiet room; theinstruction is to close the eyes and attempt to sleep.
Sleep logs or actigraphy should be obtained for at least 1 wk before the study to ascertainsleep–wake cycles to assure that naps are obtained during the patient’s usual wake times.
For diagnostic purposes, the study is not valid if sleep-influencing drugs are either present orrecently withdrawn (an exception would be to evaluate the effect of a drug on sleep latency, butthis is typically a research application). A wide variety of medications are stimulants, depres-sants, or REM inhibitors. These medications need to be discontinued before the study by aninterval of at least five half-lives of the longest active metabolite. When planning drug discon-tinuation before study, it is important to recognize that withdrawal effects on sleep architecturemay persist after washout of the drug. Adequate time should be allowed for return of thepatient’s sleep to a baseline condition. Drug screening is usually obtained in the morning.Smoking is not allowed 30 min before the naps. Caffeine is also prohibited during the study.
4.2.3. Scoring of the MSLT
During each nap, the patient is given a 20-min opportunity to fall asleep. If no sleep occurs,the sleep latency is recorded as 20 min and the nap is ended.
Sleep onset is defined as the latency to the first epoch of any stage of sleep. An epoch ofsleep is defined as greater than 15 s cumulative sleep in a 30-s epoch. If sleep occurs, the studyis ended 15 min after the onset of sleep, by “clock time” not sleep time. Thus, if a patient fellasleep at minute 19, the study would end at minute 34, whether the patient were asleep orawake. If the patient fell asleep at minute 2, the study would end at minute 17.
430 Matheson, Singh, and Packard
23_Matheson 4/11/07 10:36 PM Page 430

REM latency is defined as the time from the first epoch of sleep to the first epoch of REMincluding any wake epochs that may occur. A REM epoch requires greater than 15 s of REMin a 30-s epoch.
Reporting should include start and end times of naps, mean sleep latency averaged overthe five naps, number of sleep-onset REM periods, and latency to each REM period.
4.2.4. Interpretation of the MSLT
The primary measures of importance in the MSLT are:
1. The presence or absence of sleep-onset REM.2. The mean sleep latency.
The occurrence of REM sleep at any time during a nap is defined as sleep-onset REM.Because REM sleep typically occurs 90 min after sleep onset, REM onset within 15 min ofsleep onset during a nap is an abnormal finding; most narcoleptics have two sleep-onset REMperiods in five naps, as will be discussed later, in Subheading 6. (11). However, sleep-onsetREM is not a specific finding. Previous sleep deprivation, medication (especially medicationwithdrawal), and circadian rhythm disturbances may result in sleep-onset REM. This factunderscores the fact that the study can only be interpreted when there is a careful analysis ofthe patient’s clinical history and the conditions of the test. A recent extensive review of theMSLT by a Task Force of the Standards of Practice of the AASM concluded that the meansleep latency on the MSLT does not discriminate well between populations of patients withsleep disorders and normal patients because of a large standard deviation of the mean (12).The mean latency to sleep in normal subjects is approx 10 min, with a two standard deviationof 1.8 to 19 min. However, in the clinical context of the evaluation of a sleepy patient who,on clinical grounds, may have narcolepsy, the combination of assessment of sleep latency andthe presence of sleep-onset REM is of use and is included in formal diagnostic criteria(Subheading 6.2.1.). In narcolepsy, the mean sleep latency is usually less than 8 min. In ameta-analysis of 255 patients with narcolepsy, the mean latency was reported as 3.1 min, witha standard deviation of 2.9 min.
4.3. The MWT
The MWT is another limited-montage laboratory polysomnographic study. It is a validatedobjective measure of the ability to stay awake for a defined time. Subjects are studied in amanner similar to the MSLT in daytime nap opportunities, but are instructed to stay awakerather than fall asleep. Protocols exist for both 20-min and 40-min trials, but the 20-min pro-tocol is of limited use. New guidelines for the MWT were also recently published by theAASM (8).
4.3.1. Indications for the MWT per AASM Practice Parameters are as Follows:“1. The MWT 40-min protocol may be used to assess an individual’s ability to remain awake when
his or her inability to remain awake constitutes a public or personal safety issue.2. The MWT may be indicated in patients with excessive sleepiness to assess response to treat-
ment.” (11)
4.3.2. Techniques of the MWT
The MWT uses the same montage as the MSLT. A previous-night PSG is not necessary butmay be performed depending on the question to be answered by study. A four-trial protocolwith each trial 40 min in duration is preferred. Four trials are performed at 2-h intervals, with
Sleep Disorders 431
23_Matheson 4/11/07 10:36 PM Page 431

the first starting 1.5 to 3 h after the patient’s usual wake time. The room should be lit by lowlight, 0.1 to 0.13 lux, equivalent to a 7.5-watt night light behind the patient’s head. The patientis seated in bed. The subject is instructed to sit still and try to stay awake. Alerting measuressuch as singing or clapping are not allowed. Prescription medications, including stimulants,caffeine, and tobacco are allowed if the study is designed to assess ability to stay awake withthese substances in place; these should be documented.
4.3.3. Scoring of the MWT
Trials are ended at 40 min if no sleep occurs. In contrast, if the subject experiences theoccurrence of three continuous epochs of stage 1 sleep or one epoch or any other sleep stage(termed “unequivocal sleep”), the patient is awoken and trial ended.
Sleep onset is defined as the first epoch of greater than 15 s of cumulative sleep in a 30-sepoch.
Reporting should include start and stop times for each trial, sleep latency, total sleep time,stages of sleep achieved, and mean sleep latency for the four trials. Absence of sleep isrecorded as a latency of 40 min.
4.3.4. Interpretation of the MWT
Similar to the MSLT, the MWT has a wide range of normal values that makes it a poordiscriminator between normal and abnormal populations. However, staying awake for four40-min trials is considered strong objective evidence of the ability to stay awake in similarnonstimulating environments. It is understood that the test may not reliably predict sleepi-ness in another environment in which conditions, such as previous sleep, may be different.On the other hand, a mean latency of less than 8 min is abnormal. Latencies between 8 and40 min are of unknown significance.
5. ACTIGRAPHY
Actigraphy is an ambulatory study that uses a small portable digital device, the actigraph,to record body movements of a subject during long periods of time, typically days, and, thus,enabling the assessment, by inference, of the subject’s rest–activity cycle. The device is usu-ally worn on the wrist, but may be worn on the trunk or ankle. The actigraph uses accelerom-eters to detect movement, which is sampled multiple times per second, averaged in epochs of30 s or 1 min, and stored on the device for downloading at the end of the interval studied. Acomputer analysis of the data produces a histogram that demonstrates the activity level oversuccessive 24-h periods. Other indices, such as sleep latency may be derived from this data.Actigraphy is best used with a sleep diary. Recording of sleep–wake behaviors with either acareful sleep log, or actigraphy is now required in the diagnostic criteria of the circadian rhythmdisorders. Actigraphy is useful before the MSLT to document the preceding sleep–wake patterns.This avoids studying the patient under conditions of sleep deprivation or disturbed circadianphase. The technique is deemed a reliable method for detecting sleep in normal populations.However, using movement as a measure of wakefulness may not be reliable in patients withmovement disorders. Nonetheless, the technique has been modified for use in detecting periodicleg movements in research applications.
6. CLINICAL APPLICATION OF TESTING
The sleep disorders described next are those that are particularly well-suited for polysomno-graphic analysis. The revised ICSD, Diagnostic and Coding Manual (5) establishes both clinical and
432 Matheson, Singh, and Packard
23_Matheson 4/11/07 10:36 PM Page 432

Sleep Disorders 433
polysomnographic criteria for the diagnosis of sleep disorders, which are abstracted in Tables 7to 11. As noted in Subheading 4., the AASM approved indications for polysomnography include:
1. Suspicion of sleep-related breathing disorders.2. Treatment and follow up of sleep-related breathing disorders.3. In combination with the MSLT for suspected narcolepsy.4. Evaluation of sleep-related behaviors that are violent, potentially injurious, or do not respond to
conventional therapy.5. To assist in the diagnosis of paroxysmal arousals that are suggestive of seizure disorder (with
additional video and EEG).6. Evaluation of sleep-related movement disorders.
Even if polysomnographic analysis is not specifically required in the assessment of a sleepcomplaint, clinicians often find that the judicious use of polysomnography may be remarkablyrevealing. For example, although the diagnoses of the various insomnias do not include therequirement of a PSG, polysomnographic study may reveal subtle sleep-disordered breathing,leg movements inducing arousal, or show that no objective impairment of sleep correlates withthe patient’s subjective report.
6.1. Sleep-Related Breathing Disorders
Sleep-related breathing disorders are disorders in which respiration is abnormal duringsleep. The PSG is a necessary test in the diagnosis and management of these disorders.
Disorders in this classification include central sleep apnea, OSA, and sleep-related hypoventi-lation syndromes.
Patients with sleep-related breathing disorders may present with a wide variety of com-plaints, including daytime sleepiness, insomnia, inattentiveness, cognitive decline, loud snor-ing, nocturnal gasping, witnessed apneas, nocturnal chest pain, nonrestorative sleep, andmorning headaches. Nocturnal hypoxia exacerbates ischemic heart disease and promotes thedevelopment of pulmonary hypertension. OSA is known to be associated with excessive day-time sleepiness and the development of hypertension. Associations with insulin resistance,nocturnal arrhythmia, stroke, myocardial infarction, insomnia, and mood disorders are likely.
Central sleep apnea syndromes (Table 7) are characterized by episodes of decreased respi-ratory effort that are either cyclic or intermittent (Fig. 10). OSA syndromes (Table 8) arecharacterized by airway obstruction with persistent respiratory effort (Fig. 9). Lastly, sleep-related hypoventilation syndromes (Table 9) include a variety of disorders, either primaryidiopathic or secondary to other medical conditions, that result in sleep-induced or sleep-exacerbated hypercapnia and hypoxia. These abnormalities are quantified using the respira-tory monitoring techniques described in Subheading 4.1.
The PSG in each of these disorders is distinctive (Tables 7–9), but some abnormalities arecommon to this group of disorders. Abnormal respiratory events of any type tend to fragmentsleep. Polysomnographic evidence of sleep fragmentation includes increased stage 1 sleep,delayed REM latency, decreased REM and stages 3 and 4 sleep, increased arousals, increasedawakenings, and decreased sleep efficiency. Sleep latency may be prolonged.
Polysomnography is also an important tool in treatment of sleep-related breathing disorders.Positive pressure applied as either constant positive airway pressure or bi-level positive airwaypressure is the mainstay of treatment for obstructive and some central apneas. The appropriate at-home pressures are determined through the process of “titration” in the sleep laboratory, in whichpressures are gradually adjusted during the course of the night to eliminate apneas, hypopneas,
23_Matheson 4/11/07 10:36 PM Page 433

434 Matheson, Singh, and Packard
desaturations, and arousals. Supplemental oxygen is also frequently applied, and the effectsmonitored, during therapeutic PSGs with and without positive pressure, especially in patientswith central sleep apnea or hypoventilation syndromes. Automatic titrating machines for at homeuse are available but have generally not replaced in-laboratory positive pressure titration.
6.2. Hypersomnias of Central Origin
Hypersomnias of central origin refer to a group of disorders that result in excessive daytimesleepiness but are not caused by disturbed nocturnal sleep or disorders of circadian rhythms.Excessive daytime sleepiness is defined as “the inability to stay awake and alert during the majorwaking episodes of the day, resulting in unintended lapses into drowsiness or sleep.” Patientswith these disorders may or may not demonstrate excessive sleep during a 24-h period.Diagnostic and Clinical Criteria of the ICSD for narcolepsy and idiopathic hypersomnia are out-lined in Table 10. For the rarer disorders in this category, the reader is referred to the ICSD-2 (2).
6.2.1. Narcolepsy
The most important and common disorder in this category is narcolepsy, with a prevalenceof 0.02 to 0.18% in the United States. Narcolepsy is now classified as narcolepsy with cata-plexy, narcolepsy without cataplexy, and narcolepsy secondary to medical condition. The lastis extremely rare. Cataplexy refers to episodes of muscle weakness associated with strongemotion, often laughter. These episodes are typically brief, often involve the knees and/or face,and are unassociated with a change of consciousness, although sleep sometimes follows imme-diately. Cataplexy is pathognomonic of narcolepsy, but need not be present. Other commonfeatures of narcolepsy include hallucinations at sleep onset (hypnagogic hallucinations), sleepparalysis, inattentive “automatic behavior,” and poorly maintained nocturnal sleep. Most of thecharacteristic symptoms of the disorder seem to reflect a disorder of the control mechanismsthat regulate REM sleep. Episodes of REM occur at the wrong time, intruding on wakefulness,and the physiological components of REM sleep dissociate and appear independently.Cataplexy and sleep paralysis, for example, are manifestations of the muscle atonia of REMsleep appearing during wakefulness. Recent discoveries suggest that narcolepsy is caused by theloss of hypothalamic neurons containing the neuropeptide, hypocretin-1. In the past, neurophys-iological testing with both the PSG and MSLT provided the only confirmatory evidence for thediagnosis of narcolepsy with and without cataplexy. New diagnostic guidelines include theoption of obtaining cerebrospinal fluid levels of hypocretin-1, an assay that can be obtained bysending the sample to specialized centers. Approximately 90% of patients who demonstratecataplexy have low hypocretin levels, whereas only 10 to 20% of patients classified as havingnarcolepsy without cataplexy show low hypocretin levels. Narcolepsy with cataplexy is highlyassociated with HLA subtype DQB1*0602, but because 12 to 38% of controls are positive forthis antigen, HLA typing is not used as a diagnostic criterion. Narcolepsy without cataplexyhas a less strong association with DQB1*0602. Many patients who carry the diagnosis of nar-colepsy without cataplexy are likely to have been misdiagnosed and have another sleep disor-der. The MSLT is a study that requires close attention to procedural detail and patientpreparation, as described in Subheading 4.2. Improper administration of the MSLT results inboth false-positive and false-negative results. The highest specificity (99.2%) and positive pre-dictive value (87%) for MSLT findings are with the criteria of three or more sleep-onset REMperiods combined with a mean sleep latency of less than 5 min (13). Narcolepsy caused bymedical condition, also referred to as symptomatic narcolepsy or secondary narcolepsy, is usually
23_Matheson 4/11/07 10:36 PM Page 434

Sleep Disorders 435
associated with pathology of the hypothalamus and may also result in low hypocretin levels.Although this presentation is rare, a variety of disease processes have been identified in thesepatients, including tumors, cerebral infarct, sarcoidosis, Niemann-Pick type C, multiple sclero-sis, disseminated encephalomyelitis, and paraneoplastic syndromes.
6.2.2. Idiopathic Hypersomnia
If no other condition can be identified that explains excessive daytime sleepiness, the diag-nosis “idiopathic hypersomnia” is applied. Polysomnographic studies as well as a careful med-ical neurological and psychiatric assessment are particularly important in these disorders toexclude subtle or occult abnormalities. Brain MRI is appropriate. The ICSD-2 now classifiesthese patients as idiopathic hypersomnia with prolonged sleep time, and idiopathic hypersom-nia without prolonged sleep time. When subjected to detailed study using the more-sensitivemeasures of respiratory effort noted in Subheading 4.1.2., many patients who carry this diag-nosis are identified as having RERAs, indicative of a sleep-related breathing disorder.
6.3. Parasomnias
The term parasomnia refers to undesirable events that occur during sleep, sleep onset, oron arousal from sleep. Parasomnias often include complex behaviors. Although the behav-iors may seem to be goal directed, they are not under conscious control. These disorders typi-cally are sleep-stage specific. The classification includes:
1. Disorders of arousal (from NREM sleep). 2. Parasomnias usually associated with REM sleep.3. Other parasomnias.
By ICSD-2 standards, polysomnographic analysis is required only for the diagnosis ofREM behavior disorder. In practice, however, polysomnographic analysis is extremely usefulboth to document the disorders and, more importantly, to identify other sleep disorders thatmay act as precipitants to arousal and subsequent behavioral manifestations.
6.3.1. REM Behavior Disorder
REM behavior disorder (Table 11) is characterized by abnormal behaviors that emerge duringREM sleep. The typical complaints are violent thrashing, hitting, or yelling, accompanied bynightmares. The disorder is more common in men older than 50 yr. Polysomnographic studyshows that the behavioral outbursts are associated with the intermittent loss of the muscle atoniathat normally characterizes the REM sleep state (Fig. 14). If awoken spontaneously or by othersduring the episode, patients are often, but not always, able to correlate the actions to dream men-tation. The disorder is highly correlated with parkinsonian states, including Parkinson disease,dementia with Lewy bodies, and multisystem atrophy. The disorder can emerge years beforethese diagnoses are clinically apparent, but idiopathic and drug-induced REM behavior disorderpresentations are also recognized.
6.3.2. Disorders of Arousal (From NREM Sleep)
Disorders of arousal from NREM sleep (Table 11) include sleep terrors, sleepwalking, andconfusional arousals. These disorders are characterized by confusion and automatic behaviorafter sudden arousal from NREM, usually stages 3 or 4 sleep (slow-wave sleep) (Fig. 15). As aresult, symptoms tend to occur early in the night, when slow-wave sleep is prominent. Patientsmay sit bolt upright with a blood-curdling scream and autonomic activation (sleep terror),
23_Matheson 4/11/07 10:36 PM Page 435

436
Fig. 14. Rapid eye movement (REM) behavior disorder. In this epoch, during REM there is a loss of the usual REM atonia. Excessivemotor activity is captured in the leg EMG leads. The chin EMG tone remains atonic, as expected in REM. The elevation in motor toneassociated with this disorder is rarely generalized. (30-s epoch)
23_Matheson 4/11/07 10:36 PM Page 436

437
Fig. 15. Arousal from delta sleep. A sudden unprovoked arousal occurs from hypersynchronous delta sleep.
23_Matheson 4/11/07 10:36 PM Page 437

438 Matheson, Singh, and Packard
engage in complex acts (sleep walking), or arouse in a confused state (confusional arousal).Patients are difficult to fully awaken and are mostly amnestic for the episode. The tendencyto arouse spontaneously from delta sleep tends to be a familial trait, with first presentation inchildhood and resolution by adolescence. Stress, sleep deprivation, or any factors that con-tribute to sleep disruption, such as sleep-disordered breathing, are exacerbants that may resultin the re-emergence of the behavioral syndrome in adulthood. Polysomnographic study maydemonstrate the typical behaviors emerging from slow-wave sleep, sudden unexplainedarousals from slow-wave sleep, or an underlying cause of arousal, such as sleep-disorderedbreathing or leg movements.
6.4. Sleep-Related Movement Disorders
Sleep-related movement disorders include conditions in which simple stereotyped move-ments are present during sleep and induce sleep disruption. Difficulty initiating and/or main-taining sleep are the typical complaints.
6.4.1. Periodic Limb Movement Disorder
The most prevalent of these disorders is PLMD. PLMD (Table 12) is characterized by peri-ods of repetitive stereotyped leg movements that disturb sleep (PLMS) (Fig. 13). The legmovements are similar to the triple flexion response of the Babinski reflex, but arm move-ments may also occur. Other types of leg movements may be present without periodicity, orwithout sleep disruption, or may be secondary to other primary sleep disorders, in whichcase, the term PLMS is not appropriate. Leg movements, for example, frequently accompanyarousals from sleep-disordered breathing. Many medications are implicated in the inductionof periodic and aperiodic leg movements, most commonly selective serotonin reuptakeinhibitors and tricyclic antidepressants.
6.4.2. Restless Legs Syndrome
RLS (Table 12) is a disorder characterized by an urge to move accompanied by uncom-fortable sensations, predominantly in the legs, that are relieved by movement, occur whensedentary, and are worse in the evening (14). This syndrome is closely associated withPLMD because 80 to 90% of patients with this disorder have PLMS. Some of these patientsalso demonstrate periodic limb movements while awake. RLS, however, is a syndromebased on clinical, not polysomnographic criteria. The disorder is familial in 50% of cases.Abnormalities of both dopamine and iron metabolism are implicated in the underlyingpathophysiology. In patients with RLS, PET studies have shown decreased dopamine D2binding and decreased dopamine storage in striatum. It has been postulated that brain irondeficiency underlies dopamine dysfunction in this disorder. Recent postmortem evidencesuggests a deficiency of iron acquisition in the substantia nigra of patients with RLS. Irondeficiency is known to exacerbate or precipitate restless legs and periodic leg movements infamilial and nonfamilial cases. Increasing iron stores by long-term iron supplementation is often therapeutic even in patients with low normal ferritin levels (less than 50).Dopaminergic agonists are highly successful treatments. Iron and dopamine may be func-tionally linked by the fact that tyrosine hydroxylase is a cofactor in dopamine metabolism.Secondary causes of RLS are subject to some debate because of limited data, and includeuremia, neuropathy, medications (especially antidopaminergic drugs and selective serotoninreuptake inhibitors), and caffeine.
23_Matheson 4/11/07 10:36 PM Page 438

439
Table 12Periodic Limb Movement Disorder and Restless Legs Syndrome
Disorder Clinical criteria Polysomnographic criteria Other requirements Other features
Periodic limb There is a clinical sleep PSG: Stereotyped limb movements PLMS are not better If PLMS are present without movement disturbance or a during sleep (PLMS) that are: explained by another sleep disturbance, the disorder complaint of daytime • 0.5–5 s in duration current sleep disorder, finding can be noted as a
fatigue. • Of amplitude ≥25% of toe medical or neurological polysomnographic dorsiflexion during calibration disorder, mental disorder, finding, but criteria are
• In a sequence of 4 or more medication use, or are not met for a movements substance use disorder. diagnosis of PLMD
• Separated by an interval of PLMS are found in a variety>5 s and <90 s of other sleep disorders,
PLMS index (events/hour of sleep) including narcolepsy,exceeds 15/h in adults, 5/h in RBD and RLS. The termchildren PLMD should not be
used when diagnostic criteria for these disorders are fulfilled.
Screen for low serum ferritin, neuropathy, and renal disease
Leg movements decrease with low-dose dopaminergic agonists
(Continued)
23_Matheson 4/11/07 10:36 PM Page 439

440
Table 12 (Continued)
Disorder Clinical criteria Polysomnographic criteria Other requirements Other features
Restless legs The patient reports an urge None The disorder is not better Often familialsyndrome to move the legs, usually PLMS occur in 80–90% explained by another Screen for low serum
accompanied or caused of patients current sleep disorder, ferritin, neuropathy, andby uncomfortable and PLMW may be present another medical or renal diseaseunpleasant sensations in neurological disorder, Symptoms improve with the legs. mental disorder, low-dose dopaminergic
The urge to move or the medication use, or agonists.unpleasant sensations substance use disorder.begin or worsen during periods of rest or inactivity, such as lying or sitting.
The urge to move or the unpleasant sensations are partially or totally relieved by movement,such as walking or stretching.
The urge to move or the unpleasant sensations are worse, or only occur, in the evening or night.
PLMD, periodic limb movement disorder; RBD, REM behavior disorder; REM, rapid eye movement sleep; RLS, restless legs syndrome; PLMW, periodic legmovements during wakefulness.
Abstracted from ref. 5, with permission.
23_Matheson 4/11/07 10:36 PM Page 440

Sleep Disorders 441
REVIEW QUESTIONS
1. Polysomnography:A. Is routinely performed in an ambulatory setting; only very sick, unstable patients require close
monitoring in a laboratory.B. Is not required for the diagnosis of restless legs syndrome.C. Is essential for the diagnosis of insomnia.D. Is indicated only for the diagnosis of sleep apnea.
2. Stage 2 sleep is defined by the presence of:A. K-complexes or spindles of at least 0.5 s in duration in the absence of sufficient slow wave
acitivity to define the presence of stages 3 and 4 sleep.B. Saw tooth waves.C. Absence of alpha activity for 50% of the epoch.D. K-complexes of at least 75 microvolts in amplitude.
3. Stage 1 sleep is characterized by all of the following except:A. Occasional vertex waves of less than 0.5 s.B. An epoch with less than 50% alpha activity.C. Slow rolling eye movements.D. Spindles lasting 0.5 s or more.
4. Stage 3 sleep is defined by epochs (30 s) with:A. Not more than 50%, but greater than or equal to 20% slow activity of 3 Hz or less with an
amplitude of 75 µV.B. Not more than 50% but greater than or equal to 20% slow wave activity of 2 Hz or less with
no amplitude criterion.C. Not more than 50% but greater than or equal to 20% slow wave activity of 2 Hz or less with
an amplitude of >75 µV.D. At least 50% high-voltage slow activity of at least 2 Hz with an amplitude of 75 µV.
5. Scoring REM sleep requires:A. Saw tooth waves.B. EEG with an at least 8-channel montage.C. EMG of chin, eye movement recording (EOG), and EEG with central leads.D. EMG of both chin and anterior tibialis muscles.E. Phasic changes in respiration.
6. Current Center for Medicare and Medicaid Services (CMS) guidelines define hypopnea as:A. Any decrease in airflow.B. Any decrease in airflow or thoracoabdominal movement with an arousal or oxygen desaturation.C. 30% Decrease in airflow with 4% oxygen desaturation or an arousal.D. 30% Decrease in airflow or thoracoabdominal movement with at least 4% desaturation.
7. A mixed apnea is defined as:A. Absence of airflow for 10 s without any other criterion.B. Absence of airflow for 10 s with decreased but persistent respiratory effort on thoracoabdomi-
nal monitors throughout the event.C. Absence of airflow for less than 10 s with or without respiratory effort.D. Absence of airflow for 10 s with initial absence of respiratory effort followed by resumption
of respiratory effort before airflow resumes.8. Proper administration of a multiple sleep latency test (MSLT):
A. Involves a patient sitting up in a minimally lit room to stay awake during the testing.B. Requires discontinuation of all drugs that affect sleep for a period of 15 days, or for a period
of at least 5 times the half life of the drug and its longest acting metabolite.C. Consists of a neurophysiological recording during two 20-min long nap opportunities, typi-
cally scheduled on the afternoon preceding a whole-night PSG.D. Requires a minimum of 6 h of sleep deprivation on the night before testing.
23_Matheson 4/11/07 10:36 PM Page 441

9. A periodic leg movement sequence is scored when:A. There is any repetitive EMG activity in the anterior tibialis muscle of 0.5–5 s in duration,
with an amplitude of at least 25% of the calibration EMG activity.B. There is a series of leg movements lasting at least 90 s, with an amplitude of 25% of the
calibration EMG.C. Synchronous repetitive contractions of agonist and antagonist leg muscles are noted while
awake or asleep.D. There is a series of 4 or more bursts of anterior tibialis EMG activity, each of 0.5–5 s in duration,
with an amplitude of 25% of the calibration EMG, separated by more than 5 and less than 90 s.10. Growth hormone secretion is associated with:
A. The onset of REM.B. Stage one sleep.C. Arousal from slow-wave sleep.D. Slow wave sleep.
11. In a patient with excessive daytime sleepiness and equivocal cataplexy, a diagnosis of narcolepsywith cataplexy may be confirmed with which of the following:A. CSF fluid hypocretin measurements.B. MSLT alone.C. PSG showing no other sleep disorder accounting for sleepiness.D. PSG showing no other sleep disorder and MSLT showing sleep onset REM in any one of
5 naps and mean latency of at most 8 min.12. Which of the following is not required for the diagnosis of restless legs syndrome:
A. The patient reports the urge to move the legs accompanied by unpleasant sensations.B. Symptoms are precipitated by rest and relieved by activity.C. Symptoms are worse in the evening or night.D. Periodic limb movements are demonstrated on PSG.
13. By current guidelines, Medicare will approve treatment of obstructive sleep apnea with positivepressure in which of the following situations:A. Respiratory disturbance index of 15 or greater.B. Apnea hypopnea index of 15 or greater.C. Apnea hypopnea index of 15, only when there is an associated lowest oxygen desaturation to 88%.D. Apnea hypopnea index of 15, only if there are associated clinical symptoms.
14. The term “Disorder of Arousal” refers to:A. Any disorder that results in frequent arousals from sleep.B. A disorder characterized by abnormal tone during REM sleep.C. A disorder characterized by sudden arousal from NREM, usually slow wave sleep.D. A disorder characterized by marked difficulty waking after a normal sleep period.
15. REM behavior disorder is characterized by all of the following except:A. Often precedes the onset of parkinsonian disorders.B. Lack of the usual atonia during REM sleep.C. Violent and potentially self-injurious behaviors.D. Patients are typically amnestic for the behaviors.
16. Which of the following is not an effect of aging on sleep architecture:A. A reduction in slow wave sleep.B. A reduction in the percentage of REM sleep.C. A reduction in total sleep time.D. An increase in arousals.
17. What is the utility of the maintenance of wakefulness test (MWT)?A. It is used to diagnose narcolepsy.B. It measures both the ability to fall asleep and to stay awake in a controlled environment.C. It is a measure of the ability to stay awake in the provided testing conditions.D. It predicts the risk of an accident due to inappropriate episodes of sleep in the real world.
442 Matheson, Singh, and Packard
23_Matheson 4/11/07 10:36 PM Page 442

18. Restless leg syndrome responds to:A. Treatment with selective SSRIs.B. Treatment with dopaminergic antagonists.C. Treatment with dopaminergic agonists.D. No effective treatment is available.
19. The diagnosis of obstructive sleep apnea:A. Always requires the presence of obstructive apneas.B. Always is associated with significant oxygen desaturation.C. Requires that the patient demonstrate excessive daytime sleepiness.D. May be made in the absence of clinical criteria if the polysomnogram shows at least 15
obstructive events an hour including RERAs, hypopneas, and apneas.20. A RERA (respiratory effort related arousal) is:
A. Associated with increased negative intrathoracic pressure.B. Is obvious on chest and abdomen effort bands.C. Is typically associated with oxygen desaturation.D. Is never a major cause of sleep disruption.
REVIEW ANSWERS
1. B. Polysomnography is not required to establish a diagnosis of restless legs syndrome. The diag-nosis of restless legs is made based on four essential criteria including: (1) an urge to moveaccompanied by uncomfortable sensations, predominantly in the legs that are (2) relieved bymovement, (3) occur when sedentary and (4) are worse in the evening.
2. A. Stage 2 is defined by the presence of sleep spindles (≥0.5 sec) and/or K complexes (≥0.5sec)in the absence of sufficient slow activity to define stages 3 or 4 sleep.
3. B. The transition from drowsiness to stage 1 is characterized by slowing of the EEG. As this tran-sition occurs, when less than 50% or a 30 second epoch demonstrates alpha activity, the epochis scored stage 1. Slow rolling eye movements typically herald and occur during stage one sleep,but are not required for scoring.
4. C. The definition of Stage 3 is based on EEG frequency, amplitude, and epoch composition of deltaactivity. The delta activity required for stage 3 is <2 Hz, >75µV, and ≥20% but ≤50% of the epoch.
5. C. REM sleep is defined by low amplitude, asynchronous frequency EEG activity, REMs, incombination with the lowest tonic submental EMG level during sleep (usually atonia). Saw toothwaves are frequently present but are neither sufficient nor necessary for scoring REM.
6. D. Medicare (CMS) adopted the hypopnea definition used in the Sleep Heart Health Study anon-going large-scale epidemiologic study of sleep-disordered breathing. This definition does notinclude any measure of sleep disturbance.
7. D A mixed apnea is so called because of the presence of both central and obstructive features.The event begins with absence of respiratory effort and airflow. When respiratory effort resumes,airflow does not resume simultaneously because of obstruction of the airway. The total durationof absence of airflow is 10 s.
8. B. Medications that affect sleep architecture distort the findings on the MSLT by influencingboth sleep latency and the presence of REM sleep. The current recommendation of the ICSD-2 is that prior to the administration of the MSLT the patient should be free of medications thatinfluence sleep for 15 days, or at least five times the half- life of the drug and its longestmetabolites. Rapid withdrawal of REM- influencing drugs may induce REM rebound and falsepositives. REM- inhibiting drugs produce false negative studies. Often, a meaningful MSLTcannot be obtained because the patient's underlying disorders do not allow for medicationwithdrawal.
9. D. Leg movements fulfilling the described requirements are necessary for the diagnosis ofPLMD. Most adult patients demonstrate an index of greater than 15 leg movements per hour.
10. D. Maximal growth hormone release occurs within minutes of the onset of slow wave sleep.
Sleep Disorders 443
23_Matheson 4/11/07 10:36 PM Page 443

11. A. Cerebrospinal hypocretin-1 <110 pg/ml or less than 1/3 normal control values is found in90% of patients with narcolepsy with cataplexy and almost never in controls or other patients.The test may be useful when REM suppressant medications cannot be discontinued or when anMSLT is difficult to interpret. The test is not influenced by concurrent sleep disorders and psy-chotropic medications/substances.
12. D. Restless legs syndrome is a clinical diagnosis based on symptoms alone (see Question 1.) Thedisorder usually associated with PLMD, but periodic limb movements are not required to con-firm the diagnosis of restless legs syndrome.
13. B. Medicare and other insurance carries adhering to Centers for Medicare and Medicaid Services(CMS) coverage criteria will approve treatment for obstructive sleep apnea if the AHI ≥15 in anasymptomatic patient or ≥5 with a history of any one or more of the following: excessive day-time sleepiness, impaired cognition, mood disorders or insomnia, or documented hypertension,ischemic heart disease, or history of stroke.
14. C. These non-REM parasomnias most often arise from slow wave sleep and are therefore occurmore often during the first third of the night. A family history disorders of arousal is common andprovocative factors include sleep deprivation, stress, medications, alcohol, caffeine and other sleepdisorders that increase the probability of arousal such as sleep-related breathing disorders or PLMD.
15. D Patients with REM behavior disorder often report detailed dream activity consistent withobserved dream-enacting behaviors. On the other hand, patients with non-REM parasomnias aretypically amnestic for the demonstrated behaviors.
16. B. Under normal circumstances, the percentage of REM sleep in an older individual is similarto that of a younger adult. Slow wave sleep (stages 3 and 4 sleep) and total sleep time decreasewith age. Arousals and sleep fragmentation increase with age.
17. C. The maintenance of wakefulness test (MWT) was designed to assess an individual's abilityto resist sleep in a standardized, non-stimulating environment. The test has received criticismdue to a lack of recreating realistic circumstances. Nonetheless, the MWT is often utilized toassess therapeutic response of a sleep disorder to treatment, and to evaluate an individual's abil-ity to stay awake when impaired alertness poses a safety hazard.
18. C. Dopaminergic agonists are an effective treatment for RLS. Dopaminergic antagonists andSSRIs can exacerbate RLS.
19. D. Obstructive sleep apnea syndrome describes a spectrum of sleep related breathing disorderscharacterized by an absence or reduction in airflow despite continued respiratory effort. Someadvocate that a response to CPAP aids in the diagnosis and others adhere to CMS guidelines as thedefinition. According to the AASM, OSA exists when 5 or more obstructive respiratory events areaccompanied with a clinical presentation. Variation in recording methods of respiratory parametersexists and therefore a variation in diagnostic sensitivities continues to exist.
20. A. A RERA is characterized a sequence of increasing effort and/or breathing, not meeting thedefinition for an apnea or hypopnea, and terminating with an arousal.
REFERENCES
1. Loomis AL, Harvey EN, Hobart G. Cerebral states during sleep, as studied by human brainpotentials. J Exp Psychol 1937;21:127–144.
2. Aserinsky E, Kleitman N. Regularly occurring periods of eye motility, and concomitant pheno-mena, during sleep. Science 1953;118:273–274.
3. Dement W, Kleitman N. Cyclic variations in EEG during sleep and their relation to eye movements,body motility, and dreaming. Electroencephalogr Clin Neurophysiol Suppl 1957;9:673–690.
4. Rechtschaffen AKA. A Manual Standardized Terminology: Techniques and Scoring System forSleep Stages of Human Subjects. Los Angeles: UCLA Brain Information Service/Brain ResearchInstitute, 1968.
5. The International Classification of Sleep Disorders: Diagnostic & Coding Manual, ICSD-2.Westchester, IL: American Academy of Sleep Medicine, 2005.
444 Matheson, Singh, and Packard
23_Matheson 4/11/07 10:36 PM Page 444

6. Espana RA, Scammell TE. Sleep neurobiology for the clinician. Sleep 2004;27:811–820.7. Kushida CA, Littner MR, et al. Practice parameters for the indications for polysomnography and
related procedures: an update for 2005. Sleep 28(4):499–521.8. EEG arousals: scoring rules and examples: a preliminary report from the Sleep Disorders Atlas
Task Force of the American Sleep Disorders Association. Sleep 1992;15:173–184.9. Meoli AL, Casey KR, Clark RW, et al. Hypopnea in sleep-disordered breathing in adults. Sleep
2001;24:469–470.10. Recording the scoring leg movements. The Atlas Task Force. Sleep 1993;16:748–759.11. Littner MR, Kushida C, Wise M, et al. Practice parameters for clinical use of the multiple sleep
latency test and the maintenance of wakefulness test. Sleep 2005;28:113–121.12. Arand D, Bonnet M, Hurwitz T, Mitler M, Rosa R, Sangal RB. The clinical use of the MSLT and
MWT. Sleep 2005;28:123–144.13. Aldrich MS, Chervin, RD, Malow BA. Value of the multiple sleep latency test (MSLT) for the
diagnosis of narcolepsy. Sleep 1997;20:620–629.14. Allen RP, Picchietti D, Hening WA, Tenkwalder C, Walters AS, Montplaisi J. Restless legs syn-
drome: diagnostic criteria, special considerations, and epidemiology. A report from the restlesslegs syndrome diagnosis and epidemiology workshop at the National Institutes of Health. SleepMed 2003;4:101–119.
15. Kryger MH, Roth T, Dement WC. Principles and practice of sleep medicine. Philadelphia, PA:Elsevier/Saunders, 2005:xxxiii.
16. Williams RL, Karacan I, Hursch CJ. Electroencephalography (EEG) of human sleep: clinicalapplications. New York, Wiley, NY, 1974:xiv.
17. Kales A, Kales JD. Sleep disorders. Recent findings in the diagnosis and treatment of disturbedsleep. NEJM 1974;290:487–499.
Sleep Disorders 445
23_Matheson 4/11/07 10:36 PM Page 445

23_Matheson 4/11/07 10:36 PM Page 446

24Autonomic Nervous System Testing
Frederick K. Nahm and Roy Freeman
SummaryAutonomic testing encompasses an array of procedures that can be used to assess a variety of symp-
toms ranging from lightheadedness and dizziness to anhydrosis to constipation and urinary inconti-nence. A number of procedures are available for testing of the many varied aspects of both theparasympathetic and sympathetic nervous systems. These tests include Valsalva maneuver testing, RRinterval testing, tilt-table testing, microneurography, and the thermoregulatory sweat test. This chapterreviews the basic neuroanatomy and neurophysiology of the autonomic nervous system and the teststhat are most effective in their evaluation.
Key Words: Anhydrosis; hypotension; lightheadedness; neuropathy; parasympathetic; sympathetic.
1. INTRODUCTION
Disorders of the autonomic nervous system (ANS) can be found in many conditions thatspan the disciplinary boundaries of medicine. The neurophysiological evaluation of the humanautonomic nervous system function is challenging because most autonomic structures arelocated at a distance from the skin, and, thus, less amenable to direct observation or study. Inaddition, most neurophysiological measures of the ANS reflect end-organ function (smoothmuscle, cardiac muscle, and glandular organs), rather than direct neural activity in the sympa-thetic and parasympathetic nerves. Despite these methodological difficulties, there are a num-ber of clinically useful techniques that test the functional integrity of the sympathetic andparasympathetic nervous system. The aim of this chapter is to provide a basic understandingof neurophysiological testing methods that are used to evaluate autonomic disorders.
Neurophysiological tests of autonomic function are extensions of the clinical exam, andtheir appropriate use requires a thorough history and physical examination. In addition, acareful review of autonomic symptoms should be taken, with attention to systems commonlyaffected by autonomic dysfunction. As in all clinical tests, the pretest clinical probabilityaffects the power of ANS testing, and a clear, well-formulated question should precede ANStesting. A brief list of the more common autonomic symptoms are listed in Table 1. A few ofthe more common indications for ANS testing are listed in Table 2.
2. NEUROANATOMIC AND NEUROPHYSIOLOGICAL PRINCIPLES
A systematic approach to ANS testing is important given its neuroanatomical complexity. Auseful conceptual approach for understanding sympathetic and parasympathetic function is tothink in terms of neuronal circuits and autonomic reflex arcs (Fig. 1). Afferent information arises
From: The Clinical Neurophysiology PrimerEdited by: A. S. Blum and S. B. Rutkove © Humana Press Inc., Totowa, NJ
447
24_Freeman 4/11/07 10:09 AM Page 447

from end-organ receptors, such as baroreceptors in vessel walls, and mechanoreceptors andmetaboreceptors in skeletal muscle. Signals arising from these structures are directed tocentral autonomic structures via unmyelinated and myelinated autonomic nerves. Thenucleus tractus solitarius, located in the dorsal medulla, receives much of the afferentperipheral autonomic input. This structure has reciprocal connections to central regionsregulating both sympathetic and parasympathetic function and plays an important role infeedback regulatory circuits.
448 Nahm and Freeman
Table 1Common Autonomic Symptoms
Orthostatic intoleranceDizzinessLightheadednessFatigue“Coathanger” headacheNauseaPalpitationsNear-syncope and syncope
GenitourinaryBladder urgency or frequencyIncontinenceNocturiaErectile dysfunctionEjaculatory disturbances
GastrointestinalDiarrheaConstipationFecal incontinencePostprandial fullness, cramping, or bloating
SudomotorHyperhidrosisHypohidrosis and anhidrosis
Table 2Indications for Autonomic Nervous System Testing
SyncopeCentral autonomic degenerations (e.g., multiple system atrophy with autonomic failure, and Parkinson
disease)Pure autonomic failurePostural tachycardia syndromeAutonomic and small-fiber peripheral neuropathies (e.g., diabetic peripheral neuropathy, amyloid
peripheral neuropathy, and hereditary peripheral neuropathies)Sympathetically mediated painEvaluating response to therapyDifferentiating benign symptoms (e.g., dizziness) from life-threatening autonomic disorders
24_Freeman 4/11/07 10:09 AM Page 448
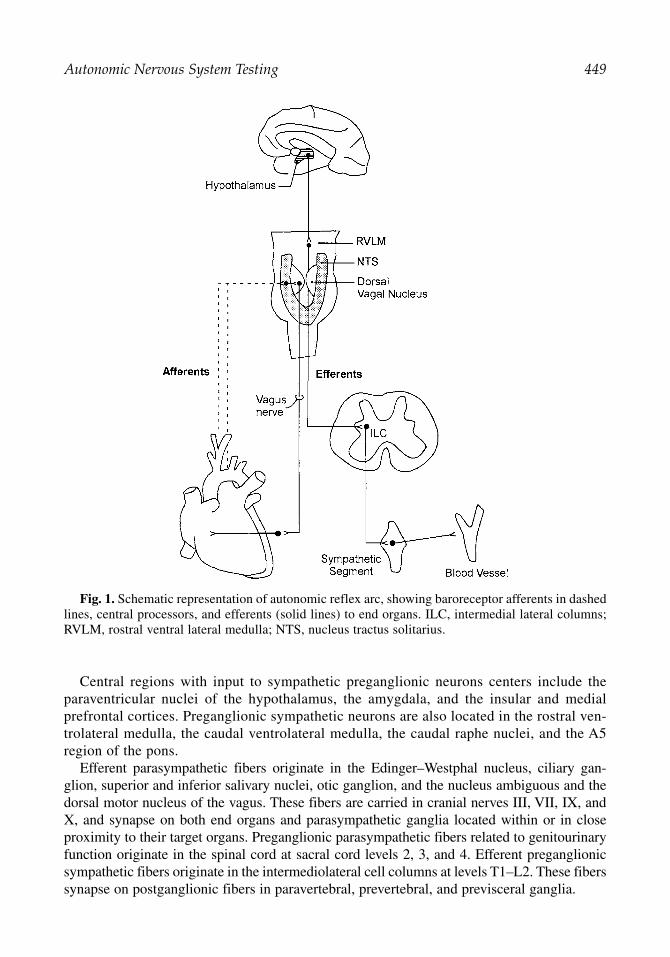
Central regions with input to sympathetic preganglionic neurons centers include theparaventricular nuclei of the hypothalamus, the amygdala, and the insular and medial prefrontal cortices. Preganglionic sympathetic neurons are also located in the rostral ven-trolateral medulla, the caudal ventrolateral medulla, the caudal raphe nuclei, and the A5region of the pons.
Efferent parasympathetic fibers originate in the Edinger–Westphal nucleus, ciliary gan-glion, superior and inferior salivary nuclei, otic ganglion, and the nucleus ambiguous and thedorsal motor nucleus of the vagus. These fibers are carried in cranial nerves III, VII, IX, andX, and synapse on both end organs and parasympathetic ganglia located within or in closeproximity to their target organs. Preganglionic parasympathetic fibers related to genitourinaryfunction originate in the spinal cord at sacral cord levels 2, 3, and 4. Efferent preganglionicsympathetic fibers originate in the intermediolateral cell columns at levels T1–L2. These fiberssynapse on postganglionic fibers in paravertebral, prevertebral, and previsceral ganglia.
Autonomic Nervous System Testing 449
Fig. 1. Schematic representation of autonomic reflex arc, showing baroreceptor afferents in dashedlines, central processors, and efferents (solid lines) to end organs. ILC, intermedial lateral columns;RVLM, rostral ventral lateral medulla; NTS, nucleus tractus solitarius.
24_Freeman 4/11/07 10:09 AM Page 449

3. PATIENT PREPARATION FOR AUTONOMIC TESTING
Before ANS testing, patients should refrain from heavy meals, coffee, and nicotine for atleast 3 to 4 h before studies. Medications with either anticholinergic effects or those withα- and β-receptor agonist or antagonist activity should be withheld (if medically appropriate)24 to 48 h before testing, because these can significantly affect the outcome of ANS tests.
Most autonomic testing sessions are 60 to 90 min. Patients should wear loose-fittingclothes for comfort and to facilitate the application of cardiac electrodes and blood pressure(BP) cuffs.
4. ELECTROPHYSIOLOGICAL METHODS
4.1. Heart Rate Recording and the RR Interval
Heart rate (HR) is routinely recorded with a three-lead electrocardiograph (ECG) machine.Tests evaluating HR variability can only be performed in the setting of sinus rhythm. TheECG leads are placed at anterior chest locations, which minimize movement artifact, and thereference electrode is usually placed at the mid-axillary line at approximately the T4 level.Autonomic tests of HR variability may be based on HR measure in beats per minute or itsinverse, the RR interval, measured in milliseconds (Fig. 2).
4.2. BP Recording
BP during autonomic testing can be measured intermittently or continuously. Some methodsrely on brachial artery cuffs, whereas others use devices that are applied to the wrist or the finger. The intermittent recording techniques rely on occlusive cuff methods. Techniques fordetecting arterial lumen opening include auscultatory and oscillometric methods. Auscultationfor Korotkoff sounds is a widely available, and invaluable, bedside tool. The oscillometric tech-nique is based on the observation that during cuff deflation, the point of maximal oscillationbetween systolic and diastolic pressure corresponds to the mean arterial pressure. Although boththe auscultatory and oscillometric techniques are relatively easy to perform, they provide onlyperiodic sampling of BP.
Plethysmography and arterial tonometry are methods used for continuous, beat-to-beat,noninvasive BP recording. Plethysmography is an indirect measure of BP, whereby the pulsepressure is derived from the blood volume. The volume clamp method of Peñaz, also calledarterial counterpulsation, uses a servo-loop circuit that continuously counterbalances arterialpressure, thereby clamping the volume of blood flow to maintain a transmural pressure of
450 Nahm and Freeman
Fig. 2. The RR interval is the duration, measured in milliseconds, between successive R waves inthe QRS complex.
24_Freeman 4/11/07 10:09 AM Page 450

zero. The counterpulsation pressure provides a real-time measure of arterial pulse pressure.The volume clamp technique of Peñaz has been used with digital pressure cuffs and fingerphotoplethysmography. A potential drawback to this method is its sensitivity to decreases indistal limb temperature, which may significantly alter the measured BP.
Arterial tonometry is a method in which arrays of pressure sensors compress and partiallyflatten (applanation) an artery at a constant pressure. The intra-arterial forces measured by thesensor array are then translated into arterial pressure waveforms displayed in real time. Thetonometric sensors, which are placed over the radial artery, may be affected by both impropersensor placement as well as tremors. Both methods may be inaccurate in subjects withperipheral vascular occlusive disease, and both are dependent on arm position. Recordingsshould be made with the arm abducted or elbow flexed so that the recording site is at the levelof the heart throughout autonomic testing.
During formal tests of autonomic function, both intermittent and continuous BP recordingsare usually obtained. Oscillometric BP recordings may be used to verify the accuracy of thecontinuous BP recordings, and may serve as a more reliable means of BP recording in theevent of marked decreases in BP.
5. PARASYMPATHETIC FUNCTION TESTS
Neurophysiological tests of cardiovascular parasympathetic function evaluate the integrityof a reflex arc that includes the vagus and glossopharyngeal nerves; cardiopulmonary barore-ceptors located in structures, such as the carotid sinus and aortic arch; pulmonary receptors;cardiac atria and ventricles; and pulmonary arteries and veins. Afferent signals from thereceptors are carried in both myelinated and unmyelinated fibers, and travel in sympatheticnerves to the spinal cord and in the vagus and glossopharyngeal nerves to the nucleus tractussolitarius and other areas in the medulla that play a role in BP and HR control.
5.1. HR Response to Valsalva Maneuver
The Valsalva ratio (VR) is an index of HR changes that occur during a Valsalva maneuver(see Table 3). The Valsalva maneuver is performed by having the patient exhale for 15 s,while maintaining an expiratory pressure of 40 mmHg. Expiratory pressure can be measuredby having the patient blow into a mouthpiece connected to a pressure transducer. Forced expi-ration to maintain an expiratory pressure of 40 mmHg produces the most consistent changein BP. Typically, a baseline HR and BP will be obtained during 3 min before the Valsalvamaneuver. The patient is then instructed to inhale deeply, exhale completely, then takeanother deep breath in and blow into the mouth piece. Both HR and BP are recorded duringthe maneuver and up to 60 s after the Valsalva maneuver is terminated. A mild degree of light-headedness is often reported during this procedure. Because of the need for prolonged expi-ratory effort, the elderly and those with any underlying pulmonary disorders may find theValsalva maneuver difficult to perform. Typically, one to two trials are obtained for analysis,with an adequate time between trials (3–5 min) to allow subjects to return to a baseline state.Because intraocular pressure increases during Valsalva maneuver, recent retinal surgery orhemorrhage is a relative contraindication to performing this test.
The VR is a measure of the HR response to BP changes resulting from the mechanical andcardiovascular effects of the Valsalva maneuver. There are four phases of BP, designated I toIV, which delineate the cardiovascular changes during the Valsalva maneuver. Phase I consistsof a transient rise in BP that results from the increased intrathoracic and intra-abdominal
Autonomic Nervous System Testing 451
24_Freeman 4/11/07 10:09 AM Page 451

pressures. During phase II, there is a fall and recovery of BP. During phase III, there is adecrease in BP caused by the release of intrathoracic pressure. During phase IV, there is an“overshoot” caused by the increase cardiac output into a vasoconstricted peripheral circulation.
As the BP falls in phase II, there is an increase in HR caused by parasympathetic with-drawal that is then followed by sympathetic activation. This results in an increase in HR dur-ing and shortly after the Valsalva maneuver. In response to the BP overshoot during phase IV,approx 15 to 30 s after the end of the maneuver, the HR falls and produces a transient brady-cardia that persists, in the normal state, until after the BP overshoot. This results in the min-imum HR. The VR is calculated as the maximum HR, which occurs during or shortly afterthe Valsalva maneuver, divided by the minimum HR, which occurs after the cessation of theValsalva maneuver (VR = max HR/min HR). A normal HR and BP response to Valsalvamaneuver is depicted in Fig. 3.
A normal VR reflects an intact baroreceptor-mediated rise and fall in HR. The VR valuesare age related, and decline with increasing age. A reduced VR reflects baroreceptor and car-diovagal dysfunction. However, it is important that an adequate and steady expiratory pres-sure is maintained during the maneuver for these results to be meaningful.
5.2. HR Variability With Respiration (Respiratory Sinus Arrhythmia)
The expiratory/inspiratory (E/I) ratio, similar to the VR, is a measure of parasympatheticfunction (see Table 4). Timed breathing potentiates the normal sinus arrhythmia that occursnormally during respiratory cycles. The physiological mechanism of respiratory sinusarrhythmia is complex and includes pulmonary stretch and cardiac mechanoreceptor acti-vation, baroreceptor activation, local cardiac reflexes and central factors. During inspira-tion, there is a reflex withdrawal of parasympathetic activity, increased excitability ofcardiac pacemaker cells in the sinoatrial node, and an increase in HR. Respiratory sinusarrhythmia provides a measure of parasympathetic control of HR variation throughout therespiratory cycle.
The respiratory sinus arrhythmia is recorded with the patient supine and breathing at afixed rate. A respiratory frequency of six breaths per minute, with slow inhalation and exha-lation (5 s each) provides close to maximum HR variability (Fig. 4). The timed breathing isperformed with the aid of either verbal coaching, or an electronic visual cue. This is a safe,easily performed test, without contraindications. Typically, six to eight cycles are recorded,and one to two trials are performed. The variation in HR across this cycle of six to eightbreaths is often expressed as the mean difference between the maximum and minimum HR.Alternatively, one can calculate the E/I ratio, which is the sum of the longest RR intervalsdivided by sum of the shortest RR intervals (E/I = Σ longest RR/Σ shortest RR). Other
452 Nahm and Freeman
Table 3Valsalva Ratio
Stimulus Expiration of 40 mmHg for 15 sAfferent Baroreceptors, glossopharyngeal, and vagus nervesCentral Nucleus tractus solitariusEfferent Vagus and sympathetic nervous systemResponse 1. Heart rate response to blood pressure changes
2. Fall and rise in blood pressure (phases I–IV)
24_Freeman 4/11/07 10:09 AM Page 452

Autonomic Nervous System Testing 453
Fig. 3. Blood pressure and heart rate response to Valsalva maneuver. Top tracing represents meanarterial pressure (MAP) with phases denoted by Roman numerals. Middle tracing represents heartrate (HR). Bottom tracing shows expiratory pressure during Valsalva maneuver. The shaded areadelimits both early and late phase II.
Fig. 4. Top tracing shows the variation in heart rate (HR) during metronomic breathing. Lowertrace represents corresponding respiratory (resp) pattern.
Table 4Expiratory/Inspiratory Ratio
Stimulus Deep breathing (6 cycles/second)Afferent Pulmonary receptors, cardiac mechanoreceptors, vagus and glossopharyngeal
nerves, respiratory centerCentral Nucleus tractus solitariusEfferent VagusResponse 1. Heart rate increase during inspiration
2. Heart rate decrease during expiration
analyses used to describe HR variability include measurements of HR standard deviation,mean consecutive difference, mean square consecutive difference, mean circular resultant,and power spectral analysis.
24_Freeman 4/11/07 10:09 AM Page 453

HR variability with respiration decreases with increasing age. Reduced HR variability withrespiration can be observed in cases of autonomic failure caused by autonomic peripheralneuropathies and central autonomic degenerations. Other factors known to influence the HRresponse to deep breathing include poor respiratory effort, hypocapnia, salicylates, position-ing, and obesity.
5.3. The 30:15 Ratio
The 30:15 ratio, similar to the VR and E/I ratio, is a measure of parasympathetic cardio-vagal function (see Table 5). Immediately after standing, there is an increase in HR thatreflects an exercise reflex and withdrawal of parasympathetic tone. There is a further HRincrease at approx 15 s that reflects a compensatory response to decreased venous return anddecreased cardiac output and a fall in BP. This is followed by a second period of relativebradycardia at approx 30 s. The 30:15 ratio is the RR interval at approx 30 s, divided by theRR interval at approx 15 s.
A baseline HR should be obtained in the supine position, and the patients are then askedto quickly stand upright onto their feet. A chair may be placed behind subjects to sit on shouldthey become symptomatic suddenly. The HR variability is recorded for at least 1 min ofactive standing. A normal ratio is greater than unity, and reflects intact vagally mediated HRvariation. An abnormal ratio suggests parasympathetic cardiovagal dysfunction. A number ofgeneral medical conditions, such as hypovolemia, medical deconditioning, and hypothy-roidism can lead to misinterpretation of the 30:15 ratio and, thus, these factors should betaken into account when interpreting the test results.
6. SYMPATHETIC FUNCTION TESTS
6.1. Head-Up Tilt-Table Testing
During the tilt-table test, the BP and HR response to an orthostatic challenge is used to pro-vide a measure of sympathetic function (see Table 6). Similar to the early response to activestanding, the early cardiovascular response to head-up tilt is largely caused by blood volumeredistribution to the lower extremities. However, tilt-table testing is more sensitive to suchredistribution because there is minimal contraction of lower extremity muscles, thus, furtherreducing the amount of venous return. This test is used to assess orthostatic intolerancecaused by sympathetic nervous system dysfunction and also to uncover a predisposition toneurally mediated (vasovagal syncope).
The patient lies supine on the tilt table. Beat-to-beat and oscillometric BP instruments areattached to each arm. EKG monitoring should take place throughout the test. A large waist
454 Nahm and Freeman
Table 5Active Standing (30:15 Ratio)
Stimulus Decreased central blood volume Afferent Baroreceptors, ergoreceptors, “central command,” and vagus and glossopharyngeal
nervesCentral Nucleus tractus solitarius, rostral ventrolateral medullaEfferent VagusResponse 1. Heart rate increase at beat ~15
2. Heart rate decrease at beat ~30
24_Freeman 4/11/07 10:09 AM Page 454
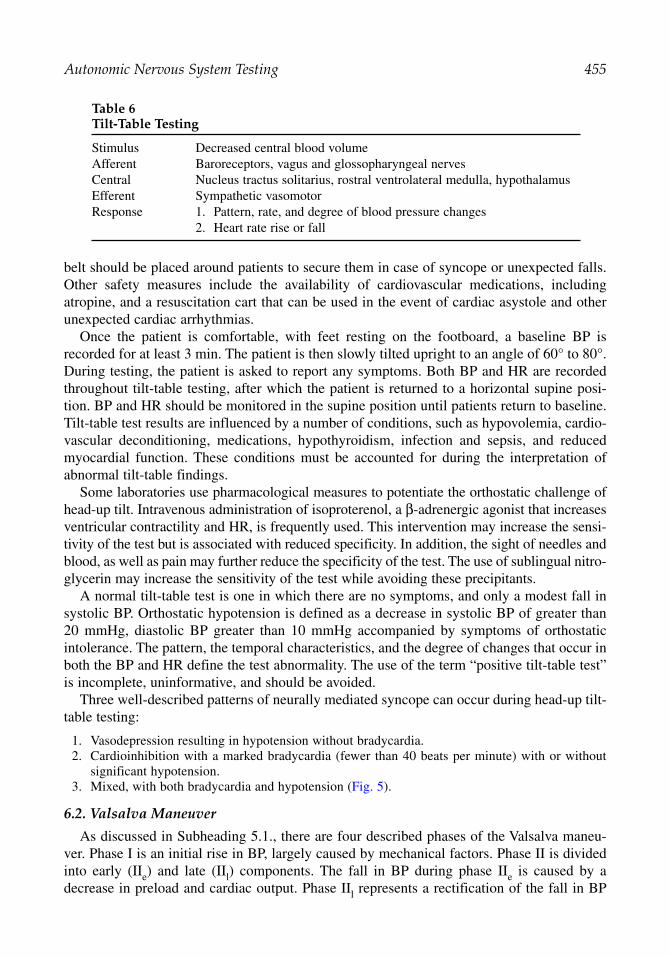
belt should be placed around patients to secure them in case of syncope or unexpected falls.Other safety measures include the availability of cardiovascular medications, includingatropine, and a resuscitation cart that can be used in the event of cardiac asystole and otherunexpected cardiac arrhythmias.
Once the patient is comfortable, with feet resting on the footboard, a baseline BP isrecorded for at least 3 min. The patient is then slowly tilted upright to an angle of 60° to 80°.During testing, the patient is asked to report any symptoms. Both BP and HR are recordedthroughout tilt-table testing, after which the patient is returned to a horizontal supine posi-tion. BP and HR should be monitored in the supine position until patients return to baseline.Tilt-table test results are influenced by a number of conditions, such as hypovolemia, cardio-vascular deconditioning, medications, hypothyroidism, infection and sepsis, and reducedmyocardial function. These conditions must be accounted for during the interpretation ofabnormal tilt-table findings.
Some laboratories use pharmacological measures to potentiate the orthostatic challenge ofhead-up tilt. Intravenous administration of isoproterenol, a β-adrenergic agonist that increasesventricular contractility and HR, is frequently used. This intervention may increase the sensi-tivity of the test but is associated with reduced specificity. In addition, the sight of needles andblood, as well as pain may further reduce the specificity of the test. The use of sublingual nitro-glycerin may increase the sensitivity of the test while avoiding these precipitants.
A normal tilt-table test is one in which there are no symptoms, and only a modest fall insystolic BP. Orthostatic hypotension is defined as a decrease in systolic BP of greater than20 mmHg, diastolic BP greater than 10 mmHg accompanied by symptoms of orthostaticintolerance. The pattern, the temporal characteristics, and the degree of changes that occur inboth the BP and HR define the test abnormality. The use of the term “positive tilt-table test”is incomplete, uninformative, and should be avoided.
Three well-described patterns of neurally mediated syncope can occur during head-up tilt-table testing:
1. Vasodepression resulting in hypotension without bradycardia.2. Cardioinhibition with a marked bradycardia (fewer than 40 beats per minute) with or without
significant hypotension.3. Mixed, with both bradycardia and hypotension (Fig. 5).
6.2. Valsalva Maneuver
As discussed in Subheading 5.1., there are four described phases of the Valsalva maneu-ver. Phase I is an initial rise in BP, largely caused by mechanical factors. Phase II is dividedinto early (IIe) and late (IIl) components. The fall in BP during phase IIe is caused by adecrease in preload and cardiac output. Phase IIl represents a rectification of the fall in BP
Autonomic Nervous System Testing 455
Table 6Tilt-Table Testing
Stimulus Decreased central blood volumeAfferent Baroreceptors, vagus and glossopharyngeal nervesCentral Nucleus tractus solitarius, rostral ventrolateral medulla, hypothalamusEfferent Sympathetic vasomotorResponse 1. Pattern, rate, and degree of blood pressure changes
2. Heart rate rise or fall
24_Freeman 4/11/07 10:09 AM Page 455

caused by an α-adrenergic sympathetically mediated increase in total peripheral vascularresistance and the increase in HR. The abrupt fall in BP during phase III represents a with-drawal of intrathoracic pressure at the termination of forced expiration. Phase IV, thelast phase of the Valsalva maneuver, reflects a BP overshoot caused by the increase in α-adrenergic-mediated peripheral vascular resistance, and β-adrenoreceptor-mediatedincrease in cardiac output.
An abnormal response to the maneuver includes an excessive BP fall in the early phaseII, an absent or incomplete recovery failure in late phase II, and/or the absence of a BPovershoot during phase IV. These abnormalities are observed in the presence of sympa-thetic dysfunction.
6.3. Sympathetic Cholinergic Sweat Function
The best-known neurophysiological test of sympathetic sudomotor function is the sympa-thetic skin response (SSR), or galvanic skin response. Increased sympathetic nerve fibersudomotor activity causes release of sweat from glands in the skin, which can be detected asa change in surface conductivity. A standard EMG instrument can be used to measure thisresponse. A small recording electrode is attached to the palmar and dorsal surface of bothhands and feet, with a long sweep speed (10 s) setting, and a bandpass filter of 1 Hz to 2000 Hz.After a stable baseline is obtained, a stimulus is administered and the SSR is recorded. Anystimulus that activates the sympathetic system can be administered, such as an electrical stim-ulus, a loud noise, or a bright light. Simultaneous recording from both hand and foot can beperformed, which demonstrates the length-dependent latency difference between these sites.Typically, three to four trials are obtained at each site. A normal SSR is a monophasic orbiphasic deflection that habituates with time and repeated trials (Fig. 6). An abnormal
456 Nahm and Freeman
Fig. 5. Blood pressure and heart rate (HR) response to prolonged 45-min tilt-table test at 60° ofupright position. Top tracing is mean arterial blood pressure (MAP) curve; bottom tracing is HR. Thedark arrow depicts the point of head-up tilt. The hollow arrow depicts return to supine position. At 25 min into the test, there is a precipitous fall in both mean arterial pressure and heart rate. Theinset is a sample of the ECG occurring at the 25 min mark, which shows heart rate slowing andasystole. See text for further details.
24_Freeman 4/11/07 10:09 AM Page 456

response is an absent SSR, and reflects sympathetic sudomotor dysfunction. This test doesnot differentiate between preganglionic or postganglionic sympathetic dysfunction.
In the silastic imprint test, a plastic or silicone film is applied to the area of sweat glandactivity provoked by the iontophoresis of a cholinergic agonist. The film is then removed, andthe number of active sweat glands, their density, and the volume of sweat secreted can bedetermined by digital image analysis.
The thermoregulatory sweat test is performed by the application of an indicator, such asalizarin red, which changes color in the presence of moisture. The indicator is applied to thebody of the patient, who is then placed in a thermally controlled environment, and the coretemperature is raised above baseline. The pattern of color changes, which can be expressedas percentage of body surface, is used to quantify hypohypohidrosis and anhidrosis.
Iontophoresis of cholinergic agonists can also be used to evoke an axon reflex-mediatedresponse from a more distal population of sweat glands. The response is recorded using asudorometer, which measures changes in humidity resulting from sweat production. Thisquantitative sudomotor axon reflex test (Q-SART) can be used to measure both sweat volumeand sweat pattern (Fig. 7). It is largely a measure of postganglionic sympathetic function, butmay be reduced with severe preganglionic disorders.
7. MICRONEUROGRAPHY
Intraneural microneurography enables the direct measurement of muscle sympatheticnerve activity. A tungsten microelectrode of approx 5 µm in size is inserted into a fascicle ofa distal sympathetic nerve to the skin or muscles. Using this technique, sympathetic outflowto skin and muscle can be measured at rest and in response to various physiological pertur-bations (Fig. 8). Muscle sympathetic nerve activity, consisting predominantly of efferentmuscle blood vessel vasoconstrictor impulses, are grouped in relationship to the cardiacrhythm. Skin sympathetic activity consists of vasoconstrictor impulses to skin capillaries,arteriovenous shunts, and sudomotor and pilomotor impulses. They appear as irregular bursts
Autonomic Nervous System Testing 457
Fig. 6. Sympathetic skin response (SSR) measured from the left hand (LH) and right hand (RH),and left foot (LF) and right foot (RF) after a 30-mA stimulation to the proximal left upper extremity.The onset of the stimulus is denoted by the arrow and the dashed line. Note the delay in onset in theSSR recorded from the feet as compared with the arms.
24_Freeman 4/11/07 10:09 AM Page 457

458 Nahm and Freeman
of varying duration, often occurring in relationship to the respiratory rhythm. This techniqueis primarily used in research, rather than in clinical laboratories.
SUGGESTED READING
Clinical autonomic testing report of the therapeutics and technology assessment subcommittee of theAmerican Academy of Neurology. Neurology 1996;46:873–880.
Low PA. Laboratory evaluation of autonomic function. In: Clinical Autonomic Disorders, 2nd ed.(Low PA, ed.). Lippincott-Raven, Philadelphia, PA, 1997.
Primer on the Autonomic Nervous System (Robertson D, Low PA, Polinsky RJ, eds.). AcademicPress, San Diego, CA, 1996.
Fig. 7. Neurophysiology of the axon reflex test. Acetylcholine (ACh) is iontophoresed onto asweat gland (1), initiating an antidromic signal (2) in the distal postganglionic sympathetic fiber,which is then transmitted orthodromically (3) down an axon branch, stimulating glandular secretionat a distal site (4). The hatched area represents structures within the skin.
Fig. 8. Muscle sympathetic nerve activity displayed as integrated units (AIU) in response to sympatheticactivation provoked by a nitroprusside bolus.
24_Freeman 4/11/07 10:09 AM Page 458

Autonomic Failure—A Textbook of Clinical Disorders of the Autonomic Nervous System, 4th ed.(Mathias CJ, Bannister R, eds.). Oxford University Press, Oxford, England and New York, NY,2001, p. 592.
Freeman R. Noninvasive evaluation of heart rate variability. In: Clinical Autonomic Disorders, 2nd ed.(Low PA, ed.). Lippincott-Raven, Philadelphia, PA, 1997, pp. 297–307.
The Autonomic Nervous System: An Introduction to Basic and Clinical Concepts, 5th ed.(Appenzeller O, Oribe E, eds.). Elsevier Science, New York, NY, 1997, p. 868.
REVIEW QUESTIONS
1. HR variability with respiration is a measure of:A. Parasympathetic nervous system function.B. Sinus arrhythmia.C. Vagal nerve activity.D. All of the above.
2. Head-up tilt-table testing may be used to measure:A. Parasympathetic nervous system function.B. Sympathetic nervous system function.C. A predisposition to vasovagal syncope.D. B and C.
3. A normal early phase II in the Valsalva maneuver refers to:A. HR increase.B. HR fall.C. BP overshoot.D. BP fall.
4. A decrease in the RR interval occurs when:A. The HR increases.B. The HR decreases.C. Vagal nerve activity increases.D. Vagal nerve activity decreases.E. E and D.F. B and C.
5. Which of the following agents can be used to induce axon reflex sweating:A. Isoproterenol.B. Propranolol.C. Nitroprusside.D. Acetylcholine.
6. The E/I ratio reflects:A. Sympathetic nervous system function.B. Parasympathetic function.C. BP fluctuations.D. HR variability.E. A and C.F. B and D.
7. The Valsalva maneuver is primarily used to evaluate:A. Sympathetic autonomic function.B. Parasympathetic baroreceptor function.C. A subject’s expiratory capacity.D. A and B.E. A, B, and C.
8. The patterns of neurally mediate syncope include:A. Vasodepression.B. Mixed.
Autonomic Nervous System Testing 459
24_Freeman 4/11/07 10:09 AM Page 459

C. Cardioinhibitory.D. All of the above.
9. Intravenous isoproterenol administered during a tilt-table test may:A. Increase HR.B. Reduce the specificity of the test.C. Increase cardiac contractility.D. All of the above.
10. The sudomotor axon reflex test is primarily a measure of these fibers:A. Preganglionic sympathetic cholinergic.B. Preganglionic sympathetic adrenergic.C. Postganglionic sympathetic cholinergic.D. Postganglionic sympathetic adrenergic.
REVIEW ANSWERS
1. The correct answer is D. The RR interval is the time between successive QRS complexes, and isa measure of cardiac vagal outflow. During normal breathing, a sinus arrhythmia can beobserved in the RR interval, which is a normal physiological condition.
2. The correct answer is D. The head-up tilt-table test is used to assess orthostatic tolerance inpatients with orthostatic hypotension caused by sympathetic nervous system dysfunction. It isalso used to demonstrate a predisposition to neurally mediated syncope.
3. The correct answer is D. The early phase II section of Valsalva maneuver refers to the fall in BPthat occurs during forced expiration. A BP overshoot can also be observed during phase IV ofthe maneuver; this overshoot occurs after the termination of forced expiration.
4. The correct answer is E. The RR interval is a measure of the time (in milliseconds) between suc-cessive QRS wave complexes. A decrease in the RR interval occurs when the HR increases.Because HR is under vagal control, a decrease in the RR interval, corresponding to an increasein the HR, occurs with the withdrawal of parasympathetic tone observed during a decrease invagal nerve activity.
5. The correct answer is D. The cholinergic agonists are used to provoke axon reflex-mediatedsweating. These agents are used to measure sudomotor function in the quantitative sudomotoraxon reflex test and the silastic imprint method.
6. The correct answer is F. The E/I ratio is a measure of sinus arrhythmia. It is largely an index ofcardiac vagal parasympathetic activity.
7. The correct answer is D. The HR and BP response to Valsalva maneuver is influenced by boththe sympathetic and parasympathetic nervous system. Although an adequate forced expiration of40 mmHg for 10 to 15 s is required to obtain reliable data during the Valsalva maneuver, it is nota formal test of pulmonary capacity or forced expiratory volume.
8. The correct answer is D. There are three patterns of cardiovascular responses that have beendescribed during neurally mediated syncope. Vasodepression refers to a primary fall in BP with-out significant HR changes. The mixed form observed during head-up tilt-table testing is char-acterized by both hypotension and relative bradycardia, and cardioinhibitory neurally mediatedsyncope refers to a primary bradycardia below 40 beats per minute.
9. The correct answer is D. Intravenous isoproterenol increases cardiac inotropy and chronotropy.Although this intervention increases the sensitivity of the test, it reduces the specificity and canresult in false positive studies.
10. The correct answer is C. The sudomotor axon reflex test is based on the fact that postganglionicnerve fibers can be antidromically stimulated by the application of a cholinergic agonist to theskin. This results in a signal traveling to a branch point, and then orthodromically down anadjoining postganglionic fiber, which results in the release of acetylcholine and the stimulationof eccrine glands in the skin. This test is used to evaluate the postganglionic sympathetic cholin-ergic system.
460 Nahm and Freeman
24_Freeman 4/11/07 10:09 AM Page 460

25Visual Evoked Potentials
Frank W. Drislane
SummaryThe visual evoked potential (VEP) is primarily a relatively large, positive polarity wave generated
in the occipital cortex in response to visual stimulation. It measures the conduction time of neuronalactivity from the retina to the occipital cortex and is used clinically as a measure of the integrity andfunction of that pathway. The optic nerve is the primary structure examined. The standard VEP aver-ages many responses, time-locked to a photic stimulus. Of primary interest is the latency of the posi-tive wave at a midline occipital EEG electrode, usually at approx 100 ms after stimulation, called theP100. This chapter summarizes the methodology for recording the VEP, provides an approach to itsinterpretation, and discusses its role in clinical practice.
Key Words: Evoked potential; visual; optic nerve; demyelination; latency; multiple sclerosis; P100;optic chiasm; occipital; blindness.
1. INTRODUCTION
The visual evoked potential (VEP) is primarily a relatively large, positive polarity wave gen-erated in the occipital cortex in response to visual stimulation. It measures the conduction timeof neuronal activity from the retina to the occipital cortex and is used clinically as a measure ofthe integrity and function of that pathway. The optic nerve is the primary structure examined.
The VEP is of large enough voltage that it can be seen occasionally on a routine EEG asan occipital waveform within the first 150 ms after a single photic stimulus. The standardVEP averages many such waveforms, time-locked to the stimulus. Of primary interest is thelatency of the positive wave at a midline occipital EEG electrode, usually at approx 100 msafter stimulation, called the P100. This P100 peak is usually easy to recognize and measure.
2. RECORDING THE VEP
2.1. Stimulus
The standard stimulus for VEPs is a checkerboard pattern in which the squares alternatefrom black to white—the pattern reversal VEP (PRVEP). Dark squares become light and viceversa, without a change in the overall luminance of the display. Typically, the pattern isreversed 100 or 128 times at 1 to 2 Hz, and the results are then averaged. Usually a repeattrial of averaged stimuli is also recorded.
PRVEPs require maintaining visual fixation on the center of the pattern. The occipital cortex is particularly sensitive to the perception of edges, and a sharp-bordered checkerboard
From: The Clinical Neurophysiology PrimerEdited by: A. S. Blum and S. B. Rutkove © Humana Press Inc., Totowa, NJ
461
25_Drislane 4/11/07 10:10 AM Page 461

produces a strong and measurable response. PRVEPs are remarkably precise and constant fora given subject (who has no clinical change) and are very sensitive to dysfunction in thevisual conducting system.
Alternatively, a flashing light in a strobe sequence (flash VEPs) or even alternating inten-sities or luminances of light can be the stimuli. They are used typically when a subject isunable to cooperate, for instance, neonates or patients with impaired mental status. Fixationis not required, and the eyes may be closed. Flash VEPs assess the integrity of the visual sys-tem at least through the lateral geniculate nucleus and can help to determine whether the opticnerve is intact. Flash potentials have greater latency variability and less sensitivity to visualconduction defects.
The PRVEP stimulus is generally presented on a television screen or video monitor posi-tioned 1 m in front of the subject who is asked to focus on the center of the display. Inadequatefixation reduces the voltage (or amplitude) of the VEP—and, in the limiting case, will elimi-nate it. Eyes are tested one at a time, with the other eye covered by a patch. Simultaneousbinocular testing could not localize an abnormality to one optic nerve or the other.
2.2. Check Size
Rather than describe the size of the stimulus, it is more appropriate to specify the visualangle it subtends. One degree (or 1/360th of a circle) is divided into 60 min (60′). An indi-vidual checkerboard square usually has a visual angle of 30′, with 8° for the entire stimulusor video screen. Smaller checks are more sensitive in detecting visual system defects, butvisual acuity can be a problem. Peripheral vision is stimulated better by larger checks. Largechecks produce more variable responses, perhaps because the subject focuses on areas of dif-ferent luminance rather than on the edges. Checks larger than 50′ may help to compensate forpoor visual acuity, but sensitivity to contrast in central vision is better with smaller checks.
2.3. Contrast
Contrast is the difference in luminance (or brightness) of the dark and light areas dividedby the sum of their luminances. Low contrast decreases the P100 amplitude and increases thelatency. Greater luminance decreases the P100 latency and increases the amplitude. Thepatient’s pupils should not be dilated pharmacologically because this will alter luminance atthe retina. Luminance is not one of the most important variables, but it must be kept constantover trials and among patients for standardization in the laboratory.
2.4. Repetition Frequency
The pattern reversal rate is usually approx two per second. Some components of the VEPlast hundreds of milliseconds after the stimulus. Thus, repetition faster than four per secondcan produce overlap (interference of one potential with the next) and distort the waveform; italso may increase the P100 latency. Slower repetition rates prolong testing and might producea varied response because of diminished attention. All stimuli and recording techniques mustbe kept constant in a laboratory.
2.5. Averaging
The time-locked voltage signals are averaged over 100 to 200 trials, usually with aduration of 500 ms each. A signal sampling rate of 1000 samples in 500 ms (2000 samplesper second) is high enough to avoid distortion of the waveform. VEPs are usually amplified
462 Drislane
25_Drislane 4/11/07 10:10 AM Page 462

by a factor of 50,000. VEPs have a relatively high signal-to-noise ratio, and a larger numberof trials is not required. This is in contrast to the subcortical or far-field auditory andsomatosensory evoked potentials (EPs), which have much lower signal-to-noise ratios,requiring up to thousands of repetitions to produce reliable recordings. Averaging the wave-forms eliminates the variation unrelated to the stimulus, distinguishing the VEP from theEEG background. The two separate trials (each following averaging) should be nearly super-imposable. The recording computer usually includes artifact-rejecting programs; many pro-vide an additional smoothing function.
2.6. Hardware
The recording EEG electrodes are placed 5 cm above the occipital midline (OZ) posi-tion and 5 cm to the right and left of this electrode—designated MO, RO, and LO. Usually,four channels are recorded. The first three channels consist of electrodes MO, RO, and LO,each referenced to a midfrontal electrode (MF). The fourth channel records MF referencedto an ear electrode and shows the active component of the MF electrode at approx 100 ms(with a negative polarity in contrast to that of the P100) and helps to explain some P100distortions. MO–MF is the primary channel used for most readings. Noncephalic refer-ences generally contain too much artifact to be useful.
2.7. Filters
The low-frequency filter is usually set at 1 Hz and the high-frequency filter at 100 to 300 Hz(the shape of the standard P100 has a frequency of approx 15–20 Hz). A lower high-frequencyfilter frequency may cause an apparent increase in P100 latency.
2.8. Patient Factors
The patient should be alert and comfortable. No noise should accompany the stimulus; thiscould cause artifact. It is important to be sure that the stimulus can be seen clearly. Visual acuitymust be tested. Usual eyeglasses are used to optimize visual acuity. There should be no pharma-cological pupillary dilation. One eye is tested at a time. The technologist should ascertain that thepatient is actually focusing on the center of the target throughout the test. This is particularly dif-ficult for children and infants (note that fixation is not required with flash stimuli; they can beused even with comatose patients).
It should be determined before testing whether the patient has a significant visual fieldabnormality. If so, the distribution of the P100 field may be distorted and the latency prolongedsomewhat. It may need to be recorded with more laterally placed electrodes.
If there are difficulties, it is important to check the patient’s visual acuity and ability tocooperate. Low-amplitude VEPs may arise from inattention to the stimulus. The technologistshould ask whether the stimulus is seen clearly. If visual acuity is a problem, increasing checksize may help. It is also appropriate to check the integrity of the recording apparatus.Technical problems often eliminate all potentials, so the finding of some normal and someabnormal potentials suggests that there is a true clinical deficit.
3. NORMAL AND ABNORMAL VEPS
The VEP is a measure of physiologic function rather than primarily reflecting neuroanatomic lesions. EPs are particularly helpful clinically in determining a physiologicabnormality where the neurologic and ophthalmologic examinations are normal. VEPs are
Visual Evoked Potentials 463
25_Drislane 4/11/07 10:10 AM Page 463

extremely sensitive and can detect dysfunction not discernible to neurologic, ophthalmologic,or other examinations. The primary measurement of interest clinically is the P100 latency afterpattern reversal stimulation. Over time in the same healthy subject, P100 latencies may varyby as much as 10 ms, and interocular differences by as much as 9 ms. Most subjects have muchless variability, and the results are often remarkably precise and reproducible.
3.1. Technical Factors
Latencies are determined from the stimulus signal to the peak of a deflection rather than at theonset of a deflection (as is common in peripheral nerve conduction testing). The clinical neuro-physiologist should determine latencies and peak durations, with knowledge of the clinical neurophysiology and recording technique, often using paper printouts, rather than by computercursors. Peaks may be determined simply by marking the nadir of the curve. Because manypeaks are not so symmetric or regular, however, it is common to draw tangents to the slope of theprimary downward and upward sides of the curve and assess the P100 latency at the intersectionof those tangents (Fig. 1). Whatever the method of determination, it must be kept standardizedfor each laboratory.
As in EEG convention, the tracing has an upward deflection when the first electrode listedbecomes more negative; the second electrode listed is considered the reference electrode. Thefull-field VEP displays a maximum voltage peak at the occipital midline. Thus, in most VEPrecordings, with MO the first electrode in a channel, the P100 is a large downward deflec-tion, appearing at approx 85 to 115 ms. Often, there is a smaller negative (or upward) peakat 60 to 80 ms, commonly designated the N75 peak. Another negative peak may follow the
464 Drislane
Fig. 1. Normal right eye pattern reversal visual evoked potential in a 39-yr-old woman. The N75and N145 peaks help to identify the P100 (not necessary in this case). Triangulation lines help todetermine the P100 latency precisely, at 93 ms in this case.
25_Drislane 4/11/07 10:10 AM Page 464

P100. Latencies of the negative peaks are generally not of clinical interest, but their presencemay assist in recognition of the P100.
There is a roughly normal distribution of P100 latencies in a healthy population; latencies 2.5to 3 standard deviations beyond the mean are considered abnormal. Depending on the labora-tory, this tends to be 114 to 117 ms. The upper limit of normal must be determined for a healthypopulation, with standard recording variables kept constant over time. VEPs are usually veryprecise for an individual over repeated trials, even months and years apart.
An excessive difference in the latencies on the two sides (usually 6–10 ms) is also consid-ered abnormal. If the two peaks have normal latencies but an excessive difference betweenthem, this raises concern for an abnormality in conduction in the visual pathway with thelonger latency. This is not as reliable clinically as a prolonged latency itself.
Because the MF electrode is active and produces a negative potential at approximately thesame time as the P100, a W-shaped wave can occur. The distorted P100 wave may also becaused by projections from different parts of the calcarine or occipital cortex, and stimulationof inferior visual fields may improve the waveform and demonstrate a normal (or abnormal)latency. This is not always recognized in the laboratory before the interpretation, and thisrealization may come too late to clarify an individual EP. Use of triangulation from the slopeson either side may overcome this problem. Use of a different reference electrode may do thesame, but this also must be determined during the testing rather than at a subsequent reading.The actual shape or waveform is not constant enough to be considered normal or abnormal.
The amplitude of the P100 peak is variable, but often approx 10 µV, and, thus, would blendinto the normal EEG background. Amplitude measurements are generally not of clear clini-cal significance or interest. The wave duration is determined from the peak of preceding N75wave to the point at which the P100 wave returns to the earlier baseline. P100 duration, how-ever, is not usually a clinically useful variable. Most markedly prolonged durations are asso-ciated with delayed latencies, as well.
VEPs are considered long latency and near-field potentials, coming after a significant delay(latency) after the stimulus. Near-field EPs appear to represent the excitatory and inhibitorypostsynaptic potentials of cortical neurons. The visual (striate) cortex is generally consideredthe generator for N75 and P100. Large lesions in these areas can abolish the peaks.
3.2. Subject-Related Factors3.2.1. Age
Under ideal conditions, PRVEPs may be recorded in infants and young children, but mostinfants cannot fixate on the pattern reversal target. Flash VEPs are generally abandoned oncethe subject can focus on that target.
P100 latencies decrease substantially during the first year of life. They assume typicaladult values by age 1 yr, at least for larger check sizes, and certainly by age 5 yr for smallerchecks. Each laboratory needs separately determined pediatric statistical norms. Latency maydecrease slightly during adolescence but changes very little thereafter until it increasesslightly after age 60 yr, possibly by approx 3 ms per decade.
3.2.2. Gender
Women have slightly shorter P100 latencies (by ~3 ms); this may be related to head size.Amplitudes are slightly higher in women. The P100 latency may increase slightly withincreased body temperature. Most medications have little effect.
Visual Evoked Potentials 465
25_Drislane 4/11/07 10:10 AM Page 465

3.2.3. Acuity
If the image is sharp (not blurred), visual acuity is usually sufficient to get a reliable P100latency. Extreme miosis or visual acuity less than 20/200 may increase the P100 latency some-what, but the amount of light reaching the retina is usually not a major factor. Compensationfor poor visual acuity can be made in part by increasing the check size. Smaller checks maybe seen less well and increase the latency, particularly in children. Most differences in stimu-lation factors cause relatively small changes in latency and are not a problem, but these vari-ables must be controlled and kept constant within a laboratory over different patients.
4. INTERPRETATION
4.1. Anterior Pathways
The primary role of VEPs is to assess the anterior visual pathway on each side. Monocular,full visual field stimulation restricts interpretation of an individual potential to the visualpathway anterior to the chiasm. A normal P100 latency indicates normal conduction from theretina to the occipital cortex. A delayed potential after stimulation of one eye (with a normalpotential after stimulation of the other) implies a defect in conduction in the optic pathwayanterior to the chiasm on that side.
If a P100 is absent, it must be determined whether this is caused by technical factors (the mostcommon explanation) before it can be considered abnormal. Technical problems can includefaulty electrodes, amplifiers, or averaging hardware, or failure of the subject to focus on the tar-get. If not a technical artifact, complete absence of the VEP is generally caused by severe ocularor optic nerve disease, such as complete blindness in an eye or interruption of the optic nerve.
Pathways posterior to the optic chiasm share conduction of activity from both retinae.Bilaterally delayed latencies after stimulation of each eye separately could be caused by bilat-eral optic nerve lesions, but they could also be caused by chiasmatic or widespread posteriorlesions, so the finding is not as useful clinically. Without hemifield stimulation, posteriorvisual pathways cannot be assessed.
Most abnormally prolonged P100 latencies are caused by disease affecting the optic nerve,particularly demyelination, compression, and other optic neuropathies. In clinical practice,VEPs are used primarily to detect lesions when they are not easily demonstrable by clinicalexamination or indicated by history. Often, the disease process (e.g., multiple sclerosis [MS])is suspected, and the VEP is part of a search for lesions caused by that disease.
4.2. Posterior Pathways
Full-field stimulation of either eye activates both occipital cortices. The occipital cortexon each side generates a response large enough to be recorded over a wide area, includingthe opposite occipital region. Because cortical activity in either occipital lobe can produce aP100 wave with a normal latency at the occipital midline, and because the signals from eachoccipital lobe cannot be separated, full-field stimulation can produce a normal VEP even ifthere is a large lesion in posterior optic pathways.
Hemifield stimulation is required to assess posterior pathways. This is more difficult tech-nically and is not performed in many laboratories; standardization is also difficult. Stimuli andpatient considerations are the same. The patient focuses on the center of the screen. A random-ization program may be used to present standardized stimuli alternately to either visual field
466 Drislane
25_Drislane 4/11/07 10:10 AM Page 466
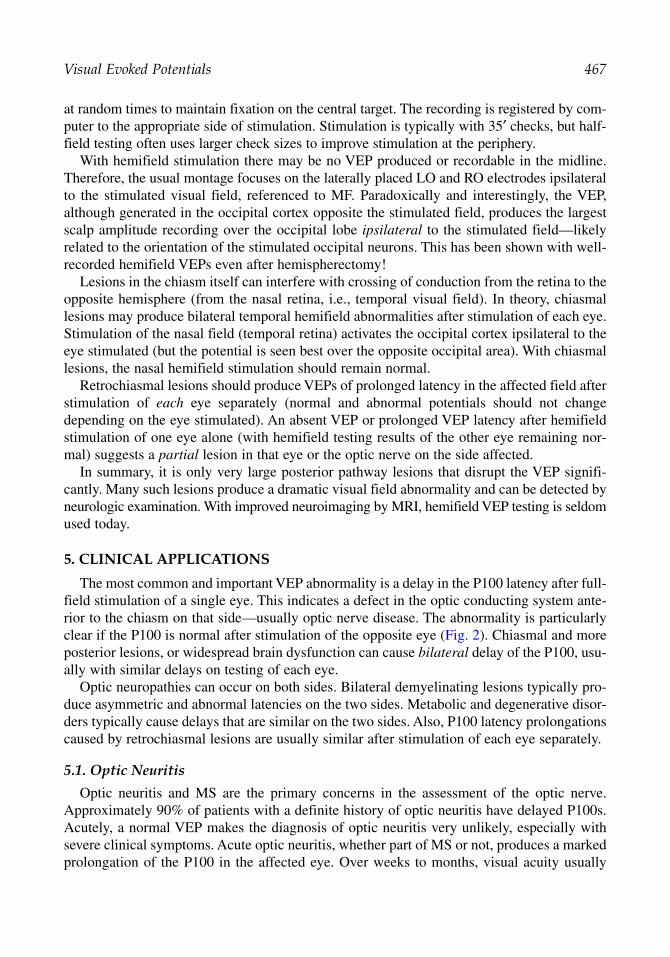
at random times to maintain fixation on the central target. The recording is registered by com-puter to the appropriate side of stimulation. Stimulation is typically with 35′ checks, but half-field testing often uses larger check sizes to improve stimulation at the periphery.
With hemifield stimulation there may be no VEP produced or recordable in the midline.Therefore, the usual montage focuses on the laterally placed LO and RO electrodes ipsilateralto the stimulated visual field, referenced to MF. Paradoxically and interestingly, the VEP,although generated in the occipital cortex opposite the stimulated field, produces the largestscalp amplitude recording over the occipital lobe ipsilateral to the stimulated field—likelyrelated to the orientation of the stimulated occipital neurons. This has been shown with well-recorded hemifield VEPs even after hemispherectomy!
Lesions in the chiasm itself can interfere with crossing of conduction from the retina to theopposite hemisphere (from the nasal retina, i.e., temporal visual field). In theory, chiasmallesions may produce bilateral temporal hemifield abnormalities after stimulation of each eye.Stimulation of the nasal field (temporal retina) activates the occipital cortex ipsilateral to theeye stimulated (but the potential is seen best over the opposite occipital area). With chiasmallesions, the nasal hemifield stimulation should remain normal.
Retrochiasmal lesions should produce VEPs of prolonged latency in the affected field afterstimulation of each eye separately (normal and abnormal potentials should not changedepending on the eye stimulated). An absent VEP or prolonged VEP latency after hemifieldstimulation of one eye alone (with hemifield testing results of the other eye remaining nor-mal) suggests a partial lesion in that eye or the optic nerve on the side affected.
In summary, it is only very large posterior pathway lesions that disrupt the VEP signifi-cantly. Many such lesions produce a dramatic visual field abnormality and can be detected byneurologic examination. With improved neuroimaging by MRI, hemifield VEP testing is seldomused today.
5. CLINICAL APPLICATIONS
The most common and important VEP abnormality is a delay in the P100 latency after full-field stimulation of a single eye. This indicates a defect in the optic conducting system ante-rior to the chiasm on that side—usually optic nerve disease. The abnormality is particularlyclear if the P100 is normal after stimulation of the opposite eye (Fig. 2). Chiasmal and moreposterior lesions, or widespread brain dysfunction can cause bilateral delay of the P100, usu-ally with similar delays on testing of each eye.
Optic neuropathies can occur on both sides. Bilateral demyelinating lesions typically pro-duce asymmetric and abnormal latencies on the two sides. Metabolic and degenerative disor-ders typically cause delays that are similar on the two sides. Also, P100 latency prolongationscaused by retrochiasmal lesions are usually similar after stimulation of each eye separately.
5.1. Optic Neuritis
Optic neuritis and MS are the primary concerns in the assessment of the optic nerve.Approximately 90% of patients with a definite history of optic neuritis have delayed P100s.Acutely, a normal VEP makes the diagnosis of optic neuritis very unlikely, especially withsevere clinical symptoms. Acute optic neuritis, whether part of MS or not, produces a markedprolongation of the P100 in the affected eye. Over weeks to months, visual acuity usually
Visual Evoked Potentials 467
25_Drislane 4/11/07 10:10 AM Page 467

468 Drislane
Fig. 2. (A) Normal pattern reversal visual evoked potential on the left (P100, 98 ms) and (B)significantly delayed P100 on the right (P100, 122 ms) in a 46-yr-old woman with right eye pain andabnormal T2-weighted spots on her MRI of the brain, considered clinically to have “possible MS.”
25_Drislane 4/11/07 10:10 AM Page 468

improves, and approx 5% may return to normal after years. An abnormal VEP in an eye thatappears normal clinically suggests an old optic neuritis with clinical recovery. Often, the VEPwill improve also, though it seldom returns to normal. If an optic neuropathy is evident clin-ically before testing, the VEP will not add to the clinical impression.
5.2. Multiple Sclerosis
A clinically silent optic neuropathy found by VEP can be an aid in making the diagnosisof MS (although the diagnosis is often made now with greater reliance on MRI scans). Withinthe context of a diagnosis of MS, the VEP can be used to answer the question of whether theoptic nerve is involved or not.
In MS with optic nerve involvement, there is typically a marked delay (e.g., 20–30 ms),but not complete absence of the P100. Very asymmetric bilateral abnormalities suggest bilat-eral optic neuropathies, possibly at different stages of development or recovery. P100sdelayed to a similar degree on both sides may represent bilateral optic neuropathies but alsoraise the possibility of chiasmal, posterior, or more widespread metabolic disturbances.
VEPs are the single most useful EP in the evaluation of MS. They are abnormal in approx90% of patients with definite MS and in up to 25% of patients with normal MRI results whoare being evaluated for the possibility of MS. VEPs are more reproducible and reliable thansomatosensory EPs and narrow the abnormality to a smaller region. Brainstem auditorypotentials are far less sensitive in a diagnosis of MS. For study of the optic nerve alone, VEPshave sensitivity comparable to that of MRI. Neither, however, is completely specific for MS.
In patients with suspected “probable” or “possible” (rather than definite) MS but no his-tory of optic neuritis, VEPs may show a clinically unsuspected lesion in 50% of patients andhelp to establish a diagnosis. If the diagnosis of optic neuritis or another cause of optic neu-ropathy is clear clinically, the VEP will add little additional information. Fewer than 10% ofprolonged P100s return to normal in optic neuritis in the setting of MS, but this may reachone-third of patients with isolated optic neuritis (without MS).
In the case of suspected transverse myelitis, the VEP may offer evidence of demyelinationfar removed from the clinically obvious lesion. This may help to distinguish an isolated trans-verse myelitis from a multifocal disease process (such as MS) that includes a spinal cord lesion.
Finally, the VEP may also be used to monitor the progress of patients with optic neuritisor MS, but this may not be superior to clinical assessment alone. VEPs may be used as anassay for following progress in MS clinical treatment trials, but lesion burden on the MRI isgenerally considered a more reliable surrogate for the clinical status. VEPs may worsen evenwithout a clinical recurrence of optic neuritis, so the correlation with disease burden isimprecise.
5.3. Ischemic Optic Neuropathy
Ischemic optic neuropathy may delay the P100. It often reduces the amplitude but typicallydoes not affect the latency as much as demyelination does.
5.4. Compressive Optic Nerve Lesions
Compressive optic nerve lesions, such as those caused by tumors, may increase thelatency of the P100 but they also tend to decrease the amplitude and may even abolish the
Visual Evoked Potentials 469
25_Drislane 4/11/07 10:10 AM Page 469
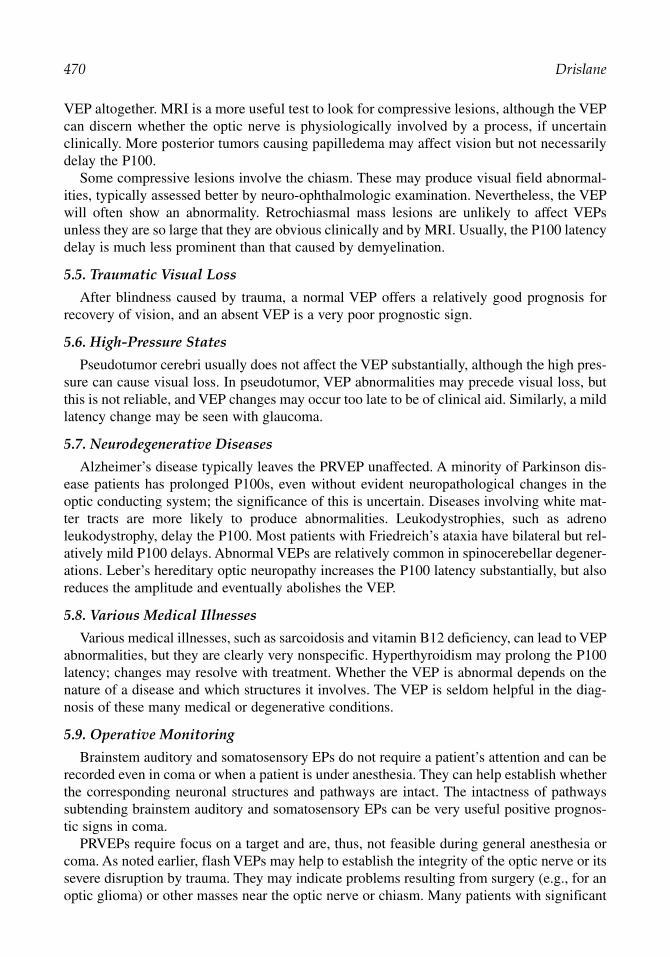
VEP altogether. MRI is a more useful test to look for compressive lesions, although the VEPcan discern whether the optic nerve is physiologically involved by a process, if uncertainclinically. More posterior tumors causing papilledema may affect vision but not necessarilydelay the P100.
Some compressive lesions involve the chiasm. These may produce visual field abnormal-ities, typically assessed better by neuro-ophthalmologic examination. Nevertheless, the VEPwill often show an abnormality. Retrochiasmal mass lesions are unlikely to affect VEPsunless they are so large that they are obvious clinically and by MRI. Usually, the P100 latencydelay is much less prominent than that caused by demyelination.
5.5. Traumatic Visual Loss
After blindness caused by trauma, a normal VEP offers a relatively good prognosis forrecovery of vision, and an absent VEP is a very poor prognostic sign.
5.6. High-Pressure States
Pseudotumor cerebri usually does not affect the VEP substantially, although the high pres-sure can cause visual loss. In pseudotumor, VEP abnormalities may precede visual loss, butthis is not reliable, and VEP changes may occur too late to be of clinical aid. Similarly, a mildlatency change may be seen with glaucoma.
5.7. Neurodegenerative Diseases
Alzheimer’s disease typically leaves the PRVEP unaffected. A minority of Parkinson dis-ease patients has prolonged P100s, even without evident neuropathological changes in theoptic conducting system; the significance of this is uncertain. Diseases involving white mat-ter tracts are more likely to produce abnormalities. Leukodystrophies, such as adrenoleukodystrophy, delay the P100. Most patients with Friedreich’s ataxia have bilateral but rel-atively mild P100 delays. Abnormal VEPs are relatively common in spinocerebellar degener-ations. Leber’s hereditary optic neuropathy increases the P100 latency substantially, but alsoreduces the amplitude and eventually abolishes the VEP.
5.8. Various Medical Illnesses
Various medical illnesses, such as sarcoidosis and vitamin B12 deficiency, can lead to VEPabnormalities, but they are clearly very nonspecific. Hyperthyroidism may prolong the P100latency; changes may resolve with treatment. Whether the VEP is abnormal depends on thenature of a disease and which structures it involves. The VEP is seldom helpful in the diag-nosis of these many medical or degenerative conditions.
5.9. Operative Monitoring
Brainstem auditory and somatosensory EPs do not require a patient’s attention and can berecorded even in coma or when a patient is under anesthesia. They can help establish whetherthe corresponding neuronal structures and pathways are intact. The intactness of pathwayssubtending brainstem auditory and somatosensory EPs can be very useful positive prognos-tic signs in coma.
PRVEPs require focus on a target and are, thus, not feasible during general anesthesia orcoma. As noted earlier, flash VEPs may help to establish the integrity of the optic nerve or itssevere disruption by trauma. They may indicate problems resulting from surgery (e.g., for anoptic glioma) or other masses near the optic nerve or chiasm. Many patients with significant
470 Drislane
25_Drislane 4/11/07 10:10 AM Page 470

disease in these areas may have retained normal VEPs, however, so they cannot be used asscreening tests.
5.10. Chiasmal Lesions
Chiasmal lesions often produce dramatic and unusual visual field defects, best detectedclinically. They may produce bilaterally delayed P100 latencies, and, at times, hemifield stim-ulation may be abnormal. In most cases, however, the visual field examination and MRI scanare of greater use in detecting chiasm area lesions.
5.11. Retrochiasmal Lesions
Retrochiasmal lesions are rarely detectable by full-field stimulation. Bilateral posteriorpathway lesions may delay the P100 bilaterally, typically in a symmetric fashion. Hemifieldstimulation is necessary to detect unilateral posterior pathway lesions but, again, these lesionsmust generally be very large, clinically apparent to visual field or neurologic testing, andessentially always evident on MRI scans.
5.12. Ocular Problems
Ocular problems diminishing luminance at the retina tend to lower P100 amplitude, butany increase in VEP latency should be minimal. This can occur with eye closure, ptosis,corneal opacities, cataracts, severe miosis, or hemorrhages and other material in the corneaor liquid chambers of the eye. Retinopathy and glaucoma may increase the P100 latencyslightly. Cataracts and other causes of loss of visual acuity do not typically affect the P100wave latency until visual impairment becomes severe. Most ocular causes of abnormal VEPsare associated with markedly abnormal visual acuity and are often evident clinically.
Some ocular problems can be overcome by using a larger check size, particularly if thereis diminished visual acuity. By varying check sizes and looking for responses, one can estab-lish a rough estimate of visual acuity in very young children or others unable to report on theirown vision.
5.13. Psychiatric Blindness
Psychiatric blindness can be evaluated to some degree with VEPs. Most activities leadingto an intentional diminution of VEP recording (such as poor fixation or eye closure) can beseen by the technologist, and they typically will not affect latency anyway. As long as the sub-ject looks at a target stimulus to some extent, a normal latency VEP may be obtained. This sug-gests normal conduction from the retina to the cortex, but it may not exonerate the entireoccipital cortex from involvement with disease—cortical blindness can coexist with a normalVEP (flash VEPs test continuity of the visual pathway through the lateral geniculate alone anddo not bear on the function of the posterior pathways or occipital cortex). Usually, however,VEPs are abnormal in cortical blindness. Thus, the normal VEP cannot be used to determinewith certainty that blindness is psychiatric in origin, although a normal VEP would be unusualwith symptoms of severe visual loss. Conversely, however, an abnormal VEP would be quitehelpful in establishing biological disease in a patient suspected of psychiatric blindness.
SUGGESTED READING
Celesia GG. Visual evoked potentials and electroretinograms. In: Electroencephalography, BasicPrinciples, Clinical Applications, and Related Fields, 3rd ed. (Niedermeyer E, Lopes Da Silva F,eds.). Williams & Wilkins, Baltimore, MD, 1993, pp. 911–936.
Visual Evoked Potentials 471
25_Drislane 4/11/07 10:10 AM Page 471

Chiappa KH. Pattern-shift visual evoked potentials: methodology and interpretation. Chapters 2 and3 in: Evoked Potentials in Clinical Medicine (Chiappa KH, ed.), Lippincott Raven Press, New York,NY, 1997, pp. 31–130.
Drislane FW. Use of evoked potentials in the diagnosis and follow-up of multiple sclerosis. ClinNeurosci 1994;2:196–201.
Misulis KE. Chapters 6 to 10: Visual evoked potentials. In: Spehlmann’s Evoked Potential Primer,2nd ed. (Misulis KE, ed.). Butterworth-Heinemann, Boston, MA, 1994, pp. 53–112.
Quality Standards Subcommittee of the American Academy of Neurology. Practice parameter: theusefulness of evoked potentials in identifying clinically silent lesions in patients with suspectedmultiple sclerosis (an evidence-based review). Neurology 2000;54(9):1720–1750.
REVIEW QUESTIONS
1. What is a VEP? What is the P100?2. What does the PRVEP require of the patient? When is flash VEP used?3. Which decrease the P100 amplitude: low or high contrast, and low or high luminance?4. Which increase the P100 latency: low or high contrast, and low or high luminance?5. What is the implication of a completely abolished VEP after stimulation of one eye?6. What is the implication of a delayed VEP after stimulation of one eye?7. What is the implication of bilaterally, but very asymmetrically delayed, VEPs after monocular
stimulation of each eye?8. What VEP technique is theoretically valuable to detect retrochiasmal lesions?9. What is the value of the VEP in patients in whom MS is suspected?
10. Is there a role for VEP in the evaluation of patients with suspected psychogenic blindness?
REVIEW ANSWERS
1. The VEP is the waveform evoked from the occipital cortex after visual stimulation. The P100 isthe name of the waveform measured using scalp occipital electrodes, time-locked to visual stim-ulation. It is usually a large positive deflection at approx 100 ms after stimulation, hence thename P100.
2. The PRVEP requires the patient to maintain visual fixation on the center of the target screen. Thepatient should be able to see the stimulus adequately. Whenever possible, optimization of thepatient’s visual acuity is desirable. Check size can be increased, if need be, to accommodate forpoor visual acuity. Flash VEP can be used in subjects who are unable to fixate, such as neonates,or patients with impaired mental status.
3. Low contrast and low luminance lower the amplitude of the P100.4. Low contrast and low luminance increase the P100 latency.5. A completely absent VEP after monocular stimulation of one eye may suggest a lesion involv-
ing the anterior optic pathway on that side, but also may simply relate to technical factors, suchas failure to fixate, or improperly functioning electrodes or hardware. In addition, severe oculardisease may be the explanation, rather than optic nerve disease.
6. A unilaterally delayed VEP response suggests a lesion of the optic pathway on that side, ante-rior to the chiasm.
7. Bilateral, but very asymmetrically, delayed VEPs usually suggest bilateral optic nerve lesions,possibly at different stages of recovery. Nevetheless, one cannot exclude chiasmatic or morebroadly distributed postchiasmatic lesions.
8. Hemifield stimulation can theoretically be applied to sort out retrochiasmal pathways. This tech-nique is not commonly performed, however, because MRI can often address such concerns muchmore easily.
9. VEP testing may be useful to identify clinically silent lesions in those with possible or probableMS based on other criteria. VEPs are abnormal in 90% of those with definite MS and up to 25%
472 Drislane
25_Drislane 4/11/07 10:10 AM Page 472

of those with suspected MS and normal MRI results. Less than 10% of those with previous opticneuritis with MS will have normalization of the VEP over time.
10. VEPs may be helpful in the evaluation of suspected psychogenic blindness. In particular, anabnormal VEP speaks to an organic pathological process at work. A normal VEP can be support-ive of psychogenic blindness, but cortical blindness can occasionally be associated with normalVEPs. Thus, a normal VEP does not exclude cortical blindness altogether.
Visual Evoked Potentials 473
25_Drislane 4/11/07 10:10 AM Page 473

25_Drislane 4/11/07 10:10 AM Page 474
26Brainstem Auditory Evoked Potentials
Jacob R. Berger and Andrew S. Blum
SummaryBrainstem auditory evoked potentials (BAEPs) are electrical field potentials generated by stimula-
tion of the auditory pathways. With repetitive auditory stimulation, reproducible electrical potentialscan be elicited and recorded from scalp electrodes. These waves are generated by specific brain regionsand occur at predictable intervals. Clinically, this neurophysiological property is useful to evaluate theintegrity of auditory pathways (plus, by extension, neighboring CNS structures) and to localize defec-tive transmission. This chapter summarizes the methodology and clinical application of BAEPs in theinvestigation of disorders affecting auditory pathways and the surrounding brainstem.
Key Words: Acoustic nerve; cerebellopontine angle; hearing; intraoperative monitoring; latency;midbrain; pons.
1. INTRODUCTION
Brainstem auditory evoked potentials (BAEPs) are electrical field potentials generated bystimulation of the auditory pathways. With repetitive auditory stimulation, reproducible elec-trical potentials can be elicited and recorded from scalp electrodes. Differences in electricalpotential between active and reference electrodes are displayed graphically as a function oftime after the auditory stimulus. These waves are generated by specific brain regions andoccur at predictable intervals. Clinically, this neurophysiological property is useful to evalu-ate the integrity of auditory pathways (plus, by extension, neighboring CNS structures) andto localize defective transmission.
2. ANATOMY OF AUDITORY PATHWAYS AND CORRELATION WITH BAEP GENERATORS
To accurately interpret BAEP waveforms, a working knowledge of auditory pathwayanatomy and physiology is important. The auditory pathway starts in the cochlea. Vibrationsfrom sound waves cause hydrostatic pressure changes that are sensed by hair cells in theorgan of Corti. Hair cells communicate with bipolar neurons that have cell bodies in thecochlea. These neurons project to the pontomedullary junction via the acoustic nerve. Aftersynapsing in the ventral (low-frequency tones) or dorsal (high-frequency tones) cochlearnuclei in the rostral, lateral medulla, second-order neurons project to ipsilateral and contralat-eral superior olivary nuclei. Note that acoustic information is bilaterally represented at thispoint onward throughout the auditory system. Neurons in the superior olive then project
From: The Clinical Neurophysiology PrimerEdited by: A. S. Blum and S. B. Rutkove © Humana Press Inc., Totowa, NJ
475
26_Blum 4/11/07 10:11 AM Page 475

through the lateral lemniscus in the pontine tegmentum to the inferior colliculus. The inferiorcolliculus projects to the medial geniculate nucleus of thalamus, which projects forward toHeschl’s gyrus (superior temporal gyrus), the primary auditory cortex.
BAEPs are made up of a sequence of stereotyped waveforms; five well-recognized waves areobserved, numbered I to V (Fig. 1). Two later-appearing waves (VI and VII) are less reliable andof limited clinical value. These waveforms, elicited by auditory stimulation, are generated byspecific structures in the auditory pathway described in the previous paragraph. All BAEPwaveforms represent far-field potentials, caused by activity of deep gray and/or white matterstructures, relatively far from the surface recording electrodes. Table 1 lists the known or likelygenerators for each of these waves.
476 Berger and Blum
Fig. 1. Normal BAEP waveforms. These waveforms are from a 30-yr-old woman undergoing awork-up for possible multiple sclerosis. She had no auditory complaints. The top two channels represent results after left ear stimulation and the bottom two channels after right ear stimulation.Recording montages are indicated. Each study was performed in duplicate. Note the replicableBAEP waveforms, numbered I to V, as described in the text. Waveform latencies are measured foreach and interwave latencies are derived including I to III, III to V, and I to V intervals. These arethen compared with normative values. These BAEPs are normal and symmetric, side-to-side.
26_Blum 4/11/07 10:11 AM Page 476

3. METHODOLOGY
3.1. Stimulation and Recording Technique
Auditory evoked potentials (AEPs) are classified as short, middle, or long latency poten-tials depending on their latency from stimulus onset. The short latency AEPs, occurringwithin 10 to 15 ms of stimulus onset, consist of the electrocochleogram and BAEPs. The elec-trocochleogram, middle, and late-onset AEPs are of less clinical relevance and will not beincluded in this review.
To elicit and record BAEPs, an aural stimulus is delivered to the patient via headphones orindwelling earphones. Surface electrodes placed at A1 (left ear or mastoid), and A2 (right earor mastoid) positions record voltage differences generated by stimulation of auditory path-ways, using Cz (vertex) as a common reference. Waveforms are recorded from ipsilateral andcontralateral pathways simultaneously, allowing easier recognition of individual peaks. Low-and high-frequency filters are commonly set to frequencies of 10 to 3000 Hz, respectively.Low-frequency filters can be raised to 100 to 200 Hz if muscle or mechanical artifact provesproblematic. However, as the bandpass narrows, distortion of waveform morphology, ampli-tude, and latency can occur because of exclusion of low-frequency elements.
Although pure tones are routinely used to analyze the specific frequency spectra of hearingloss, they are generally not used to elicit BAEPs. The most common acoustic stimuli used inBAEP testing are broadband (wide frequency spectra) 2-ms-long clicks, which are generatedby a 100 µs square-wave pulse delivered to the diaphragm of the speaker membrane. As oneear is stimulated with clicks, the other is masked with white noise, an equal mixture of all ofthe frequencies within the range of human hearing (typically 20 Hz–20 kHz). This methodhelps to prevent the undesired coactivation of the contralateral ear caused by bony conductionfrom the ipsilateral stimulated ear.
As with visual and somatosensory evoked potentials (SSEPs), and owing to the relativelysmall amplitude of the evoked auditory potentials, it is essential to average the BAEP wave-forms produced by multiple stimulations to increase the signal-to-noise ratio. In general,1000 to 4000 stimuli are given and averaged in BAEP testing. Eight to ten stimuli are given
Brainstem Auditory Evoked Potentials 477
Table 1Brainstem Auditory Evoked Potential Waveforms and Their Associated PhysiologicalGenerators
Wave Generator
I Proximal acoustic nerve (segment near cochlea)II Distal acoustic nerve (segment near brainstem) or cochlear nucleiIII Superior olive and projections to the lateral lemniscus; medial nucleus of trapezoid
body might generate a part of wave IIIIV Most likely the lateral lemniscus, but data is not definitiveV High pontine or lower midbrain structures: probably the lateral lemniscus, inferior
colliculus, or a combination thereof VI Most likely the medial geniculate nucleus or projections from the inferior
colliculusVII Most likely the auditory radiations to primary auditory cortex
26_Blum 4/11/07 10:11 AM Page 477

per second in most laboratories. Higher rates of frequency cause a rate-dependent reductionof amplitude, dispersion of waveforms, and longer interpeak latencies. Thus, if stimulationrates exceed 10 Hz, a different set of normative values must be used.
Click intensity can impact BAEP generation. With decreasing click intensity, absolute laten-cies are increased and amplitudes are diminished. However, interpeak latencies remain rela-tively constant. Click stimulus intensity is measured in units of decibel sensation level (dBSL),decibel hearing level (dBHL), or decibel peak equivalent sound pressure level (dBpeSPL)rather than the more familiar decibels. Units of dBSL are used when hearing thresholds aredetermined for the individual ear being examined. If hearing thresholds are established usinga group of healthy people, dBHL units are used. To ensure maximal and consistent BAEPacquisition, the stimulus intensity is set to 65 dB above dBSL or dBHL. As an example, if aperson or group studied had a mean perceptual threshold of 10 dB for pure tone audiometry inthe testing environment, an appropriate click stimulus intensity for BAEP acquisition wouldbe 75 dB. Both the dBSL and dBHL are subjective measurements. If more objective measuresare required, the dBpeSPL can be used. To determine the dBpeSPL, the amplitude of the head-phone speaker’s membrane response to a brief click is recorded. This amplitude is matched toa longer duration sine-wave stimulus of defined dB intensity. In general, the dBpeSPL isapprox 30 dB greater than the dBSL or dBHL.
Stimulus polarity can also affect BAEP waveforms. The movement of the speaker membranetowards the eardrum is called condensation; movement away from the eardrum is termed rarefaction. Most BAEPs are recorded during rarefaction, but it is often helpful to switch polar-ity (record during condensation) to distinguish artifact from true BAEP waveforms. Artifactshould reverse in polarity whereas BAEPs should not be altered. Wave I is the BAEP mostaffected by changes in stimulus polarity, with rarefaction producing a shorter latency. It may benecessary to change stimulus polarity to adequately see individual waveforms in some patients.Wave V in particular may seem to be absent until stimulus polarity is reversed.
3.2. Patient-Related Variables Affecting BAEPs
A number of patient-related factors may also impact the BAEP recording. These includethe individual’s age, gender, level of arousal, body position, temperature, medications, andpreexisting hearing loss. Of these, body position, level of arousal, medications, and patienttemperature can be adjusted to optimize results.
Muscle artifact can interfere with the facile recording of BAEPs in 30 to 50% of wakingpatients. Sleep, most anesthetics, and coma of metabolic origin reduce this artifact. In the out-patient arena, it is often helpful to encourage the patient to try to sleep. Proper body position-ing can also reduce the degree of muscle artifact caused by the cervical musculature as wellas providing a situation more conducive to sleep.
Although minor differences in BAEP amplitudes and latencies occur as an individualmatures to adulthood, the most pronounced changes occur in infancy and early childhood.Neonates and infants have thinner skulls and smaller head sizes than adults. As a result, theirscalp recording electrodes are in closer proximity to the generators for these potentials. Thisresults in higher amplitude BAEPs. Premature infants less than 30 wk of age may not havedetectable BAEP waveforms. By age 3 to 6 mo, waveform morphology should approximatethat observed in adulthood; by 1 to 2 yr, latencies shorten to adult values. Changes occur mostrapidly in early infancy, reflecting the rate of myelination, nerve fiber growth, and develop-ment of synaptic efficiency occurring in the developing nervous system.
478 Berger and Blum
26_Blum 4/11/07 10:11 AM Page 478

Female patients typically have shorter peak and interpeak latencies than male patients.Higher amplitudes are also frequently observed in female patients. Although effects of tem-perature on BAEPs are well-established, they are rarely clinically relevant, except for casesof severe hypothermia. Decreasing temperature prolongs both absolute and interpeak laten-cies. Waveforms can be observed at 27°C and above. If necessary, correction factors can beused. Hyperthermia has unclear effects on BAEP waveforms.
Numerous toxins and medications affect BAEPs. Ethanol intoxication prolongs bothabsolute and interpeak latencies without affecting amplitude; ethanol withdrawal has uncleareffects. Barbiturates, benzodiazepines, chloral hydrate, and most anesthetics do not signifi-cantly alter BAEPs in all but extreme doses. Paralytic agents can reduce muscle artifact andfacilitate waveform recognition. Aminoglycosides and salicylates cause prolonged wave Ilatency and reduced BAEP amplitudes; these changes are usually reversible with medicationcessation. Platinum-containing chemotherapeutic medications prolong all BAEP latenciesand raise the threshold needed to elicit BAEPs. Some anticonvulsants, including phenytoin,carbamazepine, and valproate, prolong absolute and interpeak latencies.
Sensorineural or conductive hearing loss can significantly impact the recording of BAEPwaveforms. Mild hearing loss prolongs absolute latencies but will not affect interpeak laten-cies, as long as the stimulus intensity is strong enough. Severe hearing loss results in dispersedwaveforms, phase cancellation, and difficult-to-interpret BAEP peaks. This may appear asabsence of all waveforms. The I to V interpeak latency may be shorter with hearing loss,because of relative prolongation of the absolute latency of wave I. Cochlear dysfunction, asobserved in Ménière’s disease or in presbyacusis, is characterized by a hearing deficit, whichis maximal at threshold. Increasing stimulus intensity can result in normalization of wave-forms, presumably by augmenting recruitment of cochlear neurons.
4. INTERPRETATION
It is important to note that, in many normal individuals, all BAEP waves are not alwayspresent. Waves III and V should be detectable in all healthy individuals; wave I should alsobe observed but will only be present ipsilaterally. Wave II is often absent and wave IV is fre-quently buried and, therefore, indistinguishable from wave V. Wave III often has decreasedamplitude on the side contralateral to that being stimulated. Waves VI and VII appear vari-ably after wave V. Amplitudes of BAEP waveforms are extremely variable and, therefore,generally not of clinical significance. In most laboratories, latencies are considered abnormalif they fall beyond three standard deviations of the mean. Laboratories usually establish theirown normative database. However, published tables of normal absolute and interpeak laten-cies are available (e.g., Chiappa, 1997).
BAEPs have been studied in humans since the 1950s, although routine clinical use did notoccur for another 20 yr. Historically, BAEPs were largely used to diagnose suspected lesionsof the brainstem or the VIIIth cranial nerve that were unable to be visualized by imaging tech-niques in the pre-MRI era. BAEPs have played a particularly important role in the diagnosisof multiple sclerosis and cerebellopontine angle (CPA) tumors and helped differentiatebetween metabolic and structural causes of coma. The advent of MRI and other advancedneuroimaging techniques have dramatically decreased the use of BAEPs because of the rela-tive ease and sensitivity of these modern imaging modalities for posterior fossa processes.
Despite its fall from favor as the initial test of choice in suspected brainstem or VIIIth cra-nial nerve disease, important clinical roles for BAEPs still exist. It should be remembered
Brainstem Auditory Evoked Potentials 479
26_Blum 4/11/07 10:11 AM Page 479

that BAEPs assess function of auditory pathways whereas neuroimaging studies examinestructure. BAEPs are still a test of choice if physical examination and imaging findings areunrevealing but suspicion remains high for a brainstem or VIIIth cranial nerve functionaldeficit. In individuals who cannot undergo MRI secondary to implanted pacemakers, defib-rillators, claustrophobia, and other reasons, BAEPs may provide valuable informationregarding brainstem integrity.
Because BAEPs are sensitive to auditory pathway dysfunction, a suspicion for clinicallysilent disease can be supported via evoked potential abnormalities. In demyelinating condi-tions, such as multiple sclerosis, BAEP testing can detect subclinical lesions, helping todefine the extent and distribution of disease. However, BAEPs are less sensitive than VEPsand SSEPs in detecting abnormalities in patients with multiple sclerosis. The sensitivity forBAEPs in all those with suspected or confirmed multiple sclerosis is approx 46%. Thosewithout overt brainstem symptoms have an even lower yield. In addition, BAEPs have a fairlylow specificity for multiple sclerosis because numerous brainstem processes may result inabnormal responses. Nonetheless, testing enables the clinician to establish a baseline forcomparison with future studies. In this way, improvement or progression of disease can bemonitored objectively with electrophysiological data.
On the other hand, BAEPs exhibit much greater sensitivity for acoustic schwannomas andother tumors of the CPA. Sensitivities ranging from 75 to 100% have been reported in the detec-tion of various tumors in this locale. BAEPs may even be higher in sensitivity than CT imaging,although inferior to MRI for tumors of the CPA. As in demyelinating diseases, the specificity ofBAEPs for recognizing cerebellopontine tumors is less impressive than is its sensitivity.
BAEPs are also routinely used to assess hearing function in populations who cannot reli-ably cooperate with standard audiological testing (e.g., neonates and infants, and individualswith cognitive impairment). In addition, BAEPs are occasionally monitored in patents receiv-ing potentially ototoxic chemotherapeutic agents.
480 Berger and Blum
Table 2Overall Patterns of Brainstem Auditory Evoked Potential Abnormalitiesa
Brainstem auditory evoked potential finding Lesion
Prolonged wave I latency Distal CN VIIIProlonged I–III interpeak latency Between proximal CN VIII and pons (CPA masses)Prolonged III–V interpeak latency Lesion between caudal pons and midbrain
(stroke, tumor, MS, ICH, AVM, etc.)Prolonged I–III and III–V latencies Both rostral pons or midbrain and acoustic nerve
or caudal ponsAbsent wave I with normal III and V Mild to moderate peripheral hearing lossAbsent wave III with normal I and V Normal variantAbsent wave V with normal I and III Above the caudal ponsAbsence of all waves Severe hearing lossAbsence of all waves except I Brain death
(and possibly II)aCN, cranial nerve; CPA, cerebellopontine angle; MS, multiple sclerosis; ICH, intracranial hemorrhage; AVM,
arteriovenous malformation.
26_Blum 4/11/07 10:11 AM Page 480
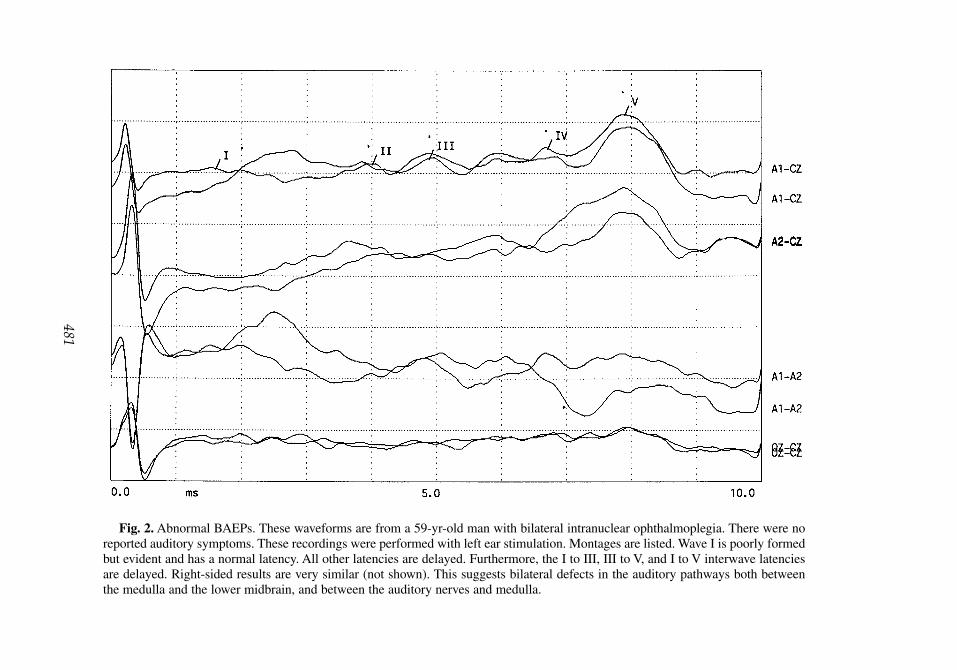
Fig. 2. Abnormal BAEPs. These waveforms are from a 59-yr-old man with bilateral intranuclear ophthalmoplegia. There were noreported auditory symptoms. These recordings were performed with left ear stimulation. Montages are listed. Wave I is poorly formedbut evident and has a normal latency. All other latencies are delayed. Furthermore, the I to III, III to V, and I to V interwave latenciesare delayed. Right-sided results are very similar (not shown). This suggests bilateral defects in the auditory pathways both betweenthe medulla and the lower midbrain, and between the auditory nerves and medulla.
481
26_Blum 4/11/07 10:11 AM Page 481

482 Berger and Blum
Today, intraoperative monitoring has emerged as one of the most important uses ofBAEPs. Often, BAEPs are requested during posterior fossa surgery to monitor brainstem andacoustic nerve integrity in “real time.” BAEPs are not affected by most anesthetic agents andremain reliable measures of brainstem function under general anesthesia. If BAEP wave-forms become abnormally prolonged or lost during surgery, the procedure can be adjusted inan attempt to avoid long-lasting neurological injury. Examples of surgeries in which BAEPsare often used include resection of acoustic neuromas, microvascular cranial nerve decom-pression, and clipping/repair of posterior circulation aneurysms.
Table 2 outlines the common patterns of BAEP abnormalities and identifies their mostcommonly associated pathological causes. The most useful and informative measures derivedfrom BAEP testing are the following:
1. Absolute latency of wave I: prolongation implies a lesion of the VIIIth cranial nerve. This canbe observed in sensorineural or conductive hearing loss. Most schwannomas spare wave I.
2. Wave I to III interpeak latency: prolongation implies a lesion between the proximal segment ofthe eighth cranial nerve and the superior olivary nucleus. Often this reflects damage to structuresat the CPA. Meningiomas and schwannomas at the CPA are typical examples of neoplasms thatcan cause prolonged I to III interpeak latency.
3. Wave III to V interpeak latency: prolongation suggests a lesion in pathways traveling from thecaudal pons to the midbrain. Demyelinating plaques, infarcts, and neoplasms in the brainstemare often associated with increased III to V latency.
Figure 2 illustrates an example of an abnormal BAEP evaluation with accompanying inter-pretation. In addition to hearing loss, demyelinating lesions, CPA tumors, brainstem tumors,and infarcts affecting the auditory pathways, BAEP abnormalities have been described innumerous other disease states. Texts such as that of Chiappa (1997) have summarized thesefindings, which are beyond the scope of this review.
SUGGESTED READING
Celesia GG, Brigell M. Auditory evoked potentials. In: Electroencephalography, Basic Principles, ClinicalApplications, and Related Fields, 3rd ed. (Neidermeyer E, Lopes Da Silva F, eds.). Williams &Wilkins, Baltimore, MD, 1993, pp. 937–956.
Chiappa KH. Evoked potentials in clinical medicine, 3rd ed. Lippincott-Raven, Philadelphia, PA, 1997.Erwin CW, Husain AM. Brainstem auditory evoked potentials. In: Current practice of clinical electroen-
cephalography (Ebersole JS, Pedley TA, eds.). Lippincott Williams & Wilkins, Philadelphia, PA,2003, pp. 864–891.
Huszar L. Clinical utility of evoked potentials. eMedicine [serial online] 2006. Available atwww.emedicine.com/neuro/topic69.htm.
Misulis KE. Spehlmann’s Evoked Potential Primer, 2nd ed. Butterworth-Heinemann, Boston,MA, 1994.
Misulis KE, Head TC. Brainstem auditory-evoked potentials. In: Essentials of Clinical Neurophysiology,3rd ed. Butterworth-Heinemann, Boston, MA, 2003, pp. 211–220.
REVIEW QUESTIONS
1. A 66-yr-old man with bilateral watershed infarcts from complications of cardiac bypass surgeryseems to have pure word deafness. BAEP testing would most likely reveal which of the following:A. Absence of all waveforms.B. Bilateral absence of wave V, VI, and VII.C. No abnormalities.D. Prolonged III to V interpeak latency.
26_Blum 4/11/07 10:11 AM Page 482

2. A 22-yr-old woman, deaf in both ears because of complications of meningitis in infancy, developssymptoms suggestive of multiple sclerosis. BAEPs will most likely reveal which of the following:A. Prolonged absolute latency of wave I.B. Prolonged III to V interpeak latency.C. Prolonged I to III interpeak latency.D. Absence of all waveforms.E. No abnormalities.
3. A prolonged I to III interwave latency would most likely be caused by which of the following:A. Coma.B. Meningioma.C. Demyelinating disease.D. Brainstem hemorrhage.
4. BAEPs in a patient meeting criteria for brain death would show which of the following:A. Absence of all waves.B. Intact waveforms I and II.C. No abnormalities.D. Absence of wave I.
5. When recording BAEPs, improving the signal-to-noise ratio is largely accomplished by whichof the following:A. Increasing stimulus intensity.B. Increasing rate of repetitions.C. Increasing amplification of elicited waveforms.D. Giving multiple stimulus repetitions.
6. A patient with sensorineural hearing loss may have which of the following changes in BAEPwaveforms:A. Global increase in waveform amplitude.B. Global increase in absolute latencies.C. Increased I to V interpeak latency.D. Rapid correction of prolonged latency with increased stimulus intensity.E. B and D.F. B and C.
7. Changes in stimulus polarity affect which BAEP waveform latency the most consistently:A. Wave I.B. Wave III.C. Wave IV.D. Wave V.
8. A BAEP study notable for a prolonged I to V interpeak latency might indicate the presenceof which of the following:A. Pontine glioma.B. Neurofibromatosis type II.C. Multiple sclerosis.D. All of the above.
9. The inferior colliculus likely plays a role in generating which of the following waveforms:A. Wave I.B. Wave II.C. Wave III.D. Wave IV.E. Wave V.
10. The least-sensitive diagnostic assay for multiple sclerosis is which of the following:A. MRI of the brain with contrast enhancement.B. BAEPs.C. VEPs.D. SSEPs.
Brainstem Auditory Evoked Potentials 483
26_Blum 4/11/07 10:11 AM Page 483

REVIEW ANSWERS
1. The correct answer is C. Cortical lesions should not affect BAEP waveforms. It is possible thatwave VII might be affected by a lesion involving the auditory radiations, but waves VI and VIIare not used routinely in clinical evaluation.
2. The correct answer is D. Severe hearing loss can cause BAEP amplitudes to be reduced so muchthat they are not detectable.
3. The correct answer is B. Masses at the CPA often cause this pattern of abnormalities on BAEPtesting. Common lesions include vestibular schwannomas and meningiomas.
4. The correct answer is B. Patients who meet criteria for brain death typically have intact wave Iresponses. In approx 10% of individuals, wave II may also be present.
5. The correct answer is D. Giving multiple stimulus repetitions is essential to achieving an ade-quate signal-to-noise ratio. Hundreds to thousands of stimuli are given to differentiate smallAEPs from EEG potentials.
6. The correct answer is E. Mild-to-moderate hearing loss globally prolongs absolute latencies.Interpeak latencies are not appreciably changed. Increasing stimulus intensity can result innormalization of waveforms.
7. The correct answer is A. Rarefaction causes shorter absolute wave I latency than condensation.Although changing polarity can affect the amplitudes and latencies of other waveforms, there ismore variation between individuals. Use of alternating polarity clicks is not routinely usedbecause of the potential of phase cancellation. In most cases, rarefaction clicks produce themost reliable waveforms. If artifact is suspected or certain waveforms seem absent, a trial withcondensation clicks is warranted.
8. The correct answer is D. All of the above are correct. A pontine glioma, depending on its loca-tion, could impact the I to III and/or III to V interpeak latencies. Neurofibromatosis type II isoften characterized by bilateral acoustic schwannomas, resulting in prolonged I to III latencies.Demyelinating lesions in the brainstem can cause prolonged III to V latency. All of these would,in turn, cause I to V interpeak latency prolongation.
9. The correct answer is E. Wave V is probably, at least in part, generated by activity in the inferiorcolliculus.
10. The correct answer is B. BAEPs have the least sensitivity for detecting abnormalities in multiplesclerosis.
484 Berger and Blum
26_Blum 4/11/07 10:11 AM Page 484

27Somatosensory Evoked Potentials
Jacob R. Berger and Andrew S. Blum
SummarySomatosensory evoked potentials (SSEPs) are electrical potentials generated by various portions of
the ascending sensory pathways in response to stimulation of peripheral sensory nerves. SSEPs can beeasily elicited and recorded and can be used to examine the functional integrity of somatosensory path-ways. This chapter summarizes the methodology for the recording of SSEPs, as well as their role inthe evaluation of processes that may affect ascending sensory pathways (e.g., demyelination), andhighlights their particular usefulness as an intraoperative tool during spinal cord surgery.
Key Words: Demyelination; dorsal columns; intraoperative monitoring; latency; multiple sclerosis;signal averaging.
1. INTRODUCTION
Somatosensory evoked potentials (SSEPs) are electrical potentials generated by variousportions of the ascending sensory pathways in response to stimulation of peripheral sensorynerves. SSEPs can be easily elicited and recorded and can be used to examine the functionalintegrity of somatosensory pathways. SSEPs conceptually resemble brainstem auditory evokedpotentials (BAEPs) and visual evoked potentials (VEPs); both of these are produced afterstimulation of auditory and visual pathways, respectively, and have been discussed in previouschapters (Chapters 25 and 26). Motor evoked potentials (MEPs), recorded from peripheral muscles in response to cortical stimulation, also have important and emerging clinical uses,but, historically, have been used with less frequency than SSEPs. MEPs will not be discussedin this chapter.
2. PHYSIOLOGY AND ANATOMY
As with electroencephalography, evoked potential surface electrodes record changes inextracellular voltage at the skin or scalp surface. SSEP waveforms reflect the activity of sum-mated dendritic potentials of underlying gray matter as well as the propagating electricalactivity of nerve fiber conduction along white matter pathways. Most elicited SSEP wave-forms probably have components of both gray and white matter activity, but generally one orthe other predominates. When gray matter activity in the cortex or spinal cord is responsiblefor the main electrical generators of the recorded SSEP waveform, the evoked potential istermed a “near-field” potential. “Far-field” potentials reflect electrical activity distant to therecording electrode, typically operant in white matter tracts or subcortical structures. Unlike
From: The Clinical Neurophysiology PrimerEdited by: A. S. Blum and S. B. Rutkove © Humana Press Inc., Totowa, NJ
485
27_Blum 4/11/07 10:36 PM Page 485
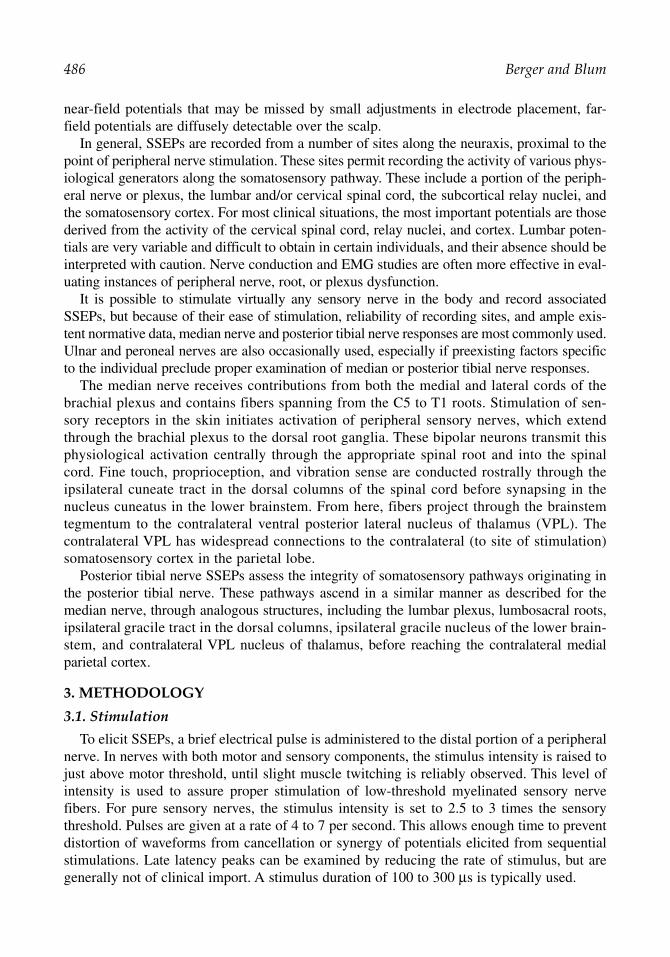
near-field potentials that may be missed by small adjustments in electrode placement, far-field potentials are diffusely detectable over the scalp.
In general, SSEPs are recorded from a number of sites along the neuraxis, proximal to thepoint of peripheral nerve stimulation. These sites permit recording the activity of various phys-iological generators along the somatosensory pathway. These include a portion of the periph-eral nerve or plexus, the lumbar and/or cervical spinal cord, the subcortical relay nuclei, andthe somatosensory cortex. For most clinical situations, the most important potentials are thosederived from the activity of the cervical spinal cord, relay nuclei, and cortex. Lumbar poten-tials are very variable and difficult to obtain in certain individuals, and their absence should beinterpreted with caution. Nerve conduction and EMG studies are often more effective in eval-uating instances of peripheral nerve, root, or plexus dysfunction.
It is possible to stimulate virtually any sensory nerve in the body and record associatedSSEPs, but because of their ease of stimulation, reliability of recording sites, and ample exis-tent normative data, median nerve and posterior tibial nerve responses are most commonly used.Ulnar and peroneal nerves are also occasionally used, especially if preexisting factors specificto the individual preclude proper examination of median or posterior tibial nerve responses.
The median nerve receives contributions from both the medial and lateral cords of thebrachial plexus and contains fibers spanning from the C5 to T1 roots. Stimulation of sen-sory receptors in the skin initiates activation of peripheral sensory nerves, which extendthrough the brachial plexus to the dorsal root ganglia. These bipolar neurons transmit thisphysiological activation centrally through the appropriate spinal root and into the spinalcord. Fine touch, proprioception, and vibration sense are conducted rostrally through theipsilateral cuneate tract in the dorsal columns of the spinal cord before synapsing in thenucleus cuneatus in the lower brainstem. From here, fibers project through the brainstemtegmentum to the contralateral ventral posterior lateral nucleus of thalamus (VPL). Thecontralateral VPL has widespread connections to the contralateral (to site of stimulation)somatosensory cortex in the parietal lobe.
Posterior tibial nerve SSEPs assess the integrity of somatosensory pathways originating inthe posterior tibial nerve. These pathways ascend in a similar manner as described for themedian nerve, through analogous structures, including the lumbar plexus, lumbosacral roots,ipsilateral gracile tract in the dorsal columns, ipsilateral gracile nucleus of the lower brain-stem, and contralateral VPL nucleus of thalamus, before reaching the contralateral medialparietal cortex.
3. METHODOLOGY
3.1. Stimulation
To elicit SSEPs, a brief electrical pulse is administered to the distal portion of a peripheralnerve. In nerves with both motor and sensory components, the stimulus intensity is raised tojust above motor threshold, until slight muscle twitching is reliably observed. This level ofintensity is used to assure proper stimulation of low-threshold myelinated sensory nervefibers. For pure sensory nerves, the stimulus intensity is set to 2.5 to 3 times the sensorythreshold. Pulses are given at a rate of 4 to 7 per second. This allows enough time to preventdistortion of waveforms from cancellation or synergy of potentials elicited from sequentialstimulations. Late latency peaks can be examined by reducing the rate of stimulus, but aregenerally not of clinical import. A stimulus duration of 100 to 300 µs is typically used.
486 Berger and Blum
27_Blum 4/11/07 10:36 PM Page 486

3.2. Recording
As with VEPs and BAEPs, multiple (500–2000 for SSEPs) stimulus trials are given andaveraged to maximize the signal to noise ratio. Standard surface recording electrodes areplaced at key points along each sensory pathway. Recording parameters should follow guide-lines proposed by the American Electroencephalographic Society. Reasonable settings includea wide bandpass with a low-frequency filter set at 5 to 30 Hz and high-frequency filter set at2500 to 4000 Hz.
Evoked potential waveforms are named for the characteristic polarity of their voltage peakand the characteristic time to maximal amplitude, as measured in milliseconds after stimula-tion. For example, an upward (negative by convention) deflection maximal at 9 ms after stimu-lation would be termed the N9 response. Note that different texts use slightly different namesto refer to the same significant peaks (e.g., N9 as opposed to N10), because of slight variationin normative values established by individual laboratories. Ideally, each laboratory shouldestablish its own set of normal values from the population from which it draws. In addition,sets of normal values may be found in publication.
3.3. Median Nerve SSEPs
SSEP recording from the median nerve is the most common evoked potential test to assessthe integrity of somatosensory pathways involving the upper limbs. To elicit median nerveSSEPs, stimulation is given 2 cm proximal to the wrist crease, over the median nerve. Standardrecording sites for median SSEPs are at Erb’s point, over the cervical spine, and on the scalp.Erb’s point is located above the clavicle, just lateral to the edge of the sternocleidomastoidmuscle. Proper placement can be assured if stimulation at Erb’s point induces abduction of aflexed arm. A second electrode is placed over the C2 or C5 spinous process. This site is iden-tified in relation to the prominent spinous process of the C7 vertebra. Scalp electrodes areplaced 2 cm posterior to the C3 and C4 electrode placements, as defined by the International10-20 system. This region overlies the primary somatosensory cortices. Reference (Ref) elec-trodes are often placed at the contralateral Erb’s point (EPc) or at Fz, per the 10–20 system,although other sites, such as the elbow or distal arm may be used.
The recording sites are labeled as EPi, Erb’s point (ipsilateral); C2s, C2 spinous process;C5s, C5 spinous process; CPc, centroparietal cortex (contralateral); CPi, centroparietal cortex(ipsilateral); and Ref (EPc, Fz).
A common montage used to view median nerve SSEPs involves channel 1: CPc–CPi,detects near-field cortical potentials; channel 2: CPi–Ref (Fz), detects subcortical far-fieldpotentials; channel 3: C5s–Ref (Fz), records cervical cord activation; and channel 4: EPi–Ref(EPc), records activity of afferents under Erb’s point.
This montage allows for comparison of evoked potentials to a common reference andemphasizes the comparison of evoked responses between the ipsilateral and contralateral sen-sory cortex. In certain situations, other derivations and montages can be used to optimizelocalization, but these are used infrequently.
Although it is prudent to wait 60 to 80 ms to exclude the possibility of prolonged poten-tials, the most clinically relevant median nerve SSEP waveforms typically occur within 4 to40 ms after stimulation. These include the N9 (displayed best by channel 4), the P13/14 (dis-played best in channel 2), and the N20 (observed best in channels 1 and 2). Figure 1 showsan example of a normal median nerve SSEP recording.
Somatosensory Evoked Potentials 487
27_Blum 4/11/07 10:36 PM Page 487

Depending on montage and electrode placement, waves generated by different CNS struc-tures can have the same polarity and latency. For example, both subcortical and corticalpotentials having maximum positivity 24 ms after stimulation could be equally termed theP24. It is essential to realize that proper interpretation of a named waveform is not possibleunless its generator is understood.
Despite the fact that SSEPs have been used clinically for decades, the areas of the nervoussystem responsible for generating many SSEP waveforms have not been definitively eluci-dated. Table 1 identifies the most probable generators associated with their respective SSEPwaveforms, based on the available data.
488 Berger and Blum
Fig. 1. Normal median nerve SSEPs from a 30-yr-old woman undergoing a work-up for possiblemultiple sclerosis. She reported tingling in the arms. Recording montages are indicated. The studieswere performed in duplicate. This represents stimulation of the left median nerve. Recognizablewaveforms are seen and labeled accordingly. The N9 potential is seen clearly in the bottom channel.The N/P13 is evident in the middle channel. The N20 response is recognized in the upper channel.Waveform latencies are measured; interwave latencies are similarly derived from these measure-ments. These values are then compared with normal values. In this instance, all such values were normal.Results after right median nerve stimulation were symmetric.
27_Blum 4/11/07 10:36 PM Page 488

3.4. Posterior Tibial SSEPs
Posterior tibial nerve SSEPs are elicited by stimulating in between the Achilles tendon andmedial malleolus, using a stimulus intensity just strong enough to cause plantar flexion of thetoes. Most of the relevant waveforms appear within 60 ms of stimulation. If none appear, aninterval of 100 ms should be used to exclude the possibility of extremely prolonged wave-forms. Recording electrodes are placed as CPi, the same locus as for median nerve SSEPrecording, except ipsilateral; CPz, midline, between Cz and Pz; C5s, same location as formedian nerve SSEP recording; T12s over the T12 spinous process; and Ref, common sitesinclude the iliac crest, elbow, or Fpz. (frontopolar midline, per 10–20 system).
A common montage for posterior tibial nerve SSEPs using these electrodes is channel1: Cpi–Ref (Fpz), detects near-field potentials over cortex; channel 2: CPz–Ref (Fpz),detects near-field potentials over cortex; channel 3: Fpz–Ref (C5s), detects subcortical far-field potentials; and channel 4: T12–Ref (iliac crest), detects near-field potentials fromlumbar cord.
Figure 2 illustrates a set of normal posterior tibial nerve SSEP responses using the abovemontage. As illustrated, there are three main identifiable waveforms that appear. As before,they are named according to their polarity and latency. These are the LP/N22 (or lumbarpotential), the N34, and the P37/38. As mentioned, the LP/N22 response is highly variablebecause of technical factors (e.g., interfering EMG-derived artifact). The responses that are
Somatosensory Evoked Potentials 489
Table 1Median Nerve Somatosensory Evoked Potential Waveforms and Corresponding Generators
Waveform Generator
N9 This clavicular potential, recorded by channel 4, represents a near-field potential,generated by afferent action potentials in the brachial plexus, near EPi. Thispotential can be strongly influenced by changes in shoulder position.
N13 This near-field cervical potential, recorded by channel 3, is likely generated by dorsal horn neurons and from ascending afferents in the cuneate tract (dorsalcolumns).
P/N 13/14 This far-field potential, recorded by channel 2, is likely generated by the caudal medial lemniscus in the brainstem. As with most subcortical (far-field) potentials,it is observed in all scalp electrodes. Latency and morphology varies widelybetween individuals but is stable in an individual. The P13/14 can be monophasic,biphasic, or triphasic, possibly reflecting input from multiple generators.
N18 This long-duration potential recorded by channel 2 likely stems from postsynaptic activity of tectal and pretectal nuclei, which receive input from the mediallemniscus. Thalamic lesions do not affect the N18, implying a neuronalgenerator that is more caudal. The N18 probably represents a compositewaveform with multiple generators.
N20 This is a near-field potential recorded by channels 1 and 2, over the contralateral parietal cortex. It is likely generated from thalamocortical radiations projectingfrom the ventral posterior lateral thalamus. The N20 may also represent a compositewaveform.
27_Blum 4/11/07 10:36 PM Page 489

more rostral are more consistently and cleanly recorded (with higher signal-to-noise ratio)and, therefore, of more clinical value. These posterior tibial nerve SSEP responses and their(likely) corresponding physiological generators are outlined in Table 2.
Remember that the sensory cortex for the lower leg is located on the medial aspect of thehemisphere. As a result, it is thought that evoked tangential dipoles involving bilateral sen-sory cortices result in the predominant waveform appearing ipsilateral to the stimulation. Bycontrast, stimulation of lower extremity sensory nerves that are more proximal, with relativelymore lateral cortical representation evoke waveforms that are observed best in the contralateralhemisphere.
490 Berger and Blum
Fig. 2. Normal posterior tibial nerve somatosensory evoked potentials from a 27-yr-old man withataxia, dysarthria, and white matter changes on MRI. Recording montages are listed. The studieswere performed in duplicate. This is from stimulation of the left leg. Recognized waveforms arelabeled. The potential from the popliteal fossa is seen clearly in the bottom channel. The N21 (lumbarpotential) response is observed in the middle channel. The uppermost channel displays the corticalpotential (P37). Latencies are measured and interwave latencies are derived. Values are comparedwith a normative sample. Values for this study were found to be within normal limits.
27_Blum 4/11/07 10:36 PM Page 490

4. INTERPRETATION
The use of SSEPs, similar to BAEPs and VEPs, has decreased dramatically as novel neu-roimaging techniques have become better at identifying structural lesions in the spinal cordand brainstem. Still, in situations in which imaging cannot be performed or when it is unre-vealing, evoked potential testing can provide useful information regarding the functionalintegrity of sensory pathways.
SSEPs are sensitive for sensory pathway dysfunction and can detect abnormalities inpatients with normal or inconclusive imaging studies, especially in demyelinating disease,such as multiple sclerosis or neuromyelitis optica (Devic’s). Abnormal SSEPs are found in91% of patients with definite multiple sclerosis. SSEP testing in individuals with probableand possible multiple sclerosis reveals a sensitivity of 79% and 42%, respectively. Posteriortibial nerve SSEPs are more sensitive than median nerve SSEPs; however, the yield is highestwhen both are combined. Sensitivity is increased when sensory symptoms and/or signs arepresent. Still, 40 to 50% of multiple sclerosis patients without clinical sensory involvementwill have abnormal SSEPs. Figure 3 illustrates an abnormal posterior tibial nerve SSEP studyin a patient with suspected multiple sclerosis.
In addition to their role in diagnosis, SSEPs can help establish a baseline to better moni-tor disease progression or effect of therapy. The use of SSEP monitoring in spine surgery hasalso become commonplace. It is difficult to imagine advances in imaging techniques thatwould supplant the usefulness of real-time functional monitoring of spinal cord integrity inthe operative setting.
As with other evoked potential studies, the most important information is gleaned from thepresence or absence of specific waveforms, as well as latencies of such waveforms, andinterpeak latencies. Amplitudes in evoked potential studies are highly variable and rarely ofclinical use. Waveforms with isolated abnormalities of amplitude but with normal latenciesshould be interpreted to be within the broad spectrum of normal. Most laboratories considerlatencies within three standard deviations of the mean to be within normal limits.
Among the various SSEP waveforms, those of cortical origin (e.g., the N20 and P37) arethe most tenuous. They are often prolonged or abolished by sleep, sedation, and many
Somatosensory Evoked Potentials 491
Table 2Posterior Tibial Nerve Somatosensory Evoked Potential Waveforms and Corresponding Generators
Waveform Generator
LP/N22 This lumbar potential is likely generated by activity in the dorsal roots, dorsal root entry zone, and by postsynaptic activity in the lumbar cord enlargement. It ismaximally detected by electrodes overlying the lower thoracic or upper lumbarspine. In the described montage, it appears best in channel 4. It is analogous tothe N13 wave observed with median nerve somatosensory evoked potentials.
N34 This potential likely reflects subcortical activity from multiple brainstem nuclei along the somatosensory pathway. This appears best in channel 3.
P37/38 This near-field response is a large waveform with a field restricted to the ipsilateralparasagittal area, near Cz or Pz. A simultaneously occurring negative waveformcan often be observed with frontocentral leads (the N38).
27_Blum 4/11/07 10:36 PM Page 491

anesthetic agents. Barbiturates, benzodiazepines, and nitrous oxide can also cause attenua-tion or absence of cortical waveforms, although typically this is less pronounced than withthe halogenated anesthetic agents (e.g., halothane and isoflurane). Downregulated activity ofthalamocortical projections likely contributes to this effect. Subcortical potentials, however,are generally not affected by anesthesia. This property makes the more resilient subcorticalSSEPs particularly valuable in the intraoperative arena. Etomidate, an intravenous anestheticagent, increases the amplitude of cortical waveforms. Thus, etomidate can be administered topatients to enhance the visibility of cortical SSEPs when they are deemed especially vital.
492 Berger and Blum
Fig. 3. Abnormal posterior tibial nerve somatosensory evoked potentials SSEPs. Same patient asin Fig. 1. She also reported tingling sensations in the legs. Montages are listed. The studies are induplicate. This shows results of right leg stimulation. Waveforms are identified; latencies have beenmeasured, and interwave latencies derived accordingly. Her popliteal fossa (PF) and lumbar (N21)potentials exhibit normal latencies (lower two channels). However, her cortical potentials (P37/N45)are delayed (46 and 51 ms, respectively) and interpeak latencies involving these cortical potentialsare prolonged. Cortical responses were not observed with left leg stimulation (not shown). This sug-gests an abnormality affecting the central somatosensory pathway between the lumbar cord and thesensory cortex. When this study is considered together with her normal median nerve SSEP results(Fig. 1), a lesion is suggested more specifically between the lumbar and cervical cord.
27_Blum 4/11/07 10:36 PM Page 492

However, some authors have expressed concern that its usage might artificially potentiatecortical SSEPs and, thereby, mask important changes in somatosensory pathway function.
Most data on normative values for SSEPs have been obtained from adults. Median andposterior tibial nerve SSEPs can be recorded in infancy, although an incompletely developednervous system renders markedly different recordings than those of adults. Although subcor-tical components should be detectable in full term neonates, the N20 may not be observeduntil 2 mo of age. Reproducible P37/38 responses should be observed by 1 yr of age. Thedelay of reliable cortical SSEPs is likely multifactorial, including incomplete myelination andincreased time spent in sleep states, which are known to attenuate cortical SSEP waveforms.As CNS myelination progresses with maturation, conduction time decreases. This matura-tional change occurs most rapidly in early infancy and more slowly in early childhood.Normal median nerve SSEP latencies are observed by age 6 to 8 yr; normal posterior tibialnerve latencies are observed by age 5 to 7 yr.
5. APPLICATIONS: CORRELATION WITH VARIOUS PATHOLOGIES
Numerous pathological mechanisms may impact somatosensory conduction, and thesemay all evoke abnormalities in SSEP testing. These include, but are not limited to, ischemia,tumor, spinal cord compression, and demyelination. Individuals with vitamin B12 deficiency,vitamin E deficiency, HIV, amyotrophic lateral sclerosis, myotonic dystrophy, diabetes, andsome hereditary neurodegenerative disorders often exhibit abnormal SSEP results. Evenasymptomatic subjects heterozygotic for mutations associated with adrenoleukodystrophy and adrenomyeloneuropathy demonstrate SSEP abnormalities. Certain progressive myoclonicsyndromes are associated with abnormally high-voltage (“giant”) SSEP responses (e.g., LaforaBody disease or Unverricht–Lundborg disease). The absence of certain SSEP waveforms canbe associated with brain death.
Median nerve SSEPs are frequently used in conjunction with lower-extremity SSEP stud-ies to assist clinical localization. Assuming intact peripheral nerves, a normal median nerveSSEP response paired with abnormal lower extremity SSEPs implies a lesion between thecauda equina and the cervical spinal cord. Alternatively, normal posterior tibial nerve studieswith abnormal median nerve responses suggest a peripheral lesion along the median nervepathway. Tables 3 and 4 illustrate various patterns of SSEP (median and posterior tibial nerve,respectively) abnormalities, with their associated localizing values.
6. APPLICATIONS: INTRAOPERATIVE MONITORING
Intraoperative monitoring has emerged as one of the major uses for SSEPs, providing areal-time measure of central nervous system integrity. Many surgeons use SSEP monitoringroutinely for certain spine procedures, such as scoliosis corrections and spinal fusions. Lossof scalp responses to stimulation alerts the surgeon to potential CNS injury and allows foradjustment in the operative approach. Lack of corrective intervention in response to SSEPsignal changes during spinal corrective surgeries has been associated with poorer outcomes.SSEPs can also help to define essential neuroanatomic structures that may not be easilydistinguishable with visual inspection. For instance, SSEPs have been used to define the pri-mary somatosensory cortex and central sulcus in patients undergoing epilepsy surgery in thefrontoparietal region.
To monitor SSEPs in the intraoperative setting, a preoperative baseline test is performed toensure that reliable potentials can be obtained. Intraoperative measurements are continuously
Somatosensory Evoked Potentials 493
27_Blum 4/11/07 10:36 PM Page 493

updated throughout the surgery, with special attention given to the periods before instrumen-tation, during instrumentation, after instrumentation is complete, and before closing. In mostcases, posterior tibial nerve SSEPs are used, with median nerve responses serving as acontrol. As mentioned in Section 4, subcortical potentials are much more resilient to theeffects of anesthesia. They provide a key backup potential in the operative environment to thecortical responses, which are much more labile.
494 Berger and Blum
Table 4Posterior Tibial Nerve Somatosensory Evoked Potentials: Response Patterns and Localization
Somatosensory evokedpotentials findings Localization
Prolonged or absent N22 Severe peripheral neuropathyNormal interpeak latencies Cauda equina lesion (less likely)Nonrecordable potentialsProlonged N22–P37 interpeak latency Between cauda equina and cortexMedian nerve SSEPs either Even if median nerve SSEP findings
not performed or abnormal suggest a lesion rostral to the mid-cervical cord,other more caudal lesions are possible
Prolonged N22–P37 interpeak latency Between cauda equina and mid cervical cordNormal median nerve SSEPsInferior displacement of the N22 Tethered cord
recording site
Table 3Median Nerve Somatosensory Evoked Potentials: Response Patterns and Localization
Somatosensory evokedpotentials findings Localization of lesion
Absent N9 Normal studyNormal P14, N20 absolute latenciesProlonged or absent N9 Distal to brachial plexusEqually prolonged P14 and N20
absolute latencies with normalinterpeak latencies
Prolonged N9–P14 interval Between brachial plexus and lower medullaNormal P14–N20 intervalProlonged P14–N20 interval Between lower medulla and cerebral cortexOtherwise normal (often observed with multiple sclerosis
plaques)Bilaterally absent N20s Associated with poor prognosis in coma patients
if not medication effectObserved in brain death
Intact cervical N13 Between cervical cord and medial lemniscusAbnormal scalp P14 (e.g., cervical cord compression)
27_Blum 4/11/07 10:36 PM Page 494

Although SSEPs have been used to monitor CNS integrity during carotid endarterectomy,monitoring with electroencephalography is used more frequently. This is primarily becauseof the ease of monitoring, the ability to examine broader areas of cortical function, and therapidity with which ischemic changes in the EEG can be identified.
SUGGESTED READING
American Electroencephalographic Society. Guidelines on evoked potentials. J Clin Neurophysiol1994;11:40–73.
Chiappa KH. Evoked Potentials in Clinical Medicine, 3rd ed. Lippincott–Raven, Philadelphia, PA, 1997.Emerson RG, Adams DC. Intraoperative monitoring. In: Current Practice of Clinical Electroence-
phalography (Ebersole JS, Pedley TA, eds.). Lippincott, Williams & Wilkins, Philadelphia, PA,2003, pp. 936–954.
Emerson RG, Pedley TA. Somatosensory evoked potentials. In: Current Practice of Clinical Electro-encephalography (Ebersole JS, Pedley TA, eds.). Lippincott, Williams & Wilkins, Philadelphia,PA, 2003, pp. 892–922.
Erwin CW, Rozear MP, Radtke RA, Erwin AC. Somatosensory evoked potentials and surgical moni-toring. In: Electroencephalography, Basic Principles, Clinical Applications, and Related Fields,3rd ed. (Neidermeyer E, Lopes Da Silva F, eds.). Williams & Wilkins, Baltimore, MD, 1993,pp. 957–974.
Misulis KE. Spehlmann’s Evoked Potential Primer, 2nd ed. Butterworth-Heinemann, Boston, MA, 1994.
REVIEW QUESTIONS
1. All of the following medications may diminish cortical SSEP waveform amplitude except whichof the following:A. Isoflurane.B. Halothane.C. Midazolam.D. Nitrous oxide.E. Phenobarbital.F. None of the above.
2. SSEP testing will show abnormalities if which of the following tracts is damaged:A. Gracile.B. Corticospinal.C. Spinothalamic.D. Lateral lemniscus.
3. Increased amplitude of cortical SSEP waveforms can be associated with which of the following:A. Nitrous oxide use.B. Myoclonic epileptic syndromes.C. Anxiety.D. Etomidate.E. More than one of the above.
4. SSEPs in children typically demonstrate which of the following characteristics:A. Normal median SSEP latencies by age 5 yr.B. Most marked change in latency after age 4 yr.C. The presence of N20 in all term neonates.D. Subcortical potentials in all term neonates.
5. Intraoperative posterior tibial SSEP testing identifies loss of P37. Concurrent median SSEPsshow normal N9 but loss of subcortical and cortical potentials recorded from scalp electrodes.The site of damage is most likely at which of the following sites:A. Peripheral nerves.B. Cauda equina.
Somatosensory Evoked Potentials 495
27_Blum 4/11/07 10:36 PM Page 495

C. Between the cauda equina and mid-cervical spinal cord.D. Above the level of the mid-cervical spinal cord.E. Two of the above.F. Definitely one, and possibly two of the above.
6. A waveform, which, when averaged over multiple trials, has a maximum downward deflection34 ms and upward deflection at 36 ms after stimulation would be termed:A. N34.B. P34.C. P36.
7. The most important methodological factor in maximizing signal-to-noise ration in SSEP testing is:A. Relaxation of the patient.B. Averaging of multiple trials.C. Intensity of the stimulus.D. Strength of signal amplification.
8. A term neonate with a brachial plexus injury could have all of the following on median SSEPtesting except:A. Absent N20.B. Absent P14.C. Absent N9.D. Prolonged P14.
9. Absent N22 waveform from a recording electrode at T12 could indicate all of the followingexcept:A. Inferior displaced lumbar enlargement/tethered cord.B. Peripheral neuropathy.C. Cauda equina lesion.D. Thoracic cord lesion.
10. An isolated demyelinating lesion in the mid thoracic cord would be expected to have which ofthe following patterns:A. Normal N22 latency, normal N22–P37 latency, abnormal N9–P14 latency.B. Normal N22 latency, abnormal N22–P37 latency, abnormal N9–N20 latency.C. Normal N22 latency, abnormal N22–P37 latency, normal N9–N20 latency.D. Abnormal N22 latency, abnormal N22–P37 latency, normal N9–N20 latency.
REVIEW ANSWERS
1. The correct answer is F. All of the above agents may diminish the cortical SSEP waveform.Benzodiazepines, phenobarbital, and low-concentration nitrous oxide typically have a lessereffect than halogenated anesthetics, such as isoflurane and halothane.
2. The correct answer is A. SSEP testing primarily tests the dorsal columns of the spinal cord,where the cuneate and gracile tracts lie. The corticospinal tract can be assessed with MEP test-ing. The spinothalamic tract runs lateral to the dorsal columns and contains input from lessmyelinated and nonmyelinated fibers carrying information regarding pain and temperature. Thelateral lemniscus can be assessed with BAEPs.
3. The correct answer is E. Myoclonic epileptic syndromes and the use of etomidate, a neuromus-cular blocker, have been associated with heightened amplitude of SSEP waveforms. Anxietymight mask cortical waveforms because of increased muscle artifact. Nitrous oxide use mayattenuate cortical waveforms.
4. The correct answer is D. Subcortical potentials should be observed in all term neonates. MedianSSEPs reach normal values after tibial SSEPs, typically at age 6 to 8 yr. The most rapid changein conduction speed occurs in early infancy, not after age 4 yr. N20 potentials may not be presentuntil 2 mo of age.
496 Berger and Blum
27_Blum 4/11/07 10:36 PM Page 496

5. The correct answer is F. The abnormalities on median SSEPs implies a lesion above the level ofthe mid-cervical cord. This, alone, could cause the abnormalities observed in the tibial studies.However, a second lesion, inferior to the cervical cord may also be present.
6. The correct answer is B. Waveforms are named by their polarity and the latency at which theyhave maximal amplitude. Keep in mind that the waveform represents the averaged amplitude andlatency of hundreds of stimulations. It is essential to know the derivation and context from whichthe waveform is derived. For example, N22 means two very different things if recorded from T12after peroneal stimulation or from the scalp after median nerve stimulation.
7. The correct answer is B. Averaging of multiple trials is essential in maximizing signal-to-noiseratio. It is necessary to help factor out EEG potentials that often mask the relatively low-voltageSSEP potentials. Although relaxing the patient will improve the recording, averaging remainsthe single most important factor.
8. The correct answer is B. Brachial plexus injury in neonates and adults may cause absent N9 withequally delayed, but present subcortical potentials. Adults should also have equally delayedcortical potentials. Neonates may not have N20 responses present until 2 mo of age.
9. The correct answer is D. A thoracic cord lesion would result in prolonged N22–P37 conductiontime but N22 latency would remain normal. Electrodes that are placed more inferiorly wouldhelp to identify a tethered cord. Peripheral nerve conduction studies may help to identify aperipheral neuropathy if abnormal N22 is found on SSEP testing.
10. The correct answer is C. Only conduction between the lumbosacral cord and thoracic lesionshould be affected. Median potentials should be normal, as should conduction from peripheralnerves to the lumbosacral cord.
Somatosensory Evoked Potentials 497
27_Blum 4/11/07 10:36 PM Page 497

27_Blum 4/11/07 10:36 PM Page 498

28Transcranial Magnetic Stimulation
Masahito Kobayashi and Alvaro Pascual-Leone
SummaryDuring the past two decades, transcranial magnetic stimulation (TMS) has emerged as an important
modality for the exploration of cerebral function and assessing the integrity of human motor pathways.In TMS, a strong magnetic pulse activates neural elements oriented predominantly horizontally to thebrain surface, and a motor evoked potential can be recorded in the activated muscles. In single-pulseTMS, stimulation can be applied to different levels of the nervous system, including the spinal cord,to assist in localizing a lesion to a specific level and helping to characterize it as demyelinating oraxonal in nature. A central motor conduction time can also be calculated; this is defined as the latencydifference between the motor evoked potentials induced by stimulation of the motor cortex and thoseevoked by spinal (motor root) stimulation. A variety of additional testing paradigms have been createdover the years, including the use of paired-pulse techniques and repetitive stimulation, the latter poten-tially assisting in treating a variety of disorders, including depression and Parkinson disease.
Key Words: Central conduction time; excitability; motor evoked potential; repetitive stimulation;silent period; transcranial magnetic stimulation.
1. INTRODUCTION
The purpose of this chapter is to introduce transcranial magnetic stimulation (TMS) andreview its applications in clinical neurophysiology to date and its future potential. TMS, ascurrently used, was introduced by Anthony Barker from the University of Sheffield in 1985.Since its introduction, the use of TMS in clinical neurophysiology, neurology, neuroscience,and psychiatry has spread widely, mostly in research applications, but also increasingly withclinical aims in mind. TMS provides a noninvasive and safe method of activating the humanmotor cortex, and assessing the integrity of the central motor pathways. It has the advantageover transcranial electric stimulation (TES) of being practically painless.
2. BASIC PRINCIPLES OF MAGNETIC STIMULATION
TMS is based on the principle of electromagnetic induction, discovered by Michael Faradayin 1838. As a pulse of current passes through a coil of wire, a magnetic field is generatedperpendicular to it. The rate of change of that magnetic field determines the induction of asecondary current in any nearby conductor. If a current pulse passing through a coil placedover a subject’s head has sufficient strength and short enough duration, a rapidly changingmagnetic pulse is generated that penetrates scalp and skull, reaching the brain with negligibleattenuation, inducing a secondary ionic current in the brain. Properly induced currents can
From: The Clinical Neurophysiology PrimerEdited by: A. S. Blum and S. B. Rutkove © Humana Press Inc., Totowa, NJ
499
28_Alvaro 4/11/07 10:37 PM Page 499

depolarize neurons that are appropriately oriented in relationship to the magnetic fields and thesecondarily induced current, and generate action potentials (Fig. 1A).
During the past 15 yr, the term “TMS” has become established, even though it is a mis-nomer. It is true that the neurons are stimulated and depolarized transcranially by the TMScoil applied to the scalp, even though the behavioral outcome may be disruptive, rather thanactivating (i.e., stimulating). It is, however, not the case that magnetic fields exert the maineffect. Indeed, TMS is better conceptualized as transcranial electrodeless electric stimulationthrough electromagnetic induction, because electrical charges flow into an excitable cellmembrane, causing a change in transmembrane potential. This can result in the initiation ofan action potential, which spreads along the neural tissue.
Although TMS depolarizes neurons by virtue of the induced electric current, there aresome differences between electromagnetic induction and direct electric stimulation. Theonset latency of motor evoked potentials (MEPs) induced by TMS of the motor cortex incontralateral hand muscles is often longer than that induced by TES. Direct recording from
500 Kobayashi and Pascual-Leone
Fig. 1. (A) Principle of transcranial magnetic stimulation (TMS). The current flowing briefly inthe coil generates a changing magnetic field that induces an electric current in the tissue, in the oppo-site direction. (B) Direct recording from the surface of the spinal cord after transcranial magneticstimulation (TMS) and transcranial electric stimulation (TES). Both types of stimuli can evoke andearly spike termed a direct (D) wave and up to four further spikes, termed indirect (I) waves. The currentevoked by TMS flows in the posterior to anterior direction. TMS preferentially evokes I-waves,whereas TES evokes D-waves.
28_Alvaro 4/11/07 10:37 PM Page 500

the surface of the spinal cord has shown that both types of stimulation, TMS and TES, canevoke an early spike, termed a direct (D) wave and up to four further spikes, termed indirect(I) waves (Fig. 1B). TMS will evoke I-waves preferentially activating the pyramidal cellsindirectly, that is, transsynaptically, whereas TES activates pyramidal tract neurons directlyat their axon hillock, eliciting D-waves. For TMS, fast-conducting axons (>75 m/s) have alower threshold for D-waves, whereas slowly conducting axons (<55 m/s) have a lowerthreshold for I-waves. Conversely, for TES, the majority of axons have a lower threshold forD-waves or a similar threshold for D- and I-waves. In addition, with the stronger stimuli, thesite of activation by TES will shift below the cortex, whereas TMS will still excite axonsmostly within the cortex, even with much stronger intensity of stimuli. The different sites ofactivation by TMS and TES as well as the different distribution of D- and I-waves that theyevoke may cause the differential timing of MEPs and, in general, the differential effects ofthese noninvasive stimulation effects. However, further work on the mechanisms of action ofTMS and TES on the brain is needed to fully explore these issues.
The precise mechanisms underlying the brain effects of TMS remain filled with questionsand unknowns. Currents induced in the brain by TMS flow parallel to the plane of the stimu-lation coil (approximately parallel to the brain’s cortical surface when the stimulation coil isheld tangentially to the scalp). Therefore, in contrast to electrical cortical stimulation, TMSpreferentially activates neural elements oriented horizontally to the brain surface. Exactlywhat neural elements are activated by TMS remains unclear and may, in fact, be variableacross different brain areas and different subjects. The combination of TMS with other neu-roimaging and neurophysiological techniques provides an enhanced understanding of themechanisms of action of TMS and a novel approach to the study functional connectivitybetween different areas in the human brain.
3. EQUIPMENT
The design of magnetic stimulators is relatively simple. They consist of a main unit and astimulating coil (Fig. 2). The main unit is composed of a charging system, one or more energystorage capacitors, a discharge switch, and circuits for pulse shaping, energy recovery, andcontrol functions. Different charging systems are possible; the simplest design uses step-uptransformers operating at a line frequency of 50 to 60 Hz. Energy storage capacitors can alsobe of different types. The essential factors in the effectiveness of a magnetic stimulator arethe speed of the magnetic field rise time and the maximization of the peak coil energy.Therefore, large energy storage capacitors and very efficient energy transfer from the capaci-tor to the coil are important. Typically, energy storage capacity is approx 2000 J, and 500 Jare transferred from the capacitors into the stimulating coil in less than 100 µs via a thyris-tor, an electronic device that is capable of switching large currents in a few microseconds.The peak discharge current needs to be several thousand amperes to induce currents in thebrain of sufficient magnitude to depolarize neural elements (~10 mA/cm2).
During transcranial brain stimulation only, the stimulating coil needs to come in close con-tact with the subject. Stimulating coils consist of one or more well-insulated coils of copperwire frequently housed in a molded plastic cover. Stimulating coils are available in a varietyof shapes and sizes. The focality of the magnetic field and, hence, of the current induced byTMS varies depending on the geometry of the stimulation coil used. Two different shapes ofcoils are most commonly used, an “8”-shaped coil and a circular coil (Fig. 2). The formerprovides a more focal means of stimulation, making fairly detailed mapping of cortical outputs
Transcranial Magnetic Stimulation 501
28_Alvaro 4/11/07 10:37 PM Page 501

502 Kobayashi and Pascual-Leone
Fig. 2. Stereotactic frameless navigation system. Under the navigation according to anatomic orfunctional imaging, the coil can be placed precisely on the subject’s scalp just above a targeted brainregion.
in cortical functions possible. Current knowledge suggests, largely based on mathematicalmodeling, that the most focal forms of TMS currently available affect an area of 0.5 × 0.5 cmat the level of the brain cortex. Stimulation is restricted to rather superficial layers in the con-vexity of the brain (cortex or gray–white matter junction) and direct effect onto deep brainstructures is not possible. Circular coils, on the other hand, can induce a more widely distri-buted electric field, possibly with greater depth penetration, and, thus, evoke MEPs more readilyor stimulate a larger brain area, both hemispheres simultaneously, which is often desirable,particularly in the study of central motor conduction times (CMCTs).
It is obviously desirable to localize the TMS coil precisely at the targeted area of the brain,a task that can be challenging if the targeted area is outside the primary motor or visual cortex.In such instances, TMS may not evoke a readily, immediately measurable effect, and scalp-to-brain relations can be quite variable from subject to subject. Digitization of the subject’s headand registration of the TMS stimulation sites onto the MRI of the subject’s head addresses suchissues of anatomic specificity of the TMS effects by identifying the actual brain target in eachexperimental subject. The use of optical digitization and frameless stereotactic systems repre-sents a further improvement. Such systems were originally developed for neurosurgical inter-ventions. With minimal adaptations to the specific needs of TMS, frameless stereotactic devicescan be used to guide the placement of the stimulation coil on the subject’s scalp to preciselytarget a particular brain region defined anatomically or by functional neuroimaging (Fig. 2).
4. SAFETY CONSIDERATIONS
TMS, especially repetitive TMS (rTMS, see Section 5.3), remains an experimental tech-nique, side effects are possible, and strict safety and ethical guidelines need to be followed.In 1996, a consensus conference on the safety of TMS/rTMS was held under the auspices of
28_Alvaro 4/11/07 10:37 PM Page 502

the National Institutes of Health and specific guidelines and precautions recommended thatshould be strictly adhered to. There are relative and absolute contraindications to TMS.Examples of contraindications include metal anywhere in the head (excluding the mouth),cardiac pacemakers and implanted medication pumps, intracranial or intracardiac electrodes,raised intracranial pressure, pregnancy, a history of seizures, a family history of epilepsy, andmedications that might increase the risk of seizures.
The main safety concern in using TMS is its potential to induce a seizure, even in subjectswithout any predisposing illness. This risk is low (on the order of 1 in 1000 studies or fewer)and essentially limited to the application of rTMS. However, it is important to note that evenwhen safety guidelines are followed, induction of a seizure is possible and, hence, laborato-ries should be set up to recognize and promptly treat a possible seizure. This is particularlythe case if rTMS is applied at higher stimulation frequencies. Table 1 shows that the maxi-mum safe durations of single trains of rTMS at various frequencies and intensities determinedfrom experience in the National Institutes of Neurological Disorders and Stroke (NINDS). Itis important to note that the NINDS researchers did reduce the allowable duration of a trainby 25% in the studies, if the potential clinical benefits would be speculative or if no clinicalbenefit would be expected. If repeated trains of rTMS are used, the inter-train interval shouldbe considered because of a cumulative increase in cortical excitability. According to Chenet al. (1997), an inter-train interval of 5 s seems to be safe if 10 trains of rTMS are used withthe inte nsity of 110% of motor threshold and at the frequency of 20 Hz. Combination of anyof the stimulating parameters should also be safe with an inter-train interval of 5 s. EvenrTMS with fewer than 10 trains should follow these guidelines for inter-train intervalsbecause of possible spread of excitation. For stimulus intensities of 120% of motor thresholdor higher, the inter-train interval should be longer than 1 min, because no potentiation wasobserved at the inter-train interval of 1 min.
Approximately 10 to 20% of subjects studied with TMS develop a muscle tensionheadache or a neck ache. Generally, these mild discomforts respond promptly to aspirin, acet-aminophen, or other common analgesics. If the subjects do not wear earplugs during therTMS studies, rTMS can also cause ringing in the ears or even transient hearing loss.Therefore, adequate ear protection is strongly recommended. Finally, it is important to realizethat TMS has only been studied for approx 15 yr and the data in humans are still few.Although animal studies have not shown any risks of brain damage or long-term injury to thebrain or its functions after TMS, caution is still imperative. This is particularly the case
Transcranial Magnetic Stimulation 503
Table 1Safe Duration/Number of Pulses for Single Trains of Repetitive Transcranial MagneticStimulation in Normal Volunteers
Repetitive transcranial magnetic stimulation intensity (% of motor threshold)
Frequency (Hz) 100 110 120 130 140 150 160
1 1800 s/1800 1800 s/1800 360 s/360 50 s/50 50 s/50 50 s/50 50 s/505 10 s/50 10 s/50 10 s/50 10 s/50 7.6 s/38 5.2 s/16 3.6 s/810 5 s/50 5 s/50 4.2 s/42 2.9 s/29 1.3 s/13 0.8 s/8 0.7 s/720 2.05 s/41 1.6 s/32 1.0 s/20 0.55 s/11 0.35 s/7 0.25 s/5 0.25 s/525 1.28 s/32 0.84 s/21 0.4 s/10 0.24 s/6 0.2 s/5 0.2 s/5 0.2 s/5
aTo add an additional margin of safety, reduce the allowable duration of a train by 25%.
28_Alvaro 4/11/07 10:37 PM Page 503

regarding cognitive deficits that might be induced by TMS. Neuropsychological assessment,appropriately tailored to the brain area stimulated, should be considered after rTMS toexclude undesirable side effects.
5. METHODS AND MEASUREMENTS OF TMS
5.1. Single-Pulse TMS
Single-pulse TMS delivered to different levels of the neuraxis (motor system) will provideinformation regarding the excitability of the motor cortex and the conduction along corti-cospinal, corticonuclear, and callosal fibers. The excitability of nerve roots and the conduc-tion along the peripheral motor pathway to the muscles will also influence the measuresobtained by TMS. In the clinical point of view, the patterns of findings will help us to localizethe level of a lesion within the nervous system, to distinguish between a predominantlydemyelinating or axonal lesion in the motor tracts, or to predict the functional motor outcome(Table 2). Similar to other neurophysiological tests, however, the abnormalities revealed byTMS are not always disease specific. It remains to be fully evaluated whether such neuro-physiological findings provide earlier prognostic indicators as those that might be obtainedfrom careful, longitudinal neurological exams.
5.1.1. Motor Threshold
When TMS is applied to the motor cortex at an appropriate stimulation intensity, MEPscan be recorded from contralateral extremity muscles. Motor threshold refers to the lowestTMS intensity necessary to evoke MEPs in the target muscle if single-pulse TMS is appliedto the representation of the targeted muscle on the motor cortex. In the majority of recentTMS studies, motor threshold is defined as the lowest intensity required to elicit MEPs ofmore than 50-µV peak-to-peak amplitude in at least 50% of successive trials, in resting oractivated (slightly contracted) target muscles. Motor threshold is thought to reflect excitabilityof the membrane of mainly corticospinal neurons and interneurons projecting onto theseneurons in the motor cortex, as well as the excitability of motor neurons in the spinal cord,neuromuscular junctions, and muscle. In addition to the membrane excitability, the motorthreshold should reflect the activities of neural inputs that may affect membrane excitability,that is, tonic inhibitory and excitatory drives onto the cortical output neurons, and also theefficacy of a chain of synapses from presynaptic cortical neurons to muscles. The change ofthe motor threshold has been studied in various diseases. Motor threshold is often increasedin diseases that may affect the corticospinal tract, such as multiple sclerosis, stroke, and brainor spinal cord injury.
When single-pulse TMS is applied over the occipital lobe, phosphenes can be induced ina large number of subjects. A similar methodology as the motor threshold can determine thethreshold for the phosphene, which may reflect the excitability of occipital cortex. Studies onphosphene threshold can provide novel insights into the neurophysiology of the human visualcortex. A decrease of the phosphene threshold, that is, increased excitability of visual cortex,has been demonstrated in healthy subjects during mental visual imagery. From a more clini-cal viewpoint, previous studies have investigated phosphene thresholds in patients sufferingfrom migraines (both with and without visual aura) for the study of the pathophysiology ofmigraine aura. According to their studies, phosphene thresholds are significantly lower in
504 Kobayashi and Pascual-Leone
28_Alvaro 4/11/07 10:37 PM Page 504

Transcranial Magnetic Stimulation 505
Table 2Diagnostic Application of Transcranial Magnetic Stimulation
TMS measure Abnormal findings Diseases and symptoms
CMCT Long MS, ALS, stroke, secodaryparkinsonism, secondarydystonia, brain injury, SCI/CS
MEP Dispersed MS, ALS, strokeSmall or absent MS, ALS, stroke, brain injury,
SCI/CS (19), hydrocephalus,Bell’s palsy
Large PD, dystoniaMEP with triple- Central conduction MS, ALS (with upper neuron damage),
stimulation failureb stroke, secondary parkinsonism, braintechnique injury, SCI/CS, hydrocephalus
Silent period Long MS, strokec, brain injury,SCI/CS, polyradiculitis, demyelinating polyneuropathy, epilepsy (63)
Short ALS, PD, dystoniaagenesis of corpus callosum
Absent SCI/CSInterhemispheric Long latencyd MS, stroke, brain injury
conduction (with transcallosal lesion), dysgenesis of corpus callosum, hydrocephalus
Reduced interhemispheric MS, ALSinhibition
Interhemispheric Stroke (with transcallosal lesion),inhibition absent dysgenesis of the corpus
callosum, hydrocephalusMotor cortex High motor thresholde MS, stroke, agenesis of corpus
excitability callosum, brain injury, SCI/CSLow motor thresholde ALS, hydrocephalus,
epilepsy (116)Increased intracortical Early-stage ALS
inhibitionDecreased intracortical PD, SCI/CS,
inhibition epilepsy (116), strokeEnlarged cortical Dystonia
representationaTMS, transcranial magnetic stimulation; CMCT, central motor conduction time; MS, multiple sclerosis; ALS,
amyotrophic lateral sclerosis; SCI, spinal cord injury; CS, cervical spondylosis; MEP, motor evoked potential; PD,Parkinson disease.
bCentral conduction failure indicates smaller size of the test MEP than that of control examined by triple-stimulation technique.
cProlonged duration with normal MEP and CMCT may be observed in the motor syndrome, with exaggeratedinhibition within the motor cortex, resembling motor neglect. See text also.
dThe latency for transcallosal inhibition (ipsilateral silent period) after single-pulse TMS (Fig. 5B).eHigh or low value of the motor threshold indicates that they are higher or lower compared with intact hemi-
sphere or healthy subjects.
28_Alvaro 4/11/07 10:37 PM Page 505

migraineurs (i.e., greater visual cortical excitability) as compared with sex- and age-matchedhealthy controls, even in asymptomatic intervals. However, these thresholds may varydepending on other factors, such as thickness of skull and scalp or medication and so on, andthat, thus, at times, it can be difficult to compare them among individual subjects and betweenhemispheres.
5.1.2. Central Motor Conduction Time
CMCT is defined as the latency difference between the MEPs induced by stimulation ofthe motor cortex and those evoked by spinal (motor root) stimulation. It is calculated by thesubtraction of the latency of peripheral segment of the motor pathway (spinal motor root tomuscle) from that of the entire motor pathway (motor cortex to muscle) (Fig. 3). If a TMScoil is placed over the back of the neck or spine, the magnetic pulse will stimulate spinalnerve roots but not the descending spinal tracts themselves. Bone is the major governor ofinduced current in the human body because ofits extremely low conductivity. The inducedelectric field and its first spatial derivative increase remarkably at the neuroforamen of thespine, whereas those induced in the spinal canal are relatively small. Indeed, it is extremelydifficult to stimulate the trunk of spinal cord with magnetic stimulation of the neck, and thelatency of elicited MEPs will not shift even when moving the coil along the rostrocaudal axisof the spine. The CMCT calculated from the data of magnetic stimulation, therefore, includesboth the true time for central motor conduction plus the time taken for at least one synapticdelay at the spinal level and the time from the proximal root to the intervertebral foramen.
506 Kobayashi and Pascual-Leone
Fig. 3. Schematic representation of the calculation of central motor conduction time (CMCT). (a) Motor evoked potential (MEP) induced by transcranial magnetic stimulation (TMS). (b) MEPafter cervical spinal root stimulation. (c) F-waves after ulnar nerve electric stimulation. CMCT isestimated by onset latency of T1 minus onset latency of T2. Using F-wave latency, it can be evaluatedmore precisely as T1 − (1/2)(F + M − 1), where T1 is the onset latency of MEP elicited by TMS, T2is the onset latency of the MEP elicited by the coil placed on the back of cervical spine, M is the onsetlatency of the M-wave by electrical ulnar nerve stimulation, and F is the onset latency of the F-waveby electrical ulnar nerve stimulation. FDI, first dorsal interosseous.
28_Alvaro 4/11/07 10:37 PM Page 506

More precise peripheral central conduction time can be calculated using F-wave latencyinstead of spinal root TMS (Fig. 3). Table 3 shows normal values of the latency of the MEPsand CMCT for the muscles used frequently for central conduction studies. Most previousstudies obtained MEPs under the facilitation of muscles, that is, slight voluntary contraction,to obtain stable MEPs with constant latencies.
Abnormalities of CMCT have been demonstrated in a variety of neurological disorders.Significant prolongation of CMCT suggests demyelination of central motor pathways,whereas low-amplitude MEPs with little delay or absence of responses are more suggestive ofloss of neurons or axons. The CMCT also correlates with the grade of motor deficits afterstroke. Measurement of CMCT can provide supporting evidence for the diagnosis of variousdiseases, and serial measures of CMCT can be used as objective markers of disease progres-sion and prognosis. However, changes in CMCT are not specific for any one particular disease.
5.1.3. Motor Evoked Potentials
The amplitude of the MEP reflects not only the integrity of the corticospinal tract but alsothe excitability of motor cortex and nerve roots and the conduction along the peripheral motorpathway to the muscles, as the motor threshold. With some lesions or diseases that affect cor-ticospinal tract, abnormal findings will be observed in the MEPs. After stroke lesions, emer-gence of the MEPs from paretic extremities induced by TMS of the motor cortex of theaffected side correlate with a favorable recovery, whereas the absence of MEPs suggests apoor outcome.
Some previous clinical studies with TMS, however, have been addressing mainly the slow-ing CMCT when evaluating corticospinal tract function. The reduced size of MEPs shouldreflect the central motor conduction failure, but, at times, their evaluation has been less suc-cessful. Even in healthy subjects, the sizes of MEPs can vary among trials for one individualsubject as well as among subjects, leading to a broad range of normal values. In addition,
Transcranial Magnetic Stimulation 507
Table 3Normal Values for Central Conductiona
Total conduction timeMuscle Age (yr) (ms) CMCT-F (ms) CMCT-S (ms)
APB 18–83 20.4 ± 1.5 (n = 150) 4.3 ± 0.8 (n = 19) 6.5 ± 1.2 (n = 222)ADM 17–75 19.3 ± 1.2 (n = 52) 5.0 ± 1.2 (n = 100) 6.2 ± 1.2 (n = 152)FDI 17–84 21.1 ± 1.6 (n = 51) 5.9 ± 1.1 (n = 51)Pollicis 25–62 20.1 ± 1.0 (n = 11) 5.8 ± 1.1 (n = 11)EDC 20–83 15.2 ± 1.5 (n = 150) 6.4 ± 1.2 (n = 150)Biceps 18–87 11.8 ± 1.2 (n = 49) 5.5 ± 1.2 (n = 122)Pectoralis 47–87 5.6 ± 1.2 (n = 53)Triceps 47–87 5.3 ± 0.7 (n = 53)Tibialis anterior 17–76 27.4 ± 2.3 (n = 202) 13.1 ± 3.8 (n = 150) 13.6 ± 1.8 (n = 106)Abductor hallucis 19–74 39.3 ± 2.4b (n = 48) 12.7 ± 1.6 (n = 50) 17.3 ± 1.8b (n = 48)
aAll data except “b” were calculated from the MEPs obtained with facilitation. CMCT-F, calculated using F-wave latencies; CMCT-S, calculated using data obtained by the transcranial magnetic stimulation of spinalroots; APB, abductor pollicis brevis; n, number of subjects in each study; ADM, abductor digiti minimi; FDI, firstdorsal interosseous; EDC, extensor digitorum communis.
bMEPs were recorded from the relaxed muscles.
28_Alvaro 4/11/07 10:37 PM Page 507

508 Kobayashi and Pascual-Leone
Fig. 4. The principle of the triple-stimulation technique (TST), consisting of a single-pulse tran-scranial magnetic stimulation (TMS) and peripheral nerve stimuli at Erb’s point and the wrist. Thesize of response to the third stimuli (one at Erb’s point) is studied (TST curve). (A) The control con-dition. (A1) A maximal stimulus is applied to Erb’s point. (A2) After a delay, a maximal stimulus isgiven at the wrist that evokes the first large response (orthodromic action potentials) and collides withdescending action potentials and cancels them (antidromic action potentials). (A3) After a delay, amaximal stimulus is applied again to Erb’s point and (A4) a synchronized response is recorded as acontrol response. (B) TST on a healthy subject. In this example, maximal TMS excites all axons.and desynchronization is assumed to occur. (B1) Maximal TMS is applied to the motor area andevokes descending volleys with various latencies, including multiple volleys (*). (B2) After a delay,a maximum stimulus is given at the wrist and cancels the descending action potentials with variouslatencies. (B3) The second discharge (*) on the axon is not cancelled and causes a small response.(B4) After a delay, a maximal stimulus is applied at Erb’s point, and the synchronized response
28_Alvaro 4/11/07 10:37 PM Page 508

Transcranial Magnetic Stimulation 509
Fig. 4. (Continued) from all axons excited initially by TMS is recorded as a second response. (C)TST on a subject with a partial failure of central conduction. (C1) Even maximal TMS could notexcite all axons. (C2–C4) Because of the conduction failure, only a part of the peripheral nerves issynchronized, and the TST test curve is smaller than that of the TST control curve. Stim, stimulus.
MEPs by TMS are usually much smaller than compound muscle potentials evoked by periph-eral nerve stimulation, and TMS does not seem to accomplish depolarization of all spinalmotor neurons.
Solving these problems, Magistris et al. (1999) developed a triple-stimulation technique,which has provided a quantitative electrophysiological measurement of the central motorconduction failure (Fig. 4). With their method, applying peripheral stimuli at Erb’s point andwrist stimulation as well as TMS, they have induced two collisions in the peripheral motorneurons and have successfully suppressed the desynchronization of MEPs caused by multi-ple descending volleys evoked by TMS. Their methods demonstrate that TMS can depolarizealmost all spinal motor neurons supplying target muscle in healthy subjects. According totheir data, the sizes of MEPs by TMS get smaller than those of compound muscle potentialsbecause of “phase cancellation,” in which the negative phases of individual motor unit poten-tials are cancelled by the positive phases of others, because of their various latencies. Theirnew technique provides new insights into corticospinal tract conduction of healthy subjectsand, when applied to patients with corticospinal dysfunction, is 2.75 times more sensitivethan conventional MEPs in detecting corticospinal conduction failures. This technique, thus,improves detection and also gives quantitative information on deficits of the corticospinalconduction. Further studies are required, but the triple-stimulation technique will be useful infollowing clinical courses of patients and be beneficial for assessment and following treat-ment of disorders affecting central motor conduction.
5.1.4. Silent Period
If a subject is instructed to maintain muscle contraction of a targeted muscle and a singleTMS pulse with suprathreshold intensity is applied over the motor cortex representing thetargeted muscle, the EMG activity of the muscle will be arrested for a few hundred millisecondsafter the MEP (Fig. 5A). This period of EMG suppression is referred to as a “silent period,”often defined as the time from the end of the MEP to the return of voluntary EMG activity.It is, at times, difficult to define the end of the MEPs, and some reports define the duration ofthe silent period as the time interval from stimulus delivery to the return of the voluntaryactivity. Most of this period is thought to be caused by cortical inhibitory mechanisms of themotor cortex, whereas spinal inhibitory mechanisms, such as Renshaw inhibition, are conside-red to contribute only to the first 50 or 60 ms of this suppression. The neuronal elementsresponsible for the silent period are most likely mediated by γ-aminobutyric acid-B receptors.Silent periods of abnormally short or long duration are observed in patients with variousmovement disorders.
5.1.5. Transcallosal Conduction
TMS of a single pulse delivered to one motor cortex can suppress ongoing voluntary EMGactivity in small hand muscles ipsilateral to the side of the TMS. This can be demonstratedby having the subjects maintain the intrinsic hand muscles contracted with more than 50% of
28_Alvaro 4/11/07 10:37 PM Page 509
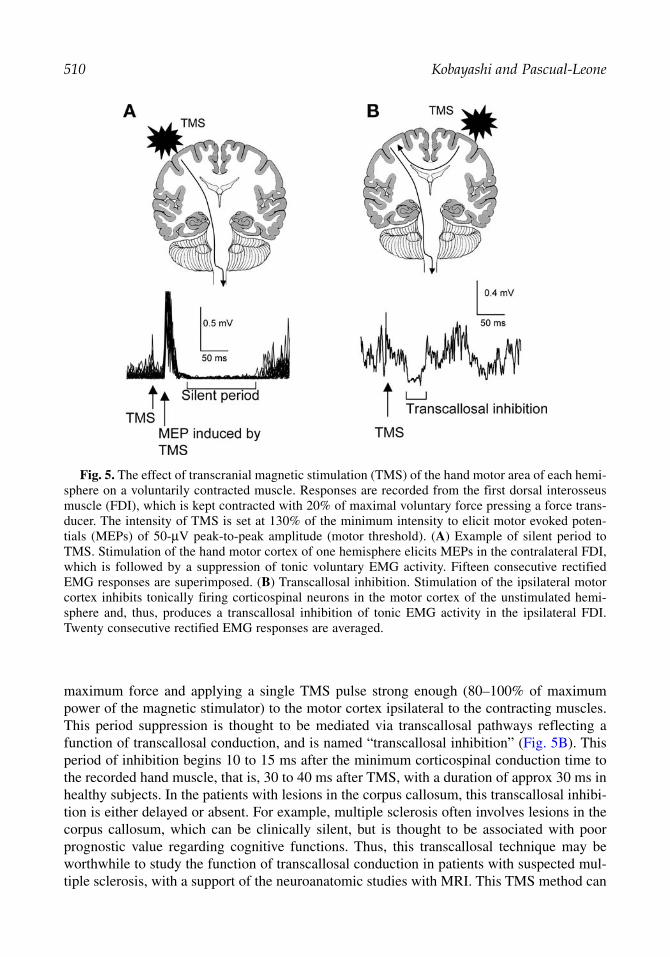
510 Kobayashi and Pascual-Leone
Fig. 5. The effect of transcranial magnetic stimulation (TMS) of the hand motor area of each hemi-sphere on a voluntarily contracted muscle. Responses are recorded from the first dorsal interosseusmuscle (FDI), which is kept contracted with 20% of maximal voluntary force pressing a force trans-ducer. The intensity of TMS is set at 130% of the minimum intensity to elicit motor evoked poten-tials (MEPs) of 50-µV peak-to-peak amplitude (motor threshold). (A) Example of silent period toTMS. Stimulation of the hand motor cortex of one hemisphere elicits MEPs in the contralateral FDI,which is followed by a suppression of tonic voluntary EMG activity. Fifteen consecutive rectifiedEMG responses are superimposed. (B) Transcallosal inhibition. Stimulation of the ipsilateral motorcortex inhibits tonically firing corticospinal neurons in the motor cortex of the unstimulated hemi-sphere and, thus, produces a transcallosal inhibition of tonic EMG activity in the ipsilateral FDI.Twenty consecutive rectified EMG responses are averaged.
maximum force and applying a single TMS pulse strong enough (80–100% of maximumpower of the magnetic stimulator) to the motor cortex ipsilateral to the contracting muscles.This period suppression is thought to be mediated via transcallosal pathways reflecting afunction of transcallosal conduction, and is named “transcallosal inhibition” (Fig. 5B). Thisperiod of inhibition begins 10 to 15 ms after the minimum corticospinal conduction time tothe recorded hand muscle, that is, 30 to 40 ms after TMS, with a duration of approx 30 ms inhealthy subjects. In the patients with lesions in the corpus callosum, this transcallosal inhibi-tion is either delayed or absent. For example, multiple sclerosis often involves lesions in thecorpus callosum, which can be clinically silent, but is thought to be associated with poorprognostic value regarding cognitive functions. Thus, this transcallosal technique may beworthwhile to study the function of transcallosal conduction in patients with suspected mul-tiple sclerosis, with a support of the neuroanatomic studies with MRI. This TMS method can
28_Alvaro 4/11/07 10:37 PM Page 510

be associated with the paired-pulse TMS technique to investigate interhemispheric interac-tions further (see Section 5.2.2.).
5.2. Paired-Pulse TMS5.2.1. Paired-Pulse TMS to Examine Intracortical Inhibitory and Facilitatory Mechanisms
Combining a subthreshold conditioning stimulus with a suprathreshold test stimulus at dif-ferent short (1–20 ms) interstimulus intervals through the same TMS coil (Fig. 6A), it is possi-ble to study inhibitory and facilitory interactions in the cortex and examine the functionalintegrity of intracortical neuronal structures. The effects of the conditioning TMS on the size oftest MEP depend on the stimulus intensity and the interstimulus interval. In a number of previ-ous studies using this paired-pulse TMS paradigm, the conditioning TMS is most commonly setat 60 to 80% of the resting motor threshold because the conditioning TMS with this intensitycan induce stable effects on the test MEP and will not cause any descending volleys, avoidingany modification of the excitability at the spinal level. If a conditioning stimulus is set at 60 to80% of the resting motor threshold, maximum inhibitory effects are found at short interstimu-lus intervals of 1 to 4 ms. The maximum amount of this inhibition is usually 20 to 40% of thetest MEP. Facilitory effects of the conditioning TMS pulse with the same subthreshold intensityonto the test MEP can be observed at intervals of 7 to 20 ms. The magnitude of this facilitationis very variable across subjects, from 120 to 300% of the test MEPs. The amount of these effectscan vary depending on the size of test MEPs, and, thus, for this paired-pulse TMS study, it iscritical to maintain the relaxation of patients and adjust the size of test MEPs across trials andsubjects. Previous studies, applying this method on the motor representation of various muscles,showed that these phenomena of intracortical inhibition and facilitation are very similar forintrinsic hand muscles, lower face, leg, or proximal arm muscles, indicating that these intracor-tical mechanisms are similar across different motor representations. The intracortical inhibitionand facilitation measured by this technique are induced by separate mechanisms and theireffects seem to originate at the motor cortical level, but not at subcortical or spinal levels.
This paired-pulse technique has also been used to examine the effects of CNS-active drugson the human motor cortex. In this context, paired-pulse TMS might be useful in selectingthe best-suited medication for a given patient by matching the identified abnormality in agiven disorder with the effects of different pharmaceutical agents. Such a neurophysiology-based approach to medication selection in epilepsy or psychosis would certainly be desirable,although systematic studies are needed.
Paired-pulse TMS can also reveal changes of the excitability in the motor cortex induced byvarious neurological and psychiatric diseases (Table 2). These results, however, appear to benonspecific for each disease. For example, essentially the same abnormalities in the paired-pulse curve can be seen in dystonia and idiopathic Parkinson disease (PD). Furthermore, disor-ders without clear motor cortex pathology, such as schizophrenia, depression, orobsessive–compulsive disorder have been found to cause alterations of the intracortical inhibi-tion and facilitation, hence, raising further questions regarding the specificity of these findings.Nevertheless, longitudinal studies of the clinical neurophysiology using this paired-pulse TMStechnique may well have prognostic significance for neurological and psychiatric diseases.
5.2.2. Paired-Pulse Paradigm to Examine Interhemispheric Interactions
The term paired-pulse TMS can also be used to refer to the application of single stimuli to twodifferent brain regions. For instance, interhemispheric interactions and transcallosal conduction
Transcranial Magnetic Stimulation 511
28_Alvaro 4/11/07 10:37 PM Page 511

512 Kobayashi and Pascual-Leone
Fig. 6. (A) The change of motor evoked potential (MEP) sizes obtained by the pairedconditioning–test–stimulus paradigm from the first dorsal interosseus (FDI) muscle. The intensity of con-ditioning transcranial magnetic stimulation (TMS) was set to 80% of resting motor threshold. The inten-sity of test TMS was adjusted to produce a control MEP of an average peak-to-peak amplitude of 1 mVwhen given alone. In the graph, the size of the MEPs is expressed as a percentage of the control, uncon-ditioned MEPs, and plotted against the interstimulus interval. Data are means of eight healthy subjects(mean age, 31.6 ± 4.9 yr). Error bars indicate standard errors. Note that the conditioning stimulus inhibi-ted the test MEP at short interstimulus intervals (1–4 ms), but facilitated the test MEP at longer intervals(6–20 ms). (B) Modulation of the amplitude of the MEPs induced in the FDI by TMS of the contralateralmotor cortex as a consequence of a conditioning TMS pulse applied to the motor cortex of the oppositehemisphere (ipsilateral to the target FDI). The intensity of the conditioning TMS was set to 110% of rest-ing motor threshold (for induction of MEPs in the contralateral FDI), and the intensity of test TMS wasadjusted to produce a control MEP of an average peak-to-peak amplitude of 1 mV when given alone. In the graph, the size of MEPs is expressed as a percentage of the control, unconditioned TMS, and plot-ted against the interstimulus interval. Data are means of eight healthy subjects (mean age, 31.6 ± 4.9 yr).Error bars indicate standard errors. Note the significant inhibition at the interstimulus interval of 7 to 12 ms.
times between motor cortices in both sides can be examined, applying a conditioningsuprathreshold stimulus to one motor cortex and the following test TMS pulse after a short inter-val (4–30 ms) to the other motor cortex. This paradigm was first introduced by Ferbert et al. (1992), who showed that the cortical excitability of one motor cortex is decreased
28_Alvaro 4/11/07 10:37 PM Page 512

7 to 15 ms after suprathreshold TMS of the opposite motor cortex (Fig. 6B). This interhemi-spheric interaction is influenced by the intensity of the conditioning TMS; the stronger the conditioning TMS, the greater and longer the induced interhemispheric inhibition. In addition tointerhemispheric inhibition, Ugawa et al. (1993) have reported early interhemispheric facilita-tion, which can be observed at interstimulus intervals of 4 to 5 ms, using conditioning TMS of relatively low intensity.
This methodology allows the investigation of interhemispheric interactions in a variety of cir-cumstances. For instance, musical instrumentalists have been shown to have less interhemi-spheric interactions than nonmusicians. Right-handed people have more significantinterhemispheric influence of the right, nondominant side by the dominant side, than in the oppo-site direction. Patients with cortical myoclonus show no such interhemispheric interactions, sug-gesting affected transcallosal or cortical inhibitory interneurons. Patients with mirror movementsor those recovering from a stroke are likely to show changes in these interhemispheric influences.
5.3. Repetitive TMS
Generally, rTMS refers to the application of a train of TMS pulses of the same intensity toa single brain area at a given frequency. The frequency can range from 1 stimulus per secondto 20 or more. The higher the stimulation frequency and intensity, the greater is the disrup-tion of cortical function during the applied train of stimulation. However, after such immediateeffects, a train of rTMS can also induce a modulation of cortical excitability, which may lastbeyond the duration of the rTMS itself. This effect may range from inhibition to facilitation,depending on the stimulation parameters (particularly frequency of stimulation). Lowerfrequencies of rTMS with the 1-Hz stimulation applied over the motor cortex can suppressexcitability of the targeted motor cortex, whereas 20-Hz stimulation trains seem to lead to atemporary increase in cortical excitability. Although these effects vary among individuals, theeffect of low-frequency rTMS is relatively robust and long lasting and can be applied to themotor cortex and to other cortical region to study brain–behavior relations.
The mechanisms of this modulation of cortical excitability beyond the duration of therTMS train are still unclear. Long-term potentiation and depression of cortical synapses orclosely related neuronal mechanisms have been drawn as possible mechanisms to explain theeffect of high- and low-frequency rTMS, respectively. Animal studies suggest that modula-tion of neurotransmitters and gene induction may contribute to these long lasting modulatoryeffects of rTMS.
The lasting modulation of cortical activity by rTMS is not limited to motor cortical areas.There is also evidence that these long-lasting effects of rTMS can be induced in areas outsidethe motor cortex and be associated with measurable behavioral effects, including visual,prefrontal, and parietal cortex as well as the cerebellum. This approach, using long-lastingmodulation of cortical activity, so-called “off-line effect of rTMS,” both locally and alongfunctional neural networks, can be extremely useful to study brain–behavior relations.
5.3.1. Clinical Use of rTMS
The lasting, modulatory effects of rTMS on the excitability of the cerebral cortex have alsobeen observed in patients with neurological and psychiatric disorders, leading to behavioraland possibly therapeutic effects. A number of studies on a variety of neurological disordersare providing tantalizing results on applications of rTMS. To establish a clinical therapeuticindication, however, well-controlled, multicenter randomized clinical trials with sufficiently
Transcranial Magnetic Stimulation 513
28_Alvaro 4/11/07 10:37 PM Page 513

high numbers of patients are required, and it may be worth pursuing trials for some neuro-logical disorders.
The potential clinical application of rTMS for major depression is the most thoroughlystudied. Lasting beneficial effects have been seen in approx 40% of patients with medication-resistant depression in recent publications. It is reported that both high-frequency rTMS ofthe left dorsolateral prefrontal cortex and low-frequency rTMS of the right side can improvedepression. It seems that patients with decreased cerebral metabolism may respond better tohigh-frequency stimulation and those with hypermetabolism may respond better to low-frequency stimulation, which is in line with the frequency-dependant effects of rTMS on themotor cortical excitability.
In PD, sub-motor threshold rTMS at high frequency (5 Hz) to the motor cortex has beenshown to improve contralateral hand performance in some studies. However, other studieshave not been able to confirm this effect. There are two rationales for rTMS trials in PD:
1. Increasing cortical excitability to thalamocortical drive, which is believed to be lacking in thisdisease.
2. Modifying catecholamine metabolism subcortically through cortical stimulation.
However, at this point, any beneficial effect of rTMS in PD is unproven and speculative.Because the physiological studies of task-specific dystonia have suggested hyperexcitability
of the motor cortex or a failure of intracortical inhibition, rTMS of the motor cortex at 1 Hzhas resulted in a clinical improvement in patients with writers’ cramp. In tic disorders, a sim-ilarly abnormal increase of cortical excitability has been reported, and 1-Hz rTMS of themotor cortex may reduce the frequency of tics. These effects are transient and not meaning-ful for all patients, but the data suggest the impaired inhibitory mechanisms in the motorcortex of these patients.
Using low-frequency rTMS, several other studies have shown successful reduction in thefrequency of seizures or abnormal movements caused by intractable seizures or corticalmyoclonus, although in very small numbers of patients. Similar logic might be applicable tospasticity, intractable neurogenic pain, or schizophrenia, in which suppression of abnormallyincreased cortical excitability might achieve desirable symptomatic relief.
Outcome after stroke may be favorably influenced by rTMS, suppressing abnormal, mal-adaptive cortical plasticity and enhancing adaptive cortical activity to promote neurorehabil-itation. Some activities in the uninjured brain could reflect beneficial cortical reorganizationpromoting functional recovery, but some may be maladaptive, generating the behaviors that,if suppressed, would improve functional outcome. Indeed, after stroke, some patients maysuffer from some additional symptoms, involving abnormal hyperactivity of the residualbrain. Contralesional spatial neglect after stroke is not only caused by the lesion but prima-rily caused by the hyperactivity of the intact hemisphere and 1-Hz rTMS of the unaffectedparietal lobe; suppressing excitability of the intact hemisphere can improve contralesionalvisuospatial neglect after stroke. In addition, it patients with Broca’s aphasia caused by leftfrontal stroke may improve their naming after 1-Hz rTMS of the right Brodmann’s area 45,which is supposedly overactivated in patients with unrecovered, nonfluent aphasia. It ispremature to propose these observations as realistic therapeutic applications, but rTMS canshow us the property of plastic changes of the cortical circuitry after brain damages and mayhint at novel clinical interventions.
514 Kobayashi and Pascual-Leone
28_Alvaro 4/11/07 10:37 PM Page 514

SUGGESTED READING
Berardelli A. Transcranial magnetic stimulation in movement disorders. Electroencephalogr ClinNeurophysiol 1999;51(Suppl):276–280.
Chen R, Gerloff C, Classen J, et al. Safety of different inter-train intervals for repetitive transcranialmagnetic stimulation and recommendations for safe ranges of stimulation parameters.Electroencephalogr Clin Neurophys 1997;105:415–421.
Ferbert A, Priori A, Rothwell JC, J, et al. Interhemispheric inhibition of the human motor cortex J Physiol 1992;453:525–546
Fitzgerald PB, Brown TL, Daskalakis ZJ. The application of transcranial magnetic stimulation inpsychiatry and neurosciences research. Acta Psychiatr Scand 2002;105:324–340.
Gugino LD, Romero JR, Aglio L, et al. Transcranial magnetic stimulation coregistered with MRI: acomparison of a guided versus blind stimulation technique and its effect on evoked compoundmuscle action potentials. Clin Neurophysiol 2001;112:1781–1792.
Kobayashi M, Pascual-Leone. Transcranial magnetic stimulation in neurology. Lancet Neurology2003;3:145–156.
Kujirai T, Caramia MD, Rothwell JC, et al. Corticocortical inhibition in human motor cortex. J Physiol 1993;471:501–519.
Magistris MR, Rosler KM, Truffert A, et al. A clinical study of motor evoked potentials using a triplestimulation technique. Brain 1999;122:265–279.
Mills KR. Magnetic Stimulation of the Human Nervous System. Oxford University Press, Oxford,England, 1999.
Pascual-Leone A, Davey N, Wassermann EM, Rothwell J, Puri BK, eds. Handbook of TranscranialMagnetic Stimulation. Arnold, London, UK, 2001.
Pascual-Leone A, Valls-Sole J, Wassermann EM, Hallett M. Responses to rapid-rate transcranial mag-netic stimulation of the human motor cortex. Brain 1994;117:847–858.
Rossini PM. Is transcranial magnetic stimulation of the motor cortex a prognostic tool for motorrecovery after stroke? Stroke 2000;31:1463–1464.
Rossini PM, Barker AT, Berardelli A, et al. Non-invasive electrical and magnetic stimulation of thebrain, spinal cord and roots: basic principles and procedures for routine clinical application.Report of an IFCN committee. Electroencephalogr Clin Neurophysiol. 1994;91:79–92.
Rossini PM, Rossi S. Clinical applications of motor evoked potentials. Electroencephalogr ClinNeurophysiol 1998;106:180–194.
Sparing R, Mottaghy FM, Ganis G, et al. Visual cortex excitability increases during visual mentalimagery: a TMS study in healthy human subjects. Brain Res 2002;938:92–97.
Ugawa Y, Hanajima R, Kanazawa I. Interhemispheric facilitation of the hand area of the human motorcortex. Neurosci Lett 1993;160:153–155
Walsh V, Pascual-Leone A. Neurochronometrics of Mind: TMS in Cognitive Science. MIT Press,Cambridge, MA, 2003.
Wassermann EM, Lisanby SH. Therapeutic application of repetitive transcranial magnetic stimula-tion: a review. Clin Neurophysiol 2001;112:1367–1377.
Weber M, Eisen AA. Magnetic stimulation of the central and peripheral nervous systems. MuscleNerve 2002;25:160–175.
Transcranial Magnetic Stimulation 515
28_Alvaro 4/11/07 10:37 PM Page 515

28_Alvaro 4/11/07 10:37 PM Page 516

Index 517
Index
517
Absence epilepsy, pediatric electroencephalogram,182, 183, 186
AC, see Alternating currentAcetylcholine receptor,
intercellular communication, 29main immunogenic region, 354
Actigraphy, 433Action potential,
ion channels, 23–25, 38population spike in electroencephalogram, 25propagation, 39transmission, 26
Active transport, 36, 37Acute inflammatory demyelinating
polyradiculoneuropathy (AIDP),diagnostic criteria, 278, 281pediatric electromyography, 378, 379
ADC, see Analog-to-digital converterADHD, see Attention deficit/hyperactivity disorderAdolescents, see Pediatric electroencephalogramAIDP, see Acute inflammatory demyelinating
polyradiculoneuropathyAIN, see Anterior interosseus neuropathyAlpha coma, 135, 137Alpha rhythm, electroencephalogram,
normal rhythm, 58–60variant patterns,
adults, 83–85children,
fast alpha variant, 176slow alpha variant, 172
ALS, see Amyotrophic lateral sclerosisAlternating current (AC), 6, 8AMPA receptor, intercellular communication, 27,
28Amplifier, 10, 11Amyotrophic lateral sclerosis (ALS), 290, 291, 321Analog-to-digital converter (ADC), 14, 15ANS testing, see Autonomic nervous system testingAnterior interosseus neuropathy (AIN), 255Apnea,
central apnea, 413, 415, 421, 422mixed apnea, 413, 416obstructive apnea, 413, 414, 423
Attention deficit/hyperactivity disorder (ADHD),epileptiform activity, 180
Atypical partial benign epilepsy of childhood, 194,198
Autonomic nervous system (ANS) testing,blood pressure recording, 450, 451heart rate,
recording, 450respiratory sinus arrhythmia, 452–45430:15 ratio, 454Valsalva maneuver response, 451, 452
indications, 448microneurography, 457, 458neuroanatomy, 447–449patient preparation, 450sympathetic function tests,
head-up tilt-table testing, 454, 455sympathetic skin response, 456, 457Valsalva maneuver, 455, 456
A-wave, 213, 214Axillary neuropathy, 263
BAEP, see Brainstem auditory evoked potentialBell’s palsy,
clinical features, 319initial evaluation, 319, 320later studies, 320
Benign epileptiform transients of sleep (BETS), 88,90, 103, 107
Benign myoclonic epilepsy of infancy, 182Benign occipital epilepsy, electroencephalogram,
189, 191Benign Rolandic epilepsy (BRE),
electroencephalogram, 189, 190Beta activity, electroencephalogram,
focal ictal patterns, 119, 121overview, 60
BETS, see Benign epileptiform transients of sleepBlink reflex, 315–317Botulism, 363, 364, 3821Brachial plexopathy,
anatomy, 300, 301electrodiagnostics
electromyography, 302, 303nerve conduction studies,
F-waves, 302motor nerve, 301sensory nerve, 301, 302
nerve root stimulation, 302patterns by disorder, 303, 306pediatric electromyography, 377, 378
pathophysiology, 301
Blum_Index_996_4_Final 4/17/07, 8:26 AM517
518 Index
Brain death, electroencephalogram, 135, 138, 139Brainstem auditory evoked potential (BAEP),
audiitory pathway anatomy, 475, 476interpretation, 479–482patient-related variables, 478, 479recording, 477, 478stimulation, 477waveforms, 476, 477
BRE, see Benign Rolandic epilepsyBurst suppression, coma, 135, 136
Canal of Guyon, 257, 258Capacitive reactance, 6Capacitor, 5, 6, 9, 26Carpal tunnel syndrome (CTS),
clinical presentation, 252differential diagnosis, 252, 253electromyography, 254nerve conduction study, 253, 254treatment, 254
Central apnea, 413, 415, 421, 422Central motor conduction time (CMCT), 506, 507Centrotemporal spikes, 110–113Cerebellopontine angle (CPA) tumor, brainstem
auditory evoked potential, 479, 480,482
Channel gating, 22, 23Charcot-Marie-Tooth disease,
pediatric electromyography, 379, 380polyneuropathy, 279, 280
Cheyne-Stokes respiration, 135Children, see Pediatric electroencephalogram;
Pediatric electromyographyChronic inflammatory demyelinating
polyradiculoneuropathy (CIDP),diagnostic criteria, 278, 282pediatric electromyography, 379, 380
CIDP, see Chronic inflammatory demyelinatingpolyradiculoneuropathy
CMAP, see Compound motor action potentialCMCT, see Central motor conduction timeComa, electroencephalogram, 132, 134–137Complex repetitive discharges (CRDs), 235–237Compound motor action potential (CMAP),
measurement, 209, 210, 220, 357Conductor, 4Cone-shaped (O) waves, 92, 96Continuous spike waves of sleep (CSWS), 180, 202Coulomb, 3CPA tumor, see Cerebellopontine angle tumorCramp discharge, 239Cranial nerves, see specific nervesCRDs, see Complex repetitive dischargesCSWS, see Continuous spike waves of sleep
CTS, see Carpal tunnel syndromeCurrent, 3–5
DC, see Direct currentDepolarization, 26Dermatomyositis, electromyography, 347Diabetic amyotrophy, 308Direct current (DC), 6Doose syndrome, see Myoclonic astatic epilepsyDrug withdrawal, electroencephalogram activation,
80
ECF, see Extracellular fluidECI, see Electrocerebral inactivityEDB, see Extensor digitorum brevisEdinger-Westphal nucleus, 449EEG, see ElectroencephalogramEKG, see ElectrocardiographyElectrical safety, 15–17Electrical status epilepticus of sleep (ESES), 198Electrocardiography (EKG), sleep studies, 418Electrocerebral inactivity (ECI), 135, 138, 139Electroencephalogram (EEG),
activation,drug withdrawal, 80hyperventilation, 62, 73–77photic stimulation, 62–64, 77, 78sleep deprivation, 78–80
age-dependent variants, 98alpha rhythm, 58–60, 83–85awake and resting state, 58benign epileptiform transients of sleep, 88, 90beta activity, 60brain death, 135, 138, 139coma, 132, 134–137digital signal analysis, 14, 15electrodes,
placement, 12types, 11, 12
epileptiform abnormalities, see Ictal patterns;Interictal epileptiform abnormalities;Periodic epileptiform discharges
epileptiform variant patterns, see Epileptiformvariant patterns
focal slowing, 127–129frontal arousal rhythm, 88generalized slowing, 129–132lambda wave, 60, 62, 91, 93lambdoids, 92, 94–96montages, 12, 46mu rhythm, 60, 61, 85, 86pediatric, see Pediatric electroencephalogramphysiological basis, 29–31polysomnography, see Polysomnography
Blum_Index_996_4_Final 4/17/07, 8:26 AM518

Index 519
population spike, 25recording principles, 57, 58sleep recordings, 64–70subclinical rhythmic electrographic discharge,
85, 88theta rhythm, 60, 85, 87, 88youth waves, 97, 98
Electromyography (EMG),brachial plexopathy, 302, 303carpal tunnel syndrome, 254chin electromyography in sleep staging, 401, 402cranial muscles, 318, 319femoral neuropathy, 266limb electromyography in sleep studies, 418, 419loudspeaker/amplifier, 230, 231lumbosacral plexopathy, 308motor unit potential,
activation, 242, 243age-dependent changes, 248amplitude, 241duration, 240, 241needle placement and morphology, 246, 248phases, 241, 242recruitment, 242time course of abnormality development,
myopathic disorders, 243, 246neurogenic disorders, 243
voluntary motor activity evaluation, 24muscle strength, 248myopathy, see Myopathyneedle electrode, 229, 230neuromuscular transmission studies,
motor unit potential, 357single-fiber electromyography, 359–362
normal muscle physiology,insertional activity, 331motor unit action potential, 330–333motor unit recruitment, 333, 334spontaneous activity, 331
oscilloscope, 230pediatric, see Pediatric electromyographyperoneal neuropathy, 265polyneuropathy, 276radiculopathy and motor neuron disease
electrodiagnostics, 293–296sampling error, 248sciatic neuropathy, 267, 268spontaneous potentials,
motor neurons,cramp discharge, 239doublets, triplets, and multiplets, 238fasciculation potential, 237, 238myokymic discharge, 238, 239neuromyotonic discharge, 239
muscle fibers,complex repetitive discharges, 235–237fibrillation potentials, 232, 233myotonic discharges, 234, 235positive sharp waves, 233, 234
superficial radial sensory neuropathy, 261, 262tarsal tunnel syndrome, 268technique, 231ulnar neuropathy,
elbow, 256, 257wrist, 258, 259
volume conduction effects,end-plate spikes, 50fibrillation potentials and positive sharp
waves, 49, 50motor unit potentials, 50
EMG, see ElectromyographyEpilepsy with GTCS on awakening, 183, 189Epileptiform variant patterns,
benign epileptiform transients of sleep, 88, 90children, 172–17614- and 6-Hz positive bursts, 88, 89, 109, 110,
172phantom spike and wave, 91, 110wicket spikes, 91, 92
EPSP, see Excitatory postsynaptic potentialESES, see Electrical status epilepticus of sleepEvoked potentials, see Brainstem auditory evoked
potential; Motor evoked potential;Somatosensory evoked potential;Visual evoked potential
Excitatory postsynaptic potential (EPSP), 27, 29–31Extensor digitorum brevis (EDB), 224, 225Extracellular fluid (ECF), 35, 36Eyelid myoclonus with absences,
electroencephalogram, 198, 200
Facial nerve,anatomy, 313, 314conduction studies, 314
FAR, see Frontal arousal rhythmFasciculation potential, 237, 238Febrile seizure, electroencephalogram, 182, 184, 185Femoral nerve,
anatomy, 265neuropathy,
clinical presentation, 266electrophysiology, 266imaging, 266
Femoral nerve, lumbosacral plexus, 306Fibrillation potentials, 232, 233Filter, 9, 10FIRDA, see Frontal intermittent rhythmic delta
activity
Blum_Index_996_4_Final 4/17/07, 8:26 AM519

520 Index
Focal slowing, electroencephalogram, 127–129Frontal arousal rhythm (FAR), 88Frontal intermittent rhythmic delta activity
(FIRDA), 129, 131Frontal sharp waves, 112F-wave,
applications, 211, 212brachial plexopathy, 302minimum latency, 210, 211motor neuron disease, 292, 293origins, 210
GABA receptors, intercellular communication,28, 29
Gating, channels, 22, 23GBS, see Guillain-Barré syndromeGeneralized slowing, electroencephalogram,
129–132Glia, properties, 19Goldman equation, 22, 37, 38Guillain-Barré syndrome (GBS), 276, 278, 281,
378, 379
Heart rate,recording, 450respiratory sinus arrhythmia, 452–45430:15 ratio, 454Valsalva maneuver response, 451, 452
Hemifacial spasm, evaluation, 320HIHARS, see Hyperventilation-induced high-
amplitude rhythmic slowingH-reflex,
motor neuron disease, 293recording, 212, 213minimum latency, 213
Hyperventilation, electroencephalogram activationclinical significance, 76mechanism, 74overview, 62, 73, 74sobbing in children, 154, 162technique, 75, 76
Hyperventilation-induced high-amplitude rhythmicslowing (HIHARS), 183
Hypoapnea, 413, 417Hypogloseal nerve
anatomy, 318conduction studies, 318
ICES, see International Classification of EpilepticSeizures
ICF, see Intracellular fluidIctal patterns,
focal patterns, 119generalized patterns, 118, 119
Idiopathic hypersomnia, 436Impedance, 8, 9Inclusion body myositis, electromyography, 347Inductive reactance, 6Inductor, 6Infants, see Pediatric electroencephalogramInhibitory postsynaptic potential (IPSP), 27Input resistance, 26Insulator, 4Interictal epileptiform abnormalities, see also
Epileptiform variant patterns,activation and precipitants, 112, 117clinical interpretation, 117discharges by location,
centrotemporal spikes, 110–113frontal sharp waves, 112generalized spikes, 112, 114–116occipital spikes, 112temporal spikes, 110
spikes and sharp waves, 101–110Intermittent rhythmic delta activity (IRDA), 129,
130, 183International Classification of Epileptic Seizures
(ICES), 180, 181Intracellular fluid (ICF), 35, 36IPSP, see Inhibitory postsynaptic potentialIRDA, see Intermittent rhythmic delta activity
Jeavons syndrome, see Eyelid myoclonus withabsences
JME, see Juvenile myoclonic epilepsyJoule, 3, 4Juvenile myoclonic epilepsy (JME),
electroencephalogram, 183, 188
Lambda wave, electroencephalogram, 60, 62, 91, 93Lambdoids, see Positive occipital slow waves of
sleepLambert-Eaton myasthenic syndrome (LEMS), 357,
362, 363, 382Landau-Kleffner syndrome (LKS), epileptiform
activity, 180, 198, 201, 202LEMS, see Lambert-Eaton myasthenic syndromeLennox-Gastaut syndrome (LGS),
electroencephalogram, 194, 196, 197LGS, see Lennox-Gastaut syndromeLKS, see Landau-Klefner syndromeLong thoracic neuropathy, 263Lumbosacral plexopathy,
anatomy, 306electrodiagnostics,
electromyography, 308nerve conduction studies,
F-waves, 308
Blum_Index_996_4_Final 4/17/07, 8:26 AM520

Index 521
motor nerve, 307sensory nerve, 307, 308
patterns by disorder, 308, 309pathophysiology, 306
Maintenance of wakefulness test (MWT)indications, 432interpretation, 433polysomnography, 398scoring, 433techniques, 432, 433
Martin-Gruber anastomosis (MGA), 223–225Masseter reflex, 316Masseter silent period, 316, 317Median nerve,
anatomy, 251, 252neuropathy, see also Carpal tunnel syndrome,
anterior interosseus neuropathy, 255proximal median neuropathy, 254, 255
somatosensory evoked potentials, 487–489, 494Membrane potential, 20, 22, 23, 37, 38MEP, see Motor evoked potentialMEPP, see Miniature end-plate potentialMGA, see Martin-Gruber anastomosisMicroneurography, 457, 458Miniature end-plate potential (MEPP), 356Mixed apnea, 413, 416Motor evoked potential (MEP), transcranial
magnetic stimulation, 507, 509Motor neuron disease,
anatomic considerations, 290electrodiagnostic examination,
electromyography, 293–296nerve conduction studies,
F-waves, 292, 293H-reflexes, 293motor nerves, 292, 296sensory nerves, 291–292, 296
overview, 289pediatric electromyography, 376physiological considerations, 290, 291
Motor unit action potential (MUAP),myopathic muscle, 340–343normal muscle, 330–333
Motor unit potential (MUP),activation, 242, 243age-dependent changes, 248amplitude, 241duration, 240, 241morphology, 230needle placement and morphology, 246, 248phases, 241, 242recruitment, 242time course of abnormality development,
myopathic disorders, 243, 246neurogenic disorders, 243
voluntary motor activity evaluation, 240MS, see Multiple sclerosisMSLT, see Multiple sleep latency testMUAP, see Motor unit action potentialMultiple independent spike syndrome, 198Multiple sclerosis (MS), visual evoked potential,
469Multiple sleep latency test (MSLT),
indications, 431interpretation, 432polysomnography, 398scoring, 431, 432technique, 431
Mu rhythm, electroencephalogram, 60, 61, 85, 86Muscle,
anatomy, 327–329electromyography, see Electromyographyphysiology, 329, 330
Muscular dystrophy, pediatric electromyography,383, 384
Musculocutaneous neuropathy, 263MWT, see Maintenance of wakefulness testMyasthenia gravis, 364, 365, 381Myelin, 39, 40Myoclonic astatic epilepsy, electroencephalogram,
198, 199Myokymic discharge, 238, 239Myopathy,
classification, 325, 326clinical patterns, 326, 327differential diagnosis with electrophysiology,
345–347electromyography,
acute illness myopathy, 348advantages, 343, 344congenital myopathy, 348dermatomyositis, 347endocrine myopathy, 348inclusion body myositis, 347insertional activity, 335limitations, 344motor unit action potential, 340–343motor unit recruitment, 342myotonic myopathy, 348planning, 344polymyositis, 347spontaneous activity, 335–340
histopathology, 334, 335nerve conduction studies, 344, 345normal muscle anatomy and physiology, 327–
330pediatric electromyography, 383, 384
Blum_Index_996_4_Final 4/17/07, 8:26 AM521

522 Index
Myotonic discharges, 234, 235Myotonic disorders, pediatric electromyography,
384, 385Myotonic myopathy, electromyography, 348
Narcolepsy, 435, 436NCS, see Nerve conduction studyNeedle electrode examination, see
ElectromyographyNeonates, see Pediatric electroencephalogramNernst equation, 21Nernst potential, 37Nerve conduction study (NCS),
A-wave, 213, 214anatomic variations,
extensor digitorum brevis, 224, 225Martin-Gruber anastomosis, 223–225
anodal block, 219, 220averaging, 220, 221brachial plexopathy,
F-waves, 302motor nerve, 301sensory nerve, 301, 302
carpal tunnel syndrome, 253, 254compound motor action potential measurement,
209, 210cranial nerves, see specific nervesF-wave, 210–212femoral neuropathy, 266H-reflex, 212, 213lumbosacral plexopathy,
F-waves, 308motor nerve, 307sensory nerve, 307, 308
myopathy, 344, 345pediatric, see Pediatric nerve conduction studyperoneal neuropathy, 265physiological factors affecting,
age, 221, 222height, 222, 223temperature, 221
physiology of stimulation, 207polyneuropathy, 275, 276radiculopathy and motor neuron disease
electrodiagnostics,F-waves, 292, 293H-reflexes, 293motor nerves, 292, 295, 296sensory nerves, 291–292, 295, 296
recording electrodes, 218, 219sciatic neuropathy, 267, 268sensory nerve action potential measurement,
208, 209skin preparation, 217, 218
stimulus artifact, 218superficial radial sensory neuropathy, 261, 262tarsal tunnel syndrome, 268ulnar neuropathy,
elbow, 256, 257wrist, 258, 259
virtual cathode, 219volume conduction effects in sensory nerve
conduction study, 47Neuromuscular junction (NMJ),
anatomy of terminal end-plate region, 353, 354diseases,
botulism, 363, 364congenital myasthenic syndromes, 365, 366Lambert-Eaton myasthenic syndrome, 362,
363myasthenia gravis, 364, 365
neuromuscular transmission studies,electromyography,
motor unit potential, 357single-fiber electromyography, 359–362
repetitive nerve stimulation, 357–359pediatric electromyography, 381–383postsynaptic electrophysiology of neuromuscular
transmission, 356, 357presynaptic physiology, 355, 356
Neuromyotonic discharge, 239Neuron, properties, 19Neuropathy, see Polyneuropathy; specific nervesNMDA receptor, intercellular communication, 27,
28NMJ, see Neuromuscular junctionNodes of Ranvier, 40Nonconvulsive status epilepticus, coma induction,
132, 133
Obstructive apnea, 413, 414, 423Obturator nerve, lumbosacral plexus, 306Occipital intermittent rhythmic delta activity
(OIRDA), 183, 187Occipital spikes, 112Occipital spikes of blindness, 110OIRDA, see Occipital intermittent rhythmic delta
activityOptic nerve dysfunction, visual evoked potential,
469, 470Optic neuritis, visual evoked potential, 467, 469O waves, see Cone-shaped waves
Parallel, circuit, 5, 6Parasomnias, 436–439Paroxysmal depolarization shift (PDS), 32Parsonage-Turner syndrome, 303Passive transport, 36
Blum_Index_996_4_Final 4/17/07, 8:26 AM522

Index 523
PDS, see Paroxysmal depolarization shiftPediatric electroencephalogram,
abnormalities,benign epileptic syndromes, 182–192malignant epileptic syndromes, 192–202overview, 179–181
adolescents, 165, 171, 172early childhood, 154, 160–164infancy,
early infantile epileptic encephalopathy, 193infantile spasms, 193–195normal electroencephalogram, 154–159severe myoclonic seizures, 193
late childhood, 165, 168–170neonates,
myoclonic encephalopathy, 193preterm infants, 141–148seizures, 192term infants, 142, 150–153
normal variant patterns, 172–176preschool children, 165–167
Pediatric electromyography,applications, 369findings,
brachial plexus injury, 377, 378mononeuropathy, 380, 381motor neuron disease, 376myopathy, 383, 384myotonic disorders, 384, 385neuromuscular junction, 381–383polyneuropathy, 378–380sensory neuropathy, 376, 377
indications, 374–376technique and parameters, 372, 373
Pediatric nerve conduction study, technique andparameters, 370–372
Periodic epileptiform discharges,overview, 119, 122periodic generalized sharp complexes, 122periodic generalized sharp waves with one-per-
second frequency, 122, 123periodic lateralized epileptiform discharges, 122,
124Periodic limb movement disorder (PLMD), 439Peroneal nerve,
anatomy, 264lumbosacral plexus, 306neuropathy at fibular head,
clinical presentation, 264electrophysiology, 265pediatric electromyography, 381
Phantom spike and wave, 91, 110, 172, 173Photic stimulation, electroencephalogram,
clinical significance, 78
mechanism, 77, 78overview, 62–64, 77technique, 78
Photosensitive epilepsy, 198PIN, see Posterior interosseous neuropathyPlexopathy, see Brachial plexopathy; Lumbosacral
plexopathyPLMD, see Periodic limb movement disorderPolymyositis, electromyography, 347Polyneuropathy,
acute axonal sensorimotor polyneuropathies, 282acute demyelinating sensorimotor
polyneuropathies, 281, 282chronic axonal sensorimotor polyneuropathies,
282chronic demyelinating sensorimotor
polyneuropathies, 282differential diagnosis,
acquired versus inherited polyneuropathies,279, 280
axonal versus demyelinating injury, 277–279multiple mononeuropathies, 282–285small fiber neuropathies, 280
electromyography, 276motor polyneuropathies, 281nerve conduction studies, 275, 276pediatric electromyography, 378–380sensory polyneuropathies, 281
Polysomnography,body position, 419components, 396, 397electrocardiography, 418historical perspective, 393, 394idiopathic hypersomnia, 435indications, 396interpretation, 419, 421–432limb movement recording, 418–420maintenance of wakefulness test, 398, 430, 431medication effects, 398, 404multiple sleep latency test, 398, 431, 432narcolepsy, 434, 435parasomnias, 435–438periodic limb movement disorder, 438respiratory measures,
airflow, 411, 412oxygen saturation, 413respiratory effort, 413
restless legs syndrome, 438, 441sleep stage scoring,
chin electromyography, 401, 402electroencephalography, 398, 401eye movement recording, 401normative values, 398, 403rules,
Blum_Index_996_4_Final 4/17/07, 8:26 AM523
524 Index
EEG arousals, 406movement arousal, 406movement time, 404, 406overview, 398–400rapid eye movement sleep, 408, 410stage 1, 406, 407stage 2, 406–408stage W, 404, 405stages 3 and 4, 407–409
sleep variables, 398, 401sleep-related breathing disorders, 433, 434video polysomnography, 419
Polyspikes, 103, 105, 118Positive occipital slow waves of sleep (POSTS), 92,
94–96, 165, 170Positive sharp waves (PSWs), 233, 234Posterior interosseous neuropathy (PIN), 260Posterior slow waves of youth, 97, 98, 165, 166Posterior tibeal nerve, somatosensory evoked
potentials, 489–491, 494POSTS, see Positive occipital slow waves of sleepPotassium, gradients, 22Power, 8PSWs, see Positive sharp wavesPulse oximetry, 413
Radial nerve,anatomy, 258, 260neuropathy,
axilla, 260pediatric electromyography, 381posterior interosseous neuropathy, 260spiral groove, 260superficial radial sensory neuropathy,
clinical presentation, 260, 261differential diagnosis, 261electrophysiology, 261, 262
Radiculopathy,anatomic considerations, 290electrodiagnostic examination,
electromyography, 293–295nerve conduction studies,
F-waves, 292, 293H-reflexes, 293motor nerves, 292, 295sensory nerves, 291–292, 295
overview, 289physiological considerations, 290
Rapid eye movement (REM) sleep,electroencephalogram, 69, 70, 394, 395
Recurrent laryngeal nerve,anatomy, 318conduction studies, 318
REM sleep, see Rapid eye movement sleep
Repetitive nerve stimulation (RNS), neuromusculartransmission studies, 357–359
Repetitive transcranial magnetic stimulationclinical applications, 513, 514overview, 513
Resistance, 4Respiratory inductance plethysmography (RIP),
411, 413Restless legs syndrome (RLS), 439, 441RIP, see Respiratory inductance plethysmographyRLS, see Restless legs syndromeRNS, see Repetitive nerve stimulation
Safety, electrical, 15–17Saltatory conduction, 40Schwann cell, 40Sciatic nerve,
anatomy, 267lumbosacral plexus, 306neuropathy,
clinical presentation, 267electrophysiology, 267, 268imaging, 267
Sensory nerve action potential (SNAP),brachial plexopathy, 301measurement, 208, 209motor neuron disease, 291, 292
Series, circuit, 5, 6Sharply contoured artifact, electroencephalogram,
110Sharp theta in the occiput of premature infants
(STOP), 142, 144Sleep deprivation, electroencephalogram activation,
clinical significance, 78, 79mechanism, 79, 80technique, 80
Sleep disorders,actigraphy, 433apnea,
central apnea, 413, 415, 421, 422mixed apnea, 413, 416obstructive apnea, 413, 414, 423
classification, 394, 395hypoapnea, 413, 417maintenance of wakefulness test, 398, 431, 432multiple sleep latency test, 398, 430, 431periodic limb movement disorder, 438polysomnography, see Polysomnographyrespiratory effort-related arousal, 418restless legs syndrome, 438, 441
Sleep,benign epileptiform transients of sleep, 88, 90,
103, 107electroencephalograms, 64–70
Blum_Index_996_4_Final 4/17/07, 8:26 AM524

Index 525
infant electroencephalograms, 154–159neonatal electroencephalograms,
preterm infants, 141–148term infants, 142, 150–153
regulation, 395, 396stages,
rapid eye movement sleep, 69, 70, 394, 395stage I, 64, 65stage II, 64, 66stage III, 66, 67stage IV, 68, 70
SNAP, see Sensory nerve action potentialSodium,
action potential, 23, 24gradients, 22
Sodium-potassium pump, 37, 38Somatosensory evoked potential (SSEP),
anatomy and physiology, 485, 486applications,
disease, 493intraoperative monitoring, 493–495
interpretation, 491–494median nerve potentials, 487–489, 494posterior tibeal nerve potentials, 489–491recording, 487stimulation, 486volume conduction effects, 44, 50, 51
Spike-and-slow wave complex, 103, 118Spinal accessory nerve,
anatomy, 317conduction studies, 317, 318
Spinal accessory neuropathy, 263, 264, 321SREDA, see Subclinical rhythmic electro-
graphic dischargeSSEP, see Somatosensory evoked potentialSSR, see Sympathetic skin responseStanding wave, 47STOP, see Sharp theta in the occiput of pre-
mature infantsSubclinical rhythmic electrographic discharge
(SREDA), 85, 88Suprascapular neuropathy, 262, 263Sympathetic skin response (SSR), 456, 457
Tarsal tunnel syndrome (TTS),clinical presentation, 267, 268electrophysiology, 268, 269
Temporal spikes, 110Theta rhythm, electroencephalogram,
focal ictal patterns, 119, 120midline theta rhythm, 88normal rhythm, 60psychomotor variant, 85, 87, 107, 108,
172, 175
sharp theta in the occiput of premature infants,142, 144
temporal theta in the elderly, 98Thoracic outlet syndrome, 303Tibial nerve,
anatomy, 268posterior tibeal nerve somatosensory evoked
potentials, 489–491, 494tarsal tunnel syndrome,
clinical presentation, 267, 268electrophysiology, 268
Tilt-table testing, 454, 455,Transcranial magnetic stimulation (TMS)
equipment, 501, 502paired-pulse transcranial magnetic stimulation
interhemispheric interactions, 511–513intracortical inhibitory and facilitatory
mechanisms, 511principles, 499–501repetitive transcranial magnetic stimulation,
clinical applications, 513, 514overview, 513
safety considerations, 502–504single-pulse transcranial magnetic stimulation,
central motor conduction time, 506, 507diagnostic applications, 504, 505motor evoked potential, 507, 509motor threshold, 504, 506silent period, 509transcallosal conduction, 509–511
Trigeminal nerve,blink reflex, 315–317conduction studies, 315masseter reflex, 316masseter silent period, 316, 317neuralgia/neuropathy, 320, 321
Triphasic waves, 132, 133TTS, see Tarsal tunnel syndrome
Ulnar nerve,anatomy, 255neuropathy at elbow,
causes, 256clinical presentation, 255, 256electrophysiology, 256, 257treatment, 257
neuropathy at wrist,clinical syndromes, 257, 258electrophysiology, 258, 259
pediatric electromyography, 380
Valsalva maneuver,heart rate response, 451, 452sympathetic function tests, 455, 456
Blum_Index_996_4_Final 4/17/07, 8:26 AM525

526 Index
Valsalva ratio (VR), 451, 452VEP, see Visual evoked potentialVertex wave, 103, 106Visual evoked potential (VEP),
chiasmal lesions, 471compressive optic nerve lesions, 469, 470features, 461, 463, 464high-pressure state, 470interpretation,
anterior pathways, 466posterior pathways, 466, 467
ischemic optic neuropathy, 469multiple sclerosis, 469neurodegenerative disease, 470operative monitoring, 470, 471optic neuritis, 467, 469P100, 467, 468, 471psychiatric blindness, 471recording,
averaging, 462, 463check size, 462contrast, 462filters, 463hardware, 463patient factors, 463repetition frequency, 462stimulus, 461, 462
retrochiasmal lesions, 471subject-related factors,
acuity, 466age, 465gender, 465
technical factors, 464, 465traumatic visual loss, 470
Voltage, 3, 26Volume conduction,
definition, 43effects
electromyography,end-plate spikes, 50fibrillation potentials and positive sharp
waves, 49, 50motor unit potentials, 50
motor studies, 47–49sensory nerve conduction study, 47somatosensory evoked potentials, 50, 51
far-field potential, 44near-field potential, 43working model, 44, 46
VR, see Valsalva ratio
West syndrome, electroencephalogram, 193–195Wicket spikes, 91, 92, 103, 107Wrist drop, differential diagnosis, 261
Blum_Index_996_4_Final 4/17/07, 8:26 AM526