![masos for the masses part three - []](https://static.fdokumen.com/doc/165x107/6328d98472264f12480374b5/masos-for-the-masses-part-three-.jpg)
The circulation, water masses and sea-ice of Baffin Bay
46
The circulation, water masses and sea-ice of Baffin Bay Charles C.L Tang * , Charles K. Ross, Tom Yao, Brian Petrie, Brendan M. DeTracey, Ewa Dunlap Ocean Sciences Division, Bedford Institute of Oceanography, Fisheries and Oceans Canada, P.O. Box 1006, Dartmouth, Nova Scotia, Canada B2Y 4A2 Received 8 December 2003; received in revised form 6 September 2004; accepted 14 September 2004 Abstract The oceanographic, meteorological and sea-ice conditions in Baffin Bay are studied using historical hydrographic, satellite and meteorological data, and a set of current meter data from a mooring program of the Bedford Institute of Oceanography. Baffin Bay is partially covered by sea-ice all year except August and September. The interannual var- iation of the ice extent is shown to be correlated with winter air temperature. Available hydrographic data were used to study the water masses and the horizontal and vertical distribution of temperature/salinity. Three water masses can be identified – Arctic Water in the upper 100–300 m of all regions except the southeast, West Greenland Intermediate Water at 300–800 m in most of the interior of Baffin Bay, and Deep Baffin Bay Water in all regions below 1200 m. The temperature and salinity in Baffin Bay have limited seasonal variability except in the upper 300 m of eastern Davis Strait, northern Baffin Bay and the mouth of Lancaster Sound. Summer data have a temperature minimum at 100 m, which suggests winter convection does not penetrate deeper than this depth. Current meter data and results of a circu- lation model indicate that the mean circulation is cyclonic. The seasonal variation of the currents is complex. Overall, summer and fall tend to have stronger currents than winter and spring at all depths. Among the different regions, the largest seasonal variation occurs at the mouth of Lancaster Sound and the Baffin Island slope. Model generated velocity fields show a basic agreement with the observed currents, and indicate strong topographic control in the vicinity of Davis Strait and on the Greenland shelves. The model also produces a southward counter current on the Greenland slope, which may explain the observed high horizontal shears over the Greenland slope. Estimates of the volume and fresh water transports through Lancaster, Jones and Smith Sounds are reviewed. Transports through Davis Strait are computed from the current meter data. The balance of freshwater budget and sensitivity of the thermohaline cir- culation to freshwater transport are discussed. Crown Copyright Ó 2004 Published by Elsevier Ltd. All rights reserved. Keywords: Baffin Bay; Davis Strait; Circulation; Current meter data; Water masses; Sea-ice 0079-6611/$ - see front matter. Crown Copyright Ó 2004 Published by Elsevier Ltd. All rights reserved. doi:10.1016/j.pocean.2004.09.005 * Corresponding author. Tel.: +1 902 426 2960; fax: +1 902 426 6927. E-mail address: [email protected] (C.C.L Tang). Progress in Oceanography 63 (2004) 183–228 Progress in Oceanography www.elsevier.com/locate/pocean
-
Upload
independent -
Category
Documents
-
view
1 -
download
0
Transcript of The circulation, water masses and sea-ice of Baffin Bay

Progress in Oceanography 63 (2004) 183–228
Progress inOceanography
www.elsevier.com/locate/pocean
The circulation, water masses and sea-ice of Baffin Bay
Charles C.L Tang *, Charles K. Ross, Tom Yao, Brian Petrie,Brendan M. DeTracey, Ewa Dunlap
Ocean Sciences Division, Bedford Institute of Oceanography, Fisheries and Oceans Canada, P.O. Box 1006, Dartmouth,
Nova Scotia, Canada B2Y 4A2
Received 8 December 2003; received in revised form 6 September 2004; accepted 14 September 2004
Abstract
The oceanographic, meteorological and sea-ice conditions in Baffin Bay are studied using historical hydrographic,
satellite and meteorological data, and a set of current meter data from a mooring program of the Bedford Institute
of Oceanography. Baffin Bay is partially covered by sea-ice all year except August and September. The interannual var-
iation of the ice extent is shown to be correlated with winter air temperature. Available hydrographic data were used to
study the water masses and the horizontal and vertical distribution of temperature/salinity. Three water masses can be
identified – Arctic Water in the upper 100–300 m of all regions except the southeast, West Greenland Intermediate
Water at 300–800 m in most of the interior of Baffin Bay, and Deep Baffin Bay Water in all regions below 1200 m.
The temperature and salinity in Baffin Bay have limited seasonal variability except in the upper 300 m of eastern Davis
Strait, northern Baffin Bay and the mouth of Lancaster Sound. Summer data have a temperature minimum at �100 m,
which suggests winter convection does not penetrate deeper than this depth. Current meter data and results of a circu-
lation model indicate that the mean circulation is cyclonic. The seasonal variation of the currents is complex. Overall,
summer and fall tend to have stronger currents than winter and spring at all depths. Among the different regions, the
largest seasonal variation occurs at the mouth of Lancaster Sound and the Baffin Island slope. Model generated velocity
fields show a basic agreement with the observed currents, and indicate strong topographic control in the vicinity of
Davis Strait and on the Greenland shelves. The model also produces a southward counter current on the Greenland
slope, which may explain the observed high horizontal shears over the Greenland slope. Estimates of the volume
and fresh water transports through Lancaster, Jones and Smith Sounds are reviewed. Transports through Davis Strait
are computed from the current meter data. The balance of freshwater budget and sensitivity of the thermohaline cir-
culation to freshwater transport are discussed.
Crown Copyright � 2004 Published by Elsevier Ltd. All rights reserved.
Keywords: Baffin Bay; Davis Strait; Circulation; Current meter data; Water masses; Sea-ice
0079-6611/$ - see front matter. Crown Copyright � 2004 Published by Elsevier Ltd. All rights reserved.
doi:10.1016/j.pocean.2004.09.005
* Corresponding author. Tel.: +1 902 426 2960; fax: +1 902 426 6927.
E-mail address: [email protected] (C.C.L Tang).

184 C.C.L Tang et al. / Progress in Oceanography 63 (2004) 183–228
Contents
1. Introduction . . . . . . . . . . . . . . . . . . . . . . . . . . . . . . . . . . . . . . . . . . . . . . . . . . . . . . . . . . . . . . . . . . 184
2. Meteorological conditions. . . . . . . . . . . . . . . . . . . . . . . . . . . . . . . . . . . . . . . . . . . . . . . . . . . . . . . . . 187
3. Sea-ice and icebergs . . . . . . . . . . . . . . . . . . . . . . . . . . . . . . . . . . . . . . . . . . . . . . . . . . . . . . . . . . . . . 188
3.1. Annual and interannual variations of ice cover. . . . . . . . . . . . . . . . . . . . . . . . . . . . . . . . . . . . . . 189
3.2. Ice velocity, thickness and flux . . . . . . . . . . . . . . . . . . . . . . . . . . . . . . . . . . . . . . . . . . . . . . . . . 191
3.3. North Water polynya . . . . . . . . . . . . . . . . . . . . . . . . . . . . . . . . . . . . . . . . . . . . . . . . . . . . . . . . 192
3.4. Icebergs . . . . . . . . . . . . . . . . . . . . . . . . . . . . . . . . . . . . . . . . . . . . . . . . . . . . . . . . . . . . . . . . . . 193
4. Temperature/salinity distribution and water masses. . . . . . . . . . . . . . . . . . . . . . . . . . . . . . . . . . . . . . . 194
4.1. Vertical sections . . . . . . . . . . . . . . . . . . . . . . . . . . . . . . . . . . . . . . . . . . . . . . . . . . . . . . . . . . . . 194
4.2. Horizontal distribution . . . . . . . . . . . . . . . . . . . . . . . . . . . . . . . . . . . . . . . . . . . . . . . . . . . . . . . 196
4.3. Water masses and bottom water formation . . . . . . . . . . . . . . . . . . . . . . . . . . . . . . . . . . . . . . . . 197
4.4. Interannual variability . . . . . . . . . . . . . . . . . . . . . . . . . . . . . . . . . . . . . . . . . . . . . . . . . . . . . . . 199
5. Circulation . . . . . . . . . . . . . . . . . . . . . . . . . . . . . . . . . . . . . . . . . . . . . . . . . . . . . . . . . . . . . . . . . . . 201
5.1. BIO�s mooring program . . . . . . . . . . . . . . . . . . . . . . . . . . . . . . . . . . . . . . . . . . . . . . . . . . . . . . 202
5.2. Mean currents . . . . . . . . . . . . . . . . . . . . . . . . . . . . . . . . . . . . . . . . . . . . . . . . . . . . . . . . . . . . . 203
5.3. Seasonal variability. . . . . . . . . . . . . . . . . . . . . . . . . . . . . . . . . . . . . . . . . . . . . . . . . . . . . . . . . . 205
5.3.1. Seasonal currents . . . . . . . . . . . . . . . . . . . . . . . . . . . . . . . . . . . . . . . . . . . . . . . . . . . . . 205
5.3.2. Annual harmonics. . . . . . . . . . . . . . . . . . . . . . . . . . . . . . . . . . . . . . . . . . . . . . . . . . . . . 207
5.4. Temperature and salinity from moorings . . . . . . . . . . . . . . . . . . . . . . . . . . . . . . . . . . . . . . . . . . 209
6. Mean circulation from a numerical model . . . . . . . . . . . . . . . . . . . . . . . . . . . . . . . . . . . . . . . . . . . . . 215
6.1. Model implementation . . . . . . . . . . . . . . . . . . . . . . . . . . . . . . . . . . . . . . . . . . . . . . . . . . . . . . . 216
6.2. General features of the circulation . . . . . . . . . . . . . . . . . . . . . . . . . . . . . . . . . . . . . . . . . . . . . . . 217
6.3. Current field in the vicinity of Davis Strait. . . . . . . . . . . . . . . . . . . . . . . . . . . . . . . . . . . . . . . . . 217
7. Volume and freshwater transports . . . . . . . . . . . . . . . . . . . . . . . . . . . . . . . . . . . . . . . . . . . . . . . . . . . 218
7.1. Northern channels . . . . . . . . . . . . . . . . . . . . . . . . . . . . . . . . . . . . . . . . . . . . . . . . . . . . . . . . . . 218
7.2. Davis Strait . . . . . . . . . . . . . . . . . . . . . . . . . . . . . . . . . . . . . . . . . . . . . . . . . . . . . . . . . . . . . . . 219
8. Summary and discussion . . . . . . . . . . . . . . . . . . . . . . . . . . . . . . . . . . . . . . . . . . . . . . . . . . . . . . . . . 222
8.1. Sea-ice and iceberg . . . . . . . . . . . . . . . . . . . . . . . . . . . . . . . . . . . . . . . . . . . . . . . . . . . . . . . . . . 222
8.2. Water masses . . . . . . . . . . . . . . . . . . . . . . . . . . . . . . . . . . . . . . . . . . . . . . . . . . . . . . . . . . . . . . 223
8.3. Currents. . . . . . . . . . . . . . . . . . . . . . . . . . . . . . . . . . . . . . . . . . . . . . . . . . . . . . . . . . . . . . . . . . 223
8.4. Volume and freshwater transports . . . . . . . . . . . . . . . . . . . . . . . . . . . . . . . . . . . . . . . . . . . . . . . 224
Acknowledgements . . . . . . . . . . . . . . . . . . . . . . . . . . . . . . . . . . . . . . . . . . . . . . . . . . . . . . . . . . . . . 225
References . . . . . . . . . . . . . . . . . . . . . . . . . . . . . . . . . . . . . . . . . . . . . . . . . . . . . . . . . . . . . . . . . . . 226
1. Introduction
Baffin Bay is a mediterranean sea connected through restrictive straits to the Arctic Ocean and the Lab-
rador Sea/Atlantic Ocean (Fig. 1). Its area is about 1400 km by 550 km with a large abyssal plain in the

C.C.L Tang et al. / Progress in Oceanography 63 (2004) 183–228 185
central region having depths in excess of 2300 m. The continental shelf off Baffin Island is relatively narrow
compared to the Greenland side. Both shelves are deeply cut by canyons running across the shelf. Baffin
Bay is connected to the Labrador Sea by its biggest and deepest channel, Davis Strait, which has a sill depth
of about 650 m and a width of about 170 km at the 500 m contour. There are three connections to the Arc-
tic Ocean – the smallest through Jones Sound with a 120 m deep sill at Hell�s Gate (western end of JonesSound) and a channel width of less than 30 km. The other shallow connection is to the west of Lancaster
Sound at Barrow Strait where the sill depth is about 125 m and the width is about 55 km. The deepest con-
nection is through Nares Strait with the sill in Kane Basin at a depth about 250 m. The width at the sill is
quite large but there are horizontal constrictions to the north (Robeson Channel < 40 km) and south (north
Smith Sound �40 km). Baffin Bay is a marginal ice zone with almost complete clearance of ice in late sum-
mer. The onset of local freezing occurs in early fall and near complete coverage of ice exists from December
to April. The ice starts to clear in spring starting in the North Water region and in the southeastern region
of the bay.Dunbar (1951) has given an exhaustive overview of the history of marine observations in this region,
starting with the voyage of Erik the Red in 983 AD. The early expeditions to Baffin Bay were motivated
by exploration of unknown geography, the search for the �Northwest Passage�, in conjunction with the
whaling industry, in support of the fishing industry, etc. Most of these observations were ancillary to the
prime objectives of the expeditions. However, during this time the connection to the Arctic and some of
the surface circulation were noted from the drift of ice and abandoned ships. By the end of the 19th century
it was known that warm water entered Baffin Bay through Davis Strait and cold water flowed southward on
the western side of Baffin Bay (Hayes, 1867; Petermann, 1867; Petterson, 1900). Also known by this timewas the three-layer structure of Baffin Bay, a cold, fresh layer overlying warm, salty water at mid-depth and
cold, slightly fresher layer in the deep water.
Fig. 1. Bathymetry of Baffin Bay and location of sections used in Figs. 9–12 and stations (a,b,c,d,e) used in Fig. 14. Depth contours are
500, 1000 and 2000 m. Symbols in the map are: B – Barrow Strait; C - Clyde River; D – Disko Island; DI – Devon Island; DS – Davis
Strait; H – Hell�s Gate; J – Jones Sound; K – Kane Basin; L – Lancaster Sound; M – Melville Bay; N – Nares Strait; R – Robeson
Channel; S – Smith Sound; Y – Cape York.

186 C.C.L Tang et al. / Progress in Oceanography 63 (2004) 183–228
In the 20th century, many directed oceanographic expeditions were undertaken. The sinking of the
Titanic in 1912 gave impetus to the interest in the regions producing the icebergs that threatened the
shipping lanes of the North Atlantic. The International Ice Patrol of the US Coast Guard mounted
the Marion and General Greene expeditions to the western Labrador Sea and as far north as Disko Is-
land in Baffin Bay. From these, Smith, Soule, and Mosby (1937) described the geostrophic flow of waterin Davis Strait. In 1928 the Danish Godthaab Expedition (Riis-Carstenson, 1931) produced the first
extensive coverage of observations in Baffin Bay. Kiilerich (1939) analyzed these data and described
major baroclinic currents within the bay, a northward current along the eastern side and a southward
current along the western side.
Later in the 20th century, there were new reasons to investigate the northern regions, viz. military
interest in the direct route for submarines between North America and USSR, sovereignty issues for
Canada and Denmark/Greenland, and petroleum exploration off the Greenland coast. American and
Canadian icebreakers made many observations, especially during the 1960s. These data, mostly innorthern Baffin Bay, were incorporated in the work of Collin and Dunbar (1964) and Muench
(1970, 1971). In southeastern Baffin Bay, a large amount of oceanographic, sea-ice and meteorological
data were collected by the Greenland Technical Organization in the period 1975–1978 and by the petro-
leum industry during the years 1976 and 1977 (Danish Hydraulic Institute, 1979). The physical environ-
ment of eastern Baffin Bay was reviewed by Valeur, Hansen, Hansen, Rasmussen, and Thingvad (1996).
Sadler (1976) reported on month-long measurements of currents in Nares Strait that indicated a net
southward flow into Baffin Bay from the Arctic Ocean. Later, Prinsenberg and Bennett (1987) described
the results of an eight-month mooring in Barrow Strait that indicated a net transport of water from theArctic Ocean towards Baffin Bay.
Environmental concerns dictated an intensive investigation of the oceanography in and around the pro-
posed petroleum drilling locations in eastern Lancaster Sound. In 1978 and 1979 an extensive effort was
directed to understanding the area of northwestern Baffin Bay. Measurements included CTD stations in
the open season (Fissel, Lemon, & Birch, 1982), moored current meters (Fissel, 1982), tracking of icebergs
both visually and via ARGOS beacons (deLange Boom, MacNeill, & Buckley, 1982). These measurements
confirmed the idea that the circulation in northwestern Baffin Bay is cyclonic with an intense intrusion into
eastern Lancaster Sound and a major southward flowing current concentrated over the Baffin Island slope.Starting in 1983, the Bedford Institute of Oceanography (BIO) commenced a program of year-long current
meter moorings in Baffin Bay. Each year a different region of Baffin Bay was chosen for measurement
(Ross, 1990a, 1990b, 1991, 1993). From 1987 to 1990, an array of five moorings was maintained across
Davis Strait.
The recurring polynya in Smith Sound called �North Water� has been known since the time of the early
whalers. It has always been of great interest to marine biologists and has been the subject of many studies
that have included physical observations. A recurring interest to sample the waters during the �winter�months has only recently been accomplished. Aircraft (Steffen, 1985) and spacecraft (Press & Blais,1993) have looked at the surface manifestations and recently surface ships have entered the area (Barber,
Hanesiak, Chan, & Piwowar, 2001).
Recent interest in Baffin Bay arises from its role in Arctic Ocean-North Atlantic interaction. Baffin Bay
is the pathway of the fresh and cold Arctic water to the Labrador Sea, where deep convection occurs and
contributes to the thermohaline circulation of the North Atlantic. The Arctic water in Baffin Bay is partly
of Pacific origin, which flows into the Arctic Ocean through Bering Strait and enters Baffin Bay through the
Canadian Archipelago (Jones et al., 2003). The interannual variability of deep convection in the Labrador
Sea can be related to changes in freshwater and sea-ice fluxes from Baffin Bay as freshening of the upperocean tends to stabilize the water column and thus impedes convection (Tang, Gui, & DeTracey, 1999). A
numerical study by Goosse, Fichefet, and Campin (1997) shows that these fluxes plays a significant role in
controlling the salinity of the Labrador Sea and the meridional overturning of the North Atlantic.

C.C.L Tang et al. / Progress in Oceanography 63 (2004) 183–228 187
In this paper, we examine the mean, annual and interannual variability of currents, sea-ice and temper-
ature/salinity in Baffin Bay based on available data. We review research conducted in the past 80 years, and
present results of new analyses. The focus is on the circulation, water masses, sea-ice distribution, and fresh-
water and volume transports. The meteorological and sea-ice conditions are described in Sections 2 and 3.
In Section 4, the distribution of temperature and salinity, and the identification and mixing of water massesare discussed. The BIO mooring program and analysis of the current meter data are presented in Section 5.
Results from a circulation model are presented in Section 6. The volume and freshwater transports through
Davis Strait and the northern channels are discussed in Section 7. The final section is a summary and
discussion.
2. Meteorological conditions
Baffin Bay lies to the north of the main path of the planetary westerlies and the zone of cyclonic activ-
ities. The meteorological conditions are strongly influenced by the North American and Greenland land
masses, the local sea-ice and ocean conditions, and the Arctic atmospheric system. In this section, we pres-
ent meteorological variables most important to sea-ice and ocean variability. The data were extracted from
the NCEP/NCAR re-analysis (Kistler et al., 2001).
The air temperature (Fig. 2) is characterized by high east–west gradients in winter and almost uniform
distribution in summer. January is the coldest month of the year with the lowest surface air temperature,
�35 �C, in the north and northwest, and highest temperature, �15 �C, in eastern Davis Strait. The warmtongue along the southern Greenland coast is apparently related to the warm water of the West Greenland
Current which flows north along the coast and the lack of ice cover most of the year. This spatial pattern
persists through spring. Towards summer, the air temperature becomes more uniform. The temperature
variation in the region is reduced from 20 �C in January to 5 �C in July.
The interannual variation of air temperature, particularly during winter, is a major cause of sea-ice var-
iability (see Section 3.1). Fig. 3 shows the time series of the areal mean summer (July, August, September)
and winter (January, February, March) temperature from 1950 to 1999. The means and standard devia-
tions for winter and summer are 28.6 ± 2.3 �C and �0.56 ± 0.60 �C. The variability in winter is four timesgreater than in summer. Low frequency variability is also apparent with a cooling tendency in the summer
from the early 1950s to the early 1970s. A statistical analysis of the winter temperature suggests more cycli-
cal behavior with periods in the range of 5–20 years.
Wind stresses over Baffin Bay are highly seasonal. Fig. 4 shows the mean wind stresses (averages of 3-
hourly wind stresses computed from the NCEP/NCAR surface winds using a conventional bulk formula)
Fig. 2. Monthly mean air temperature climatology (1960–2000) for January and July.

Fig. 3. Areal mean (65�–80�N, 80�–50�W) summer (upper panel) and winter (lower panel) air temperature from 1950 to 1999. The
solid lines are means and the dotted lines are standard deviations.
188 C.C.L Tang et al. / Progress in Oceanography 63 (2004) 183–228
for January and July. From January to April, the spatial patterns are similar - weak stresses in central andnorthern Baffin Bay and strong stresses at Davis Strait and in northern Labrador Sea. The strong wind
stresses in winter are a major force moving sea-ice from Baffin Bay to the Labrador Sea. A rapid weakening
occurs between April and May. From June to August, the wind stresses are weak in most areas. September
to October is a transitional period between summer and winter conditions.
3. Sea-ice and icebergs
In the early years of Arctic research, observations of sea-ice distribution in Baffin Bay were made by
ships and reconnaissance flights. Kaminski (1955) presented maps of monthly ice distribution and gave a
detailed description of ice conditions at different locations based on several hundred aerial ice reconnais-
sance surveys. The first Canadian airborne ice observations were from the Hudson Strait Expedition in
Fig. 4. Monthly wind stress climatology (1960–2000) calculated from the Large and Pond bulk formula for January, and July.
C.C.L Tang et al. / Progress in Oceanography 63 (2004) 183–228 189
1927 (Dunbar, 1954). Since 1972, satellite passive-microwave data have provided a much-improved descrip-
tion of ice coverage (Parkinson & Cavalieri, 1989). Data presented in this sub-section come from US Geo-
logical Survey Digital Data Series and the National Snow and Ice Data Center.
3.1. Annual and interannual variations of ice cover
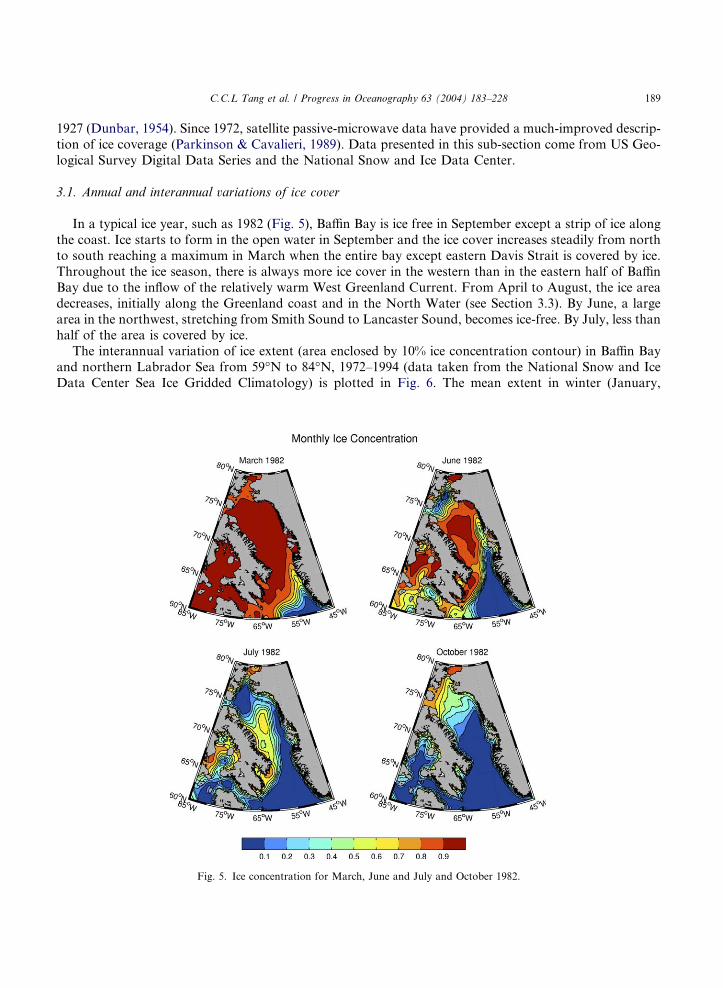
In a typical ice year, such as 1982 (Fig. 5), Baffin Bay is ice free in September except a strip of ice along
the coast. Ice starts to form in the open water in September and the ice cover increases steadily from north
to south reaching a maximum in March when the entire bay except eastern Davis Strait is covered by ice.
Throughout the ice season, there is always more ice cover in the western than in the eastern half of Baffin
Bay due to the inflow of the relatively warm West Greenland Current. From April to August, the ice area
decreases, initially along the Greenland coast and in the North Water (see Section 3.3). By June, a large
area in the northwest, stretching from Smith Sound to Lancaster Sound, becomes ice-free. By July, less thanhalf of the area is covered by ice.
The interannual variation of ice extent (area enclosed by 10% ice concentration contour) in Baffin Bay
and northern Labrador Sea from 59�N to 84�N, 1972–1994 (data taken from the National Snow and Ice
Data Center Sea Ice Gridded Climatology) is plotted in Fig. 6. The mean extent in winter (January,
Fig. 5. Ice concentration for March, June and July and October 1982.

Year
Cov
erag
e (1
0 6 k
m 2
)
Baffin Bay Monthly Ice Coverage
72 74 76 78 80 82 84 86 88 90 92 94 960
0.2
0.4
0.6
0.8
1
1.2
1.4
1.6unsmoothedwintermean winter
Fig. 6. Monthly ice extent from 1972 to 1995 (thick line). The medium thick and heavy lines indicate mean of winter months (January,
February, March) and mean of all winters. The data are from National Ice Center covering 59�–84�N.
190 C.C.L Tang et al. / Progress in Oceanography 63 (2004) 183–228
February, March) is 1.13 · 106 km2. The interannual variation has a range of 0.24 · 106 km2. A major dif-
ference between a heavy and a light ice year, e.g., 1984 and 1979, is the much reduced ice coverage off the
southern Greenland coast in 1979 (Fig. 7). On a local scale, the interannual variation can be different from
that for the entire bay. For example, Barber et al. (2001) found 1991 to be a normal year for the North
Water region, but Fig. 6 indicates that 1991 is a heavy ice year.
Fig. 7. Ice concentration for January 1984 (heavy ice year) and 1979 (light ice year).

C.C.L Tang et al. / Progress in Oceanography 63 (2004) 183–228 191
From a comparison of Figs. 6 and 3, it is apparent that ice extent is correlated to winter air temperature
(correlation squared = 0.66). Cold winters, 1973, 1983, 1984 and 1989, have high ice extent, and warmer
winters, 1977 and 1986, have low ice extent. Exceptions, such as 1990 and 1991, indicate that the ice extent
also depends on other factors such as wind strength and currents. Around Davis Strait, the interannual var-
iability is more likely caused by synoptic-scale atmospheric conditions. Using data from satellites and rou-tine ice patrol flights from the Davis Strait area, Crane (1978) found that early ice retreat corresponded to
an increased frequency of warmer southerly winds; early ice advance corresponded to an increased fre-
quency of cooler northerly and westerly winds.
3.2. Ice velocity, thickness and flux
Ice velocity data from Baffin Bay are scarce. Most published data were obtained by tracking ice beacons
or large ice floes from satellite images. Jordan and Neu (1981) analyzed visible and infra-red images fromNOAA-5 and found that nearly all ice movement in the western region of Davis Strait was directed south-
ward. A typical ice velocity in winter and early spring was 10 cm s�1 in the southern part of Baffin Bay,
increasing to 20 and 30 cm s�1 in Davis Strait and decreasing to 10 and 15 cm s�1 along the Baffin Island
coast toward Hudson Strait. Kwok, Schweiger, Rothrock, Pang, and Lottmeier (1998) developed an ice
motion tracker to determine ice velocity from sequential SSM/I brightness temperature fields.
Ice thickness in Davis Strait is highly variable (Kaminski, 1955; Valeur et al., 1996). Ice formed in newly
opened leads can acquire a thickness of half a meter or more during the winter months. Older ice commenc-
ing formation in autumn can attain a thickness of 1.2 m. The western side of the pack ice contains floes ofhummocked polar ice and floes that are extremely rough and laced with pressure ridges exceeding 3 m. Ice
thickness data inferred from satellite images indicate that the ice field in Baffin Bay is a combination of first
year medium (0.7–1.2 m), first year thin (0.3–0.7 m), young ice (0.1–0.3 m) and new ice (0–0.1 m). First year
medium ice is by far the dominant ice thickness. Only a small amount of multi-year ice drifts into Baffin Bay
from Nares Strait and Lancaster Sound, and its distribution is largely restricted to western Baffin Bay. Syn-
thesizing thickness data from measurements and results of empirical formulae and thermodynamic model-
ing, J.E. Markham of Canadian Ice Service (Valeur et al., 1996) produced a distribution map which showed
that the mean thickness of level ice decreased from 1.75 m in the northwest, to less than 0.75 m in the south-east. Along the coast of Baffin Island, the mean thickness was 1.25–1.5 m. Ice thickness inferred from sa-
tellite data does not take into account increased thickness due to pressure ridges, rafting and hummocking.
Measurements by an electromagnetic-laser system in the Gulf of St. Lawrence by Prinsenberg and Peterson
(2003) indicated deformed ice may increase the mean total ice thickness by 20–80%.
Long-term near-shore measurements of ice thickness have been made only at one location in Baffin Bay.
Fig. 8 shows the annual cycle for Clyde River, on the coast of Baffin Island (based on data collected by
Environment Canada). Mean ice thickness increases through the winter and most of the spring reaching
a maximum value of about 1.6 m near the end of May. The thickness decreases rapidly after this date.Ice flux out of the northern channels (Smith, Jones and Lancaster Sounds) into Baffin Bay has been esti-
mated by several investigators (Dey, 1981; Dunbar, 1973; Sadler, 1976) using data from satellite, reconnais-
sance flight and ships (Table 1). ‘‘Canadian Archipelago’’ in Table 1 means the sum of the ice flux through
Robeson Channel, Jones and Lancaster Sounds. Most of the estimates were based on a crude knowledge of
ice speeds and periods of ice cover. The channels are covered for several months of the year with landfast ice
and transport virtually ceases. The main contribution to the ice flux is made in summer, when much of the
ice moves into and melts in Baffin Bay, and in the early fall before ice in the channels becomes landfast. We
note that the only significant ice transport from the Arctic Ocean to Baffin Bay is through Nares Strait. Thisis because ice in the other channels is mostly locally formed, and the presence of landfast ice impedes the
flow of Arctic pack ice into the bay. A recent estimate of ice transport through Nares Strait based on re-
mote sensing data is 300–350 km3 y�1(1 km3 y�1 = 31.71 m3 s�1) of which 135 km3 y�1 is pack ice and

0 50 100 150 200 250 300 3500
50
100
150
200
250
Ice
Th
ickn
ess
(cm
)
Year Day
Fig. 8. Ice thickness at Clyde River (70.47�N, 67.42�W) near the coast of western Baffin Bay. Small dots are individual observations.
Large dots are the means. Dash lines are the standard deviations.
192 C.C.L Tang et al. / Progress in Oceanography 63 (2004) 183–228
200 km3 y�1 is newly formed ice (T. Agnew, personal communication). In comparison, ice transport
through Fram Strait is much larger: estimated at 1100–4000 km3 y�1 (Kwok & Rothrock, 1999; Thomas,
Martin, Rothrock, & Steele, 1996; Vinje, Nordlund, & Kvambekk, 1998; Wadhams, 1983).Using the monthly ice concentration presented in Section 3.1, Jordan and Neu�s (1981) ice velocity data
and a mean ice thickness of 1 m, we obtain an ice flux of 873 km3 y�1 through Davis Strait. Cuny (2003)
used SMMR data from 1992 to 2000, monthly thickness data from National Ice Center and Jordan and
Neu�s (1981) ice velocity estimates to obtain an ice flux of 553 km3 y�1. The greatest uncertainties in both
estimates are ice thickness and ice velocity.
3.3. North Water polynya
The North Water, at the northern end of Baffin Bay, is a region of recurrent, anomalously light ice con-
ditions. It consists of polynyas in Smith, Jones and Lancaster Sounds which merge by late spring (roughly
the 0.4 contour line of ice concentration in June in northern Baffin Bay in Fig. 5) (Steffen, 1985). A history
of the North Water is given by Dunbar and Dunbar (1972) and a review of physical processes is given by
Ingram, Bacle, Barber, Gratton, and Melling (2002).
Table 1
Ice fluxes into Baffin Bay from the northern channels and through Davis Strait
Ice flux (km3 y�1) Method Reference
Lancaster Sounda 482 Satellite data Dey (1981)
Jones Sounda 47 Satellite data Dey (1981)
Smith Sound 75 Aircraft Dunbar (1973)
110 Ship Sadler (1976)
126 Satellite data Dey (1981)
300–350b Satellite data Tom Agnew (personal communication)
Canadian Archipelago 220 Ship Sadler (1976)
Davis Strait 873 Satellite data This work
553 Satellite data Cuny (2003)
a Mostly locally formed ice at the entrance to Baffin Bay.b Of which 135 km3 y�1 is pack ice.

C.C.L Tang et al. / Progress in Oceanography 63 (2004) 183–228 193
The northern boundary of the North Water is well defined by an ice arch, which forms in the southern
end of Kane Basin and prevents influx of ice from the north. The formation and duration of the ice arch is
highly variable and it appears to be forming later and breaking earlier in the 1990s compared with the 1980s
(Barber et al., 2001). Ice formed in the North Water is swept southward under the combined effects of wind
and currents (Dunbar, 1981; Muench, 1971). The southern boundary of the North Water is less clearlydefined because the ice conditions gradually merge toward those of Baffin Bay.
Steffen (1986) used an airborne radiation thermometer to measure surface temperature from which ice
thickness was inferred. In winter, less than 10% of the North Water is ice-free. There is a substantial frac-
tion of white ice with thickness exceeding 0.3 m. Steffen and Ohmura (1985) showed that ice thickness tends
to decrease toward the Greenland coast. Mundy and Barber (2001) derived a statistical sea-ice classification
of Radarsat synthetic aperture radar data and found that during the period of the ice arch in 1998, the
dominant grouping in Smith Sound contained 26% open water. The polynya extended farther along the
Greenland coast where higher concentrations of open water were observed; higher concentrations ofdeformed ice were observed along the coast of Ellesmere Island.
A polynya which forms by the removal of ice from a coastline or fast ice edge by winds and currents is
termed a latent heat polynya (Smith, Muench, & Pease, 1990). In a latent heat polynya, heat is extracted
from the ocean to the atmosphere as latent heat of fusion of ice growth. A polynya which forms when
oceanic heat is sufficient to balance heat loss to the atmosphere and prevent formation of ice is termed a
sensible heat polynya. The classification into latent and sensible heat polynyas is not entirely apt since
ice formed in a latent heat polynya may generate brine convection and ocean heat flux through entrain-
ment. Melling, Gratton, and Ingram (2001) discussed results from an array of instruments moored in north-ern Baffin Bay and clarified the latent and sensible heat mechanisms in the North Water. They suggested
that the upward flux of sensible heat in the ocean is about one third of the total heat lost to the atmosphere
(the remaining two thirds is latent heat of fusion of ice growth). Steffen (1985) reported the occurrence of
warm water cells off the Greenland coast in which surface temperatures exceeded the freezing point. He
hypothesized that the warm water cells were related to coastal upwelling driven by northerly winds elevat-
ing the thermocline.
A series of modeling investigations into the processes which maintain the North Water has coupled poly-
nya flux models with coastal upwelling models. In a polynya flux model, the size of the polynya dependsupon a balance of frazil ice formation within the polynya and the export of consolidated pack ice away
from the polynya. Mysak and Huang (1992) coupled the latent heat polynya model of Pease (1987) with
a reduced gravity ocean model. The effect of the upwelling was to increase the polynya width along the
coast on a time scale longer than the time scale for opening of the polynya by the wind. Darby, Willmott,
and Mysak (1994) and Biggs and Willmott (2001) improved the model by adding a diverging channel con-
figuration and allowing a general wind stress. They found that the polynya width was most sensitive to the
ocean transport and the ice-water drag coefficient and less sensitive to the parameterization of entrainment.
Bjornsson, Willmott, Mysak, and Maqueda (2001) using a dynamical-thermodynamic sea ice modelshowed the importance of a downwind coast to create convergence in ice drift and a distinct ice edge.
Yao and Tang (2003) coupled a numerical sea ice model and a three-dimensional ocean model with
realistic topography to simulate the formation and maintenance of the North Water. They demonstrated
enhanced ice growth and sensible heat loss in the polynya. The surface salt flux from ice growth was
balanced by horizontal advection and mixing within the ocean.
3.4. Icebergs
The majority of icebergs in Baffin Bay are produced by the glaciers on the west coast of Greenland north
of 68�N (Danish Hydraulic Institute, 1979; Valeur et al., 1996). The total number of icebergs is about
12,000–40,000. The most productive areas are Disko Bay and Umanak Bay (south and north of Disko

194 C.C.L Tang et al. / Progress in Oceanography 63 (2004) 183–228
Island, respectively). The total mass production is approximately 1015 kg y�1 (Bauer, 1955). No icebergs of
significant size are produced by glaciers of the Canadian Archipelago. Many of the icebergs produced in
Disko Bay will leave Baffin Bay and enter the Labrador Sea through Davis Strait. The icebergs produced
north of Disko Bay may drift northward with the West Greenland Current, cross northern Baffin Bay and
then proceed southward along the coast. Icebergs with mass greater than 1 million tons tend to drift north,while smaller icebergs tend to drift in the southward and southeastward directions. The icebergs melt as
they are carried southward by the Labrador Current. Some reach the Grand Banks and disappear in the
relatively warm waters of the northwest Atlantic.
Long-term drift of icebergs in western Baffin Bay has been monitored using air deployed satellite-tracked
buoys (Marko, Birch, & Wilson, 1982; Robe, Maier, & Russell, 1980). In western Baffin Bay, iceberg move-
ments are concentrated in the core of the Baffin Current, which moves south following the shelf edge. Sig-
nificant features of the iceberg trajectories include intrusion into Lancaster Sound and intermittent presence
of loops. The iceberg movements consist of rapid 10–30 km d�1 drifts interrupted by long periods ofgrounding and entrapment in the landfast ice zone. Iceberg drift studies in northeast Baffin Bay (Valeur
et al., 1996) indicate that the icebergs move erratically with little mean drift; the drift speed rarely exceeds
0.2 ms�1.
4. Temperature/salinity distribution and water masses
Temperature and salinity data (1948–1999) from the BIO archive were analyzed to study the water massdistribution and mixing in Baffin Bay. The data were obtained mainly through the Marine Environmental
Data Service of Canada and the National Oceanographic Data Center of the US augmented with data from
other sources. From July to October, when Baffin Bay is ice-free or partially ice covered, there are sufficient
data to allow mapping of the horizontal distribution of water properties. In June, observations are concen-
trated in the coastal areas in eastern Baffin Bay. During the rest of the year, hydrographic data are very
scarce. The plots presented in the following sub-sections are based on an objectively analyzed data set.
In the analysis, raw data for each month were binned into boxes of 1/12� · 1/12� and 27 depths. The binned
data were averaged using an iterative difference-correction procedure and depth dependent domains ofaveraging (Tang & Wang, 1996). The procedure is a modification of the method used by Levitus (1982)
for global data.
4.1. Vertical sections
Figs. 9–11 show two east–west sections (Davis Strait and northern Baffin Bay) and a north–south section
through the middle of Baffin Bay (see Fig. 1 for locations) for August. Common features are a temperature
minimum at �100 m, and a maximum at 500–800 m throughout the bay. The origin of the maximum canbe traced to the relativelywarmWestGreenlandCurrent, which spreads from easternDavis Strait to the entire
bay. The temperature minimum, a remnant of winter cooling, is present in central and northern Baffin Bay
(Figs. 10, 11) and westernDavis Strait (Fig. 9). The presence of the temperature minimum in the summer data
suggests that winter convection can reach depths greater than 100 m. Winter data indicate that temperature
below 100 m in central Baffin Bay does not changemuch from fall through early spring. A single station taken
at mid-basin (72�N, 62�W) in February (not shown) indicates that the temperature at 400–600 m is about
1.8 �C, similar to October. CTD data taken in the North Water in April 1998 gave a mixed layer depth of
70 m (Melling et al., 2001). Temperature time series from current meter data confirm the small seasonal var-iation except in Davis Strait, around the mouth of Lancaster Sound and in northern Baffin Bay (see Section
5.4). The salinity distribution has high vertical gradients above 200 m and very low gradients below 400 m. A
weak maximum can be found at 800–1000. Below the maximum, the salinity is almost uniform.

0
200
400
600
800
1000
1200
Baffin Bay (Davis Strait Section)
33
34
32.533.5
34.5
Salinity (August)km
0 100
W E
0
200
400
600
800
1000
1200
Dep
th(m
eter
)
1 0
1
1
2
1 2 3 4
Temperature (August)
0
200
400
600
800
1000
1200
2627
26.4 26.8
27.227.4
27.6
Potential Density (August)
Fig. 9. Temperature, salinity and density sections at 66.6�N (Davis Strait line in Fig. 1) for August. Data points used for the plot are
shown in Fig. 13.
C.C.L Tang et al. / Progress in Oceanography 63 (2004) 183–228 195
At Davis Strait (Fig. 9), there is a high east–west temperature gradient with warmer water on the Green-
land side. The temperature in the upper layer, 0–50 m, increases from 0.5 �C at the Baffin Island coast to
4 �C at the Greenland coast. The tilt of the isopycnals over most of the deep water area of Davis Strait
implies a broad southward flowing current. The longitudinal section (Fig. 11) features northward deepening
isopycnals in the upper 200 m in the northern part of the bay and in the region south of Davis Strait, indic-ative of westward flowing currents.
There are significant differences in water properties between southern Baffin Bay and the Labrador Sea
(Fig. 11). At the surface, the Labrador Sea water is 2 more saline and 7 �C warmer than the Baffin Bay
water. A prominent feature of the temperature and salinity distributions is the high horizontal gradients
around Davis Strait. The high gradient region in the salinity section extends from the surface to 200 m.
In the temperature section, the entire water column has high horizontal gradients.
Reliable data for the study of the annual cycle at Davis Strait are available only from June to November
(Fig. 12). Salinity increases from west to east for each month. Off the Baffin Island coast, salinity decreasesfrom 33.5 in June to 32 in August, but the change from August to October is slight. Temperature in the
upper 100 m also increases from west to east for each month. The maximum temperature, 4 �C, occursin August on the Greenland shelf. A notable feature of the temperature distribution is a warm core over
the Greenland slope and a cold core over the Baffin Island slope. The warm core has a temperature of
>3 �C in June, decreasing to >2 �C in August and increasing from September to November. The seasonal

0
500
1000
1500
2000
2500
Baffin Bay (Northern Section)
3334
33.5
34.5
34.5
Salinity (August) km0 100
W
0
500
1000
1500
2000
2500
Dep
th(m
eter
)
01
0
0
1
1
0
2
Temperature (August)
0
500
1000
1500
2000
2500
2727.227.4
27.6
Potential Density (August)
E
Fig. 10. Temperature, salinity and density sections at 73.86�N (northern Baffin Bay line in Fig. 1) for August. Data points used for the
plot are shown in Fig. 13.
196 C.C.L Tang et al. / Progress in Oceanography 63 (2004) 183–228
variations of the temperature and salinity in eastern Davis Strait are closely related to the annual cycle in
West Greenland Current (not shown).
4.2. Horizontal distribution
Fig. 13 shows the horizontal distribution of temperature and salinity at 20 and 400 m for August. At
20 m, the temperature in central Baffin Bay is 3�–6 �C lower and the salinity is 0.5–1 fresher than the Lab-
rador Sea (at the bottom of the plots). These large differences (also see Fig. 11) reflect the warm and salty
inflow of West Greenland Current from the eastern side of Davis Strait and the cold and fresh outflow from
the Canadian Archipelago and water mass produced within Baffin Bay.
A salient feature of the salinity distribution is the local maximum (Fig. 13) in northern Baffin Bay. Thismaximum can also be seen in the north–south vertical section (Fig. 11), and the horizontal salinity distri-
bution maps for other months (not shown). The mechanism that creates the maximum may be salt rejection
from enhanced ice growth (Yao & Tang, 2003) coupled with westward advection of the water mass.
At 20 m, the salinity and temperature contour lines south of Davis Strait are aligned predominantly in
the north–south direction. At 400 m, they run in the northeast-southwest direction suggesting that, at mid-
depth, topography strongly affects the flows.

0
500
1000
1500
2000
2500
3000
Baffin Bay (NorthSouth Section)
333433.5
34.5
34.5
34.5
Salinity (August) km0 100 200
N S
0
500
1000
1500
2000
2500
3000
Dep
th(m
eter
)
011
1
0
23
4
5 6
3
Temperature (August)
0
500
1000
1500
2000
2500
3000
27 27.2 27.427.6
27.8
Potential Density (August)
Fig. 11. Temperature, salinity and density sections for a north–south transect in Baffin Bay (north–south line in Fig. 1) for August.
Data points used for the plot are shown in Fig. 13.
C.C.L Tang et al. / Progress in Oceanography 63 (2004) 183–228 197
4.3. Water masses and bottom water formation
The water in Baffin Bay has two sources – the Arctic Ocean and the Atlantic Ocean (Muench, 1971). A
h–S diagram (Fig. 14) shows how the two sources produce the water masses within Baffin Bay. All authors
accept the description of a cold, low-salinity upper layer as being present throughout the bay. Different
names have been applied to this water mass, e.g. �Arctic’’, �Polar�, �Cold�. We shall refer to this water mass
as �Arctic Water�. It results from mixing between the upper layer of water entering Baffin Bay on the eastern
side of Davis Strait (Site e, Fig. 1), that is cooled in the winter as it circulates within the bay, and the inflow
of upper water from the Arctic Ocean via Lancaster (Site a), Jones and Smith Sounds (Site b) that has beencooled in the Arctic Ocean in previous winters. This layer within Baffin Bay is generally identified as sub-
zero water down to the temperature minimum that occurs near a salinity of 33.7. In northeastern Baffin
Bay, this layer extends to about 100 m. In the western part of the bay, the inflow from the Arctic Ocean
deepens this layer to about 300 m. This water eventually leaves Baffin Bay on the western side of Davis
Strait (Site d).
The warm layer found at 300–800 m in most of the interior of Baffin Bay is a distinctive water mass (Site
c, Fig. 1). This water mass, often defined as having h > 0 �C, S > 34, has also been given different names,
e.g. �Atlantic� �Baffin Bay Intermediate�, �Atlantic Intermediate� and �Arctic Intermediate’’. We shall refer tothis water mass as �West Greenland Intermediate Water�. The dominant inflow is through eastern Davis

0
200
400
600
800
Davis Strait SectionTemperature
Dep
th (
m)
01
23
2
Junekm0 100
0
200
400
600
800
Salinity33.5
34
34.5
June
W EW E
0
200
400
600
800
Dep
th (
m)
1
0
1
1
2
1 2
July
0
200
400
600
800
33 33.5
34
34.5
34.5
July
0
200
400
600
800
Dep
th (
m) 1 0
1
1
2
1 2 3
August
0
200
400
600
800
32.5 33 33.5
34
34.5
August
0
200
400
600
800
Dep
th (
m) 1 0 1
1
2
2
October
0
200
400
600
800
32.5 33 33.5
34
34.5
October
0
200
400
600
800
Dep
th (
m)
12
3
Nodata
November
0
200
400
600
800
3333.534No
data
November
Fig. 12. Temperature and salinity sections at Davis Strait (66.6� N) for June, July, August, October and November.
198 C.C.L Tang et al. / Progress in Oceanography 63 (2004) 183–228
Strait (Site e). The temperature maximum is reduced as the water circulates around Baffin Bay (Sites c, aand d). The West Greenland Current is the southern source for both the cold, fresh upper water and the
mid-layer water. Its temperature and salinity properties are characterized by the slope stations of the
well-sampled Fylla Bank section (curves f1 and f2, Fig. 14; Site f, Fig. 1). At both Sites e and f, the mid-
layer waters are normally warmer in November than in August. Such a warming trend from summer to
winter can be traced to West Greenland Current south of Cape Farewell.
Below the West Greenland Intermediate Water, the salinity changes little and the potential temperature
decreases monotonically to the bottom. These waters are generally called Baffin Bay Deep water for
1200 < z < 1800 m and Baffin Bay Bottom Water for z > 1800 m. The salinity in these two water massesis only slightly less than 34.5 with a minimum at 1800 m. The potential temperature at the bottom is
approximately �0.5 �C. We shall refer to this water mass as �Baffin Bay Deep Water� indicated by the blue
oval (Fig. 14).
Since the sill depths of the Arctic channels and Davis Strait are less than 700 m, the deep layers in Baffin
Bay have no direct access to the Arctic and Atlantic Oceans. The formation of the deep and bottom water is
a subject of some controversy. Collin (1965) and Bailey (1956) proposed that subsurface water (>250 m)
from Nares Strait was the source of the deep water. Sverdrup, Johnson, and Fleming (1942) suggested that
the bottom water was a mixture of Labrador Sea deep water and brine enriched surface water formed dur-ing ice growth in winter. Tan and Strain (1980) supported the presence of brine enriched surface water in

Fig. 13. Temperature and salinity distribution at 20 and 400 m for August. The dots are data points.
C.C.L Tang et al. / Progress in Oceanography 63 (2004) 183–228 199
the bottom water based on the d18O/salinity relation. Muench (1970), however, argued that the depth of
convective mixing from freezing would be too shallow to produce the bottom water. The presence of a tem-
perature minimum at �100 m discussed in Section 4.1 (Figs. 10, 11) lends support to Muench�s argument;
however, it does not preclude the formation of dense water on the continental shelf and subsequent trans-
port down the slope into deep Baffin Bay. Bourke and Paquette (1991) and Bourke, Addison, and Paquette
(1989), based on data from Nares Strait, proposed the formation of cold and saline water in the North
Water in winter and migration of this water to the deep basin of Baffin Bay. Wallace (1985) has reviewed
the various hypotheses. He noted the lack of some authors to take into account adiabatic heating, and whenit was considered there were several errors in the calculations. The origin of deep Baffin Bay water has not
been settled unequivocally.
4.4. Interannual variability
Scarcity of winter hydrographic data in a large part of Baffin Bay precludes basin-scale studies of inter-
annual variability of the water properties. However, abundant summer data are available for eastern Davis
Strait, mostly from Danish sources. Fig. 15 shows the means and standard deviations of temperature andsalinity calculated from July data in a 50 km · 50 km box centered at (66.67�N, 56.68�W) near the 500 m
isobath in eastern Davis Strait. The change in standard deviations of temperature with depth is small, from

31 32 33 34 35 362
1
0
1
2
3
4
5
6
7
8
Salinity
Pot
entia
l Tem
pera
ture
( o C
)
25 26 27 28
a
ab
c cd
f1
e1
f2
e2
o
+
x
o
+ x
West Greenland Intermediate WaterBaffin Bay Deep WaterArctic Water
Fig. 14. Water masses and h–S diagram for selected locations �a� to �f� (see Fig. 1). A location symbol without a subscript or with
subscript �1� denotes August. A location symbol with subscript �2� denotes November. h–S points at 150, 300 and 500 m on curves �e1�and �d� are marked by open circles, crosses and ·�s, respectively.
200 C.C.L Tang et al. / Progress in Oceanography 63 (2004) 183–228
1.3 �C at the surface to 0.8 �C at 400 m. In comparison, the change in salinity variation is much larger, from
0.6 at the surface to 0.1 at 400 m. This suggests that the interannual variation of the water properties is
mostly caused by surface water flux through runoff, precipitation and ice melt and possibly modulated
by advection from West Greenland Current.
1 0 1 2 3 4 5
0
50
100
150
200
250
300
350
400
450
500
Temperature (°C)
Dep
th (
m)
66.67N 56.68W Mean 1950–2000 July
32 32.5 33 33.5 34 34.5 35
0
50
100
150
200
250
300
350
400
450
500
Salinity
Dep
th (
m)
Fig. 15. Mean and standard deviation of temperature and salinity profiles for eastern Davis Strait for July. The data are taken from a
50 km · 50 km box centered at 66.67�N, 56.68�W.

C.C.L Tang et al. / Progress in Oceanography 63 (2004) 183–228 201
Deviations from the means for July over 50 years show that the changes in temperature and salinity do
not seem to have a trend (Fig. 16). Prominent anomalies occur on time scales of 2–5 years. Of particular
interest are the anomalies in 1968–1970 (in both temperature and salinity) and 1982 (in salinity only), which
may have the same origin as those in the northern and central Labrador Sea documented by Drinkwater
(1996) and Belkin, Levitus, Antonov, and Malmberg (1998). The 1982 anomaly does not appear to be cor-related with sea-ice extent (Fig. 6) as expected if ice melt were a significant factor in surface salinity. The
lack of correlation is probably due to the fact that water properties in eastern Davis Strait are governed
by West Greenland Current, which originates outside Baffin Bay. The anomalies are likely a result of
the variation of the large-scale North Atlantic circulation and atmospheric conditions.
5. Circulation
Currents in Baffin Bay were first investigated through ship and ice drift observations in the late 1860s.
The data compiled by Nutt (1966) indicate a net southward surface flow during the winter months. The
baroclinic circulation of Baffin Bay based on data prior to 1966 has been studied by Barnes (1941), Palfrey
and Day (1968), and Muench (1971). Their dynamical calculations show the basic features of baroclinic
circulation – the northward West Greenland Current, which turns west in Melville Bay and south of Cape
York, the southward Baffin Current along the shelf edge of western Baffin Bay, and the cyclonic gyre in the
region between Jones and Lancaster Sounds and Cape York. Currents in northern Baffin Bay (the North
Water) were studied using data from a mooring array deployed in 1997–1998 by Melling et al. (2001). They
63.88N 53.36W July Anomalies 19502000
Dep
th (
m)
Temperature2
2
2
2
11
1
1
1
1
1 1
1
10
0
0 00 0
0
00
0
0
0
0
0
00
00
0
0
00
0
0
0
0
0 0
0 0
11 1 1
1
11
1
1
1
1
1
1
1
1
1
1 1
1
2 2
2
2
50 52 54 56 58 60 62 64 66 68 70 72 74 76 78 80 82 84 86 88 90 92 94 96 98 00
0
100
200
300
400
500
Dep
th (
m)
Salinity
0.75
0.5
0.5
0.5
0.25 0.25
0.25 0.25
0.25
0.25
0.25
0.25
0.25
0.25
0
0
0
0 0
0
0
0
00
0
00
0
0
00
0
0
0 0
0
0
0
0
0
0
0
00.25
0.25
0.25
0.25 0.
25
0.25
0.25
0.25
0.25
0.5
0.5
0.5
50 52 54 56 58 60 62 64 66 68 70 72 74 76 78 80 82 84 86 88 90 92 94 96 98 00
0
100
200
300
400
500
Fig. 16. Temperature and salinity anomalies in the depth-time plane for eastern Davis Strait. The data are taken from a 50 km · 50 km
box centered at 66.67�N, 56.68�W. Dots indicate instrument/data depths.

202 C.C.L Tang et al. / Progress in Oceanography 63 (2004) 183–228
found the southward movement of cold Arctic Water was the dominant circulation feature of the area, and
the strongest flow occurred in Smith Sound east of Devon Island.
The circulation and currents in Baffin Bay investigated in the paper are based on data from a field pro-
gram by Bedford Institute of Oceanography (BIO) supplemented by data from a physical oceanography
program in Lancaster Sound (Fissel et al., 1982; Lemon & Fissel, 1982).
5.1. BIO’s mooring program
Starting in 1983 and continuing for 4 years, an array of current meter moorings was placed in a different
area of Baffin Bay each year to be recovered the following year. In 1987, five moorings were set across Davis
Strait at 66.25�N (Sites A–E, Fig. 17). Site D was located near a spur that extended into the strait from the
southwest. For the first year of the Davis Strait program, the mooring D was on the western side (Da) and
for the last two years it was on the eastern side (Db) of the spur.
80oW
70oW 60oW 50
oW
60 oN
70 oN
80 oN
1983
W200
W500
W1000
N500X
W10
00A
1984
SW400
SW1000
SW600N
SW600S
1985N1000
N500
N300
N550
1986
NE500
E500E500
NE1000
E1000
1987
A B CD
a
E
19889
A B CD
b
E
1978
LF1LF10
LF13
LF2
LF8a
Fig. 17. Location of current meter moorings. The depth contours are 500, 1000 and 2000 m. The 600 m contour (black line) is added to
the 1987–89 insert maps to better show the extent of the spur.

C.C.L Tang et al. / Progress in Oceanography 63 (2004) 183–228 203
The mooring sites for the BIO and Lancaster programs are shown in Fig. 17 and pertinent information is
given in Table 2. The name convention for the BIO moorings is a letter indicating the general area, N –
north, W – west, SW – southwest; E – east, NE –northeast, followed by a number indicating the approx-
imate water depth. A letter is appended at the end if there is more than one mooring in the same area at a
similar water depth. The repeat mooring locations in Davis Strait are designated letters �A� to �E� runningfrom west to east. The mooring sites for the Lancaster Sound program are prefixed by ‘‘LF’’. The mooring
details, graphic displays and statistics of the BIO program are given by Ross (1990a, 1990b, 1991, 1993).
5.2. Mean currents
The record mean velocities from current meters in different layers are presented in Fig. 18. The upper
layer generally represents the cold, fresh Arctic water. The next two layers cover the intrusion of warm,
salty West Greenland Intermediate Water into Baffin Bay. The deepest layer lies below the maximum silldepth of the bay. Records from nearly the same location and depth (viz. deepest records from N500X
Table 2
Mooring locations. The instrument depth with an asterisk in column 6 corresponds to the record length with an asterisk in column 7
Year, location, data source Mooring
site
Latitude
(�N)
Longitude
(�W)
Water
depth (m)
Instrument
depth (m)
Record length
(months)
1978–1979, Mouth of Lancaster
Sound, LF
LF1 74 34.2 79 24.0 552 250, 400 10
LF2 74 54.0 78 43.2 461 35, 125, 250 10
LF8a 73 43.8 78 46.2 878 35, 250, 500 10
LF10 74 31.2 77 16.8 575 250, 500 10
LF13 72 28.2 72 40.2 889 35, 250, 500, 750 10
1983–1984, Northern Baffin
Island Shelf, BIO
W200 71 45.8 71 40.8 210 95, 195* 14, *10
W500 71 50.2 71 23.1 487 22, 72, 172, 472 2
W1000A 71 45.3 70 38.4 928 513, 613, 913 10
W1000 71 55.2 71 13.8 981 81, 181, 481 13
N500X 75 23.7 74 27.1 500 285, 485 14
1984–1985, Southern Baffin
Island Shelf, BIO
SW400 67 40.6 62 33.0 385 260, 360 12
SW1000 67 45.8 62 17.6 1035 235, 335, 535 12
SW600N 67 24.3 61 27.0 582 257, 357, 557 12
SW600S 66 54.5 60 48.3 550 325, 525* *12, 5
1985–1986, Southeastern
Ellesmere Island Shelf, BIO
N1000 74 34.1 72 13.5 1013 178, 328, 478 10
N500 75 20.4 74 21.8 533 193, 343, 493 10
N300 76 00.7 76 04.7 314 229, 292 10
N550 76 29.2 73 37.2 546 174, 324, 531 10
1986–1987, Greenland Slope,
BIO
NE500 75 02.0 66 41.1 516 199, 299, 499 13
E500 70 59.5 60 02.1 521 204, 304, 504 13
NE1000 74 55.4 67 07.6 992 175, 475, 975 13
E1000 70 55.4 60 41.3 971 154, 454*, 954 13, *5
1987–1990, Davis Strait, BIO A 66 13.6 60 58.0 320 150, 300* 36, *10
B 66 14.5 59 59.3 532 161*, 312, 572* 36, *25
C 66 15.2 59 01.3 665 165*, 316**, 515 36, *21, **24
Da 66 16.1 58 23.3 555 150, 300, 500 13
Db 66 15.0 57 27.4 585 148, 297, 497* 23, *20
E 66 15.7 56 46.5 589 150, 300*, 504** 36, *32, **12
The positions and water and instrument depths of the moorings at Davis Strait are the means from three separate deployments.

Record Means
z<205m
80 oW
70oW 60oW 50
oW
70 oN
80 oN
10 cm s1
205<z≤400m
80 oW
70oW 60oW 50
oW
60 oN
70 oN
80 oN
10 cm s 1
400<z<614m
80 oW
70oW 60oW 50
oW
70 oN
80 oN
10 cm s 1
z>614m
80 oW
70oW 60oW 50
oW
60 oN
70 oN
80 oN
10 cm s 1
Fig. 18. Mean currents in four depth ranges.
204 C.C.L Tang et al. / Progress in Oceanography 63 (2004) 183–228
and N500 and each of the moorings across Davis Strait) were concatenated and are shown as a single vec-
tor. Only current records at least 150 days long are shown.
Themean currents range from 0 to 17 cm s�1 of which 23% are less than 2 cm s�1 and 15% are greater than7 cm s�1. The currents over the slopes of Baffin Bay are cyclonic as inferred earlier. There is inflow on the very
eastern slope of Davis Strait, southward through Smith Sound and on the southern side of Lancaster Sound.
Outflow from Baffin Bay is distributed broadly across Davis Strait from the western edge to near the north-
ward flow on the eastern slope. The strongest outflow (Site Db) is only 35 km from the strong inflow (Site E).
There are very strong upper layer currents at the eastern end of Lancaster Sound. Fissel et al. (1982) have
described an intrusion into the sound on the northern side, crossing to the south and joining water from the
Arctic before returning to Baffin Bay and flowing southward along the Baffin Island slope and shelf.

C.C.L Tang et al. / Progress in Oceanography 63 (2004) 183–228 205
Currents decrease with depth at many of the mooring sites, e.g. Lancaster Sound, Davis Strait and
southwestern Baffin Bay, whereas others increase with depth, e.g. N550 in Smith Sound, E500 on the
Greenland shelf break. The strength of the deepest currents at W1000A and NE1000, well below the max-
imum sill depth into Baffin Bay, are notable. The mean speeds are 10 and 14 cm s�1, which are matched
only by the shallow measurements in eastern entrance to Lancaster Sound. Considering the combinationof W1000 and W1000A as defining the vertical structure of the current on the Baffin Island slope, the min-
imum flow is at 181 m and increases monotonically by a factor of 2.5 to the bottom.
The horizontal scale of currents can be very short. In eastern and northeastern Baffin Bay, moorings
were placed on the nominal 500 and 1000 m isobaths which are about 20 km apart. The southern pair
(E500 and E1000) had moderate currents at the 500 m isobath mooring and virtually no mean flow at
the 1000 m isobath. The reverse situation was encountered at the northern pair (NE500 and NE1000) of
moorings.
5.3. Seasonal variability
To put the variability study in perspective, we calculated the variance spectrum of the 3-year long, joined
current meter records from Davis Strait (Site A and E at 150 m). Overall, 8–21% of the total variance was
contained in periods longer than 30 days, about 16–20% in the diurnal and 46–68% in the semidiurnal band.
These results indicate that although seasonal-scale currents are more efficient in transporting heat and
freshwater than tidal currents, tidal currents are the most energetic flows in Davis Strait. The shorter dura-
tion (approximately 1 year) of the other moorings in Baffin Bay (larger statistical uncertainty) prevents usfrom drawing a definitive conclusion about the relative importance of seasonal currents and tidal currents
there.
The seasonal variability of the circulation in Baffin Bay is examined in two ways: seasonal and monthly
averages of the currents and harmonic analysis of monthly mean flows. For the seasonal averages, winter is
defined as January to March; spring as April to June; summer as July to September and fall as October to
December. The harmonics were determined by a least squares fit of a mean and a harmonic with a period of
12 months to the monthly mean currents in the direction of the overall mean flow (median ratio of current
variance in this direction is 12 times that perpendicular to the mean flow). This generally corresponds to thealong-isobath direction and reflects the cyclonic nature of the flow in Baffin Bay. The phase gives the time
of the maximum flow in the given direction. A phase of 0 months correspond to January 1, 1 month cor-
responds to February 1, etc.
5.3.1. Seasonal currents
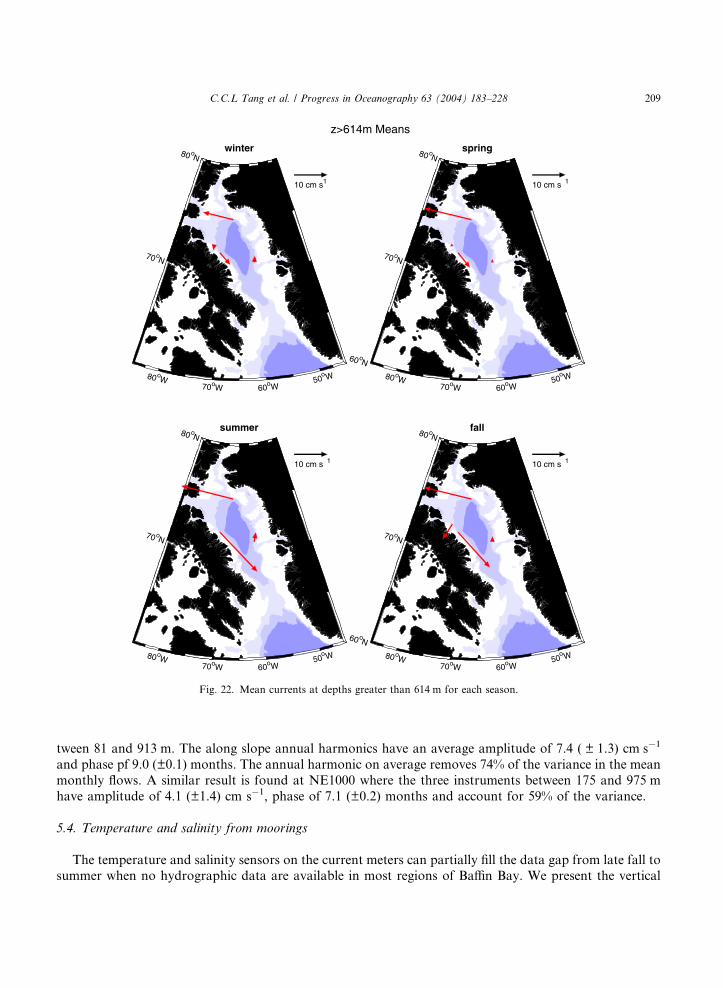
Figs. 19–22 show the seasonal mean currents. The variations of the currents with depth, season and re-
gion are complex, but some general trends are apparent. Summer and fall tend to have stronger currents
than winter and spring at all depths. Strong seasonal variability is evident at many sites in all depth layers,including the deepest one. Among the different regions, the largest seasonal variation occurs at the mouth
of Lancaster Sound and the Baffin Island slope. The currents in Smith Sound change little with season.
The monthly mean currents in Davis Strait have relatively large seasonal variation only at 150 m, espe-
cially at Sites A and E (Fig. 23). The most prominent features are the northward counter current in the
winter at A that lasts for 2–4 months, and the maximum northward current in the fall at E. The annual
cycle is less pronounced at D where the flow was generally to the south and was especially strong for a
7 month period in 1989. The bottom panel, based on the monthly current meter data for the area from
the Baffin Island coast to the shelf break off Greenland, shows four transport estimates: the net transport,the total northward transport, the transport at Site E and the southward transport through the current me-
ter section. Missing monthly means were replaced by the averages for the same month, site and depth; the
overall return was 71.5%. More than half the missing data months are accounted for at Da and Db which

z<205m Means
winter
80 oW
70oW 60oW 50
oW
70 oN
80 oN
10 cm s1
spring
80 oW
70oW 60oW 50
oW
60 oN
70 oN
80 oN
10 cm s 1
summer
80 oW
70oW 60oW 50
oW
70 oN
80 oN
10 cm s 1
fall
80 oW
70oW 60oW 50
oW
60 oN
70 oN
80 oN
10 cm s 1
Fig. 19. Mean currents for depths less than 205 m for each season.
206 C.C.L Tang et al. / Progress in Oceanography 63 (2004) 183–228
were never intended to be occupied simultaneously. Data were recovered from Site B only over one third of
the possible record. The northward transport is dominated by the contribution from Site E, supplemented
by the 150 m flow at Site A in the fall and early winter. During this period, the northward transport is stron-
gest. The seasonal variation of the southward transport is weak with the most notable event during the
summer and fall of 1989 when a prolonged period of strong southward flow occurred. The northward
and southward components combined to give a relatively steady net transport but with a large southward
increase in the summer and fall of 1989 followed by a sharp decrease to nearly zero net transport that lasted
for 1 month.

205<z≤400m Means
winter
80 oW
70oW 60oW 50
oW
70 oN
80 oN
10 cm s1
spring
80 oW
70oW 60oW 50
oW
60 oN
70 oN
80 oN
10 cm s 1
summer
80 oW
70oW 60oW 50
oW
70 oN
80 oN
10 cm s 1
fall
80 oW
70oW 60oW 50
oW
60 oN
70 oN
80 oN
10 cm s 1
Fig. 20. Mean currents between 205 and 400 m for each season.
C.C.L Tang et al. / Progress in Oceanography 63 (2004) 183–228 207
5.3.2. Annual harmonics
A summary of the results of the harmonic analysis is presented in Fig. 24 for the <205 m, 205–614 m and
>614 m layers. In the upper layer, the annual harmonics account for �48% of the variance in the monthly
means; the median phase was 6.8 months with most values clustered from mid summer to early fall. The
largest amplitudes were at the southern side of Lancaster Sound and Baffin Island slope with a phase of
9 months. Davis Strait had relatively strong annual cycles at A and E. The times of peak northward current
at E and A were in mid-October and mid-February, respectively.
In the middle layer, the median phase was 8.3 months; the harmonic accounted for about 35% of thevariance. Most phases are concentrated in the mid-summer to early fall period. The annual harmonic

400<z<614m Means
winter
80 oW
70oW 60oW 50
oW
70 oN
80 oN
10 cm s1
spring
80 oW
70oW 60oW 50
oW
60 oN
70 oN
80 oN
10 cm s 1
summer
80 oW
70oW 60oW 50
oW
70 oN
80 oN
10 cm s 1
fall
80 oW
70oW 60oW 50
oW
60 oN
70 oN
80 oN
10 cm s 1
Fig. 21. Mean currents between 400 and 614 m for each season.
208 C.C.L Tang et al. / Progress in Oceanography 63 (2004) 183–228
phases of the 205–614 m currents counter-clockwise from the eastern moorings using the distance along
500 m isobath are shown in panel d. The sites having current amplitudes greater than the median value
(black dots) show a linear progression of the phase around the bay at the rate of �25 cm s�1; the exception
is the record from the mouth of Smith Sound (at 700 km, phase = 1.26), which was omitted from the fit.
Most of the shallow (S) and deep (D) layer harmonics also lie near the straight line fit. We do not have
an explanation for the observed phase progression. At Davis Strait, the amplitudes at the mid-layer were
generally weaker than in the upper layer. In the deep layer, the annual cycles were quite strong except for
the eastern Baffin Bay record.A nearly barotropic response of the annual cycle is seen at two sites. In western Baffin Bay on the 1000 m
isobath, moorings W1000 and W1000A may be combined to give a vertical profile of six instruments be-
z>614m Means
winter
80 oW
70oW 60oW 50
oW
70 oN
80 oN
10 cm s1
spring
80 oW
70oW 60oW 50
oW
60 oN
70 oN
80 oN
10 cm s 1
summer
80 oW
70oW 60oW 50
oW
70 oN
80 oN
10 cm s 1
fall
80 oW
70oW 60oW 50
oW
60 oN
70 oN
80 oN
10 cm s 1
Fig. 22. Mean currents at depths greater than 614 m for each season.
C.C.L Tang et al. / Progress in Oceanography 63 (2004) 183–228 209
tween 81 and 913 m. The along slope annual harmonics have an average amplitude of 7.4 ( ± 1.3) cm s�1
and phase pf 9.0 (±0.1) months. The annual harmonic on average removes 74% of the variance in the mean
monthly flows. A similar result is found at NE1000 where the three instruments between 175 and 975 m
have amplitude of 4.1 (±1.4) cm s�1, phase of 7.1 (±0.2) months and account for 59% of the variance.
5.4. Temperature and salinity from moorings
The temperature and salinity sensors on the current meters can partially fill the data gap from late fall tosummer when no hydrographic data are available in most regions of Baffin Bay. We present the vertical

0.2
0.1
0.0
0.1
0.2
Cu
rren
t (m
s
(a)
0.2
0.1
0.0
0.1
0.2
Cu
rren
t (m
s) (b)
0.2
0.1
0.0
0.1
0.2
Cu
rren
t (m
s
(c)
1988 1989 1990 19916
4
2
0
2
4(d)
Tra
nsp
ort
(10
6m
3s
–1)
–1
)–1
)–1
Fig. 23. Monthly along-strait currents resolved in the north–south direction from (a) site A, (b) site D (Da and Db joined) and (c) site E
in Davis Strait at �150 m, 1987–1990. (d) Net (solid circle), southward (open circle), northward (open triangle) and site E (solid
triangle) transports through Davis Strait.
210 C.C.L Tang et al. / Progress in Oceanography 63 (2004) 183–228
distribution of the mean temperatures, salinities and the standard deviations based on the monthly meanvalues (Figs. 25 and 26). The salinities have been adjusted using CTD data.
Throughout the bay, temperature and salinity have limited seasonal variability especially at the eastern,
northeastern, western (except salinity at the shallowest depth) and southwestern sites. In northeastern Baf-
fin Bay, the temperatures were about 0.5–0.75 �C lower and the salinities slightly lower than at the eastern
moorings at comparable depths. In northern Baffin Bay, the temperature profile has a complex vertical
structure. The offshore mooring (N1000) has the same temperature and salinity properties as northeastern
Baffin Bay, whereas the other moorings show the influence of flow from Smith Sound. The mean standard
deviation is about 0.4 �C. The largest annual variations (±0.7 �C for temperature, ±0.2 for salinity) and

0 2 4 6 8 10 120
2
4
6
8
10
12
E1
E5 NE1
NE5
N5
LF8
LF13
W1
W2
N55N1
LF2
LF2
W1
W2
A
B C
Da
Db
E
(a) Z < 205 m
Am
plit
ud
e (c
m s
–1)
0 2 4 6 8 10 120
2
4
6
8
10
12
14
E5 E5
NE1
N3
N3
N5
N1 N1
LF1
LF1
LF10
LF10
LF8
LF8
LF13LF13
W1
W1A W1A
SW1
NE5
NE5
N55 N55
N5
N5X N5X
LF2
SW1
SW1
SW4 SW4
SW6NSW6N
SW6N
SW6S
A B
B
C
C
Da
Da
Db Db
E
E
(b) 205 ≤ Z ≤ 614 m
Phase (months)
Am
plit
ud
e (c
m s
–1)
0 2 4 6 8 10 120
2
4
6
8
10
LF13
W1A
E1
NE1
(c) Z > 614 m
Phase (months)
Am
plit
ud
e (c
m s
–1)
0 500 1000 1500 2000 25000
2
4
6
8
10
12
S
S
SS
S
S
S
S
S S
S
S
S
S SD
D
D
D
Distance (km)
Ph
ase
(mo
nth
s)
(d)
Fig. 24. Results of annual harmonic analysis. (a–c) Distribution of amplitude and phase in different depth ranges. The current meter
sites are abbreviated by dropping the zeros, e.g., N3 is Site N300. The vertical and horizontal dash lines are the medians. Bold-face
letters indicate variance removed from monthly means greater than 50%. (d) Phase of annual harmonic in relation to the eastern Baffin
Bay moorings. Black (grey) dots indicate 205–614 m phases whose amplitude is greater (less) than the median value, S indicates <205 m
phases, D > 614 m phases. The straight line is the best linear fit to the black dots with the one outlier removed.
C.C.L Tang et al. / Progress in Oceanography 63 (2004) 183–228 211

1000
800
600
400
200
0
Dep
th (
m)
Lancaster Sound
N Baffin Bay
1000
800
600
400
200
0
Dep
th (
m)
W Baffin Bay
NE Baffin Bay
2 1 0 1 2 32000
1500
1000
500
0
Dep
th (
m)
Temperature (°C)
SW Baffin Bay
2 1 0 1 2 3
Temperature (°C)
E Baffin Bay
Fig. 25. Average temperature and standard deviation based on monthly means from current meters for northern Baffin Bay (moorings
prefixed with ‘‘N’’; N500 and N500X open circle, N1000 solid circle, N500 and N300 open square), Lancaster Sound, western Baffin
Bay (�W� and LF13 solid circle), and southwestern (�SW�) Baffin Bay.
212 C.C.L Tang et al. / Progress in Oceanography 63 (2004) 183–228
lowest salinity in Baffin Bay were recorded in the vicinity of Lancaster Sound at shallow depths (<250 m).
The records in western Baffin Bay indicate a deeper, colder upper layer than elsewhere within the bay. This
reflects the cold Arctic Water flowing from the south side of Lancaster Sound. Downstream in southwest-
ern Baffin Bay, the temperature structure shows an almost linear increase from the cold upper layer to the
warmer water at �550 m. The water in the upper 300 m of western Baffin Bay is mostly Arctic Water.
The annual cycle of monthly averaged temperature–salinity at 150, 300 and 500 m in Davis Strait are
shown in three separate T–S diagrams (Fig. 27); the size of the marker is scaled by the north–south trans-
port. This figure is complemented by Table 3 which concisely summarizes the results as the annual means ofthe total northward and southward transports, their mean temperatures and salinities for the three depth

1000
800
600
400
200
0
Dep
th (
m)
Lancaster Sound N Baffin Bay
1000
800
600
400
200
0
Dep
th (
m)
W Baffin Bay NE Baffin Bay
32 33 34 351000
800
600
400
200
0
Dep
th (
m)
Salinity
SW Baffin Bay
NO DATA
32 33 34 35Salinity
E Baffin Bay
Fig. 26. Average salinity and standard deviation based on monthly means from current meters for northern Baffin Bay (moorings
prefixed with ‘‘N’’; N500 and N500X open circle, N1000 solid circle, N500 and N300 open square), Lancaster Sound, and western
Baffin Bay (�W� and LF13 solid circle).
C.C.L Tang et al. / Progress in Oceanography 63 (2004) 183–228 213
levels. To put the T–S ranges in the context of water mass structure of Baffin Bay and Labrador Sea, we
connect the h–S points at 150, 300 and 500 m on curve (d) to the corresponding points on curve (e) in Fig.
14 (dotted lines). These three dotted lines represent the T–S variation across Davis Strait at the given depths
(h and T are almost identical at these depths).The T–S variations for moorings A–C at 150 m are characteristic of Arctic Water (Fig. 14) and follow an
anti-clockwise path, have their minimum temperatures in January, and are confined to a small temperature
range. The flow at mooring A is to the north from December–March. There is weak northward flow at B
only in January; transport at C was to the south for all months. Moorings A–C have roughly the same tem-
perature range but show an increasing salinity to the east. At mooring E, the T–S curve is characteristic of
water in the upper West Greenland Current and moves in a clockwise sense with the transports to the

32 32.5 33 33.5 34 34.52
1
0
1
2
3
4
Jan
Tem
per
atu
re (°
C)
Jan
Jan
Jan
Jan
Jan
(a) 100,000 m3 s 1
250,000
1,000,000
33.5 34 34.5 352
1
0
1
2
3
4
5
6
JanTem
per
atu
re (°
C)
Jan
Jan
Jan
JanJan
(b) 100,000 m3 s 1
250,000
1,000,000
34.5 350
1
2
3
4
5
6
Tem
per
atu
re (°
C)
Salinity
Jan
Jan
Jan
Jan
Jan (c) 25,000 m3 s 1
62,500
250,000
A B C D
a D
b E
Fig. 27. Monthly average temperature at 150 m (a), 300 m (b) and 500 m (c) from current meter data from Davis Strait. Monthly
transports are represented by the size of the marker. A solid (open) marker indicates southward (northward) flow.
214 C.C.L Tang et al. / Progress in Oceanography 63 (2004) 183–228
north, weakest from January to April; minimum temperatures occur in July. Moorings Da and Db lie be-tween these two regimes and indicate that strong horizontal gradients of T and S are found in this area. At
times, the properties at Da match those of Arctic Water, whereas from December to February, they ap-
proach or overlap the warmer/saltier water of the upper West Greenland Current. The water at Db lies
within the same salinity range as at E but is generally cooler by about 2�C. This suggests that it could
be upper water of the West Greenland Current that has cooled for some time in Baffin Bay before returning
to Davis Strait as a southward current.
The T–S properties vary almost linearly across Davis Strait at 300 m from the minimum temperature of
about�1.25 �Cand a salinity of about 33.65 at sitesA andB, indicative ofArcticWater to 4.9 �C, 34.67 nearlymatching the temperature and salinity of Fylla Bank (curve f2, Fig. 14). The linear gradient fromone site to the

Table 3
Annual total northward and southward transports, temperatures and salinities for the three nominal depth levels of the Davis Strait
current meters
Depth Annual means
Transport (Sv) Temperature (�C) Salinity
150 m northward 0.59 0.9 33.48
150 m southward 2.37 �0.9 33.31
300 m northward 0.26 3.9 34.62
300 m southward 0.91 0.8 34.16
500 m northward 0.12 4.0 34.90
500 m southward 0.26 1.6 34.52
The annual means were calculated from monthly means; temperature and salinity weighted by monthly mean transports.
C.C.L Tang et al. / Progress in Oceanography 63 (2004) 183–228 215
next one suggestsmixing betweenArctic andWestGreenland IntermediateWater. The flows are almost exclu-
sively southward at sitesA–Db and are northward for allmonths at E.Water properties atA andBoverlap but
are out of phase with the coldest, freshest water in January at B but in September–October at A.
At 500 m, temperature and salinity increase towards the east with a distinct separation between D and E.This is consistent with the northward flowing water at E making an extended flow cyclonically around Baf-
fin Bay, mixing with adjacent water to become colder and fresher before exiting Baffin Bay as detected at
moorings B–D. At any site, the temperature and salinity are near their maximum values in January. The
southward transport at site Db has distinctly different T–S properties than the northward flow at site E.
Although CTD data were used to adjust the current meter observations at the start and end of the record
at site E, salinity was above 35 from November to February. The long-term data from the Fylla Bank re-
gion and eastern Davis Strait (Fig. 12) did not show salinities this high; contemporaneous data from the
northern Labrador Sea also did not have such high values. The November to February salinities at leastare suspect and may be high by as much as 0.3.
The increasing separation of T–S between Db and E from 150 to 500 m suggests that the flow fields in the
vicinity of Davis Strait at different depths are dissimilar. Waters at these two locations may have a common
source at shallow depths, but not at great depths. A better understanding of the circulation can be gained
from the results of a numerical model presented in the following section.
Another interesting feature of Fig. 27 is the time of maximum temperatures at Db and E: November to
February. At first glance, this seems to be counter intuitive. But hydrographic data are consistent with
the warming trend of the deep water from summer to winter. Fig. 12 shows from August to Novembertemperature below 150 m in eastern Davis Strait increases by approximately 1 �C. Near the surface, the
temperature decreases by up to 3 �C over the same period. Accelerated surface cooling in winter would
cause further decrease in surface temperature. The annual cycles of the upper and lower layers are out of
phase.
6. Mean circulation from a numerical model
A numerical model (Princeton Ocean Model) has been applied to the Baffin Bay region to study the
horizontal structure of the circulation. Our objective is not to reproduce the observations as closely as
possible, but to reveal features in the circulation that could not be obtained from the sparse current me-
ter measurements. In this section, we discuss the results from two model simulations: a short (10-day)
diagnostic spin-up with no atmospheric forcing to generate the mean circulation of Baffin Bay (Sections
6.2 and 6.3, Figs. 28 and 30), and a three-month prognostic run with forcing for Davis Strait (Section
6.3, Fig. 29).

216 C.C.L Tang et al. / Progress in Oceanography 63 (2004) 183–228
6.1. Model implementation
The model domain covers the entire Labrador Sea and Baffin Bay (inset in Fig. 28). The resolution is 1/3�in longitude (15 km at Davis Strait) with a variable latitude interval to maintain approximately square grid
cells. The model is forced by a prescribed transport of 35 Sv (1 Sv = 106 m3 s�1) at the open boundary southof Greenland. Net inflows of 0.9, 0.2 and 1.1 Sv are specified at Smith Sound, Jones Sound and Lancaster
Sound, respectively. Initial conditions are the objectively analyzed climatological October temperature and
salinity fields described in Section 4. Strictly speaking, results for the spin-up run represent the mean cir-
culation for October. Here, they are taken to be a first approximation to the mean current fields.
0.1 m s1
84 oW
76oW 68oW 60oW
52o W
64 oN
68 oN
72 oN
76 oN
80 oN
Fig. 28. Model currents at 50 m. The contour interval for depth is 500 m. The model domain is shown in the inset.

C.C.L Tang et al. / Progress in Oceanography 63 (2004) 183–228 217
6.2. General features of the circulation
The velocity field at 50 m for the northern portion of the model domain is shown in Fig. 28. The West
Greenland Current enters Baffin Bay in the southeast corner of the figure. A part of the current reaches as
far north as 66�N before reversing to round the northern Labrador Sea. The remainder, 2 Sv, continues intothe eastern side of Baffin Bay. The circulation in Baffin Bay is complex with strong topographic control.
The West Greenland Current penetrates eastern Smith Sound to about 77�N. The current is augmented
by outflows from Smith, Jones and Lancaster Sounds to become the Baffin Current. The Baffin Current
flows along the western side of the bay offshore of the 500 m isobath. At the shelf break between 69 and
72� and the south shore of Lancaster Sound the current is quite intense. The difference in the flow over
the broad shelf in eastern Baffin Bay and over the narrow shelf and steep slope in western Baffin Bay is
evident.
The model results demonstrate the topographic control of currents, particularly in the Davis Strait re-gion, over the canyons of eastern Baffin Bay, in the vicinity of Smith and Lancaster Sounds, and over the
steep slope off central Baffin Island. An unexpected result of the model is a southward counter current along
the 1000 and 1500 m isobaths off the Greenland shelf from 72 to 68�N. Over most parts of the Greenland
shelf, the currents are northward. In particular, strong northward currents are found between 71 and 73�Nover the 500 m isobath. The existence of the southward counter current may explain the high horizontal
shears between two adjacent moorings, E500 and E1000, only 17 km apart at the eastern shelf edge
(Fig. 18). The very low speed at E1000 suggests that the mooring is located between the northward current
and the southward counter currents. The counter current crosses the bay to join the southward flow off theBaffin Island coast at 67�N and then continues south.
6.3. Current field in the vicinity of Davis Strait
To examine the structure of the current field in the vicinity of Davis Strait in greater detail, a prognostic
run integrating the model from October (spin-up field) for 90 days with monthly forcing (air temperature,
wind, humidity, precipitation and cloud cover) was made. Fig. 29 shows the model mean current fields and
measured currents for fall (average of October, November and December) at the mean current meter depthsof 156, 304 and 506 m. There is a reasonably good agreement between the modeled and measured currents.
At 156 m, the strongest inflow is along the 500 m isobath on the Greenland side near mooring E. A reversal
in direction occurs within only 30 km west of E. The current field around Db has a complex structure. At
156 and 304 m, part of the flow at Db is from E. At 506 m, the current at Db appears to be a continuation of
the southward counter current along the 500 m isobath on the Greenland slope. The directions of both the
inflow and outflow in the vicinity of Davis Strait follow the topography closely. On the Baffin Island side,
the strongest current is found along the 500 m isobath parallel to the bathymetric contours. Close to the
shore and at A, the currents are much weaker.Temperature and salinity data from the current meters at Davis Strait described in Section 5.4 are con-
sistent with the flow fields shown in Fig. 29. At 150 m and 300 m, the partial overlap of T–S at Sites Db and
E (Fig. 27) suggests that the waters at Db and E are connected. At 500 m, the separation of T–S between Db
and E implies that the southward flow at Db and northward flow at E have different origins.
Fig. 30 (upper panel) shows a cross-section of model along-strait currents at Davis Strait (66.25�N) from
the spin-up run (October climatology). Also shown (middle panel) are the model and measured depth-inte-
grated currents for October (see Section 7.2 for the calculation of the depth-integrated currents), and the
model transport integrated from the western side of the strait (lower panel). There is general agreement be-tween the model and the data. The measured and model currents are strongest between 56 and 58�W where
there are opposing north and south flowing jets. The model predicts lower southward currents at A and
higher southward currents at Db compared to the observations.

218 C.C.L Tang et al. / Progress in Oceanography 63 (2004) 183–228
7. Volume and freshwater transports
Only crude estimates of volume and freshwater transports from the three northern channels, Lancaster,
Smith and Jones Sounds, into Baffin Bay have been made owing to scarcity of data, especially current
observations. A review of transport estimates prior to 1987 has been given by Melling (2000). In this sec-tion, we collect all reported estimates since 1936. The transports through Davis Strait have been determined
by Cuny (2003); Cuny, Rhines and Kwok (2005) and in this work using current and salinity data from BIO.
7.1. Northern channels
Estimates of volume transports through the northern channels have been made using hydrographic data,
moored current meter data and a model (Table 4). Errors in these estimates can be large. The estimates
from hydrographic data were all based on limited numbers of surveys, and thus may not represent the meantransports. There are uncertainties associated with reference level. Sadler�s (1976) estimate for Robeson
Channel (northern end of Nares Strait) was based on three moorings across the channel with 10 Braincon
current meters for periods of 37–41 days. The large difference between Sadler�s (1976)and Muench�s (1971)estimates suggest barotropic current may be underestimated in the latter�s geostrophic current calculations.(Fissel, Birch, Melling, & Lake, 1988) estimate for Lancaster Sound is the sum of transports through Bar-
row Strait (2 sites, 4 current meters, 2 depths) and Wellington Channel (13 sites, 13 current meters, 1 depth).
Prinsenberg and Hamilton (2004) have estimated the annual volume transport through Lancaster Sound
Table 4
Volume transports through the northern channels. The pressure level in the ‘‘Method’’ column gives the level of no motion in
geostrophic current calculations
Volume transport (Sv) Method Reference
Lancaster Sound
0.65 1000 db Kiilerich (1939)
1.0 500 db Collin (1965)
0.3, 0.6 700 db Muench (1971)
0.68 Current meter data Fissel et al. (1988)
0.75 (±0.25) ADCP data Prinsenberg and Hamilton (2004)
Jones Sound
0.3 1000 db Kiilerich (1939)
0.27 500 db Collin (1965)
0.2, 0.42 700 db Palfrey and Day (1968)
Smith Sound/Robeson Channel
0.2 Variable Muench (1971)
0.67 Current meter Sadler (1976)
Canadian Archipelago
0.54 Model Steele et al. (1996)
1.0 Model Rudels (1986)
0.9–2.5 (summer) Model Kliem and Greenberg (2003)
Davis Strait
2.6 (±1.2) (not including WGS) Current meter data This work
3.4 (not including WGS) Current meter data Cuny et al. (2005)
2.6 (±1.0) (including WGS) Current meter data Cuny et al. (2005)
The entry under ‘‘Canadian Archipelago’’ is the total transport through the three channels. The numbers in bracket are standard
deviations of seasonal variation. ‘‘WGS’’ in the Davis Strait transport stands for ‘‘West Greenland Shelf’’.

C.C.L Tang et al. / Progress in Oceanography 63 (2004) 183–228 219
for 1998–2001 based on ADCP moorings on the north and south sides of the Sound. The annual transport
varied from 0.39 to 0.96 Sv with an average value of 0.75Sv.
In addition to estimation based on data, Steele, Thomas, Rothrock, and Martin (1996) used a box model
for the Arctic Ocean and sea-ice and oceanographic data in the upper 200 m to study the freshwater budget
of the Arctic Ocean. They found a volume transport of 0.54 Sv through the Canadian Archipelago. Thisvalue is smaller than the range of transports, 0.7–2.1 Sv, based on the estimates from the three northern
channels. Rudels (1986) used an idealized 2-layer model to obtain a volume transport of 0.7 Sv in the upper
layer through Canadian Archipelago. He also assumes that 0.3 Sv of Arctic water enters the deep Baffin
Bay to account for the renewal of the bottom water and the cooling of the deep water. Using a diagnostic
model for the Canadian Archipelago Kliem and Greenberg (2003) found the volume transport was sensitive
to the elevation difference between the Arctic Ocean and Baffin Bay; Smith Sound had the largest transport.
Freshwater transport through the Canadian Archipelago has been estimated by Aagaard and Carmack
(1989) using Fissel et al.�s (1988) transport, a mean salinity of 34.2 and a reference salinity of 34.8, and bySteele et al. (1996) using a box model for the Arctic Ocean. The two estimates (Table 5) have the same order
of magnitude. Prinsenberg and Hamilton (2004) have combined current meter data and in situ salinity
observations and obtained an average annual transport (1998–2001) of 1420 km3 y�1 through Lancaster
Sound alone. By comparison, the freshwater transports through Fram Strait and Bering Strait were esti-
mated at 820 and 1670 km3 y�1, respectively, by Aagaard and Carmack (1989). The freshwater transport
through the Canadian Archipelago is a significant component of the freshwater budget of the Arctic Ocean
and Baffin Bay.
7.2. Davis Strait
Cuny et al. (2005) used the current meter data (speed, direction, temperature, and salinity) from the six
moorings sites in Davis Strait to estimate the volume and freshwater transports. Data over all years were
averaged to obtain a one year mean. Corrections were made to the current meter temperature and salinity
time series using CTD observations taken when the moorings were deployed and recovered. Current shear
in September and October for the upper 150 m was estimated using geostrophy and the CTD sections taken
in September 1987, 1989 and 1990 and October 1988 by Ross (1992), Ross (1993). Shear for June-Augustand November was estimated from archived data. For the December-May period, temperature and salinity
were assumed constant in the upper 150 m and taken as the value recorded by the 150 m current meter. A
reference salinity of 34.8 was used to compute the freshwater transport. The West Greenland Shelf trans-
port was estimated using the 150 m current from the easternmost mooring. The freshwater transport cal-
culation incorporated archived salinity observations from the shelf. Cuny et al.�s best estimates of the
annual net transport and the freshwater transport are (2.6 ± 1.0) Sv and (2900 ± 1070) km3 y1, respectively
Table 5
Freshwater transport through the Canadian Archipelago and Davis Strait
Freshwater transport (km3 y�1) Method Reference
Canadian Archipelago 920 Data Aagaard and Carmack (1989)
1232 Model Steele et al. (1996)
Lancaster Sound 1420 ADCP data Prinsenberg and Hamilton (2004)
Davis Strait 3120 (±1070) (not including WGS) Current meter data This work
4100 (not including WGS) Current meter data Cuny et al. (2005)
2900 (±2080) (including WGS) Current meter data Cuny et al. (2005)
The errors in the estimates for Davis Strait are standard deviations of seasonal variation. The numbers in bracket are standard
deviations of seasonal variation. ‘‘WGS’’ in the Davis Strait transport stands for ‘‘West Greenland Shelf’’.

220 C.C.L Tang et al. / Progress in Oceanography 63 (2004) 183–228
(Tables 4 and 5). The net transport includes the northward transport of West Greenland Shelf of 0.8 ± 0.8
Sv. Excluding the West Greenland Shelf, Cuny (2003) found that the transport had a weak annual cycle of
about 0.1 Sv and accounted for only about 1% of the annual variance; on the other hand the fresh water
transport had a strong annual cycle of about 1451 km3 y�1, peaked to the south at the end of October and
accounted for 56% of the variance.We used the same data under slightly different assumptions to estimate volume and freshwater
transport from the western side of the strait to the shelf break off Greenland. We assumed that the
150 m data represented the flow from the surface to halfway to the nearest instrument. We used all
of the archived CTD and bottle data to determine the salinity gradient, dS/dz, in the upper 150 m
at each mooring site. In practice this could be done only for July–November; other months had either
no or insufficient data. The salinity gradient was linearly interpolated from November to July. All data
were combined by month to produce one annual cycle. The net annual transport was 2.6 Sv south-
ward with a peak of 3.5 Sv in August and a minimum of 1.3 Sv in December. The annual meanis 0.8 Sv smaller than that determined by Cuny et al. (2005) for the same area. A typical monthly
standard deviation, estimated from the subtidal variance, was 1.2 Sv. An annual harmonic fit to
the monthly values has amplitude of 0.65 Sv, peaking in mid-August southward and accounting for
51% of the monthly mean variance. The annual mean freshwater transport was southward at about
3120 km3 y�1, with a peak in October of 5200 km3 y�1 and a minimum in January of 660 km3 y�1.
A typical monthly standard deviation was 1070 km3 y�1. Again the annual mean is smaller than Cuny
et al.�s estimate of 4100 km3 y�1.
We have limited our estimates to the area defined by the Baffin Island coast and the Greenland shelfbreak; we have neglected the volume and freshwater transport on the Greenland Shelf because of the lack
of current meter data and year-round salinity observations there. However, we can make some rough
estimates of a potential shelf contribution by using the 150 m current measurements from the Greenland
Slope (mooring E) and available hydrographic data from the shelf (mainly from summer and early fall).
The 150 m currents are likely to represent an upper bound since they are taken in the extension of the
strong West Greenland Current. Taking the shelf as 125 km wide, 100 m deep and the annual average
current at E, 150 m as 5.5 cm s�1, we get a potential shelf transport northward of 0.7 Sv; the minimum
transport, 0.2 Sv southward, is for March, and the maximum, 2 Sv northward, is in November. Using anaverage shelf salinity of 33.5, we find annual freshwater transport of 1100 km3 y�1, a minimum of
380 km3 y1 southward, and a maximum of 2470 km3 y�1 northward. These shelf transports represent
an important potential component to the overall volume and freshwater budgets. We note that the model
current field (Figs. 29, 30) shows that the speeds over the shelf are smaller than those at E and the direc-
tions are more variable. The shelf transports based on current measurements at E are most likely over-
estimates. The uncertainties in the estimates indicate the need to obtain year-round current and salinity
observations on the shelf.
Additional considerations concerning the accuracy of the estimates of the transports are the horizon-tal and vertical coherence of the array and the choice of reference salinity. Horizontal coherence was
calculated among the 150 m along-strait time series for 1987, the year with best data return at this
depth. A representative median value of the coherence for all periods longer than diurnal is about
0.15. The coherence between adjacent moorings in the lowest frequency band ranged from 0.03 to
0.46. Thus, there is essentially no spatial overlap of the array across the strait. This indicates that
the uncertainty in our estimates of monthly volume and freshwater transport are likely larger than indi-
cated above. On the other hand, the vertical resolution of the array deeper than 150 m seems adequate.
We computed the vertical e-folding scale of along-strait currents as about 440 m by fitting an exponen-tial to the correlations determined from the daily mean current time series for all possible pairs from
1987 to 1990. This gives a representative correlation of 0.71 (roughly half of the variance) for separa-
tions of 150 m (i.e., between the 150 and 300 m instruments) and 0.64 (about 41% of the variance) be-

Fig. 29. Mean model currents in the vicinity of Davis Strait at 156, 304 and 506 m for fall (October to December). Observed fall mean
currents are drawn as red vectors.
C.C.L Tang et al. / Progress in Oceanography 63 (2004) 183–228 221
tween the 300 and 500 m. However, the absence of observations from depths less than 150 m is a major
problem, particularly for salinity.
To indicate the sensitivity of the freshwater transport calculation to the reference salinity, we considered
values of 34.6 and 35. For a reference salinity of 34.6 (35), the mean annual freshwater transport was re-
duced (increased) to about 2664 km3 y�1 (3595 km3 y�1).

62 60 58 56 54-100
-50
0
50
100
dept
h-in
tegr
ated
curr
ent(
ms
)2
-1
A B C EDa Db
(b)
62 60 58 56 540
1
2
3
4
5
tran
spor
t(S
v)
longitude (˚W)
(c)
dept
h(m
)
62 60 58 56 54-800
-600
-400
-200
0
(a)
0.1
0.2
-0.1-0
.1
Fig. 30. Comparison of currents/transport between model and measurements at Davis Strait. Upper panel: cross-section of model
along-strait currents at Davis Strait (66.25�N). Middle panel: model (solid line) and measured depth-integrated currents (bars). Lower
panel: integrated transports from the Baffin Island coast from model (solid line) and measurement (solid circle).
222 C.C.L Tang et al. / Progress in Oceanography 63 (2004) 183–228
8. Summary and discussion
8.1. Sea-ice and iceberg
Sea-ice is present in Baffin Bay most of the year with nearly complete clearance of ice only in August and
September. Ice starts to form in October and the ice cover increases steadily from north to south reaching a
maximum in March when the entire Baffin Bay except eastern Davis Strait is covered by ice. The interan-
nual variation is ice extent is correlated to winter air temperature (Figs. 3 and 6). Baffin Bay is the major
source of freshwater and sea-ice for the Labrador Sea. Icebergs in Baffin Bay are produced by the glacierson the west coast of Greenland north of 68�N. No icebergs of significant size are produced by glaciers of the
Canadian Archipelago. Large icebergs tend to drift north while small icebergs tend to drift south.

C.C.L Tang et al. / Progress in Oceanography 63 (2004) 183–228 223
The North Water in northern Baffin Bay is a recurrent polynya. An ice arch in Kane Basin blocks inflow
of ice from the north. Winds and currents move ice away from the arch and the coast of Greenland creating
a region of thin ice and open water. The polynya is characterized by enhanced atmospheric heat loss and
enhanced ice growth. The North Water is thought to be principally a latent heat polynya.
8.2. Water masses
The water of Baffin Bay has two sources – the Arctic Ocean and the Atlantic Ocean. Within Baffin Bay
we identify three water masses, viz. Arctic Water, West Greenland Intermediate Water, Baffin Bay Deep
Water (Fig. 14). The dominant source of Arctic Water (upper layer down to temperature minimum below
0 �C) is from the Arctic Ocean through the Canadian Archipelago and Nares Strait, and can be found in the
upper 300 m of western Baffin Bay. The warm and salty (h > 0 �C, S > 34) West Greenland Intermediate
Water is the deeper water of the West Greenland Current entering Baffin Bay through eastern Davis Strait.A comparison between the temperature and salinity at mooring E in eastern Davis Strait and Fylla Bank
indicates that throughout the year the inflow at eastern Davis Strait is dominated by water characteristic of
the Greenland Slope and can be found at 300–800 m in most of the interior of Baffin Bay. The temperature
maximum of this layer is lowered as the water circulates around Baffin Bay and mixes with adjacent waters.
The Baffin Bay Deep Water is found in central Baffin Bay below 1200 m. The formation of this water is not
determined.
A temperature minimum at �100 m in central, northern and western Baffin Bay found in the summer
data suggests winter convection does not penetrate much deeper than 100 m (Fig. 11). Such a shallow mixedlayer is not unexpected considering that Baffin Bay is covered by sea-ice most of the year, and ice insulates
the ocean from cold winter air and reduces air–sea heat fluxes. The difference in mixed layer depth between
ice covered ocean and open ocean can be large. On the Labrador shelf, CTD data collected across the pack
ice indicated that the mixed-layer depth increased from 80 m under sea-ice to 200 m in open water (Tang &
DeTracey, 1998). The shallow mixed layer supports Muench�s (1970) argument that broad scale convective
mixing could not be responsible for the deep water formation of Baffin Bay if only vertical processes are
considered. However, convective mixing over shallow shelves and then advection of cold, salty water down
the slope could introduce water at depths below the temperature maximum.Seasonal variations of temperature and salinity are small except in Davis Strait and the shelf regions in
northern Baffin Bay and the mouth of Lancaster Sound. In eastern Davis Strait, the annual temperature
cycles in the upper and lower layers are out of phase (Fig. 27). Maximum (minimum) temperature occurs
in winter (summer) which reflects the annual temperature variation of West Greenland Current.
8.3. Currents
Current meter data from the BIO program in 1983–1990 and the Lancaster Sound moorings in 1978–1979 show that the circulation is predominantly cyclonic with inflow from eastern Davis Strait and
Smith, Lancaster and Jones Sounds, and a broad outflow at Davis Strait (Fig. 18). Below the mixed
layer, the strongest inflow and outflow are both on the Greenland side of the strait separated by only
35 km. The horizontal structure indicates that current field in the vicinity of Davis Strait is strongly af-
fected by topography.
The depth dependence of the currents differs from region to region. At Davis Strait, southwestern Baffin
Bay and mouth of Lancaster Sound, there is a general trend of decreasing speed with depth. In other parts
of Baffin Bay, the speeds tend to increase with depth. At two locations on the slope of the bay, the currentsincrease to a depth approaching 1000 m. The seasonal variation of the currents in Baffin Bay is complex.
Overall, summer and fall tend to have stronger currents than winter and spring have at all depths. Among
the different regions, the largest seasonal variation occurs at the mouth of Lancaster Sound and the Baffin
224 C.C.L Tang et al. / Progress in Oceanography 63 (2004) 183–228
Island slope. The currents at Smith Sound change little with the season. The locations of strong, deep cur-
rents appear to have an annual cycle that has a significant barotropic component.
The currents at Davis Strait have relatively large seasonal variation at Sites A and E at 150 m. Near the
Baffin Island coast (Site A), the flow was northward only in winter. Over the Greenland slope (Site E, all
depths), the flow was northward and maximum velocity occurs in November–December (Fig. 23). The in-creased northward flows in fall and winter may be related to: (a) the seasonal variation of inflows from the
northern straits; (b) the seasonal density structure of Baffin Bay and Davis Strait; and (c) the large transport
of the Labrador Sea gyre in fall and winter (Han & Tang, 2001). Preliminary model results (E. Dunlap,
personal communication) indicate that inflow at eastern Davis Strait increases from July to October (no
change in northern boundary inflow). The model results also show that a decrease in the northern inflow
causes an increase in the Davis Strait inflow. Recent measurements of volume transport through Lancaster
Sound indicate that minimum transport occurs in fall (Prinsenberg & Hamilton, 2004). This implies that the
reduced volume transport in fall from the northern channel is partially responsible for the high northwardvelocity in eastern Davis Strait.
Results from a three-dimensional circulation model show that part of the inflow from the West Green-
land current in the upper layer of eastern Davis Strait reverses its direction toward the Labrador Sea in the
vicinity of 66�N (Fig. 29). However, at 500 m, the current field has a different horizontal structure. The in-
flow is much weaker and the outflow appears to be a continuation of a southward counter current which
originates from the Greenland slope inside the bay and flows along the 2000 m isobath.
8.4. Volume and freshwater transports
Crude estimates of volume and freshwater transports from the three northern channels to Baffin Bay
have been made by previous investigators based on oceanographic and remote sensing data. The total vol-
ume transport through the northern channels is in the range 0.7–2.1 Sv, and the freshwater transport is in
the range 920–1460 km3 y�1. The volume and freshwater transports through Davis Strait have been calcu-
lated by Cuny et al. (2005) and in this work using the BIO data. Cuny et al. (2005) obtained a mean south-
ward volume transport of 3.4 Sv while we estimate the transport as 2.6 Sv (not including the Greenland
Shelf transport in both cases). The northward Greenland Shelf transport was estimated at 0.8 Sv by Cunyet al. (2005). The estimates for the mean freshwater transport were 41000 km3 y1 (Cuny et al., 2005) and
3120 km3 y�1 (this work, not including Greenland Shelf in both cases). Cuny et al. (2005) estimate an an-
nual northward freshwater transport on the Greenland Shelf of 1200 km3 y�1. There may be large uncer-
tainties associated with the estimates for the Greenland Shelf because of the lack of current data from the
shelf.
The thermohaline circulation of the North Atlantic Ocean can be sensitive to the volume and freshwater
transport from Arctic Ocean to Baffin Bay and Labrador Sea. A large freshwater transport can lower the
surface salinity, stabilize the water column and thus reduce the rate of deep water formation in the Labra-dor Sea. Goosse et al. (1997) study the thermohaline circulation using a general circulation model in which
Canadian Archipelago can be closed or opened. An opened Canadian Archipelago with a volume transport
of 1 Sv gives a meridional overturning 2.5 Sv smaller than a closed one. A similar modeling study by Wad-
ley and Bigg (2002) found a decrease of the overturning rate from 25 Sv when the Canadian Archipelago is
closed to 20 Sv when it is open with a volume transport of 0.7 Sv. The high sensitivity is the result of chang-
ing buoyancy, or stability of the water column, which is mainly controlled by salinity at high latitude.
Goosse et al.�s (1997) model produced a salinity decrease of about 0.2 at 120 m in the Labrador Sea from
a closed to an opened Canadian Archipelago with a freshwater transport of 2200 km y�1. Both models havecoarse resolution and heavily smoothed T/S fields in the Labrador Sea. Tang et al. (1999) used a high-
resolution T/S data set in a regional model and found that a decrease of surface salinity of 1% (around
0.3) in the Labrador Sea resulted in a decrease of mixed-layer depth by about 50%. These studies demon-

C.C.L Tang et al. / Progress in Oceanography 63 (2004) 183–228 225
strate the high correlation and sensitivity of convective activities to freshwater transport. We note that deep
convection can also be initiated by ocean heat loss. To gain a better understanding of the variability of ther-
mohaline circulation, the effects of freshwater must be considered in conjunction with ocean heat loss.
The total freshwater transport is the sum of freshwater transport in the ocean and ice transport (for sim-
plicity we assume the salinity of sea-ice is zero, and the density of water and ice is the same). The freshwatertransport through Davis Strait is of the order 3000 km3 y�1 (Table 5) and the ice transport is of the order
800 km3 y1 (Table 1). The sum cannot be balanced by the freshwater inflow of the order 1000 km3 y�1 from
the northern channels and ice flux through Smith Sound of the order 100 km3 y�1 according to published
results (Table 5). There are a number of additional sources that can contribute to the freshwater budget –
iceberg, runoff and precipitation. Bauer (1955) estimated that the total mass of icebergs produced from
glaciers in the west coast of Greenland is approximately 1015 kg y�1, which is equivalent to 1000 km3 y�1
freshwater if all the icebergs are melted in Baffin Bay. However, icebergs are known to move out of Baffin
Bay reaching the Labrador and Newfoundland shelves. Even if 50 % of the iceberg mass is melted, which ishighly unlikely, the impact on the freshwater budget is still too small to balance the fresh water transport
estimated from Davis Strait. Precipitation rate in Baffin Bay is low, about 0.1 m yr�1 (Appenzeller, Schwan-
der, Sommer, & Stocker, 1998), which gives a freshwater input of only 28 km3 y�1 and cannot have a sig-
nificant impact on the freshwater budget.
Preliminary results from recent measurements with long-term ADCP moorings at Lancaster Sound
(Prinsenberg & Hamilton, 2004) indicate that both the volume (0.75 Sv) and the freshwater transports
(1420 km3 y1) are considerable higher than previous estimates (Tables 3 and 4 ). If we use 0.75 Sv as the
volume transport for Lancaster Sound, and assume 34% of the archipelago transport is through LancasterSound (Kliem & Greenberg, 2003), we obtain a total volume transport of 2.2 Sv, which is much higher than
the model estimates of 0.54–1 Sv (Table 4). For freshwater transport, the archipelago model predicts that
40 % of the Arctic freshwater flows through Lancaster Sound. This gives a total archipelago fresh water and
ice transports of 3700 km3 y�1 (Lancaster Sound freshwater 1420/0.4 + Nares Strait pack ice 135 � 3700,
see Section 3.2 and Table 1). This number compares to the combined freshwater (�3000 km3 y�1) and
ice transports (�800 km3 y�1) through Davis Strait estimated in this work and by Cuny (2003) and Cuny
et al. (2005).
A more accurate determination of the volume and freshwater transport through Baffin Bay is still anoutstanding issue. In Davis Strait, a 3-year program of five moorings did not adequately sample the
horizontal structure of the flow or the vertical structure of the upper 150 m. The horizontal shears
of currents in eastern Davis Strait where the largest inflow and outflow were observed and simulated
were high (Fig. 30). Archived hydrographic data covering less than half the year indicate considerable
vertical salinity gradients in the upper layer. Current, ongoing observation and modeling programs in
the archipelago and Davis Strait should help resolve the uncertainties in the volume and fresh water
transports.
Acknowledgments
The research has been supported by the Climate Change Impacts on the Energy Sector of the Program
for Energy Research and Development (Canada), and University of Washington�s Arctic–subarctic Ocean
Fluxes (ASOF) program (NSF-OPP grant OPP0230381). The BIO field program was initially supported by
the Northern Oil and Gas Action Program (NOGAP). We thank Simon Prinsenberg and Ken Drinkwater
for reading an earlier version of the manuscript and providing helpful comments. We also thank the shipcrews, instrument and data technicians for generating the data for BIO�s mooring program, in particular,
Tom Foote, for the care in deploying and recovering the moorings. Chou Wang assisted in data analysis
and preparation of the figures.

226 C.C.L Tang et al. / Progress in Oceanography 63 (2004) 183–228
References
Aagaard, K., & Carmack, E. C. (1989). The role of sea ice and other fresh water in the Arctic circulation. Journal of Geophysical
Research, 94, 14485–14498.
Appenzeller Schwander, C. J., Sommer, S., & Stocker, T. F. (1998). The North Atlantic Oscillation and its imprint on precipitation and
ice accumulation in Greenland. Geophysical Research Letters, 25, 1939–1942.
Bailey, W. B. (1956). On the origin of deep Baffin Bay water. Journal of the Fisheries Research Board of Canada, 13, 303–308.
Barber, D. G., Hanesiak, J. M., Chan, W., & Piwowar, J. (2001). Sea-ice and meteorological conditions in northern Baffin Bay and the
North Water polynya between 1978 and 1996. Atmosphere–Ocean, 39, 343–359.
Barnes, C. A. (1941). Oceanographic investigations in Baffin Bay in 1940. United States Coast Guard Bulletin, 30, 27–56.
Bauer, A. (1955). The balance of the Greenland ice sheet. Journal of Glaciology, 12, 456–462.
Belkin, I. M., Levitus, S., Antonov, J. I., & Malmberg, S.-A. (1998). ‘‘Great Salinity Anomalies’’ in the North Atlantic. Progress in
Oceanography, 41, 1–68.
Biggs, N. R. T., & Willmott, A. J. (2001). A steady-state coupled ocean-polynya flux model of the North Water, Baffin Bay.
Geophysical and Astrophysical Fluid Dynamics, 95, 1–29.
Bjornsson, H., Willmott, A. J., Mysak, L. A., & Maqueda, M. A. M. (2001). Polynyas in a high resolution dynamic-thermodynamic
sea ice model and their parameterization using flux models. Tellus A, 53, 245–265.
Bourke, R. H., Addison, V. G., & Paquette, R. G. (1989). Oceanography of Nares Strait and northern Baffin Bay in 1986 with
emphasis on deep and bottom water formation. Journal of Geophysical Research, 94, 8289–8302.
Bourke, R. H., & Paquette, R. G. (1991). Formation of Baffin Bay bottom and deep waters. In P. C. Chu & J. C. Gascard (Eds.), Deep
convection and deep water formation in the oceans (pp. 135–155). Amsterdam: Elsevier.
Collin, A. E. (1965). Oceanographic observations in Nares Strait, northern Baffin Bay 1963, 1964, Report 65–5, 9 pp., Bedford Institute
of Oceanography Report, Dartmouth, NS.
Collin, A. E., & Dunbar, M. J. (1964). Physical oceanography in Arctic Canada. Oceanography and Marine Biology Annual Review, 2,
45–75.
Crane, R. G. (1978). Seasonal variations of sea ice extent in the Davis Strait-Labrador Sea area and relationships with synoptic-scale
atmospheric circulation. Arctic, 31, 434–447.
Cuny, J. (2003). Labrador Sea boundary currents. Ph.D. thesis, University of Washington, Seattle, US, unpublished.
Cuny J., Rhines, P. B., & Kwok, R. (2005). Davis Strait volume, freshwater and heat fluxes. Deep-Sea Research (in press).
Danish Hydraulic Institute. (1979). Environmental conditions offshore West Greenland. Vol. 1. Summary. Greenland Technical
Organization, Horsholm, Danmark.
Darby, M. S., Willmott, A. J., & Mysak, L. A. (1994). A nonlinear steady-state model of the North Water polynya, Baffin Bay. Journal
of Physical Oceanography, 24, 1011–1020.
deLange Boom, B. R., MacNeill, M. R., & Buckley, J. R. (1982). Iceberg motion in Lancaster Sound and northwest Baffin Bay summer
1978. Arctic, 35(1), 219–233.
Dey, B. (1981). Monitoring winter sea ice dynamics in the Canadian Arctic with NOAA-TIR images. Journal of Geophysical Research,
86, 3223–3235.
Drinkwater, K. F. (1996). Atmospheric and oceanographic variability in the Northwest Atlantic during the 1980s and early 1990s.
Journal of Northwest Atlantic Fisheries Science, 18, 77–97.
Dunbar, M. (1954). The pattern of ice distribution in Canadian Arctic Seas. Transactions of the Royal Society of Canada, XLVIII,
9–18.
Dunbar, M. (1973). Ice regime and ice transport in Nares Strait. Arctic, 26, 282–291.
Dunbar, M. J. (1951). Eastern Arctic waters. Journal of the Fisheries Research Board Bulletin, 88, 1–131.
Dunbar, M. J. (1981). Physical causes and biological significance of polynyas and other open water in sea ice. In I. Stirling & H.
Cleator (Eds.), Polynyas in the Canadian Arctic, Canadian Wildlife Service, Occasional Paper 45 (pp. 29–43).
Dunbar, M., & Dunbar, M. J. (1972). The history of the North Water. Proceedings of the Royal Society Edinburgh B, 72, 231–241.
Fissel, D. B. (1982). Tidal currents and inertial oscillations in northwestern Baffin Bay. Arctic, 35, 201–210.
Fissel, D. B., Birch, J. R., Melling, H., & Lake, R. A. (1988). Non-tidal flows in the Northwest Passage. Canadian Technical Report of
Hydrography and Ocean Sciences, No. 98 (143 pp).
Fissel, D. B., Lemon, D. D., & Birch, J. R. (1982). Major features of the summer near-surface circulation of western Baffin Bay, 1978
and 1979. Arctic, 35, 180–200.
Goosse, H., Fichefet, T., & Campin, J.-M. (1997). The effects of the water flow through the Canadian archipelago in a global ice-ocean
model. Geophysical Research Letters, 24, 1507–1510.
Han, G., & Tang, C. L. (2001). Interannual variation of sea level and volume transport in the western Labrador Sea. Journal of
Physical Oceanography, 32, 199–211.
Hayes, I. I. (1867). The open Polar Sea pp. 454. New York: Hurd and Houghlin.

C.C.L Tang et al. / Progress in Oceanography 63 (2004) 183–228 227
Ingram, R. G., Bacle, J., Barber, D. G., Gratton, Y., & Melling, H. (2002). An overview of physical processes in the North Water.
Deep-Sea Research II, 49, 4893–4906.
Jones, E. P., Swift, J. H., Anderson, L. G., Lipizer, M., Civitarese, G., Falkner, K. K., et al. (2003). Tracing Pacific water in the North
Atlantic Ocean. Journal of Geophysical Research, 108, 13-1–13-10.
Jordan, F., & Neu, H. J. A. (1981). Ice floe movement in Baffin Bay and Davis Strait from Satellite pictures. Report Series/BI-R-81-4/
March 1981. Bedford Institute of Oceanography, Dartmouth, Canada.
Kaminski, H. S. (1955). Distribution of ice in Baffin Bay and Davis Strait. Technical Report.U.S. Washington DC: Navy Hydrographic
Office.
Kiilerich, A. B. (1939). The Godthaab Expedition 1928 – a theoretical treatment of the hydrographical observation material. Medd.
Grønland, 78(5), 1–148.
Kistler, R., Kalnay, E., Collins, W., Saha, S., White, G., Woollen, J., et al. (2001). The NCEP-NCAR 50-year reanalysis: monthly
means CD-ROM and documentation. Bulletin of the American Meteorological Society, 82, 247–267.
Kliem, N., & Greenberg, D. A. (2003). Diagnostic simulations of the summer circulation in the Canadian Arctic Archipelago.
Atmosphere–Ocean, 41, 273–289.
Kwok, R., Schweiger, A., Rothrock, D. A., Pang, S., & Lottmeier, C. (1998). Sea ice motion from satellite passive microwave imagery
assessed with ERSSAR and buoy motions. Journal of Geophysical Research, 103, 8191–8214.
Kwok, R., & Rothrock, D. A. (1999). Variability of Fram Strait ice flux and North Atlantic Oscillation. Journal of Geophysical
Research, 104, 5177–5189.
Lemon, D. D., & Fissel, D. B. (1982). Seasonal variations in currents and water properties in northwestern Baffin Bay, 1978–1979.
Arctic, 35, 211–218.
Levitus, S. (1982). Climatological atlas of the world ocean. NOAA Professional Paper 13, National Oceanic and Atmospheric
Administration, Washington, DC.
Marko, J. R., Birch, J. R., & Wilson, M. A. (1982). A study of long-term satellite-tracked iceberg drifts in Baffin Bay and Davis Strait.
Arctic, 35, 234–240.
Melling, H. (2000). Exchanges of freshwater through the shallow straits of the North American Arctic. The freshwater budget of the
Arctic Ocean (pp. 479–502). The Netherlands: Kluwer Academic Publishers.
Melling, H., Gratton, Y., & Ingram, G. (2001). Ocean circulation within the North Water polynya of Baffin Bay. Atmosphere–Ocean,
39, 301–325.
Muench, R. D. (1970). The physical oceanography of the northern Baffin Bay region. Ph.D. thesis, University of Washington, Seattle,
USA.
Muench, R. D. (1971). The physical oceanography of the northern Baffin Bay region. The Baffin Bay-North Water Project, Project
Scientific Report, Number 1, Arctic Institute of North America, Montreal (150 pp).
Mundy, C. J., & Barber, D. G. (2001). On the relationship between spatial patterns of sea ice type and the mechanisms which create
and maintain the North Water (NOW) polynya. Atmosphere–Ocean, 39, 327–341.
Mysak, L. A., & Huang, F. (1992). A latent- and sensible-heat polynya model for the North Water, northern Baffin Bay. Journal of
Physical Oceanography, 22, 596–608.
Nutt, D. C. (1966). The drift of ice island WH-5. Arctic, 19, 244–262.
Palfrey, K. M., & Day, C. G. (1968). Oceanography of Baffin Bay and Nares Strait in the summer of 1966 and current measurements in
Smith Sound, summer 1963. United States Coast Guard Oceanographic Report, Number 16 (204 pp).
Parkinson, C. L., & Cavalieri, D. J. (1989). Arctic sea ice 1973–1987: seasonal, regional and interannual variability. Journal of
Geophysical Research, 94, 14499–14523.
Pease, C. H. (1987). The size of wind-driven coastal polynyas. Journal of Geophysical Research, 92, 7049–7059.
Petermann, A. (1867). Das Nordlichste Land der Erde. Petermann�s Geographische Mitteil., Number 13.
Petterson, O. (1900). Die wasser ziukulation im Nordatlantischen Ozean. Petermann�s Geographische Mitteil., 46(III), 61–65, and
46(IV), 81–92.
Press, M. J., & Blais, R. (1993). A study of the North Water polynya using passive microwave and infrared imagery. Canadian Journal
of Remote Sensing, 19(1), 92–101.
Prinsenberg, S. J., & Bennett, E. B. (1987). Mixing and transports in Barrow Strait, the central part of the Northwest Passage.
Continental Shelf Research, 7(8), 913–935.
Prinsenberg, S. J., & Peterson, I. (2003). Comparing ice chart parameters against ice observations. In Proceedings of international
offshore and polar engineering conference, Honolulu, May 25–30.
Prinsenber, S. J., & Hamilton, J. (2004). The oceanic fluxes through Lancaster Sound of the Canadian Arctic Archipelago. Arctic/
Subarctic Ocean Fluexs Newsletter, 2, 8–11.
Riis-Carstenson, E. (1931). The GODTHAAB expedition 1928. Report on the Expedition. Medd. Grønland, 78(1), 1–105.
Robe, R. Q., Maier, D. C., & Russell, W. E. (1980). Long-term drift of icebergs in Baffin Bay and the Labrador Sea. Cold Regions
Science and Technology, 1, 183–193.

228 C.C.L Tang et al. / Progress in Oceanography 63 (2004) 183–228
Ross, C. K. (1990a). Currents and temperature data from northwestern Baffin Bay, September 1983–September 1984. Canadian Data
Report of Hydrography and Ocean Science, Number 78 (viii + 227 pp).
Ross, C. K. (1990b). Currents and temperature data from southwestern Baffin Bay, October 1984–October 1985. Canadian Data
Report of Hydrography and Ocean Science, Number 79 (vii + 180 pp).
Ross, C. K. (1991). Currents, temperature and salinity data from northern Baffin Bay, October 1985–August 1986. Canadian Data
Report of Hydrography and Ocean Science, Number 95 (vii + 161 pp).
Ross, C. K. (1993). Currents temperature and salinity data from eastern Baffin Bay, August 1986–September 1987. Canadian Data
Report of Hydrography and Ocean Science, Number 118 (vii + 193 pp).
Rudels, B. (1986). The outflow of polar water through the Arctic Archipelago and the oceanographic conditions in Baffin Bay. Polar
Research, 4, 161–180.
Sadler, H. E. (1976). Water, heat, and salt transports through Nares Strait, Ellesmere Island. Journal of the Fisheries Research Board of
Canada, 33, 2286–2295.
Smith, E. H., Soule, F. M., & Mosby, O. (1937). The MARION expedition to Davis Strait and Baffin Bay: Part II, Physical
Oceanography. United State Coast Guard Bulletin, Number 19.
Smith, S. D., Muench, R. D., & Pease, C. H. (1990). Polynyas and leads: an overview of physical processes and environment. Journal of
Geophysical Research, 95, 9461–9479.
Steele, M., Thomas, D., Rothrock, D., & Martin, S. (1996). A simple model study of the Arctic Ocean freshwater balance, 1979–1985.
Journal of Geophysical Research, 101, 20,833–20,848.
Steffen, K. (1985). Warm water cells in the North Water, northern Baffin Bay during winter. Journal of Geophysical Research, 90,
9129–9136.
Steffen, K. (1986). Ice conditions of an Arctic polynya: North Water in winter. Journal of Glaciology, 32, 383–390.
Steffen, K., & Ohmura, A. (1985). Heat exchange and surface conditions in North Water, northern Baffin Bay. Annals of Glaciology, 6,
178–181.
Sverdrup, H. V., Johnson, M. W., & Fleming, R. H. (1942). The ocean, their physics, chemistry and general biology. Englewood Cliffs,
NJ, USA: Prentice-Hall, pp. 1087.
Tan, F. C., & Strain, P. M. (1980). The distribution of sea ice meltwater in the Eastern Canadian Arctic. Journal of Geophysical
Research, 85, 1925–1932.
Tang, C. L., & DeTracey, B. M. (1998). Space–time variation of mixed-layer properties, heat and salt fluxes and ice melt in the
Newfoundland marginal ice zone. Journal of Geophysical Research, 103, 1177–1191.
Tang, C. L., & Wang, C. K. (1996). A gridded data set of temperature and salinity for the northwest Atlantic Ocean. Canadian Data
Report of Hydrography and Ocean Sciences, Number 148 (iv + 45 pp).
Tang, C. L., Gui, Q., & DeTracey, B. M. (1999). A modeling study of upper ocean processes in the Labrador Sea. Journal of
Geophysical Research, 104, 23411–23425.
Thomas, D., Martin, S., Rothrock, D., & Steele, M. (1996). Assimilating satellite concentration data into an Arctic sea ice mass
balance model, 1979–1985. Journal of Geophysical Research, 101, 20,849–20,868.
Valeur, H. H., Hansen, C., Hansen, K. Q., Rasmussen, L., & Thingvad, N. (1996). Weather, sea and ice conditions in eastern Baffin
Bay, offshore northwest Greenland, a review. Danish Meteorological Institute Technical Report Number 96-12.
Vinje, T., Nordlund, N., & Kvambekk, A. (1998). Monitoring ice thickness in Fram Strait. Journal of Geophysical Research, 103,
10,437–10,449.
Wadhams, P. (1983). Sea ice thickness distribution in Fram Strait. Nature, 305, 108–111.
Wadley, M. R., & Bigg, G. R. (2002). Impact of flow through the Canadian Archipelago and Bering Strait on the North Atlantic and
Arctic circulation: an ocean modelling study. Quarterly Journal of the Royal Meteorological Society, 128, 2187–2203.
Wallace, D.W.R. (1985). A study of the ventilation of Arctic waters using chlorofluoromethanes as tracers. Ph.D. thesis. Dalhousie
University, Halifax NS, Canada.
Yao, T., & Tang, C. L. (2003). The formation and maintenance of the North Water. Atmosphere–Ocean, 41, 187–201.