Brain Tumors: Convection-Enhanced Delivery of Drugs (Method)
AMERICANMETEOROLOGICALSOCIETY
Bulletin of the American Meteorological Society
EARLY ONLINE RELEASEThis is a preliminary PDF of the author-producedmanuscript that has been peer-reviewed and accepted for publication. Since it is being postedso soon after acceptance, it has not yet beencopyedited, formatted, or processed by AMSPublications. This preliminary version of the manuscript may be downloaded, distributed, andcited, but please be aware that there will be visualdifferences and possibly some content differences between this version and the final published version.
The DOI for this manuscript is doi: 10.1175/BAMS-D-13-00084.1
The final published version of this manuscript will replacethe preliminary version at the above DOI once it is available.
© 201 American Meteorological Society 4

1
The CHUVA Project – how does convection vary
across Brazil?
Luiz A. T. Machado1, Maria A. F. Silva Dias2, Carlos Morales2, Gilberto Fisch3, Daniel Vila1, Rachel Albrecht1, Steven J. Goodman4, Alan Calheiros1, Thiago Biscaro1, Christian Kummerow5, Julia Cohen6, David Fitzjarrald7, Ernani Nascimento8, Meiry Sakamoto9, Christopher Cunningham1, Jean-Pierre Chaboureau10, Walter A. Petersen11, David Adams12, Luca Baldini13, Carlos F. Angelis1, Luiz F. Sapucci1, Paola Salio14, Henrique M. J. Barbosa15, Eduardo Landulfo16, Rodrigo F. Souza17, Richard J. Blakeslee18, Jeffrey Bailey19 , Saulo Freitas1, Wagner. F. A. Lima1 and Ali Tokay20
1. Instituto Nacional de Pesquisas Espaciais (INPE). Centro de Previsão de Tempo e Estudos Climáticos (CPTEC), Brazil. 2. Universidade de São Paulo. Instituto de Astronomia, Geofísica e Ciências Atmosféricas, Brazil. 3. Departamento de Ciências e Tecnologia Espacial. Instituto de Aeronáutica e Espaço, Brazil 4. National Oceanic and Atmospheric Administration (NOAA/NESDIS/GSFC), USA 5. Colorado State University, Cooperative Institute for Research in the Atmosphere, USA 6. Universidade Federal do Pará. Instituto de Geociências, Brazil. 7. University at Albany, SUNY, Atmospheric Sciences Research Center, USA 8. Universidade Federal de Santa Maria, Departamento de Física, Brazil 9. Fundação Cearense de Meteorologia, Brazil 10. Laboratoired'Aérologie, University of Toulouse, France 11. NASA Wallops Flight Facility, USA 12. Universidad Nacional Autónoma de México, Centro de Ciencias de la Atmósfera, Mexico 13. CNR Istituto di Scienze dell'Atmosfera e del Clima, Italy 14. Universidade e Buenos Aires, Argentina 15. Universidade de São Paulo. Instituto de Física, Brazil 16. Instituto de Pesquisas Energéticas e Nucleares, Brazil. 17. Universidade do Estado do Amazonas, Brazil. 18. NASA Marshall Space Flight Center, Huntsville, Alabama USA 19. University of Alabama in Huntsville, Huntsville, Alabama USA 20. University of Maryland Baltimore County Baltimore, Maryland, USA
BAMS-D-13-00084
Submitted to Bulletin of the American Meteorological Society
September, 2013.
2
ABSTRACT
CHUVA, meaning “rain” in Portuguese, is the acronym for the Cloud processes of tHe
main precipitation systems in Brazil: A contribUtion to cloud resolVing modeling and to
the GPM (GlobAl Precipitation Measurement). The CHUVA project has conducted five
field campaigns; the sixth and last campaign will be held in Manaus in 2014. CHUVA's
main scientific motivation is to contribute to the understanding of cloud processes,
which represent one of the least understood components of the weather and climate
system. The five CHUVA campaigns were designed to investigate specific tropical
weather regimes. The first two experiments, namely, Alcantara and Fortaleza in
northeast Brazil, focused on warm clouds. The third campaign, which was conducted in
Belem, was dedicated to tropical squall lines that often form along the sea-breeze
front. The fourth campaign was in the Vale do Paraiba of southeastern Brazil, which is
a region with intense lightning activity. In addition to contributing to the
understanding of cloud process evolution from storms to thunderstorms, this fourth
campaign also provided a high fidelity total lightning proxy dataset for the NOAA
GOES-R program. The fifth campaign was carried out in Santa Maria, southern Brazil, a
region of intense hailstorms associated with frequent mesoscale convective complexes.
This campaign employed a multi-model high resolution ensemble experiment. The
data collected from contrasting precipitation regimes in tropical continental regions
allow the various cloud processes in diverse environments to be compared. Some
examples of these previous experiments are presented to illustrate the variability of
convection across the tropics.
3
1
2
3
Capsule 4
5
CHUVA reveals very diverse cloud processes in tropical continental regions and 6
contributes to improving satellite precipitation estimation, nowcasting, cloud resolving 7
models and the understanding of cloud electrification. 8
9

4
1. Introduction 10
11
The CHUVA project began in 2010 and has conducted five field campaigns; the last 12
experiment will be held in Manaus as part of GoAmazon (Green Ocean Amazon), in 13
2014 (see http://campaign.arm.gov/goamazon2014/ for a detailed description). 14
CHUVA's main scientific motivation is to contribute to the understanding of cloud 15
processes, which represent one of the least understood components of the climate 16
system. 17
Brazil has an area of 8.5 million km2 and lies primarily south of the Equator and 18
within the tropics. Therefore, Brazil is ideally situated for studying tropical 19
continental convection over a broad range of precipitation regimes within a single 20
country. In the Northeast Brazil, a semi-arid region, the CHUVA project was 21
designed to characterize warm clouds (Costa et al., 2000) and the organized 22
convection influenced by the inter-tropical convergence zone and easterly waves 23
(Kouadio al., 2012). Cotton (1982) defines warm clouds as clouds in which the ice 24
phase does not play a substantial role in the precipitation process. In the Amazon, 25
specifically in the Belem and Manaus regions, the main targeted precipitation 26
regimes were tropical squall lines (Cohen et al., 1995); local convection, which is 27
strongly forced by the diurnal cycle (Machado et al. 2002); and mesoscale 28
convective systems (Rickenbach, 2004). In southern Brazil, at the boundary of the 29
tropical and subtropical regions, CHUVA measured the convection associated with 30
cold fronts (Garreaud, 2000), mesoscale convective complexes (Salio et al., 2007) 31
and strongly electrified convection (Cecil and Blankenship, 2012). The field 32
campaigns in each of these regions collected detailed observations of various 33

5
rainfall regimes over a tropical continental region to improve our understanding of 34
cloud processes. The campaigns focused on the following applications: satellite 35
precipitation estimation, cloud resolving models, nowcasting and cloud 36
electrification. CHUVA is contributing to the National Aeronautics and Space 37
Administration (NASA) - Japan Aerospace Exploration Agency (JAXA) Global 38
Precipitation Measurement (GPM), National Oceanic and Atmospheric 39
Administration (NOAA) Geostationary Operational Environmental Satellite R-series 40
(GOES-R) and GoAmazon Programs. 41
Schumacher and Houze (2003) demonstrated large seasonal and regional variability 42
in the stratiform rain fraction (the contribution of stratiform precipitation to the 43
total precipitation) over Brazil using the TRMM precipitation radar. Precipitation 44
estimation has been noticeably improved by the Tropical Rainfall Measuring 45
Mission (TRMM) and the development of new algorithms (Tapiador et al., 2012). 46
However, precipitation estimation over land using passive radiometers still has 47
several deficiencies. Specifically, precipitation is indirectly estimated (Berg et al., 48
2006). Moreover, precipitation from warm clouds is largely underestimated, 49
especially when using microwave radiometers, and contributes (7.5% on average) 50
to the total rainfall in tropical coastal regions (Liu and Zipser, 2009). Over land, 51
microwave satellite precipitation estimates exploit the relationship between ice 52
aloft and rainfall at the surface. Because these clouds have no ice, the precipitation 53
estimates for warm cloud rainfall are inaccurate. For example, during November 54
2008, 283 mm of rainfall, mostly from orographic warm clouds, was measured by 55
rain gauge over twenty-four hours in southeastern Brazil. However, only very light 56
precipitation amounts (approximately 30 mm) were estimated using satellite data 57

6
(Silva Dias, 2009). Williams and Stanfill (2002) discuss the formation of warm cloud 58
rainfall in the context of cloud condensation nuclei and updrafts and contrast the 59
marine and continental environments. 60
The passive microwave rainfall sensors used by the GPM constellation to achieve 61
three-hour rainfall estimates have largely relied on ice scattering signals to convert 62
brightness temperature depressions into rainfall rates over continental regions. 63
The CHUVA field campaigns, in addition to their focus on the microphysical 64
properties of tropical clouds, have an important role in improving existing 65
algorithms for precipitation retrieval for the Global Precipitation Measurement 66
mission. Therefore, an important component of CHUVA was to provide a 67
homogeneous dataset to the community that supports GPM algorithm 68
development in both warm and cold phase clouds. As mentioned, warm rain clouds 69
are particularly challenging for the passive microwave remote sensing of 70
precipitation. CHUVA data will help address this issue. 71
The dataset collected in this project, combined with cloud modeling, is expected to 72
create a solid basis for the development of improved database on cloud process 73
over the continental tropics. This dataset contains hydrometeor classifications, 74
thermodynamics profiles, rainfall drop size distributions and several remote 75
sensing (both active and passive) cloud property measurements. Realistic 76
parameterizations of cloud processes are a prerequisite for reliable current and 77
future climate simulations. Meteorological models, at very high resolution, 78
explicitly describe cloud processes to a large degree; however, the cloud 79
microphysics and turbulent processes require parameterization. Morrison et al. 80
(2007) demonstrate the large sensitivity of high–resolution simulations to the 81

7
microphysical parameterizations. The CHUVA dataset, combining model, satellite, 82
radar, radiometer and other in-situ data, will provide an opportunity to validate 83
and improve cloud resolving models over various tropical continental regions. 84
GOES-R, the next generation of NOAA geostationary satellites, includes a new 85
capability for total lightning detection from the Geostationary Lightning Mapper 86
(GLM). The GLM will aid in forecasting severe storms, tornadic activity and will 87
address convective weather impacts on aviation safety and efficiency (Goodman et 88
al., 2013). The CHUVA measurements provide a high fidelity dataset for GLM 89
application development in continental tropical regions. 90
This study outlines the motivation for developing the CHUVA project and general 91
information on the measurement strategy and how to access the database and the 92
project webpage. Additionally, this study presents a specific description of each 93
field experiment, a discussion of the preparation for the final campaign, and a 94
summary of the main results and activities for project outreach. 95
96
2. Motivation 97
98
CHUVA's principal motivation is the description and understanding of the cloud 99
processes of the various precipitation regimes of Brazil. The expected results 100
include improved satellite precipitation estimates, especially from warm clouds; 101
cloud resolving model evaluation; development of nowcasting techniques for 102
intense thunderstorms; and an improved understanding of the cloud electrification 103
processes in the tropics/sub-tropics. The CHUVA project addresses the following 104
questions: 105

8
How can satellite estimates of warm cloud precipitation be improved? 106
How can GPM satellite-based retrievals of rainfall over the continent be 107
improved? 108
What are the typical cloud processes that occur in the main precipitation 109
regimes of Brazil? 110
What are the major surface and boundary layer processes relevant to the 111
formation and maintenance of clouds? 112
What are the primary processes in the evolution from shallow to deep 113
convection and how do cloud microphysical and electrification processes 114
evolve during this transition and cloud life cycle? 115
How can the representation of clouds and accuracy be improved in cloud 116
resolving models, especially for intense thunderstorms? 117
How can all of the acquired knowledge be utilized to improve nowcasting 118
and forecasting in tropical regions? 119
120
To answer these questions, the CHUVA Project focused on collecting data that 121
describes the multi-dimensional structure of clouds in different precipitation 122
regimes. These data include: a) The selected cloud properties from XPOL and MRR 123
data; b) satellite and radar precipitation fields, cloud type classification and cloud 124
and rain cell life cycles; c) the electric fields and lightning associated with clouds 125
from the lightning network and field mills (an electro-mechanical device which 126
measures the strength of the electrostatic field at the surface), which are essential 127
for describing thunderstorm electrification processes; and d) mesoscale 128
atmospheric conditions and surface fluxes from rawinsondes and from towers to 129
9
assess the atmospheric dynamical and thermodynamic properties. These data are 130
combined with a cloud resolving model (the Brazilian version of the Regional 131
Atmospheric Modeling System - BRAMS) to describe the typical cloud processes of 132
the various precipitation regimes. As proposed by Negri et al. (2013), comparing 133
satellite and/or radar measurements with virtual images simulated by radiative 134
transfer and cloud resolving model outputs can validate the model and create a 135
microphysical database. 136
These datasets are specifically used to (1) test different methodologies for 137
estimating warm cloud precipitation, (2) evaluate the possible relationships 138
between integrated ice content, electrification and precipitation as functions of the 139
cloud life stage, (3) employ different satellite rainfall algorithms and assess the 140
associated regional errors, (4) describe the temporal evolution of the electrical 141
field during thunderstorm development in conjunction with the radar polarimetric 142
variables, (5) investigate the column-integrated atmospheric water vapor during 143
periods preceding intense thunderstorms and (6) analyze the capability of cloud 144
resolving models to describe the microphysical properties and the effect of the 145
turbulence parameterization on cloud organization. 146
147
3. Experimental Design 148
149
a) Sites and Measurement Strategies 150
151
CHUVA consists of six field campaigns, five of which have already taken place. The 152
sixth will be carried out in 2014 in Manaus as part of the GoAmazon initiative 153

10
(http://campaign.arm.gov/goamazon2014/). Figure 1 (left panel) shows the 154
experimental sites of the CHUVA projects and illustrates the main precipitation 155
regime expected in each region. Figure 1 (right panel) shows a schematic 156
representation of the measurement strategy employed in the CHUVA campaigns. A 157
primary instrument used for CHUVA is a mobile X-band dual polarization radar (X-158
Pol). Schneebeli et al. (2012a and 2012b) give a detailed description of the radar, 159
operation and data processing. The radar scan strategy consists of a volume scan 160
with 10 to 14 elevations (depending on the main type of clouds targeted) and at 161
least one Range-Height Indicator (RHI) scan along the direction of the main 162
instrumentation site. The RHI is performed with an antenna rotation rate of nine 163
degrees per second, a high angular resolution (every 0.50°) and a high sampling 164
frequency (obtained using 150 samples per ray) to ensure a high vertical resolution 165
and data accuracy. The entire procedure (strategy) also includes a differential 166
reflectivity (Zdr) offset check using a vertical measurement along the column above 167
the radar. Figure 1 presents a typical description of the measurement strategy. The 168
distance between the radar site and the main site is approximately 20 km; the 169
main site is equipped with the following basic instruments (see Table I for a 170
detailed description): impact (Joss-Valdwogel) and laser (OTT Parsivel and Thies) 171
disdrometers; rain gauges (tipping bucket employed in a dual gauge configuration 172
at the main site); a microwave radiometer (MP3000A with 35 channels) ranging 173
from 22.00 to 30.00 GHz (21 channels), range associated with water vapor 174
emissions, and from 51.00 to 59.00 GHz (14 channels), range associated with 175
molecular oxygen emissions (Ware et al., 2003). Additionally, the main site 176
instrumentation includes one vertically pointing K-Band (24.1 GHz) micro rain radar 177

11
(MRR) (see Peter et al. (2005) for a detailed description), a Raman lidar at 532/604 178
nm, a GPS dual-frequency receiver to retrieve the column-integrated atmospheric 179
water (Sapucci et al., 2007), a field mill and a surface weather station to measure 180
surface latent and sensible heat fluxes, soil moisture and temperature. In addition 181
to the main site, two to four other sites instrumented with disdrometers, rain 182
gauges, a GPS receiver and field mills (variable number) were installed at various 183
distances from the radar. Rawinsondes were routinely released (at least twice a 184
day). During specific intensive observation periods (IOPs), a triangle of rawinsondes 185
in a nearly equilateral arrangement was launched 4 times a day (00:00, 06:00, 186
12:00 and 18:00 UTC). 187
188
b) Data Access and the CHUVA Web Page 189
190
The CHUVA website – http://chuvaproject.cptec.inpe.br – is the primary access to 191
the CHUVA information and data. For each campaign, a specific webpage was 192
developed (Figure 2). These web pages contain a wide variety of information 193
including the daily weather report, instrument strategy, instrument locations, quick 194
looks of the main events, data reports, cloud pictures and the SOS-CHUVA (Severe 195
storm Observation System), a geographical information system that utilizes data 196
from the CHUVA project and allows retrospective access to the radar, satellite and 197
model images, when available. The use of SOS-CHUVA for nowcasting will be 198
discussed in more detail in section 5. The CHUVA dataset has been pre-processed 199
and is available through the CHUVA website. Data can be accessed at different 200
levels. For example, level 0 data from the X-band radar are raw data in ASCII and 201

12
universal format (UF), level 1 data consist of the attenuation-corrected (Zh and Zdr) 202
data in ASCII and UF (see Testud et al., 2000, for a detailed description of the 203
attenuation correction), and level 2 data consist of the corrected reflectivity 204
constant altitude plan position indicators (CAPPIs) at various altitude levels. 205
Additional corrections, such as the correction for bias due to a wet radome and the 206
ZDR offset adjustment, are not applied in this dataset. However, instructions and 207
tables are accessible to the users for their own applications. Data for each 208
instrument comes with a “readme” file with information about the data and how 209
to manipulate the files. All raw data and several processed data (level 2) are 210
publicly available through the CHUVA website. 211
In addition, the CHUVA datasets for each campaign include the available 212
operational S-band radar data covering the field campaign region (see Table I for a 213
description of additional instrumentation), the GOES and Meteosat geostationary 214
satellite images (infrared channels) and all overpasses of the operational 215
environmental low-orbiting satellites carrying passive microwave sensors (channels 216
similar to TRMM-TMI). 217
218
4. Field Campaigns 219
220
a) Alcantara 221
222
Alcantara was the first CHUVA campaign from March 1-25, 2010. In addition to the 223
array of CHUVA instruments, the Alcantara experiment employed the Advanced 224
Microwave Radiometer for Rain Identification (ADMIRARI) (see Battaglia et al. 225

13
(2011) for a detailed description). The ADMIRARI measurements consist of passive 226
radiances collected at vertical and horizontal polarization at frequencies of 10.7, 227
21.0 and 36.5 GHz, and one co-staring active radar (MRR). The ADMIRARI were 228
pointed at a fixed 30° elevation angle oriented along a radial directed toward the X-229
Pol radar located at a range of 7.65 km. Along the line between the X-Pol radar and 230
the ADMIRARI, two additional sites measured rainfall and drop size distributions. 231
Three distinct weather conditions were observed during the campaign. During the 232
first period (1 to 9 March) the convection was suppressed with only scattered 233
clouds and sparse rainfall. The second period (10 to 16 March) was characterized 234
by the beginning of the wet season with isolated local convection and dominant 235
warm cloud processes. The last period (16 to 25 March) experienced intense 236
convection with warm and deep (cold cloud/ice phase) convection, with 237
precipitation rates as high as 150 mm h-1, the 99th percentile corresponds to 137 238
mm h-1 (the rain rate information described in this study was computed using rain 239
gauge tipping buckets integrated over one-minute intervals). The warm rainfall 240
events in Alcantara were associated with the highest concentration of large drops 241
(larger than 4 mm). Battaglia et al. (2011) describes two precipitation events during 242
the campaign in which the 21.0 and 36.5 GHz channels and the MRR were 243
repeatedly saturated with heavy rain. In one event, the 10 GHz signal was 244
saturated, which was the first time the ADMIRARI operation ever observed 245
saturation on this channel (this was the third ADMIRARI campaign). TRMM co-246
located 2A25 version-7 near-surface precipitation radar was compared against the 247
precipitation measured during the CHUVA campaign by rain gauge. Alcantara 248
precipitation estimation from TRMM is underestimated by more than 50%. Of all 249

14
the campaigns to date, Alcantara has the highest average rainfall rate from warm 250
clouds (7.2 mm h-1), one of the largest vertically integrated water vapor values and 251
high cloud water contents for non-precipitating clouds (0.34 mm), only slightly 252
smaller than observed in Belem. Alcantara also has the highest CAPE; the 99th 253
percentile corresponds to 1950 J Kg-1. 254
255
b) Fortaleza 256
257
The data collection period spanned April 3-28, 2011, during the rainy season. The 258
main site was installed in the yard of the Civil Defense Organization (the 259
organization responsible for responding to natural disasters) in Fortaleza. A 260
partnership with Fundação Cearense de Meteorologia e Recursos Hídricos 261
(FUNCEME) was established for monitoring intense thunderstorms. The X-Pol radar 262
was installed in the city of Osorio, 20.5 km from the main CHUVA site. Additionally, 263
three more sites with disdrometers, rain gauges and GPS receivers were installed 264
around Fortaleza, and the most distant was 32.6 km from the radar. Given that the 265
focus of this campaign was warm cloud processes and deep convection associated 266
with the inter-tropical convergence zone (ITCZ), a volume scan strategy was 267
implemented with thirteen elevations focusing on both the lower and upper 268
troposphere (i.e., warm and deep cloud types). As already mentioned, the strategy 269
for all campaigns included a Zdr offset check and RHIs scans. For Fortaleza, two 270
RHIs scans were performed: one over the main site and another at 180 degrees, 271
perpendicular to the coast, where most systems propagate into the continent. 272
Three complete scans (volume scan, RHIs and vertically pointing) were run in 20-273
15
minute cycles and a zero check (background noise estimation) was performed once 274
per hour. 275
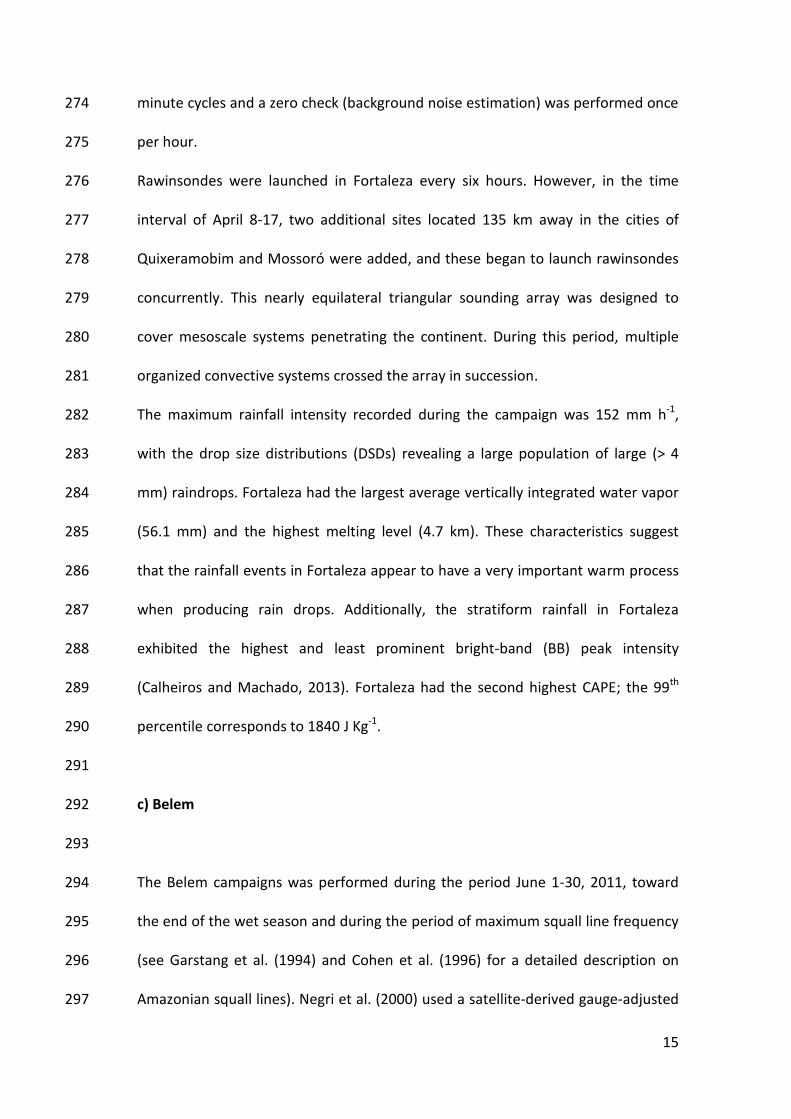
Rawinsondes were launched in Fortaleza every six hours. However, in the time 276
interval of April 8-17, two additional sites located 135 km away in the cities of 277
Quixeramobim and Mossoró were added, and these began to launch rawinsondes 278
concurrently. This nearly equilateral triangular sounding array was designed to 279
cover mesoscale systems penetrating the continent. During this period, multiple 280
organized convective systems crossed the array in succession. 281
The maximum rainfall intensity recorded during the campaign was 152 mm h-1, 282
with the drop size distributions (DSDs) revealing a large population of large (> 4 283
mm) raindrops. Fortaleza had the largest average vertically integrated water vapor 284
(56.1 mm) and the highest melting level (4.7 km). These characteristics suggest 285
that the rainfall events in Fortaleza appear to have a very important warm process 286
when producing rain drops. Additionally, the stratiform rainfall in Fortaleza 287
exhibited the highest and least prominent bright-band (BB) peak intensity 288
(Calheiros and Machado, 2013). Fortaleza had the second highest CAPE; the 99th 289
percentile corresponds to 1840 J Kg-1. 290
291
c) Belem 292
293
The Belem campaigns was performed during the period June 1-30, 2011, toward 294
the end of the wet season and during the period of maximum squall line frequency 295
(see Garstang et al. (1994) and Cohen et al. (1996) for a detailed description on 296
Amazonian squall lines). Negri et al. (2000) used a satellite-derived gauge-adjusted 297

16
precipitation climatology from microwave measurements, i.e., the Goddard 298
Profiling algorithm. They found a persistent local rainfall maximum at 1800 LST, 299
which moved inland at 21:00 LST, due to interactions between sea-breeze and 300
squall line formation and propagation into the Amazon along the northern coast of 301
Brazil. 302
The X-Pol radar was installed on the roof of the Meteorology Department of the 303
Federal University of Pará along the Guama River, a tributary of the Amazonas 304
River. Two main sites were set up, one in Outeiro and another in Benevides, 23.0 305
and 27.7 km from the radar, respectively. In general, rawinsondes were launched 306
twice daily in Belem, with the exception of an intensive observation period from 307
June 18-26, during which four rawinsondes were launched daily in the cities of 308
Tomé Açu and São Miguel, approximately 120 km apart. The radar volume scan 309
strategy was similar to that used in the previous experiments. Additionally, within 310
the ten-minute scan period strategy, ten more RHIs were performed (separated by 311
1.5 degrees) perpendicular to the Amazonas River covering the rawinsondes 312
triangle network. In addition to the typical CHUVA instrumentation, a mesoscale 313
GPS meteorological network was established (Adams et al. 2011) with fifteen 314
stations in close proximity (a 5 km to 10 km separation distance within Belem and a 315
40 km distance outside of Belem). This GPS network provided very high spatial and 316
temporal resolution for the column-integrated atmospheric water vapor and its 317
variability. Additionally, three field mill sensors were installed at Belem and the 318
main sites. Finally, controlled meteorological (CMET) balloons (Voss et al. 2005) 319
were launched from Tomé-Açu, Pará. These balloons are altitude controlled via 320
satellite, and the winds were determined using GPS tracking and a package carrying 321

17
temperature and moisture sensors. Two CMETs were launched twelve hours apart. 322
The CMET measurements, i.e., temperature and relative humidity, show the same 323
boundary layer structure as the Tomé-Açu rawinsondes. Each CMET was recovered. 324
The CMETs landed in the Tocantins River after six hours of flight. During the flights, 325
a mesoscale convective system to the south led to a strong directional wind shear 326
in the lower layers. Preliminary numerical studies using the BRAMS model 327
employing back trajectory are consistent with a southerly flow in response to a 328
depression associated with the interaction of a mesoscale convective system and a 329
developing sea breeze, which also promoted a southerly flow. 330
Several squall lines formed along the coast and sea breeze front, propagating 331
inland over the Amazonian rainforest, as described earlier by Cohen et al. (1995). 332
However, several of the observed squall lines were not initiated along the coast but 333
along the boundary of the rain forest and the semi-arid region to the east of Belem. 334
These squall lines propagated almost parallel to the coast. Another interesting 335
feature was the multi-scale nature of these large squall lines. Embedded in the 336
large cloud deck, successively smaller scale propagating rainfall cell lines were 337
detected by the radar. Figure 3 displays one example of the consecutive RHI scans 338
through the squall line on June 7, 2011. A typical vertical cross-section of the 339
evolving squall line is apparent; initially shallow warm clouds develop, followed by 340
rapidly deepening clouds up to 14 km. Following the convective region, the 341
stratiform sector evolved with a clear bright-band and a cloud top approximately 342
13 km at 22:00 UTC. During the dissipation phase (cloud collapse), the cloud top 343
height decreases and the bright-band region intensifies. The bright-band signature 344
is the result of complex microphysical processes that occur when snowflakes melt 345

18
in stratiform precipitation (Fabry and Zawadsky, 1995). More than twenty rain 346
events crossed the experimental region; the rain rate at the 99th percentile was 347
122 mm h-1. The CAPE was also very high. However, the CAPE was less than at 348
Alcantara and Fortaleza; the 99th percentile corresponds to 1380 J Kg-1. 349
350
d) Vale do Paraíba 351
352
The Vale do Paraíba campaign had the longest duration, with an IOP from 353
November 1 to December 22, 2011, followed by a second period with less intensive 354
measurements continuing through March 31, 2012. The instrumentation was 355
installed along a line perpendicular to the coast. The radar was 90 km inland from 356
the ocean at an elevation of 650 m. The main site was installed 11 km from the X-357
Pol radar, and a succession of sites (spaced by approximately 20 km) was installed 358
along a line perpendicular to the ocean. These sites had at least one GPS IPW 359
(Integrated Precipitable Water) station, one disdrometer and multiple rain gauges. 360
Additionally, five field mills, spaced 1 km apart, formed a very high spatial 361
resolution array close to the radar. The radar strategy was designed to run for six 362
minutes. 363
During November and the first week of December, the region had an anomalous 364
southeasterly flow, decreasing the air temperature and increasing convective 365
inhibition. From the second week of December to March, several intense 366
thunderstorms and some severe weather events were reported in the region. 367
The primary objective of this campaign was to study storm electrification. As such, 368
comprehensive ground-based measurements of total lightning activity were 369

19
collected to improve our understanding and knowledge of thunderstorm initiation 370
and behavior and also develop more advanced nowcasting tools that combine 371
radar, lightning, satellite and numerical weather prediction (Goodman et al., 2012). 372
The second objective was to conduct cross-network inter-comparisons and 373
capability assessments of operational and research ground-based regional 2-D and 374
3-D total lightning mapping networks that might be useful for merging with or 375
validating the space-based lightning measurements becoming available late this 376
decade. This specific component of the field experiment included a very successful 377
collaboration among Brazilian, US, and European organizations (from universities 378
and industry). The participating lightning location systems (LLSs) were STARNET 379
(Sferics Timing And Ranging NETwork), RINDAT (Rede Integrada Nacional de 380
Detecção de Descargas Atmosféricas), WWLLN (World Wide Lightning Location 381
Network), ATDnet (Arrival Time Difference network), Vaisala GLD360 (Global 382
Lightning Dataset) and TLS200 (Total Lightning Sensor), BrasilDAT (Sistema 383
Brasileiro de Detecção de Descargas Atmosféricas), LINET (Lightning Network), and 384
LMA (Lightning Mapping Array). The last four networks were deployed along a 385
short baseline for total (intracloud and cloud-to-ground) lightning detection in 386
support of the development of proxy datasets and validation protocols in 387
preparation for the next generation of operational weather satellites (Goodman et 388
al., 2013) and the Meteosat Third Generation Lightning Imager in 2018 (Holler et al., 389
2013). The lightning measurements provided by these LLSs were made 390
concurrently with overpasses of the TRMM Lightning Imaging Sensor (LIS) and the 391
SEVIRI (Spinning Enhanced Visible and Infrared Imager) on the Meteosat Second 392
Generation satellite. A 10-station Lightning Mapping Array network, expanded to 393

20
twelve stations in early December and then providing near-real time data, was 394
deployed over the eastern region of the Vale do Paraiba in the vicinity of São Paulo 395
to be one of the references for total lightning measurements. The distance 396
between the LMA stations was 15-30 km, and the network “diameter” was 397
approximately 60 km. Bailey et al., (2011) discuss a similar LMA configuration that 398
provides accurate 3-D lightning mapping and good detection efficiency as far as 399
150 km from the network center. This specific network installed in CHUVA has no 400
information about the specific efficiency detection; this information will be 401
available only after the cross-network inter-comparisons. 402
The combined lightning, satellite and radar data provide the most comprehensive 403
dataset to date. The dataset prepares users for the next generation of 404
geostationary satellite imagery and lightning mappers using SEVERI and LIS 405
measurements. Figure 4 presents an example of the characteristic lightning data 406
collected during one overpass of the TRMM satellite. The LMA, as well as the LIS, 407
were able to detect and locate lightning from various sub-components of individual 408
flashes. 409
Additionally, nowcasting applications were tested based on detailed information of 410
intense thunderstorms that produced hail, damaging winds and flooding over the 411
metropolitan area of São Paulo and Vale do Paraiba. Figure 5 provides an example 412
of a severe weather event that produced very large hail (up to 20 mm) and flooding 413
in the region. A rapid increase in lightning source numbers, known as the 414
“lightning-jump”, firstly discussed by William et al., (1999), is associated with 415
severe weather, occurred in advance of the hail event. Figure 5A shows the 15-416
minute accumulated LMA source density (number of sources in a 1x1 km2 grid 417

21
during a 15-minute period) plotted in latitude-longitude, latitude-height and 418
longitude-height projections and the observed signature of the lightning-jump. This 419
cell was initiated southwest of Sao Paulo and traveled through Sao Paulo and 420
Guarulhos cities with reflectivities greater than 40 dBZ from 1700 to 1830 UTC, 421
reaching values greater than 65 dBZ at 1745 UTC when hail was reported in 422
downtown Sao Paulo. Moreover, 15 minutes later, hail and flooding were reported 423
in Guarulhos, which corresponds with the maximum observed LMA sources (Figure 424
5B). The electrical structure of this cell exhibited two well-developed charge 425
centers with maximum activity near 1800UTC. This lighting source maximum 426
(lightning-jump) and has been associated with severe weather, including tornados 427
(Schultz et al., 2009). The lightning activity had two major source regions at 428
approximately 7 km and 10 km. These thunderstorms extended to a height of 18 429
km. Cloud electrification is tightly controlled by updrafts and precipitation 430
formation. Therefore, monitoring lightning activity inside a cloud can lead to severe 431
weather warnings detected by a lightning-jump signature. 432
The LMA mapped the convective cells in near real-time. The most recent 10 433
minutes of the LMA lightning data were uploaded to the CHUVA nowcasting 434
website (SOS) every 5 minutes. This site provides civil defense, management 435
organizations, electrical power companies and the public with information on real-436
time convection and lightning threat. 437
During the Vale do Paraiba campaign, several intense thunderstorms and some 438
severe weather events were recorded, including a downburst, causing destruction 439
of many trees, and many cases of hailstorms. The rain rate at the 99th percentile at 440
the main site was 137 mm h-1. Warm clouds during the Vale do Paraiba campaign 441

22
had a lower frequency and average rain rate than the others CHUVA tropical sites. 442
Moreover, non-precipitating clouds exhibited a small average measured value 443
(0.13 mm) and the largest difference with the adiabatic calculation. One possible 444
reason for this finding is the dry entrainment effect that reduces the liquid water 445
content below the estimated adiabatic value. The CAPE value at vale do Paraiba 446
was nearly identical to the observations in Belem; the 99th percentile corresponds 447
to 1260 J Kg-1. The Vale do Paraiba and Santa Maria locations had a very small 448
average integrated water vapor amount (27 and 29 mm, respectively) compared 449
with the sites located closer to the equator. 450
451
e) Santa Maria 452
453
The Santa Maria campaign, named CHUVA SUL, took place from November 5 to 454
December 12, 2012. Zipser et al. (2006) report that very intense thunderstorms are 455
observed in this region and mesoscale convective systems organized by the 456
penetration of cold fronts are common. Liu et al. (2010) used a 10-year satellite 457
database from TRMM to show that most precipitation in this region (more than 458
2000 mm/year) comes from thunderstorms. During the campaign, the rain rate at 459
the 99th percentile was 106 mm h-1. Six mesoscale convective systems crossed the 460
region during the campaign, with intense activity confined primarily to Argentina 461
and Uruguay. On 1 December, a convective event brought down trees near the 462
main site and was considered the most intense storm crossing the sites. 463
Unfortunately, the X-band radar suffered a voltaic arc and could not be repaired in 464
time for the campaign. However, two S-band radars operated by the Brazilian Air 465

23
Force, one in Santiago and another in Cambuçu, 100 km and 180 km from the main 466
site, respectively, made measurements during this event. These radars ran a 467
volume scan strategy, employing 15 elevations every ten minutes. All of the CHUVA 468
instruments were installed similar to the other campaigns using rainfall 469
measurement sites, a GPS mesoscale network and a field mill network. Additional 470
instrumentation included surface weather stations in a mesoscale network 471
composed of six stations spaced 20 km apart. The rawinsondes were launched 472
twice a day. During the occurrence of organized systems, soundings were also 473
launched every six hours in Santiago and Cruz Alta, approximately 120 km apart. 474
The Santa Maria campaign showed the lowest value for CAPE; the 99th percentile 475
corresponds to only 400 J Kg-1, larger values were only observed closed to the six 476
main events. A unique activity in CHUVA SUL was the use of the High Resolution 477
Limited Area Model Ensemble (HRLAMENS). The HRLAMENS effort was developed 478
under mutual collaboration between CHUVA and the LPB-RDP (La Plata Basin - 479
Research and Development Project, which focuses on high impact weather), which 480
aimed to furnish additional information on the total amounts and locations of 481
precipitation and their uncertainties. The HRLAMENS was composed of five models 482
(two versions of the BRAMS model and three versions of the Weather Research 483
and Forecasting (WRF) model), which were integrated using the Centro de Previsão 484
de Tempo e Estudos Climáticos (CPTEC) supercomputing facilities. Moreover, four 485
others model configurations were ran in others Institutions in Brazil and Argentina. 486
This core set of models was designed to be driven by selected global ensemble 487
prediction system members from CPTEC and the National Centers for 488
Environmental Prediction. The simulations were homogeneous in domain size and 489

24
horizontal and vertical resolution (2 km grid spacing and 41 levels). Partner 490
institutions in the project assisted with the multi-model composition in their 491
respective model (WRF running in University of Buenos Aires, WRF running at 492
University of Santa Maria and MESO-NH from the Laboratoire d'Aerologie (France)). 493
The results are still being evaluated. Nevertheless, preliminary conclusions indicate, 494
as expected, sensitivity to the lateral boundary conditions and model 495
characteristics. The ultimate objective is to find an optimal balance among 496
ensemble members that would improve the current state of rainfall predictions for 497
the region. 498
499
f) GoAmazon - Manaus. 500
501
The GoAmazon experiment seeks to understand the interaction of aerosol and 502
cloud life cycles. The GoAmazon experiment will be performed in Manaus, a 503
megacity of almost 1.8 million people in the central Amazon. Two intensive 504
operating periods (IOP) are being prepared for 2014, one in February-March, 505
during the wet season, and another in September-October, at the end of the dry 506
season. The GoAmazon experiment consists of several combined efforts, including 507
the deployment of the ARM mobile facility (Cadeddu et al., 2013), the Grumman 508
Gulfstream 159 (G-1) aircraft (from the Pacific Northwest National Laboratory) to 509
collect chemistry and microphysical properties, ACRIDICON (Aerosol, Cloud, 510
Precipitation, and Radiation Interactions and Dynamics of Convective Cloud 511
Systems) with the High Altitude and Long Range Research Aircraft (HALO), which is 512
the new research aircraft of the German Science Community (Gulfstream G-550) 513

25
and the CHUVA project. The CHUVA campaign will employ an X-Pol measurement 514
strategy, which provides volume scans and several RHIs over the sites in 515
coordination with the ARM cloud radar. It is important to note that the GPM core 516
observatory will be launched during the first IOP. Hence, there will be an 517
opportunity to combine data from the TRMM and GPM core satellites with those 518
collected during GoAmazon to study cloud and precipitation processes over one of 519
the rainiest continental regions of the planet. 520
521
5. CHUVA Outreach 522
523
a) The CHUVA-SOS Nowcasting system 524
525
The SOS-CHUVA is a web-based geographic information system combining 526
observations from radar, lightning networks, satellite images, numerical models 527
and nowcasting procedures. This is a useful tool to interpret, summarize and 528
integrate the environmental information and display and send warnings for 529
emergency management groups. In addition, SOS_CHUVA is an open access system 530
serving the population through real time information, thereby reducing citizen 531
vulnerability. By taking advantage of the instrumentation employed in each 532
campaign, a nowcasting pilot project is set up for each region, which addresses 533
specific vulnerabilities and needs. The SOS-CHUVA provides high resolution radar, 534
satellite and lightning data nearly in real time. It also provides the results from 535
several nowcasting applications, including the radar forecast for the next ten 536
minutes (based on Fortracc, Vila et al., 2007, and the Rainbow data processing 537

26
system software) and the lightning probability (Machado et al., 2009), among 538
several other functions, such as the total integrated precipitation for each 539
neighborhood. For the regions outside of the radar coverage, the system provides 540
information based on the hydroestimator and the Fortracc nowcasting cloud 541
systems for the following two hours using geostationary satellite data. The system 542
also provides forecast data from the BRAMS cloud resolving model at a resolution 543
of a few kilometers. The SOS-CHUVA in each campaign was developed in 544
partnership with the local civil defense and fire departments. 545
546
b) Training and Education and Workshop 547
548
Outreach activities are an important component of the CHUVA project. For 549
example, training lectures were presented to local students during each campaign 550
via a one-week course that covered themes of nowcasting, cloud resolving models, 551
polarimetric radar, satellite data usage, lidar, GPS and cloud microphysics. The 552
lectures were offered to graduate and undergraduate students in environmental 553
sciences; more than 100 students attended each campaign course. The programs 554
and details of each course are available from the specific webpage of the campaign. 555
Finally, an international workshop was organized in May 2013 in São Paulo. Access 556
to the abstracts and the presentations is available at the following URL: 557
http://chuvaproject.cptec.inpe.br/portal/workshop/index.html. 558
559
6. Discussion. 560
561

27
The use of similar instruments across campaigns in the various precipitation 562
regimes makes it possible to study the regional contrasts and correspondences. 563
Figure 6 illustrates examples of similarities and differences among the various 564
precipitation regimes. Figure 6A shows the DSD adjustment to the gamma function 565
(using the momentum method described by Tokay and Short, 1996) in the three-566
dimensional space of the gamma parameters: the intercept (N0) in the x axis, the 567
shape (m) in the y axis and the width () in the z axis, using the same procedure 568
employed by Cecchini et al. (2013). In this three-dimensional space (a logarithmic 569
option is applied to N0 to adjust the data to the same range), the DSD gamma 570
parameters are represented for the Vale do Paraiba, Belem and Santa Maria 571
campaigns. Each point in this diagram corresponds to a specific DSD. We note the 572
regional differences in the frequency of occurrence over the gamma parameter´s 573
spatial domains. However, it is very interesting to see that all points, regardless of 574
the regime, are nearly over the same adjusted surface. Therefore, we can 575
parameterize the Gamma distribution using only two independent parameters. The 576
raindrop size distribution characteristics observed by surface based disdrometers 577
can distinguish different precipitation systems. Tokay et al. (2002) demonstrated 578
the presence of more large drops and small concentration in easterly regime than 579
in the westerly regime in the southwestern Amazon basin. In their study, DSD 580
differences were also observed between the monsoon and break regimes in 581
Northwest Australia. The DSD features from CHUVA will be analyzed in detail after 582
the completion of the GoAmazon project. 583
Another example of regional contrasts/similarities is presented in Figure 6B using 584
the warm cloud-ice cloud index (WII). The WII is defined as the ratio of the 585

28
difference between the cloud thickness of the cloud layer below and above the 586
freezing level and the total cloud thickness (see Figure 6b for a schematic view and 587
the associated equation). The WII was computed using the vertical profile of 588
reflectivity (VPR) by employing data from the X-Pol RHI scanning mode and the co-589
located rawinsondes (+-3 hour interval) over the main site. Only continuous cloud 590
layers were considered in this analysis; multi-layer clouds were discarded. A 591
continuous layer cloud was defined as having a continuous layer with values larger 592
than 0 dBZ in the warm sector and -10 dBZ in the layer above the 0°C isotherm. 593
Different thresholds were used because ice has a smaller refractive index than 594
liquid water. All rain events (rain rate greater than 0.1 mm h-1) from non-595
multilayers clouds and when rawinsonde data were available were computed in 596
the WII analysis. The thickness of the layer under the melting layer (L1) was defined 597
as the layer between the lifting condensation level (LCL) and the melting level 598
(both obtained from rawinsondes). The LCL is used to avoid possible rain layers 599
detected by the radar below the cloud base. The parameter L2, characterizing the 600
layer above the melting layer, is defined as the thickness of the layer between the 601
melting level and the last level of the continuous layer of reflectivities larger than -602
10 dBZ. L2 roughly represent the cloud layer above 0°C isotherm, because radar 603
does not detect the cloud boundaries. The WII ranges from 1 (a pure warm cloud) 604
to -1 (clouds associated only with ice and/or supercooled water). Figure 6b 605
presents the rainfall cumulative frequency for each WII value. The cumulative 606
rainfall is obtained from a disdrometer located at the main site along the RHI 607
azimuth direction employed to build the VPR. The population for each site (rainfall 608
cases at the main site were associated with a single layer cloud that occurred 609

29
within the six-hour interval centered on the rawinsonde launch time) is variable, 610
ranging from 116 in Alcantara to 1500 Vale do Paraiba, depending on the number 611
of rainy days, the frequency of multilayer clouds and the duration of the campaign. 612
The cumulative rainfall, for each site, is presented as function of the WII values in 613
Fig. 6b to give an information about the specific cloud population of WII values in 614
the total rainfall. Two different behaviors can be observed in Fig. 6b.The first 615
behavior corresponds to negative WII values, responsible for approximately 70%-616
75% of the total precipitation amount. Vale do Paraiba and Belem exhibit deep 617
clouds with a layer L2 above the melting level that is nearly three times larger (a 618
WII value of approximately -0.5) than the warm layer L1; for Fortaleza and 619
Alcantara, this layer is only 1.5 times larger than the warm layer (a WII around -0.3). 620
The second behavior, accounting for the remaining 30%-25% of precipitation, is 621
nearly linearly distributed for the positive values of the WII, expect for Vale do 622
Paraiba. These clouds are characterized by rain processes that are primarily below 623
the melting layer. Alcantara, Belem and Fortaleza present a very similar behavior; 624
approximately 25% of the precipitation is from clouds with most of their thickness 625
below the melting layer (associated with warm processes). However, the Vale do 626
Paraiba rainfall events display a different behavior, in which a very small portion, 627
i.e., less than 5%, of the rainfall is associated with warm clouds. This clearly shows 628
a distinction between coastal and continental rainfall events; a different population 629
of rainfall events from warm clouds was observed. This difference could be reason 630
of cloud process in the clean maritime air near the coast and the more polluted air 631
inland. 632

30
Another regional comparison was performed to evaluate cloud organization using 633
GOES satellite images. Figure 6c shows the cumulative distribution of the 634
convective cloud fraction (defined as 10.7 m Brightness Temperature smaller than 635
235 K) as a function of the cloud cluster effective radius (an equivalent area circle; 636
effective radius = (Area/)1/2). This convective cloud size distribution only includes 637
clouds with very high cloud tops, i.e., colder than 235 K. Therefore, no warm clouds 638
are included. The calculation was performed using the same procedure as 639
employed by Machado and Rossow (1993) over a region centered on the main site 640
with a radius of 250 km. The regional convective cloud size distributions are very 641
similar. Approximately 80% of the convective cloud fraction is explained by cloud 642
organization with radii smaller than 31 km for all regions. Only slight regional 643
differences are noted for convective cloud organization smaller than 31 km 644
effective radius. Alcantara and Belem have fewer small convective clouds than the 645
others sites. Moreover, Vale do Paraiba exhibits more moderately sized systems 646
(approximately 31 km). However, the largest difference is for convective cloud 647
organization larger than 31 km. Santa Maria has the largest cloud organization, 648
probably due to the more baroclinic instability favoring large MCCs and cold fronts. 649
The CHUVA dataset has just begun to be explored, but some clear regional 650
characteristics can already be described. The warm clouds in Alcantara feature very 651
large droplets (disdrometer measurement) and high liquid water contents 652
(microwave radiometer). Several pixels that were classified as stratiform due to the 653
presence of a bright-band exhibiting large reflectivities and rain rates values. It is 654
possible that the ice aloft, prior to the bright-band formation, is sufficiently 655
vigorous to produce larger rain rates than expected for normal stratiform cloud 656

31
conditions. The largest CAPE found in Alcantara could explain this strength in the 657
ice production. The highest and most prominent bright-band was observed in 658
Alcantara, which agrees with this notion. Deep convective clouds in Fortaleza 659
display the largest amount of rain water below the melting layer. Costa et al. (2000) 660
showed different DSDs for maritime, coastal, continental and polluted warm clouds 661
in the Fortaleza region. They demonstrated a pronounced increase in 662
concentration and decrease in the maximum droplet diameter as the clouds moved 663
from the ocean to the continent into polluted regions. The high CAPE for these 664
coastal sites helps the development of deep convection. However, these coastal 665
tropical sites have more warm rain clouds and less deep convection than the Vale 666
do Paraiba and Santa Maria locations. Several processes must be considered, such 667
as the small concentration of Cloud Condensation Nuclei (CCN) at the coastal sites. 668
Moreover, the larger trade wind inversion could contribute suppressing deep 669
convection and increase warm cloud formation. 670
The deepest clouds were recorded in Santa Maria, Belem and Vale do Paraiba. 671
These are the regions of very deep clouds, often with cloud tops above 15 km, and 672
organized convection with a more dominant ice phase. Belem presented the most 673
developed glaciated layer (above 7 km), whereas Vale do Paraiba displayed the 674
most developed mixed phase layer, i.e., between the melting layer and 7 km 675
(Calheiros and Machado, 2013). 676
677
7. Summary. 678
679

32
CHUVA provides a comprehensive dataset characterizing the main precipitation 680
regimes in Brazil. The project consistently uses a core complement of 681
instrumentation for each campaign and has recorded and made available high 682
spatial and temporal resolution observations (ground and satellite based) of cloud 683
and precipitation characteristics. 684
CHUVA field campaigns around the tropical region of Brazil provide education and 685
training with respect to the employed instrumentation and the physical processes 686
describing cloud and rainfall formation. CHUVA takes advantage of the 687
instrumentation to present a nowcasting test-bed based on the SOS-CHUVA. The 688
CHUVA data are available through the website, which includes all of the 689
information on each campaign, daily reports, data strategy, quick looks, instrument 690
locations and photos. 691
The CHUVA project contributes to the GLM effort to develop algorithms based on 692
the planned GOES-R and METEOSAT third generation lightning sensors and the 693
preparation of the GPM validation and algorithm development. The large number 694
of warm rain clouds measured in various regions is an important resource for the 695
satellite precipitation algorithms, especially for GPM, to test the ability of retrieving 696
rainfall from non-ice scattering clouds over land. 697
Open access to the database will certainly contribute to improving the knowledge 698
of clouds over tropical regions and advance the description and parameterization 699
of cloud processes. 700
701
8. Acknowledgement 702

33
This work was supported by FAPESP grant No. 2009/15235-8, CHUVA Project and 703
CNPQ No. 573797/2008 (Brazilian National Institute of Science and Technology for 704
Climate Change). Special thanks to Mário Figueiredo for maintaining the CHUVA 705
database, Claudinei Camargo for assisting in figure preparation, Jorge Melo and 706
Jorge Marton for their engineering support during the field campaigns, Moacir 707
Lacerda, Evandro Anselmo and João Neves for their support during lightning 708
installation and Izabelly Carvalho for processing the disdrometer dataset. The 709
authors acknowledge the anonymous reviewers and the comments provided by 710
Earle Williams. The authors would also like to thank all of the participants in the 711
CHUVA field campaigns that contributed directly or indirectly during the years of 712
field work. 713

34
9. References
Adams,D.K.,R.Fernandes,E.R.Kursinski,J.Maia,L.Sapucci,L.Machado,I.Vitorello,K.Hol
ub,S.Gutman,NazianoFilizola,R.Bennett,2011:A Dense GNSS Meteorological
Network for Observing Deep Convection in the Amazon, Atmospheric Science
Letters, DOI:10.1002/asl.312
Bailey, J. C., L. D. Carey, R. J. Blakeslee, S. J. Goodman, R. I. Albrecht, C. A. Morales,
and O. Pinto, Jr., 2011: São Paulo Lightning Mapping Array (SP-LMA): Deployment
and Plans. Proceedings XIV International Conf. on Atmospheric Electricity, Rio de
Janeiro, Brazil.
Battaglia, A., P. Saavedra, C. A. Morales, and C. Simmer, 2011: Understanding 3D
effects in polarized observations with the ground-based ADMIRARI radiometer
during the CHUVA campaign. J. Geophys. Res.,116,D09204,
doi:10.1029/2010JD015335.
Berg, W., T. L'Ecuyer, and C. Kummerow, 2006: Rainfall Climate Regimes: The
Relationship of Regional TRMM Rainfall Biases to the Environment. J. Appl. Meteor.
Climatol.,45, 434–454.
Cadeddu, M. P., J.C. Liljegren, and D. D. Turner, 2013: The Atmospheric Radiation
Measurement (ARM) program network of microwave radiometers:
instrumentation, data, and retrievals. Atmos. Meas. Tech. Discuss., 6, 3723-3763,
doi:10.5194/amtd-6-3723-2013.

35
Calheiros, A.J.P. and L.A. T. Machado, 2013: The Cloud and Rain Liquid Water
Characteristics of Different Precipitation Regimes in Brazil. Atmos. Res.
Cecchini, M. A., L.A.T. Machado, and P. E. A., 2013: Droplet Size Distributions as a
Function of Rainy System Type and Cloud Condensation Nuclei Concentrations.
Atmos. Res.
Cecil, D. J. and C. B. Blankenship, 2012: Toward a Global Climatology of Severe
Hailstorms as Estimated by Satellite Passive Microwave Imagers. J. Climate, 25,
687–703.
Cohen, J. C. P., M. A. F. da Silva Dias, and C. A. Nobre, 1995: Environmental
Conditions Associated with Amazonian Squall Lines: A Case Study. Mon. Wea. Rev.,
123, 3163–3174.
Costa A. A., C. J. Oliveira, J. C. P. Oliveira, and A. J. C. Sampaio, 2000: Microphysical
observations of warm cumulus clouds in Ceará, Brazil. Atmos. Res., 54, 2–3, 167-
199.
Cotton, W.R., 1982 : Modification of precipitation from warm clouds-A review. Bull.
Amer. Meteor. Soc., 63, 146-160.
Fabry, Frederic, Isztar Zawadzki, 1995: Long-Term Radar Observations of the
Melting Layer of Precipitation and Their Interpretation. J. Atmos. Sci., 52, 838–851.
Garreaud, R. D., 2000: Cold air incursions over subtropical South America: Mean
structure and dynamics. Mon. Wea. Rev., 128, 2544–2559.

36
Garstang, Michael, Harold L. Massie, Jeffrey Halverson, Steven Greco, John Scala,
1994: Amazon Coastal Squall Lines. Part I: Structure and Kinematics. Mon. Wea.
Rev., 122, 608–622.
Goodman, S. J., J. Gurka, M. DeMaria, T. Schmit, A. Mostek, G. Jedlovec, C. Siewert,
W. Feltz, J. Gerth, R. Brummer, S. Miller, B. Reed, and R. Reynolds, 2012: The GOES-
R Proving Ground: Accelerating User Readiness for the Next Generation
Geostationary Environmental Satellite System. Bull. Am. Meteor. Soc.,93, 1029-
1040. DOI:10.1175/BAMS-D-11-00175.1.
Goodman, S. J., R. J. Blakeslee, W. J. Koshak, D. Mach, J. C. Bailey, L. D. Carey, D. E.
Buechler, C. D. Schultz, M. Bateman, E. McCaul, and G. Stano, 2013: The GOES-R
Geostationary Lightning Mapper. Atmos. Res., Volumes 125–126, 34-49.
Höller, H., H.-D. Betz, C.A. Morales, R. Blakeslee, J. C. Bailey and R. I. Albrecht, 2013:
Multi-sensor field studies of lightning and implications for MTG-LI. 2013 EUMETSAT
Meteorological Satellite Conference and 19th American Meteorological Society
(AMS) satellite meteorology, oceanography, and climatology conference,
September 16-20, Vienna, Austria.
Kouadio Y.K., J. Servain, L. A. T. Machado and C. A. D. Lentini, 2012: Heavy rainfall
episodes in the eastern northeast Brazil linked to large-scale ocean-atmosphere
conditions in the tropical Atlantic. Advances in Meteorology, 2012, ID 369567, doi
10.1155/2012/369567
Liu, C. and E.J. Zipser, 2009: Warm Rain in the Tropics: Seasonal and Regional
Distributions Based on 9 yr of TRMM Data. J. Climate, 22, 767–779.

37
Liu, Chuntao, Earle R. Williams, Edward J. Zipser, Gary Burns, 2010: Diurnal
Variations of Global Thunderstorms and Electrified Shower Clouds and Their
Contribution to the Global Electrical Circuit. J. Atmos. Sci., 67, 309–323.
Machado, L. A. T., W. F. S. Lima, O. Pinto Jr, and C. A. Morales, 2009: Relationship
between cloud-ground discharge and penetrative clouds: a multi-channel satellite
application. Atmos. Res., 93, 304-309.
Machado L. A. T. and W. B. Rossow, 1993: Structural characteristics and radiative
properties of tropical cloud clusters. Mon. Wea. Rev., 121, 3234–3260
Morrison, H. and W. W. Grabowski, 2007: Comparison of Bulk and Bin Warm-Rain
Microphysics Models Using a Kinematic Framework. J. Atmos. Sci.,64, 2839–2861.
Morales, C.A., L. A. T. Machado, C. F. de Angelis, M. A. F. da Silva Dias, G. Fisch, D.
Vila, J. Sakuragi, I. C. Carvalho, J.R. Neves, E.M. Anselmo, and T. Biscaro, 2013:
Evaluation of TRMM PR Rainfall Estimates Over Brazil: A Contribution of CHUVA
Project. Atmos. Res. (submitted).
Negri, R. G., L. A. T. Machado, S. English and M. Forsythe, 2013: Combining Cloud
Resolving Model with Satellite for Cloud Process Model Simulation Validation. J.
Appl. Meteor. Clim., in press.
Negri, Andrew J., Emmanouil N. Anagnostou, Robert F. Adler, 2000: A 10-yr
Climatology of Amazonian Rainfall Derived from Passive Microwave Satellite
Observations. J. Appl. Meteor., 39, 42–56.

38
Peters, G., B. Fischer, H. Münster, M. Clemens, and A. Wagner, 2005: Profiles of
Raindrop Size Distributions as Retrieved by Micro rain Radars. J. Appl. Meteor., 44,
1930-1949.
Rickenbach T.M, 2004: Nocturnal Cloud Systems and the Diurnal Variation of
Clouds and Rainfall in Southwestern Amazonia. Mon. Wea. Rev., 132, 1201-1219.
Salio, P., M. Nicolini and E. J. Zipser, 2007: Mesoscale Convective Systems over
Southeastern South America and Their Relationship with the South American Low-
Level Jet. Mon. Wea. Rev., 135, 1290–1309.
Sapucci, L. F., L. A. T. Machado, J. F. G. Monico, and A. Plana-Fattori, 2007:
Intercomparison of Integrated Water Vapor Estimates from Multisensors in the
Amazonian Region. J. Atmos. Oceanic Technol.,24, 1880–1894.
Schneebeli, M., J. Sakuragi, T, Biscaro, C. F. de Angelis, I. Carvalho da Costa, C. A.
Morales, L. Baldini, and Machado, L. A. T, 2012a.: Observations of tropical rain with
a polarimetric X-band radar: first results from the CHUVA campaign, Atmos. Meas.
Tech. Discuss., 5, 1717-1761 (.doi:10.5194/amtd-5-1717-2012)
Schneebeli, M., J. Sakuragi, T. Biscaro, C. F. de Angelis, I. Carvalho da Costa, C. A.
Morales, L. Baldini, and Machado, L. A. T, 2012b: Polarimetric X-band weather
radar measurements in the tropics: radome and rain attenuation correction. Atmos.
Meas. Tech.,5, 2183-2199.
Schumacher, Courtney, Robert A. Houze, 2003: Stratiform Rain in the Tropics as
Seen by the TRMM Precipitation Radar. J. Climate, 16, 1739–1756.

39
Silva Dias MAF (Ed.) (2009) As chuvas de novembro de 2008 em Santa Catarina: um
estudo de caso visando à melhoria do monitoramento e da previsão de eventos
extremos. Nota técnica. São José dos Campos, INPE. 67p.
Schultz, Christopher J., Walter A. Petersen, Lawrence D. Carey, 2009: Preliminary
Development and Evaluation of Lightning Jump Algorithms for the Real-Time
Detection of Severe Weather. J. Appl. Meteor. Climatol., 48, 2543–2563.
Tapiador, F.J., F.J. Turk, W. Petersen, A. Y. Hou, E. G. Ortega, L. A. T. Machado, C. F.
Angelis, P. Salio, C. Kidd, G. J. Huffman, and M. Castro, 2012: Global precipitation
measurement: methods, datasets and applications. Atmos. Res.,104–105, 70-97.
Testud, J., E. Le Bouar, E. Obligis and M. Ali-Mehenni, 2000: The rain profiling
algorithm applied to polarimetric weather radar, J. Atmos. Oceanic Technol., vol.
17, 322-356.
Tokay, A. and Short, D.A. Evidence from tropical raindrop spectra of the origin of
rain from stratiform versus convective clouds. J. Appl. Meteorol., 35, 355-371, 1996
Tokay, A., A. Kruger, and W. Krajewski, A. Perreira, 2002: Measurements of drop
size distribution in southwestern Amazon region, J. Geophys. Res., 107 (D20).
Vandenberghe, F., 2003: A multichannel radiometric profiler of temperature,
humidity, and cloud liquid. Radio Sci., 38, 8079.
Vila, D. A., L. A. T. Machado, H. Laurent and I. Velasco, 2008: Forecast and Tracking
the Evolution of Cloud Clusters (ForTraCC) Using Satellite Infrared Imagery:
Methodology and Validation. Wea. Forecasting, 23, 233–245.

40
Voss, P.B., E.E. Riddle, and M.S. Smith, 2005: Altitude Control of Planetary Balloons.
J. of Aircraft, 43, 478-482.
Ware, R., R. Carpenter, J. Güldner, J. Liljegren, T. Nehrkorn, F. Solheim, and F.
Vandenberghe (2003). Radio Sci., 38(4), 8079, doi:10.1029/2002RS002856.
Williams, E. R., Stanfill, S. B., The Physical Origin of the Land-Ocean Contrast in
Lightning Activity, Comptes Rendus Physique, Volume 3, Number 10, pp. 1277-
1292, 2002.
Williams, E., R. Boldi, A. Matlin, M. Weber, S. Hodanish, D. Sharp, S. Goodman, R.
Raghavan, and D. Buechler, The behavior of total lightning activity in severe Florida
thunderstorms, Atmospheric Research, 51, 245-265, 1999.
Zipser, E. J., C. Liu, D. J. Cecil, S. W. Nesbitt, and D. P. Yorty, 2006: Where are the
most intense thunderstorms on earth?.Bull. Amer. Meteor. Soc., 87, 1057–1071.

41
FIGURE CAPTIONS
Figure 1: A description of the CHUVA field campaigns over Brazil and an illustration of
the main precipitation regimes. On the right, the diagram describes the reference
measurement strategy adopted during the field campaigns, along with the radar site
and main site with other ground instruments.
Figure 2: The CHUVA webpage (center) and examples of the data access panel (left)
and the web page for the Vale do Paraiba campaign (right). Additionally, one example
picture (bottom) showing the radar installation for the Vale do Paraiba campaign is
shown.
Figure 3: The sequence of the RHI over a squall line crossing the main site. The
illustration is presented for each hour from 17:00 to 24:00 UTC (June 7, 2011) for the
Belem field campaign.
Figure 4: The coincident lightning observations on February 10, 2012 at 1900 UTC
during a Lightning Imaging Sensor (LIS) overpass from approximately 19:01:10 to
19:03:24 UTC. The plotted ground-based lightning data are limited both temporally
and spatially to the LIS overpass limits. The left panel shows the LIS pixels (grey squares)
and the ground strikes detected by LMA VHF sources (the colored dots are function of
the time). The projections east–west (top) and north-south (left) as functions of the
altitude and the number of sources as a function of the altitude are also shown in the
left panel.
Figure 5: A) Accumulated LMA lightning source density (number of sources in a 1x1 km
grid box during a 15-minute period) for a hail-producing convective cell on 7 January
2012. The upper panels show a plan (latitude-longitude) view and the bottom panels
show height-longitude views of the convective cell. Horizontal black lines in the
bottom panels indicate the approximate heights of the -10oC and -40oC isotherms,
where most of the electrical charge transfer occurs. B) Time evolution of the maximum
reflectivity and the number of LMA lightning sources. Red lines indicate hail

42
occurrences in São Paulo and Guarulhos (the two cities showed in panels of A). Only
data from the hail-producing convective cell are shown.
Figure 6: A) The DSD gamma parameters for Vale do Paraiba (black dots), Belem
(brown dots) and Santa Maria (white dots) in the three-dimensional space composed
by N0, m and The color of the interpolated surface is associated with the values. B)
The cumulative rainfall as a function of the WII (warm cloud–ice cloud index) for
Alcantara, Fortaleza, Belem and Vale do Paraiba. LCL stands for lifting condensation
level. C) The cumulative convective cloud cover (Tir<235K) as a function of the cloud
cluster effective radius for each campaign.

43
Figure 1: A description of the CHUVA field campaigns over Brazil and an illustration of
the main precipitation regimes. On the right, the diagram describes the reference
measurement strategy adopted during the field campaigns, along with the radar site
and main site with other ground instruments.

44
Figure 2: The CHUVA webpage (center) and examples of the data access panel (left)
and the web page for the Vale do Paraiba campaign (right). Additionally, one example
picture (bottom) showing the radar installation for the Vale do Paraiba campaign is
shown.

45
Figure 3: The sequence of the RHI over a squall line crossing the main site. The
illustration is presented for each hour from 17:00 to 24:00 UTC (June 7, 2011) for the
Belem field campaign.

46
Figure 4: The coincident lightning observations on February 10, 2012 at 1900 UTC
during a Lightning Imaging Sensor (LIS) overpass from approximately 19:01:10 to
19:03:24 UTC. The plotted ground-based lightning data are limited both temporally
and spatially to the LIS overpass limits. The left panel shows the LIS pixels (grey squares)
and the ground strikes detected by LMA VHF sources (the colored dots are function of
the time). The projections east–west (top) and north-south (left) as functions of the
altitude and the number of sources as a function of the altitude are also shown in the
left panel.

47
Figure 5: A) Accumulated LMA lightning source density (number of sources in a 1x1 km
grid box during a 15-minute period) for a hail-producing convective cell on 7 January
2012. The upper panels show a plan (latitude-longitude) view and the bottom panels
show height-longitude views of the convective cell. Horizontal black lines in the
bottom panels indicate the approximate heights of the -10oC and -40oC isotherms,
where most of the electrical charge transfer occurs. B) Time evolution of the maximum
reflectivity and the number of LMA lightning sources. Red lines indicate hail
occurrences in São Paulo and Guarulhos (the two cities showed in panels of A). Only
data from the hail-producing convective cell are shown.

48
Figure 6: A) The DSD gamma parameters for Vale do Paraiba (black dots), Belem
(brown dots) and Santa Maria (white dots) in the three-dimensional space composed
by N0, m and The color of the interpolated surface is associated with the values. B)
The cumulative rainfall as a function of the WII (warm cloud–ice cloud index) for
Alcantara, Fortaleza, Belem and Vale do Paraiba. LCL stands for lifting condensation
level. C) The cumulative convective cloud cover (Tir<235K) as a function of the cloud
cluster effective radius for each campaign.
49
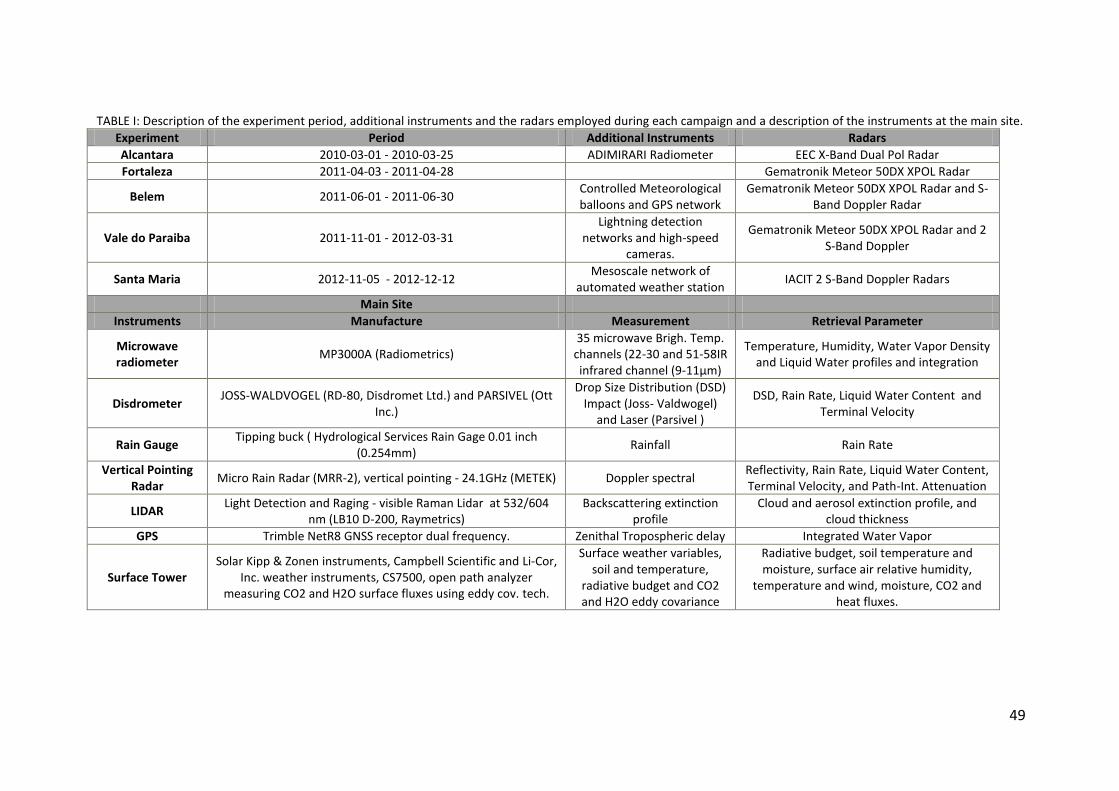
TABLE I: Description of the experiment period, additional instruments and the radars employed during each campaign and a description of the instruments at the main site.
Experiment Period Additional Instruments Radars
Alcantara 2010-03-01 - 2010-03-25 ADIMIRARI Radiometer EEC X-Band Dual Pol Radar
Fortaleza 2011-04-03 - 2011-04-28 Gematronik Meteor 50DX XPOL Radar
Belem 2011-06-01 - 2011-06-30 Controlled Meteorological balloons and GPS network
Gematronik Meteor 50DX XPOL Radar and S-Band Doppler Radar
Vale do Paraiba 2011-11-01 - 2012-03-31 Lightning detection
networks and high-speed cameras.
Gematronik Meteor 50DX XPOL Radar and 2 S-Band Doppler
Santa Maria 2012-11-05 - 2012-12-12 Mesoscale network of
automated weather station IACIT 2 S-Band Doppler Radars
Main Site
Instruments Manufacture Measurement Retrieval Parameter
Microwave radiometer
MP3000A (Radiometrics) 35 microwave Brigh. Temp.
channels (22-30 and 51-58IR infrared channel (9-11µm)
Temperature, Humidity, Water Vapor Density and Liquid Water profiles and integration
Disdrometer JOSS-WALDVOGEL (RD-80, Disdromet Ltd.) and PARSIVEL (Ott
Inc.)
Drop Size Distribution (DSD) Impact (Joss- Valdwogel)
and Laser (Parsivel )
DSD, Rain Rate, Liquid Water Content and Terminal Velocity
Rain Gauge Tipping buck ( Hydrological Services Rain Gage 0.01 inch
(0.254mm) Rainfall Rain Rate
Vertical Pointing Radar
Micro Rain Radar (MRR-2), vertical pointing - 24.1GHz (METEK) Doppler spectral Reflectivity, Rain Rate, Liquid Water Content, Terminal Velocity, and Path-Int. Attenuation
LIDAR Light Detection and Raging - visible Raman Lidar at 532/604
nm (LB10 D-200, Raymetrics) Backscattering extinction
profile Cloud and aerosol extinction profile, and
cloud thickness
GPS Trimble NetR8 GNSS receptor dual frequency. Zenithal Tropospheric delay Integrated Water Vapor
Surface Tower Solar Kipp & Zonen instruments, Campbell Scientific and Li-Cor,
Inc. weather instruments, CS7500, open path analyzer measuring CO2 and H2O surface fluxes using eddy cov. tech.
Surface weather variables, soil and temperature,
radiative budget and CO2 and H2O eddy covariance
Radiative budget, soil temperature and moisture, surface air relative humidity,
temperature and wind, moisture, CO2 and heat fluxes.
Copyright © 2022 FDOKUMEN