How does exposure to pesticides vary in space and time for ...
19
This is a repository copy of How does exposure to pesticides vary in space and time for residents living near to treated orchards?. White Rose Research Online URL for this paper: https://eprints.whiterose.ac.uk/121741/ Version: Published Version Article: Wong, Hie Ling, Garthwaite, Dave, Ramwell, Carmel T et al. (1 more author) (2017) How does exposure to pesticides vary in space and time for residents living near to treated orchards? Environmental science and pollution research. pp. 26444-26461. ISSN 0944- 1344 https://doi.org/10.1007/s11356-017-0064-5 [email protected] https://eprints.whiterose.ac.uk/ Reuse This article is distributed under the terms of the Creative Commons Attribution (CC BY) licence. This licence allows you to distribute, remix, tweak, and build upon the work, even commercially, as long as you credit the authors for the original work. More information and the full terms of the licence here: https://creativecommons.org/licenses/ Takedown If you consider content in White Rose Research Online to be in breach of UK law, please notify us by emailing [email protected] including the URL of the record and the reason for the withdrawal request.
-
Upload
khangminh22 -
Category
Documents
-
view
1 -
download
0
Transcript of How does exposure to pesticides vary in space and time for ...

This is a repository copy of How does exposure to pesticides vary in space and time for residents living near to treated orchards?.
White Rose Research Online URL for this paper:https://eprints.whiterose.ac.uk/121741/
Version: Published Version
Article:
Wong, Hie Ling, Garthwaite, Dave, Ramwell, Carmel T et al. (1 more author) (2017) How does exposure to pesticides vary in space and time for residents living near to treated orchards? Environmental science and pollution research. pp. 26444-26461. ISSN 0944-1344
https://doi.org/10.1007/s11356-017-0064-5
[email protected]://eprints.whiterose.ac.uk/
Reuse
This article is distributed under the terms of the Creative Commons Attribution (CC BY) licence. This licence allows you to distribute, remix, tweak, and build upon the work, even commercially, as long as you credit the authors for the original work. More information and the full terms of the licence here: https://creativecommons.org/licenses/
Takedown
If you consider content in White Rose Research Online to be in breach of UK law, please notify us by emailing [email protected] including the URL of the record and the reason for the withdrawal request.

RESEARCH ARTICLE
How does exposure to pesticides vary in space and timefor residents living near to treated orchards?
Hie Ling Wong1,2 & David G. Garthwaite3 & Carmel T. Ramwell3 & Colin D. Brown1
Received: 1 March 2017 /Accepted: 1 September 2017# The Author(s) 2017. This article is an open access publication
Abstract This study investigated changes over 25 years
(1987–2012) in pesticide usage in orchards in England and
Wales and associated changes to exposure and risk for resident
pregnant women living 100 and 1000 m downwind of treated
areas. A model was developed to estimate aggregated daily
exposure to pesticides via inhaled vapour and indirect dermal
contact with contaminated ground, whilst risk was expressed
as a hazard quotient (HQ) based on estimated exposure and
the no observed (adverse) effect level for reproductive and
developmental effects. Results show the largest changes oc-
curred between 1987 and 1996 with total pesticide usage re-
duced by ca. 25%, exposure per unit of pesticide applied
slightly increased, and a reduction in risk per unit exposure
by factors of 1.3 to 3. Thereafter, there were no consistent
changes in use between 1996 and 2012, with an increase in
number of applications to each crop balanced by a decrease in
average application rate. Exposure per unit of pesticide ap-
plied decreased consistently over this period such that values
in 2012 for this metric were 48–65% of those in 1987, and
there were further smaller decreases in risk per unit exposure.
All aggregated hazard quotients were two to three orders of
magnitude smaller than one, despite the inherent simplifica-
tions of assuming co-occurrence of exposure to all pesticides
and additivity of effects. Hazard quotients at 1000 m were 5 to
16 times smaller than those at 100 m. There were clear signals
of the impact of regulatory intervention in improving the fate
and hazard profiles of pesticides used in orchards in England
and Wales over the period investigated.
Keywords Pesticide . Usage . Orchard . Resident .
Exposure . Risk . Regulation
Introduction
Pesticides are bioactive substances that have been widely used
to improve agricultural production, reduce yield losses and
maintain high product quality in order to meet the increasing
demand for food from the world’s growing population, partic-
ularly in intensive agricultural systems. Pesticides are chemi-
cal or biological agents designed to kill potential disease-
causing organisms and control insects, other pests and weeds
in both open and protected environments. Due to their intrin-
sic toxicity, it is necessary to quantify potential for transporta-
tion away from the point of application, exposure to humans
and non-target ecosystems, and risk to human and ecological
health. Pesticides are amongst the most highly regulated
chemical classes due to the combination of bioactivity and
use in open environments.
Spray drift and volatilisation followed by transport in the
vapour phase are potential routes for dispersal of pesticides via
the air. Spray drift is the downwind movement of spray drop-
lets beyond the treated area at the time of application or soon
after (Felsot et al. 2010). It is influenced by the nozzle and
operating pressure of the equipment, height of the spray
boom, and weather conditions at the time of application
Responsible editor: Philippe Garrigues
Electronic supplementary material The online version of this article
(https://doi.org/10.1007/s11356-017-0064-5) contains supplementary
material, which is available to authorized users.
* Hie Ling Wong
1 Environment Department, University of York, York YO10 5NG, UK
2 Faculty of Earth Science, UniversityMalaysia Kelantan, Locked Bag
100, 17600 Jeli, Kelantan, Malaysia
3 Fera Science Ltd (Fera), Sand Hutton, York YO41 1LZ, UK
Environ Sci Pollut Res
DOI 10.1007/s11356-017-0064-5

(Hofman and Solseng 2001). After an application is complete,
volatilisation followed by transport in the vapour phase can be
an important pathway for pesticide emission from treated soil
and plant surfaces, at the extreme accounting for as much as
90% of the applied dose over a period of a few days to several
weeks (Bedos et al. 2002; Lichiheb et al. 2014). Sarigiannis
et al. (2013) proposed that volatilisation from plant surfaces
can be up to three times greater than that from soil, and
volatilisation can be more important for total emissions of
active substances compared to spray drift in the long term.
After entering into the atmosphere, spray drift can be
transported by the wind before deposition of spray droplets
locally whilst pesticide in the vapour phase following
volatilisation can be transported over longer distances
(Briand et al. 2002). Whilst much work has been done to
measure downwind deposition of spray droplets, there is a
lack of consistent methodology for quantifying airborne pes-
ticide concentrations at a range of scales (Zivan et al. 2016;
Lichiheb et al. 2016). Mathematical models are useful in
complementing expensive and time-consuming field trials
by including the complex processes that mediate the transfer
of pesticides between different environmental compartments
(Salcedo et al. 2017). A number of previous studies calculated
vapour exposure using volatilisation models coupled with dif-
ferent dispersion modelling approaches including 3D
Gaussian and a 2D version of OPS (Operational
Atmospheric Transport Model for Priority Substances) (van
den Berg et al. 2016). The BROWSE model (Bystanders,
Residents, Operators and WorkerS Exposure models for plant
protection products) is a recent development that combines a
mechanistic volatilisation model and an advanced 3D disper-
sion model of OPS (van den Berg et al. 2016). Development
of models for aerial transport and exposure to pesticides is still
restricted by data availability. For example, the best data avail-
able whilst developing the airborne spray component of the
BROWSE’s orchard model did not give sufficient confidence
in quantifying spray drift under different meteorological con-
ditions and at different distances of exposure, implying that
further experimental data are needed (Butler Ellis et al. 2017).
There is evidence to suggest that residents living close to
agricultural fields have greater exposure to pesticides com-
pared to the general population, but very few studies have
examined the dose-response relationships between exposure
and health outcomes of interest (Shirangi et al. 2010).
Sensitive sub-populations amongst residents could be at
higher risk of health impacts than the general population and
include foetuses, children, pregnant and nursing mothers, and
the elderly (Costa et al. 2014). A systematic review and meta-
analysis on residential exposure to pesticides and childhood
leukaemia for 13 case-control studies published between 1987
and 2009 indicated stronger risk for exposure during pregnan-
cy (meta-rate ratio (mRR): 2.19, 95% confidence intervals
(CI): 1.92–2.50) compared to after pregnancy (mRR: 1.65,
95% CI: 1.33–2.05) (Van Maele-Fabry et al. 2011).
Nevertheless, the study highlighted recall bias as a major lim-
itation of case-control studies where questionnaire data are
used to assess past exposure. Shirangi et al. (2010) suggested
that residential proximity to pesticide applications during
pregnancy could be associated with adverse reproductive out-
comes in offspring. However, epidemiological evidence from
25 studies published between 1950 and 2007 was generally
weak, primarily due to limitations in the assessment of
exposure. The study suggested that future research should
refine the methods on exposure modelling by incorporating
environmental monitoring studies on pesticide drift. Weselak
et al. (2007) reviewed epidemiological evidence on
periconceptual pesticide exposures and developmental out-
comes based on studies published between 1966 and 2005
and reported generally poor exposure estimations and limited
evidence for causality in all the associations examined due to
self-reported, indirect, or proxy exposure measures.
Regulatory assessments prior to authorisation of plant pro-
tection products require quantitative estimates of exposure to
pesticides via the air for comparison with toxicological refer-
ence levels, below which no adverse health effects are expect-
ed (Galea et al. 2015). In Europe, the estimation of exposure to
pesticides for operators, workers, residents and bystanders is
underpinned by the guidance of EFSA (2014). However,
sparcity of data on concentrations of volatilised pesticides in
air has been noted as a limitation on exposure assessment
(Butler Ellis et al. 2010), as has a general lack of research into
methods for estimating exposure and risk to the general public
(Coscolla et al. 2017).
The Pesticide Authorisation Directive 91/414/EEC, ratified
in 1993, legislated for a comprehensive review of plant pro-
tection products already on the market; of the ca. 1000 active
substances on the market in 1993 in at least oneMember State,
only around 250 (26%) passed the EU harmonised safety as-
sessment, with the remainder either unsupported by industry
(67%) or rejected following review (7%) (Balderacchi and
Trevisan 2010; European Commission 2009). These pesti-
cides were mainly deregistered due to either their toxicity
profile or restricted efficacy due to the development of resis-
tance in the control target (Karabelas et al. 2009).
Post-authorisation monitoring schemes provide an impor-
tant check that regulatory procedures are robust in the protec-
tion afforded to human health. In the UK, the Pesticide
Incidents Appraisal Panel (PIAP) of the Health and Safety
Executive (HSE) reviews incidents of alleged ill health that
are attributed to pesticide exposure both at work and for mem-
bers of the public (HSE 2015). The Pesticide Incident Report
2012/13 (HSE 2015) investigated 45 pesticide incidents (64%
lower than the average for the previous 10 years), with 15
complaints involving allegations of ill health of which 20–
25% were classified as ‘confirmed’ or ‘likely’. An earlier
scheme based on general practitioners estimated the
Environ Sci Pollut Res

prevalence and incidence of pesticide-related illness between
2004 and 2008. That study identified significant limitations in
defining a pesticide-related cause of ill health because there is
generally limited information on actual chemicals used and no
routine confirmation of exposure through biological tests
(Rushton and Mann 2008). These are important caveats on
the overall conclusion from post-authorisation monitoring that
there is no evidence for widespread impacts of agricultural
pesticides on human health in the UK.
Whilst much work considers the risks to human health
from use of pesticides, there is a gap between risk assessment
as part of regulatory procedures, post-authorisation monitor-
ing, and longer-term epidemiological investigations.
Regulatory assessments are the only place where exposure is
routinely quantified, but this is done one chemical at a time
and there is no oversight of total exposure to pesticides or of
how this may be changing in time. Post-authorisation moni-
toring and epidemiological studies take a more holistic per-
spective on potential for health impacts, but have generally
failed to include quantitative estimates of exposure. Thus an
independent study of how exposure to pesticides varies in
space and time provides an important check for the regulatory
process.
This study investigates how pesticide usage and associated
exposure and risk vary in space and time to provide a holistic
evaluation of the impact of regulation. We selected off-target
exposure to residents living close to treated areas as our test
system, focusing on orchards which have relatively high us-
age of pesticides and treatments that are often directed into
crop canopies, and pregnant women who are a vulnerable
group because they may spend long periods at home and be-
cause some pesticides have potential for reproductive and/or
developmental effects. We assessed variation in pesticide us-
age, exposure and risk (i) between orchard crops, (ii) between
regions of England and Wales, (iii) across different seasons,
and (iv) between different years over a time series spanning
25 years (1987–2012).
Method
Identification of potential routes/pathways of exposure
Cornelis et al. (2009) developed a GIS-based indicator for
environmental exposure to pesticides, proposing the selection
of cut-off values for the radii of zones around the site of ap-
plication based on the decrease in airborne concentrations of
pesticides. Following this procedure, two categories of prox-
imity were identified in the current study, namely 0–200 m
(central point at 100 m) and 0–2000 m (central point at
1000 m) such that airborne pesticide concentrations decreased
by approximately 5-fold from 100 to 1000 m.
Off-target movement of pesticides can result in contami-
nated food, water, air, dust, and soil and the potential for
human exposure via inhalation, ingestion or dermal absorp-
tion through contact with contaminated surfaces (Sutton et al.
2011). Four pathways of exposure are considered in the stan-
dard EU risk assessment for residents which uses a model of
residents living 8 m downwind from the middle of the last row
in orchard crops (EFSA 2014); these pathways are (i) spray
drift resulting in direct exposure via dermal penetration and
inhalation; (ii) spray drift causing deposits on the ground and
other surfaces leading to dermal exposure; (iii) vapour dispers-
al leading to inhalation of airborne pesticides following
volatilisation from residues on soil and/or the treated crop;
and (iv) entry into treated crops causing exposure through
direct contact with surface residues. Spray drift decreases very
rapidly with distance from the treated field (Rautmann et al.
1999) and preliminary modelling showed that direct dermal
and inhalation exposure from spray drift were insignificant
contributors to total exposure for residents living 100 or
1000 m from the treated area due to the combination of rapid
fallout of spray droplets from the air with increasing distance
from the site of application (Sarigiannis et al. 2013; van de
Zande et al. 2014), and short duration of exposure. As direct
exposure to airborne spray droplets occurs only at the time of
application or soon after, residents are mainly exposed to pes-
ticides via the indirect dermal route from spray drift deposits
(e.g. working, standing or sitting in a garden near to the appli-
cation) and inhaled pesticide vapour that may occur continu-
ously throughout the day (Felsot et al. 2010; Martin et al.
2008). We assumed that there was no entry of our target pop-
ulation into the treated crop. Calculations thus considered the
potential for individuals living in the vicinity of treated or-
chards to be exposed via inhalation of pesticide vapour and
indirect dermal contact with contaminated surfaces for a peri-
od of time following the application.
Pesticide usage data
Information on the use of plant protection products in the UK
is required under EU legislation (EC Regulation 1185/09).
Pesticide usage data have been collected systematically since
1965 by the Pesticide Usage Survey carried out by Fera
Science Ltd. (formerly Central Science Laboratory, and the
Food and Environment Research Agency). Field level data
were not stored on relational databases until 1987. Prior to this
only summary data from the published reports were stored on
a relational database. The survey relies on a stratified random
sample of farms to estimate total use, allowing comparability
of data over time. For the current investigation, orchard data
had been collected on a 4-year rolling basis, i.e., 1987, 1992,
1996, 2000, 2004, 2008, and 2012. Collecting data via per-
sonal visits to the farms improves accuracy as surveyors can
scrutinise all potential pesticide uses which might have
Environ Sci Pollut Res

occurred to ensure the farmers do not omit or forget anything
important (Thomas 1999; Eurostat 2008).
In this study, we first evaluated changes in usage across all
survey years and then selected 4 years for more detailed anal-
ysis to estimate changes in exposure and risk to health. The
first orchard usage data were collected in 1983, but method-
ology was not consistent with subsequent studies. Hence,
1987 was chosen as the starting year and 1996, 2004, and
2012 were included to give approximately 8-year intervals
up to the latest survey reported at the time of analysis. The
main orchard crops grown in England and Wales are listed in
Table 1 alongside the four regions of England and Wales in-
cluded in the analysis on the basis that together they accounted
for 95.8% of total orchard cultivation in 2012 (Fig. S1). A
total of 132 individual active substances are identified within
the usage surveys as having been applied to major orchard
crops in at least one of the years considered. The application
rate, AR of an active substance for every application was one
of the major factors in the exposure modelling. We estimated
the average rate applied to each hectare of orchard from sta-
tistics for total amount applied and total area of each crop
grown in a region. We calculated the exposure from applica-
tions of individual active substances based on monthly usage
statistics. Hence, both treatments with a single substance in
successive months or a single treatment with a product con-
taining two active substances would both count as two appli-
cations in the exposure calculation.
Models for pesticide fate and exposure
Exposure calculations predicted the maximum daily exposure
(mg kg bw−1 day−1) to each active substance applied to or-
chard crops, calculating the exposure as that for the first 24 h
after pesticide application. The EFSA assessment for resi-
dents’ exposure to pesticides is currently based on the highest
time-weighted average exposure for the first 24 h after appli-
cation via inhalation from vapour and 2 h of dermal exposure
to surface deposits (EFSA 2014). The FOCUS Air group con-
sidered that the largest exposure would occur within a 24-h
period following application when taking into account the
effects of dilution and dispersion of residues due to changing
meteorological conditions (FOCUS 2008). Here, we used a
simplified additive method to calculate the exposure to, and
the cumulative reproductive and/or developmental risk asso-
ciated with, all pesticides applied to a single orchard crop type
across a chosen year. Dissipation of active substances in soil
and on plant surfaces was not included, so no attempt was
made to estimate the change in exposure during the days/
weeks after treatment.
A new model was developed to estimate exposure via in-
halation of vapour, drawing on existing algorithms used in
PEARL (Pesticide Emission Assessment at Regional and
Local scales; van den Berg and Leistra 2004), PELMO
(Pesticide Leaching Model; Ferrari et al. 2005), and ISCST2
(Industrial Source Complex Short Term 2; US EPA 1992a).
Indirect dermal contact with contaminated ground was esti-
mated from the equations provided by EFSA (2014) for sys-
temic exposures of residents via dermal routes. Where param-
eters were set to default values, these are listed in Table S1.
Volatilisation from treated surfaces (source emission)
Algorithms from the PEARL and PELMO models were ad-
justed to estimate the rate of pesticide emissions after applica-
tion from plant and soil surfaces, respectively. The PEARL
model incorporates the concept of atmospheric resistance to
pesticide volatilisation based on the thickness of laminar air
boundary layers and diffusion of vapour from the plant surface
to the turbulent air. It incorporates the effect of prevailing
meteorological conditions on the initial estimation of pesticide
volatilisation from crops in the field. PELMO estimates
volatilisation from soil water by assuming negligibly low con-
centration of pesticide in the air above the soil (not including
soil-air partitioning) (Wolters et al. 2003). Other competing
processes for dissipation of pesticides in different environ-
mental compartments were not included in our calculations
so that leaching, transformation and wash-off from plant sur-
faces were all excluded, creating a more protective risk
assessment.
The saturated vapour concentration of pesticide in the gas
phase at the plant surface, Cg;ps(g m−3), depends on its
substance-specific vapour pressure at the prevailing tempera-
ture.Cg;psis calculated using the Gas Law as described by van
den Berg and Leistra (2004):
Cg;ps¼ M ∙VP Tð Þ
R∙Tð1Þ
whereM is the molecular mass (g mol−1), VP(T) is the vapour
pressure of the pesticide (Pa) as a function of temperature
based on PPDB (2017), R is the universal gas constant (Pa
m3 K−1 mol−1), and T is the air temperature (K). The potential
rate of volatilisation of pesticide from the leaf surface, Jplant (g
m−2 day−1) is calculated as:
J v;pot ¼ Cg;ps−Cair
rð2Þ
where Cair is the concentration in the turbulent air just outside
the laminar air layer (gm−3), and r is the resistance to transport
from plant surface to atmosphere (d m−1) calculated as the
ratio of thickness of the boundary air layer, d (m) to the ad-
justed air diffusion coefficient, Da (m2 day−1). It has been
proposed that d ranges between 0.05 and 0.1 cm depending
on the micrometeorological conditions (e.g. air velocity and
turbulence) and surface properties (e.g. temperature and
roughness) (Leistra and Wolters 2004; FOCUS 2008;
Environ Sci Pollut Res

Lichiheb et al. 2014; Houbraken et al. 2016). We used default
values of 0.06 and 0.1 cm for the thickness of the boundary air
layers on plant leaves and soil surfaces, respectively (van den
Berg et al. 2016); sensitivity of rate of pesticide volatilisation
to the value of d (Fig. S2) illustrates the inversely proportional
relationship (a doubling in d halves the emission rate).
However, all the areic quantities such as fluxes are expressed
per m2 field surface (not plant surface). Consequently, the
actual rate of pesticide volatilisation from plant surfaces,
Jplant (g m−2 day−1; maximum daily emission is the mass of
pesticide per unit area of plant immediately after application)
is estimated by taking into account the mass of pesticide on the
plants:
Jplant ¼ f mas∙J v;pot ð3Þ
where fmas (dimensionless) is the factor to adjust amount of
pesticide present on the plants as described by:
f mas ¼Ap
Ap;ref
ð4Þ
where Ap refers to the areic mass of pesticide on the plants (g
m−2) obtained by multiplying application rate, AR (g m−2)
with the crop interception factor, and Ap , ref is the reference
areic mass of pesticide on the plants. This assumes that thinner
deposits on the leaves will be depleted sooner and the
volatilising surface decreases along with the mass of pesticide
in the deposit.
Algorithms from PELMO were used in the estimation of
pesticide emission rates from exposed soil surfaces on a daily
basis (Wolters et al. 2003; Ferrari et al. 2005):
J soil ¼ H0csol
rð5Þ
where Jsoil is the volatilisation rate from soil (g m−2 day−1;
maximum daily emission is the mass of pesticide per unit area
of soil immediately after application), Da is the diffusion coef-
ficient in air (m2 day−1), H'is the non-dimensional Henry’s law
constant, d is the air boundary layer (m), csol is pesticide con-
centration in the soil pore water (g cm−3), and r is the resistance
to transport from the soil surface to the atmosphere as calculat-
ed in Eq. 2 (d m−1). Adjustments were required for three
temperature-dependent parameters, namely Da, H' and VP,
whilst csol depends on application rate and the substance-
specific organic carbon partition coefficient,Koc (mL g−1), with
the use of default values for fraction of organic carbon, foc, soil
water content (g g-1), and dry soil bulk density (g cm−3).
According to Leistra et al. (2001), Da was adjusted with:
Da ¼ Da;ref
T
T ref
� �1:75
ð6Þ
whereDa , ref is the diffusion coefficient in air at 20 °C, and Trefis the reference temperature at 20 °C. H' was adjusted with a
Q10 factor that was derived as the median value of a range of
factors (1.15–2.28) that have been reported for different active
substances (Staudinger and Roberts 2001; Feigenbrugel et al.
2004; Cetin et al. 2006). Q10 is defined as the ratio of degra-
dation rates between the rates at 20° and 10 °C (EFSA 2007).
According to Sarigiannis et al. (2013),
VP ¼ VPref ⋅exp −ΔH vap
R
1
T−
1
T ref
� �� �
ð7Þ
Table 1 Area of major orchard crops in four regions that accounted for 95.8% of total orchard cultivation in England and Wales in 2012 (Garthwaite
et al. 2012)
Crop type Crop area grown (ha)
Eastern West Midlands South-Eastern South-Western Total for England
and Wales
Cherries 27 187 464 1 697
Cider apples/perry pears 83 5244 41 2731 8619
Culinary apples (Bramley) 585 47 1438 10 2140
Culinary apples (others) 129 – 1 8 146
Dessert apples (Cox) 277 288 1317 33 1960
Dessert apples (others) 419 414 3367 86 4447
Other top fruit (incl. nuts) 45 – 131 36 213
Pears 340 88 1295 24 1757
Plums 160 170 426 150 973
Total grown area 2065 6438 8480 3079 20,952
% of total area 9.9 30.7 40.5 14.7 100.0
Environ Sci Pollut Res

where VPref is the saturated vapour pressure of the substance
at reference conditions (mPa),ΔHvap is the molar enthalpy of
evaporation (J mol−1), R is the universal gas constant (J
K−1 mol−1), T is the air temperature (K), and Tref is the refer-
ence air temperature (K).
Two parameters were shared between calculations for
volatilisation from the two surfaces, namely the crop in-
terception factor (CI) and monthly air temperature. For CI,
emission rates of the pesticide from treated surfaces (plant
and soil) were both estimated based on pesticide deposi-
tion at different growth stages (Leistra et al. 2001). CI
values for apple trees were obtained from FOCUS
(2000) and applied in calculations for all other orchard
crops (Table S2). The proportion of sprayed pesticide
reaching the soil surface was calculated by difference.
Mean monthly air temperatures for the past 35 years
(1980–2015) were obtained from the Meteorological
Office as regional climatic records and the 35 values for
each month were averaged to derive monthly air tempera-
ture values to input into the calculations (Table S3).
The area source emission rate (Qact, g m−2 s−1) from all
treated surfaces was calculated for each application of an ac-
tive substance:
Qact ¼Jplant þ J soilð Þ
86; 400ð8Þ
where 86,400 converts the units of time from days to seconds.
Dispersion of volatilised pesticides downwind
A Gaussian diffusion model was used to estimate airborne
concentrations of pesticide at different distances downwind
of the emission source. ISCST2 was chosen because it is
adaptable to various types of source emissions (i.e. point
sources, volume sources, and area sources). The area source
model of ISCST2 has frequently been used to assess the ef-
fects of pollutants on local air quality using emission rates and
meteorological conditions as model inputs (Abdul-Wahab
2004). It is adjustable for various parameters including height
of crops (m), treated area (ha), wind speed (m s−1), and mixing
height (m).
By assuming that no crosswind (y=0) occurs at the
area source and that atmospheric conditions are neutral,
the total emission rate from both soil and plant surfaces
was translated into airborne pesticide concentration at
downwind distance, X (m) (measured from the down-
wind edge of the source area) by:
X ¼ Qact ⋅V⋅E⋅Xo
4⋅ffiffiffi
2p
⋅U s⋅σz
ð9Þ
whereQact is the area source emission rate (g m−2 s−1), V is the
vertical term (−), E is the error function term (−), Xo is the
length of the side of the square area source (m),Us is the wind
speed (m s−1), and σz is the vertical standard deviation (−).The parameter, V was required to change the form of the
vertical concentration distribution from Gaussian to rectangu-
lar (uniform concentration within the surface mixing layer) at
downwind distances as follows:
V ¼ exp −0:5zr−heσz
� �2" #
þ exp −0:5zr þ he
σz
� �2" #
þ ∑∞
i¼1
exp −0:5zr– 2izi–heð Þ
σz
� �2" #
þ exp −0:5zr þ 2izi–heð Þ
σz
� �2" #
þ exp −0:5zr– 2izi þ heð Þ
σz
� �2" #
þ exp −0:5zr þ 2izi þ heð Þ
σz
� �2" #
8
>
>
>
>
>
>
>
>
>
>
>
>
>
>
>
>
>
<
>
>
>
>
>
>
>
>
>
>
>
>
>
>
>
>
>
:
9
>
>
>
>
>
>
>
>
>
>
>
>
>
>
>
>
>
=
>
>
>
>
>
>
>
>
>
>
>
>
>
>
>
>
>
;
ð10Þ
where he is the crop height (m), zr is adult height above ground
(m), and zi is the mixing height (m) adjusted based on crop
height (Randerson 1984) with:
zi ¼0:3 u*
fð11Þ
where f is the Coriolis parameter (s−1 at 40° latitude) and u∗ is
friction velocity (m s−1) calculated for the reference wind
speed, u(z) at 2.0 m above the ground using the logarithmic
wind profile relationship:
u zð Þ ¼ u*
kIn
z
z0
� �
ð12Þ
where k is the von Karman’s constant (dimensionless) and z0is the roughness parameter (m) approximated as 10% of the
height of the crop surface.
The error function term, E is described by:
E ¼ erfr0o þ yffiffiffi
2p
σy
!
þ erfr0o−yffiffiffi
2p
σy
!
ð13Þ
where ro' is the effective radius of area source X o
√π(m), and σy is
the lateral vertical standard deviation.
The dispersion parameters were calculated according to a
power-law fit to wind tunnel data (US EPA 1992b):
σy ¼ 0:73547 X0:64931 ð14Þ
Environ Sci Pollut Res
σz ¼ 0:28565 X0:71285 ð15Þ
Calculation of inhalation exposure
Concentrations in air derived from the air dispersion model-
ling were converted into individual exposures according to
EFSA (2014):
SERI ¼VC⋅IR⋅ABW
ð16Þ
where SERI is defined as the systemic exposure of residents
via the inhalation route (mg kg bw−1 day−1), VC is the esti-
mated pesticide vapour concentration (mg m−3) at the selected
proximity, IR is inhalation rate (m3 day−1), IA is inhalation
absorption (−), and BW is body weight (kg).
Inhalation rate was set to 13.8 m3 day−1 based on default
values for an adult female of 0.23 m3 day−1 kg−1 daily inha-
lation rate of residents to vapours and 60 kg body weight for
adults (US EPA 2009; EFSA 2010). A literature search was
undertaken for information on absorption factors via the lungs
following inhalation of pesticides; there is no consistent infor-
mation on this process, so a default value of 100% absorption
via inhalation was used (Butler Ellis et al. 2013; EFSA 2014;
GroBkopf et al. 2013). Body weight for an adult female was
set to 60 kg as recommended by EFSA (2014).
Calculation of indirect dermal exposure
Systemic exposure via the dermal route, SERD (mg kg bw−1
day−1) was calculated according to EFSA (2014):
SERD ¼ AR⋅D⋅TTR⋅TC⋅H ⋅DABW
ð17Þ
where AR is the application rate (mg cm−2), TTR is the turf
transferable residue (−), TC is the transfer coefficient
(cm2 h−1),H is the exposure duration (hour),DA is the dermal
absorption (−), and BW is the body weight (kg). D is the drift
fraction which is calculated in accordance with crop growth
stages:
For early growth stages;D ¼ 3908:3* X−2:421� �
100
!
ð18Þ
For late growth stages;D ¼ 298:83* X−1:8672� �
100
!
ð19Þ
For downward herbicide applications;D
¼ 2:7705* X−0:9787� �
ð20Þ
where X is the selected downwind distance (m) (Rautmann
et al. 1999).
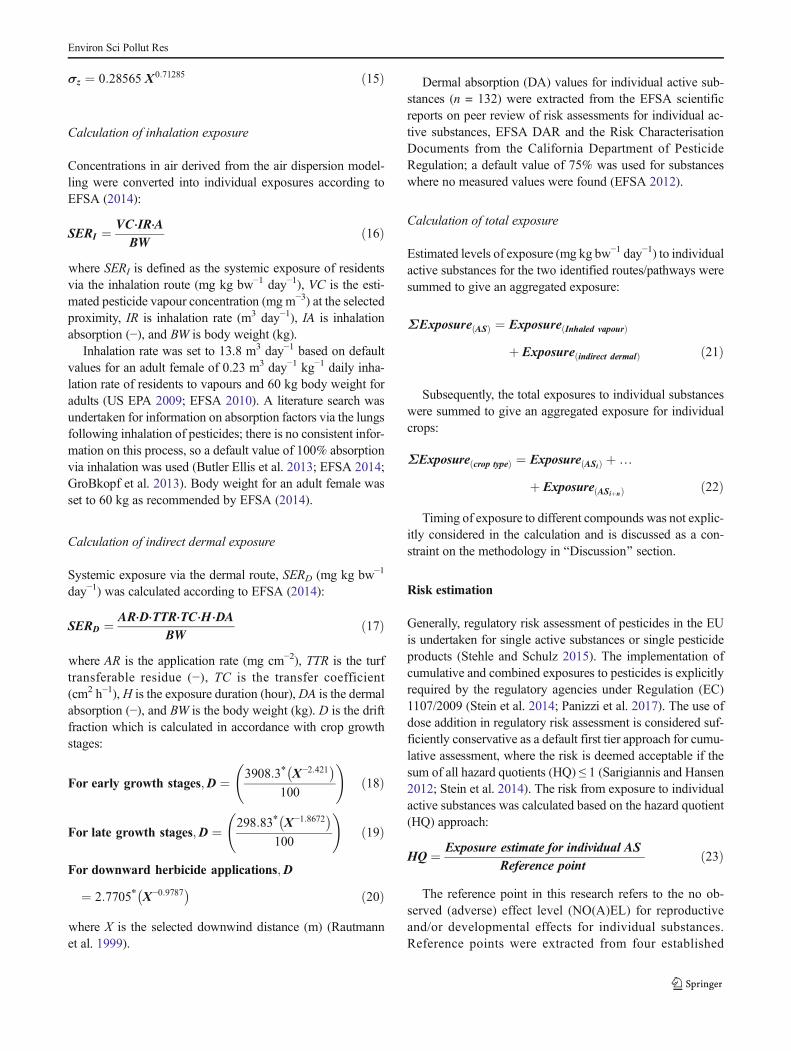
Dermal absorption (DA) values for individual active sub-
stances (n = 132) were extracted from the EFSA scientific
reports on peer review of risk assessments for individual ac-
tive substances, EFSA DAR and the Risk Characterisation
Documents from the California Department of Pesticide
Regulation; a default value of 75% was used for substances
where no measured values were found (EFSA 2012).
Calculation of total exposure
Estimated levels of exposure (mg kg bw−1 day−1) to individual
active substances for the two identified routes/pathways were
summed to give an aggregated exposure:
ΣExposure ASð Þ ¼ Exposure Inhaled vapourð Þ
þ Exposure indirect dermalð Þ ð21Þ
Subsequently, the total exposures to individual substances
were summed to give an aggregated exposure for individual
crops:
ΣExposure crop typeð Þ ¼ Exposure ASið Þ þ…
þ Exposure ASiþnð Þ ð22Þ
Timing of exposure to different compounds was not explic-
itly considered in the calculation and is discussed as a con-
straint on the methodology in BDiscussion^ section.
Risk estimation
Generally, regulatory risk assessment of pesticides in the EU
is undertaken for single active substances or single pesticide
products (Stehle and Schulz 2015). The implementation of
cumulative and combined exposures to pesticides is explicitly
required by the regulatory agencies under Regulation (EC)
1107/2009 (Stein et al. 2014; Panizzi et al. 2017). The use of
dose addition in regulatory risk assessment is considered suf-
ficiently conservative as a default first tier approach for cumu-
lative assessment, where the risk is deemed acceptable if the
sum of all hazard quotients (HQ) ≤ 1 (Sarigiannis and Hansen
2012; Stein et al. 2014). The risk from exposure to individual
active substances was calculated based on the hazard quotient
(HQ) approach:
HQ ¼ Exposure estimate for individual AS
Reference pointð23Þ
The reference point in this research refers to the no ob-
served (adverse) effect level (NO(A)EL) for reproductive
and/or developmental effects for individual substances.
Reference points were extracted from four established
Environ Sci Pollut Res

toxicological databases, namely the EFSA Draft Risk
Assessment Report (DAR) and Assessment Report (AR)
(http://dar.efsa.europa.eu/dar-web/provision), the Joint
Meeting on Pesticide Residues (JMPR) of the International
Programme on Chemical Safety (IPCS INCHEM, http://
www.inchem.org/pages/jmpr.html), the Integrated Risk
Information System (IRIS, https://www.epa.gov/iris), and the
Hazardous Substances Data Bank (HSDB) in the Toxicology
Data Network (TOXNET, https://toxnet.nlm.nih.gov/
newtoxnet/hsdb.htm).
One of the major issues in selecting the most relevant
threshold for an individual active substance was the unclear
boundary between reproductive and developmental effects for
different periods of exposure (i.e. before pregnancy and dur-
ing different trimesters). For instance, the EFSA DAR defines
reproductive toxicities based on endpoints such as reduced
offspring body weight or liver weight in two- and/or three-
generation studies whilst developmental toxicities are
assessed based on endpoints such as skeletal malformation,
teratogenicity, and foetotoxicity. Meanwhile, the JMPR inter-
prets the reproductive parameters as number of implants, re-
sorptions, and dead foetuses, and developmental parameters
refers to post-implantation variation in foetuses, and decreased
viability indices. Generally, reproductive toxicity refers to any
toxicological effects that may occur at different phases within
the reproductive cycle whilst developmental toxicity refers to
any effects in prenatal developmental studies and in one- or
multi-generation studies (Wolterink et al. 2013). Since the test
parameters were not uniquely classified, the lowest
NO(A)ELs for reproductive and/or developmental effects
were selected for use. As for the different thresholds in four
different toxicological databases due to different study de-
signs, the lowest NO(A)ELs for either reproductive or devel-
opmental toxicity were selected for use. This approach avoids
any exclusion of potential higher toxicity for an individual
active substance. It was found that 8 out of the 132 active
substances applied to orchards in our dataset have no pub-
lished toxicological thresholds for reproductive and/or devel-
opmental effects due to their chemical structure and here no
NO(A)ELs was allocated (Table S4). For four active sub-
stances with significant use in at least one of the study years,
the NO(A)EL were allocated based on either a major constit-
uent in the compound (benzo-a-pyrene for tar oil), or similar-
ity of chemical structures (dichlorprop-P/dichlorprop and
mecoprop-P/mecoprop). Heptenophos has no data but is ex-
pected to be hazardous, so the NOAEL for chlorpyrifos was
used, whilst the NOAEL for metiram was estimated by divid-
ing the published LOAEL by two.
Studies on inhalation toxicity are lacking for most pesti-
cides. Approximately 80% of inhalation risk assessments are
based on route-extrapolated oral studies, whilst 20% of inha-
lation NOAEL data are route-extrapolated to dose (in mg kg
bw−1 day−1) from measured air concentrations (Salem and
Katz 2006). In the absence of data, the inhalation NOAEL is
typically extrapolated from an oral study by assuming inhala-
tion absorption is 100% of oral absorption due to the likeli-
hood of higher absorbed dose via the inhalation route (Kegley
and Conlisk 2010).
Results
Pesticide usage
Figure 1 shows changes in total amount of pesticides applied
to orchards in the four regions over a 25-year period with 4-
year intervals. Data are shown with (Fig. 1a) and without (Fig.
1b) applications of tar oils as some of the associated rates of
application were large and could mask changes in the other
active substances used. Across the full period, the total
amount of pesticide applied in any 1 year ranged between
2.0 and 21.0 kg ha−1. Generally, there was greater usage of
pesticide for orchards in the Eastern and South-Eastern re-
gions compared to the West Midlands and South-Western re-
gions. The total amount of pesticide applied was always
greatest in 1987 and had decreased by 1992 and 1996 in all
four regions. In contrast, no consistent changes were found for
the later survey years (1996–2012) with some increases in
total amounts applied in specific years between 2000 and
2012. The results revealed that the South-Western region
had a large decrease in total applied amounts from 1987 to
1992, followed by a constant decline from 1992 to 2004 and
inconsistent changes between 2004 and 2012. In contrast, total
pesticide used in the South-Eastern region was approximately
equal in 1987 and 2012 independent of whether or not tar oils
were included.
The results were further analysed for four chosen years
with approximately 8-year intervals from 1987 up to 2012 to
investigate trends in pesticide usage for individual crop types.
Tar oils were excluded from this analysis as they significantly
skewed the total application amounts for plums and cherries in
1987 and to a lesser extent in 1996 and 2004. For instance, the
highest application rate for plums in the South-Western region
in 1987 (60.2 kg a.s. ha−1) and cherries in the West Midlands
region in 1987 (35.6 kg a.s. ha−1) comprised 98.6 and 99.8%
tar oils, respectively (Fig. S3).
Total amount of pesticides applied to individual crop types
was generally less than 30.0 kg a.s. ha−1 when tar oils were
excluded (Fig. 2). Some consistently low application amounts
were identified for crops such as cherries, other top fruit and
plums in all four regions (Fig. 3b; Fig. S4b) although sample
size was small due to the small area of each crop grown. The
Eastern region showed declining trends of total application
amounts for culinary apples (Bramley and others) and dessert
apples (Cox) from 1987 to 2012. Meanwhile, the West
Midlands and South-Western regions with relatively smaller
Environ Sci Pollut Res

pesticide usage showed no significant trends. Most crop types
in the South-Eastern region had higher total application
amounts in 2012 as compared to 2004. When tar oils were
removed from the dataset, the greatest total amount of pesti-
cide applied was for culinary apples (others) in the South-
Eastern region in 2012 that comprised 71.5% captan, 8.3%
chlorpyrifos, 6.0% dithianon, and 14.2% other substances.
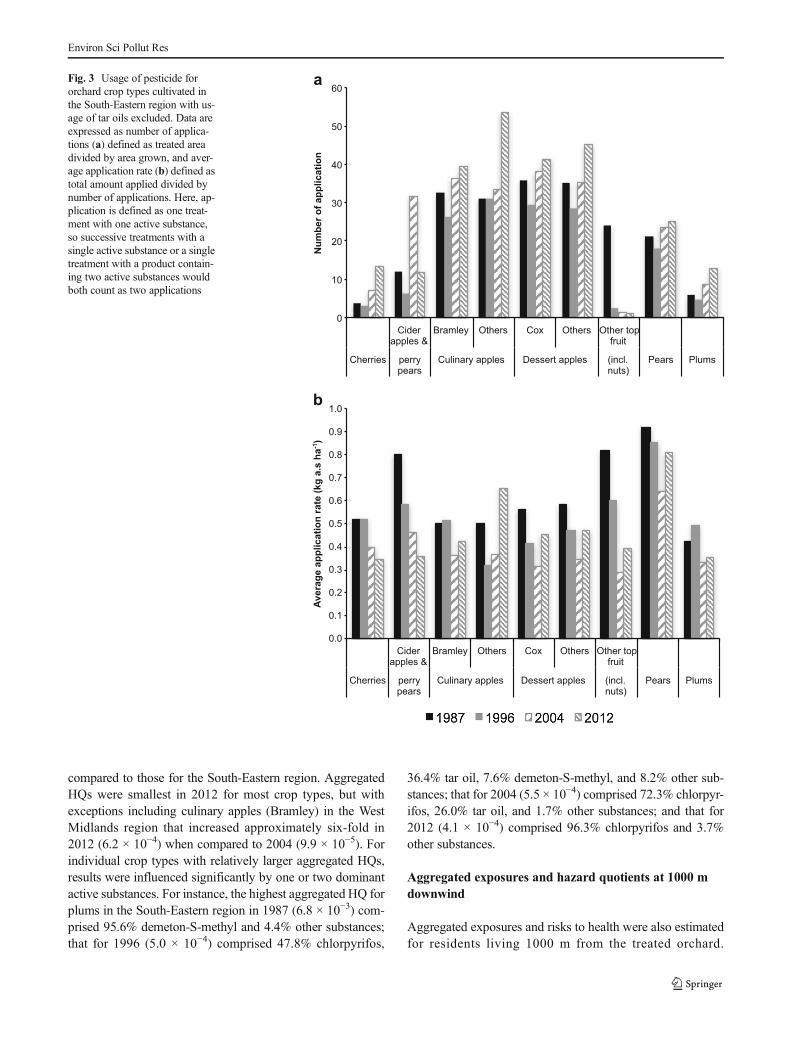
Figure 3 presents the usage data as total number of appli-
cations of an active substance and as average rate of applica-
tion across all treatments. There has generally been an increase
in the number of applications of an active substance (Fig. 3a),
but this has been accompanied by a general decrease in the
average rate of application (Fig. 3b). The average application
rate (Fig. 3b) better explains the trends in pesticide usage with
similar patterns to those shown in Fig. 1, i.e. the highest aver-
age application rates and total applied amounts were in 1987
for all chosen regions (Fig. S4).
Aggregated exposures for residents living 100 m
downwind
Aggregated exposure to pesticides via inhaled pesticide va-
pour and contact with contaminated ground were estimated
for residents living 100 m downwind of individual crop types.
a
b
0
5
10
15
20
25
Eastern West Midlands South-Eastern South-Western
To
tal am
ou
nt
ap
plied
(kg
a.s
. h
a-1
)
0
5
10
15
20
25
Eastern West Midlands South-Eastern South-Western
To
tal am
ou
nt
ap
plied
(kg
a.s
. h
a-1
)
Fig. 1 Changes between 1987
and 2012 in total amount of
pesticide applied to orchards
cultivated in four regions of
England and Wales. Data are
shown either with tar oils
included (a) or excluded (b)
Environ Sci Pollut Res

Tar oils were included in all estimations of exposure and risk.
Aggregated exposures to individual crop types were generally
smaller than 2.0 × 10⁻³ mg kg bw−1 day−1 with most of the
largest estimates in 1987 and values decreasing over the sur-
vey years (Fig. 4). The Eastern and South-Western regions
showed decreasing trends for most of the crop types whilst
the West Midlands region showed less consistency in aggre-
gated exposures. In comparison, the South-Eastern region in-
dicated relatively high and constant exposures with small
changes over the years. Overall, the exposures were smallest
in 2012 with a couple of exceptions including culinary apples
(Bramley) in the West Midlands region that increased approx-
imately sevenfold from 2004 (1.4 × 10⁻⁴ mg kg bw−1 day−1)
to 2012 (9.6 × 10⁻⁴ mg kg bw−1 day−1). In some cases, aggre-
gated exposures greater than 2.0 × 10⁻³ mg kg bw−1 day−1
were strongly affected by tar oils, i.e. plums in the South-
Western region in 1987 (6.1 × 10⁻³ mg kg bw−1 day−1) and
cherries in the West Midlands region in 1987 (3.6 × 10⁻³ mg
kg bw−1 day−1) where total exposure was approximately
99.5% attributable to tar oils.
Aggregated hazard quotients for residents living 100 m
downwind
Exposure estimates were converted into HQs using reproduc-
tive and/or developmental toxicities of the applied pesticides.
Figure 5 shows that all aggregated HQs were at least two to
three orders of magnitude smaller than 1, despite the inherent
simplifications of assuming co-occurrence of exposure to all
pesticides and additivity of effects. 1987 had the highest ag-
gregated HQs and these decreased greatly by 1996, followed
by smaller changes between 1996 and 2012. Generally, the
Eastern, West Midlands, and South-Western regions had rela-
tively lower aggregated HQs for most of the crop types
a
b
0
5
10
15
20
25
30
35
Cider apples &
Bramley Others Cox Others Other top fruit
Cherries perry pears
Culinary apples Dessert apples (incl.nuts)
Pears Plums
0
5
10
15
20
25
30
35
Cider apples &
Bramley Others Cox Others Other top fruit
Cherries perrypears
Culinary apples Dessert apples (incl. nuts)
Pears Plums
c
d
0
5
10
15
20
25
30
35
Ciderapples &
Bramley Others Cox Others Other top fruit
Cherries perry pears
Culinary apples Dessert apples (incl. nuts)
Pears Plums
0
5
10
15
20
25
30
35
Cider apples &
Bramley Others Cox Others Other top fruit
Cherries perry pears
Culinary apples Dessert apples (incl. nuts)
Pears Plums
To
tal a
mo
un
t a
pp
lie
d (
kg
a.s
. h
a-1)
To
tal a
mo
un
t a
pp
lie
d (
kg
a.s
. h
a-1)
To
tal a
mo
un
t a
pp
lie
d (
kg
a.s
. h
a-1)
To
tal a
mo
un
t a
pp
lie
d (
kg
a.s
. h
a-1)
Fig. 2 Total amount of pesticide applied to major orchard crop types
between 1987 and 2012 for Eastern (a), West Midlands (b), South-
Eastern (c), and South-Western (d) regions. Blanks indicate that none of
that orchard type was sampled in that region and tar oils are excluded
from the data as large application rates obscure other trends
Environ Sci Pollut Res
compared to those for the South-Eastern region. Aggregated
HQs were smallest in 2012 for most crop types, but with
exceptions including culinary apples (Bramley) in the West
Midlands region that increased approximately six-fold in
2012 (6.2 × 10⁻⁴) when compared to 2004 (9.9 × 10⁻⁵). For
individual crop types with relatively larger aggregated HQs,
results were influenced significantly by one or two dominant
active substances. For instance, the highest aggregated HQ for
plums in the South-Eastern region in 1987 (6.8 × 10⁻³) com-
prised 95.6% demeton-S-methyl and 4.4% other substances;
that for 1996 (5.0 × 10⁻⁴) comprised 47.8% chlorpyrifos,
36.4% tar oil, 7.6% demeton-S-methyl, and 8.2% other sub-
stances; that for 2004 (5.5 × 10⁻⁴) comprised 72.3% chlorpyr-
ifos, 26.0% tar oil, and 1.7% other substances; and that for
2012 (4.1 × 10⁻⁴) comprised 96.3% chlorpyrifos and 3.7%
other substances.
Aggregated exposures and hazard quotients at 1000 m
downwind
Aggregated exposures and risks to health were also estimated
for residents living 1000 m from the treated orchard.
Ciderapples &
Bramley Others Cox Others Other topfruit
Cherries perrypears
Culinary apples Dessert apples (incl.nuts)
Pears Plums
0
10
20
30
40
50
60a
Nu
mb
er
of
ap
pli
ca
tio
n
b
0.0
0.1
0.2
0.3
0.4
0.5
0.6
0.7
0.8
0.9
1.0
Ciderapples &
Bramley Others Cox Others Other topfruit
Cherries perrypears
Culinary apples Dessert apples (incl.nuts)
Pears Plums
Av
era
ge
ap
pli
ca
tio
n r
ate
(k
g a
.s h
a-1)
Fig. 3 Usage of pesticide for
orchard crop types cultivated in
the South-Eastern region with us-
age of tar oils excluded. Data are
expressed as number of applica-
tions (a) defined as treated area
divided by area grown, and aver-
age application rate (b) defined as
total amount applied divided by
number of applications. Here, ap-
plication is defined as one treat-
ment with one active substance,
so successive treatments with a
single active substance or a single
treatment with a product contain-
ing two active substances would
both count as two applications
Environ Sci Pollut Res

Aggregated exposures to most of the crop types were smaller
than 3.0 × 10⁻⁴ mg kg bw−1 day−1 (Fig. S5) with exposure in
1987 and 1996 again estimated to be generally larger than that
in 2004 and 2012. The estimations indicated decreasing trends
in exposure for most crop types, particularly between 1996
and 2012. The aggregated exposures at 1000 m were convert-
ed into corresponding aggregated HQs and the results showed
the same trends as at 100 m but with much smaller absolute
values (Fig. S6). Overall, the aggregated exposures and HQs
at 1000 m for different crop types were approximately 5 to 16
times smaller than the equivalent values at 100 m.
Discussion
We applied consistent methodologies to compare year-on-year
changes in pesticide usage, potential for residential exposure
to pesticides, potential risk for reproductive or developmental
effects on human health, as well as the major drivers of any
changes over the past 30 years in England and Wales. It is
important to note that aggregated exposures and risks summed
daily values into a single measure even though exposure to
different active substances will be widely dispersed in time;
thus the data should not be taken as true estimates of daily
exposure for direct comparison with daily dose thresholds for
toxicity.
Based on four representative regions, average of total pes-
ticide usage across the surveyed years showed a significant
decrease from 1987 (66.2 kg a.s. ha−1) to 1996 (49.8 kg a.s.
ha−1), followed by smaller changes through to 2012 (41.7 kg
a.s. ha−1) (Fig. S7). This finding is supported by a time series
analysis of orchard fruit production in Great Britain with a
decrease of approximately 22% in the mean usage from
1992 (42,000 kg) to 2008 (33,000 kg) (Cross 2012). Our re-
sults show an average 13% increase in total usage in 2012
(41.7 kg a.s. ha−1) compared to 2008 due to widespread ap-
plication of fungicides (Fig. S7; Fig. S8) to control scab and
powdery mildew in the wet weather conditions (Garthwaite
c
d
0.0E+00
1.0E-03
2.0E-03
3.0E-03
4.0E-03
5.0E-03
6.0E-03
7.0E-03
Cider apples &
Bramley Others Cox Others Other top fruit
Cherries perry pears
Culinary apples Dessert apples (incl. nuts)
Pears Plums
0.0E+00
1.0E-03
2.0E-03
3.0E-03
4.0E-03
5.0E-03
6.0E-03
7.0E-03
Cider apples &
Bramley Others Cox Others Other top fruit
Cherries perry pears
Culinary apples Dessert apples (incl. nuts)
Pears Plums
a
b
0.0E+00
1.0E-03
2.0E-03
3.0E-03
4.0E-03
5.0E-03
6.0E-03
7.0E-03
Cider apples &
Bramley Others Cox Others Other top fruit
Cherries perry pears
Culinary apples Dessert apples (incl. nuts)
Pears Plums
0.0E+00
1.0E-03
2.0E-03
3.0E-03
4.0E-03
5.0E-03
6.0E-03
7.0E-03
Ciderapples &
Bramley Others Cox Others Other top fruit
Cherries perry pears
Culinary apples Dessert apples (incl. nuts)
Pears Plums
Ag
gre
gate
d e
xp
osu
re (
mg
kg
bw
-1d
-1)
Ag
gre
gate
d e
xp
osu
re (
mg
kg
bw
-1d
-1)
Ag
gre
gate
d e
xp
osu
re (
mg
kg
bw
-1d
-1)
Ag
gre
gate
d e
xp
osu
re (
mg
kg
bw
-1d
-1)
Fig. 4 Aggregated exposures to applied pesticide for residents living 100 m downwind of individual crop types. Data are shown for 4 years between
1987 and 2012 and for Eastern (a), West Midlands (b), South-Eastern (c), and South-Western (d) regions
Environ Sci Pollut Res

et al. 2012). Our results are expressed as amount of pesticide
applied to 1 ha of crop, so are adjusted for any changes in the
area of cultivated orchards over time (Thomas 2003). There
was a small but relatively consistent increase in the number of
applications of individual active substances to crops; this was
offset by a small, but relatively consistent decrease in average
application rates over the surveyed years (Fig. 3; Fig. S4).
This could reflect an increased uptake of reduced-rate appli-
cations at less than the maximum recommended label rate and
the introduction of newmolecules that are active at lower dose
rates (Thomas 2003).
We simplified the estimation of exposure by only consid-
ering that part of the dose received within 24 h of the pesticide
treatment. This should give a maximum dose when expressed
on a daily basis. We further simplified within our aggregation
procedure, by summing the daily doses and hazard quotients
calculated for each individual treatment, independent of when
those treatments occurred. Analysis shows that usage and thus
exposure were significantly larger between April and July
than for the remainder of the year (Fig. S9). The relative sen-
sitivity for reproductive and/or developmental outcomes of
exposure pre-conception or during a specific trimester is un-
known (Gonzalez-Alzaga et al. 2015). This is because the
critical embryologic period is short and limited to the early
stage of gestation before the diagnosis of pregnancy (Castilla
et al. 2001). The peak in exposure each year suggests that
temporal differentiation in health outcomes would be expect-
ed if such outcomes were associated with pesticide use (Li
et al. 2014). The CHAMACOS study of associations (95%
CI) of proximity to methyl bromide use within a 5-km radius
during pregnancy (n = 442) showed that the second trimester
was a critical period for gestational growth and that exposure
was associated with a decrease in means of birth weight
(21.4 g), length (0.16 cm) and head circumferences
(0.08 cm) (Gemmill et al. 2013). Despite the simplifications
in producing aggregated estimates of risk, all values for the
a
0.0E+00
1.0E-03
2.0E-03
3.0E-03
4.0E-03
5.0E-03
6.0E-03
7.0E-03
Cider apples &
Bramley Others Cox Others Other top fruit
Cherries perry pears
Culinary apples Dessert apples (incl. nuts)
Pears Plums
c
0.0E+00
1.0E-03
2.0E-03
3.0E-03
4.0E-03
5.0E-03
6.0E-03
7.0E-03
Cider apples &
Bramley Others Cox Others Other top fruit
Cherries perrypears
Culinary apples Dessert apples (incl. nuts)
Pears Plums
d
0.0E+00
1.0E-03
2.0E-03
3.0E-03
4.0E-03
5.0E-03
6.0E-03
7.0E-03
Ciderapples &
Bramley Others Cox Others Other top fruit
Cherries perry pears
Culinary apples Dessert apples (incl. nuts)
Pears Plums
Ag
gre
ga
ted
ha
za
rd q
uo
tie
nt
(HQ
)A
gg
reg
ate
d h
azard
qu
oti
en
t (H
Q)
Ag
gre
gate
d h
azard
qu
oti
en
t (H
Q)
b
0.0E+00
1.0E-03
2.0E-03
3.0E-03
4.0E-03
5.0E-03
6.0E-03
7.0E-03
Cider apples &
Bramley Others Cox Others Other top fruit
Cherries perry pears
Culinary apples Dessert apples (incl. nuts)
Pears Plums
Ag
gre
ga
ted
ha
za
rd q
uo
tie
nt
(HQ
)
Fig. 5 Aggregated hazard quotients of reproductive and/or developmen-
tal toxicities to applied pesticide of resident pregnant women living 100m
downwind of individual crop types. Data are shown for four years
between 1987 and 2012 and for Eastern (a), West Midlands (b), South-
Eastern (c), and South-Western (d) regions
Environ Sci Pollut Res

aggregated hazard quotient were two to three orders of mag-
nitude or more smaller than one. Overall, this suggests a low
level of risk to human health for this situation because co-
occurrence of exposure to all pesticides applied to a single
crop and additivity of effects from all individual active sub-
stances were implicit assumptions that will not hold true.
Figures 4 and 5 indicate that although there was no consis-
tent change in total pesticide applied to orchard crops over
time, there were small decreases in exposure and larger de-
creases in risk over time for most of the crop and region
combinations. To investigate this further, data were normal-
ised to express exposure per unit pesticide applied and risk per
unit of exposure (Fig. 6). Overall, there was a small increase in
estimated exposure per unit application between 1987 and
1996, but a steady decrease thereafter in all four regions
(Fig. 6a). In contrast, there was a relatively large decrease in
risk per unit exposure between 1987 and 1996 for three of the
four regions, with only small changes thereafter (Fig. 6b). The
decrease in risk per unit exposure between 1987 and 1996 can
be attributed to the review and withdrawal from the market of
compounds with relatively high toxicity for reproductive/
developmental effects, including DDT, methidathion,
azinphos-methyl, and cyhexatin. This initial impact of
deregistrations around the time of introduction of Directive
91/414 is not apparent in the calculations for exposure per unit
application (Fig. 6a). However, it is interesting to note that this
metric does decrease during the period 1996 to 2012, primar-
ily due to the cessation of use of active substances with rela-
tively higher volatility such as demeton-S-methyl, gamma-
HCH, and fenitrothion. Over the full period considered, there
has been a clear shift in the properties of pesticides applied to
orchards away from compounds with large vapour pressures
and small NO(A)ELs (high toxicity) (Fig. S10). FOCUS
(2008 ) p roposed a vapou r p r e s su r e t r i gge r o f
> 1.0 × 10⁻⁵ Pa to indicate those substances with potential
for significant volatilisation from treated plant surfaces. 61%
of the 76 compounds applied to orchards in 1987 had relative-
ly large vapour pressure (> 1.0 × 10⁻⁵ Pa) and relatively high
reproductive/developmental toxicity (NO(A)EL < 10 mg kg
bw−1 day−1); by 2012, this group of substances had reduced to
44% of the 54 compounds applied (Fig. S10). The decreasing
trend in total emission rate from treated surfaces and in the
resulting concentration in air also indicates the improving fate
profile of pesticides applied over the 25-year period (Fig.
S11). The sum of airborne concentrations for all pesticides at
100 m decreased by a factor of 3.5 from 1987 (4.6 x 10⁻³ mg
m−3) to 2012 (1.3 x 10⁻³ mg m−3) with concentrations for
individual pesticides in the range 4.3 × 10⁻¹⁷ to
1.3 × 10⁻² mg m−3. Zivan et al. (2016) measured chlorpyrifos
in air collected 74 m downwind from a persimmon orchard in
the range 6.3 × 10⁻⁴ to 2.0 × 10⁻³ mg m−3, whilst Coscolla
et al. (2010) detected 41 pesticides in ambient air in central
France (2006–2008) with individual average concentrations
ranging between 1.7 × 10⁻⁷ mg m−3 for vinclozolin and
2.5 × 10⁻⁵ mg m−3 for captan. Overall, the results reflect the
influence of changing policies during the 1990s; Cross and
Edwards-Jones (2006) found it impossible to identify any sin-
gle policy leading to changes in pesticide risk over time, but
the longer time series analysis possible in our study suggests
that the introduction of European Directive 91/414 as well as
the ongoing pesticides review programme at national level
had a substantive effect in decreasing the overall toxicity pro-
file of pesticides applied to orchards in the UK.
The present study estimated risk of applied pesticides
based on maximum aggregated exposure on the first day
after the application was made. This is likely to give the
maximum daily dose of the pesticide (dose is expressed
on a ‘per day’ basis) and indeed some studies show that
volatilisation losses of pesticides including chlorpyrifos,
prosulfocarb and trifluralin can be nearly complete within
24 h (Rudel 1997; Carlsen et al. 2006; Zivan et al. 2016).
Vo l a t i l i s a t i o n o f o t h e r p e s t i c i d e s i n c l u d i n g
fenpropimorph and parathion-methyl has been shown to
proceed over several days or weeks after application
(Rudel 1997; Leistra et al. 2008; Kosikowska and
Biziuk 2010; Yusa et al. 2014). Whilst the fate of sub-
stances beyond the first day after application is not con-
sidered in the present work, more prolonged emission of
pesticides is possible and could be considered in future
studies to provide a more refined assessment of how ex-
posure varies over time. The present work used the haz-
ard quotient as a single figure to assess the risk to human
health, combining the toxicity, amount and degree to
which humans are exposed (Toronto Public Health
2002). Relatively small exposures were estimated at our
selected proximities due to the strong influence of prox-
imity to spraying on magnitude of exposure. Ramaprasad
et al. (2009) showed that children of agricultural opera-
tors living less than 61 m from an orchard had higher
frequencies and greater levels of detectable urinary di-
methyl thiophosphate levels than those living farther
away. Our results also indicate higher potential hazard
for inhalation exposure compared to dermal contact with
spray deposits at distances farther downwind from treated
orchards. This is due to longer duration of vapour drift
because volatilization followed by aerial dispersion gen-
erally occurs over longer periods than spray drift and
ground deposition (FOCUS 2008). Active substances
with greater volatility contributed more to total exposure
at 1000 m compared to 100 m; for example, demeton-S-
methyl applied to plums in the West Midlands region in
1987 contributed 15.0 and 25.0% of total exposure at 100
and 1000 m, respectively. In contrast, exposure to spray
droplets is less likely at greater proximities due to the
relatively short time that droplets stay in the air; for ex-
ample, duration in air is approximately 4 s for fine spray
Environ Sci Pollut Res

(200 μm in diameter) and 2 s for coarse spray (400 μm)
to fall 3 m in still air (Klein et al. 2007).
Several limitations in data availability were encountered
during the study. Atmospheric dispersion was the most sig-
nificant transport pathways for volatilised pesticides yet it is
poorly studied with most research focusing on measure-
ments of downwind deposition of pesticide rather than air-
borne concentrations (Butler Ellis et al. 2010; Zivan et al.
2016). Lack of data on airborne pesticide concentrations and
spray deposition at different proximities from treated or-
chards has been noted previously as a constraint on model
validation (Butler Ellis et al. 2013). Our exposure estimates
assume that residents receive 24 h of exposure via inhalation
of pesticide vapour and 2 h of dermal exposure through
activities on the contaminated ground; there is no consider-
ation of structures that might interrupt pathways of exposure
such as tree windbreaks, hedges, fences, or houses. We only
considered toxicity for reproductive and/or developmental
endpoints and did not consider all toxic mechanisms to as-
sess overall potential for impact on health of residents. We
also ignored some additional pathways of exposure such as
dietary intake because these were assessed as relatively in-
significant in the initial problem definition phase. Set against
this, we summed daily exposures to all pesticides into a
0.0E+00
5.0E-05
1.0E-04
1.5E-04
2.0E-04
2.5E-04a
b
Eastern West Midlands South-Eastern South-Western
0.0
0.5
1.0
1.5
2.0
2.5
3.0
3.5
4.0
Eastern West Midlands South-Eastern South-Western
Avera
ge o
f exp
osu
re p
er
un
it o
f ap
pli
cati
on
Avera
ge o
f H
Q p
er
un
it o
f exp
osu
re
Fig. 6 Data for aggregated
exposure normalised by
expressing per kg of pesticide
applied (a) and aggregated hazard
quotient normalised by
expressing per mg kg bw day−1 of
exposure (b). All data are for
resident pregnant women living
100 m downwind of treated crops
and are shown for 4 years
between 1987 and 2012 and for
Eastern, West Midlands, South-
Eastern, and South-Western
regions. Error bars represent
standard deviations of exposures
and hazard quotients for identified
crop types, respectively
Environ Sci Pollut Res

single aggregated value for exposure, even though these
exposures will actually be widely spaced in time.
Conclusion
This study investigated trends in pesticide usage, exposure to
pesticides via inhaled vapour and dermal contact with contam-
inated ground, and risk posed by pesticides applied to orchards
for resident pregnant women living 100 or 1000 m downwind
of treated areas. The exposure model is flexible and can be
adjusted for a range of physicochemical properties of pesticides
and atmospheric dispersion parameters. The model should be
further validated and improved as field data become available
for deposition and airborne concentrations of pesticides at
greater distances from the site of application. The explicit cal-
culation of exposures and the long time series of analysis add to
the existing body of knowledge and allow a holistic assessment
of the impact of pesticide regulation on use, exposure and risk.
It is found that quantitative estimation of exposure can express
the causal relationship between usage and associated risk in
terms of space and time, which is a common caveat in post-
authorisation monitoring and epidemiological investigations.
There has not been a consistent change in usage over time, with
a small increase in number of applications compensated by a
small reduction in the average rate applied. Risk levels are
generally small and have declined over time, with the cessation
of use of several active substances with relatively high toxicity,
and a net change to active substances with lower volatility. This
evaluation of changes in pesticide use, exposure and risk over a
25-year time span can inform public debate about the effective-
ness of regulatory interventions.
Acknowledgements The authors gratefully acknowledge sponsorship
of this research by theMinistry of Education,Malaysia and the University
Malaysia Kelantan (UMK).
Compliance with ethical standards
Conflict of interest The authors declare that they have no conflict of
interest.
Open Access This article is distributed under the terms of the Creative
Commons At t r ibut ion 4 .0 In te rna t ional License (h t tp : / /
creativecommons.org/licenses/by/4.0/), which permits unrestricted use,
distribution, and reproduction in any medium, provided you give
appropriate credit to the original author(s) and the source, provide a link
to the Creative Commons license, and indicate if changes were made.
References
Abdul-Wahab SA (2004) Evaluation of the industrial source complex
short-term model: dispersion over terrain. J Air Waste Manage
Assoc 54:396–408
Balderacchi M, Trevisan M (2010) Comments on pesticide risk assess-
ment by the revision of Directive EU 91/414. Environ Sci Pollut Res
17:523–528
Bedos C, Cellier P, Calvet R, Barriuso E, Gabriellie B (2002) Mass
transfer of pesticides into the atmosphere by volatilisation from soils
and plants: overview. Agronomie 22:21–33
Briand O, Bertrand F, Seux R, Millet M (2002) Comparison of different
sampling techniques for the evaluation of pesticide spray drift in
apple orchards. Sci Total Environ 288:199–213
Butler Ellis MC, Underwood B, Peirce MJ, Walker CT, Miller PCH
(2010) Modelling the dispersion of volatilised pesticides in air after
application for the assessment of resident and bystander exposure.
Biosyst Eng 107:149–154
Butler Ellis MC, van den Berg E, Kennedy M et al (2013) BROWSE:
deliverable 3.4. Work package 3: models of exposure to agricultural
pesticides for bystanders and residents, supported by the European
Union 7th Framework Programme and coordinated by Fera
Butler Ellis MC, van de Zande JC, van den Berg F et al (2017) The
BROWSE model for predicting exposures of residents and by-
standers to agricultural use of plant protection products: an over-
view. Biosyst Eng 154:92–104
Carlsen SCK, Spliid NH, Svensmark B (2006) Drift of 10 herbicides after
tractor spray application. 1. Secondary drift (evaporation).
Chemosphere 64:787–794
Castilla EE, Lopez-Camelo JS, Campana H, Rittler M (2001)
Epidemiological methods to assess the correlation between industri-
al contaminants and rates of congenital anomalies. Mutat Res 489:
123–145
Cetin B, Ozer S, Sofuoglu A, Odabasi M (2006) Determination of
Henry’s law constants of organochlorine pesticides in deionized
and saline water as a function of temperature. Atmos Environ 40:
4538–4546
Cornelis C, Schoeters G, Kellen E et al (2009) Development of a GIS-
based indicator for environmental pesticide exposure and its appli-
cation to a Belgian case-control study on bladder cancer. Int J Hyg
Environ Health 212:172–185
Coscolla C, Colin P, Yahyaoui A et al (2010) Occurrence of currently
used pesticides in ambient air of Centre Region (France). Atmos
Environ 44:3915–3925
Coscolla C, Lopez A, Yahyaoui A et al (2017) Human exposure and risk
assessment to airborne pesticides in a rural French community. Sci
Total Environ 584-585:856–868
Costa C, Garcia-Leston J, Costa S et al (2014) Is organic farming safer to
farmers’ health? A comparison between organic and traditional
farming. Toxicol Lett 230:166–176
Cross P (2012) Pesticide hazard trends in orchard fruit production in
Great Britain from 1992 to 2008: a time-series analysis. Pest
Manag Sci 69:768–774
Cross P, Edwards-Jones G (2006) Variation in pesticide hazard from
arable crop production in Great Britain from 1992 to 2002: pesticide
risk indices and policy analysis. Crop Prot 25:1101–1108
EFSA (2010) Scientific opinion on preparation of a guidance document
on pesticide exposure assessment for workers, operators, bystanders
and residents. EFSA J 8(2):1501
EFSA (2012) Guidance on dermal absorption EFSA panel on plant pro-
tection products and their residues (PPR). EFSA J 10(4):2665
EFSA (2014) EFSA guidance on the assessment of exposure for opera-
tors, workers, residents and bystanders in risk assessment for plant
protection product. EFSA J 12(10):3874
European Commission (2009) EU action on pesticides: Bour food has
become greener^ (factsheet). In: Directorate-general for health and
consumers (Hrsg.). European Commission, Brussels. http://www.
bezpecnostpotravin.cz/UserFiles/File/Kvasnickova/factsheet_
pesticides_web.pdf. Accessed 2 Feb 2017
Eurostat (2008) Eurostat methodologies and working papers: a common
methodology for thecollection of pesticide usage statistics within
Environ Sci Pollut Res

agricul ture and hort icul ture 2008 edit ion. Office for
OfficialPublications of the European Communities, Luxembourg
Feigenbrugel V, Calve SL, Mirabel P (2004) Temperature dependence of
Henry’s law constants of metolachlor and diazinon. Chemosphere
57:319–327
Felsot AS, Unsworth JB, Linders JBHJ et al (2010) Agrochemical spray
drift: assessment and mitigation—a review. J Environ Sci Health B
46:1–23
Ferrari F, Klein M, Capri E, Trevisan M (2005) Prediction of pesticide
volatilisation with PELMO 3.31. Chemosphere 60:705–713
FOCUS (2000) FOCUS groundwater scenarios in the EU review of ac-
tive substances. The report of the work of the Groundwater
Scenarios Workgroup of FOCUS (FOrum for the Coordination of
pesticide fate models and their USe) version 1, EC Document
Reference SANCO/321/2000-rev.2
FOCUS (2008) Pesticides in air: considerations for exposure assessment.
Report of the FOCUS Working Group on Pesticides in Air, EC
Document Reference SANCO/10553/2006-rev.2
Galea KS, MacCalman L, Jones K et al (2015) Comparison of residents’
pesticide exposure with predictions obtained using the UK regula-
tory exposure assessment approach. Regul Toxicol Pharmacol 13:
634–643
Garthwaite DG, Hudson S, Barker I et al (2012) Pesticide usage survey
report 252: orchards in the United Kingdom 2012. DEFRA, York,
UK
Gemmill A, Gunier RB, Bradman A, Eskenazi B, Kim GH (2013)
Residential proximity to methyl bromide use and birth outcomes
in an agricultural population in California. Environ Health
Perspect 121:737–743
Gonzalez-Alzaga B, Hernandez AF, Rodriguez-Barranco M et al (2015)
Pre- and postnatal exposures to pesticides and neurodevelopmental
effects in children living in agricultural communities from Souh-
Eastern Spain. Environ Int 85:229–237
GroBkopf C, Martin S, Mielke H et al (2013) Joint development of a new
agricultural operator exposure model. J Verbr Lebensm. https://doi.
org/10.1007/s00003-013-0836-x
Hofman V, Solseng E (2001) Reducing spray drift. North Dakota State
University Extension Service. Publication AE-1210, North Dakota
State University. https://www.ag.ndsu.edu/publications/crops/
reducingspray-drift/ae1210.pdf. Accessed 15 Nov 2016
HoubrakenM, van den Berg F, Butler Ellis CM et al (2016) Volatilisation
of pesticides under field conditions: inverse modelling and pesticide
fate models. Pest Manag Sci 72:1309–1321
HSE (2015) Pesticide Incidents Report 2012/13. http://www.hse.gov.uk/
agriculture/pdf/pir1213.pdf. Accessed 30 November 2016
Karabelas AJ, Plakas KV, Solomou ES et al (2009) Impact of European
legislation on marketed pesticides—a view from the standpoint of
health impact assessment studies. Environ Int 35:1096–1107
Kegley S, Conlisk E (2010) Pesticide risk mitigation engine. Inhalation
risk index – white paper. https://pesticiderisk.org/materials/
PRiME_Inhalation_Index_white_paper_092910.pdf. Accessed 28
May 2017
Klein RN, Schulze L, Ogg CL (2007) NebGuide: spray drift of pesticides.
Publication G1773. University of Nebraska-Lincoln. http://
extensionpublications.unl.edu/assets/pdf/g1773.pdf. Accessed 15
Nov 2016
Kosikowska M, Biziuk M (2010) Review of the determination of pesti-
cide residues in ambient air. Trends Anal Chem 29:1064–1072
Leistra M, Wolters A (2004) Computations on the volatilisation of the
fungicide fenpropimorph from plants in a wind tunnel. Water Air
Soil Pollut 157:133–148
Leistra M, van der Linden AMA, Boesten JJTI, Tiktak A, van den Berg F
(2001) PEARL model for pesticide behaviour and emissions in soil-
plant system; Description of the processes in FOCUS PEARL v
1.1.1. RIVM report 711401009/Alterra-rapport 013. Alterra,
Wageningen
Leistra M, Wolters A, van den Berg F (2008) Volatilisation and compet-
ing processes computed for a pesticide applied to plants in a wind
tunnel system. Pest Manag Sci 64:669–675
Li H, Ma H, Lydy MJ, You J (2014) Occurrence, seasonal variation and
inhalation exposure of atmospheric organophosphate and pyrethroid
pesticides in an urban community in South China. Chemosphere 95:
363–369
Lichiheb N, Personne E, Bedos C, Barriuso E (2014) Adaptation of a
resistive model to pesticide volatilization from plants at the field
scale: comparison with a dataset. Atmos Environ 83:260–268
Lichiheb N, Personne E, Bedos C et al (2016) Implementation of the
effects of physicochemical properties on the foliar penetration of
pesticides and its potential for estimating pesticide volatilisation
from plants. Sci Total Environ 550:1022–1031
Martin S, Westphal D, Erdtmann-Vourliotis M et al (2008) Guidance for
exposure and risk evaluation for bystanders and residents exposed to
plant protection products during and after application. J Verbr
Lebensm 3:272–281
Panizzi S, Suciu NA, Trevisan M (2017) Combined ecotoxicological risk
assessment in the frame of European authorisation of pesticides. Sci
Total Environ 580:136–146
PPDB (2017) The Pesticide Properties Database (PPDB) developed by
the Agriculture & Environment Research Unit (AERU), University
of Hertfordshire. http://sitem.herts.ac.uk/aeru/ppdb/en/index.htm.
Accessed 2 Feb 2017
Ramaprasad J, Tsai MY, Fenske RA et al (2009) Children’s inhalation
exposure to methamidophos from sprayed potato fields in
Washington State: exploring the use of probabilistic modelling of
meteorological data in exposure assessment. J Exp Sci Environ
Epidemiol 19:613–623
Randerson D (1984) Atmospheric science and power production. DOE/
TIC-27601 (DE84005177). Technical information center, office of
scientific and technical information, United States Department of
Energy. https://doi.org/10.2172/6503687
Rautmann D, Sreloke M, Winkler R (1999) New basic drift values in the
authorisation procedure for plant protection products. Workshop on
risk assessment and risk mitigationmeasures (WORMM), Germany,
pp 27–29
Rudel H (1997) Volatilisation of pesticides from soil and plant surfaces.
Chemosphere 35:143–152
Rushton L, Mann V (2008) Estimating the prevalence and incidence of
pesticide-related illness presented to general practitioners in Great
Britain. Research report RR608. http://www.hse.gov.uk/research/
rrpdf/rr608.pdf. Accessed 2 Febr 2017
Salcedo R, Vallet A, Granell R et al (2017) Eulerian-Lagrangian model of
the behaviour of droplets produced by an air-assisted sprayer in a
citrus orchard. Biosyst Eng 154:76–91
Salem H, Katz SA (2006) Inhalation toxicology, 2nd edn. Chapter 1-
Inhalation risk assessment at the Environmental Protection
Agency. CRC Press, Boca Raton
Sarigiannis DA, Hansen U (2012) Considering the cumulative risk of
mixtures of chemicals—a challenge for policy makers. Environ
Health 11(Suppl 1):S18
Sarigiannis DA, Kontoroupis P, Solomou ES, Nikolaki S, Karabelas AJ
(2013) Inventory of pesticide emissions into the air in Europe.
Atmos Environ 75:6–14
Shirangi A, NieuwenhuijsenM, Vienneau D, Holman CDJ (2010) Living
near agricultural pesticide applications and the risk of adverse repro-
ductive outcomes: a review of the literature. Paediatr Perinat
Epidemiol 25:172–191
Staudinger J, Roberts PV (2001) A critical compilation of Henry’s law
constant temperature dependence relations for organic compounds
in dilute aqueous solutions. Chemosphere 44:561–576
Stehle S, Schulz R (2015) Pesticide authorization in the EU—environ-
ment unprotected? Environ Sci Pollut Res 22:19632–19647
Environ Sci Pollut Res

Stein B,Michalski B,Martin S et al (2014) Human health risk assessment
from combined exposure in the framework of plant protection prod-
ucts and biocidal products. J Verbr Lebensm 9:367–376
Sutton P, Perron J, Giudice LC, Woodruff TJ (2011) Pesticides matter a
primer for reproductive health physicians. Program on reproductive
health and the environment, University of California, San Francisco.
https://prhe.ucsf.edu/sites/prhe.ucsf.edu/files/pesticidesmatter_
whitepaper.pdf. Accessed 2 Febr 2017
Thomas MR (1999) Guidelines for the collection of pesticide usage sta-
tistics within agriculture and horticulture, OECD, Eurostat. http://
www.oecd.org/chemicalsafety/pesticides-biocides/2078031.pdf.
Accessed 2 Feb 2017
Thomas MR (2003) Pesticide usage in some vegetables crops in Great
Britain: real on-farm applications. Pest Manag Sci 59:591–596
Toronto Public Health (2002) Lawn and garden pesticides: a review of
human exposure & health effects research. Health Promotion &
Environmental Protection Office, Ontario
US EPA (1992a) User’s guide for the industrial source complex (ISC2)
dispersion models. Volume II—description of model algorithms.
EPA-450/4–92-008b. Office of Air Quality Planning and
Standards, Technical Support Division Research Triangle Park, US
Environmental Protection Agency, North Carolina
US EPA (1992b) Comparison of a revised area source algorithm for the
industrial source complex short term model and wind tunnel data.
EPA-454/R-92-014. Office of Air Quality Planning and Standards,
Technical Support Division Research Triangle Park, US
Environmental Protection Agency, North Carolina
US EPA (2009) Metabolically derived human ventilation rates: a revised
approach based on oxygen consumption rates. EPA/600/R-06/129F.
National Center for Environmental Assessment, Office of Research
and Development, US Environmental Protection Agency,
Washington
Van den Berg F, Leistra M (2004) Improvement of the model concept for
volatilisation of pesticides from soils and plant surfaces in PEARL.
Description and user’s guide for PEARL 2(1):1–C1
Van den Berg F, Jacobs CMJ, Butler Ellis MC et al (2016) Modelling
exposure of workers, residents and bystanders to vapour of plant
protection products after application to crops. Sci Total Environ
573:1010–1020
Van Maele-Fabry G, Lantin AC, Hoet P, Lison D (2011) Residential
exposure to pesticides and childhood leukaemia: a systematic re-
view and meta-analysis. Environ Int 37:280–291
Van de Zande JC, Butler Ellis MC, Wenneker M et al (2014) Spray drift
and bystander risk from fruit crop spraying. In conference
International advances in pesticide application. Aspects of Applied
Biology, vol 122. Association of Applied Biologists, Oxford, pp
177-185, 8-10 January 2014
Weselak M, Arbuckle TE, Foster W (2007) Pesticide exposures and de-
velopmental outcomes: the epidemiological evidence. J Toxicol
Environ Health B: Crit Rev 10:41–80
Wolterink G, Ruggeri L, Printemps N et al (2013) Toxicological data
analysis to support grouping of pesticide active substances for cu-
mulative risk assessment of effects on liver, on the nervous system
and on reproduction and development. Supporting Publications:EN-
392. http://onlinelibrary.wiley.com/store/10.2903/sp.efsa.2013.EN-
3 9 2 / a s s e t / e f s 3 3 9 2 e . p d f ? v = 1 & t = j 7 s v h 7 x k & s =
8e0a46514a99ca01df4abb1b7359d68ec2506790. Accessed 28
May 2017
Wolters A, Linnemann V, Herbst M et al (2003) Pesticide volatilisation
from soil: lysimeter measurements versus predictions of European
registration models. J Environ Qual 32:1183–1193
Yusa V, Coscolla C, Millet M (2014) New screening approach for risk
assessment of pesticides in ambient air. Atmos Environ 96:322–330
Zivan O, Segal-Rosenheirmer M, Dubowski Y (2016) Airborne organo-
phosphate pesticides drift in Mediterranean climate: the importance
of secondary drift. Atmos Environ 127:155–162
Environ Sci Pollut Res