Passive Air Sampling of Organochlorine Pesticides in Mexico
6
Passive Air Sampling of Organochlorine Pesticides, Polychlorinated Biphenyls, and Polybrominated Diphenyl Ethers Across the Tibetan Plateau XIAO-PING WANG,* ,† PING GONG, † TAN-DONG YAO, † AND KEVIN C. JONES ‡ Key Laboratory of Tibetan Environment Changes and Land Surface Processes, Institute of Tibetan Plateau Research, Chinese Academy of Sciences, Beijing 100085, China, and Lancaster Environmental Centre, Lancaster University, Lancaster LA1 4YQ, U.K. Received November 6, 2009. Revised manuscript received February 9, 2010. Accepted February 24, 2010. So far there are limited data on persistent organic pollutants (POPs) in the atmosphere of the Tibetan Plateau. XAD 2-resin based passive air samplers were therefore deployed for 1 year (between July 2007-June 2008) at 16 locations across the Tibetan Plateau. Based on previously reported sampling rates ( R) derived in the north and south America, and their correlations with atmospheric temperature and pressure, R values in the present study were in the range of 2.2-3.3 m 3 d -1 (average ) 2.7 ( 0.3). Derived air concentrations (pg/m 3 ) ranged as follows: DDTs, 5-75; HCHs, 0.1-36; R-endosulfan, 0.1-10; HCB, 2.8-80; sum of 15 PCBs, 1.8-8.2; and sum of 9 PBDEs, 0.1-8.3. The highest DDTs occurred at Qamdo, where the sampling site is near to farm land, indicating the spatial distribution of DDTs across the plateau may be influenced by scattered local usage of DDT. Higher levels of HCHs were observed at sites with high elevation ( >4000 m) and close to the China-India border, indicating possible long-range atmospheric transport. The highest levels of HCB, PCBs, and PBDEs were found at a site impacted by forest fire during the sampling campaign. Introduction Persistent organic pollutants (POPs) are known to undergo long-range atmospheric transport (LRAT), reaching remote regions where they have never been produced or used. In order to better understand the key processes that control POPs distribution, environmental data are needed from all regions of the globe. The United Nations Environmental Program (UNEP) recommended several target media - air, bivalves, biota, and human milk - as suitable for regional or global scale monitoring studies (1). The atmosphere is particularly important, because it reflects ongoing emissions, responds rapidly to efforts at source reduction, and is key to the global dispersal of POPs. Air data are required to improve the understanding of atmospheric transport and the air- surface exchange of POPs and to validate atmospheric POPs transport models (2). Atmospheric monitoring of POPs traditionally relies on high volume air samplers. However, active air sampling requires trained operators and electricity supply which is rarely found at truly remote sites. In recent years, various types of passive air samplers (PAS) have been developed and used for POPs monitoring (3). PAS can be simple and cheap to use and therefore suitable for mapping the spatial distribution of POPs. The Global Atmospheric Passive Sampling (GAPS) project was initiated in December 2004 and has been monitoring POPs at 40 background sites on 7 continents using polyurethane foam disk samplers, deployed for 3 monthly exposure periods (2). Similarly, regional-scale efforts have been initiated in North America (4), South America (5), Europe (6), and Asia (7–9). PAS networks have been used to aid better understanding of region-specific sources, transport, and fate of POPs. Deploying samplers in monitoring networks over several seasons and years will yield data on temporal trends, to check on the effectiveness of bans and restrictions on use (10, 11). Asia is a key area for study, because it is a major source/ use region for many POPs, with scope for LRAT to the Arctic, the Pacific, and the Tibetan Plateau. However, so far, efforts have focused more on the source component (e.g., urban areas) than the dispersal to remote locations. PAS sampling campaigns have included China, Japan, Korea, Singapore, and India (e.g. refs 7–9). However, very little data have so far been produced in the hinterlands abutted by Central/East/ South Asia - the Tibetan Plateau. The Tibetan Plateau, with an area of over 2.5 × 10 6 km 2 and an average elevation of >4000 m, is known as “the third pole of the world” and is the highest and most extensive plateau on Earth. The atmosphere over the Tibetan Plateau remains relatively pristine due to sparse human population and minimal industrial activities. Air masses over the Tibetan Plateau are mainly dominated by continental air from central Asia and maritime air from the Indian Ocean. Based on air mass trajectory analysis and ice core records of sulfate and black carbon, good correlations have been found between levels of pollutants in ice strata and trajectories originating from South Asia (12). Model predictions clearly show that the Tibetan anticyclone could ‘trap’ anthropogenic emissions lifted from South Asia (13). The Indian subcontinent has experienced heavy use of organochlorine pesticides (OCPs), such as HCHs and DDTs, while India continues the use of DDT to combat vector borne diseases which are prevalent in the monsoon season (8). Li et al. (14) reported very high levels of HCH in India in 1990, while recently attention has also been drawn to the processing of electronic (e-) waste (15). Monitoring data on POPs in soil, grass, and ice samples from the Tibetan Plateau (16–18) have suggested that it may be impacted by air masses derived from the Indian sub- continent as well as more local sources. This study was therefore conducted using PAS deployed at 16 sites across the Tibetan Plateau, to investigate the distribution of a range of POPs. Materials and Methods Sampling and Site Characterization. Details of the sites and their locations are given in Supporting Information (SI) Table SI-1. The samplers have been described elsewhere (19). XAD resin PAS are designed for mainly collecting POPs that normally dominate in the atmospheric gas phase and can be used for long-term air monitoring because they have a high capacity for POP and continue accumulating over year-round * Corresponding author phone: +86-10-62849397; e-mail: [email protected]. † Chinese Academy of Sciences. ‡ Lancaster University. Environ. Sci. Technol. 2010, 44, 2988–2993 2988 9 ENVIRONMENTAL SCIENCE & TECHNOLOGY / VOL. 44, NO. 8, 2010 10.1021/es9033759 2010 American Chemical Society Published on Web 03/18/2010
-
Upload
independent -
Category
Documents
-
view
2 -
download
0
Transcript of Passive Air Sampling of Organochlorine Pesticides in Mexico
Passive Air Sampling ofOrganochlorine Pesticides,Polychlorinated Biphenyls, andPolybrominated Diphenyl EthersAcross the Tibetan PlateauX I A O - P I N G W A N G , * , † P I N G G O N G , †
T A N - D O N G Y A O , † A N D K E V I N C . J O N E S ‡
Key Laboratory of Tibetan Environment Changes and LandSurface Processes, Institute of Tibetan Plateau Research,Chinese Academy of Sciences, Beijing 100085, China, andLancaster Environmental Centre, Lancaster University,Lancaster LA1 4YQ, U.K.
Received November 6, 2009. Revised manuscript receivedFebruary 9, 2010. Accepted February 24, 2010.
So far there are limited data on persistent organic pollutants(POPs) in the atmosphere of the Tibetan Plateau. XAD 2-resinbased passive air samplers were therefore deployed for 1year (between July 2007-June 2008) at 16 locations across theTibetan Plateau. Based on previously reported samplingrates (R) derived in the north and south America, and theircorrelations with atmospheric temperature and pressure, Rvalues in the present study were in the range of 2.2-3.3 m3 d-1
(average ) 2.7 ( 0.3). Derived air concentrations (pg/m3)ranged as follows: DDTs, 5-75; HCHs, 0.1-36; R-endosulfan,0.1-10; HCB, 2.8-80; sum of 15 PCBs, 1.8-8.2; and sum of 9PBDEs, 0.1-8.3. The highest DDTs occurred at Qamdo,where the sampling site is near to farm land, indicating thespatial distribution of DDTs across the plateau may be influencedby scattered local usage of DDT. Higher levels of HCHswere observed at sites with high elevation (>4000 m) andclose to the China-India border, indicating possible long-rangeatmospheric transport. The highest levels of HCB, PCBs, andPBDEs were found at a site impacted by forest fire during thesampling campaign.
Introduction
Persistent organic pollutants (POPs) are known to undergolong-range atmospheric transport (LRAT), reaching remoteregions where they have never been produced or used. Inorder to better understand the key processes that controlPOPs distribution, environmental data are needed from allregions of the globe. The United Nations EnvironmentalProgram (UNEP) recommended several target media - air,bivalves, biota, and human milk - as suitable for regional orglobal scale monitoring studies (1). The atmosphere isparticularly important, because it reflects ongoing emissions,responds rapidly to efforts at source reduction, and is key tothe global dispersal of POPs. Air data are required to improvethe understanding of atmospheric transport and the air-
surface exchange of POPs and to validate atmospheric POPstransport models (2).
Atmospheric monitoring of POPs traditionally relies onhigh volume air samplers. However, active air samplingrequires trained operators and electricity supply which israrely found at truly remote sites. In recent years, varioustypes of passive air samplers (PAS) have been developed andused for POPs monitoring (3). PAS can be simple and cheapto use and therefore suitable for mapping the spatialdistribution of POPs. The Global Atmospheric PassiveSampling (GAPS) project was initiated in December 2004and has been monitoring POPs at 40 background sites on 7continents using polyurethane foam disk samplers, deployedfor 3 monthly exposure periods (2). Similarly, regional-scaleefforts have been initiated in North America (4), SouthAmerica (5), Europe (6), and Asia (7–9). PAS networks havebeen used to aid better understanding of region-specificsources, transport, and fate of POPs. Deploying samplers inmonitoring networks over several seasons and years will yielddata on temporal trends, to check on the effectiveness ofbans and restrictions on use (10, 11).
Asia is a key area for study, because it is a major source/use region for many POPs, with scope for LRAT to the Arctic,the Pacific, and the Tibetan Plateau. However, so far, effortshave focused more on the source component (e.g., urbanareas) than the dispersal to remote locations. PAS samplingcampaigns have included China, Japan, Korea, Singapore,and India (e.g. refs 7–9). However, very little data have so farbeen produced in the hinterlands abutted by Central/East/South Asia - the Tibetan Plateau.
The Tibetan Plateau, with an area of over 2.5 × 10⁶ km2
and an average elevation of >4000 m, is known as “the thirdpole of the world” and is the highest and most extensiveplateau on Earth. The atmosphere over the Tibetan Plateauremains relatively pristine due to sparse human populationand minimal industrial activities. Air masses over the TibetanPlateau are mainly dominated by continental air from centralAsia and maritime air from the Indian Ocean. Based on airmass trajectory analysis and ice core records of sulfate andblack carbon, good correlations have been found betweenlevels of pollutants in ice strata and trajectories originatingfrom South Asia (12). Model predictions clearly show thatthe Tibetan anticyclone could ‘trap’ anthropogenic emissionslifted from South Asia (13). The Indian subcontinent hasexperienced heavy use of organochlorine pesticides (OCPs),such as HCHs and DDTs, while India continues the use ofDDT to combat vector borne diseases which are prevalentin the monsoon season (8). Li et al. (14) reported very highlevels of HCH in India in 1990, while recently attention hasalso been drawn to the processing of electronic (e-) waste(15). Monitoring data on POPs in soil, grass, and ice samplesfrom the Tibetan Plateau (16–18) have suggested that it maybe impacted by air masses derived from the Indian sub-continent as well as more local sources. This study wastherefore conducted using PAS deployed at 16 sites acrossthe Tibetan Plateau, to investigate the distribution of a rangeof POPs.
Materials and MethodsSampling and Site Characterization. Details of the sites andtheir locations are given in Supporting Information (SI) TableSI-1. The samplers have been described elsewhere (19). XADresin PAS are designed for mainly collecting POPs thatnormally dominate in the atmospheric gas phase and can beused for long-term air monitoring because they have a highcapacity for POP and continue accumulating over year-round
* Corresponding author phone: +86-10-62849397; e-mail:[email protected].
† Chinese Academy of Sciences.‡ Lancaster University.
Environ. Sci. Technol. 2010, 44, 2988–2993
2988 9 ENVIRONMENTAL SCIENCE & TECHNOLOGY / VOL. 44, NO. 8, 2010 10.1021/es9033759 2010 American Chemical SocietyPublished on Web 03/18/2010

monitoring (4, 19, 20). In this study, XAD-filled mesh cylinderswere sealed in airtight containers with Teflon lids to avoidcontamination during transit to the sites. Samples weretaken at 16 sites across the Tibetan Plateau (Figure 1).The SI gives details of the sampling program (Text SI1) andannual average temperature conditions (Table SI1). HarvestedXAD cylinders were stored in sealed, solvent rinsed, glassjars and sent by courier to Lancaster University. Upon receipt,the samplers were stored at -20 °C until extraction.
Sample Preparation, Extraction, and Analysis. Prior todeployment, XAD resin was Soxhlet extracted using in turnmethanol, acetonitrile, and dichloromethane (DCM). TheXAD resin (60 mL of wet XAD in methanol) was transferredto a precleaned stainless steel mesh cylinder and dried in aclean desiccator. Dry cylinders were sealed in an airtightstainless steel tube with Teflon lids. Samples were extractedin a dedicated clean laboratory, which has filtered, charcoal-stripped air and positive pressure conditions. Each samplewas transferred into the glass Soxhlet thimble and spikedwith recovery standards of 13C-labeled PCB congeners (13CPCB-28, 52, 101, 138, 153, 180) and PBDE congeners (PBDE-51, 128, 190). Samples were Soxhlet extracted using DCM for24 h. The extracts were first solvent-exchanged by hexaneand loaded on the top of a fractionation column (2 g of 3%deactivated alumina/3 g of 6% deactivated silica). The firstfraction was eluted by hexane and contained HCB, PCB, andDDEs. All HCHs, DDTs, endosulfans, and PBDEs were elutedby DCM and composed the second fraction. Both fractionswere further cleaned on activated alumina/silica columnsand gel permeation chromatography (GPC, containing 6 gof Biobeads SX 3). Before GPC cleanup, the first fraction wastreated with concentrated sulfuric acid to remove possibleinterferences. Samples were finally solvent exchanged to 25µL of dodecane containing PCB-30, 13C12PCB-141, and PBDE-69, 181 as internal standards. The samples were analyzed ona Finnigan-TRACE GC-MS system with a CP-Sil 8 CB capillarycolumn (50 m, 0.25 mm, 0.25 µm), operating under single-ion monitoring (SIM) mode. Helium was used as the carriergas at 1.0 mL min-1 under constant-flow mode. The oventemperature began at 100 °C for 2 min and increased to 140°C at a rate of 20 °C min-1, to 200 °C (10 min hold time) ata rate of 4 °C min-1, 4 °C min-1 to 300 °C, and held for 17min. The following compounds were monitored in the XADsamples: tri-PCBs 18, 22, 28, and 31; tetra-PCBs 44, 49, 53,70, and 74; penta-PCBs 87, 90/101, 95, 99, 105, 110, 118, and123; hexa-PCBs 138, 141, 149, 151, 153/132, and 158; hepta-PCBs 170, 174, 180, 183, and 187; octa-PCBs 194, 199, and203; HCB; o,p′-DDT, o,p′-DDE, p,p′-DDT, and p,p′-DDE; andPBDEs 28, 47, 49, 99, 100, 153, 154, and 183. Quantificationof R,γ-HCH, and R-endolsulfan was performed on the same
instrument operated in negative chemical ionization modewith ammonia as the reagent gas.
Quality Control/Quality Assurance (QA/QC). All analyti-cal procedures were monitored using strict quality assuranceand control measures. Laboratory blanks (pre-extracted XADresin filled cellulose thimbles) and field blanks were extractedand analyzed in the same way as the samples. Methoddetection limits (MDLs) were derived as 3 times the standarddeviation of the mean field blank concentrations. However,most of the PCB and PBDE congeners and OCPs were notdetected in the laboratory and field blanks, indicatingcontamination was negligible during transport, storage, andanalysis. In this case the concentration of the lowestcalibration standard was taken as the detection limit (0.03ng/sample). MDLs ranged between 0.03 and 0.18 ng/samplefor PCBs and PBDEs and between 0.03 and 1.3 ng/ samplefor OCPs. All reported values are field blank corrected butnot corrected for the recovery rates. Analyte concentrationsthat were below the method detection limit (MDL) arereported as below detection limit (BDL) in the results.Recoveries were between 72% and 140% for 13C12 PCBs and56-158% for PBDEs. Lower variations between duplicatePAS were observed (Table SI 2).
Back-Trajectories/Wind Direction. The wind directionduring the sampling period was determined by analyzingmeteorological data from the National Center for Environ-mental Prediction (NCEP). Figure SI1 shows the winddirection and speed in the Indian monsoon season andnonmonsoon season. Five-day back trajectories were cal-culated using the Hybrid Single-Particle Lagrangian Inte-grated Trajectory (HYSPLIT) model for 16 stations across theTibetan Plateau at 1000 m above ground level at 6 h intervalsfor the whole year deployment (Figure SI2, 3). Clusters oftrajectories were integrated based on the percent change intotal space variance.
Results and DiscussionIntroductory Remarks. A wind tunnel study has shown thatthe sampling rate (R) of the XAD resin PAS design is notstrongly influenced by wind speed (19). The mass transferof POPs to the XAD sampling resin is influenced bytemperature, pressure, and compound molecular size (5, 19).A challenge for this study is that atmospheric pressure valueson the Tibetan Plateau can be different from those in previousfield campaigns. In field trials, uptake rates have variedbetween ∼0.5-2.1 m3 d-1 PAS-1. R is proportional to themolecular diffusivity (Dair) of substances, and Dair is pro-portional to T1.75 and 1/P (5, 19). Therefore R ) K(T1.75/P),where K is a constant. Reported R values from field studiesare as follows: 0.5, 1, 2, and 2.1 m3 ·d-1 for Alert (256 K, 1010
FIGURE 1. General pattern of atmospheric circulation systems over the Tibetan Plateau and map showing sampling sites. Sitedescription: GBJD ) Gongbog’ Yamda.
VOL. 44, NO. 8, 2010 / ENVIRONMENTAL SCIENCE & TECHNOLOGY 9 2989

hpa), Burnt Island (280.3 K, 890 hpa), Point Petre (281.7 K,850 hpa), and Costa Rica (296 K, 1003 hpa), respectively.Taking these values together (Figure SI-4) gives R positivelycorrelated with T1.75/P, with the following equation: R )0.16T1.75/P - 2.14 (r2 ) 0.92). Annual average temperaturesand pressures of individual sampling sites in this study arelisted in Table SI-3. Based on these values, sampling ratesranged from 2.2 to 3.3 m3 d-1 giving an average of 2.7 ( 0.3m3 d-1 (Table SI-3). Results are presented here primarily asamounts of POPs sequestered over the sampling period (ng/sampler per year) and compared with data from other studiesemploying the same sampler and undergoing a year-rounddeployment (Table SI-4, 5). However, in order to make somegeneral comparisons with other air measurements reportedin the literature (Table 1, SI-6, 7), sequestered concentrationswere derived using sampling rate at individual sites to yieldvolumetric air concentrations (pg/m3).
General Comments on Ambient Concentrations. TotalPCB concentrations (sum of PCBs 22, 28/31, 41/64, 44, 49,52, 56/60, 70, 74, 90/101, 110, 138, 149, 151, and 153/132)were a few ng/sample and comparable to data from the Arctic(Figure 2, Table SI-4, 5). HCB values ranged from 2.5 to 61ng/sampler; values of 18 ng/sampler has been reported forthe Arctic (21). HCB air concentrations are quite uniform inthe Arctic, with the H/L values (ratio of the highest to thelowest) ∼2. The greater variability across the Tibetan Plateausuggests some primary emissions. Chemical usage is onepossibility, another may be incomplete combustion (22, 23);low oxygen levels on the plateau lead to inefficient combus-tion in this area. Σ9PBDE values were also generally low,ranging from 0.08-2 ng/sampler (Figure 2, Table SI-4,excluding a high value at Bomi). These are similar to thosereported for Arctic Alert (0.8 ng/sampler) and the CRM (1.2ng/sampler) (24).
HCH, DDT, and endosulfan are also summarized in TableSI-4. Maximum values were in the tens ng/sampler range,higher than reported for the Arctic and CRM region (TableSI-5). The higher values on the plateau suggest closerproximity to source regions and scattered pesticide usage.This is discussed further below.
Comparison between volumetric air concentrations de-rived here and other studies indicates that the Tibetan Plateauhas the following: i. PCB concentrations which are consider-ably lower than reported for other remote/rural areas in
China/India, European high mountains, and the AtlanticOcean; ii. p,p′-DDT, o,p′-DDT,R- and γ-HCH concentrationsabout 2-10-fold lower than other remote and rural parts ofChina/India; however, similar levels ofR-endosulfan to ruralIndia; iii. higher level of p,p′-DDT than European highmountains (Table SI-7).
Air Circulation over the Tibetan Plateau and PossibleTransport Pathways. Westerlies, blowing from the west toeast, are blocked by the Tibetan Plateau into two flows - thesouthern and northern branch (see Figure 1, SI-1-right). Ingeneral, westerly branches are strongest in the winter andweakest during the summer. However, the Indian Monsoondominates the plateau’s climate - especially in summer -when air masses plume across the Indian subcontinent andBay of Bengal and then lift toward the north, penetratingthe barrier of the Himalayan Mountains and reaching thehinterland of the Tibetan Plateau (Figure SI-1-left).The westerlies, together with the monsoon system, are theprevailing meteorology of the plateau. Monsoon windsmake a strong impact on the plateau’s south side but areblocked from going further north (Figure SI-1-left). Theplateau may therefore be considered in two parts - themonsoon region (MR) and the westerly region (WR) (FigureSI-5, Text SI-2). The height of the atmospheric boundarylayer (ABL) over the plateau can extend to heights of almost3 km (25). Details of the ABL over the plateau are given inText SI-3. Cooling of glaciers/snow on the upper-mountainportions and heating of the valley surfaces play importantroles in accelerating vertical exchanges. Sinking of the coldair leads to an important “pump-down” driving force forpollutant transport (26).
Evidence for LRAT of pollutants on the plateau has beenfound in glacier studies. For example, Xie et al. (27) observeda high level of n-alkanes in the Dasuopu glacier on the plateau,with the source being oil fires during the 1991 Gulf War.Recently, Xu et al. (28) observed good agreement betweensoot emissions in the India subcontinent and black carbonin southern Tibetan glaciers. In the present study, possibleLRAT pathways were clustered by analysis of back trajectories,which is consistent with previous studies (28) (Figure SI-2,3). Different parts of the Plateau will be more or less affectedby prevailing LRAT inputs (Figure SI-2, 3). Moreover, mostof the agricultural regions of Tibet are located in the valleyswith lower elevation (<2000-3500 m). Scattered usage of
TABLE 1. Estimated Volumetric Air Concentrations (pg m-3) from the Tibetan Plateau Sitesa
Σ15PCBs HCB r-HCH γ-HCH, r/γ-HCH r-ENDO o,p′-DDE, p,p′-DDE o,p′-DDT p,p′-DDTo,p′-DDT/p,p′-DDT′
p,p′-DDT/p,p′-DDE Σ9PBDEs
Monsoon RegionBomi 8.2 80.0 8.6 4.7 1.8 3.2 2.6 5.5 15.2 4.0 3.8 0.7 8.3Rawu 6.0 11.9 16.6 18.9 0.9 10.4 1.1 4.1 39.4 7.3 5.4 1.8 0.1Lulang 5.5 19.5 1.8 0.6 3.2 0.9 3.3 4.5 32.9 7.5 4.4 1.7 0.6Naqu 3.0 32.0 8.5 2.2 3.8 1.9 2.0 0.9 17.9 4.8 3.7 5.1 0.9Namco 1.8 2.8 0.1 0.7 2.6 3.2 0.6 5.8 0.5GBJD 4.9 26.2 7.8 2.4 3.3 2.4 3.9 7.7 31.9 7.4 4.3 1.0 2.2Lhasa 4.4 66.2 4.6 1.6 2.9 0.8 2.5 6.4 24.9 6.9 3.6 1.1 0.9Lhaze 3.0 22.5 1.6 0.8 2.0 1.0 1.0 1.0 9.6 2.6 3.8 2.5 0.6Xikaze 7.1 29.2 3.7 1.4 2.6 1.8 3.7 5.8 30.7 12.7 2.4 2.2 1.3Everest 4.2 28.3 5.8 7.0 0.8 1.4 0.1 0.4 4.0 0.6 6.2 1.7 0.5Saga 3.2 19.9 4.8 1.6 3.1 1.3 3.2 5.6 28.1 8.9 3.2 1.6 1.4Qamdo 7.3 19.6 1.5 1.3 1.1 1.1 8.2 13.4 41.9 11.4 3.7 0.9 0.8Yushu 5.0 34.2 1.7 3.0 0.6 0.1 1.6 7.4 2.1 5.1 0.4 0.7 0.4average 4.4 ( 1.4 28 ( 18 4.0 ( 2.3 2.4 ( 3 2.2 1.2 ( 1.3 2.9 ( 2 5.4 ( 3.7 19 ( 13 6.1 ( 3.8 3.7 1.8 1.1 ( 0.6
Westerly RegionGolmud 4.2 60.4 4.0 1.4 2.9 0.7 2.1 1.6 1.9 0.7 2.8 0.4 1.1Gaerze 3.9 5.2 3.1 3.1 1.0 4.5 0.1 0.8 5.1 2.2 2.3 2.8 0.1Gar 5.0 7.9 3.5 12.3 0.3 4.3 0.9 1.8 8.8 2.0 4.4 1.1 0.2average 4.4 ( 0.6 25 ( 31 3.5 ( 0.4 5.6 ( 5.9 1.4 3.1 ( 2.1 1.0 ( 1 1.3 ( 0.5 5.3 ( 3.4 1.6 ( 0.8 3.2 1.4 0.4 ( 0.6
a BDL means below the detectable level; H/L ratio refers to the ratio between the highest and lowest value of thecompound.
2990 9 ENVIRONMENTAL SCIENCE & TECHNOLOGY / VOL. 44, NO. 8, 2010
pesticides in these regions is possible. Considering thepossible influence by LRAT and local contamination, it isappropriate to consider the spatial distribution of POPs acrossthe plateau.
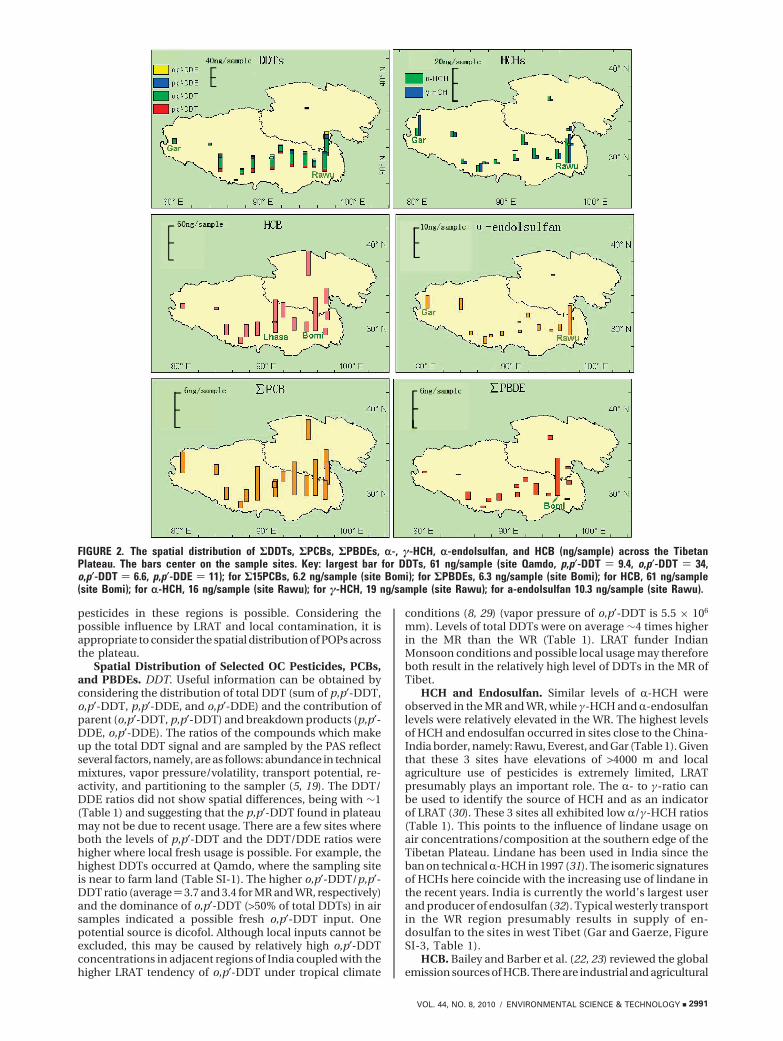
Spatial Distribution of Selected OC Pesticides, PCBs,and PBDEs. DDT. Useful information can be obtained byconsidering the distribution of total DDT (sum of p,p′-DDT,o,p′-DDT, p,p′-DDE, and o,p′-DDE) and the contribution ofparent (o,p′-DDT, p,p′-DDT) and breakdown products (p,p′-DDE, o,p′-DDE). The ratios of the compounds which makeup the total DDT signal and are sampled by the PAS reflectseveral factors, namely, are as follows: abundance in technicalmixtures, vapor pressure/volatility, transport potential, re-activity, and partitioning to the sampler (5, 19). The DDT/DDE ratios did not show spatial differences, being with ∼1(Table 1) and suggesting that the p,p′-DDT found in plateaumay not be due to recent usage. There are a few sites whereboth the levels of p,p′-DDT and the DDT/DDE ratios werehigher where local fresh usage is possible. For example, thehighest DDTs occurred at Qamdo, where the sampling siteis near to farm land (Table SI-1). The higher o,p′-DDT/p,p′-DDT ratio (average)3.7 and 3.4 for MR and WR, respectively)and the dominance of o,p′-DDT (>50% of total DDTs) in airsamples indicated a possible fresh o,p′-DDT input. Onepotential source is dicofol. Although local inputs cannot beexcluded, this may be caused by relatively high o,p′-DDTconcentrations in adjacent regions of India coupled with thehigher LRAT tendency of o,p′-DDT under tropical climate
conditions (8, 29) (vapor pressure of o,p′-DDT is 5.5 × 10⁶
mm). Levels of total DDTs were on average ∼4 times higherin the MR than the WR (Table 1). LRAT funder IndianMonsoon conditions and possible local usage may thereforeboth result in the relatively high level of DDTs in the MR ofTibet.
HCH and Endosulfan. Similar levels of R-HCH wereobserved in the MR and WR, while γ-HCH andR-endosulfanlevels were relatively elevated in the WR. The highest levelsof HCH and endosulfan occurred in sites close to the China-India border, namely: Rawu, Everest, and Gar (Table 1). Giventhat these 3 sites have elevations of >4000 m and localagriculture use of pesticides is extremely limited, LRATpresumably plays an important role. The R- to γ-ratio canbe used to identify the source of HCH and as an indicatorof LRAT (30). These 3 sites all exhibited low R/γ-HCH ratios(Table 1). This points to the influence of lindane usage onair concentrations/composition at the southern edge of theTibetan Plateau. Lindane has been used in India since theban on technicalR-HCH in 1997 (31). The isomeric signaturesof HCHs here coincide with the increasing use of lindane inthe recent years. India is currently the world’s largest userand producer of endosulfan (32). Typical westerly transportin the WR region presumably results in supply of en-dosulfan to the sites in west Tibet (Gar and Gaerze, FigureSI-3, Table 1).
HCB. Bailey and Barber et al. (22, 23) reviewed the globalemission sources of HCB. There are industrial and agricultural
FIGURE 2. The spatial distribution of ΣDDTs, ΣPCBs, ΣPBDEs, r-, γ-HCH, r-endolsulfan, and HCB (ng/sample) across the TibetanPlateau. The bars center on the sample sites. Key: largest bar for DDTs, 61 ng/sample (site Qamdo, p,p′-DDT ) 9.4, o,p′-DDT ) 34,o,p′-DDT ) 6.6, p,p′-DDE ) 11); for Σ15PCBs, 6.2 ng/sample (site Bomi); for ΣPBDEs, 6.3 ng/sample (site Bomi); for HCB, 61 ng/sample(site Bomi); for r-HCH, 16 ng/sample (site Rawu); for γ-HCH, 19 ng/sample (site Rawu); for a-endolsulfan 10.3 ng/sample (site Rawu).
VOL. 44, NO. 8, 2010 / ENVIRONMENTAL SCIENCE & TECHNOLOGY 9 2991
uses of HCB, together with emissions from incompletecombustion (22). Waste, coal, fuel, and biomass combustioncan produce HCB (22). An interesting observation from thisstudy is the relatively high loadings of HCB in areas whereinefficient combustion at high altitude may be important -either in the more populated regions (Lhasa and Golmud)or at a site heavily influenced by forest fires during the studyperiod (Bomi).
PCB. An interesting observation is that the tetra-chlorinated congeners are a major part of the total PCBcomposition of the samples (Figure SI-6). This is differentfrom that reported previously for urban and background sitesin other parts of China, where the tri-PCBs dominated (7, 9).Zhang et al. (8) also found tetra-PCBs dominating at ruralsites in India, perhaps providing further evidence of thissource region on the air composition of the Tibetan Plateau.Considering the transport potential of PCB congeners, lowerchlorinated congeners can be efficiently degraded duringLRAT, and higher chlorinated ones have less volatility andcan be efficiently removed by particle-bound deposition. Theintermediate chlorinated congeners therefore have greaterLRAT potential (33).
PBDEs. As for HCB and PCB, the highest PBDE concen-tration was observed at Bomi, where forest fires had occurred(3 forest fires occurred near or during sampling period,namely: May 3rd, August 16th, and Jan 21st). Relatively highlevels of other OCPs were found at this site as well (Table 1,Figure 2). High temperatures during forest fire events canpromote re-evaporation of pollutants from soil or vegetation(34, 35). In the present study, BDE-47 accounted for 22-72%of total PBDEs, with BDE-99 at 14-47%. BDE-47 has a greaterreported atmospheric travel distance than BDE-99 (33). Theseresults therefore suggest both local and LRAT signals of BDEson the Plateau.
This study confirms that XAD-PAS provide semiquanti-tative information and are particularly useful for this kind oflong exposure time study in remote locations. Air masstransport in Tibetan Plateau shows obvious seasonality.Future work should focus on seasonally resolved data, tobetter investigate inputs from different transport processes.Local usage information should be gathered prior to samplingand OCP levels in agriculture region of Tibet should beconsidered.
AcknowledgmentsWe are grateful to Dr. Rosalinda Gioia and Ph.D. candidateChun Lin for their help. This study was supported by theNational Natural Science Foundation of China (40871233)and Innovation Program of Chinese Academy of Sciences(KZCX2-YW-146).
Supporting Information AvailableDetailed information about sampling program, sampling rateat different sampling sites, original concentration data, backtrajectory analysis. and other supplementary results.
This material is available free of charge via the Internet athttp://pubs.acs.org.
Literature Cited(1) Guidance for a global monitoring programme for persistent
organicpollutants,1sted.;UNEPChemicals:Geneva,Switzerland,June 2004. http://www.chem.unep.ch/gmn/GuidanceGPM.pdf.
(2) Pozo, K.; Harner, T.; Wania, F.; Muir, D. C. G.; Jones, K. C.;Barrie, L. A. Toward a global network for persistent organicpollutants in air: Results from the GAPS study. Environ. Sci.Technol. 2006, 40, 4867–4873.
(3) Shoeib, M.; Harner, T. Characterization and comparison of threepassive air samplers for persistent organic pollutants. Environ.Sci. Technol. 2002, 36, 4142–4151.
(4) Shen, L.; Wania, F.; Lei, Y. D.; Teixeira, C.; Muir, D. C. G.;Bidleman, T. F. Hexachlorocyclohexanes in the North AmericanAtmosphere. Environ. Sci. Technol. 2004, 38, 965–975.
(5) Gouin, T.; Wania, F.; Ruepert, C.; Castillo, L. E. Field testingpassive air samplers for current use pesticides in a tropicalenvironment. Environ. Sci. Technol. 2008, 42, 6625–6630.
(6) Jaward, F. M.; Farrar, N. J.; Harner, T.; Sweetman, A. J.; Jones,K. C. Passive air sampling of PCBs, PBDEs, and OrganochlorinePesticides across Europe. Environ. Sci. Technol. 2004, 38, 34–41.
(7) Jaward, F. M.; Zhang, G.; Nam, J. J.; Sweetman, A. J.; Obbard,J. P.; Kobara, Y.; Jones, K. C. Passive air sampling of polychlo-rinated biphenyls, organochlorine compounds, and polybro-minated diphenyl ethers across Asia. Environ. Sci. Technol. 2005,39, 8638–8645.
(8) Zhang, G.; Chakraborty, P.; Li, J.; Sampathkumar, P.; Bala-subramanian, T.; Kathiresan, K.; Takahashi, S.; Subramanian,A.; Tanabe, S.; Jones, K. C. Passive atmospheric sampling oforganochlorine pesticides, polychlorinated biphenyls, andpolybrominated diphenyl ethers in urban, rural, and wetlandsites along the coastal length of India. Environ. Sci. Technol.2008, 42, 8218–8223.
(9) Zhang, Z.; Liu, L.; Li, Y. F.; Wang, D.; Jia, H.; Harner, T.; Sverko,E.; Wan, X.; Xu, D.; Ren, N.; Ma, J.; Pozo, K. Analysis ofpolychlorinated biphenyls in concurrently sampled Chineseair and surface soil. Environ. Sci. Technol. 2008, 42, 6514–6518.
(10) Liu, X.; Zhang, G.; Li, J.; Yu, L. L.; Xu, Y.; Li, X. D.; Kobara, Y.;Jones, K. C. Seasonal patterns and current sources of DDTs,chlordanes, hexachlorobenzene, and endosulfan in the atmo-sphere of 37 Chinese cities. Environ. Sci. Technol. 2009, 43,1316–1321.
(11) Pozo, K.; Harner, T.; Lee, S. C.; Wania, F.; Muir, D. C. G.; Jones,K. C. Seasonally resolved concentrations of persistent organicpollutants in the global atmosphere from the first year of theGAPS Study. Environ. Sci. Technol. 2009, 43, 796–803.
(12) Ming, J.; Cachier, H.; Xiao, C.; Qin, D.; Kang, S.; Hou, S.; Xu, J.Black carbon record based on a shallow Himalayan ice coreand its climatic implications. Atmos. Chem. Phys. 2008, 8, 1343–1352.
(13) Fu, R.; Hu, Y.; Wright, J. S.; Jiang, J. H.; Dickinson, R. E.; Chen,M.; Filipiak, M.; Read, W. G.; Waters, J. W.; Wu, D. L. Shortcircuit of water vapor and polluted air to the global stratosphereby convective transport over the Tibetan Plateau. Proc. Natl.Acad. Sci. U.S.A. 2006, 103, 5664–5669.
(14) Li, Y. F.; Scholtz, M. T.; Van Heyst, B. J. Global gridded emissioninventories of R-hexachlorocyclohexane. J. Geophys. Res.-Atmos. 2000, 105, 6621–6632.
(15) Pandve, H. T. E-waste management in India: An emergingenvironmental and health issue. Indian J. Occup. Environ. Med.2007, 11, 116.
(16) Wang, X. P.; Xu, B. Q.; Kang, S. C.; Cong, Z. Y.; Yao, T. D. Thehistorical residue trend of DDT, hexachlorocyclohexanes andpolycyclic aromatic hydrocarbons in ice core from Mt. Qomo-langma (Everest), central Himalayas, China. Atmos. Environ.2008, 42, 6699–6709.
(17) Wang, X. P.; Yao, T. D.; Cong, Z. Y.; Yan, X. L.; Kang, S. C.; Zhang,Y. Gradient distribution of persistent organic contaminantsalong northern slope of central-Himalayas, China. Sci. TotalEnviron. 2006, 372, 193–202.
(18) Wang, X. P.; Yao, T. D.; Cong, Z. Y.; Yan, X. L.; Kang, S. C.; Zhang,Y. Distribution of persistent organic pollutants in soil and grassesaround Mt. Qomolangma, China. Arch. Environ. Contam.Toxicol. 2007, 52, 153–162.
(19) Wania, F.; Shen, L.; Lei, Y. D.; Teixeira, C.; Muir, D. C. G.Development and calibration of a resin-based passive samplingsystem for monitoring persistent organic pollutants in theatmosphere. Environ. Sci. Technol. 2003, 37, 1352–1359.
(20) Choi, S. D.; Baek, S. Y.; Chang, Y. S.; Wania, F.; Ikonomou, M. G.;Yoon, Y. J.; Park, B. K.; Hong, S. Passive air sampling ofpolychlorinated biphenyls and organochlorine pesticides at theKorean arctic and antarctic research stations: Implications forlong-range transport and local pollution. Environ. Sci. Technol.2008, 42, 7125–7131.
(21) Shen, L.; Wania, F.; Lei, Y. D.; Teixeira, C.; Muir, D. C. G.;Bidleman, T. F. Atmospheric distribution and long-rangetransport behavior of organochlorine pesticides in NorthAmerica. Environ. Sci. Technol. 2005, 39, 409–420.
(22) Bailey, R. E. Global hexachlorobenzene emissions. Chemosphere2001, 43, 167–182.
(23) Barber, J. L.; Sweetman, A. J.; Van Wijk, D.; Jones, K. C.Hexachlorobenzene in the global environment: Emissions,
2992 9 ENVIRONMENTAL SCIENCE & TECHNOLOGY / VOL. 44, NO. 8, 2010
levels, distribution, trends and processes. Sci. Total Environ.2005, 349, 1–44.
(24) Shen, L.; Wania, F.; Lei, Y. D.; Teixeira, C.; Muir, D. C. G.; Xiao,H. Polychlorinated biphenyls and polybrominated diphenylethers in the North American atmosphere. Environ. Pollut. 2006,144, 434–444.
(25) Yang, K.; Koike, T.; Fujii, H.; Tamura, T. The daytime evolutionof the atmospheric boundary layer and convection over theTibetan Plateau: Observations and Simulations. J. Meteor. Soc.Jpn. 2004, 82, 1777–1792.
(26) Zhu, T.; Lin, W. L.; Song, Y.; Cai, Y. H.; Zou, H.; Kang, L.; Zhou,L. B.; Akimoto, K. Downward transport of ozone-rich air nearMt. Everest. Geophy. Res. Lett. 2006, 33, L23809, doi:10.1029/2006GL027726.
(27) Xie, S.; Yao, T.; Kang, S.; Duan, K.; Xu, B.; Thompson, L. G.Climatic and environmental implications from organic matterin Dasuopu glacier in Xixiabangma in Qinghai-Tibetan Plateau.Sci. China, Ser. D: Earth Sci. 1999, 42, 383–391.
(28) Xu, B.; Cao, J.; Hansen, J.; Yao, T.; Joswia, R. D.; Wang, N.; Wu,G.; Wang, M.; Zhao, H.; Yang, W.; Liu, X.; He, J. Black soot andthe survival of Tibetan glaciers. Proc. Natl. Acad. Sci. U.S.A.2009, 106, 22114–22118.
(29) Spencer, W.; Cliath, M. M. Volatility of DDT and relatedcompounds. J. Agric. Food Chem. 1972, 20, 645–649.
(30) Kutz, F. W.; Wood, P. H.; Bottimore, D. P. Organochlorinepesticides and polychlorinate dbiphenyls in human adiposetissue. Rev. Environ. Contam. Toxicol. 1991, 120, 1–82.
(31) Gupta, P. K. Pesticide exposure-Indian scene. Toxicology 2004,198, 83–90.
(32) Pathak, R.; Suke, S. G.; Ahmed, R. S.; Tripathi, A. K.; Guleria, K.;Sharma, C. S.; Makhijani, S. D.; Mishra, M.; Banerjee, B. D.Endosulfan and other organochlorine pesticide residues inmaternal and cord blood in North Indian population. Bull.Environ. Contam. Toxicol. 2008, 81, 216–219.
(33) Wania,F.;Dugani,C.B.Assessingthelong-rangetransportpotentialof polybrominated diphenyl ethers: A comparison of four mul-timedia models. Environ. Toxicol. Chem. 2003, 22, 1252–1261.
(34) Eckhardt, S.; Breivik, K.; Mano, S.; Stohl, A. Record high peaksin PCB concentrations in the Arctic atmosphere due to long-range transport of biomass burning emissions. Atmos. Chem.Phy. Dis. 2007, 7, 6229–6254.
(35) Genualdi, S. A.; Killin, R. K.; Woods, J.; Wilson, G.; Schmedding,D.; Simonich, S. L. M. Trans-pacific and regional atmospherictransport of polycyclic aromatic hydrocarbons and pesticidesin biomass burning emissions to western north America.Environ. Sci. Technol. 2009, 43, 1061–1066.
ES9033759
VOL. 44, NO. 8, 2010 / ENVIRONMENTAL SCIENCE & TECHNOLOGY 9 2993