The Chronic Care Model and Relationships to Patient Health Status and Health-Related Quality of Life
9
The Chronic Care Model and Relationships to Patient Health Status and Health-Related Quality of Life Dorothy Y. Hung, PhD, MPH, Russell E. Glasgow, PhD, L. Miriam Dickinson, PhD, Desireé B. Froshaug, MS, Douglas H. Fernald, MA, Bijal A. Balasubramanian, MBBS, PhD, Larry A. Green, MD Background: The chronic care model (CCM) is a system-level framework used to guide quality improvement efforts in health care. However, little is known about its relationship to patient-level health measures. This study describes the implementation of the CCM as adapted for prevention and health behavior counseling in primary care practices, and examines relationships between the CCM and patient health measures, including general health status and health-related quality of life (HRQOL). Methods: Baseline data from Round 2 of the Prescription for Health initiative (2005–2007) were used to assess CCM implementation in 57 practices located nationwide. Relationships between the CCM and three separate measures of health among 4735 patients were analyzed in 2007. A hierarchical generalized linear modeling approach to ordinal regression was used to estimate categories of general health status, unhealthy days, and activity-limiting days, adjusting for patient covariates and clustering effects. Results: Outcome variances were significantly accounted for by differences in practice characteris- tics (p0.001). Practices that used individual or group planned visits were more likely to see patients in lower health categories across all measures (OR0.74 – 0.81, p0.05). Practices that used patient registries, health promotion champions, evidence-based guide- lines, publicly reported performance measures, and support for behavior change were associated with higher patient health levels (OR1.28 –1.98, p0.05). Conclusions: A practice’s implementation of the CCM was significantly related to patient health status and HRQOL. Adapting the CCM for prevention may serve to reorient care delivery toward more proactive behavior change and improvements in patient health outcomes. (Am J Prev Med 2008;35(5S):S398 –S406) © 2008 American Journal of Preventive Medicine Introduction E fforts to improve the quality of care have brought forth new conceptual frameworks and innovations for redesigning the healthcare set- ting. The chronic care model (CCM) is a comprehen- sive framework featuring six major areas for quality improvement: (1) the health system and organization of care, (2) self-management support for patients to participate in managing their own care, (3) a delivery system design that proactively determines and ad- dresses health needs, (4) decision support for clinicians based on scientific evidence, (5) clinical information systems that provide access to patient population data, and (6) linkages to community resources to facilitate care outside the clinical setting. These elements are conceptualized as fostering productive interactions between patients and healthcare providers, resulting in improved patient outcomes. 1 While most empirical work on the CCM thus far has focused on the management of chronic illnesses such as diabetes, cardiovascular disease, hypertension, and asthma, 2–10 the model has also been explored prelimi- narily as a template for prevention and for the delivery of services that address health risk behaviors. 11,12 This focus on prevention and behavior change is consis- tent with a growing sense that quality improvement in health care must facilitate a transformation of the healthcare system from its current pattern of reacting to illness and responding mainly when a person is sick to a more proactive focus on promoting health and preventing disease among individuals and populations. 13,14 From the Department of Sociomedical Sciences, Columbia University Mailman School of Public Health (Hung), New York, New York; Kaiser Permanente (Glasgow), Denver; the Department of Family Medicine, School of Medicine, University of Colorado Denver (Dick- inson, Froshaug, Fernald, Green), Aurora, Colorado; and the Depart- ment of Family Medicine, University of Medicine and Dentistry of New Jersey–Robert Wood Johnson Medical School (Balasubrama- nian), Somerset, New Jersey Address correspondence and reprint requests to: Dorothy Y. Hung, PhD, MPH, 722 W. 168th Street, Suite 548, New York NY 10032. E-mail: [email protected]. S398 Am J Prev Med 2008;35(5S) 0749-3797/08/$–see front matter © 2008 American Journal of Preventive Medicine • Published by Elsevier Inc. doi:10.1016/j.amepre.2008.08.009
-
Upload
dailycamera -
Category
Documents
-
view
2 -
download
0
Transcript of The Chronic Care Model and Relationships to Patient Health Status and Health-Related Quality of Life

TtQDD
B
M
R
C
I
Etsiopsd
FMKMimNn
PE
S
he Chronic Care Model and Relationshipso Patient Health Status and Health-Relateduality of Life
orothy Y. Hung, PhD, MPH, Russell E. Glasgow, PhD, L. Miriam Dickinson, PhD, Desireé B. Froshaug, MS,ouglas H. Fernald, MA, Bijal A. Balasubramanian, MBBS, PhD, Larry A. Green, MD
ackground: The chronic care model (CCM) is a system-level framework used to guide qualityimprovement efforts in health care. However, little is known about its relationship topatient-level health measures. This study describes the implementation of the CCM asadapted for prevention and health behavior counseling in primary care practices, andexamines relationships between the CCM and patient health measures, including generalhealth status and health-related quality of life (HRQOL).
ethods: Baseline data from Round 2 of the Prescription for Health initiative (2005–2007) were usedto assess CCM implementation in 57 practices located nationwide. Relationships betweenthe CCM and three separate measures of health among 4735 patients were analyzed in2007. A hierarchical generalized linear modeling approach to ordinal regression was usedto estimate categories of general health status, unhealthy days, and activity-limiting days,adjusting for patient covariates and clustering effects.
esults: Outcome variances were significantly accounted for by differences in practice characteris-tics (p�0.001). Practices that used individual or group planned visits were more likely tosee patients in lower health categories across all measures (OR�0.74–0.81, p�0.05).Practices that used patient registries, health promotion champions, evidence-based guide-lines, publicly reported performance measures, and support for behavior change wereassociated with higher patient health levels (OR�1.28–1.98, p�0.05).
onclusions: A practice’s implementation of the CCM was significantly related to patient health statusand HRQOL. Adapting the CCM for prevention may serve to reorient care delivery towardmore proactive behavior change and improvements in patient health outcomes.(Am J Prev Med 2008;35(5S):S398–S406) © 2008 American Journal of Preventive Medicine
bsaccbi
faanoftihtsa
ntroduction
fforts to improve the quality of care havebrought forth new conceptual frameworks andinnovations for redesigning the healthcare set-
ing. The chronic care model (CCM) is a comprehen-ive framework featuring six major areas for qualitymprovement: (1) the health system and organizationf care, (2) self-management support for patients toarticipate in managing their own care, (3) a deliveryystem design that proactively determines and ad-resses health needs, (4) decision support for clinicians
rom the Department of Sociomedical Sciences, Columbia Universityailman School of Public Health (Hung), New York, New York;aiser Permanente (Glasgow), Denver; the Department of Familyedicine, School of Medicine, University of Colorado Denver (Dick-
nson, Froshaug, Fernald, Green), Aurora, Colorado; and the Depart-ent of Family Medicine, University of Medicine and Dentistry ofew Jersey–Robert Wood Johnson Medical School (Balasubrama-ian), Somerset, New JerseyAddress correspondence and reprint requests to: Dorothy Y. Hung,
phD, MPH, 722 W. 168th Street, Suite 548, New York NY 10032.-mail: [email protected].
398 Am J Prev Med 2008;35(5S)© 2008 American Journal of Preventive Medicine • Publish
ased on scientific evidence, (5) clinical informationystems that provide access to patient population data,nd (6) linkages to community resources to facilitateare outside the clinical setting. These elements areonceptualized as fostering productive interactionsetween patients and healthcare providers, resulting
n improved patient outcomes.1
While most empirical work on the CCM thus far hasocused on the management of chronic illnesses suchs diabetes, cardiovascular disease, hypertension, andsthma,2–10 the model has also been explored prelimi-arily as a template for prevention and for the deliveryf services that address health risk behaviors.11,12 Thisocus on prevention and behavior change is consis-ent with a growing sense that quality improvementn health care must facilitate a transformation of theealthcare system from its current pattern of reacting
o illness and responding mainly when a person isick to a more proactive focus on promoting healthnd preventing disease among individuals and
opulations.13,140749-3797/08/$–see front mattered by Elsevier Inc. doi:10.1016/j.amepre.2008.08.009
oppoogtean
CetiitrtttCtpdp(i
M
D
TPtpd(sttParof
M
Drqsgvo
t
updsstHmctth
adaclmvt
Iaateiphswtml
caccClttbfpbsewiama
pcfce
N
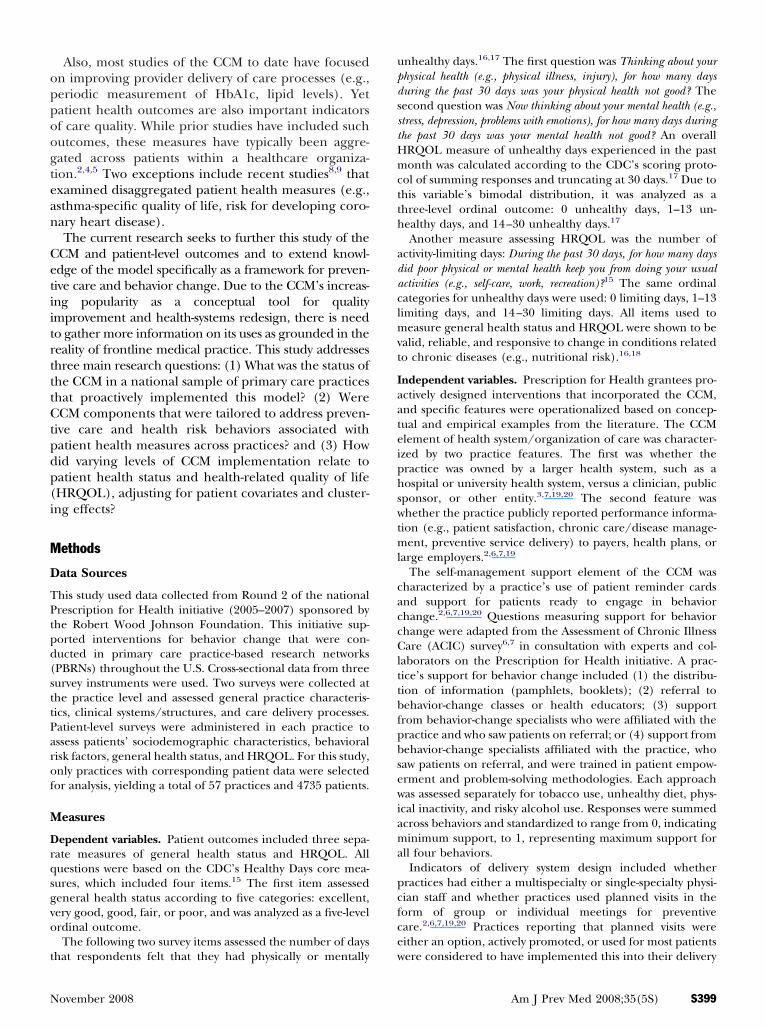
Also, most studies of the CCM to date have focusedn improving provider delivery of care processes (e.g.,eriodic measurement of HbA1c, lipid levels). Yetatient health outcomes are also important indicatorsf care quality. While prior studies have included suchutcomes, these measures have typically been aggre-ated across patients within a healthcare organiza-ion.2,4,5 Two exceptions include recent studies8,9 thatxamined disaggregated patient health measures (e.g.,sthma-specific quality of life, risk for developing coro-ary heart disease).The current research seeks to further this study of the
CM and patient-level outcomes and to extend knowl-dge of the model specifically as a framework for preven-ive care and behavior change. Due to the CCM’s increas-ng popularity as a conceptual tool for qualitymprovement and health-systems redesign, there is needo gather more information on its uses as grounded in theeality of frontline medical practice. This study addresseshree main research questions: (1) What was the status ofhe CCM in a national sample of primary care practiceshat proactively implemented this model? (2) WereCM components that were tailored to address preven-
ive care and health risk behaviors associated withatient health measures across practices? and (3) Howid varying levels of CCM implementation relate toatient health status and health-related quality of lifeHRQOL), adjusting for patient covariates and cluster-ng effects?
ethods
ata Sources
his study used data collected from Round 2 of the nationalrescription for Health initiative (2005–2007) sponsored byhe Robert Wood Johnson Foundation. This initiative sup-orted interventions for behavior change that were con-ucted in primary care practice-based research networksPBRNs) throughout the U.S. Cross-sectional data from threeurvey instruments were used. Two surveys were collected athe practice level and assessed general practice characteris-ics, clinical systems/structures, and care delivery processes.atient-level surveys were administered in each practice tossess patients’ sociodemographic characteristics, behavioralisk factors, general health status, and HRQOL. For this study,nly practices with corresponding patient data were selectedor analysis, yielding a total of 57 practices and 4735 patients.
easures
ependent variables. Patient outcomes included three sepa-ate measures of general health status and HRQOL. Alluestions were based on the CDC’s Healthy Days core mea-ures, which included four items.15 The first item assessedeneral health status according to five categories: excellent,ery good, good, fair, or poor, and was analyzed as a five-levelrdinal outcome.The following two survey items assessed the number of days
hat respondents felt that they had physically or mentally w
ovember 2008
nhealthy days.16,17 The first question was Thinking about yourhysical health (e.g., physical illness, injury), for how many daysuring the past 30 days was your physical health not good? Theecond question was Now thinking about your mental health (e.g.,tress, depression, problems with emotions), for how many days duringhe past 30 days was your mental health not good? An overall
RQOL measure of unhealthy days experienced in the pastonth was calculated according to the CDC’s scoring proto-
ol of summing responses and truncating at 30 days.17 Due tohis variable’s bimodal distribution, it was analyzed as ahree-level ordinal outcome: 0 unhealthy days, 1–13 un-ealthy days, and 14–30 unhealthy days.17
Another measure assessing HRQOL was the number ofctivity-limiting days: During the past 30 days, for how many daysid poor physical or mental health keep you from doing your usualctivities (e.g., self-care, work, recreation)?15 The same ordinalategories for unhealthy days were used: 0 limiting days, 1–13imiting days, and 14–30 limiting days. All items used to
easure general health status and HRQOL were shown to bealid, reliable, and responsive to change in conditions relatedo chronic diseases (e.g., nutritional risk).16,18
ndependent variables. Prescription for Health grantees pro-ctively designed interventions that incorporated the CCM,nd specific features were operationalized based on concep-ual and empirical examples from the literature. The CCMlement of health system/organization of care was character-zed by two practice features. The first was whether theractice was owned by a larger health system, such as aospital or university health system, versus a clinician, publicponsor, or other entity.3,7,19,20 The second feature washether the practice publicly reported performance informa-
ion (e.g., patient satisfaction, chronic care/disease manage-ent, preventive service delivery) to payers, health plans, or
arge employers.2,6,7,19
The self-management support element of the CCM washaracterized by a practice’s use of patient reminder cardsnd support for patients ready to engage in behaviorhange.2,6,7,19,20 Questions measuring support for behaviorhange were adapted from the Assessment of Chronic Illnessare (ACIC) survey6,7 in consultation with experts and col-
aborators on the Prescription for Health initiative. A prac-ice’s support for behavior change included (1) the distribu-ion of information (pamphlets, booklets); (2) referral toehavior-change classes or health educators; (3) supportrom behavior-change specialists who were affiliated with theractice and who saw patients on referral; or (4) support fromehavior-change specialists affiliated with the practice, whoaw patients on referral, and were trained in patient empow-rment and problem-solving methodologies. Each approachas assessed separately for tobacco use, unhealthy diet, phys-
cal inactivity, and risky alcohol use. Responses were summedcross behaviors and standardized to range from 0, indicatinginimum support, to 1, representing maximum support for
ll four behaviors.Indicators of delivery system design included whether
ractices had either a multispecialty or single-specialty physi-ian staff and whether practices used planned visits in theorm of group or individual meetings for preventiveare.2,6,7,19,20 Practices reporting that planned visits wereither an option, actively promoted, or used for most patients
ere considered to have implemented this into their deliveryAm J Prev Med 2008;35(5S) S399

swhssa
abt(scogtmefc
at
awcsbpe(pi
a
TC
C
H
S
D
D
C
C
C
T
Hp
G
U
A
A
G
R
E
I
O
S
S
ystem design. The presence of practice champions or leadersho mobilized others to make and sustain improvements toealth promotion was also included as a part of the deliveryystem design.2,7 This item was measured on a 5-point Likertcale, and responses of agree or strongly agree were consideredffirmative.
Decision support consisted of a practice’s integrationnd support of evidence-based guidelines for treating riskehaviors.2,6,7,19–21 Responses to these ACIC-adapted ques-ions on evidence-based guidelines included (1) not available;2) available but not integrated into care delivery; (3) available andupported by clinician education; or (4) available, supported bylinician education, and integrated into care through reminders andther clinician behavior-change methods. Practices that integrateduidelines into care delivery and/or supported guidelineshrough clinician education were considered to have imple-
ented decision support. These responses were assessed forach risk behavior, summed, and standardized across theour behaviors. Computerized decision support for clini-
able 1. Practice characteristics and implementation ofCM elements (N�57)
CM elements n % or M (SD)
ealth system and organization of carePractice ownership
Hospital health system 22 38.6University health system 11 19.3Clinician wholly or partially 17 29.8Public sponsor 4 7.0Other 3 5.3
Public reporting of practiceperformance
26 45.6
elf-management supportSupport for behavior change (range
0.25–1)57 0.45 (0.19)
Patient reminder cards 22 38.6elivery system designSpecialty type
Single specialty 41 71.9Multispecialty 16 28.1
Group or individual planned visitsfor prevention
29 50.9
Practice champions or leaders whopromote health
39 68.4
ecision supportEvidence-based guidelines for
treating risk behaviors (range0–1)
57 0.47 (0.46)
Personal digital assistant 25 43.9linical information systemsPatient registry 35 61.4EMRs 30 52.6Electronic patient records 28 49.1E-prescribing 20 35.1Electronic lab orders 19 33.3Electronic interface with hospital
records20 35.1
Number of EMR functions (range0–4)
57 1.53 (1.67)
ommunity resourcesLinkages to resources for behavior
change (range 0–1)57 0.59 (0.42)
CM, chronic care model; EMR, electronic medical record
ians in the form of personal digital assistants (PDAs) was
400 American Journal of Preventive Medicine, Volume 35, Num
lso included.19 Typical uses for PDAs included referenceo medication, diagnostic, and therapeutic information.
The implementation of clinical information systems wasssessed by whether practices used registries to track patientsith specific conditions.2,6,7,19,20 These conditions includedhronic illnesses such as diabetes, high cholesterol, hyperten-ion, coronary artery disease, asthma, and cancer, as well asehavioral risk factors including tobacco use, unhealthy diet,hysical inactivity, and risky alcohol use. Additionally, thextent of a practice’s use of electronic medical recordsEMRs) was indicated by the sum of four EMR capabilities:atient records, e-prescribing, lab orders, and electronic
nterface with hospital records.2,20,22
Finally, the community resources element was assessedccording to what approach practices used to link patients to
able 2. Patient characteristics (N�4735)
ealth measures andatient covariates n
% orM (SD)
eneral health statusExcellent 188 4.0Very good 978 21.2Good 1784 38.6Fair 1238 26.8Poor 434 9.4nhealthy daysNumber of physical/mental unhealthy
days in past month (range 0–30)3945 11.4 (11.9)
0 1041 26.41–13 1465 37.1�14 1439 36.5
ctivity-limiting daysDays kept from doing usual activities
(e.g., self-care, work, recreation, inpast month; range 0–30)
3502 5.4 (9.2)
0 1876 53.61–13 1030 29.4�14 596 17.0
ge (years)18–39 1348 28.940–54 1476 31.655–64 925 19.8�65 921 19.7enderMale 1319 27.9Female 3377 71.3
aceNon-Hispanic white 2652 58.1Non-Hispanic black 775 17.0Hispanic 915 20.0Other 226 4.9
ducation�High school 748 16.7High school graduate 3736 83.3
ncome ($)�25,000 1963 48.725,000–50,000 1035 25.7�50,000 1029 25.6verweight/obeseYes 3470 76.5No 1064 23.5
mokerYes 1206 26.2
No 3390 73.8ber 5S www.ajpm-online.net

Table 3. Bivariate results: CCM elements, patient characteristics, and patient health measures across practices
General health status n (%) HRQOL M (SD) or Pearson r
Excellent Very good Good Fair Poor �2 or F Unhealthy days Activity-limiting days
Health system and organization of carePractice ownership 79.3*** t� –2.40* t� –1.44Hospital or university health system 109 (3.9) 494 (17.9) 1036 (37.4) 827 (29.9) 301 (10.9) 11.8 (12.1) 5.6 (8.9)Other 79 (4.3) 484 (26.1) 748 (40.3) 411 (22.2) 133 (7.2) 10.9 (11.5) 5.2 (9.4)Public reporting of performance 169.3*** t�8.93*** t�8.57***
Yes 118 (5.2) 594 (26.4) 918 (40.8) 458 (20.4) 160 (7.1) 9.7 (11.1) 4.1 (8.1)No 70 (2.9) 384 (16.2) 866 (36.5) 780 (32.9) 274 (11.5) 13.1 (12.3) 6.7 (10.0)
Self-management supportSupport for behavior change M (SD) 0.41 (0.17) 0.41(0.16) 0.44 (0.18) 0.50 (0.20) 0.52 (0.20) F�56.1*** r �0.14*** r �0.09***Patient reminder cards 16.2** t� –1.08 t�1.58
Yes 77 (4.5) 322 (19.0) 702 (41.4) 427 (25.2) 168 (9.9) 11.7 (12.0) 5.1 (9.0)No 111 (3.8) 656 (22.4) 1082 (37.0) 811 (27.7) 266 (9.1) 11.3 (11.8) 5.6 (9.3)
Delivery system designMultispecialty staff 130.8*** t� –4.93*** t� –2.01*
Yes 44 (3.8) 152 (13.1) 396 (34.3) 395 (34.2) 169 (14.6) 13.1 (12.2) 6.0 (9.6)No 144 (4.2) 826 (23.8) 1388 (40.0) 843 (24.3) 265 (7.6) 10.9 (11.7) 5.3 (9.0)
Group/individual planned visits for prevention 17.0** t�2.71** t�1.46Yes 97 (3.9) 543 (21.9) 896 (36.1) 709 (28.5) 239 (9.6) 10.9 (11.7) 5.2 (9.2)No 91 (4.3) 435 (20.3) 888 (41.5) 529 (24.7) 195 (9.1) 12.0 (12.0) 5.7 (9.3)
Practice champions who promote health 38.1*** t�5.90*** t�6.98***Yes 178 (4.4) 895 (21.9) 1594 (39.0) 1060 (25.9) 362 (8.9) 11.1 (11.7) 5.1 (8.9)No 10 (1.9) 83 (15.6) 190 (35.6) 178 (33.4) 72 (13.5) 14.7 (12.3) 8.9 (11.1)
Decision supportEvidence-based guidelines for risk behaviors M (SD) 0.55 (0.48) 0.56 (0.48) 0.55 (0.46) 0.48 (0.44) 0.49 (0.43) F�6.20*** r �–0.05** r � –0.02Personal digital assistant 213.9*** t� –9.54*** t� –6.06***
Yes 63 (2.9) 318 (14.5) 813 (37.0) 725 (33.0) 278 (12.7) 13.3 (12.3) 6.4 (9.8)No 125 (5.2) 660 (27.2) 971 (40.0) 513 (21.2) 156 (6.4) 9.8 (11.2) 4.5 (8.6)
Clinical information systemsPatient registry 112.3*** t�9.64*** t�9.94***
Yes 140 (5.0) 659 (23.7) 1138 (40.9) 632 (22.7) 213 (7.7) 10.0 (11.3) 4.2 (8.3)No 48 (2.6) 319 (17.3) 646 (35.1) 606 (32.9) 221 (12.0) 13.7 (12.4) 7.3 (10.2)
Number of EMR functions 1.65 (1.54) 1.83 (1.54) 1.91 (1.54) 1.92 (1.55) 1.99 (1.55) F�2.10* r � –0.04* r �0.04*Community resources
Linkages to community resources M (SD) 0.70 (0.41) 0.67 (0.43) 0.64 (0.44) 0.55 (0.46) 0.56 (0.46) F�14.7*** r �0.07*** r �0.07**Patient age (years) 37.2*** F�20.6*** F�4.83**
18–39 67 (5.1) 286 (21.7) 525 (39.8) 341 (25.8) 101 (7.7) 12.1 (11.5) 5.0 (8.3)40–54 49 (3.4) 262 (18.0) 560 (38.6) 412 (28.4) 169 (11.6) 12.6 (12.2) 6.2 (9.7)55–64 35 (3.9) 201 (22.2) 331 (36.6) 245 (27.1) 93 (10.3) 11.2 (12.1) 5.5 (9.5)�65 36 (4.1) 213 (24.0) 351 (39.6) 222 (25.0) 65 (7.3) 8.3 (11.1) 4.8 (9.4)
Gender 3.84 t�4.87*** t� –0.70Male 128 (3.9) 696 (21.1) 1267 (38.4) 904 (27.4) 306 (9.3) 12.0 (11.8) 5.4 (9.0)Female 60 (4.7) 275 (21.4) 506 (39.3) 321 (25.0) 125 (9.6) 10.0 (11.8) 5.6 (9.8)
Race 192.9*** F�8.74*** F�7.91***White 112 (4.3) 662 (25.5) 1038 (39.9) 581 (22.3) 207 (8.0) 11.0 (11.7) 5.2 (9.0)Black 28 (3.7) 135 (17.8) 312 (41.1) 224 (29.5) 61 (8.0) 11.0 (11.6) 4.7 (8.7)Hispanic 31 (3.4) 90 (10.0) 303 (33.6) 346 (38.4) 132 (14.6) 13.5 (12.5) 6.9 (10.2)Other 11 (5.1) 52 (24.3) 80 (37.4) 50 (23.4) 21 (9.8) 10.7 (11.9) 5.9 (10.0)
(continued on next page)
Novem
ber2008
Am
JPrev
Med
2008;35(5S)S401
oA(rubPhop
eodsl
S
Pbepgttv(lgeoHrswu
R
Ti5sprtcsihwfcArb
ble
3.B
ivar
iate
resu
lts:
CC
Mel
emen
ts,
pati
ent
char
acte
rist
ics,
and
pati
ent
hea
lth
mea
sure
sac
ross
prac
tice
s(c
ontin
ued)
Gen
eral
heal
thst
atus
n(%
)H
RQ
OL
M(S
D)
orP
ears
onr
Exc
elle
ntV
ery
good
Goo
dFa
irP
oor
�2
orF
Unh
ealt
hyda
ysA
ctiv
ity-
limit
ing
days
ucat
ion
133.
4***
t�–4
.98*
**t�
–4.8
8***
Hig
hsc
hoo
lgr
adua
te23
(3.1
)80
(10.
9)23
7(3
2.4)
885
(38.
5)30
1(1
5.0)
13.8
(12.
7)10
.6(7
.3)
Hig
hsc
hoo
lgr
adua
te15
9(4
.3)
853
(23.
2)14
72(4
0.1)
282
(24.
1)11
0(8
.2)
11.1
(11.
7)8.
9(5
.1)
ome
($)
574.
3***
F�13
9.3*
**F�
113.
3***
25,0
0035
(1.8
)20
8(1
0.8)
665
(34.
5)72
3(3
7.5)
295
(15.
3)15
.2(1
2.2)
8.3
(10.
8)5,
000–
50,0
0043
(4.2
)26
8(2
6.1)
457
(44.
6)20
3(1
9.8)
54(5
.3)
9.9
(11.
1)3.
5(7
.2)
50,0
0065
(6.4
)36
5(3
6.0)
414
(40.
8)14
4(1
4.2)
26(2
.6)
7.7
(10.
0)3.
0(6
.6)
erw
eigh
t/ob
ese
148.
9***
t�–3
.98*
**t�
–3.2
0***
es10
8(3
.2)
624
(18.
4)13
27(3
9.0)
996
(29.
3)34
5(1
0.1)
11.9
(12.
0)5.
7(9
.4)
o76
(7.3
)32
9(3
1.6)
380
(36.
5)18
8(1
8.1)
67(6
.4)
10.1
(11.
2)4.
5(8
.5)
oker
123.
2***
t�–1
0.3*
**t�
–9.0
6***
es23
(2.0
)26
3(1
3.8)
443
(37.
8)37
7(3
2.1)
168
(14.
3)14
.6(1
2.2)
7.6
(10.
4)o
162
(4.9
)80
6(2
4.2)
1303
(39.
1)80
9(2
4.3)
255
(7.6
)10
.2(1
1.5)
4.5
(8.5
)
0.05
;**p
�0.
01;*
**p�
0.00
1M
,ch
ron
icca
rem
odel
;E
MR
,el
ectr
onic
med
ical
reco
rd;
HR
QO
L,
hea
lth
-rel
ated
qual
ity
oflif
e
S4
utside community resources.2,6,7,23 Responses to theseCIC-adapted questions included (1) no systematic approach;2) list of identified community resources; (3) designated staff personesponsible for ensuring that providers and patients make maximumse of community resources; or (4) coordination and feedbacketween the practice, community service agencies, and patients.ractices with no systematic approach were considered not toave implemented this CCM component. Responses for eachf the four behaviors were summed and standardized acrossractices.Patient covariates included age, gender, race/ethnicity,
ducation, and income. Clinical covariates included obesity/verweight (BMI �25 kg/m2) and smoking status. Respon-ents were identified as smokers if they reported havingmoked 100 cigarettes in their lifetime and had smoked ateast part of a cigarette in the last 30 days.
tatistical Analysis
ractice and patient characteristics were described, followedy the analysis of unadjusted bivariate relationships betweenach CCM component and patient health measure. Becauseatient data were nested within practice data, hierarchicaleneralized linear modeling (HGLM) was used.24 Uncondi-ional models produced significantly large intraclass correla-ion coefficients, indicating that a large portion of outcomeariances were accounted for by practice differencesp�0.001). Thus, patient outcomes were modeled at twoevels, using restricted maximum likelihood estimation. Be-inning with all conceptually relevant variables, a backwardlimination of CCM components was used to avoid problemsf overfitting and to produce models that were stable. AnGLM cumulative probability approach to ordinal logistic
egression was used to estimate categories of general healthtatus, unhealthy days, and activity-limiting days. All analysesere conducted in 2007, and multilevel models were analyzedsing HLM version 6.02.
esults
able 1 describes practices in the study and theirmplementation of CCM components. Approximately8% of the practices belonged to a hospital or univer-ity health system, and reported moderate support foratients’ behavior change, as assessed on a spectrumanging from limited approaches (e.g., pamphlet dis-ribution) to comprehensive involvement by behavior-hange specialists. Approximately 28.1% had a multi-pecialty physician staff, 50.9% reported using group orndividual planned visits for preventive care, and 68.4%ad champions or leaders for health promotion. Thereas moderate integration of evidence-based guidelines
or treating risk behaviors, and 43.9% reported usingomputerized forms of decision support such as PDAs.pproximately two thirds of practices used a patient
egistry and linked patients to community resources forehavior change.Table 2 describes the characteristics of patients in-
cluded in the study sample. Approximately 65% re-Ta
Ed � �
Inc � 2 �
Ov Y N
SmY N
*p�
CC
02 American Journal of Preventive Medicine, Volume 35, Number 5S www.ajpm-online.net

pnenffwSitb
attiobotwC
lesp
TstbttsIccthp(po(
T
C
S
D
D
C
PA
G
R
E
I
R
N*C
N
orted being in good or fair health. The averageumber of physical or mental unhealthy days experi-nced in the past month was 11.4, and the averageumber of days in which poor health kept patients
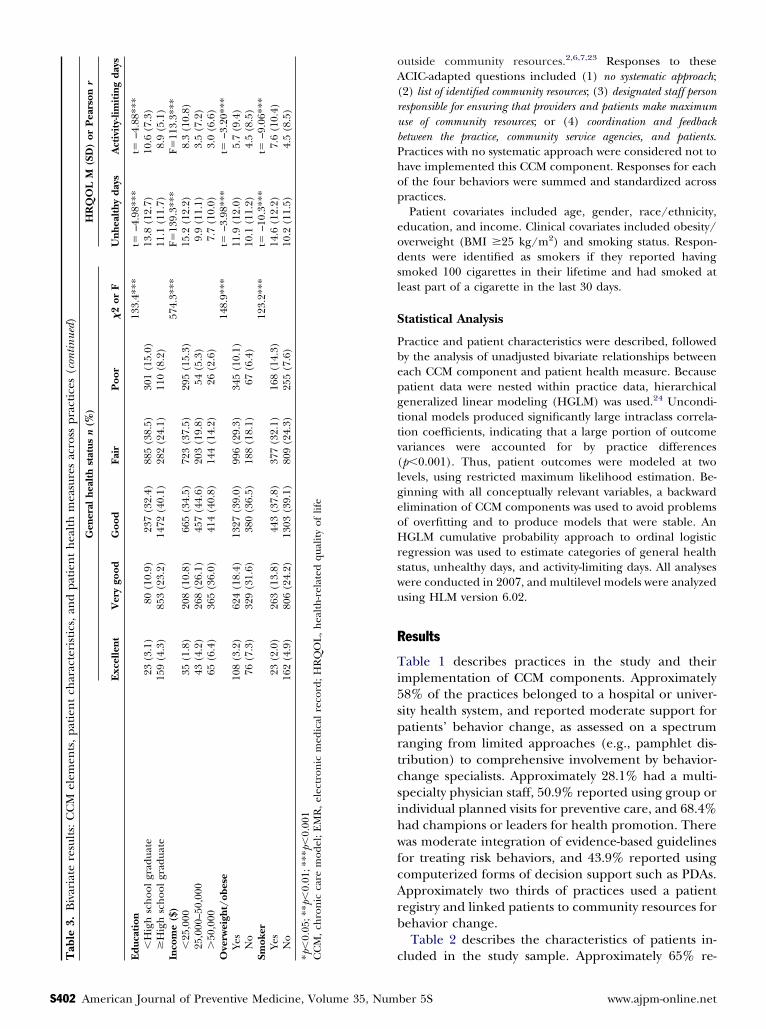
rom doing usual activities was 5.4. Most patients wereemale (71.3%); aged �55 years (60.5%); non-Hispanichite (58.1%); and high school educated (83.3%).lightly more than half (51.3%) reported an annualncome of at least $25,000. Approximately three quar-ers of the sample were overweight/obese and reportedeing nonsmokers.Table 3 presents unadjusted bivariate associations
mong practices’ implementation of the CCM, pa-ients’ characteristics and health measures. Across prac-ices, general health status varied significantly accord-ng to CCM elements such as the health system andrganization of care, self-management support forehavior change, delivery system design, integrationf decision support, use of clinical information sys-ems, and community resources (p�0.01). Thereere also significant relationships among almost allCM components and both unhealthy and activity-
able 4. HGLM results: CCM and patient correlates of bette
CM ELEMENTSInterceptHealth system and organization of careHospital or university health system
elf-management supportSupport for behavior changeelivery system designMultispecialty practiceGroup/individual planned visits for preventive carePractice champions who promote healthecision supportPersonal digital assistant
linical information systemsPatient registry
ATIENT CHARACTERISTICSge (years) (ref: 18–39)40–5455–64�65ender (ref: female)Male
ace (ref: non-Hispanic white)Non-Hispanic blackHispanicOther
ducation (ref: high school graduate)�High school
ncome ($) (ref: �50,000)�25,00025,000–50,000
isk factorsOverweight/obeseSmoker
ote: Better general health status is defined as higher categories mea
p�0.05; **p�0.01; ***p�0.001CM, chronic care model; HGLM, hierarchical generalized linear modelovember 2008
imiting days (p�0.05). Patients’ ages, race/ethnicity,ducation, income, and behavioral risk factors wereignificantly related to all health measures acrossractices (p�0.01).Adjusting for patient covariates and clustering in
able 4, patients seen in hospital/university healthystem–owned practices (OR�0.73, p�0.01) and mul-ispecialty practices (OR�0.67, p�0.01) were likely toe in a lower health category. Similarly, patients in prac-ices that used group/individual planned visits for preven-ion (OR�0.81, p�0.05) and PDAs for clinician-decisionupport (OR�0.61, p�0.01) reported lower health status.n contrast, patients in practices that supported behaviorhange (OR�1.98, p�0.05); had health promotionhampions onsite (OR�1.47, p�0.001); and used pa-ient registries (OR�1.33, p�0.01) had better generalealth status. Within-practice modeling found thatatients with less than a high school educationOR�0.67, p�0.001) and lower incomes (OR�0.31,�0.001) had lower health status, as did overweight/bese patients (OR�0.50, p�0.001) and smokersOR�0.64, p�0.001).
eral health status
Coefficient (SE) OR (95% CI)
–2.38 (0.22)*** 0.09 (0.05, 0.14)
–0.30 (0.08)** 0.73 (0.61, 0.87)
0.68 (0.27)* 1.98 (1.14, 3.44)
–0.38 (0.11)** 0.67 (0.54, 0.85)–0.19 (0.09)* 0.81 (0.68, 0.98)0.38 (0.09)*** 1.47 (1.20, 1.79)
–0.49 (0.10)** 0.61 (0.49, 0.75)
0.28 (0.08)** 1.33 (1.12, 1.57)
–0.16 (0.08) 0.85 (0.72, 1.00)–0.09 (0.10) 0.90 (0.73, 1.12)–0.11 (0.13) 0.88 (0.67, 1.16)
0.04 (0.07) 1.05 (0.91, 1.21)
–0.06 (0.09) 0.93 (0.77, 1.12)–0.11 (0.10) 0.89 (0.72, 1.10)–0.08 (0.13) 0.91 (0.70, 1.20)
–0.38 (0.08)*** 0.67 (0.57, 0.80)
–1.15 (0.10)*** 0.31 (0.25, 0.38)–0.41 (0.10)*** 0.66 (0.53, 0.81)
–0.68 (0.11)*** 0.50 (0.40, 0.63)–0.43 (0.06)*** 0.64 (0.57, 0.73)
on the ordinal scale: excellent, very good, good, fair, poor.
r gen
sured
Am J Prev Med 2008;35(5S) S403

aotgph(peh1(onbu(hmw
DTampipaitfyfatstpi
T
CIH
S
D
D
C
PA
G
R
E
I
R
N*C hiera
S
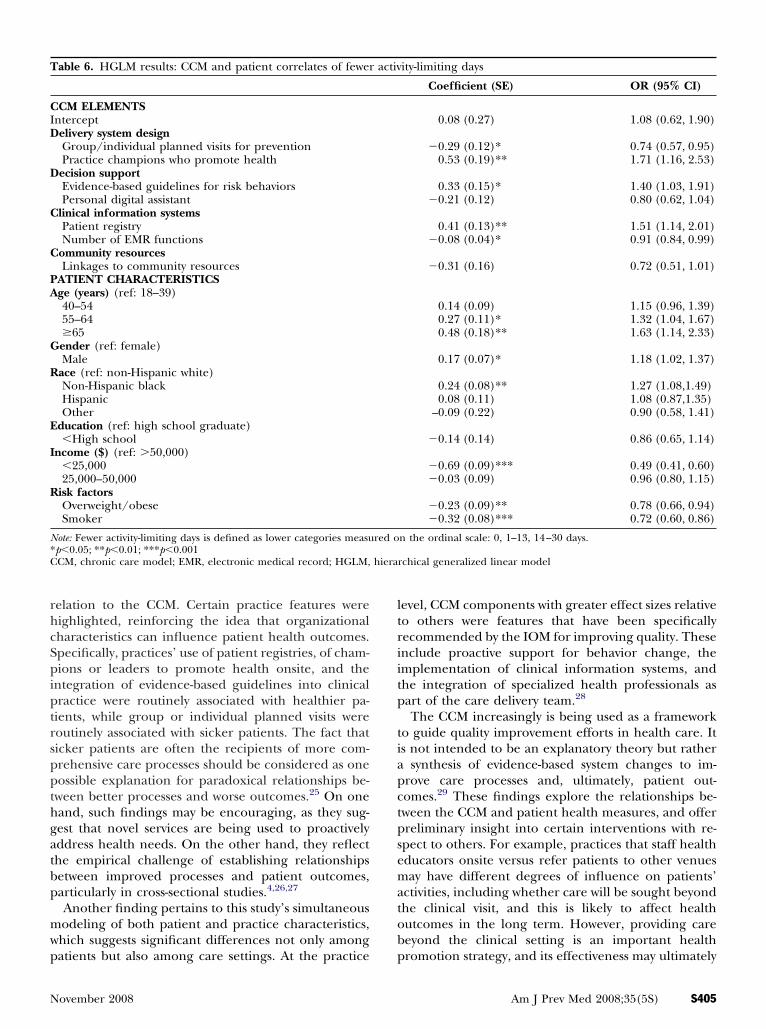
Tables 5 and 6 present estimates of unhealthy daysnd activity-limiting days that reflected similar trendsbserved with general health status. Adjusting for pa-ient covariates and clustering, practices that usedroup/individual planned visits for prevention andatient reminder cards saw patients with more un-ealthy (OR�0.69, p�0.001) or activity-limiting daysOR�0.74, p�0.05). In contrast, practices that usedatient registries , health promotion champions , andvidence-based guidelines for treating risk behaviorsad patients with fewer unhealthy days (OR�1.29–.41, p�0.01) and fewer activity-limiting daysOR�1.40–1.51, p�0.05). In addition, public reportingf performance measures (OR�1.28, p�0.01) and theumber of EMR functions (OR�1.08, p�0.01) wereoth associated with fewer unhealthy days, while EMRse was associated with more activity-limiting daysOR�0.91, p�0.05). Within these study practices,igher HRQOL was associated with being older, male,ore affluent, African American or Hispanic, and
able 5. HGLM results: CCM and patient correlates of fewer
CM ELEMENTSnterceptealth system and organization of carePublic reporting of performance
elf-management supportPatient reminder cardselivery system designGroup/individual planned visits for preventionPractice champions who promote healthecision supportEvidence-based guidelines for risk behaviors
linical Information systemsPatient registryNumber of EMR functions
ATIENT CHARACTERISTICSge (years) (ref: 18–39)40–5455–64�65ender (ref: female)Male
ace (ref: non-Hispanic white)Non-Hispanic blackHispanicOther
ducation (ref: high school graduate)�High school
ncome ($) (ref: �50,000)�25,00025,000–50,000
isk factorsOverweight/obeseSmoker
ote: Fewer unhealthy days is defined as lower categories measured op�0.05; **p�0.01; ***p�0.001CM, chronic care model; EMR, electronic medical record; HGLM,
ithout behavioral risk factors (p�0.05). o
404 American Journal of Preventive Medicine, Volume 35, Num
iscussionhis study found that features consistent with the CCMnd adapted for behavior change were implemented to aoderate degree among frontline primary care practices
articipating in Round 2 of the Prescription for Healthnitiative. Comparisons with a similar national sample ofractices participating in Round 1 suggest an increaseddoption of the CCM, with the most dramatic changenvolving the implementation of clinical information sys-ems.12 Reported rates of using patient registries doubledrom 32% to 61% over the course of approximately 3ears, and rates of using EMR systems more than tripledrom 15% to 53%. These increases suggest a much greaterwareness and investment in monitoring patient-popula-ion data, and transitioning from paper to electronictorage and management of clinical information. Seekingo understand how patients’ health may be affected byractice implementation of features outlined by the CCM
s important and timely.These findings indicate that three separate measures
ealthy days
efficient (SE) OR 95% CI
.48 (0.15)*** 0.22 (0.16, 0.30)
.25 (0.07)** 1.28 (1.09, 1.51)
.36 (0.08)*** 0.69 (0.58, 0.82)
.29 (0.08)** 0.74 (0.62, 0.89)
.34 (0.07)*** 1.41 (1.22, 1.64)
.26 (0.07)** 1.30 (1.12, 1.51)
.26 (0.08)** 1.29 (1.09, 1.53)
.07 (0.02)** 1.08 (1.03, 1.13)
.03 (0.10) 1.03 (0.84, 1.25)
.31 (0.12)** 1.37 (1.07, 1.74)
.65 (0.13)*** 1.91 (1.45, 2.52)
.38 (0.08)*** 1.46 (1.23, 1.73)
.28 (0.09)** 1.33 (1.11, 1.59)
.29 (0.11)* 1.34 (1.07, 1.68)
.20 (0.16) 1.23 (0.89, 1.70)
.19 (0.12) 0.82 (0.64, 1.05)
.84 (0.09)*** 0.42 (0.35, 0.51)
.35 (0.11)** 0.70 (0.56, 0.87)
.13 (0.07) 0.87 (0.75, 1.02)
.30 (0.09)** 0.73 (0.61, 0.88)
ordinal scale: 0, 1–13, 14–30 unhealthy days.
rchical generalized linear model
unh
Co
�1
0
�0
�00
0
00
000
0
000
�0
�0�0
�0�0
n the
f patient health and HRQOL performed similarly in
ber 5S www.ajpm-online.net
rhcSpiptrsppthgatbp
mwp
ltriitp
tiapctpsematob
T
CID
D
C
C
PA
G
R
E
I
R
N*C hiera
N
elation to the CCM. Certain practice features wereighlighted, reinforcing the idea that organizationalharacteristics can influence patient health outcomes.pecifically, practices’ use of patient registries, of cham-ions or leaders to promote health onsite, and the
ntegration of evidence-based guidelines into clinicalractice were routinely associated with healthier pa-ients, while group or individual planned visits wereoutinely associated with sicker patients. The fact thaticker patients are often the recipients of more com-rehensive care processes should be considered as oneossible explanation for paradoxical relationships be-ween better processes and worse outcomes.25 On oneand, such findings may be encouraging, as they sug-est that novel services are being used to proactivelyddress health needs. On the other hand, they reflecthe empirical challenge of establishing relationshipsetween improved processes and patient outcomes,articularly in cross-sectional studies.4,26,27
Another finding pertains to this study’s simultaneousodeling of both patient and practice characteristics,hich suggests significant differences not only among
able 6. HGLM results: CCM and patient correlates of fewer
CM ELEMENTSnterceptelivery system designGroup/individual planned visits for preventionPractice champions who promote healthecision supportEvidence-based guidelines for risk behaviorsPersonal digital assistant
linical information systemsPatient registryNumber of EMR functions
ommunity resourcesLinkages to community resources
ATIENT CHARACTERISTICSge (years) (ref: 18–39)40–5455–64�65ender (ref: female)Male
ace (ref: non-Hispanic white)Non-Hispanic blackHispanicOther
ducation (ref: high school graduate)�High school
ncome ($) (ref: �50,000)�25,00025,000–50,000
isk factorsOverweight/obeseSmoker
ote: Fewer activity-limiting days is defined as lower categories measup�0.05; **p�0.01; ***p�0.001CM, chronic care model; EMR, electronic medical record; HGLM,
atients but also among care settings. At the practice p
ovember 2008
evel, CCM components with greater effect sizes relativeo others were features that have been specificallyecommended by the IOM for improving quality. Thesenclude proactive support for behavior change, themplementation of clinical information systems, andhe integration of specialized health professionals asart of the care delivery team.28
The CCM increasingly is being used as a frameworko guide quality improvement efforts in health care. Its not intended to be an explanatory theory but rather
synthesis of evidence-based system changes to im-rove care processes and, ultimately, patient out-omes.29 These findings explore the relationships be-ween the CCM and patient health measures, and offerreliminary insight into certain interventions with re-pect to others. For example, practices that staff healthducators onsite versus refer patients to other venuesay have different degrees of influence on patients’
ctivities, including whether care will be sought beyondhe clinical visit, and this is likely to affect healthutcomes in the long term. However, providing careeyond the clinical setting is an important health
ity-limiting days
Coefficient (SE) OR (95% CI)
0.08 (0.27) 1.08 (0.62, 1.90)
�0.29 (0.12)* 0.74 (0.57, 0.95)0.53 (0.19)** 1.71 (1.16, 2.53)
0.33 (0.15)* 1.40 (1.03, 1.91)�0.21 (0.12) 0.80 (0.62, 1.04)
0.41 (0.13)** 1.51 (1.14, 2.01)�0.08 (0.04)* 0.91 (0.84, 0.99)
�0.31 (0.16) 0.72 (0.51, 1.01)
0.14 (0.09) 1.15 (0.96, 1.39)0.27 (0.11)* 1.32 (1.04, 1.67)0.48 (0.18)** 1.63 (1.14, 2.33)
0.17 (0.07)* 1.18 (1.02, 1.37)
0.24 (0.08)** 1.27 (1.08,1.49)0.08 (0.11) 1.08 (0.87,1.35)
–0.09 (0.22) 0.90 (0.58, 1.41)
�0.14 (0.14) 0.86 (0.65, 1.14)
�0.69 (0.09)*** 0.49 (0.41, 0.60)�0.03 (0.09) 0.96 (0.80, 1.15)
�0.23 (0.09)** 0.78 (0.66, 0.94)�0.32 (0.08)*** 0.72 (0.60, 0.86)
n the ordinal scale: 0, 1–13, 14–30 days.
rchical generalized linear model
activ
red o
romotion strategy, and its effectiveness may ultimately
Am J Prev Med 2008;35(5S) S405

dpWa
trlahCicFttihcmc
etsAosl
C
Tpbtppwmtmi
Ttf
t
R
1
1
1
1
1
1
1
1
1
1
2
2
2
2
2
2
2
2
2
2
S
epend on how accountability relationships betweenatients and various care providers are structured.ell-organized interventions may yield health benefits
nd warrant further, longitudinal study.Limitations of this study include the cross-sectional data
hat are insufficient to establish causality. For a variety ofeasons, different practices may tend to attract more- oress-healthy patients, although existing practice structuresnd care systems may also, in turn, lead to favorableealth outcomes. While this study is suggestive of theCM’s utility as a framework for health behavior change
n primary and secondary prevention, understanding theomplexity of the interaction is a work in progress.ollow-up data from practices participating in this initia-ive are now being collected, offering further opportuni-ies for longitudinal study. Additionally, the list of exam-ned CCM components was not exhaustive as there mayave been other related tools and structures that were notaptured. Finally, the fact that all sites were part of a PBRNay affect the generalizability of results to other primary
are practices.Study strengths include an opportunistic ability to
xamine applications of the CCM through the Prescrip-ion for Health initiative, which involved a diverseample of practices and patients across the country.lso, the use of advanced analytic approaches, such asrdinal HGLM, contributes to an improved under-tanding of possible systems-level effects on patient-evel outcomes as conceptualized by the CCM.
onclusion
his study reports on CCM implementation in frontlinerimary care practices, and finds significant differencesetween practices and corresponding associations with pa-ient health measures. Increasing adaptation of the CCM forrevention and health behavior counseling may be an im-ortant step in proactively addressing health needs any-here along the spectrum of health maintenance to diseaseanagement. Implementing system changes that are consis-
ent with the CCM may serve to reorient care delivery towardore proactive behavior change and, ultimately, toward
mprovements in patient health outcomes.
his study was funded by grants #047075 and #053221 fromhe Robert Wood Johnson Foundation, and K02 HS017007rom the Agency for Healthcare Research and Quality.
No financial disclosures were reported by the authors ofhis paper.
eferences1. Improving Chronic Illness Care. The chronic care model. www.
improvingchroniccare.org.2. Wagner EH, Glasgow RE, Davis C, et al. Quality improvement in chronic
illness care: a collaborative approach. Jt Comm J Qual Improv 2001;
27:63–80.406 American Journal of Preventive Medicine, Volume 35, Num
3. Bodenheimer T, Wagner EH, Grumbach K. Improving primary care forpatients with chronic illness: the chronic care model, Part 2. JAMA2002;288:1909–14.
4. Sperl-Hillen JM, Solberg LI, Hroscikoski MC, Crain AL, Engebretson KI,O’Connor PJ. Do all components of the chronic care model contributeequally to quality improvement? Jt Comm J Qual Improv 2004;30:303–9.
5. Stroebel RJ, Gloor B, Freytag S, et al. Adapting the chronic care model totreat chronic illness at a free medical clinic. J Health Care Poor Under-served 2005;16:286–96.
6. Bonomi AE, Wagner EH, Glasgow RE, VonKorff M. Assessment of chronicillness care (ACIC): a practical tool to measure quality improvement.Health Serv Res 2002;37:791–820.
7. Pearson ML, Wu SY, Schaefer J, et al. Assessing the implementation of thechronic care model in quality improvement collaboratives. Health Serv Res2005;40:978–96.
8. Mangione-Smith R, Schonlau M, Chan KS, et al. Measuring the effective-ness of a collaborative for quality improvement in pediatric asthma care:does implementing the chronic care model improve processes and out-comes of care? Ambul Pediatr 2005;5:75–82.
9. Parchman ML, Zeber JE, Romero RR, Pugh JA. Risk of coronary arterydisease in type 2 diabetes and the delivery of care consistent with thechronic care model in primary care settings: a STARNet study. Med Care2007;45:1129–34.
0. Nutting PA, Dickinson WP, Dickinson LM, et al. Use of chronic care modelelements in associated with higher-quality care for diabetes. Ann Fam Med2007;5:14–20.
1. Glasgow RE, Orleans CT, Wagner EH, Curry SJ, Solberg LI. Does thechronic care model serve also as a template for improving prevention?Milbank Q 2001;79:579–612, iv–v.
2. Hung DY, Rundall TG, Tallia AF, Cohen D, Halpin HA, Crabtree BF.Rethinking prevention in primary care: applying the chronic care model toaddress health risk behaviors. Milbank Q 2007;85:69–91.
3. Wagner EH, Austin BT, Von Korff M. Organizing care for patients withchronic illness. Milbank Q 1996;74:511–44.
4. Calkins E, Boult C, Wagner H, Pacala J. New ways to care for older people:building systems based on evidence. New York: Springer, 1999.
5. CDC. Measuring healthy days: population assessment of health-relatedquality of life. Washington DC: USDHHS, 2000.
6. Moriarty DG, Kobau R, Zack MM. Tracking health days: a window on thehealth of older adults. Prev Chronic Dis 2005;2:A16.
7. CDC. Health-related quality of life surveillance: U.S., 1993–2002. MMWRSurveill Summ 2005;54:1–35.
8. Keller HH, Ostbye T, Goy R. Nutritional risk predicts quality of life inelderly community-living Canadians. J Gerontol A Biol Sci Med Sci2004;59:68–74.
9. Wagner EH, Davis C, Schaefer J, Von Korff M, Austin B. A survey of leadingchronic disease management programs: are they consistent with theliterature? Manag Care Q 1999;7:56–66.
0. Bodenheimer T, Wagner EH, Grumbach K. Improving primary care forpatients with chronic illness. JAMA 2002;288:1775–9.
1. Woolf SH, Grol R, Hutchinson A, Eccles M, Grimshaw J. Clinical guidelines:potential benefits, limitations, and harms of clinical guidelines. BMJ1999;318:527–30.
2. Rundall TG, Shortell SM, Wang MC, et al. As good as it gets? Chronic caremanagement in nine leading U.S. physician organizations. BMJ 2002;325:958–61.
3. Solberg LI. Guideline implementation: what the literature doesn’t tell us.Jt Comm J Qual Improv 2000;26:525–37.
4. Raudenbush SW, Bryk AS. Hierarchical linear models: applications anddata analysis methods. Thousand Oaks CA: Sage Publications, 2002.
5. Kahn KL, Tisnado DM, Adams JL, et al. Does ambulatory process of carepredict health-related quality of life outcomes for patients with chronicdisease? Health Serv Res 2007;42:63–83.
6. Kerr EA, Smith DM, Hogan MM, Hofer TP, Hayward RA. Avoiding pitfallsin chronic disease quality measurement: a case for the next generation oftechnical quality measurement. Am J Manag Care 2001;7:1033–43.
7. Leatherman S, Berwick DM, Iles D, et al. The business case for quality: casestudies and an analysis. Health Aff (Millwood) 2003;22:17–30.
8. IOM. Crossing the quality chasm: a new health system for the 21st century.Washington DC: The National Academies Press, 2001.
9. Wagner EH, Austin BT, Davis C, Hindmarsh M, Schaefer J, Bonomi A.Improving chronic illness care: translating evidence into action. Health Aff
(Millwood) 2001;20:64–78.ber 5S www.ajpm-online.net