The Chinese Banking System: Economic Performance and Prospects for Future Development
22
TRANSITION FINANCE, BANKING AND CURRENCY RESEARCH The Chinese Banking System: Economic Performance and Prospects for Future Development Enrico Geretto Rubens Pauluzzo Received: 22 July 2008 / Accepted: 4 September 2008 / Published online: 25 February 2009 Ó Springer-Verlag 2009 Abstract This paper examines the main characteristics of the Chinese banking industry. In particular, it analyses the main performance indicators of the system together with some prospects of future development. The paper also considers the problems related to high levels of non-performing loans and the internationalization paths of the Chinese banking market. In spite of some recent reforms, further legislative improvements are required to develop the system and to allow a gradual opening to foreign competition. Keywords China Banking system Economic performance JEL Classification F37 G21 Introduction The gradual opening of the People’s Republic of China to international markets raises the problem of how the financial system, and in particular the banking market, will be able to support this phenomenon (Fishman 2004; Lemoine 2005; Dobson and Kashyap 2006; Rampini 2006; Chiarlone and Amighini 2007). This paper aims at deepening the economic performances of the major banks of the People’s Republic of China and the main problems related to the entire Chinese banking system. In particular, after a short examination of the main balance sheet items of the major Chinese banks, we propose an analytical scheme of the results achieved, in E. Geretto (&) R. Pauluzzo Faculty of Economics, University of Udine, Udine, Italy e-mail: Enrico.Geretto@dfimf.uniud.it R. Pauluzzo e-mail: [email protected] 123 Transit Stud Rev (2009) 16:92–113 DOI 10.1007/s11300-009-0055-4
Transcript of The Chinese Banking System: Economic Performance and Prospects for Future Development

TRANSI TI ON FIN ANC E, BANK ING AND CURRENCY RESEARCH
The Chinese Banking System: Economic Performanceand Prospects for Future Development
Enrico Geretto Æ Rubens Pauluzzo
Received: 22 July 2008 / Accepted: 4 September 2008 / Published online: 25 February 2009
� Springer-Verlag 2009
Abstract This paper examines the main characteristics of the Chinese banking
industry. In particular, it analyses the main performance indicators of the system
together with some prospects of future development. The paper also considers the
problems related to high levels of non-performing loans and the internationalization
paths of the Chinese banking market. In spite of some recent reforms, further
legislative improvements are required to develop the system and to allow a gradual
opening to foreign competition.
Keywords China � Banking system � Economic performance
JEL Classification F37 � G21
Introduction
The gradual opening of the People’s Republic of China to international markets
raises the problem of how the financial system, and in particular the banking market,
will be able to support this phenomenon (Fishman 2004; Lemoine 2005; Dobson
and Kashyap 2006; Rampini 2006; Chiarlone and Amighini 2007). This paper aims
at deepening the economic performances of the major banks of the People’s
Republic of China and the main problems related to the entire Chinese banking
system.
In particular, after a short examination of the main balance sheet items of the
major Chinese banks, we propose an analytical scheme of the results achieved, in
E. Geretto (&) � R. Pauluzzo
Faculty of Economics, University of Udine, Udine, Italy
e-mail: [email protected]
R. Pauluzzo
e-mail: [email protected]
123
Transit Stud Rev (2009) 16:92–113
DOI 10.1007/s11300-009-0055-4

order to provide a structured evaluation of them. The final section of the paper
analyses the possible future scenarios and specific problems of the banking system.
Structure of the Chinese Banking System
The Chinese banking system is characterized by a pyramid structure. Its top is
represented by the People’s Bank of China (PBOC), established in 1948, with
central bank functions. Since April 2003, the PBOC has been supported by the
China Banking Regulatory Commission (CBRC), established to deal with the
regulatory and supervisory activities, allowing the PBOC to focus exclusively on
monetary policy issues. The core of the Chinese banking system is represented by
the State-Owned Banks, divided into Commercial Banks and State Policy Banks.
Commercial Banks are the four major banks of the country1 (Big four), established
in 1980 by the modernization of PBOC. They include:
• Industrial & Commercial Bank of China;
• Bank of China;
• China Construction Bank;
• Agricultural Bank of China.
The market share of these institutions (52%) is mainly due to their role in
implementing the economic and social policies of the government, as a result of the
firm relationship with State-Owned Enterprises (SOEs). The Big four have several
branches and offices throughout the country, allowing them to maintain large and
stable relations with the market. The government involvement in their management
activities has generated an inefficient costs structure, a weak corporate governance
and high levels of non-performing loans (NPLs).
In order to avoid the risk that the Big four could be used as mere instruments for
financial support to public projects and to focus their activities on better commercial
criteria, three State Policy Banks were established in 1994:
• Agricultural Development Bank of China;
• China Development Bank;
• Export-Import Bank of China.
These banks represent a crucial lever for the Chinese economic development.
They have inherited the typical activities of state banks, but they have not taken
charge of their outstanding debts; their main source of funding is represented by
bonds, placed both on the domestic (National Inter-Bank Bond Market); (CBRC
2005, 2006d, 2007a, b, c), and on the international markets.
Other important bank categories of the Chinese system are represented by Joint
Stock Commercial Banks and City Commercial Banks. Joint Stock Commercial
Banks are owned by the state, local authorities and other investors: some of them
1 Official statistics have been considering a fifth bank, Bank of Communication (BOCOM), in State-owned banks since March 2007. In this study, however, that bank is not considered because its data at the
end of 2006 were not self-important.
The Chinese Banking System 93
123

have placed their shares on stock markets. These commercial banks are authorized
to carry out any banking activities, including currency transactions (Fioroni and
Cianci 2004). In spite of their relatively small size, they are growing at a quick pace,
attracting the interest of foreign banks. Half of the 13 Joint Stock Commercial
Banks in China have a partnership with a foreign investor. City Commercial Banks,
on the other hand, operate exclusively within the main urban centers. Owned by
local governments and local companies, they provide their services to SMEs in
Beijing, Shanghai, Tianjin, Guangzhou and Dalian, which are the most developed
areas of the country.
The Chinese banking system is completed by Rural Credit Cooperatives. There
are almost 40,000 cooperative banks, supporting the activities of outlying SMEs.
Until a few years ago, they were controlled by the Agricultural Bank of China but,
nowadays, they are supervised by the PBOC. The firm connection of such banks to
the local authorities, or to highly politicized public bodies, means that their
management criteria are largely influenced by state mechanisms.
Performance of the Main Credit Institutions
The paper analyses nine Chinese credit institutions: Agricultural Bank of China
(ABC), Bank of China (BOC), Construction Bank of China (CBC), Industrial and
Commercial Bank of China (ICBC), China Development Bank (CDB), Bank of
Communications (BOCOM), China Merchants Bank (CMC), China Minsheng
Banking Corporation (CMBC) and Shenzhen Development Bank (SDB). Their bank
counters are 75,686, more than 90% of total Chinese bank counters. Their
employees are 1,535,579 (83.3% of total bank employees). The funds they manage
represent 84% of the total funds managed by the entire Chinese banking system2
(CBRC 2006a, b, c, d, 2007a, b, c).
In order to better analyze the economic performance of the panel, we consider
the following reclassification of financial statements. Assets are divided into
interest bearing assets (loans) and non-interest bearing assets (cash, fixed assets,
etc.). Liabilities are also divided into interest bearing liabilities (deposits) and
non-interest bearing liabilities (provisions for risks and other charges). As for
income statements, we consider interest net income (the difference between interest
income and interest expenses), intermediation margin (calculated by adding the
commissions and other incomes to the interest net income), profit before tax
(intermediation margin minus commissions and other expenses) and net profit after
tax (profit before tax minus tax income) (Tables 1, 2).
LSþ OA ¼DSþ OLþ EQ
II� IE ¼NIþ CI ¼ IM� CE ¼ PBT� IT ¼ NPAT
2 All data refer to 2005.
94 E. Geretto, R. Pauluzzo
123

Tab
le1
Bal
ance
shee
t2
00
5—
(mil
lio
ns
of€)
Bal
ance
shee
t2
00
5A
BC
BO
CC
BC
ICB
CC
DB
BO
CO
MC
MB
CM
BC
SD
BT
ota
l
Lo
ans
(LS
)2
93
,39
92
26
,03
02
51
,37
93
36
,73
71
79
,82
47
9,7
00
48
,17
83
2,3
98
15
,71
51
,463
,360
Oth
eras
sets
(OA
)2
07
,73
92
72
,14
42
30
,13
03
41
,40
11
9,6
10
69
,64
82
8,9
83
26
,12
17
,63
71
,203
,413
To
tal
asse
ts(T
A)
50
1,1
38
49
8,1
74
48
1,5
10
67
8,1
39
19
9,4
35
14
9,3
48
77
,16
25
8,5
20
23
,35
22
,666
,773
Dep
osi
ts(D
S)
42
4,0
23
38
9,0
37
42
0,5
96
60
2,5
88
14
,37
41
28
,23
46
6,6
36
50
,16
52
1,1
98
2,1
16
,852
Oth
erli
abil
itie
s(O
L)
68,7
53
81,5
52
30,7
28
48,2
53
171,3
52
12,3
40
7,7
94
6,7
31
1,6
23
429,1
28
Tota
lli
abil
itie
s492,7
76
470,5
89
451,3
24
650,8
42
185,7
27
140,5
75
74,4
31
56,8
96
22,8
21
2,5
45,9
80
Ow
ner
’s/S
har
e-hold
ers’
equit
y(E
Q)
8,3
61
27,5
85
30,1
86
27,2
96
13,7
08
8,7
73
2,7
30
1,6
23
530
120,7
93
Tota
lli
abil
itie
san
deq
uit
y501,1
38
498,1
74
481,5
10
678,1
39
199,4
35
149,3
48
77,1
62
58,5
20
23,3
52
2,6
66,7
73
To
tal
mea
ns
the
tota
lo
fth
esa
mp
le,
no
tth
eto
tal
of
the
enti
resy
stem
The Chinese Banking System 95
123

Tab
le2
Inco
me
stat
emen
t2
00
5—
(mil
lio
ns
of€)
Inco
me
stat
emen
t2005
AB
CB
OC
CB
CIC
BC
CD
BB
OC
OM
CM
BC
MB
CS
DB
Tota
l
Inte
rest
inco
me
(II)
11
,04
21
7,5
77
18
,23
42
5,2
30
9,7
43
5,2
18
2,7
18
1,8
37
91
09
2,5
09
Inte
rest
expen
ses
(I.E
)-
6,4
49
-7
,03
1-
5,9
92
-9
,096
-5
,52
5-
1,9
00
-9
70
-8
21
-3
96
-3
8,1
80
Net
inte
rest
inco
me
(NI)
4,5
93
10
,54
61
2,2
42
16
,13
44
,218
3,3
18
1,7
48
1,0
15
51
45
4,3
29
Com
mis
sions
&oth
erin
com
es(C
I)3,9
92
1,8
12
1,3
62
2,0
85
229
420
300
662
68
10,9
30
Inte
rmed
iati
on
mar
gin
(IM
)8,5
85
12,3
58
13,6
04
18,2
19
4,4
47
3,7
38
2,0
48
1,6
78
582
65,2
59
Com
mis
sions
&oth
erex
pen
ses
(CE
)-
7,7
58
-6
,56
6-
7,7
89
-1
1,5
99
-9
92
-2
,389
-1
,369
-1
,232
-5
20
-4
0,2
14
Pro
fit
bef
ore
tax
(PB
T)
82
75
,79
15
,815
6,6
20
3,4
55
1,3
49
67
84
45
62
25
,04
5
Inco
me
tax
(IT
)-
71
7-
2,3
67
-8
68
-2
,626
-1
,06
2-
37
8-
28
4-
16
1-
30
-8
,493
Net
pro
fit
afte
rta
x(N
PA
T)
10
93
,42
34
,946
3,9
93
2.3
93
97
13
93
28
33
21
6,5
52
AB
CA
gri
cult
ura
lB
ank
of
Chin
a,B
OC
Ban
ko
fC
hin
a,C
BC
Co
nst
ruct
ion
Ban
ko
fC
hin
a,IC
BC
Ind
ust
rial
and
Com
mer
cial
Ban
ko
fC
hin
a,C
DB
Chin
aD
evel
op
men
t
Ban
k,
BO
CO
MB
ank
of
Com
mu
nic
atio
ns,
CM
CC
hin
aM
erch
ants
Ban
k,
CM
BC
Ch
ina
Min
shen
gB
ankin
gC
orp
ora
tio
n,
SD
BS
hen
zhen
Dev
elop
men
tB
ank
So
urc
eC
BR
C,
An
nu
alR
eport
20
06
–2
00
5;
Nat
ion
alB
ure
auo
fS
tati
stic
so
fth
eP
eople
’sR
epub
lic
of
Ch
ina.
Ow
nel
abora
tion
96 E. Geretto, R. Pauluzzo
123

We are therefore able to provide some economic performance indicators:
PBT=EQ ¼ NI=EQð Þ � IM=NIð Þ � PBT=IMð Þ ¼ Gð ÞROE
NPAT=EQ ¼ NI=EQð Þ � IM=NIð Þ � NPAT=IMð Þ ¼ Nð ÞROE
Splitting ROE into three parts makes it easier to understand changes in ROE. In
particular, Gross or Net ROE can be decomposed into interest net income divided
by owner’s/share-holders’ equity (NI/EQ), intermediation margin divided by
interest net income (IM/NI) and profit before tax or net profit after tax divided by
intermediation margin (PBT or NPAT/IM) (Tables 3, 4).
NI/EQ can be analyzed considering its relation with total assets (good proxy for
managed funds):
NI=EQ ¼ NI=TAð Þ � TA=EQð ÞThis allows us to examine, on the one hand, the return on assets (ROA) and, on
the other hand, the leverage of a specific bank.
Because of the central role played by the ratio NI/EQ in the ROE equation, we
would also like to suggest the following decomposition (Table 5):
NI=EQ ¼ II=LSð Þ � LS� DSð Þ=EQ½ �f g þ II=LSð Þ � IE=DSð Þ½ � � DS=EQð Þf gWe consider the determinants of the interest net income, represented by the
spread earned on the share of invested deposits (second addend), and the average
interest rate multiplied by the ratio between net monetary working capital (loans
minus deposits) and owner’s/share-holders’ equity (first addend).
The collected data show a gross return on equity [(G) ROE] of about 21% for the
entire panel in 2005: the burden of taxation is about 7% points [(N)
ROE = 13.70%]. In both cases, this is a significant performance level. The key
factor to the overall profitability is the interest net income: its ratio to the owner’s/
share-holders’ equity is 45%. The influence of commissions and other incomes is
only 20%: this is mainly due to the limited use of banking services by customers
and/or a low supply level by banks (Table 6). Finally, operational costs absorb more
than 60% of the intermediation margin: data show low levels of efficiency
(Tables 7, 8). As stated before, the overall profitability is strongly influenced by the
Table 3 Gross ROE
2005 NI/EQ * IM/NI * PBT/IM (G) ROE %
ABC 0.5493 * 1.8691 * 0.0963 0.0989 9.89
BOC 0.3823 * 1.1718 * 0.4687 0.2100 21.00
CBC 0.4056 * 1.1113 * 0.4274 0.1926 19.26
ICBC 0.5911 * 1.1292 * 0.3634 0.2425 24.25
CDB 0.3077 * 1.0543 * 0.7769 0.2520 25.20
BOCOM 0.3782 * 1.1266 * 0.3609 0.1538 15.38
CMB 0.6403 * 1.1716 * 0.3315 0.2487 24.87
CMBC 0.6260 * 1.6516 * 0.2658 0.2748 27.48
SDB 0.9680 * 1.1323 * 0.1065 0.1168 11.68
Total 0.4498 * 1.2012 * 0.3838 0.2073 20.73
The Chinese Banking System 97
123
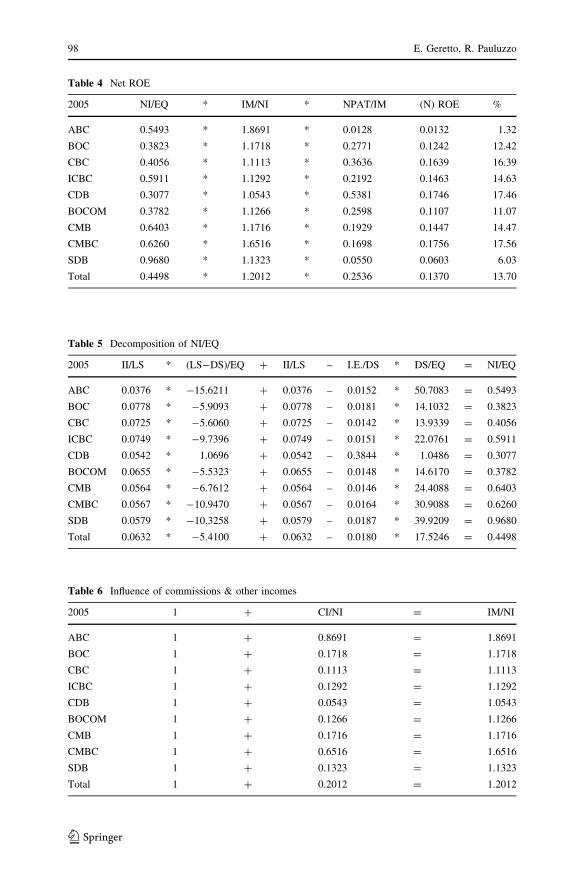
Table 5 Decomposition of NI/EQ
2005 II/LS * (LS-DS)/EQ ? II/LS – I.E./DS * DS/EQ = NI/EQ
ABC 0.0376 * -15.6211 ? 0.0376 – 0.0152 * 50.7083 = 0.5493
BOC 0.0778 * -5.9093 ? 0.0778 – 0.0181 * 14.1032 = 0.3823
CBC 0.0725 * -5.6060 ? 0.0725 – 0.0142 * 13.9339 = 0.4056
ICBC 0.0749 * -9.7396 ? 0.0749 – 0.0151 * 22.0761 = 0.5911
CDB 0.0542 * 1.0696 ? 0.0542 – 0.3844 * 1.0486 = 0.3077
BOCOM 0.0655 * -5.5323 ? 0.0655 – 0.0148 * 14.6170 = 0.3782
CMB 0.0564 * -6.7612 ? 0.0564 – 0.0146 * 24.4088 = 0.6403
CMBC 0.0567 * -10.9470 ? 0.0567 – 0.0164 * 30.9088 = 0.6260
SDB 0.0579 * -10.3258 ? 0.0579 – 0.0187 * 39.9209 = 0.9680
Total 0.0632 * -5.4100 ? 0.0632 – 0.0180 * 17.5246 = 0.4498
Table 6 Influence of commissions & other incomes
2005 1 ? CI/NI = IM/NI
ABC 1 ? 0.8691 = 1.8691
BOC 1 ? 0.1718 = 1.1718
CBC 1 ? 0.1113 = 1.1113
ICBC 1 ? 0.1292 = 1.1292
CDB 1 ? 0.0543 = 1.0543
BOCOM 1 ? 0.1266 = 1.1266
CMB 1 ? 0.1716 = 1.1716
CMBC 1 ? 0.6516 = 1.6516
SDB 1 ? 0.1323 = 1.1323
Total 1 ? 0.2012 = 1.2012
Table 4 Net ROE
2005 NI/EQ * IM/NI * NPAT/IM (N) ROE %
ABC 0.5493 * 1.8691 * 0.0128 0.0132 1.32
BOC 0.3823 * 1.1718 * 0.2771 0.1242 12.42
CBC 0.4056 * 1.1113 * 0.3636 0.1639 16.39
ICBC 0.5911 * 1.1292 * 0.2192 0.1463 14.63
CDB 0.3077 * 1.0543 * 0.5381 0.1746 17.46
BOCOM 0.3782 * 1.1266 * 0.2598 0.1107 11.07
CMB 0.6403 * 1.1716 * 0.1929 0.1447 14.47
CMBC 0.6260 * 1.6516 * 0.1698 0.1756 17.56
SDB 0.9680 * 1.1323 * 0.0550 0.0603 6.03
Total 0.4498 * 1.2012 * 0.2536 0.1370 13.70
98 E. Geretto, R. Pauluzzo
123

Table 7 Influence of commissions & other expenses
2005 1 – CE/IM = PBT/IM
ABC 1 – 0.9037 = 0.0963
BOC 1 – 0.5313 = 0.4687
CBC 1 – 0.5726 = 0.4274
ICBC 1 – 0.6366 = 0.3634
CDB 1 – 0.2231 = 0.7769
BOCOM 1 – 0.6391 = 0.3609
CMB 1 – 0.6685 = 0.3315
CMBC 1 – 0.7342 = 0.2658
SDB 1 – 0.8935 = 0.1065
Total 1 – 0.6162 = 0.3838
Table 8 Influence of commissions & other income and income tax
2005 1 – CE ? IT/IM = NPAT/IM
ABC 1 – 0.9872 = 0.0128
BOC 1 – 0.7229 = 0.2771
CBC 1 – 0.6364 = 0.3636
ICBC 1 – 0.7808 = 0.2192
CDB 1 – 0.4619 = 0.5381
BOCOM 1 – 0.7402 = 0.2598
CMB 1 – 0.8071 = 0.1929
CMBC 1 – 0.8302 = 0.1698
SDB 1 – 0.9450 = 0.0550
Total 1 – 0.7464 = 0.2536
Table 9 ROA and Leverage
2005 NI/TA * TA/EQ = NI/EQ
ABC 0.0092 * 59.9304 = 0.5493
BOC 0.0212 * 18.0596 = 0.3823
CBC 0.0254 * 15.9519 = 0.4056
ICBC 0.0238 * 24.8439 = 0.5911
CDB 0.0211 * 14.5487 = 0.3077
BOCOM 0.0222 * 17.0236 = 0.3782
CMB 0.0227 * 28.2641 = 0.6403
CMBC 0.0174 * 36.0561 = 0.6260
SDB 0.0220 * 43.9774 = 0.9680
Total 0.0204 * 22.0772 = 0.4498
The Chinese Banking System 99
123

Ta
ble
10
Bal
ance
shee
t2
00
6—
(mil
lio
ns
of€)
Bal
ance
shee
t2
00
6A
BC
BO
CC
BC
ICB
CC
DB
BO
CO
MC
MB
CM
BC
SD
BT
OT
AL
Lo
ans
(LS
)3
01
,80
22
27
,40
02
69
,20
53
43
,79
61
94
,09
28
8,5
57
53
,44
94
2,9
05
17
,04
81
,538
,25
4
Oth
eras
sets
21
8,0
73
29
0,6
58
25
7,8
65
38
6,6
78
31
,04
77
8,5
10
37
,41
62
5,2
37
8,3
01
1,3
33
,78
6
To
tal
asse
ts(T
A)
51
9,8
75
51
8,0
59
52
7,0
70
73
0,4
74
22
5,1
39
16
7,0
68
90
,86
56
8,1
42
25
,35
02
,872
,04
0
Dep
osi
ts(D
S)
46
0,1
85
39
8,4
15
45
6,5
34
61
7,8
85
15
,10
91
38
,17
47
5,2
73
56
,74
72
2,5
90
2,2
40
,91
2
Oth
erL
iabil
itie
s5
1,5
18
78
,99
73
8,4
61
66
,76
81
94
,64
22
0,0
63
10
,23
29
,517
2,1
30
47
2,3
28
To
tal
liab
ilit
ies
51
1,7
03
47
7,4
12
49
4,9
95
68
4,6
53
20
9,7
51
15
8,2
37
85
,50
56
6,2
64
24
,72
02
,713
,24
0
Ow
ner
’s/S
har
e-h
old
ers’
equ
ity
(EQ
)8
,172
40
,64
63
2,0
75
45
,82
01
5,3
88
8,8
30
5,3
60
1,8
78
63
01
58
,80
0
To
tal
liab
ilit
ies
and
equ
ity
51
9,8
75
51
8,0
59
52
7,0
70
73
0,4
74
22
5,1
39
16
7,0
68
90
,86
56
8,1
42
25
,35
02
,872
,04
0
100 E. Geretto, R. Pauluzzo
123

Ta
ble
11
Inco
me
stat
emen
t2
00
6—
(mil
lio
ns
of€)
Inco
me
stat
emen
t2
00
6A
BC
BO
CC
BC
ICB
CC
DB
BO
CO
MC
MB
CM
BC
SD
BT
ota
l
Inte
rest
inco
me
(II)
14
,68
12
0,8
84
20
,93
42
6,5
53
11
,29
66
,279
3,3
07
2,6
62
1,1
24
10
7,7
20
Inte
rest
expen
ses
(I.E
)-
7,6
70
-9
,14
1-
7,2
79
-1
0,6
84
-6
,143
-2
,407
-1
,214
-1
,089
-4
93
-4
6,1
20
Net
inte
rest
inco
mb
e(N
I)7
,01
01
1,7
43
13
,65
51
5,8
69
5,1
53
3,8
72
2,0
92
1,5
73
63
16
1,6
00
Co
mm
issi
on
s&
oth
erin
com
es(C
I)4
,49
72
,11
51
,623
2,0
16
48
94
57
37
31
46
87
11
,80
3
Inte
rmed
iati
on
mar
gin
(IM
)1
1,5
08
13
,85
81
5,2
78
17
,88
55
,642
4,3
29
2,4
66
1,7
19
71
87
3,4
03
Com
mis
sions
&oth
erex
pen
ses
(CE
)-
10
,32
1-
7,3
39
-8
,885
-1
0,8
73
-1
,727
-2
,636
-1
,484
-1
,201
-5
24
-4
4,9
90
Pro
fit
bef
ore
tax
(PB
T)
1,1
86
6,5
19
6,3
93
7,0
11
3,9
15
1,6
93
98
15
18
19
42
8,4
13
Inco
me
tax
(IT
)-
62
1-
1,9
32
-1
,887
-2
,15
8-
1,2
25
-5
00
-3
20
-1
45
-6
7-
8,8
55
Net
pro
fit
afte
rta
x(N
P)
56
54
,58
74
,506
4,8
52
2,6
90
1,1
94
66
13
73
12
71
9,5
58
AB
CA
gri
cult
ura
lB
ank
of
Ch
ina,
BO
CB
ank
of
Ch
ina,
CB
CC
on
stru
ctio
nB
ank
of
Ch
ina,
ICB
CIn
du
stri
alan
dC
om
mer
cial
Ban
ko
fC
hin
a,C
DB
Ch
ina
Dev
elo
pm
ent
Ban
k,
BO
CO
MB
ank
of
Com
munic
atio
ns,
CM
CC
hin
aM
erch
ants
Ban
k,
CM
BC
Ch
ina
Min
shen
gB
ank
ing
Co
rpo
rati
on
,S
DB
Sh
enzh
enD
evel
op
men
tB
ank
So
urc
eC
BR
C,
An
nu
alR
eport
20
06
–2
00
5;
Nat
ion
alB
ure
auo
fS
tati
stic
so
fth
eP
eop
le’s
Rep
ub
lic
of
Ch
ina.
Ow
nel
abora
tio
n
The Chinese Banking System 101
123

Table 13 Net ROE
2006 NI/EQ * IM/NI * NPAT/IM (N) ROE %
ABC 0.8579 * 1.6414 * 0.0492 0.0693 6.93
BOC 0.2889 * 1.1801 * 0.3310 0.1129 11.29
CBC 0.4257 * 1.1189 * 0.2949 0.1405 14.05
ICBC 0.3463 * 1.1270 * 0.2714 0.1059 10.59
CDB 0.3349 * 1.0949 * 0.4768 0.1748 17.48
BOCOM 0.4385 * 1.1180 * 0.2756 0.1351 13.51
CMB 0.3905 * 1.1782 * 0.2685 0.1235 12.35
CMBC 0.8376 * 1.0928 * 0.2170 0.1986 19.86
SDB 1.0016 * 1.1379 * 0.1769 0.2016 20.16
Total 0.3879 * 1.1916 * 0.2664 0.1232 12.32
Table 14 ROA and Leverage
2006 NI/TA * TA/EQ = NI/EQ
ABC 0.0135 * 63.6166 = 0.8579
BOC 0.0227 * 12.7456 = 0.2889
CBC 0.0259 * 16.4324 = 0.4257
ICBC 0.0217 * 15.9419 = 0.3463
CDB 0.0229 * 14.6308 = 0.3349
BOCOM 0.0232 * 18.9204 = 0.4385
CMB 0.0230 * 16.9524 = 0.3905
CMBC 0.0231 * 36.2843 = 0.8376
SDB 0.0249 * 40.2381 = 1.0016
Total 0.0214 * 18.0859 = 0.3879
Table 12 Gross ROE
2006 NI/EQ * IM/NI * PBT/IM (G) ROE %
ABC 0.8579 * 1.6414 * 0.1031 0.1453 14.53
BOC 0.2889 * 1.1801 * 0.4704 0.1604 16.04
CBC 0.4257 * 1.1189 * 0.4184 0.1993 19.93
ICBC 0.3463 * 1.1270 * 0.3921 0.1530 15.30
CDB 0.3349 * 1.0949 * 0.6939 0.2544 25.44
BOCOM 0.4385 * 1.1180 * 0.3911 0.1917 19.17
CMB 0.3905 * 1.1782 * 0.3982 0.1832 18.32
CMBC 0.8376 * 1.0928 * 0.3013 0.2758 27.58
SDB 1.0016 * 1.1379 * 0.2702 0.3079 30.79
Total 0.3879 * 1.1916 * 0.3871 0.1789 17.89
102 E. Geretto, R. Pauluzzo
123

Table 15 Influence of commissions & other income
2006 1 ? CI/NI = IM/NI
ABC 1 ? 0.6414 = 1.6414
BOC 1 ? 0.1801 = 1.1801
CBC 1 ? 0.1189 = 1.1189
ICBC 1 ? 0.1270 = 1.1270
CDB 1 ? 0.0949 = 1.0949
BOCOM 1 ? 0.1180 = 1.1180
CMB 1 ? 0.1782 = 1.1782
CMBC 1 ? 0.0928 = 1.0928
SDB 1 ? 0.1379 = 1.1379
Total 1 ? 0.1916 = 1.1916
Table 16 Influence of commissions & other expenses
2006 1 – CE/IM = PBT/IM
ABC 1 – 0.8969 = 0.1031
BOC 1 – 0.5296 = 0.4704
CBC 1 – 0.5816 = 0.4184
ICBC 1 – 0.6079 = 0.3921
CDB 1 – 0.3061 = 0.6939
BOCOM 1 – 0.6089 = 0.3911
CMB 1 – 0.6018 = 0.3982
CMBC 1 – 0.6987 = 0.3013
SDB 1 – 0.7298 = 0.2702
Total 1 – 0.6129 = 0.3871
Table 17 Influence of commissions & other income and income tax
2006 1 – CE ? IT/IM = NPAT/IM
ABC 1 – 0.9508 = 0.0492
BOC 1 – 0.6690 = 0.3310
CBC 1 – 0.7051 = 0.2949
ICBC 1 – 0.7286 = 0.2714
CDB 1 – 0.5232 = 0.4768
BOCOM 1 – 0.7244 = 0.2756
CMB 1 – 0.7315 = 0.2685
CMBC 1 – 0.7830 = 0.2170
SDB 1 – 0.8231 = 0.1769
Total 1 – 0.7336 = 0.2664
The Chinese Banking System 103
123

Table 18 Decomposition of NI/EQ
2006 II/LS * (LS-DS)/EQ ? II/LS – I.E./DS * DS/EQ = NI/EQ
ABC 0.0486 * -19.3812 ? 0.0486 – 0.0167 * 56.3124 = 0.8579
BOC 0.0918 * -4.2074 ? 0.0918 – 0.0229 * 9.8021 = 0.2889
CBC 0.0778 * -5.8403 ? 0.0778 – 0.0159 * 14.2333 = 0.4257
ICBC 0.0772 * -5.9817 ? 0.0772 – 0.0173 * 13.4848 = 0.3463
CDB 0.0582 * 11.6313 ? 0.0582 – 0.4066 * 0.9819 = 0.3349
BOCOM 0.0709 * -5.6191 ? 0.0709 – 0.0174 * 15.6482 = 0.4385
CMB 0.0619 * -4.0716 ? 0.0619 – 0.0161 * 14.0435 = 0.3905
CMBC 0.0620 * -7.3706 ? 0.0620 – 0.0192 * 30.2167 = 0.8376
SDB 0.0659 * -8.7968 ? 0.0659 – 0.0218 * 35.8571 = 1.0016
Total 0.0700 * -4.4248 ? 0.0700 – 0.0206 * 14.1115 = 0.3879
Table 19 NPLs of commercial banks (millions of €)
Banks I Quarter 2006 II Quarter 2006 III Quarter 2006 IV Quarter 2006
NPLs % NPLs % NPLs % NPLs %
SOCBs 109,113.52 9.78 103,864.61 9.47 105,511.32 9.31 102,486.67 9.22
JSCBs 15,253.76 3.92 12,014.04 3.09 11,677.29 2.91 11,363.63 2.81
Major commercial banks 124,367.28 8.26 115,878.66 7.80 117,188.60 7.64 113,850.29 7.51
City comm. Banks 8,877.93 7.59 8,316.96 6.72 8,067.67 6.07 6,369.12 4.78
Rural commercial banks 1,629.25 6.96 1,637.03 6.64 1,667.90 6.58 1,494.27 5.90
Foreign banks 378.20 0.95 360.07 0.87 354.77 0.81 368.70 0.78
Total 135,252.66 8.03 126,192.71 7.53 127,278.94 7.33 122,082.38 7.09
Next to the values there is the percentage proportion of NPLs of the total loans
Source China Banking Regulatory Commission. Own elaboration
Table 20 Type of NPLs (millions of €)
NPLs classification I Quarter 2006 II Quarter 2006 III Quarter 2006 IV Quarter 2006
NPLs % NPLs % NPLs % NPLs %
Substandard 33,815.48 2.01 30,169.89 1.80 29,213.71 1.68 26,019.31 1.51
Doubtful 51,887.71 3.08 49,572.19 2.96 50,954.35 2.93 50,483.07 2.93
Loss 49,549.46 2.94 46,450.63 2.77 47,110.89 2.71 45,580.00 2.65
Total 135,252.66 8.03 126,192.71 7.53 127,278.94 7.33 122,082.38 7.09
Next to the values there is the percentage proportion of NPLs of the total loans. The loans classification
has five levels: Pass, Special Mention, Substandard, Doubtful, and Loss. The last three categories are
considered NPLs. Cf. C.R.B�C., Statistics, 2007
Source China Banking Regulatory Commission. Own elaboration
104 E. Geretto, R. Pauluzzo
123

interest net income: its decomposition (Table 9) shows the ROA (about 2%)
multiplied by a leverage effect (TA/EQ) equal to 22%. The NI/EQ ratio is positively
influenced by a spread between positive and negative average rates (4.5%), but is
negatively affected by the net monetary working capital.
Net profit after tax in 2006 is lower than the previous year (gross ROE decreases
from 21% to about 17.9%), mainly because of the fall of net interest income, as the
influence of commissions and other incomes and the influence of commissions and
other expenses still remains almost unchanged. As for the NI/EQ ratio, with ROA
remaining equal there is a reduction of the leverage effect; the spread increases (5%
points) and the DS/EQ ratio drops to 14% (Tables 10, 11, 12, 13, 14, 15, 16, 17, 18).
Non-Performing Loans Management
The practice widely followed by several Chinese banks to provide credit on the
basis of patronage favours, rather than actual risk–performance principles, has led to
a high level of outstanding credits (Mallory, 1931; Tam On-Kit, 1992; Tsai, 2000).
The stock of bad loans registered by the Chinese banking system reached RMB
2,400 billion3 at the end of 2003, more than 25% of fund uses. Although this data
reached 7.09% at the end of 2006, it is estimated that more than 60% of this
reduction is due to write-offs related to the transfer of bad loans to asset-
management companies (Gotti Tedeschi 2007) (Tables 19, 20).
Four management companies (AMCs—Asset Management Companies) were
established in 19994 (Chiarlone and Amighini 2007; Malle 2007) to support the
Table 21 NPLs recovered by AMCs (31.12.2005, millions of €)
Data Huarong Great China Orient Cinda Total
Accumulated disposal 25,564.15 27,665.96 13,839.81 21,134.70 88,204.61
Cash recovered 5,713.02 2,872.79 3,362.27 6,600.59 18,548.66
Disposal ratio (%) 69.17 77.88 52.08 63.82 66.74
Asset recovery ratio (%) 26.92 12.90 28.73 34.30 24.58
Cash recovery ratio (%) 22.35 10.39 24.30 31.23 21.03
Accumulated disposal = accumulated amount of cash and non-cash assets recovered as well as loss
incurred by the end of the reporting period, Cash recovered = amount of cash assets recovered, Disposal
ratio = Accumulated disposal/Total NPLs purchased, Asset recovery ration = total assets recovered/
accumulated disposal, Cash recovery ratio = cash recovered/accumulated disposal
Source China Banking Regulatory Commission. Own elaboration
3 Equivalent to about € 229,6 billion (exchange rate: 31.12.2003).4 Cinda for China Construction Bank; Huarong for Industrial and Commercial Bank of China; Orient for
Bank of China and Great Wall and for the Agricultural Bank of China. The AMCs have been subject to a
considerable reform process. In February 2004, the State Council approved a proposal by the Minister of
Finance, according to which the AMCs should be transformed into genuine commercial companies after
2006, the deadline to complete the transfer of debts from the big four. This should ensure that
management companies will be able to use the equity capital in order to purchase non-performing assets
on the basis of commercial criteria: it is widely believed that the reform will lead to the restructuring of
debtor companies in order to attract strategic investors, both domestic and foreign.
The Chinese Banking System 105
123

activity of the Big four. One-hundred and thirty-five billion euros of bad loans (14% of
the GDP of the country) were transferred: however, more than half of NPLs remained
in banks’ portfolios, since only those originated before 1996 were transferred. At the
end of 2005, the AMCs found that 88 billion euros could be recovered,*65% of total
NPLs acquired; nevertheless the cash recovery ratio is still low (21.03%), that is about
18 billion euros. AMCs have different performance levels (Table 21) due to the
different type of their loans. If Great Wall, on the one hand, has acquired low quality
loans from the Agricultural Bank of China, a traditional source of funding for many
rural enterprises, Cinda, on the other hand, has acquired its portfolio from China
Construction Bank, involved in supporting construction projects and urban housing
development (Xu 2005). After a difficult start-up phase, Chinese banks are beginning
to obtain interesting results in doubtful loans management (Xu 2005). In particular,
significant results were achieved by market auctions of bad loans in 2004. The main
buyers of these auctions were the AMCs, often in joint-venture with some of the most
important international financial institutions, such as Morgan Stanley, Goldman
Sachs and Deutsche Bank. Direct sales of NPLs to investors, generally have the form
of individual assets sales, or bulk sales, including negotiated sales and auctions. The
main advantage of these transactions is the immediate liquidity available, often at the
expense of lower recovery values (Table 22).
In order to improve the quality of loan portfolios, China started the first
securitization transactions in 2005. In particular, the Chinese government developed
a regulatory framework, allowing a quick development of the internal market for
asset-backed securities. In order to enter the market, the Big four have received
several aids, mainly in the form of recapitalization, while other banks have been
subject to particular capital-asset constraints (Gyntelberg and Remolona 2006).
These differences explain the interest of the Chinese government in supporting the
main banks of the system, preserving their management and solvency levels, even at
the expense of a fair competition.
Further legislative improvements would be desirable to increase the number of
investors interested in the securitization market. Until a few years ago, Chinese
insurance companies and mutual funds were not allowed to access the asset-backed
securities market, dominated by commercial banks and non-financial private
operators (Gyntelberg and Remolona 2006).
Internationalization of the Banking System
In spite of the negative aspects considered, there are still positive circumstances
that make the Chinese banking market particularly attractive to foreign operators.
The fast growing economy, that should lead to a gradual reduction of bad loans,
government support to a coherent development of the system, as well as high
savings rates5 (IMF 2005), high levels of foreign exchange reserves and a strong
5 Chinese population savings rate, equal to about 25% of disposable income, remains high, despite a low
real interest rate on bank deposits. The high level of savings reflects the demographic development of the
country, with the gradual ageing of the population, the uncertainty regarding the pension benefits, health
care and education, and limited access to credit by individuals for purchasing durable goods and housing.
106 E. Geretto, R. Pauluzzo
123

Tab
le2
2D
irec
tN
PL
ssa
les
tofo
reig
nin
ves
tors
AM
C/B
ank
Yea
rB
oo
kv
alu
eS
ale
val
ue
Sal
ety
pe
Inv
esto
rs
Cin
da
2001
145
mm
.$–1.2
bn.
RM
BN
egoti
ated
Chen
ery
asso
ciat
es
Ori
ent
2001
217
mm
.$–1.8
bn.
RM
B2
1m
m.
$N
egoti
ated
Chen
ery
Ass
oci
ates
Ori
ent
2002
210
mm
.$–1.7
bn.
RM
BN
egoti
ated
Chen
ery
Ass
oci
ates
Hu
aro
ng
20
02
1.3
bn
.$
–1
0.8
bn
.R
MB
87
7.5
mm
.R
MB
Op
enau
ctio
nC
on
sort
ium
led
by
Mo
rgan
Sta
nle
y
Hu
aro
ng
20
02
24
0m
m.
£–
1.9
7b
n.
RM
B1
97
mm
.R
MB
Op
enau
ctio
nG
old
man
Sac
hs
BoC
(Cay
man
)2
00
31
.8b
n.
$–
14.9
bn
.R
MB
Op
enau
ctio
nC
itig
roup
Hu
aro
ng
20
04
2.2
bn
.$
–1
8.4
bn
.R
MB
Op
enau
ctio
nM
org
anS
tan
ley,
Cit
igro
up
,U
BS
,
Go
ldm
anS
ach
s,JP
Mo
rgan
,
Leh
man
,A
oY
iE
r(d
om
esti
c)
CC
B2
00
45
13
mm
.$
–4
.2b
n.
RM
B1
78
mm
.$
–1
.5b
n.
RM
BO
pen
auct
ion
Mo
rgan
Sta
nle
y,
Deu
tsch
eB
ank
To
tal
clo
sed
6.6
bn
.$
CC
B2
00
35
24
mm
.$
–4
.3b
n.
RM
BC
lose
dau
ctio
nM
org
anS
tan
ley
Hu
aro
ng
20
04
21
5m
m.
$–
1.8
bn
.R
MB
Clo
sed
auct
ion
Mo
rgan
Sta
nle
y,
GE
Gre
atW
all
20
04
28
1m
m.
$–
2.3
bn
.R
MB
Neg
oti
ated
Cit
igro
up
Gre
atW
all
20
04
1b
n.
$–
8.3
bn
.R
MB
Go
ldm
anS
ach
s
Gre
atW
all
20
04
Ab
ou
t1
40
mm
.$
Ab
ou
t1
4–
15
mm
.$
Au
ctio
n1
do
mes
tic
and
1in
tern
atio
nal
bu
yer
Ori
ent
20
04
29
0m
m.
$–
2.4
bn
.R
MB
Op
enau
ctio
nC
SF
SB
Cin
da
20
04
29
.7m
m.
$–
24
6m
m.
RM
B1
0.2
mm
.$
–8
5.1
bn
.R
MB
Op
enau
ctio
n1
do
mes
tic
and
1in
tern
atio
nal
bu
yer
To
tal
clo
sed/s
ign
ed2
.5b
n.
$
So
urc
eM
inX
u,
Res
olu
tio
no
fN
on
-Per
form
ing
Lo
ans
inC
hin
a,o
p.
cit.
,p
.4
0
The Chinese Banking System 107
123

net credit position, represent fundamental internal shock absorbers and attract the
investments of large international groups (Meng 1943; D’Agnolo 2001; Aiqun
et al. 2005). In 2003, in the Chinese banking system there were 191 branches of
foreign banks, 2 mixed capital companies, 11 mixed capital fund management
companies and 67 branches of foreign insurance companies. Since then, the
government has aimed at improving the openness of the financial sector to
international operators.6 In order to honour the WTO commitments, the State
Council, the highest administrative authority of the People’s Republic of China,
promulgated the Regulations of the People’s Republic of China on Administration
of Foreign-funded Banks at the end of 2006. These Regulations are formulated for
the purpose of meeting the needs of internationalization and economic develop-
ment of the Chinese system, strengthening and improving supervision and
regulation over foreign-funded banks,7 and promoting safe and sound operations of
the banking industry. In order to establish a wholly foreign-funded bank or a
Chinese-foreign joint venture bank, the minimum registered capital shall be RMB
1 billion8 or an equivalent amount in convertible currencies. When a wholly
foreign-funded bank or a Chinese-foreign joint venture bank establishes a branch
within the territory of the People’s Republic of China, the branch shall receive
from its parent bank a non-callable allocation of not less than RMB 100 million9 or
an equivalent amount in convertible currencies of operating capital. Conversely, a
branch of a foreign bank shall receive from its parent bank a non-callable
allocation of not less than RMB 200 million10 or an equivalent amount in
convertible currencies of operating capital.
When the regulations became effective, foreign banks that met specific prudential
requirements were able to operate in Chinese currency, both in the retail and in the
wholesale market, without any territorial or customer restriction, whereas such
institutions were previously able to operate only in the main cities. However, some
restrictions still persist for the branches of foreign banks: a branch of a foreign bank
6 The pilot project to transform the Bank of China and China Construction Bank into joint-stock
companies is being carried out with the aim of creating modern commercial banks, with share capital, and
internationally competitive. The recapitalization of the three major Chinese banks began in 2003, with a
capital contribution by the People’s Bank of China, amounting to 22.5 billion dollars in the Bank of China
and in the China Construction Bank. The same recapitalization continued in April 2005, with the
contribution of 15 billion dollars to the Industrial and Commercial Bank of China.7 The term foreign-funded banks in these regulations means:
• Wholly foreign-funded bank, funded solely by a foreign bank or jointly with any other foreign
financial institution;
• Chinese-foreign joint venture bank, jointly funded by a foreign financial institution with a Chinese
company or enterprise;
• Branch of a foreign bank;
• Representative office of a foreign bank.
In these Regulations, Wholly foreign-owned banks, Chinese-foreign joint venture banks and the
Branches of a foreign bank are collectively referred to Operational foreign banking entities.8 Equivalent to about € 96.7 million (exchange rate: 01.08.2007).9 Equivalent to about € 9.7 million (exchange rate: 01.08.2007).10 Equivalent to about € 19.3 million (exchange rate: 01.08.2007). The State Council, for prudential
purposes, can raise the above minimum capital requirements.
108 E. Geretto, R. Pauluzzo
123

Ta
ble
23
Op
enin
g-u
pst
ages
of
the
Chin
ese
ban
kin
gsy
stem
toin
tern
atio
nal
com
pet
itio
n:
19
80–
20
06
Sta
ges
Yea
rE
ven
ts
Fir
stst
age
19
80
Jap
anIm
port
and
Ex
port
Ban
kse
tu
pth
efi
rst
fore
ign
ban
kre
pre
sen
tati
ve
offi
cein
Bei
jin
g.
1981
Nan
yan
gC
om
mer
cial
Ban
kse
tup
abra
nch
inS
hen
zhen
asth
efi
rst
oper
atio
nal
fore
ign-
fun
ded
ban
ksi
nce
the
ado
pti
on
of
op
enin
gu
pan
dre
form
po
lice
.
1983
The
Reg
ula
tions
for
the
Est
abli
shm
ent
of
Rep
rese
nta
tive
Offi
ces
inC
hin
aby
Over
seas
Chin
ese
and
Fore
ign
Fin
anci
alIn
stit
uti
ons
wer
epro
mulg
ated
.
19
85
Th
eR
egula
tio
ns
on
the
Ad
min
istr
atio
no
fF
ore
ign
Ban
ks
and
Chin
ese-
fore
ign
Join
t-ven
ture
Ban
ks
inS
pec
ial
Eco
nom
icZ
on
eso
fth
eP
eople
’sR
epub
lic
of
Chin
aw
ere
pro
mu
lgat
ed,
allo
win
gfo
reig
nb
ank
sto
set
up
op
erat
ion
alb
ran
ches
inS
hen
zhen
,Z
hu
hai
,X
iam
en,
Sh
anto
uan
dH
ain
an.
1990
The
Reg
ula
tions
on
the
Adm
inis
trat
ion
of
Fore
ign
Fin
anci
alIn
stit
uti
ons
and
Chin
ese-
fore
ign
Join
t-v
entu
reF
inan
cial
Inst
itu
tio
ns
inS
han
gh
aiw
ere
pro
mu
lgat
ed.
Sec
ond
stag
e1
99
4T
he
Reg
ula
tio
ns
of
the
Peo
ple
’sR
epub
lic
of
Ch
ina
on
the
Ad
min
istr
atio
no
fF
ore
ign
Fin
anci
alIn
stit
uti
on
sw
ere
pro
mu
lgat
edas
the
firs
tre
gu
lati
on
sst
andar
diz
ing
fore
ign
ban
ks
beh
avio
rin
Ch
ina,
incl
ud
ing
mar
ket
acce
ssre
qu
irem
ents
and
sup
erv
iso
ryst
andar
ds
for
fore
ign
ban
ks
op
erat
ing
inC
hin
a.
1996
The
Pro
vis
ional
Reg
ula
tions
for
Fore
ign
Fin
anci
alIn
stit
uti
ons
toU
nder
take
RM
BB
usi
nes
s
on
AT
rial
Bas
isin
Sh
ang
hai
Pu
do
ng
Are
aw
ere
pro
mu
lgat
ed,
allo
win
gfo
reig
nb
ank
sto
un
der
tak
eR
MB
bu
sin
ess
tofo
reig
nen
terp
rise
san
dre
sid
ents
on
atr
ial
bas
isin
Sh
ang
hai
Pu
do
ng
area
.
19
98
Th
eC
ircu
lar
of
Issu
esC
on
cern
ing
the
Ap
pro
val
toF
ore
ign
Ban
ks
toE
ng
age
inth
eIn
ter-
ban
k
Borr
ow
ing
inC
hin
aw
asis
sued
,al
low
ing
fore
ign
ban
ks
acce
ssto
dom
esti
cin
ter-
ban
k
off
erin
gm
arket
,an
dto
engag
ein
RM
Bin
ter-
ban
ktr
adin
gan
dca
shtr
ansa
ctio
n.
19
98
Sh
enzh
enw
asap
pro
ved
tob
ea
seco
nd
tria
lci
tyw
her
efo
reig
nb
ank
sco
uld
star
tR
MB
bu
sin
ess.
19
99
Th
eC
ircu
lar
abo
ut
Ex
pan
din
gF
ore
ign
Ban
ks’
RM
BB
usi
nes
sS
cope
inS
han
gh
aian
d
Sh
enzh
enw
asis
sued
,re
lax
ing
the
geo
gra
ph
ical
and
vo
lum
ere
stri
ctio
ns
of
RM
Bb
usi
nes
s
for
fore
ign
ban
ks,
and
allo
win
gth
emto
bo
rro
wR
MB
cap
ital
from
oth
erb
ank
sw
ith
the
mat
uri
tyo
fm
ore
than
1y
ear.
The Chinese Banking System 109
123

Ta
ble
23
con
tin
ued
Sta
ges
Yea
rE
ven
ts
Th
ird
Sta
ge
20
01
Ch
ina
join
edth
eW
TO
.T
he
geo
gra
phic
alan
dcu
sto
mer
rest
rict
ion
so
nfo
reig
ncu
rren
cyfo
r
fore
ign
ban
ks
wer
ere
mo
ved
.F
ore
ign
ban
ks
wer
eal
low
edto
un
der
tak
efo
reig
ncu
rren
cy
busi
nes
sto
Chin
ese
ente
rpri
ses
and
resi
den
ts,
and
tounder
take
RM
Bbusi
nes
sin
Shan
ghai
,
Sh
enzh
en,
Tia
nji
n,
and
Dal
ian
.
20
01
Th
eR
egu
lati
on
so
fth
eP
eop
le’s
Rep
ub
lic
of
Ch
ina
on
the
Ad
min
istr
atio
no
fF
ore
ign
Fin
anci
alIn
stit
uti
ons
(Am
ended
)w
ere
publi
cize
d.
20
02
Th
eR
ule
sfo
rIm
ple
men
tin
gth
eR
egu
lati
on
so
fth
eP
eop
le’s
Rep
ub
lic
of
Ch
ina
on
the
Adm
inis
trat
ion
of
Fore
ign
Fin
anci
alIn
stit
uti
ons
(Am
ended
)w
ere
publi
cize
d.
20
02
RM
Bb
usi
nes
sw
aso
pen
edto
fore
ign
ban
ks
infi
ve
citi
esi.
e.G
uan
gzh
ou
,Q
ing
dao
,Z
hu
hai
,
Nan
jin
gan
dW
uh
an.
20
03
RM
Bb
usi
nes
sw
aso
pen
edto
fore
ign
ban
ks
info
ur
citi
esi.
e.Ji
nan
,F
uzh
ou
,C
hen
gd
uan
d
Cho
ng
qin
g.
Fo
reig
nb
ank
sw
ere
per
mit
ted
tou
nd
erta
ke
corp
ora
teR
MB
bu
sin
ess
inal
lth
e
citi
esw
her
eR
MB
bu
sin
ess
was
op
ened
tofo
reig
nco
mp
etit
ion
.
2003
The
Reg
ula
tions
on
Equit
yIn
ves
tmen
tof
Fore
ign
Fin
anci
alIn
stit
uti
ons
inC
hin
ese
Fin
anci
al
Intu
itio
ns
wer
ep
rom
ulg
ated
,st
ipu
lati
ng
the
qu
alifi
cati
on
so
fth
ein
ves
tors
and
the
pro
port
ion
of
shar
esth
eyco
uld
hold
inth
eC
hin
ese
ban
ks.
20
04
RM
Bb
usi
nes
sw
aso
pen
edto
fore
ign
ban
ks
infi
ve
citi
esi.
e.K
un
min
g,
Bei
jin
g,
Xia
men
,
Sh
eny
ang
and
Xi’
an.
20
05
RM
Bb
usi
nes
sw
aso
pen
edto
fore
ign
ban
ks
inse
ven
citi
esi.
e.S
han
tou
,N
ing
bo
,H
arbin
,
Chan
gch
un
,L
anzh
ou
,Y
inch
uan
,an
dN
ann
ing
.
2006
The
Reg
ula
tions
of
the
Peo
ple
’sR
epubli
cof
Chin
aon
Adm
inis
trat
ion
of
Fore
ign-f
unded
Ban
ks
and
its
imp
lem
enti
ng
rule
sw
ere
mad
ep
ub
lic.
20
06
Th
eg
eog
rap
hic
alan
dcu
stom
erre
stri
ctio
ns
of
RM
Bb
usi
nes
so
nfo
reig
nb
ank
sw
ere
rem
oved
,
thus
allo
win
gfo
reig
nb
ank
sto
off
erR
MB
bu
sin
ess
toal
lk
ind
so
fcu
stom
ers.
Th
en
on
-
pru
den
tial
rest
rict
ion
so
nfo
reig
nb
ank
s’o
per
atio
ns
inC
hin
aw
ere
also
rem
ov
ed.
So
urc
eC
hin
aB
ankin
gR
egula
tory
Co
mm
issi
on
,R
eport
on
the
Op
enin
g-u
po
fth
eC
hin
ese
Ban
kin
gS
ecto
r,h
ttp
://w
ww
.cb
rc.g
ov.c
n,
25
Jan
uar
y2
00
7
110 E. Geretto, R. Pauluzzo
123

may receive a time deposit of not less than RMB 1 million11 from a Chinese citizen
within the territory of China; they are also not allowed to distribute credit cards to
private operators. Foreign financial institutions, interested in operating in local
currency, will be able to have at least three years’ working experience in the
territory of the PBOC and should have achieved positive results for at least two
consecutive years prior to the application. The limit, according to which the total
amount of foreign exchange deposits taken within the Chinese territory by a foreign-
funded financial institution shall not exceed 70% of its total foreign exchange assets
within the Chinese territory, has been abolished. This restriction has been replaced
with the requirement that the total domestic assets of a foreign bank branch shall not
be less than its total domestic liabilities. Several measures were also introduced in
order to increase the supervision and inspection powers of government credit
authorities. In this regard, there are specific provisions regarding internal control
systems, corporate disclosure, corporate governance, and anti-money laundering
rules. Therefore, foreign-funded banks are considered comparable to Chinese
commercial banks (Standing Committee of the Tenth National People’s Congress
2003): the main differences lie in the authorization mechanisms and in their feasible
activities (Table 23).
The number of products managed by foreign banks were more than 100 at the
beginning of 2007; 115 foreign-funded banks have already gained the permission to
provide RMB services. These banks owned € 78.45 billion in assets, accounting for
1.8% of the total Chinese banking assets. In particular, foreign-funded banks
managed (values expressed in euros):
• € 51.33 billion in foreign currency assets and € 27.12 billion in local currency
assets;
• € 13.51 billion in foreign currency deposits and € 16.6 billion in local currency
deposits;
• € 27.26 billion in foreign currency loans and € 19.48 billion in local currency
loans (CBRC 2007a–d).
Thanks to the new market conditions, several foreign banks have expressed their
interest in acquiring stakes in some Chinese institutions (Tebbutt et al. 2007). The
Hang Seng Bank of Hong Kong has acquired 12% of Industrial Bank of Fujian,
Citigroup has acquired 4.2% of Shanghai Pudong Development Bank and 20% of
Guangdong Development Bank, HSBC has acquired 19.9% of Bank of Commu-
nications and 8% of Bank of Shanghai. Relevant development opportunities have
Newbridge Capital, with 17.9% of Shenzhen Development Bank. Shenzhen
Development Bank has already placed on the market 72.4% of its shares and
Newbridge has become the first foreign investor to control a Chinese bank. Temasek
has also acquired stakes in the Bank of China (4.1%), China Construction Bank
(6%) and China Minsheng Banking Corp. (3.9%): this is a private bank considered a
model for the Chinese banking sector, with low outstanding levels and international
corporate governance standards (Ping 1999; Tomba 2005). Additional holdings are
those acquired by Goldman Sachs, Allianz Capital and American Express in the
11 Equivalent to about € 96,700 (exchange rate: 01.08.2007).
The Chinese Banking System 111
123

Industrial & Commercial Bank of China (7.4%), by Royal Bank of Scotland (8.3%)
and UBS (1.3%) in the Bank of China, by Bank of America (8.5%) in China
Construction Bank, by Deutsche Bank in Hua Xia Bank (7%), by ING in the Bank
of Beijing (19.9%), by Banco Bilbao Vizcaya Argenta in China CITIC Bank (4.8%)
and by the Australia & New Zealand Banking Group, the Commonwealth Bank of
Australia, the Bank of Nova Scotia and BNP in several City Commercial Banks
(Tebbutt et al. 2007). The Chinese government has also encouraged the establish-
ment of foreign-funded banks and joint-ventures, and supported institutional
investors’ operations on stock markets (CSRC 2007). Over the last 3 years, the
number of operators with a QFII license (Qualified Foreign Institutional Investor),
granted by the China Securities Regulatory Commission, has risen from 12 to 52.
This license allows to invest in shares, treasury bonds, convertible bonds, corporate
bonds and closed-end/open-end funds negotiated on the Chinese stock markets.
Conclusion
The analysis of the economic performance of the major banks of the country shows
that the system still lacks of well-developed relationships with the market. This is
mainly due to the brokerage costs for the community (measured by the spread), and
to the low level of commissions and other incomes. At the same time, the
operational management efficiency is not particularly brilliant, because of the high
level of operational costs. The main problem is represented by the volume of NPLs
due to a lending policy based on patronage favours: the solution of this problem lies
in specific regulatory measures and in a different attitude of bank management.
Despite the relevant internationalization and privatization process, there are still
considerable problems, whose solutions will affect the future development and
growth of the Chinese banking and financial system.
On the one hand, the first critical aspect is concerned with the time needed to
implement the required changes. A gradual reform appears the best alternative: the
main risk is to expand the economic gap between developed and inner regions. Too
rapid changes could not ensure the desired results: due to the depth of the issues, too
fast and superficial approaches would leave unanswered questions. On the other
hand, the gradual evolution of the Chinese banking system will probably reduce
government control. Despite the encouraging results in the promotion of access to
small business credit, uncertainties on the final outcome of these measures still
persist: SOEs still have a more favourable treatment, a form of discrimination
against private enterprises, the real growth and development engine for the country.
References
Aiqun P, Pierrepont S, Long A (2005) Export opportunities in the Chinese Banking Industry, CS Market
Research
Chiarlone S, Amighini A (2007) L’economia della Cina. Dalla pianificazione al mercato, Carocci
112 E. Geretto, R. Pauluzzo
123

China Banking Regulatory Commission (2005) Guidelines on bank’s lending to small enterprises.
http://www.cbrc.gov.cn
China Banking Regulatory Commission (2006a) Latest developments in lending to small enterprises.
http://www.cbrc.gov.cn
China Banking Regulatory Commission (2006b) Guidelines on due diligence of commercial banks’
lending to small enterprises (Tentative). http://www.cbrc.gov.cn
China Banking Regulatory Commission (2006c) Regulations of the People’s Republic of China on
administration of foreign-funded banks, Chairman’s Decree of the State Council of the People’s
Republic of China No 478. http://www.cbrc.gov.cn
China Banking Regulatory Commission (2006d) Annual report 2005. http://www.cbrc.gov.cn
China Banking Regulatory Commission (2007a) Rules for implementing the regulations of the People’s
Republic of China on Administration of Foreign-funded Banks, Chairman’s Decree of China
Banking Regulatory Commission No 6, www.cbrc.gov.cn
China Banking Regulatory Commission (2007b) Report on the opening-up of the Chinese Banking
Sector. http://www.cbrc.gov.cn
China Banking Regulatory Commission (2007c) Annual report 2006. http://www.cbrc.gov.cn
China Securities Regulatory Commission (2007) List of QIIFs (as of December 2006), www.csrc.gov.cn
D’Agnolo G (2001) Cina: guida al commercio estero e agli investimenti. Einaudi, Torino
Dobson W, Kashyap AK (2006) The contradiction in China’s gradualist banking reform, Brookings Panel
on Economic Activity, pp 1–39
Fioroni L, Cianci C (2004) Rapporto Rischio paese Cina, Gruppo MPS, Area attivita internazionali—
Servizio rischio paese e controparti estere
Fishman TC (2004) The Chinese century. New York Times Magazine
Gotti Tedeschi C (2007) Il settore bancario in Cina: la crescita del credito e la recente apertura agli
investitori strategici stranieri, Corriere Asia Publishing Ltd
Gyntelberg J, Remolona EM (2006) La cartolarizzazione nella regione Asia-Pacifico: implicazioni per i
rischi di liquidita e di credito, Banca dei Regolamenti Internazionali, Rassegna Trimestrale
International Monetary Fund (2005) World Economic Outlook
Lemoine F (2005) L’economia cinese, Societa editrice il Mulino, Bologna
Malle S (2007) Il profilo economico della Cina oggi, Camera di Commercio di Verona, Convegno
‘‘Verona nel mondo–Report 2007’’
Mallory WH (1931) Rural cooperative credit in China. Quart J Econ 45(3):484–498
Meng CYW (1943) Foreign enterprise in postwar China. Far East Surv 12(22):212–219
On-Kit T (1992) A Private Bank in China: Hui Tong Urban Co-operative Bank, The China Quarterly, No
131, Special Issue: The Chinese Economy in the 1990s, pp 767–777
Ping X (1999) Bank restructuring in China, Bank for International Settlements, pp 124–129
Rampini F (2006) L’impero di Cindia. Strade blu Mondatori, Milano
Standing Committee of the Tenth National People’s Congress (2003) Law of the People’s Republic of
China on Commercial Banks, 27 December 2003
Tebbutt P, Chu C, Lin L (2007) Foreign Banks’ Expansion in China, with a focus on Hong Kong’s Banks,
Fitch Ratings
Tomba L (2005) Una finestra sul Pacifico. Cina. Rischi e opportunita nel settore del credito, Bollettino
della Comunita Scientifica in Australasia, Ambasciata d’Italia, Canberra
Tsai KS (2000) Banquet banking: gender and rotating savings and credit associations in South China. The
China Quarterly, vol 161, pp 142–170
Xu M (2005) Resolution of non-performing loans in China. The Leonard N. Stern School of Business,
Glucksman Institute for Research in Securities Markets
The Chinese Banking System 113
123