Nanobarcoding: detecting nanoparticles in biological samples ...
Upload
mayoclinicCategory
view
2download
0
Genetic Epidemiology 33 (Supplement 1): S58–S67 (2009)
The Challenge of Detecting Epistasis (G�G Interactions):Genetic Analysis Workshop 16
Ping An,1 Odity Mukherjee,2 Pritam Chanda,3 Li Yao,4 Corinne D. Engelman,4 Chien-Hsun Huang,5
Tian Zheng,5 Ilija P. Kovac,6 Marie-Pierre Dube,6 Xueying Liang,7 Jia Li,8 Mariza de Andrade,8
Robert Culverhouse,9 Doerthe Malzahn,10 Alisa K. Manning,11 Geraldine M. Clarke,12 Jeesun Jung,13
and Michael A. Province1�
1Division of Statistical Genomics and Department of Genetics, Washington University School of Medicine, St. Louis, Missouri2National Center for Biological Sciences, Bangalore, India
3Department of Computer Science and Engineering, State University of New York, Buffalo, New York4Department of Human Development and Family Studies, University of Wisconsin-Madison, Madison, Wisconsin
5Department of Statistics, Columbia University, New York, New York6Research Center of the Montreal Heart Institute, Montreal, Quebec, Canada
7Division of Cancer Epidemiology and Genetics, National Cancer Institute, NIH, DHHS, Bethesda, Maryland8Department of Health Sciences Research, Mayo Clinic, Rochester, Minnesota
9Department of Medicine, Washington University School of Medicine, St. Louis, Missouri10Department of Genetic Epidemiology, University Medical Center, University of Goettingen, Goettingen, Germany
11School of Public Health, Boston University, Boston, Massachusetts12Wellcome Trust Centre for Human Genetics, University of Oxford, Oxford, United Kingdom
13Department of Medical and Molecular Genetics, Indiana University School of Medicine, Indianapolis, Indiana
Interest is increasing in epistasis as a possible source of the unexplained variance missed by genome-wide associationstudies. The Genetic Analysis Workshop 16 Group 9 participants evaluated a wide variety of classical and novel analyticalmethods for detecting epistasis, in both the statistical and machine learning paradigms, applied to both real and simulateddata. Because the magnitude of epistasis is clearly relative to scale of penetrance, and therefore to some extent, to the choiceof model framework, it is not surprising that strong interactions under one model might be minimized or even disappearentirely under a different modeling framework. Genet. Epidemiol. 33 (Suppl. 1):S58–S67, 2009. r 2009 Wiley-Liss, Inc.
Key words: generalized linear model; machine learning methods
Contract grant sponsor: NIH; Contract grant numbers: R01 GM031575; 1U54RR023496; AR44422; N01-AR-7-2232; AA01572; DA023166;GM070789; GM69590; HL087700; HL088215; HL088655; HL87660; Contract grant sponsor: National Heart, Lung, and Blood Institute;Contract grant number: N01 HC25195; Contract grant sponsor: USA National Science Foundation; Contract grant number: DMS 0714669;Contract grant sponsor: American Cancer Society; Contract grant number: IRG-58-010-50; Contract grant sponsors: Urological ResearchFoundation; The German Federal Ministry of Education and Research BMBF; Contract grant number: 01GS0837; Contract grant sponsors:Fonds de la recherche en sante du Quebec; Fogarty International Postdoctoral Fellowship; Contract grant number: TW0511-05.�Correspondence to: Michael A. Province, Division of Statistical Genomics, Washington University School of Medicine, Box 8506, 4444Forest Park Blvd, St. Louis, MO 63108. E-mail: [email protected] online in Wiley InterScience (www.interscience.wiley.com).DOI: 10.1002/gepi.20474
INTRODUCTION
The term ‘‘epistasis’’ was first described by the Englishgeneticist William Bateson [1907] to denote the suppres-sion of gene expression at one locus by a gene at anotherlocus. However, modern geneticists more often think ofepistasis using Fisher’s [1918] conceptualization, as adeparture from additivity in the penetrance for two ormore loci, in the same way that dominance is a departurefrom additivity in the penetrance at one locus. Thus,penetrance models of epistasis require additional interac-tion terms (each with its own corresponding parameter) inand above the additive ‘‘main effect’’ terms for each locus.In this framework a test of epistasis is a test of whether
these gene-gene (G�G) interaction term(s) are zero or not,and lack of epistasis represents a special class of allpossible multi-locus penetrance functions. It is of coursean empirical question whether epistasis plays a major orminor role for any given trait in any particular populationor defined subsample. But interest has lately beenincreasing in epistasis as one possible source of the so-called ‘‘dark matter’’ or ‘‘missing R2’’ in genome-wideassociation scans (GWAS) for complex traits (i.e., the factthat the cumulative main effects from GWAS signalsaccount for far less of the total predictive R2 than theestimated heritabilities of these traits). Correspondingly,analytical methods to detect and estimate the degree ofepistasis are becoming more sophisticated and morenumerous. In an attempt to compare and contrast the
r 2009 Wiley-Liss, Inc.

advantages and disadvantages of various epistatic modelsand methods of detection, investigators participating inGenetic Analysis Workshop 16 (GAW16) Group 9 applieda number of traditional as well as novel methods to threelarge, complex trait data sets.
DATA
Eight groups analyzed the North American RheumatoidArthritis Consortium rheumatoid arthritis (RA) data(GAW16 Problem 1 [Amos et al., 2009]): Chanda et al.[2009], Clarke et al. [2009], Huang et al. [2009], Junget al. [2009], Li et al. [2009], Liang et al. [2009], Manninget al. [2009], and Mukherjee et al. [2009]. Three groupsanalyzed the Framingham Heart Study (FHS) data (GAW16Problem 2 [Cupples et al., 2009]): An et al. [2009], Malzahnet al. [2009], and Yao et al. [2009]. Finally, three groupsanalyzed the simulated data which was based upon FHS(GAW16 Problem 3 [Kraja et al., 2009]): Culverhouse et al.[2009], Kovac and Dube [2009], and Malzahn et al. [2009].While most groups assessed discrete traits (RA, coronaryheart disease, type 2 diabetes), five groups also focused onquantitative traits including triglyceride/high-density lipo-protein ratio [An et al., 2009], anti-cyclic citrinullated peptideand rheumatoid factor IgM [Mukherjee et al., 2009], low-density lipoprotein [Kovac and Dube, 2009], coronary arterycalcification (CAC) and coronary event [Culverhouse et al.,2009], and CAC and body mass index [Malzahn et al., 2009].Two groups assessed longitudinal quantitative traits in theFHS data including changes in triglyceride/high-densitylipoprotein ratio [An et al., 2009] and changes in CAC andbody mass index [Malzahn et al., 2009].
METHODS FOR DETECTING EPISTASIS
Approaches to detecting epistasis can be classified aseither statistical or machine learning methods. Statisticalmethods make formal models of stochasticity or random-ness, and most propose formal hypothesis tests of epistasis.By contrast, machine learning methods [Alpaydin, 2004]tend to be more heuristic. Data-mining techniques do notnecessarily rely on formal statistical tests, but concentrateon efficient algorithms to identify epistatic patterns inhigh-dimensional spaces, such as the space of all possibleG�G interactions among a set of candidate genes, forinstance. Some machine learning methods do build theirsearch algorithm around formal statistical models. An earlyexample of such a technique is stepwise regression. Eachstage in the ‘‘variable selection’’ model-building process isa formal statistical multiple regression model, but using thestepwise algorithm itself to add and delete new predictorsis a heuristic way to reasonably search the space for allpossible models, and we typically do not worry about suchformal statistical issues as corrections for multiple compar-isons between submodels, the possibility of partial nullhypotheses, or other probability issues concerning multiplemodels considered simultaneously. In GAW16 Group 9,both statistical models and machine learning approacheswere used to attempt to identify epistasis, as summarizedin Table I, and discussed below.
STATISTICAL METHODS FOR EPISTASIS
The general approach of statistical epistasis methods isto take the null hypothesis as ‘‘no epistasis’’ (additivity),which is preferred unless there is overwhelming evidence
in the data in favor of epistasis. A significance level isprovided that quantifies the probability of observing thedata (or more extreme data) if the null is true (i.e., noepistasis). Thus, in the typical hypothesis testing para-digm, statistical methods tend to conclude in favor of thenull of no epistasis, unless there is strong evidence in favorof epistasis. This is also in keeping with standardepidemiological practice about interactions in general, inwhich we tend to favor simpler models with no interactionover more complex models requiring interaction, underthe principle of Occam’s Razor. If we can reasonablymodel the data assuming additivity, we prefer this overrequiring epistasis to explain the data. In fact, manystatistical tests for epistasis are done in the context ofspecified multivariate penetrance models, which tend tobe one form or another of generalized linear models(GLMs).
GENERALIZED LINEAR MODEL
GLM notation developed by Nelder and Wedderburn[1972] is a general framework for describing multivariablelinear models. Given a stochastic random variable pheno-type, Y, and a set of (fixed, non-random) predictors, X(which includes genes Gi and Gj), we assume that (Y|X)follows a specified parametric probability distribution, P,such that:
E½YjX� ¼ l�1ðD½X�bÞ;
where D[X] denotes the design matrix for X, whichincludes as a submatrix [GikGjkGiXGj], i.e., the designmatrix contains main effect terms for each of Gi and Gj
(additive as well as dominance terms for each gene) aswell as interaction terms between Gi and Gj (in general,four terms for additive� additive, additive�dominance,dominance� additive, and dominance�dominance). b isan unknown parameter vector of intercept and slopes thatwe estimate from the data, and we are typically interestedin the b-coefficients corresponding to the epistasis terms inthe model. l ( � ) is a known, specified link function that is1–1 and invertible. This framework is quite general, andmany of the classical models of statistics can be formulatedthis way by an appropriate choice of probability distribu-tion and link function, as shown in Table II. In fact, most ofthe epistasis statistical models used in GAW16 can be castinto this canonical GLM formulation, which allows us tocompare and contrast models.
CASE-ONLY
Clarke et al. [2009] considered modeling a binary trait asbeing influenced by two bi-allelic disease susceptibilityloci, F and G, according to a model of joint locus effects.Here, F denotes a candidate gene single-nucleotide poly-morphism (SNP) and G denotes an ‘‘equilibrium SNP’’ (i.e.,tag SNPs covering a region which themselves are pairwisein low linkage disequilibrium (LD) r2o0.2). They tested forG�G interaction between gene and equilibrium SNPsusing GLM tests based on logistic odds, proportional odds,and multinomial link functions. For each model, there aretwo regressions: first, F is modeled as the outcome variableand G the predictor, then vice versa. The outcome variableis categorized appropriately according to the relevantmodel: a binary categorization for the logistic model, anordinal categorization for the proportional odds model,
S59The Challenge of Detecting Epistasis
Genet. Epidemiol.

TABLE I. Methods to detect and estimate G�G Interactions utilized in GAW16
Group 9contribution Method Idea Method Ref.
Statistical Most based upon GLM E[YjX] 5 l�1 (D[X] b) where X are predictors; {Gi, Gj}DX forgene variants Gi, Gj; [GikGjkGi�Gj]DD[X] (design matrix contains both maineffects as well as interactions between Gi and Gj) and l( � ) is link functiondepending upon the scale of Y (identity, logistic; proportional odds; multinomial,proportional hazards, etc.)
Clarke et al. Case-only E[GijGj] 5 l�1 (D[Gj] b) (test if Gj predicts Gi in cases)An et al. Kovac
et al.Family mixed
modelE[YjX, PEDID] 5 l�1 (D[X] b)1D[PEDID]g) where g�N(0,S)
(add random effect, g, for pedigrees)Jung et al. Allelic score E[YjX] 5 l�1 (D[X] b) S(Aiu, Ajv)DD[Gi�Gj] for u, v 5 1, 2,
where S(Aiu, Ajv) 5 P[/AiuS/AjvSjGi 5 Ai1Ai2,Gj 5 Aj1Aj2] 5 P[/AiuSjGi 5 Ai1Ai2] P[/AjvSjGj 5 Aj1Aj2],where /AS is the state value of allele A (assumingindependent loci i, j)
Liang et al. Omnibus test Form L(G) latent factors from linear combinations of G loci, andtest E[YjL(G)] 5 l�1 (D[L(G)] b) with Lm�Ln latentinteractions; infer Gi�Gj interactions from Lm�Ln
interactions and latent path loadings
Chatterjee et al.,2006
Li et al. PCA Form PCA(G) PCs of G loci, and test E[YjPCA(G)] 5 l�1
(D[PCA(G)] b) with PCAm�PCAn interactions; infer Gi�Gj
interactions from PCAm�PCAn interactions and factorloadings
Murcray et al.,2009
Manning et al. Interactions amongsignificant maineffect genes
Test b[Gi�Gj] 5 0 terms only for significant b[Gi] 6¼0 or b[Gj] 6¼0
main effects
Manning et al. Interactions amongpathway genes
Test b[Gi�Gj] 5 0 terms only when {Gi, Gj}DPathway
Li et al. Two-step approach Test b[Gi�Gj] 5 0 terms only when GLM E[GijGj] 5 l�1 (Gj b)significant
Murcray et al.,2009
Malzahn et al. LNPT No GLM, longitudinal rank-sum test, no assumptions aboutdistribution F of quantitative trait, test contrast between traitdistributions Fkl of two-locus genotype strata (k, l)
Brunner et al.,2001
Malzahn et al. Proportionalhazards model
Event time as age at first exam when quantitative longitudinaltrait crossed a predefined threshold, multiplicative hazardratio null H0: HR(G1,G2) 5 HR(G1)HR(G2).
Therneau andGrambsch,2000
Kovac et al. UNPHASED Combine genotypes into estimated haplotypes; H, to testE[YjX] 5 l�1 (D[X] b), where HDX
Dudbridge,2008
Machine Learning High dimensional heuristic search algorithms to detect G�Ginteractions that mostly rely upon split samples with crossvalidation to avoid fitting to noise. Some use the basic GLMto evaluate particular interactions, but many of thesedetection methods do not utilize a formal G�G model per se,and therefore do not provide an estimate of effect size. Theemphasis is on efficient search among a large number ofpossible G�G interactions to determine which are signalsand which are noise, rather than on detailed modeling of anyparticular G�G interaction
Liang et al. MDR 8 pair of genes Gi, Gj, form binary I{gi� gjjgiAGi, gjAGj,O(Y, gi� gj)41} and fit GLM, where O(Y, Gi�Gj) 5
E[Y 5 1jGi�Gj]/E[Y 5 0jGi�Gj]j
Ritchie et al.,2001
Mukherjee et al. GMDR 8 pair of genes Gi, Gj, form binary I{gi� gjjgiAGi, gjAGj,S(Y, gi� gj)4T} and fit GLM, where S(Y, gi� gj) is a scorefunction measuring relationship between Y and Gi�Gj andT is threshold
Culverhouseet al.
RPM Pool {Gi, Gj} wheneverjE[YjGi]–E[YjGj]joe_
and fit GLM Culverhouseet al., 2004
Liang et al. RF Bootstrap samples of subjects and Gi values to fit TREEs
(recursively partition sample by binary splits I[Girc] tomaximize Y purity)
Breiman, 2001
S60 An et al.
Genet. Epidemiol.

and a nominal categorization for the multinomial model,which result in three different link functions in the GLMformulation. The predictor variable is categorized as anordinal variable in all three regressions.
FAMILY-MIXED MODEL
Kovac and Dube [2009] and An et al. [2009] used a family-mixed model [Borecki and Province, 2008], which is anextension of the multiple regression model, to deal withassociation in family data. It can overcome the problem ofnon-independence of residuals within pedigrees that pro-duces inflation of type I error if one applies regularregression and ignores family relationships. This GLM usesa gaussian probability distribution and an identity linkfunction, just as in linear regression, but includes anadditional random effect component predictor for pedigrees.
ALLELIC SCORING METHOD
The underlying principle of this method of Jung et al.[2009] is to identify the association of allelic combinationbetween two unlinked markers with a disease trait so thatsubjects are assigned an allelic score given their observedgenotype information. The score is a conditional prob-ability of obtaining the particular allelic combination giventhe observed genotypes at the two loci of each subject.A linear trend of proportion of cases over total number ofsubjects at each allelic combination can be modeled usingan extension of the Cochran-Armitage trend regression.
OMNIBUS TEST (OT)
Liang et al. [2009] applied the OT of Chatterjee et al.[2006] to detect epistasis. The omnibus method tests for
gene-based effects by considering all SNPs in a given geneor a region as a single group and evaluates this geneassuming that a second known gene or other risk factorsplay a role. Specifically, the method forms L(G) latentfactors from linear combinations of G loci, and tests theGLM E[Y|L(G)] 5 l�1(D[L(G)]b) with Lm� Ln latent inter-actions. It then infers Gi�Gj interactions from Lm� Ln
interactions and latent path loadings. The application toGAW16 Problem 1 used a logistic regression approach(binomial distribution with a logit link in the GLM) but thesignificance of the test gene effect includes both the maineffect and the interaction between this gene and theknown risk factor or gene. For the genes identified bythese methods, logistic regression was used to testformally whether the interaction terms were significantpredictors.
PRINCIPAL-COMPONENT ANALYSIS (PCA)
Li et al. [2009] extended the original PC approach to testfor association between disease and multiple SNPs in acandidate gene in order to incorporate a test for G�Ginteraction. The procedure involves the following steps. (1)Let glk be the number of minor alleles at SNP k for lthsubject, l 5 1,y, N, k 5 1,y, K. (2) Calculate the correlationmatrix R, where Rij ¼ corðgi; gjÞ and gi and gj represent thegenotypes of all subjects for SNP i and SNP j, respectively.(3) Decompose R by singular value decomposition:
R ¼ ALAT. (4) Determine the factor loading by L ¼ AffiffiffiffiLp
.(5) Determine the PCs by PC 5 GA, where G is thestandardized N�K matrix of genotypes. The standardized
genotypes are calculated as: glk��gk
sdðgkÞ; where �gk ¼
PN
l¼1glk
N is the
TABLE I. Continued
Group 9contribution Method Idea Method Ref.
Yao et al. GUIDE TREE model which selects variables to split nodes via chi-
square test
Loh, 2002
Chanda et al. KWII Stepwise select gene G into S that gives largest KWII(S) 5P
tDS
(�1)jSj�jtj H(t) that is not redundant to S or G [whereH(t) 5
PtAu P(t 5 u) log2 (P(t 5 u)) is Shannon entropy
information]Huang et al. GTD V ¼
Pg2G (E[Y 5 1jg]–E[Y 5 0jg])2 to measure joint effects of
SNPs interaction of SNPs are measured by excess effect of apair over their marginal effects; assess significance bypermutation test
Lo and Zheng,2002; Zhenget al., 2006
TABLE II. Common GLM examples
P (Probability distribution) l (Link function) Corresponds to this type of model
Normal Identity: m Linear regressionBinomial Logit: log it: logðp=ð1�pÞÞ Logistic regression
Binomial Probit: 1ffiffiffiffi2ppR m�1
expð� 12 Z2ÞdZ Probit regression
Poisson Log: log(m) Poisson regressionPoisson Log-hazard ratio: log(h(t)/h0(t)) Proportional hazardsNegative-binomial Log: log(m) Negative-binomial regressionGamma Reciprocal: 1/m Gamma regression
S61The Challenge of Detecting Epistasis
Genet. Epidemiol.

mean genotype across subjects and
sdðgkÞ ¼
ffiffiffiffiffiffiffiffiffiffiffiffiffiffiffiffiffiffiffiffiffiffiffiffiffiffiffiffiffiffiffiffiffiffiffiffiffiffiffiffiffiffiffiffiffiffiXN
l¼1
ðglk � �gkÞ2=ðN � 1Þ
vuut
is the standard deviation.Li et al. [2009] used PCs that explained at least 80% of
the variation as the gene representation to perform a G�Ginteraction analysis by applying logistic regression to testfor interaction between every combination of two PCs.Once significant PC interactions were identified, PCloadings were used to determine the influence of a specificSNP on the PCs because the loading represents thecorrelation of a SNP with a component.
INTERACTIONS AMONG MAIN EFFECTGENES AND INTERACTIONS AMONGPATHWAY GENES
In a GWAS, or even when there are a large number ofcandidate genes, there can be too many possible G�Ginteractions to evaluate exhaustively. Manning et al. [2009]utilized two complementary approaches to reduce thenumber of possible G�G interactions to test. The firststrategy is to use a two-stage approach test for interactionsonly among genes that show significant main effects. InStage 1, a set of additive GLMs are fit, one variant at a time,and the susbset of variants that show significance areselected for further consideration. In Stage 2, a series of two-variant GLMs are refit, which include every pairwisecombination of the main effect subset as well as theirrespective interactions. The second approach, interactionsamong pathway genes, is similar in spirit and design. Again,a subset of genes is selected in Stage 1 and interactions areonly evaluated among genes in that subset. But in thisstrategy, the Stage 1 subset is selected based on the externalbiological knowledge that genes belong to the same relevantpathway rather than based on internal statistical tests fromthe data itself.
TWO-STEP APPROACH
Li et al. [2009] modified the two-step approach ofMurcray et al. [2009] to detect gene-environment interac-tion to be applied to detect G�G interaction. In the firststep, a GLM model is fit predicting G from F in thecombined case-control data, using the approximatemethod to detect epistasis in PLINK (note that thisanalysis does not involve phenotype, only the twogenotypes). This can be considered as a modified versionof the case-only approach for epistasis. Only those SNPsthat show significant epistasis in Step 1 are carriedforward to Step 2, in which a saturated logistic model(GLM with binomial distribution and logit link) is fit. Thetest of the G�G product term is the final test of epistasis.
LONGITUDINAL NONPARAMETRICASSOCIATION TEST (LNPT)
Malzahn et al. [2009] adopted a test statistic from thearea of clinical studies [Brunner et al., 2001]. The LNPTtests for association of longitudinal quantitative traits withrespect to a set of influencing factors. The latter divide thecohort into subgroups. The LNPT tests the null hypothesisof no difference in trait distribution F between these
subgroups HF0: CF 5 0, where C is a contrast matrix and
F ¼ fFklst g is the set of distribution functions Fkls
t ordered byobservational time point t and the influencing factors (kls)of interest (for example, two factors k, l 5 0, 1, 2 for SNPgenotype at two bi-allelic loci and additional factors forcovariates, e.g., sex s ¼ fm;wg). The LNPT test statistic isinvariant with respect to monotone trait transformations.The LNPT is not a GLM because no distributionalassumptions are made about F and the test is not restrictedto contrasts of expected values. However, its test statisticresembles a heteroscedastic repeated measures GLManalysis of variance (ANOVA), which is performed onthe mid-ranks of the longitudinal traits, estimating long-itudinal covariance from the ranks without assuming anystructure. The LNPT requires that individuals be followedup at the same time intervals, but individuals withpartially missing values for the longitudinal phenotypecan be included for computation of the test statistic. TheLNPT yields a set of adjusted P-values for tests of averageeffects of the loci, covariates (e.g., sex), number of exam,and for tests of all interactions.
COX MODEL
Malzahn et al. [2009] converted longitudinal quantita-tive traits to event-time data, testing for evidence of G�Ginteractions with the established semi-parametric Coxmodel of survival analysis [e.g., Therneau and Grambsch,2000]. Event-time was defined as age at the first examwhen the longitudinal trait crossed a predefined thresh-old. Event times are invariant with respect to monotonetransformations of the trait. The Cox model estimateshazard ratios HR(Gi) to quantify the impact of a genotypeGi on event-time. Significance of G�G interactions(rejection of H0: HR(G1, G2) 5 HR(G1)HR(G2)) was evalu-ated with the likelihood ratio test.
UNPHASED
Kovac and Dube [2009] utilized a haplotype approach toepistasis, as implemented in the program UNPHASED[Dudbridge, 2008]. It uses a likelihood framework forprimarily haplotype-based analysis of data, which caninclude both familial and unrelated subjects. The test forG�G interaction for a quantitative trait compares the nullhypothesis of equal contributions for all gene combina-tions (in haplotype form) sharing the same alleles at theconditioning marker vs. the alternative hypothesis ofdifferential multiplicative contributions from the testmarker. The test uses a likelihood-ratio w2 statistics tocompare models with and without the interaction terms.
MACHINE LEARNING METHODS FOREPISTASIS
Complementary to the statistical methods for epistasisare the machine learning ones, which typically arehigh-dimensional heuristic search algorithms to detectG�G interactions that mostly rely upon split sampleswith cross validation to avoid fitting to noise. Some use thebasic GLM to evaluate particular interactions, but many ofthese detection methods do not utilize a formal G�Gmodel per se, and therefore do not provide an estimate ofeffect size. The emphasis is on efficient search among alarge number of possible G�G interactions to determine
S62 An et al.
Genet. Epidemiol.

which are signals and which are noise, rather than ondetailed modeling of any particular G�G interaction.
MULTIFACTOR DIMENSIONALITYREDUCTION (MDR) AND GENERALIZEDMDR (GMDR)
Mukherjee et al. [2009] applied the GMDR method, ascore-based extension of the MDR [Ritchie et al., 2001]. InMDR, multi-locus genotype combinations are classified ashigh-risk or low-risk genotype combinations using athreshold on the ratios of cases to controls in eachcombination. The best model is selected as the combina-tion of marker with maximum cross-validation consistencyand minimum prediction error. GMDR generalizes thisframework, replacing the ratio of cases to controls byscores in each cell to discriminate between high risk andlow risk. The GMDR algorithm allows for increasedflexibility to use covariates, handling both dichotomousand continuous phenotypes, and a variety of population-based study designs such as using unbalanced case-control samples.
RESTRICTED PARTITIONING METHOD (RPM)
Culverhouse et al. [2009] applied the RPM [Culverhouseet al., 2004], which reduces the dimensionality of genotypecomparisons by using a multiple comparisons ANOVA toevaluate whether the phenotypes associated with each(multi-locus) genotype in a particular model (e.g., a two-SNP model consisting of nine genotypes) come from thesame distribution. If the answer is no, the method proposesa partition of the genotypes. The test statistic is theproportion of the trait variation explained by the partition.Statistical significance is determined by permutationtesting. The RPM was developed as a method for analyzingdata sets consisting of unrelated subjects, and hence can beconsidered only as an approximately correct screening toolwhen applied to pedigree data, such as the FHS.
GENERALIZED, UNBIASED INTERACTIONDETECTION AND ESTIMATION (GUIDE)
Yao et al. [2009] utilized GUIDE [Loh, 2002], a treebuilding software package. GUIDE develops classificationtrees using three steps: (1) perform a w2 test to select themost significant variable to split a node; (2) select the splitthreshold that minimizes the node impurity measure; (3)recursively repeat Steps 1 and 2 until there are too fewobservations in each node. After building a complete tree,three methods are used to decide how much of the tree toretain: cross-validation pruning, test-sample pruning, andno pruning, where the criterion for judging the correctamount of pruning is that which minimizes the unbiasedestimate of misclassification cost. GUIDE allows fastcomputation, provides a natural extension to data setswith categorical variables, and direct detection of localtwo-variable interactions. It has four useful properties: (1)negligible selection bias; (2) sensitivity to curvature andlocal pairwise interactions between regressor variables; (3)inclusion of categorical predictor variables; and (4) choiceof three roles for each ordered predictor variable: splitselection only, regression modeling only, or both. GUIDEcan process a large number of SNPs in one run. However,it is still not feasible to run the entire Problem 2 FHS data
set at one time due to computation limitations (350k SNPsafter filtering for lack of Hardy-Weinberg equilibrium(Po0.001) and low minor allele frequency o5%, whichresults in a file over 10 GB in size).
RANDOM FORESTS (RF)
Liang et al. [2009] utilized the RF approach of Breiman[2001], which involves tree models fit to bootstrappedsamples of subjects and predictors. Each bootstrap treeprovides a classification, and these are aggregated as votesto form a final classification. RFs are less likely to fit tonoise than are simple trees.
K-WAY INTERACTION INFORMATION (KWII)
Chanda et al. [2009] developed an entropy-based methodfor detecting epistasis called KWII. KWII is defined as theamount of information (redundancy or synergy) present inthe set of variables that is not present in any subset of thesevariables. Formally, if S is a set of variables that includesboth predictors (including genes) as well as the responsephenotype, then KWIIðSÞ¼
Pt�S ð�1ÞjSj�jtjHðtÞ; where HðtÞ¼P
t2u Pðt ¼ uÞlog2½Pðt ¼ uÞ� is the Shannon entropy infor-mation (which measures the amount of information in asystem one is missing if that variable is unknown ornot used). Sets of predictors with larger KWII indicatestronger interactions with the phenotype, and thus higherassociation. Given the strong LD patterns in the genome,there can be multiple sets of SNPs that are formallydisjoint, but essentially contain the same information,which is characterized by a redundancy metric:specifically, the redundancy between sets of predictors S1
and S2 is given by the maximized average of pairwiseLD (R2) between variables from S1 and S2 redðS1S2Þ ¼
maxðP
x2S1 ;y2S2r2ðx; yÞ=mÞ. The KWII algorithm performs a
stepwise search for the set of predictors that when addedto the existing set, S, produces the greatest KWII and is notredundant to S. The computational burden on checkingredundancy is sufficiently high that only a fixed numberof iterations can be performed, which yields a fixednumber of single- and two-variable combinations and theircorresponding KWII values, which are input to a secondevaluation stage. In this stage, a traditional logisticregression fully saturated GLM is performed, using abinomial distribution and a logit link.
GENOTYPE TRAIT DISTORTION (GTD)
The GTD method of Huang et al. [2009] is a variation onthe backward haplotype transmission association [Lo andZheng, 2002] and backward genotype-trait associationmethods of Zheng et al. [2006]. Given k SNP markers,there are 3k possible unphased genotypes. The GTDstatistic, V, is defined on the sum of squared differencebetween genotypes’ relative frequency among the casesand controls and measures the joint effects of thesek SNPs on the disease status. Specifically V ¼P
g2GðE½Y ¼ 1jg� � E½Y ¼ 0jg�Þ2. Based on V as the measureof joint effect for a set of SNPs, Huang et al. [2009]measures the evidence of interaction by using the relativeexcess effect from a pair of SNPs over their individualmarginal effects. Significance of the interaction measure isassessed by permutation testing.
S63The Challenge of Detecting Epistasis
Genet. Epidemiol.

RESULTS
In Figure 1, we show the epistasis detected by variousmethods for the GAW16 Problem 1 (RA data set), whichwas the data that was analyzed by most groups forepistasis. The most striking observation is the lack ofconsistency of results. There are a few genes that showconsistent epistasis by multiple methods, such as TRAF1-C5 and PTPN22 (three methods: MDR, RF, and OT); HLA-DRB1 and PTPN22 (two methods: OT and RF), HLA-DRB1and TRAF1-C5 (two methods: RF and OT); and HLA-B andHLA-C (two methods: GTD and KWII). Some methodsfound many G�G interactions that few (if any) othermethods found. For instance, GMDR found 18 interactions,not one of which any other method found. GTD found 17interactions, only one of which one other method found.Some methods found only a small number of interactions.For example, MDR identified two: HLA-C and PTPN22 aswell as PTPN22 and TRAF1-C5. Either some of thesemethods are homing in on information not being used byother methods, or some are more powerful than others, orsome are more prone to fitting to noise than others. It isdifficult to reach a definitive conclusion because this is areal data example, and we therefore do not know the truth.Hence, we do not know when to praise or scold a method
for either finding or not finding what it ‘‘should have.’’ Butpart of the difficulty in comparing methods may arise fromthe relativity of epistasis to scale of penetrance.
DISCUSSION
THE RELATIVITY OF EPISTASIS
Because epistasis is simply a departure from additivity inmulti-locus penetrance, it has been known for some timethat such statistical interactions are scale dependent[Greenland et al., 2008]. Recently, several authors [Cordell,2002; Frankel and Schork, 1996; Greenland and Rothman,1998] have emphasized that the choice of how one modelsepistasis and in particular, the scale upon which penetranceis measured, will greatly affect whether additivity ismaintained and therefore whether there ‘‘is’’ or ‘‘is not’’epistasis. In particular, by simply rescaling the problem wecan ‘‘create’’ or ‘‘remove’’ epistasis. This is illustrated inFigure 2, for two hypothetical two-locus examples. InFigure 2(A and B), we show the interaction between twogenes G and F in which the probability of disease(penetrance) for the baseline genotype group is P[disea-sejG 5 aa, F 5 bb] 5 0.001, and each A allele dose for gene Gincreases the conditional probability risk by sixfold, while
Fig. 1. Gene�gene interactions found in RA GAW16 data set Problem 1 by various methods.
S64 An et al.
Genet. Epidemiol.

each B allele for gene F increases the conditional probabilityrisk by fivefold. In Figure 2(A), both genes have nodominance and no interaction when modeled on themultiplicative scale (i.e., all three F genotype lines whenplotted against the G genotype on the x-axis and the logprobability of disease given genotype along the y-axis, arelinear and parallel). This would utilize a log(P) link functionin the GLM, which corresponds to a multiplicative riskmodel. However, these same data are shown in Figure 2(B)on the log(odds) scale as is relevant when analyzing bylogistic regression (using a logit link 5 log(P/(1�P)) in theGLM). Here, both genes show strong dominance (non-linearresponse to the G genotype by the F genotype) as well asstrong G�G interaction (non-parallel lines). We have notchanged the data, just the scale of the y-axis, and we havecreated epistasis. By contrast, in Figure 2(C and D), considertwo other genes J and K in which the baseline genotypegroup penetrance is P[disease |J 5 cc, K 5 dd] 5 0.5, (which
corresponds to odds(P) 5 1), and each C allele dose for geneJ increases the odds fourfold, while each D allele dose forgene K increases the odds twofold. Both genes show strongdominance as well as G�G interaction on the log(P) scale(Fig. 2(C)), which would be the conclusion according to amultiplicative model, but these same data show nodominance and no interaction on the log(odds) scale forlogistic regression (Fig. 2(D)). By simply rescaling the y-axis,we have removed epistasis.
Hence, for most methods, the existence of epistasis and/or dominance is dependent upon the scale of the responseand therefore also on the choice of model or link function.It would therefore not be surprising that some modelsmight find strong epistasis, while others applied to thesame data might find little or no epistasis, just as weobserved in GAW16. It is important to realize that this isa deeper issue than just that the ‘‘power to detectepistasis’’ differs by method. In Figure 2(A and D), there
Fig. 2. Dependence of the existence of epistasis on scale of response and model choice (link function). In (A) and (B), we show the
interaction between genes G and F in which the probability of disease (penetrance) for the baseline genotype group isP[disease|G 5 aa, F 5 bb] 5 0.001, and each A allele dose for gene G increases the risk by sixfold while each B allele for gene Fincreases the risk by fivefold. In (A), both genes show no dominance and no interaction on the multiplicative probability scale (all three
genotype lines are linear and parallel), which would be the conclusion from a log-linear model, whereas these same data show strong
dominance (non-linear response by genotype) as well as strong G�G interaction (non-parallel lines) on the log-odds scale, whichwould be the conclusion from logistic regression. By contrast, in (C) and (D), we show two other genes J and K in which the baseline
genotype group penetrance is P[diseasejJ 5 cc, K 5 dd] 5 0.5, (which corresponds to odds(P) 5 1), and each C allele dose for gene Jincreases the odds fourfold, while each D allele dose for gene K increases the odds twofold. Here, both genes show strong dominance aswell as G�G interaction on the multiplicative probability scale (C) which would be the conclusion from a log-linear model, but these
same data show no dominance and no interaction on the log(odds) scale for logistic regression (D). Hence, the existence or lack of
epistasis and/or dominance is dependent upon the scale of the response and therefore also on the choice of model (link function).
S65The Challenge of Detecting Epistasis
Genet. Epidemiol.
is metaphysically no epistasis (not just close to zeroepistasis, which might possibly be detected by some morepowerful methods). We have found a scale in which it isimpossible to detect epistasis, because by simply changingscale, we have flipped from the alternative to the nullhypothesis (where issues of power are moot). Evidently,the term ‘‘epistasis’’ in the sense of Fisher is non-additivity,not some objective biological condition that exists in and ofitself, outside of the way in which we model it. Rather,‘‘epistasis’’ vs. ‘‘additivity’’ are relative concepts for whichwe must specify a particular penetrance scale, much like inphysics where the ideas of ‘‘motion’’ and ‘‘rest’’ only makesense with respect to a particular frame of reference.
THE REALITY OF EPISTASIS
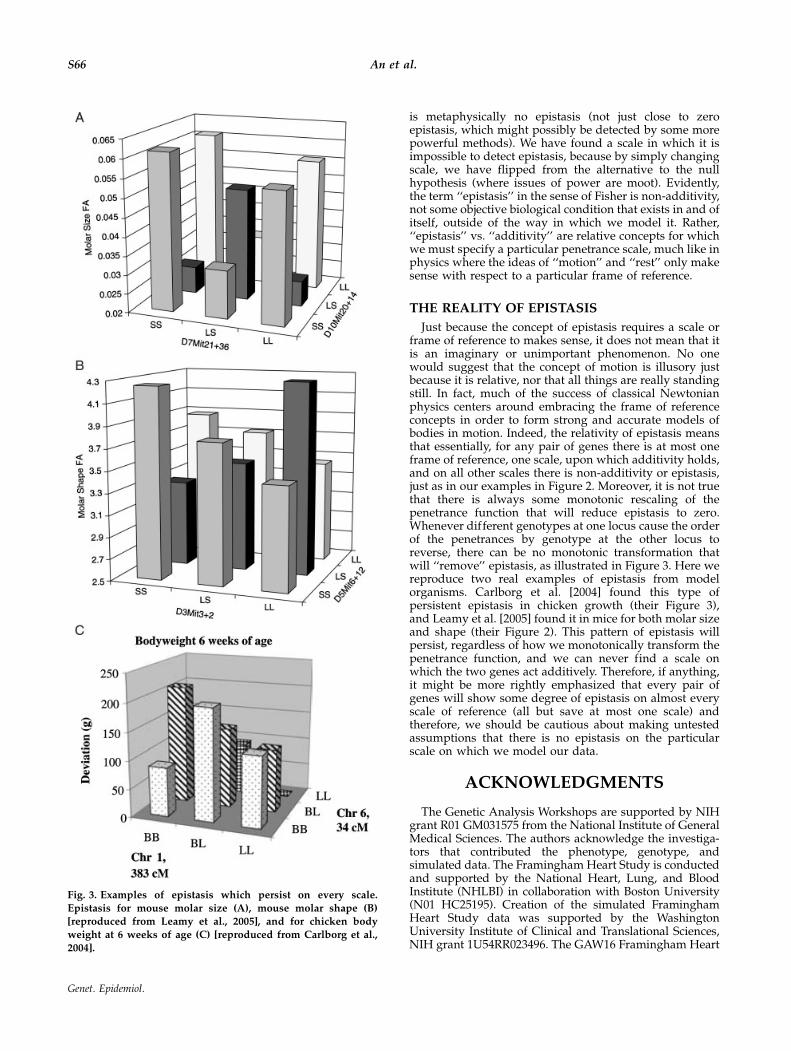
Just because the concept of epistasis requires a scale orframe of reference to makes sense, it does not mean that itis an imaginary or unimportant phenomenon. No onewould suggest that the concept of motion is illusory justbecause it is relative, nor that all things are really standingstill. In fact, much of the success of classical Newtonianphysics centers around embracing the frame of referenceconcepts in order to form strong and accurate models ofbodies in motion. Indeed, the relativity of epistasis meansthat essentially, for any pair of genes there is at most oneframe of reference, one scale, upon which additivity holds,and on all other scales there is non-additivity or epistasis,just as in our examples in Figure 2. Moreover, it is not truethat there is always some monotonic rescaling of thepenetrance function that will reduce epistasis to zero.Whenever different genotypes at one locus cause the orderof the penetrances by genotype at the other locus toreverse, there can be no monotonic transformation thatwill ‘‘remove’’ epistasis, as illustrated in Figure 3. Here wereproduce two real examples of epistasis from modelorganisms. Carlborg et al. [2004] found this type ofpersistent epistasis in chicken growth (their Figure 3),and Leamy et al. [2005] found it in mice for both molar sizeand shape (their Figure 2). This pattern of epistasis willpersist, regardless of how we monotonically transform thepenetrance function, and we can never find a scale onwhich the two genes act additively. Therefore, if anything,it might be more rightly emphasized that every pair ofgenes will show some degree of epistasis on almost everyscale of reference (all but save at most one scale) andtherefore, we should be cautious about making untestedassumptions that there is no epistasis on the particularscale on which we model our data.
ACKNOWLEDGMENTS
The Genetic Analysis Workshops are supported by NIHgrant R01 GM031575 from the National Institute of GeneralMedical Sciences. The authors acknowledge the investiga-tors that contributed the phenotype, genotype, andsimulated data. The Framingham Heart Study is conductedand supported by the National Heart, Lung, and BloodInstitute (NHLBI) in collaboration with Boston University(N01 HC25195). Creation of the simulated FraminghamHeart Study data was supported by the WashingtonUniversity Institute of Clinical and Translational Sciences,NIH grant 1U54RR023496. The GAW16 Framingham Heart
Fig. 3. Examples of epistasis which persist on every scale.
Epistasis for mouse molar size (A), mouse molar shape (B)[reproduced from Leamy et al., 2005], and for chicken body
weight at 6 weeks of age (C) [reproduced from Carlborg et al.,
2004].
S66 An et al.
Genet. Epidemiol.

Study and simulated data were obtained through dbGaP(accession number phs000128.v1.p1). The RA data wassupported by NIH grant AR44422 and NIH contract N01-AR-7-2232. This work was partially supported by USANational Institute of Health grants AA01572, DA023166,GM070789, GM69590, HL087700, HL088215, HL088655,HL87660; USA National Science Foundation grant DMS0714669; American Cancer Society grant IRG-58-010-50;a grant from the Urological Research Foundation, theGerman Federal Ministry of Education and Research BMBF(01GS0837); Fonds de la recherche en sante du Quebec(FRSQ); and Fogarty International Postdoctoral FellowshipTW0511-05. The authors thank the GAW16 Group 9participants for their stimulating discussion and forsharing their insights into the epistasis problem.
REFERENCESAlpaydin E. 2004. Introduction to Machine Learning. Cambridge: MIT
Press.
Amos CI, Chen WV, Seldin MF, Remmers E, Taylor KE, Criswell LA,
Lee AT, Plenge RM, Kastner DL, Gregersen PK. 2009. Data for
Genetic Analysis Workshop 16 Problem 1, association analysis of
rheumatoid arthritis data. BMC Proc 3:S2.
An P, Feitosa M, Ketkar S, Adelman A, Lin S, Borecki IB, Province MA.
2009. Epistatic interactions of CDKN2B-TCF7L2 for risk of type 2
diabetes and CDKN2B-JAZF1 for triglyceride/high-density lipo-
protein ratio longitudinal change: evidence from the Framingham
Heart Study. BMC Proc 3:S71.
Bateson W. 1907. Facts limiting the theory of heredity. Science 26:
649–660.
Borecki IB, Province MA. 2008. Genetic and genomic discovery using
family studies. Circulation 118:1057–1063.Breiman L. 2001. Random forests. Mach Learn 45:5–32.
Brunner E, Domhof S, Langer F. 2001. Nonparametric Analysis of
Longitudinal Data in Factorial Experiments. New York: Wiley.
Carlborg O, Hocking P, Burt D, Haley C. 2004. Simultaneous mapping
of epistatic QTL in chickens reveals clusters of QTL pairs with
similar genetic effects on growth. Genet Res 83:197–209.
Chanda P, Zhang A, Sucheston L, Ramanathan M. 2009. A two-stage
search strategy for detecting multiple loci associated with
rheumatoid arthritis. BMC Proc 3:S72.
Chatterjee N, Kalaylioglu Z, Moslehi R, Peters U, Wacholder S. 2006.
Powerful multilocus tests of genetic association in the presence of
gene-gene and gene-environment interactions. Am J Hum Genet
79:1002–1016.
Clarke GM, Pettersson FH, Morris AP. 2009. A comparison of case-
only designs for detecting gene� gene interaction in rheumatoid
arthritis using genome-wide case-control data in Genetic Analysis
Workshop 16. BMC Proc 3:S73.
Cordell HJ. 2002. Epistasis: What it means, what it doesn’t mean, andstatistical methods to detect it in humans. Hum Mol Genet 11:
2463–2468.
Culverhouse R, Klein T, Shannon W. 2004. Detecting epistatic
interactions contributing to quantiative traits. Genetic Epidemiol
27:141–152.
Culverhouse R, Jin W, Jin CH, Hinrichs T, Suarez BK. 2009. Power and
false-positive rates for the restricted partition methods (RPM) in a
large candidate gene data set. BMC Proc 3:S74.
Cupples LA, Heard-Costa N, Lee M, Atwood LD, for the Framingham
Heart Study Investigators. 2009. Genetics Analysis Workshop 16
Problem 2: The Framingham Heart Study data. BMC Proc 3:S3.
Dudbridge F. 2008. Likelihood-based association analysis for nuclear
families and unrelated subjects with missing genotype data. Hum
Hered 66:87–98.
Frankel WN, Schork NJ. 1996. Who’s afraid of epistasis? Nat Genet
14:371–373.
Fisher RA. 1918. The correlation between relatives on the supposition
of Mendelian inheritance. Trans R Soc Edin 52:399–433.
Greenland S, Rothman KJ. 1998. Concepts of interaction. In:
Rothman KJ, Greenland S, editors. Modern Epidemiology, 2nd
edition. Philadelphia: Lippincott-Raven Publishers. p 329–342.
Greenland S, Lash TL, Rothman KJ. 2008. Concepts of interaction. In:
Rothman KJ, Greenland S, Lash TL, editors. Modern Epidemiol-
ogy, 3rd edition. Philadelphia: Lippincott-Williams & Wilkins.
p 71–86.
Huang C-H, Cong L, Xie J, Qiao B, Lo S-H, Zheng T. 2009. Rheumatoid
arthritis-associated gene-gene interaction network for rheumatoid
arthritis candidate genes. BMC Proc 3:S75.
Jung J, Song JJ, Kwon D. 2009. Allelic based gene-gene interactions in
rheumatoid arthritis. BMC Proc 3:S76.
Kovac IP, Dube M-P. 2009. Different models and single-nucleotide
polymorphisms signal the simulated weak gene-gene interaction
for a quantitative trait using haplotype-based and mixed models
testing. BMC Proc 3:S77.Kraja AT, Culverhouse R, Daw EW, Wu J, Van Brunt A, Province MA,
Borecki IB. 2009. The Genetic Analysis Workshop 16 Problem 3:
simulation of heritable longitudinal cardiovascular phenotypes
based on actual genome-wide single-nucleotide polymorphisms in
the Framingham Heart Study. BMC Proc 3:S4.
Leamy LJ, Workman MS, Routman EJ, Cheverud JM. 2005. An
epistatic genetic basis for fluctuating asymmetry of tooth size and
shape in mice. Heredity 94:316–325.
Li J, Tang R, Biernacka JM, de Andrade M. 2009. Identification of gene-
gene interaction using principal components. BMC Proc 3:S78.Liang X, Gao Y, Lam TK, Li Q, Falk C, Yang XR, Goldstein AM,
Goldin LR. 2009. Identifying rheumatoid arthritis susceptibility
genes using high-dimensional methods. BMC Proc 3:S79.
Lo SH, Zheng T. 2002. Backward haplotype transmission association
(BHTA) algorithm—a fast multiple-marker screening method.
Hum Hered 53:197–215.
Loh W-Y. 2002. Regression trees with unbiased variable selection and
interaction detection. Stat Sinica 12:361–386.
Malzahn D, Balavarca Y, Lozano JP, Bickeboller H. 2009. Tests for
candidate-gene interaction for longitudinal quantitative traits
measured in a large cohort. BMC Proc 3:S80.
Manning AK, Ngwa JS, Hendricks AE, Liu C-T, Johnson AD, Dupuis J,
Cupples LA. 2009. Incorporating biological knowledge in the
search for gene� gene interaction in genome-wide association
studies. BMC Proc 3:S81.
Mukherjee O, Sanapala KR, Anbazhagana P, Ghosh S. 2009. Evaluating
epistatic interaction signals in complex traits using quantitative
traits. BMC Proc 3:S82.
Murcray CE, Lewinger JP, Gauderman WJ. 2009. Gene-environment
interaction in genome-wide association studies. Am J Epidemiol
169:219–226.Nelder J, Wedderburn R. 1972. Generalized linear models. J Roy Stat
Soc Ser A 135:370–384.
Ritchie MD, Hahn LW, Roodi N, Bailey LR, Dupont WD, Parl FF,
Moore JH. 2001. Multifactor-dimensionality reduction reveals
high-order interactions among estrogen-metabolism genes in
sporadic breast cancer. Am J Hum Genet 69:138–147.
Therneau T, Grambsch P. 2000. Modeling Survival Data. Extending the
Cox Model. New York: Springer-Verlag.
Yao L, Zhong W, Zhang Z, Maenner MJ, Engelman CD. 2009.
Classification tree for detection of single-nucleotide polymorphism
(SNP)-by-SNP interactions related to heart disease: Framingham
Heart Study. BMC Proc 3:S83.
Zheng T, Wang H, Lo SH. 2006. Backward genotype-trait association
(BGTA)-based dissection of complex traits in case-control designs.
Hum Hered 62:196–212.
S67The Challenge of Detecting Epistasis
Genet. Epidemiol.
Copyright © 2022 FDOKUMEN


![Samenvatting urban challenge[1]](https://static.fdokumen.com/doc/165x107/6313d00f3ed465f0570ad8b4/samenvatting-urban-challenge1.jpg)