The challenge of detecting epistasis (G×G Interactions): Genetic Analysis Workshop 16
Upload
independentCategory
view
3download
0
Epistasis between neurochemical gene polymorphisms and risk for ADHD
Ricardo Segurado(1), Mark A Bellgrove(2), Francesca Manconi(3),
Michael Gill(1), Ziarah Hawi(1)
Running Title: Exploration of epistasis in ADHD candidate genes
Affiliations:
1. Neuropsychiatric Genetics Group, Department of Psychiatry, Trinity
College Dublin, Ireland
2. The University of Queensland, Queensland Brain Institute and School
of Psychology, Brisbane, Australia
3. Department of Neurosciences "B. B. Brodie", University of Cagliari,
Italy
Corresponding author:
Ricardo Segurado
Department of Psychiatry, Institute for Molecular Medicine, Trinity
Centre for Health Sciences, St. James' Hospital, Dublin 8, Ireland
phone: +353(0)18963405
fax: +353(0)18968461
e-mail: [email protected]
peer
-006
1125
1, v
ersi
on 1
- 26
Jul
201
1Author manuscript, published in "European Journal of Human Genetics (2011)"
DOI : 10.1038/ejhg.2010.250

Abstract
A number of genes with function related to synaptic neurochemistry
have been genetically associated with Attention-Deficit/Hyperactivity
Disorder. However, susceptibility to the development of common
psychiatric disorders by single variants acting alone, can so far only
explain a small proportion of the heritability of the phenotype. It
has been postulated that the unexplained “dark heritability” may at
least in part be due to epistatic effects, which may account for the
small observed marginal associations, and the difficulties with
replication of positive findings. We undertook a comprehensive
exploration of pair-wise interactions between genetic variants in 24
candidate genic regions involved in monoaminergic catabolism,
anabolism, release, re-uptake and signal transmission, in a sample of
177 parent-affected child trios using a case-only design and a case-
pseudocontrol design using conditional logistic regression. Marker-
pairs thresholded on interaction odds ratio and p-value are presented.
We detected a number of interaction odds ratios greater than 4.0,
including an interesting correlation between markers in the ADRA1B and
DBH genes in affected individuals, and several further interesting,
peer
-006
1125
1, v
ersi
on 1
- 26
Jul
201
1

but smaller effects. These effects are no larger than you would expect
by chance under the assumption of independence of all pair-wise
relations, however independence is unlikely. Furthermore, the size of
these effects is of interest and attempts to replicate these results
in other samples are anticipated.
Keywords
ADHD, epistasis, candidate gene
Introduction
The heritability of Attention Deficit/Hyperactivity Disorder (ADHD) is
well established, and genetic association data has been reviewed and
meta-analysed recently by Gizer and colleagues1. The detection of DNA
variants which increase risk for this disorder is important for
biochemical and pharmacological research into this disorder, and may
permit the facilitation of diagnosis, or refinement of the phenotype
on the basis of a biological marker. Specifically, association between
monoaminergic genes and ADHD is an active area of investigation,
stimulated principally by the mode of action of current
pharmacological treatments for the disorder, primary among which is
methylphenidate, a known dopamine and noradrenaline re-uptake
peer
-006
1125
1, v
ersi
on 1
- 26
Jul
201
1

inhibitor. Associations between variants at the dopamine, serotonin
and noradrenaline transporter and receptor genes, with ADHD, have been
investigated, and meta-analyses support the presence of ADHD risk
alleles with small to moderate effects at the DRD4, DRD5 and SLC6A3
genes1-3 in candidate gene studies, and modest evidence at ADRA1A, TPH2
and DDC from a recent meta-analysis of genome-wide association
studies4.
The influence of higher-order interactions between genes has been
posited for common, complex genetic disorders on the basis of
biological plausibility, and the presence of interactions influencing
gene expression and protein function both in model organisms and in
human disease susceptibility5-6. In the case of ADHD the most likely
known risk genes inhabit the same biochemical neighbourhood, in that
the functions of each gene product are related directly via protein-
protein interaction, or indirectly via regulatory pathways. Therefore
there are grounds for prior supposition that common genetic variants
in several risk genes may act synergistically to influence disease
risk. Methods for detecting interaction, or epistasis, in case-control
samples have received much attention recently9,10, particularly in the
rapidly developing areas of machine learning. Methods for family-based
samples are less well developed - usually adaptations of case-control
peer
-006
1125
1, v
ersi
on 1
- 26
Jul
201
1

methods (e.g. using matched case-pseudo-control samples). However, in
addition to large family based samples being used in the latest
generation of gene-mapping studies (e.g. the Autism Genome Project11;
IMAGE:12), family-based samples were extensively used in candidate gene
experiments prior to the emergence of genome-wide association studies.
These are excellent genotype resources for exploring epistasis as
these studies have genotyped a relatively small number of genetic
polymorphisms within strong candidate genes.
The aim of this study was to use a subset of genetic markers which we
expect to be enriched for true involvement in pathogenesis of ADHD,
to: 1) attempt to detect any large epistatic effects which may exist;
2) explore epistatic effect sizes between candidate genes, for
prioritisation of further investigation in this sample, and
replication in other samples. To this end a limited number of variants
in a range of strong candidate genes for ADHD were selected (see
Methods). As this study was a focused exploration of interaction, we
elected to use two principal techniques to analyse the data thoroughly
for various forms of interaction effects. Thus, firstly, a case-only
design was adopted in order to detect association between unlinked
genes in affected individuals. This allows calculation of an
“interaction odds ratio”, equivalent to the interaction relative
peer
-006
1125
1, v
ersi
on 1
- 26
Jul
201
1

risk under the assumption of independence of the genes in the general
population13. Secondly, a similar model was fitted to binary affection
status by logistic regression14. This method examines patterns of
transmission of alleles from each of the markers in a pair, thus is
robust to bias arising from population stratification.
Methods
Recruitment and Sample description
One hundred and seventy seven children and their families participated
in the study including 5 families with two affected children. The
families were recruited from child guidance clinics, ADHD support
groups, and via direct clinician refferal. A stringent diagnosis of
DSM-IV and/or ICD10 ADHD was made as described by Kirley et al15, using
the Child and Adolescent Psychiatric Assessment (CAPA) and the Teacher
Telephone Interview. Exclusion criteria included epilepsy, fragile X
syndrome, foetal alcohol syndrome, pervasive developmental disorder,
Tourette's syndrome, psychosis or IQ <70. Affected children met
research criteria for ICD-10 hyperkinetic disorder (HKD: 100 children)
and/or DSM-IV ADHD (combined: 112, inattentive: 21, or hyperactive-
impulsive: 11 subtypes), and/or a clinical diagnosis of ADHD not
meeting full research criteria, but deemed to lie on the broad ADHD
phenotypic spectrum. Therefore the present sample consisted of 172
peer
-006
1125
1, v
ersi
on 1
- 26
Jul
201
1

parent – affected child trios.
Marker selection and Genotyping
Gene selection began with a set of candidate genes previously typed in
this sample, and was expanded to include several genes found to be
associated in other samples and to genes within neurochemical systems
plausibly linked to ADHD (table 1; supplemental tables S1 and S2).
This study was limited to 25 autosomal genes (CES1 and SLC6A2 were
treated as one unit due to physical proximity). Markers within these
genes were either (i) previously characterised in this sample; (ii)
previously associated in other samples; (iii) selected due to known or
suspected functional relevance (on gene or protein expression, protein
sequence, and including presence in a known promoter region and lying
within 500 base pairs of an exonic boundary); or (iv) in order to tag
the remainder of the gene (r2 ≥ 0.8) insofar as gene size and marker
density made possible. Markers and genes were placed on the human
genome 18 physical map (hg18; NCBI build 36.3) using dbSNP
(http://www.ncbi.nlm.nih.gov/SNP/), or by linear interpolation from
flanking markers.
A total of 179 markers were genotyped. Single Nucleotide Polymorphisms
(SNPs) were genotyped commercially at K-Bioscience using a competitive
peer
-006
1125
1, v
ersi
on 1
- 26
Jul
201
1

allele-specific polymerase chain reaction (PCR) – KASPar (K-
Bioscience, Hoddesdon, UK; personal communication), or Taqman
chemistries (Applied Biosystems, California, USA). Three markers, at
the DBH (rs1611115 and rs6271) and COMT (rs4680) genes were genotyped
in-house with Taqman assays on a 7900HT sequence analyzer (Applied
Biosystems). Microsatellite and minisatellite markers were typed in-
house as described previously; these included the markers in SLC6A3
and DRD516, DRD417, TH18 and SLC6A419.
Multiallelic (> 2 alleles) markers were collapsed into 2 categories on
the basis of 1) bimodality of the allele frequency histogram in
founder individuals, 2) so as to approximate equifrequency of the
down-coded "alleles". This might be expected to reflect the genetic
history of the microsatellite. We did not use previously associated
alleles at these markers as a basis for recoding20.
Only autosomal genetic markers with a minor allele frequency in
founders of >0.05 were retained; only markers with over 80% genotype
rate were included; Pedcheck21 was used to detect Mendelisation errors,
genotypes showing errors were removed for the entire trio; finally,
markers which showed extreme deviation from Hardy-Weinberg equilibrium
in the parents were excluded due to the possibility of miscalled
peer
-006
1125
1, v
ersi
on 1
- 26
Jul
201
1

genotypes. When markers within the same gene were in near perfect
linkage disequilibrium in founders (r2 ≥ 0.98), the one with least
complete genotyping was discarded.
Data Analysis
An allelic case-only test for pair-wise interaction of SNPs22 was
performed, using the proband from each pedigree. In order to exclude
the effect of linkage disequilibrium between SNPs, all intragenic SNP
pairs, and all intergenic SNP pairs separated by less than 500
kilobases were excluded. Tables with any zero cell count were
discarded. A chi-square test (1 d.f.) was performed on the 2x2 tables,
and an odds ratio estimate was calculated.
The null distribution of the odds ratio for each pair of SNPs examined
was simulated by fixing genotypes at the first marker, and permuting
genotypes at the second. Two-sided p-values for the odds ratios were
estimated from 50 000 permutations, or from 1 000 000 permutations for
marker pairs which showed an initial empirical p-value less than
0.001. 95% confidence intervals for the interaction Odds Ratios were
generated from 1 000 bootstrap samples, for each marker pair. A
global, family-wise p-value was also calculated from the proportion of
peer
-006
1125
1, v
ersi
on 1
- 26
Jul
201
1

the 50 000 permutations in which an odds ratio was exceeded in any of
the pair-wise tests.
Interactions were also tested in a logistic regression model,
implemented on a matched case-pseudocontrol sample14. Fifteen pseudo-
controls were generated for each trio, for each marker pair, from all
combinations of parental two-marker genotypes. Two models were fitted
to the data in R (http://cran.r-project.org) with the coxph function
from the survival package, using robust variance estimation,
stratified on a family ID variable (equivalent to a conditional
logistic regression). An interaction parameter was tested by
contrasting the model with a nested model containing main effects
alone using a likelihood ratio chi-square test with one degree of
freedom. Only additive allelic effects were examined. For each marker
pair, perfectly collinear variables were handled by removing one from
the model. A pseudo-R2 for each model representing how much of the
variance in the dependent variable (affection status) is explained by
the genetic terms was also calculated.
Results
Twenty-seven markers were excluded (see Methods) due to low genotyping
rate, 4 due to low minor allele frequency in parents, and 3 due to
peer
-006
1125
1, v
ersi
on 1
- 26
Jul
201
1

extreme deviation from Hardy-Weinberg equilibrium in parents
(goodness-of-fit Chi-square, p < 0.00033 = 0.05/177). Interaction
between one pair of genes (CES1-SLC6A2) was not examined due to
physical proximity <500 kbp. Four markers were removed due to near
perfect linkage disequilibrium in parents with neighbouring markers (r2
= 0.98 – 1.00). Table 1 shows genic positions, marker number and
spacing. The Chi-square test statistic had very low correlation with
the intermarker distance, for syntenic markers (supplemental figure
S3).
The remaining 141 markers had a mean missing genotype rate of 0.075 in
affected individuals. We estimated from single-marker missingness that
82.4% (142) of cases would be genotyped at both markers of a marker-
pair, on average across all between-gene pairs. The observed average
was 85.3%. Mean minor allele frequency in founders was 0.304 (range:
0.051 – 0.498). The mean expected frequency of minor allele – minor
allele conjunctions over all marker pairs in cases was 0.0874 (range:
0.0023 – 0.2468), and approximately 64% of expected minor allele –
minor allele pair frequencies were greater than 0.05. The observed
mean minor allele – minor allele frequency in cases was 0.0871, with
71.0% being greater than 0.05.
peer
-006
1125
1, v
ersi
on 1
- 26
Jul
201
1
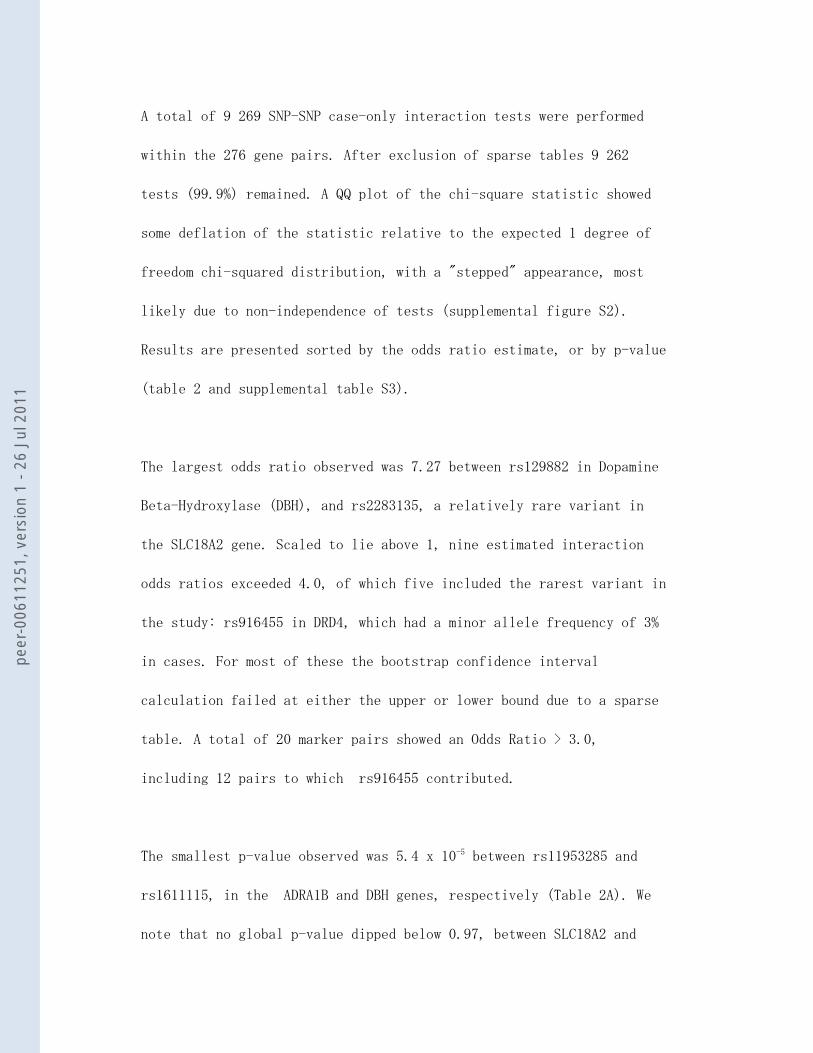
A total of 9 269 SNP-SNP case-only interaction tests were performed
within the 276 gene pairs. After exclusion of sparse tables 9 262
tests (99.9%) remained. A QQ plot of the chi-square statistic showed
some deflation of the statistic relative to the expected 1 degree of
freedom chi-squared distribution, with a "stepped" appearance, most
likely due to non-independence of tests (supplemental figure S2).
Results are presented sorted by the odds ratio estimate, or by p-value
(table 2 and supplemental table S3).
The largest odds ratio observed was 7.27 between rs129882 in Dopamine
Beta-Hydroxylase (DBH), and rs2283135, a relatively rare variant in
the SLC18A2 gene. Scaled to lie above 1, nine estimated interaction
odds ratios exceeded 4.0, of which five included the rarest variant in
the study: rs916455 in DRD4, which had a minor allele frequency of 3%
in cases. For most of these the bootstrap confidence interval
calculation failed at either the upper or lower bound due to a sparse
table. A total of 20 marker pairs showed an Odds Ratio > 3.0,
including 12 pairs to which rs916455 contributed.
The smallest p-value observed was 5.4 x 10⁻⁵ between rs11953285 and
rs1611115, in the ADRA1B and DBH genes, respectively (Table 2A). We
note that no global p-value dipped below 0.97, between SLC18A2 and
peer
-006
1125
1, v
ersi
on 1
- 26
Jul
201
1

DBH, and all marker-pairs excluded from Table 2 showed a global p-
value = 1.
The conditional logistic regression approach yielded maximum pseudo-R2
values of 0.033 (partial model) to 0.045 (full model), indicating a
small fraction of the variance in affection status could be accounted
for by the interaction terms. Correlation with the top case-only test
results was strong (Spearman rho for p-values = 0.776); over 80% of
interaction Odds Ratios were in the same direction, i.e. with the same
allele (supplemental figure 5). Table 2 and supplmentary table S3 show
the results from the logistic regression.
Discussion
From Pierce and Ahsan13, we estimate that a single pair-wise case-only
analysis with our sample size may have had good power to detect
relatively large interaction relative risks (>2), with interacting
minor allele frequencies of approximately 0.3. Considering a range of
minor allele frequencies from 0.05 to 0.5, the least power would be
obtained in the case where interacting loci both have risk alleles
with frequency of 0.05. In this case 80% power would be obtained for
an odds ratio of 4.86 (p < 0.05). If one locus had risk allele
frequency of 0.05, and the other locus 0.5, 80% power is obtained at
peer
-006
1125
1, v
ersi
on 1
- 26
Jul
201
1

OR = 2.24. If both risk alleles had frequency 0.5, an odds ratio of
2.5 could be detected with 80% power at a significance level of 5.1 x
10-6. Effects of these magnitudes are large by the standards seen to
date in genetic association studies of ADHD, however with the large
number of tests between all markers in the candidate genes we
examined, we did not expect to be able to achieve an acceptable gobal
false positive level, nor in fact was this acheived. Therefore, we
leave these findings as exploratory, to be used for prioritisation of
future studies in independent samples. In a more detailed exploration
of the interaction model (using, for example a four-parameter model of
additive x additive, additive x dominance, dominance x additive,
dominance x dominance) it was universally the case that unreliable
parameter estimates were obtained for the top marker-pair
interactions, and the model likelihoods did not converge. This may
simply reflect our modest sample size.
The presence of markers with a low MAF in the top interactions ranked
by the odds ratios is expected, due to unreliability of odds ratios
derived from tables with small cell sizes as indicated by wide
confidence intervals, and as reflected in the p-values for these tests
(see supplemental figure 4). When the Odds Ratio is sensitive to
small observed cell counts, the empirical p-value is of use to judge
peer
-006
1125
1, v
ersi
on 1
- 26
Jul
201
1
whether a particularly large estimate would be likely to occur by
chance alone.
It is probable that several factors exist which preclude the
independence of the individual pair-wise interaction tests performed
with either the case-only design, or the regression. These include
linkage disequilibrium within genes to due ancestral co-segregation.
We hope to have robustly excluded any effect due to LD between
syntenic markers by using a severe minimum distance between genes of
500 kilobasepairs. However, adjacent genes frequently share features
at a functional level and in expression profile23, and a large minimum
distance may exclude some true functional interactions. Other
potential confounders may also cause correlation between genes. These
include, but are probably not limited to, higher-order interaction
effects on disease, on survival to age of sampling, and membership of
cryptic subpopulations. We have not tested the first of these due to
sample size limitations, and to avoid a large increase in the number
of tests and increased computational burden. Epistatic effects on
survival to sampling cannot be excluded, however no reports of
marginal effects at these genes exist in the literature. Unfortunately
this sample was not genotyped at sufficient loci to allow an estimate
of population stratification, or to allow a genomic correction to be
peer
-006
1125
1, v
ersi
on 1
- 26
Jul
201
1

applied, however, the sample is ethnically homogeneous therefore we do
not expect any severe bias. This is supported by the strong
correlation between the case-only and the family trio-based logistic
regression results, which is not susceptible to the cryptic population
structure in the sample.
As this study was intended to be hypothesis-generating, no threshold
defining statistical significance was enforced. Formal statistical
evaluation of the evidence for interaction at the gene pair level is
not trivial, as it would require consideration of both the number of
markers within each gene and the extent of linkage disequilibrium, as
well as higher order effects. Methods such as that of Chatterjee and
colleagues10 are of interest, but are not yet applicable to family-
based or case-only designs. The LD patterns within each gene are
relatively low (supplemental figure 1), and use of a gene-based
permutation procedure which controls for LD will be important when a
threshold for statistical significance is applied.
The most studied gene – gene interaction in ADHD is for a joint effect
of the dopamine receptor 4 gene (DRD4) and the dopamine transporter
gene (SLC6A3) VNTR polymorphisms, with some suggestive results24-26. We
were unable to demonstrate strong effects between DRD4 and SLC6A3.
peer
-006
1125
1, v
ersi
on 1
- 26
Jul
201
1

There is also a report in the literature of an interaction between the
Noradrenaline transporter (SLC6A2 / NET1) and the catechol-O-
methyltransferase (COMT) genes affecting quantitative traits derived
from an ADHD self-report scale27. Pairs of markers from these genes are
amongst our top results, ranked by p-value: COMT marker rs737866, when
paired with three SLC6A2 markers had Odds Ratios of 1.89 (95% CI:
1.27-2.83; p = 0.000866) with rs36017, 1.66 (1.14-2.41; p = 0.0085)
with rs1345429, and 1.76 (1.23 – 2.68; p = 0.00128) with rs5569. These
three SLC6A2 variants are relatively highly correlated with each other
(r2 from 0.38 to 0.90; all D' > 0.97), which may explain the
correlation of odds ratios (see Supplmentary materials, figure S1(O)).
It has been hypothesised that functional disruption of serotonin-
related genes (SLC6A4, HTR1A, HTR1B) may act synergistically at the
synapse to increase extracellular serotonin levels28. We did observe
modest interaction effects (table 2) between two of these genes –
SLC6A4 and HTR1B (we did not examine HTR1A). While this did not stand
out as a finding in the case-only analysis, the logistic regression
showed a large interaction odds ratio estimate of 3.24 (suppl. table
S3).
Two pairs of interactions with the smallest p-values stand out. ADRA1B
peer
-006
1125
1, v
ersi
on 1
- 26
Jul
201
1

showed a minimum p-value of 0.00005 with DBH (odds ratio = 4.56). DBH
converts dopamine (DA) to noradrenaline (NA), and in particular the
SNP rs1611115 (-1021C→T) in the DBH gene promoter has been shown to
have a strong effect on plasma enzyme activity29. Here the “low-
activity” C allele (implying lack of NA and accumulation of DA) shows
a synergistic effect with an ADRA1B allele to increase risk. An
interaction at or near this SNP could potentially explain some of the
heterogeneous marginal association findings at this gene1. There is a
dearth of well-targetted studies on the ADRA1B gene product, and its
central neural functions are unknown.
The second pair involves HTR2A with ADRA1A, showing a minimum p-value
of 0.0008, with an odds ratio = 1.96 (see table 2, supplemental table
S3). Linking these results, one publication has suggested that a
HTR2A-mediated pathway may compensate for ADRA1B inactivity in a mouse
hyperactivity model30, raising the possibility that the products of
these two genes may have some complementary function in a dopaminergic
regulation that is also targetted by amphetamines (including
methylphenidate).
Of course, a reasonable disease mechanism may be deduced from any
subset of interactions that one selects, especially since these genes
peer
-006
1125
1, v
ersi
on 1
- 26
Jul
201
1

and polymorphisms were preselected for this very reason – this
discussion on the potential functional relevance of these results is
purely speculative, especially in the absence of known functional
effects of the markers studied. However, these results have implicated
a number of gene-pairs with interesting effect sizes, and suggestive
of a functionally consistent set of interactions which may converge on
a common neurochemical phenotype, and which should be prioritised in
future studies.
While the detection of a statistical interaction may imply a
biological (physico-chemical) interaction between the genes and/or
gene products or via regulatory mechanisms, proof and further
elucidation require extensive cell and molecular experiments. We also
note that the statistical tests performed were exploratory, and we
place greater emphasis on estimates of the effect sizes demonstrated
here; which must, however, must await replication in a larger,
independent sample. Here we were able to primarily investigate
interaction in the form of a deviation from multiplicative effect on
the risk ratio at pairs of markers in or near strong candidate genes.
Interactions may lead to a marginal effect on disease risk at either
or both of the loci, however such marginal effects may appear
considerably smaller than the true, unmeasured interaction, and
peer
-006
1125
1, v
ersi
on 1
- 26
Jul
201
1
therefore on a genome-wide scale power to detect such effects will be
low, while controlling the family-wise error rate. For this reason we
feel that directed studies of interaction such as the present one may
be fruitful, when small but suggestive marginal effect sizes at the
genes of interest have been demonstrated. This exploration of
interactions between a select set of candidate genes in our sample of
ADHD cases has found some interesting results, justifying such further
study.
Acknowledgements
The authors gratefully acknowledge the Health Research Board, Ireland
for salaries and project funding (RS, ZH).
Conflict of Interest The authors declare no conflict of interest.
Supplementary information is available at the European Journal of
Human Genetic's website.
References
1. Gizer IR, Ficks C, Waldman ID: Candidate gene studies of ADHD: a
meta-analytic review. Human Genetics 2009; 126(1):51-90.
2. Li D, Sham PC, Owen MJ, He L: Meta-analysis shows significant
peer
-006
1125
1, v
ersi
on 1
- 26
Jul
201
1

association between dopamine system genes and attention deficit
hyperactivity disorder (ADHD). Human Molecular Genetics 2006;
15(14):2276-2284.
3. Yang B, Chan RC, Jing J, Li T, Sham P, Chen RY: A meta-analysis
of association studies between the 10-repeat allele of a VNTR
polymorphism in the 3'-UTR of dopamine transporter gene and
attention deficit hyperactivity disorder. American Journal of
Medical Genetics Part B (Neuropsychiatric Genetics) 2007; 144B:541-
550.
4. Neale BM, Medland SE, Ripke S, et al: Meta-analysis of genome-
wide association studies of attention-deficit/hyperactivity
disorder. Journal of the American Academy of Child & Adolescent
Psychiatry 2010; 49(9):884-897.
5. Elena SF, Lenski RE: Test of synergistic interactions among
deleterious mutations in bacteria. Nature 1997; 390:395-398.
6. Clark AG, Wang L: Epistasis in measured genotypes: drosophila P-
element insertions. Genetics 1997; 147:157-163.
7. Komili S, Roth FP: Genetic interaction screens advance in
reverse. Genes and Development 2007; 21(2):137-142.
8. Rio Frio T, Civic N, Ransijn A, Backmann JS, Rivolta C: Two
trans-acting eQTLs modulate the penetrance of PRPF31 mutations.
Human Molecular Genetics 2008; 17(20):3154-3165.
peer
-006
1125
1, v
ersi
on 1
- 26
Jul
201
1
9. Cordell HJ: Detecting gene-gene interactions that underlie human
diseases. Nature Reviews Genetics 2009; 10:392-404.
10. Chatterjee N, Kalaylioglu Z, Moslehi R, Peters U, Wacholder S:
Powerful multilocus tests of genetic association in the presence of
gene-gene and gene-environment interactions. American Journal of
Human Genetics 2006; 79(6):1002-1016.
11. Autism Genome Project Consortium, Szatmari P, Paterson AD:
Mapping autism risk loci using genetic linkage and chromosome
rearrangements. Nature Genetics 2007; 39(3):319-328.
12. Neale BM, Laksy-Su J, Anney R et al: Genome-wide association
scan of attention deficit hyperactivity disorder. American Journal
of Medical Genetics B (Neurospychiatric Genetics) 2008;
147B(8):1337-1344.
13. Pierce BL, Ahsan H: Case-only genome-wide interaction study of
disease risk, prognosis and treatment. Genetic Epidemiology 2009; e-
pub: DOI: 10.1002/gepi.20427.
14. Cordell HJ, Barratt BJ, Clayton DG: Case/Pseudocontrol analysis
in genetic association studies: a unified framework for detection of
genotype and haplotype associations, gene-gene and gene-environment
interactions, and parent-of-origin effects. Genetic Epidemiology
2004; 26:167-185.
15. Kirley A, Lowe N, Hawi Z et al: Association of the 480 bp DAT1
peer
-006
1125
1, v
ersi
on 1
- 26
Jul
201
1
allele with methylphenidate response in a sample of Irish children
with ADHD. American Journal of Medical Genetics B (Neuropsychiatric
Genetics) 2003; 121B(1):50-54.
16. Hawi Z, Lowe N, Kirley A et al: Linkage disequilibrium mapping
at DAT1, DRD5 and DBH narrows the search for ADHD susceptibility
alleles at these loci. Molecular Psychiatry 2003; 8(3):299-308.
17. Lowe N, Kirley A, Mullins C, Fitzgerald M, Gill M, Hawi Z:
Multiple marker analysis at the promoter region of the DRD4 gene and
ADHD: evidence of linkage and association with the SNP -616.
American Journal of Medical Genetics B (Neuropsychiatric Genetics)
2004; 131B(1):33-7.
18. Hawi Z, Segurado R, Conroy J et al: Preferential transmission of
paternal alleles at risk genes in attention-deficit/hyperactivity
disorder. American Journal of Human Genetics 2005; 77(6):958-65.
19. Kent L, Doerry U, Hardy E et al: Evidence that variation at the
serotonin transporter gene influences susceptibility to attention
deficit hyperactivity disorder (ADHD): analysis and pooled analysis.
Molecular Psychiatry 2002; 7(8):908-12.
20. Gatto NM, Campbell UB, Rundle AG, Ahsan H: Further development
of the case-only design for assessing gene-environment interaction:
evaluation of and adjustment for bias. International Journal of
Epidemiology 2004; 33:1014-1024.
peer
-006
1125
1, v
ersi
on 1
- 26
Jul
201
1
21. O'Connell JR, Weeks DE: PedCheck: a program for the
identification of genotype incompatibilities in linkage analysis.
American Journal of Human Genetics 2998; 63(1):259-266.
22. Yang Q, Khoury MJ, Sun F, Flanders WD: Case-only design to
measure gene-gene interaction. Epidemiology 1999; 10(2):167-170.
23. Hurst LD, Pál C, Lercher MJ: The evolutionary dynamics of
eukaryotic gene order. Nature Reviews Genetics 2004; 5(4):299-310.
24. Roman T, Schimtz M, Polanczyk G, Eizirik M, Rohde LA, Hutz MH:
Attention-deficit hyperactivity disorder: a study of association
with both the dopamine transporter gene and the dopamine D4 receptor
gene. American Journal of Medical Genetics (Neuropsychiatric
Genetics) 2001; 195:471-478.
25. Carrasco X, Rothhammer P, Moraga M et al: Genotypic interaction
between DRD4 and DAT1 loci is a high risk factor for attention-
deficit/hyperactivity disorder in Chilean families. American Journal
of Medical Genetics Part B (Neuropsychiatric Genetics) 2006;
141B:51-54.
26. Henríquez H, Henríquez M, Carasco X et al: Combination of DRD4
and DAT1 genotypes is an important risk factor for attention deficit
disorder with hyperactivity families living in Santiago, Chile. Rev
Méd Chile 2008; 136:719-724.
27. Retz W, Rösler M, Kissling C et al: Norepinephrine transporter
peer
-006
1125
1, v
ersi
on 1
- 26
Jul
201
1
and catecholamine-O-methyltransferase gene variants and attention-
deficit/hyperactivity disorder symptoms in adults. Journal of Neural
Transmission 2008; 115:323-329.
28. Stoltenberg SF: Epistasis among presynaptic serotonergic
components. Behavior Genetics 2005; 35(2):199-209.
29. Zabetian CP, Anderson GM, Buxbaum SG et al: A quantitative-trait
analysis of human plasma-dopamine beta-hydroxylase acitivty:
evidence for a major functional polymiorphism at the DBH locus.
American Journal of Human Genetics 2001; 68:515-522.
30. Auclair A, Drouin C, Cotecchia S, Glowinski J, Tassin JP: 5-HT2A
and alpha1b-adrenergic receptors entirely mediate dopamine release,
locomotor response and behavioural sensitization to opiates and
psychostimulants. European Journal of Neuroscience 2004;
20(11):3073-3084.
peer
-006
1125
1, v
ersi
on 1
- 26
Jul
201
1
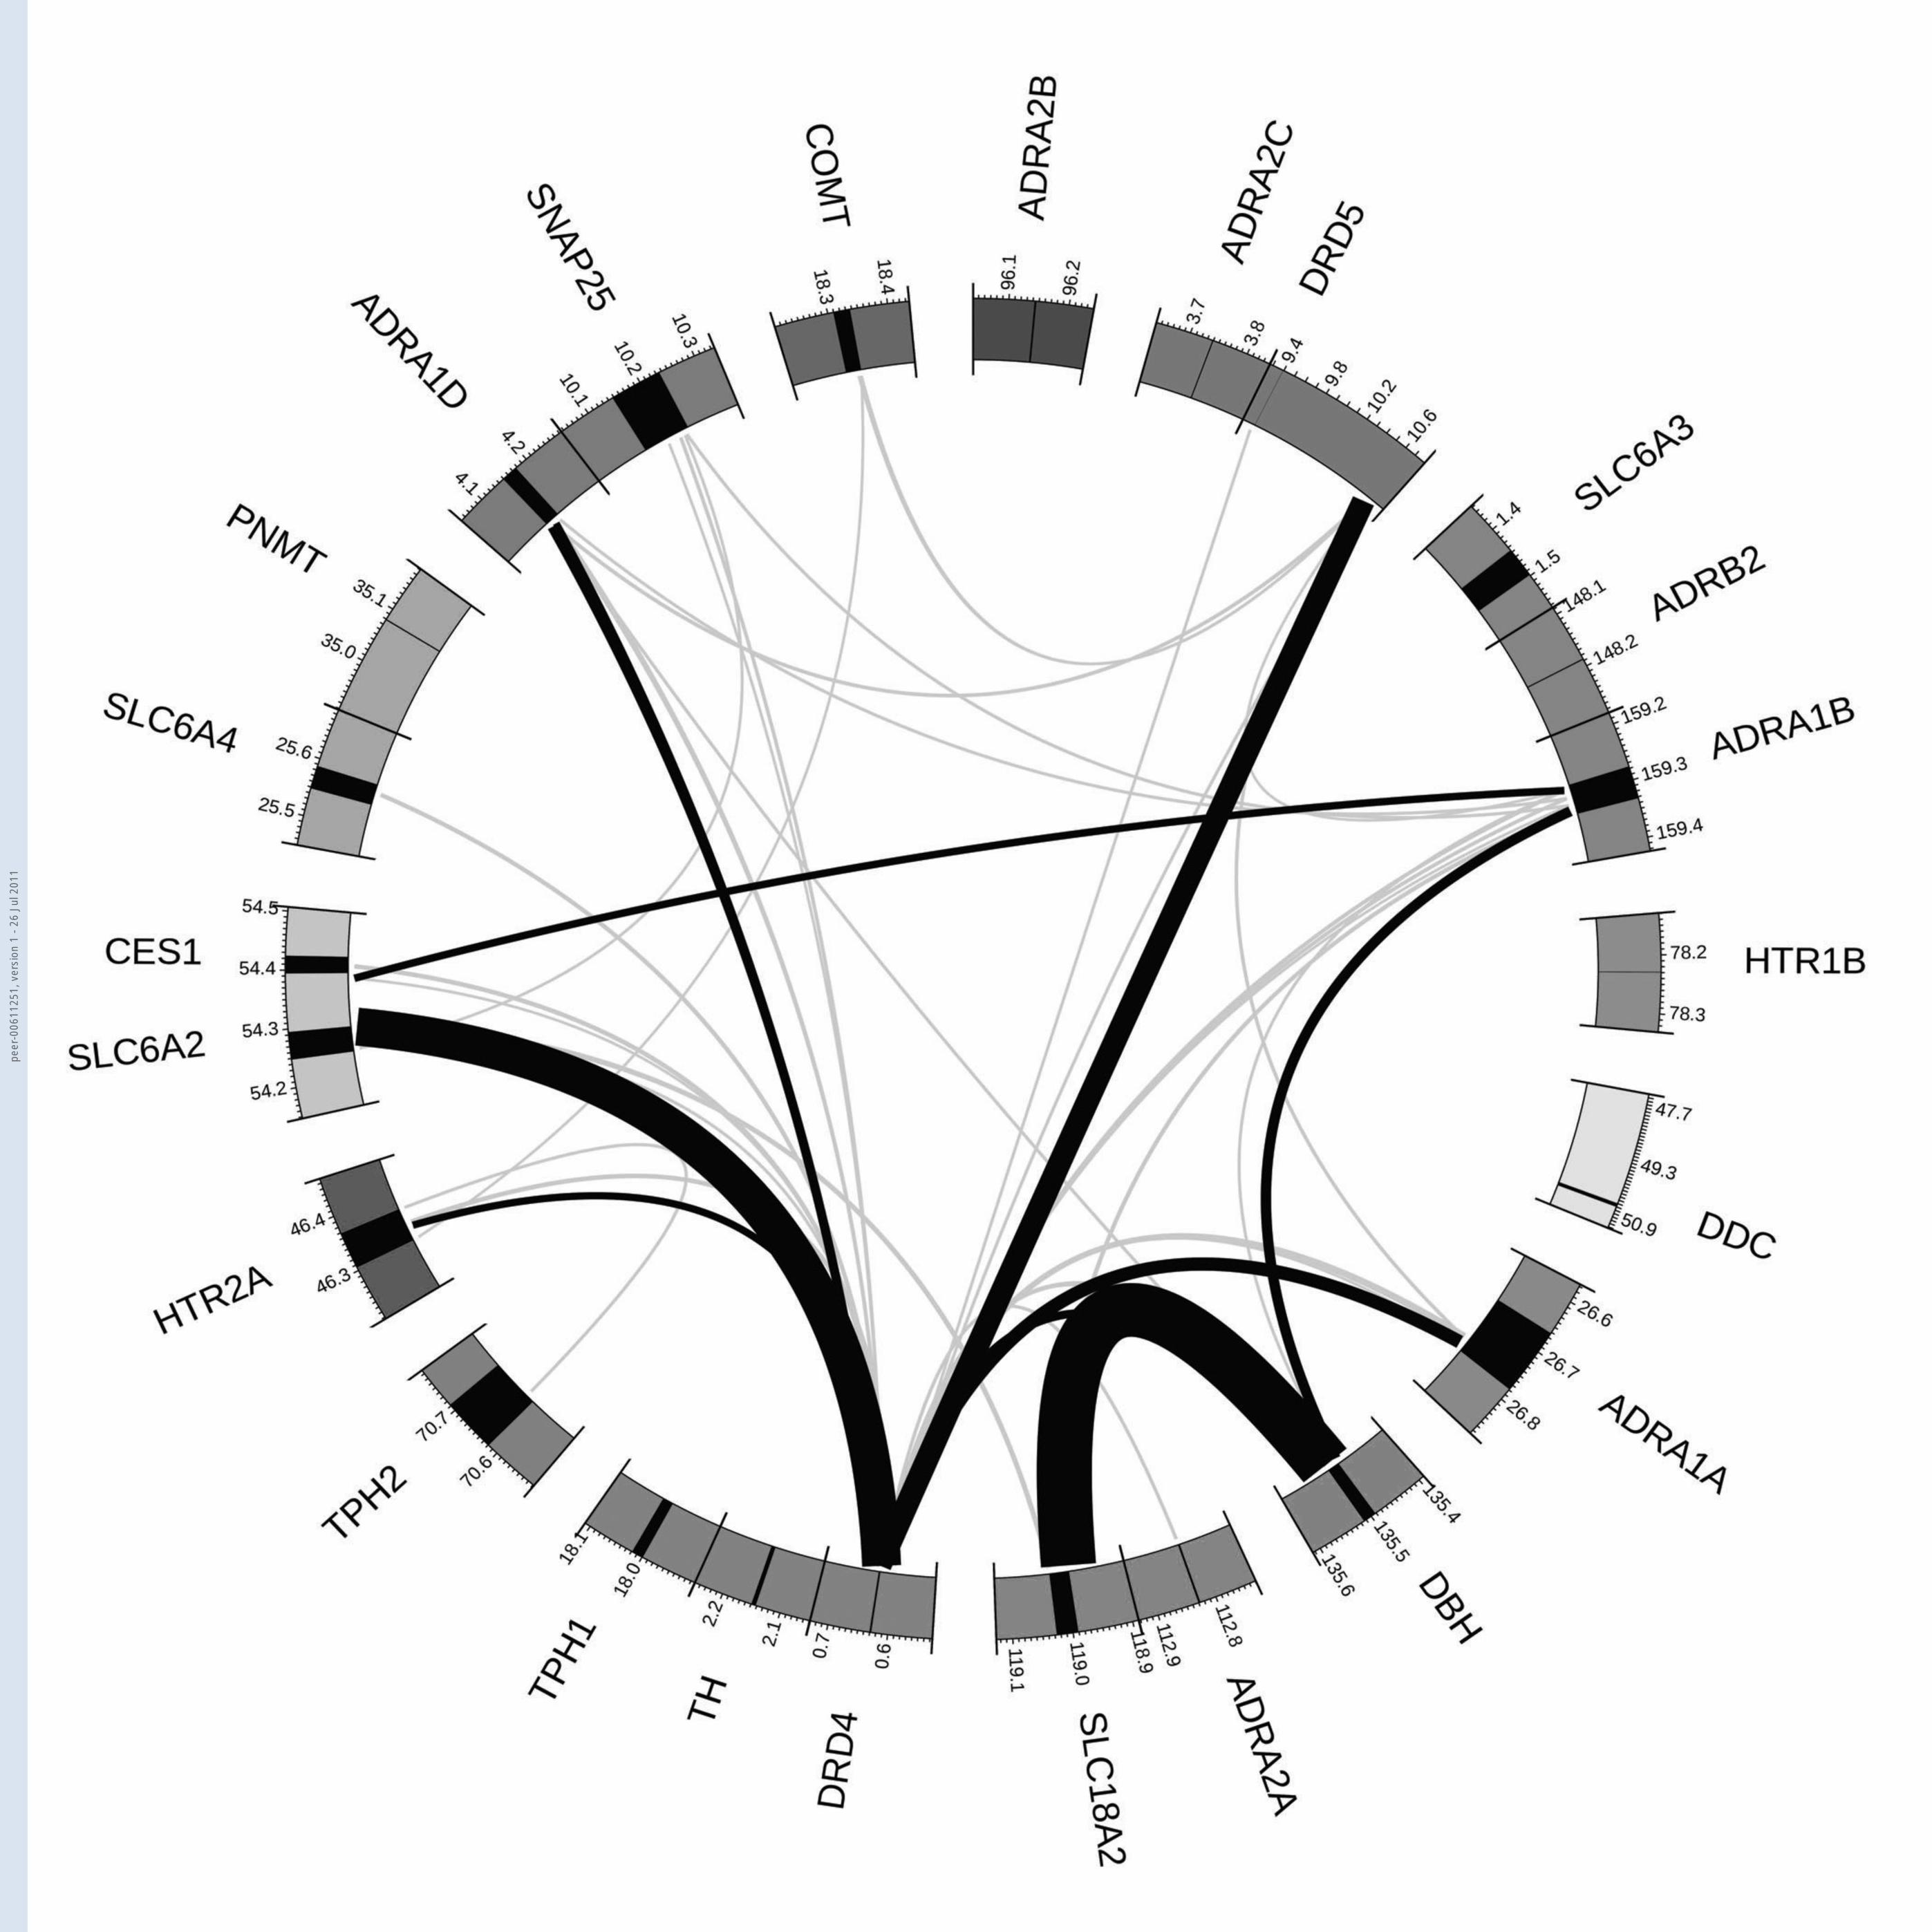
Titles and legends to figures
Figure 1. Visual representation of the interaction relative risk
estimates for the top 0.5% of variant-variant interactions. Legend:
chromosomes are colour-coded; gene spans in black. Note that the
regions around the DDC and DRD5 genes are rescaled reltive to other
genes (1:17 and 1:5 respectively) due to distance to the furthest
marker; interaction links are shaded by quantile: grey = 99.5th –
99.9th, black = >99.9th; arc widths are proportional to the
interaction Odds Ratio.
peer
-006
1125
1, v
ersi
on 1
- 26
Jul
201
1

peer
-006
1125
1, v
ersi
on 1
- 26
Jul
201
1
peer
-006
1125
1, v
ersi
on 1
- 26
Jul
201
1

Table 1. Description of candidate genes typed and marker coverage. Spacing
based on human genome build hg18.
Gene Chr
Position (b.p.)
#markers
Mean marker
spacing
(bp) start stop
ADRA2B 2 96,142,350 96,145,615 1 -
ADRA2C 4 3,738,094 3,740,051 1 -
DRD5 4 9,392,356 9,394,731 3 663,473
ADRA1B 5 159,276,318 159,332,595 11 4,433
ADRB2 5 148,186,349 148,188,381 2 33
SLC6A3 5 1,445,910 1,498,538 2 17,933
HTR1B 6 78,228,667 78,229,839 5 470
DDC 7 50,493,628 50,600,648 2 3,744,601
ADRA1A 8 26,661,584 26,778,839 14 8,550
DBH 9 135,491,306 135,514,287 11 2,315
ADRA2A 10 112,826,780 112,830,652 3 1,859
SLC18A2 10 118,990,706 119,027,085 5 9,173
DRD4 11 627,305 630,703 5 1,011
TH 11 2,141,735 2,149,611 1 -
TPH1 11 17,998,660 18,018,911 3 3,526
TPH2 12 70,618,893 70,712,488 12 6,266
HTR2A 13 46,305,514 46,369,170 8 8,701
SLC6A2 16 54,248,057 54,295,201 9 6,526
CES1 16 54,394,265 54,424,576 3 22,743
PNMT 17 35,078,033 35,080,254 3 3,093
SLC6A4 17 25,547,506 25,587,080 5 9,879
ADRA1D 20 4,149,278 4,177,659 11 2,359
SNAP25 20 10,147,477 10,236,065 16 6,019
COMT 22 18,309,263 18,337,496 5 6,396
peer
-006
1125
1, v
ersi
on 1
- 26
Jul
201
1

Table 2. Top case-only interaction results (p-value < 0.005 and OR �> 2)
Locus 1 Locus 2 Case-only test Regression test
gene marker chr:pos gene marker chr:pos
Odds Ratio
(95% C.I.)
p-value
(1)
Odds
Ratio p-value
full model
pseudo-R2
(3)
ADRA1B rs11953285
5:159,324,38
9 DBH rs1611115 9:135,490,336
4.56 (2.10-
20.02) 0.000054 4.83 0.0004 0.018
SLC6A3 Intron8 VNTR 5:1,464,855 SNAP25 rs362562 20:10,191,186
2.41 (1.46-
4.23) 0.000558 1.60 0.0871 0.008
ADRA1B rs7737796
5:159,302,00
7 SNAP25 rs363006 20:10,228,083
2.43 (1.50-
4.37) 0.000711 2.27 0.0102 0.016
ADRA1A rs472865 8:26,754,388 DRD4 exon 3 VNTR 11:629,989
3.64 (1.61-
14.41 0.00100 3.80 0.0048 0.015
ADRA1B rs6884105
5:159,281,02
1 SNAP25 rs363006 20:10,228,083
2.18 (1.38-
3.85) 0.00104 2.13 0.0215 0.008
ADRA1A rs486354 8:26,766,207 DRD4
120 bp
duplication 11:625,946
2.46 (1.42-
5.21) 0.00134 2.66 0.0111 0.012
DBH rs129882
9:135,513,49
0 SLC18A2 rs2283135 (2)
10:118,989,92
2 7.27 (N/A) 0.00178 9.45 0.0037 0.016
DRD4 rs12720373 11:626,688 CES1 rs3815589 16:54,384,420
2.47 (1.38-
5.36) 0.00204 2.21 0.0222 0.015
DRD5 D4S2928 (2) 4:10,612,311 DRD4 exon 3 VNTR 11:629,989 5.84 (N/A) 0.00250 3.66 0.0664 0.007
CES1 rs3815589
16:54,384,42
0 ADRA1D rs4815670 20:4,164,864
2.03 (1.23-
3.47) 0.00314 2.03 0.0252 0.010
ADRA1A rs472865 8:26,754,388 DBH rs2797849 9:135,491,762
2.33 (1.36-
4.71) 0.00328 2.28 0.0220 0.011
ADRA1B rs13162302
5:159,299,85
3 ADRA1D rs6052456 20:4,173,573
2.67 (1.41-
6.64) 0.00410 3.82 0.0010 0.021
DRD5 D4S2928 (2) 4:10,612,311 COMT rs4680 22:18,331,271
2.60 (1.38-
5.27) 0.00416 2.04 0.0904 0.004
HTR1B rs1228814 6:78,230,539 SLC6A4 rs1872924 17:25,570,472
2.06 (1.23-
4.09) 0.00456 3.24 0.0068 0.016
SLC18A2 rs363279
10:119,026,6
15 SLC6A2 rs9930182 16:54,298,798
3.38 (1.59-
13.27) 0.00474 4.15 0.0033 0.017
Legend:
VNTR = Variable Number of Tandem Repeats polymorphism; chr:pos = chromosome:
position (base pairs from pter; hg18); odds ratio were rescaled to lie above 1,
confidence intervals were derived from 1,000 bootstrap samples, "N/A" indicates
that a ceiling or floor effect was observed in the bootstrap estimates, due to
sparse contingency table; see supplementary materials for the full results.
(1) - empirical p-value from 50,000 or 1,000,000 (in bold) Monte Carlo
peer
-006
1125
1, v
ersi
on 1
- 26
Jul
201
1

permutations.
(2) - Minor allele frequency < 0.1 in parents.
(3) – McFadden pseudo-R2 for the full model including main effects and
interaction.
NB: The p-values presented are unadjusted for multiple testing; none of them are
significant at p < 0.05 after correction for the number of tests.
peer
-006
1125
1, v
ersi
on 1
- 26
Jul
201
1
Copyright © 2022 FDOKUMEN