The cellular basis for phenotypic plasticity of body size in Western Spadefoot toad (Spea hammondi)...
12
Biological Journal of the Linnean Society, 2006, 88, 499–510. With 7 figures © 2006 The Linnean Society of London, Biological Journal of the Linnean Society, 2006, 88, 499–510 499 Blackwell Publishing LtdOxford, UKBIJBiological Journal of the Linnean Society0024-4066The Linnean Society of London, 2006*** 2006 883 499510 Original Article FOOD AND TEMPERATURE EFFECTS ON MUSCLE STRUCTURE J. D. ARENDT *E-mail: [email protected] The cellular basis for phenotypic plasticity of body size in Western Spadefoot toad (Spea hammondi) tadpoles: patterns of cell growth and recruitment in response to food and temperature manipulations JEFF D. ARENDT* Department. of Biology, University of California at Riverside, Riverside, CA 92521, USA Received 25 October 2004; accepted for publication 5 December 2005 Body size is highly variable within and among populations, both as a result of genetic variation and as a plastic response to environmental variation. From a proximate perspective, body size depends upon cell size, cell number, and extracellular matrix, but we know little about their independent contributions to size nor how these contribu- tions vary with environmental influences. Here, I introduce the tail muscle of anuran tadpoles as a new system for studying this issue. Body size and tail size of tadpoles is sensitive to variation in food and temperature. I show first that tail muscle size is strongly correlated with overall body size, thus making it a good tissue to study size regu- lation. Second, the relative role of cell size and cell number, but not extracellular matrix, shows an interaction between food and temperature treatments and across ages. For example, in young tadpoles food effects on size are due exclusively to cell size at low temperatures but both cell size and number at high temperatures. This pattern par- tially reverses for older tadpoles. Despite the complexity of this interaction, the two populations compared show nearly identical patterns, suggesting that the plastic response is robust. © 2006 The Linnean Society of London, Biological Journal of the Linnean Society, 2006, 88, 499–510. ADDITIONAL KEYWORDS: anuran – cell number – cell size – extracellular matrix – food level – tail muscle. INTRODUCTION Body size plays a critical role in most biological pro- cesses. Size is generally heritable, but it is also extremely plastic (Atkinson, 1994; Blanckenhorn, 2000). Two of the most pervasive ecological factors that influence phenotypic variation in body size are resource availability and temperature, and most organisms show distinctly different reaction norms in response to these factors (Stearns & Koella, 1986; Atkinson, 1994; Berrigan & Charnov, 1994). High resource levels usually result in faster growth and ear- lier maturation at a larger size than low resource lev- els. In contrast, high temperature results in faster growth and earlier maturation, but at a smaller size than low temperatures (Fig. 1). Most research has tried to explain why these very different reaction norms might be adaptive (e.g. Berrigan & Charnov, 1994; Atkinson & Sibly, 1997; Blanckenhorn, 1998; Angilletta. & Dunham 2003). Another important issue is understanding the developmental basis for these reaction norms. At the cellular level, three factors contribute to over- all body size: cell number, cell size, and extracellular matrix. Relative contribution of cell size and cell num- ber to body size has been best studied in wing epider- mal cells of Drosophila melanogaster (extracellular matrix has not been considered here). Generally, it is thought that temperature affects body size primarily through variation in cell size while food affects body size through cell number (e.g. Robertson, 1959). How- ever, the same trends are not always seen in selection experiments (Partridge et al., 1994, 1999; McCabe, French & Partridge, 1997) or in population compari- sons along a latitudinal cline (James, Azevedo & Partridge, 1997; Zwaan et al., 2000). Either genetic differences are not the same as those underlying phe- notypic plasticity, or the relevant selection pressure
-
Upload
ucriverside -
Category
Documents
-
view
2 -
download
0
Transcript of The cellular basis for phenotypic plasticity of body size in Western Spadefoot toad (Spea hammondi)...
Biological Journal of the Linnean Society
, 2006,
88
, 499–510. With 7 figures
© 2006 The Linnean Society of London,
Biological Journal of the Linnean Society,
2006,
88
, 499–510
499
Blackwell Publishing LtdOxford, UKBIJBiological Journal of the Linnean Society0024-4066The Linnean Society of London, 2006*** 2006883499510Original Article
FOOD AND TEMPERATURE EFFECTS ON MUSCLE STRUCTUREJ. D. ARENDT
*E-mail: [email protected]
The cellular basis for phenotypic plasticity of body size in Western Spadefoot toad (
Spea hammondi)
tadpoles: patterns of cell growth and recruitment in response to food and temperature manipulations
JEFF D. ARENDT*
Department. of Biology, University of California at Riverside, Riverside, CA 92521, USA
Received 25 October 2004; accepted for publication 5 December 2005
Body size is highly variable within and among populations, both as a result of genetic variation and as a plasticresponse to environmental variation. From a proximate perspective, body size depends upon cell size, cell number,and extracellular matrix, but we know little about their independent contributions to size nor how these contribu-tions vary with environmental influences. Here, I introduce the tail muscle of anuran tadpoles as a new system forstudying this issue. Body size and tail size of tadpoles is sensitive to variation in food and temperature. I show firstthat tail muscle size is strongly correlated with overall body size, thus making it a good tissue to study size regu-lation. Second, the relative role of cell size and cell number, but not extracellular matrix, shows an interactionbetween food and temperature treatments and across ages. For example, in young tadpoles food effects on size aredue exclusively to cell size at low temperatures but both cell size and number at high temperatures. This pattern par-tially reverses for older tadpoles. Despite the complexity of this interaction, the two populations compared shownearly identical patterns, suggesting that the plastic response is robust. © 2006 The Linnean Society of London,
Biological Journal of the Linnean Society
, 2006,
88
, 499–510.
ADDITIONAL KEYWORDS:
anuran – cell number – cell size – extracellular matrix – food level – tail muscle.
INTRODUCTION
Body size plays a critical role in most biological pro-cesses. Size is generally heritable, but it is alsoextremely plastic (Atkinson, 1994; Blanckenhorn,2000). Two of the most pervasive ecological factorsthat influence phenotypic variation in body size areresource availability and temperature, and mostorganisms show distinctly different reaction norms inresponse to these factors (Stearns & Koella, 1986;Atkinson, 1994; Berrigan & Charnov, 1994). Highresource levels usually result in faster growth and ear-lier maturation at a larger size than low resource lev-els. In contrast, high temperature results in fastergrowth and earlier maturation, but at a smaller sizethan low temperatures (Fig. 1). Most research hastried to explain why these very different reactionnorms might be adaptive (e.g. Berrigan & Charnov,
1994; Atkinson & Sibly, 1997; Blanckenhorn, 1998;Angilletta. & Dunham 2003). Another important issueis understanding the developmental basis for thesereaction norms.
At the cellular level, three factors contribute to over-all body size: cell number, cell size, and extracellularmatrix. Relative contribution of cell size and cell num-ber to body size has been best studied in wing epider-mal cells of
Drosophila melanogaster
(extracellularmatrix has not been considered here). Generally, it isthought that temperature affects body size primarilythrough variation in cell size while food affects bodysize through cell number (e.g. Robertson, 1959). How-ever, the same trends are not always seen in selectionexperiments (Partridge
et al
., 1994, 1999; McCabe,French & Partridge, 1997) or in population compari-sons along a latitudinal cline (James, Azevedo &Partridge, 1997; Zwaan
et al
., 2000). Either geneticdifferences are not the same as those underlying phe-notypic plasticity, or the relevant selection pressure

500
J. D. ARENDT
© 2006 The Linnean Society of London,
Biological Journal of the Linnean Society,
2006,
88
, 499–510
has been misidentified. In addition, the only study toincorporate both food and temperature (De Moed, DeJong & Scharloo, 1997) found an interaction betweenthese manipulations. For vertebrates, a number ofinvestigators have looked at muscle cell size and num-ber in teleosts (e.g. Vieria & Johnston, 1992; Natha-nailides, Lopez-Albors & Stickland, 1995; Alami-Durante
et al
., 1997; Rasmussen & Ostenfeld, 2000).Results in teleosts have been less consistent even thanthose for
D. melanogaster
, possibly because studiesinclude distantly related species as well as differentdevelopmental stages (larval, juvenile, and adult).
As a model organism,
Drosophila
provides manyadvantages for this research. It is, however, limited inthat no growth occurs in the adult such that size andage effects are necessarily confounded. This makes itdifficult to examine how cell recruitment and growthvary throughout ontogeny. Because teleosts have inde-terminate growth, and fibre recruitment continueslate into ontogeny (Weatherley, Gill & Lobo, 1988), it iseasier to characterize patterns of growth during devel-opment, although to my knowledge this has not beendone. Fibre recruitment in teleosts can continue forseveral years, depending upon species, making longi-tudinal comparisons difficult. Here, I introduce a new
system for studying the role of cell growth and recruit-ment in determining body size; the tail muscle of anu-ran tadpoles. The tadpole stage of frogs and toads isrelatively short (typically a matter of weeks ratherthan years), and the tail muscle completes develop-ment and then is fully resorbed during this time. Inaddition, we can quantify the functional (locomotor)consequences of a muscle made up of many small vs. afew large cells. The work presented here improvesupon most previous studies on cell growth and recruit-ment in two ways as (1) tadpoles were sampled at twoages rather than one (see also Valente
et al
., 1999) and(2) the joint effects of food and temperature wereexamined (see also De Moed
et al
., 1997). Analysis ofswimming performance will be reported elsewhere.
This study was conducted with tadpoles of theWestern Spadefoot toad (
Spea hammondi
) from thefamily Pelobatidae. This species breeds in ephemeralpools that fill during winter rains in southern Califor-nia. Larval development takes from 3 to 6 weeks,depending upon food and temperature (Fig. 1). Ques-tions addressed in this study include: (1) Does growthof tail muscle correlate with body size in an anurantadpole? It is hardly surprising that muscle tissueshould correlate strongly with body size in fishes as
Figure 1.
Typical growth trajectories for tadpoles on each of the temperature by food combinations (for temperatures:squares
=
warm, circles
=
cold; for food levels: open symbols
=
high food, closed symbols
=
low food). Arrows indicatecollection ages. Each trajectory is the mean of ten tadpoles from the Motte population raised alongside those used forcellular analyses, but weighed every other day and maintained through metamorphosis. Peak mass occurs just prior tometamorphic climax with weight loss through the emergence of forelegs (the final point in each line) with weight againincreasing when fully terrestrial metamorphs begin to feed (not shown).

FOOD AND TEMPERATURE EFFECTS ON MUSCLE STRUCTURE
501
© 2006 The Linnean Society of London,
Biological Journal of the Linnean Society,
2006,
88
, 499–510
muscle makes up to 80% of a fish’s wet weight(Weatherley & Gill, 1987). However, the tail of
Speahammondi
makes up less than 20% of its wet weight(J. D. Arendt, unpubl. data) and disappears at meta-morphosis. (2) Do food and temperature manipula-tions influence body growth through similar ordifferent mechanisms? (3) Are these mechanisms her-itable (i.e. do they have the potential to evolve) anddo we see any G–E interaction (i.e. can plasticityevolve) in these characters?
MATERIAL AND METHODS
Egg masses of
S. hammondii
were collected on themorning following breeding in two populations. Nineegg masses were collected from the Box SpringsNature Preserve (western Riverside County, Califor-nia) in February 2003 and ten egg masses were col-lected from a pool just north of the Motte Reserve(western Riverside County, California) in March2003. A female will lay multiple egg masses in closeproximity, and therefore individual masses were col-lected from isolated groups to make it likely each isfrom a different set of parents. Egg masses were keptisolated in plastic shoeboxes with 2 L of dechlorinatedtap water. Initial weights were taken four days afterhatching by blotting tadpoles dry and weighing to thenearest 0.1 mg. Each tadpole was then isolated in a2 L container with approximately 1.3 L of water. Halfof the containers were placed on shelves and watertemperature allowed to equilibrate with room temper-ature (21.0–22.0
°
C). The other half were placed inwading pools filled with water and heated by aquar-ium heaters (two heaters on opposite sides of eachpool) to 24.0–26.0
°
C. Half of each temperature groupreceived a food ration (3 : 1 mixture of ground rabbitpellets : flake fish food) of approximately 0.02 g perday and the other half received approximately 0.10 gper day. Water was changed every other day from acommon room temperature water source (i.e. warmtreatments were in cooler water until temperaturesreturned to that in the pool after about 30 min).
I initially set up 72 tadpoles per high food treatmentsand 48 for the cold, low food treatment for the BoxSprings population (room constraints prevented mefrom carrying out the warm, low food treatment at thistime). I set up 60 tadpoles per treatment for the Mottepopulation. Half of the Box Springs tadpoles werecollected at 10 days posthatching and the remainingcollected at 14 days when the fastest developers werenear metamorphic climax. For the Motte population Icollected 40 from each treatment 10 days posthatchingand 20 from each treatment 16 days posthatching. Theresult is a 2
×
2
×
2 (temperature
×
food
×
age) factorialdesign with the warm, low food treatment missing fromthe Box Springs population.
On the day of collection, tadpoles were killed withan overdose of MS-222, weighed, then preserved in10% buffered formalin. After fixing for several months,tadpoles were staged following Gosner (1960; modifiedby Hall, Larsen & Fitzner, 1997) and tails removed atthe base. Approximately 2 cm of the tail from the ante-rior end was removed, embedded in paraplast, cross-sections made at 10
µ
m, and sections stained withhaematoxylin-eosin. Photomicrographs were thentaken and muscle characters measured using SigmaS-can Pro 5 imaging software. To determine whethermuscle size could predict total body size, I measuredtotal cross-sectional area of the right and left tail mus-cles. To determine cell size, I measured the long axis ofa given fibre and the axis perpendicular to this. Areaswere estimated as if the fibres were ovals. On average,245 fibres (min
=
128, max
=
553) fibres were mea-sured per tadpole. Fibres in the tail muscle of tadpolesare segregated like the trunk muscles of teleosts, withwhite (anaerobic) fibres located proximal to the noto-chord with a distal layer of small red (aerobic) fibresjust under the epidermis (Muntz, Hornby & Dalooi,1989). Ideally, fibre types would be handled separatelybut for various procedural reasons I measured allwhite fibres that could be easily distinguished on oneside then counted all additional fibres on that side. Asa result, estimates of cell size are based on white fibresonly, but cell number is based on both red and whitefibres. In
S. hammondi
tadpoles the connective tissuethat fills the tail fin and regions around the notochordoften extends around individual muscle fibres. Anindex of this extracellular matrix (ECM) was derivedfrom the above measures [ECM
=
(total muscle area –(mean fibre area
×
fibre number))/total muscle area].Ideally, this would give the percentage of muscle areanot filled by muscle fibres. Because fibre size is esti-mated only from white fibres, but fibre numberincludes all countable fibres, this only serves as anindex of extracellular matrix, although the indexcorrelates well with qualitative measures of ECM(
r
2
>
0.62 for both populations).Growth trajectories were estimated from additional
tadpoles on identical treatments to those given above.Eight tadpoles per treatment were weighed everyother day until metamorphic climax. Trajectoriesdescribe the mean masses for these tadpoles and linesrepresent smoothed splines.
STATISTICAL ANALYSIS
All size measures were natural log (ln) transformedprior to analysis. Because allometry changed betweenages (see below), they were analysed separately.Treatment effects for the Motte population were anal-ysed using a three factor ANOVA (brood
×
temperature
×
food) with brood treated as a random factor. Because

502
J. D. ARENDT
© 2006 The Linnean Society of London,
Biological Journal of the Linnean Society,
2006,
88
, 499–510
one treatment is missing for the Box Springs samplesI used a general linear model approach removing allinteractions containing food
×
temperature. Because Iam trying to identify general patterns rather than test-ing specific predictions, corrections for multiple compar-isons were not made. Broad sense heritabilities wereestimated from Mean Squares following Roff (1997).
RESULTS
H
OW
DO
FOOD
AND
TEMPERATURE
INFLUENCE
GROWTH
AND
DEVELOPMENT
?
Overall, growth trajectories follow the typicalresponses to food and temperature. Increasing food
results in faster growth, but metamorphic climax ata larger size (Fig. 1; compare like symbols). Increas-ing temperature results in faster growth, but meta-morphic climax at a smaller size (Fig. 1; compareopen symbols or closed symbols). At age 10 days, thehigh food treatment groups were significantly larger(
F
1,9
=
265,
P
<
0.01) and at a more advanced devel-opmental stage (
F
1,9
=
33.3,
P
<
0.01) than the lowfood treatment groups (group means shown inFig. 2). The warm treatment groups were signifi-cantly larger (
F
1,9
=
222,
P
<
0.01) and at a moreadvanced stage (
F
1,9
=
370,
P
<
0.01) than the cooltreatment groups (Fig. 2). Patterns were similarfor both populations. For the Motte, there was a
Figure 2.
Bivariate reaction norms for size and developmental stage of (A) Box Springs and (B) Motte populations(mean
±
1 SE). Filled symbols
=
early (10 day) collection, open symbols
=
late (14 or 16 day) collection. Circles
=
cold, lowfood; squares
=
cold, high food; triangles
=
warm, low food; diamonds
=
warm, high food.

FOOD AND TEMPERATURE EFFECTS ON MUSCLE STRUCTURE
503
© 2006 The Linnean Society of London,
Biological Journal of the Linnean Society,
2006,
88
, 499–510
significant food–temperature interaction for size(
F
1,9
=
21.7,
P
<
0.01) but not stage (
F
1,9
=
2.5,
P
=
0.10), apparently because food effects wereenhanced at the higher temperature (this compari-son could not be made for Box Springs). Resultswere broadly similar for the older tadpoles (Fig. 2:open symbols). Both size (young
h
2
=
1.05; old
h
2
=
0.49) and developmental stage (young
h
2
=
0.47;old
h
2
=
0.57) were significantly heritable for theMotte population at each age. (Because I could notaccount for interactions among treatments I did notattempt to calculate heritabilities for Box Springstadpoles.)
D
OES
SIZE
OF
THE TAIL MUSCLE PREDICT OVERALL BODY SIZE?
There was a strong correlation between ln(musclecross-sectional area) and ln(mass) (Fig. 3), so tail sizeis a good predictor of body size. In 10-day-old tadpolesmuscle size explained a similar amount of variation inbody size for both populations (r2 = 0.81 for BoxSprings; r2 = 0.84 for Motte; P < 0.01 for both) and theslopes of the regressions were similar for both popu-lations (Box Springs β= 0.93; Motte β= 0.97). The fitwas not quite as strong for the older tadpoles (r2 = 0.66for Box Springs; r2 = 0.69 for Motte; P < 0.01 for both)
Figure 3. Relationship between cross-sectional muscle area and total body mass for (A) early collection and (B) latecollection. Because slopes did not differ among treatments, all are combined here. Open circles and dashedregression = Motte; filled circles and solid regression = Box Springs.
504 J. D. ARENDT
© 2006 The Linnean Society of London, Biological Journal of the Linnean Society, 2006, 88, 499–510
and slopes were shallower than for younger tadpoles(Box Springs β= 0.66; Motte β= 0.88), although thisdifference was only significant for the Box Springs.
HOW DO FOOD AND TEMPERATURE AFFECT CELL SIZE, CELL NUMBER, AND ECM?
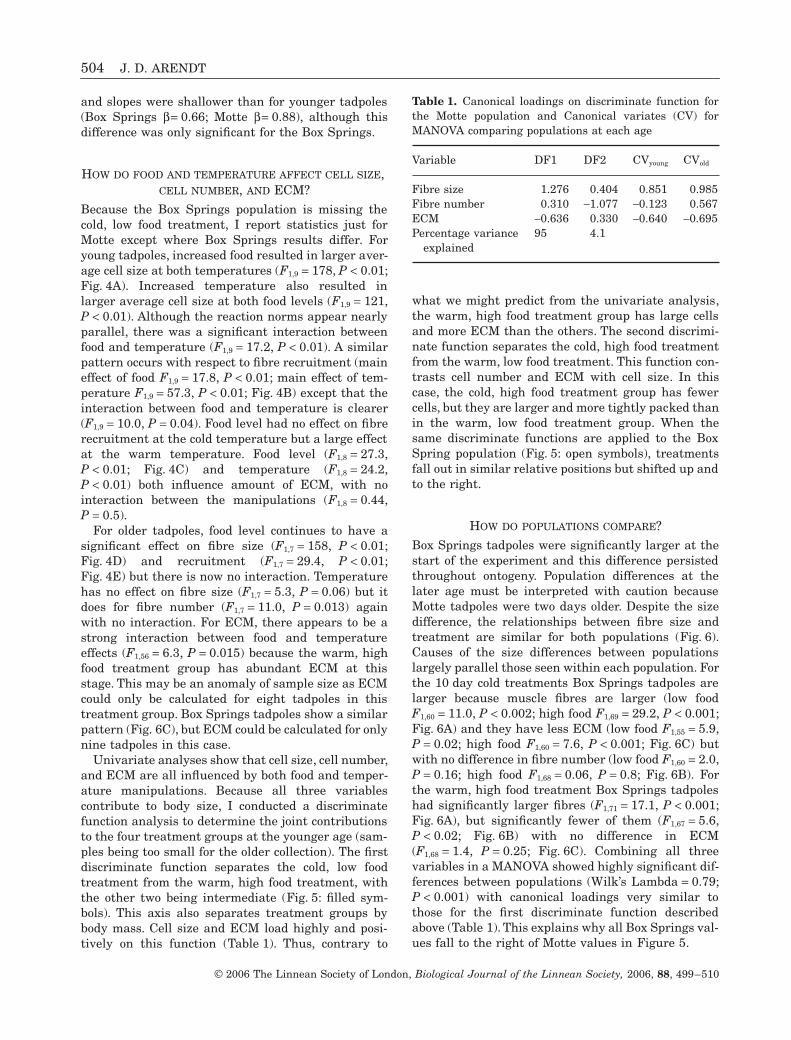
Because the Box Springs population is missing thecold, low food treatment, I report statistics just forMotte except where Box Springs results differ. Foryoung tadpoles, increased food resulted in larger aver-age cell size at both temperatures (F1,9 = 178, P < 0.01;Fig. 4A). Increased temperature also resulted inlarger average cell size at both food levels (F1,9 = 121,P < 0.01). Although the reaction norms appear nearlyparallel, there was a significant interaction betweenfood and temperature (F1,9 = 17.2, P < 0.01). A similarpattern occurs with respect to fibre recruitment (maineffect of food F1,9 = 17.8, P < 0.01; main effect of tem-perature F1,9 = 57.3, P < 0.01; Fig. 4B) except that theinteraction between food and temperature is clearer(F1,9 = 10.0, P = 0.04). Food level had no effect on fibrerecruitment at the cold temperature but a large effectat the warm temperature. Food level (F1,8 = 27.3,P < 0.01; Fig. 4C) and temperature (F1,8 = 24.2,P < 0.01) both influence amount of ECM, with nointeraction between the manipulations (F1,8 = 0.44,P = 0.5).
For older tadpoles, food level continues to have asignificant effect on fibre size (F1,7 = 158, P < 0.01;Fig. 4D) and recruitment (F1,7 = 29.4, P < 0.01;Fig. 4E) but there is now no interaction. Temperaturehas no effect on fibre size (F1,7 = 5.3, P = 0.06) but itdoes for fibre number (F1,7 = 11.0, P = 0.013) againwith no interaction. For ECM, there appears to be astrong interaction between food and temperatureeffects (F1,56 = 6.3, P = 0.015) because the warm, highfood treatment group has abundant ECM at thisstage. This may be an anomaly of sample size as ECMcould only be calculated for eight tadpoles in thistreatment group. Box Springs tadpoles show a similarpattern (Fig. 6C), but ECM could be calculated for onlynine tadpoles in this case.
Univariate analyses show that cell size, cell number,and ECM are all influenced by both food and temper-ature manipulations. Because all three variablescontribute to body size, I conducted a discriminatefunction analysis to determine the joint contributionsto the four treatment groups at the younger age (sam-ples being too small for the older collection). The firstdiscriminate function separates the cold, low foodtreatment from the warm, high food treatment, withthe other two being intermediate (Fig. 5: filled sym-bols). This axis also separates treatment groups bybody mass. Cell size and ECM load highly and posi-tively on this function (Table 1). Thus, contrary to
what we might predict from the univariate analysis,the warm, high food treatment group has large cellsand more ECM than the others. The second discrimi-nate function separates the cold, high food treatmentfrom the warm, low food treatment. This function con-trasts cell number and ECM with cell size. In thiscase, the cold, high food treatment group has fewercells, but they are larger and more tightly packed thanin the warm, low food treatment group. When thesame discriminate functions are applied to the BoxSpring population (Fig. 5: open symbols), treatmentsfall out in similar relative positions but shifted up andto the right.
HOW DO POPULATIONS COMPARE?Box Springs tadpoles were significantly larger at thestart of the experiment and this difference persistedthroughout ontogeny. Population differences at thelater age must be interpreted with caution becauseMotte tadpoles were two days older. Despite the sizedifference, the relationships between fibre size andtreatment are similar for both populations (Fig. 6).Causes of the size differences between populationslargely parallel those seen within each population. Forthe 10 day cold treatments Box Springs tadpoles arelarger because muscle fibres are larger (low foodF1,60 = 11.0, P < 0.002; high food F1,69 = 29.2, P < 0.001;Fig. 6A) and they have less ECM (low food F1,55 = 5.9,P = 0.02; high food F1,60 = 7.6, P < 0.001; Fig. 6C) butwith no difference in fibre number (low food F1,60 = 2.0,P = 0.16; high food F1,68 = 0.06, P = 0.8; Fig. 6B). Forthe warm, high food treatment Box Springs tadpoleshad significantly larger fibres (F1,71 = 17.1, P < 0.001;Fig. 6A), but significantly fewer of them (F1,67 = 5.6,P < 0.02; Fig. 6B) with no difference in ECM(F1,68 = 1.4, P = 0.25; Fig. 6C). Combining all threevariables in a MANOVA showed highly significant dif-ferences between populations (Wilk’s Lambda = 0.79;P < 0.001) with canonical loadings very similar tothose for the first discriminate function describedabove (Table 1). This explains why all Box Springs val-ues fall to the right of Motte values in Figure 5.
Table 1. Canonical loadings on discriminate function forthe Motte population and Canonical variates (CV) forMANOVA comparing populations at each age
Variable DF1 DF2 CVyoung CVold
Fibre size 1.276 0.404 0.851 0.985Fibre number 0.310 −1.077 −0.123 0.567ECM −0.636 0.330 −0.640 −0.695Percentage variance
explained95 4.1

FOOD AND TEMPERATURE EFFECTS ON MUSCLE STRUCTURE 505
© 2006 The Linnean Society of London, Biological Journal of the Linnean Society, 2006, 88, 499–510
Figure 4. Interaction graphs showing effects of temperature (along x-axis) and food effects (separate lines) for Mottetadpoles (mean ± 1 SE; symbols as in Fig. 2). Young tadpoles show a significant change in (A) muscle fibre size, (B) numberof fibres, and (C) ECM in response to both food (open vs. filled circles) and temperature. There is also a significantinteraction in the first two cases. Food has no effect on fibre number at the cold temperature. Older tadpoles show asignificant response to (D) muscle fibre size, (E) fibre number, and (F) ECM in response to food, but not temperature. Thesignificant interaction for ECM is probably a result of low sample size in the warm, high food treatment (open diamond).

506 J. D. ARENDT
© 2006 The Linnean Society of London, Biological Journal of the Linnean Society, 2006, 88, 499–510
Box Springs tadpoles still had larger fibres at thelater collection for all treatments (cold, low F1,41 = 10.8,P = 0.002; cold, high F1,50 = 5.8, P = 0.02; warm, highF1,39 = 8.7, P < 0.005). The cold, low food treatmentgroup showed a significant increase in fibre numberfor both populations but the number remained com-parable (F1,41 = 0.08, P = 0.8). For the two high foodtreatments, Box Springs tadpoles showed morerecruitment than the Motte tadpoles so that cold BoxSprings tadpoles had significantly more fibres(F1,50 = 5.9, P < 0.02) while the warm Box Springs tad-poles had caught up in total fibre number (F1,34 = 0.05,P = 0.8). ECM differed significantly only for the cold,low food treatment (F1,41 = 9.1, P < 0.01), with BoxSpring tadpoles still having less than Motte tadpoles.The multivariate comparison was similar to that foryoung tadpoles except that fibre number now contrib-utes to population differences.
ARE CELLULAR CHARACTERISTICS AND PLASTICITIES HERITABLE?
Just as mass and developmental stage are heritable, Ifound that fibre size (young h2 = 0.97; old h2 = 0.82)and fibre number (young h2 = 0.37; old h2 = 0.92) aresignificantly heritable for the Motte tadpoles. Furtherevolution of plasticity requires significant G–E inter-actions. I found no significant interactions for mass ateither age but developmental stage of the older tad-poles had significant brood × food (F8,34 = 2.7, P = 0.02)and brood × temperature (F8,34 = 2.4, P = 0.04) interac-
tions. Interactions for fibre size, fibre number andECM were all nonsignificant at both ages, althoughthe three way (brood × food × temperature) interac-tion approached significance for both characters at theyounger age (fibre size F9,110 = 1.9, P = 0.065; fibrenumber F9,106 = 1.8, P = 0.078). Given the correlationsbetween cell size, cell number, and ECM a multivari-ate comparison gives a more realistic estimate of phe-notypic plasticity. I found a marginally significantbrood × temperature effect (Wilk’s Lambda = 0.66;P = 0.058), and highly significant brood × food (Wilk’sLambda = 0.61; P = 0.014) and brood × food × temper-ature effects (Wilk’s Lambda = 0.56; P < 0.01), sug-gesting that there is heritable variation for plasticityin overall muscle composition even though this wasnot detectable for individual components.
DISCUSSION
Anuran tadpole tail muscle is a promising new sys-tem for studying the contribution of cell size andnumber to overall organ and body size. First, mus-cle cross-sectional area correlates strongly with over-all body mass so that growth in the tail isproportional to growth of the whole organism. Sec-ond, tadpoles showed strong plastic responses toboth food and temperature manipulations. As pheno-typic manipulations did not alter the allometrybetween muscle area and body mass, this should bea good tissue to further explore regulation of growthand size. In addition, all traits measured were
Figure 5. Discriminate functions for the four different treatments (symbols as in Fig. 2). DF1 separates the warm, highfood treatment from cold, low food. High values have large muscle fibres and lots of ECM. DF2 separates the warm, lowfood from the cold, high food treatment. Large values on this axis have large but relatively few muscle fibres and littleECM. Motte population is represented by solid symbols, Box Springs by open symbols.

FOOD AND TEMPERATURE EFFECTS ON MUSCLE STRUCTURE 507
© 2006 The Linnean Society of London, Biological Journal of the Linnean Society, 2006, 88, 499–510
highly heritable although the full-sib analysis usedhere likely inflates these values.
I did not see a simple additive response to foodand temperature as expected from prior work on
D. melanogaster. By combining food and temperaturein a single factorial experiment I found interactionsfor effects on cell size and cell number (similar to DeMoed et al., 1997) but not for ECM. For young tadpoles
Figure 6. Treatment means (symbols as in Fig. 2) for Motte (open symbols) and Box Springs (filled symbols) at younger(solid lines) and older (dashed lines) collections. A, muscle fibre size; B, ECM; C, fibre number relative to body mass.Although the Box Springs samples are larger (symbols shifted to right), they show very similar response to treatments.The major exception to this is the greater fibre recruitment of older Box Springs tadpoles on the high food treatments.

508 J. D. ARENDT
© 2006 The Linnean Society of London, Biological Journal of the Linnean Society, 2006, 88, 499–510
at cool temperatures, food affects body size throughchanges in cell size and ECM while at warm temper-atures cell number also contributes. Temperature actsthrough all three factors at both food levels. For older
tadpoles food now affects body size through all threefactors at both temperatures. By contrast, tempera-ture acts through cell size alone at low food levels andfibre number alone at high food levels. Unfortunately,these results are not directly comparable to the anal-ysis of adult size in the Drosophila literature becausetadpoles were sampled while still growing. It shouldbe possible to make direct comparisons in the future iftadpoles are sampled near metamorphic climax whenthey reach their maximal size (i.e. peaks of growth tra-jectories in Fig. 1).
Examining patterns at a single age as summarizedabove gives the impression that each treatment fol-lows a unique pattern of cell growth and recruitmentsuch that no generalities are possible. However,because tadpoles were sampled at two ages we cangain more insight by examining treatment effectsalong an ontogenetic trajectory. Figure 7 shows thesetrajectories with a common hypothetical startingvalue for each treatment. From this perspective sev-eral general patterns emerge, including the overallincrease in cell size and cell number and generaldecrease in ECM as tadpoles grow, as well as howthese values rank with overall body size. The onepeculiar pattern is the lack of cell recruitment foryoung tadpoles on both cold treatments. The fact thatthe same pattern occurs in both populations suggeststhat it is not an accident of sampling but a trueresponse to temperature. A likely explanation for thispattern is that tadpoles experience two phases of cellrecruitment (see Johnston et al., 2003). The first phaseof recruitment occurs prior to day four when treat-ments started. By the first sampling, tadpoles in thewarm treatment groups have entered a second phaseof recruitment. Recruitment is enhanced in the highfood group compared with the low food group. The coldtreatments have not entered this phase yet and so noeffect of food level can be detected. At some timebetween the ages sampled, the cold treatments enterthe second phase of recruitment and food level nowinfluences fibre number. For the warm treatments, thelow food group appears to have stopped recruiting ataround 10 days (ages do not differ significantlyF1,56 = 2.2, P = 0.15) while the high food has sustainedrecruitment to an older age. We could test this sce-nario by sampling all treatments at additional ages.Earlier samples of the warm treatment would showwhen these tadpoles enter the second phase of recruit-ment. Later samples of the cold treatment would con-firm whether or not the cold, low food treatment againceases recruitment prior to metamorphic climax justas the warm, low food treatment appears to.
Although the cellular responses to food and temper-ature are complex, the patterns were consistentbetween the two populations compared. This suggeststhat the patterns are robust for the species. Popula-
Figure 7. Ontogenetic changes in (A) muscle fibre size, (B)fibre number, and (C) ECM. All treatments share a commonstarting condition (shown here as a hypothetical point onleft of each graph). Growth is greatly accelerated in thecold, high food treatment between the young and old sam-ple resulting in a large increase in cell size and cell numberwith a rapid decrease in ECM. Both cold treatments showa delay in the start of fibre recruitment (B).

FOOD AND TEMPERATURE EFFECTS ON MUSCLE STRUCTURE 509
© 2006 The Linnean Society of London, Biological Journal of the Linnean Society, 2006, 88, 499–510
tions did differ in overall body size and also in cellularcharacters in at least two ways. First, for the warm,high food treatment the larger Box Springs tadpoleshad larger but fewer muscle cells than the Motte tad-poles. This means that for this treatment cell growthmust have been faster in Box Springs tadpoles inorder to compensate for having fewer cells. Second, forthe high food treatment at both temperatures the BoxSprings tadpoles showed greater fibre recruitmentthan did Motte tadpoles. This difference is even moredramatic than that indicated because the Box Springstadpoles are younger than the Motte tadpoles.
Tadpole tail muscle is an excellent system for study-ing the importance of cell size, cell number, and ECMin determining overall body size, both in terms ofgenetic variation and plastic responses to environ-mental conditions. Although the sampling schedulefollowed here does not allow direct comparison withprevious work done on wing epidermal cells of Droso-phila adults, I note a sampling schedule that shouldbe comparable. The use of tadpole tail muscle has onemajor advantage over that of epidermal cells in thatwe can explore the functional consequences of cellularcomposition. For flies, it is likely that the relative sizeand shape of the wing influences flying performance(e.g. Petavy et al., 1997; Roberts et al., 2001; Berwaert,Van Dyck & Aerts, 2002), with differences in cell sizeand number having little impact (Zwaan et al., 2000).In tadpole tail muscle, however, cell size, cell number,and ECM are likely to have a large impact onswimming performance. For example, growth rateand burst swimming speed show a trade-off inS. hammondi (Arendt, 2003), and this is likely to be aconsequence of the underlying growth process. Under-standing the functional consequences of differences incell size, cell number, and ECM are an obvious nextstep in studying the adaptive nature of the growthprocess.
ACKNOWLEDGEMENTS
Thanks to D. Reznick for advice on an earlier draftof this paper. This research was supported by NSFIBN-0117536.
REFERENCES
Alami-Durante H, Fauconneau B, Rouel M, Escaffre AM,Bergot P. 1997. Growth and multiplication of white skeletalmuscle fibres in carp larvae in relation to somatic growthrate. Journal of Fish Biology 50: 1285–1302.
Angilletta MJ Jr, Dunham AE. 2003. The temperature-sizerule in ectotherms: simple evolutionary explanations maynot be general. American Naturalist 162: 332–342.
Arendt JD. 2003. Reduced burst speed is a cost of rapidgrowth in anuran tadpoles: problems of autocorrelation and
inferences about growth rates. Functional Ecology 17: 328–334.
Atkinson D. 1994. Temperature and organism size – a biolog-ical law for ectotherms ? Advances in Ecological Research 25:1–58.
Atkinson D, Sibly RM. 1997. Why are organisms usually big-ger in colder environments? Making sense of a life historypuzzle. Trends in Ecology and Evolution 12: 235–239.
Berrigan D, Charnov EL. 1994. Reaction norms for age andsize at maturity in response to temperature: a puzzle for lifehistorians. Oikos 70: 474–478.
Berwaerts K, Van Dyck H, Aerts P. 2002. Does flight mor-phology relate to flight performance? An experimental testwith the butterfly Pararge aegeria. Functional Ecology 16:484–491.
Blanckenhorn WU. 1998. Adaptive phenotypic plasticity ingrowth, development, and body size in the yellow dung fly.Evolution 52: 1394–1407.
Blanckenhorn WU. 2000. The evolution of body size: whatkeeps organisms small? Quarterly Review of Biology 75: 385–407.
De Moed GH, De Jong G, Scharloo W. 1997. Environmentaleffects on body size variation in Drosophila melanogaster.Genetical Research, Cambridge 70: 35–43.
Gosner KL. 1960. A simplified table for staging anuranembryos and larvae with notes on identification. Herpetolog-ica 16: 183–190.
Hall JA, Larsen JH Jr, Fitzner RE. 1997. Postembryonicontogeny of the spadefoot toad Scaphiopus intermontanus(Anura: Pelobatidae): external morphology. HerpetologicalMonographs 11: 124–178.
James AC, Azevedo RBR, Partridge L. 1997. Genetic andenvironmental responses to temperature of Drosophila mel-anogaster from a latitudinal cline. Genetics 146: 881–890.
Johnston IA, Fernandez DA, Calvo J, Vieira VLA, NorthAW, Abercromby M, Garland T Jr. 2003. Reduction inmuscle fibre number during the adaptive radiation of nototh-enioid fishes: a phylogenetic perspective. Journal of Experi-mental Biology 206: 2595–2609.
McCabe J, French V, Partridge L. 1997. Joint regulation ofcell size and cell number in the wing blade of Drosophila mel-anogaster. Genetical Research 69: 61–68.
Muntz L, Hornby JE, Dalooi MRK. 1989. A comparison ofthe distribution of muscle type in the tadpole tails of Xenopuslaevis and Rana temporaria: an histological and ultrastruc-tural study. Tissue and Cell 21: 773–781.
Nathanailides C, Lopez-Albors O, Stickland NC. 1995.Influence of prehatch temperature on the development ofmuscle cellularity in posthatch Atlantic Salmon (Salmosalar). Canadian Journal of Fisheries and Aquatic Sciences52: 675–680.
Partridge L, Barrie B, Fowler K, French V. 1994. Evolu-tion and development of body size and cell size in Drosophilamelanogaster in response to temperature. Evolution 48:1269–1276.
Partridge L, Langelan R, Fowler K, Zwaan B, French V.1999. Correlated responses to selection on body size inDrosophila melanogaster. Genetical Research 74: 43–54.

510 J. D. ARENDT
© 2006 The Linnean Society of London, Biological Journal of the Linnean Society, 2006, 88, 499–510
Petavy G, Morin JP, Moreteau B, David JR. 1997. Growthtemperature and phenotypic plasticity in two Drosophila sib-ling species: probably adaptive changes in flight capacities.Journal of Evolutionary Biology 10: 875–887.
Rasmussen RS, Ostenfeld TH. 2000. Influence of growthrate on white muscle dynamics in rainbow trout and brooktrout. Journal of Fish Biology 56: 1548–1552.
Roberts SP, Frazier MR, Kirkton SD, Harrison JF. 2001.Temperature sensitivity of Drosophila development andflight performance. American Zoologist 41: 1570.
Robertson F, W. 1959. Studies in quantitative genetics. XII.Cell size and number in relation to genetic and environmen-tal variation of body size in Drosophila. Genetics 44: 869–896.
Roff DA. 1997. Evolutionary Quantitative Genetics. New York:Chapman & Hall.
Stearns SC, Koella JC. 1986. The evolution of pheno-typic plasticity in life-history traits: predictions of reac-tion norms for age and size at maturity. Evolution 40:893–913.
Valente IMP, Rocha E, Gomes EFS, Silva MW, OliveiraMH, Monteiro RAF, Fauconneau B. 1999. Growthdynamics of white and red muscle fibres in fast- and slow-growing strains of rainbow trout. Journal of Fish Biology 55:675–691.
Vieria VLA, Johnston IA. 1992. Influence of temperature onmuscle-fibre development in larvae of the herring Clupeaharengus. Marine Biology 112: 333–341.
Weatherley AH, Gill HS. 1987. The Biology of Fish Growth.London: Academic Press.
Weatherley AH, Gill HS, Lobo AF. 1988. Recruitment andmaximal diameter of axial fibres in teleosts and their rela-tionship to somatic growth and ultimate size. Journal of FishBiology 33: 851–859.
Zwaan BJ, Azevedo RBR, James AC, Van ‘T, Land J Par-tridge L 2000. Cellular basis of wing size variation in Droso-phila melanogaster: a comparison of latitudinal clines on twocontinents. Heredity 84: 338–347.