Biomechanical and energetic determinants of technique selection in classical cross-country skiing
Upload
independentCategory
view
2download
0
The CDR3 regions of an immunodominant T cellreceptor dictate the ‘energetic landscape’ ofpeptide-MHC recognition
Natalie A Borg1,4, Lauren K Ely1,4, Travis Beddoe1, Whitney A Macdonald1, Hugh H Reid1, Craig S Clements1,Anthony W Purcell2, Lars Kjer-Nielsen2, John J Miles3, Scott R Burrows3, James McCluskey2 &Jamie Rossjohn1
The energetic bases of T cell recognition are unclear. Here, we studied the ‘energetic landscape’ of peptide–major
histocompatibility complex (pMHC) recognition by an immunodominant ab T cell receptor (TCR). We quantified and evaluated
the effect of natural and systematic substitutions in the complementarity-determining region (CDR) loops on ligand binding in
the context of the structural detail of each component of the immunodominant TCR-pMHC complex. The CDR1 and CDR2 loops
contributed minimal energy through direct recognition of the antigen and instead had a chief function in stabilizing the ligated
CDR3 loops. The underlying energetic basis for recognition lay in the CDR3 loops. Therefore the energetic burden of the
CDR loops in the TCR-pMHC interaction is variable among TCRs, reflecting the inherent adaptability of the TCR in ligating
different ligands.
The specificity of the cellular immune responses is determined mostlythrough the clonally distributed ab T cell antigen receptors (TCRs)that ‘co-recognize’ structural determinants on peptides in complex withproducts of the major histocompatibility complex (pMHC)1. Theatomic detail of the TCR-pMHC interactions permits several general-izations to be made regarding the nature of TCR engagement of thepMHC complex2–14. The emerging paradigm of TCR recognitionsuggests a common diagonal docking mode that may be an importantfactor in coreceptor ligation or signalling15–17. In this diagonal frame-work, the complementarity-determining region 1 (CDR1) and CDR2loops of the TCR contact the MHC a-helices, whereas the hypervari-able CDR3 regions interact mainly with the peptide, although varia-tions on these generalities have been reported17.
Those structural investigations have been complemented by anevaluation of the biophysical basis of the TCR-pMHC interaction.Such studies, using surface plasmon resonance and calorimetryapproaches, showed the TCR-pMHC interaction to be dominatedby weak intermolecular interactions (low micromolar range), withslow association rates and fast dissociation rates18. The slow associa-tion rates are consistent with the conformational plasticity of the CDRloops that was noted after pMHC engagement. Evidence so farsuggests the TCR-pMHC interaction is enthalpically driven (heat islost)19,20 and order is imposed (entropic penalty), which is consistent
with the reported inherent flexibility of the TCR CDR loops’ beingstabilized after pMHC ligation. The biological outcome of TCRengagement is considered to be related to the half-life and heatcapacity changes of the complex19–22.
To probe the nature of the TCR-pMHC engagement further, alanine-scanning mutagenesis has been done in three systems: the MHCclass I–restricted mouse 2C system23,24, the MHC class II I-Ek-2B4(ref. 25) and the MHC class I–restricted A6 TCR26. The 2C systeminvolved substitutions in the TCR, whereas the other two systemsinvolved substitutions in the pMHC. The 2C studies showed thatalthough residues in each Va and Vb CDR are important for binding,the most important energetic interaction is contributed by CDR1and CDR2 (refs. 23,24). Studies of the I-Ek–moth cytochrome Csystem suggested a two-step mechanism for TCR recognition of thepMHC complex, whereby MHC contacts dictate the initial associa-tion, followed by peptide-mediated contacts dominating stabilizationof the TCR-pMHC complex25. Mutational studies of the A6 TCRsystem showed a small region or ‘hotspot’ of the a1 helix thatprovides most of the interactions vital for TCR recognition26. Bio-physical and structural data suggest that relatively rigid CDR1 andCDR2 loops are principally involved in stabilizing the initial associa-tion, whereas the malleable CDR3 loops stabilize the peptide contacts,enabling T cell triggering25,26.
Published online 9 January 2005; doi:10.1038/ni1155
1The Protein Crystallography Unit, Monash Centre for Synchrotron Science, Department of Biochemistry and Molecular Biology, School of Biomedical Sciences,Monash University, Clayton, Victoria 3800, Australia. 2Department of Microbiology & Immunology, University of Melbourne, Parkville, Victoria 3010, Australia.3Cellular Immunology Laboratory, Queensland Institute of Medical Research, Brisbane, QLD 4029, Australia. 4These authors contributed equally to this work.Correspondence should be addressed to J.M. ([email protected]) or J.R. ([email protected]).
NATURE IMMUNOLOGY VOLUME 6 NUMBER 2 FEBRUARY 2005 17 1
A R T I C L E S©
2005
Nat
ure
Pub
lishi
ng G
roup
ht
tp://
ww
w.n
atur
e.co
m/n
atur
eim
mun
olog
y

Although the potential repertoire of TCRs is vast27, some immuneresponses, for example the immune response to Epstein-Barr virus(EBV), show strong biases in TCR selection28–30. Unrelated peoplewith HLA-B8+ (B*0801) all make an immunodominant cytotoxic Tlymphocyte response to the peptide FLRGRAYGL (FLR) derived fromthe latent EBV nuclear antigen (EBNA3)28. Structural analyses of T cellimmunodominance in the immune response to infection with EBV13
or influenza14 have demonstrated the unique molecular properties ofthe immunodominant TCRs that confer specificity. However, theenergetic contribution of the structural elements that govern theimmunodominant TCR-pMHC interaction was not clear from thosestudies. To determine whether the emerging rules of engagement inTCR-pMHC interactions apply to an immunodominant TCR, weundertook binding studies and accompanying biochemical analyses of39 mutants of the immunodominant TCR LC13, which recognizesFLR–HLA-B8. Our data show that residues in strictly conservedgermline- and nongermline-encoded regions of the CDR3 loopsdictate the stabilization of the complex. Thus, the energetic basis ofTCR-pMHC interaction for this immunodominant TCR differs fromthat previously noted and demonstrates plasticity in the energeticcontribution of the CDRs in TCR-pMHC ligation.
RESULTS
Rational selection and characterization of LC13 mutants
Crystal structures of the LC13 TCR and FLR–HLA-B8 alone and incomplex have provided detailed insight into the structural basis ofrecognition13,31,32. However, those data did not indicate which LC13TCR residues make crucial energetic contributions to binding. There-fore, we targeted LC13 TCR residues for substitution based on thepreviously determined crystal structures13,32. We targeted for muta-genesis the residues in the LC13 TCR that interacted with the FLR–HLA-B8 or that underwent conformational change after ligation orwere exposed to solvent on a CDR loop. Accordingly, apart from twoframework residues (His33a and His48a) that were involved inbinding to the FLR–HLA-B8 complex, all substitutions were restrictedto the CDR loops of the LC13 TCR. In total, 40 amino acids weresubstituted to an alanine, with the exception of alanine residues, whichwere substituted to glycine. The altered LC13 TCR residues were asfollows: in CDR1a, Ser25, Thr26, Ser28, Thr30, Asp30A and Tyr31; inCDR2a, Leu50, Thr51, Ser52 and Asn54; in CDR3a, Pro93, Leu94,Ala95, Gly96, Gly97, Thr98, Ser99, Tyr100, Gly102, Lys103 andLeu104; in CDR1b, Ser27, Gly28, Val30 and Ser31; in CDR2b,
Gln50, Asn51 and Glu52; and in CDR3b, Ser94, Ser95, Leu96, Gly 97,Gln98, Ala99, Tyr100, Glu105, Gln106 and Tyr107 and the twoframework residues, His33a and His48a. Of the 40 recombinantreceptors with different single-residue substitutions, only one,Leu104aAla (VaLeu104 ! Ala104), did not express and refold.
We verified the structural integrity of the refolded LC13 TCRmutants in two ways. First, we compared the solubility, yield andchromatographic activity of each receptor mutant with that of thenative, refolded LC13 TCR. Second, we tested the reactivity of allreceptors to an LC13 TCR monoclonal antibody (mAb; specificity,Supplementary Figs. 1–3 online). Compared directly with the nativeLC13 TCR, all mutant proteins, except for His33aAla and Ser52aAla,had overlapping gel filtration and ion-exchange profiles and identicalmotilities by reducing and nonreducing SDS-PAGE. Moreover, all themutant proteins reacted strongly with the LC13 mAb as did the wild-type TCR (data not shown). The yields of the purified, refolded LC13TCR mutant proteins were also comparable to that of the typical yieldof the native LC13 TCR, with 24 LC13 TCR mutants showing a similarrecovery (more than 75%). Ten mutant proteins produced a moderaterecovery (40–75%) and six LC13 TCR mutant proteins gave arelatively low yield (less than 40%), with the lowest recovery beingthat of 22% for the Gln50bAla mutant. However, we obtainedsufficient quantities for the low-yielding LC13 TCR mutants fordetailed surface plasmon resonance analyses. For all the mutantLC13 TCRs that were folded, none had a stability problem, as assessedby mAb reactivity (data not shown).
Surface plasmon resonance studies of the LC13 mutants
We assayed the alanine substitutions for binding to recombinant FLR–HLA-B8 using surface plasmon resonance. Measurements for theLC13–FLR–HLA-B8 interaction yielded the following values: equili-brium binding constant (Kdeq), 12.53 mM; kinetic binding constant(Kdcalc), 12.30 mM; association constant (Kass), 34,755 per molar persecond; and dissociation constant (Kdiss), 0.39 per second (Fig. 1 andTable 1). Using the same technique, we measured the affinity of theLC13 TCR for an antagonist complex (FLRGRFYGL-HLA-B8, whereP7Y is substituted with F (underlined)) as 138 mM and for a weakagonist complex (FLRGRAFGL-HLA-B8) as 113 mM (data not shown).Given that the FLRGRFYGL-HLA-B8 antagonist complex had achange in free energy (DDG) of 1.42 kcal/mol and the FLRGRAFGL-HLA-B8 weak agonist complex had a DDG value of 1.33 kcal/mol(data not shown), these values emphasize the small energetic
6050403020
Time (s)
100–50
0
50
100
150
200
250
Res
pons
e (R
U)
Res
pons
e (R
U)
LC13 D30a
LC13 G96
LC13 WT
140120100806040200–20–50
0
50
100
150
200
250
Time (s)
1.8 µM3.2 µM
5.6 µM
10.0 µM
17.8 µM
31.6 µM
56.2 µM
6054484236302418126.00LC13 (µM)
200
150
100
50
0
Res
pons
e (R
U)
ab
Figure 1 Binding analysis of LC13 TCR Ala point mutants to FLR–HLA-B8 by surface plasmon resonance. (a) Concentration series for affinity and kinetic
constants measurements showing the binding of LC13 S25aAla mutants to FLR–HLA-B8; inset, equilibrium concentration–response relationship.(b) Comparative response of the binding of 31.6 mM LC13 wild-type (WT), LC13 G96aAla (G96) and LC13 D30AaAla (D30a) to FLR–HLA-B8.
1 72 VOLUME 6 NUMBER 2 FEBRUARY 2005 NATURE IMMUNOLOGY
A R T I C L E S©
2005
Nat
ure
Pub
lishi
ng G
roup
ht
tp://
ww
w.n
atur
e.co
m/n
atur
eim
mun
olog
y

Table 1 The effect of defined substitutions on LC13 ligand binding
Residue
Kdeq
(mM)
Ka
(�104 per molar per second)
Kd
(per second)
t1/2a
(s)
DDGeqb
(kcal/mol) FLR–HLA-B8 contacts Effect on affinity
WT 12.5 7 2.1 3.48 7 0.75 0.39 7 0.020 1.78 7 0.11 – – –
CDR1a
S25 14.8 7 0.55 2.41 7 0.35 0.37 7 0.006 1.88 7 0.03 0.1 7 0.02 N *
T26 19.4 7 0.55 4.04 7 0.29 0.49 7 0.002 1.43 7 0.004 0.26 7 0.02 N *
S28 11.7 7 0.85 4.12 7 0.29 0.40 7 0.019 1.75 7 0.08 �0.04 7 0.04 Y *
T30 33.7 7 1.2 1.63 7 0.015 0.66 7 0.050 1.06 7 0.04 0.58 7 0.02 Y **
D30A 4200 ND ND ND 41.64 N ***
Y31 26.7 7 4.2 ND ND ND 0.45 7 0.09 Y peptide **
Framework residues
H33 4200 ND ND ND 41.64 Y ***
H48 82.4 7 2.9 0.54 7 0.10 0.56 7 0.075 1.26 7 0.08 1.12 7 0.02 Y ***
CDR2a
L50 4200 ND ND ND 41.64 Y ***
T51 4.87 7 0.09 3.43 7 0.020 0.23 7 0.016 3.09 7 0.21 �0.56 7 0.01 N *
S52 28.2 7 2.2 1.09 7 0.12 0.25 7 0.018 2.84 7 0.20 0.48 7 0.05 N **
N54 12.1 7 0.45 2.61 7 0.35 0.29 7 0.017 2.37 7 0.13 �0.02 7 0.02 N *
CDR3a
P93 4200 ND ND ND 41.64 N ***
L94 4200 ND ND ND 41.64 Y peptide ***
A95 34.9 7 3.6 ND ND ND 0.61 7 0.06 N **
G96 45.4 7 4.2 ND ND ND 0.76 7 0.05 Y **
G97 4200 ND ND ND 41.64 Y ***
T98 61.4 7 4.8 ND ND ND 0.94 7 0.05 Y ***
S99 50.5 7 0.8 ND ND ND 0.83 7 0.01 Y ***
Y100 4200 ND ND ND 41.64 Y ***
G102 4200 ND ND ND 41.64 N ***
K103 4200 ND ND ND 41.64 N ***
CDR1b
S27 13.2 7 1.0 2.89 7 0.14 0.41 7 0.047 1.72 7 0.20 0.03 7 0.04 N *
G28 7.67 7 0.06 3.53 7 0.43 0.41 7 0.070 1.72 7 0.29 �0.29 7 0.001 N *
V30 20.5 7 1.3 ND ND ND 0.29 7 0.04 N *
S31 75.3 7 1.1 ND ND ND 1.06 7 0.01 Y ***
CDR2b
Q50 11.1 7 1.4 3.45 7 0.005 0.47 7 0.021 1.49 7 0.07 �0.07 7 0.07 Y *
N51 6.02 7 1.5 2.21 7 0.32 0.19 7 0.005 3.62 7 0.09 �0.43 7 0.15 Y *
E52 49.8 7 4.3 ND ND ND 0.82 7 0.05 Y **
CDR3b
S94 20.8 7 1.1 2.40 7 0.015 0.53 7 0.064 1.32 7 0.16 0.3 7 0.03 N *
S95 4.45 7 0.30 3.10 7 0.095 0.15 7 0.002 4.52 7 0.04 �0.61 7 0.04 N *
L96 15.2 7 1.0 2.35 7 0.53 0.40 7 0.007 1.75 7 0.03 0.11 7 0.04 Y *
G97 4200 ND ND ND 41.64 Y ***
Q98 4200 ND ND ND 41.64 Y peptide ***
A99 4200 ND ND ND 41.64 Y peptide ***
Y100 4200 ND ND ND 41.64 Y peptide ***
E105 15.3 7 1.2 2.12 7 0.28 0.44 7 0.050 1.61 7 0.17 0.12 7 0.04 N *
Q106 4200 ND ND ND 41.64 N ***
Y107 19.4 7 0.7 2.42 7 0.16 0.53 7 0.055 1.32 7 0.14 0.26 7 0.02 N *
at1/2 ¼ 0.693/kd. bDDG ¼ RTIn(Kdmut/KdWT), where R is the gas constant and T is the temperature in Kelvin. mut, mutant; WT, wild type; *, less than twice the wild-type value; **, less thanfour times the wild-type value; ***, four times or more the wild-type value. ND, not determined; Y, Yes; N, no.
NATURE IMMUNOLOGY VOLUME 6 NUMBER 2 FEBRUARY 2005 17 3
A R T I C L E S©
2005
Nat
ure
Pub
lishi
ng G
roup
ht
tp://
ww
w.n
atur
e.co
m/n
atur
eim
mun
olog
y

differential for signaling or nonsignaling out-comes for this immunodominant TCR.
We determined the Kdeq of the interactionfor the 39 LC13 TCR substitutions (Figs. 1and 2, Table 1 and Supplementary Figs. 1–3online) and measured the kinetic rate con-stants of the interaction for approximatelyhalf of the LC13 TCR mutants that had a Kdeq
of less than 100 mM (Table 1 and Supple-mentary Figs. 1–3 online). No mutant had aKdeq of between 100 and 200 mM. However,we recorded many Kdeq values above 200 mM(Table 1 and Supplementary Figs. 1–3online). We consider a Kdeq above 200 mMas approaching the upper limit of reasonablyaccurate estimations for affinity in this sys-tem and so we designated any Kdeq value forthe LC13 mutants above 200 mM as beinggreater than 200 mM. In all cases, the Kd
calculated from the kinetic data matchedthe Kd estimated from the equilibrium data,emphasizing the internal consistency of thedata and indicating that that there were nomass transport effects at the concentration ofthe reagents used. We considered the substi-tutions as having a small effect on the inter-action if the Kdeq for the mutant was less thantwofold, an intermediate effect if the Kdeq forthe mutant was between two and fourfold, and a notable effect if theKdeq was more than fourfold compared with the Kdeq of the nativeLC13-FLR–HLA-B8 interaction (Table 1 and Fig. 2).
Structural perspectives
Structures have been determined to a resolution of 1.8 A for non-liganded FLR–HLA-B8 (ref. 31), to a resolution of 1.5 A for non-liganded LC13 TCR32 and to a resolution of 2.5 A in complex withFLR–HLA-B8 (ref. 13). After ligation, the buried surface area (BSA) ofthe LC13 TCR was approximately 1,100 A2 with the CDR1a, CDR2a,CDR3a and CDR3b loops undergoing considerable conformationalchanges. All the CDR loops of the LC13 TCR were in contact withFLR–HLA-B8, with the CDR1b loop contributing 4% BSA (1%contacts); CDR1a, 17% BSA (15% contacts); CDR2a, 17% BSA(4% contacts); CDR2b loops, 17% BSA (17% contacts); CDR3bloop, 21% BSA (37% contacts); and CDR3a loop, 24% BSA (25%contacts) at the interface. In the complex with ligand, four residuesfrom CDR1a and no residues from CDR2a interacted with CDR3a;whereas three residues from CDR1b and no residues from CDR2binteracted with CDR3b.
Effect of CDR1b mutants
Given that CDR1b interacts marginally with FLR–HLA-B8, it was notunexpected that three of the four substituted residues in CDR1b hadlittle effect on recognition (Table 1 and Fig. 3a). However, theSer31bAla substitution had a considerable effect on the interaction(DDG, 1.06 kcal/mol). At first, this result seemed to represent ananomaly; the Ser31b side chain formed one van der Waals contact,with a residue on the a1 helix of HLA-B8 (Fig. 3a), yet substitution ofthis residue to Ala resulted in a substantial reduction in affinity(Table 1). Although the CDR1b loop did not change conformationafter binding to FLR–HLA-B8, the CDR3b loop was repositioned suchthat it then was in contact with the CDR1b loop. The only contact
formed between CDR1b and CDR3b loops was mediated through theSer31bOg group, where it formed hydrogen bonds onto Gln98bN ofthe CDR3b loop (Fig. 3a). Accordingly, the structural and surfaceplasmon resonance data suggest that Ser31b is essential in stabilizingthe ligated conformation of the CDR3b loop. This finding supportsobservations made with the 2C TCR, for which CDR1b residues thatwere not in contact with antigen still contributed substantially tobinding energy through stabilization of the CDR3b loop23.
Effect of CDR1a mutants
The CDR1a loop interacted at discrete sites on the FLR–HLA-B8complex, contacting Arg62 of the a1 helix and a stretch of the a2 helix(residues 151–155) as well as the antigenic peptide (Fig. 3b). Three ofthe six LC13 TCR mutants in the CDR1a loop had a small effect onthe recognition of FLR–HLA-B8 (Table 1 and Fig. 3b). The Ser25aand Thr26a side chains did not contact FLR–HLA-B8 and so theirnegligible effect on ligand recognition was predicted. However, Ser28aformed hydrogen bonds to Arg62 (Fig. 3b) and, given the apparentimportance of the polymorphic Arg62 residue in ligating the CDR1aloop in all known TCR complexes33, it was unexpected that theSer28aAla replacement had little effect on recognition (Table 1).However, Arg62 also formed a water-mediated hydrogen bond withthe Thr26a main chain (Fig. 3b) and so we could not conclusively ruleout a precise energetic function for Arg62 ligation here. AlthoughTyr31a formed van der Waals contacts with the aromatic ring of theP7-Tyr (FLR peptide residue 7) that is essential to the specificity of theLC13 TCR and also formed hydrogen bonds onto HLA-B8 (Fig. 3b),the Tyr31aAla substitution had only a moderate effect on ligandrecognition (Fig. 2 and Table 1). Conversely, neither the Thr30a northe Asp30Aa side chains interacted with FLR–HLA-B8, yet theThr30aAla substitution had a moderate effect on recognition, whereasthe Asp30AaAla substitution had a profound effect on recognition(Table 1 and Fig. 2). The structural basis of the effect of these
–0.8
–0.6
–0.4
–0.2
–0.0
0.2
0.4
0.6
0.8
1.0
1.2
1.4
1.6
∆∆G
eq (
kcal
/mol
)wt
S25T26S28T30D30
aY31H33H48L5
0T51S52N54P93L9
4A95
GG96G97T98S99
Y100G10
2K10
3S27G28V30S31Q50N51E52S94S95L9
6G97Q98
A99GY10
0E10
5Q10
6Y10
7
LC13 TCR
∆∆G equilibrium+ + + + + + + + + + + + + +
Frameworkresidue
CDR3βCDR2βCDR1βCDR3αCDR2αCDR1α
Figure 2 Effect of substitutions on the LC13–FLR–HLA-B8 interaction. Change in energy (DDGeq)
associated with the ligation of the LC13 TCR with FLR–HLA-B8 for the 39 LC13 TCR mutants
generated. Larger positive values indicate less-favorable binding energy than that of wild-type. Errorbars represent the standard error of replicate experiments.
1 74 VOLUME 6 NUMBER 2 FEBRUARY 2005 NATURE IMMUNOLOGY
A R T I C L E S©
2005
Nat
ure
Pub
lishi
ng G
roup
ht
tp://
ww
w.n
atur
e.co
m/n
atur
eim
mun
olog
y

substitutions was apparent when we compared the non-liganded andliganded conformations of the LC13 TCR (Fig. 3b). In the non-liganded state, the CDR1a loop did not interact with the other CDRloops; however, after binding, the CDR3a loop shifted forward andcontacted residues 28–32 of the CDR1a loop (Fig. 3b). The Thr30aand Asp30Aa residues were the sole residues from the CDR1a loopthat mediated contacts with the ligated CDR3a loop, with Thr30aforming hydrogen bonds to Gly96aO and Asp30Aa forming hydrogenbonds onto the main chain of Ala95a and Gly96a (Fig. 3b). Thus, theCDR1a loop is essential in stabilizing the conformation of the ligatedCDR3a loop, analogous to the function of CDR1b in stabilizingCDR3b discussed above.
Effect of CDR2b mutants
The CDR2b loop contained many polar side chains (Gln50b, Asn51band Glu52b) that interacted extensively with a localized stretch of theHLA-B8 a1 helix (residues 72–79; Fig. 3c). Nevertheless, substitutions
in the CDR2b loop had a modest effect on recognition. For example,despite the fact that Gln50b formed two hydrogen bonds with HLA-B8, the Gln50bAla mutant showed a small change in DDG (Fig. 3cand Table 1). Moreover, the Asn51bAla substitution improved theaffinity of the interaction (discussed later). The Glu52bAla substitu-tion, which would disrupt the only salt bridge at the interface, did havea moderate effect on the interaction (Table 1). To form the Glu52b-Arg79 interaction after TCR ligation, Arg79 has to break a salt bridgewith Glu89 of HLA-B8, and this may have offset the favorableenergetic contribution normally associated with salt bridge formation(Fig. 3c). Collectively, the energetic contribution of the CDR2b loopwas unexpectedly small.
Effect of CDR2a mutants
Three of the four residues that were substituted in the CDR2a loop(Thr51a, Ser52a and Asn54a) were not in contact with the antigen,with Thr51a and Asn54a minimally affecting recognition (Table 1 and
Q98β
Y100βL94α
H33α
H48α
Y31α
P7-Tyr
T69
L94G97
T98
A95 S99Y100
P93K103
CDR3β
CDR3α
CDR2βCDR1α
CDR3α
CDR3β
CDR2αCDR3β
CDR1β
CDR1α
CDR3α
L104
E89R79
E76
N51Q50
E52
V30
G28
S27
S31
S25T26 A95
R62 S28G96
D30AY31
T30
α2 helixα1 helix
N54
S52 T51L50
31
24
A158
Q106 Y107S94
S95 E105A99
Q98
Q72 Y100L96
T73 E76
> 0.85 kcal/mol< 0.85 kcal/mol< 0.40 kcal/mol
a b c d
e f g
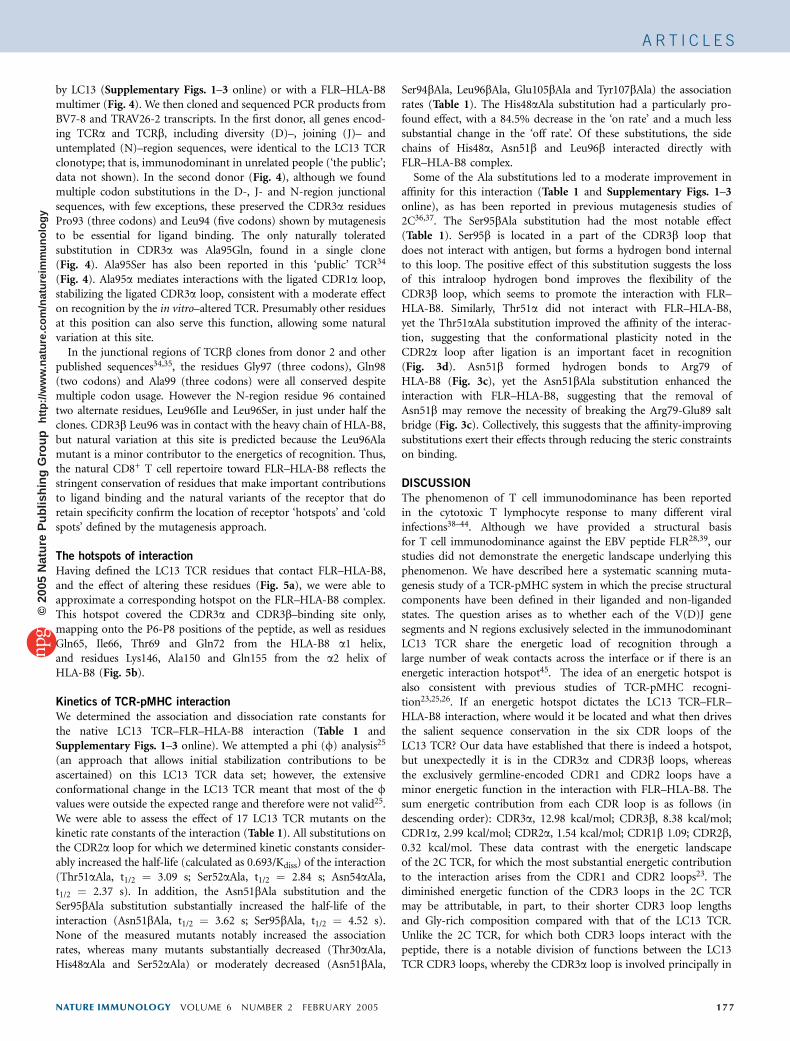
Figure 3 LC13 TCR residues that are essential for interaction with FLR–HLA-B8. CDR loops: CDR1a, red; CDR3a, blue; CDR1b, orange; CDR3b, cyan.
Interactions, dotted lines; non-liganded conformations, dark gray; HLA-B8, light gray; peptide, purple. LC13 TCR residues are assigned colors according to
energetic contribution (key). (a) Ser31 of CDR1b stabilizes the ligated conformation of the ligated CDR3b loop. (b) CDR1a loop interactions with the CDR3aloop and HLA-B8. (c) The polar contacts mediated through the CDR2b loop. (d) Comparison of the conformations of CDR2a loop with and without ligand
formation. (e) CDR3a interactions with HLA-B8. (f) CDR3b loop interactions with HLA-B8 and the FLR peptide. (g) Interaction of the framework residues
(His33 and His48) with the FLR peptide.
TRBV7-8 TRBD1 TRBJ2-7 FC A S S L G Q A Y E Q Y FTGT GCC AGC AGC TTA GGG CAG GCC TAC GAG CAG TAC TTC 30%TGT GCC AGC AGC TTA GGG CAG GCT TAC GAG CAG TAC TTC 26%C A S S S G Q A Y E Q Y FTGT GCC AGC AGC TCA GGA CAG GCC TAC GAG CAG TAC TTC 40%C A S S I G Q A Y E Q Y FTGT GCC AGC AGC ATC GGA CAG GCA TAC GAG CAG TAC TTC 4%
TRBV7-8 TRBD1 TRBJ2-7 FC A S S L G Q A Y E Q Y FTGT GCC AGC AGC TTA GGG CAG GCC TAC GAG CAG TAC TTC 45%TGT GCC AGC AGC TTA GGG CAG GCT TAC GAG CAG TAC TTC 25%TGT GCC AGC AGC CTA GGA CAG GCC TAC GAG CAG TAC TTC 5%C A S S S G Q A Y E Q Y FTGT GCC AGC AGC TCA GGA CAG GCC TAC GAG CAG TAC TTC 20%TGT GCC AGC AGC TCG GGA CAG GCC TAC GAG CAG TAC TTC 5%
TRAV26-2 TRAJ52 FC I L P L A G G T S Y G K L T FTGC ATC CTG CCC TTG GCT GGT GGT ACT AGC TAT GGA AAG CTG ACA TTT 23%TGC ATC CTT CCC CTA GCT GGT GGT ACT AGC TAT GGA AAG CTG ACA TTT 23%TGC ATC CTC CCA CTT GCT GGT GGT ACT AGC TAT GGA AAG CTG ACA TTT 18%TGC ATC CTT CCT TTG GCT GGT GGT ACT AGC TAT GGA AAG CTG ACA TTT 12%TGC ATC CTC CCC CTT GCT GGT GGT ACT AGC TAT GGA AAG CTG ACA TTT 12%TGC ATC CTT CCC CTT GCT GGT GGT ACT AGC TAT GGA AAG CTG ACA TTT 6%C I L P L Q G G T S Y G K L T FTGC ATC CTC CCT CTC CAA GGT GGT ACT AGC TAT GGA AAG CTG ACA TTT 6%
TRAV26-2 TRAJ52 FC I L P L A G G T S Y G K L T FTGC ATC CTT CCT TTG GCT GGT GGT ACT AGC TAT GGA AAG CTG ACA TTT 38%TGC ATC CTC CCC CTT GCT GGT GGT ACT AGC TAT GGA AAG CTG ACA TTT 25%TGC ATC CTT CCC CTT GCT GGT GGT ACT AGC TAT GGA AAG CTG ACA TTT 25%TGC ATC CTC CCA CTT GCT GGT GGT ACT AGC TAT GGA AAG CTG ACA TTT 6%TGC ATC CTG CCC TTG GCT GGT GGT ACT AGC TAT GGA AAG CTG ACA TTT 6%
a
b
c
d
Figure 4 Natural variation in ‘public’ TCR sequences used in the HLA-B8-restricted, FLR-specific antiviral CD8+ T cell response. Nucleotide and
amino acid sequences of natural TRBV7-8 and TRAV26-2 CDR3 chains isolated from bone marrow donor volunteers. FLR-specific CD8+ T cell populations
were expanded and were sorted with an HLA-B0801-FLRGRAYGL multimer (a,c) or a mAb specific for the TRBV7-8 ‘public’ TCR (b,d). DNA from each pool
of sorted cells was amplified with TRBV7 primers (a,c) and TRAV26 primers (b,d) and the products were cloned into bacteria. Many bacterial clones were
sequenced; F (far right) indicates the frequency of a particular chain. Green, Va or Vb family germline nucleotides; blue, TRBD (b-chain diversity segment)
germline nucleotides; red, Ja or Jb (joining region family) germline nucleotides.
NATURE IMMUNOLOGY VOLUME 6 NUMBER 2 FEBRUARY 2005 17 5
A R T I C L E S©
2005
Nat
ure
Pub
lishi
ng G
roup
ht
tp://
ww
w.n
atur
e.co
m/n
atur
eim
mun
olog
y

Fig. 3d). In contrast, the Ser52aAla showed a moderate effect onrecognition, which seems to correspond to a function for Ser52a instabilizing the conformation of the CDR2b loop in the state withoutligand formation (Table 1 and Fig. 2). The Leu50aAla substitution hada considerable effect on the interaction with FLR–HLA-B8 (Fig. 2).Leu50a interacted directly with HLA-B8; however, the effect of thisLeu50aAla substitution was disproportional to the extent of contact, asit formed only a single van der Waals interaction with HLA-B8(Leu50aCd2 interacted with Ala158Cb; Fig. 3d). The structural analysessuggest that Leu50a has a principal function in stabilizing the ligatedconformation of the CDR1a loop, where it makes van der Waalscontacts with the main chains of the CDR1a C-terminal residues(Gly29a, Thr30a and Asp30Aa), as well as the side chain of Tyr31a.
Effect of CDR3a mutants
We made 11 substitutions in the CDR3a loop in the regionbetween Pro93a and Leu104a, the two residues that defined thepivot points of conformational change that occurred in this loopafter ligation (Table 1 and Fig. 3e). The Leu104aAla mutant could notbe refolded, emphasizing the important structural function thisresidue has in LC13 TCR stability. Eight of the ten substitutions hada profound effect on recognition (Table 1 and Figs. 2 and 3e).The side chains of Leu94a, Thr98a and Tyr100a were in contactwith FLR–HLA-B8 and the substantial effect of their substitutionswas directly related to a loss of specificity-governing interactions(Fig. 3e). Ala95a and Gly96a, whose substitutions had a moderateeffect on recognition, mediated the interactions with the ligatedCDR1a loop and thereby stabilized the conformation of theligated CDR3a loop. The Gly96a residue was also in contact withantigen (along with Gly97a), so some of the effect of these substitu-tions must also reflect this function. The CDR3a loop contains threeGly residues, suggesting that structural plasticity of the CDR3a loop isessential for antigen recognition. Pro93a is a nongermline-encodedresidue that does not contact the antigen, yet, as judged by the effect ofthe Pro93aAla substitution (Table 1), seems to represent a criticalresidue that controls the conformational dynamics of the CDR3aloop. Similarly, the effect of the Ser99aAla substitution showed thatSer99a, which formed hydrogen bonds onto Gly96aN, was importantin stabilizing the conformation of the CDR3a loop in the unligandedstate (data not shown). The effect of the Lys103aAla substitutionsuggests that Lys103a, which participates in intersubunit interactions,is essential in stabilizing the Va-Vb interface. Our data establishthat the CDR3a loop, which interacts mainly with the a1-helix ofHLA-B8, has an essential function in the energetics of recognition ofthe FLR–HLA-B8 complex.
Effect of CDR3b mutants
The CDR3b loop is the principal loop of the immunodominant TCRthat interacts with the FLR peptide. We made ten substitutions in theCDR3b loop and of these substitutions, five (Gly97bAla, Gln98bAla,Ala99bGly, Tyr100bAla and Gln106bAla; Table 1 and Fig. 3f) hada profound effect on recognition (DDG 4 1.64 kcal/mol). Ser95b,Glu105b and Tyr107b neither contact FLR–HLA-B8 nor changeconformation after ligation13, so their substitution had a negligibleeffect on recognition (Fig. 3e). Although Leu96b was in contact withthe heavy chain of HLA-B8, results with the Leu96bAla substitutionsuggested that Leu96b was not essential in the energetics of recogni-tion. However, Ala99b and Tyr100b formed direct contacts with theP7-Tyr group, and the effect of their substitutions demonstrated acorrespondingly essential energetic function in the interaction(Table 1 and Fig. 3f). Similarly, the residue Gln98b, encoded by theDbN region, participated in interactions with Va, the peptide and theHLA-B8 heavy chain and this was reflected in the substantial con-tribution of this amino acid to the energetics of antigen recognition.The CDR3b loop was essential in recognition of the FLR–HLA-B8complex (Table 1 and Fig. 2).
Effect of Va framework residues
In addition to the substitutions in the CDR regions, we targeted twosubstitutions (His33aAla and His48aAla), as these amino acids arepart of the germline-encoded Va (TRAV26-2*01) that is highlyselected in unrelated, EBV+ people who express HLA-B8. These tworesidues, located deep in the central pocket of LC13, formed water-mediated hydrogen bonds with the P7-Tyr from the peptide13
(Fig. 3g). The importance of these water-mediated hydrogen bondsis suggested by the 90% loss of T cell activation after P7-Tyr–to–Phesubstitution of FLRGRAFGL13 and a corresponding 90% loss inthe affinity of the LC13 TCR for this HLA-B8-peptide complex(data not shown). Consistent with these observations, both of thesesubstitutions had a profound effect on recognition, confirmingthe importance of these residues in the selection of the LC13immunodominant TCR.
Natural sequence variation in LC13 TCR
To further examine the energetic landscape of binding of LC13 toFLR–HLA-B8, we evaluated the natural sequence variation in theLC13-like TCRs of two healthy, EBV+, HLA-B8+ donors (Fig. 4) aswell as those reported in the literature34,35 (Supplementary Figs. 1–3online). We stimulated peripheral blood mononuclear cells from eachdonor with the FLR peptide in vitro for 10 d and sorted theresponding CD8+ T cells with mAb specific for the BV7-8 Vb used
Figure 5 The LC13 TCR and HLA-B8 hotspot.
(a) Surface representation of the LC13 TCR in
the liganded state. TCR residues are assigned
colors according to the effect of their substitution
on binding to FLR–HLA-B8. Residues that
weakened the affinity by at least fourfold are red;
by fourfold, yellow; by twofold, green. FLR
peptide (presented for reference) is purple.(b) Surface representation of the conformation
of FLR–HLA-B8 with ligand demonstrating
residues that make substantial contact with
the LC13 TCR. Contact residues are assigned
colors according to the effect that LC13 TCR
substitution has on binding to FLR–HLA-B8
(as in a). FLR–HLA-B8 residues that are in contact with more than one LC13 TCR residue have been assigned colors according to the most important effect
noted. The FLR peptide is in purple except for important contact residues; those residues have been labeled.
a b
1 76 VOLUME 6 NUMBER 2 FEBRUARY 2005 NATURE IMMUNOLOGY
A R T I C L E S©
2005
Nat
ure
Pub
lishi
ng G
roup
ht
tp://
ww
w.n
atur
e.co
m/n
atur
eim
mun
olog
y
by LC13 (Supplementary Figs. 1–3 online) or with a FLR–HLA-B8multimer (Fig. 4). We then cloned and sequenced PCR products fromBV7-8 and TRAV26-2 transcripts. In the first donor, all genes encod-ing TCRa and TCRb, including diversity (D)–, joining (J)– anduntemplated (N)–region sequences, were identical to the LC13 TCRclonotype; that is, immunodominant in unrelated people (‘the public’;data not shown). In the second donor (Fig. 4), although we foundmultiple codon substitutions in the D-, J- and N-region junctionalsequences, with few exceptions, these preserved the CDR3a residuesPro93 (three codons) and Leu94 (five codons) shown by mutagenesisto be essential for ligand binding. The only naturally toleratedsubstitution in CDR3a was Ala95Gln, found in a single clone(Fig. 4). Ala95Ser has also been reported in this ‘public’ TCR34
(Fig. 4). Ala95a mediates interactions with the ligated CDR1a loop,stabilizing the ligated CDR3a loop, consistent with a moderate effecton recognition by the in vitro–altered TCR. Presumably other residuesat this position can also serve this function, allowing some naturalvariation at this site.
In the junctional regions of TCRb clones from donor 2 and otherpublished sequences34,35, the residues Gly97 (three codons), Gln98(two codons) and Ala99 (three codons) were all conserved despitemultiple codon usage. However the N-region residue 96 containedtwo alternate residues, Leu96Ile and Leu96Ser, in just under half theclones. CDR3b Leu96 was in contact with the heavy chain of HLA-B8,but natural variation at this site is predicted because the Leu96Alamutant is a minor contributor to the energetics of recognition. Thus,the natural CD8+ T cell repertoire toward FLR–HLA-B8 reflects thestringent conservation of residues that make important contributionsto ligand binding and the natural variants of the receptor that doretain specificity confirm the location of receptor ‘hotspots’ and ‘coldspots’ defined by the mutagenesis approach.
The hotspots of interaction
Having defined the LC13 TCR residues that contact FLR–HLA-B8,and the effect of altering these residues (Fig. 5a), we were able toapproximate a corresponding hotspot on the FLR–HLA-B8 complex.This hotspot covered the CDR3a and CDR3b–binding site only,mapping onto the P6-P8 positions of the peptide, as well as residuesGln65, Ile66, Thr69 and Gln72 from the HLA-B8 a1 helix,and residues Lys146, Ala150 and Gln155 from the a2 helix ofHLA-B8 (Fig. 5b).
Kinetics of TCR-pMHC interaction
We determined the association and dissociation rate constants forthe native LC13 TCR–FLR–HLA-B8 interaction (Table 1 andSupplementary Figs. 1–3 online). We attempted a phi (f) analysis25
(an approach that allows initial stabilization contributions to beascertained) on this LC13 TCR data set; however, the extensiveconformational change in the LC13 TCR meant that most of the fvalues were outside the expected range and therefore were not valid25.We were able to assess the effect of 17 LC13 TCR mutants on thekinetic rate constants of the interaction (Table 1). All substitutions onthe CDR2a loop for which we determined kinetic constants consider-ably increased the half-life (calculated as 0.693/Kdiss) of the interaction(Thr51aAla, t1/2 ¼ 3.09 s; Ser52aAla, t1/2 ¼ 2.84 s; Asn54aAla,t1/2 ¼ 2.37 s). In addition, the Asn51bAla substitution and theSer95bAla substitution substantially increased the half-life of theinteraction (Asn51bAla, t1/2 ¼ 3.62 s; Ser95bAla, t1/2 ¼ 4.52 s).None of the measured mutants notably increased the associationrates, whereas many mutants substantially decreased (Thr30aAla,His48aAla and Ser52aAla) or moderately decreased (Asn51bAla,
Ser94bAla, Leu96bAla, Glu105bAla and Tyr107bAla) the associationrates (Table 1). The His48aAla substitution had a particularly pro-found effect, with a 84.5% decrease in the ‘on rate’ and a much lesssubstantial change in the ‘off rate’. Of these substitutions, the sidechains of His48a, Asn51b and Leu96b interacted directly withFLR–HLA-B8 complex.
Some of the Ala substitutions led to a moderate improvement inaffinity for this interaction (Table 1 and Supplementary Figs. 1–3online), as has been reported in previous mutagenesis studies of2C36,37. The Ser95bAla substitution had the most notable effect(Table 1). Ser95b is located in a part of the CDR3b loop thatdoes not interact with antigen, but forms a hydrogen bond internalto this loop. The positive effect of this substitution suggests the lossof this intraloop hydrogen bond improves the flexibility of theCDR3b loop, which seems to promote the interaction with FLR–HLA-B8. Similarly, Thr51a did not interact with FLR–HLA-B8,yet the Thr51aAla substitution improved the affinity of the interac-tion, suggesting that the conformational plasticity noted in theCDR2a loop after ligation is an important facet in recognition(Fig. 3d). Asn51b formed hydrogen bonds to Arg79 ofHLA-B8 (Fig. 3c), yet the Asn51bAla substitution enhanced theinteraction with FLR–HLA-B8, suggesting that the removal ofAsn51b may remove the necessity of breaking the Arg79-Glu89 saltbridge (Fig. 3c). Collectively, this suggests that the affinity-improvingsubstitutions exert their effects through reducing the steric constraintson binding.
DISCUSSION
The phenomenon of T cell immunodominance has been reportedin the cytotoxic T lymphocyte response to many different viralinfections38–44. Although we have provided a structural basisfor T cell immunodominance against the EBV peptide FLR28,39, ourstudies did not demonstrate the energetic landscape underlying thisphenomenon. We have described here a systematic scanning muta-genesis study of a TCR-pMHC system in which the precise structuralcomponents have been defined in their liganded and non-ligandedstates. The question arises as to whether each of the V(D)J genesegments and N regions exclusively selected in the immunodominantLC13 TCR share the energetic load of recognition through alarge number of weak contacts across the interface or if there is anenergetic interaction hotspot45. The idea of an energetic hotspot isalso consistent with previous studies of TCR-pMHC recogni-tion23,25,26. If an energetic hotspot dictates the LC13 TCR–FLR–HLA-B8 interaction, where would it be located and what then drivesthe salient sequence conservation in the six CDR loops of theLC13 TCR? Our data have established that there is indeed a hotspot,but unexpectedly it is in the CDR3a and CDR3b loops, whereasthe exclusively germline-encoded CDR1 and CDR2 loops have aminor energetic function in the interaction with FLR–HLA-B8. Thesum energetic contribution from each CDR loop is as follows (indescending order): CDR3a, 12.98 kcal/mol; CDR3b, 8.38 kcal/mol;CDR1a, 2.99 kcal/mol; CDR2a, 1.54 kcal/mol; CDR1b 1.09; CDR2b,0.32 kcal/mol. These data contrast with the energetic landscapeof the 2C TCR, for which the most substantial energetic contributionto the interaction arises from the CDR1 and CDR2 loops23. Thediminished energetic function of the CDR3 loops in the 2C TCRmay be attributable, in part, to their shorter CDR3 loop lengthsand Gly-rich composition compared with that of the LC13 TCR.Unlike the 2C TCR, for which both CDR3 loops interact with thepeptide, there is a notable division of functions between the LC13TCR CDR3 loops, whereby the CDR3a loop is involved principally in
NATURE IMMUNOLOGY VOLUME 6 NUMBER 2 FEBRUARY 2005 17 7
A R T I C L E S©
2005
Nat
ure
Pub
lishi
ng G
roup
ht
tp://
ww
w.n
atur
e.co
m/n
atur
eim
mun
olog
y

interacting with the HLA-B8 heavy chain and the CDR3b loopinteracts with the peptide. To assume these differing functions, bothCDR3 loops of the LC13 TCR undergo large-scale conformationalchanges that focus the energetic hotspot to the central region of theLC13 TCR. In these CDR3 loops, most residues are critically impor-tant in specificity-determining interactions and in mediating confor-mational change.
To accommodate the CDR3 conformational change that occursafter ligation of FLR–HLA-B8, a concerted movement of the CDR1aand CDR2a loops is essential13. The largest energetic functionattributable to the CDR1a loop lies in stabilizing the ligatedCDR3a loop. Similarly, the CDR1b loop, which has a smaller functionin directly interacting with the antigen, is critical in stabilizingthe ligated conformation of the CDR3b loop. Moreover, our datasuggest that conformational change in the CDR2a loop after ligationassists in the remolding of the CDR1a and CDR3a loops rather thanmaking a direct specificity contribution to binding. Unexpectedly, theCDR2b loop, despite forming multiple ionic interactions within alocalized stretch on the HLA-B8 a1-helix, had the least energeticfunction of the CDR loops at the interface. This observation isconsistent with the location of the CDR2b loop at the periphery ofthe interface, whereby the need to break polar bonds offsets thecontribution of bond formation. Conversely, Tyr100b from theCDR3b loop and the two framework residues encoded by the Vagene, His33a and His48a all have an essential energetic function inrecognition of the P7-Tyr.
The FLR–HLA-B8 hotspot is much more extensive than thatnoted before in studies of HLA-A2 (refs. 26, 46, 47). The HLA-A2hotspot corresponds with the HLA-B8 hotspot, despite polymorphismbetween these alleles at a1 helix residues 65 and 66. Definingthe HLA-B8 hotspot also represents an important step towardunderstanding the alloreactivity of the LC13 TCR to HLA-B*4402.Of the 31 amino acid polymorphisms between HLA-B*0801 and HLAB*4402, six map to the antigen surface; four, onto the a1 helix(residues 80, 81, 82 and 83); and two, onto the a2 helix (residues163 and 167). None of these residues is involved in LC13 TCR ligationof HLA B8-FLRGRAYGL, and the remaining polymorphisms areburied. This indicates that LC13 TCR binds HLA-B*4402 (refs. 48, 49)in a way similar to HLA-B8. Thus, the sequence of the allopeptideligand is likely to be a critical determinant of the HLA B*4402alloreactivity, whereas the main contribution of CDR3a to bindingthe HLA a1 helix is also a potential conserved hotspot for alloreactiv-ity. Our studies have shown how the TCR interaction can vary itsstructural focus between the peptide antigen and the HLA heavychain, depending on the available array of solvent-exposed side chains.Thus, the MHC has more extensive involvement in TCR stabilizationwhen there is lack of prominently exposed peptide residues to contactthe TCR.
Given that the CDR1 and CDR2 loops contribute minimal energyto the direct interaction with FLR–HLA-B8, a two-step mechanism inTCR recognition is not consistent with our results. One of the greatmysteries of T cell recognition is that even though the TCR isimmunoglobulin like, antigen recognition is highly restricted topMHC ligands. This might be explained if TCRs have a rudimentaryscanning function, as suggested by the observation that MHC class Iand class II restriction correlates with particular sequences in the TCRCDR1 and CDR 2 regions50–54, although exceptions to these patternsare reported36. However, the germline-encoded CDR1 and CDR2loops of the LC13 TCR have a minimal energetic function inrecognizing the FLR–HLA-B8 complex. Thus, the energetic burdenof different CDR loops in TCR-pMHC interaction apparently shifts
according to the nature of the ligand, emphasizing TCR adaptabilityin recognizing diverse ligands. This is consistent with the idea thatthe TCR ‘footprint’ shifts between conserved residues in differentpMHC complexes55.
What are the energetic principles governing the positive selection ofthe LC13 TCR? The nongermline-encoded regions of the LC13 TCRCDR3 loops have prominent functions in recognition. Thus, it ispossible that the nongermline-encoded regions of the TCR may have afunction that is as important as that of the germline regions indictating TCR recognition and immunodominance in selection ofthe T cell repertoire. Some somatic alterations in antibodies thatimprove the affinity for the antigen also stabilize CDR loop con-formation rather than directly contacting the antigen itself 56. Thus,the evolution of antibody maturation seems to mirror the evolution ofTCR recognition, which for this particular immunodominant TCRhas been raised to combat the ancient EBV.
METHODSConstruction of LC13 mutants. In total, 40 amino acids were substituted
to Ala, except for Ala residues, which were substituted to Gly. The original
LC13 human T cell clone was prepared as described57 and was used as the
template to generate the forty LC13 mutants by site-directed mutagenesis
(QuikChange; Stratagene).
Expression and purification of recombinant proteins. Soluble FLR–HLA-B8
complex was prepared from Escherichia coli as described57. The refolded
complexes were concentrated and purified by anion exchange and gel filtration
chromatography. The a- and b-chains of the LC13 TCR were expressed in
BL21 (DE3) E. coli cells, refolded from inclusion bodies and purified as
described57. The structural integrity of the refolded proteins was confirmed
by the apparent molecular weight of the protein after size-exclusion chromato-
graphy and by SDS-PAGE.
Enzyme-linked immunosorbent assay (ELISA) and mAbs reactive against
LC13 TCR. Two mAbs reactive to LC13 were generated ‘in-house’ (description,
Supplementary Figs. 1–3 online) and were used to probe the native con-
formation of recombinant TCRs in a capture ELISA assay. The mAb 12H8
(IgG, to Ca; 100 ml at a concentration of 10 mg/ml) was used to coat 96-well
ELISA plates (U96 Maxisorp, Nunc) at 4 1C for 16 h before blocking at 37 1C
for 1 h with 200 ml of 1% BSA in PBS. Positive control wild-type LC13, the
mutant LC13 TCRs or the negative control TCR CF34 were then added to
the wells for 1 h in triplicate at a concentration of 10, 1, 0.1 or 0.01 mg/ml. The
biotinylated mAb 13G11 (IgG, to LC13 Vb) was then added at a concentration
of 1 mg/ml and bound mAb was detected with horseradish peroxidase–
conjugated antibody to mouse immunoglobulin (Silenus). Reaction with the
substrate O-phenylenediamine substrate (Sigma) was terminated with HCl,
and ELISA plates were ‘read’ at 492 nm on a Labsystems Multiscan ELISA
plate reader.
Surface plasmon resonance measurements and analysis. All surface plasmon
resonance experiments were done at 25 1C on a Biacore 3000 instrument with
HBS buffer (10 mM HEPES HCl, pH 7.4, 150 mM NaCl and 0.005% surfactant
P20 supplied by the manufacturer) supplemented with 1% BSA to inhibit
nonspecific binding. The antibody W6/32 (ref. 58) was coupled in 10 mM citric
acid, pH 5.0, to research grade CM5 chips with standard amine coupling at
9,000–11,000 resonance units (RU). For each experiment, 200–400 RU of the
FLR–HLA-B8 was ‘captured to’ the antibody. LC13 wild-type and mutants were
injected over all flow cells at a rate of 20 ml/min or more. The final response was
calculated by subtraction of the response of the antibody alone from that of the
antibody–HLA-B8 complex. The antibody surface was regenerated between
each analyte injection with ActiSep (Sterogene). All measurements were
minimally in duplicate, and where the replicates were not consistent, the
measurements were repeated. All mutants were originally tested in a concen-
tration range of 1–56.2 mM; if the binding was too weak, the concentration
range was increased to 50–200 mM. BIAevaluation Version 3.1 (Biacore AB) was
1 78 VOLUME 6 NUMBER 2 FEBRUARY 2005 NATURE IMMUNOLOGY
A R T I C L E S©
2005
Nat
ure
Pub
lishi
ng G
roup
ht
tp://
ww
w.n
atur
e.co
m/n
atur
eim
mun
olog
y

used for all data analysis; the 1:1 Langmuir binding model, allowing for local
fitting of the binding maximum, was used to calculate the kinetic constants. To
allow for the capture system, the model was modified to include an additional
parameter for the drifting baseline and local fitting of the binding maxima. The
Kdcalc (Kdiss/Kass) concurred with the Kdeq for all reported values.
Generation of bulk T cell cultures, sorting and TCR gene sequencing. Short-
term cytotoxic T lymphocyte bulk cultures from two EBV+, HLA-B8+ donors
were generated by culture of peripheral blood mononuclear cells (2 � 106 per
2-ml well) in growth medium with autologous peripheral blood mononuclear
cells that had been precoated with FLR peptide (1 mM for 1 h; responder:-
stimulator ratio, 2:1). On days 3 and 7, cultures were supplemented with
recombinant interleukin 2 (20 U/ml) before sorting on day 10 with either
FLR–HLA-B8R–phycoerythrin tetramer or FLR–HLA-B8R–phycoerythrin
pentamer (ProImmune) or mAb 13G11 (data not shown) specific for the
BV7-2 (TCR b-chain) expressed by LC13. Cells were labeled with CD8–tricolor
(Caltag) and CD3-allophycocyanin (BD Pharmingen) and were sorted on a
MoFlo apparatus (Cytomation).
Total RNA was extracted from bulk cultures with TRIzol reagent (Invitro-
gen). Reverse transcription was done with Superscript III (Invitrogen) and
antisense TCRa and TCRb chain primers59. PCR used a 25-ml volume contain-
ing 200 mM dNTPs, 20 mM MgCl2 and 1.25 U of AmpliTaq Gold (Applied
Biosystems) with a TCRa constant region primer and TRAV26 family–specific
primer, or a TCRb constant region primer and a TRBV6 family–specific
primer59. PCR products were purified and cloned into the pGEM-T vector
system (Promega) and were sequenced with the ABI PRISM Big Dye Termina-
tion Reaction Kit (Applied Biosystems).
Note: Supplementary information is available on the Nature Immunology website.
ACKNOWLEDGMENTSThe authors thank F. Carbone and A. Brooks for critically reading themanuscript, and K. Davern (The Walter and Eliza Hall Institute ofMedical Research) for assistance in producing the mAbs to LC13. Supported bya Wellcome Trust Senior Research Fellowship in Biomedical Science in Australia(J.R.), the University of Melbourne (A.W.P.), National Health and MedicalResearch Council (Australia) and Australian Research Council, the RocheOrgan Transplantation Research Foundation and the Juvenile DiabetesResearch Foundation.
COMPETING INTERESTS STATEMENTThe authors declare that they have no competing financial interests.
Received 24 September; accepted 8 December 2004
Published online at http://www.nature.com/natureimmunology/
1. Davis, M.M. & Bjorkman, P.J. T-cell antigen receptor genes and T-cell recognition.Nature 334, 395–402 (1988).
2. Garcia, K.C. et al. An ab T cell receptor structure at 2.5 A and its orientation in theTCR-MHC complex. Science 274, 209–219 (1996).
3. Garboczi, D.N. et al. Structure of the complex between human T-cell receptor, viralpeptide and HLA-A2. Nature 384, 134–141 (1996).
4. Ding, Y.H., Baker, B.M., Garboczi, D.N., Biddison, W.E. & Wiley, D.C. Four A6-TCR/peptide/HLA-A2 structures that generate very different T cell signals are nearlyidentical. Immunity 11, 45–56 (1999).
5. Garcia, K.C. et al. Structural basis of plasticity in T cell receptor recognition of a selfpeptide-MHC antigen. Science 279, 1166–1172 (1998).
6. Reinherz, E.L. et al. The crystal structure of a T cell receptor in complex with peptideand MHC class II. Science 286, 1913–1921 (1999).
7. Degano, M. et al. A functional hot spot for antigen recognition in a superagonistTCR/MHC complex. Immunity 12, 251–261 (2000).
8. Hennecke, J., Carfi, A. & Wiley, D.C. Structure of a covalently stabilized complex of ahuman ab T cell receptor, influenza HA peptide and MHC class II molecule, HLA-DR1.EMBO J. 19, 5611–5624 (2000).
9. Reiser, J.B. et al. Crystal structure of a T cell receptor bound to an allogeneic MHCmolecule. Nat. Immunol. 1, 291–297 (2000).
10. Reiser, J.B. et al. A T cell receptor CDR3b loop undergoes conformational changesof unprecedented magnitude upon binding to a peptide/MHC class I complex.Immunity 16, 345–354 (2002).
11. Reiser, J.B. et al. CDR3 loop flexibility contributes to the degeneracy of TCR recogni-tion. Nat. Immunol. 4, 241–247 (2003).
12. Luz, J.G. et al. Structural comparison of allogeneic and syngeneic T cell receptor-peptide-major histocompatibility complex complexes: a buried alloreactive mutation
subtly alters peptide presentation substantially increasing Vb interactions. J. Exp. Med.195, 1175–1186 (2002).
13. Kjer-Nielsen, L. et al. A structural basis for the selection of dominant ab Tcell receptorsin antiviral immunity. Immunity 18, 53–64 (2003).
14. Stewart-Jones, G.B., McMichael, A.J., Bell, J.I., Stuart, D.I. & Jones, E.Y. A structuralbasis for immunodominant human T cell receptor recognition. Nat. Immunol. 4,657–663 (2003).
15. Garcia, K.C., Teyton, L. & Wilson, I.A. Structural basis of T cell recognition. Annu. Rev.Immunol. 17, 369–397 (1999).
16. Hennecke, J. & Wiley, D.C. T cell receptor-MHC interactions up close. Cell 104, 1–4(2001).
17. Rudolph, M.G. & Wilson, I.A. The specificity of TCR/pMHC interaction. Curr. Opin.Immunol. 14, 52–65 (2002).
18. van der Merwe, P.A. & Davis, S.J. Molecular interactions mediating T cell antigenrecognition. Annu. Rev. Immunol. 21, 659–684 (2003).
19. Willcox, B.E. et al. TCR binding to peptide-MHC stabilizes a flexible recognitioninterface. Immunity 10, 357–365 (1999).
20. Krogsgaard, M. et al. Evidence that structural rearrangements and/or flexibilityduring TCR binding can contribute to T cell activation. Mol. Cell 12, 1367–1378(2003).
21. Boniface, J.J., Reich, Z., Lyons, D.S. & Davis, M.M. Thermodynamics of T cell receptorbinding to peptide-MHC: evidence for a general mechanism of molecular scanning.Proc. Natl. Acad. Sci. USA 96, 11446–11451 (1999).
22. Kersh, G.J., Kersh, E.N., Fremont, D.H. & Allen, P.M. High- and low-potency ligandswith similar affinities for the TCR: the importance of kinetics in TCR signaling.Immunity 9, 817–826 (1998).
23. Manning, T.C. et al. Alanine scanning mutagenesis of an ab T cell receptor: mappingthe energy of antigen recognition. Immunity 8, 413–425 (1998).
24. Lee, P.U., Churchill, H.R., Daniels, M., Jameson, S.C. & Kranz, D.M. Role of 2CT cellreceptor residues in the binding of self- and allo-major histocompatibility complexes.J. Exp. Med. 191, 1355–1364 (2000).
25. Wu, L.C., Tuot, D.S., Lyons, D.S., Garcia, K.C. & Davis, M.M. Two-step bindingmechanism for T-cell receptor recognition of peptide MHC. Nature 418, 552–556(2002).
26. Baker, B.M., Turner, R.V., Gagnon, S.J., Wiley, D.C. & Biddison, W.E. Identification of acrucial energetic footprint on the a1 helix of human histocompatibility leukocyteantigen (HLA)-A2 that provides functional interactions for recognition by tax peptide/HLA-A2-specific T cell receptors. J. Exp. Med. 193, 551–562 (2001).
27. Arstila, T.P. et al. A direct estimate of the human ab T cell receptor diversity. Science286, 958–961 (1999).
28. Argaet, V.P. et al. Dominant selection of an invariant T cell antigen receptor in responseto persistent infection by Epstein-Barr virus. J. Exp. Med. 180, 2335–2340 (1994).
29. Callan, M.F. et al. Large clonal expansions of CD8+ T cells in acute infectiousmononucleosis. Nat. Med. 2, 906–911 (1996).
30. Annels, N.E., Callan, M.F., Tan, L. & Rickinson, A.B. Changing patterns of dominantTCR usage with maturation of an EBV-specific cytotoxic T cell response. J. Immunol.165, 4831–4841 (2000).
31. Kjer-Nielsen, L. et al. The structure of HLA-B8 complexed to an immunodominant viraldeterminant: peptide-induced conformational changes and a mode of MHC class Idimerization. J. Immunol. 169, 5153–5160 (2002).
32. Kjer-Nielsen, L. et al. The 1.5 a crystal structure of a highly selected antiviral T cellreceptor provides evidence for a structural basis of immunodominance. Structure(Camb) 10, 1521–1532 (2002).
33. Webb, A.I. et al. The structure of H-2Kb and Kbm8 complexed to a herpes simplex virusdeterminant: evidence for a conformational switch that governs T cell repertoireselection and viral resistance. J. Immunol. 173, 402–409 (2004).
34. Argaet, V.P. et al. Dominant selection of an invariant T cell antigen receptor inresponse to persistent infection by Epstein-Barr virus. J. Exp. Med. 180, 2335–2340 (1994).
35. Callan, M.F. et al. T cell selection during the evolution of CD8+ T cell memory in vivo.Eur. J. Immunol. 28, 4382–4390 (1998).
36. Manning, T.C., Parke, E.A., Teyton, L. & Kranz, D.M. Effects of complementaritydetermining region mutations on the affinity of an ab T cell receptor: measuring theenergy associated with CD4/CD8 repertoire skewing. J. Exp. Med. 189, 461–470(1999).
37. Speir, J.A. et al. Structural basis of 2C TCR allorecognition of H-2Ld peptidecomplexes. Immunity 8, 553–562 (1998).
38. Callan, M.F. & McMichael, A.J. T cell receptor usage in infectious disease. SpringerSemin. Immunopathol. 21, 37–54 (1999).
39. Callan, M.F. et al. T cell selection during the evolution of CD8+ T cell memory in vivo.Eur. J. Immunol. 28, 4382–4390 (1998).
40. Callan, M.F. et al. CD8+ T-cell selection, function, and death in the primary immuneresponse in vivo. J. Clin. Invest. 106, 1251–1261 (2000).
41. Mongkolsapaya, J. et al. Antigen-specific expansion of cytotoxic T lymphocytes in acutemeasles virus infection. J. Virol. 73, 67–71 (1999).
42. Callan, M.F. et al. Selection of T cell receptor variable gene-encoded amino acids on thethird binding site loop: a factor influencing variable chain selection in a Tcell response.Eur. J. Immunol. 25, 1529–1534 (1995).
43. Kedzierska, K., Turner, S.J. & Doherty, P.C. Conserved T cell receptor usage in primaryand recall responses to an immunodominant influenza virus nucleoprotein epitope.Proc. Natl. Acad. Sci. USA 101, 4942–4947 (2004).
44. Wilson, J.D. et al. Oligoclonal expansions of CD8+ T cells in chronic HIV infection areantigen specific. J. Exp. Med. 188, 785–790 (1998).
NATURE IMMUNOLOGY VOLUME 6 NUMBER 2 FEBRUARY 2005 17 9
A R T I C L E S©
2005
Nat
ure
Pub
lishi
ng G
roup
ht
tp://
ww
w.n
atur
e.co
m/n
atur
eim
mun
olog
y

45. Clackson, T. & Wells, J.A. A hot spot of binding energy in a hormone-receptor interface.Science 267, 383–386 (1995).
46. Wang, Z., Turner, R., Baker, B.M. & Biddison, W.E. MHC allele-specific molecularfeatures determine peptide/HLA-A2 conformations that are recognized by HLA-A2-restricted T cell receptors. J. Immunol. 169, 3146–3154 (2002).
47. Baxter, T.K. et al. Strategic mutations in the class I major histocompatibility complexHLA-A2 independently affect both peptide binding and T cell receptor recognition.J. Biol. Chem. 279, 29175–29184 (2004).
48. Burrows, S.R., Khanna, R., Burrows, J.M. & Moss, D.J. An alloresponse in humansis dominated by cytotoxic T lymphocytes (CTL) cross-reactive with a single Epstein-Barrvirus CTL epitope: implications for graft-versus-host disease. J. Exp. Med. 179, 1155–1161 (1994).
49. Burrows, S.R. et al. Human leukocyte antigen phenotype imposes complex constraintson the antigen-specific cytotoxic T lymphocyte repertoire. Eur. J. Immunol. 27, 178–182 (1997).
50. Zerrahn, J., Held, W. & Raulet, D.H. The MHC reactivity of the T cell repertoire prior topositive and negative selection. Cell 88, 627–636 (1997).
51. Jameson, S.C., Kaye, J. & Gascoigne, N.R. A T cell receptor Va region selectivelyexpressed in CD4+ cells. J. Immunol. 145, 1324–1331 (1990).
52. Sim, B-C., Zerva, L., Greene, M.I. & Gascoigne, N.R.J. Control of MHC restriction byTcR Va CDR1 and CDR2. Science 273, 963–966 (1996).
53. Sim, B.C., Wung, J.L. & Gascoigne, N.R. Polymorphism within a TCRAV familyinfluences the repertoire through class I/II restriction. J. Immunol. 160, 1204–1211(1998).
54. Sha, W.C. et al. Selective expression of an antigen receptor on CD8-bearingT lymphocytes in transgenic mice. Nature 335, 271–274 (1988).
55. Garboczi, D.N. & Biddison, W.E. Shapes of MHC restriction. Immunity 10, 1–7(1999).
56. Patten, P.A. et al. The immunological evolution of catalysis. Science 271, 1086–1091(1996).
57. Clements, C.S. et al. The production, purification and crystallization of a solubleheterodimeric form of a highly selected T-cell receptor in its unliganded and ligandedstate. Acta Crystallogr. D Biol. Crystallogr. 58, 2131–2134 (2002).
58. Parham, P., Barnstable, C.J. & Bodmer, W.F. Use of a monoclonal antibody (W6/32)in structural studies of HLA-A,B,C, antigens. J. Immunol. 123, 342–349 (1979).
59. Panzara, M.A., Gussoni, E., Steinman, L. & Oksenberg, J.R. Analysis of the T cellrepertoire using the PCR and specific oligonucleotide primers. Biotechniques 12,728–735 (1992).
1 80 VOLUME 6 NUMBER 2 FEBRUARY 2005 NATURE IMMUNOLOGY
A R T I C L E S©
2005
Nat
ure
Pub
lishi
ng G
roup
ht
tp://
ww
w.n
atur
e.co
m/n
atur
eim
mun
olog
y
Copyright © 2022 FDOKUMEN