The carbon balance of atriplex vesicaria
290
,b.w t?- THE CARBON BALANCE OF ATRTPLEX WSTCARTA Desmond F. Coleman B.Sc.(Hons) A thesis submítted to the Uníversity of Adelaide ín fulfíllment of the requírements for the degree of Doctor of PhílosoPhy. Department of BotanY University of Adelaíde by March, 1982
-
Upload
khangminh22 -
Category
Documents
-
view
1 -
download
0
Transcript of The carbon balance of atriplex vesicaria

,b.w t?-
THE CARBON BALANCE OF ATRTPLEX WSTCARTA
Desmond F. Coleman B.Sc.(Hons)
A thesis submítted to the Uníversity of Adelaide
ín fulfíllment of the requírements for the degree
of Doctor of PhílosoPhy.
Department of BotanY
University of Adelaíde
by
March, 1982

',Initsrighthandwasabladelikeastabbingtongueoffire;
in its left it hetd a whip of many thongs"" 'A Balrog'r muttered
Gandalf.'Nowlunderstand.,Hefalteredandleanedheavilyon
his staff . twhat an evil fortr¡ne! And f am already weary' "'
Lord of the Rings
J. R. R. Tolkien

l_l-t
vt
CONTENTS
Sumtary
Statement
Acknowledgements
Chapter 1. Att'ipLeæ uesicaría., its biology and use by the
pastoral industry
1.I BiologY
1.11 Distrilcution and general description
L.L2 Variation within the sPecies
L.2 The use of chenopod shrubland by the pastoral industry
1.3 ftre ímpact of stock on saltJoush pastures
1.31 Vegetation
L.32 Soils
chapter 2. Physiological responses to defoliation a¡d
water stress
2.1 Introduction
2.2 fhe response of,4. uesicaria. to defoliation
2.3 Tt¡e carbon balance of arid zone pÌants
chapter 3. seasonal variatíon in total non-structural
carbohydrate content
3.I Introduction
3.2 Study area
3.3 Bud growth after clefoliation
3.4 Materials ancl methods
3.4I Sampte selection
3.42 Sample PreParation
3.43 TNC extraction and analYsis
]-X
x
I
I
I
4
6
11
I1
L4
18
18
23
29
36
Jþ
38
42
46
46
47
49

l-v
3.5 Results: Seasonal variation of TNC
3.5I fNC concentration
3.52 TNC content
3-6 Discussion
3.61 Defoliation
3.62 TNC extraction and measurement
3.63 Seasonal variation of TNC
Chapter 4. Seasonal patterns of shoot and root growttr
in the field
4.L Introduction
4.2 Methods
4.2L Shoot growth
4.22 Root growth
4.3 Results
4.3L Shoot growttr
4.32 Root growth
4.4 Discussion
Chapter 5. Gas exchange
5.1 Introduction
5.2 Materials a¡rd methods
5.2L Plant material
5.22 Treatments
5.23 Gas exchange
5.3 Results
5.3I Gas exchange during rehydration
5.32 Gas exchange during dehydration
52
52
55
58
58
59
64
76
76
76
76
7A
79
79
84
88
90
90
92
92
92
93
97
97
100

5.4 Discussion
5.4I Net CO, uptake at high water potential
5.42 Net CO2 exchange at low water potential
Chapter 6. Growth responses to declining water potential
6.1 Introduction
6.2 Methods
6.3 Results
6.31 Growth responses to declining water potential
, 6.32 Growtlt responses to irrigation
6.4 Discussion
6.4L Growth responses to irrigation
6.42 Growth responses to decreasing water potential
Chapter 7. Water Potential
7.L Introduction
7.2 Methods
7.3 Results and discussion
7.3L Seasonal water Potentials
7.32 Water potential of irrigated plants
7.33 RehYdration of field Plants
7.34 Growth responses to irrigation
Chapter 8. Summary and conclusions
S.lRainfallandphysiologicalactivityínthefield
8.2 TNC concentration and shrub growth after defoliation
or rain
8.3 TNC content of Á. UesicAria and other arid zone species
8.4 Further research
Bibliography
v
104
104
110
114
LL4
LL7
L20
L20
l-24
130
130
131
]-43
L43
L46
148
148
152
L54
161
L67
L67
r72
r75
L79
184

VI
SUTû(ARY
The work reported in this Èhesl-s was done to defíne the times of
accumulation and depletíon, as well as the locatíon and magnitude,
of stores of total non-sLructural carbohydrate (TNC) ln AtrípLet Desieari'a
(bladder saltbush), a chenopod shrub common in arid and semí-arid reglons
of southern AusÈralia. The shrub is grazed by sheep and cattle r"rhen
herbage is ín short supply buË, unlíke some arid zone chenopods' cannot
withsÈand heavy grazíng. The reasons for the poor survival of heavily
grazed saltbush are not known, but other researchers have suggested that
the concentrat.ion of non-sÈructural carbohydrate may be too low to
support adequate regrowth. Seasonal records of TNC concentration were
made in this sÈudy to provide a basis for the planning of future experí-
ments on the relationships between defoliation, carbohydrate concentra-
tion and regrowth. such relationships have been used to formulate
suggesËions for the management of perennial specíes in gxazlng systems
elsewhere.
Between october, Lg77 and January, 1980, rnonthly field tríps were
made to monitor TNC concentraÈÍon, water potenËial and phenology of
individual-s in a small populatíon of shrubs protected from grazing at
Koonamore Statíon, an area with a mean annual rainfall of 2l-4 nrm in Èhe
north-east pastoral- district of South Australía. TNC concentratíons
\¡rere measured 1n up to seven plant fractions. Shoot growth and leaf
production \¡rere followed by means of a series of photographs of tagged
shoots, whíle the timing and ext,ent of root growÈh vlere assessed from
measurements of the e1-ongation of roots vísible through perspex r'rindows
ínstalled ín covered Plts.
The híghest concenÈrations of TNC (70-145 mg/g dry weíght of tissue)
were found in the leaf and young sËem fractions. Old stem and woody
root, had lower maxímum TNC concentraËíons (50-65 rng/g) but because of

vra
their greater dry weíght contaíned the second and thírd largest stores
of TNC, respectively. The largest store of TNC was contained in the
leaves. Between April, L979 and January, 1980, over 50 per cent of
the dry weíght of TNC was found ín the leaf and young stem fractions
which are accessible to gxazj:ng animals. These fractions also showed
the greatest fluctuatíons in TNC concentration following rain and
subsequent growth, both in summer and wínter. The fluctuations were
superímposed on a pronounced seasonal pattern. TNC concentratíons were
highest in summer and autumn and lowest in winËer and early spring.
Root and shoot growth \^lere mosË rapid ín wínter and spring'
although some grovruh followed heavy raíns aË any time of the year.
.1 n."k of root and shoot growth was observed from late winter to mid-
spring in each year. In summer and autumn some contraction of shoots
was observed when htater potentials T^Iere low, but rarely was the con-
traction in length due to loss of tissue from the shoot apex.
To'further defíne the líkely times of carbohydrate accumul-ation,
co, exchange and growth (leaf expansíon, shooÈ and root elongation)
of field-gro\^tn cuttÍngs and glasshouse-gror.m seedlings \¡Iere measured
during drying cycles in the laboratory. The gas sampllng and condítioning
sysÈem used had Ëo be assembled and buílt for this purpose' Studies
on the co, exchange of field-grown cuttíngs showed that duríng a
drying phase, after shrubs had been rehydrated in the laboratory'
terminal shooËs t¡i7ere capable of positive net c02 uptake at a water
poÈential of -9 MPa. Small positive rates !üere recorded for some shoots
with fíeld-gror,m leaves at l^7ater pot,entials less than -10 MPa and ín one
case less Ëhan -11 MPa. Plants which dehydraÈed to the poínt r¡here net
co, uptake \^Ias zero responded to waterÍng wíËhin one day and regained
90 per cent of Eheir photosynÈhetic capaciÈy in about five days.

vll_r
Growth of glasshouse-groI^tn seedll-ngs ' as measured by leaf expansion
and shoot exËension stopped or 1¡7as substantially reduced at \^tater
potentials 1o\nler than -3 MPa.
In Èhe fiel-d dawn water potentials as low as ' or 1o\^7er than' -11 MPa
r¡rere recorded in summer for some Índividuals but ín general, water
potent,ials r^rere higher than the hydration comPensatíon point for net
CO, uptake measured 1n the laboratory.
The data on TNC accumulatíon and hraËer potential ín the fíeld and
gas exchange at low water potential in Ëhe laboratory suggest that net
co, uptake by shooÈs of .4. uesiearia is reduced to zeto only in very
dry years. The fluctuat.ions ín TNC concentration after heawy slJlnmer
rains and the data on CO, exchange during and after rehydration 1n the
laboratory Índicate that TNC Ís needed to supPort suÍmer growth.
The results of Èhís sËudy are also discussed in relaLion to the
effecËs of climaÈe and gxazi¡¡¡g on the vígour and survíval of A' UesicavLa'

x
ACKNOI,ILEDGEMENTS
I am grateful for the encouragement and guidance from my supervisor,
Dr R. Sinclair duríng the course of this study. I also thank Dr J' sílsbury
of the I'Iaite Agricultural Research Institute for his advice on infrared
gas analysfs techníques and Brian Rowland and Richard Norrish for their
help and technical advíce duríng the constructlon of the gas samplíng
and conditioning system. I appreciate the helpful díscussions on my
\^rork r,rTith Joan Gibbs-clema and her help wíth fieldwork and typing parts
of this thesís. Cecil-ia Marcellíne also assisted with Èhe typing of
two chapters. For the greater Part of the typíng, I am grateful to
Joan Davison for her excell-ent and patient work'
Thanks are due to Mr A. P. Mclachlan, the then o'b,ner of Koonamore'
and the manager, Les Gardiner, for allowing a fíeld síte to be con-
structed on the ProPerÈY.
This project r^ras carrfed out ín the Department of Botany, University
of Adelaíde, wiËh financial assÍstance provÍ-ded by an Adelaide University
Research Grant.
Finally, I thank my wife, Leona, for her understandíng throughout and
for her help with fíeld work, editing and Ëhe fínal preparation of
this thesis.

CHAPTER 1.
L A|;ripLen Uesieay,iq its biology and use by the pastoral industry
1.I Biology
1.lf Distribution and general description
The perennial shrub, AttipLeæ Ðesieari,a (bladder. saltbush) is a wide-
spread dominant or co-dominant component of chenopod shrublands, which
occupy approximately 6 per ceht of the area of Australia (Leigh' L972).
It also occurs as a major component in the understorey of low,
open wood-Iands dominated by Casuanirta cri.stata, MyopoTLm pLd.tAcqrpum,
Acacia ane1t?a,, Heterod.endrwn oleifoLiwn and' EucaLyptus spp. (Hall- et aL.,
1964; Ox1eyr LgTg) and has been recorded outside those areas described as
chenopod shrubfands on published maps. It is likely Èhat these records
are from small pockets of unmapped chenopod shruþland or of individual-s
from plant communities dominated by other species. In the central part of
its range the species extends northwards to latitude 23oS (Hal1 et aL. '
Lg64) a distribution which corresponds with that of the mapped areas of
chenopod. shrubland, which lie mainly below the Tropic of Capricorn (lat'
Z3.SoS) in areas with a mean annual rainfall of I50-5OO mm (Leigh, L912) -
A. uesiearia, a dioecious, multi-stemmed shrub up to I metre taII'
is a C4 species belonging to the family Chenopodiaceae. The leaves are
flat with dimensions of the order of 5-25 mm. An account of leaf size
and shape for a number of geographic and edaphíc variants can be found in
Parr-Smith and Calder (1979). The stems are brittle and usually erect'
although in the eastern part of the specíest range individuals growing
on stony ridges may have decumbent stems (Parr-Smith and Calder, 1979) -
The root system is shallow and fibrous with the greatest concentratio¡t
of rooÈs immediately under the canopy. Laterals extend to between one and
two metres from the plant and the bulk of the dry matter (80-90%) is res-

2
tricted to the top 30 cm of the soíl profíle (-osborn et aL., 7932;
Carrodus, 1962; Jones- and Hodgkärson, 1970', Sharma, 7976). Lateral roots
produce numerous.groups-of fine drought-decíduous roots whích are renewed
in wet periods' (Ostiorn et aL., 7932).
The leaves- are als'o drought-deciduous, the extent of defolíatíon
depending on the s'everity of the drought. The lamina is covered with
numerous bladder-lÍke epidermal hairs which are rich l-n salt (Itlood , 1925;
Black, 7954). A number of functions have been ascribed to these vesicles,
among them water storage and absorption of water vapour from the atmosphere,
but their most likely function is that suggested by Osmond et aL. (1969).
They found some evídence that the vesf.cular hairs of AtnipLeæ spongíosa
play a role in regulatíng íon levels in the leaves. The eventual rupture
of the vesicles spreads'a layer of crystallíne sodium chloríde over the
leaf surface. Sinclair and Thomas (1970) measured a high coefficient of
reflectÍon (n =.50%) for leaves oÍ. A. oesicav,ia and attributed this to
the layer of salt and collapsed vesicles. The hígh reflectance I^las suffícient
to sígnificantly reduce the absorption coeffl-cíent and hence the heat load
on the leaf. Of the specÍes they examined only in A. Ðesicaria and
A. stipitata were the leaf optícal properties suffÍcíently modified to be
consÍdered a sígnifl'cant adaption to the hígh solar radÍat.Íon encoulltered
in warm arid regíons. The matted layer of collapsed bladders probably
serves to increase the boundary layer reslstance to l^later vapour movement
away from the leaf and sfnce the epÍdermÍs has only a Èhin cutÍcule (I,¡ood,
1925) thls rnay also be an fmportant adaption to arid condftions. The leaves
of A. oesíearia are also likely to exhibit the high water use efficíency
characterístic of those species with fix co, via the c4 pathway.
The r¿ater potential of soils supportÍng stands of perennial saltbush
is often very low and consequently planÈ \,rater potential must be lower to
maintain Ìrater flow from soll to plant. AndersorL et a,L. (1972) have stated
3
that individuals of A. uesicay,ia can tolerate internal water potentials
of about -l-3Mpafor long periods between rains. If at these times stomata
are open during the day, a gradient along which water can ffow from leaf
to air will exist because of the low water vapour pressure of the atmos-
phere. under these conditions, if the rate of water absorption from the
soil is less than the transpiration rate' the leaf cells may lose water'
When stomates close Some water wilt be taken up, because water loss has
lowered the osmotic potential of the mesophyll, but further rehydration
can occur only if the cells are capable of osmotic adjustment.
Although there is no direct evidence of high concentrations of in-
organic ions within the l-amina of field grown plants of A. Desiea7ia ít
is probable that as leaf water potential falls turgor is maintained
through active ion uptake by mesophyll cells. It is known that the leaf
salt content is high even for plants growing on non-saline soils (!'rood, 1925¡
Beadle et aL., Lg57). Active ion uptake by mesophyll cells of another
member of the genus (A.spongiosa) has been demonstrated by Luttge et aL'
(1970) and high ion concentrations have been found in both lamina and
bladders of A. Uesi.cur'ia grown on saline culture solution (Osmond et aL',
l-969) . The salt content of leaves of field grown plants is highest in
summer and fowest in winter (sharma et aL., Ig72) a result consistent with
osmotic adjustment during the dry season and one which provides some
evidence of high ion concentration in the mesophyll as the summer values
remained high despite heavy rains which would have washed some of the
salt from the leaf surface. charley (1959) showed that up to half the
total satt content of the plant could be leached from the leaves by rain,
so presumably there was a high concentration of ions in the mesophyll of
those plants examined by sharma and co-workers. The ability to maintain
turgor by osmotic adjustment would explain the wide distribution of
A. Uesicaria in the arid and semi-arid zones despite the fact that

4
individual shrubs have a relatively small root system strongly concen-
trated near the soil surface where water potentials often faII to very
Iow values.
The distribution of A. Uesiedr'¿a is shown in fig. I (from Hall
et aL. L964). The fíeld \^¡ork reported in the following chapters was done
at Koonamore Station, marked on the map by a star. From the diagram
accompanying the distribution map it can be seen that Koonamore represents
the cooler end of the distribution of A. Uesíearia. It is also among the
drier sites, as measured by mean monthly rainfall efficiency (precipitafíon/
saturation deficit), occupied by the species but apparently receives more
summer rain than many sites in the \n/inter rainfall zone. Further informat-
ion on conditions there can be found in Osborn et aL. (f935) and in later
chapters of this thesis.
I.L2 Variation within the sPecies
A knowledge of the conditions at Koonamore allo\^¡s the work described
here to be put into some perspective but any extrapolation from one area
to another ought to be done with the und,erstanding that /. uesicar'ía is a
very variable species. I,'food (1936) and Jessup (195f) described a number of
ectotypes associated with different soil types. More recently Parr-Smith
and Calder (L979) defined hine forms including the previously described
ectotlpes. The various forms were separated on the basis of characters of
the female inflorescence and bracteoles surrounding the fruit, and with
some reference to habit and leaf form. The singJ-e most useful characÈer was
the form of the dorsal appendage, or bladder, on the fruiting bracteol-es.
The true fruit is a nut encased in a membranous pericarp. Anatomical and
micro-morphological features were not used as few appeared taxonomically
useful. parr-Smith and Calder intend to define these forms as subspecies
of A. Des'Lcdria in a future Paper-

Figure 1.1 Díagram frorn Hal1 et aL. (L964) showíng the dísÈribuÈíon of
AtripLeæ uesieay"ia and clímatic condítions for the localítíes
occupíed by the specíes. In Èhe dístributíon map, closed
symbols represent sítes from which herbarium specimens
have been collected and open symbols show l-ocalítíes for
whích reliable observations have been recorded in the
literature. The positíon of Koonamore ís indicated by a
sLar.
The accompanying chart (precipitation/saturation deficit
vs. temperature) shows mean winter, mean sunrmer and mean
monthly clirnatic condítions for sites occupied by the
species. The small closed symbols are for sítes j-n the
winter ral-nfall zone and the open symbols are for sites
in the sunrmer raínfall zone. The climatíc conditions for
Koonamore are indícated by a star. Note that, temperatures
are in oF.

(¡o) ¡HnrYHscW3roeô6od
( 8tl
öL óe ÔÊ Ôvo6o0o9 OLÊ'o
e
t
c
9
Ls6ot
{.!r¡
I
oz
oe
-l-¡
I :' I\ o
\I \ \
\ \\ io\.òf
o
\o..t o. þ.\r-
n \o
o
I
.t
a
a ao
o o oa aJa
a aa
a ¡ ata
aa at
a a ßa
a
a
faa
o
ooaÒoa
a. (l.
$aa
toal
a
a
ao oa' eD.
a
.la
5
The form of A. Ues¿car¿a adjacent to the Koonamore vegetation reserve
(KVR), where my study site was Located, corresponds to the 'Iimestone'
form of parr-Smith and Calder (1979) . It is considered a recognizable
variant of the 'small bfadder' form, which is the most common and wide-
spread, but was not clearly separated from.the latter in a canonical
variates analysis. There are also populations with bl-adders intermediate
between the tlimestonet and'large bladder' forms, both of which occur on
Koonamore station, but in most cases these two were easily separated'
There is no experimentaf evidence of physiotogical differences between
the various forms of A. uesícaria but the possibility of such differences
shoutd be kept in mind when evidence on the functioning of plants in one
area is used to help interpret results for those in another. For example,
much of the work outlined in this short review was done on the Riverine
plain of New South Wales which supports a form of saltbush restricted to
that area. It is apparent from the work of Parr SmiLh and Calder, described
below, that the saltbush adjacent to KVR belong to a form which is widely
distributed throughout the arid and semi-arid zones. Together with the
,Iarge bladder, form with which the 'limestone' form intergrades in some
areas, these forms constitute the bulk of the species. Results from salt-
bush at Koonamore may thus have wider application. However' even within
the 'smal-l- bladder' form there is considerable variation. According to
parr-smith and calder, as well as being the most common, it is the most
complex and least understood form of the species.

6
L.2 The use of chenopod shrubland by the pastoral industry
A comparison of the maps published by oxley Q979) and Costin and
Mosley (1969) shows that large areas of chenopod shrubland (dominant or
understorey) near the border between south Australia and western Australia
and elsewhere are classed as vacant crown land' but most of this land is
contained wiÈhin pastoral leases carrying sheep and/ot cattre. The salt-
bush (Attipleæ spp.) and bluebush (Mainearta spp') pastures of South Australia'
New south wales and western Australia are gtazed mainly by sheep' Those
north of the dog fence in south Australia, however I are considered unsuit-
able for sheep because of the presence of wild dogs (Canis føníLiaris '
dingo) and in these areas they are replaced by cattte even though the vegetat-
ionisconsidered.moresuitedtosheep(NewmanandCondon,1969).
Willians(1968)foundthatsaltlcushcommunitiessupportedexception-
atly high rates of wool growÈh, but it is unlikely that these rates can be
attributed to the shrub itself as sheep show a marked preference for the
herbaceous plants growing between the shrubs (r,eigh and Mulham 1966) '
Saltbush has a lower in Uitz'o digestibitity than the herbaceous component
of the vegetation and hence cannot be expected to support such high rates
of growth as the latter even if the voluntary intake is high' Nevertheless
seasonal values for digestibility and nutritive quarity do not fluctuate
as markedly as those for grasses, and saltbush can provide a maintenance
diet,ifgoodqualitywaterisavailablenattimeswhentheanimalsare
forced to browse because of the lack of grasses and herbs
In the early l97Os the cattle industry became relatively more profit-
ableandtherewasanappreciableincreaseinthenurrrberofcattleon
pastures dominated by AttipLeæ Ues'Lcaria (Graetz and lfilson' 1980) ' In
the years between 1950 and 1968 cattle numbers' expressed as sheep equi-
varents, were about one tenth that of the sheep popuration but this figure
had risen to about one fourth by :-972 (Wilson, Lg76) ' According to Graetz
and v,lilson (1980) it is a widely held view among pastoralists that cattle

7
are unable to forage as selectively as sheep and therefore cannot maintain
as high a quality diet when grazíng saltbush pastures, especially in dry
times. The assumed loss of production was a reason for excluding cattle
from these areas in the past. Hov/ever' Wilson and Graetz (1980) found
that the mean weight gains (kg,/ha) of equivalent numbers of sheep and
cattle grazíng saltbush pastures were similar. Economic factors were
responsible for the increased number of cattle carried on chenopod shrub-
lands and Wifson (L976) suggqsted that it will be these, rather than
foraging ability, which influence the number of cattle carried on pastoral
l-eases normally used for sheeP.
Although there is no conclusive evidence available on the effect of
cattle on the long-term population dynamics of the perennial shrubs in
these patures (Fatchen and Lange ' L979) ttre following outline of what is
known of sheep and cattte diets does allo$¡ some conclusions on the possible
consequences of higher cattle numbers. Conclusions about vegetation change
from dietary studies should be treated with caution as such information
fails to account for the response of the ingested species to frequent
defoliation (Graetz and V'lilson, l-979). Both Barker and Lange (1970) and
Fatchen and Lange (L919) observed vegetation changes contrary to an expec-
tation based on supposed preference by stock for the species involved -
However, in the case of ,4.. oesicaría a more confident prediction can be
made as the response of the species to heavy grazíng has been wefl document-
ed (see SectiÒns 1.3, 2.2 \ although l-ess is known of the response to
partial defoliation.
The diet of sheep grazíng pastures dominated by chenopodiaceous shrubs
has been extensively studied in a series of experiments carried out on the
Ríverîne, plain in New South l¡lales (f,eigtr and Mulham, 1966, 19'67¡ Vlílson
et aL., 1969) - The data for an A. ües¿car|a. community \¡rere sunmarized by
B
Leigh and Wilson (1970) . In this case saltbush provided only 10 per cent
of the diet during the wetter months when herbaceous plants growíng between
the bushes were abundant. In summer and autumn the intake of bush was
higher,
Sal-tbush
although the amount eaten depended on rainfall and stocking rate.
constituted 25 per cent of the diet if rainfafl was high and
rate low, or as much as 90 per c-eftË if either rainfall was low or
rate high. The sheep ate less saltbush when herbs \,¡ere present
s tock ing
s tock ing
following
Pen
summer rains.
feeding trials (Wilson, ]-966) have shown that ,4. uesican'ia can
provide a maintenance diet for sheep with access to fresh water at aII
times. In the grazing experiment summarized below stocking rates were
0.4,0.81 and I.62 ha/sheep yet even at the lowest stocking rate sheep lost
body weight during periods of low rainfall when 1. DesieaTia was the major
component of their diet. These sheep also had unrestricted access to fresh
water but were not confined to metabolism cages. The availability of water
is important for sheep on a diet of saltbush as the intake of salt is high
and more water is required for the urinary excretion of sodium (Wilson'
1966). The lowest stocking rate corresponds to the average district stock-
ing rate for similar pastures, in an area with a mean annual- rainfall of
335mn (Wilson et aL., 1969). rn drier áreas sheep are probably forced to
rely on shrubs for a high proportion of their diet earlier in the year and
consequently weight losses over the whole season may be greater. The
location and number of watering points within a paddock is also important
in saÌtbush communities. Large flocks of sheep confined to sparsely vege-
tated paddocks in the drier areas graze 2-3 km or more from water in summer
and autumn and the high sodíum intake from a diet of saltbush often forces
them to walk to water twice a day (Wilson, 1978) resulting in a larger
energy requirement for maintenance. A high salt díet may also reduce the
tolerance of sheep to saline water which, when the only source of water,can

9
cause Ioss of body weight and poor lambing performance even when the
animals are grazíng nore mesic pastures (Peirce, 1968; Potter and
McKintosh J-97 4) .
Cattle grazíng sal-tbush pastures do not select from as wide a range
of plants as sheep, but basically have the same preference for herbaceous
species (Graetz and Vlilson, I9B0). Since they are unable to graze as
closely as sheep (Leigh, I974) the herbage availabl-e to them is fess and
hence saltbush forms a greater proportion of their diet especially in dry
periods or when they are grazíng pastures in common with sheep. The effect
of such a diet on production from cattle is not wel-l understood. Wilson
and Graetz (1980) found no evidence of poor performance in cattle on salt-
bush pastures but in that experiment neither food nor water were limiting.
When grazing large paddocks, traditionalJ-y used for sheep, cattle may
be less productive as they have a higher water turnover (McFarlane and
Howard, L974) and consequentÌy may have to spend more time walking to
water. They also have a lower tolerance to saline water than sheep (Weeth
and Haviland, 1961). The amount of water consumed by cattle in the grazing
experiment reported by Wilson and Graetz (1980) was 50 per cent higher than
that by an equivalent number of sheep. Part of the increased water intake
can probabJ-y be attributed to the higher proportion of saltbush in the diet
of these cattle. Graziers using such pastures for cattle lnay therefore be
forced either to increase the water supply by at least 50 per cent or to
carry less cattle than the pasture can support.
rndirect evidence suggests that cattle may have a bigger impact on the
shrub population because of their higher intake, although according to
Wilson (1976) cattle are not as adept at removing the last leaves from
among the woody stems of. A, Des¿car,¿a. so that more may survive heavy grazíng.
AtripLer DesicaTia appears to be neither highly preferred by domestic
stock nor particularly nutritious. fn uitro measurements return low values

10
(ca. 50S) for digestibility but these máy be lower t}ran in DiDo vaLues.
The shrub can provide a maintenance diet in some circumstances but its
rnain value to the pastoral industry, at least in the short term, is that
its presence enables stock to be carried, albeit with some weight loss,
over short periods of drought. Williams (1960) concluded that the
reduced fluctuation in stocking rates on saltbush pastures at Hay in
New South lrlales compared with that for Lhe wetter grasslands at nearby
Deniliquin \^¡as due in part to the more stable forage production frorn the
saltbush pastures. Horrrever, in a prolonged drought increasing use ís made
of the shrubs and ultimately the population may begin to decline if stock
are not removed.
11
1.3 The impact of stock on saltbush pastures
I.31 Vegetation
Since the introduction of stock to the arld and seml--aríd zones
over 100 years ago, the general pattern has been one of hígh but variable
stock numbers, followed by a decline to a number much less than that
carried ln earlÍer years' (Newman and Condon, 1969). Accordíng to these
authors ÍÈ was a contrnon occurrence ín South Australía, where \^Iater
\^/as scarce in the early years', for 10 000 sheep to vrater at one
watering point durÍng a drought. It is current practlce on some stations
in the north=wes-t pastoral distrfct of South AusËralJ-a, with well managed
shrub populations, to set-s'tock each waterfng poinÈ rn'íth less than 300 sheep.
The hígh numbers'carríed during drought in earlier years had a big ímpact
on Ëhe perenníal shrub population which was seríously depleted by the rníd-
rhirties (-Ratclíff e, 1936).
Osborn et aL. (-1ggf) describe the condÍtions which led to the removal
of all but a few badly overgrazed bushes' of. A. uesiearia from part of a
paddock on Koonamore station in the north-east pastoral district of South
AustralÍa. This episode occurred in 1925 r¿hen an estf.mated I 425 sheep
(-Crisp, 7975) ïrere Ìnratering at a bore about 10 km aI^ray. The severe
deterioration of the vegetaËlon at that distance from water indícated a
high paddock stocking rate but was partly due to the fact that sheep con-
gregated in the area Ëecause of the shade provided by Èrees and because
they could smel1 water Ín the adJacent, paddock to the south. The estimate
of sheep numbers was based on a dÍstrlct stocking rate (15 sheep /U^2)
considered conservative at that tÍme. No records \^Iere available for 1925
but ln the followfng year an îsolated entry Ín the Koonamore files records
1 400 sheep grazîng the paddock in question. The Koonamore Vegetation
Reserye, an area of 400 ha ln the tworst eaten outr corner of the paddock,
was fenced off in 7926 and subsequent studíes of regeneration have shown
that recolonízatÍon of the area by perennlal shrubs was iniÈíally very slow,
I2
especially on eroded land (Hall- et aL. 1964; lr7ood, 1936)
osbornetaL.(]932)describedlessextremeexamplesoftheeffects
of sheep grazíng saltbush pastures. They studied populations in four
concentric zones around a watering point, and expected the vigour of the
plants, as measured by degree of foliation, to improve as grazing pressure
decreased with increasing distance from water. In order of increasing
distance from water the four zones were as follows:
A O - 400 m : heavily gtazed and trampled
B 400 - I ;600 m : moderate to heavy grazing
c I600 -3200m : IightlYgtazed
D over 65OOm : unstocked
The A zone was qenerally bare to a distance depending on the number
of stock using the watering point; the bush density then rapidly inceased
until it merged with the B zone where the density was not significantly
different from that of the unstocked country. The C zone had a higher
bush density but a high proportion \^/ere wilting in contrast to those in
the B zone where vigour was greatest. Osborn et aL. attributed the poor
vigour of the bushes in the lightly stocked zone to competition between
the bushes, presumably for water and nutrients. They considered the grazing
pressure insufficient to remove moribund plants yet enough to contribute to
a significant increase in bush density through planting of seed by trampring
hooves. on the other hand, the high grazíng pressure in the B zone result-
ed in the mechanical removal of moríbund plants and the production of more
compact, vigorous bushes due to the stimulation of Iateral growth by
frequent removal of the terminal apices. It is difficult to know the value
of a visual assessment of vigour. A compact bush, presenting a dense area
of foliage, may simply look healthier than its more open neighbour'
However, it is probably true, as Leigh and Mulham (1971) have pointed out,
that a compact bush is less prone to complete defoliation and more likely
to survive heavy grazíng than is an open straggly bush where all the foliage

13
is accessible to sheeP.
The concept of a radial gradient in vegetation was later used by
Lange and his graduate students who refined the technique and appJ-ied it
to the analysis of vegetation around watering points in much more con-
servatively stocked country. Lange (1969) called the area affected by
animals grazing around such a watering poínt, the pioshpere. From among
the piospheres that she studied, Barker (L97g) found that only ,4. Desica?ia
was disappearing close to water points as a direct result of sheep stocking.
The significance of such changes, which often include the invasion of the
trough area by less preferred species, is that they are taking place under
conservative stocking policies. The observed changes in.4. OesiearLa
populations around one watering point occurred over a short radial distance,.
numbers increasing to a high,er value beyond about 200m from water (Barker
and Lange, 1970). In this case tÅe watering point, a trough fed from a
pipeline, \{as independent of topography (cf. dam or earth tank) and there-
fore of pre-existing pattern on the scale detecLed. They also concluded
that the presence of sma1l populations of seedlings, young and matur.e plants
in the vicinity of the trough hras an indication of recolonization of the
area which had previously been denuded of A. Desied'r'ia; and that the present
stocking rate (250 - 300 sheep/waierl allowed some recovery without spèlling.
However, change is not always restricted to the immediate vicinity of
the watering point. on some stations. surveyed by Lay (L972]' I the shrub
cover had been compLetely eaten out for up to I km from the water point.
Nor, it seems, does a conservative stocking policy guarantee survival of
the shrubs as he observed appreciable bush loss on apparently well managed
stations. It is possible, of course, that these deaths were due to some in-
fluence other than grazing pressure, such as drought. The mean annual rain-
fall for the area surveyed is only 150-I60mm, a value cloSe to bhe lower

t4
Iimitforareasoccupiedbychenopodshrublands.Thesechanges,recorded
byLay(Lg72)hadoccurredinthe20yearssinceaSurveyoftheSamearea
by JessuP (1951) .
)..32 SoiIs
The most serious consequence of mismanagement of chenopod shrublands
is erosion leading to truncation of the soil profile and Loss of nutrients '
rt is stitr commonly herd that arid zone soils are potentiarly very fertile
and that plant gro$¡th is limited only by the lack of wateri the main
evidence for this belief is the dramatic response of plant growth in arid
areasfoJ.Iowingunusuallyheavyrains.However,aridzonesoils,and
in particular those of the Australian arid zone' are poor in nitrogen'
phosphorus and organic matter (Chartey and Cowling, f968) ' The high plant
production following heavy rains often receives comment but according to
Trumble and l¡Ioodroffe (1954) it is not so widely known that when two good
seasons occur in succession plant growth in the second is slight' The
poor response in the second season they ascribe to the fact that,..the small
circulating pool of readily available nutrients is targely depleted by the
previous seasonrs growth.
ofthetotalnitrogenandphosphorusinaperennialsa].tbushcommunity
onlyasmal].fractionwasfoundintheabovegroundportionoftheplant
(charley and cowling, 1968). Thus' even the removal of all the shrub cover
by overgr azing in that community, vJould not constit'ut'e a Serious loss of
nutrients provided that the soil surface remained intact' However' arid
zone soils are particularly susceptible to erosion by both wind and water
(Marshafl,Ig.72;Condon,Lg72)andsincemostofthenutrientsareconcen-
trated near the surface (Charley and Cowling, 1968) the potential loss is
serious. wind erosion is possÍble ín Iess extreme cases than the hypo-
thetical example cited above. Jessup (195I) considered that a bush densiby

15
of about 3 000/ha was the minímum required to prevent wínd erosion. The
bushes serve to decrease the wind speed over the soil surface (Marshall,
Ig12). llater erosion is also promoted by the action of many hooves which
break up the llchen crus't, pulverise the soil surface and compact the sub-
surface soil CBarker, 7979) . As a result infíltratíon ís poor and runoff
carries away the powdery srrrface soÍl. The dJ-spersal of the surface layers
may eventually result ln a poorer nutrient status in the underlyíng soils
as nÍtrogen fíTÍng organisms-have been shown to occur ln the lichen crust
(Rogers et aL. 1966).
Charley and CowlÍng (.1968) observed that the loss of 5 cm of the
surface soil is a coîtrnon result of erosÍon ln aríd regions and that a 10 cm
loss ís not unusual. A 10 cm truncatÍon of the sol-l profile in the comm-
uníty studied would mean a loss of. 27 per cent nitrogen' 21 per cent
phosphorus and 38 per cent organic matter from the total ín a rooting zone
45 cm deep.
Erosion of the texture contrast soíls supporting many perennial salt-
bush communitfes-, as well as resul-ËÍng Ín a loss of nutrients, may expose
a sealing clay B horizon (.Condon, 7972) whích promotes runoff and hence poor
water storage. Such condîtions are unfavourable for germination and estab-
líshment and subsequent recolonÍzation by perennial vegeËatlon is slow
(Hatt et aL. 7964; Charley and Cowlfng, 1968).
The use of these shrublands by the pastoral Índustry has resulted ín
degeneration of much of the perennial vegetatíon. In a review of condítion
and trend ín arid connnunities Newman and Condon (1969) classed 25 per cent
of shrublands as severely degenerated, whíle only 10 per cent were consld-
ered Ín excellent condÍtíon. Most of the damage occurred in the early years
of settlement but erosion begun then is often aggravated during drought.
Jones (.1966) has found evÍdence of natural reclamation of scalds in the
Hay area of New South T¡Iales, and Ín this and other areas where stock numbers
haye been reduced (Newman and Condon, 1969; Barker and Lange' 1970) the

16
trend seems to be towards irnprovement. In other areas the trend is still
towards deterioration (Lay, I972¡ Dawson
is most subject to abuse during droughts
when stock numbers have been allowed to ]-ncrease.
The results of overstocking are not confined to removal of shrubs and
erosion but may be found in the replacement of palatable shrubs by less
palatable or inedible vegetation (Newman and Condon, 1969¡ Barker, 1979).
Though less darnaging to the country, in that loss of soil and nutrients is
avoided, such changes must eventually place more pressure on the remaining
edible shrubs. perhaps the most subtle consequence of stocking, in some
areas, is the lack of recruitment of seedlings to long lived tree (Acacia
pd.pATocarpal and shrub (Maireana sedifoLi,a) populations (Lange and Purdie,
1976¡ Crisp, L975). In the case of M. sedifoLia the problern is aggravated
by infrequent seeding. Edible shrubs, such as Rhagodia and Enchylaern sPP.,
associated with A. papArocarpa may al-so be lost if the tree population
eventually disappears, thus placing more pressure on the remaining edible
shrubs. The loss of shade may also result in reduced animal production due
to heat stress when radiation l-oads and air temperatures are high (Brown
and Hutchinson , Lg73; Lynch and Al-exander, 1973) . Another example of the
less obvious effects of stock on vegetation is the preferential grazing of
female plants of. A. Uesicaria (Willíams , L972; Graetz, L978) reducing the
female,/ma1e ratio and possibly the reproductive capacity of the population.
Höweverr Graetz (1978) considered that intra specifÍc diet selection was of
Iittle consequence for the shrub poputation as a whole, or to management.
Managers are primarily concerned with maintaining good anirnal condition
but, as perry (L974ù has pointed out, greater emphasis should be placed on
the maintenance or improvement of vegetation and soil condition since in the
long run animal production will depend on the stability of these resources-
Because the changes occurring at present are slo\^¡, and often not
and Boy1and, L974). The vegetation
following a run of good seasons
L7
immediately obvious, one approach to the development of rnanagement
principles to counter these changes is to set up standards for assessing
the health (condition) of plant conmunities and to monitor the condition
of those communities at regular intervals. According to Perry (L961',I974a)
the devefopment of useful condition and trend standards is being held up
because of our poor understanding of al-l- the interactions between plants '
grazing animals and their environment. Only a few of these have been
outlined in this and previous sections '
In contrast to the approach taken in the arid regions of North America,
one area of research which has received little attention in this country
is the biology of major plant species and in particular their physiological
response to the environment and to defoliation. Although physiological
condition is not likely to be used as a direct measure of community condition
an understanding of the physiological responses of major pl-ant species to
environment and defoliation may influence the choice of management strat-
egies designed to arrest any trends towards poor condition which are ident-
ified. Perry (L961) considered such studies basic to the precise definition
of condition and trend standards, and to our general understanding of the
effects of various management practices. Some progress has been made since
these articles were written but it is still true that very little is known
of the biology of key species in the Australian arid zone.
A.UeSicaria, for example, is not persistent under heavy grazíng because
of its brittle easily damaged stems and its inability to recover from severe
defoliation (Leigh and Mulham, 1971) . Atz'ipLeæ nurtmularía and Maireana
sedifOLia, on the other hand, are abl-e to resprout from stem stumps after
complete removal of the shoot (Hall et aL.' 1964; Leigh and wilson, 1970)'
The physiological reasons for these differences are not known' Leigh and
wilson (1970) and Hodgkinson and Baas-Becking (L977) have advanced a number
of explanations for the response of A. Des¿e7p¿q. to complete and severe
defoliation which wilI be discussed in the next chapter.
18
CHAPTER 2
2. physiological responses to defoliation and water stress
2.1- Introduction
The two main factors affecting the growth and survival of
individuals of AtripLer Uesí,cdrLa are overgrazing and drought'
It becarne apparent in the early years of settlement that ,4. DesicaTia
is unable to withstand heavy gtazíng. on Koonamore station in south
Australia, for example, a large ftock of 4 500 sheep reduced a dense stand
of saltbush and other chenopod shrubs to dust, \^tithin a radios of 2 km
from water, in about six weeks (see crisp, 1975). On part of the southern
Riverine plain, a much wetter area in New South V'Iales, disclimax grasslands
have been produced by overgr azing of chenopod communities dominaLed by
A. Ues¿cdl,ia.. The ease with which this may be accomplished has been shown
by wilson et aL. (l-969). All but 2 per cent of saltbush in experimental
plots, stocked at twice the district rate for similar pastures, were dead
within three years from the start of the experiment'
Although ,4. DesiearLa is wel-I adapted to frequent periods of Iittle
or no rainfal-I the effects of an extended drought may be almost as drastic.
osborn et aL. (1932) estimated that 9-5 per cent of saltbush in a stand in
unstocked country were leafless as a result of drought. Individuals of.
A. uesicaria can resþrout from the base after complete defoliation but it
ís doubtful whether they can survive for long without leaves. Regrowth
of droughted shrubs probably depends on a substantial rain soon after de-
foliation.
on the other hand, saltlcush apparently cannot survive compJ-ete
defoliation by grazíng animals under any conditions. Leigh and Mulham (197I)
followed the persistence of shrubs after complete defoliation in an
19
experiment where both irrigated and control plots of saltbush were
defoliated in mid spring and late summer. AIl died irrespective of
soil moisture status or season. They attributed the death of these
shrubs to the removal of all poÈential growing points. They found no
evidence of the regrowth, from near the base of stemst recorded for plants
recovering from drought-induced defoliation (Osborn et aL. ' L932) and
suggested that atl primordia, from which new growth could be initiated,
are located on the young terminal stems removed with the leaves by gtazíng
animals.
prior to the publication of details of this work the main results
were outlined in a short review by Leigh and wilson (1970) who indicated
a number of areas of research which might help explain the high mortality
observed.. Among these was the suggesÈion that the use of stored photo-
synthate may be important for regrowth following partial defoliation,
the implication being that in completely defoliated plants' where reserves
must be used, the failure to resprout was due either to a lack of reserves
or an ina-bility to mobilize those stores existing at the time of defoliation'
Ho\^Iever, there are aspects of the effect of water deficit on plant
tissues, and the water relations and growth of arid zone plants which lead
to the conclusion that shallow-rooted' species, such as '4' DeSicAr'¿A! are
Iikely to maintain high concentrations of stored photosynthate in their
tissues (Section 2.3 ) .
Both grazing and seasonaf (or aseasonal) water deficit, ¿rmong other
factors, are known to affect the carbon balance, carbohydrate content and
growth of arid zone shrubs (Mooney , Lg72; Moore I 1917; Trlica, L977 ¡
Depuit , L919). The influence of season and intensity of use on the amount
and rate of regrowth and carbohydrate content of pasture species has been
the subject of extensive research in the United States (see Trlica' L977:i"

20
Trlica and singh , LgTg). some of these studies have shown that the
vigour of regrowth (,as measured by some aspect of production) is
correlated with the carbohydrate concentratíon in plant tissues at the
time of defoliation. In general, regrowth is slower and the amount of
regrowth is less for plants with Iower levels of carbohydrate resêrves -
Conversely, defoliation often results in a l-ower level of carbohydrate
reserves after regrowth. If ptants are defoliated late in the growing season
regrowth and subsequent carbon gain and storage may be limited. Possible
consequences are poor survival if adverse conditions foflow (e.g' temp-
erature or water stress) , reduced growth during the next growing period, or
a further decline in vigour after the next defoliation. Frequent heavy
grazing may lead to a severe depletion of reserves and eventuaf death of
the plant, but defoliation need be neither heavy nor frequent to affect
plant vigour.
to the extent
cook and child (197I) showed that desert shrubs defoliated
that vigour was only moderately reduced had not fully
recovered seven years after the l-ast treatment.
The evidence for the role of reserve carbohydrates in growth following
a period of dormancy or quiescence and in regrowth after partial defofiation
is largely circumstantiat, mainly based on correlation between growth and
carbohydrate content. Some workers have questioned the role of reserve
carbohydrates in regrowth (e.g., May, l-960; Jarneson, l-963) an issue which
is still not resolved. Nevertheless, carbohydrate content has been strongly
(though not uníversaJ-Iy) implicated as an important influence on the response
of plants to both grazing and environnent and later articl-es have provided
some evidence for direct use of labelled reserve carbohydrates at the growing
May (1960). has also questioned the use of the term!reserves'because ofthe fafse impressions it may give about the rol-e of stored carbohydrate'It is retained here for convenience and is used to denote stores of non-
structural carbohydrate accumulated as a result of relatíveIy high ratesof photosynthesis during periods when growth and rnaintenance respirationare low.

2T
point (Pearce et aL., 1969; Smith and Marten, 1970) '
lr,luch of this work was done with a veiw to using the results as a basis
for sound management of vegetation supporting Iivestock. of the two main
factors affecting the survival of .4. Oesi'caria grazíng pressure is the
most damaging and also the only one that can be manipulated. A knowledge
of the interactions between carbohydrate content, growth and grazing is
therefore of prime interest but since carbohydrate content may vary widely
in response to phenological events a knowl-edge of its seasonal variation
is also important, if only as a guide in planning defoliation or clipping
treatments to best advantage.
The seasonal pattern of accumulation and depletion of total non-
structural carbohydrate (TîiC) has been described for a number of species
from the American arid areas as a prelude to studies on plant response to
defoliation (coyne and cook , 1910). Most species showed marked short-term
fluctuations, which were not explained, superimposed on definite seasonal
trends. This report has since been supplemented by papers on the effects
of defoliation on vigour and carbohydrate content. (Cook and Child, L91I¡
Trlica and Cook, I97L) .
To my knowledge no work of this kind has been done on any shrub species
of the Australian arid zone except for the defoliation treatments imposed
by Leigh and Mulham (1971) and Hodgkinson and Baas-Becking (1971\. A start
has been mâde on research into the response of A. uesicaria to clipping
treat,ments (Bluff, 1980) but this work is not yet far enough advanced for
any firm conclusions to be drawn. The only report on carbohydrate concen-
tration is that by wood (Ig32) who analyzed the feaves of three arid zone
species, on two occasions, in connection with an hypothesis on drought
resistance. The work presented in this thesis, a study of the pattern of
accumulation and depletion of TNC and some of the factors affecting it, was

)')
done as a first step towards an understanding of the carbon balance of
A. Desícaria.
The work that has been done on ,4. uesicar\a, although not specifically
designed to answer questions about carbohydrate content and plant growth,
is of interest here because of information on the response of the species
to defoliation which allows some predictions about the location and level
of reserves. This work is discussed in the next section and is followed
by a discussion of the water relations and growth of arid zone plants, in
which the factors most likely to affect the carbon baLance and storage of
carbohydrate in .4.. uesicaria are outlined'

23
2.2 The response of Á. uesicaz'ia to defoliation
In the grazíng experiment reported by Wilson et aL. (1969) the shrub
population declined over a period of three years (section 2.L ). The
authors l-ater speculated about physiological responses to grazing which
might have Ied to the death of these shrubs (Leigh and Wilson, 1970) '
Because the plants were defofiated by sheep the removal of leaf material
from individual shrubs took place over several seasons and it was not clear
whether shrubs died because they could not withstand the l-oss of existing
feaves or whether the repeated removal- of regrowth ultimately 1ed to a
complete exhaustion of reserves-
To obtain more information on shrub death in response to grazíng I
particularly on the influence of soil moisture status and season at the
time of defotiation, Leigh and Mulham (1971) designed an experiment in which
irrigated and control plots of saltbush were defoliated by sheep over a
much shorter period of 8-12 days. The experiment \,/as done in late summer
and repeated in spring. The defoliation treatments were: complete defoliation,
severe defoliation (1-40 l-eaves remaining) and control (ungrazed) ' AII
completely defoliated bushes died and the survival rate of shrubs in the
severe defoliation treatments depended on the number of leaves remaining
after defoliation; the higher the number of leaves the higher the survival
rate. Leigh and Mulham suggested that completely defoliated shrubs died
because of the removal of alf growing points and that the survival rate
of severely defolíated plants was a direct function of the number of sites
left from which regrowth could occur.
However, whether the location of buds is sufficient explanation of shrub
response to such treaLments is not clear. Leigh and lVilson (1970) suggested
that anatomical and morphological studies might provide an answer but these
have not yet been done. Hodgkinson and Baas-Becking (L911) showed that bud
removal need not necessarily result in shrub death. They removed al-I leaves
24
and visible buds from young saltbush plants and all recovered from this
treatment. The fact that new growth by these plants occurred on young stem
is consistent with the hypothesis óf Leigh and Mulham but it appears ' never-
theless, that the cambium can differentiate new buds when the existing
ones are removed. From the pattern of regrowth observed by Osborn et AL',
(Ig32) on drought-defoliated shrubs and the general growth habit of well
watered plants it can be inferred that some buds must be located near the
base of the sþrub on old woody stem. on Lhe basis of these observations
it is perhaps more likely that reqrowth is limited because severe defof-
iation inhibits the development of epicormic buds on ol-d stem in some way'
rather than by a lack of growing points '
More information on the response of A. DesicaTia to defoliation has
been provided by Hodgkinson and Baas-Becking (1917). To assess the effect
of defoliation on root growth they imposed a number of treatments on plants
grown in large sand fiLled boxes fitted with perspex windows. These plants '
wefl watered and adequately supplied with nutrients, a1l recovered from quite
severe defoliation and clipping treatments. The treatments were complete
defoliation, complete defoliation with removal of all visibl-e buds and
lastly, clipping to a height of 50.mm from the soil surface. They observed
a long period of depressed root growth following defoliation and suggested
that reduced root growth may be responsible for the death of shrubs
severely defoliated by grazing animals. Leigh and Mulham had observed some
regrowth on completely defoliated plants but none of these shoots survived
more than a few weeks even when the soil was well watered' Hodgkinson and
Baas-Becking suggested that the shoots may have died because of the inability
of the root system, which they described as stationary and dying, to supply
the shoot with enough water to replace that lost by transpiration' The
loss of roots and depression of root elongation may contribute to the death
of defoliated shrubs in some circumstances buL they do not exprain the'deáth of

atr
severely defoliated plants which had been well watered before and after
defoliation. Complete defoliation resulted in only 10 per cent loss of roots'
and those remaining, although their extension rate declined, did not stop
growing and began to recover four days after defoliation, attaining the
originar growth rate (approx. :omm d-f) in about 20 days. considering the
smal-l- amount of material teft on severely defoliated plants, the effect on
the root system is relatively minor. Even in the treatment involving
complete defoliation and bud removal 50 per cent of the roots remained alive
and eventually recommenced growth. However, since the remaining live roots
did stop growing it is probable that such a treatment would contribute to
the death of unwatered plants in the field (e.g. those defoliated by
Leigh and Mutham) but it is difficult to explain the death of shrubs in
well watered field plots on the basis of water stress ' Such a large propor-
tion of living root material (50-90%) should be able to supply enough water
to the much reduced shoot in both severe and complete defoliation treatments
especially when soit moisture status is high; yet even in the irrigated
plots (75 mm every 3-4 weeks) there was a total loss of shrubs in the
complete defoliation treatrnent. The survival of small shoots on these
shrubs for extended periods indicates that the root system was able to
supply water to maintain turgor in these leaves for some tine. The fact
that they did not develop further remains unexplained. The lack of regrowth
by plants in unwatered plots, on the other hand, is not surprising as turgor'
even in healthy fully foliated shrubs ís probably not sufficÍenE for rapid
leaf expansion.
Leigh and wilson (1970) in their review of the work by Leigh and Mulham
suggested that auxins synthesised in the leaf may play a role in regrowth'
This idea could be extended to include any hormone' or other stimufus to
growth, normafly supplied by the shoot to growing points in the p1ant.
Defoliation in this case would act to remove the source of some necessary

26
stimulus for growth. However, the rel-ativel-y rapid resumption of shoot
growthbycompletelydefoliatedplantsintheexperimentbyHodgkinsonand
Baas-Becking teads to the conclusion that specific stimul-i synthesised by
the leaf are not of primary importance in the initiation of regrowth' The
regrowth of drought-defoliated ,4. Uesicarzø must afso be independent of
such stimul-i as is .the growth of. AtripLefr nulrÍTuLaria and Maireana secLLfolia
from stem stumps after removal of the entire shoot. on the other hand,
since removal of buds as well as leaves results in a fivefold increase in
root loss, a hormonal effect cannot be ruled out. It is difficuÌt to see
how bud rernoval coul-d elicit Such a response on any other basis'
None of the mechanisms discussed so far can be ruled out as a contrib-
uting factor in the overall response of sal-tbush to grazing but the evidence
is strongly indicative that some other factor is involved'
The observed responses are most easily explained by recQurse to the
hypothesis that ,4. Desica?iq is unable to withsband heavy grazing because
of a lack, or low l-evel, of stored carbohydrates or an inability to rnobiÌize
the stores existing at the time of defoliation. completely defoliated
sal-tbush must rely on stored photosynthate for regrowth except perhaps for
a possible contribution from stem photosynthesís. Their fail-ure to respond
to any great extent, despite being well watered could result from a low level
of accessibfe carbohydrate, a condiLion which would also explain the eventual-
death of the plant. As suggested by Hodgkinson and Baas-Beckinq, the plant
might eventually die because of the death of the root system but this
response, I suspect, is due to theeventuaLexhaUstlonof reserves rather
than an initial- inability to supply the shoot with sufficient water and
nutrients.
The survival of severely defoliated plants (Leigh and Mulham, 197r) v¡as
considered to be a direct function of the number of sites remaining for
regrowth, but could also be a direct function of the amount of carbohydrate

27
left in young stem and leaf tissue I or of the amount of photosynthetic
tissue providing assimilates, to maintain the plant body and support new
growth. In the latter case, the dependence of survivaf on photosynthetic
capacity also implies a lack of stored carbohydrate'
ff, however, availability of stored carbohydrate is proposed to account
for the lack of regrowth of plants in the field the reason for the resumption
of growth of plants in the root growth experiment remains to be explained'
There are at least two possible explanations, both related to the method
of defoliation. Firstly, in the latter experirnent most treatments did not
invol-ve the removal of stem thus leaving a bigger potential source of carbo-
hydrates. when stem was removed, in the clipping treatment, the initial
dectine in root growth was more rapid' a response which the authors attrib-
uted to the removal of carbohydrate reserves contained in the stem. Secondly,
and perhaps more importantly, the plants !,¡ere defoliated by hand whereas
those in the field were defoliated by sheep over a refatively long period.
Twefve days is probably enough tírne for any reserves present to be committed
to regrowth. Repeated removal of new growth would tend to lower the non-
structural carbohydrate content of the plant. A sin91e rapid defol-iation
by hand would not reduce the amount of carbohydr,ate in the remaining plant
par ts .
A sinilar explanation coul-d account for the higher survival rate of
plants defotiated by drought. wood (1932) measured high concentrations of
non-structural carbohydrates in the leaves of 1'1. Uesicaria' Withdrawal of
carbohydrates and other organic and inorganic compounds, before leaf
abscission, and storage elsewhere in the plant would provide a relatively
Iarge source of assimilates to maintain the plant during drought and to
support subsequent regrowth.
some aspects of the response of root growth to shoot pruning can also
be explained on the basis of l-ow carbohydrate content. Root growth could
2B
be inhibited because of an increased demand for assimilates by the shoot-
The root/shoot ratio is considered a dynamic equilibrium (tVareing, I912)
and shoot pruning in many plants results in a redistribution of assimilates
in favour of the shoot (Brouwer , 1966; Wareing , L972; Fick et aL. ' f975) .
The failure of saltbush shoots to develop, despite this priority, again
indicates a lack of stored carbohydrate. The increasing proportion of root
foss with increasing severity of defoliation, and especially the response
to bud removaf, is more difficuft to explain. The death of some roots,
rather than sirnply a general reduction in the rate of growth of all roots' is
perhaps a consequence of competition for a limited supply of assimilates'
Strong sinks are known to attract a disproportionate arnount of available
assimil-ates (Evans , l:g'].5) in which case less active roots may have been
unabl-e to compete successfully. Nevertheless. much of the response of
A. uesícaria to both drought and defoliation stil-1 remains unexplained.
There are quite cornplex exchanges of metabofites and nutrients between
root and shoot, during normal growth (wareing, L912). Defoliation may
disrupt the traffic of vitamins, amino acids or hormonal precursors between
root and shoot (Pate, 1966; Crozier and Reid 1971) '
The proposal that the observed responses are due to low levels of non-
structural carbohydrates is also not entirely satisfactory since' as discussed
in the next section, there are aspects of the water relations and growth of
A. Ðestcaria. that woufd favour a high carbohydrate content' If this is true
ít is possible that the response of the species to defoliation reflects an
inability to mobilize stores of carbohydrate rapidly, perhaps as a result
of hormonal imbalance, rather than a l-ow concentration of carbohydrate in
the tissues. A second possibility is that the butk of carbohydrate which
could support regrowth is located in the tissues removed by grazing animals'
29
2.3 The carbon balance of arid zone plants-
Arid lands have been defined (Noy-Meir, 1973) as "water controlled
ecosystems with infrequent, discrete and largely unpredictable water
inputs.,' Because of the low water input to these ecosystems a good deal of
attention has been focused on the drought resisLance of aríd zone perennials
which survive the often long interval-s between rains by avoidance or
tolerance of water stress" (e.g. Levitt, Ig'].2). These forms of resistance
are not mutually exclusive, howeverf as some species may tolerate an in-
ternal water stress which has devefoped despite adaptations which minimise
water loss. Some species do not restrict water loss but avoid stress because
they have access to large reserves of soil water, stored at high potential,
from which transpiration losses can be rapidly replaced' Others avoid stress
by early stomatal- closure or a reduction of transpiring surface area (e'S'
leaf rolling, leaf shedding) during the dry season (Parker, 1968; Orshan'
::912). A few ultimatefy survive because of an abilíty to tolerate dessication
(e.g. oppenheimer. 1960; cafi fSZf) but such a high degree of tolerance
is more common among the lower plants '
Themorphologyofmanyofthewaterconservingdroughtavoidersalso
results in a high resistance to water vapour ross but since the pathways of
water foss and co, uptake are essentially the same ' rnorphological- and
physiological adaptations which minimise transpiration also tend to reduce
co, uptake. Hence an important aspect of the survival of plants which do
restrict water loss is the maintenance of a positive carbon balance over long
periods (Anderson et aL-, I972; Levitt, I972) ' This applies particularly
to those plants in warm arid areas where the conditions favourable for high
ratesofgrowthareusua]-lyinfrequentandofshortduration.
During long intervals without rain these drought-persistent plants
(terminology of Noy-Meir, 1973) are in danger of secondary drought injury
(starvation) due to a negative carbon balance. The likelihood of such an

30
occurrence is offset to some extent by biochemical and physiological
adaptations which allow CO, uptake under conditions of environmental or
internal- water stress. The high water use efficiency of succulents, for
example, allows some carbon gain during prolonged droughts, due to their
ability to cfose stomata during the day and fix CO, at night by the
Crassulacean acid metabolism (CAM) pathway' when evaporative demand is
relatively low. When environmental stress becomes severe they can appar-
ently reduce carbon loss by recycling respiratorY co:- internally (szarek
et aL. Lg13; Szarek and Ting, Lg74). hToody shrubs which restrict trans-
piration less effectively are often tol-erant of \n/ater stress and CO, uptake
continues at a low rate when tissue water potential is fow' Examples of
an increase in water use efficiency at low leaf water potential have been
reported for leaves of both C3 (Mooney et aL. ' 1977) and C4 (Pearcy et aL',
L974) speciesr a response which would prolong positive net co, uptake-
Acclimation of photosynthesis and respiration to prevailing seasonal
temperatures in some species (strain, Lg69; Caldwel-l-, I912) also indirectl-y
increases the capacity for carbon gain during hot dry weather.
Nevertheless despite adaptations which allow continued co, uPtake when
internal water stress is high, water potentials may often fall below the
hydration compensation point (water potential at zero net co, uptake) in
arid environments (strain , Lg6g; Kozlowski, I912). The activity of
Artemesia hetba-alba under severe stress illustrates this point' The Ieaves
of. A. hez,ba-aLba. aye capable of activity at fow water potential as shown by
Kappen et aL. (1g12) who recorded positive net photosynthesis by shoots of
this dwarf shrub for two hours on a day when pre-dawn xylem water potential
was -l-0 MPa. During the remainder of the 24-hour period the carbon balance
was negative. Xylem water potential fel-l to -I2.3 MPa on that day' A week
later, when the minimum water potential had fallen to -l-6.3 MPa, carbon
balance was probably negative for the whole day. since root respiration was

3t
not accounted for, the whole plant carbon bafance was probably negative
for some time before these measurements were taken'
The xylem water potential of Att"LpLeæ üesicav'ia fù.\s to comparable
values (-13 ùlPa) for considerable periods (Anderson et aL., r972). Unless
this species can match the photosynthetic capability of A. herba--aLba carbon
balance wil-l be negative at such l-ower water potentials' According to
Moore (Ig77) studies of Eu.rotia Lonata and AtnipLeæ confet'tifoLia (both
chenopods) have indicated photosynthetic capability comparabfe to that of
A. herba-aLba (White e|; aL. unpubl.). There is also some evidence that
A. Uesicaria is capable of positive net CO, uptake at low water potential.
Wood (Ig32') measured positive net CO, uptake for shoots of this species in
summer at the end of a sequence of years of below average rainfall ' He
did not measure internal water stress but, judging from the pattern of
rainfall in the months prior to this measurement (see HalI et aL., 1964)
and the conditions prevailing at the time, it is likely to have been high.
Although photosynthate may be produced by some species throughout
the dry season (Oechel et aL., Ig72), most net production of structural
biomass occurs during the short favoqrable periods when tissue v¡ater
potential is high (Noy-Meir , I973r. The rates of cell division and
elongation are often the most sensitive to water stress (Hsiao, L973;
Boyer, Ig11). As water deficits devefop these processes sl-ow down and
thereafter most production is channelled to storage except perhaps for a
small proportion translocated to support continued root growth in localized
pockets of high soil water potential (Newman, 1966). As a result, species
which are able to assimilate CO, at low water potential are l-ikely to have
amassed considerable reserves before net CO, uptake is reduced to zeto by
severe stress. The subsequent rate of depletion is probably low (see Kappen
et aL., Ig72) as r¡/ater def icit wiII have reduced the rate of respiration
as well as that 9f photosynthesis (Brix, 1962; Crafts, l-968). The expected
32
increase in carbohydrate reserves, during periods of water Stress, has
been observed for a number of species (Brown and Blaser' 1965; Sosebee
and wiebe , :-:gll; Dina and l(l-ikof f , L973). In general therefore, it
seems likely that apart from a slow drain during times of severe stress '
the l-evel of carbohydrate reserves in plants such as ,4. Uesicaria wifl be
high during the drY season.
However, if falls of rain heavy enough to result in high turgor and
growth occur during the dry season reserves may be depleted for short periods
as ,4. UesicarLa is capable of very rapid growth when water potential- is
high (Jones and Hodgkinson, Lglo; wifliams, l-972). wood (1932) stated
that "maximal growth" of this species occurred foffowing summer rains'
This statement is consistent with the fact that .4 - Uesicaria ís a C4
plant, with the high temperature optimum for net photosynthesis associated
with such species, but whether rapid summer growth could occur largely at
the expense of current photosynthate, as it apparently does in the evergreen
Larrea diuaricata (OecheL et aL., 1972) is uncertain. Wood (1936) was of
the opinion that A. 'Uesicaria díd not live on its reserves at any time but
there is reason to believe that reserves may be used at least to initiate
new growth following periods of severe water stress ' For a shaflow rooted
species such as 1. UeSl'CAriA leaf production and stem elongation in summer
must be rapid if they are to occur before direct evaporation and transpir-
atÍon have reduced soif water potential to a levef below that necessary to
allow the plant to maintain a critical turgor (tlsiao, L973) at the growing
points.
fn many crop species the development of water deficits in the tissues
resufts in a sl-ow recovery on rehydration (slatyer, 1967; Hsiao, l973).
Depending on the species and the severity of the water deficit, such plants
can take one to several days to regain their furl photosynthetic capacity.
The sl_ow recovery of these plants when rewatered nay be due whol]y or partly

33
to impaired stomatal function (Fischer et aL., L970) or in some cases to
persistent tissue water deficit (Boyer, 197Ia; Slatyer, L967). In one
instance (Brix, 1962',) photosynthetic capacity was not fully regained on
rehydration. Although many arid zone species are more tolerant of water
stress, their refative success in a drier environment does not guarantee
perfect adaptation to severe water stress. Since arid zone plants develop
water potentials very much l-ower than those required to produce an after-
effect in crop species it is possible that some impairment of photo-
synthetic capacity resul-ts. Tn an environment where quite substantial- falfs
of rain (l-2.5 mm) may evaporate within a single day (Cowling' 1969) a
sl-ow recovery woul-d severefy timit the growth of plants relying on current
photosynthate as a source of energy and dry matter. Use of reserves \'vould
allow rapid production until the demand for photosynthate at growing points
could be met by new leaf.
Low leaf water potential does not necessarily imply temporary or last-
ing damage to gas exchange capacity of shrubs since some dessication toler-
ant plants recover rapidly on rehydration. Ziegler and Vieweg (1970)
described a rapid recovery of net Co, uptak e in Mgt'othamnus fLabeLLifoLía'
atthough Hoffman (1968) found that oxygen evoluation in this species took
rnuch longer to respond (7-24 hours) than respiration, which began immed-
iately on rehydration. Studies on drought-persistent species o, an" *ur*
arid regions of North America have shown that the recovery of photosyn-
thet.ic capacity is rapid in some but not in others (Odening el; aL., L974).
Several days elapsed before the phyllodes of Acacia aneL[TQ' a dessic-
ation-resistant species of arid Australia, reached maximum relative water
content (RWC) afterarain of f3 mm. Slatyer (196I) considered this period
to be a measure of the rate of resumption of normal metabolisrn and growth.
f n contrasL Panicwn mafi,iïwm., a tropical grass with a hydration compensation
point of about -l-.2 Mpa recovered full photosynthetic capacity (adjusted
34
for leaf age) in two days (Ludlow, 1975). These plants were rewatered
after leaf water potential- had faflen to -9.0 MPa whereas the water potential
of A. aneura. phyllodes which took 3-4 days to recover was only about
-8.0 MPa (RWC = 45?) when rain fell. The slow recovery of high RI^IC in
A. aneura may have been partly a result of slow infiftration to a root zone
of high density although this was not considered as a possible cause,in the
original articl-e. The apparently anomalous difference between the latter
two species may also be due, in part, to differences in the rate of dessic-
ation or in the length of the stress period.
Apart frorn the possibility of after-effects induced by drought when
stress is severe and prolonged, there may be a further limitation to rapid
structural growth for A. uesícaria and other drought-deciduous species in
that when precipitation does occur these plants must photosynthesise with
a reduced amount of leaf materiaf, There may be an immediate demand for
photosynthate in these species to replace the fine drought-deciduous roots
in the nutrient-rich surface soils (Cowling, 1969). Although some new shoot
growth may be supported by nutrients withdrawn from abscissing leaves root
growth may have to precede rapid shoot growth and presumably must draw on
reserves to do so. However, if net CO, uptake continues at low water potential
the general l-evel of reserves will remain high as any used during periods of
rapid sutTìmer growth wilI be quickty replaced because high rates of structural
growth are unl-ikely to be naintained for long in summer conditions.
The advantage of such prompt growth is not the replacement of, or
increase in, reserve levefs, which no doubt would have increased in the absence
of structural growth but, in the short term a possible increase in drought
resistance due to the productions of leaves with a higher water use efficiency
(Cunningham and Strain, L969; Orshan, L912) and in the long term, the replace-
ment of ageing Ieaves of reduced photosynthetic capacity, with young l-eaves
better able to contribute favourably to the carbon bal-ance of the plant.

35.
In addition to the work on phenology and carbohydrate content out-
lined earlier, the following chapters include details of work on some
issues discussed in this section. Studies of CO, exchange and growth
during drying cycles were done to further define the periods of demand for
and accumul-ation of non structural carbohydrates'
36
CHAPTER 3
3. Seasonal variation in totat non-structural carbohydrate content
3. I Introduction
It has been suggested in the previous chapter that the amount and
avaifability of total non-structural carbohydrates are IikeIy to be
important factors controlling the exLent and vigour of growth by
individuals of /. uesicarLa following partial defoliation or a period of
water stress. Stored carbohydrates may serve as a source of energy
for respiratory activity during growth and associated processes or as
a source of structural components incorporated into new growth. As
in previous studies of this kind the importance of stored carbohydrates'
if present, has been assumed pending further evidence for their direct
use at the growing point. In the long run the practical information
required is the relationship between grazing, carbohydrate content and
plant growth but since carbohydrate concentrations in plant tissues
are known to vary seasonallY¡ or at different stageS of regular growth
cycles; studies of such relationships may be more effectively planned
and carried out if seasonal trends in carbohydrate concentration and
content are known. In A, UesicAriA, which has an opportunistic growth
pattern, the seasonal variation in carbohydrate content may be more
complex than that for species in temperate zones where the seasons and
the annual growth cycle are welf defined.
The results of a series of observations on the concentration of total

37
non-structuraf carbohydrate (TNC) *
'in the tíssues of A. Desicaría are
reported in this chapter. this work was done to establish firstly the
existence of carbohydrate stores, secondly whether Lhere are seasonal or
aseasonal- trends in concentration of carbohydrates and thirdly the location
of such stores within the plant. The observed changes in TNC concentration
are compared with the phenology of shrubs at the time of sampling and the
prevailing weather conditions, particularty rainfall, in the interval
before sampling.
The field site on Koonamore Station and the climate of the general area
are also described to allow this work, as well as that in subsequent
chapters, to be placed in perspective by others working on sirnilar species
elsewhere.
Because there has been a suggestion that regrowth following partial
or complete defoliation of. A. Desica,TLa is limited by the number of
available growing points rather than carbohydrate concentration, as
suggested here, the results of a series of observations on regrowth after
complete defoliation are included in this chapter '
Total_ available carbohydrate (TAC) is a phrase often used by þotaniststo describe the carbohydrate energy readily available to plants. As
defined by coyne and cook (1970), TAC may consist of one or all ofstarch, dextrins, fructosans r sucrose and reducing sugars but notstructural carbohydrates such as pentosans, hemicelLulose or cellulose'This definition will apply to TNC as used in this thesis' smith (1969)
has pointed out that totaf available carbohydrate is defined differentlyin studies of ruminant physiotogy and that interchange of informationbetween plant and animal physiologists interested in grazing systemswould be less confused if the more descriptive phrase TNC was adopted
by botanists.
*

38
3.2 Study area
Field work was done at a site on Koonamore Station in the north-east
pastoral district of South Australia about 400 km north of Adelaide
(figure 3.1). Koonamore Homestead (32o 04's, 1390 23'E) is more or less
centrally l-ocated on a pastoral lease of l-200 k*2r n.u. the southern edge
of the winter rainfafl arid zone (see Perry. 1967). The mean annual
rainfall at the homestead calculated from 83 observations since I8B8' is
214 mm. the annual rainfall of warm arid areas is typically highly
variable and Koonamore is no exception with annual totals as low as 35 mm
during a drought year and as high as 850 mm in the extremely wet year of
]-'g74. Such extremes result in sustained alterations to the ]ong-term
running mean. The median annual rainfall, a statistic which is less
affected by rare extreme values, is 184 mm. nainfall and other clinatic
conditions at or near Koonamore are treaLed in more detail- in Osborn et aL.
(1935), Hall et aL. (1964) and Carrodus et aL. (f965). Some of this
information, as well as more recent figures for mean monthly rainfall'
temperatures and relative humidity are summarized in figure 3.2' As rainfall
figures only are regularly collected at Koonamore the remaining data are
for Yunta, 65 km to the south.
Since Koonamore is tocated in the winter rainfall zone it receives
rain from southern depression systems in the winter. However, there is also
a large sunmer component, derived from northern monsoon systems' in the
annual tot,al. HaII et; aL. (1964) claim that there ha6 been a marked increase
in the incidence of summer rainfall at Koonamore since early this century.
The high mean rainfall relative to the median in the summer months inplies
that much of this rain falls in light showers which probably do not result
in plant growth. The relatively low mean number of rainy days, on the other
hand, implies that summer rainfall is increased by a small number of very

o
J
ú,Ftt,f
- r 50-_
25
t!F
to
NORTHER ì¡
¡
¡
i
l<11:rIF.lloi'n
I
I
TIBEIIg,LY. leugeNsuNo
150_
aot-I
J---
9,,,.50oKilomelres
IRoinfoll cm
-Evqporotion cm -----
Figure 3.1 Map of South Australía showing the locatíon of Koonamore
and relevant isolines for annual pan evaPoration and
rainfa11.

Figure 3.2 Mean monthly clirnatic conditions at Koonamore and Yunta
(a) nainfall statistics (Koonamore)
(b) Maximum and minimum temperature (Yunta)
(c) nelative humidity (Yunta)
(d) Cloud coveï on a scale of 0-10 (Yunta). Mean of 9am and 3pm.Days of frost (Koonamore)
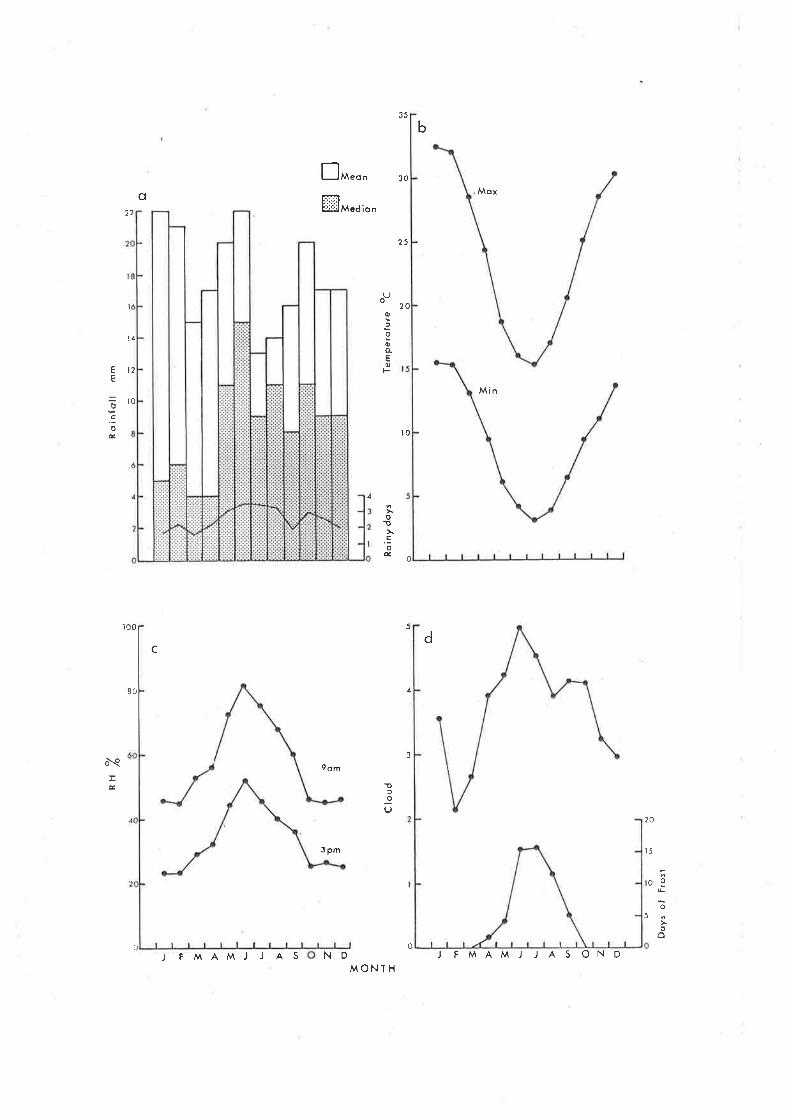
Ro
i ny
doys
Roi
nfol
l m
m
o
o-I em
pero
lure
L
RH
Zo
o oo
oo
ô
r I =
H¡
==
oo do õ')
l
t 3z o
= o z I I
9 o :l
C lo
ud
0o
o
ì oI f
f
f = ì o z o
oo
Doy
s of
F
rost

heavy showers.
probability of
recorded falls
39
Figures in Hall et aL. (1964) show that although the
a dry month is greatest
of rain have occurred at
in summer and autumn, the heaviest
these times. Most falls of
rain greater than about 40 mm (over 125 mm in one instance) have been
recorded between November and March inclusive.
Carrodus et aL. (1965) also described the landscape¡ vegetation and
soil-s of Koonamore. Six vegetation sub-forms, ranging from epherneral herb
and grassland to arid scrub were recognised and subdivided into f5
associations. AttipLeæ Ðesicaria dominates some areas of low shrubland
and is codominant with Maiy,eana sedifoLia and M. astrotrícha in others.
ft is also prominenL in the understorey of low open woodlardsdominated
yry Myoporun pLal;ycarpum, Casuarina cristata and Heterodendt'um oLeifoliwn
Annuals or biejnnials, maini-y Stipa (spear grass) and ScLeroLaena (bindy-i)
speciesf occupy the area between the shrubs.
Soil profiles were sampled by Carrodvs el; a.L. át frequent intervafs
along traverses across the property, usually wherever changes in vegetation
occurred. The 15 vegetation associations described for the station were
found on six intergrading groups of soils. The groups are a focaf
classification and often incl-ude more than one of the main classes of soils
described, for example, in Northcote (1960). The heavy textured soils
found in low-lying saline areas ('Lakes'soils) are replaced by lighter
textured soil-s in hilly areas ('Hitls' soils) . A. Uesicaria grows in
extensive stands on the shallow uniform cafcareÓus , loams and duplex soils
of the 'Oopina' soil- group and in nixed stands witin Maiz'eqlla. astrotricha
anð./or M. sedífoLia on the transition zone between the Oopina and Hil-ls
soils.
A wide belt of country across the centre of Koonamore is characterized
by sand plains and sand dunes supporting communities dominated by
40
Acacia aneuqa (mql-ga) Casuay,ina cristata (btack oak) and to a lesser extent
by Eucalypl;us sociaLis (mallee) . Distributed among the dunes and between
dune systems are large areas of solonized brown loam (Gc 1.I2 of Northcote,
1960) in which the texture gradually becomes finer with depth due to the
flocculation and leaching of clay colloids in the presence of sodium and
calcium ions in the soil solution. Limestone nodules are present at
in the profile of all the soils in this group (Bindy-i soils).varying depth
In the upper
cemented into
profile of the .l-oams there are
a prominent kunkar laYer close
often many nodules which maY be
to the soil surface. These
M. sedifolia or a mixture of
these soil-s have a similar
a sparse canopy in these
soifs support low shrublands of A. Desicaria'
the two. Large areas of low open woodland on
shrub stratum. Ittyoporum pLatycarpizn provides
areas
A field site adjacent to the l{oonamore Vegetation Reserve was set up
by fencing an area of about one hectare, to exclude domestic stock. The
paddock in which the encl-osure was located is normally used only when sheep
have been mustered for shearing and is lightly grazed,if at all,at other
times of the year. Grazing is intermittent but heavy. No extra measures
were taken to exclude rabbits and kangaroos from the experimental site.
The vegetation in the immediate area is a low open woodland as describ'ed
above, with ,4. Ðesicaria and M. sedifoLia dominating the shrub stratum.
Other species of Maireartn are scattered over the area with Lycium, Cheno-
podiwn and 1l]í,|;Tania species occupying slíght depressions. The annual
component of the vegetation consisted mainly of Stipa nitida, ScLerolaena'
patenticuspis and Dissocarpus paTadoæu;. Soils are as described above with
much nodular limestone in the upper layers of the profile. A solid crust
of fimestone near the surface was evident in only a few places. Represent-
ative profiles and mechanical anal-yses can be found in osborn et aL. (1931)
carrodus (L962) Carrodus and specht (1965) and Carrodus et aL, (1965) .

41
Individual profiles. give some indication of the variation of soils in the
field. Mechanical analysis of the surface layers of 'saltbush soils' by
Osborn et aL. (I93L) for example, revealed a high proportion of coarse
sand. The surface soil in another profile of this soil type was composed
mainly of silt and fine sand. A survey by Crísp (1975) also showed that the
surface soils of the nearby reserve graded continuously from sand through
loam to silty loam.
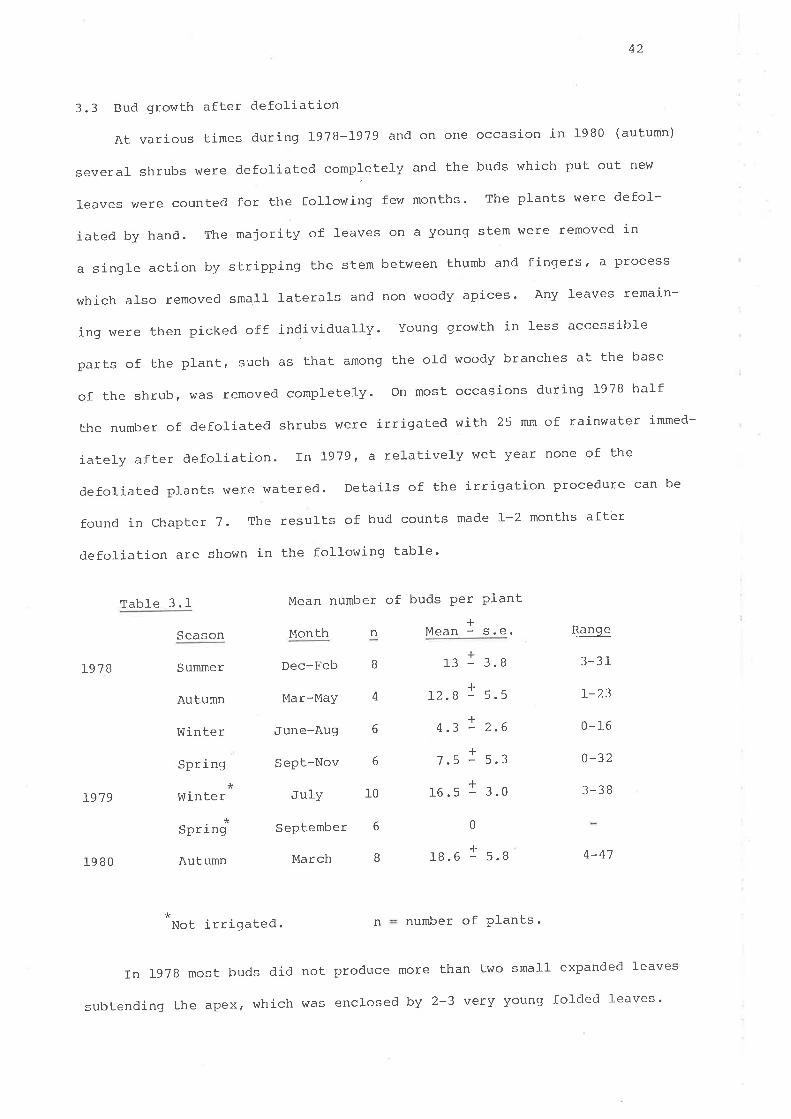
42
3.3 Bud growth after defoliation
At various times during Lg78-I979 and on one occasion in I9B0 (autumn)
severaf shrubs were defoliated completely and the buds which put out new
Ieaves were counted for the fotlowing few months. The plants were defol-
iated by hand. The majority of feaves on a young stem were removed in
a single action by stripping the stem between thumb and fingers ' a process
which arso removed sma1l laterals and non woody apices. Any leaves rernain-
ing were then picked off individually. Young growth in less accessible
partsoftheptant,suchasthatamongtheoldwoodybranchesatthebase
of the shrub, \^/as removed completely. On most occasions during 1978 half
the number of defoliated shrubs were irrigated with 25 mm of rainwater immed-
iately after defoliation. In 1979, a relatively wet year none of the
defoliated plants were watered. Detail-s of the irrigation procedure can be
found in chapter 7. The resutts of bud counÈs rnade l--2 months after
defoliation are shown in the fottowing table'
1978
L919
Season
Summer
Autumn
V'Iinte r
Spr i ng
Winter
Table 3: I Mean number of
Month
buds per plant+
Mean - s'e.
a4.3 : 2.6
16ú
Dec-Feb
Mar-May
June-Aug
Sept-Nov
JulY
September
March
n
B
4
6
6
10
r13 - 3.8
f
r2.8 : 5.5
I
7.5 - 5.3a
.5 - 3.0
f,
- 5.8
Range
3-31
r-23
0-16
0-32
3-38
4-41
expanded leaves
fofded leaves.
*Spring
Autumn
6
B
0
1980 tB .6
+number of plants.Not irrigated.
In t97B most buds did not produce more than two srnall
n
subtending the apex, which was enclosed by 2-3 vety young

43
Rare instances of shoots with 5-10 Jeaves, including a few futly expanded
l-eaves, were observed; these developed from epicormic buds on old stem near
the base of the shrub. All died within five months from the date of defol-
iation except those defoliaLed in March, 1980. The small-er shoots described
above had usualty withered within two nonths of defoliation of the shrub -
Bud expansion was apparently initiated soon after defol-iation. In
midsummer Ig78, for example, expansion and leaf production were evident
within two days. During that year unwatered plants showed no sign of
regrowth except for a few buds produced in midwinter.
One of tl're main features of the data presented in table 3.1 is the vari-
ability ip the number of buds produced per p1ant, as shown by the relatively
large sta¡rdard errors. In the first year part of the variation may be
attributed to the facl- that not all- plants in a given season were defoliated
in the same month. However, in 1979 and 1980 the figures given are for pJ-ants
defoliated on the same day. The range of values is similar to that for
plants in 1978.
These resul-ts are ín sharp contrast to those of Leigh and Mulham (197I)
who nonitored plants defoliated by sheep in spring and midsummer (Chapter 2) .
Even with a much larger sample size (3 plots of 20 plants in each season)
they recorded regrowth from only one point on each of several plants in
the summer group. At Koonamore, a complete lack of regrowth' by any of
the shrubs, was observed on only two occasions, both in spring- At other
Limes of the year while there were some plants which produced very few, if
any, shoots others resprouted from a large number of sites. This was true
even of the shrubs defoliated in March 1980. when two individuals produced
enough regrowth to survive the treatment. Regrowth was prolific when cornpared
with that produced by shrubs on previous occasions. Although many of the
buds did not develop into J-arge shoots and a proportíon had withered by the
time regrowth was first recorded in June, about 2 months after defol-iati:on,
a few plants produced up to 20 Iarge shoots with I0 or more fully expanded
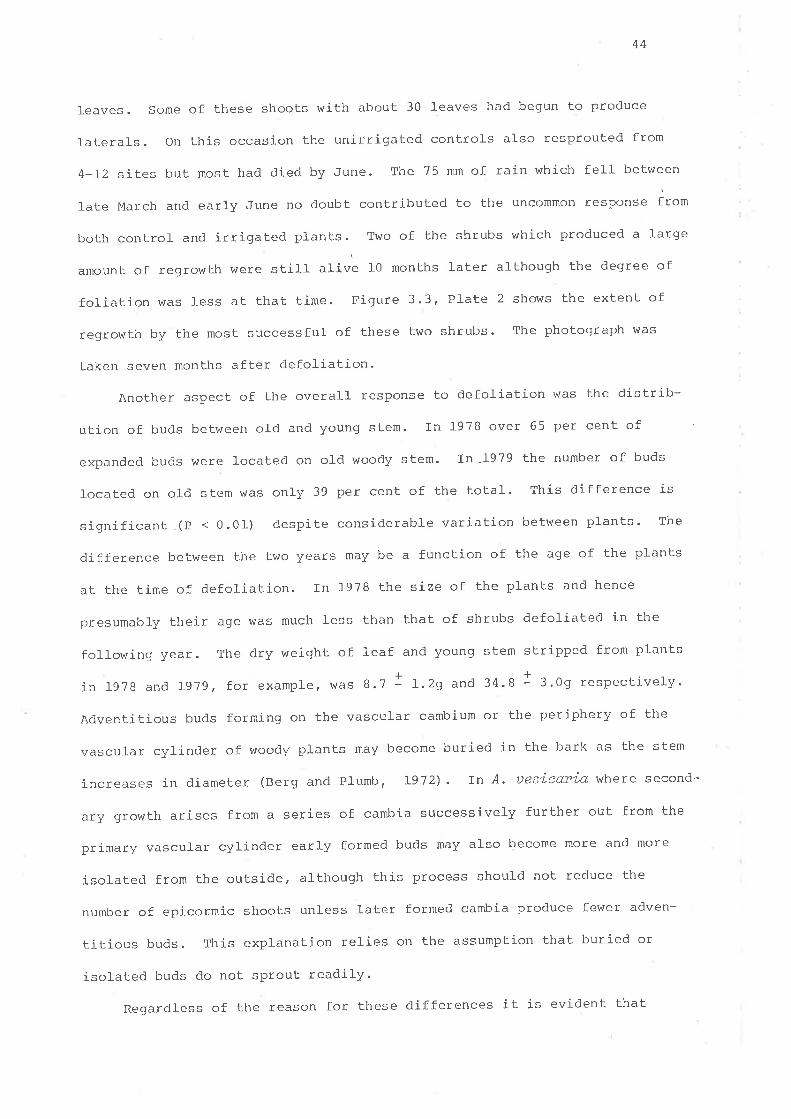
44
leaves. Some of these shool-s with about 30 teaves had begun to produce
laterals. On this occasion the unirrigated controls also resprouted from
4-I2 sites but most had died by June. The 75 mm of rain which fell between
late March and early June no doubt contributed to the uncommon respor,r" Ëro^
both control- and irrigated plants. Two of the shrubs which produced a J-arge
amount of regrowth were still- al,i,r! 10 months later atthough the degree of
foliation was less at that time. Figure 3.3, Plate 2 shows the extent of
regrowth by the most successful- of these two shrubs. The photograph was
taken seven months after defoliation-
Another aspect of the overall response to defoliation was the distrib-
ution of buds between old and young stem. In 1978 over 65 per cent of
expanded buds were located on ofd woody stem. In -1979 the number of buds
located on old stem was only 39 per cent of the total. This difference is
significant (P < 0.01) despite considerable variation between plants' The
difference between the two years may be a function of the age of the plants
at the time of defoliation. In 1978 the size of the plants and hence
presunably tl-reir age was much l-ess than that of shrubs defol-iated in the
following year. The dry weight of leaf and young stem stripped from plants
in 1978 and L9' g, for example, was 8.7 1 I.29 and 34.8 1 3.0g respectively'
Adventitious buds forming on the vascular cambium or the periphery of the
vascular cylinder of woody plants may become buried in the bark as the stem
íncreases in diameter (Berg and Plumb , Ig72). In ,4. Ðes¿cdY'ia where second-
ary growth arises from a series of carnbia successively further out from the
primary vascufar cylinder early formed buds may also l¡ecome more and more
isol-ated from the outside, although this process should not reduce the
number of epicormic shoots unl-ess later formed cambia produce fewer adven-
titious buds. This explanation relies on the assumpLion that buried or
isolated buds do not sprout readily.
Regardless of the reason for these differences it is evident that

Figure 3.3 Regrowth of A. uesicaría after complete defoliation.
Plate 1 shor¿s the predominantly basal patÈern of
regrowth two months after defoliation.
P1ate 2 shows the extent of regrowth after seven months.
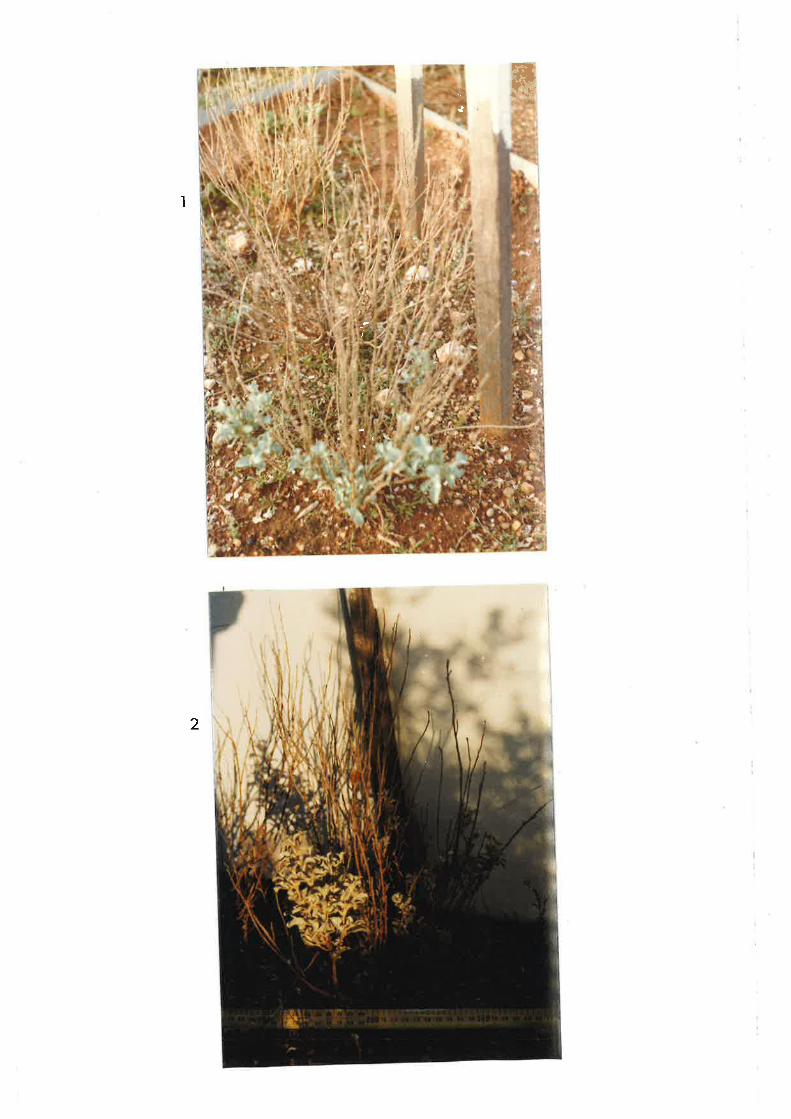
I trI
I
\I
I
irI
)Ia
)
a
I
2

45
regrowth by A. Uesícaria, at least at Koonamore, is not limited by a lack
of growing points. In particular, the potential for regrowth from adven-
titious buds on old woody stem appears to be quite high' Figure 3'3
plate I shows the predominant.ly basal pattern of regrowth by one of the
shrubs defoliated in March 1980. other shrubs produced shoots on younger
stem in addition to those arising from old woody stem'
This result is at variance with the suggestion by Leigh and Mulham
(197I) that all growing points are located on youngstèms. It is possible
that the observed difference in the response to deforiation between plants
at Koonamore and on the Riverine Plain (nmmet Vale) is related to the
method of defoliation. Shrubs at trmmet VaLe were defotiated by sheep over
a period of 12 days. If any regrowth did occur durinq this time sheep
may have reduced the number of avairable buds by nipping off young emerging
shoots. As rnentioned earlier on one occasion at l{oonamore buds on def-
oliated shrubs began to expand within 2 days '
ïf on the other hand their speculation on the l-ocation of buds is
correct then there are, apparently, differences between saltbush on the
Riverine plain and those at Koonamore, This may well bre an example of
anatomical and/or physiological differences between two forms of the species
defined by Parr-smith and calder (L919). A discussion of these forms was
included in section I.L2 where it was noted that the Riverine Plains form
is restricted to that area. However, although shrubs at Koonamore which
belong to a much more widespread form, usually produced many small shoots
after defoliation aL various times of the yearr in most cases the potential
for regrowth was not realized. shrubs survived defoliation on only one
occasion (I{arch, 19B0). Apart from that instance the longest surviving
shoots of appreciable síze (10 leaves) also grew on shrubs defoliated at
the same time of the year (March, I97B). A possibte explanation for this
coincidence is suggested in the discussion of the results for TNC analyses
which are presented in section 3'5'
46
3 .4 lvlateriaf s and methods
3.41 Sample selection
AI1 plant mal-erial for TNC analysis in the laboratory was coll-ected
from the field site clescribed in the previous section. During L977-78
3-5 female and an equal numl¡er of male plants, were collected at approxirn-
ately monthly intervals from a population of young plants protected from
grazing. In 1979 five female plants were selected at each sampling date.
plants were chosen aL random from a tagged population chosen for uníformity
of size and appearance. old, very open plants with a high proportion of
dead branches and twigs, for exampler were avoided' In general the plants
sampled were young, mature plants between 30-40 cm high and 20-30 cm in
diameter. At different sampling times throughout the year the amount of leaf
on these plants varied but when initially selected they were aI1 well
foliated. collections were made at the same time of day, shortly after
sunrise, on each occasion to avoid the possibility of ffuctuations in the
measured vafue for TNC clue to diurnal changes in carbohydrate content' The
entire shoot and a subsample of the root system of each plant was collected
and l-ater processed in the laboratory. It was found impractical to attempt
a thorough excavation of the root system because of thê soif structure and
the high concentration of limestone nodufes in the soil profiÌe' The
brittle saftbush roots were readily broken on removal of the rubbl-e' The
root system was subsampled by loosening the soil around the plant to a depth
of 20-30 cm and easing the ptant, from the soil to retain as much of thê
unbroken root system as possíble. This procedure resulted in a large
sample of both young and woody roots and had the advantage of reducing the
time between disturbance of the plant and processing of the sampled material'
Most of the root system to a radius of about 30 cm \^/as reLained on the plant'
only those roots still attached were used for TNC analysis.
In the first few months individual plants were collected on successive
days and separated into fractions within two hours. The various plant parts

47
were then kitled in boifing B0% ethanol and air dried. The plant material
togetl-rer with the residue of solids extracted by the ethanol was later
milled, oven dried and stored in seated glass vials. Although it is desir-
abl_e to kil-f the plant material as quickty as possible, to minimise respir-
atory l-osses after collection, the procedure adopted for the first sampling
dates was found to interfere with other work during field trips and subse-
quently aII plant material \^/as Stored under dry ice until returned to the
laboratory where it was stored at -2OoC until processed' Dry ice was
manufactured in the fiel-d from a cylinder of compressed cor. A mixture of
gaseous and liquid co2 forced up an eductor tube reaching to the bottom of
l-he cylinder was sprayed over the plants with a device of the type used to
freeze water in pipes during maintenance work in 1ar9e buildings. This
consisted of a hand held section of high pressure tubing fitted with a fine
nozzle and attached directly to the cylinder outlet. During rapid expansion
of the co, a thick layer of dry ice forms over the plants. Because the
co, is forced out under full cytinder pressure the plants were sealed in
plastic bags to avoid l-oss of leaf material-. The device is simple and
robust ancl it can be left attached to a small cylinder of CO, enabling easy
replenishment of the dry ice during transport to the laboratory in hot
weather.
3.42 Samp1e preparation
The plants were separated into six fractions in the laboratory.
Those were leaf, young stem, young woody sLemf old stem' young root and
woocly root. The young stem and root fractions were separated from older
tissue on the basis of a subjective assessment of their woodiness' The
young stem, for example, could be bent before it broke \^/hereas young woody
'stem although of similar diameter was brittle and snapped easiLy' Old and
young woody stem were separated, arbitrarily, at the point where splits in
the bark became noticeable. The leaf fraction in l-911-I978 contained a small

48
amount of non-woody young stem. During that period the shoot was subsampled
by selecting entire branches until errough of the srnaller fractions had
been sorted. Root samples were \^/ashed in colcl water to remove residual soil
and any obviously young tissue removed wíth the soif was separated from
the bulk of the root system by flotation and sieving. only non-woody root
\^/as classified as young; the remainder was bulked with older material irres-
pective of its diameter. The fractions were killed as described earlier
and the ethanol- evaporated under lamps in a fume hood. The air-dried mater-
ial was then ground to pass a I mm screen in a small hammer mill, oven dried
at 70oc and cool-ed in a dessicator before being sealed into glass vials'
priesttey (L962t emphasised the importance of calculating the weight
of TNC in various plant parts in order to identify the major storage sites'
Since this calculation depends on the size of the storage site as well as
the TNC concentration, in l-979 the whole shoot was separated into fractions
and the dry weight of each measurecl. The crown, defined by coyne and cook
(1970) as the woody tissue between the first stem branch and the first
concentration of roots was included as a seventh fraction' The calculation
of TNC content for the various fractions is described later.
In the previous year it was found difficult to separate leaf and stem
completely when the shoots were fresh and since solubl-e carbohydrates
are extracted when tissues are killed in boiling B0 per cent ethanol no
further attempt was made to separate the young stem contained in the leaf
fraction afLer the solvent had evaporated. For these reasons in 1979 the
l-eaf and young stem tissues were killed by drying in an oven for up to an
hour at 100oc. The remaining plant parts were also treated in this way'
Because carbohydrate losses can occur if tissues are dried completely at
tOOoC (Smith ,Lg6g) drying was cornpleted at 70oC. The high initial-
tenperature was used to rapidly denature respiratory enzymes and to decrease
the overall cìrying time. The dried tissue was then easily separated into
49
fractions composed entirely of leaf or young stem. The samples were then
miIIed, redried and stored in glass vials with tightly fitting caps.
3.43 TNC extraction and analYsis
Non-structural carbohydrates were removed from dried plant material
by extraction in hot dil-ute sulphuric acid. Arguments for and against the
dilute acid extraction method have been presented by Priestly (I962Ì' and
Smith (1969). The merits of those arguments as they apply to this study are
examined in the discussion of results reported in this chapter.
Accuratel-y weighed samples of about 250 mg were refluxed in 25 mI of
0.2 N sulphuric acid for one hour. The hot solutíon was then fil-tered to
remove woody material and cooled to room temperature. Proteins were not
removed.
The concentration of hexose sugafs in the extract \4ras assayed by the
anthrone methocl described in Yemm and willis (1954). The intensity of the
bJ-ue-green colour produced when carbohydrate sofutions are heated with
anthrone in concentrated tI2SO4 is linearly reJ-ated to carbohydrate concen-
trations in the range 0-100 PS/II-
The anthrone reagent (9,1-0 dihydro-9-oxoanthracene) was prepared by
dissolving 0.2 g of the compound in l-00 ml- of sulphuric acid made by adding
500 nÌ of concerltrated acid (AR) to 200 ml of water. The sofution was all-owed
to stand for at least an hour, with occasional shaking, until perfectly
clear. The reagent was freshly prepared each day and used within 6-8 hours'
The acid solvent concentralion usecl I viz. that chosen by Trevelyan ancl
Flarrison (L952) to minimise the heat of mixing on addition of the aqueous
sample, is only just high enough to prevent precipitation of anthrone from
the finaf sol-ution. For this reason the solvent was afso prepared regularly
ratlrer than in bulk to prevent gradual dil'ution by water vapour frorn the
atmosphere. As found by Yemm and willis (1954), some commercial- samples of
anthrone were not sufficiently pure and did not dissolve completely in the
50
acid solvent. These batches \{ere recrystaltized from benzene and light
petroleum (p. 741 Vogel, 1957) before use.
The anthrone reagent (7.5 ml) was pipetted into thick-wafled Pyrex
tubes and chill-ed in ice water. Appropriate ditutions of the carbohydrate
extracts were macle and 1.5 ml aliquots were layered on the anthrone solution.
The tubes were chilled for a further 5 minutes before the contents were
rapidly and thoroughly mixed and rechil-fecl. The tubes, capped with glass
marbl-es, were then lowered into a vigorously boiling water bath, in a fume
hood, and heated for 10 minutes. The solutions were cooled to room temper-
ature and the absorbance at 625 nm read immediately against a reagent bl-ank
in either a Beckman DB oi Col-eman 295E spectrophotometer. The reagent
bl-ank consisted of I.5 mf of glass distilled water treated in the same \"/ay
as the samples. Each run incl-uded duplicate samples of several standard
glucose solutions. The TNC concentration of plant extracts was estimated
from the mean absorbance of triplicate aliquots and a calibration curve
based on the absorbance readings of the standard sofutions.
The col-our reaction with anthrone is specific for carbohydrates although
other compounds may interfere with the reaction. One of the main interfering
substances is the chloride ion. Chl-oride concentrations as low as 0.02 M
resulted in a 10 per cent higher colour production in test sol-utions
(scott and Melvin, 1953) . Use of the anthrone meLhod for saltbush may
result in overesLimates of TNC concentration, particularly in the leaf
fracl-ion, to a cliffercnL exLent aL differetrl times of Lhe year uuless the
interfering ion is removed. In this study chloride was removed by ion
exchange. The sample dilutions for TNC analysis were deionized by shaking
for f0 minutes with a míxed bed resin composed of equal parts of a weakly
basic anion exchange resin (Amberlite 1R45 (oH) ) and a strongfy acid cation
exchange resin (Amberlite IRl20 H) . Sugars are not taken up by ion exchange
resins of the type and forrn usecl in this study (I(ressman, L956; Morries and
Stuckey, 1956).

51
The mixed bed resin tr\Ias regenerated when necessary by separating the compon-
ents and treating with the appropriate acid or alkali. separation of the
two resins was achieved by pouring the mixture into a column and back-
ftushing the column slowly with distilled v/ater. The chloride form of the
anion exchanger is less dense than the sodium form of the cation exchange
resin and a sharp boundary is quickly formed between the two. The upper
layer can then be siphoned off with very littte if any contamination from
the cation exchanger. The chl-oride concentration of the sample dilutions
was checked, before and after ion exchange, by titration of duplicate sub-
samples with silver nitrate (Mohr titration p'260, Vogel' l-961-) '

52
3.5 Results: Seasonal variation of TNC
3.5I TNC concentration
The results of TNC analyses for shrubs col-lected over a period of
28 months are shown in figures 3.4 to 3.6. The data points in these
diagrams represent the TNC concentration, expressed as glucose equival-
ents in mg/g dry weight, for various plant fractions. The TNC concen-
trations were calculated from the mean of three absorbance readings for
each dilute acid hydrolysate. Extracted samples were composed of equal
subsamples of the dried material- from 3-5 plants colfected on a given
sampling date. The pl-renoJ-ogical stage of the plants at the time of collection
is shown by the discontinuous horizontal bars above the set of TNC curves'
A sol_id line to the left of a particular date indicates that the majority
of plarlts incfuded in the TNC sample on that day were, ror example,
flowering or showed evidence of recent root growth' Broken fines indicate
that some evidence of vegetative or reproductive growth was noted but in
less than haff of the sampled plants. The extension of the bar back to the
previous date signifies that growth occurred at some time in the intervaf
between the two samPlings.
The accompanying vertical bar diagrams depict two sets ot' rainfall
data. The upper diagram shows the rainfal-l accumulated at the fiefd site
between sarnpling dates, whife the fower shows daily rainfalf figures for
Koonamore Itomest.ead, about T km to the north. Because of the possibility of
local thunderstorms, particularly in summer and autumn, the incidence of
rainy days at the two recording stations cannot be expected to correspond
exactly at all- times (e.g. May 1978). Nevertheless the latter are included
to indicate the probable distribution of rainfafl at the field site during
the intervals between readings.
53
nigure 3.4 shows seasonal trends in TNC concentration for the various
fractions from samples of female plants collected between October f977 and
December 1978. Until February 1978 young woody stem was included as ol-d
stem. Similarly young root was combined with woody root before that date.
The TNC concentration of the older material is unlikely to have been
al-tered sig¡ificantly as the dry weight of Lhe younger tissue was only a small
proportion of the total. As shown by the horizontal bar for root growth
young root did not appear in appreciable amounts until May. Leaf samples
during 1917-18 contained a smalf amount of young stem' which is also
considered negligible.
A marked seasonal trend in carbohydrates is evident from figure 3.4.
TNC concentrations were highest ín summer and autumn and lowest in winter
arrcl early spring. This pattern applied to all Lhe fractions measured but
the range of values was greater for the above-ground organs. The concen-
tral-ion of TNC was higher in leaves than in young stem and while there
appeared to be little difference between the two young stem fractions these
had concentrations higher than that of old stem. TNC concentration in
root sampfes was in turlt fower than that ín old stem.
The fluctuations in TNC concentration were largely consistent with the
pattern of growth and rainfaff. A substantial rain in early December f977
resul-ted in a short flush of growth and a large depression of TNC concentration
in all the fractions relative to those recorded for the November samples.
In the followíng low rainfall periocì, when litLle if any vegetative or
reproductive growth was apparent, there was an increase in carbohydrate
concentration in most fractions. TNC concentrations began to fal-l before
the major wint,er rains in July. The onset of growth prior to the sampling
date in June illustrates the effectiveness of smaff amountsof rain at this
time of the year. According to the daily rainfall figures from Koonamore

-1FÍgure 3.4 Total non-structural carbohydrate concentratlon (TNC mg g
for combined subsamples of Èhe dríed tÍssue from samples of
3-5 fernale plants collected from the field at monthly
intervals between OcËobe4, L977 and Decembeq L97B'
The horlzontal bars show Èhe pattern of vegetative and
reproductive growth assessed from notes on the phenology
of sampled shrubs. The contlnuous lfne índicates that
half or more of the shrubs hTere active and the broken
línq less than hal-f .
The accompanyi-ng diagrams show total rainfall- accumulaÈed
at the experimental site between samplíngs, and daí1-y
rainfall for Koonamore Homestead, 7 km to the north'
)

O lcofQ Young rlcm
A Young woodYtla m
AOld ¡tcm
OWoody root
lYoung rool
Root growthFruitingtloweringShoot growth
a
---ô--_
^
lo,
o,E
UzF
¡ó0
140
r20
¡00
80
óo
40
10
30
20
r0
o
a
tr
Oct Nov
o__9c
6----¿--- o
^
.-.8------o.b-- ____.\¡ o
I
Dec Jon Feb Mor
Mor
iun Jul Aug seP NovAPt Moy Dec
ó0
EE
o.EoÉ
Totol
Do ily20
lo
oAPt Jul
t97B1977Dec Jon te
Month
Moy Jun Aug S"P Ocl Nov Dec

54
the I0 mrn of rain collected from the field site gauge in June, fell only
a few days before sampling. The second and larger of the two falfs in
May occurred a few days after the sampling date in that month and hence
total rainfall in the interval- between samplings was 24 mm. Thus both the
timing and amount of rainfall may have contributed to growth and the fall of
TNC concentration between May and June. There are' nonethelessr sollê
ftuctuations in TNC concentration which cannot be explained on the basis of
rainfall or phenology notes, notably those for leaf nateríal- in February
and December l-978. This may sirnply be due to the inadequacies of using
phenology notes to assess the stage of growth. This point will be.referred
to in the next chapter where results of shoot and root growth measurements
for other plants are reported. other possible reasons for the fal-l- in
TNC concentration on those occasions include a redistribution of carbohydrates
from feaf to stem or their use as a source of energy for osmotic adjustment
during periods of high evaporative demand and relatively low rainfal-l'
Figure 3.5 shows the seasonal pattern of TNC concentration in the
various fractions from mafe plants cofl-ected on the same dates as the female
plants. The trends are similar to those for fernale plants and hence the
comments in the preceding pqges also apply here'
The large fall in carbohydrate concentration for the old stem fraction
in November 1979 coincided with a period of prolific root production. Many
young root tips were obvious on male plants on that occasion. The depression
of TNC concentration in the same fracl-ion of the female plants was less
pronounced. The amount of root growth was more variable for female plants'
For example, one of the females had produced long sections of 1ar9e succttlent
young roots 2-3 mm in diameter but others showed little or no evidence of
recent root growth.
The replenishment of TT{c stores in old stem between November and
December may partty account for the previousty unexplained faII in TNC

-1Figure 3.5 Total non-structural carbohydrate concentrat.ion (TNC mg g
for combined subsamples of the dried tíssue from samples
of 3-5 male plants collected from the fíeld at monthly
intervals between Octobeq L977 and December, 1-978. The
horízontal bars show the pattern of vegeËative and
reproductive growth assessed from notes on the phenology
of sampled shrubs. The contínuous line indicat.es Ëhat
half or more of the shrubs I^rere active and the broken
line,less than half.
The aceompanying diagrams show total raínfal1 accumulated
at the experímental síte between samplings, and daily
raínfall for l(oonamore Homestead, 7 lcn to the north.
)

O tcofQ Young r lrm
4 Young woodyrl€m
A Old rlem
SWoody ræl
!Young root
t40
t20
t00
I o)
PtoUzóol-
a
\,'
\----À--____
^_-_--À
^-----B ------o- ___^__40
20
0
ó0
50
10
30
Ero=o3.5Pzo
o
Ocl Nov Dec Jqn
lolol
Doily
teb Mor Ap.
Apt
^
Moy Jun Jul Arg
t.....-a
s"p Oct Nov Dec
l0
0Jul
197I1977Dec Jon Feb Mor
Month
Moy Jun Aug s"p Oct Nov Dec
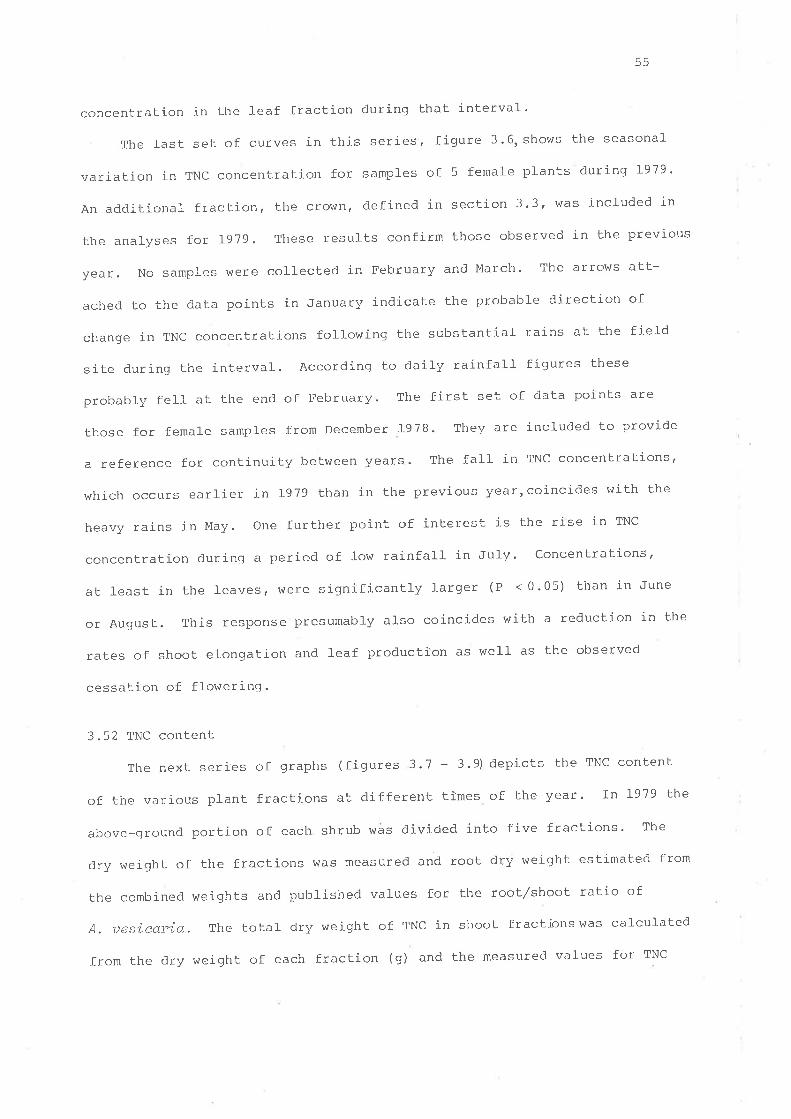
55
concentration in 1-ire leaf fraction during that interval.
The fast set of curves in this series, figure 3.6rshows the seasonaf
variation in TNC conceptration for samples of 5 female plants during L979 '
An additional fraction, the crown, defined in section 3'3' was included in
the analyses for i--919. These resufts confirm those observed in the previous
year. No samples were coflected in February and March. The arrows att-
ached to the data points in January indicate the probable direction of
change in TNC concentrations following the substantial- rains at the fiel-d
site during the interval. Àccording to daily rainfall fígures these
probably fel-l at the end of February. The first set of data points are
those for female samples from December 1978' They are included to provide
a reference for continuity between years. The fall in TNC concentrations'
which occurs earlier in 1979 than in the previous year,coincides with the
heavy rains in May. one further point of interest is the rise in TNC
concentration during a period of low rainfafl in Ju1y. concentrations,
at least in the leaves, were significantly J-arger (P < 0.05) than in June
or August. This response presumably also coincides with a reduction in the
rates of shoot elongation and leaf productÍon as well as the observed
cessation of flowering.
3.52 TNC content
The next series of graphs (figures 3.7 - 3.9) depicts the TNC content
of the various plant fractions at different tlmes of the year' In 1979 the
above-ground portion of each shrub was divided into five fractions' The
dry weight of the fractions was measured and root dry weight estimated from
the combined weights and published values for the root,/shoot ratio of
A. Uesicatia. The total- dry weight of TNC in shoot fractions was calcul-ated
from the dry weight of each fraction (s) and the measured values for TNC

-1Figure 3.6 Total non-structural carbohydrate concentratíon (fNC rng g
for combined subsamples of the dríed tlssue from samples
of 5 female plants collected from Ëhe fleld at monËhly
intervals between January, L979 and Januar¡ 1980. The
horízonËal bars sho¡¿ the pattern of vegetatlve and
reproductíve growth assessed from notes on the phenology
of sampl-ed shrubs. The contínuous lÍne indicates that
half or more of the shrubs T¡rere active and the broken
l1nq less than half.
The accompanying diagrams show total- rainfall accumulated
at the experímental,site betr¡een samplings, and daíly
rainfall for Koonamore Homestead, 7 km to the north.
)

r20
t00
80
¡o
20
o
olo,E
()zl--
lo
óo
50
10
30
=oco^^
É, JV
a
---^-\- 'ìA-
Arg s"P
--- Rool growthFrui ringFloweringShoot growth
O teofO Young tlcm
4 Young woodyrlc m
A Old ¡tcm
a
@ Crown
flWoody rool
I Young root
Dec Jon
Jon
I 980
\
^-
'^
\
I
\o\
\¡\
Jon
Jon
1979
EE
to
Mor APt Moy
lolol
Doily
Oct Nov
20
to
Jun Jul Arg
Month
0Feb Mor Apr Moy suP Ocl Nov Dec

56
concentration (nS/S). Simil-arly the TNC content of the root system was
estimated from the appropriate figures. The combined values give an
estimate of the TNC content per plant.
Figure 3.7 shows the TNC content of shrubs during 1979. The height
of each bar represents the mean TNC content (S) per plant. The width of the
divisions within each bar shorns the proportion of TNC in the designated
fractions. Figures given are for plants with a dry weight of I00 g.
The pattern of variation in TNC content per plant is much the sarne as
that for TNC concentration shown in figure 3.6. The only deviation from
that pattern is the relatively high value for January, L979 which, due Lo
loss of pa,rt of each of the sampled plants, was calculated from the average
proportion of dry weight per fraction between April, 1979 and January, l-980.
There is no reason, however, to expect exactly the same pattern for TNC
concentration and content as the proportion of leaf, the fraction with the
highest concentration of carbohydratesr varies from month to month' The
extent of this variation can be seen in figure 3.8a which shows the mean
proportion of dry weight in each fraction at various times of the year. The
accompanying figure (3.sb) shovrs the proportion of TNC per fraction over the
same period. The information in figure 3.Bb is the same as that given by
the width of the divisions in figure 3.7 but gives a cl-earer picture of
the variation over the year. Inspection of these figures reveals that while
the dry weight of old sLem is the largest fraction of the total, the highest
proportion of Lhe TNC content is located in the leaves. Except in August
the top l-hree fracl-ions, leaf, young stem and youtlg woody stem contained
at least 50 per cent of the TNC content of the plant ' These figures are based
on estimates of bush dry weight using a root/$noot ratio (be1ow ground/above
ground) of 0.32, measured for I-2 year old shrubs (Jones and tlodgkinson,
1970) . Shrubs older than B years in that study had a lower root/shoot ratio
(0.21). The use of the latter figure Lo estimate shrub dry weight woul-d
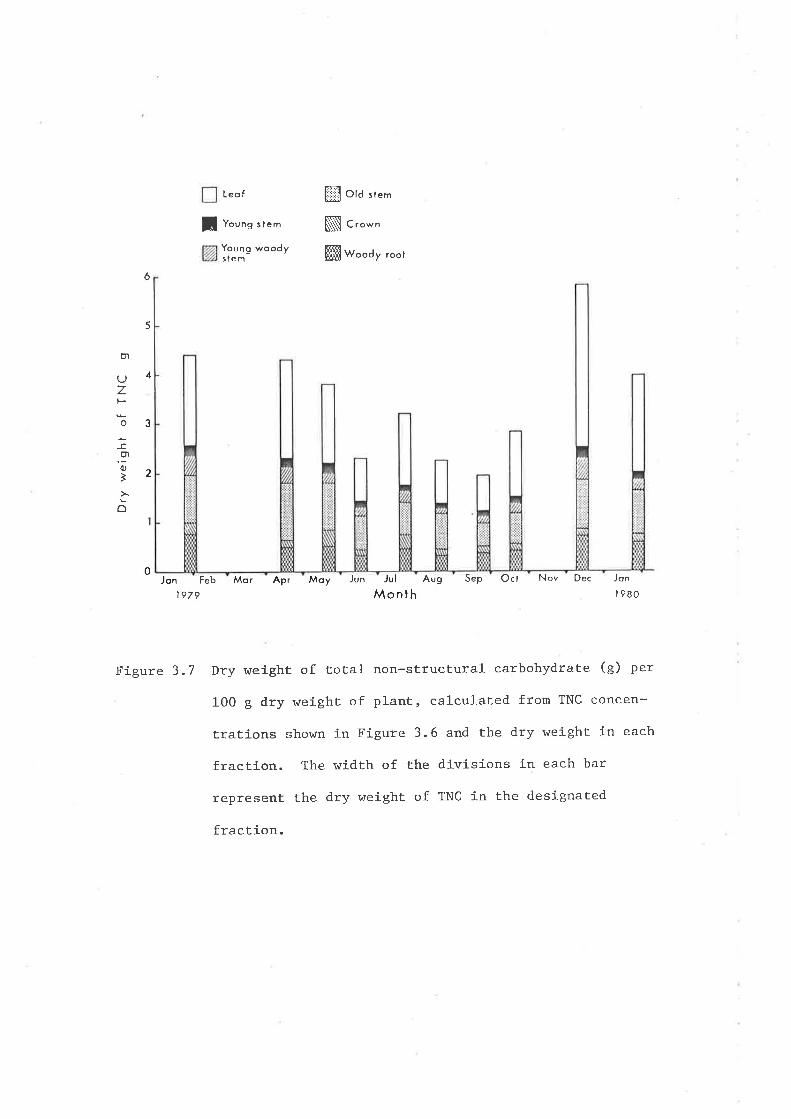
f, Young stem
Young woodystem
ffi otd ,r.'
NI c,o*n
ffil Woody root
Leo f
6
5
4
U)
L)zl--
o
-cO)'õì
ô
3
2
0Jon
197 9
Figure 3.7
Feb Ap, Moy Jun JulMorMonth
Aug s"p Ocl Nov Dec Jon
I 980
Dry weight of total non-structural carbohydrate (g) per
100 g dry weight of plant, calculated from TNC concen-
tratíons shor¡/n in Figure 3. 6 and the dry \^/eight in each
fraction. The width of the divisions in each bar
represenÈ the dry \^/eight of TNC in the designated
fraction.

Figure 3.8 The mean proportion of dry weight (a) and TNC (b) in
various fractions of samples of 5 femal-e plants collected
between April, 1-979 and January,19B0. The values
associated with Figure 3.Ba are the overall means
and standard errors for dry weíght during that period'
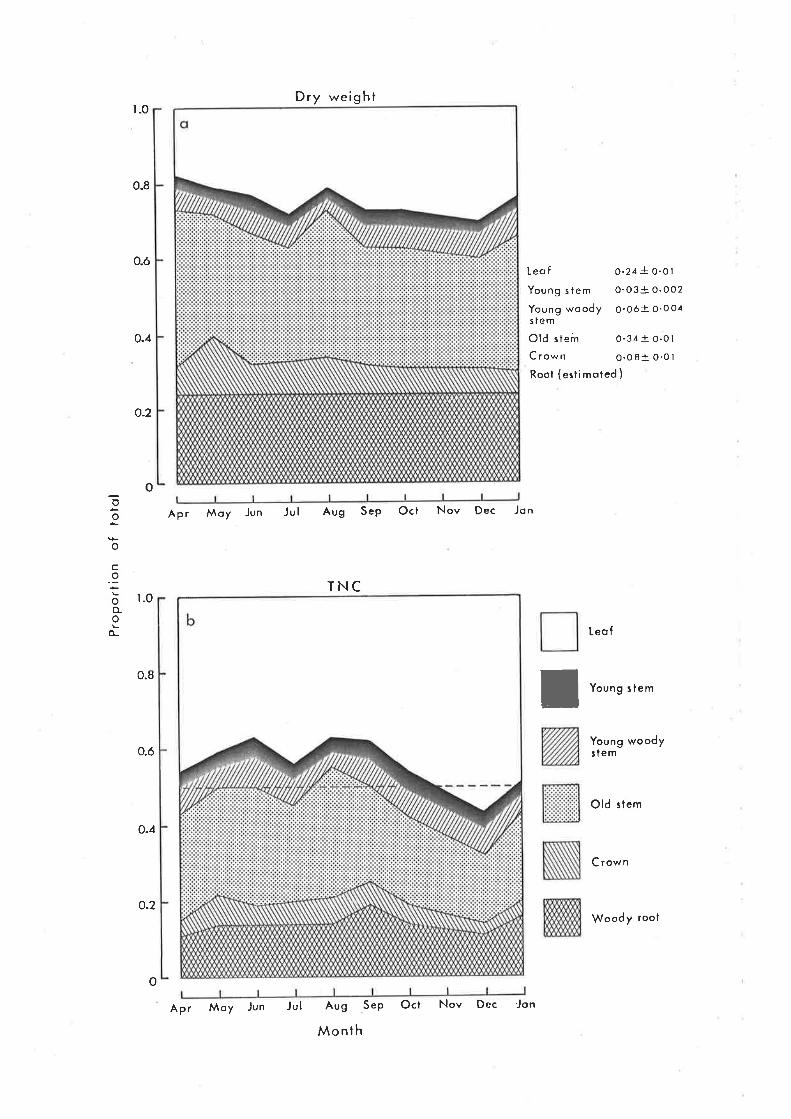
0-8
0.ó
r_o
r_0
o.ó
o-4
o.2
I
Dry weight
Apr Mo), Jun Jul Arg S"P Oct Nov Dec Jon
TNC
Leo f
Young stem
Young woody
0.24 + O.Oì
o.o3+ 0.002
O.Oó+ O.OOa
o-4
o-2
s tem
Old slem 0.34 + o.olCrown o.o8+ o.olRoot (eslimoted )
Leof
oEo
o
C
.9
oo_o
o-
o-8Young stem
Young woodystem
Old stem
Crown
Apr Moy Jun Jul Arg S"P
Month
o
Oct Nov Dec Jon
Woody root

57
increase the calculated proportion of toLa1 dry weight in the shoot
fractions and since TNC concentrations in the younger shoot tissue are
often much higher than those in other fractions the proportion of TNC in
leaf and,young stem may be increased to over 50 per cent of the total.
Nevertheless, despite a lower carbohydrate concentration, because of its
bulk old stem contains the second largest store of TNC in the plant.
Figure 3.9 shows the seasonal- variation in TNC content over the period
October ;-91':. Lo December 1978 for mal-e and female plants. Because the
collected pÌants were subsampled for analysis of TNC concentration no direct
inforrnation on the proportion of dry weight in each fraction is available-
The TNC content of the various plant parts, and hence of the whole plant'
are estimates based on the overall mean of monthly figures for the propor-
tion of dry weight observed in 1979. The mean and standard error for the
proportions used are shown in figure 3.8a. Although there was sone varia-
tion in measured dry weights between months, analyses of variance showed
that the proportion of the total , f.or a given fractionf was not significantly
different over the whole year (April 1919 - January 1980). The data
were not transformed for the analyses as there seemed no reason to expect
any deviation from normality or dependence of the variance on the
mean as found, for example, in proportions derived from sampling binomial
populations.
The TNC content of old stem and woody root are slightly inflated because
the dry weight calculated for crown tissue was divided equally beLween
these fractions. In the first four rnonths young woody stem was also classed
as old stem thus further increasing the estimated proportion of TNC in the
latter.

Figure 3.9 Dry weight of total non-structural- carbohydrate per 1009
dry weighE of planË for samples of 3-5 shrubs collected
between October, L977 and December, L978. (a) Female plants
(b) Male plants. Values for dry wetght of TNC were
calculated from the TNC concentrati.ons shown Ín
Figures 3.4 and 3.5 and the overall meân proportíon
of dry weight measured for shrubs 1n 1979 (see fig. 3.Ba).
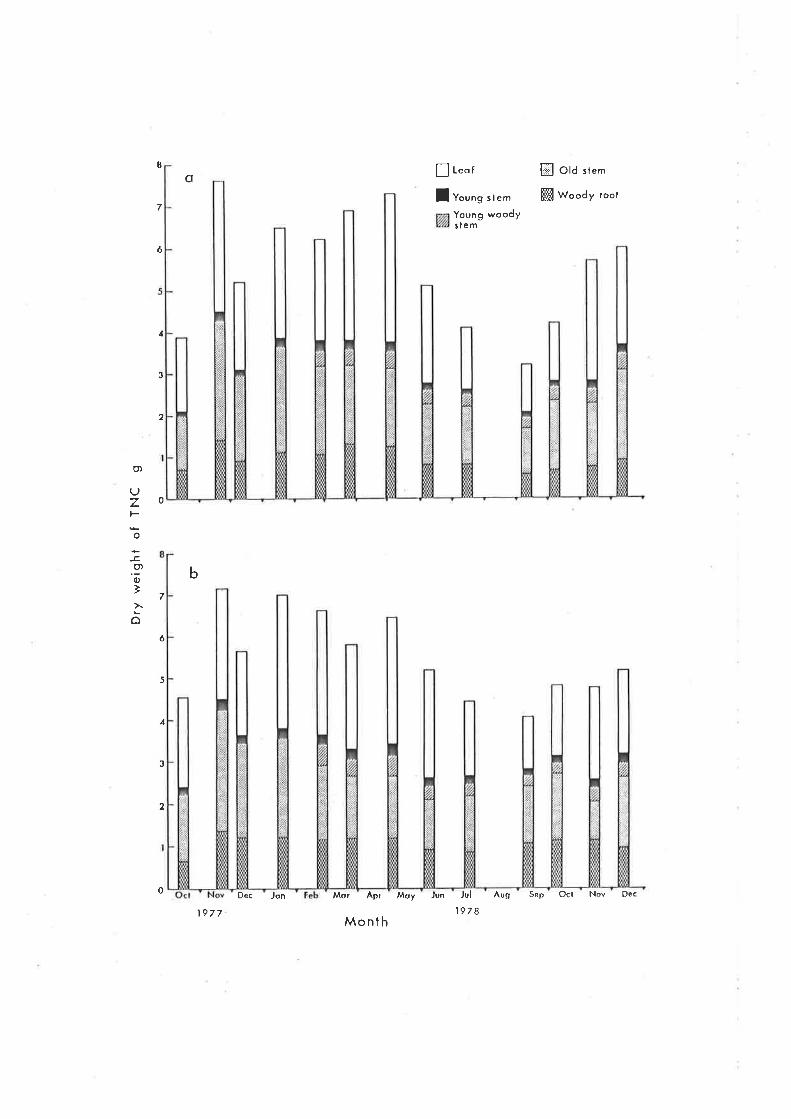
oI
7
ó
f]le"f
! Yorng ste.Young woodYslem
ffi otd tr".
ffi Woody root
Ocl Nov Dec
4
3
2
o)
L)zt-
o
-co)'õÌ
ô
0
b
7
6
5
4
3
2
oDec Jon Mor APt Jul
197IMoy Jun Âug s"p
197 7Month

5B
3.6 Discussion
Before the nain section of results from monthly samples for TNC
concentration are cliscussed two points raised earlier wilt be deaft with.
The first of these relates to the survival- of shrubs after complete
defoliation, the second to criticisms of the dilute acid method of
carbohydrate extraction in the literature'
3.61 Defoliation
The results and discussion of worl( on survival of defoliated shrubs
were presented together because essentially it was intended as a preÌiminary
demonstration that, at least for the form of the species at Koonamore, shrub
regrowth is independent of either the number or location of buds' The
alternative suggestion, outlined in chapter 2, that TNC concentration
influences regrowth is supported by the observation that buds are present
yet do not usually develop into large shoots. It is perhaps significant
that appreciable regrowth was observed on only two occasions (l4arch, I978,
19B0) in the season, if not the exact month, when TNC concentrations were
l-righest.
Howeverf this is by no means conclusive evidence of the overriding
importance of TNC concentration. Regrowth inthe field is no doubt
influenced by interaction between a number of factors. Grazíng by sheep'
for example, may alter the number of growing points on old sten by the
time defoliation is complete, in which case the tentative conclusion
reached by Leigh and Mulham about the location of buds on plants
defoliated in that particular experirnent may have been correct' Any regrowth
fron growing points on old stem may have been removed by sheep during the
12 days they were given access to the shrubs. ALl viabÌe buds on old stem
could have sprouted before sheep h/ere removed from the experímental pIots.

59
3.62 TNC extraction and measurement-
According to Smith (1969) the two methods most commonly used to extract
TNC from plant tissues are incubation of the tissue with diastatic enzyme
preparations or hydrolysis with dilute acids. Extraction in hot water has
also been used but although amylose is targely soluble in water, amylopectin,
a highly branched molecule of higl-r molecul-ar weight, is not. The amylopectin
content of starch ranges from 70-908 and therefore hot waLer extraction is
not recomrnended for tissues rich in starch. It is,however, a usefuf method
where TNC is composed largely of water soluble fructosans.
Smith et aL. (1964) compared these methods by analyzing TNC concentrat-
ions of the various extracts from tissues of two species' one rich in
fructosans and the other in starch. For both species the enzyme and dil-ute
acid hydrolysates gave almost identical results, while hot water gave
similar results only when littte or no starch was present. They recommended
the dil-ute acid method because the time involved in preparation for analysis
was much less (B vs. 56 hours). Later Smith (1969), in a review of methods'
recommendecl incubation with takadiastase because of reports that 0.2N H2SO4
desLroyed some fructose, hydrolyzed some structural carbohydrate, as indic-
ated by the presence of xylose, and faited to hydrolyze over 60 per cent of
the starch contained in some tissues (Grotelueschen and Smith, 1967) .
priestley (L962) on the other hand cited references in which it was clairned
that the dilute acid method gives more reproducible results. However, in
view of the above there is little doubt that the use of takadiastase is
the safest and probably the most accurate method especially when the compos-
ition of TNC is not known. Disadvantages are the long incubation during
which the samples require attention and an increased number of steps in the
analysis (e.g. removal of protein before analysis), a possible reason for

60
the poorer reproducibility cl-aimed in Priestly (I962). Since diastatic
enzymes do not hydrolyze fructosans, extracts from tissues containing fructose
polyrners stil-1 require acid hydrolysis after incubation with the enzyme' a
procedure which may involve some loss of fructose.
The dilute acid methocl was chosen in this study for convenience
because in practice there appears to be little difference between the two
methods (see Smith eL aL., 1964) .
There are aspects of the use of anthrone for analysis of TNC concentra-
tion which may negate the criticisms of the dil-ute acid method of extraction.
Smith (1969) used FehJ-ings solutions to analyse for carbohydrate concentration.
Since this method depends on the reducing power of sugar monomers any
fructose destruction, hydrolysis of structural carbohydrate or presence of
unhydrolyzed nonstructural carbohydrate wil-I lead to incorrect results for
TNC concentration. Llowever, the presence of unhydrolyzed sugar polyrners in
the extract, potentially the biggest source of error, is not importarlt when
the anthrone method is used as the reaction is carried out in the presence
of 75 per cent sulphuric acid. Grotelueschen and Smith (l-967) detected
xylose in dilute acid extracts. They attributed the presence of xylose'
which amounted to less than 2 per cent of the total nonstructural carbo-
hydrate, to the hydrolysis of hemicel-l-ulose during extraction. The xylose
would not be detected by the anthrone method as cofour production by pentose
sugars is much less than that by hexoses and under the reaction conditions
used the rate of colour destruction during incubation is such that after
I0 minutes little of the initial- colour due to pentose rernains. However'
if the hemicetl-ulose involved is a xyloqlucan there is a possibitity of
contamination of the extract with small amounts of glucose. The fructose
destruction reported for dilute acid hydrolysates is probably due to the
production of 5-hydroxymethyl-furfural during extraction (pp . 44I-443,
Finar, 1963). Although furfurals possess an aldehyde group Fehling's

61
sol-ution, a weak oxidizing agent, is probably not strong enough to attack the
ethylenic bond in the ring structure. They are chenically very similar to
benzaldehyde which does not reduce Fehling's solution. However, since
colour production by sugars in the presence of anthrone in sulphuric acid
is thought to be due to reaction of furfural derivatives with anthrone
(Yemm and Willis, 1954) the formation of such compounds during extraction
with dil-ute acids woufd not after the outcome of the analysis as it rnay do
when TNC concentration is measured by analysing for reducing power. Thus
when used in combination with anthronef the method of extraction with
dilute acid, for which a higher precision .has been claimed, may also yield
resul-ts as accurate as those from enzymatic hydrolysis folfowed by analysis
for reducing power.
The only known biological compound which interferes with the anthrone
reaction is tryptophan. Colour production by glucose in the presence of an
approximately equal weighL of tryptophan was about 5 per cent less than that
produced by glucose alone. D-galacturonic acid yields about J-0 per cent of
the colour produced by an equaÌ weight of glucose. Tryptophan may also inter-
fere with this reaction. As these compounds are unl-ikely to occur in such
high concentralions their effect on the measurement of TNC is believed to
be minimal (Yemm and Wi11is, f954).
The chloride ion is known to affect the accuracy of the anthrone method
by enhancing colour production. I-Iowever, the chloride concentrations in the
final dilution on the sample exl-racts were less than 0.005 M,a concentration
which according to Scott and Melvin (1953) increased colour production by
l-ess than 1 per cent. Despite the low concentration of these ions it was
considered safer to remove them. Since amino acids and uronic acids are
taken up by the types of ion exchange resin used in this study some of th'e
other interfering substances may al-so have been removed during this step.
Since the carbohydrate concentration ís low in the final diÌution, less

62
than f00 VS/IL, the main source of analytical error is contamination by
extraneous carbohydrate. For this reason the glassware must be kept
scrupuÌously clean and reaction sofutions protected frorn contamination with
cellulose fibre from the atrnosphere.
In practice the method gave reproducible results. The standard error
for the mean absorbance by individual concentrations of the standard glucose
sol-utions over all- runs was less than 1.5 per cent of the mean. For the
50 pgrlml standard the standard error was less than 0.6 per cent of the mean.
These errors include possible contamination, dil-ution er'rors and differences
in incubaLion time.
The largest source of error
by sampling for plant rnaterial.
subsarnples for a given fraction,
overal-l is like1y to be that introduced
The rather frugal practice of cornbining
from al-l
l-o lack
plants in the original sarnpJ-e, was
of time. However, standardnot initially intended but was due
errors calculated for the mean on 15 occasions when one or more of the
fractions from each plant were analyzed individually were less than I0 per
cent of the mean. On average the percentage standard error for those
samples was 6..6 per cent. The average standard error quoted by McConnell
and Garrison (1966) for two root fractions and 3 top fractions of Purshia
ty,idenLata over a whole season were 9.9 and 5.5 per cent of the mean res-
pectively. Figures for arid zone shrubs referred to later in this thesis
are not availabfe as the authors eil-her adopted the same practice of
combining samples or did not quote standard errors.
The errors represented by the figures for,4. Uesicaria, quoted above,
inctude variation between plants and errors introduced during the extraction
procedures as well as those quoted earlier for the precision of the anthrone
analysis. The variation between plants appears sufficiently small to al-low
an experimental approach to work on the detaifs of TNC accumulation and
depletion, in response to grazíng or other manipulations of the environment'

63
withoul- increasing the sample size beyond reasonable l-imits imposed by
time and expense. For fractions such as old stem, however, in wl'ich TNC
concentration does not vary widely during the year,the number of plants
included in the sample woulcl need to be relatively higher. On the basis of
resul-ts presented here sample size might justifiably be increased by sub-
sampling a J-arger number of plants rather than increasing the number of
entire shrubs in the sarnple. The simul-taneous variation in TNC concentration
of all fractions particutarly during L979, as well as the apparently
stable relative concentration in these fractions indicates that little
information would be l-ost by selecting a single branch from each of an
appropriate number of shrubs and ignoring roots and crowns. The four shoot
fractions obtained by sampling in this way would account for rnost of the
TNC i¡ the p¡-ant" Given 1-hat roots are idenlifiable they could be incl-uded
in the analysis if necessary by sampling with a soil auger. TNC contents
could be calcul-ated by adapting a procedure such as the point quadrat
analysis used to estimate leaf area by Warren Witson (1965) to estimate the
dry weigl-rh in various shoot fractions. This procedure woul-d also have tho
advantage of being mucl-l l-ess destructive-
There are no figures avail-able for comparing eiLlrer t'.he:precision I
or accuracy of the rnethods used here for ,4. uesi'caria with enzymatic
hydrolysis ancl analysis for reducing power. However, the maximum values
recorded for leaves of 1.1. uesican"ia in this study (100-145 nS/S) are much
tlre same as those measured by l4ood (L932) who analyzed for Lhe reducing power
of ditute acid hydrolysates of sal-tbush l-eaves. Flexose polysaccharides
ancl soluble sugars toget-her accountecl for about 15.5 per cent (155 mg/g) of
tl-re dry weight of leaves colf ected f rom Koonamore in early summer ' At the
end of the preceding winter (August 1931) the concentration of these compounds
(76.5 nS/Ð, alLl-rough higher than that recordecl at the same time of year in
þhis stucly (ca. 30-50.ng/s),was approximately half the December value, a
pal-tern simil-ar to that ilf ustrated in f igures 3 .4-3 .6 . The h igher

64
concentrations are predictable as l-93I niarked the end of a sequence of low
rainfall years during which storage carbohydrates might have been expected
to accumulate (see Ch. 2) . The main reason for the work done by Wood was
to estabfish the existence of high concentrations of non-structural pentosans,
which he bel-ieved contriþuted to the drought resistance of arid zone species
with tomentose succulent leaves. Irrespective of the effect of their presence'
pentosans were found in significar-rt quantities in the feaves of saltbush.
In August ancl December the concentration of pentosans was 17 and 70 mg/g
respectively. Sorne may have been derived from cell wall constituents during
the relatively long 3-llour extraction in dilute acid but their presence in
the protoplasm was checl<ed in fresh sections by a staining technique'
The concentration of accessible carbohydrates in leaves, and possibly
young stem, may therefore by subsl-antially higher than estimated by the
anthrone nethod used here.
3.63 Seasonal variation of TNC
TNC concentration
The pattern of TNC accumulation and depletion by saltbush during 1978
and 1979 is in general consistent with that expected from the amount and
distribution of rainfall and henoe the growth pattern. TNC was depleted at
times of rapid growth and accumul-ated during periods of fow rainfall- or
reduced growth as judged from observations on the phenology of the shrubs
sampled for TNC analysis. While the results presented in this chapter
provide no information on the role of storage carbohydrates during growLh
they do a1low some conclusions on growth and photosynthetic activity of
saltbush at various times of the year.
O¡e of the suggestions made in section 2.3 was that the TNC concen-
tration of arid zone plants, and other species, will increase during periods
of low rainfall because structural growth is restricted earlier than net
65
photosynLhesis as leaf water potential decreases. According to the
references cited, witÌr further decreases in water potential growt-h ceases
well before net phol-osyr-rthesis is reduced to zero. The relativel-y rapid
rise in TNC concenl-ration of most plant parts during spring and early
summer (SepLember-Decernber) observed during this study is coincident with
decreasing xylem water potential and presumably the sequence of events
described above. Seasonal changes in xylem water potential are il-lustrated
in Cl-rapter 7. Tl'iere were substantial rains during the spring in both years
which, as seen from the October peak in mean monthly rainfall figures
(fiS. 3.2a) are quite common. Spring rains were foll-owed by some growth which
might have l¡een expecLed to result in a depression of TNC concentration,
as observed, for exampfe,after summer rains. The most obvious exp'lanation
is thal- any fluctuations were missed due to the relatively long interval
between samplíng dates lcut the rise in TNC concentration is not inconsisteut
with expected patterns of photosynthetic acl-ivity and growth during
spring, The apparently steady increase may be a consequence of rising
ternperatures and decreasing relative humidity and their effect on photo-
synthesis, growth and soil water storage. While the potential maximum rate
of net photosynthesis by individual leaves of ,4. Desielr'ía, a C4 speciesl
is likely to occur during a weL summer when temperatures are high (see Wood'
Ig32) the maximum rate of net CO, uptake in years with drier summers probably
coincides wil-h the iucreasing air temperature and relativefy high soil water
poLential during spring. Since shrubs are hhen relatively well foliated
witl-r young active leaves the highest rates of carbon gain per shrub may
normally occur in milcl spring condil-ions. Fluctuations in lNC concentration
are likely to be smal-l- or short fived either because current photosynthate
is abl-e Lo meet all of the demand or because Lhe depleted stores of TNC can
be rapidly replenished. Strucl-ural growth incremenLs will afso be small if,
as expected, rainfall- becomes increasingly less effective in maintaining

66
turgor for long periods as the season progresses. The net result will be
an increase in TNC concentration since most photosynthate under those
co¡clitions would be diverted to storage. There is some evidence for l'righ
rates of carbon gain during spring by individual leaves of A. uesícaria ín
the fiel-d. The peal< rates of fíxation of labelled CO, measured by Chapman
and Jacobs (1979) approximate the highest rates of net CO, uPtake measured
under favourable conditions in the laboratory during this study (see Ch. 5).
Another factor contributing to the apparently steady increasein TNC
concentration during spring may be the availability of nutrients. Trumble
and Woodroffe (1954) and Charley ancl Cowling (1968) suggested that poor growth
by arid zone comnunities in the secoud of two good years was probably due
to depletio¡ of small- pools of reaclily availabfe nutrienls by tl-re previous
year,s growth. The same sequence of events may also occur over a shorter
period; depletion of soil nutrients during rapíd spring growt-h may shorten
the growing period after spring raius. Much of the avaifable nitrogen and
phosphorous is cycled through l-itter by soil microflora. In the normal course
of events the pool of soil nutrients is increased in dry weather by small
fa11s of rain which, although ineffective in producing plant growth, are able
to initiate microbial activity and hence mineralization of organic nltrogen
and phosphorous in litter. These rains calfed 'minerafization rains' by
Charley (Ig72) may also activate nitrogen fixing organisms in the l-ichen
crust and soil. Such rains are most effective in summer (pp. 245-247 ín
osmond el; aL.r 19B0). If the nutrient pool cannot be adequately replenished
in the intervaf between rainy seasons in successive yearsr the rate of Iitter
falf and reprocessing of organic nutrients may not be high enough to support
rapid spring growth for long periods. Afthough growth rates in spring are
high (Ch. 4) a combination of high photosynthetic rate and a short growing
period may obscure any fLuctuations in TNC concentration which do occur.
In contrast to the apparent fack of response to spring rains the short

67
growth fl-ush observed in December I977, initiated by rainfalfs totalling
30 mm, resul-ted in a large depression of TNC concentration (figs 3-4-3.5)'
This response is relevant to a seconcl predicti'on made in Chapter 2 where it
was suggested that carbon gain may be restricted following summer rains
due to the effects of prior water stress on the photosynthetic capacity of
individual leaves or on the total- amount of leaf materiat. Assuming that
TNC is used to support new growth, the observed result implies that for either
or both of these reasons the supply of current photosynthate was inadequate
to meet the demand. The rainfall- in 1977 was relativefy low (86.5 mm) and
miclclay xylem water potentials had fallen to between -9.1 and -10.7 MPa by
November and possibly lower by the tirne rain feII towards the end of that
month. Afthough noL conclusive evidence of irnpaired photosynthetic capacity
during rehydration l-he apparent use of stored carbol-rydrate does give some
support for this possibility. The effects of low water potentíal- on the
subsequent rate of nel- CO, uPtake by shoots of ,4. Desica?ia' during and after
rehyciratioll are examined f urther ín chapl-er 5 '
The fluctuations in TNC concentration during the low rainfall period
afl-er December 1977 may have been due to cambial- growth or to the use of
carbohyclrate as an ellergy source during osmotic adjustment' The overal-I rise
in TNC concentration of the younger shoot tissue of femal-e plants during this
period, when clawn waLer potentiaf of some plants reached a ninimum of less
than -I1.0 MPa, inclicaLes that 11. UesiccrTi.A is capable of posil-ive net CO,
uptal<e at 1ow l-eaf wal-er pohential. Ilowever, while concelltrabion in t-he
Ieaves of male plant.s (fis. 3.5) was Ìrigher in April after Lhe low in December
the trend is fess convincing, wiLh an apparent fall in TNC concentration from
a peak in January. The difference in the trend of TNC concentrations for
males and femal-es may be rel-ated Lo the difference in growth paLtern' The
determinate growl-h of shoots on male plants ' many of which had produced ter-
minal ffower spikes in and before December nay mean that the leaf population
68
on male shrubs was composed of leaves of a greater average age, and hence
lower photosynt-hetic capacity, than those on fernale shrubs. There is also
some evidence of a srnall decline in the TNC concentration of old sl-em of male
plants between míd summer and autumn, and this decline coincided with
l-hat observed in their l-eaves, and possibly with one in young woody stem.
The trend was fess pronounced, in old stem of female plants (fig. 3.4),
a response which could also be explained by a greater photosynthetic
capacity of the leaf popul-ation as suggested above. Tn felnales current photo-
synthate may meet some of the demand for assimilates from old stem. However,
as outlined earlier, the observed changes in TNC concentration of ofd
stem may not be significant, although the fact that similar trends occurred
in various other fractions ancl in the two independent samples (male and
femafe) lencls some supporl- for the possibiJ-ity that the measured decline was
a real response to prevailing concìitions. It is notable that a small change
in TNC concentration of old stem involves a much larger foss or gain of TNC
than a similar concentration change in young or youllg woody stem due to the
smaller bufk of the fatter.
If there were fosses of TNC from ofd stem occurring during this dry
inLerval the rapicl rise in TNC concentration in the l-eaves of female plants
relative to that in other plant parts may indicate some restriction on the
movemenL of carbol-iydrate from feaf tissue. Although low water potential is
not thought to affecl- translocation markedly tl-rere is some eviclence that
tire loacling of assimilales into the phloem is restrícted (Wardlaw' 1968).
The high TNC concentrations in l-eaf mal-erial during dry periods may be partly
a result of reducecl movernent- of assimilal-es although it is unlikely that
traffic of carbohydrates and other compounds is stopped completely by low
l-eaf water potential. charley (1978), for example, observed withdrawal of
some minerals and nutrienLs prior to leaf shedding'
The interpretation given to the fall- in TNC after sulnmer rains in 1977
69
can probably also be applied to the decline in TNC concentration after late
autumn or winter rains, observed in both the following years' Jameson
(1963) and Davidson and Milthorpe (1965) befieved that, in general, storage
carbohydrates contribute significantly to growth only in the first few days
afl-er clefoliatí6n. Jameson concluded Lhat once the carbohydrate needs for
new leaf have l¡een met there is little reason to believe that additionaf
stored carlcohydrates wilf result in additional growth. If carbohydrate use
by saltbush after a period of water stress in summer and autumn follows the
same patternr TNC concentrations might be expected to increase or at feast
remain steady after production of the first flush of new leaves. However,
the continuing decline in TNC concentration of most fractions throughout
the winter and early spring, except for a brief rise in midwinter (July)
Ig79, implies that stored carbohydrate contributes to growth during the whole
period of rapid growth, on this basis it woul-d appear that structural
growth of saltbush clepends primarily on the activity of the various sinks
for assimilate rather than the rate of supply of current phol-osynthate'
Ilence¡ given different combinations of the environmental- factors controlling
the activity of meristems ' TNC concentrations in winter may be reduced to even
lower values than recorcled here. A combination of relatively high air
temperatures at night and cloud sover for part of the day, for example, rnay
increase the use of stored carbohydrate. Although it is rarely suggested
that the l-evel of irracliance might limit photosynthesis by plants in arid
areas it is possible that cloud cover in relatively wet winters could
reduce the rate of net CO, uptake, particularly by C4 species, with the
result that stored carboi-lydrates are drawn upon by acLively growing tissues
to compensate for the shortfal-I. Noy-Meir (1973) has suggested that the
assumption of saturating irradiance should in general be treated with some
caution. Holrlever, changes ín TNC concentration are undoubtedly influenced

70
by a complex of interacting factors and their detail-ed interpretation
requires a much more experimental approach than used here. It is not cl-ear,
for example. whel-her the small- peak of TNC concentration in midwinter l-979
was due to the observed cessation of flowering, a reduced rate of vegetative
growth or simply Lo an increase in the rate of net CO, uptake beyond the
requirements of an unimpeded growth rate.
Nevertheless, the pattern of accumulation and depletion of TNC by
saltbush does lend some support for the predictions:'made about the effects
of environment on growth, net CO2 uptake and the use of stored photosynthate
at different times of the year. similarly the figures for TNc content
(figs 3.J,3.9) allow some conclusions about the extent of the dependence of
this species on stored carbohydrates.
TNC content
In comparison with other species which occupy areas with adverse
climatic conditions the maximum TNC concentrations recorded here for
A. uesicaria (100-145 mg/g leaf tissue) are low. Such diverse species as
alpine herbs, tundra graminoids and drought-deciduous trees had TNC concen-
trations between 350 and 600 milligrams per gram dry weight in various storage
organs (Mooney and Billings, 1960; shaver and Billings, L916i Mooney and
Bartholornew, Ig74). The bul-bs and rhízomes of perennial ephemeroids in
desert ecosystems also have large stores of carbohydrate and proteín. In
some species Lhe dry weight of stored assimitates may be comparable to peak
vegel-ative biomass (Noy-Meir, Ig73). These species, however' are obÌiged
l-o use stored carbohydrate to replace, or at feast initiate replacement of,
most or all of their photosynthetically actíve tissue after killing frosts
in winter or drought-induced leaf fall in summer. The lower concentrations
recorded for saltbush probably reflect a greater abil-ity to maintain positive
net photosynthesis for most or all- of the year. Comparing concentrations of
7I
the different fractions of a given species can be rnisleading as the
relal-ive amount of TNC avaifable for growth or maintenance depends on the
dry weight of the storage organ or fraction as well as the concentral-ion
(priestly , 1962) . This point is well- ill-ustrated in the l-iterature.
Sprague and Sullivan (1950), for example, found that although roots of
orchard grass had a lower carbohydrate concentration than other storage
orgatìs, the tol-al quantity stored in roots was higher because of the
greater clry weight of the root system. In contrast,IlcConnel and Garrison
(1966) found higl-rer coucentrations of TNC in the roots of Purshí'o. trídentata
(bitter brush) than in shoot fractions. In this case Lhe root sysl-em also
contained most of the TNC despite a smaller dry weigl-rt'
Calcufatiorr of the amount of TNC in the different fractions of
A. Uesicaria (figs 3.1 - 3.9) reveals that, due to their butk, ol-d stem and
woody root which have relatively low concentrations of TNC are the second
and tl-iird largesl- sites of storage respectively. Both fractions are rela-
tivety dry and brittle and at first sight appear un-likely storage sites for
TNC. Accorcling to Trtica anct Singh (1979) non-structural carbohydrate may
be storecl temporarily in all perennating plant parts but most storage occurs
in living parenchyma ceIls. The anomalous secondary growth of chenopod stems
has been l-ikened to Lhe pattern of growth in the rool,s of BetA spp.
(CI'renopodíaceae) where the vascular strands are separated by wide radial
panels of storage parenchyma (p. 252 trsau, 1960). The stems and roots of
A. Uesíeat'íal whicir presumably have concentric uninterrupted rings of vascular
tissue, fray have some storage parenchyma although obviously not as much as
the roots of sugar beet. Other possible storage sites for TNC in chenopods
are the libriform fibres in woody tissue. Fahn and Leshem (L962) exarnined
60 species from the Negev desert and the hills around Jerusalem and found
that the xylem fibres of the entire sapwood in 70 per cent of the species
had tiving protoplasts. Their criteria for the vitality of the protoplasts
were the integrity of the nucfeus and the reductíon of triphenyl tetrazolium

72
chloride (TTC) by dehydrogenases. Thirteen of the species were chenopods
ancl of these twelve were found to have living protoplasts. There was no
specific reference to the presence of starch in the fibres of Lhese cheno-
pods but they dicl suggest that since both living fibres and parenchyma cells
can store starch the funcl-ional difference between the two cell types was
climinishecl. The fibre lumens of CaLLigonum comosum (polygonaceae) and
Tanarir spp. (Tamaricaceae) were densely packed with starch grains and
Fahn and Arnon (L962) found starch grains in the fibres of up to twelve of
l-he most recent growth rings of Tamatir aphyLLa. Seasonal changes in the
sLarch content of the outermost wood of that species had previously been
described by Jlahn (195S). As a result of their survey Fahn and Leshem (1962)
speculated that the frequent occu¡:rellce of living fibres in subshrubs and
shrul¡s may be associated with a diminishinq support function and that such
fil¡res represent transition forms leading towards the evolution of paren-
cl-ryma cells,prevalent in the stem tissue of herbs. They also suggested
that living fibres may appear more frequently in plants of arid habitats
in which the woody plants are generally subshrubs or shrubs.
No attempt was made to check for the presence of living fibres in the
woocly tissue of A. UesicAría. Llowever, considering the high proportion
of chenopocls found to have fil¡res with the potential for storagg such fibres
may constitute a substantial proportion of carbohydrate-contaíning tissue
in the apparently clry and britLle stems and roots of A, Uesicaria'
trrespecLive of the exacl- site of sLorage/ the carl:ohydrat,e conl-ained within
old stem tissues is apparently readily accessible to the plant during
periods of high clemand. of the TNC used during the initial depletion
between April and June LgTg 23 per;cent was derived from old stem, the
seconcl largest source of stored carbohydrate over that interval. During
the growth ffush at the beginning of f980, on the other hand' only 9 per cent
was supplied by old stem perl-raps reflecting limited root growth in that

t3
period. Sip¡s for assimifates are usually supplied by the nearest source
(trvans , L976) .
Although stored carbohydrate is depleted during periods of rapid
growth t-he total- amount used appears relatively low. The TNC used between
April and September 1979, for example, amounted to about 3 grams per bush
of 100 g dry weight (fig. 3.7). Based on theoretical carbon cos;Ls for
construction of l-eaf tissue (Mooney, 1972; Penning de Vries , I915Ì' only
betwee¡ f .4 and 2.0 grams, of l-eaf would result were the wl'iole of that amount
cliverted to support new leaf growth. Such estimates are approximate and vary
deper-rding on leaf composition. If the value of IO mg clry weight ptt "*2 of
leaf is used as a guide (Calciwell e1, aL., L977) the TNC could have been
used to produce a maximum of about 400 l-eaves,each with an area of 0.5 cm2.
For a bush wil-h 100 primary and seconclary shoots, a conservative figure , 2 g
of TNC could support l-he growth of 4 leaves per shoot provided it was
equally distributed among the shoots. However' since shoots produced an
average of al¡out 20 leaves of varying size during theinterval (see Ch. 4)
it appears that- at best TNC would be able to support only about 20 per cent
of the observecl leaf growth. Since l-he figures quoted do not account for
stem growth, the cal-culated number of leaves per shoot is an overestimate.
It is also unreasonabl-e to expect TNC from all parts of the shrub to be
cliverted to the growth of ne¡ feaves, over long or short periods, whil-e other
vegetative and reproducbive organs are growing; in this case the allocation
of TNC to tire shoot apices and hence its contribution to new leaf growth
rvould be reduced,
a growth flush probablY
olher species (see
growth only in Lhe
supported by stored
The
parallels
Jamesot-t,
firsL few
pal-tern of use of
ti-raL befieved to
TNC by /1. uesi'caz'ia during
occur after defofiation in
1963) where TNC contribul-es significantly to
rnay be largelyc1ays. The first few leaves

74
phol-osynthate and thereafter growl-h is probably increasingly dependetlt
otl current photosynl-llate from new and existing leaves, al-though as noted
earlier TNC may be clrawn upor-r further if for any reason net CO, uPtake is
depr essed
Nonetheless, tl-re peak TNC conl-ent of the shrubs sarnpled during this
study is equivafent- to over l-wice l-he average net productivity of non woody
slroot biomass (t g *-2 yr-]) estimated by Noble (Lg11) for a small- population
of A. Uesicaria o¡ a quadra! in Lhe adjacent I(oonamore Veqetal-ion Reserve'
The estimates of productivity were macle by analysis of photopoint records
and for much of the period between 1926 and f970 the density of the bushes
on the quadrat was aboul- 0.5 per square metre (I{all- et aL.' 1964). If the
net productivity approximated l-he long term average (t g ^-2
yr-]) during that
time the net increment per bush must have been about 2 g yr-r, slightly
less than the weight of TNC stored in shrubs of 50-60 g dry weight sarnpled
in this study. The amount of TNC used by shrubs of that size during the
winter growth period in 1979, again corrected for construction losses, coufd
account for half the average yearly growth of non woody shoot mass. Of course '
the yearly increments, which are underestinates because they do not account
for l-itter turnover (Nobfe , Ig71) must necessarily be the result of newly
fixed carl:on and are in part due to the increased-storage capacil-y for TNC'
The significance of the rel-ative figures quoted above is Lhat the weight of
TNC storecl appears to be sufficient to replace a yearts growth in the event of
loss dr-re, ror example, to qrazing or drought. Exactly how significant t'he
size of u1e TNC store is to tì-re long and short term procluction of A. uesican'ia
nusl- awaiL more cletailed studies on the relationship between TNC contenl and
vigour of the shrul¡ and the effects of the environment, including grazíng,
on both. If, as suggestecl, only a small proportion of TNC is used to initiate
growth the quant.ities involved may be adequate to accoul-lt for a numl¡er of
small- fosses evell over a sllort period, but studies by Cool< and Child (197f )
75
on simil-ar species indicat-e that relatively low usage results in a depression
of vigour which may not be recovered for up to seven years. According to
the data in Coyne and Cook (L970) these plants, including two AtripLeæ
species, have much higher TNC contents than ,4 . uesicaria.
Perhaps the most significant feature of the results of TNC measurements
for A. Desicaria is the high proportion stored in young shoot tissue. In
the absence of grazíng the observed distribution coul-d be seen as an efficient
adaptation as TNC is located cl-ose to sites where it might be used (cf.
Evans , I976). The possibility of loss during drought-induced defol-iation
or senescence is presumably avoided by
Even moderate grazing, howeverf poses
possibly survival, of A. uesicaria ín
a substantial part of the TNC within
for its renewal.
translocation before leaf abscission.
a twofold threat to the vigour, and
that it resulLs in the removaf of both
the plant and reduces the capacity
76
CHAPTER 4
4 Seasonal patterns of shoot and root giowth in the field
4.I Introduction
The data on shoot and root growth in the field, summarized in the
foJ-lowing pages, were gathered, initially, for comparison with the resul-ts
of measurements of TNC concentration. They are presented separately
here for several reasons, partly to avoid the inclusion of a number of
points of discussion on growth, unrelated to changes in TNC concentratíon,
in the preceding chapter. Growth of individual pJ-anÈs, in a given interval'
was variable and it was considered more appropriate to compare TNC
concentrations with growth activity assessed from notes on the shrubs
sampled for analysis. Ho\^/ever, as sho\^¡n in chapter 3, on occasion the
phenology notes did not adequately explain the fluctuations in carbohydrate
concentration. Where relevant, the results of regular measurements of
growth, reported in section 4.3, will be compared with those changes in
TNC concentration.
Measurements of shoot elongation, Ieaf production and root elongation
are al-so compared with patterns of growth exhibited by other arid zone
species and discussed briefly in that context-
4.2 Methods
4.2I Shoot growth
Changes in shoot tength bet\4reen October, L977 and .Tanuaryr 1980 were
assessed from a photographic record of tagged shoots. This approach was
taken, rather than a direct measurement, to avoid excessive handling of
the brittle stems and hence to minimise leaf foss and stem breakage.
77
shoots were chosen initially by passing a needle point through
the shrub canopy at randomly setected positions. The sample consisted
of fifty shoots in total, five on each of ten plants. Five of the shrubs
were female and the remainder male. Shoots chosen in this \^/ay v/ere
sometimes relatively inaccessible and when replacements were necessary,
due to shoot death or breakage. they were selected from the outer canoPy.
In most cases shoots were laterals near the apex of secondary branches.
Photographs of these shoots were taken, at about monthly intervals
(see ch. 3), against a background of graph paper supported on a steel
plate which was in turn supported at a preset distance from the lens by
a light metal rod fixed to the base of the camera. The background also
included a counter, identifying the plant and the shoot, and a small
magnet which could be aligned next to the tagged shoot to help locate
the latter easily when subsequent measurements were made. v'fith the.focus
preset the camera, held in one hand, was used to manipulate the backing
plate behind the shoot which was lightly held flat against the graph
paper for the photograph.
AII measurements of shoot length were made from projected images
of black and white negatives (.1977-78) or cofour positives (L979) using
a segment of sma1l diameter plastic tubing to follow curves or bends in
the shoot. The length of tubinq, measured against the shoot, was then
compared with the background scale provided by the image of the graph paper-
This technique was also used to monitor shoot growth of several other
groups of plants including a group of four plants adjacent to the root
growth observation chambers described in the next section. In addition
pairs of plants were irrigated at various times in 1978 and shoot growth
was recorded in the following one or t\¡/o months. Another group of four
¡rlants was irrigated regularly in 1978 and shoot growth \¡¡as recorded each
month. The response of irrigated shrubs is reported in chapter 7.

78
4.22 Roolu growth
In February 1977 two root growth observation chambers. similar
to those constructed by Fernandez and Caldwell (I915) in Curlew Valley'
northern Utah, were installed at Koonamore. A third was dug in August L971.
They consisted of square pits with vertical sides lined with perspex sheet'
through which root growth could be observed. Between observations the
perspex faces were covered with sheets of plastic foam and the chamber
was covered by a l-id supported on a wooden frame resting on the soil
surface. A second cover fixed to a separate frame vlas placed over the
inner lid enclosing an insul-ating air space of about 5 cm between the
two. The chambers vlere about I metre square and 70-80 cm deep.
The depth to which the soil was excavated was governed partly by
the.distribution of roots expected for the species (e.9. Jones and
Hodgkinson, 1970) and partly by the increasing amount of hard limestone
rubble at depth. Because of the limestone nodules higher in the profile
a clean straight surface could noL be cut and, as found by Fernandez and
Caldwell, it was necessary to backfil-l the gap between perspex and soil
(2-5 mm) with some of the excavated soil.
An attempt was made to compare soil water potential down the profile
next to the observation panels with that in the profile alcout I metre from
one of the chambers by installing thermocouple psychrometers but these
were found to be unreliable under field conditions at Koonamore.
The chambers \^¡ere fenced to exclude stock and the area within the
fences r4/as. kept clear, as far as possible, of other small species in the
understorey. The krases of shrubs adjacent to the charnber were 20-30 cm
behind the observation panels.
Root growth was mapped on transparent plastic sheets placed over the
windows at about monthly intervals. A permanent record of the pattern
and amount of root growth was kept by transferring the data to tracíng
79
paper. Ihe same method as that used for shoots was used to measure the
length of curved traces.
4.3 Results
4.3I Shoot growth
Figure 4.f shows the pattern of shoot elongation between October,
1977 and December, l,9l9. The data from five male and five female plants
have been combined in figure 4 -la as there were no significant differences
between the two groups. The solid bars represent the mean change in total
length and the hatched bars the mean change in length of that segment of
the stem bearing leaves, for fifty shoots, in the interval- between
sampling dates. The horizontal bars show the activity of shoots assessed
from notes made on plants sampled for TNC analysis. As before (ch. 3)
some indication of the variation between plants is shown. In this case
the solid section of the phenology bar signifies that more than half the
nrunber of sampled plants showed signs of recent shoot growth. The hatched
section indicates that half or less were active.
Figure 4.Ib shows, for comparison, the mean increase in length of
twenty shoots on four plants adjacent to two of the root growth observation
chambers. Comments on this comparison are made at the end of this section.
In both diagrams l-east significant differences (LSD, P < 0.05) for comparing
means in different months are shown. From left to right in the upper diagram
the LSDs refer to the mean increase in total and foliated shoot length,
respectively.
Variation in growth between shoots on the same or different shrubs
was such that only large differences between means are significant. In some
instances some shoots on the one plant grew while others decreased in length.
It is possible that, on occasion, small decreases recorded for shoots in
a given interval were due to error. If shoots v¡ere.not held flat against

Figure 4.1 Gror.rth of tagged shoots in the fleld.
(a) Mean ehange in total length and folíated shoot length
for 50 tagged shoots recorded between October, I977 and'
December, 1978 (folíated length is that portíon of the
stem bearíng leaves). LSDs for comparison of means
over time (p.0.05) are, frorn left to rlght, for total
and foliated length, respectively. The horizontal bar
shor¿s the activity of shrubs assessed from phenology
of shrubs sampled for TNC analysls (Chapter 3). The
solid sectíon indicates Ëhat half or more of the shrubs
showed signs of recent shooË growth; and the hatched
sectíon, that less than half were active.
(b) The mean change 1n Èota1 lengÈh for a sample of
20 shoots on p1a-nts adjacent to root growth observation
chambers (LSl at P<0.05).

ot0
I
I7
6
5
4
3
2
I
o
-l
-2
t5
l4
ì3
t2
ll
r
I torot
ffil rolio'.d
I
EE
b
Eo)
o)
q)
o)co
EU
CoOJ
ã
c
7
5
4
3
2
I
o
Nov Dec
1977
Jon Feb Mor Apr Moy Jun Jul Aug S.p Oct Nov Dec
Month
1978
80
the background when photographs t¡/ere taken the image would be foreshortened.
On a few photographs this was obvious and such images l¡¡ere discarded from
the sample. Ho\^rever, shrinkage and swelling of tissues, due'to changes in
water content,llave, been observed for many other plant species and hence
the observed decreases are considered likely to be real-. This phenomenon
is discussed at length in Chapter 6, where mèasurements of growth of glass-
house gro\^¡n seedlings are reported.
Figure 4.2a shows the mean change in total and foliated length
for 25 shoots on 5 female plants in the interval- between December, 1978
and January, 1980. The scale is smaller than that in figurè 4.Ia and the
data from the last two readings in l-978 are reprbduced in figure 4.2a
for comparison with the mean monthly values in the \n/etter year of L979 -
Figùre 4.2b shows the growth of laterals on the tagged shoots in f979-
There was littte lateral growth in the previous year' despite the presence
of male shoots in the sample- The latter htere expected to initiate
Iatera] growth when flowering terminat.ed vegetative growth at the apex -
Figure 4.2c shows the gain and loss of leaves on tagged shoots'
in 1979, expressed as a percentage of the number present at the l-ast
sampling date. I¡lhereas the use of bl-ack and white fil-m in 1977-78 made
it difficult to assess the change in leaf numbers' especially at times of
rapid growth when large numbers of axilliary leaves were produced, the
use of colour positives in L979 allowed accurate leaf counts.
The seasonal pattern of growth illustrated in fign:res 4.Ia and 4-2a
is similar in both years, with little growth in summer and autumn and a
peak in late winter to mid-spring. However, the pattern of growth may
be distorted in places in these two figures. On three occasions the
int-ervals were longer than a month and the mean increase in length over the
interval has been shown as two or three equal increments. No measure-

Fígure 4.2 Growth and leaf production of tagged shoots in the field.
(a) Mean change in total length and foliated shoot length
for 25 tagged shoots recorded between November, l97B and
January,1980 (foliated length is thaE porÈion of the stem
bearing leaves). LSDs for comparison of means over time
(P<0.05) are, from left to ríght, for toÈal and folíated
length, respect,ively. The horlzontal bar shows the
acÈívíty of shrubs assessed from phenology of shrubs
sampled for TNC analysis (Chapter 3). The solld sectíon
índicated that half or more of the shrubs showed sígns
of recent shoot grohrth; and the hatched section, that
l-ess than half were active.
(b) Gror¿Eh of laterals on tagged shoots (LSD, P< 0.05).
(c) Change Ín l-eaf number on tagged shoots, including
leaves on small laterals' expressed as percentage of
the numbe-'' of leaves Present at Èhe beginníng of each
ínterval (LSDs, P < 0.05).

No recordT
o
I tot"t
ffi F"l;ot"dt5
l0
-5
I
5EE
o
Aug S"p Ocl Nov Dec JonNov Dec Jon Feb Mor APt MoY Jun )
_c
o)cc,
.=
CJ
o)co
-cU
co4)
ã
l0 b
5
Nol showno
c40
30
20
No record
o
o
0
.=ott)
oo)
-) L(lJ
-oEfc
o.;-'Eo -oo\
oo)
-)20
t97Ir Apr Moy Jun Jul
1979
MonÌh
Aug S"p Ocl Nov Dec Jon
I 980
81
ments vTere taken beÈween January and April, L97g (fLg. 4.2a) for example,
and the three equal means are probably not an accurate rePresentation
of the growth pattern during that time. According to the daily rainfall
figures from Koonamore Homestead (see figs 3.4-3.6) most of the rain
during the interval fell over 3-4 days in Februaryr probably resulting
in a peak of growth as seen at other times when substantial rains fell
in summer. similarly the increase in length recorded in December, 1979
for the interval since october may have been 1ar9e1y produced in November
âsr apparently, no rain fell between mid-November and the sarnplíng date
early in December.
The change in foliated length shown in these two figures, gives some
indication of the pattern of leaf gain and loss. As expected, on most
occasl-ons an Increase in shoot length r^Ias associated with an increase in
ì-ength of feaf-bearing stem and no doubt with production of leaves as well
as an increase in internode tength. on almost all sampling dates the
change in foliated length differed from the change in total- length'
The difference between the two variables is a measure of leaf 10ss over
a given interval, Given no leaf loss the changes should be equal and
hence the shortfall implies a loss of lower leaves '
In one instance (September, Lg7g, fig' 4'2a) the recorded mean
increase in foliated length exceeded the increase in overall length'
Although such a result appears anomalous, and is in this case not
signíficant,itisnotinconsistentwiththepatternofgrowthof
individual shoots. If lower leaves, subtending viable leaf or stem buds'
are lost before one measurement of foliated lengrth then a period of growth
before the next measurement may result in elongation at the apex and
production of leaves at lower nodes thus leading to a change ín foliated

82
length greater than the overall increase in shoot length.
The relative changes in overall and foliated length in September,
1979 also imply no loss of leaf at that time. This il-Iustrates another
Iimitation to the use of this approach to represent the pattern of leaf
l-oss since such changes do not account for the foss of leaves on inter-
mediate nodes. As shown in figure 4.2c some leaf loss, calculated from
l-eaf counts, was evident on all sampling dates in 1979. Part of the
difference in pattern of leaf production in figures 4.2a and 4.2c can
be attributed to the inclusion of leaves on short laterals, and expanded
axilliary l-eaves, in leaf counts. Nevertheless, these results show that
s'¡bstantial- loss of leaf can be expected at times of rapid growth as
well as during dry periods. Judging by the data in figure 4.la part of
the decrease in foliated length in summer and autumn (December-t'lay) is
due to both feaf alcscission and contraction of the stem along its length-
Contractions of this nature have been observed for other species -
Oechel et aL. (1972), for example' measured a decrease in the length of
primary and secondary stems of Larrea diuaricata in sunmer' which they
attributed to water loss and tissue shrinkage. There was no loss of
tissue from the stems and apical buds remained undamaged. In most cases
this was also true of Ææsíearia buiu the apex of some shoots was damaged
when conditions were severe.
Dry conditions during the period of observations on shoot growth
were not maintained for long enough to result in the massive loss of
leaf sometimes observed for A. uesieaz"La (osborn et aL. L932) but it is
apparent that leaf loss is not restricted to summer. References cited
in Syvertsen and Cunningham (L977) indicate that the rate of senescence of
mature leaves of. L. tridenata is closely associated with the rate of leaf
production. periods of greatest leaf fall and litter accumulation coincide
with periods of maximum growth rate for that species. Leaf loss has also
been shown to coincide with leaf production in the arid zone tree species'

83
HeteyodenCrum oLeifoLiun (Maconochie and Lange' 1970).
In Chapter 3 it was shown that on several occasions fluctuations
in TNC concentratíon did not correspond to the pattern predicted from
notes on the growth stage or sampled shrubs. Because of the imprecision'
due to natural variation between shoots of the estimates of growth activity
reported here, these data are of tittte more use in predicting changes
in TNC concentration. One problem associated with correlation of in-
creases in shoot length over long intervals with changes in TNC concen-
tration is that growth apparently occurs in short pulses. This subject
is enlarged upon in Chapters 6 and 7. How well the increment in growth
correlates with observed changes in TNC concentrátion over the same
interval will depend on the timing of the growth pulse relative to the
date.of sampling for TNC concentration. A fall in TNC concentration
resulting from a growth pulse early in the ínterval will probably not
be detected due to subsequent accumulation of TNC before the next sampling
date. The peak in TNC concentration in July, L979 (fig. 3.6) was associated
with low rainfall as expected buÈ apparently not with a reduced growth
rate (fiq. 4.2). The rainfall for the interval, fell shortly after the
sampling date in the previous month allowing a long period for accumulat-
íon of TNC.
There were also fatls in TNC concentration in December' 1978 and
January, 1980 which were not expected according to notes on phenology-
Growth in summer is difficult to detect just by observation as young
stem rapidly hardens and appears similar to older tissue. As far as can
be judged from the data in figures 4.1 and 4.2, however, there vtas some
growth in the intervals leading up to the above dates and this could
account for the observed fall in TNC concentration.

84
The results of observations on root growth are described in the next
section. Shoot growth of plants adjacent to the observation chambers
over the period November, 197'7 to December, L978 is iflustrated in
figure 4.l.b. The mean increase in tength for shoots on these plants was
greater than that for the undisturbed control plants shown in figure 4-J-a-
In particul-ar, growth continued during summer whereas shoots on control
plants apparently decreased in length-
These plants \¡rere gror¡¡ing in an area where the soil overlying the
kunkar layer or high concentration of limestone nodules was much deeper
than that for the control plants. Vüater potential readings at various
times showed that while the difference between the two groups was small
in winter (0.06-0.56 MPa) the water potential of the controls in summer
was'up to 3.3 MPa lower than that of plants adjacent to Èhe observation
chambers.
4.32 Root growth
The first roots appeared at the observation windo\^¡s in June, 1977
and November, L977 fot chambers installed in February and August, 1977,
respectively. For comparison. the first roots of. Att'ipLeæ eonfertifoLia
(Fernandez and Catdwell , Ig75) appeared at the windows of observation
chambers install-ed in that community about 5-6 weeks after install-ation-
The photographs in figure 4-3 show the appearance of a few roots
growing at the interface between soil and perspex. The hairs on these
particular roots, first noted in September, L9'78, were still visible in
December, Lg7g. However, not all roots had obvious root hairs' nor did
aII roots remain visible for so long. It is not certain whether roots
which disappeared from view died. In some cases root segments disappeared
from view during a dry period and reappeared in the same place after rain.
Figure 4.4a shows the mean root production from 2-5 panels of
the observation ehanùers between Julfr L977 and Deçember, L979' a panel

Fígure 4.3 Root observat.íon panels
Plates 1 and 2 show the appearance of roots observable
at the face of perspex panels in Ëhe root growth
observation chambers. 0n the left hand side of Plate I
there is evídence of the condensation referred to ín
the text.

I
2

85
consisted of half of one of the observation chamber walls which were
divided in two by a vertical strut supporting the perspex window.
Root growth was mapped to a depth of 60 cm and hence panel area was
approximately 3 OOO cm2.
The remarks made about the possibility of distortions in the
pattern of shoot growth over intervals longer than a month due to their
presentation as equal increments during the intervening months also
apply here. Apart from this, however, the pattern of root growth is
simifar to that for shoot growth with increases in new root length at
the observation windows showing a peak in late winter to mid-spring.
Fernande:z and Calù¡rell (1975) found little difference between
temperatures and soil water potentials at observation panels and in the
undisturbed profile at a distance of I metre from their chambers in
Curlew Valley but at Koonamore patches of condensation were sometimes
observed at the soit-perspex interface, suggesting differences in temp-
erature and soil water potential for different areas of the same panel.
This patchiness was another reason, apart from the unrelia-l¡ility of
thermocouple psychrometers, for abandoning the attempt to measure soil-
r^7ater potential . Figure 4.4b shows the mean number of new roots appearing
at the observation panels during a given interval. Presumably for most of
the time these roots would have been growing in undisturbed soif where
conditions were probably similar to those in the profile some distance
from the chamber. The pattern is essentially the same as that for root
elongation at the interface suggesting Èhat the latter may be representative
of the pattern if not the amount of growth expected in undisturbed soiL.
On several occasions during the period that root growth was monitored
individual roots were active at the time measurements were taken. The
rate of growth of some of these roots is shown in figure 4.4c.
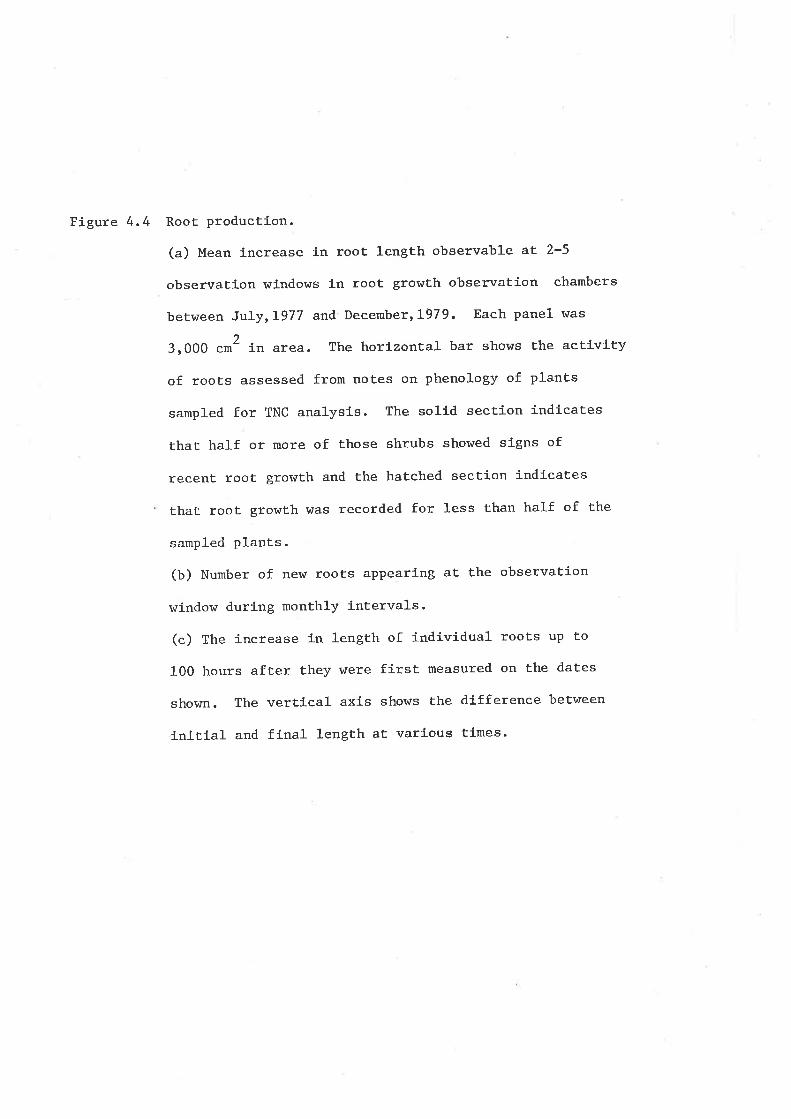
Ei-gr:;re 4.4 Root productíon.
(a) t"tean increase in root, length observable at 2-5
observation vrindows in root growth observatíon chambers
between July,L977 arrd December,l979- Each panel was
)3,000 ct' ír, area. The horizontal bar shows the activíty
of roots assessed from noÈes on phenology of planÈs
sampled for TNC analysis. The solid section indícates
that half or more of those shrubs showed sígns of
recent ïoot growth and the haÈched section índicates
that root growt,h r^7as recorded for less than half of the
sampled plants.
(b) Number of new roots appearing at the observation
window duríng monthly intervals.
(c) fhe increase ín 1-ength of índívídual roots up to
100 hours after they were first measured on Èhe dates
shovm. The vertlcal axis shows the difference between
ínitial and final length at various times.

SI NNI30
N
9xÊc-20fo)cû)
o9 lo':q)
oc)
Uc
JASOND J T MAMJ J ASONDJ F MAMJ J AS OND
40b
20
oo
ÌOJ
c
o
oz
0
J AS1977
ONDJTMAMJ1978
JASONDJ
Month
^
A
FMAMJJASOND197 I
a Oct tgZB
O Jun tgzg
A Sep 1978
c9
8
7
6
5
4
3
Ao
EU
o)co)
oo
e.
a
a
o
o
o
2
0
a
0 ó0
Hours
20 40 80 r00

86
The maximum rate of root growth, from the stope of individual plots
of elongation with time, ',./as about 3-5 cm per day' a value similar to
rates recorded el-sewhere (e.g. Jones and Hodgkinson , Ig7O, Hodgkinson
and Baas-Becking, L977). However, because the gap between perpex and
soif had to be back-fiIled with loose soíl' root growth rates at the
interface are probaJrly hiqher than those in the undisturbed soil profile,
due to the low mechanicaf resistance to root growth at the interface
(see Drew, 1979) .
A comparison of the root activity recorded in phenological notes
on excavated plants, depicted by the horízontal bar in figure 4.4a,
with the pattern of growth in the body of that figure shows some major
discrepancies. In the interval leading up to the main peaks in root
growth little or no young growth \¡ras recorded in phenological notes.
However, most of the young growth recorded for excavated plants was
concentrated near the root cro\^/n, or along primary rootS, whereas that
observed in observation chambers was probably the resul-t of apical
etongation of existing secorldary or tertiary roots. Root production at
or near the crown need not coincide with elongation of existing roots
in which case the discrepancies are probalrly due to the loss of young
apical root gro\^/th while root systems of plants sampled for TNC analysis
were being removed from the soil.' Fernandez and Caldwelt (f975) presented data on root growth at
various depths in an AtripLeæ confez,tifoLía community. Figure 4.5 shows
similar data at lO cm intervals down the profile in a stand of .4. Desica?id.
The mean increase in new root length, at depths down to 60 cm, is shown
in figure 4.5a for the period between JuIy, l-979 and December , L979.
Each subdivision in the panel encompasses an areâ of 500 cm2.

8l
Judging by the data in this figure there appears to be considerable
root growth at depths as great as 50-60 cm. Part of the root presence
at that and higher levels in the profile I¡Ias, however' due to roots
growing down the interface between window and soil' gro\^lth which may
not have occurred in an undisturbed profile. Figure 4.5b al-so illustrates
growth at depth for A. UesicaTia but in this case increases in root
length were recorded onty while the apex remained in the zone of origin'
as judged by its first appearance at the observation panef. Growth of
roots after they had crossed the boundary of the subdivisíon was not
recorded further. Even on this basis there v¡as some root growth at depths
below that expected for A. Uesicay'ia. A diagramatic section of root
distribution for this species in Jones and Hodgkinson (1970) shows l-ittle
lateral spread of roots at depths below abouÈ 20 cm. On the other hand
they did observe some root mass at depths as great as 90 cm. As noted
earlier, the observation chaÍibers at Koonamore \^/ere located in deep soil
in a slight depression which apparently has allowed deeper penetration
of the root system than in areas !¡here a hardpan is found close to the
soil surface (Cf . osborn et d.L. 1932).
The data of Fernandez and Caldwetl (1975) f.or A. confez'tifoLia
and two other species sho\^¡ a progression of root activity from the upper
layers of the profile to the lower as the dry season advances. Littl-e
evidence of such a progression \,vas observed f.or A. Desica?ia aL Koonamore'
except for some semblance of a transfer of root activity to lower levels
in the first year of observation between July, L977 and June, 19'18
(fig. 4.5b), most change occurring in the tÒp 3-4 levefs. This response
may not be characteristic, however, as root growth patterns were possibly
altered in the first year after installation of the observation chambers -

Figure 4.5 Root production aÈ various depths.
(a) The lncrease 'ln root length, at 10 cm lnterval-s
down the soíl proflle, recorded at observatlon windows
between Ju1-y, L977 and Decenber, L979. Val'ues for other
than the top 10 em include measurements on roots which
grew down the ínterface beÈween Èhe persPex window
and the soll- f rom hígher levels.

0-10 cm
l0-20
?0-30
30-40
40-50
50-ó0
l0
8
6
4
2
0
6
4
2
ó
ôlox
'EE
Eo)co
oo
.5c,
oo,
u0
JASONDJFMA1977 1978
MJJASONDJFMAMJJASOND1979
Month
Figure 4.5 Root producÈ1on at varfous depÈhs.
(b) The increase in root l-ength, at 10 cm fntervals
dor,¡n the soíl profíle, recorded at observaÈíon wl-ndows
betÍreen July, 1977 and December,1978. Sections of
root after they'had grown out of Èhelr zone of orlgin
r,üere not incl-uded 1n summations of rooÈ length for
lower levels (cf. fte. 4.5a).

0-10 cm
L-6
to-20
-----
20-30
-),-
ô{oxEE
Eu)c(,
oo
.5qJ
oCJ
u
2
0
6
4
2
0
6
4
2
0
ó
4
2
0
6
4
2
0
3O-,10
40-50
50-ó0
Jul A1977
SOND JonFM
Month
AMJ Jul A
197 B
SOND

8B
The following year was too r^ret to allow the devefopment of a similar
response. Nevertheless, a pattern of growth of this kind may occur
in stands of A. Uesicaï"La. probably over a much shorter period than in
the case of A. eonfertifoLia in Curlew Valley' where the seasons are
better defined. Regular observation at intervals much shorter than a
month are probably required to detect such a progression of root production
by individuals of A. uesicaz'ia.
4.4 Discussion
An important feature of the data on shoot growth presented here
is the high variability in the response of individual shoots at any given
time. During the description of results the means were assumed to be
accurate despite their statistical imprecision (see Sokal and Rohlf,
Lg6g, p. 13) although strictly no significance can be attached to the
details of smal-l fluctuations in growth-
The overall pattern of growth suggests that plants will respond to
heavy rain at any time of the year. The highest rates of growth in the
two years of observation v/ere recorded in spring and were presumably
associated with the increasing air temperature during that time as well
as high soil water potential.
The pattern of root growth was similar to that for shoots but it
is not certain whether root growth in the undisturbed soil profile corres-
ponds to that in observation chambers. The growth of roots down the
observation panel makes it difficult to interpret these data. A project
designed specifically for the study of root growth could yield usefuf
results on root growth in the field using this method, provided that
measurements are made to d.efine the soif environment, but probably the best
use of observation panels is thaÈ made by Hodgkinson and Baas-Becking (1977)
or Billings et a.L. (Lg76) who used an experimental approach, involving

89
manipulation of the plant or its environment. For example, some useful
results on root growth of A. uesicav,ia following defoliation of the shoot
were described in Hodgkinson and Baas-Becking (L977) -
The variability in the response of shoots suggests that more attention
should be paid to the choice of shoots for detailed studies of shoot activity.
The position of the shoot on the plant may be important and hence samples
may need to be selected by a process of restricted randomization to ensure
precise results. On the other hand., variabfe water absorption by roots in
soil zones of differing moisture content and complicated patterns of xylem
connections (see ch. 6) may be responsible for the variability between
shoots which may still be evident in subclasses of shoots chosen in such
a way.
As it stands the pattern of shoot growth broadly accounts for the
observed changes in TNC, within the limítations discussed in the previous
section. The notes on phenology also have limitations as a means of pre-
dicÈing changes in TNC concentration, for example, in summer when ne\¡/
growth is difficult to detect, but r¡/hen such notes are combined with
rainfal-l records they provide a good indication of likely changes.

CHAPTER 5 90
5. Gas exchange
5.1 Introduction
The possibility of positive net photosynthesis at low water potential
and its importance to the carbon balance of sal-tbush have been outlined
earlier (Ch.2). The only published rates of photosynthesis for A. uesicatia,
to my knowledge, are those reported by Wood (1932), Chapman and. Jacobs
(1979) and CaldwelL et aL. Q-971). As the last named authors were interested
in temperature accl-imation of photosynthesis leaf water potential was
maintained at a high level throughout their experiments. Wood (1932) and
Chapman and Jacobs (1979) measured the rates of photosynthesis by shoots
and individual l-eaves of field grown plants, respectively. Ìì.easurements
were made at times when leaf v¡ater potential was fikely to have been low
but since water potentials v¡ere either not recorcled or too l-ow to measure
with the equipment at hand no data on photosynthetic capacity at low
hrater potential are available.
Another aspect of photosynthesis under conditions expected in the fiel-d,
and outlined in introdr:ctory re-rnarks, is the possibility of damage to
metabolic and physiological systems, aurinq dehydration to the very l-ow water
potentials observed in .4. UesicarLa G.g. Anderson et aL., 1O7Z; Sharma,
I976, 1978). The development of water deficits in plant tissues affects
almost every aspect of plant function either directJ-y or indirectly (e.9.
Slatyer , tg67; Flsiao , 7973; Boyer , 797'7; osmond et aL., 1980). The prog-
ressive faIl in the rate of net CO, assimilation, wil-h increasing water
deficit, can be attributed mainly to stomataf closure in many species but
in others a non-stomat-al component, increas-'r-ng the:resistance to CO, transfer
through the mesophyll or to CO, fixation at t-he sites of carboxylation, ßâY
be equally ar even largely responsible for the inhibition of net CO, uptake.

91
Associated with such changes are increased rates of protein and nucleic
acid breakdown and changes in the level of hormones in the tissues. Severe
Ievels of stress may induce migration of inorganic and organic nutrients
from the leaves and structural damage to organelles. These few examples
show the scope for damage to systems involved in the transport and fixaLion
of CO, during photosynthesis. The result, as shotnrn for many crop species,
is often a slow recovery on rehydration. Part of the overall response in
some species may stem from a reduction in the rate of rehydration due to
increased suberization of the root system and death of root hairs, but in
many species the rate of recovery depends on the ability of the stomata to
function normally and an unknown degree of inhibition by non-stomatal
factors.
In this chapter these two aspects of photosynthesis, activity at low
vrater potential and recovery on rehydration, are examined and discussed
in relation to some of the issues raised in the preceding paragraphs.

5.2 Materials and methods 92
5.21- Plant material
AII gas exchange measurements detailed in this chapter were done on
terminal shoots of 3-year-ol-d field grown plants. The plants were raised
as cuttings collected from a site ad.jacent to the Koonamore Vegetation
Reserve (KVR). Once established, in small pots of sand from the Koonamore
area, they were returned to this site and grov/n in 30 cm pots until rea.dy
for use. To ensure that the microcfimate around the cuttings was similar
to that around plants naturally established in the field the pots were
buried up to their rims; the excavated silty loam soil (Osborn el; aL., 1935;
Carrodus et aL, 1-965) was used to refill the pots, the d.eeper layers first,
such that when the original surface layers were packed around the cuttings
the surface \¡/as flush with tnat of the surrounding undisturbed soil. The
cuttings were given supplementary water when transplanted and on two sub-
sequent occasions, at internais of 3-4 weeks, to aid their re-establishment
in the field. After 2.5 years in the field these plants had. grown to
O.2 - 0.4 m high and O.2 - 0.3 n in diameter. In comparison Osborn et aL.
(L932) reported mean values of 0.32 m for height and 0.34 m for diameter of
a sample of shrubs (n=5000) growing in the sarne general area.
5.22 Treatments
lndividual pJ-ants were collected from the field for measurements of net
photosynthesis and respiration in the laboratory. At this stage plants
were maintained on a laboratory bench under Metafarc lamps (ern Sylvania)
providing a quantum flux of 150 nE crn -'"-1 (400-7OO nm) at the top of the
canopy for l-6 hours per day. Air temperature and humidity were not
controlfed. At the time gas exchange measurements were taken (summer and
autumn of 1979-80) day/night temperatures in the l-aboratory were as high
as 3'7/25"C and as low as 3O/2L"C.
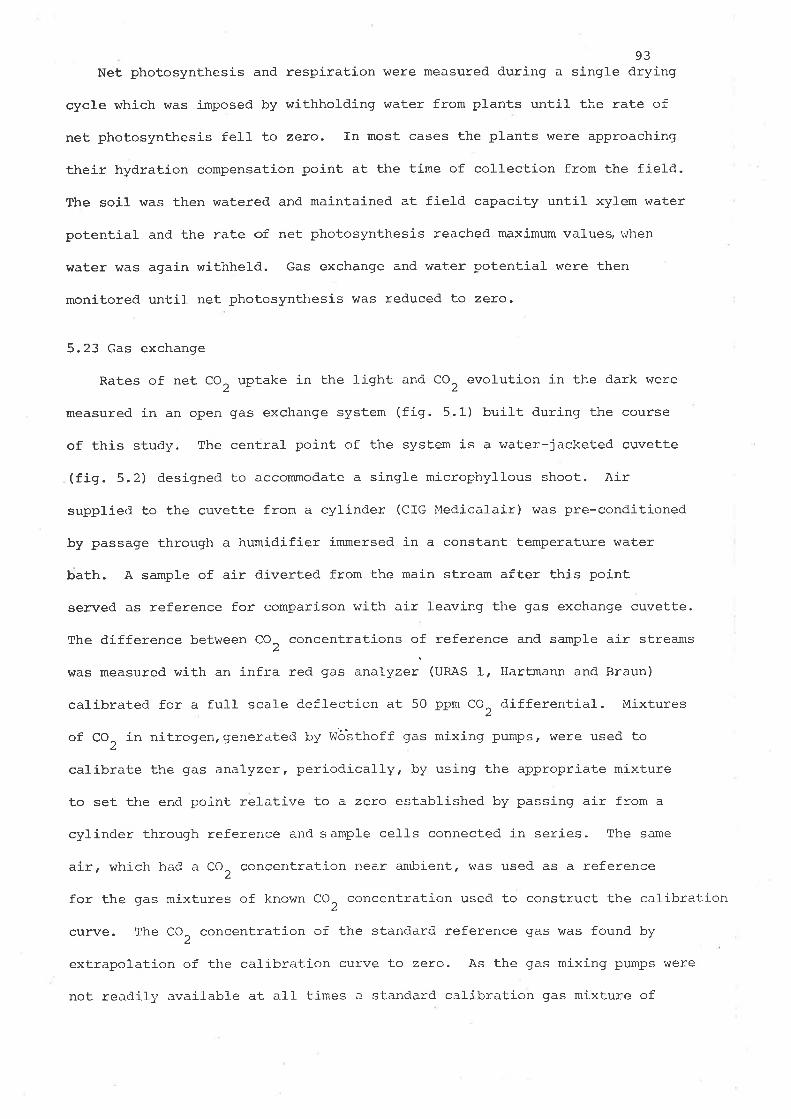
93Net photosynthesis and respiration were measured d.uring a single drying
cycÌe which was imposed by withholding water from plants until the rate of
net photosynthesis fell- to zeto. In most cases the plants vrere approaching
their hydration compensation point at the time of collection from the field.
The soil was then watered and maintained at f,ield capacity until xylem water
potential and the rate of net photosynthesis reached, maximum values, rvhen
water was again withheld. Gas exchange and water potential were then
monitored untif net photosynthesis was red.uced to zero.
5.23 Gas exchange
Rates of net CO, uptake in the light. and CO, evolution i.n the dark were
measured in an open gas exchange system (fig. 5.1) built during the course
of this study. The central point of the system is a water-jacketed cuvette
(fig. 5.2) designed to accommodate a single microphyllous shoot. Air
supplied to the cuvette from a cylinder (CIG Medicalair) $tas pre-cond.itioned
by passage through a humidifier immersed in a constant temperature water
bath. A sample of air diverted from the main streain after this point
served as reference for comparison with air leaving the gas exchange cuvette.
The difference between CO, concentrations of reference and sample air strea¡rs
was measured with an infra red gas analyzer (unes 1. Hartmann and Braun)
calibrated for a full scale deflection at 50 ppm Co, rlifferential. Mixtures
of CO^ in nitrogen.generated by VJö'sthoff gas mixing pumps, weïe used toz
calibrate the gas analyzer, periodically, by using the appropriate mixture
to set the end point rel-ative to a zero established by passing air from a
cylinder through reference and sample cel-ls connected in series. The same
air, which had a CO2 concentrat.ion near a¡r-bient, ivas used as a reference
for the gas mixtures of known CO, concentration usecl to construct the calibration
curve. The Co, concentration of the standarcl reference gas was found. by
extrapolation of the calibration curve to zero. As the gas míxing pumps were
not readily availabl-e at all times a sta¡rdarcl cal-ibration gas mixture cf

94
appropriate CO, concentraÈion was made by adding nitrogen to a pàrtly used
cytinder of compressed air. The standard reference and calibration gases
were used to calibrate the instrument daily. To avoid changes in CO, concen-
tration these gases were remixed for I-2 hours before use by warming the
bases of the storage cylinders (Sestak et aL., 1971)'
The construction and dimensions of the gas exchange cuvette are shown
in fig 5.2. A single attached shoot bearing several leaves was enclosed in
the cuvette, before each run, by means of a split circular plate fitted
around the stem and sealed with plasticine. Fine control of the air flow
rate was effecterl by adjustment of a flow meter (Fischer and Porter. Triflat)
inserted in the air line just before the cuvette. The CO2 concentration of
air within the cuvette, adjusted by alterations in the flow rate, was never
allowed to differ from that of the reference air stream by more than 20 ppm
duríng measurements of CO, uptake in the light. As the contents of compressed
air cylÍnders used as an air supply for the system v¡ere chosen to have a CO,
concentraticn betv¡een 310-330 ppm+-he CO, concentration of air within the
cuvette did not fall below 290 ppm. Because of the design and size of the
cuvette it was considered impractical to instal a fan; to avoid the formation
of CO, and water vapour gradients, air entering the cuvette, at a rate of at
least 30 litres per hour, was recirculated over the shoot by means of an
external pump in closed circuit. with the cuvette. Recirculation at a rate_1
of I L min-' was sufficient to minimise the boundary layer resistance to
CO, diffusion for the leafiest shoot used, as judged by the response of CO,
uptake rate to increases in the rate of recirculation.
Air and leaf ternperatures were measured by shacled copper-constantan
thermocouples inserted through access ports in the perspex rings supporting
the copper-walled cuvette. Air temperature was controlled by adjusting the
temperature of the water circulating through the water jacket. The fine
wire thermocor-rple usecl for measuring ieaf temperature was adpressed to the

FF
wl
çw2
Diagram of CO, exchange system.
A - AÍr supply
C - Gas exchange cuvette
F - Flowmeters
H - Hurnidifíer
N - Liquid nitrogen bath
P - Air or r^rater pump
S - Standarcl calibratíon qases
T - Thermocouple psychrometer
Figure 5.1
A
c
Ns S
I
R
G
A

FÍgure 5.2 (a)
A-
B-
c-
D-
E-
F-
Sectíon and (b) plan of gas exehange cuvette
Cuvette
I,Iater jacket
Ports for air entry and exiË. Al-so represents porËs
for recirculation of air vie an aÍr pump in closed
clrcult wiËh the cuveÈte (shovm only in plan).
Thermocoupl-e entry ports
Split circular plate used to seal shooÈs in the cuvette
Base plate
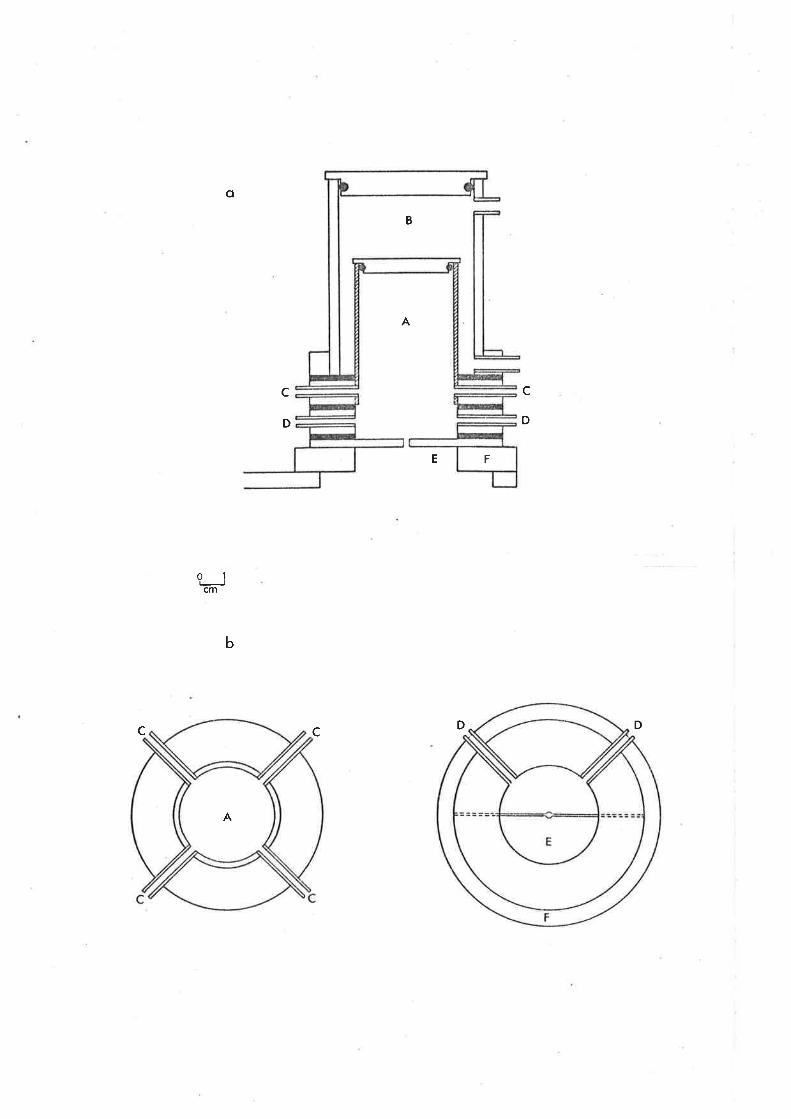
B
o
A
OJcm
b
A
DDcc
c
D
c
D
E F

95
ventral surface of a Young leaf.
The relative humidity of the air entering the cuvette was adjusted to
the required value by controlling the temperature at which air was saturated
with water vapour, by passing it through a copper coil and humidifier imm-
ersed in a water bath, before it reached the cuvette. On reaching the cuvette
air temperature was raised and in the process relative humidit-y was reduced
to a value equal to the ratio of the saturaÈion vapour pressure of air at
the temperature of the cooler bath to the saturation vapour pressure at
cuvette temperature (Bierhuizen and Slatyer , L964r. A differential thermo-
couple psychrometer was built according to specifications given in Slatyer
and Bierhuizen (1964) and Bierhuizen and SÌatyer (1964) to measure the
increase in vapour pressure of the air leaving the cuveite due to transpir-
ation. However, in order to obtain a realistic value for net phot-osynthesis
by the microphyllous shoots of .4. uesicaria, the number of leaves used for
a measurement was Iimited by the necessity to reduce shading of lower l-eaves
to a minimum. T'l':e small- amount of leaf tZ-S cn2l used was insuff icient to
significantly affect the vapour pressure of the air so that in practice the
psychrometer was used simply to monitor the vapour pressure of '-he air enter-
ing the cuvette.
The reference and sample air streams passing to the gas anai-yzer were
dried by freezing out the water vapout over a bath of liquid ni*;rogen. The
efficiency of drying was checked periodically by venting the air streams
Ieaving the analyzer through columns of dried silica gel. On all occasions
the result was a loss of weight of the silica gel columns.
The ligtrt source for the shoot during rneasurement was a qurirtz-iodj.de
lamp mounted directly above the cuvette. Irradiance was altered, if necess-
ary, by raising or lowering the light source. The constant flow of water
through the wat-er jacket reduced the amount of infrared radiation reaching
the cuvette. The quantum flux (400-700nm) at the top of the shoot h¡as meas-
ured with either a Licor sensar (Lambda Tnstruments) or a calibrated light

96
dependent resistor, consLructed to fit within the cuvette.
Leaf area was neasured daily by exposing each leaf over small pieces
of Iight sensitive paper which, when developed in ammonia vapour, produced
a positive image of the leaf. The leaf shapes were then excised, weighed
and leaf area \,vas estimated by comparing the cutout weight with that of
known area of exposed and developed paper.
Xylem water potentials \^¡ere measured by the pressure chamber technique
(Dixon, L9L4i Scholander et aL., 1965). Since the same shoot, where possible'
was used for al-l gas exchange measurements during a particular phase of
the drying cycle for a given plant,daily water potential readings were
taken on similar shoots when net CO, uptake reached a steady state' usually
1-2 hours after beginning a gas exchange run and 7-8 hours after the main
ligtrts were turned on.
During a gas exchange ri-ln the quantum flux at the top of the shoot was
200.nE.*-' =-t. Leaf temperature was maintained at 30+ 0.5oc (cf. Caldrvell
et aL., Lg77). The relative humidiLy of air entering the cuvette was 55
per cent. Assuming that the intercellular spaces were saturated with water
vapour the vapour pressure deficit between leaf and air was 15 mb.
After the rate of CO, uptake had remained stable for 45-60 minutes the
Iight was switched off and the cuvette covered with a black cloth. The
efflux of Ce, in the clark was then recorded untif a stable rate had been
achieved. The water jacket temperature was not adjusted during the dark
period and as a result leaf temperature dropped to a value I-2oC Iower than
that in the light.
At this point the shoot was removed from the cuvette and a reading was
taken with the cuvette empty to account for any difference in CO, concentration
of the air streams not due to net CO, exchange by the shoot. I,lhen this read-
ing differed from the zero established during calibration it served as the
reference point for the CO. differential used to cafculate the rate of net
CO, exchange.
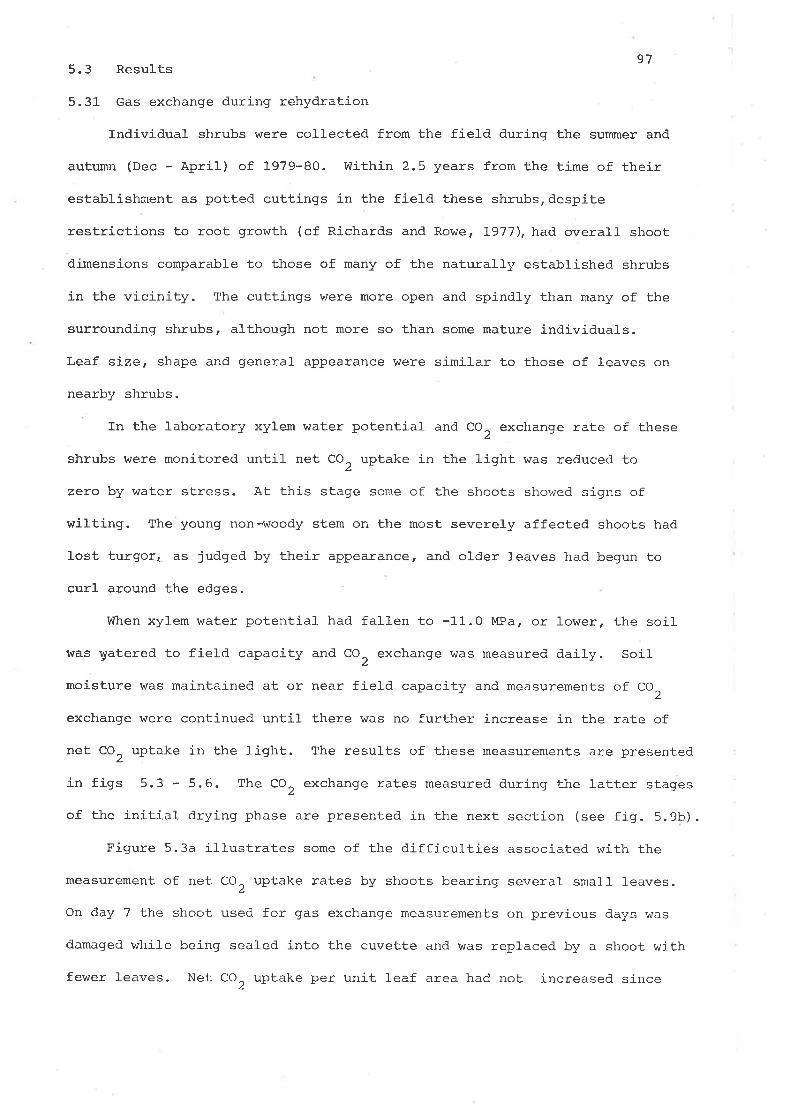
5. 3 Resul-ts 97
5.31- Gas exchange during rehydration
Individual shrubs were collected from the field during the summer and
autunn (Dec - April) of 1979-80. Within 2.5 years from the time of their
establishment as potted cuttings in the field these shrubs, despite
restrictions to root growth (cf Richards and Rowe, 1-977), had overafl shoot
dimensions comparable to those of many of the naturalJ-y established shrubs
in the vicinity. The cuttings were more open and spindly than many of the
surrounding shrubs, although not more so than some mature individual-s.
Leaf size, shape and general- appearance were similar to those of leaves on
nearby shrubs.
In the laboratory xylem water potential and CO, exchange rate of these
shrubs were monitored until- net CO, uptake in the light was reduced to
zero by water stress. At this stage some cf the shoots showed signs of
wilting. The young non-woody stem on the most severely affected shoots had
Iost turgorr. as judged by their appearance, and older leaves had begun to
curl around the edges.
lVhen xylem water potential had fallen to -11.0 MPa, or 1ower, the soil
was yatered to fiel<l capacity and Co, exchange was measured daily. SoiI
moisture was maintained at or near field capacity and measurements of Co,
exchange were continued until there v/as no further increase in the rate of
net CO2 uptake in the 1ight. The results of these measurements are presented
in figs 5.3 - 5.6. The CO, exchange rates measurecl during the latter stages
of the inítial drying phase are presented. in the next section (see fig. 5.9b).
Figure 5.3a illustrates some of the diffícul-ties associated with the
measurement of net CO, uptake rates by shoots bearing several- smafl leaves.
On day 7 the shoot used for gas exchange measurements on previous days was
damaged while being sealed into the cuvette and was replaced by a shoot with
fewer leaves. Net Co, uptake per unit leaf area had. not increased since

Figure 5.3 Net CO, uptake, hlater potential and leaf area for
shoots of fleld grovn cutÈings duríng and after re-
hydration in the laboratory.
(a) Net CO, uptake (closed symbol-s) for two shoots- Rates
of net CO, uptake up to day 5 are based on shoot leaf
areas estimaËed from the leaf area on day 6 and sub-
sequent daíly rates of leaf area íncrease measured
for shooËs on the sarne and other shrubs after watering.
The dashed líne rePresents Èhe response of a shoot
with a leaf area of 8. g "^2. After day 6 a shoot wíth
a smaller leaf area was used. Xylen r^r¿ter potentials
(open symbols) for símíIar shoots on the shrub were
measured when net CO, upËake by the shooÈ in the cuvette
reached a steady rate.
(b) The leaf area of two shoots on a second shrub during
and afËer rehydration ín the laboratory.

Leof
ore
o .r
2N
et C
Oz
upto
ke n
g
l\¡èO
.oo
oo o
crrf
2 ,-
l o
@ oN
(¡t
Al¡
o
oo
\
d \.
ao
N) È
r.O
\
0 o oo'
o { 1@ o t. ) (p
I o \ o I o
t .ì I .l
I o
o !.) è
o
a
o
o
I ñtI o
I ñ)tl¡ @
o.à
Wol
er p
oten
tioi
MP
o o

98
day 4, indicating that individual leaves had recovered, as far:s possible,
from the effects of low water potential. Ho\n¡ever, net CO, uPtake rates
calculated from measurements on the second shoot increased for a further
2 or 3 days. The apparent maximum rates measured on days 4 to 6 were
attributed to uneven ill-umination caused by self shadÍng within the shoot.
An increase in the proportion of shaded leaf photosynthesising at less than
maximum capacity, on a given day, apparently masked increases in the
capacity for neÈ CO2 uptake by the whole shoot. Because of the relatively
large initial leaf area of this shoot leaf expansion was not immediateJ-y
obvious. Daily measurements of leaf area from day 7, however, showed that
shoot leaf area was increasing by up to LTpercent per day. The increase
in leaf area v/as due partly to the expansion of existing leaves and partly
to the production of new leaves. Such rapid production of leaf area was
characteristic of all plants used in this series of experiments. Figure 5.3b
shows the increase in leaf area with time for two shoots used ior gas
exchange measurements during and after rehydration. fn this case totaL
leaf area \^/as more than doubling in five days. The initial rates of net
CO, uptake presenl-ed in fig. 5.3a are based on estimates of leaf area
calculated from the final Ieaf area for the shoot involved and average
rates of leaf area increase measured on later occasions. AII subsequent
rates are based on leaf areas measured immediately after the gas exchange
run. The final leaf area of the first shoot used (8.9cm2) was obviousJ-y
far too high and later shoots used had an initial leaf area of less than
)2cttt'. These were discarded in favour of a smal-Ier shoot when Lotal leaf
area exceeded 5 cm2. Because of Ieaf growth at the apex and leaf production
in the axils of existing leaves self shading could not be entirely el-in-
inated. Slight differences in position of the shoot within the cuvette
from day to day were also unavoidable. As a consequence variable shadinq
may have contributed to the fluctuations in the rate of rret CO, uptake
observed after rehydratio¡r and photosynthetic recovery were complete,

99
although large fluctuations in photosynthetic rate of ^4.. Ðes¿caria, and
other specíes, over much shorter periods (hours) have been recorded by
others (Caldwell et aL., 1977i Chapman and Jacobs' 19791. Short term
fluctuations vlere not observed during this series of measurements.
Recovery of net photosynthetic capacity under better light conditions
is shown in figure 5.4. Leaf orientation and position on the shoot used
were such that seff shading was minimal, at least initially, except for
the oldest leaves which were partly folded along the midrib. In this case
maximum capacity for net CO, uptake was attained in 7-I0 days whereas
rehydration \¡/as complete within 2 days after an initíal stress (less than
-I1.OMpa) which was sufficient to kill a smaller plant growing in the same
pot.
A smatt plateau in the curve for net CO, uptake, sinilar to that shown
in figure 5.3a, developed on days 2-4. In this case the resumption of
daily increases in the rate of net photosynthesis coincided with the onset
of leaf production by both apical and axil-fiary ¡r.s¡istems. Before day 5
there had been no evidence of new growth other than the expansion of exist-
ing leaves as the stress irnposed during the drying phase had killed the
young leaves enclosing the apex and presumably inhibited meristem activity.
The water potential of a third plant fell to at least -11.7¡4p¿before
soil moisture was restored Lo field capacity. This resulted irr the death
of many of the apical meristems. On the shoot used, the apical meristem and
those in the axils of the top three expanded leaves all died. The meristern
in the axif of the fourth leaf did not begin rapid leaf production until
day ì-6. Neverthel-ess expansion of the four remaining leaves began soon
after the soil was watered and their capacity for net CO, uptake increased
at a rate similar to that for shoots on other plants. fn some instances the
rate of net CO, uptake began to fall shortly after reaching a maximum. The
rate of net CO, uptake by this shoot, in particul-ar, began to fa1l immediately

ît 'ofî, 'ol-
o
0216
o
oo
IDoys
aa
a
oo o
oCL
{
Eco)
oo-
-2
-1
-6I
()
oì
l0 l2 l4 tó 18 20 22 21
ofter wolering
FÍgure 5.4 Net CO2 uptake (closed sy'mbols) and hrater potentj.al
(open symbols) for shoots of a fÍeld grohrn cutting
duri'g and after rehydration'in the laboratory. xylen
water potentials Ì/r'ere measured on simÍlar shoots when
net C0, uptake by the shoot Ín the cuvette reached a
steady raËe. The Ínverted triangle for ïdater potentíal
on day 0 índlcates that \¡/aËer poËential was less than
-1-1 MPa, the 1Ímit of the pressure chamber.

100
after reaching a maximum on day B and was finally reduced to zero by day
60 (fig. 5.5). By that time aII but one of the origina.l leaves had fa1len
and the remaining leaf had apparently lost most of its chlorphyll. Never-
theless relatively high rates of net CO, uptake h'ere maintained for most of
this period despite visible symptoms of ageing.
The resulÈs of gas exchange measurements during rehydration, for six
plants, are summarized in figures 5.6 and 5.7. Rehydration v¡as' on average'
conplete by about day 4. Maxinum rates of net CO, uptake' on the other hand'
were not achieved until day 8 or 10 although 90 per cent of capacity was
regained by about daY 5.
Respiration rates, measured immediately after a period of net CO,
uptake in the Iight, increased rapidly during rehydration and reached
maximum, though fairly unstable, raLes in 3-4 days. Large fluctuations
were observed for some shooÈs (fiS. 5.7). The rapid increase in respiration
rate parallels the rate of increase of water potential and is consistent
with the early enlargement of leaves during rehydration.
5.32 Gas exchange during dehydration
When no further increases in the tute of net CO, uptake by rehydrating
shoots could be detected water was again withhel-d and gas exchange was
monitored until net photosynthesis was reduced to zero. The conditions
in the cuvette eTere simitar to those during rehydration. In most cases
a different shoot was chosen from among those which had not produced large
numbers of lateral leaves near the apex during rehydration. AIl but one
shoot, however, as a result of rapid growth duri-ng rehydraÈion, consisiecl
entirely of young growth not previously exposed to water stress. New
shoots were chosen to avoid the problems associated lvith the presence of
shaded Ieaves. Horvever, some new leaves were produced ,Suring the first
few days white turgor remained high, Shading was less of a problem ouring
the drying phase as shoot leaf area dec¡:eased at low water potentiai. This

u,t4I 4
oÌ-atE6
P5a
a
o021ô8
a
a
a
a
o3
0)Joo-tN
oU
0,z
ca
ttll30to 20 40 50 óo
Doys ofter wotering
The decline in net CO, uptake'measured for a shoot on
a field groürn cutting maintaíned at high tTater potential
after rehydration ín the laboratory. Initíal waÈer
potential before wateríng was 1or¿ enough to kil1 the apex
and buds in the axils of the top four leaves' whích all
abscised duríng the period of rneasurement. The numbers
along the top of the diagram show the number of leaves
remaining on the days índicated by the arrows. The inset
shows rates of net, CO, ultake by those four leaves in Ëhe
first I days after r+atering.
Fígure 5.5

Flgure 5.6 Relatíve net CO2 uptake arrd mean rüater potential for
shoots of six field-grown cuttings duríng and after
rehydration ín the laboratory.
(a) t¡et CO, uptake expressed as percenÈage of the
nean maximum value reached after rehydration.
(b) Mean hrater potentíal on successive days after
watering. The inverted triangle on day 0 indicat,es
that lrater potenÈials were less Èhan.-11 MPa.

oo
N o
oo
Net
CO
z up
loke
(,,
À
(¡
o.'
o o
o 'o I
oo
@>
o o
o/o
mox
. vo
lue
\@lo
ooo
o¡r Þ
o
oo
Þo
o oo
oI
I \)I (¡t
. W
oter
pot
enlio
l M
Po
jlrlll
llO
.Oco
\O'(¡
À
oo
oú
o
o
Þx,
ls
Þo
ss
o
I o o OO { o o l'o (o
o DO
oÞ
o. c¡ oo
N}.
)
È!
ler
)o
aÞo
o>
> o
æ
Þ
lol
Þo a>
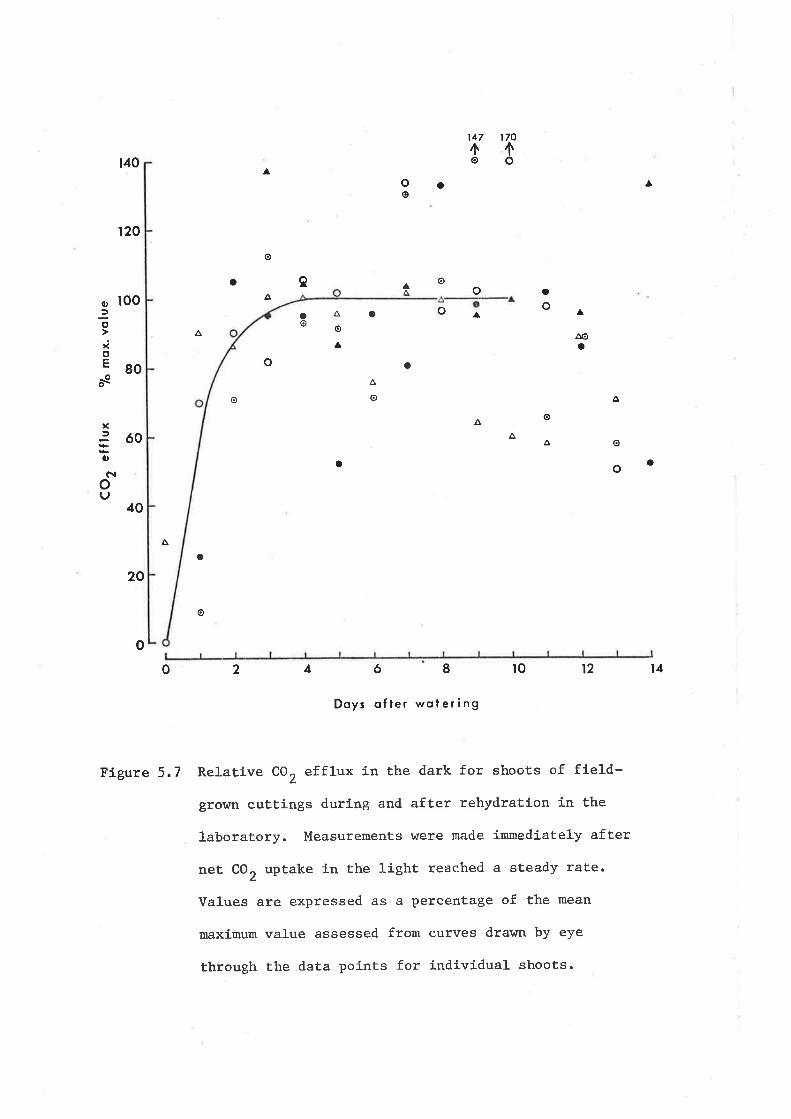
À oo
}\' o
coz
effl
ux o. o
?o m
ox. vo
lue ¿
¿c.
toN
ÀoO
oo Þ
o
oÞ
o
>oÞ
a
Þ
oo
o
rOoo
a
oÞ
oÞ
>oO
oo
o
Þo
.à5
o+:
Þ Þo
oo
ooÞ
o
o
4 qc Ê Ft o :" {
l\) Þ o q, o l\'
I o o o { o o t. t (rI
r1Ë
<Þ
l.¡O
q'Ë
rfF
Þoo
tFlo
FrX
llr1c
'"qH
oH.É
o€pr
cËO
c)F
IÞrr
õó:i-
øoÞ
1.5d
Nr1
O<Þ
oÉo
t-r<
HdF
lrrI'Þ
oE<
-oH
rr.H
'O.É
oÈÞ
No.
ox'(o
q[''
UiD
tØo
rtN
HO
-l-il
rDoO
ts.P
iÈH
r'v
røri0
ÊF
!o(n
ÉÞ
lCO
C'tO
rtt-
JH.X
F.ø
o.!'o
ÞÞ
ooã0
4t1
t'1Ê
.ÞoÞ
A(,
)HÞ
Ê'
h¡H
.r1Þ
rtF
+rH
ÊJO
aOÀ
5oo
fOriP
E11
{P¡
OO
r+rO
.H
.Ort
F,lF
l |-
tÞsG
Ooo
oBitB
oÞH
?rH
'<!o
Ë<
oÈl'Þ
EÞ
È.Ø
oroÈ
ooito
qÊ.o
:'Fl
do.o
<Þ
rtÞ
l-.!È
o.þ$
oBF
llf'É
H¡u
tËP
)OV
tlrto
rto
!frrO
O.P
'rtõd
forH
'oø
,ok
oÊpr
!Jr-
t <
ØoH
oP'|'
rr;-
<õF
1HÞ
OÞ
0r<
Þrf
rîH
. gr*ã
'g11
Èol H
Þ

hras due to contraction of existing leaf area rather than loss of individúal:-' - .. ,'1,
leaves. On the other hand, at very low water potential, poor leaf orien-
tation due to wilting petioles and folding along the midrib did result in
poor illumination for some leaves on all shoots.
The results of CO, exchange measurements during dehydration, expressed
as percent.,of initial value, lor shoots from five plants are summarized in
figure 5.8. As xylem water potential fell below about -3.5rMPathe rate of
net CO, uptake decreased rapidly. On averagerless than 50 per'centof initj.al-
activity remained at water potentials near -5.O'IvIPa. At Lower water poten-
tials the decline was not as rapid and low rates of positive net CO, uptake
were observed at water potentials less than -11.O:MPa. After an initial
decline in the rate of dark respiration the relative rates were maintained
at high levels until water potential had fallen to between -8.0 and -9.0. MPa.
However, the errors associated with the calculation of CO, exchange rates
at very low water potentials v¡ere such that it is not possible to say
wíth any certainty, that net CO, uptake in the l-ight and CO, effl-ux in the
dark were positive ut *ut., potentials less than -9.0MPa and -8.5MPa res-
pectively. These errors are depicted in figure 5.9 which shows the response
to decreasing water potential for two of the shoots included in iigure 5.8.
The bars represent the percentage error associaÈed with the calculation of
absolute rates of net CO, exchange at low water potential.
Most of the error of measurement was due to low output from the anallrzer
when plant water potential was l-ow. The output from the gas analyzer is
independenL of the flow rate only at normal flow rates of 30-60 Iitres per
hour. fn order to avoid complications the fl-ow rate of sample and reference
air streans were maintained at not l-ess than 30 litres per hour. Air fl-ow
rates of 30-50 liLres per hour were high enough Lo maintain a CO, clifferen-
tial of 20 ppm between sample and reference air streams v¡hen the srnall amount,s
of leaf used ivere photosvnthesising at maximum rates. As net CO, uptake

Figure 5.8 RelaËive neË CO, uptake in the light and relatíve CO,
effl-r:x Ín the dark for shcot,s of field grorarrì cuttings
duríng dehydratíon in the laboratory. Most leaves on
these shoots vrere gro\¡tn under: laboraÈory conditíons durÍng
a period of rehydratíon which preceded these measurements.
For data plotted at -11 MPa water potential was in all
cases less than -il MPa, 'i:he lÍmit of the gauge on the
pressure chamber normally used.
(a) tlet CO, uptake (pe-rcent. initial value) wíÈh decreasing
\^raËer potential.
(b) CO2 efflux (percent. initial .r"tnå) with decreasing
hrater poÈential. Measurements of CO, efflux in the dark
vrere nade immediately after net CO2 uptake Ín the light
reached a steady sËaÈe.
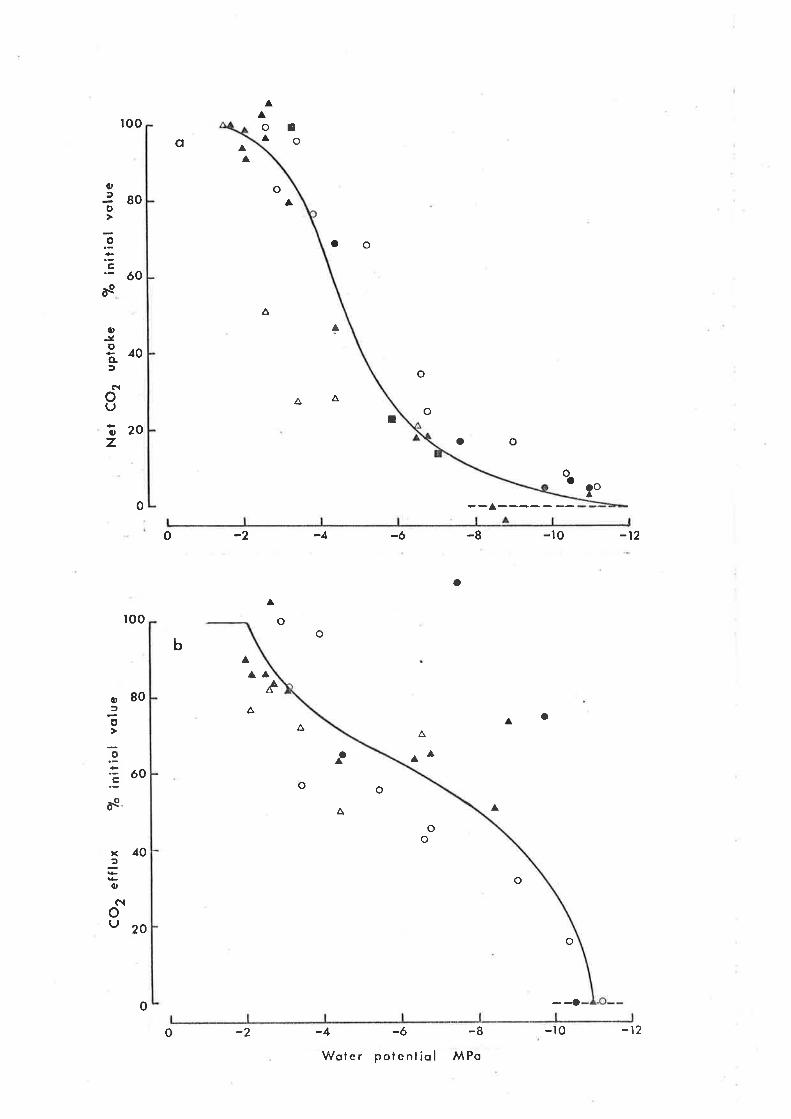
o
CO
2 ef
flux
?o in
ilìol
N oè o
o. o
Þ>
o o
vol u
e @ o
Þ a
o oo
o o
Net
CO
z up
toke
r$À
oo
Þ
I oo
7" in
¡t¡o
l vol
ueO
.@ oo
oo
uo
I NI t\)
ÞÞ
o
Þ>
o>>
ob
ool
I à I o
a
o
Þoo
I
{à o o E q lr .e O
.1 1 E
r oåa o
I æ I o
o
a o
oI ¡
I I I I I I I I Iao
I o I ñ)
Þa o
I ñ)
Figure 5.9 Net CO, uptâke and CO, efflux for two shoots on field-
gro\dn cut,tÍngs shor.ring the observed range of variability
between shoots and percentage errors associaËed with
measurement.s of CO, exchange during dehydration of shrubs
in the laborat,ory. For data p1oÈËed aË -11 MPa r,¡ater
potentials were in all cases less Ëhan -11 MPa, the
lírnit of the gauge on tire pressure chamber normally used.
(a) CO, exchange for a shooË bearing leaves gro\,ür in the
laboratory. Closed and open symbols rePresent net COt
uptake in Ëhe light and C0, efflux in the dark, respectively.
(b) CO2 exchange for a shoot wíth some field grown leaves
of unknown age. The closed tríangles represent data
for shoots with all leaves gro\^In ín the fÍeId. These
daËa r¿ere recorded duríng an iníÈía1 drying phase shortly
after shrubs were collected from the field and before
they were r^ratered. Al-1 the rates of net CO, uptake for
these shoots were significantly greater Èhan zero excePË
for the smaller of che two rates aÈ less than -11 MPa.
Symbols are otherwise as in Fígure 5.9a.

CO
Z e
xcho
nge
ng
l' !l
:r.¡
L)À
t¡o.
\@x¡
=N
crÀ
(¡õo
.ooõ
õoóo
oooo
oooo
o
q
ooo
oo
oa
o
a
-2 -
tcm
s
I N) o
o I N
o-
o
oO
oI è
{ o o
I
ðo õ. r- 9-
I @ ¡ o
l4o
I T o
I N)

l-02
decreased at low water potentials, the CO, differential could not be
maintained by decreasing the flow rate and the error associated with reading
the chart became ari increasingly greater proportion of the output from the
analyzer, with the result that many of the calculated rates at very low
water potential are no: significantly different from zero.
Hoï¡ever, f consider it probable that positive net CO, uptake by some
shoots does take ptace at water potentiaì-s less than -11. MPaand that this
could be dernonstratecl with wel-l illuminated shoots. In all cases there was
some shading of axitliary leaves as well as folding and poor orientation of
older leaves which probably represented some unused photosynthetic capacity
during measurements of net CO, uptake at low water potential. These leaves
were not deád as they regained turgor when high water potential was restored.
Their contribution to the total- net CO, uptake by the shoot under better
light conditions would i.,.r".=" the calculated rate of net photosynthesis
and more importantly the output from the analyzer, thus reducing the per-
centage error associated with the calculation. The alternative to increas-
ing irradiance to the lower l-eaves, which might be done by líning the
cuvette walls with crinkled aluminium foil, is to increase the leaf area in
the cuvette. The output from the analyzer could be increased in this way
without reducing the flow rate to the measuring cells. A cuvette designed
to accomodate several small shoots and lined with reflecting foil would
provide more prec'ise estimates of gas exchange. Increasing the leaf area
on a single shoot would simply compound the probJ-ems of self shading described
in section 5.31.
Figure 5.9 also illustrates differences betv¡een shoots due to natural
variaLion or preconditioning. Although some leaves may be capable of
positive net CO, uptake at low water potential. net CO, uptake by the shoot
as a whole may be reduced to zero at higher watér potential-s, dtte simply to
natural variation between shoots or plants. An example of such a rapid

I03
decline is shown in figure 5.9b. This resulL was unexpected as the shoot
represented was the only one used during the detrydraÈíon series which still
retained a number of field-gro\^rn leaves. These \^/ere expected to maintain
high rates of net photosynthesis at low water potential and thus contribute
more favourably to net CO, uptake by the whole shoot. However, their age was
not known and their photosynthetic capacity may have been reduced by the
apparently rapid progress of physiological ageing at high water potential
during prior rehydration (see fig. 5.5 and Section 5.4). The rates
represented by triangles in figure 5.9b are for shoots bearing field-grorvn
leaves only. These measurements were taken during the initial dryinE phase
before rehydration. AIl were measurably greaÈer than zero except for the
two lowest rates at water pot.entials less than -11.0 lvlPa.
5.4 Discussion ro4
5.41 Net CO, uFtake at high water potential
The maximum rates of neÈ CO, uptake recorded (ca.5O-1OO ,rg "*-2 =-1¡
are comparable to those reported for A. uesicar"iq, by CaIdweII et a.L. i6g77)
and. Chapman and Jacobs (1979). CaIdweII et a/. measured maximum rates at
30oC of 50-60 rrg.^-2"-1 for shoots of glasshouse grown specimens- of
A, uesicavia and.4.. confertífoLia. The irradiance used for those measure-
ments was half that used for the measurements reported in this chapter.
chapman and Jacobs reported, maximum rates between 70 and 105 ng .*-2 =-tfor individual feaves of A. uesicar'¿a.. These measurements hrere made in
spring, when xylem water potential was high, on plants growing in the field.
In this case the measured rates were based on the amount of labelted CO,
fixed by leaf segments during a 2O-second exposure and therefore represent
gross rather than net CO, uptake (Shimshi, 7969). These rates were
maintained. for only brief periods in the fieid.
The rates of net Co, uptake record.ed for shoots are an average for afl
leaves and hence are not a good indication of maxjmum leaf rates, which
are usually attained at the time l-eaves reach full expansion (e.g. Ludfow
and. V,Iilson, 1977). Field grown individuals of Atri.pleæ nwrm,LLay,i.e, for
example, were observed to photosynthesise at about 67 per cent of maximum
leaf rates (Jones et aL., 7g7o) due, in part, to the presence of young anc
ord leaves. very high net assimilation rates (NAR) of o.:1 g crn-2 d-y-1,
equal to the highest rates achieved by Helianthus annutts (l¡Jârren !,ii1son,
7966) have been recorded for young plants of A. uesicariq. (Jones et aL., 1970).
lfarren !ùilson cafculated that maximum rates of net Co, r-rptake, by whol-e pJ-ants,
-) -1of 13O ng cm - s ^ could account for the high NAR recorded for H. annLtus and
estimaterf varues of up to 18o.rg "*-2 =-1 for the most active l-eaves.
similar high rates might perhaps be expected for mature feaves of A. Des.í.aar¿e.
although they need not be as high if total respiratory losses are l-ess than

I05
those óf. H. annuLls. If the highest rates recorded here are corrected
according to the figures given for A. rnmnntLaní.a by Jones et aL (1970)
values of about 150 ng .*-' "-1
are obtained. These are within the range
estimated for H. annuus and somewhat higher .than a rate measured for apical
Ieavesof a young seedli-ngof A, uesicayia f:35 ng .--2 ".-1)
while the gas
exchange system built during this study h'as being tested. Even higher rates
night be achieved in the field during periods of high water potential in
summer. Wood (1932) observed a temperature optimum at air temperatures
between 40-45oC f<¡r net CO, uptake by shoots of fj.etd gro\,In plants. These
temperatures are tO-tSoC higher than leaf temperatures maintained during
measurements in this study and mean air temperatures prevailing during
measurements of NAR by Jones et aL. (1970). Some degree of temperature
accl-imation, however, may reduce any differences in assimilation rate at
the two temperatures (Strain, L969; Mooney and Harrison, 1970) . Caldwell
et aL., for example, observed a temperature optimum for net CO, uptake at
30oc for shoots of A. uesicaria grown in a glasshouse at or near that
temperature.
Since net CO, uptake was not measured. at high water potential before
stress was imposed it is not known whether photoslznthetic capacity was fully
regained on rehydration. Five woodland species studied by Davies and
Kozlowski (1.977) fail-ed to regain original rates of net phot-osynthesis after
a stress of less than -2.0'MFa. This result was attributed to accelerated
leaf senescence. Ludlow (1975), however,considered that if photosynthetic
recovery lagged rehydration any depression of final" maximum rates of photo-
synthesis was due tc normal dectine with leaf age. Since, for A. uesicaria
similar maximum rates were obtained for shoots both with and without a l.arge
proportíon of new growth pre-stress rates of net CO, uptake were probably
regained by stressed l-eaves.
The patter:n of recovery is similar to that described by Ashton (1956)
. 106for sugar cane recovering from repeated drying cycles between field capacity
and rpermanent wilting percentage'. Recovery, as for sal-tbush, \^ras charac-
terized by an initial rapid incrèase of net CO, uptake followed by a sl-ower
increase to pre-stress l-evel-s. The times taken to regain full photosynthetic
capacity ranged from 6 to 11 days after soil moisture was restored to field
capacity. Shoots of A. Desicar"La., in comparison, took 7-10 days to recover.
The slow recovery is clearly not due to persistent tissue water deficit
as rehyd.ration is relatively rapid. It is possible that part of the lag i¡
recovery for some shoots is due to the prod.uction of young and shaded. leaves
in the axils of existing leaves and is therefore an artefact resul-ting from
the use of shoots rather than single leaves for measurements of net CO,
uptake d.uring rehyd.ration. The photosynthetic rate of young leaves increases
with age until- they reach furl size (e.g. Ludrow and wirson, l-971). rn
this series of measurements the leaf area of all l-eaves, irrespective of
their age' \^ias used to calcutate the rate of net CO, uptake. Therefore unt-il
the proportion of leaf area contributed by young leaves becomes less as the
new and exisr-ing leaves expand the calculated rates may be low and thus
contribute to an apparent 1ag in recovery. However, judging by the equally
sl-ow recovery by one shoot (fig. 5.5, inset) on which no new leaves were
produced, due to d.eath of the meristems, apparent inhibition by 1ow
photosynthetÍc rates of young leaves is likely to account for only a small
part of the observed response. Most studies of this kind are d.one on single
leaves and therefore interpretation of the response is not complicated by the
presence of previously unstressed Leaves or leaves of different ages.
As a result of such experiments tl¡e after-eff.ect of moisture stress has
been attributed to inhibition of stomatal opening although, in some cases,
a non-stomatal component has been detected. (Boyer, I97Ib¡ Kriedemann and
Loveys, 79'75; Davies and Kozlowski, 1977). One of the theories

r07
on stomatal regulat.ion during water stress is Èhat an imbalance between
abscisic acid ûAtsA) and cytokinj¡r levels acts to promote stomatal closure
via effects on ceII permeability to inorganic ions (Itai and Benzioni,
I976). Massive accumulation of ABA during stress (e.9. Vùright and Hiron,
1969) had been considered responsible for after-effects on stomatal opening.
However, because endogerrous ABA le'¿els drop precipitously ori rehydration
Kriedemann and Loveys (1975) suggested and provided evidence that high
levels of phaseic acid, a product of ABA metabolism, contributed to both
stomatal and non-stomatal inhibitíon of photosynthesis by viñe leaves
aftel. rehydraÈion.
From the limited amount of eviderrce available so far it is not clear
whether hormonal effects play a large part in the recovery of arid zone
plants. Kriedemann and Loveys (L914) found that four arid zone species,
including two chenopods, had low initial levels of ABA which increased only
slightly during stress. They concl-uded that the low leve1s h¡ere an adap-
tation which would allow flrll use of intermittentLr¡ available water but the
slow recovery-observed for A, uesicaria in this study suggests either a
high stomatal sensi.tivity t-o low ccncentra.Lions of ÀBA (or phaseic acid) or
that high concentrations are accumulated in the leaves during stress.
Allaway and Mansfield (1970) and Davies and Kozl-ov¿ski (1971), on the other
hand, considered that an after-effect delaying stomatal opening would be an
advantage for species on dry sites in that water coul-d be conserved following
rehydration. For shallow rooLed species such as .4. uesíeari,a the benefits
of such a response may be reduced because of water loss by direct evaporation
from Lhe shalfow root zone during the period of photosynthetic recovery.
In some circumstances, horvever, the loss of water by direct evaporation
from the soil surface may be rapidly reduced if initially high rates of
evaporation and rapid drying of the surface soil lead to the establishment
of a zone of high resistance t-o water vapour oiffusion in the upper layers

r08
of the profilei (see Milthorpe, 1960)¿ Most of the soil water would then
be available for plant. use after recovery of fuLl photosynthetic potential.
fn this case an after-effect delaying stomatal opening may be an advantage
especiallV if CO, fixing mechanisms are not.inhibited. Relatively high
rates of net CO, uptake might then be achieved in the days immediately
after rain through generation of large CO, concentration gradients across
partly open stomata. This applies particularly to C4 plants in which the
rate of CO, fixation is saturated at lol intercellular CO, concentrations.
On this hypothesis, horvever, the slow recovery of. A. uesicaria implies that
stomatal opening, CO2 fixationror bothrwere strongly depressed by the
presence of inhibitors.
A second possibility is that the stomatal apparatus or enz)¡me systerns
involved in CO, fíxation sustained direct structural damage during the
severe stresses imposed.
In the absence of data on stomatal and residual or mesophyll resis-
tance to CO, uptake the exact reasons for the slow recovery of high rates
of net CO, uptake by shoots of .4. ües'Learta remain unexplained. Possibly
both stornatal and non-stomatal inhibition ¿re involved. The relatively
rapid recovery of high rates of CO2 effl-ux in the dark gives some indic-
ation that the enz)rme systems involved in respiration are less affected, if
at all, by the presence of inhibitors. A possible reason for early increases
in respiration, unrelated Èo water stress, is the daily handling of shoots
and leaves during leaf area meâsurements. Gentle mechanical stimulation
of leaves has been shown to aimost double the rate of dark respiraÈion, arì
effect which may last up to two days (pp.158-159 in EvansI L972) These l-ast
remarks also apply to Lhe interpreta.tiot-t of results on photosynthetic
response during dehydration.
Before those results are <liscussed there is one further aspect of
photosynthesis at hiEh water: poLential. observed following rehydration which

109
perhaps warrants some discussion. Figure 5.5 illustrates the photo-
synthetic response of the four topmost leaves on a shoot with damaged
meristems. A1I those leaves died within 60 days after rehydration yet
according to Charley (l-972) Èhe average life of leaves on field-grown
A. Uesícaria is about one year. The apparently premature death of the
Ieaves in question may have been a result of darnage to the meristems but
this explanation is not consistent with the observation that experimental
removal of apical meristems from individuals of some species has been shown
to defer senescence of older leaves (trIothes and Baudisch, 1958; Woofhouse'
1-974). Contrarlr to the commonly accepted belief that water stress
accelerates ageing,.Gates (1968) and Ludlow and Ng (I974)'suqgested that
physiological ageing is suspended by water stress and have presented some
evidence to support their view. If this is true then the death of leaves
hetd at high water potential in the laboratory may be due to the normal
process of ageing and the longer survival of leaves in the field a consequence
of only intermi.Ètent periods at high water potential.
It is also of interest that the leaves represented in figure 5.5
maintained relatively high rates of net CQ, uptake almost to the point of
abscission, despite obvious symptoms of senescence. In this case the leaves
were attached to a shoo! with damaged meristems. On a normal shoot rates
of CQ, uptake by ageing leaves may be even higher if they are acting as
a source of photosynthaie for younger leaves during rapid growth. High
demand from active sinks has been shown to increase the rate of photosyn-
thesis by source leaves (e.g. the flag leaf of wheat; King et aL., 1967).
On the other hand leaves attached to a normal shoot may age more rapiclly
because of the presence of an active apical meristem thus reducing any
benefit gained from higher rates of CO, uptake stimulated by demand. None-
t.heless if the behaviour illustrated in figure 5.5 is characteristic of
ageing Ieaves of A. uesicay'ia it seems that leaves of this species continue

1I0
to contribute significant amounts of photosynthate to growth or storage
until a few days before abscission.
5.42 Net CO, exchange at low water potential
The problems associated with measurement of photosynthesis by micro-
phyllous shoots at low water potential have been outlined earlier and wiII
not be discussed further here. It is clear, horvever, that leaves of
A. uesicaria are capable of positive net photosynthesis at very lorv water
potentials less than -9.0 MPa and probably, according to the data from plants
before rehydration (figure 5.9b), less than -11.0 MPa. This capacity is
comparable to that of other arid zone plants (Kappen et aL., 1972¡ odening
et aL., 19741. Net photosynthesis by shoots of Lanrea &í.uar"Lcctta, for
example, \^/as reduced to zero aL water potentials around -7.5 MPa (Odening
et aL. 19741. These water potentials, however, were taken at dawn and
therefore presumably underestimate that at the time of gas exchange
measurements. According to Moore (1977) other chenopods are also capable
of positive net CO, uptake at water potentials near *-I0.0 MPa.
The capacity for positive net photosynthesis at low water potential is
also consistent with the reports by Wood tìS:Zl of net CO, uptake in summer
at Koonarnore and by Chapman and Jacobs (1979) of fixation of labelled CO,
in autumn at Fowler's Gap in N.S.Ví. In both cases water stress was likely
to have been high although in the first case Wood was unabl-e to measure
v¡ater potential and in the second Chapman and Jacobs \¡/ere able to inclicate
only that xylem water potential was l-ess than -4.0 MPa, the limit of their
instrument. The maximum rates recorded were 20 nn "*-'=-t (wood) and
_) _-l35-40 ng cm ' s ' (Chapman and Jacobs) . The latter represent gross rather
than net photosynthesis and were maintained only for brief periods in the
field as was the case for measurements at high water potential, described ear-
lier. Tt is notable that for two of the three days on which COruptake was rec-
orded maximum activity occurred near the middte of the day when water potentials
111\,rrere lìkely to have been at a minimum.
The figures given by Wood are probably underestimates of potential
net CO^ uptake. The photosynthetic rate observed, in conjunction with thez
Iow flow rate (10 L h-1) and large leaf area (1OO cm2) used for measurement,
would have been sufficient to reduce the COr'concentration around the shoot
to at least 85 ppm. Since the air enteríng the enclc=ing glass vessel was
not recirculated. over the shoot, CO, concentration may have been much lower
in tlre vicinity of the leaves. aOZ concentration of this order are well
below even the intercellular space COz concentration (ca 150 ppm) observed
by CaIdweII et aL. (1,977) to saturate the rate of net CO. uptake by shoots¿
of. A. Desicay"La.. An intercellular concentration of 85 ppm would clepress
the rate of net CO, uptake by 15 per cent in which case the rates of net
photosynthesis observed by Wood underestimated. the potential rate by at
least that amount. Self-shading in a shoot of the size used would afso have
contributed to a low estimate for net CO, uPtake per unit leaf area.
Water potentials of the plants used were probably low as Osborn et aL.
(1932) had observed many wiJ-ting plants in the same area at the end of
the previous year. Water potentiais of about -l-0.0 to -l-l-.0 ¡4Pa hrere
required to produce such symptoms of water stress in laboratory grown shoots.
Since l{ood3 measurements were made at the end of a sequence of years rvith
below average rainfaff and as most of the rain fell early in the year of
observation xylem water potential was probably very 1ow. For example, some
plants with dawn wate:: potentials of fess than -11-.0 MPa were observed in
1977, when rainfall was below average, in tLre middl-e of a sequence of years
of high rainfall. Woocls figure of 20 r',g "*-2 =-1 fot net Co. uptake per¿
unit leaf area is simil-ar to those repcrted here for laboratory grovrn shooLs
at water potentials of -4 to -5 MPa and for fiefd grown shoots at water
potentials of about -8 MPa (fig. 5.9). Because of the higher degree of self-
shading ancl poorer ventil.ation, estimates of net CO, uptaker at any given
water potential, made under the conditions used by Wood would be fow in

LT2
compa;ison with those reported in this chapter. A combination of these
results suggests that figures obtai¡red for laboratory grown shoots
under-estimate the photosynthetic capacity of shoots at low v/ater potential
in the field.
this view is supported by results for other species. Maize leaves
are not normally capable of net photosynthesis at less than -l-.5 MPa when
grohrrì at high water potential in controlled environments but have been
shown to continue positive net photosynthesis at water potentials approaching
-4.0 MPa in the field (Ludl-ow, 1976). The capacity for net photosynthesis
at low water potential is increased by pre-conditioning leaves to water
stress during and after growth, a process which decreases stomatal
sensitivity to water stress (McCree,7974; Brown et czL., Lg76). This is
n<¡t Iíkely to be a benefit, however, unless non-stomatal aspects of
photosynthesis are relatively unaffected at the lower rvater potentials
cleveloped before stomatal .to=rrt.. Other effects of growth at mild or
moderate levefs of stress are an increase in leaf thickness and a more
compact mesophyll, leaf characteristics which according to Cunninghair, and
Strain (1969) increase the water use efficiency and allow positive net
photosynthesis for longer, al-though at a reduced rate. The ability of stomata
to remain partly open at low water potential is possibly a function of the
size of guard cel-ls. Cut1er et aL.(l-977) suggested that there is an
increase,l capacity for turgor maintenance in small cell-s, often developed
as a result of growth during mild stress, due to their ability to maintain
lower celluf ar osmotic potentials. These three responses to interm-i-ttent
mild or moderate stress during gr:owth interact to conserve water; they
a1lolv moderate rates of net CO, uptake at relatively high water potential
further into the d.ry season and, since some turgor is maintaíned, some
uptake at low water potential.

1r3
There is a good deal more work to be done before the limits to
photosynthetic production by .4. Ðesiear"ia are established. Some
suggestions for further r.rork are made in chapter 8. It is clear, hou/ever,
that individual shoots are capable of positive net photosynthesis at
very low water potential and that there is some inhibition of photosynthesis
during and after rehydration.
I14
CHAPTER 6
6 Growth responses to declining water potential
6. I Introduction
One of thé bases of the conceptuaf moaef of primary production in arid
ecosysÈems presented by Noy-Meir (1973) is that growth occurs mainly in
short pulses when conditions are favourable foilowing rainfall. This is
so particularly in warm arid regions where falfs of rain may be separated
by intervals much longer than the relaxation time of the system in response
to individual events. A large proportion of net production by drought
persistent species, which are considered to retain at least a residual
ability to fix CO, throughout the dry seasonf must therefore be translocated
to reserves. As far as can be assessed from the results presented in
chapters 3 and 5 .4. Uesicar,ía behaves in the way expected of drought
persistent plants in that net CO, uptake continues at low water potential
and non-structural carbohydrates accumul-ate at times of low rainfall.
For a given species the time available for the accumulation of reserve
carbohydrate will depend on the sensitivity of growth processes, as well
as net CO^ fixation, to decreasing water pttentiat. In this chapter unless¿
otherwise indicated, the term growth is intended to include those processes
which result in an increase in plant size as distinct from an increase in
dry weight. Such processes include root elongation, shoot extension and the
production and irreversible expansion of leaves. Tn most circumstances
the production of new str:uctural material during growth is accompanied by
an increase in total plant dry weight although if reserve materiafs are
used to support new grorvLh total dry weight may be temporarily reduced.
The response of the growth processes described above to decreasing
water potential has been used as a guide to the timing of reserve accum-
ulation ín A. uesicaría.. Reductions in gr:owth rate have been taken as an

J-l_5
indication of the diversion of newly fixed assimil-ates to storage. Vlhile
the diversion of all current photosynthate from synthetic processes does
not necessarily coincide with the cessation of growth as measured by shoot
extension for example, references cited in Hsiao (1973) show that metabolic
activities such as protein and cell wall synthesis are markedly reduced by
small water deficits. A comparison of various physiological processes
reveals that synthetic activitl', although l-ess sensitive to decreasing
water potential than growth, is substantially reduced at similar high
water potentials.
Judging by the information given in various reviews (e.9. Slavik, L975;
Ludlow, L9'16; Boyer 1977) studies on the dependence of growth on water
potential are largely restricted to those of crop and pasture plants, many
of which are mesophytes. From the data available it appears that growth
of such species is highfy sensitive to water stress. Acevedo et aL. (f971)
de¡nonstrated a reduction in the rate of laminar extension in maize pJ-ants
at v"eter po+-ential.s as high as -0.28 MPa. Boyer (1970) found that water
potentials of -0.4 MPa were sufficient to reduce the rate of leaf expansion
of soybean and maize to about 33 and 25 per cent that of wel-l watered
controls respectively. Expansion of sunflower leaves was stopped completell'
by similar water potentials. Net photosynthesis was unaffected by the
mild stresses invol-ved during Lhe early stages of dehydration and altLiough
leaves of soybean continued to expand at a very low rate until water poten-
tial had fal-len to between -I.6 and -2.0 lttPa net Co, uptake was observed at
water potentials beyond -4.0 MPa.
The degree of water stress resulting in reduced grorvth rates in the
crop plants referred to above is not likely to be common to afl species.
Boyer (L977) pointed out that leaves at the tops of tall trees and those of
halophytes are abte to expand rapidì-y even though water potential may always
be less than -0.4 MPa. Xylem water: potentials of 1. uesicaz'ía (Ch. 7)
116
have rarely been observed to approach the high values reported for crop
species. Ho\^¡ever, since growth depends on turgor potential rather than
directly on total water potential, cell growth at water potentials lower
than the limiting values observed for mesophytes can take place if high
turgor potentials are developed in response to low intracellular osmotic
potentials. The low water potentials Ín .4. uesiear|a, Ieaves are partly
due to high concentrations of inorganic ions in Èhe lamina (Osmond unpubl.
p234 in Osmond et aL., 1980). The results of several series of measurements
on growth responses of. A. uesicar"ia to decreasing water and turgor potential
are described in the following pages. Since growtlr following the relief
of water stress may result in a demand for stored carbohydrate, as ouL-
lined in earlier chapters, data on growth responses, particularly leaf
expansion, following irrigation of droughted plants have also been
included here.
117
6.2 i"lethods
Two sets of measurements on leaf area are reported in this chapter.
The leaf area of shoots selected for measurements of net CO, uptake (Ch.5)
v¡as recorded daíly while shrubs v¡ere recovering from a period of water
stress. After recovery was complete water was withheld and the leaf area
of similar shoots was rnonitored as water poterrtial declined" Details of
the conditions at the time rneasurements were taken have already been des-
cribed in Section 5.21. The shrubs used were 3-year-old cuttíngs gro$¡n
for most of their life in the field. During the drying cycle they were
kept under lighr-s in a laboratory where temperature and humidity were not
controlled.
In a second series of measurements the expansion of individual young
leaves and shoot and root extension were mouitored as xylem water potential
decreased after water was withheld from young plants grown in containers
with transparent walls. These pJ-ants were four-month-old seedlings grohtn
in a temperature controlled glasshouse at Adel-aide. Temperature regulation
did not provide precise control but prevented air temperature from rising
above 30oC during Lhe day an<i falling below 22oC at night. SupplemenLary
light, I00 ,,E "*-2 s-I ut the top of the canopy was provided by a Metafarc
Iamp (sytvania GTE) for 16 hours per day. The young seedlings r^/ere grown
in 2.5-Iitre square-sided glass containers holding about 5kg of air-dry
sand from the Koonamore area. The planLs were transferred to these con-
tainers two weeks before the start of the experiment and supplied with
enough water to wet the soil to within 1 cm of the botÈom of the container.
The final weight was maintaíned by watering daily, if necessary, until the
start of the experirnent. water was withheLd when the first roots appeared
at the walls of the conta-iner.
Similar measurements were fater made on a single 2-year-o1d seedling
grown under similar conditions in a perspex container of dimensions

ltB
50 x 30 x 30 cm. This shrub was transplanted one month before the start of
routine measurements. The size of this shrub allowed more frequent sampling
for xylem water potential during the course of the experiment. In all
cases the sides of the containers were shielded from Iight between measure-
ments of root growth,which took less than 15 minutes per day.
Most of the methods used to monitor growth have been described prev-
iously. The use of liqht sensitive paper to estimate leaf area, for example,
was outlined in chapter 5. Shoot extension \ilas measured directly with a
millimetre rule rather than from photographs (cf Ch.4.) Root growth
measurements were done in the same way as in observation pits in the field
but in this case measurements were taken directly from the transparent
faces of the containers in which plants \¡¡ere grov¡n without Èransferring the
pattern of growth onto plastic sheeÈs. A temporary record of root growth
was kept by marking the extenL and pattern of root growth on the sides
of the contaíners.
Xylem water potentials were measured with a pressure chamber. This
instrument was also used to estimate osmotic and hence turgor potentials
of shoots at intervals during the drying cyc1e. The average osmotic poten-
tial of the leaves on small shoots was estimated from a pressure-vol-ume
curve (Scholander et aL., 1965) a relationship betwee¡t pressure applied
to the shoot and the cumulative volume of sap expressed from the cut
surface at successively higher pressures. The intercept on Lhe ordinate
forrned by extrapolation of the linear section of a pressure-volume curve
estimates l-he osmotic potential of the leaf cells at the tine the shoot was
removed from the plant. Turgor potential can then be calculated as the
difference between the initial balance point and the esti¡nated osmotic
potential. Tyree and Hammel (L972) have provided a detailed account of the
theory on which these estimates are based.

r19
rlet CO, uptake was also measured at intervals. The conditions
during measurement were the same as those described earlier for field
grown cuttings (see Ch. 5).

l_20
6.3 Results
6.31 Growth responses to decreasing vrater potential
The data presented in this section represent measurements on shoots
from field grown cuttings and glasshouse grown seedlings. The terminal
portions of shoots on cuttings were, however, gro\,rrn entirely in the laboratory
over a period of between 15 - 20 days while shrubs were recovering from a
water stress of less than -1I.0 llPa. After rehydration xylem'.¡ater potential
y¡as, on average, about -2.2 þLPa. Figure 6.1 shows the decrease in leaf area
on several shoots during the foffowing dehydration phase. As noted earlier
(Ch. 5) no leaves were lost and therefore any decrease in Ieaf area was due
to contraction of existing leaves. Leaf areas are expressed as percent.
of maximum value and graphed as a function of xylem water potential.
Because leaf areas were measured at intervals of several days, particularly
during the early stages of dehydration, the maximum leaf area on which
percentage areas are based may underestimate the true value slightly if
leaf area peaked dr-rring one of the intervals. ft appears thaL little if
any leaf expansion occurred at water potentials less than about -2.0 MPa.
The xylem water potentials associated witt¡. the values for percentage leaf
area \¡¡ere measured during the light period and hence, because leaf growth
is more likely to be correlated with dawn water potentiaÌ, the limiting
value may be even hiqher. It is not clear from these measurements, however,
whether the growth of young leaves was completely inhibited at such high
water potentials or whether the contractions of older leaves was sufficient
to mask continuing growth of young apical or axilliary leaves. Nonetheless,
growth rates during dehydration were substantially reduced in contparison
with those measured during and after rehydration when water potential
was maintained at values of. -2.0 MPa or higher (see Section 6.32).
Figures 6.2 a-e ill-ust¡:ate the growth of roots, stems and individual

r00
50
a
oo
A
A
o -2 -4 -6 -8 -t0 -12
Woler potenliol MPo
Leaf atea (percent. maxfmum val-ue) of shoots of fleld-
groürn cuttíngs durlig dehydratlon of shrubs in the
laboratory. All leaves were grovrrt under l-aboratory
conditíons during prior rehydratlon.
àa
ao o
^"90)rioE
-o 80o-
70
ó0
oc,
o
oc,
Fígure 6.1
T2I
young leaves of the glasshouse gro\Á/n seedlings as water potenti-I decreased
over a periocl of about 30 days. Fígures 6.2 a-d describe the response of
four 3-to 4-month-old seedlings. Althoughconditions were the same for
all of these seedlings and water was withhetrd at the same time, dehydration
proceeded at different raÈes. Because of the variati.on from day to day
between plants the data from each plant are presented separately. Figure
6.2e shows the response of the 2-year-old seedling. Each figure consists
of a set of four diagrarns depicting root growth, shoot elongation, leaf
expansion and water potential, numbered (i) - (iv) respectively. Water
potentials (iv) for the younger seedlings (a-d) prior to day 14 were meas-
ured in mid morning. On a1l other occasions readings were taken at dawn.
lVater potential diagrams ín figures 6.2a and 6.2e also incorporate data
on net CO, uptake and turgor potential respectively.
The results of measurements on these seedlings confirm the conclusion
drawn from the data in figure 6.1 that growth of saltbush is sensitive to
relatively high water potentials. The vertical Iines intersecting the dia-
grams in these figures show, approximately, the day when xylem water poten-
tial had fallen tc¡ -3.0 MPa, a vaJ-ue to whích no special biological signif-
icance is attached. ft is intended mainly as a reference point, although
under the conditions used in this experiment growth ceased at water poLent-
ials near that value. Leaf expansion (iii), for example, stopped shortly
before or shortly afr-er water potential had fa1len to -3.0 MPa. fn figures
6.2 a-d rates of leaf expansiorr (mm2 per day) for individual leaves are
graphed separately. Values were calculated from mean areas based on 5 images
per leaf. Those shown are for the second unfolded leaf below the apex on
a given shoot and the inverted arro\^,¡ indicates the day on which Ieaf area
of the youngest unfolded leaf reached a maximum. Growth rates for the latter
are not plotted. An inverted tríangle replaces the symbol locating the rate
of leaf expansion on the corresponcìi.ng day for bhe older l-eaves. Beyond the
122
days denoted in that manner Leaf area declined. The vertical ba:s represent
the least significant difference (P<0.05) between rates of leaf expansion on
successive days.
In figure 6.2e (iii) each graph depicts the mean rate of expansion
of 5 leaves (5 images per leaf). The open symbols describe the response
of the youngest unfolded leaf and the closed symbols that of the leaf on the
node immediately below.
Apart from the high sensitivity of leaf growth to decreasing water
potential the most striking feature of the data is the fluctuation in leaf
expansion rate from day to day and the differences between leaves on the
same plant. On some days the area of one leaf increased while that of a
second decLined. It should be noted, however, that in these diagrams a
positive expansion rate immediately following a negative value does not
necessarily imply leaf growth. The positive values on days 22 and 23 for
leaf I in figure 6.2a, for example, represent only a partial recovery of
the decline in Leaf area from the maximum reached on day 18. Even earlier
in the dehydration phase, I-3 days were sometimes required for the previous
peak in leaf area Lo be regained foJ-lowing.a decline. In most cases the
older leaves stopped expanding several <lays before the cessation of growth
by the youngest unfolded leaves. Xylem water potentials at that stage were
often higher than -2.0 MPa.
Fluctuations in stem length and differences between similar shoots on
the same plant wer:e also evident during dehydration. Stem lengths, expressed
as percent. of initial length, for individuaL shoots of the four young
seedlings are graphed separately in figures 6.2 a-d (ii) while the ciata in
figure 6.2e are mean values basecl on 5 shoots from the two-1zear-old seedling.
Stem growth was sensitive to rel-atively high water potentials and elongation
ceased at water potentials similar to those which stopped leaf expansion and
in some cases well before the nominal value of -3.0 MPa. The rnean and

123
standard deviation of the increase in length for all shoots up to the tine
plants \¡rere rehratered was ]3.:1S.4 mm. Although shoots produced between
2 and 6 leaves during that time, as judged by the nurnber of unfolded leaves,
these remained clustered near the apex and most elongation was confined to
the internodes immediately below.
The topmost diagram (i) in each figure il-Iustrates the pattern of root
growth as water potential decreased. In all figures the closed symbols rep-
resent the maximum daily rate of grovrth (mm) by an individual root and the
open symbols, the total new root length (mm) produced since the previous
day. The scales for these two variables differ in some of the diagrams.
Day to day variation in root growth rate and the amount of new growth
was considerable even when water potential was high during the early stages
of dehydration. As was the case for growth of above ground parts, root
elongation was reduced to zero shortly before or shortly after water poten-
tial decreased to -3.0 MPa. There was, however, one exception. Root
production by the 2-year-old seedling (fig.6.2el continued until day 22
when xylem water potential was slightly less than -6.0 MPa. The growth
recorded between days 19 and 22 was restricted to a small area on one face
of the perspex container and was preceded by several days during which no
root growth was observed.
l{hereas growth of boLh fi.eld grown cuttings arrd glasshouse grown seed-
lings was, in most cases, reduced to zero at relatively high water potentials
the rate of net CO, uptake was unaffected at similar values and uptake,
although at reduced ratesr $¡as observed at water potentials as low as -7.I l'1Pa
Figure 6.2a (iv) depicts the raLe of net CO, uPLake at both high and low
water potential. Rates of net CO2 uptake by the two-year-ofd seedling were
also measured while the plant ma-intained a high water potential but these are
not presented in graphicaJ- form. A fault, which could not be repaired irnmed-
iately, developed in the gas analyzer on day 18 and hence no subsequent

Ffgure 6.2 Growth responses of glasshouse-gror¡rn seedlings to decliníng
water potentÍal measured for up Èo 30 days'after rüater was
r^/Íthheld. Five ful-l page diagrams (a) - (e) Ín sequence
for four 3-month-o1d seedlíngs (a) - (d) and one two-year-old
seedlíng (").
(a)
(í) Maxínum rate of elongation by an indivídual root and
total ner¡/ root length observed through the t.ransparent
walls of the container.
(il) Shoot lengLh (percent. inítia1 value) for tr¿o shooËs.
(iii¡ Rate of leaf expansion (t*2¿-1) for two leaves.
Leaf area began Èo finally decline on the day indicated
by the i-nvert.ed triangles. The arror¡/ shows the day leaf
area began to deeline for the youngest exparrded leaf
(data not ploÈted). LSD, P < 0.05, for comparison of
rates of leaf expansion over time.
(ív) I^laËer potentíal of representatíve shoots and net C0,
uptake by a single small shooÈ. I,Iater potentials recorded
at dawn except those prior to day 14 r¿hich were rneasured
several hours after dawn.

Leof
exp
onrio
n t.2
d-l
l,ToN
Ào.
É
Sho
ot le
ngth
% ¡
nitio
l vo
lue
Mox
. ro
ol g
row
lh t
- d-
lo
-o
oN
ÀO
.@oo
ooo o
MP
o O
lent
iol
Wot
er p
o
oo Net
}\)ü
)À9r
oooo
ooffi
llrll
o@o.
!No
.g
x,èo
@o
oooo
o N) ò ô @
I oo oõ =,s õ-
o.{ o-
@o :. t
ì.)(o
o
c I \b I I I a q þ q \
o-í
:o
t-{
o---
oo I I t I I I I I I I I I I t I I I I I I I I I I I
b I I I e L Y I I ö I t ¡ b t I ¡ þ ì I I I t I I
I I I I_-
----
----
---{
N N)
N À N o. N)
cû c) oo o
àO.@
ooo
CO
z up
loke
.,n-2
,-l
o
Tol
ol n
ew r
oot
leng
f h
mm
o
n9
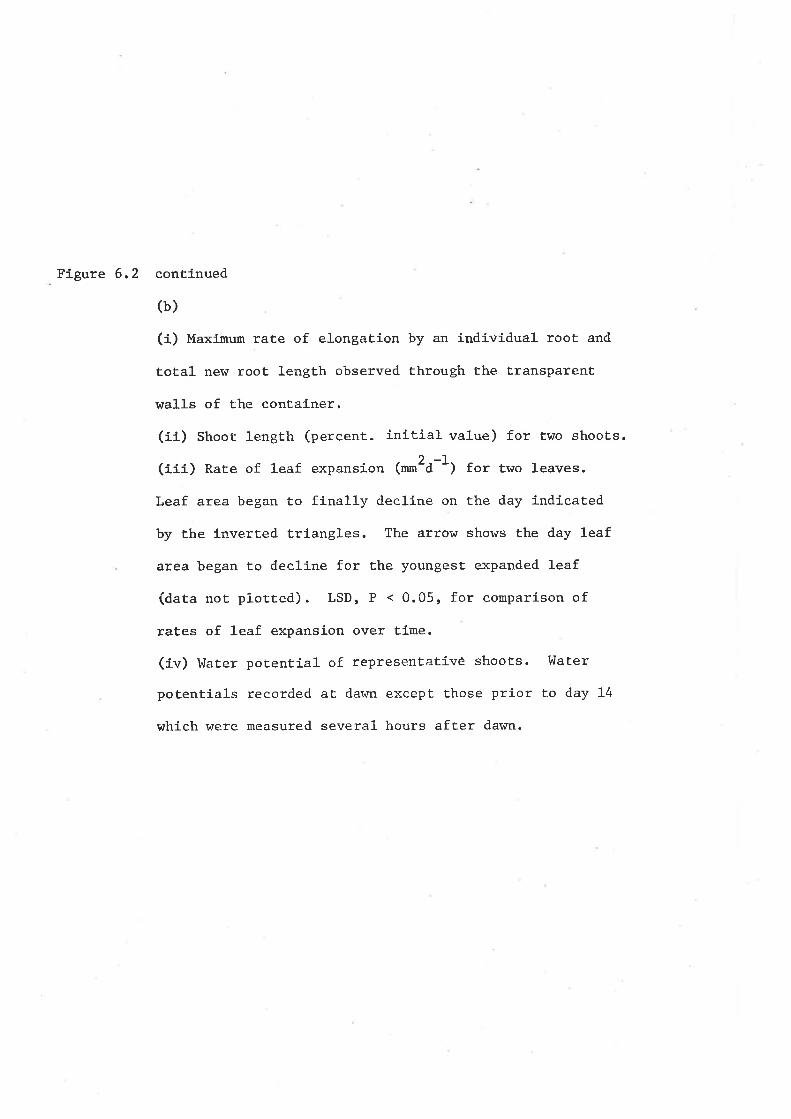
Figure 6.2 continued
(b)
(i) Maxírnum rate of elongaÈíon by an índividual rooÈ and
total- new root length observed through the transparent
walls of the conËainer.
(íi) Shoot length (percent. initiai value) for two shoots.
(iii) Rate of leaf expansion (*n2¿-1) for two leaves.
Leaf area began to finally declíne on the day indÍcated
by the inverted tríangles. The arrol¡I shows Ehe day leaf
area began to decline for the youngest expanded leaf
(data not plotted). LSD, P < 0.05, for comparíson of
rates of leaf expansíon over time.
(ív) IlaËer potential of rePresentativê shoots. tr{ater
potentials recorded aE dar¡n except those príor to day 14
which ¡nrere measured several hours afËer dawn.

Wol
erot
enlio
lM
Po
Leof
exp
onsi
on
-.2
d-l
,to'.,
Sho
ot l
engl
ha
?" ¡
nit¡
ol v
olue
Ol\,
)!O
.@oo
ooo
t_t_
¡_T
-l
Mox
. ro
ol g
row
lh m
m
Nü'
è(¡
oooo
o
d-P
I oI o
l,:ot
!o.
\oo
.l' I a I i
0 o o õ- { o o :. f (o
o
,o
-:P
{ b-__
]---
----
-'o
o-
--:o
----
>O
I I o I I I ö L ö I I , I o , , I
\ ló
]--{
oa oË
à8tg
BT
otol
new
roo
l len
glh
mm
o

FÍgure 6.2 contínued
(c)
(i) Maxiurum rate of elongaËíon by an indívidual rooÈ and
total nerü root l-ength observed through the transparcnÈ
wa1ls of the container.
(íi) Shoot length (percent. initial value) for two shoots.
(iÍi) Rate of leaf expansion (o*2¿-1) for two leaves.
Leaf area began to fínally decline on Ëhe day indicated
by the inverted triangles. The arroüi shows the day leaf
area began to decline for the youngest expanded leaf
(daËa not plotted). LSD, P < 0.05, for comparison of
rates of leaf expansion over tÍme.
(iv) I¡ater potential of represenÈative shoots. llater
potentials recorded at. dawn except those prior to day 14
which r^¡ere measured several hours after dawn.
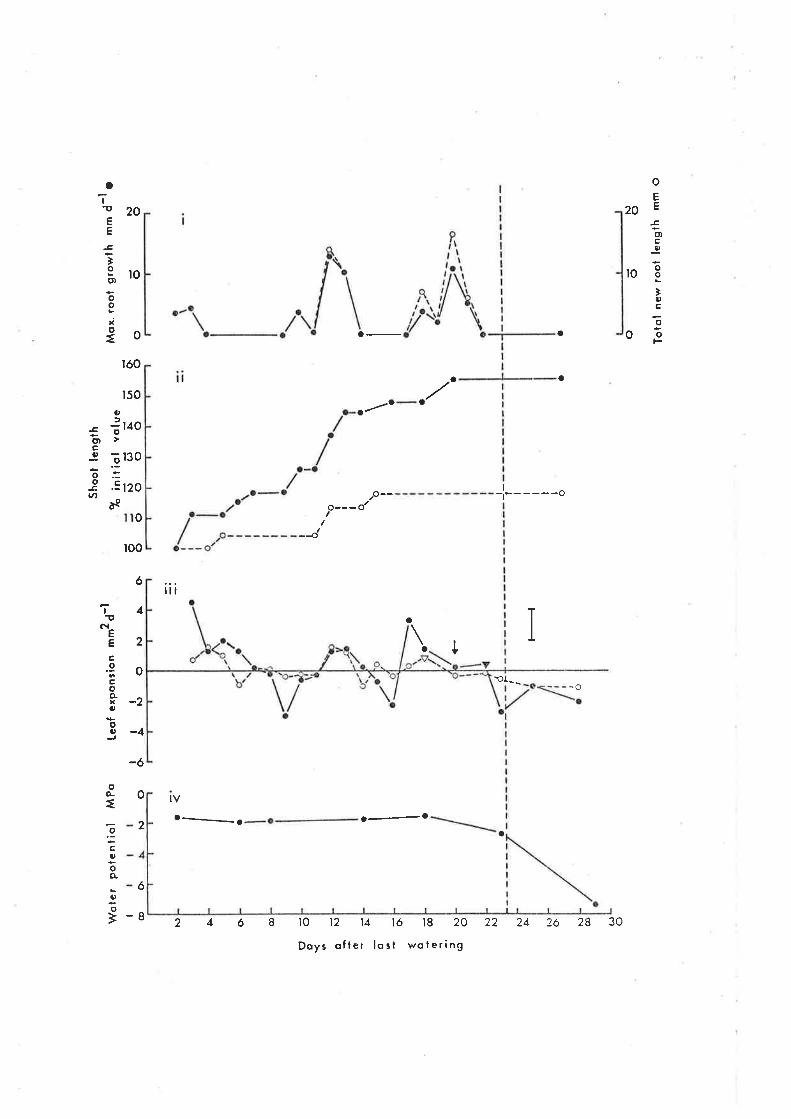
oE
20EË,c1'
to -8
Ìc)c
Eo-oF
20
ro
aI-(,
EE
3Ìoqt
oo
xof
140
130
a,)=otD>Car-
o
o.:OcÉat,
ðe
120
0
roo
6
î41t
ôaE,Ê.30goox-la,
o_g -4
-6
o
6
oÈf
.9c0oo{toì 24ó8
-¿
oo
l0 t2 14 ló l8 20
Doyr ofler losl wolering
a
-l-- ----o
-o
a-o
¡óo
150
a
./'
,o--o'o---
jo
lil
IV
o__a
to
'ol-_
o
2
24 26 28 3022-8
Fígure 6.2 contlnued
(d)
(i) t"taxirnum rat,e of elongation by an indÍvidual root and
total ne!í root length observed through the transparent
walls of the contai-ner.
(ii) Shoot length (percent. íniÈial value) for two shoots.
(fif) Rate of 1-eaf expansion (o-2¿-1) for two leaves.
Leaf area began to finally decline on the day indÍcated
by the inr¡erted tríangles. The arroüI shows the day leaf
area began to decllne for the youngest exPanded leaf
(data not plotted). LSD, P < 0.05, for comparíson of
rates of leaf expansíon over tirne.
(ív) !üater poEential of representatÍve shoots. Water
potentials recorded aË dawn except those prior to day 14
which r¡rere measrrred severa-l hours after dawn.
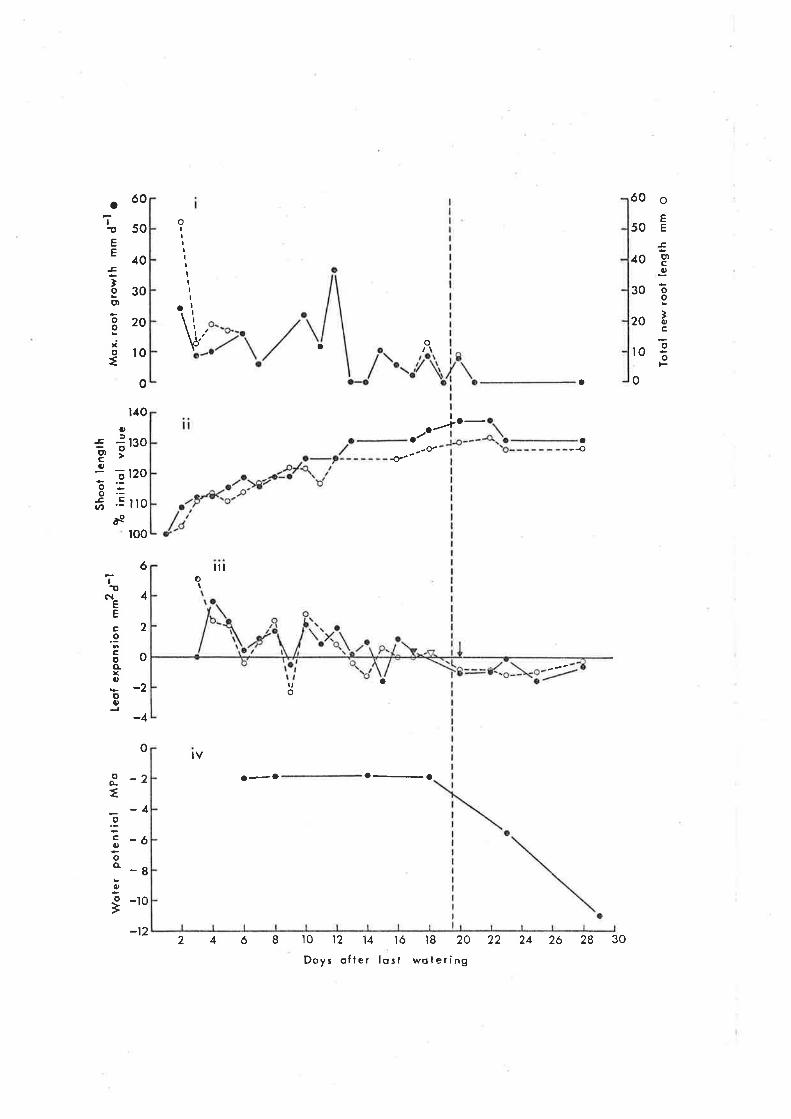
oo
MP
o I l\)I \)
tlrt
O@
GÀ
Wol
er p
oten
liol
Leof
exp
onsi
on r
nrn2
d-l
l.Lor
eÀo.
Sho
ot l
engt
h
% ¡
n¡tio
l vo
luc
l\J(,
)Èoo
oo
t I t Ia
a \- I
I ò
Mox
. ro
ol g
row
lh .
. d-
l o
Ñ)(
tèt¡
o\oo
oooo
ã._
_-__
_---
-o
o o
N) ! o. o
-o
o
o
I o a
o:go o oN
)=ô o
ô{ o-
@o :. ;ts
t.J NJ t\) È N) o. N) o (J o
I I ¡
)o
l9G
)èU
rôoo
oooo
Tol
ol n
ew r
oot
!eng
th m
m o
ao o

Ffgure 6.2 contínued
(e)
(í) Maximum rate of elongation by an individual- root and
total ner^r root lengËh observed through Ëhe transparent
walls of the container.
(ii) Mean shoot length (percent. iniÈial value) for
5 shooËs. LSD, P < 0.05.
(iii¡ Mean rate of leaf expansíon for 5 leaves. Open
circles represent the youngest exPanded leaf and closed
cÍrcles the leaf on Ëhe node immedíately below.
LSD, P < 0.05 for comparison of rneans over time.
(iv) Total water potentíal and turgor poÈential of
representatíve shooÈd recorded at dawn.
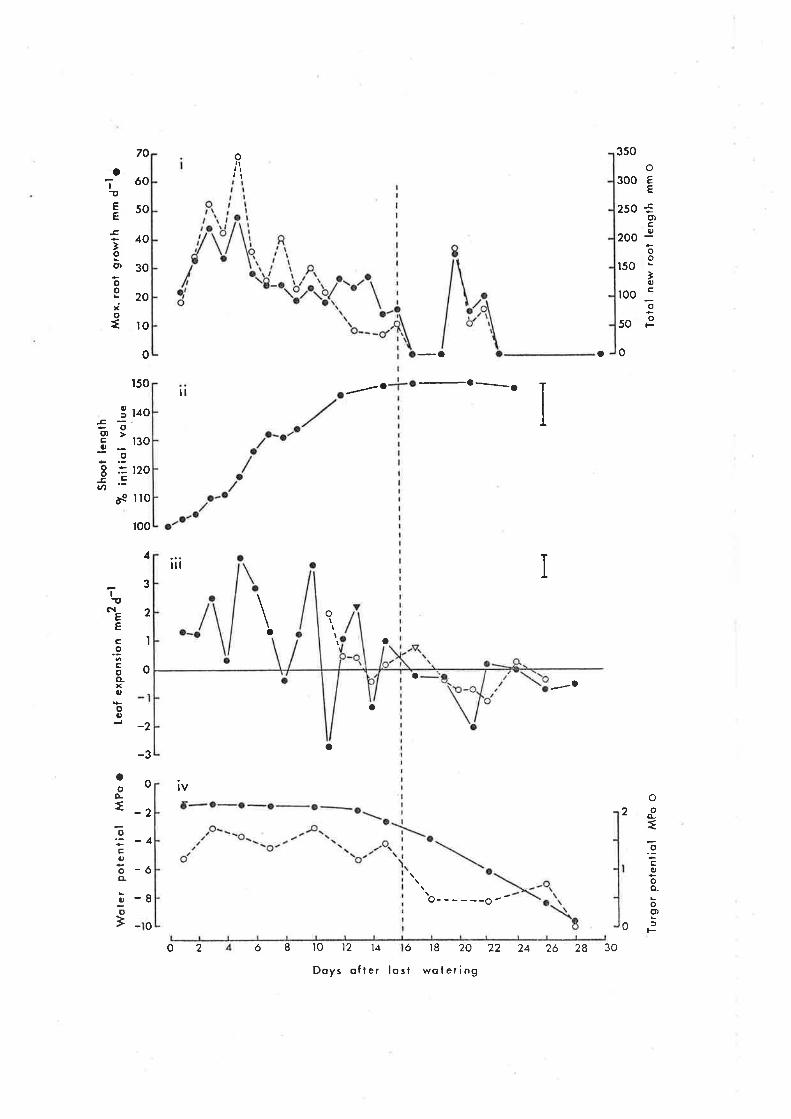
Wol
er p
oten
tiol
MP
o o
Leof
exp
onsi
on t.
2d-l
Sho
ot le
ngth
% ¡
n¡tio
l vo
lue
Ol\)
(rÈ
oooo
o
Mox
. ro
ol g
row
lh m
. d-
l¡
tN(r
Àut
o.\
oooo
oooo
o
o N) è N o. 1..)
@ (j o
rlrll
O@
O.\N
)
Þ
llO
L)N
ON
o¡! ,-
"o
l.J
----
:oo @ o N è o. õ N
) o }.J N
./
0 o o o ó- { o o :. f (o
O
\ a l o l o
aO
o
I ao' ¡ I I I I l o \ I
H
\ o
o oo
(ì-l\
)l\)a
JL)
ö839
888
loto
l ne
w r
ool
leng
th m
m O
Tur
gor
pote
nlio
l MP
o o

124
measurements h¡ere made. By day 15, however, when xylem water pouential was
-2.6 MPa and growth rates were markedly reduced,the rate of net photosynthesis
was stitl 51.5 ng.*-t "-t,
80 per cent of the mean maximum value cal-culated
from,.,,measur,ements, made earlier.
As noted in the introduction, growth is more likely to be related to
turgor potential than total water potential. Some data on turgor potentials
during dehydration are shown in figure 6.2e (iv). There appears to be no
consistent relatíonship between fluctuations in growth and turgor potential'
It is clear, nevertheless, that turgor is not reduced to zero unt.il wel-1 after
growth stops. Turgor poÈentials of the younger seedl-ings were estimated
less regularly for any given plant bub are consistent with those presented
in figure 6.2e. The highest recorded values (I.18 to I.40 MPa) are within
the range of those observed for the ol-der seedling (1.17 to f.75 MPa)
However, while turgor was not reduced io zero untÍI tot.al water potential
had fallen to between -8.4 and -9.7 l4Pa in the latter, one of the younger
seedlings had lost all turgcr by the time water potential had falle¡r to
-7.3 MPa. Records for that seedling were not Çaken reguJ-arly enough to
establish the water potential at which turgor was reduced to zero but it was
probably close to -7.3 MPa as another seeciling from the same group main-
tained a turgor of 0.55 MPa when total water potential was -7.I MPa. In
that instance also, some turgor was naintained weII afÈer growth had
ceased.
6.32 Growth responses to irr:'.gation
Some inclication of the rapid prorJurction of leaf area during rehydration
fotlowing a period of severe water stress wa.s given in figure 5.3b which
showed the daily increases in l-eaf area of two shoots from a field grown
cutting. Those clata are given in figure 6.3 which also includes data
from most of the shrubs used for the series of measuremerrts of net CO, upt-ake
described in chapter 5. Because of the hiç¡h degree of variability betvreen

230
220
2ro
200
ì90
r80
170
ló0
r50
r40
t20
ll0
roo
Figure 6.3
^
IA
Â
tl,to
E
:i-o
ooo
oo
A
Atr
a
I o/
o
2 4 12
Doys ofter wotering
Leaf area (percent. initial value) for shooËs on field grown
cuttings during and after rehydratíon in the laboratory.
The open circles show the increase in leaf area of a shoot
with apical and axillary meristems killed by water stress
and the open squares show that for a sample of 5 leaves
from dífferent shoot.s of a 2-year-o1d glasshouse gro\^rn
seedling. The remainíng symbol-s represent the increase
Ín total leaf area of shoots due to. the expansion of
exisÈing leaves and the production of new leaves.
oA
t30o
oI
r086
oA
o

L25
Shoots, leaf areas, expressed as percent. of initial value, have been
plotted individualty and a number of curves fitted by eye. For most shoots
Ieaf area increase was due to expansion of both existing and new leaves. the
open circles represent a shoot which did noÈ produce any new leaves. The
relatively low rate of increase in leaf area observed for that shoot is not
necessarily characteristic of the response of indivídual leaves. The
open sguares depicting the mean increase in area of a sample of young leaves
from the two-year-o1d seedling described earlier show that the rate of
increase in area of those leaves is similar to that for a shoot which
doubLed its leaf area in 4 days. The area of one of the leaves in the sample
doubled in 3 days. The central group may represent a more usual response.
However, the tiny leaves enclosing the apices of at least one of the shoots
in that group were damaged at the very l-ow water potentials reached before
irrigation. Other shoots in that group may also have sustained sufficient
damage to inhibit their initial development immedíately after irrigation.
Water potenÈials of the glasshouse gro'dn seedJ-ings fel-l to between
-7.I and -I1.0 MPa during the dehydration phase. Inihen these plants were
rev¡atered both water potential and leaf area were monitored for up to 3 days.
Figures 6.4a and b show the observed increases in water potential and leaf
area respectively during the first 30 hours. Data on mean leaf area of a
sample of 5 leaves and xylem \n¡ater potential of one of the field gro\4/n
cuttings (open circles) are included in this diagram. Both water potential
and leaf area had increased by the time the first records were taken
approximatety I arrd 2 hoursr. respectively, after the soil- arouud the plants
was watered, On two earlier occasions when net CO, uptake was monitored
immediately after irrì.gation there was no response in the first 5 hours
before the tight period ended although assimil-ation rate had increased by
the fol.lowing norning.
Turgor potentials also increase rapidly during rehydration and reach

Figure 6.4 (a) tr{ater potential of glasshouse-gror'rn seedllngs during
the fírst 30 hours after watering. The open cÍrcles show
the response of a saurple of leaves from a field-grovm
cutting dehydraÈed to a water potentíal of less than
-l-1 MPa for the second time since collected from the field.(b) teaf area (percent. iniËía1 value) during the fírst
30 hours after watering. Synbol-s as for (a).

0
-l
-2
-.t
-A
-5
-6
-7
-8
-9
-to
-tt
-12
r50
30
o
o
o
co
o
o
O
o
^o
oo-ã
Ec(,
oo.
tu
oÌ
o
oÐ
o
b
40
o
E
ð9
ooo
t20
r00
T
0oo
0 to 20 30
Hours of ter wolering

126
very high values. The response of two seedlings for up Lo 46 hours after
rewatering is shown is figure 6.5c. Each estimate was based on a single
pressure-volume curve. Examples of the pressure-volume curves used to
calculate turgor potentials are shown in figure 6.5. The straight line in
6.5a represents a shoot at zero turgor while the deviation from linearity
in 6.5b indicates a positive turgor potential.
Tralenty hours after plants \^¡ere rer¡¡atered the turgor potential of one
of the young glasshouse grown seedlings had reached 2.95 MPa while that of
another had risen to 2.48 I{Pa in only 12 hours. Leaf expansion of these two
seedlings during the first 30 hours after rewatering is illustrated in figure
6.4b. It is notable that whereas the latter (closed circles in both figures)
continued growing in the following I0 hours and turgor potential decreased
to I.72 I4Pa the leaf area of the former (closed triangles) did not increase
during that time.
The high turgor pressures are probably a consequence of osmotic
adjustment ouring the dehydration phase leaoing to high concentrations of
ions ín the vacuoles of leaf cells during the initial stages óf rehydration.
Osmotic potential fell from -2.8 Èo -9.7 IvFa in one instance but to what
extent active ion uptake contributed to the increasing ion concentration
is not known. If there r^/ere no osmotic adjustment as water potential de-.
clined the osmotic potential at similar high water potentials before and after
stress should be approximately the same. Pre- and post-stress values for
the two seedlings referred to above, numbered for convenience, are compared
in the following table. The second block of figures for seedling I are
measurements taken during development of and recovery from stress.
Figure 6.5 Turgor potenÈials for two seedlings at varíous tímes after
wateríng and examples of Ëhe pressure-voLume curves used
to estimate turgor potenÈial (see Methods). V" is the
cumulatíve volume of sap expressed from the cut surface
of the shoot at successively hígher pressures.
(a) P-V curve before wateríng when total water potentíal
was -9.8 MPa and turgot Ìras zexo.
(b) P-V curve 12 hours after hraËerlng when total ¡,rater
potentlal lras -4.0 MPa and turgor potential was 2.5 MPa.
(c) Turgor potential for two seedlings in the first
50 hours after naterÍng.

Tur
gor
pole
ntio
l M
Po
ly'p
r"rr
ure)
' lO
-4
oN
(,(¡
o(¡
ol\J o
(¡o
oo
uo
ôa
o (^o
o
I La
Ñ,
lJr
o c ,o o { o o --.
f (o
\
a
N) o
(Jr o

]-27
Table 6.I Components of water potential (MPa) before and after stress
Seedling I Seedling I Seedling 2
Before
\y -2.59 -2.r9
v -4.06 -3.22
Y L.47 o.92P
*The bracketed figures show the number of hours after watering.
The high post-stress osmotic potential in the leaves of the first
seedling relatíve to ihat before stress was imposed might be taken as
evidence of little or no osmotic adjustment to decreasing water potentía1
in the substrate. The result is inconclusive, however, because of the
possibility that the finat concentration of osmotic solutes was reduced
during rehydration by redistribution of inorganic ions to epidermal bladders
and the use of organic solutes as substrate for synthetic reactions. The
corresponding values for osmotic potential of the second seedling indicate
considerable osmotic adjustment. Tt is probable that the leaves of tire
first seedling also adjusted osmotically during stress. At an earlier
stage of rehydration, about 12 hours after watering, the osmotic potential
was -6.5I MPa when total water potential was -4.03 MPa (table 6.I)' more
than 2 MPa fower than that at a similar water potential during the development
of stress.
The followíng observations and specufation on leaf growth in saltbush
may explain the observed results. As low water potentials deveJ-oped in
the seedlings used in these experirnents the area of all- monitored lea.ves
decreased (figs 6.2a-e). The final area \^/as on average 73.e 1:.6 per cent
of the maxir¡um value reached at high water potential. The contraction
implies that peaks in leaf area were due to an elastic expansion of the
cell walls. on rervatering earl1t expansion of leaves may thus represent
T
After ( 40) *
-2.66
-3.62
0 .96
Before
-3.79
-4.26
0 .47
After ( I2)
-4.03
-6.sr
2.48
Before After ( 20 )
-2.48
-5.43
2.95

12B
only the recovery of prior cell volume to the point where further waII
Ioosening and synthesis is required for continued irreversible growth
(see Cleland, t97I). Given a mean decrease in leaf area of about 25 per
cent ít appears from figure 6.4b that 15-16 'hours lvere required for leaf
area to increase to pre-stress values (ca. I33 per cent of the area just
prior to rewatering) . The failure of cell walls to loosen after an initial
increase in leaf area of about 29 per cent rnay account for the temporary halt
in leaf growth of seedling 2 (closed triangles, fig 6.4b) 7-12 hours after
watering, and both the high turgor potential and low osmotic potential 20
hours after watering (fig. 6.5c, table 6.I.). Although similar high turgor
and low osmotic potentials v¡ere recorded for seedling I, 12 hours after
watering, in this case ce11 wall loosening resulted in continued growth,
an increased osmotic potentiaf and a decrease in turgor potential. The rise
in osmotic potential can be accounted for by the metabolic processes referred
to earlier or may be due simply to Èhe dilution of cell contents as cell
volume increases during growth.
The cause of the temporary cessation of leaf growth despite the high
turgor, in seedLíng 2, is not clear. This'seedling was one of three which
aII behaved in the same way. The final record of leaf area was taken in the
morning 25 hours after watering wher:eas turgor potential was estimated at
dawn. At such high turgor only a smafl amount of cell water need be lost
to result in a large drop in turgor and hence by the time leaf area was
measured turgor may have fallen below some critical value and all-owed leaf
contraction. These concepts will be discussed in more detail shortly.
Whereas, in general, leaf expansion was inunediate ar¡d rapid following
irrigation root growth was nct observed in the two weeks after the four
young seedlings r^rere re\¡¡atered. Some of Lhe existing roots of the older
seedling recommenced growth on day 2 but elongat-ion rates were not as high
as those observed after the initial watering. Maximum rates (L4-25 mmrzday)

t29
vrere recorded on day 4. Over the next few days root growth rates declined
to low values and since measurements \,¡ere then discorrtinued the time taken
for sustained high rates of growth to be reestablished is not known.
Shoot elongation rates, on the other hand, were similar to those
observed in the period immediately after water was withheld and growth was
recorded on the day after the seedlings were rewatered.

130
6.4 Discussion
6.4I Growth responses to irrigation
The depression of TNC concentration observed in field plants following
a substantial rain in summer (Ch.3) implies rapid growth which cannot be
supported entirely by current photosynthate. Results of measurements of
net CO, uptake during rehydration, described in chapter 5, are consistent
with that explanation although the stresses irnposed in those experiments were
severe and the observed slow recovery of high rates of net CO, uptake may
not be representative of the response to v/ater potentials normally developed
in the fietd.
The rapid resumption of leaf production and expansion of existing
leaves (figs 6.3, 6.4) is also consistent with the predicted sequence of
events folJ-owing the relief of water stress. Although the details of the
response of individual seedlings were based on speculation about the prop-
erties of the ceIl wall it can be inferred from the results that osmotic
adjustment did take place during stress wíth the consequent high turgor
potential providing the driving force for the observed rapid growth. The
turgor potentials recorded in the first 30 hours after rewatering were 2-3
times higher than the values quoted [0.5 - 0.9 MPa) for weII watered plants
in Hsiao (1973) but were much the sâme as those reported fox Trítícum
dieoccum (1.3 - 2.5 MPa) by Turner and Jones (1980). Similar high turgor
potentials have been recorded for .4. uesíearta in the field. A group of
undergraduate students from the Botany Department at Adelaide University
calculated turgor potentiaJ-s as high as 2.8 MPa from pressure-volume curves
for saltbush growing on a sand dune at Koonamore. The corresponding osmctic
potential was -5.0 MPa. These figures are comparabl-e to those in table 6.1-.
According Èo references cited in Turner and Jones (1980) osmotic adjust-
ments of 0.4 - 0.7 MPa take l-0-ll days t-o disappear after relief of stress

13r
in sc:ne species. From the results for seedling I in table 6.1 it appears
that an osmotic adjustrnent of about 2.0 MPa disappeared within 2 days
of rewatering bui considering the capacity for removal of ions from the
mesophyll by A. ues¿car"La and the rapid growth observed with consequenL
dilution of ce11 contents Lhe difference is not surprising.
However, while it is evident that leaves begin to expand almost
inmediately when plants are rewatered it is not clear whether ce11 wall
synthesis is involved in the apparent leaf growth in the first few hours.
As noted in the previous section the initial expansion may be wholly or
partly elastic. Ne'rertheless it is unlikely that expansion can continue
for any length of time without wall synthesis (Hsiao , J-9731. It is also
debatable, judgirig by models of cell wa1l extension outl-ined in Cleland
(1971) , whether a temporary halt in leaf growth is accompanied by a decrease
in wall synthesis. According to one model, elastic extensions following
metabolically controlled waII loosening are rendered irreversible by a
second biochemical sÈep, involving waII synthesis a,nd hence the use of current
or stored photosynthate.
The growth of stems and roots during and after rehydration will also
constitute a sink for photosynthate from one or both of these sources.
Although root growth after rehydration hras apparentÌy siow or non-existent,
as judged from the response of roots already established at the transparent
faces of the containers, there may have been considerable root production
from the root crown soon after the soil was rewatered.
6.42 Growth responses to decreasing water potential
Whil-e high water potential was maintained at the beginning of the
dehydration phase root growth was rapid and the peak rate of growth by an
individual root exceeded 60 mm per day. In general the raÈe of rcot elon-
gation was similar to that recorded in the field (Ch. 4) and the published

t32
values of.23 - 50 mm per day (Jones and Hodgkinson, 1970; Williams' L972¡
Hodgkinson and Baas-Becking, 1977). There was, nonetheless, considerable
variation in the maximum rate of root elongation from day to day and between
roots of the same p1.ant on any one day. This variation may have been partly
responsíble for the fluctuations in leaf and stem growth at high water
potential if roots $rere grorving through patches of high soil moisture. The
rool- growth observed when xylem water potential was about -6.0 MPa, for
example, was apparently confined to a relatively small volume of soil which
may have held water at a higher potential than the surroundings. Slatyer
(1973) cited tl:e work of Newman (1966), who found the rate of elongation
of flax roots to be highly dependent orl local soil water potential, and
pointed out that roots in relatively moist soil may continue to elongate
even though Èhe plant as a whole is subject to severe internal water stress.
Specifying a 1ímiting water potential for root growth is somewhat difficult
for this reason, especially when it is based on xylem rather than soil
water poterrtial . It is also possible that conditions for root growtÌ'r at
the walls of the containers were unrepresentative of those in the bulk soil.
Another difficulty associated with the interpretation of Èhe root grotvth
data is the treatment given the seedlings during the dehydration phase,
namely the removal of shoots for measurements of water potenÈial' a proc-
edure which may have altered the root-shoot ratio enough to depress the rate
of root growth before it was directly affected by falling turgor" This re-
sponse would be especially true of the younger seedlj.ngs from which about
one quarter to one t,hircl of the total num̡er of shoots were removecl during
the course of the experiment. In such circumstances restoration of the
dynamic equilibrium between root and shoot (l{areing, 7972) would favour
shoot growth providecl LhaL rvater potentiai was adequaLe. Howeverra much
smal.Ier proportion of the total number of shoots, Iess than l0 per cent,
hras renìovecl from ihe two-year-ofd seedling whil-e \¡¡ater potential remained

133
high yet root growth stiIl decline.l. Although this seedling did produce
some root growth when xylem water potential was low the general pattern of
growth vras more consistent with the idea that root elongation is dependent
on local soil water potential rather than inhibition by shoot removal. The
fact remains, holever, that xylem water potential is not a good indicator
of root response.
Although there were some aspects of leaf expansion at high water poten-
tial which were unexpected, the data on leaf growth are not subject to the
same uncertainties as those for root growth. Xylem water potential is the
most conveniently measured variable likely to be associated with the rate
of leaf expansion but as noted in the introduction to this chapter increases
irr cell volume are dependent on turgor potential rather than total water
potential.
High turgor potentiats "ere associated with interrnittently high rates
of leaf expansion during the initial stages of dehydration and relatively
lovr turgor potentials with an overall decline in leaf area at lower watcr
potentiat but there !ì¡as no consistent relationship between individual pairs
of values for growth rate and turgor potential. There is no question that
leaf expansion is dependent on turgor potential but while a high mean value
is expected at times of rapid growth there may be fluctuations in turgor pot-
ential if growth is reduced as a resuft of conditions other than a sub-
critical turgor. Under these conditions, provided that osmotic potential
is highr turgor potential will rise as the cell waII becomes more rigid and,
unless osmotic potential is maintained, decline at times of rapid growth.
On this basis the cl-oseness of the relationship between the two variables
wilI depend on the tj-me interval between leaf expansiot'¡ and estimates of
turgor potential. A cLose correlation nright be expected onJ-y if estimates
are made during periods of steady state growth and if expansion is

f34
propcrtional to turgor potential in excess of some critical value. The
second condition may be met when soil water content is maintained at field
capacity but apparently is not, even in the first few days, after water is
withheld.
The fluctuations in the rate of leaf expansion at high water potential
could be related to varying ambient conditions around the shoot or to changes
in root growth although recorded fluctuations in the latber do rrot always
correspond to changes in the rate of leaf growth (figs 6.2 a-e) possibly
because observabfe root growth is not a good indication of overall- root
activity.
Of rather more interest are the fluctuations in leaf area (negative
growth rates) which occur at high water potential. These are also like1y
to be the result of changes in turgor conLrolfed by the rel-ative rates of
water absorption and transpiration or, according +-o Kozlowski (I972b) ,
internal redistribution of water within the plant. Many observations of
similar changes in dir,'erse plant parts ha¡,'e been reviewed by Kozlcwski (I972b) ,
wl¡o attributed the shrinkage and swelling of tissues to changes in hydration
and temperature. He considered that changes in hydration are responsible for
mgch greater reversi-ble changes in the size of plant tissues during +-heir
development than are direct thermal effects. Changes j-n size of plant
tissues occur in response to diurnal and seasonal rvater deficits and often
involve diurnal changes of decreasing antplitude superimposed r:n the trend
of net shrinkage during a drought.
Diurnal charrges in size may be quite l.arge. The length of the apical
shoot of Pínus radiata, for example, decreased by I cm during the dayJ-ight.
hours (rielding, 1955), while changes in leaf thickness of between 4 and
7.5 per cent have been recorded foll-owing a change in'Ieaf ntoistur:e content'
of 1 per cent in the feaves of various o1-her species (Meidner , 1952) '
Raschke (1970) measured a decrease of 32 and 18 per cent in the thickness

I35
of the epiclermis and entire leaf, respecLively, of Zea mays duríng a
drying cycle. The latter figures are comparable to the decrease in leaf
àrea of about 25 per cent observed for ,4. uesiearta as xylem water potential
decreased.
AII the examples cited in Kozlowski (L972b) were reports of changes in
leaf thickness rather than area. To what extent these reflect changes in
area is not known. Apart from Lhe work of Cremer (1976), who recorded
diurnal contractions in both shoot and leaf length for Pinus v'adiata and
EucaLgptus Í'egnans, f am not aware of any reports of diurnal or seasonal
contractions in the area of individual leaves. The absence of any such
examples from the review by Kozlowski suggests that they are rare at best.
Gíven that turgor dependent reduction in the area of individual leaves is
a common occurrence, as it may weII be judging by the numerous examples
of changes in leaf thickness, the apparent rarity of reports on this subject
is surprising. It is probably a consequence of the use of fixed leaf areas
for many daily measurements of variables expressed on a leaf area basis and
the use of dry weights in lieu of area for microphylJ-ous species. Changes
in leaf area during drought are usually assessed from successive sarples of
plants a procedure which is unlikely to detect the changes in area of
individual leaves.
The fluctuations in leaf area while turgor potentials remain high'
(fig 6.2e) implies that there is a threshhold turgor pobential associated
wíth leaf expansion. Below the critical poÈential cells contract and can
recover only through osmol-ic adjustment or an improvement in soil water
availability allowing sufficient water uptake to account for the deficit.
An approximate estimate of the critical turgor potential fox A, ue.sican'ia,
of between 1.0 and 1.5 MPa, appears high when compared with that for other
species. Auena coleoptiles, for example, have a threshhold value of about
0.6 MPa (CIeIand, 1959) and leaves of sunflower require a turgor potential

136
of about 0.35 MPa before leaf enlargement begins (Boyer, 1977).
However, if the value suggested for A. uesicatia is accepted the smalf
recovery in leaf area on day 22 (a small positive rate of expansion) ' when
turgor potential was less than 0.5 MPa, is untenable. A possible explanation
may be found in a moder of cell waII extension outlined in Clel-and (1971)
which incorporates a shifting critical growth turgor. The model states
that the critical turgor is determined by a balance between a metabolic
process which lowers the yield point of the cell wafls and a physical strain
hardening caused by extension of the cell walls during growth. When turgor
potential fall-s below the critical value strain hardening no longer occurs
and the critical value is lowered by the metabolic process, until it is
once again lower than the turgor pressure in the ceII, whereupon growth
resumes. The theory was developed to explain growth responses of the
internode cells of the ^tgu
NiteLLa and at the time the review was written
was untested. Nevertheless, positive expansion rates by the youngest
leal'es, depicted in figure 6.2e, at a time when +-urgcr potential t'¡as
apparently falling (days 16-18) may depend on a lower threshhold potential.
On the other hand, there are several obvious objections to the necessity
for invoking such a theory to expJ-ain the recovery of leaf area or irrevers-
ible growth at low turgor potentials. Sma-l-l increases in leaf area may be
independent of the critical potential and simpty represent an elastic
expansion in response to any change in turgor. Judging by the overall
response of leaves to decreasing water potentiaL it appears that at any
given time a considerable proportion of the area of a leaf (25 per cent or
nrore) is due to elastic expansion in which case most of the ffuctuations
at both high and Iow water potential may be independent of a critical turgor
potential. ft becomes more difficult, on this hypothesis, to specify a
Iirniting water potential for growth but it will be higher than that indicated
for leaf expansion in the diagrams (fj-S. 6-2a-c\ .
137
Turgor potentials derived from pressure volume curves are an average
value for al.I the cells in the tissue. Attempts to relate values obtained
ín this way to rates of expansion or growth of individual leaves are con-
founded by the possibility of dÍffering turgor potentials in different
leaves. This point is well illusErated in figures 6.2 a-e where there are
se\reral examples of positive and negative expansion rates for leaves on the
same plant, or even the same shoot, on the same day. A high turgor in
young leaves when the recorded average is low would obviate the need to
explain leaf area recoveL'y by a low threshhold turgor potential. References
cited in l{ardlaw (1968) and Canny (1973) provide evidence of complicated
patterns of vascular connections which may explain apparent differences in
hydration of leaves of similar age on the same or different shoots.
Observations and experiment have shown, that the pattern of translocation
of organic solutes from a given source can be restricted to files of
vascular tissue leading to a specific sink. The removal of the leaves
from one side of a sunflower shoot, for exam¡rle, ieacis t-o the failure of
all the florets on one side of the head. Other examples include the greater
development of swede tubers on the sunny sides of the planL and the suppl-y
of specific parts of beet root systems by various leaves. Xylem connections
from the leaves on oifferent shoots tnay therefore lead to different- parts
of the root sysrem with access to water held at different poÈentials.
Although water movement, when compared with solute transport-, is likely tå
be more uniform, clue to fateral movement in response to water potential.
gradients, the i¡rcreased resistance associated with a more ci,rcuitous
pathway may alter the balance between transpiration and water uptake by diff-
erent leaves. Stocker (1960) cites an example where the tip of tomato shoots
above the first node shorved fairly uniform growt,h during both day and night
while the lower j.nternodes gretv only at night and stopped or even shrank
during the day.

138
In the preceding pages the discussion of decreases in leaf area have
been based on the premise that cell waII contraction and a decrease in the
volume of individual cells, as outlined in Cieland (I97f)r are involved
in the observed response. An elastic contraction of the ceII walls has
been observed when Auerm coleoptile sections are ex¡:csed to low external
osmotic potentials. Howeverr. an" Ioss of leaf area in ,4. uesica.v'ia need
not be due to reductions in cell volume if decreases in turgor potenLial
allow a change in cell shape resulting in a closer packing of cells and a
loss of air space in the mesophyll. The contraction of epidermal cells and
cuticle may still be necessary unless there is some buckling of that tissue
associated with decreasing projecteC area of the Leat¡es.
The loss of leaf area in l-he way just described would have Èhe dis-
advantage of reducing the internal surface area available for CO, absorption
whereas the ability to reduce leaf by contraction of the cell walls, thus
reducing ceII volume, may have constituted a selecti'¿e advantage over
indi'¡iduals with ncre rigid cell walls. AlÈhough some internal absorbing
area would be lost as cell volume decreased the resistance to CO, or organic
acid diffusion in the aqueolls pathway may be reduced. CelI waII contraction
may also play a significant role in maintaining turgor potential during
periods of moderate stress, directly due to the contracting cell wa1l and
indirectly by increasing the solute concenLration. The loss of internal
surface area in conjunction with the maintenance of turgor potential may
result in some CO, fixation without a reducÈion in water use efficiency by
reducing water loss through the transpiration stream. There is no evidence
for direct effects of turgor potential. cn CO, fixatj.on (e.S. Boyer and
Potter I L973) although there has been some specufation that changes in
pressure differentials across the cell" v¡all-plasma lemma boundary may result
in conformational changes in enzymes located in the pJ-asmalemma (Hsiao,
1973) and thus influence Co, fixation indirectly (osmond et aL., 1980).

139
Hsiao (1973) has also pointed out that pressure within the cytoplasm is
isotropic and changes in turgor potential cannot influence the electron
transport systems of chloroplast membranes in the same way. The spatial
relations and hence function of proteins in enzyme complexes in cel1
membranes rnay also be altered as membranes stretch or contract wíth turgor
dependent changes in celI volume. Since organelles behave as osmotic sacs,
taking up or losing water as cell water content changes, the funct.ion of
enzymes in chloroplasl membranes may be directly affected in this way.
Hsiao concl-uded, however, that the major effect of changes in turgor
potential on cell metabolism is indirect rzia effects on cell expansion.
Cell division may be reduced in turn if meristematic cel1s are unable to
reach a minimum sÍze before mitosis can occur. Hence because of a lack of
demand for assimilates the rates of net CO, uptake and other synthetic
processes may be reduced if ðell growÈh st,ops for any length of time.
Turgor maintenance by cell contraction would retain neither the spatial-
relations and function of enzyme complexes in organelle membranes
demand for and hence production of current photosynthate and other
nor anv
cell
constj.tuenLs, as might occur if turgor was maintained by osrnotic adjustment.
Any advantage of turgor maintenance by ce11 ccntraction must therefore rely
on the existence of a more direct effect of turgor on metabolic processes.
Although the dependence of such processes on turgor is still- obscure, in
more recent reviews (Hsiao et aL., 1976, osmond et aL., 1980; Turner and
Jones, 1980) there appears to be general agreement that changes in metabol-ism
during stress are most likely to be mediaÈed by changes in turgor potential.
According to Zimrrrermann(1978) there is srrfficient experimental evidence for
a direct control of membrane transport and the electrical properties of the
ceII membrane by turgor pressure. He suggested that during cell expansion
t.urgor controls the uptake of solutes required for continuing growth. Taking
this argument one step further, it is possible that a degree of turgor main-
I40
tenance due to cell contraction may be of some advantage if it allows íon
uptake to continue and hence increases the time available for osmotic
adjustment during drought.
CeII contraction may also influence processes such as net CO, uptake
indirectty by enabling stomata to open more readily' Since stomatal turgor
is not closely linked .to that in mesophyll, cell contraction in the latter
is unlikely to affect stomatal opening but if guard celLs and other epidermal
cells also contract during stress a greater stomatal sensitívity may result
from the higher turgor allowing some opening and hence CO, uptake at lower
water potentials. Normal stomatal control would operate to reduce water
loss.
Given that turgor is important in maintaining metabolic processes
and if the effects of cell contraction on turgor potential, intercellular
space and water use efficiency during leaf area reduction are as outlined
earlier then diurnal fluctuations in leaf area at times of sLress may allow
a greater carbon gai.n than if cell walls were rigid. Nocturnal rehydration
and leaf expansjon would result in the maximum possible area for light
interception in the early morning when thq water status of the tissues is
relatively high, while progressive leaf contraction during the day would
allow some CO, uptake rvhen perhaps leaves with rigid cell walls have lost
sufficient turgor to induce a reduction in the rate of net photosynthesis.
However while the detailed response of leaves after water was withheld
has raised more questions than it answered, and the flucLuations in leaf
area make it difficult to specify the point where growth, as distinct from
reversible expansion, ceases, it appears that growth of all plant parts is
highly sensitive to decreasing water potentiaf and, for plants grown in the
glasshouse, stops at water potentials between -2.0 and -3.0 MPa. The use
of photosynthaLe for elaboration of new cefl wafl and protoplasmic constit-
uents is unlikely to continue for long after cell growth stops and hence,

14r
apart from its use directly or indirectly in osmotic adjustment, maintenance
respiration, suberizatíon and similar processes, most current phoÈosynthate
will be diverted to storage.
Whether growth under field conditions is equally sensitive is not
known. The ability to maintain turgor potential high enough to extend the
range of water potentials over which growth is possible will depend on the
time available for osmotic adjustment (Turner and Jones, 1980) which will
in turn depend on the depth of rainfall penetration and the evaporative
demand during growth. Since á. uesícania has a shallow root system it is
debatable wheÈher the rate of dehydration will be any Iess than that for
glasshouse grown seedlings. Some information on growth and rates of decrease
in total water potential following rainfall or irrigation in the field is
presented in the next chapter.
There are other factors which influence the turgor potential at a
given water potential including the elasticity of the ceII walls and ceIl
size. Smaller cell size attendant on development of leaves under conditions
of mild stress has been shown to resul-t in an increased capacity for turgor
maintenance (Cutler et aL., L977) and increased elasticity of the cefl walls
(Steudle et aL.r 1977 cited in Turner and Jones, 1980). Although changes
in cell wall properties may aJ-1ow continueo growth at lower turgor potential
Turner and Jones (f980) have also suggested that in some circumstances
increases in the minimum turgor for growth or changes in ceII extensibi.lity
may override any beneficial effects of osmotic adjustment in prolonging
grorvth. The maintenance of turgor due to r-he development of cells of smalfer
maximum size appears more likely to be related to survival rather than growth
despite t-he possible changes in ceLl wall- properties.
The way in which development under field conditions affects the ability
of A. Desica?ía to continue growth as water potential- f'alls is not knc¡wn.
The changes which result in growth aL lower: water potential are also expected

r42
to allow greater carbon gain by existing leaves. Presumably the increase
in leaf area wí11 increase the whole plant carbon gain even further, although
against this, possible increases in the rate of water loss must be considered.
Hence even if growth does continue at lower water potentials i.n the field
the hydration compensation point for net carbon gain may also be lower, in
which case the range of water potentials over which the bulk of current
photosynthate is channelled to storage will not differ markedly from that
estimated in the laboratorY.

r43
C'T]APTER 7
7 Water potential
7.I Introduction
The observation that xylem water potenii.t of saltbush may fall
to -I3 MPa (Anderson, unpubl., cited in Anderson et aL., 1972) was used
earlier as an example of the very low water potentials recorded for this
species. Others have recorded similar values during dry conditions in
summer. Sharma (1976) estimated water potentials of about -11 MPa from
relative leaf water content (RLWC) of leaves harvested early in the morn-
ings in a year with rainfall close to the long-term average. Evapotrans-
piration had reduced soil water pc,tentials in the profile beneath this
community to -80 , -25 and -I2 MPa at depths between 7.5 - 15 cm, 15 - 30 cm
and 30 - 45 cm respectively. Exc¿rvation of a few individuals revealed
that most of the root system (ca. 93Zl r¡¡as concentrated in the top 15 cm,
and all but 0.22 ín the top 45 cm of the profile. Under these conditions
it is unlikely that the small amount of root mass with access to water
stored at high potential could maintain the observed xylem water potentials
for long unl-ess stomatal resistance \¡¡as very high. From the relation
between relative leaf water content and pressure chamber readings (Sharma,
1976, it is evident that, at lov¡ water potentials, very little water need
be lost to lower water potential markedly. A fall from 72 per cent to
62 per cent RLtr^iC corresponds to a reduction in xylem water potential
from -4 MPa to -1I MPa. However, while xylem water potentials may regularly
fall to low values, and on occasion remain low for lengthy periods,
for much of the time water potentials are likely to be higher than the
minimum vafues guoted above. Will-iams (I972), for example, measured
xylem water potentials for saltbush at a number of topographic sites where
minimum dawn readings in summer vJere as hiqh as -5.0 MPa in a run on area

l-44
and . 8.5 MPa at the driest site.
At the other end of bhe sca1e, readings as ltigh as -0.1 MPa have
been recorded for,4. pesicar'ía in early spring (Chapman and Jacobs, 1979)
but maximum v¡ater potentials recorded for this species are usually belôw
-I MPa even for well watered plants. (e.9. Osmond, unpubl.' p256 in
osmond et aL., 1980) .
Because water availability has such an overriding influence on the
physiology and growth of arid zone plants, regular measurements of plant
water status are useful in that, given other information on plant response
to ¡¡ater potential, they allow some idea of the physiological eondition of
individuals under various conditions in the field. Seasonal trends and
absolute values of water potential will vary from year to year and from
site to site. Studies on water use, hydrology, root distribution and
weather conditions, for example, may eventually be combined to produce models
capable of predicting soiI, and possibly plant, waÈer potential for a given
site or soil type but until this is done direc*- ineasurements taken more
or less regularly remain the only indication of plant water statu*s at
various times of the year. The most comprehensive account to date for
A. oesicaria is that by Williams (L972\ who measured dawn water potentials
for saltbush over a period of twenty months, although during tìris tine
readings were taken on only seven occasions.
In the following pages data from a similar series of measurements at
Koonamore are presented and compared with published values of water potential
for A. uesicaria aE other sites. Seasonal values for plants given supple-
mentary water at regular intervals are also shown.
In earlier chapters the high potential rate of evapotratrspiration and
its importance in the water relations of A. uesicania and other shallow
rooted species have been emphasised. A rapiC rate of rehydration was
considered necessary f-or A. uesíearía to make full use of intermittently

14s
available vùater. For plants in the laboratory it has been shown that
rehydration is rapid during recovery from low water potential. There is
no reason to expect that under similar conditions rehydration in the field
would be any tess rapid. However, at times of low water potential in the
field environmental conditions are 1ikely to be much harsher than those
in the laboratory. Apart from the possibility of rapid loss of water from
the soil, which may result in a lower maximum water potential after recovery,
rehydration may be initially delayed because of slow infiltration. Some
indication of the immediate response to substantial faIIs of rain can be
gleaned from the seasonal records of water potential. This information is
supplemented with data from a few short experiments in which water poÈential
of fietd plants was monitored for a few days after irrigation with varying
amounts of water.

r46
7 .2 i"lethods
Seasonal- values for xylern water potential were measured with a
pressure chamber (Scholander et aL., 1965). on the days when water potential
was measured dawn and midday readings were taken to estimate the maximum and
minimum water potential respectively. Measurements were made on a random
sample of 4-8 plants, growing within an exclosure of 0.5 ha, on each
occasion. Two of these, chosen randomly at the beginning of +-he series of
measurements, were sampled on every sampling date. For most readings,
particularly those at midday and when r^rater potential was low, shoots were
wrapped in plastic film, before excision, to minimise transpiration. In
hot dry weather the relative humidity of the gas around the shoot was
increased by lining the inside of the pressure chamber with damp blotting
paper.
On several occasions xylem water potential was monitored for a few
days following irrigation. These plants were irrigated with rain water
collected from a large underground storage tank at tr{aukaringa, 24 km south
of Koonamore. The water was pumped directly onto the soil surface. Since
up to 25 mm was applied within a few minutes runoff was prevented by means
of a steel collar enclosing the plant, or plants, and 1-4 square metres of
the surrounding area. Because the soil surface was rare.ly flat the use of
four sguare metre collars, enclosing a central group of plants resulted j-n
uneven infiltration over the area enclosed. Applied water was more evenly
distributed within the smaller collars. Damage to surface roots \^/as more
likely in the lattercase but, as the collars penetrated the soil to a
depth of less than 3 cm, the damage \,ras probably negligible.
An individual saltbush bears an array of shoots cf varying age and
condition, sorne relatively well foliated and others partly withered or
damaged by insect gaIls, In all cases, whether for irrigated or control
plants, shoots fo¡: water potential readings were chosen from among those
with the healthÍest appearance in a gj-ven bush. fntensive sampling of a

L47
single bush, on a feÌ¡¡ occasions showed that when this procedure was
followed the standard error was within 2 per cent of the mean. Therefore
unless a given bush had a water potential which varied narkedly from others
on the same date no more than two shoots were sampled. In most cases
duplicates had a balance point within I00 kPa.

148
7.3 Results and discussion
7.31 Seasonal water potentials
The results of water potential readings taken over a period of 30
months are shown in figure 7.1. On most occasÍons these readings were
taken in consecutive months, with only a few instances of longer intervals
between readíngs. Each point is the mean of measurements on 4-8 plants.
The standard error is shown for those points where it exceeds the diameter
of the symbol locating the mean. Closed symbols represent dawn, and open
symbols midday wat,er potential . The accompanying bar diagrams depicr- two
sets of rainfall data. The upper diagram shows the rainfall accumulated
between readings at the site where water potential measurements were taken,
while' the lower shows the daily rainfall figures for Koonamore homestead
about 7 km to the north. As before the latter are included to indicate the
probable distribution of rainfall at the ex¡rerimental site during the
intervals between readings.
Xylem water potentials, as expected, were low in summer and high in
winter. The lowest values \¡¡ere recorded during the summer of l-977-L978 aE
the end of a year of well below average rainfall. Total rainfall in L977
(86.5mn) was less than half the long-term average (2I mm) for Koonamore.
At the end of that summer (February, I97B) the mean value for dawn water:
potential was less than -9 MPa and some individual readings include<l in the
mean \¡rere l-ess than -II MPa. The mean for the February sample is located
by an inverted triangle which signifies that the balance point for one or
more of the sampled plants was not reached by the time Lhe pressure applied
to the shoot equalled the limit of the gauge on the pressure chanber (I1 l"lPa) .
The limiting values (-I1 MPa) , which were included in the calcufation, yield
a mean and standard error which were higher and Lower, respectively, than
the true values. A few earlier sampJ-e neans were also overestimaLes but in

f igrure 7. I Mean water potentials for samples of 4-8 shrubs in the field-
Closecl symbols represent dawn water potential and open symbols
midday water potential.
(a) Recorded between October, l-977 and. December, L978..
(b) Recordecl between January, L979 and March, 1980.
The two sets of rainfall data beneath each plot of vtaLer
potential show total rainfall accumulated at the site between
samplings and daily rainfall at Koonamore HomesÈead. Standard
errors are shown for potentials where they exceed the diameter
of the symbol locating the mean, Inverted triangles indicaÈe
that the balance point for some shoots in the sample could
not be measured either because Èhe limit of Èhe gauge on the
pressure chamber was reached or because of low gas pressure
in tfre supply cylinder. rn November, L977, 9ês pressure was
too low at dawn but rose high enough as temperature increased
during the day to allow balance points to be recorded at
midday.

o
I
ol
-rlIO âlÀ
á_3
-9 -4E-5O
!-o--7t,i-eì
-9-lo50
40 folol
2
Ir
Do ily
Ocl Nov
1977
oÊoe
20
t0
Dæ Jon tcb Mo. Ap. Moy Jun Jul Aug Sep O(l ¡¡d Dcc
t978
b
¡
0
o-lrã-2-3o
?-4o;-sô-
--ó2-7oÌ-B
-9
,a)
---l----o
¡------Y----__
Totol
EE
o
.soe
Doily
Jon F¡b
1979
0 Mot Ap, À^oy Jvn Jul A"g S.p Oct Nov Dlc Jon F¿b Mor
r 980

r49
those cases the balance point of some of the shoots in the sample was not
reached because of low gas pressure in the cylinder supplying the pressure
chamber.
Water potentials did not fall to such low values in the early months
of the followÍng years due to substantial summer rains. In the interval
between January and ApriI 1979 no readings were taken but water potentials
were probably maintaíned at refatively high values by heavy rains totalling
50 mm, the major part of which apparently felI in the middle of that period.
Even when plants were highly stressed substantial falls of rain were able
to reverse the downward trend in water potential during sunmer. Falls of
rain totalling 29 mm in December L977, for example' resulted in a large
increase in water potential. According to the daily rainfall figures this
rain probably fell 8-10 days earlier, in which case the maximum value
rnay have been higher than ttlat strown. In comparison, the response to 10 run
of rain in the following June illustrates the greater effectiveness of rain
dr:ring the cooler months of the year, although part of this increase nayr ha','e
been due to the second and larger of the two falls of rain recorded in May.
This fall \¡/as recorded a few days after the May water potential reading, thus
raising the total rainfall for the May-June interval (26mm) to a value similar
to that recorded in December. Two such falls if weII separated would
probably have been less effective in the summer months due to higher
evaporative losses from the soil surface.
Most of the changes in water potential can be adequately accounted
for by the figures for rainfall accumulated between readings bui the smal.l
rise between February and May, L918, which v,'as significant at the 5 per cent
Ievel, was unexpected because of the low rainfall- duríng that period. The
significance of this difference is based partly on a standard error (February)
which, as noted earlier, is an underestir¡ate but judging by standard errors
in preceding months it is not a gross unclerestimate. Part of l-he response
was due to mild and overcast conditions cn the days leading up to, and

I50
including, the sampling date in May. Rain (14mm) fell a few days after.
These conditions Ì¡¡ere refl-ected in the small diurnal fal1 in water potential
on that day. As will be shown later heavy cloud during the day, even in
a hot dry period, can result in large changes Ín dawn water potential.
The water potentials observed aÈ Koonamore were similar to those
recorded elsewhere. The lowest values observed during the summer of. L977-78
vüere as low as, or J-ower than, those estimated by Sharma (L976) and Williams
(L9721 for shrubs on the Riverine Plain in New South h7ales and the range
of water potentials observed at Koonamore during the following comparatively
wet summers (-4 to -B MPa) was similar to that observed by the l-atter
author (-5 to -8.5 MPa).
During a diurnal series of measurements in spring Osmond (unpubl. see
Osmond et aL., 1980) measured a dawn water potential of -6.5 MPa, close
to the lowest recorded at a similar time at Koonamore. Osmond also measured
a diurnal range of 1.5 MPa for an irrigated plant on the same day but was
unabl-e to establish the extent of the afternoon depression for unwatered
plants because water potentials fel1 below the limit of the pressure
chamber. From the tone of the discussion in Osmond et aL. (1980) in which
this work was described (p. 256) it was implied that because plants hrere stiIl
Iosing water they retained some physiological activity at such l-ow water
potentials. On this basis plants at Koonamore were active at much lower
water potentials. Midday depression of water potential (represented by
open symbols in fig. 7.1) and subsequent rehydration at night continued at
water potentials less than -9 MPa and on one occasion at less than -9.8 MPa.
Results sumnarizing the exteltt of the nidday depression at various tirnes of
the year and for the whol-e period of observation are presented in table 7.1.

Table 7.l-
Time
Sunmer (Dec - Feb)
Autumn (Mar - May)
Winter (June - Aug)
Spring (Sept - Nov)
Total (year)
Irrigated (year)
Midday depression of xylem water potential (MPa)
Isl
+Mean - s.e.Number of observations
16
L2
I2
63
2T
23 1. 54
r.18
I. 41
1. 59
1. 43
0.07
0.r0
0.25
0.12
0.07
+
+
II+
r.zs 1 o.rq
An analysis of variance showed that under the conditions prevailing
during this set of observations there \dere no significant differences in the
magnitude of the midday depression at different times of the year, nor between
irrigated and control plants over all seasons. The values shown in table
7.1 are similar to that reported by Osmond (1.5 MPa) for an irrigated
plant on the Riverine P1ain. Water potential of the control plant in
his experiment, for which the change was unmeasurable, probably also fe1l
by approximately the same amount.
During the cooler months xylem water potentials at Koonamore reached
higher maximum values ( fiS. 7.1) than those recorded at the same time of the
year elsewhere; Williams (L972) reported maxima of between -I.6 and -2.3 MPa
and Sharma (1976), a maximum of -2.5 MPa. The values reported by Sharma are
probably less than the potential maximum as plants v¿ere sampled in tire
early morning (6am-9am) rather than at dawn or before. Chapman and Jacobs
(1979) recorded a maximum of -0.8 MPa in spring at Fowlers Gap irr New South
Wales. This value is similar to the highest observed (-0.69 MPa) for
unwatèred plants at Koonarnore but the very high value of -0.1 MPa which
they observed for a plant at Hay (N.S.W.) was not achieved at Koonamore even
by plants irrigated with 25 mm per month in
Although too few records of water potential
whether water poÈentials as high as -0.1 MPa
that some of the values recorded durinq that
at Hay were overestimates. A spurious balance
at Koonamore due to gas entering xylem vessels
]-52
addition to naLural rainfall.
have been taken to assess
are conìmon iÈ is probable
diurnal series of measurements
recently fallen
to be fitted in
leaves or, in some cases, those
point was often observed
through holes teft by
removed to allow the shoot
the lid of the pressure chamber. This caused bubbling
at the cut surface well before the true balance point was reached. The
Iarge fluctuati.ons
hour in the middle
in water potential at Hay, -0.I to -1.5 MPa within an
cf the day, were probably due to this source of error.
7.32 Water potential of irrigated plants
Figure 7.2 shows seasonal dawn water potentials for irrigated and
control plants. The open symbols represent the average for two plants
irrigated with 25 mm of water every month, in addition to natural rainfall,
while the closed symbols show the average for the tlo control plants
which were sampled regularly (see Methods). Readings for irrigated plants
were taken about one nonth after water was applied. On three occasions
during sunmer and autumn water potential was monit.ored for l-4 days after
irrigation. These resul-ts are shown in the inset in figure 7.2.
During the cooler months (June - September) water potentials of control
and irrigated shrubs were similar. The latter may have reached higher water
potentials briefly following irrigation but no readings were taken to verify
this. However, in June, several pairs of plants on a nearby sand dune were
irrigatecl with 25 mm of water for undergraduate students taking a course in
plant-water relations. During a diurnal series of measurements they founC
no difference between the maximum water potential-s of a pair of unwatered

oÈÉ
lgct¡)
oo-
ooÌ
-3
-4
-5
-ó
-7
-8
-9
-to
,tt
APr
Mor ---o0
-2
-4
-6
-8-10
F¿b
-aa'
t
34
EE
ó0
AO
=o.g zoo
æ,
Doyr oller wolcring
Jul Aug s.p Ocl Nov Deco ov Dec Jon Feb Mor AP, Moy Jun
1977 1978
Eigure 7.2 Water potential of control and irrigated plants in the field"
The open symbols represent the mean dawn water potential of
two shrubs irrigated with 25 mm of rainwater each monüì in
addition to natural rainfall and the closed slzmbols that
of two nearby unirrigated shrubs. Records rvere taken between
November, 1977 and Deceniber, l-978, the day before irrigation.
The inset shows the water potential of irrigated shrubs
for 1-4 days after irrigation on the dates sho\^m.
fhe amount of rainfaLl accumulated at tlre site bettveen
readings is shov¡n in the accompanying bar diagram.

I53
plants and those irrigated 0 - 3 days earlj.er. Differences v¡erc reduced
because of a 9 mm rain a few days earlier but it seems that a high minimum
concentration of osmotic solutes and possibly a reduced turgor pressure
during rapid cell expansion in relatively mild winter conditions imposes an
upper limit on the maximum water potential of saltbush on these soils.
An unexpected observation (fig. 7.2) was the comparatively low v¿aÈer
potential of irrigated shrubs in January and February of 1978. Water
potential was similar to the mean for all control plants (fig. 7.f) at that
time but, as shown by the representative controls in figure 7.2, waber
potentials were higher in some unwatered shrubs. In both cases water loss
from irrigated ptots must have been much greater than that from unirrigated
areas. Later in the year as weather conditions become less harsh the water
potential of irrigated plants exceeded that of the controls and remained
high for the rest of the year.
The data, in the inset, depicting the immediate response to irrigation
show that waÈer potential increased rapidly, but in February water potential
began falling three days after water was applied. If this is a characteristic
response pattern water potential evidently. does not remain high for long
after rehydration in summer. On the other hand, evapotranspiration is likely
to be less after substantial summer rains than after irrigation. An irrig-
ated plot wiII lose water rapi<ily to the dry surroundings, which constitute
a very J-arge sink for water vapour, vrhereas rainfall as well as affecting
a much larger area than that irrigated may be associated with cloud, lower
air temperatures and higher refative hunidity both before and after the '
event.
The rapid increase in water poLential observed for these few plants may
not be representative of the response to surnmer rains by plants in the field.
Regular irr:igation may have allowed the shrubs to retain active root.s during
rs4
the dry season and hence rehydrate more rapidly than unirrigated plants.
The latter shed Lertiary roots during the dry season (Osborn et aL. 1932)
and water absorption may be slow when the soil is rewetted if the remainder
of the root system is suberized before an effecÈive rainfall. According
to Drew (L979) if the root systems of some species are subjected lo severe
water stress they show a lower average perneability to water for several
days after rewetting.
For plants rehydrated in the laboratory (Chapters 5 and 6) there was
no evidence of a slow recovery of water potential but the extent of suberiz-
ation may depend on the length of the drought period and the activity of roots
during that time (Slatyer , I973J, factors which nay differ between field
and laboratory. The other possibility is thatr if surface roots have been
shed, slow infiltration may deJ-ay rehydration simply because acÈive or pot-
entially active roots do not have immediate access to water.
A slow recovery by previously unlvatered field plants would allow
qualified support fcr the vier.,' thaL such factors are important under field
conditions. T\¡¡o short experiments on the immediate response to a single
irrigation are described in the following pages.
7.33 Rehydration of fieLcì plants
fn early summer (9th Decernber) l-979 seven shrubs were irrigated with
25,,m¡nof water. Water poLentials were measured at dawn and at intervals
during the day for the following few days. A ferv unwatered plants were also
monitored over the same period. The results from this experiment are pres-
ented in figure 7.3. Dawn water potentials for individual shrubs are shown
in figure 7.3a. For convenience the results for irrigated plants are
separated into two groups. The data in figure 7.3a (ii) are from plants
treated by rvatering 1 *2 of surrou¡rding soil and figure 7.3a (iii) represents
two groups of tv¡o plants irrigated with an eguivalent amount of waLer spread

155
tover 4 m'of the surrounding soil surface. Diurnal water potentials are
shown in figure 7.3b.
It is apparent from these figures that recovery of high water potential
following irrigation in the fietd is at least as fast as that observed for
potted cuttings in the laboratory. The latter reached maximum water potentials'
on average, within 4 days. In most cases dawn water potential of field plants
showed signs of leve1ling off by about day 3. The v¡ater potential of control
plants decreased during this time and probably would have continued to do
so but for a sudden change in weather conditions. Shortly after midday on
day 3 a dense, complete cloud cover reduced irraCiance markedly. Air
temperature felt to 15oC and strong winds blew for most of the afternoon.
A small amount of rain fe1l br.rt did not register in any of the gauges.
frradiance which approximated that at approaching dusk remained 1ow for the
rest of the day. On previous days there had been little cloud and air
temperatures had reached maxima of 30 - 40oC. The peaks of the graphs of
diurnal water potentials in figure 7.3b are dawn maxima. From the trend of
these peaks for the control ptot (-represented by open symbols) it appears
that the overcast conditions had allowerl tþe unwatered plants to rehydrate
to a level beyond that expected for tl¡e following dawn by 1800 hrs in the
afternoon. A similar rise in water potential during that afternoon was
evident for irrigated planÈs. Further rehydration during the night resulted
in elevated dawn \,JaÈer potenti-als on day 4 for both control and irrigated
plants. The effect is most clearly seen in figure 7.3a. However by the
following day water potentials of the controls resumed their dowlrward trend
and those of the irrigated plants had begun to faII. Nevertheless, in most
cases water potentials on day 5 were higìrer than on day 3. The effect of
this longer than normal period for diurnal rehydraLion was therefore not
transient. This result implies that the decline in water potential of the
control plants was due to a progressively greater discrepancy between

Figure 7.3 Vùater potentíal of shrubs irrigated in .Èhe field.
(a) Dawn water potentials of controls and indivjdual shrubs
(i) Unirrigated
(ii) The surrounding I m2 of soil irrigated
(iii) ILre surror:nding 4 m2 of soit irrigated
The last two groups are graphed separately Lor convenience.
(b) Mean diurnal water potentials for irrigated (closed symbols)
and unirrigated shrubs (open symbols) in the days after
irrigation. The shading on the abscissa indicates the time
between sunset and sunrise. The arrow shows the time of
watering on day 0. The doÈted line passes through the points
representing dawn water potential for unirrigated shrubs and
that for 1800 hours on ttre afternoon of day 3 when overcast
conditions had al-lowed water potential to rise to a value
higher than tlrat expected for the following dawn. Íhe value
that was expected is indicated by a star located directly
below the recorded dawn vúater potential for day 4- The
experiment was done in December, L979.

o
-2 ilt
O -âÀ
=
=-1ct,oo-5(,oì-6
,,II,lI
Á-_
-l
l,IIt a
Â
o
-7
-8
-2
-ó
o
c
A
A
o
¡a
t234 150r2315 t5 0l ?315 t5
Doyr ofler wolering
b
I
-5
oÀf.9cooèooÌ
ttI
o
-8
-96 t2 t8 24 6 12 t8 24 ö 12 18 24 6 t2 l8 24 ó 12 18 24 ó
Doy 0 Doy I Doy 2 Doy 3 Doy 4
lime of doy (hours)
156
equilibrium and actual dawn water potential rather than an upper Iimit
imposed by falling soil water potential. If the rate of water absorption
at night is linited by the number of active roots and equilibriurn with
the soil is not attained by dawn, water loss during the following light
period wiIl further depress water potential and as a consequence the plant
may falI short of equiJ-ibrium with the soil by an even larger amount the
next morning. The extra time for rehydration provided by overcast condítions
during the light period allows the plants to approach the equilibrium water
potenLial more closely. Since the maximum water potential of irrigated
plants was also apparently Iimited by the time available for el-iminating
the diurnal water deficit it is possible Èhat water absorption by these
plants depended on a few active old roots rather than new root growth.
However,Cowling (1969) observed new root growth for ,4. uesícarùq I-4 days
after irrigation so part o, .ff of the increase in water potential on day 4
for irrigated plants may have been due to root growth. This is unlikely to
have been the reason for increasing water potential in the controls.
If overcast conditions rather than root growth were responsible for the
elevated v¡ater potentials of irrigated plants on day 4, and this seems
probable considering Èhe simultaneous increase for the controls, then the
observed response demonstrates that rehydration following a substantial
rain in sunmer is likely lo be more rapid than after an experimental irrig-
ation ln hot dry conditions. A large fall at the beginning of an overcast
ra.iny period woul-d be particularty effective. It is also evident that
heavy cloucl during the day in summer can have an appreciabfe effect on
water poLenLial even if no rain faIls.
As well as ill-ustrating the response Lo irrigation,figure 7.3 shows that
the water potential of shrubs growing in the field varies widely at any given
time. The extent of this variation can be gauged from the dawn water
potentials of the controls and those of the irrigated plants on day 0,

r57
a feti hours before irrigation. lfater potentials were as high as -5 MPa
and as low as -B MPa at that time presumably because the microtopography
of the area leads to an uneven distribution of soil water. As predicted
in Section 7.2 (Methods) this effect was reflected in the post-irrigation
water potentials when rt¡ater was applied to a large area of scil (¿ *2)
around a group of plants. Uneven infiltration resulted in a wide varíation
in maximum dawn water potential (fiS. 7.3a (iii) ) for groups of plants
watered in this way. The water potentials of individually írrigated shrubs
were much less varj-abIe. Such variation might perhaps be reduced progressively
during a drought if plants in drier sites restrict water loss earlier than
those in run on areas but in Dec. 1979 insufficient tine had elapsed since
recent rains. Total rainfall at the site since mid October was 36 mm.
Judging by the daity rainfall records for Koonamore (fiS. 7.I) most of this
fell in mid-November, only a little over 3 weeks before the start of the
experiment.
Because the control plants had high initial dawn water potentials
relative to those of irrigated plants the data for this group provide no
information on the diurnal pattern of water loss; at very low water potential.
Measurements taken later, on days Ì4 and 15, when water potentials of most
plants had falten to pre-irrigation values, confirm that diurnal changes were
still occurring. On average water potential on the evening of day 14 was
1.2 MPa less than at dawn the following day.
The rate of decline in water potential for the controls when compared
with that for írrigated shrubs does allotv some speculation on the overall
pattern of dehydration following irrigation in the field. T'he mean
rate of dehydration between day 5 and 15 for control plants was 0.I3 MPa/
day whereas that for irrigated plants was 0.37 lvlPa/day. If the rate of
dehydration of irrigated plants at low water potential is similar to that
of control pJ-ants t.hen this implies that the initial rate of dehydration
of irrigated plants vlas muclr higher, which in turn implies that high post

tsB
irrigation water potentials are not maintained for long. There is not
enough data from the controls to confidently establish the significance
of the difference between these rates of dehydration but the latter
prediction is consistent with the pattern of water loss from a saltbush
plantation on the Riverine Plain (Sharma, 1976). Evapotranspiration
from this comrnunity averaged 2 mm per day over 55 days but initial rates
calculated for the first I0 days were over 5 mm per day. Greenwood and
Beresford (1980) measured rates of 0.7 - I.3 mm per day from an /. uesiearia
plantation but in this case the soil surface was moist and encrusted with
salt a condition which according to Milthorpe (1960) can result in a fower
initiat rate of evaporation from the soil. However' even the average rate
of 2 mm per day is sufficient to explain the drop in water potential of
irrigated plants at Koonamore. Fifteen days after irrigation with 25 mm
the water potential of some plants was close to that measured on day 0.
Assuming that a reLurn to pre-irrigation water potential implies the loss
of aII the applied water, an average rate of i.7 mrr per day, or iess for sonre
plants, over the l5-day period, could account for the obserl'ed response.
Sharma (1976) noted that most of the water stored in the profile beneath
a saltbush community on the Riverine Pl-ain following a 30 mm rain in mid-
summer was depleted within 15-20 days. Considering the possible differ-
ences in prevailing weather conditions and other factors affecting v¡ater loss
at the two sites, this close correspondence between the inferred raÈe of
water Ioss from small irrigated plots and the calculated rate from a naturally
watered plantation is doubtless a coincidence. The comparatively low rate
of water loss from a community at Koonamore following a siniilar rain in early
sunmer (29 mn in Decernber, L977, see fig. 7.f) was probabJ-y a resul-t of
such differences. fn thj.s case depletion of sojl water, again inferred
frorn changes in xylem water potential, was not complete until about 50 days
after rain.
159
-4 second short irrigation experiment was started in late December 1980 '
when 3 groups of two plants were irrigated with 6, 12 and 25 mm of water.
As before dawn water potentials were monitored over the following few days.
For the first three <lays nidday water potentials r,\tere measured but these
readings were discontinued to conserve the gas supply to the pressure
charnber. The results for individual shrubs are sho\^¡n in figure 7.4.
On this occasion the mean dawn water potential of the plants before
irrigation (8.43 1 O.¿e Iæ.) was lower than in the previous year (6.g¿ 1
0.34 Mpa) despite rainfalls totalling 52 mm since mid-October. Over half
this rain fell. in December according to the distribution of rainfall at
Koonamore Homestead during the same period. Conditions during the course
of the experiment were uniformly hot and dry except for a rain of 4.1 mrn fate
on day 5. Maximum and minimum air temperatures tùere as high as 44.5oC arrd
25oC respectively. on most days maximum temperature was higher than 43oc.
Shrubs irrigated v/ith 25 mm of water behaved as in the earlier experiment.
All had rehydrated blz day 3. The third shrub in this group was watered one
day later than the others, hence the shift of the arro\,r' indicating rain.
OnIy one other shrub of the remainder showed a positive response to irrigation;
the water potential of one of the pair irrigated with 12 mrn of water also
increased to a maximum by day 3 but in this case did not rise much above
-5 Mpa. The water potential of this shrub had fallen to -6.4 MPa b1z day 5.
The depth of penetration of applied water into the soil around the remaining
shrubs v¡as presumably too smal.l- to allow much of a response before signif-
icant losses occurred as a result of evaporation.
For the first four days the water potential of one of the unwatered
plants declinecl more rapidly than that of unwatered plants in the previous
summer but ther:eafter was maintained at the same level. The nean midday
depression of v¡ater potential of all the plants before irrigation was
1.4 1 0.08 Mpa and that for the controls over the first 3 days I.32! 0.17 I4Pa,

Figure 7.4 Dawn water potentials of pairs of shrubs irrigated with different
amourts of rainwater in December, 1980.
(a) unirrigated
(b) 6 mm
(c) 12 nun
(d) 25 rnm
The arrow indicates a fall of 4.1 nun of rain. The ttrird
shrub in (d) represented by open symbols was irrigated one
day later than thei others, hence the shift in position of
ttre arrow.

b
-4
-6
-8
-lo
-12
-4
-6
-8
t\.
o
a-a
a
o
I I
¡--o-c ¡-c
o
Ecc,
oo
c,
o3
0 r. 2 3 I 5 ó
-a-O-O
o-_g
o-o
--a-/'
012345ó
a-
d
O
o
o
a
-*Q
-2
II
û
4çII
c
a
a
oI
o-.-)-a¡\-o- g-ç./'
-10
o12315ó 0r 2345ó-12
Doys of ler wolering

r60
so it is obvious that the plants \^rere losing water at that time. It is not
known whether there \das a diurnal change in water potential on the last
few days when dawn water potential remained steady. If there was it is
possible that early stomatal closure allowed the plants to rehydrate by the
foltowing morning. Some species have been sho\^¡n to respond directly to low
relative humidity by reducing stomatal aperture (Schulze e'b aL., L972) .
These shrubs may have been responding to the hot dry conditions in this way
although Whiteman and Koller (1967) found no evidence of such a reaction for
well watered individuals of. A. uesicar"Lct at least not for vapour pressure
deficits (between leaf and air) over the range 10-30 mbar. However, given
a mean minimum humidity of 35 per cent in January (Osborn et aL.r 1935) and
assuming the intercelfular spaces to be saturated with water vapour, the
vapour pressure deficit may have been closer tc 40 mbar. Stomates may also
be more sensitive to humidity when leaf water potential is low.
The other possibil-ities are that the decline in water potential was
halted by stomatal clcsure in response to hormones or low leaf water potential
but since other plants have been shown to continue water loss at much lower
water potentials than those recorded for the control in this experiment (e.9.
fig. 7.I) this is perhaps unlikely. On the other hand, while uneven infil-
tration of rainfall has been suggested several times as a reason for the wide
variation in pre-irrigation water potential, it may be that differences in
stomatal sensitivity between indíviduals wj.th different genotypes is partly
responsible for the variation in water potentiaJ..
Osborn et aL. (L932) suggested that 25 points 10 mm) was the minimum
effective rainfall f<¡r saltbush during a dry period at Koonamore. frrigation
wit-h 6 mm at best stopped water potential front declining further. Under
the conclitions of this experimenL 12-25 mm of water were required to pro-
duce an appreciabl-e increase in vrater potential. As discussed earlier, an

161
equivalent fall of rain may be much more effective, although the 4 mm
rain on day 5, in this instance, had little effectonthecontrols by
the following morning.
In both irrigation experiments described in the precedinq pages
it appeared that water potential began to decline after reaching a
maximum on about day 3, a decline which was arrested or reversed either
by overcast conditions or rain. Judging by the response of glasshouse
grovrn plants to declining water potential, growth follorving irrigation
in summer may therefore be limited. Some information on shoot elongation
of írrigaLed plants in the field is presented in the next section.
7.34 Grovtth responses to irrigation
At various times between November , L977 and October ' 1978 pairs of
shrubs were irrigated once with 25 rnm of water and the growth of five
shoots on each v¡as recorded in the following I-2 months. During this time '
beginning in October, 1977, a group of four shrubs was irrigated regularly'
and a series of measurements were made on these plants. Just before
irrigation in each month the length of twenty tagged shoots fron this group
was recorded. ln both cases measurements were made from photographs as
described in Chapter 4. The mean water potential of two of the individuals
from the group is illustrated in figure 7-2.
The results of growth measurements are "nourn
in figures 7.5 and 7.6.
The height of the bars represents the mean increase in length of the shoot
as a whole (solid bars) and foliated stem (cross-hatched) except in
figure 7.6a where the height of the stippled bars shows the mean increase
in length of laterals of tagged shoots on rnale plants in the regularly
irrigated group. The abscissa in figure 7.5 shows the month of irrigation
and the number of subsequent monthly measurements on plants irrigated once
only. Ì-or shrubs irrigated in December, 1977, for example, readings were

l-62
taken in January and February and che increase in length is shown for
those two intervals. On two occasions no record vlas taken in the
second month. Least significant differences (P <0.05) ' from left
to right where applicable, refer to increases in overall and foliated
Iength, respectively.
It seems from figure 7.5 that little growth occurs in the second
month after irrigation, especially in the hot, dry months of the year.
On two occasions shoots of shrubs watered in the sunmer months (Dec-Feb)
decreased in length after a flush of growth during the first interval.
This rvas alsc true of shrubs receiving naturaL rainfall only. The mean
increase in shoot length for 47 shoots on control plants after a rain
of.29 mm in December 1977 was 5.2! I.2 mrn while in the following month,
when no rain feil. shoot length decreased by 1.¿ I 0.5 mm. Figures for
l0 shoots from a pair of =nr,rU" irrigated later that month were 5.9 I 1.8 mm
and -2.0 1 0.9 mm, respectively. The LSDs also illustrate the large
variation between shoots of this species and their response to rehydratiorr.
rn some cases, as found in earlier chapter:s' the variation was such that
while some shoots grew, others on the same plant contracted. Standard
errors were so large that, while differences betrveen growth on the first
and second month after rainfall or irrigation, were usually significant,
increases in l.ength in the first month, at different times of the year'
were not significantly different in most cases. Later in the year growth
in the second month was initiated by rainfall and the data thus provide
litt-]e further information on the length of the growth period except to
demonstrate the obvious point that frequent rains or milcl conditions are
required to naj.ntain continued growth. The amount of rainfall associated
with growth in those instances can be assessed from rainfal-l data presented
earlier.
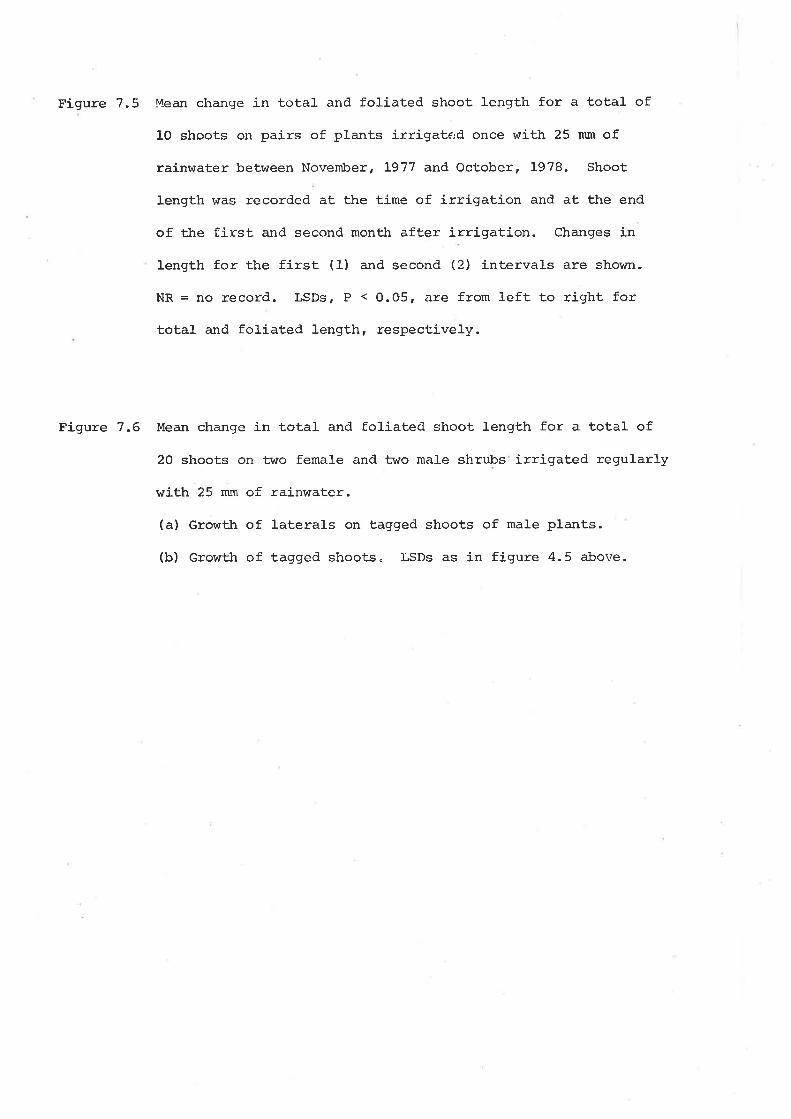
Figure 7.5
Fígure 7.6
Mean change in total and foliated shoot length for a total of
10 shoots on pairs of plants irrigat<,d once with 25 mm of
rainwater between November, 1977 and October, 1978. Shoot
length rvas recorded at the tíme of írrigation and at the end
of the first and second monttr after irrigation. Changes in
Iength for the first (1) and second (2) intervals are shown.
NR = no record. LSDs, P < 0.O5, are from left to right for
total and foliated length, respectively.
Mean change in total and foliated shoot length for a total of
20 shoots on two female and two male shrubs irrigated regularly
with 25 mm of rainwater.
(a) Growttr of laterals on tagged shoots of male plants.
(b) Growth of tagged shoots. LSDs as in figure 4.5 abor¡e.

t Tolol ffi tol iol ed
2
EE
8
6
4
2
0
-4
Eo)(¡)
a
O)
O)co
-c
ooã
t0
-2
-2
r0 b
-2
222 2 2 2 2
o8
6
4
Nov Dec Jon Feb Mor Moy1978
Jun Oct
1977
lolol
Fol i ot ed
Nov Dec Jon Feb Mor Apt Moy Jun Jul 5"P Oct
EE
o)c0,
.9
C)
O)
oEU
Co0,
f
2
0
IW
8
ó
4
2
0
-41977 l9 78

l_6 3
In some months the increase in fofiated length was greater than
the increase in shoot length, an apparent anomaly which was explained
in Chapter 4. To recap.briefly, if basal leaves have been shed before
the first measurement, Ieaving viable axillary buds' the latter can sprout
when the shrub rehydrates. In conjunction with apical production of
leaves the increase in foliated length can exceed that of the shoot.
Regular irrigation (fig. 7.6b) allowed some growth in each of the
summer months. It was shown earlier that this treatment (25 nn of water
per rnonth) was not adequate to maintain trigh water potential-s during
sunmer (fiS. 7.2) which implies in conjunction with the data in figures
Z.3a and 7.5 that growth occurred in pulses while water potential remained
high for a short period after irrigation-
The seasonal pattern of shoot growth in figure 7.6 is inconsistent
with that shown by unirrigated plants (ch. 4) which grew rapidly in spring.
The growth of irrigated shrubs was significantly less at that tine despite
regular supplements of water. ln fact, irrigated shrubs began to appear
unhealthy after several months of watering. Possibly the repeated
ponding of water on the surface of the soiJ resulted in leaching of nutrients
away from the root zone, or had some other detrimental effect.
Hodgkinson et a,L. (1978) found that although a 23 mm rain in mid-
su¡nmer increased the dawn water potential of Atz"LpLeæ confertifoLia
(Curlew Valley, N. Utah) from about -3.0 to -1.6 MPa in 1-2 days, a weekly
watering treatment later in the sunmer, while reducing the decline on
water potential recorded for unirrigated shrubs, did not maintain water
potentials at the value measured shortly before regular irrigation was
begun. Water poÈential was maintai¡rec1 above thaL of the controls but
feII from -2.4 Lo -3.1 MPa over a three-week period. A single application

164
of.25 Íun to previously unirrigated shrubs, on the other hand, resulted
in an increase in water potential within 24 hours.
Their data on water potential do not imply that regular watering
was detrÍmental, as suggested for A. UesiCAT'LA., but shoot growth by
A. confertifoLia ín summer could not be initiat.ed by either watering
or watering plus nitrogen, a response which was attributed, with some
qualification, to partitioning of photosynthate to the root syst-em rather
than the shoot, since root growth was observed. The authors,
Hodgkinson ei a.L. (I97 8), discounted summer dormancy as a reason for the
lack of growth. The partiLioning of photosynthate to roots may be a
response to, rather than a cause of, the lack of shoot growth. This
possibility was implicit in their final- comment where it was suggested
that evolution of tolerance to a cold winter environment had resulted
in the loss of abílity to initiate shoot growth in summer, In other
words, the response is due to changes in shoot rather than root metabol-ism.
The observed actj.vi.ty cf the root system suggests that metabolites
originating from the root which promote shoot growth ought not be lacking.
Considering the high sensitivity of shoot growth to \,Iater stress
in glasshouse grown seedl-ings of ,4" U¿sicarLa, the lack of growth of
A. confez,tifoLia in summer may have a physical rather than a metabolic
cause. The lattér species may also be unable to mainLain turgor above a
critical val-ue for cell expansiotr in the leaves and stem during sumlr,er.
However, dawn water potentials were as high as -2.0 MPa and since the species
has been shown to exhibit considerable osnotic adjustment during surnmer
(see Hsiao et aL, L976) A. conferLì,foLia wouJ.d have to be particularly
sensitive to water stress for this explanal-ion to account for its failure
to respond to irrigation.
165
In contrast, shoots of ,4. Ðel'Lc1z,ia grew in response to eiLìter
rainfall or irrigation in sunmer (ch. 4, fí9.7.5). In the irrigation
experiment in summer 1979 growth of shoots was recorded over the first
5 days after irrigation. The mean increase'in shoot length (n = 19)
was 3.0 t 0.3 mm. The increase in length of unirrigated shrubs, which
had water potentials as high as -4.9 MPa during that period, was 0.5 t
0.3 nm (n = 10). Th" difference bet\^reen the two groups is significant
(p < 0.00I) and the increase in shoot length of unirrigated plants is not
significantly different from zero. Since water potential (fiS. 7.3')
apparently began to decline shortly after reachinq a peak on day 3 it
is also interesting to compare the above figures with the growth of
other irrigated shrubs in the field. The mean increase in length of
50 shoots in the first month after irrigation in the dry conditions of
summer and autumn, 1978 was 4.8 ! 0.8 mm which is significantly greater
than that over the first 5 days in 1979. Nevertheless, given the same
initial rate and pattern srr grolth over 60 per cent of the increment in
length over a month might be expected in the first few days after irrigation.
The mean increase in length of 47 control shoots in December, L977
which grew in response to rainfalfs totafling 29 mm, 8-11 days earlier,
was 5.2 ! t 2 mm also significant]-y higher than the 5-day total for
irrigated shrubs in 1979 but not significantty higher than that over a month
for other irrigated shrubs. As noted earlier stems' on average, had
contracted some time between irrigation or rainfall and the second sampling
date, and possibly had stopped grovring even before the first measurement
when the increment was recorded. Growth was probably not much more than
that shown.

166
If growth is aesumed to be negligible at water potentials near
-5.0 MPa, as shohtn for the controls in 1979, and since shrubs appear
to be most active in the first 5-I0 days after rainfall or ifrigation
then, unless water potentials decline very fapidly to a low critical
value for celI expansion, that value must be quite high, perhaps not
much lower than for glasshouse gro\¡¡n plants. However, depending on
conditions during previous shoot production and on the rate of dehydration
after a given input of soil moisture the ability of cells to maintain
turgor may vary. Direct measurements of growth following irrigation or
raÍnfall shoud be done at different times of the year to establ-ish the
range of vtater potentials over which growth occurs in the field.
Further comments on the data in this chapter are made in the nexÈ
chapter where the results are briefll' Ciscussed in relation to other work
described in this thesis.

167
CHAPTER B
8. Summary and conclusions
In the preceding chapters the main emphasis in the discussion of
results has been placed on conditions during the experiment, experimental
methods and on possible physiological mechanisms for the observed
responses. Tn the following pages the results of measurements of CO,
exchange and growth in the faboratory are compared with those on growth,
water potential and the accumulaÈion of TNC in the field. Some
conclusions about the known reacti,on of A, UesicaYLa to heavy gr.azLng
are made from the data on the accumufation of TNC and its distribution
within the shrub.
The results are also discussed in relation to the amount and
pattern of rainfal1 which is the most important feature of the physicai
environment of /. Ues,Lcaz"ia. Hall- et aL. (1964) sr.rggested that there v/as
an increase in the incidence of summer rainfall at Koonamore over the
two decades preceding their study compared. with that in earlier years.
The possible consequences of such an incregse are outlined. It is not
known whether there is a definite trend toward a higher frequency of
heavy summer rainfalls at Koonamore but the preclictions mad.e about the
growth and survivaf of A. uesieav"La i-n a grazing system after heavy
summer rains may apply to shrubs in summer rainfalf areas.
The chapter is conclucled with some suggestions for further
research on the physioJ-ogy ancl ecology of A. uesicarLa..
8.1- Rainfall and physiological actir,'ity in the field
Ir{ost of the seasonal records of xylem water .ootential were tal<en
during years of average to above average rainfall and hence for much of
the time were weII above the lowest values recorded for A. uesicaria aL
l_6 IKoonamore and el-sewhere. In the years preceding the experiments
reported here, there were also some with high total rainfal-I. Tn L974,
for example, rainfalls totalling 850 mm, four times the long-term and
4.6 times the median, were recorded at Koonamore Homestead. Nevertheless,
very low water potentials were developed during the summer of l-977-78
at the end of a year of below average rainfall. The sequence of wet
years leading up to 1977 probably resulted in some water storage iow in
the profife but in the main ,4. uesicaz"La has limited access to s/ater
stored at depth and relies on frequent rain to maintain high water
potential. Fluctuations in water potential were observed even in winter
when rainfall was low.
Rehydration of ,4. Ðesicar¿a is rapid follow-i.ng heavy sutnmeï rains,
judging by the response to irrigation, but high water potenÈials are
not maintained for longer than a few days. For some shrubs maximum
post-irrigation water potential in the field was less than that at
which leaf expansion and shoot extension ceased in the glasshouse
but it is evid.ent that conditions during rehydration can markedly
influence water potentia!; for example, when skies ïiere overcast
during the day a higher maximum water potential was reached by the
following dawn, It is also likely that a direct comparison of water
potential and growth in the field will- show that the threshold. is
slightly lower for field grown shoots. The different conditions
associated wíth irrigation and rainfall in sumrner also influence the rate
of rehydration dur:'-ng subsequent rainless periods. The mean water
potential of a sample of shrubs 8-10 days after a heavy sunmer rain was
not significantly different from the peak water poÈential of shrubs
irrigated with a similar amount of water (ca. 25 mm) at the same time
of the year. The water potentiaJ- of irrigated plants reached a maximum

169
by about day 3 and then began to decline. In the hot, dry conditions
prevailing when shrubs were irrigated with less than 25 mm (fig. 7 -4)
water potential did not reach the threshold for shoot extension
measured for glasshouse-grown seedlings.
Rainfalls greater than 25 mm are more conmon in sunÌmer than in
winter (see HalI et aL.11964) but it is unl-ikely that saltbush will
have many opportunities for long periods of rapid growth in the warmer
months. In contrast, water potentials in the field were generally much
higher than the hydration compensation point for net CO, uPtake measured
for shoots in the laboratory. There were some individuals which
developed very low water potentials by the end of the driest interval
during this study presumably because run-off from the sites occupied by
these particular shrubs was high, or perhaps because their roots were
unable to penetrate a layer of limestone rubble or a hardpan lying cl-ose
to the soil surface. Conditions in the fietd probably allow positive
net CO^ uptake by individuals on more favourabl-e sites, in all seasons,z
even during years of below average rainfall. Provid.ed that monthly
rainfall during the warmer months is not substantially less than average,
net photosynthesis may be reduced to zero only at the end of a sequence
of dry years.
There are, of course, objections to the use of measurements made
in the l-aboratory for predictions of physiological limits in the fie1d.
Most measurements of net CO, uptake aÈ fow water potential during this
study were made on shoots grohtn under faboratory conditions. The
evidence from other studies, in which net Co, uptake of various species
in the field and controfled. environments has been compared, points towarcls
a lower hydration compensation point when plants are gro\^/n under field
conditions. The only evidence to support the view tirat the same is true
for A. Desica?La. are the measurements of net CO, uPtake made on shoots
170
of field gro!{n cuttings, shortly after they were returned to the
laboratory, before they were watere<l . lrlhereas the rates of net CO,
uptake calculated for laboratory grown shoots of A. pesicar"ta In/ere not
significantty higher than zero at water potentials less than -9 MPa,
two of the measurements made on field grov¿n shoots ac -I0 MPa, or lower,
Ììrere greater than zero. On one occasion a positive rate of net CO,
uptake $/as recorded at a water potential less than -I1 MPa. It was
suggested that, with modifications to the gas exchange cuvette'
positive net CO, uptake could also be demonstrat-ed for laboratory grown
shoots at water potentials of that magniÈude. It is likely that
individual shoots on shrubs in the field are capable of positive net CO,
uptake at such low water potentials but it is possibJ-e that the hydration
compensation point for the whole plant is higher than that for shoots,
due to respiratory losses by non-photosynthetic tissues. However,
since leaf and young stem make up by far the largest proportion of
Iive tissue (ch. 3) the hydration compensation point for the whole plant
may not be very different from that of the individual shoots.
The overall trend toward higher TNC cbncentration in the leaves
during intervals with little or no rain (ch. 3) suggests that net CO,
uptake continued at low water potenLial., but wiÈh increasing difficulty
in loading the phloem (e.g. Wardlarv, 1968). Part of the increase may
be due to withdrawal of carbohydrate from lower leaves before drought-
induced abscission but why, if this h'ere true, the transfer would be
from leaf to leaf rather Lhan l-o stem or root is not clear. Lower leaves
on annual plants, at least, are thought tc export metabolites primarily
to the root (e.g. Canny' 1973) . 'Ihe rapid response of shoot growth
(ch.6) and root growth (CowIing, 1969) on rehydration of saltbush
suggests that carbohydrate is required quickly at both shoot and root
apices. If low water potentiaf does affect loading of the phloem the

17J-
withdrawal of carbohydrates from ol-der leaves, iÎ this occurs after they
develop water deficits severe enough to eventually induce leaf
abscission, is presumably associated with altered membrane characteristics
due either to hormones or damage.
The need for stored carbohydrate to support the rapid growth
during and after rehydration is illustrated by the slow recovery of high
rates of net CO, uptake and relativel-y rapid recovery of respiratory
activity measured for shoots of field grown cuttings in the laboratory
(ch. 5.). In this case the shoots used were gro\^/n in the field and,
apart from the fact that shrubs were kept under laboratory conditions
during and between measurements after they were watered, the observed
response is probably similar to that following summer rains in the field.
Shoot growth was so fast that, towards the end of Èhe recovery period,
a high proportion of the numbers of leaves present had developed under
laboratory conditions, but the response immediately after watering,
at least, is likely to be representative of normal behaviour in the field.
In sufimer, when mild. conditions associated with rainfall do not
Iast long, recovery may not be compJ-ete Uui iuaging by the immed.iaÈe
increase in photosynthetic activity observed fo:l rehydrating shoots in
the laboratory, rainfalfs sufficienÈ to induce an increase in water
potential proba-b1y also result in higher rates of carbon gain, even if no
structural growth occurs. If the ffuctuations in TNC following heawy
summer rains can be used as a guide, the photosynthetic recovery of
shrubs in the field is sufficientiy slow that substantial amounts of TNC
are required to support growth. The high post-stress turgor potentiaì-s
(ca 3.0 MPa) recorded in the laboratory suggest that leaf expansion and
shoot etongation wil-l- be rapid as considerable osmotic adjustment can be
expected to occur in t-he f ield during dry per-iods.

]-72
8.2 TNC concentration and shrub growth after defoliation or rain
The dec] ine in TNC concentration at such times may have been
responsible for the eventual death of irrigated shrubs defoliated by
sheep at Deniliquin, N.S.Vü. (Leigh and. Mulharn, L97I). lrlater equivalent
to a rainfall of 75 mm every 3-4 weeks was applied to the soil around
these shrubs throughout the grazing experiment. This treatment probably
Iowered the TNC concenÈration in aI1 plant parts (cf. figs 3.4-3.6).
The first water was applied two weeks before the start of the grazing
experiment so that growth had probably reduced TNC concentration even
before sheep were given access to the plants. Further reductions in
TNC concentration, due to regrowth during the 12 days sheep v¡ere
confined to the experimental areasr mây have occurred. leaving little
substrate for regrowth after sheep were removed. However. repeated
removal of regrowth by sheep may also have reduced the number of
available buds. At Koonamore regrowth from epicormic buds began within
two days of a mid-suflìmer defoliation. The increasingly poor growth of
regularly irrigated shrubs at Koonamore (fig. 7.6b) suggests that the
large amounts of water applied to defoliated, shrubs at Deniliquin may
also have contributed to their death in some way.
The loss of sorne leaf and young stem during a clry períod wiJ-1
not have an immediate effect on TNC concentration as regrowth is
unlikely to occur when turgor potential is l-orv. The loss, in this case,
may even ameliorate the effects of drought since total water loss by
the shrub may be reduced or the water supply to the remaining leaves
improved. On the other hand, the loss of roots and temporary cessation
of root growth observed by Hodgkinson and Baas-BecJcing (L977) on well
watered. defofiated shrubs suggests that water absorption could be
adversely affected (ch. 2) although the less ser¡ere treatments, clipping
for exampì-e, in that experiment did not result in much roc¡t loss. It

J_7 3
would be interesting to know the effect of d.efoliation on the growth
and survival of roots in initially dry soil-. Mod.erate grazi-ng during
dry periods may also affect shrub productivity for some time considering
the seven years of reduced vigour recorded for some North Americ,an arid
species by Cook and Child (1971). In Á. ues¿ea?ia about half the TNC is
located in the edible parts accessible to grazing animals.
If TNC concentration is a critical factor controlling the regrowth
of saltbush grazed by sheep then the increase in occurrence of heavy
rains during suÍuner, suggested by llaLL et aL. Q,964) r nây have unfavourable
consequences for shrub survival. Sheep make most use of sal-tbush in
the dry season. Hence given a rain heavy enough to produce growth of
saltbush and. a large fall in TNC concentration, especially in the root
and inedible stem fractions, then contínued graztng by sheep may severely
restrict the ability of the shrubs to regrow if defoliation has been
severe. Thus sunmer rains which in the absence of graz;-,ng animals might
be expected to improve the overall carbon-bal.ance of individual shrubs,
due to the partial replacement of the existing leaf population with
younger and perhaps more drought resistant leaves, frêy in fact be
detrimental in a grazing system. On this basis, even without more
frequent summer rains, the most critical period may be when TNC
concentration is red.uced. dramatical-ly after the first heavy rains at
the end of the dry season, before the germination and establishment of
herbaceous species which sheep prefer. The chances of shrub survival may
be higher in the ensuing cooler months but shrub productivity in the longer
term if it depends partly on the arnount of TNC available, may be
supressed as nuch, if not more, by grazing immediately after l-ate
autumn or early winter rains than after heavy sunmer raj-ns. In winter
the grazing pressure on the shrubs around some watering points may be
reduced due to the growth of herbs and the formation of casual waters,
allowing a wj-der dispersal of the flock.

r74
r'he relatively high concentration of TNC in the tissues of
saltbush in summer and autumn may also account for the observations on
Iong-term changes in edible biomass by Noble (1977). On the basis of
data from an analysis of photo point records for Koonamore Vegetation
Reserve Noble suggested that while rain in cool seasons contributed to
the growth af A. uesicaria the pattern of growth was essentially that of
a pulse most frequently triggered by summer rains and folfowed by a slow
decline. The pattern of growth of tagged shoots over two years in this
study suggests that while sunmer rains initiate some growth, most
occurs in late winter and spring. However, as stated by Noble (1977)
the data from photo point records represented standing non-t^loody biomass
and the estimated change between any two records may have been the sum
of a num.ber of periods of production and loss. Since estÍmates were made
from records taken at about the same time each year, it is not possible to
say with certainty when plant growth took place. Nevertheless, the
peaks in biomass T¡¡ere built up over a period of several years in most
cases, a pattern which Noble suggested b/as associated with the life span
of individual leaf-bearing shoots. It is not clear to me whether the
description given for those shoots referred to small lateral-s on prinary
branches or the prirnary branches themselves but a relatively high
concentration of TNC in the tissues in summer may be responsible for the
initiation of primary shoots from the base of the plant after summer rather
than winter or spring rains. In the cooler months when shoot elongatllon
and leaf production j-s rapid the demand for photosynthate from alf
sources by existing shoots may be high enough to inhibit the development
of epicormic buds near the base of the p1ant. fn summer' when TNC
concentrations are initially higher and growth of terminal apices in full
sun is restricted by falling turgor, the supply of stored photosynthate
may be sufficient to allohr some development of ner¡I primary branches fro¡n
epicormic buds.

17s
Initiation of buds may also be associated with higher temperaLures
as well as higher TNC concentration in summer. Their partial deveJ-opment.,
after initial expansion, ilây be facilitated by better light penetration,
due to the sparser canopy in summer, and that development in Èurn may
result in a higher demand for the available TNC in competition with
existing shoots. FuIl development is no doubt deferred until later in
the same, or succeeding years, as suggested by the growth patterns shown
in Chapter 4, but nevertheless this explanation could account for the
observation by Noble (L977) that long-term fluctuations in productivity
are initiated by sunìmer rains.
The only information on bud growth from this study is that after
complete defoliation. Overall, bud expansíon was not significantly
higher in the r¡armer months but some bud growth was recorded on each
occasion in summer and autumn. fn contrast, the only times no bud
activiÈy vJas recorded after defoliation, for either individuals or the
whole sample, were in winter and spring when TNC concentrations are
relatively low.
8.3 TNC content of ,4. Desica.v"La and other arid zone species
fn chapter 3 the TNC concentration in the tissues of A. ÐesicaTl:a.
vras sho\^rn to be low compared wi.th that in various storage organs of
diverse species which regularly shed much of their above-ground tissue
in cofd or dry seasons. Those species included herbs and drought-
deciduous trees.
The most useful comparj.son is that with similar shrubs from an arid
area. Coyne ancl Cook (1970) described the seasonal pattern of TNC
accumulaLion and deptetÍon for five shrub specì-es, including two from the
genus AtrLpLeæ, from a semi-arid area of iorthern Utah. Leaves were not
analyzed for TNC. On the basis of the data presented f.or AtripLex
l_7 6
*confez,tifoLia and A. nuttallü the main difference between these
two species and.4. uesieav,ía is the concentration of TNC in the roots.
The roots of these species had maximum TNC concentrations between 2.5
and 3.5 tines that in the roots of A. ues¿caria,. the figure for
A. nuttaLLii was the highest recorded by Coyne and Cook for any of the
five shrub species, all of which had higher concentrations of TNC in
root tissue than did ,4. uesicaria.
Ttre difference in allocation of TNC to roots of. A. uesieania and
A. eonferttfoLia, for exampJ-e, becomes even more pronounced when root-
shoot ratios are compared. The root-shoot ratio for A, confertifoLia
is about 7, whereas that 1.or A. uesiearLa is about 0.3 or less. The
quantity of TNC stored in roots of A. confertifoLia when both differences
in dry weight and concentrations are taken into account may be 60-70 t.imes
that stored in roots of A. uesícaz"La. The greater part of the TNC in
A. eonfertifoLía is thus stored below ground. A. Desica.r'¿a. on the other
hand, as showrr in figure.l .8b, stores most of its TNC in the leaves
and a large proportion in old stem. Even if ,4. eonfertífolia sbores
Iittle non-structural carbohydrate in its'Ieaves it is evident that the
quantity of carbohydrate stored in A, uesicav"ia j.s much less than that
in the cold winter desert species.
The greater allocation of both structural and non-structural
assimilates to the root system of A. conferl;ífoLi.a is probably also
related to the climate in which ít lives. Melting snow in spring, is
Iikely to wet the soil Lo a much greaLer depth than tte sporadic rainfall
of warm arid areas. Vlhile extensive root systems among arid zone species
are not restricted to those in cold winter areas selection for a deeper
Coyne and Cook used the binomial .4. faLcata in association withthe comrnon name "Nuttall saltbush". Apparently this is now asynonym for A. nuttaLlii (see p. 28 in osmond et aL. 1980).
*
r77
root system would probably operate in a system where the soil is
regularly wet to a great depth. The increase in TNC concentration of
roots, observed for .4. confez.tifoLia. ís probably associated with lower
air temperatures around the shoot with the approach of winter. Assimilate
partÍtioning towards the root is increased when shoo! growth is
restricted by low temperatures relative to those around the roots (e.g-
in naple seedlings, Richardson, 1956). Vühile root extension of three
desert species in that cli¡r.ate, especially / . confeTtifoLia' continued for
severaL weeks after cessation of shoot growth (Fernandez and Caldwell'
1975) the reduced rate of root growth appeai:s to have resulted in storage
of large quantities of photosynthate. As welI as apparently supplying
assimil-ates for shoot growlh in spring these high concentrations may
also allow increased resistance of the root systen to the freezing
temperatures in Lhe upper soil layers during winter. Conversion of
starch to sugars has been associated with increased frost hardiness in
some plants (e.g. Sininovitch et aL.' 1953).
A similar increase in allocation to the root system of shrubs in
warm arid areas might al-so be expected as .shoot growth is restricted by
the onset of water sLress, although in this case¡ as noted eariier
carbohydrates may be retained in the leaves for other reasons.
Maximum TNC concentrations (ca 80 nS/S) in the leaves from 3
of 4 shrub species from the Colorado clesert in California (Strain, 1969)
were lower than those recorded fox A. Uesicaría (ca. I50 mg/g). The
drought-deciduous species EnceLia fez'ínosa, however:, had concentrations
as high as 450 rng/g in early spring. The values for these species were
based on the dry weight of samples taken for starch extraction after
alcohol solubl.e sugars had been removed. Since sugars, included in the
final figure, v¡ere sometimes about 7C per cent of TNC the high vaiues a.re
quite large ovt:r-estimates refative to Èhose calculate<l for .4. üesicaT'La.
1.7 B
TNC cuncentrations for the latter were also based on dry weight
consisting of up to 20 per cent salt, if it is assumed that the cation
providing electrical balance for chloride ions is sodium. The use of
ash-free dry weights, perhaps a more suitabte figure for comparison with
species which do not accumulate large amourÈs of salt' t¡¡ould increase
the calculated TNC concentrations for saltbush leaf by up to 25 per cent.
The percentage increase would be higher if heavier ions such as
potassium were assumed to contribute to the electrical balance. Similarly
TNC concentrations in the young stem fraction of /. Ues'Lcan'La are
increased by up to Il per cent when dry weights are adjusted to account
for salt content.
The greater allocation of TNC to root,s of North American shrubs,
at least for the cold winter species, may also be associated with Lhe
Ionger grazing history of animals native to the region. fndividuals with
¡nost TNC above ground may have been selected against in those
circumstances. EII-is et aL. 1977) did find evidence ihat macropods
native to Australia [kangaroos and euros) do eat flat-Ieavecl chenopods
at timesr,4. uesicay,ia for example, but these arrimals are mobile enough
to seek out preferred herbaceous plants in other areas when drought
reduces their availabilitY.
The storage of high concentration of TNC in leaves of drought-
deciduous species (e.g. Encelia far"i.nosa, A. Desiea.Tia) would also seem
to be a disadvantage. Except in severe droughts, Ieaf fall presumably
does not involve a significant loss of TNC or, alternatively' reserves
stored in other plant parts are adequate to support regrowth. V'lithdralal
of carbohydrates from abscissing leaves may also be important. Oechel-
et aL. (1972) suggested that, although Lanv,ea diuarLcata loses most of its
leaves in severe droughts, it can be considered an evergreen. In most
years the species retains a high proportion of its leaves. This is aÌso

r-t9a reasonable description of A. uesicar|a, at least of those at Koonalnore.
The advantage of large stores of 1-ri'iC in young shoot tisoues may be that
photosynthate is more accessible at times when rapid growth is possible.
Losses due to leaf fall apparently do not pose a threat to
survival of shrubs protected. from grazing. However' I suspect that the
distribution of TNC in,4. UesicarLa is a prime factor in the response of
individuals to heavy grazlng. Undoubtedly shrubs such as /. nwmnuLaria
and, Mairearta sedtfoLia (ch. 2) survive after complete removal of the shoot
because they have ad.equate stores of TNC in the root system. These
shrubs have extensive root systems which shoufd allow much greaÈer
storage of TNC than does the sma1l root system of ,4. uesieaz"La. The low
overall content of TNC in the latter may simply reflect an ability to
maintai.n positive net photosynÈhesis throughout the year.
a.4 Further research
As noted in Chapter 2 the information on TNC accumulation for
species in the arid areas of North America was collected with the expressed
intention of using it as a basis for management policies. The work there
has been supplemented with data on the response to defoliation at different
times of the year. The response of /. uesícat"La to grazing in different
circumstances has also been studied but whereas in North America work on
the effect of grazing on TNC concentration has been done and related to
the subseguent vigour of shrubs, little is known of physiological
responses by shrubs of the Australian arid zone to the removal of young
Ieaf and stem tissue. The information on seesonal patterns of TNC
accumulation presented in this thesis prov'ides a basis for planning
grazing experinents of thís kind.
It is possible that grazing experiments will show that the greatest
reduction in TNC concentration and shrub vigour will occur after heavy
180
grazíng in the wake of late autumn or summer rains. Grazing of saltbush
in early spring when TNC concentration is at a minimum may also be
detrimental but under normaf circumstances saltbushes are not heavily
grazed in the cooler months because preferred herbaceous species are
available. However, the respcnse of shrubs'is likely to be complex and
should be tested by clipping or grazLng at various +-imes of the year.
Recommendations for management may be possible from the results of such
studies, although such recommendations may be difficult to impJ-ement.
Judging by various revi.ews (Perry ' 1967, L974a, I974b¡ Moore'
1,969, Newman | 7974) the management of chenopod shrublands in tÏre past
has been re]atively inflexible. The maín policy has been one of year-long
seÈ stocking and the main option that of reducing or increasing stock
numbers. Decisions are generally made on the basis of animal condition
rather than pasture condition. This may have to change in the future,
particularly if pasture conÈinues to cleteriorate, but it is probable
that policy will continue to be directed by economic factors for some time.
High stocking rates are often maintained despite suggestions that
economic return may be higher in the long term if paddocks are stocked
with a smaller number of anj.mal-s. ft" ptotfem is complicated by the
presence of a mosai,c of plant communj-ties in most paddocks and pastures
have to be managecl for the conservation of the species most susceptible
to grazing. The presence of sucir mosaics may also reduce the effectiveness
of rest-rotation grazing systems if the season of defoliation is important,
since some populations of susceptibie species would stifl- be exposed to
grazing at critical times.
Apart from. the more ,oractical aspects of research into the probJ-ems
of shrub productivity and survival- in arj.d zone grazing systerns, which are
of prime importance, the br:oad basis of this thesis has naturally left many
othe¡: questions about the biofogy of A. Ðesi'co?ia unanswered and raised others.

18I
The assembly and construction of parts of the gas exchange system
described in Chapter 5 left insufficient time to explore some of the
relevant questions on gas exchange of,4. Uesícav"La. The possibility
of a higher hydration compensation point for whole plants has already been
mentioned. A large assimitatíon chamber designed to accommodaÈe young
shrubs was built during the course of this study but was not used,.
Ideally some measurenents on both whole plants and shoots should be done
in the field although this approach is both difficult and costly.
The response to dehydration at higher leaf temperatures would be
of interest as increases in respiration at higher temperatures may cause
a more rapid decline in the raÈe of net photosynthesis (Depuit, 1979)
unless substantial temperature acclimation occurs (Strain, 1969).
Since xyJ-em water potentials are more often maintained at higher
values than the severe stresses imposed during this study the response
of net CO^ uptake to rehydration at higher minimum water potentials may¿
help establish the level of stress at which the after-effect becomes
apparent. A. Ðesicdr"La has several different forms and hence a comparison
of the physiology of two or more of these ïould be useful. A comparison
of CO^ exchange measurements during drying cycles would serve the¿
purpose of checking the results reported. here and, if combined with
measurements of stomatal- resistance and transpiration, may allow some
insight into the reasons for the relatively slow recovery of net CO"
uptake on rehydration.
Some hypotheses on net CO, uptake at low water potential formulated
before experimental work was begun were al-so left untested. One of these
was the possibílity that Ieaf abscission in dror.rght-deciduous species'
as well as reducing overall water loss and postponing stress in the
younger leaved, could result in some increase in net CO" uptake by the

182
remaining leaves. I $ras led to considering this possibility by the
work of v,Iareing et a,L. (1968) who concluded that the observed increases
in net photosynthef-ic rate of maize and bean plants, partialJ-y
defoliated by the removal of lower leaves, was due to the effects of an
improvement in the cytokinin supply- on carboxytation capacity in the
remaining leaves. The roots of droughted plants supply less cytokinin
to leaves (Ben Zioni et aL., ].967; Itai and Vaad.ia, ],97I) and hence
the reduction in the number of sinks for this metabolite, by leaf fall
ín water-stressed saftbush, fräy contribute to the maintenance of positive
net photosynthesis at low water potential.
A further possibility for research arose duri.ng the discussion of
turgor maintenance in chapter 6. ft was suggested, as an extension to
the theory that ion uptake is controllecl partty by pressure on the plasma-
lemma (Zimmermann,1978), that if cell walls contract as leaves of
A- uesicaz"La dnri-nk with declining water potential, then some turgor
maintetrance by this means may al-fow a J-onger time for maintenance of
turgor by osmotic adjustment. r suspect, however, having considered
ways in which this might be explored that the hypothesis is untestabte.
An examination of the environmental and internal controls of the reversible
changes i¡r l-e.ef area for,4. uesicaz"ia, and perhaps other species, on the
other hand, is warranted.
One of the reasons for selecting both male and female shrubs for
studies of shoot etongation, TNC concent::at:Lon and water potential in the
f ield was the possibility of dif f erences bei'.veen the two. No significant
d.if fererices were found. However, Freeman et aL. (7976) found signif.icant
differ:ences between the number of males and fenares of tItrLpleæ
confertifolia, and several- other dioecious species, on dry and moist sites
in Norl:hern Utah, vrith more mal-es occupying d.rier sites. Given that such a
dístribution occurs on the spatiatly heterogeneous sites occupied..,by

183
A. uesiearia it is possible that selection of greater drought hardiness
has occurred in male populations. Experiments designed specifically to
test this may establish such differences.
These aspects of gas exchange and qrowth all relate to the survival
and productivity of A. uesicayia to some extent and are of considerable
interest in themselves but the details of mechanisms behind some of the
observed responses are unlikely to ad.d much to the management of shrub
populations. One of the main issues in this thesis is the role of stored
carbohydrate in growth either after defol.iation or a period of water stress.
Most of the discussion of this subject is based on the assumption that
fluctuations in TNC imply their direct use at Èhe growing point. This may
be a reasonable conclusion from the correlations between changes in TNC
concentration, vigour or individual growEh events but it is neverthel.ess
an assurnption. Perhaps one of the most important areas of research, apart
from the more practical aspects of physiological responses to grazing
mentioned earlier, is the study of patterns of movement and reallocation
of stored photosynthate and its incorporation into structural or metabol-ic
components of new growth. It is likely that such studies on.A. uesiear¿a,
¡viIl show that TNC is used at the growing point, as shown for alfalfa by
. Smith and Marten (f970) .
On this basis the abiliLy of A. uesieqïia, to photosynthesize at low
water potential is important in that as weII as maintaining the plant
during dry periods it also results in the accumulation of TNC which can be
used to support growth after sunìmer rains when photosynthetic rates are
initially low. The consequence of TNC depletion during sunmer growth is
that any removaL of existing or new growbh by grazing animals will reduce
the shrub's capacity to replace TNC stores. Since shrubs apparently use
stored carbohydrate throughout the win'ber growth period, if stores of TNC
have not been replaced before t-he end of the dry season regrowth in
winter will be slow and shn:b vigour may decline.

BIBLTOGRAPHY 184
Acevedo, E., Hsiao, T.c. and Henderson, D.w. (1971) . Im¡rrediate and
subsequent growth responses of maize Ieaves to changes
in water status. PLant PhytioL- 48'- 631-6-
A1laway, W.G. and Mansfield, T.A. (I970). Experiments and observations
on the aftereffect of wilting on stomata of Rumeæ
sanguíneus. Can.. J. Bot, 48: 513-21.
Anderson, D.J., Perry, R.A. and Leigh, J.H. (J-972). Some perspectives
on shrubr/environment interactions. In "lrTildland
shrubs - Their Biology and utilizatiojl." Eds c.M. McKell-,
J.P. Blaisdell and J.R. Goodinr PP. L72-8I, USDA
Forest Service General Technical Report INT-I.
Ashby, w.c. and Beadle, N.c.bI. (1957). Studies in halophytes. IfI.
Salinity factors in the growth of Australian saltbushes.
EcoLogY 382 344-52.
Ashton, F.M. (1956). Effects of a series of cycles of low and high
soil water on the rate of apparent photosynthesis in
Fugar-cane. PLant PhysioL. 3I: 266-74.
Barker, s. (l-979). Shrub population dynamics under grazing - within
paddock studies. In "studies of the Australian Arid
Zone. IV. Chenopod Shrublands. Eds R.D. Graetz and
K.M.w. Howes, pp. 83-106 (CSIRO, Melbourne) -
Barker, S. and Lange, R.T. (1970). Population ecology of AtripLeæ under
sheep stocking. In "The Biology of Att'iplen". Ed.
R. Jones, pp. 105-20 (CSIRO, Canberra).
Beadle, N.C.W., lVhalley, R.D.B. and Gibson, J.B- (1957). Studies in
halophytes. II. Analytic data on the mineral constj-tuents
of three species of Att"ipLe:r anð' their accompanyi-ng soils
in Australia. EeoLogY 3Az 340-4.

IB5
Ben-Zioni, 4., Itai, C. and Vaadia, Y. (L967). Water and salt-stresses
kínetin and protein synÈhesis in tobacco leaves.
PLant PhgsioL. 422 361-s.
Bers' A'R' and
ïï":. ;,::::';^",,'";";";i""" ".,,,,1.,""1. ;"C.M. McKeIl, J.P. Blaisdell and J-R. Goodinr PP. 219-86,
USDA Forest Service General Technical Report INT-I.
Bierhuizen, J.F. and slatyer, R.o. (1964). An apparatus for the
continuous and simultaneous measurement of photosynthesis
and transpiration under controlled environmental conditions.
CSIRO Div' Land Res. Tech. PaP. 24-
Billings, !ù.D., Shaver, G.R. and Trent, A.w. (1976) . Measurement of
root grohrth in simulated and natural temperature gradients
over permtttost . Atct. ALp. Res.8: 247-50.
Black, R.F. (1954). The leaf anatomy of Australian members of the
genus AtrípLeæ. r. Att'ipLe* Ðesicar'ía Heward and
l. nwnnuLariø Lindl . Aust. J. Bot. 2z 269-86.
Bluff, E. (1980). Grolvth and response to defoliation of two arid range-
Iands fodder species. Unptrblished Honours Thesis '
Uni.¡er:sity of Adelaide.
Boyer, J.S. (l-970). Differing sensitivity of photosynthesis to low
leaf water potentials in corn and soybean. Plant Phys'LoL.
462 236-9.
Boyer, J.S. (1971a). Recover-Í of photosynthesis in sunfl-ower after a
periocl of low leaf water potential. PLartt PhgsíoL,
47: 81.6-20.
186
Boyer, i.s. (I97Ib). Non-stomatai inhibition of photosynthesis in
sunfloweratlowleafwaterpotentialsinhighlight
intensities. PLant PhysioL. 48: 532-6'
Boyer, J.S. (L977) . Water deficits and photosynthesis. In "lVater
Defici'-s and Plant Growth", VoI. 4. Ed. T.T. Kozlowski,
pp. 153-90 (Academic Press, London).
Boyer, J.S. and Potter, J.R. (1973). Chloroplast response to low
Ieaf water potentials. I. Role of turgor. PLant
PhysíoL, 5l: 989-92-
Brix, H. (Lg62). The effect of waÈer stress on the rates of photosynthesis
and respiration in tomato plant and loblolly pine
seedlings . PltysíoL. PLant. 15l 10-20.
Brouwer, R. (f966). Root growth of grasses and cereals. In "The GrowÈh
cf Cereals and Grasses". Eds F.L. Milthorpe and
J.D. Ivinsr pp. 153-66 (Butten'¡orths, London) .
Brou/rr, G.D. and Hutchinson, J.c.D. (1973) . Climate and animal
production. In "The Pastoral Industries of Australia".
Eds G. Alexander and O.B. Williams, pp. 336-70
(Sydney University Press, Sydney) .
Bïown, K.W., Jordan, !ü.R. and Thomas, J.C. (1976) . Water stress induced
alterations of the stomatal response to decreases in
leaf water potential. PlrysioL. PLant. 37t I-5.
Brown, R.H. and Blaser, R.E. (1965). Relationship between reserve
carbohydrate accumufation and growth rate in orchardgrass
(DactyLis gLomerata t .) and tall fescue (Festuca aTundínaeea.) -
Crop Seí. 5: 571-82.
Caldwell, M.M. (-L972). Gas exchange of shrubs. In "Wildfand Shrubs -
Thej.r Biology and Util-izatíon". Eds C.M. trfcKell ,
J.P. Blaisdell and J.R. C'oodinr PP 260-10' USDA Forest
Service General Technical Report INT-I.
J_8 7
Caldwell, M.M. ' Osmond, C.B. and riott, D.L. (L977) - C4 path\'say
photosynthesis at low temperature in cold-tolerant
AtripLar species. PLant PhysíoL- 60: L57-64-
White, R.S., Moore, R.T. and Camp, L'B. (1977). Carbon
balanc¿, productivity and water use of cold-winter
desert shrub communities dominated by C3 and C4 species.
)eeoLogía (Berl.) 29; 275-3OO.
Caldr¡¡ell, M.M. ,
Canny, M.J. (1973). "Phloem Translocation" (Cambriage University Press'
Lond,on) .
Carrodus, B.B. (L962). Some aspects of the ecology of arid South
AustraÌia: the relative distribution of Atr'ípLeæ
uesicarLa Heward ex Benth. and Kochia sedifoLia F.v.M.
M.Sc. Thesis, University of Adelaide.
Carrodus, B.B. and Specht, R.L. (1.965). Factors affecting the relative
distriburion of Atripleæ ues¿caria and Koehia sedifoLia
(Chenoporiiaceae) in the arid zone of South AusÈralia.
Aust. J. Bot. 13: 419-33-
Carrodus, B'.B., Specht, R.L. and Jackman, M.L. (f965) . The vegetation
of Koonamore StaÈion, South Australia- Trans. R' Soe'
S. Aust. 89: 4L-57 -
Chapman, E.A. and Jacobs, S.W.L. (1979). Photosynthetic responses in
semi-arid environments. In "Studies of the Australian
Arid Zone. IV. Chenopocl Shrublands". Eds R.D. Graetz
and K.M. Howes, pp 4t-53 (csrRo, Melbourne) '
Charley, J.L" (1959) . Soil-sal-inity-vegetation paÈÈerns in western
New south wales and their modification by overgrazing.
Ph.D. Thesis, University of New England.

188
Charley, J.L. (1972). The róle of shrubs in nutrient cyclíng. Ig
'trfildland Shrubs - Their Biology and Utilízatíotltt -
Eds C,M. McKell, J.P. Blaisdell and J.R. Goodin, pp.
182-.203, USDA Forest Servíce General Technical Report
INT.I.
charl ev' r'L t:::":.,"".ï":,ï,::,";:."-;..":.;.",::""", ;
215-56 (Society for Range Management, Denver, Colorado).
Charley, J.L, and Cowling, S.W. (1968). Changes in soíl nutríent status
resulting from overgrazing and their consequences 1n
plant cormunities in semi-arid areas. Pnoc. EeoL. Soe.
Aust. 3: 28-38.
Cleland, R. (f959). Effect of osmotlc concenÈratíon on auxin-action
and on Írreversible and reversible extension of Auena
coleoptile. PhysioL. PLant. L2z 809-25.
Cleland, R. (1971). Cell wall extension. Annu. Þts. PLont. PttysioL.
222 197-222.
Condon, R.trü. (J972). Soil erosîon in dryland Australia. In 'rÏhe
Use of Trees and Shrubs in the Dry Country of Australia'r.
Ed. N. Hall, pp. 116-37 (AustralÍan Goverrunent Publishíng
Service, Canberra).
Cook, C.W. and ChÍld, R.D. (f971). Recovery of desert plants in various
states of vigor. J. funge Manage. 242 339-43.
Costin, A,B. and Mosley, J.G. (f969). Conservation and recreatÍon in
arid Australia. In "Arid Lands of Australia". Eds
R.O. S1-atyer and R.A. Perryr pp. 158-68 (Australian
NatÍonal University Press, Canberra).
CowlÍng, S.I^I. (1969). A study of vegetatÍon activity patterns in a
semi-aríd environment. Ph.D. Thesís, Uníversity of
New England.

189
Cóyne, p.I. and Cook, C.W. (1970). Seasonal carbohydrate reserve
cycles in eight desert range species. J. Range Manage.
23. 438-44-
crafts, A.s. (1968) . lrtater deficits and physiological processes.
In "water Deficits and Plant Growth", Vol. II. Ed'
T.T. Kozlowskir PP. 85-133 (Academic Press' Ne\¡¡ York).
Cremer, K.W. (1976). Daily patterns of shoot elongation ín Pírtus
z,adiata and EucaLyptus regnans. Neu PhytoL. 762 459-68.
Crisp. M.D. (1975). Long term change in arid zone vegetation at
Koonamore, South Australia. Ph.D. Thesis, University
of Adelaide.
Croz¡-.er, A. and Reid, D.M. (1971). Do roots synthesize gibberellins?
Can. J. Bot. 492 967-'15-
Cunningham, G.L. and Strain, B.R. (1969). In ecological signifieance
of seasonal leaf variability in a desert shrub.
EcoLogY 50: 400-8.
Cutler, J.M., Rains, D.W. and Loomis, R.S. (1977). The importance
cf cell size in tJ.e water relations of plants - PhgsioL.
PLant. AOt 255-60.
Davies, !Í.J. and Kozlowski, T.T . (Lg77) . Variation= '.*otg woorly plants
in stomatal conductance and photosynthesis Curing
and after drought. PLant SoiL sez 435-44-
Davidson, J.L. and Milthorpe, E.L. (1966). The effect of defoliation
on the carbon balance ín DaetyLis gLomerata- Ann. Bot.
30: 186-98.
Dawson, N.M. and Boyland, D.E. (1974). Resource use. Queensl-
Dep. Primary Ind. Tech. BuLl. No. 12.

. r90
Depuit, E.J. (1979). PhotosynÈhesis and respiration of plants in
thearidecosystem.rn"Arid-IandEcosystems:
'structurerFunctioningandManagement"'Vol'l'Eds
D.W. Goodall and R.A. PerrYr PP' 509-35 (Cambridge
UniversitY Press, London) .
Dina, S.J. and Klikoff, L.G. (1973). Effect of plant moisture stress
¡n carbohydrate and nitrogen content in big sagebrush'
,L Rønge Marøge. 262 207,-9.
Dixon, H.H. (I9I4). "Transpiration and the Ascent of Sap in Plants"
(I'lacMillan, London) .
Drew, M.C. (1979) . Root d,eveLopment and actrvities. In "Arid-land
Ecosystems: Structure, Functioning and Management",
Vol. I. Eds D.W. Goodall and R.A- PerrY, PP. 573-606
(Caurbl,idge University Press, Lonclon) .
EIIis, 8.A., Russell , E.M., Dai^rson, T.J. and Harrop' C.J.F. Q977).
Seasonal changes in diet preferences of free ranging
red kangaroos, euros and sheep in western New South
vüales. Aust. wíLdL. Res. 4z L27'44.
Esau, K. (l-960). "Anatomy of Seed Plantsì'n 376 pp. (Wiley, New york) .
Evans, G.C - (Ig72l. "The Quantitative Analysis of Plant Growth"
(Blackwell Scien*.ific Publications, Oxford) .
Evans. L.T. (1975) . The physioJ-ogical basis of crop yield. In
"Crop Physiology". Ed. L.T. Evans, PP- 327-55 (Cambridge
University Press, Carnbridge) .
Evans, L.T. (1976) . Transport an<l distribution in plants. I¡t_
"Transport and Transfer Processes ín Plants"' Eds
I.t-. Wardlaw and J.B. Passioura (Academic Press, London) .
Fahn, A. (1958). Xylem structure and annual rhythn of development
in trees and shrubs of the desert. I. Tantaríæ aphyLLa'
I. jondanis val. negeuensis, T. gaLliea var. mai"is-mortui,
Itop. Woods LOgz 81.

19J-
Fahn, A. and Arnon, N. (L962). The living wood fibres of Tønaris aphyLLa
and the changes occurring in them in transition from sap-
wood to heartwood. Neu PhytoL. 622 99-Lo4
Fahn, A. and Leshem, B. (L962). lrfood fjlcres with living protoplasts.
Nøt't PhytoL. 622 9r-8.
Fatchen, T.J. and Lange, R.T. (f979). Piosphere pattern and dynamícs in
a chenopod pasture grazed by cattle. Tn "Studies of the
Australian Arid Zone. IV. Chenopod Shrublands" - Eds
R.D. Graetz and K.M.vt. Howes, PP. 160-9 (CSIRO, Melbourne) .
Fernandez, O.A. and Caldwell, M.M. (1975). Phenology and dynamics of
root growth of three cool semi-desert shrubs under field
cond.itions. J. EeoL. 63: 7o3-L4.
Fick, G.W., Loomis, R.S. and lviltiams, w.A. (1975) . Sugar beet. In
"Crop Physiology". Ed. L.T. Evans, PP. 259-95
(Cambridge University Press, Cambridge) .
Fielding, J.M. (1955). The seasonal and daily elongation of the shoots
of Monterey pine and the daily elongation of the roots.
Aust. Forest Bur. Leafl. 75.
Finar, I.L. (f963) . "Organic Chemistry", Vol. I, 4th edition (Longmans,
London) .
Fischer, R.4., Hsiao, T.C. and Hagan, R.tvt. (1970). AfÈer-effect of water
stress on stomatal opening potential. J. Eæp. Bot. 2L:
371-85.
Freeman, D.C., K1ikoff, L.G. and Harper, K.T. (1976). Differential
resource utilization by the sexes of dioecious plants.
Scíenee I93z 59'7-9.

192
Gaff, D. (f97f). Dessication-tolerant flowering plants in southern
Africa. Scíence L74¿ 1033-4.
Gates, C.T. (1968). hlater deficits and growth of herbaceous plants.
In "lrlater Deficits and Plant Growth", Vol- II- Ed-
T.T. Kozlowski, PP. 135-90 (Academic Press' Neht York) .
Graeluz, R.D. (f978). The influence of grazing by sheep on the structure
of a saltbush (Atz'ipLeæ Desiea?La Hew. ex Benth.)
population. Aust. RangeL, J. I: IL7-25.
Graelz, R.D. and Wilson, A.D. (L979). An assessment of herbivore diets
in the chenopod shrublands. In "Studies of the Australian
Arid Zone. IV. Chenopod Shrublands". Eds R.D. Graetz
and K.M.!ù. Howes, PP. 144'59. (CSIRO, Melbourne).
Graetz, R.D. and Wilson, A.D. (1980) . Comparison of the diets of sheep
and cattle grazing a semi-arid chenopod shrubland.
Aust. RangeL. J. 2z 67-75.
Greenwood, E.A.N. and Beresford, J.D. (1980). Evaporation from vegetation
in landscapes devetoping secondary salinity using the
ventilated-chamber techniquè. II. Evaporation from
A,trípLeæ plantations over a shallow saline water table.
J , Hydrol. (Amst. ) 452 313-9 .
Grotelueschen, R.D. and Smith, D. (1967). Determination and identification
of nonstructural carbohydrates removed from grass and
legume tissue by various sulfuric acid concentrations'
takadiastase, and water. J. Agríe. Food Chem. 15: 1048-5Ì.
HaIl , E.A.A., Specht, R.L. and Eardtey, c.M. (1964) . Regeneration of
the vegetation on Koonamore Vegetation Reserve, L926-L962.
Ausi. J, Bot. L2z 205-64.
193
Hodgkinson, K.C. and Baas Becking, H.G. (L977). Effect of defoliation
on root growth of sorne arid zone perennial plants'
Aust. J. Agric. Res. 29= 3L-42.
Hodgkinson, K.c., Johnson, P.s. and Norton, B.E. (1978) . Influence
of summer rainfall on root and shoot growth of a cold-
!.rinter desert shrub , Atr.ipLeæ confez,tifoLia. )eeología
(eerl.) 34: 353-62.
Hoffmann, p. (1968). Pigmentgehalt und Gaswechsel von MyrotVtørtnus-
Blättern nach Austrocknung r.ud !'fiederaufsättigung'
PhotosYnthetica 2z 245-52 -
Hsiao, T.C. (1973). plant responses to water stress. Annu. Reo. Plant
PhysíoL. 242 519-70.
Hsiao, T.c., Acevedo, E. and Henrferson, D.!rl- (1976). Vüater stress,
growth a¡rd osmotic adjustment. PlriLos. fuans. R. Soc.
Lond. B. 2732 479-5oo.
Itai, C. and Benzioni, A. (f976) . I¡later stress and hormonal response.
In "lfater and Plant Life: Problems and Modern Approaches",
Ecological Studies, Vol. iS. Eds o.L. Lange, L. Kappen
and E.'D. Shulzer pp. 225-42 (Springer-Verla9, Berlin) .
Itai, C. and Vaadia, Y. (1971). Cytokinin activity in water-stressed
shoots. PLant Physíol. 472 87-90.
Jameson, D.A. (I963) . Responses of indiviclual plants to harvesting.
Bot. Reu, 29= 532-9Å.
Jessup, R.W. (1951). The soils, geology and vegetation of north-western
South Australia. Ttans. R. Soc. S. Aust. 742 L89'273-
]-94
Jones, R. and Hodgkinson, K.C. (1970). Root growth of rangelanci
chenopods: Morphology and production of. AtripLeæ ntnnnuLania
anð. AtripLeæ uesicavia. fn "The Biology of Att'ipLeæ".
Ed. R. Jones, pp 77-86 (CSIRO, Canberra).
Jones, R., Hodgkinson, K.C. and Rixon, A.J. (1970). Growth and productivity
in rangeland species of AtripLeæ. In "The Biology of
AtrípLer". Ed. R. Jones, pp 3J--42 (CSrRO, Canberra) .
Jones, R.M. (1966). Scald reclamation studies in the Hay district'
N.S.w. 1. Natr:ral reclamation scalcls. J. SoiL Consenu.
Seru. N.S.l^/. 222 L47-6O.
Kappen, L.rLanget O.L.t Schulze, E.D., Evenari, M. and Buschbom, U.
(L972). Extreme l^Iater stress and photosynthetic activity
of the desert plant Artemisia herba-aLbø Asso. )eeoLogùa
(Berl.) 10: L77-82.
King, R.W., I¡lard1aw, I.F. and Evans, L.T. (f967). Effect of assirnilate
utilization on photosvnthetic rate in wheat. PLanta
772 26L-76.
Kozlowski, T.T. (I972a). Physiology of water stress. Int'vüildland Shrubs -
Iheir Biology and Utilization". Eds C.M. McKeIl, J.P.
Blaisdell" and J.R. Goodinr pp. 229-44, USDA I'oresÈ Service
General Technical Report INT-I.
Kozlowski, T.T. (L972b). Shrinking and swel-Iing of plant tissues. In.
"['later Deficits and Plant Growth", Vol . rrI. Ed. T.T. Kozlowski,
pp. 1-64 (Academic Press, New York).
Kressman, T.R.E. (1956). Laboratory applications of ion exchange resins.
Part III - Developments in organic and biochemical applications.
Lab. Praetiee 5z 163-6.

19s
Kriedmann, P.E. and Loveys, B.R. (i974). Hormonal mediation of plant
responses to environmental s'Lress. In "Mechanisms of
Regulation of Plant Growth". Eds R.L. Bieleski, A.R.
Ferguson and M.M. Cresswell, pp 46L-5, R. Soc. N.z. Bull " L2.
Kried.mann, P.E. and Lcïeys, B.R. (f975). Flormonal influences on stomatal
physiology and photosynthesis. In "Environmental and
Biological Controf of Photosynthesis". Ed. R. Marcelle,
pp. 227-36. (Ì^f . Junk, The Hague).
Lange, R. and Purdie, R, (1976) . v'Iestern myall (Acacia soudenii) ,
its survival prospects and management needs. Aust. RangeL. J,
l:64-9.
Lange, R.T. (1969). The piosphere: sheep track and dung patterns.
J. Range Manage. 222 396-400.
Lay, B.G. (L972). Ecological- stuaies of arid rangelands in South Australia.
M.,Sc. Thesis, University of Adelaide.
Leigh, J.H. (L972). Saltbush and other chenopod browse shrubs. In
'The Use of Trees and Shrubs in the Dry Country of Australia".
Ed. N. Hall, pp. 284-98 (eustralian Government Publishing
Service, Canberra).
Leigh, J.H. (1974). Diet selection and the effects of grazing on the
composition and structure of arid and semi-arid vegetation.
In "SÈudies of the Australian Arid Zone. II. Animal
Procluction". Ed. A.D. Wilsonr pp LO2-26 (CSIRO, Melbourne).
Leigh, J.H. and Mullram, !V.E. (1966). Selection of di.et by sheep grazing
semi-arid pastures on the Riverine Plain. l. A bl-adder
saltbush (ALríp'Leæ ues¿car"ia) - co*-ton bush (Kochia aphyLLa)
community. Aust. J. Eæp. Agri,c. Anim. Ih,tsb. 6: 460-7.

196
Leigh, J.H. and Mulham, W.E. (1967) . Selection of diet by sheep
grazj'ng semi-arid pastures on the Riverine Plain.
III. A bladder saltbush (AttipLeæ uesieayia) -
pigface (Disphymø aust?q,Le) ' community. Aust. J.
Eæp. AgrLc. Anim. Husb. 7z 42I'5"
Leigh, J.H. and Mulham, W.E. (1971). The effect of defoliation on the
persistence of AtrípLeæ Ðesicar"La,. Aust- J. Agtic.
Res. 222 239-44-
Leigh, J.H. and !,lilson, A.D. (1970) . Utilization of Att"ipLeæ species
by sheep. In "The Biol-ogy of Atnipleæ". Ed. R. Jones,
pp. 97-104 (CSIRO, Canberra).
Levitt, J. (I972). "Responses of Plants to Environmental Stresses"
(Acade¡tic Press, Nevr York) .
Levitt, J. and Ben Zaken, R. (1975). Effects of small water stress on
:ell turgor and. intercellular space. PVrysíoL. PLant.
342 273-9.
Ludlow, M.M. (1975). Effect of water stress on the decline of l-eaf net
photosynthesis with age. in "Environmental and Biological
Control of Photosynthesis". Ed. R. Marcelle, pp. 123-34
(V[. Junk, The llague) .
Ludlow, M.M. (1976). Ecophysiology of C4 grasses. In "lrlater and Plant
Life: Problems and Modern Approaches", Ecological Studies,
VoI. 19. Eds O.L. Lang€, L. Kappen and E.-D. Schulze,
pp. 364-86 (Springer-Verlag, Berlin) .
Ludlow, M.M. and Ng. T.T. (L974). vlater stress suspends leaf ageing.
PLant Sci. Lett. 3: 235-40.
Ludlow, M.M. and lrlilson, G.L. (197f ). Photosynthesis of tropical pasture
plants. rrr. Leaf age. Aust. J. BíoL. Sci. 242 Lo77-87.
197
Lüttge, U., Pallaghy, C.K. and Osnucnd, C.B. (1970). Coupling of ion
transport in green cells of Atz,ipLeæ spongiosa leaves
to energy sources in the light and in the dark.
J. Membr. BioL. 2z 17-30.
Lynch, J.J. and Alexander, G. (1973). Animal behaviour and the pastoral
industries. fn "The Pastoral fndustries of Australia".
Eds G. Alexander and O.B. Williams, pp. 371-400 (Sydney
University Press, Sydney) .
Macfarlane, !ri.V. and Howard, B. (L974) . RuminanË water metabolism in
arid areas. In "Studies of the Australian Arid Zone.
II. Animal Production". Ed. A.D. Wilson, pp. 7-22
(CSIRO, Melbourne).
Maconochie, J.R. and Lange, R.T. (l-970). Canopy dynamics of trees and
shrubs with particular reference to the arid-zone topfeecl
species. Trans. R, Soe. S. Auet. 94: 243-8.
Marshal-Ì, 'j.K. (L9'i2). PrincipJ-es of soil erosion and its prevenbion.
In "The Use of Trees and Shrubs in the Dry Country of
Australia". Ed. N. HaII, Èp. 90-107 (Australian GovernmenÈ
Publishj-ng Service, Canberra) .
Mayr L.H. (1960). The util-ization of carbohydrate reserves in pasture
plants after defoliation, Herbtzge Absfu,. 30: 239-15.
McConnell, B.R. and Garrison, G.A. (l-966). Seasonal variat-ions of
avaj.lal¡Ie carbohyCrates j-n bitterbrush. J. WiLdL. Marnge.
30: 168-'72.
McCree, K.J. (L974). Changes in the stomatal- response characteristics
of grain sorghum produced by v,'ater stress during growth.
CYop Sci. L4z 273-8.
198
Meidner, H. (1952). An insÈrument for the continuous determination of
leaf thickness changes in the field. J, Eæp. Bot.
3: 3I9.
Milthorpe, F.L. (1960). The income and loss of lÁrater in arid and semi-arid
zones. fn "Plant-V'Iater Refationships in Arid and Semi-
arid Conditions", Reviews of Research, PP. 9-36, (UNESCO'
paris) .
Mooney, H.A. (1972). The carbon balance of plants. Anr¿u. ReU. EcoL.
SYst. 3z 315-46.
Mooney, H.A. and BarEholomew, B. (1974). Comparative carbon balance and
reproductive modes of two Californian AescuLas species.
Bot. Gz'az, Ì3 5: 306-13
Mooney, H.A. and Billings, W-D. (l-960) . The annual carbohydrate cycle
of alpine plants as related to growth. Am. J. Bot.
472 594-8.
l4ooney, H.4., Björkmanr o. and Collatz, G.J. (L977). Photosynthetic
acclimation to Èemperature and \^¡ater stress in the desert
shrub, Layrea diuarieata. Cernegie Inst. r¡lash. Iear Book
'Ì62 328-35.
Mooney, H.A. and Harrison, A.T. (1970). TLre influence of conditioning
temperature on subsequent temperature-relate<l photosynthetic
capacity in higher plants. In "Prediction and Measurement
of Photosynthetic Productivity", pp. 411-7 (Centre Agríc.
Pub. Doc. , V'Iageningen) .
Moore, C.Vü.8. (1969). Application of ecology to the management of pas'toral
leases in north-western New South Wales - Pv'oc. EeoL, Soc.
Aust. 4¡ 39-54-
199
¡,!oore, R.T. (L917\ . Gas exchange and photosynthetic pathways in
. range plants, In "Rangeland Plant Physiology". Ed.
R.E. Sosebee, pp. L-46 (Society for Range Management,
Denver, Colorado).
Morries, P. and Str-rckeyi R.E. (f956). Lal¡oratory applications of ion
exchauge resins. Part l. Lab. fuaetice 5'. 92-7.
Mothes, K. and Baudisch, W. (1958). Untersuchungen über die Reversibilität
der Ausbleichung grüner Blätter. FLora L46z 521-3I.
Newman, E.L. (1966). Relationship between root growth of flax (LinUm
usitatissimwn) and soil I¡/ater potential . Neu PhytoL,
652 273-83.
Newman, J.C. (L974). Effects of past grazing in determining range
management principles in Australia. In "Plant MorphoEenesis
as the Basis for Scientific Management of Range Resources",
Proc. Workshop, Berkeley, I97I, pp. L97'206' USDA
Miscellaneous Publication No. 1271.
Newrnan, J.C. and Condon, R.Vü. (1969). Land use and present condition.
In "Arid Lands of Australia". Eds R.O. Slatyer and
R.A. Perryr pp, t05-32 (Australian National University
Press, Canberra).
Nobte, I.R. (f977). Long-term biomass dynamics in an arid chenopod shrub
comrnunity at Koonamore, South Austratia. Aust, J. Bot.
252 639-53.
Northcote, K.H. (1960). A factual key for the recognition of Australian
soils. CSIRO Soils Div" Rep. 4/60.
Noy-Meir, I, (1973). Desert ecosystems: environment and producers.
Annu. Reu. EeoL. Syst. 4z 25-5L.

200
Odening, Vü.R., Strain, B.R. and Oechel , I,'t.C. (I974). The effect of
decreasing water potential on net CO, exchange of
intact desert shrubs. EeoLogy 552 1086-95.
Oechel, W.C., Strain, B.R. and Odening, W.R. (L972). Tissue water
potential, photosynthesis I 4c-t.b.led photosynthate
utilization, and growth in the desert shrub LavT'ea
diuarLeata cav. EeoL. Monogx. 42¿ L27-4L.
oppenheimer' H
";rj".-,].., ..i";:":r""";:"^::'""ï"-i-",ÏConditions", Reviews of Research' pp. 105-38
(uNusco, Paris).
Orshan, G. (I9721. Morphological and physiological plasÈicity in
relation to drought. In "vüildland Shrubs - Their
Biology and Utilization".. Eds C.M. McKell, J.P. Blaisdell
and ,J.R. Goodinr pp. 245-54, USDA Forest Service General
Technical Report INT-I.
Osborn, T.G.B., Wood, J.G. and Paltridge, T.B. (f931) . On the autecology
of St'ípa nitíd.a,, a study of a fodder grass in arid
Australia. fuoe. Linn. Soc. N.S.W, 56: 299-324.
Osborn, T.G.B., !'lood, J.G. and Paltridge, T.B. (f932) . On the growth
and reaction to grazing of the perennial saltbush,
AtripLeæ uesicar,íwn. An ecological study of the biotic
factor. Proe. Linn. Soc. N.S.h/.572 377-4A2.
Osborn, T.G.B., lrlood, J.G. and PalÈridge, T.B. (1935) . On the climate
and vegetation of the Koonamore Vegetation Reserve to
1931 . Pyoc. Linn. Sae. N . S.l,l. 60: 392-427 .
20I
Osmond, C.8., tsjörkman, o. and Anderson, D.J. (I98O). "Physiological
Processes in P1ant Ecology: Towards a Synthesis with
AtnipLeæ" Ecologicat Studies Vol. 36, 463 pp. (Springer-
Verlag, Berlin).
Osrnond, C.B., Lüttge. U., West, K.R., Pallaghy, C.K. and Shacher-Hill , B.
(1969). ron absorption in AtripLeæ ].eaf tissue" II.
Secretion of ions to epidermal bladders. Aust. J. BíoL.
Sei. 222 797-8L4.
Oxleyr R.E. (L979). The perennial chenopod pasture l-ands of Australia.
In "Studies of The Australian Arid Zone. TV. Chenopod
Shnrblands". Eds R.D. Graetz and K.M.W. Howes, pp. t-I6
(csrRo, Melbourne).
Parker, J. (1968) . Drought-resistance mechanisms. In "lrlater Deficits
and Plant Growth", VoI. I. Ed. T.T. Kozlowski, pp. I95-
234 (Academic Press, Neral York).
Parr-Smith, c.A. and Calder, D.M. (1979). AttipLeæ uesiearia Heward. ex
Benth- and related species: taxonomy. In "Studj.es of
the Australian Arid Zone. IV. Chenopod Shrubla¡rdsr'.
Eds R.D. Graetz and K.M.W. Howes, pp. I7-2A (CSIRO,
Melbourne) .
Pate, J. (1966). Photosynthesizing leaves and nodulated roots as donors
of carbon to protein of the shoot of the field pea
(piswn aruense L.). Am. Bot. 30: 93-109.
Pearce, R.8., l-isse1., G. and Carlson, G.E. (1969). Carbon uptake and
distribution before and after defoliation of alfalfa.
CYop Sci. 9z 756-9

202
Pearcy, R.W. Harrison, 4.T., Mooney, H.A. and Björkman' O. (L974) .
Seasonal changes in net photosynthesis of AtripLeæ
hymeneLyfu'ø shrr¡bs growing in Death VaIIey, California.
OecoLogía (Berl.) L7z 111-21-.
Peirce, A.W. (1968). Studies on salt tolerance of sheep. VIII. The
tolerance of grazing er^res and their lambs for drinking
waters of the types obtained from und,erground sources
in Australia. Aust. J. Agníc. Res. 19: 589-95.
Penning de Vries, F.b¡.T. (1975). Use of assimilates in higher plants.
In "Photosynthesis and Productivity in Different
Environments", International Biological Programme 3.
Ed. J.P. Cooperr pp. 459-80 (Cambridge University Press,
Melbourne) .
Perry, R.A. (1967). The need for rangelands research in AusEralia.
fuoc. EeoL. Soe. Aust. 2: l-14.
Perry, R.A. (L974a). Future of arid land vegetation under graaing.
In "Studies of Èhe Australian Arid Zone. II. Animal
Production" . Ed. A.D. lv'ilsonr pp . L44-5O (CSIRO,
l'lelbourne) .
Perry, R.A. (I974b). Strategies avai-1abIe for managing mulÈispecific
communities in Australia. In "Plant Morphogenesis as
bhe Basis for Scientific l{anagement of Range Resources",
Proc. ÌVorkshop, Berkeley, L97I , pp. 124-37, USDA
Miscellaneous Publication No. L27I.
Potter, B.J. and Mclntosh, G.H. (L974). Effect of salt water ingestion
on pregnancy in the ewe and on lamb survival. Aust" J,
\gric. Res. 252 909-17.

203
priestley, C.A- (L962). Carbohydrate reserves within tJre perennial
plant. Commonw. Bur. Hortic- Plant- Crops Tech. Commun.
27, LL6 PP.
Raschke, K. (1970). Leaf hydraulic system: rapid epidermal and
stomatal responses to changes in water supply'
Science L67z 189-
Ratclíffe, F.N. (1936). Soil drift in arid pastoral areas of south
Australia. Counc. Sci. Ind. Res. Aust. Pamph' No 64'
Richards, D. and Rowe, R.N. (L977). Effects of root restriction' root
pruning and 6-Benzylaminopurine on the growth of peach
seedlings. Ann. Bot. 4Lz 729-40.
Richardson, S.D. (1956). Studies of root growth i,n Aeez' saeeVør¿nWn
L. IV. The effect of differential shoot and root
temperature on root growth. Proe. K. Ned. Aked. lfet.
59: 428-38.
Rogers, R.W. ' Lange, R.T. and Nicholas, D.J-D. (1966) . Nitrogen
fixation by J-ichens of arid. soil crusts. Nature
(Lond.) 2O9z 96-7.
Scholander, P.F., Hammel-, H.T., Bradstreet, E.D. and Hemmingsen, E.A.
(1965) . Sap pressure in plants. Scíence L48z 339-46.
Schulze t 8.D., Lange, O.L., Buschbom, U., Kappe¡, L. and Evenari, M'
(1972). Stomatal responses to changes in humidity in
plants growing in the desert. Planta (nerl.) IO8: 259-70'
Scott, T.A. and l"lelvin, E.H. (1953). Determination of dextran with
anthrone. Avta.L, CVtem. 252 I656-6r.
sestak, 2., catsky, J. and Jarvis, P.G. (I97I). (Eds). "Plant Photo-
synthetic Production: Manual of Methods", 818 pp.
(vü. Junk, The Hague).

204
Sharma, M.L. (1976). Soil water regimes and water extraction patterns
under two semi-arid shrub (Atr'ípLeæ spp.) communities.
Aust. J. EeoL. 1: 249-58.
Sharma, M.L. (1978). V'rater use by chenopod shrublands. In "Studies
of the Australian Arid Zone. III. Water in Rangelands".
Ed. K.M.Vü. Howes, Pp. J-39'49 (CSIRO, Melbourne).
Sharma, M.L., Tunny, J. and Tongway, D.J. (L972). Seasonal changes in
sodium and chloride concentration of saltbush (Al;rípLe.æ spp. )
leaves as related to soil and plant water potential.
Aust. J. AgrLc. Res. 23: 1007-19.
Shaver, G.R. and Billings, W.D. (1976). Carbohydrate accumulation in
tundra graminoid plants as a function of season and
tíssue age. Flora L65: 247'67.
Shimshi, D. (1969). A rapid field method for measuring photosynthesj-s
with ta-belled carbon dioxide. J. Eæp. Bot. 2Oz 381-401.
Siminovitch, D., blilson, C.M. and Briggs, D.R. (1953) . Studies on
the chemistry of living bark in relation to frost
hardiness, v. PLant PhysioL. 282 383-400.
Sinclair, R. and Thomas, D.A. (1970). optical properties of leaves of
some specj-es in arid South Austrafia. Aust. J. Bot.
18:26I-73.
Slatyer, R.O. (1961-) . Internal water balance of Acaeia aneuv'¿Q, F. Muell .
in relati-o¡r to environmental conclitions . UI'\ESC) Az'id.
Zone Res. 16: 13'1-46.
Slatyer, R.o. (1967). "P1ant-tr{ater Relationships"" 366 pp. (Academic
Press, l,ondon).

205
Slatyer, R.O. (1973). The effect of internal water status on plant
growth, development and yiell. In "Plant Response
to Climatic Factors", Proc. Uppsala Symp.,1970, pp.
I77-9I (UNESCO, Paris) .
Slatyer, R.O. and Bierhuizen, J.F. (L964). A differential psychrometer
for conÈinuous measurements of transpiration. PLant
PhysioL. 35: 105r-6.
Slavik, B. (1975). Water stress, photosynÈhesis and the use of photo-
synthates. In "Photosyn*-hesis and Productivity in
Different Environments ", Internationat Biological
Programme 3. Ed. J.P. Cooper, pp.511-36 (Cambridge
University Press, Melbourne) .
Smith, D. (f969). Removing and analyzing total nonstructural carbo-
hydrates from plant tissue. University of lfisconsin
College of Agricultural and Life Sciences Research
Report 41, 1l pp.
Smith, D-, Paulsen, G.M. and Raguse, C.A. (f964). Extraction of total
available carbohydraÈes from grass and legume Èissue.
Plant PhysioL. 39: 960-2.
Smith, L.H. and Marten, G.C. (1970). Foliar regrowth of alfalfa
,tifiri.,g l4C- Irb.Iled carbohydrates stored in roots.
Crop. Scí. 10: 146-5r.
Sokal , R.R. and Roh-lf . F.J. (f969). "Biornetry" (W.H. Freeman and Co.,
San Francisco).
Sosebee, R.E. and I¡Jiebe, II .H. (1971). Effect of water stress and cÌipping
on photosynthate transl-ocation in t\^ro grasses. Agron, J,
63 ¡ L4-7 .
206
Sprague, V.G. and Sul-livan, J.T. (1950) . Reserve carbohydrates in
orchardgrass clipped períodically. PLant PhysioL.
252 92-LO2.
Steudte, 8., Zimmermanri, U. and Lüttgêr U.' (L977). Effect of turgor
pressure and cell size on the wal.I clasticity of plant
cetls. PLant Physiol. 59: 285-89.
Stocker, o. (1960). Physiological and morphological changes in plants
due to water deficiency. In "Plant-lVater Relationships
in Arid ancl Semi-arid Conditions", Reviews of Research,
pp. 63-104 (UNESCO. Paris) .
Strain, B.R. (f969). Seasonal adaptations in photosynthesis and res-
piration in four desert shrubs growing in situ.
EeoLogY 5Ot 5lr-1-?.
Syvertsen, J.P. and Cunningham, G.L. (L977). Rate of leaf production
and senescence and effect of leaf age on net gas ex-
change in creosotebush. Photosynthetiea LJ-z I61-6.
Szarek, S.R., Johnson, H"B. and Ting, f .P. (1973). Drought adaption
ín Cpunt'La basiLaz.i.s¿ significance of recycling carbon
Ehrough Crassufacean acid metaboiism. Plant PhysioL.
52: 539-4L.
Szarek, S.R. and Ting, I.P. (L974). Seasonal patterns of acid metal¡olism
and gas exchange ín Opuntda basiLaris. PLant Physíol,
54: 76-8L.
Trevelyan, W.E. and Harrison, J.S. (L952). Studies on yeasÈ metabolism.
1. Fractionation and microdeter:nr-ination of cel-l carbo-
hydrates. Biochen. ,T, 50: 298-303.

207
Trlica, M.J. (1977). Distribution and utilization of carbohyd'rate
reserves in range plants. ln "Rangeland Plant
Physiology". Ed. R.E. Sosebee, pp. 73-96 (Society
for Range Management, Denver, Colorado).
Trlica, M.J. and cook, c.!{. (1971) . Defoliation effects on carbo-
hydrate reserves of desert species. J. Range. Marnge.
242 418-25.
Trlica, M.J. and Singh, J.S. (f979). Translocation of assimilates
and creation, distribution and utilization of reserves.
In "Arid-Iand Ecosystems: Structure, Functioning and
Management", Vol . I. Eds. D.W. GoodaII and R.A. Perry'
pp. 537-7L (Cambridge University Press, london).
Tru:nb1e, H.C. and Vloodroffe, K. (1954) . The influence of climatic
factors on an. reaction of desert shrubs to grazing
by sheep. In "Biology of Deserts". Ed. J.L. Cloudsley-
Thompson (Institute of Biology, London).
Turner, N.C. and Jones, M.M. (1980) . Turgor maintenance by osmotic
adjustment: a review and evaluation. In "Adaption of
Plants to Water and High Temperature Stress". Eds
N.C. Turner and P.J. Kramerr pP. 87-103 (J. Wiley and
Sons, New York).
Tyree, M.T. and Hammel , H.T. (I9'1 2). The measurement of the turgor
pressure and the water relations of plants by the
pressure-bomb technique. J. Eæp. Bot. 23'. 267-82.
Vogel, A.I. (f957). "A Textbook of Practical Organic Chemistry Incl-uCing
Quantitative Organic Analysis", 3rd edition (Longimans,
London) .
vogel, A.r. (1961). "A Textbook of Quancitative rnorganic Analysís
Including Elementary Instrumental Analysis", 3rd edítíon
(Longmans, London).

208
lrlardlaw, I.F. (1968). The control and. pattern of movement of carbohydrates
in plants. Bot. Reu. 34¿ 79-105.
f'Iareing, P.F. (L972). Some further aspects of control of crop processes.
In "Crop Processes in Controlled Environments". Eds
A.R. Rees, K.E. Cockshu1l , D.W. Hand and R.G. Hurdr PP.
363-7L, (Academic Press, London).
lrlareing, P.F., Khalifa, M.M. and Treharner K..-r. (1968) . Rate-limiting
processes in photosynthesis at saturating light intensities.
Natute (Lond.) 22O: 453-7.
lùarren !'Iilson, J. (1965). Point quadrat analysis of foliage distribution
for plants growing singly or in rows. Aust. J. Bot.
13: 405-9.
lrlarren Wifson, J. (1966). High net assimilation rates of sunflower plants
in an arid climate. Ann. Bot. 30: 745-5L.
Weeth, H.J. and Haviland, L.H. (f96I). Tolerance of growing cattle for
ilrinking water containiñg sodium chloride. J. Anim. Sci.
2Oz 518-21.
Whiteman, P.C. and Koller, D. (L967). Species characteristics in whole
plant resistances to water vapour and CO. diffusion. J.
ÃppL. EcoL. 4t 363-77.
Williams, D.G. Q912) . Ecological studies on shrub-steppe of the Western
Riverina, New South i{al-es . Ph.D . Thesis, Australian
National University.
Williams, O,B. (1960). The selection and esta-blishment of pasture species
in a semi-arid environment- an ecological assessment of
the problem. J. Aust. Inst, Agric. Sei. 262 25e-65.

209
Ifllliams, O.B. (1968). Pasture manaElemenË in the pastoral zone -
a revieh¡. I'looL TeehnoL. Sheep Bv'eed. 15: 45'8.
l[illíams, O.B. (1979). Ecosystems of Australia. In "Arid-land
Ecosystems: Structure, Functioning and Managementrr,
Vol. 1. Eds' D.tiI. Goodall and R.A, Perryr pp. 145-212
(.Cambridge University Press, London).
I,trilson, A.D. (1966). The value of. AtripLeæ (saltbush) and Koehia
(bluebush) specfes as food for sheep. Aust. J, Agric. ks.
L7: L47-53.
Wilson, A.D. (-1976). Compari.son of sheep and catËle grazÍng on a
semiarÍd gras'sland . Aust. J. Agrie. þs. 27 z 155-62.
Wilson, A.D. (1978). l.Iater requirønents of sheep. In "StudLes of the
Australian Arid Zone. III. I,Iater Ín Rangelandstt.
Ed, K.M.I{. }lowesr pp. 178-89 (CSIRO, Melbourne).
l{ilson, A.D. and Graetz, R.D. C-1980). CattLe and sheep producËíon on
an AtrtpLeæ uesicaria(saltbush) community. Aust. J.
\gnic. þs . 31 : 369-78.
tr'IÍlson, 4.D., LeÍgh, J.H. and Ïul-ham, W.E. (1969). A study of Merino
sheep grazlng a bladder saltbush Atr"ipLeæ uesíeaz.íd -
cotton-bush (Koehía aphyLLd conuuunity on the Ríverine
Plain. Aust. J. Agrie. tus. 20: 1723-36.
Wood" J.G. (7925). The selectíve absorption of chlorine ions; and
the absorptÍon of water by the leaves in the genus
Atz,ipLeæ. Aust. J. Eæp. BioL, Med. Scí. 2: 48-56.
lloodo J.G. (7932). The physíology of xerophytism in Australian plants:
The carbohydrate metabolism of plants with tomentose
succulent leaves. Aust. J, Erp. BioL. Med. Sei.
10: 89-95.
2]-0
I^lood, J.G. C1936). Regeneration of the vegetation on the Koonamore
VegeÈation Reserve, 7926-7936. Tt'ctts' R Soc' S' Aust'
60: 96-111.
trIool-house, H.W. (L974). LongevÍÈy and senescence in plants. Sei.
Pnog. 61: 123-47.
Wright, S.T.C, and HÍ:on, R.]^I.P. (1969) . Abscísic acid, the gro1Tth
fnhibÍtor induced in detached wheat leaves by a period
of r,rîltîng. Natut'e (Lond.) 2242 7L9-2O.
Yenrn, E.t[. and !tí]-lis, A.J, (.1954). The estimation of carbohydrates
in plant extracts by anthrone. Biochem, J. 56: 508-14.
Zíeg1-er, LI. and VÍe.weg, G.H. (1970). PoikÍlohydre Pteridophyta und
Sper:natophyta. In "Die Hydration und Hydratur des
ProËoplasmas der Pflanzen und ihre okophysiologísche
Bedeutung", Protoplasmatologica IIC. Eds H. Iüalter and
K. Kieebr pp. 88-108 (Springer, Vienna).
Zimnermann, U. C1978). Physîcs of turgor- and osmoregulation. Anrtu.
þD. PLant PtrysíoL. 291 721-48.