
High temperature causes negative whole-plant carbon balance under mild drought
10
High temperature causes negative whole-plant carbon balance under mild drought Junbin Zhao 1,2,3 , Henrik Hartmann 1 , Susan Trumbore 1 , Waldemar Ziegler 1 and Yiping Zhang 2 1 Max Planck Institute for Biogeochemistry, Jena, 07745, Germany; 2 Key Laboratory of Tropical Forest Ecology, Xishuangbanna Tropical Botanical Garden, Chinese Academy of Sciences, Menglun, 666303, China; 3 University of Chinese Academy of Sciences, Beijing, 100049, China Author for correspondence: Junbin Zhao Tel: +86 87165160904 Email: [email protected] Received: 19 April 2013 Accepted: 6 June 2013 New Phytologist (2013) doi: 10.1111/nph.12400 Key words: carbon compensation point, carbon limitation, drought, high temperature, whole-plant chamber. Summary Theoretically, progressive drought can force trees into negative carbon (C) balance by reducing stomatal conductance to prevent water loss, which also decreases C assimilation. At higher temperatures, negative C balance should be initiated at higher soil moisture because of increased respiratory demand and earlier stomatal closure. Few data are available on how these theoretical relationships integrate over the whole plant. We exposed Thuja occidentalis to progressive drought under three temperature conditions (15, 25, and 35°C), and measured C and water fluxes using a whole-tree chamber design. High transpiration rates at higher temperatures led to a rapid decline in soil moisture. During the progressive drought, soil moisture-driven changes in photosynthesis had a greater impact on the whole-plant C balance than respiration. The soil moisture content at which whole- plant C balance became negative increased with temperature, mainly as a result of higher respiration rates and an earlier onset of stomatal closure under a warmer condition. Our results suggest that the effect of drought on whole-plant C balance is highly tempera- ture-dependent. High temperature causes a negative C balance even under mild drought and may increase the risk of C starvation. Introduction Forests represent large global stores of carbon (C) and account for the largest proportion of annual C exchange with the atmo- sphere (Phillips et al., 1998; Malhi et al., 1999; Le Quere et al., 2008; Pan et al., 2011; Ballantyne et al., 2012). The C balance of forest ecosystems is sensitive to climate change, which is influenced, for example, by increased growing season duration (Walther et al., 2002), changes in tree growth rates (Clark et al., 2003; Cole et al., 2009) and increased plant respiration and pho- tosynthesis (Piao et al., 2008). There are different means of evalu- ating the C budget of an ecosystem, such as the widely used eddy covariance technique (Baldocchi, 2003). However, forest ecosys- tems are made up of individual trees that can respond differently to environmental conditions (e.g. isohydric and anisohydric spe- cies; see Tardieu & Simonneau, 1998). Hence, explaining changes in net forest C gain or loss depends on improved under- standing of C fluxes at the level of individual trees. The C balance of an individual plant is the difference between photosynthesis (C input) and respiration (C output). The sum of daytime CO 2 uptake from photosynthesis minus the sum of 24 h CO 2 release through respiration, referred to as the whole-plant daily C balance, is a meaningful indicator of C accumulation within plants (McCree, 1986). Under favorable conditions, a plant takes up more C than it consumes on a daily basis (C sur- plus) and the excess C is used for growth and synthesis of defense compounds or is stored in the form of nonstructural carbohydrates for future use, resulting in biomass increase (McCree, 1986; Estiarte & Pe~ nuelas, 1999). Environmental stresses can alter both photosynthetic and respiratory rates and therefore affect the plant C budget in the short term. The point of zero net C assimilation for the whole plant (i.e. when photosynthetic C uptake equals respiratory C loss on a 24 h basis) is a useful concept to investigate the whole- plant C balance under environmental stresses, and is defined here as the whole-plant C compensation point (CCP). Under progressive drought, plant growth can be reduced at first (McDowell, 2011) and, as water stress progresses, photosyn- thesis will be curtailed when stomatal conductance is reduced to prevent water loss through transpiration (Bates & Hall, 1982; Schulze, 1986; McDowell et al., 2008a). However, maintenance respiration may not decline as fast as photosynthesis and the resulting C deficit forces plants to consume stored carbohydrates for respiration (McDowell, 2011). If this C deficit persists, plants will suffer from C starvation as carbohydrates are depleted (Sayer & Haywood, 2006; McDowell, 2011). At elevated temperatures, enhanced transpiration can hasten the closure of stomata under water stress to prevent water loss (Schulze et al., 1973), simultaneously advancing the decline of photosynthesis. In addition, plants usually present higher mainte- nance respiration at higher temperatures (Atkin et al., 2000; Atkin & Tjoelker, 2003), which, combined with reductions in photosynthesis, could lead to a rapid depletion of C storage pools (McDowell, 2011). Some authors suggest that, under elevated Ó 2013 The Authors New Phytologist Ó 2013 New Phytologist Trust New Phytologist (2013) 1 www.newphytologist.com Research
Transcript of High temperature causes negative whole-plant carbon balance under mild drought
High temperature causes negative whole-plant carbon balanceunder mild drought
Junbin Zhao1,2,3, Henrik Hartmann1, Susan Trumbore1, Waldemar Ziegler1 and Yiping Zhang2
1Max Planck Institute for Biogeochemistry, Jena, 07745, Germany; 2Key Laboratory of Tropical Forest Ecology, Xishuangbanna Tropical Botanical Garden, Chinese Academy of Sciences,
Menglun, 666303, China; 3University of Chinese Academy of Sciences, Beijing, 100049, China
Author for correspondence:Junbin Zhao
Tel: +86 87165160904Email: [email protected]
Received: 19 April 2013
Accepted: 6 June 2013
New Phytologist (2013)doi: 10.1111/nph.12400
Key words: carbon compensation point,carbon limitation, drought, high temperature,whole-plant chamber.
Summary
� Theoretically, progressive drought can force trees into negative carbon (C) balance by
reducing stomatal conductance to prevent water loss, which also decreases C assimilation. At
higher temperatures, negative C balance should be initiated at higher soil moisture because of
increased respiratory demand and earlier stomatal closure. Few data are available on how
these theoretical relationships integrate over the whole plant.� We exposed Thuja occidentalis to progressive drought under three temperature conditions
(15, 25, and 35°C), and measured C and water fluxes using a whole-tree chamber design.� High transpiration rates at higher temperatures led to a rapid decline in soil moisture. During
the progressive drought, soil moisture-driven changes in photosynthesis had a greater impact
on the whole-plant C balance than respiration. The soil moisture content at which whole-
plant C balance became negative increased with temperature, mainly as a result of higher
respiration rates and an earlier onset of stomatal closure under a warmer condition.� Our results suggest that the effect of drought on whole-plant C balance is highly tempera-
ture-dependent. High temperature causes a negative C balance even under mild drought and
may increase the risk of C starvation.
Introduction
Forests represent large global stores of carbon (C) and accountfor the largest proportion of annual C exchange with the atmo-sphere (Phillips et al., 1998; Malhi et al., 1999; Le Quere et al.,2008; Pan et al., 2011; Ballantyne et al., 2012). The C balance offorest ecosystems is sensitive to climate change, which isinfluenced, for example, by increased growing season duration(Walther et al., 2002), changes in tree growth rates (Clark et al.,2003; Cole et al., 2009) and increased plant respiration and pho-tosynthesis (Piao et al., 2008). There are different means of evalu-ating the C budget of an ecosystem, such as the widely used eddycovariance technique (Baldocchi, 2003). However, forest ecosys-tems are made up of individual trees that can respond differentlyto environmental conditions (e.g. isohydric and anisohydric spe-cies; see Tardieu & Simonneau, 1998). Hence, explainingchanges in net forest C gain or loss depends on improved under-standing of C fluxes at the level of individual trees.
The C balance of an individual plant is the difference betweenphotosynthesis (C input) and respiration (C output). The sum ofdaytime CO2 uptake from photosynthesis minus the sum of 24 hCO2 release through respiration, referred to as the whole-plantdaily C balance, is a meaningful indicator of C accumulationwithin plants (McCree, 1986). Under favorable conditions, aplant takes up more C than it consumes on a daily basis (C sur-plus) and the excess C is used for growth and synthesis of defensecompounds or is stored in the form of nonstructural
carbohydrates for future use, resulting in biomass increase(McCree, 1986; Estiarte & Pe~nuelas, 1999).
Environmental stresses can alter both photosynthetic andrespiratory rates and therefore affect the plant C budget in theshort term. The point of zero net C assimilation for the wholeplant (i.e. when photosynthetic C uptake equals respiratory Closs on a 24 h basis) is a useful concept to investigate the whole-plant C balance under environmental stresses, and is defined hereas the whole-plant C compensation point (CCP).
Under progressive drought, plant growth can be reduced atfirst (McDowell, 2011) and, as water stress progresses, photosyn-thesis will be curtailed when stomatal conductance is reduced toprevent water loss through transpiration (Bates & Hall, 1982;Schulze, 1986; McDowell et al., 2008a). However, maintenancerespiration may not decline as fast as photosynthesis and theresulting C deficit forces plants to consume stored carbohydratesfor respiration (McDowell, 2011). If this C deficit persists, plantswill suffer from C starvation as carbohydrates are depleted (Sayer& Haywood, 2006; McDowell, 2011).
At elevated temperatures, enhanced transpiration can hastenthe closure of stomata under water stress to prevent water loss(Schulze et al., 1973), simultaneously advancing the decline ofphotosynthesis. In addition, plants usually present higher mainte-nance respiration at higher temperatures (Atkin et al., 2000;Atkin & Tjoelker, 2003), which, combined with reductions inphotosynthesis, could lead to a rapid depletion of C storage pools(McDowell, 2011). Some authors suggest that, under elevated
� 2013 The Authors
New Phytologist� 2013 New Phytologist TrustNew Phytologist (2013) 1
www.newphytologist.com
Research
temperature and drought, plants could be threatened by, or evendie from, C starvation rather than hydraulic failure (McDowellet al., 2008a; Sala et al., 2010; Hartmann, 2011; McDowell,2011). In support of this hypothesis, Adams et al. (2009) pro-vided evidence that under drought stress, leaf-level respiratory Cconsumption by pinyon pines was significantly higher at elevatedtemperature (+ 4°C) than under ambient temperature. However,difficulties of scaling leaf-level observations of gas exchange to thewhole plant did not allow quantification of the net C balance ofthese trees, owing to the mismatch between leaf-level CO2
exchange measurements and actual biomass responses (Evans &Dunstone, 1970; Wardlaw, 1990). Responses of plants todrought and high temperature have been mostly studied at thetissue level, while changes in whole-plant C balance have rarelybeen studied (but for studies in some crops, see McCree, 1986;Miller et al., 2001). To our knowledge, the combined effects ofelevated temperature and drought on the whole-plant CCP havenot been assessed.
In this study, we carried out a water stress experiment onThuja occidentalis L. at three different temperatures (15, 25 and35°C), and focused on tracking variations of the components (i.e.photosynthesis and respiration) of whole-plant daily C balance assoil moisture declined. T. occidentalis is a drought-tolerant ever-green coniferous species in the Cupressaceae family (Collier &Boyer, 1989). It grows in a wide range of moisture conditions,from swamps to cliff edges, making it an interesting choice fordrought studies (Beals, 1965; Collier & Boyer, 1989; Kelly &Larson, 2003; Harlow et al., 2005). The average temperature ofits natural habitat usually ranges from �12 to �4°C in winterand from 16 to 25°C in summer (Fowells, 1965). Our hypothesiswas that trees would be forced into a negative C balance at highersoil moisture content when grown under high temperature(> 30°C) because of higher respiratory demand combined withreduced photosynthesis driven by earlier stomatal closure. Atlower temperatures, trees should survive longer and reach theCCP at lower soil moisture contents. The results improve ourunderstanding of the effects of environmental drivers on thewhole-plant C balance, with implications for the mechanismsunderlying drought-induced tree mortality.
Materials and Methods
Materials
Four-year-old trees of T. occidentalis L. (half-siblings) purchasedfrom a regional nursery were transferred to plastic pots (14.5 cmdiameter9 16 cm high) and kept well watered outdoors forc. 10 months. The trees were planted in a C-free mixture of ver-miculate and sand (volumetric ratio 2 : 1) without any addedorganic matter. This ensured that CO2 released from the soil wassolely derived from roots in our short-term experiment. Nutrientswere supplied with a single application of instant fertilizer(Manna Wuxal Super 8-8-6 with microelements; Wilhelm HaugGmbH & Co. KG, Dusseldorf, Germany), combined with aslow-release conifer fertilizer (Substral Osmocote 11-8-17; ScottsCelaflor GmbH, Mainz, Germany). In July, 2012, nine healthy
individuals (height from stem base = 58� 3 cm, diameter at stembase = 1.0� 0.2 cm) were randomly chosen and transferred intoairtight cylindrical transparent chambers (17 cm diame-ter9 80 cm high, made of methyl methacrylate resin) connectedto a measurement system to determine CO2 and H2O exchange.The chambers were placed in a climate chamber to control tem-perature and light. A plastic lid (acrylonitrile butadiene styreneresin) covered each pot and was used to separate the chamber intoabove- and below-ground compartments. The tree stem passedthrough center of the cover and was fitted with an airtight seal.
Experimental design
Three trees were randomly assigned to each of the three differ-ent temperatures (15, 25 and 35°C). A cycle of 12 h daylight,which was supplied by halogen lamps with a constantphotosynthetically active radiation of 390� 10 lmol m�2 s�1
(the approximate light saturation point of T. occidentalis,Matthessears & Larson, 1991) measured inside the chambers atthe top, was followed by 12 h of darkness. Air and soil tempera-tures within the chambers were kept constant during the experi-ment in each temperature treatment. As lighting had a heatingeffect on the temperature inside the chambers, the temperatureoutside the chambers was down-regulated 3–4°C during thedaytime to maintain constant temperature inside the chambers.The growth substrate was watered to achieve field capacity (vol-umetric water content c. 50%) at the beginning (data from thefirst day at 25°C were missing as a result of technical failure),and pots were then left to dry with no further moisture addi-tion until the end of the experiment. Trees were kept wellwatered and under their corresponding temperature treatmentfor 2 d before the experiment started to let them acclimate tothe experimental conditions. Because of limited room in thegrowth chamber, the three temperature treatments were con-ducted in three separate trials and lasted for 34, 30 and 11 d,respectively. Trees from the different trials were not significantlydifferent in size (height and basal stem diameter) or phenologyat the start, to ensure comparability among trials. The experi-ment ended when transpiration approached zero (i.e. below0.03 mol H2O d�1). At the end, the foliage of all the trees wasbrown and dry.
Ambient air with constant moisture ([CO2], 400� 20 ppm;d13C-CO2, �9.2� 0.5&; and vapor pressure deficit (VPD),1.02, 1.90 and 3.94 kPa for 15, 25 and 35°C, respectively) wascontinuously pumped through above- and below-ground com-partments of the chambers at constant rates (above ground, 5.5,6.5 and 9.5 l min�1; below ground, 1.0, 1.0 and 1.5 l min�1 for15, 25 and 35°C, respectively), which were controlled by needlevalves outside the growth chamber. The difference in flow ratesbetween temperatures was to ensure that the difference in theCO2 and H2O concentrations between incoming and outgoingair was within 60 ppm and 20&, respectively. CO2 and H2Oconcentrations of the air entering and leaving each compartmentwere measured separately with a LI-6262 (Li-Cor Inc., Lincoln,NE, USA) once every hour for 6 min and 40 s, switching fromone compartment to the next automatically with electromagnetic
New Phytologist (2013) � 2013 The Authors
New Phytologist� 2013 New Phytologist Trustwww.newphytologist.com
Research
NewPhytologist2
valves. Data were collected with a CR1000 data logger (CampbellScientific Inc., Logan, UT, USA). Hourly CO2 and H2O fluxes(lmol h�1) in each compartment were calculated by
FS ¼ ½S �o � ½S �e22:4
� FR � 60; Eqn 1
where [S]o and [S]e are the CO2 (or H2O) concentrations(ppm) of the air leaving and entering each compartment,respectively; FR is the air flow rate (l min�1) through eachcompartment; and 22.4 is the molar volume at standard tem-perature and pressure (l mol�1). The hourly fluxes were thensummed to obtain a daily value. The daytime (12 h) CO2 fluxfrom the above-ground compartment was defined as net photo-synthesis (Pn) and the night-time (12 h) above-ground CO2
flux was defined as above-ground respiration. Root respirationwas the summed 24 h below-ground CO2 flux. The sum ofroot and above-ground respiration on a daily basis is referred toas total respiration. The above-ground H2O flux was defined astranspiration and was divided into night-time (En) and daytime(Ed) components. Water-use efficiency (WUE) was calculatedas Pn divided by the daytime transpiration (Ed) on a daily basis.Stomatal conductance (Gs, mol d�1) was estimated by (Jarvis& McNaughton, 1986; Whitehead, 1998; McDowell et al.,2008b)
GS ¼ Ed
VPDEqn 2
During CO2 assimilation, a reduction in discriminationagainst 13C is considered to be a physiological indicator ofdrought stress (Farquhar et al., 1989). To reveal the variation of13C discrimination as soil water content declines and droughtstress increases, discrete air samples were taken from the air flowentering and leaving above-ground compartments every 1–3 d ata fixed time (i.e. 2 h after the light was switched on), and wereanalyzed for 13C composition in reference to Pee Dee Belemnite(d13C) with a Delta+ XL Isotope Ratio Mass Spectrometry(IRMS, ThermoFinnigan, Bremen, Germany). d13Cp indicateshere the 13C composition of the CO2 assimilated by trees, com-puted from the mass balance of CO2 and
13CO2 of the air enter-ing and leaving the chamber:
d13Cp ¼ ½CO2�o � do � ½CO2�e � de½CO2�o � ½CO2�e
Eqn 3
where do and de represent13C composition of the CO2 in the air
leaving and entering the chamber, respectively. We assumed theshift in d13Cp mainly reflects photosynthetic fractionation.
A dendrometer (self-assembled with an 8 mm potentiometriclinear transducer supplied by Megatron Elektronik AG & Co.,Putzbrunn, Germany) was installed on the stem of one tree in eachtrial to measure stem diameter variation in response to drought asa proxy for water capacitance (Zweifel et al., 2005). We reporthere the difference in stem diameter (lm) at a given soil moisturefrom initial diameter. Soil moisture and air/soil temperature were
monitored using a ThetaProbe ML2x (Delta-T Devices Ltd,Burwell, Cambridge, UK) and a 100 kΩ NTC Thermistor EC95(Thermometrics Corporation, USA), respectively.
Statistics
The stress point (SP) was defined as the first day that transpira-tion showed a significant decline from the average value of theprevious days (t-test, P < 0.05), and the mean soil moisture value(� SD) at the SP of the three individuals was compared amongthe three temperature treatments. For the period before the SP, itis assumed that no water stress was imposed and differences inrespiration and photosynthesis rates reflected the influence oftemperature only. The average values of each variable (i.e. Pn, res-piration, transpiration, WUE, net C gain, ratio of respiration toPn and d13Cp) before the SP were computed and comparedamong the three temperature treatments. One-way ANOVA fol-lowed by a Holm–�Sid�ak test (P < 0.05) was applied to identifyinstances with statistically significant differences. For the periodafter the SP, we applied mixed-effects modeling to investigatehow soil moisture and temperature influenced the C balance ofthe plants using net C gain, Pn, or total respiration as dependentvariables. Interactions of soil volumetric water content (or Gs)and temperature were included as fixed effects and temperatureas random effects to obtain separate intercepts and slopes for eachtemperature (see Supporting Information, Table S1, for a sum-mary of the models). By modeling the temperature effect on thecomponents of C gain, we aimed to separate the temperatureeffects on the whole-plant C balance from those of Pn (via stoma-tal conductance) and respiration.
To determine the CCP under each temperature treatment, asigmoidal model was fitted to the daily net CO2 gain as a func-tion of soil moisture, from the starting point to the lowest point:
y ¼ a þ b
1þ e ðc�dxÞ Eqn 4
where y is the daily net CO2 gain, x is the soil moisture and a–dare regression parameters. The point (measured as soil moisture)where net CO2 gain equals zero was defined as the CCP. All sta-tistics were carried out with R, version 2.15.0 (R DevelopmentCore Team, 2012) and the package ‘lme4’ (Bates et al., 2012)was used in the mixed-effects modeling.
Results
Progressive drought
Pn and respiration showed similar patterns of response for allthree temperature treatments as the soil dried out (Fig. 1a–c). Pndeclined sharply after the SP and continued to decrease to valuesbelow the respiration rates. Respiration also decreased after theSP but not as fast as Pn. After the CCP, respiration rates showeda rapid decline, eventually reaching values close to zero. Daily netC gain began to decline at the SP and became negative after CCP(Fig. 1d). As total respiration declined to near zero at the end of
� 2013 The Authors
New Phytologist� 2013 New Phytologist TrustNew Phytologist (2013)
www.newphytologist.com
NewPhytologist Research 3
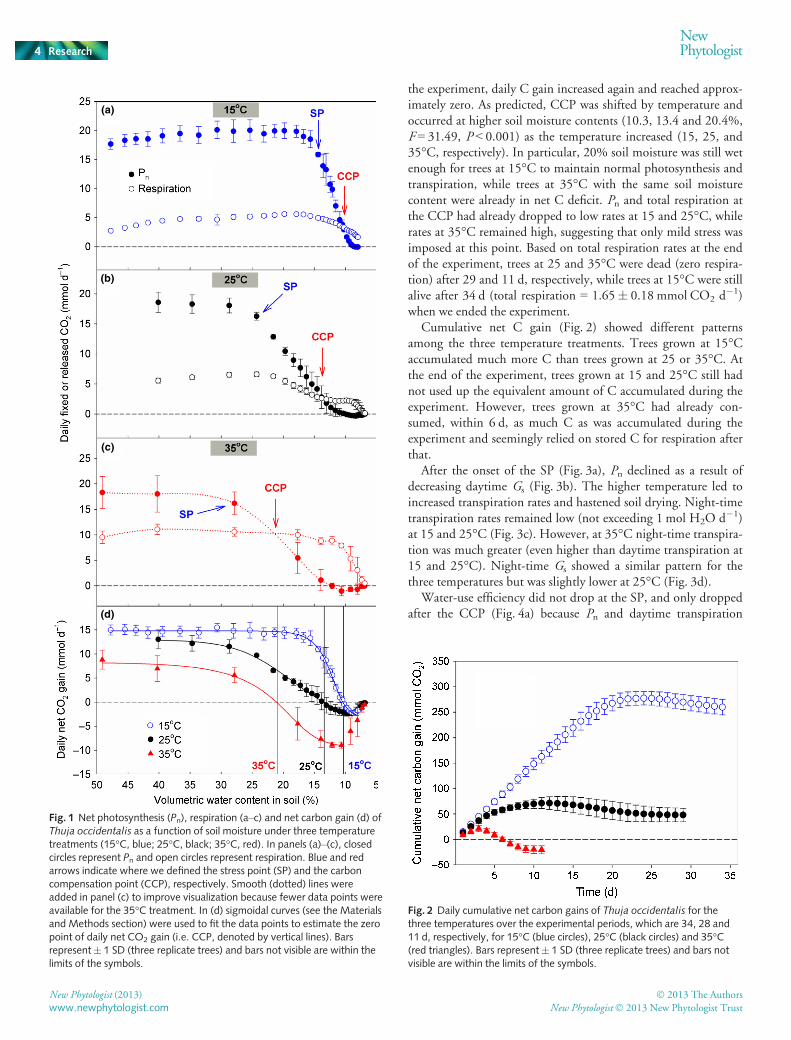
the experiment, daily C gain increased again and reached approx-imately zero. As predicted, CCP was shifted by temperature andoccurred at higher soil moisture contents (10.3, 13.4 and 20.4%,F = 31.49, P < 0.001) as the temperature increased (15, 25, and35°C, respectively). In particular, 20% soil moisture was still wetenough for trees at 15°C to maintain normal photosynthesis andtranspiration, while trees at 35°C with the same soil moisturecontent were already in net C deficit. Pn and total respiration atthe CCP had already dropped to low rates at 15 and 25°C, whilerates at 35°C remained high, suggesting that only mild stress wasimposed at this point. Based on total respiration rates at the endof the experiment, trees at 25 and 35°C were dead (zero respira-tion) after 29 and 11 d, respectively, while trees at 15°C were stillalive after 34 d (total respiration = 1.65� 0.18 mmol CO2 d
�1)when we ended the experiment.
Cumulative net C gain (Fig. 2) showed different patternsamong the three temperature treatments. Trees grown at 15°Caccumulated much more C than trees grown at 25 or 35°C. Atthe end of the experiment, trees grown at 15 and 25°C still hadnot used up the equivalent amount of C accumulated during theexperiment. However, trees grown at 35°C had already con-sumed, within 6 d, as much C as was accumulated during theexperiment and seemingly relied on stored C for respiration afterthat.
After the onset of the SP (Fig. 3a), Pn declined as a result ofdecreasing daytime Gs (Fig. 3b). The higher temperature led toincreased transpiration rates and hastened soil drying. Night-timetranspiration rates remained low (not exceeding 1 mol H2O d�1)at 15 and 25°C (Fig. 3c). However, at 35°C night-time transpira-tion was much greater (even higher than daytime transpiration at15 and 25°C). Night-time Gs showed a similar pattern for thethree temperatures but was slightly lower at 25°C (Fig. 3d).
Water-use efficiency did not drop at the SP, and only droppedafter the CCP (Fig. 4a) because Pn and daytime transpiration
(a)
(b)
(c)
(d)
Fig. 1 Net photosynthesis (Pn), respiration (a–c) and net carbon gain (d) ofThuja occidentalis as a function of soil moisture under three temperaturetreatments (15°C, blue; 25°C, black; 35°C, red). In panels (a)–(c), closedcircles represent Pn and open circles represent respiration. Blue and redarrows indicate where we defined the stress point (SP) and the carboncompensation point (CCP), respectively. Smooth (dotted) lines wereadded in panel (c) to improve visualization because fewer data points wereavailable for the 35°C treatment. In (d) sigmoidal curves (see the Materialsand Methods section) were used to fit the data points to estimate the zeropoint of daily net CO2 gain (i.e. CCP, denoted by vertical lines). Barsrepresent� 1 SD (three replicate trees) and bars not visible are within thelimits of the symbols.
Fig. 2 Daily cumulative net carbon gains of Thuja occidentalis for thethree temperatures over the experimental periods, which are 34, 28 and11 d, respectively, for 15°C (blue circles), 25°C (black circles) and 35°C(red triangles). Bars represent� 1 SD (three replicate trees) and bars notvisible are within the limits of the symbols.
New Phytologist (2013) � 2013 The Authors
New Phytologist� 2013 New Phytologist Trustwww.newphytologist.com
Research
NewPhytologist4
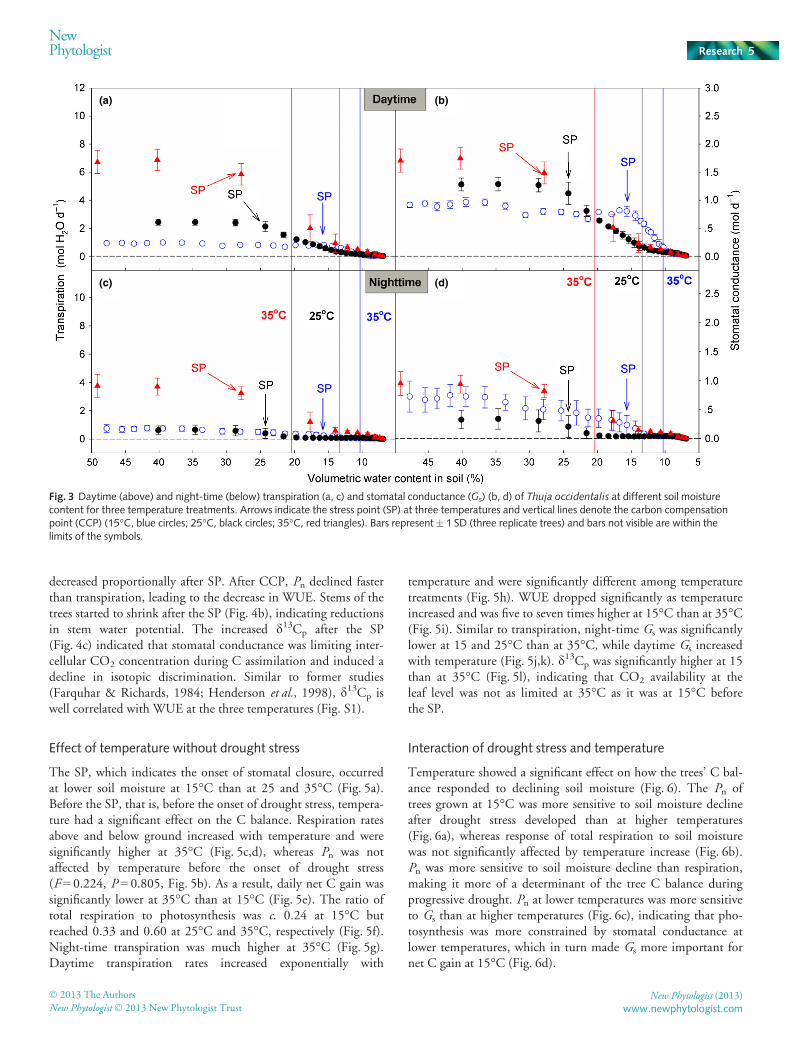
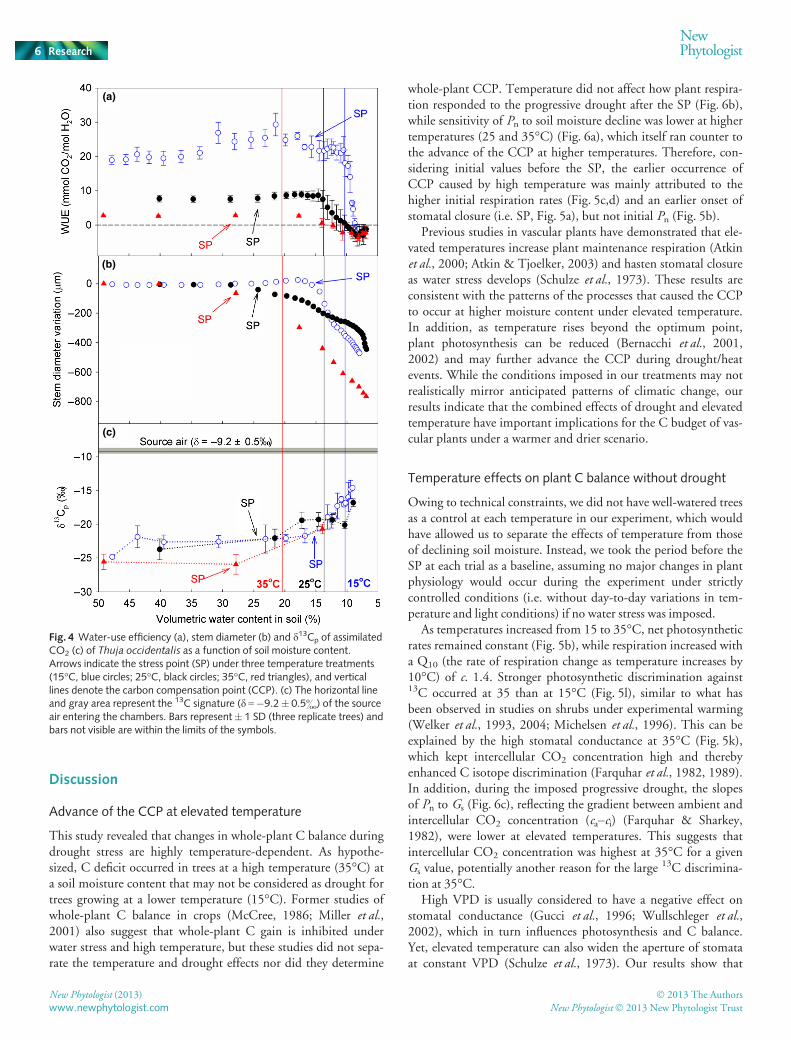
decreased proportionally after SP. After CCP, Pn declined fasterthan transpiration, leading to the decrease in WUE. Stems of thetrees started to shrink after the SP (Fig. 4b), indicating reductionsin stem water potential. The increased d13Cp after the SP(Fig. 4c) indicated that stomatal conductance was limiting inter-cellular CO2 concentration during C assimilation and induced adecline in isotopic discrimination. Similar to former studies(Farquhar & Richards, 1984; Henderson et al., 1998), d13Cp iswell correlated with WUE at the three temperatures (Fig. S1).
Effect of temperature without drought stress
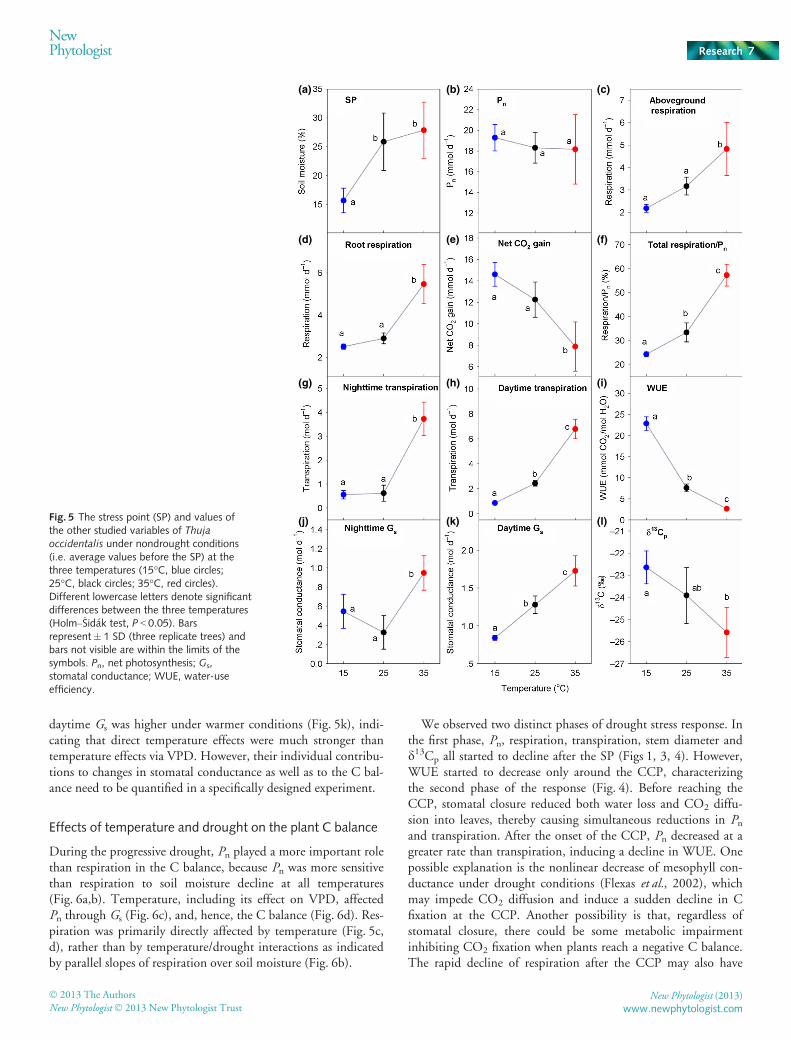
The SP, which indicates the onset of stomatal closure, occurredat lower soil moisture at 15°C than at 25 and 35°C (Fig. 5a).Before the SP, that is, before the onset of drought stress, tempera-ture had a significant effect on the C balance. Respiration ratesabove and below ground increased with temperature and weresignificantly higher at 35°C (Fig. 5c,d), whereas Pn was notaffected by temperature before the onset of drought stress(F = 0.224, P = 0.805, Fig. 5b). As a result, daily net C gain wassignificantly lower at 35°C than at 15°C (Fig. 5e). The ratio oftotal respiration to photosynthesis was c. 0.24 at 15°C butreached 0.33 and 0.60 at 25°C and 35°C, respectively (Fig. 5f).Night-time transpiration was much higher at 35°C (Fig. 5g).Daytime transpiration rates increased exponentially with
temperature and were significantly different among temperaturetreatments (Fig. 5h). WUE dropped significantly as temperatureincreased and was five to seven times higher at 15°C than at 35°C(Fig. 5i). Similar to transpiration, night-time Gs was significantlylower at 15 and 25°C than at 35°C, while daytime Gs increasedwith temperature (Fig. 5j,k). d13Cp was significantly higher at 15than at 35°C (Fig. 5l), indicating that CO2 availability at theleaf level was not as limited at 35°C as it was at 15°C beforethe SP.
Interaction of drought stress and temperature
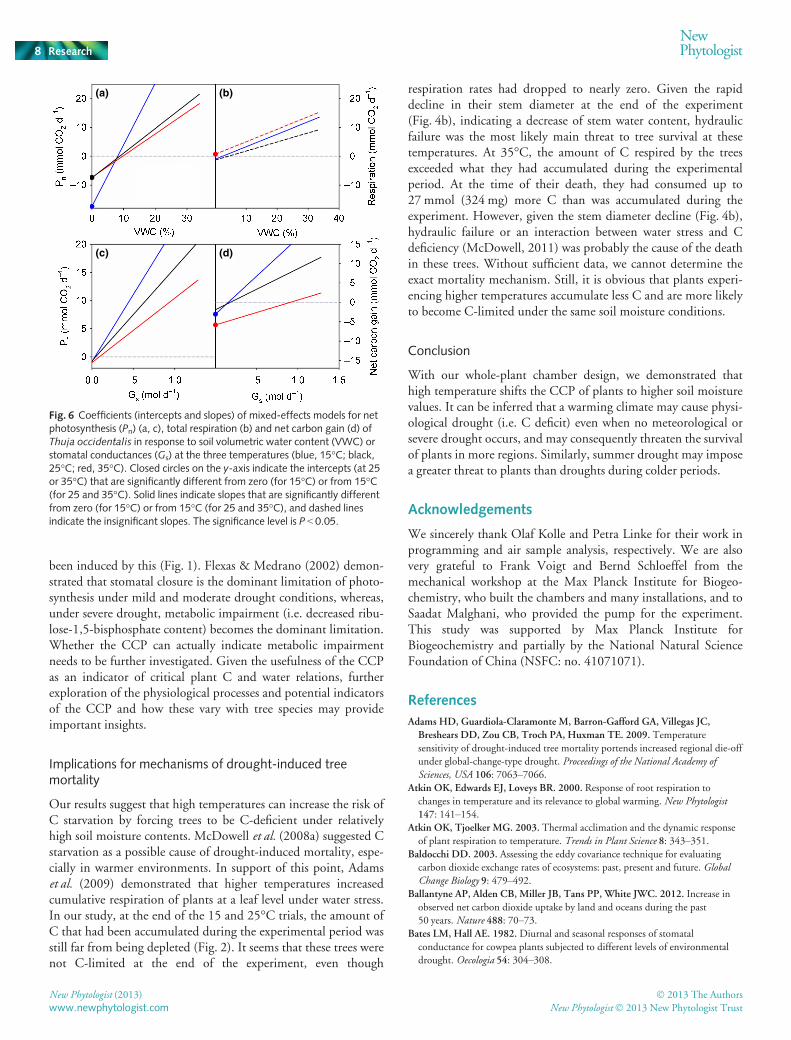
Temperature showed a significant effect on how the trees’ C bal-ance responded to declining soil moisture (Fig. 6). The Pn oftrees grown at 15°C was more sensitive to soil moisture declineafter drought stress developed than at higher temperatures(Fig. 6a), whereas response of total respiration to soil moisturewas not significantly affected by temperature increase (Fig. 6b).Pn was more sensitive to soil moisture decline than respiration,making it more of a determinant of the tree C balance duringprogressive drought. Pn at lower temperatures was more sensitiveto Gs than at higher temperatures (Fig. 6c), indicating that pho-tosynthesis was more constrained by stomatal conductance atlower temperatures, which in turn made Gs more important fornet C gain at 15°C (Fig. 6d).
(a) (b)
(d)(c)
Fig. 3 Daytime (above) and night-time (below) transpiration (a, c) and stomatal conductance (Gs) (b, d) of Thuja occidentalis at different soil moisturecontent for three temperature treatments. Arrows indicate the stress point (SP) at three temperatures and vertical lines denote the carbon compensationpoint (CCP) (15°C, blue circles; 25°C, black circles; 35°C, red triangles). Bars represent� 1 SD (three replicate trees) and bars not visible are within thelimits of the symbols.
� 2013 The Authors
New Phytologist� 2013 New Phytologist TrustNew Phytologist (2013)
www.newphytologist.com
NewPhytologist Research 5
Discussion
Advance of the CCP at elevated temperature
This study revealed that changes in whole-plant C balance duringdrought stress are highly temperature-dependent. As hypothe-sized, C deficit occurred in trees at a high temperature (35°C) ata soil moisture content that may not be considered as drought fortrees growing at a lower temperature (15°C). Former studies ofwhole-plant C balance in crops (McCree, 1986; Miller et al.,2001) also suggest that whole-plant C gain is inhibited underwater stress and high temperature, but these studies did not sepa-rate the temperature and drought effects nor did they determine
whole-plant CCP. Temperature did not affect how plant respira-tion responded to the progressive drought after the SP (Fig. 6b),while sensitivity of Pn to soil moisture decline was lower at highertemperatures (25 and 35°C) (Fig. 6a), which itself ran counter tothe advance of the CCP at higher temperatures. Therefore, con-sidering initial values before the SP, the earlier occurrence ofCCP caused by high temperature was mainly attributed to thehigher initial respiration rates (Fig. 5c,d) and an earlier onset ofstomatal closure (i.e. SP, Fig. 5a), but not initial Pn (Fig. 5b).
Previous studies in vascular plants have demonstrated that ele-vated temperatures increase plant maintenance respiration (Atkinet al., 2000; Atkin & Tjoelker, 2003) and hasten stomatal closureas water stress develops (Schulze et al., 1973). These results areconsistent with the patterns of the processes that caused the CCPto occur at higher moisture content under elevated temperature.In addition, as temperature rises beyond the optimum point,plant photosynthesis can be reduced (Bernacchi et al., 2001,2002) and may further advance the CCP during drought/heatevents. While the conditions imposed in our treatments may notrealistically mirror anticipated patterns of climatic change, ourresults indicate that the combined effects of drought and elevatedtemperature have important implications for the C budget of vas-cular plants under a warmer and drier scenario.
Temperature effects on plant C balance without drought
Owing to technical constraints, we did not have well-watered treesas a control at each temperature in our experiment, which wouldhave allowed us to separate the effects of temperature from thoseof declining soil moisture. Instead, we took the period before theSP at each trial as a baseline, assuming no major changes in plantphysiology would occur during the experiment under strictlycontrolled conditions (i.e. without day-to-day variations in tem-perature and light conditions) if no water stress was imposed.
As temperatures increased from 15 to 35°C, net photosyntheticrates remained constant (Fig. 5b), while respiration increased witha Q10 (the rate of respiration change as temperature increases by10°C) of c. 1.4. Stronger photosynthetic discrimination against13C occurred at 35 than at 15°C (Fig. 5l), similar to what hasbeen observed in studies on shrubs under experimental warming(Welker et al., 1993, 2004; Michelsen et al., 1996). This can beexplained by the high stomatal conductance at 35°C (Fig. 5k),which kept intercellular CO2 concentration high and therebyenhanced C isotope discrimination (Farquhar et al., 1982, 1989).In addition, during the imposed progressive drought, the slopesof Pn to Gs (Fig. 6c), reflecting the gradient between ambient andintercellular CO2 concentration (ca–ci) (Farquhar & Sharkey,1982), were lower at elevated temperatures. This suggests thatintercellular CO2 concentration was highest at 35°C for a givenGs value, potentially another reason for the large 13C discrimina-tion at 35°C.
High VPD is usually considered to have a negative effect onstomatal conductance (Gucci et al., 1996; Wullschleger et al.,2002), which in turn influences photosynthesis and C balance.Yet, elevated temperature can also widen the aperture of stomataat constant VPD (Schulze et al., 1973). Our results show that
(a)
(b)
(c)
Fig. 4 Water-use efficiency (a), stem diameter (b) and d13Cp of assimilatedCO2 (c) of Thuja occidentalis as a function of soil moisture content.Arrows indicate the stress point (SP) under three temperature treatments(15°C, blue circles; 25°C, black circles; 35°C, red triangles), and verticallines denote the carbon compensation point (CCP). (c) The horizontal lineand gray area represent the 13C signature (d =�9.2� 0.5&) of the sourceair entering the chambers. Bars represent� 1 SD (three replicate trees) andbars not visible are within the limits of the symbols.
New Phytologist (2013) � 2013 The Authors
New Phytologist� 2013 New Phytologist Trustwww.newphytologist.com
Research
NewPhytologist6
daytime Gs was higher under warmer conditions (Fig. 5k), indi-cating that direct temperature effects were much stronger thantemperature effects via VPD. However, their individual contribu-tions to changes in stomatal conductance as well as to the C bal-ance need to be quantified in a specifically designed experiment.
Effects of temperature and drought on the plant C balance
During the progressive drought, Pn played a more important rolethan respiration in the C balance, because Pn was more sensitivethan respiration to soil moisture decline at all temperatures(Fig. 6a,b). Temperature, including its effect on VPD, affectedPn through Gs (Fig. 6c), and, hence, the C balance (Fig. 6d). Res-piration was primarily directly affected by temperature (Fig. 5c,d), rather than by temperature/drought interactions as indicatedby parallel slopes of respiration over soil moisture (Fig. 6b).
We observed two distinct phases of drought stress response. Inthe first phase, Pn, respiration, transpiration, stem diameter andd13Cp all started to decline after the SP (Figs 1, 3, 4). However,WUE started to decrease only around the CCP, characterizingthe second phase of the response (Fig. 4). Before reaching theCCP, stomatal closure reduced both water loss and CO2 diffu-sion into leaves, thereby causing simultaneous reductions in Pnand transpiration. After the onset of the CCP, Pn decreased at agreater rate than transpiration, inducing a decline in WUE. Onepossible explanation is the nonlinear decrease of mesophyll con-ductance under drought conditions (Flexas et al., 2002), whichmay impede CO2 diffusion and induce a sudden decline in Cfixation at the CCP. Another possibility is that, regardless ofstomatal closure, there could be some metabolic impairmentinhibiting CO2 fixation when plants reach a negative C balance.The rapid decline of respiration after the CCP may also have
(a) (b) (c)
(d) (e) (f)
(g) (h) (i)
(j) (k) (l)Fig. 5 The stress point (SP) and values ofthe other studied variables of Thujaoccidentalis under nondrought conditions(i.e. average values before the SP) at thethree temperatures (15°C, blue circles;25°C, black circles; 35°C, red circles).Different lowercase letters denote significantdifferences between the three temperatures(Holm–�Sid�ak test, P < 0.05). Barsrepresent� 1 SD (three replicate trees) andbars not visible are within the limits of thesymbols. Pn, net photosynthesis; Gs,stomatal conductance; WUE, water-useefficiency.
� 2013 The Authors
New Phytologist� 2013 New Phytologist TrustNew Phytologist (2013)
www.newphytologist.com
NewPhytologist Research 7
been induced by this (Fig. 1). Flexas & Medrano (2002) demon-strated that stomatal closure is the dominant limitation of photo-synthesis under mild and moderate drought conditions, whereas,under severe drought, metabolic impairment (i.e. decreased ribu-lose-1,5-bisphosphate content) becomes the dominant limitation.Whether the CCP can actually indicate metabolic impairmentneeds to be further investigated. Given the usefulness of the CCPas an indicator of critical plant C and water relations, furtherexploration of the physiological processes and potential indicatorsof the CCP and how these vary with tree species may provideimportant insights.
Implications for mechanisms of drought-induced treemortality
Our results suggest that high temperatures can increase the risk ofC starvation by forcing trees to be C-deficient under relativelyhigh soil moisture contents. McDowell et al. (2008a) suggested Cstarvation as a possible cause of drought-induced mortality, espe-cially in warmer environments. In support of this point, Adamset al. (2009) demonstrated that higher temperatures increasedcumulative respiration of plants at a leaf level under water stress.In our study, at the end of the 15 and 25°C trials, the amount ofC that had been accumulated during the experimental period wasstill far from being depleted (Fig. 2). It seems that these trees werenot C-limited at the end of the experiment, even though
respiration rates had dropped to nearly zero. Given the rapiddecline in their stem diameter at the end of the experiment(Fig. 4b), indicating a decrease of stem water content, hydraulicfailure was the most likely main threat to tree survival at thesetemperatures. At 35°C, the amount of C respired by the treesexceeded what they had accumulated during the experimentalperiod. At the time of their death, they had consumed up to27 mmol (324 mg) more C than was accumulated during theexperiment. However, given the stem diameter decline (Fig. 4b),hydraulic failure or an interaction between water stress and Cdeficiency (McDowell, 2011) was probably the cause of the deathin these trees. Without sufficient data, we cannot determine theexact mortality mechanism. Still, it is obvious that plants experi-encing higher temperatures accumulate less C and are more likelyto become C-limited under the same soil moisture conditions.
Conclusion
With our whole-plant chamber design, we demonstrated thathigh temperature shifts the CCP of plants to higher soil moisturevalues. It can be inferred that a warming climate may cause physi-ological drought (i.e. C deficit) even when no meteorological orsevere drought occurs, and may consequently threaten the survivalof plants in more regions. Similarly, summer drought may imposea greater threat to plants than droughts during colder periods.
Acknowledgements
We sincerely thank Olaf Kolle and Petra Linke for their work inprogramming and air sample analysis, respectively. We are alsovery grateful to Frank Voigt and Bernd Schloeffel from themechanical workshop at the Max Planck Institute for Biogeo-chemistry, who built the chambers and many installations, and toSaadat Malghani, who provided the pump for the experiment.This study was supported by Max Planck Institute forBiogeochemistry and partially by the National Natural ScienceFoundation of China (NSFC: no. 41071071).
References
Adams HD, Guardiola-Claramonte M, Barron-Gafford GA, Villegas JC,
Breshears DD, Zou CB, Troch PA, Huxman TE. 2009. Temperature
sensitivity of drought-induced tree mortality portends increased regional die-off
under global-change-type drought. Proceedings of the National Academy ofSciences, USA 106: 7063–7066.
Atkin OK, Edwards EJ, Loveys BR. 2000. Response of root respiration to
changes in temperature and its relevance to global warming. New Phytologist147: 141–154.
Atkin OK, Tjoelker MG. 2003. Thermal acclimation and the dynamic response
of plant respiration to temperature. Trends in Plant Science 8: 343–351.Baldocchi DD. 2003. Assessing the eddy covariance technique for evaluating
carbon dioxide exchange rates of ecosystems: past, present and future. GlobalChange Biology 9: 479–492.
Ballantyne AP, Alden CB, Miller JB, Tans PP, White JWC. 2012. Increase in
observed net carbon dioxide uptake by land and oceans during the past
50 years. Nature 488: 70–73.Bates LM, Hall AE. 1982. Diurnal and seasonal responses of stomatal
conductance for cowpea plants subjected to different levels of environmental
drought. Oecologia 54: 304–308.
(a) (b)
(c) (d)
Fig. 6 Coefficients (intercepts and slopes) of mixed-effects models for netphotosynthesis (Pn) (a, c), total respiration (b) and net carbon gain (d) ofThuja occidentalis in response to soil volumetric water content (VWC) orstomatal conductances (Gs) at the three temperatures (blue, 15°C; black,25°C; red, 35°C). Closed circles on the y-axis indicate the intercepts (at 25or 35°C) that are significantly different from zero (for 15°C) or from 15°C(for 25 and 35°C). Solid lines indicate slopes that are significantly differentfrom zero (for 15°C) or from 15°C (for 25 and 35°C), and dashed linesindicate the insignificant slopes. The significance level is P < 0.05.
New Phytologist (2013) � 2013 The Authors
New Phytologist� 2013 New Phytologist Trustwww.newphytologist.com
Research
NewPhytologist8
Bates D, Maechler M, Bolker B. 2012. lme4: Linear mixed-effects models using S4classes. R package version 0.999999-0. [WWW document] URL
http://CRAN.R-project.org/package=lme4 [accessed on 7 March 2013].
Beals EW. 1965. An anomalous white cedar-black spruce swamp in northern
Wisconsin. American Midland Naturalist 74: 244.Bernacchi CJ, Portis AR, Nakano H, von Caemmerer S, Long SP. 2002.
Temperature response of mesophyll conductance. Implications for the
determination of Rubisco enzyme kinetics and for limitations to photosynthesis
in vivo. Plant Physiology 130: 1992–1998.Bernacchi CJ, Singsaas EL, Pimentel C, Portis AR, Long SP. 2001. Improved
temperature response functions for models of Rubisco-limited photosynthesis.
Plant, Cell & Environment 24: 253–259.Clark DA, Piper SC, Keeling CD, Clark DB. 2003. Tropical rain forest tree
growth and atmospheric carbon dynamics linked to interannual temperature
variation during 1984–2000. Proceedings of the National Academy of Sciences,USA 100: 5852–5857.
Cole CT, Anderson JE, Lindroth RL, Waller DM. 2009. Rising concentrations
of atmospheric CO2 have increased growth in natural stands of quaking aspen
(Populus tremuloides). Global Change Biology 16: 2186–2197.Collier DE, Boyer MG. 1989. The water relations of Thuja occidentalis L. from 2
sites of contrasting moisture availability. Botanical Gazette 150: 445–448.Estiarte M, Pe~nuelas J. 1999. Excess carbon: the relationship with phenotypical
plasticity in storage and defense functions of plants. Orsis 14: 159–203.Evans LT, Dunstone RL. 1970. Some physiological aspects of evolution in
wheat. Australian Journal of Biological Sciences 23: 725–742.Farquhar G, Ball M, Caemmerer S, Roksandic Z. 1982. Effect of salinity and
humidity on d 13C value of halophytes – evidence for diffusional isotopefractionation determined by the ratio of intercellular/atmospheric partial
pressure of CO2 under different environmental conditions. Oecologia 52: 121–124.
Farquhar GD, Ehleringer JR, Hubick KT. 1989. Carbon Isotope Discrimination
and Photosynthesis. Annual Review of Plant Physiology and Plant MolecularBiology 40: 503–537.
Farquhar GD, Richards RA. 1984. Isotopic composition of plant carbon
correlates with water-use efficiency of wheat genotypes. Australian Journal ofPlant Physiology 11: 539–552.
Farquhar GD, Sharkey TD. 1982. Stomatal conductance and photosynthesis.
Annual Review of Plant Physiology and Plant Molecular Biology 33: 317–345.Flexas J, Bota J, Escalona JM, Sampol B, Medrano H. 2002. Effects of drought
on photosynthesis in grapevines under field conditions: an evaluation of
stomatal and mesophyll limitations. Functional Plant Biology 29: 461–471.Flexas J, Medrano H. 2002. Drought-inhibition of photosynthesis in C3 plants:
stomatal and non-stomatal limitations revisited. Annals of Botany 89: 183–189.Fowells HA. 1965. Silvics of forest trees of the United States. Washington, DC,
USA: US Department of Agriculture, Forest Service.
Gucci R, Massai R, Xiloyannis C, Flore JA. 1996. The effect of drought and
vapour pressure deficit on gas exchange of young kiwifruit (Actinidia deliciosavar deliciosa) vines. Annals of Botany 77: 605–613.
Harlow BA, Duursma RA, Marshall JD. 2005. Leaf longevity of western red
cedar (Thuja plicata) increases with depth in the canopy. Tree Physiology 25:557–562.
Hartmann H. 2011.Will a 385 million year-struggle for light become a struggle
for water and for carbon? –How trees may cope with more frequent climate
change-type drought events. Global Change Biology 17: 642–655.Henderson S, von Caemmerer S, Farquhar GD, Wade LJ, Hammer G. 1998.
Correlation between carbon isotope discrimination and transpiration efficiency
in lines of the C4 species Sorghum bicolor in the glasshouse and the field.
Australian Journal of Plant Physiology 25: 111–123.Jarvis PG, McNaughton KG. 1986. Stomatal control of transpiration – scalingup from leaf to region. Advances in Ecological Research 15: 1–49.
Kelly PE, Larson DW. 2003. Effects of rock climbing on populations of
presettlement eastern white cedar (Thuja occidentalis) on cliffs of the Niagara
Escarpment, Canada. Conservation Biology 11: 1125–1132.Le Quere C, Rodenbeck C, Buitenhuis ET, Conway TJ, Langenfelds R, Gomez
A, Labuschagne C, Ramonet M, Nakazawa T, Metzl N et al. 2008. Saturationof the Southern Ocean CO2 sink due to recent climate change. Science 316:1735–1738.
Malhi Y, Baldocchi DD, Jarvis PG. 1999. The carbon balance of tropical,
temperate and boreal forests. Plant, Cell & Environment 22: 715–740.Matthessears U, Larson DW. 1991. Growth and physiology of Thuja occidentalisL. from cliffs and swamps – is variation habitat or site specific. BotanicalGazette 152: 500–508.
McCree KJ. 1986.Whole-plant carbon balance during osmotic adjustment to
drought and salinity stress. Australian Journal of Plant Physiology 13: 33–43.McDowell NG. 2011.Mechanisms linking drought, hydraulics, carbon
metabolism, and vegetation mortality. Plant Physiology 155: 1051–1059.McDowell NG, Pockman WT, Allen CD, Breshears DD, Cobb N, Kolb T,
Plaut J, Sperry J, West A, Williams DG. 2008a.Mechanisms of plant survival
and mortality during drought: why do some plants survive while others
succumb to drought? New Phytologist 178: 719–739.McDowell NG, White S, Pockman WT. 2008b. Transpiration and stomatal
conductance across a steep climate gradient in the southern Rocky Mountains.
Ecohydrology 1: 193–204.Michelsen A, Jonasson S, Sleep D, HavstromM, Callaghan TV. 1996. Shoot
biomass, d13C, nitrogen and chlorophyll responses of two arctic dwarf shrubs
to in situ shading, nutrient application and warming simulating climatic
change. Oecologia 105: 1–12.Miller AM, van Iersel MW, Armitage AM. 2001.Whole-plant carbon dioxide
exchange responses of Angelonia angustifolia to temperature and irradiance.
Journal of the American Society for Horticultural Science 126: 606–610.Pan YD, Birdsey RA, Fang JY, Houghton R, Kauppi PE, Kurz WA, Phillips
OL, Shvidenko A, Lewis SL, Canadell JG et al. 2011. A large and persistent
carbon sink in the world’s forests. Science 333: 988–993.Phillips OL, Malhi Y, Higuchi N, Laurance WF, Nunez PV, Vasquez RM,
Laurance SG, Ferreira LV, Stern M, Brown S et al. 1998. Changes in the
carbon balance of tropical forests: evidence from long-term plots. Science 282:439–442.
Piao SL, Ciais P, Friedlingstein P, Peylin P, Reichstein M, Luyssaert S,
Margolis H, Fang JY, Barr A, Chen AP et al. 2008. Net carbon dioxide
losses of northern ecosystems in response to autumn warming. Nature 451:49–52.
R Development Core Team. 2012. R: a language and environment for statisticalcomputing. Vienna, Austria: R Foundation for Statistical Computing. ISBN
3-900051-07-0, URL http://www.R-project.org/.
Sala A, Piper F, Hoch G. 2010. Physiological mechanisms of drought–inducedtree mortality are far from being resolved. New Phytologist 186: 274–281.
Sayer MAS, Haywood JD. 2006. Fine root production and carbohydrate
concentrations of mature longleaf pine (Pinus palustris P. Mill.) as affected by
season of prescribed fire and drought. Trees-Structure and Function 20:165–175.
Schulze ED. 1986. Carbon-dioxide and water-vapor exchange in response to
drought in the atmosphere and in the soil. Annual Review of Plant Physiologyand Plant Molecular Biology 37: 247–274.
Schulze ED, Lange OL, Kappen L, Buschbom U, Evenari M. 1973. Stomatal
responses to changes in temperature at increasing water stress. Planta 110:29–42.
Tardieu F, Simonneau T. 1998. Variability among species of stomatal control
under fluctuating soil water status and evaporative demand: modelling
isohydric and anisohydric behaviours. Journal of Experimental Botany 49:419–432.
Walther GR, Post E, Convey P, Menzel A, Parmesan C, Beebee TJ, Fromentin
JM, Hoegh-Guldberg O, Bairlein F. 2002. Ecological responses to recent
climate change. Nature 416: 389–395.Wardlaw IF. 1990. Tansley Review No 27 - the control of carbon partitioning in
plants. New Phytologist 116: 341–381.Welker JM, Fahnestock JT, Henry GHR, O’Dea KW, Chimner RA. 2004. CO2
exchange in three Canadian High Arctic ecosystems: response to long-term
experimental warming. Global Change Biology 10: 1981–1995.Welker JM, Wookey PA, Parsons AN, Press MC, Callaghan TV, Lee JA. 1993.
Leaf carbon-isotope discrimination and vegetative responses of Dryas octopetalato temperature and water manipulations in a High Arctic Polar semidesert,
Svalbard. Oecologia 95: 463–469.Whitehead D. 1998. Regulation of stomatal conductance and transpiration in
forest canopies. Tree Physiology 18: 633–644.
� 2013 The Authors
New Phytologist� 2013 New Phytologist TrustNew Phytologist (2013)
www.newphytologist.com
NewPhytologist Research 9

Wullschleger SD, Gunderson CA, Hanson PJ, Wilson KB, Norby RJ. 2002.
Sensitivity of stomatal and canopy conductance to elevated CO2 concentration
– interacting variables and perspectives of scale. New Phytologist 153: 485–496.Zweifel R, Zimmermann L, Newbery DM. 2005.Modeling tree water deficit
from microclimate: an approach to quantifying drought stress. Tree Physiology25: 147–156.
Supporting Information
Additional supporting information may be found in the onlineversion of this article.
Fig. S1 Correlations between d13Cp and WUE at the three tem-peratures.
Table S1 Summary of the mixed-effects models with temperature(15, 25 and 35°C) as the random effect
Please note: Wiley-Blackwell are not responsible for the contentor functionality of any supporting information supplied by theauthors. Any queries (other than missing material) should bedirected to the New Phytologist Central Office.
New Phytologist is an electronic (online-only) journal owned by the New Phytologist Trust, a not-for-profit organization dedicatedto the promotion of plant science, facilitating projects from symposia to free access for our Tansley reviews.
Regular papers, Letters, Research reviews, Rapid reports and both Modelling/Theory and Methods papers are encouraged. We are committed to rapid processing, from online submission through to publication ‘as ready’ via Early View – our average timeto decision is <25 days. There are no page or colour charges and a PDF version will be provided for each article.
The journal is available online at Wiley Online Library. Visit www.newphytologist.com to search the articles and register for tableof contents email alerts.
If you have any questions, do get in touch with Central Office ([email protected]) or, if it is more convenient,our USA Office ([email protected])
For submission instructions, subscription and all the latest information visit www.newphytologist.com
New Phytologist (2013) � 2013 The Authors
New Phytologist� 2013 New Phytologist Trustwww.newphytologist.com
Research
NewPhytologist10