Atriplex atacamensis and Atriplex halimus resist As contamination in Pre-Andean soils (northern...
12
Screening risk assessment tools for assessing the environmental impact in an abandoned pyritic mine in Spain Eduardo Moreno-Jiménez a , Concepción García-Gómez b , Ana Lourdes Oropesa c , Elvira Esteban a , Amparo Haro b , Ramón Carpena-Ruiz a , Jose Vicente Tarazona b , Jesus Manuel Peñalosa a , María Dolores Fernández b, ⁎ a Department of Agricultural Chemistry, Faculty of Sciences, Universidad Autónoma de Madrid, 28049 Madrid, Spain b Laboratory for Ecotoxicology, Department of the Environment, INIA Ctra. A Coruña, Km. 7.5, 28040 Madrid, Spain c Department of Animal Health, Veterinary Faculty, University of Extremadura, Avda. de la Universidad s/n, P.O. Box 643, 10071-Caceres, Spain abstract article info Article history: Received 26 March 2010 Received in revised form 22 October 2010 Accepted 29 October 2010 Available online 27 November 2010 Keywords: Contaminated soils Trace elements Environmental impact assessment Risk assessment Mining This paper describes a new methodology for assessing site-specific environmental impact of contaminants. The proposed method integrates traditional risk assessment approaches with real and variable environmental characteristics at a local scale. Environmental impact on selected receptors was classified for each environmental compartment into 5 categories derived from the whole (chronic and acute) risk assessment using 8 risk levels. Risk levels were established according to three hazard quotients (HQs) which represented the ratio of exposure to acute and chronic toxicity values. This tool allowed integrating in only one impact category all the elements involved in the standard risk assessment. The methodology was applied to an abandoned metal mine in Spain, where high levels of As, Cd, Zn and Cu were detected. Risk affecting potential receptors such as aquatic and soil organisms and terrestrial vertebrates were assessed. Whole results showed that impact to the ecosystem is likely high and further investigation or remedial actions are necessary. Some proposals to refine the risk assessment for a more realistic diagnostic are included. Published by Elsevier B.V. 1. Introduction Contamination of the environment with trace elements has increased dramatically since the onset of the industrial revolution (Nriagu, 1979). The main anthropogenic sources of the contamination by metal(loid)s are fossil fuel burning, mining and smelting of metalliferous ores, municipal waste, landfill leachates, fertilisers, pesticides and sewage (Forstner, 1995). Concerning mining activities, presently mines are specifically designed with mitigation methods to manage potential environmental impacts; however, in former mines the extracted mineral deposits may remain after mines have been abandoned and usually become a large and uncontrolled source of metal and metalloid contamination. There are many areas impacted by pyritic mine spreading all around Spain (Álvarez et al., 2003; Clemente et al., 2006; Rufo et al., 2007), which after becoming derelict sites now require environmental rectifications. In the pyrite deposits, natural weathering interaction may release elements such as As, Zn, Pb, Cu, Mn, Cd, Mo, Cr, and Ni which may contaminate water, soil and plant ecosystems at unacceptable levels (Quevauviller et al., 1989; Santos Oliveira et al., 2002). Releases may cause direct adverse effects on terrestrial and aquatic organisms. Moreover some trace elements can be incorporated in plants and/or animals leading under certain circumstances to secondary poisoning in vertebrates due to the consumption of contaminated food (Anawar et al., 2006; Chen and Liu, 2006; McLaughlin et al., 2000). Therefore, the management of abandoned derelict mines is a major concern. Risk assessment methodology has been recognised as a powerful tool for the decision-making process in contaminated sites management, espe- cially when contamination of soil or water is involved (Suter et al., 2000; US-EPA, 1998). The use of risk assessment techniques in mining activities has mainly focused on human health issues (Kim et al., 2005; Lee et al., 2006). Ecological risk tends to be considered a second priority however to propose remediation techniques or new occupa- tion plans of these contaminated sites is very difficult if the potential risks to biological communities are not considered. Through this paper, we propose a screening methodology for quantitative impact assessment based on Environmental Risk Assess- ment (ERA) tools. The proposed screening methodology established Science of the Total Environment 409 (2011) 692–703 Abbreviations: BacF, Bioaccessibility Factor; W, Body Weight; DD, Daily Dose; DS, Distant Sites; FIR, Food Ingestion Rate; HQ, Hazard Quotient; IDS, Intermediate Distance Sites; ImI, Impact Index; NB, Nearby sites; RI, Risk Index. ⁎ Corresponding author. INIA, Ctra. A Coruña, Km. 7.5, 28040 Madrid, Spain. Tel.: + 34 91 3471483; fax: +34 91 347 40 08. E-mail addresses: [email protected] (E. Moreno-Jiménez), [email protected] (C. García-Gómez), [email protected] (A.L. Oropesa), [email protected] (A. Haro), [email protected] (J.V. Tarazona), [email protected] (M.D. Fernández). 0048-9697/$ – see front matter. Published by Elsevier B.V. doi:10.1016/j.scitotenv.2010.10.056 Contents lists available at ScienceDirect Science of the Total Environment journal homepage: www.elsevier.com/locate/scitotenv
Transcript of Atriplex atacamensis and Atriplex halimus resist As contamination in Pre-Andean soils (northern...

Science of the Total Environment 409 (2011) 692–703
Contents lists available at ScienceDirect
Science of the Total Environment
j ourna l homepage: www.e lsev ie r.com/ locate /sc i totenv
Screening risk assessment tools for assessing the environmental impact in anabandoned pyritic mine in Spain
Eduardo Moreno-Jiménez a, Concepción García-Gómez b, Ana Lourdes Oropesa c, Elvira Esteban a,Amparo Haro b, Ramón Carpena-Ruiz a, Jose Vicente Tarazona b,Jesus Manuel Peñalosa a, María Dolores Fernández b,⁎a Department of Agricultural Chemistry, Faculty of Sciences, Universidad Autónoma de Madrid, 28049 Madrid, Spainb Laboratory for Ecotoxicology, Department of the Environment, INIA Ctra. A Coruña, Km. 7.5, 28040 Madrid, Spainc Department of Animal Health, Veterinary Faculty, University of Extremadura, Avda. de la Universidad s/n, P.O. Box 643, 10071-Caceres, Spain
Abbreviations: BacF, Bioaccessibility Factor; W, BodDistant Sites; FIR, Food Ingestion Rate; HQ, Hazard QuotiSites; ImI, Impact Index; NB, Nearby sites; RI, Risk Inde⁎ Corresponding author. INIA, Ctra. ACoruña,Km.7.5, 28
3471483; fax: +34 91 347 40 08.E-mail addresses: [email protected] (E. More
(C. García-Gómez), [email protected] (A.L. Oropesa), [email protected] (J.V. Tarazona), mdfdez@
0048-9697/$ – see front matter. Published by Elsevierdoi:10.1016/j.scitotenv.2010.10.056
a b s t r a c t
a r t i c l e i n f oArticle history:Received 26 March 2010Received in revised form 22 October 2010Accepted 29 October 2010Available online 27 November 2010
Keywords:Contaminated soilsTrace elementsEnvironmental impact assessmentRisk assessmentMining
This paper describes a new methodology for assessing site-specific environmental impact of contaminants.The proposedmethod integrates traditional risk assessment approaches with real and variable environmentalcharacteristics at a local scale. Environmental impact on selected receptors was classified for eachenvironmental compartment into 5 categories derived from the whole (chronic and acute) risk assessmentusing 8 risk levels. Risk levels were established according to three hazard quotients (HQs) which representedthe ratio of exposure to acute and chronic toxicity values. This tool allowed integrating in only one impactcategory all the elements involved in the standard risk assessment.The methodology was applied to an abandoned metal mine in Spain, where high levels of As, Cd, Zn and Cuwere detected. Risk affecting potential receptors such as aquatic and soil organisms and terrestrial vertebrateswere assessed. Whole results showed that impact to the ecosystem is likely high and further investigation orremedial actions are necessary. Some proposals to refine the risk assessment for a more realistic diagnostic areincluded.
y Weight; DD, Daily Dose; DS,ent; IDS, Intermediate Distancex.040Madrid, Spain. Tel.:+3491
no-Jiménez), [email protected][email protected] (A. Haro),inia.es (M.D. Fernández).
B.V.
Published by Elsevier B.V.
1. Introduction
Contamination of the environment with trace elements hasincreased dramatically since the onset of the industrial revolution(Nriagu, 1979). Themain anthropogenic sources of the contaminationby metal(loid)s are fossil fuel burning, mining and smelting ofmetalliferous ores, municipal waste, landfill leachates, fertilisers,pesticides and sewage (Forstner, 1995). Concerning mining activities,presently mines are specifically designed with mitigation methods tomanage potential environmental impacts; however, in former minesthe extracted mineral deposits may remain after mines have beenabandoned and usually become a large and uncontrolled source ofmetal and metalloid contamination. There are many areas impactedby pyritic mine spreading all around Spain (Álvarez et al., 2003;Clemente et al., 2006; Rufo et al., 2007), which after becoming derelict
sites now require environmental rectifications. In the pyrite deposits,natural weathering interaction may release elements such as As, Zn,Pb, Cu, Mn, Cd, Mo, Cr, and Ni which may contaminate water, soil andplant ecosystems at unacceptable levels (Quevauviller et al., 1989;Santos Oliveira et al., 2002). Releases may cause direct adverse effectson terrestrial and aquatic organisms. Moreover some trace elementscan be incorporated in plants and/or animals leading under certaincircumstances to secondary poisoning in vertebrates due to theconsumption of contaminated food (Anawar et al., 2006; Chen andLiu, 2006; McLaughlin et al., 2000). Therefore, the management ofabandoned derelict mines is a major concern. Risk assessmentmethodology has been recognised as a powerful tool for thedecision-making process in contaminated sites management, espe-cially when contamination of soil or water is involved (Suter et al.,2000; US-EPA, 1998). The use of risk assessment techniques in miningactivities has mainly focused on human health issues (Kim et al.,2005; Lee et al., 2006). Ecological risk tends to be considered a secondpriority however to propose remediation techniques or new occupa-tion plans of these contaminated sites is very difficult if the potentialrisks to biological communities are not considered.
Through this paper, we propose a screening methodology forquantitative impact assessment based on Environmental Risk Assess-ment (ERA) tools. The proposed screening methodology established

693E. Moreno-Jiménez et al. / Science of the Total Environment 409 (2011) 692–703
eight risk levels according to the values of three complementaryhazard quotients (HQs). Later, the expected impact is classifiedaccording to the short term and chronic potential risks.
This evaluation model has been applied to an abandoned pyrite minein Bustarviejo (Madrid, Spain). This site is included in an environmentalreserve proposed for the Natura 2000 Network under Council Directive92/43/CEE (1992). Furthermore, the mine site itself is the object of anational rehabilitation project creating the first Geological and MiningInterpretation Centre in Madrid as well as cultural and scientific facilities.The potential environmental risk on this site comes mainly from thetailings with high concentrations of arsenic and metals such as copper,cadmium and zinc leading to significant contamination of soil, plants andwaters at the streams (Moreno-Jiménez et al., 2009, 2010) which mayrepresent an environmental concern.
Themain objectives of this work are: i) to develop a new screeningprocedure for assessing environmental impacts in contaminated sitesusing risk assessment tools, ii) to establish a ranking of expectedenvironmental impacts based on hazard quotients and iii) to apply themethod in the environmental evaluation of an abandoned pyriticmining site in Spain as a case study.
2. Materials and methods
2.1. Description of the environmental impact method
The methodology developed in this work applies generic principlesfor chemical risk assessment, such as those described in EU TechnicalGuidance Document (TGD) (EC, 2003), for setting a semi-quantitativeimpact value. The expected environmental impact of contaminants wasdetermined for each environmental compartment in two stages.
The first stage consisted in the risk quantification model whichallowed estimating the risk indexes (RI). The second stage consistedin establishing a ranking of potential impacts divided in fivecategories of increasing concern based on the RI.
2.1.1. Derivation of the risk indexesPotential risk of the site was classified on eight risk levels or
categories established according to the hazard quotients (HQs) values(Table 1). The HQ was expressed as the ratio of the exposureconcentration (environmental concentrations or total daily intake)and a set of toxicity values to target organisms (reference doses or theacute toxic dose). A scoring system of eight risk indexes (RIs)(Table 1) was defined. RIs from 0 to 4 were based on chronic exposureand RIs from 5 to 7 were based on acute exposure.
PNEC (Predicted non-effect concentration) and NOEC (Non-observedeffect concentration) were the two reference doses employed to coverlong term effects and L(E)C50 (50% lethal (effect) concentration) was
Table 1Risk index derivation based on the hazard quotients and on the potential level ofdisturbance in the environmental compartments.
Hazard quotient (HQ) Risk index (RI) Level of disturbance
Chronic riskHQPNEC b1 0a Negligible effectsHQPNEC 1–10 1b Sensitive speciesHQNOEC 1–10 2b Standard species
10–100 3 CommunityN100 4 Ecological structure
Acute riskHQ(LC50) 1–10 5 Standard species
10–100 6 CommunityN100 7 Ecological structure
a Prevails over all other impact values.b Only use the highest value in the series.
used to cover acute effects. PNEC,which is amodelized value, was used asan expression of precautionary concern because it covers species moresensitive than those on which toxicity has been measured. NOEC orNOAEL (Non-observed or adverse effect concentration) of the mostsensitive taxa were used because they represent the actual long termconcern. Finally, L(E)C50 of the most sensitive taxa was chosen and itrepresents the actual short-term concern.
2.1.2. Classification and ranking of the impact indexesThe second part of the conceptual model evaluates the overall
potential impacts of the site based on the named Impact Indexes(ImIs). These indexes were obtained as the sum of the chronic andacute RIs (Section 2.1.1). Finally, the ImI obtained was assigned to fivedifferent categories from “negligible” to “very high” impact accordingto the following criteria:
RI HQchronicð Þ+RI HQacuteð Þ = ImI≤ 1 “negligible impact”ImI≤ 2 “low impact”ImI≤ 7 “moderate impact”ImI≤ 9 “high impact”ImI N 9 “very high impact”
2.2. Application of the environmental impact method
2.2.1. Site descriptionThe site extends across 200,000 m2 within La Mina stream valley,
between the following UTM coordinates: 30 T — X=0438606,Y=4524302; X=0437797, Y=4523518, where a shrub land (highersites) and a woodland (lower sites) are developed. Further description isdetailed in Moreno-Jiménez et al. (2009, 2010). Two water streams(with water depth between 10 and 15 cm) were present at the studiedsite: La Mina and La Barranca.
2.2.2. Soil, water and plant samplingSurface soils (0–30 cm) for chemical analyses were sampled in the
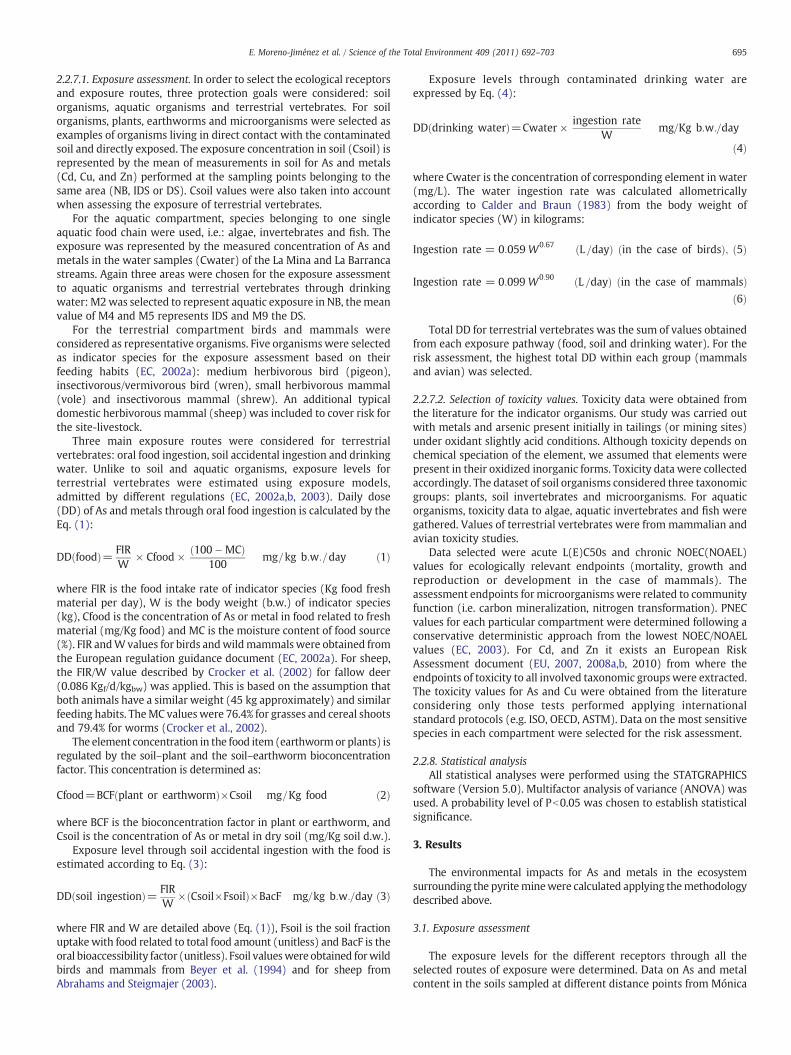
surroundings of theMónicamine inMay and June 2006. Samplesweredistributed into three groups according to their mine distance: nearbysites (NB: 3–312 m), intermediate distance sites (IDS: 459–657 m)and distant sites (DS: 771–1229 m). Five soils from each group werecollected, dried at 50 °C for 7 days, sieved to 2 mm and analyzed to beused in the exposure assessment (Fig. 1).
Soil samples (nearby tailing soil and control soil) for theearthworms bioconcentration assay were taken from the top soillayer (0–20 cm), air-dried and sieved (2 mm mesh). A representativecontaminated soil was taken from a nearby tailing site. Mainphysicochemical characteristics of this soil were: pH 5.93 and organicmatter (OM) 0.85%; and element levels were: As 5698±98, Cd 27±1,Zn 10,185±807 and Cu 1997±107 mg/kg d.w. (dried weight).Control soil was collected from a field located near Madrid (Spain).This soil was also used to prepare dilutions series of contaminated soil.Main physicochemical characteristics of this soil were: pH 7.27, OM1.9%, and element concentrations of As 4.4±0.3, Cd 0.144±0.005, Zn87±7 and Cu 8.4±0.3 mg/kg d.w.
Surface waters from the La Mina and La Barranca streams weresampled twice, in early summer and in late winter, to evaluate theeffects of discharge variations. Sampling points are detailed in Fig. 1.Samples M1 and M2 were taken in a stream that goes through themine and leaves without being diluted with adjacent streams, M1within and M2 outside mine. M3 was taken upstream of the mine inorder to obtain background levels for waters in the site. M4 and M5samples were taken in streams which cross mine surroundings. M9sample was taken in the stream, in flowed from adjacent streams, atthemost distant site. Surface waters (100 mL)were sampled in plasticflasks and HNO3 was added at a ratio of 1 mL of HNO3 per 40 mL of

Fig. 1. Orthophoto of adjacent soils to the Monica mine. Soil and water sampling pointsare shown in the figure. Former mine is located on the right top of the photo.NB=nearby sites, IDS=intermediate distance sites, and DS=distant sites. Watersamples were identified as M1, M2, M3, M4, M5 and M9.
694 E. Moreno-Jiménez et al. / Science of the Total Environment 409 (2011) 692–703
water. Non filtered samples were stored at 4 °C for 20 days to befurther analyzed.
Plants (shoots) were sampled in the surroundings of the Mónicamine in May and June 2006. They were natural species from themining site and previously identified (Moreno-Jiménez et al., 2009).They were selected on the basis of their abundance in each vegetationunit of each plant group (ferns, herbaceous plants, shrubs and trees).Shoots were collected, as well as representative soil samples adjacentto the sampled plants. Plant material wasmilled to a fine powder witha grinder and then stored in plastic bags until the samplemineralization following Lozano–Rodríguez et al. (1995).
2.2.3. Plant bioconcentration assayThree plant bioconcentration factors (BCFplants) were calculated
according to the distance from the mine and corresponding to NB, IDSand DS sampling sites, using data from soil and plants in each zone.The BCF for plants were determined for each chemical as the ratiobetween the measured element concentrations in the aerial part ofthe plant and in the adjacent soil, from the same site (or samplingpoint), both related to dried weight. The BCF corresponding to eachzone was an average considering seven plant species: Cytisusscoparius, Genista cinerascens, Pteridium aquilinum, Silene vulgaris,Digitalis thapsi, Centaurea nigra and Salix atrocinerea.
2.2.4. Earthworm bioconcentration assayThe earthworm bioconcentration factor (BCFworms) was obtained
from a laboratory study set as follows: Earthworms (Eisenia fetida)from our own culture were exposed for 21 days to different dilutionsof sample soil with control soil (12.5, 25, 50 and 100%, w/w) prepared
on a dry-weight basis and produced by manual mixing. Thesepercentages of soil dilution were established having into accountthe previously determined mean As and metal levels in each area andto mimic the site conditions as much as possible. Control and test soilswere placed in 15 cm height×15 cm diameter methacrylate columns(2.0 kg soil d.w. per column). Three replicates of each treatment wereexamined. Earthworms between 300 and 600 mg of wet weight werewashed with distilled water and kept for 24 h on moist filter paper todepurate the gut content. Next, 20 adult earthworms were added percolumn on each soil surface. Columns were incubated in a climateroom (20±2 °C) and illuminated under fluorescent bulbs(800–1000 lx) with photoperiod (16/8) day/night light. Water wasadded to bring the soil to its water holding capacity. Columns werewatered 5 days a week with 50 mL of dechlorinated water, and thenallowing the soils to drain to field capacity. After the exposure periodsurviving earthworms were counted, washed with distilled water andkept for 24 h on moist filter paper. Then, they were frozen at −20 °Cfor 24 h, lyophilized (Telstar Cryodos) and analyzed for total As andmetals as described in Chemical analyses section. The value ofBCFworms was calculated as the ratio between the measuredconcentrations of chemical in the body and in soil, both related todried weight. Finally, BCF obtained for the 50, 25 and 12.5% laboratorysoil dilutions were assigned to NB, IDS and DS, respectively.
2.2.5. Oral bioaccessibility assayThree samples of soil from the three areas (NB, IDS and DS
sampling sites) were selected to evaluate oral bioaccessibility (BacF)of As and metals after soil ingestion. The fraction of As and metals inthe soil that may be absorbed in the gastrointestinal tract wasdetermined using the Simple Bioavailability Extraction Test (SBET)following Lee et al. (2006). Briefly: 0.5 g of soil were suspended in a30 g/L glycine solution, shaken for 1 h at 37 °C in a water bath, filteredwith a num. 42 filter paper (Whatman) and As and metals weremeasured in the filtrate.
Samples were stored at 4 °C under darkness and measured as soonas possible. The BacF value was calculated as the ratio of themeasuredconcentration from glycine soil extracts to the measured chemical insoil (Csoil).
2.2.6. Chemical analysesAfter drying, sieving andhomogenizing the soils, dichromate-oxidable
organic matter (OM) and the pH of a 1:2.5 (soil:water) suspension weremeasured following the protocols of the Spanish Ministry of Agriculture(MAPA, 1994). Pseudo-total concentrations of elements were assayedafter HNO3:H2O2 digestion in an autoclave (Wenzel et al., 2001). Extractswere filtered (num. 42 filter paper, Whatman) and diluted with milli-Qwater.
Plant material was washed thoroughly in tap water and laterdistilled water and dried at 50 °C for 7 days. Lyophilized earthwormswere ground to a fine powder in an agate pestle and mortar. Allearthworms belonging to the same columnwere treated and analyzedtogether. For acid mineralization of organism tissues, 10 mL of milli-Qwater, 3 mL of HNO3 and 2 mL of H2O2 were added to 0.5 g (d.w.) oftissue, digestion was performed at 1500 Pa and 125 °C in an autoclave(Lozano-Rodríguez et al., 1995). The extract was filtered and dilutedwith water to 25 mL.
As and metal concentration in samples of water, soil, plants andearthwormsextracts,were analyzedbyatomic absorption spectrometry(Perkin Elmer Analyst 800, Cd, Cu and Zn) or atomic fluorescence(PSAnalytical, As). Three analytical replicates were measured persample.
2.2.7. Calculation of the hazard quotientsHQs were calculated as the ratio between environmental exposure
and toxicity values (see Section 2.1.1).
695E. Moreno-Jiménez et al. / Science of the Total Environment 409 (2011) 692–703
2.2.7.1. Exposure assessment. In order to select the ecological receptorsand exposure routes, three protection goals were considered: soilorganisms, aquatic organisms and terrestrial vertebrates. For soilorganisms, plants, earthworms and microorganisms were selected asexamples of organisms living in direct contact with the contaminatedsoil and directly exposed. The exposure concentration in soil (Csoil) isrepresented by the mean of measurements in soil for As and metals(Cd, Cu, and Zn) performed at the sampling points belonging to thesame area (NB, IDS or DS). Csoil values were also taken into accountwhen assessing the exposure of terrestrial vertebrates.
For the aquatic compartment, species belonging to one singleaquatic food chain were used, i.e.: algae, invertebrates and fish. Theexposure was represented by the measured concentration of As andmetals in the water samples (Cwater) of the La Mina and La Barrancastreams. Again three areas were chosen for the exposure assessmentto aquatic organisms and terrestrial vertebrates through drinkingwater:M2was selected to represent aquatic exposure in NB, themeanvalue of M4 and M5 represents IDS and M9 the DS.
For the terrestrial compartment birds and mammals wereconsidered as representative organisms. Five organismswere selectedas indicator species for the exposure assessment based on theirfeeding habits (EC, 2002a): medium herbivorous bird (pigeon),insectivorous/vermivorous bird (wren), small herbivorous mammal(vole) and insectivorous mammal (shrew). An additional typicaldomestic herbivorous mammal (sheep) was included to cover risk forthe site-livestock.
Three main exposure routes were considered for terrestrialvertebrates: oral food ingestion, soil accidental ingestion and drinkingwater. Unlike to soil and aquatic organisms, exposure levels forterrestrial vertebrates were estimated using exposure models,admitted by different regulations (EC, 2002a,b, 2003). Daily dose(DD) of As and metals through oral food ingestion is calculated by theEq. (1):
DDðfoodÞ= FIRW
× Cfood ×100�MCð Þ
100mg=kg b:w:=day ð1Þ
where FIR is the food intake rate of indicator species (Kg food freshmaterial per day), W is the body weight (b.w.) of indicator species(kg), Cfood is the concentration of As or metal in food related to freshmaterial (mg/Kg food) and MC is the moisture content of food source(%). FIR andWvalues for birds andwildmammalswere obtained fromthe European regulation guidance document (EC, 2002a). For sheep,the FIR/W value described by Crocker et al. (2002) for fallow deer(0.086 Kgf/d/kgbw) was applied. This is based on the assumption thatboth animals have a similar weight (45 kg approximately) and similarfeeding habits. TheMC valueswere 76.4% for grasses and cereal shootsand 79.4% for worms (Crocker et al., 2002).
The element concentration in the food item (earthwormor plants) isregulated by the soil–plant and the soil–earthworm bioconcentrationfactor. This concentration is determined as:
Cfood=BCFðplant or earthwormÞ×Csoil mg=Kg food ð2Þ
where BCF is the bioconcentration factor in plant or earthworm, andCsoil is the concentration of As or metal in dry soil (mg/Kg soil d.w.).
Exposure level through soil accidental ingestion with the food isestimated according to Eq. (3):
DDðsoil ingestionÞ= FIRW
×ðCsoil×FsoilÞ×BacF mg=kg b:w:=day ð3Þ
where FIR and W are detailed above (Eq. (1)), Fsoil is the soil fractionuptakewith food related to total food amount (unitless) and BacF is theoral bioaccessibility factor (unitless). Fsoil valueswere obtained forwildbirds and mammals from Beyer et al. (1994) and for sheep fromAbrahams and Steigmajer (2003).
Exposure levels through contaminated drinking water areexpressed by Eq. (4):
DDðdrinking waterÞ=Cwater ×ingestion rate
Wmg=Kg b:w:=day
ð4Þ
where Cwater is the concentration of corresponding element in water(mg/L). The water ingestion rate was calculated allometricallyaccording to Calder and Braun (1983) from the body weight ofindicator species (W) in kilograms:
Ingestion rate = 0:059W0:67 L =dayð Þ in the case of birdsð Þ; ð5Þ
Ingestion rate = 0:099W0:90 L =dayð Þ in the case of mammalsð Þð6Þ
Total DD for terrestrial vertebrates was the sum of values obtainedfrom each exposure pathway (food, soil and drinking water). For therisk assessment, the highest total DD within each group (mammalsand avian) was selected.
2.2.7.2. Selection of toxicity values. Toxicity data were obtained fromthe literature for the indicator organisms. Our study was carried outwith metals and arsenic present initially in tailings (or mining sites)under oxidant slightly acid conditions. Although toxicity depends onchemical speciation of the element, we assumed that elements werepresent in their oxidized inorganic forms. Toxicity data were collectedaccordingly. The dataset of soil organisms considered three taxonomicgroups: plants, soil invertebrates and microorganisms. For aquaticorganisms, toxicity data to algae, aquatic invertebrates and fish weregathered. Values of terrestrial vertebrates were from mammalian andavian toxicity studies.
Data selected were acute L(E)C50s and chronic NOEC(NOAEL)values for ecologically relevant endpoints (mortality, growth andreproduction or development in the case of mammals). Theassessment endpoints for microorganismswere related to communityfunction (i.e. carbon mineralization, nitrogen transformation). PNECvalues for each particular compartment were determined following aconservative deterministic approach from the lowest NOEC/NOAELvalues (EC, 2003). For Cd, and Zn it exists an European RiskAssessment document (EU, 2007, 2008a,b, 2010) from where theendpoints of toxicity to all involved taxonomic groups were extracted.The toxicity values for As and Cu were obtained from the literatureconsidering only those tests performed applying internationalstandard protocols (e.g. ISO, OECD, ASTM). Data on the most sensitivespecies in each compartment were selected for the risk assessment.
2.2.8. Statistical analysisAll statistical analyses were performed using the STATGRAPHICS
software (Version 5.0). Multifactor analysis of variance (ANOVA) wasused. A probability level of Pb0.05 was chosen to establish statisticalsignificance.
3. Results
The environmental impacts for As and metals in the ecosystemsurrounding the pyriteminewere calculated applying themethodologydescribed above.
3.1. Exposure assessment
The exposure levels for the different receptors through all theselected routes of exposure were determined. Data on As and metalcontent in the soils sampled at different distance points from Mónica

Table 2Data of pH, dichromate-oxidable organic matter (OM) and trace element concentrations in soils (Csoil) surrounding the Mónica mine.
Distance(m)
OM(%)
pHw Csoil (mg/kg)
As Cd Cu Zn
Nearby sites3 0.67 4.02 3 002.5 23.4 590.3 845.0126 0.69 3.89 1774.8 7.9 213.8 512.5171 0.85 4.34 1549.8 13.7 371.5 636.0257 1.11 4.86 1787.1 8.9 301.6 1475.9312 8.61 5.08 2137.1 34.9 606.0 2243.0
Mean 173±54 2.4±1.6 4.4±0.2 2 050±256 17±5 417±78 1142±172
Intermediate distance sites459 6.22 5.64 689.2 13.6 387.0 685.7526 5.34 5.07 745.3 13.6 186.7 1141.4543 9.97 4.81 33.0 3.0 13.4 84.7572 7.10 5.02 13.7 2.7 5.8 38.4657 7.48 5.12 41.6 5.3 18.2 161.9
Mean 551±32 7.2±0.8 5.1±0.1 304±169 8±2 122±74 422±214
Distant sites771 7.42 4.18 14.9 2.62 10.2 69.0811 4.87 4.95 15.1 5.60 9.9 103.9972 2.21 5.19 11.2 1.39 6.2 33.91229 7.74 4.30 5.3 3.15 17.3 113.21311 3.46 5.28 209.1 2.45 34.9 155.4
Mean 1019±109 5±1 4.8±0.2 51±40 3.0±0.7 16±5 95±21
696 E. Moreno-Jiménez et al. / Science of the Total Environment 409 (2011) 692–703
mine surroundings are collected in Table 2 together with some soilphysicochemical characteristics.
Levels of As, Cu, and Zn in NB were very high, reaching up to 3003,606, and 2243 mg kg−1 respectively. Cd levels were around 2 ordersof magnitude lower than the rest of elements (up to 35 mg kg−1), butthis difference did not give rise to the lowest level of impact for thismetal, as it is shown below.
The relation of pseudo-total concentrations between NB and DSsamples were evaluated by [Csoil]NB/[Csoil]DS ratio. This methodinformed on how easy is a contaminant dispersed from the source tothe receptor site. The [Csoil]NB/[Csoil]DS ratio indicated a lowermigration of As (40) and Cu (20) compared to Zn (12) and Cd (6),which were easily dispersed. This aspect had implications in the riskestimated in the three study areas.
As and metal exposure levels for aquatic organisms were directlymeasured in the water columns (Table 3). Samples M1 and M2reached the highest concentration of As andmetals and the lowest pHdue to they were sampled at the closest points from the mine. Watermetal concentration increased in the order CdbCubZn, which wasaccording to the soil concentration. M3 was taken in order to obtainbackground levels for waters in the site; however, values higher thanexpected were obtained for Zn. The concentrations of As, Cu and Zn inall the sampling points exceeded the Spanish indicative values forsurface waters (Ministerio de Medio Ambiente, 2000). Values for Cdare not legislated yet. Although As extractability is low in soils under
Table 3Metal content in water samples (Cwater) in the streams surrounding the Mónica mine.Values shown are themedium concentrations of samples taken in two different seasons(early summer and late winter).
Cwater (mg/L)
pH As Cd Cu Zn
M1 4.16 0.175±0.003 0.122±0.005 1.310±0.023 5.812±0.048M2 4.34 0.313±0.003 0.109±0.007 1.343±0.008 5.644±0.054M3 7.00 0.038±0.010 0.004±0.002 0.040±0.028 0.218±0.039M4 6.95 0.119±0.066 0.024±0.003 0.079±0.061 0.288±0.130M5 7.05 0.190±0.076 0.029±0.007 0.109±0.030 0.178±0.084M9 7.29 0.059±0.006 0.005±0.002 0.056±0.075 0.088±0.015
oxidant conditions, the surface waters showed large concentrationsall over the studied area. At the farthest sites As levels were still higherthan the World Health Organisation (WHO) recommendation of10 μg/L for drinking water related to human health protection(Steinmaus et al., 2006).
Exposure concentration for terrestrial vertebrates was estimatedthrough three exposure pathways. Metal concentration in fooddepends on the transference of contaminant from soil to foodstuffwhich is regulated by the bioconcentration factor.
BCFplants obtained from As and metals concentration in plantsfrom each study area are shown in Table 4. There was not a linealrelation between BCFplants and metal soil concentration because theBCFplants values in each zone depended on soil concentration andnaturally occurring plant species (see Section 2.2.3). BCFplants wasless than 1 for all elements except for Cd, which was consistent withthe described high bioavailability of Cd to plants (Moreno-Jiménezet al., 2009). The lowest BCFplants value was for As, approximatelytwo orders of magnitude less than for the other elements, indicatingvery low transfer of As from soil to plants. This agrees with literaturewhere soil–plant transfer coefficients b0.01 are described for thiselement (Adriano, 2001; Warren et al., 2003). Transference of tracemetals from soils to plants decreases with soil concentration increase(McLaughlin, 2001), even showing a plateau when soil concentrationexceeds a certain limit (Hamon et al., 1999). Plants have manyphysiological mechanisms to control the influx and translocation ofelements in order to avoid their toxicity (Clemens et al., 2002; Hamonet al., 1999). Despite that, values obtained for each area studied in thepresent work were not very different in general.
Table 4Bioconcentration factor for plants (BCFplants) and oral bioaccessibility factor (BacF)from ingested soil at different distance sites.
BCFplant (Moreno-Jiménezet al., 2009, 2010)
BacF
As Cd Zn Cu As Cd Zn Cu
Nearby 23 E–4 0.89 0.25 0.32 0.021 0.003 0.014 0.267Intermediate 33 E–4 1.53 0.45 0.62 0.021 0.002 0.013 0.324Distant 75 E–4 1.35 0.66 0.66 0.017 3 E-5 0.048 0.078

Table 5Bioconcentration factor for earthworms (BCFworm) obtained at different contaminated soil concentrations.
Sampling site Soil dilution(%)
Csoil (mg/kgd.w) BCFworm
As Cd Zn Cu As Cd Zn Cu
100 5658±98d 27±1e 10,185±807d 1997±107d 0.12a 0.20a 0.13a 0.12a
NB⁎ 50 3245±610c 11.9±0.5d 4391±94c 862±28c 0.17a 0.40ab 0.22a 0.20a
IDS⁎⁎ 25 1552±138b 6.4±0.2c 2585±131b 489±26b 0.20a 0.48b 0.17a 0.15a
DS⁎⁎⁎ 12.5 700±130a 3.2±0.1b 1151±22ab 220±8a 0.38b 1.18c 0.21a 0.15a
Mean 0.18±0.08 0.15±0.07
a–e: different letters indicate significantly different values using one-way ANOVA (LSD; Pb0.05).⁎ Nearby sites (NB) are related with Csoil from columns filled with 50% diluted soil.
⁎⁎ Intermediate distance sites (IDS) are related with Csoil from columns filled with 25% diluted soil.⁎⁎⁎ Distant sites (DS) are related with Csoil from columns filled with 12.5% diluted soil.
697E. Moreno-Jiménez et al. / Science of the Total Environment 409 (2011) 692–703
The BCFworms values for studied elements are included in Table 5.In this study, values for As and especially Cd showed an increase of theBCF factor with soil decreasing levels. Consequently, for the As and Cdexposure assessment different values of BCFworms at 50, 25 and12.5% soil concentration were assigned to NB, IDS and DS respectively.Conversely, at the tested concentrations, BCF for Zn and Cu wereindependent of soil concentration. In this case the mean BCF values of0.18 and 0.15 were derived based on the lack of statistical significance(ANOVA). BCFworms values for all elements were less than 1 exceptfor Cd at the lowest concentrations, indicating that cadmium wasconcentrated from the soil into the earthworm body. BCFworms for Aswere higher than in plants and they were in the same magnitudeorder than Zn and Cu. BCFworms values were, in general, lower thanvalues in the literature from non contaminated or moderatelycontaminated sites (Van Vliet et al., 2006). Moreover, the expecteddecrease of BCFworms concentrations with the increase of soilconcentration (Nahmani et al., 2007; Spurgeon and Hopkin, 1999)was not observed in this work. These results are consistent with thecapacity of earthworms to partially regulate concentrations ofcontaminants in their body, especially in the case of essential metalssuch as Zn and Cu (Langdon et al., 2003; Lee and Kim, 2008;Peijnenburg et al., 1999).
Table 6Food ingestion rates based on fresh food material (FIR), soil fraction uptake (Fsoil) and arsedrinking water in nearby, intermediate and distant sites from the mine.
As Cd
FIR/W Fsoil DD (mg/kgb.w./d) DD (mg/kgb.w
Kgf/d/kgbw Food Soil Water Food So
Nearby sitesPigeon 0.76 0.139a 0.85 1.07 0.03 2.84 0.0Wren 1.04 0.10b 73.19 0.90 0.08 1.49 0.0Vole 1.39 0.024b 1.51 0.33 0.04 5.06 0.0Shrew 0.63 0.04b 45.31 0.22 0.05 0.92 0.0Sheep 0.086 0.176c 0.09 0.15 0.02 0.32 0.0
Intermediate distance sitesPigeon 0.18 0.16 0.01 2.11 4Wren 12.79 0.13 0.02 0.77 3Vole 0.32 0.05 0.02 3.75 1Shrew 7.92 0.03 0.02 0.48 8Sheep 0.02 0.02 0.01 0.23 1
Distant sitesPigeon 0.29 0.09 0.005 3.12 3Wren 20.20 0.09 0.015 3.73 3Vole 0.53 0.03 0.008 5.70 1Shrew 12.24 0.02 0.009 2.26 1Sheep 0.11 0.04 0.004 1.15 1
a From Cal/Ecotox Database, 2010.b From Beyer et al 1994.c From Abrahams and Steigmajer, 2003.
An additional transference parameter, the oral bioaccessibilityfactor (BacF), was determined in order to correct the amount of As ormetal which can be absorbed through the soil portion accidentallyingested by vertebrates. Bioaccessibility is defined as the fraction of asubstance in soil that is available for absorption in the gastrointestinaltract (Ruby et al., 1999). Data on BacF obtained in this study are shownin Table 4. Except for Cu, values obtained were very low (3·10−5 to0.048) indicating that the pool of As and metals that terrestrialvertebrates may incorporate from soil ingestion is only a smallfraction of total soil metal content. Copper showed the highest valuesof BacF (0.078–0.267), which did not correlate with the highest BCFvalues in plants and earthworms.
The daily ingestion for the generic terrestrial vertebrates consideringthe three exposure pathways are shown in Table 6. Values for FIR/WandFsoil are also included.
Comparing the three exposure pathways for terrestrial verte-brates, food is the main exposure route except for sheep exposed toAs. Thus, at NB, the main exposure pathway of As for livestock isaccidental soil ingestion. It was due to its high soil concentration andits low BCFplants values, which increase the soil ingestion versus dietfor metal exposure (Fairbrother et al., 2007). The relative importanceof drinking water compared to soil ingestion contribution depended
nic and metal daily dose (DD) for birds and mammals through food, accidental soil and
Zn Cu
./d) DD (mg/kgb.w./d) DD (mg/kgb.w./d)
il Water Food Soil Water Food Soil Water
01 0.01 51.41 0.40 0.49 24.00 2.78 0.1201 0.03 43.1 0.33 1.52 13.12 2.34 0.3600 0.02 91.39 0.12 0.81 42.66 0.85 0.1900 0.02 26.73 0.08 0.88 8.12 0.58 0.2100 0.01 5.71 0.05 0.44 2.67 0.39 0.10
E-4 0.002 34.22 0.14 0.03 12.64 0.99 0.01E-4 0.007 15.97 0.11 0.08 3.85 0.83 0.02E-4 0.004 60.83 0.04 0.04 24.25 0.30 0.01E-5 0.004 9.88 0.03 0.05 2.38 0.20 0.01E-4 0.002 3.80 0.02 0.02 1.51 0.14 0.01
E-6 4 E-4 47.70 0.48 8.7 E-3 7.87 0.13 3 E-4
E-6 13 E-4 17.80 0.47 0.027 2.45 0.13 8 E-4
E-6 7 E-4 87.24 0.15 0.014 14.40 0.04 4 E-4
E-6 8 E-4 10.78 0.11 0.016 1.48 0.03 5 E-4
E-6 4 E-4 17.57 0.22 7.8 E-3 2.90

698 E. Moreno-Jiménez et al. / Science of the Total Environment 409 (2011) 692–703
on the trace element. In general, exposure through drinking waterwas lower than accidental soil ingestion, except for zinc at NB and IDSand mainly for cadmium where 1 or 2 order of magnitude lower wasobserved for soil ingestion.
3.2. Toxicity assessment
The toxicity values are shown in Table 7. The source of each data isindicated under the value and the most sensitive species is indicatedby footnotes to the table. Toxicity varied substantially depending onelement and species. For the aquatic organisms, the most toxicelements were Cd and Cu. Differences between acute and chronictoxicities were low, except for Cd. Thus, EC50 and NOEC values for As,Cu and Zn were in the same order of magnitude whereas for Cd thedifference was of 2 orders of magnitude, with a change in the mostsensitive species. In the case of soil organisms, Cd was the most toxicelement with a narrow difference between acute and chronic effectconcentrations. The toxicity increases as follows: CdNZnNAsNCu.Acute effects were 10 fold chronic effect concentrations for As, Zn, andCu, and 2 fold for Cd. In the case of mammals and birds, the toxicitydecreased in the order CdNZnNAsNCu. In general, acute and chronictoxicity were similar or higher to mammals than to birds except for AsNOEC that was one order of magnitude lower for mammals.
PNEC values were calculated from NOEC or NOAEL (in the case ofmammals) data; consequently, they follow the same tendency aschronic values, except for the As PNEC value for soil organisms and ZnPNEC value to mammals. This different tendency is due to the largeassessment factors (AF=100 against AF=2–10) needed to deal withthe uncertainty derived from the few chronic toxicity data (EC, 2003),which led to more conservative PNEC values.
Table 7Acute (L(E)C50) and chronic (NOEC) toxicity values and PNEC for the most sensitive aquat
As Cd
Aquatic organismsL(E)C50 (μg/L) 159a(Chen et al., 1994) 35.2a(EU, 2007)NOEC (μg/L) 100a(Pawlik-Skowronska et al., 2004) 0.16b(EU, 2007)PNEC (μg/L) 10 0.016
Soil organismsL(E)C50 (mg/Kgdw) 207c(New Zealand Ecotoxicity Test Results, 2007) 2.8d(EU, 2007)NOEC (mg/Kgdw) 10c(Vaughan and Greenslade, 1998) 1.8d(EU, 2007)PNEC (mg/Kgdw) 0.1 0.18
MammalsLC50 (mg/Kgbw/d) 70.6f(Schafer and Bowles, 1985) 1.5i(EU, 2007)NOAEL (mg/Kgbw/d) 0.75h(Nemec et al., 1998) 0.15i(EU, 2007)PNEL (mg/Kgbw/d) 0.075 0.015
BirdsLC50 (mg/Kgbw/d) 19l(Nemec et al., 1998) 1.6NOEC (mg/Kgbw/d) 9.3k(Stanley et al., 1994) 0.16k
(EU, 2007)PNEC (mg/Kgbw/d) 0.93 0.016
a Algae.b Aquatic invertebrate.c Terrestrial invertebrate.d Terrestrial plant.e Microbial activity.f Mouse.g Rat.h Rabbit.i Monkey.j Hamster.k Duck.l Quail.m Goose.n Sheep.
3.3. Risk quantification
The HQs values related to each of the three study areas are shownin Fig. 2. HQPNEC values were higher than 1 indicating potential risk tosensitive species in all the compartments and areas considered exceptfor livestock in IDS and DS (Fig. 2A). For soil organisms the riskassociated with the As exposure was the highest at all distancesconsidered. This is due not only to the high As soil concentrationfound in the mine surroundings but also to the conservative value ofPNEC obtained for this element. The assessment factor influencedHQPNEC value since HQNOEC and HQL(E)C50 for As and the metals weremore homogeneous (Fig. 2B and C, respectively). For aquatic species,the risk associated (HQPNEC) with cadmium is the highest due to thehigh chronic toxicity of this element and hence the low PNEC valuederived. Unlike soil species, for aquatic organisms As HQPNEC is oflower concern than metals as result of its low toxicity and the lowconcentration of this element measured in water samples.
HQPNEC values for terrestrial vertebrates were highly influenced bythe source of food: plants or worms (Table 6). Thus, As showed thehighest differences betweenmammals and livestock due to the higherDDfood to organisms feeding on earthworms than plants for thiselement. As result, exposures via food for livestock (plants) werelower than for other vermivorous mammals. The risk to vertebratesdecreases with the distance from the mine faster for As and Cu thanfor Cd and Zn, due to the higher migration found for these elements.Consequently, the exposure to As and Cu is more dependent on thedistance from the mine than the exposure to Cd and Zn.
In Fig. 2B are represented the values of HQNOEC data related to thetarget organisms at the three studied areas. In the NB and IDS allvalues were higher than 1, except for livestock, which only showedpotential chronic risk for Cd. At DS, risk of chronic effects for soil and
ic and soil organisms and terrestrial vertebrates to arsenic and metals.
Zn Cu
40a(EU, 2008b) 9a(De Schamphelaere and Janssen, 2006)17a(EU, 2008b) 3.12b(EFSA, 2008)8.5 0.62
80d(EU, 2008b) 302c
17e(EU, 2008b) 30.3c(EU, 2008a,b)8.5 3.0
60n(Worthing, 1991) 163g
19.9j(EU, 2008a) 16.3g(SCHER, 2008)0.2 1.6
7.5m(Johnson and Fagerstone, 1992) 173l
2.0k(Gwaltney-Brant, 2004) 5.1l
0.2 0.51
http://ecb.jrc.ec.europa.eu/DOCUMENTS/Existing-Chemicals/RISK_ASSESSMENT/REPORT/cdoxidereport302.pdf
http://ecb.jrc.ec.europa.eu/DOCUMENTS/Existing-Chemicals/RISK_ASSESSMENT/REPORT/cdoxidereport302.pdf
http://ecb.jrc.ec.europa.eu/DOCUMENTS/Existing-Chemicals/RISK_ASSESSMENT/REPORT/cdoxidereport302.pdf
http://ecb.jrc.ec.europa.eu/DOCUMENTS/Existing-Chemicals/RISK_ASSESSMENT/REPORT/cdoxidereport302.pdf
http://ecb.jrc.ec.europa.eu/DOCUMENTS/Existing-Chemicals/RISK_ASSESSMENT/REPORT/cdoxidereport302.pdf

Nearby sites
0.1
1
10
100
1000
10000
100000
Soil org Aqu org Livestock Mammal Avian
HQ PNEC
Intermediate distance sites
0.1
1
10
100
1000
10000
Soil org Aqu org Livestock Mammal Avian
HQ PNEC
Distant sites
0.1
1
10
100
1000
10000
Soil org Aqu org Livestock Mammal Avian
HQ PNEC
As Cd Zn Cu
Nearby sites
0.1
1
10
100
1000
Soil org Aqu org Livestock Mammal Avian
HQ NOEC
Intermediate distance sites
Intermediate distance sites
0.1
1
10
100
1000
Soil org Aqu org Livestock Mammal Avian
HQ NOEC
Distant sites
0.1
1
10
100
1000
Soil org Aqu org Livestock Mammal Avian
HQ NOEC
As Cd Zn Cu
Nearby sites
0.1
1
10
100
1000
Soil org Aqu org Livestock Mammal Avian
HQ LC50
0.1
1
10
100
Soil org Aqu org Livestock Mammal Avian
HQ LC50
Distant sites
0.1
1
10
100
Soil org Aqu org Livestock Mammal Avian
HQ LC50
As Cd Zn Cu
A
B
C
HQs to target organisms related to the distance to the mine based on toxicity values of the elements
Fig. 2. Hazard quotients (HQs) to soil and aquatic organisms and terrestrial vertebrates related to the distance to the mine. Three HQs are presented according with the ratio ofexposure to (A)PNEC, (B) NOEC and (C) LC50 toxicity values.
699E. Moreno-Jiménez et al. / Science of the Total Environment 409 (2011) 692–703
aquatic organisms persisted except for Cu and As, respectively; forterrestrial vertebrates, chronic risk was only detected to mammals forAs and Cd, and to birds for Cd and Zn.
The analysis of HQLC50 indicates the risk for acute effects (Fig. 2C).The profile showed by HQNOEC and HQLC50 figures is similar. However,remarkable chronic-to-acute differences were found for Cd in aquaticorganisms and As in mammals. In NB, the highest risk is to aquaticorganismswith HQLC50 values N100 for Cu and Zn. In DS, unacceptablerisk of acute effects was only detected to aquatic organisms due to Znand Cu and to avian due to Zn.
3.4. Classification and ranking of impacts
Finally the screening model evaluated the overall potential impactof As and metals according to the sum of chronic and acute indexes ofrisk (RIs) associated to every trace element and every target in siteslocated at the three different distances. According to this model, risk isquantified by the ImIs (Fig. 3).
The application of this conceptual model to the scenario studiedhere showed, in most situations, a concern about the old miningactivity on ecological receptors even in the distant sites (Fig. 3).According to the ranking of impacts proposed in Table 1, very highimpact, reaching above 9 in the NB, was expected for aquaticorganisms due mainly to Zn and Cu. Even at long distances from themine high impact (ImI≥7) was obtained for these metals. Also highimpact to soil organismswas foreseen in both NB and IDS. However, atDS a low impact index was found for soil organisms because of thelack of acute unacceptable risk. Low impacts were expected forlivestock (ImIb2) even at NB distances. Other terrestrial vertebrates
(birds and mammals) were expected to be seriously affected by Cdand Zn concentrations based on the ImI of 7 and 8, (moderate andhigh impact) in NB and IDS sites. By contrast, at DS Cd and Zn showedlow impact values except for birds exposed to Zn due to thecontribution of unacceptable acute risk of this metal (RI=5) as aresult of its high acute toxicity to birds.
4. Discussion
4.1. Environmental impact method
The screening impact model has been developed as a tool forranking the environmental potential risks associated to contaminatedsites. This model can be applied to any environmental compartmentand considers simultaneously chronic and acute exposures tocontaminants.
4.1.1. Derivation of the risk indexesThe assignation of RIs to the HQ values is proposed to quantify the
potential risks associated to the contaminated sites. The RI consists oftwo contributions based on the exposure period (Table 1). The firstpart corresponds to chronic hazards (RI from 0 to 4) and it is derivedfrom HQPNEC and HQNOEC. The second part takes into account acutehazards (RI from 5 to 7) and it is based on HQLC50. The value of each RIscores the weight of the potential risk, the higher index value thehigher potential risk. This is different from other approaches where acommon score system is used for both chronic and acute riskquantification and an additional parameter is included to considerthe time-scale hazard (Finizio et al., 2001). Other approaches have

As Cd Zn Cu
Very high
High
Moderate
Low
Negligible
NBImI
11
9
012
7
Soil org Aqu. org Livestock Mammal Avian
11
9
012
7
Soil org Aqu. org Livestock Mammal Avian
IDSIm
Soil org Livestock AvianMammalAqu. org
11
9
012
7
DSIm
Expected environmental impacts in the surroundings of the Monica mine
Fig. 3. Expected environmental impacts of As, Cd, Zn and Cu on target organisms in the surroundings of the Monica mine. Classification of environmental impacts is based on theImpact Indexes (ImIs) obtained for the trace elements at three different distance sites.
700 E. Moreno-Jiménez et al. / Science of the Total Environment 409 (2011) 692–703
into account exclusively the value of NOEC (Lu et al., 2003) or LC50(Sala and Vighi, 2008).
The HQPNEC covers the potential risk of non-tested sensitivespecies. The standard inter-species application factor is 10 (EC, 2003),as a consequence, HQPNEC values lower than 1 means that not enoughcontaminant concentrations are present for producing any damage,the risk is acceptable and then the RI assigned is 0. A HQPNEC rangingbetween 1 and 10, (meaning an exposure level within one order ofmagnitude above the PNEC) should be identified as a potential risk forsensitive species, RI is 1. HQPNEC above 10 are expected to be coveredby the other reference dose (NOEC, with RI value higher than 1).
Three levels of RI (from 2 to 4) were defined for the reference doseNOEC based on increased 10-fold values according to EC (2003) safetyfactors. Every step represents a different level of ecosystemprotection. HQNOEC represents a potential long term risk to the mostsensitive standard species tested. As a result, the HQNOEC rangingbetween 1 and 10 (meaning an exposure level and NOEC are of thesame order of magnitude) is associated with a RI of 2. If HQNOEC isbetween 10 and 100, according to the inter-species application factorof 10, a potential long term risk is expected for additional speciesothers than the most sensitive. At this point, an alteration ofpopulations resulting in a community impact could occur; in thiscase the RI assigned is 3. HQNOEC higher than 100 suggests anextremely serious effects on communities which could affect theecological structure of the site, and RI equal to 4 is applied.
The potential consequences of short term exposures are catego-rized by the values of the HQL(E)C50 based on acute toxic effects. TheHQL(E)C50 are associated to a real hazard so the highest risk indexes,from 5 to 7 were assigned. Similar to NOEC, the RI values were basedon increased 10-fold of HQL(E)C50, according to EC, 2003 safety factors.The HQL(E)C50 data is a sign of the potential for recolonization/recovery of species in the site.
4.1.2. Classification of the impact indexesThe RIs derived from chronic and acute HQs are joined in the
impact assessment for the derivation of the ImIs into five categories(see Section 2.1.2). In this sense, ImIs consider both the affectation ofspecies living currently in the site and the potential for colonization ofothers which could have disappeared (HQNOEC and HQL(E)C50
contributions, respectively).ImI of 1 or lower is obtained when the environmental concentra-
tion is equal or lower than the PNEC value. In this case, the impact islikely “negligible”.
ImI lower or equal to 2 is obtained only in terms of chronicpotential risk for the most sensitive tested species. In this state otherspecies belonging or not to the same taxonomic group but withsimilar functions in the ecosystem, can replace it. In addition, no acute
effect is detected allowing the recolonization of the zone by speciescoming from adjacent zones; consequently “low impact” is expected.
Total ImI lower or equal to 7 can be reasonably obtained when themost sensitive tested species is subject to chronic and acute exposure(RIchronic 2+RIacute 5). In this situation, chronic and acute affectationof the most sensitive species is identified, and accordingly “moderateimpact” is expected.
ImI lower or equal than 9 are obtained with the suspicion ofundesirable community effects under both time scales chronic andacute (3+6) or in terms of serious potential chronic harm of theecosystem structure and also acute effects of sensitive tested species(4+5). In both situations the risk associated to the long termexposures is high and the potential for colonization is doubtful. Asresult, based on the probable ecosystem damage the impact categoryassigned is “high impact”. Themathematical combination of RI (2+7)was not considered because L(E)C50 value 5 orders of magnitudegreater than NOEC for the same contaminant is very unlikely.
Impact index values higher than 9 implicate possible chroniceffects affecting both the ecological structure of the site and therecovery of a range of species. Under this situation the impactprovoked by the contamination is so high that the recovery of thezone without a previous cleaning of the site would be compromised.Hence, the impact category is stated as “very high”.
4.2. Application of the environmental impact method
4.2.1. Exposure assessmentAs expected, exposure levels for birds and mammals through food
(DDfood) was highly dependent on the source of food (plants orworms) and the relative importance of the bioconcentration factor ofplants and earthworms. BCF varies depending on soil type and soilconcentrations up to 50-fold or higher within the same metal (Ma,1982; Wright and Stringer, 1980; Fairbrother et al., 2007). Conse-quently, values of BCFplants were determined site-specific in order toreduce the uncertainly of risk of metals associated with the foodtransfer. BCFplants also depends on plant species, thus, plantsnaturally living in the site were used. The high mobility in the fielddemonstrated by earthworms complicates relating element soilconcentration to worm body concentration to obtain bioconcentra-tion factors. Hence, BCFworms for As and metals was obtained from alaboratory assay performed in columns at different soil concentrationsunder controlled conditions.
In the case of As, BCFplants (0.0023–0.0075) and BCFworms (0.17–0.38) differed strongly which meant, accordingly, much higherexposure levels for vermivores (wren and shrew) than for herbivores(pigeon and vole) (Table 6). For metals, BCFplants values are similaror slightly higher than BCFworms, hence DDfood was determined bythe corresponding FIR/W values. Thus, the exposure to metals for

701E. Moreno-Jiménez et al. / Science of the Total Environment 409 (2011) 692–703
animals feeding on plants was higher than those feeding on wormsaccording to the higher FIR/W for herbivores with the exception ofsheep.
The estimation of exposure through accidental soil ingestion wasimproved using the BacF. This factor allows correcting metalabsorption in gut from soils (Ollson and Koch, 2009). Its importancedepends on the manner in which an element occurs in soils. In minesites, As and metals are present in poor soluble forms andconsequently, their bioaccessibility is expected to be low (Ruby etal., 1999). In general, values of bioaccessibility were very low exceptfor Cu, indicating low release from soil under gastric conditions (Table4). Consequently the incorporation of this factor allowed reducinguncertainty and obtaining more realistic risk estimations (Ollson andKoch, 2009).
4.2.2. Risk assessmentIn NB and IDS (Fig. 2), soil organisms are expected to suffer acute
effects both to species and to the community due to the presence of Asand Cd, and Zn, respectively. In this zone the natural recovery could bethreatened since survival of species is endangered and essential soilfunctions cannot be guaranteed. In DS, risk of long term effects forstandard species of soil was detected caused by As, Cd and Zn. For Asand Zn, values of NOEC (10 and 17 mg/kg d.w., respectively) werelower than naturally occurring levels (51 and 85 mg/kg d.w.,respectively) described by De Miguel et al. (2002). Consequently,chronic effects to standard species were detected which may lead toan overestimation of risk. One method of obtaining more realistic riskestimation is to quantify the fraction of metals in soils that is reallybioavailable. However, at present a method which allows correlatingtoxicity to soil organisms and bioavailable fraction in soil is notgenerally admitted (Berthelot et al., 2008; McLaughlin et al., 2000).Moreover, the sensitivity of metal bioavailability to temporal changesin soil conditions complicates the use of models based on the free ionactivity or extractant solutions. Therefore, risk assessment based ontotal concentration seemed more appropriate in this first stage.Consequently, to exceed such levels does not mean that a high riskexists but that a site-specific risk assessment may be needed(Fairbrother et al., 2007).
For the aquatic compartment the total As and metal concentrationsin the water column was used assuming the worst case situation. Therisk assessment showed a potential risk due to acute effects even indistant zones, as a result,mainly, of Zn and Cu exposure. InNB, HQL(E)C50
valueshigher than100were estimated. Consequently, unacceptable riskof acute exposure affecting to aquatic ecosystem could be expected.Similar to soil organisms, refinement for the aquatic organisms shouldbe based on bioavailability since stream characteristics such as pH,hardness, organic content and suspended solids levels can significantlyaffect element exposure to affected organisms.
For the terrestrial vertebrates Cd and Zn were the most concern.Cadmium can be bioaccumulated and biomagnified through foodchains (Chen and Liu, 2006). In this work, high HQs were estimated asa consequence of its high toxicity to mammals and birds and itsbioconcentration in plants andworms (BCFN1) in spite of the fact thatCd soil concentration was the least. It is remarkable, the high HQvalues to mammals and birds obtained for Zn, in spite of Zn togetherwith Cu are essential elements and auto-regulated in plants,invertebrates and vertebrates. BCFs for zinc were lower than 1 forplants and earthworms, however, due to the high Zn soil concentra-tions, high Zn levels were detected inside plants growing in the zonewith values in the range of 30–708 mg/kg shoot d.w. (Moreno-Jiménez et al., 2009) and in worms (246–1330 mg/kg d.w.), asmeasured in this work. Consequently, high Zn DDfood (Table 6) andhence high HQs were detected for terrestrial vertebrates. Potentialrisk to livestock was lower than to mammals and birds due to thelower exposure through food.
Data for terrestrial vertebrates were based on worst caseestimations which assume that wildlife consumes 100% of their dietfrom the contaminated sites. This is not an actual case because birdsand mammals use a large territory to develop their activity. Riskrelated to a more realistic situation; feeding habitats, composition ofdiet and time spent on each of the different zones (NB, IDS and DS)should be considered in order to obtain a closer and more accuratedefinition of concerns.
4.2.3. Impacts categoriesThe site study showed that As and metals may cause from low to
high impacts in the whole area studied affecting at all potentialreceptors (Fig. 3). The only exception was As and Cu to livestock at alldistance sites, where ImI of 1 or lower were obtained.
According to the proposed classification, the ecosystem in the NBsites was affected by very high impact to the aquatic compartmentdue to Zn and Cu, and high impact to soil organisms (all elements) andto avian and mammals due to Cd and Zn. For livestock the impact waslow for all elements.
At IDS high impact was expected to all organisms except forlivestock. One special case was identified for Cd in aquatic organisms(ImI of 4). According to the proposed method, a structural damage inthe ecosystem was expected as a result of exclusively long termexposures. This situation could be of high concern depending on theaffected species, the endpoint and the type of effect. The extent of thedamage would need additional assessment to classify the impact asmoderate or high having also taken into account that no acuteconsequences were identified and the replacement of affectedorganisms by others from adjacent areas is possible.
At DS low impact was detected to all organismswith the exceptionof aquatic organisms as result of Cd and Zn (moderate impact) and Cu(high impact) and avian in the case of Zn (moderate impact).
These results could be over protective due to all values werecalculated under the worst case assumption. In other words, the mostsensitive endpoints of the most sensitive species within a group, onlyone type of contaminated food rather than a distribution of items inthe diet and the continued stay of species in the site were selected todetermine the possible impacts (risk). In addition, the assessmentwasbased on the total soil and water concentrations. The bioavailablefraction and trace element speciation could be considered key factorsfor a more realistic approach. The accurate application of the methodrequires extensive toxicity data. The limited database addressingtoxicity for soil organisms was a source of uncertainty for As (soilorganisms). Therefore, following the usual risk assessment method-ology, a refinement of HQs based on more realistic exposure and/ortoxicity assessment is advisable prior to further intervention.
The criteria to define different levels of risk and impact indexeshave been arbitrary. This limitation is common to any classificationbased on scores values. They are based in our knowledge ofenvironmental risk assessment and it is proposed as a tool to besustained in the future by scientific validation.
Despite of the importance of the associated uncertainties to theabove issues, we consider that this approach is a good method toclassify risk to sites because it includes relevant exposure routes andtoxicity data. The method could be very useful for comparativepurposes and it is of universal application.
5. Conclusions
The proposed method is an attempt to integrate traditional riskassessment approaches with real variable environmental character-istics at local scale. The strength of the method is that integrates in anonly value (impact index): element concentrations in the environ-mental compartments, element toxicity and other factors affectingexposure levels. Another advantage is that it could be applied to anyisolated environmental compartment or to a whole area; in addition,

702 E. Moreno-Jiménez et al. / Science of the Total Environment 409 (2011) 692–703
no specific requirements other than those needed for traditional riskassessment are necessary. The model is intended to represent the firststage and proposes a scientific and systematic tool to identify andprioritize main expected impacts in order to take action measures.However it still requires further refinement and experimentalvalidation for a realistic assess of damage to the ecosystems.
The application of this impact quantification tool to the miningarea indicated that the current presence of As and metals in the sitemay cause impacts that affect at all potentially receptors in the wholearea studied with the exception of livestock. The high impact indexessuggest an ecosystem where most of biological species and in somecases even the whole ecosystem would be seriously affected.Moreover, the recovery of the zone could be seriously compromised.To reduce uncertainties generic and specific information data arerequired. Further refinements would include, at least, bioavailabilityassays together with feeding habits and behaviour of species. Theknowledge of chemical speciation should be included when thecutting-edge analytical methodologies are more accessible.
Acknowledgements
Theauthors aregrateful toCarmendelRio,DanielAlonsoandLuis Zazoby the technical assistance. This work has been financed by MadridCommunity through EIADES Project S-0505/AMB/0296, and by SpanishMinistry of Education and Science, project CTM-2007-66401-CO2/TECNO.
The authors thank also to the Excmo. Ayuntamiento deBustarviejo, foradmittance to the mine zone.
References
Abrahams PW, Steigmajer J. Soil ingestion sheep grazing the metal enriched floodplainsoils of mid-Wales. Environ Geochem Health 2003;25:17–24.
Adriano DC. Trace elements in terrestrial environments. Biogeochemistry, bioavailabilityand risk of metals2nd ed. . New York: Springer-Verlag; 2001.
Álvarez E, Fernández-Marcos ML, Vaamonde C, Fernández-Sanjurjo MJ. Heavymetals inthe dump of an abandoned mine in Galicia (NW Spain) and in the spontaneouslyoccurring vegetation. Sci Total Environ 2003;313:185–97.
Anawar HM, García-Sanchez A, Murciego A, Buyolo T. Exposure and bioavailability ofarsenic in contaminated soils from the La Parrilla mine, Spain. Environ Geol2006;50:170–9.
Berthelot Y, Valton E, Auroy A, Trottier B, Robidoux PY. Integration of toxicological andchemical tools to assess the bioavailability of metals and energetic compounds incontaminated soils. Chemosphere 2008;74:166–77.
Beyer WN, Connor EE, Gerould SG. Estimates of soil ingestion in wildlife. J Wild Manage1994;58:375–82.
Cal/Ecotox Database (The California Wildlife Biology, Exposure Factor, and ToxicityDatabase). At: http://oehha.ca.gov/cal_ecotox/default.htm accessed March 18,2010.
Calder WA, Braun EJ. Scaling of osmotic regulation in mammals and birds. Am J Physiol1983;244:601–6.
Chen C-M, Liu M-C. Ecological risk assessment on a cadmium contaminated soil landfill— a preliminary evaluation based on toxicity tests on local species and site-specificinformation. Sci Total Environ 2006;359:120–9.
Chen F, Chen W, Dai S. Toxicities of four arsenic species to Scenedesmus obliguus andinfluence of phosphate on inorganic arsenic toxicities. Toxicol Environ Chem1994;41:1–7.
Clemens S, Palmgren MG, Krämer U. A long way understanding and engineering plantmetal accumulation. Trends Plant Sci 2002;7:309–15.
Clemente R, Almela C, Bernal MP. A remediation strategy based on active phytoremediationfollowed by natural attenuation in a soil contaminated by pyrite waste. Environ Pollut2006;143:397–406.
Council Directive 92/43/EEC of 21May 1992 on the conservation of natural habitats andof wild fauna and flora. Official Journal L 206, 22/07/1992 p. 0007–0050.
Crocker D, Hart A, Gurney J, McCoy C. Project PN0908: Methods for estimating dailyfood intake of wild birds and mammals. Final Report. DEFRA; 2002.
De Miguel E, Callaba A, Arranz JC, Cala V, Chacón E, Gallego E, et al. Determinación deNiveles de Fondo y Niveles de Referencia de Metales Pesados y Otros ElementosTraza en Suelos de la Comunidad de Madrid. Madrid: IGME; 2002.
De Schamphelaere KAC, Janssen CR. Bioavailability models for predicting coppertoxicity to freshwater green microalgae as a function of water chemistry. EnvironSci Technol 2006;40:4514–22.
EC (European Commission). Guidance Document on risk assessment for birds andmammals under Council Directive 91/414/EEC. SANCO/4145/2000; 2002a.
EC (European Commission). Guidance Document on aquatic ecotoxicology in thecontext of the Directive 91/414/EEC. SANCO/4145/2000; 2002b.
EC (European Commission). Technical Guidance Document, 2003. Technical GuidanceDocument in support of the Commission Directive 93/67/CEE on risk assessment ofnew notified substances and the Commission Regulation (EC) 1488/94 on riskassessment for existing substances. Ispra, Italy: European Chemical Bureau; 2003.
EFSA (European Food Safety Authority). Conclusion regarding the peer review of thepesticide risk assessment of the active substance copper compounds. EFSAScientific Report 2008;187:1–101.
EU (European Union). European Union Risk Assessment Report. Cadmium oxide andCadmiummetal. CASNo: 1306-19-0. CAS No:7440-43-9. Part I environment. EUR 22919EN. Institute for Health and Consumer Protection. European Chemical Bureau. Office forofficial publications of the European Communities, Italy; 2007, Vol. 72. 527 pp. 2007. At:http://ecb.jrc.ec.europa.eu/DOCUMENTS/Existing-Chemicals/RISK_ASSESSMENT/RE-PORT/cdoxidereport302.pdf. accessed November 15, 2010.
EU(EuropeanUnion). EuropeanUnionRiskAssessmentReport. Zincoxide. CASNo:1314-13-2. Part II Human Health. EUR R073-0805-en. Institute for Health and ConsumerProtection. European Chemical Bureau. Office for official publications of the EuropeanCommunities, Italy; 2008a, 237 pp. At: http://ecb.jrc.ec.europa.eu/DOCUMENTS/Exist-ing-Chemicals/RISK_ASSESSMENT/REPORT/zincoxidereport073.pdf accessed November15, 2010.
EU(EuropeanUnion). EuropeanUnionRiskAssessmentReport. Zincmetal. CASNo:7440-66-6.Part I environment.EURR072_0805_env. Institute forHealthandConsumerProtection.European Chemical Bureau. Office for official publications of the European Communities,Italy; 2008b. 681 pp. At: http://ecb.jrc.ec.europa.eu/DOCUMENTS/Existing-Chemicals/RISK_ASSESSMENT/REPORT/zincmetalreport072.pdf accessed November 15, 2010.
EU (European Union). Risk Assessment Report (RAR). — [copper, copper (II) sulphatepentahydrate, copper(I)oxide, copper(II)oxide, dicopper chloride trihydroxide] cas[7440-50-8, 7758-98-7, 1317-3-1, 1317–38–0, 1332-65-6]. Chapter 3.2_ Environmentaleffects. 2008b. At: http://www.eurocopper.org/copper/copper-ra.html accessed March18, 2010.
Fairbrother A, Wenstel R, Sappington K, Wood W. Framework for metals riskassessment. Ecotoxicol Environ Saf 2007;68:145–227.
Finizio A, CallieraM, Vighi M. Rating systems for pesticide risk classification on differentecosystems. Ecotoxicol Environ Saf 2001;49:262–74.
Forstner U. Land contamination by metals global scope and magnitude of problem. In:Allen HE, Huang CP, Baley GW, Bowers ER, editors. Metal Speciation andContamination of Soil. Boca Raton, Florida: CRC Press; 1995. p. 1-33.
Gwaltney-Brant S. Lead. In: Plumlee KH, editor. Clinical Veterinary Toxicology. St. Louis,Missouri: Mosby; 2004. p. 204–10.
Hamon RE, Holm PE, Lorenz SE, Mc Grath SP, Christensen TH. Metal uptake by plantsfrom sludge amended soils: caution is required in the plateau interpretation. PlantSoil 1999;216:53–64.
Johnson GD, Fagerstone KA. Primary and secondary hazards of zinc phosphide tonontarget wildlife: a review of the literature. Denver. Colorado: Denver WildlifeResearch Center. USDA/APHIS; 1992.
Kim JY, Kim KW, Ahn J, Ko I, Lee CH. Investigation and risk assessment modeling of Asand other heavy metals contamination around five abandoned metal mines inKorea. Environ Geochem Health 2005;27:193–203.
Langdon CJ, Piearce TG, Meharg AA, Semple KT. Interactions between earthworms andarsenic in the soil environment: a review. Environ Pollut 2003;124:361–73.
Lee BT, Kim KW. Arsenic accumulation and toxicity in the earthworm Eisenia fetidaaffected by chloride and phosphate. Environ Toxicol Chem 2008;27:2488–95.
Lee SW, Lee BT, Kim J-Y, Kim KW, Lee JS. Human risk assessment for heavymetals and ascontamination in the abandoned metal mine areas, Korea. Environ Monit Assess2006;119:233–44.
Lozano-Rodríguez E, Luguera M, Lucena JJ, Carpena-Ruiz RO. Evaluation of two differentacid digestion methods in closed systems of trace elements determination inplants. Quim Anal 1995;14:27–30.
Lu HY, Axe L, Tyson TA. Development and application of computer simulation tools forecological risk assessment. Environ Model Assess 2003;8:311–22.
Ma WC. The influence of soil properties and worm related factors on the concentrationof heavy metals in earthworms. Pedobiologia 1982;24:109–19.
MAPA (Ministerio de Agricultura, Pesca y Alimentación). Métodos Oficiales de Análisis,Vol. III. Madrid, Spain; 1994.
McLaughlin MJ. Bioavailability of metals to terrestrial plants. In: Allen HE, editor.Bioavailability of metals in terrestrial ecosystems: importance of partitioning forbioavailability to invertebrates,microbes, and plants. Pensacola, Florida: SETACPress; 2001. p. 39–68.
McLaughlin MJ, Zarcinas BA, Stevens DP, Cook N. Soil testing for heavy metals. CommunSoil Sci Plant Anal 2000;31:1661–700.
Ministerio de Medio Ambiente. Real Decreto 995/2000 de 2 de junio, por el que se fijanobjetivos de calidad para determinadas sustancias contaminantes y se modifica elReglamento de Dominio Público Hidráulico, aprobado por el Real Decreto849/1986, de 11 de abril. Bol Oficial Estado 2000;147:21558–62.
Moreno-Jiménez E, Peñalosa JM, Manzano R, Carpena-Ruiz RO, Gamarra R, Esteban E.Heavy metals distribution in soils surrounding an abandoned mine in NW Madrid(Spain) and their transference to wild flora. J Hazar Mater 2009;162:854–9.
Moreno-Jiménez E, Manzano R, Esteban E, Peñalosa JM. The fate of arsenic in soilsadjacent to an old-mine site (Bustarviejo, Spain): Mobility and transfer to nativeflora. J Soils Sediments 2010;10:301–12.
Nahmani J, Hodson ME, Devin SG, Vijver M. Effects of metals on life cycle parameters ofthe earthworm Eisenia fetida exposed to field-contaminated, metal-polluted soils.Environ Pollut 2007;149:44–58.
Nemec MD, Holson JF, Farr CH, Hood RD. Developmental toxicity assessment of arsenicacid in mice and rabbits. Reprod Toxicol 1998;12:647–58.
New Zealand Ecotoxicity Test Results, 2007. At: http://contamsites.landcareresearch.co.nz/new_zealand_ecotoxicity_test_results.htm accessed March 18, 2010.

703E. Moreno-Jiménez et al. / Science of the Total Environment 409 (2011) 692–703
Nriagu JO. Global inventory of natural and anthropogenic emissions of trace metals tothe atmosphere. Nature 1979;279:409–11.
Ollson CA, Koch I. Addressing arsenic bioaccessibility in ecological risk assessment: a novelapproach to avoid overestimating risk. Environ Toxicol Chem 2009;28:668–75.
Pawlik-Skowronska B, Pirszel J, Kalinowska R, Skowronski T. Arsenic availability.Toxicity and direct role of GSH and phytochelatins in As detoxification in the greenalga Stichococcus bacillaris. Aquat Toxicol 2004;70:201–12.
Peijnenburg W, Posthuma L, Zweers PGPC, Baerselman R, de Groot AC, Van Veen RPM,et al. Prediction of metal bioavailability in Dutch field soils for the oligochaeteEnchytraeus crypticus. Ecotoxicol Environ Saf 1999;43:170–86.
Quevauviller P, Lavigne R, Cortez L. Impact of industrial and mine drainage wastes onthe heavy metal distribution in the drainage basin and estuary of the Sado River(Portugal). Environ Pollut 1989;59:267–86.
Ruby MV, Schoof R, Brattin W. Advances in evaluating the oral bioavailability ofinorganics in soil for use in human health risk assessment. Environ Sci Technol1999;33:3697–705.
Rufo L, Rodríguez N, Amils R, de la Fuente V, Jiménez-Ballesta R. Surface geochemistry ofsoils associated with the Tinto River (Huelva, Spain). Sci Total Environ 2007;378:223–7.
Sala S, Vighi M. GIS-based procedure for site-specific risk assessment of pesticides foraquatic ecosystems. Ecotoxicol Environ Saf 2008;69:1-12.
Santos Oliveira J.M., Farinha J., Matos J.X., Ávila P., Rosa C., Canto Machado M.J., et al.Diagnóstico Ambiental das Principais Áreas Mineiras Degradadas do País. InstitutoGeológico e Mineiro. Boletim de Minas, Lisboa 2002; 39:267–85.
Schafer Jr EW, Bowles Jr WA. Acute oral toxicity and repellency of 933 chemicals tohouse and deer mice. Arch Environ Cont Toxicol 1985;14:111–29.
SCHER (Scientific Committee on Health and Environmental Risks). Copper, Copper IIsulphate pentahydrate, Copper(I)oxide, Copper(II)oxide, Dicopper chloride trihydr-oxide Human health part. The SCHER adopted this opinion at its 24th plenary on 15July 2008.
Spurgeon DJ, Hopkin SP. Comparisons of metal accumulation and excretion kinetics inearthworms (Eisenia fetida) exposed to contaminated field and laboratory soils.Appl Soil Ecol 1999;11:227–343.
Stanley Jr TR, Spann JW, Smith GJ, Rosscoe R. Main and interactive effects of arsenic andselenium on mallard reproduction and duckling growth and survival. Arch EnvironCont Toxicol 1994;26:444–51.
Steinmaus CM, George CM, Kalman DA, Smith AH. Evaluation of two new arsenic fieldtest kits capable of detecting arsenic water concentrations close to 10 μg/L. EnvironSci Technol 2006;40:3362–6.
Suter GW, Efroymson RA, Sample BE, Jones DS. Ecological risk assessment forcontaminated sites. Boca Raton, Florida: Lewis Publishers; 2000.
US-EPA (U.S. Environmental Protection Agency). Guidelines for ecological riskassessment. EPA/630/R-95/002 F. Washinghton, DC: Risk Assessment Forum.Vincke P. Multicriteria Decision-aid; 1998.
Van Vliet PCJ, Didden WAM, Zee SEATM, Peijnenburg WJGM. Accumulation of heavymetals by enchytraeids and earthworms in a floodplain. Eur J Soil Biol 2006;42:117–26.
Vaughan GT, Greenslade PM. Sensitive bioassays for risk assessment of contaminatedsoils. Final Report CET/IR 55. Sydney. NSW. Australia: Commonealth Scientific andIndustrial Research Organisation; 1998.
Warren GP, Alloway BJ, Lepp NW, Singh B, Bochereau FJM, Penny C. Field trials to assessthe uptake of arsenic by vegetables from contaminated soils and soil remediationwith iron oxides. Sci Total Environ 2003;311:19–33.
Wenzel WW, Kirchbaumer N, Prohaska T, Stingeder G, Lombi E, Adriano DC. Arsenicfractionation in soils using an improved sequential extraction procedure. AnalChim Acta 2001;436:309–23.
Worthing CR. The pesticide manual: a world compendium. The British Crop ProtectionCouncil; 1991.
Wright MA, Stringer A. Lead, zinc and cadmium content of earthworms from pasture inthe vicinity of an industrial smelting complex. Environ Pollut 1980;23:313–21.