The assessment of local sustainability using fuzzy logic: An expert opinion system to evaluate...
9
This article appeared in a journal published by Elsevier. The attached copy is furnished to the author for internal non-commercial research and education use, including for instruction at the authors institution and sharing with colleagues. Other uses, including reproduction and distribution, or selling or licensing copies, or posting to personal, institutional or third party websites are prohibited. In most cases authors are permitted to post their version of the article (e.g. in Word or Tex form) to their personal website or institutional repository. Authors requiring further information regarding Elsevier’s archiving and manuscript policies are encouraged to visit: http://www.elsevier.com/authorsrights
Transcript of The assessment of local sustainability using fuzzy logic: An expert opinion system to evaluate...

This article appeared in a journal published by Elsevier. The attachedcopy is furnished to the author for internal non-commercial researchand education use, including for instruction at the authors institution
and sharing with colleagues.
Other uses, including reproduction and distribution, or selling orlicensing copies, or posting to personal, institutional or third party
websites are prohibited.
In most cases authors are permitted to post their version of thearticle (e.g. in Word or Tex form) to their personal website orinstitutional repository. Authors requiring further information
regarding Elsevier’s archiving and manuscript policies areencouraged to visit:
http://www.elsevier.com/authorsrights
Author's personal copy
Ecological Indicators 36 (2014) 711– 718
Contents lists available at ScienceDirect
Ecological Indicators
jou rn al hom epage: www.elsev ier .com/ locate /eco l ind
The assessment of local sustainability using fuzzy logic: An expertopinion system to evaluate environmental sanitation in the Algarveregion, Portugal
Daniel Canavesea,∗, Neli Regina Siqueira Ortegab, Margarida Queirósc
a Federal University of Paraná, Coast Campus, Matinhos, Brazilb University of São Paulo, School of Medicine, Center of Fuzzy Systems in Health, São Paulo, Brazilc University of Lisbon, Center of Geographical Studies, Lisbon, Portugal
a r t i c l e i n f o
Article history:Received 17 June 2013Received in revised form17 September 2013Accepted 19 September 2013
Keywords:Fuzzy logicFuzzy knowledge-based modelingSustainable developmentEnvironmental health assessmentLocal-regional assessmentDecision making support
a b s t r a c t
Understanding the relationship between environmental factors and public health is critical to improvingsustainability at a sub-national level. Proposals to evaluate the status of environmental health in a regionmust consider factors including the diversity of indicators, geographical scale, incomplete or inaccuratedata and the need for focused methodologies that capture the complexity of this subject. This paperpresents the design of a system based on expert knowledge to assess environmental sanitation in citiesin the Algarve region of Portugal. It was used fuzzy logic to assess uncertainties in the system. Concep-tually, the use of fuzzy sets theory is simple and can integrate human expertise. The current proposaldemonstrates the usefulness of aggregating information and opinion-based classifications to categorizemunicipalities according to their environmental health characteristics. The analysis shows that improvedenvironmental sanitation conditions have been observed in municipalities located in the region’s center.In the west, municipalities have worse conditions not only in environmental health but also in othersustainability indicators. A main feature of the system, presented here, is the ability for users to selectvariables to be considered by experts and opinion-makers without re-modeling, which allows the sys-tem to be adapted to different situations and scenarios. Therefore, the assessment method based on fuzzylogic is useful to investigators looking for a more systemic assessment of sustainability.
© 2013 Published by Elsevier Ltd.
1. Introduction
Environmental health has been a main concern since the ori-gin of sustainable development concepts (WCED, 1987; UnitedNations, 1992). The relationship between environmental factorsand public health is central to improving sustainability. Increasedfocus on this subject has expanded interest in investigations con-ducted at the regional level. At this scale, researchers may helpauthorities respond to specific demands and promote more effec-tive local policies. For this reason, the main players involved in thiskey issue have been interested in exploring environmental healthfactors at the regional level. However, this method of evaluationhas encountered challenging perspectives.
The number of proposed indicators used to assess environ-mental health at the regional level has increased. Fortunately, assuggested by Tanguay et al. (2010), there are a considerable numberof indicators that have been proposed to assess sustainability. Nev-ertheless, choosing among them and setting a reference group has
∗ Corresponding author. Tel.: +55 4197105103.E-mail address: [email protected] (D. Canavese).
been a difficult task. There is a lack of consensus on which indicatorsare indispensable because this decision is not only based on scien-tific knowledge and techniques but also, as noted by Rametsteineret al. (2011), involves political negotiation.
The geographical scale of analysis plays a significant role on theselection of indicators. Moldan et al. (2012) discuss that althoughenvironmental limits at the planetary level are now quite evi-dent, sustainability is interlinked with geographic scales. At thesame time, the majority of indicators focus on a national scale,and research on this issue at local and regional levels is still rel-atively new. Although various initiatives have been developed todate, there are no standard criteria to determine what informationwould better represent the different geographical scales (Ramos,2009; Singh et al., 2009; Dahl, 2012).
Similarly, when considering the use of tools for data analysis,different methodologies have been used to capture the complex-ity of environmental health issues. Some authors have argued thatsustainability analyses should use concepts from complex theoryand post-normal science (Ravetz, 2004; Gatrell, 2005; Hezri andDovers, 2006; Queirós, 2009; Canavese et al., 2012). This theo-retical perspective contributes to a wider and more holistic viewof the field. There is an urgent need for methodologies based on
1470-160X/$ – see front matter © 2013 Published by Elsevier Ltd.http://dx.doi.org/10.1016/j.ecolind.2013.09.030
Author's personal copy
712 D. Canavese et al. / Ecological Indicators 36 (2014) 711– 718
quali-quantitative information and expert knowledge that takeinto consideration the uncertainty and inaccuracies of the dataor methodologies. Methods used to study environmental healthat a regional level have to manage issues such as diverse indica-tors, unequal data availability at different geographical scales andincomplete or inaccurate data.
1.1. The contributions of fuzzy logic
Fuzzy logic, a theory formally presented in 1965 by Zadeh, hasappropriate contributions to this work. Some of its general prop-erties, such as the capacity to deal with uncertainty, the ability tomodel complex realities, the use of subjective information basedon human knowledge and experience, the relatively simple mathinvolved and the capacity to provide precise answers, prove thatit can be used as an adequate modeling tool (Ross, 1995; Ortegaet al., 2008; Massad et al., 2008; Zadeh, 2008). The fuzzy setstheory has already been used in diverse applications of interestto this study (Silvert, 1997, 2000; Massad et al., 1999; Mckoneand Deshpande, 2005; Ocampo-Duque et al., 2006; Icaga, 2007;Marchini et al., 2009; Ascough et al., 2008; Janssen et al., 2010;Prato, 2010).
In the area of sustainability, Andriantiatsaholiniaina and Phillis(2001) developed a methodology using fuzzy logic, to examine thesustainability of cities, states and countries. Similarly, in his inves-tigation, Prato (2005) determined that conventional approachesare incompatible with the numerous uncertainties in ecosystemassessments and that the use of fuzzy logic overcomes this prob-lem. Nevertheless, the author states that fuzzy logic requires moredata than other approaches, which can be partially explained by thefact that the theory aggregates quantitative and qualitative datain addition to information provided by human knowledge. Fuzzylogic has been used in a variety of approaches involving sustaina-bility assessments. For example, both Liu (2007), while developinga multi-criteria decision-making system which addresses subjec-tive judgments, and Beynon and Munday (2008), while consideringuncertainty in environmental footprint estimations, used fuzzylogic. Recently, Canavese and Ortega (2013) proposed a fuzzy rule-based system to develop an indicator to integrate factors dealingwith health and health sanitation. Fuzzy logic appears to be suitablefor incorporating both ecosystem complexity and expert opinion.Considering that both are predicates of this study, fuzzy logic waschosen as a key aspect of the methodology used.
1.2. Region overview
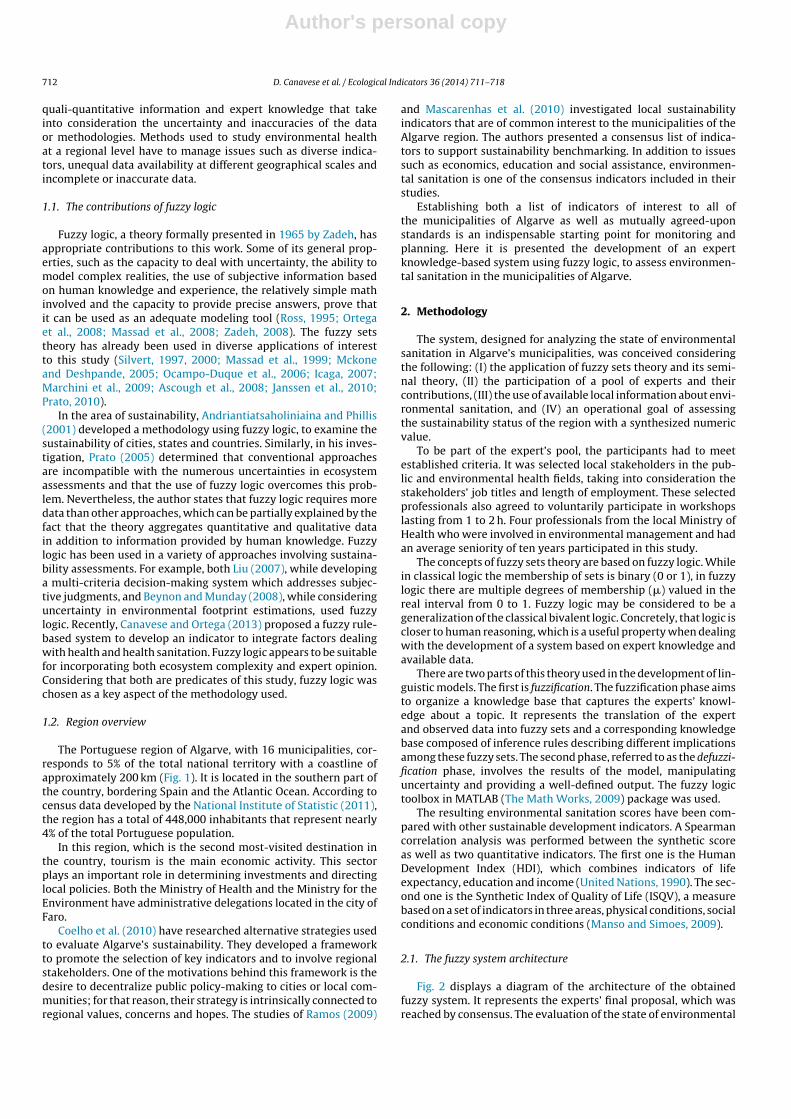
The Portuguese region of Algarve, with 16 municipalities, cor-responds to 5% of the total national territory with a coastline ofapproximately 200 km (Fig. 1). It is located in the southern part ofthe country, bordering Spain and the Atlantic Ocean. According tocensus data developed by the National Institute of Statistic (2011),the region has a total of 448,000 inhabitants that represent nearly4% of the total Portuguese population.
In this region, which is the second most-visited destination inthe country, tourism is the main economic activity. This sectorplays an important role in determining investments and directinglocal policies. Both the Ministry of Health and the Ministry for theEnvironment have administrative delegations located in the city ofFaro.
Coelho et al. (2010) have researched alternative strategies usedto evaluate Algarve’s sustainability. They developed a frameworkto promote the selection of key indicators and to involve regionalstakeholders. One of the motivations behind this framework is thedesire to decentralize public policy-making to cities or local com-munities; for that reason, their strategy is intrinsically connected toregional values, concerns and hopes. The studies of Ramos (2009)
and Mascarenhas et al. (2010) investigated local sustainabilityindicators that are of common interest to the municipalities of theAlgarve region. The authors presented a consensus list of indica-tors to support sustainability benchmarking. In addition to issuessuch as economics, education and social assistance, environmen-tal sanitation is one of the consensus indicators included in theirstudies.
Establishing both a list of indicators of interest to all ofthe municipalities of Algarve as well as mutually agreed-uponstandards is an indispensable starting point for monitoring andplanning. Here it is presented the development of an expertknowledge-based system using fuzzy logic, to assess environmen-tal sanitation in the municipalities of Algarve.
2. Methodology
The system, designed for analyzing the state of environmentalsanitation in Algarve’s municipalities, was conceived consideringthe following: (I) the application of fuzzy sets theory and its semi-nal theory, (II) the participation of a pool of experts and theircontributions, (III) the use of available local information about envi-ronmental sanitation, and (IV) an operational goal of assessingthe sustainability status of the region with a synthesized numericvalue.
To be part of the expert’s pool, the participants had to meetestablished criteria. It was selected local stakeholders in the pub-lic and environmental health fields, taking into consideration thestakeholders’ job titles and length of employment. These selectedprofessionals also agreed to voluntarily participate in workshopslasting from 1 to 2 h. Four professionals from the local Ministry ofHealth who were involved in environmental management and hadan average seniority of ten years participated in this study.
The concepts of fuzzy sets theory are based on fuzzy logic. Whilein classical logic the membership of sets is binary (0 or 1), in fuzzylogic there are multiple degrees of membership (�) valued in thereal interval from 0 to 1. Fuzzy logic may be considered to be ageneralization of the classical bivalent logic. Concretely, that logic iscloser to human reasoning, which is a useful property when dealingwith the development of a system based on expert knowledge andavailable data.
There are two parts of this theory used in the development of lin-guistic models. The first is fuzzification. The fuzzification phase aimsto organize a knowledge base that captures the experts’ knowl-edge about a topic. It represents the translation of the expertand observed data into fuzzy sets and a corresponding knowledgebase composed of inference rules describing different implicationsamong these fuzzy sets. The second phase, referred to as the defuzzi-fication phase, involves the results of the model, manipulatinguncertainty and providing a well-defined output. The fuzzy logictoolbox in MATLAB (The Math Works, 2009) package was used.
The resulting environmental sanitation scores have been com-pared with other sustainable development indicators. A Spearmancorrelation analysis was performed between the synthetic scoreas well as two quantitative indicators. The first one is the HumanDevelopment Index (HDI), which combines indicators of lifeexpectancy, education and income (United Nations, 1990). The sec-ond one is the Synthetic Index of Quality of Life (ISQV), a measurebased on a set of indicators in three areas, physical conditions, socialconditions and economic conditions (Manso and Simoes, 2009).
2.1. The fuzzy system architecture
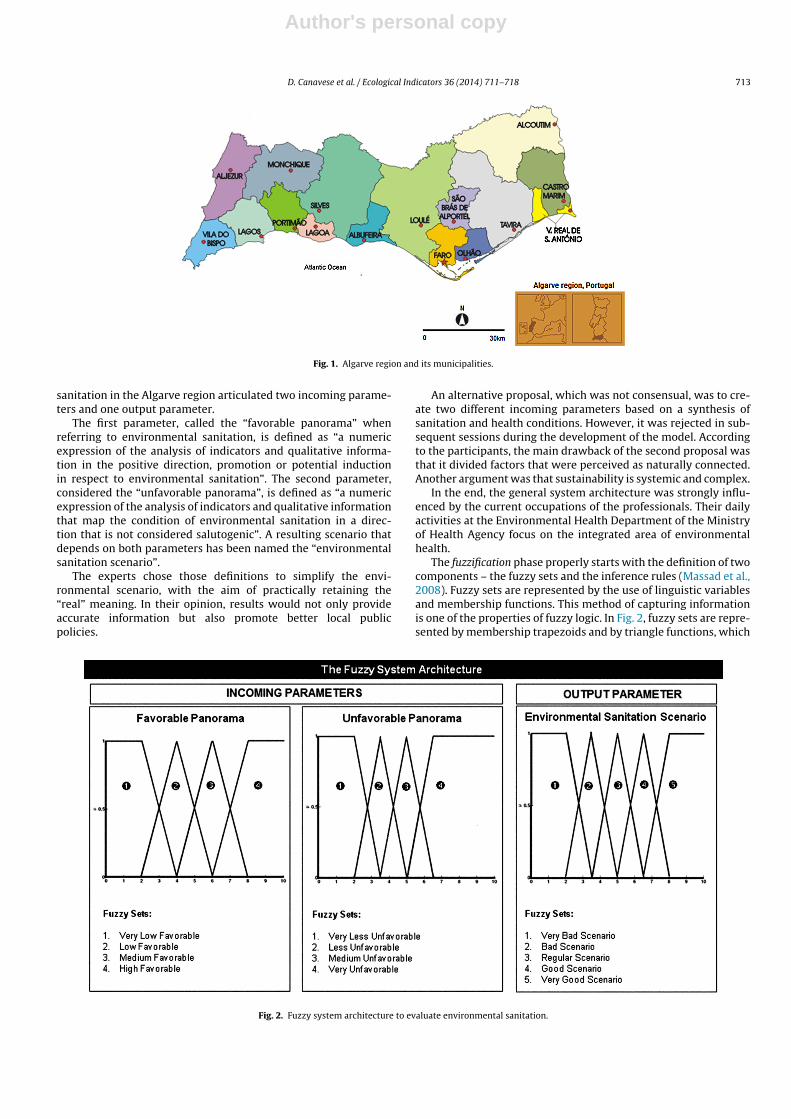
Fig. 2 displays a diagram of the architecture of the obtainedfuzzy system. It represents the experts’ final proposal, which wasreached by consensus. The evaluation of the state of environmental
Author's personal copy
D. Canavese et al. / Ecological Indicators 36 (2014) 711– 718 713
Fig. 1. Algarve region and its municipalities.
sanitation in the Algarve region articulated two incoming parame-ters and one output parameter.
The first parameter, called the “favorable panorama” whenreferring to environmental sanitation, is defined as “a numericexpression of the analysis of indicators and qualitative informa-tion in the positive direction, promotion or potential inductionin respect to environmental sanitation”. The second parameter,considered the “unfavorable panorama”, is defined as “a numericexpression of the analysis of indicators and qualitative informationthat map the condition of environmental sanitation in a direc-tion that is not considered salutogenic”. A resulting scenario thatdepends on both parameters has been named the “environmentalsanitation scenario”.
The experts chose those definitions to simplify the envi-ronmental scenario, with the aim of practically retaining the“real” meaning. In their opinion, results would not only provideaccurate information but also promote better local publicpolicies.
An alternative proposal, which was not consensual, was to cre-ate two different incoming parameters based on a synthesis ofsanitation and health conditions. However, it was rejected in sub-sequent sessions during the development of the model. Accordingto the participants, the main drawback of the second proposal wasthat it divided factors that were perceived as naturally connected.Another argument was that sustainability is systemic and complex.
In the end, the general system architecture was strongly influ-enced by the current occupations of the professionals. Their dailyactivities at the Environmental Health Department of the Ministryof Health Agency focus on the integrated area of environmentalhealth.
The fuzzification phase properly starts with the definition of twocomponents – the fuzzy sets and the inference rules (Massad et al.,2008). Fuzzy sets are represented by the use of linguistic variablesand membership functions. This method of capturing informationis one of the properties of fuzzy logic. In Fig. 2, fuzzy sets are repre-sented by membership trapezoids and by triangle functions, which
Fig. 2. Fuzzy system architecture to evaluate environmental sanitation.
Author's personal copy
714 D. Canavese et al. / Ecological Indicators 36 (2014) 711– 718
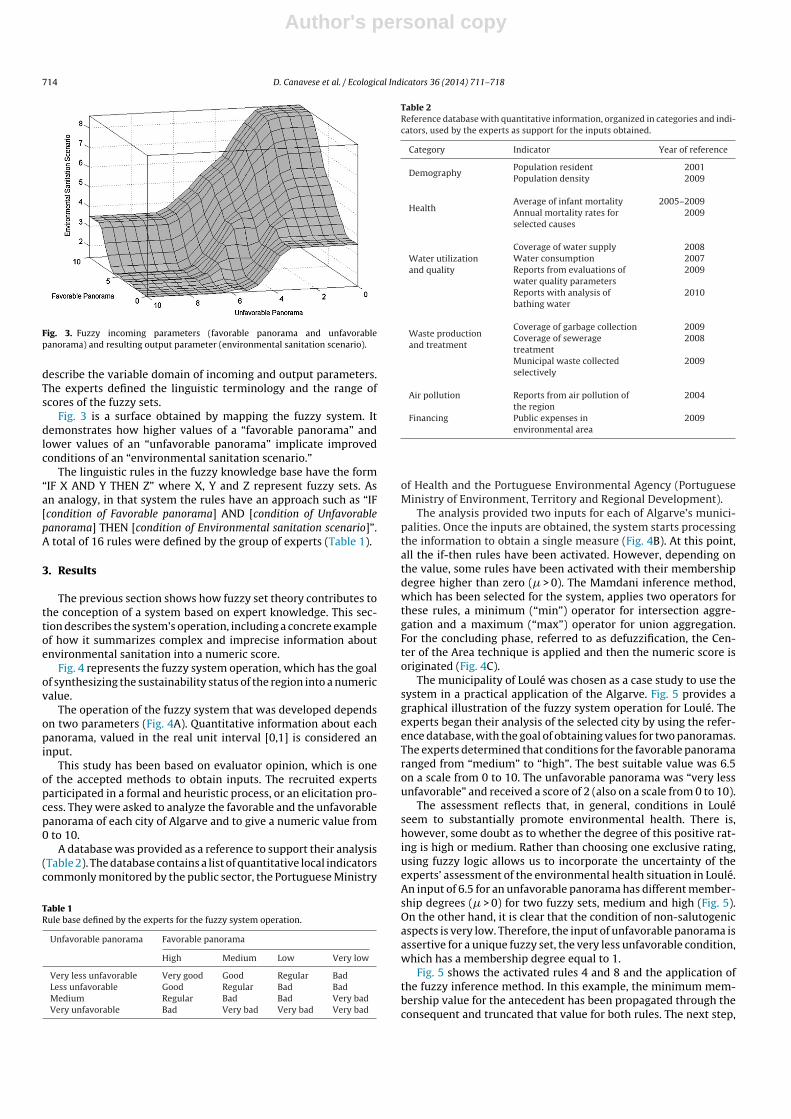
Fig. 3. Fuzzy incoming parameters (favorable panorama and unfavorablepanorama) and resulting output parameter (environmental sanitation scenario).
describe the variable domain of incoming and output parameters.The experts defined the linguistic terminology and the range ofscores of the fuzzy sets.
Fig. 3 is a surface obtained by mapping the fuzzy system. Itdemonstrates how higher values of a “favorable panorama” andlower values of an “unfavorable panorama” implicate improvedconditions of an “environmental sanitation scenario.”
The linguistic rules in the fuzzy knowledge base have the form“IF X AND Y THEN Z” where X, Y and Z represent fuzzy sets. Asan analogy, in that system the rules have an approach such as “IF[condition of Favorable panorama] AND [condition of Unfavorablepanorama] THEN [condition of Environmental sanitation scenario]”.A total of 16 rules were defined by the group of experts (Table 1).
3. Results
The previous section shows how fuzzy set theory contributes tothe conception of a system based on expert knowledge. This sec-tion describes the system’s operation, including a concrete exampleof how it summarizes complex and imprecise information aboutenvironmental sanitation into a numeric score.
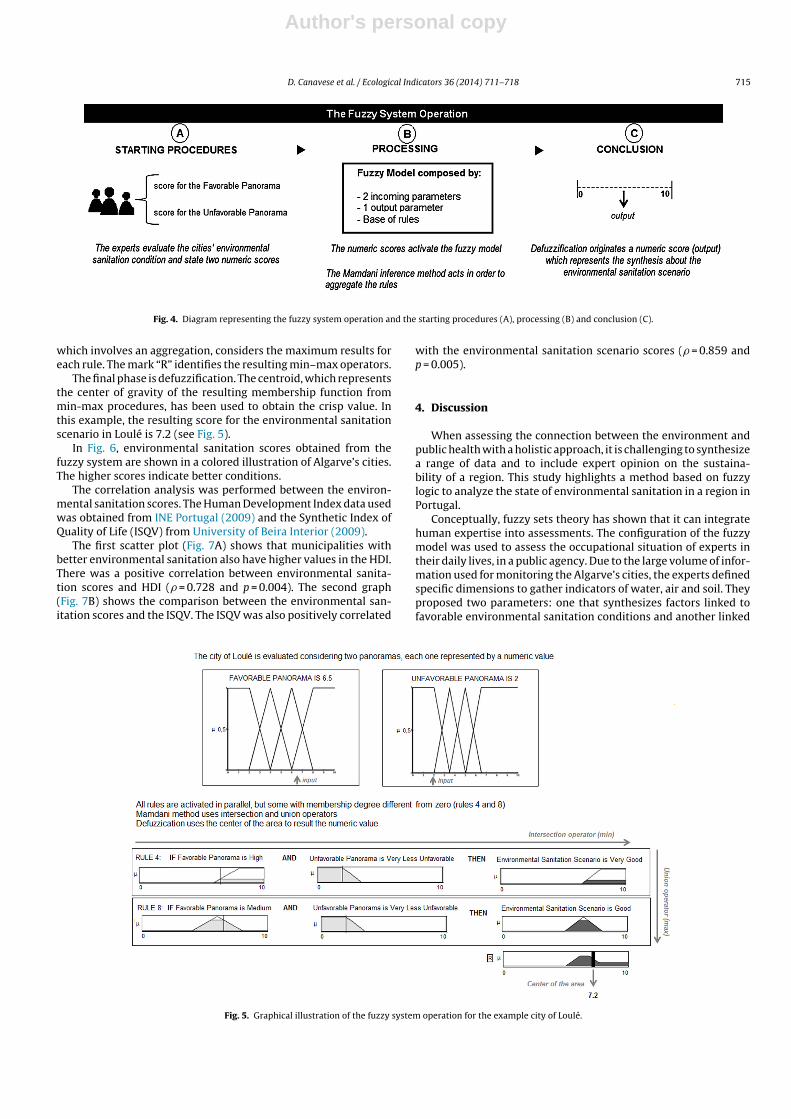
Fig. 4 represents the fuzzy system operation, which has the goalof synthesizing the sustainability status of the region into a numericvalue.
The operation of the fuzzy system that was developed dependson two parameters (Fig. 4A). Quantitative information about eachpanorama, valued in the real unit interval [0,1] is considered aninput.
This study has been based on evaluator opinion, which is oneof the accepted methods to obtain inputs. The recruited expertsparticipated in a formal and heuristic process, or an elicitation pro-cess. They were asked to analyze the favorable and the unfavorablepanorama of each city of Algarve and to give a numeric value from0 to 10.
A database was provided as a reference to support their analysis(Table 2). The database contains a list of quantitative local indicatorscommonly monitored by the public sector, the Portuguese Ministry
Table 1Rule base defined by the experts for the fuzzy system operation.
Unfavorable panorama Favorable panorama
High Medium Low Very low
Very less unfavorable Very good Good Regular BadLess unfavorable Good Regular Bad BadMedium Regular Bad Bad Very badVery unfavorable Bad Very bad Very bad Very bad
Table 2Reference database with quantitative information, organized in categories and indi-cators, used by the experts as support for the inputs obtained.
Category Indicator Year of reference
DemographyPopulation resident 2001Population density 2009
HealthAverage of infant mortality 2005–2009Annual mortality rates forselected causes
2009
Water utilizationand quality
Coverage of water supply 2008Water consumption 2007Reports from evaluations ofwater quality parameters
2009
Reports with analysis ofbathing water
2010
Waste productionand treatment
Coverage of garbage collection 2009Coverage of seweragetreatment
2008
Municipal waste collectedselectively
2009
Air pollution Reports from air pollution ofthe region
2004
Financing Public expenses inenvironmental area
2009
of Health and the Portuguese Environmental Agency (PortugueseMinistry of Environment, Territory and Regional Development).
The analysis provided two inputs for each of Algarve’s munici-palities. Once the inputs are obtained, the system starts processingthe information to obtain a single measure (Fig. 4B). At this point,all the if-then rules have been activated. However, depending onthe value, some rules have been activated with their membershipdegree higher than zero (� > 0). The Mamdani inference method,which has been selected for the system, applies two operators forthese rules, a minimum (“min”) operator for intersection aggre-gation and a maximum (“max”) operator for union aggregation.For the concluding phase, referred to as defuzzification, the Cen-ter of the Area technique is applied and then the numeric score isoriginated (Fig. 4C).
The municipality of Loulé was chosen as a case study to use thesystem in a practical application of the Algarve. Fig. 5 provides agraphical illustration of the fuzzy system operation for Loulé. Theexperts began their analysis of the selected city by using the refer-ence database, with the goal of obtaining values for two panoramas.The experts determined that conditions for the favorable panoramaranged from “medium” to “high”. The best suitable value was 6.5on a scale from 0 to 10. The unfavorable panorama was “very lessunfavorable” and received a score of 2 (also on a scale from 0 to 10).
The assessment reflects that, in general, conditions in Louléseem to substantially promote environmental health. There is,however, some doubt as to whether the degree of this positive rat-ing is high or medium. Rather than choosing one exclusive rating,using fuzzy logic allows us to incorporate the uncertainty of theexperts’ assessment of the environmental health situation in Loulé.An input of 6.5 for an unfavorable panorama has different member-ship degrees (� > 0) for two fuzzy sets, medium and high (Fig. 5).On the other hand, it is clear that the condition of non-salutogenicaspects is very low. Therefore, the input of unfavorable panorama isassertive for a unique fuzzy set, the very less unfavorable condition,which has a membership degree equal to 1.
Fig. 5 shows the activated rules 4 and 8 and the application ofthe fuzzy inference method. In this example, the minimum mem-bership value for the antecedent has been propagated through theconsequent and truncated that value for both rules. The next step,
Author's personal copy
D. Canavese et al. / Ecological Indicators 36 (2014) 711– 718 715
Fig. 4. Diagram representing the fuzzy system operation and the starting procedures (A), processing (B) and conclusion (C).
which involves an aggregation, considers the maximum results foreach rule. The mark “R” identifies the resulting min–max operators.
The final phase is defuzzification. The centroid, which representsthe center of gravity of the resulting membership function frommin-max procedures, has been used to obtain the crisp value. Inthis example, the resulting score for the environmental sanitationscenario in Loulé is 7.2 (see Fig. 5).
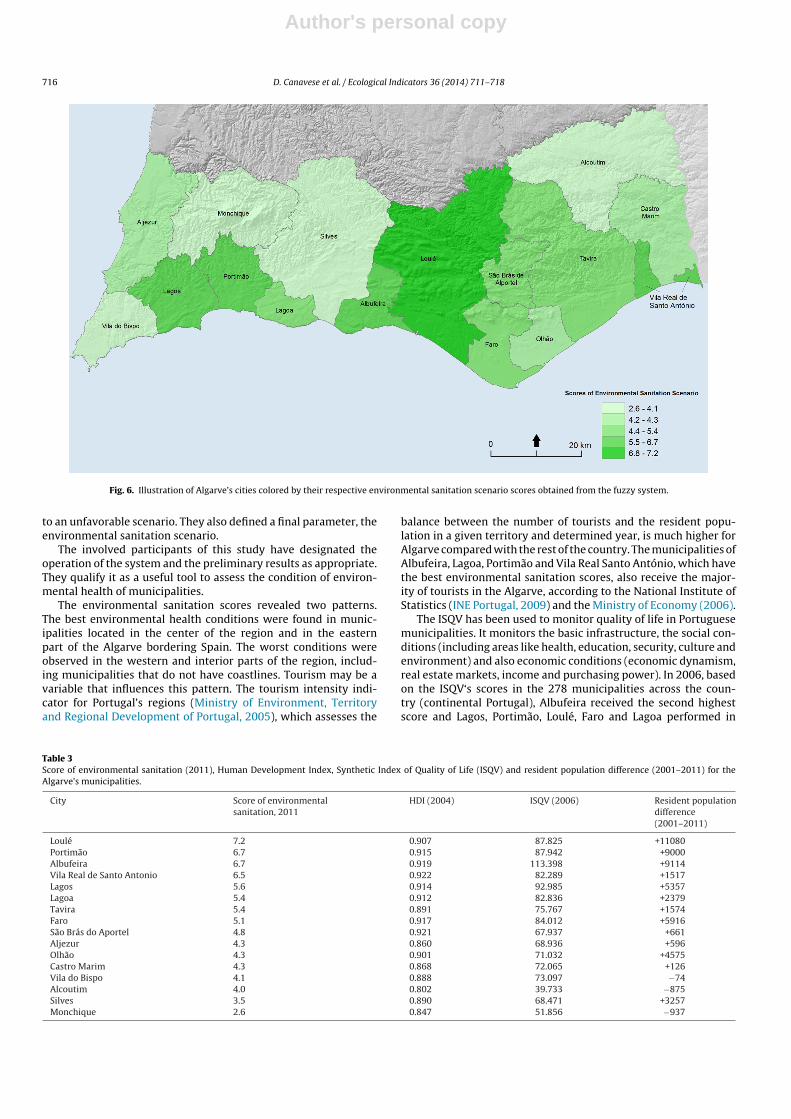
In Fig. 6, environmental sanitation scores obtained from thefuzzy system are shown in a colored illustration of Algarve’s cities.The higher scores indicate better conditions.
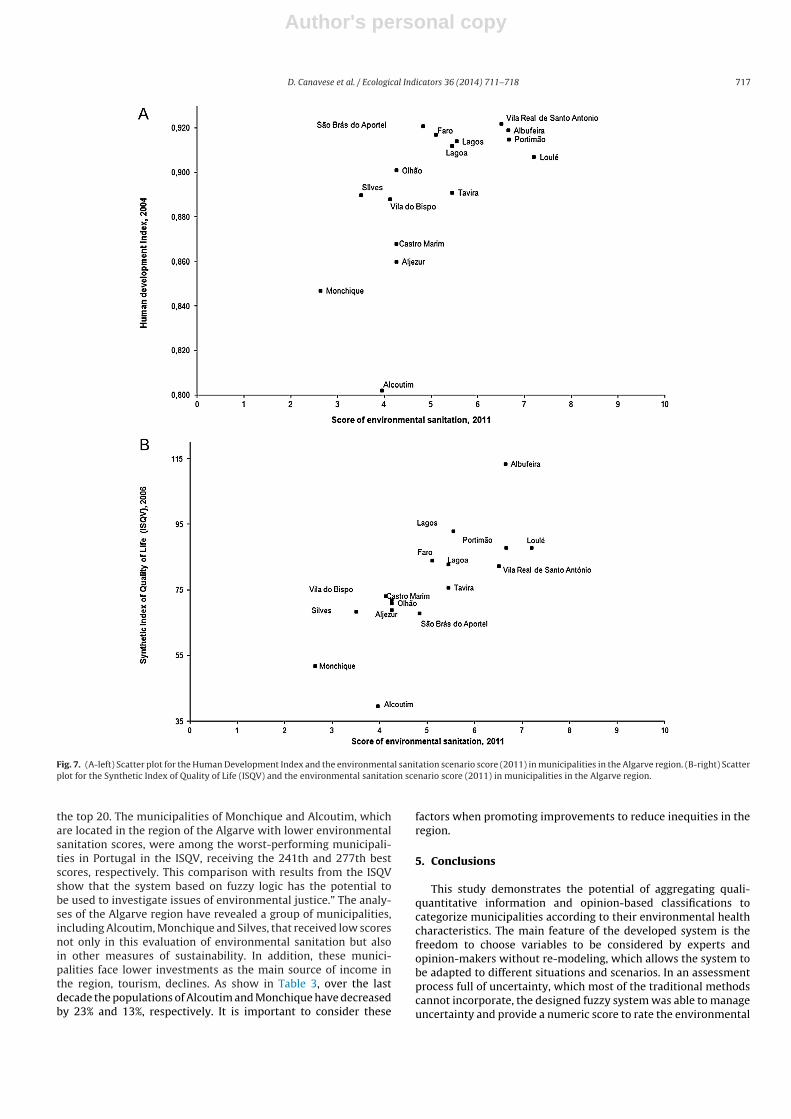
The correlation analysis was performed between the environ-mental sanitation scores. The Human Development Index data usedwas obtained from INE Portugal (2009) and the Synthetic Index ofQuality of Life (ISQV) from University of Beira Interior (2009).
The first scatter plot (Fig. 7A) shows that municipalities withbetter environmental sanitation also have higher values in the HDI.There was a positive correlation between environmental sanita-tion scores and HDI (� = 0.728 and p = 0.004). The second graph(Fig. 7B) shows the comparison between the environmental san-itation scores and the ISQV. The ISQV was also positively correlated
with the environmental sanitation scenario scores (� = 0.859 andp = 0.005).
4. Discussion
When assessing the connection between the environment andpublic health with a holistic approach, it is challenging to synthesizea range of data and to include expert opinion on the sustaina-bility of a region. This study highlights a method based on fuzzylogic to analyze the state of environmental sanitation in a region inPortugal.
Conceptually, fuzzy sets theory has shown that it can integratehuman expertise into assessments. The configuration of the fuzzymodel was used to assess the occupational situation of experts intheir daily lives, in a public agency. Due to the large volume of infor-mation used for monitoring the Algarve’s cities, the experts definedspecific dimensions to gather indicators of water, air and soil. Theyproposed two parameters: one that synthesizes factors linked tofavorable environmental sanitation conditions and another linked
Fig. 5. Graphical illustration of the fuzzy system operation for the example city of Loulé.
Author's personal copy
716 D. Canavese et al. / Ecological Indicators 36 (2014) 711– 718
Fig. 6. Illustration of Algarve’s cities colored by their respective environmental sanitation scenario scores obtained from the fuzzy system.
to an unfavorable scenario. They also defined a final parameter, theenvironmental sanitation scenario.
The involved participants of this study have designated theoperation of the system and the preliminary results as appropriate.They qualify it as a useful tool to assess the condition of environ-mental health of municipalities.
The environmental sanitation scores revealed two patterns.The best environmental health conditions were found in munic-ipalities located in the center of the region and in the easternpart of the Algarve bordering Spain. The worst conditions wereobserved in the western and interior parts of the region, includ-ing municipalities that do not have coastlines. Tourism may be avariable that influences this pattern. The tourism intensity indi-cator for Portugal’s regions (Ministry of Environment, Territoryand Regional Development of Portugal, 2005), which assesses the
balance between the number of tourists and the resident popu-lation in a given territory and determined year, is much higher forAlgarve compared with the rest of the country. The municipalities ofAlbufeira, Lagoa, Portimão and Vila Real Santo António, which havethe best environmental sanitation scores, also receive the major-ity of tourists in the Algarve, according to the National Institute ofStatistics (INE Portugal, 2009) and the Ministry of Economy (2006).
The ISQV has been used to monitor quality of life in Portuguesemunicipalities. It monitors the basic infrastructure, the social con-ditions (including areas like health, education, security, culture andenvironment) and also economic conditions (economic dynamism,real estate markets, income and purchasing power). In 2006, basedon the ISQV‘s scores in the 278 municipalities across the coun-try (continental Portugal), Albufeira received the second highestscore and Lagos, Portimão, Loulé, Faro and Lagoa performed in
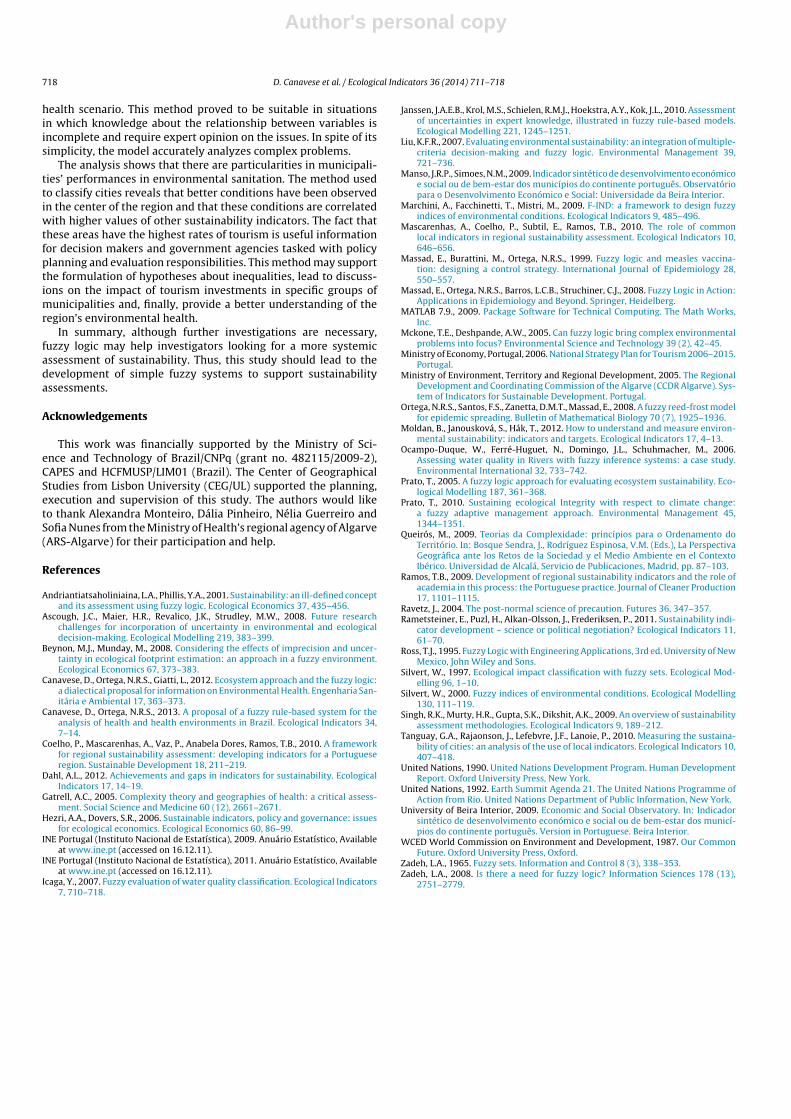
Table 3Score of environmental sanitation (2011), Human Development Index, Synthetic Index of Quality of Life (ISQV) and resident population difference (2001–2011) for theAlgarve’s municipalities.
City Score of environmentalsanitation, 2011
HDI (2004) ISQV (2006) Resident populationdifference(2001–2011)
Loulé 7.2 0.907 87.825 +11080Portimão 6.7 0.915 87.942 +9000Albufeira 6.7 0.919 113.398 +9114Vila Real de Santo Antonio 6.5 0.922 82.289 +1517Lagos 5.6 0.914 92.985 +5357Lagoa 5.4 0.912 82.836 +2379Tavira 5.4 0.891 75.767 +1574Faro 5.1 0.917 84.012 +5916São Brás do Aportel 4.8 0.921 67.937 +661Aljezur 4.3 0.860 68.936 +596Olhão 4.3 0.901 71.032 +4575Castro Marim 4.3 0.868 72.065 +126Vila do Bispo 4.1 0.888 73.097 −74Alcoutim 4.0 0.802 39.733 −875Silves 3.5 0.890 68.471 +3257Monchique 2.6 0.847 51.856 −937
Author's personal copy
D. Canavese et al. / Ecological Indicators 36 (2014) 711– 718 717
Fig. 7. (A-left) Scatter plot for the Human Development Index and the environmental sanitation scenario score (2011) in municipalities in the Algarve region. (B-right) Scatterplot for the Synthetic Index of Quality of Life (ISQV) and the environmental sanitation scenario score (2011) in municipalities in the Algarve region.
the top 20. The municipalities of Monchique and Alcoutim, whichare located in the region of the Algarve with lower environmentalsanitation scores, were among the worst-performing municipali-ties in Portugal in the ISQV, receiving the 241th and 277th bestscores, respectively. This comparison with results from the ISQVshow that the system based on fuzzy logic has the potential tobe used to investigate issues of environmental justice.” The analy-ses of the Algarve region have revealed a group of municipalities,including Alcoutim, Monchique and Silves, that received low scoresnot only in this evaluation of environmental sanitation but alsoin other measures of sustainability. In addition, these munici-palities face lower investments as the main source of income inthe region, tourism, declines. As show in Table 3, over the lastdecade the populations of Alcoutim and Monchique have decreasedby 23% and 13%, respectively. It is important to consider these
factors when promoting improvements to reduce inequities in theregion.
5. Conclusions
This study demonstrates the potential of aggregating quali-quantitative information and opinion-based classifications tocategorize municipalities according to their environmental healthcharacteristics. The main feature of the developed system is thefreedom to choose variables to be considered by experts andopinion-makers without re-modeling, which allows the system tobe adapted to different situations and scenarios. In an assessmentprocess full of uncertainty, which most of the traditional methodscannot incorporate, the designed fuzzy system was able to manageuncertainty and provide a numeric score to rate the environmental
Author's personal copy
718 D. Canavese et al. / Ecological Indicators 36 (2014) 711– 718
health scenario. This method proved to be suitable in situationsin which knowledge about the relationship between variables isincomplete and require expert opinion on the issues. In spite of itssimplicity, the model accurately analyzes complex problems.
The analysis shows that there are particularities in municipali-ties’ performances in environmental sanitation. The method usedto classify cities reveals that better conditions have been observedin the center of the region and that these conditions are correlatedwith higher values of other sustainability indicators. The fact thatthese areas have the highest rates of tourism is useful informationfor decision makers and government agencies tasked with policyplanning and evaluation responsibilities. This method may supportthe formulation of hypotheses about inequalities, lead to discuss-ions on the impact of tourism investments in specific groups ofmunicipalities and, finally, provide a better understanding of theregion’s environmental health.
In summary, although further investigations are necessary,fuzzy logic may help investigators looking for a more systemicassessment of sustainability. Thus, this study should lead to thedevelopment of simple fuzzy systems to support sustainabilityassessments.
Acknowledgements
This work was financially supported by the Ministry of Sci-ence and Technology of Brazil/CNPq (grant no. 482115/2009-2),CAPES and HCFMUSP/LIM01 (Brazil). The Center of GeographicalStudies from Lisbon University (CEG/UL) supported the planning,execution and supervision of this study. The authors would liketo thank Alexandra Monteiro, Dália Pinheiro, Nélia Guerreiro andSofia Nunes from the Ministry of Health’s regional agency of Algarve(ARS-Algarve) for their participation and help.
References
Andriantiatsaholiniaina, L.A., Phillis, Y.A., 2001. Sustainability: an ill-defined conceptand its assessment using fuzzy logic. Ecological Economics 37, 435–456.
Ascough, J.C., Maier, H.R., Revalico, J.K., Strudley, M.W., 2008. Future researchchallenges for incorporation of uncertainty in environmental and ecologicaldecision-making. Ecological Modelling 219, 383–399.
Beynon, M.J., Munday, M., 2008. Considering the effects of imprecision and uncer-tainty in ecological footprint estimation: an approach in a fuzzy environment.Ecological Economics 67, 373–383.
Canavese, D., Ortega, N.R.S., Giatti, L., 2012. Ecosystem approach and the fuzzy logic:a dialectical proposal for information on Environmental Health. Engenharia San-itária e Ambiental 17, 363–373.
Canavese, D., Ortega, N.R.S., 2013. A proposal of a fuzzy rule-based system for theanalysis of health and health environments in Brazil. Ecological Indicators 34,7–14.
Coelho, P., Mascarenhas, A., Vaz, P., Anabela Dores, Ramos, T.B., 2010. A frameworkfor regional sustainability assessment: developing indicators for a Portugueseregion. Sustainable Development 18, 211–219.
Dahl, A.L., 2012. Achievements and gaps in indicators for sustainability. EcologicalIndicators 17, 14–19.
Gatrell, A.C., 2005. Complexity theory and geographies of health: a critical assess-ment. Social Science and Medicine 60 (12), 2661–2671.
Hezri, A.A., Dovers, S.R., 2006. Sustainable indicators, policy and governance: issuesfor ecological economics. Ecological Economics 60, 86–99.
INE Portugal (Instituto Nacional de Estatística), 2009. Anuário Estatístico, Availableat www.ine.pt (accessed on 16.12.11).
INE Portugal (Instituto Nacional de Estatística), 2011. Anuário Estatístico, Availableat www.ine.pt (accessed on 16.12.11).
Icaga, Y., 2007. Fuzzy evaluation of water quality classification. Ecological Indicators7, 710–718.
Janssen, J.A.E.B., Krol, M.S., Schielen, R.M.J., Hoekstra, A.Y., Kok, J.L., 2010. Assessmentof uncertainties in expert knowledge, illustrated in fuzzy rule-based models.Ecological Modelling 221, 1245–1251.
Liu, K.F.R., 2007. Evaluating environmental sustainability: an integration of multiple-criteria decision-making and fuzzy logic. Environmental Management 39,721–736.
Manso, J.R.P., Simoes, N.M., 2009. Indicador sintético de desenvolvimento económicoe social ou de bem-estar dos municípios do continente português. Observatóriopara o Desenvolvimento Económico e Social: Universidade da Beira Interior.
Marchini, A., Facchinetti, T., Mistri, M., 2009. F-IND: a framework to design fuzzyindices of environmental conditions. Ecological Indicators 9, 485–496.
Mascarenhas, A., Coelho, P., Subtil, E., Ramos, T.B., 2010. The role of commonlocal indicators in regional sustainability assessment. Ecological Indicators 10,646–656.
Massad, E., Burattini, M., Ortega, N.R.S., 1999. Fuzzy logic and measles vaccina-tion: designing a control strategy. International Journal of Epidemiology 28,550–557.
Massad, E., Ortega, N.R.S., Barros, L.C.B., Struchiner, C.J., 2008. Fuzzy Logic in Action:Applications in Epidemiology and Beyond. Springer, Heidelberg.
MATLAB 7.9., 2009. Package Software for Technical Computing. The Math Works,Inc.
Mckone, T.E., Deshpande, A.W., 2005. Can fuzzy logic bring complex environmentalproblems into focus? Environmental Science and Technology 39 (2), 42–45.
Ministry of Economy, Portugal, 2006. National Strategy Plan for Tourism 2006–2015.Portugal.
Ministry of Environment, Territory and Regional Development, 2005. The RegionalDevelopment and Coordinating Commission of the Algarve (CCDR Algarve). Sys-tem of Indicators for Sustainable Development. Portugal.
Ortega, N.R.S., Santos, F.S., Zanetta, D.M.T., Massad, E., 2008. A fuzzy reed-frost modelfor epidemic spreading. Bulletin of Mathematical Biology 70 (7), 1925–1936.
Moldan, B., Janousková, S., Hák, T., 2012. How to understand and measure environ-mental sustainability: indicators and targets. Ecological Indicators 17, 4–13.
Ocampo-Duque, W., Ferré-Huguet, N., Domingo, J.L., Schuhmacher, M., 2006.Assessing water quality in Rivers with fuzzy inference systems: a case study.Environmental International 32, 733–742.
Prato, T., 2005. A fuzzy logic approach for evaluating ecosystem sustainability. Eco-logical Modelling 187, 361–368.
Prato, T., 2010. Sustaining ecological Integrity with respect to climate change:a fuzzy adaptive management approach. Environmental Management 45,1344–1351.
Queirós, M., 2009. Teorias da Complexidade: princípios para o Ordenamento doTerritório. In: Bosque Sendra, J., Rodríguez Espinosa, V.M. (Eds.), La PerspectivaGeográfica ante los Retos de la Sociedad y el Medio Ambiente en el ContextoIbérico. Universidad de Alcalá, Servicio de Publicaciones, Madrid, pp. 87–103.
Ramos, T.B., 2009. Development of regional sustainability indicators and the role ofacademia in this process: the Portuguese practice. Journal of Cleaner Production17, 1101–1115.
Ravetz, J., 2004. The post-normal science of precaution. Futures 36, 347–357.Rametsteiner, E., Puzl, H., Alkan-Olsson, J., Frederiksen, P., 2011. Sustainability indi-
cator development – science or political negotiation? Ecological Indicators 11,61–70.
Ross, T.J., 1995. Fuzzy Logic with Engineering Applications, 3rd ed. University of NewMexico, John Wiley and Sons.
Silvert, W., 1997. Ecological impact classification with fuzzy sets. Ecological Mod-elling 96, 1–10.
Silvert, W., 2000. Fuzzy indices of environmental conditions. Ecological Modelling130, 111–119.
Singh, R.K., Murty, H.R., Gupta, S.K., Dikshit, A.K., 2009. An overview of sustainabilityassessment methodologies. Ecological Indicators 9, 189–212.
Tanguay, G.A., Rajaonson, J., Lefebvre, J.F., Lanoie, P., 2010. Measuring the sustaina-bility of cities: an analysis of the use of local indicators. Ecological Indicators 10,407–418.
United Nations, 1990. United Nations Development Program. Human DevelopmentReport. Oxford University Press, New York.
United Nations, 1992. Earth Summit Agenda 21. The United Nations Programme ofAction from Rio. United Nations Department of Public Information, New York.
University of Beira Interior, 2009. Economic and Social Observatory. In: Indicadorsintético de desenvolvimento económico e social ou de bem-estar dos municí-pios do continente português. Version in Portuguese. Beira Interior.
WCED World Commission on Environment and Development, 1987. Our CommonFuture. Oxford University Press, Oxford.
Zadeh, L.A., 1965. Fuzzy sets. Information and Control 8 (3), 338–353.Zadeh, L.A., 2008. Is there a need for fuzzy logic? Information Sciences 178 (13),
2751–2779.