Immigration and urban housing market dynamics: the case of Haifa
Upload
khangminh22Category
view
3download
0
GLOBAL WATER AND SANITATION MARKET
DYNAMICS: IMPLICATIONS FOR
SOUTH AFRICA’S INDUSTRIAL DEVELOPMENT
Gaylor Montmasson-Clair
July 2018
Trade & Industrial
Policy Strategies
(TIPS) is a research
organisation that
facilitates policy
development and
dialogue across
three focus areas:
trade and industrial
policy, inequality
and economic
inclusion, and
sustainable growth
+27 12 433 9340
www.tips.org.za
Gaylor
Montmasson-Clair
is Senior Economist:
Sustainable Growth
at TIPS

2
ACKNOWLEDGEMENTS
Trade & Industrial Policy Strategies (TIPS) would like to thank the Department of Trade and Industry
(the dti) of the Republic of South Africa for funding and supporting this research, and for its continual
involvement in the project.
The committed support of the Water Research Commission (WRC) of the Republic of South Africa
throughout the project must also be warmly acknowledged.
Special thanks go to the numerous stakeholders which were consulted and interviewed as part of the
project and provided invaluable information. The analysis presented in this policy paper would not
have been as rich and insightful without their participation.
3
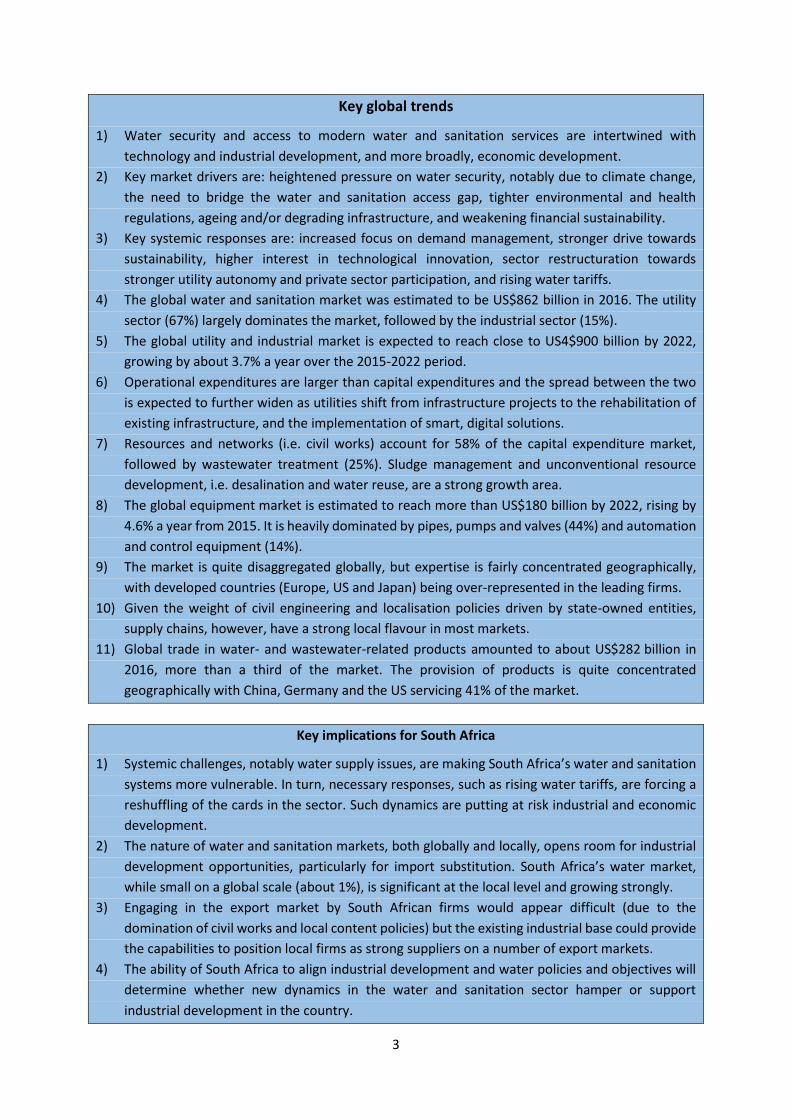
Key global trends
1) Water security and access to modern water and sanitation services are intertwined with
technology and industrial development, and more broadly, economic development.
2) Key market drivers are: heightened pressure on water security, notably due to climate change,
the need to bridge the water and sanitation access gap, tighter environmental and health
regulations, ageing and/or degrading infrastructure, and weakening financial sustainability.
3) Key systemic responses are: increased focus on demand management, stronger drive towards
sustainability, higher interest in technological innovation, sector restructuration towards
stronger utility autonomy and private sector participation, and rising water tariffs.
4) The global water and sanitation market was estimated to be US$862 billion in 2016. The utility
sector (67%) largely dominates the market, followed by the industrial sector (15%).
5) The global utility and industrial market is expected to reach close to US4$900 billion by 2022,
growing by about 3.7% a year over the 2015-2022 period.
6) Operational expenditures are larger than capital expenditures and the spread between the two
is expected to further widen as utilities shift from infrastructure projects to the rehabilitation of
existing infrastructure, and the implementation of smart, digital solutions.
7) Resources and networks (i.e. civil works) account for 58% of the capital expenditure market,
followed by wastewater treatment (25%). Sludge management and unconventional resource
development, i.e. desalination and water reuse, are a strong growth area.
8) The global equipment market is estimated to reach more than US$180 billion by 2022, rising by
4.6% a year from 2015. It is heavily dominated by pipes, pumps and valves (44%) and automation
and control equipment (14%).
9) The market is quite disaggregated globally, but expertise is fairly concentrated geographically,
with developed countries (Europe, US and Japan) being over-represented in the leading firms.
10) Given the weight of civil engineering and localisation policies driven by state-owned entities,
supply chains, however, have a strong local flavour in most markets.
11) Global trade in water- and wastewater-related products amounted to about US$282 billion in
2016, more than a third of the market. The provision of products is quite concentrated
geographically with China, Germany and the US servicing 41% of the market.
Key implications for South Africa
1) Systemic challenges, notably water supply issues, are making South Africa’s water and sanitation
systems more vulnerable. In turn, necessary responses, such as rising water tariffs, are forcing a
reshuffling of the cards in the sector. Such dynamics are putting at risk industrial and economic
development.
2) The nature of water and sanitation markets, both globally and locally, opens room for industrial
development opportunities, particularly for import substitution. South Africa’s water market,
while small on a global scale (about 1%), is significant at the local level and growing strongly.
3) Engaging in the export market by South African firms would appear difficult (due to the
domination of civil works and local content policies) but the existing industrial base could provide
the capabilities to position local firms as strong suppliers on a number of export markets.
4) The ability of South Africa to align industrial development and water policies and objectives will
determine whether new dynamics in the water and sanitation sector hamper or support
industrial development in the country.

4
TABLE OF CONTENTS
Acknowledgements ................................................................................................................................. 2
Table of contents .................................................................................................................................... 4
Abbreviations………………………………………………………………………………………………………...............................5
1.Introduction ......................................................................................................................................... 6
2.Systemic trends and dynamics: Shifting sands in the face of structural challenges ............................ 7
2.1. Systemic challenges: Pressures towards structural change ................................................... 7
2.2. Systemic responses: Towards a more sustainable sector ..................................................... 10
3.Global market demand: A utility-driven sector ................................................................................. 15
3.1. Market structure ................................................................................................................... 15
3.2. Geographically-concentrated markets ................................................................................. 17
3.3. Market segment / technology .............................................................................................. 19
4.Global supply dynamics: Disaggregated but geographically-concentrated ....................................... 23
5.Implications for South Africa’s industrial development .................................................................... 25
6.Conclusion .......................................................................................................................................... 30
References ............................................................................................................................................ 31

5
ABBREVIATIONS
AMI Advanced Metering Infrastructure
BOO Build-Own-Operate
BOT Build-Operate-Transfer
DB Design-Build
DBO Design-Build-Operate
dti (the) Department of Trade and Industry
DWS Department of Water and Sanitation
EPC Engineering, Procurement and Construction
GWI Global Water Intelligence
IPAP Industrial Policy Action Plan
IWA International Water Association
L Litres
MDGs Millennium Development Goals
O&M Operations and Maintenance
SDGs Sustainable Development Goals
TIPS Trade & Industrial Policy Strategies
UK United Kingdom
US United States
WRC Water Research Commission

6
1. INTRODUCTION
Water is considered the most precious and – at the same time – the most wasted natural resource.
Core to the development of life, water is also central for socio-economic progress, notably by enabling
sanitation. Water is, however, an increasingly prominent source of conflicts, both at local and
international levels. Indeed, water management is inherently a regional issue, with both supply- and
demand-related decisions of a community having repercussions on its neighbours.
Correspondingly, the importance of water and sanitation has been recognised internationally through
their inclusion in the Sustainable Development Goals (SDGs) and in their predecessors, the Millennium
Development Goals (MDGs). Specifically, SDG 6 aims to “ensure availability and sustainable
management of water and sanitation for all” (United Nations, 2017, p. 6). Under the ambit of this goal,
a host of targets aim to improve water and sanitation access, water quality, water efficiency, water
resource management, the protection of water ecosystems, international support, and the inclusion
of local communities.
From a trade and industry perspective, water and sanitation are intertwined with technology, and
industrial and economic development. Water security and access to modern water and sanitation
services rely on technology and industrial development, while industrial development, and more
broadly, economic development, depend on water security and modern water and sanitation services.
The centrality of water and sanitation drives a spectrum of activities to provide safe, affordable and
modern access to water and sanitation services to all. This includes the development, storage and
transport of water resources, the collection, treatment and beneficiation of wastewater, and the
management of water consumption.
In South Africa, the water and sanitation sector has been identified by the country’s Industrial Policy
Action Plan (IPAP) as a potential driver of industrial development, notably through the emergence and
growth of locally-designed and manufactured products and services (the dti, 2018).
To inform the role that South African industries can play in the water and sanitation sector, this report
focuses on providing a strategic outlook of global dynamics.
Section 2 analyses the systemic trends and dynamics shaping the water and sanitation sector.
Section 3 reviews the global market, identifying key segments as well as fast-growing areas for the
upcoming years.
Section 4 provides an overview of global supply dynamics, identifying leading market players.
Finally, Section 5 concludes with a discussion on the implications from South Africa’s industrial
development.

7
2. SYSTEMIC TRENDS AND DYNAMICS: SHIFTING SANDS IN THE FACE OF STRUCTURAL CHALLENGES
2.1. Systemic challenges: Pressures towards structural change
A number of inter-related, systemic challenges, as illustrated in Figure 1, drive the water and sanitation
markets around the world. Heightened pressure on water security, notably due to climate change, the
need to bridge the water and sanitation access gap, tighter environmental and health regulations,
ageing and/or degrading infrastructure, and weakening financial sustainability are the key challenges
structuring the market (Deloitte, 2016; GWI, 2017, 2018; IWA, 2016; Montmasson-Clair et al., 2017).
Figure 1: Main market drivers and constraints
Source: Author
First, heightened pressure on water supply security, particularly in the light of climate change impacts,
forces the industry to respond to increased water scarcity as well as a rising volume of natural
disasters, such as floods and droughts. Large parts of the world are in a situation of permanent water
stress (see Figure 2). About 8% of the world’s population live in areas where the natural renewable
water available annually is below 1 000 m3 per capita. Global warming is worsening this picture,
notably through heightened seasonal variation and increasingly severe droughts.
Figure 2: Water stress by region
Source: GWI, 2017

8
Second, access to water and sanitation services remains very unequal with large parts of the world
still lagging significantly behind. In 2015, respectively 29% and 61% of the world’s population did not
enjoy safely managed services for water access and sanitation (see Figures 3 and 4).
Despite some improvement over the last few decades, the vast remaining gap drives governments
and donor agencies globally to emphasise the increase in access of poor households to modern water
and sanitation services. The transition towards a more urbanised society (from about a third of
population in 1950 to half today and two-thirds by 2050) is exercising pressure on water supply and
wastewater systems, driving the need for more complex, compact and innovative solutions.
Figure 3: Global access to sanitation services from 2000 to 2015
Figure 4: Global access to water services from 2000 to 2015
Source: Author, based on Joint Monitoring Programme (JMP) data (https://washdata.org/)
Notes: Safely managed: use of improved facilities which are not shared with other households and where excreta are safely disposed in situ or transported and treated off-site; Basic: use of improved facilities which are not shared with other households; Limited service: use of improved facilities shared between two or more households; Unimproved: use of pit latrines without a slab or platform, hanging latrines or bucket latrines; Open defecation: disposal of human faeces in fields, forests, bushes, open bodies of water, beaches and other open spaces or with solid waste.
Safely managed: drinking water from an improved water source which is located on premises, available when needed and free from faecal and priority chemical contamination; Basic service: drinking water from an improved source, provided collection time is not more than 30 minutes for a roundtrip including queuing; Limited service: drinking water from an improved source for which collection time exceeds 30 minutes for a roundtrip including queuing; Unimproved: drinking water from an unprotected dug well or unprotected spring; Surface water: drinking water directly from a river, dam, lake, pond, stream, canal or irrigation canal.
Third, increasingly tighter health and environmental regulations on drinking water standards and
wastewater treatment are pushing utilities and relevant stakeholders to adopt new technologies and
modernise their systems. For example, regulations around the maximum amount of water to be used
by flushing toilets are emerging in many parts of the world, capping water use to as low as 4.8 litres (L)
in Saudi Arabia and parts of the United States (US). A range of other countries, such as England, China,
Mexico, Brazil, and Canada have caps ranging from 6.0 to 7.5L.
0
1
2
3
4
5
6
7
8
2000 2002 2004 2006 2008 2010 2012 2014
Bill
ion
Basic service Limited service
Open defecation Safely managed service
Unimproved
0
1
2
3
4
5
6
7
8
2000 2002 2004 2006 2008 2010 2012 2014
Bill
ion
Basic service Limited service
Safely managed service Surface water
Unimproved

9
Figure 5 illustrates the evolution of water efficiency of conventional toilets over the last four decades
in Japan, China and the US.
Figure 5: Trends in water efficiency of conventional toilets
Source: Author, based on Toto (https://jp.toto.com/en/company/environment/approach/water/index.htm)
Fourth, ageing infrastructure in mature markets, such as Europe and North America, and degraded
infrastructure in many developing markets, such as South Africa, leads to significant failures, leakages
and contamination. The extent of non-revenue water, arising from losses, leaks and operating
inefficiencies, illustrates the problem faced by utilities worldwide (Figure 6). Although non-revenue
water tends to be higher in developing countries than in developed countries, high non-revenue water
is a plague impacting countries of all levels of development.
Figure 6: Non-revenue water in selected countries in 2016
Source: Author, based on data from Global Water Intelligence (GWI)
Fifth, financial sustainability is becoming increasingly more difficult to ensure for utilities. Insufficient
revenues (as a result of ageing populations and declining tax bases in mature markets, erratic revenue
collection in developing markets, and protracted, weak economic growth) and rising input costs, such
as energy, squeeze the ability of utilities to operate and leave less and less room to manoeuvre.
3,8
0
5
10
15
20
Litr
e p
er la
rge
flu
sh
Japan China USA
0%
10%
20%
30%
40%
50%
60%
70%
Uga
nd
a
Tan
zan
ia
Cô
te d
'Ivo
ire
Mo
rocc
o
Bo
livia
Pak
ista
n
Ho
nd
ura
s
El S
alva
do
r
Gh
ana
Ch
ina
Ru
ssia
n F
eder
atio
n
Mex
ico
Arg
enti
na
Sou
th A
fric
a
Co
lom
bia
Leb
ano
n
Co
sta
Ric
a
Bu
lgar
ia
Ku
wai
t
Jap
an
Au
stra
lia
Can
ada
Au
stri
a
Fin
lan
d
Bel
giu
m
Qat
ar
Hu
nga
ry
Ho
ng
Ko
ng
Un
ited
Ara
b E
mir
ate
s
Slo
ven
ia
Ch
ile
Irel
and
Low incomeLower middle income Upper middle income High income

10
In addition, the institutional structure of utilities, which are mostly integrated into existing
governmental departments (see Section 2.2), often prevents transparency and accountability, which
hinder sustainable management practices.
Compounding such challenges, policy and regulatory developments often act as further obstacles by
preventing the evolution of the sector. Political economy dynamics around the allocation and pricing
of water to different economic sectors and segments of society are particularly pertinent in this
respect. The lack of implementation (due to mismanagement, funding gaps and political pressures)
also hampers the development of the sector in many countries.
2.2. Systemic responses: Towards a more sustainable sector
The underlying challenges identified in the previous section have triggered a series of systemic
responses shaping the market, as depicted in Figure 1 (page 7). These systemic responses include:
increased focus on demand management, stronger drive towards sustainability, higher interest in
technological innovation, sector restructuration towards stronger utility autonomy and private sector
participation, and rising water tariffs (Deloitte, 2016; GWI, 2017, 2018; IWA, 2016; Montmasson-Clair
et al., 2017). The systemic responses are explored in turn.
First, increased focus on demand management is a key trend pushing evolution in the water and
sanitation sector. Increased water scarcity, coupled with rising water prices, has driven a global
movement to better manage and consume water through a shift to smart water and sanitation
systems (i.e. the collection of meaningful and actionable data about the flow, pressure and
distribution of an area’s water supply and waste).While this trend is less pronounced in the agricultural
sector due to historical low prices and subsidisation (despite the existence of technologies, such as
drip irrigation, to half irrigation-related water losses), water-intensive industrial activities are
increasingly investing in demand management. At the supply level, water utilities have similarly begun
to place increasing emphasis on reducing non-revenue water, particularly leakages, as well as
harnessing opportunities for water supply arising from wastewater treatment and water reuse. As
shown in Figure 7, one-quarter of all the new companies targeting the water space are focused on
monitoring, forecast and process controls (through sensors and Internet of Things applications) while
roughly the same number is focusing on basic wastewater treatment.
Figure 7: Start-up technology types in the water and sanitation sector
Source: Lux Research, 2013
Monitoring, forecast and control; 25%
Organic, nutrients and solids
treatment; 24%metals or organics removal/recovery;
16%
Disinfection; 10%
Desalination; 5%
Leak repair and pipe replacement; 5%
Reuse and non-tradition
al sourcing
; 4%
Scalant and
corrosion
control; 4%
Liquid/liquid and liquid/gas
separation; 4%
Pumps and valves; 2%
Other; 1%

11
Second, the global and worsening nature of the water security challenges (both on quantity and
quality fronts) has triggered increasing responses from water providers as well as users. Increased
water scarcity, stronger regulations and heightened community activism are progressively pushing
companies to pay more attention to ensuring water security in conducting their operations. Leading
companies worldwide are raising increased water scarcity (i.e. supply concerns) and increased water
stress (which includes quality and accessibility in addition to supply) as the main two key water-related
risk to their business (Figure 8). Overall, physical risks (66%) dominate the concerns of reporting
companies. As a response, firms are putting more emphasis on reducing the water footprint of their
economic activities in order to mitigate reputational risks and maintain their licence to operate. The
drive towards sustainable development is also supporting investment in demand management and
circular economy initiatives, notably to leverage the opportunities associated with wastewater and
sludge management.
Figure 8: Reported water risks that could impact firms’ direct operations
Source: Author, based on CDP data (https://www.cdp.net/en) Note: percentage calculated out of 2 703 risks reported in 2016
Third, coupled with the increasing need to do more with less, due to increased financial constraints,
these heightened risks have spurred interest in technological innovation, particularly smart/digital
systems, waste minimisation and beneficiation and water treatment/reuse. The economics of water
and sanitation, a sector which generally values safety over financial gains, is progressively changing to
let innovation play a larger role in the future of the sector.
Fourth, increasing financial constraints also push the sector to restructure to some extent. Structural
regulations, defining the roles and responsibilities of different players with the water sector,
particularly private sector participation, and economic regulation, providing checks and balances on
natural monopolies and highly concentrated markets, are progressively changing the rules of the
game, introducing more stringent control but also opening the door to new market players.
Indeed, the operating models of utilities, which are primarily unincorporated departments within
government (see Table 1), is progressively evolving, with increasing autonomy and accountability (i.e.
a move towards incorporated entities) and greater reliance on the private sector to deliver solutions
Physical-Increased water scarcity
9% Physical-Increased water stress
9%
Physical-Flooding7%
Physical-Drought7%
Physical-Declining water quality
6%Physical-Climate
change6%
Regulatory-Higher water prices
5%
Physical-Projected water scarcity
4%
Physical-Projected water stress…
Regulatory-Regulatory uncertainty
4%
Other39%

12
and/or improve operations. Private sector participation takes various forms (see Table 2), with
performance and management contracts, which are widely used across the globe, and operations and
maintenance (O&M) contracts, leading the way. Utility leases and investor-owned utilities, which
transfer significant (if not all) responsibilities to the private sector remain the exception rather than
the norm.
Table 1: Corporate structure of utilities worldwide
Utility structure Key features Number of utilities
Populated served
Spending
Unincorporated municipal or government departments
Part of government department, direct political control, no separate balance sheets
290 000 44% 33%
Subsidiaries of incorporated public works or multi-utility organisations
Own balance sheet as part of separate municipal or governmental organisation also providing other public works and utility operations.
7 000 15% 24%
Incorporated municipal or government bodies
Separate entity under municipal ownership and control but own balance sheets
9 000 24% 35%
Mixed economy organisations
Majority owned by the local government, with private investors as minority shareholders, direct responsibility for finances, but no direct control over tariff setting.
100 1% 2%
Investor-owned utilities
Privately owned but regulated by a government appointed body. 250 2% 5%
Independent not-for-profit organisations
Independent of government, but not run on a for-profit basis. 20 1% 1%
No utility service No utility coverage n/a 14% n/a
Source: GWI, 2017
Table 2: Private sector involvement at the utility level, based on capital equipment requirement and degree of control
Contract type Key features
Capital expenditure requirement for private partner
Degree of control of private partner
Investor-owned
utilities
Private utilities, generally with regulation of prices and
service quality): rare and the result of privatisation (UK,
Chile) or historical quirks (US)
High High
Utility leases
Based on releasing equity from public water assets on the
basis of long-term utility leases: used as an answer for
small-size, cash-strapped municipalities (US, Australia)
Medium High
Concessions
and canon
contracts
Equity release similar to utility leasing, as the
concessionaire has direct control over capital spending,
but with increased focus on performance
Medium High
Affermage-type
contracts The private contractor concentrates on O&M without
taking risk on capital expenditure: used in different
countries with varying degrees of responsibilities
Low Medium-
high
Operations and
maintenance Low Medium

13
contracts allocated to the private operator (main models originate
from the US, France and Spain)
Management
contracts
A private operator takes management responsibility for
the utility for a period of time, typically to achieve some
transformational objectives
Low Medium-low
Performance
contracts
Address specific issues (from performance improvement
to leakage reduction, energy management or smart
metering) at the utility, with remuneration dependent on
successful delivery: well spread in both developed and
developing countries, with support from donor agencies
Low Low
Source: Author, based on GWI information
At the project level, a shift towards greater private sector involvement can also be witnessed in order
to rebalance risk between parties, with an ongoing move from simply commissioning plants from
contractors to getting the private sector involved in the O&M of projects.
As illustrated by Figure 9, more extensive contract structures are limiting risks, particularly for the
commissioning entity. As a result, client-financed Engineering, Procurement and Construction (EPC) /
Design-Build (DB) contracts, which solely focus on construction and handover, are becoming less
prominent in the sector. Design-Build-Operate (DBO) contracts, which entail an EPC/DB procurement
with an outsourcing operations contract included are increasingly used, particularly when the client
has access to capital but is concerned with operational risks. Contracts based on co-financing are
moreover witnessing increasing interest. Ideal for new technology, complex operations, and high
capital costs, they involve a private developer co-financing an infrastructure project along with the
client, building, owning and operating a facility (BOO) and, in some cases, transferring it back to the
client (BOT) after a fixed period.
Figure 9: Risk-sharing by contract structure for infrastructure provision
Source: Author, based on GWI, 2017
Along these large trends, other forms of public-private partnerships are emerging. In the US,
municipal-industrial partnerships see utilities selling treated wastewater to industrial partners (such
as power generation, oil and gas, and refining facilities), as a form of beneficial reuse. Such
arrangements allow utilities to monetise otherwise discarded streams while industries secure
additional water supply.

14
In South Africa, reverse transactions have been witnessed with mining companies treating and supply
water to municipalities. For example, Anglo American treats water from its and South32’s coal mining
activities, then selling it directly to the local Emalahleni municipality for use as drinking water. A form
of extended vendor credit (dubbed Build-Transfer) is also appearing in China, in which a private
contractor builds and finances a facility and then allows the client to operate it for a period of up to
five years, before the client pays for the asset and achieves ownership.
Fifth, at the same time, water tariffs are evolving rapidly. Historically, water tariffs have been set below
the level required to cover both operating costs and capital investment projects in most parts of the
world, largely for political reasons. This is, however, changing with tariffs rising fast in numerous cities
around the globe. This is further re-enforcing consumers’ focus on demand management, in an
attempt by governments to improve efficiencies and extract more value out of each litre of water
consumed. In addition, some governments are looking at strategies to direct the allocation of water,
either through rationing, restrictions on certain usages or direct water allocation management,
specific targets for water reuse for example (like in India), differentiated pricing, and/or the creation
of “water rights markets” (US, Australia, Israel).
Figure 10: Water tariffs in selected cities in 2015 (in US$) and compound annual growth rate over the 2011-2015 period (in percentage)
Source: Author, based on GWI data
While at times constituting a hindering factor (as already highlighted), the policy and regulatory
framework is critical in stimulating the evolution of the sector and facilitating its adaptation to new
circumstances. Policy direction is, for example, paramount in driving demand management, through
regulations, standards, pricing strategies and support mechanisms. Political leadership is also required
to efficiently restructure the sector, improve its accountability and performance and manage the
difficult trade-offs between security of supply, affordability, equity and socio-economic development.
-10%
-5%
0%
5%
10%
15%
20%
25%
30%
35%
40%
45%
50%
55%
$- $1 $2 $3 $4 $5 $6 $7 $8 $9
CA
GR
(2
01
1-2
01
5)
Water price per m3 (in US$)

15
3. GLOBAL MARKET DEMAND: A UTILITY-DRIVEN SECTOR
3.1. Market structure
The central role of water and sanitation and the dynamics highlighted in the previous section point to
a significant and growing market. The global water and sanitation market, including both capital and
operational expenditures, was estimated to be US$862 billion in 2016. The utility sector (67%) largely
dominates the market, followed by the industrial (15%) sector and the bottled water segment (14%).
Agriculture, while consuming more than two-third of water globally, only accounts for a marginal
share of the market (Figure 11).
Figure 11: Global water and sanitation market in 2016
Source: Author, based on data from GWI
As illustrated in Figure 12, focusing on the two largest markets, i.e. the utility and industrial sectors,
the market is expected to reach close to US$900 billion by 2022, growing by +3.7% a year over the
2015-2022 period.
Operational expenditures are larger than capital expenditures and account for about two-thirds (64%)
of the market over the period from 2015-2022. Water- and wastewater-related operational
expenditure by utilities account for the lion’s share of this market, representing respectively 28% and
20% of total expenditure.
Utility; US$ 579
billion
Industrial; US$ 133billion
Bottled water; US$ 120 billion
Point of use; US$ 16billion
Agricultural ; US$ 14billion

16
Figure 12: Global capital and operational expenditure per application (in US$ billion)
Source: Author, based on data from GWI
The spread between operational and capital expenditure is expected to further widen in the future as
utilities in developed markets shift from large infrastructure projects to the rehabilitation of existing
infrastructure and the implementation of smart, digital solutions. Developed water markets are
increasingly driven by the need to improve performance and efficiencies, extend the life of existing
systems, and maximise cost savings. Examples include cured-in-place piping solutions, efficient water
treatment chemical dosing, advanced asset management systems, such as advanced metering
infrastructure (AMI), leakage detection, advanced data analysis tools, control automation, and sewer
optimisation (Deloitte, 2016; GWI, 2018, 2017; IWA, 2016).
In addition, decentralised solutions for both water supply and wastewater treatment are increasingly
attractive and rapidly spreading out. Decentralised solutions can be mobile or permanent and are
generally pre-fabricated, modular and containerised systems. Specific markets where decentralised
solutions are deepening their footprint include water supply (through desalination and reuse) and
wastewater treatment (through next generation sanitation technologies) in sparsely-populated
and/or isolated areas, and industrial wastewater management. For instance, the industrial demand
for mobile water treatment plants is expected to reach US$850 million by 2020, rising by more than
8% per annum from 2013.
Global trade in water- and wastewater-related products amounted to around US$282 billion in 2016
(see Figure 13), i.e. more than a third of the global market in that year. While this is consistent with
the structure of the market, which favours local players (due to the strong weight of local, state-owned
utilities and civil engineering on the market), it also denotes the key role of trade in equipment. In line
with the global spending on equipment (see Figure 19 and discussion further on), trade is dominated
by pumps, valves and compressors. As listed in Table 3, a limited set of 10 products accounts from
about two-thirds of the trade.
0
100
200
300
400
500
600
700
800
900
2015 2016 2017 2018 2019 2020 2021 2022
USD
bill
ion Utility wastewater operational expenditure
Utility water operational expenditure
Industrial operational expenditure
Industrial capital expenditure
Sludge management
Wastewater treatment plants
Wastewater networks
Seawater and brackish water desalination
Water resources (excl. desalination)
Water treatment plants
Water networks

17
Figure 13: Global trade in water- and wastewater-related goods from 2001 to 2016 (in US$ billion)
Source: Author, based on data from Trade Map
Note: the sum of individual categories is larger than global trade due to some products figuring in more than one category
Table 3: List of main traded water- and wastewater-related products in 2016
Item HS Code Value
(US$ billion) Share of total
trade
Valves, such as pressure or flow control, flush, ball, butterfly
or diaphragm valves 848180 48.3 17,1%
Electrical machines and apparatus 854370 32.8 11,6%
Air pumps, air/ gas compressors and ventilating or recycling
hoods incorporating a fan 841480 18.8 6,6%
Parts of air/vacuum pumps, air/gas compressors, fans and
ventilating or recycling hoods incorporating a fan 841490 15.3 5,4%
Compressors for refrigerating equipment 841430 13.0 4,6%
Centrifugal, power-driven pumps 841370 12.2 4,3%
Parts of machinery and apparatus for filtering or purifying
liquids or gases 842199 12.1 4,3%
Refrigerating or freezing equipment 841869 8.5 3,0%
Instruments and apparatus for measuring or checking
pressure of liquids or gases 902620 8.3 2,9%
Machinery and apparatus for filtering or purifying liquids 842129 7.7 2,7%
Other 60 products n/a 105.5 37,3%
Source: Author, based on data from Trade Map
3.2. Geographically-concentrated markets
Geographically, the bulk of the global market is focused on a limited number of countries, with the
top 15 countries accounting for 76% of demand. The US (21%), China (15%) and Japan (12%) lead the
pack, concentrating about half the market (48%), as depicted in Figure 14. South Africa, ranked 16th,
accounts for 1.3% of the global market. Africa as a whole remains relatively small, representing 3%-
4% of global demand (between US$28 and US$33 billion in 2022).
Global trade(right axis)
0
50
100
150
200
250
300
350
0
25
50
75
100
125
2001 2002 2003 2004 2005 2006 2007 2008 2009 2010 2011 2012 2013 2014 2015 2016
USD
bill
ion
USD
bill
ion
Wastewater Water handling goods and equipment Wastewater Aeration systems
Wastewater Air-handling equipment Water supply Waste treatment equipment
Wastewater Waste treatment equipment Water supply Aeration systems
Water supply Water pruficiation systems

18
Large mature markets, such as the US, Japan and Western Europe, are expected to grow at a pace
below the world average of 3.7% a year over the 2015-2022 period. Australia and Canada are the
notable exceptions in this respect, with forecasted growth rate above 5% a year. India (+9,8%) and
Saudi Arabia (+9,2%) are forecasted to witness the fastest growth in top markets, while a number of
smaller markets are seeing exceptional growth, such as Jordan (+24%) and Ethiopia (+16%).
Figure 14: Global capital and operational expenditure per country from 2015 to 2022 (in US$ billion)
Source: Author, based on data from GWI
Correspondingly, imports of water- and wastewater-related products are dominated by few countries
(see Figure 15). Half the demand originates from just 10 countries, with the US, China, Germany,
France and Canada leading. All leading importers feature as top market (and vice-versa).
Mexico, a top importer despite a relatively small market, is one notable exception, probably due to its
role in bringing products into the North American Free Trade Area.
South AfricaSouth Africa
0
100
200
300
400
500
600
700
800
900
2015 2016 2017 2018 2019 2020 2021 2022
USD
bill
ion
United States China Japan France
Brazil Germany Russian Federation India
United Kingdom Australia Canada Korea, Republic
Italy Spain Saudi Arabia South Africa
Rest of the world

19
Figure 15: Import of water- and wastewater-related goods in 2016 per country
Source: Author, based on Trade Map data
3.3. Market segment / technology
Capital expenditure is expected to grow at 4.6% a year over the 2015-2022 period. From a market
segment perspective (Figure 16), the development of water resources and networks, i.e. civil works
and engineering, account for 58% of the capital expenditure market, followed by wastewater
treatment (25%). All segments are expected to grow between 4%-15% a year over the 2015-2022
period. The desalination (1.7%) and produced water treatment (1.2%) segments are forecasted to
witness the strongest growth, respectively at 15% and 12% a year.
Figure 16: Global capital expenditure per segment from 2015 to 2022 (in US$ billion)
Source: Author, based on data from GWI
From a technology perspective (Figure 17), besides resources and networks (58%), this corresponds
to general construction (11%), suspended solid removal (10%) and biological treatment (8%) being the
main second-tier markets.
United States of America
15%China
8%
Germany6%
France4%
Canada3%Mexico
3%United Kingdom
3%Korea, Republic of3%
Japan3%
Thailand2%
India2%
Italy2%
Netherlands2%
Russian Federation2%
Rest of the world42%
0
50
100
150
200
250
300
350
2015 2016 2017 2018 2019 2020 2021 2022
USD
bill
ion
Resources & networks Process/drinking water treatment
Ultrapure water systems Seawater and brackish water desalination
Wastewater treatment Produced water treatment

20
Despite accounting for only about 3% of the capital expenditure, sludge management is a strong
growth area. Sludge management is a rising area of concern for increasingly populated and
industrialised countries. Opportunities for sludge beneficiation, both through wastewater treatment
plants and other technologies, such as anaerobic digestion, are also leading utilities and industries to
upgrading sludge treatment capabilities. For example, biogas production through anaerobic digestion
and enhanced dewaterability (i.e. the ease through which water can be removed from sludge),
thermal/drying technologies, and nutrient and phosphorus recovery are driving the industry towards
advanced sludge management systems.
Wastewater management is forecasted to grow strongly with capital expenditure by utilities for
wastewater treatment plants and sludge management growing by 5.4% and 5.5% respectively over
the 2015-2022 period, amounting to US$63.5 and US$11.9 billion in 2022.
Figure 17: Global capital expenditure per technology from 2015 to 2022 (in US$ billion)
Source: Author, based on data from GWI
Unconventional resource development, i.e. desalination and water reuse, is also experiencing strong
growth on the back of rising water security concerns (Figure 18).
The market for desalination is forecasted to reach US$4.8 billion in 2022, rapidly increasing at rate of
15.3% a year from 2015. Similarly, demand for membranes should witness some solid growth
prospects. High pressure membranes (RO/NF), low pressure membranes (MF/UF), non-membrane
filtration and disinfection and chemical feeds should respectively grow by 7.6%, 6.5%, 4.3% and 4.0%
over the 2015-2022 period, reaching US$12.8 billion.
0
50
100
150
200
250
300
350
2015 2016 2017 2018 2019 2020 2021 2022
US$
bill
ion
Oil-water separation Suspended solids removal Dissolved solids removal
Biological treatment Disinfection Sludge management
Intakes / outfalls General construction / other Networks & resources

21
Figure 18: Incremental contracted desalination and reuse capacity from 1990-2022
Source: GWI, 2018
Beyond the water desalination and reuse, the global equipment market, which is essentially
technology-based, is estimated to reach more than US$180 billion by 2022 (Figure 19), rising by 4.6%
a year from 2015. It is equivalent in value to the civil engineering and fabrication market, which is
almost exclusively driven by the utility sector (95%). The equipment market is heavily dominated by
pipes, pumps and valves, which account for 44% of it (and growing at 4.0% per year). Automation and
control equipment, including sensors and meters, constitutes the second largest segment (14%),
increasing by 5.6% per annum over the 2015-2022 period.
Figure 19: Global equipment expenditure per segment from 2015 to 2022 (in US$ billion)
Source: Author, based on data from GWI
The emphasis on digital solutions by utilities is supported by the imperatives of stretching capital
budgets and optimising operations as well as transitioning towards smart city management. The
market for digital transformation is expected to grow by 6.6% a year over the 2015-2022 period,
primarily driven by data management and analysis (+10.3%).
0
50
100
150
200
2015 2016 2017 2018 2019 2020 2021 2022
US$
bill
ion
Pipes, valves and pumps Screens
Standard process equipment Aeration
Non-membrane filtration Disinfection and chem feeds
A&C / test / meters MF/UF
RO/NF Sludge
Other / specialist Civil engineering/fabrication and associated costs

22
Figure 20: Global spending on digital solutions in the utility sector from 2015 to 2022 (in US$ billion)
Source: Author, based on data from GWI
At a sectoral level, the utility sector drives the bulk of the demand for equipment (83%, spilt between
43% for wastewater and 40% for water).
Food and beverages (4%) as well as upstream oil and gas (3%) are the largest industrial markets.
Upstream oil and gas (+10.1%), pharmaceuticals (5.8%) and food and beverages (5.4%) are expected
to be the fastest growing market segments over the 2015-2022 period.
0
5
10
15
20
25
30
2015 2016 2017 2018 2019 2020 2021 2022
US$
bill
ion
Physical parameter meters Water quality sensors Customer meters
Laboratory / field testing Other automation & control Data management / analysis

23
4. Global supply dynamics: Disaggregated but geographically-concentrated
Given the structure of demand, dominated by civil works/engineering and localisation policies driven
by state-owned entities, supply chains have a strong local flavour in most markets. As raised in the
previous section, global trade in water- and wastewater-related goods, driven by equipment, is
nevertheless sizeable. Systemic trends (see Section 2) driving the move from capital to operational
expenditure and the focus on technological solutions and cutting-edge expertise (for demand
management for example) are furthermore increasingly globalising water and sanitation markets.
As it stands though, water businesses are not large businesses by global industrial standards. Indeed,
the market is fairly disaggregated, with local firms playing a strong role. In addition, aside from utilities,
there are few water pure players. Most private companies are subsidiaries of larger groups, like Veolia
Environnement (US$27 billion in yearly revenue in 2017). Veolia and Suez, the two market leaders,
both total annual revenues in excess of US$10 billion for their water operations, but only
50 companies harness revenues of US$1 billion or more.1 In addition, there are about 1 300 privately-
owned businesses active in the industry with revenues in excess of US50 million.
Table 4: Leading global water-related companies in 2017
Firm Origin Description Revenue
(US$ billion)
Sectors of
operation
Veolia France Water operator and systems integrator 12,5 Eq Sy En Op C
Suez France Water operator and systems integrator 11 Eq Sy En Op Ow C
Ecolab US Water treatment chemicals and related
services 7,1 Sy C
Pentair US Pumps, valves, UF membranes, and pool
equipment 5 Eq Sy
Xylem US Pumps, analytics, & wastewater technology
supplier 3,7 Eq Sy
Grundfos Denmark Pump supplier with strength in residential
services 3,2 Eq
American Water US Regulated utility & non-regulated services 3 Op Ow
Sabesp Brazil Water concessionaire 3 Op Ow
Thames Water UK Regulated utility 2,9 Op Ow
Severn Trent UK Regulated utility and contract operations 2,6 Op Ow
Source: Author, based on GWI data
Note: Eq = Equipment; Sy = Systems; En = Engineering;
C = Chemicals; Op = Operations; Ow = Ownership
Despite this high degree of disaggregation, expertise is fairly concentrated geographically. As listed in
Table 4, developed countries are over-represented in the leading firms, with French, US, Danish,
British, German, Japanese and Finnish firms featuring strongly. Importantly though, a number of
Chinese firms have progressively made their way to the top 50 of the industry (Sound, Origin, Beijing
Capital and Beijing Enterprises Water Group Limited).
1 For comparison, the revenues of top 500 companies worldwide range from US$22 to US$486 billion.

24
As with the firm level, the provision of tradable water- and wastewater-related products (see
Figure 21) is concentrated geographically with China, Germany and the US servicing 41% of the market
and the top 10 exporters accounting for more than two-thirds of the market.
Figure 21: Water- and wastewater-related exports by country in 2016
Source: Author, based on Trade Map data
Leading exporters remain relatively unchanged across top segments (Figure 22), with China, the US,
Germany and Japan leading the pack. This picture (of manufacturers) is slightly different from the
origin of top firms, which tend to provide services and expertise rather than manufactured products.
Most notably, China and Germany, while not among the leading providers of water and sanitation
expertise, are the two leading exporters of water- and wastewater-related products.
Figure 22: Leading exporters of main water-related traded products
Source: Author, based on Trade Map data
China16%
Germany13%
United States of America
12%
Italy6%Japan
5%France
4%Mexico
3%United Kingdom
3%
Netherlands3%
Korea, Republic of3%
Singapore2%
Belgium2%
Rest of the world28%
China China China
USA USA USA
Germany GermanyGermanyJapan Japan
JapanSingaporeItaly
ItalyItaly
ThailandThailand
FranceFrance France
MexicoMexico Mexico
South KoreaSouth Korea South Korea
Belgium UKNetherlands
Rest of the world Rest of the world Rest of the world
0%
10%
20%
30%
40%
50%
60%
70%
80%
90%
100%
Aeration systems Air-handling equipment Water handling goods andequipment

25
5. IMPLICATIONS FOR SOUTH AFRICA’S INDUSTRIAL DEVELOPMENT
From the perspective of South Africa’s industrial development, global dynamics, as they shape and
permeate the local market, constitute a both a challenge and an opportunity.
On the one hand, South Africa faces similar challenges as the rest of the world in terms of water
security, access to water and sanitation services, water quality, infrastructure development and
financial sustainability. This puts significant pressure on the country’s water and sanitation systems,
in turn jeopardising the country’s industrial development. South Africa is indeed a water-stressed
country and climate change impacts are set to further compromise water supply (DWS, 2015).
In addition, water quality is increasingly problematic, as exemplified by the challenges associated with
acid mine drainage and algal blooms in dams (i.e. a quick increase in the algae population). Coupled
with water supply challenges, a steep increase in water demand has been witnessed over the last
couple of decades, spurred by growing population and economic activity. Projections show that South
Africa will approach physical water scarcity by 2025 and would require 17% more water than what
would currently available by 2030, as illustrated by Figures 23 and 24. Severe shortages are expected
in core industrial areas, including Gauteng, Mpumalanga, KwaZulu-Natal and the Western Cape.
Figure 23: Projected water demand in South Africa
Figure 24: Project gap between water supply and demand in 2030
(in percentage of 2030 demand)
Source: Addams et al, 2009
Along with global trends, South Africa’s water prices, while still low by international standards, have
been rising materially over the past few years (Figure 25), putting additional pressure on all
consumers, notably in municipal areas. Furthermore, the state of the water infrastructure, with dams,
treatment plants and piping in dire straits, is set to push prices higher in the coming years. Capital
replacement costs for water infrastructure in South Africa are estimated to be R855 billion over the
2015-2025 period (in real terms) (DWS, 2017). These trends are extremely worrying from the
perspective of industrial development, with large parts of the economy being directly dependent on
water supply. About 9.5 million jobs are significantly dependent on water in South Africa (Figure 26),
raising serious questions about the management of the country’s water supply and consumption.
02468
1012141618
2005 2020 2030
Pe
rce
nta
ge (
%)
Commercial Public
Households Leakage
Mining Manufacturing
Power Irrigation
Afforestation Existing supply

26
Figure 25: South African municipal tariffs from 2010 to 2016 per consumption levels (in percentage growth)
Source: Author, based on DWS, 2016
Figure 26: South Africa’s employment by degree of water dependency in South Africa in 2016
Source: TIPS, based on data from Statistics South Africa
In the agricultural sector, which utilises around two-thirds of South Africa’s water resources,
uncertainty in water supply would directly threaten domestic food security. Particularly vulnerable
groups, like small-scale farmers, would face increased business risks from supply constraints. At the
same time, the sector is particularly water-inefficient, largely as a result of historically low water
supply. Mining, power generation and industry account for about 11% and also rely heavily on water
for their business activities. Coal-based power generation, the predominant form of generation in
South Africa, is a water-intensive process. The addition of the coal-fired Kusile and Medupi power
plants will further increase the vulnerability of South Africa’s electricity supply to water scarcity.
Similarly, the mining industry is reliant on water for extraction, processing and beneficiation.
Numerous manufacturing industries also depend directly on water supply, such as agro-processing,
mineral beneficiation, pulp and paper and textile. In addition to jeopardising current operations, the
lack of water availability could severely hinder future developments in such water-dependent,
hampering economic growth and job creation.
-5%
5%
15%
25%
35%
45%
2010 2011 2012 2013 2014 2015 2016
0-6kl 6-20kl 20-60kl >60kl CPI
830 185
1 105 432
1 121 7453 057 362
43 694
2 210 864
4 223 844
6 478 401
368 477
6 730 4687 098 945
0%
10%
20%
30%
40%
50%
60%
70%
80%
90%
100%
Agriculture Industry Services Total
High dependency Moderate dependency Low dependency

27
Figure 27: South Africa’s water availability cost curve
Source: Addams et al, 2009
Water supply considerations (i.e. quantity, quality and price) will, going forward, increasingly
permeate industrial policy decisions. Water policy choices will inform, if not constrain, industrial
development in the future triggering critical trade-offs between economic activities. As illustrated in
Figure 27, water supply solutions vary greatly in cost and impact, with efficiency and leak repair
measures bringing significant co-benefits. Competition between uses and users will become an
increasing reality with social needs, the requirements of strategic industries (such as power
generation), mining, manufacturing, agriculture and a range of other economic sectors, the
preservation of the ecological reserve coming in opposition. Allocation decisions in the context of
scarcity, cost and competing demands will be at the core of industrial policy in the future.
Figure 28: Water use in South Africa by sector
Figure 29: Financial value of water sales by sector
Source: TIPS, based on data from GreenCape
Irrigation; 67%
Urban areas; 18%
Mining; 5%
Rural areas; 4%
Afforestatio… Power generation; 2%
Transfers out; 1%
Agriculture; 2%
Municipal water
services; 58%
Mining; 11%
Trade; 8%
Food, beverages, tobacco;
7%
Business; 5%
Manufacturing; 4%
Financial and other services;
2%
Government
services; 2%
Health and others; 1%

28
The case of agriculture exemplifies the complexity of the problem. While agriculture consumes more
than two-thirds of the country’s water, it only accounts for 2% of the value of water sales, at the favour
of rain water harnessing and low prices (see Figures 28 and 29). At the same time, the sector generates
low value add and employment per unit of water compared to other sectors of the economy.
However, agriculture is paramount for food security, the development of rural areas and the
preservation of water resources (notably through water stewardship).
On the other hand, South Africa’s water market, while small on a global scale (slightly more than 1%),
is significant at the local level. Rising at 6.2% a year from 2015 to 2022, it is expected to reach
US$11.7 billion at the end of forecast period (Figure 30). The civil engineering and equipment and
components (Figure 31), which account respectively for 18% and 17% of the South African market, are
furthermore projected to grow strongly, at 7.5% and 6.9% a year over the 2015-2022 period.
Figure 30: South Africa’s capital and operational expenditure (in US$ billion)
Source: Author, based on data from GWI
Figure 31: South Africa’s equipment expenditure per segment from 2015 to 2022 (in US$ billion)
Source: Author, based on data from GWI
-3
2
7
12
2015 2016 2017 2018 2019 2020 2021 2022
US$
bill
ion
Water - Water networks Water - Water treatment plants
Water - Water resources (excl. desalination) Water - Seawater and brackish water desalination
Wastewater - Wastewater networks Wastewater - Wastewater treatment plants
Wastewater - Sludge management Industrial - Capex
Utility water - Opex Utility wastewater - Opex
Industrial - Opex
0
1
1
2
2
3
2015 2016 2017 2018 2019 2020 2021 2022
US$
bill
ion
Pipes, valves and pumps Screens
Standard process equipment Aeration
Non-membrane filtration Disinfection and chem feeds
A&C / test / meters MF/UF
RO/NF Sludge
Other / specialist Civil engineering/fabrication and associated costs

29
The South African market is nevertheless heavily dependent on imports (Figures 32 and 33). Despite
noteworthy exports (between US$0.8 billion and US$1.1 billion over the 2012-2017 period), imports
of water- and wastewater-related products are materially larger (between US$1.4 billion and
US$2.3 billion over the same period). This could open opportunities for import substitution,
particularly for pipes, pumps and valves (50% of total South African equipment market) as well as
automation and control equipment (16%) which accounts for the bulk of the equipment demand in
the country.
Figure 32: South Africa’s import of water- and wastewater-related goods (in US$ million)
Source: Author, based on Trade Map data
Note: “Imports” depict total South African imports of water- and wastewater-related goods. Other
categories represent the leading five categories (out of 18). These are not additive due to some
products featuring in more than one category.
Figure 33: South Africa’s export of water- and wastewater-related goods (in US$ million)
Source: Author, based on Trade Map data
Note: Exports depicts total South African exports of water- and wastewater-related goods. Other
categories represent the leading five categories (out of 18). These are not additive due to some
products featuring in more than one category.
0
500
1 000
1 500
2 000
2 500
2001 2002 2003 2004 2005 2006 2007 2008 2009 2010 2011 2012 2013 2014 2015 2016 2017
US$
mill
ion
Wastewater Water handling goods and equipment Wastewater Aeration systems
Wastewater Air-handling equipment Wastewater Chemical recovery systems
Wastewater Screens & strainers Imports
0
500
1 000
1 500
2 000
2 500
2001 2002 2003 2004 2005 2006 2007 2008 2009 2010 2011 2012 2013 2014 2015 2016 2017
USD
mill
ion
Wastewater Water handling goods and equipment Wastewater Chemical recovery systems
Wastewater Aeration systems Wastewater Air-handling equipment
Wastewater Sewage treatment Exports

30
Engaging on the export market would appear more difficult, off the existing basis. South Africa
currently supplies only 0.2% of global trade in water- and wastewater-related goods and, although the
market is fairly disaggregated, competition is fierce. The market is dominated by civil works and
engineering, which are generally highly localised, and most equipments and technologies originate
from a limited number of countries, and while the supply market is relatively disaggregated, strong,
leading firms operate in most countries. Coupled with trade barriers (primarily non-tariff barriers, such
as localisation requirements), this limits the ability to transform a potential opportunity into a genuine
market. The existing industrial base could, however, provide the capabilities to position local firms as
stronger suppliers on a number of export markets. The move towards smart, digital, decentralised and
efficient and circular systems appears to be an opportunity worth exploring (GreenCape, 2018, 2017).
Doing so requires careful, in-depth assessments of global and local supply and demand dynamics at
the segment level.
6. CONCLUSION
The global water and sanitation sector is a vibrant market, growing at a strong pace. It is also a sector
in transition, facing structural challenges both internally (such as financial constraints) and externally
(such as climate change and urbanisation). The progressive restructuration of the sector to adapt to
its new operating conditions are opening doors for prospects. The increase interest in innovative
solutions and technologies does provide the platform for new companies to seize worthwhile market
shares.
Demand remains largely dominated by (state-owned) utilities rather than industries or households.
Water and sanitation issues are indeed essentially state-led in every country. Despite the need for
significant improvement at the point of use and the increasing impetus by consumers to invest in
improved water and sanitation solutions, the consumer market is dwarfed by utility-related
expenditure. As utilities restructure and adapt to their new environment, notably by shifting from
capital to operational expenditure, this opens new opportunities on the market.
From a South African industrial development perspective, systemic challenges are increasing the
vulnerability of South Africa’s water and sanitation systems. In turn, necessary responses are forcing
a reshuffling of the cards in the sector. Altogether, such dynamics are putting at risk industrial and
economic development. At the same time, the nature of water and sanitation markets, both globally
and locally, opens room for industrial development opportunities, particularly for import substitution.
In the end, the ability of South Africa to align industrial development and water policies and objectives
will determine whether new dynamics in the water and sanitation sector hamper or support industrial
development in the country.

31
REFERENCES
Addams, L., Boccaletti, G., Kerlin, M., Stuchtey, M., 2009. Charting Our Water Future: Economic
frameworks to inform decision-making. 2030 Water Resources Group, Washington, D.C.
Deloitte, 2016. Water Tight 2.0: The Top Trends in the Global Water Sector. Deloitte, London.
Department of Trade and Industry (the dti), 2018. Industrial Policy Action Plan 2017/18 - 2019/20.
Department of Trade and Industry, Pretoria.
DWS, 2017. National Water Investment Framework. Department of Water and Sanitation, Pretoria.
DWS, 2016. Water Services Tariffs 2015-2016: A National Assessment of Water Services Tariffs from
Source to Tap and Return Flows to Source. Department of Water and Sanitation, Pretoria.
DWS, 2015. Strategic overview of the water services sector in South Africa 2015 (Version 4).
Department of Water and Sanitation, Republic of South Africa.
GreenCape, 2018. Water – 2018 Market Intelligence Report. GreenCape, Cape Town.
GreenCape, 2017. Water – 2017 Market Intelligence Report. GreenCape, Cape Town.
GWI, 2018. The Global Water Market in 2018. Global Water Intelligence, Oxford.
GWI, 2017. The Global Water Market 2017. Volume 1: Companies and Markets. Global Water
Intelligence, Oxford.
IWA, 2016. Global Trends and Challenges in Water Science, Research and Management (No. Second
Edition). International Water Association, London.
Lux Research, 2013. Making money in the water industry. Boston: Lux Research.
Montmasson-Clair, G., Wood, C., Mudombi, S., Deonarain, B., 2017. A Green Economy Industry and
Trade Analysis: Assessing South Africa’s Potential. Department of Environmental Affairs, Department
of Trade and Industry, Department of Science and Technology, United Nations Environment
Programme and United Nations Industrial Development Organization, Pretoria.
United Nations, 2017. The Sustainable Development Goals Report 2017. United Nations, New York.
Copyright © 2022 FDOKUMEN