The Appraisal of the Risk in the Bridges of Babolsar through the "ANP & FSAW" Methods
16
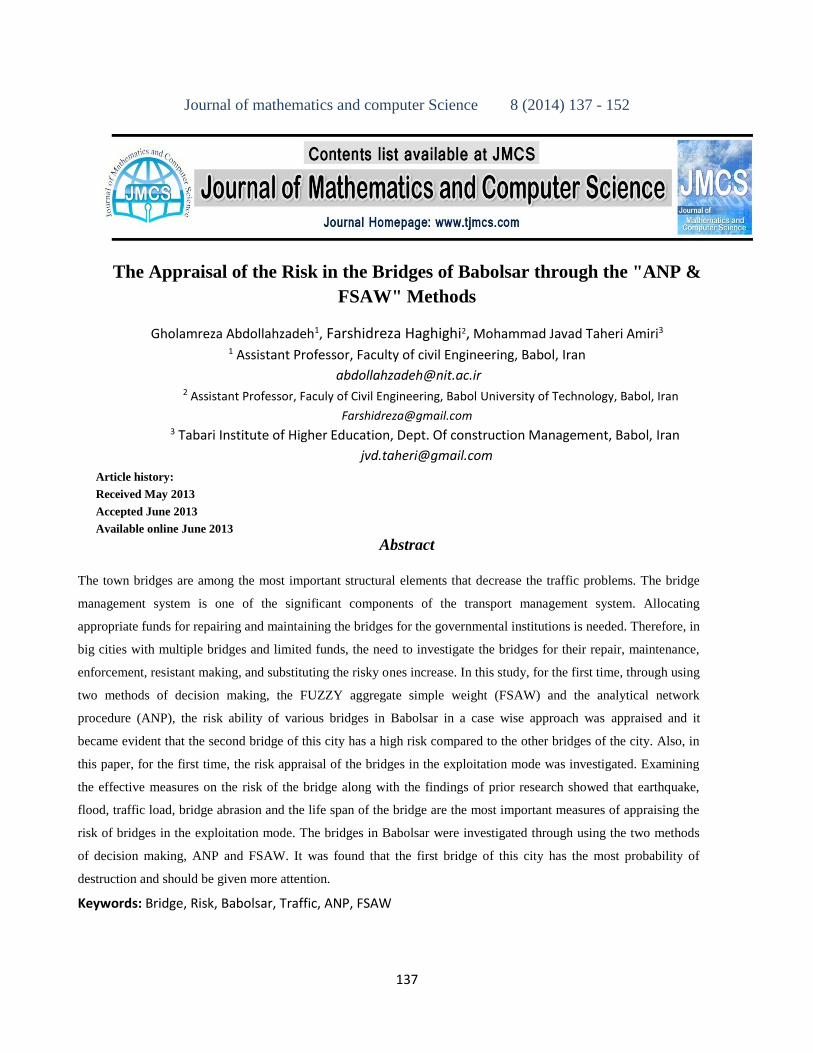
137 Journal of mathematics and computer Science 8 (2014) 137 - 152 The Appraisal of the Risk in the Bridges of Babolsar through the "ANP & FSAW" Methods Gholamreza Abdollahzadeh 1 , Farshidreza Haghighi 2 , Mohammad Javad Taheri Amiri 3 1 Assistant Professor, Faculty of civil Engineering, Babol, Iran [email protected] 2 Assistant Professor, Faculy of Civil Engineering, Babol University of Technology, Babol, Iran [email protected] 3 Tabari Institute of Higher Education, Dept. Of construction Management, Babol, Iran [email protected] Article history: Received May 2013 Accepted June 2013 Available online June 2013 Abstract The town bridges are among the most important structural elements that decrease the traffic problems. The bridge management system is one of the significant components of the transport management system. Allocating appropriate funds for repairing and maintaining the bridges for the governmental institutions is needed. Therefore, in big cities with multiple bridges and limited funds, the need to investigate the bridges for their repair, maintenance, enforcement, resistant making, and substituting the risky ones increase. In this study, for the first time, through using two methods of decision making, the FUZZY aggregate simple weight (FSAW) and the analytical network procedure (ANP), the risk ability of various bridges in Babolsar in a case wise approach was appraised and it became evident that the second bridge of this city has a high risk compared to the other bridges of the city. Also, in this paper, for the first time, the risk appraisal of the bridges in the exploitation mode was investigated. Examining the effective measures on the risk of the bridge along with the findings of prior research showed that earthquake, flood, traffic load, bridge abrasion and the life span of the bridge are the most important measures of appraising the risk of bridges in the exploitation mode. The bridges in Babolsar were investigated through using the two methods of decision making, ANP and FSAW. It was found that the first bridge of this city has the most probability of destruction and should be given more attention. Keywords: Bridge, Risk, Babolsar, Traffic, ANP, FSAW
Transcript of The Appraisal of the Risk in the Bridges of Babolsar through the "ANP & FSAW" Methods
137
Journal of mathematics and computer Science 8 (2014) 137 - 152
The Appraisal of the Risk in the Bridges of Babolsar through the "ANP &
FSAW" Methods
Gholamreza Abdollahzadeh1, Farshidreza Haghighi2, Mohammad Javad Taheri Amiri3
1 Assistant Professor, Faculty of civil Engineering, Babol, Iran
2 Assistant Professor, Faculy of Civil Engineering, Babol University of Technology, Babol, Iran
[email protected] 3 Tabari Institute of Higher Education, Dept. Of construction Management, Babol, Iran
Article history:
Received May 2013
Accepted June 2013
Available online June 2013
Abstract
The town bridges are among the most important structural elements that decrease the traffic problems. The bridge
management system is one of the significant components of the transport management system. Allocating
appropriate funds for repairing and maintaining the bridges for the governmental institutions is needed. Therefore, in
big cities with multiple bridges and limited funds, the need to investigate the bridges for their repair, maintenance,
enforcement, resistant making, and substituting the risky ones increase. In this study, for the first time, through using
two methods of decision making, the FUZZY aggregate simple weight (FSAW) and the analytical network
procedure (ANP), the risk ability of various bridges in Babolsar in a case wise approach was appraised and it
became evident that the second bridge of this city has a high risk compared to the other bridges of the city. Also, in
this paper, for the first time, the risk appraisal of the bridges in the exploitation mode was investigated. Examining
the effective measures on the risk of the bridge along with the findings of prior research showed that earthquake,
flood, traffic load, bridge abrasion and the life span of the bridge are the most important measures of appraising the
risk of bridges in the exploitation mode. The bridges in Babolsar were investigated through using the two methods
of decision making, ANP and FSAW. It was found that the first bridge of this city has the most probability of
destruction and should be given more attention.
Keywords: Bridge, Risk, Babolsar, Traffic, ANP, FSAW
G. Abdollahzadeh, F. Haghighi, M.J. Taheri Amiri / J. Math. Computer Sci. 8 (2014) 137 - 152
138
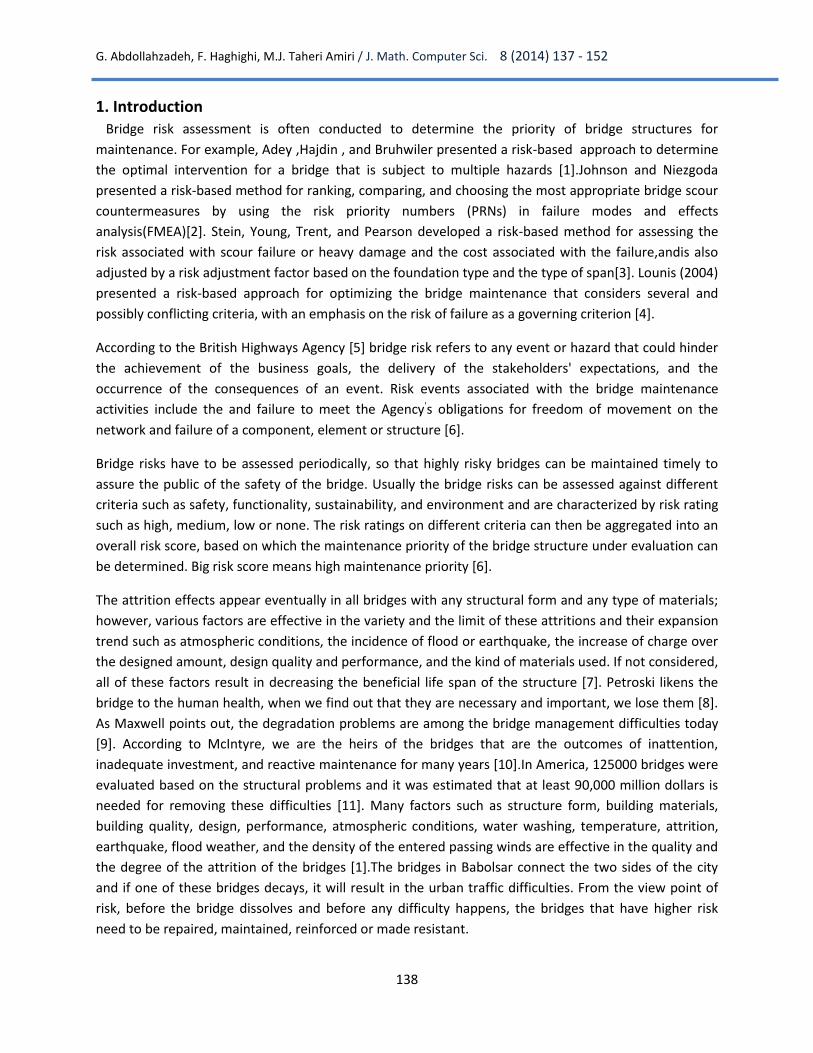
1. Introduction
Bridge risk assessment is often conducted to determine the priority of bridge structures for
maintenance. For example, Adey ,Hajdin , and Bruhwiler presented a risk-based approach to determine
the optimal intervention for a bridge that is subject to multiple hazards [1].Johnson and Niezgoda
presented a risk-based method for ranking, comparing, and choosing the most appropriate bridge scour
countermeasures by using the risk priority numbers (PRNs) in failure modes and effects
analysis(FMEA)[2]. Stein, Young, Trent, and Pearson developed a risk-based method for assessing the
risk associated with scour failure or heavy damage and the cost associated with the failure,andis also
adjusted by a risk adjustment factor based on the foundation type and the type of span[3]. Lounis (2004)
presented a risk-based approach for optimizing the bridge maintenance that considers several and
possibly conflicting criteria, with an emphasis on the risk of failure as a governing criterion [4].
According to the British Highways Agency [5] bridge risk refers to any event or hazard that could hinder
the achievement of the business goals, the delivery of the stakeholders' expectations, and the
occurrence of the consequences of an event. Risk events associated with the bridge maintenance
activities include the and failure to meet the Agency's obligations for freedom of movement on the
network and failure of a component, element or structure [6].
Bridge risks have to be assessed periodically, so that highly risky bridges can be maintained timely to
assure the public of the safety of the bridge. Usually the bridge risks can be assessed against different
criteria such as safety, functionality, sustainability, and environment and are characterized by risk rating
such as high, medium, low or none. The risk ratings on different criteria can then be aggregated into an
overall risk score, based on which the maintenance priority of the bridge structure under evaluation can
be determined. Big risk score means high maintenance priority [6].
The attrition effects appear eventually in all bridges with any structural form and any type of materials;
however, various factors are effective in the variety and the limit of these attritions and their expansion
trend such as atmospheric conditions, the incidence of flood or earthquake, the increase of charge over
the designed amount, design quality and performance, and the kind of materials used. If not considered,
all of these factors result in decreasing the beneficial life span of the structure [7]. Petroski likens the
bridge to the human health, when we find out that they are necessary and important, we lose them [8].
As Maxwell points out, the degradation problems are among the bridge management difficulties today
[9]. According to McIntyre, we are the heirs of the bridges that are the outcomes of inattention,
inadequate investment, and reactive maintenance for many years [10].In America, 125000 bridges were
evaluated based on the structural problems and it was estimated that at least 90,000 million dollars is
needed for removing these difficulties [11]. Many factors such as structure form, building materials,
building quality, design, performance, atmospheric conditions, water washing, temperature, attrition,
earthquake, flood weather, and the density of the entered passing winds are effective in the quality and
the degree of the attrition of the bridges [1].The bridges in Babolsar connect the two sides of the city
and if one of these bridges decays, it will result in the urban traffic difficulties. From the view point of
risk, before the bridge dissolves and before any difficulty happens, the bridges that have higher risk
need to be repaired, maintained, reinforced or made resistant.
G. Abdollahzadeh, F. Haghighi, M.J. Taheri Amiri / J. Math. Computer Sci. 8 (2014) 137 - 152
139
2 Risk
The project management association in standard PMBOK defines the risk as an indefinite incidence or
conditions that will positively or negatively influence the project aims .A risk has a cause and if happens, it
will have an outcome. The project risk involves some threats for the project aims as well as opportunities
to improve in line with these aims. The project risk origin is in the uncertainty that exists in all projects.
The determinable risks are the ones that are identified or analyzed and they can be programmed. The
undeterminable risks are not manageable, although it is possible that the project managers manage them
by applying a general suitability based on the experience from similar projects [12].
An agreed upon definition about the risk in the structural world is as follows [7] :
Destruction results (𝐶𝑓) * destruction probability (𝑃𝑓) = risk (1)
2.1. The destruction result The destruction of a bridge is usually an important and considerable event and causes the losses of life
and property. In England, one bridge is destroyed per one or two years [13]. The destruction results have
been summarized in four groups [14]:
1- The human elements that are effective on the death rate and the physical damages include high traffic
loads, the pedestrians passing over or under the bridge, the destruction expansion (partial or complete),
the accumulation possibility, and the destruction nature such as ductile or fragile
2- The bioenvironmental destruction results from permeating of the dangerous ingredients, the kind of
intersection (road, rail, river), the industrial, urban, rural or coastal bridged region, and being exposed to
wind, storm, tempest, or earthquake.
3. The traffic delays and the digressive paths (in city roads, the acoustic pollution and heavy vehicles
passing cause the destruction of the road surface).
4. Economical factors include the cost of taking the construction materials residuals away, reconstruction,
the destruction indemnity of the vehicles, the environmental catharsis, and the legal costs.
2.2. Destruction possibility
The probable nature of the bridge destruction results from inaccurate mode in the estimating
operations of the maximal traffic load, randomizing the materials characteristics and, the lack of certainty
in the applied analysis methods for estimating the effects of load and capacities [14].
3 Methodology In this study, two different decisions making methods were used in definite and FUZZY modes to
evaluate the risk in various bridges in Babolsar as a pattern. In the Definite mode, the ANP decision
making methods and in the FUZZY mode the FSAW method were used. In ANP (network analysis), at first
the optimal points and the negative optima are determined. Then the distance of the other points are
calculated and compared to these points in return for each value and option that uses the distance
function.

G. Abdollahzadeh, F. Haghighi, M.J. Taheri Amiri / J. Math. Computer Sci. 8 (2014) 137 - 152
140
Finally, the options are compared to each other. The FUZZY data were also considered to make the
evaluation more authentic because they were closer to the reality and implement the uncertainty in the
model. Then through the FSAW method, the options were evaluated. In what follows, each of these
procedures is described.
3.1. FSAW procedure
In this procedure, just like many other decision making procedures, at first the criteria are scored or
given a point. Table 1 shows the basis of the Bigemen comparisons.
TABLE I- The basal values for judgment [15]
Preferences (oral judgment)
Numerical
Intensive 9 Very strong preference
7
Strong preference 5 Average preference 3
Equal preference 1 The preferences
among the mentioned distances
8,6,4,2
The simple aggregate weight model is one of the commonest procedures of multi-criterion decision
making. In this research, a triangular FUZZY number was used that is shown as (𝑎𝑙 , 𝑎𝑐 , 𝑎𝑢) , they show
low, average, and high values respectively. After calculating the weight of indices, we can simply use this
procedure. To use this procedure, the following steps are necessary:
-the 1st step: making the decision making matrix quantitative,
-the 2nd step: making the decision making matrix values not scale,
-the 3rd step: multiplying the value Matrix by the indices weight,
- The 4th step: making the data non-FUZZY based on the Yager method [16]:
A= ac+1/3 (𝑎𝑢 − 𝑎𝑙) (2)
- The 5th step: giving priority to the options.
3.2. ANP procedure According to Saati, ANP is a complete and general method compared to AHP which is not, it also allows
to analyze different problems by having and the interactive relations among the elements [17]. He
developed a method entitled ''Super-matrix'' to calculate the weight of these problems [18]. Super-
matrix regulates the effect of the elements connected to each other. By considering a matrix associated
to this method, we can point to this view that the ANP arranges not only the elements but also the
G. Abdollahzadeh, F. Haghighi, M.J. Taheri Amiri / J. Math. Computer Sci. 8 (2014) 137 - 152
141
clusters from the elements in relation with the right of priority [19]. The network analytical process,
ANP, is the only mathematical theory that allows to investigate various kinds of reactions and
dependencies systematically. The reason for the success of this method is the way of extracting the
judgments and using the mathematical measurement operations to measure the relative scales. The
preferences are conceiving numerical foundations that guide the primitive accounting operations
meaningfully [20]. Therefore, the ANP power is solidified by using the relative scales to control all
reactions for accurate forecasting and to make the decisions suitably. The step by step stages of ANP
method are as follows:
The 1st step: at first we determine the options and indices and develop a questionnaire based on it.
The 2ndstep: we do the Bigemen comparisons among the indices. Then we do the Bigemen comparisons
among the options for every index and make these comparisons for each option among the indices.
The 3rd step: we normalize the Bigemen comparisons.
The 4th step: obtaining the accounting average of every matrix line Bigemen comparisons normalized (it
is called relative weights).
The 5thstep: in this step, we form the relative weight matrix that is called primitive super-matrix or non-
weight super matrix.
The 6th step: this super matrix is cubed based on the Markova chain technique so that its lines incline to
fixed numbers. In this matrix the option that has the highest terminal weight is the best option.
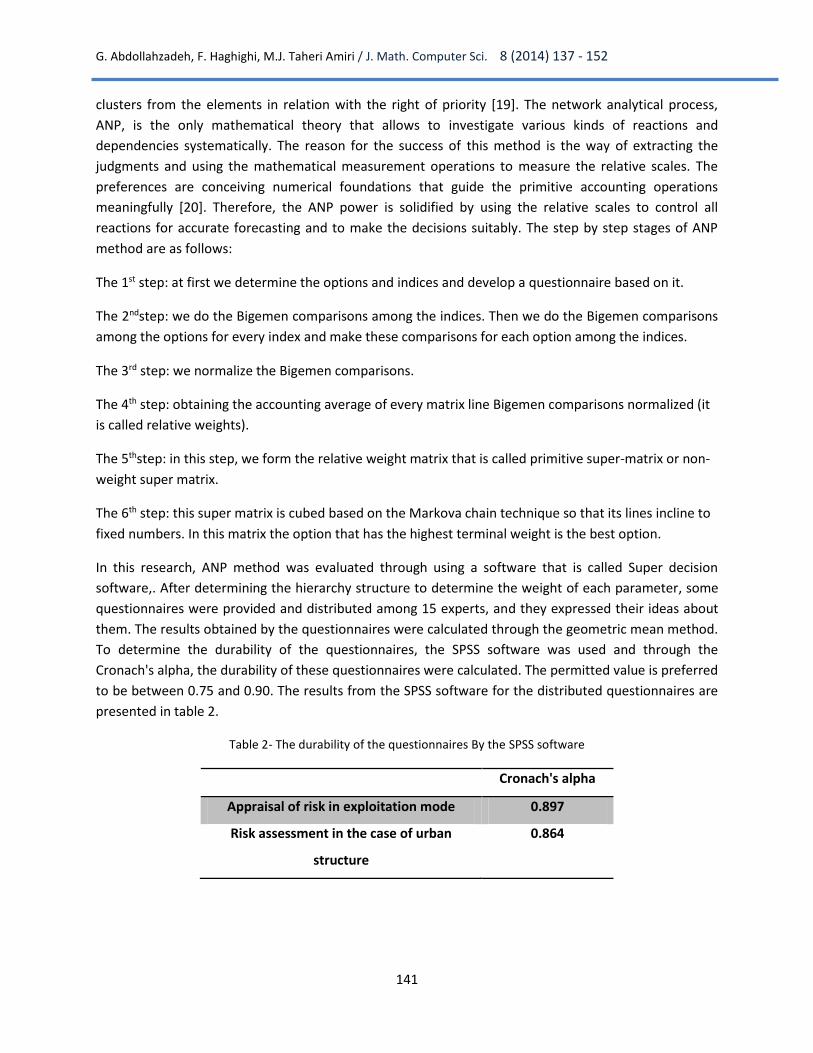
In this research, ANP method was evaluated through using a software that is called Super decision
software,. After determining the hierarchy structure to determine the weight of each parameter, some
questionnaires were provided and distributed among 15 experts, and they expressed their ideas about
them. The results obtained by the questionnaires were calculated through the geometric mean method.
To determine the durability of the questionnaires, the SPSS software was used and through the
Cronach's alpha, the durability of these questionnaires were calculated. The permitted value is preferred
to be between 0.75 and 0.90. The results from the SPSS software for the distributed questionnaires are
presented in table 2.
Table 2- The durability of the questionnaires By the SPSS software
Cronach's alpha
Appraisal of risk in exploitation mode 0.897
Risk assessment in the case of urban
structure
0.864
G. Abdollahzadeh, F. Haghighi, M.J. Taheri Amiri / J. Math. Computer Sci. 8 (2014) 137 - 152
142
4. The appraisal of the risk of the bridges in Babolsar
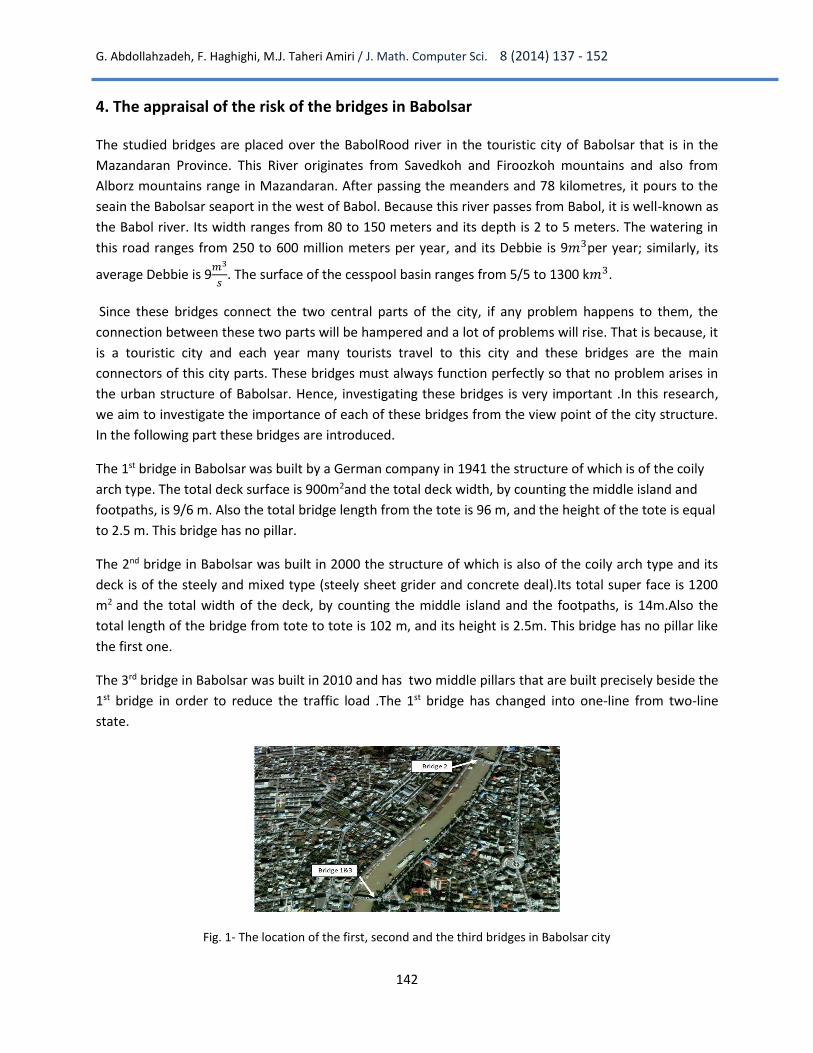
The studied bridges are placed over the BabolRood river in the touristic city of Babolsar that is in the
Mazandaran Province. This River originates from Savedkoh and Firoozkoh mountains and also from
Alborz mountains range in Mazandaran. After passing the meanders and 78 kilometres, it pours to the
seain the Babolsar seaport in the west of Babol. Because this river passes from Babol, it is well-known as
the Babol river. Its width ranges from 80 to 150 meters and its depth is 2 to 5 meters. The watering in
this road ranges from 250 to 600 million meters per year, and its Debbie is 9𝑚3per year; similarly, its
average Debbie is 9𝑚3
𝑠. The surface of the cesspool basin ranges from 5/5 to 1300 k𝑚3.
Since these bridges connect the two central parts of the city, if any problem happens to them, the
connection between these two parts will be hampered and a lot of problems will rise. That is because, it
is a touristic city and each year many tourists travel to this city and these bridges are the main
connectors of this city parts. These bridges must always function perfectly so that no problem arises in
the urban structure of Babolsar. Hence, investigating these bridges is very important .In this research,
we aim to investigate the importance of each of these bridges from the view point of the city structure.
In the following part these bridges are introduced.
The 1st bridge in Babolsar was built by a German company in 1941 the structure of which is of the coily
arch type. The total deck surface is 900m2and the total deck width, by counting the middle island and
footpaths, is 9/6 m. Also the total bridge length from the tote is 96 m, and the height of the tote is equal
to 2.5 m. This bridge has no pillar.
The 2nd bridge in Babolsar was built in 2000 the structure of which is also of the coily arch type and its
deck is of the steely and mixed type (steely sheet grider and concrete deal).Its total super face is 1200
m2 and the total width of the deck, by counting the middle island and the footpaths, is 14m.Also the
total length of the bridge from tote to tote is 102 m, and its height is 2.5m. This bridge has no pillar like
the first one.
The 3rd bridge in Babolsar was built in 2010 and has two middle pillars that are built precisely beside the
1st bridge in order to reduce the traffic load .The 1st bridge has changed into one-line from two-line
state.
Fig. 1- The location of the first, second and the third bridges in Babolsar city
G. Abdollahzadeh, F. Haghighi, M.J. Taheri Amiri / J. Math. Computer Sci. 8 (2014) 137 - 152
143
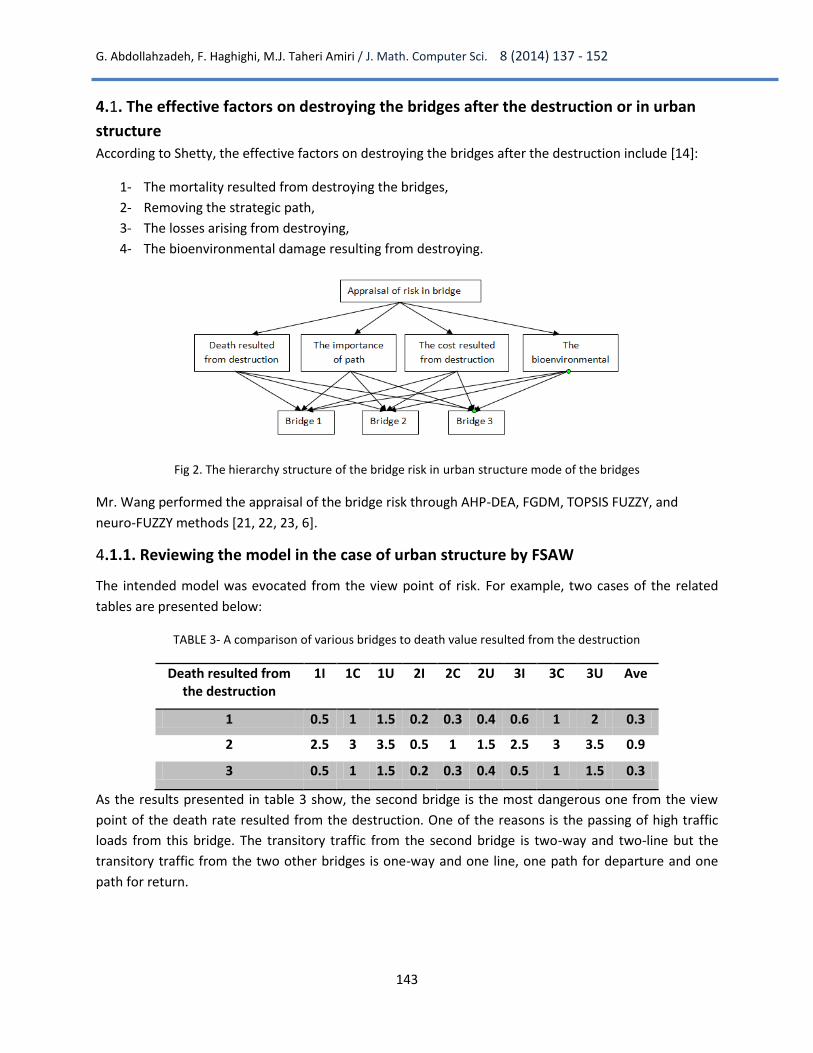
4.1. The effective factors on destroying the bridges after the destruction or in urban
structure
According to Shetty, the effective factors on destroying the bridges after the destruction include [14]:
1- The mortality resulted from destroying the bridges,
2- Removing the strategic path,
3- The losses arising from destroying,
4- The bioenvironmental damage resulting from destroying.
Fig 2. The hierarchy structure of the bridge risk in urban structure mode of the bridges
Mr. Wang performed the appraisal of the bridge risk through AHP-DEA, FGDM, TOPSIS FUZZY, and
neuro-FUZZY methods [21, 22, 23, 6].
4.1.1. Reviewing the model in the case of urban structure by FSAW
The intended model was evocated from the view point of risk. For example, two cases of the related
tables are presented below:
TABLE 3- A comparison of various bridges to death value resulted from the destruction
Death resulted from the destruction
1I 1C 1U 2I 2C 2U 3I 3C 3U Ave
1 0.5 1 1.5 0.2 0.3 0.4 0.6 1 2 0.3
2 2.5 3 3.5 0.5 1 1.5 2.5 3 3.5 0.9
3 0.5 1 1.5 0.2 0.3 0.4 0.5 1 1.5 0.3
As the results presented in table 3 show, the second bridge is the most dangerous one from the view
point of the death rate resulted from the destruction. One of the reasons is the passing of high traffic
loads from this bridge. The transitory traffic from the second bridge is two-way and two-line but the
transitory traffic from the two other bridges is one-way and one line, one path for departure and one
path for return.
G. Abdollahzadeh, F. Haghighi, M.J. Taheri Amiri / J. Math. Computer Sci. 8 (2014) 137 - 152
144
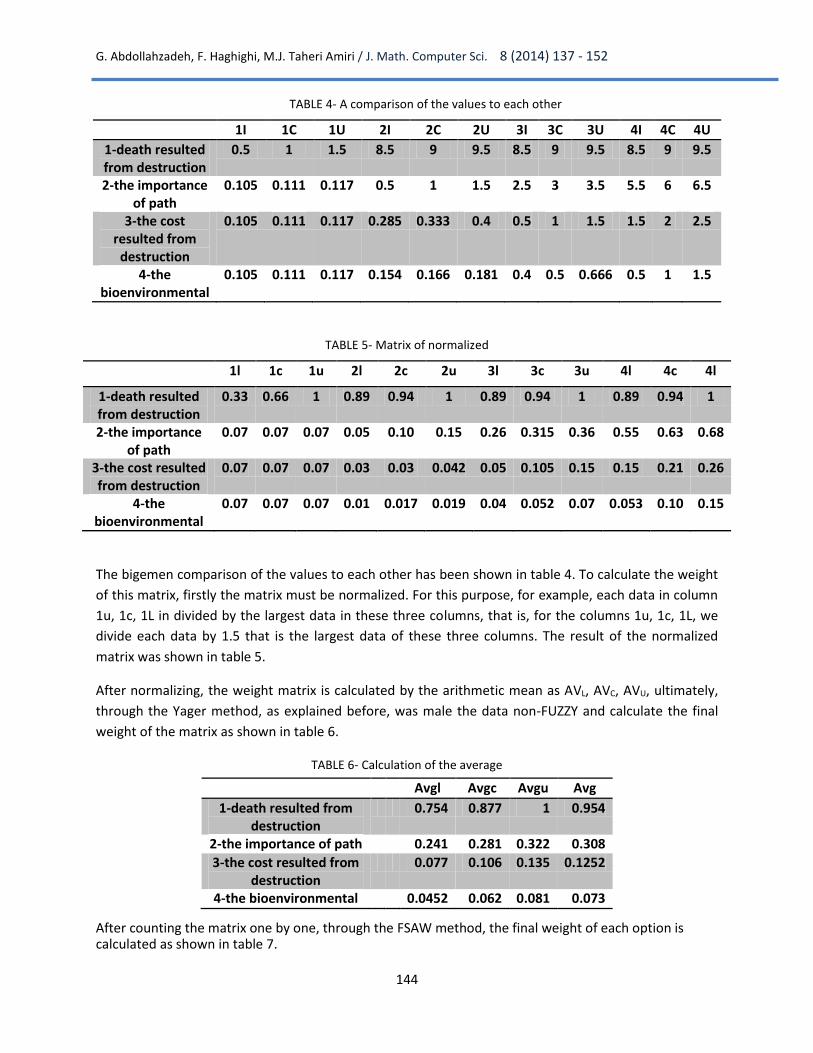
TABLE 4- A comparison of the values to each other
1I 1C 1U 2I 2C 2U 3I 3C 3U 4I 4C 4U
1-death resulted from destruction
0.5 1 1.5 8.5 9 9.5 8.5 9 9.5 8.5 9 9.5
2-the importance of path
0.105 0.111 0.117 0.5 1 1.5 2.5 3 3.5 5.5 6 6.5
3-the cost resulted from
destruction
0.105 0.111 0.117 0.285 0.333 0.4 0.5 1 1.5 1.5 2 2.5
4-the bioenvironmental
0.105 0.111 0.117 0.154 0.166 0.181 0.4 0.5 0.666 0.5 1 1.5
TABLE 5- Matrix of normalized
1l 1c 1u 2l 2c 2u 3l 3c 3u 4l 4c 4l
1-death resulted from destruction
0.33 0.66 1 0.89 0.94 1 0.89 0.94 1 0.89 0.94 1
2-the importance of path
0.07 0.07 0.07 0.05 0.10 0.15 0.26 0.315 0.36 0.55 0.63 0.68
3-the cost resulted from destruction
0.07 0.07 0.07 0.03 0.03 0.042 0.05 0.105 0.15 0.15 0.21 0.26
4-the bioenvironmental
0.07 0.07 0.07 0.01 0.017 0.019 0.04 0.052 0.07 0.053 0.10 0.15
The bigemen comparison of the values to each other has been shown in table 4. To calculate the weight
of this matrix, firstly the matrix must be normalized. For this purpose, for example, each data in column
1u, 1c, 1L in divided by the largest data in these three columns, that is, for the columns 1u, 1c, 1L, we
divide each data by 1.5 that is the largest data of these three columns. The result of the normalized
matrix was shown in table 5.
After normalizing, the weight matrix is calculated by the arithmetic mean as AVL, AVC, AVU, ultimately,
through the Yager method, as explained before, was male the data non-FUZZY and calculate the final
weight of the matrix as shown in table 6.
TABLE 6- Calculation of the average
Avgl Avgc Avgu Avg
1-death resulted from destruction
0.754 0.877 1 0.954
2-the importance of path 0.241 0.281 0.322 0.308
3-the cost resulted from destruction
0.077 0.106 0.135 0.1252
4-the bioenvironmental 0.0452 0.062 0.081 0.073
After counting the matrix one by one, through the FSAW method, the final weight of each option is calculated as shown in table 7.
G. Abdollahzadeh, F. Haghighi, M.J. Taheri Amiri / J. Math. Computer Sci. 8 (2014) 137 - 152
145
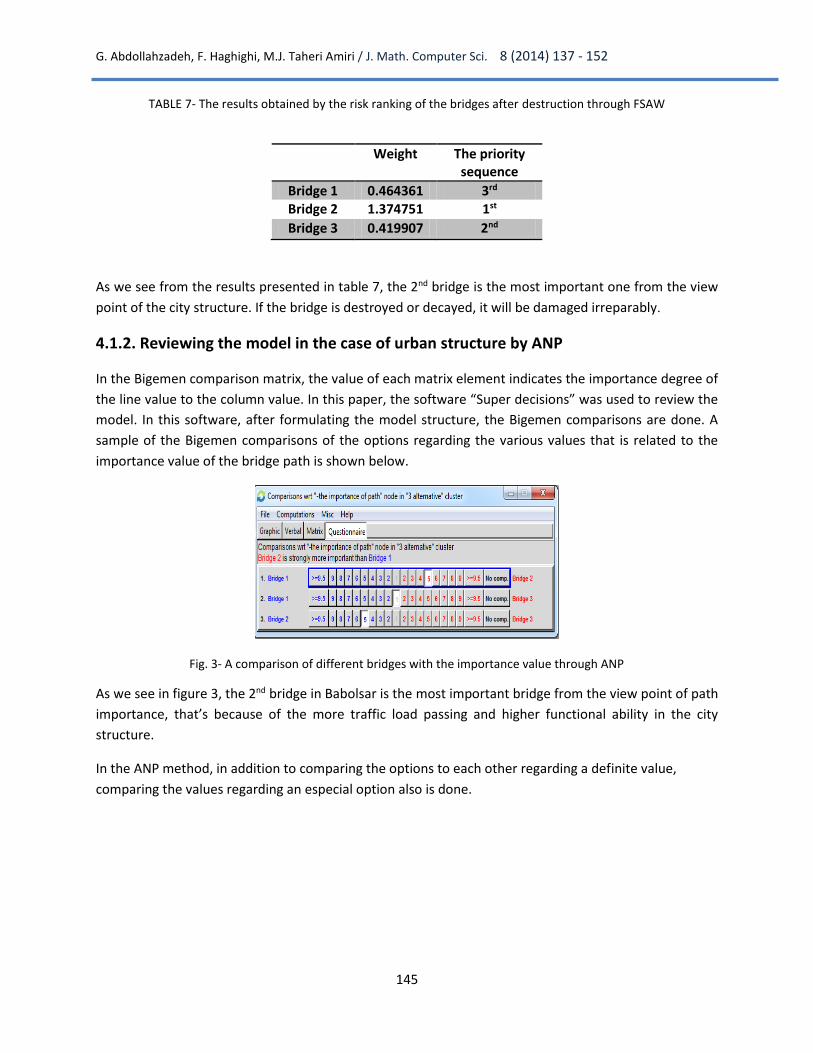
TABLE 7- The results obtained by the risk ranking of the bridges after destruction through FSAW
As we see from the results presented in table 7, the 2nd bridge is the most important one from the view
point of the city structure. If the bridge is destroyed or decayed, it will be damaged irreparably.
4.1.2. Reviewing the model in the case of urban structure by ANP
In the Bigemen comparison matrix, the value of each matrix element indicates the importance degree of
the line value to the column value. In this paper, the software “Super decisions” was used to review the
model. In this software, after formulating the model structure, the Bigemen comparisons are done. A
sample of the Bigemen comparisons of the options regarding the various values that is related to the
importance value of the bridge path is shown below.
Fig. 3- A comparison of different bridges with the importance value through ANP
As we see in figure 3, the 2nd bridge in Babolsar is the most important bridge from the view point of path
importance, that’s because of the more traffic load passing and higher functional ability in the city
structure.
In the ANP method, in addition to comparing the options to each other regarding a definite value,
comparing the values regarding an especial option also is done.
Weight The priority sequence
Bridge 1 0.464361 3rd Bridge 2 1.374751 1st
Bridge 3 0.419907 2nd

G. Abdollahzadeh, F. Haghighi, M.J. Taheri Amiri / J. Math. Computer Sci. 8 (2014) 137 - 152
146
Fig. 4-A comparison of different values regarding the 1st bridge option through ANP
After doing the Bigemen comparisons among the values and options, the Super decision software
constituted the super matrices by counting the weight of each matrix as shown in figure 5.
Fig. 5-The super matrix resulted from the matrices weight
After constituting the super matrices, we multiply these matrices by itself until the numbers on the
matrix surface are equal and show the final weight of the options .The prioritization of the options
weight are shown is figure 6.
Fig. 6- The ranking of the most important bridges from the viewpoint of the city structure through ANP
G. Abdollahzadeh, F. Haghighi, M.J. Taheri Amiri / J. Math. Computer Sci. 8 (2014) 137 - 152
147
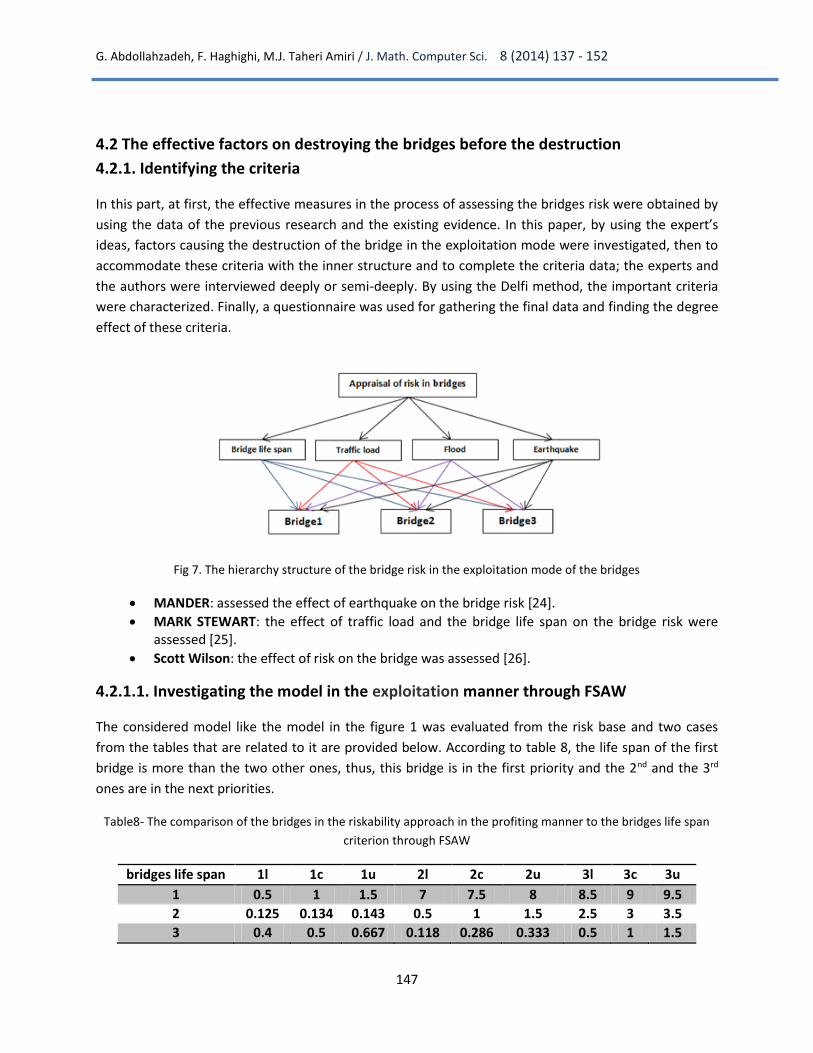
4.2 The effective factors on destroying the bridges before the destruction
4.2.1. Identifying the criteria
In this part, at first, the effective measures in the process of assessing the bridges risk were obtained by
using the data of the previous research and the existing evidence. In this paper, by using the expert’s
ideas, factors causing the destruction of the bridge in the exploitation mode were investigated, then to
accommodate these criteria with the inner structure and to complete the criteria data; the experts and
the authors were interviewed deeply or semi-deeply. By using the Delfi method, the important criteria
were characterized. Finally, a questionnaire was used for gathering the final data and finding the degree
effect of these criteria.
Fig 7. The hierarchy structure of the bridge risk in the exploitation mode of the bridges
MANDER: assessed the effect of earthquake on the bridge risk [24].
MARK STEWART: the effect of traffic load and the bridge life span on the bridge risk were assessed [25].
Scott Wilson: the effect of risk on the bridge was assessed [26].
4.2.1.1. Investigating the model in the exploitation manner through FSAW
The considered model like the model in the figure 1 was evaluated from the risk base and two cases
from the tables that are related to it are provided below. According to table 8, the life span of the first
bridge is more than the two other ones, thus, this bridge is in the first priority and the 2nd and the 3rd
ones are in the next priorities.
Table8- The comparison of the bridges in the riskability approach in the profiting manner to the bridges life span
criterion through FSAW
bridges life span 1l 1c 1u 2l 2c 2u 3l 3c 3u
1 0.5 1 1.5 7 7.5 8 8.5 9 9.5
2 0.125 0.134 0.143 0.5 1 1.5 2.5 3 3.5
3 0.4 0.5 0.667 0.118 0.286 0.333 0.5 1 1.5
G. Abdollahzadeh, F. Haghighi, M.J. Taheri Amiri / J. Math. Computer Sci. 8 (2014) 137 - 152
148
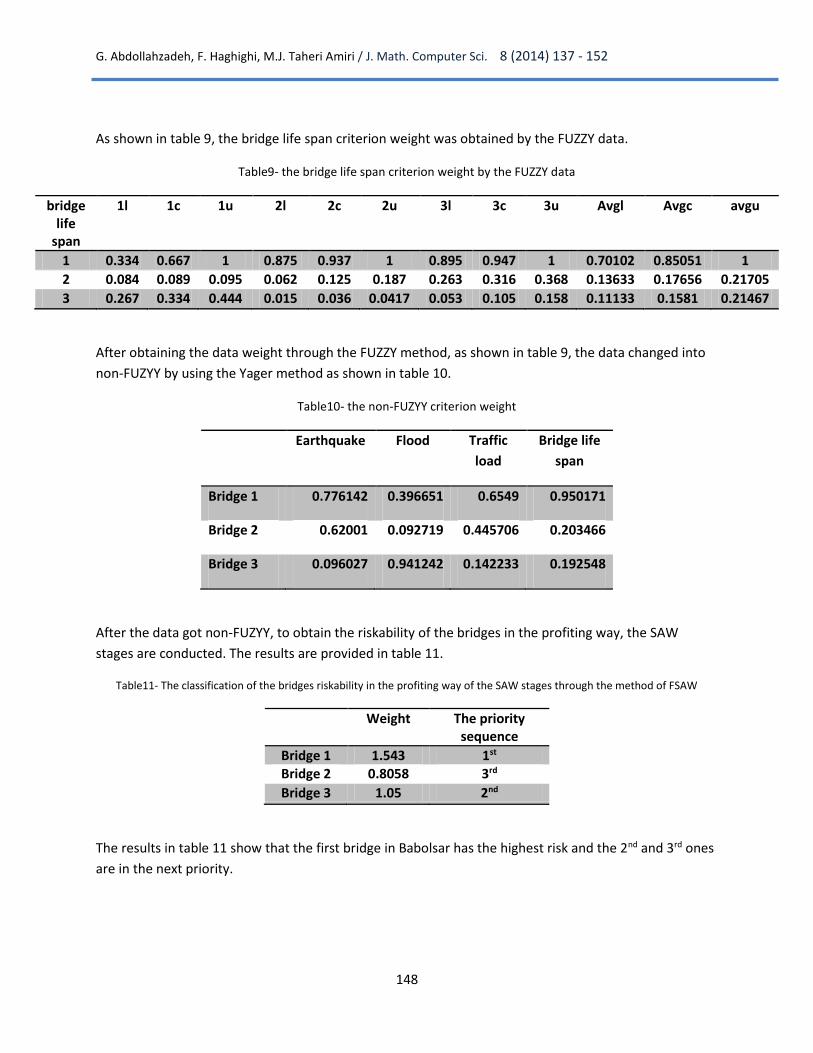
As shown in table 9, the bridge life span criterion weight was obtained by the FUZZY data.
Table9- the bridge life span criterion weight by the FUZZY data
bridge life
span
1l 1c 1u 2l 2c 2u 3l 3c 3u Avgl Avgc avgu
1 0.334 0.667 1 0.875 0.937 1 0.895 0.947 1 0.70102 0.85051 1
2 0.084 0.089 0.095 0.062 0.125 0.187 0.263 0.316 0.368 0.13633 0.17656 0.21705
3 0.267 0.334 0.444 0.015 0.036 0.0417 0.053 0.105 0.158 0.11133 0.1581 0.21467
After obtaining the data weight through the FUZZY method, as shown in table 9, the data changed into
non-FUZYY by using the Yager method as shown in table 10.
Table10- the non-FUZYY criterion weight
Earthquake Flood Traffic
load
Bridge life
span
Bridge 1 0.776142 0.396651 0.6549 0.950171
Bridge 2 0.62001 0.092719 0.445706 0.203466
Bridge 3 0.096027 0.941242 0.142233 0.192548
After the data got non-FUZYY, to obtain the riskability of the bridges in the profiting way, the SAW
stages are conducted. The results are provided in table 11.
Table11- The classification of the bridges riskability in the profiting way of the SAW stages through the method of FSAW
Weight The priority sequence
Bridge 1 1.543 1st Bridge 2 0.8058 3rd
Bridge 3 1.05 2nd
The results in table 11 show that the first bridge in Babolsar has the highest risk and the 2nd and 3rd ones
are in the next priority.
G. Abdollahzadeh, F. Haghighi, M.J. Taheri Amiri / J. Math. Computer Sci. 8 (2014) 137 - 152
149
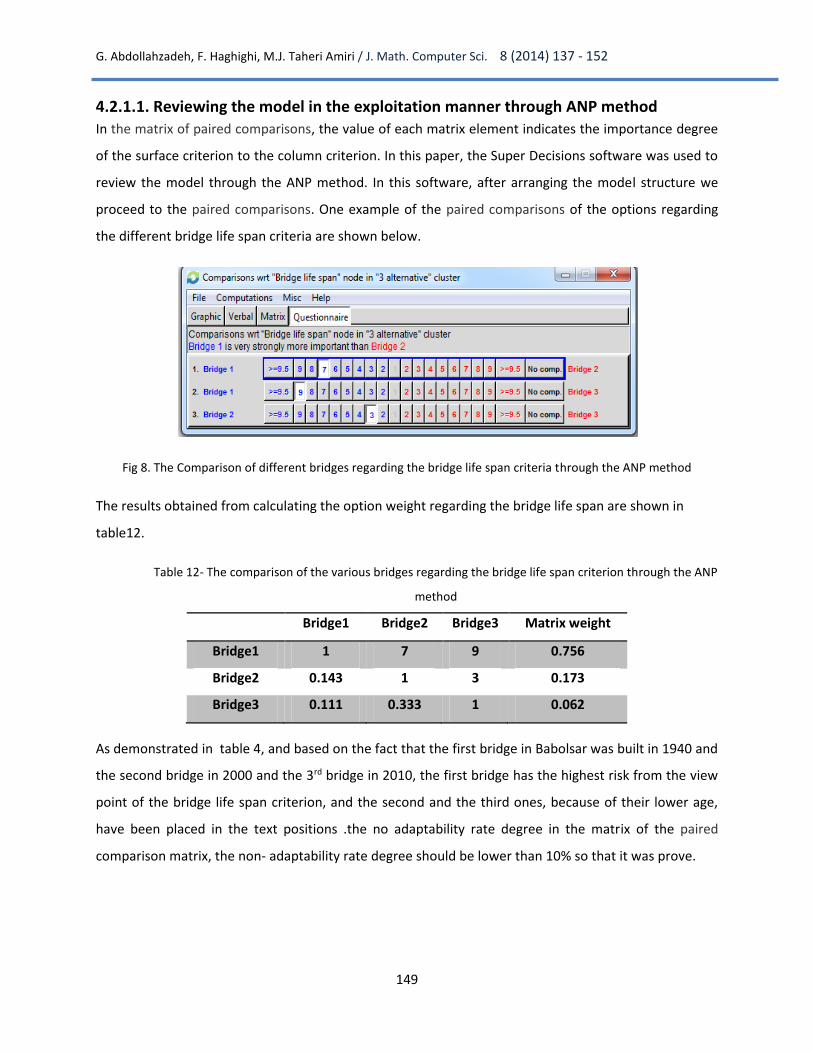
4.2.1.1. Reviewing the model in the exploitation manner through ANP method
In the matrix of paired comparisons, the value of each matrix element indicates the importance degree
of the surface criterion to the column criterion. In this paper, the Super Decisions software was used to
review the model through the ANP method. In this software, after arranging the model structure we
proceed to the paired comparisons. One example of the paired comparisons of the options regarding
the different bridge life span criteria are shown below.
Fig 8. The Comparison of different bridges regarding the bridge life span criteria through the ANP method
The results obtained from calculating the option weight regarding the bridge life span are shown in
table12.
Table 12- The comparison of the various bridges regarding the bridge life span criterion through the ANP
method
Bridge1 Bridge2 Bridge3 Matrix weight
Bridge1 1 7 9 0.756
Bridge2 0.143 1 3 0.173
Bridge3 0.111 0.333 1 0.062
As demonstrated in table 4, and based on the fact that the first bridge in Babolsar was built in 1940 and
the second bridge in 2000 and the 3rd bridge in 2010, the first bridge has the highest risk from the view
point of the bridge life span criterion, and the second and the third ones, because of their lower age,
have been placed in the text positions .the no adaptability rate degree in the matrix of the paired
comparison matrix, the non- adaptability rate degree should be lower than 10% so that it was prove.
G. Abdollahzadeh, F. Haghighi, M.J. Taheri Amiri / J. Math. Computer Sci. 8 (2014) 137 - 152
150
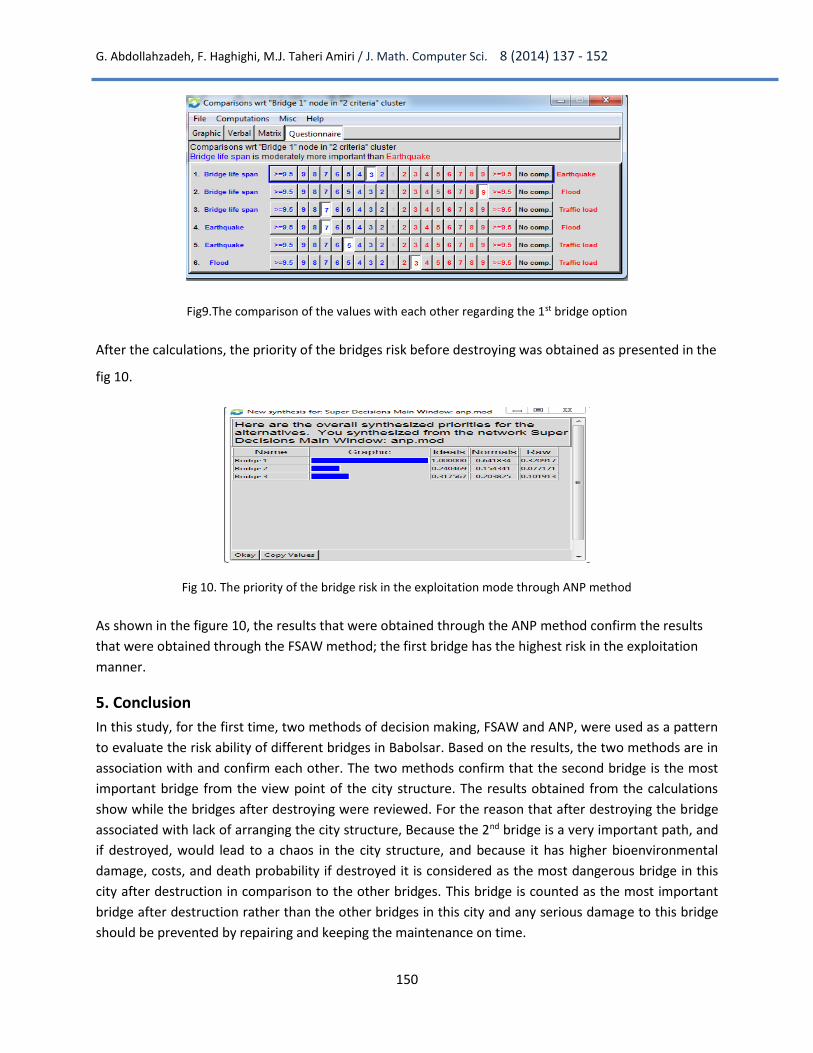
Fig9.The comparison of the values with each other regarding the 1st bridge option
After the calculations, the priority of the bridges risk before destroying was obtained as presented in the
fig 10.
Fig 10. The priority of the bridge risk in the exploitation mode through ANP method
As shown in the figure 10, the results that were obtained through the ANP method confirm the results
that were obtained through the FSAW method; the first bridge has the highest risk in the exploitation
manner.
5. Conclusion
In this study, for the first time, two methods of decision making, FSAW and ANP, were used as a pattern
to evaluate the risk ability of different bridges in Babolsar. Based on the results, the two methods are in
association with and confirm each other. The two methods confirm that the second bridge is the most
important bridge from the view point of the city structure. The results obtained from the calculations
show while the bridges after destroying were reviewed. For the reason that after destroying the bridge
associated with lack of arranging the city structure, Because the 2nd bridge is a very important path, and
if destroyed, would lead to a chaos in the city structure, and because it has higher bioenvironmental
damage, costs, and death probability if destroyed it is considered as the most dangerous bridge in this
city after destruction in comparison to the other bridges. This bridge is counted as the most important
bridge after destruction rather than the other bridges in this city and any serious damage to this bridge
should be prevented by repairing and keeping the maintenance on time.
G. Abdollahzadeh, F. Haghighi, M.J. Taheri Amiri / J. Math. Computer Sci. 8 (2014) 137 - 152
151
Reviewing the factors effective on the destruction of the bridges showed that, the first bridge in this
city, due to its high age and weakness in the structural construction is weaker under factors like the
earthquake, flood, traffic load, and etc, and has higher risk in comparison to the other bridges. As the
destruction factors often refer to the structural construction of such bridges, this bridge also needs to be
reviewed structurally. Therefore, the first bridge, by considering all aspects, is the most dangerous
bridge of the city and the second and the third bridges are the next priorities. Because of the probable
damages that may happen to the first bridge, it is recommended to study the bridge structurally as soon
as possible, and either make it resistant or remove it from the list of the urban bridges and substitute it
with a new one.
6. References [1] B. Adey, R. Hajdin and E. Bruhwiler, Risk-based approach to determination of optimal interventions for bridges
affected by multiple hazards, engineering structures, 25, 903-912, (2003)
[2] P.A. Johnson, S.L. Niezgoda, Risk-based method for selecting Bridge Scour counter measures, Journal of
Hydrolic Engineering, 130(2), 121-128, (2004)
[3] S. M. Stein, G.K. Young and K.C. Wang, Evaluating tourist risks from fuzzy perspectives. Annals of Tourism
Research, 24, 796-812. (1997)
[4] Z. Lounis, Risk-based maintenance optimization of bridge structure, (2004)
[5] British Highways Agency, “Value Management of the structures Renewal Programme”, Version 2.2. (2004)
[6] Y.M. Wang, M.S. Elhag, An adaptive neuro-fuzzy inference system for bridge risk assessment, Expert Systems
with Applications, 3099-3106, (2008)
[7] “Bridge Management”, Department of Transportation, Department of Education, Institute for Transportation
Research and Technology, (in Persian). (2006)
[8] H. Petroski, “Engineers of Dreams”, Allfred A. Knopf, New York, (1995)
[9] J.W.S. Maxwell, “highway bridge management”, First International Conference on Bridge Management, pp.
113-120, Elsevier. (1990), London
[10] D. McIntyre, “Weak bridges: the impact on freight movement”. Proc. Conference on British Roads: National
asset or national Disgrace, Sponsored by Surveyor Magazine and the Automobile Association, (1997)
[11] K.R. Dunker, B.G. Rabbat, “Why America s bridges are crumbling”, 66-72. (1993)
[12] “Project Management Body of Knowledge”, ANSI/PMI-001-99/2008, PMI Institute, USA. (2008)
[13] J.B. Menzies, {Bridges Failures, hazards and societal risk}, Symposium on the safety of Bridges(Ed) P .G.Das,
ICE, pp.36-41, (1997), London
[14] N.K. Shetty, M.S. Chubb and D. Halden, {an overall risk-based assessment procedure for substandard bridges, Symposium on the safety of Bridges}, (Ed) P .G. Das, pp.225-235, ICE, (1997), London. [15] T.L. Saaty, “The analytic hierarchy process NewYork”, McGrow-Hill, (1980)
[16] Peidro, D. Mula, J. Poler and R. Verdegay, j, l. Fuzzy optimization for supply chain planning under supply,
demand and process uncertainties, (2009)
[17] J. Castro, D. Gomez and Tejada, A polynomial rule for the problem of sharing delay costs in PERT Network,
Computers & Operations Research 35, pp. 2376-2387, (2008)
[18] T.L. Saaty, “Decision making with dependence and feedback”, RWS Publications, Pittsburgh, PA, (1996)
[19] T.L. Saaty,”Fundamental of the Analytic Network Process”, ISAHP, JAPAN: Kobe, (1999)
[20] T.L. Saaty, “Fundamental of the analytic network process”, Dependence and feedback in Decision-making with
a single Network, Pittsburgh: university of Pittsburgh, (2004)
[21] Y.M. Wang, J. Liu, M.S. Elhag, An integrated AHP-DEA methodology for bridge risk assessment, Computers
&Industrial Engineering, 53, 513-525, (2008)
G. Abdollahzadeh, F. Haghighi, M.J. Taheri Amiri / J. Math. Computer Sci. 8 (2014) 137 - 152
152
[22] Y.M. Wang, M.S. Elhag, A Fuzzy Group Decision Making approach for bridge risk assessment, Computers
&Industrial Engineering, 53, 137-148., (2007)
[23] Y.M. Wang, M.S. Elhag, Fuzzy-TOPSIS method based on alpha level sets with an application to bridge risk
assessment, Expert Systems with Applications, 309-319, (2006)
[24] J.B. Mander, R.P. Dhakal, N. Mashiko, M. Sabery, International dynamic analysis applied to seismic financial
risk assessment of bridges,Engineering Structures, 29. 2662-2672, (2007)
[25] M.G. Stewart, Reliability-based assessment of ageing bridges using risk ranking and life cycle cost decision
analyses, Reliability Engineering and system safety,74, 263-273,(2001)
[26] S. Wilson, Walton Bridge Flood Risk Assessment, (Report), (2004)