The analytical problem of measuring total concentrations of organic pollutants in whole water
12
This article appeared in a journal published by Elsevier. The attached copy is furnished to the author for internal non-commercial research and education use, including for instruction at the authors institution and sharing with colleagues. Other uses, including reproduction and distribution, or selling or licensing copies, or posting to personal, institutional or third party websites are prohibited. In most cases authors are permitted to post their version of the article (e.g. in Word or Tex form) to their personal website or institutional repository. Authors requiring further information regarding Elsevier’s archiving and manuscript policies are encouraged to visit: http://www.elsevier.com/copyright
-
Upload
independent -
Category
Documents
-
view
1 -
download
0
Transcript of The analytical problem of measuring total concentrations of organic pollutants in whole water
This article appeared in a journal published by Elsevier. The attachedcopy is furnished to the author for internal non-commercial researchand education use, including for instruction at the authors institution
and sharing with colleagues.
Other uses, including reproduction and distribution, or selling orlicensing copies, or posting to personal, institutional or third party
websites are prohibited.
In most cases authors are permitted to post their version of thearticle (e.g. in Word or Tex form) to their personal website orinstitutional repository. Authors requiring further information
regarding Elsevier’s archiving and manuscript policies areencouraged to visit:
http://www.elsevier.com/copyright
Author's personal copy
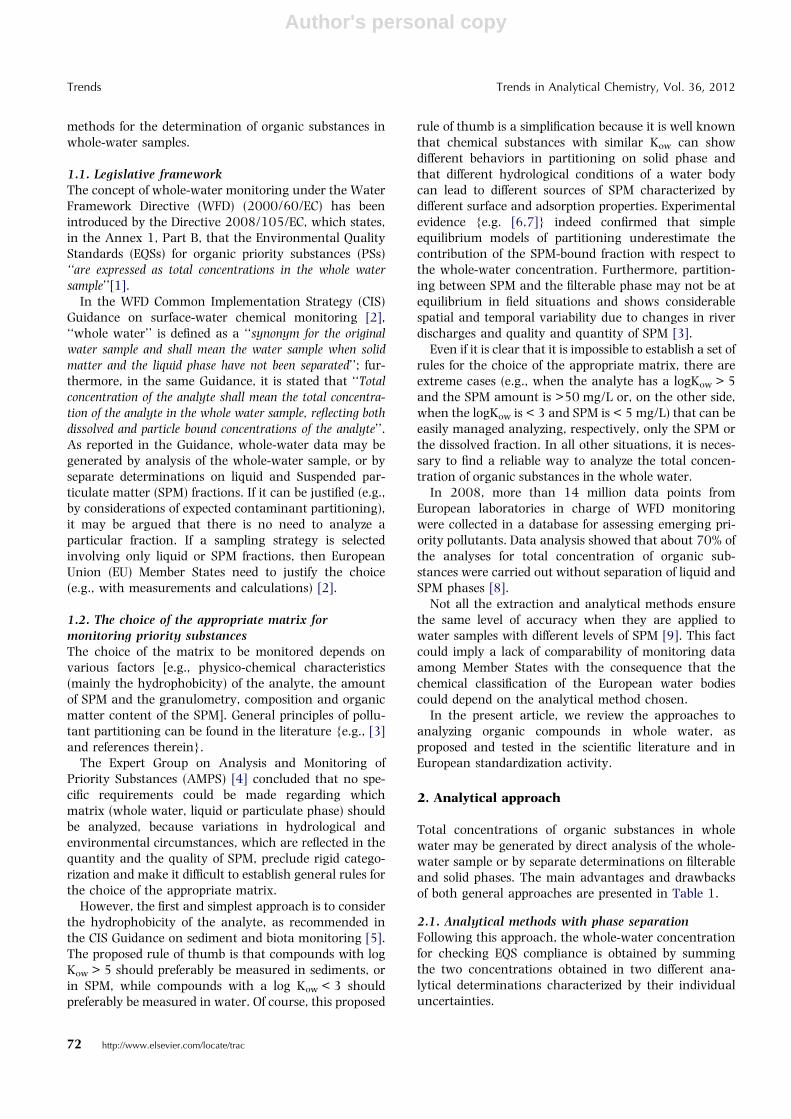
The analytical problem ofmeasuring total concentrations oforganic pollutants in whole waterN. Ademollo, L. Patrolecco, S. Polesello, S. Valsecchi, J. Wollgast, G. Mariani,
G. Hanke
The Water Framework Directive (WFD) (2000/60/EC) of the European Union provides protection from chemical pollutants
through the Environmental Quality Standards (EQS) Directive (2008/105/EC), which sets EQSs for priority substances (PSs) and
certain other pollutants, according to the requirements set out in Article 16(8) of the WFD. For organic PSs, these EQSs are
expressed as total concentrations in the whole-water sample. Total concentrations can be obtained by direct analysis of the
whole-water sample or by separate determinations on filterable and solid phases. Both solutions have their advantages and
drawbacks, which we critically discuss in the present review.
Analysis of data in the literature and experience from standardization activities show that it is possible to find a simple
extraction method for analyzing whole water without time-consuming separation steps. The solid-phase extraction disk is now
subject to standardization efforts as the most promising technique to achieve this goal. We discuss limitations of this approach in
the light of the consequences for chemical-status assessment.
ª 2012 Elsevier Ltd. All rights reserved.
Keywords: Chemical monitoring; Extraction method; Liquid-liquid extraction (LLE); Membrane-extraction disk; Organic pollutant; Priority substance;
Pressurized-liquid extraction (PLE); Suspended particulate matter (SPM); Water Framework Directive (WFD); Whole-water analysis
Abbreviations: CFC, Continuous-flow centrifugation; CRM, Certified reference material; EQS, Environmental quality standard; LLE, Liquid-liquid
extraction; PAH, Polycyclic aromatic hydrocarbon; PBDE, Polybrominated diphenyl ether; PCB, Polychlorinated biphenyl; PCDD, Polychlorinated
dibenzodioxin; PCDF, Polychlorinated dibenzofurans; PLE, Pressurized-liquid extraction; PT, Proficiency test; SBSE, Stir-bar sorptive extraction;
SCCP, Short-chain chlorinated paraffin; SPE, Solid-phase extraction; SPM, Suspended particulate matter; TBT, Tributyltin; TOC, Total organic
carbon; WFD, Water Framework Directive
1. Introduction
Organic substances discharged into awater body are subjected to a partitionbetween dissolved and suspended solidphases. Organisms are exposed to thecontaminants present in both phases viabioconcentration from water and sus-pended solid ingestion. As a consequence,for ecosystem protection, it is important toanalyze the total concentration of organicsubstances, which is defined as the con-centration of substances in whole-watersamples. This concept has also been rec-ognized in the European monitoring pro-grams for the chemical-status assessmentof the water bodies. The implementation ofmonitoring plans requires the availabilityof reliable and cost-effective analytical
N. Ademollo, L. Patrolecco
CNR-IRSA, Via Salaria Km 29,300, 00015 Monterotondo Scalo (Roma), Italy
S. Polesello*, S. Valsecchi
CNR-IRSA, Via del Mulino 19, 20861 Brugherio (MB), Italy
J. Wollgast
Institute for Health and Consumer Protection, T.P. 202,
European Commission Joint Research Centre (JRC), I-21027 Ispra (VA), Italy
G. Mariani, G. Hanke
Institute for Environment and Sustainability T.P. 290,
European Commission Joint Research Centre (JRC), I-21027 Ispra (VA), Italy
*Corresponding author.
E-mail: [email protected]
Trends in Analytical Chemistry, Vol. 36, 2012 Trends
0165-9936/$ - see front matter ª 2012 Elsevier Ltd. All rights reserved. http://dx.doi.org/10.1016/j.trac.2012.01.008 71
Author's personal copy
methods for the determination of organic substances inwhole-water samples.
1.1. Legislative frameworkThe concept of whole-water monitoring under the WaterFramework Directive (WFD) (2000/60/EC) has beenintroduced by the Directive 2008/105/EC, which states,in the Annex 1, Part B, that the Environmental QualityStandards (EQSs) for organic priority substances (PSs)‘‘are expressed as total concentrations in the whole watersample’’[1].
In the WFD Common Implementation Strategy (CIS)Guidance on surface-water chemical monitoring [2],‘‘whole water’’ is defined as a ‘‘synonym for the originalwater sample and shall mean the water sample when solidmatter and the liquid phase have not been separated’’; fur-thermore, in the same Guidance, it is stated that ‘‘Totalconcentration of the analyte shall mean the total concentra-tion of the analyte in the whole water sample, reflecting bothdissolved and particle bound concentrations of the analyte’’.As reported in the Guidance, whole-water data may begenerated by analysis of the whole-water sample, or byseparate determinations on liquid and Suspended par-ticulate matter (SPM) fractions. If it can be justified (e.g.,by considerations of expected contaminant partitioning),it may be argued that there is no need to analyze aparticular fraction. If a sampling strategy is selectedinvolving only liquid or SPM fractions, then EuropeanUnion (EU) Member States need to justify the choice(e.g., with measurements and calculations) [2].
1.2. The choice of the appropriate matrix formonitoring priority substancesThe choice of the matrix to be monitored depends onvarious factors [e.g., physico-chemical characteristics(mainly the hydrophobicity) of the analyte, the amountof SPM and the granulometry, composition and organicmatter content of the SPM]. General principles of pollu-tant partitioning can be found in the literature {e.g., [3]and references therein}.
The Expert Group on Analysis and Monitoring ofPriority Substances (AMPS) [4] concluded that no spe-cific requirements could be made regarding whichmatrix (whole water, liquid or particulate phase) shouldbe analyzed, because variations in hydrological andenvironmental circumstances, which are reflected in thequantity and the quality of SPM, preclude rigid catego-rization and make it difficult to establish general rules forthe choice of the appropriate matrix.
However, the first and simplest approach is to considerthe hydrophobicity of the analyte, as recommended inthe CIS Guidance on sediment and biota monitoring [5].The proposed rule of thumb is that compounds with logKow > 5 should preferably be measured in sediments, orin SPM, while compounds with a log Kow < 3 shouldpreferably be measured in water. Of course, this proposed
rule of thumb is a simplification because it is well knownthat chemical substances with similar Kow can showdifferent behaviors in partitioning on solid phase andthat different hydrological conditions of a water bodycan lead to different sources of SPM characterized bydifferent surface and adsorption properties. Experimentalevidence {e.g. [6,7]} indeed confirmed that simpleequilibrium models of partitioning underestimate thecontribution of the SPM-bound fraction with respect tothe whole-water concentration. Furthermore, partition-ing between SPM and the filterable phase may not be atequilibrium in field situations and shows considerablespatial and temporal variability due to changes in riverdischarges and quality and quantity of SPM [3].
Even if it is clear that it is impossible to establish a set ofrules for the choice of the appropriate matrix, there areextreme cases (e.g., when the analyte has a logKow > 5and the SPM amount is >50 mg/L or, on the other side,when the logKow is < 3 and SPM is < 5 mg/L) that can beeasily managed analyzing, respectively, only the SPM orthe dissolved fraction. In all other situations, it is neces-sary to find a reliable way to analyze the total concen-tration of organic substances in the whole water.
In 2008, more than 14 million data points fromEuropean laboratories in charge of WFD monitoringwere collected in a database for assessing emerging pri-ority pollutants. Data analysis showed that about 70% ofthe analyses for total concentration of organic sub-stances were carried out without separation of liquid andSPM phases [8].
Not all the extraction and analytical methods ensurethe same level of accuracy when they are applied towater samples with different levels of SPM [9]. This factcould imply a lack of comparability of monitoring dataamong Member States with the consequence that thechemical classification of the European water bodiescould depend on the analytical method chosen.
In the present article, we review the approaches toanalyzing organic compounds in whole water, asproposed and tested in the scientific literature and inEuropean standardization activity.
2. Analytical approach
Total concentrations of organic substances in wholewater may be generated by direct analysis of the whole-water sample or by separate determinations on filterableand solid phases. The main advantages and drawbacksof both general approaches are presented in Table 1.
2.1. Analytical methods with phase separationFollowing this approach, the whole-water concentrationfor checking EQS compliance is obtained by summingthe two concentrations obtained in two different ana-lytical determinations characterized by their individualuncertainties.
Trends Trends in Analytical Chemistry, Vol. 36, 2012
72 http://www.elsevier.com/locate/trac
Author's personal copy
Reporting separately the results of dissolved and SPMcontaminant concentrations could be valuable in envi-ronmental risk assessment of a river basin [7,9], but thedistribution of organic compounds into the two differentphases is strongly affected by the separation techniqueused, since the distinction between the dissolved phaseand the solid phase is operationally defined and eachseparation procedure leads to its own partition artifacts.Nevertheless, these artifacts do not significantly influ-ence the measurement of the total concentration inwhole water for checking EQS compliance.
Filtration is the simplest way to provide both aqueousand solid matrices for contaminant analysis. Clogging,analyte adsorption on the filter and on the layer ofparticulate matter accumulating on the filter are themain problems encountered during filtration [10–12].Analyte adsorption can alter the partitioning analysis,modifying the distribution of the analyte in the twophases, even if the total concentration is not significantlyaffected because the filter with SPM is then solvent
extracted. The need to filter large sample volumes inorder to obtain sufficient amounts of SPM for subsequentanalysis also increases the risk of contaminant releasefrom the filter material. Depth filtration with glass-fiberfilters having a nominal retention rate of 0.7 lm at 98%efficiency is commonly used for the analysis of organiccompounds due to the solvent resistance of the filtermaterial.
Clogging can be avoided by sequential filtrationthrough an array of filters with decreasing cut-off size[13]. Sorption of dissolved analytes onto the accumu-lating particle layer could be reduced by filtering smallersample portions per filter or optimizing the volume-to-surface ratio.
After the separation, particulate and dissolved frac-tions undergo separate analytical procedures, doublingthe extraction and analytical steps. Nevertheless, in thisway, it is possible to apply proper standardized and val-idated methods to each separate phase, although theneed to perform additional sample-handling steps can
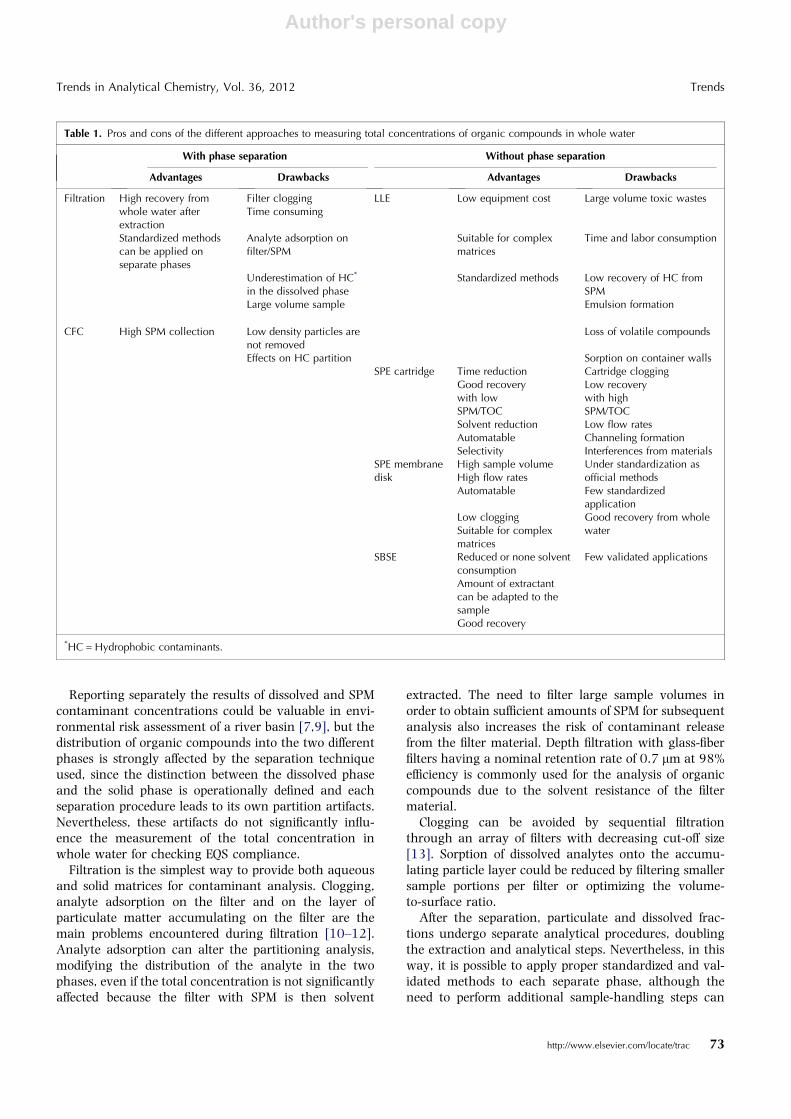
Table 1. Pros and cons of the different approaches to measuring total concentrations of organic compounds in whole water
With phase separation Without phase separation
Advantages Drawbacks Advantages Drawbacks
Filtration High recovery fromwhole water afterextraction
Filter cloggingTime consuming
LLE Low equipment cost Large volume toxic wastes
Standardized methodscan be applied onseparate phases
Analyte adsorption onfilter/SPM
Suitable for complexmatrices
Time and labor consumption
Underestimation of HC*
in the dissolved phaseStandardized methods Low recovery of HC from
SPMLarge volume sample Emulsion formation
CFC High SPM collection Low density particles arenot removed
Loss of volatile compounds
Effects on HC partition Sorption on container wallsSPE cartridge Time reduction Cartridge clogging
Good recoverywith lowSPM/TOC
Low recoverywith highSPM/TOC
Solvent reduction Low flow ratesAutomatable Channeling formationSelectivity Interferences from materials
SPE membranedisk
High sample volumeHigh flow rates
Under standardization asofficial methods
Automatable Few standardizedapplication
Low cloggingSuitable for complexmatrices
Good recovery from wholewater
SBSE Reduced or none solventconsumption
Few validated applications
Amount of extractantcan be adapted to thesampleGood recovery
*HC = Hydrophobic contaminants.
Trends in Analytical Chemistry, Vol. 36, 2012 Trends
http://www.elsevier.com/locate/trac 73
Author's personal copy
increase the risk of sample contamination or increasedblank values. While filtered water is usually extracted bysolid-phase extraction (SPE), particulate matter collectedon filter can be subjected to different extraction proce-dures – from washing with few mL of solvent [13] – tothe traditional methods for soil and sediment {Soxhlet[14], pressurized-liquid [14,15] and ultrasonic-assisted[16] extraction}. Heemken et al. [14] compared thedifferent extraction techniques for the determination oforganic micropollutants in SPM.
Some improvements in handling the filtration stephave been obtained by designing apparatus for simul-taneous filtration and extraction [17]. The proposeddesign has the main advantage of enabling isolation ofSPM and preconcentration of the analyte in a single step.The SPE cartridge and the filter are then extracted sep-arately. The procedure can be performed easily in thefield. Application of a glass-bead filtration bed instead ofa filter prevents possible clogging of the filter and the SPEcartridge. The vessel can also be used in combinationwith an Empore disk (3 M, St. Paul, MN, USA). Thisdevice has been used for the analysis of PAHs, PCBs [17]and pesticides [18].
An alternative to filtration is continuous flow centri-fugation (CFC), which is a well-established techniqueused to collect large amounts of suspended solids innatural surface waters [13,15]. One of the limitationsduring centrifugation is that particles with low densityare not sampled quantitatively and particles with densityequal to or lower than water are not removed, sohydrophobic compounds accumulated on them can belost.
Chemical characterization of SPM collected by filtra-tion (0.45 lm) and CFC usually compare favorably forwater containing large amounts of suspended solids[19,20]. However, the situation differs for waters havinglow ionic strength, low levels of SPM, and relatively highamounts of organic matter, where comparison of filtra-tion and CFC is less straightforward, as demonstrated inthe case of organochlorine analysis [21]. CFC is a veryefficient system for collecting large amounts of SPM infield, achieving a good separation of solid and water(91–98%) [13,22], but the dissolved portion is notimmediately accessible from the output of the centrifuge.The possibility of using CFC effluent for analysis of thefilterable fraction has been tested only for metal analysis[20,23].
2.2. Analytical methods without phase separationThe alternative, desirable approach is to find a method ofextraction, which determines the total concentration inwhole water, avoiding the phase-separation step.
Traditionally, liquid-liquid extraction (LLE) methodshave been used in order to deal with ‘‘dirty’’ or unfil-terable samples: omitting the known drawbacks intrinsicto the technique (e.g., production of toxic wastes, the
time taken, the labor required and the formation ofemulsion), the critical point is the recovery of the ana-lytes in the presence of particulate and/or dissolved or-ganic carbon, since the organic solvent cannoteffectively penetrate into the particles or micro-aggre-gates surrounded by water.
Validation studies on difficult matrices (e.g., waste-water and sewage-sludge samples) demonstrated thatLLE recovery was also satisfactory for hydrophobiccompounds (e.g., PAHs) [24,25], but the spiking methodused for recovery assessment is always questionable.
However, LLE requires a phase-separation step andsubsequent drying of the organic phase with a desiccant,which could be hampered by a complex matrix and thuslead to loss of analyte. Both sample solution and organicsolvents get into contact with large container andequipment surfaces during LLE, which can lead tosorption of analytes. Evaporation and/or switching ofsolvents can further reduce the amount of analytesavailable to the analysis, especially of highly volatilecompounds [26].
For many years, LLE methods have been replaced bythe SPE technique, which avoids the formation ofemulsions, reduces the analysis time and the amount ofsolvent needed and can be easily automated. SPE hasbeen applied to water samples with and without a pre-ceding filtration step. Some authors {e.g., Sanchez-Avilaet al. [27]} have claimed that SPE without filtrationavoids underestimating the total concentration of pri-ority organic pollutants (PAHs, PCBs, PBDEs, alkylphe-nols, phtalates and bisphenol A), because both dissolvedand particulate-bound chemicals are extracted. Accord-ing to Sanchez-Avila et al. [27], the problem of particle-bound hydrophobic compounds can be controlled byusing surrogate addition before the extraction.
Lacorte et al. [28] compared the extraction efficiency ofSPE and LLE in the analysis of chlorobenzidines inindustrial effluents and studied the effect of total organiccarbon (TOC) on the recovery. Concentrations obtainedby SPE after filtration on 0.45-lm membrane were alwaysgreater (almost double) than those obtained by LLE onunfiltered samples, except for the sample with the highestTOC (70 mg/L). Competition for analyte adsorptionbetween dissolved and particulate organic carbon andsorbent-active sites decreases recovery in SPE and is anon-negligible source of variability in the analyticalmethod, as also demonstrated for humic substances[29].
Wolska [30] presented an interlaboratory study thataimed to compare extraction methods for PAHs in syn-thetic water with SPM, which was prepared by addingcertified sediments to natural river water. The methodscompared were:� LLE on unfiltered samples;� disk SPE without filtration; and,� cartridge SPE on filtered samples.
Trends Trends in Analytical Chemistry, Vol. 36, 2012
74 http://www.elsevier.com/locate/trac
Author's personal copy
Recoveries reported in the experiment were not eval-uated on certified sediment concentrations but on spikedstandards. They ranged from 25% for column SPE afterfiltration to 40–60% for LLE and, finally, 80–90% forSPE disk, but it was impossible to distinguish betweenthe contribution of spiked PAHs and those extractedfrom the suspended sediments. Validation procedures,especially recovery tests, should be properly designedand optimized for whole-water analysis.
The main problem experienced with SPE disks is clog-ging during extraction of unfiltered samples with sus-pended matter. This problem was overcome by combininga filtration step with SPE-disk extraction by adding a filterbed with sand, glass wool and filter paper on top of theextraction membrane [31]. With this apparatus, theentire sample, both dissolved and particulate phase, wasextracted for the determination of PCDDs and PCDFs ineffluent samples. A 30-mL rinse with ethanol/toluene(70:30), which remained in contact with the filteringmedia and disk for 20 min, achieved an acceptableextraction (65–77%) of the analytes. The validation wascarried out by both evaluating the recoveries of theinternal quantitation standard and extracting an artifi-cial, reconstructed sample prepared by suspending 2 g ofknown sediment in 1 L of HPLC water. In the formerexperiment, after correction for the clean-up standardrecoveries, LLE and SPE methods showed an extractionefficiency of about 90%. In the latter validation test, sus-pended sediment samples were extracted by LLE and SPEand the resulting concentrations were compared withthose obtained extracting the dry sediment by Soxhlet.The comparison indicated that both disk SPE and LLEwere quantitative and that Soxhlet extraction of the SPEdisk was unnecessary [31].
The commercial evolution of this apparatus for SPE isthe so-called Speedisk (Bakerbond, J.T. Baker, USA),
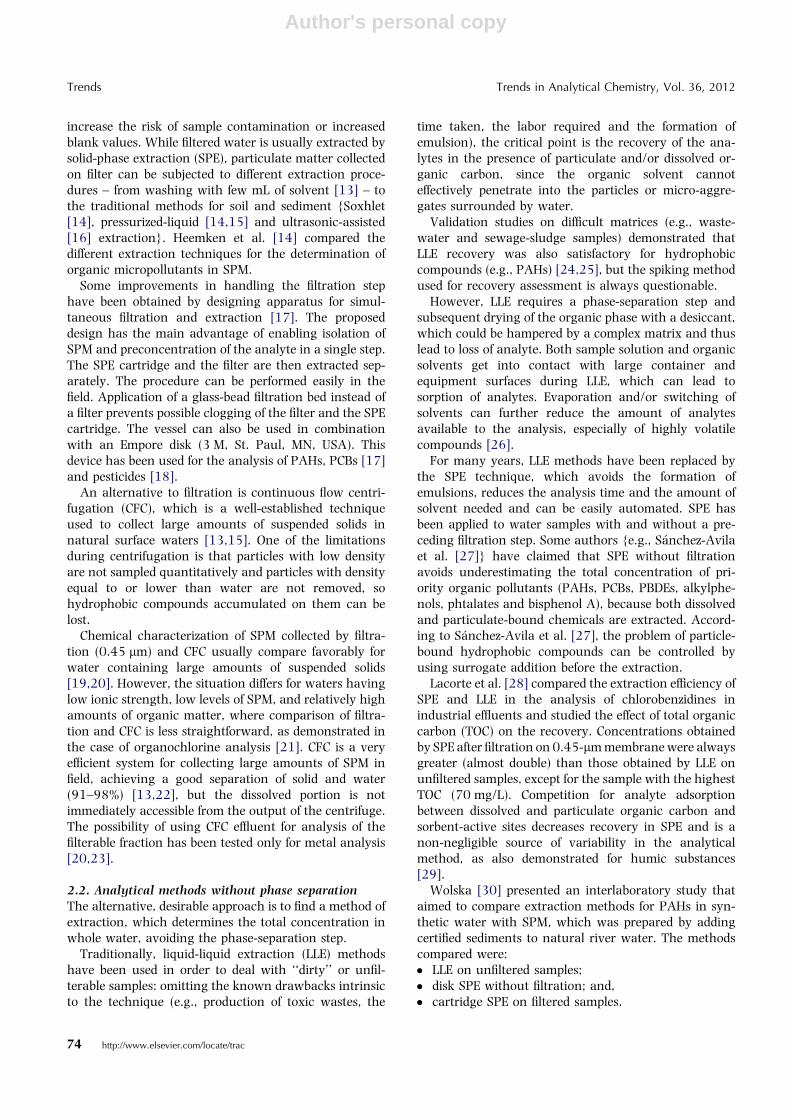
which embodies a filtration membrane on top of theactive sorbent so that the sample can be directly applied,and filtration and adsorption take place simultaneously.The main advantages are high capacity, so that highvolume of water can be processed, and high sample flow(up to 200 mL/min). This extraction system has beenused since the late 1990s for the determination of PCDDs[32] and phenols in industrial effluents with high TOCcontent, up to 500 mgC/L [33]. Recently, we carried outsome tests to verify the applicability of Speedisk in thedetermination of nonylphenol in polluted surface waters[Valsecchi, unpublished results]. Speedisk extraction wascompared with a method based on filtration and separateextraction of the filtered water and SPM. It is evidentfrom Fig. 1 that the recovery spread between the twomethods increases with increasing SPM content in theriver, suggesting that, at least for this class of com-pounds, the applicability of disk extractions should beverified for each type of analyzed water.
The introduction of an automated extractor forSpeedisk and the new requirements of the WFD regard-ing whole-water analysis have motivated exploring thefeasibility of standardized disk-based SPE methods asinternational standard methods.
Validation carried out to standardize the ISO 28540method [34] for the analysis of PAHs in whole water hasbeen presented in Werres et al. [35]. Investigatedparameters included the maximum total amount of SPMthat could be handled by the SPE disk with sufficientrecovery, the selection of a suitable non-halogenatedsolvent for extracting the SPE disk, and the potential tosimplify the method by omitting a solvent-concentrationstep. Furthermore, to substantiate the advantages of theSPE-disk method over LLE procedures, recoveries withboth methods were thoroughly compared. The extrac-tion efficiency was evaluated by mixing aliquots of real
Speedisk
Particulate fraction
Dissolved fraction
µg/L NP
SPM3 mg/L
SPM13 mg/L
SPM38 mg/L
Figure 1. Comparison between total concentrations of nonylphenol (NP, lg/L) in river waters measured by Speedisk and determined on separatefractions after filtration.
Trends in Analytical Chemistry, Vol. 36, 2012 Trends
http://www.elsevier.com/locate/trac 75
Author's personal copy
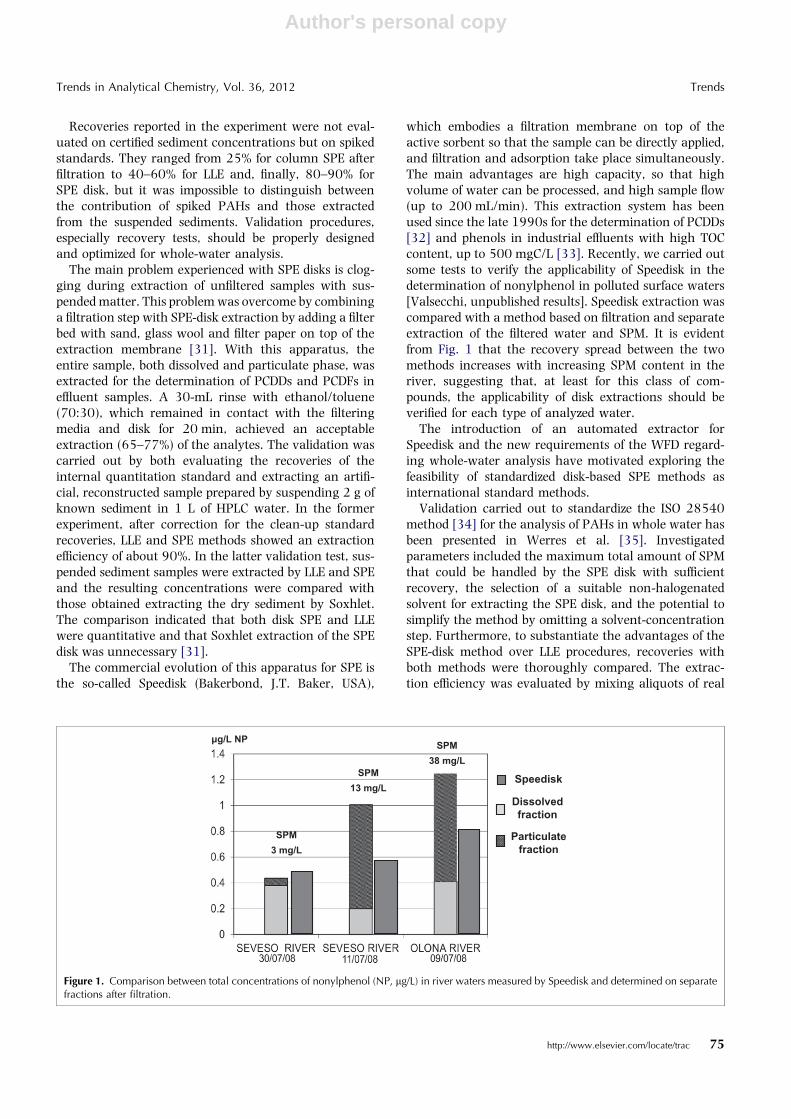
surface water with different amounts (50–1000 mg/L) ofdried certified sediment. SPE elution was carried out withthree steps each of 3 mL acetone, allowing the solvent tosoak in each time (1 min, 5 min and 1 min). It can beseen from the results presented in Fig. 2 that LLEextraction yields and the achieved precision are lowerthan those obtained with the SPE-disk procedure. Directcomparison of reference values with values found usingthe SPE-disk method or the LLE procedure showed thatboth methods do not fully extract the sediment, withfailure of about 10–30% for SPE and 30–70% for LLE.However, the reference values themselves bear a ratherlarge uncertainty, as shown in Fig. 2.
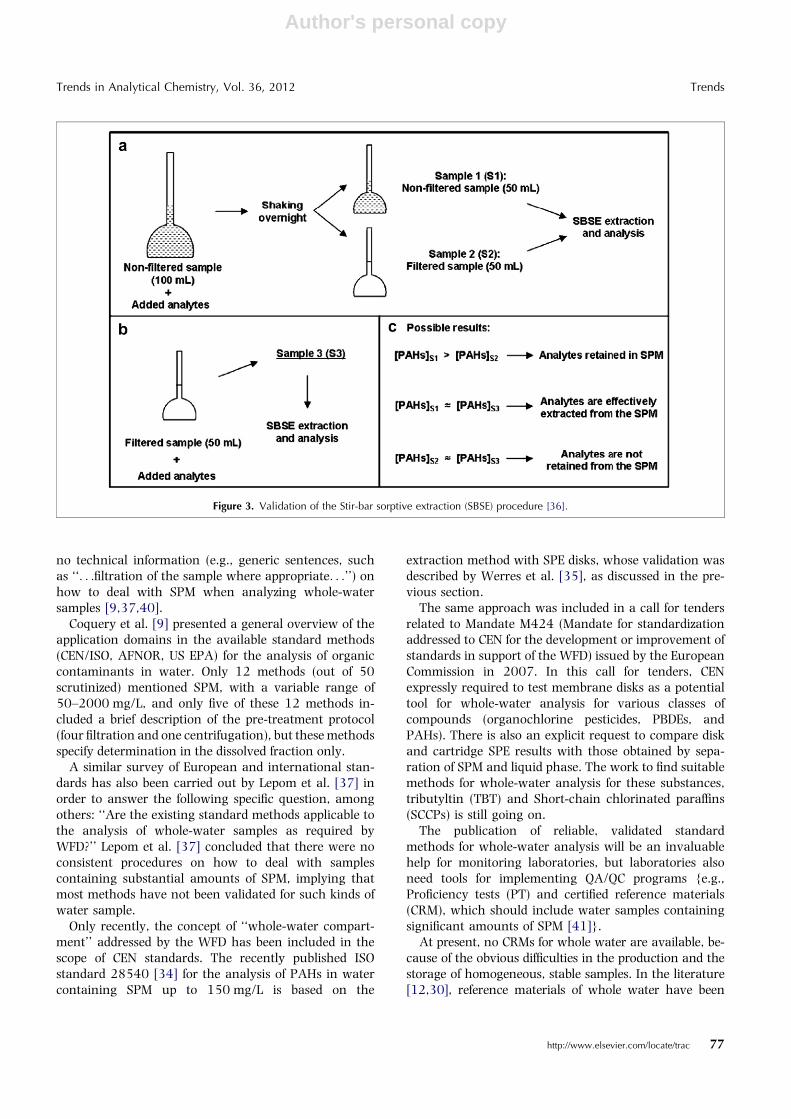
An interesting alternative validation scheme, illus-trated in Fig. 3, was proposed for the determination of totalconcentrations of PAHs in wastewater using stir-barsorptive extraction (SBSE, Gerstel, Mulheim, Germany)[36]. According to Barco-Bonilla et al. [36], results dem-onstrated the suitability of SBSE in carrying out compre-hensive analysis of water samples containing up to100 mg/L of SPM, but the reported recoveries werecalculated, as usual, on spiked wastewater.
SBSE has been compared with LLE for the analysis ofPAHs in complex aqueous matrices (e.g., eluates fromsoil tests) [26]. SBSE was employed because stir barswith higher amounts of sorbent could also access colloidand particle-linked PAHs by affecting partitioning equi-libriums. Particle-bound PAHs may be released as freedissolved PAHs and adsorbed on the stir bar. Recoveriesby SBSE greater than 90% were reported, and Krugeret al. [26] observed that the higher the sample turbidity(used as an indicator of SPM amount), the higher werePAH concentrations determined by SBSE compared toLLE, showing that LLE is not really able to extract
particulate PAHs. Nevertheless, at the end of their paper[26], there was also a statement, not fully explained,that the presence of dissolved organic matter (DOM) in astandard solution of PAHs, as well as on a pre-coated stirbar, seems to hamper the PAH sorption on the stir bar,leading to a smaller amount of PAHs being detected.
3. Standard methods and intercalibrationactivities
Within the Chemical Monitoring Activity (CMA) of theWFD CIS, a questionnaire was distributed among EUMember State laboratories. It showed that the majorityof laboratories analyzed all substances in original watersamples without any pre-treatment and did not mentionany difficulties. Only three laboratories reported separateanalysis of dissolved and particulate phases for PBDEs[37]. This situation poses a potential problem for theanalysis of hydrophobic organic contaminants in wholewater on a European scale, because of the poor compa-rability of data among different laboratories and coun-tries, even if internationally recognized standardmethods are used. In the great majority of the standardmethods designed for the determination of organic con-taminants in water [9], the problem of properly analyz-ing whole-water samples was not explicitly considereduntil very recently.
For example, among recent ISO standards, methodsfor nonylphenol using LLE [38] and SPE extraction [39]should be applied to non-filtered samples, as specified inthe title. The application domain of the SPE method isclaimed to be water containing up to 0.5 g/L of SPM.
By contrast, most standard methods have been vali-dated only for filtered water samples and provide little or
Figure 2. Comparison of Solid-phase extraction (SPE) disk and Liquid-liquid extraction (LLE) method for extraction of certified sediment. Uncer-tainty limits of the certified sediment are shown as error bars. Crosses: values for SPE, triangles: values for LLE. RMSE: root mean squared error[35].
Trends Trends in Analytical Chemistry, Vol. 36, 2012
76 http://www.elsevier.com/locate/trac
Author's personal copy
no technical information (e.g., generic sentences, suchas ‘‘. . .filtration of the sample where appropriate. . .’’) onhow to deal with SPM when analyzing whole-watersamples [9,37,40].
Coquery et al. [9] presented a general overview of theapplication domains in the available standard methods(CEN/ISO, AFNOR, US EPA) for the analysis of organiccontaminants in water. Only 12 methods (out of 50scrutinized) mentioned SPM, with a variable range of50–2000 mg/L, and only five of these 12 methods in-cluded a brief description of the pre-treatment protocol(four filtration and one centrifugation), but these methodsspecify determination in the dissolved fraction only.
A similar survey of European and international stan-dards has also been carried out by Lepom et al. [37] inorder to answer the following specific question, amongothers: ‘‘Are the existing standard methods applicable tothe analysis of whole-water samples as required byWFD?’’ Lepom et al. [37] concluded that there were noconsistent procedures on how to deal with samplescontaining substantial amounts of SPM, implying thatmost methods have not been validated for such kinds ofwater sample.
Only recently, the concept of ‘‘whole-water compart-ment’’ addressed by the WFD has been included in thescope of CEN standards. The recently published ISOstandard 28540 [34] for the analysis of PAHs in watercontaining SPM up to 150 mg/L is based on the
extraction method with SPE disks, whose validation wasdescribed by Werres et al. [35], as discussed in the pre-vious section.
The same approach was included in a call for tendersrelated to Mandate M424 (Mandate for standardizationaddressed to CEN for the development or improvement ofstandards in support of the WFD) issued by the EuropeanCommission in 2007. In this call for tenders, CENexpressly required to test membrane disks as a potentialtool for whole-water analysis for various classes ofcompounds (organochlorine pesticides, PBDEs, andPAHs). There is also an explicit request to compare diskand cartridge SPE results with those obtained by sepa-ration of SPM and liquid phase. The work to find suitablemethods for whole-water analysis for these substances,tributyltin (TBT) and Short-chain chlorinated paraffins(SCCPs) is still going on.
The publication of reliable, validated standardmethods for whole-water analysis will be an invaluablehelp for monitoring laboratories, but laboratories alsoneed tools for implementing QA/QC programs {e.g.,Proficiency tests (PT) and certified reference materials(CRM), which should include water samples containingsignificant amounts of SPM [41]}.
At present, no CRMs for whole water are available, be-cause of the obvious difficulties in the production and thestorage of homogeneous, stable samples. In the literature[12,30], reference materials of whole water have been
Figure 3. Validation of the Stir-bar sorptive extraction (SBSE) procedure [36].
Trends in Analytical Chemistry, Vol. 36, 2012 Trends
http://www.elsevier.com/locate/trac 77
Author's personal copy
prepared in the laboratory by suspending certified referencesediment in artificial or real water, and allowing sufficienttime to establish the partition equilibriums.
Regarding PTs, in 2007–08, an interlaboratorycomparison on total concentrations of eight PAHcongeners in natural inland water was carried out bythe International Measurement Evaluation Programme(IMEP) within the framework of WFD-implementationactivities [42]. With the aim of providing realistic, yetwell-defined, sample material, groundwater was spikedwith purified humic acid to mimic natural colloids.Humic substances can adsorb PAHs, but it was foundthat some laboratories did not apply analytical proce-dures that sufficiently accounted for this. Although theoverall measurement capability appeared satisfactory,it was clear that an improvement in analytical pro-cedures for the use of measurement standards wasneeded.
Recently some European PT providers created a PT-WFD network (http://www.pt-wfd.eu) which jointlyorganizes PTs for chemical analysis of priority and othersubstances in the context of WFD monitoring. Samplesfor intercalibration, characterized by very low concen-tration ranges relevant to the EQS-monitoring require-ments, comprise real surface-water samples spiked withsuspended solids. In 2011, PTs were carried out forPAHs and SSCPs in surface waters with SPM.
3.1. CMA on-site trialThe European Commission Joint Research Centre (JRC)has organized collaborative field campaigns (ChemicalMonitoring on-site) together with EU Member Statelaboratories within the framework of the WFD CMA.
During the exercise on the River Po (Ferrara, Italy, 11October 2006), the JRC IES laboratory compared the
following methods for whole-water analysis, so aimingat broad coverage of sampling and extraction methods:� 2 L LLE without phase separation� 20 L GF/F filtration + LLE
This large-volume version of a classical LLE approachallowed the reduction of blank values in relation to thesample volume.� 226 L GFC filtration + 2 x 250 g XAD
A large volume filtration/adsorption approach whichuses a 2-inch glass fiber cartridge before two large 250 gXAD cartridges.� 45 L GF/F filtration + 2 x 50 g XAD
Filtration in combination with adsorptive extraction ofa medium-sized sample.� SPE disk with filtration
A glass-fiber filter on top of the membrane-extractiondisk also allowed the separate determination of con-taminant in the particulate fraction.
GF/F and GF/C are glass-fiber filtration materials witha retention of 0.7 lm and 1.0 lm, respectively, at 98%efficiency (Whatman, GE Healthcare, USA)
The analytical determinations were carried out in theJRC laboratories, with the same instrumental analyticalmethods. Detailed results were presented in the finalreport of the trial [43].
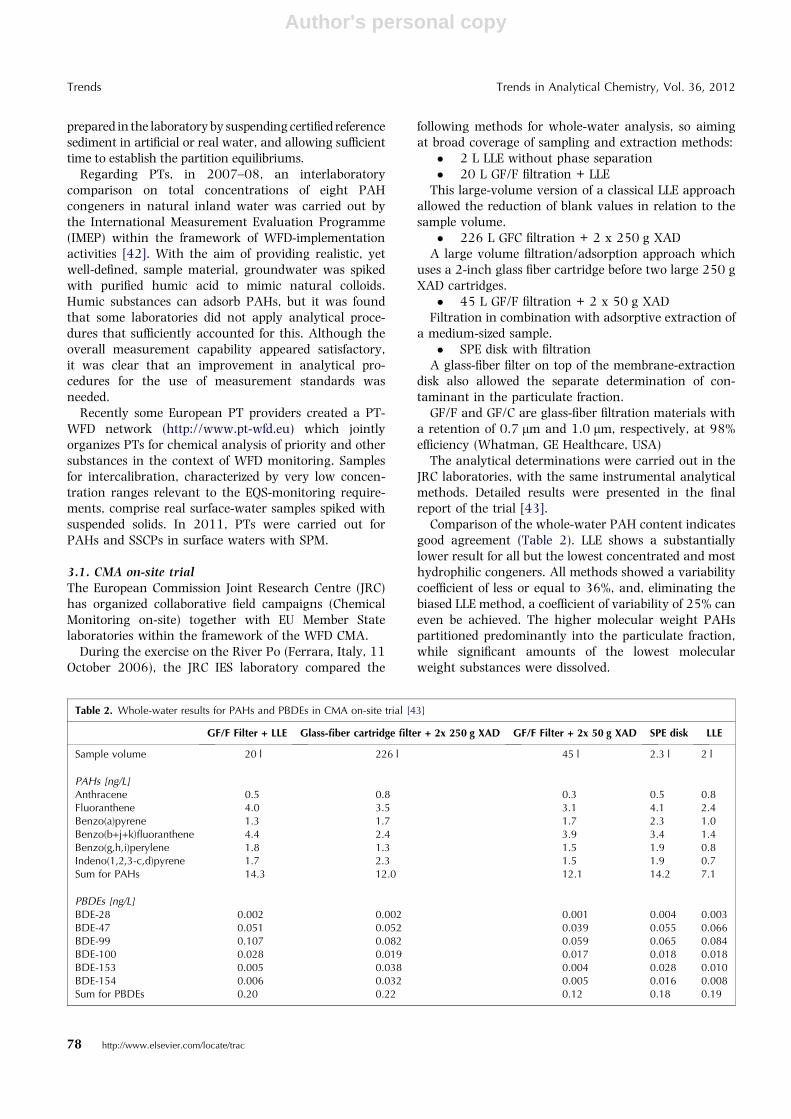
Comparison of the whole-water PAH content indicatesgood agreement (Table 2). LLE shows a substantiallylower result for all but the lowest concentrated and mosthydrophilic congeners. All methods showed a variabilitycoefficient of less or equal to 36%, and, eliminating thebiased LLE method, a coefficient of variability of 25% caneven be achieved. The higher molecular weight PAHspartitioned predominantly into the particulate fraction,while significant amounts of the lowest molecularweight substances were dissolved.
Table 2. Whole-water results for PAHs and PBDEs in CMA on-site trial [43]
GF/F Filter + LLE Glass-fiber cartridge filter + 2x 250 g XAD GF/F Filter + 2x 50 g XAD SPE disk LLE
Sample volume 20 l 226 l 45 l 2.3 l 2 l
PAHs [ng/L]Anthracene 0.5 0.8 0.3 0.5 0.8Fluoranthene 4.0 3.5 3.1 4.1 2.4Benzo(a)pyrene 1.3 1.7 1.7 2.3 1.0Benzo(b+j+k)fluoranthene 4.4 2.4 3.9 3.4 1.4Benzo(g,h,i)perylene 1.8 1.3 1.5 1.9 0.8Indeno(1,2,3-c,d)pyrene 1.7 2.3 1.5 1.9 0.7Sum for PAHs 14.3 12.0 12.1 14.2 7.1
PBDEs [ng/L]BDE-28 0.002 0.002 0.001 0.004 0.003BDE-47 0.051 0.052 0.039 0.055 0.066BDE-99 0.107 0.082 0.059 0.065 0.084BDE-100 0.028 0.019 0.017 0.018 0.018BDE-153 0.005 0.038 0.004 0.028 0.010BDE-154 0.006 0.032 0.005 0.016 0.008Sum for PBDEs 0.20 0.22 0.12 0.18 0.19
Trends Trends in Analytical Chemistry, Vol. 36, 2012
78 http://www.elsevier.com/locate/trac
Author's personal copy
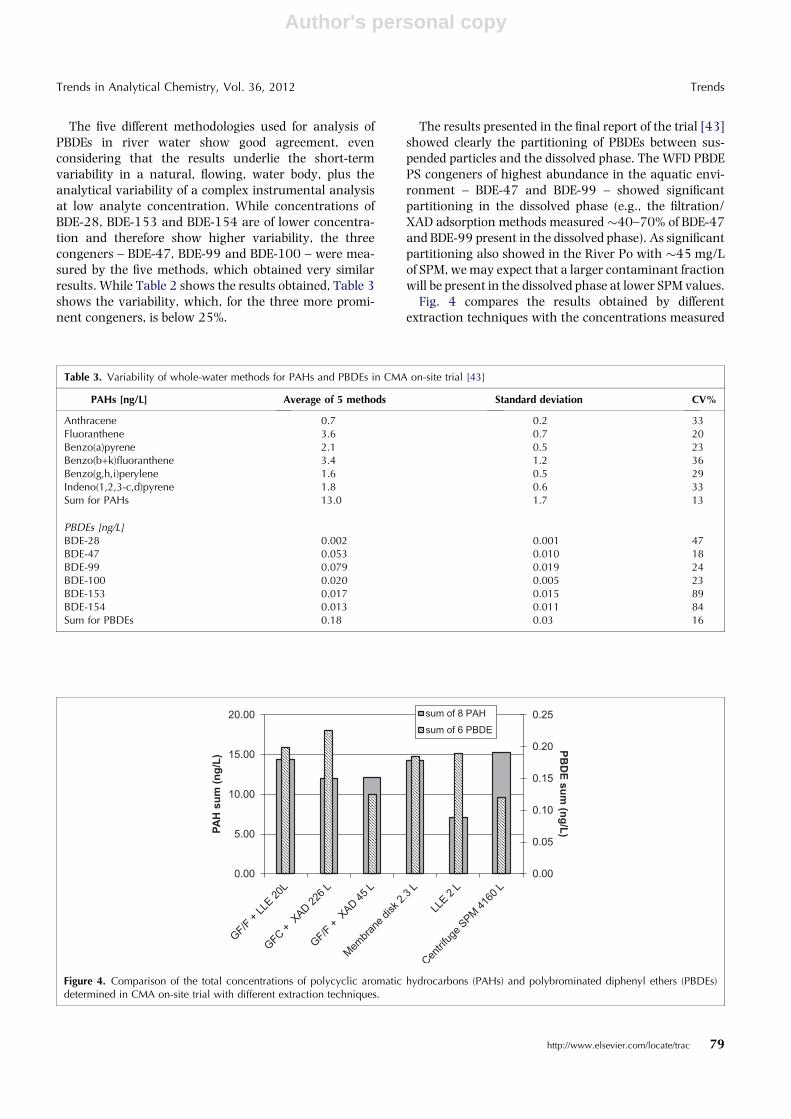
The five different methodologies used for analysis ofPBDEs in river water show good agreement, evenconsidering that the results underlie the short-termvariability in a natural, flowing, water body, plus theanalytical variability of a complex instrumental analysisat low analyte concentration. While concentrations ofBDE-28, BDE-153 and BDE-154 are of lower concentra-tion and therefore show higher variability, the threecongeners – BDE-47, BDE-99 and BDE-100 – were mea-sured by the five methods, which obtained very similarresults. While Table 2 shows the results obtained, Table 3shows the variability, which, for the three more promi-nent congeners, is below 25%.
The results presented in the final report of the trial [43]showed clearly the partitioning of PBDEs between sus-pended particles and the dissolved phase. The WFD PBDEPS congeners of highest abundance in the aquatic envi-ronment – BDE-47 and BDE-99 – showed significantpartitioning in the dissolved phase (e.g., the filtration/XAD adsorption methods measured �40–70% of BDE-47and BDE-99 present in the dissolved phase). As significantpartitioning also showed in the River Po with �45 mg/Lof SPM, we may expect that a larger contaminant fractionwill be present in the dissolved phase at lower SPM values.
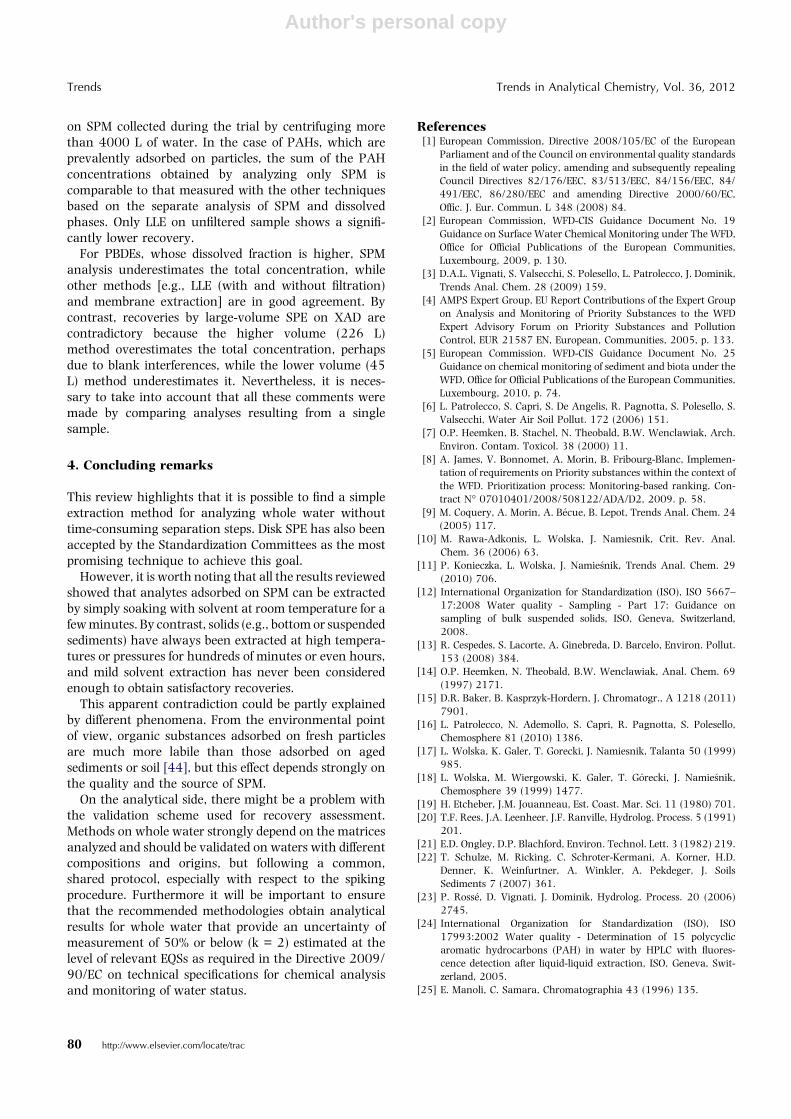
Fig. 4 compares the results obtained by differentextraction techniques with the concentrations measured
Table 3. Variability of whole-water methods for PAHs and PBDEs in CMA on-site trial [43]
PAHs [ng/L] Average of 5 methods Standard deviation CV%
Anthracene 0.7 0.2 33Fluoranthene 3.6 0.7 20Benzo(a)pyrene 2.1 0.5 23Benzo(b+k)fluoranthene 3.4 1.2 36Benzo(g,h,i)perylene 1.6 0.5 29Indeno(1,2,3-c,d)pyrene 1.8 0.6 33Sum for PAHs 13.0 1.7 13
PBDEs [ng/L]BDE-28 0.002 0.001 47BDE-47 0.053 0.010 18BDE-99 0.079 0.019 24BDE-100 0.020 0.005 23BDE-153 0.017 0.015 89BDE-154 0.013 0.011 84Sum for PBDEs 0.18 0.03 16
0.00
0.05
0.10
0.15
0.20
0.25
0.00
5.00
10.00
15.00
20.00
PBD
E sum (ng/L)PA
H s
um (n
g/L)
sum of 8 PAHsum of 6 PBDE
Figure 4. Comparison of the total concentrations of polycyclic aromatic hydrocarbons (PAHs) and polybrominated diphenyl ethers (PBDEs)determined in CMA on-site trial with different extraction techniques.
Trends in Analytical Chemistry, Vol. 36, 2012 Trends
http://www.elsevier.com/locate/trac 79
Author's personal copy
on SPM collected during the trial by centrifuging morethan 4000 L of water. In the case of PAHs, which areprevalently adsorbed on particles, the sum of the PAHconcentrations obtained by analyzing only SPM iscomparable to that measured with the other techniquesbased on the separate analysis of SPM and dissolvedphases. Only LLE on unfiltered sample shows a signifi-cantly lower recovery.
For PBDEs, whose dissolved fraction is higher, SPManalysis underestimates the total concentration, whileother methods [e.g., LLE (with and without filtration)and membrane extraction] are in good agreement. Bycontrast, recoveries by large-volume SPE on XAD arecontradictory because the higher volume (226 L)method overestimates the total concentration, perhapsdue to blank interferences, while the lower volume (45L) method underestimates it. Nevertheless, it is neces-sary to take into account that all these comments weremade by comparing analyses resulting from a singlesample.
4. Concluding remarks
This review highlights that it is possible to find a simpleextraction method for analyzing whole water withouttime-consuming separation steps. Disk SPE has also beenaccepted by the Standardization Committees as the mostpromising technique to achieve this goal.
However, it is worth noting that all the results reviewedshowed that analytes adsorbed on SPM can be extractedby simply soaking with solvent at room temperature for afew minutes. By contrast, solids (e.g., bottom or suspendedsediments) have always been extracted at high tempera-tures or pressures for hundreds of minutes or even hours,and mild solvent extraction has never been consideredenough to obtain satisfactory recoveries.
This apparent contradiction could be partly explainedby different phenomena. From the environmental pointof view, organic substances adsorbed on fresh particlesare much more labile than those adsorbed on agedsediments or soil [44], but this effect depends strongly onthe quality and the source of SPM.
On the analytical side, there might be a problem withthe validation scheme used for recovery assessment.Methods on whole water strongly depend on the matricesanalyzed and should be validated on waters with differentcompositions and origins, but following a common,shared protocol, especially with respect to the spikingprocedure. Furthermore it will be important to ensurethat the recommended methodologies obtain analyticalresults for whole water that provide an uncertainty ofmeasurement of 50% or below (k = 2) estimated at thelevel of relevant EQSs as required in the Directive 2009/90/EC on technical specifications for chemical analysisand monitoring of water status.
References[1] European Commission, Directive 2008/105/EC of the European
Parliament and of the Council on environmental quality standards
in the field of water policy, amending and subsequently repealing
Council Directives 82/176/EEC, 83/513/EEC, 84/156/EEC, 84/
491/EEC, 86/280/EEC and amending Directive 2000/60/EC,
Offic. J. Eur. Commun. L 348 (2008) 84.
[2] European Commission, WFD-CIS Guidance Document No. 19
Guidance on Surface Water Chemical Monitoring under The WFD,
Office for Official Publications of the European Communities,
Luxembourg, 2009, p. 130.
[3] D.A.L. Vignati, S. Valsecchi, S. Polesello, L. Patrolecco, J. Dominik,
Trends Anal. Chem. 28 (2009) 159.
[4] AMPS Expert Group, EU Report Contributions of the Expert Group
on Analysis and Monitoring of Priority Substances to the WFD
Expert Advisory Forum on Priority Substances and Pollution
Control, EUR 21587 EN, European, Communities, 2005, p. 133.
[5] European Commission. WFD-CIS Guidance Document No. 25
Guidance on chemical monitoring of sediment and biota under the
WFD, Office for Official Publications of the European Communities,
Luxembourg, 2010, p. 74.
[6] L. Patrolecco, S. Capri, S. De Angelis, R. Pagnotta, S. Polesello, S.
Valsecchi, Water Air Soil Pollut. 172 (2006) 151.
[7] O.P. Heemken, B. Stachel, N. Theobald, B.W. Wenclawiak, Arch.
Environ. Contam. Toxicol. 38 (2000) 11.
[8] A. James, V. Bonnomet, A. Morin, B. Fribourg-Blanc, Implemen-
tation of requirements on Priority substances within the context of
the WFD. Prioritization process: Monitoring-based ranking. Con-
tract N� 07010401/2008/508122/ADA/D2, 2009. p. 58.
[9] M. Coquery, A. Morin, A. Becue, B. Lepot, Trends Anal. Chem. 24
(2005) 117.
[10] M. Rawa-Adkonis, L. Wolska, J. Namiesnik, Crit. Rev. Anal.
Chem. 36 (2006) 63.
[11] P. Konieczka, L. Wolska, J. Namiesnik, Trends Anal. Chem. 29
(2010) 706.
[12] International Organization for Standardization (ISO), ISO 5667–
17:2008 Water quality - Sampling - Part 17: Guidance on
sampling of bulk suspended solids, ISO, Geneva, Switzerland,
2008.
[13] R. Cespedes, S. Lacorte, A. Ginebreda, D. Barcelo, Environ. Pollut.
153 (2008) 384.
[14] O.P. Heemken, N. Theobald, B.W. Wenclawiak, Anal. Chem. 69
(1997) 2171.
[15] D.R. Baker, B. Kasprzyk-Hordern, J. Chromatogr., A 1218 (2011)
7901.
[16] L. Patrolecco, N. Ademollo, S. Capri, R. Pagnotta, S. Polesello,
Chemosphere 81 (2010) 1386.
[17] L. Wolska, K. Galer, T. Gorecki, J. Namiesnik, Talanta 50 (1999)
985.
[18] L. Wolska, M. Wiergowski, K. Galer, T. Gorecki, J. Namiesnik,
Chemosphere 39 (1999) 1477.
[19] H. Etcheber, J.M. Jouanneau, Est. Coast. Mar. Sci. 11 (1980) 701.
[20] T.F. Rees, J.A. Leenheer, J.F. Ranville, Hydrolog. Process. 5 (1991)
201.
[21] E.D. Ongley, D.P. Blachford, Environ. Technol. Lett. 3 (1982) 219.
[22] T. Schulze, M. Ricking, C. Schroter-Kermani, A. Korner, H.D.
Denner, K. Weinfurtner, A. Winkler, A. Pekdeger, J. Soils
Sediments 7 (2007) 361.
[23] P. Rosse, D. Vignati, J. Dominik, Hydrolog. Process. 20 (2006)
2745.
[24] International Organization for Standardization (ISO), ISO
17993:2002 Water quality - Determination of 15 polycyclic
aromatic hydrocarbons (PAH) in water by HPLC with fluores-
cence detection after liquid-liquid extraction, ISO, Geneva, Swit-
zerland, 2005.
[25] E. Manoli, C. Samara, Chromatographia 43 (1996) 135.
Trends Trends in Analytical Chemistry, Vol. 36, 2012
80 http://www.elsevier.com/locate/trac
Author's personal copy
[26] O. Kruger, G. Christoph, U. Kalbe, W. Berger, Talanta 85 (2011)
1428.
[27] J. Sanchez-Avila, J. Bonet, G. Velasco, S. Lacorte, Sci. Total
Environ. 407 (2009) 4157.
[28] S. Lacorte, M.C. Perrot, D. Fraisse, D. Barcelo, J. Chromatogr., A
833 (1999) 181.
[29] I. Liska, E.R. Brouwer, H. Lingeman, U.A.T. Brinkman, Chroma-
tographia 37 (1993) 13.
[30] L. Wolska, Anal. Bioanal. Chem. 391 (2008) 2647.
[31] K. Taylor, D.S. Waddell, E.J. Reiner, K.A. MacPherson, Anal.
Chem. 67 (1995) 1186.
[32] E. Pujadas, J. Diaz-Ferrero, R. Marti, F. Broto-Puig, L. Comellas,
M.C. Rodriguez-Larena, Chemosphere 43 (2001) 449.
[33] S. Lacorte, D. Fraisse, D. Barcelo, J. Chromatogr., A 857 (1999) 97.
[34] International Organization for Standardization (ISO), ISO
28540:2011 Water quality - Determination of 16 polycyclic
aromatic hydrocarbons (PAH) in water - Method using gas
chromatography with mass spectrometric detection (GC-MS), ISO,
Geneva, Switzerland, 2011.
[35] F. Werres, P. Balsaa, T.C. Schmidt, J. Chromatogr., A 1216
(2009) 2235.
[36] N. Barco-Bonilla, R. Romero-Gonzalez, P. Plaza-Bolanos, J.L.
Fernandez-Moreno, A.G. Frenich, J.L. Vidal, Anal. Chim. Acta 693
(2011) 62.
[37] P. Lepom, B. Brown, G. Hanke, R. Loos, P. Quevauviller, J.
Wollgast, J. Chromatogr., A 1216 (2009) 302.
[38] International Organization for Standardization (ISO), ISO 18857–
1:2005 Water quality - Determination of selected alkylphenols -
Part 1: Method for non-filtered samples using liquid-liquid
extraction and gas chromatography with mass selective detection,
ISO, Geneva, Switzerland, 2005.
[39] International Organization for Standardization (ISO), ISO 18857–
2:2009 Water quality - Determination of selected alkylphenols -
Part 2: Gas chromatographic-mass spectrometric determination of
alkylphenols, their ethoxylates and bisphenol A in non-filtered
samples following solid-phase extraction and derivatization, ISO,
Geneva, Switzerland, 2009.
[40] P. Lepom, A. Duffek, EAQC–WISE Specific Targeted Research
Project, Scientific Support to Policies (SSP), Deliverables number:
D16 Report on existing AQC tools and validated methods; D19
Gaps Analysis for Validated, Methods, 2005, p. 11.
[41] A. Held, H. Emons, P. Taylor, EAQC–WISE Specific Targeted
Research Project, Scientific Support to Policies (SSP), Deliverables
number: D25 Final report of the project: The blue print, 2008, p. 53.
[42] J. van de Kreeke, B. de la Calle, A. Held, O. Bercaru, M. Ricci, P.
Shegunova, P. Taylor, Trends Anal. Chem. 29 (2010) 928.
[43] G. Hanke, J. Wollgast, R. Loos, J. Castro-Jimenez, G. Umlauf, G.
Mariani, A. Mueller, T. Huber, E. H. Christoph, G. Locoro, J.M.
Zaldıvar, G. Bidoglio, Comparison of monitoring approaches for
selected priority pollutants in surface water -An initiative in support
to the WFD Chemical Monitoring Activity. JRC Scientific and
Technical Reports. EUR 22922 EN, Office for Official Publications of
the European Communities, Luxembourg, 2007, p. 74.
[44] C.T.A. Moermond, I. Roessink, M.T.O. Jonker, T. Meijer, A.A.
Koelmans, Environ. Toxicol. Chem. 26 (2007) 607.
Trends in Analytical Chemistry, Vol. 36, 2012 Trends
http://www.elsevier.com/locate/trac 81