Distribution of blood concentrations of persistent organic pollutants in a representative sample of...
14
This article appeared in a journal published by Elsevier. The attached copy is furnished to the author for internal non-commercial research and education use, including for instruction at the authors institution and sharing with colleagues. Other uses, including reproduction and distribution, or selling or licensing copies, or posting to personal, institutional or third party websites are prohibited. In most cases authors are permitted to post their version of the article (e.g. in Word or Tex form) to their personal website or institutional repository. Authors requiring further information regarding Elsevier’s archiving and manuscript policies are encouraged to visit: http://www.elsevier.com/copyright
Transcript of Distribution of blood concentrations of persistent organic pollutants in a representative sample of...
This article appeared in a journal published by Elsevier. The attachedcopy is furnished to the author for internal non-commercial researchand education use, including for instruction at the authors institution
and sharing with colleagues.
Other uses, including reproduction and distribution, or selling orlicensing copies, or posting to personal, institutional or third party
websites are prohibited.
In most cases authors are permitted to post their version of thearticle (e.g. in Word or Tex form) to their personal website orinstitutional repository. Authors requiring further information
regarding Elsevier’s archiving and manuscript policies areencouraged to visit:
http://www.elsevier.com/copyright
Author's personal copy
Distribution of blood concentrations of persistent organic pollutants in arepresentative sample of the population of Barcelona in 2006, and comparison withlevels in 2002
Miquel Porta a,b,c,⁎, Tomàs López a,b,c, Magda Gasull a,c, Maica Rodríguez-Sanz c,d,e, Mercè Garí f,José Pumarega a,c, Carme Borrell c,d,e, Joan O. Grimalt f
a Hospital del Mar Research Institute- IMIM, Barcelona, Catalonia, Spainb School of Medicine, Universitat Autònoma de Barcelona, Spainc CIBER de Epidemiología y Salud Pública (CIBERESP), Spaind Agència de Salut Pública de Barcelona, Spaine Universitat Pompeu Fabra, Barcelona, Spainf Department of Environmental Chemistry, Institute of Environmental Assessment and Water Research (IDAEA-CSIC), Barcelona, Spain
a b s t r a c ta r t i c l e i n f o
Article history:Received 1 December 2011Received in revised form 31 January 2012Accepted 1 February 2012Available online 6 March 2012
Keywords:Human biomonitoringHealth surveyPersistent organic pollutantsPesticide residuesEnvironmental pollutantsEnvironmental exposure/human samples
Introduction: POP biomonitoring programs are useful for exposure assessment, to analyze patterns, and toevaluate policies. However, population-representative surveys are scarce and heterogeneous. Reports ontime trends in representative samples using the same methods are rare.Objectives: To analyze the distribution of serum concentrations of 19 POPs in the general population of Barcelonacity in 2006, and to compare it with the distribution in 2002.Methods:231participants in theBarcelonaHealth Surveywere interviewed face-to-face, gaveblood, andunderwenta physical exam. Density plots (“POP Geoffrey Rose curves”) were used to represent the full population distributionof each compound.Results: Eight POPs were each detected in >80% of the study subjects: p,p′-DDT, p,p′-DDE, PCB congeners 118, 138,153 and 180, HCB and β-HCH. The minimum number of POPs detected in one person was 5, and 72% of thepopulation accumulated ≥10 compounds. p,p′-DDE and HCB showed the highest concentrations (median=219and 109 ng/g lipid, respectively). Concentrations decreased by 34–56% from2002 to 2006. The decreasewas similarin women andmen, and in all age groups/birth cohorts. It was larger with increasing BMI; for p,p′-DDT, HCB and β-HCH the decrease in obese individuals was 31–44 percentage points larger than in subjects with normal weight.The distribution of POP concentrationswas always switched towards higher values inwomen thanmen. POP levelsalso differed significantly by age, body mass index, weight gain, birth place and social class, but not by parity andbreastfeeding. The two younger cohorts had a higher DDT/DDE ratio than the oldest cohort.Conclusion: Although human POP contamination remains common in the city of Barcelona, concentrationsdecreased significantly in 4 years. Our approach suggests innovative ways to conceive, analyze and present resultsfor other monitoring programs.
© 2012 Elsevier B.V. All rights reserved.
1. Introduction
Persistent organic pollutants (POPs) comprise a large variety of toxicsubstances such as hexachlorobenzene (HCB), hexachlorocyclohexanes(HCHs), dioxins, dichlorodiphenyltrichloroethane (DDT) and itsmetab-olites (notably, dichlorodiphenyldichloroethene, DDE), and polychlori-nated biphenyls (PCBs). POPs are highly lipophilic and resistant todegradation; they thus accumulate in adipose tissue and in organssuch as liver, brain, or pancreas (WHO, 2003).Manyhumanpopulationsare exposed to POP mixtures over the lifecourse, usually at low doses(Luzardo et al., 2009). A variety of studies have shown that POPs mayadversely influence health and well-being: they contribute to causeinfertility, birth defects, learning disabilities, endocrine disruption,
Science of the Total Environment 423 (2012) 151–161
Abbreviations: BHS, Barcelona Health Survey; β, regression coefficient; BMI, bodymass index; CHS, Catalan Health Survey; CI, confidence interval; DDD, dichlorodiphe-nyldichloroethane; DDE, dichlorodiphenyldichloroethene; DDT, dichlorodiphenyltri-chloroethane; GLM, General Linear Model; HCB, hexachlorobenzene; HCH,hexachlorocyclohexane; LOD, limit of detection; LOQ, limit of quantification; PCBs,polychlorinated biphenyls; PeCB, pentachlorobenzene; POPs, persistent organicpollutants.⁎ Corresponding author at: Hospital del Mar Research Institute-IMIM, Universitat
Autònoma de Barcelona, Carrer del Dr. Aiguader, 88, E-08003 Barcelona, Catalonia,Spain. Tel.: +34 93 316 0700; fax: +34 93 316 0410.
E-mail address: [email protected] (M. Porta).
0048-9697/$ – see front matter © 2012 Elsevier B.V. All rights reserved.doi:10.1016/j.scitotenv.2012.02.001
Contents lists available at SciVerse ScienceDirect
Science of the Total Environment
j ourna l homepage: www.e lsev ie r .com/ locate /sc i totenv

Author's personal copy
diabetes, several cancers, Alzheimer's and Parkinson's disease, and otherneurological, gynecological and immunological disorders (Alonso-Magdalena et al., 2011; Casals-Casas and Desvergne, 2011; Diamanti-Kandarakis et al., 2009; Kaiser, 2005; La Merrill and Birnbaum, 2011;Schug, 2011; Soto and Sonnenschein, 2011; UNEP, 2002). However, nu-merous uncertainties exist on the health effects of chronic exposure toPOPs in the general population (Henkler and Luch, 2011; Hernández etal., 2009; Lee et al., 2009; Myers et al., 2009). To decrease suchuncertainties and appropriately protect the health of citizens, betterknowledge on the levels and trends of contamination of the populationis essential.
Most POPs are presently targeted for elimination or reduction. Legalinstruments as the Stockholm Convention encourage countries to inte-grate population-based surveillance of POP levels in humans withintheir health monitoring systems (Porta and Zumeta, 2002; UNEP,2005). POP monitoring programs are useful for exposure assessment,to analyze trends and patterns of contamination, and to evaluate theeffectiveness of policies aimed at decreasing exposure. However, world-wide, comprehensive monitoring of human contamination by POPs isscarce, fragmented and heterogeneous. Methodological characteristicsof studies vary largely, including selection of participants, sociodemo-graphic information, chemical and statistical methods, and frameworksfor interpretation of results (Porta et al., 2008b, 2009a). For example, thefull range of POP concentrations is often overlooked, and little attentionis paid to the characteristics of the distribution of the concentrations(e.g., differences across subgroups in kurtosis, skewness, and coefficientof variation) (Porta et al., 2008b, 2010a). Also, national studies monitor-ing human exposure to POPs do not usually include data on parity andbreastfeeding (Dewailly et al., 1996; Tajimi et al., 2004). Anotherexample of a variable that is not usually collected in population biomo-nitoring studies is weight change, whichmay alter blood lipid levels andbias estimates of exposure to lipophilic compounds like POPs. As weshall see below, the influence of parity, breastfeeding andweight changewas assessed in the present study.
As in other countries, in Spain most POPs were banned during the1970s, and levels of some of them have decreased (Porta et al., 2008a).However, uncertainties abound, and the only two Spanish studiesbased on representative samples of a population detected a substantialnumber of compounds in over 85% of citizens (Zumbado et al., 2005;Porta et al., 2010b; Henríquez-Hernández et al., 2011; Porta et al.,2012). In 2006, the Public Health Agency of Barcelona conducted thefifth Barcelona Health Survey (BHS), which included a physical exami-nation and, for the first time, blood drawing – explicitly conceived forPOPs monitoring – in a sample of participants; serum concentrationsof 19 POPs were thus determined in 231 subjects (Porta et al., 2009a).In 2002, POP concentrationswere analyzed in the Catalan Health Survey(CHS); based on a representative sample of the population of Catalonia(Porta et al., 2010b), it included a subsample of individuals representa-tive of the city of Barcelona. Therefore, for the first time in Spain, wecould assess trends in POP levels in Barcelona measured in an identicalway. Reports on POP time trends in representative samples using thesame methods are also extremely rare worldwide.
The aimof the present studywas,firstly, to analyze the distribution ofserum concentrations of 19 POPs in the non-institutionalized adultpopulation of Barcelona city, and its main socio-demographic predictors;and, secondly, to compare the concentrations of POPs analyzed in theBHS with the concentrations in individuals from Barcelona studied fouryears earlier in the CHS.
2. Methods
2.1. Study population and health interview survey
The study population of the Barcelona Health Survey of 2006(BHS) has been described in detail elsewhere (Porta et al., 2009a;Rodríguez-Sanz et al., 2008). Briefly, at the end of the interview the
study monitors offered BHS participants ≥15 years old to take partin the POP study (Porta et al., 2009a); the youngest person who actu-ally participated in the POP study was 18 years old. Subsequently, anurse personally interviewed each person who accepted to participatein the POP study, measured the weight, height, and the hip and waistcircumference, and collected a blood sample. Participants had beenasked to fast for at least 4 h before blood extraction. Bloodwas collectedin a vacuum system tube and centrifuged for 15 min×3000 rpm at 4 °Cto obtain serum. Right after centrifugation, serumwasdivided in 1–3 mLaliquots and stored at −80 °C until 2008, when POP concentrationswere analyzed. The additional interview for the POP study includedstructured questions about recent and past changes in body weight,and on whether the person had been breastfed. Women were alsoasked questions about parity, breastfeeding and abortion histories.
Bodymass indexwas computed bymeasuredweight [kg] divided bymeasured height squared [m2]. The lower educational category ofsubjects without formal studies included the illiterate. To assign occupa-tional social class we used the Spanish classification (Rodríguez-Sanz etal., 2008); classwas hence assigned through the current or last occupationof the interviewee or, if the person had not worked, through the currentor last occupation of the head of the household (Rodríguez-Sanz et al.,2008).
The average age of participants was 48 years and 59% of all partici-pants were women. About 18% were obese (BMI≥30 kg/m2), 85% werebreastfed in childhood, 67% were born in Catalonia, 96% had completedat least primary schooling (1st. stage), 31%were from occupational socialclass IV, and 61% were employed (Table 1). There were no significantdifferences in the distribution of age, BMI, educational level and socialclass by sex. However, a greater proportion of men than women hadbeen breastfed, were born in Catalonia and were employed.
2.2. Analytical chemical methods
Analyses of BHS samples were carried out in the Department ofEnvironmental Chemistry (IIQAB-CSIC) in Barcelona, Spain, during2008. Analyses of POP concentrations in samples from the CatalanHealth Survey (CHS) were also performed in the same Department,using the same methodology, in 2006–2008 (Porta et al., 2010b).The following POPs were analyzed in serum: o,p′-DDT, p,p′-DDT, o,p′-DDE, p,p′-DDE, o,p′-DDD, p,p′-DDD, PCB congeners 28, 52, 101, 118,138, 153, and 180, PeCB, HCB, α-HCH, β-HCH, γ-HCH and δ-HCH(Porta et al., 2009b). 10 mL screw-capped Pyrex centrifuge tubes cappedwith Teflon septa were used to keep and digest the samples. 25 μL of thesurrogate solution (0.36 mg/L of tetrabromobenzene (TBB) and0.52 mg/L of PCB 209), was added to 1 mL aliquots of serum in thesame Pyrex centrifuge tubeswhere the sampleswere stored. Acid diges-tion of themixture was performed by addition of 3 mL of n-hexane and2 mL of concentrated sulphuric acid. Gas chromatography (GC) analyseswere performed with an Agilent Technologies model GC-6890N provid-ed with an ECD and a 60 m, 0.25 mm i.d. DB-5 column (J &W Scientific,Folsom, CA, USA; film thickness 0.25 μm). A fused silica precolumn of2 m×0.32 mm i.d. was used and renewed every 30 samples. Selectedsamples were analyzed by NICI GC–MSwith a FisonsMD 800. The linearrange of the detector was determined from injection of standard mix-tures. Calibration lines were performed for all POPs mentioned above.These analytes were then quantitated in the samples by the externalstandard method after replicate analysis. The concentrations of HCBand β-hexachlorocyclohexane (β-HCH) were corrected for volatilitylosses using TBB as internal standard. The recoveries of TBB andpolychlorinated biphenyl 209 were 100.6% (SD 20.5) and 94.5% (SD19.7), respectively. The calculation of the limits of detection (LOD) andquantification (LOQ) was based on the analysis of proficiency testingmaterials, an external quality assessment for selected pollutants, andthe study of the signal/noise ratio of chromatograms obtained fromGC-ECD injection (Garí and Grimalt, 2010).
152 M. Porta et al. / Science of the Total Environment 423 (2012) 151–161
Author's personal copy
To be conservative, the main statistical analyses were limited tocompounds that were detected above the detection limit in >80% ofparticipants. LODs (all in ng/mL) ranged from 0.002 to 0.024, andLOQs from 0.007 to 0.071 for PCB 101 and γ-HCH, respectively. LODsfor the eight compounds included in the main analyses ranged from0.010 to 0.020 ng/mL, and LOQs from 0.029 to 0.060 ng/mL, for PCB180 and β-HCH, respectively (all limits are shown in SupplementaryTables 1 and 2). LODs and LOQs were the same in BHS and CHS. Whena samplehad a concentration of an analyte below thedetection threshold,it was assigned themid-value of this limit; when a POPwas detected but
under the quantification threshold, themid-value between detection andquantification limits was used (Porta et al., 2009b, 2010b).
Total cholesterol and triglyceride levels were determined withenzymatic methods, using serum specifically obtained in the BSH andCHS studies on POPs (Rodríguez-Sanz et al., 2008). Total serum lipids(TL)were calculated by the standard short formula (or Standard formula2) of Phillips et al., which is based on total cholesterol and triglycerides(Bernert et al., 2007; Phillips et al., 1989; Porta et al., 2009b). POPconcentrations were individually corrected for TL by dividing thecrude serum POP concentration by TL, and are expressed in nanogramsof analyte per gram lipid (ng/g lipid). Among the 231 individuals, mean(standard deviation) serum concentrations of total cholesterol, triglyc-erides and total lipids were, respectively, 207.9 (41.2), 102.1 (61.0)and 636.3 (131.2) mg/dL.
2.3. Statistical analysis
Univariate statistics were computed as customary (Armitage et al.,2002; Kleinbaumet al., 2007). Kruskal–Wallis' test andMann–Whitney'sU test were used to assess differences in concentrations of POPs by socio-demographic characteristics of the participants. Spearman's rank corre-lation coefficients (ρ) were computed to evaluate correlations amongpairs of POPs. The Kolmogorov–Smirnov test for normality was used tocheck the distributions of POPs; as none was normal, log-transformedvalues were used in regression analyses. All new log-transformedvariables, except log-PCB 118 in women, satisfied normality. The para-metric tests and confidence intervals used in our regression analysisare robust to such departures from normality (Kleinbaum et al., 2007).Density plots were used to chart the distributions of POP serum concen-trations in the different age and sex population groups; we named thesegraphs “POP Geoffrey Rose curves” to emphasize their relevance forRose's “population approach” (Porta, 2004, 2008; Porta et al., 2008b,2010a, 2010b; Rose, 1992).We analyzed three properties of the curves:kurtosis, skewness, and coefficient of variation (Armitage et al., 2002;Kleinbaum et al., 2007; Porta et al., 2010b). In order to analyze variationsin lipid-corrected and log-transformed concentrations of POPs, GeneralLinear regression Models (GLM) were used. The main effects of allpredictors were independently explored in base models. Confoundingvariables were retained in the models when they materially altered theestimates. Due to the complex designs of the BHS and CHS, and inorder to compensate for differences in gender and age, sample weightswere used in the analysis. We compared the concentrations of POPsanalyzed in the BHSwith the concentrations analyzed in 147 individualsrepresentative of the city of Barcelona from CHS through multivariatemodels. We used sample weights for both studies. The level of statisticalsignificance was set at 0.05 and all tests were two tailed. Analyses wereconducted using SPSS version 12.0 (SPSS, Chicago, IL, USA, 2003), Rversion 2.7.1 (2008), Minitab (version 15, 2007) and Stata 8.0.
3. Results
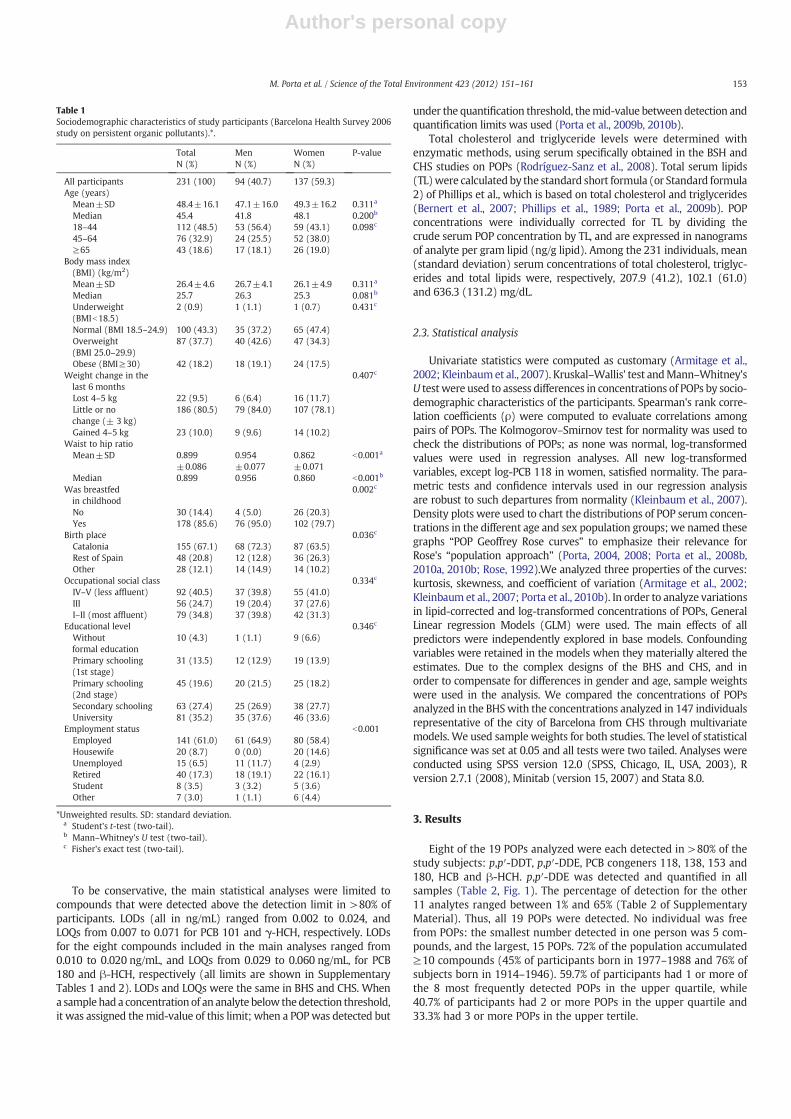
Eight of the 19 POPs analyzed were each detected in >80% of thestudy subjects: p,p′-DDT, p,p′-DDE, PCB congeners 118, 138, 153 and180, HCB and β-HCH. p,p′-DDE was detected and quantified in allsamples (Table 2, Fig. 1). The percentage of detection for the other11 analytes ranged between 1% and 65% (Table 2 of SupplementaryMaterial). Thus, all 19 POPs were detected. No individual was freefrom POPs: the smallest number detected in one person was 5 com-pounds, and the largest, 15 POPs. 72% of the population accumulated≥10 compounds (45% of participants born in 1977–1988 and 76% ofsubjects born in 1914–1946). 59.7% of participants had 1 or more ofthe 8 most frequently detected POPs in the upper quartile, while40.7% of participants had 2 or more POPs in the upper quartile and33.3% had 3 or more POPs in the upper tertile.
Table 1Sociodemographic characteristics of study participants (Barcelona Health Survey 2006study on persistent organic pollutants).*.
TotalN (%)
MenN (%)
WomenN (%)
P-value
All participants 231 (100) 94 (40.7) 137 (59.3)Age (years)
Mean±SD 48.4±16.1 47.1±16.0 49.3±16.2 0.311a
Median 45.4 41.8 48.1 0.200b
18–44 112 (48.5) 53 (56.4) 59 (43.1) 0.098c
45–64 76 (32.9) 24 (25.5) 52 (38.0)≥65 43 (18.6) 17 (18.1) 26 (19.0)
Body mass index(BMI) (kg/m2)Mean±SD 26.4±4.6 26.7±4.1 26.1±4.9 0.311a
Median 25.7 26.3 25.3 0.081b
Underweight(BMIb18.5)
2 (0.9) 1 (1.1) 1 (0.7) 0.431c
Normal (BMI 18.5–24.9) 100 (43.3) 35 (37.2) 65 (47.4)Overweight(BMI 25.0–29.9)
87 (37.7) 40 (42.6) 47 (34.3)
Obese (BMI≥30) 42 (18.2) 18 (19.1) 24 (17.5)Weight change in thelast 6 months
0.407c
Lost 4–5 kg 22 (9.5) 6 (6.4) 16 (11.7)Little or nochange (± 3 kg)
186 (80.5) 79 (84.0) 107 (78.1)
Gained 4–5 kg 23 (10.0) 9 (9.6) 14 (10.2)Waist to hip ratio
Mean±SD 0.899±0.086
0.954±0.077
0.862±0.071
b0.001a
Median 0.899 0.956 0.860 b0.001b
Was breastfedin childhood
0.002c
No 30 (14.4) 4 (5.0) 26 (20.3)Yes 178 (85.6) 76 (95.0) 102 (79.7)
Birth place 0.036c
Catalonia 155 (67.1) 68 (72.3) 87 (63.5)Rest of Spain 48 (20.8) 12 (12.8) 36 (26.3)Other 28 (12.1) 14 (14.9) 14 (10.2)
Occupational social class 0.334c
IV–V (less affluent) 92 (40.5) 37 (39.8) 55 (41.0)III 56 (24.7) 19 (20.4) 37 (27.6)I–II (most affluent) 79 (34.8) 37 (39.8) 42 (31.3)
Educational level 0.346c
Withoutformal education
10 (4.3) 1 (1.1) 9 (6.6)
Primary schooling(1st stage)
31 (13.5) 12 (12.9) 19 (13.9)
Primary schooling(2nd stage)
45 (19.6) 20 (21.5) 25 (18.2)
Secondary schooling 63 (27.4) 25 (26.9) 38 (27.7)University 81 (35.2) 35 (37.6) 46 (33.6)
Employment status b0.001Employed 141 (61.0) 61 (64.9) 80 (58.4)Housewife 20 (8.7) 0 (0.0) 20 (14.6)Unemployed 15 (6.5) 11 (11.7) 4 (2.9)Retired 40 (17.3) 18 (19.1) 22 (16.1)Student 8 (3.5) 3 (3.2) 5 (3.6)Other 7 (3.0) 1 (1.1) 6 (4.4)
*Unweighted results. SD: standard deviation.a Student's t-test (two-tail).b Mann–Whitney's U test (two-tail).c Fisher's exact test (two-tail).
153M. Porta et al. / Science of the Total Environment 423 (2012) 151–161
Author's personal copy
The median concentrations of the most frequently detectedcompounds are shown in Table 2. Among the less frequently detectedcompounds, median concentrations ranged from 0.16 ng/g (PCB 101)
to 5.46 ng/g (δ-HCH) (Table 2 of Supplementary Material). There weresubstantial interindividual differences: the highest individual concen-tration of p,p′-DDE (8227.20 ng/g) was over 1190 times higher thanthe lowest (6.89 ng/g); for HCB the corresponding values were1210.47 and 1.41 ng/g (a 858-fold difference), and for β-HCH, 898.26and 1.50 ng/g (600-fold). Thus, a majority of the population had muchlower concentrations than a certain minority.
The highest Spearman's correlation coefficientwas observed betweenPCBs 138 and 153 (ρ=0.978), PCBs 153 and 180 (ρ=0.958), PCBs 138and 180 (ρ=0.942), and HCB and β-HCH (ρ=0.910). For p,p′-DDT andp,p′-DDE, ρwas 0.542 (all pb0.001).
Themedian value of the DDT/DDE ratiowas 0.09; it was significantlyhigher in men than women (pb0.001). The ratio decreased withincreasing age (pb0.001); the median values were 0.15, 0.06 and 0.05for age groups 18–44, 45–64 and ≥65 years, respectively. Differencesbetween men and women remained statistically significant for agegroup 18–44 years; in the two oldest groups' men still had a non-significant higher ratio than women.
POP levels in BHSwere lower than those found four years earlier forthe entire Catalonia in CHS (Porta et al., 2010b). When comparing onlythe subjects from Barcelona city in the two studies (BHS and CHS), theconcentrations of the eight most prevalent POPs were significantlylower in BHS (Table 2). Specifically, the eight median POP concentra-tions corrected by lipids were 34–56% lower in BHS than in subjectsfrom Barcelona in CHS (28–47% lower when uncorrected by lipids).When geometric means adjusted by age, sex and BMI were compared,concentrations in 2006 were 41–69% lower than in 2002 (37–65%lower when uncorrected by lipids) (Table 2). The decrease from 2002to 2006 (in the adjusted geometric mean of the concentrations) was≥7 percentage points higher in men than in women for p,p′-DDE andPCBs 153 and 180, and higher in women than in men for p,p′-DDT and
Table 2Comparison of serum concentrations of persistent organic pollutants in the Barcelona Health Survey of 2006 and in the Catalan Health Survey of 2002.
Catalan Health Survey 2002(subjects from Barcelona only) (N=147)
Barcelona Health Survey 2006 (N=231) Change 2002–2006%>LOD (P-value)b Medians (%)c aGMa (%)d
%>LOD Median (P25–P75) aGMa (CI 95%) %>LOD Median (P25–P75) aGMa (CI 95%)
p,p′-DDTng/g lipid 36.1 (19.7–76.1) 37.2 (31.9–43.5) 22.0 (13.0–34.9) 20.3 (17.9–22.9) +0.3 −39 −45ng/mL 96.3 0.22 (0.12–0.42) 0.22 (0.19–0.25) 96.9 0.14 (0.08–0.21) 0.12 (0.11–0.14) (1.000) −36 −45
p,p′-DDEng/g lipid 470.5 (228.7–789.2) 491.2 (421.3–572.7) 219.1 (97.4–625.2) 233.6 (206.8–263.8) 0.0 −53 −52ng/mL 100.0 2.53 (1.25–5.11) 2.85 (2.44–3.33) 100.0 1.36 (0.56–4.16) 1.44 (1.27–1.63) (1.000) −46 −49
PCB 118ng/g lipid 30.8 (17.7–48.5) 30.0 (25.3–35.5) 13.5 (5.2–22.7) 9.4 (8.2–10.8) −12.7 −56 −69ng/mL 95.2 0.17 (0.11–0.30) 0.17 (0.15–0.21) 82.5 0.09 (0.03–0.14) 0.06 (0.05–0.07) (b0.001) −47 −65
PCB 138ng/g lipid 91.9 (64.3-128.5) 88.0 (78.0 - 99.2) 48.3 (29.1-87.1) 44.0 (40.0 - 48.4) −0.9 −47 −50ng/mL 98.7 0.55 (0.32–0.77) 0.51 (0.45–0.58) 97.8 0.30 (0.17–0.58) 0.27 (0.25–0.30) (0.411) −45 −47
PCB 153ng/g lipid 121.9 (86.3-176.6) 122.6 (108.4 - 138.8) 68.6 (41.6-135.5) 63.4 (57.5 - 70.0) −2.2 −44 −48ng/mL 100.0 0.71 (0.45–1.01) 0.71 (0.63–0.81) 97.8 0.45 (0.25–0.86) 0.39 (0.35–0.43) (0.161) −34 −45
PCB 180ng/g lipid 95.6 (64.5–432.2) 92.4 (49.7–59.6) 63.4 (38.6–104.0) 54.4 (82.4–103.5) −1.9 −34 −41ng/mL 100.0 0.54 (0.37–0.77) 0.54 (0.48–0.60) 98.1 0.39 (0.22–0.68) 0.34 (0.31–0.37) (0.159) −28 −37
HCBng/g lipid 233.4 (90.9–432.2) 226.9 (199.5–258.1) 109.0 (50.0–339.0) 106.8 (96.4–118.3) −1.6 −53 −53ng/mL 100.0 1.32 (0.52–2.61) 1.32 (1.16–1.50) 98.4 0.70 (0.29–2.32) 0.66 (0.59–0.73) (0.159) −47 −50
β-HCHng/g lipid 128.9 (53.2–269.7) 119.4 (103.5–137.8) 64.2 (24.8–195.4) 59.3 (53.0–66.4) +0.4 −50 −50ng/mL 96.5 0.71 (0.29–1.55) 0.69 (0.60–0.80) 96.9 0.40 (0.14–1.26) 0.37 (0.33–0.41) (0.774) −44 −46
LOD: limit of detection. %>LOD: percent of subjects with concentrations above the LOD. Limits of detection and quantification are given in Tables 1 and 2 of Supplemental Material.P25, P75: 25th, and 75th percentiles, respectively.
a aGM: Geometric mean adjusted by age, sex and BMI.b Difference in percentage points between the Catalan Health Survey 2002 and the Barcelona Health Survey 2006 in the percent of subjects with concentrations above the limit of
detection (Fisher's exact test, two-tail test).c Percent change in the median of the Catalan Health Survey 2002 and the median of the Barcelona Health Survey 2006; the differences between such pairs of medians were all
statistically significant (p≤0.001, Mann–Whitney's U test, two-tail).d Percent change in the aGM of the Catalan Health Survey 2002 and the aGM of the Barcelona Health Survey 2006; the differences between such pairs of aGMwere all statistically
significant (p≤0.001, Wald test).
0%
10%
20%
30%
40%
50%
60%
70%
80%
90%
100%
p,p'
-DD
T
o,p'
-DD
T
p,p'
-DD
E
o,p'
-DD
E
p,p'
-DD
D
o,p'
-DD
D
PC
B 2
8
PC
B 5
2
PC
B 1
01
PC
B 1
18
PC
B 1
38
PC
B 1
53
PC
B 1
80
HC
B
PeC
B
α-H
CH
β-H
CH
γ-H
CH
δ-H
CH
100%97%
87%
98% 98% 98% 98% 97%
83%
Fig. 1. Percentages of detection of organochlorine compounds in serum in a representativesample of the general population of Barcelona (samples collected in 2006). Blue (B): detectedand quantified. Purple (P): detected, non-quantified.White: non-detected. The figures insidethe bars refer to the percentage of detection (B+P) of the 8 most frequently detectedPOPs. DDT, dichlorodiphenyltrichloroethane; DDE, dichlorodiphenyldichloroethene; DDD,dichlorodiphenyldichloroethane; PCBs, polychlorinated biphenyls; HCB, hexachlorobenzene;PeCB, pentachlorobenzene; HCH, hexachlorocyclohexane.
154 M. Porta et al. / Science of the Total Environment 423 (2012) 151–161
Author's personal copy
β-HCH; however, none of these differences was statistically significant(Table 3). The decrease in concentrations from 2002 to 2006 becamesmaller with increasing age for p,p′-DDE and PCBs 138, 153 and 180.Practically the same pattern was observed when individuals weregrouped by birth cohort instead of age. The decrease in concentrationsfrom 2002 to 2006 was larger with increasing BMI for seven of theeight POPs (all but p,p′-DDE); differences were statistically significantfor p,p′-DDT, HCB and β-HCH; in these compounds, the decrease inobese individuals was 31–44 points larger than in subjects with normalweight.
The percentages of detection were similar in 2002 and 2006(Table 2). For 9 of the 11 less frequently detected POPs, the percentageof detectionwas also statistically significantly lower in BHS. Fig. 2 showsthe population distribution of concentrations of PCB 153 by sex andperiod. The four distributions lean towards the left (lower levels), butmore so in 2006 than in 2002; levels are always higher in women. Thepopulation distribution of the concentrations of POPs was alwaysswitched towards higher values in women than men (Fig. 3); womenhad statistically significantly higher median concentrations than menof seven of the eight most prevalent POPs (the exception was p,p′-DDT). After adjusting by age and BMI, levels of p,p′-DDE, HCB and β-HCH remained significantly higher in women than men. The differencebetween women and men in median concentrations of HCB increasedwith age/cohort (Fig. 4); so did for concentrations of PCB 118 and β-HCH. This increase in the difference between women and men withage was not due to a higher weight with increasing age in womenthan men (results not shown).
The median, geometric mean, 25th percentile and 75th percentile ofall 8 most commonly detected POPs increased with increasing agegroup; thus, for instance, among the eldest groupmedian concentrationsof p,p′-DDE, HCB and β-HCH were between four and nine times higherthan in the younger group (Tables 4 and 5). Although differences werenot statistically significant, the percentage of detection of the 11 POPsless frequently detected was always higher in the oldest than in theyoungest age group (Table 2 of Supplementary Material); the possibleexceptions were α-HCH, γ-HCH and δ-HCH, whose percentages ofdetection were slightly higher in the youngest than in the oldest group.
We observed a pattern of progressive flattening of the curveswith in-creasing age. The kurtosis of each POP distribution in each younger groupwas between 2.2 and 33 times higher than that of the correspondingolder group; i.e., in the younger groups POP concentrations clusteredmore around a few values than in the older groups. Simultaneously, theskewness of each POP distribution in the youngest group was between1.6 and 9.4 times greater than that of the oldest group. In addition, the
coefficient of variation of the distribution of each POP was between 1.2and 2.0 times higher in the youngest than in the oldest group.
BMI was positively associated to concentrations of HCB and β-HCHin women and men, and of p,p′-DDE in men; obese individuals hadmedians of these POPs between 2.7 and 4.7 times higher than individ-uals with normal weight (Tables 4a and 5a). However, after adjustingfor age, no positive association remained statistically significantbetween POP concentrations and BMI, while PCB 180 (in both womenand men), and p,p′-DDT (in men), showed decreasing concentrationswith increasing BMI (Tables 4a, 4b and 5b). Controlling by occupationalsocial class, educational level (or parity, in women), did not materiallyalter these patterns.
Individuals who had gained 4–5 kg in the 6 months prior to BHSblood draw had lower median concentrations of all eight POPs – exceptPCB 118 in women – than those who had little or no weight change;although this pattern was common, none of the 15 differences was sta-tistically significant (Tables 4 and 5). The general pattern remainedapparent after adjusting for age, and the inverse association observedin men between p,p′-DDT and weight gain became statistically signifi-cant (p=0.029). POP concentrationswere similar between participantswho had lost weight and those with little or no weight change; onlysignificantly higher concentrations of PCB 118 were found in men whohad lostweight, after adjusting for age (p=0.027). Having been breastfedin infancy was virtually unrelated to POP levels (Tables 4 and 5).
Menwhowere born abroad of Spain had higher age-adjusted concen-trations of p,p′-DDT and p,p′-DDE than men who were born in Catalonia(both pb0.03). Women who were born abroad had higher concentra-tions of p,p′-DDT and p,p′-DDE, and lower concentrations of PCBs 138,153 and 180, HCB and β-HCH (Tables 4 and 5).
Crude and multivariate analyses showed that concentrations of all8 prevalent POPs were highest in women from the less affluent socialclasses (IV–V), although only differences for p,p′-DDE were statisticallysignificant after adjusting for age (Table 4). Men in social classes IV–Vhad the highest concentrations of p,p′-DDT and p,p′-DDE (p=0.023and 0.181, respectively); they also had the lowest concentrations ofHCB and PCB 118 (p-values≤0.005) (Table 4). Men in class III had thelowest values of the other three PCB congeners (p-values≤0.025).
Crude analyses did not show decreasing POP concentrations inwomen with increasing number of children or with increasing monthsof having breastfed their children; in fact, the highest (unadjusted)concentrations of almost all POPs were seen in women with ≥3 chil-dren, and inwomenwho had breastfed>6 months (Table 4). However,parity and breastfeedingwere positively associatedwith age and, hence,after adjusting by age, there was no association between parity orbreastfeeding and POP levels. Adjusting by BMI, social class or educationdid not change these results.
4. Discussion
Eight POPs were each detected in >80% of the study subjects, andno individual was free from POPs; the smallest number detected inone person was 5 compounds, while ten or more compounds weredetected in 72% of the population. However, from 2002 to 2006serum concentrations of POPs decreased 34–56% in Barcelona city(Porta et al., 2010b).
In the BHS a pattern of progressive “flattening” of the POP distribu-tions with increasing age was also seen, as previously in the CHS(Porta et al., 2010b). Compared to older subjects, all POP distributionsof younger participants had higher kurtosis, skewness and coefficientof variation. To our knowledge, these patterns have not been noticedin other populations, although they are likely to occur as well. In across-sectional study it is of course impossible to know whether thepattern is related to ageing or cohort effects. Either case,we hypothesizethat the two main underlying processes may be: a) in the youngest agegroup/cohort there is both less and more inequality in the concentra-tions of each POP: less because most of the subjects have similar values,
Table 3Change in the concentrations of persistent organic pollutants in the population of thecity of Barcelona from 2002 to 2006, by sex, age and body mass index.a.
Sexb Agec Body mass indexd
Men Women 18–44years
45–64years
≥65years
Normalweight
Overweight Obese
p,p′-DDT −41 −49 −39 −54 −53 −25 −52 −69*p,p′-DDE −58 −45 −57 −44 −30 −52 −53 −51PCB 118 −71 −66 −66 −74 −61 −59 −74 −79PCB 138 −50 −49 −53 −48 −31 −42 −53 −65PCB 153 −53 −43 −54 −43 −22 −44 −48 −63PCB 180 −47 −35 −48 −38 −15 −36 −41 −58HCB −53 −52 −52 −53 −46 −38 −61 −64*β-HCH −46 −53 −48 −49 −48 −31 −61 −62*
*p≤0.05, Wald test.a Percent change in the adjusted geometric mean of the lipid-corrected serum concen-
trations of each compound (ng/g lipid) in the Catalan Health Survey of 2002 (subjectsfrom Barcelona) and the Barcelona Health Survey of 2006.
b General linear regression models, adjusted by age.c General linear regression models, adjusted by sex.d General linear regression models, adjusted by age and sex.
155M. Porta et al. / Science of the Total Environment 423 (2012) 151–161

Author's personal copy
andmore because there is a large differencebetween their concentrationand that of the minority of the subjects at the right end of the tail; andb) as age increases, inequalities increase in the subgroup with initiallysimilarly low concentrations but, on average, such group gets closer tothe minority with top concentrations. The processes of exposure andaccumulation that underlie these phenomena deserve more attentionthan they have received so far (Porta, 2004; Porta et al., 2008b).
Our two younger age groups/cohorts had a higher DDT/DDE ratiothan the oldest cohort. This observation results from the followingtwo facts: in the younger cohorts concentrations of DDE were 7times lower than in the oldest cohort, whereas concentrations ofDDT were 2 times lower in the younger than in the oldest cohort.These relationships are in turn coherent with the fact that the DDT/DDE ratio increased from 2002 to 2006, given that concentrations of
0.000
0.003
0.006
0.009
0 100 200 300 400 5000.000
0.003
0.006
0.009
0 100 200 300 400 500PCB 153 (ng/g) PCB 153 (ng/g)
Women, BHS Study 2006Median: 87.97 ng/gMaximum: 529.40 ng/g
Women, CHS Study 2002Median: 120.81 ng/gMaximum: 370.50 ng/g
Men, BHS Study 2006Median: 65.89 ng/gMaximum: 549.29 ng/g
Men, CHS Study 2002Median: 113.96 ng/gMaximum: 567.32 ng/g
Pro
bab
ility
den
sity
Fig. 2. Distribution of serum concentrations of PCB 153 in the city of Barcelona by sex (2006, BHS; 2002, subjects from Barcelona city in CHS).
0.000
0.005
0.010
0.015
0.020
0.025
0.030
0.035
0 50 100 150 200 250
Pro
bab
ility
den
sity
Pro
bab
ility
den
sity
Pro
bab
ility
den
sity
0.0000
0.0005
0.0010
0.0015
0.0020
0.0025
0.0030
0 1000 2000 3000p,p’-DDT (ng/g) p,p’-DDE (ng/g)
0.000
0.002
0.004
0.006
0.008
0.010
0.012
0.014
0 50 100 150 200 250PCB 138 (ng/g)
0.000
0.002
0.004
0.006
0.008
0 200 400 600 800 1000HCB (ng/g)
0.000
0.002
0.004
0.006
0.008
0.010
0 50 100 150 200 250 300 350PCB 180 (ng/g)
0.000
0.002
0.004
0.006
0.008
0.010
0.012
0 200 400 600 800B-HCH (ng/g)
Pro
bab
ility
den
sity
Pro
bab
ility
den
sity
Pro
bab
ility
den
sity
Women Men
Fig. 3. Population distributions of six prevalent POPs by sex (Barcelona, 2006).
156 M. Porta et al. / Science of the Total Environment 423 (2012) 151–161

Author's personal copy
DDE decreased more than concentrations of DDT (Table 2). As in indi-viduals, the “population kinetics” of DDE and DDT is not linear, andlevels decrease more slowly when they are lower (Porta, 2004;Porta et al., 2008b; Wolff et al., 2005, 2007).
Chemical analyses for BHS and CHS were performed in the samelaboratory, using the same methodology. Nevertheless, two minordifferences between the two studies could slightly affect the analysisof changes in concentrations from 2002 to 2006: a)while in BHS 2006serum samples were stored frozen during two years before POPanalyses, the corresponding time in CHS 2002 was four years, whichmight have caused a slightly underestimation of the decrease inconcentrations seen in BHS relative to CHS; and b) the time of fastingrequested before blood draw was ≥4 h in BHS and ≥12 h in CHS.However, almost all participants were fasting (98% in BHS an 99% inCHS); also, all POP concentrations were corrected for lipids, acommon technique to account for inevitable differences in fasting inpopulation-based studies (Bernert et al., 2007; Phillips et al., 1989;
Porta et al., 2009b). In BHS, lipid concentrations were slightly higherthan in CHS (Porta et al., 2010b); therefore, compared to crude values(uncorrected for lipids), lipid-corrected POP concentrations in BHSexperienced a higher relative decrease than in CHS, which would tendto slightly overestimate the difference in concentrations between thetwo studies. Nevertheless, crude concentrations were also significantlylower in BHS than in CHS (Table 2). Furthermore, differences between2006 and2002 remained significant for all eight POPswhenwe adjustedby age, sex, lipids and BMI. The decrease in concentrations from 2002 to2006was similar inwomen andmen,with no clear pattern. For p,p′-DDEand PCBs 138, 153 and 180 the decrease in concentrations was larger inthe younger age groups; practically the same pattern was observedwhen individualswere grouped by birth cohort. The decrease in concen-trations from 2002 to 2006was larger in obese individuals (except for p,p′-DDE); this was so in spite of the positive association between mostPOPs and BMI in the two studies (BMI was inversely associated withPCBs in both BHS and CHS). Thus, POP contamination likely decreasedin the citizens of Barcelona in the four years between studies, andreasons for the change deserve further research.
Papers reporting time trends in representative samples using similarmethodologies are extremely rare (Hagmar et al., 2006; Axmon et al.,2008; Porta et al., 2008b; Hardell et al., 2010; Donaldson et al., 2010).Our findings are broadly in accordance with these studies. For instance,significant declines were observed for most contaminants in maternalblood from 1992–1996 to 2004–2006 within different Arctic regions(Donaldson et al., 2010). In a small convenience sample from Sweden,levels of PCB 153 also decreased more in obese than in lean individuals(Hagmar et al., 2006). In some 200 young Swedish males investigatedin 2000 and 2004, themedian serum concentration of PCB 153 decreasedan average of 26% per year; this congenerwas detected in 100% of partic-ipants in 2000 and in 70% in 2004; the correspondingfigures for p,p′-DDEwere 94% and 35% (Axmon et al., 2008).
Women had significantly higher concentrations than men of sevenPOPs. Values of three compounds with high concentrations overall (p,p′-DDE, HCB and β-HCH) remained significantly higher in women afteradjusting by age and BMI. Thus, the specific reasons for sex differences
0
100
200
300
400
500
600
ng
/g H
CB
Men Women
Age groupBirth cohort 1988-1977 1976-1962 1961-1947 1931
18-29 30-44 45-59 751946-1932
60-74
Fig. 4. Median concentration of HCB by age group/birth cohort and by sex (Barcelona,2006).
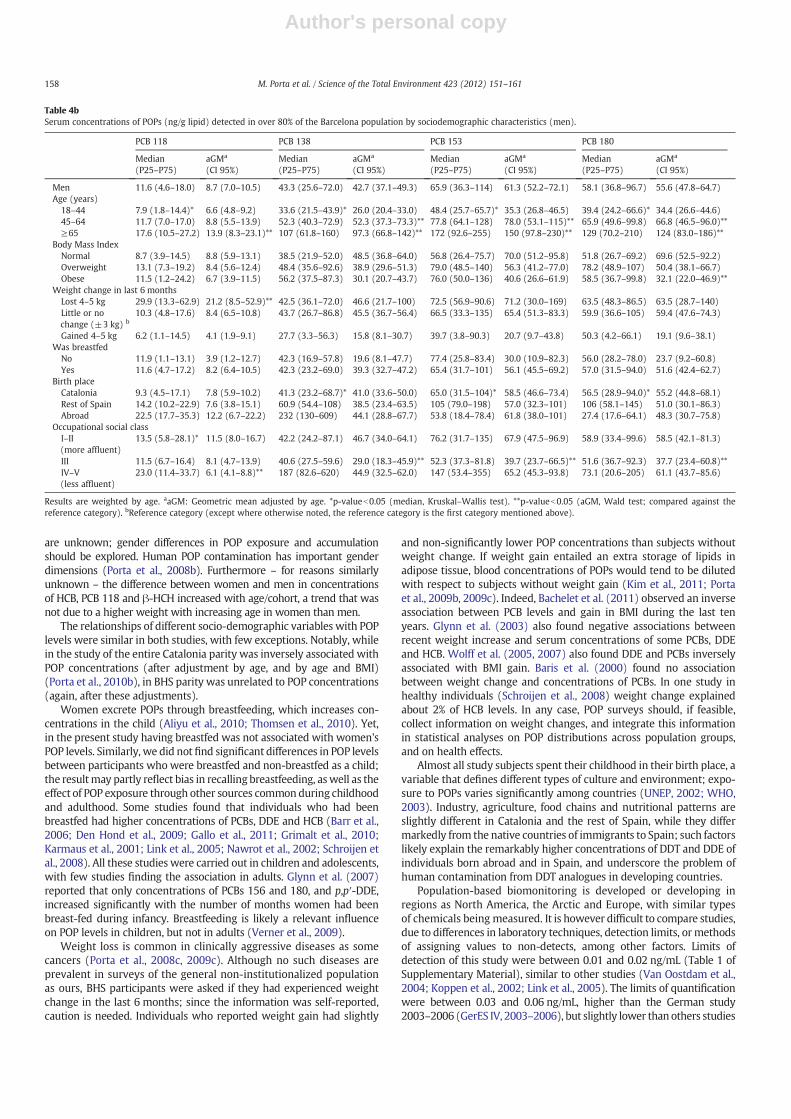
Table 4aSerum concentrations of POPs (ng/g lipid) detected in over 80% of the Barcelona population by sociodemographic characteristics (men).
p,p′-DDT p,p′-DDE HCB β-HCH
Median(P25–P75)
aGMa
(CI 95%)Median(P25–P75)
aGMa
(CI 95%)Median(P25–P75)
aGMa
(CI 95%)Median(P25–P75)
aGMa
(CI 95%)
Men 21.1 (12.4–34.8) 20.9 (17.8–24.6) 147 (81.1–441) 194 (159–236) 69.4 (35.8–157) 71.0 (60.0–84.0) 39.6 (19.9–107) 42.9 (36.7–50.3)Age (years)
18–44 17.6 (10.4–28.1)* 17.0 (13.5–21.5) 97.0 (62.2–148)* 98.3 (74.9–129) 49.1 (27.2–62.7)* 37.2 (27.8–49.8) 22.8 (13.8–35.5)* 18.4 (14.0–24.2)45–64 22.2 (12.9–26.1) 19.0 (13.7–26.3) 242 (131–542) 271 (185–397)** 103 (60.4–172) 90.3 (60.0–136)** 80.9 (40.9–113) 62.6 (42.8–91.5)**≥65 40.6 (18.3–61.6) 36.6 (25.5–52.7)** 662 (255–1859) 566 (370–865)** 214 (122–351) 204 (130–322)** 193 (104–275) 165 (108–252)**
Body mass indexNormal 21.7 (15.9–35.1) 27.8 (21.0–36.6) 114 (64.3–153)* 161 (116–224) 51.3 (28.2–70.6)* 64.3 (45.7–90.3) 23.9 (16.6–38.5)* 40.8 (29.8–55.9)Overweight 20.2 (13.8–38.8) 17.5 (13.3–23.1)** 187 (122–552) 172 (124–239) 93.1 (57.5–197) 62.9 (44.8–88.2) 61.7 (24.0–164) 34.8 (25.5–47.6)Obese 19.8 (9.2–29.6) 14.4 (9.9–20.8)** 313 (96.0–1675) 272 (175–424) 152 (47.3–331) 87.5 (55.4–138) 99.0 (40.6–191) 52.8 (34.6–80.7)
Weight change in last 6 monthsLost 4–5 kg 33.8 (17.7–35.3) 24.4 (12.6–47.3) 113 (64.6–267) 124 (48.0–322) 77.5 (71.6–92.6) 73.7 (27.6–197) 51.0 (26.4–117) 53.6 (19.4–148)Little or nochange (± 3 kg)b
21.7 (12.6–39.7) 22.2 (18.5–26.8) 156 (91.9–464) 199 (152–260) 69.8 (35.8–177) 70.1 (53.2–92.4) 40.6 (19.9–113) 44.3 (33.3–58.9)
Gained 4–5 kg 14.6 (2.7–22.7) 8.8 (5.0–15.8)** 91.7 (54.7–488) 145 (63.1–331) 42.2 (9.1–350) 46.2 (19.7–109) 24.2 (1.6–105) 15.1 (6.2–36.6)Was breastfed
No 25.4 (15.2–60.0) 23.2 (9.3–58.2) 1433 (167–2047) 494 (176–1386) 106 (18.2–329) 45.1 (15.3–133) 77.7 (10.3–263) 27.2 (9.8–76.1)Yes 18.7 (12.2–30.4) 19.7 (16.3–23.8) 140 (72.2–333) 175 (141–216)** 61.6 (35.2–134) 63.2 (50.6–79.0) 36.9 (19.2–99.9) 38.0 (30.7–47.0)
Birth placeCatalonia 19.2 (11.2–30.2) 19.9 (16.3–24.2) 133 (67.7–267)* 162 (129–204) 59.7 (35.8–141)* 70.4 (55.4–89.5) 38.5 (19.7–87.4)* 39.9 (31.9–49.9)Rest of Spain 24.1 (12.0–40.9) 15.8 (9.6–26.1) 346 (163–1498) 211 (119–376) 190 (89.0–311) 79.8 (43.8–146) 169 (69.8–239) 44.8 (25.5–78.8)Abroad 22.5 (17.7–35.3) 29.9 (19.5–45.9)** 232 (130–609) 301 (184–493)** 53.8 (18.4–78.4) 46.1 (27.6–77.1) 27.4 (17.6–64.1) 37.8 (23.3–61.2)
Occupational social classI–II (more affluent) 18.8 (10.9–30.2) 19.2 (14.7–25.1) 129 (64.4–392) 160 (109–234) 70.1 (43.4–151) 85.6 (57.8–127) 33.7 (19.5–88.9) 43.1 (28.2–65.7)III 16.5 (10.9–25.3) 13.5 (9.1–19.9) 139 (54.7–239) 156 (89.8–271) 66.2 (45.7–177) 65.2 (36.9–115) 41.6 (17.0–99.8) 32.7 (17.7–60.2)IV–V (less affluent) 23.6 (16.0–51.6) 27.6 (21.0–36.3)** 187 (129–613) 242 (164–357) 70.9 (27.2–170) 54.3 (36.4–81.2)** 39.0 (22.9–149) 43.6 (28.3–67.1)
Results are weighted by age. aaGM: Geometric mean adjusted by age. *p-valueb0.05 (median, Kruskal–Wallis test). **p-valueb0.05 (aGM, Wald test; compared against thereference category). bReference category (except where otherwise noted, the reference category is the first category mentioned above).
157M. Porta et al. / Science of the Total Environment 423 (2012) 151–161
Author's personal copy
are unknown; gender differences in POP exposure and accumulationshould be explored. Human POP contamination has important genderdimensions (Porta et al., 2008b). Furthermore – for reasons similarlyunknown – the difference between women and men in concentrationsof HCB, PCB 118 and β-HCH increased with age/cohort, a trend that wasnot due to a higher weight with increasing age in women than men.
The relationships of different socio-demographic variables with POPlevels were similar in both studies, with few exceptions. Notably, whilein the study of the entire Catalonia parity was inversely associated withPOP concentrations (after adjustment by age, and by age and BMI)(Porta et al., 2010b), in BHS parity was unrelated to POP concentrations(again, after these adjustments).
Women excrete POPs through breastfeeding, which increases con-centrations in the child (Aliyu et al., 2010; Thomsen et al., 2010). Yet,in the present study having breastfed was not associated with women'sPOP levels. Similarly, we did not find significant differences in POP levelsbetween participants who were breastfed and non-breastfed as a child;the resultmay partly reflect bias in recalling breastfeeding, aswell as theeffect of POP exposure through other sources commonduring childhoodand adulthood. Some studies found that individuals who had beenbreastfed had higher concentrations of PCBs, DDE and HCB (Barr et al.,2006; Den Hond et al., 2009; Gallo et al., 2011; Grimalt et al., 2010;Karmaus et al., 2001; Link et al., 2005; Nawrot et al., 2002; Schroijen etal., 2008). All these studies were carried out in children and adolescents,with few studies finding the association in adults. Glynn et al. (2007)reported that only concentrations of PCBs 156 and 180, and p,p′-DDE,increased significantly with the number of months women had beenbreast-fed during infancy. Breastfeeding is likely a relevant influenceon POP levels in children, but not in adults (Verner et al., 2009).
Weight loss is common in clinically aggressive diseases as somecancers (Porta et al., 2008c, 2009c). Although no such diseases areprevalent in surveys of the general non-institutionalized populationas ours, BHS participants were asked if they had experienced weightchange in the last 6 months; since the information was self-reported,caution is needed. Individuals who reported weight gain had slightly
and non-significantly lower POP concentrations than subjects withoutweight change. If weight gain entailed an extra storage of lipids inadipose tissue, blood concentrations of POPs would tend to be dilutedwith respect to subjects without weight gain (Kim et al., 2011; Portaet al., 2009b, 2009c). Indeed, Bachelet et al. (2011) observed an inverseassociation between PCB levels and gain in BMI during the last tenyears. Glynn et al. (2003) also found negative associations betweenrecent weight increase and serum concentrations of some PCBs, DDEand HCB. Wolff et al. (2005, 2007) also found DDE and PCBs inverselyassociated with BMI gain. Baris et al. (2000) found no associationbetween weight change and concentrations of PCBs. In one study inhealthy individuals (Schroijen et al., 2008) weight change explainedabout 2% of HCB levels. In any case, POP surveys should, if feasible,collect information on weight changes, and integrate this informationin statistical analyses on POP distributions across population groups,and on health effects.
Almost all study subjects spent their childhood in their birth place, avariable that defines different types of culture and environment; expo-sure to POPs varies significantly among countries (UNEP, 2002; WHO,2003). Industry, agriculture, food chains and nutritional patterns areslightly different in Catalonia and the rest of Spain, while they differmarkedly from the native countries of immigrants to Spain; such factorslikely explain the remarkably higher concentrations of DDT and DDE ofindividuals born abroad and in Spain, and underscore the problem ofhuman contamination from DDT analogues in developing countries.
Population-based biomonitoring is developed or developing inregions as North America, the Arctic and Europe, with similar typesof chemicals being measured. It is however difficult to compare studies,due to differences in laboratory techniques, detection limits, ormethodsof assigning values to non-detects, among other factors. Limits ofdetection of this study were between 0.01 and 0.02 ng/mL (Table 1 ofSupplementary Material), similar to other studies (Van Oostdam et al.,2004; Koppen et al., 2002; Link et al., 2005). The limits of quantificationwere between 0.03 and 0.06 ng/mL, higher than the German study2003–2006 (GerES IV, 2003–2006), but slightly lower than others studies
Table 4bSerum concentrations of POPs (ng/g lipid) detected in over 80% of the Barcelona population by sociodemographic characteristics (men).
PCB 118 PCB 138 PCB 153 PCB 180
Median(P25–P75)
aGMa
(CI 95%)Median(P25–P75)
aGMa
(CI 95%)Median(P25–P75)
aGMa
(CI 95%)Median(P25–P75)
aGMa
(CI 95%)
Men 11.6 (4.6–18.0) 8.7 (7.0–10.5) 43.3 (25.6–72.0) 42.7 (37.1–49.3) 65.9 (36.3–114) 61.3 (52.2–72.1) 58.1 (36.8–96.7) 55.6 (47.8–64.7)Age (years)
18–44 7.9 (1.8–14.4)* 6.6 (4.8–9.2) 33.6 (21.5–43.9)* 26.0 (20.4–33.0) 48.4 (25.7–65.7)* 35.3 (26.8–46.5) 39.4 (24.2–66.6)* 34.4 (26.6–44.6)45–64 11.7 (7.0–17.0) 8.8 (5.5–13.9) 52.3 (40.3–72.9) 52.3 (37.3–73.3)** 77.8 (64.1–128) 78.0 (53.1–115)** 65.9 (49.6–99.8) 66.8 (46.5–96.0)**≥65 17.6 (10.5–27.2) 13.9 (8.3–23.1)** 107 (61.8–160) 97.3 (66.8–142)** 172 (92.6–255) 150 (97.8–230)** 129 (70.2–210) 124 (83.0–186)**
Body Mass IndexNormal 8.7 (3.9–14.5) 8.8 (5.9–13.1) 38.5 (21.9–52.0) 48.5 (36.8–64.0) 56.8 (26.4–75.7) 70.0 (51.2–95.8) 51.8 (26.7–69.2) 69.6 (52.5–92.2)Overweight 13.1 (7.3–19.2) 8.4 (5.6–12.4) 48.4 (35.6–92.6) 38.9 (29.6–51.3) 79.0 (48.5–140) 56.3 (41.2–77.0) 78.2 (48.9–107) 50.4 (38.1–66.7)Obese 11.5 (1.2–24.2) 6.7 (3.9–11.5) 56.2 (37.5–87.3) 30.1 (20.7–43.7) 76.0 (50.0–136) 40.6 (26.6–61.9) 58.5 (36.7–99.8) 32.1 (22.0–46.9)**
Weight change in last 6 monthsLost 4–5 kg 29.9 (13.3–62.9) 21.2 (8.5–52.9)** 42.5 (36.1–72.0) 46.6 (21.7–100) 72.5 (56.9–90.6) 71.2 (30.0–169) 63.5 (48.3–86.5) 63.5 (28.7–140)Little or nochange (±3 kg) b
10.3 (4.8–17.6) 8.4 (6.5–10.8) 43.7 (26.7–86.8) 45.5 (36.7–56.4) 66.5 (33.3–135) 65.4 (51.3–83.3) 59.9 (36.6–105) 59.4 (47.6–74.3)
Gained 4–5 kg 6.2 (1.1–14.5) 4.1 (1.9–9.1) 27.7 (3.3–56.3) 15.8 (8.1–30.7) 39.7 (3.8–90.3) 20.7 (9.7–43.8) 50.3 (4.2–66.1) 19.1 (9.6–38.1)Was breastfed
No 11.9 (1.1–13.1) 3.9 (1.2–12.7) 42.3 (16.9–57.8) 19.6 (8.1–47.7) 77.4 (25.8–83.4) 30.0 (10.9–82.3) 56.0 (28.2–78.0) 23.7 (9.2–60.8)Yes 11.6 (4.7–17.2) 8.2 (6.4–10.5) 42.3 (23.2–69.0) 39.3 (32.7–47.2) 65.4 (31.7–101) 56.1 (45.5–69.2) 57.0 (31.5–94.0) 51.6 (42.4–62.7)
Birth placeCatalonia 9.3 (4.5–17.1) 7.8 (5.9–10.2) 41.3 (23.2–68.7)* 41.0 (33.6–50.0) 65.0 (31.5–104)* 58.5 (46.6–73.4) 56.5 (28.9–94.0)* 55.2 (44.8–68.1)Rest of Spain 14.2 (10.2–22.9) 7.6 (3.8–15.1) 60.9 (54.4–108) 38.5 (23.4–63.5) 105 (79.0–198) 57.0 (32.3–101) 106 (58.1–145) 51.0 (30.1–86.3)Abroad 22.5 (17.7–35.3) 12.2 (6.7–22.2) 232 (130–609) 44.1 (28.8–67.7) 53.8 (18.4–78.4) 61.8 (38.0–101) 27.4 (17.6–64.1) 48.3 (30.7–75.8)
Occupational social classI–II(more affluent)
13.5 (5.8–28.1)* 11.5 (8.0–16.7) 42.2 (24.2–87.1) 46.7 (34.0–64.1) 76.2 (31.7–135) 67.9 (47.5–96.9) 58.9 (33.4–99.6) 58.5 (42.1–81.3)
III 11.5 (6.7–16.4) 8.1 (4.7–13.9) 40.6 (27.5–59.6) 29.0 (18.3–45.9)** 52.3 (37.3–81.8) 39.7 (23.7–66.5)** 51.6 (36.7–92.3) 37.7 (23.4–60.8)**IV–V(less affluent)
23.0 (11.4–33.7) 6.1 (4.1–8.8)** 187 (82.6–620) 44.9 (32.5–62.0) 147 (53.4–355) 65.2 (45.3–93.8) 73.1 (20.6–205) 61.1 (43.7–85.6)
Results are weighted by age. aaGM: Geometric mean adjusted by age. *p-valueb0.05 (median, Kruskal–Wallis test). **p-valueb0.05 (aGM, Wald test; compared against thereference category). bReference category (except where otherwise noted, the reference category is the first category mentioned above).
158 M. Porta et al. / Science of the Total Environment 423 (2012) 151–161
Author's personal copy
(Becker et al., 2002; Jakszyn et al., 2009). The studies with higher limitsof quantification were from years 1998 and 1992–96, respectively,which might explain the difference. Nevertheless, our laboratorytechniques were state-of-the-art and are highly unlikely to have biasedthe results.
Almost all concentrations of POPs found in the U.S. population in2003–2004 (Department of Health and Human Services, 2009) arelower than values found in the present study, except p,p′-DDE,whose levels were similar. Concentrations of p,p′-DDE, β-HCH andPCBs 138, 153 and 180 seen in the German population in 1998(Becker et al., 2002) were higher than concentrations in the presentstudy, probably because of the year of sampling. Values of p,p′-DDEin West Germany were similar to those we found in the age group26–55 years, but lower in other age groups. Concentrations of HCB(in different age groups) were similar between the German studyand the present study. Concentrations of p,p′-DDE and the sum ofPCBs (138, 153 and 180) found in the adult Flemish population(50–65 years) in 2002–2006 (De Coster et al., 2008) were slightlyhigher than in the adult population of BHS, while HCB concentrationsin Flemish adults were lower than HCB levels in the adult populationof Barcelona. In a Czech study of adults conducted in 2006 (Cerná et al.,2008) concentrations of PCBs 18, 52, 118, 138, 153 and 180 were be-tween 5 and 10 times higher than those in the population of Barcelona.Concentrations of PCBs 138 and 153 were very similar in a study ofpopulations living near incinerators in Italy in 2005–2006 (De Felip etal., 2008), while levels of PCB 180were higher in this Italian population.In a study in Slovakia in 2001 (Petrik et al., 2006), concentrations of p p′-DDT, p,p′-DDE, HCB and PCBs 118, 138, 153 and 180 were higher thanconcentrations in Barcelona; only β-HCH concentrations were lowerin Slovakia. p,p′-DDE concentrations found in French women in2005–2007 (Bachelet et al., 2011) were lower than values in BHS
women, but values of PCB 153 were similar. In another Spanish studyof 2006 (Zubero et al., 2009) concentrations of PCB 118 were similarto our study, while levels of PCBs 138, 153 and 180were slightly higher.
Although our sample size was small in general terms, the size maybe attractive to local and regional governments with limitedresources. Furthermore, subjects were selected from a representativesample of the city, participation rates were carefully analyzed (Portaet al., 2009a), and sample weights were used to compensate fordifferences in age and sex (Porta et al., 2009a). Moreover, relevantindicators – that are not usually part of biomonitoring surveys –
were prospectively collected, such as weight changes, lactation, andanthropometric data measured by nurses.
Sociodemographic variables as age, gender, occupational socialclass or place of birth are important determinants of POP levels orare associated with processes that influence POP exposure. Policiesaimed at decreasing human POP contamination need to take intoaccount such influences. Furthermore, these variables can decisivelyinfluence participation in a study where subjects provide biologicalsamples (Porta et al., 2009a).
5. Conclusions
Although all POPs analyzed were banned decades ago, humancontamination remains common in the city of Barcelona, as elsewhere.Eight of the 19 POPs analyzed were (each) detected in >80% of thestudy subjects, the minimum number of POPs detected in one personwas 5, and therewere large interindividual differences in concentrations.However, POP concentrations decreased 34–56% in 4 years.
While scarce and heterogeneous worldwide, population-based sur-veys on the distribution of POP concentrations in humans are essentialto understand patterns, trends and determinants of POP contamination.
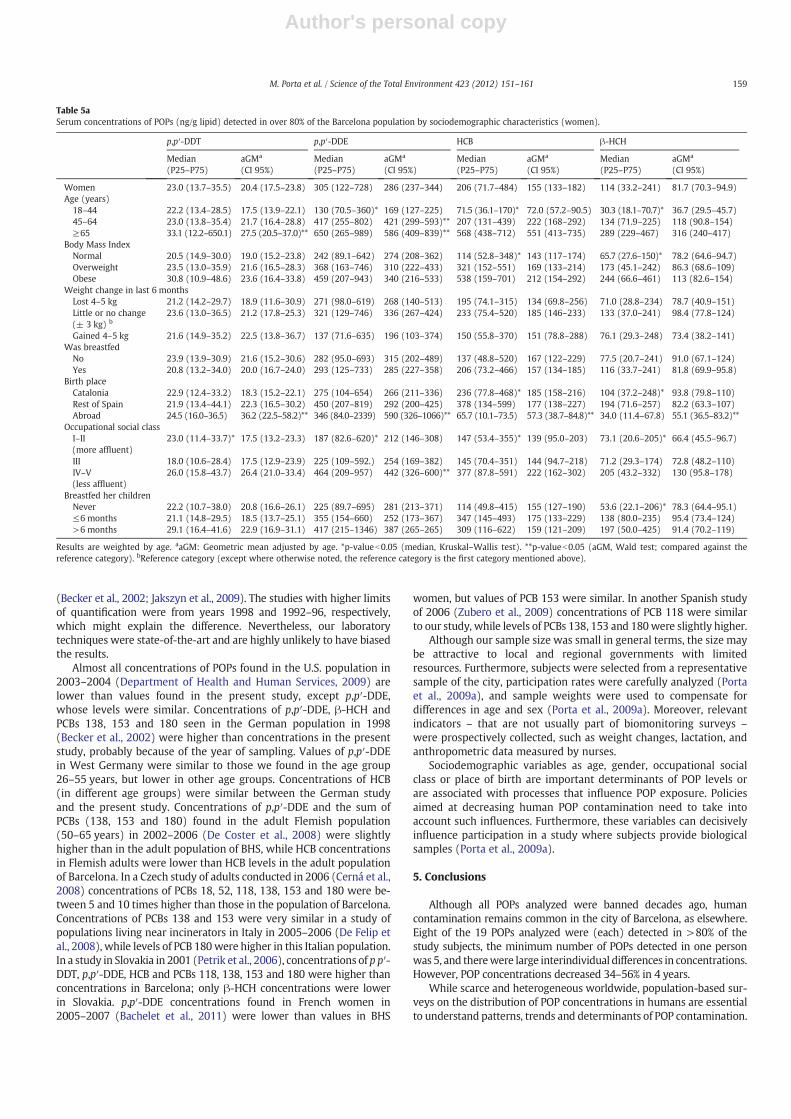
Table 5aSerum concentrations of POPs (ng/g lipid) detected in over 80% of the Barcelona population by sociodemographic characteristics (women).
p,p′-DDT p,p′-DDE HCB β-HCH
Median(P25–P75)
aGMa
(CI 95%)Median(P25–P75)
aGMa
(CI 95%)Median(P25–P75)
aGMa
(CI 95%)Median(P25–P75)
aGMa
(CI 95%)
Women 23.0 (13.7–35.5) 20.4 (17.5–23.8) 305 (122–728) 286 (237–344) 206 (71.7–484) 155 (133–182) 114 (33.2–241) 81.7 (70.3–94.9)Age (years)
18–44 22.2 (13.4–28.5) 17.5 (13.9–22.1) 130 (70.5–360)* 169 (127–225) 71.5 (36.1–170)* 72.0 (57.2–90.5) 30.3 (18.1–70.7)* 36.7 (29.5–45.7)45–64 23.0 (13.8–35.4) 21.7 (16.4–28.8) 417 (255–802) 421 (299–593)** 207 (131–439) 222 (168–292) 134 (71.9–225) 118 (90.8–154)≥65 33.1 (12.2–650.1) 27.5 (20.5–37.0)** 650 (265–989) 586 (409–839)** 568 (438–712) 551 (413–735) 289 (229–467) 316 (240–417)
Body Mass IndexNormal 20.5 (14.9–30.0) 19.0 (15.2–23.8) 242 (89.1–642) 274 (208–362) 114 (52.8–348)* 143 (117–174) 65.7 (27.6–150)* 78.2 (64.6–94.7)Overweight 23.5 (13.0–35.9) 21.6 (16.5–28.3) 368 (163–746) 310 (222–433) 321 (152–551) 169 (133–214) 173 (45.1–242) 86.3 (68.6–109)Obese 30.8 (10.9–48.6) 23.6 (16.4–33.8) 459 (207–943) 340 (216–533) 538 (159–701) 212 (154–292) 244 (66.6–461) 113 (82.6–154)
Weight change in last 6 monthsLost 4–5 kg 21.2 (14.2–29.7) 18.9 (11.6–30.9) 271 (98.0–619) 268 (140–513) 195 (74.1–315) 134 (69.8–256) 71.0 (28.8–234) 78.7 (40.9–151)Little or no change(± 3 kg) b
23.6 (13.0–36.5) 21.2 (17.8–25.3) 321 (129–746) 336 (267–424) 233 (75.4–520) 185 (146–233) 133 (37.0–241) 98.4 (77.8–124)
Gained 4–5 kg 21.6 (14.9–35.2) 22.5 (13.8–36.7) 137 (71.6–635) 196 (103–374) 150 (55.8–370) 151 (78.8–288) 76.1 (29.3–248) 73.4 (38.2–141)Was breastfed
No 23.9 (13.9–30.9) 21.6 (15.2–30.6) 282 (95.0–693) 315 (202–489) 137 (48.8–520) 167 (122–229) 77.5 (20.7–241) 91.0 (67.1–124)Yes 20.8 (13.2–34.0) 20.0 (16.7–24.0) 293 (125–733) 285 (227–358) 206 (73.2–466) 157 (134–185) 116 (33.7–241) 81.8 (69.9–95.8)
Birth placeCatalonia 22.9 (12.4–33.2) 18.3 (15.2–22.1) 275 (104–654) 266 (211–336) 236 (77.8–468)* 185 (158–216) 104 (37.2–248)* 93.8 (79.8–110)Rest of Spain 21.9 (13.4–44.1) 22.3 (16.5–30.2) 450 (207–819) 292 (200–425) 378 (134–599) 177 (138–227) 194 (71.6–257) 82.2 (63.3–107)Abroad 24.5 (16.0–36.5) 36.2 (22.5–58.2)** 346 (84.0–2339) 590 (326–1066)** 65.7 (10.1–73.5) 57.3 (38.7–84.8)** 34.0 (11.4–67.8) 55.1 (36.5–83.2)**
Occupational social classI–II(more affluent)
23.0 (11.4–33.7)* 17.5 (13.2–23.3) 187 (82.6–620)* 212 (146–308) 147 (53.4–355)* 139 (95.0–203) 73.1 (20.6–205)* 66.4 (45.5–96.7)
III 18.0 (10.6–28.4) 17.5 (12.9–23.9) 225 (109–592.) 254 (169–382) 145 (70.4–351) 144 (94.7–218) 71.2 (29.3–174) 72.8 (48.2–110)IV–V(less affluent)
26.0 (15.8–43.7) 26.4 (21.0–33.4) 464 (209–957) 442 (326–600)** 377 (87.8–591) 222 (162–302) 205 (43.2–332) 130 (95.8–178)
Breastfed her childrenNever 22.2 (10.7–38.0) 20.8 (16.6–26.1) 225 (89.7–695) 281 (213–371) 114 (49.8–415) 155 (127–190) 53.6 (22.1–206)* 78.3 (64.4–95.1)≤6 months 21.1 (14.8–29.5) 18.5 (13.7–25.1) 355 (154–660) 252 (173–367) 347 (145–493) 175 (133–229) 138 (80.0–235) 95.4 (73.4–124)>6 months 29.1 (16.4–41.6) 22.9 (16.9–31.1) 417 (215–1346) 387 (265–265) 309 (116–622) 159 (121–209) 197 (50.0–425) 91.4 (70.2–119)
Results are weighted by age. aaGM: Geometric mean adjusted by age. *p-valueb0.05 (median, Kruskal–Wallis test). **p-valueb0.05 (aGM, Wald test; compared against thereference category). bReference category (except where otherwise noted, the reference category is the first category mentioned above).
159M. Porta et al. / Science of the Total Environment 423 (2012) 151–161
Author's personal copy
Improvements are necessary in their conception, methods, analysis,interpretation and, most importantly, subsequent use by governments,institutions, companies and relevant social agents. We believe our re-port suggests ways thatmay inspire others tomake further progress to-wards such goals.
Supplementary materials related to this article can be found on-line at doi:10.1016/j.scitotenv.2012.02.001.
Conflicts of interest
The authors declare they have no competing financial interests.
Acknowledgements
Supported in part by research grants from the Department of Health,Government of Catalonia; ‘Red temática de investigación cooperativa decentros en Cáncer’ (C03/10); ‘Red temática de investigación cooperativade centros en Epidemiología y salud pública’ (C03/09); andCIBER de Epi-demiología, Instituto de Salud Carlos III, Ministry of Health, Governmentof Spain. The authors gratefully acknowledge technical and scientific as-sistance provided by Joan Guix, Montserrat Guillén, Elisa Puigdomènech,Javier Selva, Magda Bosch de Basea, Jordi Sunyer, Carolina Rebato, VickyTurmo, Ana Linas, Xavier Llebaria, Marta Crous-Bou and Yolanda Rovira.
References
Aliyu MH, Alio AP, Salihu HM. To breastfeed or not to breastfeed: a review of the impactof lactational exposure to polychlorinated biphenyls (PCBs) on infants. J EnvironHealth 2010;73:8-14.
Alonso-Magdalena P, Quesada I, Nadal A. Endocrine disruptors in the etiology of type 2diabetes. Nat Rev Endocrinol 2011;7:346–53.
Armitage P, Berry G, Matthews JNS. Statistical methods inmedical research. 4th ed. Oxford,U.K: Blackwell; 2002.
Axmon A, Hagmar L, Jönsson BA. Rapid decline of persistent organochlorine pollutantsin serum among young Swedish males. Chemosphere 2008;70:1620–8.
Bachelet D, Truong T, Verner MA, Arveux P, Kerbrat P, Charlier C, et al. Determinants ofserum concentrations of 1,1-dichloro-2,2-bis(p-chlorophenyl)ethylene and poly-chlorinated biphenyls among French women in the CECILE study. Environ Res2011;111:861–70.
Baris D, Kwak LW, Rothman N, Wilson W, Manns A, Tarone R, et al. Blood levels oforganochlorines before and after chemotherapy among non-Hodgkin's lymphomapatients. Cancer Epidemiol Biomarkers Prev 2000;9:193–7.
Barr DB, Weihe P, Davis MD, Needham LL, Grandjean P. Serum polychlorinated biphenyland organochlorine insecticide concentrations in a Faroese birth cohort. Chemosphere2006;62:1167–82.
Becker K, Kaus S, Krause C, Lepom P, Schulz C, Seiwert M, et al. German EnvironmentalSurvey 1998 (GerES III): environmental pollutants in blood of theGerman population.Int J Hyg Environ Health 2002;205:297–308.
Bernert JT, Turner WE, Patterson Jr DG, Needham LL. Calculation of serum “total lipid”concentrations for the adjustment of persistent organohalogen toxicantmeasurementsin human samples. Chemosphere 2007;68:824–31.
Casals-Casas C, Desvergne B. Endocrine disruptors: from endocrine tometabolic disruption.Annu Rev Physiol 2011;73:135–62.
CernáM,MalýM, Grabic R, Batáriová A, Smíd J, Benes B. Serum concentrations of indicatorPCB congeners in the Czech adult population. Chemosphere 2008;72:1124–31.
De Coster S, Koppen G, Bracke M, Schroijen C, Den Hond E, Nelen V, et al. Pollutanteffects on genotoxic parameters and tumor-associated protein levels in adults: across sectional study. Environ Health 2008;7:26.
De Felip E, Abballe A, Casalino F, di Domenico A, Domenici P, Iacovella N, et al. Serumlevels of PCDDs, PCDFs and PCBs in non-occupationally exposed population groupsliving near two incineration plants in Tuscany, Italy. Chemosphere 2008;72:25–33.
DenHond E, Govarts E, Bruckers L, Schoeters G. Determinants of polychlorinated aromatichydrocarbons in serum in three age classes. Methodological implications for humanbiomonitoring. Environ Res 2009;109:495–502.
Department of Health and Human Services. Fourth National Report on Human Exposureto Environmental Chemicals [Internet]. Atlanta: Centers for Disease Control andPrevention; 2009. Available from http://www.cdc.gov/exposurereport/index.html.[accessed 30 January 2012].
Dewailly E, Ayotte P, Laliberté C, Weber JP, Gingras S, Nantel J. Polychlorinated biphenyl(PCB) and dichlorodiphenyl dichloroethylene (DDE) concentrations in the breastmilk of women in Quebec. Am J Public Health 1996;86:1241–6.
Table 5bSerum concentrations of POPs (ng/g lipid) detected in over 80% of the Barcelona population by sociodemographic characteristics (women).
PCB 118 PCB 138 PCB 153 PCB 180
Median(P25–P75)
aGMa
(CI 95%)Median(P25–P75)
aGMa
(CI 95%)Median(P25–P75)
aGMa
(CI 95%)Median(P25–P75)
aGMa
(CI 95%)
Women 17.6 (5.6–25.8) 10.6 (8.8–12.9) 57.0 (32.2–92.7) 47.3 (41.4–54.1) 87.0 (45.3–150.1) 69.1 (59.3–80.4) 67.2 (41.6–109.2) 56.8 (49.2–65.5)Age (years)
18–44 8.6 (1.7–17.9)* 6.7 (5.1–8.7) 32.5 (20.4–50.7)* 30.9 (25.7–37.1) 47.5 (25.6–77.9)* 44.3 (35.9–54.5) 38.6 (23.1–66.5)* 38.3 (31.4–46.7)45–64 17.5 (9.2–22.3) 11.6 (8.5–15.9)** 64.7 (45.5–88.5) 59.3 (47.5–74.0)** 103 (64.2–137) 88.3 (68.7–113)** 71.3 (58.6–106) 71.9 (56.6–91.3)**≥65 31.1 (20.1–41.5) 25.5 (18.3–35.6)** 106 (60.2–142) 96.1 (76.2–121)** 167 (87.9–218) 144 (111–187)** 106 (75.0–163) 108 (83.8–138)**
Body Mass IndexNormal 14.0 (5.6–22.0) 11.3 (8.8–14.6) 47.9 (28.2–89.2) 54.6 (46.1–64.8) 67.7 (47.5–148) 82.1 (67.7–99.6) 61.2 (37.1–112) 68.3 (56.9–82.0)Overweight 17.7 (5.0–27.7) 9.6 (7.0–13.0) 61.3 (33.5–97.6) 43.7 (35.6–53.7) 91.6 (52.3–162) 63.1 (49.9–79.6) 72.7 (43.7–110) 50.3 (40.4–62.7)Obese 22.9 (13.6–29.7) 11.8 (7.8–17.8) 63.6 (37.9–101) 43.0 (32.6–56.8) 104 (43.7–142) 60.1 (43.9–82.3) 69.1 (44.1–98.4) 49.9 (37.1–67.0)**
Weight change in last 6 monthsLost 4–5 kg 11.6 (4.8–20.3) 8.8 (4.8–16.2) 55.4 (31.6–87.4) 47.5 (30.2–74.6) 85.7 (42.9–144) 68.9 (41.8–113) 70.4 (37.4–112) 58.7 (36.8–93.7)Little or no change(± 3 kg) b
17.8 (5.6–27.6) 11.4 (9.2–14.2) 57.7 (33.5–97.0) 53.2 (45.3–62.6) 87.5 (49.6–158) 79.0 (66.1–94.5) 68.3 (44.2–110) 63.1 (53.4–74.6)
Gained 4–5 kg 19.1 (9.0–26.9) 13.7 (7.4–25.2) 33.8 (21.1–86.4) 39.6 (25.2–62.1) 46.2 (22.3–133) 53.8 (32.7–88.5) 44.8 (28.9–97.2) 49.8 (31.2–79.3)Was breastfed
No 9.7 (4.5–19.3) 9.6 (6.5–14.2) 52.5 (23.7–81.6) 55.0 (41.8–72.3) 83.9 (32.9–115) 79.6 (58.3–109) 56.5 (30.0–104) 62.2 (46.2–83.6)Yes 17.9 (6.2–25.8) 10.8 (8.8–13.3) 54.7 (32.6–95.5) 46.3 (40.2–53.3) 80.6 (47.5–145) 67.4 (57.5–79.2) 68.0 (43.0–107) 56.5 (48.5–65.9)
Birth placeCatalonia 15.9 (5.4–25.7) 10.6 (8.5–13.1) 57.7 (32.5–88.8)* 52.3 (45.3–60.3) 87.5 (48.4–154)* 78.7 (67.0–92.4) 68.7 (42.1–112)* 63.6 (54.6–74.2)Rest of Spain 18.2 (8.8–29.7) 9.9 (7.0–14.0) 68.1 (42.9–103) 52.6 (41.7–66.2) 110 (62.6–163) 77.8 (60.0–101) 90.5 (51.4–110) 62.4 (48.7–80.0)Abroad 19.1 (4.9–26.5) 15.0 (8.7–25.9) 21.0 (15.4–51.5) 27.6 (19.2–39.8)** 26.1 (15.0–62.7) 33.5 (22.3–50.4)** 35.7 (17.4–61.1) 31.3 (21.2–46.3)**
Occupational social classI–II(more affluent)
14.0 (4.6–20.9)* 9.5 (6.6–13.6) 41.3 (25.8–89.8) 43.6 (33.3–56.9) 63.0 (30.9–163) 66.7 (49.5–89.8) 57.3 (31.8–119) 58.1 (43.9–76.7)
III 12.6 (5.4–21.0) 9.5 (6.4–14.1) 56.8 (32.6–77.3) 49.8 (37.2–66.8) 87.5 (48.0–119) 75.6 (54.6–105) 65.6 (35.4–104) 57.4 (42.3–77.8)IV–V(less affluent)
19.8 (6.7–30.6) 13.7 (10.2–18.3) 66.4 (37.8–107) 57.1 (45.8–71.1) 104 (46.9–163) 79.9 (62.6–102) 74.0 (44.1–110) 65.1 (51.8–81.8)
Breastfed her childrenNever 13.8 (5.5–21.8) 12.5 (9.7–16.1) 44.7 (21.3–85.4)* 45.2 (37.9–53.8) 62.9 (26.9–133)* 63.7 (52.3–77.7) 53.3 (26.9–97.2)* 52.0 (43.1–62.7)≤6 months 18.8 (5.4–28.7) 9.1 (6.5–12.8) 63.6 (40.4–95.7) 51.7 (40.8–65.4) 93.2 (58.6–158) 78.9 (60.4–103.0) 80.6 (54.1–110) 67.5 (52.4–86.8)>6 months 18.2 (8.6–30.0) 9.6 (6.8–13.6) 71.7 (46.3–104) 53.6 (42.3–67.9) 112 (63.6–164) 80.8 (61.8–106) 85.5 (55.7–113) 64.2 (49.8–82.7)
Results are weighted by age. aaGM: Geometric mean adjusted by age. *p-valueb0.05 (median, Kruskal–Wallis test). **p-valueb0.05 (aGM, Wald test; compared against thereference category). bReference category (except where otherwise noted, the reference category is the first category mentioned above).
160 M. Porta et al. / Science of the Total Environment 423 (2012) 151–161
Author's personal copy
Diamanti-Kandarakis E, Bourguignon JP, Giudice LC, Hauser R, Prins GS, Soto AM, et al.Endocrine-disrupting chemicals: an Endocrine Society scientific statement. EndocrRev 2009;30:293–342.
Donaldson SG, Van Oostdam J, Tikhonov C, Feeley M, Armstrong B, Ayotte P, et al.Environmental contaminants and human health in the Canadian Arctic. Sci TotalEnviron 2010;408:5165–234.
Gallo MV, Schell LM, Decaprio AP, Jacobs A. Levels of persistent organic pollutant andtheir predictors among young adults. Chemosphere 2011;83:1374–82.
Garí M, Grimalt JO. Use of proficiency testing materials for the calculation of detectionand quantification limits in the analysis of organochlorine compounds in humanserum. Anal Bioanal Chem 2010;397:1383–7.
GerES IV. German Environmental Survey for Children 2003/06 — GerES IV. Available fromhttp://www.umweltdaten.de/publikationen/fpdf-l/3355.pdf2003/06. [accessed30 January 2012.
Glynn AW, Granath F, AuneM, Atuma S, Darnerud PO, Bjerselius R, et al. Organochlorinesin Swedish women: determinants of serum concentrations. Environ Health Perspect2003;111:349–55.
Glynn A, Aune M, Darnerud PO, Cnattingius S, Bjerselius R, Becker W, et al. Determinantsof serum concentrations of organochlorine compounds in Swedish pregnant women:a cross-sectional study. Environ Health 2007;6:2.
Grimalt JO, Carrizo D, GaríM, Font-Ribera L, Ribas-Fito N, TorrentM, et al. An evaluation ofthe sexual differences in the accumulation of organochlorine compounds in childrenat birth and at the age of 4 years. Environ Res 2010;110:244–50.
Hagmar L,Wallin E, Vessby B, Jönsson BA, Bergman A, Rylander L. Intra-individual variationsand time trends1991–2001 inhuman serum levels of PCB,DDEandhexachlorobenzene.Chemosphere 2006;64:1507–13.
Hardell E, Carlberg M, Nordström M, van Bavel B. Time trends of persistent organicpollutants in Sweden during 1993–2007 and relation to age, gender, body massindex, breast-feeding and parity. Sci Total Environ 2010;408:4412–9.
Henkler F, Luch A. Adverse health effects of environmental chemical agents throughnon-genotoxic mechanisms [Editorial]. J Epidemiol Community Health 2011;65:1–3.
Henríquez-Hernández LA, Luzardo OP, Almeida-González M, Alvarez-León EE, Serra-MajemL, ZumbadoM, et al. Background levels of polychlorinated biphenyls in the population ofthe Canary Islands (Spain). Environ Res 2011;111:10–6.
Hernández L, van Steeg H, Luijten M, van Benthem J. Mechanisms of non-genotoxiccarcinogens and importance of a weight of evidence approach. Mutat Res2009;682:94-109.
Jakszyn P, Goñi F, Etxeandia A, VivesA,Millán E, López R, et al. Serum levels of organochlorinepesticides in healthy adults from five regions of Spain. Chemosphere 2009;76:1518–24.
Kaiser J. Endocrine disrupters trigger fertility problems in multiple generations. Science2005;308:1391–2.
Karmaus W, DeKoning EP, Kruse H, Witten J, Osius N. Early childhood determinants oforganochlorine concentrations in school-aged children. Pediatr Res 2001;50:331–6.
Kim MJ, Marchand P, Henegar C, Antignac JP, Alili R, Poitou C, et al. Fate and com-plex pathogenic effects of dioxins and polychlorinated biphenyls in obese sub-jects before and after drastic weight loss. Environ Health Perspect 2011;119:377–83.
KleinbaumDG, Kupper LL,Muller KE, NizamA. Applied regression analysis andmultivariablemethods. 4th ed. Pacific Grove, CA: Duxbury; 2007.
KoppenG, Covaci A, Van Cleuvenbergen R, Schepens P,WinnekeG, Schoeters G. Persistentorganochlorine pollutants in human serum of 50–65 years oldwomen in the FlandersEnvironmental and Health Study (FLEHS). Part 1: concentrations and regionaldifferences. Chemosphere 2002;48:811–25.
La Merrill M, Birnbaum LS. Childhood obesity and environmental chemicals. Mt Sinai JMed 2011;78:22–48.
LeeDH, Jacobs Jr DR, PortaM.Hypothesis: a unifyingmechanism for nutrition and chemicalsas lifelong modulators of DNA hypomethylation. Environ Health Perspect 2009;117:1799–802.
Link B, Gabrio T, Zoellner I, Piechotowski I, Paepke O, Herrmann T, et al. Biomonitoringof persistent organochlorine pesticides, PCDD/PCDFs and dioxin-like PCBs in bloodof children from South West Germany (Baden-Wuerttemberg) from 1993 to 2003.Chemosphere 2005;58:1185–201.
Luzardo OP, Mahtani V, Troyano JM, Alvarez de la Rosa M, Padilla-Pérez AI, Zumbado M.Determinants of organochlorine levels detectable in the amniotic fluid of womenfrom Tenerife Island (Canary Islands, Spain). Environ Res 2009;109:607–13.
Myers JP, Zoeller RT, vom Saal FS. A clash of old and new scientific concepts in toxicity,with important implication for public health. Environ Health Perspect 2009;117:1652–5.
Nawrot TS, Staessen JA, Den Hond EM, Koppen G, Schoeters G, Fagard R, et al. Host andenvironmental determinants of polychlorinated aromatic hydrocarbons in serumof adolescents. Environ Health Perspect 2002;110:583–9.
Petrik J, Drobna B, Pavuk M, Jursa S, Wimmerova S, Chovancova J. Serum PCBs andorganochlorine pesticides in Slovakia: age, gender, and residence as determinantsof organochlorine concentrations. Chemosphere 2006;65:410–8.
Phillips DL, Pirkle JL, Burse VW, Bernert Jr JT, Henderson LO, Needham LL. Chlorinatedhydrocarbon levels in human serum: effects of fasting and feeding. Arch EnvironContam Toxicol 1989;18:495–500.
Porta M. Persistent toxic substances: exposed individuals and exposed populations.J Epidemiol Community Health 2004;58:534–5.
Porta M, editor. A dictionary of epidemiology. 5th ed. New York: Oxford UniversityPress; 2008. p. 112, 237–238.
Porta M, Zumeta E. Implementing the Stockholm treaty on POPs [Editorial]. OccupEnviron Med 2002;59:651–2.
Porta M, Puigdomènech E, Ballester F, Selva J, Ribas-Fitó N, Domínguez-Boada L, et al.Studies conducted in Spain on concentrations in humans of persistent toxic compounds.Gac Sanit 2008a;22:248–66.
Porta M, Puigdomènech E, Ballester F, Selva J, Ribas-Fitó N, Llop S, et al. Monitoringconcentrations of persistent organic pollutants in the general population: theinternational experience. Environ Int 2008b;34:546–61.
Porta M, Ferrer-Armengou O, Pumarega J, López T, Crous-Bou M, Alguacil J, et al. Exocrinepancreatic cancer clinical factors were related to timing of blood extraction andinfluenced serum concentrations of lipids. J Clin Epidemiol 2008c;61:695–704.
Porta M, Gasull M, Puigdomènech E, Rodríguez-Sanz M, Pumarega J, Rebato C, et al.Sociodemographic factors influencing participation in the Barcelona Health Surveystudy on serum concentrations of persistent organic pollutants. Chemosphere2009a;76:216–25.
Porta M, Jariod M, López T, Pumarega J, Puigdomènech E, Marco E, et al. Correctingserum concentrations of organochlorine compounds by lipids: alternatives to theorganochlorine/total lipids ratio. Environ Int 2009b;35:1080–5.
Porta M, Pumarega J, López T, Jariod M, Marco E, Grimalt JO. Influence of tumor stage,symptoms and time of blood draw on serum concentrations of organochlorinecompounds in exocrine pancreatic cancer. Cancer Causes Control 2009c;20:1893–906.
Porta M, Gasull M, López T, Pumarega J. Distribution of blood concentrations of persistentorganic pollutants in representative samples of thegeneral population. Annual TechnicalPublication, 9. United Nations Environment Programme - Regional Activity Centre forCleaner Production (CP/RAC); 2010b. p. 24–31.
Porta M, Gasull M, Puigdomènech E, Garí M, Bosch de Basea M, Guillén M. Distributionof blood concentrations of persistent organic pollutants in a representative sampleof the population of Catalonia. Environ Int 2010a;36:655–64.
Porta M, Pumarega J, Gasull M. Number of persistent organic pollutants detected athigh concentrations in a general population. Environ Int 2012 doi:10.1016/j.envint.2012.02.005.
Rodríguez-Sanz M, Morales E, Pasarín MI, Borrell C. Enquesta de Salut de Barcelona2006. Barcelona, Spain: Agència de Salut Pública de Barcelona; 2008. Availablefrom http://www.aspb.es/quefem/docs/Enquesta%20Salut%20Barcelona%202006.pdf [accessed 30 January 2012].
Rose, G. The strategy of preventive medicine. Oxford: Oxford University Press; 1992.Annotated version edited by Khaw, K. T., Marmot, M. Oxford University Press; 2008.
Schroijen C, Baeyens W, Schoeters G, Den Hond E, Koppen G, Bruckers L, et al. Internalexposure to pollutants measured in blood and urine of Flemish adolescents infunction of area of residence. Chemosphere 2008;71:1317–25.
Schug T. NTPworkshop investigates links between chemicals and obesity. Environ Factor; 2011(Febr.). Available from http://www.niehs.nih.gov/news/newsletter/2011/february/science-ntp-workshop [accessed 30 January 2012].
Soto AM, Sonnenschein C. Environmental causes of cancer: endocrine disruptors ascarcinogens. Nat Rev Endocrinol 2011;6:363–70.
Tajimi M, Watanabe M, Oki I, Ojima T, Nakamura Y. PCDDs, PCdfs and Co-PCBs in humanbreast milk samples collected in Tokyo, Japan. Acta Paediatr 2004;93:1098–102.
Thomsen C, Haug LS, Stigum H, Frøshaug M, Broadwell SL, Becher G. Changes inconcentrations of perfluorinated compounds, polybrominated diphenyl ethers,and polychlorinated biphenyls in Norwegian breast-milk during twelve monthsof lactation. Environ Sci Technol 2010;44:9550–6. Erratum in: Environ Sci Technol.2011;45:3192.
UNEP (United Nations Environment Programme Chemicals). Ridding the World ofPOPs: A Guide to the Stockholm Convention on Persistent Organic Pollutants.Geneva, Switzerland: United Nations Environment Programme Chemicals; 2005.
UNEP (UnitedNations EnvironmentProgramme). Chemicals. Regionally-BasedAssessmentof Persistent Toxic Substances, Mediterranean Regional Report. Châtelaine, Sweden:UNEP Chemicals; 2002.. Available from http://www.chem.unep.ch.. [accessed 30January 2012].
Van Oostdam JC, Dewailly E, Gilman A, Hansen JC, Odland JO, Chashchin V, et al.Circumpolar maternal blood contaminant survey, 1994–1997 organochlorinecompounds. Sci Total Environ 2004;330:55–70.
Verner MA, Ayotte P, Muckle G, Charbonneau M, Haddad S. A physiologically basedpharmacokinetic model for the assessment of infant exposure to persistent organicpollutants in epidemiologic studies. Environ Health Perspect 2009;117:481–7.
WolffMS, Britton JA, TeitelbaumSL, Eng S, Deych E, IrelandK, et al. Improving organochlorinebiomarker models for cancer research. Cancer Epidemiol Biomarkers Prev 2005;14:2224–36.
Wolff MS, Anderson HA, Britton JA, Rothman N. Pharmacokinetic variability and modernepidemiology — the example of dichlorodiphenyltrichloroethane, body mass index,and birth cohort. Cancer Epidemiol Biomarkers Prev 2007;16:1925–30.
World Health Organization (WHO). Health risks of persistent organic pollutants fromlong-range transboundary air pollution. Copenhagen, Denmark: Regional Officefor Europe of the World Health Organization; 2003.
Zubero MB, Ibarluzea JM, Aurrekoetxea JJ, Rivera J, Parera J, Abad E, et al. Serum levels ofpolychlorinateddibenzodioxins anddibenzofurans and PCBs in the general populationliving near an urban waste treatment plant in Biscay, Basque Country. Chemosphere2009;76:784–91.
Zumbado M, Goethals M, Alvarez-León EE, Luzardo OP, Cabrera F, Serra-Majem L, et al.Inadvertent exposure to organochlorine pesticides DDT and derivatives in peoplefrom the Canary Islands (Spain). Sci Total Environ 2005;339:49–62.
161M. Porta et al. / Science of the Total Environment 423 (2012) 151–161

POPs in Barcelona 2006 – Supplementary Tables (M. Porta et al. Science of the Total Environment, 2012) 1
Table 1 of Supplemental material. Serum concentrations of the 8 POPs detected in >80% of the population of Barcelona in 2006 (n = 231).
LOD LOQ %>LOD AM (SD) GM (95% CI) Median (P25-P75) P95 Range
p,p'-DDT
ng/g lipid 31.04 (38.72) 20.89 (18.61-23.45) 21.97 (13.04-34.92) 87.18 1.16-341.86ng/ml 0.017 0.050 97 0.20 (0.25) 0.13 (0.12-0.15) 0.14 (0.08-0.21) 0.49 0.01-2.18
p,p'-DDE ng/g lipid 527.67 (848.19) 245.19 (208.99-287.67) 219.06 (97.37-625.24) 2047.16 6.89-8227.20ng/ml 0.016 0.047 100 3.47 (5.80) 1.53 (1.29-1.80) 1.36 (0.56-4.16) 13.38 0.05-62.43
PCB 118
ng/g lipid 16.30 (14.35) 9.82 (8.44-11.43) 13.50 (5.20-22.70) 42.29 0.82-83.40ng/ml 0.014 0.042 83 0.11 (0.10) 0.06 (0.05-0.07) 0.09 (0.03-0.14) 0.30 0.01-0.59
PCB 138
ng/g lipid 64.29 (51.51) 46.33 (41.09-52.24) 48.27 (29.05-87.07) 173.79 1.05-332.37ng/ml 0.014 0.041 98 0.42 (0.36) 0.29 (0.25-0.33) 0.30 (0.17-0.58) 1.16 0.01-2.36
PCB 153
ng/g lipid 99.73 (86.55) 67.20 (58.77-76.85) 68.63 (41.56-135.51) 281.26 1.05-549.29ng/ml 0.014 0.041 98 0.65 (0.59) 0.42 (0.36-0.48) 0.45 (0.25-0.86) 1.95 0.01-3.76
PCB 180
ng/g lipid 80.36 (64.00) 57.70 (50.97-65.32) 63.35 (38.57-103.95) 207.59 0.75-422.94ng/ml 0.010 0.029 98 0.52 (0.42) 0.36 (0.32-0.41) 0.39 (0.22-0.68) 1.51 0.01-2.62
HCB
ng/g lipid 217.64 (232.93) 112.17 (94.66-132.92) 109.00 (50.00-339.04) 716.63 1.41-1210.47ng/ml 0.011 0.033 98 1.45 (1.62) 0.70 (0.58-0.84) 0.70 (0.29-2.32) 4.80 0.01-6.95
-HCH
ng/g lipid 130.05 (156.09) 63.31 (53.30-75.19) 64.21 (24.82-195.42) 473.94 1.50-898.26ng/ml 0.020 0.060 97 0.88 (1.10) 0.39 (0.33-0.47) 0.40 (0.14-1.26) 3.59 0.01-5.88
LOD: limit of detection. LOQ: limit of quantification. AM: arithmetic mean. SD: standard deviation. GM: geometric mean. P25, P75, P95: 25th, 75th and 95th percentile, respectively.
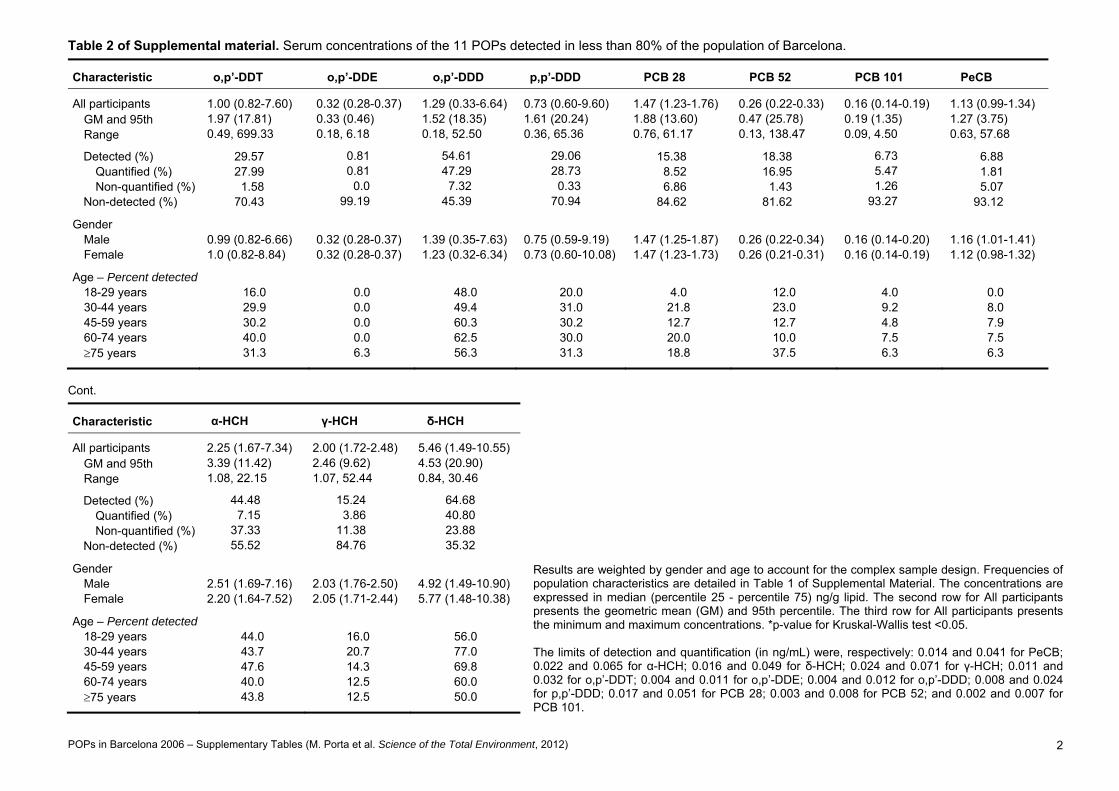
POPs in Barcelona 2006 – Supplementary Tables (M. Porta et al. Science of the Total Environment, 2012) 2
Table 2 of Supplemental material. Serum concentrations of the 11 POPs detected in less than 80% of the population of Barcelona.
Characteristic o,p’-DDT o,p’-DDE o,p’-DDD p,p’-DDD PCB 28 PCB 52 PCB 101 PeCB
All participants 1.00 (0.82-7.60) 0.32 (0.28-0.37) 1.29 (0.33-6.64) 0.73 (0.60-9.60) 1.47 (1.23-1.76) 0.26 (0.22-0.33) 0.16 (0.14-0.19) 1.13 (0.99-1.34) GM and 95th 1.97 (17.81) 0.33 (0.46) 1.52 (18.35) 1.61 (20.24) 1.88 (13.60) 0.47 (25.78) 0.19 (1.35) 1.27 (3.75) Range 0.49, 699.33 0.18, 6.18 0.18, 52.50 0.36, 65.36 0.76, 61.17 0.13, 138.47 0.09, 4.50 0.63, 57.68
Detected (%) 29.57 0.81 54.61 29.06 15.38 18.38 6.73 6.88 Quantified (%) 27.99 0.81 47.29 28.73 8.52 16.95 5.47 1.81 Non-quantified (%) 1.58 0.0 7.32 0.33 6.86 1.43 1.26 5.07
Non-detected (%) 70.43 99.19 45.39 70.94 84.62 81.62 93.27 93.12
Gender Male 0.99 (0.82-6.66) 0.32 (0.28-0.37) 1.39 (0.35-7.63) 0.75 (0.59-9.19) 1.47 (1.25-1.87) 0.26 (0.22-0.34) 0.16 (0.14-0.20) 1.16 (1.01-1.41) Female 1.0 (0.82-8.84) 0.32 (0.28-0.37) 1.23 (0.32-6.34) 0.73 (0.60-10.08) 1.47 (1.23-1.73) 0.26 (0.21-0.31) 0.16 (0.14-0.19) 1.12 (0.98-1.32)
Age – Percent detected 18-29 years 16.0 0.0 48.0 20.0 4.0 12.0 4.0 0.0 30-44 years 29.9 0.0 49.4 31.0 21.8 23.0 9.2 8.0 45-59 years 30.2 0.0 60.3 30.2 12.7 12.7 4.8 7.9 60-74 years 40.0 0.0 62.5 30.0 20.0 10.0 7.5 7.5 75 years 31.3 6.3 56.3 31.3 18.8 37.5 6.3 6.3
Cont.
Results are weighted by gender and age to account for the complex sample design. Frequencies of population characteristics are detailed in Table 1 of Supplemental Material. The concentrations are expressed in median (percentile 25 - percentile 75) ng/g lipid. The second row for All participants presents the geometric mean (GM) and 95th percentile. The third row for All participants presents the minimum and maximum concentrations. *p-value for Kruskal-Wallis test <0.05. The limits of detection and quantification (in ng/mL) were, respectively: 0.014 and 0.041 for PeCB; 0.022 and 0.065 for α-HCH; 0.016 and 0.049 for δ-HCH; 0.024 and 0.071 for γ-HCH; 0.011 and 0.032 for o,p’-DDT; 0.004 and 0.011 for o,p’-DDE; 0.004 and 0.012 for o,p’-DDD; 0.008 and 0.024 for p,p’-DDD; 0.017 and 0.051 for PCB 28; 0.003 and 0.008 for PCB 52; and 0.002 and 0.007 for PCB 101.
Characteristic α-HCH γ-HCH δ-HCH
All participants 2.25 (1.67-7.34) 2.00 (1.72-2.48) 5.46 (1.49-10.55) GM and 95th 3.39 (11.42) 2.46 (9.62) 4.53 (20.90) Range 1.08, 22.15 1.07, 52.44 0.84, 30.46
Detected (%) 44.48 15.24 64.68 Quantified (%) 7.15 3.86 40.80 Non-quantified (%) 37.33 11.38 23.88
Non-detected (%) 55.52 84.76 35.32
Gender Male 2.51 (1.69-7.16) 2.03 (1.76-2.50) 4.92 (1.49-10.90) Female 2.20 (1.64-7.52) 2.05 (1.71-2.44) 5.77 (1.48-10.38)
Age – Percent detected 18-29 years 44.0 16.0 56.0 30-44 years 43.7 20.7 77.0 45-59 years 47.6 14.3 69.8 60-74 years 40.0 12.5 60.0 75 years 43.8 12.5 50.0