Synthesis and Biological Activity of Some New 4-(Aminoacyl ...
Upload
khangminh22Category
view
0download
0
Citation: Sangha, A.K.; Kantidakis, T.
The Aminoacyl-tRNA Synthetase and
tRNA Expression Levels Are
Deregulated in Cancer and Correlate
Independently with Patient Survival.
Curr. Issues Mol. Biol. 2022, 44,
3001–3018. https://doi.org/
10.3390/cimb44070207
Academic Editor: Guido Giordano
Received: 25 May 2022
Accepted: 24 June 2022
Published: 2 July 2022
Publisher’s Note: MDPI stays neutral
with regard to jurisdictional claims in
published maps and institutional affil-
iations.
Copyright: © 2022 by the authors.
Licensee MDPI, Basel, Switzerland.
This article is an open access article
distributed under the terms and
conditions of the Creative Commons
Attribution (CC BY) license (https://
creativecommons.org/licenses/by/
4.0/).
Article
The Aminoacyl-tRNA Synthetase and tRNA Expression LevelsAre Deregulated in Cancer and Correlate Independently withPatient SurvivalAnmolpreet Kaur Sangha and Theodoros Kantidakis *
Aston Medical School, College of Health and Life Sciences, Aston University, Birmingham B4 7ET, UK;[email protected]* Correspondence: [email protected]
Abstract: Aminoacyl-tRNA synthetases (ARSs) are essential enzymes that load amino acids to theircognate tRNA molecules. The expression of certain ARSs and tRNAs has been shown to be deregu-lated in cancer, presumably to accommodate elevated protein synthesis requirements. In this work,the expression of cytoplasmic ARSs and tRNAs in ten TCGA cancers has been systematically exam-ined. ARSs were found to be mostly upregulated in tumours and their upregulation often correlatedwith worse patient survival. tRNAs were found to be either upregulated or downregulated in tu-mours and their expression sometimes correlated to worse survival outcomes. However, althoughthe expression of most ARSs and tRNAs was deregulated in tumours when compared to healthyadjacent tissues, only in a few cases, and independently, did it correlate to patient survival. Thesedata point to the general uncoupling of concomitant ARS and tRNA expression deregulation andpatient survival, highlighting the different ARS and tRNA requirements in cancers.
Keywords: aminoacyl-tRNA synthetase; ARS; tRNA; expression; cancer; TCGA; patient survival
1. Introduction
The aminoacyl-tRNA synthetases (ARSs) are essential, ubiquitously expressed en-zymes involved in protein translation and conserved from bacteria to humans [1]. They areresponsible for the loading of each amino acid to its cognate tRNA molecule, in a two-stepaminoacylation reaction process [2]. In the first step, the ARS binds the amino acid and amolecule of ATP to form an aminoacyl adenylate intermediate, while in a second step, thetRNA molecule binds the ARS and the amino acid is transferred to the tRNA [2]. Thereare 36 ARSs in humans, 17 of which function exclusively in the cytoplasm (AARS, CARS,DARS, EPRS, FARS, HARS, IARS, LARS, MARS, NARS, QARS, RARS, SARS, TARS, VARS,WARS, YARS; Table S1), another 17 in the mitochondria (AARS2, CARS2, DARS2, EARS2,FARS2, HARS2, IARS2, LARS2, MARS2, NARS2, PARS2, RARS2, SARS2, TARS2, VARS2,WARS2, YARS2) and two (GARS and KARS) in both [1,3]. One of the cytoplasmic ARSs,glutamyl-propyl-tRNA synthetase (EPRS), is responsible for charging two cognate tRNAswith either proline or glutamic acid [4]. Eight of the ARSs are found in multiple synthetasecomplexes together with three scaffolding proteins, the aminoacyl tRNA synthase complex-interacting multifunctional proteins (AIMP1, AIMP2 and AIMP3, the latter also beingknown as eukaryotic translation elongation factor 1 epsilon 1 or EEF1E1). These are vitalfor the assembly of the multiple synthetase complexes and their contribution to cellularhomeostasis [5].
ARSs have been traditionally viewed as housekeeping genes participating in proteintranslation, a view that has been changing in the last ten years [6]. More specifically, alter-native functions of ARSs have emerged that highlight their involvement in disease [2,7–10],including cancer [2,11,12]. Although the mechanistic details are largely unclear, deregula-tion of ARS expression has been connected to carcinogenesis. For example, methionyl-tRNA
Curr. Issues Mol. Biol. 2022, 44, 3001–3018. https://doi.org/10.3390/cimb44070207 https://www.mdpi.com/journal/cimb
Curr. Issues Mol. Biol. 2022, 44 3002
synthetase (MARS) and threonyl-tRNA synthetase (TARS) overexpression has been associ-ated with poor clinical outcomes in lung cancer [13] and pancreatic cancer [14], respectively.Tryptophanyl-tRNA synthetase (WARS) is overexpressed in oral squamous cell carcino-mas and correlates with tumour stage and invasion [15], whereas several ARSs, includingthe glycyl(GARS)- and lysyl(KARS)-tRNA synthetases, have been found deregulated inprostate cancer [16].
Similarly to ARSs, the expression of tRNA genes by RNA polymerase III (RNAPIII)has also been considered a housekeeping activity in the past, a view that has graduallychanged, as the expression of tRNA genes has been shown to be tightly regulated [17].tRNA expression has been found overexpressed in cancers in order to sustain increasedcell proliferation and growth [18], but specific tRNA gene overexpression has also beenreported in skin melanoma [19], multiple myeloma [20] and breast cancer [21]. Moreover,tRNAiMet overexpression has been shown to increase proliferation [22] and tRNAGlu hasbeen shown to directly drive metastasis in breast cancer cells [23].
Although ARSs and tRNAs can be upregulated or downregulated in several differentcancers, their relationship has been hypothesised, but not investigated to date. Since themain function of ARSs is the charging of amino acids to their cognate tRNAs, it can beargued that ARS overexpression in cancers would be associated to tRNA overexpression,in order to enhance protein translation. Having said this, it is also possible that individ-ual upregulation or downregulation of ARSs or tRNAs might have no effect on proteintranslation, but might serve translation-independent functions.
During the last decade, the Cancer Genome Atlas (TCGA) research network, a largecollaborative consortium, has accumulated a plethora of cancer data [24]. Thousands oftumour samples from different cancers have been analysed with the same methodologies,both at the DNA and RNA level [24]. It is therefore now possible to question the relationshipbetween ARSs and tRNA overexpression in the same tumour samples in several differentcancers. In this work, the open-access TCGA resources were employed to examine thecorrelation of cytoplasmic ARS and tRNA expression deregulation in patient tumoursamples, as well as their link to patient survival.
2. Materials and Methods
All the data analysed in this work were generated by the TCGA research network [24].The data were retrieved from the UCSC Xena hub (https://tcga.xenahubs.net, accessed 1July 2021) [25] and derived from the TCGA Data Coordinating Center (DCC) in January2016. Out of all the available TCGA datasets, only 10 contained 30 or more tumour andadjacent normal samples for DNA, mRNA and tRNA analyses, and these were selected forthis study (Table S2).
2.1. Mutation Number Analysis
The list of cytoplasmic ARS genes was retrieved from the HGNC database [26]. Themutation profiles and DNA alteration frequencies were generated based on TCGA datafrom the cBioPortal (accessed 26 June 2021) [27,28].
2.2. Gene Expression Analysis
The ARS mRNA expression TCGA data were retrieved from the UCSC Xena plat-form [25]. The tRNA expression TCGA data were originally analysed by Zhang et al. [29]and retrieved from the open-source research platform Synapse (https://www.synapse.org,syn8367012, accessed 15 July 2021). The heatmaps and correlations were computed byPrism v8.4.3 (GraphPad Software, San Diego, CA, USA). The non-parametric Spearmancorrelation coefficient (r) is provided in each correlation graph. The p-values for the tRNAisoacceptor fold change (FC) upregulation were calculated with the unpaired, two-tail,unequal variance t-test.

Curr. Issues Mol. Biol. 2022, 44 3003
2.3. Patient Survival Analysis
The clinical data used in patient survival analyses were retrieved from the UCSCXena platform [25]. The ARS and tRNA expression and patient survival heatmaps weregenerated using the UCSC Xena platform [25] and Prism v8.4.3 (GraphPad Software, SanDiego, CA, USA). The Cox proportional hazards regression [30] and logrank analyses [31]of the patient survival data were performed by Prism v9.3.1 (GraphPad Software, SanDiego, CA, USA).
2.4. Statistical Analysis
The statistical analyses were performed by Prism v8.4.3 or v9.3.1 (GraphPad Software,San Diego, CA, USA). The q-value (false discovery rate—FDR) was calculated using theBenjamini and Hochberg method [32] in Prism v8.4.3 (GraphPad Software, San Diego, CA,USA). p and q values < 0.05 were considered significant. The asterisks indicate statisticalsignificance; p < 0.05 (*), p < 0.01 (**), p < 0.001 (***), and p < 0.0001 (l). Not significantp-values were indicated by “ns”.
3. Results
Mutations in the ARS genes have been associated with human diseases, includingcancer [2,11,12]. Therefore, the TCGA cancer data [24] were examined for mutations inARSs in cancers of different origin. The ARS abbreviations, sample numbers and cancerstudies are shown in Tables S1 and S2. The search was narrowed to TCGA studies thatcontained more than 30 tumour samples and adjacent normal samples for DNA, mRNAand tRNA analyses, to ensure enough samples for valid statistical analyses, and focusedon the cytoplasmic ARSs. This led to 10 different cancer datasets that presented ARSmutational alteration frequencies from 0% to 5.6% (Figure 1A). The most mutated ARSswere EPRS in LUSC (5.6%) and STAD (4.6%), VARS in STAD (5.3%) and CARS in LUSC(4.5%). These alterations include non-silent mutations, such a as nonsense, missenseor splice-site introducing mutations, as defined in the cBioPortal database [27,28]. Asexpected, since the ARSs are essential proteins, the overall number of mutations wasgenerally low. Interestingly though, a relatively higher number of structural changes, suchas gains/amplifications and losses/deletions, was observed in these genes (Figure 1B).More specifically, the copy number alterations (CNAs) ranged from 0% to 14.8%, withRARS in KIRC (14.8%); TARS in LUSC (14.8%); LARS, HARS and QARS in KIRC (14.2%,14% and 10.6%, respectively); and EPRS in BRCA (11.6%) most affected. A closer look at theCNAs (Figure S1A,B, respectively) revealed that, overall, there were more amplificationsthan deletions, resulting in a higher ratio of amplifications versus deletions in most cancers(Figure S1A–C). An examination of the most affected ARSs revealed that apart from QARSin KIRC, CNAs correlated with changes in ARSs gene expression (Figure S2). Increasedmutation levels, including CNAs, can be a sign of tumour drivers, genes that are oftenmutated and contribute to carcinogenesis [33]. It was therefore examined if any of theARSs had been found to have a potential cancer driver role, using the established cancerdriver database Intogen (https://www.intogen.org/, accessed 28 June 2021) [34]. However,according to Intogen [34], none of the ARSs were found to have a cancer driver role in theexamined cancers.
The mRNA expression of the ARSs was investigated next. In general, the mRNAexpression of ARSs was significantly higher in the tumour samples compared to theadjacent normal tissues, except from KIRP and THCA, which did not achieve statisticalsignificance, despite showing a similar trend to a degree (Figure 2A). The median increasewas 19%, with LUSC (75%), LUAD (52%), LIHC (38%) and STAD (36%) showing the highestupregulation. As expected, the ARSs presented differential levels of expression in normaland tumour samples, with VARS increasing its overall median expression among all cancersby 62%, followed by GARS (51%) and YARS (36%) (Figure 2B andFigure S3). Several ARSswere upregulated by more than two-fold, including TARS (3-fold), GARS (2.4-fold), FARSB(2.4-fold each) and MARS (2.2-fold) in LUSC; WARS (2.6-fold) in HNSC; DARS (2.3-fold)

Curr. Issues Mol. Biol. 2022, 44 3004
in KIRC; MARS (2.3-fold) and VARS (2.2-fold) in LUAD; and YARS (2-fold) in THCA(Figure 2B and Figure S3). Although overall the expression of ARSs increased in tumoursamples, the expression of several genes was decreased more than 30%, as compared to thenormal samples, with WARS being downregulated in LUSC, LUAD and KIRP (by 45%, 41%and 35%, respectively), as were QARS in HNSC (45%) and NARS in KIRC (36%) (Figure 2Band Figure S3). These data show differential expression regulation of ARSs in tumoursamples as compared to those from adjacent healthy tissue.
Figure 1. ARS mutational alteration frequencies (%) in TCGA cancers. (A) Point mutation alterationfrequencies. These include non-silent mutations, such a as nonsense, missense or splice-site introduc-ing mutations. (B) Copy number alteration (CNA) frequencies. These include gains/amplificationsand losses/deletions.
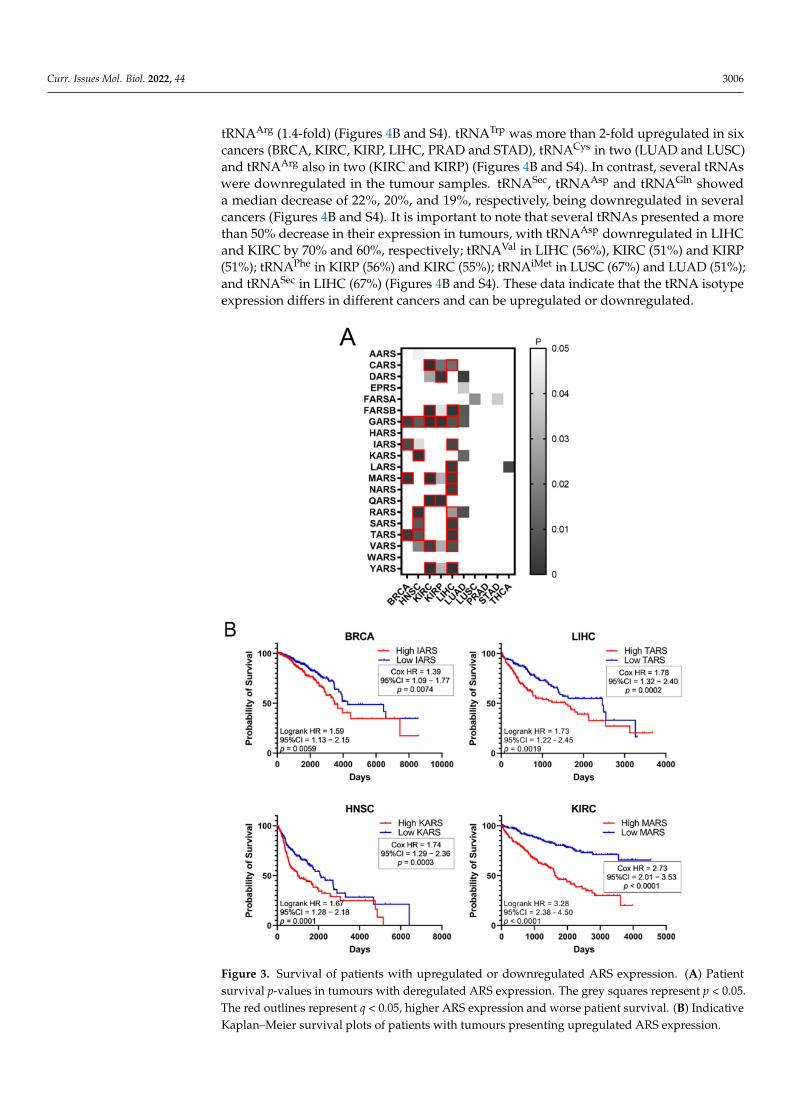
Higher expression of ARSs in tumours and high fold-change (FC) tumour to normalexpression ratios could indicate a potential role of ARSs in cancer. To test the hypothesis thatincreased ARS expression can affect cancer survival, the survival of patients with elevatedARS expression was tested. To this end, the p-values of Kaplan–Meier plots from tumoursamples expressing high or low levels of ARSs were plotted as a heatmap (Figure 3A). Thegrey squares represent p < 0.05 (logrank test) and the red outlines represent p < 0.05 and q< 0.05 for ARSs whose overexpression correlated with worse patient survival. The whitesquares, seen as white background, represent p > 0.05 (not significant). Several ARSs withincreased expression correlated with lower patient survival (Figure 3A). As expected, thisvaried among cancers, with LIHC presenting twelve ARSs correlating with significantlylower survival, followed by KIRC with seven and HNSC with five (Figure 3A). GARSwas found to significantly correlate with five different types of cancer tumours (BRCA,HNSC, KIRC, KIRP and LIHC), followed by MARS and TARS that correlated with threedifferent types of tumours (BRCA, KIRC, LIHC and BRCA, HNSC, LIHC, respectively)(Figure 3A). There were no ARSs (p < 0.05 and q < 0.05) found in which lower expressionwas associated with worse survival (Figure 3A). Indicative Kaplan–Meier survival plotsare shown in Figure 3B, showing that increased expression of certain ARSs correlates withlower patient survival (Figure 3B). These data indicate an important role for ARSs in cancersurvival.

Curr. Issues Mol. Biol. 2022, 44 3005
Figure 2. ARS mRNA expression in normal and tumour tissues. (A) Median ARS mRNA expressionin normal (N) and tumour (T) tissues. The p-values were calculated using the non-parametric Mann–Whitney test. **** p < 0.0001, *** p < 0.001, ns: not significant. (B) Fold change (FC) of individual ARSmedian expression in tumour vs. normal tissues.
It has been shown that tRNA expression is altered in certain tumours [21–23,35]. Itcan therefore be argued that increased expression of ARS in tumours might correlate withhigher expression levels of the tRNAs to which ARSs bind. To test this hypothesis, theexpression of tRNAs in the same 10 cancers and samples was investigated. In only 5 ofthe 10 cancers the median tRNA expression was significantly upregulated in tumourscompared to the adjacent normal tissues (Figure 4A). The overall median increase was 5%,with the most upregulated tRNA expression in LUAD (14%), BRCA (11%) and HNSC (11%).Similarly to ARSs, the tRNAs presented differential levels of expression in normal andtumour samples (Figures 4B and S4). tRNATrp was the tRNA that was most upregulated inall the examined cancers, with a median of 2.2-fold, followed by tRNACys (1.4-fold) and
Curr. Issues Mol. Biol. 2022, 44 3006
tRNAArg (1.4-fold) (Figures 4B and S4). tRNATrp was more than 2-fold upregulated in sixcancers (BRCA, KIRC, KIRP, LIHC, PRAD and STAD), tRNACys in two (LUAD and LUSC)and tRNAArg also in two (KIRC and KIRP) (Figures 4B and S4). In contrast, several tRNAswere downregulated in the tumour samples. tRNASec, tRNAAsp and tRNAGln showeda median decrease of 22%, 20%, and 19%, respectively, being downregulated in severalcancers (Figures 4B and S4). It is important to note that several tRNAs presented a morethan 50% decrease in their expression in tumours, with tRNAAsp downregulated in LIHCand KIRC by 70% and 60%, respectively; tRNAVal in LIHC (56%), KIRC (51%) and KIRP(51%); tRNAPhe in KIRP (56%) and KIRC (55%); tRNAiMet in LUSC (67%) and LUAD (51%);and tRNASec in LIHC (67%) (Figures 4B and S4). These data indicate that the tRNA isotypeexpression differs in different cancers and can be upregulated or downregulated.
Figure 3. Survival of patients with upregulated or downregulated ARS expression. (A) Patientsurvival p-values in tumours with deregulated ARS expression. The grey squares represent p < 0.05.The red outlines represent q < 0.05, higher ARS expression and worse patient survival. (B) IndicativeKaplan–Meier survival plots of patients with tumours presenting upregulated ARS expression.

Curr. Issues Mol. Biol. 2022, 44 3007
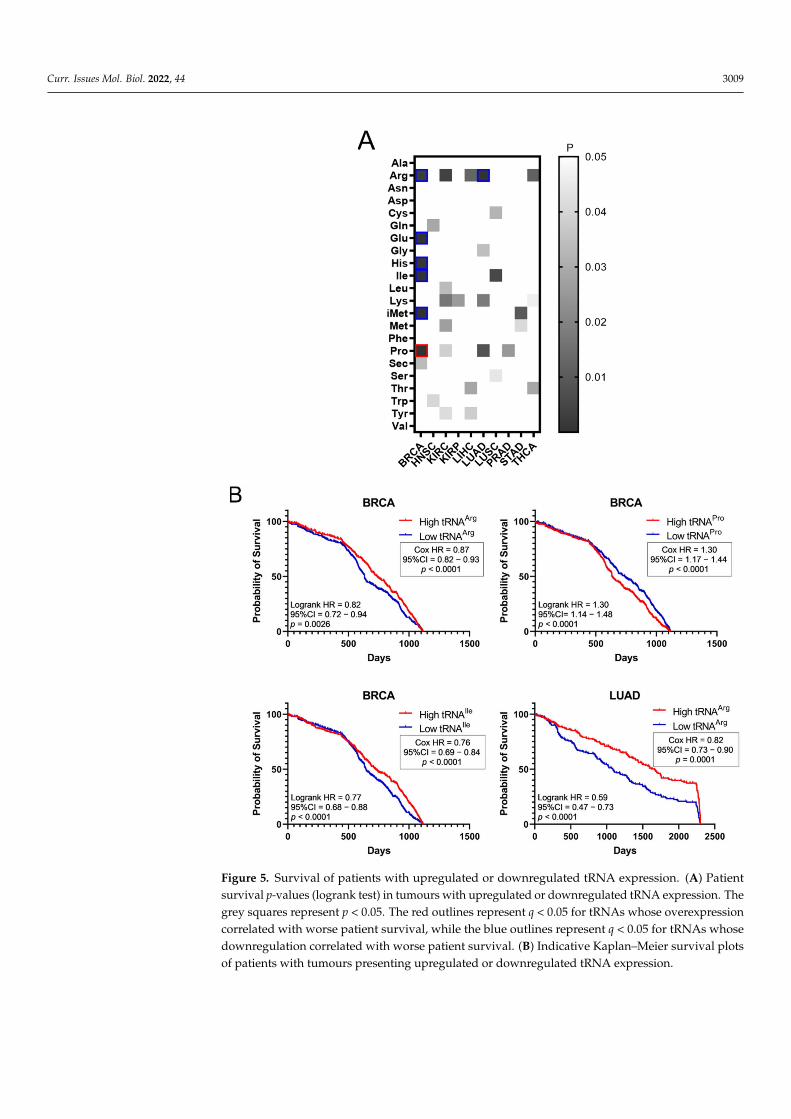
The effect of tRNA expression on patient survival was investigated next (Figure 5).The aim was to examine if higher or lower tRNA expression in tumours is correlated withpatient survival. The p-values of Kaplan–Meier plots from tumour samples expressinghigh or low levels of tRNAs were plotted as a heatmap (Figure 5A). The grey squaresrepresent p < 0.05, the red outlines represent p < 0.05 and q < 0.05 for tRNAs whose overex-pression correlated with worse patient survival, while the blue outlines represent p < 0.05and q < 0.05 for tRNAs whose downregulation correlated with worse patient survival(Figure 5A). It was found that higher expression of tRNAPro in BRCA correlated withworse patient outcomes, whereas decreased expression of tRNAArg, tRNAGlu, tRNAHis,tRNAIle and tRNAiMet in BRCA, as well as tRNAArg in LUAD, correlated with worsepatient outcomes (Figure 5A). Indicative patient survival plots for the above are shownin Figure 5B. These data collectively reveal that either upregulation or downregulation oftRNA expression in tumours can correlate with worse patient survival outcomes.
The common occurrences where both ARSs and tRNA expression deregulation corre-lated with patient survival were then determined (Figure 6A). More specifically, there wereeleven cases found in total, with a p-value < 0.05 for both ARSs and tRNAs. In five of those,overexpression of ARSs and their cognate tRNAs was related with worse patient survival(shown in red, Figure 6A), and in six cases overexpression of ARSs but downregulation oftheir cognate tRNAs was related with worse patient survival (shown in blue, Figure 6A).It is important to note that for some of these cases, although the p-values were <0.05, thiswas not the case for the q-values (Figures 3A and 5A), suggesting a higher probability ofbeing false positives. If the observed concomitant expression deregulation of ARSs andtRNAs was associated with patient survival, a correlation between them might have beenexpected within each tumour. However, there was no correlation observed between ARSmRNA and tRNA expression (Figure 6B). These data suggest that although in some casesboth the ARS and its cognate tRNA deregulation were associated with patient survival,there was no correlation, positive or negative, found between their RNA expression.
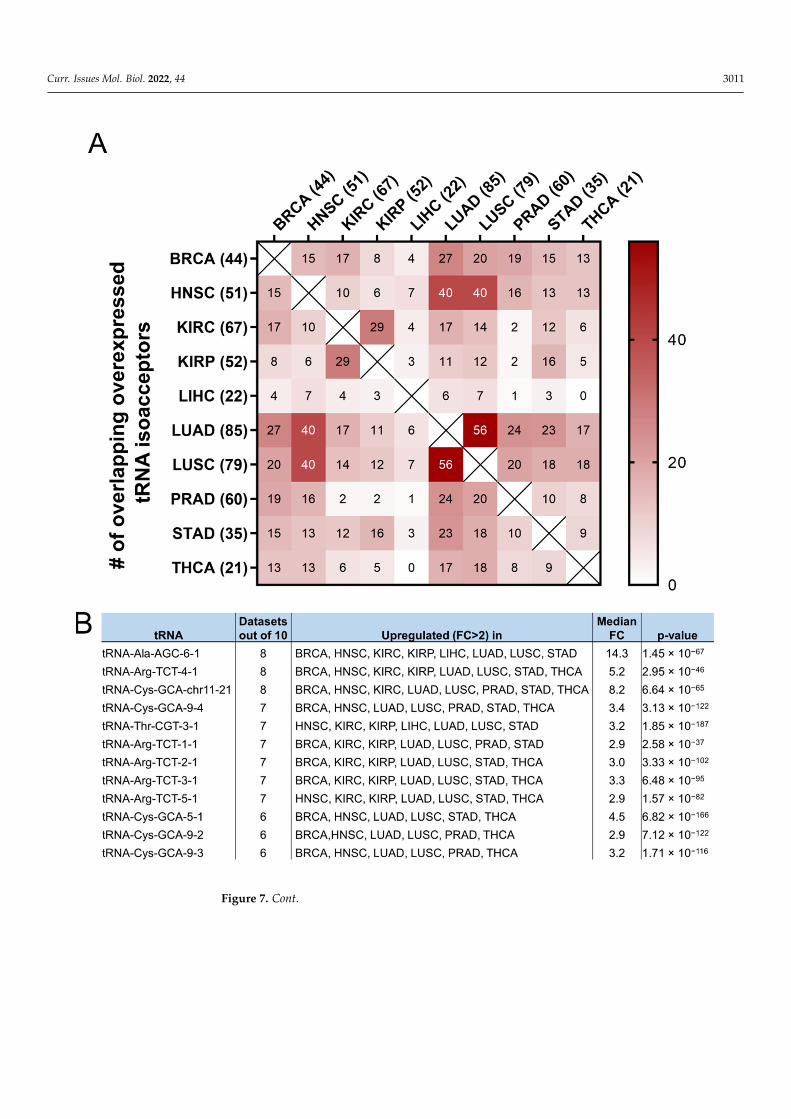
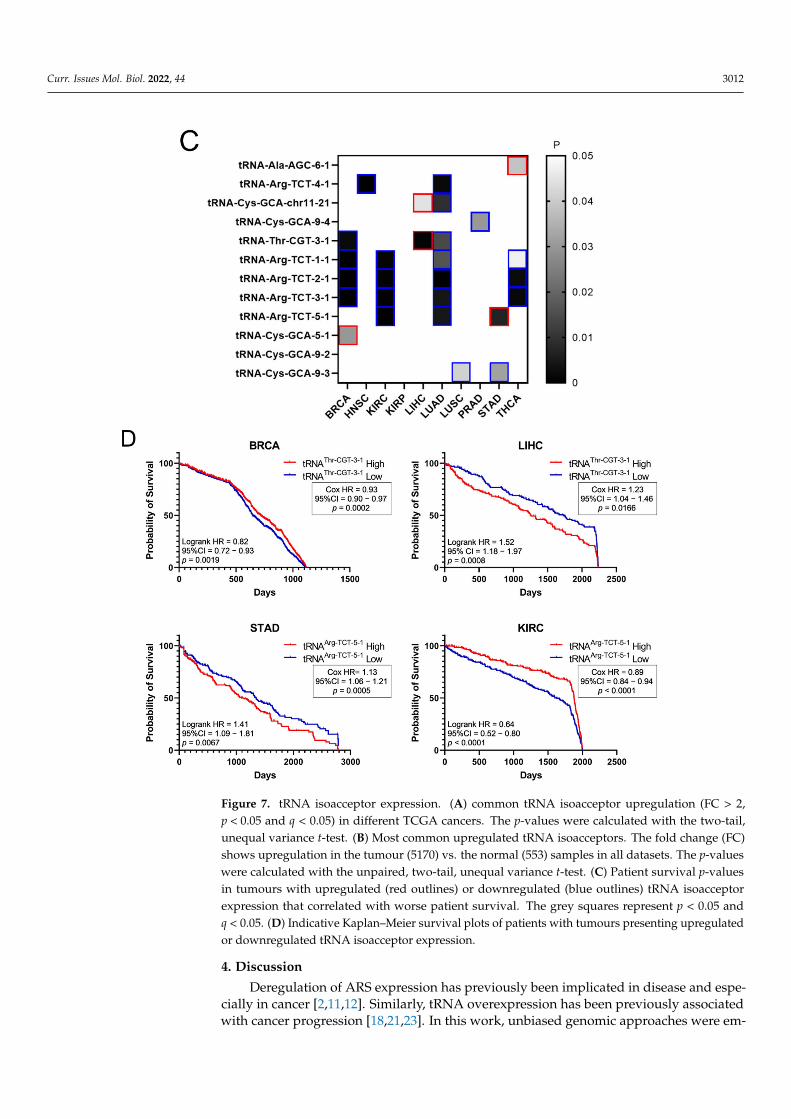
It was then investigated if the tRNA specific isoacceptor expression was better associ-ated with patient survival than the tRNA isotype expression. To this end, the expressionof individual tRNA isoacceptors that were deregulated by more than two-fold (FC > 2,p < 0.05, q < 0.05) in cancer, compared to the adjacent healthy tissue, was investigated. Itwas found that many tRNA isoacceptors are consistently upregulated in different cancers(Figure 7A). For example, 56 out of the 85 tRNA isoacceptors overexpressed in LUAD werealso overexpressed in LUSC (66%) and 40 in HNSC (47%) (Figure 7A). Intriguingly, severaltRNA isoacceptors were found overexpressed in most of the examined datasets (Figure 7B).These include tRNAAla-AGC−6−1, tRNAArg-TCT−4−1 and tRNACys-GCA-chr11−21, which weresignificantly overexpressed more than 5-fold in 8 out of the 10 examined cancers (Figure 7B).However, similar to the tRNA isotype expression, the upregulation of these tRNA isoac-ceptors in the tumours as compared to normal tissue did not necessarily correlate withworse patient survival. Indeed, upregulation (red) or downregulation (blue) of these tRNAisoacceptors’ expression correlated with worse patient survival (Figure 7C,D), revealing noclear connection between tRNA isoacceptor expression deregulation in the tumours andpatient survival.

Curr. Issues Mol. Biol. 2022, 44 3008
Figure 4. tRNA expression in normal and tumour tissues. (A) Median tRNA expression in normal (N)and tumour (T) tissues. The p-values were calculated using the Mann–Whitney test. **** p < 0.0001,*** p < 0.001, ** p < 0.01, ns: not significant. (B) Fold change (FC) of tRNA median expression intumour vs. normal tissues.
Curr. Issues Mol. Biol. 2022, 44 3009
Figure 5. Survival of patients with upregulated or downregulated tRNA expression. (A) Patientsurvival p-values (logrank test) in tumours with upregulated or downregulated tRNA expression. Thegrey squares represent p < 0.05. The red outlines represent q < 0.05 for tRNAs whose overexpressioncorrelated with worse patient survival, while the blue outlines represent q < 0.05 for tRNAs whosedownregulation correlated with worse patient survival. (B) Indicative Kaplan–Meier survival plotsof patients with tumours presenting upregulated or downregulated tRNA expression.

Curr. Issues Mol. Biol. 2022, 44 3010
Figure 6. Concomitant ARS and tRNA expression deregulation in tumours. (A) Concomitantderegulation of ARS and tRNA expression in tumours affecting patient survival. Red squares denoteARS and tRNA overexpression associated with worse patient survival, while blue squares denoteupregulation of ARS, but downregulation of their cognate tRNA expression and association withworse patient survival. This panel was generated based on the p-values of the data shown in Figures3A and 5A. (B) Correlation of ARSs mRNA and their cognate tRNA expression. The Spearmancorrelation coefficient (r) is shown.
Curr. Issues Mol. Biol. 2022, 44 3011
Figure 7. Cont.
Curr. Issues Mol. Biol. 2022, 44 3012
Figure 7. tRNA isoacceptor expression. (A) common tRNA isoacceptor upregulation (FC > 2,p < 0.05 and q < 0.05) in different TCGA cancers. The p-values were calculated with the two-tail,unequal variance t-test. (B) Most common upregulated tRNA isoacceptors. The fold change (FC)shows upregulation in the tumour (5170) vs. the normal (553) samples in all datasets. The p-valueswere calculated with the unpaired, two-tail, unequal variance t-test. (C) Patient survival p-valuesin tumours with upregulated (red outlines) or downregulated (blue outlines) tRNA isoacceptorexpression that correlated with worse patient survival. The grey squares represent p < 0.05 andq < 0.05. (D) Indicative Kaplan–Meier survival plots of patients with tumours presenting upregulatedor downregulated tRNA isoacceptor expression.
4. Discussion
Deregulation of ARS expression has previously been implicated in disease and espe-cially in cancer [2,11,12]. Similarly, tRNA overexpression has been previously associatedwith cancer progression [18,21,23]. In this work, unbiased genomic approaches were em-

Curr. Issues Mol. Biol. 2022, 44 3013
ployed to investigate the relationships between ARS mRNA and tRNA expression andpatient survival in cancers of different origin. No general patterns were revealed for eitherthe ARSs or the tRNAs. The ARS mutation frequencies were relatively low and inconsistent,while their expression varied among cancers, as did the expression of tRNAs. Overexpres-sion of certain ARSs strongly correlated with decreased patient survival in some cancers,but not with concomitant overexpression of their cognate tRNAs. tRNAs were found to beupregulated or downregulated in tumours and, in contrast to ARSs, both their upregulationand downregulation correlated with decreased patient survival.
The ARSs were mutated in several cancers (Figure 1A,B). However, they are essentialenzymes, and as such it is not a surprise that their alteration frequencies overall are low(Figure 1A,B), with most of the selected mutations being copy number gains (amplifications)(Figure 1B and Figure S1). Chromosomal gains/amplifications of certain ARSs were foundin several cancers, with HARS, LARS and RARS in KIRC, EPRS in BRCA and TARS in LUSCat relatively high frequencies B and Figure S1). Interestingly, the mRNA expression of ARSsaffected by amplifications in the tumours examined was increased (Figure S2), suggestingthat many of these gains/amplifications at the DNA level were actively transcribed andcontributed to the elevated mRNA expression. There were fewer losses/deletions of ARSsobserved (Figure S1B,C), with the most pronounced one being QARS in KIRC. Interestinglythough, in that case the median QARS mRNA expression did not seem to significantlychange in the tumours with QARS losses as compared to the ones without (Figure S2A).It is not clear why this is the case, but it might be attributed to partial DNA loss ordecreased mRNA degradation. Although significant overexpression of certain genes,namely cancer drivers, can drive carcinogenesis, none of the ARSs were found to be apotential cancer driver gene [34], in accordance with a previously published report onamplification-dependent cancer driver genes in TCGA cancers [36].
Regardless of the alteration frequencies at the DNA level, the mRNA expression ofmost ARSs was upregulated in the examined cancers (Figure 2A). This is in general agree-ment with a recent study that also found that most ARSs were upregulated independentlyof the DNA alteration frequencies [37]. More specifically, in eight of the ten cancers, themedian ARS mRNA expression was significantly upregulated (Figure 2A). It is important tonote that in most cases the mRNA expression of ARSs varied significantly among them andbetween normal and tumour samples (Figure 2B, Figures S3 and S5A), with VARS beingthe most upregulated ARS mRNA among all tumours, as compared to normal adjacenttissues, followed by GARS and TARS (Figure 2B).
Importantly, upregulation of ARSs broadly correlated with worse outcomes of patientsurvival (Figure 3A). For example, upregulation of GARS correlated with worse patientsurvival in BRCA, HNSC, KIRC, KIRP and LIHC, as did upregulation of MARS in BRCA,KIRC and LIHC, and TARS in BRCA, HNSC and LIHC (Figure 3A,B). Upregulation ofCARS, FARSB, IARS, QARS, RARS, SARS, VARS and YARS mRNA also correlated withlower patient survival in more than one cancer (Figure 3A). However, not all ARS overex-pression correlated with worse patient survival outcomes. Statistical significance (p < 0.05,q < 0.05) was not reached for some cancers, such as LUAD, LUSC, PRAD, STAD and THCA,although, apart from PRAD, they presented at least one ARS with which its overexpressioncorrelated with decreased patient survival (p < 0.05, but q > 0.05) (Figure 3A). Similarconclusions were reached by a recent study that followed different research methodologiesand included the mitochondrial ARSs as well as the AIMPs [37]. Taken together, the abovedata indicate that it is not the overall overexpression of ARSs that is related to patients’survival, but rather the overexpression of specific ARSs in specific tumours. It is of interestto note that based on these observations, the expression of certain ARSs could be of futureprognostic value for patient survival, after they become validated by experiments designedto confirm the potential biomarker value of these ARSs.
The deregulation of tRNAs in individual tumours and cancer cell lines has alreadybeen established [18,38]. The expression of tRNAs in 10 TCGA cancers was systematicallyevaluated in this work. The median tRNA expression was significantly altered in five out
Curr. Issues Mol. Biol. 2022, 44 3014
of the ten cancers (Figure 4A). Among them, the median tRNA expression was upregulatedin BRCA, an observation in accordance with previous studies reporting overexpressionof tRNAs in breast cancer cell lines and tumours [21,29,39]. Not much is known aboutthe contribution of tRNA deregulation in cancers other than of the breast, but the datain this work suggest that it might play a significant role in HNSC, LUAD, LUSC andSTAD (Figure 4A). It is important to note that the tRNA isolated and sequenced by theTCGA consortium does not necessarily accurately represent the full repertoire of tRNAsat a given time. Due to their structure and post-transcriptional modifications, tRNAs canpresent significant difficulties during their processing for small RNA sequencing. Severalnovel methods for tRNA isolation and sequencing have been presented recently [40–45].Although these methods are more accurate at representing tRNA expression, they have notto our knowledge been used to isolate tRNAs from tumours and adjacent normal tissues.Therefore, in our view, the current data from the TCGA project, with their inherent vulner-abilities, are the best currently existing that allow multi-omic analyses to be performed,enabling the analysis of ARS/tRNA expression in different cancers and the correlation ofgene expression with patient survival.
Interestingly, individual tRNA isotype expression in most cases could significantly beeither upregulated or downregulated in tumours when compared to the normal controltissue (Figure 4B, Figures S4 and S5B). tRNATrp, tRNACys and tRNAArg were the mostupregulated, while tRNAGln, tRNAMet and tRNASec were often, but not always, downreg-ulated (Figure 4B). Importantly it was found that the expression of tRNAiMet, the tRNAresponsible for transferring the initiator methionine (iMet), was upregulated in breastcancer (Figure 4B). Upregulation of tRNAiMet in breast cells has been reported before andlinked to tumour initiation [21], while tRNAiMet has also been shown to promote cancercell migration and invasion [18], as well as tumour growth and angiogenesis [46]. Basedon the data presented in this work (Figure 4B), tRNAiMet was also upregulated in LIHCand, to a lesser degree, STAD, and therefore it would be interesting to investigate the roleof tRNAiMet in these cancers.
The upregulation or downregulation of individual tRNA expression correlated withworse patient survival (Figure 5A,B). For example, upregulation of tRNAPro expressionin BRCA correlated with worse patient survival, while the downregulation of five othertRNAs correlated with worse patient survival (Figure 5A,B). This is in contrast with ARSoverexpression, which was found to correlate exclusively with worse patient survival(Figure 3). Importantly, concomitant deregulation of RNA expression of both the ARSand its cognate tRNA was observed only in 11 cases, in 5 of which the upregulation oftRNA expression correlated with worse patient survival, while in the other 6 the tRNAdownregulation correlated with worse patient survival (Figure 6A). Moreover, there was nosignificant correlation found between the ARS mRNA expression and the tRNA expression(Figure 6B), as could be expected if their co-expression was of functional significance. Theabove data suggest that the concomitant deregulation of ARS mRNA and tRNA expressionis not essential for their functional contribution to patient survival.
Following from the above, the possibility that specific tRNA isoacceptors, ratherthan isotypes, associate better with patient survival was investigated. Many of the sameisoacceptors were found to be consistently upregulated in several of the examined cancers(Figure 7A) and it is envisaged that some of them could be used as potential cancerbiomarkers (Figure 7B), something that could be experimentally validated in future studies.The expression of specific isoacceptors has been shown to have a role in breast cancermetastasis [23], translation regulation [35] and more recently in stress-induced tRNAfragmentation [47], which in turn can repress protein translation and cell growth [48].Therefore, the finding that many isoacceptors (Figure 7A,B) are commonly overexpressedin different cancers might indicate a role in specific stages of carcinogenesis and/or stress-induced responses, affecting protein translation and cell growth.
As there was no significant correlation found between the tRNA isotypes and theirARSs (Figure 6B), it was investigated if the expression of individual isoacceptors and the

Curr. Issues Mol. Biol. 2022, 44 3015
expression of their relevant ARSs were positively or negatively correlated. However, simi-larly to the findings in Figure 6B, no strong or moderate correlations were detected, at leastfor the isoacceptors shown in Figure 7B, in BRCA and LUAD (Figures S6 and S7). Amongthe twelve tRNA isoacceptors examined, tRNAThr-CGT−3−1 and perhaps tRNAAla-AGC−6−1
were marginally better correlated with their respective ARSs (Figures S6 and S7). It isprobable that the expression of certain tRNA isoacceptors is better correlated with theirrelevant ARSs, rather than the isotypes, but these isoacceptors might not necessarily be ashighly overexpressed as the ones examined in this work (Figure 7B).
Similarly to the tRNA isotype expression (Figure 5A), both the upregulation anddownregulation of the tRNA isoacceptors examined (Figure 7B) were found to correlatewith decreased patient survival (p < 0.05, q < 0.05, Figure 7C,D). In contrast, only ARSoverexpression was associated with lower patient survival (Figure 3A). Consequently, thereseems to be an uncoupling between ARS/tRNA expression and patient survival in cancer,which was underlined by the finding that the tRNA (isotype or isoacceptor) and ARSmRNA expression were mostly uncoupled (Figure 6B, Figures S6 and S7).
The data on tRNA isotypes and isoacceptors presented in this work indicate that theindividual deregulation of ARS mRNA and tRNA expression might affect carcinogenesisand patient survival in different ways. The overall upregulation on ARS expression incancers is likely a functional adaptation to the increased need of protein translation in can-cer cells. However, the specific high overexpression of individual ARSs in certain cancersimplies that these ARSs could have roles in cancer, independently of aminoacylation [2,8].Regarding the tRNA expression deregulation, it has been previously shown that differentsubsets of tRNAs are favoured in cell proliferation versus cell differentiation [35]. Forexample, in the case of BRCA, while tRNAiMet overexpression might significantly con-tribute to tumour initiation, at the later stages of tumourigenesis it is the upregulationof isoacceptors tRNAArg-CCG and tRNAGlu-UUC that will promote metastasis [23]. It istherefore probable that cancers benefit not only from the overall overexpression of ARSsand tRNAs needed for increased protein synthesis, but also from the specific imbalance inthe ratios of ARS and cognate tRNAs, resulting either in the mischarging of tRNAs, leadingto translational errors [49,50], or the preferential recruitment of specific tRNA pools thatcould affect translational speed and efficiency [23,51].
To summarise, this work investigated the relationships between ARS mRNA and tRNAexpression and patient survival in ten cancers. Overexpression of specific ARSs stronglycorrelated with decreased patient survival in some cancers, but not with concomitant over-expression of their cognate tRNAs. tRNAs were found to be upregulated or downregulatedin tumours and, contrary to ARSs, both their upregulation and downregulation correlatedwith decreased patient survival. Although the expression of specific tRNA isoacceptorsvaries in different cancers, certain isoacceptors were upregulated in most cancers examined,presumably to ensure high levels of protein translation, cell growth and cancer progression.
Supplementary Materials: The following are available online at https://www.mdpi.com/article/10.3390/cimb44070207/s1: Figure S1: Copy number alterations (CNAs) in ARSs; Figure S2: mRNAexpression of samples with or without CNAs; Figure S3: mRNA expression of ARS genes in normaltissues (N) or tumours (T) in 10 TCGA cancers; Figure S4: tRNA expression in normal tissues (N) ortumours (T) in 10 TCGA cancers; Figure S5: ARS and tRNA Fold-Change (FC) q-values in cancers;Figure S6: ARS and tRNA isoacceptor expression correlations in BRCA; Figure S7: ARS and tRNAisoacceptor expression correlations in LUAD; Table S1: Aminoacyl-tRNA synthetases; Table S2: TCGAcancer types and sample numbers per TCGA dataset.
Author Contributions: T.K. conceived and designed the study, retrieved the datasets from publicdatabases, analysed the data and wrote the manuscript. A.K.S. analysed data and contributed to themanuscript. All authors have read and agreed to the published version of the manuscript.
Funding: This research received no external funding. The APC was funded by the College of Healthand Life Sciences, Aston University.

Curr. Issues Mol. Biol. 2022, 44 3016
Data Availability Statement: The data reported in this work are available from the author uponrequest. The original data examined in the study can be retrieved from the following sources: UCSCXena (https://tcga.xenahubs.net, accessed 1 July 2021), cBioPortal (http://www.cbioportal.org/,accessed 26 June 2021) and Synapse (Synapse (https://www.synapse.org, syn8367012, accessed15 July 2021).
Acknowledgments: We would like to thank members of the Aston Medical School for critical readingof the manuscript.
Conflicts of Interest: The authors declare no conflict of interest.
References1. Antonellis, A.; Green, E.D. The Role of Aminoacyl-TRNA Synthetases in Genetic Diseases. Annu. Rev. Genom. Hum. Genet. 2008,
9, 87–107. [CrossRef] [PubMed]2. Kwon, N.H.; Fox, P.L.; Kim, S. Aminoacyl-TRNA Synthetases as Therapeutic Targets. Nat. Rev. Drug Discov. 2019, 18, 629–650.
[CrossRef] [PubMed]3. Friederich, M.W.; Timal, S.; Powell, C.A.; Dallabona, C.; Kurolap, A.; Palacios-Zambrano, S.; Bratkovic, D.; Derks, T.G.J.; Bick,
D.; Bouman, K.; et al. Pathogenic Variants in Glutamyl-TRNAGln Amidotransferase Subunits Cause a Lethal MitochondrialCardiomyopathy Disorder. Nat. Commun. 2018, 9, 4065. [CrossRef] [PubMed]
4. Berthonneau, E.; Mirande, M. A Gene Fusion Event in the Evolution of Aminoacyl-TRNA Synthetases. FEBS Lett. 2000, 470,300–304. [CrossRef]
5. Zhou, Z.; Sun, B.; Huang, S.; Yu, D.; Zhang, X. Roles of Aminoacyl-TRNA Synthetase-Interacting Multi-Functional Proteins inPhysiology and Cancer. Cell Death Dis. 2020, 11, 579. [CrossRef]
6. Guo, M.; Yang, X.-L.; Schimmel, P. New Functions of Aminoacyl-TRNA Synthetases beyond Translation. Nat. Rev. Mol. Cell Biol.2010, 11, 668–674. [CrossRef]
7. Park, S.G.; Schimmel, P.; Kim, S. Aminoacyl TRNA Synthetases and Their Connections to Disease. Proc. Natl. Acad. Sci. USA 2008,105, 11043–11049. [CrossRef]
8. Guo, M.; Schimmel, P. Essential Nontranslational Functions of TRNA Synthetases. Nat. Chem. Biol. 2013, 9, 145–153. [CrossRef]9. Nie, A.; Sun, B.; Fu, Z.; Yu, D. Roles of Aminoacyl-TRNA Synthetases in Immune Regulation and Immune Diseases. Cell Death
Dis. 2019, 10, 901. [CrossRef]10. Boczonadi, V.; Jennings, M.J.; Horvath, R. The Role of TRNA Synthetases in Neurological and Neuromuscular Disorders. FEBS
Lett. 2018, 592, 703–717. [CrossRef]11. Kim, S.; You, S.; Hwang, D. Aminoacyl-TRNA Synthetases and Tumorigenesis: More than Housekeeping. Nat. Rev. Cancer 2011,
11, 708–718. [CrossRef]12. Zhou, Z.; Sun, B.; Nie, A.; Yu, D.; Bian, M. Roles of Aminoacyl-TRNA Synthetases in Cancer. Front. Cell Dev. Biol. 2020, 8, 599765.
[CrossRef]13. Kim, E.Y.; Jung, J.Y.; Kim, A.; Kim, K.; Chang, Y.S. Methionyl-TRNA Synthetase Overexpression Is Associated with Poor Clinical
Outcomes in Non-Small Cell Lung Cancer. BMC Cancer 2017, 17, 467. [CrossRef]14. Jeong, S.J.; Kim, J.H.; Lim, B.J.; Yoon, I.; Song, J.-A.; Moon, H.; Kim, D.; Lee, D.K.; Kim, S. Inhibition of MUC1 Biosynthesis via
Threonyl-TRNA Synthetase Suppresses Pancreatic Cancer Cell Migration. Exp. Mol. Med. 2018, 50, e424. [CrossRef]15. Lee, C.-W.; Chang, K.-P.; Chen, Y.-Y.; Liang, Y.; Hsueh, C.; Yu, J.-S.; Chang, Y.-S.; Yu, C.-J. Overexpressed Tryptophanyl-TRNA
Synthetase, an Angiostatic Protein, Enhances Oral Cancer Cell Invasiveness. Oncotarget 2015, 6, 21979–21992. [CrossRef]16. Vellaichamy, A.; Sreekumar, A.; Strahler, J.R.; Rajendiran, T.; Yu, J.; Varambally, S.; Li, Y.; Omenn, G.S.; Chinnaiyan, A.M.;
Nesvizhskii, A.I. Proteomic Interrogation of Androgen Action in Prostate Cancer Cells Reveals Roles of Aminoacyl TRNASynthetases. PLoS ONE 2009, 4, e7075. [CrossRef]
17. White, R.J. Transcription by RNA Polymerase III: More Complex than We Thought. Nat. Rev. Genet. 2011, 12, 459–463. [CrossRef]18. White, R.J. RNA Polymerases I and III, Growth Control and Cancer. Nat. Rev. Mol. Cell Biol. 2005, 6, 69–78. [CrossRef]19. Birch, J.; Clarke, C.J.; Campbell, A.D.; Campbell, K.; Mitchell, L.; Liko, D.; Kalna, G.; Strathdee, D.; Sansom, O.J.; Neilson, M.; et al.
The Initiator Methionine TRNA Drives Cell Migration and Invasion Leading to Increased Metastatic Potential in Melanoma. Biol.Open 2016, 5, 1371–1379. [CrossRef]
20. Zhou, Y.; Goodenbour, J.M.; Godley, L.A.; Wickrema, A.; Pan, T. High Levels of TRNA Abundance and Alteration of TRNACharging by Bortezomib in Multiple Myeloma. Biochem. Biophys. Res. Commun. 2009, 385, 160–164. [CrossRef]
21. Pavon-Eternod, M.; Gomes, S.; Geslain, R.; Dai, Q.; Rosner, M.R.; Pan, T. TRNA Over-Expression in Breast Cancer and FunctionalConsequences. Nucleic Acids Res. 2009, 37, 7268–7280. [CrossRef]
22. Pavon-Eternod, M.; Gomes, S.; Rosner, M.R.; Pan, T. Overexpression of Initiator Methionine TRNA Leads to Global Reprogram-ming of TRNA Expression and Increased Proliferation in Human Epithelial Cells. RNA 2013, 19, 461–466. [CrossRef]
23. Goodarzi, H.; Nguyen, H.C.B.; Zhang, S.; Dill, B.D.; Molina, H.; Tavazoie, S.F. Modulated Expression of Specific TRNAs DrivesGene Expression and Cancer Progression. Cell 2016, 165, 1416–1427. [CrossRef]
24. The Cancer Genome Atlas—National Cancer Institute. Available online: https://www.cancer.gov/tcga (accessed on30 November 2020).
Curr. Issues Mol. Biol. 2022, 44 3017
25. Goldman, M.J.; Craft, B.; Hastie, M.; Repecka, K.; McDade, F.; Kamath, A.; Banerjee, A.; Luo, Y.; Rogers, D.; Brooks, A.N.; et al.Visualizing and Interpreting Cancer Genomics Data via the Xena Platform. Nat. Biotechnol. 2020, 38, 675–678. [CrossRef]
26. Braschi, B.; Denny, P.; Gray, K.; Jones, T.; Seal, R.; Tweedie, S.; Yates, B.; Bruford, E. Genenames.Org: The HGNC and VGNCResources in 2019. Nucleic Acids Res. 2019, 47, D786–D792. [CrossRef]
27. Cerami, E.; Gao, J.; Dogrusoz, U.; Gross, B.E.; Sumer, S.O.; Aksoy, B.A.; Jacobsen, A.; Byrne, C.J.; Heuer, M.L.; Larsson, E.; et al.The CBio Cancer Genomics Portal: An Open Platform for Exploring Multidimensional Cancer Genomics Data. Cancer Discov.2012, 2, 401–404. [CrossRef]
28. Gao, J.; Aksoy, B.A.; Dogrusoz, U.; Dresdner, G.; Gross, B.; Sumer, S.O.; Sun, Y.; Jacobsen, A.; Sinha, R.; Larsson, E.; et al.Integrative Analysis of Complex Cancer Genomics and Clinical Profiles Using the CBioPortal. Sci. Signal 2013, 6, pl1. [CrossRef]
29. Zhang, Z.; Ye, Y.; Gong, J.; Ruan, H.; Liu, C.-J.; Xiang, Y.; Cai, C.; Guo, A.-Y.; Ling, J.; Diao, L.; et al. Global Analysis of TRNA andTranslation Factor Expression Reveals a Dynamic Landscape of Translational Regulation in Human Cancers. Commun. Biol. 2018,1, 234. [CrossRef]
30. Cox, D.R. Regression Models and Life-Tables. J. R. Stat. Society. Ser. B (Methodol.) 1972, 34, 187–220. [CrossRef]31. Bland, J.M.; Altman, D.G. The Logrank Test. BMJ 2004, 328, 1073. [CrossRef]32. Benjamini, Y.; Hochberg, Y. Controlling the False Discovery Rate: A Practical and Powerful Approach to Multiple Testing. J. R.
Stat. Society. Ser. B (Methodol.) 1995, 57, 289–300. [CrossRef]33. Martínez-Jiménez, F.; Muiños, F.; Sentís, I.; Deu-Pons, J.; Reyes-Salazar, I.; Arnedo-Pac, C.; Mularoni, L.; Pich, O.; Bonet, J.; Kranas,
H.; et al. A Compendium of Mutational Cancer Driver Genes. Nat. Rev. Cancer 2020, 20, 555–572. [CrossRef] [PubMed]34. Gonzalez-Perez, A.; Perez-Llamas, C.; Deu-Pons, J.; Tamborero, D.; Schroeder, M.P.; Jene-Sanz, A.; Santos, A.; Lopez-Bigas, N.
IntOGen-Mutations Identifies Cancer Drivers across Tumor Types. Nat. Methods 2013, 10, 1081–1082. [CrossRef] [PubMed]35. Gingold, H.; Tehler, D.; Christoffersen, N.R.; Nielsen, M.M.; Asmar, F.; Kooistra, S.M.; Christophersen, N.S.; Christensen, L.L.;
Borre, M.; Sorensen, K.D.; et al. A Dual Program for Translation Regulation in Cellular Proliferation and Differentiation. Cell 2014,158, 1281–1292. [CrossRef]
36. Ohshima, K.; Hatakeyama, K.; Nagashima, T.; Watanabe, Y.; Kanto, K.; Doi, Y.; Ide, T.; Shimoda, Y.; Tanabe, T.; Ohnami, S.;et al. Integrated Analysis of Gene Expression and Copy Number Identified Potential Cancer Driver Genes with Amplification-Dependent Overexpression in 1,454 Solid Tumors. Sci. Rep. 2017, 7, 641. [CrossRef]
37. Wang, J.; Vallee, I.; Dutta, A.; Wang, Y.; Mo, Z.; Liu, Z.; Cui, H.; Su, A.I.; Yang, X.-L. Multi-Omics Database Analysis ofAminoacyl-TRNA Synthetases in Cancer. Genes 2020, 11, 1384. [CrossRef]
38. Santos, M.; Fidalgo, A.; Varanda, A.S.; Oliveira, C.; Santos, M.A.S. TRNA Deregulation and Its Consequences in Cancer. TrendsMol. Med. 2019, 25, 853–865. [CrossRef]
39. Krishnan, P.; Ghosh, S.; Wang, B.; Heyns, M.; Li, D.; Mackey, J.R.; Kovalchuk, O.; Damaraju, S. Genome-Wide Profiling of TransferRNAs and Their Role as Novel Prognostic Markers for Breast Cancer. Sci. Rep. 2016, 6, 32843. [CrossRef]
40. Zheng, G.; Qin, Y.; Clark, W.C.; Dai, Q.; Yi, C.; He, C.; Lambowitz, A.M.; Pan, T. Efficient and Quantitative High-ThroughputTRNA Sequencing. Nat. Methods 2015, 12, 835–837. [CrossRef]
41. Cozen, A.E.; Quartley, E.; Holmes, A.D.; Hrabeta-Robinson, E.; Phizicky, E.M.; Lowe, T.M. ARM-Seq: AlkB-Facilitated RNAMethylation Sequencing Reveals a Complex Landscape of Modified TRNA Fragments. Nat. Methods 2015, 12, 879–884. [CrossRef]
42. Gogakos, T.; Brown, M.; Garzia, A.; Meyer, C.; Hafner, M.; Tuschl, T. Characterizing Expression and Processing of Precursor andMature Human TRNAs by Hydro-TRNAseq and PAR-CLIP. Cell Rep. 2017, 20, 1463–1475. [CrossRef]
43. Shigematsu, M.; Honda, S.; Loher, P.; Telonis, A.G.; Rigoutsos, I.; Kirino, Y. YAMAT-Seq: An Efficient Method for High-ThroughputSequencing of Mature Transfer RNAs. Nucleic Acids Res. 2017, 45, e70. [CrossRef]
44. Behrens, A.; Rodschinka, G.; Nedialkova, D.D. High-Resolution Quantitative Profiling of TRNA Abundance and ModificationStatus in Eukaryotes by Mim-TRNAseq. Mol. Cell 2021, 81, 1802–1815. [CrossRef]
45. Hu, J.F.; Yim, D.; Ma, D.; Huber, S.M.; Davis, N.; Bacusmo, J.M.; Vermeulen, S.; Zhou, J.; Begley, T.J.; DeMott, M.S.; et al.Quantitative Mapping of the Cellular Small RNA Landscape with AQRNA-Seq. Nat. Biotechnol. 2021, 39, 978–988. [CrossRef]
46. Clarke, C.J.; Berg, T.J.; Birch, J.; Ennis, D.; Mitchell, L.; Cloix, C.; Campbell, A.; Sumpton, D.; Nixon, C.; Campbell, K.; et al.The Initiator Methionine TRNA Drives Secretion of Type II Collagen from Stromal Fibroblasts to Promote Tumor Growth andAngiogenesis. Curr. Biol. 2016, 26, 755–765. [CrossRef]
47. Huh, D.; Passarelli, M.C.; Gao, J.; Dusmatova, S.N.; Goin, C.; Fish, L.; Pinzaru, A.M.; Molina, H.; Ren, Z.; McMillan, E.A.; et al. AStress-Induced Tyrosine-TRNA Depletion Response Mediates Codon-Based Translational Repression and Growth Suppression.EMBO J. 2021, 40, e106696. [CrossRef]
48. Guzzi, N.; Bellodi, C. Stressin’ and Slicin’: Stress-Induced TRNA Fragmentation Codon-Adapts Translation to Repress CellGrowth. EMBO J. 2021, 40, e107097. [CrossRef]
49. Kramer, E.B.; Farabaugh, P.J. The Frequency of Translational Misreading Errors in E. coli Is Largely Determined by TRNACompetition. RNA 2007, 13, 87–96. [CrossRef]
50. Shah, P.; Gilchrist, M.A. Effect of Correlated TRNA Abundances on Translation Errors and Evolution of Codon Usage Bias. PLoSGenet. 2010, 6, e1001128. [CrossRef]
51. Kirchner, S.; Ignatova, Z. Emerging Roles of TRNA in Adaptive Translation, Signalling Dynamics and Disease. Nat. Rev. Genet.2015, 16, 98–112. [CrossRef]
Copyright © 2022 FDOKUMEN