Search procedure for improving Modified Ambiguity Function Approach
The Ambiguity of Test Preparation:A Multimethod Analysis in One State
WILLIAM A. FIRESTONE, LORA MONFILS,GREGORY CAMILLI, ROBERTA Y. SCHORR,AND JENNIFER E. HICKSRutgers University
DAVID MAYROWETZUniversity of Illinois, Chicago
We studied test preparation activity among fourth-grade math and science teachers inNew Jersey, using a survey of almost 300 teachers and observations of and inter-views with almost 60. New Jersey uses a mix of open-ended and multiple-choice tests;links few stakes to test results, except for publication of scores; and offers limitedprofessional development to teachers. New Jersey teachers are adopting specific tech-niques associated with more inquiry-oriented instruction, but their basic approachdoes not appear to be changing. Teachers do teach the content on the test with a newwrinkle. When more students are passing a test in one subject area than in another,emphasis shifts to the area with low scores. We found more direct instruction in lowersocioeconomic districts but not less inquiry-oriented instruction. Finally, principalsupport has more influence on the test preparation strategies teachers use than doespressure to comply.
Since at least the 1960s, state testing has been a major policy tool forattempting to influence educational practice ~Resnick & Resnick, 1992!.Since then, 48 out of 50 states have begun some kind of testing ~EditorialProjects in Education, 2001!. As might be expected of a policy this perva-sive, opinions about its usefulness vary. Advocates fall into two broad camps.
The group favoring using testing for influencing practice itself has twocamps. One believes that the improvement of American education dependson holding teachers and children more accountable and that to hold themaccountable, testing is necessary. In this view, the form of assessment is lesscritical than its use for distributing stronger rewards and punishments—higher stakes—to ensure greater effort ~National Alliance of Business, 2000!.
The second camp holds that the form of assessment is critical, arguingthat teachers inevitably teach to the test but that doing so can be a good
Teachers College Record Volume 104, Number 7, October 2002, pp. 1485–1523Copyright © by Teachers College, Columbia University0161-4681

thing if they teach to good tests. This group also argues for the greater useof portfolios, performance assessments, and other forms of authentic tasks~Baron & Wolf, 1996; Resnick & Resnick, 1992!. It hopes that such assess-ments will provide models for student work in which students not onlylearn facts and procedures but also learn how to construct knowledge forthemselves, understand connections among concepts, and see intellectualdisciplines as fields of inquiry with standards of discourse and proof ~New-mann & Associates, 1996!. Moreover, it is believed that such assessments willsteer teachers and students to content areas that are important for modernsociety but have received inadequate attention in the past ~National Coun-cil of Teachers of Mathematics, 2000!. Finally, it is hoped that testing willenhance equity by holding all children accountable to the same high stan-dards ~O’Day & Smith, 1993!.
Opponents of testing are legion. Often they have documented the effectsof high-stakes testing showing that rather than promoting more intellectu-ally challenging instruction and more complex student thinking, it reinforcesthe American tendency to focus on teaching facts and procedures withoutmeaning or understanding. They argue that the tests narrow the curricu-lum, which is often the most conventional or measurable aspect of thesubject tested. Teaching tasks become simplified, often mimicking items onthe test and leaving little room for intellectual challenge. Such results aremost common with conventional multiple-choice tests, but they also havehappened with other kinds of tests. Moreover, rather than contributing toeducational equity, the negative consequences of testing are strongest inunderfunded schools serving the poor and minorities ~Kannapel, Coe,Aagaard, Moore, & Reeves, 2000; McNeil, 2000; Smith, 1996!.
A moderate stakes perspective falls somewhere between the advocatesand opponents of testing. In this view, the effects of testing—like otherpolicies—depend in large part on how it is implemented locally ~McLaughlin,1990!. The power of state-formulated rewards and punishments will dependon how they are interpreted by teachers and school and district adminis-trators. Some point out that the kind of intellectually challenging educa-tion that advocates of performance-based assessments want requires teachersto understand better the content taught, appropriate representations ofthat content, and methods for having students making sense of the content~Borko & Putnam, 1995!. Thus, even with tests that reinforce more chal-lenging instruction, changes in practice will depend on teachers’ opportu-nities to learn about them and try them out ~Cohen & Hill, 1998; Saxe,Franke, Gearhart, Howard, & Michele, 1997; Supovitz, Mayer, & Kahle,2000!.
Considerable ambiguity remains about how state testing will influenceinstructional practice. Effects may depend on the nature of the test, otherpolicies accompanying the test, teachers’ knowledge, and administrative
1486 Teachers College Record

support. The purpose of this article is to shed some light on this issuethrough an exploration of teachers’ responses to testing in one state, NewJersey, at one grade level, fourth grade. In some ways, New Jersey providesa useful case study. The math and science tests examined are more thanmultiple-choice tests without being full f ledged performance assessments, acombination that is becoming more common ~Editorial Projects in Educa-tion, 2001!. The stakes involved are low to moderate. In this context, ourexploration will address four questions:
1. How does test preparation affect instruction?
2. How does test preparation affect content coverage?
3. To what extent does test preparation contribute to educationalinequities?
4. What factors affect the nature of test preparation in the state?
We begin by giving a brief history of educational policy and testing in NewJersey. Then we describe our research methods before addressing thesefour questions.
THE NEW JERSEY POLICY CONTEXT
A recent report on state education rates New Jersey among the top 10 foradequacy of resources for education, with the highest expenditures perpupil in the country. However, it is in the bottom 10 in equity of resourcedistribution, in spite of recent court decisions that are supposed to equalizeexpenditures between the state’s wealthiest and poorest districts ~EditorialProjects in Education, 2001!. The percentage of children ages 5–17 living inpoverty in New Jersey is estimated at 14%, whereas it is about 19% nation-wide ~National Center for Education Statistics, 1998!. Approximately 38%of the elementary and secondary students in New Jersey are members ofminority populations, and these students comprise 78% of all studentsenrolled in urban schools ~National Center for Education Statistics, 2000!.
New Jersey adopted its core curriculum content standards in 1996. Twoof the mathematics standards stated that students would “develop the abil-ity to pose and solve mathematical problems in mathematics, other disci-plines, and everyday experience” and “communicate mathematically throughwritten, oral, symbolic, and visual forms of expression” ~New Jersey StateDepartment of Education, 1996, p. 4–9!. These and other standards sup-ported a concept of achievement in both mathematics and science thatincorporates understanding of subject content in line with the most chal-lenging national standards for mathematics and science ~National Councilof Teachers of Mathematics, 2000; National Research Council, 1996!. Within
Ambiguity of Test Preparation 1487

2 years, the state began adopting tests in the 4th, 8th, and 11th grades thatwere aligned with these standards. The fourth-grade Elementary SchoolPerformance Assessment ~ESPA! was piloted in mathematics and languagearts testing in 1997 and in science in 1998. The mathematics, science, andlanguage arts tests were implemented statewide in the spring of 1999.Students spend about half their time answering multiple-choice items andthe other half answering open-ended items. The test specifications placeditems on a grid, with one dimension labeled “knowledge and skills” ~con-ceptual understanding, procedural knowledge, and problem-solving! andthe other labeled “content” ~number sense, operations, and properties;measurement, spatial sense, and geometry; data analysis, probability, anddiscrete mathematics; and patterns and algebra! Each item is also classifiedaccording to the underlying power base skills it assesses ~logical reasoning,connecting mathematical ideas to one another and to other disciplines,communicating mathematical understanding, problem solving, using toolsand technology, and estimating effectively!.
At the same time, New Jersey had a weak accountability system, at leastwith regard to the fourth-grade test. Though test scores were releasedannually and published in the newspapers, they had no bearing on studentpromotion,1 and there was little, if any, relationship to teachers’ or admin-istrators’ remuneration. Although the state did have a law allowing fordistrict takeover and had already taken over three districts, criticism of thatprogram suggested that the state would be unlikely to take over any moredistricts. Moreover, there was no provision for taking over individual schools.Schools that did not have the requisite number of students achieving pro-ficiency on the state test would, however, be subject to more intensivemonitoring and additional paper work.
New Jersey has a rather underdeveloped system for addressing otherelements that might constitute a systemic strategy for shaping instruction.For instance, unlike California and Texas, the state has no centralizedtextbook or materials approval system. Nor does it have an elaborate systemfor offering professional development to support the new standards andassessments. The state has recently adopted a requirement that teachersreceive 100 hours of professional development every 5 years, but the rangeof activities that count as professional development appears to be broad,and the 100 hours is roughly consistent with current practice. It remains tobe seen whether teachers will take more professional development relatedto standards or instruction in assessed areas. Nor does the state have thekind of professional development networks that several other states havehad at various times ~Pennell & Firestone, 1997!. Thus, in many ways, NewJersey appears to be a middle-of-the-road state that does not go to extremeswith regard to its accountability system or its assessment design ~comparedwith other states rated in Editorial Projects in Education, 2001!.
1488 Teachers College Record

METHODS
Our study combines a statewide survey with a more intensive observationand interview study of a smaller sample of teachers. In this section, wedescribe separately the samples for quantitative and qualitative analyses andtheir corresponding variables. After describing the sample, we discuss thequantitative and qualitative methodology. In the next section we give results.
SURVEY
Sample
Our data come from the first two phases of a 3-year research study. In thespring of 1999, we began a statewide study to examine teachers’ responsesto New Jersey’s fourth-grade testing program, the Elementary School Per-formance Assessment ~ESPA!, in the areas of mathematics and science. Datawere collected from a statewide sample of fourth-grade teachers who wereasked to respond to a complex set of instruments that elicited informationabout curriculum, instructional practices, and school context. After con-tacting approximately 600 teachers, data were collected in the form oftelephone surveys from 245 teachers, written surveys from 177 teachers,and portfolios of instructional materials from 110 teachers. During the 2ndyear of the study, all items were combined into a telephone survey toimprove response rates, but instructional materials were not collected. Inthe spring of 2000, a total of 287 teachers, including 160 from the 1st year,responded to the telephone survey. Of the 358 teachers contacted, 71declined to participate. Samples in both phases were highly representativewith regard to geographic and district wealth and demographics.
Measures: Dependent Variables
To explore teaching to the test more thoroughly in the survey, we borrowedand revised a “teaching to the test” scale that had been developed for astudy of Maryland’s state testing program ~Koretz, Mitchell, Barron, & Keith,1996!, which uses test items that are even more performance oriented thanthose used in New Jersey. Hence, the scale items referred to a number ofactivities that would not be included in the more critical definitions ofteaching to the test suggested by Smith ~1991! and McNeil ~2000!. Therevised scale contained items assessing how often teachers did the followingthings:
Ambiguity of Test Preparation 1489

1. Motivate students to make their best effort on the ESPA, such assuggesting they prepare by getting a good night’s sleep or encourag-ing them to try hard.
2. Teach test-taking mechanics, such as filling in bubbles, writingyour name on the test, or pacing yourself during the test.
3. Teach test-besting skills, such as methods for turning story prob-lems into arithmetic calculations or how much to write after an open-ended math item.
4. Use commercial test preparation materials, such as “Scoring High”and “Measuring Up on the ESPA.”
5. Give practice tests with items similar to those on the ESPA.
6. Teach the regular curriculum using performance-based exercisessimilar to ESPA.
7. Have students use rubrics to grade each other’s work.
These items represent a range of test preparation activities that areroughly ordered from content-free activities directly linked to the test ~e.g.,motivating students to do their best! to those that are embedded in thecurriculum. For example, having students use rubrics to grade each other’swork is an instructional activity that promotes learning through peer reviewand self-assessment of the quality of work and thus provides opportunitiesto judge the reasonableness of solution paths in comparison to other pos-sible strategies ~National Council of Teachers of Mathematics, 1995!. More-over, this activity has the potential to promote student discourse aboutimportant mathematical ideas because students explain their reasoning anddefend their solution strategies. We asked teachers how often they did thesevarious activities throughout the year and during the month just before thetest was given.
To explore whether teaching to the test was associated with direct orinquiry-oriented instruction, we examined the correlations between scaleswe developed to measure each of these two latter constructs and the teach-ing to the test scale. Inquiry-oriented instruction is similar to constructivistor authentic instruction and appears to be similar to the kind of instructionencouraged by the National Council of Teachers of Mathematics ~NCTM!standards. In this approach students have considerable opportunity to exploreideas in subject areas ~Cohen & Hill, 1998; Newmann & Associates, 1996!.Direct instruction is closer to conventional teaching. Teachers are active,and students tend to practice more than explore ~Brophy & Good, 1986;
1490 Teachers College Record

Cuban, 1993!. Measures of direct and inquiry-oriented teaching were devel-oped as part of a larger 3-year study ~Monfils, Camilli, Firestone, & May-rowetz, 2000!.
The direct instruction scales have 11 items, and the 2000 sample had areliability of .63 for math and .64 for science. These items asked teachershow often they did things such as “emphasize the importance of followingprocedures in solving math problems” and “begin each unit by describingscientific terms.” The inquiry-oriented instruction scales had 19 items andreliabilities of .80 for math and .77 for science. Teachers were asked howoften they did things such as “have students show or explain a concept inmore than one way” and “allow students to design their own scienceexperiment.”
Measures: Independent Variables
We conceptualized six categories of influence on teaching to the test:student context, organizational context, professional development, accessto materials, teacher background, and teacher beliefs.
Student context is the variable District Factor Group ~DFG!, a compositemeasure of district wealth that includes indicators such as family income,occupation, the amount of poverty, and several measures of education. NewJersey has eight district factor groups that range from poorest ~A! to wealth-iest ~ J!. We collapsed these ratings into four wealth categories to obtainreasonable frequencies in each category.
Organizational context is operationalized in this analysis by two scales,principal support and ESPA pressure. Principal support contributes to avariety of kinds of change in practice ~Louis, Toole, & Hargreaves, 1999!.Principals support change less by coaching teachers on specific instruc-tional approaches than by creating a context that encourages experimen-tation and change. They do the latter by setting goals and building a visionof improved practice and encouraging teacher commitment to that vision~Hallinger & Heck, 1996; Leithwood, Jantzi, & Steinbach, 1999!. We used afive-item scale of principal support asking teachers how much they agreedwith statements such as “My principal is making changes to implement themathematics and science standards successfully” and “My principal believesthat ESPA measures important aspects of student learning” ~alpha 5 .56!.
In addition to examining support for changing practice, we exploredteachers’ feelings of pressure to conform to the demands of the stateassessment policy. The ESPA pressure scale consists of five items, including“Too much time is diverted from instruction to raising scores on ESPA” and“March and April are pretty tough in this school because of the time andattention focused on getting ready for ESPA.” This scale recognizes thatpressure surrounding the state testing program may originate from many
Ambiguity of Test Preparation 1491

sources, such as the central office, the superintendent, or the board ofeducation. Only one item—“My principal indicates that doing well on ESPAis a top priority”—indicates a source of pressure. ~See Appendix A for itemscomprising each scale.!
Professional development is a form of support that helps teachers con-struct the knowledge to assess and apply new practices. There is a growingbody of practice-based knowledge on effective professional developmentstrategies ~Loucks-Horsley, Hewson, Love, & Stiles, 1998!, and a small num-ber of studies show that well-designed programs can have a lasting effect oninstructional practice ~Cohen & Hill, 1998; Supovitz et al., 2000!. Suchsupport is likely to be especially important if teachers are to move pastadopting specific instructional practices and change their basic approachto teaching math and science ~Schorr & Lesh, 2001!. Nevertheless, profes-sional development rarely reaches its potential for promoting change, inpart because the duration of most professional development activities is tooshort and not designed to help teachers put new knowledge into practice~Firestone, Camilli, Yurecko, Monfils, & Mayrowetz, 2000!.
We used three measures of professional development. The first was acomposite measure of whether or not teachers had participated in person-ally initiated professional development in external programs, such as takinga college course or attending the National Science Foundation’s State Sys-temic Initiatives ~SSI! workshops, and in school-level activities, such as men-toring another teacher or serving on a curriculum committee. In addition,we asked how much time teachers spent in district-provided professionaldevelopment. Although we asked about several kinds of professional devel-opment at the district level, the most important kind for this purpose wasprofessional development on strategies to help students score high on theESPA math and science tests.
Materials is also a form of support that can be especially important forpreparing children for open-ended and performance-oriented items on astate test. Familiarity with such items may help children score better. More-over, insofar as there is any intent to promote inquiry-oriented instruction,some materials may facilitate such inquiry. We asked teachers how muchaccess they had to calculators and “science kits—i.e., sets of materials foruse in several lessons.”
We explored two teacher characteristics. The first was knowledge ofnational and state standards in both math and science. Teachers could ratethemselves on a scale ranging from awareness only to expert (could lead aworkshop). We also asked teachers about their sense of personal efficacy.Personal efficacy is one of two dimensions of teacher efficacy that has beenlinked to a variety of phenomena, including student achievement and easeof implementing innovations ~Tschannen-Moran, Woolfolk Hoy, & Hoy,1998!. Teachers were asked how strongly they agreed with one statement
1492 Teachers College Record

that has been frequently used in past research: “When I really try, I can getthrough to the most difficult or unmotivated students.” All independentvariables are defined and described in Tables 1 and 2.2
QUALITATIVE METHODS
Mathematics education research has many studies of a single teacher or asmall group ~c.f. Lehrer, Jacobson, Kemeny, & Strom, 1999; Simon & Tzur,1999!. Although this approach helps understand the effects of state policieson how particular teachers think about their work ~Borko, Elliot, & Uchiy-ana, 1999; Firestone, Mayrowetz, & Fairman, 1998!, it does not provideenough information for assessing the effects of a policy statewide. A largersample could be beneficial in this regard if supplemented with interpretivematerial from small n studies. The current study complements the surveydescribed above with direct observation and interviews of more than 60teachers. Our intention is to supplement findings from the survey with amore intensive analysis of a few teachers.
Sample
The observation study focuses on 63 teachers drawn from two samples. Thefirst sample was drawn from our 1999 sample and had responded to the twoscales assessing direct and inquiry-oriented instructional practices ~Monfils,Camilli, Firestone, & Mayrowetz, 2000!. We then looked for teachers whoscored at extremes on both scales, reflecting four typologies of teachingpractice: high inquiry-oriented and high direct instruction, high inquiry-oriented and low direct instruction, low inquiry-oriented and high directinstruction, and low inquiry-oriented and low direct instruction. Ultimately,22 teachers agreed to participate. Three teachers were selected for scoringhigh on both inquiry-oriented and direct instruction, 6 for scoring high oninquiry-oriented instruction but low on direct instruction, 7 for scoring lowon inquiry-oriented instruction but high on direct instruction, and 6 forbeing low on both. Using the same selection criteria, we also includedobservation and interview data from 10 teachers who participated in anobservational study in the spring of 1999 to help validate the survey scales.Thus, the combined distribution of teaching typologies among the selectedteachers was 5 high inquiry–high direct, 12 high inquiry–low direct, 8 lowinquiry–high direct, and 7 low inquiry–low direct.
The second sample came from a study of professional development pro-vided by districts working with New Jersey’s SSI. Seven districts were selectedas actively working with SSI regional centers that focused on elementarymath. The districts varied in adequacy of funding and in geographic regionof the state ~regional centers, in this case, refer to colleges or universities
Ambiguity of Test Preparation 1493

that provide teacher education in mathematics!. Within each district, mathcoordinators chose teachers who participated actively in the professionaldevelopment program. Thirty-two teachers were selected from these dis-tricts, of whom 31 were observed during their mathematics lessons.
Table 1. Definitions and description of variables used inthe math test prep regression models
Variable Description or Item Mean SD
Test prep month Test preparation the month before ESPA scale score 2.82 0.52Test prep year Test preparation throughout the year scale score 2.45 0.50Rubrics month Have students use rubrics to grade each other’s work the
month before ESPA ~1 5 almost never, 4 5 almost always!2.31 0.98
Rubrics year Have students use rubrics to grade each other’s workthroughout the year ~1 5 almost never, 4 5 almost always!
2.16 0.88
Performanceitems month
Teach the regular curriculum using performance-basedexercises similar to ESPA the month before ESPA~1 5 almost never, 4 5 almost always!
3.04 0.77
Performanceitems year
Teach the regular curriculum using performance-basedexercises similar to ESPA throughout the year~1 5 almost never, 4 5 almost always!
2.81 0.75
Practice sessionsmonth
Have practice sessions with ESPA-like items the monthbefore ESPA ~1 5 almost never, 4 5 almost always!
3.01 0.84
Practice sessionsyear
Have practice sessions with ESPA-like items throughoutthe year ~1 5 almost never, 4 5 almost always!
2.50 0.80
Mechanicsmonth
Teach test taking mechanics like filling in bubbles, howto put your name on the test, or how to pace yourselfduring the test the month before ESPA ~1 5 almost never,4 5 almost always!
2.32 0.92
Mechanics year Teach test taking mechanics like filling in bubbles, howto put your name on the test, or how to pace yourselfduring the test throughout the year ~1 5 almost never,4 5 almost always!
1.97 0.92
DFG District factor group category 1 5 lowest ~A, B!,4 5 highest ~I, J!
— —
PRNSUP Principal support scale score 3.11 0.53PRESSR ESPA pressure scale score 3.18 0.50PROFDEV Sum of 14 dichotomous teacher initiated professional
development items for previous year ~mentoring,curriculum writing, college course, SSI participation!
2.20 1.43
ESPAPD Professional development on helping students score highon ESPA math ~0 5 none, 3 5 more than 2 days or161 hours!
1.56 1.16
CALCS Access to calculators ~0 5 none, 3 5 enough for every child ! 2.94 0.27NCTM Knowledge of national mathematics standards ~e.g.,
NCTM! ~1 5 awareness only, 5 5 expert, could leada workshop!
2.93 1.07
NJSTAND Knowledge of New Jeresy Core Curriculum ContentStandards in mathematics ~1 5 awareness only,5 5 expert, could lead a workshop!
3.34 0.91
PEREFF Personal efficacy: When I really try I can get through tothe most difficult or unmotivated students.~1 5 strongly disagree, 5 5 strongly agree!
3.20 0.74
1494 Teachers College Record

Observations and Interviews
Fifty-eight teachers were observed for two math lessons, and 5 teacherswere observed once. The classroom researcher kept a running record of
Table 2. Definitions and description of variables used inthe science test prep regression models
Variable Description or Item Mean SD
Test prep month Test preparation the month before ESPA scale score 2.83 0.52Test prep year Test preparation throughout the year scale score 2.48 0.51Rubrics month Have students use rubrics to grade each other’s work the
month before ESPA ~1 5 almost never, 4 5 almost always!2.31 0.97
Rubrics year Have students use rubrics to grade each other’s workthroughout the year ~1 5 almost never, 4 5 almost always!
2.17 0.85
Performanceitems month
Teach the regular curriculum using performance-basedexercises similar to ESPA the month before ESPA~1 5 almost never, 4 5 almost always!
3.05 0.77
Performanceitems year
Teach the regular curriculum using performance-basedexercises similar to ESPA throughout the year~1 5 almost never, 4 5 almost always!
2.85 0.76
Practice sessionsmonth
Have practice sessions with ESPA-like items the monthbefore ESPA ~1 5 almost never, 4 5 almost always!
3.03 0.85
Practice sessionsyear
Have practice sessions with ESPA-like items throughoutthe year ~1 5 almost never, 4 5 almost always!
2.52 0.83
Mechanicsmonth
Teach test taking mechanics like filling in bubbles, howto put your name on the test, or how to pace yourselfduring the test the month before ESPA ~1 5 almost never,4 5 almost always!
2.35 0.94
Mechanics year Teach test taking mechanics like filling in bubbles, howto put your name on the test, or how to pace yourselfduring the test throughout the year ~1 5 almost never,4 5 almost always!
2.00 0.95
DFG District factor group category 1 5 lowest ~A, B!,4 5 highest ~I, J!
—- —
PRNSUP Principal support scale score 3.13 0.51PRESSR ESPA pressure scale score 3.22 0.48PROFDEV Sum of 14 dichotomous teacher initiated professional
development items for previous year ~mentoring,curriculum writing, college course, SSI participation!
2.28 1.46
ESPAPD Professional development on helping students score highon ESPA science ~0 5 none, 3 5 more than 2 days or161 hours!
1.19 1.13
KITS Access to science kits ~0 5 none, 3 5 enough for every child ! 1.80 0.76NRC Knowledge of national mathematics standards ~e.g.,
NCTM! ~1 5 awareness only, 5 5 expert, could leada workshop!
2.62 1.06
NJSTAND Knowledge of New Jeresy Core Curriculum ContentStandards in science ~1 5 awareness only, 5 5 expert,could lead a workshop!
3.24 0.92
PEREFF Personal efficacy: When I really try I can get through tothe most difficult or unmotivated students.~1 5 strongly disagree, 5 5 strongly agree!
3.21 0.76
Ambiguity of Test Preparation 1495
the events in the classroom, with attention to the activities of both theteacher and the students. The field notes recorded all the problem activi-ties and explorations, the materials used, the questions posed, the responsesgiven—whether by students or teachers—the overall atmosphere of theclassroom environment, and any other aspects of the class discernible throughobservation.
At the conclusion of each lesson, the teachers were asked to respond toa series of open-ended questions about the observed lesson. These included,among others, questions on the goal of the lesson and the pedagogy employedand their reaction to the lesson as implemented. Teachers were also askedhow state testing affected their teaching. In particular, teachers were asked:
What kinds of things do you generally do to help your students get ready forthe Elementary School Performance Assessment (ESPA)?
Considering either the ESPA or the Content Standards, how, if at all, hasthat affected the topics you teach?
How have you changed the teaching strategies you use in response to theESPA and0or the Content Standards?
Coding and Analysis of Observations
While observations were underway, researchers conducted detailed analysesof records of classroom observations, seeking to pinpoint important themesor issues that could be explored through the classroom observation data. Asthe observations drew to a close, we adapted several preexisting schemes tobe used for coding the classroom data. These were based on the works ofStein, Smith, Henningsen, and Silver ~2000!; Stigler and Hiebert ~1997,1999!; Davis, Wagner, and Shafer ~1997!; and Hiebert and Wearne ~1993!. Apreliminary coding scheme was tried on approximately six observationsbefore being agreed upon. A sheet of code definitions was created, and atraining session was held for the six coders involved in the activity ~seeAppendix A!.
Two individuals independently coded each observation—at least onecoder was an experienced mathematics education researcher. Where dif-ferences occurred, raters sought to reconcile their differences and weresuccessful in all but 2 of the 108 cases. In those 2 cases, another mathemat-ics education researcher discussed differences with the raters and helpedthem to reach agreement. After interrater reliability was assessed on theinitial coding, 18 codes were found to have agreement levels of 70% orhigher and were retained for further analysis. ~Code definitions and inter-rater reliabilities are given in Appendix B.!
1496 Teachers College Record
Interview data were transcribed and entered in NUD*IST, a qualitativedata analysis software package. Interviews were sorted by question. Responseswere analyzed in clusters because there was considerable overlap in responsesgiven to individual questions. Within each cluster, responses to specificquestions on test preparation practices were reviewed and coded accordingto emergent themes. Responses were counted within each code. Interviewsfrom 58 of the 63 teachers were available for analysis.
Open-Ended Survey Responses
The large-scale surveys included two open-ended questions concerning theinfluence of ESPA on implemented curriculum. Teachers were asked whatcontent areas or skills they emphasized more in response to ESPA and whatcontent areas or skills they emphasized less. Two experienced mathematicsteachers, one a member of the research team, reviewed responses anddeveloped codes based on emergent themes. The codes were then com-pared with the state test specifications and core curriculum content stan-dards in mathematics, and they were then further refined. Using the finalcoding scheme, one teacher coded all the responses and recorded countswithin each code for each sample year. The second mathematics teachercoded a random sample of 30 teacher responses. The rate of agreementacross codes was approximately 90%.
RESULTS
To contextualize our findings regarding our four research questions, webegin this section by reviewing teachers’ comments on the quality of theESPA drawn from teacher interviews. Next, we give findings regarding ourfour research questions. Rather than presenting quantitative and qualitativeresults separately, we draw on the two sources of information as necessary.
TEACHERS’ PERCEPTIONS OF THE QUALITY OF ESPA
In keeping with our theme of ambiguity, the 51 teachers who commentedon the quality of the ESPA gave the test mixed reviews, with 38 makingpositive comments and 46 making negative ones, so a large number madesome of both. The general question allowed teachers to comment on anyelement of the ESPA, including the math, science, and language arts sec-tions. The positive comments focused on two main themes. The first tappedthe general idea that the quality of ESPA was better than that of other testsin that it was more valid or assessed more important aspects of achievementthan other assessments. Often teachers’ statements were very general. Some
Ambiguity of Test Preparation 1497

were clearly positive, such as with the teacher who said, “I can understandwhy @ESPA# matches, you know, the demands that are placed on these kidsfor the future. I can understand the need to enhance communication andproblem solving.” Other positive comments were more guarded, as illus-trated by one teacher, who said, “I think that the intent of the ESPAs arewell-meant . . . I think that the idea to test in a way that children learn isgood, but I don’t think that today’s ESPAs do that.“
The second theme focused on ESPA’s quality. Twenty-three teachersmade generally positive comments about the test. Some made specificobservations. For instance, 14 teachers thought that requiring students toexplain their thinking was a good idea, making statements such as, “it’s, youknow, a good idea to get kids to be able to think about their math . . . , tobe able to write something down. Their reasoning behind it.” Seven appre-ciated that ESPA required students to apply what they learn because the testis “more focused on getting students to apply their knowledge instead ofjust to regurgitate information.” Although teachers were generally criticalof the language arts section—the one on which children’s scores wereconsistently lowest—they were more supportive of the other two sections,with 12 making positive comments about the science section and 13 makingsimilar comments about the math section. For example, teachers said, “@ESPA#really got at what you want kids to do in science and figure things out andsee how the world works” or “if there’s any section that I think is reasonablein the ESPA, I think it’s the math because they do put some computation inthere, @but# they @also# put some higher-level thinking which we’ve alwaystried to infiltrate in mathematics.”
Some teachers also liked the changes they had to make to accommodateto ESPA. Nine made general comments to the effect that “@ESPA is# forcingteachers who may have gotten caught in a rut to evaluate their teachingstyle because they just won’t be able to do it if they don’t teach to standards.They just can’t get kids up to par.” A few made more specific commentsthat the presence of ESPA was encouraging them to use alternative teach-ing methodologies, such as manipulatives in mathematics ~mentioned by 3!,or have children respond to more open-ended questions ~mentioned by 2!.
Although many teachers believed that ESPA was encouraging construc-tive changes, they also pointed to difficulties. The most commonly men-tioned difficulty was simply that the test was too long ~mentioned by 24!.Almost as many teachers ~20! felt that the test was too difficult. As oneexplained, “its asking a fourth grader to do something that a sixth gradershould be doing. And it’s a very good test for a @gifted# student.” Thisteacher thought the math itself was too much for 9-year-olds. A relatedconcern was that the math portion of the test was difficult for students withlimited literacy skills. In both cases, it is difficult to know whether the testreally was too hard or was successfully raising expectations.
1498 Teachers College Record

Although many positive comments focused on the open-ended items,these items raised concerns that scoring might be too subjective ~men-tioned by 13 teachers!. One teacher described his experience at a workshopwhere he had to score responses like those on ESPA:
There were many times I’d disagree. Say that kid got a zero. I’d say,well, you know, in my reading and looking at what he did, it’s prettyclear to me that he understands what he’s doing. And maybe he hasn’tfully explained it. . . . So maybe I was easy on the kid, the kids, I don’tknow. But I just . . . to me it leaves something open, wide open to yourinterpretation or my interpretation.
In addition to concerns about subjectivity, 14 teachers felt under morepressure because of ESPA. Some described a general sense that too muchwas expected of them: 3 mentioned that pressure came from parents, and6 said that it came from administrators. Eleven teachers were more con-cerned about the pressure put on students “I had kids in tears the first yearand . . . it was very frustrating” or “the publicity level of ESPA is a problem.And I think that by the time our children sit down to take it, they’re a mess.They’re a basket case.”
Taken together, these comments suggest that ESPA is encouraging teach-ers to introduce new content and to rethink their teaching methods in theway some reformers suggest. However, it is also putting teachers and per-haps students under more pressure than they have felt in the past, and ittakes up a certain amount of time that could be used for instruction. Wenow turn to our four research questions and explore these findings withgreater specificity.
Question 1: How Is the Test Affecting Instructional Practice?
Our evidence suggests that teaching to the test is encouraging teachers toconsider more inquiry-oriented instructional practice. However, changesare modest: Teachers are trying out specific techniques rather than chang-ing their basic paradigms for instruction. During interviews teachers describedboth general changes and test preparation activities as more narrowly con-ceived, although the two often overlapped. The general direction of thesechanges is to try to make teaching more conceptual and to engage childrenin a wider range of activities. As one teacher explained, “It’s become myphilosophy to teach them the concepts before, just, you know, rammingthese rote facts down their throats.” For instance, a teacher said, “We nolonger hand out a math page and tell the kids to do 20 problems.” How-ever, based on classroom observations, conventional instructional approachesstill predominated.
Ambiguity of Test Preparation 1499

During the interviews, teachers mentioned four general changes: havingstudents explain their thought processes, using manipulatives, problem solv-ing, and working on students’ writing. Twenty-five of the 58 teachers inter-viewed ~43%! talked about trying to get students to explain their thinkingin more detail. According to one teacher, the part “that I guess I reallydidn’t do a lot of before is really get the students to start to learn how toexplain their thinking. To explain what they were doing. Sometimes theydo it in writing, sometimes they do it to a partner. Sometimes they do it tome.” One strategy to encourage explaining, mentioned by 19 teachers ~33%!,was to use more open-ended questions on tests and in class. Of course, thischange also reflects the most obvious change brought about by ESPA. Eightteachers ~14%! talked about using more “how” and “why” questions in theirwhole-group teaching. One described this change as working on “criticalthinking skills” instead of “feeding them the answer” ~one might argue thatthis constitutes a rather narrow view of critical thinking!. Eight also talkedabout using small-group instruction so students would explain their work toeach other.
A second theme was using manipulatives, mentioned by 26 teachers~45%!. Manipulatives are believed useful in part because as concreterepresentations—they help children understand ideas that are more diffi-cult if one uses only conventional mathematical notation. Teachers said:
@Gifted# kids can learn without the hands-on, . . . without seeing. Andthen I have the other kids, the majority of my room . . . who need tosee the manipulatives. Who need to see the little squares, and whenI’m dividing, they need to see in front of them 16 divided into 4groups, there’s 4 in each group—with no remainder, there’s nothingleft over.
. . . some things that I would never have thought to be concrete canbe made concrete if you think about them in a little different way. Imean even, really even division. . . . Based upon the way I learned it,I would never think to do division by actually breaking up and shar-ing. We used the circles, but I mean it could have been done with abig pile of M & Ms.
This rationale fits with a more cognitive perspective that children under-stand things better when they can make connections between more thanone representation of an idea or operation. Moreover, the ESPA has ques-tions that involve at least written or pictorial descriptions of manipulatives.Students who are more familiar with some of the current manipulatives canbetter respond to these questions.
A third theme was a greater emphasis on problem solving ~mentioned by22 teachers or 38%!. The meaning of “problem solving” was not always
1500 Teachers College Record
clear. It is clearly different from computation as when teachers say they tryto “balance problem-solving and computation.” Beyond that, sometimes itrefers to exploring different strategies for solving what might be consideredto be conventional math problems ~mentioned by 9 teachers!. Teachers mayactually give students a set of strategies ~i.e., draw a picture, think of asimpler problem, work backwards!. These strategies, or heuristics can beuseful to students as they attempt to solve a problem for which a solutionis not obvious ~Polya, 1957!. At other times, teachers talked about learningto decode word problems. One teacher said, “We do a lot of work withproblem-solving skills, just the basic skills of how you read a problem, howdo you find the question, how do you find the information that you need,how do you check to see whether your solution is logical and can solve it acouple of different ways.” This emphasis on word problems reflects in partthe use of open-ended problems on the ESPA. Rarely did problem solvingfocus on making sense of extremely poorly structured problems or the kindof open-ended and extended exploration of a mathematical issue describedby Lampert ~1990!.
Finally, 23 teachers ~40%! said that they emphasize “writing” to preparetheir students for the ESPA. Some of this writing may have referred to thelanguage arts section of the ESPA, rather than the math or science sections.However, one teacher who seemed to refer to writing in language arts alsosaid she had her students “write all the time for all subjects.” Some teachersused “writing” so that students could explain their line of thinking inmathematics. In fact, 12 teachers said they had students keep journals inmath as well as in other subjects. One teacher described how she linkedclass discussion and writing to help students improve their capacity toexplain and to cope with the state test:
Having them express themselves in math. . . . Just explanation, eitherverbal, @or# “OK, now write it down in your journal for me.” I do liketo have class discussion, cause some kids are still not quite sure whatto write. But they can tell me. So then I build their confidence andsay, “That’s exactly what you can write down. Do you think you can dothat for me?” I model a lot about how to do that. Just give them, youknow, off-the-cuff in the morning, explain to me how to do thisdivision problem. And they just have to verbalize it. It’s amazing howthat’s a struggle for them—the more you get them to do it, they don’t,you know, blink an eye at it. So I figure that for ESPA, when they seethat, they’re just gonna go, “OK.”
These themes are echoed in the open-ended responses in the survey.When teachers were asked what they taught more of because of ESPA, thebiggest theme was problem solving broadly conceived, mentioned by 61%
Ambiguity of Test Preparation 1501

of the teachers in 1999 and 74% in 2000. Not surprisingly, given the natureof ESPA, teachers talked primarily about helping children work with open-ended problems ~mentioned by 20% in 1999 and 38% in 2000! and wordproblems ~14% in 1999 and 12% in 2000!. There was also some emphasison critical and logical thinking ~12% in both 1999 and 2000!. The otherimportant theme was having children write more ~mentioned by 15% in1999 and 26% in 2000!. Moreover, some teachers ~13%! said they workedon having children explain their answers more, presumably in mathematics.
The most frequently mentioned narrow test preparation activity in theinterviews was using specific materials. Twenty teachers ~34%! said theyused commercially available test preparation materials, and another 17~29%! said they used sample problems. These problems might have beendownloaded from the state Web site or developed by the teachers them-selves. With respect to time, some teachers focused their preparation activ-ities on the month before the exam was given, and others gave sampleproblems at least once a week from the beginning of the year. Some teach-ers used ESPA problems as a “problem of the day” to start class, whereasothers gave timed exams to give students a feel for what taking ESPA wouldbe like. However, only a small number of teachers said that they taught orreviewed test-taking skills to prepare their students for the ESPA. Indeed,only four teachers mentioned issues such as stress management, advisingstudents about good “test-week” habits including an early bedtime andeating a good breakfast, time-saving procedures, using a process of elimi-nation when dealing with a multiple-choice question, and going over howto read directions.
Table 3 shows the correlations between the two test preparation scalesand direct and inquiry-oriented math and science teaching. In fact, teach-ing to the test is correlated with both kinds of instruction. In three of fourcases, correlations are higher with test preparation throughout the yearthan during the month before the test is given, suggesting that the former
Table 3. Test preparation and pedagogy scale correlations
TPYEAR TPMONTH IMATH DMATH ISCI DSCI
TPYEAR .71TPMONTH .677 .71I MATH .479 .369 .80DMATH .221 .279 .199 .66ISCI .386 .284 .677 .046 .77SCI .306 .288 .270 .717 .200 .64
Note: Scale reliabilities are on the diagonal. All correlations significant at the .01level except that for ISCI with DMATH.
1502 Teachers College Record

represents something closer to a long-term adjustment in instructionalapproach. Moreover, in three out of four comparisons, the correlationswith inquiry-oriented instruction are higher than the correlation with directinstruction. The exception concerns test preparation the month before thetest is given and science instruction. The implication here is that test prep-aration is more associated with inquiry-oriented than direct instruction.
The nature of teaching to the test is hotly debated with some peopleobserving that it involves a narrowing of the curriculum and more drill-based instructional strategies ~McNeil, 2000! and others at least hoping thatit will involve more intellectually challenging activities that help childrenunderstand concepts and the connections between them ~Resnick & Resnick,1992!.
As described earlier, the items in the teaching to the test scale reflecteda range of positions on this issue. At one extreme is an item about havingstudents use rubrics to grade each other’s work, an activity that is likely toget children to reflect on the nature of their peers’ work and, ideally, getthem to discuss their work and the thinking behind it with each other. Atthe other extreme was an item regarding teaching test-taking mechanics,which probably takes away from any form of instruction. In between is anitem that asks about integrating performance-based items into regular instruc-tion, which has the potential at least to add more inquiry-oriented instruc-tion to regular classroom work, and another that asks about having practicesessions with items similar to those on the ESPA.
Table 4 shows the correlations between these items and the inquiry-oriented and direct instruction scales for both the month before the test isgiven and the whole year. For both time frames and for both math andscience, the correlations with inquiry-oriented instruction are highest forhaving students use rubrics and descend until they are lowest with teachingtest-taking mechanics. The correlations with direct instruction are lowestfor having students use rubrics and peak with teaching test-taking mechan-ics. Moreover, the correlations with inquiry-oriented instruction are highestwhen asking about teaching throughout the year, and the correlations withdirect instruction are highest during the month before the test is given.Across the board, the correlations with inquiry-oriented instruction aresomewhat higher for science than for math. These data suggest that somekinds of teaching to the test are more congruent with inquiry-orientedinstruction, and some kinds are more congruent with direct instruction.Moreover, this relationship changes throughout the year, with direct instruc-tion becoming more predominant just before the test is given, even amongteachers who take a more inquiry-oriented approach.
Some types of test preparation appear to be more conducive to inquiry-oriented instruction, whereas others are more conducive to direct instruc-tion. To illustrate this point in another way, Figure 1 graphs the use of these
Ambiguity of Test Preparation 1503

four test preparation items—use of rubrics, using performance items inregular instruction, having special practice tests, and teaching testingmechanics—against the percentage of teachers reporting they almost alwayshave having children explain their conclusions or solutions in writing, aninquiry-oriented practice. About 55% teachers who almost always use rubricshave children explain in writing almost always, wheras only about 22%teachers who almost never use rubrics have children explain in writingalmost always.
Using performance items and practice tests follows similar progressions.However, only 12% of those who report almost always teaching test mechan-ics have children almost always explain in writing, whereas 20% of thosewho never teach test mechanics have children explain in writing. In fact,the results for rubrics trace a curve that bottoms out among teachers whouse them once in a while. The results for test mechanics actually tops outat the once in a while response. Thus, the use of rubrics may be a telltalesign that teachers are focusing on a deeper aspect of reform. In addition,
Table 4. Correlations between specific test preparation behaviors andinstructional approaches in math and science
HavingStudents
Use Rubricsto Grade
EachOther’sWork
Teaching theRegular
CurriculumUsing
Performance-Based Items
Similarto ESPA
HavingPracticeSessions
With ItemsSimilar toThose onthe ESPA
TeachingTest TakingMechanicsLike Fillingin Bubbles,. . . or how
to PaceYourself
MATHMonth Before
Inquiry Oriented .390** .315** .176** .169**Direct Instruction 2.009 .162** .208** .285**
All YearInquiry Oriented .456** .332** .366** .180**Direct Instruction 2.020 .097 .158** .241**
SCIENCEMonth Before
Inquiry Oriented .348** .243** .140* .049Direct Instruction .041 .190** .213** .231**
All YearInquiry Oriented .416** .258** .239** .142*Direct Instruction .018 .128* .210** .240**
**p , .01.*p , .05.
1504 Teachers College Record

Figure 1. Relationship between Teaching to the Test and Having Students Explain in Writing

teaching test mechanics and teaching rubric use appear to be competitiveprocesses. The use of performance items and practice tests appear to reflectthe same dynamic as using rubrics only less strongly.
The interviews and survey data suggest that, on balance, teachers’ responsesto the ESPA are encouraging them to explore approaches to teachingmathematics and science that are more intellectually challenging by mak-ing the connection between abstract symbols and more concrete represen-tations and by asking children to explain what they are doing and to justifythe procedures they use. However, the observational data suggest thatalthough teachers are exploring these issues, the changes they have madeare not so fundamental. They are exploring specific techniques while main-taining their basic approaches to the subjects taught. Consider the case ofmanipulative use, a fairly significant area of change according to the inter-views. Manipulatives were used in 73 of the 121 observed math lessons~60%!. However, the fact that manipulatives were used does not mean thattheir potential was reached. In fact, they were used in an algorithmic-likeway that reflects a direct-instruction orientation in 47 of those cases ~64%of the cases where manipulatives were used!.
Manipulatives can be used to provide a concrete representation of ideasthat are usually expressed in mathematical symbols. They can also be usedto allow students to explore relationships among concepts using concretematerials. Algorithmic use occurs when children use manipulatives as directedby the teacher, generally without any understanding of how and why thematerials connect to the actual problem or other representations ~includ-ing symbolic representations!. For example, this occurs when a teacher tellsthe students exactly how to use the materials, and the students must followalong as directed. In such cases, the opportunity for exploration is lost, andstudents are merely following a procedure, which happens to be manipu-lating materials or learning a set of terms. At its extreme, it may be reducedto getting children to recognize and remember a series of shapes or objects.
In more subtle forms, teachers direct children in ways that remove thepossibility for exploration. For instance, one teacher put a class of studentsinto groups of four and gave each 84 chips. She then asked the children touse the chips to calculate two thirds of 84. The original task had room forexploration, but it became more algorithmic when she stopped the classfrom generating their own solutions. Some children were putting chips intofour groups, so she asked the class how many groups of chips were needed.When one student said two thirds, she proceeded to demonstrate for thewhole class how to divide the chips into three groups, saying “rememberthe denominator tells you how many groups you need.” She then patrolledthe groups and made sure each one had formed three equal groups beforeproceeding. In effect, she gave children a rule ~the denominator tells youhow many groups you need!, demonstrated her own understanding of how
1506 Teachers College Record

of how the rule worked in the particular problem, and then had the chil-dren practice it. In another four cases, the teacher simply demonstrated amathematical procedure with manipulatives and did not let students usethem at all.
The teachers only allowed students to explore ideas in 22 ~18%! ofobserved lessons. For instance, to help students develop an understandingof fractions by considering the area of different shapes, another teacherhad a class work with geoboards containing 16 square units. In the first partof the class, she had children find as many ways as they could to divide theboard into quarters and then into eighths. Children were encouraged toshare their solutions. Children also had an opportunity to talk with eachother about their solutions. For instance, one girl asked another how manyways she found to divide the geoboard. When the second girl said she’dfound 10 ways, the first girl said she’d found 11, and the second girl askedto see them. Later the teacher asked pairs of students to show each othertheir favorite ways of dividing the geoboard and then coached students onhow to give feedback without hurting feelings if they thought their partnerhad divided the board wrong. Unlike the first task, this one was open-ended with many possible responses and many opportunities for childrento show each other their work, explain it, challenge it, and justify it.
Teachers also said they had students explain their thought processesmore during lessons. Yet, students were observed to explain the thinkingbehind the approach they used or to justify it in only seven lessons ~6%!. Wealso coded how teachers responded to student answers to their questions.In 88 observations ~73%!, the teacher was only interested in getting thecorrect answer to a calculation. In these cases, their response was usually ashort neutral comment like “okay” or “fine,” and no attempt was made toget the student to expand the answer or use the answer to start a discussion.In 79% of the lessons ~96!, no attempt was made to get students to considerwhether the answer given was reasonable.
It appears that teachers are trying to make changes or are thinkingabout making changes that they are not yet carrying off with substantialskill in the classroom. Stigler and Hiebert ~1999! suggest that there arenational paradigms for teaching mathematics. What might be called theAmerican paradigm seems to focus on repetitive practice to help childrenlearn procedural knowledge ~i.e., knowledge of facts and how to carry outprocedures to get correct answers!. There is less interest in having childrenlearn by exploring ideas or understanding the connections among math-ematical concepts or the principles behind the procedures. Indeed, 79% ofthe lessons observed required students to practice procedures rather thanapply those procedures in new contexts or invent new ones. This is com-parable to what we found in two other states with tests using open-endeditems ~Firestone et al., 1998! and somewhat lower than what Stigler and
Ambiguity of Test Preparation 1507

Hiebert ~1997! found among American teachers in the TIMSS video study.Moreover, 85% of the observed lessons focused only on procedural knowl-edge without encouraging a deeper understanding of mathematical con-cepts and the connections among them.
Question 2: How Is the Test Affecting the Content Covered?
One frequent charge about state testing is that it narrows curriculum.Basically, the fear is that only what gets tested will get taught. Untestedsubjects—such as art and music—fall out of the curriculum, and topicswithin subjects that are not on the test get put off until the end of the year,if they are taught at all ~Corbett & Wilson, 1991; McNeil, 2000!.
Yet, there is much to criticize about the American curriculum as it hasexisted for years, even before the recent round of state testing. In compar-ison with other countries, the American elementary math and science cur-riculum has very little depth. The same things get taught repeatedly inshort segments and with little sense of progression. There would be roomto teach new areas if each grade level focused on a few topics in enoughdepth for children to really learn them ~Schmidt, McKnight, & Raizen,1996!. Whereas some argue that the American curriculum already has toomany topics, the NCTM standards suggest adding such topics that are notpart of the elementary curriculum as statistics, the interpretation of data,and some prealgebra topics ~National Council of Teachers of Mathematics,2000!.
This thrust is reflected in New Jersey’s Core Curriculum Content Stan-dards. There is a new and greater emphasis in fourth-grade mathematics onsuch issues as using models to explore operations with fractions; measure-ment issues; understanding patterns, relationships, and functions, for instanceby using tables, open sentences, and a variety of graphic representations;and understanding statistics, to name just a few areas. The fourth-gradescience standards place a greater emphasis on understanding the investi-gative process in science and on topics in chemistry and physics than hasbeen the case in the past ~New Jersey State Department of Education, 1996!.
The fourth-grade test specifications are organized around a three-dimensional grid. One dimension refers to content clusters that includenumber sense, operations, and properties; measurement; spatial sense, andgeometry; data analysis, probability, and discrete mathematics; and patternsand algebra ~New Jersey State Department of Education, 1998a!. The sci-ence test specifications are more closely geared to the standards themselvesbut detail the kinds of knowledge that students should have about proper-ties of matter, force and motion, and a variety of other areas ~New JerseyState Department of Education, 1998b!.
1508 Teachers College Record
One other factor to be considered is that over time, a perception hasdeveloped that the science test is easier than those in mathematics andlanguage arts and less in need of special “teaching to.” In the spring of2000, about 55% of the students were marked as proficient in languagearts, 66% in mathematics, and 86% in science.
Our data suggest that as a result of these policies and perceptions, thebalance of topics is shifting in math, and less time is being spent on sciencethan had been in the recent past. These conclusions are based on two kindsof information on content coverage. First, in response to the open-endedquestions about what teachers are teaching more and less of in mathemat-ics, many teachers described changes in covered content. Teachers onlyreported reducing coverage of one area. That was computation—the pro-cedures of addition, subtraction, multiplication, and division. This reduc-tion was volunteered by 41% of the respondents in 1999 and by 51% in2000. There was less agreement about what was being added, but teachersdid mention three areas that had not been central to the traditional ele-mentary mathematics curriculum: geometry ~mentioned by 21% in both1999 and 2000!, measurement ~20% in 1999 and 18% in 2000!, and prob-ability ~8% in 1999 but 17% in 2000!.
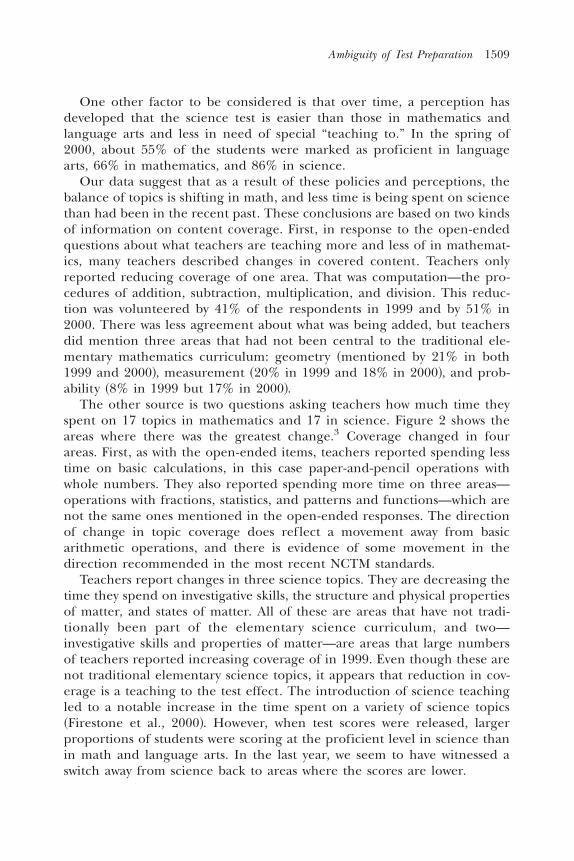
The other source is two questions asking teachers how much time theyspent on 17 topics in mathematics and 17 in science. Figure 2 shows theareas where there was the greatest change.3 Coverage changed in fourareas. First, as with the open-ended items, teachers reported spending lesstime on basic calculations, in this case paper-and-pencil operations withwhole numbers. They also reported spending more time on three areas—operations with fractions, statistics, and patterns and functions—which arenot the same ones mentioned in the open-ended responses. The directionof change in topic coverage does reflect a movement away from basicarithmetic operations, and there is evidence of some movement in thedirection recommended in the most recent NCTM standards.
Teachers report changes in three science topics. They are decreasing thetime they spend on investigative skills, the structure and physical propertiesof matter, and states of matter. All of these are areas that have not tradi-tionally been part of the elementary science curriculum, and two—investigative skills and properties of matter—are areas that large numbersof teachers reported increasing coverage of in 1999. Even though these arenot traditional elementary science topics, it appears that reduction in cov-erage is a teaching to the test effect. The introduction of science teachingled to a notable increase in the time spent on a variety of science topics~Firestone et al., 2000!. However, when test scores were released, largerproportions of students were scoring at the proficient level in science thanin math and language arts. In the last year, we seem to have witnessed aswitch away from science back to areas where the scores are lower.
Ambiguity of Test Preparation 1509

Figure 2. Percent of Teachers Devoting 11 or More Lessons Per Year in Math and Science Topics

Question 3: To What Degree Is Teaching to the Test Contributing to Inequities?
Critics of state testing argue that the negative effects of teaching to the testare most extreme in urban school districts serving the nation’s poorestchildren and those already least likely to succeed ~McNeil, 2000!. They havealso argued that direct instruction predominates in urban schools whereinquiry-oriented instruction is especially difficult to promote ~Haberman,1991!. The association between teaching to the test and inquiry-orientedinstruction that we have identified raises the intriguing possibility that evenif teaching to the test predominated in urban schools, it might have thebenefit of encouraging more inquiry-oriented instruction.
As previously described, New Jersey provides a measure of district wealth,which combines such indicators as family income, occupation, the amountof poverty, and several measures of education. Using this composite mea-sure, districts are placed into eight categories from A ~the least well-offdistricts! to J ~the most well-off districts!. Figure 3 shows a substantial asso-ciation between the district factor group ~DFG! and teaching to the testwith—as predicted by others—the most teaching to the test occurring inthe poorest districts. This relationship holds for the scale as a whole and forthe four items analyzed individually in Table 4 with one exception. Thatexception is having students use rubrics to score each other’s work, theitem most closely associated with inquiry-oriented instruction. Using rubricshas a U-shaped relationship to DFG, such that it occurs most frequently inboth the richest and the poorest districts. This result suggests that testingmay be encouraging more inquiry-oriented instruction in urban districts, afinding that would contradict what certain researchers have reported ~e.g.,McNeil, 2000!.
In work reported elsewhere, we show that direct instruction is, in fact,more prevalent in New Jersey’s poor urban districts, and there is no rela-tionship between district wealth and inquiry-oriented instruction ~Fire-stone, Monfils, & Camilli, 2001!.
Question 4: What Factors Promote Teaching to the Test?
A number of critics have suggested that teaching to the test is a responseborn of teachers’ fear and frustration with the high stakes attached to thetest ~Corbett & Wilson, 1991; McNeil, 2000!. This explanation seems toosimple for the kind of teaching to the test documented here, partly becausethe stakes are not high in New Jersey when compared with other states.Moreover, rather than “dumbing down” teaching, as has been reportedelsewhere, ESPA appears to be sensitizing teachers to new instructionalpractices, even if it is not leading to major change. This result suggests theneed for a more complex framework that reflects the pressure that teachers
Ambiguity of Test Preparation 1511

are likely to be under but also the support that is needed to adopt newapproaches to teaching ~Fullan, 1991!. Both pressure and support are likelyto come from the teachers’ immediate surroundings, the schools and dis-tricts in which they work ~McLaughlin, 1990!. The kind of teaching to thetest observed in New Jersey also suggests that teachers’ own knowledge andbeliefs are likely to have a substantial effect on their response to bothpressure and support ~Carpenter, Fennema, Peterson, Chiang, & Loef, 1989;National Commission on Mathematics and Science Teaching for the 21stCentury, 2000!.
We examined six categories of influence on teaching to the test describedpreviously: student context, organizational context, access to materials, pro-fessional development, teacher background, and teacher beliefs. Using regres-sion analyses, we examined the effects of these variables on test preparationoverall and the separate test preparation items analyzed in Table 4. The
Figure 3. Teaching to the Test by DFG
1512 Teachers College Record

reader should note that relatively small proportions of variance are explainedby these variables, especially for separate aspects of test preparation and forscience in general in Tables 5 and 6, respectively.
Despite the limitations on these results, they do provide some insightinto how pressure and support influence teaching to the test. From pastcritiques of state testing policy, we thought that pressure might have asingularly large impact on teaching to the test. This has proved not to bethe case. Though pressure ~as reflected in the ESPA pressure scale, whichwith one exception does not specify the source of the pressure! becomes amajor factor in what teachers do the month before the test is given, influ-encing teaching to the test overall as well as such specific practices as usingperformance items and giving practice tests, it is only the most importantexplanatory factor for holding practice sessions ~these patterns are quiteconsistent for both math and science!.
Pressure does not show up as an explanatory factor nearly as often asprincipal support, which is a significant explanatory factor for eight of thevariables in math and for seven in science. Of all the pressure and supportvariables, principal support is the most consistently significant factor. Foroverall test preparation, it is the most powerful factor affecting math, sec-ond only to DFG for science. Principal support has substantial impact onteachers’ work across the year and during the month before the test isgiven, and this result holds for both math and science. General professionaldevelopment encourages the use of performance items in regular lessonsand special practice sessions. It tends to influence these behaviors through-out the year and for both math and science.
Most of the other variables work somewhat differently for math andscience. For instance, professional development focused on ESPA shows upfor a number of aspects of math test preparation, including the overallscale and practice sessions for the month before the test and all year longas well as using rubrics and performance items the month before the test isgiven. However, it is less of a factor for science, affecting only overall testpreparation and practice sessions throughout the year. Knowledge of thestate standards is important for math—significantly contributing to varia-tion in both test preparation overall and the use of rubrics both throughoutthe year and just before the test—but such knowledge only influences onevariable, rubric use the month before ESPA, related to test preparation inscience.
By contrast, access to science kits contributes to overall test preparationin science and to the use of performance items and practice sessions themonth before the test is given. However, in math the use of calculators isonly associated with the use of performance items the month before theexam is given. Thus materials seem to be more important for science thanfor math. We suspect that these differences reflect the greater sense of
Ambiguity of Test Preparation 1513

Table 5. Mathematics test preparation and policy variables
TestPrep
Month
TestPrepYear
RubricsMonth
RubricsYear
Perform.Items
Month
Perform.ItemsYear
PracticeSessionsMonth
PracticeSessions
YearMechanics
MonthMechanics
Year
DFG 2.171a 2.226a 2.179a 2.185a 2.176a 2.182a 2.209a
PRNSUP .235a .264a .142b .262a .228a .178a .138b .184a
PRESSR .187a .176a .272a
PROFDEV .149b .128b
ESPAPD .190a .176a .169a .161a .220a .210a
CALC .135b
NCTMNJSTAND .120b .113b .214a .200a
PEREFF .186a .134b
Adj R2 .232 .194 .104 .079 .212 .100 .140 .148 .044 .068N 269 269 269 269 269 269 269 269 269 269
ap , .01.bp , .05.

Table 6. Science test preparation and policy variables
TestPrep
Month
TestPrepYear
RubricsMonth
RubricsYear
Perform.Items
Month
Perform.ItemsYear
PracticeSessionsMonth
PracticeSessions
YearMechanics
MonthMechanics
Year
DFG 2.271a 2.321a 2.223a 2.188a 2.145b 2.248a 2.213a 2.232a
PRNSUP .196a .203a .156b .203a .178a .193a .140b
PRESSR .188a .214a .265a
PROFDEV .192a .146b
ESPAPD .139b .189a
KITS .143b .152b .195a .205a
NRCNJSTAND .165b
PEREFF .184a .184a
Adj R2 .167 .189 .054 .053 .176 .090 .122 .168 .041 .063N 243 243 243 243 243 243 243 243 243 243
ap , .01.bp , .05.

urgency surrounding the math tests and the lesser emphasis on the sciencetests in New Jersey, but they may reflect the greater importance of materialsfor teaching science. Personal efficacy only influences the use of rubrics,but it does so for both math and science and both the month before thetest is given and throughout the year.
As Figure 3 suggests, DFG is an important factor, increasing the overallamount of test preparation activity in poorer districts. In fact, it competeswith principal support as the factor influencing the most aspects of teach-ing to the test. Having students use rubrics, however, is not one of thosevariables for either math or science. This pattern reinforces the suggestionmade before that the aspects of test preparation that vary most by DFG arethe ones least likely to encourage inquiry-oriented instruction and mostlikely to promote direct instruction.
CONCLUSIONS
In this project, we used a mix of surveys, interviews, and direct observationto address questions about how test preparation affects instruction andcontent coverage, whether test preparation increases or decreases educa-tional inequities, and the factors that affect test preparation. The strengthof our approach is the use of multiple methods to explore a related set ofissues. While the sample of teachers is among the larger used to explorethese issues, the study remains limited by its focus on a single grade level,two subjects, and one state. Nevertheless, we believe it offers a useful addi-tion to the small but growing literature on the effects of state testingprograms.
This research throws some light on how teachers respond to tests underconditions of relatively low stakes and tests requiring some open-endedresponses ~but not extended performance assessments!. The picture weoffer is, in fact, both mixed and ambiguous. In most areas we explore, ourfindings include good news and bad news. For instance, test preparationitself consists of a multitude of activities. In the context of a test usingopen-ended items, there is room for test preparation to include havingchildren use rubrics and performance items as well as to drill them usingmultiple-choice questions. Thus, in the New Jersey context, test prepara-tion includes a mix of more and less intellectually challenging activities.Although we found that the test influences curriculum and instruction, thenature of that influence depends on the nature of the test.
When we look at the changes taking place in New Jersey, we see teachersbeing sensitized to new instructional approaches, including problem solv-ing, questioning that requires students to explain more, and the use ofmanipulatives. The good news is that teachers are exploring these newoptions. The bad news is that so far these changes appear to be relatively
1516 Teachers College Record

cosmetic. Sometimes they appear to be nothing more than coping strat-egies for dealing with the new test. For the most part, math and scienceteachers in New Jersey still emphasize practice that focuses on procedures.
In some ways, these findings reinforce our earlier suggestion that teach-ers are more sensitive to policies governing content coverage than instruc-tion ~Firestone et al., 1998!. In math, teachers report a movement awayfrom a focus on computation to spending more time on a variety of othertopics. The problem here is that there appears to be no clear focus amongthese new topics. If the American curriculum has been a mile wide and aninch deep in the past ~Schmidt et al., 1996!, there is a risk that New Jersey’sstandards and assessments merely amplifies that trend. Similarly, we see arather rapid response in science, with teachers reporting that they spendmore time on topics in a particular year as new tests come on line and thencut back as high test scores suggest the need to focus more on other issues.From a policy perspective, the good news is that content is amenable toinfluence. The bad news is that one has to consider not only the design ofspecific tests but also the interaction among them as one hard test maydetract from efforts in other content areas. Clearly, there is a lot of roomfor unintended negative consequences.
With regard to equity, our findings generally correspond to those ofothers who have found that test preparation reinforces conventional instruc-tion and drill-oriented approaches in urban classrooms. Although the kindsof test preparation associated with conventional instruction are most con-centrated in poor school districts, the kinds associated within inquiry-oriented instruction are not concentrated in the wealthiest districts butseem to occur in both rich and poor school districts. Whether the distri-bution of test preparation practices such as using rubrics can become acatalyst for more inquiry-oriented instruction in urban districts remains tobe seen. The danger here is that the use of rubrics might itself becomealgorithmic without suitable teacher supports.
Perhaps the major source of optimism in our findings concerns thefactors ~other than district wealth! influencing test preparation. Overall, avariety of sources of support, more than pressure, influence test prepara-tion. The principal’s role stands out in this regard. Our measure does notsuggest that principals are more aggressively taking on the role of instruc-tional coach or lead teacher. However, by putting the focus on testing andachievement and by providing resources and encouragement, principalsare influencing what teachers do. Moreover, district professional develop-ment also plays an important role. Local leadership appears to have acomprehensive, if not terribly strong, influence on teaching practice. Asnoted in other work though, pressure does lead to intensified test prepa-ration right before the test is given. Moreover our pressure and supportvariables predict test preparation better for mathematics than for science,
Ambiguity of Test Preparation 1517

suggesting that pressure from state-level sources continues to influenceteachers.4
Taken together, our findings suggest that state testing is neither themagic policy bullet that advocates of accountability hope for nor the forcefor deskilling, dumbing down, and disparity of life chances that certainopponents have claimed. On the basis of what we have observed, the bestthat can be said for state testing is that, when properly designed, it cansensitize teachers to new instructional approaches and promote shifts in thecontent that is taught. Deeper changes in instructional practice and seriousreduction in the inequities facing American children depend on orches-trating state tests with other policies and administrative practices.
APPENDIX A
Principal Support Scale ~alpha 5 .56!
1. If changes made to teach to the mathematics and science standardsare criticized by parents, my principal will defend those changes.
2. My principal believes that ESPA measures important aspects ofstudent learning.
3. My principal is making changes to implement the mathematics andscience standards successfully.
4. My principal provides time for teachers to meet and share ideas.
5. My principal understands what good standards-oriented mathemat-ics and science teaching is like.
ESPA Pressure Scale ~alpha .49!
1. My principal indicates that doing well on ESPA is a top priority.
2. When I design lessons and activities in math and science, it isunderstood that an important goal is to raise ESPA scores.
3. I feel that I am familiar enough with ESPA to adequately preparemy students for the test.
4. March and April are pretty tough in this school because of thetime and attention focused on getting ready for ESPA.
5. Too much time is diverted from instruction to raising scores onESPA.
1518 Teachers College Record

APPENDIX B
ObservationCode Definition
InterraterReliability
Stein Taska,d Task demand: Memorization, procedures withoutconnections, procedures with connections, “doingmath.”
.74
Manipulativesd Manipulative usage: Demonstration by the teacher,algorithmic-like procedural use by students, ornon-algorithmic use by student as a tool to solveproblems or explore patterns.
.80
Groupwork 1 Collaboration between students. .74Groupwork 2 Collaboration or competition. .83Stigler Taskb Practice of routine procedures vs. non-routine
problems..89
Stigler Numberb Number of problems: 5 or fewer, more than 5. .80Stigler
KnowledgebDefinition0procedural vs. principled0conceptual
knowledge..93
C1c The lesson provided opportunities for students tomake conjectures about mathematical ideas.
.71
C2c,e The lesson fostered the development of conceptualunderstanding.
.61
C3c Connections within mathematics were explored in thelesson.
.85
C4c Connections between mathematics and students’ dailylives were apparent in the lesson.
.70
C4.5 Attempt at Real World connections. .74C5c Students explained their responses or solution
strategies..88
C5.5d,e Teacher’s use of questioning: Recall, describe, generatea problem, examine underlying features.
.65
C6c Multiple strategies were encouraged and valued. .74C7c The teacher valued students’ statements about
mathematics and used them to build discussion orwork toward shared understanding for the class.
.80
C8c The teacher used student inquiries, comments orobservations as a guide for instructional mathematicsinvestigations or as a guide to shape the mathemati-cal content of the lesson.
.71
C9c The teacher encouraged students to reflect on thereasonableness of their responses.
.83
D1 Student exchanges with peers reflected substantiveconversation of mathematical ideas.
.82
Coherenceb Stigler Lesson Coherence .76
aStein, Smith, Henningsen, and Silver ~2000!bStigler and Hiebert ~1997, 1999!cDavis, Wagner, and Shafer ~1997!dHiebert and Wearne ~1993!eCode omitted due to low interrater reliability.
Ambiguity of Test Preparation 1519

An earlier version of this paper was presented at the annual meeting of the AmericanEducational Research Association in Seattle, WA, April 11, 2001. This paper was preparedwith support from grants # 9804925 and 9980458 from the National Science Foundation.The opinions expressed here are those of the authors and not of the Foundation or RutgersUniversity. Thanks are due to Joanne Torok for help with coding the open-ended survey data.
Notes
1 Students did have to pass the 11th grade test to graduate from high school.2 A complete listing of items in scales can be found at www.cepa.gse.rutgers.edu.3 Actually, we asked the question two ways each year. First, we asked teachers how many
lessons they devoted to each topic. Then, we asked whether the amount of time they had givento the topic had increased, decreased or stayed the same. The topics mentioned here are thosewhere there is a statistically significant difference in the number of lessons from 1999 to 2000and where in 2000 teachers generally agreed that time spent had increased or decreased.
4 We should also note the ambiguous role of professional development focusing onESPA. Its greater importance on math activities than science and its influence on math testprep the month before the test is given suggest a need to reconceptualize this variablesomewhat. Although ESPA test preparation does provide teachers with new knowledge, thevery fact of these sessions may send signals to teachers that reinforce the pressure on them toget students to score high.
References
Baron, J. B., & Wolf, D. P. ~1996!. Performance-based student assessment: challenges and possibilities.Chicago: University of Chicago Press.
Borko, H., Elliott, R., & Uchiyama, K. ~1999!. Professional development: A key to Kentucky’s reformeffort ~CSE Technical Report #512!. Los Angeles: CRESST.
Borko, H., & Putnam, R. T. ~1995!. Expanding a teacher’s knowledge base: A cognitive psy-chological perspective on professional development. In T. R. Guskey & M. Huberman~Eds.!, Professional development in education ~pp. 35–65!. New York: Teachers College Press.
Brophy, J., & Good, T. L. ~1986!. Teacher behavior and student achievement. In M. Wittrock~Ed.!, Handbook of research on teaching ~3rd ed., pp. 328–375!. New York: MacMillan.
Carpenter, T. P., Fennema, E., Peterson, P. L., Chiang, C.-P., & Loef, M. ~1989!. Using knowl-edge of children’s mathematics thinking in classroom teaching: An experimental study.American Educational Research Journal, 26~4!, 499–531.
Cohen, D. K., & Hill, H. C. ~1998!. Instructional policy and classroom performance: Themathematics reform in California. Teachers College Record, 102~2!, 294–343.
Corbett, H. D., & Wilson, B. L. ~1991!. Testing, reform, and rebellion. Norwood, NJ: Ablex.Cuban, L. ~1993!. How teachers taught: Constancy and change in American classrooms, 1890–1980.
New York: Teachers College Press.Davis, J., Wagner, L. R., & Shafer, M. C. ~1997!. Classroom observation scale. Madison: University
of Wisconsin.Editorial Projects in Education. ~2001!. A better balance: Standards, tests, and the tools to succeed:
Quality Counts 2001. Bethesda, MD: Author.Firestone, W. A., Camilli, G., Yurecko, M., Monfils, L., & Mayrowetz, D. ~2000!. State standards,
socio-fiscal context and opportunity to learn in New Jersey. Education Policy Analysis Archives,8~35!. Retrieved August 1, 2000, from http:00epaa.asu.edu0epaa0v8n350
Firestone, W. A., Mayrowetz, D., & Fairman, J. ~1998!. Performance-based assessment and
1520 Teachers College Record

instructional change: The effects of testing in Maine and Maryland. Educational Evaluationand Policy Analysis, 20~2!, 95–113.
Firestone, W. A., Monfils, L., & Camilli, G. ~2001, April!. Pressure, support, and instructionalchange in the context of a state testing program. Paper presented at the Annual meeting of theAmerican Educational Research Association, Seattle, WA.
Fullan, M. ~1991!. The new meaning of educational change. New York: Teachers College Press.Haberman, M. ~1991!. The pedagogy of poverty versus good teaching. Phi Delta Kappan, 73~4!,
290–294.Hallinger, P., & Heck, R. L. ~1996!. Reassessing the principal’s role in school effectiveness: A
review of the empirical research: 1980–95. Educational Administraton Quarterly, 32~1!, 5–44.Hiebert, J., & Wearne, D. ~1993!. Instructional tasks, classroom discourse, and students’ learn-
ing in second grade arithmetic. American Educational Research Journal, 30~2!, 393–425.Kannapel, P. J., Coe, P., Aagaard, L., Moore, B. D., & Reeves, C. ~2000!. Teacher responses to
rewards and sanctions: Effects of and reactions to Kentucky’s high-stakes accountabilityprogram. In B. L. Whitford & K. Jones ~Eds.!, Accountability, assessment, and teacher commitment:Lessons from Kentucky’s reform efforts ~pp. 127–148!. Albany: State University of New York Press.
Koretz, D., Mitchell, K., Barron, S., & Keith, S. ~1996!. Final report: Perceived effects of theMaryland School Performance Assessment Program. Los Angeles: National Center for Researchon Evaluation, Standards, and Student Testing.
Lampert, M. ~1990!. When the problem is not the question and the solution is not the answer:Mathematical knowing and teaching. American Educational Research Journal, 27~1!, 29–63.
Lehrer, R., Jacobson, C., Kemeny, V., & Strom, D. ~1999!. Building on children’s intuitions todevelop mathematical understanding of space. In E. Fennema & T. A. Romberg ~Eds.!,Mathematics classrooms that promote understanding ~pp. 63–88!. Mahwah, NJ: Erlbaum.
Leithwood, K., Jantzi, D., & Steinbach, R. ~1999!. Changing leadership for changing times. Buck-ingham, UK: Open University Press.
Loucks-Horsley, S., Hewson, P. W., Love, N., & Stiles, K. E. ~1998!. Designing professional devel-opment for teachers of science and mathematics. Thousand Oaks, CA: Corwin.
Louis, K. S., Toole, J., & Hargreaves, A. ~1999!. Rethinking school improvement. In K. S. Louis& J. Murphy ~Eds.!, Handbook of research on educational administration ~2nd ed., pp. 251–276!.San Francisco: Jossey-Bass.
McLaughlin, M. W. ~1990!. The Rand Change Agent study revisited: Macro perspectives andmicro realities. Educational Researcher, 19~9!, 11–16.
McNeil, L. M. ~2000!. Contradictions of school reform: Educational costs of standardized testing. NewYork: Routledge.
Monfils, L., Camilli, G., Firestone, W. A., & Mayrowetz, D. ~2000!. Multidimensional analysis ofscales developed to measure standards-based instruction in response to systemic reform. Paper pre-sented at the Annual meeting of the American Educational Research Association, NewOrleans, LA.
National Alliance of Business. ~2000!. Improving performance: Competition in American public edu-cation. Washington, DC: Author.
National Center for Education Statistics. ~1998!. Digest of educational statistics, 1998. Washing-ton, DC: Author.
National Center for Education Statistics. ~2000!. Statistics in brief: Overview of public elementaryand secondary school districts: school year 1998–99. Washington, DC: Author.
National Commission on Mathematics and Science Teaching for the 21st Century. ~2000!. Beforeit’s too late. Washington, DC: Education Publications Center, US Department of Education.
National Council of Teachers of Mathematics. ~1995!. Assessment standards for school mathematics.Reston, VA: Author.
National Council of Teachers of Mathematics. ~2000!. Principles and standards for school math-ematics. Reston, VA: Author.
Ambiguity of Test Preparation 1521

National Research Council. ~1996!. National science education standards. Washington, DC: NationalAcademy Press.
New Jersey State Department of Education. ~1996!. Core curriculum content standards. Trenton,NJ: Author.
New Jersey State Department of Education. ~1998a!. Directory of test specifications and sample itemsfor the Elementary School Proficiency Assessment (ESPA) in mathematics. Trenton, NJ: Author.
New Jersey State Department of Education. ~1998b!. Directory of test specifications and sample itemsfor the Elementary School Proficiency Assessment (ESPA) in science. Trenton: Author.
Newmann, F. M., & Associates. ~Eds.!. ~1996!. Authentic achievement: Restructuring schools forintellectual quality. San Francisco: Jossey-Bass.
O’Day, J., & Smith, M. S. ~1993!. Systemic reform and educational opportunity. In S. H.Fuhrman ~Ed.!, Designing coherent educational policy ~pp. 250–312!. San Francisco: Jossey-Bass.
Pennell, J. R., & Firestone, W. A. ~1997!. Changing practices through teacher networks: Match-ing program features with teacher characteristics and circumstances. Teachers College Record,34~5!, 209–235.
Polya, G. ~1957!. How to solve it. New York: Doubleday Anchor Books.Resnick, L. B., & Resnick, D. P. ~1992!. Assessing the thinking curriculum: New tools for edu-
cational reform. In B. R. Gifford & M. C. O’Connor ~Eds.!, Changing assessments: Alternativeviews of aptitude, achievement, and instruction ~pp. 37–75!. Boston: Kluwer Academic Publishers.
Saxe, G. B., Franke, M. L., Gearhart, M., Howard, S., & Michele, C. ~1997!. Teachers’ shiftingassessment practices in the context of educational reform in mathematics ~CSE Technical Report471!. Los Angeles: CRESST.
Schmidt, W. H., McKnight, C. C., & Raizen, S. A. ~1996!. A splintered vision: An investigation ofU.S. science and mathematic education. East Lansing, MI: U.S. National Research Center forthe Third International Mathematics and Science Study.
Schorr, R. Y., & Lesh, R. ~2001!. A models and modeling perspective on classroom-basedteacher development. In R. Lesh & H. Doerr ~Eds.!, Beyond constructivism: A models andmodeling perspective on teaching, learning, and problem solving in mathematics education. Hills-dale, NJ: Earlbaum.
Simon, M. A., & Tzur, R. ~1999!. Explicating the teacher’s perspective from the researchers’perspective: Generating accounts of mathematics teachers’ practice. Journal for Research inMathematics Education, 30~3!, 252–264.
Smith, M. L. ~1991!. Meanings of test preparation. American Educational Research Journal, 28~3!,521–542.
Smith, M. L. ~1996!. Reforming schools by reforming assessment: Consequences of the Arizona StudentAssessment Program. Tempe: Southwest Educational Policy Studies, Arizona State University.
Stein, M. K., Smith, M. S., Henningsen, M. A., & Silver, E. A. ~2000!. Implementing standards-based mathematics instruction. New York: Teachers College Press.
Stigler, J. W., & Hiebert, J. ~1997!. Understanding and improving classroom mathematicsinstruction. Phi Delta Kappan, 79~1!, 14–21.
Stigler, J. W., & Hiebert, J. ~1999!. The teaching gap: Best ideas from the world’s teachers for improvingeducation in the classroom. New York: The Free Press.
Supovitz, J. A., Mayer, D. P., & Kahle, J. B. ~2000!. Promoting inquiry-based instructionalpractice: The longitudinal impact of professional development in the context of systemicreform. Educational Policy, 14~3!, 357–384.
Tschannen-Moran, M., Woolfolk Hoy, A., & Hoy, W. K. ~1998!. Teacher efficacy: Its meaningand measure. Review of Educational Research, 68~2!, 202–248.
WILLIAM A. FIRESTONE is professor of educational policy and director ofthe Center for Educational Policy Analysis at the Rutgers Graduate Schoolof Education. He is interested in policy implementation and especially the
1522 Teachers College Record

effects of state testing on teaching as well as the integration of qualitativeand quantitative research methods. His recent publications include “Rethink-ing ‘High Stakes’: Lessons from the US and England and Wales” ~withDavid Mayrowetz! in Teachers College Record and From Cashbox to Classroom:The Struggle for Fiscal Reform and Educational Change in New Jersey ~with Mar-garet Goertz and Gary Natriello!.
LORA MONFILS is a research associate at the Center for EducationalPolicy Analysis, Rutgers Graduate School of Education, and a doctoralcandidate in educational psychology at Rutgers University. Her researchinterests include statistical modeling, large-scale assessment policy issues,and equity in mathematics and science education.
GREGORY CAMILLI is a professor in the department of educational psychol-ogy, at the Rutgers Graduate School of Education. His areas of researchinterest include psychometric issues in educational policy, meta-analysis, anddifferential item functioning. Examples of recent publications include “Ap-plication of a Method of Estimating DIF for Polytomous Test Items” ~Journalof Educational and Behavioral Statistics, 1999!, “Standard Errors in EducationalAssessment: A Policy Analysis Perspective” ~Educational Policy Analysis Archives,1996!, “Values and State Ratings: An Examination of the State-by-State Edu-cation Indicators in Quality Counts” ~Educational Measurement: Issues and Prac-tice, 2000!, and Methods for Identifying Biased Items ~Sage, 1994!.
ROBERTA Y. SCHORR is an assistant professor in the Department of Edu-cation and Academic Foundations where she teaches mathematics and math-ematics education at the undergraduate and graduate levels. Her researchis focused on the following interrelated areas: assessment, professional devel-opment, technology, and the development of mathematical ideas in students.
JENNIFER HICKS is a research associate at the Center for EducationalPolicy Analysis, Rutgers Graduate School of Education, and a doctoralstudent in educational policy at Rutgers University. Her research interestsinclude school choice and standards-based reform and assessment.
DAVID MAYROWETZ is an assistant professor of policy studies at the Uni-versity of Illinois, Chicago. He is interested in educational policy imple-mentation, specifically the impact of general education policies on specialeducation students and programs. Mayrowetz coauthored “Sources of Lead-ership for Inclusive Education: Creating Schools for All Children” withCarol Weinstein in Educational Administration Quarterly ~1999! and “Rethink-ing ‘High Stakes’: Lessons from the US, England and Wales” with WilliamFirestone in Teachers College Record ~2000!.
Ambiguity of Test Preparation 1523

Copyright © 2022 FDOKUMEN