sport team fandom, arousal, and communication: a multimethod
106
SPORT TEAM FANDOM, AROUSAL, AND COMMUNICATION: A MULTIMETHOD COMPARISON OF SPORT TEAM IDENTIFICATION WITH PSYCHOLOGICAL, COGNITIVE, BEHAVIORAL, AFFECTIVE, AND PHYSIOLOGICAL MEASURES A Dissertation Submitted to the Graduate Faculty of the Louisiana State University and Agricultural and Mechanical College in partial fulfillment of the requirements for the degree of Doctor of Philosophy in The Department of Communication Studies by Shaughan Alan Keaton B.A., University of Central Florida, 2002 M.A., University of Central Florida, 2004 May 2013
-
Upload
khangminh22 -
Category
Documents
-
view
0 -
download
0
Transcript of sport team fandom, arousal, and communication: a multimethod

SPORT TEAM FANDOM, AROUSAL, AND COMMUNICATION: A MULTIMETHOD COMPARISON OF SPORT TEAM IDENTIFICATION WITH PSYCHOLOGICAL, COGNITIVE, BEHAVIORAL, AFFECTIVE, AND PHYSIOLOGICAL MEASURES
A Dissertation
Submitted to the Graduate Faculty of the Louisiana State University and
Agricultural and Mechanical College in partial fulfillment of the
requirements for the degree of Doctor of Philosophy
in
The Department of Communication Studies
by
Shaughan Alan Keaton B.A., University of Central Florida, 2002 M.A., University of Central Florida, 2004
May 2013

!
! ii!
DEDICATION
RIP, Brak the Chinese Dog with triangle ears, I’ll always miss you, my friend. You
almost made it to the end. This dissertation is dedicated to you and all of my family and friends
who have put up with me and were supportive of the huge effort it took to leave Florida and go
all the way to Louisiana to chase a dream.

!
! iii!
ACKNOWLEDGEMENTS
I would be remiss without thanking the many people that helped make my dream to earn
a PhD a reality. Along my life journey, there at key points came wonderful individuals who
chose to believe in me. These situations were often transition periods in my life, and I’d like to
thank the following people for making a huge difference in the direction it has taken: Tony at
Ponderosa, Joanne Lynch at Pizza Hut, my 8th grade art teacher, Mr. Fish, my high school
English teachers, Mr. Stockum and Mr. Lukasko, and two of my professors at the University of
Central Florida, Scott Wise and Patricia Angley.
Coming to LSU was the single best decision I have made in my life, and I’m proud to say
that I received a world-class education. The remarkable thing is that there were no less than four
amazing people who believed in my work and me. The fantastic support I received from my
most excellent advisor, James Honeycutt, was integral. Dr. Honeycutt always went above and
beyond the call of duty for me, and I commend him as a great friend and as an advisor. Graham
Bodie was also a great friend committee member who took an interest in me not only as a
scholar, but also as a person. James Garand’s excellent ability to convey complex statistical
procedures and his investment in his students’ learning and development as scholars and future
professors were only outdone by his warm demeanor and generosity. And finally, thanks to my
great friend Chris Gearhart, with whom I’ve written so many papers, played Madden, partied,
and survived the experimental statistics department (You’re my boy, Blue!). I would also like to
thank the CMST administrators, Renee Edwards and Andy King, as well as Lisa Landry and
Donna Sparks. I have so many other great friends at LSU and although I’d love to list them all, I
will settle for saying that I have not forgotten them, there are just too many to list, and that is a
great thing. I am truly fortunate in that regard: Geaux Tigers!

!
! iv!
Next, outside of LSU, I would like to thank my friend and supporter, Bob McCann, who
was complimentary, supportive, and always had time for me even given his ridiculous schedule
as a prominent scholar and administrator at UCLA. I’d also like to thank my great friend and
colleague Lance Percy—and the whole EAP crew!—at Full Sail University for their belief and
support.
I must finally thank my awesome dog and cats, who have kept me sane. Leela-boop,
Rusty Brains, El Señor Gato, and the Little Cat were all always there to make me laugh when I
felt as if I were going out of my mind! Last, thanks to the magnificent Elizabeth Sills, who was
often a stable island in the midst of the raging storm of dissertation research and writing and all
that it brings.
!
! v!
TABLE OF CONTENTS ACKNOWLEDGEMENTS ………………………………………………………………... iii
LIST OF TABLES …………………………………………………………………………. viii
LIST OF FIGURES ………………………………………………………………………... ix
ABSTRACT ………………………………………………………………………………... x CHAPTER
ONE THEORETICAL RATIONALE FOR CONCEPTUAL FRAMEWORK OF SPORT FANDOM AND COMMUNICATION ……………………...
1
Social Learning and Identity Theories .......................................... 5 Social Learning………………………………………... 6 Identity ………………………………………………... 7 Problem Statement: Inconsistent Definition of Fandom and
Reliance on Self-Report ………………………………………… 10
TWO HYPOTHESES, RESEARCH QUESTION, AND RATIONALE ……….. 14
Path A: Link between Identity Formation and Psychological Outcomes ………………………………………………………...
14
Path B: Link between Identity Formation and Self-Categorization …………………………………………………...
15
Path C: Link between Identity Formation and Communicative/Physiological Outcomes ……………………….
16
Path D: Link between Self-Categorization and Psychological Outcomes ………………………………………………………...
17
Path E: Link between Self-Categorization and Communicative/Physiological Outcomes ……………………….
18
Conclusion ………………………………………………………. 22
THREE METHODS, PROCEDURES, AND MANIPULATION CHECKS ……... 23 Participants and Power Analysis ………………………………... 23 Self-Report (Method 1) …………………………………………. 24 Procedures …………………………………………….. 24 Psychometrics and Manipulation Checks …………….. 25 Causation of Team Identification Scale ………... 25 Sport Team Psychological Commitment Scale ... 28 Cognitive Measures (Method 2) ………………………………… 29 Procedures and Manipulation Checks ………………… 29 Behavioral, Affective and Physiological Measures (Methods 3 &
4) ………………………………………………………………… 34
Procedures …………………………………………….. 34 Manipulation Checks for Behaviors and Physiology …. 39

!
! vi!
Verbal and Nonverbal Communicative and Affective Responses ……………………………
39
Physiological and Affective Responses ………... 40 Interval α ……………………………………….. 43 Interval β ……………………………………….. 45 Interval γ ……………………………………….. 46 Interval δ ……………………………………….. 47
Conclusion ………………………………………………………. 48
FOUR RESULTS AND HYPOTHESIS ASSESSMENT ………………………... 50 Path A: Link between Identity Formation and Psychological
Outcomes ………………………………………………………... 50
Path B: Link between Identity Formation and Self-Categorization …………………………………………………...
53
Path C: Link between Identity Formation and Communicative and Physiological Outcomes …………………………………….
54
Path D: Link between Self-Categorization and Psychological Outcomes ………………………………………………………...
54
Path E: Link between Self-Categorization and Communicative and Physiological Outcomes …………………………………….
55
Physiological Arousal, Communication, and Sex ………………. 56 Review of Hypothesis Support ………………………………….. 57 A Model of Sport Fandom and Communication ………………... 58 Summary and Conclusion ………………………………………. 61
FIVE DISCUSSION OF HYPOTHESES, RESEARCH QUESTION, PROBLEM STATEMENT, MEDIATED MODEL, AND VALIDITY EVIDENCE ………………………………………………………………..
63
Discussion of Hypothesis and Research Question Support …….. 63 Research Question: Communicative, Affective, and
Physiological Sex-Based Differences …………………………... 67
Validity Evidence ……………………………………………….. 68 Problem Statement: Inconsistent Definitions of Fandom and
Overreliance on Self-Report …………………………………….. 70
Summary and Conclusion ………………………………………. 71 Limitations ……………………………………………………… 72 Future Research …………………………………………………. 73 REFERENCES ……………………………………………………………………………... 74 APPENDIX A: DESCRIPTION OF SELF-REPORT SCALES AND PSYCHOMETRIC PROPERTIES ………………………………………………………………………………
85
APPENDIX B: BEHAVIORAL CODING MANUAL ……………………………………. 89 APPENDIX C: LSU INSTITUTIONAL REVIEW BOARD APPROVAL ………………. 95

!
! vii!
VITA ……………………………………………………………………………………….. 96

!
! viii!
LIST OF TABLES 3.1: Correlation matrix between and within measurement scales …………………………... 26
3.2: List of trait adjectives for cognitive task 1 ……………………………………………... 31
3.3: Fit statistics for unconditional latent growth curve models …………………………….. 43
3.4: Fit statistics for conditional latent growth curve models ……………………………….. 45
4.1: Correlation matric for team identity formation, psychological effects, self-categorization, strength of identity, and behavioral responses ………………………………
51
4.2: Hypotheses, research question, descriptions, variables, and paths ……………………...
52
4.3: Comparison of means between male and female communicative responses …………... 57
4.4: Standardized path coefficients and factor loadings for latent variable model ………….. 60
5.1: Matrix of variable correlations ………………………………………………………….
69
AA.1: Scale items and reliability coefficients for developed scales ………………………... 86

!
! ix!
LIST OF FIGURES
1.1: Conceptual relationships between identity formation, self-categorization, identity strength, psychological effects, and behavioral outcomes ……………………………………
4
3.1: Systematic associations between self-categorization and RT …………………………… 33
3.2: Change in communicative affect over the course of the video segments ……………….. 39
3.3: Change in mean heart rates during video segments ……………………………………... 41
3.4: Change in mean heart rates according to biological sex during the video segments ……. 42
4.1: General latent variable model with coefficients .………………………………………... 59

!
! x!
ABSTRACT
The study of sport fandom is undertaken in a variety of disciplines, including but not limited to
communication, psychology, sociology, economics, marketing and business. These
investigations are significant because of the ubiquitous presence of sport fandom in world culture
and its interdisciplinary adaptability in academia. To date however, there has not been a
consistent conceptual or operational definition of sport fandom and related factors such as
spectatorship, involvement and identification. Consequently, this lack of cohesiveness has
serious ramifications, including lack of comparability in results and an inability to generate
consistent evidence of the validity and reliability of the various self-report measures developed
and utilized. This investigation aims to contribute to the stability of the sport communication
field by applying previously refined scales (Keaton & Gearhart, 2013) and contributing to their
validity portfolios through comparison with a variety of cognitive, behavioral, and physiological
measures of team fandom. This endeavor will have multiple effects, namely the development of
more consistent and empirically supported operational constructs of sport fandom, recognition of
sport fandom’s antecedents and effects, and further understanding the role of communication in
this process. In service of these goals, current sport literature is reviewed, followed by an
overview of theoretical foundations. Afterwards, theoretical connections between these
constructs are posited. Next, the methods, procedures and manipulation checks are detailed,
followed by methods triangulation and hypothesis assessment. Finally, relevant theoretical
considerations are discussed.

!
! 1!
CHAPTER ONE THEORETICAL RATIONALE FOR CONCEPTUAL FRAMEWORK OF SPORT
FANDOM AND COMMUNICATION
Most of us have some notion of the factors that influence sport fandom and how these
factors cause us to feel and behave. Many individuals can bring to mind instances in which they
or others exhibited some sort of socially undesirable behavior as a result of viewing a sporting
contest. I can recall my father angrily throwing remote controls, yelling at rival players or
insulting the referees and rival teams’ fans. As a child, after John Elway led “The Drive” against
my Cleveland Browns, I remember not wishing to speak to others for days afterwards. Indeed,
as Stearns notes, “Spectator sports allow 20th- and 21st century men to vent emotions that they
know are normally inappropriate, despite greater acceptability in the past” (2008, p. 27). These
types of communicatively aggressive and avoidant emotions and behaviors as outcomes of sport
fandom only serve to exemplify its powerful role in our daily lives and its influence on our
communicative processes.
Of course, the results are not all negatively oriented. I can recollect joyfully making trips
to the mall to purchase entire arrays of merchandise intended to proclaim my allegiance to my
favorite teams, including clothing, posters, pennants, collector cards, action figures and games.
My family and friends gathered around the television to socialize and share the outcomes of the
contests with our team and with each other, experiencing a whole range of emotions. Even better
were the chances to see the games in person—whether at the stadium, arena, court, field or
rink—to be there with the team as they won or lost and to provide our own live play-by-play
commentary. These scenarios provided instances through which my parents modeled behavior
in regards to sport fandom, and these traits and characteristics were passed on to me through
reinforced social learning. Through them, and these social encounters, I formulated allegiance to

!
! 2!
family-endorsed teams, and continue to follow them today. These team allegiances affect how
often I view games, how much merchandise I purchase, how I feel, think, react physiologically
or emotionally, and how I communicate.
These examples only serve to elaborate on the ways in which sport fandom affects our
communication and other behavior, whether it is emotional or communicative output (Wann,
1994, 2006a; Wann et al., 2005; Wann, Melnick, Russell, & Pease, 2001; Wann, Peterson,
Cothran, & Dykes, 1999; Wann, Schrader, & Adamson, 1998), consumer involvement (Milne &
McDonald, 1999; Trail & James, 2002) or spectatorship (Earnheardt & Haridakis, 2009; Harris,
2004; Kahle, Kambara, & Rose, 1996; Milne & McDonald, 1999; Trail & James, 2002; Wann,
1995). However, behavior is not the only way in which individuals are affected by sport
fandom: There is also psychological involvement reflected through commitment and investment
that explains the extent to which sport fandom is part of an individual’s self-concept. These
psychological effects can be positive or negative, including myriad outcome variables such as
self-esteem, well-being, pride, self-enhancement (Branscombe & Wann, 1991; Wann, 1994,
2006a, 2006b; Wann, Carlson, & Schrader, 1999; Wann, Royalty, & Roberts, 2000), and
satisfaction or enjoyment. It is necessary to examine these psychological factors in tandem with
our resultant behaviors. The way we think, in other words, affects the way we act and feel;
therefore, factors that reflect both types of output—both psychological and behavioral—belong
in the larger conceptual framework of sport fandom. However, to only examine output ignores a
very important part of the equation in the study of sport fandom, namely its causality.
The causal nature of how sport fandom comes to be part of an individual’s self-concept
(i.e., identification) is commonly viewed through the lens of sport team fandom, which falls
under the larger umbrella of sport fandom in general. The antecedents of sport fandom, and

!
! 3!
hence team fandom, are crucial and largely neglected in favor of the consequences (Jacobson,
2003). One important contributory factor is geography (Wann, Tucker, & Schrader, 1996).
Communities (towns, cities, universities, neighborhoods, etc.) allow for the easy formation of
social in-groups around local sport teams that are reinforced and maintained through local news
outlets and advertising, as well as through opportunities for live spectatorship. The formation of
in-groups around sport team fandom also involves socialization, which can be defined as the
process through which an individual develops socially relevant behavior through interaction with
others (Zigler & Child, 1969). Because communicative interaction among individuals within and
between these resultant social groups is such an integral part of the formation of personal and
social identities, communication becomes a necessary focus in the study of sport team fandom.
Identity maintenance is necessarily a communicative phenomenon and involves a reciprocal
process of corroboration and opposition (Martin & Nakayama, 1997). The extent to which
individuals come to identify with a sport team heavily involves communicative acts both in terms
of causation and effect.
This research rests on a social identity approach (a combination of social identity and
self-categorization theories) and a conceptual notion of team fandom that relies on the following
underlying processes: Identity formation, self-categorization, identity strength, and psychological
involvement (Gearhart & Keaton, 2011; 2013; Keaton & Gearhart, 2013). This conceptual
notion asserts that the ways in which individuals come to identify with a specific sport team
(which is influenced by the aforementioned social factors and others such as family, geography,
team characteristics, performance, success and popularity) affect the tendency for an individual
to self-categorize as a sport fan and the magnitude that it becomes part of her or his self-concept.
This process leads to different sorts of behavioral motivations, levels of commitment, and levels

!
! 4!
of involvement. In turn, these processes—identity formation, self-categorization, and
psychological involvement—affect behavioral outcomes in a variety of forms such as
spectatorship choices, communicative style, emotional output, and psychological variation.
These results can manifest in the form of self-esteem, well-being, pride, self-enhancement and
enjoyment. The conceptual relationship between these variables can be viewed in Figure 1.1.
Figure 1.1: Conceptual relationships between identity formation, self-categorization, identity strength, psychological effects, and communicative and physiological outcomes The extent of individuals’ sport team fandom should be reflected through their
socialization, which manifests for sport team fans through team identity formation. Team
identity formation, in turn, influences tendencies to self-categorize as a fan and the extent to
which team fandom is part of one’s self-concepts (Path B). These processes (identity formation,
self-categorization, and identity strength) shape actual communicative, behavioral, and
physiological output (Paths C and E) and psychological involvement (Paths A and D).

!
! 5!
Psychological involvement is represented by self-actualized feelings of accomplishment, self-
esteem, commitment, and involvement. Verbal and non-verbal behaviors are represented
through observable responses to spectator scenarios, including affective verbal responses and
involuntary nonverbal reactions such as facial expressions and gestures.
This dissertation does a critical examination of these variables by administering self-
report scales specifically designed to measure the most common aspects of sport team fandom
and assessing the extent of association with cognitive, behavioral (communicative), and
physiological processes. These scales (Keaton & Gearhart, 2013; see Appendix A) measure
exogenous social factors affecting team identity formation and psychological involvement. It is
important to note that these processes are fundamentally diverse (causal, behavioral and
cognitive) and potentially require more than one method to assess: A process that measures
causality will likely be different from a study that measures effects because they do not occur at
the same time. In other words, different methods should be necessary to measure what happened
in the past (how individuals come to identify with sport teams) as compared to their present
identities (self-categorization) and how probable something is to happen in the future (behavior,
investment, commitment). This dissertation focuses on the more specific process of sport team
fandom that fall under the more extensive reach of sport fandom in general. The following
section is a brief discussion of the theoretical foundation underlying the necessity for studying
sport team fandom and the important role communication plays in terms of cause and effect.
Social Learning and Identity Theories
Social learning theory (SLT; Bandura, 1977), social identity theory (SIT; Tajfel, 1970,
1978, 1981; Tajfel & Turner, 1978, 1979; Turner, 1984), self-categorization (Hogg & Reid,
2006; Onorato & Turner, 2004; Turner, Hogg, Oakes, Reicher, & Wetherell, 1987) and self-

!
! 6!
schemata (Markus, 1977) comprise the theoretical underpinnings of sport team fan identity and
its antecedents that affect psychological and behavioral outcomes. As with many social
scientific theories, no one theory completely explains all of the variance in terms of an outcome
involving sport team fandom (Wann, 1997). However, team identity formation is deeply rooted
in social learning, and these processes affect behavioral and psychological outcomes.
Social Learning
SLT maintains that social learning transpires through close contact with others, imitation
of authority figures, comprehension of concepts, and role model behavior. This process involves
both cognitive and behavioral activity and one of its main assertions is that the environment
strongly influences behavior. The “environment” is an inclusive referent that incorporates the
effects of family, peer groups, and community culture (e.g., living in New Orleans and rooting
for the Saints or Pelicans). Individuals tend to avoid aversive stimuli and interactions with others
in which they perceive high probability of a negative outcome. Conversely, if a person believes
that a positive outcome is more probable, s/he will be more likely to engage in the behavior and
in that way the likelihood that s/he will repeat that particular behavior is reinforced and more
probable in the future. These assertions also do not dismiss cognitive processes (learning) that
influence behavior. Consequently the ability to retain what one has observed, reproduce the
behavior, and have a good reason (motivation) to do so become essential to identity. SLT is
important to the study of sport team fandom because it suggests a combination of
communicative, cognitive, and psychological factors, and hence becomes hugely influential in
regards to the communicative choices individuals make in behavioral scenarios involving sport
team fandom.

!
! 7!
Social learning is also salient in regards to the connection between fan loyalty and sport
team identity formation (Funk & James, 2001; Trail & James, 2002; Wann, 1995). It is even
more important when considering that there is a direct link between the age at which an
individual comes to become identified as a sport team fan and the amount of time s/he invests in
that team as an adult (Karastamitis, 2009). This association indicates that becoming a sport team
fan during early stages of development affects the magnitude of sport team fandom after
maturity. In fact, around half of all adults come to be indoctrinated into sport team fandom
during these early stages, roughly between the ages of six and eight. The frequency is even
higher if the age range is extended to 11 years. These findings clearly indicate the importance of
socialization on sport team identity formation.
Identity
Social identity theory (SIT) suggests that individuals use social groups and group
memberships to maintain and support their personal and collective identities (Hogg, Terry, &
White, 1995). Tajfel (1981) found that identity is also a function of the value and emotional
attachment placed on a particular group membership. As SLT proposes, individuals tend to
gravitate towards positive outcomes and therefore strive to maintain corresponding social
identities, which are primarily evaluated through comparisons to individual group members and
non-members. These evaluations involve self-schemata and other information the individual
catalogues concerning the identity salient situation.
Self-schemata are beliefs and attitudes that individuals hold about the self (Markus,
1977). This idea is integral to sport team fandom in that this dissertation is interested in the self-
categorization of sport team fans, the magnitude to which individuals believe themselves to be
fans of a team, to what degree it is part of their self-concepts, and the degree to which it

!
! 8!
contributes to their behaviors. Strong sport team fans might self label as loyal or committed,
which would in turn influence their actual (communicative) behaviors according to how they
perceive themselves in different situations regarding sport teams. Therefore, self-schemata play
a crucial role in the development of social identity through what defines self in a personal sense
and through what parts of their identities are selected and portrayed to others socially.
Social identity is that part of an individual’s self-concept derived from association with or
membership in a social group (Hogg & Vaughan, 2002; Turner & Oakes, 1986), for example
social groups formed around sport team fandom. SIT was originally posited to explain the
intergroup behavior of individuals (Tajfel & Turner, 1978, 1979). Self-categorization theory was
developed from SIT to explain the general role of self in regards to group processes. The
combined application of SIT and self-categorization is termed social identity approach (Haslam,
2001; Postmes & Branscombe, 2010) and is more applicable to this study than either alone
because a study of sport team fandom should ultimately be interested in examining the causes for
behavior between individuals belonging to these resultant social groups.
In these scenarios, identity contains two major components: Personal and social.
Personal identity (what is me and not me) is one’s definition of self and contributes to social
identity (we versus them) via self-categorization in social groups. Individuals assess their in-
group by comparing it with rival out-groups. If the comparison is favorable it leads to satisfied
social identity; if the evaluation is complimentary to the out-group then it leads to a dissatisfied
social identity. Sport team fandom involves self-categorization as fans of specific teams or
athletes on those teams, which results in social groups revolving around shared common sport
team fandom with other individuals. For instance, some sport team fans congregate together at
bars to root for their shared favorite team together. Fans of rival teams become out-groups for
!
! 9!
comparison with one’s own social group. If a fan of a rival sport team came to the same bar, the
way that individual is perceived is then defined by her or his sport team fandom. The way the
team performs and succeeds will affect the participants cognitively, psychologically and
behaviorally (e.g., displays of verbal and nonverbal communication). The ramification of these
affiliations should become clear through the extent an individual self-categorizes as a sport team
fan, the strength of that identity, the level of her or his involvement, and the way s/he
communicates with those that share sport team fandom and those who do not.
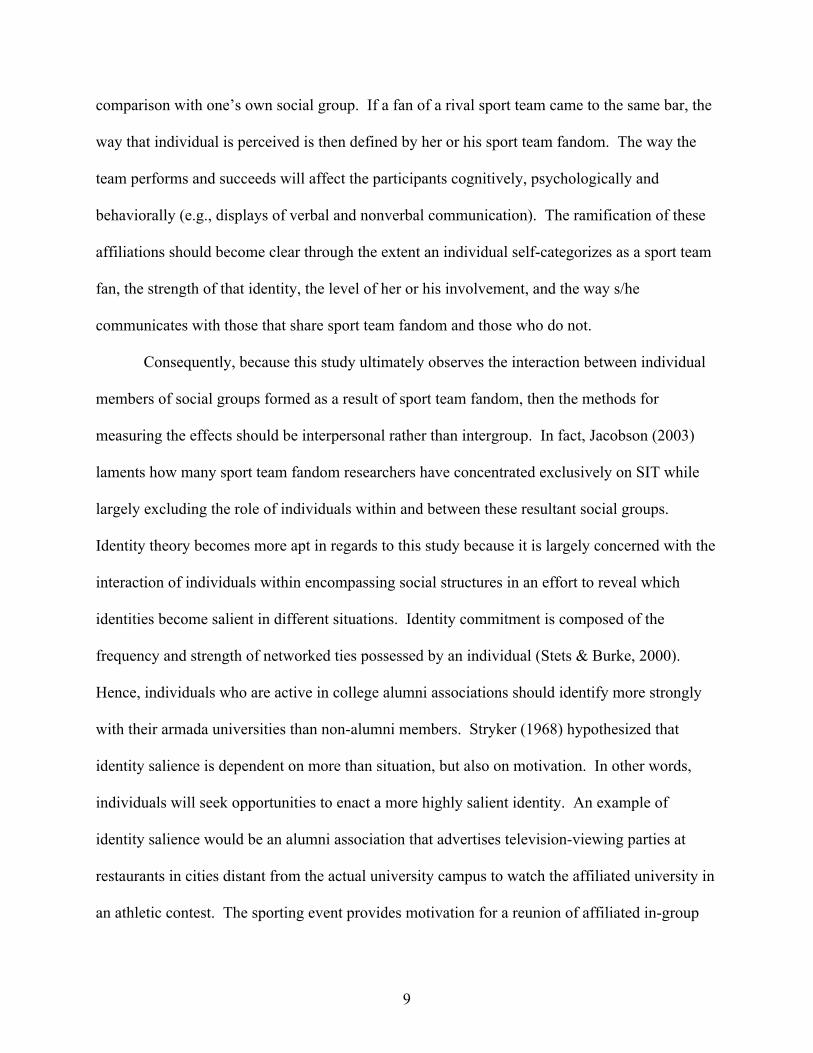
Consequently, because this study ultimately observes the interaction between individual
members of social groups formed as a result of sport team fandom, then the methods for
measuring the effects should be interpersonal rather than intergroup. In fact, Jacobson (2003)
laments how many sport team fandom researchers have concentrated exclusively on SIT while
largely excluding the role of individuals within and between these resultant social groups.
Identity theory becomes more apt in regards to this study because it is largely concerned with the
interaction of individuals within encompassing social structures in an effort to reveal which
identities become salient in different situations. Identity commitment is composed of the
frequency and strength of networked ties possessed by an individual (Stets & Burke, 2000).
Hence, individuals who are active in college alumni associations should identify more strongly
with their armada universities than non-alumni members. Stryker (1968) hypothesized that
identity salience is dependent on more than situation, but also on motivation. In other words,
individuals will seek opportunities to enact a more highly salient identity. An example of
identity salience would be an alumni association that advertises television-viewing parties at
restaurants in cities distant from the actual university campus to watch the affiliated university in
an athletic contest. The sporting event provides motivation for a reunion of affiliated in-group

!
! 10!
members, displaying that identities need more than situational initiation, but also impetus to
implement them.
The formation of identity obliges an individual to define self in terms of social
relationships. When a fan forms an identity around a sport team, he or she will likely create both
personal and social identities. Identity theory investigates why individuals make these choices.
Therefore, sport team identity formation and the specific interactions that contribute to those
identities come to the theoretical foreground. Within the parameters outlined by these theories,
personal identities are a result of self-classifications, which are in turn influenced by
interpersonal resemblance and disparity as compared to other group members. Identity theory
explains why individuals may diverge from sport team affiliations held by their parents when
they move away and formulate new identities in other communities. These personal identities
are exclusive to the individual and crucial factors such as geography and socialization become
differentially associated per fan.
In conclusion, social identity theory involves the study of social groups formed as a result
of socialization. If the study of team fandom were to apply SIT exclusively, it would primarily
be interested in the interaction between groups of individuals sharing sport team fandom.
However, because this study is an examination of cognition and communicative output between
individual participants, it will apply a framework utilizing identity theory and a social identity
approach that focuses on communicative behavior between representative individual members of
groups formed through sport team fan socialization, both shared and competitive.
Problem Statement: Inconsistent Definition of Fandom and Reliance on Self-Report
At present there have not been consistent conceptual definitions or operational
measurements of sport team fandom. This lack of cohesiveness has grave ramifications,

!
! 11!
including the inability of researchers to compare results. Previous efforts at measuring sport
team fandom constructs have been contrasting and incongruous, and at the least confusing, with
fandom applied interchangeably with other expressions such as identification, involvement and
spectatorship. These terms are related to each other and to sport team fandom in general, but do
not fully explain sport team fandom alone. These terms are also challenging because they do not
occur concurrently: Some are contributory and some are consequential. This problem is outlined
and addressed at length in Appendix A (Keaton & Gearhart, 2013b), with the result being three
measurement scales reflecting distinct processes of sport team fandom: Sport team identity
formation, spectatorship motives, and psychological commitment. At the conclusion of this
study—after assessing the relevant self-report measures (developed in Appendix A) in regards to
cognitive, behavioral, and physiological responses—a more comprehensive empirically
supported operational definition of sport team fandom will be advanced.
Additionally, many published studies on sport team fandom rely solely on self-report.
While self-report may be useful, it is not sufficient evidence in favor of the validity of a
construct, model or scale (Kotowski, Levine, Baker, & Bolt, 2009). Because validity is a
continuous variable, a strong demonstration of the validity of a construct requires several forms
of evidence (Campbell & Fiske, 1959; Nunnally & Bernstein, 1994). These forms of evidence
contribute to the validity portfolio of a construct and include—among others—factor analysis
and nomological networks. Factor analysis (exploratory and confirmatory) is used to assess
dimensionality of scales (and this process was undertaken in Appendix A). Nomological
networks hypothesize correlations amongst different measures of similar constructs and assess
the extent that the results match the theoretical predictions. This dissertation utilizes both of
these techniques.

!
! 12!
The ways in which salient social identities influence self-report measures regardless of
personal self-schemata (Onorato & Turner, 2004) display the need for research in sport
communication to go beyond self-report measures. Self-report—while certainly at times
yielding useful data depending on the scope of a particular study—may or may not correlate with
actual cognitive process of formulating and performing identity, physiological arousal, affective
response, or communicative behaviors. For example, some college students may not necessarily
self-categorize as fans of the sport teams of their universities but may see it as socially beneficial
to claim that fandom in social settings, thus self-reporting but not strongly identifying.
Consequently, these types of individuals would not likely have the same motives for behavior
(spectatorship, consumerism, communication), experience the same psychological involvement
and commitment (highly identified fans are more involved and committed to their sport team), or
exhibit the equivalent physiological or affective responses as a fan who is more highly involved
(i.e., higher arousal states). Social identity becomes more salient in these instances of self-report
and is often context based (Onorato & Turner, 2004). However, the extent individuals actually
self-categorize as sport team fans should be revealed through measurement of more stable
cognitive measures such as the selection of trait characteristics and the response latencies for
those choices, behavioral results including observation of verbal and nonverbal reactions to
sporting outcomes, and physiological correlates such as heart rate.
Accordingly, a study of sport team fandom utilizing SIT and self-categorization
perspectives should consider these crucial processes: The ways in which individuals come to
identify with a team, their self-categorization as fans of the team, to what degree they identify
with that team, communicative antecedents and effects, affective outcomes, and psychological
involvement. Thus, the conceptual relationships presented in Figure 1.1 are proposed to

!
! 13!
represent relationships between these variables of interest. There are five primary paths of
relevance in the model that reflect previous findings. Each of these paths will be discussed
further in Chapter 2 according to its label in Figure 1.1.
In summary, individual fans of a sport team might choose these teams as their favorites
and then begin to self-label themselves as sport team fans (such as a college student attending a
university). Sport team fans have schema for loyalty and/or commitment, which influence
communicative behaviors according to how they perceive themselves in different situations
regarding sport teams (as in a rival fan walking into a bar on campus and being collectively
taunted). Therefore, self-schemata for character traits such as loyalty and commitment play
crucial roles in the development of social identity. Strength of identification differentially affects
behavioral, physiological, affective, and psychological outcomes.
Chapter 2 will provide a rationale for hypotheses to be tested from Figure 1.1. Chapter 3
will describe methods, procedures, and manipulation checks designed to test the links in Figure
1.1. Chapter 4 will provide the results of testing the model and the hypotheses. Chapter 5 will
discuss the hypotheses and the implications of the model.

!
! 14!
CHAPTER 2 HYPOTHESES, RESEARCH QUESTION, AND RATIONALE
Identity formation is the first potential causal association in the sport team fandom and
communication model, typically occurring in developmental years and affected by socialization
and social learning. First, connections between identity formation and psychological outcomes
will be asserted, followed by identity formation and self-categorization. Third, hypotheses
concerning identity formation and communicative and physiological responses will be posited.
Self-categorization and identity strength are the second prospective contributory factors
in the model. Links between self-categorization and psychological outcomes are advanced first,
followed by self-categorization and communicative and physiological outcomes. Finally, the
ramifications of biological sex are considered, and a research question is posed to address them.
Path A: Link between Identity Formation and Psychological Outcomes
The effects of different types of sport team identification have been associated with
psychological outcome variables such as self-esteem and well-being. For instance, identification
with a sport team has been found to act as a barrier against feelings of depression and
estrangement, especially in situations where individuals have been geographically mobile and the
ties to their original community are diminished by distance (Branscombe & Wann, 1991).
Furthermore, sport team identification enhances feelings of belonging, self worth, and positive
psychological health (Wann, 2006b).
Additionally, in situations where individuals move away from home, sport team identity
replaces family and community attachment (Branscombe & Wann, 1991). Indeed, sport team
identity is a vicarious mechanism used to increase pride and self-concept, used to enhance a
person’s public image by displaying an affiliation with a positive source (i.e., a successful team;

!
! 15!
see Cialdini et al., 1976); it leads to greater collective group esteem amongst those sport team
fans (Wann, 1994). Subsequently, sport team fans more influenced by geography and family
who use the sport team to replace these identity affiliations should exhibit more positive
psychological outcomes than those who do not. Conversely, sport team fans choosing their sport
teams because of media popularity tend to be less strongly identified (Gearhart & Keaton, 2011)
and low sport team identification is associated with a disinclination for displaying sport team
identity in social situations. In other words, “fair-weather” sport team fans are not as committed
or invested, and therefore are not as likely to proclaim their affiliations publically or to
experience the psychological health benefits exhibited by more strongly identified sport team
fans (Wann & Branscombe, 1990). Accordingly, these hypotheses are forwarded:
H1A: Sport team identity formation factors of player performance, team or player
characteristics, family, and geography are positively associated with
psychological effects.
H1B: The sport team identity formation factor of media popularity is not associated
with psychological effects.
Path B: Link between Identity Formation and Self-Categorization
Many studies suggest that sport team identity factors are associated with commitment and
involvement with a sport team. Team or player characteristics, social indicators such as family
or geography, and sport team success have all been found to differentially relate to sport team
identification. Previous research has identified the links between self-categorization and identity
strength, and it is intuitive that these conceptual variables are highly related (Wann et al., 2000).
Therefore, sport team or sport organization characteristics (Sutton, McDonald, Milne, &
Cimperman, 1997), social indicators such as family and geography (Gearhart & Keaton, 2011),

!
! 16!
and player performance (Wann et al., 1996) should all affect self-categorization and the
subsequent magnitude of that identification.
On the other hand, sport team fans who formulate sport team identity on account of the
popularity or success of the sport team alone are inclined to be less strongly identified (Gearhart
& Keaton, 2011). Weak or nonexistent sport team identification is not associated with a
tendency to perform sport team fan identity publically and these individuals are not as
psychologically connected (Wann & Branscombe, 1990). Therefore, the following hypotheses
are advanced concerning sport team identification processes, self-categorization, and strength of
identification:
H2A: Sport team identity formation factors of player performance, team or player
characteristics, family, and geography are associated with more frequent self-
categorization as a sport team fan and stronger sport team identity.
H2B: The sport team identity formation factor of media popularity is not associated
with more frequent self-categorization as a sport team fan or stronger sport team
identity.
Path C: Link between Identity Formation and Communicative/Physiological Outcomes
Other important behavioral and physiological outcomes of sport team identification and
the ways in which it was formulated have been isolated. These connections to sport teams lead
to various effects as a result of viewing sporting events, and highly identified sport team fans act
differently both affectively and behaviorally in response to spectatorship than non-sport team
fans (Gantz & Wenner, 1995) or mere spectators (Zillmann & Paulus, 1993). For instance,
affective responses to spectatorship influence consumer satisfaction, and these types of
individuals are more likely to repurchase merchandise (Mano & Oliver, 1993; Oliver, 1993;

!
! 17!
Westbrook & Oliver, 1991), attend live events, and be more motivated to discuss their
experiences via word-of-mouth communication (Oliver, 1994).
Both positive (Raney, 2003; Zillmann, Bryant, & Sapolsky, 1989) and negative (Gearhart
& Keaton, 2011; 2013; Keaton & Gearhart, 2013) reactions to sporting outcomes have been well
documented and sport team identification has been found to have a dominant influence on many
types of affective responses such as anger, discouragement, frustration, irritation, anger, grief,
hostility, joy, and satisfaction (Madrigal, 1995, 2003; Wann & Branscombe, 1992; Wann,
Royalty, & Rochelle, 2002). Moreover, sport team fans who are influenced by sport team
popularity, image, and success in their identification process are less prone to attend games when
the team is losing (Baade & Tiehen, 1990; Becker & Suls, 1983) because the phenomena ceases
to raise their esteem in the eyes of others (Heider, 1958). Consequently, they are less likely to
experience affect because they have protected their egos by removing the negative stimulus of
the losing team. Therefore hypotheses are posited to answer questions concerning the effects of
sport team identity on communication and affective outcome variables:
H3A: Sport team identity formation factors of player performance, team or player
characteristics, family, and geography are positively associated with observable
affective and communicative behaviors in response to sport team spectatorship.
H3B: The sport team identity formation factor of media popularity is not associated
with observable affective and communicative behaviors in response to
sport team spectatorship.
Path D: Link between Self-Categorization and Psychological Outcomes
Previous studies have also undertaken to measure the extent of how highly or lowly
identified or self-categorized a sport team fan is (Capella, 2002; Wann, 2002; Wann &

!
! 18!
Branscombe, 1993; Wann et al., 2000). Self-categorization itself can be a nominal or ordinal
variable often measured using dichotomous yes/no scales or count data. Another facet, however,
is the strength of that resultant sport team identity. As noted, sport team identity is often used to
enhance a person’s public image by displaying an affiliation with a positive source (i.e., a
successful team; see Cialdini et al., 1976) and sport team identity essentially leads to greater
collective group esteem amongst more strongly identified sport team fans (Wann, 1994).
As noted previously, many other researchers have measured the effects of sport team
identification on a variety of psychological outcome variables, such as reducing feelings of
depression and estrangement (Branscombe & Wann, 1991), enhancing feelings of belonging, self
worth, positive psychological health (Wann, 2006b), and a person’s public image (Cialdini et al.,
1976). Sport team identification also leads to greater collective group esteem amongst those
sport team fans (Wann, 1994). Stronger identification, then, leads to more positive
psychological outcomes, but self-esteem has also been associated with how quickly individuals
self-categorize, which is an indicator of identity strength (Wann et al., 2000). Therefore:
H4: Self-categorization as sport team fan and strength of sport team identification are
positively associated with psychological effects.
Path E: Link between Self-Categorization and Communicative/Physiological Outcomes
A communicative perspective of sport team identity maintains that the self does not
create an identity unaided, but through communication with others in an interactive, mutual
process of corroboration and/or disagreement (Martin & Nakayama, 1997). In other words, after
identities are created, they become salient when messages are exchanged between individuals;
they are negotiated, reinforced, contested, performed and progressed through communication in
interpersonal situations (Collier, 1994). Communicator style and performance of identity in

!
! 19!
other contexts is easily extrapolated to sport team fandom. Sport spectatorship can impact
behavioral responses in the forms of communicatively avoidant and verbally aggressive acts
(during spectatorship), which also impact communicative and behavioral responses of other
attendees (M. C. Duncan, 1983; M. C. Duncan & Brummett, 1989; Gantz, 1981; Hemphill, 1995;
Wenner & Gantz, 1989). In particular, these preferences in reaction to sport teams are often
negatively aggressive, even involving outright hostility (Branscombe & Wann, 1992; Gearhart &
Keaton, 2011; Wann & Branscombe, 1992).
Examples of aggressive acts include Infante and Wigley’s (1986) verbal aggression
behaviors such as yelling and/or obscenities. It is interesting that Gottman’s (1993) discussion of
contempt applies to negative communication behaviors at sporting events. Individuals may roll
their eyes at controversial calls that go against their teams, furrow their brows, or clench their
teeth. Additionally, they also show signs of verbal contempt through sarcasm, ridicule, and
taunting. The relationship between sport consumption and communicative output has been
documented in the form of verbal aggression (taunting opposing fans, yelling at players and
coaches, shouting obscenities) and communicative avoidance (Gearhart & Keaton, 2011; Wann
et al., 2001). Therefore, individuals’ strength of sport team identity should display an
association to these types of socially undesirable communicative output:
H5: Strength of sport team identification is positively associated with contempt in the
form of aggressive and avoidant communicative responses to sporting outcomes.
Social identity is reinforced when individuals share characteristics such as knowledge,
tradition, values, behaviors and feelings acquired through shared sport team fandom. These
characteristics allow sport team identification to become a part of self-concept along with others
such as age, sex, biological sex, occupation, nationality, religion and political affiliation. Similar

!
! 20!
communicative patterns should emerge as individuals discuss, fortify, dispute, endorse and
expand their self-concept through sport team identification and therefore traditions, customs,
values, behaviors, feelings and communication patterns should also become evident.
Communicative outcomes are affected by socialization and self-concept and in turn influence
behavior. Hence, a variety of communicative responses should prove to be affected by sport
team identification. Therefore, not only should aggressive and/or avoidant reactions result from
strong sport team identification, but others involving self-esteem, well-being, satisfaction, and
other affective responses such as sadness or grief (Branscombe & Wann, 1991; Madrigal, 1995,
2003; Raney, 2003; Wann, 1994, 2006a, 2006b; Wann & Branscombe, 1992; Wann, Carlson, et
al., 1999; Wann et al., 2000; Wann et al., 2002; Zillmann et al., 1989). Therefore:
H6: Strength of sport team identification is positively associated with joyful and
sad communicative responses.
Other outcomes of sport behavior are also crucial, such as affective outcomes positive in
nature (Sloan, 1979; Zillmann et al., 1989) and potentially harmful (Branscombe & Wann, 1992;
Gearhart & Keaton, 2011; 2013; Keaton & Gearhart, 2013b; Wann & Branscombe, 1992).1
Additionally, the way in which the causes and effects of sport team fandom are associated with
physiology is an important part of the equation. Increased levels of physiological arousal have
been demonstrated to have an association with spectator violence (Branscombe & Wann, 1992),
in particular the change in diastolic and systolic blood pressure from pre to post-viewing of a
sporting event. Lowly identified sport team fans experienced no change while highly identified
sport team fans did. Arousal also predicts derogatory attitudes towards rival fans. These
!!!!!!!!!!!!!!!!!!!!!!!!!!!!!!!!!!!!!!!!!!!!!!!!!!!!!!!!1Referring to emotions as positive and negative refers to a continuum and not an assignment of value. These labels should be distinguished from those assigned to positive or negative behavioral or psychological outcomes.!

!
! 21!
observations point to the fact that individuals who strongly incorporate sport teams into their
self-concepts can experience heightened physiological responses, which also indicate a tendency
towards emotions associated with arousal such as anguish, anger, and excitement (Lövheim,
2012). Because of the aforementioned associations between sport team identification, out-group
bias (an indicator of self-concept and self-categorization), spectatorship motives, and
physiological arousal, the following hypothesis is posited:
H7: Emotions associated with increased physiological arousal—anguish, anger and
excitement—are positively associated with self-categorization as a sport team fan.
And lastly, because this study examines communicative behaviors in social contexts, it
would be remiss not to surmise about sex-based displays of verbal and nonverbal
communication. Women are typically socialized in the US to be more pleasant and conciliatory
from fear of exclusion (see Brown & Gilligan, 1993) and differences in expressions of contempt
have been found to be highly observable (Underwood, 2004). Women are more likely to convey
anger and contempt nonverbally and men have been found to be more defensive and less
expressive (Carstensen, Gottman, & Levenson, 1995).
However, factors involving sport have not always aligned with these findings about sex-
based communication. Sport team identification has not been found to be different between men
and women either in its factors of influence (Wann et al., 1996), its magnitude (Wann et al.,
2002), its effects on self-esteem (Wann et al., 2000), or its influence on post-game affect (Wann
et al., 2002). On the other hand, there have been notable differences in fan motivation, with men
more influenced by eustress, self-esteem, escape, entertainment, and aesthetics, while women
were more swayed by family in their tendency to follow sport (Wann, 1995). Hence, because of

!
! 22!
the mixed results of findings this study asks whether males and females experience different
communicative, affective, and physiological responses in reaction to sport:
RQ1: Do women and men have different communicative, affective, and physiological
responses to sport team outcomes?
Conclusion
The theoretical underpinnings of sport team fandom, including social learning theory,
social identity theory, self-categorization, and self-schemata, should all remain salient in a model
of sport team fandom that includes identity formation, self-categorization, identity strength,
commitment, involvement, behavioral output, psychological output, and physiological output.
Previous research supports the theoretical position of a model that includes five crucial
relationships. The first is that identity formation should be related to psychological involvement.
Second, identity formation should also be related to behavior, affect, and physiological
responses. Third, identity formation should be related to an individual’s tendency to self-
categorize as a sport team fan and the strength of that identity. Fourth and fifth, self-
categorization and strength of sport team identity should be related to psychological involvement
and behavioral/affective/physiological responses respectively.
Furthermore, this model should help alleviate confusion in sport research surrounding the
conceptual and operational notions of sport fandom and sport team fandom that previously
included identification, involvement, and spectatorship in various forms. This research agenda
should clarify these relationships to greater extent. The next chapter discusses the methodology
for testing these hypotheses and the research question.!

!
! 23!
CHAPTER THREE METHODS, PROCEDURES, AND MANIPULATION CHECKS
This chapter describes the methods and procedures for the four methods used to gather
data for this research and provide manipulation checks for each of the methods. In a previous,
separate study, self-report measures were developed (see Appendix A for a summary of this
process) to tap into aspects of self-reported sport team fandom (Method 1: Team identity
formation and psychological involvement; Keaton & Gearhart, 2013a). These scales were
administered to every person who participated and they are described along with their
psychometric properties.
Self-categorization and strength of identity were measured through selection of trait
adjectives and reaction time (RT; Method 2). Participants then returned to the lab within two
weeks to watch a series of highlight and lowlight videos of the Louisiana State University (LSU)
football team’s 2011 season. These instances of spectatorship were recorded and coded for
communication style and affective responses to satisfy the behavioral component of the design
(Method 3). The coding methods are outlined below. This phase also consisted of physiological
measurement (heart rate beats per minute: Method 4) during spectatorship to calculate the extent
that physiology displays an association to self-reported sport team fandom and cognitive
processes of sport team identification. The results of manipulation checks for all four methods
are reported in the order outlined above followed by a brief discussion.
Participants and Power Analysis
College students attending the Louisiana State University were recruited via an online
scheduling system. They were able to select from a variety of research credit opportunities. All
students received two credits of required research credit for their participation. All data collected

!
! 24!
were confidential, all students provided informed consent, and the appropriate Institutional
Review Board approved all procedures.
Before fitting any measurement models, data were inspected for violations of multivariate
assumptions (Tabachnick & Fidell, 2007). One observation displayed standardized residuals
greater than 2.0 in absolute value and 14 observations qualified as multivariate outliers
(Mahalanobis Distance > 174.81, p < .001). These 15 observations were deleted to avoid
inflated values. Additionally, 20 observations were removed that contained missing or
incomplete data. One hundred sixty seven participants were removed who did not complete all
four methods (self-report, cognitive, behavioral, physiological). The final sample included 203
participants (nmale = 104, nfemale = 98, one not indicated, Mage = 19.98, SDage = 1.98, rangeage = 18
to 34 years). The racial composition was distributed amongst Caucasians (73.9%), African-
Americans (12.81%), Latinos (4.43%), those of Asian descent (2.96%), and “other” (0.06%).
A post hoc power analysis was conducted using the G*Power software (Faul, Erdfelder,
Lang, & Buchner, 2007). The sample size (N = 203) was used to conduct the analysis for
recommended small (f = .10), medium (f = .30), and large (f = .50) correlations at the p < .05
levels (see Cohen, 1988). The evaluation showed that the statistical power for this sample was
.41 to detect small effects and exceeded .99 for medium and large effects. Therefore, if the
effect sizes are small, Type II error is possible in the case of nonsignificant findings. The sample
meets expectations to detect moderate to large effect sizes for bivariate correlations.
Self-Report (Method 1)
Procedures
All participants were first administered two self-report scales (Method 1) towards
evaluating H1 (Path A), H2 (Path B), H3 (Path C), and H4 (Path D): The Causation of Sport Team

!
! 25!
Identification Scale (C-STIS; Keaton & Gearhart, 2013a) and the Scale of Sport Spectatorship
Motives (SSMS; Keaton & Gearhart, 2013a). Commonly used fit indexes and evaluation
thresholds were used to assess the capacity of the scales to represent the current data: The
comparative fit index (CFI) above .90, the standardized root mean square residual (SRMR)
below .10 and the root mean square error of approximation (RMSEA) below .08.
To appraise the extent that the extant scales accurately represented the bivariate
relationships between scale items, the standardized residual covariance matrix was inspected for
values over two in absolute value. Details associated with these statistics can be located in an
array of sources (e.g., Byrne, 2010; Hoyle, 2000; Hu & Bentler, 1999; Kline, 2005; Raykov &
Marcoulides, 2006). Finally, internal consistencies of the scales and their factors were evaluated
utilizing Cronbach’s alpha.
Psychometrics and Manipulation Checks
Causation of Team Identification Scale. The first scale of exogenous factors of social
influence describes the ways in which individuals come to identify with a sport team and
contains 22 items across five latent constructs: Media Popularity (e.g., I chose my favorite team
because they are popular; n = 4; α = .86), Geography (e.g., I am a fan of this team because it is
an important connection between me and my hometown or university; n = 5; α = .87), Family (I
chose my favorite team because my parents and/or family follow this team; n = 5; α = .93),
Athletic Performance (e.g., I enjoy a skillful performance by the team; n = 4; α = .85) and Team
Characteristics (e.g., I chose my favorite team because I like their reputation/image; n = 4; α =
.78). The measurement scale represented the data well, χ2(220) = 367.85, p < .000, CFI = .94,
SRMR = .09, RMSEA = .06.

!
! 26!
The inter-factor correlations between the subscales of the C-STIS were all small to
moderate and—outside one exception—ranged from .20 to .45 (see Table 3.1 for a complete
list). Moderate associations (.50 > x > .30; see Cohen, 1988) between subscales occurred
between Family and Geography (r = .45, p < .000, r2 = .20) as well as Athletic Performance and
Team Characteristics (r = .45, p < .000, r2 = .20).
Table 3.1: Correlation matrix between and within measurement scales
C-STIS STPCS Method MP G F AP TC SA C I C-STIS Media Popularity -- Geography .35* -- Family .35* .45* -- Athletic Performance -.01 .26* .24* -- Team Characteristics .33* .20* .35* .45* -- STPCS Self-Actualization .33* .22* .34* .31* .42* -- Commitment .38* .11 .12* -.11 .12* .34* -- Investment .34* .16* .30* .18* .25* .59* .47* -- NOTE: An asterisk indicates statistical significance at the p < .05 level for a non-directonal hypothesis; MP = Media Popularity; G = Geography; F = Family; AP = Athletic Performance; TC = Team Characteristics; SA = Self Actualization; C = Commitment; I = Investment
These relationships showed moderate systematic change between family and geography,
and between athletic performance and team characteristics. In the case of the former, it is an
intuitive finding because family and community are interrelated concepts occuring oftentimes in
the same places at the same time. Examples of this occasion might be a family going to a high
school football game together or cheering for the same college team that exists in the same home
state or city (i.e., being from Baton Rouge and rooting for the LSU Tigers). In the example of
the latter, both factors describe specific dealings with the team itself that are definitely separate
(a player is a person, compared with the traits of the team itself, which is more abstract) but also

!
! 27!
related in scope. After all, a tough player such as Ray Lewis may also contribute to the tough
image of the Baltimore Ravens.
Moderate correlation between Family and Team Characteristics (r = .35, p < .000, r2 =
.12) indicate that those influenced by family are affected by the characteristics of the sport team
to similar magnitudes during sport team identity formation. This association also seems
intuitive, because if families are going through sport team identification together, they are
making decisions about the sport teams together, likely in the form of discussion and argument.
Media Popularity moderately related to Geography (r = .35, p < .000, r2 = .12), Family (r = .35, p
< .000, r2 = .12, and Team Characteristics (r = .33, p < .000, r2 = .11), but not to athletic
performance (r = -.01, p < .95, r2 = .0001). The result of these relationships with the popularity
of a sport team in the media is not surprising at all in the case of family and geography, for if
families are forming sport team identities together in the same place, then they are subject to the
same media campaigns in the same geographical proximity (i.e., residents of southeastern
Louisiana being affected by the New Orleans Pelicans’ advertising campaigns involving ticket
deals on local television and radio).
Less clear is the correlation between the popularity of the sport team in the media and its
characteristics until you consider that it may be the media outlets that are contributing to the
perceptions of the sport teams by the consumers. The most surprising outcome may be the
complete lack of systematic fluctuation between the popularity of a sport team in media and the
performance of the athletes on the sport team. The lack of mutual effect suggests that those who
chose to identify with a sport team because it is popular did not concern themselves with the
performance of the specific players. Perhaps this closer attention to detail is reflected in a

!
! 28!
different type of sport team fan, for those who do pay attention to athletic performance do not
seem to be swayed by how popular the sport team is in the media.
Small correlations (.30 > x > .10) were displayed between Geography and Team
Characteristics (r = .20, p < .004, r2 = .04), Geography and Athletic Performance (r = .26, p <
.000, r2 = .07, and Family and Athletic Performance (r = .24, p < .001, r2 = .06). The reciprocal
influence of family and geography, when paired with the athletic performances and
characteristics of the sport team, contributed nominally—but significantly—in tandem on an
individual’s sport team identity formation. Given the previously expounded relationships, these
correlations are reasonable.
Sport Team Psychological Commitment Scale. The second scale contains factors
pertinent to psychological involvement with three latent constructs and 15 items: Self-
Actualization (e.g., Being a spectator of my favorite sport helps me to develop and grow as a
person; n = 5; α = .91), Commitment (e.g., I have stopped following a team because I had too
many commitments and/or I simply did not have time; n = 6; α = .89) and Investment (e.g., I
continue to be a fan of this team because it would be very stressful for me to openly discontinue
my association with this team; n = 4; α = .81). The measurement scale replicated a covariance
matrix well, χ2(87) = 197.72, p < .000, CFI = .93, SRMR = .09, RMSEA = .08, CI90% = .07,
.10.
The three factors of this scale deal with psychological aspects of sport team fandom, such
as the benefits of being a spectator of sport teams, reasons why individuals stop following their
favorite sport teams, and level of investment as an indicator of continued sport team fandom.
The psychological benefit an individual derives from watching sport teams—such as feeling
more successful or competent—was highly correlated with the effect their level of investment (r

!
! 29!
= .59, p < .000, r2 = .35). This result is very insightful considering the scale items of the
investment variable indicate that the sport team fan would not discontinue association with the
sport team because it would be too stressful or cost too much in resources. Therefore, the
relationship between feeling self-actualized from following a sport team and potentially feeling
bad from discontinuing to follow a sport team are understandably related.
Cognitive Measures (Method 2)
After taking both self-report instruments, the participants were instructed to come to a lab
to be assess cogntively. Hence, this section describes procedures for gathering self-descriptive
psychological data to assess a person’s tendency to self-categorize as a sport team fan and the
strength of that sport team identification. This study was designed to assess Paths B (H2), D
(H4), and E (H5, H6, & H7: Table 2.1). Response latencies (i.e., reaction times) provide
information about the extent that self-schemata and self-categorization affect selection and
processing of information about the self and the extent to which self-reported beliefs and
attitudes about self are reflected through cognitive message selection. Self-categorization
involves the forms of self-judgments that are reported and these decisions differ in latency
according to the existence and contextual matter of their self-schemata. Individuals who self-
categorize as sport team fans should describe with less effort specific trait descriptions, which
indicates a stronger schema and is a marker of being more strongly identified with a sport team
(Markus, 1977). Cognitive tasks were assigned to evaluate the influence of self-schema about
sport team fandom on the processing of information about self.
Procedures and Manipulation Checks
Participants were given a list of trait adjectives associated with sport team fandom along
with aschematic indicators not associated with sport team fandom and directed to indicate for

!
! 30!
each whether or not the words were self-descriptive. The list of words was randomly ordered for
each participant via MediaLab (Jarvis, 2008). To measure self-categorization, each word was
displayed separately and for each the participants were asked to select “yes” or “no” as to
whether or not the word was self-descriptive. RT was recorded by software, which assesses
strength of sport team identification. The participants were provided with context in which they
were asked to “imagine a typical group situation, one that might occur, for example, in a
classroom or an outside social setting such as a party, dinner or similar get-together that involves
small talk or conversation.”
The trait adjectives were selected with the help of Anderson’s (1968) list of likeable and
dislikable trait adjectives and expanded with the aid of software ("Visual Thesaurus," 1998-
2012). The trait adjectives were then judged by an independent sample of 144 participants.
Eighteen terms were rated as describing strong sport team fandom (addict, crazy, emotional,
enthusiast, enthusiastic, extreme, extremist, fanatic, fanatical, hooked, irrational, junky, maniac,
nut, obsessed, overboard, passionate, and spirited; α = .87) and 18 were rated as describing non-
fandom or an individual who is indifferent toward sport teams (apathetic, blah, diplomatic,
disinclined, disinterested, easygoing, flat, flexible, gentle, impassive, independent, subtle,
unaffected, unconcerned, undecided, unenthusiastic, unimpressionable, and unresponsive; α =
.71). These 36 words represent the critical schema-related stimuli.
Twenty-two other random words having no relationship to sport team fandom (arid,
aromatic, bald, bulbous, coastal, conservative, dense, floral, humid, liberal, libertarian,
meandering, mountainous, muggy, oceanic, salty, snowy, sour, sweet, torrential, windy, and
wispy; α = .77) were included as control words. An additional sample of 94 participants
independently assessed the schema-related words for likeability. In each category, one-third of

!
! 31!
the items were negatively rated for likability (addict, blah, disinterested, extremist, flat,
irrational, junky, nut, overboard, unenthusiastic, unimpressionable, and unresponsive; α = .72),
one-third positively rated (diplomatic, easygoing, emotional, enthusiast, enthusiastic, fanatic,
flexible, gentle, independent, passionate, spirited, and subtle; α = .74) and one-third neutrally
rated (apathetic, crazy, disinclined, extreme, fanatical, hooked, impassive, maniac, obsessed,
unaffected, unconcerned, and undecided; α = .78). The complete list of trait adjectives can be
observed in Table 3.2.
Table 3.2: List of trait adjectives for cognitive task 1
Trait Strong Sport Fan (+) or Non-Fan or Apathetical (-)
Likable (+), Neutral (~) or Not Likable (-)
Control Words
Fanatic + + Mountainous Passionate + + Floral Enthusiastic + + Oceanic Spirited + + Arid Enthusiast + + Humid Emotional + + Coastal Fanatical + ~ Torrential Obsessed + ~ Windy Extreme + ~ Wispy Hooked + ~ Bulbous Crazy + ~ Dense Maniac + ~ Meandering Irrational + - Thunderous Overboard + - Snowy Addict + - Libertarian Junky + - Liberal Extremist + - Conservative Nut + - Bald Gentle - + Short Subtle - + Tall Flexible - + Sweet Independent - + Skinny Diplomatic - + Fat Easygoing - + Aromatic Disinclined - ~ Bitter Unaffected - ~ Sour Undecided - ~ Salty Apathetic - ~ Muggy

!
! 32!
(Table 3.2 continued) Trait Strong Sport Fan (+) or
Non-Fan or Apathetical (-) Likable (+), Neutral (~)
or Not Likable (-) Control Words
Unconcerned - - Impassive - ~ Blah - - Unenthusiastic - - Flat - - Disinterested - - Unresponsive - - Unimpressionable - -
For the manipulation check, a post hoc power analysis was conducted for the ability to
detect small (f = .20), medium (f = .50), and large (f = .80) effect sizes at the p < .05 levels using
t-tests. The evaluation showed that the statistical power for this sample was .22 to detect small
effects, .70 to detect medium effects, and .97 for large effects. Therefore, insignificant results
should be interpreted conservatively for small effect sizes.
The two groups clearly diverged in the average number of fan words judged to be self-
descriptive, t(201) = -10.51, p < .000, Cohen’s d = .83, with fans choosing more (Mfan = 10.5,
SDfan = 3.58) than non-fan aschematics (Mnon-fan = 2.52, SDnon-fan = 1.40).2 The two groups also
differed in the number of non-fan words they chose as self-descriptive, although the effect was
smaller, t(201) = 2.80, p < .000, Cohen’s d = .72, with non-fan aschematics choosing more non-
fan words (Mnon-fan = 7.29, SDnon-fan = 3.07) than fans (Mfan = 5.32, SDfan = 3.06). As expected,
there was no difference between the groups in the number of control words chosen as self-
descriptive, t(201) = -1.07, p < .29, Cohen’s d = .61.
There was clearly a systematic relationship towards a participant’s tendency to choose
fan words versus aschematic non-fan words (r = -.35, p < .00, r2 = .12), indicating that those with
!!!!!!!!!!!!!!!!!!!!!!!!!!!!!!!!!!!!!!!!!!!!!!!!!!!!!!!!2 For the purpose of this check, fans were defined above as participants whose average number of fan words chosen as self-descriptive was above the mean of the sample. Non-fans (or achematics) were individuals whose average number was below the mean.

!
! 33!
fan self-schemata self-identify less with aschematic non-fan indicators and vice versa. Those
choosing fan words were reliably quicker at self-identifying as a fan (r = -.26, p < .00, r2 = .07).
Individuals choosing aschematic non-fan words (r = .17, p < .02, r2 = .03) and the control words
(r = .15, p < .04, r2 = .03) had reliably slower RT, which shows that they had to think longer
about these terms before responding. Lastly, RT for fan words versus non-fan words was highly
correlated (r = .59, p < .00, r2 = .35), as well as between fan words and control words (r = .52, p
< .00, r2 = .27) suggesting that RT varied consistently across the word groups. In fact, RT for
aschematic non-fan words was highly associated with those for control words (r = .62, p < .00, r2
= .38).
Figure 3.1: Systematic associations between self-categorization and RT
The systematic relationship between RT and number of self-descriptive indicators chosen
can be observed visually in Figure 3.1, where we can clearly observe that RT for self-descriptive

!
! 34!
fan words significantly fluctuated from those for control words and aschematic non-fan words,
the latter two varying at almost exactly the same rates. The faster processing times for the fan
words imply that it is easier for individuals self-categorizing as sport team fans to label
themselves in that manner, or that they are accustomed to perceiving themselves in those ways.
Slower RT for control words and aschematic non-fan words indicate that these people did not
interpret the two sets of words distinctively in labeling themselves in the same ways as self-
described fans did. The method produced the anticipated results.
Behavioral, Affective and Physiological Measures (Methods 3 & 4)
Next, physiological, affective, and communicative outcomes were collected through the
use of heart rate monitors and observational data (the participants were recorded as sport
spectators and coded for communicative and affective responses). These data will evaluate H3,
H5, H6, H7, and RQ1 in the ensuing chapter.3
Physiological measures offer a method for circumventing self-preservation biases and
social desirability. A person may be performing an identity or social role, but physiology may
betray her or his performance and give researchers a glimpse into internal processes (Honeycutt,
2010). Variation in cardiac activity in response to stimuli are related to psychological
phenomena and emotions (for a review, see Andreassi, 2007), and there is significant interaction
between heart activity and central brain activity when emotional involvement in a stimulus
activate cardiovascular responses (Obrist et al., 1978).
Procedures
Participants were instructed to watch a video containing highlights and lowlights of the
LSU Tigers’ 2011 football season. The entire video length was 8 min 51 s long and featured two
!!!!!!!!!!!!!!!!!!!!!!!!!!!!!!!!!!!!!!!!!!!!!!!!!!!!!!!!3 A complete list of all hypotheses can be viewed in Table 4.2.

!
! 35!
sections. The first consisted of a highlight reel chosen from the LSU Tigers’ YouTube page
(LSUTigersFB, 2011) and was 4 min 41 s in length. The second segment was taken from the
Entertainment and Sports Programming Network (ESPN) College Game Day YouTube page
(GameDayESPN, 2012) and consisted of the celebration following the 2012 Allstate Bowl
Championship Series (BCS) National Championship game during which the coach of the
University of Alabama Crimson Tide, Nick Saban, accepted the trophy on behalf of the players
and answered a series of questions in interview format ("Allstate BCS National Championship
Game," 2012). This portion was 4 min 10 s in length. While they were watching the video,
participants were recorded. For coding purposes, each video was split into four equal sections
(with the position between highlights and lowlights as the midpoint) with each segment judged
for intensity for four communicative and affective categories on a 5-point Likert scale, to be
summarized in the following paragraphs.
The verbal and nonverbal channels were conflated for the sake of coding, especially
because they share so many similarities. Faces and voices, for instance, are both exemplified by
physical gesturing that conveys information about identity, emotional state, and linguistic
information (Belin, Zatorre, & Ahad, 2002). Facial expressions and voice together can also
reliably convey discrete emotions such as anger and sadness (Juslin & Laukka, 2003). Their
differences also made the conflation of verbal and nonverbal responses opportune: Because of
occasional equipment malfunctions in the lab in which the study was conducted, some videos
became blurry, lost audio, or had bad camera angles of the spectator for short time periods (in
extreme situations the observations were deleted from the sample; n = 8). Because vocal
expressions are often more effective than facial over large distances and in dim light, the relative
position of the participant was often alleviated (they at times chose different places to sit).

!
! 36!
On the other hand, facial expressions may be more successful than vocal expressions in
congested areas or in vicinities where there are competing auditory stimuli (Marler, 1977) such
as the video highlights and lowlights or other participants. And because the two can be
evaluated with variation in accuracy (Scherer, 1999), the combination gives coders more
opportunity to identify and record the different types of communicative responses. Perhaps most
importantly, the conflation of the two channels makes the most sense because their separation
has been shown to be fairly artificial and in conflict with many empirical studies that suggest that
facial and verbal expressions tend to affect emotional decisions in a corresponding and integrated
manner (de Gelder, 1999).
Next, because participants were in a controlled setting in which they were being
observed, they were often more reserved in manner despite being instructed to act as if they were
at home or wherever they may watch sporting events. By incorporating these conflated response
categories, the coders were able to get a sense of the spectators’ more natural reactions to the
stimulus (video). The affective communicative categories were chosen in reference to
differential emotions theory (Izard & Malatesta, 1987) and affect theory (Tomkins, 1962, 1963),
both of which refer to involuntary biological emotional reactions humans have to external
stimuli. Discrete emotions theory stems from Ekman and Friesen’s six universal emotions
(1971) and includes happiness (well-being, contentment, joy), surprise (a reaction to an
unexpected event), sadness (feelings of loss, despair, hopelessness), anger (a feeling of being
offended, wronged or denied that often causes retaliation), disgust (an aversive reaction to
revulsion), and fear (an aversive reaction to a perceived threat).
Affect theory goes further by refining the categories and adding low/high intensity
indicators. Two categories are positive (enjoyment/joy, interest/excitement), one is neutral

!
! 37!
(surprise/startle), and six are negative (anger/rage, disgust, dissmell, distress/anguish, fear/terror,
and shame/humiliation). It did not seem likely that three of the affective responses would be
associated with sport team spectatorship, such as surprise (the participants knew the outcome of
the season), fear (they were in a safe location on campus), or dissmell (reaction to putrid smells),
so these categories were eliminated. In fact, a bulk of extant literature focuses on anger, fear,
sadness, happiness, and disgust (see Juslin & Laukka, 2001; Murray & Arnott, 1995; Scherer,
Banse, Wallbott, & Goldbeck, 1991), so after eliminating the most obvious non-related emotion
(fear), the most apt groupings were 1) positive affective communication (combining happiness,
enjoyment, joy, interest and excitement), 2) communicative responses to perceived loss
(blending sadness, distress and anguish), 3) communicative responses to being offended
(merging anger and rage, which differ in intensity only), and 4) aversive communicative
responses (an amalgamation of disgust, shame, and humiliation). These categories were termed
happiness, sadness, anger, and disgust.
The four groupings were coded on unipolar scales ranging from 0 (no behaviors evident)
to 4 (extreme behaviors demonstrated) according to a variety of indicators.4 Smiling, laughing,
cheering, fist pumps, clapping, and overt verbal expressions indicated happiness. Sadness
involved the lowering of mood, plaintive or desperate tones, covering one’s face without turning
away, pouting, frowning, sighing, and explicit verbal expressions. Anger entailed increases in
volume of verbal expressions, fist clenching, arm crossing with tense muscles, name-calling,
obscene and hostile gestures, confrontational gestures, making oneself look more intimidating,
intense stares with tight foreheads, and verbal aggression. Disgust was described as an aversive
!!!!!!!!!!!!!!!!!!!!!!!!!!!!!!!!!!!!!!!!!!!!!!!!!!!!!!!!4 Unipolar Likert scales are commonly used response formats in behavioral research (Rosenthal, 1987, 2005).

!
! 38!
reaction denoted by turning away, refusing to watch the video, covering ears and looking away,
crinkling of nose, expressions of revulsion, and uncomfortable laughing paired with other cues.
Inter-coder reliabilities were computed at each stage of development using Cronbach’s α
(which alone is incompatible with reliability concerns, see Krippendorff, 2004a, 2004b) and
Krippendorff’s α (1970). In the pilot stage, the coding manual was edited and the
communicative categories were assessed for intercoder agreement by a pilot team of three
participants. The reliabilities for happiness, αC = .99, αK(3,20,60) = .91; sadness, αC = .78,
αK(3,22,66) = .84; anger, αC = .82, αK(3,25,75) = .74; and disgust, αC = .90, αK(3,28,84) = .78,
were at acceptable levels for the more liberal Cronbach measure and more conservative
Krippendorff estimate.
Three different techniques were implemented to estimate reliabilities for the total set of
judges. Again using Cronbach’s and Krippendorff’s coefficients, the final test reliabilities were
adequate: Happiness, αC = .99, αK(12,28,336) = .82; sadness, αC = .97; αK(12,28,336) = .71;
anger, αC = .97; αK(12,28,336) = .73; and disgust, αC = .98; αK(12,28,336) = .78. Because
Krippendorff’s α is a conservative index, lower criteria (> .667) are acceptable in most research
situations not involving seriousness ramifications as a result of its conclusions (Krippendorff,
2004a). Examples that may have grave results when allowing liberal errors in agreement might
include studies conducted in medical or criminal fields. Cronbach’s α was also adequate for the
whole set across all coders, all time intervals, and all communicative categories. (α = .80).
A third method to compute reliabilities for the total set of judges was estimated using
principle components analysis to generate an index called θ (or theta; Armor, 1974). The θ
index employs the first latent root (eigenvalue) of the first unrotated principal component and

!
! 39!
represents the amount of variance accounted for by that component.5 Using Cronbach’s α as a
guide for assessing this statistic (Rosenthal, 2005), the estimates were all exemplary: Happiness
(θ = .94), sadness (θ = .91), anger (θ = .92), and disgust (θ = .93).
Manipulation Checks for Behaviors and Physiology
Verbal and Nonverbal Communicative and Affective Responses. For each
communicative category, there was a significant difference in means across video segments.
Happiness was coded at a significantly higher rate (t(202) = 15.17, p < .000, Cohen’s d = .60) for
spectators viewing the highlights (Mh = 1.68, SDh = 1.57) versus the lowlights (Ml = 0.01, SDl =
0.07).
Figure 3.2: Change in communicative affect over the course of the video segments
!!!!!!!!!!!!!!!!!!!!!!!!!!!!!!!!!!!!!!!!!!!!!!!!!!!!!!!!5 Armor’s θ = (n/n-1)[(L-1)/L] where n is the number of judges and L is the latent root. !

!
! 40!
The other three output variables significantly differed as well, but in the opposite
direction. Sadness (t(202) = -11.59, p < .000, Cohen’s d = .50, M = 0.05/1.18, SD = 0.24/1.40),
anger (t(202) = -8.78, p < .000, Cohen’s d = .40, M = 0.02/0.87, SD = 0.14/1.37), and disgust
(t(202) = -15.61, p < .000, Cohen’s d = .59, M = 0.12/1.78, SD = 0.37/1.58) all differed
significantly and increased from the highlight segment to the lowlight segment.
These results are not surprising given that 179 of the 203 participants (88.2%) self-
reported themselves to be fans of LSU football and only one reported being a fan of Alabama
football. A visual representation of these emotions across all four intervals can be viewed in
Figure 3.2, which clearly displays that the participants had a tendency to show more happiness or
interest in the highlight videos, and more sadness, anger, and disgust or humiliation during the
segment where their favorite team’s rival accepted the championship trophy at their team’s
expense. The change in format did produce varying effects; the method produced expected
results.
Physiological and Affective Responses. The heart rate monitors recorded average beats
per minute (bpm) at 15 s intervals (n = 36). Mean heart rate differed significantly per sex, Mfemale
= 82.67, Mmale = 79.80 (t(202) = 12.78, p = .000, Cohen’s d = .84), and this result is in line with
what we know about human physiology. The left ventricle of males is typically larger, allowing
more blood to pump with each beat. For this reason, males more efficiently provide their tissues
with oxygen and nutrients and tend to have lower heart rates in general.
By plotting mean heart rate per 15 s interval for the duration of the two video segments,
several crucial trajectory changes become evident (Figure 3.3). First, beginning at 1 min, after
the participants initially accustomed themselves to the video and their surroundings (Point 1), we
can see a steady increase until the end of the highlights (Point 2); this section is labeled Interval

!
! 41!
α. From there, once the lowlights begin, to 6 min 30 s (Point 3) is termed Interval β. After Point
3, there is again steady increase until 7 min 15 s (Point 4), referred to as Interval γ. Finally, there
is again a steady decline concluding at 8 min (Point 5), labeled Interval δ.
Because the major point of interest concerning heart rate bpm was testing to what extent
it changed over time, latent growth curve (LGC) models were estimated. LGC models assess the
extent that individual heart rate trajectories vary across participants as a function of different
intercepts and slopes by holding all factor loadings constant. The technique will also assess H7
and RQ1 by adding sex as a potential time-invariant predictor of change for each interval that can
account for heterogeneity in individual growth curves (intercepts and slopes; see Byrne, 2010).
Figure 3.3: Change in mean heart rates during video segments
The change in heart rate across males and females can be visually observed in Figure 3.4.
Therefore, separate models were estimated for each of the four intervals identified above with
and without biological sex as a conditional, time-invariant factor. Finally, in each of the initial

!
! 42!
models, correlated error terms were allowed across time points within each interval (as
established by 15 s intervals recorded by the heart rate monitors), but not across intervals, as is
customary in LGC procedures (Hoyle & Smith, 1994).
Figure 3.4: Change in mean heart rates according to biological sex during the video segments
When testing growth curve models, it is often necessary to account for stationary
autocorrelation among manifest variable errors (Kuljanin, Braun, & DeShon, 2011; Sivo, Fan, &
Witta, 2005). A series of studies testing goodness of fit and parameter estimates in models
where no autocorrelation is assumed with models that specify autoregressive moving averages
reveal that when autoregression is present, “the fit of the model turns out to be poor even though
a viable growth curve process is present in the data” (Sivo et al., 2005, p. 227). Therefore,
because measurement errors of repeated measures are often related to one another (Hancock,

!
! 43!
Kuo, & Lawrence, 2001; Loehlin, 1998), allowing free or unfixed off-diagonal values (not fixing
values) in the error terms of observed variables is permissible to determine what extent the
covariation among the observed variables is due to growth processes rather than autocorrelation
when observing growth curve models of inadequate fit (T. E. Duncan, & Duncan, S. C., 1995).
The recommendation in this instance is that when a growth curve model does not fit well to
specify an autocorrelated disturbance to rule out the possibility that a viable curve process is
present but not detected due to non-specified autocorrelation amongst the error terms of the
observed variables.
Table 3.3: Fit statistics for unconditional latent growth curve models
Interval χ2 df p CFI RMSEA CI90% MS p COV p α UU 35.50 8 .000 .97 .13 .09, .17 -0.35 .06 -50.34 .000 α US lag 1 .99 .12 .07, .18 1.14 .07 -39.09 .01 α US lag 2* 5.157 3 .16 .99 .06 .00, .14 1.22 .05 -138.62 .000 β UU* 19.96 8 .01 .99 .09 .04, .13 -1.29 .02 -49.44 .000 β US lag 1 7.54 5 .18 .99 .05 .00, .12 -1.25 .02 -37.28 .01 β US lag 2 3.89 3 .27 .99 .04 .00, .13 -1.12 .03 -80.62 .01 γ UU 73.45 8 .000 .96 .20 .16, .24 1.68 .000 3.59 .72 γ US lag 1 33.80 5 .000 .98 .17 .12, .22 1.50 .000 5.34 .59 γ US lag 2* 20.47 3 .000 .99 .17 .10, .24 1.48 .000 -30.44 .14 δ UU 50.17 8 .000 .98 .16 .12, .20 1.08 .001 -31.49 .000 δ US lag 1 24.19 5 .000 .99 .14 .09, .19 1.09 .001 -29.08 .000 δ US lag 2* 4.992 3 .17 .99 .06 .00, .14 0.90 .006 -.44.35 .02 NOTE: An asterisk denotes model used for analysis; UU = unconditional, unspecified model; US = unconditional, specified model; MS = mean slop; RMSEA = root mean square error of approximation; COV = covariance
Initially, we tested unconditional models (no exogenous time-invariant predictor) for
each of the four intervals that did not specify autocorrelation, then for each time segment
estimated models for lag 1 and lag 2 covariance between error terms to determine if covariation
still existed when controlling for autocorrelated error terms. When further analysis was
warranted, the process was repeated for a corresponding conditional model (including biological
sex as a time-invariant predictor). The results for each interval are summarized with each curve

!
! 44!
analysis and can be seen in their entirety in Table 3.3.
Interval α. This interval coincided with the highlight portion, concluding at the change
of format. The unconditional, unspecified growth curve model for this interval did not fit the
data, but successive specification of autocorrelated error terms produced a fitting model. The lag
2 curve provided an adequate fit and the mean slope was positive and significant, M = 1.23, p <
.05, indicating that on average the mean changes in heart rate significantly increased over the
length of the interval.
Furthermore, the covariance between the intercept and slope factors for heart rate was
statistically significant (cov = -138.62, p = .000). The negative value implies that participants
whose heart rates were high at the beginning of the interval showed a lower rate of increase in
heart rate over the span of the interval than was the case for individuals whose heart rates were
lower at the beginning of the interval. Those with lower heart rates increased the fastest; this
occurrence is known as the law of initial values and is common in LGC models (Wilder, 1962).
Finally, all variance estimates related to the intercept and slope of heart rate were statistically
significant. This finding is important because it suggests that there were strong inter-individual
differences in both the initial heart rates at the beginning of the interval and in their change over
the duration of the interval. This result suggests strong support for further examination into
variability related to the heart rate trajectories during spectatorship (Byrne, 2010).
Therefore, as an additional manipulation check, sex was added as a time-invariant
predictor of change to explain interindividual variability in heart rate growth trajectories. The
conditional, specified lag 2 model fit was adequate (Table 3.4). However, biological sex was not
a significant predictor of an individual’s initial heart rate (b = 3.07, β = 0.10, p < .27) or their rate
of change (b = -1.05, β = -0.03, p < .42). These results suggest that although on average heart

!
! 45!
rate was higher for women by 3.07 bpm and the rate of change was slower than men by 1.05
bpm, the difference was not significant, nor was their rate of change per males or females.
Table 3.4: Fit statistics for conditional latent growth curve models
Interval χ2 df p C R CI b[I] β[I] p[I] b[S] β[S] p[S] α CU 357.72 12 .000 .65 .37 .34, .41 3.17 0.16 .08 -0.90 -0.45 .64 α CS lag 1 203.84 9 .000 .81 .32 .28, .36 4.45 0.20 .04 -2.54 -0.11 .22 α CS lag 2* 15.82 6 .02 .99 .09 .04, .14 3.07 0.10 .27 -1.05 -0.03 .42 β CU 520.71 12 .000 .59 .45 .42, .48 3.29 0.17 .07 0.03 0.001 .99 β CS lag 1 292.82 9 .000 .77 .39 .35, .42 2.82 0.12 .19 1.94 0.03 .77 β CS lag 2* 37.37 6 .000 .98 .16 .11, .21 3.74 0.11 .18 0.14 0.004 .90 δ CU 930.06 12 .000 .48 .61 .57, .64 3.23 0.19 .04 -0.91 -0.06 .56 δ CS lag 1 532.57 9 .000 .71 .52 .49, .56 1.95 0.08 .31 1.09 .05 .42 δ CS lag 2* 100.64 6 .000 .95 .28 .23, .32 2.02 0.07 .39 -0.78 -0.03 .24 NOTE: An asterisk denotes model used for analysis; C = CFI; R = RMSEA; CI = confidence interval at 90%; b[I] = intercept coefficient as a function of sex; β[I] = standardized intercept coefficient as a function of sex; p[I] = statistical significance of intercept coefficients as a function of sex; b[S] = slope coefficient as a function of sex; β[S] = standardized slope coefficient as a function of sex; p[S] = statistical significance of slope coefficients as a function of sex; CU = conditional, unspecified model; CS = conditional, specified model; MS = mean slop; RMSEA = root mean square error of approximation; COV = covariance
Interval β. This segment began shortly after the format change (4 min 45 s) and ran for
1 min 45 s total. There was a decrease in bpm during this interval as the video changed from the
highlights (exciting positive plays) to lowlights (confetti for the winners, Alabama, followed by a
trophy acceptance by the coach and an interview) that can be observed graphically. The growth
curve provided an adequate fit across unconditional non-specified and specified models,
suggesting that growth in the unspecified model was not a function of autocorrelation. The mean
slope in the unconditional, unspecified model was negative and significant, M = -1.29, p < .02,
indicating that on average the mean changes in heart rate significantly decreased over the length
of the interval. The covariance between the intercept and slope factors for heart rate was again
statistically significant (cov = -49.44, p = .000), which suggests that individuals whose heart
rates were high at the beginning of the interval showed a slower rate of decrease in heart rate

!
! 46!
over the span of the interval than was the case for individuals whose heart rates were lower at the
beginning of the interval. Those with lower heart rates decreased the quickest. All variance
estimates related to the intercept and slope of heart rate were statistically significant, warranting
additional analysis of the variability related to the heart rate trajectories.
For the conditional model with sex as a time-invariant predictor of change to explain
interindividual variability in heart rate growth trajectories, the model fit was not exemplary even
when allowing autocorrelated error terms. Even granting a larger degree of error (RMSEA =
.16) in the fit of the growth curve—in part a function of few degrees of freedom—to examine the
outcomes in the conditional, specified lag 2 model, biological sex would not be a significant
predictor of individuals’ initial heart rates (b = 3.74, β = 0.11, p < .18) or their rate of change (b
= 0.14, β = 0.004, p < .90). On average heart rate was higher for women by 3.07 bpm but there
was virtually no difference in the rate of change between sexes for this interval nor did the curve
represent that data well.
Interval γ. This segment started immediately after the previous one, beginning at 6 min
30 s, displaying a marked increase in bpm as the action changed and the interview questions of
the rival coach began. The specified lag 2 growth curve model again provided some evidence of
fit but displayed high error. Again accepting a degree of error for complementing the graphical
analysis, the mean slope was positive and significant, M = 1.48, p < .000. The mean changes in
heart rate significantly increased over the length of the interval. The covariance between the
intercept and slope factors for heart rate was not statistically significant (cov = -30.44, p = .14),
which shows that additional analysis is not necessary for explaining the variability related to the
intercepts and slopes of inter-individual heart rate trajectories. However, these results should be

!
! 47!
interpreted conservatively given the high error in the fit of the trajectory on the data given the
typically small effects for physiological data.
Interval δ. This segment ran from the end of the last and continued until 8 min. It is
during this segment that LSU was directly referenced by Saban, who stated, “and that’s what I
feel great about, all the players that put so much into this … the way they responded to terrible
pain and disappointment the first time we lost, to a very, very good LSU team, and I’d like to
congratulate them on a great year that they had” (GameDayESPN, 2012). When Saban directly
references his former school, even to congratulate the LSU players, spectators of the video in this
sample responded with a decrease in bpm.
The growth curve model provided an adequate fit. The mean slope was negative and
significant, M = 0.90, p < .001, suggesting that the mean changes in heart rate significantly
decreased over the duration of the period. The covariance between the intercept and slope
factors for heart rate was again statistically significant (cov = -44.35, p = .02), indicating that
individuals whose heart rates were high at the beginning of the interval showed a slower rate of
decrease in heart rate over the span of the interval than was the case for individuals whose heart
rates were lower at the beginning of the interval. Those with lower heart rates decreased the
quickest. All variance estimates related to the intercept and slope of heart rate were statistically
significant, so additional analysis was performed for variability related to the heart rate curves.
Therefore, for the conditional model with sex as a time-invariant predictor of change to
explain interindividual variability in heart rate growth trajectories, the model fit was not
exemplary, displaying error. If we again were to grant the larger degree of error in the fit of the
growth curve, sex would still not be a significant predictor of individuals’ initial heart rates (b =

!
! 48!
2.02, β = 0.07, p < .39) or their rate of change (b = -0.78, β = 0.03, p < .24). There was virtually
no disparity in the rate of change between sexes for this interval.
Conclusion
This chapter described the methods and procedures for the four methods used to gather
data for provide manipulation checks for each of the methods. Manipulation checks provided
validity evidence for the methods. Both self-report scales exhibited better than adequate
reliability estimates and data fit. The inter-factor correlations were overwhelmingly intuitive
except for two aberrations. For the cognitive measures, forms of self-judgments that were
reported differed in latency according to the existence and contextual matter of the participants’
self-schemata. Individuals who self-categorized as sport team fans described with less effort
specific trait descriptions, which indicated stronger schema. These connections are markers of
stronger identification with a sport team.
The communicative behavioral coding measures were supported by adequate inter-coder
reliabilities. The communicative categories varied as anticipated, with happy verbal and
nonverbal responses increasing during the highlights and decreasing during the lowlights, and
anger, sadness, and disgust all following an opposite trend. The physiological measure as
captured through average beats per minute (bpm) showed four crucial variations during the
viewing of the videos. These variations were divided into four intervals, and latent growth curve
models were estimated to assess the extent that average bpm was changing over time. The
models were estimated with and without sex as a time-invariant predictor of change. The initial
LGC model estimates all indicated that average bpm did change significantly in each of the four
intervals and that there were strong interindividual differences in the initial bpm and in their rates
of change over the duration of the intervals. In no interval were the variability differences

!
! 49!
related to sex as the differences in the rates of change per males and females either was not
significant or did not represent the data adequately
Although the within-method analyses were not implemented to assess the hypotheses but
rather to gather evidence as to their validity, they did yield some results that have bearing on the
research question posited. The latent growth curves produced evidence that the physiological
differences between men and women as a result of sport spectatorship were not significant. The
following chapter will proceed with between-method comparisons. This method triangulation
will provide evidence of support or non-support for the hypotheses and research questions, which
will be discussed.

!
! 50!
CHAPTER FOUR RESULTS AND HYPOTHESIS ASSESSMENT
This chapter will discuss the hypotheses and the research question in terms of the
conceptual model forwarded in Chapter 2. The methods were designed and tested, then assessed
for validity in Chapter 3 to evaluate hypotheses for 1) identity formation and psychological
involvement, 2) identity formation and self-categorization/strength of identity, 3) identity
formation and communication/affect, 4) self-categorization/identity strength and psychological
involvement, 5) self-categorization/identity strength and communication/affect, 6) physiology
and communication/affect, and 7) sex differences. These hypotheses will be discussed in
conjunction with between-method comparisons.
Due to small effect sizes associated with RT and behavioral coding, all bivariate
correlations involving comparisons of pertinent variables were disattenuated. Correcting for
attenuation also helps alleviate some error inherent in the behavioral coding process.
Comparisons between self-report scales were not corrected. Values before and after correction
can be observed in Table 4.1.
Path A: Link between Identity Formation and Psychological Outcomes
Path A conceptualized a connection between sport team identity formation as
operationally measured by the C-STIS and positive psychological effects as measured by the
STPC scale. The factor involving self-actualization—feeling a sense of development, growth,
success and accomplishment—was significantly related to every factor concerning sport team
identity formation including the influences of media popularity, geography, family, athletic
performance, and sport team characteristics on sport team identity formation.

!
! 51!
Table 4.1: Correlation matrix for team identity formation, psychological effects, self-categorization, strength of identity, and behavioral responses
Team Identity Formation (C-STIS) Psych. Effects (STPCS) Cognitive Behavioral Responses MP G F AP T SA C I SC SI H S A D TIF MP -- 0.02 0.00 0.01 0.06 0.05 0.04 G 0.36† -- 0.09 -0.09 0.15* 0.19# 0.12* 0.04 F 0.35† 0.45† -- 0.18# -0.21† 0.03 0.18# 0.06 0.04 AP -0.01 0.26† 0.24† -- 0.36† 0.15* 0.08 0.00 0.17# 0.13* T 0.33† 0.20# 0.35† 0.45† -- 0.23† 0.01 0.03 0.12* 0.14* 0.16# PE SA 0.33† 0.22† 0.34† 0.31† 0.42† -- 0.52† -0.22† 0.09 0.15* 0.13* 0.07 C 0.38† 0.11 0.12* -0.11 0.12* 0.34† -- 0.05 -0.15# -0.11 0.07 -0.18# -0.10 I 0.34† 0.16# 0.30† 0.18# 0.25† 0.59† 0.47† -- 0.27† -0.18# 0.14* 0.27† 0.11 0.17# Cog SC 0.02 0.08 0.16# 0.31† 0.19# 0.47† 0.04 0.23† -- 0.10 0.06 0.19# 0.08 SI 0.00 -0.07 -0.16# 0.11 0.01 -0.17# -0.11 -0.13* -0.26† -- -0.09 -0.13* -0.23† -0.28† Beh H 0.01 0.11 0.02 0.06 0.02 0.07 -0.08 0.10 0.07 -0.06 -- S 0.04 0.13* 0.13* 0.00 0.08 0.11 0.05 0.18# 0.04 -0.08 0.37† -- A 0.03 0.08 0.04 0.11 0.09 0.09 -0.12* 0.07 0.13* -0.13* 0.47† 0.24† -- D 0.03 0.03 0.03 0.09 0.11 0.05 -0.07 0.12 0.06 -0.17# 0.49† 0.34† 0.61† -- NOTE: Probability values are for one-tailed hypotheses. Correlations above the diagonal are corrected for attenuation. *statistical significance at the .05 level, #.01 level, †.001 level. TIF = Team identity formation; MP = Media popularity; G = Geography; F = Family; AP = Athletic performance; T = Team characteristics; PE = Psychological effects; SA = Self actualization; C = Commitment; I = Investment; SC = Self-Categorization; SI = Strength of identity; H = Happiness; S = Sadness; A = Anger; D = Disgust.
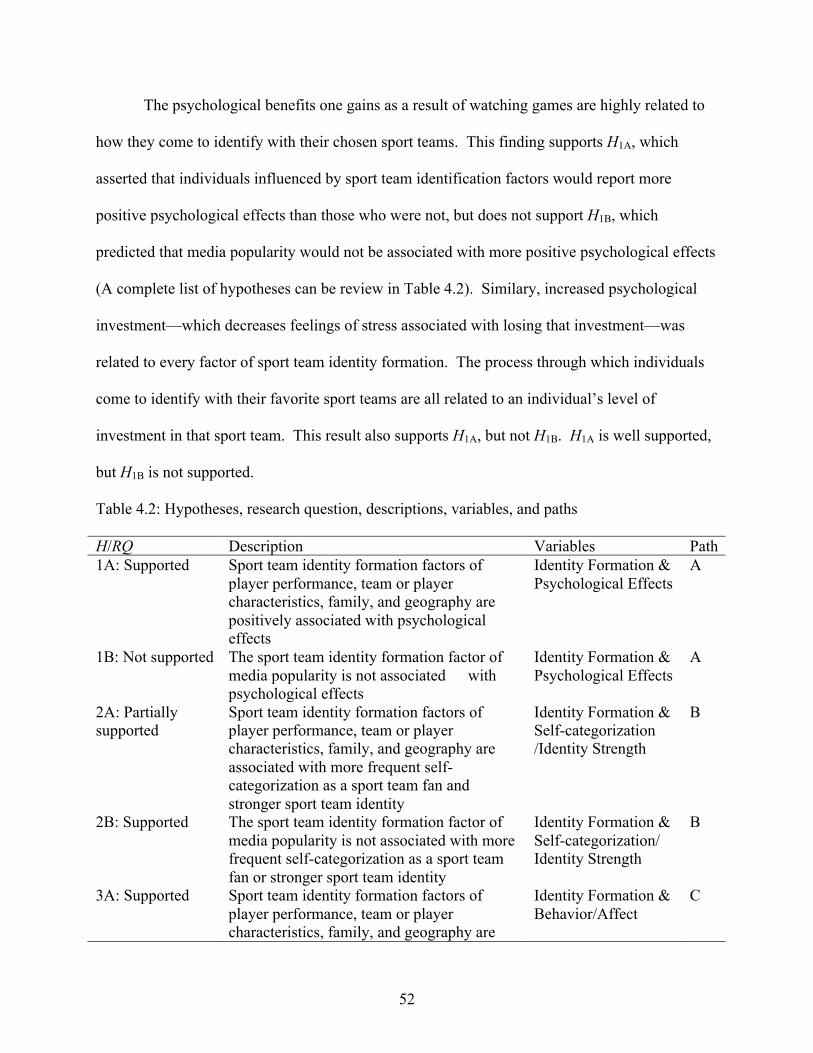
!
! 52!
The psychological benefits one gains as a result of watching games are highly related to
how they come to identify with their chosen sport teams. This finding supports H1A, which
asserted that individuals influenced by sport team identification factors would report more
positive psychological effects than those who were not, but does not support H1B, which
predicted that media popularity would not be associated with more positive psychological effects
(A complete list of hypotheses can be review in Table 4.2). Similary, increased psychological
investment—which decreases feelings of stress associated with losing that investment—was
related to every factor of sport team identity formation. The process through which individuals
come to identify with their favorite sport teams are all related to an individual’s level of
investment in that sport team. This result also supports H1A, but not H1B. H1A is well supported,
but H1B is not supported.
Table 4.2: Hypotheses, research question, descriptions, variables, and paths
H/RQ Description Variables Path 1A: Supported Sport team identity formation factors of
player performance, team or player characteristics, family, and geography are positively associated with psychological effects
Identity Formation & Psychological Effects
A
1B: Not supported The sport team identity formation factor of media popularity is not associated with psychological effects
Identity Formation & Psychological Effects
A
2A: Partially Sport team identity formation factors of Identity Formation & B supported player performance, team or player
characteristics, family, and geography are associated with more frequent self-categorization as a sport team fan and stronger sport team identity
Self-categorization /Identity Strength
2B: Supported The sport team identity formation factor of media popularity is not associated with more frequent self-categorization as a sport team fan or stronger sport team identity
Identity Formation & Self-categorization/ Identity Strength
B
3A: Supported Sport team identity formation factors of player performance, team or player characteristics, family, and geography are
Identity Formation & Behavior/Affect
C

!
! 53!
(Table 4.2 continued) H/RQ Description Variables Path positively associated with observable
affective and communicative behaviors in response to sport team spectatorship
3B: Supported The sport team identity formation factor of media popularity is not associated with observable affective and communicative behaviors in response to sport team spectatorship
Identity Formation & Behavior/Affect
C
4: Supported Self-categorization as sport team fan and strength of sport team identification are positively associated with psychological effects
Self-categorization/ Identity Strength & Psychological Effects
D
5: Partially supported
Strength of sport team identification is positively associated with contempt in the form of aggressive and avoidant communicative responses to sporting outcomes
Self-categorization/ Identity Strength & Behavior/Affect
E
6: Partially supported
Strength of sport team identification is positively associated with joyful and sad communicative responses
Self-categorization/ Identity Strength & Behavior/Affect
E
7: Partially supported
Emotions associated with increased physiological arousal—anguish, anger and excitement—are positively associated with self-categorization as a sport team fan
Self-categorization/ Identity Strength, Behavior/Affect
E
RQ1 Do women and men have different communicative, affective, and physiological responses to sport outcomes?
Physiology, Behavior/Affect, Sex
n/a
Path B: Link between Identity Formation and Self-Categorization
H2A and H2B posited a relationship between sport team identity formation, self-
categorization, and strength of sport team identification. To evaluate these hypotheses, the
factors of the C-STIS were compared to number of fan words chosen (for self-categorization)
and the RT for those selections (strength of identity). Individuals who came to identify with
their sport team because of family influence, athletic performance, or sport team characteristics
tended to self-categorize as sport team fans. In addition, those who were swayed by family
during sport team identity formation were more strongly identified, as indicated by faster RT.

!
! 54!
Interestingly, those identifying with their sport team because of athletic performance tended to
have slower RT, suggesting that they were less strongly identified even though they self-
categorized as sport team fans. Neither media popularity nor geography displayed an association
with self-categorizing as a sport team fan or strength of sport team identification, and sport team
characteristics did not associate with strength of sport team identification. Hence, there is only
partial support for H2A in that three of the four hypothesized connections (family, athletic
performance, and sport team characteristics) were related to self-categorization as a sport team
fan, and two factors (family and athletic performance) were associated with strength of sport
team identification. H2B is supported due to the lack of association between media popularity as
an influencer of sport team identification, self-categorization as a sport team fan, and strength of
sport team fan identity.
Path C: Link between Identity Formation and Communicative and Physiological Outcomes
For H3A and H3B, compared sport team identity factors to communicative outcomes
(verbal, nonverbal, affective). After correcting for attenuation, geography was related to
increased affective and communicative responses involving happiness, sadness, and anger.
Family too was correlated with sadness, while athletic performance was connected to elevated
levels of anger and disgust. Team characteristics were associated with higher levels of sadness,
anger, and disgust. Media popularity as a method of identifying with a sport team did not lead to
increased levels of affect or communicative response. There is support for H3A in that 9 of the 16
possible correlations were significant (Table 3.1). Media popularity was not associated with
communicative reactions as predicted, thus supporting H3B.

!
! 55!
Path D: Link between Self-Categorization and Psychological Outcomes
H4 claimed a connection between self-categorization, strength of sport team identification
and psychological effects. To evaluate this assertion, the factors of the STPC scale were
compared to the number of fan words chosen (self-categorization) and RT (strength of
identification) after correcting for attenuation. Self-categorized and highly identified sport team
fans did display a tendency to experience self-actualization and increased levels of investment in
a sport team. They also were not significantly linked to having a propensity towards ceasing to
follow a sport team. The evidence supports H4.
Path E: Link between Self-Categorization and Communicative and Physiological Outcomes
H5 posited that self-categorized and highly identified sport team fans would exhibit
stronger verbal, nonverbal, and affective communicative outcomes associated with contempt
(anger and disgust). H6 asserted that self-categorized and highly identified sport team fans
would exhibit stronger communicative outcomes associated with joy and sadness. Therefore,
number of fan words chosen and RT were compared with behavioral coding results. Those who
self-categorized as sport team fans only had an inclination towards anger. However, those who
were more strongly identified displayed tendencies for sadness, anger, and disgust. Happiness
was not associated with self-categorized or highly identified participants.
This data supports H5 and H6 to varying extents. Communication reactions associated
with contempt—anger and disgust—had a clear association with strength of identity, but only
anger was related to a tendency to self-categorize as a sport team fan. Therefore, H5 is partially
supported. On the other hand, sad communicative reactions were only related to strength of
identity, and happiness was not related to either cognitive variable. H6 was only partially

!
! 56!
supported. Contemptuous responses seem to be stronger explanatory reactions than sad or happy
reactions.
Given the previous relationships displayed between physiological, affective,
communicative, and cognitive measures, one would expect that self-categorization and RT for
self-descriptive words would be related to physiological measures in some way. However,
taking heart rates across sections or between markers identified in the video and comparing them
to the cognitive measures did not yield significant relationships. Studies involving
cognitive/physiological comparisons have displayed lack of association in other areas, however,
including investigations between heart rate and cognitive impairment (Britton et al., 2008; Zulli
et al., 2005). Granted the research in this dissertation is not dealing with impairment but with
normally functioning college students, and this study operationalized physiology with bpm and
not heart-rate variability or interbeat intervals, it appears that to be able to tap into the
relationship between these variables more precisely additional measures should be involved such
as blood pressure or electrodermal response (Britton et al., 2008).
There is another way, however, to assess these potential relationships. To lay the
groundwork for comparisons between communication and physiology, it was also posited in H7
that emotions associated with increased arousal such as anguish, anger, and excitement would be
related to self-categorization and identity strength. There is partial support for this assertion as
anguish and anger were both correlated with identity strength and anger was related to self-
categorization. However, anguish was not associated with self-categorization and happiness was
related to neither cognitive variable as stated above. Therefore there is varying support for H7 in
that some affective responses associated with arousal were related to cognitive functions of
identity, but not all.

!
! 57!
Physiological Arousal, Communication, and Sex
RQ1 asked if men and women differentially reacted with more prounounced
communication, affect, and physiological arousal to the sport videos. Some of the answer to this
question was revealed with the LGC estimates, where it was asserted that the variance in
changed in heart rate bpm over time was either not accounted for by sex. To look at the verbal,
nonverbal, and affective communicative differences, we return to the behavioral coding data.
Although female participants typically displayed more sadness (Mfemale = 1.39; SEfemale = 15.19)
compared to males (Mmale = 1.09; SEmale = 13.53) and male respondents showed more anger
(Mmale = 1.03; SEmale = 15.31) compared to females (Mfemale = 0.71; SEfemale = 11.4), the
differences between females’ and males’ communicative reactions to the videos were not
significant (Table 4.3). Accordingly, this data supports an answer that says there is not a
noteworthy difference between males’ and females’ communicative and physiological reactions
to sport spectatorship.
Table 4.3: Comparison of means between male and female communicative responses Communication t(df) p d Happiness 0.44(202) .66 .60 Sadness -1.48(202) .14 .51 Anger 1.63(202) .10 .89 Disgust 0.31(202) .76 .61
Review of Hypothesis Support
In reviewing the hypotheses, all seven had partial support or better. Sport team identity
formation factors involving family, geography, sport team characteristics, and player
performance were related to psychological involvement, supporting H1A. Media popularity was
associated but only partially, so H1B was supported only in part. Sport team identity formation
factors of family, atheletic performance, and sport team characteristics were related to self-
categorization and identity strength, although geography was not, offering convincing but not

!
! 58!
total report for H2A. H2B however was well-supported in that media popularity as a mechanism
for sport team identity was not correlated with either cognitive construct. The association
between sport team identity formation and verbal, nonverbal and affective communicative
reactions partially supported H3A with a majority of the constructs being related, and H3B was
held up due to the lack of relationship between media popularity and communicative reaction.
Psychological involvement was highly associated with self-categorization and identity
strength, lending credence to H4. A connection between communication and cognitive constructs
was partially supported in the casesof H5 and H6 with communication related more to disgust and
anger than happiness or sadness. Furthermore, emotions related to increased physiological
arousal were partially associated with cognitive constructs, thus lending some support for H7.
Finally, the research question queried into the differences between men and women
according to communicative, affective, and physiological responses to sporting outcomes. The
results indicated no significant differences.
A Model of Sport Fandom and Communication
Because there is evidence of connections between 1) identity formation and self-
categorization/strength of identity, psychological outcomes, and behavior, and 2) self-
categorization/strength of identity with psychological effects, communicative reactions, and
physiological responses, a generalized latent variable model was estimated using Stata 12.1
(Figure 4.1). This technique was selected because it exhibits several advantages over simple
multiple regression estimates such as possessing more flexible assumptions concerning
normality, reducing measurement error, and having the ability to test a more comprehensive
model rather than individual scales (Garson, 2009). The proposed model fits the data well,

!
! 59!
χ2(65) = 123.02, p < .000, CFI = .91, SRMR = .07, RMSEA = .06, CI90% = .05, .09.
Standardized path coefficients are displayed for the observed and latent variables in Table 4.4.
Figure 4.1: Generalized latent variable model with coefficients (N = 183). An asterisk denotes statistical significance. The conceptual links are as follows: STIS = Identity formation; ID = self-categorization; STPC = Psychological outcomes; BEH = verbal and nonverbal communicative reactions. The paths labeled in Figure 1.1 are as follows: Path A = STIS->STPC; Path B = STIS->ID; Path C = STIS->BEH; Path D = ID->STPC; Path E = ID->BEH.
Significant path coefficients from sport team identity formation to self-categorization and
strength of identity lend further support to H2A and H2B, and the significant path coefficient from
self-categorization and identity strength to psychological effects further supports H1A and H1B.
Latent path coefficients to behaviors from self-categorization, strength of identity, and sport team
identity formation to communicative responses were not significant, however. This lack of
association suggests that even though direct relations between identity formation, self-

!
! 60!
categorization, and behavioral output were evident through bivariate correlations, self-
categorization and identity strength do not have a mediating influence between team identity
formation and behavioral output. This result is may likely to due small sample size and its
ability to detect small effects paired with too much measurement error from the behavioral
coding that was attenuated with bivariate correlations but not in the latent variable model. All
observed path coefficients were significant.
The model did expose one important partially mediated relationship evident from the
model: Self-categorization appears to partially mediate the association between team identity
formation and psychological effects. Results of a Sobel test suggest that the association between
team identity formation and psychological effects is significantly mediated by self-categorization
(z’ = 1.65, p < 0.05). This finding allows for conceptual models of sport team fandom to test
Table 4.4: Standardized path coefficients and factor loadings for latent variable model Path/Factor β p Identity Formation->Cognitive 0.31 .02 Identity Formation->Psych. Effects 0.61 .000 Identity Formation->Behaviors 0.08 .25 Cognitive->Behaviors 0.12 .16 Cognitive->Psych. Effects 0.40 .000 Media Popularity 1.00 .000 Geography 0.60 .001 Family 1.08 .000 Athletic Performance 0.35 .03 Team Characteristics 0.89 .000 Self-Categorization 1.00 .000 Strength of Identity -45.41 .01 Self-Actualization 1.00 .000 Commitment 0.81 .000 Investment 0.44 .000 Happiness 1.00 .000 Sadness 0.60 .000 Anger 1.03 .000 Disgust 1.37 .000

!
! 61!
other cognitive processes such as imagined interaction, listening cognition, metacognition, and
other forms of message processing for potentially mediating effects.
Summary and Conclusion
Both self-report measures displayed association with the cognitive measures. When
family, athletic performance (distinguished from team success), and team characteristics played a
role in the sport team identity process, individuals reported more fan words as self-descriptive.
Moreover, when participants reported psychological benefits as a result of sport team fandom
and informed that there would be great emotional cost to quit following their favorite sport team,
they too selected more fan words as self-expressive. Of all of those variables, family,
psychological benefits and strong team commitment were all associated with quicker RT.
Communicative response to spectatorship played a crucial role in the identification of
important variables as well. Verbal and nonverbal expressions of sadness or anguish in response
to Nick Saban accepting the championship trophy were indicative of those who tended to allow
team performance, family, and geography to influence them during sport team identity processes.
Reactions of anger were associated with the influences of geography, athletic performance, and
sport team characteristics. Disgust was related to sport team identity constructs of team
characteristics and athletic performance. Lastly, happy verbal, nonverbal, and affective
responses were more likely to be observed by those affected by geography in the sport team
identity process. Happy, sad, or disgusted communication was more likely to be exhibited by
those who were typically more invested in their sport teams. Those who reported more positive
psychological effects as a result of sport were prone to angry or sad responses and more
committed fans also showed more anger.

!
! 62!
Just as indicators of strong sport team fandom are necessary, other variables are poignant
in isolating self-describing fans that do not incorporate sport team fandom into their self-
concepts. Those who reported a predilection for changing teams or ceasing to follow their
favorite sport team chose fewer fan words.
The final chapter will discuss the theoretical implications of the hypotheses and the
research question, the resolution of the problem statement proposed in Chapter 2, and validity
evidence for the measures used in this study.

!
! 63!
CHAPTER FIVE DISCUSSION OF HYPOTHESES, RESEARCH QUESTION, PROBLEM STATEMENT,
MEDIATED MODEL, AND VALIDITY EVIDENCE
This chapter will discuss the results in Chapters 3 and 4 in terms of previous sport team
research and the theoretical underpinnings advanced in Chapter 1 that included social learning
theory, social identity theory, self-categorization theory, and self-schemata. Next, the research
question and its implications will be considered, followed by an assessment of the problem
statement and the support the mediated model advanced in the previous chapter provides.
Following will be a discussion of the validity evidence this study provides for the methods
utilized. Finally, limitations and directions for future research are reflected on.
Discussion of Hypothesis and Research Question Support
The findings of this dissertation are not only largely supportive of connections found in
previous research, which has asserted that fans experience higher self-esteem and well-being
(Branscombe & Wann, 1991; Cialdini et al., 1976; Wann, 1994, 2006a, 2006b; Wann, Carlson,
et al., 1999; Wann, Peterson, et al., 1999; Wann et al., 2000), but also extend them through more
exhaustive measurement. This study shows through the support of H4 that fans who are more
highly identified tend to feel like sport team fandom helps them reach their potential as
individuals, grow and develop personally, and feel more successful. Evidence supporting H1A,
H2A, H2B also extends existing theory by identifying types of sport team fans more likely to feel
that way: Individuals coming to identify with their favorite teams through player performance,
team characteristics, family, and geography. Additionally, family as a mechanism for sport team
identity formation was most indicative of a highly self-categorized sport team fan.
These different types of sport team fans not only differentially experience psychological
benefits from following their sport teams but also communicate their experiences distinctively.

!
! 64!
As show from the evidence supporting H3A and H3B, there are a variety of communicative
outcomes associated with factors of sport team identity formation. Fans influenced by
geography during sport team identity formation were prone to increased affective and
communicative response involving happiness, sadness, and anger. Fans influenced by family
also experienced sadness, while others affected by athletic performance experienced elevated
levels of anger and disgust. Others finding sport team characteristics important tended to exhibit
higher levels of sadness, anger, and disgust. Furthermore, these communicative behaviors
become more salient when mediated by self-categorization and identity strength, and all four—
happiness, sadness, anger, and disgust—become significant output variables. This investigation
also supports the notion that fans who identify with teams because of media popularity are not
typically as highly identified (H2B), nor do they experience as strong communicative or
psychological outcomes (H3B) (Wann & Branscombe, 1990).
Identifying these specific processes that are or are not related to self-categorization and
strength of identity has extended theory. Family, athletic performance, and team characteristics
are all associated with self-categorization and/or stronger identity, but media popularity is
associated with neither. Furthermore, family, geography, team characteristics, and athletic
performance all associate with at least one form of joyous, grievous, angry, or disgusted verbal
or nonverbal communication as an outcome of sport team spectatorship, whereas media
popularity does not. The former types of fans are more likely to smile, laugh or clap their hands
in response to highlights, and more prone to be verbally or nonverbally aggressive, show anger,
express disgust, or show signs of grief in reaction to affronts to their team. These results hold up
the common assertion in sport literature that fair-weather sport team fans are more concerned
with the popularity and image of their sport team and are not as highly invested in the outcome

!
! 65!
either psychologically or communicatively (Cialdini et al., 1976; Madrigal, 1995, 2003; Raney,
2003; Sloan, 1979; Wann & Branscombe, 1992; Wann et al., 2002; Zillmann et al., 1989). As
shown in the mediated model (Figure 4.1), strongly self-identified sport team fans who are
influenced by family, geography, team characteristics and player performance then are more
likely to be express easily observable communication patterns in response to spectatorship, also
holding up previous findings (Branscombe & Wann, 1991; Madrigal, 1995, 2003; Raney, 2003;
Wann, 1994, 2006a, 2006b; Wann & Branscombe, 1992; Wann, Carlson, et al., 1999; Wann et
al., 2000; Wann et al., 2002; Zillmann et al., 1989). Recalling the bivariate correlation matrix
used in large part to assess H1A, H3A, H4, H5, H6, and H7—which all involved communicative and
psychological effects as a result of identity formation and self-categorization—these types of
fans more invested, more committed, more likely to benefit psychologically from their fandom,
and more prone to expressing these outcomes and processes verbally and nonverbally.
There are also marked physiological reactions to the viewing of sport. Evidenced by the
support for H5, H6 and H7, there is a connection between identity strength and emotions
associated with arousal, and the LGC model estimates support the assertions that there are
systematic physiological changes over time during the course of participants’ viewership. These
findings hold up prior research, which showed that physiology does change during spectatorship
for highly identified sport team fans (Branscombe & Wann, 1992; Hillman et al., 2000; Wann,
1991; Zillmann, 1991). These physiological changes are associated with hostility, spectator
violence, derogatory attitudes towards rival sport team fans, anguish, anger (Branscombe &
Wann, 1992; Gearhart & Keaton, 2011; 2013; Keaton & Gearhart, 2013b; Wann & Branscombe,
1992), and excitement (Sloan, 1979; Zillmann et al., 1989).

!
! 66!
Moreover, social learning theory maintains that social learning transpires through close
contact with others, imitation of authority figures, comprehension of concepts, and role model
behavior. This progression includes cognitive and communicative action and the environment
has a very strong influence on these functions. The “environment” is an inclusive referent that
incorporates the effects of family, peer groups, and community culture (e.g., living in New
Orleans and rooting for the Saints or Pelicans). Thus, geography and family have shown to be
integral to social learning and identity, which heavily affect communication.
Geography has shown to be important to sport team identification (Wann et al., 1996).
This factor, however, is not simply a reference to maps but refers to communities that allow for
the easy formation of social in-groups around local teams that are reinforced and maintained
through shared experiences of spectatorship and discussion. This study shows fans who are
influenced by geography when selecting their favorite sport team all tend towards heightened
verbal and nonverbal communicative reactions to team performance during spectatorship, more
specifically happy, sad, and angry responses. These individuals also tend to experience better
well-being as a result of their sport team identification and are more highly invested.
Family, too, is a crucial part of the sport team fandom-communication model. The
configuration of in-groups around team fandom involves socialization, which entails a
development through which socially relevant behavior is learned through interaction with others
(Zigler & Child, 1969). Identity maintenance is a communicative phenomenon and involves a
process of corroboration and opposition (Martin & Nakayama, 1997). Communicative
interaction among individuals within and between social groups is supported by this study as an
integral part of the formation of personal and social identities, and family influence facilitates the

!
! 67!
formation of these social groups and results in more observable self-categorization as sport team
fans and stronger identity.
Furthermore, because highly identified individuals tend to incorporate communicative
acts in terms of both causation and effect, it is no wonder family is part of the input, throughput,
and output in the model of sport team fandom and communication advanced by this study. Sport
team fans who are more strongly identified and influenced by family during identity formation
tend to display sadness when their teams perform poorly, but overall feel more positive well-
being, are more committed to their teams, and are more highly invested. Family is even more
significant when considering that there is a direct link between the age at which an individual
comes to become identified as a fan and the amount of time they invest in sport team fandom as
an adult (Karastamitis, 2009). This study supports and extends these findings; those affected by
family were more likely to self-categorize as sport team fans and to be more highly identified
with their sport teams. Therefore, both social learning and self-categorization are integral to the
sport team identification-communication model.
Research Question: Communicative, Affective, and Physiological Sex-Based Differences
Because women are typically socialized in the US to be more pleasant and conciliatory
from fear of exclusion (see Brown & Gilligan, 1993) and differences in expressions of contempt
have been found to be highly observable (Underwood, 2004), questions concerning biological
sex and communication arose. Women are more likely to convey anger and contempt
nonverbally and men have been found to be more defensive and less expressive
communicatively and affectively (Carstensen et al., 1995).
However, this study does not support sex differences in the outcomes of sport team
spectatorship, which was not supported by the physiological data (variability in the heart rate

!
! 68!
changes were not related to sex). Neither are sex differences significant in the verbal or
nonverbal reactions to team performance in the highlight and lowlight videos. These data are not
supportive of Brown and Gilligan’s or Underwood’s conclusions concerning verbal and
nonverbal expressions of contempt or anger. The data in this dissertation do not maintain the
idea that males and females communicate or express emotion differently in sport team
spectatorship scenarios, nor do their physiological responses vary dissimilarly.
Validity Evidence
Construct validity approximates the extent that methods measure what they claim to
measure by correlating them with theoretically related constructs (nomological network).
Because sport team fandom was shown to have clear links to self-concept, spectatorship,
emotional output and communicative responses, the self-report measures were compared to
cognitive measures of self-schemata, behavioral methods recording affective and communicative
responses, and physiological correlates related to emotions. Both self-report measures—the C-
STIS and the STPCS—had multiple subscales correlated with cognitive and communicative
methods (see Table 5.1).
Table 5.1: Matrix of variable correlations
C-STIS STPCS Method MP G F AP T SA C I Cognitive Self-categorization X X X X X Identity Strength X X X X X Verbal and Nonverbal Communicative Responses Happiness X X Sadness X X X X X Anger X X X X X Disgust X X X NOTE: MP = Media Popularity; G = Geography; F = Family; AP = Athletic performance; T = Team characteristics; SA = Self-actualization; C = Commitment; I = Investment. An X signifies that a significant correlation exists between variables.
!
! 69!
The only factor of the C-STIS that did not correlate with the methods was Media
Popularity, which was not theorized to do so. Family, Athletic Performance, and Team
Characteristics were associated with self-categorization, strength of identity, and all four
communicative channels in one combination or another. Geography did not significantly relate
to self-categorization or identity strength, but did associate with outcome variables of happiness,
sadness, disgust, self-actualization, and investment. This outcome may be explained by the fact
that those influenced by geography when selecting their favorite team are prone to expressing
emotions when their social identities are threatened (i.e., the poor performance of the team
reflects negatively upon the community and causes divergent affective responses) and experience
positive psychological benefits when the sport team does well (which reflects well on the
community). However, it seems to become less important when it pertains to personal identities
and views of the self.
The STPS also showed evidence of convergent validity. All three of its subscales—self-
actualization, commitment, and investment—displayed significant correlations with at least one
component of each of the cognitive and behavioral measures. Self-actualization and investment
were both related to self-categorization and identity strength, and commitment was associated
with identity strength. Furthermore, all four of the communication channels were accounted for
between the subscales with investment affecting happiness, sadness, and disgust, self-
actualization influencing sadness and anger, and commitment having sway over anger.
The self-report measures implemented herein show evidence of convergent validity in the
case of Geography, Family, Athletic Performance, Team Characteristics, Self-Actualization,
Commitment, and Investment and divergent validity in the instance of media popularity by
showing disassociation with the measures of identity strength and communicative output.

!
! 70!
Problem Statement: Inconsistent Definitions of Fandom and Overreliance on Self-Report
First, this dissertation has helped to alleviate the overreliance on self-report measures in
the study of sport and communication by introducing behavioral, cognitive, affective, and
physiological measures. The use of these methods has produced validity evidence for the self-
report scales applied here, giving researchers more confidence that these self-report instruments
are as closely related to sport team fandom, cognition, communication, and identification as
claimed by the developers.
Second, the model advanced by this project brings some organization to many of the
concepts integral to the study of sport team fandom and communication. It differentiates
between identity formation, identification, identity strength, spectatorship, well-being,
involvement, and commitment by placing them within a framework that emphasizes when these
process occur in the overall process. Identity formation comes first in the temporal sense; for
most people it occurs in developmental years, is communicated directly from family members,
and influences the extent and magnitude that individuals identify with a sport team later in life.
During these early stages, family and community play important communicative role s in the
sport team fandom model as the functions of parents, siblings, peers, and local media influence
choices. Hence, spectatorship decisions, well-being, involvement, and commitment come after
identity formation and self-categorization, and are results of the differential types and strengths
of the separate formative and cognitive processes involving identity. And although the path
loadings to behavioral outcomes are not significant in the model itself, the connection is
supported by many significant correlations. Sport team fandom then can at least be separated
into differential yet related constructs of identity formation, self-categorization, psychological
effects, and related communicative and affective responses. Identity formation and self-

!
! 71!
categorization are integral processes in regards to the way sport team fans feel about themselves
as a result of their team affiliations and the way they behave in response to those teams’
performances. This conceptual framework is ultimately advanced by this dissertation.
Summary and Conclusion
The role of communication in sport team fandom is present at every stage outlined above.
We can speculate through the wide array of sport fandom literature that during sport team
identity formation, sport team identification choices are communicated to individuals during
developmental phases, and these influences affect sport team fans’ communicative choices later
in life. The ways in which favorite teams of adult family members and peers at school are
passed to others socially is well rooted in social learning theory, as are the ways in which shared
fandom by the local community affect the sport team selections of children and adolescents.
In this dissertation, the effects of these forces can be observed through self-categorization
as a sport team fan and the strength of sport team identification. This resultant sport team
identity is performed socially, and is differentially affected by family, community, the
characteristics of sport teams, and the performance of the players on the sport teams. Strongly
identified sport team fans are more likely to feel positive psychological benefits such as higher
self-esteem and sense of well-being. Finally, highly identified sport team fans have a stronger
propensity towards experiencing physiological and affective variation in response to
spectatorship and sport team performances. These emotions are more likely to be communicated
nonverbally or verbally the stronger the sport team identification of the fan. Communication is
the glue that holds the experience of sport team fandom together, whether it involves social
forces that existed before any of these sport team fans were observed in this study or empirically
throughout the investigation (Underwood, 2004).

!
! 72!
Limitations
As with any study, this dissertation is not without its limitations. Particularly, “college
students in laboratory studies behave less emotionally and impulsively than the general
population” (Sears, 1986, p. 527). This observation may have had a role in diminishing
outcomes of spectatorship (i.e., the affective and communicative responses to the videos). In
addition, almost every participant was a fan of LSU sport teams, resulting in a homogenous
sample of college-age, southern football fans attending LSU. A crucial task would be to test
these findings against more heterogeneous samples, especially in more varied cultural areas.
Next, the physiological measures were likely not comprehensive enough. Although heart
rate is often a useful measure, in some contexts it fails to display association with cognitive
measures. Other measures of physiological response such as heart rate variability, respiration,
somatic wrist activity, stress hormone response, and blood pressure may be necessary to detect
correlates of physiology and team fandom, especially in relationship to cognition (Britton et al.,
2008).
Furthermore, sport team fandom is certainly more complex than even these methods can
capture. Other studies involving economics, biological sex, and age can help further unpack the
relationships between identity, involvement, and commitment. These investigations could also
aid in gathering additional validity evidence.
Finally, the settings in which the spectatorship took place were experimental, taking place
in a laboratory rather than a setting in which individuals normally watch sport. Interaction with
strangers in a lab is quite different than with those one knows, especially considering the
importance of family in the equation of sport team fandom. Therefore, although certainly

!
! 73!
challenging logistically, these self-report, cognitive, behavioral, and physiological methods
should be tested against live spectatorship.
Future Research
Future research should aim to test the extent that cognitive processes mediate the
relationship between sport team identity formation and psychological or behavioral outcomes by
investigating other phenomena such as imagined interaction, which could prove to be an apt tool
for breaking down specifically what types of cognitive functions are influencing the effects of
identity formation.
Additional methods should also be introduced to more fully understand the role of
communication and sport team fandom. Qualitative methods for examination of non-
generalizable samples could shed light on the overall model. For instance, an investigation of
inmates who are incarcerated for sport team fandom-related crimes could isolate variables
responsible for extreme psychological or behavioral outcomes.
Finally, this research should be extended to other cultural locales. It is not known to what
extent sport team fandom in Louisiana is reflective of sport team fandom in Boston, London,
Hong Kong, or Buenos Aires. English Premier League fans may or may not experience the same
types of outcomes as college football fans in the US. A comparison of national sport to
international sport is also warranted, as rival sport team fans within a country become fellow in-
group members when the stage is shifted to between countries.

!
! 74!
REFERENCES Allstate BCS National Championship Game. (2012) [Television broadcast]. USA: ESPN. Anderson, N. H. (1968). Likableness ratings of 555 personality-trait words. Journal of
Personality and Social Psychology, 9(3), 272. doi: 10.1037/h0025907 Andreassi, J. L. (2007). Psychophysiology (5th ed.). Mahwah, NJ: Erlbaum. Armor, D. J. (1974). Theta reliability and factor scaling. In H. L. Costner (Ed.), Sociological
methodology 1973-1974. San Francisco, CA: Jossey-Bass. Baade, R. A., & Tiehen, L. J. (1990). An analysis of major league baseball attendance, 1969-
1987. Journal of Sport & Social Issues, 14(1), 14-32. doi: 10.1177/019372359001400102 Bandura, A. (1977). Social learning theory. Upper Saddle River, NJ: Prentice Hall. Becker, M. A., & Suls, J. (1983). Take me out to the ballgame: The effects of objective, social,
and temporal performance information on attendance at major league baseball games. Journal of Sport Psychology(5), 302-313.
Belin, P., Zatorre, R. J., & Ahad, P. (2002). Human temporal-lobe response to vocal sounds.
Cognitive Brain Research, 13(1), 17-26. doi: 10.1016/S0926-6410(01)00084-2 Branscombe, N. R., & Wann, D. L. (1991). The positive social and self-concept consequences of
sports team identification. Journal of Sports and Social Issues, 15, 115-127. doi: 10.1177/019372359101500202
Branscombe, N. R., & Wann, D. L. (1992). Physiological arousal and reactions to outgroup
members during competitions that implicate an important social identity. Aggressive Behavior, 18(2), 85-93. doi: 10.1002/1098-2337(1992)18:2<85::AID-AB2480180202>3.0.CO;2-9
Britton, A., Singh-Manoux, A., Hnatkova, K., Malik, M., Marmot, M. G., & Shipley, M. (2008).
The association between heart rate variability and cognitive impairment in middle-aged men and women. Neuroepidemiology, 31(2), 115-121. doi: 10.1159/000148257
Brown, L. M., & Gilligan, C. (1993). Meeting at the crossroads: Women's psychology and girls'
development. Feminism & Psychology, 3(1), 11-35. doi: 10.1177/0959353593031002 Byrne, B. M. (2010). Structural equation modeling with AMOS (2nd ed.). Ottawa, Ontario,
Canada: Routledge. Campbell, D. T., & Fiske, D. W. (1959). Convergent and discriminant validation by the
multitrait-multimethod matrix. Psychological Bulletin, 56(2), 81. doi: 10.1037/h0046016

!
! 75!
Capella, M. E. (2002). Measuring sports fans' involvement: The fan behavior questionnaire. Southern Business Review, 27(2), 30-36.
Carstensen, L. L., Gottman, J. M., & Levenson, R. W. (1995). Emotional behavior in long-term
marriage. Psychology and Aging, 10(1), 140-156. doi: 10.1037/0882-7974.10.1.140 Cialdini, R. B., Borden, R. J., Thorne, A., Walker, M. R., Freeman, S., & Sloan, L. R. (1976).
Basking in reflected glory: Three (football) field studies. Journal of Personality and Social Psychology, 34, 366–375. doi: 10.1037//0022-3514.34.3.366
Cisler, J. M., Olatunji, B. O., Lohr, J. M., & Williams, N. L. (2009). Attentional bias differences
between fear and disgust: Implications for the role of disgust in disgust-related anxiety disorders. Cognition and Emotion, 23(4), 675-687. doi: 10.1080/02699930802051599
Cohen, J. (1988). Statistical power analysis for the behavioral sciences (2nd ed.). Hillsdale, NJ:
Erlbaum. Collier, M. J. (1994). Cultural identity and intercultural communication. In L. A. Samovar & R.
E. Porter (Eds.), Intercultural communication: A reader (pp. 36-45). San Francisco, CA: Wadsworth.
de Gelder, B. (1999). Recognizing emotions by ear and by eye. In R. D. Lane & L. Nadel (Eds.),
Cognitive neuroscience of emotions (pp. 84-105). New York, NY: Oxford University Press.
Duncan, M. C. (1983). The symbolic dimensions of spectator sport. Quest, 35(1), 29-36. doi:
10.1080/00336297.1983.10483780 Duncan, M. C., & Brummett, B. (1989). Types and sources of spectating pleasure in televised
sport. Sociology of Sport Journal, 6(3), 195-211. Duncan, T. E., & Duncan, S. C. (1995). Modeling the processes of development via latent
variable growth curve methodology. Structural Equation Modeling, 2, 187-213. doi: 10.1080/10705519509540009
Earnheardt, A. C., & Haridakis, P. M. (2009). An examination of fan-athlete interaction: fandom,
parasocial interaction, and identification. Ohio Communication Journal, 47, 27-53. doi: 10.1080/08838150902908270
Ekman, P., & Friesen, W. V. (1971). Constants across cultures in the face and emotion. Journal
of Personality and Social Psychology, 17(2), 124. doi: 10.1037/h0030377 Faul, F., Erdfelder, E., Lang, A. G., & Buchner, A. (2007). G* Power 3: A flexible statistical
power analysis program for the social, behavioral, and biomedical sciences. Behavior Research Methods, 39(2), 175-191. doi: 10.3758/BF03193146

!
! 76!
Funk, D. C., & James, J. (2001). The psychological continuum model: A conceptual framework for understanding an individual's psychological connection to sport. Sport Management Review, 4(2), 119-150. doi: 10.1016/S1441-3523(01)70072-1
GameDayESPN (Producer). (2012, March 1). Nick Saban holds up the BCS National
Championship Trophy. Retrieved from http://www.youtube.com/user/GameDayESPN Gantz, W. (1981). An exploration of viewing motives and behaviors associated with television
sports. Journal of Broadcasting & Electronic Media, 25(3), 263-275. doi: 10.1080/08838158109386450
Gantz, W., & Wenner, L. (1995). Fanship and the television sports viewing experience.
Sociology of Sport Journal, 12(1), 56-74. Garson, G. D. (2009). Quantitative research in public administration. from
http://faculty.chass.ncsu.edu/garson/PA765/ Gearhart, C. C., & Keaton, S. A. (2011, November). The influence of motives for selecting a
favorite team on sport team identification and fan behavior. Paper presented at the National Communication Association, New Orleans, LA.
Gearhart, C. C., & Keaton, S. A. (2013). Investigating the influence of team identity formation
and psychological involvement on fan behavior. Manuscript submitted for publication. Gottman, J. M. (1993). What predicts divorce?: The relationship between marital processes and
marital outcomes. Hillsdale, NJ: Erlbaum. Hancock, G. R., Kuo, W.-L., & Lawrence, F. R. (2001). An illustration of second-order latent
growth models. Structural Equation Modeling, 8(3), 470-489. doi: 10.1207/S15328007SEM0803_7
Harris, R. J. (2004). Sports and music: Emotion in high gear. In R. J. Harris (Ed.), A cognitive
psychology of mass communication (4th ed., pp. 151-186). Mahwah, NJ: Erlbaum. Haslam, S. A. (2001). Psychology in organizations. London, England: Sage. Heider, F. (1958). The psychology of interpersonal relations. New York, NY: John Wiley and
Sons. Hemphill, D. A. (1995). Revisioning sport spectatorism. Journal of the Philosophy of Sport,
22(1), 48-60. doi: 10.1080/00948705.1995.9714515 Hillman, C. H., Cuthbert, B. N., Cauraugh, J., Schupp, H. T., Bradley, M. M., & Lang, P. J.
(2000). Psychophysiological responses of sport fans. Motivation and Emotion, 24(1), 13-28. doi: 10.1023/A:1005535508771

!
! 77!
Hogg, M. A., & Reid, S. A. (2006). Social identity, Self-categorization, and the communication of group norms. Communication Theory, 16, 7-30. doi: 10.1111/j.1468-2885.2006.00003.x
Hogg, M. A., Terry, D. J., & White, K. M. (1995). A tale of two theories: A critical comparison
of identity theory with social identity theory. Social Psychology Quarterly, 58, 255-269. doi: 10.2307/2787127
Hogg, M. A., & Vaughan, G. (2002). Social psychology. Upper Saddle River, NJ: Prentice Hall. Honeycutt, J. M. (2010). Physiology and imagined interactions. In J. M. Honeycutt (Ed.),
Imagine that: Studies in imagined interaction (pp. 43-64). Cresskill, NJ: Hampton. Hoyle, R. H. (2000). Confirmatory factor analysis. In H. E. Tinsley & S. D. Brown (Eds.), Handbook of applied multivariate statistics and mathematical modeling. San Diego, CA:
Academic Press. Hoyle, R. H., & Smith, G. T. (1994). Formulating clinical research hypotheses as structural
equation models: A conceptual overview. Journal of Consulting and Clinical Psychology, 62(3), 429-440. doi: 10.1037/0022-006X.62.3.429
Hu, L., & Bentler, P. M. (1999). Cutoff criteria for fit indexes in covariance structure analysis:
Conventional criteria versus new alternatives. Structural Equation Modeling: A Multidisciplinary Journal, 6(1), 1-55. doi: 10.1080/10705519909540118
Infante, D. A., & Wigley, C. J., III. (1986). Verbal aggressiveness: An interpersonal model and
measure. Communication Monographs, 53(1), 61-69. doi: 10.1080/03637758609376126 Izard, C. E., & Malatesta, C. Z. (1987). Perspectives on emotional development: Differential
emotions theory of early emotional development. In J. D. Osofsky (Ed.), Handbook of infant development (2nd ed., pp. 494-540). New York, NY: J. Wiley.
Jacobson, B. (2003). The social psychology of the creation of a sports fan identity: A theoretical
view of the literature. Athletic Insight: The Online Journal of Sports Psychology, 5(2). Jarvis, B. G. (2008). MediaLab (Version 2008.1) [Computer software]. New York, NY:
Empirisoft. Juslin, P. N., & Laukka, P. (2001). Impact of intended emotion intensity on cue utilization and
decoding accuracy in vocal expression of emotion. Emotion, 1(4), 381-412. doi: 10.1037/1528-3542.1.4.381
Juslin, P. N., & Laukka, P. (2003). Communication of emotions in vocal expression and music
performance: Different channels, same code? Psychological Bulletin, 129(5), 770-814. doi: 10.1037/0033-2909.129.5.770
!
! 78!
Kahle, L. R., Kambara, K. M., & Rose, G. M. (1996). A functional model of fan attendance motivations for college football. Sport Marketing Quarterly, 5(4), 51-60.
Karastamitis, P. (2009). The relationship of childhood sports fandom development and adult
sports consumption behavior. (Doctoral dissertation, Argosy University), Retrieved from http://gradworks.umi.com/33/45/3345776.html.
Keaton, S. A., & Gearhart, C. C. (2013a). Evaluating the psychometric properties of existing
scales in sport literature: Refining and developing comprehensive sport fandom constructs. Manuscript submitted for publication.
Keaton, S. A., & Gearhart, C. C. (2013b, February). Identity formation, strength of Identification,
and self-categorization as predictors of behavioral and psychological outcomes: A model of sport fandom. Paper presented at the International Association for Communication and Sport, Austin, TX.
Kline, R. B. (2005). Principles and practice of structural equation modeling (2nd ed.). New
York, NY: Guilford. Kotowski, M. R., Levine, T. R., Baker, C. R., & Bolt, J. M. (2009). A multitrait-multimethod
validity assessment of the Verbal Aggressiveness and Argumentativeness Scales. Communication Monographs, 76(4), 443-462. doi: 10.1080/03637750903300247
Krippendorff, K. (1970). Bivariate agreement coefficients for reliability of data. In E. R.
Borgatta & G. W. Bohrnstedt (Eds.), Sociological methodology (pp. 139-150). San Francisco, CA: Jossey Bass.
Krippendorff, K. (2004a). Content analysis: An introduction to its methodology (2nd ed.).
Thousand Oaks, CA: Sage. Krippendorff, K. (2004b). Reliability in content analysis. Human Communication Research,
30(3), 411-433. doi: 10.1111/j.1468-2958.2004.tb00738.x Kuljanin, G., Braun, M. T., & DeShon, R. P. (2011). A cautionary note on applying growth
models to longitudinal data. Psychological Methods, 16, 249-264. doi: 10.1037/a0023348 Loehlin, J. C. (1998). Latent variable models: An introduction to factor, path, and structural
analysis (3rd ed.). Hillsdale, NJ: Erlbaum. Lövheim, H. (2012). A new three-dimensional model for emotions and monoamine
neurotransmitters. Medical Hypotheses, 78(2), 341-348. doi: 10.1016/j.mehy.2011.11.016 LSUTigersFB (Producer). (2011, December 1). LSU "Road to the BCS" Part 2 [Defy You].
Retrieved from http://www.youtube.com/user/LSUTigersFB

!
! 79!
Madrigal, R. (1995). Cognitive and affective determinants of fan satisfaction with sporting event attendance. Journal of Leisure Research, 27, 205-227.
Madrigal, R. (2003). Investigating an evolving leisure experience: antecedents and consequences
of spectator affect during a live sporting event. Journal of Leisure Research, 35(1), 23-48.
Mano, H., & Oliver, R. L. (1993). Assessing the dimensionality and structure of the consumption
experience: evaluation, feeling, and satisfaction. Journal of Consumer Research, 20(3), 451-466. doi: 10.1086/209361
Markus, H. R. (1977). Self-schemata and processing information about the self. Journal of
Personality and Social Psychology, 35(2), 63-78. doi: 10.1037/0022-3514.35.2.63 Marler, P. (1977). The evolution of communication. In T. A. Sebeok (Ed.), How animals
communicate (pp. 45-70). Bloomington, IN: Indiana University Press. Martin, J. N., & Nakayama, T. K. (1997). Intercultural communication in contexts. Mountain
View, CA: Mayfield. Milne, G. R., & McDonald, M. A. (1999). Sport marketing: Managing the exchange process.
Sudbury, MA: Jones and Bartless. Murray, I. R., & Arnott, J. L. (1995). Implementation and testing of a system for producing
emotion-by-rule in synthetic speech. Speech Communication, 16(4), 369-390. doi: 10.1016/0167-6393(95)00005-9
Nunnally, J. C., & Bernstein, I. H. (1994). Psychometric theory (3rd ed.). New York, NY:
McGraw-Hill. Obrist, P. A., Gaebelein, C. J., Teller, E. S., Langer, A. W., Grignolo, A., Light, K. C., &
McCubbin, J. A. (1978). The relationship among heart rate, carotid dP/dt, and blood pressure in humans as a function of the type of stress. Psychophysiology, 15, 102-115. doi: 10.1111/j.1469-8986.1978.tb01344.x
Oliver, R. L. (1993). Cognitive, affective, and attribute bases of the satisfaction response.
Journal of Consumer Research, 20(3), 418-430. doi: 10.1086/209358 Oliver, R. L. (1994). Conceptual issues in the structural-analysis of consumption emotion,
satisfaction, and quality: Evidence in a service setting. In C. T. Allen & D. R. John (Eds.), Advances in consumer research (Vol. 21, pp. 16-22). Provo, UT: Association of Consumer Research.
Onorato, R. S., & Turner, J. C. (2004). Fluidity in the self-concept: The shift from personal to
social identity. European Journal of Social Psychology, 34(3), 257-278. doi: 10.1002/ejsp.195

!
! 80!
Postmes, T., & Branscombe, N. (2010). Sources of social identity. In T. Postmes & N.
Branscombe (Eds.), Rediscovering social identity: Core sources. Oxford, England: Psychological Press.
Raney, A. A. (2003). Enjoyment of sport spectatorship. In J. Bryant, D. Roskos-Ewoldsen & J.
Cantor (Eds.), Communication and emotion: Essays in honor of Dolf Zillmann (pp. 397-416). Mahwah, NJ: Erlbaum.
Raykov, T., & Marcoulides, G. A. (2006). A first course in structural equation modeling (2nd
ed.). Mahwah, NJ: Erlbaum. Rosenthal, R. (1987). Judgment studies: Design, analysis, and meta-analysis. New York, NY:
Cambridge University Press. Rosenthal, R. (2005). Conducting judgment studies: Some methodological issues. In J. A.
Harrigan, R. Rosenthal & K. R. Scherer (Eds.), The new handbook of methods in nonverbal behavior research (pp. 199-234). London, England: Oxford University Press.
Scherer, K. R. (1999). Universality of emotional expression. In D. Levinson, J. Ponzetti & P.
Jorgenson (Eds.), Encyclopedia of human emotions (Vol. 2, pp. 669-674). New York: Macmillan.
Scherer, K. R., Banse, R., Wallbott, H. G., & Goldbeck, T. (1991). Vocal cues in emotion
encoding and decoding. Motivation and Emotion, 15(2), 123-148. doi: 10.1007/BF00995674
Sears, D. O. (1986). College sophomores in the laboratory: Influences of a narrow data base on
social psychology's view of human nature. Journal of Personality and Social Psychology, 51(3), 515-530. doi: 10.1037/0022-3514.51.3.515
Sivo, S., Fan, X., & Witta, L. (2005). The biasing effects of unmodeled ARMA time series
processes on latent growth curve model estimates. Structual Equation Modeling, 12, 215-231. doi: 10.1207/s15328007sem1202_2
Sloan, L. R. (1979). The function and impact of sports for fans: A review of the theory and
contemporary research. In J. H. Goldstein (Ed.), Sports, games, and play: Social and psychological viewpoints (pp. 219-262). Hillsdale, NJ: Erlbaum.
Stearns, P. N. (2008). History of emotions: Issues of change and impact. In M. D. Lewis, J. M.
Haviland-Jones & L. F. Barrett (Eds.), Handbook of emotions (3rd ed., pp. 17-31). New York, NY: Guilford Press.
Stets, J. E., & Burke, P. J. (2000). Identity theory and social identity theory. Social Psychology
Quarterly, 63, 224-237. doi: 10.2307/2695870

!
! 81!
Stryker, S. (1968). Identity salience and role performance: The relevance of symbolic interaction theory for family research. Journal of Marriage and the Family, 30, 558-564. doi: 10.2307/349494
Sutton, W. A., McDonald, M. A., Milne, G. R., & Cimperman, J. (1997). Creating and fostering
fan identification in professional sports. Sport Marketing Quarterly, 6, 15-22. Tabachnick, B. G., & Fidell, L. S. (2007). Using multivariate statistics (5th ed.). Boston, MA:
Pearson Education. Tajfel, H. (1970). Experiments in intergroup discrimination. Scientific American, 223, 96-102.
doi: 10.1038/scientificamerican1170-96 Tajfel, H. (1978). Social categorization, social identity and social comparison. In H. Tajfel (Ed.),
Differentiation between social groups: Studies in the social psychology of intergroup relations (pp. 61-76). London, England, UK: Academic Press.
Tajfel, H. (1981). Human groups and social categories: Studies in social psychology. London,
England, UK: Cambridge University Press. Tajfel, H., & Turner, J. C. (1978). Differentiation between social groups: Studies in the social
psychology of intergroup relations. London, England: Academic Press. Tajfel, H., & Turner, J. C. (1979). An integrative theory of intergroup conflict. In W. G. Austin
& S. Worchel (Eds.), The social psychology of intergroup relations. Monterey, CA: Brooks-Cole.
Tomkins, S. S. (1962). Affect imagery consciousness (Vol. 1). New York, NY: Springer. Tomkins, S. S. (1963). Affect imagery consciousness (Vol. 2). New York, NY: Springer. Trail, G. T., & James, J. D. (2002). The motivation scale for sports consumption: Assessment of
the scale's psychometric properties. Journal of Sport Behavior, 24(1), 108-126. Turner, J. C. (1984). Social identification and psychological group formation. In H. Tajfel (Ed.),
The social dimension: European developments on social psychology (Vol. 2, pp. 518-538). Cambridge, England: Cambridge University Press.
Turner, J. C., Hogg, M. A., Oakes, P. J., Reicher, S. D., & Wetherell, M. S. (1987).
Rediscovering the social group: A self-categorization theory. Oxford, England: Basil Blackwell.
Turner, J. C., & Oakes, P. J. (1986). The significance of the social identity concept for social
psychology with reference to individualism, interactionism and social influence. British Journal of Social Psychology, 25(3), 237-252. doi: 10.1111/j.2044-8309.1986.tb00732.x

!
! 82!
Underwood, M. K. (2004). III. Glares of contempt, eye rolls of disgust and turning away to exclude: Non-verbal forms of social aggression among girls. Feminism & Psychology, 14(3), 371-375. doi: 10.1177/0959353504044637
Videbeck, S. L. (2006). Psychiatric-mental health nursing (3rd ed.). Philadelphia, PA: Lippincott
Williams & Wilkins. Visual Thesaurus (Version 1998-2012). (1998-2012) [Computer software]. New York, NY:
Thinkmap. Retrieved from http://www.visualthesaurus.com/ Wann, D. L. (1991). The influence of identification with a group and physiological arousal on
categorization processes. (Doctoral dissertation, University of Kansas), University of Kansas. Retrieved from http://www-.lib-.lsu-.edu/apps/onoffcampus-.php-?url=http://proquest-.umi-.com/pqdweb-?did=744892641-&sid=11-&Fmt=2-&clientId=19327-&RQT=309-&VName=PQD
Wann, D. L. (1994). The "noble" sports fan: The relationships between team identification, self-
esteem, and aggression. Perceptual and Motor Skills, 78(3), 864. doi: 10.2466/pms.1994.78.3.864
Wann, D. L. (1995). Preliminary validation of the sport fan motivation scale. Journal of Sports
and Social Issues, 19, 377-396. doi: 10.1177/019372395019004004 Wann, D. L. (1997). Sport psychology. Upper Saddle River, NJ: Prentice Hall. Wann, D. L. (2002). Preliminary validation of a measure for assessing identification as a sport
fan: The sport fandom questionnaire. International Journal of Sport Management, 3, 103-115.
Wann, D. L. (2006a). The causes and consequences of sport team identification. In A. A. Raney
& J. Bryant (Eds.), Handbook of sports and media (pp. 331-352). Mahway, NJ: Erlbaum. Wann, D. L. (2006b). Examining the potential causal relationship between sport team
identification and psychological well-being. Journal of Sport Behavior, 29(1). doi: 10.1037/1089-2699.10.4.272
Wann, D. L., & Branscombe, N. R. (1990). Die-hard and fair-weather fans: Effects of
identification on BIRGing and CORFing tendencies. Journal of Sports and Social Issues, 14, 103-117. doi: 10.1177/019372359001400203
Wann, D. L., & Branscombe, N. R. (1992). Emotional responses to the sports page. Journal of
Sports and Social Issues, 16(1), 49-64. doi: 10.1177/019372359201600104 Wann, D. L., & Branscombe, N. R. (1993). Sports fans: Measuring degree of identification with
their team. International Journal of Sports Psychology, 24, 1-17.
!
! 83!
Wann, D. L., Carlson, J. D., & Schrader, M. P. (1999). The impact of team identification on the hostile and instrumental verbal aggression of sport spectators. Journal of Social Behavior & Personality, 14, 279-286.
Wann, D. L., Culver, Z., Akanda, R., Daglar, M., De Divitiis, C., & Smith, A. (2005). The
effects of team identification and game outcome on willingness to consider anonymous acts of hostile aggression. Journal of Sport Behavior, 28(3), 282-307.
Wann, D. L., Melnick, M. J., Russell, G. W., & Pease, D. G. (2001). Sport fans: The psychology
and social impact of spectators. New York, NY: Routledge. Wann, D. L., Peterson, R. R., Cothran, C., & Dykes, M. (1999). Sport fan aggression and
anonymity: The importance of team identification. Social Behavior and Personality: An International Journal, 27(6), 597-602. doi: 10.2224/sbp.1999.27.6.597
Wann, D. L., Royalty, J. L., & Roberts, A. (2000). The self-presentation of sports fans:
Investigating the importance of team identification and self-esteem. Journal of Sport Behavior, 23(2). doi: 10.1080/00224540009600455
Wann, D. L., Royalty, J. L., & Rochelle, A. R. (2002). Using motivation and team identification
to predict sport fans' emotional responses to team performance. Journal of Sport Behavior, 25(2).
Wann, D. L., Schrader, M. P., & Adamson, D. R. (1998). The cognitive and somatic anxiety of
sport spectators. Journal of Sport Behavior, 27, 322-337. Wann, D. L., Tucker, A., & Schrader, M. P. (1996). An exploratory examination of the factors
influencing the origination, continuation, and cessation of identification with sports teams. Perceptual and Motor Skills, 82(3), 995-1001. doi: 10.2466/pms.1996.82.3.995
Wenner, L. A., & Gantz, W. (1989). The audience experience with sports on television. In L. A.
Wenner (Ed.), Media, sports and society (pp. 241-268). Newbury Park, CA: Sage. Westbrook, R. A., & Oliver, R. L. (1991). The dimensionality of consumption emotion patterns
and consumer satisfaction. Journal of Consumer Research, 18(1), 84-91. doi: 10.1086/209243
Wilder, J. (1962). Basimetric approach (law of initial value) to biological rhythms. Annals of the
New York Academy of Sciences, 98(4), 1211-1220. doi: 10.1111/j.1749-6632.1962.tb30629.x
Zigler, E., & Child, I. L. (1969). Socialization. In G. Lindzey & E. Aronson (Eds.), The
handbook of social psychology (2nd ed.). Reading, MA: Addison-Wesley.

!
! 84!
Zillmann, D. (1991). Television viewing and physiological arousal. In J. Bryant & D. Zillman (Eds.), Responding to the screen: Reception and reaction processes (pp. 103-134). Hillsdale, NJ: Erlbaum.
Zillmann, D., Bryant, J., & Sapolsky, N. (1989). Enjoyment from sports spectatorship. In J.
Goldstein (Ed.), Sports, games, and play: Social and psychological viewpoints (2nd ed.). Hillsdale, NJ: Erlbaum.
Zillmann, D., & Paulus, P. B. (1993). Spectators: Reactions to sports events and effects on
athletic performance. In R. N. Singer, M. Murphey & L. K. Tennant (Eds.), Handbook of research on sport psychology (pp. 600-619). New York, NY: Macmillan.
Zulli, R., Nicosia, F., Borroni, B., Agosti, C., Prometti, P., Donati, P., . . . Padovani, A. (2005).
QT dispersion and heart rate variability abnormalities in Alzheimer's disease and in mild cognitive impairment. Journal of the American Geriatrics Society, 53(12), 2135-2139. doi: 10.1111/j.1532-5415.2005.00508.x

!
! 85!
APPENDIX A: DESCRIPTION OF SELF-REPORT SCALES AND PSYCHOMETRIC PROPERTIES
A previous project was undertaken to assess the psychometric properties of existing
scales claiming to measure aspects of sport team fandom (Keaton & Gearhart, 2013a). The
scales underwent rigorous evaluation and refinement and were tested on independent data before
use in this dissertation. The assessment of the refined structures on independent data is outlined
below.
Participants and Procedures. College students attending a large southeastern university
in the US were recruited via an online scheduling system from where they were able to select
from a variety of research credit opportunities. All students received a small amount of required
research credit for their participation. All data collected were confidential, all students provided
informed consent, and the appropriate Institutional Review Board approved all procedures. The
total sample included 329 participants (192 males, 137 females, one not indicated, Mage = 20.17,
SD = 1.71, age range: 18 to 29 years). The racial composition was distributed amongst
Caucasians (75.8%), African-Americans (14.5%), Latinos (3.%), those of Asian descent (2.%),
and “other” (2.4%). Those who selected to participate in this study were directed to an external
and secure URL where they completed the refined scales described above (54 items total).
Results
Before fitting the measurement model the data were inspected for violations of
multivariate assumptions (Tabachnick & Fidell, 2007). One observation displayed standardized
residuals greater than 2.0 in absolute value and 14 observations qualified as multivariate outliers
(Mahalanobis Distance > 174.81, p < .001). These 15 observations were deleted to avoid
inflated values. Additionally, 20 observations were removed that contained missing or
incomplete data.

!
! 86!
The first generated scale of sport team identity formation contained five subscales. The
measurement scale represented the data well in replication, χ2(199) = 334.21, p < .000, CFI =
.96, SRMR = .09, RMSEA = .05, CI90% = .04, .06, with the factors displaying satisfactory
reliability estimates: Media Popularity (α = .90), Geography (α = .85), Family (α = .85), Team
Characteristics (α = .84) and Athletic Performance (α = .86). Inter-factor correlations were again
moderate to high and significant. This scale was termed the Causation of Sport Team
Identification Scale (C-STIS).
The second scale of psychological factors also fit the data well, χ2(87) = 208.83, p < .000,
CFI = .96, SRMR = .09, RMSEA = .07, CI90% = .06, .08. Internal consistency was exemplary
for all three factors, which were named: Self-Actualization (α = .91), Commitment (α = .93) and
Investment (α = .86). Inter-factor correlations were again significant. This scale was dubbed the
Sport Team Psychological Commitment scale (STPC).
Reliability estimates were satisfactory for all of the latent constructs for the three
measurement scales across two datasets, and the theoretical groupings replicated across both
independent data samples. These results provide evidence that the developed scales are at least
generalizable to the settings in which they have been administered.
Table AA.1: Scale items and reliability coefficients for developed scales Causation of Sport Team Identification Media Popularity (α = .91/.90) I chose my favorite team because they receive a substantial amount of national television coverage. I chose my favorite team because they receive a substantial amount of national newspaper coverage. I chose my favorite team because they are popular. I chose my favorite team because they receive a substantial amount of radio coverage. Geography (α = .80/.85) I follow my favorite team because I attended school in the same city or state. I chose my favorite team because it is close to a school I now, have, or hope to attend. I chose my favorite team because I live or have lived in or around the area.

!
! 87!
(Table AA.1 continued) Causation of Sport Team Identification I have to support this team because it is located in my hometown or university. I chose my favorite team because of geographical reasons (like town, city, or state this team represents and/or I live in or around the area). Family (α = .89/.85) I chose my favorite team because older family members follow this team. I chose my favorite team because my immediate family follows this team. One of the reasons for being a fan of the team is that my family members are fans of the team. I have been a fan of my favorite team since childhood. I chose my favorite team because extended family members (e.g., cousin, aunt/uncle, grandparents) follow this team. I chose my favorite team because my parents and/or family follow this team. Athletic Performance (α = .86/.86) Watching a well-executed athletic performance is something I enjoy. I enjoy a skillful performance by the team. I am a spectator of sport because of sport competition. I enjoy watching a highly skilled player perform. Team Characteristics (α = .81/.84) I chose my favorite team because I like their reputation/image. I chose my favorite team because the players have good attitudes, are motivated, and/or demonstrate a high level of sportsmanship. I follow my favorite team because I like the league the team represents. I follow my favorite team because I like their cohesiveness and unity. Sport Team Psychological Commitment Self-Actualization (α = .92/.91) Being a spectator of my favorite sport helps me to reach my potential as an individual. Being a spectator of my favorite sport helps me to develop and grow as a person. Being a spectator of my favorite sport helps me to accomplish things I never thought I could accomplish. Being a spectator of my favorite sport makes me feel that I am a successful person. I am a spectator of sport because of helps me grow as a person. Commitment (α = .92/.93) I have stopped following a favorite team because of lack of knowledge about the sport. I have stopped following a favorite team because I stopped playing the sport. I have stopped following a team because they were over-rated and/or too successful. I have simply switched allegiance to another team. I DISLIKE my favorite team's players, and/or coaches. I have stopped following a sports team because I simply lost interest. Investment (α = .86/.86) I continue to be a fan of this team because it would be very stressful for me to openly discontinue my association with this team. I continue to be a fan of this team because it would be psychologically hard to switch my attachment to another team. I continue to be a fan of this team because I do not want to lose the monetary and psychological investments I have made in being a fan of the team.

!
! 88!
(Table AA.1 continued) Sport Team Psychological Commitment I continue to be a fan of this team because it would cost me too much to become a fan of another team. NOTE: Reliability coefficients are listed for both of the independent datasets used to 1) refine and 2) test the scales.

!
! 89!
APPENDIX B: BEHAVIORAL CODING MANUAL
Coding Instructions for Presence of Verbal and Nonverbal Behavioral Outcomes of Sport Team Spectatorship: Happiness, Sadness, Anger, and Disgust.
Introduction This manual is designed to help you code types of verbal and nonverbal communicative behaviors involving happiness, sadness, anger, and disgust. Method In the spring semester of 2012, participants were asked to watch highlights and lowlights of the 2011 LSU Tigers football season. The video highlights and lowlights together lasted approximately 9 minutes, and the participants were recorded while they were watching the videos. Some participants were alone while they watched, and some were with other participants while watching. Yet others were in the room with a confederate posing as either an LSU fan or a non-fan. A confederate is someone that is pretending to be a participant, but is really a research assistant. The participants do not know that the confederate is not actually a participant. When the confederate is present, it will be noted and you will not code that person for behaviors. Your Task Your job is to watch the recordings—once for each participant—and indicate the extent to which each participant exhibits each type of behavior while watching the highlight and lowlight videos. You will have a coding sheet designed to allow you to note when each instance occurs. Following this introduction are specific descriptions of verbal and nonverbal communicative behaviors involving happiness, sadness, anger, and disgust, as well as a coding rubric you will use while watching each participant. You are strongly encouraged to reference a copy of the detailed description while you are coding each recording. Types of Behaviors
There are four major types of behavior we will be identifying. There will be both verbal and nonverbal expressions of each of these behaviors. 1) Happiness
a. Definition: Happiness is a state of well-being characterized by pleasant emotions ranging from contentment to joy.
b. Cheering or praising the team, its players, or its coaches may verbally indicate happiness.
c. Smiling, clapping, whooping, laughing, jumping up and down, or cheering may nonverbally indicate happiness.

!
! 90!
2) Sadness a. Definition: Sadness is emotional pain associated with disadvantage, loss, despair,
helplessness, or sorrow. b. Sadness may be expressed verbally, such as “This season made me sad.” c. Crying or moaning may nonverbally indicate sadness, as well as other acts such as
burying head in heads, covering one’s face, pouting, or sighing.
3) Anger a. Definition: Anger is a participant’s interpretation of having been offended,
wronged, or denied. It is a strong emotional response to provocation and may lead to withdrawal or antagonism (Videbeck, 2006).
b. Verbal indicators of anger may be verbal aggression (such as profanity, attacking self-concept of others, name calling, threats, resentment, shouting angrily, and a tendency to be more critically outspoken (Infante & Wigley, 1986).
c. Loud sounds (groaning in or growling in frustration), gritted teeth, obscene or hostile gestures, and intense brooding stares may indicate nonverbal aggression.
4) Disgust a. Definition: Disgust is an aversive reaction that involves withdrawing from a
person or object with expressions of revulsion, generally associated with things that are unclean, inedible, infectious, gory, or offensive (Cisler, Olatunji, Lohr, & Williams, 2009).
b. Verbal expressions of disgust may involve an aversion to one’s self, one’s own team, or the rival team, describing them in terms that make them aversive.
c. Nonverbal expressions of disgust may include a crinkling of nose, turning away, or covering of eyes, nose, or ears.

!
! 91!
Coding Sheet for Behavioral Responses to Sport Team Spectatorship Coder: ___________________ Participant ID#: ______________________ Total Video Length: _____________ In VLC, first identify how long the video is. Divide the video into even quarters, (e.g., an 8 minute video would be 2 min, 2 min, 2 min, 2 min) and code each segment independently. Please ensure you have finished coding each section before moving on to the next section. Refer to the coding rubric below to make your choices. PLEASE MAKE SURE THAT THE MID POINT OF THE VIDEO IS WHERE THE HIGHLIGHTS END AND THE LOWLIGHTS BEGIN. Section 1 (TIME: ____________ to _____________ -- ends with Ware’s TD run) Happiness: 0 1 2 3 4
Sadness: 0 1 2 3 4
Anger: 0 1 2 3 4
Disgust: 0 1 2 3 4
Section 2 (TIME: ____________ to _____________ this point should end with Saban) Happiness: 0 1 2 3 4
Sadness: 0 1 2 3 4
Anger: 0 1 2 3 4
Disgust: 0 1 2 3 4
Section 3 (TIME: this point should begin with Saban ____________ to _____________ ends with “what it means to your father”) Happiness: 0 1 2 3 4
Sadness: 0 1 2 3 4
Anger: 0 1 2 3 4
Disgust: 0 1 2 3 4
Section 4 (TIME: ____________ to _____________) Happiness: 0 1 2 3 4
Sadness: 0 1 2 3 4
Anger: 0 1 2 3 4
Disgust: 0 1 2 3 4
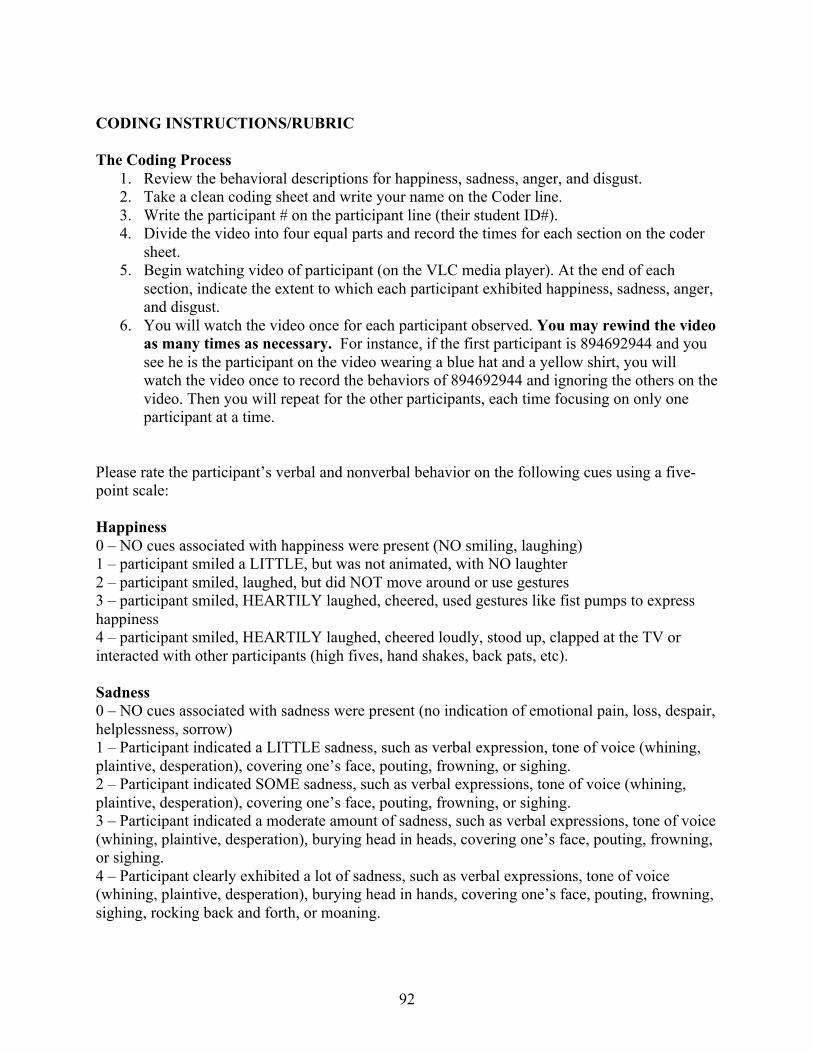
!
! 92!
CODING INSTRUCTIONS/RUBRIC The Coding Process
1. Review the behavioral descriptions for happiness, sadness, anger, and disgust. 2. Take a clean coding sheet and write your name on the Coder line. 3. Write the participant # on the participant line (their student ID#). 4. Divide the video into four equal parts and record the times for each section on the coder
sheet. 5. Begin watching video of participant (on the VLC media player). At the end of each
section, indicate the extent to which each participant exhibited happiness, sadness, anger, and disgust.
6. You will watch the video once for each participant observed. You may rewind the video as many times as necessary. For instance, if the first participant is 894692944 and you see he is the participant on the video wearing a blue hat and a yellow shirt, you will watch the video once to record the behaviors of 894692944 and ignoring the others on the video. Then you will repeat for the other participants, each time focusing on only one participant at a time.
Please rate the participant’s verbal and nonverbal behavior on the following cues using a five-point scale: Happiness 0 – NO cues associated with happiness were present (NO smiling, laughing) 1 – participant smiled a LITTLE, but was not animated, with NO laughter 2 – participant smiled, laughed, but did NOT move around or use gestures 3 – participant smiled, HEARTILY laughed, cheered, used gestures like fist pumps to express happiness 4 – participant smiled, HEARTILY laughed, cheered loudly, stood up, clapped at the TV or interacted with other participants (high fives, hand shakes, back pats, etc). Sadness 0 – NO cues associated with sadness were present (no indication of emotional pain, loss, despair, helplessness, sorrow) 1 – Participant indicated a LITTLE sadness, such as verbal expression, tone of voice (whining, plaintive, desperation), covering one’s face, pouting, frowning, or sighing. 2 – Participant indicated SOME sadness, such as verbal expressions, tone of voice (whining, plaintive, desperation), covering one’s face, pouting, frowning, or sighing. 3 – Participant indicated a moderate amount of sadness, such as verbal expressions, tone of voice (whining, plaintive, desperation), burying head in heads, covering one’s face, pouting, frowning, or sighing. 4 – Participant clearly exhibited a lot of sadness, such as verbal expressions, tone of voice (whining, plaintive, desperation), burying head in hands, covering one’s face, pouting, frowning, sighing, rocking back and forth, or moaning.

!
! 93!
Anger 0 – NO cues associated with anger were present (NO profanity, fist clenching, arm-crossing, attacking self-concept of others, name calling, threats, gritted teeth, obscene or hostile gestures, or intense brooding stares.) 1 – participant showed a LITTLE anger, but was not animated, with profanity, fist clenching, arm-crossing, attacking, name calling, or obscene and hostile gesturing). 2 – participant used some profanity, fist clenching, arm-crossing, name-calling or gritted teeth, but did NOT move around or use gestures 3 – participant used profanity, name-calling, fist clenching, arm-crossing, obscene gestures, or intense stares. 4 – participant LOUDLY used profanity, fist clenching, arm-crossing, name-calling, obscene or hostile gestures, intense stares, or attacked others verbally. Disgust 0 – NO cues associated with disgust were present (NO turning away, NO expressions of revulsion, NO nose crinkling, NO head shaking) 1 – participant showed A LITTLE disgust such as mild head shaking, but was not animated, with NO turning away 2 – participant some disgust such as facial expressions, uncomfortable laughing/smiling, head shaking or mild verbal expression, but did NOT move around or use gestures 3 – participant crinkled nose, turned away, expressed in clear terms their revulsion, turned away, expressed discomfort with CLEAR laughing/smiling, and shook head from time to time. 4 – participant crinkled nose, turned away, expressed in INTENSE terms their revulsion, turned away, expressed revulsion about video to other participants or to camera, expressed CLEARLY with a lot of uncomfortable laughing/smiling and head shaking. ***In addition to observation, sometimes you will just intuitively feel that someone is expressing his or her emotions. That is OK, a lot of coding is based upon this intuitive process. ****It is possible for arm crossing to be perceived as disgust if accompanied by additional indicators such as sighing or head shaking. ***keep in mind that heart rate goes up for happiness, sadness, and anger, and slows down for disgust.

!
! 94!
Coding Matrix
Happiness (+) Sadness (+) Smiling
Laughing
Clapping
Cheering
Fist pumping
High fiving
Hand shaking with other fans
Back pats
Tone of voice
Whining
Wailing
Covering face
Pouting
Frowning
Sighing
Rocking back and forth
Moaning
slouching
Anger (+) Disgust (-) Swearing/profanity
Fist clenching
Jaw clenching
Arm-crossing
Attacking others verbally
Name calling
Obscene gestures
Hostile gestures
Intense, brooding stares
Turning away
Nose crinkling/grimace
Head shaking
Uncomfortable laughing to cover up discomfort

!
! 95!
APPENDIX C: LSU INSTITUTIONAL REVIEW BOARD APPROVAL

!
! 96!
VITA
Shaughan was born Shawn Alan Keaton, the first child of Linda and Verl, Jr., in
Millersburg, Ohio. He was active as a writer at an early age, and this love influenced the
direction of his education: Shaughan took a BA in English from the University of Central Florida
(go Knights!) in December of 2002 and an MA in English-Literature on a fellowship from the
same school in May of 2004.
Shaughan was active in the Orlando music scene, playing such notable venues as the
House of Blues and Hard Rock Live, and went on two tours around the country during and after
his time at UCF. He also taught ethics and psychology at Full Sail University for four years
before deciding that he wanted to do behavioral and social research. At that time, he applied to
schools, got accepted to LSU, put in his notice, and moved to the strange new land of the
Louisiana bayou, much to everyone’s surprise.
Shaughan published numerous articles and received awards and top papers during his
tenure at LSU, where he will be granted a Doctorate of Philosophy in May of 2013. Where he
will go next is as unknown as it is exciting.