Plan for Aeronautical Meteorological (MET) Information ... - ICAO
Upload
independentCategory
view
3download
0
The Air Quality of aMediterranean Urban Environment Areaand Its Relation to Major Meteorological Parameters
Athanasios Karagiannidis & Anastasia Poupkou &
Theodoros Giannaros & Christos Giannaros &Dimitrios Melas & Athanassios Argiriou
Received: 10 July 2014 /Accepted: 19 November 2014# Springer International Publishing Switzerland 2014
Abstract The paper presents a comprehensive analysisof the most basic features of the air quality of aMediterranean urban environment area. The impact ofmeteorology on the air quality is also examined.Observational surface concentrations of the most impor-tant air pollutants, recorded at two measuring stations inPatras, Greece, are used. The Weather Research andForecasting (WRF) meteorological model wasemployed to produce a series of surface and upper airdata and local circulation and ventilation indices. Thesemodeled data along with selected surface meteorologi-cal observational data comprise a substantial data setthat was used to assess the effect of meteorology on theair quality. Mostly during the summer period, a signif-icant proportion of the particulate matter is transportedfrom sources away from the measuring sites. The syn-optic setting of winter and summer seasons representedprimarily by the local ventilation and recirculation, thewind, the boundary layer height, and the precipitationhas a very strong impact in the overall formation of theair quality status.
Keywords Urban environment . Boundary layer . Airquality . Meteorology
1 Introduction
Atmospheric pollution is one of the most signifi-cant environmental problems of the modern world.Its adverse effects are associated with the degrada-tion of the quality of life and the alteration of thecharacteristics of the biosphere, forcing govern-ments and international organizations to dedicateeconomic and human resources for the improve-ment of air quality in order to protect the bio-sphere. Atmospheric pollution is not a simpleproblem of control of the emission sources. Thecomplexity of the air quality management is am-plified by the inducement of uncontrollable keyfactors in the process. The most important of thesefactors is meteorology. The prevailing meteorolog-ical conditions on local and synoptic scales arevery important. The identification of the relationsbetween meteorology and air quality is necessaryand can help authorities to develop effective envi-ronmental strategies aiming to the improvement ofthe quality of life.
The city of Patras, Greece, is a typical medium-size Mediterranean coastal city of over 200,000inhabitants. It is surrounded by a number of in-dustrial facilities, including a large cement factoryon the northeastern side of the city. Middle andlow-elevation mountains and hills are located onthe southeastern side. As a modern semi-industrialcity, Patras is prone to all the air quality problemsthat such cities may present. Increased vehiculartraffic, central heating, residential activities, and
Water Air Soil Pollut (2015) 226:2239DOI 10.1007/s11270-014-2239-8
A. Karagiannidis (*) :A. Poupkou :A. ArgiriouDepartment of Physics, University of Patras,26500 Patras, Greecee-mail: [email protected]
T. Giannaros : C. Giannaros :D. MelasDepartment of Physics, Aristotle University of Thessaloniki,University Campus, 54124 Thessaloniki, Greece
industrial operations release significant amounts ofgaseous and particulate matter pollutants in theurban atmosphere, increasing their surface concen-trations (Markakis et al. 2010a and b). Moreover,the presence of a heavy-load port inside the urbanarea adds a considerable amount of port-relatedemissions and has a negative impact on the atmo-spheric quality.
Significant work has been done around the globeregarding air pollution characteristics and its relationsto meteorology. Rodríguez et al. (2002) examined theorigin of high summer PM10 and total suspended par-ticulate (TSP) concentrations at rural sites in EasternSpain, concluding, among others, that breeze circula-tions are partly responsible for these extreme events.The dependence of urban air pollutants on meteorologyin the area of Cairo was analyzed by Elminir (2005). Itwas shown that wind and humidity affected theconcentration and speciation of the pollutants.Barmpadimos et al. (2011) examined the influence ofmeteorology on PM10 trends and variability inSwitzerland from 1991 to 2008 and indicated that windand temperature are two of the most significant factors.Gadzhev et al. (2013), in a study which includes thewhole Bulgarian region, also concluded that NO2, SO2,primary organic aerosol, coarse particulate matter, andfine particulate matter present higher concentrationsduring the cold period (autumn, winter) and lower dur-ing the warm period (spring, summer). Ozone concen-trations, on the other hand, are higher during the warmerpart of the year. Regarding Greece, Lalas et al. (1987)studied the influence of the complicated land-seainteractions and the diverse geomorphology of specificareas on atmospheric pollutants and showed that the seabreeze circulation is affecting the diurnal variation ofsurface O3 in the city of Athens. Kallos et al. (1993)studied a series of air pollution episodes in Athensduring the period 1983–1990 concluding that the “dayswith critical balance between synoptic and mesoscalecirculations and/or days of warm advection in the lowertroposphere” favor such episodes. Ziomas et al. (1995)showed that the use of simple meteorological variableslike temperature and surface wind, combined with pol-lution measurements, can give rather good forecasts ofpeak pollutant levels for the city of Athens. The airquality in the Athens basin during sea breeze and non-sea breeze days was examined by Kambezidis et al.(1998) too. They showed that during sea-breeze condi-tions, O3 is convected to rather high altitudes. NO2 does
not show the same pattern, presenting low concentra-tions aloft. During the Etesian days, the O3 field is ratherhomogeneous with maximum values at altitudes lowerthan those on sea-breeze days. Kassomenos et al.(1998a) examined the relationship between specific airquality indices and the atmospheric circulation over theAthens area and showed, among others, that the mostfavorable synoptic pattern for the accumulation of highpollutant concentrations is the open anticyclonic circu-lation. They also showed that the occurrence of extremeevents is favored by the synoptic pattern of the closedanticyclone. Melas et al. (2005), using a 3D, higher-order turbulence model, showed that during days of sea-breeze, the Athens basin suffered horizontal recircula-tion that often resulted in increased pollutants levels.Papanastasiou et al. (2007) developed multiple regres-sion and neural network (NN) prediction models, using,among others, meteorological parameters as predictorsand estimated average daily PM10 concentration valuesfor the Greek city of Volos with satisfactory results.According to Poupkou et al. (2009), the urban plumeof Athens is transported to the south by the north windsprevailing during summertime in the EasternMediterranean basin and allows elevated ozone levelsto appear over the maritime areas a few hundreds ofkilometers south of Athens given also the lowdeposition velocity of ozone over the sea. Im et al.(2011) investigated the impact of temperature changeson summer time ozone and its precursors in the EasternMediterranean and found that ozone mixing ratiosincrease almost linearly with ambient temperature.Tsiotas and Argiriou (2011) modeled with satisfactoryresults the air pollution over the Athens area usingstatistical approaches. Karagiannidis et al. (2013), ana-lyzing the meteorological setting of a particulate airpollution episode in the Amyntaio-Ptolemais-Kozanibasin, showed that the weak horizontal wind field nearthe surface and the reduced mixing height combinedwith the lack of synoptic forcing resulted in the trappingof the pollutants in the lower troposphere and in theincrease of observed airborne particulate matterconcentrations.
Specific aspects of the air quality problems of the cityof Patras have already been analyzed. Danalatos andGlavas (1999), examining gaseous nitric acid, ammonia,and related particulate matter, found a distinct seasonal-ity with higher concentration during summer and evi-dence of long-range transport for particulate sulfate.Riga-Karandinos and Saitanis (2005), assessing the air
2239, Page 2 of 13 Water Air Soil Pollut (2015) 226:2239

quality of Volos and Patras, Greece, concluded that boththese cities experience high levels of NOx. Yannopoulos(2007) found that the mixing height is inversely relatedto the surface SO2 concentration. Finally, Maraziotiset al. (2008) found a strong negative correlation betweeninhalable and fine particles (PM10 and PM2.5) and thehorizontal wind speed in Patras.
In the present paper, a general assessment of the airquality of a medium-size Mediterranean coastal city likePatras is attempted and the impact of meteorology on itis elucidated. Firstly, the general picture of the air qualityof the city of Patras is illustrated. The interannual,seasonal, and weekly variations of pollutant surfaceconcentrations are presented. The impact of meteorolo-gy on the air quality is then examined using observedandmodeledmeteorological data and calculated indices.The correlation coefficients between the meteorologicalparameters and indices and the surface pollution con-centrations are calculated and discussed. Pollution rosesare also created in order to further investigate the rela-tion of air quality to surface wind field. The impact ofprecipitation is analyzed through the comparison be-tween rainy days and days without rain. Finally, a syn-thesis of the results is attempted in the conclusionsection.
2 Data and Methodology
Daily values of CO, NO, NO2, and PM10 concentrationdata, recorded at two monitoring stations operating in-side the city, are used in this study. O3 concentrations arealso measured at one of the two stations. The twostations provided hourly records of the pollutant con-centrations from 2008 to 2011 that were used to com-pute the average daily values for the same period.Table 1 provides the location information and the maincharacteristics of the two measuring sites, while Fig. 1illustrates the position of the two stations. As it can beseen, the monitoring stations are located very close tothe city center and are expected to be influenced by the
pollutants emitted from the enhanced anthropogenicactivities that take place in it. The proximity to the portis also expected to have an important impact on themeasurements of the two stations.
Very close to those two stations, inside the port area, ameteorological station is operated by the NationalObservatory of Athens. It records hourly data of mainsurface parameters, like wind speed (WS), temperature(T), mean sea level pressure (MSLP), and precipitationamount (P). These data were used to compute averagedaily values for the parameters mentioned above for theperiod 2008–2011. In order to examine the impact of aseries of dynamic meteorological parameters and indicesthat are not be measured by the surface meteorologicalstation, the numerical model Weather Research andForecast-Advanced Research Weather (WRF-ARW),version 3.2.1, was also employed in this study. WRF isa next-generation numerical weather prediction (NWP)modeling system developed to serve both operationalforecasting and atmospheric research needs. The model’sdynamics solver integrates the compressible non-hydrostatic Euler equations (Ooyama 1990), which areformulated on the Arakawa C grid using a terrain follow-ing mass vertical coordinate system (Laprise 1992).Microphysics processes were parameterized using theWRF single-moment six-class scheme (Hong and Lim2006), whereas convection in the two coarse domains(d01, d02) was parameterized with the Kain-Fritschscheme (Kain 2004). For the innermost domain (d03),no convective parameterization was used. Shortwave andlongwave radiation processes were handled with theDudhia (1989) scheme and the Goddard FluidDynamics Laboratory (GFDL) parameterization(Schwarzkopf and Fels 1991), respectively. The surfacelayer was parameterized using the MM5 similarityscheme (Skamarock et al. 2008), while for the planetaryboundary layer, the Yonsei University (YSU) parameter-ization (Hong et al. 2006) was used. Land surface pro-cesses were handled with the Noah land surface model(Chen and Dudhia 2001). A detailed description of themodel can be found in Skamarock et al. (2008).
Table 1 Characteristics of the monitoring stations (AirBase v7 Database, (EEA 2013))
Location Lat/Lon Site Name Type of station Type of area Characteristics of zone Measured pollutants
Square Drosopoulou 38.253 N/21.738 E Sta A Traffic Urban Residential/commercial CO, PM10, NO, NO2, O3
Square King George 38.246 N/21.736 E Sta B Traffic Urban Residential/commercial CO, PM10, NO, NO2
Water Air Soil Pollut (2015) 226:2239 Page 3 of 13, 2239

The model develops initial and boundary conditionsbased on the operational 12:00 UTC forecast ofECMWF in 0.5o spatial resolution. The domain of theWRF modeling system is the South-East Europe/EasternMediterranean region from 18° N to 30° N and from 34.9°E to 44.5° E. The projection is the Lambert ConformalConic, while the model runs are performed in two do-mains, the greater Balkan domain, having a grid of 10×10-km grid, and the Patras domain (37.8°–38.7° N/20.9°–22.5° E) which has a finer 2×2-km grid.
Model output consists of both 2D and 3D griddedfields. The 2D gridded fields used include 10-m hori-zontal wind components, 2-m dew point and air tem-perature, mean sea level pressure, sea surface tempera-ture, skin temperature, and four-layer soil temperatureand soil moisture (specified at 10, 30, 60, and 100 cmbelow ground).
The 3D fields used include geopotential height, rela-tive and specific humidity, temperature, and horizontaland vertical wind components. Hourly values of bound-ary layer depth and horizontal wind speed and directionat 10 m above ground are estimated by the WRF modelfor the city center of Patras (38.252° Ν, 21.738° Ε).These parameters are then used to calculate the averagedaily values of the boundary layer depth (PBLave); thegeopotential height at the 500 hPa isobaric surface(Geop500); and also the ventilation factor (V), wind run(S), and recirculation factor (R) for January, February,July, and August of 2010.
The circulation indices (ventilation factor, wind run,and recirculation factor) are defined and computed
according to Allwine and Whiteman (1994) and Melaset al. (2005) as:
V i ¼ TXiþp
j¼1
Uh i j⋅hj
� �ð1Þ
Si ¼ TXiþp
j¼1
Uh i j ð2Þ
and
Ri ¼ 1−LiSi
ð3Þ
where U is the wind speed at 10 m above groundlevel (AGL), u and v are the west-east and south-north components of wind, h is the boundary layerdepth, i=1,2,…,N−p, N is the total number ofseries data points and p ¼ =T−1 , τ the selectedtransport time, and Li the resultant transport dis-tance, defined as follows:
Li ¼ffiffiffiffiffiffiffiffiffiffiffiffiffiffiffiffiffiX 2
i þ Y 2i
qð4Þ
with
X i ¼ TXiþp
j¼i
uh i j ð5Þ
Fig. 1 aThe city of Patras. bLocations ofmonitoring stations in the urban area (sta A: Square Drosopoulou, and sta B: SquareKingGeorge)
2239, Page 4 of 13 Water Air Soil Pollut (2015) 226:2239

and
Y i ¼ TXiþp
j¼i
vh i j ð6Þ
V values close to zero indicate stagnant conditionswhile values close to unit suggest strong horizontalventilation. S is a measure of a straight line transportof an air parcel. Values close to zero are associated toalmost stagnant conditions. R values approaching 0indicate straight line transport, while values approaching1 means negligible net transport and extended localhorizontal recirculation. By definition, a value of 1means that a complete recirculation has occurred andthe air parcel returned to its origin.
After the preparation of the datasets presented earlier,the interannual, seasonal, and weekly variations of thepollutant concentrations are computed and discussed.Regarding the weekly variations, the analysis is carriedout separately for winter and summer due to the differ-ent concentration levels of pollutants on these twoseasons.
The impact of meteorology on the air quality is thenexamined. Correlation coefficients between the obser-vational meteorological data (WS, T, and MSLP) andCO, PM10, NO, NO2, and O3 concentrations are calcu-lated for winter and summer. The 95 % level of signif-icance is also calculated in order to identify the statisti-cally significant coefficients. The relation between sur-face wind and air quality is more thoroughly investigat-ed through the inspection of pollution roses that arecreated using observational wind and air quality data.Average concentrations are calculated for rain and norain days separately, in order to assess the impact ofprecipitation. Finally, theWRF dynamic parameters andindices (Geop500, PBLave, V, S, and R) are also correlatedto the pollutant concentrations and the statistically sig-nificant correlations are identified and discussed.
3 Results and Discussion
3.1 Interannual, Seasonal, and Weekly Variations
Figure 2 illustrates the interannual variation of the aver-age annual concentration of each pollutant. A cleardecrease is found for CO, PM10, NO, and NO2 duringthe 4-year period examined. For example, NO2 at sta Bdecreases from 40.3 μg/m3 during 2008 to 20.2 μg/m3
during 2011 (almost −50 %). During the same period,O3 concentrations increase from 42.6 to 80.3 μg/m3,probably due to the gradual decrease of NOx levelsresulting in reduced O3 titration. This remarkable differ-entiation is the probable outcome of two importantchanges. The first one is the Greek economic crisiswhich resulted in some cases in reduced anthropogenicactivity, e.g., in the road transport sector. The secondchange is associated to the operational start of the Patrassuburban railway station on the summer of 2010. Dailyusage of the suburban railway by a significant part of thepopulation reduced the vehicular traffic and associatedemissions inside the urban area.
The seasonal variation of the examined pollutants isillustrated in Fig. 3. CO and NOx present a clear sea-sonality with lower concentrations during summer andhigher concentrations during winter as expected by theincreased anthropogenic emissions on the cold period ofthe year. It should also be noted that CO and NOx
surface concentrations are lower on warm part of theyear due to the most frequent cases of unstable atmo-sphere that result in more intensive mixing and transportto the higher atmospheric levels. O3 variation is theopposite of that for NOx, presenting higher concentra-tions during summer. This is the result of the increasedincoming solar radiation which enhances the formationof O3, and the reduced availability of NOx during sum-mer, ending to reduced O3 titration by NOx.
The present results are in good agreement with thoseof the available literature regarding various cities aroundthe world. For example, Bigi and Harrison (2010) havefound lower levels of CO, PM10, NO, and NO2 andhigher O3 levels at a background site of central Londonduring the summer months. Kalabokas et al. (2012),studying the atmospheric concentrations of SO2, NO2,and O3 in the Athens basin, found that SΟ2 and NO2
showed highest values during winter (cold period),while ozone showed a maximum in summer.
The finding that particulate matter concentration isslightly higher during winter and autumn but the ampli-tude of the variation is much smaller than the otherpollutants is of special interest. This weak seasonalityof the average PM10 concentrations is primarily attrib-uted to significant transport of particulate matter fromsources outside the urban area during the summer periodwhich compensate for the lower local traffic and theabsence of central heating emissions.
This suggestion is supported by literature and theresults of the EU-funded “Contribution of Emission
Water Air Soil Pollut (2015) 226:2239 Page 5 of 13, 2239

Sources on the Air quality of the Port-cities in Greeceand Italy” (CESAPO) project (UP 2014). Dimitriou andKassomenos (2013) had already showed thatMediterranean cities can be significantly affected by“dust intrusions from the Sahara desert and transporta-tion of Mediterranean/Atlantic sea spray,” whilePikridas et al. (2013) in an attempt to characterize theorigin of the particulate matter in the city of Patrasshowed a seasonal variation for PM10 of almost thesame amplitude with the present study. Moreover, theyalso showed that the transported particulate matter dur-ing winter accounts for a lower percentage of the total
concentration than during summer. Maraziotis et al.(2008) has found similar results for PM10 duringwinter-spring of 2005–2006. They showed that theMarch PM10 concentrations are not lower than thoseof December to February on two of the three examinedstations. Finally, in the frame of the CESAPO project(UP 2014), winter and summer runs of the photochem-ical model CAMx were performed for the greater Patrasarea with a spatial resolution of 2 km. The sourceapportionment results of CAMx showed that the contri-bution of the pollution sources outside the city to theurban levels of PM almost doubles during summer,
Fig. 2 Interannual variation of CO, PM10, NO, NO2, and O3 average annual concentrations
Fig. 3 Seasonal variation of CO, PM10, NO, NO2, and O3 average concentrations
2239, Page 6 of 13 Water Air Soil Pollut (2015) 226:2239
indicating that the impact of remote pollution sources isquite higher during summer than winter.
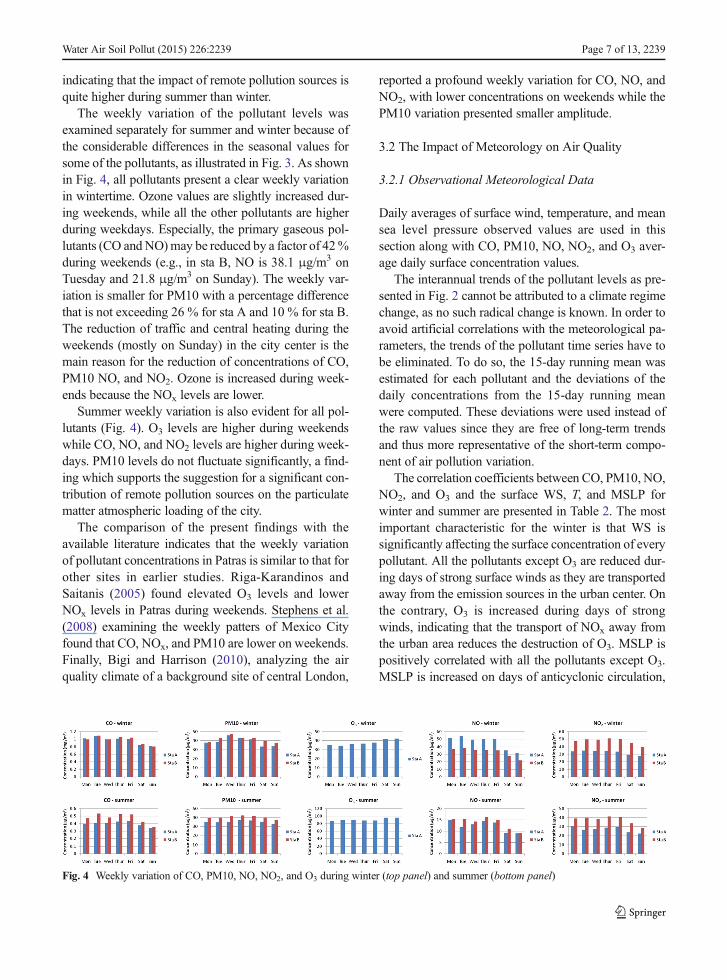
The weekly variation of the pollutant levels wasexamined separately for summer and winter because ofthe considerable differences in the seasonal values forsome of the pollutants, as illustrated in Fig. 3. As shownin Fig. 4, all pollutants present a clear weekly variationin wintertime. Ozone values are slightly increased dur-ing weekends, while all the other pollutants are higherduring weekdays. Especially, the primary gaseous pol-lutants (CO andNO)may be reduced by a factor of 42%during weekends (e.g., in sta B, NO is 38.1 μg/m3 onTuesday and 21.8 μg/m3 on Sunday). The weekly var-iation is smaller for PM10 with a percentage differencethat is not exceeding 26 % for sta A and 10 % for sta B.The reduction of traffic and central heating during theweekends (mostly on Sunday) in the city center is themain reason for the reduction of concentrations of CO,PM10 NO, and NO2. Ozone is increased during week-ends because the NOx levels are lower.
Summer weekly variation is also evident for all pol-lutants (Fig. 4). O3 levels are higher during weekendswhile CO, NO, and NO2 levels are higher during week-days. PM10 levels do not fluctuate significantly, a find-ing which supports the suggestion for a significant con-tribution of remote pollution sources on the particulatematter atmospheric loading of the city.
The comparison of the present findings with theavailable literature indicates that the weekly variationof pollutant concentrations in Patras is similar to that forother sites in earlier studies. Riga-Karandinos andSaitanis (2005) found elevated O3 levels and lowerNOx levels in Patras during weekends. Stephens et al.(2008) examining the weekly patters of Mexico Cityfound that CO, NOx, and PM10 are lower on weekends.Finally, Bigi and Harrison (2010), analyzing the airquality climate of a background site of central London,
reported a profound weekly variation for CO, NO, andNO2, with lower concentrations on weekends while thePM10 variation presented smaller amplitude.
3.2 The Impact of Meteorology on Air Quality
3.2.1 Observational Meteorological Data
Daily averages of surface wind, temperature, and meansea level pressure observed values are used in thissection along with CO, PM10, NO, NO2, and O3 aver-age daily surface concentration values.
The interannual trends of the pollutant levels as pre-sented in Fig. 2 cannot be attributed to a climate regimechange, as no such radical change is known. In order toavoid artificial correlations with the meteorological pa-rameters, the trends of the pollutant time series have tobe eliminated. To do so, the 15-day running mean wasestimated for each pollutant and the deviations of thedaily concentrations from the 15-day running meanwere computed. These deviations were used instead ofthe raw values since they are free of long-term trendsand thus more representative of the short-term compo-nent of air pollution variation.
The correlation coefficients between CO, PM10, NO,NO2, and O3 and the surface WS, T, and MSLP forwinter and summer are presented in Table 2. The mostimportant characteristic for the winter is that WS issignificantly affecting the surface concentration of everypollutant. All the pollutants except O3 are reduced dur-ing days of strong surface winds as they are transportedaway from the emission sources in the urban center. Onthe contrary, O3 is increased during days of strongwinds, indicating that the transport of NOx away fromthe urban area reduces the destruction of O3. MSLP ispositively correlated with all the pollutants except O3.MSLP is increased on days of anticyclonic circulation,
Fig. 4 Weekly variation of CO, PM10, NO, NO2, and O3 during winter (top panel) and summer (bottom panel)
Water Air Soil Pollut (2015) 226:2239 Page 7 of 13, 2239

when the surface wind field is weak. Therefore, highMSLP values are linked to higher levels for CO, PM10,NO, and NO2 and lower O3 levels, because during thesedays the average wind is weaker. The correlation be-tween WS and the pollutants during summer is weakerthan during winter but maintains its sign in almost allcases. During summer, the cyclonic systems that affectthe area are much less frequent and the prevailing windsare weaker on average. The weak winds that prevailduring summer in the area do not help in the distinctionbetween windy and calm days, and therefore, the vari-ability of the wind time-series is decreased. This has adirect impact on the correlation coefficients betweenpollutants’ concentrations and wind speed that are alsodecreased. In general, stronger summer winds lead tolower CO, PM10, NO, and NO2 and higher O3 levels, inthe same manner as they do during winter. The MSLP isalso positively correlated to most of the pollutants andnegatively correlated to O3, indicating that on days ofanticyclonic circulation, when the surface wind field is
weak, the levels of all the examined pollutants, exceptozone, are higher. Finally, for most of the cases, airtemperature is positively correlated to pollutant concen-trations because during the warm part of the year in thecity, temperature is usually increased on days of weakzonal or anticyclonic circulation when the surface windsare very weak.
The profound relation between the wind directionand the average concentration of the pollutants can bemore thoroughly examined with the use of pollutionroses. These roses illustrate the average concentrationof each pollutant for the 16 basic wind directions plusthe average concentration during calm wind days (i.e.,days when the daily average wind speed is under 0.5 m/sregardless of the direction).
Before the analysis of the pollution roses of eachpollutant, the average winter and summer wind field ofthe city should be reviewed. Wind roses for the winterand summer were created and examined (not shownhere). It was found that two specific directions dominate
Table 2 Correlation coefficients between the pollutants and the observational and WRF output meteorology parameters for winter andsummer
Observational Data WRF output Data
WS (m/s) T (deg) MSLP (hPa) Geop500 (gpm) PBL (m) V (m2/s) S (m) R (–)
Winter
CO I (mg/m3) −0.46 0.11 0.17 0.07 −0.53 −0.48 −0.28 0.19
CO II (mg/m3) −0.43 0.09 0.24 0.21 −0.67 −0.62 −0.38 0.44
PM10 I (μg/m3) −0.23 0.30 0.09 0.25 0.08 0.01 −0.15 0.13
PM10 II (μg/m3) −0.18 0.29 0.06 0.31 −0.03 −0.03 −0.17 0.27
NO I (μg/m3) −0.42 0.15 0.11 −0.07 −0.34 −0.35 −0.22 0.06
NO II (μg/m3) −0.27 0.13 0.12 0.01 −0.50 −0.36 −0.07 0.18
NO2 I (μg/m3) −0.48 0.12 0.16 0.13 −0.30 −0.44 −0.46 0.15
NO2 II (μg/m3) −0.34 0.05 0.22 0.06 −0.65 −0.56 −0.31 0.34
O3 I (μg/m3) 0.63 −0.01 −0.27 −0.17 0.71 0.68 0.41 −0.27
Summer
CO I (mg/m3) −0.26 0.23 0.23 0.47 0.16 −0.38 0.00 0.03
CO II (mg/m3) −0.03 0.19 0.17 0.18 0.26 −0.26 0.12 −0.10PM10 I (μg/m3) −0.22 0.36 −0.03 0.57 0.12 −0.41 0.22 −0.07PM10 II (μg/m3) −0.18 0.33 −0.02 0.61 0.05 −0.40 0.00 −0.01NO I (μg/m3) −0.22 −0.01 0.05 −0.13 −0.07 −0.07 −0.28 0.12
NO II (μg/m3) 0.02 0.19 0.27 0.13 0.22 −0.26 0.12 0.03
NO2 I (μg/m3) −0.46 0.08 0.16 0.36 0.03 −0.40 −0.41 0.20
NO2 II (μg/m3) −0.06 0.29 0.27 0.41 0.21 −0.52 −0.03 0.05
O3 I (μg/m3) 0.30 −0.04 −0.30 −0.09 −0.27 0.38 0.16 −0.25
Coefficients that are statistically significant at the 95 % significance level are noted in italics
2239, Page 8 of 13 Water Air Soil Pollut (2015) 226:2239

the wind field in Patras. Northeastern and southwesternsection winds prevail on both seasons while the otherdirections are almost absent. Every conclusion regard-ing these directions should be taken into account only asa suggestion and not as a sound fact. A second usefulconclusion is that the average wind field is weakerduring the warm season.
Figure 5 depicts the pollution roses for station A(station B roses are similar) for winter and summer.Regarding winter, the most striking feature is that pol-lutants having significant primary sources inside theurban area (like CO, PM10, and NO) tend to presenthigher concentrations during calm wind days. NO2 con-centrations, a pollutant which is produced by both localsources and secondary atmospheric chemistry process-es, seem to be unaffected by the wind direction. Finally,O3 which is a secondary pollutant is not favored by calmwinds because its lower levels are recorded during calmwind days.
The pollution roses for summer are also depicted inFig. 5. CO, PM10, and NO levels are increased duringcalm wind days. NO2 levels are higher during the dom-inance of northeastern winds, while O3 levels seem to beinvariable to the wind direction change. The 0 valuesthat are found in some directions and specific pollutants(e.g., for the PM10 of the ESE direction) are the result ofmissing observations during the few days that thesewinds prevailed.
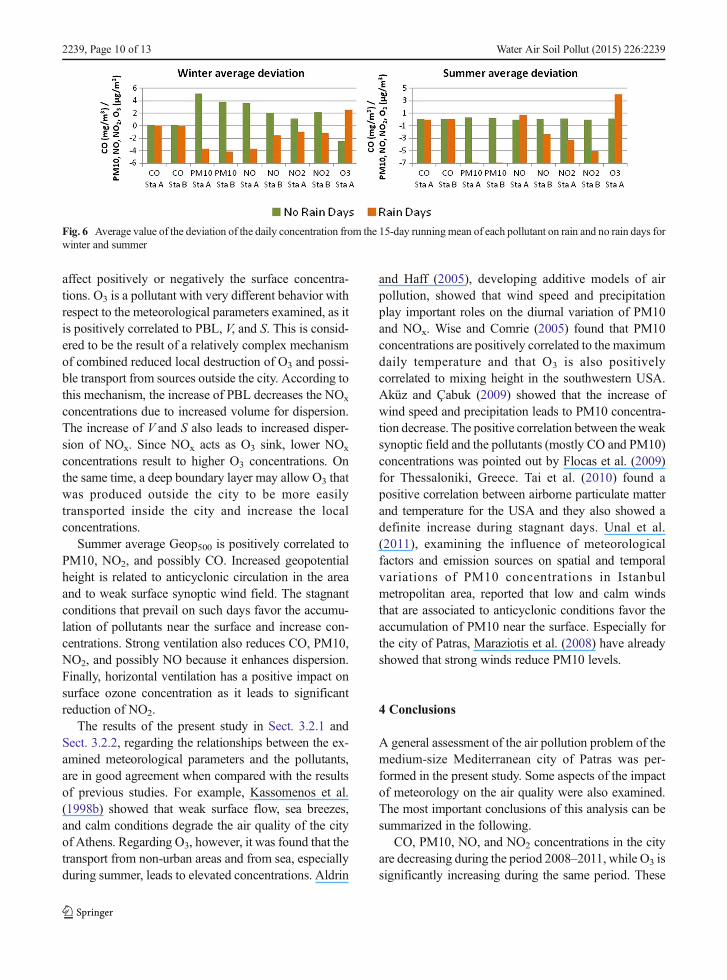
The impact of precipitation on air quality is assessedby the examination of the bar-charts of Fig. 6, where theaverage deviation of the daily concentration from the15-days running mean is compared between rainy daysand days with no rain. As rainy days are defined thosethat receive any amount of precipitation. CO is almostunaffected by the precipitation for both winter and
summer. CO is not dissolvable by water and so thescavenging of the pollutant by precipitation is verylimited. PM10 concentrations are significantly loweron rainy days due to the wash-off effect. NO and NO2
levels are also negatively affected by rain. Finally, O3
levels are lower on no rain days, most possibly due tothe reduction of NOx during these days.
3.2.2 WRF Output Data
Daily averages of WRF geopotential height at the500 hPa isobaric surface and planetary boundary layerdepth, daily ventilation factor, wind run, and recircula-tion factor values and also daily CO, PM10, NO, NO2,and O3 surface concentration averages are used in thissection. The correlation coefficients between the fiveselected dynamic meteorology parameters and indicesestimated by the WRF model results and the observedconcentrations of pollutants for winter and summer areshown in Table 2.
During winter, the average geopotential height at the500 hPa isobaric surface (Geop500) is not clearly corre-lated to any of the pollutants. PBL is negatively corre-lated to CO, NO, and NO2, implying that a deep bound-ary layer helps on the dispersion of the pollutants, re-ducing the concentrations near the surface. TheVentilation factor (V) is also negatively correlated toCO, NO, and NO2, indicating that besides verticalmixing, strong horizontal ventilation helps the disper-sion of these pollutants. Wind run (S) is negativelycorrelated to CO and NO2 because significant straightline transport carries the pollutants outside the city,reducing the local concentrations. The recirculation fac-tor (R) is not clearly correlated to any of the pollutants,suggesting that the local scale recirculation does not
Fig. 5 Pollution roses for CO, PM10, NO, NO2, and O3 for winter (top panel) and summer (bottom panel). The red line shows the averageconcentration during calm wind days (WS≤0.5 m/s)
Water Air Soil Pollut (2015) 226:2239 Page 9 of 13, 2239
affect positively or negatively the surface concentra-tions. O3 is a pollutant with very different behavior withrespect to the meteorological parameters examined, as itis positively correlated to PBL, V, and S. This is consid-ered to be the result of a relatively complex mechanismof combined reduced local destruction of O3 and possi-ble transport from sources outside the city. According tothis mechanism, the increase of PBL decreases the NOx
concentrations due to increased volume for dispersion.The increase of V and S also leads to increased disper-sion of NOx. Since NOx acts as O3 sink, lower NOx
concentrations result to higher O3 concentrations. Onthe same time, a deep boundary layer may allow O3 thatwas produced outside the city to be more easilytransported inside the city and increase the localconcentrations.
Summer average Geop500 is positively correlated toPM10, NO2, and possibly CO. Increased geopotentialheight is related to anticyclonic circulation in the areaand to weak surface synoptic wind field. The stagnantconditions that prevail on such days favor the accumu-lation of pollutants near the surface and increase con-centrations. Strong ventilation also reduces CO, PM10,NO2, and possibly NO because it enhances dispersion.Finally, horizontal ventilation has a positive impact onsurface ozone concentration as it leads to significantreduction of NO2.
The results of the present study in Sect. 3.2.1 andSect. 3.2.2, regarding the relationships between the ex-amined meteorological parameters and the pollutants,are in good agreement when compared with the resultsof previous studies. For example, Kassomenos et al.(1998b) showed that weak surface flow, sea breezes,and calm conditions degrade the air quality of the cityof Athens. Regarding O3, however, it was found that thetransport from non-urban areas and from sea, especiallyduring summer, leads to elevated concentrations. Aldrin
and Haff (2005), developing additive models of airpollution, showed that wind speed and precipitationplay important roles on the diurnal variation of PM10and NOx. Wise and Comrie (2005) found that PM10concentrations are positively correlated to the maximumdaily temperature and that O3 is also positivelycorrelated to mixing height in the southwestern USA.Aküz and Çabuk (2009) showed that the increase ofwind speed and precipitation leads to PM10 concentra-tion decrease. The positive correlation between the weaksynoptic field and the pollutants (mostly CO and PM10)concentrations was pointed out by Flocas et al. (2009)for Thessaloniki, Greece. Tai et al. (2010) found apositive correlation between airborne particulate matterand temperature for the USA and they also showed adefinite increase during stagnant days. Unal et al.(2011), examining the influence of meteorologicalfactors and emission sources on spatial and temporalvariations of PM10 concentrations in Istanbulmetropolitan area, reported that low and calm windsthat are associated to anticyclonic conditions favor theaccumulation of PM10 near the surface. Especially forthe city of Patras, Maraziotis et al. (2008) have alreadyshowed that strong winds reduce PM10 levels.
4 Conclusions
A general assessment of the air pollution problem of themedium-size Mediterranean city of Patras was per-formed in the present study. Some aspects of the impactof meteorology on the air quality were also examined.The most important conclusions of this analysis can besummarized in the following.
CO, PM10, NO, and NO2 concentrations in the cityare decreasing during the period 2008–2011, while O3 issignificantly increasing during the same period. These
Fig. 6 Average value of the deviation of the daily concentration from the 15-day runningmean of each pollutant on rain and no rain days forwinter and summer
2239, Page 10 of 13 Water Air Soil Pollut (2015) 226:2239

findings are considered to be associated to the reductionof anthropogenic activities in the urban area induced bythe economic crisis in Greece and by the changes of thelocal transport system in Patras.
CO and NOx present lower concentrations duringsummer and higher during winter due to the increasedemissions and the decreased atmospheric instability onthe cold part of the year. O3 is lower during winter andhigher during summer as a result of the reduced titrationfrom NOx during summer and the increased incomingsolar radiation which enhances the formation of O3.Particulate matter seasonality is present, with higherconcentrations during winter, but it is rather limited, afinding primarily attributed to the significant contribu-tion of remote emission sources to the determination ofPM levels mostly during summertime. These resultsimply that the wintertime PM pollution in Patras canbe possibly more effectively controlled while focusingon emission mitigation strategies for the local emissionsources. During summertime, the PM pollution is morecomplicated and can be addressed probably while con-sidering the need for decrease of PM levels in regionalscale in the Eastern Mediterranean.
All pollutants except O3 are reduced during week-ends due to reduced emissions. On the contrary, O3
levels are higher during weekends because NOx levelsare lower. PM10 summer weekly variation is ratherlimited due to the significant contribution of remotesources.
The meteorological conditions have a significant im-pact on the air quality of the city during winter. Days ofanticyclonic or weak zonal circulation are characterizedby high MSLP, shallow boundary layers, weak surfacewinds, poor ventilation, and limited straight line trans-port of air parcels. As shown by the analysis, suchconditions favor the increase of surface concentrationsof CO, PM10, NO, and NO2, due to the limited disper-sion of the pollutants. O3 is also affected by the synopticsetting, but in a reversed pattern, as it is increased duringdays of cyclonic circulation. On such days, when theboundary layer is deeper and the surface wind andventilation are stronger, the decrease of NOx concentra-tions leads to O3 increase because NOx acts as O3 sink.Moreover, the deep boundary layer may allow O3 thatwas produced by sources outside the urban area to bemore easily transported inside the city.
During summer, the impact of meteorology presentssimilar characteristics to winter. Weak zonal and anticy-clonic circulation, which leads to weaker winds,
increased temperature, and poor horizontal ventilationand transport, is associated with higher levels of CO,PM10, NO, and NO2 and lower levels of O3. The limiteddispersion increases CO, PM10, NO, and NO2 anddecreases O3 surface concentrations in the same mannerthat was described for winter.
Finally, precipitation has a positive effect on air qual-ity during winter and summer season as it removesimportant amounts of PM10, NO, and NO2.
Acknowledgments This work is financed by the European Ter-ritorial Cooperation Programme Greece-Italy 2007-2013 projectCESAPO, co-financed by the European Union (ERDF) and byNational Funds of Greece and Italy.
The weather data were kindly provided by Dr. K. Lagouvardosand Dr. V. Kontroni of the Institute for Environmental Researchand Sustainable Development of the National Observatory ofAthens.
Some of the results presented in this research paper have beenproduced using the EGI and HellasGrid infrastructures. The au-thors would like to acknowledge the support provided by theScientific Computing Center at the Aristotle University ofThessaloniki throughout the progress of this research work.
References
Aküz, M., & abuk, H. (2009). Meteorological variations ofPM2.5/PM10 concentrations and particle-associated polycy-clic aromatic hydrocarbons in the atmospheric environmentof Zonguldak, Turkey. Journal of Hazardous Materials, 170,13–21.
Aldrin, M., & Haff, I. H. (2005). Generalised additive modellingof air pollution, traffic volume andmeteorology. AtmosphericEnvironment, 39, 2145–2155.
Allwine, K. J., & Whiteman, C. D. (1994). Single-station integralmeasures of atmospheric stagnation, recirculation and venti-lation. Atmospheric Environment, 28, 713–721.
Barmpadimos, I., Hueglin, C., Keller, J., Henne, S., & Prévôt, A.S. H. (2011). Influence of meteorology on PM10 trends andvariability in Switzerland from 1991 to 2008. AtmosphericChemistry and Physics, 11, 1813–1835.
Bigi, A., & Harrison, R. M. (2010). Analysis of the air pollutionclimate at a central urban background site. AtmosphericEnvironment, 44, 2004–2012.
Chen, F., &Dudhia, J. (2001). Coupling an advanced land-surface/hydrologymodel with the Penn State/NCARMM5modelingsystem. Part I: model description and implementation.Monthly Weather Review, 129, 569–585.
Danalatos, D., & Glavas, S. (1999). Gas phase nitric acid, ammo-nia and related particulate matter at a Mediterranean coastalsite, Patras, Greece. Atmospheric Environment, 33, 3417–3425.
Dimitriou, K., & Kassomenos, P. (2013). The fine and coarseparticulate matter at four major Mediterranean cities: local
Water Air Soil Pollut (2015) 226:2239 Page 11 of 13, 2239
and regional sources. Theoretical and Applied Climatology,114, 375–391.
Dudhia, J. (1989). Numerical study of convection observed duringthe winter monsoon experiment using a mesoscale two-dimensional model. Journal of the Atmospheric Sciences,46, 3077–3107.
Elminir, H. K. (2005). Dependence of urban air pollutants onmeteorology. Science of the Total Environment, 350, 225–237.
EEA (European Environmental Agency), (2013). http://www.eea.europa.eu/data-and-maps/data/airbase-the-european-air-quality-database-7. Accessed 9 July 2014.
Flocas, H., Kelessis, A., Helmis, C., Petrakakis, M., Zoumakis,M., & Pappas, K. (2009). Synoptic and local scale atmo-spheric circulation associated with air pollution episodes inan urban Mediterranean area. Theoretical and AppliedClimatology, 95, 265–277.
Gadzhev, G. K., Ganev, K. G., Miloshev, N. G., Syrakov, D. E., &Prodanova, M. (2013). Numerical study of the atmosphericcomposition in Bulgaria. Computers and mathematics withApplications, 65, 402–422.
Hong, S. Y., & Lim, J. O. J. (2006). The WRF single-moment 6-class microphysics scheme (WSM6). Journal of the KoreanMeteorological Society, 42, 129–151.
Hong, S. Y., Noh, Y., &Dudhia, J. (2006). A new vertical diffusionpackage with an explicit treatment of entrainment processes.Monthly Weather Review, 134, 2318–2341.
Im, U., Markakis, K., Poupkou, A., Melas, D., Unal, A.,Gerasopoulos, E., Daskalakis, N., Kindap, T., &Kanakidou, M. (2011). The impact of temperature changeson summer time ozone and its precursors in the EasternMediterranean. Atmospheric Chemistry and Physics, 11,3847–3864.
Kain, J.S., (2004). The Kain–Fritsch Convective Parameterization:An Update. Journal of Applied Meteorology, 43, 170–181.
Kalabokas, P. D., Papayannis, A. D., Tsaknakis, G., & Ziomas, I.(2012). A study on the atmospheric concentrations of prima-ry and secondary air pollutants in the Athens basin performedby DOAS and DIAL measuring techniques. Science of theTotal Environment, 414, 556–563.
Kallos, G., Kassomenos, P., & Pielke, R. A. (1993). Synoptic andmesoscale weather conditions during air pollution episodes inAthens, Greece. Boundary Layer Meteorology, 62, 163–184.
Kambezidis, H. D., Weidauer, D., Melas, D., & Ulbricht, M.(1998). Air quality in the Athens basin during sea breezeand non-sea breeze days using laser-remote sensing tech-nique. Atmospheric Environment, 32, 2173–2182.
Karagiannidis, A. F., Triantafyllou, A. G., & Karacostas, T. S.(2013). Analyzing the basic meteorological aspects of aparticulate air pollution episode over the industrial area ofnorthwestern Greece during the November 2009. GobalNEST Journal, 15, 241–253.
Kassomenos, P. A., Flocas, H. A., Skouloudis, A. N., Lykoudis, S.,Asimakopoulos, V., & Petrakis, M. (1998a). Relationshipbetween air quality indicators and synoptic scale circulationat 850 hPa at Athens. Environmental Technology, 19, 13–24.
Kassomenos, P., Flocas, H. A., Lykoudis, S., & Skouloudis, A. N.(1998b). Spatial and temporal characteristics of the relation-ship between air quality status andmesoscale circulation overan urban Mediterranean basin. Science of the TotalEnvironment, 217, 37–57.
Lalas, D. P., Tombrou-Tzella, M., Petrakis, M., Asimakopoulos,D. N., & Helmis, C. G. (1987). An experimental study ofhorizontal and vertical distribution of ozone over Athens.Atmospheric Environment, 12, 2681–2693.
Laprise, R. (1992). The Euler equations of motion with hydrostaticpressure as an independent variable. Monthly WeatherReview, 120, 197–207.
Maraziotis, E., Sarotis, L., Marazioti, C., & Marazioti, P. (2008).Statistical analysis of inhalable (MP10) and fine particles(PM2.5) concentrations in urban region of Patras, Greece.Gobal NEST Journal, 10, 123–131.
Markakis, K., Poupkou, A., Melas, D., & Zerefos, C. (2010a). AGIS based anthropogenic PM10 emission inventory forGreece. Atmospheric Pollution Research, 1, 71–81.
Markakis, K., Poupkou, A., Melas, D., Tzoumaka, P., &Petrakakis, M. (2010b). A computational approach basedon GIS technology for the development of an anthropogenicemission inventory of gaseous pollutants in Greece. Water,Air, and Soil Pollution, 207, 157–180.
Melas, D., Kioutsioukis, I., & Lazaridis, M. (2005). The impact ofsea breeze on air quality in Athens area. Advances in AirPollution Modeling and Environmental Security. NATOScience Series, 54, 285–295.
Ooyama, K. V. (1990). A thermodynamic foundation for modelingthe moist atmosphere. Journal of the Atmospheric Sciences,47, 2580–2593.
Papanastasiou, D. K., Melas, D., & Kiotsioukis, I. (2007).Development and assessment of neural network and multipleregression models in order to predict PM10 levels in amedium-sized Mediterranean city. Water, Air, and SoilPollution, 182, 325–334.
Pikridas, M., Tasoglou, A., Florou, K., & Pandis, S. N. (2013).Characterization of the origin of fine particulate matter in amedium size urban area in the Mediterranean. AtmosphericEnvironment, 80, 264–274.
Poupkou, A., Melas, D., Ziomas, I., Symeonidis, P., Lisaridis, I.,Gerasopoulos, E., & Zerefos, C. (2009). Simulated summer-time regional ground-level ozone concentrations overGreece. Water, Air, and Soil Pollution, 196, 169–181.
Riga-Karandinos , A. N. , & Sai tan is , C. (2005) .Comparative assessment of ambient air quality in twotypical Mediterranean coastal cities in Greece. Chemosphere,59, 1125–1136.
Rodríguez, S.,Querola,X., Alastueya,A.,&Mantilla, E. (2002).Originof high summer PM10 and TSP concentrations at rural sites inEastern Spain. Atmospheric Environment, 36, 3101–3112.
Schwarzkopf, M. D., & Fels, S. B. (1991). The simplified ex-change method revisited—an accurate, rapid method forcomputation of infrared cooling rates and fluxes. Journal ofGeophysical Research, 96, 9075–9096.
Skamarock, W.C., Klemp, J.B., Dudhia, J., Gill D.O., BarkerD.M., Duda M.G., Huang X.Y., Wang, W., Powers J.G.,(2008). A description of the advanced researcher WRF ver-sion 3. NCAR Technical Note, 88 pages.
Stephens, S., Madronich, S., Wu, F., Olson, J. B., Ramos, R.,Retama, A., & Munoz, R. (2008). Weekly patterns ofMexico City’s surface concentrations of CO, NOx, PM10and O3 during 1986–2007. Atmospheric Chemistry andPhysics, 8, 5313–5323.
Tai, A. P. K., Mickley, L. J., & Jacob, D. J. (2010). Correlationsbetween fine particulate matter (PM2.5) and meteorological
2239, Page 12 of 13 Water Air Soil Pollut (2015) 226:2239

variables in the United States: implications for the sensitivityof PM2.5 to climate change. Atmospheric Environment, 44,3976–3984.
Tsiotas, G., & Argiriou, A. A. (2011). An efficient approach tospatiotemporal analysis and modeling of air pollution data.Journal of Agricultural, Biological, and EnvironmentalStatistics, 16, 371–388.
Unal, Y. S., Toros, H., Deniz, A., & Incecik, S. (2011). Influence ofmeteorological factors and emission sources on spatial andtemporal variations of PM10 concentrations in Istanbulmetropolitan area. Atmospheric Environment, 45,5504–5513.
UP (University of Patras), (2014). http://www.cesapo.upatras.gr/Deliverables/Deliverable 5.2.1_final_report.pdf. Accessed 9July 2014
Wise, E. K., & Comrie, A. C. (2005). Meteorologically adjustedurban air quality trends in the Southwestern United States.Atmospheric Environment, 39, 2969–2980.
Yannopoulos, P. C. (2007). Sulfur dioxide dispersion and sourcecontribution to receptors of downtown Patras, Greece.Environmental Science and Pollution Research, 14, 172–175.
Ziomas, I. C., Melas, D., Zerefos, C. Z., & Bais, A. F. (1995).Forecasting peak pollutant levels from meteorological vari-ables. Atmospheric Environment, 29, 3703–3711.
Water Air Soil Pollut (2015) 226:2239 Page 13 of 13, 2239
Copyright © 2022 FDOKUMEN