The air density equation and the transfer of the mass unit
40
IMBSIR 77-1278 | FILE copy I DO NOT REMC”E I _ “*** ' The Air Density Equation and the Transfer of the Mass Unit Frank E. Jones Institute for Basic Standards National Bureau of Standards Washington, D.C. 20234 July 1977 U. S. DEPARTMENT OF COMMERCE NATIONAL BUREAU OF STANDARDS . W t£M o' HBMi
-
Upload
khangminh22 -
Category
Documents
-
view
0 -
download
0
Transcript of The air density equation and the transfer of the mass unit
IMBSIR 77-1278
|FILE copy
I DO NOT REMC”EI _ i
' “***
'
The Air Density Equation andthe Transfer of the Mass Unit
Frank E. Jones
Institute for Basic Standards
National Bureau of Standards
Washington, D.C. 20234
July 1977
U. S. DEPARTMENT OF COMMERCENATIONAL BUREAU OF STANDARDS
. W t£M o'HBMi

NBSIR 77-1278
THE AIR DENSITY EQUATION ANDTHE TRANSFER OF THE MASS UNIT
Frank E. Jones
Institute for Basic Standards
National Bureau of Standards
Washington, D.C. 20234
July 1977
U.S. DEPARTMENT OF COMMERCE, Juanita M. Kreps, Secretary
Or. Sidney Harman. Under Secretary
Jordan J. Baruch, Assistant Secretary for Science and Technology
NATIONAL BUREAU OF STANDARDS. Ernest Ambler, Acting Director

'
The Air Density Equation and the Transfer of the Mass Unit
by
Frank E. Jones
Ah ST RAC
T
A new formulation of the equation used for the calculation of air
density has been developed. The Quinn, Colclough and Chandlervalue of the gas constant, currently accepted values of the atomic
weights, and recent determinations of the abundances of the various
constituents of air have been used. The abundance of carbon dioxide
has been treated as a variable and a factor enabling convenientadjustment of the apparent molecular weight of air for deviationof carbon dioxide abundance from a background value has been derived.
A new table of compressibility factor for the range of pressure and
temperature of interest in standards laboratories has been calculatedusing recently determined values of virial coefficients. The enhance-ment factor, which has usually been ignored in air density equations,has been explicitly included in the equation; a table of enhancementfactor has been calculated using a simple equation fitted to valuesin the range of pressure and temperature of interest. A table of the
saturation water vapor pressure has been included; a simple equationfor the calculation of saturation water vapor pressure has been fittedUncertainties, random and systematic, in the parameters and in themeasurement of environmental variables and consequent uncertaintiesin calculated air density have been estimated.
Application of the equation to air buoyancy determination and the
transfer of the mass unit at the various national standardslaboratories has been made.
Key Words: Air buoyancy, air density, mass unit transfer, real gasequation.

The Air Density Equation and the Transfer of the Hass Unit
by
Frank E. Jones
ABSTRACT
A new formulation of the equation used for the calculation of air
density has been developed. The Quinn, Colclough and Chandlervalue of the gas constant, currently accepted values of the atomicweights, and recent determinations of the abundances of the various
constituents of air have been used. The abundance of carbon dioxidehas been treated as a variable and a factor enabling convenientadjustment of the apparent molecular weight of air for deviationof carbon dioxide abundance from a background value has been derived.A new table of compressibility factor for the range of pressure and
temperature of interest in standards laboratories has been calculatedusing recently determined values of virial coefficients. The enhance-ment factor, which has usually been ignored in air density equations,has been explicitly included in the equation; a table of enhancementfactor has been calculated using a simple equation fitted to valuesin the range of pressure and temperature of interest. A table of the
saturation water vapor pressure has been included; a simple equationfor the calculation of saturation water vapor pressure has been fitted.Uncertainties, random and systematic, in the parameters and in the
measurement of environmental variables and consequent uncertaintiesin calculated air density have been estimated.
Application of the equation to air buoyancy determination and the
transfer of the mass unit at the various national standardslaboratories has been made.
Key Words: Air buoyancy, air density, mass unit transfer, real gasequation.

.
I
The Air Density Equation and the Transfer of the Mass Unit
by
Frank E. Jones
ABSTRACT
A new formulation of the equation used for the calculation of air
density has been developed. The Quinn, Colclough and Chandlervalue of the gas constant, currently accepted values of the atomic
weights, and recent determinations of the abundances of the various
constituents of air have been used. The abundance of carbon dioxide
has been treated as a variable and a factor enabling convenientadjustment of the apparent molecular weight of air for deviationof carbon dioxide abundance from a background value has been derived.
A new table of compressibility factor for the range of pressure and
temperature of interest in standards laboratories has been calculatedusing recently determined values of virial coefficients. The enhance-ment factor, which has usually been ignored in air density equations,has been explicitly included in the equation; a table of enhancementfactor has been calculated using a simple equation fitted to valuesin the range of pressure and temperature of interest. A table of the
saturation water vapor pressure has been included; a simple equationfor the calculation of saturation water vapor pressure has been fitted.Uncertainties, random and systematic, in the parameters and in the
measurement of environmental variables and consequent uncertaintiesin calculated air density have been estimated.
Application of the equation to air buoyancy determination and the
transfer of the mass unit at the various national standardslaboratories has been made.
Key Words: Air buoyancy, air density, mass unit transfer, real gas
equation.

The Air Density Equation and the Transfer of the Mass Unit
by
Frank E. Jones
ABSTRACT
A new formulation of the equation used for the calculation of air
density has been developed. The Quinn, Colclough and Chandlervalue of the gas constant, currently accepted values of the atomic
weights, and recent determinations of the abundances of the various
constituents of air have been used. The abundance of carbon dioxide
has been treated as a variable and a factor enabling convenientadjustment of the apparent molecular weight of air for deviationof carbon dioxide abundance from a background value has been derived.
A new table of compressibility factor for the range of pressure and
temperature of interest in standards laboratories has been calculatedusing recently determined values of virial coefficients. The enhance-ment factor, which has usually been ignored in air density equations,has been explicitly included in the equation; a table of enhancementfactor has been calculated using a simple equation fitted to valuesin the range of pressure and temperature of interest. A table of the
saturation water vapor pressure has been included; a simple equationfor the calculation of saturation water vapor pressure has been fitted.Uncertainties, random and systematic, in the parameters and in themeasurement of environmental variables and consequent uncertaintiesin calculated air density have been estimated.
Application of the equation to air buoyancy determination and the
transfer of the mass unit at the various national standardslaboratories has been made.
Key Words: Air buoyancy, air density, mass unit transfer, real gasequation.

m
1 . INTRODUCTION
The transfer of the mass value from one object, such as the Internat Lonal
Prototype Kilogram, to another object is accomplished by comparison of the
objects by means of a balance. The difference in buoyant force on the two
objects is proportional to the difference in their displacement volumes
and to the air density. The air density is conventionally calculated usingan equation based on the equation of state of an air-water vapor mixture.A new formulation of the air density equation is developed below.
2. DEVELOPMENT OF THE AIR DENSITY EQUATION
The total pressure, P, the total volume, V, and the absolute temperature,T, of a mixture of ideal gases are related by the ideal gas equation,
PV = nRT, (1)
where n is the number of moles of the mixture and R is the universal gas
constant. In terms of density, P, rather than volume, Eq . (1) becomes
p=pfr, (2)
where is the apparent molecular weight of the mixture.
For a mixture of dry air (indicated by subscript a) and water vapor (sub-script e), M is the apparent molecular weight of the air-water vapormixture
,
Since
m + mM = ” = _§ £
n n + na e
(3)
where m is the mass of the mixture and n is the number of moles of themixture
.
M =n M + n Ma a e e
n + na e
/ n MMa l
1 +nffl!
1 +
(4)
By introducing the water vapor mixing ratio, r:
mass of water vaporme
neMe >
m n Ma a a
mass of dry airr
(5)
Eq. (4) becomes
M =M (1 + r)a
1 +M /Me a
MBy designating the ratio — by e, Eq . (6) becomes
a
( 6 )
M (1 + r)
M = — ,
(1 + -)e
(7)
and by substituting Eq . (7) in Eq. (2), we find that
p - i T (rr? ( 8 )
The effective vapor pressure, e',
of water in moist air is defined [1] by
therefore
,
r
( e + r)P (9)
and Eq. (8) becomes
ee'r "
(P - e')
P Hr 1a
1
_1 + (e-1)
( 10 )
(ID
Eq. (11) is the ideal gas equation for a mixture of dry air and watervapor with a water vapor pressure of e'. If the air-water vapor mixturebehaved as a mixture of ideal gases,
ofr1a f—
|_1+ (e- 1)
= Z = 1, ( 12 )
where Z is the compressibility factor. Since Z is not,, in general, equalto 1, the mixture is not ideal. The magnitude of the non-ideality is
reflected in the departure of the value of Z from 1 and Eq. (12) becomes
2
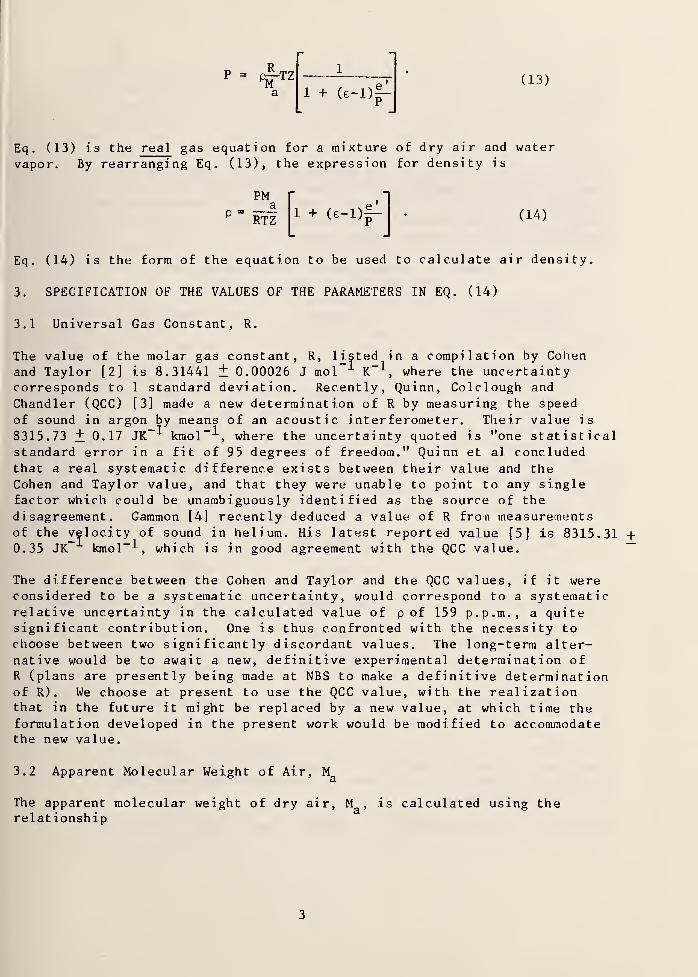
( 13 )
Eq. (13) is the real gas equation for a mixture of dry air and water
vapor. By rearranging Eq. (13), the expression for density is
PMa
RTZ (14)
Eq. (14) is the form of the equation to be used to calculate air density.
3. SPECIFICATION OF THE VALUES OF THE PARAMETERS IN EQ. (14)
3.1 Universal Gas Constant, R.
The value of the molar gas constant, R, listed in a compilation by Cohenand Taylor [2] is 8.31441 + 0.00026 J mol K
-^, where the uncertainty
corresponds to 1 standard deviation. Recently, Quinn, Colclough and
Chandler (QCC) [3] made a new determination of R by measuring the speed
of sound in argon by means of an acoustic interferometer. Their value is
8315.73 + 0.17 JK-
"*- kmol-^, where the uncertainty quoted is "one statistical
standard error in a fit of 95 degrees of freedom." Quinn et al concludedthat a real systematic difference exists between their value and theCohen and Taylor value, and that they were unable to point to any singlefactor which could be unambiguously identified as the source of the
disagreement. Gammon [4] recently deduced a value of R from measurementsof the velocity of sound in helium. His latest reported value [5] is 8315.31 +0.35 JK
_kmol-1, which is in good agreement with the QCC value.
The difference between the Cohen and Taylor and the QCC values, if it wereconsidered to be a systematic uncertainty, would correspond to a systematicrelative uncertainty in the calculated value of p of 159 p.p.m., a quitesignificant contribution. One is thus confronted with the necessity to
choose between two significantly discordant values. The long-term alter-native would be to await a new, definitive experimental determination ofR (plans are presently being made at NBS to make a definitive determinationof R) . We choose at present to use the QCC value, with the realizationthat in the future it might be replaced by a new value, at which time theformulation developed in the present work would be modified to accommodatethe new value.
3.2 Apparent Molecular Weight of Air, Mg
The apparent molecular weight of dry air, Mg ,
is calculated using therelationship
3
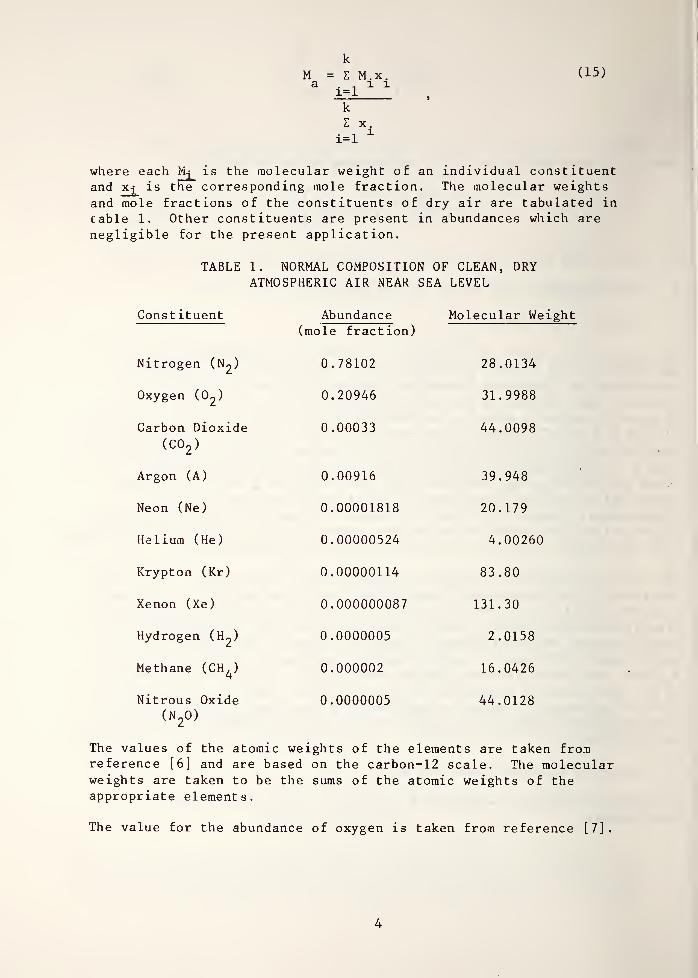
( 15 )
k
M = E M.x.a . , 1 x
i=lk
E x.
i=l1
where each M-j is the molecular weight of an individual constituentand x^ is the corresponding mole fraction. The molecular weights
and mole fractions of the constituents of dry air are tabulated in
cable 1. Other constituents are present in abundances which are
negligible for the present application.
TABLE 1. NORMAL COMPOSITION OF CLEAN, DRYATMOSPHERIC AIR NEAR SEA LEVEL
Constituent Abundance(mole fraction)
Molecular Weight
Nitrogen (N2
) 0.78102 28.0134
Oxygen (02
) 0.20946 31.9988
Carbon Dioxide(co
2)
0.00033 44.0098
Argon (A) 0.00916 39.948
Neon (Ne) 0.00001818 20.179
Helium (He) 0.00000524 4.00260
Krypton (Kr) 0.00000114 83.80
Xenon (Xe) 0.000000087 131.30
Hydrogen (H2
) 0.0000005 2.0158
Methane (CH^) 0.000002 16.0426
Nitrous Oxide 0.0000005 44.0128(n
2o)
The values of the atomic weights of the elements are taken fromreference [6] and are based on the carbon-12 scale. The molecularweights are taken to be the sums of the atomic weights of theappropriate elements.
The value for the abundance of oxygen is taken from reference [7].
4
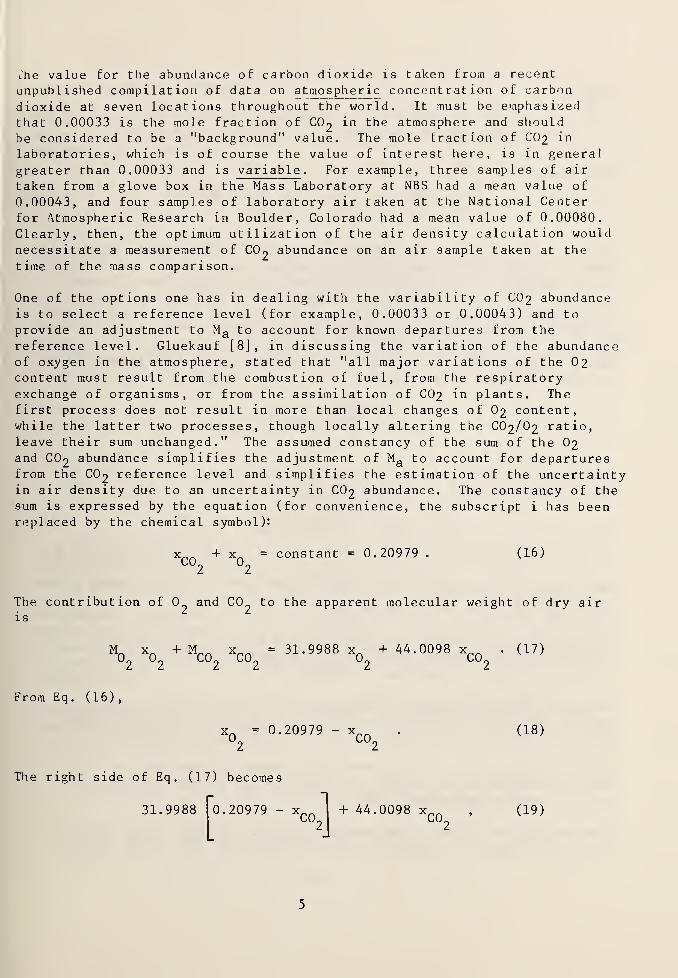
L’he value for the abundance of carbon dioxide is taken from a recent
unpublished compilation of data on atmospheric concentration of carbon
dioxide at seven locations throughout the world. It must be emphasizedthat 0.00033 is the mole fraction of CO
2in the atmosphere and should
be considered to be a "background" value. The mole fraction of CO 2 in
laboratories, which is of course the value of interest here, is in general
greater than 0.00033 and is variable. For example, three samples of air
taken from a glove box in the Mass Laboratory at NBS had a mean value of
0.00043, and four samples of laboratory air taken at the National Centerfor Atmospheric Research in Boulder, Colorado had a mean value of 0.00080.Clearly, then, the optimum utilization of the air density calculation wouldnecessitate a measurement of C0
2abundance on an air sample taken at the
time of the mass comparison.
One of the options one has in dealing with the variability of CO 2 abundanceis to select a reference level (for example, 0.00033 or 0.00043) and toprovide an adjustment to M a to account for known departures from the
reference level. Gluekauf [8], in discussing the variation of the abundanceof oxygen in the atmosphere, stated that "all major variations of the 02content must result from the combustion of fuel, from the respiratoryexchange of organisms, or from the assimilation of CO2 in plants. Thefirst process does not result in more than local changes of O 2 content,while the latter two processes, though locally altering the CO 2 /O 2 ratio,leave their sum unchanged." The assumed constancy of the sum of the O 2
and CO2
abundance simplifies the adjustment of Ma to account for departuresfrom the CO
2reference level and simplifies the estimation of the uncertaint
in air density due to an uncertainty in CO2 abundance. The constancy of the
sum is expressed by the equation (for convenience, the subscript i has beenreplaced by the chemical symbol):
x_ + x = constant = 0.20979 .
lo2
o2
(16)
The contribution of 02
and C02
to the apparent molecular weight of dry airis
mo2
xo2
+ mco
2
xco
2- 31 - 9988 x
02
+ 44 - 0098 XC0
2
• (17)
From Eq . ( 16) ,
xn = 0.20979 - xrn . (18)
zLU
2
The right side of Eq . (17) becomes
co2
31.9988 0.20979 - x + 44.0098 x (19)
thus
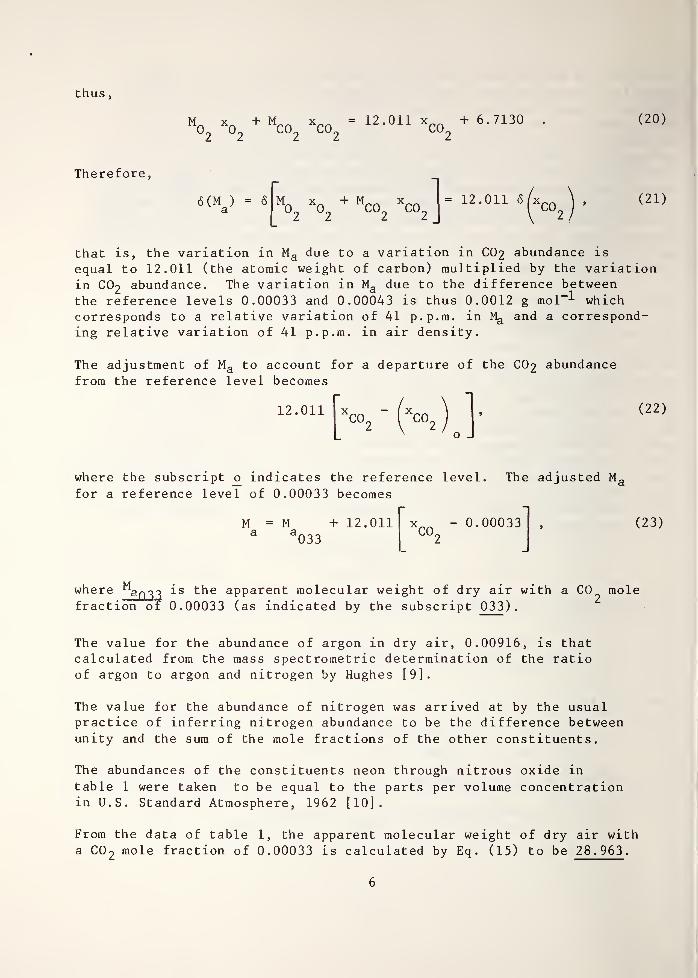
,
M°2
X02
+ MC0
2
Xc°2
' 12 ’ 011 Xc02
+6 ' 7130 ' <20)
Therefore,
S(M ) = 6a
M°2
X°2
+ M<:0
2
XC°2
= 12.011 6/xco )
, (21)
that is, the variation in Ma due to a variation in CO 2 abundance is
equal to 12.011 (the atomic weight of carbon) multiplied by the variationin CO
2abundance. The variation in Ma due to the difference between
the reference levels 0.00033 and 0.00043 is thus 0.0012 g mol-
*- whichcorresponds to a relative variation of 41 p.p.m. in Mg and a correspond-ing relative variation of 41 p.p.m. in air density.
The adjustment of Ma to account for a departure of the CO 2 abundancefrom the reference level becomes
12.011 ( 22 )
where the subscript o indicates the reference level. The adjusted Mafor a reference level of 0.00033 becomes
Ma
M + 12.011 xa033
C°20.00033 , (23)
where Mar>33
frac t ion of
is the apparent molecular weight of dry air with a CO mole
0.00033 (as indicated by the subscript 033).
The value for the abundance of argon in dry air, 0.00916, is thatcalculated from the mass spectroinetric determination of the ratioof argon to argon and nitrogen by Hughes [9].
The value for the abundance of nitrogen was arrived at by the usualpractice of inferring nitrogen abundance to be the difference betweenunity and the sum of the mole fractions of the other constituents.
The abundances of the constituents neon through nitrous oxide in
table 1 were taken to be equal to the parts per volume concentrationin U.S. Standard Atmosphere, 1962 [10].
From the data of table 1, the apparent molecular weight of dry air witha CO
2mole fraction of 0.00033 is calculated by Eq . (15) to be 28 . 963 .
6
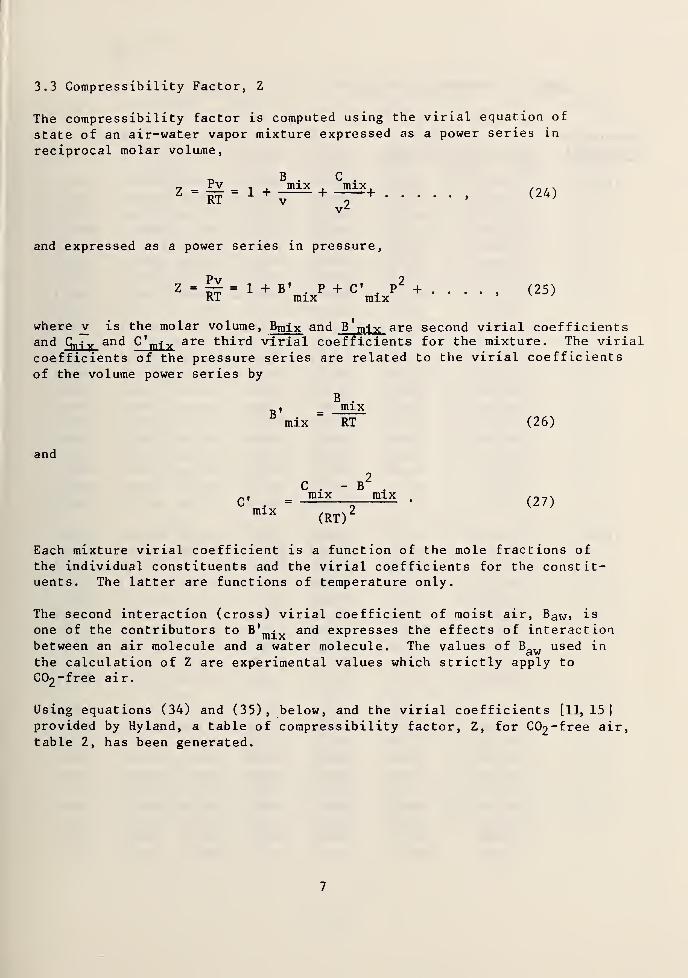
3.3 Compressibility Factor, Z
The compressibility factor is computed using the virial equation of
state of an air-water vapor mixture expressed as a power series in
reciprocal molar volume,
ZPvRT
1 +B .mixv
C .
mixj
V2* (24)
and expressed as a power series in pressure,
ZPvRT
1 + B' . P + C 1
. P2+ .
mix mix (25)
where _v is the molar volume, Bmix and B' mix are second virial coefficientsand Qn-jy and C 'mjy are third virial coefficients for the mixture. The virial
coefficients of the pressure series are related to the virial coefficients
of the volume power series by
B .
t> i = mixmix RT (26)
and
C'-fmix
mix mix
(RT)2
(27)
Each mixture virial coefficient is a function of the mole fractions of
the individual constituents and the virial coefficients for the constit-uents. The latter are functions of temperature only.
The second interaction (cross) virial coefficient of moist air, Baw ,is
one of the contributors to and expresses the effects of interactionbetween an air molecule and a water molecule. The values of BOTT used indwthe calculation of Z are experimental values which strictly apply to
C02 ~free air.
Using equations (34) and (35), below, and the virial coefficients [11, 15]provided by Hyland, a table of compressibility factor, Z, for CC^-free air,table 2, has been generated.
7
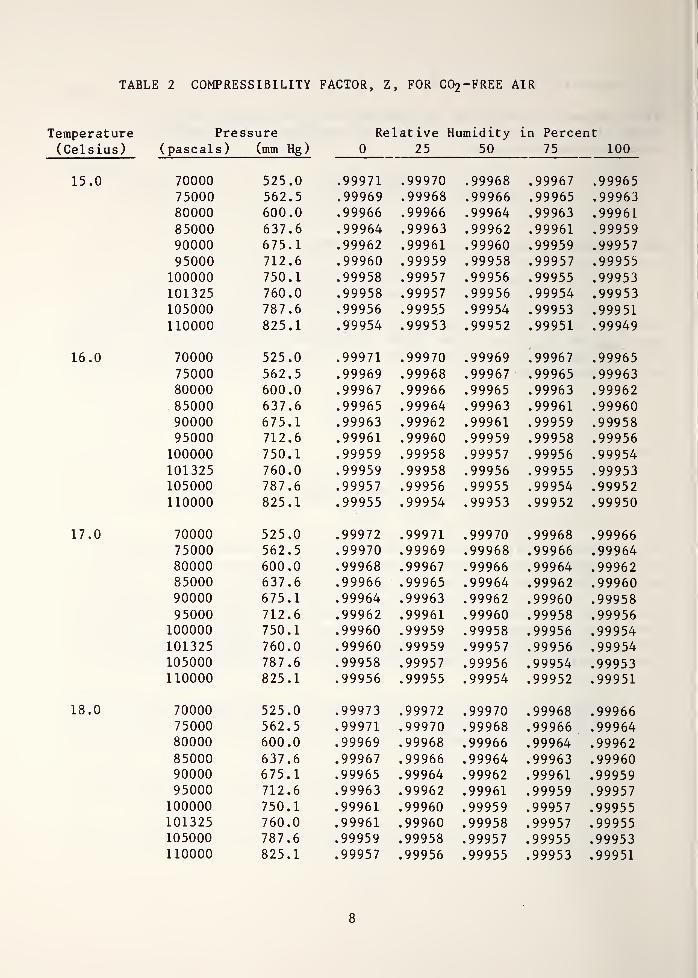
TABLE 2 COMPRESSIBILITY FACTOR, Z, FOR C02 -FREE AIR
Temperature(Celsius
)
15.0
16.0
17.0
18.0
Pressure Relative Humidity in Percent
( pascals
)
(mm Hg) 0 25 50 75 100
70000 525.0 .99971 .99970 .99968 .99967 .9996575000 562.5 .99969 .99968 .99966 .99965 .9996380000 600.0 .99966 .99966 .99964 .99963 .99961
85000 637.6 .99964 .99963 .99962 .99961 .9995990000 675.1 .99962 .99961 .99960 .99959 .9995795000 712.6 .99960 .99959 .99958 .99957 .99955
100000 750.1 .99958 .99957 .99956 .99955 .99953101325 760.0 .99958 .99957 .99956 .99954 .99953105000 787.6 .99956 .99955 .99954 .99953 .99951
110000 825.1 .99954 .99953 .99952 .99951 .99949
70000 525.0 .99971 .99970 .99969 .99967 .99965
75000 562.5 .99969 .99968 .99967 .99965 .9996380000 600.0 .99967 .99966 .99965 .99963 .9996285000 637.6 .99965 .99964 .99963 .99961 .9996090000 675.1 .99963 .99962 .99961 .99959 .9995895000 712.6 .99961 .99960 .99959 .99958 .99956100000 750.1 .99959 .99958 .99957 .99956 .99954101325 760.0 .99959 .99958 .99956 .99955 .99953105000 787.6 .99957 .99956 .99955 .99954 .99952110000 825.1 .99955 .99954 .99953 .99952 .99950
70000 525.0 .99972 .99971 .99970 .99968 .9996675000 562.5 .99970 .99969 .99968 .99966 .9996480000 600.0 .99968 .99967 .99966 .99964 .9996285000 637.6 .99966 .99965 .99964 .99962 .9996090000 675.1 .99964 .99963 .99962 .99960 .9995895000 712.6 .99962 .99961 .99960 .99958 .99956100000 750.1 .99960 .99959 .99958 .99956 .99954101325 760.0 .99960 .99959 .99957 .99956 .99954105000 787 .6 .99958 .99957 .99956 .99954 .99953110000 825.1 .99956 .99955 .99954 .99952 .99951
70000 525.0 .99973 .99972 .99970 .99968 .9996675000 562.5 .99971 .99970 .99968 .99966 .9996480000 600.0 .99969 .99968 .99966 .99964 .9996285000 637.6 .99967 .99966 .99964 .99963 .9996090000 675.1 .99965 .99964 .99962 .99961 .9995995000 712.6 .99963 .99962 .99961 .99959 .99957
100000 750.1 .99961 .99960 .99959 .99957 .99955101325 760.0 .99961 .99960 .99958 .99957 .99955105000 787.6 .99959 .99958 .99957 .99955 .99953110000 825.1 .99957 .99956 .99955 .99953 .99951
8
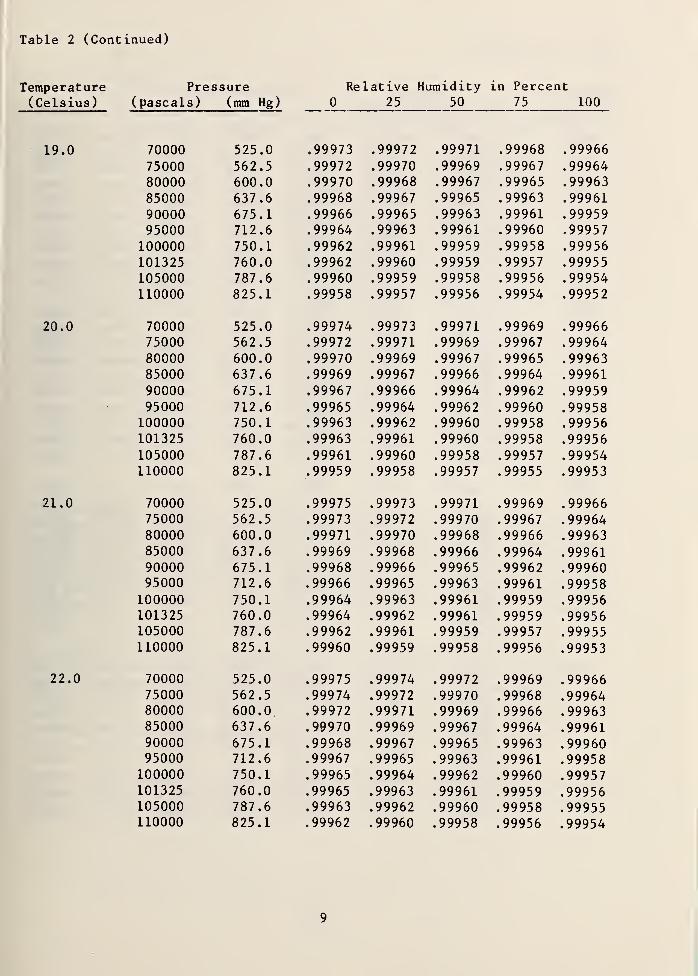
Table 2 (Continued)
Temperature Pressure Relative 1Humidity in Percent(Celsius) ( pascals) (mm Hg) 0 25 50 75 100
19.0 70000 525.0 .99973 .99972 .99971 .99968 .99966
75000 562.5 .99972 .99970 .99969 .99967 .9996480000 600.0 .99970 .99968 .99967 .99965 .99963
85000 637.6 .99968 .99967 .99965 .99963 .99961
90000 675.1 .99966 .99965 .99963 .99961 .9995995000 712.6 .99964 .99963 .99961 .99960 .99957
100000 750.1 .99962 .99961 .99959 .99958 .99956
101325 760.0 .99962 .99960 .99959 .99957 .99955
105000 787.6 .99960 .99959 .99958 .99956 .99954110000 825.1 .99958 .99957 .99956 .99954 .99952
20.0 70000 525.0 .99974 .99973 .99971 .99969 .9996675000 562.5 .99972 .99971 .99969 .99967 .99964
80000 600.0 .99970 .99969 .99967 .99965 .9996385000 637.6 .99969 .99967 .99966 .99964 .99961
90000 675.1 .99967 .99966 .99964 .99962 .9995995000 712.6 .99965 .99964 .99962 .99960 .99958100000 750.1 .99963 .99962 .99960 .99958 .99956101325 760.0 .99963 .99961 .99960 .99958 .99956105000 787.6 .99961 .99960 .99958 .99957 .99954110000 825.1 .99959 .99958 .99957 .99955 .99953
21.0 70000 525.0 .99975 .99973 .99971 .99969 .9996675000 562.5 .99973 .99972 .99970 .99967 .9996480000 600.0 .99971 .99970 .99968 .99966 .9996385000 637.6 .99969 .99968 .99966 .99964 .9996190000 675.1 .99968 .99966 .99965 .99962 .9996095000 712.6 .99966 .99965 .99963 .99961 .99958100000 750.1 .99964 .99963 .99961 .99959 .99956101325 760.0 .99964 .99962 .99961 .99959 .99956105000 787.6 .99962 .99961 .99959 .99957 .99955110000 825.1 .99960 .99959 .99958 .99956 .99953
22.0 70000 525.0 .99975 .99974 .99972 .99969 .9996675000 562.5 .99974 .99972 .99970 .99968 .9996480000 600.0 .99972 .99971 .99969 .99966 .9996385000 637.6 .99970 .99969 .99967 .99964 .9996190000 675.1 .99968 .99967 .99965 .99963 .9996095000 712.6 .99967 .99965 .99963 .99961 .99958100000 750.1 .99965 .99964 .99962 .99960 .99957101325 760.0 .99965 .99963 .99961 .99959 .99956105000 787.6 .99963 .99962 .99960 .99958 .99955110000 825.1 .99962 .99960 .99958 .99956 .99954
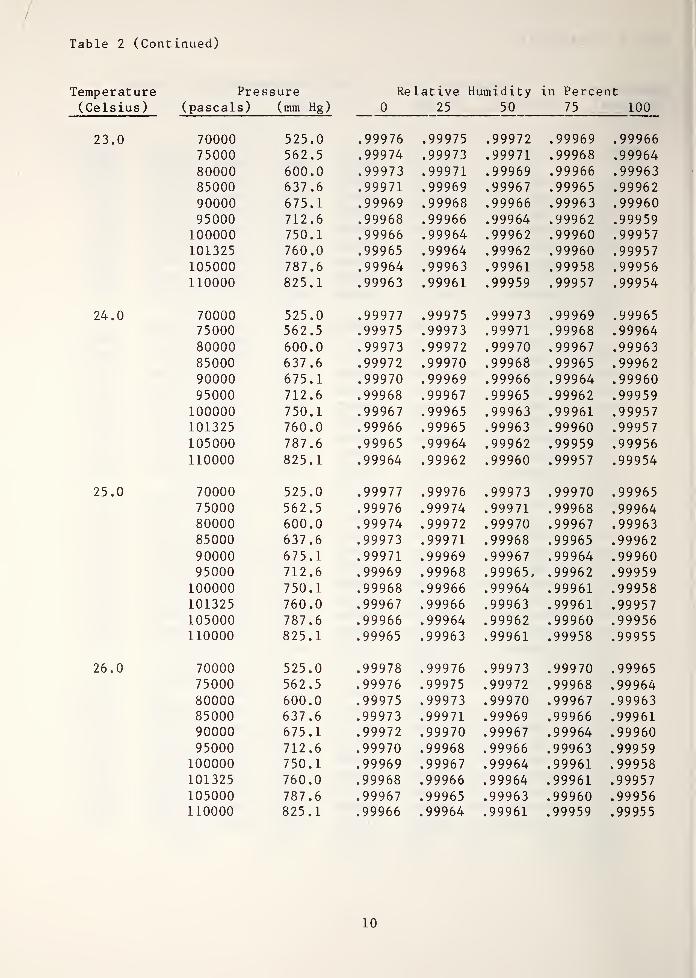
Table 2 (Continued)
Temperature Pressure Relative 1Humidity in Percent( Celsius
)
(pascals) (mm Hg) 0 25 50 75 100
23.0 70000 525.0 .99976 .99975 .99972 .99969 .9996673000 562.5 .99974 .99973 .99971 .99968 .99964
80000 600.0 .99973 .99971 .99969 .99966 .9996385000 637.6 .99971 .99969 .99967 .99965 .99962
90000 675.1 .99969 .99968 .99966 .99963 .99960
95000 712.6 .99968 .99966 .99964 .99962 .99959100000 750.1 .99966 .99964 .99962 .99960 .99957101325 760.0 .99965 .99964 .99962 .99960 .99957105000 787.6 .99964 .99963 .99961 .99958 .99956110000 825.1 .99963 .99961 .99959 .99957 .99954
24.0 70000 525.0 .99977 .99975 .99973 .99969 .9996575000 562.5 .99975 .99973 .99971 .99968 .99964
80000 600.0 .99973 .99972 .99970 .99967 .9996385000 637.6 .99972 .99970 .99968 .99965 .9996290000 675.1 .99970 .99969 .99966 .99964 .9996095000 712.6 .99968 .99967 .99965 .99962 .99959100000 750.1 .99967 .99965 .99963 .99961 .99957101325 760.0 .99966 .99965 .99963 .99960 .99957105000 787.6 .99965 .99964 .99962 .99959 .99956110000 825.1 .99964 .99962 .99960 .99957 .99954
23.0 70000 525.0 .99977 .99976 .99973 .99970 .9996575000 562.5 .99976 .99974 .99971 .99968 .9996480000 600.0 .99974 .99972 .99970 .99967 .9996385000 637.6 .99973 .99971 .99968 .99965 .9996290000 675.1 .99971 .99969 .99967 .99964 .9996095000 712.6 .99969 .99968 .99965, .99962 .99959100000 750.1 .99968 .99966 .99964 .99961 .99958101325 760.0 .99967 .99966 .99963 .99961 .99957105000 787.6 .99966 .99964 .99962 .99960 .99956110000 825.1 .99965 .99963 .99961 .99958 .99955
26.0 70000 525.0 .99978 .99976 .99973 .99970 .9996575000 562.5 .99976 .99975 .99972 .99968 .9996480000 600.0 .99975 .99973 .99970 .99967 .9996385000 637.6 .99973 .99971 .99969 .99966 .9996190000 675.1 .99972 .99970 .99967 .99964 .9996095000 712.6 .99970 .99968 .99966 .99963 .99959100000 750.1 .99969 .99967 .99964 .99961 .99958101325 760.0 .99968 .99966 .99964 .99961 .99957105000 787.6 .99967 .99965 .99963 .99960 .99956110000 825.1 .99966 .99964 .99961 .99959 .99955
10
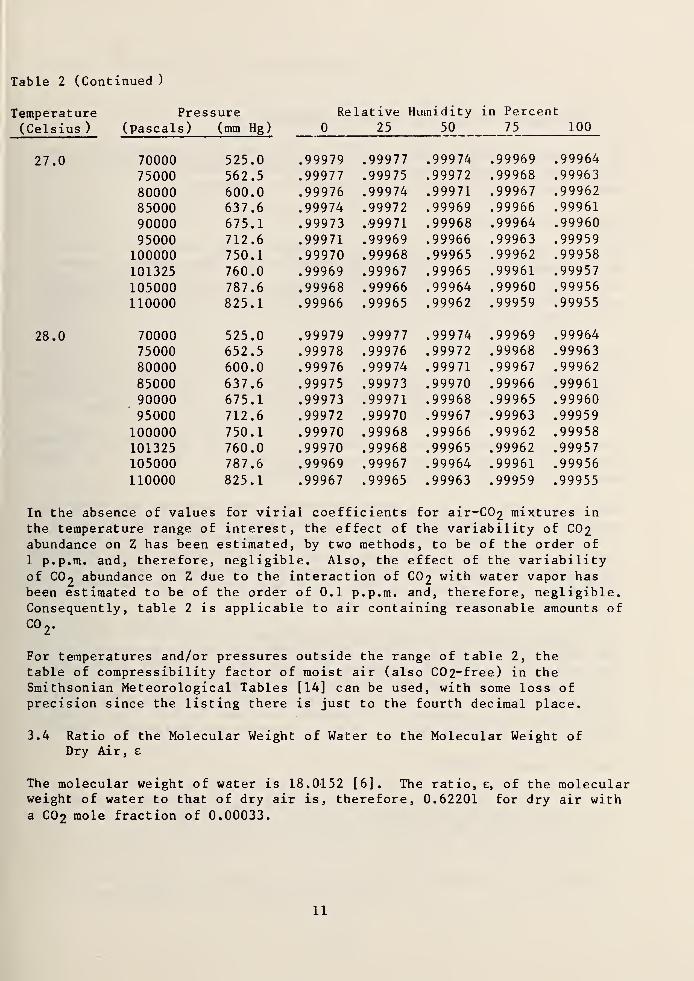
Table 2 (Continued )
Temperature Pressure Relative Humidity in Percent
(Celsius ) (pascals) (mm Hg) 0 25 50 75 100
27.0 70000 525.0 .99979 .99977 .99974 .99969 .99964
75000 562.5 .99977 .99975 .99972 .99968 .99963
80000 600.0 .99976 .99974 .99971 .99967 .99962
85000 637.6 .99974 .99972 .99969 .99966 .99961
90000 675.1 .99973 .•99971 .99968 .99964 .99960
95000 712.6 .99971 .99969 .99966 .99963 .99959
100000 750.1 .99970 .99968 .99965 .99962 .99958
101325 760.0 .99969 .99967 .99965 .99961 .99957
105000 787.6 .99968 .99966 .99964 .99960 .99956
110000 825.1 .99966 .99965 .99962 .99959 .99955
28.0 70000 525.0 .99979 .99977 .99974 .99969 .99964
75000 652.5 .99978 .99976 .99972 .99968 .99963
80000 600.0 .99976 .99974 .99971 .99967 .99962
85000 637.6 .99975 .99973 .99970 .99966 .99961
90000 675.1 .99973 .99971 .99968 .99965 .99960
95000 712.6 .99972 .99970 .99967 .99963 .99959
100000 750.1 .99970 .99968 .99966 .99962 .99958
101325 760.0 .99970 .99968 .99965 .99962 .99957
105000 787.6 .99969 .99967 .99964 .99961 .99956
110000 825.1 .99967 .99965 .99963 .99959 .99955
In the absence of values for virial coefficients for air-C02 mixtures in
the temperature range of interest, the effect of the variability of CO 2
abundance on Z has been estimated, by two methods, to be of the order of
1 p.p.m. and, therefore, negligible. Also, the effect of the variabilityof CO
2abundance on Z due to the interaction of CO 2 with water vapor has
been estimated to be of the order of 0.1 p.p.m. and, therefore, negligible.Consequently, table 2 is applicable to air containing reasonable amounts of
co2
.
For temperatures and/or pressures outside the range of table 2, thetable of compressibility factor of moist air (also C02~free) in theSmithsonian Meteorological Tables [14] can be used, with some loss ofprecision since the listing there is just to the fourth decimal place.
3.4 Ratio of the Molecular Weight of Water to the Molecular Weight ofDry Air, e
The molecular weight of water is 18.0152 [6], The ratio, £, of the molecularweight of water to that of dry air is, therefore, 0.62201 for dry air witha CO 2 mole fraction of 0.00033.
11
4. UNCERTAINTY IN CALCULATION OF AIR DENSITY
In estimating uncertainties we shall report them as 1 standard deviationand we shall follow the suggested practice of Eisenhart [12, 13] in
stating separately the random and systematic components.
4.1 Uncertainty in R
The estimates of the uncertainties in the molar gas constant are basedon the work of Quinn, Colclough and Chandler [3]. Their quoted randomuncertainty is + 0.17 JK~1 kmol“l, which is + 2.0 x 10~^. The systematicuncertainties combined in quadrature results in an "overall systematicuncertainty of 17 p.p.m."
4.2 Uncertainties in Ma
The uncertainty in the O2 abundance (mole fraction) of air [7] is separableinto a random component and a systematic component. The random uncertaintyis estimated to be + 0.00001, the systematic component is + 0.00006.
The random component of the uncertainty in the argon abundance is inferredfrom the precision of Hughes' measurements [9] to be + 0.00001. No assign-ment of systematic uncertainty was made by Hughes.
The uncertainty in the CO 2 abundance has been mentioned earlier withrespect to the variability of the CO 2 abundance in the laboratory. Fora sample of air taken at the time a mass comparison is made, the uncer-tainty in the subsequent mass spectrometric determination of CO2 abundanceis _+ 0.00003 at the 0.00033 level. Since the measurements made by the massspectrometric method are considered to be very precise, the estimateduncertainty is considered to be systematic.
Since the N^ abundance is the difference between unity and the sum ofthe mole fractions of the other constituents, the random component ofthe uncertainty in the N
2abundance is found by combining by quadrature
the random components of the uncertainties of the other three major compon-ents to be 1 x 10~
. For the systematic component, however, the practiceof finding the N
2abundance by difference provides for very significant
cancellation of uncertainties. This is shown in the following treatment.
Eq. (15) can be written:
Ma
M0„ CL
+ MC0 o CO,
ma
xa
+ V XN,
k
E
±=5
M.1
(28)
12
The mole fraction of N2
is, by difference.
x. - Z x.A
1=51
(29)
If we ignore the last term in Eq. (28), differentiate and go to finite
di f ferences
,
A <Vx." M
0AX
0,+ M
C0
,
AXC0
+ MAAxA
+ V (' Ax0?
" AxCC>
2' Ax
A>1 2 2 z z zz z
(30)
= (M02
- + (MC0
2
- mn2
)Axco
2
+ (ma -V Ax
a•
With the substitution of the appropriate systematic uncertainties and
the molecular weights into Eq. (30), the systematic component of the
relative uncertainty in Ma due to uncertainties in abundance of the
constituents is found to be 3 x 10“'*. The random component of the
relative uncertainty is found to be + 2 x 10-
~* by combining by quadraturethe product of the molecular weight and the random component of uncertaintyin abundance for each of the four major constituents and dividing by M a .
The uncertainty in M a due to the uncertainty in the value of the atomic
or molecular weights of the i-th constituent is
A(Ma )M .
= x. AM.1 1
(31)
The uncertainties in the values of the atomic or molecular weights areinferred from reference [6]^. For the four major constituents they are:
for 0^, _+ 0.0002; for CO^,
_+ 0.0005; for A, +_ 0.001; and for N 2,
+ 0.0001. These uncertainties are considered to be systematic. Thesum of the four terms represented by Eq . (3.1) is _+ 0.0001, correspondingto a relative uncertainty in M a of 4 x 10“
.
The random component of the overall relative uncertainty in M a is, byquadrature, + 2 x 10“^. The systematic component of the overall relativeuncertainty in M a is + 3 x 10“^, the sum of the component due to thesystematic uncertainty in abundance and that due to the uncertaintyin atomic or molecular weight. The corresponding random and systematiccomponents of the relative uncertainty in p are + 2 x 10“^ and + 3 x 10“-*,
respectively
.
4.3 Uncertainty in Z
The uncertainty in Z, the compressibility factor, is estimated from thevarious uncertainties in Z due to the uncertainties in the virial coef-ficients [15]. The dominant uncertainty is that assigned to B aa (one ofthe three used in the calculation of B mix of Eq . (24) [11]), the secondvirial coefficient expressing the effects of interaction between two air
1 The uncertainty assigned in the reference is divided by 3 to estimatethe uncertainty at 1 standard deviation.
13
molecules. The estimated relative uncertainty in Z at 293. 15K, 101325
Pa (1 atmosphere) and relative humidity 50 percent is + 1.7 x 10-^
. The
corresponding relative uncertainty, taken to be systematic, in p is
+ 1.7 x 10" 5.
4.4 Uncertainty in e
The uncertainty in Me ,the molecular weight of water, is +_ 0.0005 [6] and
is treated here as systematic. The uncertainty in e, the ratio of Me to
M ,is given by
3.
A G =M AM - M AMa e e a
(M )
2
a
(32)
-5The random component of Ae thus calculated is + 1 x 10 and the systematiccomponent is + 8 x 10 . The corresponding uncertainties in the factor in
Eq. ( 14) involving e,
1 + (e-l)r (33)
at 293. 15K, 101325 Pa and 50 percent relative humidity are _+ 1 x 10⁻⁷
and
9 x 10 -®, respectively. The corresponding relative uncertainties in theterm and consequently in p are + 1 x 10“7 and + 9 x 10⁻⁸
,respectively.
4.5 Combined Relative Uncertainties in p Due to the Uncertainties in
M,
R, Z and e
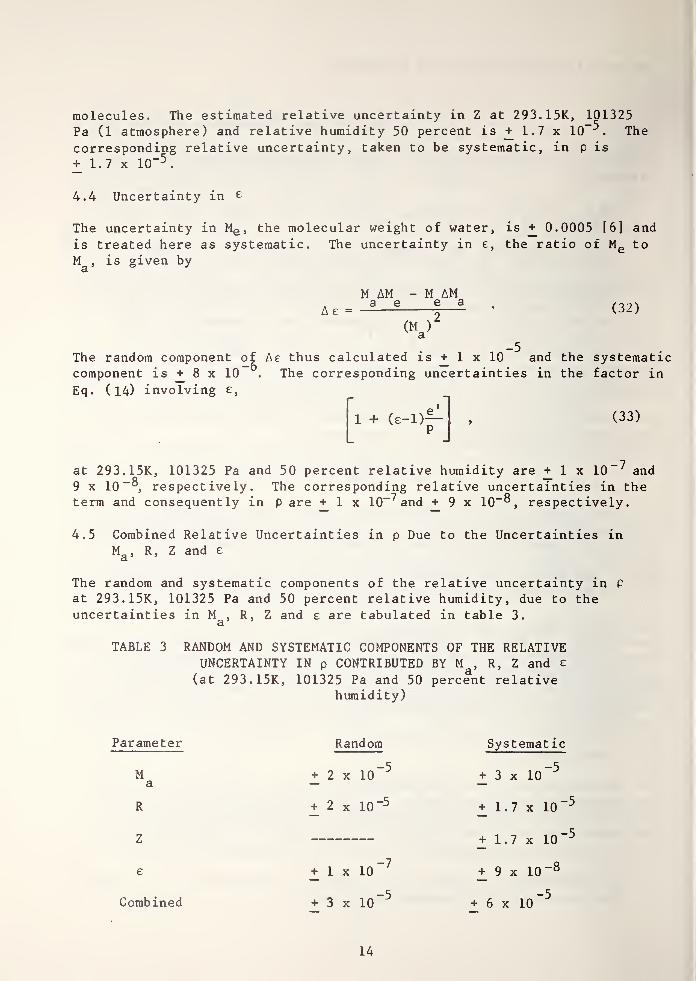
The random and systematic components of the relative uncertainty in P
at 293. 15K, 101325 Pa and 50 percent relative humidity, due to theuncertainties in M , R, Z and e are tabulated in table 3.
a
TABLE 3 RANDOM AND SYSTEMATIC COMPONENTS OF THE RELATIVEUNCERTAINTY IN p CONTRIBUTED BY M
,R, Z and e
(at 293. 15K, 101325 Pa and 50 percent relativehumidity)
Parameter
Ma
R
Z
e
Combined
Random
+ 2 x 10" 5
+ 2 x 10"5
+ 1 x 10
+ 3 x 10
Systemat ic
+ 3 x 10" 5
+ 1.7 x 10~ 5
+ 1.7 x 10~ 5
+ 9 x 10~ 8
+ 6 x 10
14
The random components were combined by quadrature, the systematic
components were combined by addition. These components of uncer-
tainty can be considered to represent the uncertainty "intrinsic"
to the air density equation, that is, that which is contributed by
the limitations on the present knowledge of M a ,M e ,
R and Z. With
these uncertainties must, of course, be combined the uncertainties
in the environmental variables: P, T and relative humidity, and in
the knowledge of the carbon dioxide abundance.
5. MEASUREMENT OF P, T AND RELATIVE HUMIDITY
In order to estimate the uncertainties in p due to uncertainties in
the measurements of the environmental variables, P, T and relative
humidity, we shall estimate the uncertainties in these measurements
when made using the best applicable instrumentation and procedures.
Therefore, the estimated uncertainties in p will be those contributed
by the best possible measurements.
5.1 Pressure Measurement
The state-of-the-art in pressure measurement [16] permits the measurementof the pressure in a laboratory with a random relative uncertainty of
less than + 2 X 10”^. Calibration of pressure measuring instru-
ments against a primary standard of pressure contributes a systematicrelative uncertainty of about _+ 3 x 10”5. The corresponding Ap/p's
contributed by uncertainties in the measurement of pressure in a
laboratory in the vicinity of a balance case are + 2 x 10-^ and + 3 x 10 ^
5.2 Temperature Measurement
The measurement of temperature in a balance case, that is the temperaturewhich determines the buoyant forces, is potentially the most criticalmeasurement in terms of its effect on the uncertainty in the calculatedair density. In the absence of experimental results, it is possible at
this time to make only a rough estimate of the temperature uncertaintyto be expected. If the balance case were instrumented with a networkof thermopile junctions, for example, the measurements would be expectedto have a standard deviation of about +_ 0.05K [17]. The systematicuncertainty is estimated to be of the order of + 0.01K. At a temperatureof 293. 15K, these uncertainties correspond to relative uncertainties of
_+ 2 x 10-<
^,and + 3 x 10
-^, respectively. The corresponding Ap/p's are
+ 2 x 10-^ and + 3 x 10
5.3
Humidity Measurement
The state-of-the-art in humidity measurement [18] permits the measurementof humidity in a balance case with a random uncertainty of + 0.5 percentrelative humidity and a systematic uncertainty of + 0.3 percent relativehumidity. These uncertainties correspond to relative uncertainties in the
15
water vapor pressure factor [1 + (e-l)e'/P], in Eq . (14) and, therefore,
to A p/p, of + 4 x 10" 5 and + 3 x 10“-*at 293. 15K, 101.325 Pa and 50 percent
relative humidity.
Since e' is the effective vapor pressure of water in mo i s t air, a
word of caution with regard to inferring e' from measurements of
relative humidity is in order. Relative humidity, RH, can be defined
[19] by
e*
RH = —
f
X 100 percent, (34)s
where is the effective saturation vapor pressure of water in moist
air. Is greater than eg ,
the saturation vapor pressure of pure phase(i.e., water vapor without the admixture of air or any other substance)
over a plane surface of pure ordinary liquid water, since the introductionof a second gas (air in this case) over the surface of the water increasesthe saturation concentration of water vapor above the surface of the
water. This "enhancement" of water vapor pressure is expressed by the
enhancement factor, f, which is defined by
f = ~• (35)
es
The most recently published [15] experimentally derived value of f at 293. 15Kand 100000 Pa is 1.00400. Therefore, the common practice of inferring e'
from measured RH and tabulated values of eg
introduces a significant errorin e
1 if f has been ignored. The corresponding relative error in p at
293. 15K, 101325 Pa and 50 percent relative humidity is about 1.7 x 10~5 . f
Is a function of temperature and pressure.
In the present work, Hyland's values of f [15] have been fitted to a three-parameter equation in the pressure and temperature (t, °C) ranges of interest ir
national standards laboratories. The resulting equation is
f = 1.00070 + 3.113 x 10" 8 P + 5.4 x 10~ 7t2
. (36)
Values of f calculated using equation (36), tabulated in table 4, are in
agreement with Hyland's values and are therefore appropriate for thepresent application.
The expression for e' is found by combining Eqs. (34) and (35) to be
, _ RH .8
100f es (37)
The systematic relative uncertainties in p due to the uncertaintiesassigned to f Cl5H and e
g [22j are approximately 1 x 10“^ and 2 x 10“^,respectively, and would be negligible whether f and e g were treated asparameters or with the environmental variables.
16
TABLE 4. VALUES OF ENHANCEMENT FACTOR, f, CALCULATEDUSING EQUATION (36)
Pressure
,
t, c
pascals 15 20 25 30
70 000 1 .0030 1.0031 1.0032 1.0034
73 000 1.0032 1.0033 1.0034 1.0035
80 000 1.0033 1.0034 1.0035 1.0037
85 000 1.0035 1.0036 1.0037 1.0038
90 000 1.0036 1.0037 1.0038 1.0040
95 000 1.0038 1.0039 1.0040 1.0041
100 000 1.0039 1.0040 1.0042 1.0043
101 325 1.0040 1.0041 1.0042 1.0043
105 000 1.0041 1.0042 1.0043 1.0045110 000 1.0043 1.0043 1.0045 1.0046
For the temperature range of interest in the present application, any of
several tables of eg ,
for example, references [21], [22], and [23], can
be used. Besley and Bottomley [24] have recently published experimentalvalues of e c in the temperature range 272.60 to 298. 04K.
b
Values of e g in the temperature range of interest for standards laboratories,
have been calculated using the formulation of Wexler and Greenspan [22]
and are tabulated in table 5.
TABLE 5 VALUES OF SATURATION WATER VAPOR PRESSURE, eg ,
CALCULATED USING FORMULATION OF WEXLER ANDGREENSPAN [22]
es ,pascals
Temperature, C
15 16 17 18 19 20 21 22 23 24 25 26 27
00 1705 1818 1938 2064 2197 2338 2487 2644 2810 2985 3169 3363 356705 1711 1824 1944 2070 2204 2346 2495 2652 2818 2994 3178 3372 357710 1716 1830 1950 2077 2211 2353 2503 2660 2827 3003 3188 3382 358815 1722 1836 1956 2083 2218 2360 2510 2669 2836 3012 3197 3392 359820 1727 1841 1962 2090 2225 2367 2518 2677 2844 3021 3207 3402 3609
25 1733 1847 1968 2097 2232 2375 2526 2685 2853 3030 3216 3413 361930 1738 1853 1975 2103 2239 2382 2533 2693 2861 3039 3226 3423 363035 1744 1859 1981 2110 2246 2390 2541 2701 2870 3048 3235 3433 364140 1749 1865 1987 2116 2253 2397 2549 2709 2879 3057 3245 3443 365145 1755 1871 1994 2123 2260 2404 2557 2718 2887 3066 3255 3453 3662
17
Table 5 (Continued)
es, pascals
Temperature, C
15 16 17 18 19 20 21 22 23 24 25 26 27
.50 1761 1877 2000 2130 2267 2412 2565 2726 2896 3075 3264 3463 3673
.55 1766 1883 2006 2136 2274 2419 2573 2734 2905 3085 3274 3473 3683
.60 1772 1889 2012 2143 2281 2427 2580 2743 2914 3094 3284 3484 1694
.65 1778 1895 2019 2150 2288 2434 2588 2751 2922 3103 3294 3494 3705
.70 1783 1901 2025 2157 2295 2442 2596 2759 2931 3112 3303 3504 3716
.75 1789 1907 2032 2163 2302 2449 2604 2768 2940 3122 3313 3515 3727
.80 1795 1913 2038 2170 2310 2457 2612 2776 2949 3131 3323 3525 3738
.85 1801 1919 2044 2177 2317 2464 2620 2785 2958 3140 3333 3535 3749
.90 1806 1925 2051 2184 2324 2472 2628 2793 2967 3150 3343 3546 3759
.95 1812 1931 2057 2190 2331 2480 2636 2801 2976 3159 3353 3556 3770
In the present work, the data of Besley and Bottomley in the temperaturerange 288.15 to 298. 15K and calculated values [22] for the remainder of
the temperature range to 301. 15K, have been fitted to a two-parameterequation. The resulting equation is
e = 1.7526 x lO^xp (-5315 . 56/T) . (38)s
Values calculated using equation (38) are sufficiently close to experimentalvalues and values calculated by the more complex formulation, within + 0.1percent, to be used in the present application.
5.4 Random and Systematic Components of the Relative Uncertainty in P
Due to Anticipated Uncertainties in State-of-the-Art Measurementsof P, T and Relative Humidity
The random and systematic components of the relative uncertainty in P at
293. 15K, 101325 Pa and 50 percent relative humidity due to anticipateduncertainties in state-of-the-art measurements of the environmentalvariables are tabulated in table 6.
TABLE 6: RANDOM AND SYSTEMATIC COMPONENTS OF THE RELATIVEUNCERTAINTY IN p DUE TO ANTICIPATED UNCERTAINTIESIN STATE-OF-THE-ART MEASUREMENTS OF P, T ANDRELATIVE HUMIDITY (at 293. 15K, 101325 Pa and 50percent relative humidity)
Variable
P
T
Relative Humidity
Combined
Random Systematic
+2 x io-4
±3 X io-5
+ 2 x io-4
±3 X 10~ 5
+4 x io'5
±3 X-5
10
+ 3 x io~4
+9 X-5
10
18
The random components were combined by quadrature, the systematic components
were combined by addition.
It is clear from inspection of tables 3 and 6 that the dominant uncertainty
in the calculation of air density is that contributed by the measurement
of pressure, temperature and relative humidity, even when the measurementsare made using the best instrumentation and procedures. Considerable care
must therefore be taken in making measurements of these environmentalvariables in order to attempt to approach the precision and accuracyrepresented in table 6.
To illustrate the effect of errors in measurement of the environmentalvariables, at 293. 15K, 101325 Pa and 50 percent relative humidity (RH) an
error of 0.1 percent in calculated air density results from an error of
0.29K in temperature measurement or a 101 Pa error in pressure measurementor an 11.3 percent RH error in the measurement of RH.
5.5 Carbon Dioxide Abundance
As stated in section 3.1, the CO2 abundances in laboratory air andconsequently in the air in balance cases is in general variable. A
variation of 0.0001 in CO2mole fraction is equivalent to a relative
variation of 4 x 10“^in calculated air density. Consequently, for
optimum utilization of the air density calculation, the CO2
abundanceshould be known. Eq (23) enables convenient adjustment of Ma for
departures from the reference level, 0.00033, of CO2
abundance.
6. OVERALL UNCERTAINTY IN p DUE TO UNCERTAINTIES IN THE PARAMETERSAND VARIABLES IN THE AIR DENSITY EQUATION
The random and systematic components of the relative uncertainties in P
tabulated in tables 3 and 6 when combined, provide estimates of thecomponents of the overall relative uncertainty in p. The randomcomponent, by quadrature, is + 3 x 10”^; the systematic component,by addition, is + 2 x 10“^. The relative uncertainty due to thevariation of CO 2 abundance (4 x 10~5 per 0.0001 in CO 2 mole fraction) is
necessarily not included in this estimate.
These components of the overall uncertainty have been estimatedat 293. 15K, 101325 Pa and 50 percent relative humidity. They arebased on the present knowledge of M
,R, Z and £ and on estimates
of the anticipated uncertainties in the measurements of the environ-mental variables (P, T and relative humidity) using the best applicablemeasurement instrumentation and procedures.
7. AIR DENSITY AT STANDARD CONDITIONS, 0Q
The air density, Pq, at standard conditions (Pq, MaQ> R>
Tq, Zq),
fordry air is expressed by an equation of the form of Eq . (14) as
19
09 )
p° RT
ozo
By dividing E«] . (1.4) by Eq . (39) we arrive al
The gas constant, R, has in en eliminated but M a has not unless the
apparent molecular weight of the dry air in the standard state is
equal to Ma . For example, if the Pq is determined by experiment,is not necessarily equal to Ma .
(40)
11 an experimental value of of sufficient accuracy were available in
the determination of which R was not used, R and its associateduncertainty would be eliminated. In the absence of such an experi-mental value, as is the present case, the use of an equation combiningEq . (14) with Eq . (21) is preferred to an equation of the form of Eq
.
(40) .
If standard conditions are taken to be = 2 73. 1 5 K ,
= 101325 Pa,
= 28.963, and relative humidity = 0, for which Z^ = 0.99940,
P is calculated by Eq . ( L 4 ) to be 1.2928 kg vn“ ^ . The same result
is obtained for M = 28.964 (i.e., for a COo mole fraction of 0.00043).a *•
8. AIR DENS LTV EQUATIONM
By combining Eq . (14) wiLh Eq . (37) and substitutedensity equation developed in this work becomes
wtor the air
P
PMa
RTZ
M \w \ RH_
M / 100a/
f es
P
(41)
By substituting the QCC value of R, the value 18.0152 for Mw and bysubstituting the appropriate value, 28.963, for '83033 in Eq . (23),Eq. (41) becomes
where
p = 0.000120254PM^
TZ~1 - 1 -
18.0152 \ RHf e
s
M i 100 Pa
(42)
M = 28.963 + 12.011 - 0.00033sl I CO
^ i (43)
20
When SI units of pressure (Pa) and temperature (K) are used, the SI unit
of density (kg m“3) results. (The 31 unit of density is, of course,
equivalent to 10“3g cm~3 > )
For T = 293. 15K, P = 101 325 Pa, RH = 50 percent and ^033 - 28.963 g mol-
"*-,
the air density calculated using Eq . (21) is 1.1991 kg m~3.
8.1 Use of Constants in the Air Density Equation
In this section we shall investigate the effect on mass comparisonsof the use of appropriate constant values of f, Z and in Eq. (42).
The buoyant effect of the displacement of air by a mass artifact is
proportional to the density of the air, P, and the displacement volume,
Vm ,of the artifact. We define here the buoyancy correction, m^, to be
added to the observed mass, by the following equation:
itl = pV = p— ,(44)
‘b m pm
where m and are the mass and density, respectively, of the artifact.
To estimate the variation, Am^, in mb due to a relative uncertainty,Ap/p, in air density, Eq. (44) is differentiated with respect to p and the
differentials are replaced by finite differences. The resulting equationcan be written
All > S- (^£) p . (45)* pm p
By substituting a nominal value of p, 1.2 mg cm ,in Eq. (45), we arrive
at
= 1.2 — (^) , (46)Pm pm
where Amb ]S in milligrams. We shall return to this equation to estimatethe uncertainty in mass comparisons due to the use of certain constantsin Eq. (42) for the calculation of air density.
To estimate the effect of a variation in f about a selected constant value,nominal values of P, T, Ma ,
Z, RH and e s are substituted in Eq . (42) andthe resulting equation is differentiated with respect to f. Nominal valuesappropriate to the^Mass Laboratory of NBS are P = 100000 Pa, T = 298. 15K,
Ma = 28.964 g mol
,RH = 30 percent and e
g = 3169 Pa. The resulting equationis
p = 1.1686 (1 - 0.003594 f). (47)
21
f
Differentiating Eq . (47) with respect to f, dividing the left and right
sides of the resulting equation by p and f, and going to finite differenceswe find that
— = -0.003609 ~ . (48)P f
The values of f in table 4 range from 1.0030 to 1.0046, therefore the.
Omaximum Af/f for a nominal value of f of 1.0042 is equal to 1.2 x 10 .
The corresponding Ap/ p is equal to 4.3 x 10“^.
To estimate the effect of a variation of Z about a selected constant value,
Eq. (42) is differentiated with respect to Z, the left and right sides of
the resulting equation are divided by p and Z and finite differences are
substituted for the partial differentials. The result is
A_e = ^AZ
P z ' (49)
To estimate the expected variation in Z, it is necessary to estimate the
ranges of the environmental variables, P, T and RH. The mean pressure in
the Mass Laboratory at NBS is estimated to be 100106 Pa. The maximum and
minimum of the atmospheric pressure at NBS, taken from climatologicalrecords of the National Weather Service of the National Oceanic and
Atmospheric Administration and adjusted to the elevation of the Mass
Laboratory, are 103850 and 96160 Pa. The expected ranges in temperatureand relative humidity are taken to be 18 and 28C and 10 and 50 percent,respectively. For the nominal values given in this section, the expectedvariations in the environmental variables result in a variation of Z between0.99957 and 0.99971. These extremes in Z correspond to relative variationsin Z about the nominal value, 0.99966, of 9 x 10 and 5 x 10 ,
respectively.The corresponding A_P's are -9 x 10”-* and -5 x 10”^.
P
As was shown in section 3.2, a variation of 0.0001 in CO2 mole fractioncorresponds to a relative variation in M of 4 x 10”'* and to a Ap/p Q f
-4 x 10”-*.
Combining by quadrature the maximum values of Ap/p due to expected variationsin f and Z and variation of 0.0001 in CO2 mole fraction, the result is 9.9 x
10 5. This is the value to be used in Eq . (46). Since the values combinedare maximum values, the combined value can be considered loosely to approximate3 standard deviations.
For various materials of interest in the comparison of mass artifacts, Am^ in
micrograms (pg) has been calculated using Eq . (46) for 1 kg and 100 g artifactsand tabulated in table 7.
22
TABLE 7 VARIATION IN BUOYANCY CORRECTION (mb )
DUE TO EXPECTED VARIATIONS IN f, Z ANDIN
s.MASS LABORATORY OF NBS
MaterialPm> Amb , av
-3g cm V g M 8
1 kg 100 g
Plat inum-iridium 21.5 5.5 0.55
Stainless steel 8.0 15 1.5
Sil icon 2.2 54 5.4
Brass 8.4 14 1.4
A1 uminum 2.7 44 4.4
Tantal urn 16.6 7.1 0.71
Water 1 .0 119 12
We shall now apply Eq . (46) and table 7 to the comparison of mass artifacts.
In the comparison of two mass artifacts of nearly equal mass, m, but different
densities, and P 2 ,the apparent difference in mass, m^
,due to the differ-
ence in buoyant force on the two artifacts is given by
md
p(P1v1>
where is the displacementair density.
A 1 x ^ A 1( —) = cm (-
Pi P2 Pi
volume of the artifact of
(50)
density P^ and p_ is the
By differentiating Eq . (50) with respect to p and going to finite differences,the resulting equation can be written
. ^ ,Ap. ,1Am, = m(—) (—
d P p.-)p = m
P-i
(^) P - ^ <^)p . (51)
Each of the terms on the right side of Eq . (51) is recognized to be of
Eq. (45). Therefore,
Amd
= (Am^) - (Am^^,
(52)
where the subscript numbers refer to materials of density P]^ and P 2 . Thusthe variation in the apparent difference in mass of two artifacts due tothe difference in buoyant force on them, resulting from the use of constantvalues of f, Z and Ma is approximated by the difference between the Amb'
s
in table 7 for the appropriate materials. For example, for a comparison ofkilogram artifacts of platinum-iridium and stainless steel the variation,Am
d ,is 15 - 5.5 = 9.5 yg.
23
On the bases of the values of Ain^ calculated using table 7 and tne
precision of the balance used for mass comparisons, a judgment can be
made concerning the adequacy of t lie use of constant values of f, Z and
M a in Eq. (42). The precision of the balance used for the comparisonsof 1 kg mass artifacts at NBS is 25 Pg at the 1 standard deviation level.
Thus it can be concluded, for example, that constant values can be usedin the comparison of platinum-iridium and stainless steel artifacts, and
stainless steel and brass kilogram artifacts, but not for comparison of
platinum-iridium and silicon kilogram artifacts. The precision of the
kilogram balance at the Bureau International des Poids et Mesures (BIPM)is 1.5 pg at the 1 standard deviation level, therefore it could be
concluded that the use of constants would not be appropriate in masscomparisons made using that balance.
For mass comparisons in the Mass Laboratory of NBS for which the valuesin table 7 indicate that the use of constant values of f (1.0042), Z
(0.99966) and Ma (28.964) in Eq . (42) is adequate, the resulting equationi s
P0.0034842
T(P - 0.0037960 RH e
g ). (53)
in °C, Eq . (5 3)
, (54)
-3where the SI units of density are equivalent to mg cm
For pressure in millimeters of mercury and temperature, t,
becomes
P '(t
+‘ 273U5) <P - 0-0037960 RH e.)
es In millimeters of mercury is cal c ul at ed us i ng an equation of the form
of Eq . (38) in which (t + 27 3.1 5) is substituted for T, and tiie preexponentialfactor is modified. The resulting equation is
es = 1.3146 x 10⁹ exp (-5315 . 56/ (t + 273.15)). (55)
Alternatively, the appropriate value of es in Pa could be taken from table 5
and multiplied by 0.00750062 to convert to millimeters of mercury.
9. SUMMARY AND CONCLUSIONS
An equation suitable for use in calculation of air density for air buoyancydetermination in the transfer of the mass unit by comparison of two massartifacts on a balance has been developed. The Quinn, Colclough and Chandlervalue of the gas constant, R, 8315.73 JK~^ kmol
-^
,has been used in the
formulation. The apparent molecular weight of dry air, Ma ,has been
calculated using currently accepted values of atomic weights and recentdeterminations of the abundances of the various constituents of air. Theabundance of CO2 has been treated as variable. A "background" value of molefraction, 0.00033, has been used and a factor enabling convenient adjustmentof M
afor deviation of CO
2abundance from the background value has been
24
derived. A new table of compressibility factor, Z, for the range of pressure
and temperature of interest in standards laboratories has been calculatedusing recently determined values of virial coefficients. The enhancement
factor, f, which has usually been ignored in air density equations, has been
included explicitly in the equation. A table of f has been calculated using
a simple equation fitted to values of f in the range of pressure and tempera-ture of interest. A table of the saturation vapor pressure of water, e s ,
based on a formulation of Wexler and Greenspan has been included. A simpleequation for the calculation of e s has been fitted.
Uncertainties, random and systematic, in the parameters R, M a ,Z, and £,
the ratio of the molecular weight of water vapor to the molecular weight
of dry air, and in the determination of the values of the environmental
variables, pressure, temperature and water vapor pressure, in the air
density equation have been estimated. The estimated random and systematicrelative uncertainties, Ap
scontributed by the parameters are + 3 x 10
- ^
and + 6 x 10~^, respectively. The relative uncertainties anticipated to
be contributed by state-of-the-art measurements of the environmentalvariables are estimated to be + 3 x 10 random and + 9 x 10 ^ systematic.The effect of an ignored deviation of CO 2 abundance from the "background"value would be an additional systematic relative uncertainty in P of+ 4 x 10 ^ per 0.0001 variation of CO 2 mole fraction. The estimatedoverall random and systematic relative uncertainties are + 3 x 1
0~^ and+ 2 x 10“^, respectively.
At 293. 15K, 101325 Pa (1 atmosphere), and 50 percent relative humidity,the estimated overall relative uncertainties in p correspond to
uncertainties in mass in the transfer between pi at i num- i r i d i urn and
stainless steel kilogram artifacts (volume difference of ^ 80 c.mJ
) ofapproximately 30 micrograms random and 20 micrograms systematic.
The following are recommendations concerning the transfer of the massunit at the various national standards laboratories:
(1) Eq. (42) should be adopted for use for all national standardslaboratories to provide both uniformity and the best availablecalculation of air density.
(2) The CO 2 concentration should be treated as a variable and at
least a "background" value should -be determined for each ofthe laboratories.
(3) Instrumentation and practices representing the state-of-the-artin the measurement of the environmental variables should be applied.
10 . ACKNOWLEDGMENTS
The author gratefully acknowledges the invaluable contributions ofR. W. Hyland in several areas, and especially with the calculation of
25
the compress ib i 1 i ty factor; the considerable computational work of
C. L. Carroll, Jr.; and the typing of the manuscript by Kathy Durant.
11. REFERENCES
[1] List, R. J., Smithsonian Meteorological Tables, (The SmithsonianInstitution, Washington, D.C~ 1951) ,
6th Revised Edition, p. 347 .
[2] Cohen, E. R.,
and Taylor, B. N.,
J. Phys. Chem. Ref. Data, 2, 663(1973).
[3] Quinn, T. J. ,Colclough, A. R.
,and Chandler, T. R. D.
,Phil. Trans.
Royal Society of London A283, 367 (1976).
[4] Gammon, B. E., J. Chem. Phys. 4, 2556 (1 976).
[5] Gammon, B. E., pr ivate commun i c at ion.
[6] International Union of Pure and Applied Chemistry, Inorganic Chemis-try Division, Commission on Atomic Weights, Pure and Appl. Chem. 47,
75 (1976).
[7] Machta, L.,
and Hughes, E., Science 168, 1582 (1970).
[8] Gluekauf, E., in Compendium of Meteorology, T. F. Malone, Editor,(The American Meteorological Society, Boston, Mass., 1951), p. 4.
[9] Hughes, E. E., A Mass Spectrometric Technique for the AccurateDetermination of Atmospheric Argon, ACS 4th Mid-Atlantic Meeting,Washington, D.C., Feb. 13, 1969, unpublished.
[10] U.S. Standard Atmosphere, 1962, (U.S. Government Printing OfficeWashi ngton
,D.C.
, 1962), p. 9.
[11] Hyland, R. W.,and Wexler, A., J
77A,
133 (1973).. Res. Nat. Bur. St and . ( U. S . )
,
[12] Eisenhart
,
C.,
J. Res. Nat . Bur. Stand. (U.S.), 67C
,
161 (1963).
[13] Eisenhart
,
C.,Science 160, 1201 (1968).
[14] List, R. J ., loc. cit., p. 333.
[15] Hyland, R. W.,
J. Res. Nat. Bur. Stand . (U. S . )
,
79A, 551 (1975).
[16] Heydemann, P. L. M.,private communication.
[17] Roeser, W. F. and Wensel, H. T.
,
in Temperature, It s Measurementand Control in Science and Industry
,American Institute of Physic s
,
National Bureau of Standards, National Research Council (ReinholdPublishing Corp., New York, 1941), p. 311.
[18] Wexler, A., Meteorological Monographs 11, 262 (1970).
26
[19] Harrison, L.P., in Humidity and Moisture, Vol. Ill, A. Wexler,
and W. A. Wildhack, Editors, (Rei nhol d Publisliing Corp.,New
York, 1964) , p. 51.
[20] Greenspan, L. , J. Res. Nat . Bur. Stand. (U .S.), 80A, 41 (1976).
[21] List, R. J. ,loc. cit., p. 352.
[22] Wexler, A. and Greenspan,75A, 213 (1971).
L.,
J
.
Re s . Nat
.
Bur. Stand. (U.S.),
[23] Ambrose, D. and Lawrenson,(1972).
I. J.,
J. Chem. Thermody nami c s 4, 755
[24] Besley, L. ,and Bottomley, G. A. , J. Chem. Thermodyaninic s 5, 397
(1973).
27
NBS-1 14A (REV. 7-73)
U.S. DEPT. OF COMM.BIBLIOGRAPHIC DATA
SHEET
1. PUBLIC ATION OR RE PORT N'O.
NBSIR 77-1278
2. Gov 't Arc t s s ion
No.3. Recipient Ns Accession No.
4. TITLE AND SUBTITLE
The Air Density Equation and the Transfer of the Mass Unit
5. Publication Date
6. Performing Organization Code
7. AUTHORISEFrank E. Jones
8 . Performing Organ. Report No.
9. PERFORMING ORGANIZATION NAME AND ADDRESS
NATIONAL BUREAU OF STANDARDSDEPARTMENT OF COMMERCEWASHINGTON, D.C. 20234
10. Pro]ect/Task Work Unit No.
213019011. Contract Grant No.
12. Sponsoring Organization Name and Complete Address (Street. City. State. ZIP) 13. Type of Report & PeriodCovered
14. Sponsoring Agency Code
15. SUPPLEMENTARY NOTES
16. ABSTRACT (A 200-word or less factual summary of most significant in formation. If document includes a significant
bibliography or literature survey, mention it here.)
A new formulation of the equation used for the calculation of air density has beendeveloped. The Quinn, Colclough and Chandler value of the gas constant, currentlyaccepted values of the atomic weights, and recent determinations of the abundancesof the various constituents of air have been used. The abundance of carbon dioxidehas been treated as a variable and a factor enabling convenient adjustment of theapparent molecular weight of air for deviation of carbon dioxide abundance from -a
background value has been derived. A new table of compressibility factor for therange of pressure and temperature of interest in standards laboratories has beencalculated using recently determined values of virial coefficients. The enhance-ment factor, which has usually been ignored in air density equations, has beenexplicitly included in the equation; a table of enhancement factor has been calculatedusing a simple equation fitted to values in the range of pressure and temperatureof interest. A table of the saturation water vapor pressure has been included; a
simple equation for the calculation of saturation water vapor pressure has beenfitted. Uncertainties, random and systematic, in the parameters and in the measure-ment of environmental variables and consequent uncertainties in calculated air densityhave been estimated.
Application of the equation to air buoyancy determination and the transfer of themass unit at the various national standards laboratories has been made.
17. KEY WORDS (six to twelve entries; alphabetical order, capitalize only the first letter of the first key word unless a propername; separated by semicolons)
Air buoyancy; air density; mass unit transfer; real gas equation.
18. AVAILABILITY !XX Unlimited
!
For Official Distribution. Do Not Release to NTIS
l~ Order From Sup. of Doc., U.S. Government Printing OfficWashington, D.C. 20402, SD Cat. No. Cl 1
K Order From National Technical Information Service (NTIS)Springfield, Virginia 22151
19. SECURITY CLASS(THIS REPORT)
UNCLASSIFIED
20. SECURITY CLASS( THIS PAGE)
UNCLASSIFIED
21. NO. OF PAGES
30
22. Price
$4.00
U SCOMM- D C 29042-P74