The Advancement of Mass Spectrometry-based Hydroxyl Radical Protein Footprinting: Application of...
225
Washington University in St. Louis Washington University Open Scholarship All eses and Dissertations (ETDs) January 2011 e Advancement of Mass Spectrometry-based Hydroxyl Radical Protein Footprinting: Application of Novel Analysis Methods to Model Proteins and Apolipoprotein E Brian Gau Washington University in St. Louis Follow this and additional works at: hp://openscholarship.wustl.edu/etd is Dissertation is brought to you for free and open access by Washington University Open Scholarship. It has been accepted for inclusion in All eses and Dissertations (ETDs) by an authorized administrator of Washington University Open Scholarship. For more information, please contact [email protected]. Recommended Citation Gau, Brian, "e Advancement of Mass Spectrometry-based Hydroxyl Radical Protein Footprinting: Application of Novel Analysis Methods to Model Proteins and Apolipoprotein E" (2011). All eses and Dissertations (ETDs). Paper 126.
-
Upload
independent -
Category
Documents
-
view
3 -
download
0
Transcript of The Advancement of Mass Spectrometry-based Hydroxyl Radical Protein Footprinting: Application of...
Washington University in St. LouisWashington University Open Scholarship
All Theses and Dissertations (ETDs)
January 2011
The Advancement of Mass Spectrometry-basedHydroxyl Radical Protein Footprinting:Application of Novel Analysis Methods to ModelProteins and Apolipoprotein EBrian GauWashington University in St. Louis
Follow this and additional works at: http://openscholarship.wustl.edu/etd
This Dissertation is brought to you for free and open access by Washington University Open Scholarship. It has been accepted for inclusion in AllTheses and Dissertations (ETDs) by an authorized administrator of Washington University Open Scholarship. For more information, please [email protected].
Recommended CitationGau, Brian, "The Advancement of Mass Spectrometry-based Hydroxyl Radical Protein Footprinting: Application of Novel AnalysisMethods to Model Proteins and Apolipoprotein E" (2011). All Theses and Dissertations (ETDs). Paper 126.
WASHINGTON UNIVERSITY IN ST. LOUIS
Department of Chemistry
Dissertation Examination Committee: Michael Gross, Chair Robert Blankenship
Carl Frieden Jacob Schaefer
John Taylor Reid Townsend
THE ADVANCEMENT OF MASS SPECTROMETRY-BASED HYDROXYL
RADICAL PROTEIN FOOTPRINTING: APPLICATION OF NOVEL ANALYSIS
METHODS TO MODEL PROTEINS AND APOLIPOPROTEIN E
by
Brian Craig Gau
A dissertation presented to the Graduate School of Arts and Sciences
of Washington University in partial fulfillment of the
requirements for the degree of Doctor of Philosophy
August 2011
Saint Louis, Missouri
ii
Abstract
Fast photochemical oxidation of proteins (FPOP) has shown great promise in the
elucidation of the regions of a protein’s structure that are changed upon interaction with
other macromolecules, ligands, or by folding. The advantage of this protein footprinting
method is that it utilizes the reactivity of hydroxyl radicals to stably modify solvent
accessible residues non-specifically in a microsecond. The extent of •OH labeling at sites
assays their solvent accessibility. We have corroborated the predicted profoundly short
timescale of labeling empirically, by FPOP-labeling three oxidation-sensitive proteins
and examining their global FPOP product outcomes. The novel test developed to validate
conformational invariance during labeling can be applied generally to any footprinting
methodology where perturbation to protein structure by the footprint labeling is
suspected. The stable modifications can be detected and quantified by the same
proteolysis, chromatography, and mass spectrometry techniques employed in proteomics
studies; however, proteomics software does not automatically report the residue-resolved
full-sequence-coverage footprint information found in proteomics-like FPOP data. Here
we report the development of software tools to facilitate a comprehensive and efficient
analysis of FPOP data, and demonstrate their use in a study of barstar in its unfolded and
native states. We next show that SO4-• can serve as an alternative non-specific labeling
agent that can be generated by the FPOP apparatus on the same fast timescale as •OH.
This demonstrates the tunable nature of FPOP. We have used FPOP to characterize the
oligomeric structures of three human apolipoprotein E (ApoE) isoforms and a monomeric

iii
mutant in their lipid-free states. Only one isoform of ApoE is strongly associated with
Alzheimer’s disease; unfortunately, the structural reason for this association is not
known, in part because no high resolution structure exists of any isoform. We find that
the three common isoforms of ApoE are very similar in their solvent accessible footprint,
that their oligomeric interactions involve several regions in the C-terminal domain, and
that the N-terminal domain of each resembles the monomeric mutant’s N-terminal
domain, the truncated form of which has been characterized as a four-helix bundle.
Finally, we find by FPOP that ApoE interacts with β-amyloid peptide 1-42 at a specific
site in its N-terminal domain.

iv
Acknowledgements
To my advisor, Dr. Michael Gross: thank you for allowing me to explore. Thank you for
enriching the lab with erudite staff and thoughtful students (and nice equipment). It is a
culture worth emulating.
To my parents, Dr. Gerald and Rita Gau: thank you for fostering my interest in science
by, among many other things, watching Carl Sagan’s Cosmos television series with me.
To my children, Alec and Anna: thank you for giving me perspective and for making
science cool.
To my wife, Dr. Megan M. Gau: thank you for your patience and encouragement and
patience.
v
Table of Contents
Abstract ............................................................................................................................................ ii
Acknowledgements ......................................................................................................................... iv
Table of Tables ................................................................................................................................ x
Table of Figures .............................................................................................................................. xi
1 Mass Spectrometry-Based Protein Footprinting ...................................................................... 1
1.1 Protein Structure Determination ...................................................................................... 1
1.1.1 High resolution determination. ................................................................................ 1
1.1.2 Low resolution determination. ................................................................................. 3
1.2 Mass Spectrometry-Based Footprinting ........................................................................... 5
1.2.1 General principles. ................................................................................................... 5
1.2.2 Global experiments. ................................................................................................. 6
1.2.3 Local experiments. ................................................................................................... 7
1.3 Hydroxyl Radical Footprinting ........................................................................................ 9
1.3.1 Utility and chemistry ................................................................................................ 9
1.3.2 Methods of •OH-labeling ....................................................................................... 12
1.3.3 Fast Photochemical Oxidation of Proteins (FPOP) ................................................ 13
1.4 Dissertation Topics ........................................................................................................ 14
1.4.1 Chapter 2 Validation of the FPOP timescale. ....................................................... 14
1.4.2 Chapter 3 Development of efficient and comprehensive footprinting analysis software. 15
1.4.3 Chapter 4 Extension of the FPOP method to new reagents. ................................. 16
1.4.4 Chapter 5 Application of FPOP: apolipoprotein E oligomerization. .................... 16
1.4.5 Chapter 6 Application of FPOP: apolipoprotein E monomeric mutant structure prediction. .............................................................................................................................. 17
1.4.6 Chapter 7 Application of FPOP: apolipoprotein E-42interaction. .................. 18
1.5 References ...................................................................................................................... 19
2 Fast Photochemical Oxidation of Protein Footprints Faster than Protein Unfolding ............ 24
2.1 Introduction .................................................................................................................... 24
2.1.1 Test of Hypothesis that FPOP Oxidizes Protein Faster than its Unfolding. .......... 28
2.2 Experimental section ...................................................................................................... 29
2.2.1 Reagents. ................................................................................................................ 29
vi
2.2.2 Oxidative-modification labeling. ........................................................................... 30
2.2.3 Mass spectrometry. ................................................................................................ 30
2.2.4 Data analysis. ......................................................................................................... 31
2.3 Mathematical Modeling ................................................................................................. 31
2.4 Results and Discussion .................................................................................................. 35
2.4.2 Argument for Poisson. ........................................................................................... 35
2.4.2 Data Acquisition and Analysis. .............................................................................. 37
2.4.3 Agreement with a Poisson Distribution. ................................................................ 39
2.5 Conclusion ..................................................................................................................... 49
2.6 Supplemental Section: Mathematical Modeling ............................................................ 50
2.7 References ...................................................................................................................... 56
3 Characterization of the Mass Spectrometry-Observed Hydroxyl Radical Footprint of Barstar in its Native and Cold-Denatured States, Using a Novel Excel-based Data Analysis Platform, Commercial LC-MS Peak Detection Software, and Error-Tolerant Database Search. ................. 59
3.1 Introduction .................................................................................................................... 59
3.2 Experimental Procedures ............................................................................................... 65
3.2.1 Reagents. ................................................................................................................ 65
3.2.2 Equilibration and FPOP labeling. .......................................................................... 65
3.2.3 Proteolysis. ............................................................................................................. 66
3.2.3 LC-MS/MS acquisition. ......................................................................................... 66
3.3 Data Analysis ................................................................................................................. 67
3.3.1 Overview. ............................................................................................................... 67
3.3.3 Mascot database searching. .................................................................................... 72
3.3.4 Protein-specific theoretical modified peptide list. ................................................. 73
3.3.5 Feature annotation. ................................................................................................. 74
3.3.6 Ranked calls. .......................................................................................................... 77
3.3.7 Validation. .............................................................................................................. 79
3.3.8 Per-peptide data processing. .................................................................................. 82
3.3.9 Per-residue data processing. ................................................................................... 84
3.4 Results and Discussion .................................................................................................. 86
3.4.1 LC-MS feature coverage. ....................................................................................... 86
3.4.2 Analytic sequence coverage. .................................................................................. 87
3.4.3 Barstar folding. ...................................................................................................... 88
3.5 Conclusion ..................................................................................................................... 91
3.6 References ...................................................................................................................... 93
vii
4 Fast photochemical oxidation of proteins (FPOP) by the sulfate radical anion probes solvent accessibility .................................................................................................................................... 96
4.1 Introduction .................................................................................................................... 96
4.2 Experimental Procedures ............................................................................................... 99
4.2.1 Reagents. ................................................................................................................ 99
4.2.1 Oxidative-modification labeling. ........................................................................... 99
4.2.2 Global mass spectrometry of FPOP-labeled -lactoglobulin. ............................. 100
4.2.3 Proteolysis and LC-MS/MS ................................................................................. 101
4.2.4 Data Analysis ....................................................................................................... 101
4.3 Results and Discussion ................................................................................................ 102
4.3.1 Optimal Sodium Persulfate FPOP Conditions. .................................................... 102
4.3.2 Residue-Resolved Modification Measurement by LC-MS/MS. .......................... 103
4.3.3 Selectivity of Na2S2O8 FPOP. .............................................................................. 105
4.3.4 Chemistry of Na2S2O8 FPOP. .............................................................................. 108
4.3.5 Solvent Accessibility. .......................................................................................... 109
4.3.6 Sodium persulfate vs. hydrogen peroxide FPOP: physical considerations and future prospects. ................................................................................................................... 113
4.4 Conclusions .................................................................................................................. 114
4.5 Supporting Information ................................................................................................ 115
4.5.1 Global mass spectrometry of FPOP-labeled β-lactoglobulin. .............................. 115
4.5.2 β-lactoglobulin FPOP global product distribution analysis. ................................ 115
4.5.3 Optimal Sodium Persulfate FPOP Conditions. .................................................... 115
4.5.4 Chemistry of Na2S2O8 FPOP. .............................................................................. 117
4.6 References ........................................................................................................................ 121
5 Mass Spectrometry-based Protein Footprinting Characterizes the Structures of Oligomeric Apolipoprotein E2, E3, and E4 .................................................................................................... 124
5.1 Introduction .................................................................................................................. 124
5.2 Experimental Procedures ............................................................................................. 127
5.2.1 Reagents. .............................................................................................................. 127
5.2.2 Protein Expression, Mutagenesis, Purification, and Solubilization. .................... 127
5.2.3 FPOP labeling. ..................................................................................................... 127
5.2.4 Carboxylic Acid labeling with GEE. ................................................................... 128
5.2.5 Proteolysis. ........................................................................................................... 129
5.2.6 LC-MS/MS acquisition. ....................................................................................... 129
5.2.7 Data analysis. ....................................................................................................... 130
viii
5.3 Results .......................................................................................................................... 131
5.3.1 Data Acquisition and Processing. ........................................................................ 131
5.3.2 WT-ApoE2 vs. ApoE3 vs. ApoE4. ...................................................................... 133
5.3.3 ApoE3 vs. ApoE3 Monomeric Mutant. ............................................................... 139
5.3.4 Glycyl Ethyl Ether (GEE) Footprinting. .............................................................. 142
5.4 Discussion .................................................................................................................... 144
5.4.1 Structures of the ApoE isoforms. ......................................................................... 144
5.4.2 Solvent Accessibility of N- vs. C-terminal Regions. ........................................... 145
5.4.3 Regions of oligomeric interaction. ....................................................................... 146
5.4.4 Comparison of GEE and FPOP footprinting. ....................................................... 147
5.4.5 Comparison of the N-terminal domains of ApoE2, ApoE3, ApoE4, and ApoE3MM. .......................................................................................................................... 148
5.5 Conclusions .................................................................................................................. 148
5.6 Supporting Information ................................................................................................ 150
5.7 References .................................................................................................................... 154
6 Characterization of the Apolipoprotein E3 Monomer Structure by Mass Spectrometry-based Protein Footprinting. .................................................................................................................... 157
6.1 Introduction .................................................................................................................. 157
6.2 Experimental Procedures ............................................................................................. 160
6.2.1 Reagents. .............................................................................................................. 160
6.2.2 FPOP labeling. ..................................................................................................... 161
6.2.3 Proteolysis. ........................................................................................................... 162
6.2.4 LC-MS/MS acquisition. ....................................................................................... 162
6.2.5 Data analysis. ....................................................................................................... 163
6.3 Results .......................................................................................................................... 164
6.3.1 LC-MS/MS analysis. ............................................................................................ 164
6.3.2 Per-residue labeling. ............................................................................................ 167
6.3.3 Basic residue yields. ............................................................................................. 169
6.3.4 Normalized labeling yields and relative solvent accessibility. ............................ 170
6.4 Discussion .................................................................................................................... 172
6.4.1 LC-MS/MS analysis of protein footprint data. .................................................... 172
6.4.2 Comparison of the labeling yields to the ApoE31-183 3D NMR structure. ............ 173
6.5 Conclusion ................................................................................................................... 177
6.6 References .................................................................................................................... 180
ix
7 β-amyloid 1-42 Binds to the Same Region in the N-terminus Domains of Apolipoprotein E3 and Apolipoprotein E4, Determined by FPOP Footprinting and Mass Spectrometric Analysis . 183
7.1 Introduction .................................................................................................................. 183
7.2 Experimental Procedures ............................................................................................. 186
7.2.1 Reagents. .............................................................................................................. 186
7.2.2 Stock solution preparations. ................................................................................. 187
7.2.3 Micromolar ApoE3 and ApoE4 experiments ....................................................... 188
7.2.4 Micromolar ApoE-orangutan experiment. ........................................................... 188
7.2.5 NanomolarApoE3 experiments. ........................................................................... 188
7.2.6 FPOP labeling. ..................................................................................................... 189
7.2.7 Proteolysis. ........................................................................................................... 191
7.2.8 LC-MS/MS acquisition. ....................................................................................... 191
7.2.9 Data Analysis. ...................................................................................................... 192
7.2.10 Utility of per-peptide and per-residue analyses. .................................................. 193
7.3 Results .......................................................................................................................... 194
7.3.1 Micromolar ApoE3 and ApoE4 experiments. ...................................................... 194
7.3.2 Nanomolar ApoE3 experiment. ........................................................................... 199
7.3.3 Micromolar ApoE-orangutan experiment. ........................................................... 202
7.4 Discussion .................................................................................................................... 202
7.4.1 ApoE N-terminus domain-Aβ interaction. ........................................................... 202
7.4.2 ApoE C-terminus domain-Aβ interaction. ........................................................... 206
7.4.3 Implications of the ApoE oligomeric state........................................................... 207
7.4.4 Heterogeneity of participants. .............................................................................. 208
7.5 Conclusion ................................................................................................................... 208
7.6 Supporting Information ................................................................................................ 209
7.7 References .................................................................................................................... 210
x
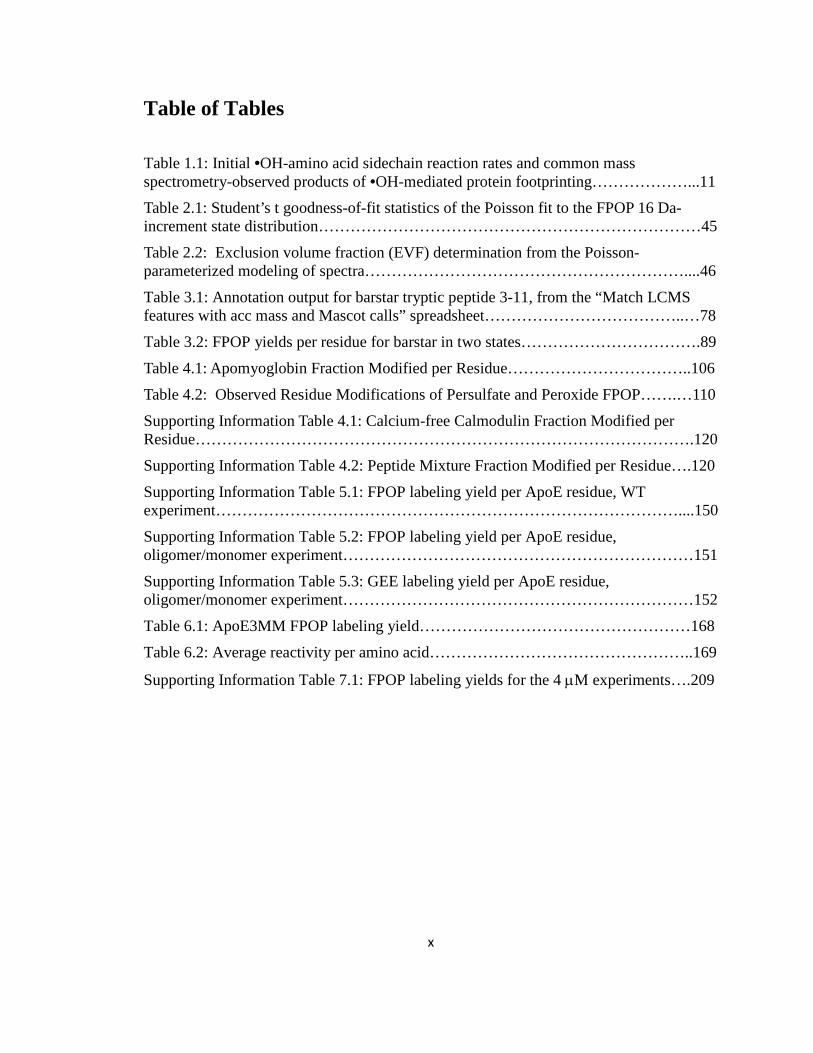
Table of Tables
Table 1.1: Initial •OH-amino acid sidechain reaction rates and common mass spectrometry-observed products of •OH-mediated protein footprinting………………...11
Table 2.1: Student’s t goodness-of-fit statistics of the Poisson fit to the FPOP 16 Da-increment state distribution………………………………………………………………45
Table 2.2: Exclusion volume fraction (EVF) determination from the Poisson-parameterized modeling of spectra……………………………………………………....46
Table 3.1: Annotation output for barstar tryptic peptide 3-11, from the “Match LCMS features with acc mass and Mascot calls” spreadsheet………………………………..…78
Table 3.2: FPOP yields per residue for barstar in two states…………………………….89
Table 4.1: Apomyoglobin Fraction Modified per Residue……………………………..106
Table 4.2: Observed Residue Modifications of Persulfate and Peroxide FPOP…….…110
Supporting Information Table 4.1: Calcium-free Calmodulin Fraction Modified per Residue………………………………………………………………………………….120
Supporting Information Table 4.2: Peptide Mixture Fraction Modified per Residue….120
Supporting Information Table 5.1: FPOP labeling yield per ApoE residue, WT experiment……………………………………………………………………………....150
Supporting Information Table 5.2: FPOP labeling yield per ApoE residue, oligomer/monomer experiment…………………………………………………………151
Supporting Information Table 5.3: GEE labeling yield per ApoE residue, oligomer/monomer experiment…………………………………………………………152
Table 6.1: ApoE3MM FPOP labeling yield……………………………………………168
Table 6.2: Average reactivity per amino acid…………………………………………..169
Supporting Information Table 7.1: FPOP labeling yields for the 4 µM experiments….209
xi
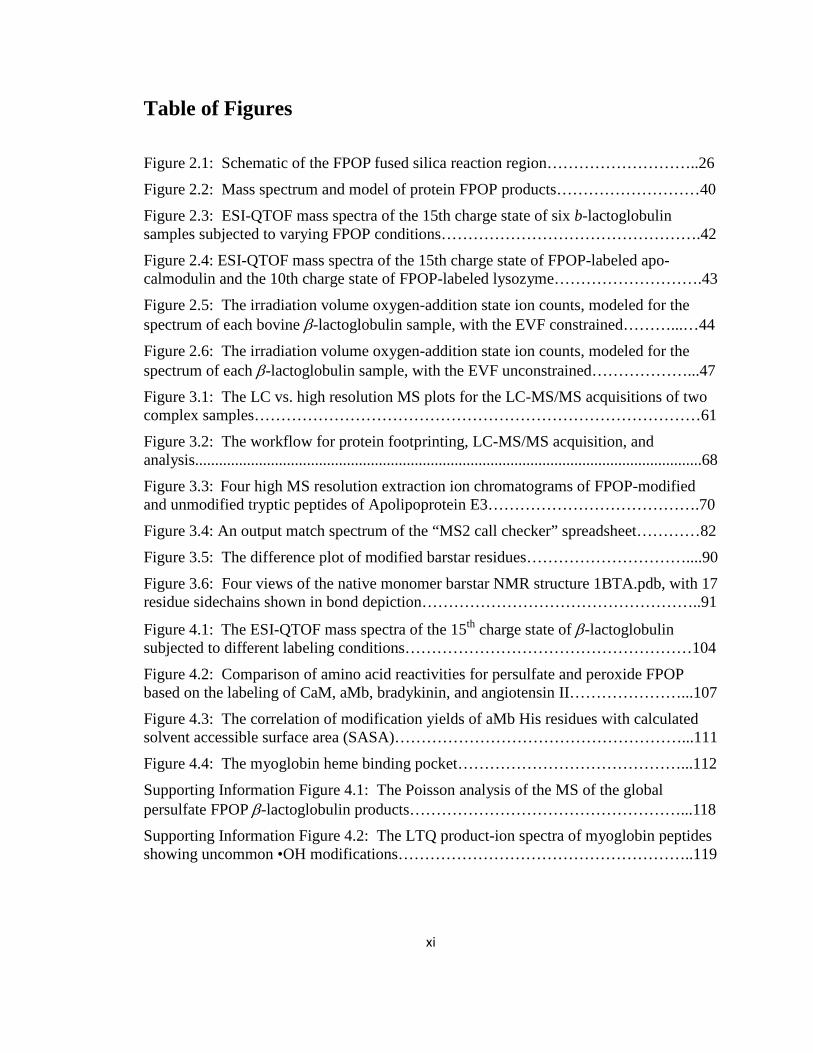
Table of Figures
Figure 2.1: Schematic of the FPOP fused silica reaction region………………………..26
Figure 2.2: Mass spectrum and model of protein FPOP products………………………40
Figure 2.3: ESI-QTOF mass spectra of the 15th charge state of six b-lactoglobulin samples subjected to varying FPOP conditions………………………………………….42
Figure 2.4: ESI-QTOF mass spectra of the 15th charge state of FPOP-labeled apo-calmodulin and the 10th charge state of FPOP-labeled lysozyme……………………….43
Figure 2.5: The irradiation volume oxygen-addition state ion counts, modeled for the spectrum of each bovine β-lactoglobulin sample, with the EVF constrained………...…44
Figure 2.6: The irradiation volume oxygen-addition state ion counts, modeled for the spectrum of each β-lactoglobulin sample, with the EVF unconstrained………………...47
Figure 3.1: The LC vs. high resolution MS plots for the LC-MS/MS acquisitions of two complex samples…………………………………………………………………………61
Figure 3.2: The workflow for protein footprinting, LC-MS/MS acquisition, and analysis...............................................................................................................................68
Figure 3.3: Four high MS resolution extraction ion chromatograms of FPOP-modified and unmodified tryptic peptides of Apolipoprotein E3………………………………….70
Figure 3.4: An output match spectrum of the “MS2 call checker” spreadsheet…………82
Figure 3.5: The difference plot of modified barstar residues…………………………....90
Figure 3.6: Four views of the native monomer barstar NMR structure 1BTA.pdb, with 17 residue sidechains shown in bond depiction……………………………………………..91
Figure 4.1: The ESI-QTOF mass spectra of the 15th charge state of β-lactoglobulin subjected to different labeling conditions………………………………………………104
Figure 4.2: Comparison of amino acid reactivities for persulfate and peroxide FPOP based on the labeling of CaM, aMb, bradykinin, and angiotensin II…………………...107
Figure 4.3: The correlation of modification yields of aMb His residues with calculated solvent accessible surface area (SASA)………………………………………………...111
Figure 4.4: The myoglobin heme binding pocket……………………………………...112
Supporting Information Figure 4.1: The Poisson analysis of the MS of the global persulfate FPOP β-lactoglobulin products……………………………………………...118
Supporting Information Figure 4.2: The LTQ product-ion spectra of myoglobin peptides showing uncommon •OH modifications………………………………………………..119
xii
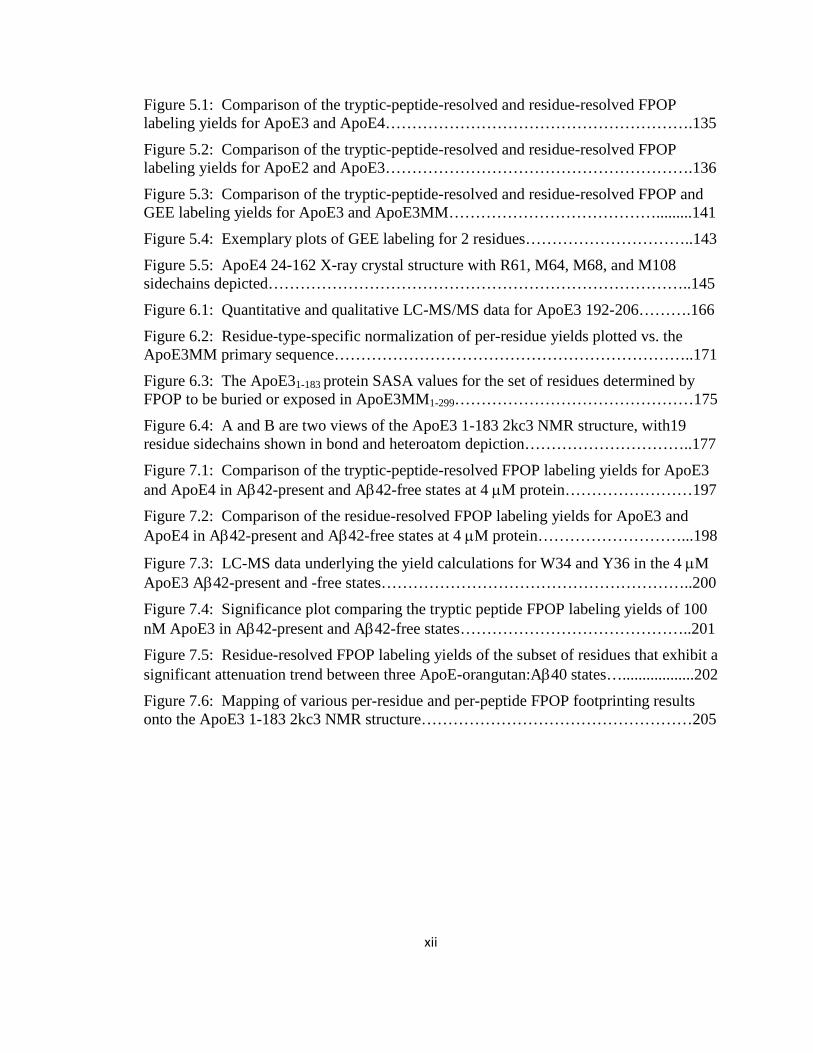
Figure 5.1: Comparison of the tryptic-peptide-resolved and residue-resolved FPOP labeling yields for ApoE3 and ApoE4………………………………………………….135
Figure 5.2: Comparison of the tryptic-peptide-resolved and residue-resolved FPOP labeling yields for ApoE2 and ApoE3………………………………………………….136
Figure 5.3: Comparison of the tryptic-peptide-resolved and residue-resolved FPOP and GEE labeling yields for ApoE3 and ApoE3MM………………………………….........141
Figure 5.4: Exemplary plots of GEE labeling for 2 residues…………………………..143
Figure 5.5: ApoE4 24-162 X-ray crystal structure with R61, M64, M68, and M108 sidechains depicted……………………………………………………………………..145
Figure 6.1: Quantitative and qualitative LC-MS/MS data for ApoE3 192-206……….166
Figure 6.2: Residue-type-specific normalization of per-residue yields plotted vs. the ApoE3MM primary sequence…………………………………………………………..171
Figure 6.3: The ApoE31-183 protein SASA values for the set of residues determined by FPOP to be buried or exposed in ApoE3MM1-299………………………………………175
Figure 6.4: A and B are two views of the ApoE3 1-183 2kc3 NMR structure, with19 residue sidechains shown in bond and heteroatom depiction…………………………..177
Figure 7.1: Comparison of the tryptic-peptide-resolved FPOP labeling yields for ApoE3 and ApoE4 in Aβ42-present and Aβ42-free states at 4 µM protein……………………197
Figure 7.2: Comparison of the residue-resolved FPOP labeling yields for ApoE3 and ApoE4 in Aβ42-present and Aβ42-free states at 4 µM protein………………………...198
Figure 7.3: LC-MS data underlying the yield calculations for W34 and Y36 in the 4 µM ApoE3 Aβ42-present and -free states…………………………………………………..200
Figure 7.4: Significance plot comparing the tryptic peptide FPOP labeling yields of 100 nM ApoE3 in Aβ42-present and Aβ42-free states……………………………………..201
Figure 7.5: Residue-resolved FPOP labeling yields of the subset of residues that exhibit a significant attenuation trend between three ApoE-orangutan:Aβ40 states…..................202
Figure 7.6: Mapping of various per-residue and per-peptide FPOP footprinting results onto the ApoE3 1-183 2kc3 NMR structure……………………………………………205
1
1 Mass Spectrometry-Based Protein Footprinting 1.1 Protein Structure Determination
1.1.1 High resolution determination.
The determination of tertiary and quaternary protein structure is the central issue
in discovering the mechanisms of protein function. X-ray crystallography is the
preeminent methodology capable of providing high resolution three-dimensional
macromolecular structure. By this method, an electron density map is generated from the
diffraction pattern created by X-rays diffracted by a protein crystal. The primary
sequence of the protein is modeled to fit this electron density map, resulting in a structure
with atomic-coordinate detail for most of its atom. At lower resolution the
macromolecular shape can be determined. Of the 72,717 structures entered in the protein
data bank (www.pdb.org)1 as of April 2011, 63,322 were determined by X-ray
crystallography.
The limitation of X-ray crystollography is primarily the limitation of protein
crystallization. Some proteins cannot crystallize because their native structure is only
stabilized by interaction with other biomolecules, which cannot be sequestered in an
ordered crystal. Many transmembrane proteins fall in this category, though much
progress has been made in their structural elucidation by crystallography2. Other proteins
may not crystallize owing to the highly variable conformations parts of their sequence
visit. The excision of such regions can give truncated protein variants that readily
crystallize3. This strategy is one of several employed in crystallography that may perturb
2
the structure of the protein from its native conformation. Protein crystals are highly
protein-concentrated. Due to this property, the determination of the monomer structure
of proteins that have a propensity to oligomerize can be difficult or impossible.
The remaining fraction of high resolution structures in the protein data bank have
been determined by NMR spectroscopy. This method utilizes the magnetic-spin
properties of nuclei to determine distance constraints between the probed atoms of a
macromolecule. These constraints and the primary sequence of the protein are used to
construct a high resolution model. The NMR experiment is usually done on proteins in
solution. This has enabled the study of proteins in a dynamic context, including protein
folding4, folding pathways5, and enzyme dynamics6. The structural progression through
such pathways can studied by NMR relaxation dispersion experiments that resolve short-
lived intermediate states and conformations of low abundance relative to the dominant
equilibrium conformation7-8.
There are two primary limitations to NMR structural determination. The first is
that, just as for X-ray crystallography, certain proteins are not well suited to study
because their native conformation is not stable under the conditions of the experiment.
NMR typically requires 100s of µg of material and operates on high protein-concentrated
solutions. As well, very flexible proteins may present an ensemble of native
conformations that thereby confounds resolved analysis. The second limitation is that
proteins <40 kDa are not well assayed by NMR unless they are highly symmetric, such as
seen with the 900 kDa GroES-GroEL complex9. Carbon-13, nitrogen-15, and fluorine-19
labeling of proteins permits NMR experiments that focus on these nuclei. For proteins
3
larger than 10 kDa, uniform 13C and 15N labeling is often employed to simplify the
analysis without sacrificing structural resolution10. In conjunction with 13C and 15N
labeling, solid state magic angle spinning NMR (MAS NMR)11 can reveal the structure of
proteins without the requiring their macroscopic alignment12; by this method the high
resolution structures of membrane proteins have been determined13-14. In proteins that
are intractable to high resolution elucidation by NMR, 19F can be used to provide lower
resolution information about domain and oligomeric properties15.
1.1.2 Low resolution determination.
Other methodologies utilize the physical, nuclear, and electronic structure
properties of the analyte protein to provide structural information about the protein by
itself or in the context of an interaction. By themselves, such particle scattering,
spectroscopic and physical methods cannot provide the detail afforded X-ray and NMR
techniques. Cryo-electron microscopy (cryo-EM) is one method which, while it cannot
determine individual protein structures at atomic resolution, is better suited for
determining the gross structure of large biomolecular assemblies than either X-ray
crystollography or NMR spectroscopy16-17. A common theme for low resolution
techniques like cryo-EM is that the interpretation of the technique’s data will coincide
with the incorporation of X-ray or NMR high resolution structures, as components of the
studied system or as a putative model of the system or part of the system18.
Circular dichroism (CD) spectroscopy has a long history of use as a technique to
characterize the secondary structure content of proteins in solution19-20, wherein the
allowed rotations between neighboring amide groups along the protein backbone are
4
probed. This spectroscopic method sees the average of all positions in a protein in its
average conformation. For some protein systems, the ensemble of protein conformations
may be broad. This may obscure important macromolecular interactions present in a
subset of proteins in the ensemble if inherently averaged spectroscopic methods are used.
Fluorescence spectroscopy and Förster (fluorescence) resonant energy transfer
(FRET) have been used to rescue such interactions by allowing for exquisite—even
single molecule21-22—detection of proteins. FRET can provide quantitative distance
information relating to the natural fluorophores tryptophan and tyrosine in their structural
context, as well as strongly absorbing fluorophores like flouroscein and rhodamine when
they are conjugated to the macromolecules or ligands. In fluorescence correlation
spectroscopy (FCS), the size and shape of macromolecules can be inferred from the FCS-
observed diffusion of a small number of such molecules in a very small volume. From
this geometric model the stoichiometry and subunit orientations of protein complexes or
oligomers can be determined23.
Sedimentation and native gel electrophoresis techniques can distinguish protein
complexes and oligomers from monomeric species. Though clearly of low resolution,
such information is critical to the understanding of quaternary structure, which more
resolved methods may not be able to probe. In addition, sedimentation experiments can
be used to assay the shape of the macromolecule or complex24.
5
1.2 Mass Spectrometry-Based Footprinting
1.2.1 General principles.
An intermediate level of structural information can be realized by mass
spectrometry (MS)-based protein footprinting. Protein footprinting is an assay that
monitors protein conformation by selectively labeling or cleaving residues. This
selectivity is in part a function of the target solvent accessibility, thus an implicit picture
of protein structure is afforded by footprinting. The ways of modifying residues are
diverse and have been in practice for over forty years25. More recently, the advent of
macro-biomolecular mass spectrometry using ESI and MALDI ionization sources has
enabled the study of proteins in physiologic quantities—though the ionization by these
methods cannot be said to be “physiologic” in most applications26-27. Certain
modification strategies are well suited to mass spectrometric analysis as they can be
employed under such physiologic conditions: aqueous neutral-buffered saline solution
with dilute homogenous or mixed protein. As a result mass spectrometry is an important
contributor to the elucidation of protein structure, and to the understanding of protein
intermolecular interaction: identifying partner binding sites, stoichiometry, affinity, and
dynamics28.
The standard approach in protein footprinting is to determine which sites or
regions on a protein exhibit a change in solvent accessibility between two or more states
of the protein. This has been applied in thousands of studies that have variously
examined protein folding29, complexation30, membrane orientation31, and other contexts
effecting change in protein structure. As long as the protein system is not perturbed by
6
the labeling, the extent of labeling will be attenuated in regions that have limited or no
solvent accessibility. For example, to map the binding site of a protein with its ligand,
one applies labeling conditions identically to both apo and holo states, digests the protein
by proteolysis, and examines the extent of labeling visited on each peptide by mass
spectrometry. Peptides or residues that have undergone more labeling in the apo state
may comprise the ligand binding site, though they may instead be distal to it and are
protected in the holo state by virtue of an allosteric response to binding. As with other
methodologies, this strategy is empowered by a priori knowledge of the apo structure;
mapping the protected regions onto the high resolution structure can help distinguish
binding sites from other regions sensitive to allostery32.
1.2.2 Global experiments.
When comparing states of a protein system, the overall level of labeling of each
state’s constituents is often informative of the presence of structural change, much like
CD spectroscopy, and may provide important thermodynamic information. Hydrogen
deuterium exchange (HDX) is a footprinting technique that probes the solvent accessible
and hydrogen bonding environment of amide backbone hydrogens33. Commonly HDX
experiments use pepsin proteolysis at low pH immediately after exchange labeling; the
peptide products are then scanned by MS for peptide-resolved analysis. Alternatively, by
skipping the proteolysis step the total protein deuterium uptake can be monitored. Such
global analysis can detect whether protein rearrangement or binding is has occurred by
comparison to a control state, for as few as 10 involved residues or fewer still, depending
on experiment precision. This is an important tool sensitive to secondary, tertiary, and
7
quaternary structural change, whereas CD spectroscopy only assays changes in secondary
structure. For example, by ligand titration the intermediate equilibria between apo and
holo endpoint states scan be examined by HDX to elucidate the binding constant of the
protein-ligand interaction34.
1.2.3 Local experiments.
Ultimately mass spectrometry-based protein footprinting is used to examine
changes in solvent accessibility at a peptide or residue-resolved level. As mentioned,
HDX is a prominent choice for peptide-resolved footprinting. The advantage to this
method is that it is non-residue specific in its amide labeling, except for proline.
Moreover, the nature of HDX ensures that solvent-exposed amide hydrogens not
involved in hydrogen bonding will be labeled with 100% efficiency for seconds-to-
minutes exposures. A useful consequence of this is that determining the labeling yield
for a peptide is done by measuring the change in mass of the peptide compared to its non-
labeled theoretical mass. The more solvent-exposed residues a peptide possesses during
the HDX exposure, the more its uptake mass will be increased. This makes HDX and
MS natural partners, because the potential ionization biases affecting mass spectral
intensity35 are not shared by the m/z measurement.
Until recently, the goal for residue-resolved HDX footprinting could only be
realized for those residues serendipitously overlapped by more than one pepsin
proteolytic peptide36. The collision induced dissociation (CID) fragmentation
experiment, conducted in ion trap mass spectrometers, is used to generate the
characteristic fragment ion spectra of peptides to uniquely identify their sequences. This
8
experiment cannot be used to locate residue sites of HDX because of 1H-2H scrambling
induced by the multiple collisions of CID37. A new method of fragmentation called
electron-transfer dissociation (ETD)38 has been demonstrated to solve this problem in the
MS analysis of HDX-labeled peptides39. In ETD, scrambling is less probable due to the
near vertical electronic transition a peptide undergoes with the addition an electron, from
which state fragmentation directly proceeds.
If the labeling is stable, identification of the modification sites can be done using
a proteomics-based “bottom-up” mass spectrometry methodology40. In this
methodology, proteolytic peptides are chromatographically resolved and detected in a
hybrid mass spectrometer capable of monitoring their accurate mass-to-charge ratios at
high resolving power (ideally). The instrument’s other spectrometer acquires the
characteristic product ion spectra of peptide ions subjected to CID in an elution-
dependent manner. The high-resolution LC-MS intensities provide a quantitative
measure of each peptide, and their product ion spectra, acquired in this tandem MS/MS
mode (MS2), can indicate their identity and modification site(s). The yield of labeling at
a residue or peptide is determined directly from levels of modified and unmodified
peptides. An important aspect of stable (irreversible) covalent labeling is that, unlike
HDX, protein conformation may be very sensitive to the labeling. If it is sensitive and its
response occurs on the timescale of the labeling, the footprinting results will be biased by
the sampling of these non-native structures. Sufficient care must be taken in the
experiment and its analysis to avoid such bias.
9
1.3 Hydroxyl Radical Footprinting
1.3.1 Utility and chemistry
Hydroxyl radical labeling is a class of stable modification footprinting methods,
each differentiated by the means of •OH generation. Hydroxyl radicals well probe
solvent accessibility by virtue of their comparable size to water and high reactivity to
several amino acid sidechains. The fundamental advantages to this strategy are twofold.
(1) While modified protein is subjected to hours or days of handling and proteolysis
before LC-MS/MS acquisition, the primary sequence of modified residues is preserved
by virtue of the stability of the covalent modification. (2) The hydroxyl radical is a
general reactant, affording a higher resolution footprint than covalent approaches which
target single chemical groups, such as the acetylation of primary amines. Xu and Chance
have shown in X-ray and γ-ray water radiolysis-initiated oxidation studies41-43 that 14 of
the 20 amino acid sidechains and the disulfide bond can be reliably modified when
solvent exposed.
While there are many pathways for •OH-mediated labeling on residue sidechains,
the most common net mass shift is the +15.9949 Da incorporation of oxygen in air-
equilibrated solutions40-41, 43-44. The initial •OH reaction is different for aromatic and
sulfur-containing residues than for aliphatic residues, but the involvement of molecular
oxygen, the involvement of secondary radical reactions, and the similarity of the end
products gives credence to examining one pathway; shown is reaction of •OH with
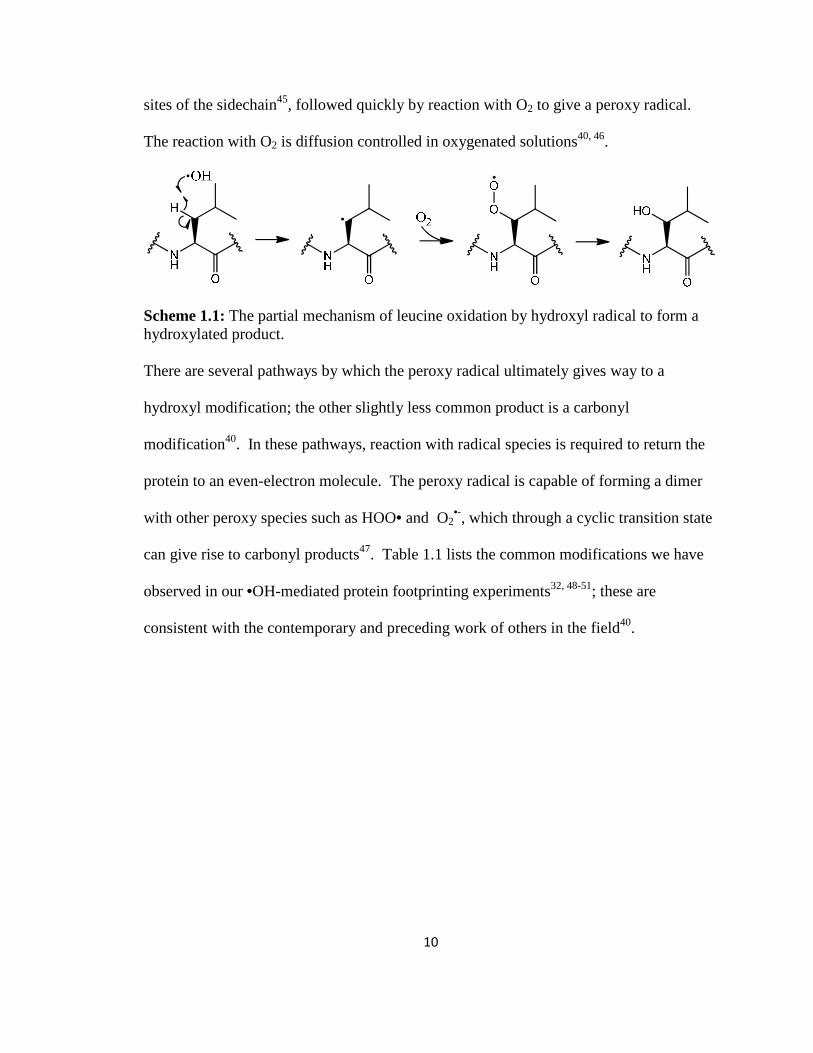
leucine (Scheme 1.1). First, hydrogen is abstracted preferentially at the β- and γ- carbon
10
sites of the sidechain45, followed quickly by reaction with O2 to give a peroxy radical.
The reaction with O2 is diffusion controlled in oxygenated solutions40, 46.
Scheme 1.1: The partial mechanism of leucine oxidation by hydroxyl radical to form a hydroxylated product. There are several pathways by which the peroxy radical ultimately gives way to a
hydroxyl modification; the other slightly less common product is a carbonyl
modification40. In these pathways, reaction with radical species is required to return the
protein to an even-electron molecule. The peroxy radical is capable of forming a dimer
with other peroxy species such as HOO• and O2•-, which through a cyclic transition state
can give rise to carbonyl products47. Table 1.1 lists the common modifications we have
observed in our •OH-mediated protein footprinting experiments32, 48-51; these are
consistent with the contemporary and preceding work of others in the field40.
11
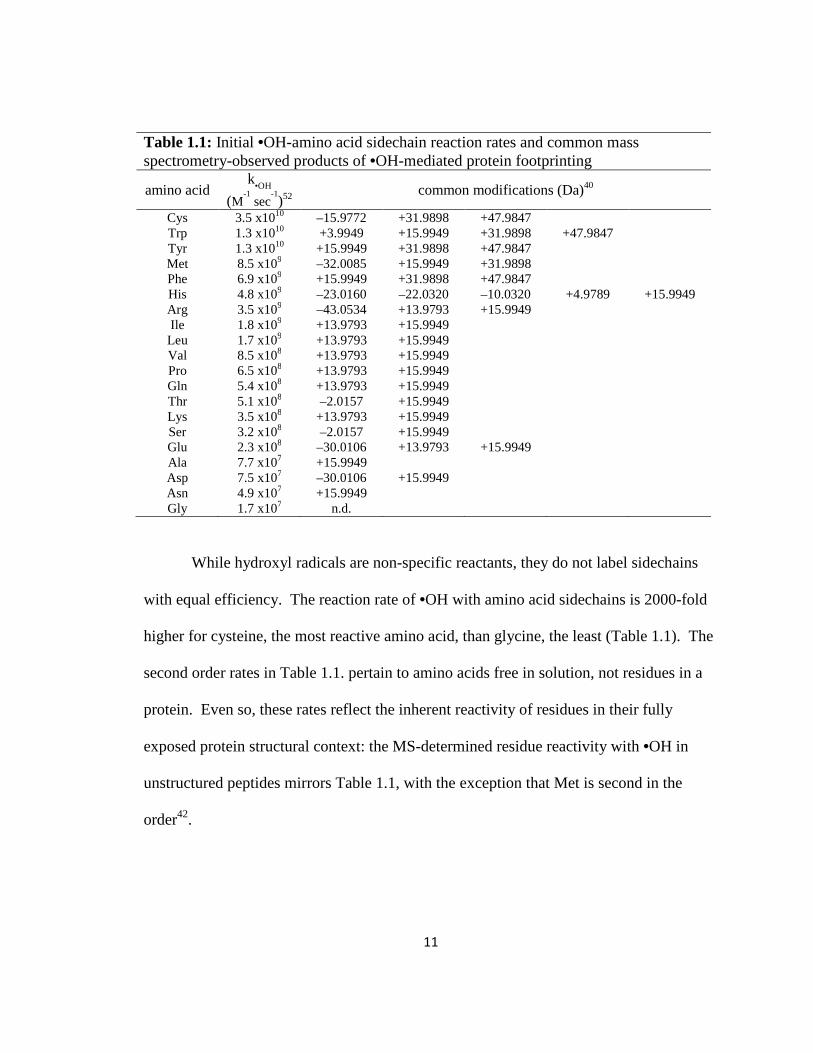
Table 1.1: Initial •OH-amino acid sidechain reaction rates and common mass spectrometry-observed products of •OH-mediated protein footprinting
amino acid k
•OH
(M-1 sec
-1)52
common modifications (Da)40
Cys 3.5 x10¹⁰ –15.9772 +31.9898 +47.9847 Trp 1.3 x10¹⁰ +3.9949 +15.9949 +31.9898 +47.9847 Tyr 1.3 x10¹⁰ +15.9949 +31.9898 +47.9847 Met 8.5 x10⁹ –32.0085 +15.9949 +31.9898 Phe 6.9 x10⁹ +15.9949 +31.9898 +47.9847 His 4.8 x10⁹ –23.0160 –22.0320 –10.0320 +4.9789 +15.9949 Arg 3.5 x10⁹ –43.0534 +13.9793 +15.9949 Ile 1.8 x10⁹ +13.9793 +15.9949 Leu 1.7 x10⁹ +13.9793 +15.9949 Val 8.5 x10⁸ +13.9793 +15.9949 Pro 6.5 x10⁸ +13.9793 +15.9949 Gln 5.4 x10⁸ +13.9793 +15.9949 Thr 5.1 x10⁸ –2.0157 +15.9949 Lys 3.5 x10⁸ +13.9793 +15.9949 Ser 3.2 x10⁸ –2.0157 +15.9949 Glu 2.3 x10⁸ –30.0106 +13.9793 +15.9949 Ala 7.7 x10⁷ +15.9949 Asp 7.5 x10⁷ –30.0106 +15.9949 Asn 4.9 x10⁷ +15.9949 Gly 1.7 x10⁷ n.d.
While hydroxyl radicals are non-specific reactants, they do not label sidechains
with equal efficiency. The reaction rate of •OH with amino acid sidechains is 2000-fold
higher for cysteine, the most reactive amino acid, than glycine, the least (Table 1.1). The
second order rates in Table 1.1. pertain to amino acids free in solution, not residues in a
protein. Even so, these rates reflect the inherent reactivity of residues in their fully
exposed protein structural context: the MS-determined residue reactivity with •OH in
unstructured peptides mirrors Table 1.1, with the exception that Met is second in the
order42.
12
Clearly another potential advantage to •OH-mediated footprinting is that it is so
fast: the residue sidechain reactivity approaches the diffusion limit for Met, Trp, Tyr, and
Cys residues. Recently Chen and colleagues53 and Stocks and Konermann29 were able to
probe sub-millisecond protein folding using a methodology, described below, which
takes advantage of inherent reactivity of •OH to make microsecond “snapshot” footprints
of the proteins.
1.3.2 Methods of •OH-labeling
There are several hydroxyl radical footprinting approaches currently in use; a
detailed review has been recently published40. Among the first DNA-protein and protein-
ligand binding site footprinting studies have used hydroxyl radicals generated from
catalytic Fenton chemistry54 consuming hydrogen peroxide55-56. The Fe(II)-
EDTA/H2O2/ascorbate Fenton system is currently a standard means for studying DNA
and RNA interactions57 because it allows for the stoichiometric generation of •OH from
Fe(II) and H2O2 at neutral pH without risking Fe(III) precipitation as Fe2O3. The
ascorbate is used to make the iron catalytic as it reduces Fe(III) back to Fe(II).
The synchrotron X-ray and 137Cs γ-ray radiolysis methods generate hydroxyl
radicals as the major reactive products from water radiolysis by high energy photons.
The first step in •OH formation is the ejection of an electron from water. This high
energy electron ionizes other water molecules, which ultimately generates hydroxyl
radicals and other less reactive oxidants58-59. These methods have been successfully
applied to footprinting DNA/protein interactions, RNA folding, and large proteins60-62.
The synchrotron X-ray source produces a high intensity beam such that millisecond
13
exposures are sufficient to oxidize proteins63; longer times are typically needed for γ-ray
radiolysis as the 137Cs source is not as intense64. The benefit to the radiolysis method is
that no additives are needed: water provides the source of •OH.
Ultraviolet light can homolytically cleave H2O2 to give •OH65. Sharp and
colleagues first demonstrated this method of footprinting by their oxidative-labeling of
myoglobin, with •OH generated from 5 M H2O2 irradiated by 254 nm light66. The
quantum yield of UV H2O2 decomposition was first measured at 0.567, but a more recent
measurement has Φ = 0.80 ± 0.168.
1.3.3 Fast Photochemical Oxidation of Proteins (FPOP)
Hambly and Gross50-51, and independently Aye and coworkers, have developed
the method of fast photochemical oxidation of proteins (FPOP), which generates the
radical from photolysis of hydrogen peroxide with pulsed 248 nm light69. At 248 nm the
extinction coefficient is 24 cm-1M-1 68. The KrF excimer laser UV source provides a high
flux of light, minimizing the exposure of protein to peroxide—the standard protocol uses
20 mM peroxide. Glutamine is included as a radical scavenger to limit the timescale of
oxidation. The synchronization of the flow rate through the fused silica reaction cell with
the excimer laser pulse frequency ensures all sample protein is irradiated once, but for a
measurable exclusion fraction.
The primary advantage to FPOP is that the near mM •OH exposure of proteins is
confined to a microsecond window, defined by the 17 ns laser pulse at its start and by the
radical scavenging of glutamine. By one microsecond the free [•OH] is 50,000-fold less
concentrated than at the outset under typical FPOP conditions, according to the pseudo-
14
first order analysis of its consumption51. This timescale of labeling predicts that the
labeling-perturbed conformations of proteins aren’t sampled by the labeling in cases
where proteins are structurally sensitive to oxidation. Studies by Chung and coworkers70-
71 using 2D IR spectroscopy, dispersed vibrational echo spectroscopy, and MD
simulation, showed that the fast-folding response of ubiquitin proceeds within 3 µs of an
abrupt T-jump. Although such perturbation is wholly different than chemical
modification, the timescale of ubiquitin response is suggestive of the earliest global
changes we may expect for proteins conformationally sensitive to oxidative modification.
In some cases, still faster ns motions in regions of flexibility give rise to larger-scale
slower motions in the protein’s exploration of conformation space72. It is possible that
initial modifications to such regions of high flexibility may alter the attendant structural
progression of larger regions. This should be kept in mind with all stable-modification
footprinting methods, and is why FPOP, with its radical scavenger-tunable timescale, is
an attractive footprinting method.
1.4 Dissertation Topics
1.4.1 Chapter 2 Validation of the FPOP timescale.
Like other chemical footprinting techniques, FPOP must ensure only the native
conformation is labeled. Although oxidation via hydroxyl radical induces unfolding in
proteins on a millisecond timescale, FPOP is designed to limit •OH exposure to 1 µs or
less by employing a pulsed laser for initiation to produce the radicals and including a
radical-scavenger to limit their lifetimes. We applied FPOP to three oxidation-sensitive
proteins and found that the distribution of modification (oxidation) states is Poisson when
15
a scavenger is present, consistent with a single conformation protein modification model.
This model breaks down when a scavenger is not used and/or hydrogen peroxide is not
removed following photolysis. The outcome verifies that FPOP occurs on a time scale
faster than global conformational changes in these proteins. This study has been
published in Analytical Chemistry73.
1.4.2 Chapter 3 Development of efficient and comprehensive footprinting analysis
software.
Mass spectrometry-based protein footprinting is a powerful method for unveiling
many kinds of protein interactions that cannot be studied by X-ray crystallography or
NMR spectroscopy. To realize the maximum information a protein footprinting study
can offer, residue-resolution of the footprinting label is needed for every residue sensitive
to the labeling chemistry. Hydroxyl radical-mediated labeling has proven to be a very
informative protein footprinting method, because of the number of solvent accessible
residues that may be labeled by •OH. The paradox of such a method is that finding all
•OH-labeling fates in the proteolyzed sample’s LC-MS/MS acquisition data is daunting
without the help of automated software. While the proteomics field has enjoyed the
concomitant development and refinement of bioinformatics software, these software are
not well suited to the task of assigning most LC-MS features from related sets of LC-
MS/MS acquisitions to the modified and unmodified proteolytic peptides of one or a few
proteins that have suffered a broad distribution of modifications. We present Excel-based
tools developed to facilitate this task, providing a means for achieving a comprehensive
residue-resolved analysis of footprinting data in an efficient manner. To demonstrate the
16
software and the utility of •OH-mediated labeling, we show that FPOP easily
distinguishes the buried and exposed residues of barstar in its folded and unfolded states.
1.4.3 Chapter 4 Extension of the FPOP method to new reagents.
The focus of this work is to expand the original design of FPOP and introduce
SO4-•, generated by 248 nm homolysis of low mM levels of persulfate, as a radical
reactant in protein footprinting. A feature of FPOP is that its design accommodates other
reagents, increasing its versatility. The new persulfate FPOP system is a potent, non-
specific, and tunable footprinting method: 3-5 times less persulfate is needed to give the
same global levels of modification seen with FPOP photolysis of hydrogen peroxide.
Although solvent-exposed His and Tyr residues are more reactive with SO4-• than with
•OH, a thorough LC/MS/MS and structural analysis of apomyoglobin and calmodulin
labeled products, shows that •OH can probe smaller accessible areas than SO4-•, with the
possible exception of when histidine is modified. This is consistent with the larger size
of the SO4-• compared to •OH. We find that His64, an axial ligand in the heme-binding
pocket of apomyoglobin, is substantially up-labeled by SO4-• relative to •OH. Finally,
because the kinds of modification and residue selectivity for both FPOP methods are
strikingly similar, we believe the choice for either method should be made considering
first the physical properties of persulfate and hydrogen peroxide, especially their
membrane permeability. This study has been published in Analytical Chemistry48.
1.4.4 Chapter 5 Application of FPOP: apolipoprotein E oligomerization.
The three common isoforms of apolipoprotein E (ApoE) differ at two sites in their
299 amino-acid sequence but these differences modulate the structure of ApoE to affect
17
profoundly the isoform associations with disease. The ApoE ε4 allele in particular is
strongly associated with Alzheimer’s disease. The study of the structural effects of these
mutation sites in aqueous media is hampered by the aggregation proclivity of each ApoE
isoform. Hence, understanding the differences between isoforms must rely on lower
resolution biophysical measurements, mutagenesis, homology studies, and the use of
truncated ApoE variants. In this study, we report two comparative studies of the ApoE
family by using the mass spectrometry-based protein footprinting methods of FPOP and
glycine ethyl ester (GEE) labeling. The first experiment examines the three full-length
WT isoforms in their tetrameric state and finds that the overall structures are similar with
the exception of M108 in ApoE4, which is more solvent-accessible in this isoform than in
ApoE2 and ApoE3. The second experiment provides clear evidence, from a comparison
of the footprinting results of the wild-type proteins and a monomeric mutant, that several
residues 183-205 and 232-251 are involved self-association.
1.4.5 Chapter 6 Application of FPOP: apolipoprotein E monomeric mutant
structure prediction.
We validate the presumed four-helix bundle structure of the N-terminal domain of
the full length Apolipoprotein E (ApoE) by means of protein footprinting using the
method of FPOP in a new way. The validation of this structure is made by comparison of
the extent of oxidative modifications at the amino-acid level with the calculated
sidechain solvent-accessible surface area, taken from the most recent high resolution N-
terminal domain structure of truncated Apolipoprotein E. We subjected a monomeric
mutant of the Apolipoprotein E3 variant to FPOP footprinting to warrant conclusions
18
based on the monomeric structure of ApoE. This study highlights the applicability FPOP
footprinting for structural hypothesis testing when high-resolution studies are not
possible, and it points to immediate application towards unraveling the structural
differences between the wild type variants of Apolipoprotein E in lipid-free and –bound
states.
1.4.6 Chapter 7 Application of FPOP: apolipoprotein E-ΑβΑβΑβΑβ42 interaction.
The β-amyloid peptide 1-42 may be the most important biomolecule implicated in
Alzheimer’s disease pathogenesis. Cerebral plaques comprised of the insoluble fibrillar
form of this peptide are found in all patients diagnosed with Alzheimer’s disease. The
soluble oligomers of β-amyloid 1-42 are neurotoxic. The amyloid hypothesis suggests
that the clearance of this peptide in the brain is central to affecting the likelihood of
Alzheimer’s disease onset. One protein known to interact with this peptide in its fibrillar
and soluble forms is apolipoprotein E. Strikingly, the apolipoprotein E4 isoform of this
protein confers a 12-fold greater risk for Alzheimer’s disease for people with two copies
of this allele than for people with no copies. The molecular characterization of β-
amyloid interaction with apolipoprotein E isoforms has thus been an important goal of
many studies; owing to the oligomeric properties of both biomolecules, no high
resolution structure of the complex or of ApoE exists. We have used the FPOP method
of mass spectrometry-based protein footprinting to provide an intermediate-resolution
picture of this interaction for lipid-free ApoE3 and ApoE4. We find that both proteins
exhibit Aβ42 binding in their N-terminus domains, involving residues W34 and Y36.
Arginine 167 also shows significant protection in the Aβ42-present state. It is not
19
contiguous in the N-terminus domain structures of ApoE, and we argue that this site is
protected by a similar allosteric response by both proteins upon Aβ42 binding. Proline
293 is also involved in a C-terminal domain interaction in ApoE3, but the overall
footprinting signals in the C-terminal domain suggest that this interaction is not as strong
as the N-terminal domain. These results are consistent with several studies that have
examined the domain interactions with Aβ independently.
1.5 References
1. Berman, H. M.; Westbrook, J.; Feng, Z.; Gilliland, G.; Bhat, T. N.; Weissig, H.; Shindyalov,
I. N.; Bourne, P. E., The Protein Data Bank. Nucleic Acids Research 2000, 28 (1), 235-242.
2. White, S. H., Biophysical dissection of membrane proteins. Nature 2009, 459 (7245),
344-346.
3. Pantazatos, D.; Kim, J. S.; Klock, H. E.; Stevens, R. C.; Wilson, I. A.; Lesley, S. A.; Woods, V.
L., Rapid refinement of crystallographic protein construct definition employing enhanced
hydrogen/deuterium exchange MS. Proc. Natl. Acad. Sci. U.S.A. 2004, 101 (3), 751-756.
4. Jane Dyson, H.; Ewright, P., Insights into the structure and dynamics of unfolded
proteins from nuclear magnetic resonance. In Advances in Protein Chemistry, George, D. R., Ed.
Academic Press: 2002; Vol. Volume 62, pp 311-340.
5. Dyson, H. J.; Wright, P. E., Unfolded Proteins and Protein Folding Studied by NMR.
Chemical Reviews 2004, 104 (8), 3607-3622.
6. Schnell, J. R.; Dyson, H. J.; Wright, P. E., Structure, Dynamics, and Catalytic Function of
Dihydrofolate Reductase. Annual Review of Biophysics and Biomolecular Structure 2004, 33 (1),
119-140.
7. Bouvignies, G.; Vallurupalli, P.; Cordes, M.; Hansen, D.; Kay, L., Measuring 1H
N
temperature coefficients in invisible protein states by relaxation dispersion NMR spectroscopy.
Journal of Biomolecular NMR 2011, 50 (1), 13-18.
8. Neudecker, P.; Lundström, P.; Kay, L. E., Relaxation Dispersion NMR Spectroscopy as a
Tool for Detailed Studies of Protein Folding. Biophysical journal 2009, 96 (6), 2045-2054.
9. Griswold, I. J.; Dahlquist, F. W., Bigger is better: megadalton protein NMR in solution.
Nat. Struct. Mol. Biol. 2002, 9 (8), 567-568.
10. Venters, R. A.; Calderone, T. L.; Spicer, L. D.; Fierke, C. A., Uniform carbon-13 isotope
labeling of proteins with sodium acetate for NMR studies: application to human carbonic
anhydrase II. Biochemistry 1991, 30 (18), 4491-4494.
11. Andrew, E. R.; Bradbury, A.; Eades, R. G., Nuclear Magnetic Resonance Spectra from a
Crystal rotated at High Speed. Nature 1958, 182 (4650), 1659-1659.
12. Castellani, F.; van Rossum, B.; Diehl, A.; Schubert, M.; Rehbein, K.; Oschkinat, H.,
Structure of a protein determined by solid-state magic-angle-spinning NMR spectroscopy.
Nature 2002, 420 (6911), 98-102.
20
13. Li, Y.; Berthold, D. A.; Gennis, R. B.; Rienstra, C. M., Chemical shift assignment of the
transmembrane helices of DsbB, a 20-kDa integral membrane enzyme, by 3D magic-angle
spinning NMR spectroscopy. Protein Sci. 2008, 17 (2), 199-204.
14. Andronesi, O. C.; Becker, S.; Seidel, K.; Heise, H.; Young, H. S.; Baldus, M., Determination
of Membrane Protein Structure and Dynamics by Magic-Angle-Spinning Solid-State NMR
Spectroscopy†. J. Am. Chem. Soc. 2005, 127 (37), 12965-12974.
15. Garai, K.; Mustafi, S. M.; Baban, B.; Frieden, C., Structural differences between
apolipoprotein E3 and E4 as measured by 19F NMR. Protein Sci. 2009, 19 (1), 66-74.
16. Jomaa, A.; Stewart, G.; Martín-Benito, J.; Zielke, R.; Campbell, T. L.; Maddock, J. R.;
Brown, E. D.; Ortega, J., Understanding ribosome assembly: the structure of in vivo assembled
immature 30S subunits revealed by cryo-electron microscopy. RNA 2011, 17 (4), 697-709.
17. Wulff, R. P.; Lundqvist, J.; Rutsdottir, G.; Hansson, A.; Stenbaek, A.; Elmlund, D.; Elmlund,
H.; Jensen, P. E.; Hansson, M., The Activity of Barley NADPH-Dependent Thioredoxin Reductase
C Is Independent of the Oligomeric State of the Protein: Tetrameric Structure Determined by
Cryo-Electron Microscopy. Biochemistry 2011, null-null.
18. Zheng, W., Accurate Flexible Fitting of High-Resolution Protein Structures into Cryo-
Electron Microscopy Maps Using Coarse-Grained Pseudo-Energy Minimization. Biophysical
journal 2011, 100 (2), 478-488.
19. D'Anna, J. A.; Isenberg, I., Histone cross-complexing pattern. Biochemistry 1974, 13 (24),
4992-4997.
20. Fasman, G. D., Circular Dichroism and the Conformational Analysis of Biomolecules.
Plenum Press: New York, 1996.
21. Schuler, B.; Eaton, W. A., Protein folding studied by single-molecule FRET. Current
Opinion in Structural Biology 2008, 18 (1), 16-26.
22. Hofmann, H.; Hillger, F.; Pfeil, S. H.; Hoffmann, A.; Streich, D.; Haenni, D.; Nettels, D.;
Lipman, E. A.; Schuler, B., Single-molecule spectroscopy of protein folding in a chaperonin cage.
Proc. Natl. Acad. Sci. U.S.A. 2010, 107 (26), 11793-11798.
23. Hess, S. T.; Huang, S.; Heikal, A. A.; Webb, W. W., Biological and Chemical Applications of
Fluorescence Correlation Spectroscopy: A Review†. Biochemistry 2001, 41 (3), 697-705.
24. Lebowitz, J.; Lewis, M. S.; Schuck, P., Modern analytical ultracentrifugation in protein
science: A tutorial review. Protein Sci. 2002, 11 (9), 2067-2079.
25. Hirs, C. H. W.; Di Sabato, G.; Ottesen, M.; Gold, A. M.; Gurd, F. R. N.; Horton, H. R.;
Koshland, D. E.; Kimmel, J. R.; Klotz, I. M.; Ludwig, M. L.; Hunter, M. J.; Neumann, N. P.; Ray, W.
J.; Riordan, J. F.; Vallee, B. L.; Sela, M.; Arnon, R.; Spande, T. F.; Witkop, B.; Stark, G. R.; Wilcox, P.
E.; Wold, F., In Methods in Enzymology, Academic Press: 1967; Vol. 11, pp 485-748.
26. Fenn, J. B.; Mann, M.; Meng, C. K.; Wong, S. F.; Whitehouse, C. M., Electrospray
ionization for mass spectrometry of large biomolecules. Science 1989, 246 (4926), 64-71.
27. Karas, M.; Bachmann, D.; Hillenkamp, F., Influence of the wavelength in high-irradiance
ultraviolet laser desorption mass spectrometry of organic molecules. Anal. Chem. 1985, 57 (14),
2935-2939.
28. Konermann, L.; Tong, X.; Pan, Y., Protein structure and dynamics studied by mass
spectrometry: H/D exchange, hydroxyl radical labeling, and related approaches. J. Mass
Spectrom. 2008, 43 (8), 1021-1036.
21
29. Stocks, B. B.; Konermann, L., Time-Dependent Changes in Side-Chain Solvent
Accessibility during Cytochrome c Folding Probed by Pulsed Oxidative Labeling and Mass
Spectrometry. Journal of Molecular Biology 2010, 398 (2), 362-373.
30. Takamoto, K.; Chance, M. R., Radiolytic Protein Footprinting with Mass Spectrometry to
Probe the Structure of Macromolecular Complexes. Annual Review of Biophysics and
Biomolecular Structure 2006, 35 (1), 251-276.
31. Wen, J.; Zhang, H.; Gross, M. L.; Blankenship, R. E., Membrane orientation of the FMO
antenna protein from Chlorobaculum tepidum as determined by mass spectrometry-based
footprinting. Proc. Natl. Acad. Sci. U.S.A. 2009, 106 (15), 6134-6139.
32. Zhang, H.; Gau, B. C.; Jones, L. M.; Vidavsky, I.; Gross, M. L., Fast Photochemical
Oxidation of Proteins for Comparing Structures of Protein-Ligand Complexes: The Calmodulin-
Peptide Model System. Anal. Chem. 2010, 83 (1), 311-318.
33. Chen, S.; Engen, J. R., Isotope Exchange and Covalent Modification Strategies for
Studying Protein Structure and Function. Cur. Anal. Chem. 2009, 5, 205-212.
34. Zhu, M. M.; Rempel, D. L.; Du, Z.; Gross, M. L., Quantification of Protein-Ligand
Interactions by Mass Spectrometry, Titration, and H/D Exchange: PLIMSTEX. J. Am. Chem. Soc.
2003, 125 (18), 5252-5253.
35. Fenn, J. B., Ion formation from charged droplets: roles of geometry, energy, and time. J.
Am. Soc. Mass Spectrom. 1993, 4 (7), 524-535.
36. Althaus, E.; Canzar, S.; Ehrler, C.; Emmett, M.; Karrenbauer, A.; Marshall, A.; Meyer-
Bäse, A.; Tipton, J.; Zhang, H.-M., Computing H/D-Exchange rates of single residues from data of
proteolytic fragments. BMC Bioinformatics 2010, 11 (1), 424.
37. Hoerner, J. K.; Xiao, H.; Dobo, A.; Kaltashov, I. A., Is There Hydrogen Scrambling in the
Gas Phase? Energetic and Structural Determinants of Proton Mobility within Protein Ions. J. Am.
Chem. Soc. 2004, 126 (24), 7709-7717.
38. Syka, J. E. P.; Coon, J. J.; Schroeder, M. J.; Shabanowitz, J.; Hunt, D. F., Peptide and
protein sequence analysis by electron transfer dissociation mass spectrometry. Proc. Natl. Acad.
Sci. U.S.A. 2004, 101 (26), 9528-9533.
39. Rand, K. D.; Zehl, M.; Jensen, O. N.; Jørgensen, T. J. D., Protein Hydrogen Exchange
Measured at Single-Residue Resolution by Electron Transfer Dissociation Mass Spectrometry.
Anal. Chem. 2009, 81 (14), 5577-5584.
40. Xu, G.; Chance, M. R., Hydroxyl Radical-Mediated Modification of Proteins as Probes for
Structural Proteomics. Chem. Rev. 2007, 107 (8), 3514-3543.
41. Xu, G.; Chance, M. R., Radiolytic Modification of Acidic Amino Acid Residues in Peptides:
Probes for Examining Protein-Protein Interactions. Anal. Chem. 2004, 76 (5), 1213-1221.
42. Xu, G.; Chance, M. R., Radiolytic Modification and Reactivity of Amino Acid Residues
Serving as Structural Probes for Protein Footprinting. Anal. Chem. 2005, 77 (14), 4549-4555.
43. Xu, G.; Chance, M. R., Radiolytic Modification of Sulfur-Containing Amino Acid Residues
in Model Peptides: Fundamental Studies for Protein Footprinting. Anal. Chem. 2005, 77 (8),
2437-2449.
44. Xu, G.; Takamoto, K.; Chance, M. R., Radiolytic Modification of Basic Amino Acid
Residues in Peptides: Probes for Examining Protein−Protein Interactions. Anal. Chem. 2003, 75
(24), 6995-7007.
22
45. L. Hawkins, C.; J. Davies, M., EPR studies on the selectivity of hydroxyl radical attack on
amino acids and peptides. Journal of the Chemical Society, Perkin Transactions 2 1998, (12),
2617-2622.
46. Garrison, W. M., Reaction mechanisms in the radiolysis of peptides, polypeptides, and
proteins. Chem. Rev. 1987, 87 (2), 381-398.
47. Russell, G. A., Deuterium-isotope Effects in the Autoxidation of Aralkyl Hydrocarbons.
Mechanism of the Interaction of PEroxy Radicals. J. Am. Chem. Soc. 1957, 79 (14), 3871-3877.
48. Gau, B. C.; Chen, H.; Zhang, Y.; Gross, M. L., Sulfate Radical Anion as a New Reagent for
Fast Photochemical Oxidation of Proteins. Anal. Chem. 2010, 82 (18), 7821-7827.
49. Gau, B. C.; Sharp, J. S.; Rempel, D. L.; Gross, M. L., FPOP Labels Proteins Faster than They
Unfold. In Proceedings of the 56th ASMS Conference on Mass Spectrometry and Allied Topics,
Denver, Colorado, 2008.
50. Hambly, D.; Gross, M., Laser flash photochemical oxidation to locate heme binding and
conformational changes in myoglobin. Int. J. Mass Spectrom. 2007, 259 (1-3), 124-129.
51. Hambly, D. M.; Gross, M. L., Laser Flash Photolysis of Hydrogen Peroxide to Oxidize
Protein Solvent-Accessible Residues on the Microsecond Timescale. J. Am. Soc. Mass Spectrom.
2005, 16 (12), 2057-2063.
52. Buxton, G. V.; Greenstock, C. L.; Helman, W. P.; Ross, A. B., Critical Review of Rate
Constants for Reactions of Hydrated Electrons, Hydrogen Atoms and Hydroxyl Radicals (*OH/*O-
) in Aqueous Solution. J. Phys. Chem. Ref. Data 1988, 17 (2), 513-886.
53. Chen, J.; Rempel, D. L.; Gross, M. L., Temperature Jump and Fast Photochemical
Oxidation Probe Submillisecond Protein Folding. J. Am. Chem. Soc. 2010, 132 (44), 15502-15504.
54. Fenton, H. J. H., The oxidation of tartaric acid in presence of iron. J. Chem. Soc. Proc.
1894, 10, 157-158.
55. Tullius, T. D.; Dombroski, B. A., Hydroxyl radical "footprinting": high-resolution
information about DNA-protein contacts and application to lambda repressor and Cro protein.
Proc. Natl. Acad. Sci. U.S.A. 1986, 83 (15), 5469-5473.
56. Shanblatt, S. H.; Revzin, A., Interactions of the catabolite activator protein (CAP) at the
galactose and lactose promoters of Escherichia coli probed by hydroxyl radical footprinting. The
second CAP molecule which binds at gal and the one CAP at lac may act to stimulate
transcription in the same way. J. Biol. Chem. 1987, 262 (24), 11422-11427.
57. Tullius, T. D.; Greenbaum, J. A., Mapping nucleic acid structure by hydroxyl radical
cleavage. Current Opinion in Chemical Biology 2005, 9 (2), 127-134.
58. Hawkins, C. L.; Davies, M. J., Generation and propagation of radical reactions on
proteins. Biochim. Biophys. Acta Bioenergetics 2001, 1504 (2-3), 196-219.
59. Davies, M. J.; Dean, R. T., Radical-Mediated Protein Oxidation: From Chemistry to
Medicine. Oxford University Press: 1997.
60. Maleknia, S. D.; Ralston, C. Y.; Brenowitz, M. D.; Downard, K. M.; Chance, M. R.,
Determination of Macromolecular Folding and Structure by Synchrotron X-Ray Radiolysis
Techniques. Anal. Biochem. 2001, 289 (2), 103-115.
61. Kiselar, J. G.; Maleknia, S. D.; Sullivan, M.; Downard, K. M.; Chance, M. R., Hydroxyl
radical probe of protein surfaces using synchrotron X-ray radiolysis and mass spectrometry. Int.
J. Radiat. Biol. 2002, 78 (2), 101 - 114.
62. Guan, J. Q.; Takamoto, K.; Almo, S. C.; Reisler, E.; Chance, M. R., Structure and Dynamics
of the Actin Filament. Biochemistry 2005, 44 (9), 3166-3175.
23
63. Maleknia, S. D.; Brenowitz, M.; Chance, M. R., Millisecond Radiolytic Modification of
Peptides by Synchrotron X-rays Identified by Mass Spectrometry. Anal. Chem. 1999, 71 (18),
3965-3973.
64. Sharp, J. S.; Tomer, K. B., Analysis of the Oxidative Damage-Induced Conformational
Changes of Apo- and Holocalmodulin by Dose-Dependent Protein Oxidative Surface Mapping.
Biophys. J. 2007, 92 (5), 1682-1692.
65. Schrank, S. G.; José, H. J.; Moreira, R. F. P. M.; Schröder, H. F., Applicability of Fenton
and H2O2/UV reactions in the treatment of tannery wastewaters. Chemosphere 2005, 60 (5),
644-655.
66. Sharp, J. S.; Becker, J. M.; Hettich, R. L., Analysis of Protein Solvent Accessible Surfaces
by Photochemical Oxidation and Mass Spectrometry. Anal. Chem. 2003, 76 (3), 672-683.
67. Weeks, J. L.; Matheson, M. S., The Primary Quantum Yield of Hydrogen Peroxide
Decomposition. J. Am. Chem. Soc. 1956, 78 (7), 1273-1278.
68. Schiffman, A.; Nelson, J. D. D.; Nesbitt, D. J., Quantum yields for OH production from 193
and 248 nm photolysis of HNO[sub 3] and H[sub 2]O[sub 2]. The Journal of Chemical Physics
1993, 98 (9), 6935-6946.
69. Aye, T. T.; Low, T. Y.; Sze, S. K., Nanosecond Laser-Induced Photochemical Oxidation
Method for Protein Surface Mapping with Mass Spectrometry. Anal. Chem. 2005, 77 (18), 5814-
5822.
70. Chung, H. S.; Ganim, Z.; Jones, K. C.; Tokmakoff, A., Transient 2D IR spectroscopy of
ubiquitin unfolding dynamics. Proc. Natl. Acad. Sci. U.S.A. 2007, 104 (36), 14237-14242.
71. Chung, H. S.; Khalil, M.; Smith, A. W.; Ganim, Z.; Tokmakoff, A., Conformational changes
during the nanosecond-to-millisecond unfolding of ubiquitin. Proc. Natl. Acad. Sci. U.S.A. 2005,
102 (3), 612-617.
72. Henzler-Wildman, K. A.; Lei, M.; Thai, V.; Kerns, S. J.; Karplus, M.; Kern, D., A hierarchy of
timescales in protein dynamics is linked to enzyme catalysis. Nature 2007, 450 (7171), 913-916.
73. Gau, B. C.; Sharp, J. S.; Rempel, D. L.; Gross, M. L., Fast Photochemical Oxidation of
Protein Footprints Faster than Protein Unfolding. Anal. Chem. 2009, 81 (16), 6563-6571.
24
2 Fast Photochemical Oxidation of Protein Footprints Faster than Protein Unfolding 2.1 Introduction
Protein footprinting is an assay that monitors protein conformation by selectively
labeling or cleaving residues. This selectivity is, in part, a function of the target protein’s
solvent accessibility; thus, an implicit picture of protein structure is afforded by
footprinting. Although the ways of modifying residues are diverse, and many have been
in practice for over forty years,1 the advent of biomolecular mass spectrometry,
associated with ESI and MALDI ionization and interfaced to liquid chromatography, now
makes possible highly specific, sensitive, and rapid analysis of modified peptides and
proteins.2-3 Thus, we are attempting to establish a marriage of mass spectrometry and
chemical footprinting to afford a tool for the elucidation of protein structure and
dynamics, and for the identification of partner binding sites, stoichiometry, and affinity. 4
Protein oxidation by hydroxyl radicals is one class of footprinting methods; the
various subclasses are differentiated by the means used to generate the •OH. Hydroxyl
radicals probe solvent accessibility because they have comparable size to solvent water
molecules and high reactivity with a significant fraction of amino acid side chains. The
advantages of hydroxyl radical footprinting are twofold. First, the primary sequence of
modified residues is preserved by virtue of the stability of the covalent modification even
though a protein may be subjected to several hours and even days of handling and
proteolysis following the chemical footprinting step. Second, the hydroxyl radical is a
reactive reagent, modifying many amino acid residues and affording a higher coverage
25
footprint than those covalent approaches that target specific residues (e.g., the acetylation
of primary amines). Xu and Chance5-7 showed that in X-ray and γ-ray water radiolysis,
up to 14 of the 20 sidechains and cys-cys disulfide bonds can be usefully modified for
footprinting experiments.
As implied above, there are several hydroxyl radical footprinting approaches
currently in use; a detailed review was recently published.8 Among the first DNA:protein
and protein:ligand binding site footprinting studies have used hydroxyl radicals generated
from catalytic Fenton chemistry9 consuming hydrogen peroxide.10-11 The synchrotron X-
ray and 137Cs γ-ray methods generate hydroxyl radicals as the major reactive products
from water radiolysis by high-energy photons. These methods were originally developed
by Chance12-14 and coworkers to footprint DNA/protein interactions, RNA folding, and
large proteins. Recently Hambly and Gross, and independently Aye et al.,15-17 reported a
method of fast photochemical oxidation of proteins (FPOP) that generates •OH by
photolysis of mM hydrogen peroxide with a pulsed laser (either 248-nm KrF excimer
laser or 266-nm frequency quadrupled Nd YAG). The laser provides a spatially small,
high flux of light, maximizing the exposure of a small volume of protein solution to
radicals and ensuring all but a small exclusion fraction of the protein is irradiated only
once (Figure 2.1). In the design by Hambly and Gross, a constituent radical scavenger
limits the timescale of oxidation. During a short timescale of oxidation (~ µs),
footprinting occurs at high yield.

Figure 2.1: Schematic of the FPOP fused silica reaction regiopulse frequency, and laser spot size settings.
Here we report the first experimental evaluation of FPOP to test the claim by
Hambly and Gross that it labels a protein faster than its unfolding. Fast laser
temperature-jump method
timescales of folding for protein model systems.
coworkers19-20 using 2D IR spectroscopy, dispersed vibrational echo spectroscopy, and
MD simulation, showed that the fast
contacts in its β-sheet, proceeds within 3
perturbation is wholly different than chemical modification, the timescale of ubiquitin
response is suggestive of the earliest changes we may expect for proteins
conformationally sensitive to oxidative modification. Small in size and tractable for
analysis, β-lactoglobulin (
not structurally similar, yet are representative of proteins exhibiting this sensitivity.
Therefore, we chose these proteins to test th
26
Schematic of the FPOP fused silica reaction region with normal flow, laser
pulse frequency, and laser spot size settings.
Here we report the first experimental evaluation of FPOP to test the claim by
Hambly and Gross that it labels a protein faster than its unfolding. Fast laser
jump methods coupled with several spectroscopy techniques have measured
timescales of folding for protein model systems.18 Recent studies by Chung and
using 2D IR spectroscopy, dispersed vibrational echo spectroscopy, and
MD simulation, showed that the fast-folding response of ubiquitin, of breaking native
sheet, proceeds within 3 µs of an abrupt T-jump. Although such
tion is wholly different than chemical modification, the timescale of ubiquitin
response is suggestive of the earliest changes we may expect for proteins
conformationally sensitive to oxidative modification. Small in size and tractable for
lactoglobulin (β-lg), apo-calmodulin (apo-CaM), and lysozyme (LysC) are
not structurally similar, yet are representative of proteins exhibiting this sensitivity.
Therefore, we chose these proteins to test the hypothesis.
n with normal flow, laser
Here we report the first experimental evaluation of FPOP to test the claim by
Hambly and Gross that it labels a protein faster than its unfolding. Fast laser
s coupled with several spectroscopy techniques have measured
Recent studies by Chung and
using 2D IR spectroscopy, dispersed vibrational echo spectroscopy, and
folding response of ubiquitin, of breaking native
jump. Although such
tion is wholly different than chemical modification, the timescale of ubiquitin
response is suggestive of the earliest changes we may expect for proteins
conformationally sensitive to oxidative modification. Small in size and tractable for
CaM), and lysozyme (LysC) are
not structurally similar, yet are representative of proteins exhibiting this sensitivity.21-22
27
Venkatesh and coworkers21 proposed a method of ascertaining whether hydroxyl
radical reactions sample the native protein conformation or upset the structural
equilibrium during the timescale of exposure. Their approach is appropriate for
continuous-dose methods because they provide a near steady state hydroxyl radical
concentration, allowing for a pseudo-first order kinetic model to be used.22-23 The FPOP
method, however, cannot be so evaluated because it is pulsed. A single laser pulse
provides a well defined start, and chemical quenching provides the “shutter” for the
reaction. The 17-nsec laser pulse generates an [•OH ] of approximately 1 mM. We
estimate that the presence of glutamine radical scavenger at 20 mM effectively quenches
radical exposure by ~ 1 µs; thus, the [•OH ] is not at steady state.16 .
The desired test is one for change in conformation induced by FPOP, but only for
change occurring on the labeling timescale. One means of monitoring protein
conformational changes is to track their charge-state distribution.24-29 This approach,
however, has difficulty distinguishing fast and slow FPOP-induced conformation
changes. One might follow Maleknia and coworkers30-32, who developed a method of
protein footprinting by generating reactive oxygen species in an ESI source,
accommodating rapid mass spectrometry analysis, but this approach suffers from the
uncertainty that protein conformation in a charge dense droplet in a high electric field is
relevant to solution biology. The special experimental features of FPOP require an
indirect evaluation method.
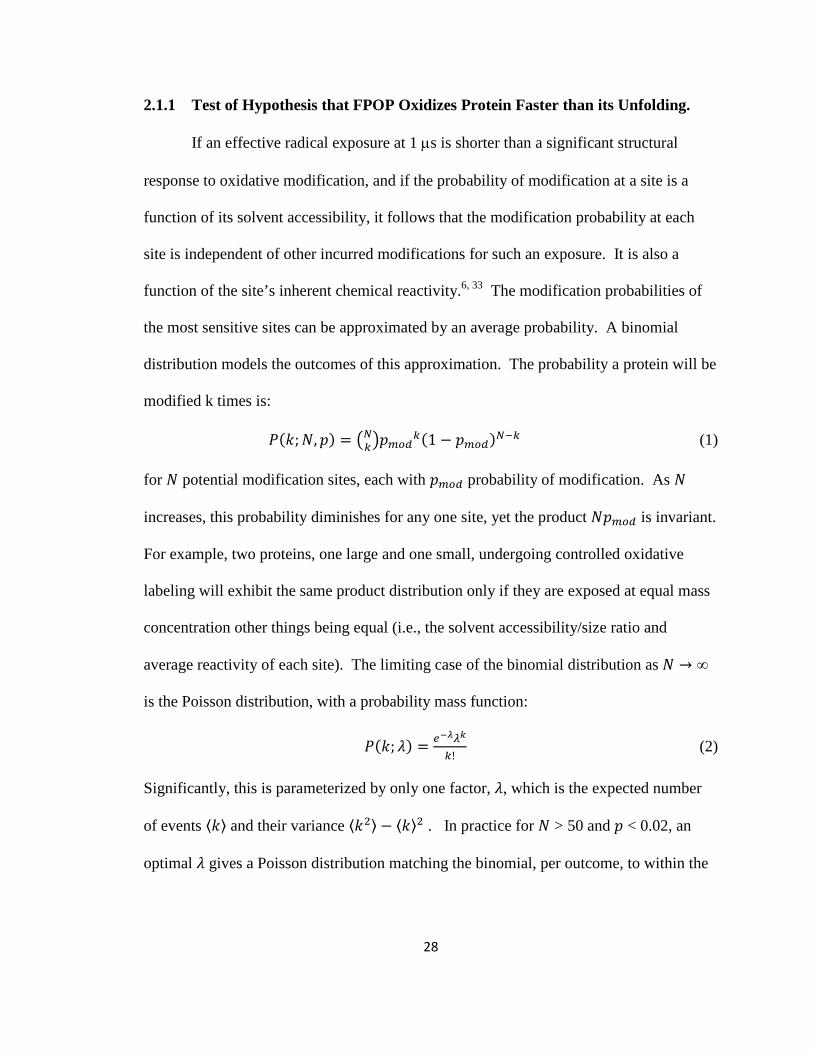
28
2.1.1 Test of Hypothesis that FPOP Oxidizes Protein Faster than its Unfolding.
If an effective radical exposure at 1 µs is shorter than a significant structural
response to oxidative modification, and if the probability of modification at a site is a
function of its solvent accessibility, it follows that the modification probability at each
site is independent of other incurred modifications for such an exposure. It is also a
function of the site’s inherent chemical reactivity.6, 33 The modification probabilities of
the most sensitive sites can be approximated by an average probability. A binomial
distribution models the outcomes of this approximation. The probability a protein will be
modified k times is:
; , 1 (1)
for potential modification sites, each with probability of modification. As
increases, this probability diminishes for any one site, yet the product is invariant.
For example, two proteins, one large and one small, undergoing controlled oxidative
labeling will exhibit the same product distribution only if they are exposed at equal mass
concentration other things being equal (i.e., the solvent accessibility/size ratio and
average reactivity of each site). The limiting case of the binomial distribution as ∞
is the Poisson distribution, with a probability mass function:
; !"! (2)
Significantly, this is parameterized by only one factor, , which is the expected number
of events $% and their variance $% $% . In practice for > 50 and < 0.02, an
optimal gives a Poisson distribution matching the binomial, per outcome, to within the
29
determination error (inclusive of experimental error and modeling uncertainty) of any
•OH modification state of a protein.
The dominant product pathway for most residue sidechains reacting with •OH is
the net addition of oxygen (+16 Da) as a hydroxyl group (as substitution of H for OH).8,
34 Consequently, the distribution of modified products can be simplified as a 0, +16, +32.
. . addition state distribution, wherein proteins are binned only by the number of
increments in 16 Da they have gained. For a properly controlled FPOP experiment, we
hypothesize that the distribution of 0, +16, +32… products should be very nearly Poisson
if the footprinting reactions occur more rapidly than any significant protein unfolding.
This hypothesis is the basis for our evaluation of the three aforementioned proteins
subjected to varying oxidation conditions.
2.2 Experimental section
2.2.1 Reagents.
Bovine β-Lactoglobulin A, lysozyme from chicken egg white, 30% hydrogen
peroxide, L-glutamine, L-methionine, catalase, urea, ethylene glycol-bis(2-
aminoethylether)-N,N,N′,N′-tetraacetic acid (EGTA), acetonitrile, formic acid, and
phosphate buffered saline (PBS) were purchased from the Sigma Aldrich Chemical
Company (St. Louis, MO). Bovine CaM was purchased from Oceanbiologics (Corvallis,
OR). The proteins were used without further purification. tris-(2-Carboxyethyl)
phosphine hydrochloride (TCEP-HCl) was purchased from Pierce Biotechnology, Inc
(Rockford, IL). Purified water (18 MΩ) was obtained from an in-house Milli-Q
Synthesis system (Millipore, Billerica, MA).
30
2.2.2 Oxidative-modification labeling.
Each 50 µL sample was prepared in PBS (10 mM phosphate buffer, 138 mM
NaCl, 2.7 mM KCl, pH 7.4 at 25 °C) with a final protein concentration of 10 M. Apo-
CaM samples included 100 µM EGTA for the chelation of adventitious calcium.
Glutamine was added to a final concentration of 20 mM in normal FPOP samples.
Hydrogen peroxide was added to a final concentration of 15 mM just before FPOP
infusion. The flowing sample solution was collected in a 0.6 mL microcentrifuge tube
containing an additional 20 µL of 100 nM catalase and 70 mM methionine in PBS, as per
the normal FPOP procedure. The breakdown of peroxide by catalase was conducted by
treating the sample for 10 min at room temperature before freezing the samples at -80°C.
FPOP was conducted as described previously, but with150 µm ID fused silica
(Polymicro Technologies, Phoenix, AZ).16 The 2.54 mm beam width was measured from
a 30-shot burn pattern on label tape affixed to a temporary beam stop placed in the plane
of the flow cell. Samples with an approximate 15% exclusion volume fraction (EVF)
were infused at a rate of 19.00 ± 0.04 µL/min, and the excimer pulse frequency was set to
6.00 ± 0.02 Hz. 30% and 60% EVF samples were infused at the same rate but with 4.94
± 0.02 and 2.82 ± 0.02 Hz pulse frequencies, respectively.
2.2.3 Mass spectrometry.
Each sample was thawed and ZiptipC4-desalted (Millipore, Billerica, MA) before
ESI MS acquisition on a Waters Ultima Global quadrupole time-of-flight (Milford, MA),
operating in V mode at 12,000 FWHM resolving power at 838.8 m/z ((CF3COONa)6Na+
calibrant ion). Some samples were subjected to a 1 h, 37 °C incubation in 8 M urea, 5
31
mM TCEP prior to de-salting. The 10 µL 50% acetonitrile 1% formic acid elution
solution was diluted 3-fold with 50% acetonitrile prior to direct infusion. The capacity of
the 0.6 µL bed ZiptipC4 is approximately 3.3 µg, so that 180-230 pmol of protein was
infused at a flow rate adjusted to insure accuracy in the time-to-digital conversion of the
multi-channel plate detector, requiring 80-180 ion counts/scan base peak. Scans
spanning the entire chromatogram were summed to improve the signal to noise, typically
60-150 scans depending on the flow rate.
2.2.4 Data analysis.
A 20-40 m/z spectrum window about the 15th charge state of β-lg and apo-CaM
and 10th charge state of LysC was fit with a model FPOP product distribution (described
below), for each protein replicate. The window range encompassed all detected product
peaks and a 10 m/z region lower than the unmodified peak average m/z for baseline
estimation.
2.3 Mathematical Modeling
The FPOP charge state spectrum model is the weighted sum of the set of Nox non-
zero oxygen-addition states [M + O + z·H]z+, [M + 2·O + z·H]z+, …, [M + Nox ·O +
z·H]z+, together with the unmodified state [M + z·H]z+. The ith state Ai is represented as
an unresolved isotopic distribution centered on the [M + i·O + z·H]z+ average m/z; its
contribution is weighted by the coefficient ai. The sum has the form:
&'()*+, ./0'1, 2⁄ ; 45, 46, … , 489 ∑ 4;89;<5 =;, 2⁄ > ? (1)
32
The baseline constant E is the average spectrum noise taken 5-7 m/z lower than the
unmodified protein peak in the zth charge state. There is no uncertainty in the form of the
isotopic distribution as we know the elemental composition of each oxygen-addition
product. A Mathcad 14 Minimize algorithm was used to fit the model to the spectrum to
determine the coefficient values; these values convey the oxygen-addition state
distribution and were tested for goodness-of-fit to a Poisson distribution. The solution
convergence tolerance was 10-12.
We further expand the spectrum model two ways. One motivation is to deal with
the charge state spectrum that is complicated by low abundance starting material and
electrospray adducts, and other FPOP oxidation products that do not correspond to +16,
+32… We assume that these latter adducts are equally likely to be observed for each
+16, +32… state, including the unmodified protein, with an important exception
discussed below. ESI MS of control samples, wherein the protein is subjected to
identical sample handling and peroxide exposure but not pulsed laser irradiation, provides
spectra for determining the presence of adducts of the starting protein and other
impurities, ESI-induced losses of ammonia and water, direct hydrogen peroxide
oxidation, and salt complexation. A peak detection algorithm was employed to detect
and pass the mass shifts and relative intensities of these peaks to the modeling algorithm.
The low abundance FPOP products that do not correspond to the substitution of H
for OH or the simple addition of an oxygen atom (+16) fall into two categories: resolved
and unresolved. Resolved peaks corresponding to losses of ammonia, water, and the -30
Da major product of acidic residue oxidation from the zero oxygen-addition state were
33
observable as they are shifted to lower m/z than the major oxygen-addition product
series. Especially for apo-CaM (see Figure 2.4), these peaks were more conspicuous than
in the control and must result from species produced in the FPOP treatment. Additional
control experiments in which hydrogen peroxide was not added showed that the excimer
laser did not contribute to these modifications (data not shown). Other FPOP products
include but are not limited to +14 Da carbonyl incorporation at aliphatic residues, -23, -
22, -10 and +5 Da shifted histidine oxidation products, and -43 Da deguanidination at
arginine.8 Their low abundance is obscured by the dominant 0, +16, +32… distribution
and so are unresolved. The distribution of proteins undergoing such reactions and having
i+16 Da additions, was modeled as a normal distribution, whose amplitude, variance, and
centroid displacement from the ith oxygen-addition state were set by the algorithm. All of
the parameters that model the complexity of each population of proteins having 0, +16,
+32… mass increments were determined by preliminary empirical modeling, in the case
of resolved and control adducts, or for the unresolved adducts, by the same Minimize
algorithm that determines the state coefficients. It is important to note that these
parameters are state-invariant, unlike the state coefficients.
The second spectrum model expansion is crucial for determining the distribution
of 0, +16, +32, . . . for its Poisson goodness-of-fit evaluation. Owing to the EVF, only a
fraction of the full contribution of the 0th state (i.e., the signal for the unoxidized protein)
should be included in the FPOP product distribution analysis. This fraction represents the
proteins in the irradiated volume that undergo no additions of 16, 32… Furthermore this
34
fraction contributes FPOP adducts other than those in the series corresponding to +16,
+32…, whereas the EVF does not. The model is rewritten as:
&'()*+, ./0'1 1 @45=′5 > @45=5 > ∑ 4;89;<6 =; > ? (2)
Here the 0th state is split between the exclusion volume portion 1 @45=′5, which has
the form of a simple isotopic distribution convolved with those adduct peaks seen in the
control experiments, and the irradiated volume portion, @45=5, which has a form
identical to all other oxygen-addition states and so contains all complicating terms. The
parameter f is not the irradiation fraction of the 0th state; rather, the adjusted coefficient
fa0, is proportional to the 0th state peak area attributed to this fraction by definition (eq 2).
The other ai coefficients are likewise proportional to their +16, +32… state peak areas.
The parameter f is fixed in the modeling algorithm by its relation to the independently
measured EVF:
@?AB 1 CDE·∑ GHI89HJKGK′ LCDE·GKGK′ (3)
The underscored state variables denote integration over the entire m/z spectrum
encompassing the charge-state product distribution.
A Mathcad 14 Minimize algorithm was also used to fit a Poisson distribution to
the set of 0, +16, +32… state peak areas M@=5, =;| O 1, … , PQ. The Poisson
characteristic parameter determined by this minimization gives the Poisson +16, +32…
addition state expectation value. A second modeling approach was also examined, in
which f was varied to optimize a Poisson fit, thereby determining the EVF. This tests the
corollary of our hypothesis: that an FPOP protein-product distribution well modeled by a
35
Poisson should provide an EVF corroborating its independent measure—although a
match doesn’t prove the converse. The reader is referred to Supporting Information for a
more detailed discussion of the modeling and Poisson-fitting algorithms.
2.4 Results and Discussion
2.4.2 Argument for Poisson.
Taking that a single conformation protein invariant to FPOP has a large number
of independent sites of low modification probability, the distribution of species for which
the molecular weight has increased by 0, +16, +32… should be well modeled by a
Poisson distribution. The low specificity of hydroxyl radical footprinting means up to 85
residue sidechains in a 100-residue protein may be modified, depending on •OH
exposure. The frequency of a residue’s modification can be further split among the
atomic sites of the residue (e.g., phenylalanine can be modified at o, m, p sites). It
follows that there are more than 100 oxidative-modification sites, even for a small 100-
residue protein. The probability of reaction is site-specific, and is determined by the
site’s inherent reactivity and solvent accessibility. Xu and Chance6 showed in γ-ray
radiolysis dose experiments that among 10 of the 12 most reactive amino acids, oxidation
by hydroxyl radicals spans a 30-fold range of first-order product formation rates..
While the reactivity at any site is unique, it is well approximated as having an
average modification probability . We designed the FPOP experiment so that the
OH radicals have a short lifetime in a properly quenched experiment. Shortening the
radical exposure time reduces the set of reactive sites, thereby improving the
representation of each site as the average—though if too short the semi-residue resolution
36
of the footprint experiment is lost. Replacing 20 mM Gln with 20 mM Phe depletes
[•OH] at a 10-fold faster rate16; we observed that >90% of oxidative-modification
products for several proteins are abolished with this change (data not shown).
In the event that the protein partially contorts from its native conformation on the
timescale of radical exposure, the distribution of products from oxygen addition will
change if one or more oxidation targets has a substantially different solvent accessibility.
In this case, the resultant distribution cannot be Poisson for two reasons. First, the site
probabilities are no longer independent. Second, the native state cannot describe
the average modification probability for newly exposed sites because their exposure time
is shorter. For the simplest example, consider the oxidative modification of a mixture of
two protein conformations, each insensitive to oxidation-induced perturbation and each
with its own . The oxygen-addition state distribution for each population is ideally
Poisson, but the overall protein population is not; that is, the distribution from the sum of
two Poisson distributions having different means is not itself Poisson.
Although we have not tested that a protein with an invariant conformation
exhibits a Poisson-like oxygen-addition distribution following FPOP, this is a reasonable
assumption. Rather, if we find the distribution of products is Poisson or nearly so, we
may conclude the conformation was unaffected during labeling. Thus, the test for
induced FPOP-timescale conformation change requires (1) determining the distribution
of products corresponding to substitution of H by OH or by addition of an oxygen atom,
(2) determining its best-fitting Poisson distribution, and (3) evaluating the goodness-of-
fit.
37
We also tested whether changes to the FPOP procedure and to post-labeling
conditions and sample handling affect the product distribution. When the Gln radical
scavenger normally constituent with the sample is removed, the radical lifetime is
determined principally by its self-reaction rate and is 100-times longer.16, 33
Consequently, we expect that oxidation-sensitive proteins will adopt significantly
different product distributions from a best fitting Poisson because there will likely be a
structural response on this timescale. Furthermore, given that covalent modification
footprinting can involve days of sample handling, millimolar levels of hydrogen peroxide
may slowly oxidize proteins especially at exposed Met and Cys.35 Intentionally or
otherwise, buried residues often experience solvent exposure with such handling, so that
all peroxide-reactive residues are vulnerable. By omitting catalase and allowing
hydrogen peroxide to persist following FPOP treatment, we can test the sensitivity of
FPOP-treated protein to further peroxide oxidation and long-time (minute-hour)
conformational change.
2.4.2 Data Acquisition and Analysis.
We chose not to model a deconvoluted or de-charged mass spectrum of each
sample, owing to uncertainties in fitting to the output of the Waters MaxEnt1 maximum
entropy algorithm supplied with the mass spectrometer data system. We selected single
charge states instead: the 15th charge state of β-lg and 10th charge state of LysC. These
choices are justified by their match to the charge state-invariant product distribution of
the FPOP-treated protein, determined in an experiment wherein the protein was denatured
by urea prior to ESI-MS (data not shown).
38
This integrity of a distribution determined for a charge state is of concern because
ESI affords different responses (different charge-state distributions) to different
conformers of a protein. A partially unfolded protein can accommodate more protons
and will have a charge state distribution shifted to higher charge. In fact, two proteins (β-
lg and LysC) exhibited product distributions that were charge-state dependent; that is, at
higher charge states, the unmodified peak is significantly diminished, and the higher +16,
+32… states are relatively more populated than at lower charge states. Denaturing and
reducing (β-lg has 2 and LysC 4 disulfide linkages) a portion of each protein following
FPOP treatment just prior to desalting and direct infusion, we could minimize any
dependence of the relative product distribution on charge state. This charge-state
dependence indicates that the protein ultimately infused for ESI analysis existed as a
mixture of conformers in the un-denatured treatment (an acidic 50% acetonitrile solution
does not fully denature β-lg and LysC although this may be a function of their intact
disulfide bonds). Venkatesh, Sharp and coworkers21-22 showed that the proteins selected
for this study are susceptible to partial unfolding upon oxidation. Our finding that
proteins undergoing multiple +16, +32…additions dominate the higher charge states
corroborates their finding. Although the 8 M urea denaturing solution was freshly
prepared, significant carbamylation (+43 Da) of primary amines was observed in the
unoxidized control sample for both proteins. On this basis, we chose to analyze single
charge states to obtain the distribution of 0, +16, +32… states and eschewed the analysis
of post-FPOP urea-denatured samples.
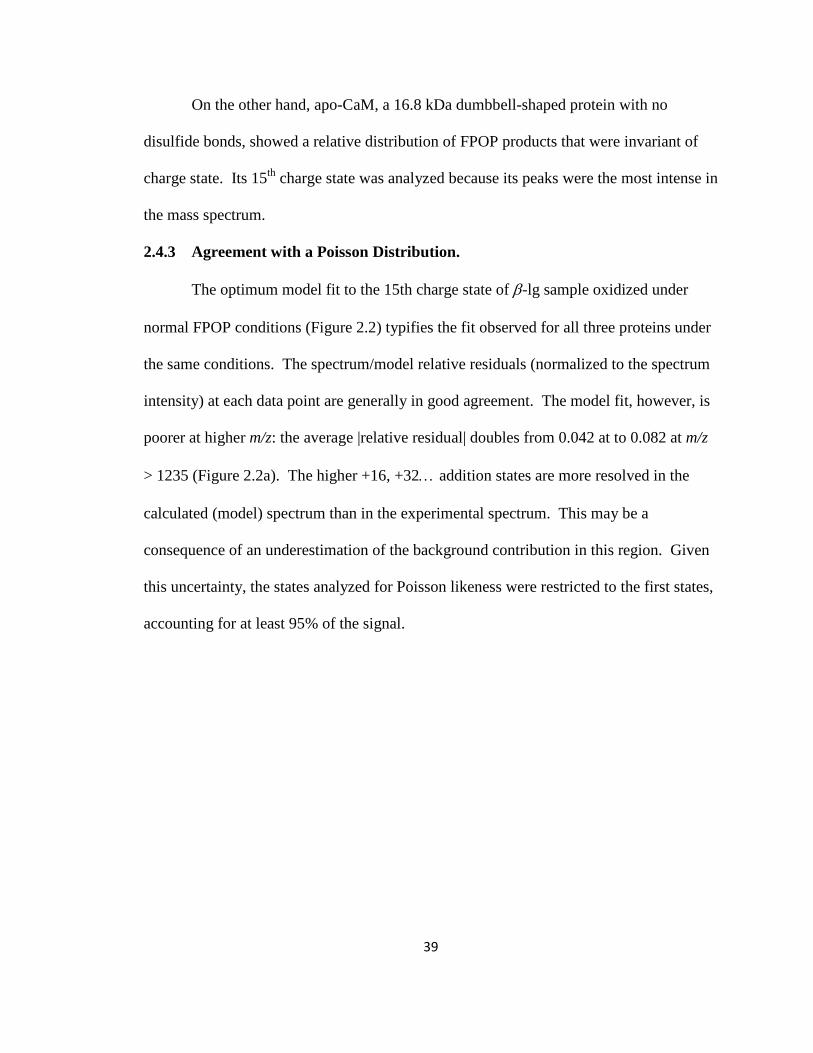
39
On the other hand, apo-CaM, a 16.8 kDa dumbbell-shaped protein with no
disulfide bonds, showed a relative distribution of FPOP products that were invariant of
charge state. Its 15th charge state was analyzed because its peaks were the most intense in
the mass spectrum.
2.4.3 Agreement with a Poisson Distribution.
The optimum model fit to the 15th charge state of β-lg sample oxidized under
normal FPOP conditions (Figure 2.2) typifies the fit observed for all three proteins under
the same conditions. The spectrum/model relative residuals (normalized to the spectrum
intensity) at each data point are generally in good agreement. The model fit, however, is
poorer at higher m/z: the average |relative residual| doubles from 0.042 at to 0.082 at m/z
> 1235 (Figure 2.2a). The higher +16, +32… addition states are more resolved in the
calculated (model) spectrum than in the experimental spectrum. This may be a
consequence of an underestimation of the background contribution in this region. Given
this uncertainty, the states analyzed for Poisson likeness were restricted to the first states,
accounting for at least 95% of the signal.
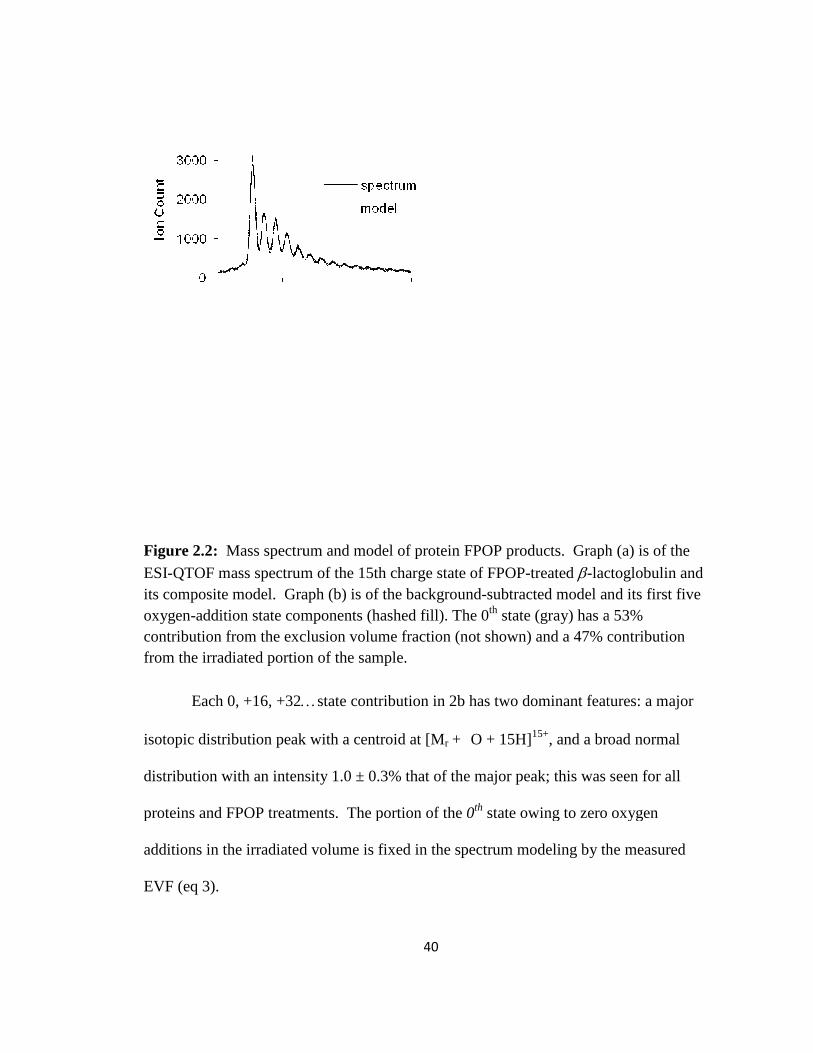
Figure 2.2: Mass spectrum and model of prote
ESI-QTOF mass spectrum of the 15th charge state of FPOPits composite model. Graph (b) is of the backgroundoxygen-addition state components (hashed filcontribution from the exclusion volume fraction (not shown) and a 47% contribution from the irradiated portion of the sample.
Each 0, +16, +32…
isotopic distribution peak with a centroid at [M
distribution with an intensity 1.0 ± 0.3% that of the major peak; this was seen for all
proteins and FPOP treatments. The portion of the
additions in the irradiated volume is fixed in the spectrum modeling by the measured
EVF (eq 3).
40
Mass spectrum and model of protein FPOP products. Graph (a) is of the
QTOF mass spectrum of the 15th charge state of FPOP-treated β-lactoglobulin and its composite model. Graph (b) is of the background-subtracted model and its first five
addition state components (hashed fill). The 0th state (gray) has a 53% contribution from the exclusion volume fraction (not shown) and a 47% contribution from the irradiated portion of the sample.
…state contribution in 2b has two dominant features: a major
distribution peak with a centroid at [Mr + O + 15H]15+, and a broad normal
distribution with an intensity 1.0 ± 0.3% that of the major peak; this was seen for all
proteins and FPOP treatments. The portion of the 0th state owing to zero oxygen
in the irradiated volume is fixed in the spectrum modeling by the measured
Graph (a) is of the
lactoglobulin and subtracted model and its first five
state (gray) has a 53% contribution from the exclusion volume fraction (not shown) and a 47% contribution
state contribution in 2b has two dominant features: a major
, and a broad normal
distribution with an intensity 1.0 ± 0.3% that of the major peak; this was seen for all
state owing to zero oxygen
in the irradiated volume is fixed in the spectrum modeling by the measured
41
The distribution is affected by changes in EVF, radical scavenger, and post-FPOP
oxidation protection: Figure 2.3 shows spectra of β-lg treated with these variations and
again typifies the CaM and LysC spectra (Figure 2.4). Intensity is plotted relative to each
spectrum’s maximum. Exposure for 5 min to 15 mM H2O2 does not oxidize the proteins
(Figures 2.3a, 2.4a, 2.4d). In the “normal” FPOP treatment, radical exposure is
controlled with constituent Gln scavenger. Post-FPOP oxidation is minimized by
removing any left over H2O2 with catalase and adding millimolar levels of Met.36
Methionine, a competitive oxidation reagent, was used because the samples were not
analyzed immediately after their treatment. Tuning the EVF from 60 to 15% by
increasing the laser frequency for samples submitted to a properly controlled FPOP
procedure (Figure 2.3b-d) increases the levels of oxidation. Without radical control (no
Gln scavenger) and/or removal of peroxide post-FPOP (Figure 2.3e-f), the product
distributions skew significantly to higher oxidation levels. The S/N is also worse, as an
equivalent amount of protein is spread over more states, relative to the other spectra.
The Poisson fitting to the modeled distribution of β-lg samples is shown in Figure
2.5. The state coefficients R@45, 4;| O 1, … , PS determined by the spectrum modeling
are proportional to the ion counts comprising the peak area of each state; these values are
normalized to give probability values in the figure. In all cases, the @ factor was fixed by
the measured EVF, except for the FPOP experiments without the glutamine scavenger.
The standard error bars are in general small except for the 0th state. This stems from the
sensitivity of the 0th state to the @ factor calculation—small changes in the set of
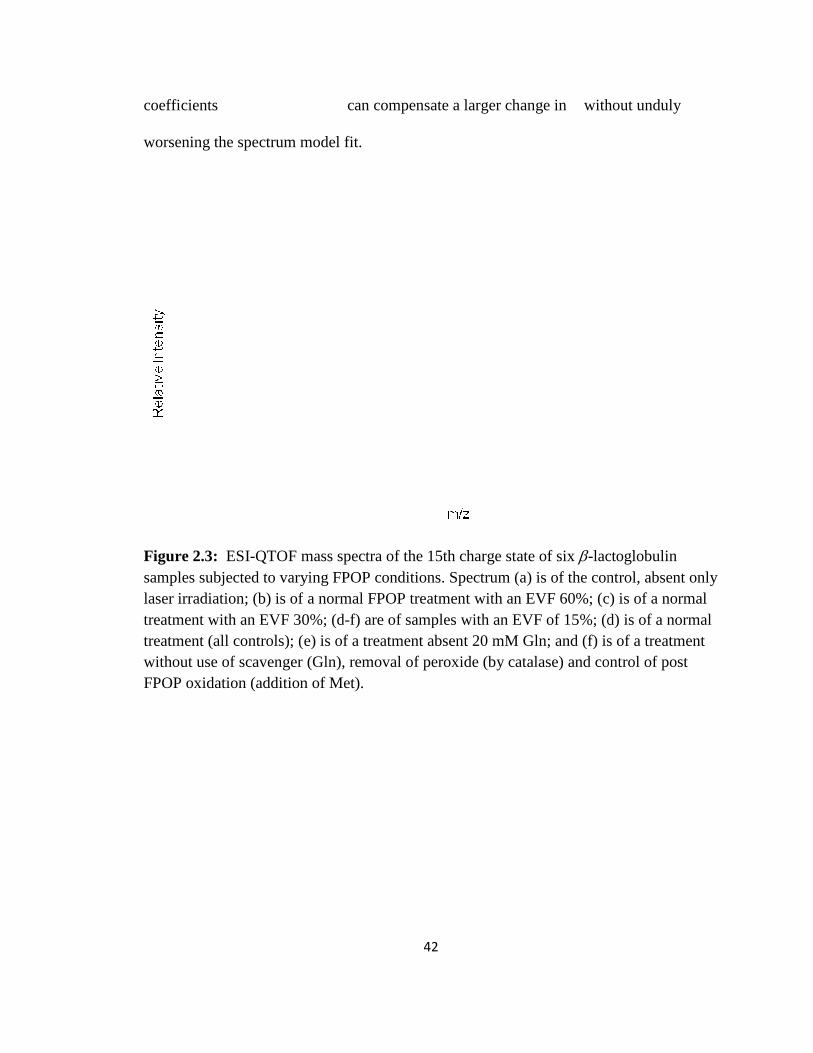
coefficients
worsening the spectrum model fit.
Figure 2.3: ESI-QTOF mass spectra of the 15th charge state of six samples subjected to varying FPOP conditions. Spectrum (a) is of the laser irradiation; (b) is of a normal FPOP treatment with an EVF 60%; (c) is of a normal treatment with an EVF 30%; (dtreatment (all controls); (e) is of a treatment absent 20 mwithout use of scavenger (Gln), removal of peroxide (by catalase) and control of post FPOP oxidation (addition of Met).
42
can compensate a larger change in without unduly
worsening the spectrum model fit.
QTOF mass spectra of the 15th charge state of six β-lactoglobulin samples subjected to varying FPOP conditions. Spectrum (a) is of the control, absent only laser irradiation; (b) is of a normal FPOP treatment with an EVF 60%; (c) is of a normal treatment with an EVF 30%; (d-f) are of samples with an EVF of 15%; (d) is of a normal treatment (all controls); (e) is of a treatment absent 20 mM Gln; and (f) is of a treatment without use of scavenger (Gln), removal of peroxide (by catalase) and control of post FPOP oxidation (addition of Met).
without unduly
lactoglobulin control, absent only
laser irradiation; (b) is of a normal FPOP treatment with an EVF 60%; (c) is of a normal f) are of samples with an EVF of 15%; (d) is of a normal
M Gln; and (f) is of a treatment without use of scavenger (Gln), removal of peroxide (by catalase) and control of post
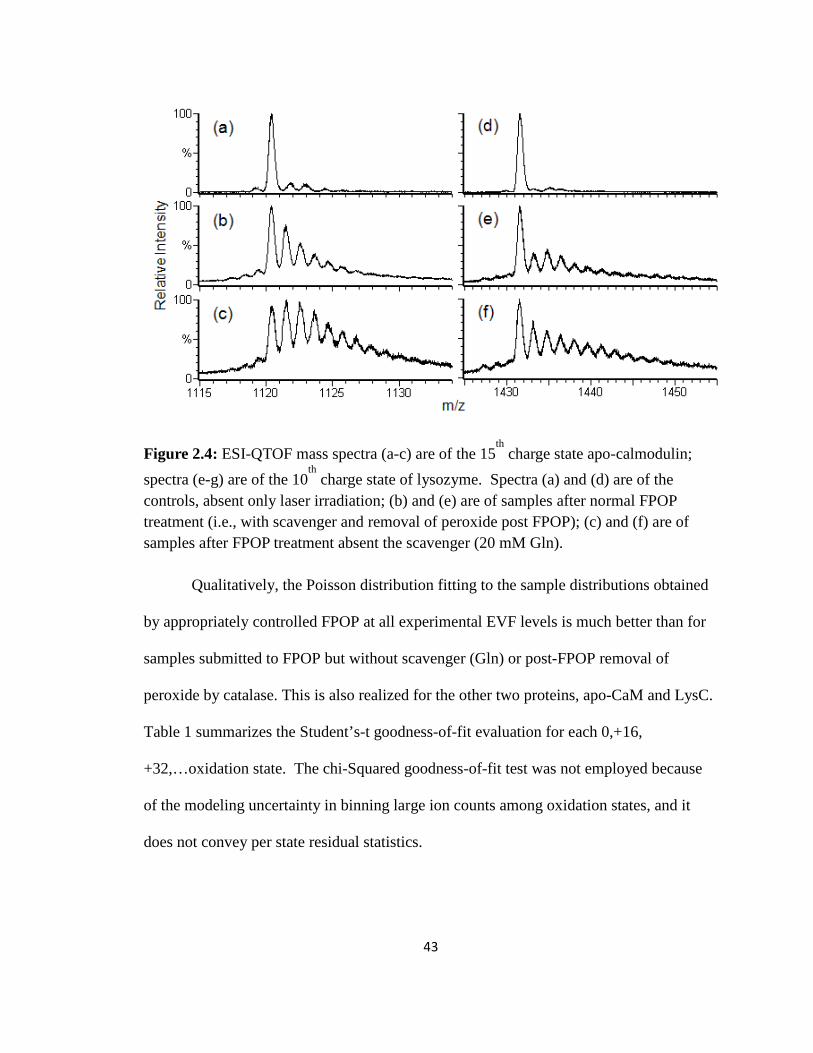
43
Figure 2.4: ESI-QTOF mass spectra (a-c) are of the 15th charge state apo-calmodulin;
spectra (e-g) are of the 10th charge state of lysozyme. Spectra (a) and (d) are of the
controls, absent only laser irradiation; (b) and (e) are of samples after normal FPOP treatment (i.e., with scavenger and removal of peroxide post FPOP); (c) and (f) are of samples after FPOP treatment absent the scavenger (20 mM Gln).
Qualitatively, the Poisson distribution fitting to the sample distributions obtained
by appropriately controlled FPOP at all experimental EVF levels is much better than for
samples submitted to FPOP but without scavenger (Gln) or post-FPOP removal of
peroxide by catalase. This is also realized for the other two proteins, apo-CaM and LysC.
Table 1 summarizes the Student’s-t goodness-of-fit evaluation for each 0,+16,
+32,…oxidation state. The chi-Squared goodness-of-fit test was not employed because
of the modeling uncertainty in binning large ion counts among oxidation states, and it
does not convey per state residual statistics.
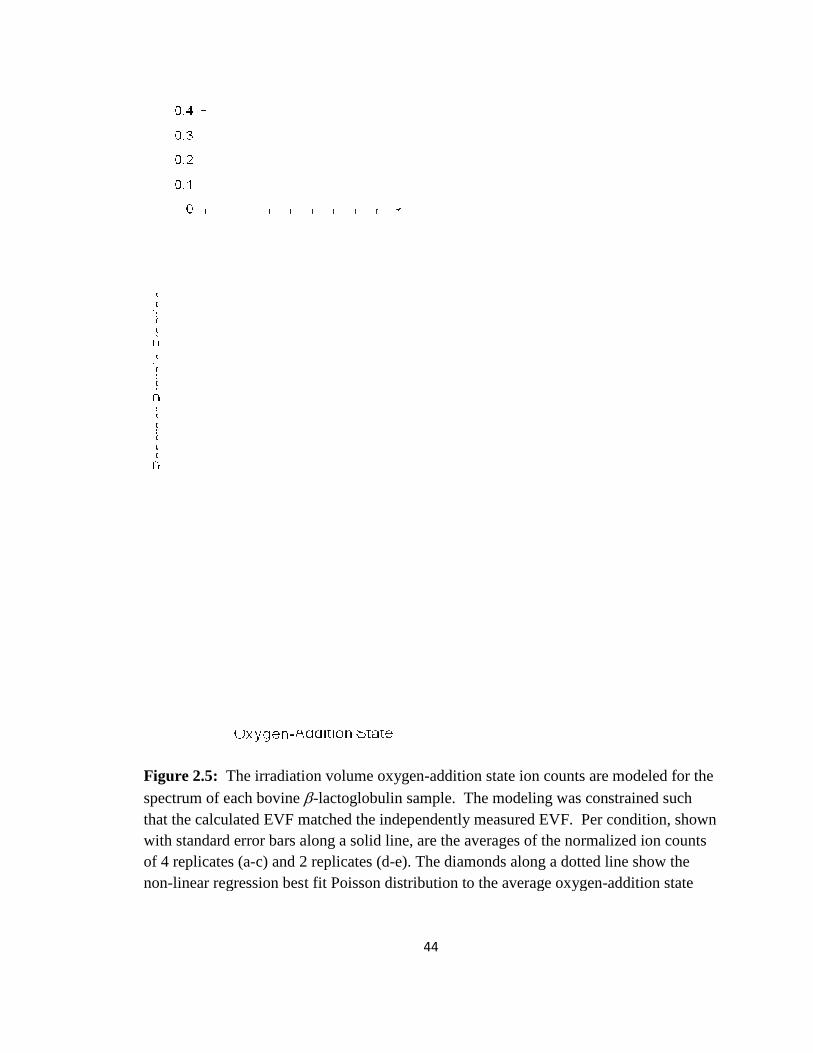
Figure 2.5: The irradiatiospectrum of each bovine β
that the calculated EVF matched the independently measured EVF. Per condition, shown with standard error bars along a solid line, are the averages of the normalized ion counts of 4 replicates (a-c) and 2 replicates (dnon-linear regression best fit Poisson distribution to the average oxygen
44
The irradiation volume oxygen-addition state ion counts are modeled for the β-lactoglobulin sample. The modeling was constrained such
that the calculated EVF matched the independently measured EVF. Per condition, shown along a solid line, are the averages of the normalized ion counts
c) and 2 replicates (d-e). The diamonds along a dotted line show the linear regression best fit Poisson distribution to the average oxygen-addition state
addition state ion counts are modeled for the lactoglobulin sample. The modeling was constrained such
that the calculated EVF matched the independently measured EVF. Per condition, shown along a solid line, are the averages of the normalized ion counts
e). The diamonds along a dotted line show the addition state
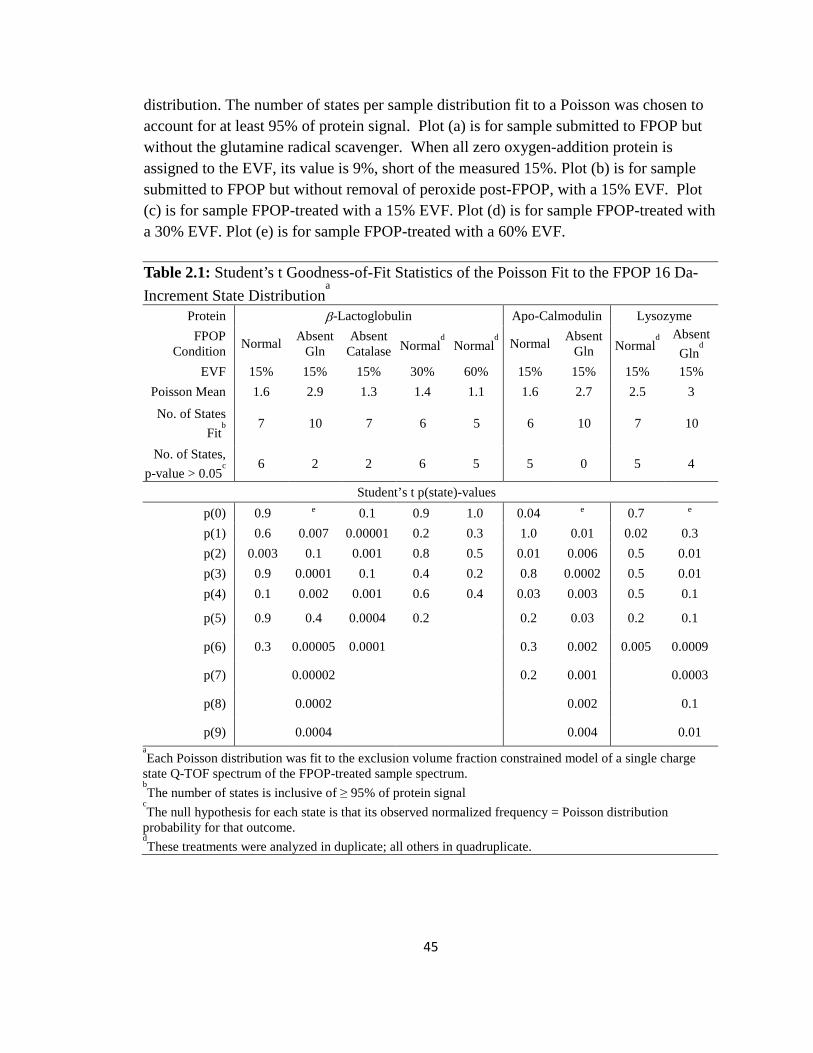
45
distribution. The number of states per sample distribution fit to a Poisson was chosen to account for at least 95% of protein signal. Plot (a) is for sample submitted to FPOP but without the glutamine radical scavenger. When all zero oxygen-addition protein is assigned to the EVF, its value is 9%, short of the measured 15%. Plot (b) is for sample submitted to FPOP but without removal of peroxide post-FPOP, with a 15% EVF. Plot (c) is for sample FPOP-treated with a 15% EVF. Plot (d) is for sample FPOP-treated with a 30% EVF. Plot (e) is for sample FPOP-treated with a 60% EVF. Table 2.1: Student’s t Goodness-of-Fit Statistics of the Poisson Fit to the FPOP 16 Da-
Increment State Distributiona
Protein β-Lactoglobulin Apo-Calmodulin Lysozyme FPOP
Condition Normal Absent Gln
Absent Catalase Normal
d Normald Normal Absent
Gln Normald Absent
Glnd
EVF 15% 15% 15% 30% 60% 15% 15% 15% 15% Poisson Mean 1.6 2.9 1.3 1.4 1.1 1.6 2.7 2.5 3 No. of States
Fitb 7 10 7 6 5 6 10 7 10
No. of States,
p-value > 0.05c 6 2 2 6 5 5 0 5 4
Student’s t p(state)-values p(0) 0.9 e 0.1 0.9 1.0 0.04 e 0.7 e p(1) 0.6 0.007 0.00001 0.2 0.3 1.0 0.01 0.02 0.3 p(2) 0.003 0.1 0.001 0.8 0.5 0.01 0.006 0.5 0.01 p(3) 0.9 0.0001 0.1 0.4 0.2 0.8 0.0002 0.5 0.01 p(4) 0.1 0.002 0.001 0.6 0.4 0.03 0.003 0.5 0.1 p(5) 0.9 0.4 0.0004 0.2 0.2 0.03 0.2 0.1 p(6) 0.3 0.00005 0.0001 0.3 0.002 0.005 0.0009 p(7) 0.00002 0.2 0.001 0.0003 p(8) 0.0002 0.002 0.1 p(9) 0.0004 0.004 0.01
aEach Poisson distribution was fit to the exclusion volume fraction constrained model of a single charge
state Q-TOF spectrum of the FPOP-treated sample spectrum. bThe number of states is inclusive of ≥ 95% of protein signal
cThe null hypothesis for each state is that its observed normalized frequency = Poisson distribution
probability for that outcome. dThese treatments were analyzed in duplicate; all others in quadruplicate.
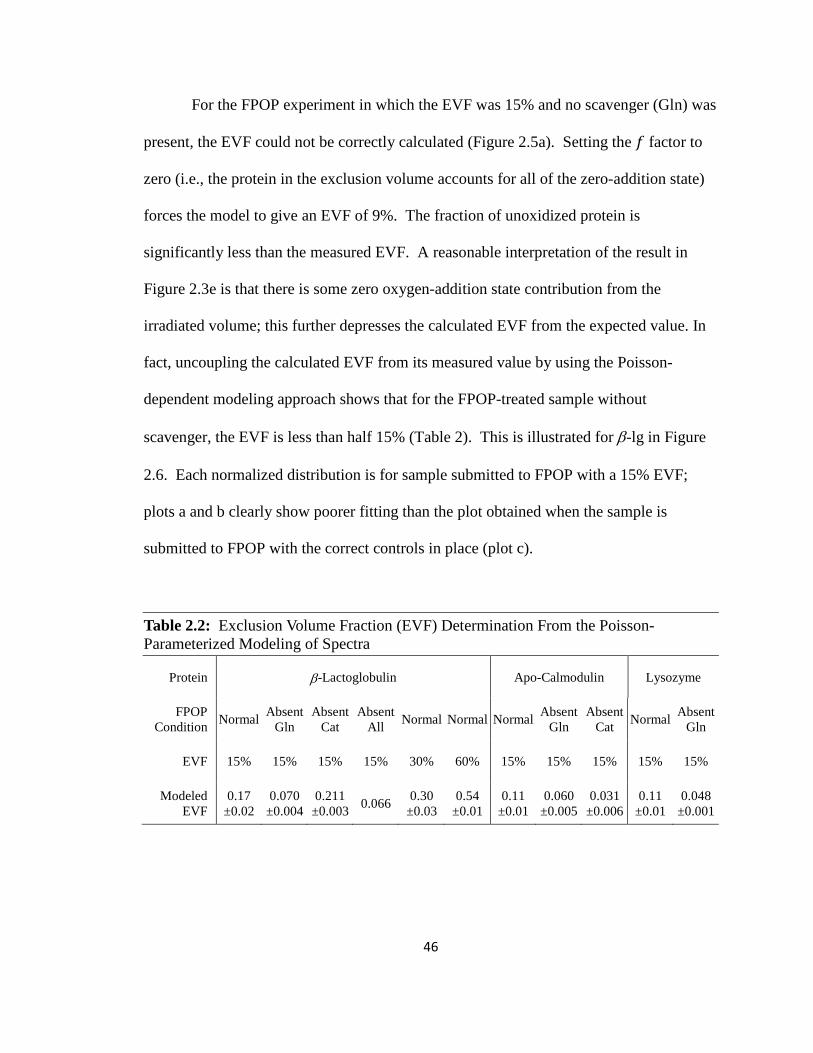
46
For the FPOP experiment in which the EVF was 15% and no scavenger (Gln) was
present, the EVF could not be correctly calculated (Figure 2.5a). Setting the @ factor to
zero (i.e., the protein in the exclusion volume accounts for all of the zero-addition state)
forces the model to give an EVF of 9%. The fraction of unoxidized protein is
significantly less than the measured EVF. A reasonable interpretation of the result in
Figure 2.3e is that there is some zero oxygen-addition state contribution from the
irradiated volume; this further depresses the calculated EVF from the expected value. In
fact, uncoupling the calculated EVF from its measured value by using the Poisson-
dependent modeling approach shows that for the FPOP-treated sample without
scavenger, the EVF is less than half 15% (Table 2). This is illustrated for β-lg in Figure
2.6. Each normalized distribution is for sample submitted to FPOP with a 15% EVF;
plots a and b clearly show poorer fitting than the plot obtained when the sample is
submitted to FPOP with the correct controls in place (plot c).
Table 2.2: Exclusion Volume Fraction (EVF) Determination From the Poisson-Parameterized Modeling of Spectra
Protein β-Lactoglobulin Apo-Calmodulin Lysozyme FPOP
Condition Normal Absent
Gln Absent
Cat Absent
All Normal Normal Normal Absent
Gln Absent
Cat Normal Absent
Gln
EVF 15% 15% 15% 15% 30% 60% 15% 15% 15% 15% 15%
Modeled EVF
0.17 ±0.02
0.070 ±0.004
0.211 ±0.003 0.066 0.30
±0.03 0.54 ±0.01
0.11 ±0.01
0.060 ±0.005
0.031 ±0.006
0.11 ±0.01
0.048 ±0.001
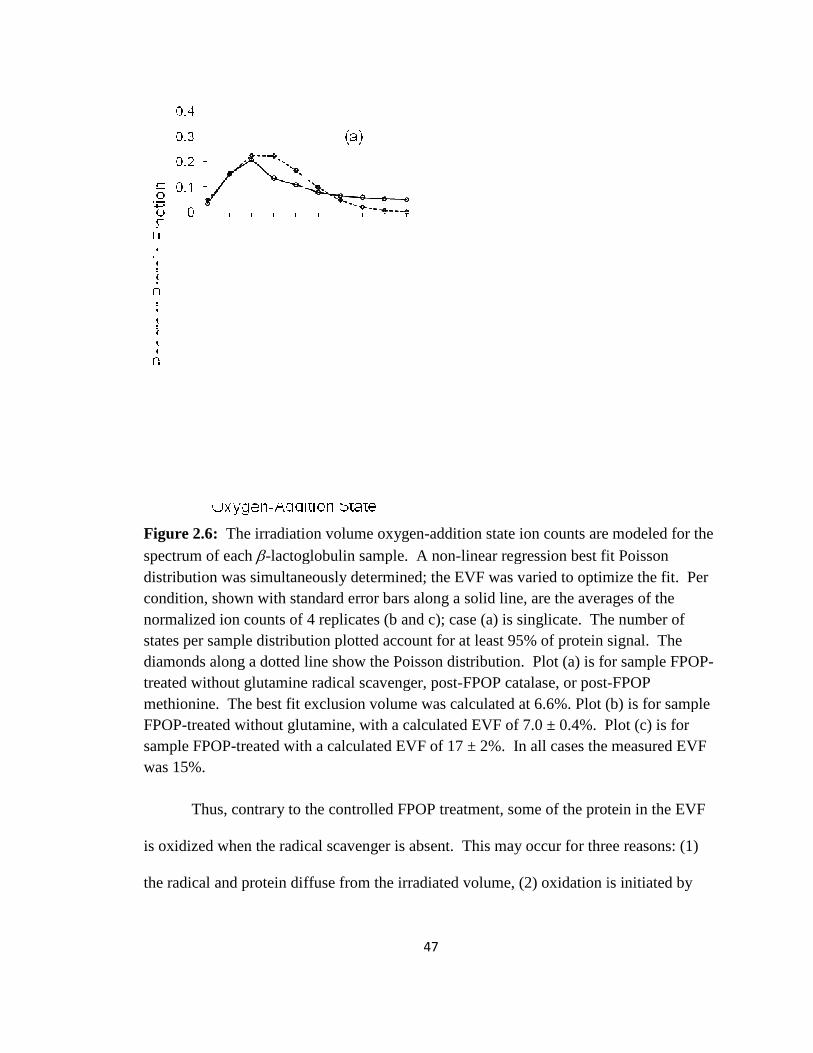
Figure 2.6: The irradiation volume oxygenspectrum of each β-lactoglobulin sample. A nondistribution was simultaneously determined; the EVF was varied to optcondition, shown with standard error bars along a solid line, are the averages of the normalized ion counts of 4 replicates (b and c); case (a) is singlicate. The number of states per sample distribution plotted account for at least 95diamonds along a dotted line show the Poisson distribution. Plot (a) is for sample FPOPtreated without glutamine radical scavenger, postmethionine. The best fit exclusion volume was calculated at 6.FPOP-treated without glutamine, with a calculated EVF of 7.0 ± 0.4%. Plot (c) is for sample FPOP-treated with a calculated EVF of 17 ± 2%. In all cases the measured EVF was 15%.
Thus, contrary to the controlled FPOP treatment,
is oxidized when the radical scavenger is absent. This may occur for three reasons: (1)
the radical and protein diffuse from the irradiated volume, (2) oxidation is initiated by
47
The irradiation volume oxygen-addition state ion counts are modeled for the
lactoglobulin sample. A non-linear regression best fit Poisson distribution was simultaneously determined; the EVF was varied to optimize the fit. Per condition, shown with standard error bars along a solid line, are the averages of the normalized ion counts of 4 replicates (b and c); case (a) is singlicate. The number of states per sample distribution plotted account for at least 95% of protein signal. The diamonds along a dotted line show the Poisson distribution. Plot (a) is for sample FPOPtreated without glutamine radical scavenger, post-FPOP catalase, or post-methionine. The best fit exclusion volume was calculated at 6.6%. Plot (b) is for sample
treated without glutamine, with a calculated EVF of 7.0 ± 0.4%. Plot (c) is for treated with a calculated EVF of 17 ± 2%. In all cases the measured EVF
Thus, contrary to the controlled FPOP treatment, some of the protein in the EVF
is oxidized when the radical scavenger is absent. This may occur for three reasons: (1)
the radical and protein diffuse from the irradiated volume, (2) oxidation is initiated by
addition state ion counts are modeled for the linear regression best fit Poisson
imize the fit. Per condition, shown with standard error bars along a solid line, are the averages of the normalized ion counts of 4 replicates (b and c); case (a) is singlicate. The number of
% of protein signal. The diamonds along a dotted line show the Poisson distribution. Plot (a) is for sample FPOP-
-FPOP 6%. Plot (b) is for sample
treated without glutamine, with a calculated EVF of 7.0 ± 0.4%. Plot (c) is for treated with a calculated EVF of 17 ± 2%. In all cases the measured EVF
some of the protein in the EVF
is oxidized when the radical scavenger is absent. This may occur for three reasons: (1)
the radical and protein diffuse from the irradiated volume, (2) oxidation is initiated by
48
diffuse 248 nm light outside the considered reaction volume, and/or (3) one protein is
oxidized by another following laser irradiation. The first mechanism is unlikely. Even
without considering the hydroxyl radical recombination rate of 5.5x10⁻⁹ M-1s-1, the
concentration of hydroxyl radical 5 microns into the exclusion volume after 100 µsec is
only 0.15% the 1 mM theoretical maximum instantaneous [•OH ] in the irradiated
volume16, 33 The •OH diffusion coefficient was estimated by molecular dynamics
simulation to be 7.1x10⁻⁹ m2 s−1.37-38 Without any scavenger, protein oxidation in the
excluded volume may be due to lingering radicals created at low levels from H2O2
photolysis. Although highly collimated, the incident laser beam edges may extend >10
microns beyond the observed irradiation width. Finally, the oxidation by hydroxyl
radicals is not a one-step process. In some protein-hydroxyl radical reactions, superoxide
is created. Superoxide has a longer half-life than hydroxyl radical; sulfur-containing
residues are sensitive to this ROS, although their reaction with O2-• is much slower than
with •OH.7, 36 Additionally, some protein-hydroperoxide intermediates may react
intermolecularly instead of following the usual pathways to modification.39 These
peroxides are formed predominantly at aliphatic residues where a carbon-centered radical
from hydrogen abstraction by an hydroxyl radical is stabilized by aqueous molecular
oxygen.34
The last mechanism of intermolecular oxidation is potentially a problem for all
oxidative-modification footprinting strategies. Yet evidence thus far from proteolysis
and MS/MS analysis of constituent peptides shows that the sites of oxidation are
consistent with the residue sidechain solvent accessibilities calculated from x-ray
49
crystallography and NMR structures of several proteins.13, 15-16, 22 States higher than +8
oxygens are of very low abundance when FPOP is correctly controlled, but they are
significantly more populated when a radical scavenger is not included. Latent protein-
peroxide oxidation of newly accessible residues may be a millisecond-minute pathway
capable of enriching these higher states without the presence of large excesses of Gln.
2.5 Conclusion
FPOP conducted properly by including control on radical lifetime and minimizing
exposure to peroxide post FPOP provides a means of footprinting proteins without
perturbing unduly their conformation during labeling. Although some proteins
undergoing several oxidations do unfold at longer times (by the time of ESI-MS), this
unfolding occurs post-FPOP, as established by finding a good fit of the +0, +16, +32…
state product distribution to a Poisson distribution under proper conditions. The
underlying assumption is that the Poisson model is applicable to footprinting a protein
population sharing an invariant conformation and having many non-cooperative
oxidation sites. In cases where radical and peroxide controls are not sufficient, the
product distribution is shifted to higher states of modification, as expected, and is not
well described by a Poisson distribution. The implication that partial unfolding occurs
during the timescale of modification is consistent with the Poisson model. This test is not
ad-hoc as it holds for three proteins. Moreover, we suggest that the approach is an
appropriate validation of any oxidative-modification footprinting. The global
modification distribution of •OH-treated proteins larger than 20 kDa can also be
examined for concordance with a Poisson distribution—in fact the Poisson approximation
50
of the binomial distribution is improved with more labeling sites. Accurate modeling
requires approximately half-height resolution of distinct +16 Da states; FTMS resolution
is needed for proteins as large as BSA (66 kDa). The modification distribution should be
only a function of the native conformation state of a protein. If the native state is an
equilibrium mixture of conformations, the distribution will not necessarily be Poisson. If
this non-Poisson distribution is the product of properly controlled FPOP, then it serves as
the model distribution for testing conformation change with additional perturbations
(such as denaturant) to the native equilibrium.
2.6 Supplemental Section: Mathematical Modeling
A model of the control spectrum was first determined, providing a set of model
peaks which were overlaid with each 0, +16, +32… peak of the oxidized protein sample
spectrum. This reasonably assumes that the adduct peaks owing to inherent protein
modification, ESI losses of ammonia and water, hydrogen peroxide oxidation, and salt
complexation were equally likely for any major 0, +16, +32… protein state. These peaks
never comprised more than 5% of the unmodified protein signal in the control spectrum
(see Figures 3a, 4a). Peak detection made use of a filter matched to the natural isotopic
profile component orthogonal to the class of linear functions, first, to identify the
spectrum points that had a filter response that was a fraction of the difference between the
local maximum and minimum as noise, second, to mark the peaks at the local maxima of
the filter response that were above the filter response to the noise points, and third, to
provide the basis for finding the peak edges via mass shifted versions of the filter
followed by peak centroid and area calculation. The parameters passed for subsequent
51
modeling are a set of mass shifts T∆VWXYZ[\| ] 1 … WXYZ[^, each with an according
fraction _ , relative to _[ 1 for the base 1th peak at ∆VWXYZ[a 0.
The FPOP charge state spectrum model is the weighted sum of the set of P 0,
+16, +32… states M=5YYc[V, =6V, … =89VQ; the set of 4; contribution coefficients
are determined by a non-linear regression fitting to the spectrum (eq 3).
&V; @ 45=5YYc[V; @ > ∑ 4;89;<6 =;V > ? (3)
The independent variable V is the spectrum m/z; the model is parameterized by 0 d @ d1. The baseline constant ? is the average noise 5-7 m/z lower than the unmodified
protein peak of the spectrum about the charge state (e. The contribution of proteins
suffering zero +16 Da additions to the spectrum can be split between the fraction
excluded from the reaction volume and the fraction in the irradiated volume escaping +16
Da chemistry (eq 4).
=5YYc[V; @ 1 @=5PW[V > @=5V (4)
The exclusion volume component absent the factor 1 @ is the sum over control
spectrum peaks, of which the base peak at .Z/(e is dominant.
=5PW[V ∑ _g8hij8a`<6 k(e · V ; Vl5` (5)
km; ml is the isotopic distribution interpolation function with its centroid at ml Da; the
argument m is supplied as a de-charged mass in Da. The isotopic distribution for a
52
protein of known composition is approximated by binning in one Da increments its
isotopes, considering the natural isotope abundances of carbon, hydrogen, nitrogen,
oxygen, and sulfur. The mass difference m ml determines the interpolation from .Z; the
normalized values of the closest bin nearer .Z and closest bin further .Z define a straight
line whose intersection with m ml provides the function value. The centroid (eq 6) is a
de-charged mass centered about the Oth +16 Da state, shifted by the ]th control mass shift.
Vl;` .Z > (e · ∆VWXYZ[\ > O · 16 (6)
The Oth +16 Da state (eq 7) has an additional compound component o;`V (eq 8)
which accounts for low abundance resolved and unresolved FPOP products.
=;V ∑ _g8hij8a`<6 pk(e · V ; Vl;` > o;`Vq (7)
o;`V r exp vpV Vl;` > wq2y z
> ( |k(e · V ; Vl;` > (e · ∆VcP" ~9
<6
> r exp vpV Vl;` > w > (e · ∆VcP"q2y z
(8)
53
Losses of ammonia, water, and the -30 Da acidic residue FPOP product from the
0 state are resolved from the major 0, +16, +32… states by virtue of a negative m/z shift.
A preliminary peak detection algorithm is employed to detect and pass the mass shifts
∆VcP"and relative intensities ( of cP d 2 “auxiliary” resolved peaks to the iterative
modeling algorithm. We model proteins suffering unresolved non +16 Da chemistry and
having O +16 Da additions as a normal distribution with an amplitude r, standard
deviation y, and with a centroid shifted from the Oth +16 Da state by w.
As there are many atomics sites for dominant 0, +16, +32… chemistry, so there
are many for the low yield pathways. We presume the likelihood of dominant chemistry
at any site is independent of the fates at other sites, as long as the protein conformation is
in stasis; it follows that the low abundance non +16 Da chemistry is also independent of
additional FPOP modification. Consequently the distribution of proteins suffering any
such resolved or unresolved non +16 Da pathway and having O +16 Da additions, but for
the centroid shift Vl;` and amplitude 4; of the state, is otherwise the same. We further
suppose that any resolved modification has its own set of additional unresolved
“daughter” products with the same normal distribution (we do not imply a lineage of
products).
Substituting equations 5 and 7 into 4 gives equation 9.
=5YYc[V; @ ∑ _g8hij8a`<6 k(e · V ; Vl5` > @ · ∑ _g8hij8a`<6 o5`V (9)
54
The parameter @ isn’t determined at a priori but rather is constrained by the independent
measure of the EVF (eq 10).
?AB@ 6GK9ga6GK9gaLGKL∑ GHI89HJ
(10)
The integrated 0, +16, +32… spectrum contributions absent @ coefficients are given
equations 11 and 12. The numerical integration range ,/26 ,/25 spans the entire
charge state and its return to baseline noise.
=; 4;=;V0V//K (11)
=5PW[ 45=5PW[V0V//K (12)
The EVF is independently determined from the ID of the fused silica tubing and the
measured flow rate of the infusion, pulse frequency of the excimer laser, and irradiation
cross-section width of the beam (see Figure 1). Equation 10 can be rearranged to give the
explicit constraint on @ (eq 13).
@?AB 1 CDE·∑ GHI89HJKGK9gaLCDE·GKGK9ga (13)
The model is fit to the real spectrum in Mathcad 14 by the “Minimize” algorithm,
which uses a quasi-Newton nonlinear regression process to determine the set == of
parameters Rr, w, y, 4; | O 0,1, … , PS minimizing the RMSD function (eq 14).
.&o== ∑ P;P9 9 (14)
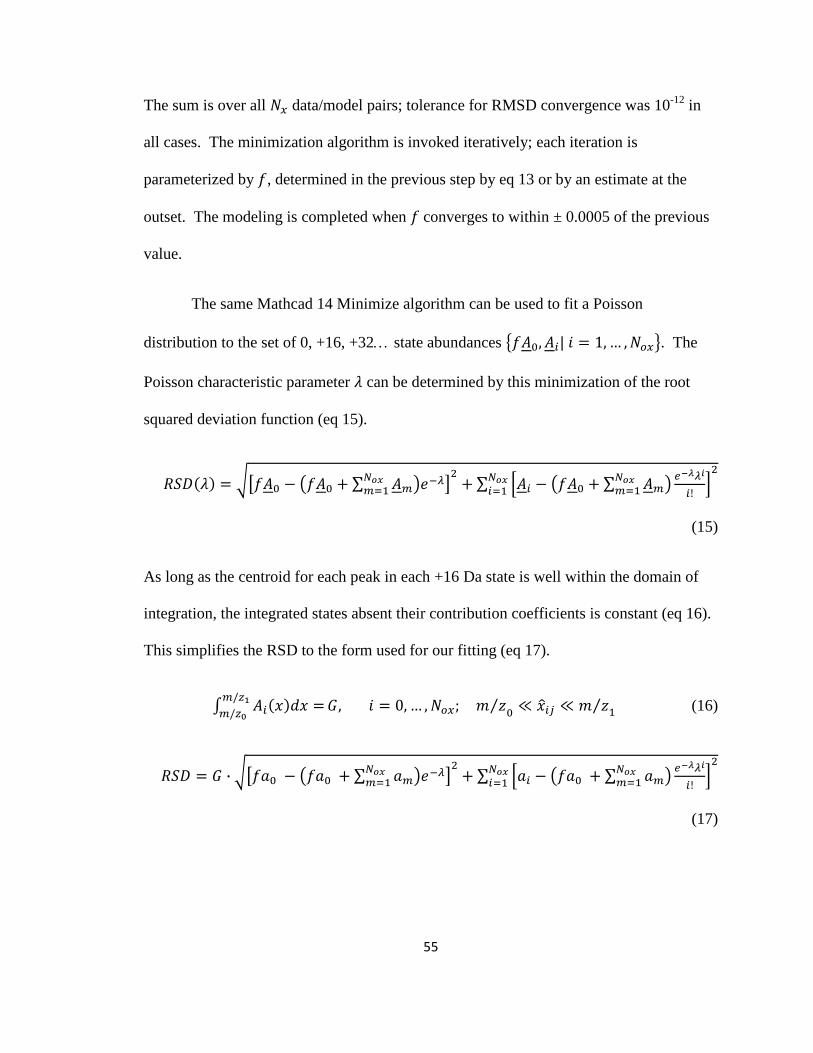
55
The sum is over all P data/model pairs; tolerance for RMSD convergence was 10-12 in
all cases. The minimization algorithm is invoked iteratively; each iteration is
parameterized by @, determined in the previous step by eq 13 or by an estimate at the
outset. The modeling is completed when @ converges to within ± 0.0005 of the previous
value.
The same Mathcad 14 Minimize algorithm can be used to fit a Poisson
distribution to the set of 0, +16, +32… state abundances M@=5, =;| O 1, … , PQ. The
Poisson characteristic parameter can be determined by this minimization of the root
squared deviation function (eq 15).
&o p@=5 @=5 > ∑ =89<6 '!q > ∑ =; @=5 > ∑ =89<6 !H;! 89;<6
(15)
As long as the centroid for each peak in each +16 Da state is well within the domain of
integration, the integrated states absent their contribution coefficients is constant (eq 16).
This simplifies the RSD to the form used for our fitting (eq 17).
=;V0V //K , O 0, … , P; , 2⁄ 5 Vl;` , 2⁄ 6 (16)
&o · p@45 @45 > ∑ 489<6 '!q > ∑ 4; @45 > ∑ 489<6 !H;! 89;<6
(17)
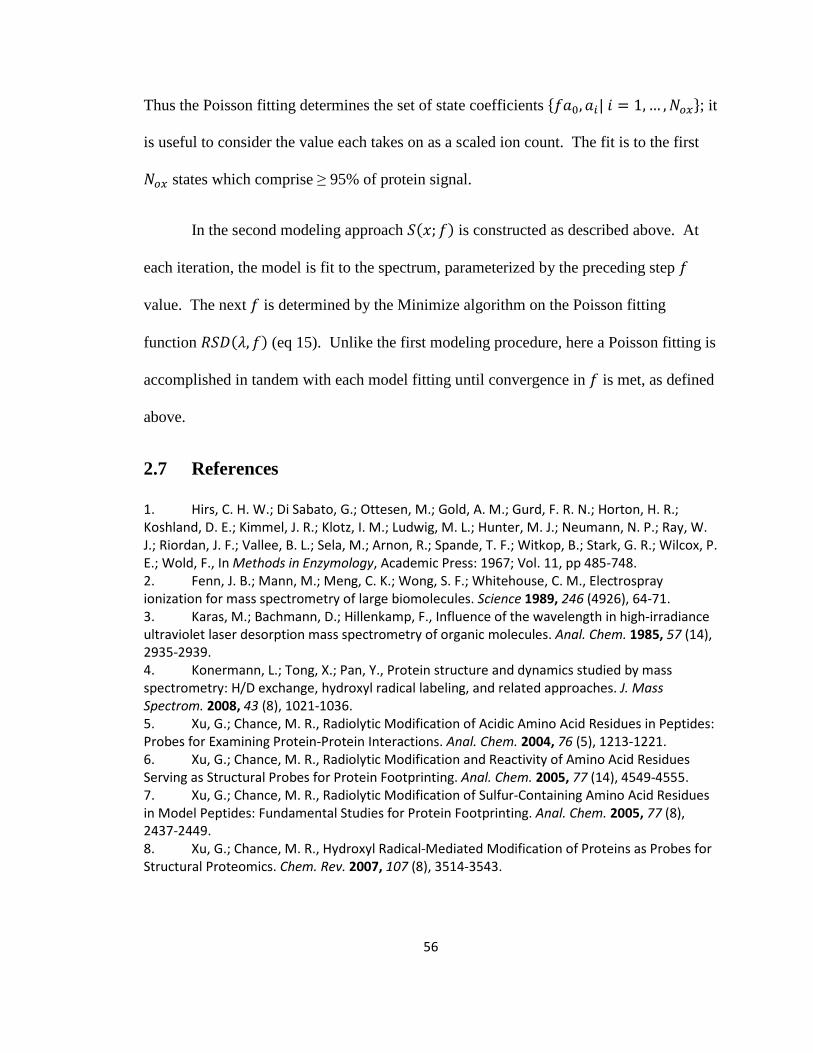
56
Thus the Poisson fitting determines the set of state coefficients R@45, 4;| O 1, … , PS; it is useful to consider the value each takes on as a scaled ion count. The fit is to the first
P states which comprise ≥ 95% of protein signal.
In the second modeling approach &V; @ is constructed as described above. At
each iteration, the model is fit to the spectrum, parameterized by the preceding step @
value. The next @ is determined by the Minimize algorithm on the Poisson fitting
function &o, @ (eq 15). Unlike the first modeling procedure, here a Poisson fitting is
accomplished in tandem with each model fitting until convergence in @ is met, as defined
above.
2.7 References
1. Hirs, C. H. W.; Di Sabato, G.; Ottesen, M.; Gold, A. M.; Gurd, F. R. N.; Horton, H. R.;
Koshland, D. E.; Kimmel, J. R.; Klotz, I. M.; Ludwig, M. L.; Hunter, M. J.; Neumann, N. P.; Ray, W.
J.; Riordan, J. F.; Vallee, B. L.; Sela, M.; Arnon, R.; Spande, T. F.; Witkop, B.; Stark, G. R.; Wilcox, P.
E.; Wold, F., In Methods in Enzymology, Academic Press: 1967; Vol. 11, pp 485-748.
2. Fenn, J. B.; Mann, M.; Meng, C. K.; Wong, S. F.; Whitehouse, C. M., Electrospray
ionization for mass spectrometry of large biomolecules. Science 1989, 246 (4926), 64-71.
3. Karas, M.; Bachmann, D.; Hillenkamp, F., Influence of the wavelength in high-irradiance
ultraviolet laser desorption mass spectrometry of organic molecules. Anal. Chem. 1985, 57 (14),
2935-2939.
4. Konermann, L.; Tong, X.; Pan, Y., Protein structure and dynamics studied by mass
spectrometry: H/D exchange, hydroxyl radical labeling, and related approaches. J. Mass
Spectrom. 2008, 43 (8), 1021-1036.
5. Xu, G.; Chance, M. R., Radiolytic Modification of Acidic Amino Acid Residues in Peptides:
Probes for Examining Protein-Protein Interactions. Anal. Chem. 2004, 76 (5), 1213-1221.
6. Xu, G.; Chance, M. R., Radiolytic Modification and Reactivity of Amino Acid Residues
Serving as Structural Probes for Protein Footprinting. Anal. Chem. 2005, 77 (14), 4549-4555.
7. Xu, G.; Chance, M. R., Radiolytic Modification of Sulfur-Containing Amino Acid Residues
in Model Peptides: Fundamental Studies for Protein Footprinting. Anal. Chem. 2005, 77 (8),
2437-2449.
8. Xu, G.; Chance, M. R., Hydroxyl Radical-Mediated Modification of Proteins as Probes for
Structural Proteomics. Chem. Rev. 2007, 107 (8), 3514-3543.
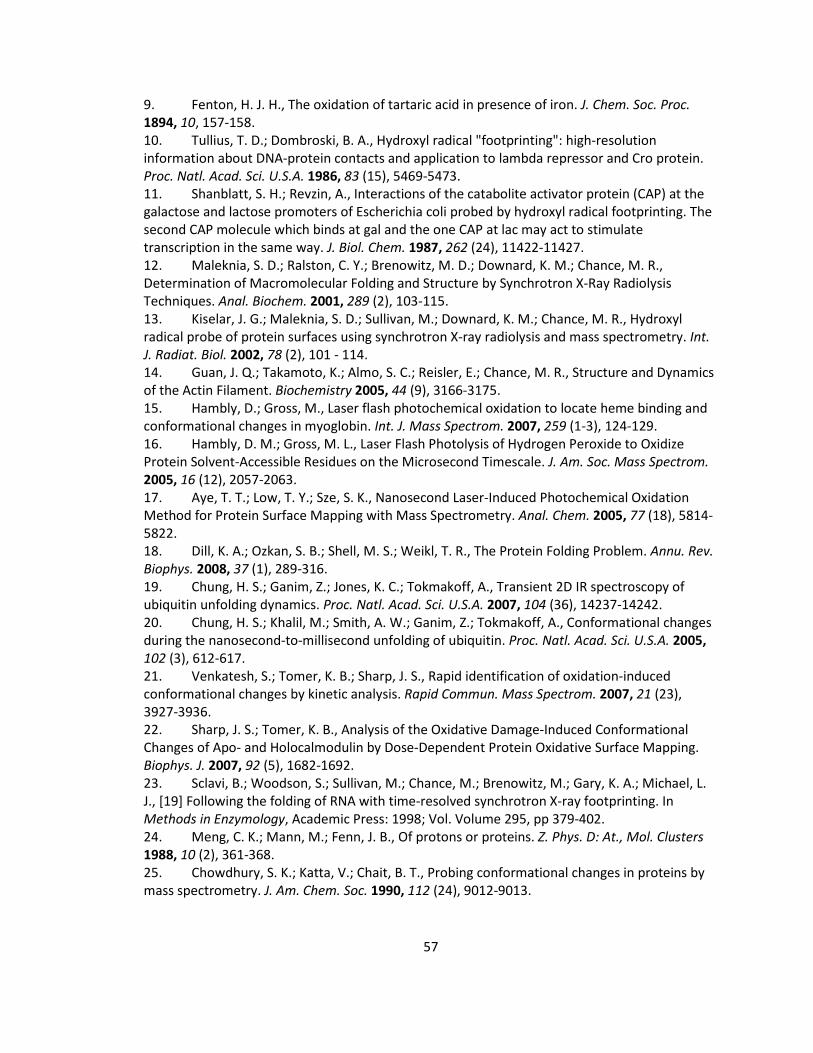
57
9. Fenton, H. J. H., The oxidation of tartaric acid in presence of iron. J. Chem. Soc. Proc.
1894, 10, 157-158.
10. Tullius, T. D.; Dombroski, B. A., Hydroxyl radical "footprinting": high-resolution
information about DNA-protein contacts and application to lambda repressor and Cro protein.
Proc. Natl. Acad. Sci. U.S.A. 1986, 83 (15), 5469-5473.
11. Shanblatt, S. H.; Revzin, A., Interactions of the catabolite activator protein (CAP) at the
galactose and lactose promoters of Escherichia coli probed by hydroxyl radical footprinting. The
second CAP molecule which binds at gal and the one CAP at lac may act to stimulate
transcription in the same way. J. Biol. Chem. 1987, 262 (24), 11422-11427.
12. Maleknia, S. D.; Ralston, C. Y.; Brenowitz, M. D.; Downard, K. M.; Chance, M. R.,
Determination of Macromolecular Folding and Structure by Synchrotron X-Ray Radiolysis
Techniques. Anal. Biochem. 2001, 289 (2), 103-115.
13. Kiselar, J. G.; Maleknia, S. D.; Sullivan, M.; Downard, K. M.; Chance, M. R., Hydroxyl
radical probe of protein surfaces using synchrotron X-ray radiolysis and mass spectrometry. Int.
J. Radiat. Biol. 2002, 78 (2), 101 - 114.
14. Guan, J. Q.; Takamoto, K.; Almo, S. C.; Reisler, E.; Chance, M. R., Structure and Dynamics
of the Actin Filament. Biochemistry 2005, 44 (9), 3166-3175.
15. Hambly, D.; Gross, M., Laser flash photochemical oxidation to locate heme binding and
conformational changes in myoglobin. Int. J. Mass Spectrom. 2007, 259 (1-3), 124-129.
16. Hambly, D. M.; Gross, M. L., Laser Flash Photolysis of Hydrogen Peroxide to Oxidize
Protein Solvent-Accessible Residues on the Microsecond Timescale. J. Am. Soc. Mass Spectrom.
2005, 16 (12), 2057-2063.
17. Aye, T. T.; Low, T. Y.; Sze, S. K., Nanosecond Laser-Induced Photochemical Oxidation
Method for Protein Surface Mapping with Mass Spectrometry. Anal. Chem. 2005, 77 (18), 5814-
5822.
18. Dill, K. A.; Ozkan, S. B.; Shell, M. S.; Weikl, T. R., The Protein Folding Problem. Annu. Rev.
Biophys. 2008, 37 (1), 289-316.
19. Chung, H. S.; Ganim, Z.; Jones, K. C.; Tokmakoff, A., Transient 2D IR spectroscopy of
ubiquitin unfolding dynamics. Proc. Natl. Acad. Sci. U.S.A. 2007, 104 (36), 14237-14242.
20. Chung, H. S.; Khalil, M.; Smith, A. W.; Ganim, Z.; Tokmakoff, A., Conformational changes
during the nanosecond-to-millisecond unfolding of ubiquitin. Proc. Natl. Acad. Sci. U.S.A. 2005,
102 (3), 612-617.
21. Venkatesh, S.; Tomer, K. B.; Sharp, J. S., Rapid identification of oxidation-induced
conformational changes by kinetic analysis. Rapid Commun. Mass Spectrom. 2007, 21 (23),
3927-3936.
22. Sharp, J. S.; Tomer, K. B., Analysis of the Oxidative Damage-Induced Conformational
Changes of Apo- and Holocalmodulin by Dose-Dependent Protein Oxidative Surface Mapping.
Biophys. J. 2007, 92 (5), 1682-1692.
23. Sclavi, B.; Woodson, S.; Sullivan, M.; Chance, M.; Brenowitz, M.; Gary, K. A.; Michael, L.
J., [19] Following the folding of RNA with time-resolved synchrotron X-ray footprinting. In
Methods in Enzymology, Academic Press: 1998; Vol. Volume 295, pp 379-402.
24. Meng, C. K.; Mann, M.; Fenn, J. B., Of protons or proteins. Z. Phys. D: At., Mol. Clusters
1988, 10 (2), 361-368.
25. Chowdhury, S. K.; Katta, V.; Chait, B. T., Probing conformational changes in proteins by
mass spectrometry. J. Am. Chem. Soc. 1990, 112 (24), 9012-9013.
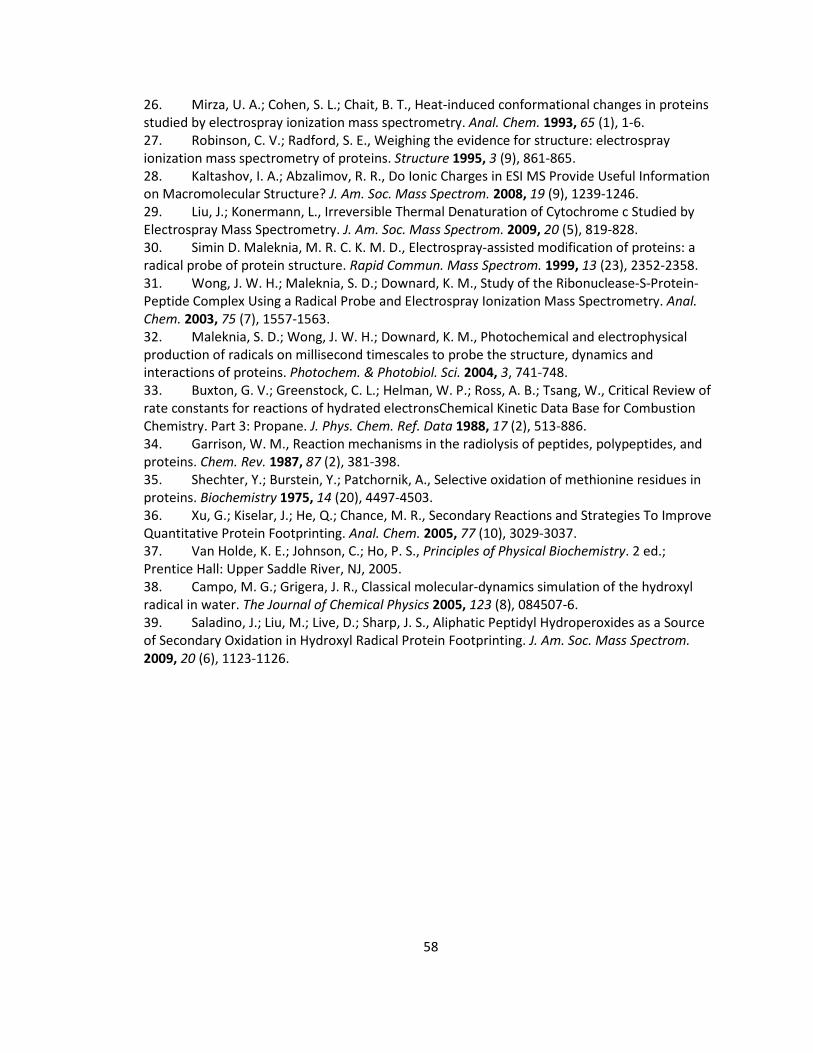
58
26. Mirza, U. A.; Cohen, S. L.; Chait, B. T., Heat-induced conformational changes in proteins
studied by electrospray ionization mass spectrometry. Anal. Chem. 1993, 65 (1), 1-6.
27. Robinson, C. V.; Radford, S. E., Weighing the evidence for structure: electrospray
ionization mass spectrometry of proteins. Structure 1995, 3 (9), 861-865.
28. Kaltashov, I. A.; Abzalimov, R. R., Do Ionic Charges in ESI MS Provide Useful Information
on Macromolecular Structure? J. Am. Soc. Mass Spectrom. 2008, 19 (9), 1239-1246.
29. Liu, J.; Konermann, L., Irreversible Thermal Denaturation of Cytochrome c Studied by
Electrospray Mass Spectrometry. J. Am. Soc. Mass Spectrom. 2009, 20 (5), 819-828.
30. Simin D. Maleknia, M. R. C. K. M. D., Electrospray-assisted modification of proteins: a
radical probe of protein structure. Rapid Commun. Mass Spectrom. 1999, 13 (23), 2352-2358.
31. Wong, J. W. H.; Maleknia, S. D.; Downard, K. M., Study of the Ribonuclease-S-Protein-
Peptide Complex Using a Radical Probe and Electrospray Ionization Mass Spectrometry. Anal.
Chem. 2003, 75 (7), 1557-1563.
32. Maleknia, S. D.; Wong, J. W. H.; Downard, K. M., Photochemical and electrophysical
production of radicals on millisecond timescales to probe the structure, dynamics and
interactions of proteins. Photochem. & Photobiol. Sci. 2004, 3, 741-748.
33. Buxton, G. V.; Greenstock, C. L.; Helman, W. P.; Ross, A. B.; Tsang, W., Critical Review of
rate constants for reactions of hydrated electronsChemical Kinetic Data Base for Combustion
Chemistry. Part 3: Propane. J. Phys. Chem. Ref. Data 1988, 17 (2), 513-886.
34. Garrison, W. M., Reaction mechanisms in the radiolysis of peptides, polypeptides, and
proteins. Chem. Rev. 1987, 87 (2), 381-398.
35. Shechter, Y.; Burstein, Y.; Patchornik, A., Selective oxidation of methionine residues in
proteins. Biochemistry 1975, 14 (20), 4497-4503.
36. Xu, G.; Kiselar, J.; He, Q.; Chance, M. R., Secondary Reactions and Strategies To Improve
Quantitative Protein Footprinting. Anal. Chem. 2005, 77 (10), 3029-3037.
37. Van Holde, K. E.; Johnson, C.; Ho, P. S., Principles of Physical Biochemistry. 2 ed.;
Prentice Hall: Upper Saddle River, NJ, 2005.
38. Campo, M. G.; Grigera, J. R., Classical molecular-dynamics simulation of the hydroxyl
radical in water. The Journal of Chemical Physics 2005, 123 (8), 084507-6.
39. Saladino, J.; Liu, M.; Live, D.; Sharp, J. S., Aliphatic Peptidyl Hydroperoxides as a Source
of Secondary Oxidation in Hydroxyl Radical Protein Footprinting. J. Am. Soc. Mass Spectrom.
2009, 20 (6), 1123-1126.
59
3 Characterization of the Mass Spectrometry-Observed Hydroxyl Radical Footprint of Barstar in its Native and Cold-Denatured States, Using a Novel Excel-based Data Analysis Platform, Commercial LC-MS Peak Detection Software, and Error-Tolerant Database Search. 3.1 Introduction
The promise of mass spectrometry-based (MS-based) protein footprinting is that
residue-resolved structural information may be realized for proteins in states inaccessible
to study by NMR spectroscopy and X-ray crystallography1-2. Hydroxyl radical-mediated
footprinting3 is one such method that has come to prominence in the last decade for
several reasons. First, all residue sidechains except glycine are reactive with •OH4,
though at differing rates5. Secondly, most of the •OH-mediated products are stable
modifications detectable by MS6-8. Finally, the size of •OH is comparable to water. Thus
with proper radical control, the extent of labeling of protein sidechains by •OH is a
function of their solvent accessibilities. The protein footprinting goal is usually to
determine which sites exhibit changes in their solvent accessible surface areas (SASAs)
upon the protein’s interaction with a ligand, another protein, or folding induction. Where
there is direct interaction, so must the labeling be attenuated9. Thus, the accurate
determination of the labeling yield at each residue is the central analytic challenge of
•OH-mediated protein footprinting.
The MS-based detection of footprinting modifications is often done in a “bottom-
up” approach, where the protein(s) of interest are isolated and proteolyzed prior to
60
chromatographic (LC) separation and MS detection. This methodology is also employed
in proteomics10. Owing to its non-specificity and reactivity, •OH-mediated footprinting
in particular complicates the LC-MS pattern of a single proteolyzed protein, so as to
resemble the information content from a more complex biological sample in a proteomics
study (Figure 3.1). In such studies, the inference of proteins in the sample is based on the
detection of their proteolytic peptides. One means of detecting these peptides is to couple
the LC to a hybrid mass spectrometer, capable of determining with ppm resolution
peptide “precursor” masses eluting in time, while in tandem performing fragmentation, or
MS2, experiments on a subset of these peptides to generate their characteristic
fragmentation spectra. These MS2 spectra, together with their precise precursor masses,
can be identified with a high degree of confidence using such algorithms such as
Mascot11 and the appropriate protein database. Automated matching can also determine
the location of modifications, if the appropriate variable modifications are considered in
the search algorithm.
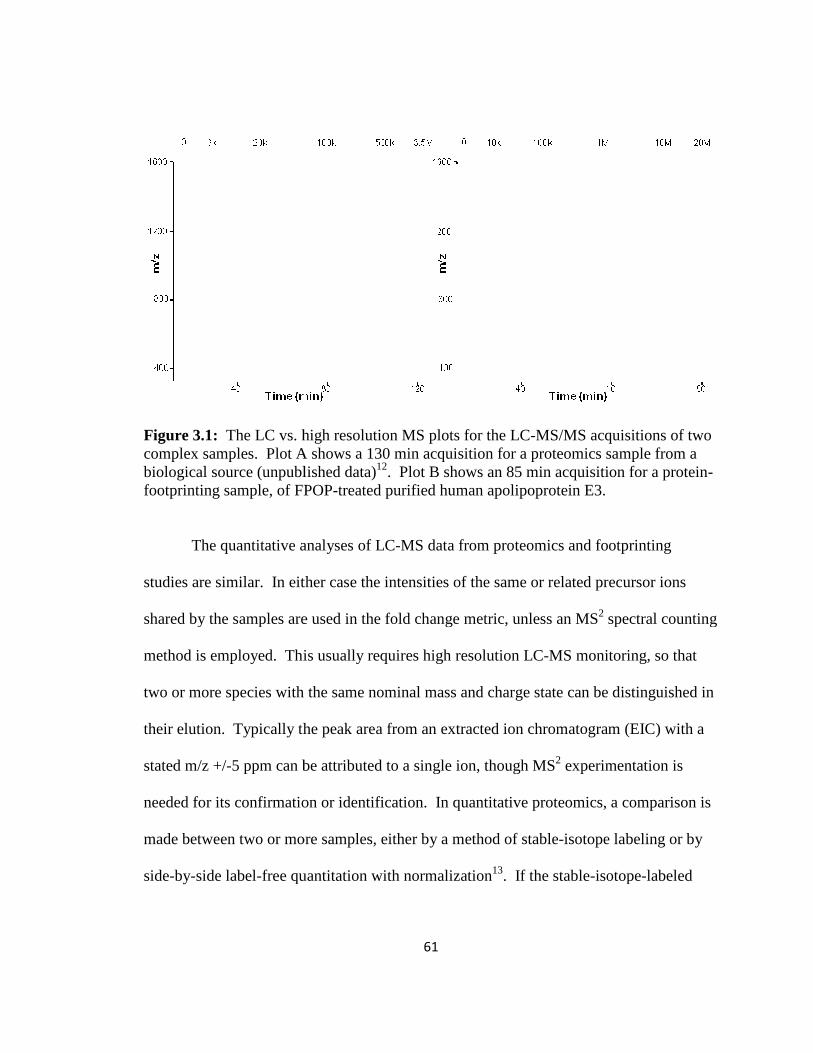
Figure 3.1: The LC vs. high resolution MS plots for the LCcomplex samples. Plot A shows a 130 min acquisition for a proteomics sample from a biological source (unpublished data)footprinting sample, of FPOP
The quantitative analyses of LC
studies are similar. In either case the
shared by the samples are used in the fold change metric, unless an MS
method is employed. This usually requires high resolution LC
two or more species with the s
their elution. Typically the peak area from an extracted ion chromatogram (EIC) with a
stated m/z +/-5 ppm can be attributed to a single ion, though MS
needed for its confirmation or identification. In quantitative proteomics, a comparison is
made between two or more samples, either by a method of stable
side-by-side label-free quantitation with normalization
61
The LC vs. high resolution MS plots for the LC-MS/MS acquisitions of two complex samples. Plot A shows a 130 min acquisition for a proteomics sample from a biological source (unpublished data)12. Plot B shows an 85 min acquisition for a proteinfootprinting sample, of FPOP-treated purified human apolipoprotein E3.
The quantitative analyses of LC-MS data from proteomics and footprinting
studies are similar. In either case the intensities of the same or related precursor ions
shared by the samples are used in the fold change metric, unless an MS2 spectral counting
method is employed. This usually requires high resolution LC-MS monitoring, so that
two or more species with the same nominal mass and charge state can be distinguished in
their elution. Typically the peak area from an extracted ion chromatogram (EIC) with a
5 ppm can be attributed to a single ion, though MS2 experimentation is
on or identification. In quantitative proteomics, a comparison is
made between two or more samples, either by a method of stable-isotope labeling or by
free quantitation with normalization13. If the stable-isotope
MS/MS acquisitions of two complex samples. Plot A shows a 130 min acquisition for a proteomics sample from a
. Plot B shows an 85 min acquisition for a protein-
MS data from proteomics and footprinting
intensities of the same or related precursor ions
spectral counting
MS monitoring, so that
ame nominal mass and charge state can be distinguished in
their elution. Typically the peak area from an extracted ion chromatogram (EIC) with a
experimentation is
on or identification. In quantitative proteomics, a comparison is
isotope labeling or by
isotope-labeled
62
sample is labeled perfectly—that is, at a precisely known frequency—and if the labeled
sample is mixed with the basis sample perfectly, then the only bias remaining between
samples is biological. The peptides that exhibit a significant difference in abundance
between samples are attributed to the up or down regulation of their associated protein.
More care must be taken in the normalization of label-free proteomics samples, to correct
for biases in overall protein expression, loss, and column loading. One large potential
source of bias is chromatographic variation—EIC peak alignment is crucial to ensure that
the same peptide abundances are compared between samples.
While mass spectrometry-based protein footprinting uses the same analytical tools
and protocols as proteome studies, there are several important distinctions that ultimately
have motivated the work presented in this study. The first is that the analyte protein(s) is
known, is often highly purified, and often is not in a biologically complex milieu. In our
footprinting studies, the quantities needed for LC-MS/MS analysis has not exceeded a
picomole9, 14-16, allowing study of protein at sub-micromolar levels if an absence of
interaction is required. This is still very much more than some proteins detected in
complex biological mixtures. The second distinction is that, whereas the detection of
only two unique peptides belonging to a protein are required to declare its presence in a
typical proteomics experiment10, the goal of footprinting analysis is to detect all
proteolytic peptides of the analyte protein at levels that enable the detection of their
footprinting-modified sibling peptides.
The final distinction between proteomics and footprinting LC-MS/MS: the
comparison is not of the abundances of a single peptide shared by two samples. Rather

63
the comparison is inherently normalized, in that per-residue labeling yields are compared.
Biases in proteolysis and column loading are unimportant because these should not affect
yield—what happens to the unmodified peptide happens equally to modified peptide.
Biases in ionization efficiency may not be shared equally between modified and
unmodified peptides, but they should be shared equally among different samples, as long
as the same column and MS source conditions are used within a contiguous time frame.
Biases in labeling are obviated by doing same-day labeling.
These distinctions have several consequences. Full “analytic” coverage is a more
stringent criterion than full sequence coverage, because regions of the protein that have
too few or many intervening sites of proteolysis may give rise to peptides that are
detected only at low abundance. Detecting the modified sibling of such peptides can be
problematic. Compensating this drawback is the a priori knowledge of protein sequence
and possible modification fates. This can be used to program the spectrometer on which
peptides to perform MS2 experiments. Low abundant eluting peaks having the right
precursor mass may thus be selected when they would have otherwise been ignored by
the normal decision algorithm. More importantly, knowing all probable outcomes of a
labeling experiment should empower the data analysis to greatly enhance analytic
coverage.
The software packages now available to analyze quantitative proteomic data is
extensive13. These software are tasked, as a first step, with identifying and measuring
peptide levels in a biological samples from the LC-MS/MS raw data. Such programs
could be used to analyze the same kind of data from a protein-footprinting study.
64
Generating a concise and single-protein-centric output, amenable to addressing the
questions of structural change, is not easily accomplished by these large packages yet.
The goal of analytic coverage, and the providence of a priori knowledge of sample
composition, demands that the highest level of scrutiny be used in indentifying modified
and unmodified peptides. Ultimately this requires the scientist’s inspection of spectra.
This also falls out of the normal purview of proteomics studies. We have written
Excel-based protein-footprinting software with these considerations in mind. Automated
LC-MS peak detection and alignment must still be performed by external software, and
MS2 database searching also done by Mascot (forthcoming versions will allow for
Sequest17 and OMSSA18 searching). Our software accomplishes four things. (1) All LC-
MS species within a certain mass tolerance of putative modified or unmodified peptides
of the analyte protein or proteins are found, and when possible, annotated with their
associated MS2 Mascot call, in a protein-centric output. (2) Chromatographically
unresolved peptide isomers and discrepant calls are identified and ranked for validation
decisions. (3) Validation can be done systematically and efficiently with the MS2 testing
tools, and by virtue of the organized protein-centric output. (4) The final per-residue
output necessary for hypothesis testing is generated.
As a demonstration of the software and the value of •OH-mediated protein
footprinting, we present the footprinting results of barstar in its folded and unfolded
states. Barstar is a 10.2 kDa protein, whose function is to inhibit the ribonuclease activity
of barnase in Bacillus amyloliquefaciens19-20. We have chosen this protein due to its
peculiar thermal stability: it adopts its native structure at room temperature but is
65
unfolded at 0 °C 21-22. The footprinting method we employed is fast photochemical
oxidation of proteins (FPOP) 16, 23, which creates •OH at sub mM levels with the
homolytic cleavage of H2O2 by a 17 ns pulse of 248 nm from a KrF excimer laser source.
The protein exposure to •OH is kinetically limited to a microsecond by the inclusion of a
radical scavenger, such that only the equilibrium state of the protein is sampled24.
3.2 Experimental Procedures
3.2.1 Reagents.
E. coli-expressed and purified barstar C82A variant was kindly provided by Drs.
C. Frieden and G. DeKoster. HPLC-grade water, 30% H2O2, L-glutamine, L-methionine,
catalase, guanidinium chloride (GdnCl), and phosphate buffered saline (PBS) were
purchased from the Sigma Aldrich Chemical Company (St. Louis, MO).
3.2.2 Equilibration and FPOP labeling.
Each sample was composed of 10 µM barstar, 1.5 M GdnCl, and 15 mM
glutamine in PBS buffer. The “cold” equilibration solution was incubated at 0 °C and the
“warm” solution at 22 °C room temperature two hours prior to labeling. Cold and warm
sample replicates were drawn from these solutions; to each replicate H2O2 was added by
10-fold dilution to a 20 mM final concentration, two min prior to its infusion through the
FPOP apparatus. The FPOP apparatus was used as previously described 16 but with 150
µm i.d. fused silica (Polymicro Technologies, Phoenix, AZ). In addition, for cold
samples, a thermally insulated box with two chambers abutted the FPOP apparatus. The
1st chamber contained an ice batch and copper tubing connected to a compressed air
supply. The 2nd adjacent chamber, into which the copper tubing emptied, was
66
constructed to enclose the syringe pump, optics stand, and intervening fused silica, with a
2 cm2 window for laser transmission. The 2nd chamber temperature was kept to less than
3°C by adjusting the compressed air flow through the ice bath.
The KrF excimer laser power (GAM Laser Inc., Orlando, FL) was adjusted to 45
mJ/pulse, and its pulse frequency was set to 5 Hz. The flow rate was adjusted to ensure a
25% exclusion volume to avoid repeat •OH exposure24. Excess H2O2 was removed
immediately following FPOP labeling by collecting samples in microcentrifuge tubes
containing 10 µL of 200 fM catalase. This catalase solution also contained methionine to
give a final concentration of 20 mM following collection. O2(g) was removed from the
samples by centrifugation, and samples were subsequently frozen in N2(l) and stored at -
80°C prior to proteolysis. A control sample was drawn from the same equilibration
solutions and handled identically except that the laser was not used.
3.2.3 Proteolysis.
All samples were proteolyzed with 10:1 protein:trypsin (by weight) at 37 °C for 3
h, then de-salted by ZiptipC18 (Millipore, Billerica, MA) with elution into 10 uL of 50%
acetonitrile 1% formic acid solution. A portion of this was diluted 25-fold with water and
0.1% formic acid for autosampler loading.
3.2.3 LC-MS/MS acquisition.
Five microliters of each replicate was loaded by autosampler onto a 20 cm
column with a PicoFrit tip (New Objective, Inc, Woburn, MA), bomb-packed with C18
reverse phase material (Magic, 0.075 mm × 200 mm, 5 µm, 300 Å, Michrom, Auburn,
CA). Peptides were eluted by a 70 min, 260 nL/min gradient coupled to the nanospray
67
source of an LTQ-Orbitrap mass spectrometer (Thermo Fisher, Waltham, MA). Mass
spectra were obtained at high mass resolving power (100,000 for ions of m/z 400) on the
Orbitrap component, and the six most abundant ions eluting per scan were each subjected
to CID MS2 experiment in the LTQ component, using a collision energy 35% of the
maximum, a 2 Da isolation width, and wideband activation. Precursor ions were added
to a dynamic exclusion list for 8 s to ensure good sampling of the apex of their elution
peaks. Blanks were run between every sample acquisition.
3.3 Data Analysis
3.3.1 Overview.
The general approach for data analysis is diagramed in Figure 3.2. Sample
replicates are drawn from a stock solution of the equilibrium conditions. Analytic
replicates can also created at the time of LC-MS/MS acquisition as typically more than
five-fold of material is present in the de-salted peptide eluent than is needed. We note
that creating analytic replicates may treble again the instrument time, already long
because of the replicate no-laser controls needed for FPOP. The inclusion of replicates
serves more than the purpose of providing statistics. Just as replicate LC-MS/MS
analyses expands the number of identified proteins in a proteomics experiment25-26, so
with replicates does the probability of selection for MS2 and subsequent identification
improve for low-abundance modified peptides.
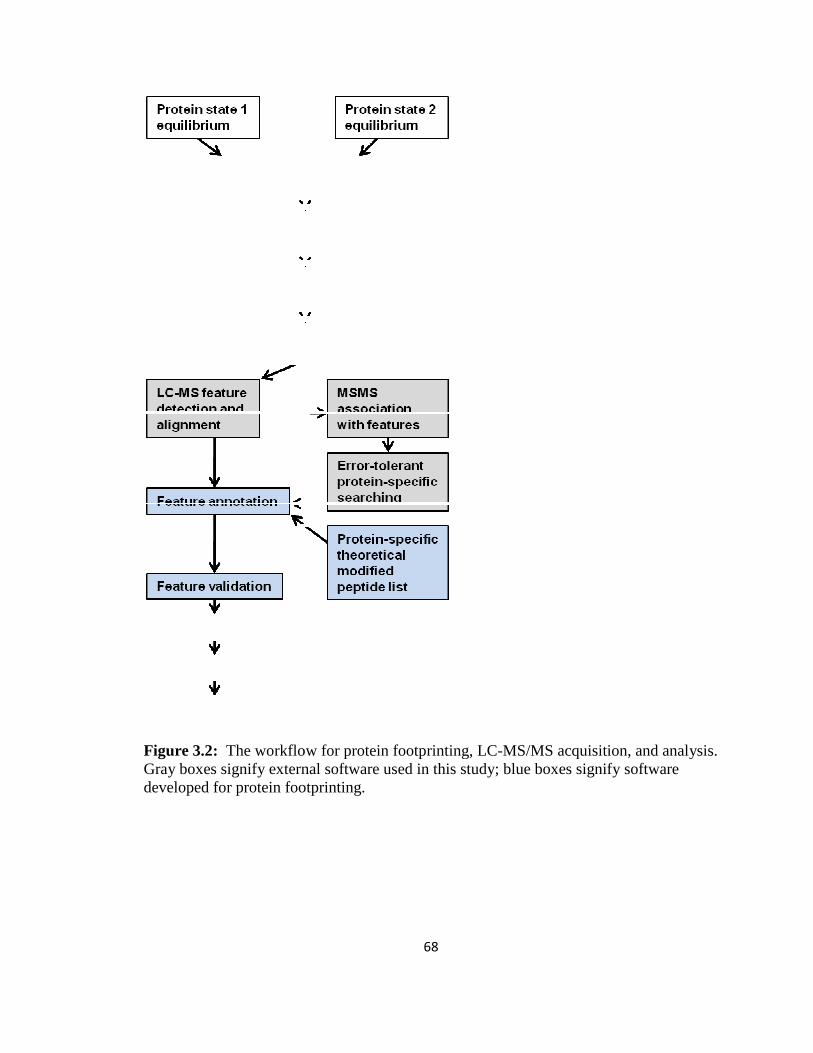
Figure 3.2: The workflow for protein footprinting, LCGray boxes signify external software used in this study; blue boxes signify software developed for protein footprinting.
68
The workflow for protein footprinting, LC-MS/MS acquisition, and analysis. Gray boxes signify external software used in this study; blue boxes signify software developed for protein footprinting.
MS/MS acquisition, and analysis. Gray boxes signify external software used in this study; blue boxes signify software
69
Good peak sampling is important in both the MS and MS2 domains. The abundance of
an ion is determined from its integrated EIC peak area in the high resolution MS domain
(Figure 3.3). Automatic gain control, maximum trap fill times, lock-mass selection, m/z
resolution, and number of MS2 experiments are all parameters that affect the frequency of
the Orbitrap scans; we have striven for a 0.3 Hz frequency to well represent 10-20 sec
peak widths. For data-dependent MS2 selection, precursor ions were added to a dynamic
exclusion list on their first occurrence for 8 s to ensure good MS2 sampling of the apex of
their elution peaks.
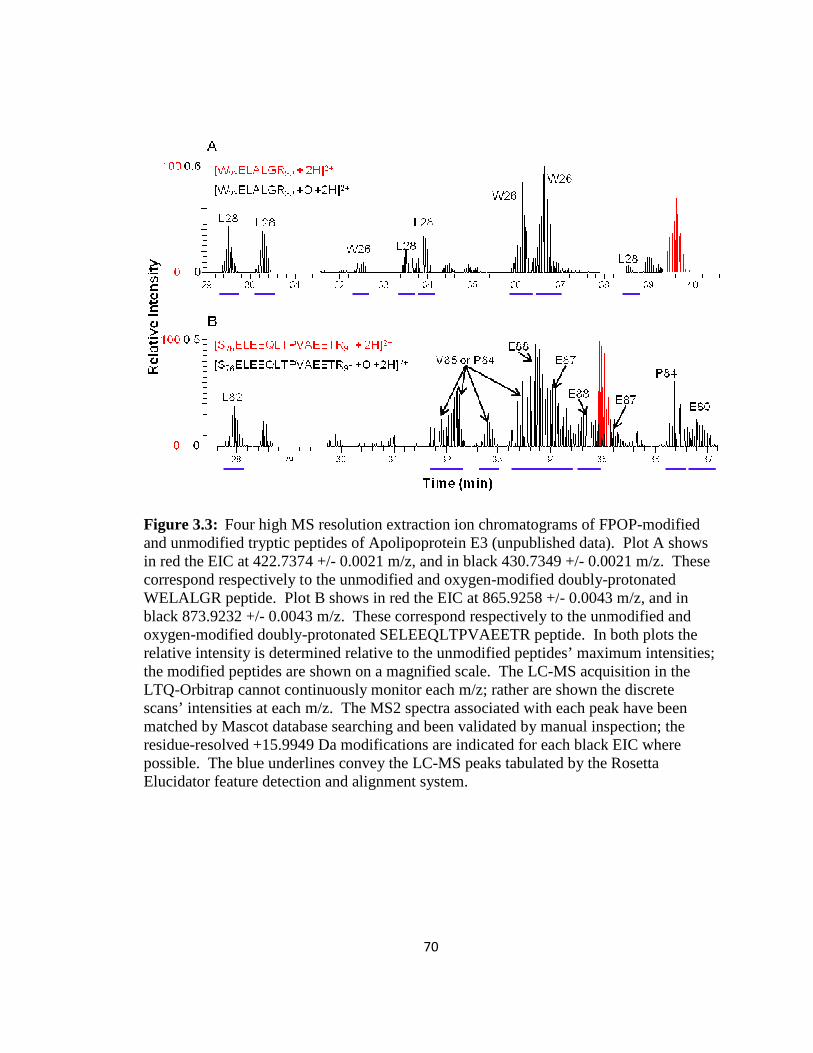
Figure 3.3: Four high MS resolution extraction ion chromatograms of FPOPand unmodified tryptic peptides of Apolipoprotein E3 (unpublished data). Plot A shows in red the EIC at 422.737correspond respectively to the unmodified and oxygenWELALGR peptide. Plot B shows in red the EIC at 865.9258 +/black 873.9232 +/- 0.0043 m/z. oxygen-modified doubly-relative intensity is determined relative to the unmodified peptides’ maximum intensities; the modified peptides are shown on LTQ-Orbitrap cannot continuously monitor each m/z; rather are shown the discrete scans’ intensities at each m/z. The MS2 spectra associated with each peak have been matched by Mascot database searching and residue-resolved +15.9949 Da modifications are indicated for each black EIC where possible. The blue underlines convey the LCElucidator feature detection and alignment system.
70
Four high MS resolution extraction ion chromatograms of FPOPand unmodified tryptic peptides of Apolipoprotein E3 (unpublished data). Plot A shows in red the EIC at 422.7374 +/- 0.0021 m/z, and in black 430.7349 +/- 0.0021 m/z. These correspond respectively to the unmodified and oxygen-modified doubly-protonated WELALGR peptide. Plot B shows in red the EIC at 865.9258 +/- 0.0043 m/z, and in
0.0043 m/z. These correspond respectively to the unmodified and -protonated SELEEQLTPVAEETR peptide. In both plots the
relative intensity is determined relative to the unmodified peptides’ maximum intensities; the modified peptides are shown on a magnified scale. The LC-MS acquisition in the
Orbitrap cannot continuously monitor each m/z; rather are shown the discrete intensities at each m/z. The MS2 spectra associated with each peak have been
matched by Mascot database searching and been validated by manual inspection; the resolved +15.9949 Da modifications are indicated for each black EIC where
possible. The blue underlines convey the LC-MS peaks tabulated by the Rosetta Elucidator feature detection and alignment system.
Four high MS resolution extraction ion chromatograms of FPOP-modified and unmodified tryptic peptides of Apolipoprotein E3 (unpublished data). Plot A shows
0.0021 m/z. These protonated
0.0043 m/z, and in These correspond respectively to the unmodified and
protonated SELEEQLTPVAEETR peptide. In both plots the relative intensity is determined relative to the unmodified peptides’ maximum intensities;
MS acquisition in the Orbitrap cannot continuously monitor each m/z; rather are shown the discrete intensities at each m/z. The MS2 spectra associated with each peak have been
been validated by manual inspection; the resolved +15.9949 Da modifications are indicated for each black EIC where
MS peaks tabulated by the Rosetta
71
3.3.2 Feature detection and alignment.
Accurate LC-MS peak software must be used to automate the accounting of 1000s
of EIC peaks. A feature is tabulated as the sum of all EIC peaks of ions with the same
elution time and same (+/- 5 ppm) de-charged monoisotopic mass. Abundant tryptic
peptide features are often the sums of ten or more ion isotopomer intensities split among
two or more charge states. The features must be listed with their de-charged
monoisotopic mass centroids. The fidelity of peak alignment software is extremely
important in footprinting analysis, as it is in label-free proteomics. If the
chromatographic reproducibility is poor, we recommend individually processing each
data set; this significantly increases the analysis time because the validation step must be
repeated for each occurrence. We have used Rosetta Elucidator (Microsoft, Bellevue,
WA) in our work, though several other free and commercial packages are available13, 27.
Usually oxidative modifications make a peptide more hydrophobic than its
unmodified root, such that it will elute earlier in reverse phase chromatography. A
solvent-exposed region of a protein may undergo modifications at several neighboring
sites in the protein population. Often the resulting set of peptide isomers perfectly
resolve, as is seen in Figure 3.3A for a peptide of FPOP-treated apolipoprotein E3
(unpublished data). Modified residues that exhibit more than one EIC peak are the result
of the non-specificity of •OH in hydrogen abstraction or direct addition4. Sometimes
these modifications are not well chromatographically resolved (Figure 3.3B), and some
peak detection programs such as Elucidator may tabulate these as a single broad peak.
72
The methodology and software presented here helps the user to make consistent,
systematic decisions about such data.
3.3.3 Mascot database searching.
The searching must be done on the .dta files created by the feature detection and
alignment software, which has been parameterized to associate one .dta file per MS2
spectrum. The IDs assigned by the LC-MS peak software connect the MS2 spectra to
their parent MS features; each unique feature ID is linked to the exact .dta filenames
created by the same LC-MS peak software for the feature’s MS2 spectra. Other programs
which also extract MS2 spectra from .raw files as .dta files, should not be used because
they will not follow the precise naming convention of the LC-MS peak software
alignment software.
Currently the software supports the comma separated values (.csv) output of
Mascot11. For •OH-mediated footprinting, all commonly observed modifications for
residues should be input into the Mascot variable modification database; redundant
entries do not confuse the algorithm. A recent review lists these and their likely
mechanisms of formation3. The set of .dtas created by the LC-MS peak software must be
merged into a Mascot generic file (.mgf) prior to search submission. If .mgf file is
smaller than 50 Mb, a single search against a restricted database and specifying the most
likely •OH modifications, such as the single and double net oxygen additions to Met, Trp,
Tyr, Phe, and His, and single net oxygen additions to Leu, Ile, Val, Gln, Glu, Lys, and
Arg, may be attempted.
73
An approach less prone to crashing and more comprehensive in its output, is to do
an “error-tolerant” search28 of the analyte protein after a preliminary search is done
without specifying variable modifications. In this approach the error-tolerant .csv output
is used as it contains a large set of modified peptide identifications, many of which will
indicate •OH-mediated product chemistry. The error-tolerant search will also contain
incorrect assignments in part because the MS2-matched putative peptide is no longer
required to have a precursor mass within the specified instrument tolerance of the
observed ion. We recommend also using the .csv output of the preliminary search in the
feature-matching program, as some spectra erroneously matched by the error tolerant
search will have their true match in the preliminary search. The benefit to doing error
tolerant searching is that many more MS2 spectra are discovered, which may be
associated with modified and unmodified peptides of the analyte protein. Then more
features of LC-MS low intensity may be considered. The tradeoff is that more manual
validation is required to accept these calls in the quest for accurate and full analytic
coverage. If two or more proteins are labeled in the experiment, error tolerant searching
should be done for each independently. Any number of .csv reports can be used by our
software.
3.3.4 Protein-specific theoretical modified peptide list.
To augment the MS2-Mascot-matched list of LC-MS features associated the
analyte protein, a list of proteolytic peptides of the protein together with any combination
of anticipated residue modifications is needed for accurate LC-MS mass matching. The
Excel spreadsheet tool “Unmodified and modified peptide masses from proteolysis of
74
protein” generates such a list. This tool uses the input sequence of the analyte protein,
and may also use optional inputs: user-defined variable and fixed modifications per
amino acid type or per specific residue, sites of known sequence breaks, and proteolytic
sites masked from cleavage. Execution of the “Get_Peptides” macro will guide the user
through choices in proteolytic enzyme, number of modifications to allow, and which
•OH-mediated products to consider, if desired. The output provides the list of putative
peptides for accurate mass matching and a list of protonated ion m/z values for manual
EIC lookup or inclusion list building. For two or more proteins in a single study, specify
an abbreviation to append to each peptide corresponding to its protein source.
3.3.5 Feature annotation.
The Excel spreadsheet “Match LCMS features with acc mass and Mascot calls”
marries the MS2-Mascot-matched calls with their LC-MS peak software-derived feature
list, and augments these with accurate mass matches from the “Unmodified and modified
peptide masses from proteolysis of protein”-generated theoretical modified peptide list.
There are four input worksheets that must be completed before the
“Match_peaks_to_peptides” macro can be run. The “input LCMS features” worksheet of
the spreadsheet requires as input, a list of the feature IDs determined by the LC-MS peak
software. Their mass and time centroids can also be included, as well as the feature
intensities for each sample by column; this option allows for other kinds of LC-MS peak
software outputs. In the “input dta list” worksheet the list of all .dta filenames and their
associated feature IDs and .raw file sources should be provided. The LC-MS peak
software should create .dta filenames for the MS2 spectra by including in them the name
75
of the .raw file from which each MS2 spectrum originated. The spreadsheet uses this
information to group spectra with their original acquisition names, thereby allowing
acquisition-specific spectral counting per feature. Into the “input exact mass list”
worksheet the theoretical modified peptide list is put.
The “input proteins” worksheet, the fourth and final input worksheet of the
spreadsheet, specifies the precedent order of proteins by the position of their sequence
entry. These sequences are used as the organizing directory for outputting annotated
features. They should be the same sequences used to generate the exact mass list, if a list
is to be used, and they must be the same sequences used by Mascot to generate the .CSV
report(s). The protein list is prioritized: a feature having a Mascot annotation exactly
matching a sequence from the first protein will be described as a peptide originating from
the first protein, even if a homologous protein lower on the list shares the same sequence.
This is intended. Same sequence peptides from two protein sources share the same LC-
MS properties, so their intensities should be compared in a single output line having one
annotation. The output columns differentiate the peptides’ sources by passing along their
acquisition names.
Execution of the “Match_peaks_to_peptides” macro initiates the dialog for
looking up aligned data files specific to each LC-MS acquisition, if this sample intensity
information was not provided in the 1st worksheet. A second dialog will ask for the .csv
report(s); these should be placed in the same folder. A threshold can optionally be
employed to filter low intensity data, though this is not recommended for beginning
experiments. We do recommend using a Mascot score threshold of 30 or better, as
76
validating matches deemed poor by Mascot is likely to be challenging or impossible.
Finally, the macro will ask for an accurate mass match tolerance; for Fourier transform
spectrometers we have used 8-10 ppm.
After execution the two outputs are provided. The “condensed Mascot output”
worksheet is a report of the Mascot-matched spectra exceeding the threshold and matched
to the proteins on the list. The first eight columns are the same fields found in the Mascot
.csv report(s), where each row pertains to a unique Mascot call. Rather than repeat the
same entry lower on the list for other matching MS2 spectra, all spectra that match this
entry are listed to the right of the annotation columns, and the best scoring peptide of
these is listed in column 19. Instead of relying on Mascot for the proper protein
annotation, the matched peptide sequence is tested against the protein list provided in the
“input proteins” worksheet. In this way redundant entries in the search database do not
confuse the output annotation. The protein-centric peptide annotation and associated LC-
MS feature ID are provided in columns 9-18. These fields are shared in the second
output described next.
The “annotate LCMS output” worksheet lists the LC-MS features matched by
Mascot searching or accurate mass matching first by protein, then N-terminus to C-
terminus peptide order, then by elution time. The first 15 columns in the output
worksheet annotate the LC-MS feature; the subsequent columns provide the intensities,
relative intensities, and spectral counts per feature for each sample acquisition. A
feature's relative intensity per sample acquisition is its absolute intensity divided by the
average of all absolute intensities, at least 0.1% as large as the acquisition’s maximum
77
intensity, in the subset of LC-MS peak software features putatively matched to the
analyte protein(s) in the “input proteins” worksheet. Table 3.1 shows the annotation
columns for one tryptic peptide of barstar. The theoretical mass is based on the Mascot-
matched call or accurate mass match, and the ppm error is based on the observed mass
difference with the putative theoretical peptide. The “net modified mass change” is
determined as the difference between the observed mass centroid and the theoretical
unmodified peptide. Features with the “# supporting MS2 spectra” field blank are
present owing to an accurate mass match with the theoretical modified peptide list. The
“potential modification(s)” field reflects one potential combination of modifications
giving rise to the net-modified-mass change for these entries.
3.3.6 Ranked calls.
Sometimes when more than one spectra are associated with a single LC-MS
feature, Mascot-matching will determine that some of the spectra are indicative of one
peptide, while the other spectra are indicative something else. These discrepancies arise
for two reasons. The first is the occasional nearly-coincident elution of modified peptide
isomers. In Figure 3.3B, a single LC-MS feature between 33.3 and 34.3 min is clearly a
mixture of three modified peptide isomers that are not resolved to half height. The
second reason is mistakes are sometimes made by error-tolerant Mascot-matching,
particularly when an MS2 spectrum is sparse, the modification is in a peptide region
insensitive to CID fragmentation, or multiple modifications are present on the peptide. It
has been beyond our scope to construct an algorithm that could resolve these
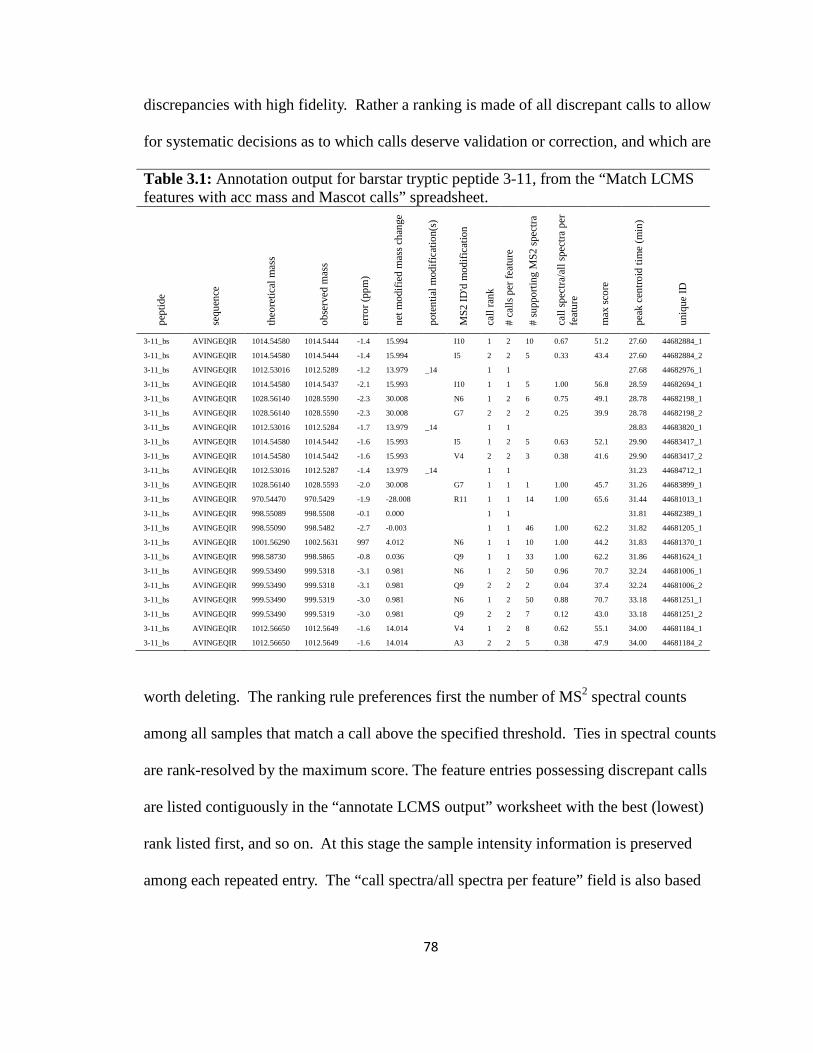
78
discrepancies with high fidelity. Rather a ranking is made of all discrepant calls to allow
for systematic decisions as to which calls deserve validation or correction, and which are
Table 3.1: Annotation output for barstar tryptic peptide 3-11, from the “Match LCMS features with acc mass and Mascot calls” spreadsheet.
pep
tide
sequ
ence
the
ore
tical
ma
ss
ob
serv
ed
ma
ss
err
or
(pp
m)
net
mo
difie
d m
ass
ch
ange
pot
entia
l mod
ifica
tion
(s)
MS
2 ID
'd m
odifi
catio
n
call
rank
# c
alls
pe
r fe
atu
re
# s
upp
ort
ing
MS
2 sp
ect
ra
call
spec
tra/
all s
pect
ra p
er
fea
ture
ma
x sc
ore
pe
ak c
entr
oid
tim
e (
min
)
uni
que
ID
3-11_bs AVINGEQIR 1014.54580 1014.5444 -1.4 15.994
I10 1 2 10 0.67 51.2 27.60 44682884_1
3-11_bs AVINGEQIR 1014.54580 1014.5444 -1.4 15.994
I5 2 2 5 0.33 43.4 27.60 44682884_2
3-11_bs AVINGEQIR 1012.53016 1012.5289 -1.2 13.979 _14
1 1
27.68 44682976_1
3-11_bs AVINGEQIR 1014.54580 1014.5437 -2.1 15.993
I10 1 1 5 1.00 56.8 28.59 44682694_1
3-11_bs AVINGEQIR 1028.56140 1028.5590 -2.3 30.008
N6 1 2 6 0.75 49.1 28.78 44682198_1
3-11_bs AVINGEQIR 1028.56140 1028.5590 -2.3 30.008
G7 2 2 2 0.25 39.9 28.78 44682198_2
3-11_bs AVINGEQIR 1012.53016 1012.5284 -1.7 13.979 _14
1 1
28.83 44683820_1
3-11_bs AVINGEQIR 1014.54580 1014.5442 -1.6 15.993
I5 1 2 5 0.63 52.1 29.90 44683417_1
3-11_bs AVINGEQIR 1014.54580 1014.5442 -1.6 15.993
V4 2 2 3 0.38 41.6 29.90 44683417_2
3-11_bs AVINGEQIR 1012.53016 1012.5287 -1.4 13.979 _14
1 1
31.23 44684712_1
3-11_bs AVINGEQIR 1028.56140 1028.5593 -2.0 30.008
G7 1 1 1 1.00 45.7 31.26 44683899_1
3-11_bs AVINGEQIR 970.54470 970.5429 -1.9 -28.008
R11 1 1 14 1.00 65.6 31.44 44681013_1
3-11_bs AVINGEQIR 998.55089 998.5508 -0.1 0.000
1 1
31.81 44682389_1
3-11_bs AVINGEQIR 998.55090 998.5482 -2.7 -0.003
1 1 46 1.00 62.2 31.82 44681205_1
3-11_bs AVINGEQIR 1001.56290 1002.5631 997 4.012
N6 1 1 10 1.00 44.2 31.83 44681370_1
3-11_bs AVINGEQIR 998.58730 998.5865 -0.8 0.036
Q9 1 1 33 1.00 62.2 31.86 44681624_1
3-11_bs AVINGEQIR 999.53490 999.5318 -3.1 0.981
N6 1 2 50 0.96 70.7 32.24 44681006_1
3-11_bs AVINGEQIR 999.53490 999.5318 -3.1 0.981
Q9 2 2 2 0.04 37.4 32.24 44681006_2
3-11_bs AVINGEQIR 999.53490 999.5319 -3.0 0.981
N6 1 2 50 0.88 70.7 33.18 44681251_1
3-11_bs AVINGEQIR 999.53490 999.5319 -3.0 0.981
Q9 2 2 7 0.12 43.0 33.18 44681251_2
3-11_bs AVINGEQIR 1012.56650 1012.5649 -1.6 14.014
V4 1 2 8 0.62 55.1 34.00 44681184_1
3-11_bs AVINGEQIR 1012.56650 1012.5649 -1.6 14.014
A3 2 2 5 0.38 47.9 34.00 44681184_2
worth deleting. The ranking rule preferences first the number of MS2 spectral counts
among all samples that match a call above the specified threshold. Ties in spectral counts
are rank-resolved by the maximum score. The feature entries possessing discrepant calls
are listed contiguously in the “annotate LCMS output” worksheet with the best (lowest)
rank listed first, and so on. At this stage the sample intensity information is preserved
among each repeated entry. The “call spectra/all spectra per feature” field is also based
79
on the spectral counts associated with calls, and can be used for quick filtering, using the
“Rank_Filter_Output” macro or Excel filtering capability.
3.3.7 Validation.
Depending on the protein system, footprinting chemistry, Mascot search
parameters, and desired level of quantitative resolution, the validation step in data
processing (Figure 3.2) can be nearly a “rubber stamp” step or can require a several-day
endeavor. This is an intimate step: no computer algorithm is employed to make
decisions. The first step is usually one of filtering. The features important to the
footprinting experiment should be scrutinized while superfluous features can be ignored
by deletion. The organization of the data in Excel allows the use of several Excel
capabilities including filtering and formula entry to assist in this filtering.
For FPOP footprinting, where analytic coverage requires finding low abundant
modifications, the filtering is often as follows. (1) Features with a maximum relative
intensity, among all samples, of less than 2% are marked for exclusion. Very often these
features did not trigger any MS2 experiments in any of the acquisitions. (2) Features with
|accurate mass errors| > 10 ppm and features with spurious modifications are corrected,
where possible, using the “Unmodified peptide accurate mass comparison” Excel tool.
This spreadsheet is not macro-enabled. Its function is to allow the user to hypothesize
correct modification calls when Mascot has made a mistake, or fill in missing sequence
when a non proteolytic peptide is suggested with a large N- or C-terminal modification.
(3) Modification calls associated with deamidation, water loss, ammonia loss, and other
chemistries that show as much abundance in control samples as FPOP samples are
80
marked for exclusion. (4) Non-tryptic peptides are marked for exclusion, though some of
the time these are born from radical labeling chemistry. (5) The .dta filename/feature ID
list prepared for the “Match LCMS features with acc mass and Mascot calls” spreadsheet
is used to determine which accurate mass-matched features lack MS2 spectra; these are
marked for exclusion. The final inclusion list is ready for validation decisions.
Without automated software and in the interest of expeditious analysis, a further
filtering step based on relative intensity may be necessary for validating and completing
the modification annotation of accurate mass-matched features. We have used a custom
Perl-based correlation program to facilitate this analysis29, and are working to make this
software available and easier to use. Manual accurate mass-matching validation and
annotation completion requires using the .raw data browser and any tools for peptide
hypothesis testing or de novo sequencing the user may already have.
The majority of features useful for footprinting should have a putatively assigned
Mascot-derived identity. The final decision in the validation step rests with which
features to accept as correct without further validation. This requires a familiarity with
the expected sites and yields of modification. For FPOP, a good starting place is the
excellent review of •OH-mediated footprinting by Xu and Chance3 as well as the bottom-
up FPOP-analyses published by the Gross lab9, 14-16.
Features selected for validation can be processed in two ways. Clearly one way is
by manual inspection. This may be necessary for LC-MS features with more than 5-10
associated spectra and having more than one probable call, as determined from each call’s
fraction of feature spectra—if such a feature provides information other
81
chromatographically resolved features do not (a new modified residue, perhaps).
Alternatively, two Excel macro-enabled tools can expedite validation and correction
before undertaking manual inspection. The “UniqueID MS2 spectra extractor”
spreadsheet takes as input the first 15 annotation columns as shown in Table 3.1 for all
selected features needing validation, and uses the “condensed Mascot output” worksheet
of the “Match LCMS features with acc mass and Mascot calls” spreadsheet to determine
the best Mascot-matched MS2 spectra supporting each uncertain feature’s annotation.
These spectra are found either in the folder containing all .dta files from the experiment
or from the merged .mgf file(s) submitted to Mascot. Keeping the latter on one’s hard
drive is preferable from a file management standpoint. The x-y data of each spectra is
output to a worksheet together with the pertinent annotation hypothesis needing testing.
The “MS2 call checker” spreadsheet is used to examine each of the spectra one-by-one
by copying and pasting the desired spectrum and its hypothesis information into the first
worksheet and executing the “compare_to_MS2_spectrum” macro. An overlay of the
theoretical and observed spectrum can provide definitive validation (Figure 3.4) of the
call, or the user may inspect the “matches” and “missed” worksheets for numerical
checking. If the hypothesis is wrong, a new one can be made by altering the sequence,
modification location(s), or modification mass in the first worksheet. With each change
or confirmation, update the final footprinting annotations accordingly.
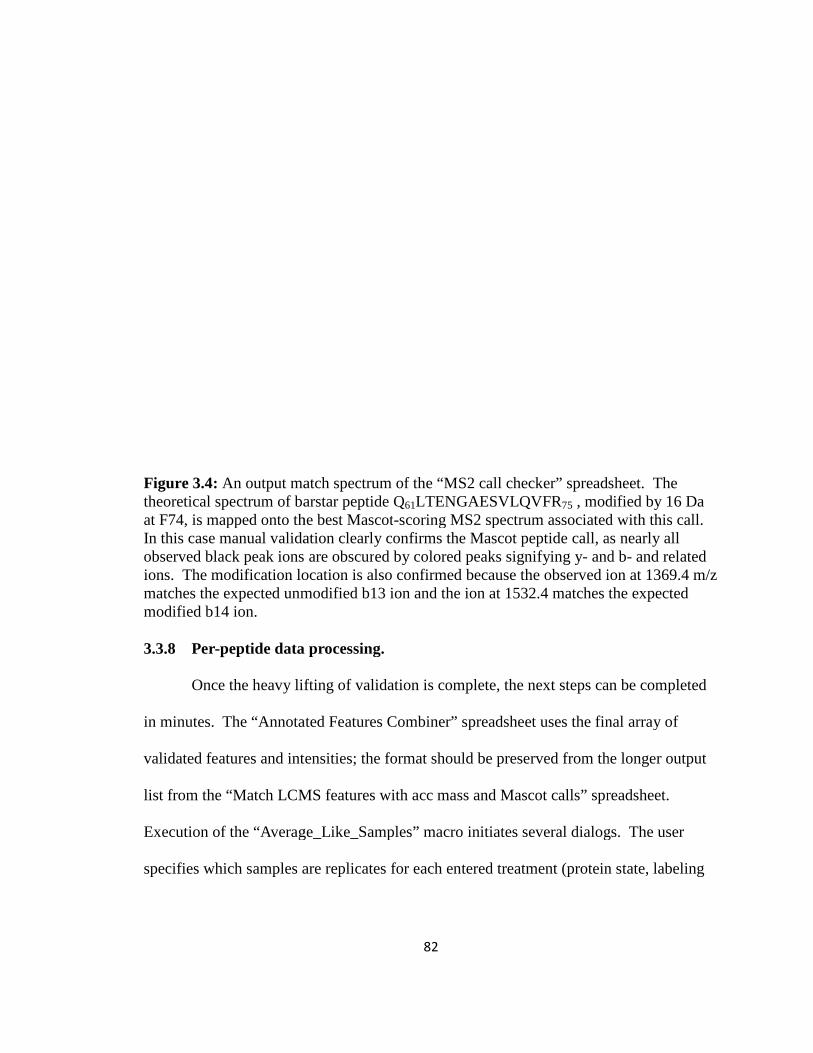
Figure 3.4: An output match spectrum of the “MS2 call checker” spreadsheet. The theoretical spectrum of barstar peat F74, is mapped onto the best MascotIn this case manual validation clearly confirms the Mascot peptide call, as nearly all observed black peak ions are obscurions. The modification location is also confirmed because the observed ion at 1369.4 m/z matches the expected unmodified b13 ion and the ion at 1532.4 matches modified b14 ion. 3.3.8 Per-peptide data processing.
Once the heavy lifting of validation is complete, the next steps can be completed
in minutes. The “Annotated Features Combiner” spreadsheet uses the final array of
validated features and intensities; the format should be preserved from the longer output
list from the “Match LCMS features with acc mass and Mascot calls” spreadsheet.
Execution of the “Average_Like_Samples” macro initiates several dialogs. The user
specifies which samples are replicates for each entered treatment (protein state, labeling
82
An output match spectrum of the “MS2 call checker” spreadsheet. The theoretical spectrum of barstar peptide Q61LTENGAESVLQVFR75 , modified by 16 Da at F74, is mapped onto the best Mascot-scoring MS2 spectrum associated with this call. In this case manual validation clearly confirms the Mascot peptide call, as nearly all observed black peak ions are obscured by colored peaks signifying y- and bions. The modification location is also confirmed because the observed ion at 1369.4 m/z matches the expected unmodified b13 ion and the ion at 1532.4 matches
eptide data processing.
Once the heavy lifting of validation is complete, the next steps can be completed
in minutes. The “Annotated Features Combiner” spreadsheet uses the final array of
validated features and intensities; the format should be preserved from the longer output
ist from the “Match LCMS features with acc mass and Mascot calls” spreadsheet.
Execution of the “Average_Like_Samples” macro initiates several dialogs. The user
specifies which samples are replicates for each entered treatment (protein state, labeling
An output match spectrum of the “MS2 call checker” spreadsheet. The , modified by 16 Da
scoring MS2 spectrum associated with this call. In this case manual validation clearly confirms the Mascot peptide call, as nearly all
and b- and related ions. The modification location is also confirmed because the observed ion at 1369.4 m/z
the expected
Once the heavy lifting of validation is complete, the next steps can be completed
in minutes. The “Annotated Features Combiner” spreadsheet uses the final array of
validated features and intensities; the format should be preserved from the longer output
ist from the “Match LCMS features with acc mass and Mascot calls” spreadsheet.
Execution of the “Average_Like_Samples” macro initiates several dialogs. The user
specifies which samples are replicates for each entered treatment (protein state, labeling

83
condition, etc.). For •OH-mediated footprinting samples, a time window can be set about
the major unmodified elution time for each proteolytic peptide. Typically oxidative
modifications make peptides more hydrophilic such that they elute up to 10-15 min
earlier than their unmodified analog in an 80 min gradient (Figure 3.3). The fellow
modified peptides eluting in this time window will be grouped with the unmodified to
determine the “root” or total measured abundance (sum of intensities) of each proteolytic
peptide. From these values the fractions of modified and unmodified peptides are
determined. The last dialog asks the user to decide how to treat features still having more
than call. The two most-used treatments are to either (1) ignore all such features, or (2)
include them but multiply their intensities by the fraction of spectral counts indicative of
each discrepant call. In this latter way important mixture peaks can be included without
overestimating their contributions.
The Combiner spreadsheet’s “output” worksheet conveys these per-peptide
footprinting results for each replicate and reports their averages and standard errors, in
addition to each feature’s fractional contribution to its root. The second output worksheet
of the Combiner spreadsheet, “per sample absolute data”, carries through the list of all
absolute intensities for each feature from the input, and reports each feature’s associated
peptide’s total intensity. This output worksheet is needed for the final Excel data
processing spreadsheet. The coloring of peptides by their root group in the output
worksheets does not convey meaning but is meant to allow easier inspection.
84
3.3.9 Per-residue data processing.
Often for radical-based modification strategies, multiple features are observed that
indicate modification at a single residue, due to five reasons. (1) Multiple atomic sites of
a residue may be vulnerable to modification, such as the indole ring of tryptophan to •OH
attack3, 30, and these isomers separate in chromatography. (2) The product chemistry may
be varied at a single site. For example, methionine is easily oxidized to a +16 Da
sulfoxide, and will readily further oxidize to a +32 Da sulfone3. (3) More than one set of
modified and unmodified proteolytic peptides spanning the residue are used in the
analysis, due to a frequent missed cleavage. Sometimes missed cleavages are desirable
as they expand the region of analytic coverage into sequence regions having proteolytic
substrate sites every 3-6 residues. (4) The LC-MS peak software has split an LC-MS
feature into two co-eluting features of the same mass centroid. Sometimes the peak
software is conservative in its de-charging, such that it does not group these LC-MS
isobaric and co-eluting component EIC peaks together as one feature. As long as these
entries were not deleted in the validation step, their proper inclusion in the per-peptide
and per-residue analysis is guaranteed. (5) Oxidations at the ESI source give rise to post-
chromatography modifications of eluted unmodified species. These features can be
filtered in the validation step by inspection of their elution times and control levels,
unless one is employing the method of •OH footprinting that utilizes the oxidative
electrochemistry possible at the ESI source31-33.
The signals from all same-residue modifications should be incorporated in its
modification yield calculation, according to equation 1.
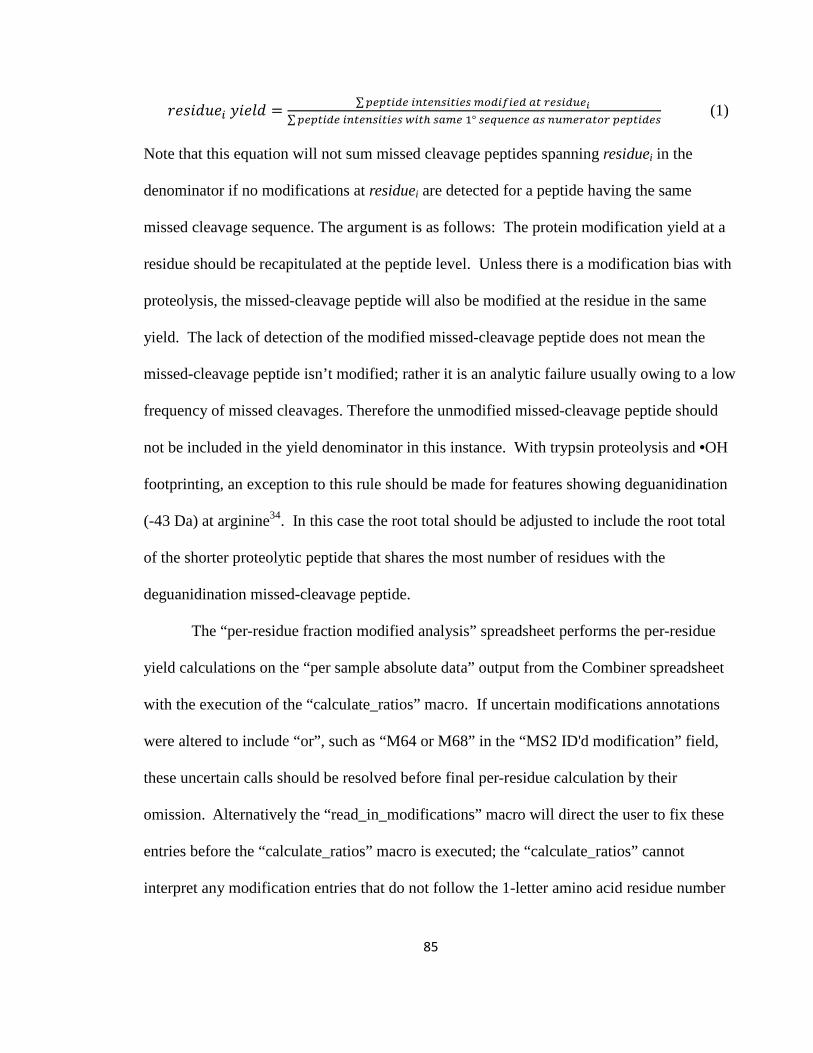
85
*'eO0+'; mO'10 ∑ Y; ;XYX;Y; ;; cY Z;H ∑ Y; ;XYX;Y; ;Y c 6° XW c XZcYZ Y; (1)
Note that this equation will not sum missed cleavage peptides spanning residuei in the
denominator if no modifications at residuei are detected for a peptide having the same
missed cleavage sequence. The argument is as follows: The protein modification yield at a
residue should be recapitulated at the peptide level. Unless there is a modification bias with
proteolysis, the missed-cleavage peptide will also be modified at the residue in the same
yield. The lack of detection of the modified missed-cleavage peptide does not mean the
missed-cleavage peptide isn’t modified; rather it is an analytic failure usually owing to a low
frequency of missed cleavages. Therefore the unmodified missed-cleavage peptide should
not be included in the yield denominator in this instance. With trypsin proteolysis and •OH
footprinting, an exception to this rule should be made for features showing deguanidination
(-43 Da) at arginine34. In this case the root total should be adjusted to include the root total
of the shorter proteolytic peptide that shares the most number of residues with the
deguanidination missed-cleavage peptide.
The “per-residue fraction modified analysis” spreadsheet performs the per-residue
yield calculations on the “per sample absolute data” output from the Combiner spreadsheet
with the execution of the “calculate_ratios” macro. If uncertain modifications annotations
were altered to include “or”, such as “M64 or M68” in the “MS2 ID'd modification” field,
these uncertain calls should be resolved before final per-residue calculation by their
omission. Alternatively the “read_in_modifications” macro will direct the user to fix these
entries before the “calculate_ratios” macro is executed; the “calculate_ratios” cannot
interpret any modification entries that do not follow the 1-letter amino acid residue number
86
format with comma separations for multiply modified features. The set of features used in
the per-residue analysis may be smaller than used in the per-peptide analysis, because
uncertain modification features still accurately convey labeling at the peptide level but
should not be used at the residue level.
With the per-residue yields in hand, the analysis of SASA and structure(s) can begin.
For footprinting strategies like FPOP, in which labeling yield depends on the inherent
reactivity of a residue as well as its SASA, state vs. state comparisons at the per-residue
level will be more discriminating than at the per-peptide level. At the per-peptide level,
small changes in yield at some sites may be masked by invariant yields at neighboring
residues that are more sensitive to •OH, like methionine.
3.4 Results and Discussion
3.4.1 LC-MS feature coverage.
Of the 19,280 LC-MS EIC ion peaks detected among the cold, warm and control
samples, 1,116 are the isotope and charge state contributors to 367 features associated
with barstar or catalase. The total peak area intensities of these 1,116 ion EICs is 69% of
all EIC peaks. The remaining 18,164 ions are predominantly singly charged or do not
have a discernable charge state, and are very low in abundance. Of the 367 features, 76
were used in the final per-residue analysis of cold and warm barstar states. Seventy-eight
features were excluded because their relative intensities were less than 2% the average
intensity for putative barstar features. Eighty-seven features were omitted because they
were not tryptic peptides of barstar. Most of these features were also present in the
control, indicating a chymotryptic or non-specific enzymatic origin, and 95% were less
87
than half the average intensity for each sample. This may be more than expected;
shortening the trypsin proteolysis may diminish the occurrence of these cleavages. It is
not clear how frequently non-specific cleavage products should be expected, as the
discovery by error-tolerant searching of non-tryptic peptides is not typically disseminated
in proteomics studies. The remaining exclusions were for features indicated as mixtures
of modified peptide isomers that could not be accurately split, features whose MS2
spectra cannot definitively locate the modification, peptide features bearing known
sample handling and ESI modifications (e.g. water loss, ammonia loss, deamidation),
peptide features bearing unexpected modifications shared by control and FPOP samples
alike (and thus are not FPOP signal), and catalase peptide features.
3.4.2 Analytic sequence coverage.
The sequence coverage of barstar in this study was 100%. All 89 residues were
spanned among the detected unmodified tryptic and non-tryptic peptides of barstar. The
analytic sequence coverage of barstar was 63%. The first two lysine residues are
invisible by virtue of trypsin proteolysis. The tryptic peptide
E23LALPEYYGENLDALWDCLTGWVEYPLVLEWR54 was not detected, but several
low abundance unmodified semi-tryptic peptides spanning this region were detected.
Unfortunately none were of sufficient abundance to warrant looking for their modified
siblings; consequently barstar 23-54 is silent in this study. This illustrates the need for
more than one proteolysis method when the footprinting study goal is complete analytic
coverage. Nevertheless, the N- and C- terminal regions of barstar are well represented,
88
and we are confident in the structural conclusions drawn from the yield data for these
regions.
3.4.3 Barstar folding.
The FPOP data indicates Barstar is folded at 22°C and partially or completely
unfolded at 0 °C. Nineteen residues were detected as modified (Table 3.2); of these, I5,
I10, L16, L20, T63, V70, L71, V73, F74, I84 are significantly more labeled and hence
solvent accessible in the cold state. E8 and E68 are significantly more protected in the
warm state. Significance is determined by the Student’s t-test at 95% confidence. We
cannot yet make any statistical conclusions for R11 and R75 (they’re both higher in the
cold state) because their modification signals stem solely from -43 Da deguanidination
missed-cleavage peptides. It is not yet clear if the denominator treatment described in the
Data Analysis section is appropriate for these modifications since these arginines are
positioned in the middle of their missed-cleavage peptides.
Statistical significance does not necessarily convey a large change in SASA. To
approximate the physical change in SASA per residue, we have normalized the cold-
warm yield difference by the maximum yield measured for residues of the same amino
acid class in Figure 3.5. The maximum yields observed for each amino acid-kind of
residue approximates the inherent reactivity of each residue type to •OH in the FPOP
experiment, because these residues are expected to be the least sterically obscured in their
respective classes. Then for a relative change approaching 100% of this maximum, as
seen for L16, L20, T63, V73, F74, and I84, signifies a large change in SASA, and thus
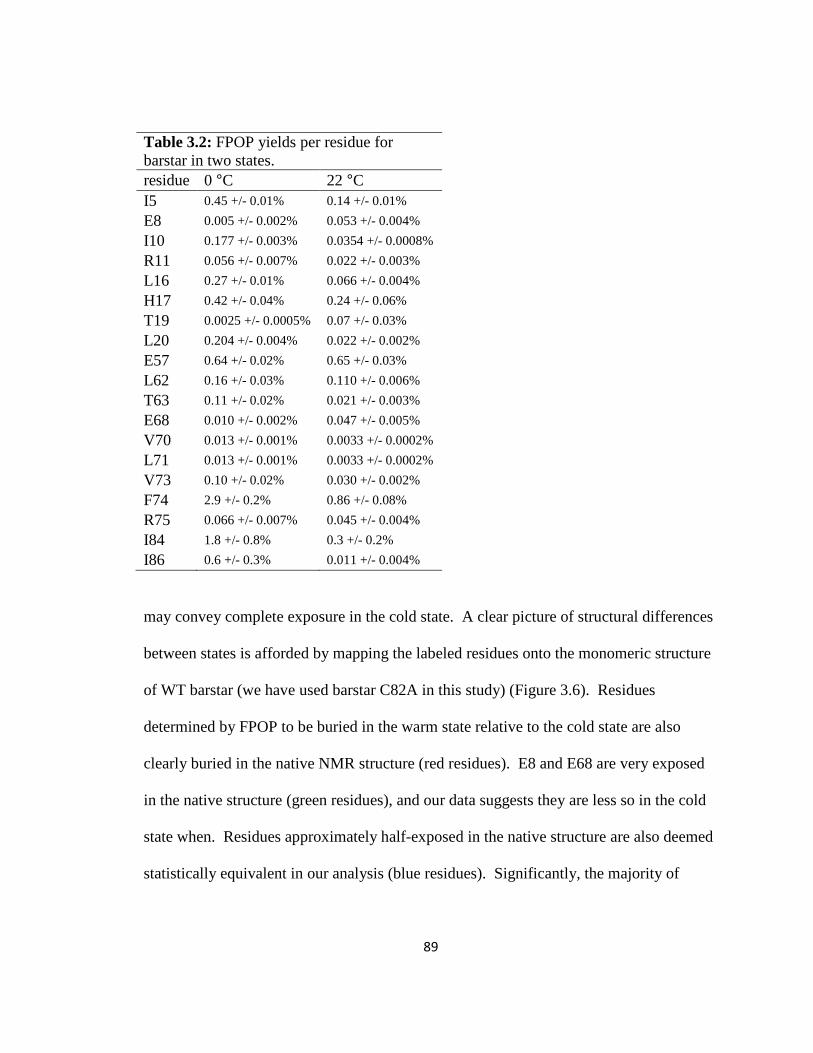
89
Table 3.2: FPOP yields per residue for barstar in two states. residue 0 °C 22 °C I5 0.45 +/- 0.01% 0.14 +/- 0.01%
E8 0.005 +/- 0.002% 0.053 +/- 0.004%
I10 0.177 +/- 0.003% 0.0354 +/- 0.0008%
R11 0.056 +/- 0.007% 0.022 +/- 0.003%
L16 0.27 +/- 0.01% 0.066 +/- 0.004%
H17 0.42 +/- 0.04% 0.24 +/- 0.06%
T19 0.0025 +/- 0.0005% 0.07 +/- 0.03%
L20 0.204 +/- 0.004% 0.022 +/- 0.002%
E57 0.64 +/- 0.02% 0.65 +/- 0.03%
L62 0.16 +/- 0.03% 0.110 +/- 0.006%
T63 0.11 +/- 0.02% 0.021 +/- 0.003%
E68 0.010 +/- 0.002% 0.047 +/- 0.005%
V70 0.013 +/- 0.001% 0.0033 +/- 0.0002%
L71 0.013 +/- 0.001% 0.0033 +/- 0.0002%
V73 0.10 +/- 0.02% 0.030 +/- 0.002%
F74 2.9 +/- 0.2% 0.86 +/- 0.08%
R75 0.066 +/- 0.007% 0.045 +/- 0.004%
I84 1.8 +/- 0.8% 0.3 +/- 0.2%
I86 0.6 +/- 0.3% 0.011 +/- 0.004%
may convey complete exposure in the cold state. A clear picture of structural differences
between states is afforded by mapping the labeled residues onto the monomeric structure
of WT barstar (we have used barstar C82A in this study) (Figure 3.6). Residues
determined by FPOP to be buried in the warm state relative to the cold state are also
clearly buried in the native NMR structure (red residues). E8 and E68 are very exposed
in the native structure (green residues), and our data suggests they are less so in the cold
state when. Residues approximately half-exposed in the native structure are also deemed
statistically equivalent in our analysis (blue residues). Significantly, the majority of
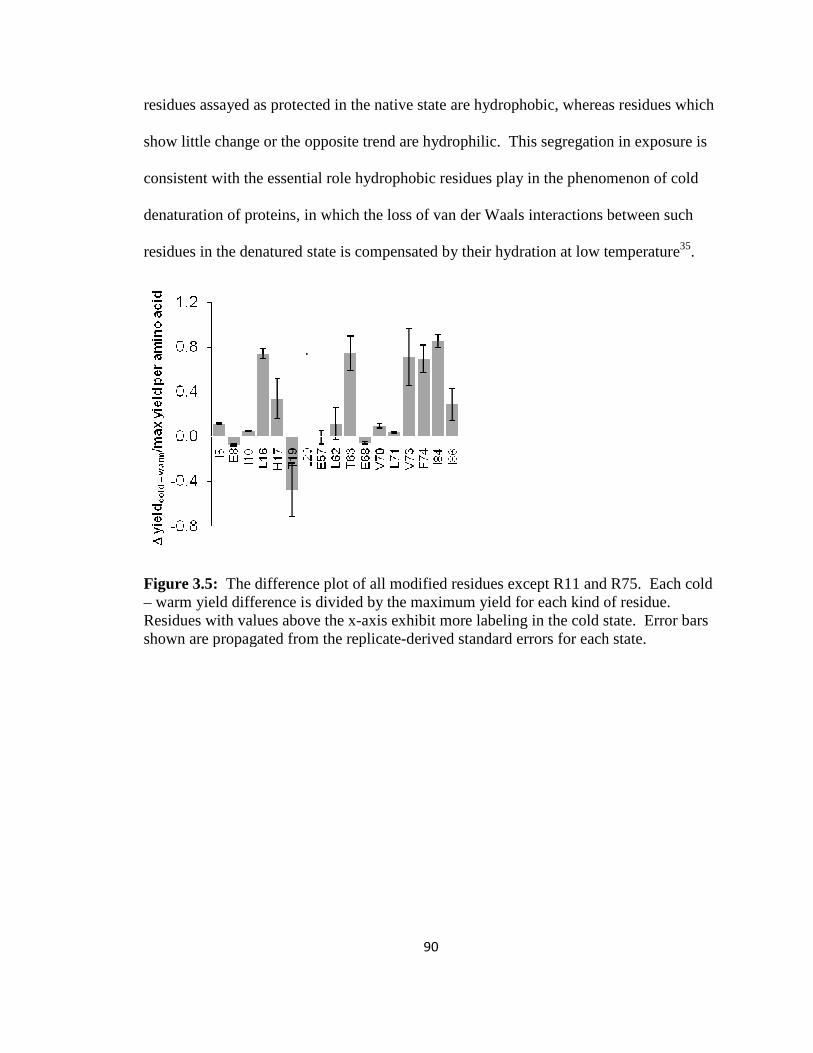
residues assayed as protected in the native state ar
show little change or the opposite trend are hydrophilic. This segregation in exposure is
consistent with the essential role hydrophobic
denaturation of proteins, in which the l
residues in the denatured state is compensated by their hydration at low temperature
Figure 3.5: The difference plot of all modified residues except R11 and R75. Each cold – warm yield difference is divided by the maximum yield for each kind of residue. Residues with values above the xshown are propagated from the replicate
90
residues assayed as protected in the native state are hydrophobic, whereas residues which
show little change or the opposite trend are hydrophilic. This segregation in exposure is
essential role hydrophobic residues play in the phenomenon of cold
, in which the loss of van der Waals interactions between such
residues in the denatured state is compensated by their hydration at low temperature
The difference plot of all modified residues except R11 and R75. Each cold fference is divided by the maximum yield for each kind of residue.
Residues with values above the x-axis exhibit more labeling in the cold state. Error bars shown are propagated from the replicate-derived standard errors for each state.
e hydrophobic, whereas residues which
show little change or the opposite trend are hydrophilic. This segregation in exposure is
play in the phenomenon of cold
oss of van der Waals interactions between such
residues in the denatured state is compensated by their hydration at low temperature35.
The difference plot of all modified residues except R11 and R75. Each cold fference is divided by the maximum yield for each kind of residue.
axis exhibit more labeling in the cold state. Error bars derived standard errors for each state.
Figure 3.6: Four views of the native monomer barstar NMR structure 1BTA.pdb17 residue sidechains shown in bond depiction. Red residues are significantly more labeled in the cold state. Green residues are significantly more labeled in the warm state. Blue residues are labeled in both states, but do not show a statistical difference. 3.5 Conclusion
In this study we have introduced a comprehensive protein
analysis method that can deliver residue
of label-sensitive residues in a protein or protein complex. This methodology is best
served by using high resolution MS hybrid instruments, nano
automated LC-MS peak detection and alignment software, and Mascot error
91
Four views of the native monomer barstar NMR structure 1BTA.pdbown in bond depiction. Red residues are significantly more
labeled in the cold state. Green residues are significantly more labeled in the warm state. Blue residues are labeled in both states, but do not show a statistical difference.
In this study we have introduced a comprehensive protein-footprinting data
can deliver residue-resolved labeling yields for the full complement
sensitive residues in a protein or protein complex. This methodology is best
ed by using high resolution MS hybrid instruments, nano-flow chromatography,
MS peak detection and alignment software, and Mascot error
Four views of the native monomer barstar NMR structure 1BTA.pdb36, with
own in bond depiction. Red residues are significantly more labeled in the cold state. Green residues are significantly more labeled in the warm state. Blue residues are labeled in both states, but do not show a statistical difference.
footprinting data
resolved labeling yields for the full complement
sensitive residues in a protein or protein complex. This methodology is best
flow chromatography,
MS peak detection and alignment software, and Mascot error-tolerant
92
search capabilities. Each of these things is a prime component of many proteomics
centers (help with reference). The methodology is applicable to targeted PTM analysis
and any protein-footprinting strategy that imparts stable covalent modifications. In
particular, this analysis method well serves •OH-mediated footprinting studies.
The application of this method to the FPOP study of cold-denatured and room
temperature-folded barstar protein shows the utility of •OH-labeling in identifying sites
sensitive to changes in SASA between protein states. In doing so, we have highlighted
the means of implementing the data analysis tools, paying particular attention to aspects
of data validation important to generating high-fidelity residue-resolved labeling yields.
Six of the seven Excel application tools presented here utilize macros written in
visual basic for applications (VBA); the seventh is code-free. We feel the relative
transparency of the VBA and capabilities of Excel make these tools excellent resources
for the skeptical protein-footprint scientist, as the data flow from one tool to the next is
eminently not “black-box” but user-guided. As of now, these tools will be available on
request; we intend to make them freely available online in the coming months. Finally,
we acknowledge that the pioneers in •OH-mediated protein footprinting have also
developed a software platform for the analysis of such data37; we have not yet compared
analysis strategies.
93
3.6 References
1. Hambly, D. M.; Gross, M. L., In The Encyclopedia of Mass Spectrometry: Ionization
Methods, Gross, M. L.; Caprioli, R. M., Eds. 2006; Vol. 6.
2. Guan, J.-Q.; Chance, M. R., Structural proteomics of macromolecular assemblies using
oxidative footprinting and mass spectrometry. Trends Biochem. Sci 2005, 10, 583-592.
3. Xu, G.; Chance, M. R., Hydroxyl Radical-Mediated Modification of Proteins as Probes for
Structural Proteomics. Chem. Rev. 2007, 107 (8), 3514-3543.
4. Garrison, W. M., Reaction mechanisms in the radiolysis of peptides, polypeptides, and
proteins. Chem. Rev. 1987, 87 (2), 381-398.
5. Buxton, G. V.; Greenstock, C. L.; Helman, W. P.; Ross, A. B., Critical Review of Rate
Constants for Reactions of Hydrated Electrons, Hydrogen Atoms and Hydroxyl Radicals (*OH/*O-
) in Aqueous Solution. J. Phys. Chem. Ref. Data 1988, 17 (2), 513-886.
6. Xu, G.; Chance, M. R., Radiolytic Modification of Sulfur-Containing Amino Acid Residues
in Model Peptides: Fundamental Studies for Protein Footprinting. Anal. Chem. 2005, 77 (8),
2437-2449.
7. Xu, G.; Chance, M. R., Radiolytic Modification and Reactivity of Amino Acid Residues
Serving as Structural Probes for Protein Footprinting. Anal. Chem. 2005, 77 (14), 4549-4555.
8. Xu, G.; Chance, M. R., Radiolytic Modification of Acidic Amino Acid Residues in Peptides:
Probes for Examining Protein-Protein Interactions. Anal. Chem. 2004, 76 (5), 1213-1221.
9. Zhang, H.; Gau, B. C.; Jones, L. M.; Vidavsky, I.; Gross, M. L., Fast Photochemical
Oxidation of Proteins for Comparing Structures of Protein-Ligand Complexes: The Calmodulin-
Peptide Model System. Anal. Chem. 2010, 83 (1), 311-318.
10. Cutillas, P. R.; Timms, J. F., LC-MS/MS in Proteomics Methods and Applications. Humana
Press: 2010; Vol. 658.
11. Perkins, D. N.; Pappin, D. J. C.; Creasy, D. M.; Cottrell, J. S., Probability-based protein
identification by searching sequence databases using mass spectrometry data.
ELECTROPHORESIS 1999, 20 (18), 3551-3567.
12. Lichti, C.; Townsend, R. R., 2011.
13. America, A. H. P.; Cordewener, J. H. G., Comparative LC-MS: A landscape of peaks and
valleys. PROTEOMICS 2008, 8 (4), 731-749.
14. Gau, B. C.; Chen, H.; Zhang, Y.; Gross, M. L., Sulfate Radical Anion as a New Reagent for
Fast Photochemical Oxidation of Proteins. Anal. Chem. 2010, 82 (18), 7821-7827.
15. Hambly, D.; Gross, M., Laser flash photochemical oxidation to locate heme binding and
conformational changes in myoglobin. Int. J. Mass Spectrom. 2007, 259 (1-3), 124-129.
16. Hambly, D. M.; Gross, M. L., Laser Flash Photolysis of Hydrogen Peroxide to Oxidize
Protein Solvent-Accessible Residues on the Microsecond Timescale. J. Am. Soc. Mass Spectrom.
2005, 16 (12), 2057-2063.
17. Eng, J.; McCormack, A.; Yates, J., An approach to correlate tandem mass spectral data of
peptides with amino acid sequences in a protein database. J. Am. Soc. Mass Spectrom. 1994, 5
(11), 976-989.
18. Geer, L. Y.; Markey, S. P.; Kowalak, J. A.; Wagner, L.; Xu, M.; Maynard, D. M.; Yang, X.;
Shi, W.; Bryant, S. H., Open Mass Spectrometry Search Algorithm. Journal of Proteome Research
2004, 3 (5), 958-964.
94
19. Hartley, R. W., Barnase and barstar : Expression of its cloned inhibitor permits
expression of a cloned ribonuclease. Journal of Molecular Biology 1988, 202 (4), 913-915.
20. Hartley, R. W., Barnase and barstar: two small proteins to fold and fit together. Trends
Biochem. Sci 1989, 14 (11), 450-454.
21. Nölting, B.; Golbik, R.; Neira, J. L.; Soler-Gonzalez, A. S.; Schreiber, G.; Fersht, A. R., The
folding pathway of a protein at high resolution from microseconds to seconds. Proc. Natl. Acad.
Sci. U.S.A. 1997, 94 (3), 826-830.
22. Nölting, B.; Golbik, R.; Fersht, A. R., Submillisecond events in protein folding. Proc. Natl.
Acad. Sci. U.S.A. 1995, 92 (23), 10668-10672.
23. Aye, T. T.; Low, T. Y.; Sze, S. K., Nanosecond Laser-Induced Photochemical Oxidation
Method for Protein Surface Mapping with Mass Spectrometry. Anal. Chem. 2005, 77 (18), 5814-
5822.
24. Gau, B. C.; Sharp, J. S.; Rempel, D. L.; Gross, M. L., Fast Photochemical Oxidation of
Protein Footprints Faster than Protein Unfolding. Anal. Chem. 2009, 81 (16), 6563-6571.
25. Slebos, R. J. C.; Brock, J. W. C.; Winters, N. F.; Stuart, S. R.; Martinez, M. A.; Li, M.;
Chambers, M. C.; Zimmerman, L. J.; Ham, A. J.; Tabb, D. L.; Liebler, D. C., Evaluation of Strong
Cation Exchange versus Isoelectric Focusing of Peptides for Multidimensional Liquid
Chromatography-Tandem Mass Spectrometry. Journal of Proteome Research 2008, 7 (12), 5286-
5294.
26. Durr, E.; Yu, J.; Krasinska, K. M.; Carver, L. A.; Yates, J. R.; Testa, J. E.; Oh, P.; Schnitzer, J.
E., Direct proteomic mapping of the lung microvascular endothelial cell surface in vivo and in cell
culture. Nat Biotech 2004, 22 (8), 985-992.
27. Zhu, W.; Smith, J. W.; Huang, C.-M., Mass Spectrometry-Based Label-Free Quantitative
Proteomics. Journal of Biomedicine and Biotechnology 2010, 2010, 1-6.
28. David M. Creasy, J. S. C., Error tolerant searching of uninterpreted tandem mass
spectrometry data. PROTEOMICS 2002, 2 (10), 1426-1434.
29. Vidavsky, I.; Rempel, D. L.; Gross, M. L., 2D Mass Spectra Correlation – Semi Automatic
Tool for Modified Peptide Discovery. In Proceedings of the 54th ASMS Conference on Mass
Spectrometry and Allied Topics, Seattle, WA, 2006.
30. Finley, E. L.; Dillon, J.; Crouch, R. K.; Schey, K. L., Identification of tryptophan oxidation
products in bovine α-crystallin. Protein Sci. 1998, 7 (11), 2391-2397.
31. Maleknia, S. D.; Wong, J. W. H.; Downard, K. M., Photochemical and electrophysical
production of radicals on millisecond timescales to probe the structure, dynamics and
interactions of proteins. Photochem. & Photobiol. Sci. 2004, 3, 741-748.
32. Wong, J. W. H.; Maleknia, S. D.; Downard, K. M., Study of the Ribonuclease-S-Protein-
Peptide Complex Using a Radical Probe and Electrospray Ionization Mass Spectrometry. Anal.
Chem. 2003, 75 (7), 1557-1563.
33. Maleknia, S. D.; Brenowitz, M.; Chance, M. R., Millisecond Radiolytic Modification of
Peptides by Synchrotron X-rays Identified by Mass Spectrometry. Anal. Chem. 1999, 71 (18),
3965-3973.
34. Xu, G.; Takamoto, K.; Chance, M. R., Radiolytic Modification of Basic Amino Acid
Residues in Peptides: Probes for Examining Protein−Protein Interactions. Anal. Chem. 2003, 75
(24), 6995-7007.
35. Privalov, P. L., Cold Denaturation of Protein. Critical Reviews in Biochemistry and
Molecular Biology 1990, 25 (5), 281-306.
95
36. Lubienski, M. J.; Bycroft, M.; Freund, S. M. V.; Fersht, A. R., Three-dimensional solution
structure and 13C assignments of barstar using nuclear magnetic resonance spectroscopy.
Biochemistry 1994, 33 (30), 8866-8877.
37. Kaur, P.; Kiselar, J. G.; Chance, M. R., Integrated Algorithms for High-Throughput
Examination of Covalently Labeled Biomolecules by Structural Mass Spectrometry. Anal. Chem.
2009, 81 (19), 8141-8149.
96
4 Fast photochemical oxidation of proteins (FPOP) by the sulfate radical anion probes solvent accessibility 4.1 Introduction
Chemical footprinting1-3 of proteins is becoming an efficient alternative and
augmentative method to X-ray crystallography and NMR spectroscopy for the elucidation
of protein structure and interactions. By mass spectrometric analysis of the protein-
footprint products in the presence and absence of ligand, the binding site(s) and induced
changes in protein conformation can be determined, provided that the labeling reactions
in these regions are attenuated in the holo state. The most general and, thus, informative
chemical reactions currently used for protein footprinting are hydrogen/deuterium
exchange (HDX)4 and hydroxyl radical oxidation.5 The methods are complementary in
revealing features of protein structure. Predominantly side chain accessibility is sampled
by properly controlled •OH reaction6, whereas HDX samples backbone amide hydrogen
accessibility and secondary structure.7-8
Hydroxyl radicals probe solvent accessibility because they have both comparable
size to solvent water molecules and high reactivity with a significant fraction of amino-
acid side chains. One of the advantages of •OH footprinting is that the stability
(irreversibility) of modifications enables a “bottom-up” proteomics methodology of
proteolysis and online LC-MS/MS for their detection and quantification. Interest in other
chemical probes that engender similarly stable modifications, including the highly
reactive methylene carbene9-11, continues to increase, driven by the possibility that
complementary structural information of protein complexes might be obtained with
different chemical selectivity of accessible protein residues.
97
We demonstrated that FPOP occurs on the microsecond timescale for •OH
labeling reactions,12 affording near millimolar levels of •OH from the homolytic
cleavage of H2O2 upon irradiation by a 17 ns flash of 248 nM KrF excimer laser.
Constituent Gln acts as a radical scavenger, ensuring the quenching of labeling on this
timescale. The strength of this approach to footprinting is the high yield of protein
modification by •OH from a profoundly short exposure. A microsecond labeling
timescale avoids the sampling of protein conformation that are altered by the
modification, as ultimately will be the case for timescales that are longer.13
Herein we report a new footprinting agent for the FPOP method, an ionic sulfate
radical anion, SO4-•. The primary reason for choosing SO4
-• is that its reduction potential
at 2430 mV is higher than that of •OH (1900 mV),14 making it a potentially useful
oxidant for proteins. For example, the formation of protein cross-links can be triggered
by SO4-•15-16, and protein oxidation using SO4
-• can occur in the metal-catalyzed
oxidation reactions.17 It is a reasonable expectation that SO4-•, like •OH, oxidizes
proteins very rapidly, which is an advantage of FPOP using •OH. Reactions of SO4-•
with amino acids and some dipeptides in aqueous solution are known albeit on a
continuous timescale rather than pulsed as we demonstrate here. This chemistry of SO4-•
is determined by its very high electron affinity and its capability to oxidize aromatic and
Met side chains to the corresponding radical cations, which subsequently undergo either
fragmentation or hydration.18-19 The sulfate radical anion can also oxidize carboxyl
anions including zwitterionic amino acids in aqueous solution to acyloxyl radicals
(RCO2•), which rapidly decarboxylate to give carbon-centered radicals.14, 20 Radicals
98
formed by SO4-• hydrogen abstraction also occur for some amino acids such as Leu and
Ser.20
The precursor compound used for the generation of SO4-• is the relatively stable
and water-soluble inorganic salt Na2S2O8. The S2O82− aqueous ion has a UV band
maximum at 215 nm; we measured the extinction coefficient at 248 nm in PBS as 24 M−1
cm−1. The photolysis of S2O82− in water gives SO4
-• radical anions with a quantum yield
of 0.55 at 308 nm.21
In the present study, we compared the amino-acid residue reactions of laser-
initiated sulfate radical anion with those of hydroxyl radicals after tuning the oxidation
levels so that they nearly match. The tests were two proteins, apomyoglobin (aMb) and
Ca2+-free calmodulin (CaM), and a mixture of peptides, bradykinin and angiontensin II,
which were subjected to both peroxide and persulfate FPOP. We focused the
proteolysis/LC-MS/MS analysis (1) to identify the types of residue modifications and
their frequency and ascertain whether any subset of residues SO4-• may better sample
than •OH and (2) to determine whether persulfate FPOP exclusively modifies solvent
accessible residues, and on a timescale fast enough to sample native conformation only.
More than any other oxidative-modification protein footprinting method, FPOP is
highly tunable both in yield (by altering starting material levels of quencher and labeling
precursor), timescale, and targeted chemistry. Besides hydroxyl radicals and sulfate
radical anions, there are several potential peroxy-22 and diazirine23 species capable of UV
photolysis to generate either other radicals or carbenes, which may be selected for their
physical properties or residue specificity. These opportunities make clear another
99
purpose of this study; that is, to illustrate a method for validating such starting materials
for developing new methods of protein footprinting by FPOP.
4.2 Experimental Procedures
4.2.1 Reagents.
Bovine β-Lactoglobulin A (BLG), 30% hydrogen peroxide, sodium persulfate,
angiotensin II, bradykinin, L-glutamine, L-methionine, catalase, urea, ethylene glycol-
bis(2-aminoethylether)-N,N,N′,N′-tetraacetic acid (EGTA), acetonitrile, formic acid,
proteomics grade trypsin, and phosphate buffered saline (PBS) were purchased from the
Sigma Aldrich Chemical Company (St. Louis, MO). Bovine CaM was purchased from
Oceanbiologics (Corvallis, OR). The proteins were used without further purification.
Purified water (18 MΩ) was obtained from an in-house Milli-Q Synthesis system
(Millipore, Billerica, MA).
4.2.1 Oxidative-modification labeling.
Each 50 µL sample was prepared in PBS (10 mM phosphate buffer, 138 mM
NaCl, 2.7 mM KCl, pH 7.4 at 25 °C), with a final protein concentration of 10 µM. The
bradykinin and angiotensin II components of peptide mixture samples were also prepared
at these concentrations. Apo-CaM samples included 100 µM EGTA for the chelation of
adventitious calcium. Glutamine was added to a final concentration of 20 mM in normal
FPOP samples. Hydrogen peroxide or Na2S2O8 was added to a final concentration of 15
mM or 3 mM, respectively, just before FPOP infusion except for BLG, where Na2S2O8
was added to 5 mM. The experimental apparatus and procedure for laser flash photolysis
of samples was detailed previously.12 The laser power was adjusted to 44 mJ/pulse. The
100
fraction of sample masked from irradiation was set to 20% by adjusting the infusion flow
rate and laser pulse frequency; this ensured that no protein was double-shot.12-13
Sample was collected in a microcentrifuge tube containing 20 µL of 70 mM Met,
and immediately purified from excess H2O2 or Na2S2O8 by Millipore Ziptip (Billerica,
MA) 0.6 µL bed solid-phase extraction. C4 tips were used for BLG, aMb, and CaM
samples; C18 tips were used for samples containing peptide mixtures. Each 10 µL Ziptip
accommodates up to 45 µL in aspirate with careful pipette action. One slow
aspiration/dispense cycle was sufficient to load the Ziptip with good recovery; this
precaution minimized post-FPOP oxidation (data not shown).
Except for BLG, four treatments per protein or peptide mixture were applied in
triplicate. “Native” samples were solutions of analyte, buffer, and Gln, and were not
laser irradiated. “Peroxide” sample solutions included H2O2 and were subjected to flash
photolysis. “Persulfate” sample solutions included Na2S2O8 and were subjected to flash
photolysis. “Persulfate control” sample solutions were prepared identically to
“Persulfate” but were not laser irradiated. Their persulfate exposure was limited to 5 min
prior to desalting. BLG samples were processed similarly but at two persulfate levels and
in duplicate.
4.2.2 Global mass spectrometry of FPOP-labeled ββββ-lactoglobulin.
For BLG samples, ZiptipC4 eluent was diluted 5-fold in 50% acetonitrile and
immediately infused onto a Waters Ultima Global quadrupole time-of-flight (Milford,
MA), operating in V mode at 12,000 FWHM resolving power at 838.8 m/z
((CF3COONa)6Na+ calibrant ion).
101
4.2.3 Proteolysis and LC-MS/MS
Apomyoglobin samples were trypsin-digested for 18 h at 37 °C; CaM samples
were trypsin-digested 6 h at 37 °C; each was digested at a 1:10 trypsin:protein weight
ratio. The peptides were desalted using ZiptipC18 (Millipore), and the 10 µL eluent was
diluted 20-fold with purified water. A small sample (2 µL) was loaded by autosampler
(Eksigent nanoLC, Dublin, CA) onto a capillary column with a laser-pulled tip (Sutter
Instruments, Novato, CA), bomb-packed with C18 reverse phase material (Magic,
0.075mm × 200mm, 5µm, 300Å, Michrom, Auburn, Ca). The gradient was from 1%
solvent B (97% acetonitrile, 3% water, 0.1% formic acid) to 60% solvent B over 60 min
at an eluent flow of 260 nL/min. The LC was coupled to the nanospray source of an
LTQ-Orbitrap mass spectrometer (Thermo Fisher, Waltham, MA), for aMb and peptide
mixture samples, or an LTQ-FT mass spectrometry (Thermo Fisher), for CaM. Mass
spectra of eluting peptides were obtained at high mass resolving power (100,000 for ions
of m/z 400) with the FT mass spectrometer component, while MS/MS experiments on the
six most abundant eluting ions per high resolution scan were performed in the LTQ at a
normalized collision energy of 35% of maximum, using a 2 Da isolation width and wide-
band activation. Ions submitted to MS/MS were placed in a dynamic exclusion list for 8
s. A blank run followed every sample acquisition.
4.2.4 Data Analysis
The peak alignment algorithm of the Rosetta Elucidator data management system
(Rosetta Biosoftware) was used to generate tables of extracted ion chromatogram
features. Manually validated Mascot error-tolerant search results were paired to their
tabulated mass spectral features by a custom Excel VBA program, which also augmented
102
the search results with a 5 ppm threshold mass list of anticipated peroxide and persulfate
FPOP products not found by Mascot. Augmented hits were included only if a product-
ion spectrum verified the accurate mass match. A third modification discovery method
utilized a correlation algorithm to compare unidentified product-ion spectra to exemplary
CID fragment spectra of unmodified tryptic peptides of aMb, CaM, and of bradykinin
and angiontensin II.24
4.3 Results and Discussion
4.3.1 Optimal Sodium Persulfate FPOP Conditions.
The mass spectrum bounding the 15th charge state of β-lactoglobulin (BLG)
obtained when 15 mM Na2S2O8 was mixed with PBS-buffered 10 µM BLG and
incubated 5 min at room temperature (Figure 4.1a) shows an insignificant amount of
protein oxidation. The base peak corresponds to unmodified BLG; the very low levels of
modified and/or ESI adducts of BLG are superimposable with the mass spectrum of a
stock solution BLG (data not shown). Thus, short-time exposure to low levels of
Na2S2O8 does not oxidize BLG. Apomyoglobin, CaM, bradykinin, and angiontensin II
also do not show Na2S2O8 oxidation over short-time exposures, although ESI MS
revealed that CaM in its starting state was already oxidized to show +16 and +32 Da
adducts.
Irradiating the flowing solution containing the same level of Na2S2O8 with the
KrF excimer laser, however, gives rise to a high yield of modified BLG (Figure 4.1b).
Two aspects are readily apparent. First, the dominant persulfate radical modification
products correspond to successive +16 Da additions (or +1.07 m/z addition for the 15th
charge state). This is also the dominant product of •OH reactions in other protein
103
footprinting chemistry5 and is what we observed with 15 mM H2O2 FPOP (Figure 4.1d).
Second, 15 mM Na2S2O8 FPOP gives a much higher yield of modified protein than the
standard 15 mM H2O2 FPOP treatment. Solely by reducing the concentration of Na2S2O8
to 5 mM, the modification distribution seen in Figure 4.1c is moderated to nearly the
same global protein outcome as with standard H2O2 FPOP. A more rigorous analysis of
this product distribution, presented in the Supporting Information section, shows it is well
modeled by a Poisson distribution of 0, +16, +32, … Da states, indicating the labeling has
sampled a single (native) conformation. β-lactoglobulin is known to be conformationally
sensitive to oxidation.25 It follows that 5 mM Na2S2O8 FPOP labeling, like 15 mM H2O2
FPOP, labels faster than most secondary and tertiary protein motions26-27 and
corroborates the theoretical prediction of sub-µs-to-µs labeling.
4.3.2 Residue-Resolved Modification Measurement by LC-MS/MS.
Owing to the stable covalent label imparted by •OH and the high percentage of
solvent-accessible residues that may be labeled, a “bottom-up” proteomics approach in
data acquisition for modification identification and quantitation can be employed in
protein footprinting, typically using trypsin proteolysis and online LC-MS/MS.5 We used
this strategy because the global pattern of persulfate modification
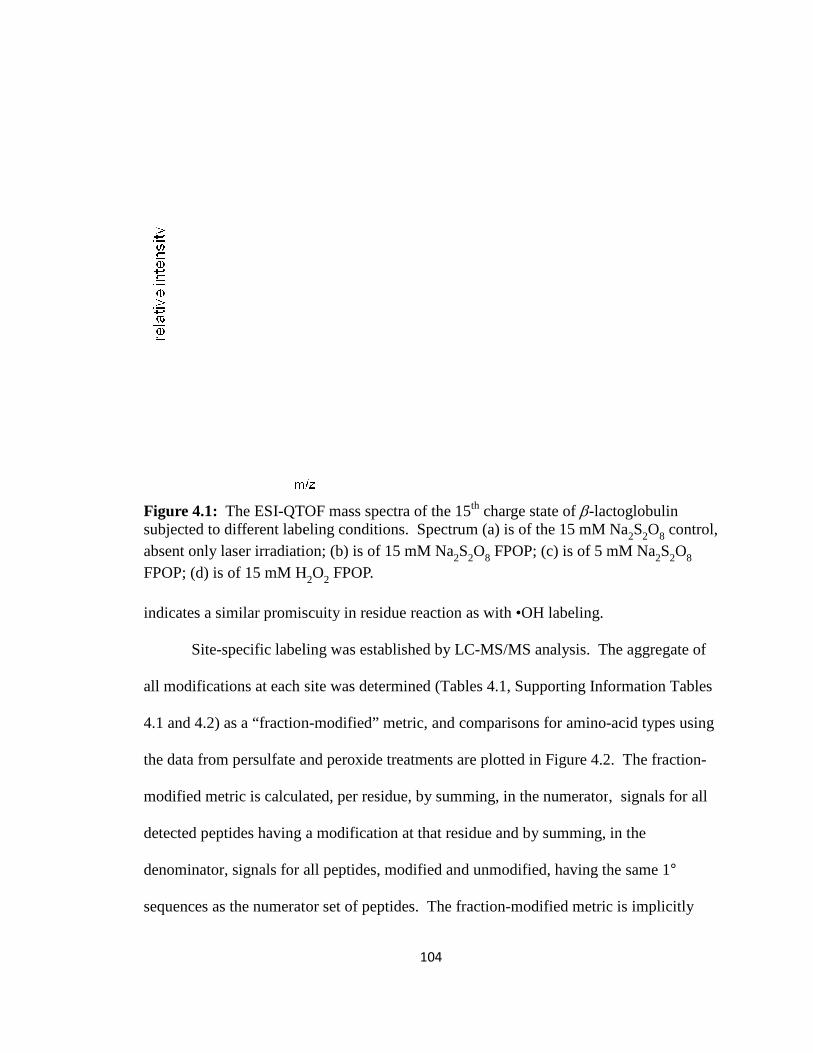
Figure 4.1: The ESI-QTOF mass spectra of the subjected to different labeling conditions. Spectrum absent only laser irradiation; FPOP; (d) is of 15 mM H indicates a similar promiscuity
Site-specific labeling was established by LC
all modifications at each site was determined (Tables 4.1, Supporting Information Tables
4.1 and 4.2) as a “fraction
the data from persulfate and peroxide treatments are plotted in Figure 4.2.
modified metric is calculated, per residue, by summing
detected peptides having a modi
denominator, signals for all peptides
sequences as the numerator set of peptides.
104
QTOF mass spectra of the 15th charge state of β-lactoglobulin
subjected to different labeling conditions. Spectrum (a) is of the 15 mM Naabsent only laser irradiation; (b) is of 15 mM Na2S2O8 FPOP; (c) is of 5 mM Na
is of 15 mM H2O2 FPOP.
indicates a similar promiscuity in residue reaction as with •OH labeling.
specific labeling was established by LC-MS/MS analysis. The aggregate of
all modifications at each site was determined (Tables 4.1, Supporting Information Tables
4.1 and 4.2) as a “fraction-modified” metric, and comparisons for amino-
the data from persulfate and peroxide treatments are plotted in Figure 4.2.
modified metric is calculated, per residue, by summing, in the numerator
peptides having a modification at that residue and by summing,
all peptides, modified and unmodified, having the same 1
sequences as the numerator set of peptides. The fraction-modified metric is implicitly
lactoglobulin is of the 15 mM Na2S2O8 control,
is of 5 mM Na2S2O8
MS/MS analysis. The aggregate of
all modifications at each site was determined (Tables 4.1, Supporting Information Tables
-acid types using
the data from persulfate and peroxide treatments are plotted in Figure 4.2. The fraction-
in the numerator, signals for all
in the
, modified and unmodified, having the same 1°
metric is implicitly
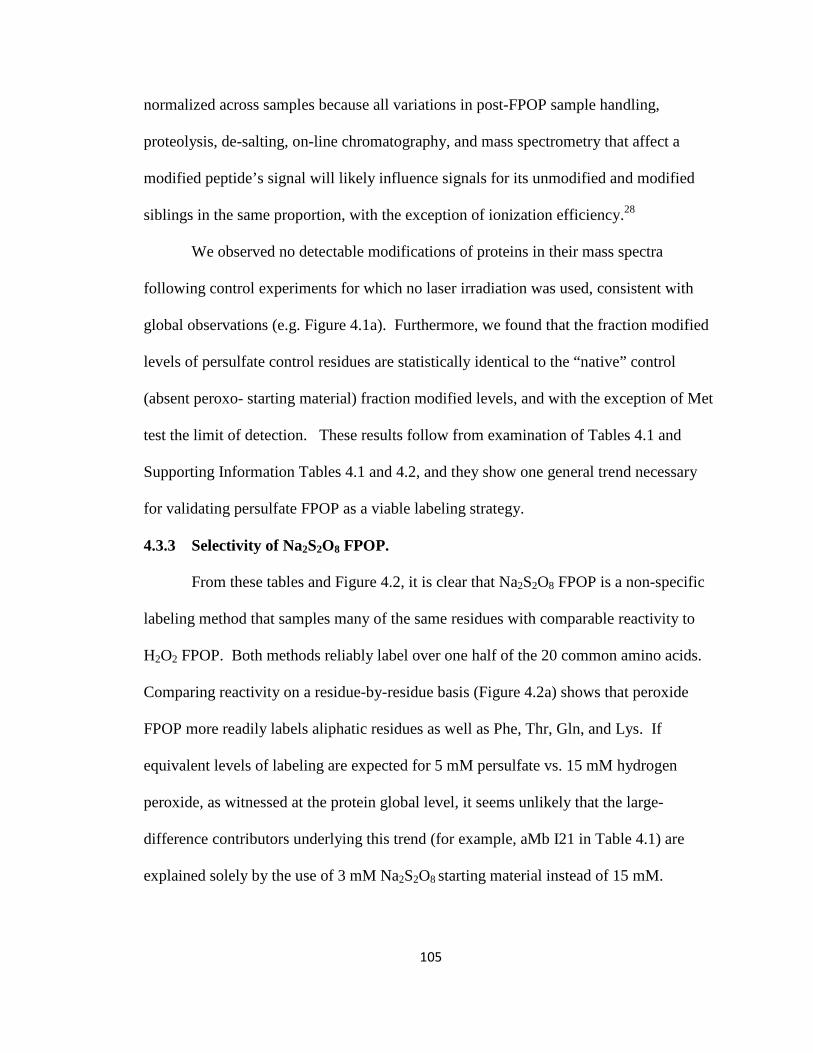
105
normalized across samples because all variations in post-FPOP sample handling,
proteolysis, de-salting, on-line chromatography, and mass spectrometry that affect a
modified peptide’s signal will likely influence signals for its unmodified and modified
siblings in the same proportion, with the exception of ionization efficiency.28
We observed no detectable modifications of proteins in their mass spectra
following control experiments for which no laser irradiation was used, consistent with
global observations (e.g. Figure 4.1a). Furthermore, we found that the fraction modified
levels of persulfate control residues are statistically identical to the “native” control
(absent peroxo- starting material) fraction modified levels, and with the exception of Met
test the limit of detection. These results follow from examination of Tables 4.1 and
Supporting Information Tables 4.1 and 4.2, and they show one general trend necessary
for validating persulfate FPOP as a viable labeling strategy.
4.3.3 Selectivity of Na2S2O8 FPOP.
From these tables and Figure 4.2, it is clear that Na2S2O8 FPOP is a non-specific
labeling method that samples many of the same residues with comparable reactivity to
H2O2 FPOP. Both methods reliably label over one half of the 20 common amino acids.
Comparing reactivity on a residue-by-residue basis (Figure 4.2a) shows that peroxide
FPOP more readily labels aliphatic residues as well as Phe, Thr, Gln, and Lys. If
equivalent levels of labeling are expected for 5 mM persulfate vs. 15 mM hydrogen
peroxide, as witnessed at the protein global level, it seems unlikely that the large-
difference contributors underlying this trend (for example, aMb I21 in Table 4.1) are
explained solely by the use of 3 mM Na2S2O8 starting material instead of 15 mM.
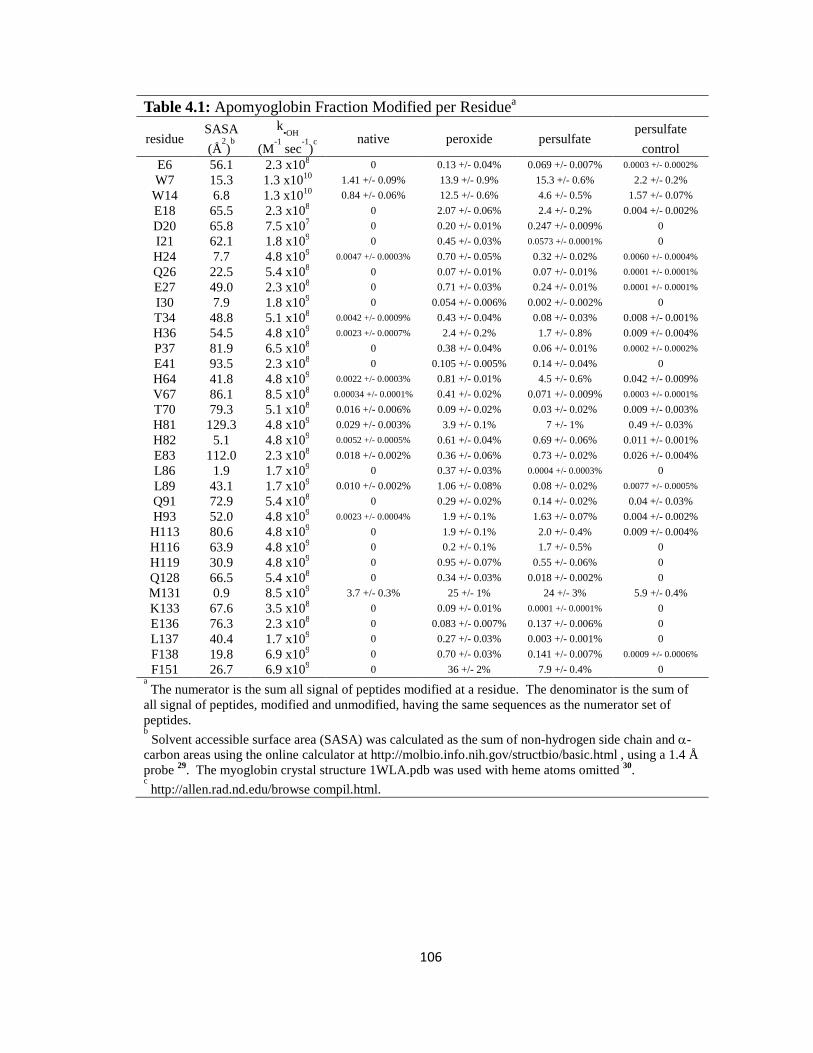
106
Table 4.1: Apomyoglobin Fraction Modified per Residuea
residue SASA
(Å2)b
k•OH
(M-1 sec
-1)c
native peroxide persulfate persulfate
control E6 56.1 2.3 x10⁸ 0 0.13 +/- 0.04% 0.069 +/- 0.007% 0.0003 +/- 0.0002%
W7 15.3 1.3 x10¹⁰ 1.41 +/- 0.09% 13.9 +/- 0.9% 15.3 +/- 0.6% 2.2 +/- 0.2%
W14 6.8 1.3 x10¹⁰ 0.84 +/- 0.06% 12.5 +/- 0.6% 4.6 +/- 0.5% 1.57 +/- 0.07%
E18 65.5 2.3 x10⁸ 0 2.07 +/- 0.06% 2.4 +/- 0.2% 0.004 +/- 0.002%
D20 65.8 7.5 x10⁷ 0 0.20 +/- 0.01% 0.247 +/- 0.009% 0
I21 62.1 1.8 x10⁹ 0 0.45 +/- 0.03% 0.0573 +/- 0.0001% 0
H24 7.7 4.8 x10⁹ 0.0047 +/- 0.0003% 0.70 +/- 0.05% 0.32 +/- 0.02% 0.0060 +/- 0.0004%
Q26 22.5 5.4 x10⁸ 0 0.07 +/- 0.01% 0.07 +/- 0.01% 0.0001 +/- 0.0001%
E27 49.0 2.3 x10⁸ 0 0.71 +/- 0.03% 0.24 +/- 0.01% 0.0001 +/- 0.0001%
I30 7.9 1.8 x10⁹ 0 0.054 +/- 0.006% 0.002 +/- 0.002% 0
T34 48.8 5.1 x10⁸ 0.0042 +/- 0.0009% 0.43 +/- 0.04% 0.08 +/- 0.03% 0.008 +/- 0.001%
H36 54.5 4.8 x10⁹ 0.0023 +/- 0.0007% 2.4 +/- 0.2% 1.7 +/- 0.8% 0.009 +/- 0.004%
P37 81.9 6.5 x10⁸ 0 0.38 +/- 0.04% 0.06 +/- 0.01% 0.0002 +/- 0.0002%
E41 93.5 2.3 x10⁸ 0 0.105 +/- 0.005% 0.14 +/- 0.04% 0
H64 41.8 4.8 x10⁹ 0.0022 +/- 0.0003% 0.81 +/- 0.01% 4.5 +/- 0.6% 0.042 +/- 0.009%
V67 86.1 8.5 x10⁸ 0.00034 +/- 0.0001% 0.41 +/- 0.02% 0.071 +/- 0.009% 0.0003 +/- 0.0001%
T70 79.3 5.1 x10⁸ 0.016 +/- 0.006% 0.09 +/- 0.02% 0.03 +/- 0.02% 0.009 +/- 0.003%
H81 129.3 4.8 x10⁹ 0.029 +/- 0.003% 3.9 +/- 0.1% 7 +/- 1% 0.49 +/- 0.03%
H82 5.1 4.8 x10⁹ 0.0052 +/- 0.0005% 0.61 +/- 0.04% 0.69 +/- 0.06% 0.011 +/- 0.001%
E83 112.0 2.3 x10⁸ 0.018 +/- 0.002% 0.36 +/- 0.06% 0.73 +/- 0.02% 0.026 +/- 0.004%
L86 1.9 1.7 x10⁹ 0 0.37 +/- 0.03% 0.0004 +/- 0.0003% 0
L89 43.1 1.7 x10⁹ 0.010 +/- 0.002% 1.06 +/- 0.08% 0.08 +/- 0.02% 0.0077 +/- 0.0005%
Q91 72.9 5.4 x10⁸ 0 0.29 +/- 0.02% 0.14 +/- 0.02% 0.04 +/- 0.03%
H93 52.0 4.8 x10⁹ 0.0023 +/- 0.0004% 1.9 +/- 0.1% 1.63 +/- 0.07% 0.004 +/- 0.002%
H113 80.6 4.8 x10⁹ 0 1.9 +/- 0.1% 2.0 +/- 0.4% 0.009 +/- 0.004%
H116 63.9 4.8 x10⁹ 0 0.2 +/- 0.1% 1.7 +/- 0.5% 0
H119 30.9 4.8 x10⁹ 0 0.95 +/- 0.07% 0.55 +/- 0.06% 0
Q128 66.5 5.4 x10⁸ 0 0.34 +/- 0.03% 0.018 +/- 0.002% 0
M131 0.9 8.5 x10⁹ 3.7 +/- 0.3% 25 +/- 1% 24 +/- 3% 5.9 +/- 0.4%
K133 67.6 3.5 x10⁸ 0 0.09 +/- 0.01% 0.0001 +/- 0.0001% 0
E136 76.3 2.3 x10⁸ 0 0.083 +/- 0.007% 0.137 +/- 0.006% 0
L137 40.4 1.7 x10⁹ 0 0.27 +/- 0.03% 0.003 +/- 0.001% 0
F138 19.8 6.9 x10⁹ 0 0.70 +/- 0.03% 0.141 +/- 0.007% 0.0009 +/- 0.0006%
F151 26.7 6.9 x10⁹ 0 36 +/- 2% 7.9 +/- 0.4% 0 a The numerator is the sum all signal of peptides modified at a residue. The denominator is the sum of
all signal of peptides, modified and unmodified, having the same sequences as the numerator set of peptides. b Solvent accessible surface area (SASA) was calculated as the sum of non-hydrogen side chain and α-
carbon areas using the online calculator at http://molbio.info.nih.gov/structbio/basic.html , using a 1.4 Å probe 29. The myoglobin crystal structure 1WLA.pdb was used with heme atoms omitted 30. c http://allen.rad.nd.edu/browse compil.html.
Figure 4.2: With (a), the relative difference between persulfate and peroxide fraction modified, of CaM, aMb, bradykinin, and angiotensin II residues, are determined per residue; these values are averaged per aminopairwise-comparison standard error. In (b) the maximum fraction modified among all same-amino acid residues is plotted. pattern bars denote Na2S2
These differences must also arise from the differences in the inherent reactivities of
and SO4-•, and from the difference in their size.
sensitive to both labeling methods; aMb W7 and W14 are equivalently labeled by H
FPOP, butW7 is 3-fold more oxidized than W14 with Na
accessible surface area values are small but non
107
With (a), the relative difference between persulfate and peroxide fraction
aMb, bradykinin, and angiotensin II residues, are determined per residue; these values are averaged per amino-acid type. The error bars denote the average
comparison standard error. In (b) the maximum fraction modified among all residues is plotted. Black bars denote H2O2 FPOP labeling; diagonal
2O8 FPOP labeling.
These differences must also arise from the differences in the inherent reactivities of
, and from the difference in their size. In particular, Trp is exceptionally
sensitive to both labeling methods; aMb W7 and W14 are equivalently labeled by H
fold more oxidized than W14 with Na2S2O8 FPOP. The solvent
accessible surface area values are small but non-zero, 15 and 7 Å2, respectively, for W7
With (a), the relative difference between persulfate and peroxide fraction aMb, bradykinin, and angiotensin II residues, are determined per
rs denote the average comparison standard error. In (b) the maximum fraction modified among all
FPOP labeling; diagonal-
These differences must also arise from the differences in the inherent reactivities of •OH
In particular, Trp is exceptionally
sensitive to both labeling methods; aMb W7 and W14 are equivalently labeled by H2O2
FPOP. The solvent-
, respectively, for W7
108
and W14, so that the difference between labeling methods for this residue type may be a
function exclusively of size differences in the reactant probes.
The amino acid labeling levels are listed from left-to-right in both graphs of
Figure 4.2 in order of decreasing observable peroxide reactivity per amino-acid group, as
established by the maximum observed fraction modified per residue of each group
(Figure 4.2b). These maximum fraction values should pertain to the most fully solvent-
exposed sidechain residues of each amino acid group, and thus allow for a comparison of
the inherent reactivity of SO4-• vs. •OH. The order of SO4
-• reactivity is slightly
different: M > Y = W > F = E = H > S > P > D = T > K = Q > L = V = I. In either case,
the most reactive residues are consistent with amino acid rate data and with the •OH
labeling products from water radiolysis31, with the exception of Glu. Persulfate FPOP is
more reactive to His, and Tyr and equally reactive to Met, Trp, Glu, and Ser. Despite the
negative charge of SO4-• and its precursor, no increased affinity for basic residues is
observed except for His. This is probably due to attenuation of electrostatic interaction
by the phosphate-buffered saline solution, but trypsin digestion may bias against
detecting modified Lys and Arg.
4.3.4 Chemistry of Na2S2O8 FPOP.
With the exception of the +34 Da His modification (Supporting Information)
many modifications discernable for peroxide FPOP were also found among persulfate
FPOP replicates (Table 4.2). Furthermore, these modifications comprise the “usual
suspects” in •OH labeling by peroxide-initiated and water radiolysis experiments.5 The
commonality of the sets of modifications produced by each FPOP method suggests that
the dominant chemical pathways of SO4-• labeling are analogous to the better understood
109
•OH mechanisms.32 A likely explanation for these similar outcomes is that both
processes begin with an initial hydrogen abstraction reaction at aliphatic sites.
Additionally, the transfer of radical to water (equation 1) may be a competing pathway,
giving rise to the common •OH footprinting products.
SO4-• + H2O
SO4
2- + H+ + •OH (1)
There may be other novel products of SO4-• not detected in these experiments; that 85%
of all +2 and higher charge state species of significant abundance were identified as aMb
modified and unmodified peptides suggests that these putative products are from low-
yield pathways.
4.3.5 Solvent Accessibility.
In comparing equilibrium states, as is typical for footprinting experiments5,
changes in the fraction modified at a residue between states should solely reflect a change
in solvent accessibility—all other biases are inherently normalized. The sensitivity of
persulfate FPOP labeling to solvent accessibility can be assayed by comparing the solvent
accessible surface area (SASA) calculated from X-ray and NMR structures to the per-
residue fraction modified for any same-amino-acid set of residues of a protein. The
restriction to same residue types stems from the inherent •OH (and presumably with SO4-
•) reactivity difference between free amino acids.5 An analysis of the aMb His
modification levels is illustrative of the promise of this approach (Figure 4.3). We find
that its inherent reactivity is not too low to limit detection of the modifications and that a
large range of SASA values are spanned by 11 myoglobin His residues. The reactivity of
His in Na2S2O8 FPOP correlates reasonably well with the calculated SASA (the Figure
4.3b straight-line fit R2 is 0.83). Although the R2 does not indicate perfect correlation,
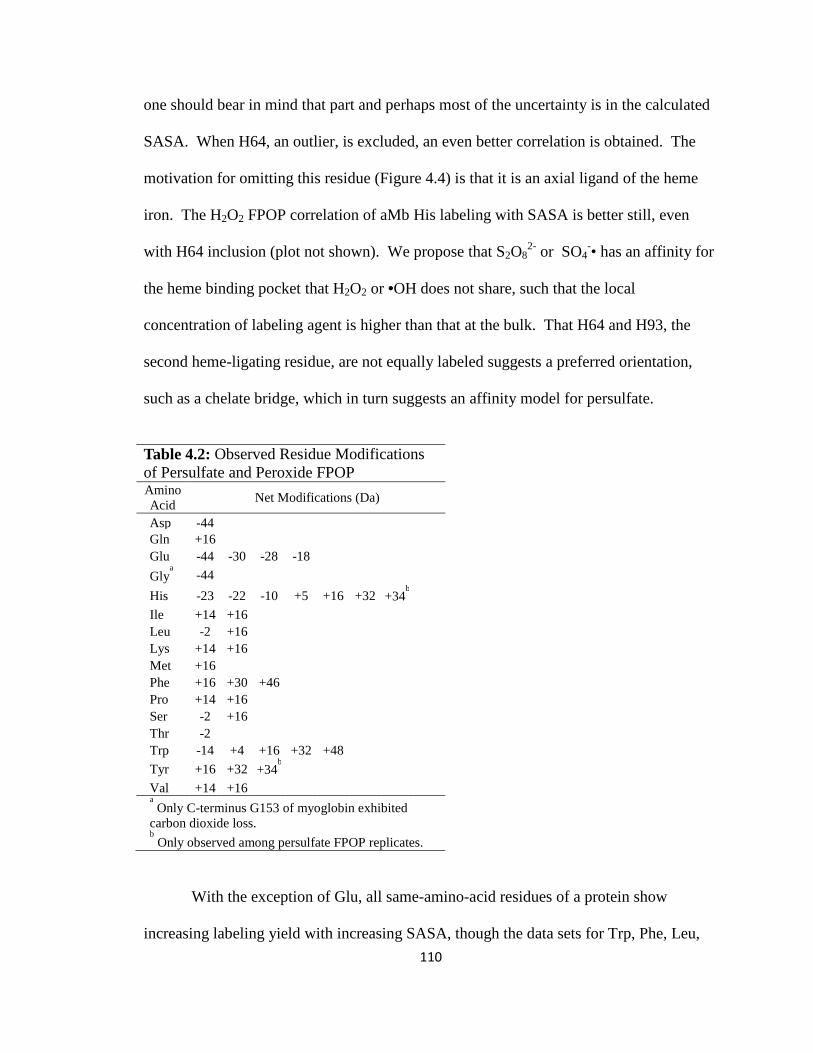
110
one should bear in mind that part and perhaps most of the uncertainty is in the calculated
SASA. When H64, an outlier, is excluded, an even better correlation is obtained. The
motivation for omitting this residue (Figure 4.4) is that it is an axial ligand of the heme
iron. The H2O2 FPOP correlation of aMb His labeling with SASA is better still, even
with H64 inclusion (plot not shown). We propose that S2O82- or SO4
-• has an affinity for
the heme binding pocket that H2O2 or •OH does not share, such that the local
concentration of labeling agent is higher than that at the bulk. That H64 and H93, the
second heme-ligating residue, are not equally labeled suggests a preferred orientation,
such as a chelate bridge, which in turn suggests an affinity model for persulfate.
Table 4.2: Observed Residue Modifications of Persulfate and Peroxide FPOP Amino Acid Net Modifications (Da) Asp -44 Gln +16 Glu -44 -30 -28 -18 Gly
a -44 His -23 -22 -10 +5 +16 +32 +34
b Ile +14 +16 Leu -2 +16 Lys +14 +16 Met +16 Phe +16 +30 +46 Pro +14 +16 Ser -2 +16 Thr -2 Trp -14 +4 +16 +32 +48 Tyr +16 +32 +34
b Val +14 +16 a Only C-terminus G153 of myoglobin exhibited
carbon dioxide loss. b Only observed among persulfate FPOP replicates.
With the exception of Glu, all same-amino-acid residues of a protein show
increasing labeling yield with increasing SASA, though the data sets for Trp, Phe, Leu,
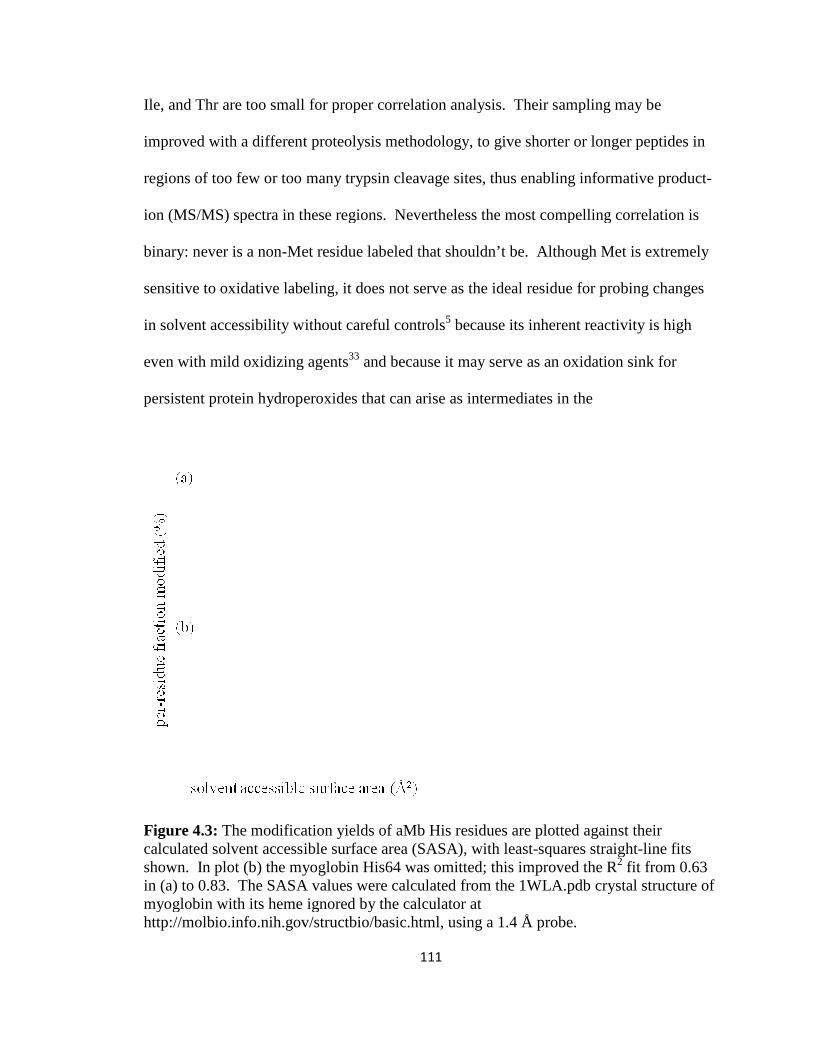
Ile, and Thr are too small for proper correlation analysis. Their sampling may be
improved with a different proteolysis methodology, to give shorter or longer peptides in
regions of too few or too many trypsin cleavage sites, thus enabling informative product
ion (MS/MS) spectra in these regions. Nevertheless the
binary: never is a non-Met residue labeled that shouldn’t be.
sensitive to oxidative labeling
in solvent accessibility without careful controls
even with mild oxidizing agents
persistent protein hydroperoxides that can arise as intermediates in the
Figure 4.3: The modification yieldcalculated solvent accessible surface area (SASA), with leastshown. In plot (b) the myoglobin His64 was omitted; this improved the Rin (a) to 0.83. The SASA values were calculated from the 1WLA.pdb crystal structure of myoglobin with its heme ignored by the calculator at http://molbio.info.nih.gov/structbio/basic.html, using a 1.4 Å probe.
111
Ile, and Thr are too small for proper correlation analysis. Their sampling may be
th a different proteolysis methodology, to give shorter or longer peptides in
regions of too few or too many trypsin cleavage sites, thus enabling informative product
ion (MS/MS) spectra in these regions. Nevertheless the most compelling correlation is
Met residue labeled that shouldn’t be. Although Met is extremely
oxidative labeling, it does not serve as the ideal residue for probing changes
in solvent accessibility without careful controls5 because its inherent reactivity is high
even with mild oxidizing agents33 and because it may serve as an oxidation sink for
persistent protein hydroperoxides that can arise as intermediates in the
modification yields of aMb His residues are plotted against their calculated solvent accessible surface area (SASA), with least-squares straightshown. In plot (b) the myoglobin His64 was omitted; this improved the R
The SASA values were calculated from the 1WLA.pdb crystal structure of myoglobin with its heme ignored by the calculator at http://molbio.info.nih.gov/structbio/basic.html, using a 1.4 Å probe.
Ile, and Thr are too small for proper correlation analysis. Their sampling may be
th a different proteolysis methodology, to give shorter or longer peptides in
regions of too few or too many trypsin cleavage sites, thus enabling informative product-
most compelling correlation is
Although Met is extremely
, it does not serve as the ideal residue for probing changes
because its inherent reactivity is high
and because it may serve as an oxidation sink for
residues are plotted against their squares straight-line fits
shown. In plot (b) the myoglobin His64 was omitted; this improved the R2 fit from 0.63 The SASA values were calculated from the 1WLA.pdb crystal structure of
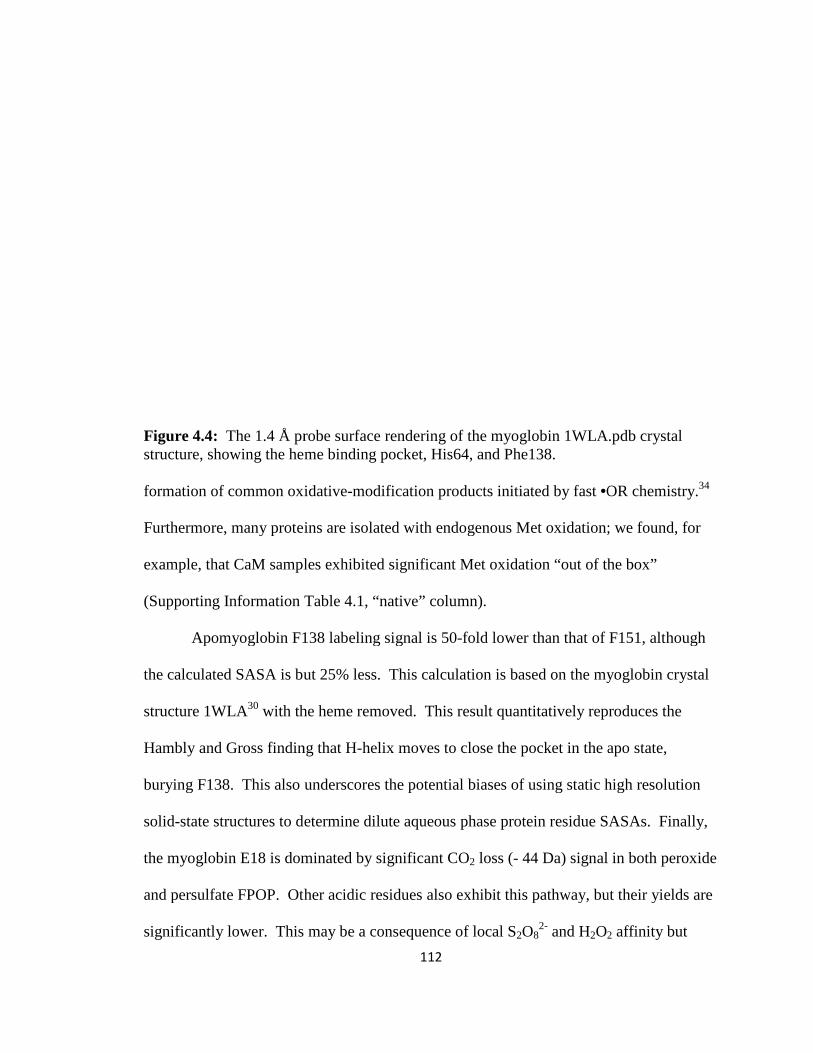
Figure 4.4: The 1.4 Å probe surface rendering of the mstructure, showing the heme binding pocket, His64, and Phe138. formation of common oxidative
Furthermore, many proteins are isolated with endogenous Met oxidation; we found, for
example, that CaM samples exhibited significant Met oxidation “out of the box”
(Supporting Information Table 4.1, “native” column).
Apomyoglobin F138 labeling signal is
the calculated SASA is but 25% less. This calculation is based on the myoglobin crystal
structure 1WLA30 with the heme removed. This result quant
Hambly and Gross finding that
burying F138. This also underscores the potential biases of using static high resolution
solid-state structures to determine dilute aqueous phase pr
the myoglobin E18 is dominated by significant CO
and persulfate FPOP. Other acidic residues also exhibit this pathway, but their yields are
significantly lower. This may be a conseque
112
The 1.4 Å probe surface rendering of the myoglobin 1WLA.pdb crystal structure, showing the heme binding pocket, His64, and Phe138.
formation of common oxidative-modification products initiated by fast •OR chemistry.
Furthermore, many proteins are isolated with endogenous Met oxidation; we found, for
example, that CaM samples exhibited significant Met oxidation “out of the box”
(Supporting Information Table 4.1, “native” column).
Apomyoglobin F138 labeling signal is 50-fold lower than that of F151, although
the calculated SASA is but 25% less. This calculation is based on the myoglobin crystal
with the heme removed. This result quantitatively reproduces the
Hambly and Gross finding that H-helix moves to close the pocket in the apo state,
burying F138. This also underscores the potential biases of using static high resolution
state structures to determine dilute aqueous phase protein residue SASAs. Finally,
the myoglobin E18 is dominated by significant CO2 loss (- 44 Da) signal in both peroxide
and persulfate FPOP. Other acidic residues also exhibit this pathway, but their yields are
significantly lower. This may be a consequence of local S2O82- and H2O2
yoglobin 1WLA.pdb crystal
OR chemistry.34
Furthermore, many proteins are isolated with endogenous Met oxidation; we found, for
example, that CaM samples exhibited significant Met oxidation “out of the box”
fold lower than that of F151, although
the calculated SASA is but 25% less. This calculation is based on the myoglobin crystal
itatively reproduces the
ves to close the pocket in the apo state,
burying F138. This also underscores the potential biases of using static high resolution
otein residue SASAs. Finally,
44 Da) signal in both peroxide
and persulfate FPOP. Other acidic residues also exhibit this pathway, but their yields are
2 affinity but
113
probably not a consequence of error in SASA estimation as the magnitude of yield
change is so large.
4.3.6 Sodium persulfate vs. hydrogen peroxide FPOP: physical considerations and
future prospects.
Although protein footprinting at physiologic levels of analyte, ionic activity, and
pH are possible with FPOP, the requirement of peroxy starting material begs the
definition of “physiologic”. It is, therefore, advantageous that persulfate FPOP requires
3-5 fold less starting material than peroxide FPOP to deliver the same levels of
modification (Figure 4.1). On the other hand, excess Na2S2O8 must be removed non-
enzymatically after labeling, and this may introduce another source of unbiased error.
One application of the FPOP method that we would like to pursue is the study of
membrane proteins in micelles, liposomes, lipoprotein particles, and synthetic protein-
wrapped phospholipid bilayer discs.35 The lipid bilayer permeability of S2O82- is in all
likelihood dramatically smaller than that of H2O2, commonly known to be membrane-
permeable 36. Marla and coworkers 37 showed that ONOO- readily permeates large
unilamellar vesicles composed of L-α-phosphatidylcholine , stearyl amine, and
cholesterol, but that SO42- is membrane-impermeable. They argued the high
peroxynitrate permeability may be due to its relatively high basicity (pKa = 6.8 38-39),
whereas sulfate is the conjugate base of a strong acid. Persulfate retains its anionic
character in PBS-buffered solution and, thus, should be membrane-impermeable. It is
possible that by using H2O2 and Na2S2O82- in tandem FPOP experiments, a footprint may
be acquired of extracellular-accessible and cytoplasmic-accessible residues in aqueous-
stable membrane particles imbedded with analyte protein. Finally, the thermal stability
114
of S2O82- relative to H2O2 is advantageous for any temperature-varied FPOP experiment
up to 50°C 40-41.
4.4 Conclusions
The H2O2 and Na2S2O8 FPOP results presented here demonstrate the viability of
persulfate FPOP protein footprinting. The ideal footprinting experiment is of state
comparisons whereby one seeks differences in labeling yield at identical sites for two
treatments (e.g., apo vs. holo, native vs. unfolded) to reflect residue protection (or
exposure with signal increase) owing to direct inter- or intramolecular interaction or
allosteric change from distal binding. If a detailed footprinting picture is required in
which the “fraction modified” ascribes a solvent accessibility value, a thorough search
and replicate quantitation for all FPOP modifications in addition to calibration with
proteins of known structure will be required. The kinds of modifications with persulfate
and peroxide, with one exception, are identical, and the promiscuity of SO4-• is similar
and tunable like •OH. The choice for utilizing persulfate FPOP for non-residue-specific
stable modification footprinting is best made considering its physical, rather than
chemical properties. Most importantly, this study demonstrates the utility of the general
FPOP method. That persulfate FPOP works serves as an invitation to try other UV-
sensitive precursor molecules, such as L-photoleucine23, or to use the sulfate radical
anion to produce other radicals and radical anions (e.g., CO3-• from HCO3
- or •NO2 from
NO2-). These approaches may give controllable radical species capable of very fast
labeling, not only sampling native conformations is a non-specific or targeted way but
also expanding the scope of FPOP.
115
4.5 Supporting Information
4.5.1 Global mass spectrometry of FPOP-labeled ββββ-lactoglobulin.
The capacity of the 0.6 µL bed ZiptipC4 was approximately 3.3 µg, so that 180-
230 pmol samples of BLG were infused at a flow rate adjusted to ensure accuracy in the
time-to-digital conversion of the QTOF multi-channel plate detector, requiring 80-180
ion counts/scan base peak. Scans spanning the entire chromatogram were summed to
improve the signal to noise, typically 60-150 scans depending on the flow rate.
4.5.2 ββββ-lactoglobulin FPOP global product distribution analysis.
A 1216-1245 m/z spectrum window centered about the 15th charge state of BLG
was fit with a model FPOP product distribution described previously13 for each BLG
duplicate. The window range encompassed all detected product peaks, and a 10 m/z
region lower than the unmodified peak average m/z was used for baseline estimation. A
Mathcad 14 Minimize algorithm was used to fit a Poisson distribution to the resulting set
of 0, +16, +32… state abundances.
4.5.3 Optimal Sodium Persulfate FPOP Conditions.
Tuning the level of radical exposure controls the kind and extent of modifications.
Early footprinting work used Fenton-generated •OH radicals to cleave DNA and protein
backbones; absence of a cleavage product was indicative of protection due to
biomolecular interaction.42 The ESI mass spectrum of BLG labeled by FPOP with 15
mM Na2S2O8 and without Gln radical scavenger shows a background in each BLG
charge state m/z region ≥ 20% the charge state’s base peak (data not shown). We
attribute this high baseline to the mass-spectral convolution of many protein fragments
generated by radical-induced cleavage along the protein backbone. Under these
116
conditions, too much radical labeling agent has persisted for too long an exposure. The
reactivity of protein side chains is, in general, not high at α-carbons because steric
hindrance is protective under typical low-exposure conditions.43-44 Thus, the
identification and quantitation of side chain-modified residues for scavenger-free
Na2S2O8 FPOP-labeled protein would not measure the solvent accessibility at these sites
in the protein’s native state.
A more difficult problem is that this excessive labeling may also be the case with
insufficient scavenger or too high a concentration of the radical precursor; that is, the
quenching is not fast enough to stop labeling before side chain modifications cause
protein conformational change leading to misleading labeling. Therefore, we undertook
an analysis on the underlying protein product distributions of the Figure 4.1 spectra to
support the hypothesis that 5 mM Na2S2O8, 20 mM Gln (Figure 4.1c) is sufficient to label
the native protein state without sampling partially unfolded products.
In a previous study, we provided empirical evidence that FPOP with H2O2 labels
proteins faster than any conformational response to •OH modifications.13 This result was
based on the analysis of the mass spectra of the modified proteins, where a model was
used to digitize signals for FPOP-labeled proteins into bins of primary modification of 0,
+16, +32, … Da. Simplification of the modification spectrum to a 0, +16, +32, …
distribution allowed for a comparison to a Poisson distribution. For BLG, CaM, and
lysozyme, a good match occurred only when radical scavenger was present. Testing for a
Poisson distribution, which should apply for proteins having an invariant single
conformation during labeling and for which there are many sites available to •OH
modification, is an appropriate means of establishing the “snapshot” nature of a
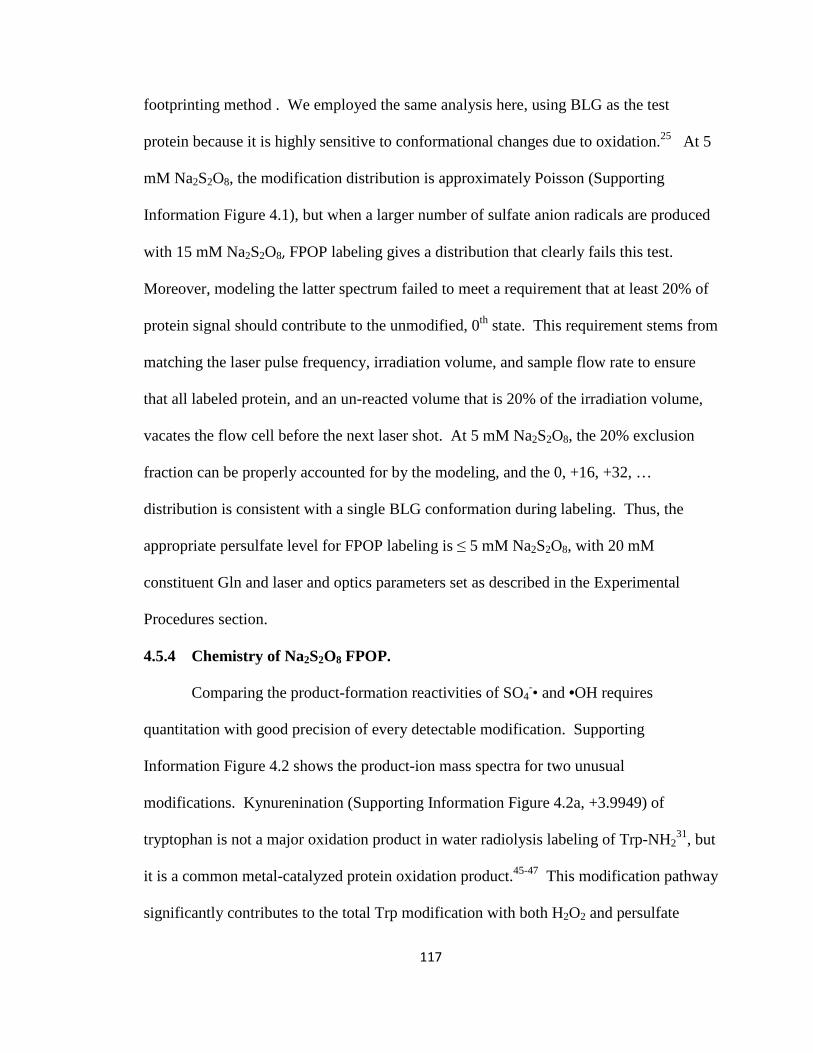
117
footprinting method . We employed the same analysis here, using BLG as the test
protein because it is highly sensitive to conformational changes due to oxidation.25 At 5
mM Na2S2O8, the modification distribution is approximately Poisson (Supporting
Information Figure 4.1), but when a larger number of sulfate anion radicals are produced
with 15 mM Na2S2O8, FPOP labeling gives a distribution that clearly fails this test.
Moreover, modeling the latter spectrum failed to meet a requirement that at least 20% of
protein signal should contribute to the unmodified, 0th state. This requirement stems from
matching the laser pulse frequency, irradiation volume, and sample flow rate to ensure
that all labeled protein, and an un-reacted volume that is 20% of the irradiation volume,
vacates the flow cell before the next laser shot. At 5 mM Na2S2O8, the 20% exclusion
fraction can be properly accounted for by the modeling, and the 0, +16, +32, …
distribution is consistent with a single BLG conformation during labeling. Thus, the
appropriate persulfate level for FPOP labeling is ≤ 5 mM Na2S2O8, with 20 mM
constituent Gln and laser and optics parameters set as described in the Experimental
Procedures section.
4.5.4 Chemistry of Na2S2O8 FPOP.
Comparing the product-formation reactivities of SO4-• and •OH requires
quantitation with good precision of every detectable modification. Supporting
Information Figure 4.2 shows the product-ion mass spectra for two unusual
modifications. Kynurenination (Supporting Information Figure 4.2a, +3.9949) of
tryptophan is not a major oxidation product in water radiolysis labeling of Trp-NH231, but
it is a common metal-catalyzed protein oxidation product.45-47 This modification pathway
significantly contributes to the total Trp modification with both H2O2 and persulfate
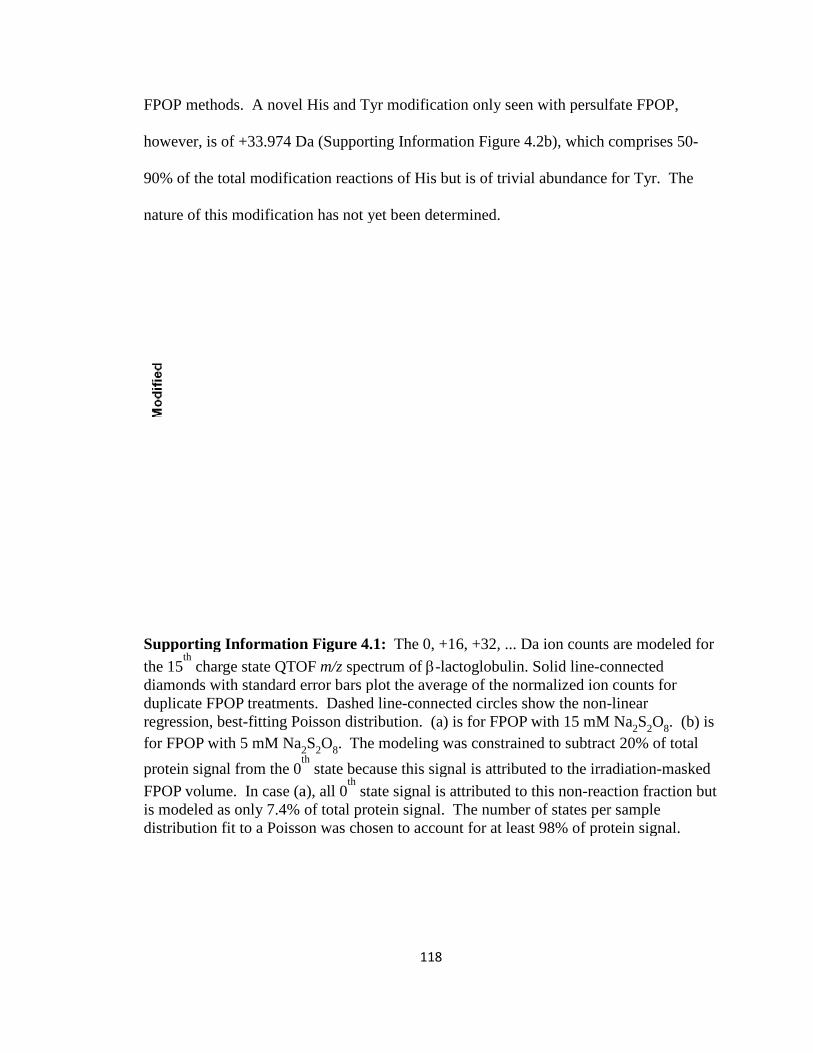
FPOP methods. A novel His and Tyr modification only seen with persulfate FPOP,
however, is of +33.974 Da (
90% of the total modification reactions of His but is of trivi
nature of this modification has not yet been determined.
Supporting Information Figure 4.1:the 15
th charge state QTOF
diamonds with standard error bars plot the average of the normalized ion counts for duplicate FPOP treatments. Dashed lineregression, best-fitting Poisson distribution. (for FPOP with 5 mM Na2protein signal from the 0
th
FPOP volume. In case (ais modeled as only 7.4% of total protein signal. The number of states per sample distribution fit to a Poisson was chosen to account for at least 98% of protein signal.
118
FPOP methods. A novel His and Tyr modification only seen with persulfate FPOP,
however, is of +33.974 Da (Supporting Information Figure 4.2b), which comprises 50
90% of the total modification reactions of His but is of trivial abundance for Tyr. The
nature of this modification has not yet been determined.
Supporting Information Figure 4.1: The 0, +16, +32, ... Da ion counts are modeled for
charge state QTOF m/z spectrum of β-lactoglobulin. Solid line-connected diamonds with standard error bars plot the average of the normalized ion counts for duplicate FPOP treatments. Dashed line-connected circles show the non-
fitting Poisson distribution. (a) is for FPOP with 15 mM Na
2S2O8. The modeling was constrained to subtractth state because this signal is attributed to the irradiation
a), all 0th state signal is attributed to this non-reactio
is modeled as only 7.4% of total protein signal. The number of states per sample distribution fit to a Poisson was chosen to account for at least 98% of protein signal.
FPOP methods. A novel His and Tyr modification only seen with persulfate FPOP,
Figure 4.2b), which comprises 50-
al abundance for Tyr. The
The 0, +16, +32, ... Da ion counts are modeled for
connected diamonds with standard error bars plot the average of the normalized ion counts for
-linear ) is for FPOP with 15 mM Na2S2O8. (b) is
subtract 20% of total
state because this signal is attributed to the irradiation-masked
reaction fraction but is modeled as only 7.4% of total protein signal. The number of states per sample distribution fit to a Poisson was chosen to account for at least 98% of protein signal.
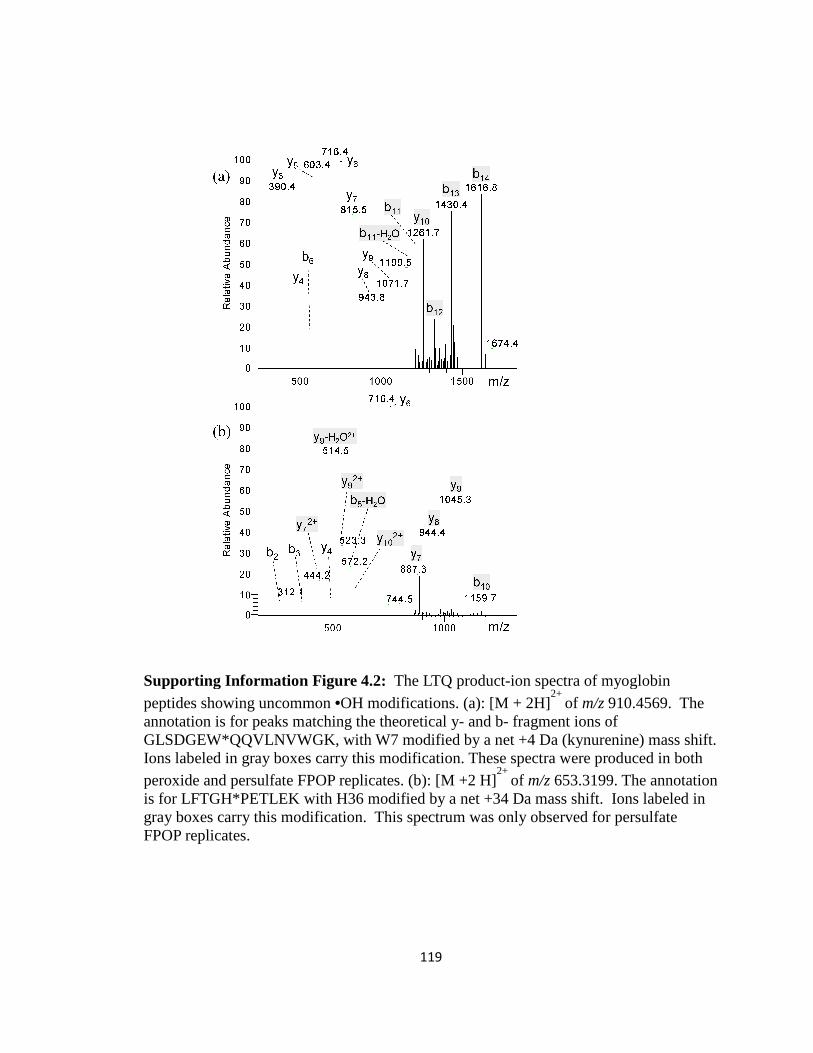
Supporting Information peptides showing uncommon annotation is for peaks matching the theoretical GLSDGEW*QQVLNVWGK, with W7 modified by a net +4 Da (kyIons labeled in gray boxes carry this modification. These spectra were produced in both peroxide and persulfate FPOP replicates. (is for LFTGH*PETLEK with H36 modified by a net +34 Da magray boxes carry this modification. This spectrum was only observed for persulfate FPOP replicates.
119
Supporting Information Figure 4.2: The LTQ product-ion spectra of myoglobin
peptides showing uncommon •OH modifications. (a): [M + 2H]2+
of m/z 910.4569. The peaks matching the theoretical y- and b- fragment ions of
GLSDGEW*QQVLNVWGK, with W7 modified by a net +4 Da (kynurenine) mass shift. Ions labeled in gray boxes carry this modification. These spectra were produced in both peroxide and persulfate FPOP replicates. (b): [M +2 H]
2+ of m/z 653.3199. The annotation
is for LFTGH*PETLEK with H36 modified by a net +34 Da mass shift. Ions labeled in gray boxes carry this modification. This spectrum was only observed for persulfate
ion spectra of myoglobin
910.4569. The fragment ions of
nurenine) mass shift. Ions labeled in gray boxes carry this modification. These spectra were produced in both
653.3199. The annotation ss shift. Ions labeled in
gray boxes carry this modification. This spectrum was only observed for persulfate
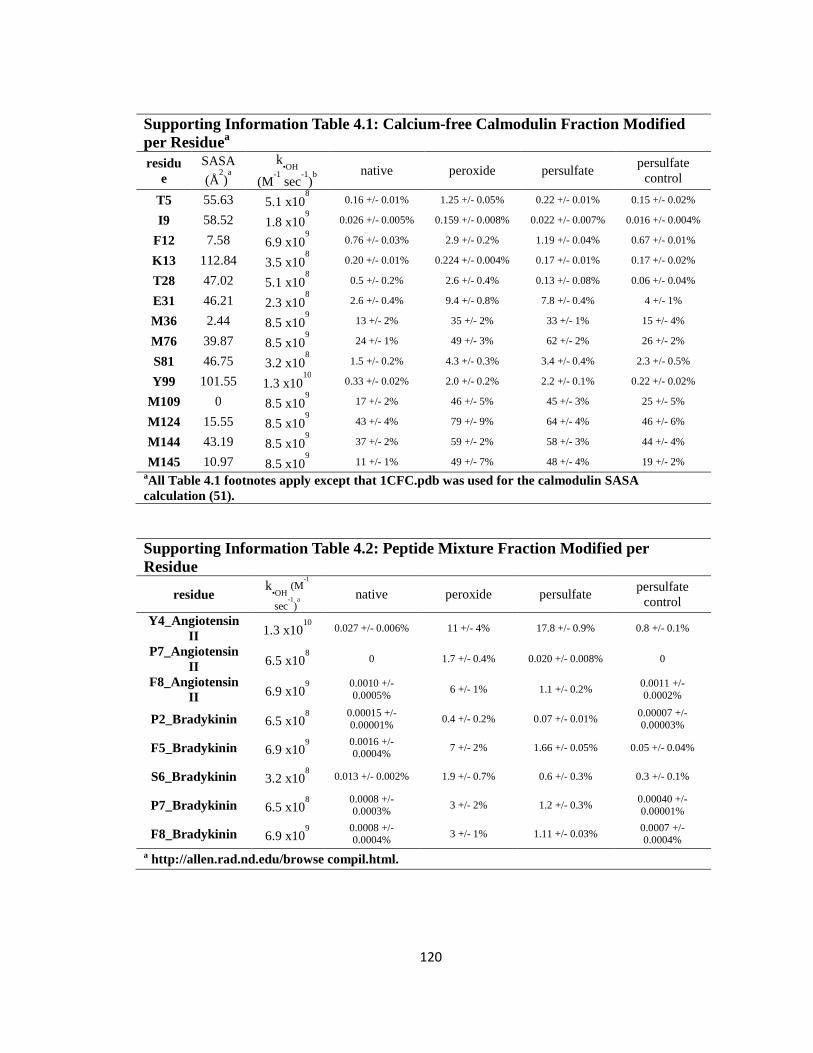
120
Supporting Information Table 4.1: Calcium-free Calmodulin Fraction Modified per Residuea residu
e SASA
(Å2)a
k•OH
(M-1 sec
-1)b
native peroxide persulfate persulfate control
T5 55.63 5.1 x10⁸ 0.16 +/- 0.01% 1.25 +/- 0.05% 0.22 +/- 0.01% 0.15 +/- 0.02%
I9 58.52 1.8 x10⁹ 0.026 +/- 0.005% 0.159 +/- 0.008% 0.022 +/- 0.007% 0.016 +/- 0.004%
F12 7.58 6.9 x10⁹ 0.76 +/- 0.03% 2.9 +/- 0.2% 1.19 +/- 0.04% 0.67 +/- 0.01%
K13 112.84 3.5 x10⁸ 0.20 +/- 0.01% 0.224 +/- 0.004% 0.17 +/- 0.01% 0.17 +/- 0.02%
T28 47.02 5.1 x10⁸ 0.5 +/- 0.2% 2.6 +/- 0.4% 0.13 +/- 0.08% 0.06 +/- 0.04%
E31 46.21 2.3 x10⁸ 2.6 +/- 0.4% 9.4 +/- 0.8% 7.8 +/- 0.4% 4 +/- 1%
M36 2.44 8.5 x10⁹ 13 +/- 2% 35 +/- 2% 33 +/- 1% 15 +/- 4%
M76 39.87 8.5 x10⁹ 24 +/- 1% 49 +/- 3% 62 +/- 2% 26 +/- 2%
S81 46.75 3.2 x10⁸ 1.5 +/- 0.2% 4.3 +/- 0.3% 3.4 +/- 0.4% 2.3 +/- 0.5%
Y99 101.55 1.3 x10¹⁰
0.33 +/- 0.02% 2.0 +/- 0.2% 2.2 +/- 0.1% 0.22 +/- 0.02%
M109 0 8.5 x10⁹ 17 +/- 2% 46 +/- 5% 45 +/- 3% 25 +/- 5%
M124 15.55 8.5 x10⁹ 43 +/- 4% 79 +/- 9% 64 +/- 4% 46 +/- 6%
M144 43.19 8.5 x10⁹ 37 +/- 2% 59 +/- 2% 58 +/- 3% 44 +/- 4%
M145 10.97 8.5 x10⁹ 11 +/- 1% 49 +/- 7% 48 +/- 4% 19 +/- 2%
aAll Table 4.1 footnotes apply except that 1CFC.pdb was used for the calmodulin SASA calculation (51).
Supporting Information Table 4.2: Peptide Mixture Fraction Modified per Residue
residue k•OH
(M-1
sec-1)a
native peroxide persulfate persulfate control
Y4_Angiotensin II 1.3 x10
10 0.027 +/- 0.006% 11 +/- 4% 17.8 +/- 0.9% 0.8 +/- 0.1%
P7_Angiotensin II 6.5 x10
8 0 1.7 +/- 0.4% 0.020 +/- 0.008% 0
F8_Angiotensin II 6.9 x10
9
0.0010 +/- 0.0005%
6 +/- 1% 1.1 +/- 0.2% 0.0011 +/- 0.0002%
P2_Bradykinin 6.5 x10⁸
0.00015 +/- 0.00001%
0.4 +/- 0.2% 0.07 +/- 0.01% 0.00007 +/- 0.00003%
F5_Bradykinin 6.9 x10⁹
0.0016 +/- 0.0004%
7 +/- 2% 1.66 +/- 0.05% 0.05 +/- 0.04%
S6_Bradykinin 3.2 x10⁸ 0.013 +/- 0.002% 1.9 +/- 0.7% 0.6 +/- 0.3% 0.3 +/- 0.1%
P7_Bradykinin 6.5 x10⁸
0.0008 +/- 0.0003%
3 +/- 2% 1.2 +/- 0.3% 0.00040 +/- 0.00001%
F8_Bradykinin 6.9 x10⁹
0.0008 +/- 0.0004%
3 +/- 1% 1.11 +/- 0.03% 0.0007 +/- 0.0004%
a http://allen.rad.nd.edu/browse compil.html.
121
4.6 References 1. Hambly, D. M.; Gross, M. L., In The Encyclopedia of Mass Spectrometry: Ionization
Methods, Gross, M. L.; Caprioli, R. M., Eds. 2006; Vol. 6.
2. Guan, J.-Q.; Chance, M. R., Structural proteomics of macromolecular assemblies using
oxidative footprinting and mass spectrometry. Trends Biochem. Sci 2005, 10, 583-592.
3. Galas, D. J.; Schmitz, A., DNAase footprinting a simple method for the detection of
protein-DNA binding specificity. Nucl. Acids Res. 1978, 5 (9), 3157-3170.
4. Chen, S.; Engen, J. R., Isotope Exchange and Covalent Modification Strategies for
Studying Protein Structure and Function. Cur. Anal. Chem. 2009, 5, 205-212.
5. Xu, G.; Chance, M. R., Hydroxyl Radical-Mediated Modification of Proteins as Probes for
Structural Proteomics. Chem. Rev. 2007, 107 (8), 3514-3543.
6. Maleknia, S. D.; Brenowitz, M.; Chance, M. R., Millisecond Radiolytic Modification of
Peptides by Synchrotron X-rays Identified by Mass Spectrometry. Anal. Chem. 1999, 71 (18),
3965-3973.
7. Zhang, Z.; Smith, D. L., Determination of amide hydrogen exchange by mass
spectrometry: A new tool for protein structure elucidation. Protein Sci. 1993, 2 (4), 522-531.
8. Katta, V.; Chait, B. T., Hydrogen/deuterium exchange electrospray ionization mass
spectrometry: a method for probing protein conformational changes in solution. J. Am. Chem.
Soc. 1993, 115 (14), 6317-6321.
9. Gabriela, E. G.; Ana, C.; Patricio, O. C.; Fernando, A. G.; José, M. D., Exploring protein
interfaces with a general photochemical reagent. Protein Sci. 2006, 15 (4), 744-752.
10. Patricio, O. C.; Daniela, B. U.; José, M. D., Probing protein conformation with a minimal
photochemical reagent. Protein Sci. 2002, 11 (6), 1353-1366.
11. Frederic, M. R.; Raphael, L.; Richard, W.; Darshan, P.; Gerard, O., Methylene as a
possible universal footprinting reagent that will include hydrophobic surface areas: Overview
and feasibility: Properties of diazirine as a precursor. Protein Sci. 2000, 9 (12), 2506-2517.
12. Hambly, D. M.; Gross, M. L., Laser Flash Photolysis of Hydrogen Peroxide to Oxidize
Protein Solvent-Accessible Residues on the Microsecond Timescale. J. Am. Soc. Mass Spectrom.
2005, 16 (12), 2057-2063.
13. Gau, B. C.; Sharp, J. S.; Rempel, D. L.; Gross, M. L., Fast Photochemical Oxidation of
Protein Footprints Faster than Protein Unfolding. Anal. Chem. 2009, 81 (16), 6563-6571.
14. Davies, M. J.; Dean, R. T., Radical-Mediated Protein Oxidation: From Chemistry to
Medicine. Oxford University Press: 1997.
15. Fancy, D. A.; Kodadek, T., Chemistry for the analysis of protein-protein interactions:
Rapid and efficient cross-linking triggered by long wavelength light. Proc. Natl. Acad. Sci. U.S.A.
1999, 96 (11), 6020-6024.
16. Rayshell, M.; Ross, J.; Werbin, H., Evidence that N-acetoxy-N-acetyl-2-aminofluorene
crosslinks DNA to protein by a free radical mechanism. Carcinogenesis 1983, 4 (5), 501-507.
17. Bridgewater, J. D.; Lim, J.; Vachet, R. W., Transition Metal-Peptide Binding Studied by
Metal-Catalyzed Oxidation Reactions and Mass Spectrometry. Anal. Chem. 2006, 78 (7), 2432-
2438.
18. Davies, M. J.; Gilbert, B. C.; Norman, R. O. C., Electron spin resonance. Part 67. Oxidation
of aliphatic sulphides and sulphoxides by the sulphate radical anion (SO4–) and of aliphatic
radicals by the peroxydisulphate anion (S2O82–
). J. Chem. Soc., Perkin Trans. 2 1984, 503-509.

122
19. Davies, M. J.; Gilbert, B. C.; McCleland, C. W.; Thomas, C. B.; Young, J., E.s.r. evidence for
the multiplicity of side-chain oxidation pathways in the acid-catalysed decomposition of
substituted hydroxycyclohexadienyl radicals. J. Chem. Soc., Chem. Commun. 1984, (15), 966-
967.
20. Rustgi, S. N.; Riesz, P., An e.s.r. and spin-trapping study of the reactions of the SO4
radical with protein and nucleic acid constituents. Int. J. Radiat. Biol. 1978, 34, 301-316.
21. Ivanov, K. L.; Glebov, E. M.; Plyusnin, V. F.; Ivanov, Y. V.; Grivin, V. P.; Bazhin, N. M.,
Laser flash photolysis of sodium persulfate in aqueous solution with additions of
dimethylformamide. J. Photochem. Photobiol., A 2000, 133 (1-2), 99-104.
22. Chatgilialoglu, C.; Lunazzi, L.; Macciantelli, D.; Placucci, G., Absolute rate constants for
hydrogen abstraction from aldehydes and conformational studies of the corresponding aromatic
acyl radicals. J. Am. Chem. Soc. 1984, 106 (18), 5252-5256.
23. Jumper, C. C.; Schriemer, D., Carbene-Labeling Strategy for Interface Mapping of Protein
Complexes. In 58th ASMS Conference on Mass Spectrometry and Allied Topics, Salt Lake City, UT,
2010.
24. Vidavsky, I.; Rempel, D. L.; Gross, M. L., 2D Mass Spectra Correlation – Semi Automatic
Tool for Modified Peptide Discovery. In Proceedings of the 54th ASMS Conference on Mass
Spectrometry and Allied Topics, Seattle, WA, 2006.
25. Venkatesh, S.; Tomer, K. B.; Sharp, J. S., Rapid identification of oxidation-induced
conformational changes by kinetic analysis. Rapid Commun. Mass Spectrom. 2007, 21 (23),
3927-3936.
26. Chung, H. S.; Ganim, Z.; Jones, K. C.; Tokmakoff, A., Transient 2D IR spectroscopy of
ubiquitin unfolding dynamics. Proc. Natl. Acad. Sci. U.S.A. 2007, 104 (36), 14237-14242.
27. Chung, H. S.; Khalil, M.; Smith, A. W.; Ganim, Z.; Tokmakoff, A., Conformational changes
during the nanosecond-to-millisecond unfolding of ubiquitin. Proc. Natl. Acad. Sci. U.S.A. 2005,
102 (3), 612-617.
28. Fenn, J. B., Ion formation from charged droplets: roles of geometry, energy, and time. J.
Am. Soc. Mass Spectrom. 1993, 4 (7), 524-535.
29. Gerstein, M., A resolution-sensitive procedure for comparing protein surfaces and its
application to the comparison of antigen-combining sites. Acta Crystallographica Section A 1992,
48 (3), 271-276.
30. Maurus, R.; Overall, C. M.; Bogumil, R.; Luo, Y.; Mauk, A. G.; Smith, M.; Brayer, G. D., A
myoglobin variant with a polar substitution in a conserved hydrophobic cluster in the heme
binding pocket. Biochim. Biophys. Acta Prot. Struct. Mol. Enzym. 1997, 1341 (1), 1-13.
31. Xu, G.; Chance, M. R., Radiolytic Modification and Reactivity of Amino Acid Residues
Serving as Structural Probes for Protein Footprinting. Anal. Chem. 2005, 77 (14), 4549-4555.
32. Garrison, W. M., Reaction mechanisms in the radiolysis of peptides, polypeptides, and
proteins. Chem. Rev. 1987, 87 (2), 381-398.
33. Shechter, Y.; Burstein, Y.; Patchornik, A., Selective oxidation of methionine residues in
proteins. Biochemistry 1975, 14 (20), 4497-4503.
34. Saladino, J.; Liu, M.; Live, D.; Sharp, J. S., Aliphatic Peptidyl Hydroperoxides as a Source
of Secondary Oxidation in Hydroxyl Radical Protein Footprinting. J. Am. Soc. Mass Spectrom.
2009, 20 (6), 1123-1126.
35. Nath, A.; Atkins, W. M.; Sligar, S. G., Applications of Phospholipid Bilayer Nanodiscs in
the Study of Membranes and Membrane Proteins Biochemistry 2007, 46 (8), 2059-2069.
36. Rozga, M.; Bal, W., The Cu(II)/Ab/Human Serum Albumin Model of Control Mechanism
for Copper-Related Amyloid Neurotoxicity. Chemical Research in Toxicology 2009.
123
37. Marla, S. S.; Lee, J.; Groves, J. T., Peroxynitrite rapidly permeates phospholipid
membranes. Proc. Natl. Acad. Sci. U.S.A. 1997, 94 (26), 14243-14248.
38. Pryor, W. A.; Jin, X.; Squadrito, G. L., One- and two-electron oxidations of methionine by
peroxynitrite. Proc. Natl. Acad. Sci. U.S.A. 1994, 91 (23), 11173-11177.
39. Radi, R.; Beckman, J. S.; Bush, K. M.; Freeman, B. A., Peroxynitrite oxidation of
sulfhydryls. The cytotoxic potential of superoxide and nitric oxide. J. Biol. Chem. 1991, 266 (7),
4244-4250.
40. Santos, A. M.; Ph, V.; Graillat, C.; Guyot, A.; Guillot, J., Study of the thermal
decomposition of potassium persulfate by potentiometry and capillary electrophoresis. J.
Polymer Sci. Polymer Chem. 1996, 34 (7), 1271-1281.
41. Rice, F. O.; Reiff, O. M., The Thermal Decomposition of Hydrogen Peroxide. J. Phys.
Chem. 1927, 31 (9), 1352-1356.
42. Heyduk, E.; Heyduk, T., Mapping Protein Domains Involved in Macromolecular
Interactions: A Novel Protein Footprinting Approach. Biochemistry 1994, 33 (32), 9643-9650.
43. Hawkins, C. L.; Davies, M. J., Generation and propagation of radical reactions on
proteins. Biochim. Biophys. Acta Bioenergetics 2001, 1504 (2-3), 196-219.
44. Hawkins, C. L.; Davies, M. J., EPR studies on the selectivity of hydroxyl radical attack on
amino acids and peptides. J. Chem. Soc., Perkin Trans. 1998, 2, 2617-2622.
45. Stadtman, E. R.; Judith, P. K., Role of oxidized amino acids in protein breakdown and
stability. In Methods in Enzymology, Academic Press: 1995; Vol. Volume 258, pp 379-393.
46. Finley, E. L.; Dillon, J.; Crouch, R. K.; Schey, K. L., Identification of tryptophan oxidation
products in bovine alpha-crystallin. Protein Sci. 1998, 7, 2391-2397.
47. Sofia, G.; Rui, V.; Rosário, D.; Francisco, A.; Pedro, D., Oxidation of bovine serum
albumin: identification of oxidation products and structural modifications. Rapid Commun. Mass
Spectrom. 2009, 23 (15), 2307-2315.
124
5 Mass Spectrometry-based Protein Footprinting Characterizes the Structures of Oligomeric Apolipoprotein E2, E3, and E4 5.1 Introduction
Apolipoprotein E is a 34 kDa protein, whose function is to regulate lipid
metabolism and control lipid redistribution in tissue and cells, especially in the brain 1.
The three most common isoforms differ at two residues; apolipoprotein E2 (ApoE2) has
cysteines at sites 112 and 158 whereas apolipoprotein E4 (ApoE4) has arginines at these
residue sites. The most common isoform, apolipoprotein E3 (ApoE3), has C112 and
R158. The ApoE4 isoform is strongly associated with Alzheimer’s disease 2-3, and is a
risk factor for several other diseases 4. These risk associations, which ultimately stem
from the single mutation C112R, differentiate ApoE4 from ApoE2 and ApoE3 in the
preferred lipoprotein particle structure 5. Structural determinations by X-ray
crystallography and solution NMR of the lipid-free N-terminal domain showed it to be an
elongated four-helix bundle6-7. Since then, no high resolution structures have been
reported for the wild type isoforms or their C-terminal domains in the lipid-free state
owing to the propensity of apoE isoforms to oligomerize.
The three ApoE isoforms each self-associate in a lipid-free solution, forming
predominantly tetramers at µM concentration 8-12. The rate constants for the association-
dissociation process of monomer-dimer-tetramer have been determined by Garai and
Frieden (8). Based on the most recent high resolution structure determination of the N-
terminal domain, Sivashanmugam and Wang 7 proposed a scheme whereby lipid binding
125
to the C-terminal-domain induces the N-terminal four-helix bundle to open, thus allowing
further lipid interaction. Potentially affecting this mechanism in a isoform-specific
manner are the lipid-free domain interaction and kinetics of oligomerization. Clearly
high resolution structures of the full-length isoforms would inform these inferences, but
no structures of the oligomers are known at the atomic level. Thus, we undertook an
implicit analysis of the full-length WT isoform structures at “residue resolution” by using
mass spectrometry (MS)-based protein footprinting. The overarching question we pose is
whether the amino acid accessibility of full-length ApoE2, ApoE3, and ApoE4 isoforms
differ in their oligomeric states at µM concentrations. We also seek to identify those
regions responsible for oligomeric interactions by comparing the protein footprints of
WT ApoE3 with those of a monomeric mutant of ApoE3.
MS-based protein footprinting provides peptide and residue-resolved structural
information in the primary sequence dimension 13-14. The general strategy provides
insight about the difference between the structure of a protein or a protein complex in two
or more states rather than resolve their structures in three dimensions. The expectation is
that labeling at solvent-accessible residues is attenuated at protein-ligand or protein-
protein interfaces in the complex compared to those residues in the apo state. The
approach is effective and efficient because, if the labeling is stable, identification of the
modification sites can be done by using a proteomics-based “bottom-up” mass
spectrometry methodology. In this methodology, proteolytic peptides are
chromatographically resolved and detected in a hybrid mass spectrometer capable of
monitoring their accurate mass-to-charge ratios at high resolving power. The
126
instrument’s other spectrometer acquires the characteristic product ion spectra of peptide
ions subjected to collisional activation in an elution-dependent manner. The high-
resolution LC-MS intensities provide a quantitative measure of each peptide, and their
product ion spectra, acquired in this tandem MS mode (MS2), can indicate their identity
and modification site(s).
An informative chemical footprinting method is hydroxyl radical-mediated
modification of solvent accessible sidechains (for a comprehensive review detailing
several methodologies for •OH generation, expected product chemistry, and MS analysis,
see ref. 15). Hydroxyl-radical labeling is advantageous because it effectively samples
solvent accessibility, given that •OH has the same size as water, and it imparts stable
(irreversible) modifications to solvent-accessible sidechains of over half of the common
amino acids 16. Here we used the method of fast photochemical oxidation of proteins
(FPOP), as developed by Hambly and Gross with an approach is similar to that of Aye
and coworkers 17-18. In the FPOP method, low millimolar levels of H2O2 are
homolytically cleaved by a 17 ns flash of 248 nm light from a KrF excimer laser source.
The resultant •OH reacts with the side chains of constituent proteins. An important
feature of FPOP is the reaction time scale can be controlled and in the presence of the
scavenger glutamine, the lifetime of the radical is approximately 1 µs. The use of a
radical scavenger ensures that only equilibrium conformations are sampled by •OH; any
modification-induced changes to conformation would evolve on a longer timescale 17, 19.
To corroborate the FPOP results, we also employed a method of acidic-side-chain
footprinting, using glycine ethyl ester (GEE) and a zero-length cross-linker 20-22.
127
5.2 Experimental Procedures
5.2.1 Reagents.
Acetonitrile, acetic acid, formic acid, 30% hydrogen peroxide, L-glutamine, L-
methionine, tris(2-carboxyethyl)phosphine hydrochloride (TCEP), catalase, guanidinium
hydrochloride, glycine ethyl ester (GEE), 1-ethyl-3-(3-
dimethylaminopropyl)carbodiimide (EDC), 2-amino-2-hydroxymethyl-propane-1,3-diol
(Tris base), and phosphate buffered saline (PBS) were purchased from Sigma Aldrich
Chemical Co. (St. Louis, MO). Trypsin, sequencing grade, was purchased from Roche
Diagnostics Corp. (Indianapolis, IN). Purified water (18 MΩ) was obtained from a Milli-
Q Synthesis system (Millipore, Billerica, MA).
5.2.2 Protein Expression, Mutagenesis, Purification, and Solubilization.
ApoE2, ApoE3, ApoE4, and ApoE3MM, each expressed in E. coli, were kindly
provided by Drs. K. Garai and C. Frieden. All proteins was dissolved in 6 M
guanidinium chloride and dialyzed overnight into phosphate buffered saline (PBS)
solution containing 100 µM TCEP disulfide reductant. Protein concentrations were
determined by measuring their 280 nm absorbance using ε280 = 44950 M-1 cm-1. The
resultant solutions were stored as aliquots at -80 °C after N2(l) freezing.
5.2.3 FPOP labeling.
The FPOP labeling of ApoE3MM and ApoE3 in the monomer/oligomer
experiment was performed on the same days under the same conditions for both proteins.
Each started with a 3 h, 22 °C equilibration of 4 µM protein containing 20 mM Gln and
128
100 µM TCEP in PBS. Three replicates were drawn from each of these solutions for
FPOP labeling. Just prior to FPOP, H2O2 was added to each replicate by 10-fold dilution
from a concentrated solution, to give a final concentration of 40 mM. The FPOP
apparatus was essentially the same as originally described 17. The KrF excimer laser
power (GAM Laser Inc., Orlando, FL) was adjusted to 39 mJ/pulse and its pulse
frequency set to 5 Hz. The flow rate was adjusted to ensure a 25% exclusion volume to
avoid repeat •OH exposure19. Each replicate was collected in a microcentrifuge tube
containing 10 µL of 200 fM catalase and Met to give a final concentration of 20 mM in
the total sample volume. The addition of Met was to mitigate post-FPOP oxidation of
protein 23. Catalase was allowed to oxidize H2O2 to O2(g) for 10 min at room
temperature with pipette mixing; O2(g) was removed by three centrifugation steps during
the incubation. After 10 min, samples were frozen by immersion in N2(l) and stored at -
80 °C prior to proteolysis. Control samples were handled in the same manner as those
submitted to FPOP, but they were not laser irradiated; instead, they were incubated for 5
min with H2O2, after which the solution was added to the catalase-methionine collection
volume. The FPOP labeling of WT-ApoE2, ApoE3, and ApoE4 was performed as
described above with the following exceptions: the final H2O2 concentration was 20 mM,
and the excimer laser power was measured to be 47 mJ/pulse.
5.2.4 Carboxylic Acid labeling with GEE.
For the monomer/oligomer experiment, samples were drawn from the same
ApoE3 and ApoE3MM equilibrated solution as was used for FPOP labeling, at
approximately the same time. GEE was added to a final concentration of 50 mM to a
129
portion of each equilibrated solution. Samples were drawn from this solution, and EDC
was added to each to give a final concentration of 5 mM. One molar acetic acid was
added to a final concentration of 0.5 M to quench the reaction after a certain incubation
period starting after the addition of EDC. Instead of running standard control samples for
the GEE labeling, time-dependent data were obtained for GEE/EDC exposures times of
1, 3, 6, and 12 min for labeled ApoE3 and ApoE3MM samples, in duplicate, to provide a
data trend. Samples were frozen in N2(l) and stored at -80 °C prior to proteolysis.
5.2.5 Proteolysis.
GEE-labeled samples were thawed and concentrated with Millipore ZiptipC4 prior
to proteolysis; the eluent, 5 µL 50% acetonitrile acid-free, was diluted to 45 µL with 250
mM Tris buffer, pH 7.3. FPOP-labeled and control samples were thawed and used as
such for proteolysis. All samples were proteolyzed with 8:1 protein:trypsin (by weight)
at 37 °C for 3 h. ESI MS of several control replicates on a Bruker Maxis Q-TOF verified
that the digestion was complete. The samples were concentrated 3-fold by SpeedVac
drying at 30 °C, then immobilized on Millipore ZiptipC18, de-salted with elution into 10
µL of 50% acetonitrile 1% formic acid solution. A portion of this was diluted 25-fold
with water and 0.1% formic acid for autosampler loading and subsequent analysis.
5.2.6 LC-MS/MS acquisition.
The experiments were not analyzed by LC-MS/MS contiguously; a new column
was packed for each, and the nanospray source conditions varied slightly for each
analysis. Five microliters of each replicate was loaded by autosampler onto a 20 cm
column with a PicoFrit tip (New Objective, Inc, Woburn, MA), bomb-packed with C18
130
reverse phase material (Magic, 0.075 mm × 200 mm, 5 µm, 300 Å, Michrom, Auburn,
CA). Peptides were eluted by a 70 min, 260 nL/min gradient coupled to the nanospray
source of an LTQ-Orbitrap mass spectrometer (Thermo Fisher, Waltham, MA). Mass
spectra were obtained at high mass resolving power (100,000 for ions of m/z 400) on the
Orbitrap component, and the six most abundant ions eluting per scan were each subjected
to CID MS2 experiment in the LTQ component, using a collision energy 35% of the
maximum, a 2 Da isolation width, and wideband activation. Precursor ions were added
to a dynamic exclusion list for 8 s to ensure good sampling of the apex of their elution
peaks. Blanks were run between every sample acquisition.
5.2.7 Data analysis.
The Rosetta Elucidator data management system (Rosetta Biosoftware) was used
to generate tables of all LC-MS features eluting in time at high m/z resolution (± 5 ppm);
all quantitation was based on ion abundances from extracted ion chromatograms.
Usually more than one high resolution feature mapped to a single eluting peptide, owing
to the splitting of its ion signal among multiple charge states and isotopomers. All such
features contributed to the measure of total peptide abundance. Most modified and
unmodified peptide features were annotated by error-tolerant Mascot database searching
(Matrix Science, Boston, MA), with the common •OH outcomes added to its variable
modification database 15. An Excel visual basic-assisted strategy was employed to
validate questionable Mascot-error tolerant calls. Ultimately the CID product-ion spectra
of over two thirds of all calls were checked manually. Additional features having no
Mascot annotations were included if their ions’ m/z matched those of putative tryptic
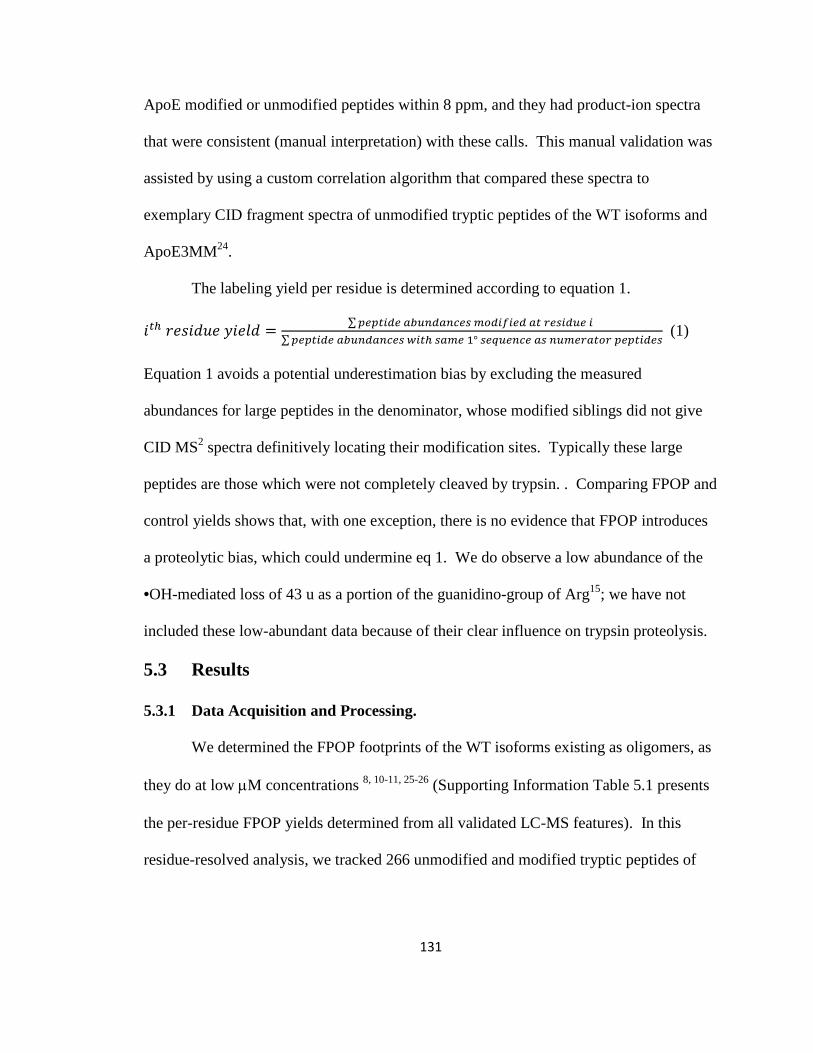
131
ApoE modified or unmodified peptides within 8 ppm, and they had product-ion spectra
that were consistent (manual interpretation) with these calls. This manual validation was
assisted by using a custom correlation algorithm that compared these spectra to
exemplary CID fragment spectra of unmodified tryptic peptides of the WT isoforms and
ApoE3MM24.
The labeling yield per residue is determined according to equation 1.
OY *'eO0+' mO'10 ∑ Y; cXcXW ;; cY Z; ; ∑ Y; cXcXW ;Y c 6° XW c XZcYZ Y; (1)
Equation 1 avoids a potential underestimation bias by excluding the measured
abundances for large peptides in the denominator, whose modified siblings did not give
CID MS2 spectra definitively locating their modification sites. Typically these large
peptides are those which were not completely cleaved by trypsin. . Comparing FPOP and
control yields shows that, with one exception, there is no evidence that FPOP introduces
a proteolytic bias, which could undermine eq 1. We do observe a low abundance of the
•OH-mediated loss of 43 u as a portion of the guanidino-group of Arg15; we have not
included these low-abundant data because of their clear influence on trypsin proteolysis.
5.3 Results
5.3.1 Data Acquisition and Processing.
We determined the FPOP footprints of the WT isoforms existing as oligomers, as
they do at low µM concentrations 8, 10-11, 25-26 (Supporting Information Table 5.1 presents
the per-residue FPOP yields determined from all validated LC-MS features). In this
residue-resolved analysis, we tracked 266 unmodified and modified tryptic peptides of
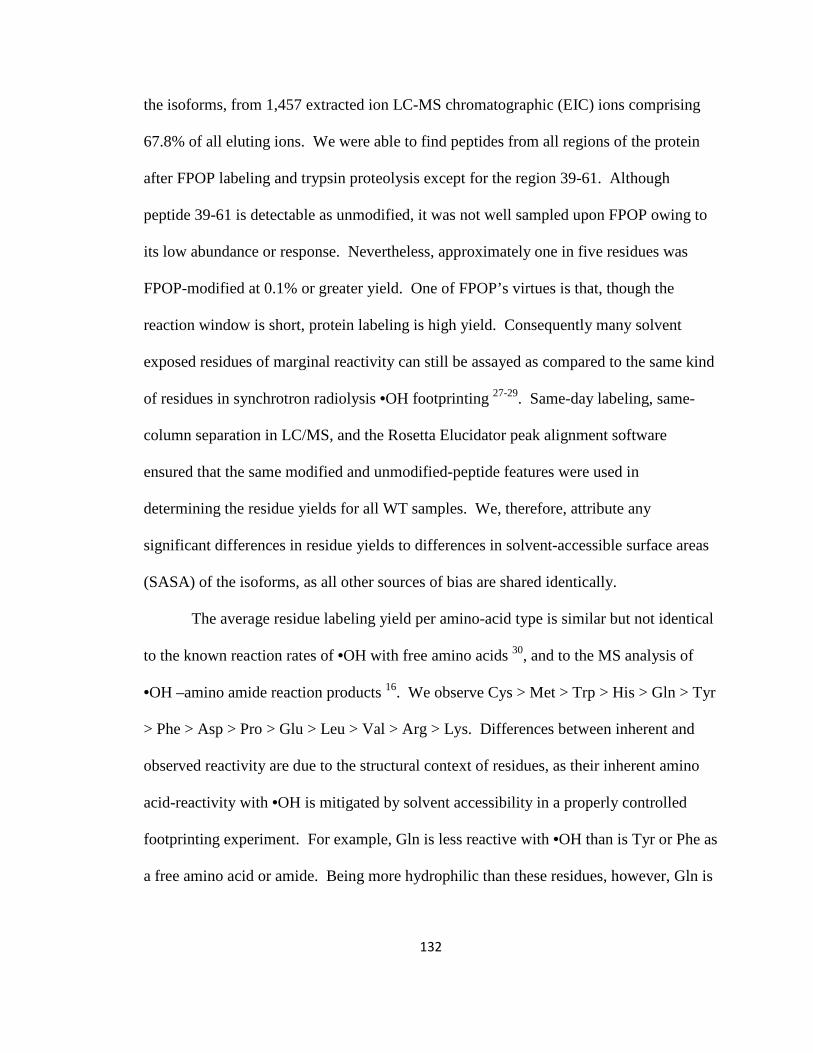
132
the isoforms, from 1,457 extracted ion LC-MS chromatographic (EIC) ions comprising
67.8% of all eluting ions. We were able to find peptides from all regions of the protein
after FPOP labeling and trypsin proteolysis except for the region 39-61. Although
peptide 39-61 is detectable as unmodified, it was not well sampled upon FPOP owing to
its low abundance or response. Nevertheless, approximately one in five residues was
FPOP-modified at 0.1% or greater yield. One of FPOP’s virtues is that, though the
reaction window is short, protein labeling is high yield. Consequently many solvent
exposed residues of marginal reactivity can still be assayed as compared to the same kind
of residues in synchrotron radiolysis •OH footprinting 27-29. Same-day labeling, same-
column separation in LC/MS, and the Rosetta Elucidator peak alignment software
ensured that the same modified and unmodified-peptide features were used in
determining the residue yields for all WT samples. We, therefore, attribute any
significant differences in residue yields to differences in solvent-accessible surface areas
(SASA) of the isoforms, as all other sources of bias are shared identically.
The average residue labeling yield per amino-acid type is similar but not identical
to the known reaction rates of •OH with free amino acids 30, and to the MS analysis of
•OH –amino amide reaction products 16. We observe Cys > Met > Trp > His > Gln > Tyr
> Phe > Asp > Pro > Glu > Leu > Val > Arg > Lys. Differences between inherent and
observed reactivity are due to the structural context of residues, as their inherent amino
acid-reactivity with •OH is mitigated by solvent accessibility in a properly controlled
footprinting experiment. For example, Gln is less reactive with •OH than is Tyr or Phe as
a free amino acid or amide. Being more hydrophilic than these residues, however, Gln is
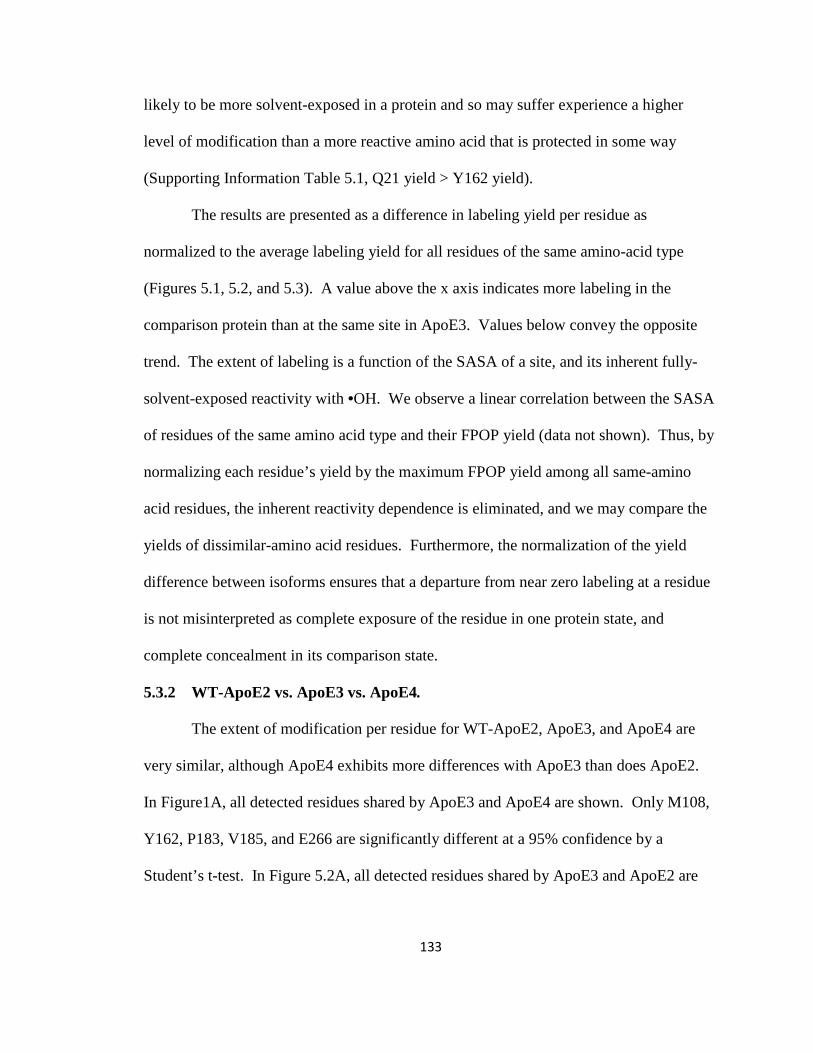
133
likely to be more solvent-exposed in a protein and so may suffer experience a higher
level of modification than a more reactive amino acid that is protected in some way
(Supporting Information Table 5.1, Q21 yield > Y162 yield).
The results are presented as a difference in labeling yield per residue as
normalized to the average labeling yield for all residues of the same amino-acid type
(Figures 5.1, 5.2, and 5.3). A value above the x axis indicates more labeling in the
comparison protein than at the same site in ApoE3. Values below convey the opposite
trend. The extent of labeling is a function of the SASA of a site, and its inherent fully-
solvent-exposed reactivity with •OH. We observe a linear correlation between the SASA
of residues of the same amino acid type and their FPOP yield (data not shown). Thus, by
normalizing each residue’s yield by the maximum FPOP yield among all same-amino
acid residues, the inherent reactivity dependence is eliminated, and we may compare the
yields of dissimilar-amino acid residues. Furthermore, the normalization of the yield
difference between isoforms ensures that a departure from near zero labeling at a residue
is not misinterpreted as complete exposure of the residue in one protein state, and
complete concealment in its comparison state.
5.3.2 WT-ApoE2 vs. ApoE3 vs. ApoE4.
The extent of modification per residue for WT-ApoE2, ApoE3, and ApoE4 are
very similar, although ApoE4 exhibits more differences with ApoE3 than does ApoE2.
In Figure1A, all detected residues shared by ApoE3 and ApoE4 are shown. Only M108,
Y162, P183, V185, and E266 are significantly different at a 95% confidence by a
Student’s t-test. In Figure 5.2A, all detected residues shared by ApoE3 and ApoE2 are
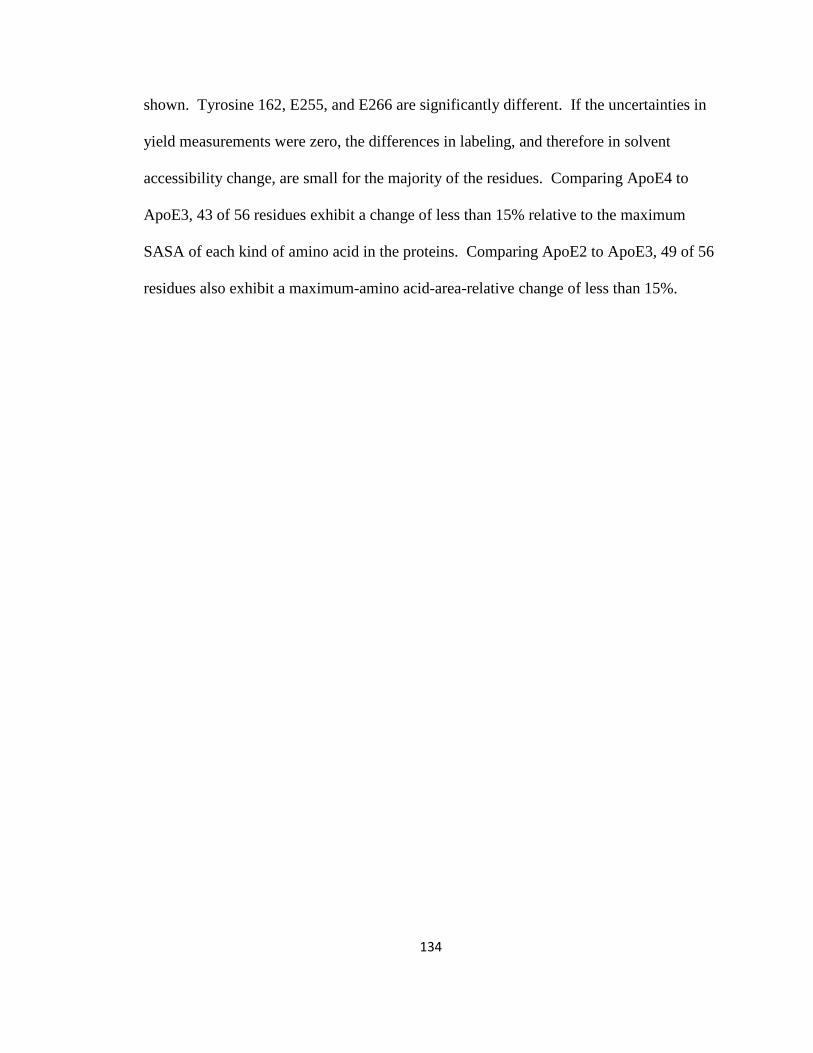
134
shown. Tyrosine 162, E255, and E266 are significantly different. If the uncertainties in
yield measurements were zero, the differences in labeling, and therefore in solvent
accessibility change, are small for the majority of the residues. Comparing ApoE4 to
ApoE3, 43 of 56 residues exhibit a change of less than 15% relative to the maximum
SASA of each kind of amino acid in the proteins. Comparing ApoE2 to ApoE3, 49 of 56
residues also exhibit a maximum-amino acid-area-relative change of less than 15%.
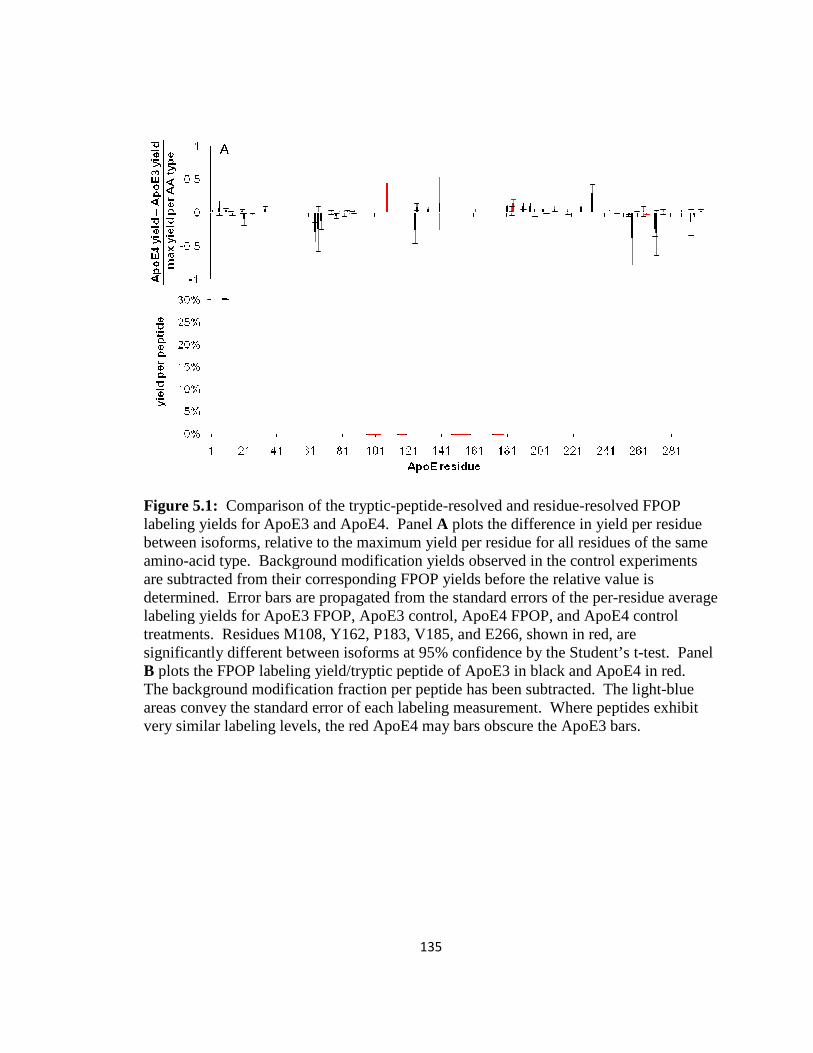
Figure 5.1: Comparison of the trypticlabeling yields for ApoE3 and ApoE4. Panel between isoforms, relative to the maximum yield per residue for all residues of the same amino-acid type. Background modification yields observed in the control experiments are subtracted from their correspondingdetermined. Error bars are propagated from the standard errors of the perlabeling yields for ApoE3 FPOP, ApoE3 control, ApoE4 FPOP, and ApoE4 control treatments. Residues M108, Y162, P183, V185, significantly different between isoforms at 95% confidence by the Student’s tB plots the FPOP labeling yield/tryptic peptide of ApoE3 in black and ApoE4 in red. The background modification fraction per peptide hasareas convey the standard error of each labeling measurement. Where peptides exhibit very similar labeling levels, the red ApoE4 may bars obscure the ApoE3 bars.
135
Comparison of the tryptic-peptide-resolved and residue-resolved FPOP labeling yields for ApoE3 and ApoE4. Panel A plots the difference in yield per residue between isoforms, relative to the maximum yield per residue for all residues of the same
acid type. Background modification yields observed in the control experiments are subtracted from their corresponding FPOP yields before the relative value is determined. Error bars are propagated from the standard errors of the perlabeling yields for ApoE3 FPOP, ApoE3 control, ApoE4 FPOP, and ApoE4 control treatments. Residues M108, Y162, P183, V185, and E266, shown in red, are significantly different between isoforms at 95% confidence by the Student’s t
plots the FPOP labeling yield/tryptic peptide of ApoE3 in black and ApoE4 in red. The background modification fraction per peptide has been subtracted. The lightareas convey the standard error of each labeling measurement. Where peptides exhibit very similar labeling levels, the red ApoE4 may bars obscure the ApoE3 bars.
resolved FPOP plots the difference in yield per residue
between isoforms, relative to the maximum yield per residue for all residues of the same acid type. Background modification yields observed in the control experiments
FPOP yields before the relative value is determined. Error bars are propagated from the standard errors of the per-residue average labeling yields for ApoE3 FPOP, ApoE3 control, ApoE4 FPOP, and ApoE4 control
and E266, shown in red, are significantly different between isoforms at 95% confidence by the Student’s t-test. Panel
plots the FPOP labeling yield/tryptic peptide of ApoE3 in black and ApoE4 in red. been subtracted. The light-blue
areas convey the standard error of each labeling measurement. Where peptides exhibit very similar labeling levels, the red ApoE4 may bars obscure the ApoE3 bars.
Figure 5.2: Comparison of the trypticlabeling yields for ApoE2 and ApoE3. Panel between isoforms, relative to the maximum yield per residue for all residues of the same amino-acid type. Background modification yields obseare subtracted from their corresponding FPOP yields before the relative value is determined. Error bars are determined as described in Figure 5.1. The asterisked residues Y162, E255, and E266, shown in red, are significantisoforms at 95% confidence by the Student’s tyield/tryptic peptide of ApoE3 in black and ApoE2 in red. The background modification fraction per peptide has been subtracted. The lightof each labeling measurement. Where peptides exhibit very similar labeling levels, the red ApoE2 may bars obscure the ApoE3 bars.
136
Comparison of the tryptic-peptide-resolved and residue-resolved FPOP labeling yields for ApoE2 and ApoE3. Panel A plots the difference in yield per residue between isoforms, relative to the maximum yield per residue for all residues of the same
acid type. Background modification yields observed in the control experiments are subtracted from their corresponding FPOP yields before the relative value is determined. Error bars are determined as described in Figure 5.1. The asterisked residues Y162, E255, and E266, shown in red, are significantly different between isoforms at 95% confidence by the Student’s t-test. Panel B plots the FPOP labeling yield/tryptic peptide of ApoE3 in black and ApoE2 in red. The background modification fraction per peptide has been subtracted. The light-blue areas convey the standard error of each labeling measurement. Where peptides exhibit very similar labeling levels, the red ApoE2 may bars obscure the ApoE3 bars.
resolved FPOP
plots the difference in yield per residue between isoforms, relative to the maximum yield per residue for all residues of the same
rved in the control experiments are subtracted from their corresponding FPOP yields before the relative value is determined. Error bars are determined as described in Figure 5.1. The asterisked
ly different between plots the FPOP labeling
yield/tryptic peptide of ApoE3 in black and ApoE2 in red. The background modification convey the standard error
of each labeling measurement. Where peptides exhibit very similar labeling levels, the
137
We contend that a 15% change in SASA relative to the maximum SASA for the
same kind of residues is small. In absolute square ångstroms, a 15% change could be less
than 5 or more than 30, depending on the type of residue—but relative to fully-exposed
sidechain surface areas, this is a small area. For example, W20 in the truncated protein
ApoE3 1-183 has a SASA value of 199 Å2, determined by the GETAREA algorithm31 for
the 1kc3.pdb NMR structure7. The relative SASA change is due to at least two different
protein oligomer conformations. In the simplest scenario one conformation would
exclusively describe 4 µM ApoE3, and the other would exclusively belong to the other
ApoE isoform at 4 µM. In this case a statistically-significant amino acid-relative labeling
change is directly attributed to a change in the surface areas of each conformation. If the
change were less than 15% we would conclude the isoform is only slightly more exposed
or protected than ApoE3. This is the case for three of the five residues in ApoE4
significantly different from their ApoE3 analogs: Y162 and P183 are slightly more
exposed, with same-amino acid-relative changes of 7% and 5%, respectively, while E266
is slightly protected, with a relative change of -10%. Two of the three significantly
different residues in ApoE2 compared to ApoE3, are not substantially so: relative to the
average of all glutamic acid yields, E255 shows a -17% and E266 a -10% change in
labeling.
The extent of modification per peptide between the isoforms is also similar
(Figures 1B and 2B). The analysis at the peptide level affords the inclusion of 88 more
features than the analysis at the residue level. Each added feature’s precursor mass is
within 5 ppm of a theoretical ApoE peptide mass, and each had an MS2 spectrum that
138
confirmed the identity of the root peptide sequence; however, each added feature’s
modification could not be localized to a single residue by its MS2 spectrum. The
inclusion of these features provides for the most accurate measure of the peptide FPOP-
labeling yield. Comparing ApoE4 to ApoE3 (Figure 5.1B), 22 of 29 peptides exhibited
statistically identical labeling yields. Peptides spanning 62-72, 120-134, and 261-274
each exhibit slightly more labeling in ApoE4 than ApoE3, while 104-112 is significantly
more labeled in ApoE3. Comparing ApoE2 to ApoE3 (Figure 5.2B), only peptide 62-68
is significantly different, with less labeling in ApoE2.
The wild-type isoforms are similar in their response to FPOP labeling and the
residue-resolved differences are small compared to the average level of labeling
measured per amino-acid type. The one exception to this trend is M108. Its modification
level (5 ± 1%) is high for ApoE4,whereas M108 undergoes negligible modification for
ApoE2 and ApoE3. This effect cannot be confirmed with peptide-level analysis because
signals corresponding to modified C112 are included in the consideration of ApoE3 104-
114 but cannot be for ApoE4 104-112 and ApoE4 104-114 tryptic peptides. This
difference suggests a structural difference in the region of ApoE4 with respect to the
other isoforms. It is also possible that C112, which is missing in E4, outcompetes M108
in ApoE3 or that the MS detection of M108 modification may have been obscured by the
multiple C112 modification fates32.
The modification extent for 158-167 of ApoE2 (Figure2B) is also high because its
primary modification is of C158, an amino-acid that is not present in ApoE3 and ApoE4.
The modification extent of Met also distinguishes ApoE 62-72 from the corresponding
139
peptides of ApoE4 and ApoE3; in this case, ApoE4 is appreciably less labeled than that
in ApoE3. A pair-wise residue comparison does not resolve this difference at 95%
confidence (M64 p = 0.11), but the modification levels of M64, E66, and M68 together
give rise to peptide signals that are significantly different. This underscores the need to
examine footprinting data at several levels of sequence context. The variance in Met and
Cys modification yields, although large, is not unusual, owing to the high sensitivity of
sulfur-containing residues to endogenous reactive oxygen species and to oxidation during
handling before and after the labeling experiment 15, 33-34.
5.3.3 ApoE3 vs. ApoE3 Monomeric Mutant.
It is clear that in the C-terminal and linker domains the FPOP yields at the residue
level of ApoE3MM are higher than those of WT-ApoE3 (Figure 5.3A). This conclusion
is based on analysis of 323 unmodified and modified tryptic peptides of ApoE3 and
ApoE3MM, from 1,182 EIC features comprising 67.2% of all detected features
(Supporting Information Table 5.2). The criteria for inclusion are identical to those
applied to the WT isoform experiment. One in four residues is detected as modified. The
order of reactivity is nearly identical to that observed for •OH footprinting of the WT
protein. Figure 5.3A plots only the residues which are significantly different between
ApoE3 and ApoE3MM, at 95% confidence. A total of 26 residues spanning residues 167
to 299 show significantly greater labeling for ApoE3MM, indicating these sites are more
solvent-protected in the WT protein than the MM. Clearly the C-terminal domain is
involved in WT oligomerization, as was inferred from previous studies 10, 35. The high
density of protected sites in regions 183-205 and 232-251 may indicate localized regions
140
of oligomeric interaction in the WT. Other sites in the C-terminal domain can’t fairly be
compared. Sites 257, 264, and 287 were detected as modified in both proteins. These are
three of the four mutation sites (F257A, W264R, L279Q, and V287E) that together
engender monomericity36. We do not compare their signals because each residue’s
inherent •OH reactivity is different from its analog, no matter their possible difference in
SASA.
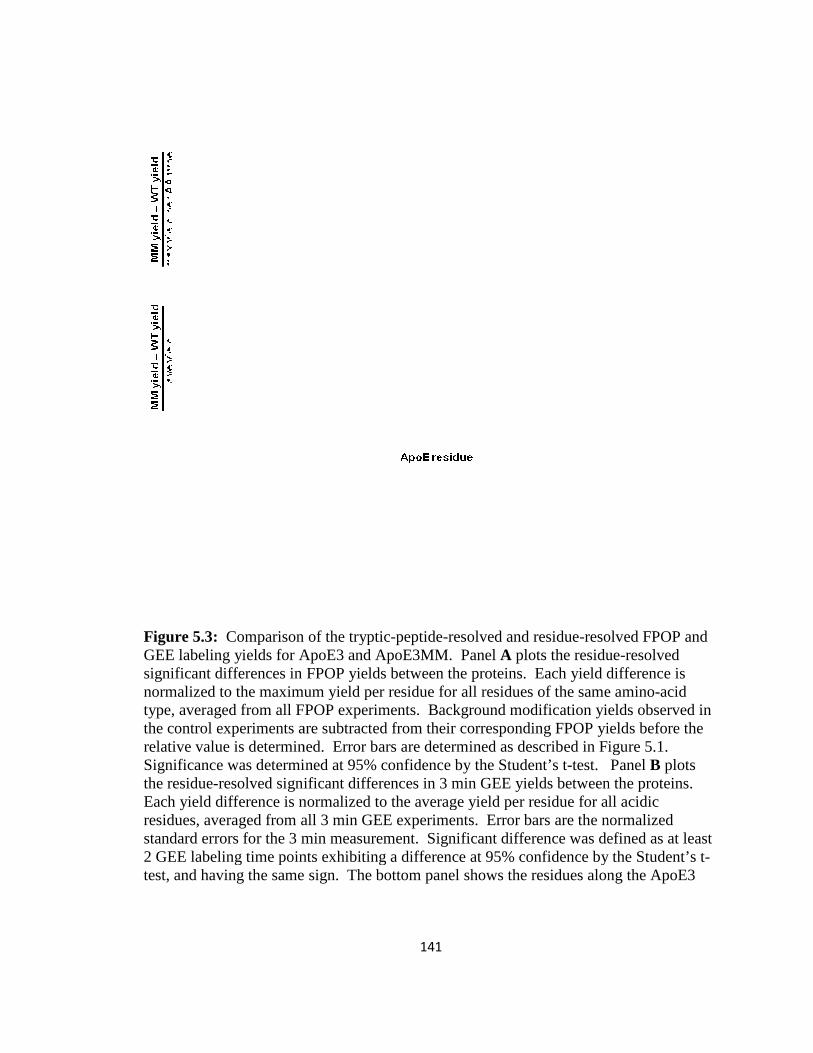
Figure 5.3: Comparison of the trypticGEE labeling yields for ApoE3 and ApoE3MM. Panel significant differences in FPOP yields between the proteins. Each yield difference is normalized to the maximum yield per residue for all residues of the same aminotype, averaged from all FPOP experiments. Background modification yields observed in the control experiments are subtracted from their corresponding FPOP yields before the relative value is determined. Error bars are determined as described in Figure 5.1. Significance was determined at 95% confidence by the Student’s tthe residue-resolved significant differences in 3 min GEE yields between the proteins. Each yield difference is normalized to the average yield per residue for all acidic residues, averaged from all 3 min GEE experiments. Error bars are the normalized standard errors for the 3 min measurement. Significant difference was defined as at least 2 GEE labeling time points exhibiting a difference at 95% confidence by the Student’s ttest, and having the same sign. The bottom panel shows the residues along the ApoE3
141
Comparison of the tryptic-peptide-resolved and residue-resolved FPOP and GEE labeling yields for ApoE3 and ApoE3MM. Panel A plots the residuesignificant differences in FPOP yields between the proteins. Each yield difference is
he maximum yield per residue for all residues of the same aminotype, averaged from all FPOP experiments. Background modification yields observed in the control experiments are subtracted from their corresponding FPOP yields before the
is determined. Error bars are determined as described in Figure 5.1. Significance was determined at 95% confidence by the Student’s t-test. Panel
resolved significant differences in 3 min GEE yields between the proteins. d difference is normalized to the average yield per residue for all acidic
residues, averaged from all 3 min GEE experiments. Error bars are the normalized standard errors for the 3 min measurement. Significant difference was defined as at least
beling time points exhibiting a difference at 95% confidence by the Student’s ttest, and having the same sign. The bottom panel shows the residues along the ApoE3
resolved FPOP and plots the residue-resolved
significant differences in FPOP yields between the proteins. Each yield difference is he maximum yield per residue for all residues of the same amino-acid
type, averaged from all FPOP experiments. Background modification yields observed in the control experiments are subtracted from their corresponding FPOP yields before the
is determined. Error bars are determined as described in Figure 5.1. test. Panel B plots
resolved significant differences in 3 min GEE yields between the proteins. d difference is normalized to the average yield per residue for all acidic
residues, averaged from all 3 min GEE experiments. Error bars are the normalized standard errors for the 3 min measurement. Significant difference was defined as at least
beling time points exhibiting a difference at 95% confidence by the Student’s t-test, and having the same sign. The bottom panel shows the residues along the ApoE3
142
primary sequence exhibiting more labeling in the monomeric mutant. Black-underlined residues convey the significant FPOP labeling difference; red-underlined residues the significant GEE labeling difference.
5.3.4 Glycyl Ethyl Ether (GEE) Footprinting.
To corroborate the findings in the FPOP monomer/oligomer experiment, we
employed a second footprinting approach whereby carboxyl side chains were submitted
to a GEE modification. As with the FPOP data, quantitation was based on unmodified
and modified LC-MS EIC features, with annotation accepted if the precursor ion is within
5 ppm mass tolerance of theory and the product-ion spectra (MS2) is acceptable. A
control whereby the protein is not submitted to modification is unnecessary for this kind
of labeling because exogenous background modifications at +85.0528 D are highly
unlikely in the protein prior to modification and do not occur during peptide workup. In
the absence of GEE-induced unfolding, the time-dependence for the modification level
should be monotonic; consequently, we used four GEE exposure times to more reliably
differentiate the labeling yields of the acidic residues (Supporting Information Table 5.3).
Two exemplary kinetic plots show that E212 is consistently more modified in ApoE3MM
(Figure4a) whereas E109 is labeled nearly identically and at a lower level for both
proteins (Figure4b). This analysis informs a conservative criterion for assigning
difference per acidic residue: by 3 min the pair-wise Student’s t-test should show a
significant difference at 95% confidence, and this trend should also pertain at 6 and 12
min. By this criterion the significantly different residues are plotted in Figure 5.3B,
showing their 3 min labeling yields.
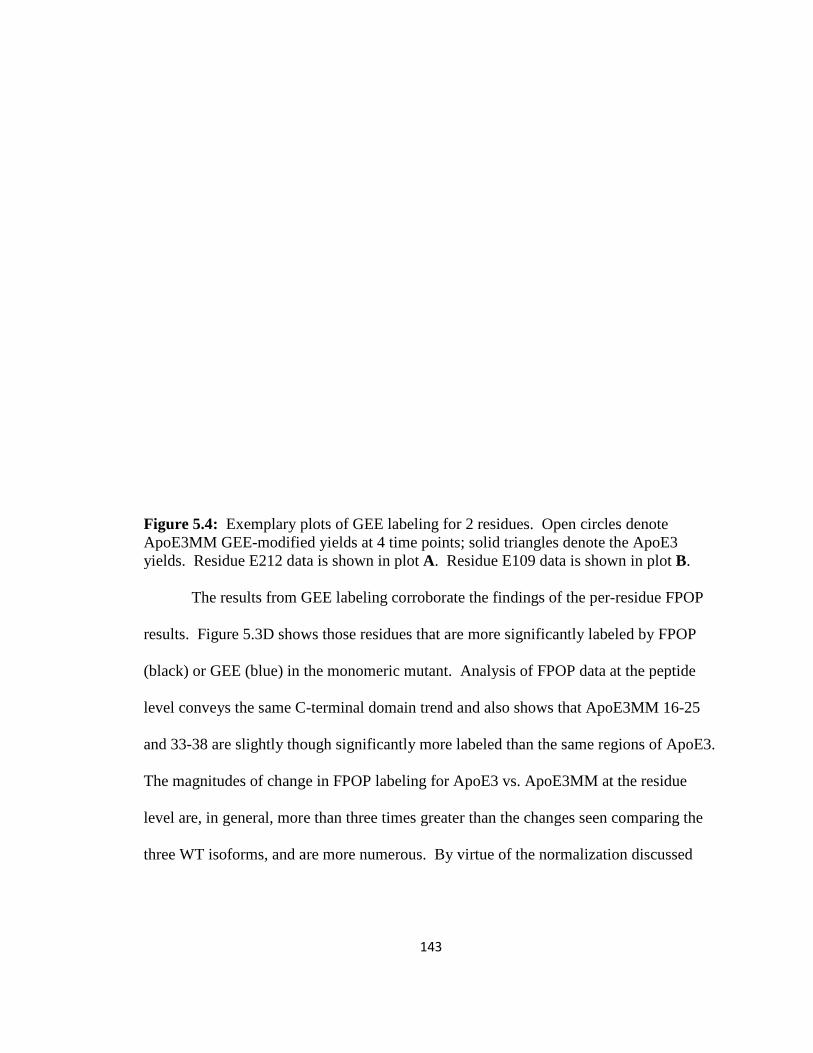
Figure 5.4: Exemplary plots of GEE labeling for 2 residues. Open circles denote ApoE3MM GEE-modified yields at 4 time points; solid triayields. Residue E212 data is shown in plot The results from GEE labeling corroborate the findings
results. Figure 5.3D shows those residues that are more significantly labeled by FPOP
(black) or GEE (blue) in the monomeric mutant. Analysis of FPOP data at the peptide
level conveys the same C
and 33-38 are slightly though significantly more labeled than the same regions of ApoE3.
The magnitudes of change in FPOP labeling for ApoE3 vs. ApoE3MM at the residue
level are, in general, more than three times greater than the changes seen comparing the
three WT isoforms, and are more numerous. By virtue of the normalization discussed
143
Exemplary plots of GEE labeling for 2 residues. Open circles denote modified yields at 4 time points; solid triangles denote the ApoE3
yields. Residue E212 data is shown in plot A. Residue E109 data is shown in plot
The results from GEE labeling corroborate the findings of the per
Figure 5.3D shows those residues that are more significantly labeled by FPOP
(black) or GEE (blue) in the monomeric mutant. Analysis of FPOP data at the peptide
level conveys the same C-terminal domain trend and also shows that ApoE3MM 16
re slightly though significantly more labeled than the same regions of ApoE3.
The magnitudes of change in FPOP labeling for ApoE3 vs. ApoE3MM at the residue
level are, in general, more than three times greater than the changes seen comparing the
isoforms, and are more numerous. By virtue of the normalization discussed
Exemplary plots of GEE labeling for 2 residues. Open circles denote ngles denote the ApoE3
. Residue E109 data is shown in plot B.
of the per-residue FPOP
Figure 5.3D shows those residues that are more significantly labeled by FPOP
(black) or GEE (blue) in the monomeric mutant. Analysis of FPOP data at the peptide
terminal domain trend and also shows that ApoE3MM 16-25
re slightly though significantly more labeled than the same regions of ApoE3.
The magnitudes of change in FPOP labeling for ApoE3 vs. ApoE3MM at the residue
level are, in general, more than three times greater than the changes seen comparing the
isoforms, and are more numerous. By virtue of the normalization discussed
144
above, the magnitude of change measured in the monomer/oligomer experiment is
indicative of a larger SASA change between monomer and oligomer, than is seen
between WT isoforms explored in the 1st experiment.
5.4 Discussion
5.4.1 Structures of the ApoE isoforms.
We conclude that the overall structures (mixtures of structures) are nearly the
same for the three ApoE isoforms by invoking a syllogism. (1) FPOP snapshot –labels an
ensemble of conformations and complexes at equilibrium17, 19. (2) Of the 56 residues
detected as modified among the isoforms, 95% were modified at statistically equivalent
levels for ApoE2 and ApoE3, and 91% were so modified for ApoE3 and ApoE4. (3)
Therefore, the overall structures of the ApoE isoforms as measured by this technique are
similar with one exception, to be discussed later.
Garai and Frieden8 have modeled the isoform monomer, dimer, and tetramer
concentrations as a function of the total monomer concentration, based on self-
association rate constants for a monomer-dimer-tetramer model determined from FRET
kinetics measurements. At 4 µM total protein, their model shows that 84% of proteins
are bound as tetramers, irrespective of the ApoE isoform. A reasonable conclusion from
the similarity in FPOP response among the ApoE isoforms, given the high prevalence of
the tetrameric component in the oligomer state studied here, is that the ApoE2, ApoE3,
and ApoE4 tetrameric structures are highly similar.
Despite the strong similarities in overall structure, the region of ApoE4 around
M108 is different from that of ApoE2 and E3. The extensive modification of M108 in
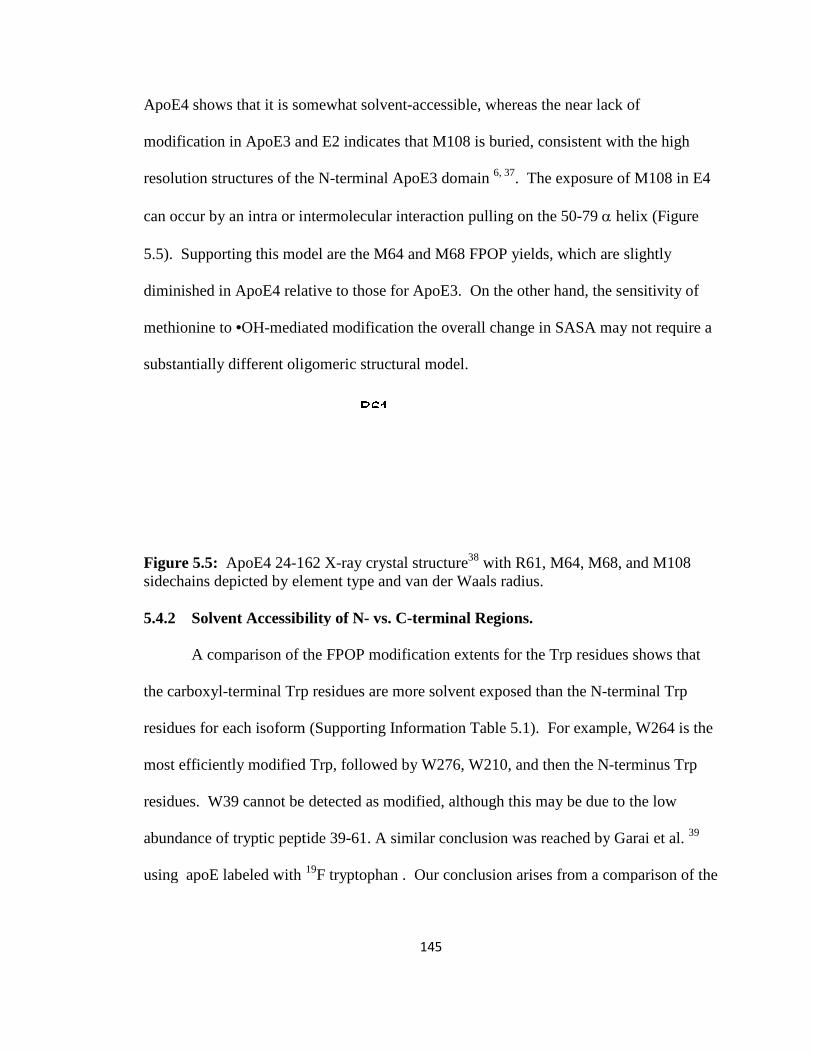
ApoE4 shows that it is somewhat solvent
modification in ApoE3 and E2 indicates that M108 is buried, consistent with the high
resolution structures of the N
can occur by an intra or intermolecular interaction pulling on the 50
5.5). Supporting this model are the M64 and M68 FPOP yields, which are slightly
diminished in ApoE4 relative to those for ApoE3. On the oth
methionine to •OH-mediated modification the overall change in SASA may not require a
substantially different oligomeric structural model.
Figure 5.5: ApoE4 24-162 Xsidechains depicted by element type and van der Waals radius. 5.4.2 Solvent Accessibility of N
A comparison of the
the carboxyl-terminal Trp residues are more solvent exposed than the
residues for each isoform
most efficiently modified Trp, followed by W276, W210, and then the N
residues. W39 cannot be detected as modified, although this may be du
abundance of tryptic peptide 39
using apoE labeled with
145
ApoE4 shows that it is somewhat solvent-accessible, whereas the near lack of
modification in ApoE3 and E2 indicates that M108 is buried, consistent with the high
resolution structures of the N-terminal ApoE3 domain 6, 37. The exposure of M108 in E4
can occur by an intra or intermolecular interaction pulling on the 50-79 α
5.5). Supporting this model are the M64 and M68 FPOP yields, which are slightly
diminished in ApoE4 relative to those for ApoE3. On the other hand, the sensitivity of
mediated modification the overall change in SASA may not require a
substantially different oligomeric structural model.
162 X-ray crystal structure38 with R61, M64, M68, and M108 cted by element type and van der Waals radius.
Solvent Accessibility of N- vs. C-terminal Regions.
A comparison of the FPOP modification extents for the Trp residues shows that
terminal Trp residues are more solvent exposed than the N-terminal Trp
isoform (Supporting Information Table 5.1). For example,
most efficiently modified Trp, followed by W276, W210, and then the N
residues. W39 cannot be detected as modified, although this may be due to the low
abundance of tryptic peptide 39-61. A similar conclusion was reached by
using apoE labeled with 19F tryptophan . Our conclusion arises from a comparison of
accessible, whereas the near lack of
modification in ApoE3 and E2 indicates that M108 is buried, consistent with the high
he exposure of M108 in E4
α helix (Figure
5.5). Supporting this model are the M64 and M68 FPOP yields, which are slightly
er hand, the sensitivity of
mediated modification the overall change in SASA may not require a
with R61, M64, M68, and M108
modification extents for the Trp residues shows that
terminal Trp
. For example, W264 is the
most efficiently modified Trp, followed by W276, W210, and then the N-terminus Trp
e to the low
A similar conclusion was reached by Garai et al. 39
a comparison of the
146
FPOP yields for same-amino-acid-type residues from the same protein. These
comparisons may allow more insightful conclusions about protein structure than yield
comparisons of same residue in two different protein isoforms. Essentially, residues of
the same type may be ranked in order of their yield; those at the top of the list should
have the highest SASA.
5.4.3 Regions of oligomeric interaction.
This is the first study of only full-length ApoE that shows that the C-terminal
domain is the primary region of self-association in the tetrameric form, which has long
been the hypothesis5, 10-11.Westerlund and Weisgraber 10 showed in sedimentation
experiments of C-terminal-truncated ApoE3 isoforms that region 267-299 is essential to
association. This conclusion was reinforced by using several biophysical techniques for
similar truncated ApoE isoforms 9, 25. Furthermore, the 10 kDa C-terminal domain itself
oligomerizes 11. The choice of ApoE3MM used in our study was determined by the
observation that mutations at F257, W264, V269, L179, and V287 resulted in a
monomeric form in both the C-terminal domain alone 35 and the full-length apoE3 protein
36. A substantial number of residues in the C-terminal and hinge domains are more
solvent-accessible in the monomeric mutant than in the ApoE3 WT isoform, whereas
modifications of their N-terminal domains are statistically identical. Moreover, this
result is demonstrated by two independent footprinting methods, FPOP and GEE labeling
(Figure 5.3), with a high degree of consistency. The FPOP data indicate that, although
these substitutions demonstrably prevent oligomerization, a larger region of self-
association interaction is at play, involving the hinge region (ApoE 192-215) as well.
147
That the formation of oligomers requires at least two patches for self-association is
consistent with our results identifying multiple regions of oligomerization.
5.4.4 Comparison of GEE and FPOP footprinting.
In general, there is good qualitative agreement between the results from FPOP
and those from GEE footprinting. An apparent discrepancy is seen for ApoE 181-205.
Although several residues undergo some increased oxidative modification by FPOP in
ApoE3MM, the levels of labeling by GEE are the same (Supporting Information Table
5.3). This region contains only two modifiable residues, E186 and E205. Aside from this
low resolution sampling by GEE, there are several other aspects of GEE and FPOP
footprinting germane to discrepancies in their outcomes. Maybe the following discussion
should come earlier. First, the secondary structure of a protein dictates that intermolecular
or inter-domain interactions are not shared equally by neighboring residues, as the
backbone torsion angles enforce different side-chain β−carbons orientations along a
sequence. Therefore, one should not expect neighboring residues to exhibit the same
response when probing the “on” and “off” states of the interaction. Second, the sampling
of acidic residues, by their “priming” by EDC and subsequent reaction with GEE,
requires interaction volumes that are larger than that of the water molecule, whereas •OH
is a probe much the same size as water. Additionally, the sites of reaction on acidic
residues are different. Whereas the e- pair of the oxygen conjugate base attack
carbodiimide carbon as a first step 40, •OH preferentially abstracts hydrogen from the Glu
β and γ carbons 15, 41. Thus the relevant solvent accessibilities are different for the same
148
residue. Finally, the timescale of labeling is dramatically different; the much longer
exposure to GEE labeling may sample conformations induced by initial labeling events.
5.4.5 Comparison of the N-terminal domains of ApoE2, ApoE3, ApoE4, and
ApoE3MM.
We find little difference between the labeling footprints of the N-terminal
domains for the WT isoforms and between ApoE3 and its monomeric mutant isoform
(Figures 1, 2, and 4). Thus, the WT isoforms must adopt similar N-terminal structures as
that of the monomeric mutant. In a separate manuscript examining the ApoE3MM data,
we propose that it adopts an N-terminal domain structure much like the most recent NMR
ApoE3 1-183 structure 7. With few exceptions, the rank order of yields of ApoE3
residues detected as modified in the first and second experiment are the same, although
the levels of modification are higher in the ApoE3 monomer/oligomer study owing to the
doubling of H2O2 starting material. Some of the detected oxidations in the latter case
may be due to secondary protein-peroxy reactions that do not sample the equilibrium
structure 42, but such signal cannot account for the overwhelming differences seen
between ApoE3 and ApoE3MM.
5.5 Conclusions
At 4 µM, WT-ApoE2, ApoE3, and ApoE4 exist in solution as similar structures,
primarily as tetramers, and that our data is consistent with the assignment of a four-helix
bundle structure in the N-terminal domain of the 299 amino acid monomeric mutant of
ApoE3. Although the overall structures are similar, that of region M108 in E4 is
149
significantly different, though its overall change in SASA may be small. By virtue of the
per-residue trends drawn from two independent MS-based footprinting data sets of
ApoE3 and ApoE3MM, we conclude that residues spanning 183-205 and 232-251 in the
hinge and C-terminal domains are involved in inter and intramolecular interactions
concomitant with tetrameric self-association in ApoE3. Owing to their sequence
invariance in this region, we suggest that the same oligomerization interaction occurs for
ApoE2 and ApoE4.
One advantage of MS-based protein footprinting is that it can sample physiologic
mixtures. Thus, future studies will characterize ApoE in the presence of Aβ proteins both
with and without the context of lipoproteins. This should be possible at high sequence
resolution and may reveal interactions implied in the genetic association of ApoE4 with
Alzheimer’s disease 43.
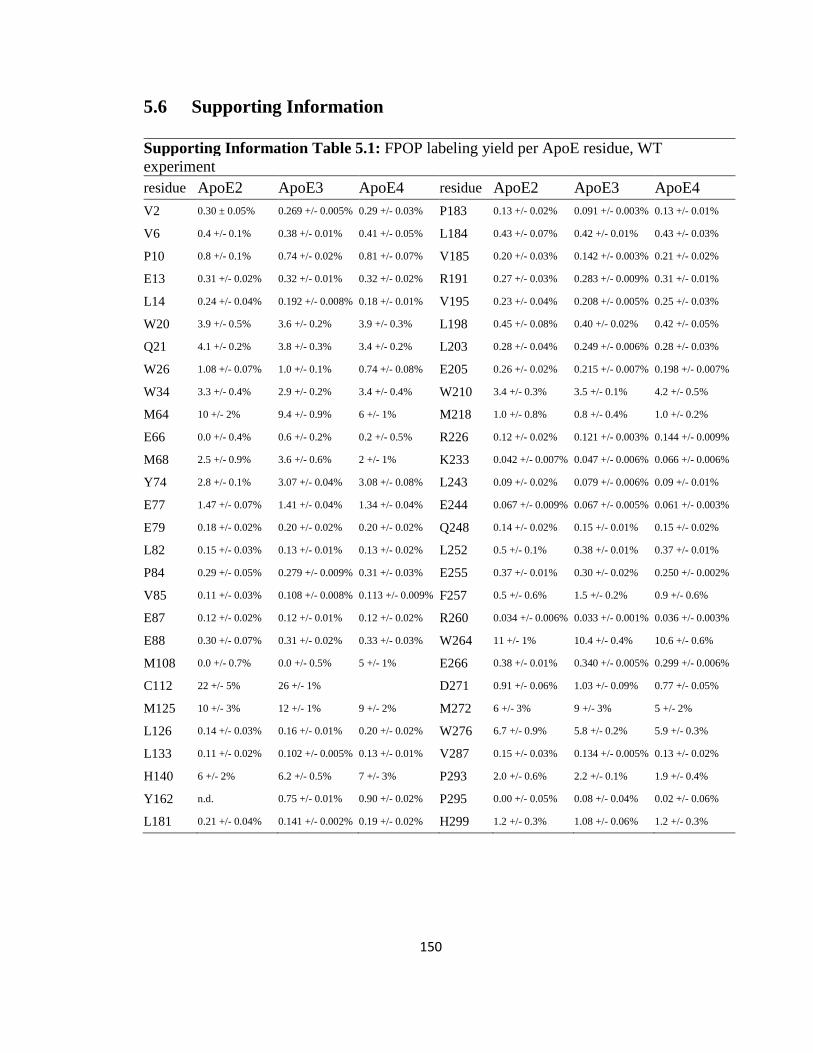
150
5.6 Supporting Information
Supporting Information Table 5.1: FPOP labeling yield per ApoE residue, WT experiment residue ApoE2 ApoE3 ApoE4 residue ApoE2 ApoE3 ApoE4
V2 0.30 ± 0.05% 0.269 +/- 0.005% 0.29 +/- 0.03% P183 0.13 +/- 0.02% 0.091 +/- 0.003% 0.13 +/- 0.01%
V6 0.4 +/- 0.1% 0.38 +/- 0.01% 0.41 +/- 0.05% L184 0.43 +/- 0.07% 0.42 +/- 0.01% 0.43 +/- 0.03%
P10 0.8 +/- 0.1% 0.74 +/- 0.02% 0.81 +/- 0.07% V185 0.20 +/- 0.03% 0.142 +/- 0.003% 0.21 +/- 0.02%
E13 0.31 +/- 0.02% 0.32 +/- 0.01% 0.32 +/- 0.02% R191 0.27 +/- 0.03% 0.283 +/- 0.009% 0.31 +/- 0.01%
L14 0.24 +/- 0.04% 0.192 +/- 0.008% 0.18 +/- 0.01% V195 0.23 +/- 0.04% 0.208 +/- 0.005% 0.25 +/- 0.03%
W20 3.9 +/- 0.5% 3.6 +/- 0.2% 3.9 +/- 0.3% L198 0.45 +/- 0.08% 0.40 +/- 0.02% 0.42 +/- 0.05%
Q21 4.1 +/- 0.2% 3.8 +/- 0.3% 3.4 +/- 0.2% L203 0.28 +/- 0.04% 0.249 +/- 0.006% 0.28 +/- 0.03%
W26 1.08 +/- 0.07% 1.0 +/- 0.1% 0.74 +/- 0.08% E205 0.26 +/- 0.02% 0.215 +/- 0.007% 0.198 +/- 0.007%
W34 3.3 +/- 0.4% 2.9 +/- 0.2% 3.4 +/- 0.4% W210 3.4 +/- 0.3% 3.5 +/- 0.1% 4.2 +/- 0.5%
M64 10 +/- 2% 9.4 +/- 0.9% 6 +/- 1% M218 1.0 +/- 0.8% 0.8 +/- 0.4% 1.0 +/- 0.2%
E66 0.0 +/- 0.4% 0.6 +/- 0.2% 0.2 +/- 0.5% R226 0.12 +/- 0.02% 0.121 +/- 0.003% 0.144 +/- 0.009%
M68 2.5 +/- 0.9% 3.6 +/- 0.6% 2 +/- 1% K233 0.042 +/- 0.007% 0.047 +/- 0.006% 0.066 +/- 0.006%
Y74 2.8 +/- 0.1% 3.07 +/- 0.04% 3.08 +/- 0.08% L243 0.09 +/- 0.02% 0.079 +/- 0.006% 0.09 +/- 0.01%
E77 1.47 +/- 0.07% 1.41 +/- 0.04% 1.34 +/- 0.04% E244 0.067 +/- 0.009% 0.067 +/- 0.005% 0.061 +/- 0.003%
E79 0.18 +/- 0.02% 0.20 +/- 0.02% 0.20 +/- 0.02% Q248 0.14 +/- 0.02% 0.15 +/- 0.01% 0.15 +/- 0.02%
L82 0.15 +/- 0.03% 0.13 +/- 0.01% 0.13 +/- 0.02% L252 0.5 +/- 0.1% 0.38 +/- 0.01% 0.37 +/- 0.01%
P84 0.29 +/- 0.05% 0.279 +/- 0.009% 0.31 +/- 0.03% E255 0.37 +/- 0.01% 0.30 +/- 0.02% 0.250 +/- 0.002%
V85 0.11 +/- 0.03% 0.108 +/- 0.008% 0.113 +/- 0.009% F257 0.5 +/- 0.6% 1.5 +/- 0.2% 0.9 +/- 0.6%
E87 0.12 +/- 0.02% 0.12 +/- 0.01% 0.12 +/- 0.02% R260 0.034 +/- 0.006% 0.033 +/- 0.001% 0.036 +/- 0.003%
E88 0.30 +/- 0.07% 0.31 +/- 0.02% 0.33 +/- 0.03% W264 11 +/- 1% 10.4 +/- 0.4% 10.6 +/- 0.6%
M108 0.0 +/- 0.7% 0.0 +/- 0.5% 5 +/- 1% E266 0.38 +/- 0.01% 0.340 +/- 0.005% 0.299 +/- 0.006%
C112 22 +/- 5% 26 +/- 1% D271 0.91 +/- 0.06% 1.03 +/- 0.09% 0.77 +/- 0.05%
M125 10 +/- 3% 12 +/- 1% 9 +/- 2% M272 6 +/- 3% 9 +/- 3% 5 +/- 2%
L126 0.14 +/- 0.03% 0.16 +/- 0.01% 0.20 +/- 0.02% W276 6.7 +/- 0.9% 5.8 +/- 0.2% 5.9 +/- 0.3%
L133 0.11 +/- 0.02% 0.102 +/- 0.005% 0.13 +/- 0.01% V287 0.15 +/- 0.03% 0.134 +/- 0.005% 0.13 +/- 0.02%
H140 6 +/- 2% 6.2 +/- 0.5% 7 +/- 3% P293 2.0 +/- 0.6% 2.2 +/- 0.1% 1.9 +/- 0.4%
Y162 n.d. 0.75 +/- 0.01% 0.90 +/- 0.02% P295 0.00 +/- 0.05% 0.08 +/- 0.04% 0.02 +/- 0.06%
L181 0.21 +/- 0.04% 0.141 +/- 0.002% 0.19 +/- 0.02% H299 1.2 +/- 0.3% 1.08 +/- 0.06% 1.2 +/- 0.3%
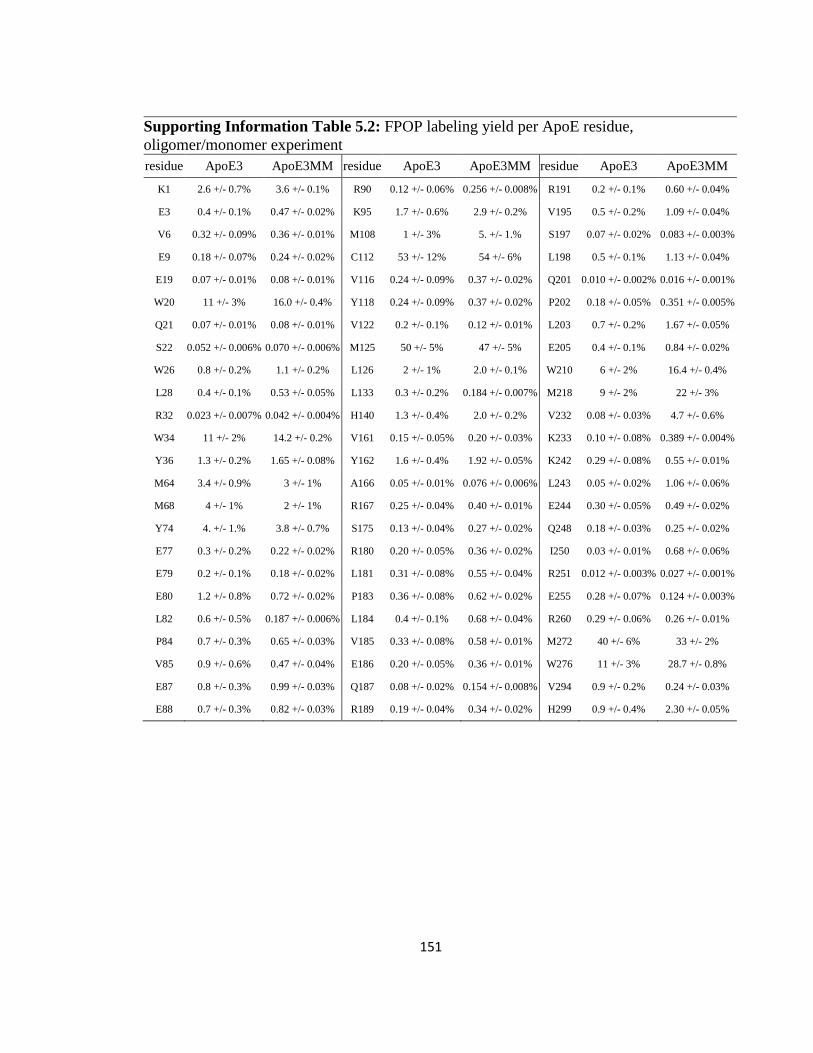
151
Supporting Information Table 5.2: FPOP labeling yield per ApoE residue, oligomer/monomer experiment
residue ApoE3 ApoE3MM residue ApoE3 ApoE3MM residue ApoE3 ApoE3MM
K1 2.6 +/- 0.7% 3.6 +/- 0.1% R90 0.12 +/- 0.06% 0.256 +/- 0.008% R191 0.2 +/- 0.1% 0.60 +/- 0.04%
E3 0.4 +/- 0.1% 0.47 +/- 0.02% K95 1.7 +/- 0.6% 2.9 +/- 0.2% V195 0.5 +/- 0.2% 1.09 +/- 0.04%
V6 0.32 +/- 0.09% 0.36 +/- 0.01% M108 1 +/- 3% 5. +/- 1.% S197 0.07 +/- 0.02% 0.083 +/- 0.003%
E9 0.18 +/- 0.07% 0.24 +/- 0.02% C112 53 +/- 12% 54 +/- 6% L198 0.5 +/- 0.1% 1.13 +/- 0.04%
E19 0.07 +/- 0.01% 0.08 +/- 0.01% V116 0.24 +/- 0.09% 0.37 +/- 0.02% Q201 0.010 +/- 0.002% 0.016 +/- 0.001%
W20 11 +/- 3% 16.0 +/- 0.4% Y118 0.24 +/- 0.09% 0.37 +/- 0.02% P202 0.18 +/- 0.05% 0.351 +/- 0.005%
Q21 0.07 +/- 0.01% 0.08 +/- 0.01% V122 0.2 +/- 0.1% 0.12 +/- 0.01% L203 0.7 +/- 0.2% 1.67 +/- 0.05%
S22 0.052 +/- 0.006% 0.070 +/- 0.006% M125 50 +/- 5% 47 +/- 5% E205 0.4 +/- 0.1% 0.84 +/- 0.02%
W26 0.8 +/- 0.2% 1.1 +/- 0.2% L126 2 +/- 1% 2.0 +/- 0.1% W210 6 +/- 2% 16.4 +/- 0.4%
L28 0.4 +/- 0.1% 0.53 +/- 0.05% L133 0.3 +/- 0.2% 0.184 +/- 0.007% M218 9 +/- 2% 22 +/- 3%
R32 0.023 +/- 0.007% 0.042 +/- 0.004% H140 1.3 +/- 0.4% 2.0 +/- 0.2% V232 0.08 +/- 0.03% 4.7 +/- 0.6%
W34 11 +/- 2% 14.2 +/- 0.2% V161 0.15 +/- 0.05% 0.20 +/- 0.03% K233 0.10 +/- 0.08% 0.389 +/- 0.004%
Y36 1.3 +/- 0.2% 1.65 +/- 0.08% Y162 1.6 +/- 0.4% 1.92 +/- 0.05% K242 0.29 +/- 0.08% 0.55 +/- 0.01%
M64 3.4 +/- 0.9% 3 +/- 1% A166 0.05 +/- 0.01% 0.076 +/- 0.006% L243 0.05 +/- 0.02% 1.06 +/- 0.06%
M68 4 +/- 1% 2 +/- 1% R167 0.25 +/- 0.04% 0.40 +/- 0.01% E244 0.30 +/- 0.05% 0.49 +/- 0.02%
Y74 4. +/- 1.% 3.8 +/- 0.7% S175 0.13 +/- 0.04% 0.27 +/- 0.02% Q248 0.18 +/- 0.03% 0.25 +/- 0.02%
E77 0.3 +/- 0.2% 0.22 +/- 0.02% R180 0.20 +/- 0.05% 0.36 +/- 0.02% I250 0.03 +/- 0.01% 0.68 +/- 0.06%
E79 0.2 +/- 0.1% 0.18 +/- 0.02% L181 0.31 +/- 0.08% 0.55 +/- 0.04% R251 0.012 +/- 0.003% 0.027 +/- 0.001%
E80 1.2 +/- 0.8% 0.72 +/- 0.02% P183 0.36 +/- 0.08% 0.62 +/- 0.02% E255 0.28 +/- 0.07% 0.124 +/- 0.003%
L82 0.6 +/- 0.5% 0.187 +/- 0.006% L184 0.4 +/- 0.1% 0.68 +/- 0.04% R260 0.29 +/- 0.06% 0.26 +/- 0.01%
P84 0.7 +/- 0.3% 0.65 +/- 0.03% V185 0.33 +/- 0.08% 0.58 +/- 0.01% M272 40 +/- 6% 33 +/- 2%
V85 0.9 +/- 0.6% 0.47 +/- 0.04% E186 0.20 +/- 0.05% 0.36 +/- 0.01% W276 11 +/- 3% 28.7 +/- 0.8%
E87 0.8 +/- 0.3% 0.99 +/- 0.03% Q187 0.08 +/- 0.02% 0.154 +/- 0.008% V294 0.9 +/- 0.2% 0.24 +/- 0.03%
E88 0.7 +/- 0.3% 0.82 +/- 0.03% R189 0.19 +/- 0.04% 0.34 +/- 0.02% H299 0.9 +/- 0.4% 2.30 +/- 0.05%
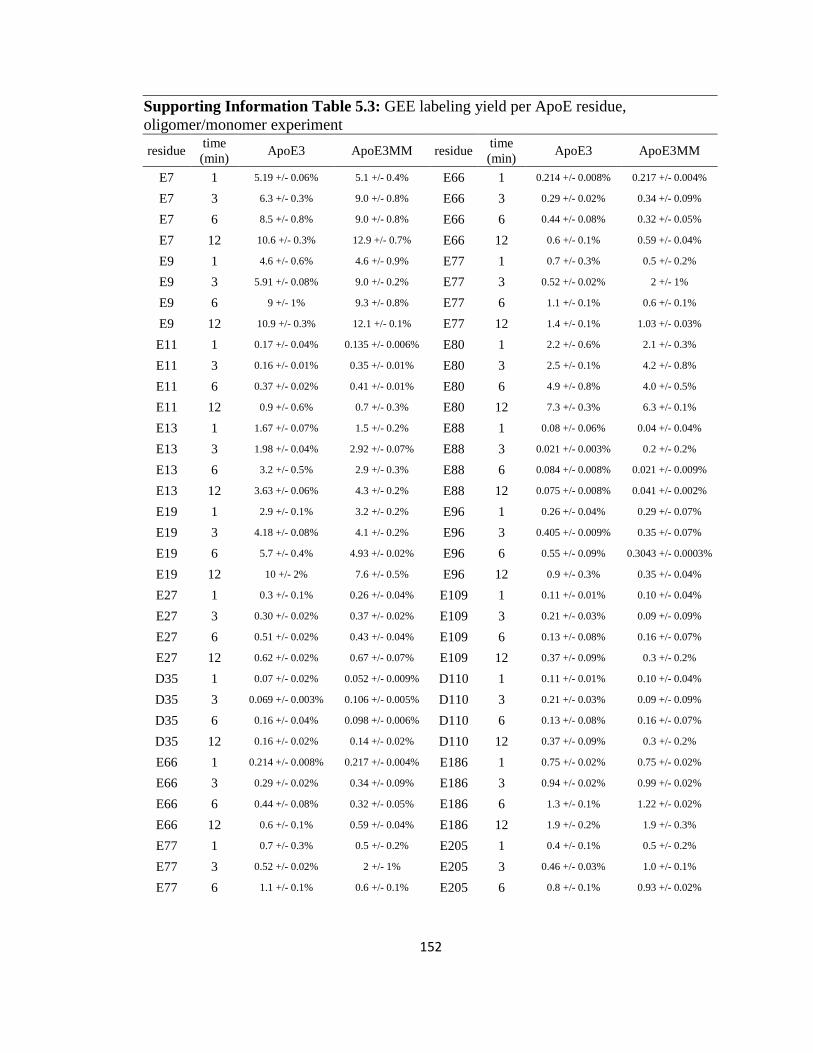
152
Supporting Information Table 5.3: GEE labeling yield per ApoE residue, oligomer/monomer experiment
residue time (min)
ApoE3 ApoE3MM residue time (min)
ApoE3 ApoE3MM
E7 1 5.19 +/- 0.06% 5.1 +/- 0.4% E66 1 0.214 +/- 0.008% 0.217 +/- 0.004%
E7 3 6.3 +/- 0.3% 9.0 +/- 0.8% E66 3 0.29 +/- 0.02% 0.34 +/- 0.09%
E7 6 8.5 +/- 0.8% 9.0 +/- 0.8% E66 6 0.44 +/- 0.08% 0.32 +/- 0.05%
E7 12 10.6 +/- 0.3% 12.9 +/- 0.7% E66 12 0.6 +/- 0.1% 0.59 +/- 0.04%
E9 1 4.6 +/- 0.6% 4.6 +/- 0.9% E77 1 0.7 +/- 0.3% 0.5 +/- 0.2%
E9 3 5.91 +/- 0.08% 9.0 +/- 0.2% E77 3 0.52 +/- 0.02% 2 +/- 1%
E9 6 9 +/- 1% 9.3 +/- 0.8% E77 6 1.1 +/- 0.1% 0.6 +/- 0.1%
E9 12 10.9 +/- 0.3% 12.1 +/- 0.1% E77 12 1.4 +/- 0.1% 1.03 +/- 0.03%
E11 1 0.17 +/- 0.04% 0.135 +/- 0.006% E80 1 2.2 +/- 0.6% 2.1 +/- 0.3%
E11 3 0.16 +/- 0.01% 0.35 +/- 0.01% E80 3 2.5 +/- 0.1% 4.2 +/- 0.8%
E11 6 0.37 +/- 0.02% 0.41 +/- 0.01% E80 6 4.9 +/- 0.8% 4.0 +/- 0.5%
E11 12 0.9 +/- 0.6% 0.7 +/- 0.3% E80 12 7.3 +/- 0.3% 6.3 +/- 0.1%
E13 1 1.67 +/- 0.07% 1.5 +/- 0.2% E88 1 0.08 +/- 0.06% 0.04 +/- 0.04%
E13 3 1.98 +/- 0.04% 2.92 +/- 0.07% E88 3 0.021 +/- 0.003% 0.2 +/- 0.2%
E13 6 3.2 +/- 0.5% 2.9 +/- 0.3% E88 6 0.084 +/- 0.008% 0.021 +/- 0.009%
E13 12 3.63 +/- 0.06% 4.3 +/- 0.2% E88 12 0.075 +/- 0.008% 0.041 +/- 0.002%
E19 1 2.9 +/- 0.1% 3.2 +/- 0.2% E96 1 0.26 +/- 0.04% 0.29 +/- 0.07%
E19 3 4.18 +/- 0.08% 4.1 +/- 0.2% E96 3 0.405 +/- 0.009% 0.35 +/- 0.07%
E19 6 5.7 +/- 0.4% 4.93 +/- 0.02% E96 6 0.55 +/- 0.09% 0.3043 +/- 0.0003%
E19 12 10 +/- 2% 7.6 +/- 0.5% E96 12 0.9 +/- 0.3% 0.35 +/- 0.04%
E27 1 0.3 +/- 0.1% 0.26 +/- 0.04% E109 1 0.11 +/- 0.01% 0.10 +/- 0.04%
E27 3 0.30 +/- 0.02% 0.37 +/- 0.02% E109 3 0.21 +/- 0.03% 0.09 +/- 0.09%
E27 6 0.51 +/- 0.02% 0.43 +/- 0.04% E109 6 0.13 +/- 0.08% 0.16 +/- 0.07%
E27 12 0.62 +/- 0.02% 0.67 +/- 0.07% E109 12 0.37 +/- 0.09% 0.3 +/- 0.2%
D35 1 0.07 +/- 0.02% 0.052 +/- 0.009% D110 1 0.11 +/- 0.01% 0.10 +/- 0.04%
D35 3 0.069 +/- 0.003% 0.106 +/- 0.005% D110 3 0.21 +/- 0.03% 0.09 +/- 0.09%
D35 6 0.16 +/- 0.04% 0.098 +/- 0.006% D110 6 0.13 +/- 0.08% 0.16 +/- 0.07%
D35 12 0.16 +/- 0.02% 0.14 +/- 0.02% D110 12 0.37 +/- 0.09% 0.3 +/- 0.2%
E66 1 0.214 +/- 0.008% 0.217 +/- 0.004% E186 1 0.75 +/- 0.02% 0.75 +/- 0.02%
E66 3 0.29 +/- 0.02% 0.34 +/- 0.09% E186 3 0.94 +/- 0.02% 0.99 +/- 0.02%
E66 6 0.44 +/- 0.08% 0.32 +/- 0.05% E186 6 1.3 +/- 0.1% 1.22 +/- 0.02%
E66 12 0.6 +/- 0.1% 0.59 +/- 0.04% E186 12 1.9 +/- 0.2% 1.9 +/- 0.3%
E77 1 0.7 +/- 0.3% 0.5 +/- 0.2% E205 1 0.4 +/- 0.1% 0.5 +/- 0.2%
E77 3 0.52 +/- 0.02% 2 +/- 1% E205 3 0.46 +/- 0.03% 1.0 +/- 0.1%
E77 6 1.1 +/- 0.1% 0.6 +/- 0.1% E205 6 0.8 +/- 0.1% 0.93 +/- 0.02%
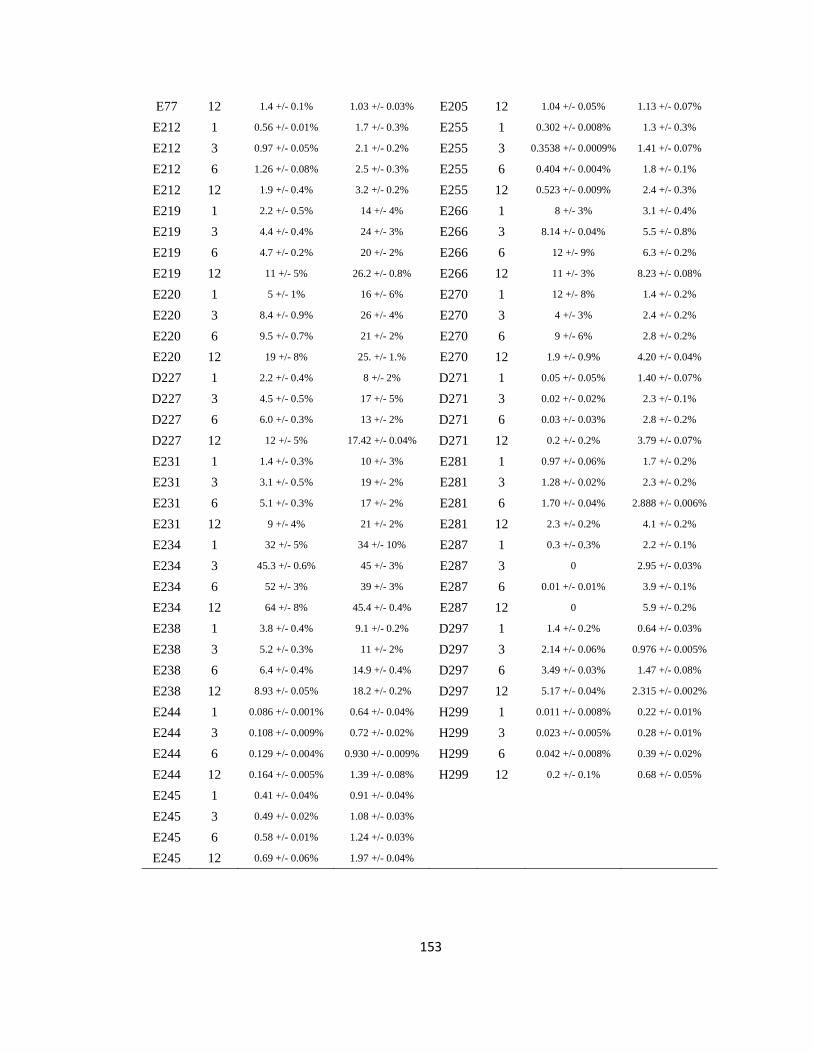
153
E77 12 1.4 +/- 0.1% 1.03 +/- 0.03% E205 12 1.04 +/- 0.05% 1.13 +/- 0.07%
E212 1 0.56 +/- 0.01% 1.7 +/- 0.3% E255 1 0.302 +/- 0.008% 1.3 +/- 0.3%
E212 3 0.97 +/- 0.05% 2.1 +/- 0.2% E255 3 0.3538 +/- 0.0009% 1.41 +/- 0.07%
E212 6 1.26 +/- 0.08% 2.5 +/- 0.3% E255 6 0.404 +/- 0.004% 1.8 +/- 0.1%
E212 12 1.9 +/- 0.4% 3.2 +/- 0.2% E255 12 0.523 +/- 0.009% 2.4 +/- 0.3%
E219 1 2.2 +/- 0.5% 14 +/- 4% E266 1 8 +/- 3% 3.1 +/- 0.4%
E219 3 4.4 +/- 0.4% 24 +/- 3% E266 3 8.14 +/- 0.04% 5.5 +/- 0.8%
E219 6 4.7 +/- 0.2% 20 +/- 2% E266 6 12 +/- 9% 6.3 +/- 0.2%
E219 12 11 +/- 5% 26.2 +/- 0.8% E266 12 11 +/- 3% 8.23 +/- 0.08%
E220 1 5 +/- 1% 16 +/- 6% E270 1 12 +/- 8% 1.4 +/- 0.2%
E220 3 8.4 +/- 0.9% 26 +/- 4% E270 3 4 +/- 3% 2.4 +/- 0.2%
E220 6 9.5 +/- 0.7% 21 +/- 2% E270 6 9 +/- 6% 2.8 +/- 0.2%
E220 12 19 +/- 8% 25. +/- 1.% E270 12 1.9 +/- 0.9% 4.20 +/- 0.04%
D227 1 2.2 +/- 0.4% 8 +/- 2% D271 1 0.05 +/- 0.05% 1.40 +/- 0.07%
D227 3 4.5 +/- 0.5% 17 +/- 5% D271 3 0.02 +/- 0.02% 2.3 +/- 0.1%
D227 6 6.0 +/- 0.3% 13 +/- 2% D271 6 0.03 +/- 0.03% 2.8 +/- 0.2%
D227 12 12 +/- 5% 17.42 +/- 0.04% D271 12 0.2 +/- 0.2% 3.79 +/- 0.07%
E231 1 1.4 +/- 0.3% 10 +/- 3% E281 1 0.97 +/- 0.06% 1.7 +/- 0.2%
E231 3 3.1 +/- 0.5% 19 +/- 2% E281 3 1.28 +/- 0.02% 2.3 +/- 0.2%
E231 6 5.1 +/- 0.3% 17 +/- 2% E281 6 1.70 +/- 0.04% 2.888 +/- 0.006%
E231 12 9 +/- 4% 21 +/- 2% E281 12 2.3 +/- 0.2% 4.1 +/- 0.2%
E234 1 32 +/- 5% 34 +/- 10% E287 1 0.3 +/- 0.3% 2.2 +/- 0.1%
E234 3 45.3 +/- 0.6% 45 +/- 3% E287 3 0 2.95 +/- 0.03%
E234 6 52 +/- 3% 39 +/- 3% E287 6 0.01 +/- 0.01% 3.9 +/- 0.1%
E234 12 64 +/- 8% 45.4 +/- 0.4% E287 12 0 5.9 +/- 0.2%
E238 1 3.8 +/- 0.4% 9.1 +/- 0.2% D297 1 1.4 +/- 0.2% 0.64 +/- 0.03%
E238 3 5.2 +/- 0.3% 11 +/- 2% D297 3 2.14 +/- 0.06% 0.976 +/- 0.005%
E238 6 6.4 +/- 0.4% 14.9 +/- 0.4% D297 6 3.49 +/- 0.03% 1.47 +/- 0.08%
E238 12 8.93 +/- 0.05% 18.2 +/- 0.2% D297 12 5.17 +/- 0.04% 2.315 +/- 0.002%
E244 1 0.086 +/- 0.001% 0.64 +/- 0.04% H299 1 0.011 +/- 0.008% 0.22 +/- 0.01%
E244 3 0.108 +/- 0.009% 0.72 +/- 0.02% H299 3 0.023 +/- 0.005% 0.28 +/- 0.01%
E244 6 0.129 +/- 0.004% 0.930 +/- 0.009% H299 6 0.042 +/- 0.008% 0.39 +/- 0.02%
E244 12 0.164 +/- 0.005% 1.39 +/- 0.08% H299 12 0.2 +/- 0.1% 0.68 +/- 0.05%
E245 1 0.41 +/- 0.04% 0.91 +/- 0.04%
E245 3 0.49 +/- 0.02% 1.08 +/- 0.03%
E245 6 0.58 +/- 0.01% 1.24 +/- 0.03%
E245 12 0.69 +/- 0.06% 1.97 +/- 0.04%
154
5.7 References
1. Mahley, R. W., Apolipoprotein E: cholesterol transport protein with expanding role in
cell biology. Science 1988, 240, 622-630.
2. Strittmatter, W. J.; Saunders, A. M.; Schmechel, D.; Pericak-Vance, M.; Enghild, J.;
Salvesen, G. S.; Roses, A. D., Apolipoprotein E: high-avidity binding to beta-amyloid and
increased frequency of type 4 allele in late-onset familial Alzheimer disease. Proc. Natl. Acad.
Sci. U.S.A. 1993, 90 (5), 1977-1981.
3. Corder, E. H.; Saunders, A. M.; Strittmatter, W. J.; Schmechel, D. E.; Gaskell, P. C.; Small,
G. W.; Roses, A. D.; Haines, J. L.; Pericak-Vance, M. A., Gene dose of apolipoprotein E type 4
allele and the risk of Alzheimer's disease in late onset families. Science 1993, 261 (5123), 921-
923.
4. Bu, G., Apolipoprotein E and its receptors in Alzheimer's disease: pathways,
pathogenesis and therapy. Nat Rev Neurosci 2009, 10 (5), 333-344.
5. Weisgraber, K. H., Apolipoprotein E: Structure-Function Relationships. In Advances in
Protein Chemistry, Academic Press: 1994; Vol. Volume 45, pp 249-302.
6. Wilson, C.; Wardell, M. R.; Weisgraber, K. H.; Mahley, R. W.; Agard, D. A., Three-
dimensional structure of the LDL receptor-binding domain of human apolipoprotein E. Science
1991, 252 (5014), 1817-1822.
7. Sivashanmugam, A.; Wang, J., A Unified Scheme for Initiation and Conformational
Adaptation of Human Apolipoprotein E N-terminal Domain upon Lipoprotein Binding and for
Receptor Binding Activity. J. Biol. Chem. 2009, 284 (21), 14657-14666.
8. Garai, K.; Frieden, C., The Association-Dissociation Behavior of the ApoE Proteins: Kinetic
and Equilibrium Studies. Biochemistry 2010, 49 (44), 9533-9541.
9. Sakamoto, T.; Tanaka, M.; Vedhachalam, C.; Nickel, M.; Nguyen, D.; Dhanasekaran, P.;
Phillips, M. C.; Lund-Katz, S.; Saito, H., Contributions of the Carboxyl-Terminal Helical Segment to
the Self-Association and Lipoprotein Preferences of Human Apolipoprotein E3 and E4 Isoforms.
Biochemistry 2008, 47 (9), 2968-2977.
10. Westerlund, J. A.; Weisgraber, K. H., Discrete carboxyl-terminal segments of
apolipoprotein E mediate lipoprotein association and protein oligomerization. J. Biol. Chem.
1993, 268 (21), 15745-15750.
11. Aggerbeck, L. P.; Wetterau, J. R.; Weisgraber, K. H.; Wu, C. S.; Lindgren, F. T., Human
apolipoprotein E3 in aqueous solution. II. Properties of the amino- and carboxyl-terminal
domains. J. Biol. Chem. 1988, 263 (13), 6249-6258.
12. Yokoyama, S.; Kawai, Y.; Tajima, S.; Yamamoto, A., Behavior of human apolipoprotein E
in aqueous solutions and at interfaces. J. Biol. Chem. 1985, 260 (30), 16375-16382.
13. Hambly, D. M.; Gross, M. L., In The Encyclopedia of Mass Spectrometry: Ionization
Methods, Gross, M. L.; Caprioli, R. M., Eds. 2006; Vol. 6.
14. Guan, J.-Q.; Chance, M. R., Structural proteomics of macromolecular assemblies using
oxidative footprinting and mass spectrometry. Trends Biochem. Sci 2005, 10, 583-592.
15. Xu, G.; Chance, M. R., Hydroxyl Radical-Mediated Modification of Proteins as Probes for
Structural Proteomics. Chem. Rev. 2007, 107 (8), 3514-3543.
16. Xu, G.; Chance, M. R., Radiolytic Modification and Reactivity of Amino Acid Residues
Serving as Structural Probes for Protein Footprinting. Anal. Chem. 2005, 77 (14), 4549-4555.
155
17. Hambly, D. M.; Gross, M. L., Laser Flash Photolysis of Hydrogen Peroxide to Oxidize
Protein Solvent-Accessible Residues on the Microsecond Timescale. J. Am. Soc. Mass Spectrom.
2005, 16 (12), 2057-2063.
18. Aye, T. T.; Low, T. Y.; Sze, S. K., Nanosecond Laser-Induced Photochemical Oxidation
Method for Protein Surface Mapping with Mass Spectrometry. Anal. Chem. 2005, 77 (18), 5814-
5822.
19. Gau, B. C.; Sharp, J. S.; Rempel, D. L.; Gross, M. L., Fast Photochemical Oxidation of
Protein Footprints Faster than Protein Unfolding. Anal. Chem. 2009, 81 (16), 6563-6571.
20. Wen, J.; Zhang, H.; Gross, M. L.; Blankenship, R. E., Membrane orientation of the FMO
antenna protein from Chlorobaculum tepidum as determined by mass spectrometry-based
footprinting. Proc. Natl. Acad. Sci. U.S.A. 2009, 106 (15), 6134-6139.
21. Swaisgood, H.; Natake, M., Effect of Carboxyl Group Modification on Some of the
Enzymatic Properties of L-Glutamate Dehydrogenase. Journal of Biochemistry 1973, 74 (1), 77-
86.
22. Hoare, D. G.; Koshland, D. E., A Method for the Quantitative Modification and
Estimation of Carboxylic Acid Groups in Proteins. The Journal of Biological Chemistry 1967, 242,
2447-2453.
23. Xu, G.; Kiselar, J.; He, Q.; Chance, M. R., Secondary Reactions and Strategies To Improve
Quantitative Protein Footprinting. Anal. Chem. 2005, 77 (10), 3029-3037.
24. Vidavsky, I.; Rempel, D. L.; Gross, M. L., 2D Mass Spectra Correlation – Semi Automatic
Tool for Modified Peptide Discovery. In Proceedings of the 54th ASMS Conference on Mass
Spectrometry and Allied Topics, Seattle, WA, 2006.
25. Chou, C.-Y.; Lin, Y.-L.; Huang, Y.-C.; Sheu, S.-Y.; Lin, T.-H.; Tsay, H.-J.; Chang, G.-G.; Shiao,
M.-S., Structural Variation in Human Apolipoprotein E3 and E4: Secondary Structure, Tertiary
Structure, and Size Distribution. Biophysical journal 2005, 88 (1), 455-466.
26. Perugini, M. A.; Schuck, P.; Howlett, G. J., Self-association of Human Apolipoprotein E3
and E4 in the Presence and Absence of Phospholipid. J. Biol. Chem. 2000, 275 (47), 36758-36765.
27. Guan, J. Q.; Vorobiev, S.; Almo, S. C.; Chance, M. R., Mapping the G-Actin Binding
Surface of Cofilin Using Synchrotron Protein Footprinting. Biochemistry 2002, 41 (18), 5765-
5775.
28. Maleknia, S. D.; Ralston, C. Y.; Brenowitz, M. D.; Downard, K. M.; Chance, M. R.,
Determination of Macromolecular Folding and Structure by Synchrotron X-Ray Radiolysis
Techniques. Anal. Biochem. 2001, 289 (2), 103-115.
29. Goldsmith, S. C.; Guan, J.-Q.; Almo, S. C.; Chance, M. R., Synchrotron Protein
Footprinting: A Technique to Investigate Protein-Protein Interactions. J. Biomol. Stuc. Dyn. 2001,
19 (3), 405-419.
30. Buxton, G. V.; Greenstock, C. L.; Helman, W. P.; Ross, A. B., Critical Review of Rate
Constants for Reactions of Hydrated Electrons, Hydrogen Atoms and Hydroxyl Radicals (*OH/*O-
) in Aqueous Solution. J. Phys. Chem. Ref. Data 1988, 17 (2), 513-886.
31. Gerstein, M., A resolution-sensitive procedure for comparing protein surfaces and its
application to the comparison of antigen-combining sites. Acta Crystallographica Section A 1992,
48 (3), 271-276.
32. Xu, G.; Chance, M. R., Radiolytic Modification of Sulfur-Containing Amino Acid Residues
in Model Peptides: Fundamental Studies for Protein Footprinting. Anal. Chem. 2005, 77 (8),
2437-2449.
156
33. Hawkins, C. L.; Morgan, P. E.; Davies, M. J., Quantification of protein modification by
oxidants. Free Radical Biology and Medicine 2009, 46 (8), 965-988.
34. Morand, K.; Talbo, G.; Mann, M., Oxidation of peptides during electrospray ionization.
Rapid Commun. Mass Spectrom. 1993, 7 (8), 738-743.
35. Fan, D.; Li, Q.; Korando, L.; Jerome, W. G.; Wang, J., A monomeric human apolipoprotein
E carboxyl-terminal domain Biochemistry 2004, 43 (17), 5055-5064.
36. Zhang, Y.; Vasudevan, S.; Sojitrawala, R.; Zhao, W.; Cui, C.; Xu, C.; Fan, D.; Newhouse, Y.;
Balestra, R.; Jerome, W. G.; Weisgraber, K.; Li, Q.; Wang, J., A Monomeric, Biologically Active,
Full-Length Human Apolipoprotein E Biochemistry 2007, 46 (37), 10722-10732.
37. Sivashanmugam, A.; Wang, J., A complete receptor binding domain of human
apolipoprotein E. Wayne State University School of Medicine: 2009.
38. Dong, L. M.; Wilson, C.; Wardell, M. R.; Simmons, T.; Mahley, R. W.; Weisgraber, K. H.;
Agard, D. A., Human apolipoprotein E. Role of arginine 61 in mediating the lipoprotein
preferences of the E3 and E4 isoforms. J. Biol. Chem. 1994, 269 (35), 22358-22365.
39. Garai, K.; Mustafi, S. M.; Baban, B.; Frieden, C., Structural differences between
apolipoprotein E3 and E4 as measured by 19F NMR. Protein Sci. 2009, 19 (1), 66-74.
40. Hermanson, G. T., Bioconjugate Techniques (Second Edition). Elsevier: 2008.
41. Garrison, W. M., Reaction mechanisms in the radiolysis of peptides, polypeptides, and
proteins. Chem. Rev. 1987, 87 (2), 381-398.
42. Saladino, J.; Liu, M.; Live, D.; Sharp, J. S., Aliphatic Peptidyl Hydroperoxides as a Source
of Secondary Oxidation in Hydroxyl Radical Protein Footprinting. J. Am. Soc. Mass Spectrom.
2009, 20 (6), 1123-1126.
43. Zhong, N.; Weisgraber, K. H., Understanding the Association of Apolipoprotein E4 with
Alzheimer Disease: Clues from Its Structure. J. Biol. Chem. 2009, 284 (10), 6027-6031.
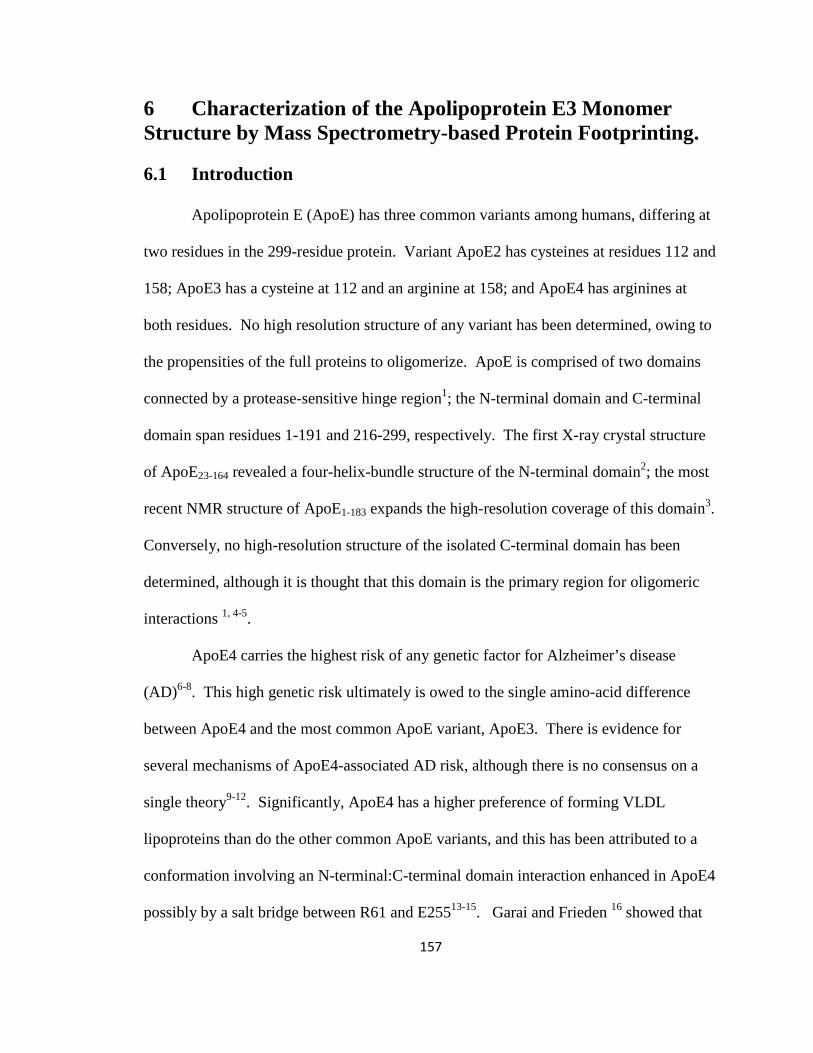
157
6 Characterization of the Apolipoprotein E3 Monomer Structure by Mass Spectrometry-based Protein Footprinting. 6.1 Introduction
Apolipoprotein E (ApoE) has three common variants among humans, differing at
two residues in the 299-residue protein. Variant ApoE2 has cysteines at residues 112 and
158; ApoE3 has a cysteine at 112 and an arginine at 158; and ApoE4 has arginines at
both residues. No high resolution structure of any variant has been determined, owing to
the propensities of the full proteins to oligomerize. ApoE is comprised of two domains
connected by a protease-sensitive hinge region1; the N-terminal domain and C-terminal
domain span residues 1-191 and 216-299, respectively. The first X-ray crystal structure
of ApoE23-164 revealed a four-helix-bundle structure of the N-terminal domain2; the most
recent NMR structure of ApoE1-183 expands the high-resolution coverage of this domain3.
Conversely, no high-resolution structure of the isolated C-terminal domain has been
determined, although it is thought that this domain is the primary region for oligomeric
interactions 1, 4-5.
ApoE4 carries the highest risk of any genetic factor for Alzheimer’s disease
(AD)6-8. This high genetic risk ultimately is owed to the single amino-acid difference
between ApoE4 and the most common ApoE variant, ApoE3. There is evidence for
several mechanisms of ApoE4-associated AD risk, although there is no consensus on a
single theory9-12. Significantly, ApoE4 has a higher preference of forming VLDL
lipoproteins than do the other common ApoE variants, and this has been attributed to a
conformation involving an N-terminal:C-terminal domain interaction enhanced in ApoE4
possibly by a salt bridge between R61 and E25513-15. Garai and Frieden 16 showed that
158
the oligomerization of lipid-free ApoE is not diffusion-controlled, and that the variants
exhibit different rates of association and dissociation. These differences may impact the
lipoprotein dynamic equilibrium in the brain. Such studies highlight the need for a
fundamental understanding of the lipid-free ApoE structure, to help unravel the
physiological consequence of mutation C158R.
The central problem inhibiting the structural characterization of ApoE is
oligomerization. Zhang and colleagues 17 recently engineered two mutants of ApoE3,
existing as monomers to 20 mg/mL and possessing lipid-binding and LDL receptor-
binding properties that are similar to those of ApoE3. The two mutants share four
substitutions in the C-terminal domain; one of the mutants has an additional substitution
in this domain. Its NMR 1H-15N HSQC spectrum in the lipid-free state shows many of
the same spectral features as the spectrum of truncated ApoE3 1-183, suggesting that the
four-helix bundle structure is present in the N-terminal domain of the full length
monomeric mutant17. This has been a common presumption in the modeling of ApoE
domain interactions and lipid-binding reorganization3, 9. We report here the testing of
this hypothesis with a different method of structural characterization.
Protein footprinting by covalent labeling of solvent-exposed sidechains, with
detection and quantitation by mass spectrometry, is a method of analyzing structure by
comparison18-19. Usually two states of a protein or protein complex are modified under
identical conditions. By virtue of the irreversibility of the modification, the proteins can
be proteolyzed in any appropriate manner, and the resulting peptides analyzed by
chromatography and mass spectrometry to reveal modification sites. In a proper
footprinting experiment, the labeling modification yield at a site will depend on the
159
inherent reactivity of the residue to the labeling agent and on the site’s average solvent
accessibility in the equilibrium state of interest. Comparing the yields of labeling at
identical residues between two states allows for an accurate assessment of the relative
change in solvent accessible surface area (SASA) at the residue. The state with
attenuated labeling has lower SASA; such a result for the holo state in a ligand-binding
experiment reveals the site of direct ligand interaction or of distal allosteric change upon
binding.
One class of protein footprinting utilizes hydroxyl-radical-mediated modification.
This method has several advantages. The •OH probes aqueous accessibility because its
size is comparable to that of water molecules, and its high reactivity allows for reliable
sampling of over half of the 20 common amino acids20-22. Additionally, in oxygenated
solutions, an abundant product of •OH-sidechain modification that is common to most
amino acids is the net incorporation of oxygen 23, a stable +16 Da modification easily
detected by mass spectrometry. While indiscriminate, •OH is not an “equal-opportunity”
labeling agent: the reaction rate constant for the most reactive amino acid, Cys, is over
1000 times greater than that for the least reactive, Gly 24.
There are several ways of generating •OH for protein footprinting, including
Fe(II)-reduction of H2O2 (Fenton chemistry)25-28, X-ray29-30 and γ-ray31-32 radiolysis of
water, and UV homolysis of H2O2 33. These methods and the various side-chain products
they typically produce are detailed in a recent review24. We use here the FPOP approach
developed by Hambly and Gross34 and, independently, by Aye and colleagues35 for •OH–
mediated footprinting. We use a KrF excimer laser to provide a 17 ns flash of 248 nm
light to initiate the homolysis of H2O2 at low millimolar levels. Twenty mM glutamine
160
serves as a chemical shutter, effectively scavenging all radicals within approximately 1
µs 34. This ensures that only the equilibrium conformation(s) of the protein is sampled at
high yield, avoiding potential oxidation-induced conformations that may evolve within
ms of exposure 36.
The hypothesis we test, that the N-terminus of the full length ApoE monomer has
the structure of truncated ApoE31-183, requires a different kind of comparison than is
normally employed in a footprinting experiment. We segregate the extents of oxidative
modification of residues among their same-amino-acid residue families, because the
FPOP-yield should be proportional to the SASA among residues of the same kind. Thus
an accurate determination of relative exposure is possible. The hypothesis of structural
similarity in the N-terminal domain is tested by comparing FPOP-indicated buried and
exposed residues to the calculated SASA of ApoE31-183.
6.2 Experimental Procedures
6.2.1 Reagents.
Acetonitrile, formic acid, 30% hydrogen peroxide, L-glutamine, L-methionine,
tris(2-carboxyethyl)phosphine hydrochloride (TCEP), catalase, guanidinium
hydrochloride, and phosphate buffered saline (PBS) were purchased from the Sigma
Aldrich Chemical Co. (St. Louis, MO). Trypsin sequencing grade was purchased from
Roche Diagnostics Corp. (Indianapolis, IN). Purified water (18 MΩ) was obtained from
a Milli-Q Synthesis system (Millipore, Billerica, MA). ApoE3MM, expressed in E. coli,
was kindly provided by Drs. K. Garai and C. Frieden. Lyophilized ApoE3MM was
solubilized in 6 M guanidinium chloride and dialyzed overnight into phosphate buffered
saline (PBS) solution containing 100 µM TCEP disulfide reductant; the protein
161
concentration was determined by 280 nm absorbance. The purity of the protein was
confirmed by ESI MS on a Bruker Maxis Q-TOF (Billerica, MA) operating at 30000
resolving power for ions of m/z 400, using a Millipore ZiptipC4 (Billerica, MA) de-salted
aliquot of the stock solution. The stock solution was split among aliquots, frozen by
immersion in N2(I), and stored at -80°C prior to use.
6.2.2 FPOP labeling.
A solution of 4 µM ApoE3MM in PBS and 100 µM TCEP was prepared from
thawed stock solutions and thermally equilibrated 2 h at room temperature (22 °C).
Glutamine was solubilized to 150 mM in PBS and added to the protein solution to a final
concentration of 20 mM. From this solution, 35 µL replicates were drawn. Just prior to
FPOP, H2O2 was added to each replicate to a final concentration of 40 mM, by 10-fold
dilution of a freshly prepared stock solution of H2O2. The FPOP apparatus was used as
previously described 34 but with 150 µm i.d. fused silica (Polymicro Technologies,
Phoenix, AZ). The KrF excimer laser power (GAM Laser Inc., Orlando, FL) was
adjusted to 39 mJ/pulse, and its pulse frequency was set to 5 Hz. The flow rate was
adjusted to ensure a 25% exclusion volume to avoid repeat •OH exposure36. Excess H2O2
was removed immediately following FPOP labeling by collecting samples in
microcentrifuge tubes containing 10 µL of 200 fM catalase. This catalase solution also
contained Met to give a final concentration of 20 mM following collection. O2(g) was
removed from the samples by centrifugation following pipette mixing three times during
a 10 minute room temperature incubation; samples were subsequently frozen in N2(l) and
stored at -80°C prior to proteolysis. Control samples were drawn from the same
equilibration solution and handled identically except that the laser was not used.
162
6.2.3 Proteolysis.
FPOP-labeled and control samples were thawed and proteolyzed at an 8:1
protein:trypsin weight ratio at 37 °C for 3 h. Digestion completion was determined by
ESI MS on a Bruker Maxis Q-TOF by using an extra control replicate. The samples were
concentrated 3-fold by SpeedVac drying at 30 °C, then Millipore ZiptipC18 de-salted, with
eluted into 10 uL of 50% acetonitrile 1% formic acid solution. A portion of this was
diluted 25-fold with water and 0.1% formic acid for autosampler loading.
6.2.4 LC-MS/MS acquisition.
Each sample replicate was loaded by 5 µL autosampler (Eksigent nanoLC,
Dublin, CA) injection onto a 20 cm x 75 µm silica capillary column with a PicoFrit tip
(New Objective, Inc, Woburn, MA), bomb-packed with C18 reverse phase material
(Magic, 0.075 mm × 200 mm, 5 µm, 300 Å, Michrom, Auburn, CA). The gradient was
from 1% solvent B (97% acetonitrile, 3% water, 0.1% formic acid) to 60% solvent B over
70 min at an eluent flow of 260 nL/min. The LC was coupled to the nanospray source of
an LTQ-Orbitrap mass spectrometer (Thermo Fisher, Waltham, MA). Mass spectra of
eluting peptides were obtained at high mass resolving power (100,000 for ions of m/z
400) by using the Orbitrap spectrometer component. The six most abundant ions eluting
per high- resolving-power scan were each subjected to CID MS2 experiment in the LTQ
component, using a collision energy 35% of the maximum, a 2 Da isolation width, and
wideband activation. Precursor ions submitted to an MS2 experiment were rejected for
repeat experiment within 6 s of their original MS2 scan; this dynamic exclusion setting
enabled good sampling of the apex of most chromatogram peaks, which were typically
12-18 s wide at half maximum. Blanks were run between every sample acquisition.
163
6.2.5 Data analysis.
A measure of the abundance of a peptide is the sum of the integrated areas of its
extracted ion chromatogram (EIC) features from the Orbitrap MS data, determined at ± 5
ppm about the theoretical m/z values of the isotopomer ions. The Rosetta Elucidator data
management system (Rosetta Biosoftware) was used to determine all EIC features
aligned in time across all FPOP and control samples. These EIC features were annotated
by Mascot (Matrix Science, Boston, MA) error-tolerant searching with the variable
modification list updated for known •OH sidechain modifications24. The feature
annotations were corrected for, or rejected by, errors in mass tolerance, unusual
modifications, and discrepant annotations, using custom VBA software for efficient
manual MS2 inspection. The custom processing also augmented the Mascot results by
identifying peaks not Mascot-annotated but within 8 ppm of a putative FPOP-modified or
unmodified tryptic peptide of ApoE3MM. These features were included if they had an
associated product-ion spectra that were consistent with their accurate-mass match. The
interpretation of such spectra was assisted by a custom-developed correlation algorithm
that compared these spectra to exemplary CID fragment spectra of unmodified tryptic
peptides of ApoE3MM37.
The yield per residue was determined as the sum of all peptide features modified
at a residue divided by all peptide features having the same sequences as the peptide
contributors modified at that residue. This definition avoids potential yield
underestimations that occurred, for example, when a tryptic peptide was detected as
modified at a residue but a missed-cleavage peptide spanning this residue was only
detected as unmodified. Here is the argument: The protein modification yield at a
164
residue should be recapitulated at the peptide level. Unless there is a modification bias
with trypsin proteolysis, the missed-cleavage peptide will also be modified at the residue
in the same yield. The lack of detection of the modified missed-cleavage peptide does
not mean the missed-cleavage peptide isn’t modified; rather it is an analytic failure
usually owing to a low frequency of trypsin missed cleavages. Therefore the unmodified
missed-cleavage peptide should not be included in the yield denominator in this instance.
Except for modifications at lysine and arginine, our data shows trypsin is not influenced
by residue modifications.
6.3 Results
6.3.1 LC-MS/MS analysis.
When subjected to LC-MS peak-alignment analysis, the proteolytic digests of the
three samples submitted to FPOP and of the three control samples had 10,122 unique ion
features of known charge state eluting during their 70 min LC-MS acquisitions. An LC-
MS feature is a single ion isotopomer in a single charge state from a species eluting as a
single peak in time. Typically a signal from an abundant tryptic peptide species was split
among two or more charge states, often +2 and +3. The Orbitrap mass analyzer resolved
the isotopomers, so that the measure of abundance of a tryptic peptide was determined by
summing the extracted ion chromatogram (EIC) peak areas for a dozen or more co-
eluting features. Owing to the precision of the Orbitrap, LC-MS features were included
for integration as a single species if their 12C monoisotopic de-charged masses were
within 5 ppm of the average of all such features co-eluting in time. Thus, the 10,122 ion
features were associated with 3,379 eluting species. Of these, Mascot error-tolerant
database searching and accurate mass-matching software identified 1,456 species,
165
comprising 62.5% of all ion abundances, as ions of ApoE3MM modified and unmodified
peptides. The remaining signal is predominantly associated with very low-abundance
species of unknown or +1 charge state and tryptic peptides from catalase.
Reporting the extent of the characterization of LC-MS/MS protein footprinting
data is important for conveying the comprehensiveness of the analysis. While we use a
“bottom-up” MS-based proteomics methodology, we are not quantifying protein levels
from a complex mixture with as few as two characteristic peptides, as is typically done in
proteomics experiments38. Instead, nearly two thirds of all signal stems from a single
protein made complex by the labeling experiment; our task is to accurately determine the
labeling yields localized to many specific sites.
In addition to observing all standard •OH sidechain products 24, we found
chemistries not commonly reported. These include the net loss of 2H at Leu and Val (-
2.0157 D); loss of HSCH2 and gain of OH at Met (-29.9928 D); and the net losses of CO
(-27.9949 D) and CO2 (-43.9898 D) involving both Asp and Glu residues. In all such
cases, the modifications tracked exclusively with FPOP-labeled samples. Figure 6.1
shows the evidence for Glu205 -44 D modification and is exemplary of FPOP-specific
signal but for one aspect. Typical •OH sidechain outcomes make the peptides more
hydrophilic than are their unmodified roots; thus, they elute earlier in reverse-phase
chromatography. Figure 6.1A shows that the peptide ApoE3MM(192-206) - CO2 elutes
later than unmodified ApoE3MM 192-206, consistent with the expectation that loss of an
electronegative oxygen increases hydrophobicity.
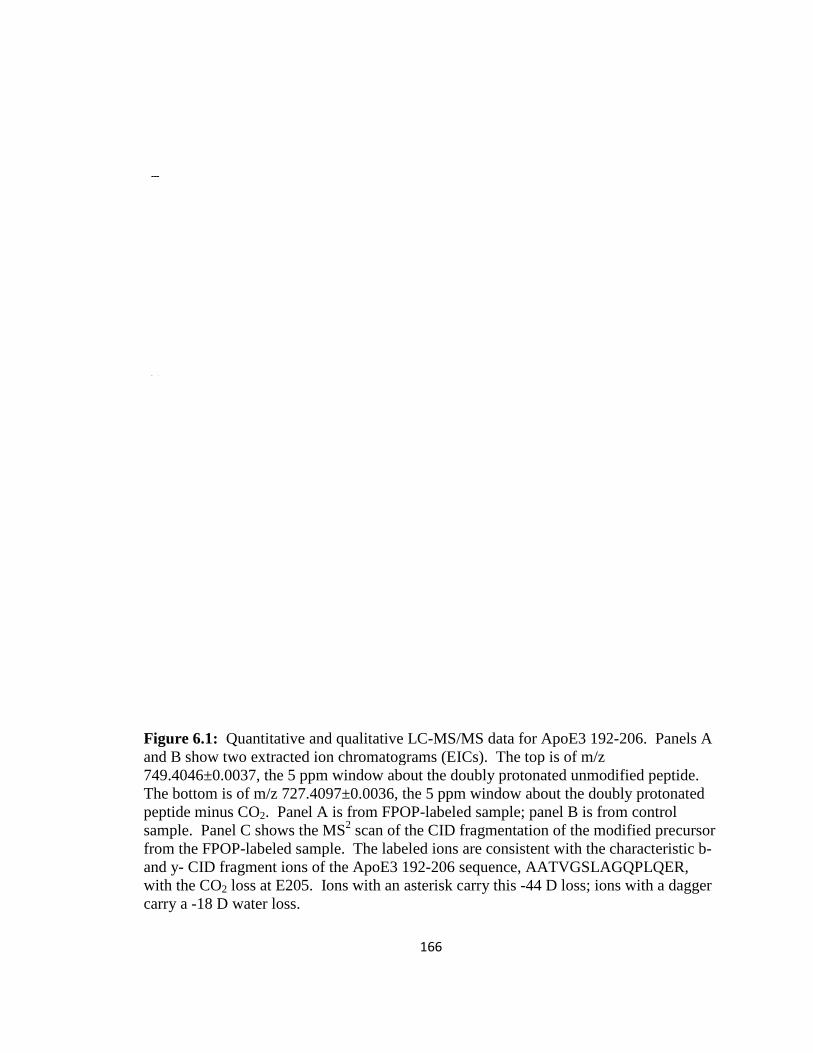
Figure 6.1: Quantitative and qualitative LCand B show two extracted ion chromatograms (EICs). The top is of m/z 749.4046±0.0037, the 5 ppm window about the doubly protonated unmodified peptide. The bottom is of m/z 727.4097peptide minus CO2. Panel A is from FPOPsample. Panel C shows the MSfrom the FPOP-labeled sample. The labeled ions are consistent with the characteristic band y- CID fragment ions of the with the CO2 loss at E205. Ions with an asterisk carry this carry a -18 D water loss.
166
Quantitative and qualitative LC-MS/MS data for ApoE3 192and B show two extracted ion chromatograms (EICs). The top is of m/z 749.4046±0.0037, the 5 ppm window about the doubly protonated unmodified peptide.
727.4097±0.0036, the 5 ppm window about the doubly protonated . Panel A is from FPOP-labeled sample; panel B is from control
sample. Panel C shows the MS2 scan of the CID fragmentation of the modified precursor labeled sample. The labeled ions are consistent with the characteristic b
CID fragment ions of the ApoE3 192-206 sequence, AATVGSLAGQPLQERloss at E205. Ions with an asterisk carry this -44 D loss; ions with a dagger
192-206. Panels A and B show two extracted ion chromatograms (EICs). The top is of m/z 749.4046±0.0037, the 5 ppm window about the doubly protonated unmodified peptide.
, the 5 ppm window about the doubly protonated labeled sample; panel B is from control
scan of the CID fragmentation of the modified precursor labeled sample. The labeled ions are consistent with the characteristic b-
AATVGSLAGQPLQER, 44 D loss; ions with a dagger
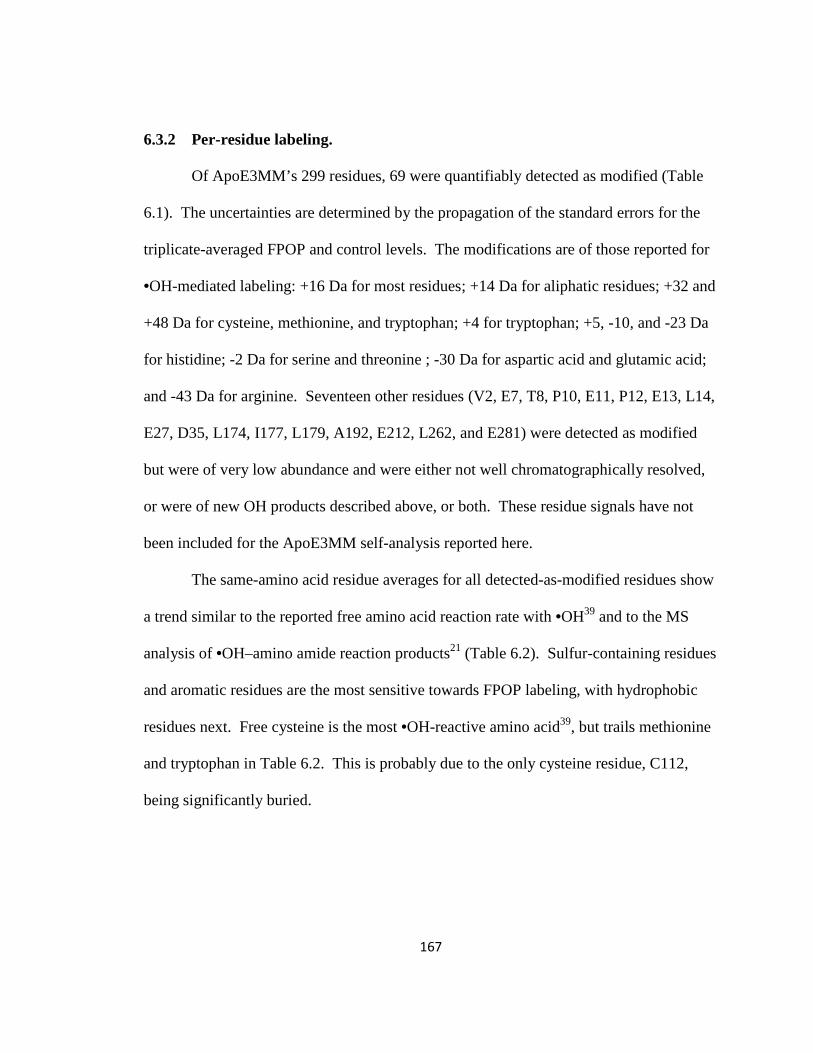
167
6.3.2 Per-residue labeling.
Of ApoE3MM’s 299 residues, 69 were quantifiably detected as modified (Table
6.1). The uncertainties are determined by the propagation of the standard errors for the
triplicate-averaged FPOP and control levels. The modifications are of those reported for
•OH-mediated labeling: +16 Da for most residues; +14 Da for aliphatic residues; +32 and
+48 Da for cysteine, methionine, and tryptophan; +4 for tryptophan; +5, -10, and -23 Da
for histidine; -2 Da for serine and threonine ; -30 Da for aspartic acid and glutamic acid;
and -43 Da for arginine. Seventeen other residues (V2, E7, T8, P10, E11, P12, E13, L14,
E27, D35, L174, I177, L179, A192, E212, L262, and E281) were detected as modified
but were of very low abundance and were either not well chromatographically resolved,
or were of new OH products described above, or both. These residue signals have not
been included for the ApoE3MM self-analysis reported here.
The same-amino acid residue averages for all detected-as-modified residues show
a trend similar to the reported free amino acid reaction rate with •OH39 and to the MS
analysis of •OH–amino amide reaction products21 (Table 6.2). Sulfur-containing residues
and aromatic residues are the most sensitive towards FPOP labeling, with hydrophobic
residues next. Free cysteine is the most •OH-reactive amino acid39, but trails methionine
and tryptophan in Table 6.2. This is probably due to the only cysteine residue, C112,
being significantly buried.
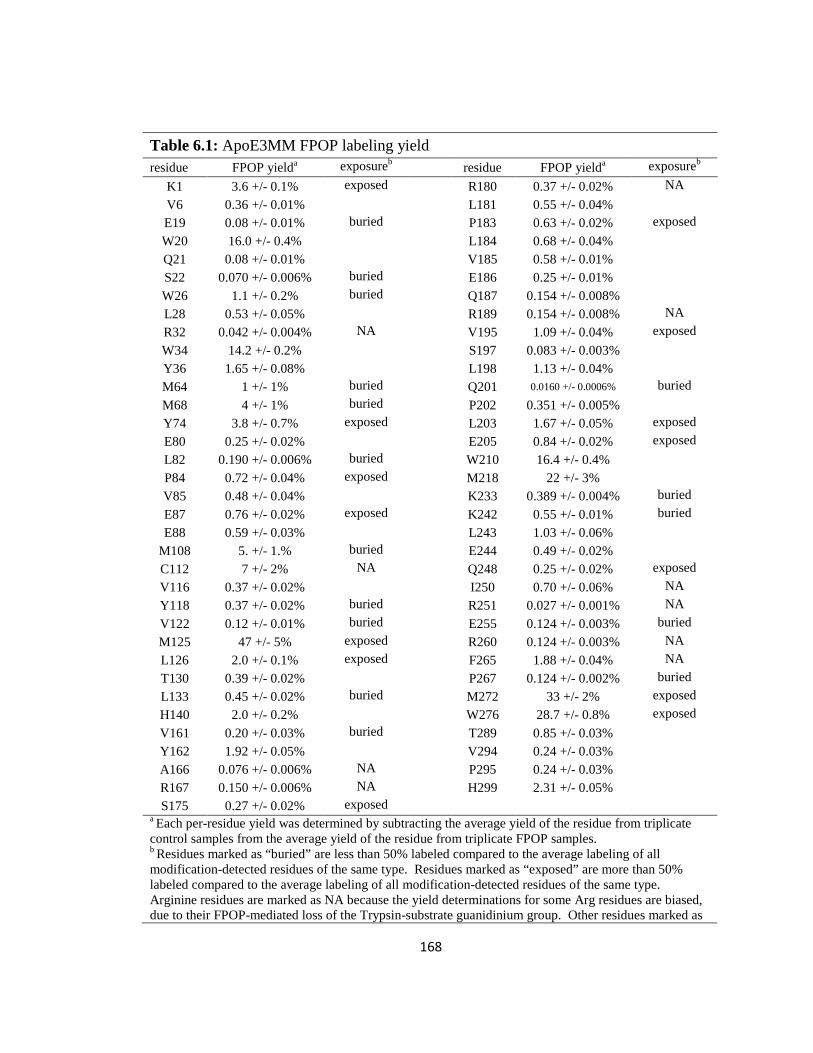
168
Table 6.1: ApoE3MM FPOP labeling yield residue FPOP yielda exposureb residue FPOP yielda exposureb
K1 3.6 +/- 0.1% exposed R180 0.37 +/- 0.02% NA
V6 0.36 +/- 0.01% L181 0.55 +/- 0.04%
E19 0.08 +/- 0.01% buried P183 0.63 +/- 0.02% exposed
W20 16.0 +/- 0.4% L184 0.68 +/- 0.04%
Q21 0.08 +/- 0.01% V185 0.58 +/- 0.01%
S22 0.070 +/- 0.006% buried E186 0.25 +/- 0.01%
W26 1.1 +/- 0.2% buried Q187 0.154 +/- 0.008%
L28 0.53 +/- 0.05% R189 0.154 +/- 0.008% NA
R32 0.042 +/- 0.004% NA V195 1.09 +/- 0.04% exposed
W34 14.2 +/- 0.2% S197 0.083 +/- 0.003%
Y36 1.65 +/- 0.08% L198 1.13 +/- 0.04%
M64 1 +/- 1% buried Q201 0.0160 +/- 0.0006% buried
M68 4 +/- 1% buried P202 0.351 +/- 0.005%
Y74 3.8 +/- 0.7% exposed L203 1.67 +/- 0.05% exposed
E80 0.25 +/- 0.02% E205 0.84 +/- 0.02% exposed
L82 0.190 +/- 0.006% buried W210 16.4 +/- 0.4%
P84 0.72 +/- 0.04% exposed M218 22 +/- 3%
V85 0.48 +/- 0.04% K233 0.389 +/- 0.004% buried
E87 0.76 +/- 0.02% exposed K242 0.55 +/- 0.01% buried
E88 0.59 +/- 0.03% L243 1.03 +/- 0.06%
M108 5. +/- 1.% buried E244 0.49 +/- 0.02%
C112 7 +/- 2% NA Q248 0.25 +/- 0.02% exposed
V116 0.37 +/- 0.02% I250 0.70 +/- 0.06% NA
Y118 0.37 +/- 0.02% buried R251 0.027 +/- 0.001% NA
V122 0.12 +/- 0.01% buried E255 0.124 +/- 0.003% buried
M125 47 +/- 5% exposed R260 0.124 +/- 0.003% NA
L126 2.0 +/- 0.1% exposed F265 1.88 +/- 0.04% NA
T130 0.39 +/- 0.02% P267 0.124 +/- 0.002% buried
L133 0.45 +/- 0.02% buried M272 33 +/- 2% exposed
H140 2.0 +/- 0.2% W276 28.7 +/- 0.8% exposed
V161 0.20 +/- 0.03% buried T289 0.85 +/- 0.03%
Y162 1.92 +/- 0.05% V294 0.24 +/- 0.03%
A166 0.076 +/- 0.006% NA P295 0.24 +/- 0.03%
R167 0.150 +/- 0.006% NA H299 2.31 +/- 0.05%
S175 0.27 +/- 0.02% exposed a Each per-residue yield was determined by subtracting the average yield of the residue from triplicate control samples from the average yield of the residue from triplicate FPOP samples. b Residues marked as “buried” are less than 50% labeled compared to the average labeling of all modification-detected residues of the same type. Residues marked as “exposed” are more than 50% labeled compared to the average labeling of all modification-detected residues of the same type. Arginine residues are marked as NA because the yield determinations for some Arg residues are biased, due to their FPOP-mediated loss of the Trypsin-substrate guanidinium group. Other residues marked as
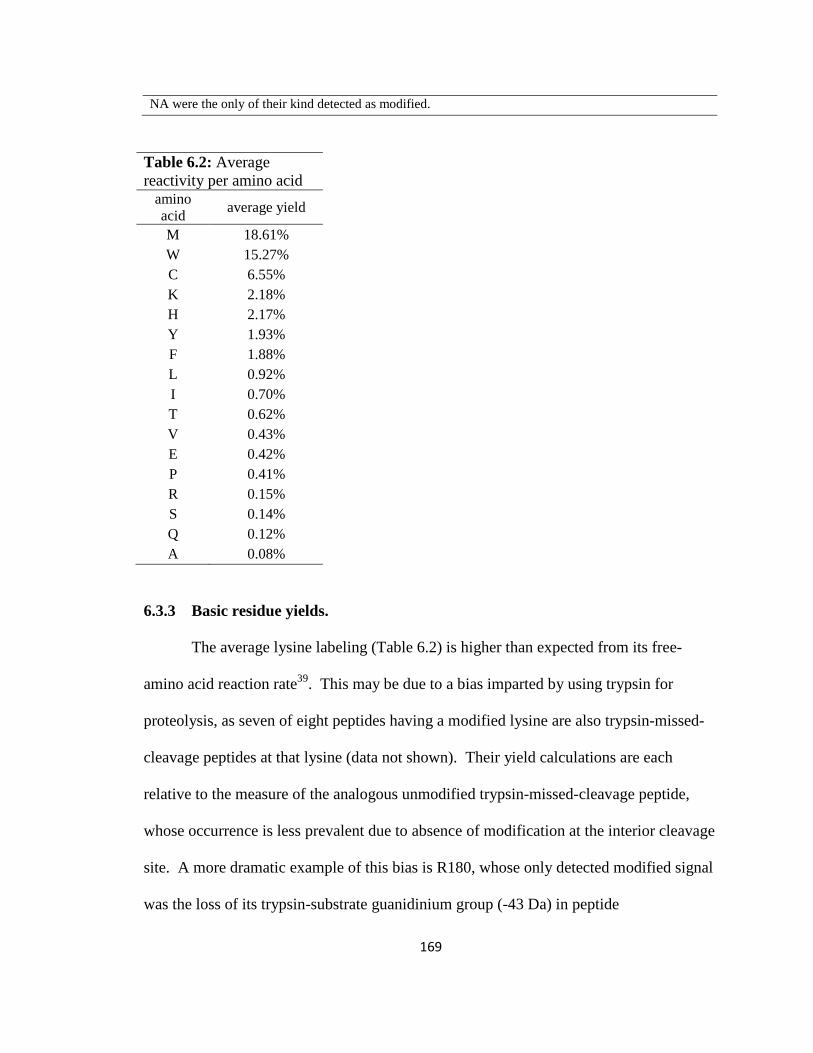
169
NA were the only of their kind detected as modified.
Table 6.2: Average reactivity per amino acid
amino acid
average yield
M 18.61% W 15.27% C 6.55% K 2.18% H 2.17% Y 1.93% F 1.88% L 0.92% I 0.70% T 0.62% V 0.43% E 0.42% P 0.41% R 0.15% S 0.14% Q 0.12% A 0.08%
6.3.3 Basic residue yields.
The average lysine labeling (Table 6.2) is higher than expected from its free-
amino acid reaction rate39. This may be due to a bias imparted by using trypsin for
proteolysis, as seven of eight peptides having a modified lysine are also trypsin-missed-
cleavage peptides at that lysine (data not shown). Their yield calculations are each
relative to the measure of the analogous unmodified trypsin-missed-cleavage peptide,
whose occurrence is less prevalent due to absence of modification at the interior cleavage
site. A more dramatic example of this bias is R180, whose only detected modified signal
was the loss of its trypsin-substrate guanidinium group (-43 Da) in peptide
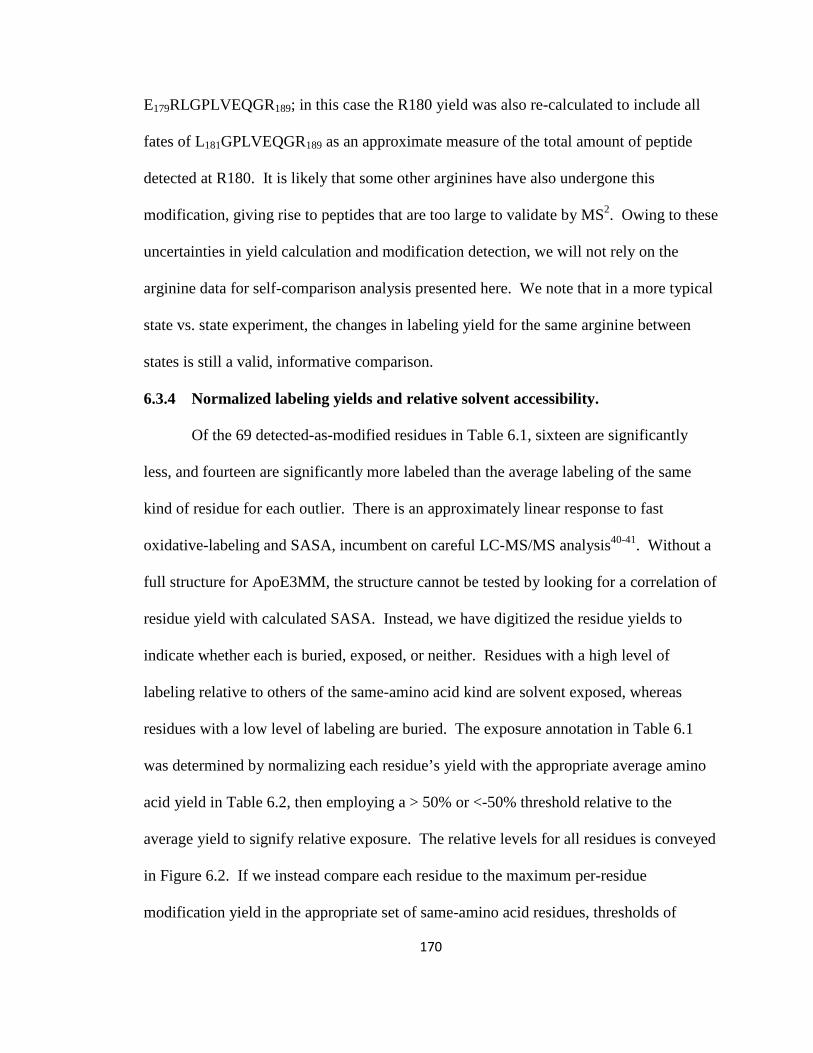
170
E179RLGPLVEQGR189; in this case the R180 yield was also re-calculated to include all
fates of L181GPLVEQGR189 as an approximate measure of the total amount of peptide
detected at R180. It is likely that some other arginines have also undergone this
modification, giving rise to peptides that are too large to validate by MS2. Owing to these
uncertainties in yield calculation and modification detection, we will not rely on the
arginine data for self-comparison analysis presented here. We note that in a more typical
state vs. state experiment, the changes in labeling yield for the same arginine between
states is still a valid, informative comparison.
6.3.4 Normalized labeling yields and relative solvent accessibility.
Of the 69 detected-as-modified residues in Table 6.1, sixteen are significantly
less, and fourteen are significantly more labeled than the average labeling of the same
kind of residue for each outlier. There is an approximately linear response to fast
oxidative-labeling and SASA, incumbent on careful LC-MS/MS analysis40-41. Without a
full structure for ApoE3MM, the structure cannot be tested by looking for a correlation of
residue yield with calculated SASA. Instead, we have digitized the residue yields to
indicate whether each is buried, exposed, or neither. Residues with a high level of
labeling relative to others of the same-amino acid kind are solvent exposed, whereas
residues with a low level of labeling are buried. The exposure annotation in Table 6.1
was determined by normalizing each residue’s yield with the appropriate average amino
acid yield in Table 6.2, then employing a > 50% or <-50% threshold relative to the
average yield to signify relative exposure. The relative levels for all residues is conveyed
in Figure 6.2. If we instead compare each residue to the maximum per-residue
modification yield in the appropriate set of same-amino acid residues, thresholds of
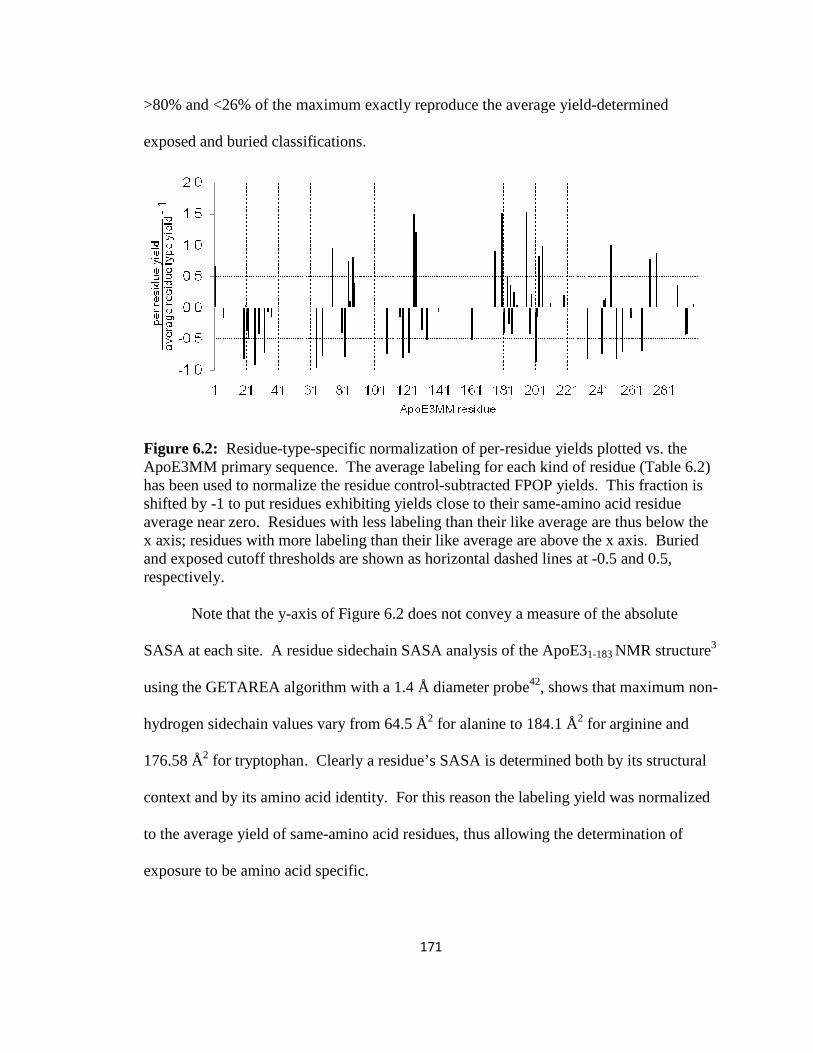
>80% and <26% of the maximum exactly reproduce the average yield
exposed and buried classi
Figure 6.2: Residue-typeApoE3MM primary sequence. The average labeling for each kind of residue (Table 6.2) has been used to normalize the residue controlshifted by -1 to put residues exhibiting yields close to their sameaverage near zero. Residues with less labeling than their like average are thus below the x axis; residues with more labeling than their like average are above the x axis. Band exposed cutoff thresholds are shownrespectively.
Note that the y-axis of Figure 6.2 does not convey a measure of the absolute
SASA at each site. A residue sidechain SASA analysis of the
using the GETAREA algorithm with a
hydrogen sidechain values vary from 64.5
176.58 Å2 for tryptophan. Clearly a residue’s SASA is determined both by its structural
context and by its amino acid identity. For this reason the labeling yield was normalized
to the average yield of same
exposure to be amino acid specific.
171
>80% and <26% of the maximum exactly reproduce the average yield-determined
exposed and buried classifications.
type-specific normalization of per-residue yields plotted vs. the ApoE3MM primary sequence. The average labeling for each kind of residue (Table 6.2) has been used to normalize the residue control-subtracted FPOP yields. This fraction is
1 to put residues exhibiting yields close to their same-amino acid residue average near zero. Residues with less labeling than their like average are thus below the x axis; residues with more labeling than their like average are above the x axis. Band exposed cutoff thresholds are shown as horizontal dashed lines at -0.5 and 0.5,
axis of Figure 6.2 does not convey a measure of the absolute
SASA at each site. A residue sidechain SASA analysis of the ApoE31-183
using the GETAREA algorithm with a 1.4 Å diameter probe42, shows that maximum non
hydrogen sidechain values vary from 64.5 Å2 for alanine to 184.1 Å2 for arginine and
for tryptophan. Clearly a residue’s SASA is determined both by its structural
context and by its amino acid identity. For this reason the labeling yield was normalized
to the average yield of same-amino acid residues, thus allowing the determination of
exposure to be amino acid specific.
determined
residue yields plotted vs. the ApoE3MM primary sequence. The average labeling for each kind of residue (Table 6.2)
subtracted FPOP yields. This fraction is amino acid residue
average near zero. Residues with less labeling than their like average are thus below the x axis; residues with more labeling than their like average are above the x axis. Buried
0.5 and 0.5,
axis of Figure 6.2 does not convey a measure of the absolute
183 NMR structure3
, shows that maximum non-
for arginine and
for tryptophan. Clearly a residue’s SASA is determined both by its structural
context and by its amino acid identity. For this reason the labeling yield was normalized
amino acid residues, thus allowing the determination of
172
6.4 Discussion
6.4.1 LC-MS/MS analysis of protein footprint data.
This study compares each residue’s labeling, relative to all other detected-as-
modified residues, for a single protein state. In contrast, in most cases of chemical
footprinting, two states of a protein are studied (e.g., apo vs. holo, native vs. unfolded)29-
30, 41, 43-45. The burden of accurate detection and quantitation for the self-comparison
experiment employed here is higher than that for the usual state vs. state experiment. In
the latter case, it is not important if some modification fates of a residue are overlooked,
as long as the proteolysis and LC-MS/MS acquisition for each state are done under
identical conditions (i.e., same-day labeling, proteolysis, and contiguous MS acquisition),
and the same set of ion signals from each sample’s acquisition are used to calculate the
yield of modification per residue. Then the difference in the measured yield at a residue
between the two states reflects the difference in its solvent accessibility, no matter if
some residue modification fates are missed. For example, tryptophan can be
hydroxylated at several positions on its indole ring. We typically see these structural
isomers resolved by reverse phase chromatography (data not shown), but sometimes one
or more of the Trp-hydroxylated isomers co-elutes with the same peptide hydroxylated at
a different residue. In the state vs. state experiment, this mixture EIC peak can be
omitted because the same tryptophan residue is compared between states, using the same
modified and unmodified peptide EIC peaks for each state—the mixture peak doesn’t add
any information the other well-resolved Trp-modified peaks communicate.
In this study’s self-comparison analysis, all Trp-modified EIC peaks are needed,
to minimize the bias of underestimation when comparing different tryptophan residues of
173
the single ApoE3MM state. Of course this applies to all kinds of residues. For two co-
eluting peptide isomers, a fraction of the mixture peak’s EIC abundance is assigned to
both peptide isomers, in proportion to the number of MS2 spectra, or spectral counts,
associated with each peptide isomer. A few mixture peaks have more than two isomer
components; mostly these are of the common +15.9949 hydroxylation fate. We have not
included this source of signal for any residues in Table 6.1 because of the uncertainty in
ascribing the appropriate EIC abundance fraction to each component. In addition, V2,
E7, T8, P10, and L14 were detected-as-modified, but all of their signal resides in such
isomer-mixture peaks; consequently, they have not been included in the relative SASA
analysis here.
Modification fates can easily be missed in standard proteomics analysis as well.
Error-tolerant searching via Mascot ensures that many more spectra looking like those of
ApoE peptides are included: the error tolerant pass improved the ApoE3MM protein
score to 56,907 from the initial broad database search score of 17,794. Such database
matching can introduce unacceptable errors in annotation, requiring manual MS and MS2
inspection for their correction. We have developed a generalized VBA software platform
to organize and assist in the manual validation of hundreds features supporting the data
reported here, and to determine which EIC peaks are comprised of isomer mixtures and
provide their spectral counts.
6.4.2 Comparison of the labeling yields to the ApoE31-183 3D NMR structure.
The FPOP footprint of ApoE3MM supports the hypothesis that the full structure
is comprised in part by an N-terminal domain of similar fold to the ApoE31-183 solution
phase NMR structure3. The primary sequences in this region of ApoE3 and ApoE3MM
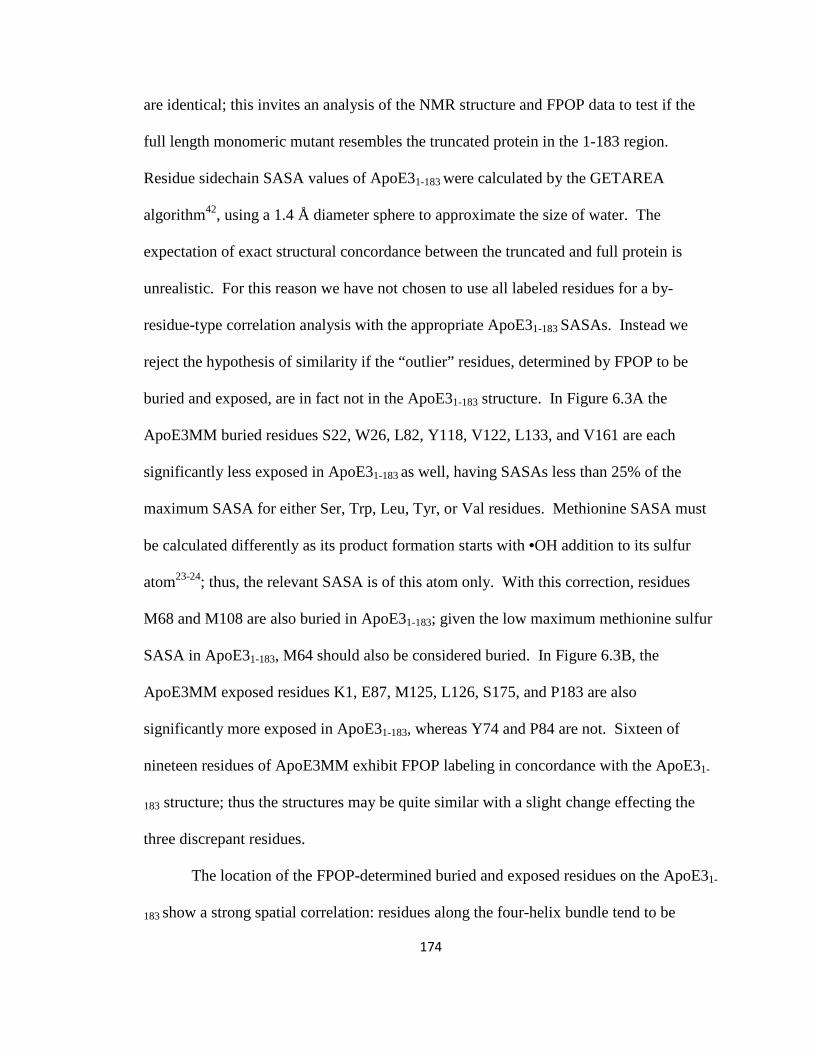
174
are identical; this invites an analysis of the NMR structure and FPOP data to test if the
full length monomeric mutant resembles the truncated protein in the 1-183 region.
Residue sidechain SASA values of ApoE31-183 were calculated by the GETAREA
algorithm42, using a 1.4 Å diameter sphere to approximate the size of water. The
expectation of exact structural concordance between the truncated and full protein is
unrealistic. For this reason we have not chosen to use all labeled residues for a by-
residue-type correlation analysis with the appropriate ApoE31-183 SASAs. Instead we
reject the hypothesis of similarity if the “outlier” residues, determined by FPOP to be
buried and exposed, are in fact not in the ApoE31-183 structure. In Figure 6.3A the
ApoE3MM buried residues S22, W26, L82, Y118, V122, L133, and V161 are each
significantly less exposed in ApoE31-183 as well, having SASAs less than 25% of the
maximum SASA for either Ser, Trp, Leu, Tyr, or Val residues. Methionine SASA must
be calculated differently as its product formation starts with •OH addition to its sulfur
atom23-24; thus, the relevant SASA is of this atom only. With this correction, residues
M68 and M108 are also buried in ApoE31-183; given the low maximum methionine sulfur
SASA in ApoE31-183, M64 should also be considered buried. In Figure 6.3B, the
ApoE3MM exposed residues K1, E87, M125, L126, S175, and P183 are also
significantly more exposed in ApoE31-183, whereas Y74 and P84 are not. Sixteen of
nineteen residues of ApoE3MM exhibit FPOP labeling in concordance with the ApoE31-
183 structure; thus the structures may be quite similar with a slight change effecting the
three discrepant residues.
The location of the FPOP-determined buried and exposed residues on the ApoE31-
183 show a strong spatial correlation: residues along the four-helix bundle tend to be
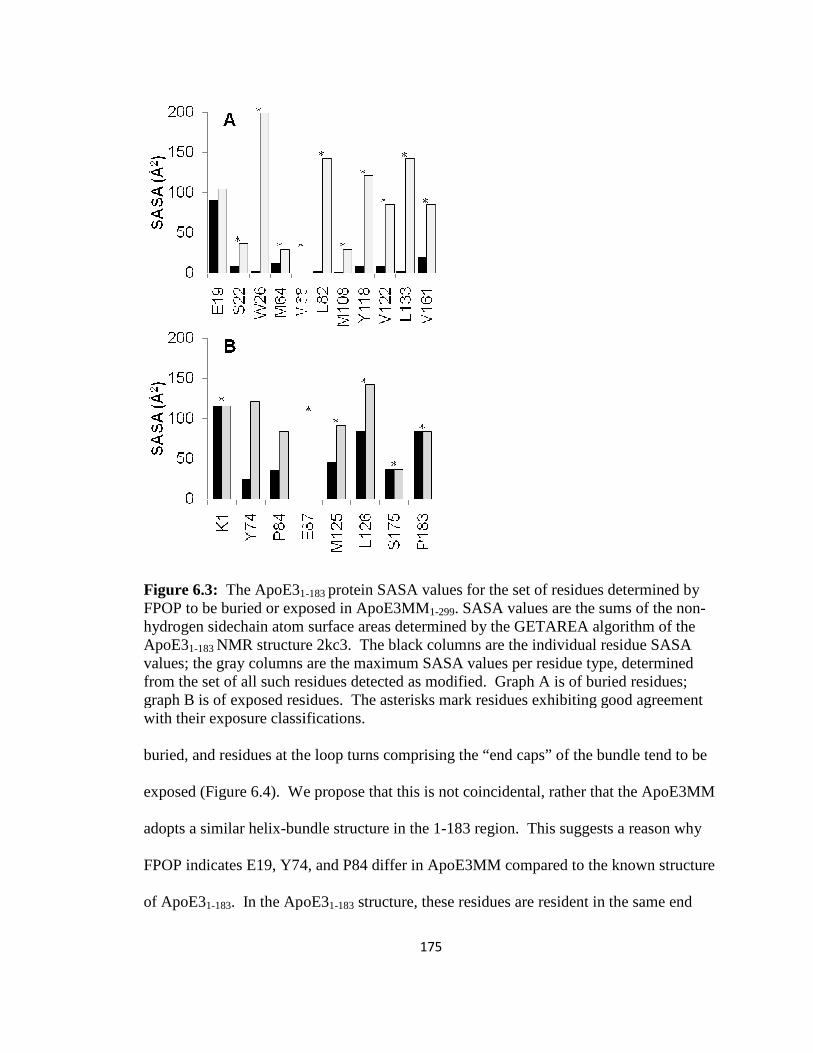
Figure 6.3: The ApoE31FPOP to be buried or exposed in ApoE3MMhydrogen sidechain atom surface areas determined by the GETAREA algorithm of the ApoE31-183 NMR structure 2kc3.values; the gray columns are the maximum SASA values per residue type, determined from the set of all such residues detected as modified. Graph A is of buried residues; graph B is of exposed residues. The asterisks mark rewith their exposure classifications. buried, and residues at the loop turns comprising the “end caps” of the bundle tend to be
exposed (Figure 6.4). We propose that this is not coincidental, rather that the ApoE3MM
adopts a similar helix-bundle structure in the 1
FPOP indicates E19, Y74, and P84 differ in ApoE3MM compared to the known structure
of ApoE31-183. In the ApoE3
175
1-183 protein SASA values for the set of residues determined by FPOP to be buried or exposed in ApoE3MM1-299. SASA values are the sums of the nonhydrogen sidechain atom surface areas determined by the GETAREA algorithm of the
NMR structure 2kc3. The black columns are the individual residue SASA values; the gray columns are the maximum SASA values per residue type, determined from the set of all such residues detected as modified. Graph A is of buried residues; graph B is of exposed residues. The asterisks mark residues exhibiting good agreement with their exposure classifications.
buried, and residues at the loop turns comprising the “end caps” of the bundle tend to be
exposed (Figure 6.4). We propose that this is not coincidental, rather that the ApoE3MM
bundle structure in the 1-183 region. This suggests a reason why
FPOP indicates E19, Y74, and P84 differ in ApoE3MM compared to the known structure
. In the ApoE31-183 structure, these residues are resident in the same end
for the set of residues determined by the sums of the non-
hydrogen sidechain atom surface areas determined by the GETAREA algorithm of the are the individual residue SASA
values; the gray columns are the maximum SASA values per residue type, determined from the set of all such residues detected as modified. Graph A is of buried residues;
sidues exhibiting good agreement
buried, and residues at the loop turns comprising the “end caps” of the bundle tend to be
exposed (Figure 6.4). We propose that this is not coincidental, rather that the ApoE3MM
183 region. This suggests a reason why
FPOP indicates E19, Y74, and P84 differ in ApoE3MM compared to the known structure
structure, these residues are resident in the same end
176
cap, from which the hinge and C-terminal domains are attached in ApoE3MM. This end
of the putative four-helix bundle may be more allosterically-sensitive then the rest of the
protein to the C-terminal domain intra- and inter-domain interactions absent in the
fragment protein. There are no significant FPOP vs. SASA discrepancies between the
structures that suggest a clear region of N- and C- terminal domain interaction, as the
observed buried residues are turned inward or otherwise masked in the ApoE31-183
structure. We cannot conclude that there is no domain-domain interaction in the
monomeric mutant.
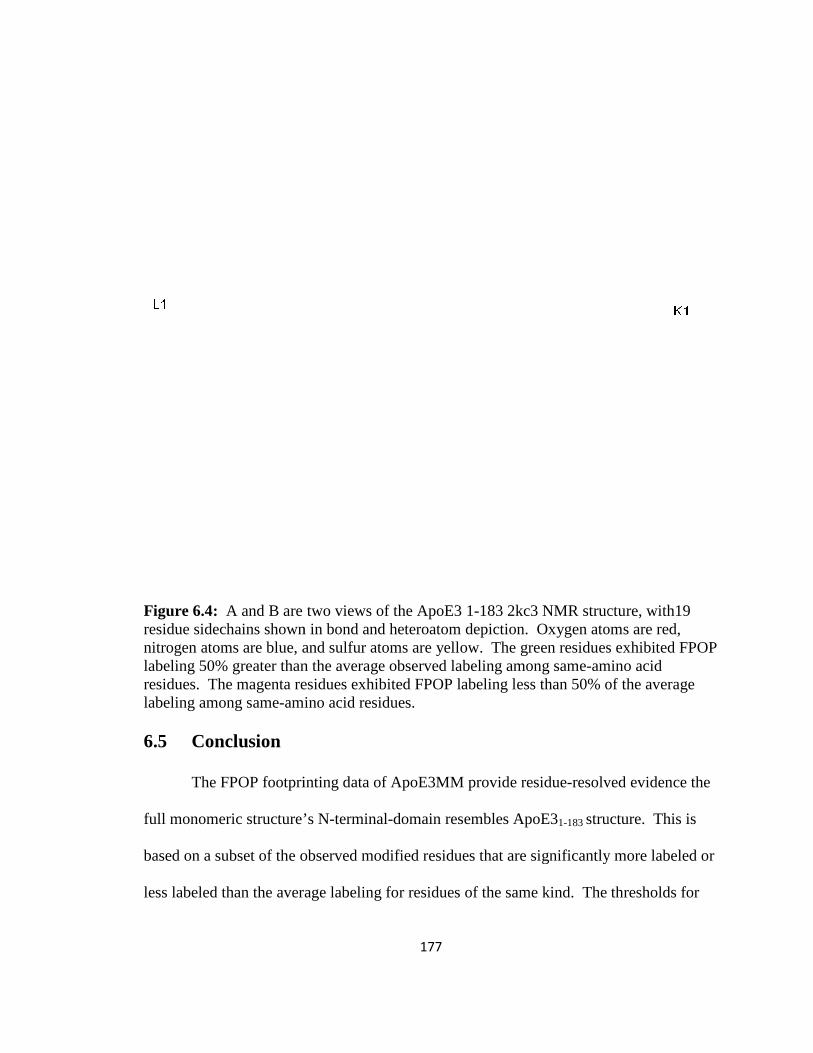
Figure 6.4: A and B are residue sidechains shown in bond and heteroatom depiction. Oxygen atoms are red, nitrogen atoms are blue, and sulfur atoms are yellow. The green residues exhibited FPOP labeling 50% greater than thresidues. The magenta residues exhibited FPOP labeling less than 50% of the average labeling among same-amino acid residues. 6.5 Conclusion
The FPOP footprinting data of ApoE3MM provide residue
full monomeric structure’s N
based on a subset of the observed modified residues
less labeled than the average labeling for residues of the same ki
177
two views of the ApoE3 1-183 2kc3 NMR structure, with19 residue sidechains shown in bond and heteroatom depiction. Oxygen atoms are red, nitrogen atoms are blue, and sulfur atoms are yellow. The green residues exhibited FPOP labeling 50% greater than the average observed labeling among same-amino acid residues. The magenta residues exhibited FPOP labeling less than 50% of the average
amino acid residues.
The FPOP footprinting data of ApoE3MM provide residue-resolved
full monomeric structure’s N-terminal-domain resembles ApoE31-183 structure. This is
based on a subset of the observed modified residues that are significantly more labeled or
less labeled than the average labeling for residues of the same kind. The thresholds for
183 2kc3 NMR structure, with19 residue sidechains shown in bond and heteroatom depiction. Oxygen atoms are red, nitrogen atoms are blue, and sulfur atoms are yellow. The green residues exhibited FPOP
amino acid residues. The magenta residues exhibited FPOP labeling less than 50% of the average
resolved evidence the
structure. This is
are significantly more labeled or
nd. The thresholds for
178
establishing relative exposure was chosen to maximize the inclusion of residues without
unduly compromising the meaning of “buried” and “exposed”, relative to the size of each
residue’s sidechain. This tradeoff is one reason there is not enough conclusive evidence
to indicate a possible N-teriminal:C-terminal domain interaction, as the subset of buried-
and exposed-classified residues does not span enough of the C-terminus. Another is that
observed attenuated labeling at a site cannot distinguish intra-domain packing and inter-
domain interaction. We propose it is likely the ApoE3MM N-terminal domain has a
structure much like ApoE31-183, because the same residues buried in this domain in
ApoE3MM, as determined by FPOP, are oriented away from solvent in the ApoE31-183
NMR structure. FPOP-observed residues buried in the ApoE3MM C-terminal domain
may be so owing to the C-terminal domain’s inherent structure, or may be due to an inter-
domain interaction.
The utility of FPOP for prediction of structure when one is not known should be
done in a digitized approach as we have employed here, to ensure that only residues that
are clearly delineated are used to test hypotheses. On the other hand, with a high
resolution structure of a highly homologous protein, a more rigorous analysis could be
undertaken to test a hypothesis of close similarity. Evidence for corroboration is seen
when the labeling yield correlates in direct proportion to the putative SASA for residues
of the same amino-acid type. In either case, the analysis is based on comparing the FPOP
yields of residues of the same-amino acid type. This is a more complex analysis than is
typically done in protein •OH footprinting experiments, which examine the changes in
protein structure between two states. Whereas tracking one modification fate of a residue
can be sufficient to distinguish a SASA difference at that site between two protein states,
179
the experimenter must strive to quantitate all FPOP fates of the protein if a reliable
judgment is to be made about the relative accessibility of each detected-as-modified
residue. Were •OH footprinting not so indiscriminate in its atomic-site targeting, this
task would be easier. The benefit to using •OH labeling, however, is that 1) they are so
promiscuous, allowing many more sites of a protein to be probed; 2) with proper
chemical control, can sample exclusively native conformations sensitive to
modifications36; and 3) are very sensitive to SASA40-41.
180
6.6 References
1. Aggerbeck, L. P.; Wetterau, J. R.; Weisgraber, K. H.; Wu, C. S.; Lindgren, F. T., Human
apolipoprotein E3 in aqueous solution. II. Properties of the amino- and carboxyl-terminal
domains. J. Biol. Chem. 1988, 263 (13), 6249-6258.
2. Wilson, C.; Wardell, M. R.; Weisgraber, K. H.; Mahley, R. W.; Agard, D. A., Three-
dimensional structure of the LDL receptor-binding domain of human apolipoprotein E. Science
1991, 252 (5014), 1817-1822.
3. Sivashanmugam, A.; Wang, J., A Unified Scheme for Initiation and Conformational
Adaptation of Human Apolipoprotein E N-terminal Domain upon Lipoprotein Binding and for
Receptor Binding Activity. J. Biol. Chem. 2009, 284 (21), 14657-14666.
4. Patel, A. B.; Khumsupan, P.; Narayanaswami, V., Pyrene Fluorescence Analysis Offers
New Insights into the Conformation of the Lipoprotein-Binding Domain of Human
Apolipoprotein E. Biochemistry 2010, 49 (8), 1766-1775.
5. Westerlund, J. A.; Weisgraber, K. H., Discrete carboxyl-terminal segments of
apolipoprotein E mediate lipoprotein association and protein oligomerization. J. Biol. Chem.
1993, 268 (21), 15745-15750.
6. Farrer, L. A.; Cupples, L. A.; Haines, J. L.; Hyman, B.; Kukull, W. A.; Mayeux, R.; Myers, R.
H.; Pericak-Vance, M. A.; Risch, N.; van Duijn, C. M., Effects of Age, Sex, and Ethnicity on the
Association Between Apolipoprotein E Genotype and Alzheimer Disease: A Meta-analysis. JAMA
1997, 278 (16), 1349-1356.
7. Strittmatter, W. J.; Saunders, A. M.; Schmechel, D.; Pericak-Vance, M.; Enghild, J.;
Salvesen, G. S.; Roses, A. D., Apolipoprotein E: high-avidity binding to beta-amyloid and
increased frequency of type 4 allele in late-onset familial Alzheimer disease. Proc. Natl. Acad.
Sci. U.S.A. 1993, 90 (5), 1977-1981.
8. Corder, E. H.; Saunders, A. M.; Strittmatter, W. J.; Schmechel, D. E.; Gaskell, P. C.; Small,
G. W.; Roses, A. D.; Haines, J. L.; Pericak-Vance, M. A., Gene dose of apolipoprotein E type 4
allele and the risk of Alzheimer's disease in late onset families. Science 1993, 261 (5123), 921-
923.
9. Zhong, N.; Weisgraber, K. H., Understanding the Association of Apolipoprotein E4 with
Alzheimer Disease: Clues from Its Structure. J. Biol. Chem. 2009, 284 (10), 6027-6031.
10. Mahley, R. W.; Weisgraber, K. H.; Huang, Y., Apolipoprotein E: structure determines
function, from atherosclerosis to Alzheimer's disease to AIDS. J. Lipid Res. 2009, 50
(Supplement), S183-S188.
11. Bu, G., Apolipoprotein E and its receptors in Alzheimer's disease: pathways,
pathogenesis and therapy. Nat Rev Neurosci 2009, 10 (5), 333-344.
12. Hauser, P. S.; Narayanaswami, V.; Ryan, R. O., Apolipoprotein E: From lipid transport to
neurobiology. Progress in Lipid Research In Press, Uncorrected Proof.
13. Xu, Q.; Brecht, W. J.; Weisgraber, K. H.; Mahley, R. W.; Huang, Y., Apolipoprotein E4
Domain Interaction Occurs in Living Neuronal Cells as Determined by Fluorescence Resonance
Energy Transfer. J. Biol. Chem. 2004, 279 (24), 25511-25516.
14. Dong, L.-M.; Weisgraber, K. H., Human Apolipoprotein E4 Domain Interaction. J. Biol.
Chem. 1996, 271 (32), 19053-19057.
181
15. Dong, L. M.; Wilson, C.; Wardell, M. R.; Simmons, T.; Mahley, R. W.; Weisgraber, K. H.;
Agard, D. A., Human apolipoprotein E. Role of arginine 61 in mediating the lipoprotein
preferences of the E3 and E4 isoforms. J. Biol. Chem. 1994, 269 (35), 22358-22365.
16. Garai, K.; Frieden, C., The Association-Dissociation Behavior of the ApoE Proteins: Kinetic
and Equilibrium Studies. Biochemistry 2010, 49 (44), 9533-9541.
17. Zhang, Y.; Vasudevan, S.; Sojitrawala, R.; Zhao, W.; Cui, C.; Xu, C.; Fan, D.; Newhouse, Y.;
Balestra, R.; Jerome, W. G.; Weisgraber, K.; Li, Q.; Wang, J., A Monomeric, Biologically Active,
Full-Length Human Apolipoprotein E Biochemistry 2007, 46 (37), 10722-10732.
18. Konermann, L.; Tong, X.; Pan, Y., Protein structure and dynamics studied by mass
spectrometry: H/D exchange, hydroxyl radical labeling, and related approaches. J. Mass
Spectrom. 2008, 43 (8), 1021-1036.
19. Chance, M., Mass Spectrometry Analysis for Protein-Protein Interactions and Dynamics.
John Wiley and Sons, Inc.: Hoboken, NJ, 2008; p 272.
20. Xu, G.; Chance, M. R., Radiolytic Modification of Sulfur-Containing Amino Acid Residues
in Model Peptides: Fundamental Studies for Protein Footprinting. Anal. Chem. 2005, 77 (8),
2437-2449.
21. Xu, G.; Chance, M. R., Radiolytic Modification and Reactivity of Amino Acid Residues
Serving as Structural Probes for Protein Footprinting. Anal. Chem. 2005, 77 (14), 4549-4555.
22. Xu, G.; Chance, M. R., Radiolytic Modification of Acidic Amino Acid Residues in Peptides:
Probes for Examining Protein-Protein Interactions. Anal. Chem. 2004, 76 (5), 1213-1221.
23. Garrison, W. M., Reaction mechanisms in the radiolysis of peptides, polypeptides, and
proteins. Chem. Rev. 1987, 87 (2), 381-398.
24. Xu, G.; Chance, M. R., Hydroxyl Radical-Mediated Modification of Proteins as Probes for
Structural Proteomics. Chem. Rev. 2007, 107 (8), 3514-3543.
25. Heyduk, E.; Heyduk, T., Mapping Protein Domains Involved in Macromolecular
Interactions: A Novel Protein Footprinting Approach. Biochemistry 1994, 33 (32), 9643-9650.
26. Shanblatt, S. H.; Revzin, A., Interactions of the catabolite activator protein (CAP) at the
galactose and lactose promoters of Escherichia coli probed by hydroxyl radical footprinting. The
second CAP molecule which binds at gal and the one CAP at lac may act to stimulate
transcription in the same way. J. Biol. Chem. 1987, 262 (24), 11422-11427.
27. Tullius, T. D.; Dombroski, B. A., Hydroxyl radical "footprinting": high-resolution
information about DNA-protein contacts and application to lambda repressor and Cro protein.
Proc. Natl. Acad. Sci. U.S.A. 1986, 83 (15), 5469-5473.
28. Fenton, H. J. H., The oxidation of tartaric acid in presence of iron. J. Chem. Soc. Proc.
1894, 10, 157-158.
29. Maleknia, S. D.; Ralston, C. Y.; Brenowitz, M. D.; Downard, K. M.; Chance, M. R.,
Determination of Macromolecular Folding and Structure by Synchrotron X-Ray Radiolysis
Techniques. Anal. Biochem. 2001, 289 (2), 103-115.
30. Goldsmith, S. C.; Guan, J.-Q.; Almo, S. C.; Chance, M. R., Synchrotron Protein
Footprinting: A Technique to Investigate Protein-Protein Interactions. J. Biomol. Stuc. Dyn. 2001,
19 (3), 405-419.
31. Venkatesh, S.; Tomer, K. B.; Sharp, J. S., Rapid identification of oxidation-induced
conformational changes by kinetic analysis. Rapid Commun. Mass Spectrom. 2007, 21 (23),
3927-3936.
32. Sharp, J. S.; Tomer, K. B., Analysis of the Oxidative Damage-Induced Conformational
Changes of Apo- and Holocalmodulin by Dose-Dependent Protein Oxidative Surface Mapping.
Biophys. J. 2007, 92 (5), 1682-1692.
182
33. Sharp, J. S.; Becker, J. M.; Hettich, R. L., Analysis of Protein Solvent Accessible Surfaces
by Photochemical Oxidation and Mass Spectrometry. Anal. Chem. 2003, 76 (3), 672-683.
34. Hambly, D. M.; Gross, M. L., Laser Flash Photolysis of Hydrogen Peroxide to Oxidize
Protein Solvent-Accessible Residues on the Microsecond Timescale. J. Am. Soc. Mass Spectrom.
2005, 16 (12), 2057-2063.
35. Aye, T. T.; Low, T. Y.; Sze, S. K., Nanosecond Laser-Induced Photochemical Oxidation
Method for Protein Surface Mapping with Mass Spectrometry. Anal. Chem. 2005, 77 (18), 5814-
5822.
36. Gau, B. C.; Sharp, J. S.; Rempel, D. L.; Gross, M. L., Fast Photochemical Oxidation of
Protein Footprints Faster than Protein Unfolding. Anal. Chem. 2009, 81 (16), 6563-6571.
37. Vidavsky, I.; Rempel, D. L.; Gross, M. L., 2D Mass Spectra Correlation – Semi Automatic
Tool for Modified Peptide Discovery. In Proceedings of the 54th ASMS Conference on Mass
Spectrometry and Allied Topics, Seattle, WA, 2006.
38. Aebersold, R.; Mann, M., Mass spectrometry-based proteomics. Nature 2003, 422
(6928), 198-207.
39. Buxton, G. V.; Greenstock, C. L.; Helman, W. P.; Ross, A. B., Critical Review of Rate
Constants for Reactions of Hydrated Electrons, Hydrogen Atoms and Hydroxyl Radicals (*OH/*O-
) in Aqueous Solution. J. Phys. Chem. Ref. Data 1988, 17 (2), 513-886.
40. Gau, B. C.; Chen, H.; Zhang, Y.; Gross, M. L., Sulfate Radical Anion as a New Reagent for
Fast Photochemical Oxidation of Proteins. Anal. Chem. 2010, 82 (18), 7821-7827.
41. Charvátová, O.; Foley, B. L.; Bern, M. W.; Sharp, J. S.; Orlando, R.; Woods, R. J.,
Quantifying Protein Interface Footprinting by Hydroxyl Radical Oxidation and Molecular
Dynamics Simulation: Application to Galectin-1. J. Am. Soc. Mass Spectrom. 2008, 19 (11), 1692-
1705.
42. Gerstein, M., A resolution-sensitive procedure for comparing protein surfaces and its
application to the comparison of antigen-combining sites. Acta Crystallographica Section A 1992,
48 (3), 271-276.
43. Hambly, D.; Gross, M., Laser flash photochemical oxidation to locate heme binding and
conformational changes in myoglobin. Int. J. Mass Spectrom. 2007, 259 (1-3), 124-129.
44. Xu, G.; Liu, R.; Zak, O.; Aisen, P.; Chance, M. R., Structural Allostery and Binding of the
Transferrinmiddle dotReceptor Complex. Mol Cell Proteomics 2005, 4 (12), 1959-1967.
45. Guan, J. Q.; Vorobiev, S.; Almo, S. C.; Chance, M. R., Mapping the G-Actin Binding
Surface of Cofilin Using Synchrotron Protein Footprinting. Biochemistry 2002, 41 (18), 5765-
5775.
183
7 ββββ-amyloid 1-42 Binds to the Same Region in the N-terminus Domains of Apolipoprotein E3 and Apolipoprotein E4, Determined by FPOP Footprinting and Mass Spectrometric Analysis 7.1 Introduction
Alzheimer’s disease (AD) is a form of dementia, effecting more than 35 million
people worldwide1. The consensus of research is that AD is caused by the accumulation
of misfolded proteins in the brain. Certain β-amyloid (Aβ) peptides are particularly
susceptible to such misfolding. Aβ peptides are 36 to 43 amino acids long and originate
from the sequential proteolysis of amyloid precursor protein, a transmembrane protein of
unknown function, by β and γ secretases2. Among these, Aβ1-40 (Aβ40) and Aβ1-42
(Aβ42) are the most abundant components in the insoluble fibrils comprising a central
characteristic feature of advanced AD, the senile plaques found in the extracellular space
of gray matter3. The “amyloid hypothesis” for AD development is that the dynamic
equilibrium of soluble Aβ40 and Aβ42 is crucial—factors that increase Aβ peptide
production or inhibit its clearance allow for their accumulation, which initiates AD and
the formation of fibrillar deposits4. This thinking stems in part from the observation that
the soluble forms of Aβ peptide, especially Aβ42, are known to be neurotoxic5.
The highest genetic risk for AD is for homozygous carriers of the apolipoprotein
E ε4 allele, who are twelve times more likely to develop late onset AD than people with
two copies of the other common isoforms of apolipoprotein E (ApoE) 6-7. ApoE is a 34
kDa protein, whose function is to regulate lipid metabolism and control lipid
184
redistribution in tissue and cells, especially in the brain 8. The three most common
isoforms differ at two residues; apolipoprotein E2 (ApoE2) has cysteines at positions 112
and 158; apolipoprotein E3 (ApoE3) has a cysteine at position 112 and an arginine at
158, and apolipoprotein E4 (ApoE4) has arginines at these positions. The protein has two
distinct domains connected by a thrombin proteolysis-sensitive region9. The N-terminal
(Nt) 1-191 residue domain contains the LDL receptor-binding site, and substantial
fragments of the Nt domain have been characterized by X-ray crystallography and
solution NMR spectroscopy as having an elongated four-helix bundle structure10-11. The
C-terminal (Ct) 216-299 residue domain has not been characterized by high resolution
methods because of its propensity to oligomerize12. This property is shared by all of the
common isoforms of ApoE, and no high resolution structures have been reported.
There are several hypotheses that explain the association of ApoE4 with AD13,
but there is no clear consensus for a single cause. In the early study that reported this
association, it was discovered that ApoE binds to Aβ in cerebrospinal fluid6. Since then
the hypothesis that ApoE is directly involved in the deposition or clearance of Aβ is
gaining widespread recognition14. Vital to understanding this mechanism is the
characterization of the ApoE-Aβ interaction. Many studies have undertaken this goal,
examining the interaction of lipoprotein and lipid-free forms of the common isoforms of
ApoE and their fragment domains with soluble and insoluble preparations of Aβ40 and
Aβ42 and Aβ analogs14. Here we focus on delipidated ApoE interactions. Several early
studies showed that lipid-free ApoE binding with soluble Aβ influences fibrillogenesis15-
17. The association of lipid-free ApoE with soluble Aβ40 can be tight, with a KD of 10-
185
20 nM, but this depends on the conformation of Aβ18-19. Based on Nt and Ct domain
fragment studies, there are at least two sites of interaction on ApoE segregated among
these domains20-23. None of these studies provide a high resolution characterization of
the sites because of the oligomeric properties of both biomolecules.
Mass spectrometry (MS)-based chemical footprinting of proteins is a method for
providing peptide and residue-resolved structural information, in the primary sequence
dimension24-25. A general strategy is to use this information to provide insight about the
difference between structures of a protein or protein complex in two or more states, rather
than resolve their structures in three dimensions. Labeling that well samples solvent
accessible residues will be attenuated at protein-ligand or protein-protein interfaces in the
complex compared to the apo state. If the labeling is stable, a proteomics-like “bottom-
up” mass spectrometry methodology can be employed, in which modified proteolytic
peptides from both states are quantified by LC-MS and identified by their MS2 CID
fragment spectra.
An important chemical footprinting method is hydroxyl radical-mediated
modification of solvent accessible sidechains; a comprehensive review detailing several
methodologies for •OH generation, expected product chemistry, and mass spectrometric
analysis has recently been published26. The advantages of •OH-based footprinting are
that (1) residue solvent accessibility surface areas (SASAs) are well sampled, because the
size of •OH is comparable to water; (2) the •OH-mediated modifications are stable and
thus amenable to proteolytic peptide-based LC-MS/MS analysis; and (3) •OH samples
residue sidechains non-specifically, detectably reacting with over half of the common
186
amino acids in properly controlled experiments27. We use the method of fast
photochemical oxidation of proteins (FPOP), developed by Hambly and Gross28, to
provide the source of •OH. This method employs a KrF excimer laser as a pulsed 248
nm source; each 17 ns flash homolytically cleaves H2O2, added to the sample at a low
millimolar level. In the flow cell the resultant •OH reacts with protein sidechains on a
microsecond timescale as added glutamine competitively scavenges radical. This ensures
that only equilibrium conformations are sampled by •OH; any modification-induced
changes to conformation evolve on a slower timescale29.
By FPOP labeling and LC-MS/MS we are able to characterize the sites of
interaction of Aβ42 with lipid-free ApoE3 and ApoE4. We have examined this
interaction at the 4 µM protein level, at which concentration these isoforms are primarily
tetramers30, and at 100 nM for ApoE3 to probe its putative monomeric interaction with
Aβ42. We also report the FPOP-characterized interaction of Aβ40 with ApoE-orangutan
because of the concordance of results with the human isoforms.
7.2 Experimental Procedures
7.2.1 Reagents.
Acetonitrile, formic acid, 30% hydrogen peroxide, L-glutamine, L-methionine,
tris(2-carboxyethyl)phosphine hydrochloride (TCEP), sodium hydroxide, hydrochloric
acid, catalase, sequencing grade trypsin, and phosphate buffered saline (PBS) were
purchased from Sigma Aldrich Chemical Co. (St. Louis, MO). Purified water (18 MΩ)
was obtained from a Milli-Q Synthesis system (Millipore, Billerica, MA). ApoE3,
ApoE4, and Aβ42, each expressed in E. coli, were kindly provided by Drs. K. Garai and
187
C. Frieden. Aβ40 was purchased from American Peptide Company (Sunnyvale, Ca).
ApoE-orangutan was purchased from BioVision (Mountain View, CA).
7.2.2 Stock solution preparations.
Purified ApoE3 and ApoE4, provided as solutions in ammonium bicarbonate,
were dialyzed overnight into PBS. To prevent adventitious disulfide bond formation in
ApoE3, TCEP was added to 200 µM; ApoE4 also received TCEP to maintain
background composition equality with ApoE3 samples. The purity of dialyzed proteins
was confirmed by ESI MS on a Maxis QTOF spectrometer (Bruker Daltonics, Billerica,
MA); disulfide-linked ApoE3 dimer was not observed (data not shown). ApoE3 and E4
solutions were split among aliquots, then frozen with N2(l) and stored at -80 °C. ApoE-
orangutan was solubilized in PBS and apportioned and stored by the same protocol. For
all ApoE isoforms, stock concentrations were determined by their UV absorbance, with
ε280 = 44,950 M-1 cm-1. Lyophilized Aβ40 was solubilized at 1 mg/mL in 10 mM NaOH
and apportioned and stored by the same protocol. The stock Aβ42 solution was prepared
from lyophilized material by solubilizing in 10 mM NaOH to 150 µM concentration; half
the volume was apportioned to 16.7 µL aliquots for the nanomolar experiments. The
remainder volume and aliquots were N2(l) frozen and stored at -80 °C prior to use.
Stock glutamine, methionine, catalase, and hydrogen peroxide solutions were prepared in
PBS on the same days as labeling. Eppendorf Protein LoBind micro tubes (Eppendorf
North America, Hauppauge, NY) were used for all protein stock and sample solutions,
except for de-salting collection that used standard polypropylene microcentrifuge tubes.
188
7.2.3 Micromolar ApoE3 and ApoE4 experiments.
Equilibration stock solutions were prepared for ApoE3 and ApoE4 to the final
concentrations of 4.0 µM protein, 22.2 mM glutamine, and for “Aβ42-present”
equilibration solutions, 20 µM Aβ42. For “Aβ42-free” samples, a volume of 10 mM
NaOH was added equal to the Aβ42 addition in the counterpart equilibration solutions.
A volume of 100 mM HCl equal to 10% of this addition volume was added to all
equilibration solutions to maintain the PBS-buffered pH of 7.4. The equilibration
solutions were stored 2 hr at 22 °C with no stirring, prior to the first replicate draws for
FPOP labeling. Due to the time needed to complete FPOP labeling of each set of
replicates, the ApoE4 equilibration solution was prepared 1 hr after the ApoE3 solution.
7.2.4 Micromolar ApoE-orangutan experiment.
Three equilibration stock solutions were prepared. For each, the final
concentrations of ApoE-orangutan and glutamine was 2.22 µM and 22.2 mM,
respectively. The “1:4”, “1:1”, and “1:0” solutions’ Aβ40 concentrations were 8.89,
2.22, and 0 µM, respectively. 10 mM NaOH was added to the 1:1 and 1:0 solutions to
maintain equivalence with the 1:4 solution, and all solutions were spiked with a 1%
volume of 100 mM HCl to return the pH to 7.4. These solutions were stored 4.5 hr at 22
°C with no stirring, prior to the first replicate draws for FPOP labeling.
7.2.5 NanomolarApoE3 experiments.
The replicate 100 nM samples were each prepared to final concentrations of 111
nM ApoE3, 22.2 mM glutamine, and for “Aβ42-present” samples, 5.6 µM Aβ42.
189
Equilibration stock solutions were not used because 25 min elapsed between each
replicate’s labeling. During this time the structural state of the system may change due to
evolving protein-protein, protein-peptide, peptide-peptide, and biomolecule-plastic
surface interactions.
Each replicate sample was processed as follows. (1) At the time of 150 µM Aβ42
stock solution preparation, 428 µL of 23.3 mM glutamine in PBS was added to 16.67 µL
aliquots of either Aβ42 in 10 mM NaOH, or 10 mM NaOH for “Aβ42-free” samples.
These aliquots were N2(l) frozen and stored at -80 °C. (2) An aliquot was thawed 12 min
and vortex-mixed. (3) Five µL of 10 µM ApoE3 was added to the sample with vortex-
mixing. (4) The sample was stored 2 hr 5 min at 22 °C, with no stirring. (5) Hydrogen
peroxide was added to the sample, and the entire volume was infused through the FPOP
apparatus. The standard FPOP protocol is described below. The collection tube was the
upper compartment of a 10000 MWCO Vivaspin 500 sample concentrator (GE
Healthcare, Waukesha, WI), and contained 0.2 µg catalase in 36 µL 150 mM methionine.
(6) The labeled sample was centrifuged at 13,500 x g for 5 min. The retentate, typically
10-20 µL, was transferred to a LoBind tube and left open for 25 min at 22 °C. (7) The
labeled sample was N2(l) frozen and stored at -80 °C prior to proteolysis.
7.2.6 FPOP labeling.
Just prior to FPOP, H2O2 was added to each replicate by 10-fold dilution from a
concentrated solution, to give a final concentration of 20 mM. Replicate draws from the
equilibrium stock solutions were 40 µL for the ApoE3 and ApoE4 µM experiments and
190
90 µL for the ApoE-orangutan µM experiment. The FPOP apparatus was essentially the
same as originally described 28, using 150 µm ID fused silica. The KrF excimer laser
(GAM Laser Inc., Orlando, FL) was focused to give a 2.54 mm irradiation window on the
silica. The laser power, laser pulse frequency, and syringe pump flow rate were adjusted
to the following values. For ApoE3 and ApoE4 µM experiments, these were 47.6
mJ/pulse, 5 Hz, and 17.95 µL/min. For the ApoE-orangutan µM experiment, these were
45.0 mJ/pulse, 5.5 Hz, and 18.52 µL/min. For the ApoE3 nM experiment, these were
47.0 mJ/pulse, 10 Hz, and 35.9 µL/min. These flow rate and pulse frequency settings
ensured at least a 20% exclusion volume to avoid repeat •OH exposure29. For µM
experiments, each replicate was collected in a microcentrifuge tube containing 0.2 µg of
catalase in 10 µL of methionine solution, to give a final concentration of 10 mM Met in
the total collected sample volume. The addition of Met was to mitigate post-FPOP
oxidation of protein 31. For µM experiments, catalase was allowed to oxidize H2O2 to
O2(g) for 10 min at room temperature with pipette mixing; O2(g) was removed by three
centrifugation steps during the incubation. After 10 min, samples were N2(l) frozen by
and stored at -80 °C prior to proteolysis. For all experiments, control samples were
handled in the same manner as those submitted to FPOP, but they were not laser
irradiated. All experiments generated three replicates for each FPOP state and each
control state, with the replicates’ origin preceding the FPOP step.
191
7.2.7 Proteolysis.
Micromolar experiment samples were proteolyzed with 8:1 protein:trypsin (by
weight) at 37 °C for 7 hr. Trypsin activity was quenched with 10% formic acid addition,
and the samples were SpeedVac-concentrated 30-60 min to 30 µL. Samples were de-
salted by ZiptipC18 (Millipore, Billerica, MA), with elution into 10 µL of 50%
acetonitrile/1% formic acid solution. A portion of each was diluted 33-fold with water
and 0.1% formic acid for autosampler loading in its LC-MS/MS analysis. Nanomolar
experiment samples were proteolyzed with 0.1 µg trypsin at 37 °C for 9 hr before
quenching with formic acid. They were ZiptipC18 de-salted without prior SpeedVac-
concentration, eluted directly into autosampler vials containing 2 µL of the elution
solution, and diluted with 50 µL of water.
7.2.8 LC-MS/MS acquisition.
Each replicate was loaded by autosampler onto a 20 cm column with a PicoFrit tip
(New Objective, Inc, Woburn, MA), bomb-packed with C18 reverse phase material
(Magic, 0.075 mm × 200 mm, 5 µm, 300 Å, Michrom, Auburn, CA). For µM samples
the load volume was 5 µL; for nM samples it was 7 µL. Peptides were eluted by an 80
min, 260 nL/min gradient coupled to the nanospray source of an LTQ-Orbitrap mass
spectrometer (Thermo Fisher, Waltham, MA). Mass spectra were obtained at high mass
resolving power (100,000 for ions of m/z 400) on the Orbitrap component, and the six
most abundant ions eluting per scan were each subjected to CID MS2 experiment in the
LTQ component, using a collision energy 35% of the maximum, a 2 Da isolation width,
192
and wideband activation. Precursor ions were added to a dynamic exclusion list for 8 s to
ensure good sampling of the apex of their elution peaks. Blanks were run between every
sample acquisition.
7.2.9 Data Analysis.
Rosetta Elucidator (Microsoft, Bellevue, WA) peak detection and alignment
software was used to generate an aligned LC-MS feature tables for each sample
acquisition. Briefly, a feature represents the naturally occurring isotopic ensemble of one
molecule eluting in time. A feature’s ion signal is split among its isotopes and sometimes
among several charge states depending on its basicity and the ionization conditions at the
MS source. A feature’s quantitation is determined by summing the areas of all such co-
eluting LC-MS extracted ion chromatogram (EIC) peaks that share the same
monoisotopic mass within a high resolution tolerance (5 ppm).
All sample replicates from the same experiment were subjected to a single
alignment analysis so that their shared features nearly co-eluting in time would have the
same unique ID and aligned elution time in the tables. The alignment program also
associated the all MS2 spectra with their LC-MS features using the same unique ID
nomenclature. Independent from the Elucidator analysis, the MS2 spectra were searched
against a restricted database containing the ApoE isoforms, Aβ peptides, catalase, and
other proteins using Mascot error-tolerant searching. Common OH modification
products26 were included in the variable modification list used by Mascot. A custom
Excel-based VBA program paired the Mascot calls with their LC-MS quantified features
using the unique ID handles. This program augmented these LC-MS Mascot annotations
193
with putative matches to a theoretical FPOP-modified tryptic peptide list of the ApoE
isoforms. These putative matches, and over half of the Mascot calls, were validated,
corrected, or rejected by manual inspection of their associated MS2 spectra before their
use in per-peptide and per-residue yield analysis.
Per-residue yields were calculated according to equation 1.
*'eO0+'; mO'10 ∑ Y; ;XYX;Y; ;; cY Z;H ∑ Y; ;XYX;Y; ;Y c 6° XW c XZcYZ Y; (1)
Here peptide is synonymous with feature and i is not the index of summation. The
denominator includes modified and unmodified peptides alike. The denominator
excludes signal from missed-cleavage peptides spanning residuei if such peptides are not
also detected as modified there, because in this case the lack of modification detection is
an analytic failure and does not stem from a true absence of labeling. Per-peptide yields
were determined more simply according to equation 2.
')O0'; mO'10 ∑ ; Y;H ;XYX;Y; X;; Y;H ;XYX;YL∑ ; Y;H ;XYX;Y; (2)
7.2.10 Utility of per-peptide and per-residue analyses.
The peptide-level survey is warranted because it is the most inclusive of LC-MS
feature data, and is easily interpreted. The per-peptide analysis uses modified peptide
features whose peptide identity is certain but whose modification residue(s) cannot be
determined by the associated MS2 spectrum or spectra. Such indeterminateness is
possible when an MS2 spectrum is sparse, the modification is in a peptide region
insensitive to CID fragmentation, or multiple modifications are present on the peptide.
The per-peptide analysis also uses LC-MS features that are clearly comprised of modified
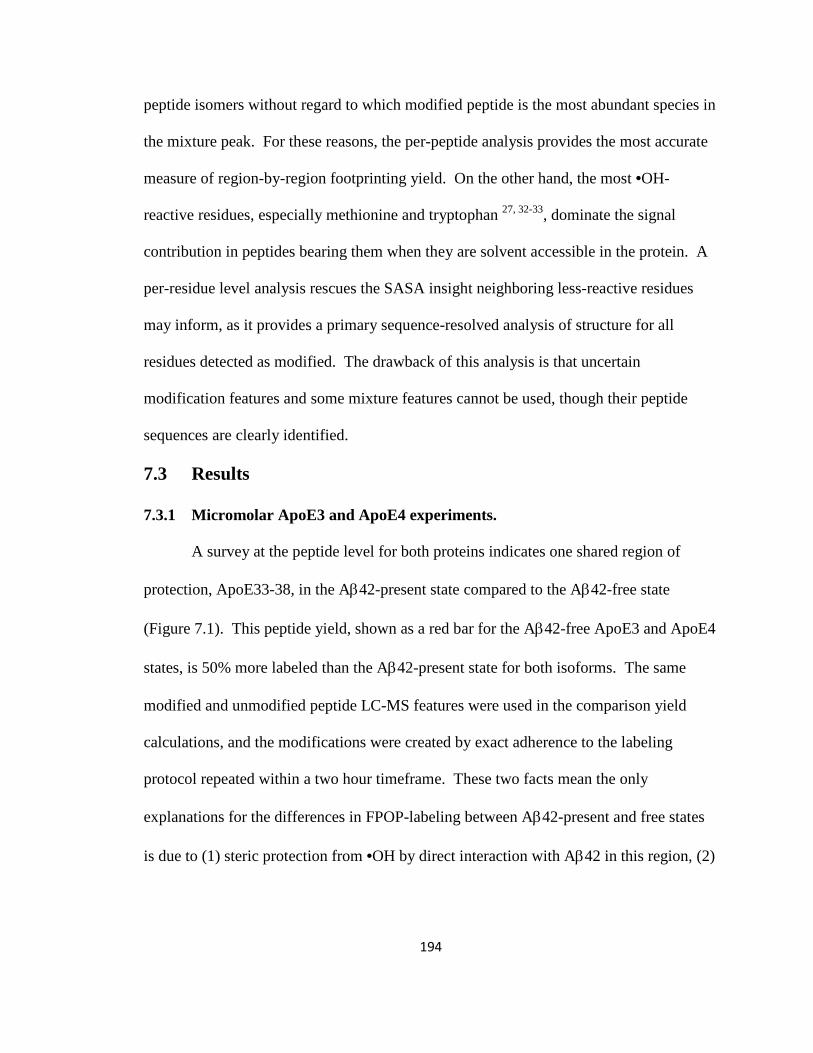
194
peptide isomers without regard to which modified peptide is the most abundant species in
the mixture peak. For these reasons, the per-peptide analysis provides the most accurate
measure of region-by-region footprinting yield. On the other hand, the most •OH-
reactive residues, especially methionine and tryptophan 27, 32-33, dominate the signal
contribution in peptides bearing them when they are solvent accessible in the protein. A
per-residue level analysis rescues the SASA insight neighboring less-reactive residues
may inform, as it provides a primary sequence-resolved analysis of structure for all
residues detected as modified. The drawback of this analysis is that uncertain
modification features and some mixture features cannot be used, though their peptide
sequences are clearly identified.
7.3 Results
7.3.1 Micromolar ApoE3 and ApoE4 experiments.
A survey at the peptide level for both proteins indicates one shared region of
protection, ApoE33-38, in the Aβ42-present state compared to the Aβ42-free state
(Figure 7.1). This peptide yield, shown as a red bar for the Aβ42-free ApoE3 and ApoE4
states, is 50% more labeled than the Aβ42-present state for both isoforms. The same
modified and unmodified peptide LC-MS features were used in the comparison yield
calculations, and the modifications were created by exact adherence to the labeling
protocol repeated within a two hour timeframe. These two facts mean the only
explanations for the differences in FPOP-labeling between Aβ42-present and free states
is due to (1) steric protection from •OH by direct interaction with Aβ42 in this region, (2)
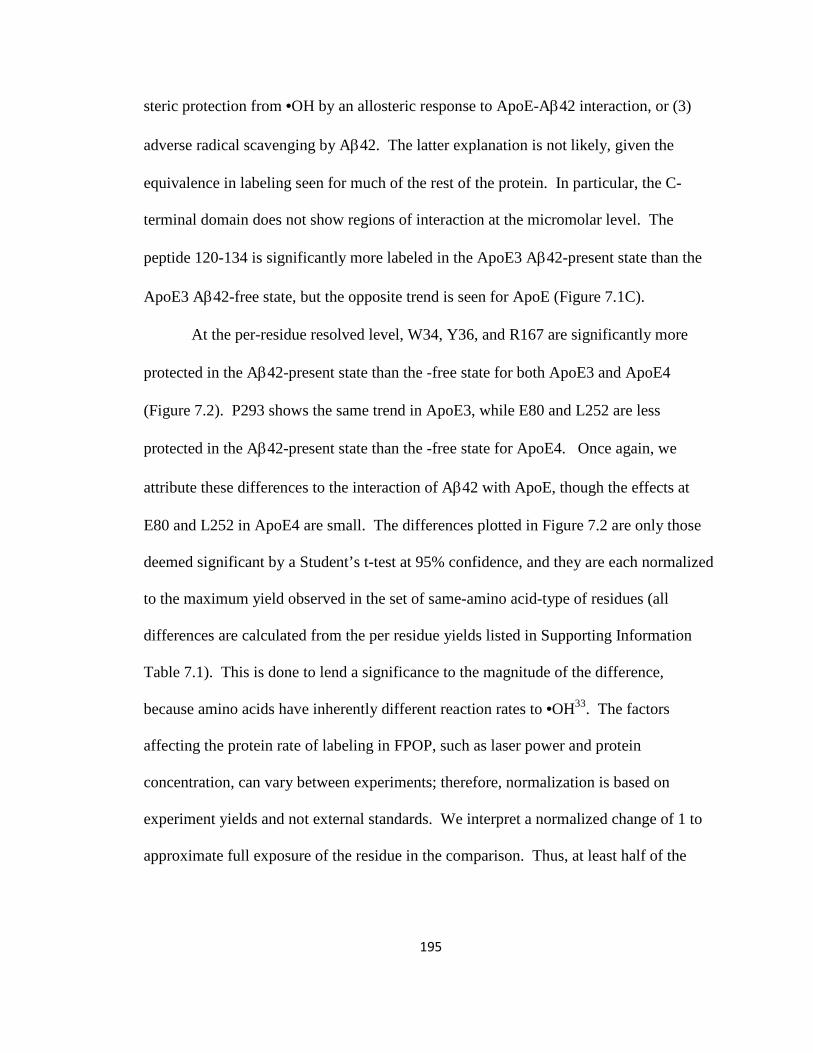
195
steric protection from •OH by an allosteric response to ApoE-Aβ42 interaction, or (3)
adverse radical scavenging by Aβ42. The latter explanation is not likely, given the
equivalence in labeling seen for much of the rest of the protein. In particular, the C-
terminal domain does not show regions of interaction at the micromolar level. The
peptide 120-134 is significantly more labeled in the ApoE3 Aβ42-present state than the
ApoE3 Aβ42-free state, but the opposite trend is seen for ApoE (Figure 7.1C).
At the per-residue resolved level, W34, Y36, and R167 are significantly more
protected in the Aβ42-present state than the -free state for both ApoE3 and ApoE4
(Figure 7.2). P293 shows the same trend in ApoE3, while E80 and L252 are less
protected in the Aβ42-present state than the -free state for ApoE4. Once again, we
attribute these differences to the interaction of Aβ42 with ApoE, though the effects at
E80 and L252 in ApoE4 are small. The differences plotted in Figure 7.2 are only those
deemed significant by a Student’s t-test at 95% confidence, and they are each normalized
to the maximum yield observed in the set of same-amino acid-type of residues (all
differences are calculated from the per residue yields listed in Supporting Information
Table 7.1). This is done to lend a significance to the magnitude of the difference,
because amino acids have inherently different reaction rates to •OH33. The factors
affecting the protein rate of labeling in FPOP, such as laser power and protein
concentration, can vary between experiments; therefore, normalization is based on
experiment yields and not external standards. We interpret a normalized change of 1 to
approximate full exposure of the residue in the comparison. Thus, at least half of the
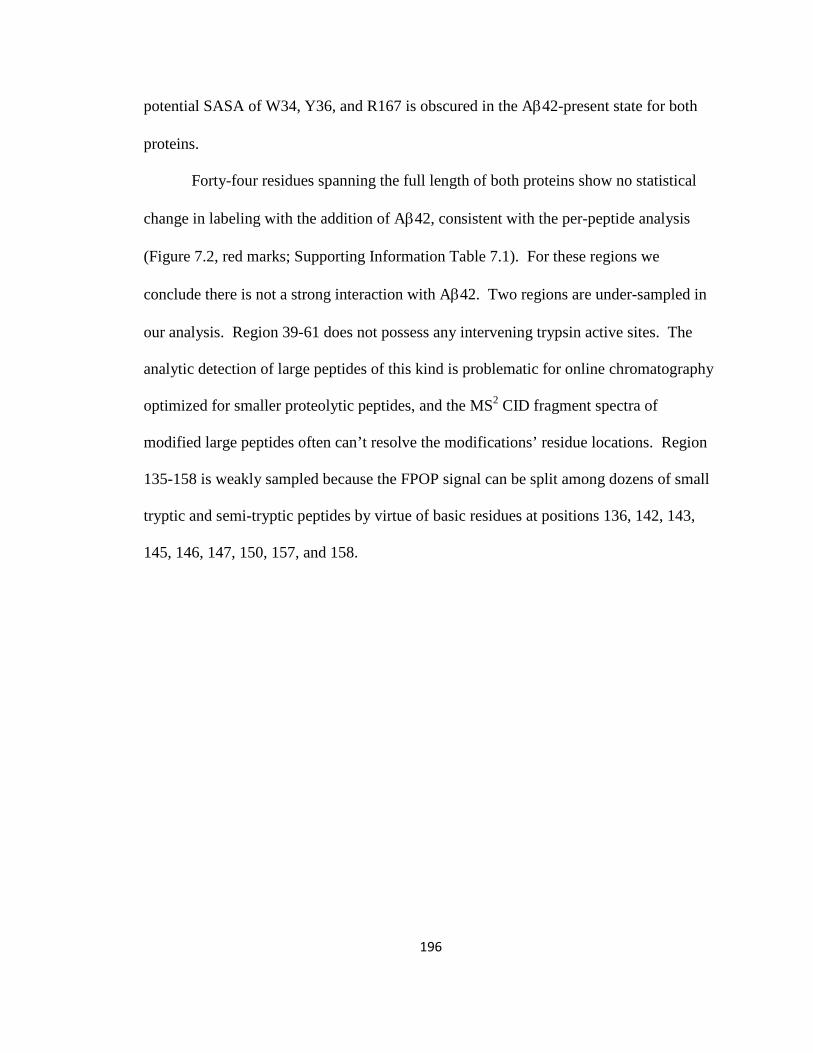
196
potential SASA of W34, Y36, and R167 is obscured in the Aβ42-present state for both
proteins.
Forty-four residues spanning the full length of both proteins show no statistical
change in labeling with the addition of Aβ42, consistent with the per-peptide analysis
(Figure 7.2, red marks; Supporting Information Table 7.1). For these regions we
conclude there is not a strong interaction with Aβ42. Two regions are under-sampled in
our analysis. Region 39-61 does not possess any intervening trypsin active sites. The
analytic detection of large peptides of this kind is problematic for online chromatography
optimized for smaller proteolytic peptides, and the MS2 CID fragment spectra of
modified large peptides often can’t resolve the modifications’ residue locations. Region
135-158 is weakly sampled because the FPOP signal can be split among dozens of small
tryptic and semi-tryptic peptides by virtue of basic residues at positions 136, 142, 143,
145, 146, 147, 150, 157, and 158.
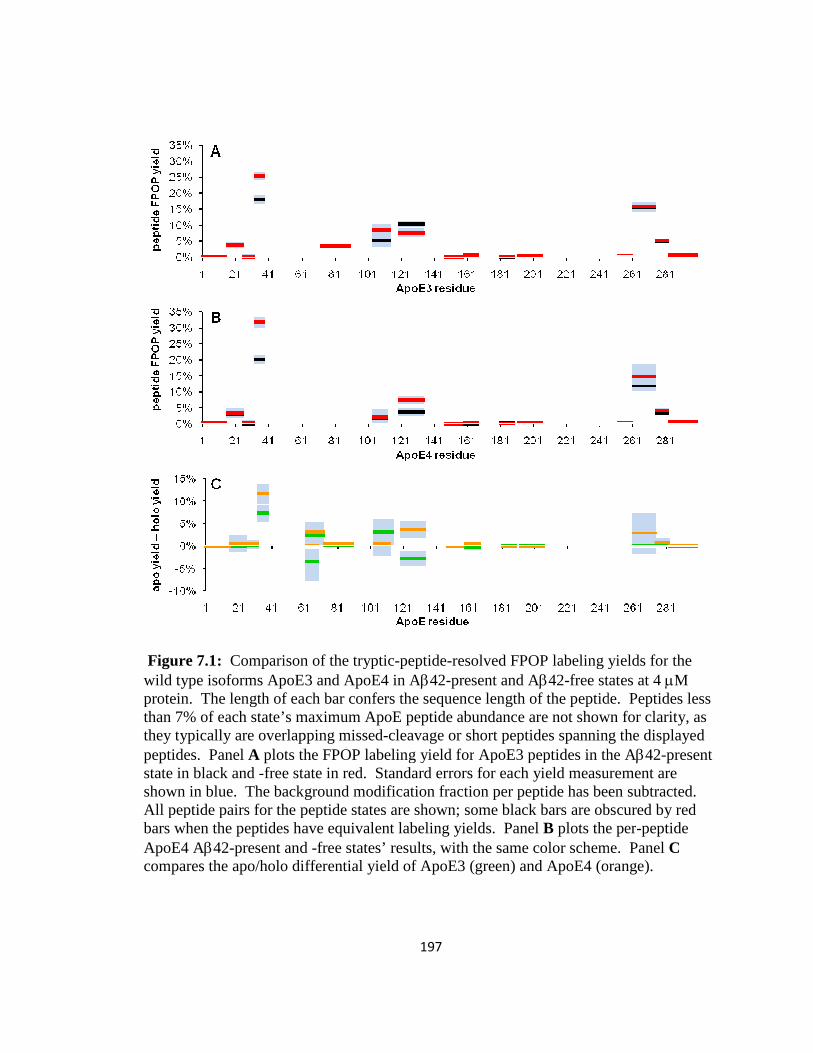
Figure 7.1: Comparison of the trypticwild type isoforms ApoE3 and ApoE4 in Aprotein. The length of each bar confers the sequence length of the peptide. Peptides less than 7% of each state’s maximum ApoE peptide abundance are not shown for clarity, as they typically are overlapping missedpeptides. Panel A plots the FPOP labeling yield forstate in black and -free state in red. Standard errors for each yield measurement are shown in blue. The background modification fractAll peptide pairs for the peptide states are shown; some black bars are obscured by red bars when the peptides have equivalent labeling yields. Panel ApoE4 Aβ42-present and compares the apo/holo differential yield of ApoE3 (green) and ApoE4 (orange).
197
Comparison of the tryptic-peptide-resolved FPOP labeling yields forApoE3 and ApoE4 in Aβ42-present and Aβ42-free states at 4
protein. The length of each bar confers the sequence length of the peptide. Peptides less than 7% of each state’s maximum ApoE peptide abundance are not shown for clarity, as they typically are overlapping missed-cleavage or short peptides spanning the displayed
ots the FPOP labeling yield for ApoE3 peptides in the Afree state in red. Standard errors for each yield measurement are
shown in blue. The background modification fraction per peptide has been subtracted. All peptide pairs for the peptide states are shown; some black bars are obscured by red bars when the peptides have equivalent labeling yields. Panel B plots the per
esent and -free states’ results, with the same color scheme. Panel compares the apo/holo differential yield of ApoE3 (green) and ApoE4 (orange).
resolved FPOP labeling yields for the free states at 4 µM
protein. The length of each bar confers the sequence length of the peptide. Peptides less than 7% of each state’s maximum ApoE peptide abundance are not shown for clarity, as
peptides spanning the displayed ApoE3 peptides in the Aβ42-present
free state in red. Standard errors for each yield measurement are ion per peptide has been subtracted.
All peptide pairs for the peptide states are shown; some black bars are obscured by red plots the per-peptide
s, with the same color scheme. Panel C compares the apo/holo differential yield of ApoE3 (green) and ApoE4 (orange).
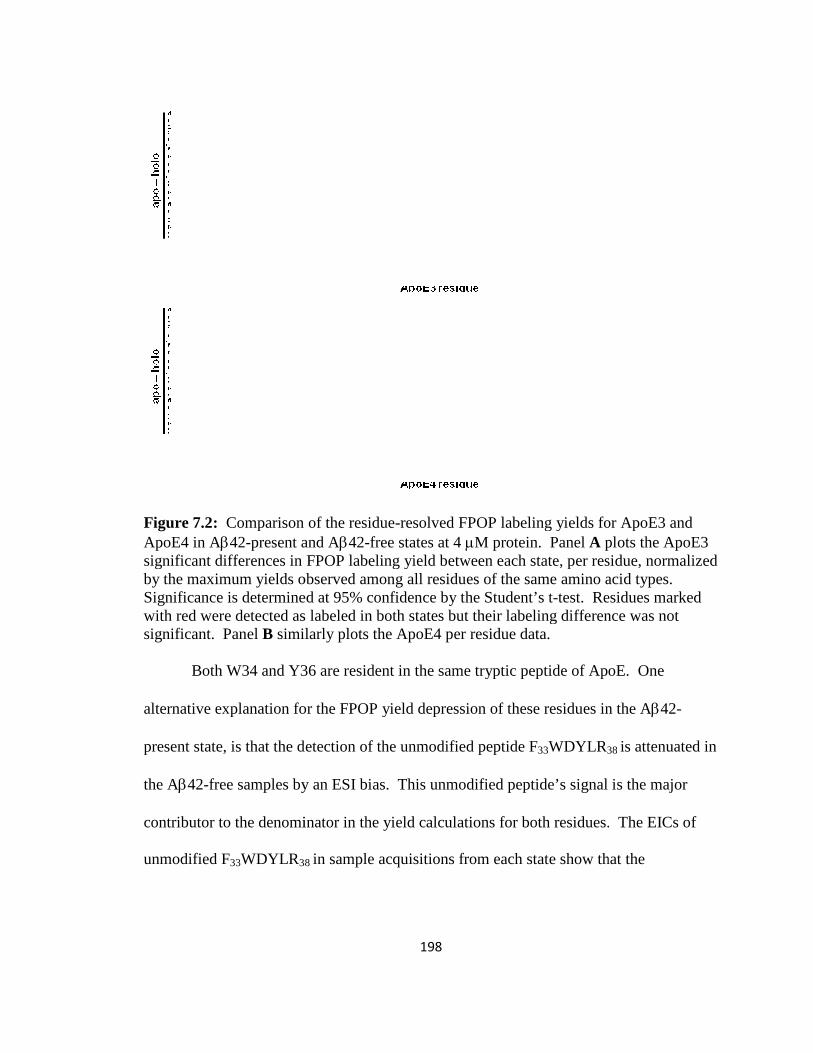
Figure 7.2: Comparison of the residueApoE4 in Aβ42-present and Asignificant differences in FPOP labeling yield between each state, per residue, normalized by the maximum yields observed among all residues of the same amino acid types. Significance is determined at 95% confidence by with red were detected as labeled in both states but their labeling difference was not significant. Panel B similarly plots the ApoE4 per residue data. Both W34 and Y36 are resident in the same tryptic peptide of
alternative explanation for the FPOP yield depression of these residues in the A
present state, is that the detection of the unmodified peptide
the Aβ42-free samples by an ESI bias. This unmodified peptide’s signa
contributor to the denominator in the yield calculations for both residues. The EICs of
unmodified F33WDYLR38
198
Comparison of the residue-resolved FPOP labeling yields for ApoE3 and present and Aβ42-free states at 4 µM protein. Panel A plots the ApoE3
significant differences in FPOP labeling yield between each state, per residue, normalized by the maximum yields observed among all residues of the same amino acid types. Significance is determined at 95% confidence by the Student’s t-test. Residues marked with red were detected as labeled in both states but their labeling difference was not
similarly plots the ApoE4 per residue data.
Both W34 and Y36 are resident in the same tryptic peptide of ApoE. One
alternative explanation for the FPOP yield depression of these residues in the A
present state, is that the detection of the unmodified peptide F33WDYLR38
free samples by an ESI bias. This unmodified peptide’s signal is the major
contributor to the denominator in the yield calculations for both residues. The EICs of
38 in sample acquisitions from each state show that the
resolved FPOP labeling yields for ApoE3 and plots the ApoE3
significant differences in FPOP labeling yield between each state, per residue, normalized by the maximum yields observed among all residues of the same amino acid types.
test. Residues marked with red were detected as labeled in both states but their labeling difference was not
ApoE. One
alternative explanation for the FPOP yield depression of these residues in the Aβ42-
38 is attenuated in
l is the major
contributor to the denominator in the yield calculations for both residues. The EICs of
in sample acquisitions from each state show that the
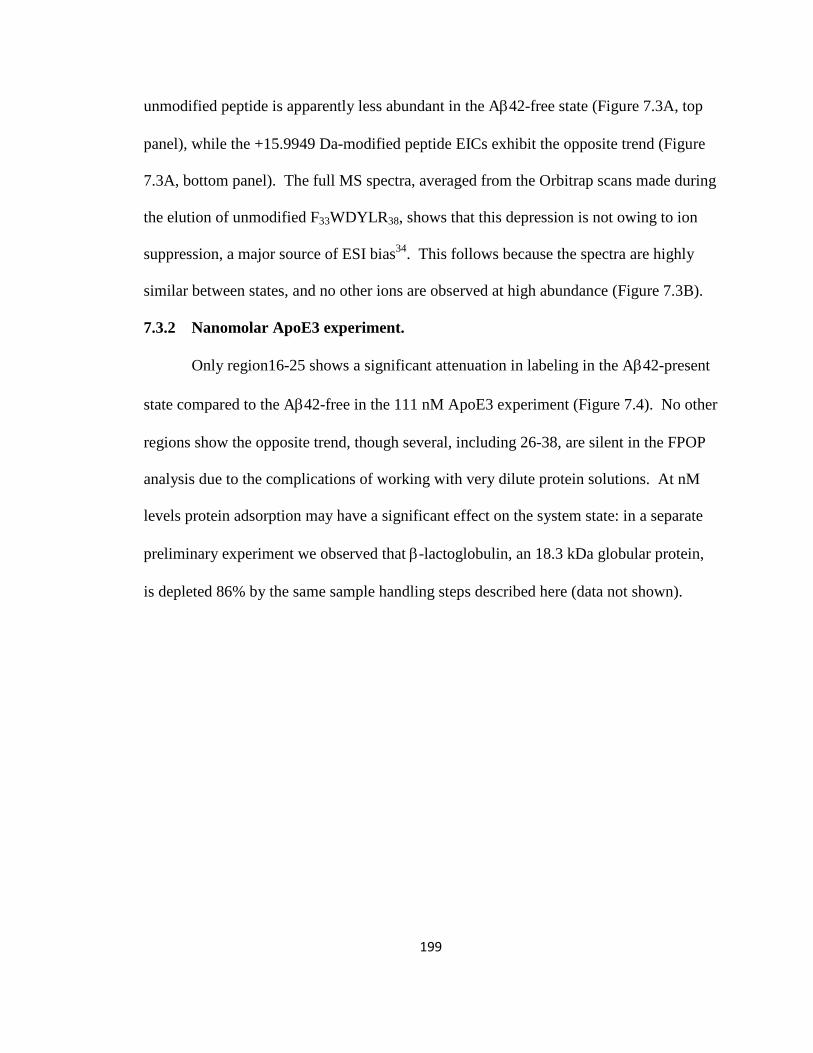
199
unmodified peptide is apparently less abundant in the Aβ42-free state (Figure 7.3A, top
panel), while the +15.9949 Da-modified peptide EICs exhibit the opposite trend (Figure
7.3A, bottom panel). The full MS spectra, averaged from the Orbitrap scans made during
the elution of unmodified F33WDYLR38, shows that this depression is not owing to ion
suppression, a major source of ESI bias34. This follows because the spectra are highly
similar between states, and no other ions are observed at high abundance (Figure 7.3B).
7.3.2 Nanomolar ApoE3 experiment.
Only region16-25 shows a significant attenuation in labeling in the Aβ42-present
state compared to the Aβ42-free in the 111 nM ApoE3 experiment (Figure 7.4). No other
regions show the opposite trend, though several, including 26-38, are silent in the FPOP
analysis due to the complications of working with very dilute protein solutions. At nM
levels protein adsorption may have a significant effect on the system state: in a separate
preliminary experiment we observed that β-lactoglobulin, an 18.3 kDa globular protein,
is depleted 86% by the same sample handling steps described here (data not shown).
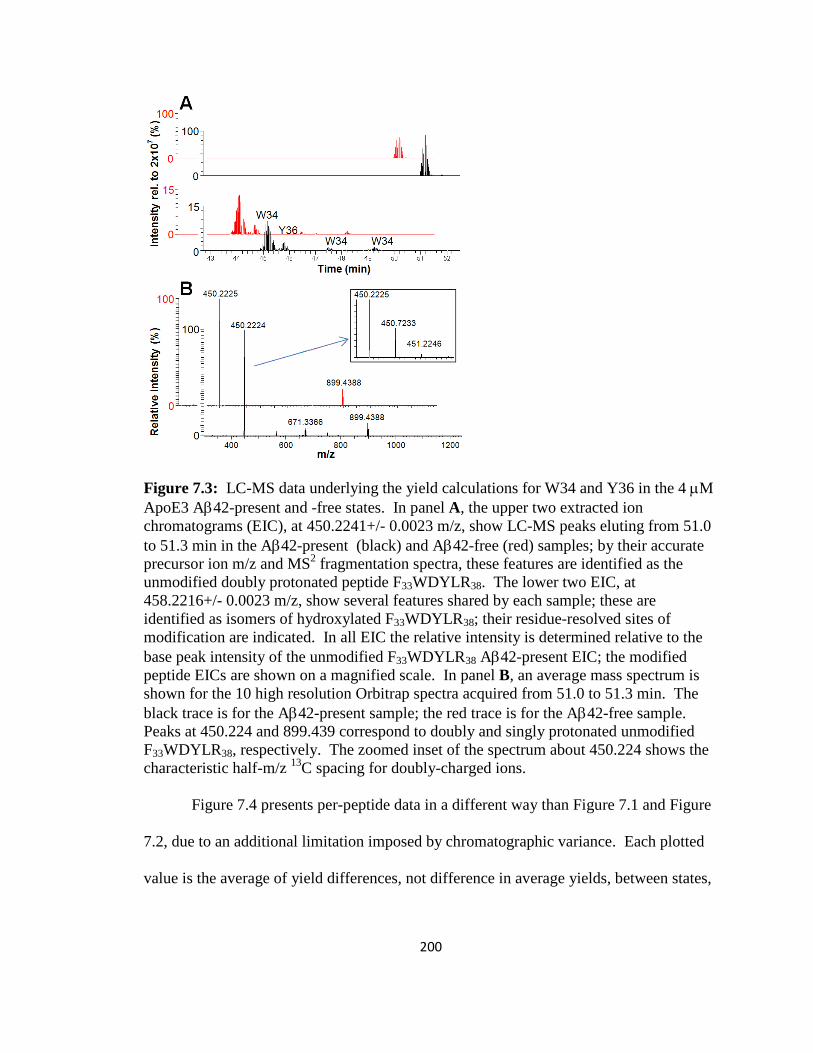
200
Figure 7.3: LC-MS data underlying the yield calculations for W34 and Y36 in the 4 µM ApoE3 Aβ42-present and -free states. In panel A, the upper two extracted ion chromatograms (EIC), at 450.2241+/- 0.0023 m/z, show LC-MS peaks eluting from 51.0 to 51.3 min in the Aβ42-present (black) and Aβ42-free (red) samples; by their accurate precursor ion m/z and MS2 fragmentation spectra, these features are identified as the unmodified doubly protonated peptide F33WDYLR38. The lower two EIC, at 458.2216+/- 0.0023 m/z, show several features shared by each sample; these are identified as isomers of hydroxylated F33WDYLR38; their residue-resolved sites of modification are indicated. In all EIC the relative intensity is determined relative to the base peak intensity of the unmodified F33WDYLR38 Aβ42-present EIC; the modified peptide EICs are shown on a magnified scale. In panel B, an average mass spectrum is shown for the 10 high resolution Orbitrap spectra acquired from 51.0 to 51.3 min. The black trace is for the Aβ42-present sample; the red trace is for the Aβ42-free sample. Peaks at 450.224 and 899.439 correspond to doubly and singly protonated unmodified F33WDYLR38, respectively. The zoomed inset of the spectrum about 450.224 shows the characteristic half-m/z 13C spacing for doubly-charged ions. Figure 7.4 presents per-peptide data in a different way than Figure 7.1 and Figure
7.2, due to an additional limitation imposed by chromatographic variance. Each plotted
value is the average of yield differences, not difference in average yields, between states,
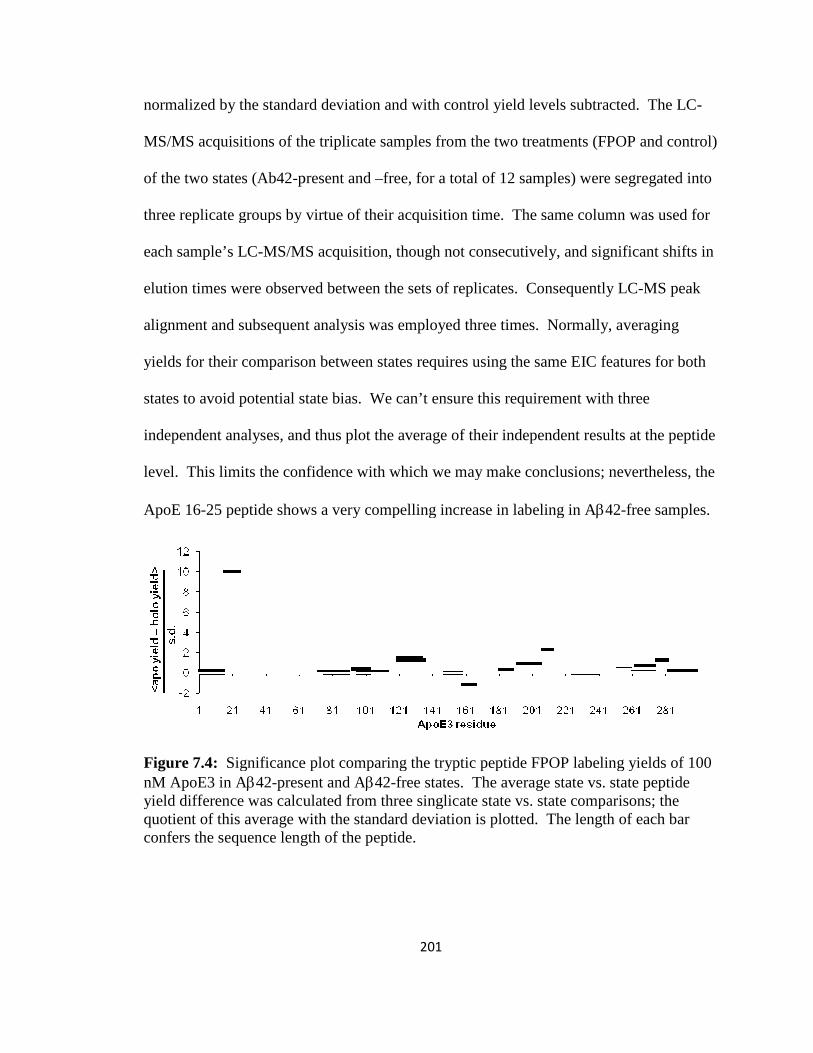
normalized by the standard deviation and with control yield levels subtracted. The LC
MS/MS acquisitions of the triplicate samples from the two treatments (FPOP and control)
of the two states (Ab42-present and
three replicate groups by virtue of their acquisition time. The same column was used for
each sample’s LC-MS/MS acquisition, though not consecutively, and significant shifts in
elution times were observed between the sets of replicates. Consequently LC
alignment and subsequent analysis was employed three times. Normally, averaging
yields for their comparison between states requires using the same EIC features for both
states to avoid potential state bias. We can’t ensure this requirement with three
independent analyses, and thus plot the average of their independent results at the peptide
level. This limits the confidence with which we may make conclusions; nevertheless, the
ApoE 16-25 peptide shows a very compelling increase in labeling in A
Figure 7.4: Significance plot comparing the tryptic peptide FPOP labeling yields of 100 nM ApoE3 in Aβ42-present and Ayield difference was calculated from three singlicate state vs. state comparisoquotient of this average with the standard deviation is plotted. The length of each bar confers the sequence length of the peptide.
201
rd deviation and with control yield levels subtracted. The LC
MS/MS acquisitions of the triplicate samples from the two treatments (FPOP and control)
present and –free, for a total of 12 samples) were segregated into
e groups by virtue of their acquisition time. The same column was used for
MS/MS acquisition, though not consecutively, and significant shifts in
elution times were observed between the sets of replicates. Consequently LC
nt and subsequent analysis was employed three times. Normally, averaging
yields for their comparison between states requires using the same EIC features for both
states to avoid potential state bias. We can’t ensure this requirement with three
t analyses, and thus plot the average of their independent results at the peptide
level. This limits the confidence with which we may make conclusions; nevertheless, the
25 peptide shows a very compelling increase in labeling in Aβ42
Significance plot comparing the tryptic peptide FPOP labeling yields of 100 present and Aβ42-free states. The average state vs. state peptide
yield difference was calculated from three singlicate state vs. state comparisoquotient of this average with the standard deviation is plotted. The length of each bar confers the sequence length of the peptide.
rd deviation and with control yield levels subtracted. The LC-
MS/MS acquisitions of the triplicate samples from the two treatments (FPOP and control)
free, for a total of 12 samples) were segregated into
e groups by virtue of their acquisition time. The same column was used for
MS/MS acquisition, though not consecutively, and significant shifts in
elution times were observed between the sets of replicates. Consequently LC-MS peak
nt and subsequent analysis was employed three times. Normally, averaging
yields for their comparison between states requires using the same EIC features for both
states to avoid potential state bias. We can’t ensure this requirement with three
t analyses, and thus plot the average of their independent results at the peptide
level. This limits the confidence with which we may make conclusions; nevertheless, the
42-free samples.
Significance plot comparing the tryptic peptide FPOP labeling yields of 100 free states. The average state vs. state peptide
yield difference was calculated from three singlicate state vs. state comparisons; the quotient of this average with the standard deviation is plotted. The length of each bar
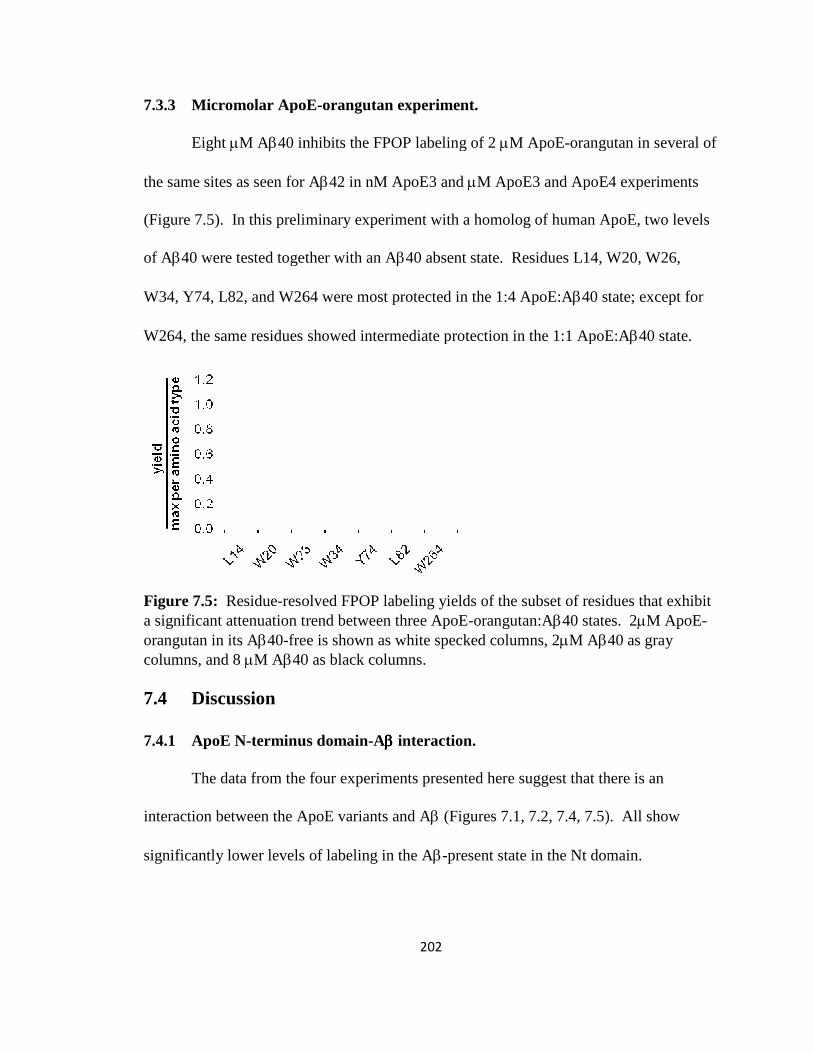
7.3.3 Micromolar ApoE
Eight µM Aβ40 inhibits the FPOP labeling of 2
the same sites as seen for A
(Figure 7.5). In this preliminary experiment with a homolog of human ApoE, two levels
of Aβ40 were tested together with an A
W34, Y74, L82, and W264 were most protected in the 1:4 ApoE:A
W264, the same residues showed intermediate protection in the 1:1 ApoE:A
Figure 7.5: Residue-resolved FPOP labeling yields of the subset of residues a significant attenuation trend between three ApoEorangutan in its Aβ40-free is shown as white specked columns, 2columns, and 8 µM Aβ40 as black columns. 7.4 Discussion
7.4.1 ApoE N-terminus
The data from the four experiments presented here suggest that there is an
interaction between the ApoE variants and A
significantly lower levels of labeling in the A
202
Micromolar ApoE-orangutan experiment.
40 inhibits the FPOP labeling of 2 µM ApoE-orangutan
the same sites as seen for Aβ42 in nM ApoE3 and µM ApoE3 and ApoE4 experiments
(Figure 7.5). In this preliminary experiment with a homolog of human ApoE, two levels
40 were tested together with an Aβ40 absent state. Residues L14, W20,
W34, Y74, L82, and W264 were most protected in the 1:4 ApoE:Aβ40 state; except for
W264, the same residues showed intermediate protection in the 1:1 ApoE:A
resolved FPOP labeling yields of the subset of residues
a significant attenuation trend between three ApoE-orangutan:Aβ40 states. 2free is shown as white specked columns, 2µM Aβ40 as gray 40 as black columns.
terminus domain-Aββββ interaction.
The data from the four experiments presented here suggest that there is an
interaction between the ApoE variants and Aβ (Figures 7.1, 7.2, 7.4, 7.5). All show
significantly lower levels of labeling in the Aβ-present state in the Nt domain.
orangutan in several of
M ApoE3 and ApoE4 experiments
(Figure 7.5). In this preliminary experiment with a homolog of human ApoE, two levels
40 absent state. Residues L14, W20, W26,
40 state; except for
W264, the same residues showed intermediate protection in the 1:1 ApoE:Aβ40 state.
resolved FPOP labeling yields of the subset of residues that exhibit 40 states. 2µM ApoE-
40 as gray
The data from the four experiments presented here suggest that there is an
7.5). All show
Nt domain.
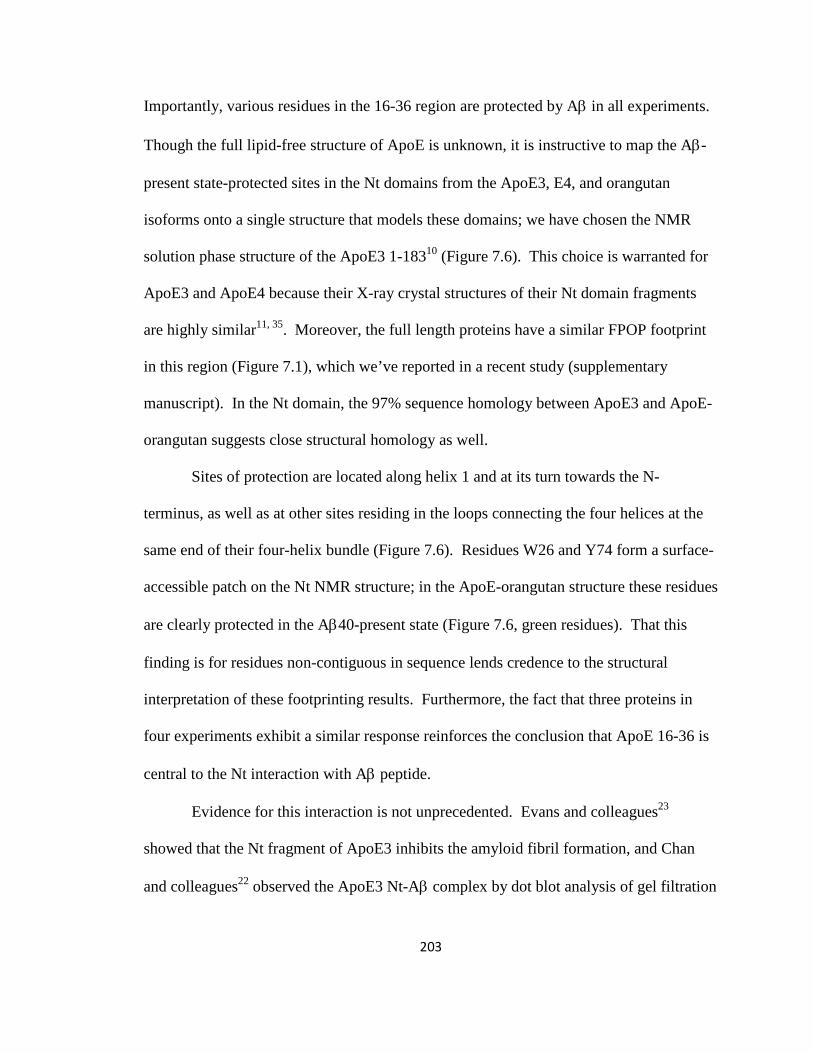
203
Importantly, various residues in the 16-36 region are protected by Aβ in all experiments.
Though the full lipid-free structure of ApoE is unknown, it is instructive to map the Aβ-
present state-protected sites in the Nt domains from the ApoE3, E4, and orangutan
isoforms onto a single structure that models these domains; we have chosen the NMR
solution phase structure of the ApoE3 1-18310 (Figure 7.6). This choice is warranted for
ApoE3 and ApoE4 because their X-ray crystal structures of their Nt domain fragments
are highly similar11, 35. Moreover, the full length proteins have a similar FPOP footprint
in this region (Figure 7.1), which we’ve reported in a recent study (supplementary
manuscript). In the Nt domain, the 97% sequence homology between ApoE3 and ApoE-
orangutan suggests close structural homology as well.
Sites of protection are located along helix 1 and at its turn towards the N-
terminus, as well as at other sites residing in the loops connecting the four helices at the
same end of their four-helix bundle (Figure 7.6). Residues W26 and Y74 form a surface-
accessible patch on the Nt NMR structure; in the ApoE-orangutan structure these residues
are clearly protected in the Aβ40-present state (Figure 7.6, green residues). That this
finding is for residues non-contiguous in sequence lends credence to the structural
interpretation of these footprinting results. Furthermore, the fact that three proteins in
four experiments exhibit a similar response reinforces the conclusion that ApoE 16-36 is
central to the Nt interaction with Aβ peptide.
Evidence for this interaction is not unprecedented. Evans and colleagues23
showed that the Nt fragment of ApoE3 inhibits the amyloid fibril formation, and Chan
and colleagues22 observed the ApoE3 Nt-Aβ complex by dot blot analysis of gel filtration
204
fractions. Golabek and colleagues21 determined the separate affinities of the ApoE3 Nt
domain and Ct domain for Aβ40, with KDs of ~11 nM and 45 nM, respectively. A recent
MD study suggests that Aβ40 monomer will form a stable complex with the Nt domains
of ApoE3 and ApoE4, with the interaction region comprising the adjacent 1st and 4th
helices 36. In this study, Luo and colleagues used the X-ray crystal structures of ApoE2,
ApoE3 and ApoE4 Nt domain fragments, and the SDS-induced α-helical structure of
Aβ40 determined by NMR spectroscopy37, as a starting point in the subsequent energy
minimization, rigid-body docking, and MD simulations. Germaine to our finding is their
conclusion of the interaction region, which clearly involves a direct interaction with W34
for both isoforms. Y36 may also experience a change, though it is oriented more towards
the 2nd helix of the four-helix bundle in the variant structures. Due to the high number of
Figure 7.6: Mapping of various peronto the ApoE31-183 2kc3 NMR svariant of ApoE3 absent Aprotection for both ApoE isoforms in the 4 Aβ42-free state. The green residues exhibited significant protection in the orangutan, 8 µM Aβ40 state, compared to the Ayellow, shows significant protection for the 100 nM ApoE3:5 to its Aβ42-free state. Relative to the Ashows more labeling in the 4 µM ApoE4:20 µM Aβ42 state. basic sites spanning 135-158, there is no residue
interaction with the 4th helix. A striking result from their study is that in the simulations
205
Mapping of various per-residue and per-peptide FPOP footprinting results
2kc3 NMR structure10. This NMR structure is of the absent Aβ and is monomeric. The red residues exhibited significant
protection for both ApoE isoforms in the 4 µM ApoE:20 µM Aβ42 state free state. The green residues exhibited significant protection in the
40 state, compared to the Aβ40-free state. Region 16yellow, shows significant protection for the 100 nM ApoE3:5 µM Aβ42 state, compared
free state. Relative to the Aβ42-free states, region 120-134, colshows more labeling in the 4 µM ApoE3:20 µM Aβ42 state, and less labeling in the 4
42 state.
158, there is no residue-resolved FPOP data to confirm the
helix. A striking result from their study is that in the simulations
peptide FPOP footprinting results This NMR structure is of the truncated
The red residues exhibited significant compared to the
free state. The green residues exhibited significant protection in the 2 µM ApoE-free state. Region 16-25, colored
42 state, compared 134, colored blue,
42 state, and less labeling in the 4
resolved FPOP data to confirm the
helix. A striking result from their study is that in the simulations
206
the ApoE4 Nt domain reorganizes its conformation to accommodate Aβ40, whose
orientation is flipped head-to-tail from the ApoE3 Nt domain-Aβ40 complex. Such
reorganization, an indirect consequence of the C112R mutation, may explain the
difference in the Aβ42-induced response we observe at E80 and region 120-134 for
ApoE3 compared to ApoE4.
7.4.2 ApoE C-terminus domain-Aββββ interaction.
While ApoE3 P293 is protected in the micromolar ApoE3 Aβ42-present state
(Figure 7.2A), most of the modified fates of ApoE3 283-299 show no such trend (Figure
7.1A). Furthermore, the remaining regions of the Ct domain for both ApoE3 and ApoE4
appear to be only slightly affected by the presence of Aβ42 in the 4µM experiments if at
all (Supporting Information Table 7.1). In particular, W264 and W276 show a concerted
negative change in their modification levels in the Aβ42-present state relative to the –free
state. Taken together these may convey significance, but individually they are not
statistically different. Phu and colleagues20 have characterized the interaction of ApoE3
201-299 (encompassing part of the thrombin-active hinge region as well as the Ct
domain) and Aβ42 by monitoring the FRET between an Aβ42-attached fluorophore and
ApoE Trp, and suggested that binding occurs in the vicinity of W264 and W276. In their
study of the Nt and Ct domains of ApoE3, Golabek and colleagues also observed Aβ40
complexation, but with 4-10 fold weaker affinity than with the Nt domain21. These
studies were conducted in the same protein concentration regime (2-12 µM) as our
micromolar experiments. This allows comparison with our FPOP state change results for
207
the ApoE3 and ApoE4 µM experiments, and we find corroboration: (1) that a strong
interaction region is localized to a region on the Nt domain; (2) a weaker interaction may
be present in the Ct domain.
7.4.3 Implications of the ApoE oligomeric state.
At µM levels, both ApoE3 and ApoE4 are mostly tetramers9, 12, 30, 38-39. In an
FPOP comparison study of a monomeric mutant of ApoE3 and WT ApoE3, we observed
a significant change in the solvent accessibility of regions 181-221 and 242-290
(supplementary manuscript). Whatever interaction may be favored with Aβ in this
region, we do not observe the kind of changes characteristic of the disruption of
oligomeric structure witnessed in the monomeric mutant. The fact that the 1-191 Nt
domain is mostly not involved in oligomerization implies that the tetramer may take up
four Aβ peptides independently, and it motivates our use of the monomeric Nt domain
structure for mapping interaction sites (Figure 7.6). This also predicts that the ApoE3
monomer should show the same Aβ interactions in the Nt domain. The 111 nM ApoE3
experiment was conducted to footprint the WT monomer-Aβ42 interaction, because at
this concentration ApoE3 is primarily monomeric30. While peptide 33-38 is not well
sampled in the experiment owing to post-labeling adsorption, the neighboring peptide 16-
25 shows significant protection. If the underlying interaction with Aβ42 is proximal to
both peptides, our prediction is validated.
208
7.4.4 Heterogeneity of participants.
The characterization of the insoluble aggregate or fibrillar content of Aβ42 and
Aβ40 was not undertaken in the experiments, though a common starting point established
for all replicates. The introduction of Aβ42 from a thawed high pH stock solution to a
final concentration of 0.09 mg/mL in PBS at 22 °C will initiate self associations that
ultimately produce the spectrum of soluble oligomer and insoluble amyloid species40.
Moreover, the 4 µM state of ApoE3 and ApoE4 cannot be describe exclusively as
tetrameric, as higher order oligomers are present as well 9, 12, 30, 38-39. Probing the
complicated evolving state of the mixture of these biomolecules without employing an
artificial simplification—such as using domain fragments, denaturants, or fluorophore
labeling—risks missing important interactions whose characteristic change in signal is
only presented by a subset of the molecules. We have nevertheless undertaken such
experiments, enabled by the sensitivity of FPOP and LC-MS/MS analysis to physiologic
SASA. The finding of significant results is more compelling in light of the inherent
complexity of the system.
7.5 Conclusion
ApoE 16-36, and W34 in particular, comprises a region in both ApoE3 and
ApoE4 that is a site of direct Aβ42 interaction. It may instead be a site of allosteric
protection, induced by Aβ42 interaction elsewhere, but in the same domain only R167
shows a similarly significant protection. We propose that its protection is rather induced
by the interaction of Aβ42 with ApoE16-36, based on a recent MD study of the Nt
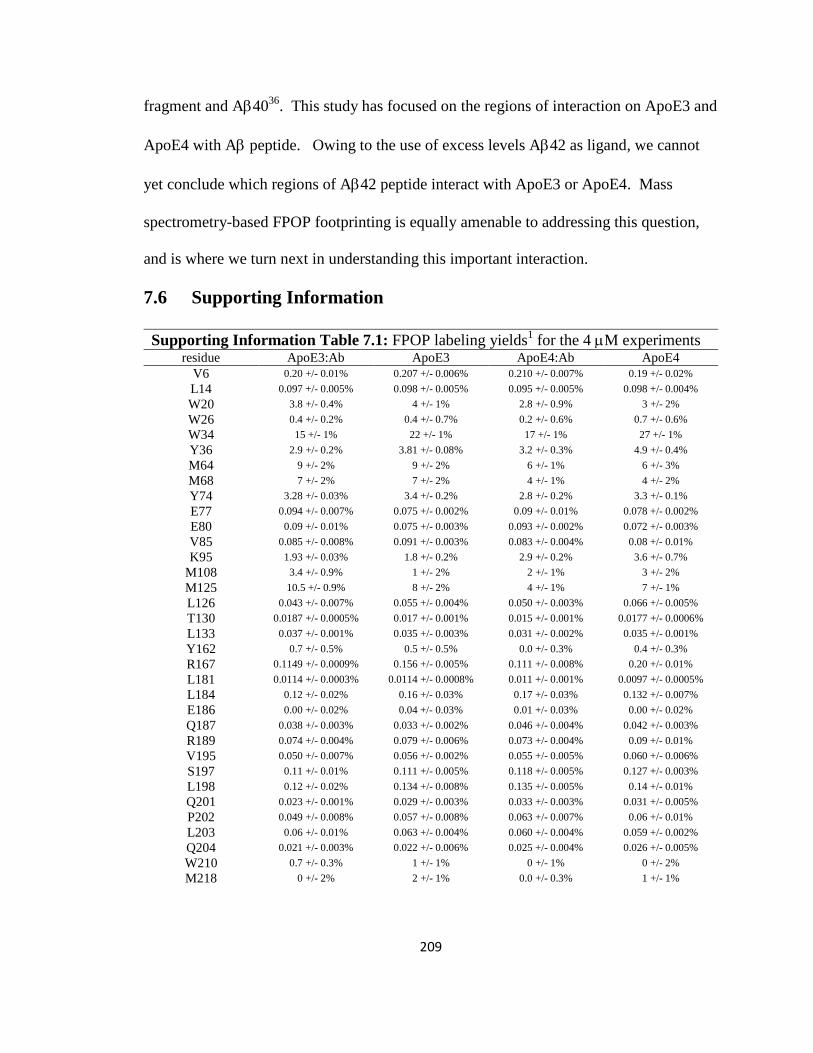
209
fragment and Aβ4036. This study has focused on the regions of interaction on ApoE3 and
ApoE4 with Aβ peptide. Owing to the use of excess levels Aβ42 as ligand, we cannot
yet conclude which regions of Aβ42 peptide interact with ApoE3 or ApoE4. Mass
spectrometry-based FPOP footprinting is equally amenable to addressing this question,
and is where we turn next in understanding this important interaction.
7.6 Supporting Information
Supporting Information Table 7.1: FPOP labeling yields1 for the 4 µM experiments residue ApoE3:Ab ApoE3 ApoE4:Ab ApoE4
V6 0.20 +/- 0.01% 0.207 +/- 0.006% 0.210 +/- 0.007% 0.19 +/- 0.02%
L14 0.097 +/- 0.005% 0.098 +/- 0.005% 0.095 +/- 0.005% 0.098 +/- 0.004%
W20 3.8 +/- 0.4% 4 +/- 1% 2.8 +/- 0.9% 3 +/- 2%
W26 0.4 +/- 0.2% 0.4 +/- 0.7% 0.2 +/- 0.6% 0.7 +/- 0.6%
W34 15 +/- 1% 22 +/- 1% 17 +/- 1% 27 +/- 1%
Y36 2.9 +/- 0.2% 3.81 +/- 0.08% 3.2 +/- 0.3% 4.9 +/- 0.4%
M64 9 +/- 2% 9 +/- 2% 6 +/- 1% 6 +/- 3%
M68 7 +/- 2% 7 +/- 2% 4 +/- 1% 4 +/- 2%
Y74 3.28 +/- 0.03% 3.4 +/- 0.2% 2.8 +/- 0.2% 3.3 +/- 0.1%
E77 0.094 +/- 0.007% 0.075 +/- 0.002% 0.09 +/- 0.01% 0.078 +/- 0.002%
E80 0.09 +/- 0.01% 0.075 +/- 0.003% 0.093 +/- 0.002% 0.072 +/- 0.003%
V85 0.085 +/- 0.008% 0.091 +/- 0.003% 0.083 +/- 0.004% 0.08 +/- 0.01%
K95 1.93 +/- 0.03% 1.8 +/- 0.2% 2.9 +/- 0.2% 3.6 +/- 0.7%
M108 3.4 +/- 0.9% 1 +/- 2% 2 +/- 1% 3 +/- 2%
M125 10.5 +/- 0.9% 8 +/- 2% 4 +/- 1% 7 +/- 1%
L126 0.043 +/- 0.007% 0.055 +/- 0.004% 0.050 +/- 0.003% 0.066 +/- 0.005%
T130 0.0187 +/- 0.0005% 0.017 +/- 0.001% 0.015 +/- 0.001% 0.0177 +/- 0.0006%
L133 0.037 +/- 0.001% 0.035 +/- 0.003% 0.031 +/- 0.002% 0.035 +/- 0.001%
Y162 0.7 +/- 0.5% 0.5 +/- 0.5% 0.0 +/- 0.3% 0.4 +/- 0.3%
R167 0.1149 +/- 0.0009% 0.156 +/- 0.005% 0.111 +/- 0.008% 0.20 +/- 0.01%
L181 0.0114 +/- 0.0003% 0.0114 +/- 0.0008% 0.011 +/- 0.001% 0.0097 +/- 0.0005%
L184 0.12 +/- 0.02% 0.16 +/- 0.03% 0.17 +/- 0.03% 0.132 +/- 0.007%
E186 0.00 +/- 0.02% 0.04 +/- 0.03% 0.01 +/- 0.03% 0.00 +/- 0.02%
Q187 0.038 +/- 0.003% 0.033 +/- 0.002% 0.046 +/- 0.004% 0.042 +/- 0.003%
R189 0.074 +/- 0.004% 0.079 +/- 0.006% 0.073 +/- 0.004% 0.09 +/- 0.01%
V195 0.050 +/- 0.007% 0.056 +/- 0.002% 0.055 +/- 0.005% 0.060 +/- 0.006%
S197 0.11 +/- 0.01% 0.111 +/- 0.005% 0.118 +/- 0.005% 0.127 +/- 0.003%
L198 0.12 +/- 0.02% 0.134 +/- 0.008% 0.135 +/- 0.005% 0.14 +/- 0.01%
Q201 0.023 +/- 0.001% 0.029 +/- 0.003% 0.033 +/- 0.003% 0.031 +/- 0.005%
P202 0.049 +/- 0.008% 0.057 +/- 0.008% 0.063 +/- 0.007% 0.06 +/- 0.01%
L203 0.06 +/- 0.01% 0.063 +/- 0.004% 0.060 +/- 0.004% 0.059 +/- 0.002%
Q204 0.021 +/- 0.003% 0.022 +/- 0.006% 0.025 +/- 0.004% 0.026 +/- 0.005%
W210 0.7 +/- 0.3% 1 +/- 1% 0 +/- 1% 0 +/- 2%
M218 0 +/- 2% 2 +/- 1% 0.0 +/- 0.3% 1 +/- 1%
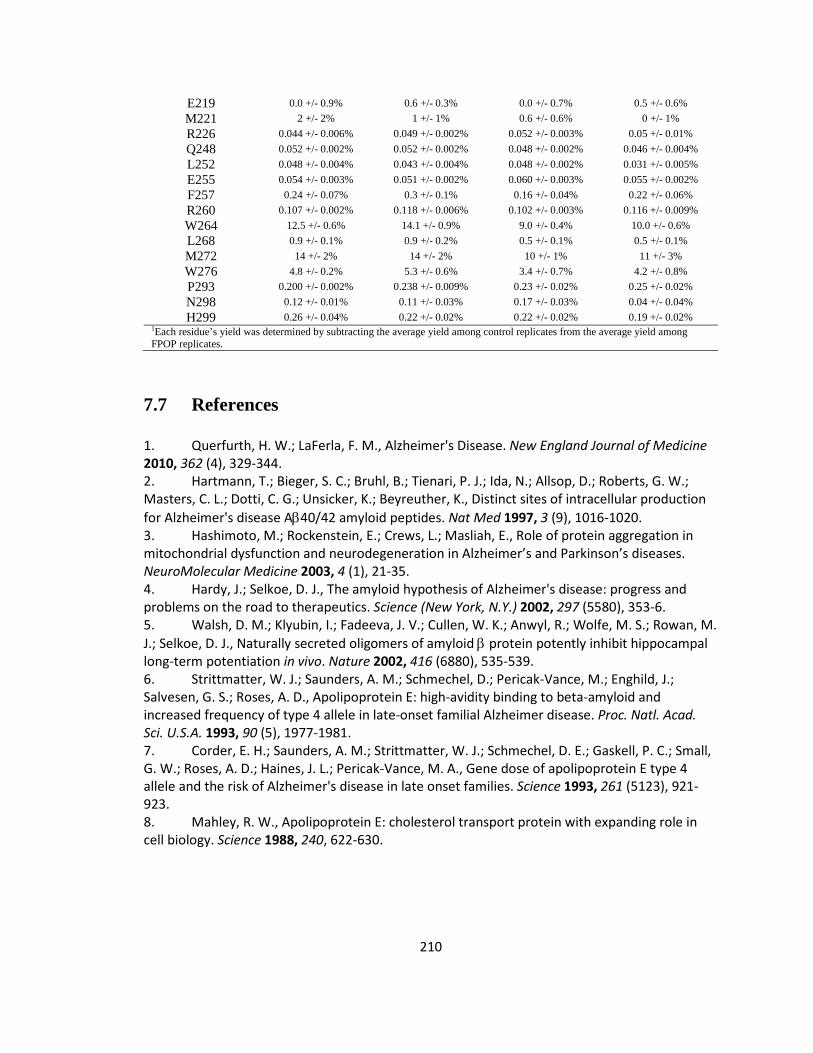
210
E219 0.0 +/- 0.9% 0.6 +/- 0.3% 0.0 +/- 0.7% 0.5 +/- 0.6%
M221 2 +/- 2% 1 +/- 1% 0.6 +/- 0.6% 0 +/- 1%
R226 0.044 +/- 0.006% 0.049 +/- 0.002% 0.052 +/- 0.003% 0.05 +/- 0.01%
Q248 0.052 +/- 0.002% 0.052 +/- 0.002% 0.048 +/- 0.002% 0.046 +/- 0.004%
L252 0.048 +/- 0.004% 0.043 +/- 0.004% 0.048 +/- 0.002% 0.031 +/- 0.005%
E255 0.054 +/- 0.003% 0.051 +/- 0.002% 0.060 +/- 0.003% 0.055 +/- 0.002%
F257 0.24 +/- 0.07% 0.3 +/- 0.1% 0.16 +/- 0.04% 0.22 +/- 0.06%
R260 0.107 +/- 0.002% 0.118 +/- 0.006% 0.102 +/- 0.003% 0.116 +/- 0.009%
W264 12.5 +/- 0.6% 14.1 +/- 0.9% 9.0 +/- 0.4% 10.0 +/- 0.6%
L268 0.9 +/- 0.1% 0.9 +/- 0.2% 0.5 +/- 0.1% 0.5 +/- 0.1%
M272 14 +/- 2% 14 +/- 2% 10 +/- 1% 11 +/- 3%
W276 4.8 +/- 0.2% 5.3 +/- 0.6% 3.4 +/- 0.7% 4.2 +/- 0.8%
P293 0.200 +/- 0.002% 0.238 +/- 0.009% 0.23 +/- 0.02% 0.25 +/- 0.02%
N298 0.12 +/- 0.01% 0.11 +/- 0.03% 0.17 +/- 0.03% 0.04 +/- 0.04%
H299 0.26 +/- 0.04% 0.22 +/- 0.02% 0.22 +/- 0.02% 0.19 +/- 0.02% 1Each residue’s yield was determined by subtracting the average yield among control replicates from the average yield among FPOP replicates.
7.7 References
1. Querfurth, H. W.; LaFerla, F. M., Alzheimer's Disease. New England Journal of Medicine
2010, 362 (4), 329-344.
2. Hartmann, T.; Bieger, S. C.; Bruhl, B.; Tienari, P. J.; Ida, N.; Allsop, D.; Roberts, G. W.;
Masters, C. L.; Dotti, C. G.; Unsicker, K.; Beyreuther, K., Distinct sites of intracellular production
for Alzheimer's disease Aβ40/42 amyloid peptides. Nat Med 1997, 3 (9), 1016-1020.
3. Hashimoto, M.; Rockenstein, E.; Crews, L.; Masliah, E., Role of protein aggregation in
mitochondrial dysfunction and neurodegeneration in Alzheimer’s and Parkinson’s diseases.
NeuroMolecular Medicine 2003, 4 (1), 21-35.
4. Hardy, J.; Selkoe, D. J., The amyloid hypothesis of Alzheimer's disease: progress and
problems on the road to therapeutics. Science (New York, N.Y.) 2002, 297 (5580), 353-6.
5. Walsh, D. M.; Klyubin, I.; Fadeeva, J. V.; Cullen, W. K.; Anwyl, R.; Wolfe, M. S.; Rowan, M.
J.; Selkoe, D. J., Naturally secreted oligomers of amyloid β protein potently inhibit hippocampal
long-term potentiation in vivo. Nature 2002, 416 (6880), 535-539.
6. Strittmatter, W. J.; Saunders, A. M.; Schmechel, D.; Pericak-Vance, M.; Enghild, J.;
Salvesen, G. S.; Roses, A. D., Apolipoprotein E: high-avidity binding to beta-amyloid and
increased frequency of type 4 allele in late-onset familial Alzheimer disease. Proc. Natl. Acad.
Sci. U.S.A. 1993, 90 (5), 1977-1981.
7. Corder, E. H.; Saunders, A. M.; Strittmatter, W. J.; Schmechel, D. E.; Gaskell, P. C.; Small,
G. W.; Roses, A. D.; Haines, J. L.; Pericak-Vance, M. A., Gene dose of apolipoprotein E type 4
allele and the risk of Alzheimer's disease in late onset families. Science 1993, 261 (5123), 921-
923.
8. Mahley, R. W., Apolipoprotein E: cholesterol transport protein with expanding role in
cell biology. Science 1988, 240, 622-630.
211
9. Aggerbeck, L. P.; Wetterau, J. R.; Weisgraber, K. H.; Wu, C. S.; Lindgren, F. T., Human
apolipoprotein E3 in aqueous solution. II. Properties of the amino- and carboxyl-terminal
domains. J. Biol. Chem. 1988, 263 (13), 6249-6258.
10. Sivashanmugam, A.; Wang, J., A Unified Scheme for Initiation and Conformational
Adaptation of Human Apolipoprotein E N-terminal Domain upon Lipoprotein Binding and for
Receptor Binding Activity. J. Biol. Chem. 2009, 284 (21), 14657-14666.
11. Wilson, C.; Wardell, M. R.; Weisgraber, K. H.; Mahley, R. W.; Agard, D. A., Three-
dimensional structure of the LDL receptor-binding domain of human apolipoprotein E. Science
1991, 252 (5014), 1817-1822.
12. Westerlund, J. A.; Weisgraber, K. H., Discrete carboxyl-terminal segments of
apolipoprotein E mediate lipoprotein association and protein oligomerization. J. Biol. Chem.
1993, 268 (21), 15745-15750.
13. Bu, G., Apolipoprotein E and its receptors in Alzheimer's disease: pathways,
pathogenesis and therapy. Nat Rev Neurosci 2009, 10 (5), 333-344.
14. Carter, D. B., The Interaction of Amyloid-β with ApoE. In Alzheimer’s Disease, Harris, J.
R.; Fahrenholz, F., Eds. Springer US: 2005; Vol. 38, pp 255-272.
15. Soto, C.; Golabek, A.; Wisniewski, T.; Castaño, E. M., Alzheimer's β-amyloid peptide is
conformationally modified by apolipoprotein E in vitro. NeuroReport 1996, 7 (3), 721-725.
16. Wisniewski, T.; Castaño, E. M.; Golabek, A.; Vogel, T.; Frangione, B., Acceleration of
Alzheimer's fibril formation by apolipoprotein E in vitro. Am J Pathol. 1994, 145 (5), 1030-1035.
17. Ma, J.; Yee, A.; Brewer, H. B.; Das, S.; Potter, H., Amyloid-associated proteins α1-
antichymotrypsin and apolipoprotein E promote assembly of Alzheimer β-protein into filaments.
Nature 1994, 372 (6501), 92-94.
18. Shuvaev, V. V.; Siest, G., Interaction between human amphipathic apolipoproteins and
amyloid β-peptide: surface plasmon resonance studies. FEBS Letters 1996, 383 (1-2), 9-12.
19. Golabek, A. A.; Soto, C.; Vogel, T.; Wisniewski, T., The Interaction between
Apolipoprotein E and Alzheimers Amyloid -Peptide Is Dependent on -Peptide Conformation. J.
Biol. Chem. 1996, 271 (18), 10602-10606.
20. Phu, M.-J.; Hawbecker, S. K.; Narayanaswami, V., Fluorescence resonance energy
transfer analysis of apolipoprotein E C-terminal domain and amyloid β peptide (1–42)
interaction. Journal of Neuroscience Research 2005, 80 (6), 877-886.
21. Golabek, A. A.; Kida, E.; Walus, M.; Perez, C.; Wisniewski, T.; Soto, C., Sodium Dodecyl
Sulfate-Resistant Complexes of Alzheimer's Amyloid β-Peptide with the N-Terminal, Receptor
Binding Domain of Apolipoprotein E. Biophysical journal 2000, 79 (2), 1008-1015.
22. Chan, W.; Fornwald, J.; Brawner, M.; Wetzel, R., Native Complex Formation between
Apolipoprotein E Isoforms and the Alzheimer's Disease Peptide Aβ. Biochemistry 1996, 35 (22),
7123-7130.
23. Evans, K. C.; Berger, E. P.; Cho, C. G.; Weisgraber, K. H.; Lansbury, P. T., Apolipoprotein E
is a kinetic but not a thermodynamic inhibitor of amyloid formation: implications for the
pathogenesis and treatment of Alzheimer disease. Proc. Natl. Acad. Sci. U.S.A. 1995, 92 (3), 763-
767.
24. Hambly, D. M.; Gross, M. L., In The Encyclopedia of Mass Spectrometry: Ionization
Methods, Gross, M. L.; Caprioli, R. M., Eds. 2006; Vol. 6.
212
25. Guan, J.-Q.; Chance, M. R., Structural proteomics of macromolecular assemblies using
oxidative footprinting and mass spectrometry. Trends Biochem. Sci 2005, 10, 583-592.
26. Xu, G.; Chance, M. R., Hydroxyl Radical-Mediated Modification of Proteins as Probes for
Structural Proteomics. Chem. Rev. 2007, 107 (8), 3514-3543.
27. Xu, G.; Chance, M. R., Radiolytic Modification and Reactivity of Amino Acid Residues
Serving as Structural Probes for Protein Footprinting. Anal. Chem. 2005, 77 (14), 4549-4555.
28. Hambly, D. M.; Gross, M. L., Laser Flash Photolysis of Hydrogen Peroxide to Oxidize
Protein Solvent-Accessible Residues on the Microsecond Timescale. J. Am. Soc. Mass Spectrom.
2005, 16 (12), 2057-2063.
29. Gau, B. C.; Sharp, J. S.; Rempel, D. L.; Gross, M. L., Fast Photochemical Oxidation of
Protein Footprints Faster than Protein Unfolding. Anal. Chem. 2009, 81 (16), 6563-6571.
30. Garai, K.; Frieden, C., The Association-Dissociation Behavior of the ApoE Proteins: Kinetic
and Equilibrium Studies. Biochemistry 2010, 49 (44), 9533-9541.
31. Xu, G.; Kiselar, J.; He, Q.; Chance, M. R., Secondary Reactions and Strategies To Improve
Quantitative Protein Footprinting. Anal. Chem. 2005, 77 (10), 3029-3037.
32. Xu, G.; Chance, M. R., Radiolytic Modification of Sulfur-Containing Amino Acid Residues
in Model Peptides: Fundamental Studies for Protein Footprinting. Anal. Chem. 2005, 77 (8),
2437-2449.
33. Buxton, G. V.; Greenstock, C. L.; Helman, W. P.; Ross, A. B., Critical Review of Rate
Constants for Reactions of Hydrated Electrons, Hydrogen Atoms and Hydroxyl Radicals (*OH/*O-
) in Aqueous Solution. J. Phys. Chem. Ref. Data 1988, 17 (2), 513-886.
34. Kebarle, P.; Tang, L., From ions in solution to ions in the gas phase - the mechanism of
electrospray mass spectrometry. Anal. Chem. 1993, 65 (22), 972A-986A.
35. Dong, L. M.; Wilson, C.; Wardell, M. R.; Simmons, T.; Mahley, R. W.; Weisgraber, K. H.;
Agard, D. A., Human apolipoprotein E. Role of arginine 61 in mediating the lipoprotein
preferences of the E3 and E4 isoforms. J. Biol. Chem. 1994, 269 (35), 22358-22365.
36. Luo, J.; Maréchal, J.-D.; Wärmländer, S.; Gräslund, A.; Perálvarez-Marín, A., In Silico
Analysis of the Apolipoprotein E and the Amyloid β Peptide Interaction: Misfolding Induced by
Frustration of the Salt Bridge Network. PLoS Comput Biol 2010, 6 (2), e1000663.
37. Coles, M.; Bicknell, W.; Watson, A. A.; Fairlie, D. P.; Craik, D. J., Solution Structure of
Amyloid β-Peptide(1−40) in a Water−Micelle Environment. Is the Membrane-Spanning Domain
Where We Think It Is?†,‡. Biochemistry 1998, 37 (31), 11064-11077.
38. Sakamoto, T.; Tanaka, M.; Vedhachalam, C.; Nickel, M.; Nguyen, D.; Dhanasekaran, P.;
Phillips, M. C.; Lund-Katz, S.; Saito, H., Contributions of the Carboxyl-Terminal Helical Segment to
the Self-Association and Lipoprotein Preferences of Human Apolipoprotein E3 and E4 Isoforms.
Biochemistry 2008, 47 (9), 2968-2977.
39. Yokoyama, S.; Kawai, Y.; Tajima, S.; Yamamoto, A., Behavior of human apolipoprotein E
in aqueous solutions and at interfaces. J. Biol. Chem. 1985, 260 (30), 16375-16382.
40. Hilbich, C.; Kisters-Woike, B.; Reed, J.; Masters, C. L.; Beyreuther, K., Aggregation and
secondary structure of synthetic amyloid [beta]A4 peptides of Alzheimer's disease. Journal of
Molecular Biology 1991, 218 (1), 149-163.