The Adoption, Use and Diffusion of Smartphones among ...
489
The Adoption, Use and Diffusion of Smartphones among Adults over Fifty in the UK A Thesis Submitted to the University of Hertfordshire in Partial Fulfilment of the Requirements for the Degree of Doctor of Philosophy By Sutee Pheeraphuttharangkoon Management, Leadership and Organisation Business School University of Hertfordshire June 2015
-
Upload
khangminh22 -
Category
Documents
-
view
1 -
download
0
Transcript of The Adoption, Use and Diffusion of Smartphones among ...

The Adoption, Use and Diffusion of
Smartphones among Adults over Fifty in
the UK
A Thesis Submitted to the University of Hertfordshire in
Partial Fulfilment of the Requirements for the Degree of
Doctor of Philosophy
By Sutee Pheeraphuttharangkoon
Management, Leadership and Organisation
Business School
University of Hertfordshire
June 2015

Abstract
Smartphones are innovations that currently provide immense benefits and convenience to users
in society. However, not all the users of society are accepting and using smart phones, more
specifically, for this research study older adults (50+) are a demographic group displaying such
an attitude. Currently, there is minimal knowledge of the reasons that older adults adopt and use
smartphones. Bearing this in mind, this research study aimed to identify, examine and explain the
adoption and usage of smartphones in the UK within the 50 years old and above population. For
this purpose, a conceptual framework, a Model of Smartphone Adoption (MOSA) was formed
drawing factors from the theories of Unified theory of Acceptance and Use of Technology
(UTAUT), the Diffusion of Innovations theory (DoI) and Technology Acceptance Model 3
(TAM3). Seven variables from the theories were brought to consideration, which were
Observability, Social influence, Compatibility, Effort expectancy, Facilitation conditions,
Performance expectancy and Perceived enjoyment.
For the research method, a quantitative approach was selected to examine and apply MOSA that
involved the data collection method of an online questionnaire survey that resulted in 204
completed replies during the pilot phase of this research and 984 in the final phase. The collected
data was analysed using SEM-PLS where the results found that six of the eight formed
hypotheses were supported, and the factors of Compatibility, Effort expectancy, Facilitation
condition, Performance expectancy and Perceived enjoyment were important for the adoption of
smartphones. From these results, it was understood that older adults used smartphones because
they have enough knowledge, time and money to use. They also think that smartphones are easy
to use, provide benefits including enjoyment and are compatible with their lifestyles. In terms of
usage, older adults frequently used the basic features of smartphones such as making a phone
call, SMS, email, and browsing. Older adults are also likely to use their devices for seeking
information about their health and for appointments with their doctors; however, from this
research it was found that more than half of the 50 years old and above adults did not use
smartphones for health and well-being purposes.
The contributions of this research are viewed to be the identification and understanding of the
factors that encourage or inhibit smartphones use within the older adult population. Secondly,
this research can inform smartphone manufacturers and developers of factors pertinent for the
design of computing devices and applications specific to silver surfers. Finally, this research can
enlighten policy makers when forming decisions that encourage the adoption and use of
smartphones within the older adult population. Regarding limitations, these existed in the form
of finance and time. To overcome the limitations, this research recommends further studies that
apply qualitative research and/or to provide a comparison between western and eastern countries.
Keywords: Smartphones, Mobile phones, Adoption, Usage, Diffusion, Silver-surfers, Older
adults, UK.

Sutee Pheeraphuttharangkoon (2015)
The Adoption, Use and Diffusion of Smartphones among Adults over Fifty in the UK iii
Dedication
I Dedicate This Thesis to My Parents,
Mr. Krailak and Mrs. Somsuk Pheeraphuttharangkoon, and
My Sister, Miss Nuttaporn Pheeraphuttharangkoon
Thank you.

Sutee Pheeraphuttharangkoon (2015)
The Adoption, Use and Diffusion of Smartphones among Adults over Fifty in the UK iv
Acknowledgements
This thesis has been one of the most difficult tasks of my life; therefore, without the help of
certain people I could not have completed it.
First of all, to my supervisors and mentors, Professor Jyoti Choudrie, Dr. Marija Cubric, and, Dr.
Mariana Dodourova. I would like to express my deep gratitude to, for firstly believing in my
ability and providing me with an opportunity to begin and get to this completion stage of the
PhD. I also learnt a lot from Dr. Marija who also was my supervisor during my Master Degree.
Thank you to both of you to help me discover my strength, encouragement, providing comments
and standing by me until the end of this research. Thank you to Professor Jyoti, for every email
and smartphone call and friendly manner that she afforded me. I am grateful to the entire
research team. I will not forget how helpful you have been and are.
I would also like to thank my parents for their continued support, encouragement, and
motivation. I would then like to thank my only sister who emotionally encouraged me every time
I felt tired. Without my lovely family, I would have never journeyed this far in my life. I hope
that the success of this Ph.D. will make you happy and proud.
I would like to personally thank Mr. and Mrs. Shojaie, Miss Coady, Mrs. Anne Pink, Dr. Amit
Vyas, Dr. Hassan Al-Zaabi, Miss Penwadee, Miss Lalita, Miss Panita, Miss Chatwarun, Miss
Siriruji, Miss Sydney and Miss Pacharawalai for being wonderful friends. In terms of friends, I
thank all my friends in the Royal Thai Embassy, in NOUR London, and friends who lived with
me in Flat 8. I am grateful to all of you for all the guidance, love, support and friendship over the
enduring years.
I wish to express my gratitude to the University of Hertfordshire for giving me the opportunity to
complete this research and also take this opportunity to acknowledge the help and support of all
the academic staff members. I thank all those expert panels and participants who spent their
valuable time answering my questionnaires on their smartphones. I also would like to thank
Oxford Internet Surveys and Office of National Statistics.
I would like to say thank you to the developers of the software that I used- Microsoft Office,
Mendeley, Dropbox, Chrome Browser, SmartPLS, and STATA. Without their applications, I
imagine that this thesis would be very hard and difficult. I also thank my computers, tablets, and
smartphones for being there in all these years of hard work and support.

Sutee Pheeraphuttharangkoon (2015)
The Adoption, Use and Diffusion of Smartphones among Adults over Fifty in the UK v
Table of Contents Abstract ........................................................................................................................................... ii
Acknowledgements ........................................................................................................................ iv
List of Appendices ....................................................................................................................... xiii
List of Tables ............................................................................................................................... xiv
List of Figures ............................................................................................................................ xviii
List of Abbreviations .................................................................................................................... xx
Publications ................................................................................................................................. xxii
Chapter 1
1.1 Introduction ............................................................................................................................. 23
1.2 Research Problem and Background ........................................................................................ 23
1.2.1 Older Adults (50+) ........................................................................................................... 23
1.2.2 Older Adults and ICT....................................................................................................... 25
1.2.3 Smartphones and Mobile Phones ..................................................................................... 26
1.3 Research Aim, Objectives and Research Questions ............................................................... 29
1.4 Research Scope ....................................................................................................................... 30
1.5 Research Contributions ........................................................................................................... 31
1.6 Research Approach ................................................................................................................. 32
1.7 Dissertation Outline ................................................................................................................ 32
1.8 Chapter Summary ................................................................................................................... 34
Chapter 2
2.1 Introduction ............................................................................................................................. 36
2.2 Literature Review.................................................................................................................... 36
2.2.1 Smartphone Technology .................................................................................................. 37
2.2.2 Smartphone Features and Services .................................................................................. 39
2.2.3 Adoption and Smartphone Development ......................................................................... 43
2.2.4 Older Adults and the Challenges of Ageing .................................................................... 46
2.2.5 Older Adults and Technology (ICT, mobile phone, smartphones); Are older adults
Accepting the Technology? ...................................................................................................... 49

Sutee Pheeraphuttharangkoon (2015)
The Adoption, Use and Diffusion of Smartphones among Adults over Fifty in the UK vi
2.2.6 The Digital Divide and Silver Surfers (50+ adults) ......................................................... 52
2.3 Theoretical Background .......................................................................................................... 56
2.3.1 Theory of Reasoned Action (TRA).................................................................................. 56
2.3.2 Technology Acceptance Model (TAM) ........................................................................... 57
2.3.3 Theory of Planned Behaviour (TPB) ............................................................................... 62
2.3.4 Diffusion of Innovation Theory (DOI) ............................................................................ 63
2.3.4.1 Innovation Decision Process ..................................................................................... 63
2.3.4.2 Attributes of the Innovation ...................................................................................... 64
2.3.4.3 Characteristics of Innovators .................................................................................... 65
2.3.4.4 The Limitations of DoI ............................................................................................. 65
2.3.5 Decomposed Theory of Planned Behaviour (DTPB) ...................................................... 65
2.3.6 Technology Acceptance Model 2 (TAM 2) ..................................................................... 67
2.3.7 Unified Theory of Acceptance and Use of Technology (UTAUT) ................................. 69
2.3.8 Technology Acceptance Model 3 (TAM 3) ..................................................................... 74
2.3.9 Unified Theory of Acceptance and Use of Technology 2 ............................................... 76
2.4 Theoretical and Conceptual Framework ................................................................................. 78
2.4.1 Conceptual Framework .................................................................................................... 78
2.4.2 MOSA Construct Definition ............................................................................................ 79
2.4.3 MOSA Hypotheses Development .................................................................................... 80
2.4.4 Demographic Variables ................................................................................................... 86
2.4.4.1 Demographic Variables as Independent Variables ................................................... 87
2.4.4.2 Demographic Variable as Moderator Variables ....................................................... 88
2.5 Chapter Summary ................................................................................................................... 90
Chapter 3
3.1 Introduction ............................................................................................................................. 92
3.1.1 Overview of the Research Process ................................................................................... 93
3.2 Research Philosophy ............................................................................................................... 93
3.2.1 Positivism ......................................................................................................................... 94
Sutee Pheeraphuttharangkoon (2015)
The Adoption, Use and Diffusion of Smartphones among Adults over Fifty in the UK vii
3.3 Research Approaches - Deductive .......................................................................................... 94
3.3.1 Deductive ......................................................................................................................... 95
3.4 Research Strategies ................................................................................................................. 95
3.4.1 Survey – Research Strategy ............................................................................................. 95
3.4.1.1 Internet and Intranet Mediated Questionnaire - Method ........................................... 96
3.5 Research Choices .................................................................................................................... 97
3.5.1 Quantitative and Qualitative Data .................................................................................... 97
3.5.2 Quantitative and Qualitative approach............................................................................. 98
3.6 Time Horizons ........................................................................................................................ 98
3.7 Data Collection and Data Analysis ......................................................................................... 98
3.7.1 Primary and Secondary Data ........................................................................................... 99
3.7.2 Sources and Management of Literature Review .............................................................. 99
3.7.3 Research Instruments ..................................................................................................... 101
3.7.4 Questionnaire construction ............................................................................................ 102
3.7.4.1 Designing Individual Questions .............................................................................. 102
3.7.4.2 Type of Questions ................................................................................................... 102
3.7.4.3 Questionnaire Types ............................................................................................... 104
3.7.4.4 Cover Letter, Ethical Issues, Closing Page, Invitation Letter. ................................ 106
3.7.5 Instrument Validation .................................................................................................... 106
3.7.5.1 Content Validity or Face Validity ........................................................................... 107
3.7.5.2 Pre - Testing ............................................................................................................ 109
3.7.5.3 Pilot Testing ............................................................................................................ 109
3.7.6 Sampling ........................................................................................................................ 110
3.7.6.1 Population ............................................................................................................... 110
3.7.6.2 Research Site ........................................................................................................... 111
3.7.6.3 Sampling Frames .................................................................................................... 112
3.7.6.4 Sample Size ............................................................................................................. 113
3.7.6.5 Sampling Types ...................................................................................................... 113
Sutee Pheeraphuttharangkoon (2015)
The Adoption, Use and Diffusion of Smartphones among Adults over Fifty in the UK viii
3.7.6.6 Sampling Technique ............................................................................................... 113
3.7.6.7 Sample Process ....................................................................................................... 114
3.7.6.8 Questionnaire Distribution Method ........................................................................ 116
3.7.6.9 Sampling Methods Summary .................................................................................. 117
3.7.7 Analysis Methods........................................................................................................... 117
3.7.7.1 First Generation Data Analysis Techniques ........................................................... 118
3.7.7.2 Second Generation Data Analysis Techniques ....................................................... 119
3.7.7.3 Reliability ................................................................................................................ 120
3.7.7.4 Validity in PLS-SEM Technique ............................................................................ 123
3.8 Chapter Summary ................................................................................................................. 124
Chapter 4
4.1 Introduction ........................................................................................................................... 126
4.2 The Pilot Study ..................................................................................................................... 126
4.2.1 Aims of the Pilot test...................................................................................................... 126
4.2.2 Pilot Survey Questionnaire Development ...................................................................... 127
4.3 Development of Construct Measurement Questions in the Pilot .......................................... 127
4.4 Developing Support Questions for the Pilot Study ............................................................... 130
4.5 Content Validation ................................................................................................................ 135
4.6 Pilot Data Collection ............................................................................................................. 136
4.6.1 Sampling and Sample Size............................................................................................. 137
4.6.2 Online Questionnaire ..................................................................................................... 137
4.6.3 Pilot Questionnaire Distribution .................................................................................... 138
4.7 Pilot Findings ........................................................................................................................ 139
4.7.1 Demographics and Background ..................................................................................... 139
4.7.2 Smartphone, Networks, Fee ........................................................................................... 141
4.7.3 Features of Smartphones Used....................................................................................... 144
4.7.3.1 Factors Affecting Smartphone Purchase ................................................................. 147
4.7.3.2 Source of Information about Smartphones ............................................................. 148

Sutee Pheeraphuttharangkoon (2015)
The Adoption, Use and Diffusion of Smartphones among Adults over Fifty in the UK ix
4.7.3.3 Using Smartphones for Health and Well-being, and, Connecting Friends and Family
Purpose ................................................................................................................................ 150
4.7.4 Reasons for Non-Adoption ............................................................................................ 151
4.7.5 Analysis Technique ........................................................................................................ 152
4.7.6 Analysis Results ............................................................................................................. 153
4.7.6.1 Reliability ................................................................................................................ 154
4.7.6.2 Validity: Convergent and Discriminant Validity .................................................... 155
4.7.7 The Analysis Results of the Above 50 Years Old Adults .............................................. 161
4.7.8 Analysis Results for the Below 50 Years Old ............................................................... 163
4.8 Pilot Discussion .................................................................................................................... 166
4.8.1 How People Use Smartphones ....................................................................................... 166
4.8.2 Why People Adopt Smartphone..................................................................................... 168
4.8.2.1 Factors Supported by Both Groups ......................................................................... 168
4.8.2.2 The Factors Supported Only 50+ Adults ................................................................ 169
4.8.2.3 The Factors Supported Only in the Below 50 Years Old Age Group .................... 170
4.9 Limitations and Future Improvement ................................................................................... 170
4.9.1 Distribution and Length of the Questionnaire ............................................................... 170
4.9.2 Final Questionnaire Layout............................................................................................ 171
4.9.3 Construct Measurement Questions ................................................................................ 172
4.9.4 Improvement to Supported Questions ........................................................................... 175
4.10 Chapter Summary ............................................................................................................... 175
Chapter 5
5.1 Introduction ........................................................................................................................... 176
5.2 Sample Size and Sampling.................................................................................................... 176
5.3 Calculating the Response Rate.............................................................................................. 179
5.4 Demographics ....................................................................................................................... 179
5.5 Instrument Validation ........................................................................................................... 183
5.5.1 Sampling Adequacy- Kaiser-Meyer-OlKin and Bartlett’s Test ..................................... 183

Sutee Pheeraphuttharangkoon (2015)
The Adoption, Use and Diffusion of Smartphones among Adults over Fifty in the UK x
5.5.2 Reflective Measurement Model ..................................................................................... 184
5.5.3 Formative Measurement ................................................................................................ 188
5.5.4 A Structural Model ........................................................................................................ 190
5.6 Hypotheses Testing and Comparison.................................................................................... 190
Hypothesis 1: Observability has a positive influence on the behavioural intention towards
smartphone adoption – Not Supported ............................................................................... 191
Hypothesis 2: Compatibility has a positive influence on the behavioural intention towards
smartphone adoption – Supported ...................................................................................... 192
Hypothesis 3: Social Influence has a positive influence on the behavioural intention towards
smartphone adoption - Not Supported ................................................................................ 192
Hypothesis 4: Facilitating Condition has a positive influence on the behavioural intention
towards smartphone adoption – Supported ......................................................................... 192
Hypothesis 5: Performance expectancy has a positive influence on the behavioural intention
towards smartphone adoption – Supported ......................................................................... 192
Hypothesis 6: Effort Expectancy has a positive influence on the behavioural intention
towards smartphone adoption – Supported ......................................................................... 192
Hypothesis 7: Enjoyment has a positive influence on the behavioural intention towards
smartphone adoption – Supported ...................................................................................... 193
Hypothesis 8: Behavioural intention has a positive influence on the smartphone usage –
Supported ............................................................................................................................ 193
5.7 The effect of Demographic Variables as Moderated Variables ............................................ 193
5.8 Adoption: Smartphone – Descriptive Statistics of Construct Measurements ....................... 196
5.9 Smartphone Usage ................................................................................................................ 199
5.9.1 Use of Smartphones for Health Purposes ...................................................................... 205
5.9.2 Usage with Friends and Family ..................................................................................... 207
5.10 Diffusion: Source of Information about Smartphones ........................................................ 209
5.11 Plan to Use Smartphone ...................................................................................................... 211
5.12 Not Using Smartphone ........................................................................................................ 213
5.13 Chapter Summary ............................................................................................................... 215

Sutee Pheeraphuttharangkoon (2015)
The Adoption, Use and Diffusion of Smartphones among Adults over Fifty in the UK xi
Chapter 6
6.1 Introduction ........................................................................................................................... 216
6.2 Evaluation for Validation ...................................................................................................... 216
6.2.1 Evaluation Definitions ................................................................................................... 216
6.3 Evaluation Approach ............................................................................................................ 217
6.3.1 Office of National Statistics (ONS) Omnibus or Opinions Survey ............................... 217
6.3.2 The Oxford Internet Surveys (OxIS) Survey ................................................................. 218
6.4 Evaluation Analysis Method ................................................................................................. 219
6.4.1 Variables from ONS ...................................................................................................... 219
6.4.2 Variables from OxIS ...................................................................................................... 220
6.5 Evaluation Findings .............................................................................................................. 220
6.5.1 ONS findings: Smartphone Usage in the UK Using Probit Analysis ............................ 220
6.5.2 ONS findings: A Longitudinal View ............................................................................. 229
6.5.3 ONS findings: Smartphone Adoption Area ................................................................... 231
6.5.4 OxIS Findings: Predicting Smartphone Use around the UK- A Probit Analysis and
Smartphone Users ................................................................................................................... 231
6.6 Final Hypotheses Testing ...................................................................................................... 235
6.6.1 Evaluation Hypothesis Testing ...................................................................................... 235
6.6.2 Discussion on ONS and OxIS Datasets ......................................................................... 236
6.7 Discussion ............................................................................................................................. 237
6.7.1 Discussion on Research Site, Sample Size and Research methods ............................... 237
6.7.3 Discussing Technology Adoption Theories ................................................................... 239
6.7.4 Discussing Smartphone Technology.............................................................................. 243
6.7.5 Research Hypotheses ..................................................................................................... 244
6.7.5.1 Hypothesis 1 Observability has a positive influence on the behavioural intention
towards smartphone adoption – Not Supported .................................................................. 244
6.7.5.2 Hypothesis 2 Compatibility has a positive influence on the behavioural intention
towards smartphone adoption – Supported ......................................................................... 245

Sutee Pheeraphuttharangkoon (2015)
The Adoption, Use and Diffusion of Smartphones among Adults over Fifty in the UK xii
6.7.5.3 Hypothesis 3 Social Influence has a positive influence on the behavioural intention
towards smartphone adoption - Not Supported .................................................................. 245
6.7.5.4 Hypothesis 4 Facilitating Conditions have a positive influence on the behavioural
intention towards smartphone adoption – Supported .......................................................... 246
6.7.5.5 Hypothesis 5 Performance expectancy has a positive influence on the behavioural
intention towards smartphone adoption – Supported .......................................................... 247
6.7.5.6 Hypothesis 6 Effort Expectancy has a positive influence on the behavioural intention
towards smartphone adoption – Supported ......................................................................... 247
6.7.5.7 Hypothesis 7 Enjoyment has a positive influence on the behavioural intention
towards smartphone adoption – Supported ......................................................................... 248
6.7.6 Mobile phone, Smartphone Older Adults ...................................................................... 249
6.7.7 Digital Divide Discussion .............................................................................................. 251
6.8 Chapter Summary ................................................................................................................. 251
Chapter 7
7.1 Introduction ........................................................................................................................... 253
7.2 Thesis Overview & Summary ............................................................................................... 253
7.3 Reflecting on the Research Questions .................................................................................. 255
7.4 Implications and contribution ............................................................................................... 256
7.4.1 Industry .......................................................................................................................... 257
7.4.2 Academia ....................................................................................................................... 258
7.4.3 Policy Makers ................................................................................................................ 258
7.5 Limitations ............................................................................................................................ 259
7.6 Future Directions .................................................................................................................. 260
7.7 Recommendations ................................................................................................................. 261
7.8 Thesis Conclusions ............................................................................................................... 262
List of References ....................................................................................................................... 264
Appendices .................................................................................................................................. 295

Sutee Pheeraphuttharangkoon (2015)
The Adoption, Use and Diffusion of Smartphones among Adults over Fifty in the UK xiii
List of Appendices
2-1 Literature reviewed 295
3-1 Content Validation Form 317
3-2 Content Validation Results 347
3-3 Paper-based Validation Forms (Photos) 359
4-1 Original Construct Measures 357
4-2 Pilot Survey Questionnaire 359
5-1 Final Survey Questionnaire 376
5-2 Final Survey Cover Letter 392
5-3 Final Survey Closing page 392
5-4 Ethics form 393
5-5 Ethics Approved Confirmed 400
5-6 Final Survey Sampling List 401
5-7 Final Survey Invitation Letter 403
5-8 Final Survey Invitation Letters (Photo) 404
5-9 Survey Distribute Track 405
5-10 Process of finding moderated variable 406
5-11 Results from SmartPLS for finding Moderated variables 414
6-1 OxIS and ONS Probit Analysis Variable Specification 484
6-2 Evaluation ONS Variables 481
6-3 Evaluation OXiS Variables 486

Sutee Pheeraphuttharangkoon (2015)
The Adoption, Use and Diffusion of Smartphones among Adults over Fifty in the UK xiv
List of Tables
Table 1.1 Dissertation Outline 32
Table 2.1 Differences between Android and IOS source 39
Table 2.2 Features of smartphones 42
Table 2.3 Some ailments that affect mainly older people. 47
Table 2.4 Related literature using TAM 58
Table 2.5 Related literature using TAM and 50+ adults 61
Table 2.6 Related literatures used UTAUT 71
Table 2.7 Related literature used UTAUT and 50+ adults 74
Table 2.8 MOSA Construction Definition 79
Table 2.9 Related literature used demographic variable as moderator variables 89
Table 3.1 Content Validation – Expert Panel 107
Table 3.2 Survey Pretest Validation Panel 109
Table 3.3 Population of London, North London and Hertfordshire 112
Table 3.4 The random numbers from MS Excel 115
Table 3.5 Selected Sample Methods and Sizes 117
Table 3.6 Summary of Reliability Estimates 121
Table 3.7 Interpretation of Cronbach's Alpha (α) 121
Table 3.8 Reliability Check from PLS-SEM technique 122
Table 3.9 Validity Check from PLS-SEM technique 124
Table 4.1 Content Validation – Expert Panel 135
Table 4.2 Survey Pretest Validation Panel 136
Table 4.3 The profile of Respondents: gender, age group, education and area 139
Table 4.4 The profile of Respondents: Employment status and occupation 140
Table 4.5 The profile of Smartphone, network and fee used and pay by respondents 142

Sutee Pheeraphuttharangkoon (2015)
The Adoption, Use and Diffusion of Smartphones among Adults over Fifty in the UK xv
Table 4.6 Features of a smartphone used by respondents 146
Table 4.7 Factors that consider when buying a smartphone 148
Table 4.8 Source of information about a smartphone 149
Table 4.9 Overview of all age groups 154
Table 4.10 Cross Loading of all age groups 156
Table 4.11 Construct Cross-Correlation Matrix and AVE analyses 157
Table 4.12 Conclusion of the Hypothesis tests of all age groups 161
Table 4.13 Conclusion of Hypothesis test of over 50 age groups 163
Table 4.14 Conclusion of Hypothesis test of below 50 age groups 164
Table 4.15 Comparison of the Hypothesis between the Over 50 and Below 50 age
groups
165
Table 4.16 Construct Measurement Questions on Pilot and Final 173
Table 5.1 Population of sample area in North of London 178
Table 5.2 Socio-demographic Summary - Gender, Age, Education, and Area 180
Table 5.3 Socio-demographic Summary - Ethnicity, Employment and Occupation 181
Table 5.4 Socio-demographic Summary - Health status 183
Table 5.5 KMO and Bartlett’s Results 184
Table 5.6 Cross-correlations, Item loadings, Average variance Extracted (AVE),
Composite Reliability (CR), R-squared and Cronbach’s Alpha (CA) of the research
model. The diagonal elements in bold in the cross-correlations matrix are the square
root of the AVE
185
Table 5.7 Factor loadings table 186
Table 5.8 List of items or indicators 187
Table 5.9 Hypothesis, Path coefficients, t-value, Significant and hypothesis support 189
Table 5.10 Hypotheses testing results: Comparison 191
Table 5.11 Significant moderator variables 195
Sutee Pheeraphuttharangkoon (2015)
The Adoption, Use and Diffusion of Smartphones among Adults over Fifty in the UK xvi
Table 5.12 Construct Measurement Results 196
Table 5.13 Lengths of using smartphones 199
Table 5.14 The profile of Smartphone, network and fee used and pay by age groups 200
Table 5.15 Length of time allows users to familiar with their smartphones 201
Table 5.16 Smartphone usage: Features of smartphones 202
Table 5.17 Features of a smartphone used by respondents 203
Table 5.18 Smartphone on well-being or health usage by age 205
Table 5.19 Smartphone on well-being or health usage by gender 207
Table 5.20 Using smartphones with friends and family by age group 208
Table 5.21 Using smartphones with friends and family by gender 209
Table 5.22 Feature considered when buying a new smartphone 210
Table 5.23 Communication channel 211
Table 5.24 Reason for planning to adopt and use smartphones 212
Table 5.25 Reasons on not use smartphones 213
Table 5.26 Factors may encourage future use of the not use smartphone group 214
Table 6.1 Probit Regression: ONS 2010 Wave 221
Table 6.2 Smartphone adoption by age from the ONS 2010 Wave 221
Table 6.3 Probit Regression: ONS 2011 Wave 222
Table 6.4 Smartphone adoption by age from the ONS 2011 Wave 223
Table 6.5 Probit Regression: ONS 2012 Wave Test 1 224
Table 6.6 Probit Regression: ONS 2012 Wave Test 2 225
Table 6.7 Smartphone adoption by age from the ONS 2012 Wave 226
Table 6.8 Probit Regression: ONS 2013 Wave 227
Table 6.9 Probit Regression: ONS 2013 Wave (50+ only) 228
Sutee Pheeraphuttharangkoon (2015)
The Adoption, Use and Diffusion of Smartphones among Adults over Fifty in the UK xvii
Table 6.10 Smartphone adoption by age from the ONS 2013 Wave 229
Table 6.11 Smartphone adoption by area from the ONS 2013 Wave 231
Table 6.12 Probit Regression: OxIS 2007 Wave 232
Table 6.13 Probit Regression: OxIS 2009 Wave 233
Table 6.14 Probit Regression: OxIS 2011 Wave 234
Table 6.15 Hypotheses Testing: Evaluation 236
Table 6.16 Discussion Research Site and Sample Size to Existing Literatures 237
Table 6.17 Discussion Research, Theory and Technology to Existing Literatures 239
Sutee Pheeraphuttharangkoon (2015)
The Adoption, Use and Diffusion of Smartphones among Adults over Fifty in the UK xviii
List of Figures
Figure 1.1 Number of smartphone owners from 2012 – 2014 28
Figure 1.2 Distribution of face time across device platforms 28
Figure 1.3 Thesis Structure Flow Diagram 34
Figure 2.1 Factors determine individuals’ behaviour in TRA 57
Figure 2.2 Technology Acceptance Model 57
Figure 2.3 Theory of Planned Behaviour 63
Figure 2.4 Decomposed Theory of Planned Behaviour version 1 66
Figure 2.5 Decomposed Theory of Planned Behaviour version 2 67
Figure 2.6 Technology Acceptance Model 2 68
Figure 2.7 Unified Theory of Acceptance and Use of Technology 70
Figure 2.8 Technology Acceptance Model 3 75
Figure 2.9 Unified Theory of Acceptance and Use of Technology 2 76
Figure 2.10 Proposed conceptual framework - Model of Smartphone Acceptance
(MOSA)
81
Figure 3.1 Research Process ‘Onion’ 92
Figure 3.2 Flow Chart of Questionnaire Design to Final Data Analysis 102
Figure 3.3 The example of question in Content Validation of the Questionnaire form 105
Figure 3.4 Map of London, England, the UK 111
Figure 3.5 Sample sizes for different sizes of population at a 95 confidence level 115
Figure 4.1 Pilot questionnaire Layout 131
Figure 4.2 Feature used by respondents, overall 145
Figure 4.3 Feature used by respondents, under 50 year old group 145
Figure 4.4 Feature used by respondents, over 50 year old group 146
Figure 4.5 How smartphones help with well-being or health, overall. 150

Sutee Pheeraphuttharangkoon (2015)
The Adoption, Use and Diffusion of Smartphones among Adults over Fifty in the UK xix
Figure 4.6 How smartphones help with bring friends and family closer, overall. 151
Figure 4.7 Reasons for not using smartphones, overall 152
Figure 4.8 PLS Results of Measurement and Structural Models of all age groups 155
Figure 4.9 Bootstrap Results of the Measurement and Structural Models of all age
groups
159
Figure 4.10 Evaluation of Structural Model of all age groups 160
Figure 4.11 Evaluation of Structural Model of over 50 age groups 162
Figure 4.12 Evaluation of Structural Model of below 50 age groups 165
Figure 4.12 Final Questionnaire Layout 172
Figure 5.1 Map of London, England, the UK 177
Figure 5.2 Bootstrap results from SmartPLS 189
Figure 5.3 Conclusion of the Hypothesis on Research Model 190
Figure 5.4 Conceptual framework with moderated variables – education and
experience
195
Figure 5.5 compares the smartphone features use 205
Figure 6.1 Graph, compare number of smartphone users from ONS survey 2010-2013 230
Sutee Pheeraphuttharangkoon (2015)
The Adoption, Use and Diffusion of Smartphones among Adults over Fifty in the UK xx
List of Abbreviations
DoI Diffusion of Innovation
ICTs Information Communication Technologies
IS Information Systems
IT Information Technology
PLS Partial Least Squares
SEM Structural Equation Modelling
TAM Technology Acceptance Model
UTAUT Unified Theory of Acceptance and Use of Technology
Ofcom The Office of Communication (UK)
OxIS Oxford Internet Surveys- University of Oxford
WOM Word of Mouth
PDA Personal Digital Assistant
3G The third generation of mobile phone standards
4G The fourth generation of mobile phone standards
4G LTE The fourth generation of mobile phone standards, Long Term Evolution

Sutee Pheeraphuttharangkoon (2015)
The Adoption, Use and Diffusion of Smartphones among Adults over Fifty in the UK xxi
WiFi Wireless connection technology under IEEE 802.11 standard
GPS Global Positioning System

Sutee Pheeraphuttharangkoon (2015)
The Adoption, Use and Diffusion of Smartphones among Adults over Fifty in the UK xxii
Publications
Choudrie, J., Pheeraphuttharangkoon, S., Zamani, E., and Giaglis, G (2014).
“Investigating the Adoption and Use of Smartphones in the UK: A Silver-Surfers
Perspective”. ECIS 2014, Tel Aviv, Israel.
Pheeraphuttharangkoon, S. and Choudrie. C (2012) “Silver Surfers adoption, use and
diffusion of smartphones: an SME perspective”. International Conference on Information
Resource Management Conf-IRM 2012 Proceedings.

Sutee Pheeraphuttharangkoon (2015)
The Adoption, Use and Diffusion of Smartphones among Adults over Fifty in the UK 23
Chapter 1 Introduction 1.1 Introduction
This chapter provides an introduction to this research study, where Section 1.2 provides a
background of the research and the research problem. Included in this section is also a
description of the current situation of smartphones penetration, and the situation with older adults
and Information Communication Technologies (ICTs). Section 1.3 then presents the aims,
objectives and research questions surrounding this research. Thereafter, the research scope and
research approach are provided in section 1.4. Next, a research contribution is proffered in
section 1.5. In section 1.6, a brief description of the research approach pursued is given. To
familiarise the readers with the contents and format of this research, a dissertation outline, and a
Thesis Structure Flow is specified in section 1.7. Finally, a summary of this chapter is in section
1.8.
1.2 Research Problem and Background
In the last decade, Information and Communication Technologies (ICT) have significantly
developed and proliferated society and organizations alike. For those unfamiliar to the term, the
United Nations Development Programme (UNDP) (2003) defined ICT as: “ICTs are basically
information-handling tools – a varied set of goods, application and services that are used to
produce, store, process, distribute and exchange information”. Rouse (2005) suggested that ICT
is an umbrella term that includes any communication devices or applications. The term ICT also
covers mobile phones, computers, tablet devices, and network hardware and software. The
development of ICT has provided benefits for many sectors of society such as in business,
education and personal life (Condie & Munro, 2007; Galloway et al., 2004; Line et al., 2011;
Selwyn et al., 2003). These technologies provide benefits to users in the form of accessibility and
management of information in a faster and easier manner. Having introduced the main device of
interest to this dissertation, the following section will explain the research background that led to
the research problem and motivation of this research. The following sub-section will initially
explain and understand the role of older adults when adopting and using ICTs, mobile phones
and smartphones.
1.2.1 Older Adults (50+)
Older population, older adults, 50+ adults or Silver Surfer are the terms frequently used in
this research. The term older adult in this research refers to individuals age 50 years and older
(Netlingo, 2010). There are many other terms that have been used to refer to this demographic

Sutee Pheeraphuttharangkoon (2015)
The Adoption, Use and Diffusion of Smartphones among Adults over Fifty in the UK 24
group of society such as, senior citizen, the young-old, older adults, pre-seniors or pre-retirees.
The different words present the variance when employing this term. For example, individuals
who are 50-64 years old are referred to as pre-seniors or pre-retirees, while the young-old are
those who are aged 65-74 years old (Lee et al., 2011). Note: This research will focus on older
adults aged 50+ adults who are also known as silver surfers. As the Cambridge Dictionary
Online (2015) states: “A silver surfer is a person aged over about 50 who uses the internet”.
It has been found that, due to advances in medicine and improvements to the quality of life and
well-being, countries around the globe are facing the prospect of an ageing population (UN
DESA, 2009). In the UK, currently more than 16.4% of the population is aged 65 years old and
above and around 40% is older than 45 years old (Office for National Statistics, 2012a; The
Telegraph, 2012). Therefore, regarding the size and the trends of this older generation, this group
should be considered as one of the important research areas.
Moreover, this demographic group is not only approximately 30% of the overall population in
the UK, but also a wealth holding group and a group that is viewed to be more affluent than the
younger individuals of society (Censky, 2011). Soule et al (2005) reported that the sources of
older adults income are different from those of the younger generation. Over 80 % of 50-59
older adults’ income is from employment and self-employment, while for the 70+ adults, 80% of
their income is from both state and private pensions. Therefore, for those who are aged more
than 70 years old, income may be considered as a limitation (Soule et al., 2005).
Contrastingly, due to the improvements in the quality of life, economic conditions within
families, some older adults are still working or becoming entrepreneurs; thereby owning and
managing their own enterprises (Meyer, 2013). A report from AgeUK found that one in six
people of 50 to 55 years is in employment (Soule et al., 2005). On the other hand, due to an
increase in life expectancy and increases in income, older adults can enjoy their later life by
partaking in a range of leisure and travel activities (Soule et al., 2005).
However, as adults age, they may face physical or cognition difficulties. Older adults may have
disorders such as diabetes, loss of muscle mass, osteoarthritis, poor vision, sciatica and stroke
(Medicinenet, 2014; Besdine, 2013). Further details on these disorders can be found in chapter 2.
Due to the physical ailments, older adults may face difficulties in their work place such as,
negative attitudes from managers and colleagues on an inability to adapt to new technologies or
resistance to change (Tishman et al., 2012). Moreover, older people may have mental illnesses,
loneliness and social isolation (NHS, 2013a).
Due to the physical ailments and mental illnesses such as worsening vision, loss of muscle mass
and Parkinson’s disease, older adults may face difficulty using some technologies such as mobile

Sutee Pheeraphuttharangkoon (2015)
The Adoption, Use and Diffusion of Smartphones among Adults over Fifty in the UK 25
phones (Kurniawan, 2008). However, mobile phones could help older adults in many ways such
as providing them with a sense of security because they could seek assistance in cases of
emergency, or reduced isolation by connecting them to their friends and family (Kurniawan et
al., 2006). Older adults could also use ICT such as laptop or desktop to access information that
they require. For example, ICT could provide information about older adult health disorders.
Having identified that ICT can provide benefits to older adults and older adults’ health, cognition
and/or mental wellbeing which can deteriorate as ageing occurs, the next section assesses the
situation with regards to ICT and older adults.
1.2.2 Older Adults and ICT
Having explained the increase in older adults and their importance in society, this section will
understand the importance older adults have in the ICT sector.
When considering the numbers of older adults using ICTs, it has been found that there are fewer
older adults, particularly the 65 years old and above adults who have access to the internet than
the younger generations. However, their numbers are rapidly increasing (Age UK, 2011). In the
United Kingdom (UK), the Office of National Statistics (ONS) (2012b), estimated that 36% of
single 65+ and 69% of older couples (where at least one person is aged 65+) have internet access
(Green & Rossall, 2013). Having such disparities, this leads to the question, why or what are the
reasons for there being fewer older adults in comparison to the younger generations?
Green and Rossall (2013) listed the influencing factors of internet adoption among older adults
(65+) as being age, income, household composition, self-perceived health status, gender,
mobility, Asian ethnicity, memory or ability to concentrate. Additionally, it has been found that
older adults do not accept new ICT due to the obstacles such as, cost of the devices, a lacking of
user friendly of the devices, unfamiliarity of the new devices, and, resistance to change facing
the new technology (Age UK, 2011). Green and Rossall (2013) also provided reasons for not
using the internet such as, perceived lack of need, lack of awareness, negative experience with
computer, skill and training, practicality and concerns about privacy and security.
Therefore, it can be seen that older people may need assistance when attempting an ICT for the
first time, but some may require help continuously or reassurance when accepting or using new
technologies (Age UK, 2011).
In the UK, there are several projects that are seeking to ensure that older adults do accept and
utilise ICT (Age UK, 2011). Examples and campaigns emphasised on older adults and ICT are as
follows:
Digital United’s Silver Surfer day: National Adults Learners’ week and Age
UK’s ITea and biscuits and my friend’s online weeks from Age UK.

Sutee Pheeraphuttharangkoon (2015)
The Adoption, Use and Diffusion of Smartphones among Adults over Fifty in the UK 26
The Moose in the Hoose Project from Age Concern Edinburgh
EverybodyOnline Programme from Citizens Online with 23 sub-projects
Connecting Milton Keynes project by Milton Keynes Council and Microsoft
Keeping IT in the Family in Birmingham
British Telecom (BT) Internet Rangers that support young people to help older
generation to get online
Digital Mentor Programme from UK Government by Media Trust
The above projects aim to encourage and help older adults to use more technology and they also
illustrate that UK is a country that is seeking to address the problems of ageing and is actively
pursuing initiatives to close the digital gap between older and younger generations. However, as
explained earlier, some older adults are still not using ICT. The next issue is about how older
adults are using the technology and what the benefits are.
A recent study showed that the main functions of mobile phones for older adults are to enable
them to connect cheaply, to their friends and family (Age UK, 2011). Other functions are
sending/receiving emails, finding information and using services for travel and accommodation
(Age UK, 2011). In other word, technology is being used to reduce loneliness and isolation in
older adults. Other benefits offered are, providing health and well-being information and
accessing public services (Green & Rossall, 2013).
At the beginning of this section, it was suggested that firstly, older people are lagging behind in
terms of new technologies usage. Secondly, 50+ adults could require assistance when starting to
use a new technology. Thirdly, the UK has provided several projects and campaigns to
encourage and support older adults to use ICT. Finally, this section explained that ICT can
benefit older adults in many ways and how some older adults are using ICT. Having assessed the
older adult and ICT situation, the next section will explain the second element of this research
study, which is the device of concern, smartphone devices.
1.2.3 Smartphones and Mobile Phones
For this research study, the device of emphasis is the smartphone. However, before delving into
any descriptions of the devices, an introduction to their functionality and background is
provided.
Before the smartphone era, mobile phones were important for communication. Mobile phones
are devices that could be used wirelessly in wide areas by providing connections to cellular
systems via radio waves (Chang et al., 2009; Oxford Dictionaries, 2014). The basic features of
mobile phones are voice communication and simple services such as Short Message Service
(Min et al., 2009; Patel et al., 2011). Mobile phones have continuously been developed by

Sutee Pheeraphuttharangkoon (2015)
The Adoption, Use and Diffusion of Smartphones among Adults over Fifty in the UK 27
increasing capacity and ability. Mobile phones are the predecessors of smartphones, which is the
technology focused on in this research.
A Smartphone is defined as a mobile device or mobile phone that allows users to make
telephone calls, sends and receives emails, downloads files, provides an internet connection and
uses applications. It usually has a touchscreen interface, and an operating system capable of
running downloaded apps (Verkasalo et al., 2010; Aldhaban, 2012; Yuan, 2005;
MobileSQUARED, 2010; PCMag.com, 2013; Oxford Dictionaries, 2013a; Park & Chen, 2007;
Osmana et al., 1814). Current examples of smartphone brands are the Apple iPhone, Samsung
Galaxy phones, that proffer operating systems such as, Windows Phone or Android Operating
Systems (Verkasalo et al., 2010).
Currently, a smartphone is one of the expedited developing novel technologies, which was
initially introduced to individuals in 1996, and since then has proliferated daily life. Smartphones
can benefit users by providing instantaneously and in a real time environment, information and
knowledge on entertainment, travel, finance, healthcare, lifestyle, photography and social
networks (Xu et al., 2011). Since their introduction, there are an estimated one billion
smartphones in the consumer market, with an expected rate of penetration to reach two billion in
2015 (Rushton, 2012). As shown in figure 1.1, in the United Kingdom (UK), the numbers of
smartphone owners have been increasing continuously from 39% in 2012 to 61% in 2014. What
is also indicated is that there are gaps between the older adults and adults in general. In 2014,
14% of the 65+ population owned smartphones compared with 39% of 55-64 and 72% of 35-54
age groups (Ofcom, 2014). The gaps were slightly larger in 2012 and 2013. It has also been
suggested that the direction of smartphones growth is increasing and not declining around the
globe (IDC, 2013). This leads to the question: Why are older adults adopting fewer smartphones
compared with other groups and what are the reasons for some older adults using smartphones,
and not others?
A global study during 2008-2009 found that users using different mobile operating systems have
varying usage differences (Verkasalo, 2010). The overall services provided by smartphones are
shown in figure 1.2. When considering the brand types of smartphones and their uses,
Blackberry users seem to use more email service than others. Symbian S60 is preferred due to its
being a better device when employing multimedia. Android users spend more time browsing the
mobile internet. In terms of the adoption gaps of email and map services, it was found that there
are wide variations. What was also discovered is that gaming, video, instant messaging and VoIP
obtained a low level of usage. When considering the satisfaction of users it was found that the
longer time a user spent on using email services, the greater the dissatisfaction. This was

Sutee Pheeraphuttharangkoon (2015)
The Adoption, Use and Diffusion of Smartphones among Adults over Fifty in the UK 28
attributed to a poor keypad function, small screens and the push mail facility-rapidly transmitted
emails (PC Mag, 2014).
Figure 1.1 Number of smartphone owners from 2012 – 2014 (Ofcom, 2014)
Figure 1.2 Distribution of face time across device platforms (Verkasalo, 2010)
When considering the usage of the operating systems of smartphones Android and Windows , it
was found that that there are diversities in many ways such as, hours per day, time between
using sessions and using patterns (Falaki et al., 2010). A popular smartphone brand type, Apple
iPhone and socio economic status were also studied and it was found that there is a positive
influence on usage patterns (Rahmati et al., 2012). From the previously mentioned research and
reports, it can be seen that smartphone usage is diversified. The usage pattern can be influenced

Sutee Pheeraphuttharangkoon (2015)
The Adoption, Use and Diffusion of Smartphones among Adults over Fifty in the UK 29
by many factors such as, smartphones brands, or age of users. It can also be implied that other
factors such as, time, money, knowledge and experience can also influence a smartphone usage.
Therefore, the question that motivated and encouraged this research was the question: What are
the factors that influence older adults to use their smartphones?
From previous explanations, it can be learnt that smartphones with advanced technology have
played an important role in assisting older adults in operating their businesses or assisting their
daily livelihoods (Is4profit, 2010). Moreover, smartphones are viewed to assist business owners,
including the older population to increase their quality of life (Kurniawan, 2006). , Smartphones
as an ICT can help older adults to reduce loneliness and isolation, and to improve their health
and well-being (Green & Rossall, 2013). These reasons further encouraged this researcher to
pursue this research study.
Having ascertained that due to a better quality of life, advances in medicine and benefits of
technology for health and wellbeing becoming emphasised, there is an older adult population that
is increasing; however, not all the older adults are accepting and using the ICT, a research gap
was identified and motivated this researcher. In the next section, the aim and objectives of this
research study are provided.
1.3 Research Aim, Objectives and Research Questions
Having identified that older adults are not readily accepting smartphones and that there are
reasons for this, a gap of research and a motivation to reduce or eliminate it was formed. This led
to the formation of an aim. The aim of this research was formed to be: To identify, examine and
explain the adoption and usage of smartphones in the UK within the 50 years old and above
population.
To fulfil the aim, the following objectives were developed:
1. A comprehensive and detailed literature review of smartphones, silver surfers,
technology adoption and usage was completed in order to gain an understanding of these
areas. The knowledge also led to confirming the existence of a research gap.
2. After gaining the theoretical knowledge, a theoretical and conceptual framework
was developed. The knowledge from the literature review on technology adoption
including IS theories in the field helped in identifying the factors that are likely
applicable to this research. Thereafter, the hypotheses and conceptual framework were
formed.

Sutee Pheeraphuttharangkoon (2015)
The Adoption, Use and Diffusion of Smartphones among Adults over Fifty in the UK 30
3. The literature review also assisted in identifying an appropriate research
methodology. The questions in the form of constructs were drawn and adapted from the
previous studies. However, to ensure that the theoretical constructs could be employed to
real life situations, the questions were validated by an expert panel consisting of
specialists in the related fields.
4. The expert panel approved questions were used in the pilot phase within a small
sample population. The pilot group included all ages in order to confirm that diverse age
groups display different behaviours when using smartphones.
5. Following the recommendations and errors detected in the pilot phase, an
improvement was made to the conceptual framework and the questionnaire utilised for
the final phase. The final phase was conducted within only on the silver surfers group in
order to gain an understanding of specifically, this demographic group and to fulfil the
research aim.
6. The obtained results were then assessed in terms of validity and reliability. After
that they were interpreted to derive the novel knowledge. The results were also compared
with the research from other institutes or organizations in order to identify its novelty and
to confirm the results.
7. The last objective was to offer a conclusion based on the end results of the final
phase. Moreover, the implications, contributions, limitations and future direction were
provided.
Research Questions
To further understand this research, several research questions were formed:
Research Question 1: What attitudinal, normative and control factors significantly affect silver
suffers when adopting smartphones?
Research Question 2: What are the features of smartphones that silver surfers used and their
frequency?
Research Question 3: What are the channels of communication that influence the diffusion of
smartphones within silver surfers?
1.4 Research Scope
Before considering the research scope, a reminder to the reader is made of the research areas of
this research study, which are Smartphones and older adults (50+). This suggests that the final

Sutee Pheeraphuttharangkoon (2015)
The Adoption, Use and Diffusion of Smartphones among Adults over Fifty in the UK 31
results will emphasis only the 50+ adults who DO use or DO NOT use smartphones. Thus, both
the social and technical factors affecting adoption and usage will be investigated. However, the
questions for this study will avoid using technical questions associated with smartphones,
adoption, and use behaviour’s. Furthermore, this research will not focus upon commercial or
marketing issues.
In terms of the context of this research, this research study is based upon the United Kingdom
(UK). For those unfamiliar to the area of the country, or its population, the UK has a total area of
244, 820 km², and consisting of several countries including, England, Wales, Scotland (Great
Britain) and Northern Ireland. The UK has a population of 61.7 million people. In terms of
economic strength, the UK is one of the largest economies of the EU, where most of its wealth is
accumulating from increasingly services provided in the economy, although it also maintains
industrial capacity in the high-technology and other sectors.
The City of London, which is the capital of England, is a world centre for financial services
(Europe.eu, 2014). Since the UK is an important nation of consideration and the researcher is
based in the UK, this research study was undertaken in the UK, more importantly, in the
Northern part of the city of London.
1.5 Research Contributions
Although smartphones or their features have been studied in several research studies as found
from the literature review of chapter 2, this research also provides unique contributions, which
are as follows:
1) For academia, more novel theory focused on the adoption and usage of smartphones, but
within an under-researched age group, the silversurfers will be produced. Academic
contributions will also be achieved from the conceptual model.
2) This research will also benefit industry-the smartphone providers and manufacturers as they
will understand the needs and requirements of older adults, or silversurfers in a better manner.
For example, the results may lead to special requirements in terms of software, hardware and
operating systems. The results may also lead to certain applications that are needed by the older
adult population and will eventually benefit software developers.
3) For government or policy makers, the findings can be used as a policy guideline to support
and help UK the needs and requirements of the older adult population.
Sutee Pheeraphuttharangkoon (2015)
The Adoption, Use and Diffusion of Smartphones among Adults over Fifty in the UK 32
1.6 Research Approach
Based on the descriptions of the aim and objectives, this research developed knowledge based on
the Information System (IS) existing researches and theories. This implies that the researcher
believes in the Positivist philosophy, which is that the smartphone adoption factors and usage
can be observed in this world. Moreover, this research intends to generalise the smartphone
adoption phenomenal among older adults. When considering the research approaches, the
deductive approach is being used. A deductive approach includes developing a theory and
testing the developed theory (Saunders et al., 2009) in order to fulfil the aim of this research.
Therefore, this research will initially gain an understanding of the smartphone phenomenon
using a literature review and then create a conceptual framework. The benefit of the framework
is viewed to be formed from the explanations that are available from the diagrammatic format
with illustrations of the key factors, constructs, variables and the relationships among them
(Miles & Huberman, 1994a). The factors were derived from IS theories that were identified in
the literature review chapter.
The data that was obtained for this research was quantitative (based on numbers) in nature and
acquired using a survey strategy. The strategy was used because of the benefits of, convenience,
cost, less time consuming and accessibility (Gilbert, 2001). The survey was completed manually
and online in order to gain the maximum numbers of responses. After collecting the data, it was
analysed using the software, SmartPLS and the technique, Partial Least Squares Structural
Equation Modelling (PLS-SEM). The PLS-SEM technique was applied because the technique
provides a complete result in one analysis phase and it is a popular technique within the subject
of business studies (Hair et al., 2011).
1.7 Dissertation Outline
Having described this research study aims, its contributions and research method, this section
informs readers by providing an overview in textual terms, which is detailed in Table 1 below.
Table 1.1 Dissertation Outline
Chapter Content
1. Introduction This first chapter provides an overview of this dissertation. It
begins with an introduction of the chapter and a background of this
research that illustrates the important of this study. Next, the aims
and objective, research questions and Scope of Study are provided.
Then, to inform readers of how the research was achieved, the
Research Approach is explained. The Research contributions then
follow where the benefits of this research are provided. Finally, the
research outline and summary of this chapter are provided to in

Sutee Pheeraphuttharangkoon (2015)
The Adoption, Use and Diffusion of Smartphones among Adults over Fifty in the UK 33
order to familiarise readers to this research.
2. Literature Review and
Conceptual Model
The second chapter provides a literature review that includes
reviews of previous older adults, smartphones, and the digital
divide studies. The chapter also assesses the theoretical
foundations for the conceptual framework that is built on the
theories of Diffusion of Innovation, Technology Acceptance
Model and Unified theory of acceptance and use of technology.
Other previous relevant research is also reviewed in this section.
Then, the conceptual model of this study is illustrated and
explained.
3. Research Methodology The third chapter explains the relevant aspects of the research
methodology of this research study. The reasons for selecting the
research philosophy, approach, strategy, time horizon, techniques
and procedures are provided.
4. Development of
Instrument and Pilot
Study
This chapter describes the constructs, analysis and findings of the
pilot phase or exploratory phase. This phase assisted in improving
the final questionnaire.
5. Research Findings The fifth chapter presents the main and final finding from a large
scale questionnaire conducted in the North of London area. The
chapter includes the results in terms of the theories of adoption and
usage. The hypothesis are also tested and discussed in this chapter.
This is followed by other important findings.
6. Evaluation and
Discussions
This chapter provides an evaluation and discussion of the research
findings. The first half of this chapter uses national datasets
obtained from two sources in order to evaluate the research
finding. This assists in illustrating some of the conditions that are
evident within the national datasets when impacting older adults.
The second half of this chapter discusses the research findings of
this research by comparing them with the existing works that were
obtained in the literature review.
7. Conclusions This last chapter provides summaries of the research findings.
Then, it provides a conclusion to this research as well as the
research contributions, and implications of this research. The
chapter also discusses the research limitations and
recommendations, and offers future directions in the field of the
older adults’ smartphones and technology adoption research.
To illustrate the text above, the following summary map is provided.

Sutee Pheeraphuttharangkoon (2015)
The Adoption, Use and Diffusion of Smartphones among Adults over Fifty in the UK 34
Chapter1Research Problem
Research Aim and ObjectivesResearch Scope
Research ApproachDissertation Outline
Chapter2Literature Review
Theoretical BackgroundDevelop Theoretical and Conceptual Model
Hypotheses Development
Chapter3Develop Research Methodology
Chapter4Conduct pilot phase test
Develop Final Research Instrument
Chapter5Data Collection and Analysis
Present Research FindingValidated Final Conceptual Model
Chapter6Evaluation and Discussions
Chapter7Conclusions
Research ImplicationResearch Contributions
Research LimitationFuture Research Directions
Figure 1.3 Thesis Structure Flow Diagram
1.8 Chapter Summary
Having introduced the main concepts and ideas associated with this research study, this chapter
draws to a close. However, to summarise, this introductory chapter initially provided the
background of this research, including the research motivation and problems. The aims,
objectives and scope of this research were then explained. The overview of the pursued research
approach was also proffered. The research outline then explained the structure and contents of
this research.
In the objectives of this research, a literature review was mentioned, which the next chapter
provides. The next chapter also provides reviews of the previous literature studies that are related
with this research. The selected IS theories that assisted in developing the conceptual framework
Sutee Pheeraphuttharangkoon (2015)
The Adoption, Use and Diffusion of Smartphones among Adults over Fifty in the UK 35
are also provided in the same chapter. This is then followed by a description and illustration of
the conceptual framework and hypothesis.

Sutee Pheeraphuttharangkoon (2015)
The Adoption, Use and Diffusion of Smartphones among Adults over Fifty in the UK 36
Chapter 2- Literature review & Conceptual
Theoretical Development
2.1 Introduction
In this chapter, the literature review & conceptual theoretical development will provide further
definitions of terminology used in this research and provide a critique to the literature related to
the main elements of this research: older people, technology adoption, technology diffusion,
technology usage, and smartphones.
Reviewing the relevant theories and previous research on the main elements of this research
leads to a further understanding of adoption, use and diffusion and to select the best possible
theories to form the conceptual framework applied to this research. A literature review can also
help in terms of determining a suitable research methodology for this research. To familiarise
readers to the structure of this chapter the following is provided. In section 2.2, a literature
review on smartphone technologies, a history of smartphones, smartphone features and usage,
older adult and technologies, and digital divide and older people is presented. Section 2.3
reviews the theories of technology adoption associated with this research. In section 2.4, the
theoretical and conceptual framework of this research is provided. Section 2.5 is a summary of
this chapter.
2.2 Literature Review
When considering the theoretical foundations of older adults and smartphones, gaps that exist
within the older generation research, the digital divide, mobile phones and smartphones were
initially identified. This was then followed by considering the theoretical foundations of the
conceptual framework that was developed for this research study.
Searching carefully across academic journals, conference publications, technology websites and
books, this research discovered that over 150 related articles were associated with the terms (See
appendix 2-1). The main elements that will be reviewed in this section are smartphones
technology, older adults, the digital divide and technology adoption. The explanations for the
process followed to provide the literature search are provided in chapter 3 section 3.7. Also
included in chapter 3, section 3.7 is details about the keywords, databases, search engines, and
duration of articles.

Sutee Pheeraphuttharangkoon (2015)
The Adoption, Use and Diffusion of Smartphones among Adults over Fifty in the UK 37
2.2.1 Smartphone Technology
As the main device of interest to this study is the smartphone, which was described in chapter 1
as an advanced form of a mobile phone, the following discussion on its background is provided.
A mobile phone (Oxford Dictionaries, 2014) is a telephone without a physical connection to the
network; therefore, it can be used over a wide area. When considering the mobile phone, it can
be learnt that the history of mobile telephony dates back to the 1920s (Dunnewijk & Hultén,
2007). The first cellular phone system was introduced in 1979 and commercialized in 1983
(Agar, 2013). When considering the development of mobile phones, the first period of mobile
phone development refers to mobile phones developed for cars in Boston and New York (Agar,
2013).
In the previous paragraph, mobile phone development was explained in the North American
continent context. In Europe, Sweden was one of the first countries to adopt mobile systems, but
when considering Sweden, it can also be noted that for its mobile phone development, also
developed was a standard named the Nordic Mobile Telephone. The standard allowed the
possibility for roaming, and the ability for a cellular customer to automatically use his/her mobile
phone outside the home network, and since 1982, in other European countries such as, Finland,
Sweden, Norway, Denmark and Iceland (Dunnewijk & Hultén, 2007).
When considering mobile phone development, standards also need to be considered, which are
explained hereafter. In the United Kingdom (UK), which is the context of this research, a mobile
network was initially developed in 1985 when the government licensed two national operators,
Cellnet and Racal-Vodafone to provide radio services (Ofcom, 2011c). At that time, several
countries developed their own mobile standards such as, Nippon Telephone and Telegraph
(NTT) by Japan; a C450 standard in Germany, and in the United States of America (USA), an
American standard Advanced Mobile Phone system (AMPS) (Dunnewijk & Hultén, 2007).
To prevent problems across various countries and to prevent further confusion, in 1982, a Global
System for Mobile Telecommunications (GSM) was introduced to standardize the mobile
telephone technology in Europe (Pelkmans, 2011). In 1987, thirteen European countries signed a
memorandum to initialize the GSM network. This GSM network along with mobile phone
manufacturers such as, Motorola, Ericsson, Nokia, Siemens and Alcatel provided great
contributions to mobile phone systems sector; thereby leading to more advanced technology
(Dunnewijk & Hultén, 2007).
When studying mobile telephones the term and device, smartphone also need to be drawn into
the conversation. The standard that supported smartphones was the third generation of mobile
phone standards (3G). The benefits of the 3G standards were that they enabled some features of

Sutee Pheeraphuttharangkoon (2015)
The Adoption, Use and Diffusion of Smartphones among Adults over Fifty in the UK 38
smartphones. Examples include, downloading of applications, or connecting to social media
platforms and services that need a rapid and reliable data connection. This technology can be
referred to as the Universal Mobile Telecommunication System that is based on the GSM
Standards. A 3G network provided a significant increase in the capacity for data and voice
communications compared to the previous 2G network capabilities (Dunnewijk & Hultén, 2007).
This meant that more users could connect to a network with expedited data connections (Tan et
al., 2007). In the UK, Italy and Sweden, the pioneering company that introduced 3rd Generation
networks was Hutchinson Whampoa. Therefore, the company was the first for 3G service
provider in the UK.
As mentioned earlier, a term that is presently widely used is the smartphone. The evolution of
smartphones began in 1992 when IBM developed the Simon phone (Mccarty, 2014). In 1996,
Nokia provided a Nokia 9000 Communicator that had additional features such as, email, web
browsing, word processing and spreadsheets. In 1997, Ericsson launched a GS 88 with touch
screen and stylus capabilities (Martin, 2014). In the early 2000s, many more manufacturers
emerged within the smartphone development sector and provided many more handsets such as,
Nokia providing Nokia N and E series with Symbian operating system, a leader in the business
and entrepreneurial sector, BlackBerry and a Windows mobile is known as Pocket PC (Martin,
2014). However, smartphones were not adopted in large numbers by the consumer and retail
market until the arrival of the Apple iPhone. In 2007, the first iPhone from Apple was introduced
that featured products and services beyond emails. The Apple iPhone offered a finger-friendly
design, large colour display, advanced web browser, multimedia functions and application
market.
About November 2007, Google also lunched a free Android mobile operating system that
allowed mobile manufacturers to install an operating system on their devices. In 2008, HTC was
the first manufacturer who provided a smartphone with an Android Operating System (OS).
Currently, Android – a mobile operating system developed by Google, has been used by several
phone providers such as Samsung, LG, and Motorola (Mccarty, 2014; Martin, 2014; Arthur,
2012).
Whilst the previous paragraphs have explained the novel standards that led to smartphone
development, it was found that the smartphones attributes are also different from their
predecessors, the mobile phone, in three ways: physical, software and connection. Currently,
smartphones have larger screens and usually, a touch finger capability that offers a full
QWERTY keypad, the common keyboard layout.

Sutee Pheeraphuttharangkoon (2015)
The Adoption, Use and Diffusion of Smartphones among Adults over Fifty in the UK 39
They also usually have powerful processors compared to their predecessors. The powerful
processors result in such as faster application opening, faster web page loads, and better games.
In terms of software, smartphones have two main operating systems. These are the Android
system from Google or iOS from Apple. The difference between both the operating system can
be found in Table 2.1 below.
Table 2.1 Differences between Android and IOS source (Diffen, 2013; Digitaltrends, 2014)
Category Android iOS
Owner/Developer Google Apple Inc.
Customisability Customisable Limited
Initial release September 2008 July 2007
App store Google Play – around million
apps available
Apple app store – around million apps
available
Device manufacturer Google, LG, Samsung, HTC,
Sony, Motorola, and many
more
Apple Inc.
Website Android.com Apple.com
Affordability (price) Price are variety from low cost
handset to luxury such as Vertu
brand (Vertu, 2015)
Does not have budget devices
Interface Material Design – minimalist
look with simple animations.
Bright and modern-feeling, easy to
understand.
Battery and Battery
life
Android device come with big
battery. Some manufacturers
provide battery saving feature.
iOS optimized the battery usage but
the battery can be consider as poor
Smartphones with their operating system can download and install other applications on top of
their operating systems. In terms of the network abilities and the smartphones being able to
connect to them, currently smartphones have the ability to connect to 3G or 4G networks and a
high speed internet connection (Bridges et al., 2010). Therefore, it can be seen that smartphones
and their mobile technologies provide many benefits for users that will be explained further in
the following sections.
2.2.2 Smartphone Features and Services
In chapter one, the aim of this research was also identified to be a consideration of smartphone
usage. For this purpose, this research needs to determine and understand the features and services

Sutee Pheeraphuttharangkoon (2015)
The Adoption, Use and Diffusion of Smartphones among Adults over Fifty in the UK 40
of smartphones. This can then lead to investigating the older adults’ usage. Without the
knowledge and information on the products and services of smartphones, it is very difficult to
understand smartphone usage.
In terms of novel features and services, a smartphone offers many. For example, research on
individuals’ life styles and mobile phones identified that smartphones provided services such as,
communication, information search, learning, the provision of office tools, and entertainment
services (Gao et al., 2012). Other features include, a multi-talking operating system, powerful
processors, full QWERTY keyboard functions, large displays with high screen resolution, fast
internet access, synchronization capability, Wi-Fi and Bluetooth connections, cameras, file
management, Global Positioning System (GPS), Radio Frequency Identification (RFID), storage
expansion, or biometric information (Chang et al., 2009). Currently, an increased number of
smartphones are equipped with more advanced sensors such as, Accelerometer, Gyroscope,
Digital Compass, fingerprint ID, and, Barometer (Phonearena, 2015).
As mentioned smartphones consist of a GPS system, which receives information from at least
three satellites to determine a current location position, time and velocity (GSMarena, 2014a).
The applications using GPS include, location searching, searches, mobile social networks, and
navigation (Liu, 2013). Location search allows a user to include his or her current location in the
search that the results will only bring things nearer to the user. An example of a location search
is a restaurant location search where only a restaurant near the user’s location will be shown.
A smartphone also has gyroscope capabilities that have been used to detect the orientation of a
device, while the accelerometer measures linear acceleration of movement. A digital Compass
ability allows the smartphone to determine directions such as, what is the Northern direction, that
helps in map applications (GSMarena, 2014b). Therefore, a smartphone will identify whether it
has been moved or not, which implies the movement of a user. These features can be applied to
health and well-being by tracking a users’ activities, as well as to encourage users to increase
exercise (Liu, 2013).
It is undeniable that smartphone apps or applications are the main features that enable
smartphones to be useful devices and enhancements or extensions of mobile phones. There are
many applications that are being provided in smartphones, but for the readers’ information, the
following important applications are identified. Xu et al (2011) classified the categories of
applications into books, business, education, entertainment, finance, games, healthcare, lifestyle,
medical, music, navigation, news, photography, productivity, reference, social network, sports,
travel, utilities, weathers and others. Some applications implement a user’s current location from

Sutee Pheeraphuttharangkoon (2015)
The Adoption, Use and Diffusion of Smartphones among Adults over Fifty in the UK 41
sensors such as GPS that are considered as local services, which provide local information for
users such as news, weather, or traffic based on a user’s current location (Xu et al., 2011).
While the previous discussions have explained the usefulness of smartphones in daily life and in
the context of a consumer, smartphones are also useful for businesses and the working life.
Amongst the foremost benefits, research on mobile emails revealed that the email feature of
smartphones can help in promoting collaboration between colleagues. The collaboration is
assisted largely due to the acceleration of work processes and keeping a team’s members
informed on the progress of the work (Beurer-Zuellig & Meckel, 2008a). Smartphones with
personal organizer features such as, contact list and automatic reminders assist users in becoming
more organized (Is4profit, 2010). Smartphone also offer instant information to users due to their
instant connections. Additionally, Smartphone users can access information such as maps,
satirize navigator, news, weather reports, traffic information, stock price or currency price from
their devices (Is4profit, 2010). Smartphones are also beneficial as they proffer camera functions
and text and voice communications abilities that can allow the sharing of photographs or using a
video call function that can provide a better experience for business in terms of communication
(Is4profit, 2010).
Of the other uses of a smartphone, the entertainment element of the device is also well known. A
smartphone can be used online and off line to listen to music and to watch videos. Music, movies
or video files can also be copied and stored in smartphones and these files can be played on the
devices due to large storage, displaying and powerful processing abilities within the smartphone.
In addition, due to the faster internet connections applications such as, YouTube, Google Play
Movie or Netflix proffer users the choice to watch videos online. Within the entertainment
context, games can be played on smartphones, which can be adventurous, in arcade format,
board games, card forms, educational, puzzle, sport and strategy. For entertainment purposes,
smartphones also allow users to connect to online social networks such as, Facebook or Twitter.
The healthcare sector also views smartphones as being important (Smallman, 2014).
Smartphones can be used by healthcare professionals to develop their skills and knowledge, or to
provide convenience to their work. Comparatively, smartphones can be tailored to the patients
individual health needs and requirements (Smallman, 2014). For the professionals, smartphones
offerings range from providing a doctor’s basic information about the medication and patient’s
dosages, observe portable heart monitors, view a patient's x-ray’s and other images, and as a
reference source for doctors, all in a mobile environment (Whalen, 2013). For members of the
public, applications for smartphones range from trackers to monitor the distance and Global
Positioning System (GPS) tracker, fitness applications, and diet and weight management tracking
facilities (Altena, 2012).

Sutee Pheeraphuttharangkoon (2015)
The Adoption, Use and Diffusion of Smartphones among Adults over Fifty in the UK 42
The previous discussions have highlighted and explained the benefits of a smartphone. To inform
readers and to summarise the benefits, a list has been developed and provided in Table 2.2.
Table 2.2 Features of smartphones
Smartphone Built-in services Taking a photo, video
Record voice
Communication services Phone call, text messaging (SMS)
Instant messaging tools such as WhatsApp, Facebook
Messenger
Email communication
Voice over IP and video communication such as
Skype
Information search services Search engine query
Read news though a browser
Transaction / banking services Mobile trading service such as m-commerce, m-
payment
Financial services such as stock trading, accounting
Mobile banking
Learning / office tools
services
Office software such as MS word, PDF
Learning tools such as dictionaries, formula
conversion
Note taking, calendar, organizer
Tracking items or packages being delivered
Entertainment services Online entertainment service such as online game,
music streaming, video streaming
Download content such as game, music, and movie
Social network services Social network services such as Facebook, Linkedin
Navigating / transportation
services
Mapping such as Google Maps
Navigating such as TomTom, Copilot
Bus, Train time table, Flight time
Health services Distance and GPS tracking
Fitness application
Diet and Weight Management applications
Sleep management
Security services Password Management
Antivirus
Accessing security systems such as using watching
CCTV, unlock a car or home with a smartphone

Sutee Pheeraphuttharangkoon (2015)
The Adoption, Use and Diffusion of Smartphones among Adults over Fifty in the UK 43
Government services Using government authority's applications such as
NHS, Jobcentreplus
Finally, smartphones offer flexibility in the manner that smartphones can be connected to other
devices such as, televisions (Y. Chen et al., 2009), they can be used to log activities (Zeni et al.,
2014), cars (Kun et al., 2013), electronic devices in apartments (Suyuti et al., 2013), and, smart
watch, mobile ultrasound, Cell Scope and Electrocardiogram for healthcare segment (Swan,
2012). Therefore, it can be concluded that smartphones offer immense benefits to users. Having
identified the usage of smartphones, the next section will now understand the adoption of
smartphones.
2.2.3 Adoption and Smartphone Development
As previously explained, smartphones have been developed since 1990s, but the device became
widespread from 2007. Amongst the first studies of smartphone adoption, a study of adoption
within doctors and nurses was conducted by Park and Chen (2007) where findings revealed that
perceived usefulness and perceived ease of use can determine smartphone adoption. The
researchers also found that in 2007, only 10% of the participants used any type of smartphone,
with approximately half of the respondents considering using a smartphone (Park & Chen,
2007).
The use of a smartphone in terms of fashion was then explained In 2008, where the impact of the
smartphone design on emotional reaction was studied and it was concluded that a smartphone is
not only a communication tool, but also a fashion accessory (Nanda et al., 2008). In 2008 studies
on the design of the smartphone also began to emerge where it was learned that users can
navigate a smartphone user interface, with or without a touch screen capability (Kim et al, 2008).
Research on the usage of smartphones found that entrepreneurial individuals had begun to adopt
smartphones in their work processes, where the email facility was identified as a popular feature
due to its providing improvements to and accelerations in the working processes (Beurer-Zuellig
& Meckel, 2008a).
Smartphone adoption studies then began to take a different direction where the case study
approach on multiple case studies (5) was used to identify whether delivery service companies
would adopt smartphones. It was suggested that the logistics industry needed instant information
sharing that can assist in supply chain management and decision making, which was proffered by
the smartphone. Therefore smartphones were considered to be viable solutions for delivery
service facilities. The research found that testing, an organizational and environmental factors
performed an important role in the adoption of smartphones in the businesses (J. Chen et al.,

Sutee Pheeraphuttharangkoon (2015)
The Adoption, Use and Diffusion of Smartphones among Adults over Fifty in the UK 44
2009). Chen et al (2009) also identified the smartphone’s recent features and characteristics
where the reviewed smartphone brands were, the first iPhone, which was a smartphone using the
Windows mobile operating system, Blackberry, and Nokia.
The adoption of three smartphone services, the internet, maps and gaming were then considered
where findings revealed that perceived enjoyment and usefulness linked to intention were the
services that were most useful (Verkasalo, 2010). A study by the same researcher in 2010 on user
behaviour using the tracking software installed on smartphones led to an interesting discovery
that user behaviour depended on the smartphone operating systems, with users tending to use the
voice and SMS features immensely, followed by calendar browsing and email, and then more
advanced features. In this study, Verkasalo (2010) also provided ideas and the software that can
be used to capture smartphone usage.
In 2011 smartphone devices had begun proliferating society, which was further supported by
official reports such as, the UK government regulation report reporting that the UK population
had become addicted to smartphones (Ofcom, 2011a). In academic studies this pattern was also
evident. For example, a comparative study from South Korea becoming more precise about the
factors that university students consider when purchasing smartphones compared to the normal
mobile phone (Kang et al., 2011). The classic adoption theories began to emerge where a study
from Thailand used UTAUT with perceived Value to study the adoption of an iPhone and
Blackberry (Pitchayadejanant, 2011). A Taiwanese study used TAM to study smartphone
acceptance within a major delivery service company (Chen et al., 2011). A South Korea study
used TAM, DoI, switching costs, and emotional attachment to study the factors impacting both
the adoption and post-adoption of smartphones (You et al., 2011).
As Japan has been facing an ageing population for several years, research studies from Japan
considered how smartphones with touch screen capabilities impacted elderly users (60+). The
results found that after a week, older adults could improve their skills of using touch screens.
This study also became more precise and explained and understood problems such as, how older
adults were often confused due to unclear instructions, the problem with a software keyboard,
and the mode of applications (Kobayashi et al., 2011). Whilst the Japanese study emphasised the
users’ aspect, studies of the application designs also began to emerge where researchers reviewed
the opinions of application developers when creating applications in mobile platforms (Holzer &
Ondrus, 2011).
As adoption studies were increasing, a review of the literature reviews and studies of smartphone
adoption was provided by Aldhaban (2012). In the reviewed study, it was found that in 2000
there were six articles related to the adoption of smartphones, but the numbers of research studies
Sutee Pheeraphuttharangkoon (2015)
The Adoption, Use and Diffusion of Smartphones among Adults over Fifty in the UK 45
emphasising smartphone's adoption began to increase from 2006 where a number of 11 articles
were founded and by 2011, there were 27 articles. What was concluded from this study was that
as advances and familiarity with smartphone technology continued, research findings were also
continuously emerging (Aldhaban, 2012).
In 2012 smartphone and adoption studies from South Korea found that within Korean students,
hedonic enjoyment and utilitarian usefulness were both important factors of consideration (Chun
et al., 2012). Rahmati et al (2012) studied the factors from a socioeconomic perspective among
iPhone users and found that people with low socioeconomic status surprisingly spend more
money on purchasing mobile applications. A comparative study of US and Korean cultures,
usability and aesthetics on smartphones acceptance using interviews and focus group revealed
that both usability and aesthetic values were important; however, users in both countries differed
in their ways of thinking about usability and aesthetic values (Shin, 2012).
Adoption studies of smartphone features and service also begun to take off. Lee et al (2012)
UTAUT was employed to study the factors influencing the use of smartphones application where
it was found that performance expectancy and effort expectancy had positive effects on usage
intention when using smartphone applications (Lee et al., 2012). Persaud and Azhar (2012)
found the reasons to adopt mobile marketing via smartphones which were shopping style, brand
trust and value.
Smartphone adoption studies also began to diversify by becoming more precise about the
applications on smartphones. For instance, Wac (2012) studied the use of smartphones for
personal health information services and found that using smartphones in this manner was
limiting. A study of the Thai patients in Thailand used UTAUT to study the adoption of
smartphones for e-Health services and found that Effort Expectancy, Facilitating conditions and
Perceived value significantly affect Behavioural Intention to use older adults use of smartphones
(Boontarig et al., 2012).
Studies also emerged within the mobile gaming and marketing sectors and in general about the
various theories of adoption. An explanation of smartphone design effecting use was provided by
applying TAM and DoI, where it was found that design varieties had a very positive effect on
perceived usefulness and the perceived ease of use of smartphone usage. Moreover, the attribute
of relative advantage, from DOI, immensely affected usage attitudes (Tsai, 2013). In terms of the
mobile games sector, TAM, connection quality, content quality, flow – great enjoyment, social
influence and usage cost were applied to study mobile gaming adoption (Zhou, 2013). The
results found that flow, social influence and usage cost effect usage intention and perceived ease
Sutee Pheeraphuttharangkoon (2015)
The Adoption, Use and Diffusion of Smartphones among Adults over Fifty in the UK 46
of use, connection quality and content quality effect flow (Zhou, 2013). This research also
revealed that the UK had the second highest of ratio of mobile game adopters.
In the marketing arena, Watson et al (2013) studied smartphone use within marketers using
functions such as the text message service, mobile website content, and QR code (a two-
dimensional barcode) where it was found that QR adoption in smartphones was possible due to
the ease of use, utility and incentives for using the code factors. Smartphone adoption preventive
factors were identified by the study, which existed in the form of lacking knowledge on how to
scan the code, or the benefits of a QR code (Watson et al., 2013).
Literature was again reviewed, but this time for older adults and using mobile phones for health
purposes. From a literature review of 21 documents between 1965 and 2012, emphasising the
60+ adult population and mobile phones, it was learnt that mobile phones were used for diabetes
care, chronic obstructive pulmonary disease, Alzheimer’s care, and osteoarthritis. This study also
confirmed that smartphones can benefit older people, particularly those who suffer from ageing
ailments (Joe & Demiris, 2013).
Therefore, from this review of adoption studies, it can be deduced that during the last decade,
research on smartphones has been completed in several topics and fields of studies. Additionally,
smartphones have played significant roles in many sectors such as healthcare, gaming,
commercial and marketing. As older adults are the demographic population of interest in this
research, the next section will explain the ageing problems that older adults face and the role of
ICT, including mobile technology.
2.2.4 Older Adults and the Challenges of Ageing
“Aging is a complex process of accumulation of damage, and it is the major risk factor for
predominant killer diseases in developed countries” (Partridge, 2010:1). When ageing occurs,
older adults could face different health, emotional and mental problems. Moreover, ageing also
causes challenges for society and governments alike. Therefore, this section will address the
potential problems that older adults may face and challenges for society and the government.
Whilst ageing, older adults are likely to face some ailments known as the term Geriatrics
syndromes. The ailments are identified and described in Table 2.3 below.

Sutee Pheeraphuttharangkoon (2015)
The Adoption, Use and Diffusion of Smartphones among Adults over Fifty in the UK 47
Table 2.3 Some ailments that affect mainly older people. Source: (Medicinenet, 2014; Besdine, 2013)
Ailment Description
Alzheimer Disease Memory and other mental function are progressively lost
Diabetes The body does not respond to the insulin it produces.
Glaucoma The optic nerve is damaged because pressure in a part of the
eye is elevated. Vision is progressively reduced, and blindness
can result
Hearing impairment Difficulty hearing other people clearly and misunderstanding
what they say
High blood cholesterol Increasing the risk of heart attack, narrowing of the arteries,
and stroke
Loss of muscle mass Loss of strength and mobility
Osteoarthritis The cartilage that lines the joints degenerates, which causes
pain
Osteoporosis Bones become less dense and more fragile.
Parkinson disease Nerve cells in the brain degenerate slowly and progressively;
thereby, causing tremor, stiff muscles and difficulty moving
and maintaining balance.
Poor vision The loss of sharpness of vision and the inability to see fine
details
Pressure sores The skin breaks down because prolonged pressure reduces the
blood flow to the affected area
Prostate cancer Cancer develops in the prostate gland and eventually interferes
with the flow of urine
Sciatica Pain, weakness, numbness or tingling of lower back and leg Stroke A blood vessel in the brain is blocked or ruptures.
Besides the ailments listed in Table 2.3 above, older adults could face health problems that are
caused by hormonal problems such as, menopause, poor kidney function, hair loss, skin
problems, urinary problems, oral and dental problems (Medicinenet, 2014). Some statistics on
some of the ailments are provided to illustrate the challenges of the geriatrics syndromes.
The first ailment in the list is Alzheimers. By 2015, there will be 850,000 people with dementia
in the UK, with one in six people aged 80 and over having dementia (Alzheimer’s Society,
Sutee Pheeraphuttharangkoon (2015)
The Adoption, Use and Diffusion of Smartphones among Adults over Fifty in the UK 48
2013). Dementia is a term for a set of symptoms including, impaired thinking and memory.
Approximately 50-70% of Alzheimer’s disease leads to Dementia (Alzheimers.net, 2013).
In the UK in 2010, there were 1.3 million older adults (60-70 years old) who had diabetes, which
means that more than half of the UK’s individuals are aged over 60 years old. Diabetes care is
expensive, with an estimated 10% of European healthcare budgets (80 billion Euro) being spent
on it (IDOP, 2011).
Heart strokes are another major health problem within older adults in the UK. Annually, around
110,000 individuals suffer from strokes in England. Strokes are the third largest cause of death,
following heart disease and cancer. Strokes are more likely to occur in older adults. One in every
four people suffering from strokes die. Survivors of strokes often face a brain injury (NHS,
2013b). From the statistics, it can be learnt that older adults are very vulnerable, where besides
the ailments; older adults could face mental difficulties.
A serious social problem of an ageing society is loneliness and social isolation. About half of the
75+ adults live alone and 5 million older adults cite television as being their source of company.
Social isolation can lead to depression and a serious decline in physical health and well-being.
Causes of social isolation including, ageing, weakness, no longer being the hub of one’s family,
a disability or illness, or the deaths of spouse and friends (NHS, 2013a). Due to this factor, older
adults could also face difficulties in their work place.
Whilst the above was a social problem, organizations perceptions of the older workers could also
impact the older adult workers. Organizations adopting a positive perspective cite benefits from
higher level managers in the form of, increasing knowledge of work habits, commitment to
quality, loyalty, punctuality and respect for authority (Tishman et al., 2012). Moreover, older
workers can be considered to be a valuable resource for all organizations due to their reliability,
experience, expertise and knowledge (Okunribido et al., 2010). However, older workers are
considered a drawback because they are considered to be inflexible, unwilling or unable to adapt
to new technologies, lack of aggression, resistance to change, complacency and a presence of
physical limitations that lead to an increase in the cost of health insurance (Tishman et al., 2012).
Challenges that older adults could face in life are as follows. Ageing brings about illness and
disease where older adults could endure a loss of cognitive capacity. Moreover, older workers
have less physical strength and endurance. Older adults may have poorer sensory abilities such
as, sight and hearing. Older workers may have difficulty adapting to change and to learn new
skills. Lastly, older people are less productive. Therefore, in the work place, older adults could
pose to be a challenge for the organization and government (Benjamin & Wilson, 2005).

Sutee Pheeraphuttharangkoon (2015)
The Adoption, Use and Diffusion of Smartphones among Adults over Fifty in the UK 49
In terms of Government spending on older adults, presently, 65% of the UK’s Department for
Work and Pensions benefits expenditure is devoted to older adults, which is an estimated £100
billion in 2010/11. Additionally, due to an ageing population there is an increase in the allocated
costs and budgets for providing UK’s health care service known as, the National Health Service
(National Health Service, NHS). In 2007/08 the average value of NHS services for retired
households was £5,200 compared with £2,800 for non-retired (Cracknell, 2010).
From the previous discussions, it has been found that older adults could face both physical and
mental challenges that could impact the older adults working life. Moreover, an ageing
population is challenging for the government and society in many ways. Nevertheless, Benjamin
and Wilson (2005) suggest that some problems, such as health problems, can be prevented or
improved by a change of lifestyle by making small adjustments to the amounts of exercise taken
and to nutrition. New technologies such as smartphone are also viewed to be a means of
improving the well-being and health of older people (Boontarig et al., 2012).
This section has discussed and identified the benefits and drawbacks of an ageing population and
also the ailments that are likely to be faced as an individual ages. ICT is the devices of interest in
this research, which the next section addresses by considering research that has been completed
with older adults and ICT.
2.2.5 Older Adults and Technology (ICT, mobile phone, smartphones); Are older adults
Accepting the Technology?
As explained in chapter 1, a group of people that this research focused on is the older adult
group, or the silver surfers. This group was selected due to their not experiencing the Internet or
advanced technologies in their adult lifetimes (Hill et al., 2008). In comparison to younger
generations, older adults will probably not have experienced innovative technologies; therefore,
they are also likely to be excluded from technology use, knowledge and information (Hill et al.,
2008). To support this view, statistics obtained from the Oxford Internet Institute Survey identify
the numbers of older adult internet users who are fewer in number of the younger generations
(Dutton et al., 2013). In terms of the mobile devices of this research, -the smartphone, at the
beginning of 2011, 55+ Adults in the UK used only 7% of smartphones, compared with 50%
from 16-24 year old age groups (Ofcom, 2011b). Data from the Ofcom report shows that the
adoption trend began from the younger generation, which meant that the 55+ years older users
were fewer. Previous research also found that technology, particularly ICT is important for older
adults to reconnect with, to improve their connections with society and improve their quality of
life (Irizany & Downing, 1997; White et al., 1999). Therefore, some countries such as the UK
and USA recognise that there are benefits of technology for older adults. However, the question

Sutee Pheeraphuttharangkoon (2015)
The Adoption, Use and Diffusion of Smartphones among Adults over Fifty in the UK 50
formed at the beginning of this millennium is how to encourage older people to use ICT (Selwyn
et al., 2003).
In terms of the positive attitude, Nimrod (2011) studied the fun culture within seniors (50+)
online communities in the USA and Canada. From 50,000 posts on six online communities, it
was found that the content seniors were posting were online social games, jokes and funny
stories. The games can be categorised as cognitive, associative and creative games. The jokes
and funny stories can be classified as stories about gender, ageing, grand parenting, faith, politics
and alcohol. Nimrod (2011) suggested that online communities should encourage social
engagement and well-being and successful ageing. This research suggests that enjoyment can be
a positive effect on technology adoption for older people.
In other ways, considering the high number of older people and ageing population, senior
portals, websites that focus on older people have been introduced. Moreover, senior portals were
predicted to be popular within the ageing population. Yoon et al (2011) studied the older adults
portals in terms of appropriate content for older adults in South Korea and found that the content
preferences were dependent on the older adults’ characteristics. For instance, some older adults
preferred entertainment and sought content that was entertaining. However, generally older
adults preferred to view content on health/medical terminology, banking, travel, current
terminology, and real estate (Yoon et al., 2011). Drawing from this research, appropriate
contents for older adults such as content about health could lead to technology adoption.
Technology usage within older adults (65+) and their attitude towards technology were studied
by Mitzner et al (2010). The technology utilised in this research included, computers, blood
glucose and blood pressure monitors, microwaves, mobile phones fax, telephone, television and
telephone. Older adults reported positive attitudes over the negative attitude. The positive
attitude related to technology support activities, enhanced convenience and useful features while
the negative attitude linked to inconvenience, unhelpful features, security concern and
unreliability of some technology. This research also confirmed that the perceived benefits of use
and ease of use led to technology adoption within older adults (Mitzner et al., 2010). From this
research, an attitude about technology from older adults is important for technology adoption.
In terms of literature, Wagner et al (2010) reviewed existing research on computer usage within
older adults and provided a historic view of the field by using the Social Cognitive Theory. This
led to 151 articles from 1990-2008 from related fields such as, business, information technology,
social sciences, and education. This research found that the number of articles related to older
adult research increased continuously. Other results included a summary of the most commonly
computer use for older adults, the barriers to computer use, variables affected personal behaviour

Sutee Pheeraphuttharangkoon (2015)
The Adoption, Use and Diffusion of Smartphones among Adults over Fifty in the UK 51
(Wagner et al., 2010). Wagner et al (2010) concluded that the barriers preventing older adults
from using computers were the factors of a perceived lack of benefit, lack of interest or
motivation, lack of knowledge, lack of access, cost and perceived barriers due to physical
limitations. In addition, most of the common computer uses within older adults were
communication and social support, leisure and entertainment, information seeking for health and
education, and productivity.
The internet and mobile phone were found to be similar in terms of adoption and usage (Rice &
Katz, 2003). Before the arrival of iPhone in 2007, Kurniawan (2006) considered mobile phone
designs that were suitable for older adults and built from the older adults’ perspective. The
suggestions included a large test and the backlight under the screen, a flip phone with antenna
which would be easy for older adults when attending to a call, the birth colour that older people
can spot easily, and, a dedicated button for emergency. The same research also suggested that
older adults adopting mobile phones were greater in number to those adopting the internet.
After the arrival of smartphones, Kurniawan (2008) studied older adults 60+ adults use of mobile
phones and found that older adults were inactive with mobile phones and feared using unfamiliar
technologies. The study also found that older adults believed that mobile phones were not
essential for them. This research implied that older adults may take some time before adopting
smartphones.
In 2011, a study of health and caregiving within the 50 years old and above older adult
population identified that 79% of the silver surfers owned mobile phones, but only 7% adopted
smartphones (Barrett, 2011). It was also learnt that within this age group, approximately half of
the 50 years old and above groups used or intended to use mobile technology for health related
matters. When considering technology use for only health purposes, 11% of the sample
population used the technologies for basic health matters such as weight, blood sugar and blood
pressure measurements (Barrett, 2011). Such research studies assisted this research team to
identify the benefits of smartphones for the older population and identified the existing gaps in
adoption studies associated with older adults.
Plaza et al (2011) addressed the issue of the ageing population in Europe, USA and Japan and the
benefits of mobile phones that improve the quality of life for the elderly. This paper also
presented a review of the status of mobile functions and applications that can fulfil the needs of
older adults and the quality of life. From a literature review which considered the needs of older
adults and provided a basis for researchers, designers, and mobile phone service providers , the
existing needs of developing trends, the existing opportunities and mobile applications were
also taken into account(Plaza et al., 2011).

Sutee Pheeraphuttharangkoon (2015)
The Adoption, Use and Diffusion of Smartphones among Adults over Fifty in the UK 52
In 2012, smartphones features that could assist with e-health services were studied within an
older adult population in Thailand (Boontarig et al., 2012). The results showed that Effort
Expectancy, Facilitating conditions and Perceived value significantly affect the Behavioural
Intention to use within older adults using smartphones. An exploratory study of older (50+)
women’s perceptions of accessing health information via a mobile phone was studied in
Singapore (Xue et al., 2012). Xue et al (2012) found that perceived usefulness, perceived ease of
use, compatibility and subjective norm affected the usage intention of health information via a
mobile phone.
It can be seen that ICT, mobile and smartphones can benefit older people in many ways.
However, the numbers of older adults using ICT are fewer than the younger generation. These
differences are emphasised within the digital divide, which is discussed next.
2.2.6 The Digital Divide and Silver Surfers (50+ adults)
The differences that exist in the ways that individuals use and accept their ICT, and innovative
technologies are associated with characterizations that are widely referred to as ‘the digital
divide’(Tsatsou, 2011).
There are various forms of the digital divide that have been discussed in academic literature,
where non-government funding agencies such as, the OECD (Oecd, 2008) have noted:
“Despite progress in broadband usage and access, certain divides are evident. Household use is
often related to income, education levels, gender (males having more access), the number of
children (households with children having more access), age, and, disability. As data for 2006-
2007 from Australia shows, use is significantly higher in the age group 15 to 17; people from
households in the top two income quintiles; people with higher levels of educational attainment;
and the employed (Australian Bureau of Statistics, 2007).
As explained above, there are various levels of the digital divide. The top level definition of the
digital divide follows Norris (2001). Norris conceptualized the digital divide as operating at
three levels:
The global divide refers to the divergence of internet access between industrialised and
developing countries;
The social divide concerns the gap between information rich and information poor in
each nation;
The democratic divide signifies the difference between those who do, and those who do
not, use the panoply of digital resources to engage, mobilise, and participate in public
life.

Sutee Pheeraphuttharangkoon (2015)
The Adoption, Use and Diffusion of Smartphones among Adults over Fifty in the UK 53
A basic strategy for overcoming the digital divide has been to provide physical access to
computers; but, as Warschauer (2004) clarifies, there are additionally three further aspects with
regard to resources: Digital resources (material made available online); Human resources (in
particular literacy and education) and Social resources (the community, institutional and societal
structures that support access to IT). The aspects that Warschauer (2004) identified as important
formed the basis of this research when evaluating and identifying the non-technical and technical
factors that lead to the adoption and usage of technology by silver surfers.
For this research, the digital divide is defined as the divide between “those who have access to a
particular technology and those who do not” (Curwen and Whalley, 2010:210). It is also posited
that “the digital divide (or the global digital divide) is generally referred to as the ‘uneven
diffusion’ or ‘gap’ or ‘disparities’ between different socio-economic levels or across countries or
between developed and developing nations in terms of ‘access’ and ‘use (usage)’ in
ICTs”(Hwang, 2006:19). When considering “the digital divide” it was also found that ‘typically’
this means Internet access, but the term has been broadened to include other ICTs (Anheire &
Toepler, 2010).
The digital divide often referred to as the “information gap” or “information inequality” has
promoted immense debates that have resulted in the digital divide being considered in a variety
of contexts, including socio-economic status, gender, age, racial, region or geography (Tsatsou,
2011).
One significant component of the digital divide is age (Selwyn et al., 2003). Having lived many
years in the world without the internet older adults tends to perceive the internet as a ‘non-
essential’. Additionally, age related problems such as declining eyesight and arthritis pose to be
major challenges to overcome when viewing computer monitors and co-ordinating mouse
interaction. This has resulted in a significant age-based divide between young and old with
internet use declining in every advancing age group (Greengard, 2009).
In the last decade, older adults applications of and benefits of novel technologies have been
examined by many researchers. When considering this issue, several diverse aspects have
emerged. These have included the digital divide where the gap between individuals who have
used ICT and those who have not used ICTs has been examined.
Several research studies have attempted to study this issue and identify the factors leading to the
age related digital divide. These factors are viewed to be in theoretical terms the factors,
perceived lack of benefits (Mann et al., 2005; Melenhorst et al., 2006), lack of interest or
motivation (Carpenter & Buday, 2007; Selwyn et al., 2003), lack of knowledge (Peacock &

Sutee Pheeraphuttharangkoon (2015)
The Adoption, Use and Diffusion of Smartphones among Adults over Fifty in the UK 54
Künemund, 2007), lack of access (Peacock & Künemund, 2007), cost (Mann et al., 2005;
Carpenter & Buday, 2007), and physical limitation (Saunders, 2004; Carpenter & Buday, 2007).
When considering the use of the internet in the 55 years old and above population of Finland, it
was found that an estimated one-third of the respondents do not use the Internet (Vuori &
Holmlund-Rytkönen, 2005). In Australia, within the 50 years old and above individuals it was
found that the internet is used five times less than the under 30s age group (Willis, 2006).
In the Netherlands, socio-demographic variables were studied to find the relationship of Internet
use and the type of Internet usage. Research found that in terms of the user numbers, there were
more younger adults than older adults, and age was an important factor to predict internet usage.
In terms of the patterns of usage, the younger generation used the internet as communication and
entertainment tools while older adults used the internet for buying products online, email, and
searching for health related (van Deursen & van Dijk, 2013).
The digital divide was studied across Europe in terms of countries by Cruz-Jesus et al (2012)
where an analysis of the digital divide in 27 European members was conducted and the causes of
the digital divide were explored. This study used several variables such as, percentage of
households having access to the internet, percentage of the population regularly using the
internet, using mobile devices, email, e-banking services, or seeking for health information, the
percentage of government services available online, and percentage of enterprise selling online.
The results were that the 27 members were divided into five groups. The UK, Germany, Austria,
Ireland, Belgium, Portugal, Slovakia, Spain and Malta were in the digital followers groups. The
best groups were the digital leaders - Denmark, Finland, Luxembourg, the Netherlands and
Sweden where the numbers of the population adopting the internet were higher and the costs
were lower (Cruz-Jesus et al., 2012). A similar study of European members was also performed
from 2001 to 2009 by Kyriakidou et al (2011) and in 2008 by Vicente and López (2011) where
the digital divide among the EU members was identified.
Brandtzæg et al (2011) also studied the digital divide in five Europe countries, Norway, Sweden,
Austria, the UK and Spain. To identify the digital divide, Brandtzæg et al (2011) categorised
12,666 European to five groups which were, non-users, sporadic users, instrumental users,
entertainment users and advanced users. The research found that in the UK, Spain and Austria,
gender, age, and household members were dependent variables to predict type of usage patterns.
The research found that over 80% of 65+ adults, around 60% of 55-64 adults and around 50% of
45-54 adults were in the non-user catalogue (Brandtzæg et al., 2011).
The digital divide was also studied from a global perspective. Doong and Ho (2012) collected
secondary data from 136 countries from 2000 and 2008 to examine global ICT development. The

Sutee Pheeraphuttharangkoon (2015)
The Adoption, Use and Diffusion of Smartphones among Adults over Fifty in the UK 55
variables in the research were Gross national income (GNI), Mobile penetration, Internet user
penetration, Capital investment in telecom, and Total telecom revenue. The study found that
countries with Higher GNI tended to invest more in the ICT infrastructure (Doong & Ho, 2012).
The research found that countries with difference GNI levels have different ICT development
paths. The study also found that the arrival of mobile phones had led to a narrower digital divide
gap (Doong & Ho, 2012). Globally, mobile internet the infrastructure has been developed
continuously where technology can substitute the wired infrastructure (Srinuan et al., 2012).
Individuals who cannot access the internet via fixed telephone lines can use mobile internet
(Srinuan et al., 2012).
In April 2012, 59% of American older adults (65+) used the internet in comparison to 86% of all
the adult population in the USA. In terms of mobile phones, 77% of older adults used mobile
phones compared to 91% of all the adults (Smith, 2014). In September 2013, 55% of the
American adults used smartphones while only 18% of the older adults (65+) used smartphones
(Smith, 2014). This shows that a digital divide exists in terms of the internet, mobile phones and
smartphones.
Friemel (2014) who studied older adults (65 years old and above) Internet usage in Switzerland
found several reasons for older adults not using the Internet. The main reasons were the
difficulties or complications of technology, immense efforts when learning how to use the
technology, safety concerns and lack of support and assistants. Some other health problems were
memory problems and limited eyesight and hearing. The research also found that older adults
preferred to have support from the family and friends at home, having the support of younger
individuals in the form of coaches, or peer-mentoring among seniors and class. Also found was
that older adults were less active with self-learning (Friemel, 2014).
Within the older adult population, health is an important issue of consideration. Health literacy is
the degree of the ability to obtain, process and understanding basic health information and
services needed to make an appropriate decision on health problems or issues (Health.gov,
2010). Levy et al (2014) studied health literacy and the digital divide among older Americans (65
years old and above). The research found that health literacy was a factor predicting internet use
for obtaining health information. Around 9.7% of older adults with low health literacy used the
internet to gain health information compared to 31.9% in terms of those who had the knowledge
(Levy et al., 2014).
Apart from physical health problems, some older adults could face mental issues such as
depression, social isolation, decreased social contact or lack of emotional support. Cotton et al
(2012) examined the link between depression and internet use within Americans aged 50 years

Sutee Pheeraphuttharangkoon (2015)
The Adoption, Use and Diffusion of Smartphones among Adults over Fifty in the UK 56
old and above. The results indicated a positive correlation between Internet use and mental well-
being of retired older adults. Internet use was found to reduce the probability of a depression
categorisation for older participants by about 20–28% (Cotten et al., 2012). Therefore, using
smartphones connected wirelessly to the internet could assist older adults to reduce their
depression as well as increase their familiarity and knowledge of the internet.
A recent study has found that there exists a digital divide and the gap is not likely to close in the
near future (Kim, 2011). When delving deeper, it was found that older adults face difficulties
when adopting novel technologies (Lee et al., 2011). However, from such studies above it was
confirmed that a digital divide exists and recognised by many researchers around the world.
From the aforementioned reviews, this research was motivated to explore further the
smartphones and older adult’s adoption, use and diffusion issues as addressed in Chapter1.
Therefore, the following section will focus on the technology adoption theories being employed
by this research study.
2.3 Theoretical Background
When considering adoption, researchers tend to apply mostly the theories of Theory of Reasoned
Action (TRA), Technology Acceptance Model (TAM), Theory of Planned Behaviour (TPB),
Diffusion of Innovation Theory (DOI), Decomposed Theory of Planned Behaviour (DTPB),
Technology Acceptance Model 2 (TAM2), and, Unified Theory of Acceptance and Use of
Technology (UTAUT). This section will now review these theories.
Technology adoption theories have been continuously developed and employed since the 1960s
with the pioneering and classic theories of adoption being TRA and TAM. The first two theories
were applied in the 1990s when mobile phones initially took off. TPB, DTPB DOI were then
used in the next wave of mobile phone development. In the 2000s when smartphones emerged,
TAM2, TAM3 and UTAUT were employed and finally, the UTAUT theory was enhanced and
employed, which is also reviewed in this section.
2.3.1 Theory of Reasoned Action (TRA)
The pioneering theory of adoption, TRA was used to explain individual behaviour and developed
in the social psychology field. At the time, researchers were trying to understand an individual’s
behaviour due to the impact of attitude (Fishbein & Ajzen, 1975). This theory explained that
individuals form behaviour based decisions based on behavioural intentions. Behavioural
intentions are based on attitude and subjective norms.
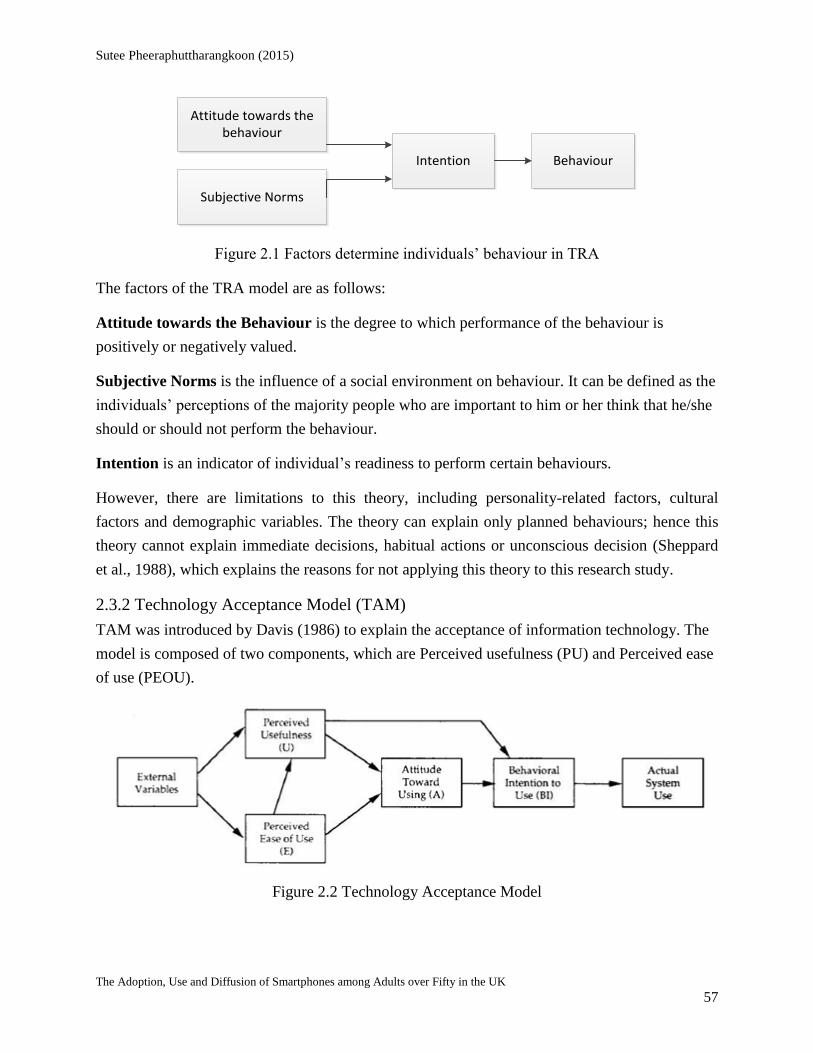
Sutee Pheeraphuttharangkoon (2015)
The Adoption, Use and Diffusion of Smartphones among Adults over Fifty in the UK 57
Attitude towards the behaviour
Subjective Norms
Intention Behaviour
Figure 2.1 Factors determine individuals’ behaviour in TRA
The factors of the TRA model are as follows:
Attitude towards the Behaviour is the degree to which performance of the behaviour is
positively or negatively valued.
Subjective Norms is the influence of a social environment on behaviour. It can be defined as the
individuals’ perceptions of the majority people who are important to him or her think that he/she
should or should not perform the behaviour.
Intention is an indicator of individual’s readiness to perform certain behaviours.
However, there are limitations to this theory, including personality-related factors, cultural
factors and demographic variables. The theory can explain only planned behaviours; hence this
theory cannot explain immediate decisions, habitual actions or unconscious decision (Sheppard
et al., 1988), which explains the reasons for not applying this theory to this research study.
2.3.2 Technology Acceptance Model (TAM)
TAM was introduced by Davis (1986) to explain the acceptance of information technology. The
model is composed of two components, which are Perceived usefulness (PU) and Perceived ease
of use (PEOU).
Figure 2.2 Technology Acceptance Model

Sutee Pheeraphuttharangkoon (2015)
The Adoption, Use and Diffusion of Smartphones among Adults over Fifty in the UK 58
PU can be defined as the degree to which a person believes that using the particular technology
would improve his or her job performance. PEOU refer to the degree to which a person believes
that using the particular technology would be free from effort (Davis, 1986). Referring to the
original research, the external variables were identified as, objective system design
characteristics, training, computer self-efficacy, user involvement in design and the nature of the
implementation process (Davis & Venkatesh, 1996). Others articles applied different external
variables such as system quality, compatibility, computer anxiety, enjoyment, computer support
and experience (Lee et al., 2003).
To illustrate the relationship between TAM’s variables Figure 2-2 is provided. Figure 2.2 shows
how the external variables affect PU and PEOU and both the main factors influence the attitude
towards use, the behavioural intention to use and actual use. Moreover, PEOU affects PU while
PU affects Behavioural Intention to use. However, compare with TRA, TAM does not integrate
Subjective Norm in the model. Finally, it can be learnt that the definition of perceived ease of
use and perceived usefulness are equal to effort expectancy and performance expectancy
respectively (Venkatesh, 2012). TAM has been further developed to introduce the theories of
TAM 2 and TAM 3 in 2000 and 2008.
Table 2.4 Related literature using TAM
Literature An area of
research
Methods
used
Research purpose/Research finding
Park & Chen
(2007)
Smartphone
adoption
A survey
of 820 US
doctors
and nurses
To investigate human motivations affecting an
adoption decision for smartphone among medical
doctors and nurses. The results found behavioural
intention to use smartphones was affected by PU and
attitude, and PEOU affects attitude.
Bouwman et
al. (2007)
Mobile
services
A survey
of 484
Finish
Consumers
This research studied 6 mobile services- mobile travel
service, GPRS, mobile surveillance, traditional and
advance entertainment and m-commerce service
bundles, where both the barriers (physical, cognitive,
security and economic) and benefits (perceived
entertainment value and perceived flexibility) of
mobile services in Finland were identified. The
research found that different services have different
adoption factors.
Shin (2009) Mobile
Payment
A survey
of 296
This study validated a comprehensive model of
consumer acceptance in the context of mobile
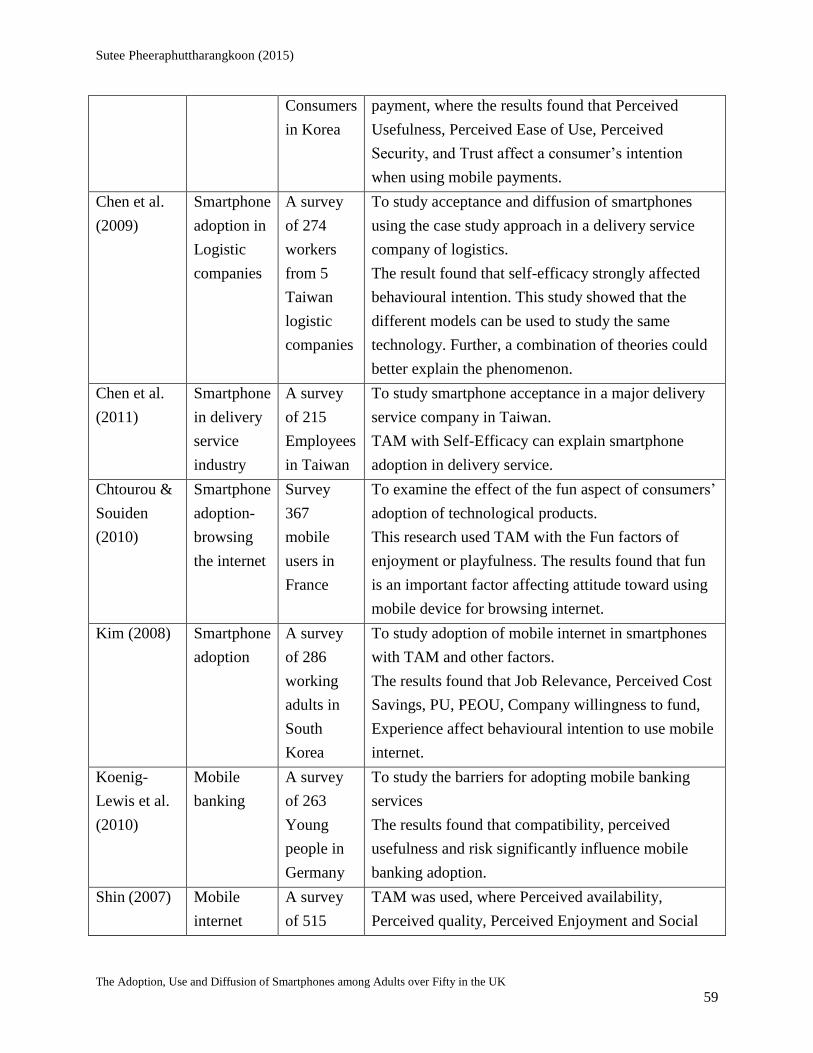
Sutee Pheeraphuttharangkoon (2015)
The Adoption, Use and Diffusion of Smartphones among Adults over Fifty in the UK 59
Consumers
in Korea
payment, where the results found that Perceived
Usefulness, Perceived Ease of Use, Perceived
Security, and Trust affect a consumer’s intention
when using mobile payments.
Chen et al.
(2009)
Smartphone
adoption in
Logistic
companies
A survey
of 274
workers
from 5
Taiwan
logistic
companies
To study acceptance and diffusion of smartphones
using the case study approach in a delivery service
company of logistics.
The result found that self-efficacy strongly affected
behavioural intention. This study showed that the
different models can be used to study the same
technology. Further, a combination of theories could
better explain the phenomenon.
Chen et al.
(2011)
Smartphone
in delivery
service
industry
A survey
of 215
Employees
in Taiwan
To study smartphone acceptance in a major delivery
service company in Taiwan.
TAM with Self-Efficacy can explain smartphone
adoption in delivery service.
Chtourou &
Souiden
(2010)
Smartphone
adoption-
browsing
the internet
Survey
367
mobile
users in
France
To examine the effect of the fun aspect of consumers’
adoption of technological products.
This research used TAM with the Fun factors of
enjoyment or playfulness. The results found that fun
is an important factor affecting attitude toward using
mobile device for browsing internet.
Kim (2008) Smartphone
adoption
A survey
of 286
working
adults in
South
Korea
To study adoption of mobile internet in smartphones
with TAM and other factors.
The results found that Job Relevance, Perceived Cost
Savings, PU, PEOU, Company willingness to fund,
Experience affect behavioural intention to use mobile
internet.
Koenig-
Lewis et al.
(2010)
Mobile
banking
A survey
of 263
Young
people in
Germany
To study the barriers for adopting mobile banking
services
The results found that compatibility, perceived
usefulness and risk significantly influence mobile
banking adoption.
Shin (2007) Mobile
internet
A survey
of 515
TAM was used, where Perceived availability,
Perceived quality, Perceived Enjoyment and Social

Sutee Pheeraphuttharangkoon (2015)
The Adoption, Use and Diffusion of Smartphones among Adults over Fifty in the UK 60
Consumers
in South
Korea
pressure examined the adoption of mobile internet.
The results showed that the variables significantly
affected attitude. However, Perceived usefulness and
Perceived enjoyment of use did not significantly
affect Intention.
Verkasalo et
al.(2010) Mobile
application
A survey
of 579
panellists
in Finland
This study examined the adoption of new mobile
application, game, internet and map.
The research found that perceived technological
barriers negatively affect behavioural control,
perceived usefulness was linked to behavioural
control except for gaming, and perceived enjoyment
and usefulness significantly affected the intention to
use applications
Wu & Wang
(2005)
Mobile
commerce
A survey
of 310 m-
commerce
users in
Taiwan
To study mobile commerce using TAM, DOI,
perceived risk and cost factors.
The results found that Perceived risk, Cost,
Compatibility and Perceived usefulness significantly
affected behavioural intention to use mobile
commerce.
Chong,
Chan, et
al.(2012)
Mobile
commerce
A survey
of 394
consumers
in
Malaysia
(172) and
China
(222)
To examine the adoption of mobile commerce in
Malaysia and China.
This research found that apart from variables from
TAM, Trust, Cost, Social influence and variety of
services can influence mobile commerce. Culture can
also affect the adoption.
Kang et
al.(2011)
Smartphone
adoption
and their
features
A survey
of 100
students in
South
Korea
TAM was used to investigate factors affecting the
adoption of smartphone and features of the
smartphones.
The research found that around half of responses used
smartphones. Wireless internet, design, multimedia,
application, after service, and, interface were
important for adoptions. Perceived usefulness and
Perceived ease of use also affect Behaviour Intention

Sutee Pheeraphuttharangkoon (2015)
The Adoption, Use and Diffusion of Smartphones among Adults over Fifty in the UK 61
to use smartphones.
Kim &
Garrison
(2008)
Mobile
internet
A survey
of 58
graduate
students in
Korea
To use TAM as a core theory with other factors to
examine Mobile wireless adoption such as cellular
and PDA.
This study found that the model can explain 58.7% of
the behavioural intention. And confirm that TAM can
still be used to explain mobile wireless technology.
Nysveen et
al.(2005) Mobile
messaging
services
A survey
of 684
mobile
chat
service
users in
Norway
To investigate the moderating effects of gender in
explaining the intention to use mobile chat services.
This research found that social norms and intrinsic
motives such as enjoyment were important for female
users, while extrinsic motives such as usefulness and
expressiveness were important for males. The model
could explain 71% of the intention to use the service
in females and 68.2% of intention to use the service
in males.
Mallat et al.
(2006)
Mobile
ticketing
A survey
of 47
business
school
students in
Finland
To study mobile ticketing service adoption in public
transportation.
The research found that compatibility is a major
factor. Others variable such as trust, mobility, social
influence also important for the adoption. The model
can explain around 56% of intention to use the mobile
ticket.
Table 2.5 Related literature using TAM and 50+ adults
Xue et al. (2012)
Health
informatics
via a mobile
A survey
of 700
older
adult
women
(50+) in
Singapore
To examine the perceived attitudes and readiness of
women aged 50 years and above on adopting a mobile
phone-based intervention.
The research found that perceived usefulness and
perceived ease of use, compatibility and subjective
norm can be used to predict the adoption intention of
the technology. The model could explain 88% of the
intention to use a mobile phone-based intervention.
Nayak et al. (2010)
Internet
usage
A survey
of 592
Used TAM and demographic variables to understand
the factors that influence internet usage among older

Sutee Pheeraphuttharangkoon (2015)
The Adoption, Use and Diffusion of Smartphones among Adults over Fifty in the UK 62
older
adults
(60-88) in
UK
adult (60-80)
The research found that attitude towards using the
internet and good health status could predict the level
of internet usage. Moreover, attitude, usefulness, good
health and gender (males) could affect internet
activity. The model could predict 20.5% of internet
usage (time in hours) and 24.2% of Internet usage
(activity level)
Form Tables 2.4 and 2.5 it can be seen that TAM is one of the most popular theory used to
understand technology adoption research. However, this research study considered employing a
new theory to explain smartphone adoption.
2.3.3 Theory of Planned Behaviour (TPB)
The Theory of Planned Behaviour was developed based on TRA to reduce the limitation of TRA
(Ajzen, 1991). TPB is viewed to be an extension of TRA by maintaining the central factors, and
the behavioural intention to perform certain behaviour. TPB differs from TRA due to the
addition of the factor, perceived behavioural control (PBC) - the brown box in the below figure.
The component responds to a situation when individuals have incomplete control over some
behaviour. From the hyphenated line, for some situation, PBC with behavioural intention can be
used to predict behaviour (Armitage & Conner, 2001).
The definitions of the components of TPB are shown as follows:
Behavioural Beliefs are the subjective probability that the behaviour will produce a given
outcome. This factor also influences Attitude towards the behaviour.
Normative Beliefs are the perceived behavioural expectations from important referent
individuals or groups such as partner, family, friends, teacher, doctor, supervisor, and co-
workers. Normative beliefs from a variety of sources form Subjective norm.
Control beliefs are the perception of the factors that may encourage or impede the performance
of behaviour. Control beliefs influence Perceived Behavioural Control.
Perceived Behavioural Control is an individual’s perception of his or her ability to perform a
given behaviour.

Sutee Pheeraphuttharangkoon (2015)
The Adoption, Use and Diffusion of Smartphones among Adults over Fifty in the UK 63
Actual Behavioural Control is the extent to which an individual has the skills, resources, and
other prerequisites needed to perform a given behaviour. This factor also influences Perceived
Behavioural control. Together with intention, this factor can directly predict behaviour.
Figure 2.3 Theory of Planned Behaviour (Ajzen, 2006)
Although this theory can be viewed to be a very broad framework, it may not be practical in
specific fields such as, consumer or technology adoption behaviour (Benbasat & Zmud, 1999;
Taylor & Todd, 1995a).
2.3.4 Diffusion of Innovation Theory (DOI)
Smartphones are viewed to be current times innovations. An innovation is defined to be a new
idea, method or product (Oxford Dictionaries, 2013b). For DOI, an innovation is perceived to be
a new item by an individual. Diffusion is a process that an innovation is communicated through
certain channels over time among member of a social system (Rogers, 2003). Rogers
highlighted four elements of diffusion, which are innovation, time, communication channels and
social systems.
2.3.4.1 Innovation Decision Process
The Innovation decision process is the process that an individual or group of decision making
unit pass from first knowledge about the innovation to formulating an attitude, to decision
regarding adoption or reject the innovation, to implementation of the innovation and to
confirmation of the decision. The process is composed office steps.
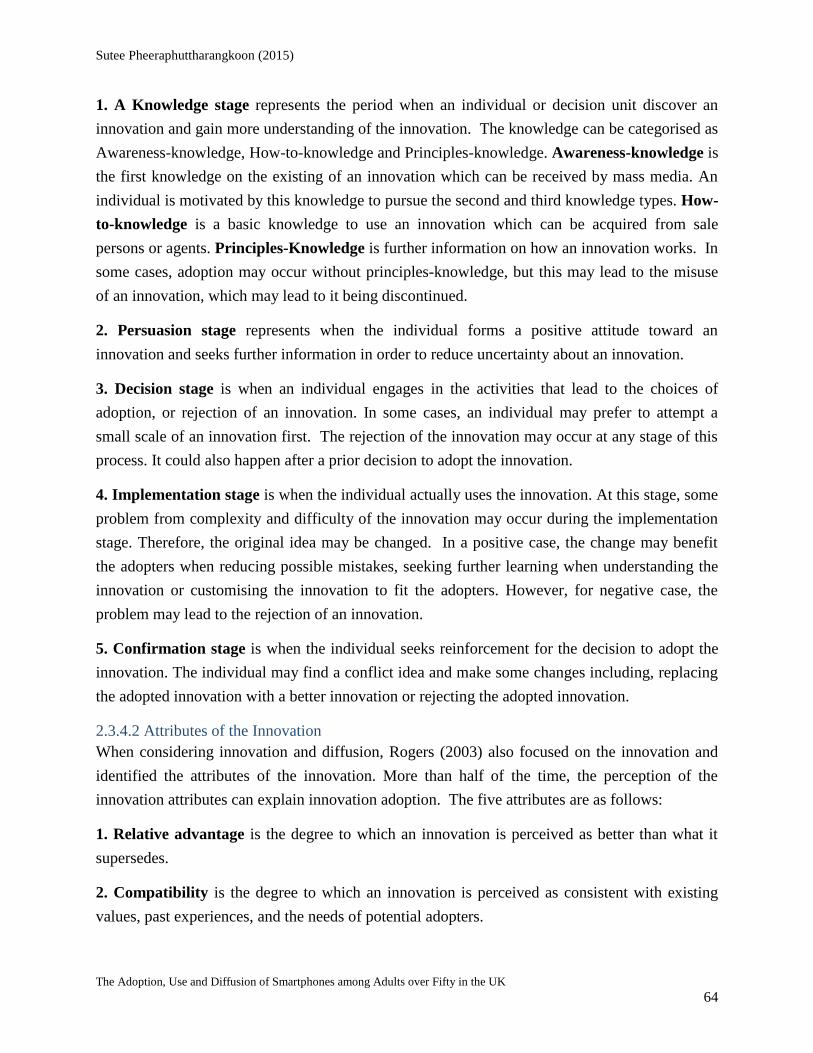
Sutee Pheeraphuttharangkoon (2015)
The Adoption, Use and Diffusion of Smartphones among Adults over Fifty in the UK 64
1. A Knowledge stage represents the period when an individual or decision unit discover an
innovation and gain more understanding of the innovation. The knowledge can be categorised as
Awareness-knowledge, How-to-knowledge and Principles-knowledge. Awareness-knowledge is
the first knowledge on the existing of an innovation which can be received by mass media. An
individual is motivated by this knowledge to pursue the second and third knowledge types. How-
to-knowledge is a basic knowledge to use an innovation which can be acquired from sale
persons or agents. Principles-Knowledge is further information on how an innovation works. In
some cases, adoption may occur without principles-knowledge, but this may lead to the misuse
of an innovation, which may lead to it being discontinued.
2. Persuasion stage represents when the individual forms a positive attitude toward an
innovation and seeks further information in order to reduce uncertainty about an innovation.
3. Decision stage is when an individual engages in the activities that lead to the choices of
adoption, or rejection of an innovation. In some cases, an individual may prefer to attempt a
small scale of an innovation first. The rejection of the innovation may occur at any stage of this
process. It could also happen after a prior decision to adopt the innovation.
4. Implementation stage is when the individual actually uses the innovation. At this stage, some
problem from complexity and difficulty of the innovation may occur during the implementation
stage. Therefore, the original idea may be changed. In a positive case, the change may benefit
the adopters when reducing possible mistakes, seeking further learning when understanding the
innovation or customising the innovation to fit the adopters. However, for negative case, the
problem may lead to the rejection of an innovation.
5. Confirmation stage is when the individual seeks reinforcement for the decision to adopt the
innovation. The individual may find a conflict idea and make some changes including, replacing
the adopted innovation with a better innovation or rejecting the adopted innovation.
2.3.4.2 Attributes of the Innovation
When considering innovation and diffusion, Rogers (2003) also focused on the innovation and
identified the attributes of the innovation. More than half of the time, the perception of the
innovation attributes can explain innovation adoption. The five attributes are as follows:
1. Relative advantage is the degree to which an innovation is perceived as better than what it
supersedes.
2. Compatibility is the degree to which an innovation is perceived as consistent with existing
values, past experiences, and the needs of potential adopters.
Sutee Pheeraphuttharangkoon (2015)
The Adoption, Use and Diffusion of Smartphones among Adults over Fifty in the UK 65
3. Complexity is the degree to which an innovation is perceived as relatively difficult to
understand and use.
4. Trialability is the degree to which an innovation may be experimented with, but on a limited
basis.
5. Observability is the degree to which the results of an innovation are visible to others.
Apart from the attributes other factors also affect adoption, which are the type of innovation
(optional, collective or authoritative), communication channel, the nature of social systems, and
the extent of a change agent’s promotion effort. Further variations affecting adoption are the
numbers of people involved in a decision, where impacts are made due to the larger the number
and the more times requests are made.
2.3.4.3 Characteristics of Innovators
In DOI, individuals can be categorised in terms of speed of their adoption. Innovators (2.5%)
are happy to spend their resources on an innovation. They also have an ability to understand,
apply complex knowledge and cope with the high uncertainty of an innovation. These types of
individuals have an important role when launching an innovation in a social system. Early
Adopters (13.5%) can be considered to be the social leaders with resources. These groups of
individuals can provide advice about the innovation. Therefore, an innovation should be
approved by this group before diffusing to a wider group. The Early Majority (34%) adopts an
innovation before the average members of the social system. With enough resources, this group
can be seen as deliberate. They may take some time before completely adapting to the
innovation. The early majority from the link in the diffusion process are the early adopters and
late majority. Late Majority (34%)
2.3.4.4 The Limitations of DoI
Although the DOI Theory provides explanations about the decision process, adoption proportion
and adoption categories, this theory does not explain how attitude is involved in the adoption
procedure and how innovation characteristics are applied to the adoption process (Karahanna et
al., 1999; Chen et al., 2002). To overcome such weaknesses, further developments of the model
and theory were made.
2.3.5 Decomposed Theory of Planned Behaviour (DTPB)
The DTPB model was further developed based on the TPB, DOI and TAM. Further, there are at
least two versions of DTPB. The first model applies DOI’s characteristics- Relative Advantage,
Complexity and Compatibility to the Attitude component, where the Normative Influences and
Subjective Norms components are maintained. For the Perceived Behavioural Control

Sutee Pheeraphuttharangkoon (2015)
The Adoption, Use and Diffusion of Smartphones among Adults over Fifty in the UK 66
component, Efficacy and Facilitating Conditions link to the component. The previous research illustrated that the DTPB is more efficient than TPB (Taylor & Todd, 1995a). The first version of
DTPB is depicted in Figure 2-4.
Figure 2.4 Decomposed Theory of Planned Behaviour version 1
The second version of DTPB was also proposed in the same year (Taylor & Todd, 1995b). In this
version, PU and Ease of Use from TAM and the Compatibility to Attitude component were
combined. For the Subjective Norms components, Peer Influence and Superior’s Influences were
used. The Perceived Behavioural Control factor is affected by Self Efficacy, Resource
Facilitating Conditions and Technology Facilitating Conditions.

Sutee Pheeraphuttharangkoon (2015)
The Adoption, Use and Diffusion of Smartphones among Adults over Fifty in the UK 67
Figure 2.5 Decomposed Theory of Planned Behaviour versions 2
It can be seen that in the two versions there are similarities except for the decomposed part.
Attitude is influenced by relative advantage, compatibility and complexity while the second
version using TAM is affected by perceived usefulness and perceived ease of use. Moreover, the
second version is more focused on Subjective Norms and Facilitating Conditions. However, the
two models still have gaps in terms of moderated variables, demographic variables, enjoyment,
or experience.
2.3.6 Technology Acceptance Model 2 (TAM 2)
In 2000 the original TAM was improved by introducing more factors. Experience and
Voluntariness were the moderated variables, while Image, Job Relevance Output Quality and
Results Demonstrability were the independent variables as shown in Figure 2.6 (Venkatesh &
Davis, 2000). This model was termed as the extended TAM. The definition of extended variables
is as follows (Venkatesh, 2012).

Sutee Pheeraphuttharangkoon (2015)
The Adoption, Use and Diffusion of Smartphones among Adults over Fifty in the UK 68
Voluntariness can be defined as the extent to which potential adopters perceive the adoption
decision to be non-mandatory.
Image can be defined as the degree to which use of an innovation is perceived to enhance one's
status in one's social system.
Job Relevance is the reference to an individual's perception regarding the degree to which the
target system is relevant to his or her job.
Output Quality is the degree to which an individual believes that the system performs his or her
work tasks well.
Subjective norm is a person's perception that most people who are important to him think he
should or should not perform the behaviour in question.
Result demonstrability is the Tangibility of the results of using the innovation.
Figure 2.6 Technology Acceptance Model 2
TAM 2 was tested on Information technology and received a 34%- 52% when predicting the
usage intentions. Therefore, this model improved the understanding of user adoption behaviour
(Venkatesh & Davis, 2000).
Several research studies used TAM2 or the extended TAM to investigate technology related to
smartphones. Lu et al (2005) studied wireless internet service via mobile technolgy and found

Sutee Pheeraphuttharangkoon (2015)
The Adoption, Use and Diffusion of Smartphones among Adults over Fifty in the UK 69
that social influences and personal innovativenss influence usefulness and ease of use. Further,
usefulness and ease of use influence the adoption intention. Rouibah et al (2011) studied in the
Arab world, the adoption of a camera-mobile phone before e-shopping and found that subjective
norms, ease of use and camera usefulness affect camera mobile phone adoption before e-
shopping. Ducey (2013) studied tablet devices adoption and found that perceived usefulness,
perceived ease of use, subjective norm, compatibility and reliability of tablets influences the
intention to adopt tablets in a medical practice. Trakulmaykee and Benrit (2014) studied mobile
tourism guide in a Thai national park and found that perceived usefulness, perceived ease of use,
mobile content quality and mobile appearance quality effect intention to use mobile tourism
guide.
The main difference between TAM and TAM2 is the additional factor of Subjective norm.
However, the model does not explain demographic variables such as, age, which is a factor of
importance to this research study. Further, some older adult research addresses the entertainment
or joyfulness aspects as factors leading to adoption (Yoon et al., 2011). Therefore, TAM 2 is not
appropriate to smartphone adoption within older adult research.
2.3.7 Unified Theory of Acceptance and Use of Technology (UTAUT)
Introduced in 2003, UTAUT was developed based on TAM, TPB and DoI (Venkatesh, Morris,
Hall, et al., 2003). The improved factors are Performance Expectancy, Effort Expectancy, Social
Influence and Facilitating Conditions that impact independent variables. For moderator variables,
UTAUT presents Gender, Age, Experience and Voluntariness of Use. UTAUT attempted to
combine all the possible previous research models to predict the acceptance and use of
technology. It was found that UTAUT can also predict approximately 70% of acceptance and use
(R-square = 0.7) (Venkatesh, Morris, Hall, et al., 2003).

Sutee Pheeraphuttharangkoon (2015)
The Adoption, Use and Diffusion of Smartphones among Adults over Fifty in the UK 70
Figure 2.7 Unified Theory of Acceptance and Use of Technology
The definitions of UTAUT’s variables are as follows (Venkatesh, 2012).
Performance Expectancy is the degree to which an individual believes that using the system
will help him or her to attain gains in job performance. This factor matches the perceived
usefulness variable from TAM and relative advantage from DOI. From figure 2.7 above, the
relationship between Performance Expectancy and Behavioural Intention can be moderated by
gender and age.
Effort Expectancy is the degree of ease associated with the use of the system. This factor is
similar to ease of use from TAM and complexity from DoI. From the original research, the
relationship between Effort Expectancy and Behavioural Intention is moderated by gender, age
and experiences.
Social Influence is the degree to which an individual perceives the important others believe he
or she should use the new system. This factor is similar to the subjective norm from TRA, TAM,
TPB and DTPB and image from DoI. Furthermore, the link between Social Influence and
Behavioural Intention is moderated by gender, age, voluntariness and experience.
Facilitating Conditions is the degree to which an individual believes that an organizational and
technical infrastructure exists to support the use of the system. This variable is similar to

Sutee Pheeraphuttharangkoon (2015)
The Adoption, Use and Diffusion of Smartphones among Adults over Fifty in the UK 71
perceived behavioural control from TPB and DTPB and compatibility from DoI. Moreover, the
relationship between Facilitating Conditions and Use Behaviour is moderated by Age and
Experience.
Table 2.6 Related literatures used UTAUT
Literature An area of
research
Methods
used
Research purpose/Research finding
Lee et al (2012) Smartphone
Applications
A survey of
215 college
students
and office
workers in
Korea
This research used UTAUT, credibility and
personalization to investigate smartphone
application adoption.
The results found that personalization
influenced performance expectancy. This
research also investigated the user
behaviour on smartphone applications and
the length of application usage.
Venkatesh et al
(2012)
Mobile
Internet
A survey of
1,512
mobile
internet
consumers
in Hong
Kong
This used UTAUT2 to study acceptance and
use of technology in a consumer context.
This research showed that UTAUT2’s
Performance expectancy, Effort expectancy,
Social Influence, Facilitating Conditions,
Hedonic Motivation, Price Value, and Habit
affect mobile internet acceptance.
Following adjustment, the model could
explain 74 % of behavioural intention.
Alkhunaizan &
Love (2012)
Mobile
Commerce
A survey of
547
smartphone
users in
Saudi
Arabia
This examined factors affecting m-
commerce in Saudi Arabia
This research found that cost, effort
expectancy and performance expectancy
influence intention to use mobile commerce.
The model explained 38 % of m-commerce
usage intention Pitchayadejanant
(2011)
Compare
adoption
between
iPhone and
Blackberry
A survey of
408
smartphone
users in
Thailand
This study used UTAUT to identify the use
of smartphones - iPhone and Black Berry in
Thailand
This research found that Facilitating
Conditions and Perceived Values affected

Sutee Pheeraphuttharangkoon (2015)
The Adoption, Use and Diffusion of Smartphones among Adults over Fifty in the UK 72
behavioural intention to use smartphones.
Zhou et al.(2010) Mobile
Banking
A survey of
250 phone
users and
students in
China
This research from China explained mobile
banking adoption. This research was
important as it emphasized the use of a
smartphone feature
The study found that Task technology fit,
Performance expectancy, and Social
influence intention, drawn from UTAUT
use mobile banking. The model can explain
57.5% or user adoption of mobile banking.
Song & Han
(2009)
Smartphone
applications
A survey of
570
consumers
in South
Korea
This study from South Korea, examined the
adoption of smartphone applications
The results showed that the quality of
content of application influenced user
performance expectancy through
enjoyment.
Kijsanayotin et
al.(2009)
Using IT in
Health
A survey of
1323
patients in
Thailand
This study from Thailand studied factors
influencing health IT adoption in the
community health centres
This research found that adoption is
influenced by UTAUT’s performance
expectancy, effort expectancy, social
influence and voluntariness. The actual use
is influenced by intention to use, facilitating
conditions and IT experiences. The model
can explain 27% of the IT usage and 54% of
intention to use the IT.
Shi (2009) Mobile
Application
A survey of
653
application
users in
China
This study from China used UTAUT to
examine smartphone software adoption
The research found that UTAUT’s
Performance Expectancy, Effort Expectancy
and Facilitating Conditions affect
behavioural intention. Moreover, Perceived
Enjoyment influence Performance
Expectancy.

Sutee Pheeraphuttharangkoon (2015)
The Adoption, Use and Diffusion of Smartphones among Adults over Fifty in the UK 73
Zhou (2008) Mobile
Commerce
A survey of
250 phone
users and
students in
China
This study again from China studied
UTAUT’s significant factors influencing
user acceptance of mobile commerce
The result found that UTAUT’s
performance expectancy, facilitating
conditions, social influence and contextual
offer significantly affected the user
acceptance of mobile commerce intention.
The model can explain 76.2% of intention
to use the m-commerce
Park et al (2007) Mobile
communication
Technology
A survey of
221 online
panellists
in China
This was a Chinese study of mobile
communication technology adoption
This research found that UTAUT’s
Performance Expectancy, Effort Expectancy
and Social Influence affect the attitude to
use the technology. Moreover, gender and
education levels significantly moderated the
UTAUT factors.
Carlsson et al.(
2006)
Adoption of
smartphone
both devices
and services
A survey of
157 mobile
consumers
in Finland
This Finnish study examined mobile device
adoption using UTAUT in organizations
The results found that performance
expectancy and effort expectancy affect
behavioural intention.
He & Lu (2007) Mobile
Advertisement
A survey of
243
individuals
in China
This Chinese study explored the consumer's
perceptions and acceptance of mobile
advertising in the SMS The research found that performance
expectations, social influence, and user's
permission had significant effects on
behavioural intention. Facilitating
conditions and behavioural intention also
had significant effects on user behaviour.
The models can explain up to 66.3 % of m-
advertising intention and 45% of actual
usage

Sutee Pheeraphuttharangkoon (2015)
The Adoption, Use and Diffusion of Smartphones among Adults over Fifty in the UK 74
Table 2.7 Related literature used UTAUT and 50+ adults
Boontarig et
al. (2012)
Smartphone
adoption of
e-health
service
A survey
of 31
elderly
adults in
Thailand
This examined the factors that influenced the Thai
older adults' population’s intention to use smartphones
as tools for e-Health services.
Of the UTAUT, the results showed that Effort
Expectancy, Facilitating conditions and Perceived
value significantly affects Behavioural Intention to use
smartphones.
It can be seen that the UTAUT model is widely employed by numerous researchers around the
globe. Compared to other models, UTAUT predicts technology intention of use up to 70 %
(Venkatesh, Morris, Hall, et al., 2003) while TAM2 predicts about 50%. In addition, this model
was published in the smartphone era. Therefore, this model was considered to be an important
model. However, this model is still weak in terms of determining entertainment or playfulness,
which led to the next model TAM3.
2.3.8 Technology Acceptance Model 3 (TAM 3)
In 2008 TAM 3 was formed to be an enhanced version of TAM 2 that consisted of additional
factors such as Computer Self efficacy, Perception of External Control, Computer Anxiety,
Computer Playfulness, Perceived Enjoyment and Objective Usability (Venkatesh & Bala, 2008).
The model was used to examine IT adoption in the workplace and could predict 53% of the
behavioural intention and 31-36% of actual use factors. The TAM 3 model is shown in figure
2.8.
The definition of the TAM 3’s additional variables can be found below.
Computer Self-Efficacy is the degree to which an individual believes that he or she has the
ability to perform a specific task/job using the computer.
Perception of External Control is the degree to which an individual believes that
organizational and technical resources exist to support the use of the computer system.
Computer Anxiety can be defined as the degree of an individual’s apprehension or even fear,
when he or she is faced with the possibility of using computers.
Computer Playfulness is the degree of cognitive spontaneity in microcomputer interactions.

Sutee Pheeraphuttharangkoon (2015)
The Adoption, Use and Diffusion of Smartphones among Adults over Fifty in the UK 75
Figure 2.8 Technology Acceptance Model 3
Perceived Enjoyment is the extent to which the activity of using a specific system is perceived
to be enjoyable in its own right, aside from any performance consequences resulting from system
use.
Objective Usability can be defined as a comparison of systems based on the actual level (rather
than perceptions) of effort required to complete specific tasks.

Sutee Pheeraphuttharangkoon (2015)
The Adoption, Use and Diffusion of Smartphones among Adults over Fifty in the UK 76
TAM 3 has been used in some research studies such as, studies of behavioural intention when
using mobile entertainment (Leong et al., 2013), mobile payment services (Jaradat & Al-
Mashaqba, 2014), mobile technology in hedonic scenarios (Abad et al., 2010) and mobile
commerce technology (Faqih & Jaradat, 2015).
TAM 3 can predict 53% of intention to use and 31-36% of actual use (Venkatesh & Bala, 2008)
while UTAUT can forecast adoption intention up to 70% (Venkatesh, Morris, Hall, et al., 2003).
However, the new factors such as Playfulness and Enjoyment were included to the new TAM.
This research believes that Enjoyment may affect smartphone adoption for older adults;
therefore, Perceived Enjoyment will be used in our research model.
2.3.9 Unified Theory of Acceptance and Use of Technology 2
In 2012, UTAUT 1 was updated by the same research team. The model was present with new
variables such as, Hedonic Motivation, Price Value and Habit. Moreover, the voluntariness of
use as a moderator variable was removed. The study examined the model with mobile internet.
The model as shown in Figure 2.9 could predict 56-74% of behavioural intention and 40-52% of
technology use (Venkatesh et al., 2012). The additional variables can be explained below.
Figure 2.9 Unified Theory of Acceptance and Use of Technology 2

Sutee Pheeraphuttharangkoon (2015)
The Adoption, Use and Diffusion of Smartphones among Adults over Fifty in the UK 77
Hedonic motivation can be defined as the fun or pleasure derived from using a technology. This
factor affect behavioural intention and the relationship can be modified by age, gender and
experience.
Price Value was applied to this model since the model was used to explain consumer behaviour.
The price value affects behavioural intention and the link can be modified by age and gender.
Habit can be defined as the extent to which people tend to perform behaviours automatically
because of learning. The factor affects both behavioural intention and use behaviour. Moreover,
the relationships can be moderated by age, gender and experience.
UTAUT 2 was introduced in 2012. Therefore, few articles are presented and some of them are in
progress which mean some research studies aim to study technologies with UTAUT2 but have
not finished at the time this chapter was written. Vongjaturapat and Chaveesuk (2013) presented
working in progress article on mobile technology Acceptance for library information services by
using UTAUT2 and technology characteristics (weight - of the mobile devices, user interface - of
the OS in the mobile devices, and form factor- size of the mobile devices) and task
characteristics (Information Retrieval and Document creation) . Ally and Gardiner (2012)
presented working in progress that they plan to use UTAUT2 and TAM to study smartphone
mobile devices. The factors that Ally and Gardiner propose were Perceived Usefulness,
Perceived ease of use, attitude, behavioural Intention, hedonic motivation, price value, habit,
facilitating conditions, social influence and social demographics. In Korea, UTAUT2 is used to
study Mobile learning among 305 university students that can explain 45% of behavioural
intention (Kang et al., 2015). UTAUT 2 is considered to be a new model that may be widely
adopted in research studies.
However, this research study decided to use UTAUT 1 as a base of the conceptual framework. It
is because firstly, UTAUT2 was published after the conceptual framework was established.
Then, the research value the established than change to UTAUT2. Secondly, the UTAUT2 is
very new compare with UTAUT which is mature in terms of researches.
Having considered the classic theories of adoption and the main topics of interest to this research
study, the next section will explain the conceptual framework of this research, the reasons for
selecting particular components from the three technology adoption models that formed this
research study’s model, the explanation hypothesis and the definitions of factors in the research
model.

Sutee Pheeraphuttharangkoon (2015)
The Adoption, Use and Diffusion of Smartphones among Adults over Fifty in the UK 78
2.4 Theoretical and Conceptual Framework As stated in the aim, adoption and use are imperative for this research. In terms of the
Information Systems (IS) discipline and adoption research, it was identified that research in this
area has matured, but studies related to adoption are still developing. The main theories applied
in adoption studies are the Diffusion of Innovation (DoI) theory (Rogers, 2003); Unified Theory
for the Acceptance and Use of Technology (UTAUT) (Venkatesh et al., 2012; Venkatesh,
Morris, Davis, et al., 2003); Technology Acceptance Model (TAM) (Davis, 1989) and Theory of
Reasoned Action (TRA) (Ajzen & Fishbein, 1980). In addition to these theories, the factor of
Enjoyment was used in the previous research studies and applied to examine and understand the
adoption and use of smartphones for this study.
To determine the combination of the theories, a review of the main and combined theories of
adoption in IS was conducted in the previous sections. It was found that TAM is the most
popular, followed by UTAUT and TRA (Aldhaban, 2012). However, there was also a preference
towards combining two or more classic IS adoption and use theories for research. For instance,
DoI and TAM were combined to explain the adoption of smartphones in the logistics industry (J.
Chen et al., 2009). This combination was also applied to research the adoption of smartphones
within medical practitioners, doctors and nurses (Park & Chen, 2007). UTAUT and Enjoyment
were combined to examine the importance of Enjoyment in mobile services (Song & Han, 2009).
Using this as reasoning, it was decided to combine more than two classic adoption and use
theories to provide a better understanding of the adoption of smartphones in the Silver surfer
population of the UK. Moreover, from this point the model that was developed for this research
study will be termed the Model of Smartphone Acceptance (MOSA). The following section will
explain the definition of components and the origin of the components.
2.4.1 Conceptual Framework
A conceptual Framework is one of the most important parts of a research study. There are
several ways to define this term. Miles and Huberman (1994) defined the term as “A conceptual
framework explains, either graphically or in narrative form, the main things to be studied - the
key factors, concepts, or variables and the presumed relationships among them. The framework
can be rudimentary or elaborate, theory-driven or commonsensical, descriptive or causal” (p. 18).
Conceptual Frameworks can help researchers in several ways. They can be used as a guide line
and they can also link the research objective and research questions (Saunders et al., 2009).
A conceptual framework can be built from experiential knowledge, existing theory and research,
pilot and exploratory research, and thought experiments (Maxwell, 2013). Oppong (2013)
supported the idea that a conceptual framework can be created from the reviewed literature. For

Sutee Pheeraphuttharangkoon (2015)
The Adoption, Use and Diffusion of Smartphones among Adults over Fifty in the UK 79
quantitative research, a conceptual framework provides the content for the study based on a
literature review or a researcher’s experience. For qualitative research, a framework is developed
based on the results of a study (Saunders et al., 2009).
This research developed a conceptual framework to study the adoption of smartphones within
older adults based on UTAUT, TAM3 and DOI. Please note that a conceptual framework may be
also termed as a research framework or conceptual model. The following section will explain
hypothesis to form MOSA conceptual framework.
2.4.2 MOSA Construct Definition
Having explained the nature of a conceptual framework, this section now provides the definitions
of the selected components of the framework and concepts drawn from the reviewed theories.
Table 2.8 MOSA Construction Definition
Factor/Components Original
Theory
Definitions
Observability DOI (Rogers,
2003)
Observability is defined as the degree which
smartphones are visible to 50+adults.
Compatibility DOI (Rogers,
2003)
Compatibility can be defined as the degree which
smartphone is compatible with 50+adults’ lifestyles.
Social Influence UTAUT
(Venkatesh,
Morris, Hall,
et al., 2003)
Social Influence be defined as the degree to which an
individual perceives that other individuals important to
the individual, such as, family, friends or other close
peers believes that he or she should use the new system
such as a smartphone.
Facilitating
Conditions
UTAUT
(Venkatesh,
Morris, Hall,
et al., 2003)
Facilitating Conditions can be defined as the degree to
which an individual believes that an organizational and
technical infrastructure exists to support the use of a
smartphone.
Performance
Expectancy
UTAUT
(Venkatesh,
Morris, Hall,
et al., 2003)
Performance Expectancy is defined as the degree to
which an individual believes that using the system will
help him or her to achieve their jobs or tasks.
Effort Expectancy UTAUT
(Venkatesh,
Morris, Hall,
et al., 2003)
Effort Expectancy can be defined as the degree of ease
associated with the use of a system.

Sutee Pheeraphuttharangkoon (2015)
The Adoption, Use and Diffusion of Smartphones among Adults over Fifty in the UK 80
Perceived
Enjoyment
TAM 3
(Venkatesh &
Bala, 2008)
Perceived enjoyment can be defined as the extent to
which the activity of using a specific system is
perceived to be enjoyable in its own right, aside from
any performance consequences resulting from system
use.
Behavioural
Intention
UTAUT
(Venkatesh,
Morris, Hall,
et al., 2003)
Behavioural Intention is the level to which a person has
formulated a conscious plan to further use a device in
the future.
These definitions of the components are important and critical for the research as these allow the
development of the hypotheses and provide the basis of the research questions.
2.4.3 MOSA Hypotheses Development
After completing the literature review, the next step is to form a conceptual framework and
hypotheses. “A hypothesis is a statement of the relationship between two variables that can be
tested empirically” (Gratton & Jones, 2010:26).
The proposed conceptual framework assumed that the dependent variable of this research, the
behavioural intention to use and the adoption of smartphones of silver surfers is influenced
initially by Observability and Compatibility that have been drawn from the DoI (Rogers, 2003).
The second group of constructs include, social influence, facilitating conditions, performance
expectancy and effort expectancy that are drawn from UTAUT (Venkatesh et al., 2012;
Venkatesh, Morris, Davis, et al., 2003) Third, Perceived Enjoyment (Song & Han, 2009;
Chtourou & Souiden, 2010) is also integrated into the model. Finally, the dependent variable
Actual use is influenced by the intention to use smartphones.

Sutee Pheeraphuttharangkoon (2015)
The Adoption, Use and Diffusion of Smartphones among Adults over Fifty in the UK 81
Use Behavior(Actual Use)
Behavioral Intention
H8
Perceived Enjoyment
H7
Observability Compatibility
DOI
H2 H1
Performance expectancy
Facilitating Condition
Social Influence
Effort Expectancy
UTAUT
H4
H5
H6
H3
Figure 2.10 Proposed conceptual framework - Model of Smartphone Acceptance (MOSA)
DoI: Observability
An innovative product is defined as a new product where the features are novel or improved
significantly from the predecessors. The contemporary features may be developed using
innovative technologies and knowledge or materials currently available (Rogers, 1998).
Smartphones, therefore, can be considered to be an innovative product because firstly, they were
introduced in 2007 with advanced designs and sophisticated technologies such as an iPhone
(Honan, 2007). Secondly, they had applications and immense advanced features compared to a
feature phone. Therefore, Rogers’s DoI is applied to this framework.
Observability is defined as the degree that smartphones are visible to silver surfers. Previous
research studies related to smartphones also identify that Observability is important for
technology adoption. Observability was applied and confirmed in the study of smartphone
adoption among doctors and nurses (Park & Chen, 2007) in Midwest, USA. Observability also
applied to study smartphone adoption among nurses in community hospitals in southeastern USA
(Putzer & Park, 2010). Observability also influenced the mobile commerce adoption within
graduate degree students (Khalifa & Cheng, 2002) and in mobile banking (Al-Jabri & Sohail,
2012). The variable was also studied and confirmed in the mobile internet context in China (Liu
& Li, 2010).
In real life situations, Observability can emerge in instances where older adults who are in
employment, are likely to observe smartphones being used by their younger co-workers. Older
adults may also see smartphone being used by their children. Smartphone providers also widely
advertise their products on several channels including traditional ones such as TV, newspapers
Sutee Pheeraphuttharangkoon (2015)
The Adoption, Use and Diffusion of Smartphones among Adults over Fifty in the UK 82
and magazines. Therefore, it can be assumed that older adults would have a chance to observe
smartphones being used.
Therefore, from DoI, this research posits that there is more a likelihood of silver surfers adopting
smart phones when they see a smartphone being used. Thus the following hypothesis is
proposed.
H1: Observability has a positive influence on the behavioural intention of smartphone
adoption within silver surfers.
DoI: Compatibility
Compatibility that is also drawn from DoI, is defined as the degree that a smartphone is
compatible with a silver surfers’ lifestyles (Rogers, 1998). This variable has been studied in
several research studies. Teo and Pok (2003) from Singapore studied WAP-enabled mobile
phones within internet users and confirmed that Compatibility can influence attitude and user
behaviour. Compatibility was also confirmed in mobile commerce adoption (Wu & Wang, 2005)
and mobile banking (Lin, 2011) studies conducted in Taiwan. In the health care industry,
compatibility was integrated and confirmed in healthcare systems using mobile devices (J.-H.
Wu et al., 2007). Xue et al (2012) applied compatibility to study accessing health informatics via
a smartphone and confirmed that compatibility influence intention to use among 50+ women in
Singapore.
In a traditional perspective, smartphones or mobile phones are compatible with business person's
lifestyle. From their benefits that are explained earlier on, smartphones can be used by every
individual, including older adults. Smartphones can be used as communication tools to operate a
business and to contact friends and family. As addressed earlier, smartphones can assist older
adults in monitoring their health. A Personal digital assistant feature of smartphones can help
those who are facing memory loss problems. With a Bluetooth connection to an application
monitoring tool used to monitor health problems such as blood pressure, sugar or hearth rate
monitor, older adults can regularly check their health status. Therefore, it can be seen that
smartphones can be compatible with an older adult’s lifestyle, which led to the proposal of the
following hypothesis.
H2: Compatibility has a positive influence on the behavioural intention of smartphone
adoption within silver surfers.

Sutee Pheeraphuttharangkoon (2015)
The Adoption, Use and Diffusion of Smartphones among Adults over Fifty in the UK 83
UTAUT: Social Influence
Social influence, one of the factors drawn from UTAUT can be defined as the degree to which an
individual perceives that others important to them such as family, friends or other close peers,
believe that they should use the new system, such as a smartphone (Venkatesh, 2012). It has
been learnt that when the silver surfers adopt new technologies, they are normally influenced by
other individuals, particularly those who are close to them; for instance, their family and good
friends. The influencing individuals can introduce smartphones to older adults, explain the
features of and the benefits of smartphones to silver surfers.
Previous research studies associated with smartphones also show that social influence is
important for technology. Examples of studies that have used social influence include a study of
3G adoption in China (Chong, Ooi, et al., 2012), mobile coupons (Chong, Ooi, et al., 2012),
mobile phone adoption within older adults (Chong, Ooi, et al., 2012), online applications on
smartphones (Shi, 2009), Smartphone Application Acceptance (Lee et al., 2012), 3G mobile
technology (Song & Han, 2009), Analysis of users and non-users of smartphone applications
(Verkasalo et al., 2010), the Thai older adults intention to use smartphone for e-Health services
(Boontarig et al., 2012), and smartphone adoption in Bangkok (Pitchayadejanant, 2011).
Therefore, the following hypothesis is proposed.
H3: Social Influence has a positive influence on the behavioural intention of smartphone
adoption within silver surfers.
UTAUT: Facilitating Conditions
Facilitating conditions drawn from UTAUT can be defined as the degree to which an individual
believes that an organizational and technical infrastructure exists to support the use of a
smartphone (Venkatesh, 2012). This factor can be explained by older adults having the necessary
resources such as knowledge, time and money to adopt smartphones (Zhou, 2008; Venkatesh,
Morris, Hall, et al., 2003). However, as with any novel technology, users who want to adopt a
smartphone will need to have some understanding of using the new device. This is because the
newer technologies are different in some way from the old ones. Therefore, the users may need
to learn how to use a new device.
Additionally, the costs of using a smartphone a handset and the monthly fee are also included
within this factor. Therefore, if the cost for using a smartphone is affordable and viewed as more
beneficial to the silver surfers, than a positive attitude may occur. This means then that the users
can use the technology and is within the budget that an older adult has allocated to use a
smartphone.

Sutee Pheeraphuttharangkoon (2015)
The Adoption, Use and Diffusion of Smartphones among Adults over Fifty in the UK 84
From previous research studies on mobile acceptance, the construct facilitating conditions are
viewed to be one of the main factors leading to acceptance; in other words, adoption (Zhou et al.,
2010; Zhou, 2008). The previous research studies integrate Facilitating Conditions such as
acceptance of smartphone online application software in China (Shi, 2009), smartphone
application acceptance in Singapore (Lee et al., 2012), intention to use smartphones in Bangkok
(Pitchayadejanant, 2011), Chinese mobile banking (Zhou et al., 2010), mobile technology
acceptance (Zhou, 2008), and mobile device and services (Carlsson et al., 2006). Therefore,
based on this reasoning, the following hypothesis is proposed.
H4: Facilitating Condition has a positive influence on the behavioural intention of
smartphone adoption within silver surfers.
UTAUT: Performance Expectancy
Performance Expectancy, which is also drawn from UTAUT, is defined as the degree to which
an individual believes that using the system will help him or her to achieve completion of their
jobs or tasks (Venkatesh, 2012). Theory also reveals that performance is also one of the factors
that affects user behavioural intention (Venkatesh, 2012). UTAUT identifies a user’s perception
of the smartphone benefits being mobility, internet connection and an application that can assist
older adults in many ways as addressed in the reviewed literature. If older users recognise the
potential benefits that a smartphone can provide, then they are likely to adopt and use a
smartphone.
Yu (2012) used Performance Expectancy to study mobile banking in Taiwan and found that the
variable was significant. He and Lu (2007) also applied the variable to study consumers
perceptions and acceptances of mobile advertising in China. In terms of mobile gaming,
Performance Expectancy also be confirmed by Chen (2011) in Taiwan. Carlsson et al (2006)
from Finland applied Performance Expectancy to study mobile device and services such as
Multimedia Message, Search service and Ring tones. Park et al (2007) also applied Performance
Expectancy to study mobile technologies including mobile phone and personal digital assistance
in China, and found that the variable was significant. In terms of using smartphones for health
services, Boontarig et al (2012) applied Performance Expectancy to study among older adults
(65+) in Thailand. Therefore, the following hypothesis is proposed.
H5: Performance expectancy has a positive influence on the behavioural intention of
smartphone adoption within silver surfers.

Sutee Pheeraphuttharangkoon (2015)
The Adoption, Use and Diffusion of Smartphones among Adults over Fifty in the UK 85
UTAUT: Effort Expectancy
Another factor taken from UTAUT is effort expectancy, which is defined as the degree of ease
associated with the use of a system (Venkatesh, 2012). Effort expectancy reflects the perceived
effort construct when users adopt a new system; in this case, a smartphone. This factor is
compared to the perceived ease-of use construct of TAM and the complexity construct from the
DoI (Venkatesh, Morris, Hall, et al., 2003). It explains a user’s perception of the difficulty
associated with using a smartphone; that is, whether using a smartphone is a difficult or easy
task. However, in the past few years, smartphone providers and developers have simplified the
operations and functions of smartphones. Therefore, some older adults may find smartphones
easy to accept and use.
Effort expectancy was integrated to study smartphone for health services adoption among Thai
older adults (Boontarig et al., 2012) and the resulted was confirmed this variable. Kijsanayotin et
al (Kijsanayotin et al., 2009) included Effort Expectancy to study Information system with health
centres, the research also confirmed that Effort Expectancy was significant for Information
system and health. Im et al (2011) applied Effort Expectancy to study music player and mobile
banking in Korea and USA. Im et al (2011) confirmed that Effort Expectancy was important for
technology adoption. For mobile gaming, Chen (2011) applied the variable to study mobile
gaming in China. Alkhunaizan and Love (2012) also applied Effort Expectancy to studies mobile
commerce in Saudi Arabia. Therefore, the following hypothesis is proposed.
H6: Effort Expectancy has a positive influence on the behavioural intention of smartphone
adoption within silver surfers.
TAM3: Perceived Enjoyment
TAM 3 provided perceived enjoyment that is defined as the extent to which the activity of using
a specific system is perceived to be enjoyable in its own right, aside from any performance
consequences resulting from system use (Venkatesh, 2012). A smartphone, which has additional
capacities such as connecting older adults with friends and family, playing music, watching
videos, installing and playing games and surfing some entertaining content, can be a device that
provides enjoyment for older adults. Perceived enjoyment was found to significantly affect the
intended use of new technology (Davis, et al, 1992).
Verkasolo et al (2010) suggested that for some features of smartphones such as mobile internet
services and mobile gaming, enjoyment was significant affected by the adoption. Nimrod (2011)
reviewed online forums and found that senior citizens also considered enjoyment when using
new technologies such as, an online community. This factor was also studied in both the contexts

Sutee Pheeraphuttharangkoon (2015)
The Adoption, Use and Diffusion of Smartphones among Adults over Fifty in the UK 86
of using software in smartphones (Song & Han, 2009; Verkasalo et al., 2010) and using mobile
Internet (Shin, 2007). Moreover, UTAUT2 (Venkatesh et al., 2012) also included Hedonic
motivation - defined as fun or pleasure derived from using a technology. Thus, this research
believes that older people may find smartphones enjoyable in many aspects. Therefore, the
following hypothesis is proposed.
H7: Perceived Enjoyment has a positive influence on the behavioural intention of smartphone
adoption within silver surfers.
Behavioural Intention/ Use Behaviour
The final factor drawn from UTAUT (Venkatesh, 2012) is Behavioural Intention, which is the
level to which a person has formulated a conscious plan to further use a device in the future. It is
also the middle factor between the dependent variables and Use behaviour.
In this research study, Behavioural Intention is considered to influence further or continue use of
the smartphones. It is because this research study believe that with appropriate time and
environments older adults can learn how to use smartphones (Chaffin & Harlow, 2005) as well
as younger generations. This research expected that, with the benefits and features as address
above in section 2.2.2 and benefits for older adults who are facing health problems such as in the
research by Joe and Demiris (2013), older adults will continue to use smartphones and perhaps
increase a frequency of usage. Moreover, some previous research studies based on UTAUT
display the strong relationship between the dependent variables and Behavioural Intention such
as the study of information technology in six organizations by Venkatesh et al (2003), and,
mobile advertising by He and Lu (2007).
Therefore, the following hypothesis is proposed.
H8: Behavioural intention has a positive influence on the smartphone usage of silver surfers.
To illustrate and understand the combined factors, their relationships and the formed hypotheses,
a structural model was formed that is shown in Figure 2.10.
This research also realizes the usage of demographic variable such as age, gender, experience
and voluntariness as in Venkatesh (2012) research. Therefore, the demographic variable will be
explained in the next section.
2.4.4 Demographic Variables
Besides the main factors identified above, socioeconomic variables such as age, gender,
education, occupation and health can provide further information on the characteristics of the
research population (Burgess, 1986). Wagner et al (2010) concluded that independents variables

Sutee Pheeraphuttharangkoon (2015)
The Adoption, Use and Diffusion of Smartphones among Adults over Fifty in the UK 87
such as age, gender, health and education could affect personal behaviour; therefore, this
research recognised these variables and included them for further consideration. The
demographic variables such as age, gender and education will be analysed both as independent
variables and moderator variables. In the following section more explanations on age are
provided.
2.4.4.1 Demographic Variables as Independent Variables
When including demographic variables in a research study generally, the researchers present and
interpret their findings in terms of demographic variables.
Age, which is a demographic variable used in this study can be used as a factor to explain a
specified social group or collective behaviour (Finch, 1986). For technology adoption research,
the younger age group is likely to adopt a new technology compared with the older age group
(Rogers, 1995). For example, younger users are likely to use a Personal Digital Assistant well
(Arning & Ziefle, 2007), while the younger users are likely to use WAP services (Hung et al.,
2003). Karim et al (2009) also found that 20-30 age groups were far more adapted to mobile
phones. For mobile commerce, Chong et al (2012) found that the younger generation (16-28) use
more mobile commerce. The actual use of mobile commerce was affected by age (Alkhunaizan
& Love, 2012).
Reasons why younger users are likely to adopt new technology more than the older adults
A strong reason for younger individuals to adopt new technologies is likely due to their attitude
toward technology. Younger users view new technologies as useful tools and important for their
lifestyles. Younger users also have a positive view of themselves when determining the
capability to use the new technologies (Broady et al., 2010; Bovée et al., 2007; Teo, 2006;
Pektaş & Erkip, 2006). Further, factors such as the level of confidence of younger users to use
new technologies (Gardner et al., 1994), or technology exposure, or experience with technology
also influence the younger users to adopt new technologies (Levine & Donitsa-Schmidt, 1998;
Bovée et al., 2007). From the above reasons, it is expected that older adults (50-59) are likely to
adopt smartphones more than 60+ adults.
Gender is also an important variable in social sciences research that can be used as both a
descriptive and explanatory variable (Morgan, 1986). From several research studies, males are
more likely to adopt innovative technology in comparison to females (Rogers, 1995). For
example, males are more likely to adopt mobile phones than females (Karim et al., 2009).
However, some research has found that the differences in numerical terms between male and
female smartphone owners may not be significant (Su & Li, 2010). Nevertheless, for the 50+
adults the numbers may be varied.

Sutee Pheeraphuttharangkoon (2015)
The Adoption, Use and Diffusion of Smartphones among Adults over Fifty in the UK 88
Education is a less popular variable that is used in research studies, particularly when compared
to age and gender. Further, studies using the education variable are still limited in technology
adoption studies (Teo, 2001). However, educational level has been used in some studies of
innovational adoption (Rogers, 1995). For example, people with higher educational levels are
more likely to adopt 3G (Chong, Ooi, et al., 2012), and mobile commerce (Alkhunaizan & Love,
2012). It is expected that people with higher education levels are likely to adopt and use
smartphones.
Occupation is considered in this research because some of the 50+ adults may still be in
employment, which could lead to them using smartphones. There have been previous research
studies of mobile phones linked with occupation in the technology adoption arena, university
students, working class and teenagers are more likely to use mobile phones compared to retired
individuals both in the UK and China (Su & Li, 2010). This variable can provide a contribution
to link smartphone adoption to occupation.
As older adults are the demographic group of interest to this study, and as ageing occurs,
disabilities, ailments and health issues emerge, which is likely to affect technology use;
hence the health variable was included in this study. Kurniawan (2008) found that older
women facing haptic (touch) problems while men have perceptual problems when using mobile
phones. The health or ailing problems may be classified as cognitive functions or memory,
vision, auditory and haptic (touch) (Kurniawan, 2008). Other diseases such as Parkinson’s
disease could lead to problems associated with the smartphone touch screen.
In some specific research studies, demographic variables can also form a hypothesis. For
example, in the research study of 3G technology the demographic variables of age, education
and gender were the independent variables used to predict the intention to adopt 3G technology
(Chong, Ooi, et al., 2012). The hypotheses in the 3G adoption research were that users who are
in lower age groups are more likely to adopt 3G, while users who have higher educational levels
are more likely to adopt 3G and males are likely to adopt 3G than females.
Further examples of using demographic variables as independent variables in the hypotheses are
the research study on mobile commerce using TAM (Yang, 2005). The hypotheses were that age
negatively influences perceived usefulness and the ease of use of mobile commerce. Gender
influences perceived usefulness and the ease of use of mobile commerce. However, the
hypotheses about gender supporting the perceived usefulness was dropped.
2.4.4.2 Demographic Variable as Moderator Variables
A demographic variable can also be used as a moderator variable in research studies such as the
research study on mobile internet by Venkatesh (2012). In the UTAUT study, the moderator

Sutee Pheeraphuttharangkoon (2015)
The Adoption, Use and Diffusion of Smartphones among Adults over Fifty in the UK 89
variables with regards to demographics are age, gender, experience and Voluntariness of use.
The UTAUT model (Venkatesh, Morris, Hall, et al., 2003) was suggested as follows.
The Effect of performance expectancy on the behavioural intention is stronger for men
and younger users.
The Effect of effort expectancy on the behavioural intention is stronger for women older
users and those with limited experience.
The Effect of social influence on behavioural intention is stronger for women, older
users, under condition of mandatory use, and with limited experience.
The Effect of facilitating condition of usage is stronger for older users with increasing
experience.
Other research studies that have utilised demographics as moderator variables in the context of
smartphones are identified below in the table below.
Table 2.9 Related literature used demographic variable as moderator variables
Literature An area of
research
Methods
used
Main Theories/ Moderator
variables/Research finding
(He & Lu, 2007) Mobile
advertisement
A survey of
243
individuals
in China
UTAUT was applied where Age, Gender,
Experience, and Voluntariness were used. The effect of social influence was
moderated by age, gender and voluntariness
of the use of mobile advertising.
(Park et al.,
2007) Mobile
technologies
A survey
221 online
panel in
China
UTAUT was implemented with Gender,
Education, and Experience. The effect of
performance expectancy and effort
expectancy was moderated by gender and
education on the use of mobile technology.
Moreover, the effect of social influence was
moderated by education. (Shin, 2009) Mobile Wallet A survey
296
website
visitors in
Korea
TAM was applied where Age, Gender and
Income were used. The effect of security
and trust was moderated by income. The
effect of perceived ease of use, self-
efficacy, social influence and intention to
use mobile wallet was moderated by age.
(Ha et al., 2007) Mobile game A survey
1169
TAM was applied where Age and Gender
were used. The effect of Perceived ease of

Sutee Pheeraphuttharangkoon (2015)
The Adoption, Use and Diffusion of Smartphones among Adults over Fifty in the UK 90
website
visitors in
Korea
use was moderated by age and gender.
(Yu, 2012) Mobile
Technology
for Chinese
Consumers
Survey 221
users in
Taiwan
UTAUT was implemented with Age and
Gender.
The effect of performance expectancy and
perceived financial cost was moderated by
gender. The effect of facilitating condition
and perceive self-efficacy was modified by
age.
From the above table, it can be seen that demographic variables as moderator variables can
provide more of an understanding of the research model. Therefore, this research will apply the
demographic variables in both ways.
However, with regards to UTAUT, The voluntariness of using the technology will be removed
from this research. The definition is “the degree to which use of the innovation is perceived as
being voluntary, or of free will” (Moore and Benbasat 1991:195). Unlike organizations, this
research is focused on general users where the users have a freedom to use or not to use their
smartphones; therefore, the voluntariness of use was omitted.
2.5 Chapter Summary
This chapter began with a background story of the smartphone in terms of statistics and literature
where it was learnt that the smartphone is a successor of the mobile phone that was developed in
1992 and the proliferation of smartphones began to occur in 2007. The key smartphone brands
are Apple, Samsung, LG, Sony and Motorola. Smartphones can provide many benefits as shown
in Table 2.1. Then, a review of the earlier studies on smartphone adoption was proffered where
the emphasis was more on the user design interface, smartphone usage and smartphone adoption
and the population that was utilised included, organizations, students, or the population in
general. Therefore, from the literature review, it was found that there is a gap in research on
older adults and smartphones.
Section 2.3 the provided discussion of the theories in technology adoption studies in IS. The
reviewed theories are TRA, TAM, TPB, DOI, DTPB, TAM2, UTAUT, TAM3 and UTAUT2.
Using the reviewed theories and selected constructs, Section 2.4 provided the conceptual

Sutee Pheeraphuttharangkoon (2015)
The Adoption, Use and Diffusion of Smartphones among Adults over Fifty in the UK 91
framework of this study, along with the eight hypotheses and an explanation of the demographic
variables as moderators were afforded.
The following chapter 3 will now offer a discussion of the chosen research methodology.
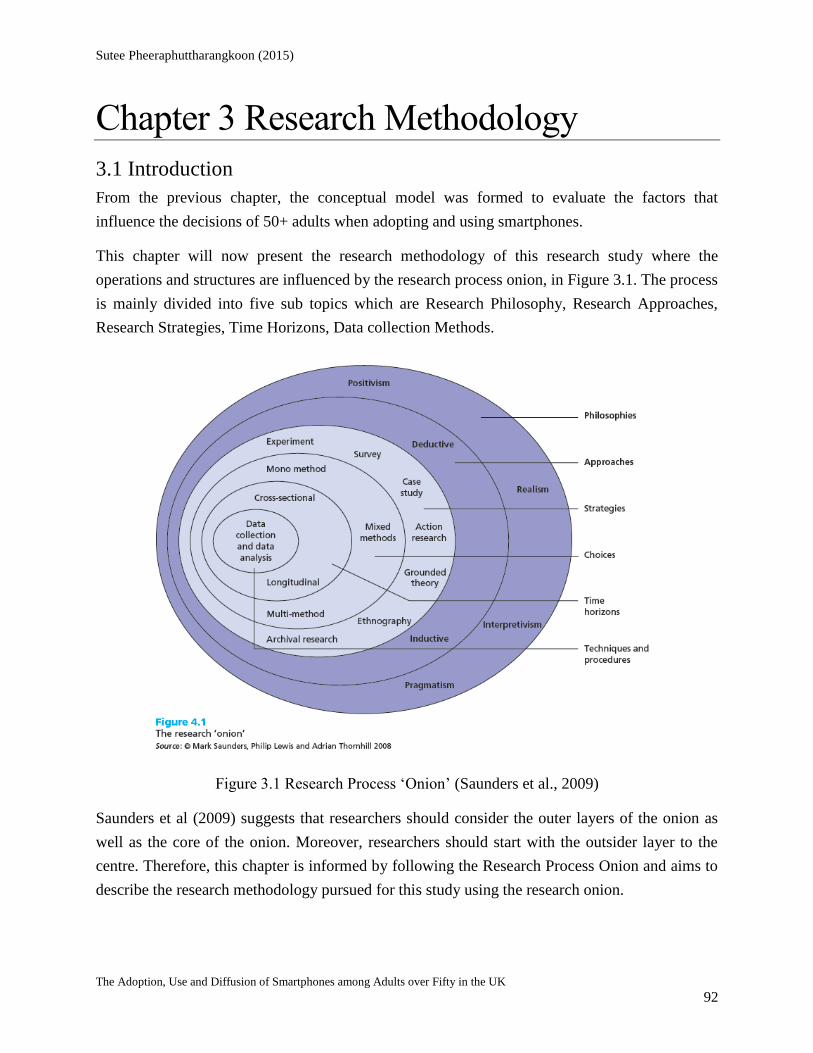
Sutee Pheeraphuttharangkoon (2015)
The Adoption, Use and Diffusion of Smartphones among Adults over Fifty in the UK 92
Chapter 3 Research Methodology
3.1 Introduction
From the previous chapter, the conceptual model was formed to evaluate the factors that
influence the decisions of 50+ adults when adopting and using smartphones.
This chapter will now present the research methodology of this research study where the
operations and structures are influenced by the research process onion, in Figure 3.1. The process
is mainly divided into five sub topics which are Research Philosophy, Research Approaches,
Research Strategies, Time Horizons, Data collection Methods.
Figure 3.1 Research Process ‘Onion’ (Saunders et al., 2009)
Saunders et al (2009) suggests that researchers should consider the outer layers of the onion as
well as the core of the onion. Moreover, researchers should start with the outsider layer to the
centre. Therefore, this chapter is informed by following the Research Process Onion and aims to
describe the research methodology pursued for this study using the research onion.

Sutee Pheeraphuttharangkoon (2015)
The Adoption, Use and Diffusion of Smartphones among Adults over Fifty in the UK 93
3.1.1 Overview of the Research Process
The following outline is provided to illustrate the research process that was pursued in this
research study.
Phase 1: Research Instrument Development & Pilot Testing
Literature review to develop the pilot questionnaire
Content Validation
Collect 200 responses from all age groups
Analyse the received data using SEM-PLS
Provide results
Develop final survey
Phase 2: Final Survey
Pre-test final survey
Collect 1,000 responses
Analyse the data using SEM-PLS
Measurement Reliability and validity
Provide final results
Phase 3 Evaluations.
Acquire nationwide dataset/s
Using Probit regression to analyse the dataset
Compare analysed national wide result with the final research result
Test research hypothesis with national wide result
To inform readers, this chapter is structured as follows: In the following section, 3.2 the research
philosophy is provided. This is followed by the research approaches section in 3.3. The research
strategy, which was pursued by this research study is proffered in section 3.4, which is followed
by a discussion of the research choices in 3.5. There were some time horizons to be considered
that are identified and explained in section 3.6. The data collection process and analysis
techniques are identified and explained in section 3.7, which leads to the conclusion to this
chapter in section 3.8.
3.2 Research Philosophy
Researchers should understand the research philosophy and be aware of the importance of a
research philosophy, which is defined as the development of knowledge and the nature of

Sutee Pheeraphuttharangkoon (2015)
The Adoption, Use and Diffusion of Smartphones among Adults over Fifty in the UK 94
knowledge ( Saunders, Lewis, & Thornhill, 2009). The components of a research philosophy are,
Epistemology, Ontology, and, Methodology.
Pursuing the suggestions of the research onion, research philosophies that researchers can apply
can be grouped into Positivism, Realism, Interpretivism and Pragmatism.
3.2.1 Positivism
Positivism is the idea of objectivism where a researcher is independent of, neither affects and nor
is affected by the subject of the research (Remenyi, 1998). Positivism is used to describe an
approach to research based on the assumption that knowledge can be discovered by collecting
data through observation, measurement and analysing it to establish truths (Somekh & Lewin,
2005). “Positivist studies are premised on the existence of a priori fixed relationships within
phenomena, which are typically investigated with structured instrumentation. Such studies serve
primarily to test theory, in an attempt to increase predictive understanding of phenomena”
(Baroudi & Orlikowski, 1990:5).
Generally, Positivism aims to discover social phenomenal by beginning with a set of hypotheses.
This type of philosophy normally uses designed experiments, measurement techniques, and
verification analysis. The outcome can be seen as causality (Easterby-Smith et al., 2006). A
positivist philosophy usually applies quantitative research and a deductive approach (Saunders et
al., 2009). Other philosophies that are based on positivism are Neo-positivism and Post-
positivism.
For this research, the researcher believes that he is not related to, or affected the subjects of this
research, 50+ adults. The researcher does not personally know all the 50+ adults in the research
sites. Secondly, the researcher believes that knowledge can be collected utilizing measurements,
although this is not entirely accurate (100 percent correct). Third, the researcher has a
background in engineering; therefore, the researcher felt more comfortable to work with
structured instrumentation or data collection method and analysis, which are associated more
with positivism.
Baroudi and Orlikowski (1991) have also suggested that Positivism is used to test theory in an
attempt to increase the predictive understanding of phenomena, in this case adoption of
smartphones among older adults. Since this research did form hypotheses and a conceptual
framework in chapter 2 and intended to examine smartphones adoption it is believed that this
research study did apply a positivist standpoint.
3.3 Research Approaches - Deductive The next layer of the onion refers to the research approaches, which are deductive and inductive.

Sutee Pheeraphuttharangkoon (2015)
The Adoption, Use and Diffusion of Smartphones among Adults over Fifty in the UK 95
3.3.1 Deductive
A deductive approach is mostly performed in the natural sciences where laws can present,
explain and predict the phenomenon. A deductive approach is applicable for quantitative data
with large sample sizes in order to explain the relationship between variables. Further, a
deductive research approach is more generally associated with positivist and quantitative
research. It involves the development of an idea, or hypothesis, from existing theory which can
then be tested through the collection of data” (Gratton & Jones, 2010:26). Therefore this research
utilised a deductive approach.
3.4 Research Strategies
As suggested by the research onion process, the strategies layer is the next layer, which consists
of an Experiment, Survey, Case study, Action research, Ground theory, Ethnography and
Archival research. A research strategy offers an overall direction to the research, including a
process of how research should be conducted and enabled such that researchers can
systematically perform the study (Remenyi, 1998). The strategies can be considered as a general
plan for researchers to perform their research study with, and to answer their research question
(Saunders et al., 2009). The factors that help the researchers to select an appropriate research
strategy are research objectives, research questions, existing information, time and other
resources as well as the selected research philosophy.
The terms research strategies and research methodology are often used interchangeably. A
research methodology can be defined as the theory of how research should be undertaken,
including the theoretical and philosophical assumptions upon which research is based and the
implications of these methods adopted (Saunders et al., 2009). This has already been discussed
earlier in the chapter. Both research strategies and research methodology are closely linked to
methods. Method refers to the techniques and procedures used to collect and analyse research
data such as questionnaires, observations, interviews and statistical and non-statistical techniques
(Saunders et al., 2009). A research methodology or research strategy employs research methods
such as a survey strategy that uses a questionnaire technique. Additionally, methods such as
questionnaires can also be referred to as a research instrument (Cooper & Schindler, 2013). This
research study applied a survey instrument that is discussed later on in the chapter.
3.4.1 Survey – Research Strategy
A Survey consists of gathering data using questionnaires (Chen & Hirschheim, 2004). A Survey
is also a common strategy for business and management studies and is associated with the
deductive approach. Surveys assist in answering ‘who, what, where, how much and how many’
questions. A survey is also commonly used because it can economically collect large amounts of

Sutee Pheeraphuttharangkoon (2015)
The Adoption, Use and Diffusion of Smartphones among Adults over Fifty in the UK 96
data (Saunders et al., 2009). From the Chen and Hirschheim (2004) study, a survey was used in
41% of the articles submitted to eight major IS publications during 1991 to 2001. Please note: A
survey is a research strategy while the questionnaire is a research tool that employs questions to
gather data.
The data collected by a survey strategy can be analysed using both descriptive and inferential
statistics. This means that a survey is used to provide the reasons for particular relationships
between variables to create models to illustrate a relationship and to allow more control over the
research process (Saunders et al., 2009).
A questionnaire can be defined as a set of carefully designed questions related to the research
topic of interest and given in exactly the same form to a group of people when collecting data
(Jupp, 2006). However, deviations are the medium of a questionnaire and how questionnaires are
answered. There are several types of questionnaires, according to the methods of a survey
strategy; for example, a paper-based, postal or online questionnaire. Moreover, questionnaires
can be classified as delivery and collection questionnaires, interviewer-administered
questionnaires, and self-administered questionnaires (Saunders et al., 2009). A questionnaire
usually provides an inexpensive and effective way to obtain data and in a structured and
manageable way. The questionnaire was the selected research instrument for this research.
For this research, a self-administered internet and intranet mediated questionnaire (online
questionnaire) was administered via email or website (Hewson, 2003). In the next section, more
explanations of a self-administered questionnaire are provided.
3.4.1.1 Internet and Intranet Mediated Questionnaire - Method The internet and intranet mediated questionnaire are suitable for a population that can access the
internet or an intranet. The strength of this type of questionnaire is coping with a large
geographic area and a large sample size. However, the response rate is around 30% within an
organizational environment and around 11% using the internet. In this instance, researchers
should provide fewer questions, the questions should be closed question and not complicated.
Researchers should allow 2-6 weeks for distribution and the financial resource can be spent on
web design or software.
The advantage of this type of questionnaire in comparison to the paper based, postal and
delivery, collection questionnaire are reducing both the times, costs of printing, distributing the
questionnaire, where the data collated is likely to be prepared for analysis due to the statistical
software. An online questionnaire also allows vast and diverse groups of potential research
participants to be reached (Hewson, 2003). In the case of this research study, the academic
institution that the researcher is completing his studies at, provide the software and a website

Sutee Pheeraphuttharangkoon (2015)
The Adoption, Use and Diffusion of Smartphones among Adults over Fifty in the UK 97
subscription for the researchers. Therefore, this research adopted the internet and intranet
mediated questionnaire.
The advantage of the survey strategy when using a questionnaire are first, the postal or online
questionnaire allows researchers to collect data from a geographically dispersed sample group
with a lower cost in comparison to interview. Secondly, questionnaires are likely to provide
structured quantitative data that is easier to analyse. Thirdly, respondents can complete the self-
administered questionnaire at their convenience (Gratton & Jones, 2010).
This strategy was applied to this research study because this strategy allowed more control over
the process of research and was achievable given the limited financial resources that the research
team had.
3.5 Research Choices
When considering research choices several options exist including the mono method, mixed
methods and multi-method. Research choices include selecting between, or with both, the
Quantitative and Qualitative approach and data. For this research, quantitative data was sought,
which is described in the next section.
3.5.1 Quantitative and Qualitative Data
The terms quantitative and qualitative data are used to explain research data characteristics.
Quantitative data is “Predominantly used as a synonym for any data collection technique such
as, a questionnaire or data analysis procedures such as, graphs or statistics that generate or use
numerical data” (Saunders et al., 2009:151). The quantitative data’s key concept is quantity and
numbers. Consequently, quantitative data is information about the data in the form of numbers
(Punch, 2013). This type of data does not occur naturally. Thus, researchers convert data into
numbers that can be measured and analysed (Punch, 2009).
Comparatively, Qualitative data is “used predominantly as a synonym for any data collection
technique such as, an interview or data analysis procedure such as categorising data that
generates or use non-numerical data” (Saunders et al., 2009:151). This type of data is appearing
in, for instance, interview transcripts, recordings and notes, observational records and notes,
documents and products and records of material culture, audio-visual materials and personal
experience materials (Punch, 2013).
For this research study that is on smartphones and older adults, the data was collected in surveys
that were then converted into numbers; therefore, quantitative data was considered to be
appropriate for this research.

Sutee Pheeraphuttharangkoon (2015)
The Adoption, Use and Diffusion of Smartphones among Adults over Fifty in the UK 98
3.5.2 Quantitative and Qualitative approach
As mentioned earlier, there are epistemologies that also exist, which is also the case for the
research data characteristics. Quantitative research is typically associated with a positivist and
objectivist stance, while qualitative research is associated with Interpretivism and
constructionism (Alasuutari et al., 2008).
This research applied a quantitative approach because firstly, the data that was obtained was in
numerical format, which is quantitative data. Secondly, the selected strategy and research
philosophy conformed to the research aims. The aim which is to understand the adoption of
smartphone using IS theories needs the quantitative data similar to the previous research in this
field (Venkatesh, 2012).
3.6 Time Horizons
Research studies and the research onion consist of a time dimension where there are two types of
time horizons, which are Longitudinal and Cross-sectional research.
Longitudinal Studies are repeated over an extended period, which allows researchers to track
changes over time (Cooper & Schindler, 2013). This type of time horizon is suitable for testing
and developing theories on human development and answers (Saunders et al., 2009).
Cross-sectional Studies are “carried out once and represent a snapshot of one point in
time”(Cooper & Schindler, 2013:128). Cross-sectional studies are likely to have a large sample
using questionnaires and the survey technique (Easterby-Smith et al., 2006). This time horizon is
suitable for studies where a particular phenomenon is considered at a specific time (Saunders et
al., 2009).
Regarding this research’s aim and questions there was an attempt to explore a smartphone
phenomenon within a limited timed period, where a cross-sectional time horizon was considered
most appropriate. Further, the cross-sectional time horizon was compatible with this research
philosophy and selected survey strategy.
3.7 Data Collection and Data Analysis
Having considered the research onion, the philosophies and research strategies were considered.
Now, this section will explain the Primary and secondary data used in this research, the literature
review sources, the research site decision, instrument validation, sampling Frames and sample
size, and finally, the sample and analysis methods.

Sutee Pheeraphuttharangkoon (2015)
The Adoption, Use and Diffusion of Smartphones among Adults over Fifty in the UK 99
3.7.1 Primary and Secondary Data
Primary data is data collected specifically for an undertaken research study (Saunders et al.,
2009). The Primary data can be collected using methods such as surveys or observations
(Zikmund et al., 2009).
Secondary data are the data that have already been collected by other researchers and for some
other purpose. Secondary data is raw data and in the form of, for example, published summaries
(Saunders et al., 2009). Secondary data can be acquired faster and is less expensive than primary
data (Zikmund et al., 2009). Published documents prepared by other researchers are secondary
data sources (Cooper & Schindler, 2013).
Due to the aim and research questions of this study, this research needed to acquire primary data.
However, secondary data was also required; for instance, for literature reviews when forming the
initial understanding and conceptual framework. In this research secondary data such as journal
articles and conference publications are used for problem definition, literature review, conceptual
development, method development, and discussion phases. Statistical documents and secondary
quantitative data sets also helped in developing the problem definition and evaluation phases.
Further, research books were also used for the research method development phase.
3.7.2 Sources and Management of Literature Review When obtaining secondary data, search engines and databases were employed, which were
Google Scholar by Google Inc., Web of Science by Thomson Reuters, Scopus and ScienceDirect
by Elsevier, Wiley Online Library, Palgrave Journals, IEEE Xplore Digital Library, Association
for Computing Machinery (ACM) Digital Library, AIS Electronic Library (AISeL), and, the
Institute for Operation Research and the Management Sciences (INFORMS).
Of the above identified search engines and databases, the Web of Science, Scopus, and Google
Scholar were mainly used. The reasoning for this is that Google Scholar is well known due to its
wide coverage of most journals from the Google universe. Google Scholar provided full-text
searches of journal articles and books (Jacsó, 2008). In terms of conference proceedings, Google
scholar offered a better comparison to the Web of Science (Franceschet, 2009) and Scopus (Bar-
Ilan, 2010). Moreover, Google is convenient as it is easily accessible from anywhere and at any
time. When employing Google Scholar, the researcher was aware that since Google Scholar is
widespread, low quality or irrelevant articles are also presented, which was found to be more
time consuming.
Web of Science and Scopus were also used to gather articles as both the databases provide better
results compared with Google scholar. Also, using both databases could achieve better coverage
Sutee Pheeraphuttharangkoon (2015)
The Adoption, Use and Diffusion of Smartphones among Adults over Fifty in the UK 100
(Vieira & Gomes, 2009; Bar-Ilan, 2010). Besides these three main databases, other databases
were considered because initially, older adults and smartphone adoption use and diffusion is
novel; therefore, the researcher sought to provide a comprehensive list of reviews. Second, this
research wanted to cover the most possible, high quality journals that are provided by the
Association of Business Schools’ (ABS) listing(Morris et al., 2009).
For the smartphone technology search, the keywords that were used were: smartphones,
smartphones, mobile phones, mobile phones adoption and, acceptance. For older people and
technologies searches, the keywords were: older adults, older people, 50+ people, senior citizens,
technologies, silver surfers, and mobile. The time frames that were used for the literature reviews
were from 2000 to 2013. The main journals used for this research study are as follows.
MIS Quarterly
Computer Standards & Interfaces
European Journal of Marketing
Industrial Management & Data Systems
Information & Management
Information Economics and Policy
Intern Journal of Research in Marketing
International Journal of Forecasting
International Journal of Industrial Organization
International Journal of Information Management
Journal of Business Research
Journal of Consumer Marketing
Journal of Interactive Marketing
Telecommunications Policy
Telematics and Informatics
The main Journals used for older people and technology studies were:
Computers in Human Behaviour
Information & Management
International Journal of Human-Computer Studies
Interacting with Computers
Journal of Aging Studies
Journal of Business Research
Poetics
Journal of Systems and Software
Sutee Pheeraphuttharangkoon (2015)
The Adoption, Use and Diffusion of Smartphones among Adults over Fifty in the UK 101
To reduce human errors for citations and to increase the efficiency of managing referenced
articles, this research used reference management software (Henning & Reichelt, 2008), which
were: EndNote from Thomson Reuters, and Mendeley. EndNote is one of the most popular
commercial reference management software that offers many features such as full text search,
online storage, large numbers of citation styles and collaborative community (EndNote, 2014).
However, Endnote costs users an amount of around 100 USD for license.
The articles from the searches were stored and managed using Mendeley, from
www.mendeley.com. Mendeley is a free reference and Portable Document Format (PDF)
manager and academic social network (Mendeley, 2014). Mendeley also provided large enough
cloud storage that allows users and researchers to automatically synchronize their PDF files.
Therefore, the researchers can access the files anytime, anywhere from various devices and
platforms.
3.7.3 Research Instruments
This research study also applied research Instruments that range from, questionnaires, interviews,
content analysis, focus groups, and observations. They can be defined as devices for obtaining
information (Wilkinson & Birmingham, 2003). When completing research studies, researchers
need to understand research instruments and select appropriate instruments for data capture the
data that can lead to answers to the research questions.
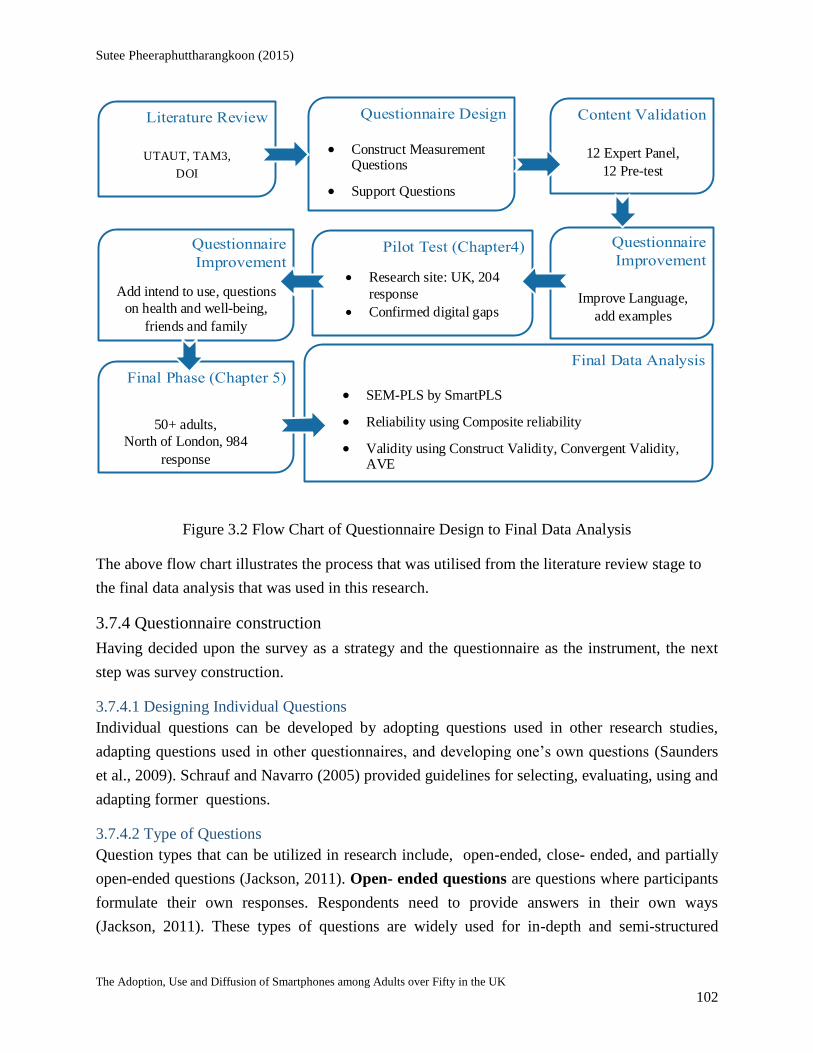
Sutee Pheeraphuttharangkoon (2015)
The Adoption, Use and Diffusion of Smartphones among Adults over Fifty in the UK 102
UTAUT, TAM3,
DOI
Construct Measurement Questions
Support Questions
12 Expert Panel,
12 Pre-test
Add intend to use, questions
on health and well-being,
friends and family
Research site: UK, 204
response
Confirmed digital gapsImprove Language,
add examples
SEM-PLS by SmartPLS
Reliability using Composite reliability
Validity using Construct Validity, Convergent Validity, AVE
50+ adults,
North of London, 984
response
Figure 3.2 Flow Chart of Questionnaire Design to Final Data Analysis
The above flow chart illustrates the process that was utilised from the literature review stage to
the final data analysis that was used in this research.
3.7.4 Questionnaire construction
Having decided upon the survey as a strategy and the questionnaire as the instrument, the next
step was survey construction.
3.7.4.1 Designing Individual Questions
Individual questions can be developed by adopting questions used in other research studies,
adapting questions used in other questionnaires, and developing one’s own questions (Saunders
et al., 2009). Schrauf and Navarro (2005) provided guidelines for selecting, evaluating, using and
adapting former questions.
3.7.4.2 Type of Questions
Question types that can be utilized in research include, open-ended, close- ended, and partially
open-ended questions (Jackson, 2011). Open- ended questions are questions where participants
formulate their own responses. Respondents need to provide answers in their own ways
(Jackson, 2011). These types of questions are widely used for in-depth and semi-structured
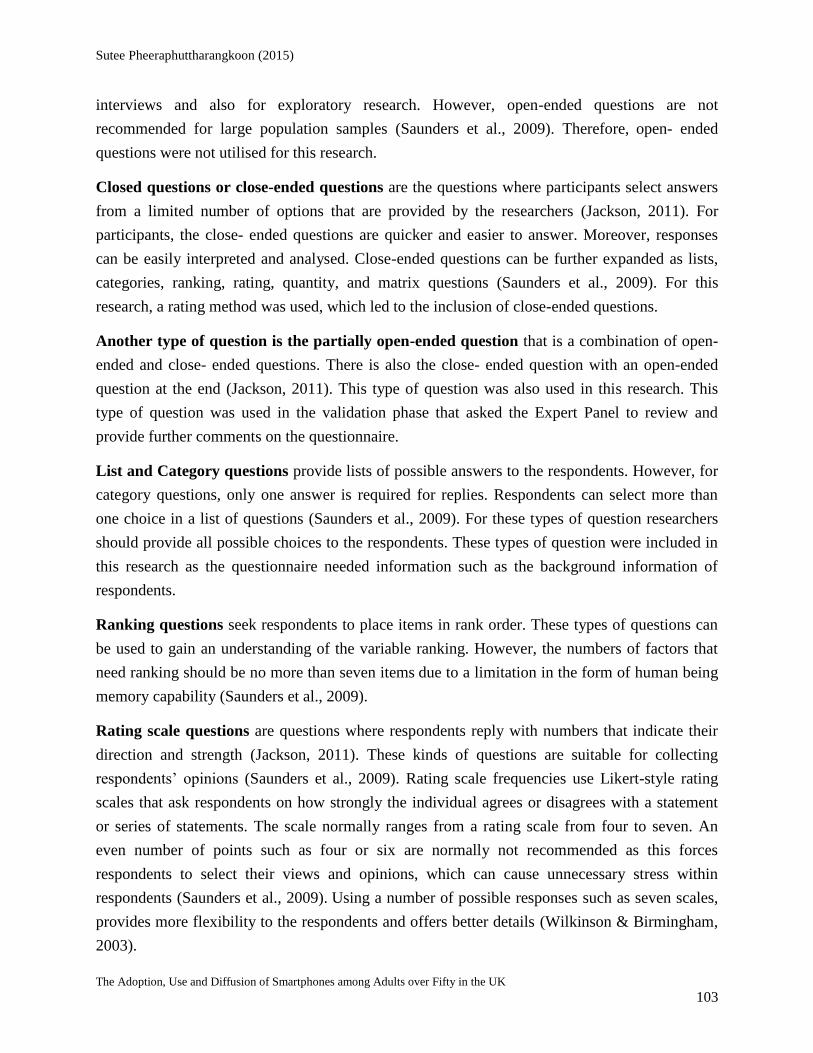
Sutee Pheeraphuttharangkoon (2015)
The Adoption, Use and Diffusion of Smartphones among Adults over Fifty in the UK 103
interviews and also for exploratory research. However, open-ended questions are not
recommended for large population samples (Saunders et al., 2009). Therefore, open- ended
questions were not utilised for this research.
Closed questions or close-ended questions are the questions where participants select answers
from a limited number of options that are provided by the researchers (Jackson, 2011). For
participants, the close- ended questions are quicker and easier to answer. Moreover, responses
can be easily interpreted and analysed. Close-ended questions can be further expanded as lists,
categories, ranking, rating, quantity, and matrix questions (Saunders et al., 2009). For this
research, a rating method was used, which led to the inclusion of close-ended questions.
Another type of question is the partially open-ended question that is a combination of open-
ended and close- ended questions. There is also the close- ended question with an open-ended
question at the end (Jackson, 2011). This type of question was also used in this research. This
type of question was used in the validation phase that asked the Expert Panel to review and
provide further comments on the questionnaire.
List and Category questions provide lists of possible answers to the respondents. However, for
category questions, only one answer is required for replies. Respondents can select more than
one choice in a list of questions (Saunders et al., 2009). For these types of question researchers
should provide all possible choices to the respondents. These types of question were included in
this research as the questionnaire needed information such as the background information of
respondents.
Ranking questions seek respondents to place items in rank order. These types of questions can
be used to gain an understanding of the variable ranking. However, the numbers of factors that
need ranking should be no more than seven items due to a limitation in the form of human being
memory capability (Saunders et al., 2009).
Rating scale questions are questions where respondents reply with numbers that indicate their
direction and strength (Jackson, 2011). These kinds of questions are suitable for collecting
respondents’ opinions (Saunders et al., 2009). Rating scale frequencies use Likert-style rating
scales that ask respondents on how strongly the individual agrees or disagrees with a statement
or series of statements. The scale normally ranges from a rating scale from four to seven. An
even number of points such as four or six are normally not recommended as this forces
respondents to select their views and opinions, which can cause unnecessary stress within
respondents (Saunders et al., 2009). Using a number of possible responses such as seven scales,
provides more flexibility to the respondents and offers better details (Wilkinson & Birmingham,
2003).

Sutee Pheeraphuttharangkoon (2015)
The Adoption, Use and Diffusion of Smartphones among Adults over Fifty in the UK 104
This research applied an odd number of scales such as five and seven, which were considered to
be less stressful. In the pilot phase, five scales were used, but in the final phase, a seven point
Likert scale was used. The five scales were used in the pilot because at the time the researcher
was concerned about the simplicity of the research. Moreover, five scales are used more often in
general questionnaires (Wilkinson & Birmingham, 2003). However, for the final phase, the scale
was increased to seven because the seven Likert scale is “a better approximation of a normal
response curve and extraction of more variability among respondents” (Cooper & Schindler,
2013:278).
Quantity questions expect participants to reply with numbers such as the participant’s year of
birth. Quantity questions are also more suitable to collect attribute data. In this research, to
collect background information, quantity questions were employed (Saunders et al., 2009).
Matrix or grid questions allow researchers to present similar questions simultaneously, where
the questions are listed on the left-hand side of a page and the replies are listed across the top.
These types of questions assist in saving space (Saunders et al., 2009). Matrix or grid questions
are similar to groups of rating scale questions. This research used grouped rating scale questions
as matrix questions.
3.7.4.3 Questionnaire Types
Having explained how the questions for the questionnaire were developed, this section now
discusses the questionnaire design and development.
Paper questionnaire – validating and pretest
After the questions were selected and developed from previous research studies, the
questionnaire needed to be validated. For this purpose, the researcher printed the online
questionnaire and using instructed interviews or a delivery and collection process, sought replies
from an expert panel. Thereafter, content validity was pursued, where the understanding and
language of the questions from the expert panel was achieved. Before disseminating the content
validity questionnaire to respondents, approval was obtained from the supervisory team. The
entire content validity form is provided in appendix 3-1, but for the reader’s current perusal, an
example is provided in Figure 3.3.

Sutee Pheeraphuttharangkoon (2015)
The Adoption, Use and Diffusion of Smartphones among Adults over Fifty in the UK 105
Figure 3.3 The example of question in Content Validation of the Questionnaire form
Following validation, some improvements were made to the questionnaire. Some of the expert
panel members provided answers using the hard (paper) format, whilst others employed the
email and online questionnaire channels.
Online questionnaire – websites for pilot and final phase
As previously explained, an online questionnaire was selected as the research strategy. However,
to ensure that a large success rate could be achieved a suitable application service provider had to
be identified. This section discusses how this research selected a particular website when hosting
the questionnaire.
When considering the online questionnaire hosting providers there were four candidates:
Qualtrics, Google Form, SurveyGizmo and Surveymonkey. Qualtrics is one of the best research
tools that has a good reputation and support service, and is used by more than 5,000 customers
and 97 top business schools. The website and created questionnaire are easy to use with Qualtrics
providing analytical and survey building tools. However, the website has a high subscription
cost; therefore Qualtrics was considered to be inappropriate (Qualtrics, 2015).
Google Form was the next choice as it is very simple to use. Nevertheless, the website is not
appropriate to the questions because Google Form is too simple, lacking appropriate survey
builder tools, and does not provide suitable analytical tools (Google, 2015).
SurveyGizmo was viewed as easy to use and a user-friendly site that offered cartoons alongside
the questionnaire. However, this website was limited to a trial period of 14 days and was an
expensive service to utilise; therefore, it was also removed as an option (SurveyGizmo, 2015).
The fourth and final website to be considered was Surveymonkey. Surveymonkey was
founded in 1999 and is a pioneer and popular provider for online questionnaires. Surveymonkey

Sutee Pheeraphuttharangkoon (2015)
The Adoption, Use and Diffusion of Smartphones among Adults over Fifty in the UK 106
is used by millions of users and provides an easy to use survey platform (Marra & Bogue, 2006;
Survey-reviews.net, 2012). The website also proffered, important features that were needed for
this research which are, Page and Question Logic. The features allow survey developers to route
respondents to particular questions (SurveyMonkey, 2013). Surveymonkey also provides graphs
and charts that are useful for presenting results and allows users to export the findings in a
variety of formats including Microsoft excel (Marra & Bogue, 2006). The data format can also
be imported into several analytical programmes such as SPSS and SmartPLS.
3.7.4.4 Cover Letter, Ethical Issues, Closing Page, Invitation Letter.
Following consideration of an appropriate questionnaire hosting website, the next stage was to
compose a covering letter (details in Appendix 5-2). The covering letter is the first part of the
questionnaire that contains an introduction to the researcher, research purpose and university.
The letter also contains details of the ethics number, instructions for completing the
questionnaire, the duration for completing the questionnaire, assuring the participants of
anonymity, results use and the researcher’s contact details (Saunders et al., 2009).
The questionnaire also contained a closing page that was at the end of the questionnaire
(Example in Appendix 5-3). This document contained a note of appreciation to the respondent
and the contact details of the researcher once again and was the format that was recommended by
(Saunders et al., 2009).
An important prerequisite for researchers is the Ethical issue where the privacy of possible
and actual participants, the voluntary nature of participation and the right to withdraw partially or
completely from the research process, consent of participants, maintenance of the confidentiality
of data provided by respondents, are provided. In brief, a research study and the researcher
should not harm both possible and actual participants and measures to ensure these aspects need
to be provided. In the researcher’s university, prior consent to ethics is required and the form to
be completed is provided in Appendices 5-4 and 5-5.
Finally, the online questionnaire contained an invitation letter that was used in the final
phase. The letter contains an introduction of the researcher, the team and university, the aims and
introduction of the research, the instruction of this questionnaire, linked to questionnaire on
Surveymonkey, and the contact details. The letter can be found in appendix 5-7. The letters were
printed out and distributed over the research area. The respondents can follow the link printed on
the letter in response to the questionnaire.
3.7.5 Instrument Validation Validity is a characteristic of measurement and involves testing the extent that a researcher
wishes to measure; and the differences found with a measurement tool. These reflect the true

Sutee Pheeraphuttharangkoon (2015)
The Adoption, Use and Diffusion of Smartphones among Adults over Fifty in the UK 107
differences amongst participants drawn from a population (Cooper & Schindler, 2013).
Instrument validation is a vital step for researchers to ensure the generation of scientifically valid
knowledge (Kim, 2009). Kim (2009) also suggests the scope of validity that begins from Content
validity. The second stage of validity involves a Pre-Test, Pilot test, and Manipulation validity.
The final and third stages are Reliability and Construct validity.
From Boudreau et al (2001) it was found that following a review of 143 articles from five IS
publications: Information & Management, Information System Research, MIS Quarterly, Journal
of Management Information System, and, Management Science, 63% applied a reliability test,
47% used a pre-test or pilot test, 42% utilised the previous instrument, 37% had Construct
Validity, and 23% had Content Validity (Boudreau et al., 2001). Therefore, it can be suggested
that validation is very important for IS research and was the reasoning applied to this research.
Please note that details and contents about construction, validity and reliability can be found in
the analysis section.
3.7.5.1 Content Validity or Face Validity
Content validity is the extent to which measurement scales provide adequate coverage of the
investigative questions (Cooper & Schindler, 2013). It can also be defined as the argument that a
question, scale, or measure appears to be logical to reflect accurately what was intended to be
measured (Saunders et al., 2009). There are several ways to justify adequate coverage. One is
using a discussion of the reviewed literature. Another is to use a panel of individuals to assess
whether each measurement question in the questionnaire is essential, useful but not essential or
not necessary (Saunders et al., 2009). In other words, validation examines whether a
questionnaire appears to make sense.
Bell (2005) recommends that a test to discover issues such as, the duration, the clarity of
instructions, layout clarity and attractiveness, any missing topics and any other comments should
be considered during validity. Following the questionnaire design, the questionnaire was
submitted to the first 12 panel participants for content validity. Four of the twelve participants
were drawn from the IS field and were academics, whilst the remaining were from other
academic fields (Details shown in Table 3.1).
Table 3.1 Content Validation – Expert Panel
Participant Area of Expertise
Academia Researcher related on IS
or older people
A Researcher on IS
B Researcher on IS
C Researcher on IS
D Researcher of old people and

Sutee Pheeraphuttharangkoon (2015)
The Adoption, Use and Diffusion of Smartphones among Adults over Fifty in the UK 108
technology
Other Academia reviewers or
related fields
E Retired Lecturer in Engineering
F Researcher of Engineering
G Researcher on Marketing
H Translator
I Master Degree Student on marketing
J Master Degree students on business
K Master Degree Student
L Graduated Student
In this process, the researcher applied both the delivery and collect, and instructed interview
methods in order to ensure a response from the panel. The content validation form and results
can be found in Appendices 3-1 and 3-2. This research applied the content validation method
provided by Lawshe (1975) and the results are provided in chapter4.
Lawshe (1975) provided a guideline that involved using the Content Validity Ratio (CVR) for
each question. The formula is shown below.
𝐶𝑉𝑅 = 𝑛𝑒 −
𝑁2
𝑁2
𝑛𝑒 is the number of panelists indicated as essential.
𝑁 is the total number of panelists.
From this formula the following results are possible. A positive scenario is that more than half of
the panel agrees with the essential elements, which suggests that the CVR is positive. However,
if more than half of the panel does not agree with the essential, then the CVR is negative.
Lawshe (1975) also suggested that the minimum value of CVR should be more than 0.62 for 10
panelists. For 12 Panelists, then the CVR should be more than 0.56. The results of the CVR
obtained by this research can be found in appendix 3-2. However, the results will be discussed
again in chapter 4.

Sutee Pheeraphuttharangkoon (2015)
The Adoption, Use and Diffusion of Smartphones among Adults over Fifty in the UK 109
3.7.5.2 Pre - Testing
After the first improvement, the next step for this research was the Pre-testing stage. Pretesting is
the assessment of questions and instruments prior to commencing a study; an established practice
for discovering errors in questions, question sequencing, instruction, or skip directions (Cooper
& Schindler, 2013). For this process, a questionnaire was created on Surveymonkey, the survey
website. At this juncture, for some of the pre-test panellists, a paper based questionnaire was
used. However, the researcher used mainly the email facility where a link to the online
questionnaire website was sent and comments for improvements were received by email or
telephone. The list of pre-test panellists is shown in Table 3-2.
Table 3.2 Survey Pretest Validation Panel
Participant Area of Expertise
Academic Professionals Dr. V Lecturer of IS
Dr. Ma Lecturer of IT
Industry Professional Ms. Pi Diplomatic officer (40+)
Ms. Ta Diplomatic officer (40+)
Mr. Ti Diplomatic officer, older adult (50+)
Mr. Me Older adults CEO (50+)
Ms. Se Business woman (40+)
Mr. Hu Older business owner (50+)
Ms. Ro Older adults Hair Dresser (50+)
Ms. Fa Accountant (40+)
Ms. Na Older Lady (60+)
Mr. Ki Very Old House Agent (65+)
For Pre-testing, it can be seen that this research focused more on Industry Professionals and older
adults by using a personal network of contacts. The pre-test results can be found in the appendix
3-2.
3.7.5.3 Pilot Testing
This research also used a pilot test. A pilot test is a trial collection of data that is used to detect
weaknesses in the design, instrumentation and provision of proxy data for the selection of a
probability sample (Cooper & Schindler, 2013). A pilot test is also defined as a small-scale study
that tests questionnaire in order to minimise the likelihood of respondents having problems with
the questions and processes. This can also help with the question validity and reliability
(Saunders et al., 2009). A Pilot not only enables a researcher to review a questionnaire used

Sutee Pheeraphuttharangkoon (2015)
The Adoption, Use and Diffusion of Smartphones among Adults over Fifty in the UK 110
mainly for distribution, but it also allows the researcher to test the analysis methods and the
framework (Bell, 2005). A pilot can assist in determining the response rate, and to understand the
questionnaire more and is useful for gathering replies to open-end questions (Dillman, 2011).
When determining the sample size for the pilot phase, there is reliance on the research questions,
objectives, final sample size, time and resources, and how well questionnaire was designed
(Saunders et al., 2009). A recommended number for a pilot are between 100 and 200 responses
(Dillman, 2011).
For the pilot phase, this research used an online questionnaire that was diffused via the social
media platform, Facebook. The process that was followed is that initially, the researcher posted
the link to the questionnaire in several Facebook pages, and placed an advertisement advertising
the questionnaire on Facebook. Any shortfall in numbers was overcome using the personal
connection networks and a snowball sampling method that led to 201 responses from the United
Kingdom (UK). Further details on the pilot are available in chapter4.
3.7.6 Sampling
Sampling is the process of selecting elements from a population to represent the overall
population(Cooper & Schindler, 2013). The reasons to use sampling are lower costs compared to
a census, and rapid data collection speed. The sampling process followed by this research
included, defining a relevant population, selecting the sample type, selecting a sampling
technique, identifying and evaluating sampling frames, selecting sampling frames and drawing
samples (Cooper & Schindler, 2013). The following section now discusses the nature of a
population.
3.7.6.1 Population
A population is defined as the complete set of cases or group members (Saunders et al., 2009).
Since this research is interested in the older adults of the UK, it was found that there are around
22.7 million people aged 50 years old and above, which is an estimated third of the UK
population (Office for National Statistics, 2014). From the previous Census in 2011, the UK
population was around 63.18 million, where the 50+ population was 21.89 million, around 34.65
% (BBC, 2012). The UK population is ageing and it is predicted to continue ageing over the next
few decades due to the number of births after World War 2 (Office for National Statistics,
2012c). Compared to other EU countries, in 2010, the numbers of members of the population
aged 65+ rose to 17% as the second highest demographic group to have such an increase (Office
for National Statistics, 2012c). Moreover, there were several research studies such as research on
mobile phones and older people using focus groups (Kurniawan, 2008), research on adoption and
usage of social media and older adults (Vyas, 2013), and research on internet access, e-public

Sutee Pheeraphuttharangkoon (2015)
The Adoption, Use and Diffusion of Smartphones among Adults over Fifty in the UK 111
services and older people (Sourbati, 2009) that were completed on the UK population. For the
aforementioned reasons, it was decided that the UK is an appropriate country to conduct such a
study.
However, the size of the entire population in the UK is immense and access to the entire country
is impossible, which led to this research study concentrating upon a smaller area of the UK.
Details of the research site and the reasoning for selecting it are provided in the next section.
3.7.6.2 Research Site
The research site for this research study is North London. There are several ways to define the
north of London; however, for this research, the areas that the study encompassed included
Barnet, Brent, Camden, Enfield, Haringey, Islington and Westminster. In 2011, north London
had a population of 1,880,852 with 474,873 older adults of 50 years old and above, where the 50
years old and above adults were 25.25% of the overall population (Office for National Statistics,
2011). The full list of north London areas can be found in appendix 5-6.
North London was also chosen for this study due to the well-developed mobile coverage
infrastructure offered in the vicinity compared to other areas around the UK (Ofcom, 2013) and
since this research study emphasises smartphones, this factor was also important.
Figure 3.4 Map of London, England, the UK

Sutee Pheeraphuttharangkoon (2015)
The Adoption, Use and Diffusion of Smartphones among Adults over Fifty in the UK 112
Table 3.3 Population of London, North London and Hertfordshire source: (Office for National Statistics, 2013)
Area Total population 50-59 60-69 70-79 Over 80 Over 50
London 8,173,941 833,226 599,362 393,117 254,860 2,080,565
North of London 1,880,852 189,273 138,404 90,572 56,624 474,873
Hertfordshire 1,116,062 136,865 110,464 74,423 51,507 373,259
Other reasons for choosing north London is that north London is next to Hertfordshire where the
University of Hertfordshire and the researcher are located; hence accessibility was easier than
other areas. Then, previous research on technology and older adults has been completed in
Hertfordshire (Vyas, 2013), which suggested that vicinities surrounding Hertfordshire could
provide some future comparative studies. To draw some comparisons, Table 3.3 has been
developed to show the differences in the population numbers of London, North of London and
Hertfordshire. What is also apparent is that the numbers of 50+ adults of North of London
outnumber the Hertfordshire older adult population numbers.
Secondly, as mentioned earlier, the University of Hertfordshire Business School has completed
some research on older adults and innovative ICT, which allowed the research team to display
some credence in the research area. Thirdly, convenience in terms of the questionnaire
distribution area/s was possible by deciding upon north London. That is, when disseminating
questionnaires, the researcher could utilise public transport to deliver the questionnaires. Finally,
the principal researcher resides in north London, so familiarity with the area was a major factor
for selecting north London as the research site of this study. Having explained the reasoning for
choosing north London, the next section provides reasons for the sampling frame.
3.7.6.3 Sampling Frames
When considering the sample size of any research study, the term sampling frame is frequented
upon. The sampling frame is a list of elements in the population from which the sample is
actually drawn (Cooper & Schindler, 2013). The list includes details such as the names of
employees in a company (Saunders et al., 2009). However, for this research, it is impractical to
access the list of older adults who live in north of London. Therefore, this research used the list
of 164 districts in the north of London. For example, Camden area is composed of districts such
as Agar Town, Belsize Park, Bloomsbury, Camden Town, Chalk Farm, Covent Garden,
Dartmouth, and Hampstead (Geographers’ A-Z Map Company, 2008). The complete list can be
found in appendix 5-6.

Sutee Pheeraphuttharangkoon (2015)
The Adoption, Use and Diffusion of Smartphones among Adults over Fifty in the UK 113
3.7.6.4 Sample Size
The term sample is also one that emerges before considering any sample size, or sample frame.
A sample is a group of cases, participants, events, or records consisting of a portion of the target
population, which is carefully selected to represent the population (Cooper & Schindler, 2013).
For Content Validation that was undertaken in this research, the recommended sample size or
expert panel size is five (Lawshe, 1975). This research obtained 12 responses from the pre-test;
whilst the pilot phase of this research gained 201 replies.
In general, the larger a sample size, the lower the likely the error exists for generalising the
population. Therefore, probability sampling is a compromise between the accuracy of a finding
and the amounts of resources in collecting, checking and analysing the data. A sample size can
be calculated statistically. For example, for a population of one million to ten million, 384
samples can provide a 95 confidence level with a 5% margin of error. For the same population,
1067 samples can provide a 95 confidence level with a 3% margin of error (Saunders et al.,
2009). Therefore, in this research, the target response rate was viewed to be 1000. However, after
the data collection, the numbers of completed response rates were at 1030. Nevertheless, after re-
examining the questionnaires, only 984 were useable, which led the researcher to conclude that
984 is very close to the targeted number of 1000 and more than the requested minimum number.
3.7.6.5 Sampling Types When determining sampling, it can be learnt that there are two categories, which are Probability
and Non-probability. For Probability sampling, all the units in the population have an equal
chance of being selected. Contrarily, when the probability of all the units in the population are
not equal, Non-probability sampling occurs (Cooper & Schindler, 2013). The probability
sampling or representative sample is normally related to a survey-based research strategy
(Saunders et al., 2009) where the processes begin with identifying an appropriate sampling frame
and sample size with regards to the research questions and objectives. Thereafter, the appropriate
sampling techniques and the sample need to be selected, which leads to this process requiring a
recheck on whether the sample represents the population. The Non-Probability sampling or
non-random sampling is applicable for the exploratory stage of research such as, for a pilot
survey (Saunders et al., 2009). Therefore, this research used Probability sampling for the final
phase and non-probability sampling in the pilot phase. In the next section, explanations about the
sampling techniques are provided.
3.7.6.6 Sampling Technique The techniques of Probability types that are available are: Simple random, Systematic, Stratified
random, Cluster, and multi stage. The techniques from Non-probability types are: Quota,
Purposive, Snowball, Self-selection, and Convenience (Saunders et al., 2009).
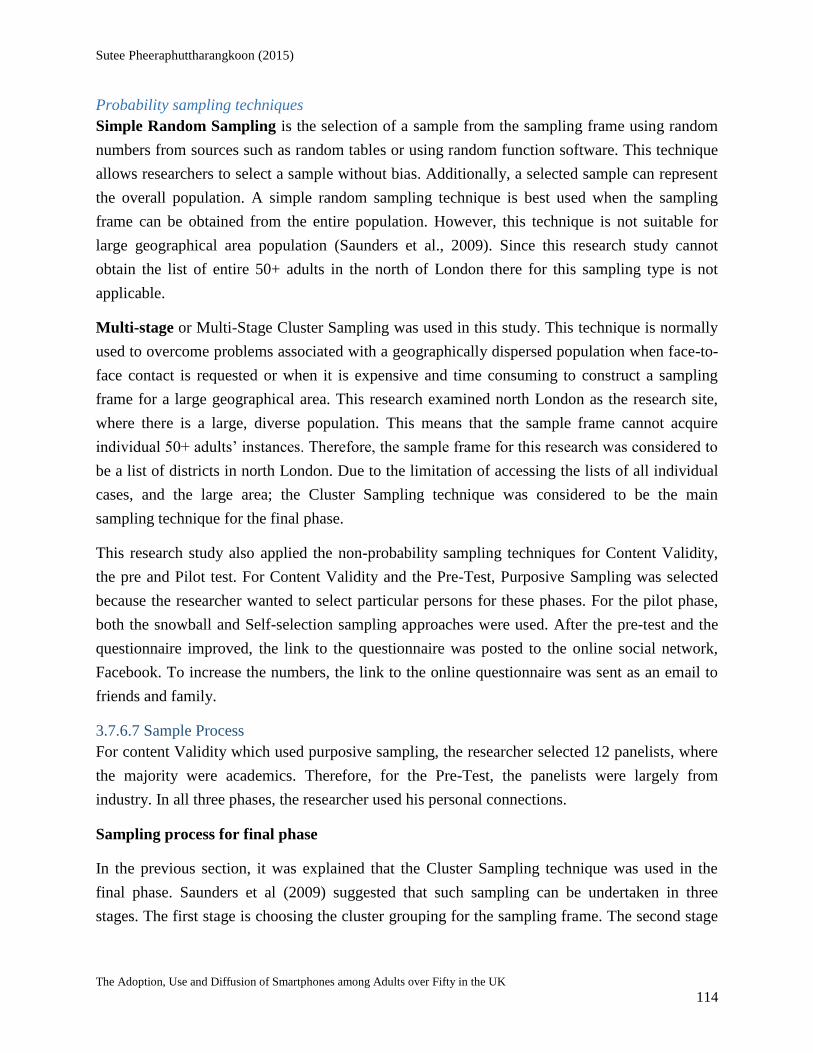
Sutee Pheeraphuttharangkoon (2015)
The Adoption, Use and Diffusion of Smartphones among Adults over Fifty in the UK 114
Probability sampling techniques
Simple Random Sampling is the selection of a sample from the sampling frame using random
numbers from sources such as random tables or using random function software. This technique
allows researchers to select a sample without bias. Additionally, a selected sample can represent
the overall population. A simple random sampling technique is best used when the sampling
frame can be obtained from the entire population. However, this technique is not suitable for
large geographical area population (Saunders et al., 2009). Since this research study cannot
obtain the list of entire 50+ adults in the north of London there for this sampling type is not
applicable.
Multi-stage or Multi-Stage Cluster Sampling was used in this study. This technique is normally
used to overcome problems associated with a geographically dispersed population when face-to-
face contact is requested or when it is expensive and time consuming to construct a sampling
frame for a large geographical area. This research examined north London as the research site,
where there is a large, diverse population. This means that the sample frame cannot acquire
individual 50+ adults’ instances. Therefore, the sample frame for this research was considered to
be a list of districts in north London. Due to the limitation of accessing the lists of all individual
cases, and the large area; the Cluster Sampling technique was considered to be the main
sampling technique for the final phase.
This research study also applied the non-probability sampling techniques for Content Validity,
the pre and Pilot test. For Content Validity and the Pre-Test, Purposive Sampling was selected
because the researcher wanted to select particular persons for these phases. For the pilot phase,
both the snowball and Self-selection sampling approaches were used. After the pre-test and the
questionnaire improved, the link to the questionnaire was posted to the online social network,
Facebook. To increase the numbers, the link to the online questionnaire was sent as an email to
friends and family.
3.7.6.7 Sample Process
For content Validity which used purposive sampling, the researcher selected 12 panelists, where
the majority were academics. Therefore, for the Pre-Test, the panelists were largely from
industry. In all three phases, the researcher used his personal connections.
Sampling process for final phase
In the previous section, it was explained that the Cluster Sampling technique was used in the
final phase. Saunders et al (2009) suggested that such sampling can be undertaken in three
stages. The first stage is choosing the cluster grouping for the sampling frame. The second stage

Sutee Pheeraphuttharangkoon (2015)
The Adoption, Use and Diffusion of Smartphones among Adults over Fifty in the UK 115
is the identification, which involves numbering each of the clusters with a unique number. The
third stage is to use a simple random technique to select the sample.
With regards to this research, initially, the seven areas of the London borough were further
divided in districts using the map as the main reference (Geographers’ A-Z Map Company,
2008). A list of 164 districts was created using Microsoft Excel 2010 and used as the sample
frame (shown in appendix 5-6). The next step involved using a simple random technique in order
to select the sample from the sampling frame. In this case, sampling involved naming the area,
and not each individual case. Therefore, the sampling size needed to be defined.
Figure 3.5 Sample sizes for different sizes of population at a 95 confidence level, source:
(Saunders et al., 2009)
For the sample size, Table 3.3 was used as a guideline. For the population of the 164 districts,
108 was selected for an estimated 5% margin of error at a 95 % confidence level. The random
selection of the 108 districts was completed using Microsoft Excel, where the function
RANDBETWEEN (0,163) was used to generate the random numbers shown in Table 3.4.
Table 3.4 The random numbers from MS Excel
120 68 152 40 64 24 139 52
7 110 89 23 38 139 110 15
63 31 104 48 56 111 26 89

Sutee Pheeraphuttharangkoon (2015)
The Adoption, Use and Diffusion of Smartphones among Adults over Fifty in the UK 116
132 46 131 113 68 93 39 55
140 89 84 17 50 16 131 110
86 57 88 24 123 162 48 161
78 54 136 19 44 140 85 34
88 2 152 127 128 20 109 14
153 33 87 69 110 129 47 151
31 53 136 128 97 48 4 86
72 17 121 115 151 65 125 92
73 143 28 96 138 154 152 19
144 22 99 58 55 141 83 106
107 147 81 27 110 81 72 110
112 150 121 151 19 155 71 148
105 127 7 50 39 151 131 35
98 46 27 59 148 61 76 78
108 28 68 147 6 27 12 159
146 73 62 106 114 70 41 66
13 161 62 108 124 14 107 48
The numbers in Table 3.4 need to match the assigned number, where the selected areas (shown
in appendix 5-6) were highlighted. As explained earlier, invitation letters for participants were
printed and distributed to the selected area (Invitation letter shown in appendix 5-7).
Please note that the 108 areas used for Cluster Sampling were essential for selecting the areas
that the invitation letters were distributed. In Table 3.3, it can be learnt that the population of 50+
adults in the north of London was 2,080,565, which is the research population. From figure 3.4,
it can be seen that for population numbers up to ten million, 384 samples can provide a 95
confidence level with a 5% margin of error. For the same population number, 1067 samples can
provide a 95 confidence level with 3% margin of error (Saunders et al., 2009). Therefore, the
target sample of individual cases was established in 1000. After the data collection, 1030
completed questionnaires were received, but 984 questionnaires were usable. Further details on
the final questionnaire can be found in chapter 5.
3.7.6.8 Questionnaire Distribution Method
For final phase, after the research site selection, an estimated 20,000 cover letter were printed.
The letters were distributed by hand.

Sutee Pheeraphuttharangkoon (2015)
The Adoption, Use and Diffusion of Smartphones among Adults over Fifty in the UK 117
3.7.6.9 Sampling Methods Summary Having explained the sampling process, terms that are of importance and the various techniques
for sampling, Table 3.5 provides a summary of the sampling process utilized for this research.
Table 3.5 Selected Sample Methods and Sizes
Phases Sampling
Technique
Target Sample Actual Sample Sampling
Frame
Content Validity Purposive
Sampling
12 12 England
Pre-Test Purposive
Sampling
12 12 England
Pilot Test Snowball and Self-
Selection Sampling
200 201 UK
Final Survey Cluster Sampling 1000 1030 (984 usable) North London
From Table 3.5 it can be learnt that the target samples and actual size samples of each phase are
satisfied and the actual response number was greater than the recommended figures (Saunders et
al., 2009; Lawshe, 1975; Dillman, 2011). For the content validity and Pre-Test phases, some
respondents were located in Hertfordshire or London. In those instances, the Sampling frame
was England. For the pilot phase, which used a Self-Selection Sampling process, the link was
posted on the Internet, which allowed individuals from across the UK to access the link. The
pilot phase also utilised the sampling frame of the UK.
3.7.7 Analysis Methods
Once the data was collected, analysis was required, which is reliant on the research questions and
objectives. Considering the measurement in research, Jupp (2006) concluded that there are four
ways of measurement which are 1) nominal- using numbers to represent categories such as 1=
men; 2= women, 2) ordinal – ranking of the categories such as scale 1-7 from strongly disagree
to strongly agree, 3) interval such as number of year, and 4) ratio such as income scale. Jupp also
suggested that nominal and ordinal measurement is non-metric while interval and ratio
measurement are metric. “Parametric statistics assume that the data are metric; to use such
statistics on non-metric statistics are incorrect” (Jupp, 2006 p 168). As addressed in question type
section, the rating scale questions (Likert-style) were applied for capture older adults’ opinion or
attitude of using smartphones, please also refer to chapter 4 pilot where the construct questions
were developed. From this point of view, the data that used this research to test the conceptual
model are non-parametric.

Sutee Pheeraphuttharangkoon (2015)
The Adoption, Use and Diffusion of Smartphones among Adults over Fifty in the UK 118
The normality test is the test for normally distributed (or bell-shaped). “In statistical analysis,
parametric tests can be done only the data is in normally distributed” (Jupp, 2006 p 214)
However, since this research applied non-parametric tests, the normality test is not requisite.
From the above guideline the following section will discusses the available analysis methods and
the method selected for this research. A point to note is that the data analysis techniques can be
grouped as first and second generations.
3.7.7.1 First Generation Data Analysis Techniques
The first generation data analysis techniques include linear regression, LOGIT, ANOVA and
MANOVA. These techniques allow researchers to analyse the item loadings on the latent
variables and the linkage of the independent variables (Gefen et al., 2000). Please note that the
justification of this first generation data analysis techniques can be found at the end of this
section.
Regression Analysis uses simple and multiple predictions to predict Y from X values (Cooper &
Schindler, 2013). The Y value can be termed as the outcome, dependent or endogenous variable.
Y is dependent on X that is referred to as the predictor, independent, explanatory or exogenous
variable (Gefen et al., 2000; Urbach & Ahlemann, 2010). Regression analysis is the process of
calculating a regression coefficient and regression equation using one independent variable and
one dependent variable (Saunders et al., 2009). The analysis uses regression equations to predict
the values of dependent variables. The equation that is used are examples such as a straight line,
parabola, normal equation and ordinary least squares. The regression coefficient is the result
from an analysis that shows the strength of the relationship between a dependent variable and
independent variable (Saunders et al., 2009).
Multiple Regression is a statistical tool used to develop a self-weighting estimating equation
that predicts values for a dependent variable from the values of independent variables, controls
confounding variables to better evaluate the contribution of other variables, tests and explains a
causal theory (Cooper & Schindler, 2013). Multiple regression analysis is the process of
calculating a coefficient of multiple determination and regression equations using more than two
independent variables and one dependent variable (Saunders et al., 2009). Multivariate analysis
is a statistical technique that focuses upon and emphasises the structure of simultaneous
relationships among three or more phenomena (Cooper & Schindler, 2013).
Analysis of Variance (ANOVA) is a statistical technique that estimates the probability that the
values of a data variable for three or more independent samples or groups are different. This test
assesses the probability of any difference between the groups occurring by chance alone
(Saunders et al., 2009).

Sutee Pheeraphuttharangkoon (2015)
The Adoption, Use and Diffusion of Smartphones among Adults over Fifty in the UK 119
Multi-variance Analysis of Variance (MANOVA) is a statistical technique that can be
implemented to study the relationship between several categorical independent variables and two
or more metric dependent variables. ANOVA can analyse only dependent variables while
MANOVA can cope with multiple dependent variables. This technique is often used to test
differences among related samples (Cooper & Schindler, 2013).
LOGIT (Log-odds) and PROBIT (Probability + Unit) is also a first-generation regression
technique, which is non-linear regression in nature. In this case, a dependent variable can be only
two values or dichotomous (binary) variables such as yes or no, like or don’t like, and enrol or
not enrol (William J. Wales et al., 2013). The model is used more in the Economics discipline
(Ai & Norton, 2003). Note: Although both PROBIT and LOGIT have different formulas, they
are similar (Gunderson, 1974). Gunderson (1974) suggested that a linear probability function is
enough for testing hypotheses. However, PROBIT and LOGIT are more accurate. The PROBIT
and LOGIT models have been used more than 10% in Strategic Management Journal in 1990s
and 2000s (Shook et al., 2003).
PROBIT and LOGIT can be employed using software packages such as, STATA, NLOGIT,
SPSS and EViews (Greene, 2010). This research considered using PROBIT with STATA in
chapter 6 to analyse the external data when comparing the collected data for validation
purposes. This method follows Ai and Norton (2003).
The first generation techniques offers “limited modeling capabilities, particularly in terms of
causal modeling” (Lowry & Gaskin, 2014: 123). In contrast, the second generation that will be
explained in the following section, “offer extensive, scalable and flexible causal-modeling
capability” (Lowry & Gaskin, 2014: 123). The secondary generation technique also appropriate
with complex causal modeling that was used in behavioural research (Lowry & Gaskin, 2014).
Since this is considered to be a behavioural research the first generation technique is considered
less appropriate for this research.
3.7.7.2 Second Generation Data Analysis Techniques
The second generation technique is Structural Equation Modelling (SEM). This technique allows
researchers to explore a set of interrelated research questions in a single, systematic and
comprehensive analysis by modelling the relationships among multiple independent and
dependent constructs simultaneously (Gefen et al., 2000).
Structural Equation Modelling (SEM) SEM has been used in literature since the 1980s (Hair et al., 2011), but in the last decade, SEM
have been widely used in IS research studies. SEM can be can be categorised into Covariance-
based SEM (CB-SEM) and Partial least squares SEM (PLS-SEM). PLS-SEM is a causal

Sutee Pheeraphuttharangkoon (2015)
The Adoption, Use and Diffusion of Smartphones among Adults over Fifty in the UK 120
modelling approach aimed at explaining the variance of the dependent latent constructs. On the
other hand, CB-SEM focuses on reproducing the theoretical covariance matrix without
explaining the variances (Hair et al., 2011).
Several researchers in IS have used CB-SEM and PLS-SEM for testing their research models in
the last decade. Urbach and Ahlemann (2010) examined 728 articles from two IS Journals,
Information Systems Research (ISR) and Management Information System Quarterly (MISQ),
between 1994 and 2008 where their findings revealed that 19.78% of the articles used SEM. In
more details 10.71% of the 728 articles applied PLS-SEM while 9.07% used CB-SEM and the
numbers of articles utilising SEM have been widely accepted by researchers.
There are several advantages of PLS-SEM. Firstly, PLS-SEM is appropriate for prediction.
Secondly, it requires a smaller sample size in comparison to other analysis methods. Thirdly,
PLS-SEM can be used to explain complex structural equation models with a large number of
constructs. Fourthly, PLS-SEM is better for theory development. And finally, PLS-SEM can
cope with both reflective and formative constructs (Urbach & Ahlemann, 2010). Hair et al
(2011) also suggested that “PLS-SEM does not presume that the data are normally distributed”
Thus, PLS applies non-parametric bootstrapping. Consequently, PLS-SEM can be used with
non-parametric data. From the above benefits, this research selected PLS-SEM as the main
technique for analyse data in the final phase.
Please note Linear regression, ANOVA, MANOVA, variance, covariance will not be used in
this research because the PLS-SEM will provide comprehensive results and enough for testing
the hypothesis. Moreover, the main research study, the study of consumer acceptance and use of
Information technology from Venkatesh et al (2012) was applied SEM-PLS.
Having selected the analysis technique, the next section provides the explanations and
justification for the software that support PLS-SEM.
Software Used with SEM
There are several software packages that can be utilised for SEM such as, AMOS from SPSS,
WebSEM, EQS, LISREL, PLS-GUI, STATA SEM and SmartPLS. Nevertheless, for this
research, the chosen software was one that supports PLS-SEM, PLS-Graph (Chin, 2001),
VisualPLS (Fu, 2006), AMOS from SPSS and SmartPLS (Ringle et al., 2005). They are popular
due to their provision of diagrams in the form of graphs.
3.7.7.3 Reliability
Reliability refers to the extent to which the data collection techniques or analysis process will
yield consistent findings (M Saunders et al., 2009). Reliability is a characteristic of measurement

Sutee Pheeraphuttharangkoon (2015)
The Adoption, Use and Diffusion of Smartphones among Adults over Fifty in the UK 121
concerned with accuracy, precision, and consistency and is a necessary, but not sufficient
condition for validity. Therefore, if a measure is unreliable, it cannot be valid (Cooper &
Schindler, 2013).
There are three types of reliability estimates available. These are, Test-Retest, Parallel Forms and
Split-Half, KR20 or Cronbach’s Alpha. The details of reliability for each type, can be found in
Table 3.6.
Table 3.6 Summary of Reliability Estimates Source: Cooper & Schindler, 2013 pp 260
Type Coefficient What is Measured Methods
Test-Retest Stability Reliability of a test or instrument inferred from
examinee scores; same test is administered twice to
the same subjects over an interval of less than six
months
Correlation
Parallel
Forms
Equivalence Degree to which alternative forms of the same
measure produce same or similar results;
administered simultaneously or with a delay.
Interrater estimates of the similarity of judges’
observations or scores.
Correlation
Split-Half,
KR20,
Cronbach’s
Alpha
Internal
Consistency
Degree to which Instrument items are homogenous
and reflect the same underling construct(s)
Specialized
correlational
formulas
For this research, the Split–Half type of Reliability was selected as a reliability estimation where
the process applies only one administration of a test to assess the internal consistency among the
collected data (Cooper & Schindler, 2013).
Cronbach’s Alpha is a classic tool that measures internal consistency in order to show how well
different research items complement each other when measuring the same concept and from a
single scale (Jupp, 2006). The interpretation of Cronbach’s Alpha value can be found in Table
3.7. A data value will be considered as homogenous if an index is larger than 0.7 for
confirmatory studies (Vinzi et al., 2010).
Table 3.7 Interpretation of Cronbach's Alpha (α)
Cronbach's Alpha (α) Internal Consistency

Sutee Pheeraphuttharangkoon (2015)
The Adoption, Use and Diffusion of Smartphones among Adults over Fifty in the UK 122
More than 0.9 Excellent
0.8 to 0.9 Good
0.7 to 0.8 Acceptable
Lower than 0.5 Unacceptable
However, when applying SEM-PLS a Cronbach alpha can be viewed as a traditional tool
because the Cronbach alpha assumes that all the indicators are equally reliable (Hair et al., 2011).
Therefore, an appropriate tool such as Composite Reliability (CR) is used for such a PLS study.
Similar to Cronbach alpha, the data can be considered as homogeneous, if a CR is larger than 0.7
(Vinzi et al., 2010).
An Indicator Reliability can be examined using outer loading where all the loadings should
more than 0.7 in order to ensure reliability (Vinzi et al., 2010). However, weak loading can be
found frequently in empirical research, particularly when new developed frameworks are used.
In this case, when the indicators with their loading are lower than 0.4, they need to be removed
from the models (Hulland, 1999).
Low loading can occur due to poorly worded questions in a questionnaire (item), an
inappropriate item, and improper transfer of an item from one context to another (Hulland,
1999). The summary of Reliability checks can be found in Table 3.8.
Table 3.8 Reliability Check from PLS-SEM technique (Wong, 2013)
Reliability SmartPLS Threshold
Indicator Reliability Outer loading numbers Square each of the outer
loadings to find the indicator
reliability value 0.7 or higher
is preferred.
If it is an exploratory
research, 0.4 or higher is
acceptable (Hulland, 1999).
Internal Consistency
Reliability
Reliability number,
Composite reliability
Composite reliability is 0.7 or
Higher.
If it is an exploratory
research, 0.6 or higher is
acceptable (Bagozzi & Yi,
1988).

Sutee Pheeraphuttharangkoon (2015)
The Adoption, Use and Diffusion of Smartphones among Adults over Fifty in the UK 123
In SmartPLS, an overview report is automatically generated, where the composite reliability and
Cronbach Alpha scores can be found in the report (Lowry & Gaskin, 2014). The Indicator
Reliability, outer loading can be found under the Outer Loading report in SmartPLS following
the PLS calculation.
3.7.7.4 Validity in PLS-SEM Technique When determining validity, PLS-SEM provides several methods for evaluating validity.
Convergent Validity and Discriminant Validity are two main important validation measures in
PLS-SEM that lead to Construct Validity.
Construct Validity is the degree to which a research instrument is able to provide evidence
based on the theory (Cooper & Schindler, 2013), or the constructs that researchers aim to
measure (Saunders et al., 2009). In other words, this validation examines whether the questions
represent the factors in a conceptual framework. Schrauf and Navarro (2005) suggest that it is
possible to use or adopt existing scales or the scales that have been used in previous research
studies. Using this as support, this research also adopted some questions from previous research
(Venkatesh, Morris, Hall, et al., 2003; Venkatesh et al., 2012). To validate the questions for this
research, and to form the constructs, convergent and discriminant validity were determined.
Convergent validity is defined as “the degree to which scores on one scale correlate with scores
on other scales designed to assess the same construct” (Cooper & Schindler, 2013:259).
Measures of convergent validity are important to ensure that variations in one indicator are
consistent with variations in the other reflective indicators of the same latent construct (Lowry &
Gaskin, 2014). In short, convergent validity presents how well the questions from a factor linked.
In the PLS-SEM technique, Convergent validity can be evaluated using the Average Variance
Extracted (AVE). The AVE values must be greater than 0.5 for convergent validity to be
acceptable. This means that the latent variables explain more than half of the indicators. In the
software SmartPLS, the data to demonstrate the convergent validity are found in the outer
loadings section of the default report following Bootstrapping. The low t-values of each items
show a lack of convergent validity on the factor.
Please note that Bootstrapping is “a way of computing sampling error and generating t-values by
using the available data as a distribution” (Lowry & Gaskin, 2014:131).
Discriminant validity is defined as “the degree to which scores on a scale do not correlate with
scores from scores designed to measure different constructs” (Cooper & Schindler, 2013:259).
Discriminant validity indicates the extent to which a given construct is different to other latent
constructs (Vinzi et al., 2010).

Sutee Pheeraphuttharangkoon (2015)
The Adoption, Use and Diffusion of Smartphones among Adults over Fifty in the UK 124
Fornell and Larcker (1981) recommended that the square root of AVE of each latent variable
should be greater than the correlations amongst the latent variables. The other method to
determine Discriminant validity is an indicator’s loading that should be higher than all of its
cross loadings (Hair et al., 2011).
Table 3.9 Validity Check from PLS-SEM technique Source: Wong, 2013
Validity SmartPLS Threshold
Convergent validity AVE number AVE is 0.5 or Higher
(Bagozzi & Yi, 1988)
Discriminant validity AVE number and Latent
Variable Correlations
The square root of AVE of
each latent variable should be
greater than the correlations
among the latent variables
(Fornell & Larcker, 1981)
In SmartPLS, the Latent Variable Correlation can be found in a default report where a new table
with the square root of AVE is manually created and written in bold on the diagonal of the table.
The Latent Variable Correlation is placed in the lower, left triangle of the table before the
comparison (Wong, 2013).
For this research, the factor analysis that leads to ensuring that the validity of the research model
was determined by pursuing both the validations that have been performed in chapters 4 and 5.
Further verification that the appropriate results had been obtained was determined by referring to
the guidelines from Hair et al (2011), Wong (2013) and the SmartPLS official website.
3.8 Chapter Summary
In chapter 2 a conceptual model was developed to investigate smartphone adoption, use and
diffusion within older adults. To ensure that the framework is applicable in practice, a research
method and methodology were required which are explained and discussed in this chapter 3. To
provide content of importance and to provide a structure to this chapter, the research onion
developed by Saunders et al., (2009) was referred to. From this chapter, it can be learnt that the
researcher believes in Positivism and applied a deductive and quantitative approach along with a
Survey Strategy. Due to the survey strategy, an online, internet based questionnaire located at the
website Surveymonkey, structured interviews and paper questionnaires were employed. In terms
of data, both primary and secondary data were utilised. Prior to commencing the questionnaire,
an invitation and Cover Letters were initially provided, which if the respondents agreed to the
Sutee Pheeraphuttharangkoon (2015)
The Adoption, Use and Diffusion of Smartphones among Adults over Fifty in the UK 125
content, led to the start of the questionnaire. Following the dissemination of the questionnaire,
Instrument and Content Validity tests were performed. The chapter also provided details about
the research site, sample size sampling type and sampling technique. For the analysis Structured
Equation Modelling (SEM-PLS) with SmartPLS were used where reasoning for using it was
provided, and finally, a summary of the chapter was provided. To inform readers, the next
chapter explains and discusses how the pilot test was conducted.
Sutee Pheeraphuttharangkoon (2015)
The Adoption, Use and Diffusion of Smartphones among Adults over Fifty in the UK 126
Chapter 4 Pilot Test & Final Survey
Development 4.1 Introduction
Having provided reasons and explanations of the research methodology pursued by this research,
this chapter aims to provide details of how the survey instrument used for the pilot test was
developed and the outcomes of the instrument’s applications. As a summary, section 4.3,
explains the reasoning for the construct measurement questions and how they were developed.
Section 4.4 explains how the content validation and pre-test occurred, which is then followed by
descriptions of the data collection process for the pilot, the sampling method utilszed, the
questionnaire used for the pilot and how the questionnaire was disseminated in section 4.5.
Section 4.6 presents the findings of the collated data, which is followed by a discussion of the
pilot’s results and section 4.9 provides a discussion of the limitations and further improvements
to the pilot survey. Finally, section 4.10 provides the summary and conclusions to the chapter.
4.2 The Pilot Study
As mentioned in chapter 3, a pilot test is also vital to the research process. In this section, more
details of the pilot with regards to this research are provided.
4.2.1 Aims of the Pilot test
The recommended purpose of a pilot test is to test a questionnaire’s wording, sequencing and
layout, gaining familiarity of the sample groups, testing response rates and testing the analysis
processes (Ticehurst & Veal, 2000). Therefore, the aims of this research’s pilot test are as
follows.
1. To examine the questions in the questionnaire.
2. For data collection, analysis and coding.
3. The pilot will be evaluated to determine the final phase of this research.
4. To gain preliminary results for smartphone adoption and usage and to examine the
construct variables.
5. To identify the constructs that are statically significant and lead to an adjustment of
the research framework.

Sutee Pheeraphuttharangkoon (2015)
The Adoption, Use and Diffusion of Smartphones among Adults over Fifty in the UK 127
6. To explore whether 50 years old and above adults have different adoption factors for
the younger generation.
Before conducting the pilot test, a survey questionnaire instrument was required as a tool to
gather the necessary data. An explanation of how the pilot survey was developed is described in
the following section.
4.2.2 Pilot Survey Questionnaire Development
“A pilot study is a small-scale research project that collects data from respondents similar to
those that will be used in the full study (Zikmund et al. 2009 p65)”. Therefore, the pilot was
developed for this research study as follows.
1. To design questions and for the survey layout, including construct measurement
questions;
2. To validate the pilot questionnaire;
3. To design the questionnaire’s distribution method;
4. To collect the pilot data;
5. To analyse the collected data;
6. To present the results from the analysis; and
7. To provide feedback to improve the research method, the conceptual framework and
the final questionnaire.
Consequently, the next section will describe how the construct measurements were developed for
the pilot.
4.3 Development of Construct Measurement Questions in the Pilot
The proposed conceptual framework (MOSA) as shown in chapter 2 assumed that the dependent
variable-usage intention-of smartphone adoption is influenced by Observability, Compatibility,
Social influence, Facilitating Conditions, Performance Expectancy, Effort Expectancy, and
Perceived Enjoyment. Moreover, the dependent variable Actual use is influenced by the usage
intention variable.
The construct measurement questions were developed by adopting questions used in other
research studies, and developing own questions (Saunders et al., 2009). This pilot process was
applied by referring to previous studies that found of 42% of 143 articles obtained from five IS
publications: Information Systems Research, MIS Quarterly, Journal of Management
Information Systems, Information & Management, and, Management Science the previous
instrument was utilised (Boudreau et al, 2001).

Sutee Pheeraphuttharangkoon (2015)
The Adoption, Use and Diffusion of Smartphones among Adults over Fifty in the UK 128
By adapting previous research studies questions to this research study, the constructed questions
amounted to 34 questions where the questions sought respondents assistance with rating the
statements using a five-point scale, 1 is strongly disagree and 5 is strongly agree. The questions
that were formed for this research are shown below together with the reference that they were
taken from. Please refer to Appendix 4-1 for original construct measures.
Intention to use / adapt (IN)
1. I intend to use a smartphone as much as possible (Venkatesh et al., 2012).
2. I intend to continue using a smartphone in the future (Venkatesh et al., 2012).
3. Whenever possible, I intend to use a smartphone in my job (Park & Chen, 2007).
4. I intend to increase my use of a smartphone in the future (Park & Chen, 2007).
Social Influence (SOC)
1. People important to me think I should use a smartphone. (For example, friends and
family) (Shin, 2007).
2. People who influence my behaviour think that I should use a smartphone (Venkatesh et
al., 2012).
3. It is expected that people like me use smartphones. (For example, similar age or position
people) (Shin, 2007).
4. I want to use a smartphone because my friends do so (Verkasalo et al., 2010).
Observability (OB)
1. I have had a lot of opportunity to see smartphones being used (Park & Chen, 2007).
2. It is easy for me to observe others using smartphones. (For example, I saw my friends use
smartphones) (Park & Chen, 2007).
Compatibility (COM)
1. I believe that using the smartphone is suitable for me (Koenig-Lewis et al., 2010).
2. I believe that using the smartphone will fit my lifestyle (Koenig-Lewis et al., 2010).
3. I think that using the smartphone fits well with the way I like to work (Park & Chen,
2007).
4. Using the smartphone fits into my work style (Park & Chen, 2007).
Facilitating Condition (FC)
1. I have the resources necessary to use the smartphone. (Venkatesh et al., 2012).
2. I have the knowledge necessary to use the smartphone (Venkatesh et al., 2012).
3. The operation costs of a smartphone do not prevent the use of it (such as price of
smartphone or monthly fee) (Qurashi, 2012).
4. I have a person available to assist me in using my smartphone (Gu et al., 2009).

Sutee Pheeraphuttharangkoon (2015)
The Adoption, Use and Diffusion of Smartphones among Adults over Fifty in the UK 129
Performance Expectancy (PE)
1. I feel a smartphone is useful (Zhou et al., 2010).
2. Using a smartphone enables me to finish tasks more quickly (Zhou et al., 2010).
3. Using a smartphone increases my productivity (Venkatesh et al., 2012).
Effort Expectancy (EE)
1. I find that using the smartphone is easy (Zhou et al., 2010).
2. Learning how to use a smartphone is easy for me (Venkatesh et al., 2012).
Enjoyment (ENJ)
1. I find a smartphone fun (I had fun using a smartphone) (Shin, 2007).
2. I think it is fun to use a smartphone (Verkasalo et al., 2010).
In order to measure the actual use of smartphones, this research followed Venkatesh (2012)
where the use aspect was tested by seeking the frequency of use ranging in time from never to
many times per day. The list was adapted from Thinkmobile by Google (2011) and through
discussions with the supervisory team. The ranges used for usage were from 1 (never) to 5 (many
times per day) for 9 of the smartphone’s features. The scales were adopted from Venkatesh et al
(2012) research findings on page 178. The list of the features that will be used to represent actual
use (ACU) is provided below.
ACU1 - Making a phone call
ACU2 - SMS, text messaging
ACU3 - E-mail
ACU4 - Browsing- surfing website(s)
ACU5 - Downloading applications (app)
ACU6 - Using social networks such as, Facebook, twitter, LinkedIn, Foursquare,
Google Plus
ACU7 - Using voice over internet protocol (VoIP) such as, Facetime, Skype,
Oovoo, Google Talk, Viber, Fring
ACU8 - Taking a photo- photography
ACU9 - Playing games
The list above represents ACU1 to ACU9 and includes features that silver surfers are expected to
use. Questions regarding smartphone usage and other supported questions will be explained in
the following section.

Sutee Pheeraphuttharangkoon (2015)
The Adoption, Use and Diffusion of Smartphones among Adults over Fifty in the UK 130
4.4 Developing Support Questions for the Pilot Study
Having explained the development of the construct measurement questions, this section will now
explain the development of the other supported questions.
In this pilot, the researcher divided the participants into two groups: those using smartphones and
those who do not. Due to this two path system, the questionnaire was designed to take two paths.
At the start of the questionnaire, both groups of participants were asked the same questions about
their demographics, state of health and ailments associated with ageing. Following these
questions, the questionnaire was then divided into those using smartphones and those not using
smartphones. Note: This research’s questionnaire included questions on health and ailments
because this research emphasises older adults. From previous research studies in literature
review chapter, it was found that older adults do suffer from some form of health ailment, which
led to the inclusion of such questions. The layout of the pilot survey is shown in Figure 4.1
below.
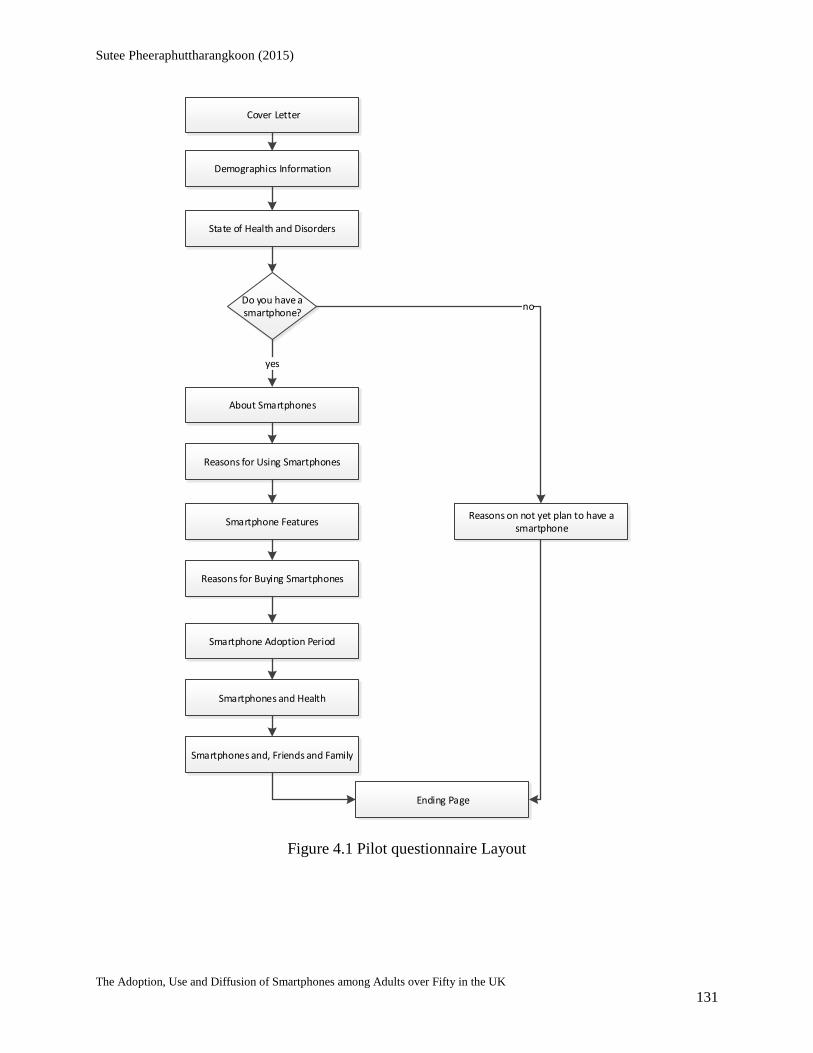
Sutee Pheeraphuttharangkoon (2015)
The Adoption, Use and Diffusion of Smartphones among Adults over Fifty in the UK 131
Cover Letter
Demographics Information
Do you have a smartphone?
About Smartphones
yes
no
Reasons on not yet plan to have a smartphone
Ending Page
State of Health and Disorders
Reasons for Using Smartphones
Smartphone Features
Reasons for Buying Smartphones
Smartphone Adoption Period
Smartphones and Health
Smartphones and, Friends and Family
Figure 4.1 Pilot questionnaire Layout

Sutee Pheeraphuttharangkoon (2015)
The Adoption, Use and Diffusion of Smartphones among Adults over Fifty in the UK 132
Having provided a brief summary of the layout of the questionnaire, this section will provide
more details of the survey. For full details and an example of the survey, please refer to appendix
5-1 section.
4.4.1 The cover Letter was the first part of the questionnaire that contained an introduction to
the researcher and the university, the purpose of the research, the ethics number, the instructions
for completing the questionnaire, the duration, the confidentiality of this research, use of the
results and finally, the contact details (Saunders et al., 2009). These details were required by the
researcher’s university, and a means of informing the respondents about the questionnaire’s
details.
4.4.2 This was followed by the Demographic Information section that consisted of seven
questions, which sought information about the participants’ age, gender, ethnicity, educational
background, the current location, employment status, and occupation. This data was vital to
allow the researcher to compare the responses from the sub-groups. Information from the
demographic factors were also important as they could allow a review of some additional factors
besides those determined from the conceptual framework that could, in turn, influence
smartphone adoption and usage.
As the demographic group being addressed in this research was the older adults, a section sought
self-assessed information from the participants about their health and any disorders. The options
that were provided were excellent, good and poor. Participants were also asked questions about
any ailments that they suffer from as a result of the ageing process.
4.4.3 The next section was Using Smartphones where the initial question provided
explanations about the nature of a smartphone. Thereafter, participants were asked to choose
between them being users, or not being users of smartphones. For those who were users, the path
leading to questions about the uses of smartphones was selected. For those who were non-users,
a diverse section seeking information about the reasons for not using a smartphone were sought.
4.4.4 Reasons for not Using Smartphones
This section was applicable to respondents who did not have smartphones where options for not
using a smartphone were provided. The options that were utilised included, the cost of using a
smartphone, use in terms of the design of the smartphones; for example, maybe feeling
uncomfortable when using smartphones, the small screens of smartphones and keyboards;
lacking knowledge, and the lifestyle of an individual. Moreover, this question provided an option
box so that respondents could supply their other reasons. This question expected to capture the

Sutee Pheeraphuttharangkoon (2015)
The Adoption, Use and Diffusion of Smartphones among Adults over Fifty in the UK 133
reasons on why older people don't use smartphones and this data was used in the discussion
chapter.
4.4.5 About The Smartphones
The section began asking respondents about the durations that they had a smartphone for,
followed by questions such as: the smartphone brand, the smartphone network provider, and the
cost for using the smartphone. In essence, this section allowed the researcher to provide a review
of the current smartphone situation in the UK. Finally, the question regarding the monthly cost
for using smartphones was used to support the hypothesis: the Facilitating conditions for using
smartphones.
4.4.6 The reason for Using Smartphones was the core section used when determining the
smartphones adoption, where this section also presented the construct measurement questions.
4.4.7 Smartphone’s Features
This section was included to satisfy the aim of this research on determining how older adults are
using smartphones; in this case, the smartphones features. The smartphone features were also
gathered from previous research studies and computer trade magazines such as, PC Mag (2012)
as explained in chapter 2. After gathering the smartphones features data from all sources, the list
was simplified by the research team, which led to the inclusion of smartphone features such as,
making a phone call, text messaging, e-mailing, browsing, downloading applications, mapping,
online shopping, online banking, reading news, social media, instant messenger, taking a photo,
filming a video, playing online games, using for health monitoring and care, using for
transportation and travel, and use for contacting government authorities. To ensure some focus to
the question, participants were asked to select one or more options.
The next question in this section regarded the usage frequency of some smartphone features as
described in the Development of Construct Measurement Questions section in this chapter where
the purpose of the questions was to measure the actual smartphones use.
4.4.8 To understand the reasons for the older adult’s purchases of a smartphone, the
section Reasons to buy smartphones was formed. Answers included smartphone appearance,
brand, price, operating systems, screen size, screen resolution, weight, battery life, size of
memory, and the numbers of applications available to download. This question was pertinent for
collating data that informed researchers about the reasons for purchasing smartphones.
The next question in this section was about the communication channel that respondents used to
gather knowledge and information from, about their smartphones. The provided options were

Sutee Pheeraphuttharangkoon (2015)
The Adoption, Use and Diffusion of Smartphones among Adults over Fifty in the UK 134
classics such as, word of mouth provided by friend and family; the media – TV, radio,
newspapers, magazines; online social networks, and professional technology review websites.
This question was pertinent to understand the communication channels that older adults used
prior to adopting new technology. For different stakeholders this is important as it identifies
efficient ways of promoting communication with older adults and encouraging them to use the
new technology.
To understand the duration that it takes older adults to get comfortable or familiar with the novel
devices (smartphones), a question regarding the 4.4.9 Smartphone adoption period was asked.
The question provided choices in the form of a time period that was, less than a day, one day to
one week, one week totwo2 weeks, two weeks to one months, one month to three months, and
more than three months.
4.4.10 Smartphones and Health
In chapter 2 it was mentioned that as ageing occurs, health problems are also apparent, which led
to the inclusion of two questions that examined smartphones and health. The first question asked
whether a smartphone assists a respondent with well-being or health, where a multiple choice
option in the form of yes, or no was provided. If the respondent replied that there was an impact-
yes, then the participant/s proceeded to the next question, where the emphasis was on how
respondent/s used the smartphone to improve their health and well-being. The provided options
were choices in the form of: seeking health related information, managing exercise, managing
with sleep, weight management, monitoring blood pressure and helping in controlling smoking.
An option in the form of ‘other’ was provided where respondents could provide their own
information if required.
4.4.11 Smartphones and friends and family
Smartphones are viewed to be beneficial in connecting older adults with friends and family;
thereby reducing problems such as, social isolation. By doing so, mental ailments that could also
affect health problems could be reduced. For this reason a question sought to ascertain whether
smartphones helped participants in connecting with their friends and family, which was followed
by a question about how the smartphone helped. Options for this included, making phone calls to
friend and family, sharing photos and videos, using instant messenger, video telephony, using
social media to follow friends and family, and playing games with friends and family.
Finally, the questionnaire had a page that thanked participants for spending their valuable time
on completing the questionnaire.

Sutee Pheeraphuttharangkoon (2015)
The Adoption, Use and Diffusion of Smartphones among Adults over Fifty in the UK 135
Having described the questionnaire, the next step was to analyse the findings, which was
possible using content validation. This process and the results are provided in the next section.
4.5 Content Validation
Following the pilot questionnaire’s implementation, the next step was to provide content
validation. Content validity is the extent to which measurement scales provide adequate coverage
of the investigative questions (Cooper & Schindler, 2013). Bell (2005) recommends this test in
order to discover issues that a developer could miss, such as the time taken for a participant to
complete the questionnaire; the instructions clarity; layout clarity and attractiveness; absence of
any topics; and any other comments.
This research also followed the suggestions from Lawshe (1975) for using a Content Validity
Radio (CVR). The validation form was initially provided to 12 panelists who were mostly from
academia (the research team) and another eight individuals from various diverse backgrounds.
The validation forms were largely delivered and collected from the panel members (Results in
Appendix 3-2).
The feedback received sought altering some technical terms, punctuation, spelling mistakes, and
removing questions on income. Moreover, examples on unclear or technical words such as
media, review websites, social media, or online magazine need to be provided as much as
possible to deliver a better understanding of the questions.
Content Validity Radios (CVR) were also the results from Content Validations that can be found
in the appendix 3-2. Lawshe (1975) suggested that the questions with CVR lower than 0.56 need
to be removed. However, after consulting with the research team, some questions with the low
CVR need to be kept to follow the previous research study. Moreover, the research team
expected different results from content validation. Therefore, it is worthy to keep those
questions.
Table 4.1 Content Validation – Expert Panel
Participant Area of Expertise
Academic Researcher related to IS
or older people
A Researcher of IS
B Researcher of IS
C Researcher of IS
D Researcher of old people and
technology
Other Academia reviewers or
related fields
E Retired Lecturer on Engineering
F Researcher on Engineering

Sutee Pheeraphuttharangkoon (2015)
The Adoption, Use and Diffusion of Smartphones among Adults over Fifty in the UK 136
G Researcher on Marketing
H Translator
I Master Degree Student on marketing
J Master Degree students on business
K Master Degree Student
L Graduated Student
After content validation, the pilot questionnaire was improved prior to the Pre-test phase. 12
panel members mostly from industry professional were helped in this phase as shown in Table
4.2 below.
Table 4.2 Survey Pretest Validation Panel
Participant Area of Expertise
Academic Professionals Dr. V Lecturer on IS
Dr. Ma Lecturer on IT
Industry Professionals Ms. Pi Diplomatic officer (40+)
Ms. Ta Diplomatic officer (40+)
Mr. Ti Diplomatic officer, older adult (50+)
Mr. Me Older adults CEO (50+)
Ms. Se Business woman (40+)
Mr. Hu Older business owner (50+)
Ms. Ro Older adults Hair Dresser (50+)
Ms. Fa Accountant (40+)
Ms. Na Older Lady (60+)
Mr. Ki Very Old House Agent (65+)
In the Pre-test phase, it can be seen that the panel member selection was focused on adults and
older adults. These would help in fine tuning the pilot survey, particularly in terms of wording in
the questionnaire.
4.6 Pilot Data Collection
After completing the Content validation and Pre-test, the next step is to provide a sample for the
pilot phase, which this section will explain and discuss.

Sutee Pheeraphuttharangkoon (2015)
The Adoption, Use and Diffusion of Smartphones among Adults over Fifty in the UK 137
4.6.1 Sampling and Sample Size
For the pilot, this research study applied non-probability, or non-random sampling, as this form
of sampling is recommended by Saunders (2009) for an exploratory stage, which is the purpose
of the pilot phase. Prior to utilising this method, both the snowball and Self-selection sampling
methods were considered and used.
To emphasise the importance of this research which was focusing on older adults, the adoption
gap needs to be illustrated. Therefore, this research selected all age groups as the target sample of
the pilot phase. The results expected to show and confirm the adoption gap, the usage frequency,
and the usage pattern. The results in the pilot will support rationality to focus the study on older
adults in the final phase.
The United Kingdom was selected because, firstly, the numbers of smartphone used in the UK.
The numbers were increased from 39% in 2012 to 61% in 2014. Secondly, the numbers of older
adults, In the UK, currently more than 16.4% of the population is aged 65 years old and above
and around 40% is older than 45 years old (Office for National Statistics, 2012a; The Telegraph,
2012). Moreover, the UK is a country that cares for the elderly. There were several organizations
and associations that found for older adults such as Age UK, 50 connect, Alzheimer’s society,
the care directory, Ceartas Advocacy, and Citizens Online (Contact-the-elderly.org.uk, 2015). In
terms of mobile technology, Ofcom (2013) reported the significant investment on
telecommunication technology including 4G mobile broadband networks and superfast
broadband. In additional, the world leaders mobile operators such as Vodafone by Vodafone
Groups, O2 by Telefónica, and EE by Orange group (Gillet, 2014). In academic terms, the
United Kingdom was selected as the research site following suggestions made by previous
research studies from Venkatesh et al (2012) where Hong Kong was used, Carlsson et al (2006)
used Finland, and Alkhunaizan and Love (2012) used Saudi Arabia. Therefore, this research
selected UK as the research site for the pilot phase.
For a pilot sample size, Cooper and Schindler (1998) recommended that the size of a pilot test
should be around 25 to 100 subjects, which was the reasoning that this study followed.
4.6.2 Online Questionnaire In order to reach all the age groups and to provide a detailed overview of the UK, this research
considered applying internet mediated questionnaires or an online survey. An online survey can
be disseminated using two methods, which are by email or to provide links or to develop a
website (Hewson et al., 2003). For the online questionnaire, four commercially and advanced
forms of applications were considered, which were Qualtrics, Google Form, SurveyGizmo and
Surveymonkey. Qualtrics is one of the best research tools with a trustworthy and reliable

Sutee Pheeraphuttharangkoon (2015)
The Adoption, Use and Diffusion of Smartphones among Adults over Fifty in the UK 138
reputation and strong supporting team. However, the drawback is that use of the application
involves a high subscription amount that large organizations are prepared to, and do pay; hence
led to the dismissal of Qualtronics. The next choice was Google Form, which is very simple to
use, but was not designed and developed to a level that the questions applied to this research
study required. Next, SurveyGizmo was considered, but it was not easy to use and involves a
trial period of free use that was limited to 14 days, which was not enough for the pilot duration;
hence discounted.
Finally, the Surveymonkey website was viewed to be suitable as it provides important features
needed for this pilot, which are Page and Question Logic. These features allow surveys to route
respondents to particular questions, specific to the answers that are provided (SurveyMonkey,
2013). Surveymonkey also provides graphs and charts which are useful for illustrating the
results. Finally, the website allows users to export the findings to a variety of formats including,
Microsoft excel (Marra & Bogue, 2006). The format can be also be imported to several analytic
programs such as, SPSS and SmartPLS. Further, Surveymonkey is amongst the oldest and
pioneering of the online questionnaire providers, which meant that there is a reliability and trust,
in turn, which has led to its popularity.
4.6.3 Pilot Questionnaire Distribution
Following a check of the questionnaire, which led to content validation and pre-test by 24
specialists including, university lecturers, postgraduate students (PhD and Master’s degree)
students, older adult professionals and adult smartphone users, the month of November 2012 was
spent on improving the questionnaire and ensuring that the questionnaire functioned as required.
The final important review was completed in the middle of January 2013.
The online pilot questionnaire was distributed using two ways. Initially, a link to the
questionnaire link was posted on at least three Facebook pages, which a majority of the Thai
community who live in the UK use for transferring money and a wholesale jewellery company’s
websites were used. The link was posted three times on the pages. The second way of
dissemination was to send emails where the link was emailed to the network of the researcher
that contained entrepreneurs, university officers, academics, translators and office workers.
After sending the email to a number of people, their assistance in the form of forwarding an
email link to the questionnaire was sought. The link was opened for three weeks and closed on 7
February 2013.
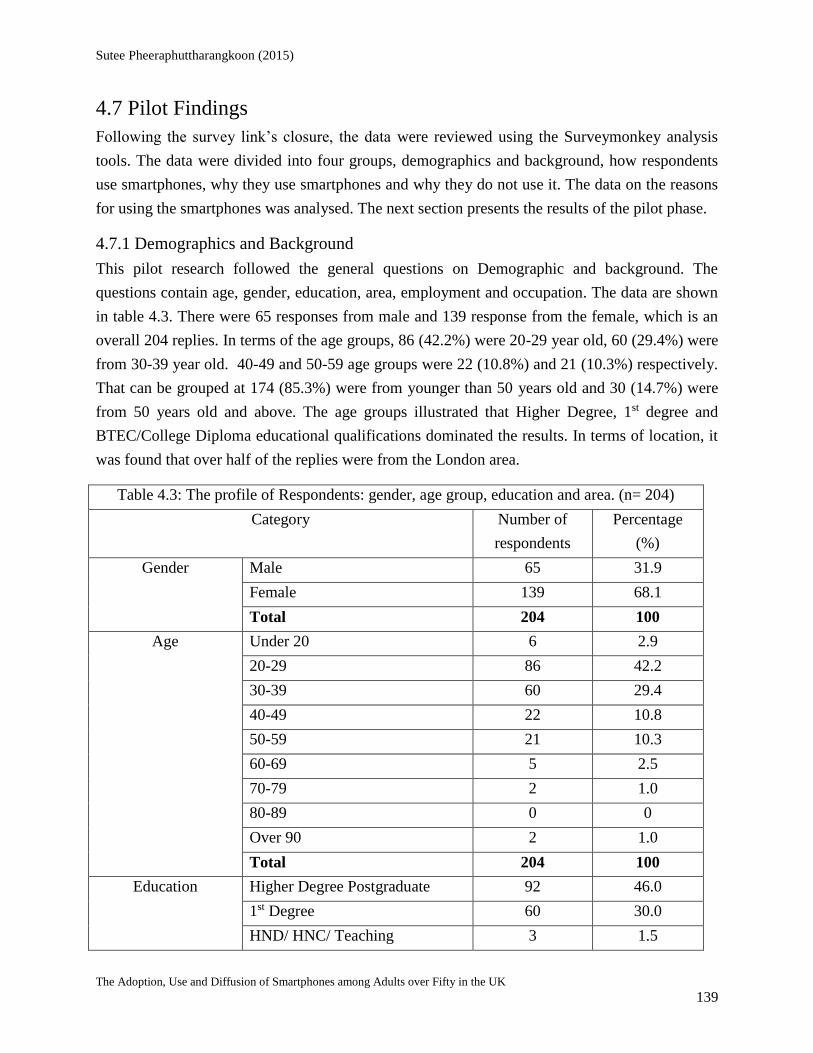
Sutee Pheeraphuttharangkoon (2015)
The Adoption, Use and Diffusion of Smartphones among Adults over Fifty in the UK 139
4.7 Pilot Findings
Following the survey link’s closure, the data were reviewed using the Surveymonkey analysis
tools. The data were divided into four groups, demographics and background, how respondents
use smartphones, why they use smartphones and why they do not use it. The data on the reasons
for using the smartphones was analysed. The next section presents the results of the pilot phase.
4.7.1 Demographics and Background
This pilot research followed the general questions on Demographic and background. The
questions contain age, gender, education, area, employment and occupation. The data are shown
in table 4.3. There were 65 responses from male and 139 response from the female, which is an
overall 204 replies. In terms of the age groups, 86 (42.2%) were 20-29 year old, 60 (29.4%) were
from 30-39 year old. 40-49 and 50-59 age groups were 22 (10.8%) and 21 (10.3%) respectively.
That can be grouped at 174 (85.3%) were from younger than 50 years old and 30 (14.7%) were
from 50 years old and above. The age groups illustrated that Higher Degree, 1st degree and
BTEC/College Diploma educational qualifications dominated the results. In terms of location, it
was found that over half of the replies were from the London area.
Table 4.3: The profile of Respondents: gender, age group, education and area. (n= 204)
Category Number of
respondents
Percentage
(%)
Gender Male 65 31.9
Female 139 68.1
Total 204 100
Age Under 20 6 2.9
20-29 86 42.2
30-39 60 29.4
40-49 22 10.8
50-59 21 10.3
60-69 5 2.5
70-79 2 1.0
80-89 0 0
Over 90 2 1.0
Total 204 100
Education Higher Degree Postgraduate 92 46.0
1st Degree 60 30.0
HND/ HNC/ Teaching 3 1.5
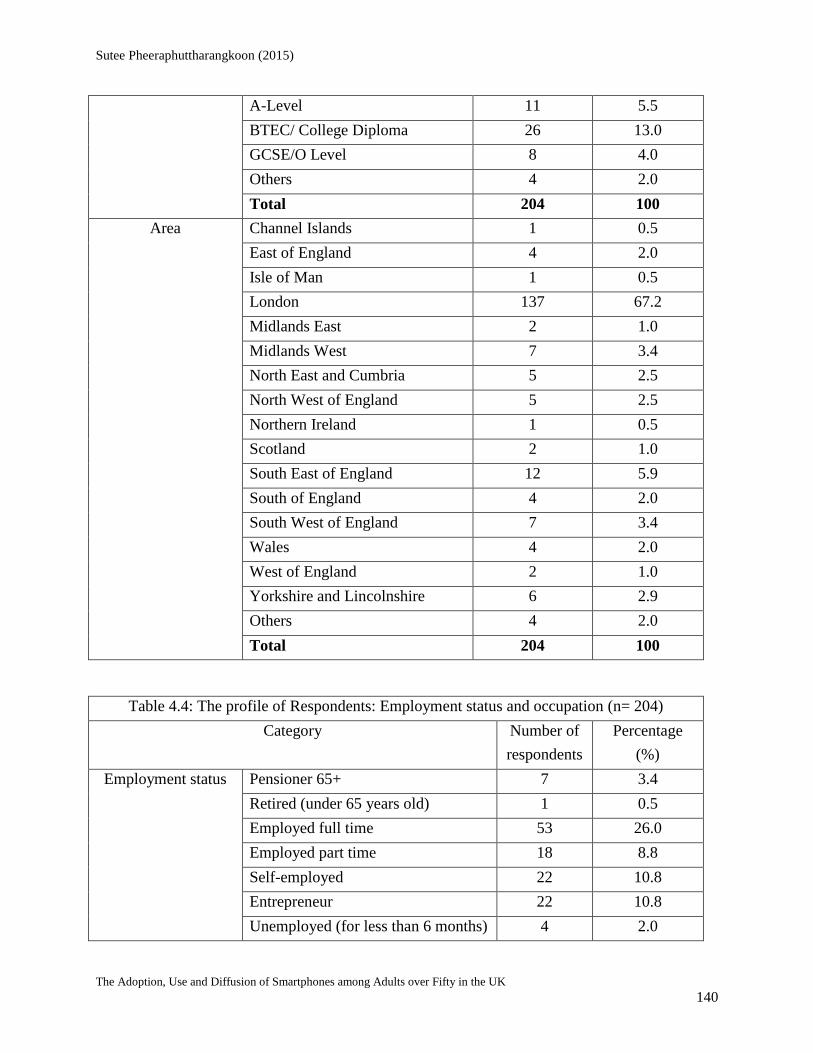
Sutee Pheeraphuttharangkoon (2015)
The Adoption, Use and Diffusion of Smartphones among Adults over Fifty in the UK 140
A-Level 11 5.5
BTEC/ College Diploma 26 13.0
GCSE/O Level 8 4.0
Others 4 2.0
Total 204 100
Area Channel Islands 1 0.5
East of England 4 2.0
Isle of Man 1 0.5
London 137 67.2
Midlands East 2 1.0
Midlands West 7 3.4
North East and Cumbria 5 2.5
North West of England 5 2.5
Northern Ireland 1 0.5
Scotland 2 1.0
South East of England 12 5.9
South of England 4 2.0
South West of England 7 3.4
Wales 4 2.0
West of England 2 1.0
Yorkshire and Lincolnshire 6 2.9
Others 4 2.0
Total 204 100
Table 4.4: The profile of Respondents: Employment status and occupation (n= 204)
Category Number of
respondents
Percentage
(%)
Employment status Pensioner 65+ 7 3.4
Retired (under 65 years old) 1 0.5
Employed full time 53 26.0
Employed part time 18 8.8
Self-employed 22 10.8
Entrepreneur 22 10.8
Unemployed (for less than 6 months) 4 2.0

Sutee Pheeraphuttharangkoon (2015)
The Adoption, Use and Diffusion of Smartphones among Adults over Fifty in the UK 141
Unemployed (for medical reasons) 0 0
Unemployed (for more than 6
months)
6 2.9
Student (part-time) 7 3.4
Student (full-time) 64 31.4
Total 207 100
Occupation Academic/Teacher 6 2.9
Agricultural/Forestry/Fishery 0 0.0
Clerk 9 4.4
Craft/Trade 4 2.0
Freelance 19 9.3
Legislator/Manager 18 8.8
Plant/Machine Operator 2 1.0
Services/Sales 40 19.6
Students 74 36.3
Others 32 15.7
Total 207 100
In terms of occupations, it can be seen that the survey replies were received from both employed
and working individuals and students as shown in Table 4.4. In terms of student numbers, it can
be seen that 74 (34.8%) responses were from both full and part time students. In terms of part
and full-time employment, there were 71 (34%) responses. There were an equal number of
entrepreneurs and self-employed individuals at 22 (10.8%) responses. Further categories of the
occupations revealed that the largest numbers of replies were received from 74 (36.3%) students.
There were 40 (19.6%) responses from service and sales individuals, Freelancers were at 19
(9.3%) responses, and 18 (8.8%) from legislator or managers.
4.7.2 Smartphone, Networks, Fee
This section explains whether the respondents used or did not use smartphones, the duration of
possessing, the brand of, the provider of, the types of subscriptions and amounts paid for the
smartphones.
In Table 4.5, most of the respondents had smartphones 180 (88.2%). For those who are below 50
years old, 161 (93.1%) used a smartphone. However, 19 (61.3%) responses were from the 50
years old and above group that used smartphones and 12 (38.7%) responses of the 50 years old
and above still did not adopt smartphones.

Sutee Pheeraphuttharangkoon (2015)
The Adoption, Use and Diffusion of Smartphones among Adults over Fifty in the UK 142
In terms of the duration that individuals had smartphones, more than half of the respondents had
used smartphones for over three years, which was the same amount within the over 50 years old
age group. What was noticeable is that in the over 50 years old age group, 5 (21%) responses had
begun using smartphones since 2012, compared to 10 (7.1%) responses from the below 50 year
old age group. This outcome also confirmed that the 50 years old and above age group is slower
at adopting new technologies.
In terms of the smartphone brand, Apple (iPhone) is the most popular one, followed by
Blackberry, Samsung and HTC. It was also found that within the older adults group Apple
iPhone usage was lower than the younger population. However, within the older age group there
were more Samsung and Blackberry users than in the younger age groups.
With regards the network providers, O2 is the most popular provider, followed by 3UK,
Vodafone, Orange, Giffgaff and Lebara. What was interesting is that the 50 years and younger
adult numbers using O2 and 3UK were outstanding compared to the 50 years old and above age
groups.
Table 4.5: The profile of smartphone, network and fee used and pay by respondents Category Below 50 years
old
Over 50 years old Overall
Number (%) Number (%) Number (%)
Having
smartphone
(n=204)
Yes 161 93.1 19 61.3 180 88.2
No 12 6.9 12 38.7 24 11.8
Length of
using
smartphone
Less than 6
months
4 2.8 2 10.5 6 3.8
6 months to
1 year
6 4.3 3 10.5 9 5.6
1 year to 2
years
21 14.9 1 5.3 22 13.8
2 years to 3
years
36 25.5 3 15.8 39 24.4
Over 3
years
74 52.5 10 52.6 84 52.5
Brand of
Smartphone
iPhone
(Apple)
109 77.3 7 36.8 116 72.5
Blackberry 27 19.1 5 26.3 32 20.0

Sutee Pheeraphuttharangkoon (2015)
The Adoption, Use and Diffusion of Smartphones among Adults over Fifty in the UK 143
HTC 9 6.4 1 5.3 10 6.3
Samsung 24 17.0 6 31.6 30 18.8
Nokia 7 5.0 1 5.3 8 5.0
Motorola 3 2.1 0 0 3 1.9
Sony 7 5.0 1 5.3 8 5.0
LG 5 3.5 0 0 5 3.1
Network
provider
3 (Three
UK)
48 34.8 3 15.8 51 32.5
EE 5 3.6 2 10.5 7 4.5
Giffgaff 8 5.8 1 5.3 9 5.7
Lebara 8 5.8 1 5.3 9 5.7
O2 56 40.6 6 31.6 62 39.5
Orange 10 7.2 5 26.3 15 9.6
T-mobile 7 5.1 3 15.8 10 6.4
Talk mobile 1 0.7 0 0 1 0.6
Virgin 3 2.2 1 5.3 4 2.5
Vodafone 21 15.2 7 36.8 28 17.8
Other 3 2.2 0 0 3 1.8
Payment Pay as you
go
44 31.2 4 21.1 48 30.0
Pay on a
monthly
basis
(contract)
105 74.5 15 78.9 120 75.0
Pay per
month
Free - £10 13 9.2 1 5.3 14 8.8
£10.01 -
£30.00
66 46.8 9 47.4 75 46.9
£30.01 -
£50.00
56 39.7 3 15.8 59 36.9
£50.01 -
£70.00
7 5.0 4 21.1 11 6.9
£70.01 -
£90.00
2 1.4 1 5.3 3 1.9
> £ 90.00 2 1.4 1 5.3 3 1.9

Sutee Pheeraphuttharangkoon (2015)
The Adoption, Use and Diffusion of Smartphones among Adults over Fifty in the UK 144
In payment terms, 120 (75%) responses of the subscribers are on a monthly (contract) agreement,
where 105 (74.5%) responses were in the below 50 years old group, 15 (78.9%) responses in the
over 50 years old. Overall, 75 (46.9%) respondents paid an estimated £10.01 - £30.00 per month,
followed by 59 (36.9%) responses who was paying between £30.01 and £50.00 per month. This
trend was apparent in both the age groups.
4.7.3 Features of Smartphones Used
In terms of the use of smartphones, this pilot questionnaire followed the recommendations of
UTAUT and mobile internet (Venkatesh et al., 2012) where the questions were drawn from
previous research studies and the type of applications in the application markets such as the
Android market. The options are shown in table 4.6. Respondents could select more than one
feature that was used on their smartphone. The top ten uses were making a phone call, taking a
photo, text messaging, emailing, browsing the website, using social networking, downloading
apps, mapping and navigator, playing games, and using the smartphone for public transport
timetabling. Figure 4.2 illustrates how the smartphones are used by all the age groups. When
considering only the below 50 year old age group, figure 4.3 was formed where the timetabling
of public transport issues was removed and replaced by using the Voice over IP facilities such as
Facetime or Skype. For the over 50 years old group, figure 4.4 was formed where filming a video
was in the top ten instead of using for public transport timetabling.
Interestingly, for the 50 years old and above group, the numbers of respondents using
smartphones for making a phone call, SMS, emailing, taking a photo, and browsing the website
(the top five) were very high. However, the sixth to the tenth- filming a video, playing games,
mapping downloading app, and using social media were far less than the first five. Filming a
video was more popular in the above 50 years old than in the below 50 years old. Comparatively,
in the above 50 years old age group there were fewer individuals making use of the downloading
apps and using social media features. Additionally, in the above 50 years old group there were
more game players.

Sutee Pheeraphuttharangkoon (2015)
The Adoption, Use and Diffusion of Smartphones among Adults over Fifty in the UK 145
Figure 4.2 Feature used by respondents, overall
Figure 4.3 Feature used by respondents, under 50 year old group

Sutee Pheeraphuttharangkoon (2015)
The Adoption, Use and Diffusion of Smartphones among Adults over Fifty in the UK 146
Figure 4.4 Feature used by respondents, over 50 year old group
Table 4.6: Features of a smartphone used by respondents
Features of a smartphone Below 50 years
old
Over 50 years
old
Overall (n=159)
Number
(n=141)
(%) Number (%) Number (%)
Making a phone call 130 92.2 18 100 148 93.1
SMS, Text messaging 118 83.7 17 94.4 135 84.9
E-mailing 118 83.7 16 88.9 134 84.3
Browsing-surfing website(s) 121 85.8 12 66.7 133 83.6
Downloading applications 110 78.0 7 38.9 117 73.6
Mapping, Navigator such as
Google Map, Tom-Tom, Copilot
105 74.5 8 44.4 113 71.1
Online shopping such as eBay
Amazon, Shopper, Groupon,
Amazon Mobile, Newegg Mobile
69 48.9 2 11.1 71 44.7
Online Banking 81 57.4 5 27.8 86 54.1
Reading online News and online
Magazines
82 58.2 3 16.7 85 53.5
Using social network such as
Facebook, Twitter
121 85.8 7 38.9 128 80.5
Using voice over IP such as
Facetime, Skype, oovoo, Google
98 69.5 3 16.7 101 63.5
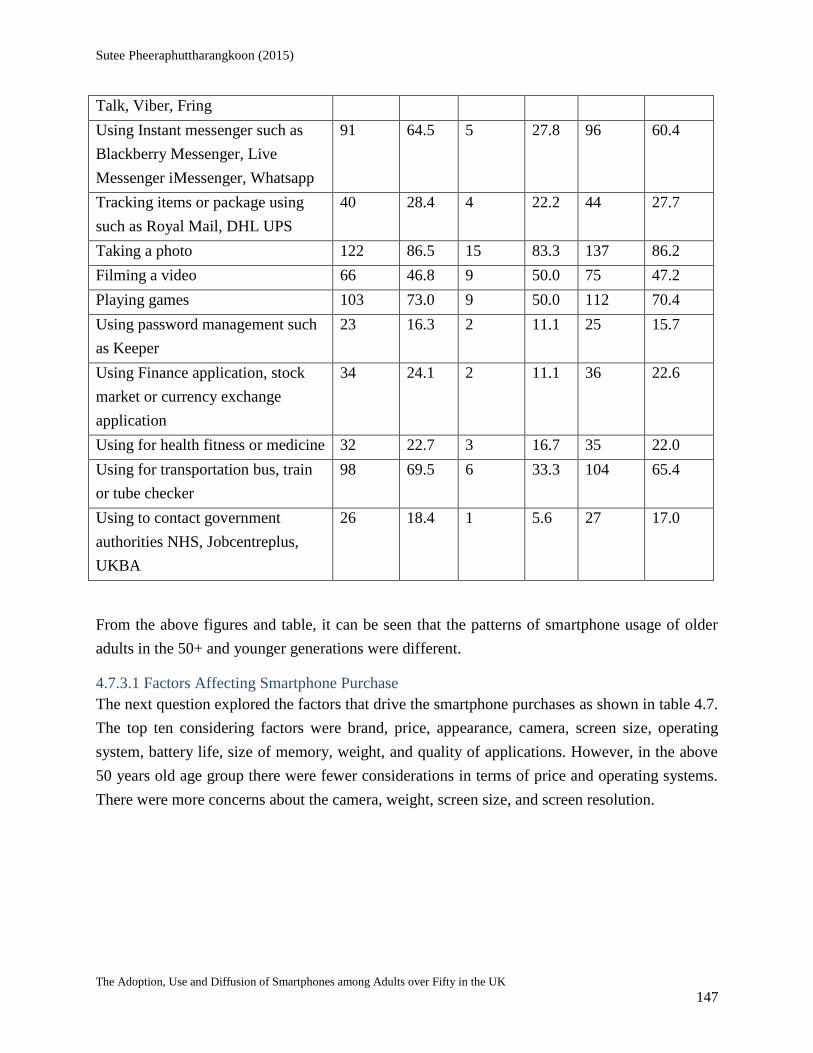
Sutee Pheeraphuttharangkoon (2015)
The Adoption, Use and Diffusion of Smartphones among Adults over Fifty in the UK 147
Talk, Viber, Fring
Using Instant messenger such as
Blackberry Messenger, Live
Messenger iMessenger, Whatsapp
91 64.5 5 27.8 96 60.4
Tracking items or package using
such as Royal Mail, DHL UPS
40 28.4 4 22.2 44 27.7
Taking a photo 122 86.5 15 83.3 137 86.2
Filming a video 66 46.8 9 50.0 75 47.2
Playing games 103 73.0 9 50.0 112 70.4
Using password management such
as Keeper
23 16.3 2 11.1 25 15.7
Using Finance application, stock
market or currency exchange
application
34 24.1 2 11.1 36 22.6
Using for health fitness or medicine 32 22.7 3 16.7 35 22.0
Using for transportation bus, train
or tube checker
98 69.5 6 33.3 104 65.4
Using to contact government
authorities NHS, Jobcentreplus,
UKBA
26 18.4 1 5.6 27 17.0
From the above figures and table, it can be seen that the patterns of smartphone usage of older
adults in the 50+ and younger generations were different.
4.7.3.1 Factors Affecting Smartphone Purchase
The next question explored the factors that drive the smartphone purchases as shown in table 4.7.
The top ten considering factors were brand, price, appearance, camera, screen size, operating
system, battery life, size of memory, weight, and quality of applications. However, in the above
50 years old age group there were fewer considerations in terms of price and operating systems.
There were more concerns about the camera, weight, screen size, and screen resolution.

Sutee Pheeraphuttharangkoon (2015)
The Adoption, Use and Diffusion of Smartphones among Adults over Fifty in the UK 148
Table 4.7: Factors that consider when buying a smartphone
Consideration in buying a
smartphone
Below 50 years
old
Over 50 years
old
Overall (n=159)
Number
(n=140)
(%) Number (%) Number (%)
Appearance such as colour material 83 59.3 9 47.4 92 57.9
Brand such as Apple, Samsung,
Nokia, Blackberry
123 87.9 13 68.4 136 85.5
Price of the smartphone 90 64.3 8 42.1 98 61.6
Camera 74 52.9 10 52.6 84 52.8
Operating System such as iOS,
Android or Windows8
66 47.1 4 21.1 70 44.0
Operating Speed 55 39.3 4 21.1 59 37.1
Voice Clarity 15 10.7 1 5.3 16 10.1
Screen Size 65 46.4 9 47.4 74 46.5
Screen Resolution 49 35.0 5 26.3 54 34.0
Weight 52 37.1 10 52.6 62 39.0
Battery life 61 43.6 7 36.8 68 42.8
Size of Memory in the phone to
store files
57 40.7 7 36.8 64 40.3
Quality of application 59 42.1 3 15.8 62 39.0
Price of applications 20 14.3 2 10.5 22 13.8
Number of application available in
app market
30 21.4 2 10.5 32 20.1
Support LTE 4G 15 10.7 0 0 15 9.4
It can be seen that older adults were concerned with smartphone screen size and weight that
supported the idea that older adults may have poor vision or weak muscles as explained in
chapter 2.
4.7.3.2 Source of Information about Smartphones
In order to understand the reasons that led to the smartphone purchase, questions regarding the
influencing factors were sought as shown in Table 4.8.

Sutee Pheeraphuttharangkoon (2015)
The Adoption, Use and Diffusion of Smartphones among Adults over Fifty in the UK 149
Table 4.8: Source of information about a smartphone
Where do you get information
about
a smartphone
Below 50 years
old
Over 50 years
old
Overall (n=157)
Number
(n=138)
(%) Number (%) Number (%)
1. Word of mouth by friends and family
91 65.9 17 89.5 108 68.8
2. High street stores 33 23.9 6 31.6 39 24.8
3. Media- TV, Radio and Newspapers
72 52.2 6 31.6 78 49.7
4. Magazines 30 21.7 3 15.8 33 21.0
5. Online social network 71 51.4 0 0 71 45.2
6. Professional technology review website such as CNET.co.uk, Trustedreviews.com
36 26.1 1 5.3 37 23.6
7. Peer technology review such as unboxing video on YouTube
29 21.0 0 0 29 18.5
Overall, as shown in Table 4.8 smartphones were purchased due to the recommendations
provided by the word of mouth, i.e. friends and family, the media (TV, Radio and Newspapers),
online social networks, high street stores, professional technology review websites, magazines
and Peer technology reviews respectively. Within the below 50 years old, purchases were made
due to the word of mouth, media and online social networks. Contrastingly, in the over 50 years
old respondents, there was more reliance on the classic communication channel of the word of
mouth, with less reliance on online social networks, the more popular, recent communication
channel. This reliance on the classic communication channel could also be a factor that could
explain the slow adoption of novel technologies as the transmission speed of the word of mouth
is much slower than an online social network, or other forms of media.

Sutee Pheeraphuttharangkoon (2015)
The Adoption, Use and Diffusion of Smartphones among Adults over Fifty in the UK 150
4.7.3.3 Using Smartphones for Health and Well-being, and, Connecting Friends and Family
Purpose
Figure 4.5 How smartphones help with well-being or health, overall.
Another benefit of a smartphone is to assist with wellbeing or health care as shown in figure 4.5.
65 respondents or 40.6% agreed that they used their smartphones for their health and well-being.
The options for this question sought information such as seeking information on health,
accessing health records, tracking exercises, managing sleep, monitoring weight, managing food,
managing moods, tracking pregnancy, managing prescriptions, managing blood pressure,
checking pollen levels, and controlling cigarette smoking.
Of the overall responses, 45 respondents had used smartphone to seek information about health
issues. The next two popular benefits that 18 respondents agreed with were helping with
managing sleep and managing food. For the 50 years old and above age group, only four of 50+
adults who used smartphones had used their smartphone for health and well-being purposes.
There were only three features used which were seeking information, managing or tracking
physical exercise and managing food. Therefore, this result shows that this benefit was not
widely recognised by smartphone users, particularly, the older adults who could benefit
immensely from this feature.
Another benefit of smartphone is to bring friends and family closer. In figure 4.6, it is shown that
140 respondents agreed that smartphones could help with this issue, with around 126 (90%) of

Sutee Pheeraphuttharangkoon (2015)
The Adoption, Use and Diffusion of Smartphones among Adults over Fifty in the UK 151
the respondents from the under 50 year old age group supporting this view and 12 of the above
50 years old age group supporting this view. In the older age groups, it was found that there was
less use of online social networks and more email being used to contact friends and family.
Comparatively, in the below 50 age group there was more online social networks use and less of
email. Location sharing with friends and family was also used more in the younger adults
compared to the older adults.
Figure 4.6 How smartphones help with bring friends and family closer, overall.
As addressed in chapter 2, new technologies can be used as a means of improving the well-being
and health of older adults (Boontarig et al., 2012). The results in this section indicate that
smartphones can help with well-being, health and loneliness. However, within the older adults,
these features are not widely adopted.
4.7.4 Reasons for Non-Adoption
Whilst the previous section understood the reasons for adoption, a question also attempted to
understand the reasons for some respondents not using smartphones. The top cited reason is the
availability of alternative devices such as laptops, netbooks or desktops, which was followed by
the cost of using a smartphone followed by discomfort when using the mobile devices small
screens and keyboards. Although not very significant results, it was discovered that private time,
knowledge and lifestyle were also factors of non-adoption.

Sutee Pheeraphuttharangkoon (2015)
The Adoption, Use and Diffusion of Smartphones among Adults over Fifty in the UK 152
Figure 4.7 Reasons for not using smartphones, overall.
Having explained the reasons for not using a smartphone, the next issue was to improve and
identify the factors that may encourage non-users to use smartphones in the future, which is
explained in the next section.
4.7.5 Analysis Technique
Data analysis was performed using the component-based approach to structural equation
modelling (SEM) and the associated statistics for validity and reliability. Specifically, this pilot
used the Partial Least Square (PLS) technique with the help of the SmartPLS version 2.0M3
(Ringle et al., 2005).
For data analysis, there are two generations of data analysis techniques. The first generation can
analyse the model, which has only one layer of connections at a time between the independent
and dependent variables. The tools in this generation include regression methods such as,
ANOVA and MANOVA. For the second generation, SEM can analyse simultaneously
relationships amongst many independent and dependent constructs and provide a comprehensive
result at the end. The second generation techniques include, Linear Structural Relations
(LISREL) or PLS (Gefen et al., 2000).
Although, LISREL and PLS are second generation techniques, they are different in many aspects
(Gefen et al., 2000). First, the objective of variance analysis is different. LISREL explains an

Sutee Pheeraphuttharangkoon (2015)
The Adoption, Use and Diffusion of Smartphones among Adults over Fifty in the UK 153
overall model while PLS explains the variance details. Second, LISREL requires a theory base
and supports only confirmatory research; while, PLS does not need a theory base and supports
both exploratory and confirmatory research. Third, refers to the minimal sample size. LISREL
requires at least 100-150 cases; whereas, PLS needs at least 10 times the number of factors in the
most complex model.
During the last few years, the PLS technique has become increasingly popular in information
systems, marketing and management research. The research on the numbers of PLS used in
Management Information Systems Quarterly (MISQ) and Information System Research (ISR) is
increasing. In 2006, 23.19% or 16 articles, from 53 articles, in MISQ and ISR used PLS (Urbach
& Ahlemann, 2010). This pilot used PLS by SmartPLS for data analysis, not only due to the
popularity of the technique, but also, due to the compatibility of the research framework and the
nature of adoption research, which is normally related to more than one layer of the links
between independent and dependent variables.
4.7.6 Analysis Results
Following distribution of the link to the online questionnaire, 205 replies were received, of which
181 were complete responses. However, the responses that could be analysed amounted to 160.
Although 160 is a relatively small sample size, it is sufficient enough to gain a reliable
understanding from the PLS results. This is due to the replies being 10 times more of the
formative factors (numbers of factors in the conceptual framework) (Chin, 1998). In this study
the numbers of formative factors are eight. Therefore, the minimum numbers of responses
required are 80 respondents.
During the analysis processes, some questions, formative indicators, were removed because the
questions did not provide good results for the factors. The removed questions were as follows:
SOC3: it is expected that people like me use a smartphone (for example, similar age or position
people).
SOC4: I want to use a smartphone because my friends do so.
FC3: The operation costs of a smartphone do not prevent the use of it (such as, price of
smartphones or monthly fee).
FC4: I have a person available to assist me in using my smartphone.
Removing these questions helped improve the overall results. What was also found is that in this
pilot phase reflective indicators, ACU3, ACU4, ACU6, ACU7, ACU8, and, ACU9 were selected
for analysis, but ACU1 and ACU2 were removed because they were not present when using

Sutee Pheeraphuttharangkoon (2015)
The Adoption, Use and Diffusion of Smartphones among Adults over Fifty in the UK 154
smartphones. Both are just simple features. ACU5 and ACU9 did not perform quite as well in the
analysis, so they were removed.
4.7.6.1 Reliability
Reliability is the first area to consider when analysing data, which is normally referred to as
internal consistency reliability and indicator reliability. The internal consistency reliability can be
tested using Cronbach’s Alpha or Composite Reliability. Cronbach’s Alpha is the reliability
indicators that assume that all items or questions are equally reliable. However, Composite
Reliability considers the different items loading to the factor. The requirement value should
above 0.7 in both indicators (Henseler et al., 2009). Table 4.9 shows all Composite Reliability of
all age groups are more than 0.8 which mean the data is in good scale.
Table 4.9: Overview of all age groups
The indicator reliability related to the manifest variables (questions) loadings should not be less
than 0.707 (Chin, 1998; Gefen et al., 2000). Figure 4.8 illustrates that all the indicators’
magnitude is greater than 0.707. Therefore, from both the reliabilities tests, the model for all the
age groups is reliable.

Sutee Pheeraphuttharangkoon (2015)
The Adoption, Use and Diffusion of Smartphones among Adults over Fifty in the UK 155
Figure 4.8: PLS Results of Measurement and Structural Models of all age groups
4.7.6.2 Validity: Convergent and Discriminant Validity
The convergent validity and the discriminant validity are normally used to check the validity.
Convergent validity is defined as “the degree to which scores on one scale correlate with scores
on other scales designed to assess the same construct” (Cooper & Schindler, 2013:259).
Convergent validity can be examined using Average Variance Extracted (AVE). Discriminant
validity indicates the extent to which a given construct is different from other latent constructs
(Vinzi et al., 2010). The square root of AVE of each latent variable should be greater than the
correlations among the latent variables (Fornell & Larcker, 1981). The further detail on
convergent and discriminant validity can be found in chapter 3, section 3.7.7.4.
The first column in table 4.9 shows that the Average Variance Extracted (AVE) for all the
constructs is higher than 0.5, except for ACU. This indicates that there is sufficient convergent
validity, and implies that each latent variable on average explains that more than 50% of their

Sutee Pheeraphuttharangkoon (2015)
The Adoption, Use and Diffusion of Smartphones among Adults over Fifty in the UK 156
indicator variance (Hair et al., 2011). Discriminant validity refers to the appropriate patterns of
inter-indicators of a construct and other constructs. The variance of a construct should be
assigned a value greater than its own indicators rather than to other constructs (Hair et al., 2011).
Table 4.10: Cross Loading of all age groups
ACU COM EE FC FUN IN OB PE SOC
ACU3 0.5429 0.5222 0.2677 0.4134 0.2054 0.3046 0.3007 0.3727 0.1902
ACU4 0.7805 0.3722 0.4203 0.4008 0.4360 0.3265 0.3307 0.3349 0.2119
ACU6 0.6738 0.1491 0.2779 0.1727 0.3638 0.1790 0.2105 0.1216 0.0504
ACU7 0.7912 0.2716 0.2423 0.2183 0.2869 0.2440 0.1927 0.1823 0.1225
ACU8 0.6679 0.1674 0.1522 0.1581 0.2546 0.2272 0.0852 0.1457 0.1497
ACU9 0.6064 0.1073 0.2228 0.1832 0.2760 0.2432 0.0879 0.0988 0.1388
COM1 0.3548 0.8927 0.5943 0.7040 0.5010 0.6060 0.5243 0.6826 0.3487
COM2 0.3611 0.9133 0.5681 0.7409 0.5921 0.5858 0.5381 0.6728 0.3040
COM3 0.3968 0.8876 0.5336 0.7469 0.4520 0.5787 0.4225 0.6750 0.1836
COM4 0.4027 0.8731 0.4844 0.7177 0.4394 0.5283 0.4146 0.6456 0.1943
EE1 0.3922 0.5919 0.9534 0.6724 0.5592 0.5833 0.3662 0.6092 0.2251
EE2 0.3795 0.5819 0.9599 0.6887 0.6416 0.6280 0.4413 0.5598 0.2153
FC1 0.3717 0.7787 0.5745 0.9191 0.5183 0.6495 0.4139 0.7113 0.2471
FC2 0.3761 0.7147 0.7323 0.9138 0.6388 0.6301 0.4794 0.6218 0.2533
FUN1 0.4168 0.5274 0.5760 0.5986 0.9427 0.5902 0.4356 0.5222 0.2556
FUN2 0.4328 0.5259 0.6113 0.5913 0.9451 0.6028 0.4948 0.5224 0.2550
IN1 0.3558 0.4579 0.4850 0.5624 0.5224 0.8183 0.3532 0.4761 0.3804
IN2 0.2717 0.5961 0.5965 0.5605 0.5727 0.8159 0.3485 0.6192 0.3219
IN3 0.3899 0.5759 0.5664 0.6398 0.4867 0.8057 0.4440 0.5867 0.2181
IN4 0.2288 0.4486 0.3831 0.4871 0.4602 0.8039 0.2241 0.4625 0.3766
OB1 0.2916 0.5376 0.4371 0.4952 0.4416 0.4213 0.9056 0.5009 0.1835
OB2 0.2425 0.3527 0.2634 0.3131 0.4021 0.2984 0.8009 0.2794 0.2655
PE1 0.1526 0.6416 0.5928 0.6172 0.5886 0.6252 0.4577 0.8140 0.1701
PE2 0.3329 0.6205 0.4610 0.6071 0.4202 0.5446 0.3620 0.8888 0.2307
PE3 0.3931 0.6482 0.4856 0.6294 0.3766 0.5142 0.3784 0.8473 0.2674
SOC1 0.1803 0.2855 0.1971 0.2712 0.2232 0.3836 0.2461 0.2700 0.9396
SOC2 0.2452 0.2585 0.2342 0.2374 0.2846 0.3542 0.2245 0.2110 0.9287

Sutee Pheeraphuttharangkoon (2015)
The Adoption, Use and Diffusion of Smartphones among Adults over Fifty in the UK 157
From Table 4.10, it can be seen that an indicator’s loading is higher than all of its cross loadings.
For example, EE1 is the question that expected to support EE (Effort Expectancy) construction.
The indicators such as EE1 should provide at least 0.8 loading value to its construct EE. From
the table 4.10, the EE1 provided loading 0.9534 to EE that was very strong. Moreover, the
loading of EE1 to other constructs (ACU, COM, FC, FUN, IN, OB, PE, and SOC) should
smaller than to EE.
From the table 4.10, indicator COM1-COM4 provide 0.8927, 0.9133, 0.8876, and, 0.8731
loading to COM; moreover, COM1-4 did not provide loading to other variables more than their
own variable (COM). Similarly EE1-2 offered 0.9534 and 0.9599 to EE, FC1-2 provided 0.9191
and 0.9138 to FC, FUN1-2 provided 0.9427 and 0.9451 to FUN, IN1-4 provided 0.8183, 0.8159,
0.8057 and 0.8039 to IN, OB1-2 provide 0.9056 and 0.8099 to OB, PE1-3 provided 0.8140,
0.8888, and 0.8473 to PE, and, SOC1-2 provided 0.9396 and 0.9287 to SOC.
Table 4.11: Construct Cross-Correlation Matrix and AVE analyses
AVE ACU COM EE FC FUN IN OB PE SOC
0.4663 ACU 0.6829
0.7953 COM 0.4237 0.8918
0.9153 EE 0.4030 0.6132 0.9567
0.8399 FC 0.4079 0.8153 0.7116 0.9165
0.8910 FUN 0.4501 0.5579 0.6291 0.6303 0.9439
0.6577 IN 0.3888 0.6458 0.6338 0.6982 0.6320 0.8110
0.7307 OB 0.3146 0.5346 0.4234 0.4868 0.4932 0.4295 0.8548
0.7236 PE 0.3351 0.7506 0.6099 0.7280 0.5533 0.6662 0.4745 0.8506
0.8726 SOC 0.2264 0.2917 0.2300 0.2729 0.2705 0.3954 0.2523 0.2586 0.9341
Discriminant validity can be examined by the square root of AVE of each latent variable
should be greater than the correlations among the latent variables (Fornell & Larcker, 1981).
From table 4.11, the square root of AVE of each latent variable was written in bold. For
example, The COM’s AVE was 0.7953 therefore, the square root of it was 0.8918. The EE’s
AVE was 0.9153, then the square root of it was 0.9567. For Discriminant validity testing, for
example, COM’s AVE, 0.8918 need to compare with construct cross-correlation which were
0.6132 from EE, 0.8153 from FC, 0.5579 from FUN, 0.6458 from IN, 0.5346 from OB, 0.7506
from PE, and 0.2917 from SOC. Then, when consider other variables’ AVE compare with cross-
correlation, the AVE were greater than the correlations. Therefore, the results satisfied
Discriminant validity.

Sutee Pheeraphuttharangkoon (2015)
The Adoption, Use and Diffusion of Smartphones among Adults over Fifty in the UK 158
4.6.6.2.1 Assessment of the Structural Model
In order to explain and predict the developed conceptual framework for this research, the
methods and suggestions provided by previous PLS literature were used (Chin, 1998; Gefen et
al., 2000; Henseler et al., 2009).
4.6.6.2.2 Explanatory Power
Figure 4.7 shows an overview of the evaluation of the modified conceptual framework for all the
age groups. The number in the blue circle shows the R-squared value that explains the variance.
In Figure 4.7 the model explains 62.3% of the intention to use a smartphone and 15.1% of the
actual smartphones use is explained.
4.6.6.2.3 Predictive power
SmartPLS was used to run bootstrapping where the t-values illustrated the line linked between
the variables (shown in Figure 4.8). The Critical t-values for the two-tailed test is 1.65 that
provide a significant level of less than 10% or 0.10; 1.96 provided a significance level of less
than 5% or 0.05, and 2.58 provided a significance level of less than 10% or 0.1 (Hair et al.,
2011). A graphical result of the conceptual model evaluation is shown in figure 4.9. For all the
age models, this pilot found that Observability (H1) and Compatibility (H2) do not have a
significant effect on the intention to use smartphones. Social Influence (H3 supported with
coefficient = 0.177) and Performance expectancy (H5 supported with coefficient = 0.231) are
positively influenced towards the behavioural intention of smartphone adoption at a significant
level of less than 0.01. Enjoyment (H7 supported with coefficient = 0.213) positively influenced
the behavioural intention towards smartphone adoption with a significant level of less than 0.05.
The facilitating Condition (H4 supported with coefficient = 0.215) and Effort Expectancy (H6
supported with coefficient = 0.144) positively influenced the behavioural intention towards
smartphone adoption with a significant level of less than 0.10. Further, behavioural intention
(H8 supported with coefficient = 0.389) had a positive influence on smartphone use at a
significant level of less than 0.01. The conclusions of these hypothesis tests for all the age groups
are shown in Table 4.12.

Sutee Pheeraphuttharangkoon (2015)
The Adoption, Use and Diffusion of Smartphones among Adults over Fifty in the UK 159
Figure 4.9: Bootstrap Results of the Measurement and Structural Models of all age groups

Sutee Pheeraphuttharangkoon (2015)
The Adoption, Use and Diffusion of Smartphones among Adults over Fifty in the UK 160
0.623
0.151
H7 0.213**
H6 0.144*
H5 0.231***
H4 0.215*
H3 0.177***
H2 0.050
H1 -0.022
H8 0.389***
OB
COM
SOC
FC
PE
EE
FUN
IN
ACU
*Significant at 0.1 level**Significant at 0.05 level***Significant at 0.01 level
Figure4.10: Evaluation of Structural Model of all age groups

Sutee Pheeraphuttharangkoon (2015)
The Adoption, Use and Diffusion of Smartphones among Adults over Fifty in the UK 161
Table 4.12 : Conclusion of the Hypothesis tests of all age groups
Hypothesis Outcome Values
Hypothesis 1 : Observability has a positive influence on the
behavioural intention towards smartphone adoption.
Not Supported
Hypothesis 2 : Compatibility has a positive influence on the
behavioural intention towards smartphone adoption.
Not Supported
Hypothesis 3 : Social Influence has a positive influence on the
behavioural intention towards smartphone adoption.
Supported 0.177
Hypothesis 4 : Facilitating Condition has a positive influence
on the behavioural intention towards smartphone adoption.
Supported 0.215
Hypothesis 5 : Performance expectancy has a positive
influence on the behavioural intention towards smartphone
adoption.
Supported 0.231
Hypothesis 6 : Effort Expectancy has a positive influence on
the behavioural intention towards smartphone adoption.
Supported 0.144
Hypothesis 7 : Enjoyment has a positive influence on the
behavioural intention towards smartphone adoption.
Supported 0.213
Hypothesis 8 : Behavioural intention has a positive influence
on the smartphone usage.
Supported 0.389
4.7.7 The Analysis Results of the Above 50 Years Old Adults
To obtain information specific to the 50 years old and above age groups, the data from the 50
years old responses were analysed using SmartPLS in the same way as overall age groups, where
the conclusions are illustrated in figure 4.11 and table 4.13.

Sutee Pheeraphuttharangkoon (2015)
The Adoption, Use and Diffusion of Smartphones among Adults over Fifty in the UK 162
0.809
0.642
H7 0.282***
H6 0.314***
H5 0.126
H4 0.417***
H3 0.207**
H2 -0.196*
H1 0.131*
H8 0.801***
OB
COM
SOC
FC
PE
EE
FUN
IN
ACU
*Significant at 0.1 level**Significant at 0.05 level***Significant at 0.01 level
Figure4.11 Evaluation of the Structural Model for the over 50 age groups
From the analysis, it was found that there are three hypotheses that are supported. These are
Facilitating Conditions (H4), Effort Expectancy (H6) and Enjoyment (H7) that have strong
significance levels (less than 0.01) with coefficients = 0.417, 0.314 and 0.282 respectively.
Social Influence (H3) was supported by the coefficient 0.207 with a significance level at less
than 0.05. Observability (H1) was also supported with a coefficient of 0.131 with a significance
level less than 0.10. Further, intention (H8) was also strongly supported by a coefficient of 0.801
at a significance level of less than 0.01. Comparatively, Compatibility (H2) had an opposite
result with a coefficient of -0.196 at a significant level less than 0.1. Performance expectancy
was not supported by this model for the over 50 age groups.
When considering the explanatory power of both intention to continue using smartphone and
smartphone actual use using the R-squared for the particular age groups, the intention and usage
were at 80.9 % and 64.2% explained respectively. Both values are quite strong. However, the R-
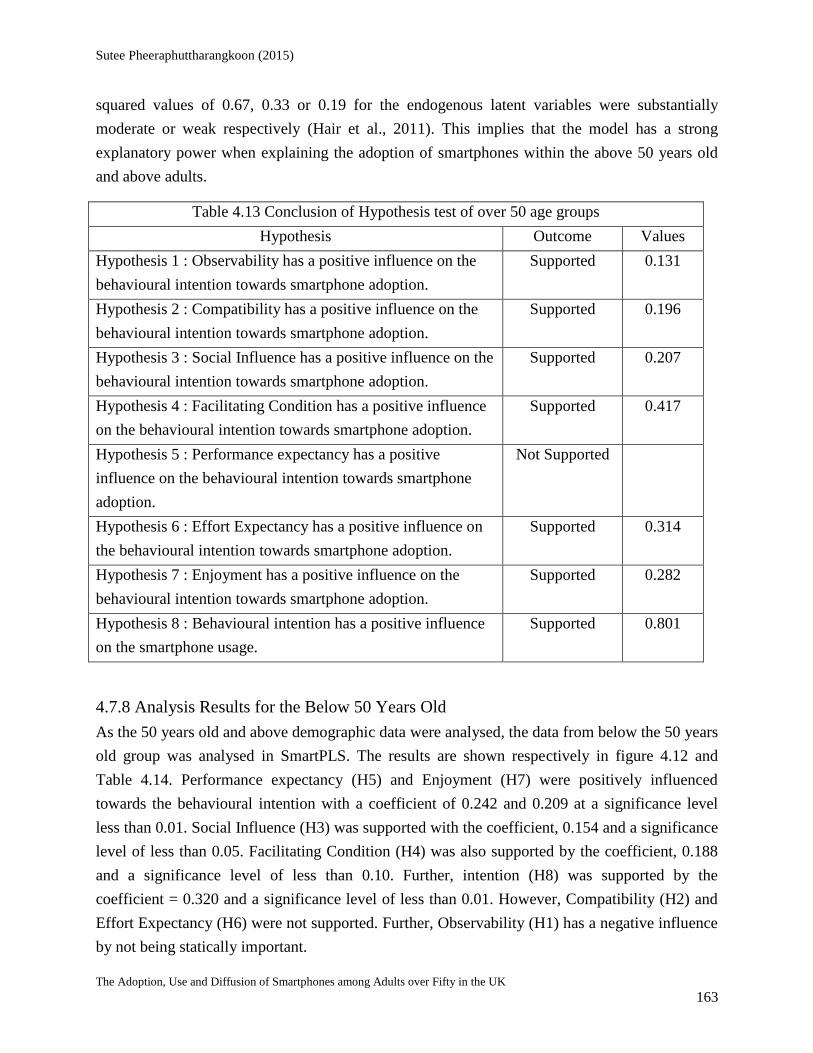
Sutee Pheeraphuttharangkoon (2015)
The Adoption, Use and Diffusion of Smartphones among Adults over Fifty in the UK 163
squared values of 0.67, 0.33 or 0.19 for the endogenous latent variables were substantially
moderate or weak respectively (Hair et al., 2011). This implies that the model has a strong
explanatory power when explaining the adoption of smartphones within the above 50 years old
and above adults.
Table 4.13 Conclusion of Hypothesis test of over 50 age groups
Hypothesis Outcome Values
Hypothesis 1 : Observability has a positive influence on the
behavioural intention towards smartphone adoption.
Supported 0.131
Hypothesis 2 : Compatibility has a positive influence on the
behavioural intention towards smartphone adoption.
Supported 0.196
Hypothesis 3 : Social Influence has a positive influence on the
behavioural intention towards smartphone adoption.
Supported 0.207
Hypothesis 4 : Facilitating Condition has a positive influence
on the behavioural intention towards smartphone adoption.
Supported 0.417
Hypothesis 5 : Performance expectancy has a positive
influence on the behavioural intention towards smartphone
adoption.
Not Supported
Hypothesis 6 : Effort Expectancy has a positive influence on
the behavioural intention towards smartphone adoption.
Supported 0.314
Hypothesis 7 : Enjoyment has a positive influence on the
behavioural intention towards smartphone adoption.
Supported 0.282
Hypothesis 8 : Behavioural intention has a positive influence
on the smartphone usage.
Supported 0.801
4.7.8 Analysis Results for the Below 50 Years Old
As the 50 years old and above demographic data were analysed, the data from below the 50 years
old group was analysed in SmartPLS. The results are shown respectively in figure 4.12 and
Table 4.14. Performance expectancy (H5) and Enjoyment (H7) were positively influenced
towards the behavioural intention with a coefficient of 0.242 and 0.209 at a significance level
less than 0.01. Social Influence (H3) was supported with the coefficient, 0.154 and a significance
level of less than 0.05. Facilitating Condition (H4) was also supported by the coefficient, 0.188
and a significance level of less than 0.10. Further, intention (H8) was supported by the
coefficient = 0.320 and a significance level of less than 0.01. However, Compatibility (H2) and
Effort Expectancy (H6) were not supported. Further, Observability (H1) has a negative influence
by not being statically important.

Sutee Pheeraphuttharangkoon (2015)
The Adoption, Use and Diffusion of Smartphones among Adults over Fifty in the UK 164
This model with this particular group can predict 61.5% of the intention to use a smartphone and
10.3% of actual use.
Table 4.14 Conclusion of Hypothesis test of below 50 age groups
Hypothesis Outcome Values
Hypothesis 1 : Observability has a positive influence on the
behavioural intention towards smartphone adoption.
Not Supported
Hypothesis 2 : Compatibility has a positive influence on the
behavioural intention towards smartphone adoption.
Not Supported
Hypothesis 3 : Social Influence has a positive influence on the
behavioural intention towards smartphone adoption.
Supported 0.154
Hypothesis 4 : Facilitating Condition has a positive influence
on the behavioural intention towards smartphone adoption.
Supported 0.188
Hypothesis 5 : Performance expectancy has a positive
influence on the behavioural intention towards smartphone
adoption.
Supported 0.242
Hypothesis 6 : Effort Expectancy has a positive influence on
the behavioural intention towards smartphone adoption.
Not Supported
Hypothesis 7 : Enjoyment has a positive influence on the
behavioural intention towards smartphone adoption.
Supported 0.209
Hypothesis 8 : Behavioral intention has a positive influence
on the smartphone usage.
Supported 0.320

Sutee Pheeraphuttharangkoon (2015)
The Adoption, Use and Diffusion of Smartphones among Adults over Fifty in the UK 165
0.615
0.103
H7 0.209***
H6 0.115
H5 0.242***
H4 0.188*
H3 0.154**
H2 0.110
H1 -0.057
H8 0.320***
OB
COM
SOC
FC
PE
EE
FUN
IN
ACU
*Significant at 0.1 level**Significant at 0.05 level***Significant at 0.01 level
Figure4.12 Evaluation of Structural Model of below 50 age groups
Table 4.15 Comparison of the Hypothesis between the Over 50 and Below 50 age groups
Hypothesis Outcome value
All age Over 50 Below 50
1. Observability -> Behavioural intention 0.131
2. Compatibility -> Behavioural intention 0.196
3. Social Influence -> Behavioural intention 0.177 0.207 0.154
4. Facilitating -> Behavioural intention 0.215 0.417 0.188
5. Performance expectancy -> Behavioural intention 0.231 0.242
6. Effort Expectancy -> Behavioural intention 0.144 0.314
7. Enjoyment -> Behavioural intention 0.213 0.282 0.209
8. Behavioural intention -> smartphone usage 0.389 0.801 0.320

Sutee Pheeraphuttharangkoon (2015)
The Adoption, Use and Diffusion of Smartphones among Adults over Fifty in the UK 166
The results from the conceptual framework with different age groups can be compared as shown
in Table 4.15. For all the age groups and the below 50 year old age group, Observability (H1)
and Compatibility (H2) are not supported in the framework. However, they positively influence
the behavioural intention for the over 50 years old age group. Performance expectancy (H5) is
positively influenced on the overall results and the below 50 age groups but it did not influence
the 50 years old and above age group. Lastly, Effort Expectancy (H6) does not affect the below
50 years old age groups.
In terms of explanation, the model can explain 62.3% of behavioural intention and 15.1% of
actual use of all the age groups. This same model can explain 80.9% of behavioural intention and
64.2% of actual use. However, the framework can describe only 61.5% of behavioural intention
and only 10.3% of actual use in the below 50 years old age group.
4.8 Pilot Discussion
Having explained the pilot data collection results, the next section will discuss the results.
4.8.1 How People Use Smartphones
From the pilot results, the numbers of people who do not currently use smartphones is 88.7%,
which means that 11.3% of the resulting population has not yet adopted smartphones. However,
if the 50 years old and above group are considered, then the numbers of people who are not
presently using smartphones is 36.7%. However, from anecdotal evidence, this number is
expected to be greater than 36.7%. This is due to the approach that was applied at this pilot phase
that employed largely the internet as a distribution channel and sought participants using emails
and Facebook. Therefore a population number that does not have the internet has been missed.
However, despite the controversial channel, it is interesting to learn that the numbers of
individuals using smartphone in this pilot are the same number as the Ofcom report that suggests
that in 2011 59 % of the UK population own smartphones (Ofcom, 2011a).
In the case of both the under and over 50 years old adult groups, more than 52% of the groups
have used smartphones for more than three years. For the over 50 years old group, 21% have just
begun using them in the last year compared to only 7.1% of those who are under 50 years old.
Therefore, it seems that the 50 years old and above adults are slowly adopting smartphones.
However, from the pilot 36.7% are still not yet using smartphones.
In terms of using the smartphone features, the features that are frequently used include, making a
phone call, taking a photo, SMS, email, browsing, social media, downloading apps, mapping,
playing games, filming, Voice over IP and checking for public transportation. There are similar
trends evident in both the below and over 50 year old age groups. However, the numbers of those

Sutee Pheeraphuttharangkoon (2015)
The Adoption, Use and Diffusion of Smartphones among Adults over Fifty in the UK 167
using the features reveal differences between the over and below 50 year old individuals. Other
interesting differences are that online shopping using a Smartphone is a new trend, which has led
to some online stores designing their websites in a manner that allows their website to support
small screen devices. In this pilot, online shopping usage is around 48.9%. Research from
Nielsen Mobile Consumer studies show that 26% of UK smartphone users have been using their
smartphones for bricks and mortar (real life) shopping purposes in the last 30 days (Moth, 2013).
However, research from Google reviews show that 79% of smartphone users’ use the phone to
partake in activities related with real life shopping such as comparing prices or searching for
store locations. Further, during shopping, 70% of the users use their phones in stores. More
importantly, 74% of smartphone users purchase products as a result of using smartphones.
Nevertheless, only 27% buy products using their smartphone (Google, 2011). Therefore,
currently smartphones provide a fast and easy way to find information.
Around 50% of the participants displayed features such as mobile banking or reading news and
magazine being moderately popular, which is similar to previous research from Google (2011)
that found that 56% individuals read news and articles on their research (Google, 2011). Mobile
banking is also getting increasingly popular. The reasons for using m-banking include, easier
access or more control over the money. Traditionally, to access internet banking products and
services, individuals needed computers and the internet, which was limited in some cases.
However, with smartphones, access to mobile banking is easier since mobile connections are
available almost everywhere. Moreover, mobile banking applications provided by banks are
increasing users’ confidence when using mobile banking (Gustke, 2010). Therefore, in the UK,
increasingly, individuals are using mobile banking.
Health, fitness and medicines are other areas that are significantly benefiting users. From this
pilot, only 22.0% of all age respondents and only 16.7% in the over 50 year old age group
showed an interest or use of these areas. This shows that fewer people are aware of this value.
Research in the USA shows that in 2012, only 10% of smartphone users have health-related apps
in their smartphones (Castillo, 2012). This kind of feature cannot replace the service provided by
human doctors, but can significantly impact individual health and wellbeing. It is believed that
the above 50 years old age group individuals should be informed of the benefits and how to use
this type of feature that can help them understand their health ailments and disorders.
From the results, there are similar directions in the way that both the over and below 50 years old
use smartphones such as using email, taking a photo, browsing, filming, playing games, mapping
or downloading apps. However, the over 50 age group still lags behind the below 50 year old
group.

Sutee Pheeraphuttharangkoon (2015)
The Adoption, Use and Diffusion of Smartphones among Adults over Fifty in the UK 168
4.8.2 Why People Adopt Smartphone
In terms of smartphone adoption, this pilot discloses the difference between above and below 50
year old age group in order to adopt smartphones. Half of the proposed factors influencing
behavioural intention are similar in both groups. The same factors in both groups are Social
Influence (H3), Facilitating (H4) and Enjoyment (H7). However, Observability (H1),
Compatibility (H2) and Effort Expectancy (H6) are supported only among over 50 year old age
group. Furthermore, Performance expectancy (H5) is supported only among below 50 year old
age group.
4.8.2.1 Factors Supported by Both Groups
Social Influence (H3) shows that friends and family can influence decisions when adopting and
using smartphones, as shown in the conceptual model and the question in table 4.8. Further, 68%
of the respondents said word of mouth messages from friends and family is an information
source about smartphones adoption and use. Other research related to smartphone such as
research on mobile banking also discovered that Social Influence positively affects user adoption
of mobile banking (Zhou et al., 2010). Moreover, previous research on mobile technology in
China also supported this hypothesis (Park et al., 2007). This factor was studied qualitatively in
mobile applications’ downloads and showed a strong influence in Japan (Katagiri & Etoh, 2011).
However, Social Influence was not found to be significant when older people had higher
education and had retried using smartphones for their health purposes in Thailand (Boontarig et
al., 2012).
Facilitating (H4), resource such as knowledge, time and money, is necessary for using
smartphones. Unlike feature phones, smartphones consist of hi-technology and many features as
shown in table 4.6. In order to use smartphone, users need to have a certain level of knowledge.
To gain knowledge, users may need some learning time. Within the older adults’ age group
results it was found that older adults require more time to get comfortable or familiar with the
basic functionality of smartphones compared to the young adult group. The subscription fee to
use or the costs of smartphones are more expensive than feature phones. Previous research on
mobile banking and mobile commerce also supported that Facilitating resource conditions are
important (Zhou, 2008; Zhou et al., 2010). Facilitating Conditions are also important when older
people adopt smartphones for their health as shown in a study from Thailand (Boontarig et al.,
2012). Therefore, to use smartphones, individuals need to have knowledge, time and money.
Enjoyment (H7) is the last common feature between both the young and old groups. From table
4.6, 70% of respondents played games. This feature implies an obvious form of enjoyment. To
achieve enjoyment, users can also use their smartphone to listen to music, watch videos or follow
others using social networks. These advantages are provided by smartphones that in turn lead to

Sutee Pheeraphuttharangkoon (2015)
The Adoption, Use and Diffusion of Smartphones among Adults over Fifty in the UK 169
smartphone usage. Previous research also supported this hypothesis (Shin, 2007; Song & Han,
2009; Verkasalo et al., 2010; Chtourou & Souiden, 2010).
4.8.2.2 The Factors Supported Only 50+ Adults
However, Observability (H1), Compatibility (H2) and Effort Expectancy (H6) affected only the
over 50 year old age group. As addressed above in table 4.3, 36.7% of over 50 year old group do
not use smartphone and 21.0% started using smartphones last year. Therefore, older age groups
began to use and adopt smartphones after their friends or family did, in comparison to younger
groups that are likely to see their friends use smartphones or closely follow the mass and social
media, which then leads to their adoption and use. Additionally, Observability (H1) was studied
in specific social groups such as in hospitals where the researchers found significant results for
smartphone adoption (Park & Chen, 2007; Putzer & Park, 2010). Therefore, Observability may
not be significant if the technology can be observed too easily. However, for specific features of
smartphones, Observability still has an important role in adoption.
Compatibility (H2) is the factor that can be considered to be both positive and negative, due to
the 50 years old age group contains individuals who are both in employment and retired.
Therefore, for those who are in employment, smartphones may be compatible with their work or
their personal lifestyles. In older, retired adults, there may not be interested in such a complicated
technology and may not adopt smartphones.
Nevertheless, Compatibility (H2) has been studied in smartphones for features such as mobile
payment (Mallat, 2007), within nurses in community hospitals (Putzer & Park, 2010), mobile
commerce (Wu & Wang, 2005) and mobile banking among young people (Koenig-Lewis et al.,
2010). Moreover, the results of these research studies found Compatibility is supported in mobile
technologies.
Effort Expectancy (H6) or the ease of use is quite important for the 50 year old and above age
group. Generally, older adults do not like complicated systems. Previous research on comparing
iPhone 5 and galaxy S3 found that iPhone 5, is an easy to use smartphone, and is more popular
within older adults (Nerney, 2013).
From a sample population that consisted of 97% of individuals below 45 years old, it was found
that Effort Expectancy does not directly affect behaviour intention when using smartphones in
Bangkok (Pitchayadejanant, 2011). The research found that Effort Expectancy indirectly
influences behaviour intention via Perceived Value. Further, the researcher explained that the
users were not concerned with Effort Expectancy but more with the value of their money when
using smartphones (Pitchayadejanant, 2011). Therefore, smartphone providers should provide
easy to use smartphones with reasonable subscription prices for older and younger people.
Sutee Pheeraphuttharangkoon (2015)
The Adoption, Use and Diffusion of Smartphones among Adults over Fifty in the UK 170
4.8.2.3 The Factors Supported Only in the Below 50 Years Old Age Group
Performance Expectancy (H5) is not supported in the 50 and above age group due to this age
group containing both working and retired people. Questions in this section sought answers
about productivity, usefulness and completing tasks. Therefore, this factor may not be applicable
to those who are retired. Additionally, older adults may not know about the performance of
smartphones. Therefore, this factor is not supported in the 50 year old and above age group.
However, this factor is supported in the below 50 year old age group where studies on
smartphone application acceptance (Lee et al., 2012), mobile banking (Zhou et al., 2010), mobile
devices and services (Carlsson et al., 2006) and mobile communication using 3G (Y. Wu et al.,
2007) shows that Performance Expectancy is supported.
From the pilot, the 50 year old and above adults could have different reasons for adopting
smartphones when compared to the younger adult group. This can be attributed to the different
lifestyles, time management and the ability to learn, with training also being important for the
older adult smartphone adoption.
4.9 Limitations and Future Improvement
Having presented the pilot results, the next step is to analyse the pilot questionnaire to determine
the existing limitations that could be improved upon in the final questionnaire. These were
identified to be the distribution channels, the low response rate, the length of the questionnaire,
and, the clarity of the questions in the questionnaire. Furthermore, some questions had to be
removed.
4.9.1 Distribution and Length of the Questionnaire
As addressed above, this pilot employs only an online version using emails and social network.
This meant that the target group was limited to those who are members of a particular social
network. Therefore, in the next round, the questionnaire should be provided in a hard copy
format or using other approaches that will lead to a high response rate within the sample
population.
Although this pilot required a few one hundred responses, the researcher felt that the response
rate was not suitable enough for an understanding. Therefore, for the next phase, the researcher
will seek to improve the survey reply rates by printing on colored paper, telephone pre-
notification, incentives and/or a follow-up-mailing protocol (Newby et al., 2003).
The length of the questionnaire is also a problem, which could account for the incomplete
replies. The changed conceptual framework and analysis should lead to an improvement in the
length of the questionnaire.

Sutee Pheeraphuttharangkoon (2015)
The Adoption, Use and Diffusion of Smartphones among Adults over Fifty in the UK 171
In terms of the research site, this research on smartphones and older adults will focus on
particular area rather than nationwide. It is because this research wants to receive the final results
from the area which the mobile infrastructure has been well established within the same level.
Moreover, this research on adoption focused on older adults who have used smartphones;
therefore, this research considered the area such as London, where most of the pilot results
received, as in table 4.3.
4.9.2 Final Questionnaire Layout
Following the pilot, some changes were made in the next phase, which is shown in Figure 4.12
below. This layout added a path for planning to purchase a smartphone. The respondents who
plan to have a smartphone will be asked questions about reasons for planning to have a
smartphone, what are the factors considered when buying a smartphone and sources of
information on smartphones. For those who do not plan to have a smartphones, questions on
factors that may encourage smartphone use were added.

Sutee Pheeraphuttharangkoon (2015)
The Adoption, Use and Diffusion of Smartphones among Adults over Fifty in the UK 172
Cover Letter
Demographics Information
Do you have a smartphone?
About smartphones
Yes No and Not Intend to have
Reasons on not yet plan to have a smartphone.
Ending Page
State of Health and Disorders
Reasons on using smartphones
Smartphone Features
Reasons to buy smartphones
Smartphone adoption period
Smartphones and Health
Smartphones and, Friends and Family
Reasons on plan to have a smartphone.
No, but I plan to have
Factors considered when buying a smartphone
Factors that may encourage future use of a smartphone
Source of information regarding use of a smartphone
Figure4.12 Final Questionnaire Layout
4.9.3 Construct Measurement Questions As addressed in the analysis result section, questions SOC3, SOC4, FC3 and FC4 that
represented social influence and facility conditions performed poorly in SEM-PLS. In the
analysis, SOC3, SOC4, FC3 and FC4 needed to be removed before the analysis. However, after
discussions with the research team, the four questions still remained in the final questionnaire.

Sutee Pheeraphuttharangkoon (2015)
The Adoption, Use and Diffusion of Smartphones among Adults over Fifty in the UK 173
The reason for this is that by including them, there could be the possibility to provide useful data
for the final phase. For example, FC4 which is “I have a person available to assist me in using
my smartphone (Gu et al., 2009)”, can link to the results that older adults need support to learn
new technologies (Age UK, 2011). However, two questions were dropped while some questions
were improved in order to provide more details and examples, as shown in Table 4.16 below.
Table 4.16 Construct Measurement Questions on Pilot and Final
Question Pilot Final
SOC1 People important to me think I should
use a smartphone. (For example,
friends and family).
People important to me think I should use
a smartphone (For example, friends and
family).
SOC2 People who influence my behaviour
think that I should use a smartphone.
People who influence my behaviour think
that I should use a smartphone.
SOC3 It is expected that people like me use
smartphones. (For example, similar age
or position people).
It is expected that people like me will use
smartphones (For example, similar age or
position people).
SOC4 I want to use a smartphone because my
friends do so.
I want to use a smartphone because my
friends do so.
OB1 I have had a lot of opportunity to see
smartphones being used.
I have had many opportunities to see
smartphones being used.
OB2 It is easy for me to observe others using
smartphones. (For example, I saw my
friends use smartphones).
It is easy for me to observe others using
smartphones. (For example, I saw my
friends use smartphones).
COM1 I believe that using the smartphone is
suitable for me.
I believe that using the smartphone is
suitable for me.
COM2 I believe that using the smartphone will
fit my lifestyle.
I believe that using the smartphone will
fit my lifestyle.
COM3 I think that using the smartphone fits
well with the way I like to work.
I think that using the smartphone fits well
with my lifestyle or my work.
COM4 Using the smartphone fits into my work
style.
DROPPED
FC1 I have the resources necessary to use
the smartphone. (For example, time and
money).
I have the resources necessary to use the
smartphone. (For example, time and
money).
FC2 I have the knowledge necessary to use
the smartphone.
I have the knowledge necessary to use the
smartphone.

Sutee Pheeraphuttharangkoon (2015)
The Adoption, Use and Diffusion of Smartphones among Adults over Fifty in the UK 174
FC3 The operation costs of a smartphone do
not prevent the use of it (such as price
of smartphone or monthly fee).
The operation costs of a smartphone do
not prevent the use of it (such as, price of
a smartphone or monthly fee).
FC4 I have a person available to assist me in
using my smartphone.
I have a person available to assist me
when using my smartphone.
PE1 I feel a smartphone is useful. I feel a smartphone is useful. (e.g. with
my lifestyle, my daily routine and my
work)
PE2 Using a smartphone enables me to
finish tasks more quickly.
Using a smartphone enables me to finish
my personal tasks or work more quickly.
PE3 Using a smartphone increases my
productivity.
Using a smartphone increases my
productivity (e.g. to receive or reply
emails faster).
EE1 I find that using the smartphone is easy. I find that using the smartphone is easy.
EE2 Learning how to use a smartphone is
easy for me.
Learning how to use a smartphone is easy
for me.
ENJ1 I find a smartphone fun (I had fun using
a smartphone).
I think it is fun to use a smartphone.
ENJ2 I think it is fun to use a smartphone. I find a smartphone fun (I had fun using a
smartphone).
IN1 I intend to use a smartphone as much as
possible.
I intend to use a smartphone as much as
possible.
IN2 I intend to continue using a smartphone
in the future.
I intend to continue using a smartphone
in the future.
IN3 Whenever possible, I intend to use a
smartphone in my job.
Whenever possible, I intend to use a
smartphone in my daily lifestyle or job.
IN4 I intend to increase my use of a
smartphone in the future.
DROPPED
Two questions have been dropped, which are COM4 and IN4. The first reason is to reduce the
numbers of questions. Then, COM4 was removed because the question is specifically associated
with work activities. For older adults, particularly the above 65 years old age group, which is
also a target research group, this question may not be appropriate. IN4 was excluded because the
wording was too specific on increasing smartphone use. Due to the suggestion of the research
team, it was felt that this question may be inappropriate for older adults. Therefore, for the

Sutee Pheeraphuttharangkoon (2015)
The Adoption, Use and Diffusion of Smartphones among Adults over Fifty in the UK 175
constructions measurements COM4 and IN4 were removed for the final phase questionnaire.
Additionally, the Likert scale was changed from 5 to 7, a strategy similar to Venkatesh (2012).
4.9.4 Improvement to Supported Questions
Having improved the construct measurement questions, the next step was to improve the overall
questionnaire and supported questions. The following steps were followed.
1. The question on ailments was removed.
2. The question of location was replaced with the list of locations in North London.
3. The options in questions about smartphone brands and providers were updated.
4. A question on frequency of smartphone usage was added.
5. Questions on smartphone features were upgraded to seven Likert scales.
6. The two questions on health and well-being were combined as well as the question on
using smartphones to connect to friends and family.
7. All choices were presented in at least two columns to virtually reduce the length of
the final questionnaire.
4.10 Chapter Summary
This chapter presented the process followed to develop the survey instrument that was used to
test smartphone adoption in this research. This process involved developing questions, validating
the questions using 24 specialists, improving the questions, creating the questionnaire in an
online environment, distributing the link to the questionnaire in the target group using email and
social media, validating the results and the instrument, analysing the result using SmartPLS and
improving the questions and the questionnaire layout for the final data collection. The results
from the pilot phase, which confirmed that smartphone usage is the difference between the older
adults (50+) and younger generations (lower than 50). Moreover, the technology adoption factors
between the groups are also different as seen in table 4.15.
The next chapter will present and analyse the results of the final data collection, which will be
conducted in specific areas of North London, UK.

Sutee Pheeraphuttharangkoon (2015)
The Adoption, Use and Diffusion of Smartphones among Adults over Fifty in the UK 176
Chapter 5 Research Findings
5.1 Introduction
The questionnaire from the pilot phase that was presented in the previous chapter was improved
after the feedback and analysis outcomes. To ensure that the newly formed conceptual
framework is applicable and suitable for this research, a final phase was pursued for which the
amended questionnaire was utilised. This chapter reveals the findings from the amended survey
along with explanations about the sample size, the sampling process, the research site and the
questionnaire distribution method. The demographics results are presented in section 5.3,
followed by section 5.4, where the instrument validity is discussed. The hypotheses testing and
comparisons between the sub-groups are described in section 5.6, which is then followed by
section 5.7 where the effect of the moderated variables is discussed. Section 5.8 then explains the
descriptive statistics of the construct measurements, after which section 5.9 explains the analysis
outcomes of smartphone use, including health and connections with friends and family. Section
5.10 then reveals the results of the sources of information leading to smartphone adoption.
Section 5.11 explains the results from older adults 50 years old and above who planned to use
smartphones. For older adults who not use smartphones, the findings are described in section
5.12, which then draws the chapter to a close with a summary that is provided in section 5.13.
5.2 Sample Size and Sampling
For this phase, the selected research site was north London. North London was selected because
London is not only the capital city of England and the United Kingdom but also advanced in
terms of technologies.

Sutee Pheeraphuttharangkoon (2015)
The Adoption, Use and Diffusion of Smartphones among Adults over Fifty in the UK 177
Figure 5.1 Map of London, England, the UK
London was also chosen due to the well-developed mobile coverage infrastructure offered in the
vicinity compared to other areas of the UK (Ofcom, 2013). In 2013 London was also one of the
pioneering cities that UK major providers launched 4G services in. Therefore, London was an
appropriate city due to an advanced and mature form of mobile signal coverage area, which
would help in determining smartphone adoption and use. North London was also selected
because the vicinity is closer in distance terms to the university; hence residents of north London
are likely to be familiar with, and recognise the name, which could lead to more assistance with
completing the questionnaire. The north London areas that were covered by this research were
Barnet, Brent, Camden, Enfield, Haringey, Islington and Westminster. A final generic reason for
selecting north London is due to the researcher being a resident of the area; thus being familiar
with the area and having links with entrepreneurs in the area, which assisted in the distribution of
the questionnaire letter (shown in Appendix 5-6).
In terms of the selection criteria used for the areas, the 108 districts were selected as explained in
chapter 3’s description of the sample selection process. The data collection was achieved by the
researcher and a team of two other individuals (a delivery man) who were delivery. The data
collection period began from 1st November 2013 and ended on 12th February 2014, with a break
of 76 days during the Christmas and New Year period (19th December 2013 to 14th January
2014).
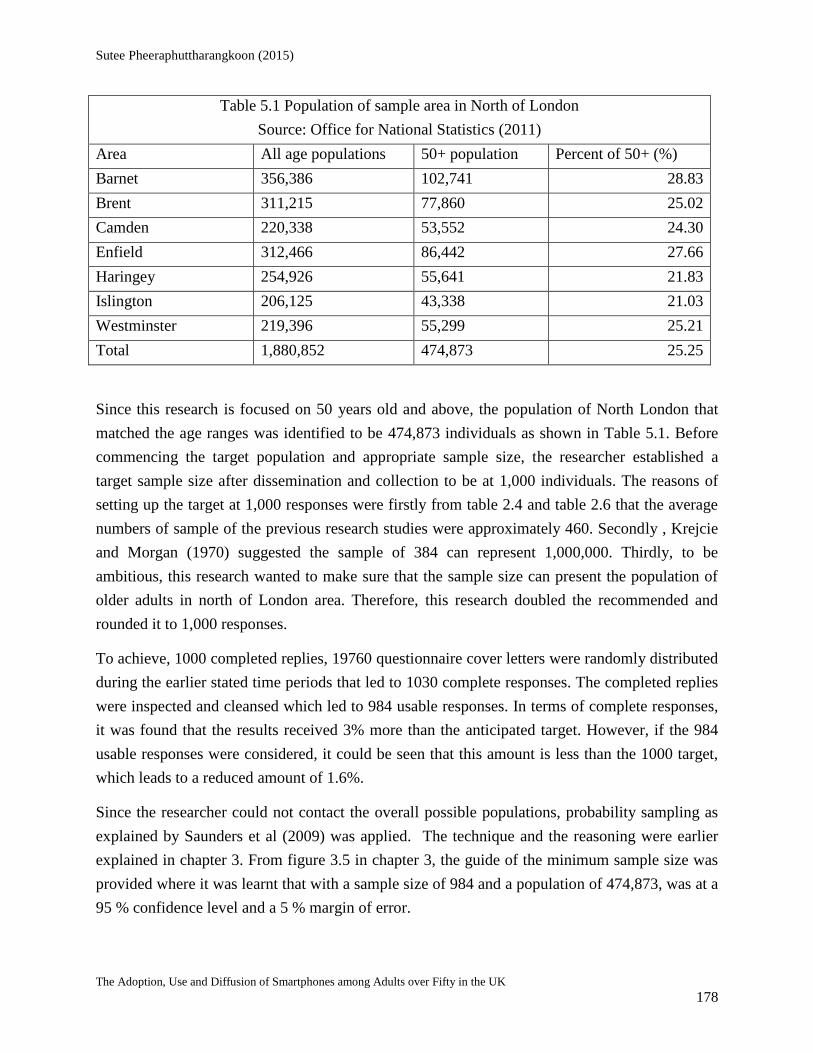
Sutee Pheeraphuttharangkoon (2015)
The Adoption, Use and Diffusion of Smartphones among Adults over Fifty in the UK 178
Table 5.1 Population of sample area in North of London
Source: Office for National Statistics (2011)
Area All age populations 50+ population Percent of 50+ (%)
Barnet 356,386 102,741 28.83
Brent 311,215 77,860 25.02
Camden 220,338 53,552 24.30
Enfield 312,466 86,442 27.66
Haringey 254,926 55,641 21.83
Islington 206,125 43,338 21.03
Westminster 219,396 55,299 25.21
Total 1,880,852 474,873 25.25
Since this research is focused on 50 years old and above, the population of North London that
matched the age ranges was identified to be 474,873 individuals as shown in Table 5.1. Before
commencing the target population and appropriate sample size, the researcher established a
target sample size after dissemination and collection to be at 1,000 individuals. The reasons of
setting up the target at 1,000 responses were firstly from table 2.4 and table 2.6 that the average
numbers of sample of the previous research studies were approximately 460. Secondly , Krejcie
and Morgan (1970) suggested the sample of 384 can represent 1,000,000. Thirdly, to be
ambitious, this research wanted to make sure that the sample size can present the population of
older adults in north of London area. Therefore, this research doubled the recommended and
rounded it to 1,000 responses.
To achieve, 1000 completed replies, 19760 questionnaire cover letters were randomly distributed
during the earlier stated time periods that led to 1030 complete responses. The completed replies
were inspected and cleansed which led to 984 usable responses. In terms of complete responses,
it was found that the results received 3% more than the anticipated target. However, if the 984
usable responses were considered, it could be seen that this amount is less than the 1000 target,
which leads to a reduced amount of 1.6%.
Since the researcher could not contact the overall possible populations, probability sampling as
explained by Saunders et al (2009) was applied. The technique and the reasoning were earlier
explained in chapter 3. From figure 3.5 in chapter 3, the guide of the minimum sample size was
provided where it was learnt that with a sample size of 984 and a population of 474,873, was at a
95 % confidence level and a 5 % margin of error.
Sutee Pheeraphuttharangkoon (2015)
The Adoption, Use and Diffusion of Smartphones among Adults over Fifty in the UK 179
5.3 Calculating the Response Rate
The response rate is a number that can explain the situation and bias in a research (Saunders et
al., 2009). The response can be calculated using the formula below.
𝑟𝑒𝑠𝑝𝑜𝑛𝑠𝑒 𝑟𝑎𝑡𝑒 = 𝑛𝑢𝑚𝑏𝑒𝑟 𝑜𝑓 𝑟𝑒𝑠𝑝𝑜𝑛𝑠𝑒𝑠
𝑛𝑢𝑚𝑏𝑒𝑟 𝑖𝑛 𝑠𝑎𝑚𝑝𝑙𝑒
𝑟𝑒𝑠𝑝𝑜𝑛𝑠𝑒 𝑟𝑎𝑡𝑒 = 1,030
19,760= 0.0521 𝑜𝑟 5.21%
The response rate can be interpreted to represent the problems when collecting the data. Non-
response rates can be caused by a refusal to respond, ineligibility to respond, inability to locate
respondent/s and respondents being located, but unable to make contact (Saunders et al., 2009).
Considering the 5.21% in this research, the number is quite low. However, when considering the
real-life situation where a random sample population that the researcher could not find within the
50 years old and above group implies that the rate of 5.21% is reasonable.
5.4 Demographics
As explained in chapters 3 and 4, the questionnaire sought answers from the respondents in terms
of the demographics, which this section now provides. The results of the socioeconomic
characteristics are shown in Table 5.2. From the 984 complete replies, there were 702 replies
within the adopters, 134 replies for the planned to have smartphones and 148 answers did not
plan to have smartphones. In terms of gender, the results showed that there were 514 (52.24%)
from the male and 470 (47.76%) from the female population. It can be deduced that the numbers
of male respondents outnumbered the females, whilst the planned to have and did not have
smartphones category showed that there were more females than male responses.
In terms of age, the majority of the respondents 553 (56.20%) were from the 50-59 age groups,
339 (34.45%) were from the 60-69 age group, 74 (7.52%) from the 70-79 age group, 16 (1.63%)
from the 80-89 age group and 2 (0.2%) from the over 90 years old. Within the adopters’
category, the majority was from the 450 (64.10%) 50-59 age group and 211 (30.06%) was from
the 60-69 age group. The majority of the replies in the do not plan to have a smartphone 73
(49.32%) were from the 60-69 age group.

Sutee Pheeraphuttharangkoon (2015)
The Adoption, Use and Diffusion of Smartphones among Adults over Fifty in the UK 180
Table5.2 Socio-demographic Summary – Gender, Age, Education, and Area (n= 984)
Category Adopted Plan to have Do plan to have Total
Respondents % Respondents % Respondents % Respondents %
Gender Male 382 54.42 59 44.03 73 49.32 514 52.24
Female 320 45.58 75 55.97 75 50.68 470 47.76
Total 702 134 148 984
Age 50-59 450 64.10 64 47.76 39 26.35 553 56.20
60-69 211 30.06 55 41.04 73 49.32 339 34.45
70-79 39 5.56 12 8.95 23 15.54 74 7.52
80-89 2 0.28 3 2.24 11 7.43 16 1.63
Over 90 0 0 0 0 2 1.36 2 0.20
702 134 148 984
Education Higher Degree
Postgraduate
95 13.53 11 8.21 12 8.11 118 11.99
1st Degree 187 26.64 41 30.59 42 28.38 270 27.44
HND/ HNC/
Teaching
48 6.84 9 6.72 14 9.46 71 7.22
A-Level 104 14.81 21 15.67 27 18.24 152 15.45
BTEC/ College
Diploma
77 10.97 9 6.72 14 9.46 100 10.16
GCSE/O Level 176 25.07 41 30.60 37 25.00 254 25.81
Others 15 2.14 2 1.49 2 1.35 19 1.93
702 134 148 984
Area Barnet 95 13.53 12 8.95 25 16.89 132 13.41
Brent 42 5.98 11 8.21 8 5.41 61 6.20
Camden 158 22.51 35 26.12 42 28.38 235 23.88
Enfield 99 14.10 25 18.66 22 14.86 146 14.84
Haringey 108 15.39 19 14.18 22 14.86 149 15.15
Islington 90 12.82 12 8.96 16 10.81 118 11.99
Westminster 110 15.67 20 14.92 13 8.79 143 14.53
702 134 148 984
For education the results were diversified with 118 (11.99%) of the respondents being highly
educated, or from a postgraduate level. 270 (27.44%) of the respondents had undergraduate (1st)
Degrees. 71 (7.22%) had educational backgrounds of HND/HNC/Teaching. 152 (15.45%) had
A-level qualifications, 100 (10.16%) had BTEC or college Diploma qualifications and 25.81%
had GCSE/ O level educational qualifications.
When considering the localities of north London, 13.41% of respondents were from Barnet,
6.2% of respondents hailed from Brent, 23.88% were from Camden, 14.84% were from Enfield,
15.15% from Haringey, 11.99% were from Islington. 14.53% were from Westminster. It can be
seen that in the Westminster area, which is in the centre and heart of London, the percentage of
people who adopted smartphones are greater than those who plan to have smartphones. In turn,

Sutee Pheeraphuttharangkoon (2015)
The Adoption, Use and Diffusion of Smartphones among Adults over Fifty in the UK 181
individuals who plan to adopt and use smartphones outnumber those who do not plan to have a
smartphone. Contrastingly, areas that are in the outskirts of central London, such as in Barnet,
reveal that those who do not plan to adopt and use smartphones are larger than the adopters,
which suggests that the area with a good or strong mobile phone coverage or facility may affect
the numbers of people that adopt smartphones.
As the UK is a multi-cultural and diverse country, ethnicity was also considered by this research
where 804 (81.71%) of the respondents were White British, 91 (9.25%) of respondents were
other White Backgrounds, 23 (2.34%) of replies were from Black/Brit African and finally, other
Ethnicities were Mixed white and black African, Mixed white and Asian, Other mixed
background, Asia/Brit Indian, Asian/Brit Pakistani, Chinese, Japanese, Other Asian background,
Black/Brit African, and others that the details can be found in Table 5.3
With regards to employment status, 323 (32.83%) of respondents were full time employees, 193
(19.61%) were pensioners at 65 years and above, 124 (12.60%) were self-employed respondents.
Both the Retired (under 65 years old) and part time respondents were at 107 (10.87%) equally.
There were 64 (6.5%) unemployed respondents, 31 (3.15%) entrepreneurs, 11 (1.12%) of the
respondents were disabled and 8 (0.81%) were homemakers.
Table5.3 Socio-demographic Summary-Ethnicity, Employment and Occupation (n= 984)
Category Adopted Plan to have Do not plan to
have
Total
Respon
dents
% Respon
dents
% Respon
dents
% Respon
dents
%
Ethnicity White British 577 82.19 104 77.61 123 83.11 804 81.71
Other white background 54 7.69 20 14.93 17 11.49 91 9.25
Mixed White & Black
African
8 1.14 1 0.75 2 1.35 11 1.12
Mixed White and Asian 3 0.43 2 1.49 2 1.35 7 0.71
Other mixed background 10 1.42 3 2.24 0 0.00 13 1.32
Asian/Brit Indian 12 1.71 0 0.00 0 0.00 12 1.22
Asian/Brit Pakistani 3 0.43 0 0.00 0 0.00 3 0.30
Chinese 4 0.57 0 0.00 0 0.00 4 0.41
Japanese 0 0.00 1 0.75 0 0.00 1 0.10
Other Asian background 11 1.57 1 0.75 2 1.35 14 1.42
Black/Brit African 19 2.71 2 1.49 2 1.35 23 2.34
Others 1 0.14 0 0.00 0 0.00 1 0.10
702 134 148 984
Employment
status
Pensioner 65+ 102 14.53 26 19.40 65 43.92 193 19.61
Retired (Under 65 Years 71 10.11 20 14.93 16 10.81 107 10.87
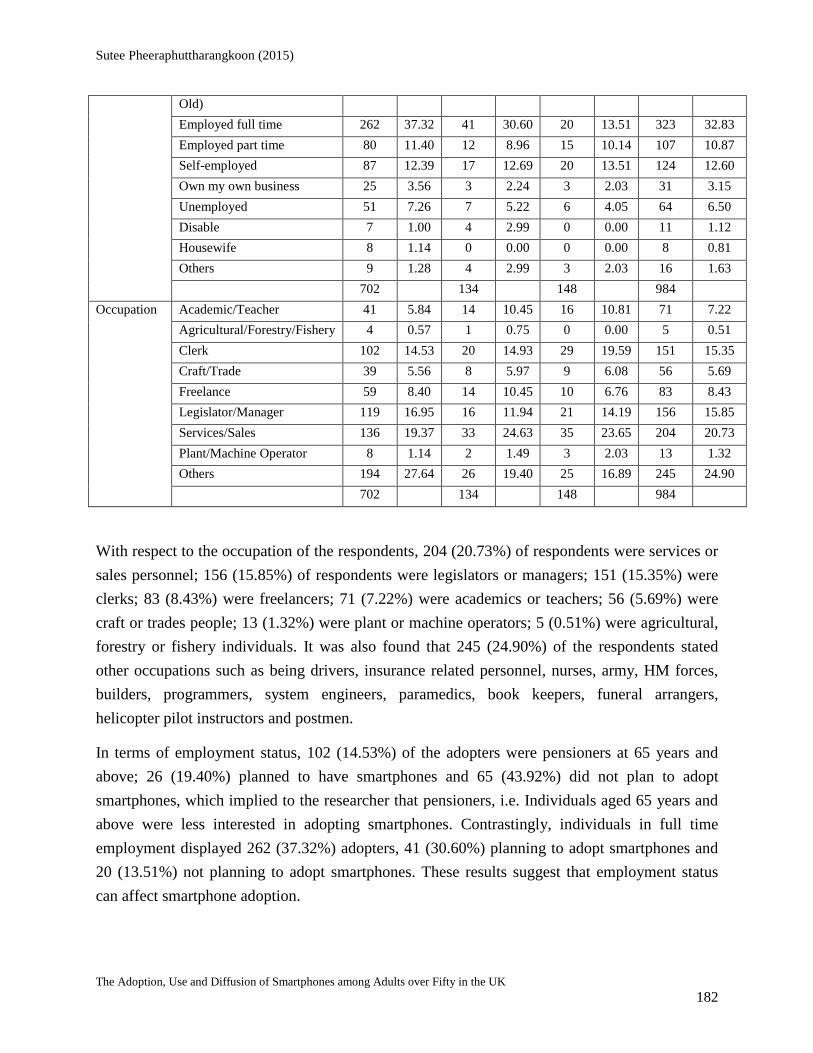
Sutee Pheeraphuttharangkoon (2015)
The Adoption, Use and Diffusion of Smartphones among Adults over Fifty in the UK 182
Old)
Employed full time 262 37.32 41 30.60 20 13.51 323 32.83
Employed part time 80 11.40 12 8.96 15 10.14 107 10.87
Self-employed 87 12.39 17 12.69 20 13.51 124 12.60
Own my own business 25 3.56 3 2.24 3 2.03 31 3.15
Unemployed 51 7.26 7 5.22 6 4.05 64 6.50
Disable 7 1.00 4 2.99 0 0.00 11 1.12
Housewife 8 1.14 0 0.00 0 0.00 8 0.81
Others 9 1.28 4 2.99 3 2.03 16 1.63
702 134 148 984
Occupation Academic/Teacher 41 5.84 14 10.45 16 10.81 71 7.22
Agricultural/Forestry/Fishery 4 0.57 1 0.75 0 0.00 5 0.51
Clerk 102 14.53 20 14.93 29 19.59 151 15.35
Craft/Trade 39 5.56 8 5.97 9 6.08 56 5.69
Freelance 59 8.40 14 10.45 10 6.76 83 8.43
Legislator/Manager 119 16.95 16 11.94 21 14.19 156 15.85
Services/Sales 136 19.37 33 24.63 35 23.65 204 20.73
Plant/Machine Operator 8 1.14 2 1.49 3 2.03 13 1.32
Others 194 27.64 26 19.40 25 16.89 245 24.90
702 134 148 984
With respect to the occupation of the respondents, 204 (20.73%) of respondents were services or
sales personnel; 156 (15.85%) of respondents were legislators or managers; 151 (15.35%) were
clerks; 83 (8.43%) were freelancers; 71 (7.22%) were academics or teachers; 56 (5.69%) were
craft or trades people; 13 (1.32%) were plant or machine operators; 5 (0.51%) were agricultural,
forestry or fishery individuals. It was also found that 245 (24.90%) of the respondents stated
other occupations such as being drivers, insurance related personnel, nurses, army, HM forces,
builders, programmers, system engineers, paramedics, book keepers, funeral arrangers,
helicopter pilot instructors and postmen.
In terms of employment status, 102 (14.53%) of the adopters were pensioners at 65 years and
above; 26 (19.40%) planned to have smartphones and 65 (43.92%) did not plan to adopt
smartphones, which implied to the researcher that pensioners, i.e. Individuals aged 65 years and
above were less interested in adopting smartphones. Contrastingly, individuals in full time
employment displayed 262 (37.32%) adopters, 41 (30.60%) planning to adopt smartphones and
20 (13.51%) not planning to adopt smartphones. These results suggest that employment status
can affect smartphone adoption.

Sutee Pheeraphuttharangkoon (2015)
The Adoption, Use and Diffusion of Smartphones among Adults over Fifty in the UK 183
Table 5.4 Socio-demographic Summary – Health status (n= 984)
Category Adopted Plan to have Do not plan to have Total
respondents % respondents % respondents % respondents %
Health Excellent 147 20.94 25 18.66 27 18.24 199 20.22
Health Good 473 67.38 94 70.15 98 66.22 665 67.58
Health Poor 82 11.68 15 11.19 23 15.54 120 12.20
702 100.00 134 100.00 148 100.00 984 100.00
Finally, as suggested in chapter 2 as adult age, health concerns emerge. This research sought
respondents to self-diagnose their health. The majority at 665 (67.58%) of the respondents
believed that their health was good. 199 (20.22%) identified their health as excellent. However,
120 (12.20%) of the respondents assessed their health as poor.
5.5 Instrument Validation
Having explained the demographics of the questionnaire, the next step was to conduct a
validation test before analysing the data further. It is very important to demonstrate that the
collected data is valid and meets statistical standards. The tools to validate in this research study
began with a sampling adequacy that applied Kaiser-Meyer-Olkin and Bartlett’s Test. The
measurement model was validated using reflective measurements that included internal
consistency reliability using Composite reliability, indicator reliability using Indicator loadings,
Convergent validity using Average Variance Extracted (AVE), and Discriminant validity using
the Fornell and Larcker (1981) methods. Those validation results will be explained in the
following section.
5.5.1 Sampling Adequacy- Kaiser-Meyer-OlKin and Bartlett’s Test
The Kaiser-Meyer-Olkin (KMO) is the first factor test to examine the collected data and to
measure the sampling adequacy. A KMO value ranges from 0 to 1, and a value greater than 0.6
displays satisfaction. (Brace et al., 2003; Hinton et al., 2004). The data from the adopted group
(n=702) was used for this test as it was only in this group that the data was brought to Path
Analysis. The data was analysed using SPSS version 21 that resulted in a value of 0.928, as
shown in table 5.5. This result suggests that this dataset is worthy to further analyse for providing
a conceptual model.

Sutee Pheeraphuttharangkoon (2015)
The Adoption, Use and Diffusion of Smartphones among Adults over Fifty in the UK 184
Table 5.5 KMO and Bartlett’s Results
KMO and Bartlett's Test
Kaiser-Meyer-Olkin Measure of Sampling Adequacy. .928
Bartlett's Test of Sphericity Approx. Chi-Square 13848.159
Df 276
Sig. .000
Bartlett's sphericity test is the second test that was conducted and examined whether there is a
relationship between the variables. A p-value less than 0.05 displays satisfaction (Hinton et al.,
2004) and was used as the guiding measure. Table 5.5 shows that for the collected data the p-
value is less than 0.001, which suggested that it is appropriate to conduct further analysis.
5.5.2 Reflective Measurement Model
In a reflective measurement model, indicators are functions of a hypothesised factor and error
terms, where empirical meaning can be said to be local. That is, the inferred parameters linking
each indicator to the construct are in principle particular to the nature of the relationships
amongst all the indicators of the construct alone and the residual for each indicator reflects
errors. Such measurements models can stand on their own (Bagozzi, 2011). This measurement
consists of internal consistency reliability, indicator reliability, convergent validity and
discriminant validity. For Internal consistency reliability, composite reliability is considered
where a satisfactory value should be higher than 0.70 (Hair et al., 2011). For this, the data was
imported into SmartPLS to perform several tests with the results displayed in table 5.6. From
table 5.6, the overall composite reliability values are greater than 0.7; therefore, this data
satisfies the internal consistency reliability test.

Sutee Pheeraphuttharangkoon (2015)
The Adoption, Use and Diffusion of Smartphones among Adults over Fifty in the UK 185
Table 5.6 Cross-correlations, Item loadings, Average variance Extracted (AVE), Composite Reliability (CR), R-squared and
Cronbach’s Alpha (CA) of the research model. The diagonal elements in bold in the cross-correlations matrix are the square root
of the AVE
Cross-correlations Item
loadings
AVE
> 0.50
CR
> 0.70 R2
CA
> 0.70 COM EE FC ENJ IN OB PE SOC
COM 0.9353 0.9212-
0.9544 0.8747 0.9544 0.9283
EE 0.6057 0.9664 0.9640-
0.9688 0.9339 0.9658 0.9293
ENJ 0.6551 0.6499 0.9817 0.9814-
0.9820 0.9637 0.9815 0.9624
FC 0.7301 0.6638 0.5379 0.8626 0.8452-
0.8869 0.7441 0.8971 0.828
INT 0.7707 0.6625 0.7765 0.6585 0.8843 0.8435-
0.9079 0.7819 0.9149 0.7596 0.8602
OBS 0.5493 0.3629 0.3269 0.5535 0.4181 0.9513 0.9472-
0.9554 0.9049 0.9501 0.8951
PE 0.7474 0.5656 0.6148 0.6121 0.7393 0.4304 0.8798 0.8497-
0.8954 0.774 0.9113 0.8543
SOC 0.4494 0.1988 0.3616 0.3174 0.3667 0.3769 0.4215 0.9393 0.9328-
0.9458 0.8823 0.9374 0.8669
ACU - 0.2078
The second test for this model is Convergent validity, where emphasis is upon the Average
Variance Extracted (AVE) that should achieve a value higher than 0.50 for satisfaction (Hair
et al., 2011). As seen in table 5.6, the minimum AVE value is 0.7441; hence the data has
satisfied convergent validity.
The third test is Indicator reliability that considers the factor loading from each indicator. In
the case of the indicators, the loadings should be higher than 0.70 (Hair et al., 2011). In table 5.7
it can be seen that the loading factors of items FC4, SOC3 and SOC4 were less than 0.8,
although this researcher does acknowledge that the results should be higher than 0.7. Due to the
previously mentioned items being less than 0.8 there were removed and only the significant
indicators were kept. The indicators that were kept in this research and known as items are listed
in Table 5.8.

Sutee Pheeraphuttharangkoon (2015)
The Adoption, Use and Diffusion of Smartphones among Adults over Fifty in the UK 186
Table 5.7 Factor loadings table
COM EE ENJ FC INT OBS PE SOC ACU
ACU 0.4447 0.334 0.3454 0.3749 0.4558 0.2301 0.4251 0.2056 1
COM1 0.9212 0.6144 0.6209 0.7212 0.7362 0.5284 0.6718 0.4299 0.4188
COM2 0.9544 0.5556 0.6194 0.6737 0.7305 0.5036 0.7011 0.5163 0.4074
COM3 0.9299 0.527 0.5967 0.6579 0.6943 0.5089 0.7255 0.5129 0.4217
EE1 0.619 0.9688 0.632 0.6425 0.6623 0.3528 0.5805 0.2532 0.3504
EE2 0.5493 0.964 0.624 0.6324 0.6166 0.3486 0.5103 0.2446 0.2932
ENJ1 0.6684 0.6442 0.982 0.5338 0.7679 0.3344 0.6101 0.4012 0.3295
ENJ2 0.6174 0.6317 0.9814 0.5241 0.7566 0.3072 0.5969 0.3711 0.3488
FC1 0.674 0.5059 0.439 0.8877 0.5583 0.5377 0.574 0.3837 0.3393
FC2 0.6297 0.7363 0.5409 0.8516 0.6017 0.4752 0.5047 0.2928 0.3015
FC3 0.5838 0.4589 0.4039 0.8461 0.5403 0.4174 0.5062 0.3131 0.3331
FC4 0.1224 -0.0349 0.0744 0.117 0.061 0.219 0.0906 0.2458 0.0182
IN1 0.672 0.5939 0.8093 0.5309 0.9 0.3289 0.672 0.406 0.446
IN2 0.6811 0.6297 0.6093 0.657 0.8435 0.4092 0.5699 0.3125 0.3533
IN3 0.6941 0.5373 0.6277 0.5693 0.9079 0.378 0.7144 0.4032 0.4042
OB1 0.5255 0.3739 0.3081 0.5359 0.4136 0.9554 0.4131 0.4108 0.2253
OB2 0.5196 0.3142 0.3142 0.5302 0.3808 0.9472 0.4056 0.4568 0.212
PE1 0.7571 0.5796 0.6022 0.6249 0.7119 0.4271 0.8497 0.4048 0.3872
PE2 0.5898 0.4374 0.4973 0.4908 0.6094 0.3535 0.8954 0.4699 0.3388
PE3 0.6052 0.4591 0.5098 0.486 0.6158 0.3452 0.8935 0.4516 0.3911
SOC1 0.4337 0.2106 0.3668 0.3093 0.3615 0.3607 0.3955 0.8564 0.14
SOC2 0.4095 0.1604 0.3097 0.3039 0.3257 0.3468 0.3967 0.8711 0.1495
SOC3 0.5005 0.3252 0.3369 0.4253 0.4043 0.4494 0.4939 0.7994 0.2297
SOC4 0.2648 0.0634 0.2157 0.1432 0.2283 0.2596 0.271 0.6489 0.117

Sutee Pheeraphuttharangkoon (2015)
The Adoption, Use and Diffusion of Smartphones among Adults over Fifty in the UK 187
Table 5.8 List of items or indicators
Construct Measure Mean SD Construct Measure Definition
Social Influence (SOC1) 4.43 1.95 1. People important to me think I should use a smartphone (For
example, friends and family)
Social Influence (SOC2) 3.81 1.95 2. People who influence my behaviour think that I should use a
smartphone
Social Influence (SOC3) 4.60 1.88 3. It is expected that people like me will use smartphones (For
example, similar age or position people).
Social Influence (SOC4) 3.00 1.90 4. I want to use a smartphone because my friends do so.
Observability (OB1) 5.51 1.64 5. I have had many opportunities to see smartphones being used.
Observability (OB2) 5.39 1.68 6. It is easy for me to observe others using smartphones. (For
example, I saw my friends use smartphones)
Compatibility (COM1) 5.91 1.37 7. I believe that using the smartphone is suitable for me.
Compatibility (COM2) 5.61 1.60 8. I believe that using the smartphone will fit my lifestyle.
Compatibility (COM3) 5.59 1.66 9. I think that using the smartphone fits well with my lifestyle or
my work.
Facilitating Condition
(FC1)
5.79 1.43 10. I have the resources necessary to use the smartphone. (For
example, time and money)
Facilitating Condition
(FC2)
5.86 1.35 11. I have the knowledge necessary to use the smartphone.
Facilitating Condition
(FC3)
5.66 1.51 12. The operation costs of a smartphone do not prevent the use of it
(such as, price of a smartphone or monthly fee).
Facilitating Condition
(FC4)
3.63 2.20 13. I have a person available to assist me when using my
smartphone.
Performance expectancy
(PE1)
5.77 1.45 14. I feel a smartphone is useful. (e.g. with my lifestyle, my daily
routine and my work)
Performance expectancy
(PE2)
4.69 1.92 15. Using a smartphone enables me to finish my personal tasks or
work more quickly.
Performance expectancy
(PE3)
4.99 1.92 16. Using a smartphone increases my productivity (e.g. to receive
or reply emails faster).
Effort Expectancy (EE1) 5.67 1.41 17. I find that using the smartphone is easy.
Effort Expectancy (EE2) 5.54 1.46 18. Learning how to use a smartphone is easy for me.
Enjoyment (ENJ1) 5.37 1.62 19. I think it is fun to use a smartphone.
Enjoyment (ENJ2) 5.20 1.73 20. I find a smartphone fun (I had fun using a smartphone).
Behavioural intention
(IN1)
5.28 1.69 21. I intend to use a smartphone as much as possible.
Behavioural intention
(IN2)
6.18 1.23 22. I intend to continue using a smartphone in the future.
Behavioural intention
(IN3)
5.53 1.61 23. Whenever possible, I intend to use a smartphone in my daily
lifestyle or job.
Actual use (ACU) 5.87 1.49 Usage frequency of your smartphone
n=702 The question used likert scale 1-7(1=strongly disagree, 7 =strongly agree)

Sutee Pheeraphuttharangkoon (2015)
The Adoption, Use and Diffusion of Smartphones among Adults over Fifty in the UK 188
The last test in this group is Discriminant validity. Firstly, an indicator’s loadings should be
greater than all of its cross loadings (Hair et al., 2011). As can be seen in factor loading table,
table 5.7, apart from the removed items, each indicator’s loadings was higher than all its cross
loading. Secondly, the AVE of each latent construct should greater than the construct’s highest
squared correlation with any other latent construct (Fornell & Larcker, 1981). In another word,
the square root of the AVE should be compared with the correlations between the latent
constructs. Moreover, the square root of the AVE should more than cross-correlations both
horizontal and vertical. In Cross-correlations table, table 5.6, the square root of AVE was
presented in bold. Each value is bigger than any other latent cross-correlations. Therefore, this
model satisfied the Reflective Measurement test.
5.5.3 Formative Measurement
Having completed the Reflective Measurement test, the next step was to conduct a Formative
Measurement test where the indicator’s weight and loading were examined. In the formative
measurement model indicators have no errors directly associated with them (Bogozzi, 2011). For
this model, bootstrapping was employed to estimate the indicator’s significance. The further
details on bootstrapping can be found at section 3.7.7.4. As shown in the earlier explanations,
this research followed the recommendations from Hair et al (2011). This research also set the
number of bootstrap samples to 5,000 times that the SmartPLS randomly select the samples from
702 case 5,000 times before providing report that can be seen in figure 5.2 and Table 5.9.

Sutee Pheeraphuttharangkoon (2015)
The Adoption, Use and Diffusion of Smartphones among Adults over Fifty in the UK 189
Figure 5.2 Bootstrap results from SmartPLS
Table 5.9 Hypothesis, Path coefficients, t-value, Significant and hypothesis support
Hypothesis Path coefficients (β) t-value Significant (p) Supported: Yes/No
1. Observability -> Behavioural intention 0.015 0.510 - NO
2. Compatibility -> Behavioural intention 0.251 5.411 <0.01 YES
3. Social Influence -> Behavioural intention 0.020 0.902 - NO
4. Facilitating -> Behavioural intention 0.089 2.001 <0.05 YES
5. Performance expectancy -> Behavioural
intention
0.232 5.928 <0.01 YES
6. Effort Expectancy -> Behavioural intention 0.083 2.548 <0.01 YES
7. Enjoyment -> Behavioural intention 0.380 10.787 <0.01 YES
8. Behavioural intention -> smartphone usage 0.456 12.380 <0.01 YES
The indicator’s weight is known as t-value and can be obtained from the numbers on the lines
between the indicators in the figure of the results from bootstrapping above. A t-value can be
interpreted to show the significance (p) of the paths. As a rule, the critical t-values for a two-
tailed test is 1.65 equal to significance level = 10 % or 0.10, 1.96 equal to significance level = 5
% or 0.05, and 2.58 equal to significance level = 1 % or 0.01 (Hair et al., 2011). Note: In most IS

Sutee Pheeraphuttharangkoon (2015)
The Adoption, Use and Diffusion of Smartphones among Adults over Fifty in the UK 190
research, significance levels of less than 0.05 are considered as significant and support a
hypothesis.
5.5.4 A Structural Model
In this section, the R-square (𝑅2) value, that represents the ability of a model to explain a
phenomenon, can be viewed in Table 5.9. In this research’s instance, the model can explain
75.96% of the 50 years and above adults’ intention to use smartphones and 20.78% of the 50
years old and above adults’ actual use of smartphones. In terms of the R-squared measurements,
the values of 0.75, 0.50 and 0.25 can be described as substantial, moderate or weak, respectively
(Hair et al., 2011). Hence, for this research the R-square of 0.7596 or 75.96% was substantial for
the intention to use smartphones. However, for actual use, the R-squared was 0.2078 or 20.78%,
which can be considered as weak. Nonetheless, when comparing smartphone use in terms of
consumer behaviours, the R-square of 0.2080 or 20.78% can be considered as significant (Hair et
al., 2011).
5.6 Hypotheses Testing and Comparison
In chapter 2 some hypothesis were formed that were also tested in the pilot and now, for this
final phase. The results from applying SmartPLS showed that the model’s R squared 75.96%
shows that the variance in Behavioural Intention’s values is explained and 20.78% of the results
revealed the Actual Use of smart phones as shown in Table 5.8.
OBSCOM
SOC
FC
PE
EE
ENJ
INTR2= 0.760
ACUR2=0.208
H7 0.380**
H6 0.083**
H5 0.232**
H4 0.089*
H3 0.020H2 0.251**
H1 0.015
H8 0.456**
*Significant at 0.05 level**Significant at 0.01 level
Figure 5.3 Conclusion of the Hypothesis on Research Model

Sutee Pheeraphuttharangkoon (2015)
The Adoption, Use and Diffusion of Smartphones among Adults over Fifty in the UK 191
The path coefficients (β) and t-value of the bootstrap and PLS algorithms were also applied to
explain the hypothesis (Hair et al., 2011; Urbach & Ahlemann, 2010). Enjoyment (H7) had the
strongest factor influencing the Behavioural intention to use smartphones within the 50 years old
and above older adults obtaining a β=0.380, t-value= 10.787 and a significance level of (p) <
0.01. Compatibility (H2) and Performance expectancy (H5) were strong factors with p < 0.01,
and β=0.251, t-value= 5.411 and β=0.232, t-value= 5.928 respectively. Facilitating Conditions
(H4) was considered significant (p < 0.05) with β=0.089, t-value= 2.001. Effort Expectancy (H6)
was considered significant (p < 0.01) with β=0.083, t-value= 2.548. More importantly,
Behavioural intention for the total sample appears to have an important effect on actual use
(β=0.456, t-value= 12.380 and p< 0.01). However, Observability (H1) and social influence (H3)
were considered as not significant with the t-value=0.510 and 0.902 respectively. Therefore, of
eight hypotheses, six were supported (results shown in Table 5.10).
Following the overall results from the 50 years old and above age groups, the data was
categorised in terms of gender (Male and Female), age groups (50-59, 60-69 and 70-79), and
education levels (Higher Degree, First Degree, A Level and O Level) for further comparison of
the results. After entering the data in SmartPLS an analysis of each demographic group was
completed, which is located in Appendices 5-10 and 5-11. The final results are illustrated in
Table 5.10, below and a comparison of each hypothesis is also provided hereafter.
Table 5.10 Hypotheses testing results: Comparison
Hypothesis Adopted
(50+)
Male Female 50-
59
60-
69
70-
79
Higher
Degree
First
Degree
A
Level
O
Level
1. Observability H1
2. Compatibility H2 Y Y Y Y Y Y Y Y Y
3. Social Influence H3
4. Facilitating H4 Y Y Y Y Y
5. Performance
expectancy H5
Y Y Y Y Y Y Y Y Y Y
6. Effort Expectancy
H6
Y Y Y
7. Enjoyment H7 Y Y Y Y Y Y Y Y Y Y
8. Behavioural intention
H8
Y Y Y Y Y Y Y Y Y Y
Hypothesis 1: Observability has a positive influence on the behavioural intention towards
smartphone adoption – Not Supported
For this hypothesis it was expected that the more chances older adults have of viewing a
smartphone, the more they intend to use the technology. From the obtained results this
hypothesis was not significant for the older adults. Therefore, it can be implied that older adults

Sutee Pheeraphuttharangkoon (2015)
The Adoption, Use and Diffusion of Smartphones among Adults over Fifty in the UK 192
have already viewed smartphones for a while; hence not displaying any further interest in the
device.
Hypothesis 2: Compatibility has a positive influence on the behavioural intention towards
smartphone adoption – Supported
This hypothesis predicted that the more smartphones are compatible with the users’ lifestyle, the
more they intend to use their smartphone. Table 5.10 above shows that this hypothesis was
supported by all categories except for within the 70-79 years old age group. Generally,
smartphones can provide many benefits to users and are compatible with most of their lifestyles.
However, for the 70-79 age group, smartphones may not yet be compatible. Moreover, from the
above results, age can be a moderating factor for this hypothesis. That means for 60+ adults,
smartphones were likely to be less compatible with their lifestyle, therefore, the 60+ people may
be less likely to adopt smartphones. In other words, the effect of compatibility on smartphone
intention would be stronger for a younger age group, in this case 50-59 adults.
Hypothesis 3: Social Influence has a positive influence on the behavioural intention towards
smartphone adoption - Not Supported
The third hypothesis expects that social Influence positively affects the intention to use
smartphones. However, this hypothesis was not supported by any category as shown in Table
5.10 above. Therefore, older adults are less influenced by society.
Hypothesis 4: Facilitating Condition has a positive influence on the behavioural intention
towards smartphone adoption – Supported
This hypothesis predicted that facilitating conditions positively influences the intention to use the
devices. This was supported by the overall results and all the levels of education. However, for
particular age groups or genders this hypothesis was not supported. Please note that the t-value of
both the genders and the 50-59 age groups for this hypothesis was very near the level of
significance.
Hypothesis 5: Performance expectancy has a positive influence on the behavioural intention
towards smartphone adoption – Supported
Performance expectancy, the fifth hypotheses, was believed to positively increase the intention to
use smartphones. From Table 5.10 above, this hypothesis was supported in every category.
Hypothesis 6: Effort Expectancy has a positive influence on the behavioural intention towards
smartphone adoption – Supported
Hypothesis 6 predicted that Effort Expectancy will positively influence technology usage
intention. This hypothesis was supported in the overall results, within the female population and
50-59 age groups. This hypothesis was not supported in the 60-69, 70-79, higher Degree, First
Degree, A level or O level groups.

Sutee Pheeraphuttharangkoon (2015)
The Adoption, Use and Diffusion of Smartphones among Adults over Fifty in the UK 193
Hypothesis 7: Enjoyment has a positive influence on the behavioural intention towards
smartphone adoption – Supported
This hypothesis expected that Perceived Enjoyment has a positive effect on the intention to use
smartphones. The results showed that this hypothesis was supported in every category.
Hypothesis 8: Behavioural intention has a positive influence on the smartphone usage –
Supported
This hypothesis predicted that the actual use of technology was positively influenced by the
intention to use smartphones. This hypothesis was supported in every category.
From these descriptions, it can be learnt that six of the overall eight hypotheses were supported.
It was also found that the strongest variable for smartphone adoption was Perceived Enjoyment.
What is also known is that the structural model can predict up to 75.96% of the intention to
continue to use smartphones, which can be considered as substantial. For actual usage, the model
can predict around 20.78%. After analysing the overall results, the data were categorised by the
demographic variables - age, gender and education. Having explained the differences between
the categories, the next section will further investigate the demographic variables as moderator
variables.
5.7 The effect of Demographic Variables as Moderated Variables
Having identified the results of the hypothesis, the next step in this study was to further analyse
the demographic factors that can be used to determine moderator variables. To study
demographic variables as a moderated variable, this study further investigated the sub categories
of demographic variables within 50+ adults.
From UTAUT, it was found that moderator variables affect relationships between the
independent and the dependent variables (Venkatesh, Morris, Hall, et al., 2003). The original
moderator variables taken from UTAUT are gender, age, experience, and voluntariness of use.
Experience for this research was defined as experienced at using a smartphone. Further, since
this research relates to older adults, health is selected as a moderator variable. Education is also
often another variable that is often used as a moderator variable in technology adoption research
(Park et al., 2007). This research study examined five moderators to smartphone adoption that
are gender, age, experience, health, and education with the supported hypothesis similar to
Dabholkar and Bagozzi (2002) and Park et al (2007).
The data collected in the final phase questionnaire was analysed following the process from
Lowry and Gaskin (2014) and using a formula from Chin (2000). The process began by dividing
the data into two main groups that are dependent on moderators. For gender, the dataset was
divided into male and female. In terms of age, the dataset was separated in terms of the age

Sutee Pheeraphuttharangkoon (2015)
The Adoption, Use and Diffusion of Smartphones among Adults over Fifty in the UK 194
groups of 50-59 and 60-79 years old. The experience of users was divided to under two years
and more than two years of using smartphones. The two years in the past (2011 to 2012) were
the years that Ofcom (2011) report 59% of the UK had smartphones. There was a significant
increase in smartphone usage. Moreover, this research would like to investigate whether two
year experience with smartphone could affect smartphone adoption.
Health was a self-assessed question that provided three choices that were available to
respondents, which were poor, good and excellent. For the moderator analysis, the expressions of
good and excellent were grouped against the poor. This is because this research wanted to further
investigate whether poor heath could affect smartphone adoption.
For the education levels, there were Higher and First Degrees against the Diploma, A level, and
O level. The sub-groups were analysed using SmartPLS in order to determine the t or significant
values.
An example of calculating moderator variables has been adapted from the formulas provided by
Lowry and Gaskin (2014) and Chin (2000). The formula to calculate the t-values between two
subgroups is shown below.
Multi-Group analysis with PLS equation source: Chin (2000)
Where
M = number of responses in case 1 such as number of females
N = number of responses in case 2 such as number of males
Path sample1 = Mean of case 1 or Regression Weight which similar to Path coefficients
of case 1
Path sample2 = Mean of case 2 or Regression Weight which similar to Path coefficients
or case 2
S.E. = Standard Error. Or STERR
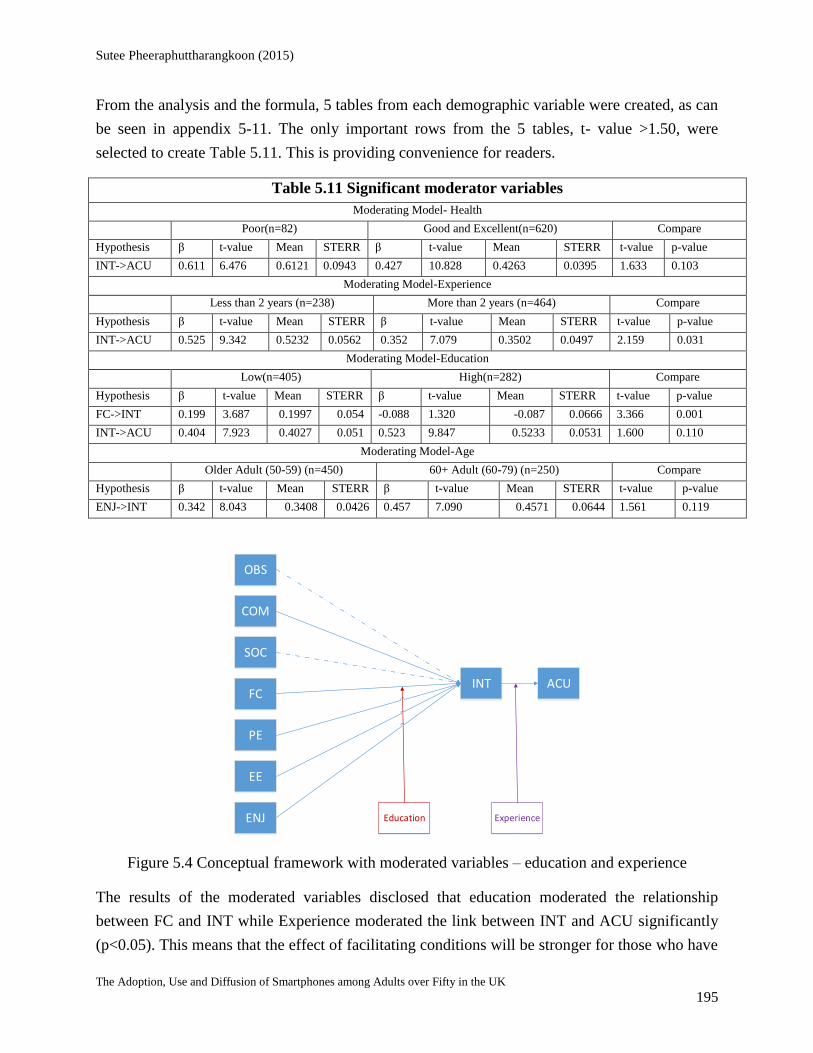
Sutee Pheeraphuttharangkoon (2015)
The Adoption, Use and Diffusion of Smartphones among Adults over Fifty in the UK 195
From the analysis and the formula, 5 tables from each demographic variable were created, as can
be seen in appendix 5-11. The only important rows from the 5 tables, t- value >1.50, were
selected to create Table 5.11. This is providing convenience for readers.
Table 5.11 Significant moderator variables
Moderating Model- Health
Poor(n=82) Good and Excellent(n=620) Compare
Hypothesis β t-value Mean STERR β t-value Mean STERR t-value p-value
INT->ACU 0.611 6.476 0.6121 0.0943 0.427 10.828 0.4263 0.0395 1.633 0.103
Moderating Model-Experience
Less than 2 years (n=238) More than 2 years (n=464) Compare
Hypothesis β t-value Mean STERR β t-value Mean STERR t-value p-value
INT->ACU 0.525 9.342 0.5232 0.0562 0.352 7.079 0.3502 0.0497 2.159 0.031
Moderating Model-Education
Low(n=405) High(n=282) Compare
Hypothesis β t-value Mean STERR β t-value Mean STERR t-value p-value
FC->INT 0.199 3.687 0.1997 0.054 -0.088 1.320 -0.087 0.0666 3.366 0.001
INT->ACU 0.404 7.923 0.4027 0.051 0.523 9.847 0.5233 0.0531 1.600 0.110
Moderating Model-Age
Older Adult (50-59) (n=450) 60+ Adult (60-79) (n=250) Compare
Hypothesis β t-value Mean STERR β t-value Mean STERR t-value p-value
ENJ->INT 0.342 8.043 0.3408 0.0426 0.457 7.090 0.4571 0.0644 1.561 0.119
INT ACU
OBS
COM
SOC
FC
PE
EE
ENJ Education Experience
Figure 5.4 Conceptual framework with moderated variables – education and experience
The results of the moderated variables disclosed that education moderated the relationship
between FC and INT while Experience moderated the link between INT and ACU significantly
(p<0.05). This means that the effect of facilitating conditions will be stronger for those who have
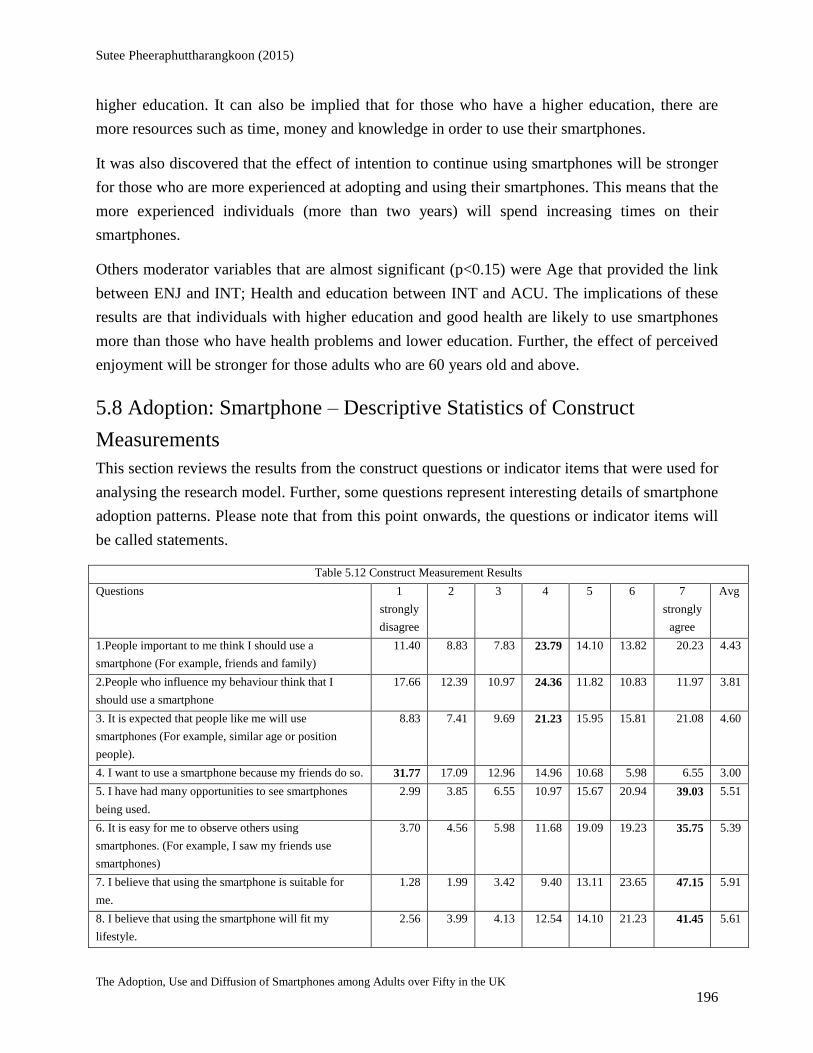
Sutee Pheeraphuttharangkoon (2015)
The Adoption, Use and Diffusion of Smartphones among Adults over Fifty in the UK 196
higher education. It can also be implied that for those who have a higher education, there are
more resources such as time, money and knowledge in order to use their smartphones.
It was also discovered that the effect of intention to continue using smartphones will be stronger
for those who are more experienced at adopting and using their smartphones. This means that the
more experienced individuals (more than two years) will spend increasing times on their
smartphones.
Others moderator variables that are almost significant (p<0.15) were Age that provided the link
between ENJ and INT; Health and education between INT and ACU. The implications of these
results are that individuals with higher education and good health are likely to use smartphones
more than those who have health problems and lower education. Further, the effect of perceived
enjoyment will be stronger for those adults who are 60 years old and above.
5.8 Adoption: Smartphone – Descriptive Statistics of Construct
Measurements
This section reviews the results from the construct questions or indicator items that were used for
analysing the research model. Further, some questions represent interesting details of smartphone
adoption patterns. Please note that from this point onwards, the questions or indicator items will
be called statements.
Table 5.12 Construct Measurement Results
Questions 1
strongly
disagree
2 3 4 5 6 7
strongly
agree
Avg
1.People important to me think I should use a
smartphone (For example, friends and family)
11.40 8.83 7.83 23.79 14.10 13.82 20.23 4.43
2.People who influence my behaviour think that I
should use a smartphone
17.66 12.39 10.97 24.36 11.82 10.83 11.97 3.81
3. It is expected that people like me will use
smartphones (For example, similar age or position
people).
8.83 7.41 9.69 21.23 15.95 15.81 21.08 4.60
4. I want to use a smartphone because my friends do so. 31.77 17.09 12.96 14.96 10.68 5.98 6.55 3.00
5. I have had many opportunities to see smartphones
being used.
2.99 3.85 6.55 10.97 15.67 20.94 39.03 5.51
6. It is easy for me to observe others using
smartphones. (For example, I saw my friends use
smartphones)
3.70 4.56 5.98 11.68 19.09 19.23 35.75 5.39
7. I believe that using the smartphone is suitable for
me.
1.28 1.99 3.42 9.40 13.11 23.65 47.15 5.91
8. I believe that using the smartphone will fit my
lifestyle.
2.56 3.99 4.13 12.54 14.10 21.23 41.45 5.61

Sutee Pheeraphuttharangkoon (2015)
The Adoption, Use and Diffusion of Smartphones among Adults over Fifty in the UK 197
9. I think that using the smartphone fits well with my
lifestyle or my work.
3.56 3.85 4.70 10.83 13.39 22.22 41.45 5.59
10. I have the resources necessary to use the
smartphone. (For example, time and money)
1.71 1.85 3.42 12.25 13.11 24.79 42.88 5.79
11. I have the knowledge necessary to use the
smartphone.
1.14 1.14 5.13 8.55 14.25 26.78 43.02 5.86
12. The operation costs of a smartphone do not prevent
the use of it (such as, price of a smartphone or monthly
fee).
1.85 2.99 4.70 11.40 16.10 22.51 40.46 5.66
13. I have a person available to assist me when using
my smartphone.
26.78 13.68 9.97 11.25 10.83 13.11 14.39 3.63
14. I feel a smartphone is useful. (eg. with my lifestyle,
my daily routine and my work)
1.71 1.85 5.41 10.11 12.54 25.93 42.45 5.77
15. Using a smartphone enables me to finish my
personal tasks or work more quickly.
8.97 7.98 8.55 17.66 16.38 16.95 23.50 4.69
16. Using a smartphone increases my productivity (eg.
to receive or reply emails faster).
7.55 7.12 7.41 13.82 15.67 17.38 31.05 4.99
17. I find that using the smartphone is easy. 1.42 2.71 4.13 10.26 17.38 28.77 35.33 5.67
18. Learning how to use a smartphone is easy for me. 1.14 3.56 5.56 11.54 19.23 25.64 33.33 5.54
19. I think it is fun to use a smartphone. 3.56 2.71 6.55 15.24 17.52 21.08 33.33 5.37
20. I find a smartphone fun (I had fun using a
smartphone).
4.70 4.99 6.55 14.53 17.66 21.94 29.63 5.20
21. I intend to use a smartphone as much as possible. 4.42 3.85 5.84 16.10 16.81 20.51 32.48 5.28
22. I intend to continue using a smartphone in the
future.
1.28 0.57 3.28 4.42 10.54 23.65 56.27 6.18
23. Whenever possible, I intend to use a smartphone in
my daily lifestyle or job.
2.99 3.13 6.13 11.82 16.38 20.80 38.75 5.53
Usage frequency of your smartphone 0.71 3.85 6.13 6.70 12.54 19.37 50.71 5.87
The first group of statements, statements 1-4, represent Social Influence, and this hypothesis was
not supported by this research. The results in Table 5.8 reveal that the average score was quite
low compared to the other statements. The third statement (SOC3) which is “It is expected that
people like me will use smartphones (for example, similar age or position people)” can lead to
the implication that 50 years old and above adults believe that some other older adults in their
age group have still not adapted to the smartphone. The fourth statement (SOC4) had the lowest
average score at 3.00 with the majority of the respondents strongly disagreeing with the
statement. This suggests that the 50 years old and above adults was less dependent on their
friends using smartphones or some of their friends not using smartphones.
The fifth and sixth statements were linked to Observability. In this case the hypothesis was
rejected in the model, but had quite a high average value and the obtained value was low
compared to other statements.

Sutee Pheeraphuttharangkoon (2015)
The Adoption, Use and Diffusion of Smartphones among Adults over Fifty in the UK 198
In the next group of statements seven to nine Compatibility was represented in the second
hypothesis. The average values of this group were more than 5.5. Moreover, the majority of
responses strongly agreed with the statements. It can be observed that for the ninth statement
that included the word ‘work’ the average value was slightly dropped. It may cause by retried
older adults may not work, which make smartphones less compatible with their lifestyle.
The tenth to thirteenth statements represent Facility Conditions that were supported by this
research. The resource in this study included time, money, knowledge, monthly fee and
assistance. The time and money was represented by the tenth and twelfth statements. The
average values of the responses in both statements were quite high. Interestingly, in the eleventh
statement, the average value is the highest in the group. This implies that silver surfers in this
research believe that they have enough knowledge to operate the smartphones. On the other
hand, it can be seen that smartphones are currently quite easy for older users to adopt and use.
Nevertheless, smartphones from time to time may cause some difficulties. The thirteenth
statement showed that when 50 years old and above individuals face smartphone related
problems, approximately half of the older adults can seek help from someone else. The majority
of responses strongly disagreed with the statement with the average value of this statement being
only 3.63.
The fourteenth to sixteenth statements represent Performance Expectancy. The fourteenth
statement addressed the usefulness of the smartphone and around half of the respondents agreed
with this statement. This led the research team to understand that the positive reply respondents
already know the benefit of smartphones. The fifteenth statement focused on enabling users to
finish their personal tasks or work rapidly. The average value of this statement, which was less
than the previous statement, showed that some adopters cannot use their smartphones correctly in
order to suit their tasks or their work. The next statement, the sixteenth, also showed a similar
trend to the fifteenth statement.
The next two statements, the seventeenth and the eighteenth, represented the hypothesis on
Effort Expectancy that showed how 50 years and above adopters think about using their
smartphones. Since the average values and majority of the replies, it can be seen that from the
silver surfers perspective that smartphones are easy to operate. The nineteenth and twentieth
statements focused on the perceived enjoyment from smartphones. It is obvious that for adopters
their smartphones are enjoyable and as shown in the previous section these factors are very
strong in this research model.
The next three statements addressed the intention to use smartphones. The twenty-first and
twenty-third statements compared quite weakly with the twenty-second statements. The twenty-
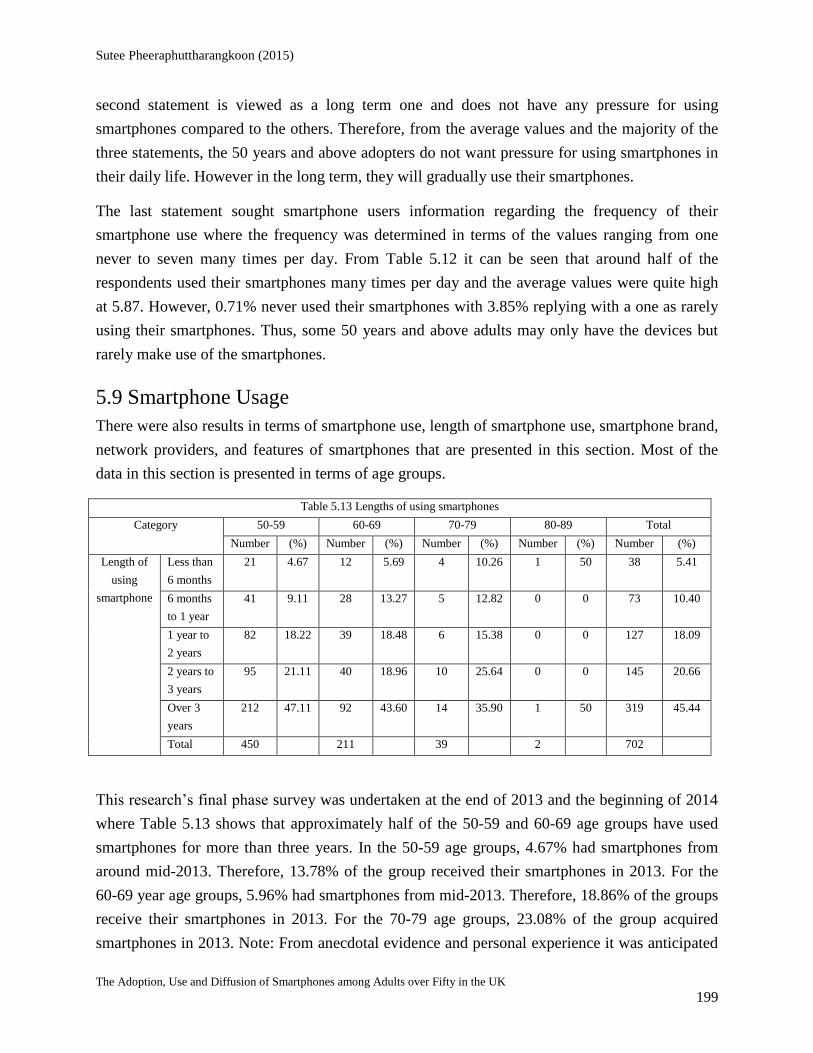
Sutee Pheeraphuttharangkoon (2015)
The Adoption, Use and Diffusion of Smartphones among Adults over Fifty in the UK 199
second statement is viewed as a long term one and does not have any pressure for using
smartphones compared to the others. Therefore, from the average values and the majority of the
three statements, the 50 years and above adopters do not want pressure for using smartphones in
their daily life. However in the long term, they will gradually use their smartphones.
The last statement sought smartphone users information regarding the frequency of their
smartphone use where the frequency was determined in terms of the values ranging from one
never to seven many times per day. From Table 5.12 it can be seen that around half of the
respondents used their smartphones many times per day and the average values were quite high
at 5.87. However, 0.71% never used their smartphones with 3.85% replying with a one as rarely
using their smartphones. Thus, some 50 years and above adults may only have the devices but
rarely make use of the smartphones.
5.9 Smartphone Usage
There were also results in terms of smartphone use, length of smartphone use, smartphone brand,
network providers, and features of smartphones that are presented in this section. Most of the
data in this section is presented in terms of age groups.
Table 5.13 Lengths of using smartphones
Category 50-59 60-69 70-79 80-89 Total
Number (%) Number (%) Number (%) Number (%) Number (%)
Length of
using
smartphone
Less than
6 months
21 4.67 12 5.69 4 10.26 1 50 38 5.41
6 months
to 1 year
41 9.11 28 13.27 5 12.82 0 0 73 10.40
1 year to
2 years
82 18.22 39 18.48 6 15.38 0 0 127 18.09
2 years to
3 years
95 21.11 40 18.96 10 25.64 0 0 145 20.66
Over 3
years
212 47.11 92 43.60 14 35.90 1 50 319 45.44
Total 450 211 39 2 702
This research’s final phase survey was undertaken at the end of 2013 and the beginning of 2014
where Table 5.13 shows that approximately half of the 50-59 and 60-69 age groups have used
smartphones for more than three years. In the 50-59 age groups, 4.67% had smartphones from
around mid-2013. Therefore, 13.78% of the group received their smartphones in 2013. For the
60-69 year age groups, 5.96% had smartphones from mid-2013. Therefore, 18.86% of the groups
receive their smartphones in 2013. For the 70-79 age groups, 23.08% of the group acquired
smartphones in 2013. Note: From anecdotal evidence and personal experience it was anticipated

Sutee Pheeraphuttharangkoon (2015)
The Adoption, Use and Diffusion of Smartphones among Adults over Fifty in the UK 200
that an increasing number of older adults adopt smartphones and the older age groups are slower
at adoption than the younger ones. However, these results can confirm that in this particular area,
the north of London, more than half of the 50 years and above adults already adopted
smartphones.
Table 5.14: The profile of Smartphone, network and fee used and pay by age groups
Category 50-59 60-69 70-79 80-89 Total
Number (%) Number (%) Number (%) Number (%) Number (%)
Brand of
Smartphone
iPhone
(Apple)
142 28.69 63 28.38 11 26.83 1 25 217 28.48
Blackberry 61 12.32 22 9.91 0 0.00 0 0 83 10.89
HTC 41 8.28 15 6.76 3 7.32 0 0 59 7.74
LG 6 1.21 8 3.60 0 0.00 0 0 14 1.84
Motorola 10 2.02 6 2.70 1 2.44 1 25 18 2.36
Nokia 40 8.08 16 7.21 5 12.20 1 25 62 8.14
Samsung 153 30.91 73 32.88 14 34.15 1 25 241 31.63
Sony 31 6.26 11 4.95 3 7.32 0 0 45 5.91
Others 11 2.22 8 3.60 4 9.76 0 0 23 3.02
Total 495 222 41 4 762
Network
provider
3 (Three
UK)
47 9.53 14 6.42 3 10.34 0 0.00 64 8.49
EE 53 10.75 20 9.17 1 3.45 1 25.00 75 9.95
Giffgaff 10 2.03 4 1.83 0 0.00 0 0.00 14 1.86
Orange 46 9.33 24 11.01 3 10.34 2 50.00 75 9.95
O2 125 25.35 54 24.77 11 37.93 1 25.00 191 25.33
Lebara 1 0.20 0 0.00 0 0.00 0 0.00 1 0.13
T-mobile 51 10.34 20 9.17 0 0.00 0 0.00 75 9.95
Virgin
media
41 8.32 25 11.47 4 13.79 0 0.00 69 9.15
Tesco 15 3.04 9 4.13 3 10.34 0 0.00 26 3.45
Vodafone 93 18.86 36 16.51 3 10.34 0 0.00 140 18.57
Other 11 2.23 12 5.50 1 3.45 0 0.00 24 3.18
493 218 29 4 754
Payment Pay as you
go
83 18.32 41 19.16 16 40.00 2 66.66 142 20.00
Pay on a
monthly
basis
(contract)
370 81.68 173 80.84 24 60.00 1 33.33 568 80.00
453 214 40 3 710
Pay per
month
Free - £10 69 15.33 53 25.12 13 33.33 1 50.00 136 19.37
£10.01 -
£30.00
242 53.78 106 50.24 23 58.97 0 0 371 52.85
£30.01 -
£50.00
117 26.00 43 20.38 3 7.69 1 50.00 164 23.36
£50.01 - 11 2.44 7 3.32 0 0.00 0 0 18 2.56

Sutee Pheeraphuttharangkoon (2015)
The Adoption, Use and Diffusion of Smartphones among Adults over Fifty in the UK 201
£70.00
£70.01 -
£90.00
6 1.33 2 0.95 0 0.00 0 0 8 1.14
> £ 90.00 5 1.11 0 0.00 0 0.00 0 0 5 0.71
450 211 39 2 702
There was also a question seeking information about the Smartphone Brand, networks providers
and costs. From table 5.14, it can be seen that Samsung, at 241 (31.63%), was the most popular
brand followed by the Apple iPhone and Blackberry at around 217 (28.48%) and 83 (10.89%)
respectively. This trend was apparent in all the age groups. In Table 5.14 it can be seen that for
the network providers, O2 seems to be a very popular network provider for the 50 years old and
above adults at around 191 (25.33%). Vodafone was the second popular at around 140 (18.57%).
However, for the 70-79 age groups, Virgin media, Tesco and Orange were popular at the same
level as Vodafone. The researcher believes that the reason for Tesco and Virgin media being
popular in the 70-79 age groups may be due to the subscription price. EE (Everything
Everywhere) that focuses on high-speed mobile internet connections seems very popular only in
the 50-59 age groups.
In terms of payments, the majority of the 50 years old and above adopters preferred the pay on a
monthly basis subscription known as a contract. Around 142 (20.00%) chose to use the pre-paid
system known as Pay as you go. However, for the 70-79 age groups, the percentages of Pay as
you go were quite high at around 16 (40%) compared with those at contract terms at around 24
(60%). The next question sought to ascertain the cost of the subscription rates that the 50 years
old and above adults spend per month. Around half of the respondents indicated spend of around
£10-£30 per month. Around 164 (23.36%) paid around £30-£50 per month followed by 136
(19.37%) paying up to £10 per month. However, the number of 50 years old and above paying
up to £10 varied age wise.
Table 5.15 Length of time allows users to familiar with their smartphones
Category 50-59 60-69 70-79 80-89 Total
Number (%) Number (%) Number (%) Number (%) Number (%)
How long did
it take you to
get familiar
with using the
basic
functionalities
of your
present
smartphone?
Less than a
day
155 34.44 73 34.60 7 17.95 2 100 237 33.76
1 day – 1
week
185 41.11 69 32.70 12 30.77 0 0 266 37.89
1 week – 2
weeks
58 12.89 34 16.11 9 23.08 0 0 101 14.39
2 weeks – 1
month
29 6.44 16 7.58 6 15.38 0 0 51 7.26
1month – 3
months
11 2.44 13 6.16 4 10.26 0 0 28 3.99
More than 3 12 2.67 6 2.84 1 2.56 0 0 19 2.71

Sutee Pheeraphuttharangkoon (2015)
The Adoption, Use and Diffusion of Smartphones among Adults over Fifty in the UK 202
months
Total 450 211 39 2 702 100
The next question sought information about the length of time that it took for users to become
familiar with the smartphone and could operate their smartphones for basic functions such as
making a phone call, sending text messages and emails, or connecting to other devices. Overall,
approximately 38% of the silver surfers spent around one day to one week to become familiar
with the new smartphones. An estimated 34% of 50 years and above adults spent only a day to
become familiar with basic functions of their smartphones. Approximately 10% of the 50 years
old and above adopters spent more than two weeks to become familiar with their smartphones.
As expected, the duration for the 70-79 age groups was longer than the younger age groups.
Table 5.16 Smartphone usage: Features of smartphones
Features of a smartphone (n=702)
Mean
(frequency of use the
feature)
From 1 to 7, 1 is never
and 7 is many times per
day.
Total
Numbers
of people
used the
feature
%
1. Making a phone call 4.76 687 98.14
2. SMS, Text messaging 5.19 689 98.43
3. E-mailing 4.19 600 85.71
4. Taking a photograph 3.58 647 92.43
5. Filming a video 2.37 454 64.86
6. Browsing-surfing website(s) 4.35 629 89.86
7. Playing games 2.89 420 60.00
8. Watching videos for example YouTube 2.45 426 60.86
9. Mapping, Navigator such as Google Map, Tom-Tom, Copilot 3.21 553 79.00
10. Taking notes such as shopping lists or task that I need to do 2.95 472 67.43
11. Managing my appointment on my calendar 3.52 508 72.57
12. Using social networks such as Facebook, Twitter 3.26 440 62.86
13. Reading online News and online Magazines 3.15 482 68.86
14. Using Facetime, Skype, oovoo, Google Talk, Viber, Fring 2.22 322 46.00
15. Using to contact government authorities – NHS,
Jobcentreplus, UKBA
1.80 243 34.71
In terms of the smartphone features uses, 15 Likert scale questions ranging from one to seven
where one is never and seven is many times of the day were asked of only those who used a
smart phone (n=702). The results are shown in table 5.16
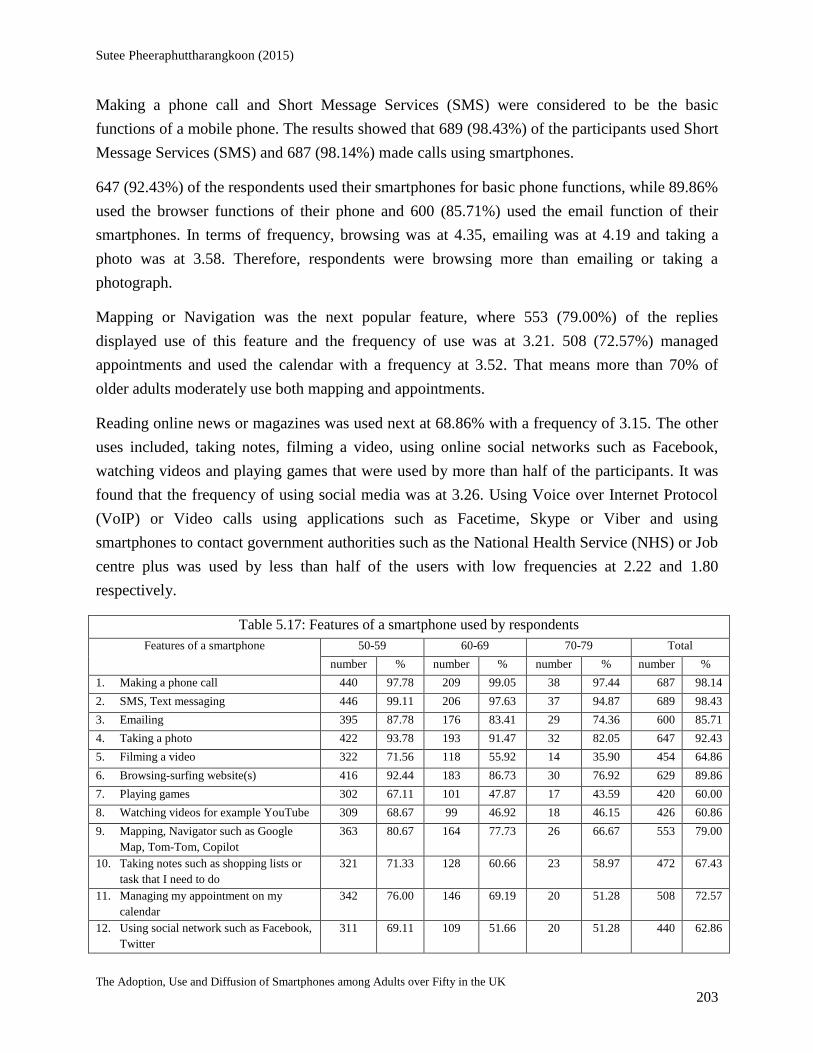
Sutee Pheeraphuttharangkoon (2015)
The Adoption, Use and Diffusion of Smartphones among Adults over Fifty in the UK 203
Making a phone call and Short Message Services (SMS) were considered to be the basic
functions of a mobile phone. The results showed that 689 (98.43%) of the participants used Short
Message Services (SMS) and 687 (98.14%) made calls using smartphones.
647 (92.43%) of the respondents used their smartphones for basic phone functions, while 89.86%
used the browser functions of their phone and 600 (85.71%) used the email function of their
smartphones. In terms of frequency, browsing was at 4.35, emailing was at 4.19 and taking a
photo was at 3.58. Therefore, respondents were browsing more than emailing or taking a
photograph.
Mapping or Navigation was the next popular feature, where 553 (79.00%) of the replies
displayed use of this feature and the frequency of use was at 3.21. 508 (72.57%) managed
appointments and used the calendar with a frequency at 3.52. That means more than 70% of
older adults moderately use both mapping and appointments.
Reading online news or magazines was used next at 68.86% with a frequency of 3.15. The other
uses included, taking notes, filming a video, using online social networks such as Facebook,
watching videos and playing games that were used by more than half of the participants. It was
found that the frequency of using social media was at 3.26. Using Voice over Internet Protocol
(VoIP) or Video calls using applications such as Facetime, Skype or Viber and using
smartphones to contact government authorities such as the National Health Service (NHS) or Job
centre plus was used by less than half of the users with low frequencies at 2.22 and 1.80
respectively.
Table 5.17: Features of a smartphone used by respondents
Features of a smartphone 50-59 60-69 70-79 Total
number % number % number % number %
1. Making a phone call 440 97.78 209 99.05 38 97.44 687 98.14
2. SMS, Text messaging 446 99.11 206 97.63 37 94.87 689 98.43
3. Emailing 395 87.78 176 83.41 29 74.36 600 85.71
4. Taking a photo 422 93.78 193 91.47 32 82.05 647 92.43
5. Filming a video 322 71.56 118 55.92 14 35.90 454 64.86
6. Browsing-surfing website(s) 416 92.44 183 86.73 30 76.92 629 89.86
7. Playing games 302 67.11 101 47.87 17 43.59 420 60.00
8. Watching videos for example YouTube 309 68.67 99 46.92 18 46.15 426 60.86
9. Mapping, Navigator such as Google
Map, Tom-Tom, Copilot
363 80.67 164 77.73 26 66.67 553 79.00
10. Taking notes such as shopping lists or
task that I need to do
321 71.33 128 60.66 23 58.97 472 67.43
11. Managing my appointment on my
calendar
342 76.00 146 69.19 20 51.28 508 72.57
12. Using social network such as Facebook,
311 69.11 109 51.66 20 51.28 440 62.86

Sutee Pheeraphuttharangkoon (2015)
The Adoption, Use and Diffusion of Smartphones among Adults over Fifty in the UK 204
13. Reading online News and online
Magazines
324 72.00 137 64.93 21 53.85 482 68.86
14. Using Facetime, Skype, oovoo, Google
Talk, Viber, Fring
219 48.67 91 43.13 12 30.77 322 46.00
15. Using to contact government authorities
– NHS, Jobcentreplus, UKBA
179 39.78 57 27.01 7 17.95 243 34.71
450 100.00 211 100.00 39 100.00 700 100.00
To further understand usage in each age group, the data was re-arranged as shown in table 5.17.
From the same question, table 5.17 shown responses from those who used the feature (answered
two or more). Please note that the 80-89 age groups were removed since the numbers were too
low.
As seen in Table 5.17, apart from the first feature, making a phone call, the numbers of users in
the 60-69 age groups were slightly higher than the numbers from the 50-59 age groups. In turn,
the numbers of users in the 50-59 age groups were higher than the 60-69 age groups and the
numbers from the 60-69 age groups were greater than the 70-79 age groups. For some basic
features such as SMS, Emailing, taking a photo, or, browsing-surfing websites(s), the numbers of
responses from the 70-79 age groups slightly dropped compare to the 60-69 and 50-59 age
groups. Comparatively, for some advanced features such as filming a video, mapping or
navigation, managing appointments, reading news or using video calls, the numbers of
respondents from the 70-79 age groups had significantly dropped compared to the other groups.

Sutee Pheeraphuttharangkoon (2015)
The Adoption, Use and Diffusion of Smartphones among Adults over Fifty in the UK 205
Figure 5.5 Compares the smartphone features use
To illustrate the above explanations, a graph is presented in Figure 5.5 where it can be seen that
the line from the 50-59 age groups is higher than other lines, while the line from the 70-79 age
groups is the lowest line. The overall line is always lower than the line of the 50-59 age groups
line, but higher than the lines of the 60-69 and 70-79 age groups.
5.9.1 Use of Smartphones for Health Purposes
For older adults, health and well-being are important issues of consideration. Smartphones are
viewed to be tools that can assist with well-being or health. Therefore, a question associated with
smartphone use that was related with health and well-being was also asked in the survey.
Table 5.18 Smartphone on well-being or health usage by age
How has using a smartphone helped
your well-being or health?
50-59 60-69 70-79 Total
number % number % number % number %
1. seek information on health issues 114 25.33 22 10.43 8 20.51 144 20.57
2. helps me with my appointment
time keeping with doctors
93 20.67 41 19.43 11 28.21 145 20.71
0.00
1.00
2.00
3.00
4.00
5.00
6.00
Usa
ge F
req
ue
ncy
, 1 n
eve
r to
7 m
any
tim
es
per
day
Comparing Smartphone usage
50-59
60-69
70-79
Overall
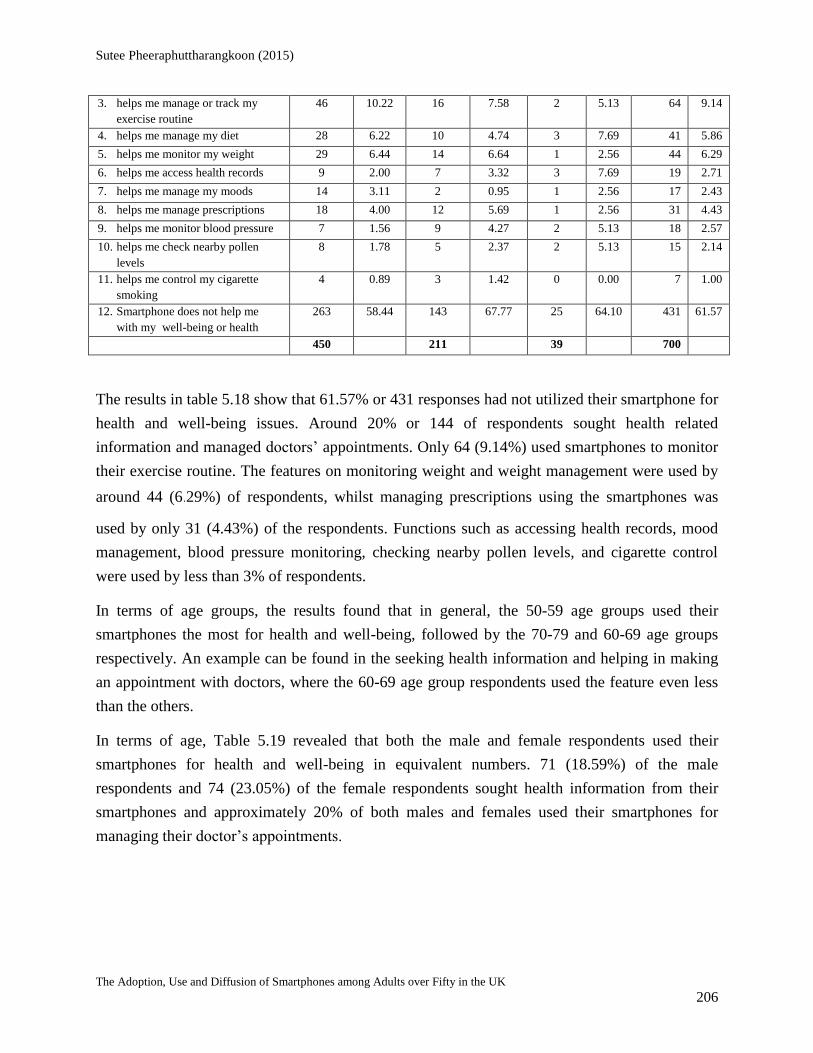
Sutee Pheeraphuttharangkoon (2015)
The Adoption, Use and Diffusion of Smartphones among Adults over Fifty in the UK 206
3. helps me manage or track my
exercise routine
46 10.22 16 7.58 2 5.13 64 9.14
4. helps me manage my diet 28 6.22 10 4.74 3 7.69 41 5.86
5. helps me monitor my weight 29 6.44 14 6.64 1 2.56 44 6.29
6. helps me access health records 9 2.00 7 3.32 3 7.69 19 2.71
7. helps me manage my moods 14 3.11 2 0.95 1 2.56 17 2.43
8. helps me manage prescriptions 18 4.00 12 5.69 1 2.56 31 4.43
9. helps me monitor blood pressure 7 1.56 9 4.27 2 5.13 18 2.57
10. helps me check nearby pollen
levels
8 1.78 5 2.37 2 5.13 15 2.14
11. helps me control my cigarette
smoking
4 0.89 3 1.42 0 0.00 7 1.00
12. Smartphone does not help me
with my well-being or health
263 58.44 143 67.77 25 64.10 431 61.57
450 211 39 700
The results in table 5.18 show that 61.57% or 431 responses had not utilized their smartphone for
health and well-being issues. Around 20% or 144 of respondents sought health related
information and managed doctors’ appointments. Only 64 (9.14%) used smartphones to monitor
their exercise routine. The features on monitoring weight and weight management were used by
around 44 (6.29%) of respondents, whilst managing prescriptions using the smartphones was
used by only 31 (4.43%) of the respondents. Functions such as accessing health records, mood
management, blood pressure monitoring, checking nearby pollen levels, and cigarette control
were used by less than 3% of respondents.
In terms of age groups, the results found that in general, the 50-59 age groups used their
smartphones the most for health and well-being, followed by the 70-79 and 60-69 age groups
respectively. An example can be found in the seeking health information and helping in making
an appointment with doctors, where the 60-69 age group respondents used the feature even less
than the others.
In terms of age, Table 5.19 revealed that both the male and female respondents used their
smartphones for health and well-being in equivalent numbers. 71 (18.59%) of the male
respondents and 74 (23.05%) of the female respondents sought health information from their
smartphones and approximately 20% of both males and females used their smartphones for
managing their doctor’s appointments.

Sutee Pheeraphuttharangkoon (2015)
The Adoption, Use and Diffusion of Smartphones among Adults over Fifty in the UK 207
A similar question to managing doctor appointments was asked in the eleventh question of table
5.17 where a question was asked about the use of management of appointments using a
smartphone calendar. 508 (72.57%) of the respondents used this feature and the amounts are
shown to be quite high in Table 5.17. Compared to Table 5.19, there were 20.71% of
respondents that used the calendar feature with their health and well-being.
To summarise, this section showed that the survey revealed smartphones can be used by older
adults for their health and well-being; however, less than half of the 50 years and above adults
adopted this smartphone benefit. Therefore, smartphone stakeholders should encourage 50 years
and above adults to use the smartphones for their health benefits.
5.9.2 Usage with Friends and Family
Friends and family are always important for older adults as they can assist in reducing isolation
within older adults. This led to the inclusion of a question seeking information about the
smartphone and friends and family.
Table 5.19 Smartphone on well-being or health usage by gender
How has using a smartphone helped your well-being or
health?
Male Female
number % number %
1. seek information on health issues 71 18.59 74 23.05
2. helps me with my appointment time keeping with
doctors
80 20.94 66 20.56
3. helps me manage or track my exercise routine 33 8.64 32 9.97
4. helps me manage my diet 16 4.19 25 7.79
5. helps me monitor my weight 20 5.24 24 7.48
6. helps me access health records 14 3.66 6 1.87
7. helps me manage my moods 10 2.62 7 2.18
8. helps me manage prescriptions 20 5.24 12 3.74
9. helps me monitor blood pressure 11 2.88 7 2.18
10. helps me check nearby pollen levels 7 1.83 8 2.49
11. helps me control my cigarette smoking 5 1.31 2 0.62
12. Smartphone does not help me with my well-
being or health
241 63.09 191 59.50
382 320

Sutee Pheeraphuttharangkoon (2015)
The Adoption, Use and Diffusion of Smartphones among Adults over Fifty in the UK 208
Table 5.20 Using smartphones with friends and family by age group
How has a smartphone helped bring your friends
and family closer to you?
50-59 60-69 70-79 Total
number % number % number % number %
1. Making phone calls to my friends and family 373 82.89 172 81.52 35 89.74 580 82.86
2. Emailing my friends and family using my
smartphone
276 61.33 117 55.45 20 51.28 413 59.00
3. Sharing photos taken from my smartphone 307 68.22 110 52.13 22 56.41 439 62.71
4. Sharing videos with from my smartphone 112 24.89 25 11.85 3 7.69 140 20.00
5. Sending instant messages such as Blackberry
Messenger, WhatsApp, Line, Facebook
messenger
194 43.11 54 25.59 9 23.08 257 36.71
6. Using video telephony software applications such
as Facetime, Tango or Skype
88 19.56 31 14.69 6 15.38 125 17.86
7. Following friends’ and family’s activities using
social media such as Facebook, Google+ on my
smartphone
172 38.22 58 27.49 5 12.82 235 33.57
8. I do not use a smartphone to contact with my
friends or family
20 4.44 13 6.16 2 5.13 35 5.00
450 211 39 700
Table 5.20 shows that using a smartphone with friends and family assists in bringing proximity
to family and friends. From Table 5.20, 580 (82.86%) made a phone call to their friends and
family, a basic function of the smartphones. Emailing is one of the advanced features allowed in
a smartphone and 413 (59.00%) of the silver surfers emailed their friends and family. Another
popular smartphone function that was used is sharing photos at 439 (62.71%). Sending instant
messages using apps such as Blackberry Messenger, WhatsApp or Facebook messenger was the
next popular feature at 257 (36.71%). Social media such as Facebook or Google+ is another
channel for older people to connect with their friends and families. In this research, 235
(33.57%) of older adults who have smartphones connect to their friends and family using social
media. However, it is interesting to compare the data of Table 5.17 with the data from table 5.20
where social media was considered. From table 5.17, 62.86% of the 50 years old and above
adults have used social media while in table 5.20 only 33.57% have used social media to connect
with friends and family.
Sharing videos was the next feature that 140 (20%) of the respondents used with friends and
family, followed by video calling using applications such as Facetime or Skype at 125 (17.86%).
Compared with Table 5.17, the number of 50 years and above adults used Facetime or Skype and
filming a video was high at 46.00% and 64.86%. Therefore, it can be seen that even though older
adults used the feature, they may not use the technology to encourage and improve their
relationship with friends or family.

Sutee Pheeraphuttharangkoon (2015)
The Adoption, Use and Diffusion of Smartphones among Adults over Fifty in the UK 209
Table 5.21 Using smartphones with friends and family by gender
How has a smartphone helped bring your friends and family
closer to you?
Male (n= 382) Female (n= 320)
number % number %
1. Making phone calls to my friends and family 314 82.20 267 83.18
2. Emailing my friends and family using my smartphone 239 62.57 175 54.52
3. Sharing photos taken from my smartphone 231 60.47 209 65.11
4. Sharing videos with from my smartphone 77 20.16 64 19.94
5. Sending instant messages such as Blackberry
Messenger, WhatsApp, Line, Facebook messenger
126 32.98 132 41.12
6. Using video telephony software applications such as
Facetime, Tango or Skype
68 17.80 57 17.76
7. Following friends’ and family’s activities using social
media such as Facebook, Google+ on my smartphone
119 31.15 116 36.14
8. I do not use a smartphone to contact with my friends or
family
24 6.28 12 3.74
In terms of gender, the data in this section was re-arranged and shown in Table 5.21. Both male
and female respondents showed a similar trend in the adoption and use of their smartphones with
friends and family. A small difference emerged where males used email slightly more than the
females. Comparatively, females shared photos and used social media slightly more than the
males.
To summarise, this section found that older adults had adopted smartphones and used some
advanced functions of the smartphone. When considering the use of smartphones with friends
and family, the 50 years and above adults normally used basic functions such as making phone
calls, emailing and sharing photos. In gender terms, both males and females used their
smartphones in similar numbers when contacting their friends and family. Therefore, to reduce
isolation and to encourage good relationships with friends and family the 50 years and above
adults should be encouraged to use smartphones.
5.10 Diffusion: Source of Information about Smartphones
In terms of diffusion and adoption, the questions began with the functions considered when
purchasing a smartphone. When investigating the attitudes of the groups, the questions were
asked of both the adopted and plan to adopt groups.

Sutee Pheeraphuttharangkoon (2015)
The Adoption, Use and Diffusion of Smartphones among Adults over Fifty in the UK 210
Table 5.22 Feature considered when buying a new smartphone
Consideration in buying a smartphone Adopted
(n=702)
Plan to use
(n=134)
Total
Number (%) Number (%) Number (%)
1. Appearance (such as colour or material) 284 40.46 42 31.34 326 39.00
2. Camera 337 48.01 41 30.60 378 45.22
3. Operating System (Such as iOS, Android or
Windows Mobile)
397 56.55 48 35.82 445 53.23
4. Brand (such as Apple, Samsung, Nokia or
Blackberry)
432 61.54 78 58.21 510 61.00
5. Price of the smartphone 464 66.10 58 43.28 522 62.44
6. Operating Speed 290 41.31 22 16.42 312 37.32
7. Screen Size 452 64.39 47 35.07 499 59.69
8. Screen Resolution 215 30.63 20 14.93 235 28.11
9. Weight 245 34.90 22 16.42 267 31.94
10. Battery life 452 64.39 52 38.81 504 60.29
11. Size of Memory in the phone to store files 268 38.18 20 14.93 288 34.45
12. Voice Clarity 171 24.36 21 15.67 192 22.97
From Table 5.22, the plan to use group may have less experience with smartphones because they
do not own the devices. 78 (58.21%) of the plan to use groups had the highest percentage where
there was immense interest in the brand of the smartphone that they intended to purchase. The
second and third highest of this group are 58 (43.28%) where interest was expressed in the
purchase price of the smartphone, followed by 52 (38.81%) the battery life. Operating systems
48 (35.82%); screen size 47 (35.07%); smartphone appearance 42 (31.34%) and camera
functions 41 (30.60%) respectively. The plan to use group was less affected 20% difference by
the operating speed, screen resolution, weight, smartphone memory size, and, voice clarity.
Comparatively, the group that adopted smartphones had some diverse experience or knowledge
issues. The adopted group at 464 (66.10%) were most interested in the smartphones purchase
price, followed by the screen size and the battery life at 452 (64.39%). 432 (61.54%) of the
adopted group emphasised the smartphone brand. Next, 397 (56.55%) of the group was
interested in the operating system followed by the adopters interested 337 (48.01%), 290
(41.31%) and 284 (40.46%) in the camera, and operating speed functions and finally, the
appearance of the smartphones. The adopters were less interested in voice clarity, screen
resolution and weight of the smartphones.
From the previous two paragraphs, it can be learnt that both groups had diverse views, with the
plan to adopt and use group being most interested in the smartphone brand and the price while

Sutee Pheeraphuttharangkoon (2015)
The Adoption, Use and Diffusion of Smartphones among Adults over Fifty in the UK 211
the adopted group was most interested in the smartphone purchase price, screen sizes and brand.
Further, from the percentage differences between both the groups, it can be seen that after the
adopted users smartphone experiences, they were likely to pay more attention to every function
of the smartphones.
Table 5.23 Communication channel
Where do you get information about
a smartphone
Adopted Plan to use Total
Number (%) Number (%) Number (%)
8. Word of mouth by friends and family 441 62.82 103 76.87 544 65.07
9. High street stores 192 27.35 58 43.28 250 29.90
10. Media- TV, Radio and Newspapers 157 22.36 36 26.87 193 23.09
11. Magazines 85 12.11 20 14.93 105 12.56
12. Online social network 70 9.97 12 8.96 82 9.81
13. Professional technology review
website such as CNET.co.uk,
Trustedreviews.com
215 30.63 39 29.10 254 30.38
14. Peer technology review such as
unboxing video on YouTube
66 9.40 8 5.97 74 8.85
15. Sales Person 153 21.79 31 23.13 184 22.01
702 100.00 134 100.00 836 100.00
This research also attempted to identify the various communication channels used for the
diffusion of the smartphones. A question provided choices in the form of eight communication
channels that were: word of mouth from friends and family; high street stores; media such as TV,
radio and newspapers, magazines, online social networks; professional technology review
websites; peer technology reviews and sales persons. The question was asked of both the adopted
and plans to use groups. Overall, both the groups received information largely from word of
mouth from friends and family 544 (65.07%). However, the plan to use groups 103 (76.87%) had
a greater reliance on the word of mouth compared to the adopters 441 (62.82%). Next, both
groups relied on professional technology review websites and high street stores 254 (30.38%)
and 250 (29.90%) respectively. Communication channels that were not so important for both
groups were peer technology review such as unboxing and review video on YouTube, online
social networks and magazines. The percentages of both groups were similar except for the plan
to use group being far more dependent on high street stores compared to the adopters.
5.11 Plan to Use Smartphone
Following feedback from the pilot test, a section on planning to adopt and use smartphones was
added to the final survey in order to further explore the reasons for the 50 years and above adults

Sutee Pheeraphuttharangkoon (2015)
The Adoption, Use and Diffusion of Smartphones among Adults over Fifty in the UK 212
intending to adopt and use smartphones. These questions could explain the decisions for
adopting smartphones.
Please note that this section is not included in the conceptual framework (MOSA) because
the data was from those who do not yet use the smartphones. Therefore, they may not fully
understand the features of smartphones and they cannot answer questions in the adopted section.
Table 5.24 Reason for planning to adopt and use smartphones (n=134)
Reasons for why you plan to use a
smartphone (n=134)
50-59 60-69 70-79 80-89 total
res % res % res % res % res %
I will get an upgrade from my provider. 13 20.31 12 21.82 1 8.33 0 0.00 26 19.40
I want to have a handy device that can
do many things such as making a
telephone call, taking a photograph,
filming, and surfing the internet.
46 71.88 34 61.82 5 41.67 2 66.67 87 64.93
Most of my friends have used
smartphones, and have convinced me to
get one.
14 21.88 20 36.36 1 8.33 1 33.33 36 26.87
I want to use a smartphone to contact
my friends or family.
17 26.56 11 20.00 1 8.33 0 0.00 29 21.64
My new job or new position requires
me to use a smartphone.
3 4.69 0 0.00 1 8.33 0 0.00 4 2.99
I want to use a smartphone to help with
my well-being or health.
2 3.13 0 0.00 0 0.00 0 0.00 2 1.49
I travel a lot and the smartphone will
help me on my travels.
7 10.94 8 14.55 0 0.00 0 0.00 15 11.19
My new smartphone will help me with
my memory.
0 0.00 3 5.45 0 0.00 0 0.00 3 2.24
My new smartphone will have a bigger
screen which is easy for me to see and
use.
17 26.56 13 23.64 5 41.67 0 0.00 35 26.12
64 100.00 55 100.00 12 100.00 3 100.00 134 100.00
In Table 5.24 it can be seen that there were approximately 134 older adults planning to adopt and
use a smartphone. The analysed results also showed that 87 (64.93%) of the plan to adopt and
use a smartphone as they were viewed to be handy devices that could provide many functions
such as making a telephone call, taking a photograph, filming and surfing the internet. This first
reason was directly linked to the provided smartphone benefits. This also supported the
hypothesis that Performance Expectancy and Perceived Enjoyment of a new smartphone is
compatible with a respondents’ lifestyle and can provide them with enjoyment.

Sutee Pheeraphuttharangkoon (2015)
The Adoption, Use and Diffusion of Smartphones among Adults over Fifty in the UK 213
The next reason for the plan to use and adopt smartphones 36 (26.87%) was due to the
respondents’ friends using smartphones and their encouragement and support convincing
respondents to adopt and use smartphones. This reason is linked to the hypothesis of social
influence that was not supported by the adopted and uses smartphones results. The screen size of
smartphones 35 (26.12%) was the next reason for the planning to adopt and use a smartphone. It
is believed that as the literature review suggested older adults suffer from vision problems; hence
the screen size being of importance to the older adults. What these results also suggest is that
smartphones with large and bright screens are compatible with the older adults population needs.
Using smartphones to contact friends and family was the next motive within the planning to
adopt and use a smartphone at 29 (21.64%). This was then followed by the respondents receiving
an offer from the mobile phone providers for a smartphone.
Other reasons considered in this study were the benefits of smartphones for travel, well-being
and health and lifestyle purposes, a requirement for the respondents’ new job, and memory as
show in table 5.24.
5.12 Not Using Smartphone
This research also determined the reasons for silver surfers not planning to use and adopt
smartphones, which is shown in Table 5.25.
Table 5.25 Reasons on not use smartphones (n=148)
Reasons on not use smartphone 50-59 60-69 70-79 80-89 total
res % res % res % res % res %
I am too old for a smartphone 4 10.26 11 15.07 4 17.39 5 45.45 26 17.57
It is too much of an effort to use a
smartphone
7 17.95 24 32.88 7 30.43 1 9.09 40 27.03
A smartphone is too complicated and
difficult to use.
7 17.95 28 38.36 8 34.78 2 18.18 46 31.08
I do not think a smartphone is useful. 7 17.95 11 15.07 3 13.04 0 0.00 21 14.19
Physical discomfort or accessibility
problems
1 2.56 6 8.22 2 8.70 0 0.00 10 6.76
The cost of using a smartphone – I do
not want to spend a lot of money
when using a smartphone.
13 33.33 36 49.32 8 34.78 2 18.18 59 39.86
I want peace and quiet after my
working hours
4 10.26 5 6.85 4 17.39 0 0.00 13 8.78
I do not feel comfortable using small
screens and tiny keyboards.
14 35.90 16 21.92 8 34.78 3 27.27 42 28.38
I do not know much about how to use 4 10.26 7 9.59 7 30.43 3 27.27 22 14.86

Sutee Pheeraphuttharangkoon (2015)
The Adoption, Use and Diffusion of Smartphones among Adults over Fifty in the UK 214
a smartphone.
I have other devices such as a laptop
or a netbook that can function as well,
or better than a smartphone.
19 48.72 29 39.73 8 34.78 3 27.27 59 39.86
Using a smartphone does not fit with
my lifestyle.
11 28.21 18 24.66 9 39.13 4 36.36 43 29.05
39 100.00 73 100.00 23 100.00 11 100.00 148 100.00
Overall, it was found that only 17.57% of the silver surfers thought that they were too old for
smartphones. However, the percentage changed from 10.26% in the 50-59 age groups to 15.07%
in the 60-69 age groups and 17.39% in the 70-79 age groups. Therefore as ageing occurs and
technologies progress, older adults do think that they are too old for technology; in this case,
smartphones.
What is also known is that smartphones are not the easiest devices to operate; therefore, the next
question determined the placed efforts for adopting and using a smartphone. Approximately
27.03% of the respondents replied that they thought it was too much of an effort to use a
smartphone. The percentage increased from 17.95% in the 50-59 age groups to 32.88% and
30.43% from the 60-69 and 70-79 age groups respectively. The next questions asked respondents
whether they viewed the smartphone as being too complicated and difficult to use where similar
views were expressed at 17.95%, 38.36% and 34.78% respectively.
Table 5.26 Factors may encourage future use of the not use smartphone group (n=148)
Factors that may encourage future use
of a smartphone.
50-59 60-69 70-79 80-89 total
res % res % res % res % res %
Nothing/ will never use a smartphone
in the future
14 35.90 22 30.14 12 52.17 7 63.64 57 38.51
Free training 10 25.64 20 27.40 5 21.74 2 18.18 37 25.00
Reduce cost of a smartphone 19 48.72 35 47.95 9 39.13 3 27.27 66 44.59
Reduce cost of monthly contract 13 33.33 31 42.47 6 26.09 3 27.27 53 35.81
39 100.00 73 100.00 23 100.00 11 100.00 148 100.00
Factors that may encourage the future use of a smartphone were also sought where the first factor
at 44.59% was the cost of a smartphone followed by 35.81% from the cost of a monthly contract
or service cost. Free training for using smartphones was also provided as a reason at 25.00%.
However, 38.51% of the 50 years and above adults resisted and stated that they will not use a
smartphone in the future. In terms of age groups, the 80-89 age groups were the largest group to
resist using a smartphone at 63.64% followed by 70-79 at 52.17%.

Sutee Pheeraphuttharangkoon (2015)
The Adoption, Use and Diffusion of Smartphones among Adults over Fifty in the UK 215
This study also asked for the reasons that prevented the 50 years and above adults from adopting
and using smartphones. The identified issues included security, screen size, complications of
smartphone usage, price and touch screen. Some people just wanted to use their current mobile
phones. For some 50 years and above Parkinson’s disease sufferers, the touchscreen use was a
difficulty due to their trembling hands often touching the smartphone screen more than was
needed. For some older adults with visionary (longsighted) problems, using small screen
smartphones was not an easy task.
5.13 Chapter Summary This chapter presented the research findings from the final phase of this study. The chapter began
by reporting on the sample size and the numbers of received replies. This was followed by
explanations of the validity tests that included descriptions of the reflective measurement,
formative measurement, and structural model testing. The data was then further analysed for
hypothesis testing where it was found that of the overall eight hypotheses, six were supported.
Further, the conceptual model could predict up to 76% of intention to use smartphones and
20.8% of actual usage. Then the effect of demographic variables as moderator variables was
discussed.
The next chapter provides an evaluation and discussion section. The evaluation parts will apply
primary datasets acquired from the Oxford Internet Survey and The office of National Statistics
Omnibus Survey in order to validate the final finding. Then, a discussion from the literature
review standpoint will be presented.

Sutee Pheeraphuttharangkoon (2015)
The Adoption, Use and Diffusion of Smartphones among Adults over Fifty in the UK 216
Chapter 6 Evaluation & Discussion
6.1 Introduction
The previous chapter presented the research findings, analysis of the research findings, and the
results of hypothesis testing. To evaluate, verify and validate the results for generalisations this
research used Nationally Representative Datasets (NRDs), which is the data from The Office of
National Statistics (ONS) Omnibus survey and the Oxford Internet Survey (OxIS). After
evaluating the results, this chapter also discusses and reflects upon the finding of this research
from a theoretical perspective by using the literature review of Chapter 2.
6.2 Evaluation for Validation
For research the validation of the results in terms of theories is very important as it confirms the
results of research (Panneerselvam, 2004). From the previous chapter, the results of the primary
data from the north of London area were obtained that achieved a conceptual model. To ensure
that the results of this research can be verified and valid an evaluation process needs to be
completed.
The process will start with a definition of evaluation, which is then followed by a description of
the process and then the reasons for selecting a particular process. Finally, the nationally results
will be presented.
6.2.1 Evaluation Definitions
Evaluation can be defined as the systematic identification and assessment of effects generated by
programmes or products (Jupp, 2006). In this case, the results of the final data collection of the
previous chapter and the tested hypothesis also within the previous chapter are evaluated.
Therefore, the aim of the evaluation is to assess the success of the results of this research study
and to obtain the information needed for further development (Rubin & Babbie, 2011).
Evaluation can be classified as summative or formative (Little, 2013). Summative evaluation is
concerned with the success or outcome of a programme. The results of a summative evaluation
convey a sense of finality where reliance on the results imply the success of a programme (Rubin
& Babbie, 2011). A summative evaluation purpose is to judge the finished product compared
with the potential alternative programmes (Little, 2013). Applying this type of evaluation to this
research, this study examined the outcome of this research.
Formative evaluations are not concerned with testing the success of a programme. They focus
instead on obtaining information that is helpful in planning the programme and in improving its

Sutee Pheeraphuttharangkoon (2015)
The Adoption, Use and Diffusion of Smartphones among Adults over Fifty in the UK 217
implementation and performance. (Rubin & Babbie, 2011) A formative evaluation is not fixed
but is still in the process of change. The goal of a formative evaluation is to provide feedback to
the programme managers with the purpose of improving the programme regarding with is and
what is not working well and not to make a final judgment on the relative merits of the
programme (Little, 2013). For this research, formative evaluation began from the literature
review in chapter 2, selecting the appropriate research method in chapter 3, pilot testing the
theoretical constructs of chapter 2 and presenting their results in chapter 4, and finally,
presenting the results and analysis in chapter 5.
Having considered evaluation types, this chapter will now apply summative evaluation to
evaluate the outcome of this research in order to confirm that the theory that collected the data
from north of London can be applied nationwide.
6.3 Evaluation Approach
Trochim and Donnelly (2001) suggest that secondary analysis is an acceptable quantitative
method for a summative evaluation. The secondary analysis involves making use of existing
sources of data, which is normally quantitative data (Trochim, 2006). The available data for
secondary analysis include census bureau data, standardized testing data, economic data, and
consumer data.
Therefore, to evaluate the results of this research study, a nationwide quantitative dataset will be
selected and utilised to perform secondary analysis. For this this phase, the research team
selected two famous secondary data sources, which were available from the Office for National
Statistics (ONS) and Oxford Internet Surveys (OxIS). In the following sections the reasons for
selecting them are presented.
6.3.1 Office of National Statistics (ONS) Omnibus or Opinions Survey
The Office for National Statistics (ONS) in Great Britain survey collects information on a range
of topics from individuals living in private households in the country (Office for National
Statistics, 2015). For this purpose, an omnibus survey that is explained as a survey that provides
those seeking information about markets and opinions with a means to get quick, relatively low
cost answers to their questions without financing and organizing a full market or opinion
research survey themselves. The omnibus survey could involve a research company conducting a
number of interviews with a target group on a regular basis where the interviews combine a
number of standard questions that are always asked - generally including demographic
information (age, sex, occupation) or e.g. company classification information for a business
survey - with questions effectively sponsored by clients. The answers to these questions are
Sutee Pheeraphuttharangkoon (2015)
The Adoption, Use and Diffusion of Smartphones among Adults over Fifty in the UK 218
analysed shortly afterwards, cross-referenced with some or all of the classification data, and
delivered to the client either as tables or in a report (Duffy and Smith, 2005).
For the ONS, the omnibus survey also known as the Opinions Survey commenced at the
beginning of 2008 and became part of the Integrated Household Survey (HIS). In 2012 the
survey name was changed once more to the Opinions and Lifestyle Survey (UK Data Service,
2014). The dataset of Omnibus and opinions surveys can be obtained from the Economic and
Social Data Service (ESDS) website. This survey was selected due to its reliability and its
nationwide coverage.
The ONS Omnibus Surveys of 2010, 2011, 2012, and 2013 provided data for using the internet
and technologies in more than 3,000 responses. This continuous data assists in reviewing the
adoption data in terms of time. However, the ONS dataset has not directly addressed the word
smartphone. ONS used the terms mobile phone. Therefore, this research needed to used further
understand the prediction of the mobile phone usage in order to interpret the smartphone usage,
such as use mobile phone to access emails or surfing internet.
As addressed in Chapter 3’s section on demographic variables, this evaluation phase will include
demographic variables such as age, gender, race, education, occupation, health, and income in
order to predict smartphone adoption.
6.3.2 The Oxford Internet Surveys (OxIS) Survey
The next data set used for this research study is the Oxford Internet (OxIS) Survey begun in
2003. OxIS is a continuous survey for internet users in Britain. OxIS is the longest-running
academic survey of Internet use in Britain operated by the Oxford Institute at the University of
Oxford (Surveys Oxford Internet, 2014). OxIS is a multi-stage national probability sample of
2,000 people in Britain.
The survey includes information on internet usage, attitudes toward the internet and technology,
demographic information and geographic information. Previous surveys conducted by OxIS have
been 2003, 2005, 2007, 2009 and 2011. OxIS uses a face-to-face survey in an interviewee’s
house where this has led to an increase in the quality of the collected data. This Survey was also
selected by this research study due to its coverage and reliability.
The OxIS questionnaire consists of four sections: general questions, questions for internet users,
questions for non-internet users and questions for ex-internet users. Further, other internet related
technologies such as Cable TV, Digital camera, Portable Mp3, Game consoles, mobile phones
are also included in this survey as well as, demographic and geographic information (Surveys
Oxford Internet, 2014). A difference when using this dataset to the ONS dataset is that

Sutee Pheeraphuttharangkoon (2015)
The Adoption, Use and Diffusion of Smartphones among Adults over Fifty in the UK 219
researchers have to seek prior permission by contacting OxIS and then obtain the dataset. Due to
some limitations, the OxIS allowed data for the periods 2007, 2009 and 2011.
6.4 Evaluation Analysis Method
Having selected the sources for evaluation, the next step for this phase involved explaining the
analysis method. The analysis method aimed to compare the results of both surveys to this
research study and second, to evaluate the conceptual framework that is found in chapter 5 by
testing the framework with the dataset.
Since both ONS and OxIS are datasets that were not particularly designed for this research study,
the previous analysis method of chapter 5 could not be used. Gunderson (1974) suggested that a
linear probability function is enough for testing hypotheses. Using this as supporting
information, Probit, a non-linear regression method was selected. The Probit and Logit models
have been used more than 10% in Strategic Management Journals in the 1990s and 2000s (Shook
et al., 2003). Research teams recommend STATA version 12 when applying Probit with the
datasets and since this version was also available in this university, the research considered this
application.
6.4.1 Variables from ONS
Having selected the datasets, the next step involved selecting variables from these datasets.
Demographic variables selected as independent variables for ONS were age, gender, married
status, regions, income, educational level, and, employment status. These demographic variables
appeared in the ONS surveys of 2010 until 2013.
The dependent variable was obtained from the question on mobile devices that can access the
internet. The choice that ONS provided were mobile phone (or smartphone) via GPRS, Mobile
phone (or smart phone) via UMTS, HSDPA (3G, 3G+), handheld computer, or Portable
computer. Only those who selected the first and the second choices were considered as using
smartphones. This question was in the ONS surveys of 2010 to 2013.
Interestingly, in 2012, ONS included further questions on smartphone usage. Choices of
smartphone use included email, news, newspaper, e-book, download game, download music, and
using social media. Therefore, for ONS 2012, smartphone usage will be included as a dependent
variable because downloading games, downloading music or social media can be considered as
using smartphones for entertainment purposes, which can then be used to verify the seventh
hypothesis on perceived Enjoyment. However, in 2013, ONS removed questions on handheld
device usage.
Sutee Pheeraphuttharangkoon (2015)
The Adoption, Use and Diffusion of Smartphones among Adults over Fifty in the UK 220
6.4.2 Variables from OxIS
For OxIS 2007, the question that will be considered as dependent variable is the question on
mobile phone usage. OxIS sought information in questions using questions such as using mobile
phones for sending text messages, playing games, accessing email or the internet, taking
pictures, sending photos, or listening to music (Mp3s). The respondents had to provide responses
by selecting one of the aforementioned choices in order to be determined as using a smartphone,
except using sending a text message. Demographic variables were also used as independent
variables.
6.5 Evaluation Findings
Having selected the variables, the datasets were analysed using STATA version 12, a method
that was also pursued by Vyas (2013). The following section provides and discusses the findings
of the selected variables obtained from the ONS data sets.
6.5.1 ONS findings: Smartphone Usage in the UK Using Probit Analysis
To gain an understanding of smartphones use based on demographics such as age, gender,
marital status, education level, employment status, and income, Probit regression analysis was
applied to the recent waves of ONS data 2013, 2012, 2011 and 2010. For those unfamiliar with
the method, Probit regression is a method of working with categorical dependent variables whose
underlying distribution is assumed to be normal. That is, the assumptions of Probit regression are
consistent with having a dichotomous dependent variable whose distribution is assumed to be a
proxy for a true underlying continuous normal distribution. Probit regression has been extended
to cover multinomial dependent variables (more than two nominal categories) and to cover
ordinal categorical dependent variables. These extensions are sometimes labelled mlogit and
ologit respectively. Probit regression is an umbrella term meaning different things in different
contexts, although the common denominator is treating categorical dependent variables assumed
to have an underlying normal distribution. When a Probit model is applied, the inverse standard
normal distribution of the probability is modelled as a linear combination of the predictors.

Sutee Pheeraphuttharangkoon (2015)
The Adoption, Use and Diffusion of Smartphones among Adults over Fifty in the UK 221
Table 6.1 Probit Regression: ONS 2010 Wave
For this research, the first wave to be considered is 2010, which is the time period that is three
and a half years after the initial launch of the first iPhone. As shown in Table 6.1 there were
4,077 usable responses in 2010. For the age category, it can be learnt that the probability of older
adults using smartphones was meaningfully decreased to -0.842 in the 50 to 65 age groups and -
1.382 in the above 66 years old age groups. In terms of education, the higher the education level
of an individual there was, it led to a higher probability of using smartphones. Further,
employment also affected smartphone usage. However, income (sum gross) did not have a
significant effect on smartphone usage in 2010.
Table 6.2 Smartphone adoption by age from the ONS 2010 Wave
Age Number of Responses Using smartphones Percent
14-19 128 50 39.06%
20-29 460 212 46.09%
30-39 671 228 33.98%
40-49 670 166 24.78%
50-59 630 85 13.49%

Sutee Pheeraphuttharangkoon (2015)
The Adoption, Use and Diffusion of Smartphones among Adults over Fifty in the UK 222
60-69 749 42 5.61%
70-79 486 6 1.23%
over 80 283 0 0.00%
Total 4077 789 19.35%
From the data set, the data can be grouped by ages as in table 6.2. Table 6.2 shows the responses
of those who used smartphones in 2010 where the numbers of 50-59 people using smartphones
was quite low at 13.49% or 85 of 670. Moreover, the 60-69 years old age group used smartphone
only 5.61% or 42 of 749 responses. Generally, there were 19.35% (789 of 4,077) of the British
who used smartphones in 2010. For 50+, the dataset show only 6.12 % (133 of 2,148). The
number 133 were from the summary of the smartphone users from 50-59 (85), 60-69(42), 70-
79(6) and over 80(0). There were 2,148 replies form the 50 years old adults in the ONS dataset
of 2010.
Table 6.3 Probit Regression: ONS 2011 Wave
From the data set of 2011 the numbers of responses were at 3307. The results showed and
confirmed a similar trend to 2010 which was that the 50 years old and above adults had a

Sutee Pheeraphuttharangkoon (2015)
The Adoption, Use and Diffusion of Smartphones among Adults over Fifty in the UK 223
significant probability of not using smartphones. In terms of income, the numbers of probability
increased from 2010 and it was significant. For the education aspect, individuals educated to the
A levels and above had had an increased possibility to use smartphones. Therefore, in 2011,
individuals who had high education levels and were younger were likely to adopt smartphones as
explained in section 5.7 that addressed the issue that 50 years old and above adults with higher
education levels were likely to adopt smartphones in 2014.
Table 6.4 Smartphone adoption by age from the ONS 2011 Wave
Age Number of Responses Using smartphones Percent
14-19 123 88 71.54%
20-29 389 258 66.32%
30-39 481 257 53.43%
40-49 580 207 35.69%
50-59 529 97 18.34%
60-69 557 62 11.13%
70-79 412 9 2.18%
over 80 236 0 0.00%
Total 3307 978 29.57%
When the dataset was grouped to show the numbers of people who used smartphones in 2011 it
was found that the numbers of 50-59 people using smartphones increased slightly from 13.49%
in 2010 to 18.34% (97 of 529) in 2011 (shown in Table 6.2 and 6.4). Similarly, for the 60-69
years old age group, the numbers had increased from 5.61% to 11.13% (62 of 557). Generally,
there was 29.57% of the overall British population that used smartphones in 2011, which had
increased from 19.35% in 2010. However, for the 50 years old and above adults, there were
9.69% (168 of 1,734) smartphone users in 2011. The percentage increased slightly from 6.12%
in 2010. Although the numbers of older adults had increased from 2010, the number was still
very low compared to the younger groups.

Sutee Pheeraphuttharangkoon (2015)
The Adoption, Use and Diffusion of Smartphones among Adults over Fifty in the UK 224
Table 6.5 Probit Regression: ONS 2012 Wave Test 1
The 2012 data set from ONS was also analysed where there were 3000 responses as shown in
Table 6.5 above. This revealed that there were some changes between 2011 and 2012 and that
the probability numbers of using smartphones within the 50 years old and above adults had
slightly increased. Educational level was also one of the most important factors in terms of the
probability of smartphone usage and it was found that Income (gross sum) had a slightly
increased probability when using smartphones.
In addition, the 2012 ONS survey had a question on the use of some features of handheld
devices. The uses were sending and/or receiving emails, reading/downloading online news/
newspapers/magazines, reading or downloading online books or e-books, playing or
downloading games, images, video or music, using podcast services to receive audio/video files,
and, online social networking using websites such as, Facebook or Twitter.

Sutee Pheeraphuttharangkoon (2015)
The Adoption, Use and Diffusion of Smartphones among Adults over Fifty in the UK 225
Table 6.6 Probit Regression: ONS 2012 Wave Test 2
Due to the presence of such information, these features were included in the second analysis with
the outcomes shown in Table 6.6. What was discovered is that the added novel six factors were
found significant for smartphone usage. Emailing and social networking showed a high
probability at around 2.584 and 2.271, respectively. Playing or downloading games, images,
video or music, and reading / downloading online news/ newspapers/ magazines increased with a
high possibility at around 1.947 and 1.633 respectively. These revelations are linked with the
fifth and the seventh hypothesis, performance expectancy and enjoyment.

Sutee Pheeraphuttharangkoon (2015)
The Adoption, Use and Diffusion of Smartphones among Adults over Fifty in the UK 226
Table 6.7 Smartphone adoption by age from the ONS 2012 Wave
Age Number of Responses Using smartphones Percent
14-19 97 84 86.60%
20-29 320 268 83.75%
30-39 472 373 79.03%
40-49 525 292 55.62%
50-59 460 180 39.13%
60-69 519 99 19.08%
70-79 391 17 4.35%
over 80 216 0 0.00%
Total 3000 1313 43.77%
In terms of the number of users in 2012, the overall number had increased from 29.57% in 2011
to 43.77% (1,313 of 3,000) in 2012. In terms of this research, it was learnt that the percentage of
users in the 50-59 age groups and 60-69 age groups had doubly increased from 18.34% to
39.13% and 11.13% to 19.08% in 2012 respectively. However, when combining the numbers of
the 50 years old and above responses and the number of 50 years old and above replies of those
who used smartphones, the percentage of 50 years old and above adults using smartphones was
at 18.66% (296 of 1,586), an increase from 9.69 % in 2012.

Sutee Pheeraphuttharangkoon (2015)
The Adoption, Use and Diffusion of Smartphones among Adults over Fifty in the UK 227
Table 6.8 Probit Regression: ONS 2013 Wave
The 2013 data set from OSN was the latest data set available at the time and the results are
shown in Table 6.8. In 2013 age was also significant and the latest data still presented similar
results, which were that the older adults are unlikely to adopt smartphones. However, the
numbers have continuously improved from 2010. The income (gross sum) also shows
significance. What was learnt was that the education levels were constantly significant and
another significant factor affecting smartphone use was employment.

Sutee Pheeraphuttharangkoon (2015)
The Adoption, Use and Diffusion of Smartphones among Adults over Fifty in the UK 228
Table 6.9 Probit Regression: ONS 2013 Wave (50+ only)
The 2013 data set from OSN was further analysed by focusing only on the 50+ adults-the
demographic group of society of interest to this research study. For this, the 18-49 years old
records were removed, that led to the numbers of responses reducing from 2,920 to 1,554 as
shown in table 6.9. It can be seen that the older respondents are less likely to adopt smartphones,
which is a result similar to the results of table 6.8. In terms of gender, the male population is
likely to adopt smartphones, a result similar to table 6.8. Living in London, income, education
levels, and employment showed similarity to the results of table 6.8. However, in terms of
marital status, it could not be predicted whether the 50 years old and above adults are likely to
adopt smartphones, which is a result different from table 6.8. This implies that the 50 years old
and above adults marital status is not significant when considering purchasing smartphones.

Sutee Pheeraphuttharangkoon (2015)
The Adoption, Use and Diffusion of Smartphones among Adults over Fifty in the UK 229
Table 6.10 Smartphone adoption by age from the ONS 2013 Wave
Age Number of Responses Using smartphones Percent
14-19 97 88 90.72%
20-29 293 251 85.67%
30-39 441 337 76.42%
40-49 535 307 57.38%
50-59 451 172 38.14%
60-69 526 98 18.63%
70-79 367 22 5.99%
over 80 210 4 1.90%
Total 2920 1279 43.80%
In terms of the numbers of smartphone users, in 2013, the overall number had grown from
43.77% to 43.80%. In terms of the age groups, there were slightly increases in every age group
except for the 30-39 and 60-69 years old age groups. For the over 80 years old and above age
groups, it was found that in 2013 the numbers of adopters was at approximately 1.90%. For the
50 years old and above adults, the number of smartphone usage had increased from 18.66% in
2012 to 19.04% (296 of 1,554).
6.5.2 ONS findings: A Longitudinal View
Whilst the previous section has been identifying an annual trend, a longitudinal perspective can
also be obtained from the trends (Saunders et al., 2009), which can generally be illustrated
visually using line graphs. Using the outcomes of 2010 to 2013 from the ONS data a line graph
was drawn to provide Figure 6.1 was drawn.

Sutee Pheeraphuttharangkoon (2015)
The Adoption, Use and Diffusion of Smartphones among Adults over Fifty in the UK 230
Figure 6.1 Graph, compare number of smartphone users from ONS survey 2010-2013
From the above graph it can be seen that the numbers of 50 years old and above adults adopting
smartphones had increased significantly from 2011 to 2012 especially for the 50-59 age groups.
In 2010, the 20-29 year age group was the highest smartphone user group at around 48%. The
40-49 age group adopted smartphones at around 25%. Individuals in the 50-59 year old age
group used smartphones at around 15%, while the 70-79 year old age group adopted at around
6%. In 2011, smartphones were widely adopted within the younger age groups of 14-19, 20-29,
30-39 and 40-49 years old. Within the younger age groups, the 14-19 years old age group was
the highest smartphone adopters group at around 72%. In the 40-49 year old age group, the
adopters were at 35%, while the 50-59 age groups of adopters was at around 18% in 2011. In
2012 the numbers of smartphone users had increased significantly from 2011. Besides the
younger generations, the below 40 years old age group , which was greater than 75% had
adopted smartphones where the 50-59 years old age group had adopted smartphones from 18%
in 2011 to 38% in 2012. However, smartphones use within the 60-69 years old age group had
increase from 12% in 2011 to 19% in 2012.
In 2013, the overall use had increased slightly. However, in 2013 the gaps between the age
groups were wider than the previous years. In 2013, the numbers of 30-39 year old users were
around 78%, followed by 68% in the 40-49 years old age group. For the 50 years old and above
adults, the numbers of 50-59 users was at around 38%, with the number of 60-69 users being
approximately 19%. Therefore, the gap between the 40-49 age groups and 50-59 age groups was
0.00%
10.00%
20.00%
30.00%
40.00%
50.00%
60.00%
70.00%
80.00%
90.00%
100.00%
2010 2011 2012 2013
Numbers of Smartphone users ONS 2010-13
14-19
20-29
30-39
40-49
50-59
60-69
70-79
over 80

Sutee Pheeraphuttharangkoon (2015)
The Adoption, Use and Diffusion of Smartphones among Adults over Fifty in the UK 231
at around 20%. Further, the gap between the 50-59 age groups and 60-69 age groups was at
around 20%, but the gap seems to be constant in 2013. Therefore, a digital divide still exists.
6.5.3 ONS findings: Smartphone Adoption Area
As addressed in chapter 5, the selected area for this final survey was the north of London where
the reasons for selection included London being the capital city of the UK and London being
important economically. Table 6.11 below that is based on the ONS results of 2013 show that
London had more adopters than any other one in the UK.
Table 6.11 Smartphone adoption by area from the ONS 2013 Wave
Area (2013) Response Use Smartphone %
London 279 155 55.56
Scotland 241 113 46.89
Wales 159 58 36.48
North 518 217 41.89
Midland 465 183 39.35
South 693 311 44.88
Yorkshire 279 115 41.22
East England 286 127 44.40
In Table 6.11 the London adopters were at 55.56% compared to the second largest area of
Scotland at 46.89% and the South of England in third place at 44.88%. Wales appeared to lesser
at 36.48%. Therefore, to study the adoption of smartphones London is an appropriate location
where there are a large number of adopters.
These results also confirmed that there is a well-developed, mobile coverage infrastructure in
London (Ofcom, 2013), which meant that individuals were more likely to adopt innovative
technologies and devices, as in the case of this research, smartphones.
6.5.4 OxIS Findings: Predicting Smartphone Use around the UK- A Probit Analysis and
Smartphone Users
Similar to the ONS, to gain an understanding of smartphone usage, the data from OxIS was
obtained from the years of 2007, 2009 and 2011 and analysed using Probit.

Sutee Pheeraphuttharangkoon (2015)
The Adoption, Use and Diffusion of Smartphones among Adults over Fifty in the UK 232
Table 6.12 Probit Regression: OxIS 2007 Wave
In Table 6.12 it can be seen that in 2007, the year that the iPhone was initially launched, age was
a significant factor. In comparison to the older age groups, the younger generation was likely to
adopt advanced mobile phones. In fact, within the 50 years old and above adults there was a
likelihood that there were no smartphone users. Income was another significant factor for
determining smartphone adoption. For OxIS, the question about health was apparent and during
the analysis this factor was included. It can be seen that health problems were a significant factor
where they moderately or negatively affected smartphone adoption. In terms of the regions, in
2007, the significant area was only in London. Therefore, in 2007 London residents were likely
to use smartphones compared to other regions.

Sutee Pheeraphuttharangkoon (2015)
The Adoption, Use and Diffusion of Smartphones among Adults over Fifty in the UK 233
Table 6.13 Probit Regression: OxIS 2009 Wave
In 2009, as shown in table 6.13, age was the main factor for predicting smartphone use.
Compared to 2007, the probability of younger adults (below 50) to use smartphones had
increased. However, the possibility of 50 years old and above adults was very low. In terms of
regions, other areas such as Scotland, Wales, North or South of England were significant factors
for predicting smartphones adoption in this year. It was found that the educational levels were
factors that were not suitable for predicting smartphone use in the year. Combined with the data
from figure 6.1, this year was considered to be the beginning of the smartphone adoption
lifecycle.

Sutee Pheeraphuttharangkoon (2015)
The Adoption, Use and Diffusion of Smartphones among Adults over Fifty in the UK 234
Table 6.14 Probit Regression: OxIS 2011 Wave
In 2011, age groups and region were significant and could bring to predict smartphone usage
similar to in 2009. However, older adults were still unlikely to use smartphones. Education levels
in this year were significant and people who graduated degrees were likely to use smartphones.
During this year, the smartphone was widely used among workers. Therefore, full time was
significant and full time workers were like to use smartphones in 2011. Health problem was
found significant to predict smartphone usage.
As addressed in section 5.7 Effect of Demographic Variable as Moderated Variables, Heath
variable is almost significant t-value = 1.633 (t-value need to more than 1.65 to be considered as
significant).

Sutee Pheeraphuttharangkoon (2015)
The Adoption, Use and Diffusion of Smartphones among Adults over Fifty in the UK 235
6.6 Final Hypotheses Testing
Having reviewed the results of both the ONS and OxIS datasets, this section will discuss how the
results validate this research study framework as in chapter 5 and the further explain the
smartphone adoption. Please note that it is expected that not all the hypothesis can be applied to
the datasets from ONS and OxIS because the both datasets did not designed to examine
smartphone adoption among older adults. This is known as secondary data (Saunders et al.,
2009).
6.6.1 Evaluation Hypothesis Testing
In chapter 5, the six of eight hypotheses were supported. The supported variables were
compatibility, facilitating conditions, performance expectancy, effort expectancy, perceived
enjoyment.
From ONS 2012, the year that ONS ask about mobile device usage, the results from Probit as in
figure 6.4, reviewed that smartphone usage can be predicted by the factors which are emailing,
social networking, playing or downloading games, images, video or music, and reading /
downloading online news/ newspapers/ magazines. These usages involved several capability of
smartphones, which the owners may expect from smartphone advertisement or word of mouth
from friend and family. Therefore, this could verify the supported variable on performance
expectancy. Moreover, when consider some activities such as listen to music or playing game,
the activities can grouped as entertainment which is bring enjoyment. Thereby, the supported by
variable on perceived enjoyment would be verified. Therefore, the fifth and the seventh
hypothesis, performance expectancy and enjoyment were tested.
From ONS 2012 and 2013, which were the latest years at the time that final questionnaire was
taken. The income (sum gross) shows significant with low attitude as in figure 6.4 and 6.5. The
education levels were constantly significant with considerably values. By the definition of
supported variable on facilitating conditions which is the users need to have necessary resources
– knowledge time and money to support smartphone usage. The results from ONS 2012 and
2013 could verify the fourth hypotheses on facilitating conditions.

Sutee Pheeraphuttharangkoon (2015)
The Adoption, Use and Diffusion of Smartphones among Adults over Fifty in the UK 236
Table 6.15 Hypotheses Testing: Evaluation
Hypotheses Evaluation
Compatibility -> behavioural intention Could not be tested
Facilitating conditions -> behavioural intention Supported
Performance expectancy -> behavioural intention Supported
Effort expectancy -> behavioural intention Could not be tested
Perceived enjoyment -> behavioural intention Supported
Behavioural intention-> smartphone usage Could not be tested
Therefore, three of six supported hypotheses were supported by nationally represented datasets
drawn from the ONS and OxIS.
6.6.2 Discussion on ONS and OxIS Datasets
Having used both datasets to verify the hypothesis in this research study, this section will discuss
other potential variables or issues that relate to smartphone adoption that are evident in the ONS
and OxIS datasets.
In terms of responses to the final phase questionnaire of this research, there were 984 completed
useable responses from the north London area as explained in chapter 5. From the datasets that
were used in this chapter, the researcher felt more confident with the completed numbers of
replies since the number of nationwide responses in the ONS dataset were an estimated 3,000
and 2,200 from OxIS. Therefore, considering the challenges that this research study endured, it
was felt that 984 responses were strong enough to represent the north of London area.
In terms of gender, the dataset from ONS revealed that especially males were likely to adopt
smartphones compared to females. This result also confirmed the finding in section 5.4 that this
research study found. That is, 54.42% of the 50 years old and above male adult population
adopted to smartphones compared to 45.58% of the 50 years old and above female adult
population.
As mentioned in the first two chapters as ageing occurs, health problems do emerge that led to
the inclusion of health problems in this study, as in the OxIS dataset. The 2011 OxIS data set as
shown in Figure 6.9 found that health problems do negatively affect smartphone adoption. This
implies that individuals with health problems are less likely to adopt smartphones. Although
health is not significant enough to modify the effect of the intention to actual use as explained in
section 5.7, it can be said that health problems could negatively affect smartphone usage.

Sutee Pheeraphuttharangkoon (2015)
The Adoption, Use and Diffusion of Smartphones among Adults over Fifty in the UK 237
From the datasets, variables such as employment, regions and married status were available,
however, due to time restrictions; they were not included within this study.
What has been learnt from this evaluation is that it is very helpful and useful to conduct
evaluation studies using secondary data in order to compare and to test the hypothesis between
the collated data of this research study and the nationwide collected datasets such as, those of the
ONS and OxIS. However, it has to be understood that only some of the results of this study can
be partially verified as all the data of chapter 5 is not evident within the datasets; however,
evaluation allows a researcher to be confident with the final findings as partial results can still be
confirmed and avoid a bias to the research.
6.7 Discussion
Having verified the MOSA using datasets from ONS and OxIS, this section will further discuss
this research findings and compare them with existing research studies associated with
smartphones. The discussion issues include research site, sample size, research methods,
theories, and hypotheses.
6.7.1 Discussion on Research Site, Sample Size and Research methods
The articles on technology adoption using both TAM and UTAUT that were addressed in chapter
2 were compiled and presented in Table 6.16 below. This allows a discussion on the research site
and sample size.
Table 6.16 Discussion Research Site and Sample Size to Existing Literatures
Existing Literature Research
Country
Sample Size Is focus on
older
adults
Park and Chen (2007) USA A survey of 820 US doctors and
nurses
NO
Chtourou and Souiden
(2010)
France A Survey 367 mobile users NO
Kim (2008) South Korea A survey of 286 working adults NO
Koenig-Lewis et al
(2010) Germany A survey of 263 Young people NO
Shin (2007) South Korea A survey of 515 Consumers NO
Verkasalo et al (2010) Finland A survey of 579 panellists NO
Wu and Wang (2005) Taiwan A survey of 310 m- commerce
users
NO

Sutee Pheeraphuttharangkoon (2015)
The Adoption, Use and Diffusion of Smartphones among Adults over Fifty in the UK 238
Chong et al (2012) Malaysia and
China
A survey of 394 consumers NO
Kang et al (2011) South Korea A survey of 100 students NO
Kim and Garrison (2008) South Korea A survey of 58 graduate students NO
Nysveen et al (2005) Norway A survey of 684 mobile chat
service users NO
Xue et al (2012) Singapore A survey of 700 older adult
women (50+)
YES
Nayak et al (2010)
United Kingdom A survey of 592 older adults (60-
88)
YES
Lee et al (2012)
South Korea A survey of 215 college students
and office workers
NO
Venkatesh et al (2012) Hong Kong A survey of 1,512 mobile internet
consumers
NO
Alkhunaizan and Love
(2012)
Saudi Arabia A survey of 547 smartphone users NO
Pitchayadejanant (2011) Thailand A survey of 408 smartphone users NO
Zhou et al (2010) China A survey of 250 phone users and
students
NO
Song and Han (2009) South Korea A survey of 570 consumers NO
Kijsanayotin et al (2009) Thailand A survey of 1323 patients NO
Shi (2009) China A survey of 653 application users NO
Zhou (2008) China A survey of 250 phone users and
students
NO
Park et al (2007) China A survey of 221 online panellists NO
Carlsson et al (2006) Finland A survey of 157 mobile consumer NO
He and Lu (2007) China A survey of 243 individuals NO
Boontarig et al (2012) Thailand A survey of 31 elderly people YES
Leong et al (2013) Malaysia A survey of 572 students NO
Abad et al (2010) Spain A focus group of 79 teenagers NO
From 28 research studies, when considering the research countries, it can be seen that there is
only one research study from the USA, seven research studies from Europe and 20 research
studies from Asia. Delving further, it can be seen that there was only one research study from the

Sutee Pheeraphuttharangkoon (2015)
The Adoption, Use and Diffusion of Smartphones among Adults over Fifty in the UK 239
UK and six research studies were from South Korea. This implies that European researchers had
less emphasis on mobile technology adoption research. Contrastingly, Asian countries such as
South Korea, China, Taiwan, Malaysia, and Thailand were more active in this type of research.
This supports the fact that the majority of smartphone brands being developed and sold within
the consumer market hail from South East Asian manufacturers such as Samsung, Lenovo, LG,
Huawei or Sony.
In terms of methodology, most of the research on mobile technology adoption applied a survey
strategy. For the sample sizes, the largest size included 1,512 responses and the average sample
size of responses was 468. From the above table, only three articles focused on older adults,
which as discussed and explained in chapter 2 is an important demographic group of society.
From the above details, this research on smartphone and older adults has quite a strong sample
size at 984, twice the size of the average. Secondly, this research provides a contribution by
focusing on older adults in the UK. Therefore, this research provides knowledge that can fill the
research gap in terms of the country (the UK) and particular demographic group (50+ adults).
6.7.3 Discussing Technology Adoption Theories
Having discussed the methodology, this section will discuss the existing literature in terms of
technology adoption theories. Please note that the following table, table 6.17 was designed to be
used for 6.7.3 to 6.7.6. Section 6.7.3 will discuss on only the base theory, TAM and UTAUT.
Then section 6.7.4 will compare only the technology that the researches focus, NOT the results
in terms of adoption or research outcome. Then, the section 6.7.4, will explain on the similarity
and difference in terms of hypothesis and adoption variables.
Table 6.17 Discussion Research, Theory and Technology to Existing Literatures
Existing Literature Supported Variables Unsupported
Variables
Base
Theory
Technology
Park and Chen
(2007)
PU, PEOU, SE, OB, AT, BI TAM Smartphone
Chtourou and
Souiden (2010)
Fun-Enjoyment, PEOU, PU TAM Mobile devices
for surfing the
internet
Kim (2008) Perceived Cost Savings, PU
and PEOU
EXP moderate effect of
company willingness to
fund to behavior intention.
TAM Mobile wireless
technology

Sutee Pheeraphuttharangkoon (2015)
The Adoption, Use and Diffusion of Smartphones among Adults over Fifty in the UK 240
Koenig-Lewis et al
(2010) PU, PEOU, Credibility,
Trust, Risk and COM
Perceived
Cost
TAM Mobile banking
Shin (2007) Perceived Availability,
Perceive quality, Social
Pressure, ENJ and PU
TAM Mobile internet
Verkasalo et al
(2010)
Technical, Barriers, Social
Norm, ENJ and PU
TAM Smartphone
application
Wu and Wang
(2005)
Perceived Risk, Cost,
COM, PEOU and PU
TAM Mobile
commerce
Chong et al (2012) Trust, Cost, SOC, Variety
of Services – Malaysian
Trust, SOC, Cost – Chinese
PU, PEOU,
Trialability –
Malaysian
PU, PEOU,
Trialability,
Variety of
Services –
Chinese
TAM M-commerce
Kang et al (2011) Wireless Internet, Design,
Multimedia, Application,
After service, PEOU and
PU
TAM Smartphones
Kim and Garrison
(2008)
Perceived ubiquity,
Perceived Reachability, Job
relevance, PEOU and PU
TAM Mobile wireless
usage
Nysveen et al
(2005)
Perceived Expressiveness,
ENJ, PU, PEOU, AT;
Normative Pressure in
Female
Normative
Pressure in
Male
TAM Mobile chat
services
Xue et al (2012) PU, PEOU, COM, and
Subjective norm,
Technological Anxiety,
Perceived User Resource
TAM Health
informatics via a
mobile phone-
based
intervention
Nayak et al (2010) AT, Usefulness, Good Education, TAM Internet usage

Sutee Pheeraphuttharangkoon (2015)
The Adoption, Use and Diffusion of Smartphones among Adults over Fifty in the UK 241
Health, gender (Males) Age, PEOU,
Relevance
Leong et al (2013) PU, PEOU, SOC and ENJ
SE;
Gender as
moderator
variable not
moderate any
effects.
TAM mobile
entertainment
Abad et al (2010) PU, PEOU
ENJ affected actual use
TAM Smartphone in
hedonic
scenarios
Lee et al (2012) Credibility, Personalisation,
PE, EE
SOC, Flow UTAUT Smartphone
application
Venkatesh et al
(2012)
PE, EE, SOC, FC, Hedonic
motivation
EXP moderate effect of
intention to actual use.
UTAUT mobile internet
Alkhunaizan and
Love (2012) Cost, EE and PE
Age can determine m-
commerce actual use.
Trust, SOC UTAUT mobile
commerce
Pitchayadejanant
(2011)
FC, Perceived Value, PE,
EE, SOC
UTAUT Smartphones
Zhou et al (2010) Task technology fit, SOC,
PE and FC
UTAUT mobile banking
Song and Han
(2009)
SOC, ENJ, PE and EE UTAUT Smartphone
application
Kijsanayotin et al
(2009)
Knowledge, EXP, FC, PE,
EE, SOC
UTAUT IT in the
community
health centres
Shi (2009) ENJ, SOC, PE, EE and FC
UTAUT Smartphone
software
adoption
Zhou (2008) PE, FC and SOC UTAUT mobile
commerce

Sutee Pheeraphuttharangkoon (2015)
The Adoption, Use and Diffusion of Smartphones among Adults over Fifty in the UK 242
Park et al (2007) PE, EE and SOC
Gender and education
levels significantly
moderated the PE, EE.
FC UTAUT mobile
communication
technology
Carlsson et al
(2006)
EE and PE
SOC UTAUT mobile
devices/services
He and Lu (2007) PE, FC, SOC EE UTAUT consumers
mobile
advertising
Boontarig et al
(2012)
EE, FC, and Perceived
value
SOC, PE UTAUT Smartphone for
e-Health
services
Note: PU= Perceived usefulness; PEOU = Perceived Ease of Use; SOC = Social Influence; ENJ
= Perceived Enjoyment; EE = Effort Expectancy; PE = Performance Expectancy; COM =
Compatibility ; OB = Observability; SE = Self-efficacy; AT= Attitude; BI = Behavioural
Intention; EXP = Experience
From Table 6.17 above 13 articles applied UTAUT while 15 article used TAM as the base
theory. It is very interesting to note that only two theories have been applied to study technology
acceptance and these two theories have been developed by the researcher V. Venkatesh.
However, both theories are different in several ways. Please refer to Chapter 2 for more details
about the theories.
Initially, the theories differ in terms of their names. UTAUT includes the word “use” in the
name, but both theories have the construct Use Behaviour. Secondly, UTAUT places greater
emphasis on moderator variables such as gender, age, experience, and voluntariness of use in
comparison to TAM 3 that includes Experience and Voluntariness. Therefore, UTAUT might
more applicable with research studies that aim to study demographic variables such as moderator
variables. Thirdly, TAM appears to be a flexible model as other variables can easily be added to
the model. Examples of this flexibility include the study from Chong et al (2012) that inserted
Trust, Cost, Variety of Service, and Trialability in order to study M-commerce, and Koenig-
Lewis et al (2010) that included Credibility, Trust, Risk and Perceived Cost to study mobile-
banking.
This discussion was essential to explain why UTAUT was used as the foundation to study
smartphone adoption within UK’s older adults. Further, from this discussion it can be learnt that

Sutee Pheeraphuttharangkoon (2015)
The Adoption, Use and Diffusion of Smartphones among Adults over Fifty in the UK 243
this research study emphasises not only adoption, but also study smartphone usage and the
demographic variables of health, experience, education and gender were studied as moderator
variables, which is similar to UTAUT.
6.7.4 Discussing Smartphone Technology
In terms of technologies in adoption research studies, smartphone technologies can be divided
into three main categories: the devices, the connection and the usage of the smartphone for
specified purposes. Researchers can focus on the smartphone itself, such as Park and Chen
(2007) who studied smartphone adoption within nurses and doctors. Kang et al (2011) studied
smartphone adoption in general, and Pitchayadejanant (2011) was interested in iPhone and
Blackberry adoption. These studies are similar to this research on smartphones and older adults
in UK that focused largely on the adoption of the devices.
Some researchers focused on mobile internet connections where examples include Shin (2007)
who focused Wireless Broadband Internet (Wi-Bro), and, Venkatesh et al (2012) who applied
UTAUT2 to study mobile Internet consumers. Although smartphones are closely linked to the
mobile connection, this research on smartphones and older adults did not focus on the
connections. Therefore, this research is different from those that studied the adoption of the
connections.
Using smartphones for specified purposes appeared to be the largest category due to a
smartphone’s ability to install several applications or using internet browsers. Examples of
smartphone use include mobile banking, mobile commerce, mobile entertainment, mobile for
health, mobile for learning and other applications. Examples of mobile commerce and adoption
research include the study of Wu and Wang (2005), Chong et al (2012), and Alkhunaizan and
Love (2012). In these studies, Perceived Risk, Cost, and Trust were added to conceptual models
when studying mobile commerce. Similarly, mobile banking has also been researched when
considering the adoption of the m financing aspect. Examples of mobile banking research
include, Koenig-Lewis et al (2010) and Zhou et al (2010) where credibility, Trust, Risk,
Perceived Cost, and Task technology fit were added to classic adoption theories in order to
research mobile banking.
The previous studies are different from this research where the research did not have an
emphasis on the particular purposes of use. This research did not test the conceptual model
(MOSA) only by considering the specific use of the smartphones. Instead, MOSA was tested
against general use of smart phones. Therefore, this research provided a broader view of use.
Nonetheless, this also means MOSA may not be fully compatible with research studies of
smartphone use being utilised for specific purposes. However, this research on smartphone and

Sutee Pheeraphuttharangkoon (2015)
The Adoption, Use and Diffusion of Smartphones among Adults over Fifty in the UK 244
older adults also included smartphone use on health and well-being, and connecting to friends
and families.
When considering the applications aspect of smartphones, Nysveen et al (2005) studied mobile
chat services where it was found that besides perceived usefulness and ease of use, perceived
expressiveness and perceived enjoyment could affect mobile chat service adoption. Further,
Nysveen et al (2005) added gender as a moderating variable of the adoption. Other research on
the applications have been conducted by Shi (2009) who studied smartphone software, Song and
Han (2009) researched smartphone applications, and Xue et al (2012) on health informatics via a
mobile phone.
It can be seen that there are several aspects of smartphone technologies that can be explored.
Therefore this research on smartphone and older adults should provide a contribution that
focuses not only on the device, but also the use aspect including the features of smartphones and
the frequency of use. An outcome of such a study is that there should be deeper knowledge. For
example, this research provides not only a MOSA conceptual framework, but shows that older
adults frequently use basic features of smartphone such as emails and browsing compared to the
advanced features such as sharing locations, using video conferencing or watching online videos.
Therefore, the strength of this research on smartphone and older adults is providing knowledge
for smartphone device adoption, which is the platform of other applications and purposes. Hence
this research should be considered as pertinent for studying the adoption of smartphones in a
demographic group of society.
6.7.5 Research Hypotheses
Having explained in terms of technology, this section focus on a discussion of the research
hypotheses compared to the previous research studies and the implication of the hypotheses.
6.7.5.1 Hypothesis 1 Observability has a positive influence on the behavioural intention towards
smartphone adoption – Not Supported
The first hypothesis expected that the more chances that older adults have of viewing
smartphones, the more they intend to use the technology. The results in chapter 5 found that this
hypothesis was not applicable.
The Observability variable in smartphone devices was studied by Park and Chen (2007) and
Putzer and Park (2010) and found that the variable could predict smartphone adoption. Both
research studies focused on smartphone adoption within nurses and doctors that included every
age group. Further, due to the emphasis on occupations, it is assumed that most likely
smartphones were used mainly for work purposes. Additionally the research was published since
2007 and 2010.

Sutee Pheeraphuttharangkoon (2015)
The Adoption, Use and Diffusion of Smartphones among Adults over Fifty in the UK 245
Therefore, the results from Park and Chen (2007) and Putzer and Park (2010) may differ to this
research study that examined smartphone adoption in 50 years old and above adults because first
the target audience is the older adults demographic group, versus nurses and doctors. At the time
that the previous research was published, older adults had been seeing the uses of smartphones
for a while; and could have lost interest in them.
Implication of Hypothesis 1 Observability
Observability was not supported in this research focused on older adults and smartphones, which
means that older adults are not convinced to use smartphones by just observing the phones at
use.
6.7.5.2 Hypothesis 2 Compatibility has a positive influence on the behavioural intention towards
smartphone adoption – Supported
This hypothesis predicted that the more smartphones are compatible with a users’ lifestyle, the
more the intention to use a smartphone exists.
There were several research studies that supported this view such as the research of mobile
banking from Koenig-Lewis et al (2010), the research of health informatics via a mobile phone-
base intervention among 50 years old and above older adult females from Xue et al (2012), and
the research of mobile commerce from Wu and Wang (2005).
Implication of Hypothesis 2 Compatibility
From the analysis of this research, it has been found that compatibility is important as older
adults will adopt smartphones only if they can use smartphones to perform their daily tasks. This
also means that smartphone stakeholders should design smartphones in a manner such that older
adults’ lifestyles can also be dealt with, rather than only the younger adults’ needs and
requirements. Smartphones can be viewed to be communication tools for workers, but older
adults could value the device more in terms of entertainment as identified by Hypothesis 7, or to
utilise the devices for connecting to friends and family. Therefore, to encourage smartphone
usage, stakeholders should illustrate that smartphones can be an older adults’ companion.
6.7.5.3 Hypothesis 3 Social Influence has a positive influence on the behavioural intention
towards smartphone adoption - Not Supported
In hypothesis 3 it is expected that social Influence will positively affect the intention to use
smartphones.
There have been several research studies that have tested this hypothesis. For instance, Chong et
al (2012) studied mobile commerce between Malaysian and Chinese users of all the age ranges
and found the social influence variable could predict mobile commerce adoption. Similarly,

Sutee Pheeraphuttharangkoon (2015)
The Adoption, Use and Diffusion of Smartphones among Adults over Fifty in the UK 246
Leong et al (2013) who studied mobile entertainment within students also found the social
influence variable significant, as did Zhou et al (2010) who studied mobile banking in China.
Contrastingly, smartphone application adoption research in South Korea focused on students and
working people found that Social influence was not significant (Lee et al, 2012). Alkhunaizan
and Love (2012) who studied mobile internet adoption in Saudi Arabia, and, Carlsson et al
(2006) who also studied the adoption of mobile devices and services in Finland found that the
hypothesis on Social influence was not supported.
Therefore, it is difficult to explain this variable. However, cultural and age groups could also
cause this uncertainty. This is based on the study of Lee et al (2013) who study the impact of
cultural differences on technology adoption by compare US and South Korea. Lee et al (2013)
found that the mobile users in individualistic cultures such as US tend to rely on themselves.
Unlike collectivistic cultures, South Korea, the Korean users tend to listen to others who have
already adopted the technology. Therefore, since the American culture is similar to the UK, it
can be implied that British people are likely to find information about the technology
independently. Therefore the effect of Social Influence was not significant within the 50 years
old and above adults in the UK.
Implication of Hypothesis 3 Social influence
Since social influence is not supported by this research it is suggested that older adults will not
be influenced by their friends and family. Therefore, it may take time to encourage older adults
to adopt new technologies, which implies that smartphone stakeholders and policy makers
should allow a longer period of time when considering the adoption of novel technologies within
older adults.
6.7.5.4 Hypothesis 4 Facilitating Conditions have a positive influence on the behavioural
intention towards smartphone adoption – Supported
This hypothesis predicted that facilitating conditions positively influence the intention to use
devices. The facilitating conditions in this case were time, money and knowledge.
To form this hypothesis, previous research that was referred to included, Venkatesh et al (2012)
who found that facilitating conditions can predict mobile internet usage, as did Pitchayadejanant
(2011) who studied smartphone adoption. In terms of only the facilitating conditions role in the
adoption of novel technologies, Zhou et al (2010) and Shi (2009) found that facilitating
conditions supported the adoption of mobile banking and smartphone software adoption
respectively.
Implication of Hypothesis 4 Facilitating Conditions.

Sutee Pheeraphuttharangkoon (2015)
The Adoption, Use and Diffusion of Smartphones among Adults over Fifty in the UK 247
The above supported research studies confirmed that older adults need to have time, money and
knowledge in order to adopt smartphones. For money and knowledge, the smartphone
manufacturer and developers could encourage older adults to use smartphone by initially,
maintaining or reducing the price of smartphones and applications. Secondly, the stakeholders,
including policy makers could provide knowledge for older adults in the form of offering short
courses or online tutorials.
6.7.5.5 Hypothesis 5 Performance expectancy has a positive influence on the behavioural
intention towards smartphone adoption – Supported
Performance expectancy refers to the related benefits of smartphones for older adults in their
daily lives or for their work purposes.
There were several research studies that found performance expectancy could predict mobile
technologies such as the research on smartphone application adoption (Lee et al, 2012), mobile
internet adoption research (Venkatesh et al, 2012), mobile commerce (Alkhunaizan and Love,
2012), and the research on mobile devices and services (Carlsson et al, 2006).
However, for specific research topics such as a smartphone being used for a specific service, e-
Health services, Boontarig et al (2012) is a good example, as their research explained that older
adults did not realize the benefits of e-Health services; hence not adopting smartphones.
Therefore, their research did not fully support this hypothesis.
Implication of Hypothesis Performance Expectancy
From Boontarig et al (2012)’s case, researchers need to evaluate their research sample groups
knowledge about a technology before including the factor of performance expectancy. For policy
makers and smartphone manufacturers, advertisements or information about novel products and
the benefits of the products are very important for adoption and should be considered within their
strategies and policies.
6.7.5.6 Hypothesis 6 Effort Expectancy has a positive influence on the behavioural intention
towards smartphone adoption – Supported
Effort Expectancy is related to the ease of use of smartphones for older adults.
There were several research studies supporting this hypothesis which included one where it was
found that effort expectancy effected mobile communication technology adoption and gender
and education levels moderated the effect of effort expectancy on attitudes when using mobile
technology (Park et al, 2007). Research has also found that effort expectancy can predict the
adoption of mobile devices and services (Carlsson et al, 2006). Finally, Song and Han (2009) and

Sutee Pheeraphuttharangkoon (2015)
The Adoption, Use and Diffusion of Smartphones among Adults over Fifty in the UK 248
Alkhunaizan and Love (2012) found that effort expectancy is pertinent for the adoption of
smartphone applications and mobile commerce respectively.
Implication of Hypothesis
This hypothesis can lead to an understanding for smartphone developers and application
developers in that they should attempt to develop devices and technologies for older adults that
are easy to use.
6.7.5.7 Hypothesis 7 Enjoyment has a positive influence on the behavioural intention towards
smartphone adoption – Supported
This hypothesis supports the view that Perceived Enjoyment has a positive effect on the intention
to use smartphones.
When this research study commenced, a second version of the Unified theory of acceptance and
use of technology (UTAUT2) by Venkatesh et al (2012) had been developed where the variable
Hedonic Motivation was added. It is defined as the fun or pleasure derived from using a
technology, and it has been shown to have an important role for determining technology
acceptance and use. In UTAUT2, Venkatesh et al (2012) referred to the previous research of
2005 and used the Model of Adoption of Technology in Households (MATH) to explain the
adoption of personal computers in the household (Brown & Venkatesh, 2005). The MATH
model used the word Application for Fun as a factor of consideration and application for fun
was defined as the pleasure derived from personal computer used.
Brown and Venkatesh’s research of 2005 was linked to the earlier research of 2001 that was
focused on personal computers. In Brown and Venkatesh (2005) research, Hedonic Outcomes
was represented by the Applications for fun when using personal computers at homes where a
hedonic outcome was defined as the pleasure derived from the consumption, or use of a product.
From these explanations it can be learnt that Fun or perceived enjoyment is important for
technology adoption ever since the personal computer era. In terms of smartphone technologies,
Song and Han (2009) found perceived enjoyment did impact smartphone application adoption
whilst, Shin (2007) Abad et al (2010) and Leong et al (2013) found that fun or perceived
enjoyment influenced smartphone adoption in hedonic scenarios, mobile internet and mobile
entertainment respectively.
Implications of this Hypothesis
By identifying the importance of this hypothesis academics could benefit by confirming that
perceived enjoyment from UTAUT2 is important. For manufacturers and developers, this
Sutee Pheeraphuttharangkoon (2015)
The Adoption, Use and Diffusion of Smartphones among Adults over Fifty in the UK 249
hypothesis suggests that enjoyments factors should be considered when developing both
software and hardware for older adult consumers.
6.7.6 Mobile phone, Smartphone Older Adults
Besides smartphones, this research also focused on older adults. However, the numbers of
articles or research studies on smartphones and older adults were limited. Therefore this research
emphasised the technology where focus was upon mobile phones, personal computers and
internet.
When considering the internet and older adults, in 2005, Vuori and Holmlund-Rytkonen (2005)
studied adults who are above the age of 55 years old and used the internet and found that the
majority (more than 50%) of respondents used the internet for sending or receiving email,
information search, e-banking, browsing, booking trips, and ticketing. The research also found
internet features such as e-shopping, entertainment, downloading software, investments, and chat
services were used by a minority of the sample group. Earlier, Eastman and Lyer (2004) studied
65-85 year old age group with 171 sample size in the US on the purpose of using the internet and
found that 67% (115) of older adults used the internet to remain in contact with friends and
relatives, 38% accessed news and events using the internet and around 32% (55) accessed health
or medical information. Cotton et al (2012) studied 50 years and older adults in the USA with
7,839 observations and found that the internet can reduce depression within older adults by
approximately 26%.
The above research studies provided similar results to this research where older adults that are 50
years and above were likely to use basic smartphone features such as SMS, emailing and surfing
internet. Moreover, in terms of purposes, this research also shows that smartphones can assist
older adults by connecting them with their friends and families. In addition older adults can use
their smartphones for health and well-being purposes.
A diverse perspective was provided by Kurniawan (2006) who proposed a mobile phone design
for older adults (65+). The design considerations included a large screen and text. Additionally,
Kurniawan (2006) found that older adults feel more confident when going out by themselves due
to the functions being tailored more to their purposes. In 2005 older adults used the mobile
phone for improving their memory by utilising features such as an address book, diary and alarm
clock that were used more than a music player, camera and videophone. Additionally,
Kurniawan argued that older adults have a higher mobile phone adoption rate than internet usage
and in 2008. Kurniawan (2006) found that older adults feared using unfamiliar technology, in
this case a mobile phone (Kurniawan, 2008). Further Kurniawan (2008) emphasised that
smartphones had helped in reducing half of the problems that mobile phones gave. The problems
Sutee Pheeraphuttharangkoon (2015)
The Adoption, Use and Diffusion of Smartphones among Adults over Fifty in the UK 250
that were mentioned were aspects such as the size of the screen, typing or texting and coverage.
However, problems such as battery life and customisation by using the phone were problems that
were still not resolved by the successor smartphones.
The design of mobile phones was also researched in Germany by comparing between easy and
complex phones and by having a usage comparison study of younger and older adults (50-64
years). Ziefle and Bay (2005) found that users can benefit more from the lower complexity of
mobile phones. Additionally, older adults need more time in comparison with the younger
generation when learning how to use a mobile phone. Kobayashi et al (2011) study on Japan’s
elderly (60 years old and above) learnt that there was a positive response to using touch screens
as the screens were easier to use. Further, the researchers’ suggested that after a week the elderly
can improve their proficiency at using a screen. Therefore, older adults could take more time
when learning how to use novel technologies.
In terms of learning to use new technology, Eastman and Lyer (2004) found that the 50 years
old and above adults learned how to use novel technologies mostly by themselves or with the
assistance of relatives. One in five 50 years and above adults managed to seek assistance from
other people or by taking a class. However, some adults learnt how to use technology from their
workplace. A qualitative study of older adults learning of mobile phones found that older adults
experimented using the mobile phones and referred to hard copy manuals when employing a
phone. In some cases, some older adults had their own hard copy notes about the use of phones
(Tang et al., 2012).
However, some older adults did not express a preference to using new technologies. Research on
mobile phone usage within older adults (48-90 year old) found that 104 (39.7%) of 262 took a
photograph while 36 (14%) of 258 used their phone to access internet (Hardill & Olphert, 2012).
When older adults were asked about the reasons for giving up mobile phones reasons such as
complications, costs of the devices and services, and peacefulness were cited. Added reasons for
not using mobile phones include a fear of breaking the device, not liking the technology, costs of
learning and owning the device, no one being available to learn from about the use of a mobile
phone, or having no one to ask a question of (Lee et al., 2011). However, Hardill and Olphert
(2012) showed that mobile phones have been gradually integrated in some of the lives of 50
years and older adults.
In terms of demographic variables, Choudrie and Dwivedi (2006) study of broadband adoption
by considering demographic variables in London found that higher income and education can
positively influence broadband adoption. Similarly, Eastman and Lyer (2004) focused on internet
usage within the elderly and confirmed that high educational levels and income could encourage

Sutee Pheeraphuttharangkoon (2015)
The Adoption, Use and Diffusion of Smartphones among Adults over Fifty in the UK 251
internet usage within the 50 years and older adults. In Eastman and Lyer (2004) research on
smartphones and older adults, the final results suggested that enough money and knowledge can
encourage smartphone adoption. Further, adults 50 years old and above with higher educational
levels were more likely to adopt smartphones.
6.7.7 Digital Divide Discussion
This research also considered the Digital divide that is defined as the gap between those who can
access the technology versus those who do not (Curwen and Whalley, 2010). The digital divide
often referred to as the “information gap” or “information inequality” has promoted immense
debates that have resulted in the digital divide being considered in a variety of contexts,
including socio-economic status, gender, age, racial, region or geography (Tsatsou, 2011). This
section will discuss the digital divide and smartphone technology.
Srinuan et al (2012) found that the mobile internet can assist in narrowing the digital divide in
terms of geography or by assisting those living in an area where the telephone network cannot be
accessed. They also found that the cost of mobile internet can negatively affect mobile internet
usage. Loo and Ngan (2012) also supported the idea that mobile telecommunications can assist
in narrowing the digital divide especially within a large developing country such as China. Loo
and Ngan (2012) also found that the installation costs for wireless networks was often cheaper
than fixed-telephone lines, especially in rural areas.
In developing countries, it is pertinent to narrow the digital divide as this will promote economic
growth, health care and education, civic education, governance and social cohesion (West,
2015). Therefore, the arrival of the internet can lead to opportunities, investments and new jobs.
It can also assist the economy by reducing poverty by creating jobs and business opportunities.
Additionally, the internet allows individuals to access knowledge, such as information about
diseases, including how to prevent and cure patients (West, 2015), which can lead to an
improvement to the quality of life within individuals.
Although, this research on smartphones and older adults did not directly contribute to a
narrowing of the UK’s digital gap, it may indirectly assist policy makers by making them
become aware of the current digital divide situation and obtain a guideline that could help in
reducing the existing digital divide between the younger and older generation.
6.8 Chapter Summary
This chapter began by explaining the diverse forms of evaluation and identifying their role for
this research. For evaluation, the datasets from ONS and OxIS were used to evaluate the MOSA
conceptual framework and revealed that three of six hypotheses formed by this research were

Sutee Pheeraphuttharangkoon (2015)
The Adoption, Use and Diffusion of Smartphones among Adults over Fifty in the UK 252
supported. Then this chapter discussed the similarities and differences between this research
study and other research studies. Having completed the evaluation and discussion, the next
chapter will conclude this research, discuss the limitations, the overall implications and future
directions.

Sutee Pheeraphuttharangkoon (2015)
The Adoption, Use and Diffusion of Smartphones among Adults over Fifty in the UK 253
Chapter 7 Conclusions 7.1 Introduction
Having presented the aims and objectives, the literature review, research methodology, pilot
findings, final phase findings and the evaluation, this chapter now concludes this research study.
The chapter begins with an overview and summaries of this research. Next, the implication of
this research in terms of academia, policy makers and industry is discussed, followed by the
limitations and future directions, some recommendations of this research and finally the
conclusion of this research.
7.2 Thesis Overview & Summary
The first chapter began by introducing the research background, which was emphasised on the
smartphone adoption and older adults. For this, the chapter commenced by presenting the
evidence of an ageing society, UK older adults and ICTs, and mobile phone adoption in the UK
that led to the research aim and questions. The aim of this research was identified as: To identify,
examine and explain the adoption and usage of smartphones in the UK within the 50 years old
and above population. This research also formed the questions on communication channels
within older adults while purchasing smartphones and on the features of smartphones used by
older adults. Next, a brief description of the research scope, the research contribution and the
outline were provided in this chapter.
The second chapter began by providing literature reviews on smartphone technology,
smartphone features, older adults and challenge of older adults, older adults and technology, and
digital divides. Then this chapter presented the available technology adoption theories which
were TRA, TAM, TPB, DOI, DTPB, TAM2, UTAUT, TAM3, and UTAUT2. Following an
understanding of the adoption theories, a conceptual framework (MOSA) was formed with
variables taken from DOI, TAM3 and UTAUT. For MOSA, the independent variables were
identified as Compatibility (COM), Observability (OB), Social Influence (SOC), Facilitating
Conditions (FC), Performance Expectancy (PE), Effort Expectancy (EE), and Perceived
Enjoyment (ENJ). The key dependent variables were Behavioural Intention (IN) and Actual Use
(ACU). All the constructs were interlinked with linear one-way causal paths. The paths
represented hypotheses formed for this study that were formed based on previous research,
rationalized and related theories. Further, this chapter addressed the demographic variables as
moderator variables that would be included in the final phase.

Sutee Pheeraphuttharangkoon (2015)
The Adoption, Use and Diffusion of Smartphones among Adults over Fifty in the UK 254
Chapter three offered explanations regarding the research methodology where for an
understanding reference was made to the research onion developed by Saunders et al (2009).
Before every decision about the research methodology and descriptions related to the onion
layers, this chapter provided the possible, available choices. This allowed the researcher to
selected Positivism as the research philosophy, a deductive research approach, and a survey as a
research strategy. For the data collection, this research utilised an internet based questionnaire
that was located at the website Surveymonkey. In terms of data, both primary and secondary data
were utilised. Chapter 3 also discussed the Instrument and Content Validity of the questionnaire
that this research used for confirming both the pre-test and pilot questions. This chapter also
provided reasoning for the utilised research site and the sample sizes of both the pilot and final
phase. In terms of the research site and sample sizes, for the pilot this research employed the UK
to examine the adoption and use of smartphones within all the age groups and for the final phase
north London for the above 50 years old age group. Finally, the chapter explained the reasoning
and application of the analysis method of SEM-PLS.
Having identified the literature review, aims and objectives and research methodology of this
research, the fourth chapter offered explanations about the survey development and outcomes
of the pilot test. The chapter commenced by describing the pilot study process, which included
examining the pilot’s aims, the development of the construct measurement questions, the
development of other related questions, the layout of the pilot questionnaire, and content
validation of the pilot. Regarding the conceptual framework (MOSA), the construct
measurement questions were adopted from previous research studies, while related questions
were based on the research questions. Then, this chapter explained the data collection process for
the pilot phase, the sampling and sample size. The pilot questionnaire received 204 completed
responses from the UK area where the reviewed results the adoption gap between the below 50
years old and the above 50 years old age groups. Further, the diverse use pattern of the two
groups was identified. The chapter also provided analysis and findings that led to an
improvement of the final phase questionnaire.
Chapter five then provided the results of the final phase of this research. The chapter started by
providing details on the sample size and sampling process. The chapter also revealed that 984
completed responses were obtained from 50 years old and above adults residing in north London.
Then the details about the validation were explained before presenting the hypothesis testing
results. The SEM-PLS analysis results showed that MOSA can explain 76% of the intention to
use smartphones among the 50 years old and above adults and 20.8% of actual use. This chapter
also found that after the analysis, six out of the eight hypotheses were supported by the collected
data. Compatibility (COM), Observability (OB), Social Influence (SOC), Facilitating Conditions
Sutee Pheeraphuttharangkoon (2015)
The Adoption, Use and Diffusion of Smartphones among Adults over Fifty in the UK 255
(FC), Performance Expectancy (PE), Effort Expectancy (EE), and Perceived Enjoyment (ENJ)
were all found to be highly significant to explain the intention to use smartphones.
The sixth chapter then examined the evaluation outcomes and placed the results of this research
within the obtained literature within the discussion section. The first half of this chapter used
datasets from the Oxford Internet Institute and Office of National Statistic to verify the findings
of chapter 5. The analysis of both datasets verified and validated some hypothesises of MOSA;
hence confirming the possibility of the MOSA to be applied at a wider scale. The second half of
this chapter described and explained similarities and differences to the adoption, use, diffusion
and digital divide previous research studies. The comparison allowed this research to clearly
provide contributions.
Chapter seven is the final chapter of this thesis where the chapter commenced with an overall
summary of this research, followed by answering the research aim and questions. Then, the
limitations and the future directions of this research were explained.
These explanations draw this section to a close. The next section reflects upon the earlier formed
research questions.
7.3 Reflecting on the Research Questions
Having summarised the thesis, this section now focuses on answering the research questions.
Research Question 1: What factors significantly affect silver suffers when adopting
smartphones?
To answer the first question, the conceptual framework (MOSA) was developed from classic IS
theories and previous research studies. To compose the framework, some possible variables were
proposed, which are Compatibility (COM), Observability (OB), Social Influence (SOC),
Facilitating Conditions (FC), Performance Expectancy (PE), Effort Expectancy (EE), and
Perceived Enjoyment (ENJ). To analyse the results of the primary data, SEM-PLS was used that
resulted in COM, EE, FC, PE and ENJ being identified as significant factors affecting the
intention to adopt smartphones within older adults. ENJ was the strongest variable followed by
COM, PE, FC and EE respectively.
Inclusion of these variables meant that: 1) older adults used smartphones because smartphones
are compatible with their lifestyle. 2) Older adults need to have a certain level of knowledge,
time and money to use smartphones. 3) The benefits or features of smartphones lead to
smartphone adoption among older adults. 4) Smartphone’s ease of use encourages smartphone

Sutee Pheeraphuttharangkoon (2015)
The Adoption, Use and Diffusion of Smartphones among Adults over Fifty in the UK 256
adoption within older adults. 5) The pleasure or enjoyment encourages smartphone use within 50
years old and above adults.
Research Question 2: What are the features of smartphones that silver surfers used and their
frequency?
To determine the use of smartphone features 15 Likert scale questions ranging from one to seven
where one is never and seven is many times of the day were asked of only those who used a
smart phone. The features were making a phone call, SMS, emailing, taking a photograph,
filming a video, browsing and surfing websites, playing games, watching videos, mapping and
navigation, taking notes, managing appointments, using social networks, reading online news
and online magazines, using video calls, and using smartphones to contact government
authorities.
The most frequently used features (more than 3.5) were making a phone call, SMS, Emailing,
taking a photograph, browsing websites, and, managing appointment. The low frequency usage
feature was filming a video, playing games, watching videos, mapping and navigation, taking
notes, using social media, reading online news and magazines, using video call, and contract
government authorities.
The detailed answers to this question can be found in section 5.9 – Smartphone use.
Research Question 3: What are the channels of communication that influence the diffusion of
smartphones within silver surfers?
To determine the diffusion aspects of smartphone adoption, the classic theory of the Diffusion of
innovation was considered in this study. The final questionnaire provided choices for the way
that older adults were likely to receive information about smartphones in the form of word of
mouth, Professional technology review websites, high street shops, and media-TV, Radio and
Newspapers. It was learnt that for older adults who had not yet adopted smartphones, but
planned to, information regarding the smartphones was obtained from the word of mouth and
high street mobile phone shops.
Having ascertained the research questions for this research study, the next section discusses the
implications and contributions of this research study.
7.4 Implications and contribution
When considering the implications of this research, three categories were formed, which are,
industry, academia and policymaking.

Sutee Pheeraphuttharangkoon (2015)
The Adoption, Use and Diffusion of Smartphones among Adults over Fifty in the UK 257
7.4.1 Industry
This research provides practical implications for stakeholders in the smartphone industry, which
are the smartphone manufacturers, network providers, and application developers.
Our research found that information and advertising about smartphones is best disseminated
using word of mouth, TV, Radio, newspaper and online social networks. This information will
benefit smartphone manufacturers and network providers seeking to encourage smartphone
adoption within older adults by using the suggested communication channels.
Further, from MOSA it was identified that facilitating and effort expectancy are significant
variables. This implies that smartphone providers could use this finding to provide older adult
friendly sales representatives as these representatives would be of a similar age group to the
older adult consumer; hence would be able to understand the challenges and problems of older
adults better than a younger sales representative. The older representatives could provide
knowledge in an easy way for older adults. In terms of knowledge, smartphone manufacturers
could consider providing short courses on how to use smartphones for older adults that inspires
future uses of smartphones.
From the perceived enjoyment, performance expectance, and compatibility variables,
smartphone manufacturers and network providers could present the benefits of smartphones,
which are tailored more towards older adults lifestyles or situations such as, using a smartphone
for video calling older adults’ friends and family, using smartphones to encourage and promote
health and well-being or to reduce isolation problems, or using smartphones for entertainment
purposes.
This research also reviewed the factors that older adults are concerned with when purchasing a
new smartphone. Older adults were interested in price, brand, battery life, screen size, operating
systems, camera, and appearance. Therefore, to increase smartphone sales, smartphone providers
could offer older adults with larger screens, longer battery life and good camera smartphones.
Similar to smartphone providers, application developers could use the results in this research to
further develop smartphone applications. Developers could also provide knowledge, including
how to use applications and features of the application that can benefit older adults. Furthermore,
if older adults are not aware of a smartphone’s health features, the developers could provide
information and knowledge about this, which can assist in maintaining older adults’ well-being;
therefore, the application developers and related organizations could provide more information in
this regard for the older adults.

Sutee Pheeraphuttharangkoon (2015)
The Adoption, Use and Diffusion of Smartphones among Adults over Fifty in the UK 258
7.4.2 Academia
From this research study, for academia, more novel theory focused on the adoption and usage of
smart phones, but within an under-researched age group, the silver-surfers is provided. Academic
contributions will also be achieved from the conceptual model (MOSA) as the model is
emphasised upon a particular age group of society.
From a theoretical perspective, this study has explored the knowledge of the factors influencing
smartphone adoption in the UK. In the pilot phase, this research compared younger and older age
groups. From these results it was also found that there is a digital divide in smartphone adoption
within younger and older generations. The key theoretical contribution of this study is the
development of the conceptual framework of smartphone adoption using components from the
theories of UTAUT, TAM3 and DOI. This research not only composed MOSA but partially
confirmed UTAUT within a particular age group. The variables of UTAUT identified in this
research can be used in the future studies examining novel technology adoption in older adults.
This research also found that the social influence variable from UTAUT and observaribility from
DOI may not be appropriate to study technology adoption among 50+ adults. For perceived
enjoyment, this research found that the variable strongly influenced technology adoption;
therefore, future studies should consider integrating this variable.
Future research studies could also benefit from this research study’s validated questions that
represent variables drawn from MOSA. Additionally, the researchers could use the
questionnaires in appendix 4-1 and 4-2 as a guideline to study technology adoption.
From chapter 6, at the time that this research was conducted, the numbers of research studies on
smartphone adoption in Europe were limited. By referring to the outcomes of this research, this
study can be extended to Europe and provide a comparative aspect to this research.
Lastly, the results can shed light on the research related to the adoption of innovative technology
such as are ageing, the knowledge on how the older generation will adopt and use the new
technology is very important in order to increase their quality of life and wellbeing. This research
could encourage future researchers to study older adult’s adoption of novel technologies and
researchers could use MOSA as a reference.
7.4.3 Policy Makers
This research also benefits policy makers of organizations that are aiming to encourage ICT
usage within older adults, such as Age UK, as addressed in the first chapter. This research found
that smartphones have a potential to prevent or reduce problems such as, loneliness for older
adults. By using smartphones to contact friends and family, or using smartphones to monitor or
assist with health problems. In health care terms, smartphones could be used for tracking

Sutee Pheeraphuttharangkoon (2015)
The Adoption, Use and Diffusion of Smartphones among Adults over Fifty in the UK 259
physical and health related activities, for quitting smoking, or for weight monitoring. Therefore,
this research could raise the level of awareness of the policymaker that would encourage older
adults to use smartphones. Further, this research also provides a guideline for the policymakers
when considering adoption as courses are focused more towards older adult needs and
requirements or advertisements emphasising to older adults wants and needs could be provided.
For policymakers of the government, this research provides evidence that increasing numbers of
people are using smartphones. However, an interesting discovery is that only 34.7% of the older
adult population have used their phone to contact the government. Therefore, the government
could consider providing some assistance or initiating some efforts that increase the level of
awareness of smartphones within this population group.
Moreover, policymakers seeking to narrow or eliminate the digital divide could use this research
study finding on smartphones as indicators that could prove to be long term solutions. The results
could also be used for policy makers of business organizations that aim to apply smartphones for
50 years old and above adult workers by applying the confirmed variables in order to encourage
older users. Further, this research will benefit IT consultants aiming to provide appropriate
devices and guidance to entrepreneurs 50 years old and above. The consultants could understand
what 50+ adults seek when adopting and using smartphones for this research.
7.5 Limitations
“All research studies have their limitation, and the sincere investigator recognises that readers
need aid when judging the study’s validity” (Cooper & Schindler, 2013:511). Having explained
the research contribution, this section discusses this research study’s limitations.
Firstly, MOSA is composed of eight variables from classic IS theories as explained earlier.
However, from chapter 2, other variables such as image, job relevance, output quality and result
demonstrability from TAM2 are also important; therefore future research could consider
including these variables. Further, there are several IS theories that were not included in this
research, such as a model of adoption of technology in households (MATH) (Brown et al.,
2006). In addition, other field’s knowledge, such as Marketing can provide some more insights
into smartphone adoption, something that this research study could not include due to time
availability.
In terms of literature, as explained in chapter 6, several articles and documents used in this
research were from Asia which are different to Europe or UK in several perspectives such as,
economic conditions or culture. This implied that applying Asia focused papers could lead to

Sutee Pheeraphuttharangkoon (2015)
The Adoption, Use and Diffusion of Smartphones among Adults over Fifty in the UK 260
limitations in terms of forming hypothesis and conceptual framework. Due to the application of
quantitative research, this research may not capture other ideas, apart from the variables included
in MOSA and the questions in the final questionnaire. Further, cross-sectional time horizons
were applied to this research, so this research could capture just a snapshot of the phenomena. To
overcome this shortcoming, this research used secondary analysis with two datasets from ONS
and OxIS to provide the trend of smartphone adoption as in chapter 6, which has proven to be a
limitation due to the use of secondary data being utilised to verify and validate primary data.
The next limitation is about the research site. This research aimed to present a UK perspective
that was based on the participation of residents living in England, which from the pilot phase was
viewed to be an impossible task; hence seeking participants from a selected area of London. This
meant that only a certain perspective of smartphone adoption was possible with two limitations.
Firstly, since the main research site was the North of London, the network exchange and the
smartphone network exchanges were viewed to be mature in terms of network infrastructure. As
governments are increasing investments in the infrastructure, this means that other areas could
also be used to provide a more in-depth perspective of the UK. Further, due to one vicinity being
utilized in this research, generalisations about the UK were not possible.
7.6 Future Directions
Having assessed the limitations of this research study, this section will explain the future
directions of this research.
Since this research used a quantitative method to study smartphone adoption, the future direction
of this study should employ quantitative aspects along with data collections methods that can be
utilised for a qualitative study such as, interviews, observations or focus groups. By doing so,
there will be a further understanding of the knowledge regarding smartphone adoption and use.
In terms of the research site, since the final phase examined only older adults in north London,
the future directions could include examining other parts of the UK such as, in other cities or
rural areas. Further, with similar concepts drawn from MOSA there could be testing of MOSA in
another part of the world such as in other developed countries or developing countries.
In terms of innovative technology, in this case smartphones, a further study can be completed on
other mobile devices such as tablets or iPad, smart watch, or activity trackers. Future research
could explore smartphone use in particular, purposes, such as smartphone use for health and
well-being, or smartphone use for sporting purposes. Particular applications available in
smartphones could be studied further; for instance, social media or messaging services on
smartphones.

Sutee Pheeraphuttharangkoon (2015)
The Adoption, Use and Diffusion of Smartphones among Adults over Fifty in the UK 261
7.7 Recommendations
For academia, it is recommended that there should be a further extension of the MOSA to study
technologies related to smartphone within older adults. This research recommends using
variables to predict smartphone usage, such as the price of smartphones, the promotions, social
values of using a smartphone, and pressure from society.
Further, this research could not find much research on smartphone adoption from Europe or
North America. Contrastingly, there was research from Asia such as from Korea, Taiwan, China,
Malaysia and Singapore. Research could also be linked to the origin of the top smartphone
brands that most of the older adults use. For example, from Asia Samsung, Lenovo, Huawei, LG
or Sony could be considered in the context of older adults. Therefore, this research recommends
that European researchers should study mobile technology adoption that may lead to more
understanding of mobile device users and may create value in economic terms.
This research also benefits Smartphone manufacturers, application developers, and network
providers as this research shows that the aforementioned stakeholders should pay more
attention to older adult age groups. Regarding the findings of the communication channels used
to diffuse smartphones within older adults, TV programs on technologies are more compatible
with older adults’ needs and requirements. Further, older adults still prefer word of mouth, so
more communities should be formed to provide teaching and learning on innovative technologies
in order to help older adults to form an understanding such that they may be encouraged to use
innovative technology.
For smartphone providers, providing an easy mode or an older adults’ mode should be one of the
selling features such as providing large screens with larger icons for older adults who face vision
impairments as ageing occurs. For very old adults, an emergency button or dedicated online
helping centre could add more value to the smartphones. Additionally, an intelligent, personal
assistant and knowledge navigator that uses a natural language to answer questions, make
recommendations, and performs actions such as Siri from Apple iPhone should be introduced to
older adults.
For application and game developers, this research found that games were played by older adults.
Therefore, the games that can help older adults to exercise their memory may be a new market
for older adults particularly since memory problems are faced as ageing occurs.
Organizations, or Businesses that are associated with older adults, such as the NHS or retail
supermarkets should consider providing older adults compatible version applications such as a

Sutee Pheeraphuttharangkoon (2015)
The Adoption, Use and Diffusion of Smartphones among Adults over Fifty in the UK 262
shopping online application for older adults, or applications that provide information such as
health information for older adults.
What has been learnt from this study is that stakeholders should provide not only short courses
for older adults on basic smartphone use, but also for using smartphone for an older adult’s
lifestyle that is different from the younger generations.
7.8 Thesis Conclusions
This research focused on two trends that are currently occurring in society and in the technology
and telecommunications sectors-an ageing society and smartphone technology. Smartphones
provide advanced telecommunication and mobile phone functions which can provide seamless
benefits to the users and, due to medical advances and better quality of life, an ageing society.
From the statistical analysis that was completed by this research it was realized that many
individuals are connected globally due to their mobile phones. A smartphone, which is a
successor of a mobile phone, has played an important role in providing more connections that
have led to changes in the telecommunications, information and communication technologies
sectors and provided many diverse benefits to users. However, what was also learnt was that
older adults are using the smartphones that are still at a basic level for making a phone call, SMS,
email, and browsing. Older adults were also likely to use their smartphones for seeking health
related information, as a calendar or diary where the smartphone reminded them of appointments
with doctors. What was also surprising was that more than half of the 50 years old and above
adults did not use smartphones for health and well-being purposes. It can be concluded that
smartphone adoption can offer saturation levels of smartphone adoption and use within younger
adults, but there still exists a gap within older adults.
To encourage older adults to use smartphones, stakeholders such as smartphone providers and
manufacturers, should provide support for the above 50 years old adults. Furthermore,
application developers may need to provide applications specific for this group of society that are
also easy to use. This is because this group of society is very important to society and to the
economy due to its wealth creating and wealth holding potentials. Therefore, this study on
adoption for older adults is important and displays that this demographic group of society
requires and warrants attention.
Due to this study and others focused on older adults it is hoped and envisaged that there will be
more research on technologies and older adults that can improve older adult’s living standards
and lifestyles.

Sutee Pheeraphuttharangkoon (2015)
The Adoption, Use and Diffusion of Smartphones among Adults over Fifty in the UK 263
Having concluded this research study, this thesis now draws to a close and hopes that it has
informed various stakeholders of the adoption, use and diffusion of smartphones within older
adults.

Sutee Pheeraphuttharangkoon (2015)
The Adoption, Use and Diffusion of Smartphones among Adults over Fifty in the UK 264
List of References
A
Abad, M., Díaz, I. & Vigo, M. (2010). 'Acceptance of mobile technology in hedonic scenarios'.
Proceeding BCS ’10 Proceedings of the 24th BCS Interaction Specialist Group Conference, pp.
250–258. Available at: http://dl.acm.org/citation.cfm?id=2146341 [Accessed: 18 December
2014].
Agar, J. (2013). Constant touch: A global history of the mobile phone. Duxford, Cambridge, UK:
Icon Books UK.
Age UK (2011). Technology and Older People Evidence Review.
Ai, C. & Norton, E.C. (2003). 'Interaction terms in logit and probit models'. Economics Letters
80(1), pp. 123–129.
Ajzen, I. (1991). 'The theory of planned behavior'. Organizational Behavior and Human
Decision Processes 50(2), pp. 179–211. Available at:
http://linkinghub.elsevier.com/retrieve/pii/074959789190020T [Accessed: 23 July 2014].
Ajzen, I. (2006). 'Theory of planned behaviour' [Online].
Ajzen, I. & Fishbein, M. (1980). Understanding attitudes and predicting social behavior.
Englewood Cliffs, NJ: Prentice-Hall.
Akca, H., Sayili, M. & Esengun, K. (2007). 'Challenge of rural people to reduce digital divide in
the globalized world : Theory and practice'. Government Information Quarterly 24, pp. 404–413.
Alasuutari, P., Bickman, L. & Brannen, J. (2008). The SAGE handbook of social research
methods. London: SAGE Publications.
Aldhaban, F. (2012). 'Exploring the Adoption of Smartphone Technology : Literature Review'.
In: PICMET ’12. Portland, OR, USA, pp. 2758–2770.
Al-Jabri, I. & Sohail, M. (2012). 'Mobile banking adoption: application of diffusion of
innovation theory'. Journal of Electronic Commerce Research 13(4), pp. 379–391. Available at:
http://www.researchgate.net/publication/258515458_Mobile_Banking_Adoption_Application_of
_Diffusion_of_Innovation_Theory/file/3deec52bdc807da02e.pdf [Accessed: 2 January 2015].
Alkhunaizan, A. & Love, S. (2012). 'What drives mobile commerce? An empirical evaluation of
the revised UTAUT model'. International Journal of Management and Marketing Academy 2(1),
pp. 82–99. Available at: http://marcomacademy.co.uk/ijmma/What-drives-mobile-commerce-
An-empirical-evaluation-of-the-revised-UTAUT-model.pdf [Accessed: 19 October 2014].

Sutee Pheeraphuttharangkoon (2015)
The Adoption, Use and Diffusion of Smartphones among Adults over Fifty in the UK 265
Ally, M. & Gardiner, M. (2012). 'The moderating influence of device characteristics and usage
on user acceptance of Smart Mobile Devices'. In: 23rd Australasian Conference on Information
Systems. pp. 1–10.
Altena, T. (2012). 'How a Smartphone Can Benefit Your Health' [Online] Available at:
http://www.acsm.org/access-public-information/articles/2012/02/02/how-a-smartphone-can-
benefit-your-health.
Alzheimer’s Society (2013). 'Statistics- Alzheimer’s Society' [Online] Available at:
http://www.alzheimers.org.uk/statistics [Accessed: 2 February 2014].
Alzheimers.net (2013). 'What is The Difference Between Alzheimer’s and Dementia' [Online]
Available at: http://www.alzheimers.net/difference-between-alzheimers-and-dementia/
[Accessed: 5 February 2014].
Anheire, H.K. & Toepler, S. (2010). 'Digital Divide'. In: International Encyclopedia of Civil
Society. Springer US, pp. 604–609.
Armitage, C.J. & Conner, M. (2001). 'Efficacy of the Theory of Planned Behaviour: a meta-
analytic review.'. The British journal of social psychology / the British Psychological Society
40(Pt 4), pp. 471–99. Available at: http://www.ncbi.nlm.nih.gov/pubmed/11795063.
Arning, K. & Ziefle, M. (2007). 'Understanding age differences in PDA acceptance and
performance'. Computers in Human Behavior 23(6), pp. 2904–2927. Available at:
http://linkinghub.elsevier.com/retrieve/pii/S0747563206000902 [Accessed: 29 March 2014].
Arruda-Filho, E.J.M., Cabusas, J. a. & Dholakia, N. (2010). 'Social behavior and brand devotion
among iPhone innovators'. International Journal of Information Management 30(6), pp. 475–
480. Available at: http://linkinghub.elsevier.com/retrieve/pii/S026840121000037X [Accessed:
14 October 2012].
Arruda-Filho, E.J.M. & Lennon, M.M. (2011). 'How iPhone innovators changed their
consumption in iDay2: Hedonic post or brand devotion'. International Journal of Information
Management 31(6), pp. 524–532. Available at:
http://linkinghub.elsevier.com/retrieve/pii/S0268401211000673 [Accessed: 12 October 2012].
Arthur, C. (2012). 'The history of smartphones: timeline' [Online] Available at:
http://www.theguardian.com/technology/2012/jan/24/smartphones-timeline.
Australian Bureau of Statistics (2007). Household Use of Information Technology, Australia,
2006-07.
B
Bagozzi, R.P. (2011). 'Measurement and Meaning in Information Systems and Organizational
Research: Methodological and Philosophical Foundations.'. Mis Quarterly 35(2), pp. 261–292.

Sutee Pheeraphuttharangkoon (2015)
The Adoption, Use and Diffusion of Smartphones among Adults over Fifty in the UK 266
Bagozzi, R.P. & Yi, Y. (1988). 'On the evaluation of structural equation models'. Journal of the
academy of marketing science 16(1), pp. 74–94.
Balocco, R., Mogre, R., Toletti, G. & Pheeraphuttharangkoon, S. (2009). 'Mobile internet and
SMEs: a focus on the adoption'. Industrial Management & Data Systems 109(2), pp. 245–261.
Available at: http://www.emeraldinsight.com/10.1108/02635570910930127 [Accessed: 14
October 2012].
Bar-Ilan, J. (2010). 'Citations to the ‘Introduction to informetrics’ indexed by WOS, Scopus and
Google Scholar'. Scientometrics 82(3), pp. 495–506. Available at:
http://link.springer.com/10.1007/s11192-010-0185-9 [Accessed: 19 September 2014].
Barrett, L. (2011). Health and Caregiving among the 50 + : Ownership , Use and Interest in
Mobile Technology. Washington, DC.
Bauer, H. & Barnes, S. (2005). 'Driving consumer acceptance of mobile marketing: A theoretical
framework and empirical study'. Journal of Electronic Commerce Research 6(3), pp. 181–192.
Available at:
http://www.ebusinessforum.gr/old/content/downloads/Baueretal_MomMarketingConsumerAcce
pt.pdf [Accessed: 16 April 2014].
BBC (2012). 'Census 2011: UK population change' [Online] Available at:
http://www.bbc.co.uk/news/uk-20757480 [Accessed: 1 July 2014].
Beiginia, R.A., Besheli, S.A., Soluklu, E.M. & Ahmadi, M. (2011). 'Assessing the Mobile
Banking Adoption Based on the Decomposed Theory of Planned Behaviour'. European journal
of Economics, Finance and Administrative Sciences 28(28), pp. 7–15.
Bell, J. (2005). 'Doing Your Research Project: A Guide for First-Time Researchers in Education,
Health and Social Science'.
Benbasat, I. & Zmud, R. (1999). 'Empirical research in information systems: the practice of
relevance'. MIS quarterly 23(1), pp. 3–16. Available at: http://www.jstor.org/stable/249403
[Accessed: 23 July 2014].
Benjamin, K. & Wilson, S. (2005). Facts and misconceptions about age , health status and
employability. Buxton.
Besdine, R.W. (2013). 'Disorders in Older People' [Online] Available at:
http://www.merckmanuals.com/home/older_peoples_health_issues/the_aging_body/disorders_in
_older_people.html [Accessed: 2 February 2014].
Beurer-Zuellig, B. & Meckel, M. (2008a). 'Smartphones enabling mobile collaboration'. Hawaii
International Conference …, pp. 49–49. Available at:
http://ieeexplore.ieee.org/lpdocs/epic03/wrapper.htm?arnumber=4438753 [Accessed: 24
November 2014].

Sutee Pheeraphuttharangkoon (2015)
The Adoption, Use and Diffusion of Smartphones among Adults over Fifty in the UK 267
Beurer-Zuellig, B. & Meckel, M. (2008b). 'Smartphones Enabling Mobile Collaboration'.
Proceedings of the 41st Annual Hawaii International Conference on System Sciences (HICSS
2008), pp. 49–49. Available at:
http://ieeexplore.ieee.org/lpdocs/epic03/wrapper.htm?arnumber=4438753.
Bodker, M., Gimpel, G. & Hedman, J. (2009). 'Smart Phones and Their Substitutes: Task-
Medium Fit and Business Models'. 2009 Eighth International Conference on Mobile Business,
pp. 24–29. Available at:
http://ieeexplore.ieee.org/lpdocs/epic03/wrapper.htm?arnumber=5169228 [Accessed: 14 October
2012].
Boontarig, W., Chutimaskul, W., Chongsuphajaisiddhi, V. & Papasratorn, B. (2012). 'Factors
influencing the Thai elderly intention to use smartphone for e-Health services'. 2012 IEEE
Symposium on Humanities, Science and Engineering Research, pp. 479–483. Available at:
http://ieeexplore.ieee.org/lpdocs/epic03/wrapper.htm?arnumber=6268881.
Boudreau, M.-C., Gefen, D. & Straub, D.W. (2001). 'Validation in information systems research:
a state-of-the-art assessment'. Mis Quarterly, pp. 1–16.
Bouwman, H., Carlsson, C., Molina-Castillo, F.J. & Walden, P. (2007). 'Barriers and drivers in
the adoption of current and future mobile services in Finland'. Telematics and Informatics 24(2),
pp. 145–160. Available at: http://linkinghub.elsevier.com/retrieve/pii/S0736585306000384
[Accessed: 7 October 2012].
Bouwman, H. & Reuver, M. De (2011). 'Mobile TV : The Search for a Holy Grail that Isn ’ t'. In:
EuroITV’11. pp. 185–193.
Bovée, C., Voogt, J. & Meelissen, M. (2007). 'Computer attitudes of primary and secondary
students in South Africa'. Computers in Human Behavior 23(4), pp. 1762–1776.
Brace, N., Kemp, R. & Snelgar, R. (2003). PSS for psychologists: a guide to data analysis using
SPSS for windows. New York: Palgrave Macmillan.
Brandtzæg, P.B., Heim, J. & Karahasanović, A. (2011). 'Understanding the new digital divide—
A typology of Internet users in Europe'. International Journal of Human-Computer Studies
69(3), pp. 123–138. Available at:
http://linkinghub.elsevier.com/retrieve/pii/S1071581910001461 [Accessed: 18 November 2014].
Bridges, L., Rempel, H. & Griggs, K. (2010). 'Making the case for a fully mobile library web
site: from floor maps to the catalog'. Reference Services Review 38(2). Available at:
http://www.emeraldinsight.com/journals.htm?articleid=1858847&show=abstract [Accessed: 29
March 2014].
Broady, T., Chan, A. & Caputi, P. (2010). 'Comparison of older and younger adults’ attitudes
towards and abilities with computers: Implications for training and learning'. British Journal of
Educational Technology 41(3), pp. 473–485.

Sutee Pheeraphuttharangkoon (2015)
The Adoption, Use and Diffusion of Smartphones among Adults over Fifty in the UK 268
Brown, S. & Venkatesh, V. (2005). 'Model of adoption of technology in households: A baseline
model test and extension incorporating household life cycle'. MIS quarterly 29(3), pp. 399–426.
Available at: http://www.jstor.org/stable/25148690 [Accessed: 16 September 2014].
Brown, S.A., Venkatesh, V. & Bala, H. (2006). 'Household technology use: Integrating
household life cycle and the model of adoption of technology in households'. The Information
Society 22(4), pp. 205–218.
Burgess, R. (1986). Key Variables in social investigation. London: Routledge.
C
Cambridge Dictionaries Online (2015). 'silver surfer - definition in the Business English
Dictionary - Cambridge Dictionaries Online' [Online] Available at:
http://dictionary.cambridge.org/dictionary/business-english/silver-surfer [Accessed: 10 April
2015].
Carlsson, C., Carlsson, J., Hyvönen, K., Puhakainen, J. & Walden, P. (2006). 'Adoption of
Mobile Devices / Services – Searching for Answers with the UTAUT'. In: Proceedings of the
39th Hawaii International Conference on System Sciences. Hawaii, USA, pp. 1–10.
Carpenter, B.D. & Buday, S. (2007). 'Computer use among older adults in a naturally occurring
retirement community'. Computers in Human Behavior 23(6), pp. 3012–3024. Available at:
http://linkinghub.elsevier.com/retrieve/pii/S0747563206001208 [Accessed: 23 April 2013].
Castillo, S. (2012). 'The 8 Best (Free!) Health Apps' [Online] Available at:
http://www.prevention.com/health/healthy-living/smartphone-apps-your-health.
Censky, A. (2011). 'Older Americans are 47 times richer than young' [Online] Available at:
http://money.cnn.com/2011/11/07/news/economy/wealth_gap_age/index.htm.
Chaffin, A.J. & Harlow, S.D. (2005). 'Cognitive Learning Applied To Older Adult Learners and
Technology'. Educational Gerontology 31(4), pp. 301–329. Available at:
http://www.tandfonline.com/doi/abs/10.1080/03601270590916803 [Accessed: 28 October 2014].
Chang, Y.F., Chen, C.S. & Zhou, H. (2009). 'Smart phone for mobile commerce'. Computer
Standards & Interfaces 31(4), pp. 740–747. Available at:
http://linkinghub.elsevier.com/retrieve/pii/S0920548908001153 [Accessed: 20 January 2014].
Chen, J., Yen, D.C. & Chen, K. (2009). 'The acceptance and diffusion of the innovative smart
phone use: A case study of a delivery service company in logistics'. Information & Management
46(4), pp. 241–248. Available at:
http://linkinghub.elsevier.com/retrieve/pii/S0378720609000445 [Accessed: 7 October 2012].
Chen, K., Chen V., J. & Yen C., D. (2011). 'Dimensions of self-efficacy in the study of smart
phone acceptance'. Computer Standards & Interfaces (33), pp. 422–431.

Sutee Pheeraphuttharangkoon (2015)
The Adoption, Use and Diffusion of Smartphones among Adults over Fifty in the UK 269
Chen, L., Gillenson, M.L. & Sherrell, D.L. (2002). 'Enticing online consumers: an extended
technology acceptance perspective'. Information & Management 39(8), pp. 705–719. Available
at: http://linkinghub.elsevier.com/retrieve/pii/S0378720601001276.
Chen, L.S.-L. (2011). 'Applicability of the UTAUT model in playing online game through
mobile phones: Moderating effects of user experience'. First International Technology
Management Conference, pp. 625–629. Available at:
http://ieeexplore.ieee.org/lpdocs/epic03/wrapper.htm?arnumber=5996035.
Chen, W. & Hirschheim, R. (2004). 'A paradigmatic and methodological examination of
information systems research from 1991 to 2001'. Information Systems Journal 14, pp. 197–235.
Chen, Y., Gibbon, D. & Jana, R. (2009). 'Project GeoTV: a three-screen service'. In: Consumer
Communications and Networking Conference, 2009. CCNC 2009. 6th IEEE. Las Vegas, NV, pp.
1–2.
Chin, W.W. (2000). 'Frequently Asked Questions – Partial Least Squares & PLS-Graph' [Online]
Available at: http://disc-nt.cba.uh.edu/chin/plsfaq.htm.
Chin, W.W. (2001). 'PLS-Graph user’s guide, version 3.0'.
Chin, W.W. (1998). The Partial Least Squares Approach to Structural Equation Modeling,".
Modern Met. Mahwah, New Jersey: Lawrence Erlbaum Associates.
Chong, A.Y.-L., Chan, F.T.S. & Ooi, K.-B. (2012). 'Predicting consumer decisions to adopt
mobile commerce: Cross country empirical examination between China and Malaysia'. Decision
Support Systems 53(1), pp. 34–43. Available at:
http://linkinghub.elsevier.com/retrieve/pii/S0167923611002302 [Accessed: 14 October 2012].
Chong, A.Y.-L., Ooi, K.-B., Lin, B. & Bao, H. (2012). 'An empirical analysis of the determinants
of 3G adoption in China'. Computers in Human Behavior 28(2), pp. 360–369. Available at:
http://linkinghub.elsevier.com/retrieve/pii/S0747563211002135 [Accessed: 19 October 2014].
Choudrie, J. & Dwivedi, Y.K. (2006). 'Examining the socio-economic determinants of
broadband adopters and non-adopters in the United Kingdom'. In: System Sciences, 2006.
HICSS’06. Proceedings of the 39th Annual Hawaii International Conference on. IEEE, p. 85a–
85a.
Chtourou, M.S. & Souiden, N. (2010). 'Rethinking the TAM model: time to consider fun'.
Journal of Consumer Marketing 27(4), pp. 336–344. Available at:
http://www.emeraldinsight.com/10.1108/07363761011052378 [Accessed: 7 October 2012].
Chun, H., Lee, H. & Kim, D. (2012). 'The integrated model of smartphone adoption: hedonic and
utilitarian value perceptions of smartphones among Korean college students.'. Cyberpsychology,
behavior and social networking 15(9), pp. 473–9. Available at:
http://www.ncbi.nlm.nih.gov/pubmed/22817671 [Accessed: 18 January 2014].

Sutee Pheeraphuttharangkoon (2015)
The Adoption, Use and Diffusion of Smartphones among Adults over Fifty in the UK 270
Condie, R. & Munro, B. (2007). The impact of ICT in schools – a landscape review. Coventry.
Contact-the-elderly.org.uk (2015). 'Contact the Elderly Charity Links' [Online] Available at:
http://www.contact-the-elderly.org.uk/links/ [Accessed: 2 February 2015].
Cooper, D. & Schindler, P. (2013). Business Research Methods: 12th Edition. McGraw-Hill
Higher Education.
Cooper, D.R. & Schindler, P.S. (1998). Business research methods. Singapore: McGraw-Hill.
Cotten, S.R., Ford, G., Ford, S. & Hale, T.M. (2012). 'Internet use and depression among older
adults'. Computers in Human Behavior 28(2), pp. 496–499. Available at:
http://linkinghub.elsevier.com/retrieve/pii/S074756321100238X [Accessed: 1 April 2014].
Cracknell, R. (2010). The ageing population.
Cruz-Jesus, F., Oliveira, T. & Bacao, F. (2012). 'Digital divide across the European Union'.
Information & Management 49(6), pp. 278–291. Available at:
http://linkinghub.elsevier.com/retrieve/pii/S037872061200064X [Accessed: 1 December 2014].
Curwen, P. & Whalley, J. (2010). Mobile telecommunications in a high-speed world : industry
structure, strategic behaviour and socio-economic impact. Surrey: Gower Publishing Limited.
D
Dabholkar, P.A. & Bagozzi, R.P. (2002). 'An Attitudinal Model of Technology-Based Self-
Service: Moderating Effects of Consumer Traits and Situational Factors'. Journal of the Academy
of Marketing Science 30(3), pp. 184–201.
Davis, F.D. (1989). 'Perceived Usefulness, Perceived Ease of Use, and User Acceptance of
Information Technology'. MIS Quarterly (September), pp. 319–340.
Davis, F.D. (1986). Technology Acceptance Model for Empirical Testing New End-User
Information System: Theory and Results. Cambridge, MA: MIT Sloan School of Management.
Davis, F.D., Bagozzi, R.P. & Warshaw, P.R. (1992). 'Extrinsic and intrinsic motivation to use
computers in the workplace'. Journal of Applied Social Psychology 22, pp. 1111–1132.
Davis, F.D. & Venkatesh, V. (1996). 'A critical assessment of potential measurement biases in
the technology acceptance model: three experiments'. International Journal of Human-Computer
Studies 45(1), pp. 19–45. Available at:
http://linkinghub.elsevier.com/retrieve/pii/S1071581996900403.
Van Deursen, a. J. & van Dijk, J. a. (2013). 'The digital divide shifts to differences in usage'.
New Media & Society 16(3), pp. 507–526. Available at:
http://nms.sagepub.com/cgi/doi/10.1177/1461444813487959 [Accessed: 19 July 2014].

Sutee Pheeraphuttharangkoon (2015)
The Adoption, Use and Diffusion of Smartphones among Adults over Fifty in the UK 271
Dickinson, A. & Gregor, P. (2006). 'Computer use has no demonstrated impact on the well-being
of older adults'. International Journal of Human-Computer Studies 64(8), pp. 744–753.
Available at: http://linkinghub.elsevier.com/retrieve/pii/S1071581906000346 [Accessed: 14
October 2012].
Diffen (2013). 'Android vs iOS- Difference and Comparison- Diffen' [Online] Available at:
http://www.diffen.com/difference/Android_vs_iOS [Accessed: 2 February 2015].
Digitaltrends (2014). 'Android vs iOS: In-Depth Comparison' [Online] Available at:
http://www.digitaltrends.com/mobile/best-smartphone-os/ [Accessed: 2 February 2015].
Dillman, D.A. (2011). Mail and Internet Surveys: The Tailored Design Method -- 2007 Update
with New Internet, Visual, and Mixed-Mode Guide. Wiley.
Doong, S.H. & Ho, S.-C. (2012). 'The impact of ICT development on the global digital divide'.
Electronic Commerce Research and Applications 11(5), pp. 518–533. Available at:
http://linkinghub.elsevier.com/retrieve/pii/S1567422312000166 [Accessed: 2 November 2014].
Ducey, A. (2013). 'Predicting Tablet Computer Use: An Extended Technology Acceptance
Model'. University of South Florida.
Duffy, B., Smith, K., Terhanian, G. & Bremer, J. (2005). 'Comparing data from online and face-
to-face surveys'. International Journal of Market Research 47(6), p. 615.
Dunnewijk, T. & Hultén, S. (2007). 'A brief history of mobile communication in Europe'.
Telematics and Informatics 24(3), pp. 164–179. Available at:
http://linkinghub.elsevier.com/retrieve/pii/S0736585307000226 [Accessed: 17 January 2014].
Dutton, H.W., Blank, G. & Groselj, D. (2013). Cultures of the Internet : The Internet in Britain.
Oxford.
E
Easterby-Smith, M., Thorpe, R. & Lowe, A. (2006). Management Research: An introduction.
2nd Editio. Sage Publications.
Eastman, J.K. & Iyer, R. (2004). 'The elderly’s uses and attitudes towards the Internet'. Journal
of Consumer Marketing 21(3), pp. 208–220.
EndNote (2014). 'EndNote' [Online] Available at: www.endnote.com.
Europe.eu (2014). 'United Kingdom' [Online] Available at: http://europa.eu/about-
eu/countries/member-countries/unitedkingdom/index_en.htm.
F
Sutee Pheeraphuttharangkoon (2015)
The Adoption, Use and Diffusion of Smartphones among Adults over Fifty in the UK 272
Falaki, H., Mahajan, R., Kandula, S., Lymberopoulos, D., Govindan, R. & Estrin, D. (2010).
'Diversity in smartphone usage'. In: Proceedings of the 8th international conference on Mobile
systems, applications, and services - MobiSys ’10. New York, New York, USA: ACM Press, p.
179.
Faqih, K.M.S. & Jaradat, M.-I.R.M. (2015). 'Assessing the moderating effect of gender
differences and individualism-collectivism at individual-level on the adoption of mobile
commerce technology: TAM3 perspective'. Journal of Retailing and Consumer Services 22, pp.
37–52. Available at: http://linkinghub.elsevier.com/retrieve/pii/S0969698914001398 [Accessed:
7 November 2014].
Finch, J. (1986). ‘Age’, in R.G. Burgess (ed) Key Variables in Social Investigation. London:
Routledge and Kegan Paul.
Fishbein, M. & Ajzen, I. (1975). Belief, attitude, intention, and behavior: an introduction to
theory and research. New York: Addison Wesley.
Fornell, C. & Larcker, D. (1981). 'Evaluating structural equation models with unobservable
variables and measurement error.'. Journal of Marketing Research (JMR) 18(1), pp. 39–50.
Available at:
http://search.ebscohost.com/login.aspx?direct=true&profile=ehost&scope=site&authtype=crawle
r&jrnl=00222437&AN=5015357&h=OgKSbKqDCpGkI8AwgRGFG2iwXDSLbfHaoONj4lNyF
/ie1kWdZWEsraVFlCqScEazb5DlbbVC5fbHP0Y+H8uz8Q==&crl=c [Accessed: 27 April
2014].
Franceschet, M. (2009). 'A comparison of bibliometric indicators for computer science scholars
and journals on Web of Science and Google Scholar'. Scientometrics 83(1), pp. 243–258.
Available at: http://link.springer.com/10.1007/s11192-009-0021-2 [Accessed: 19 September
2014].
Friemel, T.N. (2014). 'The digital divide has grown old: Determinants of a digital divide among
seniors'. New Media & Society. Available at:
http://nms.sagepub.com/cgi/doi/10.1177/1461444814538648 [Accessed: 1 December 2014].
Fu, J.-R. (2006). 'Visual PLS: A graphic user-interface program for LVPLS 1.8—version
1.04b1'.
G
Galloway, L., Mochrie, R. & Deakins, D. (2004). 'ICT-enabled collectivity as a positive rural
business strategy'. International Journal of Entrepreneurial Behaviour & Research 10(4), pp.
247–259. Available at: http://www.emeraldinsight.com/10.1108/13552550410544213
[Accessed: 6 July 2013].
Gao, S., Chen, Z., Zheng, W. & Zhou, W. (2012). 'An exploratory study on lifestyles and the
adoption of mobile services in China'. Proceedings of the 10th International Conference on

Sutee Pheeraphuttharangkoon (2015)
The Adoption, Use and Diffusion of Smartphones among Adults over Fifty in the UK 273
Advances in Mobile Computing & Multimedia - MoMM ’12, p. 249. Available at:
http://dl.acm.org/citation.cfm?doid=2428955.2429002.
Gardner, D.G., Dukes, R.L. & Discenza, R. (1994). 'Computer use, self-confidence, and
attitudes: A causal analysis'. Computers in human behavior 9(4), pp. 427–440.
Gefen, D., Straub, D.W. & Boudreau, M.-C. (2000). 'STRUCTURAL EQUATION MODELING
AND REGRESSION : GUIDELINES FOR RESEARCH PRACTICE'. Communications of AIS
4(August), pp. 1–79.
Geographers’ A-Z Map Company (2008). London Postcode and Administrative Boundaries. 6
ed.
Gilbert, a. L. & Han, H. (2005). 'Understanding mobile data services adoption: Demography,
attitudes or needs?'. Technological Forecasting and Social Change 72(3), pp. 327–337.
Available at: http://linkinghub.elsevier.com/retrieve/pii/S0040162504001118 [Accessed: 14
October 2012].
Gilbert, N. (2001). Researching Social Life. London: Sage.
Gillet, J. (2014). 'Top 20 Global mobile operator groups by connections and revenue, Q1 2013'
[Online] Available at: watchnow4k.com/2014/11/the-tomorrow-people-season-1-episode-
22.html [Accessed: 2 February 2015].
Goldfarb, A. & Prince, J. (2008). 'Internet adoption and usage patterns are different: Implications
for the digital divide'. Information Economics and Policy 20(1), pp. 2–15. Available at:
http://linkinghub.elsevier.com/retrieve/pii/S0167624507000364 [Accessed: 1 December 2014].
Google (2015). 'Google Forms - Create and analyze surveys, for free' [Online] Available at:
http://www.google.co.uk/forms/about/ [Accessed: 18 February 2015].
Google (2011). The Mobile Movement Understanding Smartphone Users.
Gratton, C. & Jones, I. (2010). Research methods for sports studies. Taylor & Francis.
Green, M. & Rossall, P. (2013). Digital inclusion evidence review.
Greene, W. (2010). 'Testing hypotheses about interaction terms in nonlinear models'. Economics
Letters 107(2), pp. 291–296. Available at: http://dx.doi.org/10.1016/j.econlet.2010.02.014.
Greengard, S. (2009). 'Facing an age-old problem'. Communications of the ACM 52(9), p. 20.
Available at: http://portal.acm.org/citation.cfm?doid=1562164.1562173 [Accessed: 25 August
2013].

Sutee Pheeraphuttharangkoon (2015)
The Adoption, Use and Diffusion of Smartphones among Adults over Fifty in the UK 274
GSMarena (2014a). 'GPS (Global Positioning System) - Mobile terms glossary -
GSMArena.com' [Online] Available at: http://www.gsmarena.com/glossary.php3?term=gps
[Accessed: 2 August 2014].
GSMarena (2014b). 'Sensors - Mobile terms glossary - GSMAena.com' [Online] Available at:
http://www.gsmarena.com/glossary.php3?term=sensors [Accessed: 2 February 2014].
Gu, J.-C., Lee, S.-C. & Suh, Y.-H. (2009). 'Determinants of behavioral intention to mobile
banking'. Expert Systems with Applications 36(9), pp. 11605–11616. Available at:
http://linkinghub.elsevier.com/retrieve/pii/S0957417409002735 [Accessed: 14 October 2012].
Gunderson, M. (1974). 'Probit and logit estimates of labour force participation'. Industrial
Relations 19, pp. 216–220.
Gustke, C. (2010). '5 reasons to use mobile banking' [Online] Available at:
http://www.bankrate.com/finance/savings/5-reasons-to-use-mobile-banking-1.aspx.
H
Ha, I., Yoon, Y. & Choi, M. (2007). 'Determinants of adoption of mobile games under mobile
broadband wireless access environment'. Information & Management 44(3), pp. 276–286.
Available at: http://linkinghub.elsevier.com/retrieve/pii/S0378720607000055 [Accessed: 21
November 2014].
Hair, J.F., Ringle, C.M. & Sarstedt, M. (2011). 'PLS-SEM: Indeed a Silver Bullet'. The Journal
of Marketing Theory and Practice 19(2), pp. 139–152. Available at:
http://mesharpe.metapress.com/openurl.asp?genre=article&id=doi:10.2753/MTP1069-
6679190202 [Accessed: 3 March 2013].
Hardill, I. & Olphert, C.W. (2012). 'Staying connected: Exploring mobile phone use amongst
older adults in the UK'. Geoforum 43(6), pp. 1306–1312. Available at:
http://linkinghub.elsevier.com/retrieve/pii/S0016718512000760 [Accessed: 20 November 2014].
He, D. & Lu, Y. (2007). 'Consumers perceptions and acceptances towards mobile advertising: an
empirical study in China'. Wireless Communications, Networking and Mobile Computing, 2007.
WiCom 2007. International Conference on, pp. 3775–3778. Available at:
http://ieeexplore.ieee.org/xpls/abs_all.jsp?arnumber=4340709 [Accessed: 21 November 2014].
Health.gov (2010). 'Health Literacy' [Online] Available at:
http://www.health.gov/communication/literacy/quickguide/factsbasic.htm#one.
Henning, V. & Reichelt, J. (2008). 'Mendeley - A Last.fm For Research?'. 2008 IEEE Fourth
International Conference on eScience, pp. 327–328. Available at:
http://ieeexplore.ieee.org/lpdocs/epic03/wrapper.htm?arnumber=4736778 [Accessed: 14 July
2014].

Sutee Pheeraphuttharangkoon (2015)
The Adoption, Use and Diffusion of Smartphones among Adults over Fifty in the UK 275
Henseler, J., Ringle, C.M. & Rudolf, S.R. (2009). 'The use of partial least squares path modeling
in international marketing'. Advances in international marketing 20(1), pp. 277–319.
Hewson, C. (2003). Internet research methods: A practical guide for the social and behavioural
sciences. Sage.
Hewson, C., Yule, P., Laurent, D. & Vogel, C. (2003). Internet Research Methods: A Practical
Guide for the Social and Behavioural Science. London: Sage.
Hill, R., Beynon-Davies, P. & Williams, M.D. (2008). 'Older people and internet engagement:
Acknowledging social moderators of internet adoption, access and use'. Information Technology
& People 21(3), pp. 244–266. Available at:
http://www.emeraldinsight.com/10.1108/09593840810896019 [Accessed: 21 July 2014].
Hinton, P.R., Brownlow, C., McMurray, I. & Cozens, B. (2004). SPSS explained. East Sussex,
England: Routledge Inc.
Ho, S.-C., Sun, W.-Y. & Wang, Y.-M. (2012). 'Investigation of factors influencing the adoption
of mobile data services'. Proceedings of the 13th International Conference on Electronic
Commerce - ICEC ’11, pp. 1–8. Available at:
http://dl.acm.org/citation.cfm?doid=2378104.2378115.
Holzer, A. & Ondrus, J. (2011). 'Mobile application market: A developer’s perspective'.
Telematics and Informatics 28(1), pp. 22–31. Available at:
http://linkinghub.elsevier.com/retrieve/pii/S0736585310000377 [Accessed: 24 March 2014].
Honan, M. (2007). 'Apple unveils iPhone' [Online] Available at:
http://www.macworld.com/article/1054769/iphone.html.
Hulland, J. (1999). 'Use of partial least squares (PLS) in strategic management research: A
review of four recent studies'. Strategic management journal 20(2), pp. 195–204.
Hung, S., Ku, C. & Chang, C. (2003). 'Critical factors of WAP services adoption: an empirical
study'. Electronic Commerce Research and Applications 2 2, pp. 42–60. Available at:
http://www.sciencedirect.com/science/article/pii/S1567422303000085 [Accessed: 24 November
2014].
Hwang, J. (2006). 'Deconstructing the Discourse of the GlobalDigital Divide in the Age of Neo-
Liberal Global Economy'. The Pennsylvania State University.
Hyvönen, K. & Repo, P. (2005). 'The Use of Mobile Services in Finland : Adoption The Use of
Mobile Services in Finland : Adoption Challenges'. GESTS Int’l Trans. Computer Science and
Engr 20(1), pp. 166–178.
I

Sutee Pheeraphuttharangkoon (2015)
The Adoption, Use and Diffusion of Smartphones among Adults over Fifty in the UK 276
IDC (2013). 'More Smartphones Were Shipped in Q1 2013 Than Feature Phones, An Industry
First According to IDC' [Online] Available at:
http://www.idc.com/getdoc.jsp?containerId=prUS24085413 [Accessed: 28 April 2013].
IDOP (2011). Older people with type 2 diabetes : European challenges and the need for
improved care.
Im, I., Hong, S. & Kang, M.S. (2011). 'An international comparison of technology adoption'.
Information & Management 48(1), pp. 1–8. Available at:
http://linkinghub.elsevier.com/retrieve/pii/S0378720610000716 [Accessed: 19 August 2014].
Irizany, C. & Downing, A. (1997). 'Computers Enhancing the Lives of Older People'. Australian
Journal on Ageing 16(4), pp. 161–165.
Is4profit (2010). 'The Benefits of Smartphones' [Online] Available at:
http://www.is4profit.com/business-advice/it-telecoms/smartphones/the-benefits-of-
smartphones.html.
J
Jackson, S. (2011). Research Methods and Statistics: A Critical Thinking Approach. Cengage
Learning.
Jacsó, P. (2008). 'Google Scholar revisited'. Online Information Review 32(1), pp. 102–114.
Available at: http://www.emeraldinsight.com/10.1108/14684520810866010 [Accessed: 10
September 2014].
Jaradat, M. & Al-Mashaqba, A. (2014). 'Understanding the adoption and usage of mobile
payment services by using TAM3'. International Journal of Business Information Systems 16,
pp. 16–18. Available at: http://inderscience.metapress.com/index/G25M5806512G4538.pdf
[Accessed: 18 December 2014].
Joe, J. & Demiris, G. (2013). 'Older adults and mobile phones for health: a review.'. Journal of
biomedical informatics 46(5), pp. 947–54. Available at:
http://www.ncbi.nlm.nih.gov/pubmed/23810858 [Accessed: 27 March 2014].
Jupp, V. (2006). The Sage dictionary of social research methods. Sage.
K
Kang, M., Liew, B., Lim, H., Jang, J. & Lee, S. (2015). 'Investigating the Determinants of
Mobile Learning Acceptance in Korea Using UTAUT2'. In: Emerging Issues in Smart Learning.
pp. 209–216.
Kang, Y.M., Cho, C. & Lee, S. (2011). 'Analysis of factors affecting the adoption of
smartphones'. In: First International Technology Management Conference. Ieee, pp. 919–925.

Sutee Pheeraphuttharangkoon (2015)
The Adoption, Use and Diffusion of Smartphones among Adults over Fifty in the UK 277
Karahanna, E., Straub, D.W. & Chervany, N.L. (1999). 'Information technology adoption across
time : A cross-sectional comparison of Pre-Adoption and Post-Adoption Beliefs'. MIS Quarterly
23(2).
Karavidas, M., Lim, N.K. & Katsikas, S.L. (2005). 'The effects of computers on older adult
users'. Computers in Human Behavior 21(5), pp. 697–711. Available at:
http://linkinghub.elsevier.com/retrieve/pii/S0747563204000597 [Accessed: 14 October 2012].
Kargin, B. & Basoglu, N. (2007). 'Factors affecting the adoption of mobile services'. In:
PICMET 2007 Proceedings,. Portland, OR, USA, pp. 2993–3001.
Karim, N.S.A., Alias, R.A., Mokhtar, S.A. & Rahim, N.Z.A. (2009). 'Mobile Phone Adoption
and Appropriation in Malaysia and the Contribution of Age and Gender'. 2009 International
Conference on Information and Multimedia Technology, pp. 485–490. Available at:
http://ieeexplore.ieee.org/lpdocs/epic03/wrapper.htm?arnumber=5381159 [Accessed: 20
November 2014].
Katagiri, M. & Etoh, M. (2011). 'Social Influence Modeling on Smartphone Usage'. In:
International Conference on Advanced Data Mining and Applications. Beijing, pp. 292–303.
Khalifa, M. & Cheng, S. (2002). 'Adoption of mobile commerce: role of exposure'. 2013 46th
Hawaii International Conference on … 00(c), pp. 1–7. Available at:
http://www.computer.org/csdl/proceedings/hicss/2002/1435/01/14350046.pdf [Accessed: 2
January 2015].
Kijsanayotin, B., Pannarunothai, S. & Speedie, S.M. (2009). 'Factors influencing health
information technology adoption in Thailand’s community health centers: applying the UTAUT
model'. International journal of medical informatics 78(6), pp. 404–16. Available at:
http://www.ncbi.nlm.nih.gov/pubmed/19196548 [Accessed: 6 October 2014].
Kim, M., Park, J. & Paik, J. (2009). 'Factors influencing adoption of Korean 3G mobile services:
The role of relative advantages, facilitating condition and adoption barriers'. In: Advanced
Communication Technology. pp. 1392–1395.
Kim, S. (2011). 'The diffusion of the Internet: Trend and causes'. Social Science Research 40(2),
pp. 602–613. Available at: http://linkinghub.elsevier.com/retrieve/pii/S0049089X10001377
[Accessed: 18 March 2013].
Kim, S. & Garrison, G. (2008). 'Investigating mobile wireless technology adoption: An extension
of the technology acceptance model'. Information Systems Frontiers 11(3), pp. 323–333.
Available at: http://www.springerlink.com/index/10.1007/s10796-008-9073-8 [Accessed: 14
October 2012].
Kim, S.H. (2008). 'Moderating effects of Job Relevance and Experience on mobile wireless
technology acceptance: Adoption of a smartphone by individuals'. Information & Management

Sutee Pheeraphuttharangkoon (2015)
The Adoption, Use and Diffusion of Smartphones among Adults over Fifty in the UK 278
45(6), pp. 387–393. Available at:
http://linkinghub.elsevier.com/retrieve/pii/S0378720608000773 [Accessed: 5 October 2012].
Kim, Y. (2009). 'Validation of psychometric research instruments: The case of information
science'. Journal of the American Society for Information Science and Technology 60(6), pp.
1178–1191.
Kobayashi, M., Hiyama, A., Miura, T., Asakawa, C., Hirose, M. & Ifukube, T. (2011). 'Elderly
User Evaluation of Mobile Touchscreen Interactions'. In: Campos, P., Graham, N., Jorge, J.,
Nunes, N., Palanque, P., and Winckler, M. eds. Human-Computer Interaction – INTERACT 2011
SE - 9. Lecture Notes in Computer Science. Springer Berlin Heidelberg, pp. 83–99.
Koenig-Lewis, N., Palmer, A. & Moll, A. (2010). 'Predicting young consumers’ take up of
mobile banking services'. International Journal of Bank Marketing 28(5), pp. 410–432.
Available at: http://www.emeraldinsight.com/10.1108/02652321011064917 [Accessed: 14
October 2012].
Krejcie, R. V & Morgan, D.W. (1970). 'Determining sample size for research activities.'. Educ
Psychol Meas.
Kun, X., Xinyue, X. & Nan, W. (2013). 'Design of vehicle control system based on bluetooth
low energy smartphone platform'. 2013 International Conference on Electrical Machines and
Systems (ICEMS), pp. 1498–1501. Available at:
http://ieeexplore.ieee.org/lpdocs/epic03/wrapper.htm?arnumber=6754414.
Kurniawan, S. (2006). 'Mobile phone design for older persons'. Interactions 14(4), pp. 24–25.
Kurniawan, S. (2008). 'Older people and mobile phones: A multi-method investigation'.
International Journal of Human-Computer Studies 66(12), pp. 889–901. Available at:
http://linkinghub.elsevier.com/retrieve/pii/S1071581908000281 [Accessed: 27 March 2014].
Kurniawan, S., Mahmud, M. & Nugroho, Y. (2006). 'A study of the use of mobile phones by
older persons'. CHI’06 extended abstracts on …, pp. 989–994. Available at:
http://dl.acm.org/citation.cfm?id=1125641 [Accessed: 7 December 2014].
Kyriakidou, V., Michalakelis, C. & Sphicopoulos, T. (2011). 'Digital divide gap convergence in
Europe'. Technology in Society 33(3-4), pp. 265–270. Available at:
http://linkinghub.elsevier.com/retrieve/pii/S0160791X1100039X [Accessed: 1 December 2014].
L
Lawshe, C.H. (1975). 'A quantitative approach to content validity1'. Personnel psychology 28(4),
pp. 563–575.
Lee, B., Chen, Y. & Hewitt, L. (2011). 'Age differences in constraints encountered by seniors in
their use of computers and the internet'. Computers in Human Behavior 27(3), pp. 1231–1237.

Sutee Pheeraphuttharangkoon (2015)
The Adoption, Use and Diffusion of Smartphones among Adults over Fifty in the UK 279
Available at: http://linkinghub.elsevier.com/retrieve/pii/S0747563211000070 [Accessed: 14
October 2012].
Lee, H.S., Kim, T.G. & Choi, J.Y. (2012). 'A Study on the Factors Affecting Smart Phone
Application Acceptance'. In: International Conference on e-Education, e-Businee, e-
Management and e-Learning. Singapore, pp. 27–34.
Lee, S.-G., Trimi, S. & Kim, C. (2013). 'The impact of cultural differences on technology
adoption'. Journal of World Business 48(1), pp. 20–29.
Lee, Y., Kozar, K. & Larsen, K. (2003). 'The technology acceptance model: past, present, and
future'. Communication of the Association for Information Systems 12, pp. 752–780. Available
at: http://aisel.aisnet.org/cgi/viewcontent.cgi?article=3217&context=cais [Accessed: 14 August
2014].
Leong, L.-Y., Ooi, K.-B., Chong, A.Y.-L. & Lin, B. (2013). 'Modeling the stimulators of the
behavioral intention to use mobile entertainment: Does gender really matter?'. Computers in
Human Behavior 29(5), pp. 2109–2121. Available at:
http://linkinghub.elsevier.com/retrieve/pii/S0747563213001076 [Accessed: 18 December 2014].
Levine, T. & Donitsa-Schmidt, S. (1998). 'Computer use, confidence, attitudes, and knowledge:
A causal analysis'. Computers in human behavior 14(1), pp. 125–146.
Levy, H., Janke, A.T. & Langa, K.M. (2014). 'Health Literacy and the Digital Divide Among
Older Americans.'. Journal of general internal medicine. Available at:
http://www.ncbi.nlm.nih.gov/pubmed/25387437 [Accessed: 17 November 2014].
Lin, H.-F. (2011). 'An empirical investigation of mobile banking adoption: The effect of
innovation attributes and knowledge-based trust'. International Journal of Information
Management 31(3), pp. 252–260. Available at:
http://linkinghub.elsevier.com/retrieve/pii/S026840121000099X [Accessed: 16 July 2014].
Line, T., Jain, J. & Lyons, G. (2011). 'The role of ICTs in everyday mobile lives'. Journal of
Transport Geography 19(6), pp. 1490–1499. Available at:
http://linkinghub.elsevier.com/retrieve/pii/S096669231000102X [Accessed: 21 May 2013].
Little, T.D. (2013). The Oxford Handbook of Quantitative Methods, Volume 1: Foundations.
Oxford University Press.
Liu, M. (2013). 'A study of mobile sensing using smartphones'. International Journal of
Distributed Sensor Networks 2013.
Liu, Y. & Li, H. (2010). 'Mobile internet diffusion in China: an empirical study'. Industrial
Management & Data Systems 110(3), pp. 309–324. Available at:
http://www.emeraldinsight.com/doi/abs/10.1108/02635571011030006 [Accessed: 27 November
2014].

Sutee Pheeraphuttharangkoon (2015)
The Adoption, Use and Diffusion of Smartphones among Adults over Fifty in the UK 280
Loo, B.P.Y. & Ngan, Y.L. (2012). 'Developing mobile telecommunications to narrow digital
divide in developing countries? Some lessons from China'. Telecommunications Policy 36(10-
11), pp. 888–900. Available at: http://dx.doi.org/10.1016/j.telpol.2012.07.015.
Lowry, P.B. & Gaskin, J. (2014). 'Partial Least Squares (PLS) Structural Equation Modeling
(SEM) for Building and Testing Behavioral Causal Theory: When to Choose It and How to Use
It'. IEEE Transactions on Professional Communication 57(2), pp. 123–146. Available at:
http://ieeexplore.ieee.org/lpdocs/epic03/wrapper.htm?arnumber=6803892.
Lu, J., Yao, J.E. & Yu, C.-S. (2005). 'Personal innovativeness, social influences and adoption of
wireless Internet services via mobile technology'. The Journal of Strategic Information Systems
14(3), pp. 245–268. Available at:
http://linkinghub.elsevier.com/retrieve/pii/S0963868705000399 [Accessed: 6 October 2014].
M
Mallat, N. (2007). 'Exploring consumer adoption of mobile payments – A qualitative study'.
Journal of Strategic Information Systems 16, pp. 413–432.
Mallat, N., Rossi, M., Tuunainen, V.K. & Öörni, A. (2006). 'An empirical investigation of
mobile ticketing service adoption in public transportation'. Personal and Ubiquitous Computing
12(1), pp. 57–65. Available at: http://link.springer.com/10.1007/s00779-006-0126-z [Accessed:
19 October 2014].
Mann, W.C., Belchior, P., Tomita, M.R. & Kemp, B.J. (2005). 'Computer use by middle-aged
and older adults with disabilities'. Technology and Disability 17(1).
Marra, R.M. & Bogue, B. (2006). 'A Critical Assessment of Online Survey Tools'. In:
Proceedings of the 2006 WEPAN Conference.
Martin, T. (2014). 'The evolution of the smartphone' [Online] Available at:
http://pocketnow.com/2014/07/28/the-evolution-of-the-smartphone.
Maxwell, J.A. (2013). Qualitative Research Design. Thousand Oaks: SAGE Publications.
Mccarty, B. (2014). 'The History of the Smartphone' [Online] Available at:
http://thenextweb.com/mobile/2011/12/06/the-history-of-the-smartphone/.
Medicinenet (2014). 'Senior Health' [Online] Available at:
http://www.medicinenet.com/senior_health/page2.htm [Accessed: 5 January 2015].
Melenhorst, A.-S., Rogers, W. a & Bouwhuis, D.G. (2006). 'Older adults’ motivated choice for
technological innovation: evidence for benefit-driven selectivity.'. Psychology and aging 21(1),
pp. 190–5. Available at: http://www.ncbi.nlm.nih.gov/pubmed/16594804 [Accessed: 10 April
2013].

Sutee Pheeraphuttharangkoon (2015)
The Adoption, Use and Diffusion of Smartphones among Adults over Fifty in the UK 281
Mendeley (2014). 'Free Reference Manager and PDF organizer' [Online] Available at:
http://www.mendeley.com/.
Meyer, H. (2013). 'Older, healthier and working: Britons say no to retirement' [Online] Available
at: http://www.theguardian.com/society/2013/aug/24/working-britons-retirement.
Miles, M.B. & Huberman, M.A. (1994a). Qualitative Data Analysis: An Expanded Sourcebook.
Beverley Hills: Sage.
Miles, M.B. & Huberman, M.A. (1994b). Qualitative data analysis: An expanded sourcebook
(2nd ed.). 2nd ed. Thousand Oaks: Sage.
Min, M., Hong, L., Ai, J. & Wah, P. (2009). 'Conceptual Paper : Factors Affecting the Demand
of Smartphone among Young Adult .'. , pp. 44–49.
Mitzner, T.L., Boron, J.B., Fausset, C.B., Adams, A.E., Charness, N., Czaja, S.J., et al. (2010).
'Older Adults Talk Technology: Technology Usage and Attitudes.'. Computers in human
behavior 26(6), pp. 1710–1721. Available at:
http://www.pubmedcentral.nih.gov/articlerender.fcgi?artid=2956433&tool=pmcentrez&renderty
pe=abstract [Accessed: 28 March 2014].
MobileSQUARED (2010). Social networking and the rise of the smart machines – 2015AD
Innovating services , optimizing delivery.
Moore, G. & Benbasat, I. (1991). 'Development of an instrument to measure the perceptions of
adopting an information technology innovation'. Information systems research 2(3), pp. 1992–
222. Available at: http://pubsonline.informs.org/doi/abs/10.1287/isre.2.3.192 [Accessed: 24
August 2014].
Morgan, D.H.J. (1986). ‘Gender’, in Burgess, R.G. (Ed) Key Variables in Social Investigation.
London: Routledge and Kegan Paul.
Morris, H., Harvey, C. & Kelly, A. (2009). 'Journal rankings and the ABS Journal Quality
Guide'. Management Decision 47(9), pp. 1441–1451. Available at:
http://www.emeraldinsight.com/10.1108/00251740910995648 [Accessed: 19 September 2014].
Moth, D. (2013). '68% of people use their smartphone for email, 26% for shopping' [Online]
Available at: http://econsultancy.com/uk/blog/62218-68-of-people-use-their-smartphone-for-
email-26-for-shopping.
N
Nanda, P., Bos, J., Kramer, K.-L., Hay, C. & Ignacz, J. (2008). 'Effect of smartphone aesthetic
design on users’ emotional reaction: An empirical study'. The TQM Journal 20(4), pp. 348–355.
Available at: http://www.emeraldinsight.com/10.1108/17542730810881339 [Accessed: 14
October 2012].

Sutee Pheeraphuttharangkoon (2015)
The Adoption, Use and Diffusion of Smartphones among Adults over Fifty in the UK 282
Nayak, L.U.S., Priest, L. & White, A.P. (2010). 'An application of the technology acceptance
model to the level of Internet usage by older adults'. Universal Access in the Information Society
9(4), pp. 367–374.
Nerney, C. (2013). 'Which smartphone do older users like more than younger users? (You may
be surprised)' [Online] Available at: http://www.itworld.com/mobile-wireless/341795/which-
smartphone-do-older-users-more-younger-users-you-may-be-surprised.
Netlingo (2010). 'silver surfer' [Online] Available at: http://www.netlingo.com/word/silver-
surfer.php.
Newby, R., Watson, J. & Woodlitt, D. (2003). 'SME Survey Methodology: Response Rates, Data
Quality, and Cost Effectiveness'. Entrepreneurship Theory and Practice 28(2), pp. 163–172.
NHS (2013a). 'Loneliness in older people' [Online] Available at:
http://www.nhs.uk/livewell/women60-plus/pages/loneliness-in-older-people.aspx [Accessed: 2
February 2014].
NHS (2013b). 'Stroke - NHS Choices' [Online] Available at:
http://www.nhs.uk/conditions/stroke/pages/introduction.aspx [Accessed: 2 February 2014].
Nimrod, G. (2011). 'The fun culture in seniors’ online communities.'. The Gerontologist 51(2),
pp. 226–37. Available at: http://www.ncbi.nlm.nih.gov/pubmed/21030471 [Accessed: 28
November 2014].
Norris, P. (2001). Digital divide: Civic engagement, information poverty, and the Internet
worldwide. Cambridge University Press.
Nysveen, H., Pedersen, P.E. & Thorbjørnsen, H. (2005). 'Explaining intention to use mobile chat
services: moderating effects of gender'. Journal of Consumer Marketing 22(5), pp. 247–256.
Available at: http://www.emeraldinsight.com/10.1108/07363760510611671 [Accessed: 14
October 2012].
O
Oecd (2008). Broadband Growth and Policies in OECD Countries. Korea.
Ofcom (2011a). 'A nation addicted to smartphones' [Online] Available at:
http://consumers.ofcom.org.uk/2011/08/a-nation-addicted-to-smartphones/.
Ofcom (2011b). Communications Market Report : UK.
Ofcom (2011c). 'History of Cellular Services' [Online] Available at:
http://licensing.ofcom.org.uk/radiocommunication-licences/mobile-wireless-broadband/cellular-
wireless-broadband/policy-and-background/history-of-cellular-services/.
Sutee Pheeraphuttharangkoon (2015)
The Adoption, Use and Diffusion of Smartphones among Adults over Fifty in the UK 283
Ofcom (2013). Infrastructure Report 2013.
Ofcom (2014). 'Three in five adults had a smartphone in Q1 2014' [Online] Available at:
http://stakeholders.ofcom.org.uk/market-data-research/market-data/communications-market-
reports/cmr14/telecoms-networks/uk-5.81.
Office for National Statistics (2014). 'Annual Mid-year Population Estimates 2013'. . Available
at: http://www.ons.gov.uk/ons/dcp171778_367167.pdf.
Office for National Statistics (2012a). Chapter 2 : Results , 2010-based NPP Reference Volume.
Office for National Statistics (2012b). Internet Access Module: Households and Individuals.
Office for National Statistics (2013). 'Neighbourhood Statistics' [Online] Available at:
http://www.neighbourhood.statistics.gov.uk/ [Accessed: 1 February 2015].
Office for National Statistics (2015). 'Opinions and Lifestyle Survey-ONS' [Online] Available at:
http://www.ons.gov.uk/ons/rel/ghs/opinions-and-lifestyle-survey/index.html [Accessed: 2 March
2015].
Office for National Statistics (2012c). Population Ageing in the United Kingdom, its Constituent
Countries and the European Union.
Office for National Statistics (2011). 'The 2011 Census for England and Wales' [Online]
Available at: http://www.ons.gov.uk/ons/guide-method/census/2011/index.html.
Okunribido, O., Wynn, T. & Hill, H. (2010). Ageing and work-related musculoskeletal disorders
RR799 Ageing and work-related musculoskeletal disorders A review of the recent literature.
Buxton.
Oppong, N. (2013). 'Construction and Application of Conceptual Framework as Research Tool:
A Researcher’s Reflections'. Research on Humanities and Social Sciences 3(13), pp. 30–41.
Available at: http://iiste.org/Journals/index.php/RHSS/article/view/7129 [Accessed: 22
December 2014].
Orlikowski, W. & Baroudi, J.J. (1991). STUDYING INFORMATION TECHNOLOGY IN
ORGANIZATIONS: RESEARCH APPROACHES AND ASSUMPTIOhTS.
Osmana, M., Sabudina, M., Osmanb, A. & Shiang-Yena, T. (1814). 'Consumer Behaviors toward
Usage of Smartphone in Malaysia'. Age 9, pp. 158–164. Available at:
http://www.ipcsit.com/vol9/30-B033.pdf [Accessed: 11 December 2014].
Oxford Dictionaries (2013a). 'Definition of smartphone in Oxford Dictionaries' [Online]
Available at: http://oxforddictionaries.com/definition/english/smartphone.

Sutee Pheeraphuttharangkoon (2015)
The Adoption, Use and Diffusion of Smartphones among Adults over Fifty in the UK 284
Oxford Dictionaries (2013b). 'Innvation: definition of innovation in Oxford dictionary' [Online]
Available at: http://www.oxforddictionaries.com/definition/english/innovation.
Oxford Dictionaries (2014). 'Mobile phone' [Online] Available at:
http://www.oxforddictionaries.com/definition/english/mobile-phone.
P
Panneerselvam, P. (2004). Research Methodology. PHI Learning Private Limited.
Park, J., Yang, S. & Lehto, X. (2007). 'Adoption of mobile technologies for chinese consumers'.
Journal of Electronic Commerce Research 8(3), pp. 196–206.
Park, Y. & Chen, J. V. (2007). 'Acceptance and adoption of the innovative use of smartphone'.
Industrial Management & Data Systems 107(9), pp. 1349–1365. Available at:
http://www.emeraldinsight.com/10.1108/02635570710834009 [Accessed: 3 April 2012].
Partridge, L. (2010). 'Ageing and ageing-related disease' [Online] Available at:
http://www.mpg.de/16434/Ageing [Accessed: 2 February 2015].
Patel, N., Klemmer, S.R. & Parikh, T.S. (2011). 'An asymmetric communications platform for
knowledge sharing with low-end mobile phones'. Proceedings of the 24th annual ACM
symposium adjunct on User interface software and technology - UIST ’11 Adjunct, p. 87.
Available at: http://dl.acm.org/citation.cfm?doid=2046396.2046436.
PC Mag (2014). 'Push e-mail Definition from PC Magazine Encyclopedia' [Online] Available at:
http://www.pcmag.com/encyclopedia/term/49975/push-e-mail.
PCMag.com (2013). 'Smartphone Definition from PC Magazine Encyclopedia' [Online]
Available at: http://www.pcmag.com/encyclopedia/term/51537/smartphone.
Peacock, S.E. & Künemund, H. (2007). 'Senior citizens and Internet technology'. European
Journal of Ageing 4(4), pp. 191–200. Available at: http://link.springer.com/10.1007/s10433-007-
0067-z [Accessed: 5 May 2013].
Pektaş, Ş.T. & Erkip, F. (2006). 'Attitudes of design students toward computer usage in design'.
International Journal of Technology and Design Education 16(1), pp. 79–95.
Pelkmans, J. (2011). 'The GSM standard: explaining a success story'. Journal of European
Public Policy 8(3), pp. 432–453. Available at:
http://www.tandfonline.com/doi/abs/10.1080/13501760110056059 [Accessed: 29 November
2014].
Persaud, A. & Azhar, I. (2012). 'Innovative mobile marketing via smartphones: Are consumers
ready?'. Marketing Intelligence & Planning 30(4), pp. 418–443. Available at:
http://www.emeraldinsight.com/10.1108/02634501211231883 [Accessed: 13 September 2014].

Sutee Pheeraphuttharangkoon (2015)
The Adoption, Use and Diffusion of Smartphones among Adults over Fifty in the UK 285
Phonearena (2015). 'Samsung Galaxy S5 specs' [Online] Available at:
http://www.phonearena.com/phones/Samsung-Galaxy-S5_id8202.
Pitchayadejanant, K. (2011). 'Intention to use of Smart phone in Bangkok Extended UTAUT
Model by Perceived Value'. In: International Conference on Management. Istanbul, Turkey, pp.
160–172.
Plaza, I., Martín, L., Martin, S. & Medrano, C. (2011). 'Mobile applications in an aging society:
Status and trends'. Journal of Systems and Software 84(11), pp. 1977–1988. Available at:
http://linkinghub.elsevier.com/retrieve/pii/S016412121100135X [Accessed: 24 March 2014].
Punch, K.F. (2009). Introduction to research methods in education. Sage.
Punch, K.F. (2013). Introduction to social research: Quantitative and qualitative approaches.
Sage.
Putzer, G.J. & Park, Y. (2010). 'The effects of innovation factors on smartphone adoption among
nurses in community hospitals.'. Perspectives in health information management / AHIMA,
American Health Information Management Association 7, p. 1b. Available at:
http://www.pubmedcentral.nih.gov/articlerender.fcgi?artid=2805554&tool=pmcentrez&renderty
pe=abstract.
Q
Qualtrics (2015). 'Qualtrics Who We Are' [Online] Available at: http://www.qualtrics.com/about/
[Accessed: 18 February 2015].
Qurashi, A. (2012). 'The Era of the Virtual Office'. Robert Gordon University.
R
Rahmati, A., Tossell, C., Shepard, C., Kortum, P. & Zhong, L. (2012). 'Exploring iPhone Usage :
The Influence of Socioeconomic Differences on Smartphone Adoption , Usage and Usability'.
In: MobileHCI ’12 Proceedings of the 14th international conference on Human-computer
interaction with mobile devices and services. pp. 11–20.
Remenyi, D. (1998). Doing Research in Business and Management: An Introduction to Process
and Method. SAGE Publications.
Rice, R.E. & Katz, J.E. (2003). 'Comparing internet and mobile phone usage: digital divides of
usage, adoption, and dropouts'. Telecommunications Policy 27(8-9), pp. 597–623. Available at:
http://linkinghub.elsevier.com/retrieve/pii/S0308596103000685 [Accessed: 3 March 2013].
Ringle, C.M., Wende, S. & Becker, J.-M. (2005). 'Next generation path modeling' [Online]
Available at: http://www.smartpls.de.
Sutee Pheeraphuttharangkoon (2015)
The Adoption, Use and Diffusion of Smartphones among Adults over Fifty in the UK 286
Rogers, E.M. (1995). Diffusion of Innovation. New York: Free Press.
Rogers, E.M. (2003). Diffusion of Innovations. New York: Free Press.
Rogers, M. (1998). The Definition and Measurement of Innovation. Melbourne.
Rouibah, K., Abbas, H. & Rouibah, S. (2011). 'Factors affecting camera mobile phone adoption
before e-shopping in the Arab world'. Technology in Society 33(3-4), pp. 271–283. Available at:
http://linkinghub.elsevier.com/retrieve/pii/S0160791X11000455 [Accessed: 19 October 2014].
Rouse, M. (2005). 'ICT (information and communications technology or technologies)' [Online]
Available at: http://searchcio-midmarket.techtarget.com/definition/ICT [Accessed: 1 February
2015].
Rubin, A. & Babbie, E. (2011). Research methods for social work. seventh ed. Belmont, CA:
New York: Longman Publishers.
Rui, H. & Lu, L. (2009). 'The diffusion and adoption research of mobile commerce-A Review'.
Management and Service Science, 2009. MASS ’09. International Conference on, pp. 1–5.
Available at: http://ieeexplore.ieee.org/xpls/abs_all.jsp?arnumber=5301184 [Accessed: 17
August 2014].
Rushton, K. (2012). 'Number of smartphones tops one billion' [Online] Available at:
http://www.telegraph.co.uk/finance/9616011/Number-of-smartphones-tops-one-billion.html.
S
Saunders, E.J. (2004). 'Maximizing computer use among the elderly in rural senior centers'.
Educational Gerontology 30(7), pp. 573–585.
Saunders, M., Lewis, P. & Thornhill, A. (2009). Research methods for business students.
London: Pearson Education Limited.
Schrauf, R.W. & Navarro, E. (2005). 'Using existing tests and scales in the field'. Field Methods
17(4), pp. 373–393.
Selwyn, N. (2006). 'Digital division or digital decision? A study of non-users and low-users of
computers'. Poetics 34(4-5), pp. 273–292. Available at:
http://linkinghub.elsevier.com/retrieve/pii/S0304422X06000155 [Accessed: 12 October 2012].
Selwyn, N. (2004). 'The information aged: A qualitative study of older adults’ use of information
and communications technology'. Journal of Aging Studies 18(4), pp. 369–384. Available at:
http://linkinghub.elsevier.com/retrieve/pii/S0890406504000477 [Accessed: 14 October 2012].
Selwyn, N., Gorard, S., Furlong, J. & Madden, L. (2003). 'Older adults’ use of information and
communications technology in everyday life'. Ageing and Society 23(5), pp. 561–582. Available
Sutee Pheeraphuttharangkoon (2015)
The Adoption, Use and Diffusion of Smartphones among Adults over Fifty in the UK 287
at: http://www.journals.cambridge.org/abstract_S0144686X03001302 [Accessed: 5 March
2013].
Sheppard, B.H., Hartwick, J., Warshaw, P.R., Journal, T. & Dec, N. (1988). 'The Theory of
Reasoned Action : A Meta-Analysis of Past Research with Recommendations for Modifications
and Future Research'. 15(3), pp. 325–343.
Shi, W. (2009). 'An Empirical Research on Users’ Acceptance of Smart Phone Online
Application Software'. 2009 International Conference on Electronic Commerce and Business
Intelligence (2006), pp. 106–110. Available at:
http://ieeexplore.ieee.org/lpdocs/epic03/wrapper.htm?arnumber=5189497 [Accessed: 19 October
2014].
Shin, D.-H. (2012). 'Cross-analysis of usability and aesthetic in smart devices: what influences
users’ preferences?'. Cross Cultural Management: An International Journal 19(4), pp. 563–587.
Available at: http://www.emeraldinsight.com/10.1108/13527601211270020 [Accessed: 4
November 2014].
Shin, D.-H. (2009). 'Towards an understanding of the consumer acceptance of mobile wallet'.
Computers in Human Behavior 25(6), pp. 1343–1354. Available at:
http://linkinghub.elsevier.com/retrieve/pii/S0747563209000958 [Accessed: 6 October 2014].
Shin, D.-H. (2007). 'User acceptance of mobile Internet: Implication for convergence
technologies'. Interacting with Computers 19(4), pp. 472–483. Available at:
http://linkinghub.elsevier.com/retrieve/pii/S0953543807000264 [Accessed: 14 October 2012].
Shook, C.L., Ketchen, D.J., Cycyota, C.S. & Crockett, D. (2003). 'Data analytic trends and
training in strategic management'. Strategic Management Journal 24(12), pp. 1231–1237.
Sly, J.R., Miller, S.J. & Jandorf, L. (2014). 'The Digital Divide and Health Disparities: a Pilot
Study Examining the Use of Short Message Service (SMS) for Colonoscopy Reminders'. Journal
of Racial and Ethnic Health Disparities 1(4), pp. 231–237. Available at:
http://link.springer.com/10.1007/s40615-014-0029-z [Accessed: 1 December 2014].
Smallman, G. (2014). 'The benefit of apps in healthcare' [Online] Available at:
http://www.theguardian.com/healthcare-network/2012/aug/21/apps-healthcare-tablets-mobile-
smartphones.
Smith, A. (2014). Older adults and technology use: Adoption is increasing but many seniors
remain isolated from digital life.
Somekh, B. & Lewin, C. (2005). Research methods in the social sciences. Thousand Oaks:
SAGE Publications.
Song, Y. & Han, J. (2009). 'Is Enjoyment Important? An Empirical Research on the Impact of
Perceive Enjoyment on Adoption of New Technology'. In: 2009 International Conference on

Sutee Pheeraphuttharangkoon (2015)
The Adoption, Use and Diffusion of Smartphones among Adults over Fifty in the UK 288
Information Management, Innovation Management and Industrial Engineering. Ieee, pp. 511–
514.
Soule, A., Babb, P., Evandrou, M., Balchin, S. & Zealey, L. (2005). Focus on Older People.
Palgrave Macmillan.
Sourbati, M. (2009). '‘It could be useful, but not for me at the moment’: older people, internet
access and e-public service provision'. New Media & Society 11(7), pp. 1083–1100. Available at:
http://nms.sagepub.com/cgi/doi/10.1177/1461444809340786 [Accessed: 19 November 2014].
Srinuan, C., Srinuan, P. & Bohlin, E. (2012). 'An analysis of mobile Internet access in Thailand:
Implications for bridging the digital divide'. Telematics and Informatics 29(3), pp. 254–262.
Available at: http://linkinghub.elsevier.com/retrieve/pii/S0736585311000694 [Accessed: 1
December 2014].
Stump, R.L. (2008). 'Exploring the Digital Divide in Mobile-phone Adoption Levels across
Countries: Do Population Socioeconomic Traits Operate in the Same Manner as Their
Individual-level Demographic Counterparts?'. Journal of Macromarketing 28(4), pp. 397–412.
Available at: http://jmk.sagepub.com/cgi/doi/10.1177/0276146708325386 [Accessed: 26
October 2014].
Su, Q.-Y. & Li, X.-W. (2010). 'Age/Gender/Occupation and Mobile Phone Technology
Adoption: A Cross-Cultural Study in China (Beijing) And the UK (Portsmouth)'. 2010
International Conference on Management and Service Science, pp. 1–4. Available at:
http://ieeexplore.ieee.org/lpdocs/epic03/wrapper.htm?arnumber=5576826.
SurveyGizmo (2015). 'About Us | SurveyGizmo' [Online] Available at:
http://www.surveygizmo.com/company/about/ [Accessed: 20 February 2015].
SurveyMonkey (2013). 'What is the difference between Question Skip logic and Page Skip
Logic?' [Online] Available at: http://help.surveymonkey.com/articles/en_US/kb/What-is-the-
difference-between-Question-Skip-logic-and-Page-Skip-Logic.
Survey-reviews.net (2012). 'Alternative to Survey Monkey' [Online] Available at:
http://www.survey-reviews.net/index.php/2012/02/alternatives-to-survey-monkey/.
Surveys Oxford Internet (2014). 'Oxford Internet Surveys- OxIS' [Online] Available at:
oxis.oii.ox.ac.uk [Accessed: 20 December 2014].
Suyuti, A., Muslimin, Z., Kitta, I. & Mayasari, F. (2013). 'Smart Electrical Installation for
Apartment'. International Journal of Engineering and Innovative Technology (IJEIT) 3(5), pp.
274–276. Available at: http://ijeit.com/Vol 3/Issue 5/IJEIT1412201311_44.pdf [Accessed: 10
December 2014].

Sutee Pheeraphuttharangkoon (2015)
The Adoption, Use and Diffusion of Smartphones among Adults over Fifty in the UK 289
Swan, M. (2012). 'Sensor Mania! The Internet of Things, Wearable Computing, Objective
Metrics, and the Quantified Self 2.0'. Journal of Sensor and Actuator Networks 1(3), pp. 217–
253. Available at: http://www.mdpi.com/2224-2708/1/3/217/ [Accessed: 15 July 2014].
T
Tan, W.L., Lam, F. & Lau, W.C. (2007). 'An Empirical Study on 3G Network Capacity and
Performance'. IEEE INFOCOM 2007 - 26th IEEE International Conference on Computer
Communications, pp. 1514–1522. Available at:
http://ieeexplore.ieee.org/xpls/abs_all.jsp?arnumber=4215760.
Tang, C., Leung, R., Haddad, S. & Mcgrenere, J. (2012). 'What Motivates Older Adults to Learn
to Use Mobile Phones'.
Taylor, S. & Todd, P. (1995a). 'Decomposition and crossover effects in the theory of planned
behavior: A study of consumer adoption intentions'. International Journal of Research in
Marketing 12(2), pp. 137–155. Available at:
http://linkinghub.elsevier.com/retrieve/pii/016781169400019K.
Taylor, S. & Todd, P. (1995b). 'Understanding information technology usage: A test of
competing models'. Information systems research 6(2), pp. 144–176. Available at:
http://pubsonline.informs.org/doi/abs/10.1287/isre.6.2.144 [Accessed: 16 April 2014].
Teo, T. (2006). 'Attitudes toward computers: A study of post-secondary students in Singapore'.
Interactive Learning Environments 14(1), pp. 17–24.
Teo, T. (2001). 'Demographic and motivation variables associated with Internet usage activities'.
Internet Research. Available at:
http://www.emeraldinsight.com/journals.htm?articleid=863707&show=abstract [Accessed: 24
November 2014].
Teo, T.S.. & Pok, S.H. (2003). 'Adoption of WAP-enabled mobile phones among Internet users'.
Omega 31(6), pp. 483–498. Available at:
http://linkinghub.elsevier.com/retrieve/pii/S0305048303000951 [Accessed: 15 December 2014].
The Telegraph (2012). 'Census 2011: UK’s population rises 7 per cent to 63.2 million' [Online]
Available at: http://www.telegraph.co.uk/earth/greenpolitics/population/9751142/Census-2011-
UKs-population-rises-7-per-cent-to-63.2-million.html.
Thinkmobile with Google (2011). The Mobile Movement: Understanding Smartphone Users.
Ticehurst, G.W. & Veal, A.J. (2000). Business research methods: a managerial approach.
Australia: Pearson Education Limited.
Tishman, F.M., Looy, S. Van & Bruyère, S.M. (2012). Employer Strategies for Responding to an
Aging Workforce.
Sutee Pheeraphuttharangkoon (2015)
The Adoption, Use and Diffusion of Smartphones among Adults over Fifty in the UK 290
Trochim, W. (2006). 'Unobtrusive Measures' [Online] Available at:
http://www.socialresearchmethods.net/kb/unobtrus.php [Accessed: 3 April 2015].
Trochim, W.M.K. & Donnelly, J.P. (2001). 'Research methods knowledge base'.
Tsai, J.-P. (2013). 'Does design matter? Affordance perspective on smartphone usage'. Industrial
Management & Data Systems 113(9), pp. 1248–1269. Available at:
http://www.emeraldinsight.com/10.1108/IMDS-04-2013-0168 [Accessed: 23 January 2014].
Tsatsou, P. (2011). 'Digital divides revisited: what is new about divides and their research?'.
Media, Culture & Society 33(2), pp. 317–331. Available at:
http://mcs.sagepub.com/cgi/doi/10.1177/0163443710393865 [Accessed: 27 June 2013].
U
UK Data Service (2014). 'UK Data Service Discover -Opinions and Lifestyle Survey' [Online]
Available at: http://discover.ukdataservice.ac.uk/series/?sn=2000043 [Accessed: 1 May 2015].
UN DESA (2009). World Population Ageing 2009. New York.
UNDP (2003). Kenya Human Development Report: Participatory Governance for Human
Development (UNDP).
Urbach, N. & Ahlemann, F. (2010). 'Structural Equation Modeling in Information Systems
Research Using Partial Least Squares'. Journal of Information Technology Theory and
Application 11(2), pp. 5–40.
V
Venkatesh, V. (2012). 'Technology Acceptance' [Online] Available at:
http://www.vvenkatesh.com/it/organizations/Theoretical_Models.asp.
Venkatesh, V. & Bala, H. (2008). 'Technology acceptance model 3 and a research agenda on
interventions'. Decision sciences 39(2), pp. 273–315. Available at:
http://onlinelibrary.wiley.com/doi/10.1111/j.1540-5915.2008.00192.x/full [Accessed: 17
September 2014].
Venkatesh, V. & Davis, F.D. (2000). 'A Theoretical Extension of the Technology Acceptance
Model: Four Longitudinal Field Studies'. Management Science 46(2), pp. 186–204. Available at:
http://pubsonline.informs.org/doi/abs/10.1287/mnsc.46.2.186.11926.
Venkatesh, V., Morris, M.G., Davis, G.B. & Davis, F.D. (2003). 'User Acceptance of
Information Technology: Toward a Unified View'. 27(3), pp. 425–478.
Venkatesh, V., Morris, M.G., Hall, M., Davis, G.B. & Davis, F.D. (2003). 'User Acceptance of
Information Technology : Towards a Unified View'. MIS Quarterly 27(3), pp. 425–478.

Sutee Pheeraphuttharangkoon (2015)
The Adoption, Use and Diffusion of Smartphones among Adults over Fifty in the UK 291
Venkatesh, V., Thong, J.Y.L. & Xu, X. (2012). 'Consumer Acceptance and Use of Information
Technology: Extending the Unified Theory of Acceptance and Use of Technology'. MIS
Quarterly 36(1), pp. 157–178.
Verkasalo, H. (2010). 'Analysis of Smartphone User Behavior'. In: 2010 Ninth International
Conference on Mobile Business and 2010 Ninth Global Mobility Roundtable (ICMB-GMR). Ieee,
pp. 258–263.
Verkasalo, H., López-Nicolás, C., Molina-Castillo, F.J. & Bouwman, H. (2010). 'Analysis of
users and non-users of smartphone applications'. Telematics and Informatics 27(3), pp. 242–255.
Available at: http://linkinghub.elsevier.com/retrieve/pii/S0736585309000793 [Accessed: 7
October 2012].
Vertu (2015). 'Signature Touch Specifications' [Online] Available at:
http://www.vertu.com/gb/en/collections/signature-touch/specifications/ [Accessed: 1 April
2015].
Vicente, M.R. & López, A.J. (2011). 'Assessing the regional digital divide across the European
Union-27'. Telecommunications Policy 35(3), pp. 220–237. Available at:
http://linkinghub.elsevier.com/retrieve/pii/S0308596110001527 [Accessed: 1 December 2014].
Vie, S. (2008). 'Digital Divide 2.0: ‘Generation M’ and Online Social Networking Sites in the
Composition Classroom'. Computers and Composition 25(1), pp. 9–23. Available at:
http://linkinghub.elsevier.com/retrieve/pii/S8755461507000989 [Accessed: 14 November 2014].
Vieira, E.S. & Gomes, J. a. N.F. (2009). 'A comparison of Scopus and Web of Science for a
typical university'. Scientometrics 81(2), pp. 587–600. Available at:
http://link.springer.com/10.1007/s11192-009-2178-0 [Accessed: 13 September 2014].
Vinzi, E. V., Chin, W.W., Henseler, J. & Wang, H. (2010). Handbook of Partial Least Squares
Concepts, Methods and Application. London: Springer Berlin Heidelberg.
Vongjaturapat, S. & Chaveesuk, S. (2013). 'Mobile technology acceptance for library
information service: A theoretical model'. Information Society (i-Society), …, pp. 290–292.
Available at: http://ieeexplore.ieee.org/xpls/abs_all.jsp?arnumber=6636393 [Accessed: 19
October 2014].
Vuori, S. & Holmlund-Rytkönen, M. (2005). '55+ People As Internet Users'. Marketing
Intelligence & Planning 23(1), pp. 58–76. Available at:
http://www.emeraldinsight.com/10.1108/02634500510577474 [Accessed: 21 October 2012].
Vyas, B.A. (2013). 'Adoption , Use and Diffusion of Online Social Networks in the Older
Population : a UK Perspective'. Phd thesis (July), pp. 1–422.
W

Sutee Pheeraphuttharangkoon (2015)
The Adoption, Use and Diffusion of Smartphones among Adults over Fifty in the UK 292
Wac, K. (2012). 'Smartphone as a personal, pervasive health informatics services platform:
literature review'. Yearb Med Inform 7(1), pp. 83–93. Available at:
http://arxiv.org/abs/1310.7965 [Accessed: 10 December 2014].
Wagner, N., Hassanein, K. & Head, M. (2010). 'Computer use by older adults: A multi-
disciplinary review'. Computers in Human Behavior 26(5), pp. 870–882. Available at:
http://linkinghub.elsevier.com/retrieve/pii/S0747563210000695 [Accessed: 6 October 2012].
Warschauer, M. (2004). Technology and social inclusion: Rethinking the digital divide.
Watson, C., McCarthy, J. & Rowley, J. (2013). 'Consumer attitudes towards mobile marketing in
the smart phone era'. International Journal of Information Management 33(5), pp. 840–849.
Available at: http://linkinghub.elsevier.com/retrieve/pii/S0268401213000868 [Accessed: 20
March 2014].
West, D.M. (2015). Digital divide: Improving Internet access in the developing world through
affordable services and diverse content. Washington, DC.
Whalen, J. (2013). 'Health Care Apps That Doctors Use' [Online] Available at:
http://www.wsj.com/articles/SB10001424052702303376904579137683810827104.
White, H., McConnell, E., Clipp, E., Bynum, L., Teague, C., Navas, L., et al. (1999). 'Surfing the
Net in Later Life: A Review of the Literature and Pilot Study of Computer Use and Quality of
Life'. Journal of Applied Gerontology 18(3), pp. 358–378. Available at:
http://jag.sagepub.com/cgi/doi/10.1177/073346489901800306 [Accessed: 22 July 2014].
Wilkinson, D. & Birmingham, P. (2003). Using research instruments: A guide for researchers.
Psychology Press.
William J. Wales, Vinit Parida & Patel, P.C. (2013). 'Too much of a good thing? absorptive
capacity, firm performance, and the moderating role of entrepreneurial orientation'. Strategic
Management Journal 343(September 2005), p. 12.
Willis, S. (2006). 'Beyond the ‘digital divide’: Internet diffusion and inequality in Australia'.
Journal of Sociology 42(1), pp. 43–59. Available at:
http://jos.sagepub.com/cgi/doi/10.1177/1440783306061352 [Accessed: 12 May 2013].
Wong, K.K.-K. (2013). 'Partial least squares structural equation modeling (PLS-SEM)
techniques using SmartPLS'. Marketing Bulletin 24(1), pp. 1–32.
Wu, J.-H. & Wang, S.-C. (2005). 'What drives mobile commerce?'. Information & Management
42(5), pp. 719–729. Available at:
http://linkinghub.elsevier.com/retrieve/pii/S0378720604000904 [Accessed: 3 October 2012].
Wu, J.-H., Wang, S.-C. & Lin, L.-M. (2007). 'Mobile computing acceptance factors in the
healthcare industry: a structural equation model.'. International journal of medical informatics

Sutee Pheeraphuttharangkoon (2015)
The Adoption, Use and Diffusion of Smartphones among Adults over Fifty in the UK 293
76(1), pp. 66–77. Available at: http://www.ncbi.nlm.nih.gov/pubmed/16901749 [Accessed: 7
August 2014].
Wu, Y., Tao, Y. & Yang, P. (2007). 'Using UTAUT to explore the behavior of 3G mobile
communication users'. 2007 IEEE International Conference on Industrial Engineering and
Engineering Management, pp. 199–203. Available at:
http://ieeexplore.ieee.org/lpdocs/epic03/wrapper.htm?arnumber=4419179.
X
Xu, Q., Mao, Z.M., Arbor, A., Erman, J., Park, F., Gerber, A., et al. (2011). 'Identifying Diverse
Usage Behaviors of Smartphone Apps'. In: IMC’11. Berlin, Germany, pp. 329–344.
Xue, L., Yen, C.C., Chang, L., Chan, H.C., Tai, B.C., Tan, S.B., et al. (2012). 'An exploratory
study of ageing women’s perception on access to health informatics via a mobile phone-based
intervention.'. International journal of medical informatics 81(9), pp. 637–48. Available at:
http://www.ncbi.nlm.nih.gov/pubmed/22658778 [Accessed: 8 April 2013].
Y
Yang, K.C.C. (2005). 'Exploring factors affecting the adoption of mobile commerce in
Singapore'. Telematics and Informatics 22(3), pp. 257–277. Available at:
http://linkinghub.elsevier.com/retrieve/pii/S0736585304000619 [Accessed: 16 October 2014].
Yoon, J., Yoon, T.E. & George, J.F. (2011). 'Anticipating information needs for senior portal
contents'. Computers in Human Behavior 27(2), pp. 1012–1020. Available at:
http://linkinghub.elsevier.com/retrieve/pii/S0747563210003729 [Accessed: 1 December 2014].
You, J., Lee, J. & Park, C. (2011). 'Factors Influencing Adoption and Post-Adoption of Smart
Phone'. International Conference on Software and Computer Applications 9, pp. 108–112.
Available at: http://www.ipcsit.com/vol9/20-B009.pdf [Accessed: 8 August 2014].
Yu, C.-S. (2012). 'Factors affecting individuals to adopt mobile banking: Empirical evidence
from the UTAUT model'. Journal of Electronic Commerce Research, pp. 104–121. Available at:
http://www.jecr.org/sites/default/files/13_3_p01_0.pdf [Accessed: 23 November 2014].
Yuan, M.J. (2005). 'What Is a Smartphone' [Online] Available at:
http://www.oreillynet.com/pub/a/wireless/2005/08/23/whatissmartphone.html.
Z
Zeni, M., Zaihrayeu, I. & Giunchiglia, F. (2014). 'Multi-device activity logging'. Proceedings of
the 2014 ACM International Joint Conference on Pervasive and Ubiquitous Computing Adjunct
Publication - UbiComp ’14 Adjunct, pp. 299–302. Available at:
http://dl.acm.org/citation.cfm?doid=2638728.2638756.

Sutee Pheeraphuttharangkoon (2015)
The Adoption, Use and Diffusion of Smartphones among Adults over Fifty in the UK 294
Zhang, L., Zhu, J. & Liu, Q. (2012). 'A meta-analysis of mobile commerce adoption and the
moderating effect of culture'. Computers in Human Behavior 28(5), pp. 1902–1911. Available at:
http://linkinghub.elsevier.com/retrieve/pii/S0747563212001367 [Accessed: 14 October 2012].
Zhou, T. (2008). 'Exploring Mobile User Acceptance Based on UTAUT and Contextual
Offering'. 2008 International Symposium on Electronic Commerce and Security, pp. 241–245.
Available at: http://ieeexplore.ieee.org/lpdocs/epic03/wrapper.htm?arnumber=4606063
[Accessed: 14 October 2012].
Zhou, T. (2013). 'Understanding the effect of flow on user adoption of mobile games'. Personal
and ubiquitous computing. Available at: http://link.springer.com/article/10.1007/s00779-012-
0613-3 [Accessed: 9 November 2014].
Zhou, T., Lu, Y. & Wang, B. (2010). 'Integrating TTF and UTAUT to explain mobile banking
user adoption'. Computers in Human Behavior 26(4), pp. 760–767. Available at:
http://linkinghub.elsevier.com/retrieve/pii/S0747563210000154 [Accessed: 11 October 2012].
Ziefle, M. & Bay, S. (2005). 'How older adults meet complexity: Aging effects on the usability
of different mobile phones'. Behaviour & Information Technology 24(5), pp. 375–389. Available
at: http://www.tandfonline.com/doi/abs/10.1080/0144929042000320009 [Accessed: 9 November
2014].
Zikmund, W.G., Babin, B.J., Carr, J.C. & Griffin, M. (2009). Business Research Methods.
South-Western Cengage Learning.

Sutee Pheeraphuttharangkoon (2015)
The Adoption, Use and Diffusion of Smartphones among Adults over Fifty in the UK 295
Appendices
2-1 Literature Reviewed Smartphone Technology Adoption/Usage/Diffusion -Literature Review
Literature An area of
research
Article Title Research purpose/Research finding
(Park & Chen,
2007)
Smartphone
adoption
Acceptance and
adoption of the
innovative use of
smartphone
A survey of 820 US doctors and nurses to investigate human
motivations affecting an adoption decision for smartphone among
medical doctors and nurses. The results found behavioural intention
to use smartphones was affected by PU and attitude, and PEOU
affects attitude.
(Bouwman et al.,
2007)
Mobile services Barriers and drivers in
the adoption of
current and future
mobile services in
Finland
A survey of 484 Finish Consumers, this research studied 6 mobile
services- mobile travel service, GPRS, mobile surveillance,
traditional and advance entertainment and m-commerce service
bundles, where both the barriers (physical, cognitive, security and
economic) and benefits (perceived entertainment value and
perceived flexibility) of mobile services in Finland were identified.
The research found that different services have different adoption
factors.
(Shin, 2009) Mobile Payment Towards an
understanding of the
consumer acceptance
of mobile wallet
A survey of 296 Consumers in Korea, this study validated a
comprehensive model of consumer acceptance in the context of
mobile payment, where the results found that Perceived Usefulness,
Perceived Ease of Use, Perceived Security, and Trust affect a
consumer’s intention when using mobile payments.
(J. Chen et al., Smartphone The acceptance and A survey of 274 workers from 5 Taiwan logistic companies, to study
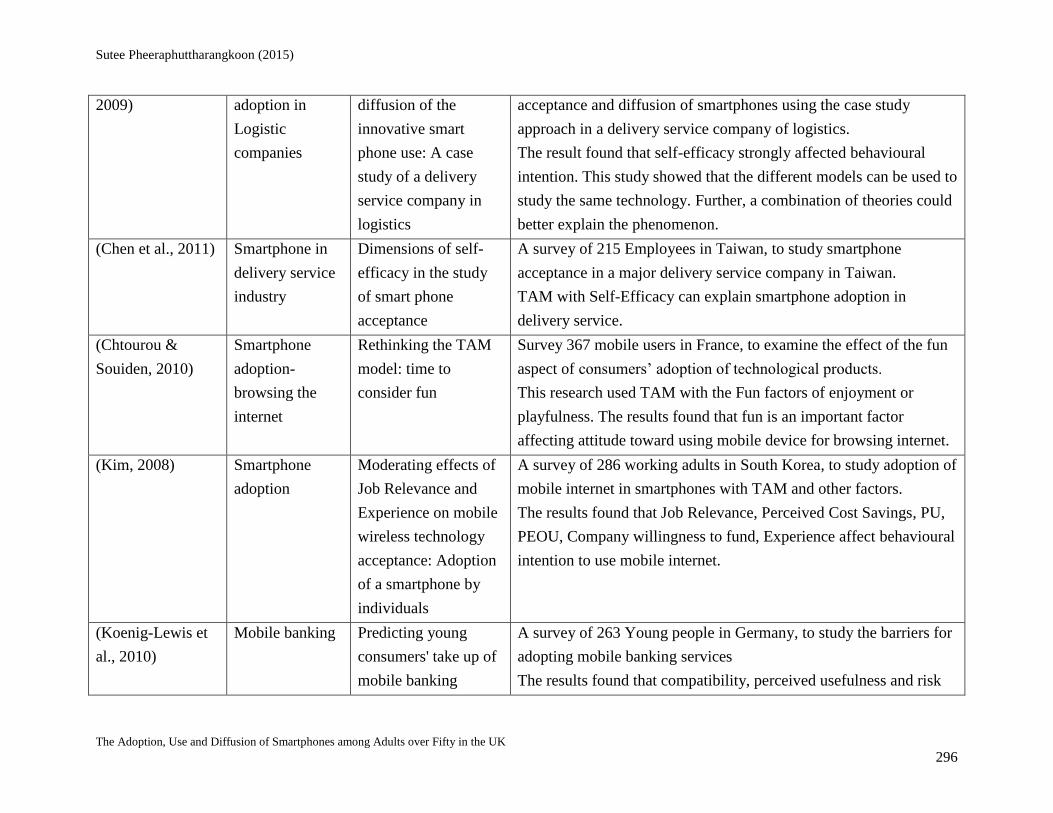
Sutee Pheeraphuttharangkoon (2015)
The Adoption, Use and Diffusion of Smartphones among Adults over Fifty in the UK 296
2009) adoption in
Logistic
companies
diffusion of the
innovative smart
phone use: A case
study of a delivery
service company in
logistics
acceptance and diffusion of smartphones using the case study
approach in a delivery service company of logistics.
The result found that self-efficacy strongly affected behavioural
intention. This study showed that the different models can be used to
study the same technology. Further, a combination of theories could
better explain the phenomenon.
(Chen et al., 2011) Smartphone in
delivery service
industry
Dimensions of self-
efficacy in the study
of smart phone
acceptance
A survey of 215 Employees in Taiwan, to study smartphone
acceptance in a major delivery service company in Taiwan.
TAM with Self-Efficacy can explain smartphone adoption in
delivery service.
(Chtourou &
Souiden, 2010)
Smartphone
adoption-
browsing the
internet
Rethinking the TAM
model: time to
consider fun
Survey 367 mobile users in France, to examine the effect of the fun
aspect of consumers’ adoption of technological products.
This research used TAM with the Fun factors of enjoyment or
playfulness. The results found that fun is an important factor
affecting attitude toward using mobile device for browsing internet.
(Kim, 2008) Smartphone
adoption
Moderating effects of
Job Relevance and
Experience on mobile
wireless technology
acceptance: Adoption
of a smartphone by
individuals
A survey of 286 working adults in South Korea, to study adoption of
mobile internet in smartphones with TAM and other factors.
The results found that Job Relevance, Perceived Cost Savings, PU,
PEOU, Company willingness to fund, Experience affect behavioural
intention to use mobile internet.
(Koenig-Lewis et
al., 2010)
Mobile banking Predicting young
consumers' take up of
mobile banking
A survey of 263 Young people in Germany, to study the barriers for
adopting mobile banking services
The results found that compatibility, perceived usefulness and risk

Sutee Pheeraphuttharangkoon (2015)
The Adoption, Use and Diffusion of Smartphones among Adults over Fifty in the UK 297
services significantly influence mobile banking adoption.
(Shin, 2007) Mobile internet User acceptance of
mobile Internet:
Implication for
convergence
technologies
A survey of 515 Consumers in South Korea, TAM was used, where
Perceived availability, Perceived quality, Perceived Enjoyment and
Social pressure examined the adoption of mobile internet.
The results showed that the variables significantly affected attitude.
However, Perceived usefulness and Perceived enjoyment of use did
not significantly affect Intention.
(Verkasalo et al.,
2010) Mobile
application
Analysis of users and
non-users of
smartphone
applications
A survey of 579 panellists in Finland, this study examined the
adoption of new mobile application, game, internet and map.
The research found that perceived technological barriers negatively
affect behavioural control, perceived usefulness was linked to
behavioural control except for gaming, and perceived enjoyment and
usefulness significantly affected the intention to use applications
(Wu & Wang,
2005)
Mobile
commerce
What drives mobile
commerce?
A survey of 310 m- commerce users in Taiwan, to study mobile
commerce using TAM, DOI, perceived risk and cost factors.
The results found that Perceived risk, Cost, Compatibility and
Perceived usefulness significantly affected behavioural intention to
use mobile commerce.
(Chong, Chan, et
al., 2012)
Mobile
commerce
Predicting consumer
decisions to adopt
mobile commerce:
Cross country
empirical examination
between China and
Malaysia
A survey of 394 consumers in Malaysia (172) and China (222), to
examine the adoption of mobile commerce in Malaysia and China.
This research found that apart from variables from TAM, Trust,
Cost, Social influence and variety of services can influence mobile
commerce. Culture can also affect the adoption.

Sutee Pheeraphuttharangkoon (2015)
The Adoption, Use and Diffusion of Smartphones among Adults over Fifty in the UK 298
(Kang et al., 2011) Smartphone
adoption and
their features
Analysis of factors
affecting the adoption
of smartphones
A survey of 100 students in South Korea, TAM was used to
investigate factors affecting the adoption of smartphone and features
of the smartphones.
The research found that around half of responses used smartphones.
Wireless internet, design, multimedia, application, after service, and,
interface were important for adoptions. Perceived usefulness and
Perceived ease of use also affect Behaviour Intention to use
smartphones.
(Kim & Garrison,
2008)
Mobile internet Investigating mobile
wireless technology
adoption: An
extension of the
technology acceptance
model
A survey of 58 graduate students in Korea, to use TAM as a core
theory with other factors to examine Mobile wireless adoption such
as cellular and PDA.
This study found that the model can explain 58.7% of the
behavioural intention. And confirm that TAM can still be used to
explain mobile wireless technology.
(Nysveen et al.,
2005)
Mobile
messaging
services
Explaining intention
to use mobile chat
services: moderating
effects of gender
A survey of 684 mobile chat service users in Norway, to investigate
the moderating effects of gender in explaining the intention to use
mobile chat services.
This research found that social norms and intrinsic motives such as
enjoyment were important for female users, while extrinsic motives
such as usefulness and expressiveness were important for males.
The model could explain 71% of the intention to use the service in
females and 68.2% of intention to use the service in males.
(Mallat et al.,
2006)
Mobile ticketing An empirical
investigation of
mobile ticketing
A survey of 47 business school students in Finland, to study mobile
ticketing service adoption in public transportation.
The research found that compatibility is a major factor. Others

Sutee Pheeraphuttharangkoon (2015)
The Adoption, Use and Diffusion of Smartphones among Adults over Fifty in the UK 299
service adoption in
public transportation
variable such as trust, mobility, social influence also important for
the adoption. The model can explain around 56% of intention to use
the mobile ticket.
(Lee et al., 2012) Smartphone
Applications
A Study on the
Factors Affecting
Smart Phone
Application
Acceptance
A survey of 215 college students and office workers in Korea, this
research used UTAUT, credibility and personalization to investigate
smartphone application adoption.
The results found that personalization influenced performance
expectancy. This research also investigated the user behaviour on
smartphone applications and the length of application usage.
(Venkatesh et al.,
2012)
Mobile Internet Consumer Acceptance
and Use of
Information
Technology:
Extending the Unified
Theory of Acceptance
and Use of
Technology
A survey of 1,512 mobile internet consumers in Hong Kong, this
used UTAUT2 to study acceptance and use of technology in a
consumer context.
This research showed that UTAUT2’s Performance expectancy,
Effort expectancy, Social Influence, Facilitating Conditions,
Hedonic Motivation, Price Value, and Habit affect mobile internet
acceptance. Following adjustment, the model could explain 74 % of
behavioural intention.
(Alkhunaizan &
Love, 2012)
Mobile
Commerce
What drives mobile
commerce? An
empirical evaluation
of the revised UTAUT
model
A survey of 547 smartphone users in Saudi Arabia, this examined
factors affecting m-commerce in Saudi Arabia
This research found that cost, effort expectancy and performance
expectancy influence intention to use mobile commerce. The model
explained 38 % of m-commerce usage intention (Pitchayadejanant,
2011)
Compare
adoption
between iPhone
Intention to use of
Smart phone in
Bangkok Extended
A survey of 408 smartphone users in Thailand, this study used
UTAUT to identify the use of smartphones - iPhone and Black
Berry in Thailand

Sutee Pheeraphuttharangkoon (2015)
The Adoption, Use and Diffusion of Smartphones among Adults over Fifty in the UK 300
and Blackberry UTAUT Model by
Perceived Value
This research found that Facilitating Conditions and Perceived
Values affected behavioural intention to use smartphones.
(Zhou et al., 2010) Mobile Banking Integrating TTF and
UTAUT to explain
mobile banking user
adoption
A survey of 250 phone users and students in China, this research
from China explained mobile banking adoption. This research was
important as it emphasized the use of a smartphone feature
The study found that Task technology fit, Performance expectancy,
and Social influence intention, drawn from UTAUT use mobile
banking. The model can explain 57.5% or user adoption of mobile
banking.
(Song & Han,
2009)
Smartphone
applications
Is Enjoyment
Important? An
Empirical Research
on the Impact of
Perceive Enjoyment
on Adoption of New
Technology
A survey of 570 consumers in South Korea, this study from South
Korea, examined the adoption of smartphone applications
The results showed that the quality of content of application
influenced user performance expectancy through enjoyment.
(Kijsanayotin et
al., 2009)
Using IT in
Health
Factors influencing
health information
technology adoption
in Thailand's
community health
centers: applying the
UTAUT model
A survey of 1323 patients in Thailand, this study from Thailand
studied factors influencing health IT adoption in the community
health centres
This research found that adoption is influenced by UTAUT’s
performance expectancy, effort expectancy, social influence and
voluntariness. The actual use is influenced by intention to use,
facilitating conditions and IT experiences. The model can explain
27% of the IT usage and 54% of intention to use the IT.
(Shi, 2009) Mobile An Empirical A survey of 653 application users in China, this study from China

Sutee Pheeraphuttharangkoon (2015)
The Adoption, Use and Diffusion of Smartphones among Adults over Fifty in the UK 301
Application Research on Users'
Acceptance of Smart
Phone Online
Application Software
used UTAUT to examine smartphone software adoption
The research found that UTAUT’s Performance Expectancy, Effort
Expectancy and Facilitating Conditions affect behavioural intention.
Moreover, Perceived Enjoyment influence Performance Expectancy.
(Zhou, 2008) Mobile
Commerce
Exploring Mobile
User Acceptance
Based on UTAUT and
Contextual Offering
A survey of 250 phone users and students in China, this study again
from China studied UTAUT’s significant factors influencing user
acceptance of mobile commerce
The result found that UTAUT’s performance expectancy,
facilitating conditions, social influence and contextual offer
significantly affected the user acceptance of mobile commerce
intention. The model can explain 76.2% of intention to use the m-
commerce
(Park et al., 2007) Mobile
communication
Technology
Adoption of mobile
technologies for
Chinese consumers
A survey of 221 online panellists in China, this was a Chinese study
of mobile communication technology adoption
This research found that UTAUT’s Performance Expectancy, Effort
Expectancy and Social Influence affect the attitude to use the
technology. Moreover, gender and education levels significantly
moderated the UTAUT factors.
(Carlsson et al.,
2006)
Adoption of
smartphone both
devices and
services
Adoption of Mobile
Devices / Services –
Searching for
Answers with the
UTAUT
A survey of 157 mobile consumers in Finland, this Finnish study
examined mobile device adoption using UTAUT in organizations
The results found that performance expectancy and effort
expectancy affect behavioural intention.
(He & Lu, 2007) Mobile
Advertisement
Consumers
perceptions and
A survey of 243 individuals in China, this Chinese study explored
the consumer's perceptions and acceptance of mobile advertising in

Sutee Pheeraphuttharangkoon (2015)
The Adoption, Use and Diffusion of Smartphones among Adults over Fifty in the UK 302
acceptances towards
mobile advertising: an
empirical study in
China
the SMS The research found that performance expectations, social influence,
and user's permission had significant effects on behavioural
intention. Facilitating conditions and behavioural intention also had
significant effects on user behaviour. The models can explain up to
66.3 % of m-advertising intention and 45% of actual usage
(Xue et al., 2012) Health
informatics via a
mobile
An exploratory study
of ageing women's
perception on access
to health informatics
via a mobile phone-
based intervention.
A survey of 700 older adult women (50+) in Singapore, To examine
the perceived attitudes and readiness of women aged 50 years and
above on adopting a mobile phone-based intervention.
The research found that perceived usefulness and perceived ease of
use, compatibility and subjective norm can be used to predict the
adoption intention of the technology. The model could explain 88%
of the intention to use a mobile phone-based intervention.
(Nayak et al.,
2010)
Internet usage An application of the
technology acceptance
model to the level of
Internet usage by
older adults
A survey of 592 older adults (60-88) in UK, used TAM and
demographic variables to understand the factors that influence
internet usage among older adult (60-80)
The research found that attitude towards using the internet and good
health status could predict the level of internet usage. Moreover,
attitude, usefulness, good health and gender (males) could affect
internet activity. The model could predict 20.5% of internet usage
(time in hours) and 24.2% of Internet usage (activity level)
(Boontarig et al.,
2012)
Smartphone
adoption of e-
health service
Factors influencing
the Thai elderly
intention to use
smartphone for e-
A survey of 31 elderly adults in Thailand, this examined the factors
that influenced the Thai older adults' population’s intention to use
smartphones as tools for e-Health services.
Of the UTAUT, the results showed that Effort Expectancy,
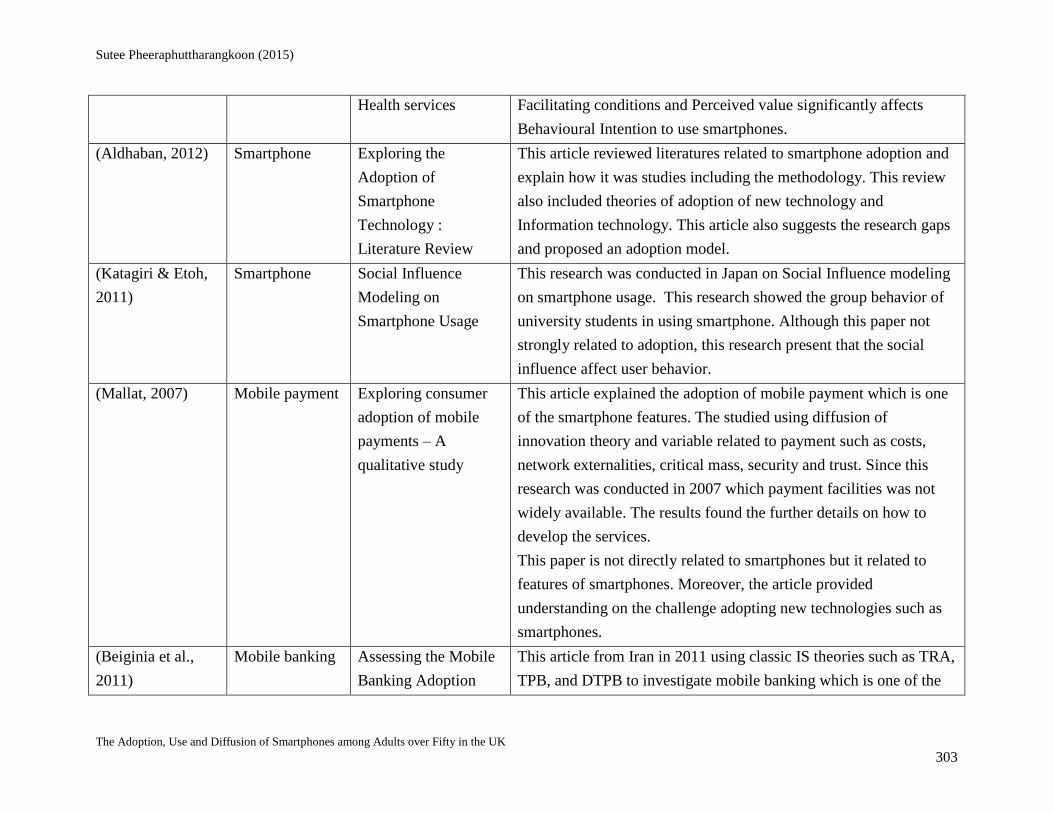
Sutee Pheeraphuttharangkoon (2015)
The Adoption, Use and Diffusion of Smartphones among Adults over Fifty in the UK 303
Health services Facilitating conditions and Perceived value significantly affects
Behavioural Intention to use smartphones.
(Aldhaban, 2012) Smartphone Exploring the
Adoption of
Smartphone
Technology :
Literature Review
This article reviewed literatures related to smartphone adoption and
explain how it was studies including the methodology. This review
also included theories of adoption of new technology and
Information technology. This article also suggests the research gaps
and proposed an adoption model.
(Katagiri & Etoh,
2011)
Smartphone Social Influence
Modeling on
Smartphone Usage
This research was conducted in Japan on Social Influence modeling
on smartphone usage. This research showed the group behavior of
university students in using smartphone. Although this paper not
strongly related to adoption, this research present that the social
influence affect user behavior.
(Mallat, 2007) Mobile payment Exploring consumer
adoption of mobile
payments – A
qualitative study
This article explained the adoption of mobile payment which is one
of the smartphone features. The studied using diffusion of
innovation theory and variable related to payment such as costs,
network externalities, critical mass, security and trust. Since this
research was conducted in 2007 which payment facilities was not
widely available. The results found the further details on how to
develop the services.
This paper is not directly related to smartphones but it related to
features of smartphones. Moreover, the article provided
understanding on the challenge adopting new technologies such as
smartphones.
(Beiginia et al.,
2011)
Mobile banking Assessing the Mobile
Banking Adoption
This article from Iran in 2011 using classic IS theories such as TRA,
TPB, and DTPB to investigate mobile banking which is one of the

Sutee Pheeraphuttharangkoon (2015)
The Adoption, Use and Diffusion of Smartphones among Adults over Fifty in the UK 304
Based on the
Decomposed Theory
of Planned Behaviour
smartphone features. With 425 questionnaires distributed and
LISREL 8.8 and SPSS, the research found that the planned behavior
model and decomposed theory of the planned behavior model could
largely explain the phenomenal.
This research provided example of using classical IS theories to
investigate one of the features of the smartphone adoption.
Moreover, this research provided the list of the questions linked to
variables and using SEM to analyze the model.
(Bouwman &
Reuver, 2011)
Mobile TV Mobile TV : The
Search for a Holy
Grail that Isn’t
Mobile TV, one of the smartphone apps that allow users to watch
TV on their smartphones, is one of the features of a smartphone.
This article aimed to study Mobile TV adoption and logged user’s
behavior to gain understanding. The research based on TAM and
adopted variable such as personal innovativeness, alone, social and
transit. The log method was tested with 118 respondents and the
adoption was examined with 515 survey responses. The results
showed that the mobile TV was mainly used for short clips and the
users would adopt if they were convinced that the mobile TV would
replace the current TV.
This article is support the concept to use TAM with external
variables. Moreover, this article illustrates one of the benefits of
smartphones.
(Gu et al., 2009) Mobile Banking Determinants of
behavioral intention to
mobile banking
This study focused on banking service on smartphones. The aim of
this paper was to examine and validate determinants of user’s
intention to mobile banking. This research applied social influence,
system quality, self-efficacy, facilitating conditions, familiarity with

Sutee Pheeraphuttharangkoon (2015)
The Adoption, Use and Diffusion of Smartphones among Adults over Fifty in the UK 305
bank, situational normality, structural assurances, calculative-based
trust, trust, perceived ease of use and perceived usefulness. This
research received 910 responses and analyzed with SEM. The
results found that self-efficiency was the strongest variable
influenced intention.
This article benefits chapter 2 in terms of support the idea to
combine theories and list of questions.
(Arruda-Filho &
Lennon, 2011)
Smartphone How iPhone
innovators changed
their consumption in
iDay2: Hedonic post
or brand devotion
This article focused on iPhone usage by analyzing posts on the
iPhone community website. The research found that innovative
users adopt and use new technology for hedonic experiences and
social positioning. The results found that innovative users preferred
really new innovation not the upgrade version.
This article provided the example of smartphone adoption and the
reasons on adoption.
(Arruda-Filho et
al., 2010)
Smartphone Social behavior and
brand devotion among
iPhone innovators
This paper aimed to investigate smartphone based on functional or
utilitarian needs. This research applied netnographic , analyzing
content on websites, as evident on iPhone usage. The results showed
that innovators adopt and use new technology because utilitarian and
experiential outcomes. Moreover, the utilitarian users also had
hedonic and social factors applied in theirs consumption patterns.
(Balocco et al.,
2009)
Mobile internet Mobile internet and
SMEs: a focus on the
adoption
This article aimed to investigate adoption of mobile internet and
application of SMEs under corporate environment and decision-
making process. This study received 646 surveys from Italian SMEs
and 28 case studies. The results found that the adoption of the
application still limited. The solutions suggested were divided into

Sutee Pheeraphuttharangkoon (2015)
The Adoption, Use and Diffusion of Smartphones among Adults over Fifty in the UK 306
connectivity-based and application based. Moreover, the research
found the reasons of not adopts the technology which were lacking
of knowledge and not perceiving the benefits of the application.
(Bauer & Barnes,
2005)
Mobile
marketing
Driving consumer
acceptance of mobile
marketing: A
theoretical framework
and empirical study
The purpose of this paper was to investigate the factors that
encourage consumers to adopt mobile phone as a means of
communicating promotional content. The research applied TRA to
explain the phenomenal. With 1,028 responses, the research found
that entertainment and information values were the strongest drivers
of the acceptance of the mobile phones.
This study supported concept to combine two or more theories to
explain technology adoption.
(Beurer-Zuellig &
Meckel, 2008b)
Smartphone Smartphones Enabling
Mobile Collaboration
This research aimed to assess the impact of smartphones and the
incorporated mobile email functionality on the performance of
employee and on firm performance. This study received survey
results from 16 German companies. The results showed that mobile
email influence on performance and attitude towards technology
affect perceived performance gains. This research confirmed that
smartphone have potential to improve and accelerate work
processes.
This study illustrated the benefits of smartphones on working
environment which 50+ people may receive benefits.
(Bodker et al.,
2009)
Smartphone
benefits
Smart Phones and
Their Substitutes:
Task-Medium Fit and
Business Models
This article aimed to improve the understanding of the role of
substitutes, device content fit issues and implications for businesses
of smartphones. This study applied prospect theory, media richness
theory and business models to investigate the phenomenal with

Sutee Pheeraphuttharangkoon (2015)
The Adoption, Use and Diffusion of Smartphones among Adults over Fifty in the UK 307
longitudinal study. This research focused on smartphone’s features
such as email, SMS, Internet Omnipresence, Camera, GPS and
MP3. The results found that smartphones are suitable devices for
businesses and businesses should be informed on benefits of them.
(You et al., 2011) Smartphone Factors Influencing
Adoption and Post-
Adoption of Smart
Phone
This article aimed to develop a research model of smartphones
adoption both before and after adoption. The first survey before the
adoption was 628 response, the second survey was 286 responses
after the adoption. The article applied TAM, DOI, social image, cost
and emotion. The results found that relative advantage, aesthetics
and social image was positively support intention. The intention is
positively to the usage. Switching cost is positively related to
continue adoption intention.
(Gilbert & Han,
2005) Mobile data Understanding mobile
data services
adoption:
Demography,
attitudes or needs?
This longtitudium research started in 2000 aim to study mobile data
service. This research divided mobile phone usage into 5 categories,
technology, mobile professionals, sophisticates, socialites, and
lifestyles. This research applied four small studies. Firstly, SMS and
WAP adoption behavior were study use focus group with 20 GSM
subscribers and 198 Survey from undergraduate and postgraduate
student from Singapore. The second and third focus on mobile
entertainment use 45 focus group and 300 mobile users. The fourth
study focused on comparison between Singapore and Malaysia wit
290 and 140 surveys.
(Ho et al., 2012) Mobile data Investigation of
factors influencing the
adoption of mobile
This paper investigated factors that affect consumers’ intention to
use mobile data service. The theoretical framework was composed
by technology acceptance and economics perspectives. This study

Sutee Pheeraphuttharangkoon (2015)
The Adoption, Use and Diffusion of Smartphones among Adults over Fifty in the UK 308
data services applied 310 surveys in late 2010. The results showed that perceived
service availability was positively impact ease of use and perceived
usefulness of mobile data services. And perceived usefulness of
mobile data positively affected intention to use mobile data.
(Hyvönen & Repo,
2005)
Mobile service The Use of Mobile
Services in Finland :
Adoption The Use of
Mobile Services in
Finland : Adoption
Challenges
This article focused on mobile services in Finland. With 582 survey
response in 2005 from panelist who use mobile phones to access
email and internet. The result found that the mobile service does not
take place as straightforwardly as the diffusion of innovation
proposes. Young people were more likely to use mobile services
than older people. The reasons to use mobile service were such as
ease of use, convenience, saving time, entertainment, and
enjoyment.
(Kargin &
Basoglu, 2007)
Mobile service Factors affecting the
adoption of mobile
services
This article focused on mobile service adoption by using value
added services. This study started from using interview with 12
users- 6 experienced and 6 novice users. The results found that Ease
of use and usefulness were perceived as most significant adoption
factors in mobile service usage. Other suggested factors were
content, social influences, mobility, cost, enjoyment, and, user
characteristics.
(Kim et al., 2009) Mobile service Factors influencing
adoption of Korean
3G mobile services:
The role of relative
advantages,
facilitating condition
This research examined use of 3G service as known as data services
using DoI- Facilitating condition, Relative advantages, and,
adoption barriers. The survey to 500 Korean users, age between 15
and 49 was applied with SPSS and AMOS. The results show that
innovativeness compare with 2G affected both willingness to
subscribe and use, handset replacement service affect only willing to

Sutee Pheeraphuttharangkoon (2015)
The Adoption, Use and Diffusion of Smartphones among Adults over Fifty in the UK 309
and adoption barriers subscribe, and, cost pressure and uncertainty also affected on both
willingness to subscribe and use. This article also show how to
implement DoI to mobile adoption researches.
(Rui & Lu, 2009) Mobile
commerce
The diffusion and
adoption research of
mobile commerce-A
Review
This paper aimed to review the literature on diffusion and adoption
of mobile commerce. From literature review, the paper found the
current problems in research, provide a source of idea for the
understanding of the key factors for diffusion and adoption of
mobile commerce and the whole process from adoption to diffusion
of mobile commerce. This paper form a table match which theory
was used with which mobile research such as TAM was used with
research on handset device, m-commerce adoption, m-internet, and
advance mobile service.
(Rui & Lu, 2009) Smartphone Importance of positive
reputation for
Smartphone adoption
This research aimed to investigate the importance of positive
reputation from external experience sources for diffusion of a
smartphone. This study the reputation source into, personal, expert,
consumers, and mass media. With 53 pilot surveys and conjoint
analysis from SPSS18.0, the research found that the prior experience
of consumer groups was the most importance for purchasing
decision and the potential of adoption. Moreover, early adopters and
female consumers give more importance on the prior consumers’
opinions. The reputation from experts and mass media were quite
low compare with that from consumers and personal group.
(Zhang et al.,
2012)
Mobile
commerce
A meta-analysis of
mobile commerce
adoption and the
This research aims to explain the factors influencing mobile
commerce adoption. This research applied TAM, DOI, Cost, Risk,
Trust, and, perceived enjoyment for conceptual model. This article

Sutee Pheeraphuttharangkoon (2015)
The Adoption, Use and Diffusion of Smartphones among Adults over Fifty in the UK 310
moderating effect of
culture
also statically relative article in terms of sample size, area, and,
culture. With literature review from 53 articles, this research found
that the extended TAM model can fit with this research. Perceived
cost, perceived risk, trust, and enjoyment were important for mobile
commerce adoption.
(Chun et al., 2012) Smartphone The integrated model
of smartphone
adoption: hedonic and
utilitarian value
perceptions of
smartphones among
Korean college
students.
With 239 Korean college students and survey, this study proposed
the adoption model with social influences, perceived technicality,
hedonic and utilitarian. This research found that the adoption was
highly influenced by social influences and self-image. Moreover, a
smartphone can be considered as symbolic product to enhance the
group status.
Older Adults/Age Related Studies -Literature Review
Literature Article Title Research purpose/Research finding
(Karavidas et al.,
2005)
The effects of computers on older
adult users
This research investigate the effects of computer anxiety and computer
knowledge on self-efficacy and life satisfaction within the retired older
adults (aged 53-88). With 222 questionnaire and path analysis, the research
found that computer use helped to reduce computer anxiety and rise self-
efficacy, then, increase life satisfaction. Moreover, females reported more
computer anxiety and less knowledge than males. This research also
provide a guideline for usage section which for older adults they may use
the technology on health, news, hobbies, investments and travel. And the
computer can be used as email, browsing internet, learning new skills and
others.
(Lee et al., 2011) Age differences in constraints
encountered by seniors in their use
of computers and the internet
This study aimed to explain older computer users’ restrictions at various
age stages (the pre-senior, the young-old, and the older-old). With 243
survey response, 50- 93 year old, and one-way analysis, this research found

Sutee Pheeraphuttharangkoon (2015)
The Adoption, Use and Diffusion of Smartphones among Adults over Fifty in the UK 311
that there were four dimensions of constraints, intrapersonal, interpersonal,
structural and functional constraints. Moreover, older people may face
diverse barriers at different age stages such as the older-old users were face
with a much higher level of challenge to start learning and using technology
than pre-senior groups. This also show that older adults frequently
experienced a high level of personal anxiety or stress and had limited self-
confidence in dealing with new technology. This article support the idea of
older people may face problem with new technology such as smartphones.
(Selwyn, 2004) The information aged: A
qualitative study of older adults'
use of information and
communications technology
This paper aimed to study old people on the reason on use or not use ICT,
the nature of the use and the support of the use, and the outcomes and life-
fit of older adults for ICTs. From 35 interviews from 60+ adults, this
research found that older adults were alienated from or unable to use new
technologies. Older people with some physiological and psychological
reasons such as poor vision, memory, and dexterity were less use new
technologies
(Wagner et al.,
2010)
Computer use by older adults: A
multi-disciplinary review
This article reviews the existing research on computer usage by older adults
and provide holistic view on the field by using Social Cognitive Theory.
With 151 article from 1990-2008 from related fields such as business,
information technology, social sciences, and education, this research found
that the number of article related to older adults was increased
continuously. In terms of field of study, Human computer interaction was
the highest to 33 in 2005-2008, Gerontology was round 12 and IS was
around 7 at the same period. Others results include summary on most
common computer uses for older adults, barriers to computer use, variables
affect personal behavior.
(Dickinson &
Gregor, 2006)
Computer use has no
demonstrated impact on the well-
being of older adults
This interesting article provide that view that computer usage were not
directly well-being of older adults. This article reviewed that previous
researches on older adults and technology and explain the weak points of
the conclusion of those researches.
(Cotten et al.,
2012)
Internet use and depression among
older adults
The research from US found that the 50+ adults and use technology to
reduce depression problems. This can provide another benefit of technology
for older adults
(Smith, 2014) Older adults and technology use: This recent report from US in 2014 showed that although more and more

Sutee Pheeraphuttharangkoon (2015)
The Adoption, Use and Diffusion of Smartphones among Adults over Fifty in the UK 312
Adoption is increasing but many
seniors remain isolated from
digital life
old adults used technology but there is the existing gap. The broadband and
internet gap was wider than the cell phone gap.
(Joe & Demiris,
2013)
Older adults and mobile phones
for health: a review.
This article review the research in health care domain that use mobile
phone to help older adults. There were twenty one article address using
mobile phone that can be categorize. The groups were such as using phone
on diabetes care, Alzhimer’s care, and osteoarthritis care.
(Hardill & Olphert,
2012)
Staying connected: Exploring
mobile phone use amongst older
adults in the UK
This article aims to explore the ways mobile phone were included in
everyday life of older people in UK. The usage including connected their
friend and family, taking photo, access internet. This article also reviewed
the reasons on not to used mobile phone such as too complicated, too
expensive and prefer private life.
Digital Divide -Literature Review
Literature Article Title Research purpose/Research finding
(Sly et al., 2014) The Digital Divide and Health
Disparities: a Pilot Study
Examining the Use of Short
Message Service (SMS) for
Colonoscopy Reminders
This research studied on whether the use of SMS appointment reminder
could help colonoscopy completion. This research was the pilot phase with
25 case studies. The cases were divided to two groups, received SMS and
not received SMS. The results showed that 46.2% participants completed a
colonoscopy compared with 72.7% of the SMS group. Therefore, it can be
seen that technology divide could affect health care significantly.
(Cruz-Jesus et al.,
2012)
Digital divide across the European
Union
This article is one of the most referenced on digital divide. This article
studied 27 countries in the European Union. The article conclude that a
digital gap still exist within the EU countries.
(Vie, 2008) Digital Divide 2.0: “Generation
M” and Online Social Networking
Sites in the Composition
Classroom
This research is focus on the problem that young students have more
technology knowledge than their teachers moreover, the classroom content
and facility may not up to date. Currently, there are much more available
study material such as online social networking websites, podcasts, audio
mash-ups, blogs, and wikis. Therefore, teachers should familiar with the
technology to provide more efficiency teaching.
(West, 2015) Digital divide: Improving Internet
access in the developing
world through affordable services
This article provide the global view of digital divide and provide benefits
guideline of the technology- internet connection, for developing countries.
The authors addressed the barrier such as cost of the devices and services,

Sutee Pheeraphuttharangkoon (2015)
The Adoption, Use and Diffusion of Smartphones among Adults over Fifty in the UK 313
and diverse content reliability of the infrastructure, and the problem in terms of languages. If
the government of the developing countries manage to improve the gap,
they will received the benefits such as economic growth, improvement in
health care and education, and increase in civic education, governance and
social cohesion.
(Levy et al., 2014) Health Literacy and the Digital
Divide Among Older Americans
Internet could be the source of information about health, this article focus
on health literacy of older adults (65+) and internet usage. This research
was the longitudinal survey of 1,584 American older adults. The results
found that older adults with low health literacy was less related to use
internet for finding health information. This research support that idea that
knowledge is one of the main factors that lead to digital divide.
(Goldfarb &
Prince, 2008)
Internet adoption and usage
patterns are different: Implications
for the digital divide
This research studied on internet adoption and usage patterns by focusing
on income and education. The results showed that people with high-
income, and hi-education were likely to adopt to internet compare with the
low-income and less-education. However, the low income and low
education groups was like to spend more time on internet.
(Willis, 2006) Beyond the 'digital divide':
Internet diffusion and inequality in
Australia
This research from Australia focusing on household income, age, education
and occupation. The 5 years period survey data found that more and more
Australian adopted to internet. However, older people was the groups that
resist to change with difficulty to learn new skill that lead to digital divide.
(Selwyn, 2006) Digital division or digital
decision? A study of non-users
and low-users of computers
This paper study using or not using new technology such as computers and
Internet. With 1001 adults survey in England and Wales and 100 follow-up
in depth interview. This research found that in 2006 around 38.4% or the
response never used a computer in life time and 46.7% used a computer at
least fairly often. Around 10% have used a computer but not for last 12
months. The results also show that the number of older adult (61+) was
very high in non-user section and very low for uses a computer at least
fairly often. The reasons on decide to not use the computers were such as
no interest/motivation, too old, no need, no skills, no access, and too busy.
This paper conclude that digital divide sometime cause by personal
decision to not use computers. This paper provided a good list of reason on
not use a technology which used in questionnaire.
(Akca et al., 2007) Challenge of rural people to This article reviewed theories and guideline to reduce the digital gap among

Sutee Pheeraphuttharangkoon (2015)
The Adoption, Use and Diffusion of Smartphones among Adults over Fifty in the UK 314
reduce digital divide in the
globalized world : Theory and
practice
countryside people. The paper introduced advantage of ICTs for rural areas
such as e-trade, training and knowledge transfer, advertisement of tourism,
or Geographic information system for management. The paper suggested
the take-off model which targeted groups such as students, youth or women
in communities used the places such as schools or women society centers
and projects from governments.
This paper benefits chapter 1 in terms of illustrating digital gaps and the
facts that ICT is less adopted in countryside.
(Stump, 2008) Exploring the Digital Divide in
Mobile-phone Adoption Levels
across Countries: Do Population
Socioeconomic Traits Operate in
the Same Manner as Their
Individual-level Demographic
Counterparts?
This article used secondary data to study mobile phone adoption using
demographic variables age, education and income. This research applied
170 counties and found that mobile phone likely to be adopt in countries
with older populations with high education and income. This article
provided the idea to use secondary data to examine smartphone adoption.
(van Deursen &
van Dijk, 2013)
The digital divide shifts to
differences in usage
This research from the Netherlands come with the question that why people
with low level education or disables spend more of their time on internet.
The general conclusion was when internet mature the usage could reflect
the real life society. People will use internet to compensate what their miss. (Rice & Katz,
2003)
Comparing internet and mobile
phone usage: digital divides of
usage, adoption, and dropouts
This research compare adoption of technologies which was mobile phone
and internet and found that the gap between mobile phone user and non-
user was related to income, work status and marital. The gap of continue
use and dropout of mobile phone user was related to income. (Friemel, 2014) The digital divide has grown old:
Determinants of a digital divide
among seniors
This research is quite recent on digital divide from Switzerland with 1,105
responses. This research found that the digital divide gap was still exist
particularly among old seniors (70+).
Methodology Related Studies – Literature Review
Publication Year Author(s) Article Title Aims/Method/Findings
Communications
of AIS
2000 Gefen, David
Straub,
Detmar W.
STRUCTURAL
EQUATION
MODELING AND
Structured Equation Modeling (SEM) is one of the important
analysis techniques using in Information System research. This
paper showed the example of how to analyse data using

Sutee Pheeraphuttharangkoon (2015)
The Adoption, Use and Diffusion of Smartphones among Adults over Fifty in the UK 315
Boudreau,
Marie-
Claude
REGRESSION :
GUIDELINES FOR
RESEARCH
PRACTICE
covariance-based SEM and Partial-Least-Squares-based SEM.
The article also discussed and compared linear regression
models and provided the guideline on how to select the
appropriate techniques.
This article provided the very useful information as a guideline
and supporting document on how and why PLS was selected.
Journal of
Information
Technology
Theory and
Application
2010 Urbach, Nils
Ahlemann,
Frederik
Structural Equation
Modeling in
Information Systems
Research Using Partial
Least Squares
This article presented the study of SEM in terms of fundamental
knowledge and statistic of the researches in Information system.
This research collected the statistic from two journals,
Information Systems Research and Management Information
Systems Quarterly (MISQ) during 1994 to 2008 to show the
numbers of research using SEM both PLS and CBSEM. The
results showed that the numbers of using PLS and SEM have
been increased in the last 10 years.
This article not only provided knowledge on using SEM and
PLS but also supported the method to use PLS to analyze the
results in chapter 5.
The Journal of
Marketing
Theory and
Practice
2011 Hair, Joe F.
Ringle,
Christian M.
Sarstedt,
Marko
PLS-SEM: Indeed a
Silver Bullet
As Structural Equation modeling (SEM) was selected as the
main technique to analyse the model. This PLS-SEM: Indeed a
silver bullet provided the simple and details way on interpret the
information received from PLS software. This article firstly
explained the overview of SEM, the algorithm of PLS-SEM,
step by step to calculate the algorithm, comparison of PLS-SEM
and CB-SEM, Evaluation of measurement model, and the
explain on bootstrapping.

Sutee Pheeraphuttharangkoon (2015)
The Adoption, Use and Diffusion of Smartphones among Adults over Fifty in the UK 316
This article shard a very bright light on the PLS-SEM technique
and this article were used as a guidebook in chapter 3, 4 and 5.

Sutee Pheeraphuttharangkoon (2015)
The Adoption, Use and Diffusion of Smartphones among Adults over Fifty in the UK 317
3-1 Content Validation Form
Content Validation of the Questionnaire I would like to ask for your co-operation in completing the form below. Your help is required as
an expert and not as a consumer or smartphone user. This means that you will be required to
provide opinions or your views to questions, choices and statements in this form. For your
information, this form contains 27 questions and 23 construct statements. For example in section
0, you have to judge whether the following question is essential, useful but not essential or not
necessary. To provide your opinion, please insert a check mark, or cross in the box on your left
hand side.
Section 0 Example
Question Your suggestion
0. Please state your gender a. Male b. Female
This question is
Essential
Useful but not
essential
Not necessary
Suggestion:
If any of the questions are confusing and need re-wording, or you are aware of any other
improvements that are needed, please provide your comment/s or suggestion/s in the left hand
side boxes or free space in the right hand boxes. If you would like to suggest any new question/s
please add it/them in the provided space at the end of this form.
Your feedback and critique are much appreciated as this will enable me to improve and validate
the content of the questionnaire.

Sutee Pheeraphuttharangkoon (2015)
The Adoption, Use and Diffusion of Smartphones among Adults over Fifty in the UK 318
Section 1 Background Information
Question Your suggestion
1. Please state the age group that you belong to a. Under 20 b. 20-29 c. 30-39 d. 40-49 e. 50-59 f. 60-69 g. 70-79 h. 80-89 i. Over 90
This question is
Essential
Useful but not
essential
Not necessary
Suggestion:
2. Please state your gender a. Male b. Female
This question is
Essential
Useful but not
essential
Not necessary
Suggestion:
3. Please select your ethnicity a. White British b. Other white background c. Mixed White & Black African d. Mixed White and Asian e. Other mixed background f. Asian/Brit Indian g. Asian/Brit Pakistani h. Chinese i. Japanese j. Other Asian background k. Black/Brit African l. Other…
This question is
Essential
Useful but not
essential
Not necessary
Suggestion:

Sutee Pheeraphuttharangkoon (2015)
The Adoption, Use and Diffusion of Smartphones among Adults over Fifty in the UK 319
4. Please state your highest level of education a. Higher Degree/Postgraduate Degree (MBA, PhD, MD,
MA, MSc) b. 1st Degree (BA/ BSc) c. HND/HNC/Teaching d. A-Level e. BTEC/College Diploma f. GCSE/ O Level g. Other…
This question is
Essential
Useful but not
essential
Not necessary
Suggestion:
5. Please indicate where you live in Camden a. Fortune Green b. West Hampstead c. Kilburn d. Frognal and Fitzjohns e. Swiss Cottage f. Hampstead Town g. Belsize h. Highgate i. Gospel Oak j. Haverstock k. Kentish Town l. Camden Town with Primrose Hill m. Cantelowes n. St Pancras and Somers Town o. Regent’s Park p. Bloomsbury q. King’s Cross r. Holborn and Covent Garden
This question is
Essential
Useful but not
essential
Not necessary
Suggestion:
6. What is your current employment status? a. Pensioner 65+ b. Retired (Under 65 Years Old) c. Employed full time d. Employed part time
This question is
Essential
Useful but not

Sutee Pheeraphuttharangkoon (2015)
The Adoption, Use and Diffusion of Smartphones among Adults over Fifty in the UK 320
e. Self-employed f. Own my own business g. Unemployed (for medical reasons) h. Unemployed (Redundant) i. Unemployed (for less than 6 months) j. Unemployed (for more than 6 months) k. Student (Part-time) l. Student (Full-time)
essential
Not necessary
Suggestion:
7. Please state your current occupation. If you are of retired/pensioner status, please select the occupation you held for the majority of your working life.
a. Academic/Teacher b. Agricultural/Forestry/Fishery c. Clerk d. Craft/Trade e. Freelance f. Legislator/Manager g. Plant/Machine Operator h. Services/Sales i. Student j. Freelance k. Other …
This question is
Essential
Useful but not
essential
Not necessary
Suggestion:
8. Which of the following do you think best describes your state of health?
a. Excellent b. Good c. Poor
This question is
Essential
Useful but not
essential
Not necessary
Suggestion:
Section 2 Do you have a smartphone?
Question and explanation of this question Your suggestion
A smartphone is a type of mobile handheld device. It allows
you to make telephone calls, send and receive e-mail,
This question is

Sutee Pheeraphuttharangkoon (2015)
The Adoption, Use and Diffusion of Smartphones among Adults over Fifty in the UK 321
download and use Applications (Apps), use the internet and
Voice Over Internet Protocols (Skype). Examples are Apple
iPhone, BlackBerry, HTC phones, Samsung Galaxy phones,
Nokia N and E series or mobile phone using Android.
9. Do you have a smartphone? a. Yes b. No, I do not have a smartphone yet, but I plan to have
one c. No, and I do not intend to, or plan to have a
smartphone
Essential
Useful but not
essential
Not necessary
Suggestion:
Section 3 General details regarding the smartphone
Question Your suggestion
10. How long have you been using a smartphone? a. Less than 6 months b. 6 months to 1 year c. 1 year to 2 years d. 2 years to 3 years e. Over 3 years
This question is
Essential
Useful but not
essential
Not necessary
Suggestion:
11. What is the brand of your smartphone(s)? (You may choose more than one option)
a. iPhone b. Samsung c. Sony d. HTC e. LG f. Blackberry g. Motorola h. Nokia i. Alcatel j. Huawei k. Asus l. Acer
This question is
Essential
Useful but not
essential
Not necessary
Suggestion:

Sutee Pheeraphuttharangkoon (2015)
The Adoption, Use and Diffusion of Smartphones among Adults over Fifty in the UK 322
m. Philips n. Sharp o. Vertu p. ZTE q. Other…
12. Who is the network provider of your smartphone(s)? (You may choose more than one option)
a. 3 (Three UK) b. Bemilo c. EE d. Giffgaff e. Lebara f. Lyca g. O2 h. Orange i. T-Mobile j. Talkmobile k. Tesco Mobile l. Toggle m. Virgin Media n. Vodafone o. Other…
This question is
Essential
Useful but not
essential
Not necessary
Suggestion:
13. How do you pay for your smartphone? a. Pay as you go b. Pay on a monthly basis (Contract)
This question is
Essential
Useful but not
essential
Not necessary
Suggestion:
14. How much do you pay per month for your smartphone? a. Free - £10.00 b. 10.01 - £30.00 c. £30.01 - £50.00 d. £50.01 - £70.00 e. £70.01 - £90.00
This question is
Essential
Useful but not

Sutee Pheeraphuttharangkoon (2015)
The Adoption, Use and Diffusion of Smartphones among Adults over Fifty in the UK 323
f. Over £90.00
essential
Not necessary
Suggestion:
Section 4 Usage of the smartphone and reasons for using the smartphone
Question Your suggestion
15. Please choose your usage frequency of your smartphone. Frequency ranges are between “1 (never)” to “7 (many times per day)”.
This question is
Essential
Useful but not
essential
Not necessary
Suggestion:
16. Please indicate to which extent you agree or disagree with the following statements. Please rate each of the provided following factors on the five-point scale. Note: 1 is Strongly Disagree and 7 is Strongly Agree.
This question is
Essential
Useful but not
essential
Not necessary
Suggestion:
a. People important to me think I should use a smartphone (For example, friends and family)
This statement is
Essential
Useful but not
essential
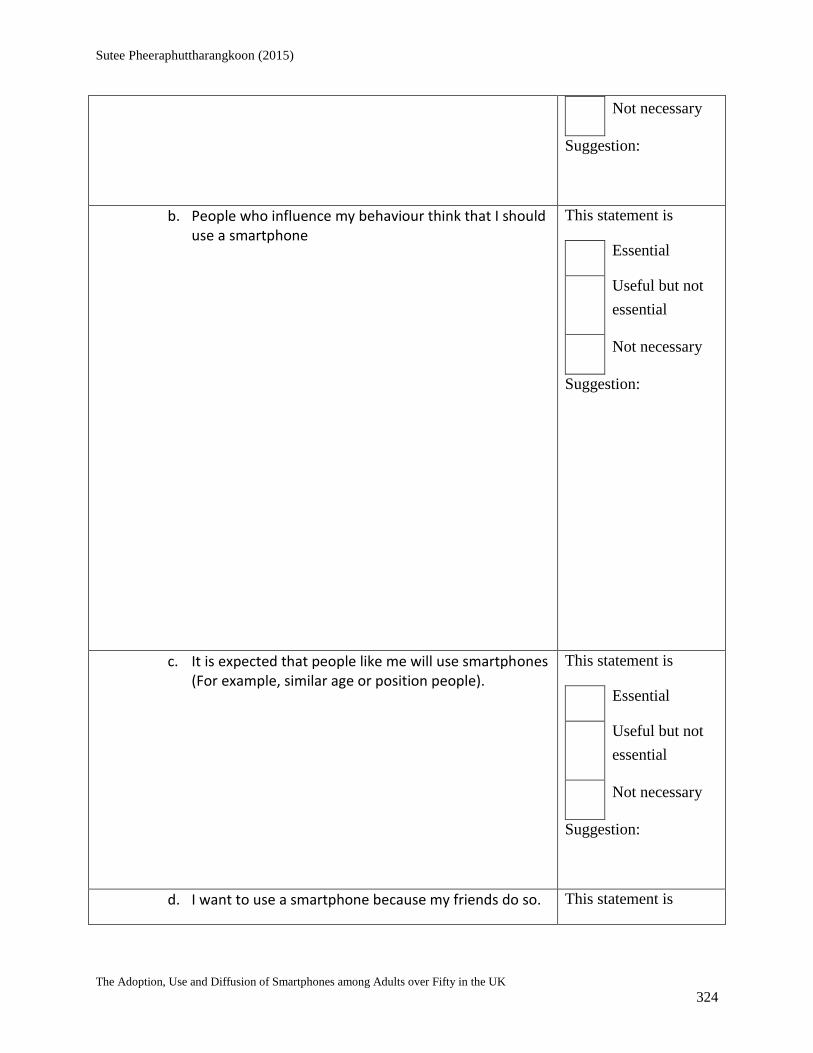
Sutee Pheeraphuttharangkoon (2015)
The Adoption, Use and Diffusion of Smartphones among Adults over Fifty in the UK 324
Not necessary
Suggestion:
b. People who influence my behaviour think that I should use a smartphone
This statement is
Essential
Useful but not
essential
Not necessary
Suggestion:
c. It is expected that people like me will use smartphones (For example, similar age or position people).
This statement is
Essential
Useful but not
essential
Not necessary
Suggestion:
d. I want to use a smartphone because my friends do so. This statement is

Sutee Pheeraphuttharangkoon (2015)
The Adoption, Use and Diffusion of Smartphones among Adults over Fifty in the UK 325
Essential
Useful but not
essential
Not necessary
Suggestion:
e. I have had many opportunities to see smartphones being used.
This statement is
Essential
Useful but not
essential
Not necessary
Suggestion:
f. It is easy for me to observe others using smartphones. (For example, I saw my friends use smartphones)
This statement is
Essential
Useful but not
essential
Not necessary
Suggestion:
g. I believe that using the smartphone is suitable for me. This statement is
Essential
Useful but not
essential
Not necessary

Sutee Pheeraphuttharangkoon (2015)
The Adoption, Use and Diffusion of Smartphones among Adults over Fifty in the UK 326
Suggestion:
h. I believe that using the smartphone will fit my lifestyle. This statement is
Essential
Useful but not
essential
Not necessary
Suggestion:
i. I think that using the smartphone fits well with the way that I work or live.
This statement is
Essential
Useful but not
essential
Not necessary
Suggestion:
j. I have the resources necessary to use the smartphone. (For example, time and money).
This statement is
Essential
Useful but not
essential
Not necessary
Suggestion:

Sutee Pheeraphuttharangkoon (2015)
The Adoption, Use and Diffusion of Smartphones among Adults over Fifty in the UK 327
k. I have the knowledge necessary to use the smartphone.
This statement is
Essential
Useful but not
essential
Not necessary
Suggestion:
l. The operation costs of a smartphone do not prevent the use of it (such as, price of a smartphone or monthly fee).
This statement is
Essential
Useful but not
essential
Not necessary
Suggestion:
m. I have a person available to assist me when using my smartphone.
This statement is
Essential
Useful but not
essential
Not necessary
Suggestion:
n. I feel a smartphone is useful. (eg. with my work, my lifestyle and my daily routine)
This statement is
Essential

Sutee Pheeraphuttharangkoon (2015)
The Adoption, Use and Diffusion of Smartphones among Adults over Fifty in the UK 328
Useful but not
essential
Not necessary
Suggestion:
o. Using a smartphone enables me to finish tasks more quickly.
This statement is
Essential
Useful but not
essential
Not necessary
Suggestion:
p. Using a smartphone increases my productivity. This statement is
Essential
Useful but not
essential
Not necessary
Suggestion:
q. I find that using the smartphone is easy. This statement is
Essential
Useful but not
essential
Not necessary
Suggestion:

Sutee Pheeraphuttharangkoon (2015)
The Adoption, Use and Diffusion of Smartphones among Adults over Fifty in the UK 329
r. Learning how to use a smartphone is easy for me. This statement is
Essential
Useful but not
essential
Not necessary
Suggestion:
s. I think it is fun to use a smartphone. This statement is
Essential
Useful but not
essential
Not necessary
Suggestion:
t. I find a smartphone fun (I had fun using a smartphone). This statement is
Essential
Useful but not
essential
Not necessary
Suggestion:
u. I intend to use a smartphone as much as possible. This statement is

Sutee Pheeraphuttharangkoon (2015)
The Adoption, Use and Diffusion of Smartphones among Adults over Fifty in the UK 330
Essential
Useful but not
essential
Not necessary
Suggestion:
v. I intend to continue using a smartphone in the future. This statement is
Essential
Useful but not
essential
Not necessary
Suggestion:
w. Whenever possible, I intend to use a smartphone in my job or my daily life.
This statement is
Essential
Useful but not
essential
Not necessary
Suggestion:
Question Your suggestion
17. What features of a smartphone are you using? Please choose your usage frequency form each of the following. Frequency ranges are between “1 (never)” to “7 (many times per day)”.
This question is
Essential
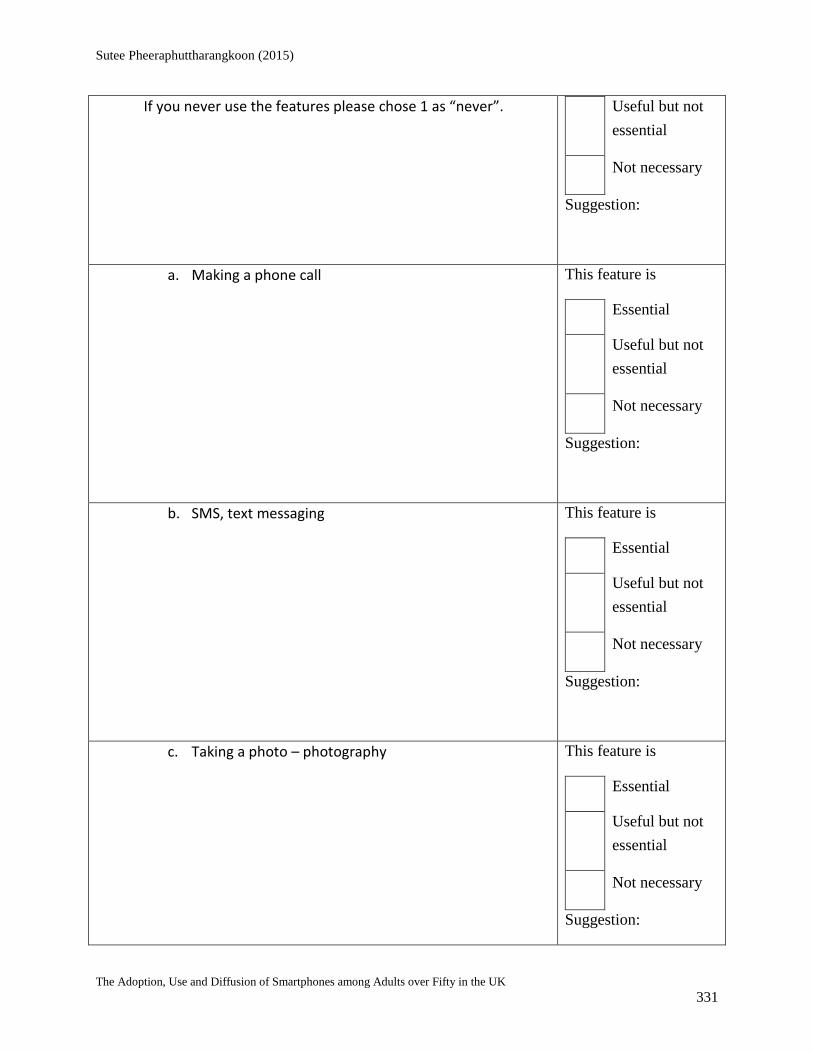
Sutee Pheeraphuttharangkoon (2015)
The Adoption, Use and Diffusion of Smartphones among Adults over Fifty in the UK 331
If you never use the features please chose 1 as “never”.
Useful but not
essential
Not necessary
Suggestion:
a. Making a phone call This feature is
Essential
Useful but not
essential
Not necessary
Suggestion:
b. SMS, text messaging This feature is
Essential
Useful but not
essential
Not necessary
Suggestion:
c. Taking a photo – photography This feature is
Essential
Useful but not
essential
Not necessary
Suggestion:

Sutee Pheeraphuttharangkoon (2015)
The Adoption, Use and Diffusion of Smartphones among Adults over Fifty in the UK 332
d. Filming a video This feature is
Essential
Useful but not
essential
Not necessary
Suggestion:
e. Browsing – surfing website(s) This feature is
Essential
Useful but not
essential
Not necessary
Suggestion:
f. Playing games This feature is
Essential
Useful but not
essential
Not necessary
Suggestion:
g. Listening to music This feature is
Essential

Sutee Pheeraphuttharangkoon (2015)
The Adoption, Use and Diffusion of Smartphones among Adults over Fifty in the UK 333
Useful but not
essential
Not necessary
Suggestion:
h. Watching videos for example YouTube This feature is
Essential
Useful but not
essential
Not necessary
Suggestion:
i. Mapping, Navigator such as Google Map, TomTom, Copilot
This feature is
Essential
Useful but not
essential
Not necessary
Suggestion:
j. Taking notes such as shopping lists or task that I need to do
This feature is
Essential
Useful but not
essential
Not necessary

Sutee Pheeraphuttharangkoon (2015)
The Adoption, Use and Diffusion of Smartphones among Adults over Fifty in the UK 334
Suggestion:
k. Managing my appointment on my calendar such as doctor appointment , business appointment, or meeting with friends
This feature is
Essential
Useful but not
essential
Not necessary
Suggestion:
l. Using a smartphone to downloading applications (apps)
This feature is
Essential
Useful but not
essential
Not necessary
Suggestion:
m. Using Social networks such as Facebook, twitter, LinkedIn, Foursquare, Google+
This feature is
Essential
Useful but not
essential
Not necessary
Suggestion:
n. Online Shopping such as eBay, Google Shopper, Groupon, Amazon Mobile, Newegg Mobile
This feature is
Essential

Sutee Pheeraphuttharangkoon (2015)
The Adoption, Use and Diffusion of Smartphones among Adults over Fifty in the UK 335
Useful but not
essential
Not necessary
Suggestion:
o. Online Banking such as Lloydstsb Mobile Banking, NatWest Mobile Banking
This feature is
Essential
Useful but not
essential
Not necessary
Suggestion:
p. Reading online News and online Magazines such as BBC, Sky News, Google Currents, Flipboard
This feature is
Essential
Useful but not
essential
Not necessary
Suggestion:
q. Using Voice over IP such as Facetime, Skype, oovoo, Google Talk, Viber, Fring
This feature is
Essential
Useful but not
essential
Not necessary
Suggestion:

Sutee Pheeraphuttharangkoon (2015)
The Adoption, Use and Diffusion of Smartphones among Adults over Fifty in the UK 336
r. Using Instant messenger services such as Blackberry Messenger, Live Messenger, iMessenger, WhatsApp
This feature is
Essential
Useful but not
essential
Not necessary
Suggestion:
s. Tracking items or packages using eg. Royal Mail, DHL, UPS
This feature is
Essential
Useful but not
essential
Not necessary
Suggestion:
t. Using Password management such as Keeper, LastPass Password Mgr
This feature is
Essential
Useful but not
essential
Not necessary
Suggestion:
u. Using Finance applications such as stock market applications, currency exchange market applications
This feature is
Essential

Sutee Pheeraphuttharangkoon (2015)
The Adoption, Use and Diffusion of Smartphones among Adults over Fifty in the UK 337
Useful but not
essential
Not necessary
Suggestion:
v. Using for well-being or health such as track my exercise routine
This feature is
Essential
Useful but not
essential
Not necessary
Suggestion:
w. Using for transport information- bus, train or tube checker
This feature is
Essential
Useful but not
essential
Not necessary
Suggestion:
x. Using to contact government authorities – NHS, Jobcentreplus, UKBA
This feature is
Essential
Useful but not
essential
Not necessary
Suggestion:

Sutee Pheeraphuttharangkoon (2015)
The Adoption, Use and Diffusion of Smartphones among Adults over Fifty in the UK 338
Question Your suggestion
18. What is (are) your consideration(s) when buying a smartphone? (You may choose more than one option)
a. Appearance (such as colour or material) b. Brand (such as Apple, Samsung, Nokia or Blackberry) c. Price of the smartphone d. Camera e. Operation System (Such as iOS, Android or Windows
Mobile) f. Operating Speed g. Voice Clarity h. Screen Size i. Screen Resolution j. Weight k. Battery life l. Size of Memory in the phone to store files such as
(Phones, movies or documents) m. Quality of Applications (apps) n. Price of Applications (apps) o. Number of Applications (apps) available in the app
Market p. Support LTE (4G)
This question is
Essential
Useful but not
essential
Not necessary
Suggestion:
19. Where did you get information regarding the use of your smartphone? (You may choose more than one option)
a. Word of mouth from friends and family b. High street stores c. Media –TV, Radio and Newspapers d. Magazines e. On-line social networks f. Professional technology review websites such as
CNET.co.uk, Trustedreviews.com g. Peer technology review such as unboxing video on
YouTube h. Sales person i. Other…
This question is
Essential
Useful but not
essential
Not necessary
Suggestion:

Sutee Pheeraphuttharangkoon (2015)
The Adoption, Use and Diffusion of Smartphones among Adults over Fifty in the UK 339
20. How long did it take you to get comfortable or familiar with using the basic functionalities of your present smartphone? Basic functionalities are described as: Making a phone call, using the internet services, using your SMS, or using email.
a. Less than a day b. 1 day – 1 week c. 1 week – 2 weeks d. 2 weeks - 1 month e. 1 month – 3 months f. More than 3 months
This question is
Essential
Useful but not
essential
Not necessary
Suggestion:
Section 5 how has a smartphone helped your well-being or health?
Question Your suggestion
21. How has using a smartphone helped your well-being or health? (You may choose more than one option)
a. It helps me seek information on health issues b. It helps me with my appointment time keeping with
doctors c. It helps me manage or track my exercise routine d. It helps me manage my diet e. It helps me monitor my weight f. It helps me access health records g. It helps me manage my moods h. It helps me manage prescriptions i. It helps me monitor blood pressure j. It helps me check nearby pollen levels k. It helps me control my cigarette smoking l. Smartphone does not help me with my well-being or
health m. Other…
This question is
Essential
Useful but not
essential
Not necessary
Suggestion:
Section 6 how a smartphone helped brings your friends and family closer to you?
Question Your suggestion

Sutee Pheeraphuttharangkoon (2015)
The Adoption, Use and Diffusion of Smartphones among Adults over Fifty in the UK 340
22. How has a smartphone helped bring your friends and family closer to you? (You may choose more than one option)
a. Making phone calls to my friends and family b. Emailing my friends and family using my smartphone c. Sharing photos taken from my smartphone d. Sharing videos with from my smartphone e. Sending instant messages such as Blackberry
Messenger, WhatsApp, Line, Facebook messenger f. Using video telephony software applications such as
Facetime, Tango or Skype g. Following friends’ and family’s activities using social
media such as Facebook, Google+ on my smartphone h. I do not use a smartphone to contact with my friends
or family i. Other…
This question is
Essential
Useful but not
essential
Not necessary
Suggestion:
Section 7 I do plan to get a smartphone
Question Your suggestion
23. What are the reasons for why you plan to use a smartphone a. I will get an upgrade from my provider. b. I want to have a handy device that can do many things
such as making a telephone call, taking a photograph, filming, and surfing the internet.
c. Most of my friends have used smartphones, and have convinced me to get one.
d. I want to use a smartphone to contact my friends or family.
e. My new job or new position requires me to use a smartphone.
f. I want to use a smartphone to help with my well-being or health.
g. I travel a lot and the smartphone will help me on my travels.
h. My new smartphone will help me with my memory. i. My new smartphone will have a bigger screen which is
easy for me to see and use. j. Other..
This question is
Essential
Useful but not
essential
Not necessary
Suggestion:
24. What is (are) your consideration(s) when buying a smartphone? (You may choose more than one option)
This question is

Sutee Pheeraphuttharangkoon (2015)
The Adoption, Use and Diffusion of Smartphones among Adults over Fifty in the UK 341
a. Appearance (such as colour or material) b. Brand (such as Apple, Samsung, Nokia or Blackberry) c. Price of the smartphone d. Camera e. Operation System (Such as iOS, Android or Windows
Mobile) f. Operating Speed g. Voice Clarity h. Screen Size i. Screen Resolution j. Weight k. Battery life l. Size of Memory in the phone to store files such as
(Phones, movies or documents) m. Quality of Applications (apps) n. Price of Applications (apps) o. Number of Applications (apps) available in the app
Market p. Support LTE (4G)
Essential
Useful but not
essential
Not necessary
Suggestion:
25. Where do you get information regarding use of your smartphone? (You may choose more than one option)
a. Word of mouth from friends and family b. High street stores c. Media –TV, Radio and Newspapers d. Magazines e. On-line social network f. Professional technology review website such as
CNET.co.uk, Trustedreviews.com g. Peer technology review such as unboxing video on
YouTube h. Sales person i. Other….
This question is
Essential
Useful but not
essential
Not necessary
Suggestion:
Section 8 I do not plan to get a smartphone
Question Your suggestion
26. What is/are the reasons/s for not getting a smartphone? (You may choose more than one option)
a. I am too old for a smartphone b. It is too much of an effort to use a smartphone c. A smartphone is too complicated and difficult to use. d. I do not think a smartphone is useful.
This question is
Essential
Useful but not
essential

Sutee Pheeraphuttharangkoon (2015)
The Adoption, Use and Diffusion of Smartphones among Adults over Fifty in the UK 342
e. Physical discomfort or accessibility problems f. The cost of using a smartphone – I do not want to
spend a lot of money when using a smartphone. g. I want peace and quiet after my working hours h. I do not feel comfortable using small screens and tiny
keyboards. i. I do not know much about how to use a smartphone. j. I have other devices such as a laptop or a netbook that
can function as well, or better than a smartphone. k. Using a smartphone does not fit with my lifestyle. l. Other…
Not necessary
Suggestion:
27. Factors that may encourage future use of a smartphone. a. Nothing/ will never use a smartphone in the future b. Free training c. Reduce cost of a smartphone d. Reduce cost of month contract e. Other…
This question is
Essential
Useful but not
essential
Not necessary
Suggestion:
1) Can you please suggest any changes that can be made to improve this survey?
2) Are there any questions that you found too intrusive or you thought may discourage
people from taking part in this survey?

Sutee Pheeraphuttharangkoon (2015)
The Adoption, Use and Diffusion of Smartphones among Adults over Fifty in the UK 343
One again I would like to take this opportunity to thank you for your valuable time and patience
in completing this form.

Sutee Pheeraphuttharangkoon (2015)
The Adoption, Use and Diffusion of Smartphones among Adults over Fifty in the UK 344
3-2 Content Validation Results
Section 1 Background Information
Question Suggestion Note/CVR
Essential Useful
but not
essential
Not
necessary
1. Please state the age group that you belong
12 0 0
2. Please state your gender 12 0 0
3. Please select your ethnicity 11 1 0 CVR = 0.83
4. Please state your highest level of education
12 0 0
5. Please indicate where you live in Camden
12 0 0
6. What is your current employment status
12 0 0 Too many
details in choices
7. Please state your current occupation. If you are of retired/pensioner status, please select the occupation you held for the majority of your working life.
12 0 0
8. Which of the following do you think best describes your state of health?
11 1 0 CVR = 0.83
Section 2 Do you have a smartphone?
Question Suggestion Note/CVR
Essential Useful
but not
essential
Not
necessary
9. Do you have a smartphone? 12 0 0
Section 3 General details regarding the smartphone
Question Suggestion Note/CVR
Essential Useful Not

Sutee Pheeraphuttharangkoon (2015)
The Adoption, Use and Diffusion of Smartphones among Adults over Fifty in the UK 345
but not
essential
necessary
10. How long have you been using a smartphone?
12 0 0
11. What is the brand of your smartphone(s)?
12 0 0
12. Who is the network provider of your smartphone?
12 0 0
13. How do you pay for your smartphone ?
12 0 0
14. How much do you pay per month for your smartphone?
11 1 0 CVR = 0.83
Section 4 Usage of the smartphone and reasons for using the smartphone
Question Suggestion Note/CVR
Essential Useful
but not
essential
Not
necessary
15. Please choose your usage frequency of your smartphone. Frequency ranges are between “1 (never)” to “7 (many times per day)”.
12 0 0
16. Please indicate to which extent you agree or disagree with the following statements. Please rate each of the provided following factors on the five-point scale. Note: 1 is Strongly Disagree and 7 is Strongly Agree.
12 0 0 Mistake
from five –
point
scales to
seven
scales
a. People important to me think I should use a smartphone (For example, friends and family)
12 0 0
b. People who influence my behaviour think that I should use a smartphone
12 0 0

Sutee Pheeraphuttharangkoon (2015)
The Adoption, Use and Diffusion of Smartphones among Adults over Fifty in the UK 346
c. It is expected that people like me will use smartphones (For example, similar age or position people).
12 0 0
d. I want to use a smartphone because my friends do so.
12 0 0
e. I have had many opportunities to see smartphones being used.
12 0 0
f. It is easy for me to observe others using smartphones. (For example, I saw my friends use smartphones)
12 0 0
g. I believe that using the smartphone is suitable for me.
12 0 0
h. I believe that using the smartphone will fit my lifestyle.
12 0 0
i. I think that using the smartphone fits well with the way that I work or live.
12 0 0 Swap
between
work or
live
j. I have the resources necessary to use the smartphone. (For example, time and money).
12 0 0
k. I have the knowledge necessary to use the smartphone.
11 1 0 CVR =
0.83
l. The operation costs of a smartphone do not prevent the use of it (such as, price of a smartphone or monthly fee).
12 0 0
m. I have a person available to assist me when using my smartphone.
8 4 0 CVR =
0.33
n. I feel a smartphone is useful. (eg. with my work, my lifestyle and my daily routine)
12 0 0 Arrange to
my daily
routine,
my
lifestyle
and with
my work
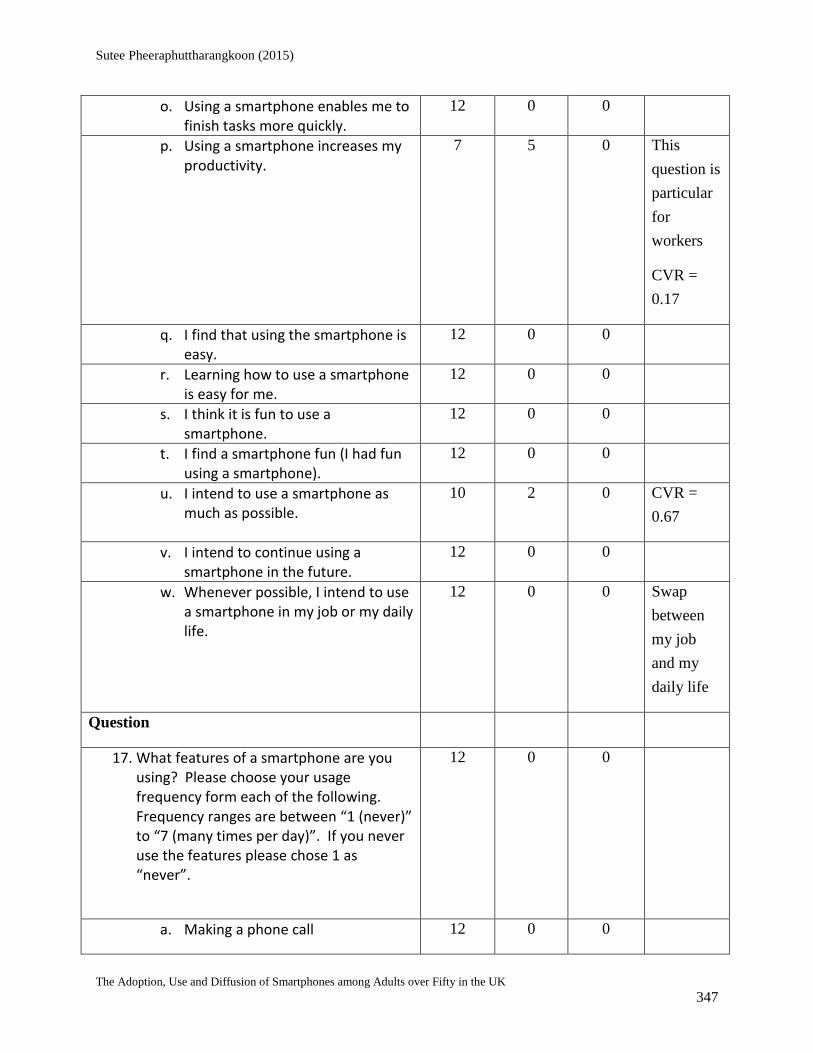
Sutee Pheeraphuttharangkoon (2015)
The Adoption, Use and Diffusion of Smartphones among Adults over Fifty in the UK 347
o. Using a smartphone enables me to finish tasks more quickly.
12 0 0
p. Using a smartphone increases my productivity.
7 5 0 This
question is
particular
for
workers
CVR =
0.17
q. I find that using the smartphone is easy.
12 0 0
r. Learning how to use a smartphone is easy for me.
12 0 0
s. I think it is fun to use a smartphone.
12 0 0
t. I find a smartphone fun (I had fun using a smartphone).
12 0 0
u. I intend to use a smartphone as much as possible.
10 2 0 CVR =
0.67
v. I intend to continue using a smartphone in the future.
12 0 0
w. Whenever possible, I intend to use a smartphone in my job or my daily life.
12 0 0 Swap
between
my job
and my
daily life
Question
17. What features of a smartphone are you using? Please choose your usage frequency form each of the following. Frequency ranges are between “1 (never)” to “7 (many times per day)”. If you never use the features please chose 1 as “never”.
12 0 0
a. Making a phone call 12 0 0

Sutee Pheeraphuttharangkoon (2015)
The Adoption, Use and Diffusion of Smartphones among Adults over Fifty in the UK 348
b. SMS, text messaging 12 0 0
c. Taking a photo – photography 12 0 0
d. Filming a video 12 0 0
e. Browsing – surfing website(s) 11 1 0 CVR =
0.83
f. Playing games 12 0 0
g. Listening to music 12 0 0 Add or
radio
h. Watching videos for example YouTube
11 1 0 Add or
film
CVR =
0.83
i. Mapping, Navigator such as Google Map, TomTom, Copilot
9 3 0 CVR = 0.5
j. Taking notes such as shopping lists or task that I need to do
8 3 1 CVR =
0.33
k. Managing my appointment on my calendar such as doctor appointment , business appointment, or meeting with friends
9 3 0 CVR = 0.5
l. Using a smartphone to downloading applications (apps)
9 3 0 CVR = 0.5
m. Using Social networks such as Facebook, twitter, LinkedIn, Foursquare, Google+
9 3 0 CVR = 0.5
n. Online Shopping such as eBay, Google Shopper, Groupon, Amazon Mobile, Newegg Mobile
6 6 0 CVR = 0
o. Online Banking such as Lloydstsb Mobile Banking, NatWest Mobile Banking
8 4 0 CVR =
0.33
p. Reading online News and online Magazines such as BBC, Sky News, Google Currents, Flipboard
7 5 0 CVR =
0.16

Sutee Pheeraphuttharangkoon (2015)
The Adoption, Use and Diffusion of Smartphones among Adults over Fifty in the UK 349
q. Using Voice over IP such as Facetime, Skype, oovoo, Google Talk, Viber, Fring
9 3 0 CVR = 0.5
r. Using Instant messenger services such as Blackberry Messenger, Live Messenger, iMessenger, WhatsApp
6 6 0 CVR = 0
s. Tracking items or packages using eg. Royal Mail, DHL, UPS
0 3 9 CVR = -1
t. Using Password management such as Keeper, LastPass Password Mgr
5 7 0 CVR = -
0.17
u. Using Finance applications such as stock market applications, currency exchange market applications
10 2 0 CVR =
0.67
v. Using for well-being or health such as track my exercise routine
8 3 1 CVR =
0.33
w. Using for transport information- bus, train or tube checker
3 9 0 CVR = -
0.5
x. Using to contact government authorities – NHS, Jobcentreplus, UKBA
2 8 1 CVR = -
0.67
Question Suggestion Note/CVR
Essential Useful
but not
essential
Not
necessary
18. What is (are) your consideration(s) when buying a smartphone? (You may choose more than one option) a. Appearance (such as colour or
material) b. Brand (such as Apple, Samsung,
Nokia or Blackberry) c. Price of the smartphone d. Camera e. Operation System (Such as iOS,
Android or Windows Mobile)
11 1 0 Remove
e., f., g.,
l., m., n.,
o., and p.
CVR =
0.83

Sutee Pheeraphuttharangkoon (2015)
The Adoption, Use and Diffusion of Smartphones among Adults over Fifty in the UK 350
f. Operating Speed g. Voice Clarity h. Screen Size i. Screen Resolution j. Weight k. Battery life l. Size of Memory in the phone to
store files such as (Phones, movies or documents)
m. Quality of Applications (apps) n. Price of Applications (apps) o. Number of Applications (apps)
available in the app Market p. Support LTE (4G)
19. Where did you get information regarding the use of your smartphone? (You may choose more than one option) a. Word of mouth from friends and
family b. High street stores c. Media –TV, Radio and Newspapers d. Magazines e. On-line social networks f. Professional technology review
websites such as CNET.co.uk, Trustedreviews.com
g. Peer technology review such as unboxing video on YouTube
h. Sales person i. Other…
12 0 0
20. How long did it take you to get comfortable or familiar with using the basic functionalities of your present smartphone? Basic functionalities are described as: Making a phone call, using the internet services, using your SMS, or using email. a. Less than a day
12 0 0

Sutee Pheeraphuttharangkoon (2015)
The Adoption, Use and Diffusion of Smartphones among Adults over Fifty in the UK 351
b. 1 day – 1 week c. 1 week – 2 weeks d. 2 weeks - 1 month e. 1 month – 3 months f. More than 3 months
Section 5 how has a smartphone helped your well-being or health?
Question Suggestion Note/CVR
Essential Useful
but not
essential
Not
necessary
21. How has using a smartphone helped your well-being or health? (You may choose more than one option) a. It helps me seek information on
health issues b. It helps me with my appointment
time keeping with doctors c. It helps me manage or track my
exercise routine d. It helps me manage my diet e. It helps me monitor my weight f. It helps me access health records g. It helps me manage my moods h. It helps me manage prescriptions i. It helps me monitor blood
pressure j. It helps me check nearby pollen
levels k. It helps me control my cigarette
smoking l. Smartphone does not help me
with my well-being or health m. Other…
11 1 0 CVR =
0.83
Section 6 how a smartphone helped brings your friends and family closer to you?
Question Suggestion Note

Sutee Pheeraphuttharangkoon (2015)
The Adoption, Use and Diffusion of Smartphones among Adults over Fifty in the UK 352
Essential Useful
but not
essential
Not
necessary
22. How has a smartphone helped bring your friends and family closer to you? (You may choose more than one option) a. Making phone calls to my friends
and family b. Emailing my friends and family
using my smartphone c. Sharing photos taken from my
smartphone d. Sharing videos with from my
smartphone e. Sending instant messages such as
Blackberry Messenger, WhatsApp, Line, Facebook messenger
f. Using video telephony software applications such as Facetime, Tango or Skype
g. Following friends’ and family’s activities using social media such as Facebook, Google+ on my smartphone
h. I do not use a smartphone to contact with my friends or family
i. Other…
12 0 0
Section 7 I do plan to get a smartphone
Question Suggestion Note
Essential Useful
but not
essential
Not
necessary
23. What are the reasons for why you plan to use a smartphone a. I will get an upgrade from my
provider. b. I want to have a handy device that
12 0 0

Sutee Pheeraphuttharangkoon (2015)
The Adoption, Use and Diffusion of Smartphones among Adults over Fifty in the UK 353
can do many things such as making a telephone call, taking a photograph, filming, and surfing the internet.
c. Most of my friends have used smartphones, and have convinced me to get one.
d. I want to use a smartphone to contact my friends or family.
e. My new job or new position requires me to use a smartphone.
f. I want to use a smartphone to help with my well-being or health.
g. I travel a lot and the smartphone will help me on my travels.
h. My new smartphone will help me with my memory.
i. My new smartphone will have a bigger screen which is easy for me to see and use.
j. Other..
24. What is (are) your consideration(s) when buying a smartphone? (You may choose more than one option) a. Appearance (such as colour or
material) b. Brand (such as Apple, Samsung,
Nokia or Blackberry) c. Price of the smartphone d. Camera e. Operation System (Such as iOS,
Android or Windows Mobile) f. Operating Speed g. Voice Clarity h. Screen Size i. Screen Resolution j. Weight k. Battery life l. Size of Memory in the phone to
store files such as (Phones, movies or documents)
m. Quality of Applications (apps)
12 0 0
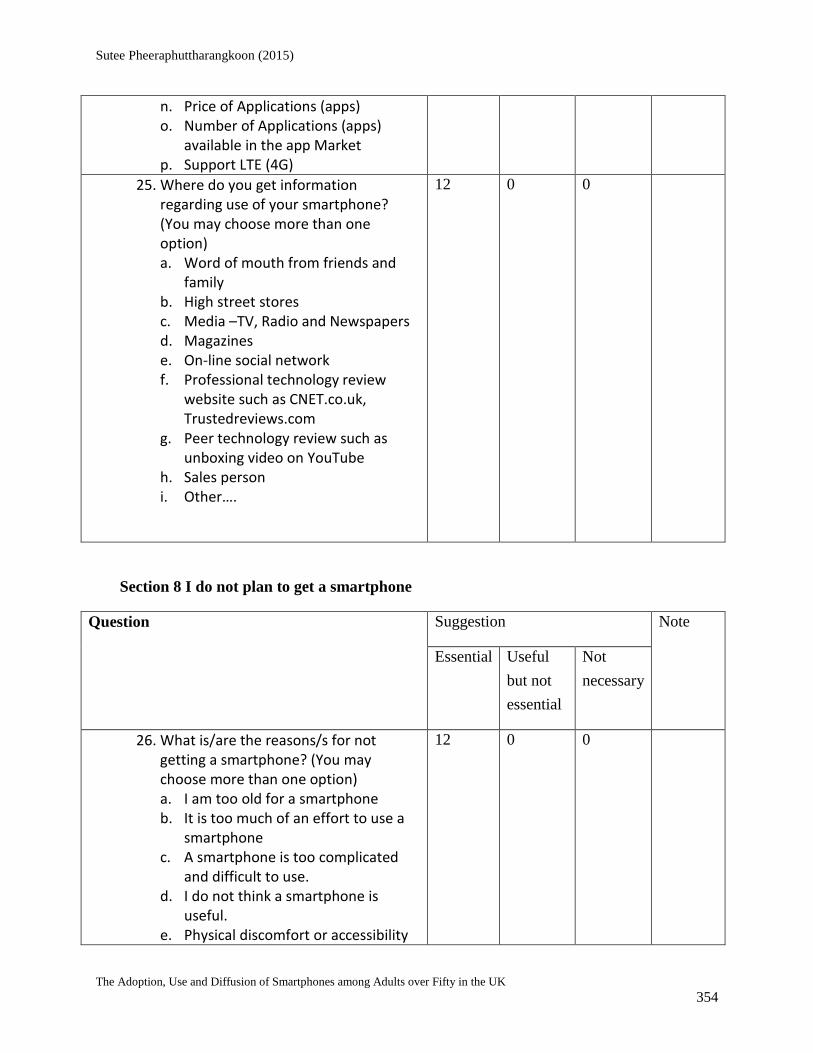
Sutee Pheeraphuttharangkoon (2015)
The Adoption, Use and Diffusion of Smartphones among Adults over Fifty in the UK 354
n. Price of Applications (apps) o. Number of Applications (apps)
available in the app Market p. Support LTE (4G)
25. Where do you get information regarding use of your smartphone? (You may choose more than one option) a. Word of mouth from friends and
family b. High street stores c. Media –TV, Radio and Newspapers d. Magazines e. On-line social network f. Professional technology review
website such as CNET.co.uk, Trustedreviews.com
g. Peer technology review such as unboxing video on YouTube
h. Sales person i. Other….
12 0 0
Section 8 I do not plan to get a smartphone
Question Suggestion Note
Essential Useful
but not
essential
Not
necessary
26. What is/are the reasons/s for not getting a smartphone? (You may choose more than one option) a. I am too old for a smartphone b. It is too much of an effort to use a
smartphone c. A smartphone is too complicated
and difficult to use. d. I do not think a smartphone is
useful. e. Physical discomfort or accessibility
12 0 0

Sutee Pheeraphuttharangkoon (2015)
The Adoption, Use and Diffusion of Smartphones among Adults over Fifty in the UK 355
problems f. The cost of using a smartphone – I
do not want to spend a lot of money when using a smartphone.
g. I want peace and quiet after my working hours
h. I do not feel comfortable using small screens and tiny keyboards.
i. I do not know much about how to use a smartphone.
j. I have other devices such as a laptop or a netbook that can function as well, or better than a smartphone.
k. Using a smartphone does not fit with my lifestyle.
l. Other…
27. Factors that may encourage future use of a smartphone. a. Nothing/ will never use a
smartphone in the future b. Free training c. Reduce cost of a smartphone d. Reduce cost of month contract e. Other…
12 0 0

Sutee Pheeraphuttharangkoon (2015)
The Adoption, Use and Diffusion of Smartphones among Adults over Fifty in the UK 356
3-3 Paper-based Validation Forms (Photos)

Sutee Pheeraphuttharangkoon (2015)
The Adoption, Use and Diffusion of Smartphones among Adults over Fifty in the UK 357
4-1 Original Construct Measures
Constructs Constructs Measure Source
Behavioral
Intention
I intend to continue using mobile Internet in the
future.
(Venkatesh et al.,
2012)
I will always try to use mobile Internet in my daily
life.
I plan to continue to use mobile internet frequently.
Whenever possible, I intend to use the smartphone in
my job.
(Park & Chen, 2007)
I intend to increase my use of the smartphone in the
future.
Social
Influence
People important to me think I should use service
(climate for networking).
(Shin, 2007)
It is expected that people like me use service
(nationalistic feelings).
(Shin, 2007)
People who influence my behavior think that I should
use mobile internet.
(Venkatesh et al.,
2012)
I want to use the service because my friends do so,
and I want to belong to the Group
(Verkasalo et al.,
2010)
Observability
It is easy for me to observe others using the
smartphone in my work.
(Park & Chen, 2007)
I have had a lot of opportunity to see the smartphone
being used.
Compatibility
I believe that using mobile banking will fit my
lifestyle.
(Koenig-Lewis et al.,
2010)
I believe that using mobile banking is suitable for me.
I think that using the smartphone fits well with the
way I like to work.
(Park & Chen, 2007)

Sutee Pheeraphuttharangkoon (2015)
The Adoption, Use and Diffusion of Smartphones among Adults over Fifty in the UK 358
Using the smartphone fits into my work style.
Facilitating
Condition
I have the resource necessary to use mobile Internet. (Venkatesh et al.,
2012) I have knowledge necessary to use mobile Internet.
Operating cost do not prevent the use of smartphones. (Qurashi, 2012)
I have the person available for assistance with mobile
banking use.
(Gu et al., 2009)
Performance
Expectancy
I feel mobile banking is useful. (Zhou et al., 2010)
Mobile banking lets me make payments more
quickly.
Using mobile Internet increase my productivity. (Venkatesh et al.,
2012) Using mobile Internet helps me accomplish things
more quickly.
Effort
Expectancy
I find that using mobile banking is easy. (Zhou et al., 2010)
Learning how to use mobile banking is easy for me. (Zhou et al., 2010)
I find mobile Internet easy to use. (Venkatesh et al.,
2012)
Learning how to use mobile Internet is easy for me. (Venkatesh et al.,
2012)
Enjoyment
I think it is fun to use the service (mobile service). (Verkasalo et al.,
2010)
I find service fun (I had fun using Wi-Bro). (Shin, 2007)

Sutee Pheeraphuttharangkoon (2015)
The Adoption, Use and Diffusion of Smartphones among Adults over Fifty in the UK 359
4-2 Pilot Survey Questionnaire

Sutee Pheeraphuttharangkoon (2015)
The Adoption, Use and Diffusion of Smartphones among Adults over Fifty in the UK 360

Sutee Pheeraphuttharangkoon (2015)
The Adoption, Use and Diffusion of Smartphones among Adults over Fifty in the UK 361

Sutee Pheeraphuttharangkoon (2015)
The Adoption, Use and Diffusion of Smartphones among Adults over Fifty in the UK 362

Sutee Pheeraphuttharangkoon (2015)
The Adoption, Use and Diffusion of Smartphones among Adults over Fifty in the UK 363

Sutee Pheeraphuttharangkoon (2015)
The Adoption, Use and Diffusion of Smartphones among Adults over Fifty in the UK 364

Sutee Pheeraphuttharangkoon (2015)
The Adoption, Use and Diffusion of Smartphones among Adults over Fifty in the UK 365
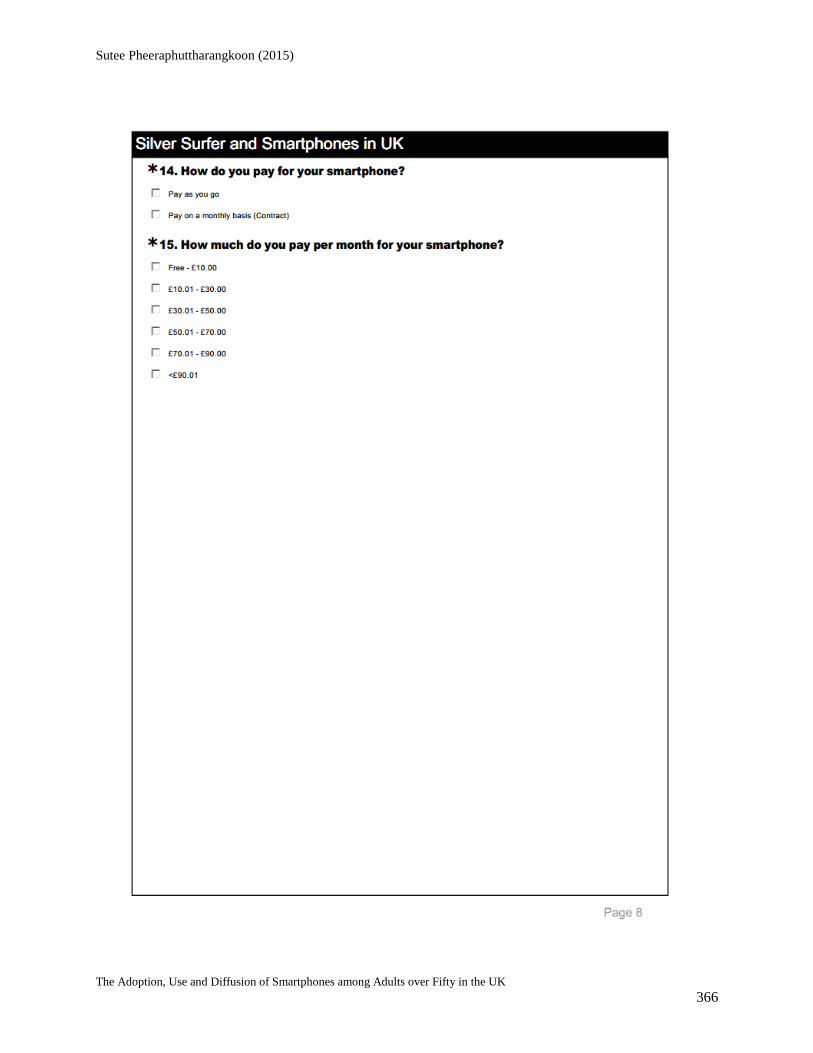
Sutee Pheeraphuttharangkoon (2015)
The Adoption, Use and Diffusion of Smartphones among Adults over Fifty in the UK 366

Sutee Pheeraphuttharangkoon (2015)
The Adoption, Use and Diffusion of Smartphones among Adults over Fifty in the UK 367

Sutee Pheeraphuttharangkoon (2015)
The Adoption, Use and Diffusion of Smartphones among Adults over Fifty in the UK 368

Sutee Pheeraphuttharangkoon (2015)
The Adoption, Use and Diffusion of Smartphones among Adults over Fifty in the UK 369

Sutee Pheeraphuttharangkoon (2015)
The Adoption, Use and Diffusion of Smartphones among Adults over Fifty in the UK 370

Sutee Pheeraphuttharangkoon (2015)
The Adoption, Use and Diffusion of Smartphones among Adults over Fifty in the UK 371
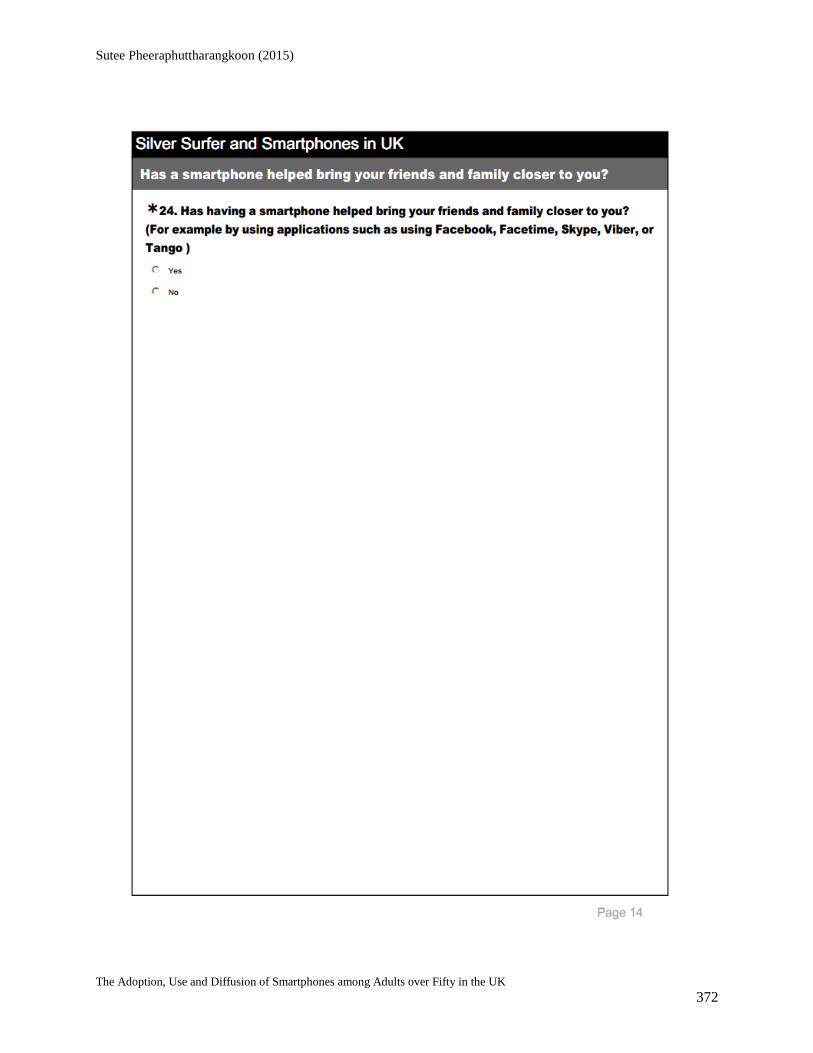
Sutee Pheeraphuttharangkoon (2015)
The Adoption, Use and Diffusion of Smartphones among Adults over Fifty in the UK 372

Sutee Pheeraphuttharangkoon (2015)
The Adoption, Use and Diffusion of Smartphones among Adults over Fifty in the UK 373

Sutee Pheeraphuttharangkoon (2015)
The Adoption, Use and Diffusion of Smartphones among Adults over Fifty in the UK 374

Sutee Pheeraphuttharangkoon (2015)
The Adoption, Use and Diffusion of Smartphones among Adults over Fifty in the UK 375

Sutee Pheeraphuttharangkoon (2015)
The Adoption, Use and Diffusion of Smartphones among Adults over Fifty in the UK 376
5-1 Final Survey Questionnaire
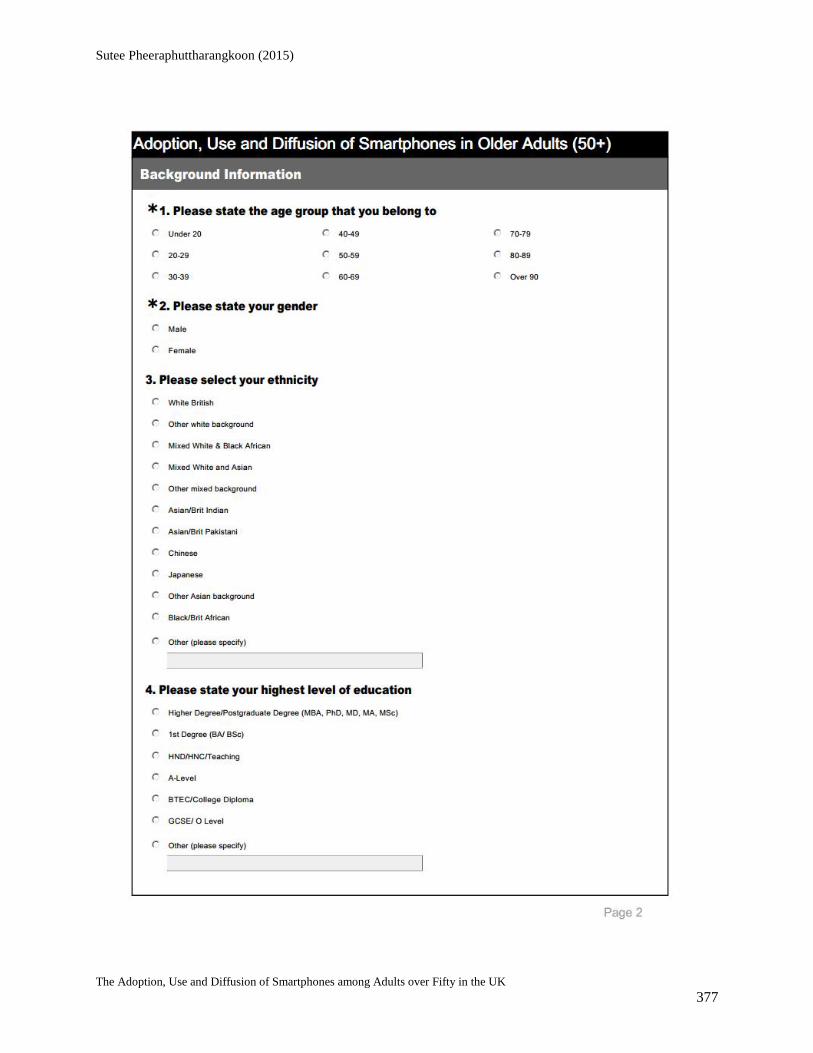
Sutee Pheeraphuttharangkoon (2015)
The Adoption, Use and Diffusion of Smartphones among Adults over Fifty in the UK 377
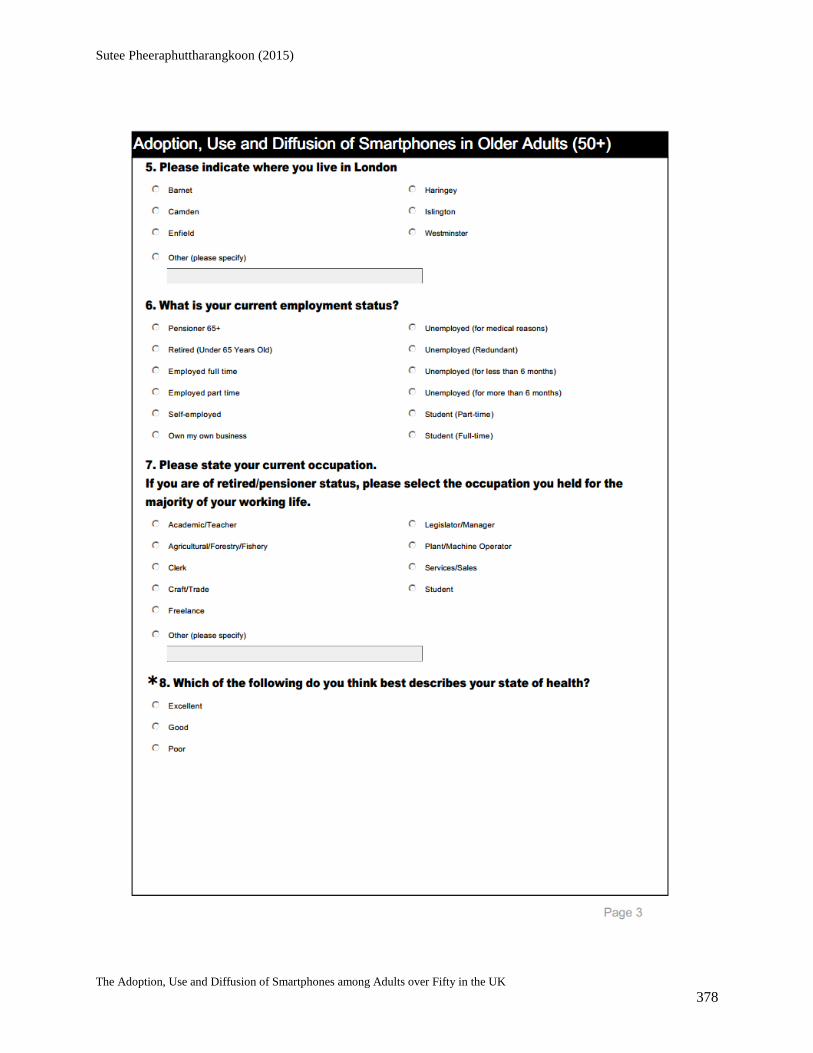
Sutee Pheeraphuttharangkoon (2015)
The Adoption, Use and Diffusion of Smartphones among Adults over Fifty in the UK 378

Sutee Pheeraphuttharangkoon (2015)
The Adoption, Use and Diffusion of Smartphones among Adults over Fifty in the UK 379

Sutee Pheeraphuttharangkoon (2015)
The Adoption, Use and Diffusion of Smartphones among Adults over Fifty in the UK 380

Sutee Pheeraphuttharangkoon (2015)
The Adoption, Use and Diffusion of Smartphones among Adults over Fifty in the UK 381
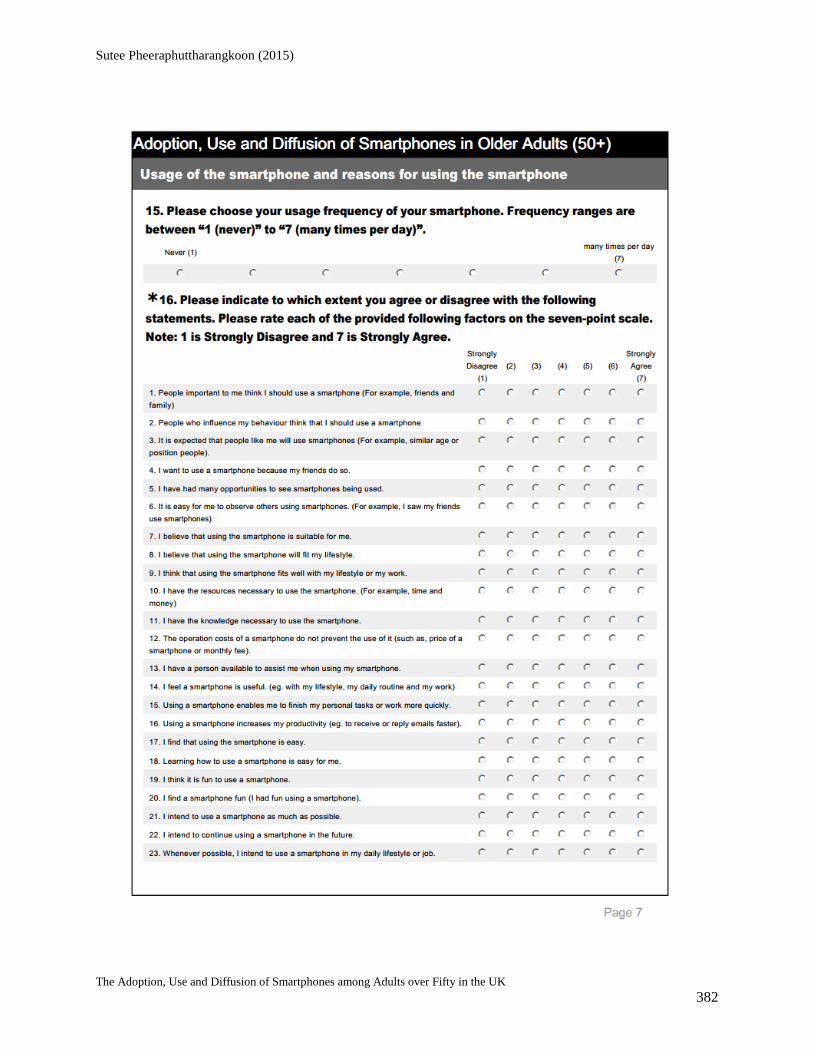
Sutee Pheeraphuttharangkoon (2015)
The Adoption, Use and Diffusion of Smartphones among Adults over Fifty in the UK 382
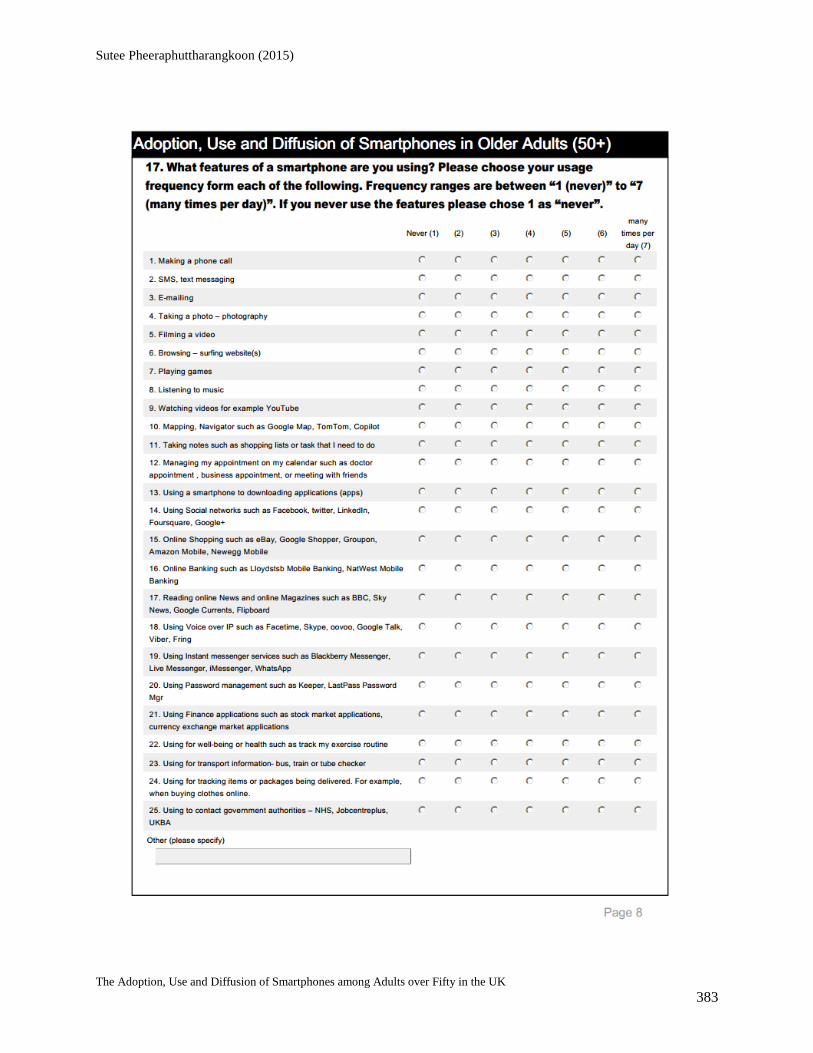
Sutee Pheeraphuttharangkoon (2015)
The Adoption, Use and Diffusion of Smartphones among Adults over Fifty in the UK 383

Sutee Pheeraphuttharangkoon (2015)
The Adoption, Use and Diffusion of Smartphones among Adults over Fifty in the UK 384

Sutee Pheeraphuttharangkoon (2015)
The Adoption, Use and Diffusion of Smartphones among Adults over Fifty in the UK 385

Sutee Pheeraphuttharangkoon (2015)
The Adoption, Use and Diffusion of Smartphones among Adults over Fifty in the UK 386

Sutee Pheeraphuttharangkoon (2015)
The Adoption, Use and Diffusion of Smartphones among Adults over Fifty in the UK 387

Sutee Pheeraphuttharangkoon (2015)
The Adoption, Use and Diffusion of Smartphones among Adults over Fifty in the UK 388

Sutee Pheeraphuttharangkoon (2015)
The Adoption, Use and Diffusion of Smartphones among Adults over Fifty in the UK 389

Sutee Pheeraphuttharangkoon (2015)
The Adoption, Use and Diffusion of Smartphones among Adults over Fifty in the UK 390

Sutee Pheeraphuttharangkoon (2015)
The Adoption, Use and Diffusion of Smartphones among Adults over Fifty in the UK 391
Sutee Pheeraphuttharangkoon (2015)
The Adoption, Use and Diffusion of Smartphones among Adults over Fifty in the UK 392
5-2 Final Survey Cover Letter
5-3 Final Survey Closing Page

Sutee Pheeraphuttharangkoon (2015)
The Adoption, Use and Diffusion of Smartphones among Adults over Fifty in the UK 393
5-4 Ethics Form

Sutee Pheeraphuttharangkoon (2015)
The Adoption, Use and Diffusion of Smartphones among Adults over Fifty in the UK 394
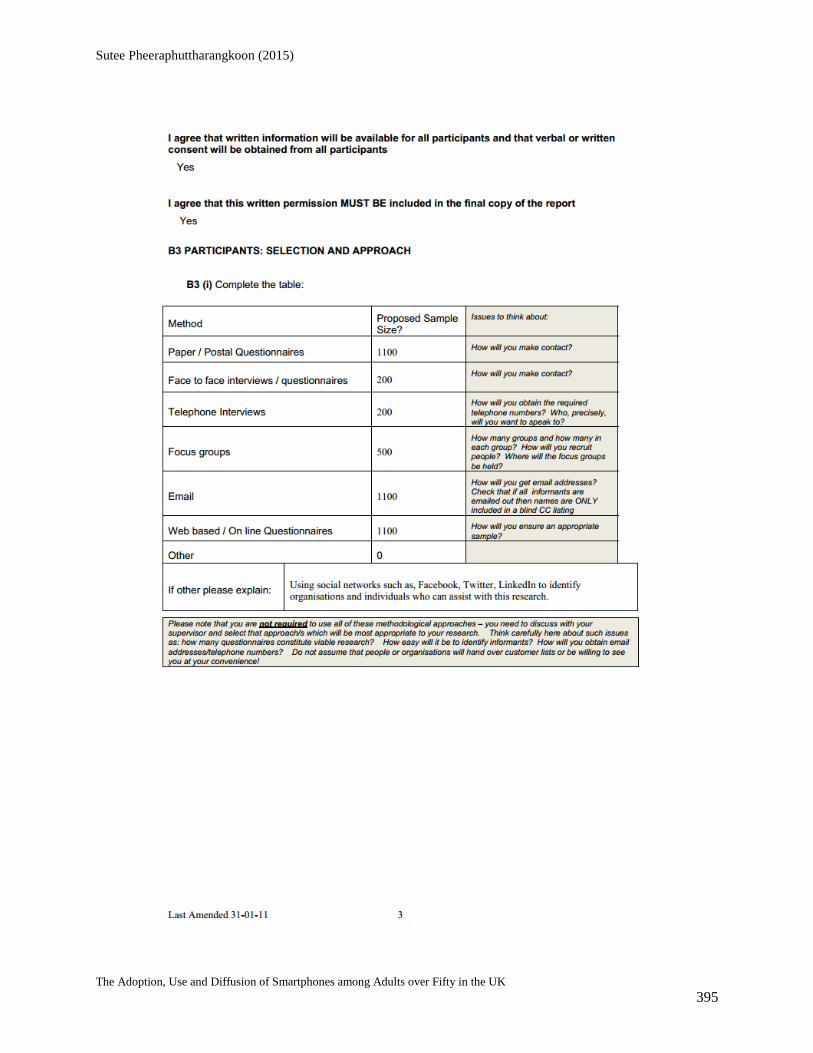
Sutee Pheeraphuttharangkoon (2015)
The Adoption, Use and Diffusion of Smartphones among Adults over Fifty in the UK 395
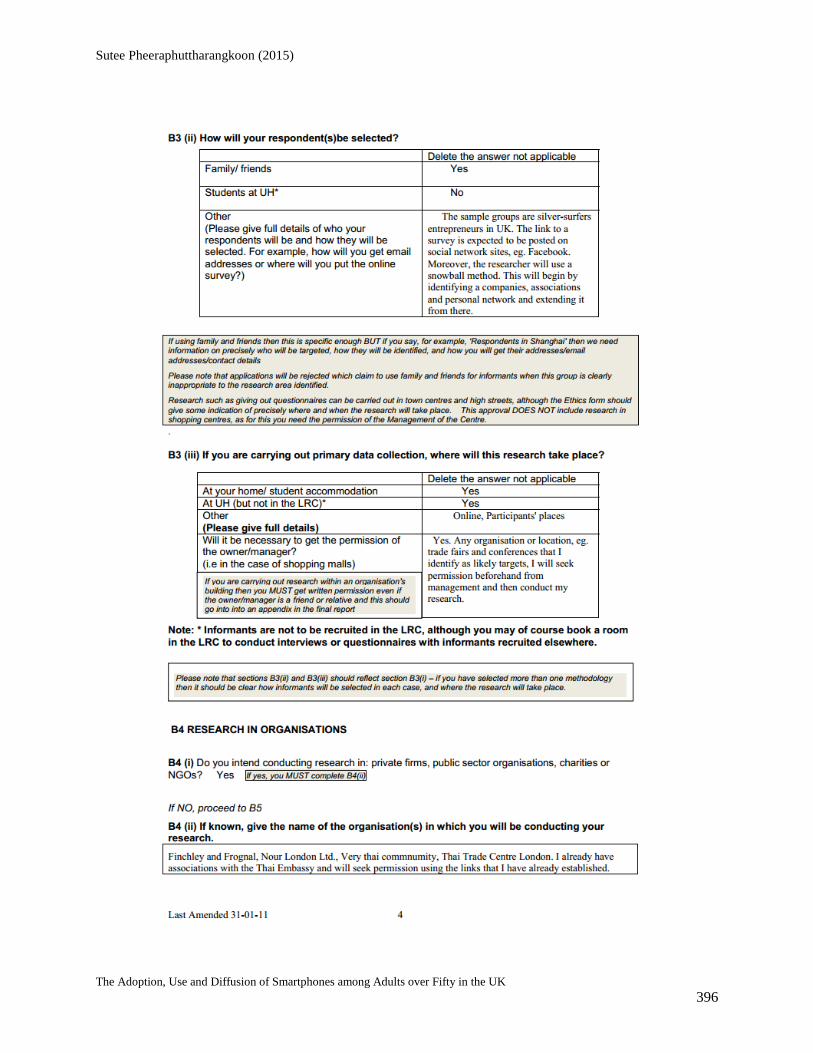
Sutee Pheeraphuttharangkoon (2015)
The Adoption, Use and Diffusion of Smartphones among Adults over Fifty in the UK 396

Sutee Pheeraphuttharangkoon (2015)
The Adoption, Use and Diffusion of Smartphones among Adults over Fifty in the UK 397

Sutee Pheeraphuttharangkoon (2015)
The Adoption, Use and Diffusion of Smartphones among Adults over Fifty in the UK 398

Sutee Pheeraphuttharangkoon (2015)
The Adoption, Use and Diffusion of Smartphones among Adults over Fifty in the UK 399
Sutee Pheeraphuttharangkoon (2015)
The Adoption, Use and Diffusion of Smartphones among Adults over Fifty in the UK 400
5-5 Ethics Approved Confirmed

Sutee Pheeraphuttharangkoon (2015)
The Adoption, Use and Diffusion of Smartphones among Adults over Fifty in the UK 401
5-6 Final Survey Sampling List
0 Agar Town 41 Dartmouth Park 82 Kensal Green 123 Seven Sisters
1 Aldwych 42 Dollis Hill 83 Kentish Town 124 Soho
2 Alperton 43 East Barnet 84 Kenton 125 Somers Town
3 Angel 44 East Finchley 85 Kilburn 126 South Hampstead
4 Archway 45 Edgware 86 Kings Cross 127 South Tottenham
5 Arkley 46 Edmonton 87 Kingsbury 128 Southgate
6 Arnos
Grove 47 Enfield Chase 88 Knightsbridge 129 St Ann’s
7 Barnet 48 Enfield High way 89 Lisson Grove 130 St James’s
8 Barnet Gate 49 Enfield Island
Village 90 Little Russia 131 St John’s Wood
9 Barnsbury 50 Enfield Lock 91 Lower
Holloway 132 St Luke’s
10 Bayswater 51 Enfield Town 92 Maida Vale 133 St Pancras
11 Belgravia 52 Enfield Wash 93 Marylebone 134 St. Giles
12 Belsize Park 53 Farringdon 94 Mayfair 135 Stonebridge
13 Bloomsbury 54 Finchley 95 Mildmay 136 Stroud Green
14 Botany Bay 55 Finsbury 96 Mill Hill 137 Sudbury
15 Bounds
Green 56 Finsbury Park 97 Millbank 138 Swiss Cottage
16 Bowes Park 57 Fitzrovia 98 Monken
Hadley 139 Temple Fortune
17 Brent Cross 58 Fortis Green 99 Muswell Hill 140 The Hale
18 Brent Park 59 Fortune Green 100 Nag’s Head 141 The Hyde
19 Brimsdown 60 Forty Hill 101 Neasden 142 Tokyngton
20 Broadwater
Farm 61 Freezywater 102 New Barnet 143 Tottenham
21 Brondesbur
y 62 Friern Barnet 103
New
Southgate 144 Tottenham Hale
22 Brondesbur
y Park 63 Frognal 104
Newington
Green 145 Totteridge
23 Brunswick
Park 64 Golders Green 105 Noel Park 146 Tufnell Park
24 Bulls Cross 65 Gospel Oak 106 North
Finchley 147 Upper Holloway
25 Burnt Oak 66 Grahame Park 107 North
Wembley 148 Victoria
26 Bush Hill
Park 67 Grange Park 108
Northumberla
nd Park 149 Wembley
27 Camden
Town 68 Hadley Wood 109
Oakleigh
Park 150 Wembley Park
28 Canonbury 69 Hampstead 110 Oakwood 151 West End of
London

Sutee Pheeraphuttharangkoon (2015)
The Adoption, Use and Diffusion of Smartphones among Adults over Fifty in the UK 402
29 Chalk Farm 70 Hampstead Garden
Suburb 111 Osidge 152 West Green
30 Childs Hill 71 Harlesden 112 Paddington 153 West Hampstead
31 Church End 72 Harringay 113 Paddington
Green 154 West Hendon
32 Clay Hill 73 Haverstock 114 Palmers
Green 155
Westbourne
Green
33 Clerkenwell 74 Hendon 115 Park Royal 156 Westminster
34 Cockfosters 75 Highbury 116 Pentonville 157 Whetstone
35 Colindale 76 Highgate 117 Pimlico 158 Willesden
36 Colney
Hatch 77 Holborn 118 Ponders End 159 Willesden Green
37 Covent
Garden 78 Holloway 119 Preston 160 Winchmore Hill
38 Crews Hill 79 Hornsey 120 Primrose Hill 161 Wood Green
39 Cricklewoo
d 80 Hyde Park 121 Queen’s Park 162 Woodside Park
40 Crouch End 81 Islington 122 Queensbury 163 World’s End

Sutee Pheeraphuttharangkoon (2015)
The Adoption, Use and Diffusion of Smartphones among Adults over Fifty in the UK 403
5-7 Final Survey Invitation Letter

Sutee Pheeraphuttharangkoon (2015)
The Adoption, Use and Diffusion of Smartphones among Adults over Fifty in the UK 404
5-8 Final Survey Invitation Letters (Photo)

Sutee Pheeraphuttharangkoon (2015)
The Adoption, Use and Diffusion of Smartphones among Adults over Fifty in the UK 405
5-9 Survey Distribute Track
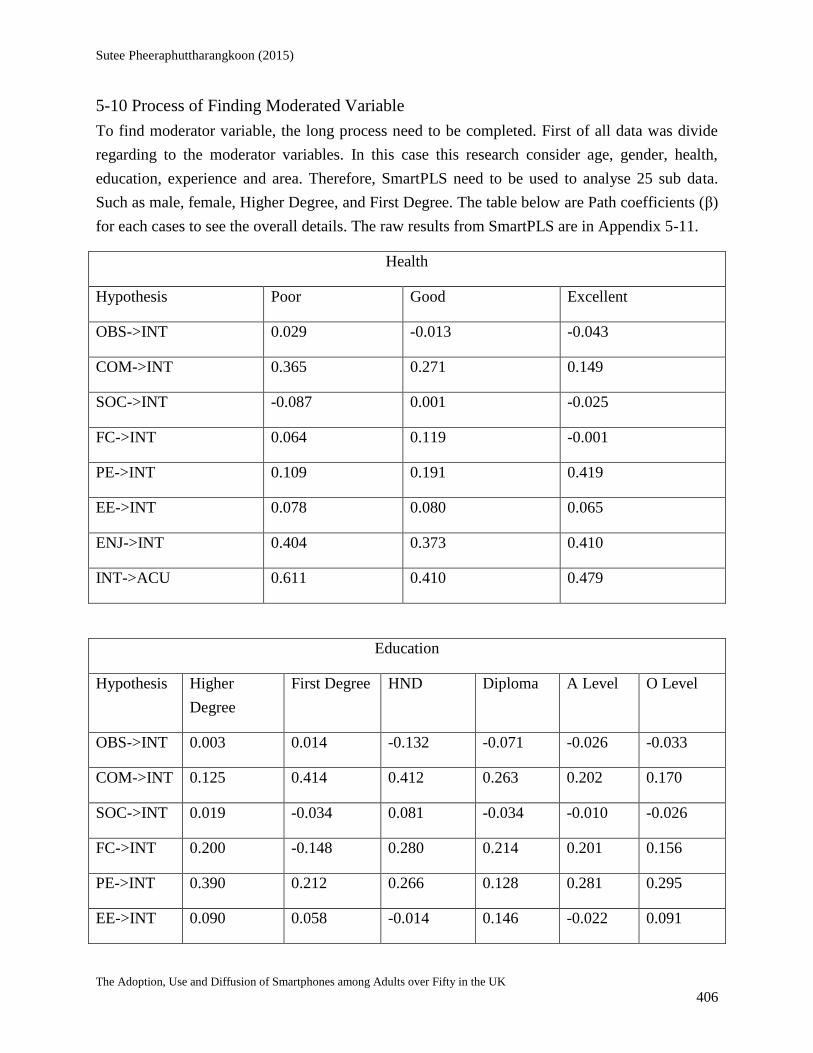
Sutee Pheeraphuttharangkoon (2015)
The Adoption, Use and Diffusion of Smartphones among Adults over Fifty in the UK 406
5-10 Process of Finding Moderated Variable
To find moderator variable, the long process need to be completed. First of all data was divide
regarding to the moderator variables. In this case this research consider age, gender, health,
education, experience and area. Therefore, SmartPLS need to be used to analyse 25 sub data.
Such as male, female, Higher Degree, and First Degree. The table below are Path coefficients (β)
for each cases to see the overall details. The raw results from SmartPLS are in Appendix 5-11.
Health
Hypothesis Poor Good Excellent
OBS->INT 0.029 -0.013 -0.043
COM->INT 0.365 0.271 0.149
SOC->INT -0.087 0.001 -0.025
FC->INT 0.064 0.119 -0.001
PE->INT 0.109 0.191 0.419
EE->INT 0.078 0.080 0.065
ENJ->INT 0.404 0.373 0.410
INT->ACU 0.611 0.410 0.479
Education
Hypothesis Higher
Degree
First Degree HND Diploma A Level O Level
OBS->INT 0.003 0.014 -0.132 -0.071 -0.026 -0.033
COM->INT 0.125 0.414 0.412 0.263 0.202 0.170
SOC->INT 0.019 -0.034 0.081 -0.034 -0.010 -0.026
FC->INT 0.200 -0.148 0.280 0.214 0.201 0.156
PE->INT 0.390 0.212 0.266 0.128 0.281 0.295
EE->INT 0.090 0.058 -0.014 0.146 -0.022 0.091

Sutee Pheeraphuttharangkoon (2015)
The Adoption, Use and Diffusion of Smartphones among Adults over Fifty in the UK 407
ENJ->INT 0.172 0.434 0.160 0.374 0.349 0.354
INT->ACU 0.542 0.516 0.374 0.540 0.385 0.378
Gender
Hypothesis Male Female
OBS->INT -0.056 0.029
COM->INT 0.242 0.257
SOC->INT -0.014 -0.027
FC->INT 0.093 0.085
PE->INT 0.223 0.252
EE->INT 0.070 0.095
ENJ->INT 0.412 0.339
INT->ACU 0.431 0.485
Age
Hypothesis 50-59 60-69 70-79
OBS->INT -0.010 -0.022 -0.006
COM->INT 0.284 0.216 0.156
SOC->INT -0.010 -0.048 0.089
FC->INT 0.088 0.062 -0.071
PE->INT 0.228 0.226 0.146
EE->INT 0.105 0.087 -0.062
ENJ->INT 0.342 0.449 0.635
INT->ACU 0.455 0.439 0.288

Sutee Pheeraphuttharangkoon (2015)
The Adoption, Use and Diffusion of Smartphones among Adults over Fifty in the UK 408
Area in North London
Hypothesis Barnet Brent Camden Enfield Haringey Islington Westminster
OBS->INT -0.026 -0.120 -0.013 0.024 -0.037 0.033 -0.110
COM->INT 0.493 0.136 0.048 0.284 0.446 0.135 0.258
SOC->INT -0.021 0.023 -0.005 -0.027 0.014 -0.128 -0.006
FC->INT 0.081 0.124 0.146 0.150 0.101 0.059 0.117
PE->INT 0.066 0.259 0.308 0.171 0.118 0.412 0.167
EE->INT -0.121 0.156 0.209 0.116 0.014 0.003 0.154
ENJ->INT 0.477 0.412 0.291 0.323 0.399 0.463 0.376
INT->ACU 0.411 0.502 0.335 0.619 0.547 0.537 0.281
Experience
Hypothesis Less than 1
year
1-2 years 2-3 years More than 3
years
OBS->INT -0.141 0.015 0.112 -0.004
COM->INT 0.112 0.338 0.065 0.359
SOC->INT 0.003 0.013 -0.046 -0.028
FC->INT 0.198 0.032 0.055 0.066
PE->INT 0.328 0.178 0.264 0.190
EE->INT 0.076 0.124 0.025 0.077

Sutee Pheeraphuttharangkoon (2015)
The Adoption, Use and Diffusion of Smartphones among Adults over Fifty in the UK 409
ENJ->INT 0.366 0.368 0.534 0.350
INT->ACU 0.557 0.448 0.468 0.231
In some cases we can identify by our eyes. However, we need to provide the solid evident and
numbers to show the significant in terms of statistic. Unfortunately SmartPLS version 2 is not
support finding moderator variables. Please note that new SmartPLS version 3 supports this
feature. The useful YouTube is https://www.youtube.com/watch?v=-BI8VweLQPc . The
example of calculating moderator variable are from Lowry and Gaskin (2014) and using formula
from Chin (2000). The formula to calculate t-value between two subgroups is shown below.
Where
M = number of response in case 1 such as number of female
N = number of responses in case 2 such as number of male
Path sample1 = Mean of case 1 or Regression Weight which similar to Path coefficients of case 1
Path sample2 = Mean of case 2 or Regression Weight which similar to Path coefficients or case 2
S.E. = Standard Error. Or STERR
Chin (2000) provided Excel file attached to this email to calculate, Stats Tools Package.xlsm.
Mean and STERR are from Bootstrapping analyse which the results are in PLS results ALL.docx
file. The below tables are from the formula to calculate t-value and p-value.
For example, Mean and STERR from Male, blue colour, and Mean and STERR from Female,
yellow colour, was bought to the excel file to calculate T-value and P-value, red colour. The t-
value more than approximately 1.96 is significant.
Moderating Model- Gender
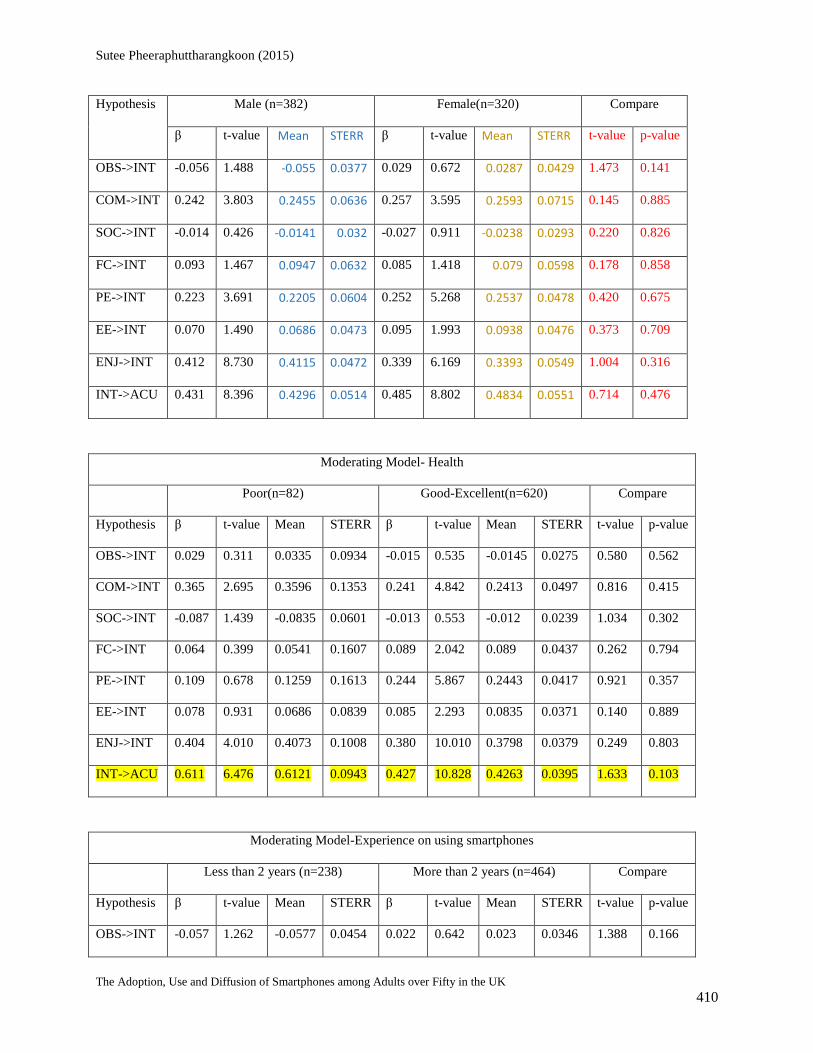
Sutee Pheeraphuttharangkoon (2015)
The Adoption, Use and Diffusion of Smartphones among Adults over Fifty in the UK 410
Hypothesis Male (n=382) Female(n=320) Compare
β t-value Mean STERR β t-value Mean STERR t-value p-value
OBS->INT -0.056 1.488 -0.055 0.0377 0.029 0.672 0.0287 0.0429 1.473 0.141
COM->INT 0.242 3.803 0.2455 0.0636 0.257 3.595 0.2593 0.0715 0.145 0.885
SOC->INT -0.014 0.426 -0.0141 0.032 -0.027 0.911 -0.0238 0.0293 0.220 0.826
FC->INT 0.093 1.467 0.0947 0.0632 0.085 1.418 0.079 0.0598 0.178 0.858
PE->INT 0.223 3.691 0.2205 0.0604 0.252 5.268 0.2537 0.0478 0.420 0.675
EE->INT 0.070 1.490 0.0686 0.0473 0.095 1.993 0.0938 0.0476 0.373 0.709
ENJ->INT 0.412 8.730 0.4115 0.0472 0.339 6.169 0.3393 0.0549 1.004 0.316
INT->ACU 0.431 8.396 0.4296 0.0514 0.485 8.802 0.4834 0.0551 0.714 0.476
Moderating Model- Health
Poor(n=82) Good-Excellent(n=620) Compare
Hypothesis β t-value Mean STERR β t-value Mean STERR t-value p-value
OBS->INT 0.029 0.311 0.0335 0.0934 -0.015 0.535 -0.0145 0.0275 0.580 0.562
COM->INT 0.365 2.695 0.3596 0.1353 0.241 4.842 0.2413 0.0497 0.816 0.415
SOC->INT -0.087 1.439 -0.0835 0.0601 -0.013 0.553 -0.012 0.0239 1.034 0.302
FC->INT 0.064 0.399 0.0541 0.1607 0.089 2.042 0.089 0.0437 0.262 0.794
PE->INT 0.109 0.678 0.1259 0.1613 0.244 5.867 0.2443 0.0417 0.921 0.357
EE->INT 0.078 0.931 0.0686 0.0839 0.085 2.293 0.0835 0.0371 0.140 0.889
ENJ->INT 0.404 4.010 0.4073 0.1008 0.380 10.010 0.3798 0.0379 0.249 0.803
INT->ACU 0.611 6.476 0.6121 0.0943 0.427 10.828 0.4263 0.0395 1.633 0.103
Moderating Model-Experience on using smartphones
Less than 2 years (n=238) More than 2 years (n=464) Compare
Hypothesis β t-value Mean STERR β t-value Mean STERR t-value p-value
OBS->INT -0.057 1.262 -0.0577 0.0454 0.022 0.642 0.023 0.0346 1.388 0.166

Sutee Pheeraphuttharangkoon (2015)
The Adoption, Use and Diffusion of Smartphones among Adults over Fifty in the UK 411
COM->INT 0.192 2.512 0.1957 0.0765 0.287 5.151 0.2882 0.0558 0.973 0.331
SOC->INT 0.005 0.118 0.0054 0.0451 -0.032 1.282 -0.0319 0.0252 0.782 0.434
FC->INT 0.119 1.651 0.1188 0.072 0.075 1.390 0.0758 0.0536 0.474 0.636
PE->INT 0.265 3.735 0.2679 0.0711 0.204 4.657 0.2026 0.0437 0.823 0.411
EE->INT 0.096 1.648 0.0941 0.0581 0.072 1.808 0.0709 0.0399 0.334 0.738
ENJ->INT 0.384 5.980 0.3807 0.0643 0.379 8.945 0.3778 0.0423 0.039 0.969
INT->ACU 0.525 9.342 0.5232 0.0562 0.352 7.079 0.3502 0.0497 2.159 0.031
Moderating Model-Education
Low(n=405) O, A Level, diploma High(n=282) Higher Degree, First Degree Compare
Hypothesis β t-value Mean STERR β t-value Mean STERR t-value p-value
OBS->INT -0.049 1.384 -0.0487 0.0352 0.011 0.221 0.0119 0.0476 1.047 0.295
COM->INT 0.216 3.729 0.2188 0.0579 0.339 4.108 0.3403 0.0826 1.244 0.214
SOC->INT -0.019 0.734 -0.0196 0.0262 -0.015 0.376 -0.0156 0.0391 0.088 0.930
FC->INT 0.199 3.687 0.1997 0.054 -0.088 1.320 -0.087 0.0666 3.366 0.001
PE->INT 0.238 4.783 0.2375 0.0497 0.263 3.941 0.2623 0.0668 0.304 0.761
EE->INT 0.050 1.197 0.0472 0.0415 0.100 1.680 0.0984 0.0593 0.731 0.465
ENJ->INT 0.366 7.576 0.3644 0.0483 0.357 6.024 0.359 0.0592 0.071 0.943
INT->ACU 0.404 7.923 0.4027 0.051 0.523 9.847 0.5233 0.0531 1.600 0.110
Moderating Model-Age
Hypothesis Young (50-59) (n=450) Old (60-69) (n=250) Compare
β t-value Mean STERR β t-value Mean STERR t-value p-value
OBS->INT -0.010 0.281 -0.0099 0.0367 -0.019 0.400 -0.0179 0.0478 0.132 0.895
COM->INT 0.284 4.679 0.2865 0.0606 0.209 2.654 0.213 0.0788 0.734 0.463
SOC->INT -0.010 0.406 -0.0102 0.0247 -0.029 0.672 -0.0305 0.0439 0.437 0.663
FC->INT 0.088 1.540 0.0884 0.0574 0.048 0.690 0.046 0.0699 0.457 0.648

Sutee Pheeraphuttharangkoon (2015)
The Adoption, Use and Diffusion of Smartphones among Adults over Fifty in the UK 412
PE->INT 0.228 5.046 0.2293 0.0452 0.218 3.142 0.2185 0.0695 0.136 0.892
EE->INT 0.105 2.371 0.102 0.0443 0.075 1.309 0.0727 0.0575 0.400 0.689
ENJ->INT 0.342 8.043 0.3408 0.0426 0.457 7.090 0.4571 0.0644 1.561 0.119
INT->ACU 0.455 9.337 0.4562 0.0488 0.417 7.824 0.4165 0.0534 0.519 0.604
After long calculation from above table. The final research model is show below. If we set p<0.1
there are only two moderators, Education on FC->INT, and, Experience on INT-> ACU.
However, if we set p-value <0.15 then 3 more moderators will be include. Which are Age on
ENJ->INT, Education on INT->ACU, Health on INT->ACU, the bright yellow highlight.

Sutee Pheeraphuttharangkoon (2015)
The Adoption, Use and Diffusion of Smartphones among Adults over Fifty in the UK 413
INT ACU
OBS
COM
SOC
FC
PE
EE
ENJ Education Experience
Research Model with Modified Variables (p<0.1)
INT ACU
OBS
COM
SOC
FC
PE
EE
ENJ Education ExperienceAge Health
Research Model with Modified Variables (p<0.15)

Sutee Pheeraphuttharangkoon (2015)
The Adoption, Use and Diffusion of Smartphones among Adults over Fifty in the UK 414
5-11 Results from SmartPLS for finding Moderated Variables
Area Barnet

Sutee Pheeraphuttharangkoon (2015)
The Adoption, Use and Diffusion of Smartphones among Adults over Fifty in the UK 415
Original
Sample (O)
Sample Mean
(M)
Standard Deviation
(STDEV)
Standard Error
(STERR)
T Statistics
(|O/STERR|)
COM -> INT 0.4929 0.4924 0.1345 0.1345 3.6636
EE -> INT -0.121 -0.1242 0.1065 0.1065 1.137
ENJ -> INT 0.4767 0.4705 0.1076 0.1076 4.4301
FC -> INT 0.0809 0.0891 0.1301 0.1301 0.6215
INT -> ACU 0.4108 0.4145 0.0971 0.0971 4.2329
OBS -> INT -0.0263 -0.0338 0.0675 0.0675 0.3894
PE -> INT 0.0662 0.0741 0.1043 0.1043 0.6342
SOC -> INT -0.0208 -0.0147 0.0606 0.0606 0.3441
AVE
Composite
Reliability
R
Square
Cronbachs
Alpha
Communalit
y
Redundanc
y
ACU 1 1 0.1688 1 1 0.1688
CO
M
0.8286 0.9354 0 0.8963 0.8286 0
EE 0.9287 0.963 0 0.9233 0.9287 0
ENJ 0.9673 0.9834 0 0.9663 0.9673 0
FC 0.7201 0.8853 0 0.8072 0.7201 0
INT 0.7754 0.9118 0.7712 0.8551 0.7754 0.4345
OBS 0.9563 0.9777 0 0.9545 0.9563 0
PE 0.743 0.8965 0 0.8281 0.743 0
SOC 0.8667 0.9285 0 0.8538 0.8667 0
ACU COM EE ENJ FC INT OBS PE SOC
ACU 1 0 0 0 0 0 0 0 0
COM 0.39 1 0 0 0 0 0 0 0
EE 0.2732 0.6316 1 0 0 0 0 0 0
ENJ 0.3798 0.6419 0.7161 1 0 0 0 0 0
FC 0.3134 0.7487 0.6591 0.4381 1 0 0 0 0
INT 0.4108 0.8126 0.615 0.7685 0.603 1 0 0 0
OBS 0.1859 0.4608 0.2677 0.2561 0.4746 0.3341 1 0 0
PE 0.3158 0.7591 0.6028 0.5774 0.6365 0.6824 0.2082 1 0
SOC 0.2256 0.4089 0.133 0.2317 0.273 0.3061 0.4126 0.2995 1

Sutee Pheeraphuttharangkoon (2015)
The Adoption, Use and Diffusion of Smartphones among Adults over Fifty in the UK 416
Area Brent

Sutee Pheeraphuttharangkoon (2015)
The Adoption, Use and Diffusion of Smartphones among Adults over Fifty in the UK 417
Original
Sample
(O)
Sample
Mean
(M)
Standard Deviation
(STDEV)
Standard Error
(STERR)
T Statistics
(|O/STERR|)
COM -> INT 0.1364 0.1376 0.2015 0.2015 0.6768
EE -> INT 0.1563 0.17 0.2366 0.2366 0.6607
ENJ -> INT 0.412 0.3472 0.1559 0.1559 2.6437
FC -> INT 0.1236 0.1711 0.2092 0.2092 0.5908
INT -> ACU 0.5021 0.4754 0.1827 0.1827 2.7478
OBS -> INT -0.1196 -0.0881 0.1083 0.1083 1.1051
PE -> INT 0.2588 0.239 0.147 0.147 1.76
SOC -> INT 0.0226 0.0228 0.0842 0.0842 0.2688
AVE
Composite
Reliability
R
Square
Cronbachs
Alpha
Communalit
y
Redundanc
y
ACU 1 1 0.2521 1 1 0.2521
CO
M
0.872 0.9533 0 0.926 0.872 0
EE 0.9652 0.9823 0 0.9639 0.9652 0
ENJ 0.9631 0.9812 0 0.9617 0.9631 0
FC 0.7792 0.9136 0 0.8583 0.7792 0
INT 0.8643 0.9502 0.8491 0.9213 0.8643 0.1667
OBS 0.8744 0.933 0 0.8594 0.8744 0
PE 0.796 0.9211 0 0.8704 0.796 0
SOC 0.9158 0.9561 0 0.9084 0.9158 0
ACU
COM
EE ENJ FC INT OBS PE SOC
ACU 1 0 0 0 0 0 0 0 0
COM 0.419 1 0 0 0 0 0 0 0
EE 0.4864 0.6441 1 0 0 0 0 0 0
ENJ 0.3662 0.7027 0.7681 1 0 0 0 0 0
FC 0.4327 0.7282 0.8349 0.669 1 0 0 0 0
INT 0.5021 0.7748 0.7986 0.8603 0.7648 1 0 0 0
OBS 0.1321 0.4953 0.3488 0.2897 0.5285 0.3502 1 0 0
PE 0.3793 0.7852 0.6574 0.6734 0.7283 0.7762 0.5931 1 0
SOC 0.1731 0.6303 0.2822 0.4448 0.465 0.469 0.4248 0.4883 1

Sutee Pheeraphuttharangkoon (2015)
The Adoption, Use and Diffusion of Smartphones among Adults over Fifty in the UK 418
Area Camden

Sutee Pheeraphuttharangkoon (2015)
The Adoption, Use and Diffusion of Smartphones among Adults over Fifty in the UK 419
Original
Sample
(O)
Sample
Mean
(M)
Standard Deviation
(STDEV)
Standard Error
(STERR)
T Statistics
(|O/STERR|)
COM -> INT 0.0483 0.0499 0.1025 0.1025 0.4712
EE -> INT 0.2087 0.2081 0.0756 0.0756 2.7613
ENJ -> INT 0.2908 0.2909 0.0728 0.0728 3.9938
FC -> INT 0.1463 0.1421 0.1115 0.1115 1.312
INT -> ACU 0.335 0.334 0.0893 0.0893 3.7511
OBS -> INT -0.0131 -0.0086 0.0782 0.0782 0.1674
PE -> INT 0.3084 0.3056 0.0786 0.0786 3.9215
SOC -> INT -0.0052 -0.0045 0.0508 0.0508 0.1027
AVE
Composite
Reliability
R
Square
Cronbachs
Alpha
Communalit
y
Redundanc
y
ACU 1 1 0.1123 1 1 0.1123
CO
M
0.8602 0.9486 0 0.9186 0.8602 0
EE 0.9337 0.9657 0 0.9291 0.9337 0
ENJ 0.955 0.977 0 0.9529 0.955 0
FC 0.7767 0.9125 0 0.8566 0.7767 0
INT 0.7599 0.9047 0.6826 0.8422 0.7599 0.0473
OBS 0.8956 0.9449 0 0.8842 0.8956 0
PE 0.7844 0.916 0 0.8632 0.7844 0
SOC 0.8526 0.9205 0 0.8272 0.8526 0
ACU COM EE ENJ FC INT OBS PE SOC
ACU 1 0 0 0 0 0 0 0 0
COM 0.3646 1 0 0 0 0 0 0 0
EE 0.2485 0.6554 1 0 0 0 0 0 0
ENJ 0.2457 0.6099 0.5794 1 0 0 0 0 0
FC 0.2938 0.7681 0.706 0.6033 1 0 0 0 0
INT 0.335 0.6686 0.6829 0.7008 0.6576 1 0 0 0
OBS 0.255 0.6001 0.4178 0.3379 0.572 0.4101 1 0 0
PE 0.3341 0.6601 0.5746 0.5755 0.5198 0.6963 0.4115 1 0
SOC 0.1112 0.367 0.1898 0.3365 0.2784 0.2981 0.3589 0.3635 1

Sutee Pheeraphuttharangkoon (2015)
The Adoption, Use and Diffusion of Smartphones among Adults over Fifty in the UK 420
Area Enfield

Sutee Pheeraphuttharangkoon (2015)
The Adoption, Use and Diffusion of Smartphones among Adults over Fifty in the UK 421
Original
Sample
(O)
Sample
Mean
(M)
Standard Deviation
(STDEV)
Standard Error
(STERR)
T Statistics
(|O/STERR|)
COM -> INT 0.2845 0.2809 0.1075 0.1075 2.6455
EE -> INT 0.116 0.1086 0.0916 0.0916 1.2662
ENJ -> INT 0.3232 0.321 0.0828 0.0828 3.904
FC -> INT 0.1497 0.1494 0.0888 0.0888 1.6858
INT -> ACU 0.619 0.6185 0.0705 0.0705 8.7766
OBS -> INT 0.0236 0.0263 0.0612 0.0612 0.3861
PE -> INT 0.1714 0.1794 0.0932 0.0932 1.8382
SOC -> INT -0.0271 -0.0214 0.0489 0.0489 0.5538
AVE Composite
Reliability
R
Square
Cronbachs
Alpha
Communalit
y
Redundanc
y
ACU 1 1 0.3832 1 1 0.3832
COM 0.8358 0.9384 0 0.9018 0.8358 0
EE 0.9466 0.9726 0 0.9438 0.9466 0
ENJ 0.9403 0.9692 0 0.9365 0.9403 0
FC 0.7482 0.8991 0 0.8318 0.7482 0
INT 0.7349 0.8926 0.7925 0.8193 0.7349 0.2826
OBS 0.8948 0.9445 0 0.8835 0.8948 0
PE 0.7298 0.8901 0 0.8198 0.7298 0
SOC 0.9131 0.9546 0 0.9049 0.9131 0
ACU
COM
EE ENJ FC INT OBS PE SOC
ACU 1 0 0 0 0 0 0 0 0
COM 0.6053 1 0 0 0 0 0 0 0
EE 0.5196 0.6799 1 0 0 0 0 0 0
ENJ 0.4807 0.7582 0.5728 1 0 0 0 0 0
FC 0.4508 0.6276 0.696 0.4836 1 0 0 0 0
INT 0.619 0.821 0.7074 0.7839 0.6636 1 0 0 0
OBS 0.2129 0.417 0.3326 0.1997 0.5059 0.3706 1 0 0
PE 0.5269 0.7031 0.627 0.6487 0.5522 0.7321 0.3396 1 0
SOC 0.1524 0.4311 0.2472 0.3603 0.3041 0.3722 0.3211 0.4573 1
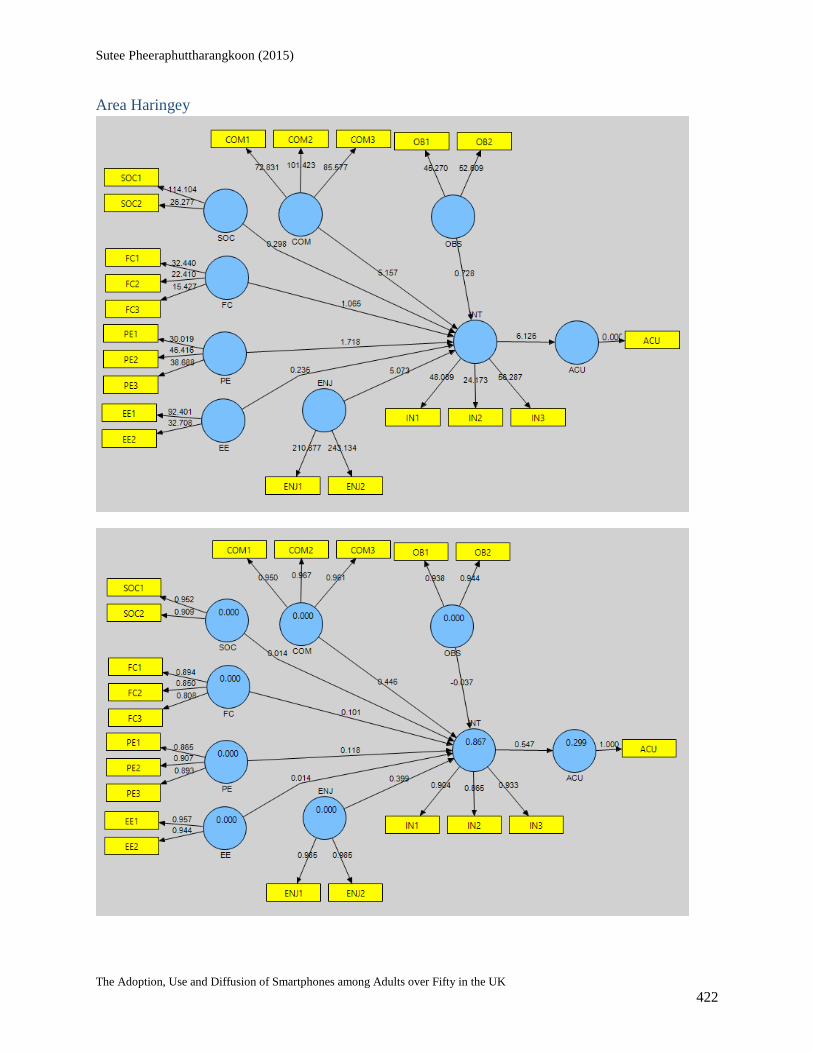
Sutee Pheeraphuttharangkoon (2015)
The Adoption, Use and Diffusion of Smartphones among Adults over Fifty in the UK 422
Area Haringey

Sutee Pheeraphuttharangkoon (2015)
The Adoption, Use and Diffusion of Smartphones among Adults over Fifty in the UK 423
Original
Sample
(O)
Sample
Mean
(M)
Standard Deviation
(STDEV)
Standard Error
(STERR)
T Statistics
(|O/STERR|)
COM -> INT 0.4458 0.4441 0.0864 0.0864 5.1568
EE -> INT 0.0142 0.0115 0.0605 0.0605 0.2346
ENJ -> INT 0.3992 0.3919 0.0787 0.0787 5.0728
FC -> INT 0.1008 0.1102 0.0947 0.0947 1.065
INT -> ACU 0.5472 0.5408 0.0893 0.0893 6.126
OBS -> INT -0.0368 -0.0361 0.0506 0.0506 0.7278
PE -> INT 0.1181 0.1199 0.0688 0.0688 1.7181
SOC -> INT 0.0143 0.0102 0.0479 0.0479 0.2985
AVE Composite
Reliability
R
Square
Cronbachs
Alpha
Communalit
y
Redundanc
y
ACU 1 1 0.2994 1 1 0.2994
COM 0.9205 0.972 0 0.9568 0.9205 0
EE 0.9034 0.9493 0 0.8936 0.9034 0
ENJ 0.9699 0.9847 0 0.9689 0.9699 0
FC 0.725 0.8876 0 0.8095 0.725 0
INT 0.8121 0.9283 0.8671 0.8838 0.8121 0.462
OBS 0.8853 0.9392 0 0.8706 0.8853 0
PE 0.7894 0.9183 0 0.8669 0.7894 0
SOC 0.8664 0.9284 0 0.8493 0.8664 0
ACU COM EE ENJ FC INT OBS PE SOC
ACU 1 0 0 0 0 0 0 0 0
COM 0.5444 1 0 0 0 0 0 0 0
EE 0.3605 0.5002 1 0 0 0 0 0 0
ENJ 0.3308 0.6381 0.6106 1 0 0 0 0 0
FC 0.4985 0.7202 0.5806 0.5152 1 0 0 0 0
INT 0.5472 0.8611 0.5843 0.8097 0.7035 1 0 0 0
OBS 0.3754 0.6354 0.4961 0.5551 0.6679 0.6212 1 0 0
PE 0.541 0.8207 0.5052 0.6646 0.7366 0.8149 0.6053 1 0
SOC 0.2481 0.509 0.2422 0.5102 0.3706 0.5198 0.5093 0.4479 1

Sutee Pheeraphuttharangkoon (2015)
The Adoption, Use and Diffusion of Smartphones among Adults over Fifty in the UK 424
Area Islington

Sutee Pheeraphuttharangkoon (2015)
The Adoption, Use and Diffusion of Smartphones among Adults over Fifty in the UK 425
Original
Sample (O)
Sample
Mean
(M)
Standard Deviation
(STDEV)
Standard Error
(STERR)
T Statistics
(|O/STERR|)
COM -> INT 0.1348 0.1322 0.1355 0.1355 0.9949
EE -> INT 0.0033 -0.0052 0.0757 0.0757 0.043
ENJ -> INT 0.4634 0.464 0.0863 0.0863 5.3731
FC -> INT 0.0589 0.0557 0.0885 0.0885 0.6651
INT -> ACU 0.5369 0.5333 0.088 0.088 6.0998
OBS -> INT 0.0332 0.0332 0.0773 0.0773 0.4291
PE -> INT 0.4123 0.4132 0.1164 0.1164 3.5426
SOC -> INT -0.1277 -0.1082 0.0579 0.0579 2.2055
AVE
Composite
Reliability
R
Square
Cronbachs
Alpha
Communalit
y
Redundanc
y
ACU 1 1 0.2882 1 1 0.2882
CO
M
0.8524 0.9454 0 0.9135 0.8524 0
EE 0.9526 0.9757 0 0.9503 0.9526 0
ENJ 0.9786 0.9892 0 0.9781 0.9786 0
FC 0.7231 0.8868 0 0.8084 0.7231 0
INT 0.7825 0.9151 0.8226 0.8612 0.7825 0.1509
OBS 0.9455 0.972 0 0.9424 0.9455 0
PE 0.8083 0.9267 0 0.8814 0.8083 0
SOC 0.8832 0.938 0 0.8679 0.8832 0
ACU COM EE ENJ FC INT OBS PE SOC
ACU 1 0 0 0 0 0 0 0 0
COM 0.5438 1 0 0 0 0 0 0 0
EE 0.3729 0.6638 1 0 0 0 0 0 0
ENJ 0.4511 0.6983 0.7194 1 0 0 0 0 0
FC 0.4515 0.8011 0.7024 0.6355 1 0 0 0 0
INT 0.5369 0.7823 0.6634 0.81 0.6909 1 0 0 0
OBS 0.2691 0.6153 0.3994 0.3363 0.5814 0.4687 1 0 0
PE 0.52 0.7456 0.5199 0.6093 0.5809 0.7883 0.4952 1 0
SOC 0.1522 0.417 0.2476 0.3891 0.2471 0.3263 0.3365 0.4632 1

Sutee Pheeraphuttharangkoon (2015)
The Adoption, Use and Diffusion of Smartphones among Adults over Fifty in the UK 426
Area Westminster

Sutee Pheeraphuttharangkoon (2015)
The Adoption, Use and Diffusion of Smartphones among Adults over Fifty in the UK 427
Original
Sample
(O)
Sample
Mean
(M)
Standard Deviation
(STDEV)
Standard Error
(STERR)
T Statistics
(|O/STERR|)
COM -> INT 0.2576 0.2639 0.1453 0.1453 1.7737
EE -> INT 0.154 0.1477 0.1131 0.1131 1.3616
ENJ -> INT 0.3764 0.369 0.1287 0.1287 2.9249
FC -> INT 0.1166 0.106 0.1274 0.1274 0.9158
INT -> ACU 0.2813 0.284 0.0808 0.0808 3.4788
OBS -> INT -0.1103 -0.0956 0.0697 0.0697 1.5813
PE -> INT 0.1666 0.1761 0.0966 0.0966 1.7246
SOC -> INT -0.0055 0.0009 0.053 0.053 0.1047
AVE
Composite
Reliability
R
Square
Cronbachs
Alpha
Communalit
y
Redundanc
y
ACU 1 1 0.0791 1 1 0.0791
CO
M
0.9272 0.9745 0 0.9607 0.9272 0
EE 0.9432 0.9708 0 0.94 0.9432 0
ENJ 0.9748 0.9872 0 0.9741 0.9748 0
FC 0.758 0.9035 0 0.84 0.758 0
INT 0.7802 0.9139 0.7331 0.8575 0.7802 0.237
OBS 0.8943 0.9442 0 0.8819 0.8943 0
PE 0.7575 0.9035 0 0.8392 0.7575 0
SOC 0.9043 0.9497 0 0.8954 0.9043 0
ACU COM EE ENJ FC INT OBS PE SOC
ACU 1 0 0 0 0 0 0 0 0
COM 0.2598 1 0 0 0 0 0 0 0
EE 0.2077 0.5148 1 0 0 0 0 0 0
ENJ 0.1974 0.6172 0.6766 1 0 0 0 0 0
FC 0.2279 0.6949 0.584 0.4543 1 0 0 0 0
INT 0.2813 0.7187 0.679 0.7677 0.6037 1 0 0 0
OBS 0.046 0.5634 0.203 0.2055 0.5245 0.282 1 0 0
PE 0.3455 0.8026 0.5588 0.5984 0.6441 0.7044 0.4743 1 0
SOC 0.0792 0.572 0.2062 0.3579 0.4258 0.4163 0.3156 0.5589 1

Sutee Pheeraphuttharangkoon (2015)
The Adoption, Use and Diffusion of Smartphones among Adults over Fifty in the UK 428
Education Higher Degree

Sutee Pheeraphuttharangkoon (2015)
The Adoption, Use and Diffusion of Smartphones among Adults over Fifty in the UK 429
Original
Sample
(O)
Sample
Mean
(M)
Standard Deviation
(STDEV)
Standard Error
(STERR)
T Statistics
(|O/STERR|)
COM -> INT 0.1246 0.1406 0.1528 0.1528 0.8157
EE -> INT 0.09 0.1191 0.1245 0.1245 0.7224
ENJ -> INT 0.1724 0.1695 0.1084 0.1084 1.591
FC -> INT 0.2002 0.1775 0.136 0.136 1.4722
INT -> ACU 0.5423 0.537 0.0972 0.0972 5.5797
OBS -> INT 0.0033 0.0012 0.1009 0.1009 0.0329
PE -> INT 0.3897 0.3739 0.1286 0.1286 3.0313
SOC -> INT 0.0188 0.0238 0.064 0.064 0.2942
AVE
Composite
Reliability
R
Square
Cronbachs
Alpha
Communalit
y
Redundanc
y
ACU 1 1 0.2941 1 1 0.2941
CO
M
0.8875 0.9595 0 0.9368 0.8875 0
EE 0.9434 0.9709 0 0.94 0.9434 0
ENJ 0.9372 0.9676 0 0.933 0.9372 0
FC 0.7114 0.8803 0 0.7962 0.7114 0
INT 0.7882 0.9176 0.7163 0.8642 0.7882 0.1327
OBS 0.8986 0.9466 0 0.8889 0.8986 0
PE 0.8186 0.9309 0 0.8871 0.8186 0
SOC 0.9223 0.9596 0 0.9163 0.9223 0
ACU COM EE ENJ FC INT OBS PE SOC
ACU 1 0 0 0 0 0 0 0 0
COM 0.4733 1 0 0 0 0 0 0 0
EE 0.5169 0.7058 1 0 0 0 0 0 0
ENJ 0.4469 0.6546 0.6962 1 0 0 0 0 0
FC 0.3403 0.7958 0.747 0.5705 1 0 0 0 0
INT 0.5423 0.7378 0.7123 0.6922 0.6803 1 0 0 0
OBS 0.213 0.6279 0.5098 0.4631 0.6679 0.4775 1 0 0
PE 0.5831 0.6894 0.6643 0.6508 0.5357 0.7624 0.3356 1 0
SOC 0.1717 0.3588 0.2249 0.3308 0.231 0.3222 0.3057 0.3441 1

Sutee Pheeraphuttharangkoon (2015)
The Adoption, Use and Diffusion of Smartphones among Adults over Fifty in the UK 430
Education First Degree

Sutee Pheeraphuttharangkoon (2015)
The Adoption, Use and Diffusion of Smartphones among Adults over Fifty in the UK 431
Original
Sample
(O)
Sample
Mean
(M)
Standard Deviation
(STDEV)
Standard Error
(STERR)
T Statistics
(|O/STERR|)
COM -> INT 0.4137 0.4076 0.097 0.097 4.2654
EE -> INT 0.0581 0.0606 0.0612 0.0612 0.9501
ENJ -> INT 0.4339 0.4325 0.0648 0.0648 6.698
FC -> INT -0.1476 -0.1441 0.0779 0.0779 1.8963
INT -> ACU 0.5163 0.5194 0.0635 0.0635 8.1321
OBS -> INT 0.014 0.0155 0.0577 0.0577 0.2423
PE -> INT 0.2116 0.2156 0.0693 0.0693 3.0522
SOC -> INT -0.0338 -0.0321 0.0461 0.0461 0.7339
AVE Composite
Reliability
R Square Cronbachs
Alpha
Communalit
y
Redundanc
y
ACU 1 1 0.2665 1 1 0.2665
COM 0.8932 0.9617 0 0.9401 0.8932 0
EE 0.9011 0.948 0 0.8914 0.9011 0
ENJ 0.9569 0.978 0 0.9549 0.9569 0
FC 0.731 0.8907 0 0.8184 0.731 0
INT 0.7772 0.9123 0.7451 0.8548 0.7772 0.3484
OBS 0.8938 0.9439 0 0.8815 0.8938 0
PE 0.7473 0.8986 0 0.8313 0.7473 0
SOC 0.9071 0.9513 0 0.8977 0.9071 0
ACU COM EE ENJ FC INT OBS PE SOC
ACU 1 0 0 0 0 0 0 0 0
COM 0.548 1 0 0 0 0 0 0 0
EE 0.3282 0.5277 1 0 0 0 0 0 0
ENJ 0.4062 0.5628 0.6443 1 0 0 0 0 0
FC 0.405 0.6973 0.4753 0.4165 1 0 0 0 0
INT 0.5163 0.7458 0.586 0.7505 0.4658 1 0 0 0
OBS 0.3604 0.5809 0.3131 0.3038 0.4859 0.4207 1 0 0
PE 0.5317 0.7844 0.481 0.5456 0.5661 0.7131 0.4769 1 0
SOC 0.2409 0.4148 0.1759 0.3523 0.2945 0.3303 0.3784 0.3195 1

Sutee Pheeraphuttharangkoon (2015)
The Adoption, Use and Diffusion of Smartphones among Adults over Fifty in the UK 432
Education A Level
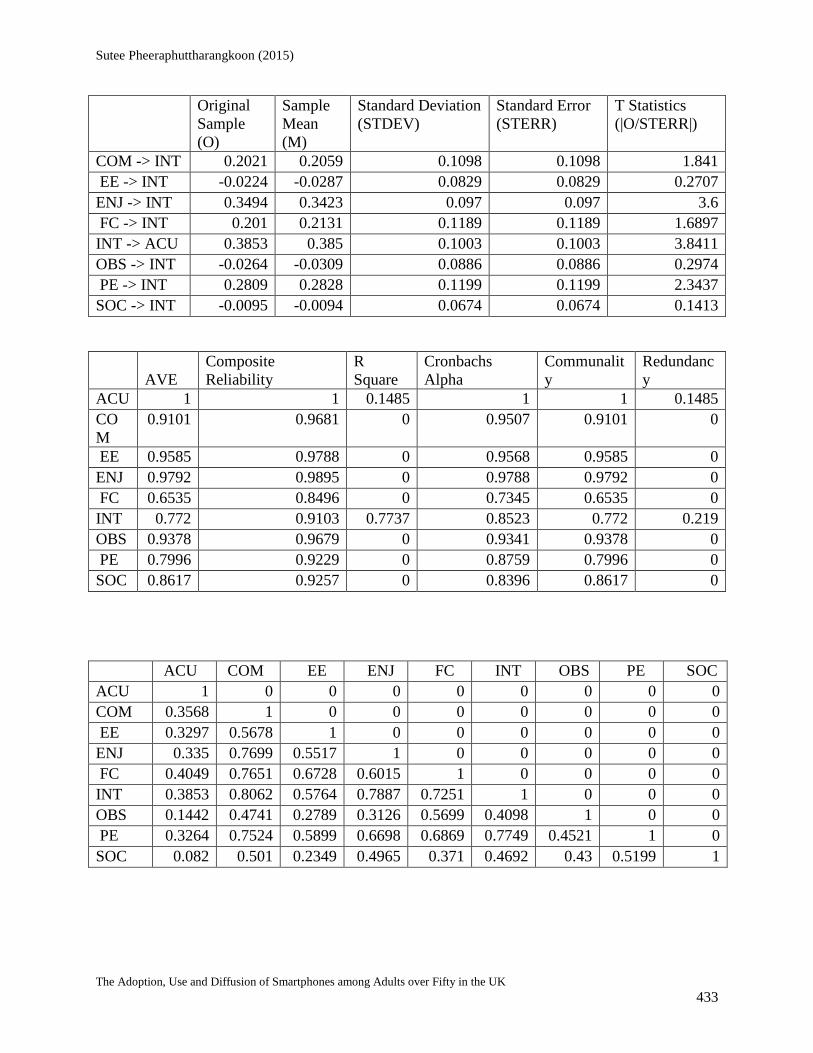
Sutee Pheeraphuttharangkoon (2015)
The Adoption, Use and Diffusion of Smartphones among Adults over Fifty in the UK 433
Original
Sample
(O)
Sample
Mean
(M)
Standard Deviation
(STDEV)
Standard Error
(STERR)
T Statistics
(|O/STERR|)
COM -> INT 0.2021 0.2059 0.1098 0.1098 1.841
EE -> INT -0.0224 -0.0287 0.0829 0.0829 0.2707
ENJ -> INT 0.3494 0.3423 0.097 0.097 3.6
FC -> INT 0.201 0.2131 0.1189 0.1189 1.6897
INT -> ACU 0.3853 0.385 0.1003 0.1003 3.8411
OBS -> INT -0.0264 -0.0309 0.0886 0.0886 0.2974
PE -> INT 0.2809 0.2828 0.1199 0.1199 2.3437
SOC -> INT -0.0095 -0.0094 0.0674 0.0674 0.1413
AVE
Composite
Reliability
R
Square
Cronbachs
Alpha
Communalit
y
Redundanc
y
ACU 1 1 0.1485 1 1 0.1485
CO
M
0.9101 0.9681 0 0.9507 0.9101 0
EE 0.9585 0.9788 0 0.9568 0.9585 0
ENJ 0.9792 0.9895 0 0.9788 0.9792 0
FC 0.6535 0.8496 0 0.7345 0.6535 0
INT 0.772 0.9103 0.7737 0.8523 0.772 0.219
OBS 0.9378 0.9679 0 0.9341 0.9378 0
PE 0.7996 0.9229 0 0.8759 0.7996 0
SOC 0.8617 0.9257 0 0.8396 0.8617 0
ACU COM EE ENJ FC INT OBS PE SOC
ACU 1 0 0 0 0 0 0 0 0
COM 0.3568 1 0 0 0 0 0 0 0
EE 0.3297 0.5678 1 0 0 0 0 0 0
ENJ 0.335 0.7699 0.5517 1 0 0 0 0 0
FC 0.4049 0.7651 0.6728 0.6015 1 0 0 0 0
INT 0.3853 0.8062 0.5764 0.7887 0.7251 1 0 0 0
OBS 0.1442 0.4741 0.2789 0.3126 0.5699 0.4098 1 0 0
PE 0.3264 0.7524 0.5899 0.6698 0.6869 0.7749 0.4521 1 0
SOC 0.082 0.501 0.2349 0.4965 0.371 0.4692 0.43 0.5199 1

Sutee Pheeraphuttharangkoon (2015)
The Adoption, Use and Diffusion of Smartphones among Adults over Fifty in the UK 434
Education O Level

Sutee Pheeraphuttharangkoon (2015)
The Adoption, Use and Diffusion of Smartphones among Adults over Fifty in the UK 435
Original
Sample
(O)
Sample
Mean
(M)
Standard Deviation
(STDEV)
Standard Error
(STERR)
T Statistics
(|O/STERR|)
COM -> INT 0.1697 0.1749 0.0825 0.0825 2.0565
EE -> INT 0.0908 0.0874 0.0671 0.0671 1.3517
ENJ -> INT 0.3537 0.3522 0.0761 0.0761 4.6487
FC -> INT 0.1557 0.1534 0.0948 0.0948 1.6424
INT -> ACU 0.3784 0.3741 0.077 0.077 4.9109
OBS -> INT -0.0326 -0.028 0.0419 0.0419 0.7764
PE -> INT 0.2946 0.2942 0.074 0.074 3.9835
SOC -> INT -0.0261 -0.0265 0.0384 0.0384 0.6795
AVE
Composite
Reliability
R
Square
Cronbachs
Alpha
Communalit
y
Redundanc
y
ACU 1 1 0.1431 1 1 0.1431
CO
M
0.8133 0.9289 0 0.8847 0.8133 0
EE 0.9399 0.969 0 0.9362 0.9399 0
ENJ 0.9757 0.9877 0 0.9751 0.9757 0
FC 0.772 0.9104 0 0.8526 0.772 0
INT 0.8065 0.9259 0.812 0.88 0.8065 0.1872
OBS 0.9065 0.951 0 0.8969 0.9065 0
PE 0.7592 0.9043 0 0.8412 0.7592 0
SOC 0.8422 0.9143 0 0.8145 0.8422 0
ACU COM EE ENJ FC INT OBS PE SOC
ACU 1 0 0 0 0 0 0 0 0
COM 0.3278 1 0 0 0 0 0 0 0
EE 0.3024 0.6506 1 0 0 0 0 0 0
ENJ 0.213 0.6407 0.7216 1 0 0 0 0 0
FC 0.3153 0.7465 0.7283 0.5932 1 0 0 0 0
INT 0.3784 0.7681 0.7403 0.8058 0.7339 1 0 0 0
OBS 0.1342 0.5214 0.3309 0.222 0.5806 0.3582 1 0 0
PE 0.3072 0.7753 0.6406 0.6864 0.6983 0.8089 0.3895 1 0
SOC 0.1449 0.5746 0.2855 0.3639 0.4336 0.4408 0.4405 0.5485 1

Sutee Pheeraphuttharangkoon (2015)
The Adoption, Use and Diffusion of Smartphones among Adults over Fifty in the UK 436
Gender Female
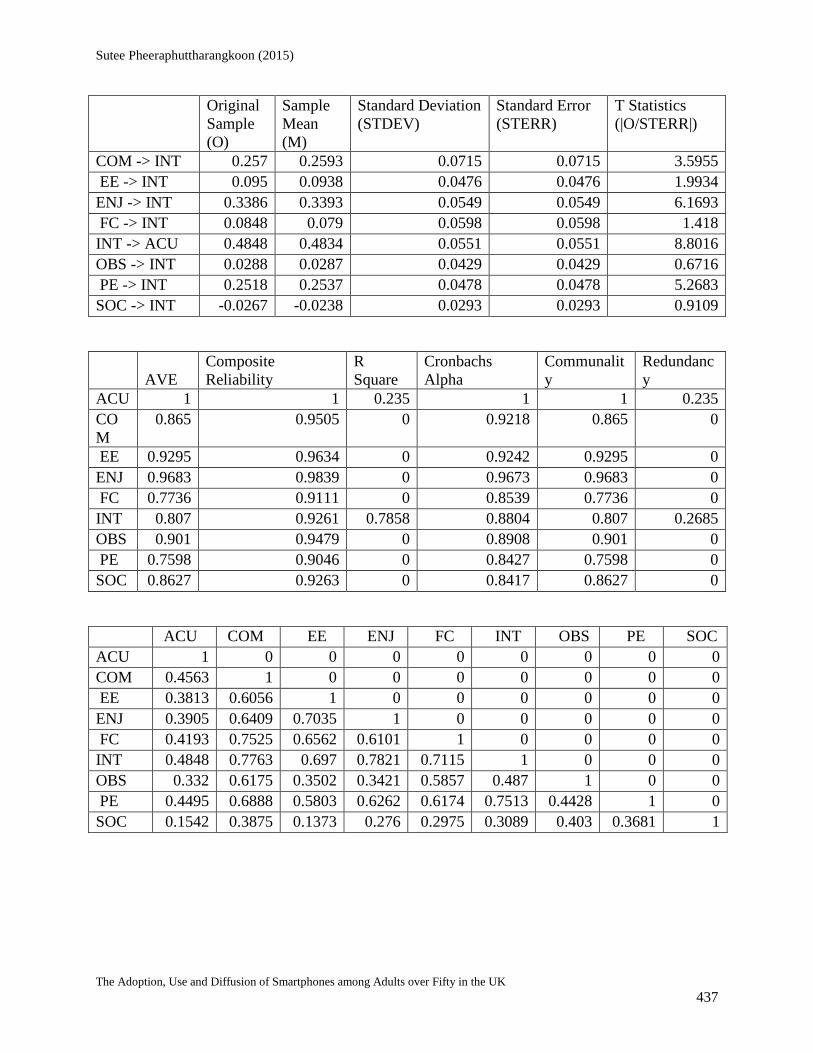
Sutee Pheeraphuttharangkoon (2015)
The Adoption, Use and Diffusion of Smartphones among Adults over Fifty in the UK 437
Original
Sample
(O)
Sample
Mean
(M)
Standard Deviation
(STDEV)
Standard Error
(STERR)
T Statistics
(|O/STERR|)
COM -> INT 0.257 0.2593 0.0715 0.0715 3.5955
EE -> INT 0.095 0.0938 0.0476 0.0476 1.9934
ENJ -> INT 0.3386 0.3393 0.0549 0.0549 6.1693
FC -> INT 0.0848 0.079 0.0598 0.0598 1.418
INT -> ACU 0.4848 0.4834 0.0551 0.0551 8.8016
OBS -> INT 0.0288 0.0287 0.0429 0.0429 0.6716
PE -> INT 0.2518 0.2537 0.0478 0.0478 5.2683
SOC -> INT -0.0267 -0.0238 0.0293 0.0293 0.9109
AVE
Composite
Reliability
R
Square
Cronbachs
Alpha
Communalit
y
Redundanc
y
ACU 1 1 0.235 1 1 0.235
CO
M
0.865 0.9505 0 0.9218 0.865 0
EE 0.9295 0.9634 0 0.9242 0.9295 0
ENJ 0.9683 0.9839 0 0.9673 0.9683 0
FC 0.7736 0.9111 0 0.8539 0.7736 0
INT 0.807 0.9261 0.7858 0.8804 0.807 0.2685
OBS 0.901 0.9479 0 0.8908 0.901 0
PE 0.7598 0.9046 0 0.8427 0.7598 0
SOC 0.8627 0.9263 0 0.8417 0.8627 0
ACU COM EE ENJ FC INT OBS PE SOC
ACU 1 0 0 0 0 0 0 0 0
COM 0.4563 1 0 0 0 0 0 0 0
EE 0.3813 0.6056 1 0 0 0 0 0 0
ENJ 0.3905 0.6409 0.7035 1 0 0 0 0 0
FC 0.4193 0.7525 0.6562 0.6101 1 0 0 0 0
INT 0.4848 0.7763 0.697 0.7821 0.7115 1 0 0 0
OBS 0.332 0.6175 0.3502 0.3421 0.5857 0.487 1 0 0
PE 0.4495 0.6888 0.5803 0.6262 0.6174 0.7513 0.4428 1 0
SOC 0.1542 0.3875 0.1373 0.276 0.2975 0.3089 0.403 0.3681 1

Sutee Pheeraphuttharangkoon (2015)
The Adoption, Use and Diffusion of Smartphones among Adults over Fifty in the UK 438
Gender Male

Sutee Pheeraphuttharangkoon (2015)
The Adoption, Use and Diffusion of Smartphones among Adults over Fifty in the UK 439
Original
Sample
(O)
Sample
Mean
(M)
Standard Deviation
(STDEV)
Standard Error
(STERR)
T Statistics
(|O/STERR|)
COM -> INT 0.242 0.2455 0.0636 0.0636 3.803
EE -> INT 0.0704 0.0686 0.0473 0.0473 1.4905
ENJ -> INT 0.4124 0.4115 0.0472 0.0472 8.7295
FC -> INT 0.0926 0.0947 0.0632 0.0632 1.4665
INT -> ACU 0.4312 0.4296 0.0514 0.0514 8.3956
OBS -> INT -0.0562 -0.055 0.0377 0.0377 1.4883
PE -> INT 0.223 0.2205 0.0604 0.0604 3.6911
SOC -> INT -0.0136 -0.0141 0.032 0.032 0.4255
AVE
Composite
Reliability
R
Square
Cronbachs
Alpha
Communalit
y
Redundanc
y
ACU 1 1 0.1859 1 1 0.1859
CO
M
0.8813 0.957 0 0.9326 0.8813 0
EE 0.939 0.9686 0 0.9352 0.939 0
ENJ 0.9602 0.9797 0 0.9585 0.9602 0
FC 0.7209 0.8855 0 0.8061 0.7209 0
INT 0.7627 0.9058 0.7438 0.8437 0.7627 0.2391
OBS 0.9076 0.9516 0 0.8983 0.9076 0
PE 0.7886 0.9179 0 0.866 0.7886 0
SOC 0.8994 0.947 0 0.8882 0.8994 0
ACU COM EE ENJ FC INT OBS PE SOC
ACU 1 0 0 0 0 0 0 0 0
COM 0.4282 1 0 0 0 0 0 0 0
EE 0.302 0.6159 1 0 0 0 0 0 0
ENJ 0.3027 0.6605 0.6132 1 0 0 0 0 0
FC 0.3419 0.7172 0.6734 0.4811 1 0 0 0 0
INT 0.4312 0.7675 0.6343 0.7726 0.6138 1 0 0 0
OBS 0.1436 0.4901 0.3795 0.3087 0.529 0.354 1 0 0
PE 0.4044 0.7957 0.5581 0.6085 0.6097 0.7325 0.4183 1 0
SOC 0.1387 0.4904 0.2633 0.4216 0.3345 0.4123 0.3486 0.464 1

Sutee Pheeraphuttharangkoon (2015)
The Adoption, Use and Diffusion of Smartphones among Adults over Fifty in the UK 440
Health Excellent

Sutee Pheeraphuttharangkoon (2015)
The Adoption, Use and Diffusion of Smartphones among Adults over Fifty in the UK 441
Original
Sample
(O)
Sample
Mean
(M)
Standard Deviation
(STDEV)
Standard Error
(STERR)
T Statistics
(|O/STERR|)
COM -> INT 0.1492 0.1633 0.1265 0.1265 1.1792
EE -> INT 0.0649 0.0658 0.0685 0.0685 0.9467
ENJ -> INT 0.4095 0.4038 0.074 0.074 5.5328
FC -> INT -0.001 -0.0099 0.0895 0.0895 0.0112
INT -> ACU 0.4794 0.4806 0.0643 0.0643 7.4566
OBS -> INT -0.0432 -0.0353 0.0763 0.0763 0.5664
PE -> INT 0.4188 0.4161 0.0771 0.0771 5.4292
SOC -> INT -0.0248 -0.0284 0.0505 0.0505 0.4899
AVE
Composite
Reliability
R
Square
Cronbachs
Alpha
Communalit
y
Redundanc
y
ACU 1 1 0.2298 1 1 0.2298
CO
M
0.8754 0.9547 0 0.9286 0.8754 0
EE 0.9429 0.9706 0 0.9396 0.9429 0
ENJ 0.967 0.9832 0 0.9658 0.967 0
FC 0.695 0.8722 0 0.7808 0.695 0
INT 0.7657 0.9073 0.7221 0.8472 0.7657 0.1322
OBS 0.9088 0.9522 0 0.8997 0.9088 0
PE 0.7674 0.908 0 0.8474 0.7674 0
SOC 0.8934 0.9437 0 0.8818 0.8934 0
ACU COM EE ENJ FC INT OBS PE SOC
ACU 1 0 0 0 0 0 0 0 0
COM 0.4209 1 0 0 0 0 0 0 0
EE 0.2857 0.4789 1 0 0 0 0 0 0
ENJ 0.3601 0.5422 0.6574 1 0 0 0 0 0
FC 0.2229 0.6326 0.5009 0.4166 1 0 0 0 0
INT 0.4794 0.6497 0.6187 0.7282 0.4887 1 0 0 0
OBS 0.1505 0.5501 0.2355 0.2529 0.4924 0.3186 1 0 0
PE 0.4172 0.6808 0.5406 0.5075 0.5276 0.7363 0.4094 1 0
SOC 0.2381 0.535 0.1021 0.2449 0.2978 0.2911 0.4033 0.3508 1
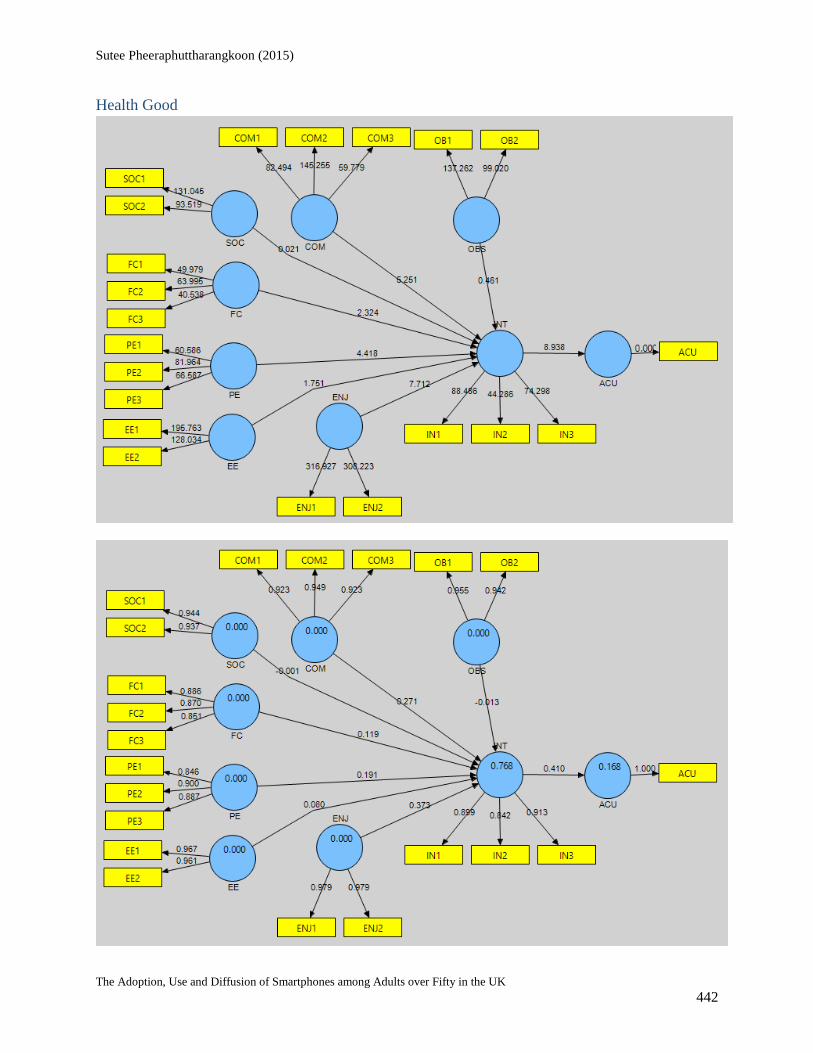
Sutee Pheeraphuttharangkoon (2015)
The Adoption, Use and Diffusion of Smartphones among Adults over Fifty in the UK 442
Health Good

Sutee Pheeraphuttharangkoon (2015)
The Adoption, Use and Diffusion of Smartphones among Adults over Fifty in the UK 443
Original
Sample
(O)
Sample
Mean
(M)
Standard Deviation
(STDEV)
Standard Error
(STERR)
T Statistics
(|O/STERR|)
COM -> INT 0.2712 0.2724 0.0516 0.0516 5.2512
EE -> INT 0.0797 0.0768 0.0455 0.0455 1.7508
ENJ -> INT 0.3732 0.3713 0.0484 0.0484 7.712
FC -> INT 0.1187 0.1204 0.0511 0.0511 2.3236
INT -> ACU 0.4098 0.4085 0.0459 0.0459 8.9384
OBS -> INT -0.013 -0.0133 0.0281 0.0281 0.4609
PE -> INT 0.1909 0.1919 0.0432 0.0432 4.4176
SOC -> INT -0.0005 0.0001 0.0262 0.0262 0.0205
AVE
Composite
Reliability
R
Square
Cronbachs
Alpha
Communalit
y
Redundanc
y
ACU 1 1 0.168 1 1 0.168
CO
M
0.8682 0.9518 0 0.924 0.8682 0
EE 0.9287 0.963 0 0.9233 0.9287 0
ENJ 0.9584 0.9788 0 0.9566 0.9584 0
FC 0.7551 0.9024 0 0.838 0.7551 0
INT 0.7832 0.9154 0.7679 0.8611 0.7832 0.2756
OBS 0.9 0.9474 0 0.8893 0.9 0
PE 0.7712 0.91 0 0.8519 0.7712 0
SOC 0.8848 0.9389 0 0.8699 0.8848 0
ACU COM EE ENJ FC INT OBS PE SOC
ACU 1 0 0 0 0 0 0 0 0
COM 0.4023 1 0 0 0 0 0 0 0
EE 0.3137 0.6139 1 0 0 0 0 0 0
ENJ 0.297 0.6592 0.6447 1 0 0 0 0 0
FC 0.3642 0.7276 0.6739 0.5373 1 0 0 0 0
INT 0.4098 0.7842 0.6657 0.7777 0.6749 1 0 0 0
OBS 0.2291 0.5672 0.3667 0.3348 0.5569 0.4369 1 0 0
PE 0.3842 0.7295 0.5436 0.603 0.5867 0.7213 0.3981 1 0
SOC 0.1045 0.4019 0.1873 0.3685 0.2939 0.3683 0.3676 0.4049 1

Sutee Pheeraphuttharangkoon (2015)
The Adoption, Use and Diffusion of Smartphones among Adults over Fifty in the UK 444
Health Poor

Sutee Pheeraphuttharangkoon (2015)
The Adoption, Use and Diffusion of Smartphones among Adults over Fifty in the UK 445
Original
Sample (O)
Sample
Mean
(M)
Standard Deviation
(STDEV)
Standard Error
(STERR)
T Statistics
(|O/STERR|)
COM -> INT 0.3645 0.3653 0.1341 0.1341 2.7193
EE -> INT 0.0782 0.0677 0.0807 0.0807 0.9685
ENJ -> INT 0.4043 0.412 0.0987 0.0987 4.0958
FC -> INT 0.064 0.0636 0.1588 0.1588 0.4034
INT -> ACU 0.6108 0.6094 0.0978 0.0978 6.2429
OBS -> INT 0.029 0.0301 0.0927 0.0927 0.313
PE -> INT 0.1094 0.1112 0.1665 0.1665 0.6566
SOC -> INT -0.0865 -0.0838 0.0596 0.0596 1.451
AVE
Composite
Reliability
R
Square
Cronbachs
Alpha
Communalit
y
Redundanc
y
ACU 1 1 0.3731 1 1 0.3731
CO
M
0.8948 0.9623 0 0.9411 0.8948 0
EE 0.9378 0.9679 0 0.9337 0.9378 0
ENJ 0.9825 0.9912 0 0.9822 0.9825 0
FC 0.7299 0.8901 0 0.8142 0.7299 0
INT 0.8006 0.9233 0.8141 0.8755 0.8006 0.3889
OBS 0.9133 0.9547 0 0.9051 0.9133 0
PE 0.7769 0.9125 0 0.8573 0.7769 0
SOC 0.8463 0.9167 0 0.8202 0.8463 0
ACU COM EE ENJ FC INT OBS PE SOC
ACU 1 0 0 0 0 0 0 0 0
COM 0.6261 1 0 0 0 0 0 0 0
EE 0.4341 0.6914 1 0 0 0 0 0 0
ENJ 0.5275 0.7844 0.6589 1 0 0 0 0 0
FC 0.5486 0.8216 0.7774 0.6972 1 0 0 0 0
INT 0.6108 0.8487 0.6971 0.84 0.7684 1 0 0 0
OBS 0.2865 0.4375 0.4551 0.3769 0.5753 0.4388 1 0 0
PE 0.5853 0.8843 0.6525 0.8178 0.7868 0.8249 0.5447 1 0
SOC 0.2602 0.567 0.3918 0.54 0.4686 0.4797 0.394 0.6319 1

Sutee Pheeraphuttharangkoon (2015)
The Adoption, Use and Diffusion of Smartphones among Adults over Fifty in the UK 446
Time less than 1 year

Sutee Pheeraphuttharangkoon (2015)
The Adoption, Use and Diffusion of Smartphones among Adults over Fifty in the UK 447
Original
Sample
(O)
Sample
Mean
(M)
Standard Deviation
(STDEV)
Standard Error
(STERR)
T Statistics
(|O/STERR|)
COM -> INT 0.1124 0.1117 0.1098 0.1098 1.0238
EE -> INT 0.0758 0.0653 0.0906 0.0906 0.8376
ENJ -> INT 0.3658 0.3606 0.1026 0.1026 3.5673
FC -> INT 0.1983 0.1975 0.0948 0.0948 2.0916
INT -> ACU 0.5572 0.5543 0.0707 0.0707 7.8855
OBS -> INT -0.1412 -0.1361 0.0712 0.0712 1.9827
PE -> INT 0.3275 0.3371 0.0993 0.0993 3.2985
SOC -> INT 0.0028 0.0121 0.0791 0.0791 0.0354
AVE
Composite
Reliability
R
Square
Cronbachs
Alpha
Communalit
y
Redundanc
y
ACU 1 1 0.3105 1 1 0.3105
CO
M
0.8825 0.9575 0 0.9332 0.8825 0
EE 0.9174 0.9569 0 0.9111 0.9174 0
ENJ 0.9651 0.9822 0 0.9639 0.9651 0
FC 0.7824 0.9151 0 0.861 0.7824 0
INT 0.8075 0.9263 0.7361 0.881 0.8075 0.1105
OBS 0.9401 0.9691 0 0.9363 0.9401 0
PE 0.7498 0.8999 0 0.8333 0.7498 0
SOC 0.8864 0.9398 0 0.872 0.8864 0
ACU COM EE ENJ FC INT OBS PE SOC
ACU 1 0 0 0 0 0 0 0 0
COM 0.4709 1 0 0 0 0 0 0 0
EE 0.3289 0.5276 1 0 0 0 0 0 0
ENJ 0.3987 0.5911 0.6697 1 0 0 0 0 0
FC 0.4066 0.6582 0.6353 0.4959 1 0 0 0 0
INT 0.5572 0.667 0.6212 0.7622 0.5948 1 0 0 0
OBS 0.2019 0.4645 0.2717 0.1437 0.4781 0.1606 1 0 0
PE 0.45 0.7074 0.4672 0.611 0.4868 0.7292 0.2461 1 0
SOC 0.2642 0.5896 0.1632 0.3396 0.3246 0.3889 0.3454 0.5117 1

Sutee Pheeraphuttharangkoon (2015)
The Adoption, Use and Diffusion of Smartphones among Adults over Fifty in the UK 448
Time 1 year to 2 years

Sutee Pheeraphuttharangkoon (2015)
The Adoption, Use and Diffusion of Smartphones among Adults over Fifty in the UK 449
Original
Sample
(O)
Sample
Mean
(M)
Standard Deviation
(STDEV)
Standard Error
(STERR)
T Statistics
(|O/STERR|)
COM -> INT 0.3384 0.3382 0.0961 0.0961 3.5213
EE -> INT 0.1242 0.1177 0.0773 0.0773 1.6077
ENJ -> INT 0.3683 0.3695 0.0807 0.0807 4.5657
FC -> INT 0.0319 0.0383 0.1006 0.1006 0.3171
INT -> ACU 0.4476 0.4502 0.085 0.085 5.2683
OBS -> INT 0.0149 0.0147 0.063 0.063 0.236
PE -> INT 0.178 0.1787 0.0916 0.0916 1.9426
SOC -> INT 0.0135 0.0126 0.0577 0.0577 0.234
AVE
Composite
Reliability
R
Square
Cronbachs
Alpha
Communalit
y
Redundanc
y
ACU 1 1 0.2004 1 1 0.2004
CO
M
0.8558 0.9468 0 0.9159 0.8558 0
EE 0.9411 0.9697 0 0.9376 0.9411 0
ENJ 0.9521 0.9755 0 0.9497 0.9521 0
FC 0.684 0.8665 0 0.7716 0.684 0
INT 0.7996 0.9229 0.7886 0.8748 0.7996 0.3368
OBS 0.9136 0.9548 0 0.9063 0.9136 0
PE 0.7722 0.9104 0 0.8517 0.7722 0
SOC 0.8772 0.9345 0 0.8617 0.8772 0
ACU COM EE ENJ FC INT OBS PE SOC
ACU 1 0 0 0 0 0 0 0 0
COM 0.4606 1 0 0 0 0 0 0 0
EE 0.382 0.5363 1 0 0 0 0 0 0
ENJ 0.3502 0.5899 0.5851 1 0 0 0 0 0
FC 0.3663 0.7491 0.5954 0.4795 1 0 0 0 0
INT 0.4476 0.79 0.6353 0.7628 0.6636 1 0 0 0
OBS 0.2129 0.5505 0.2955 0.3337 0.5755 0.4585 1 0 0
PE 0.4118 0.73 0.5075 0.5581 0.6469 0.7256 0.4138 1 0
SOC 0.1999 0.4167 0.0239 0.1903 0.2903 0.3111 0.4216 0.3819 1

Sutee Pheeraphuttharangkoon (2015)
The Adoption, Use and Diffusion of Smartphones among Adults over Fifty in the UK 450
Time 2 years to 3 years

Sutee Pheeraphuttharangkoon (2015)
The Adoption, Use and Diffusion of Smartphones among Adults over Fifty in the UK 451
Original
Sample
(O)
Sample
Mean
(M)
Standard Deviation
(STDEV)
Standard Error
(STERR)
T Statistics
(|O/STERR|)
COM -> INT 0.0652 0.064 0.1246 0.1246 0.5231
EE -> INT 0.0253 0.0124 0.0723 0.0723 0.3494
ENJ -> INT 0.5342 0.5422 0.0934 0.0934 5.7192
FC -> INT 0.0553 0.0589 0.0916 0.0916 0.6043
INT -> ACU 0.4678 0.4664 0.0724 0.0724 6.464
OBS -> INT 0.1124 0.1114 0.0591 0.0591 1.9018
PE -> INT 0.2645 0.2643 0.0816 0.0816 3.2417
SOC -> INT -0.0459 -0.0429 0.0533 0.0533 0.8614
AVE
Composite
Reliability
R
Square
Cronbachs
Alpha
Communalit
y
Redundanc
y
ACU 1 1 0.2188 1 1 0.2188
CO
M
0.8827 0.9576 0 0.9337 0.8827 0
EE 0.9295 0.9635 0 0.9242 0.9295 0
ENJ 0.9711 0.9854 0 0.9703 0.9711 0
FC 0.7109 0.8804 0 0.7976 0.7109 0
INT 0.7828 0.9153 0.7542 0.8609 0.7828 0.0739
OBS 0.8904 0.942 0 0.877 0.8904 0
PE 0.7719 0.9103 0 0.8527 0.7719 0
SOC 0.8955 0.9449 0 0.8834 0.8955 0
ACU COM EE ENJ FC INT OBS PE SOC
ACU 1 0 0 0 0 0 0 0 0
COM 0.4181 1 0 0 0 0 0 0 0
EE 0.3621 0.5783 1 0 0 0 0 0 0
ENJ 0.3853 0.7445 0.689 1 0 0 0 0 0
FC 0.4168 0.7561 0.6305 0.6114 1 0 0 0 0
INT 0.4678 0.7597 0.6411 0.8064 0.6626 1 0 0 0
OBS 0.3123 0.6316 0.3852 0.3885 0.6086 0.5072 1 0 0
PE 0.4186 0.7265 0.5429 0.5654 0.6246 0.6926 0.4536 1 0
SOC 0.1102 0.4962 0.2543 0.453 0.395 0.4173 0.3767 0.4473 1

Sutee Pheeraphuttharangkoon (2015)
The Adoption, Use and Diffusion of Smartphones among Adults over Fifty in the UK 452
Time more than 3 years
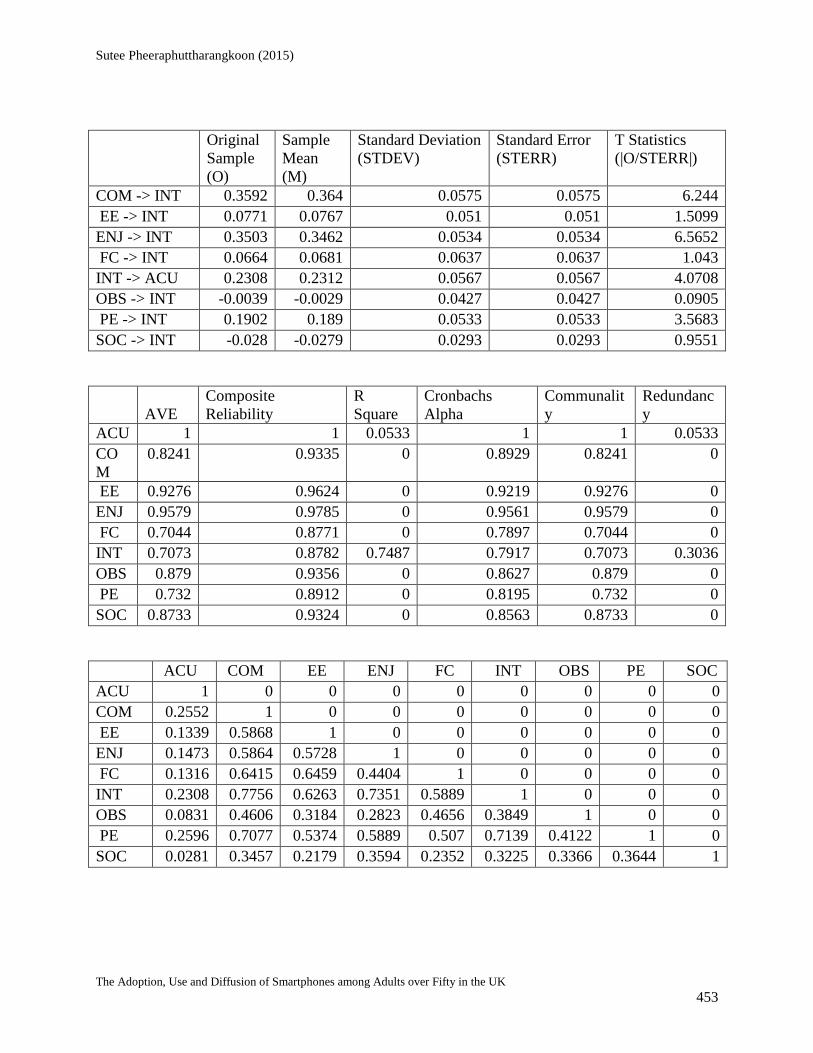
Sutee Pheeraphuttharangkoon (2015)
The Adoption, Use and Diffusion of Smartphones among Adults over Fifty in the UK 453
Original
Sample
(O)
Sample
Mean
(M)
Standard Deviation
(STDEV)
Standard Error
(STERR)
T Statistics
(|O/STERR|)
COM -> INT 0.3592 0.364 0.0575 0.0575 6.244
EE -> INT 0.0771 0.0767 0.051 0.051 1.5099
ENJ -> INT 0.3503 0.3462 0.0534 0.0534 6.5652
FC -> INT 0.0664 0.0681 0.0637 0.0637 1.043
INT -> ACU 0.2308 0.2312 0.0567 0.0567 4.0708
OBS -> INT -0.0039 -0.0029 0.0427 0.0427 0.0905
PE -> INT 0.1902 0.189 0.0533 0.0533 3.5683
SOC -> INT -0.028 -0.0279 0.0293 0.0293 0.9551
AVE
Composite
Reliability
R
Square
Cronbachs
Alpha
Communalit
y
Redundanc
y
ACU 1 1 0.0533 1 1 0.0533
CO
M
0.8241 0.9335 0 0.8929 0.8241 0
EE 0.9276 0.9624 0 0.9219 0.9276 0
ENJ 0.9579 0.9785 0 0.9561 0.9579 0
FC 0.7044 0.8771 0 0.7897 0.7044 0
INT 0.7073 0.8782 0.7487 0.7917 0.7073 0.3036
OBS 0.879 0.9356 0 0.8627 0.879 0
PE 0.732 0.8912 0 0.8195 0.732 0
SOC 0.8733 0.9324 0 0.8563 0.8733 0
ACU COM EE ENJ FC INT OBS PE SOC
ACU 1 0 0 0 0 0 0 0 0
COM 0.2552 1 0 0 0 0 0 0 0
EE 0.1339 0.5868 1 0 0 0 0 0 0
ENJ 0.1473 0.5864 0.5728 1 0 0 0 0 0
FC 0.1316 0.6415 0.6459 0.4404 1 0 0 0 0
INT 0.2308 0.7756 0.6263 0.7351 0.5889 1 0 0 0
OBS 0.0831 0.4606 0.3184 0.2823 0.4656 0.3849 1 0 0
PE 0.2596 0.7077 0.5374 0.5889 0.507 0.7139 0.4122 1 0
SOC 0.0281 0.3457 0.2179 0.3594 0.2352 0.3225 0.3366 0.3644 1

Sutee Pheeraphuttharangkoon (2015)
The Adoption, Use and Diffusion of Smartphones among Adults over Fifty in the UK 454
Age 50-59

Sutee Pheeraphuttharangkoon (2015)
The Adoption, Use and Diffusion of Smartphones among Adults over Fifty in the UK 455
Original
Sample
(O)
Sample
Mean
(M)
Standard Deviation
(STDEV)
Standard Error
(STERR)
T Statistics
(|O/STERR|)
COM -> INT 0.2836 0.2865 0.0606 0.0606 4.6787
EE -> INT 0.105 0.102 0.0443 0.0443 2.3708
ENJ -> INT 0.3424 0.3408 0.0426 0.0426 8.0435
FC -> INT 0.0884 0.0884 0.0574 0.0574 1.5404
INT -> ACU 0.4554 0.4562 0.0488 0.0488 9.3366
OBS -> INT -0.0103 -0.0099 0.0367 0.0367 0.2811
PE -> INT 0.2279 0.2293 0.0452 0.0452 5.0457
SOC -> INT -0.01 -0.0102 0.0247 0.0247 0.4061
AVE
Composite
Reliability
R
Square
Cronbachs
Alpha
Communalit
y
Redundanc
y
ACU 1 1 0.2074 1 1 0.2074
CO
M
0.8736 0.954 0 0.9275 0.8736 0
EE 0.9306 0.964 0 0.9255 0.9306 0
ENJ 0.9562 0.9776 0 0.9542 0.9562 0
FC 0.7506 0.9002 0 0.8339 0.7506 0
INT 0.7735 0.9111 0.7615 0.8536 0.7735 0.2758
OBS 0.9028 0.9489 0 0.8929 0.9028 0
PE 0.7705 0.9096 0 0.8513 0.7705 0
SOC 0.8922 0.943 0 0.8793 0.8922 0
ACU COM EE ENJ FC INT OBS PE SOC
ACU 1 0 0 0 0 0 0 0 0
COM 0.425 1 0 0 0 0 0 0 0
EE 0.3082 0.5715 1 0 0 0 0 0 0
ENJ 0.3022 0.5963 0.6537 1 0 0 0 0 0
FC 0.3577 0.7439 0.6514 0.5265 1 0 0 0 0
INT 0.4554 0.7699 0.6653 0.747 0.679 1 0 0 0
OBS 0.2306 0.6085 0.3746 0.3933 0.5904 0.4966 1 0 0
PE 0.4149 0.7305 0.5349 0.5599 0.6143 0.7284 0.4916 1 0
SOC 0.1591 0.3846 0.123 0.3229 0.2915 0.33 0.3812 0.3757 1

Sutee Pheeraphuttharangkoon (2015)
The Adoption, Use and Diffusion of Smartphones among Adults over Fifty in the UK 456
Age 60-69

Sutee Pheeraphuttharangkoon (2015)
The Adoption, Use and Diffusion of Smartphones among Adults over Fifty in the UK 457
Original
Sample
(O)
Sample
Mean
(M)
Standard Deviation
(STDEV)
Standard Error
(STERR)
T Statistics
(|O/STERR|)
COM -> INT 0.2159 0.2221 0.0776 0.0776 2.7831
EE -> INT 0.0875 0.0856 0.0714 0.0714 1.2256
ENJ -> INT 0.4494 0.4484 0.0688 0.0688 6.5334
FC -> INT 0.0624 0.0604 0.0843 0.0843 0.7405
INT -> ACU 0.4386 0.4384 0.0616 0.0616 7.1262
OBS -> INT -0.0218 -0.02 0.0503 0.0503 0.4328
PE -> INT 0.2257 0.2232 0.0788 0.0788 2.8629
SOC -> INT -0.0475 -0.0477 0.0435 0.0435 1.0935
AVE
Composite
Reliability
R
Square
Cronbachs
Alpha
Communalit
y
Redundanc
y
ACU 1 1 0.1924 1 1 0.1924
CO
M
0.8614 0.9491 0 0.9195 0.8614 0
EE 0.9321 0.9648 0 0.9271 0.9321 0
ENJ 0.9735 0.9866 0 0.9728 0.9735 0
FC 0.7231 0.8868 0 0.8095 0.7231 0
INT 0.7963 0.9211 0.7657 0.8709 0.7963 0.2229
OBS 0.9147 0.9554 0 0.9076 0.9147 0
PE 0.7627 0.906 0 0.8449 0.7627 0
SOC 0.8561 0.9225 0 0.8342 0.8561 0
ACU COM EE ENJ FC INT OBS PE SOC
ACU 1 0 0 0 0 0 0 0 0
COM 0.4121 1 0 0 0 0 0 0 0
EE 0.3399 0.639 1 0 0 0 0 0 0
ENJ 0.3761 0.6888 0.6243 1 0 0 0 0 0
FC 0.4206 0.6884 0.7146 0.5153 1 0 0 0 0
INT 0.4386 0.7556 0.6594 0.8108 0.6168 1 0 0 0
OBS 0.1817 0.4806 0.3463 0.2071 0.4781 0.2964 1 0 0
PE 0.3883 0.7402 0.5752 0.6608 0.6055 0.7398 0.351 1 0
SOC 0.1137 0.5315 0.2826 0.3933 0.3069 0.3896 0.3786 0.4873 1

Sutee Pheeraphuttharangkoon (2015)
The Adoption, Use and Diffusion of Smartphones among Adults over Fifty in the UK 458
Age 70-79

Sutee Pheeraphuttharangkoon (2015)
The Adoption, Use and Diffusion of Smartphones among Adults over Fifty in the UK 459
Original
Sample
(O)
Sample
Mean
(M)
Standard Deviation
(STDEV)
Standard Error
(STERR)
T Statistics
(|O/STERR|)
COM -> INT 0.1563 0.1493 0.3235 0.3235 0.4832
EE -> INT -0.0623 -0.0834 0.1627 0.1627 0.3833
ENJ -> INT 0.6352 0.6477 0.3084 0.3084 2.0601
FC -> INT -0.0707 -0.078 0.1761 0.1761 0.4013
INT -> ACU 0.2877 0.2852 0.1463 0.1463 1.9663
OBS -> INT -0.0064 -0.004 0.1372 0.1372 0.0466
PE -> INT 0.1459 0.1638 0.1906 0.1906 0.7652
SOC -> INT 0.0895 0.0967 0.1599 0.1599 0.5595
AVE
Composite
Reliability
R
Square
Cronbachs
Alpha
Communalit
y
Redundanc
y
ACU 1 1 0.0828 1 1 0.0828
CO
M
0.8801 0.9565 0 0.9316 0.8801 0
EE 0.9639 0.9816 0 0.9631 0.9639 0
ENJ 0.9746 0.9872 0 0.974 0.9746 0
FC 0.7493 0.8988 0 0.8305 0.7493 0
INT 0.7401 0.895 0.7438 0.8233 0.7401 0.1663
OBS 0.8388 0.9119 0 0.8461 0.8388 0
PE 0.7823 0.9151 0 0.861 0.7823 0
SOC 0.9121 0.954 0 0.9036 0.9121 0
ACU COM EE ENJ FC INT OBS PE SOC
ACU 1 0 0 0 0 0 0 0 0
COM 0.349 1 0 0 0 0 0 0 0
EE 0.1201 0.5445 1 0 0 0 0 0 0
ENJ 0.2419 0.8864 0.6561 1 0 0 0 0 0
FC 0.2175 0.7776 0.5226 0.7145 1 0 0 0 0
INT 0.2877 0.8007 0.5175 0.846 0.5961 1 0 0 0
OBS 0.2888 0.2862 0.2441 0.2213 0.465 0.1674 1 0 0
PE 0.3526 0.8203 0.5901 0.8062 0.5649 0.7505 0.1032 1 0
SOC 0.0668 0.5851 0.3399 0.5303 0.4982 0.5277 0.24 0.4655 1

Sutee Pheeraphuttharangkoon (2015)
The Adoption, Use and Diffusion of Smartphones among Adults over Fifty in the UK 460
Overall

Sutee Pheeraphuttharangkoon (2015)
The Adoption, Use and Diffusion of Smartphones among Adults over Fifty in the UK 461
Original
Sample
(O)
Sample
Mean
(M)
Standard Deviation
(STDEV)
Standard Error
(STERR)
T Statistics
(|O/STERR|)
COM -> INT 0.2506 0.2519 0.0472 0.0472 5.3132
EE -> INT 0.0829 0.0819 0.0338 0.0338 2.4513
ENJ -> INT 0.3803 0.3809 0.0356 0.0356 10.6863
FC -> INT 0.0888 0.0884 0.0421 0.0421 2.107
INT -> ACU 0.4558 0.4561 0.0366 0.0366 12.4595
OBS -> INT -0.0154 -0.0153 0.0275 0.0275 0.5606
PE -> INT 0.232 0.2313 0.0387 0.0387 5.9926
SOC -> INT -0.0201 -0.0199 0.0218 0.0218 0.9212
AVE
Composite
Reliability
R
Square
Cronbachs
Alpha
Communalit
y
Redundanc
y
ACU 1 1 0.2078 1 1 0.2078
CO
M
0.8747 0.9544 0 0.9283 0.8747 0
EE 0.9339 0.9658 0 0.9293 0.9339 0
ENJ 0.9637 0.9815 0 0.9624 0.9637 0
FC 0.7441 0.8971 0 0.828 0.7441 0
INT 0.7819 0.9149 0.7596 0.8602 0.7819 0.2532
OBS 0.9049 0.9501 0 0.8951 0.9049 0
PE 0.774 0.9113 0 0.8543 0.774 0
SOC 0.8823 0.9374 0 0.8669 0.8823 0
ACU COM EE ENJ FC INT OBS PE SOC
ACU 1 0 0 0 0 0 0 0 0
COM 0.4447 1 0 0 0 0 0 0 0
EE 0.334 0.6057 1 0 0 0 0 0 0
ENJ 0.3454 0.6551 0.6499 1 0 0 0 0 0
FC 0.3756 0.7301 0.6638 0.5379 1 0 0 0 0
INT 0.4558 0.7707 0.6625 0.7765 0.6585 1 0 0 0
OBS 0.2301 0.5493 0.3629 0.3269 0.5535 0.4181 1 0 0
PE 0.4251 0.7474 0.5656 0.6148 0.6121 0.7393 0.4304 1 0
SOC 0.1538 0.4494 0.1988 0.3616 0.3174 0.3667 0.3769 0.4215 1

Sutee Pheeraphuttharangkoon (2015)
The Adoption, Use and Diffusion of Smartphones among Adults over Fifty in the UK 462
Compare Age 69-79
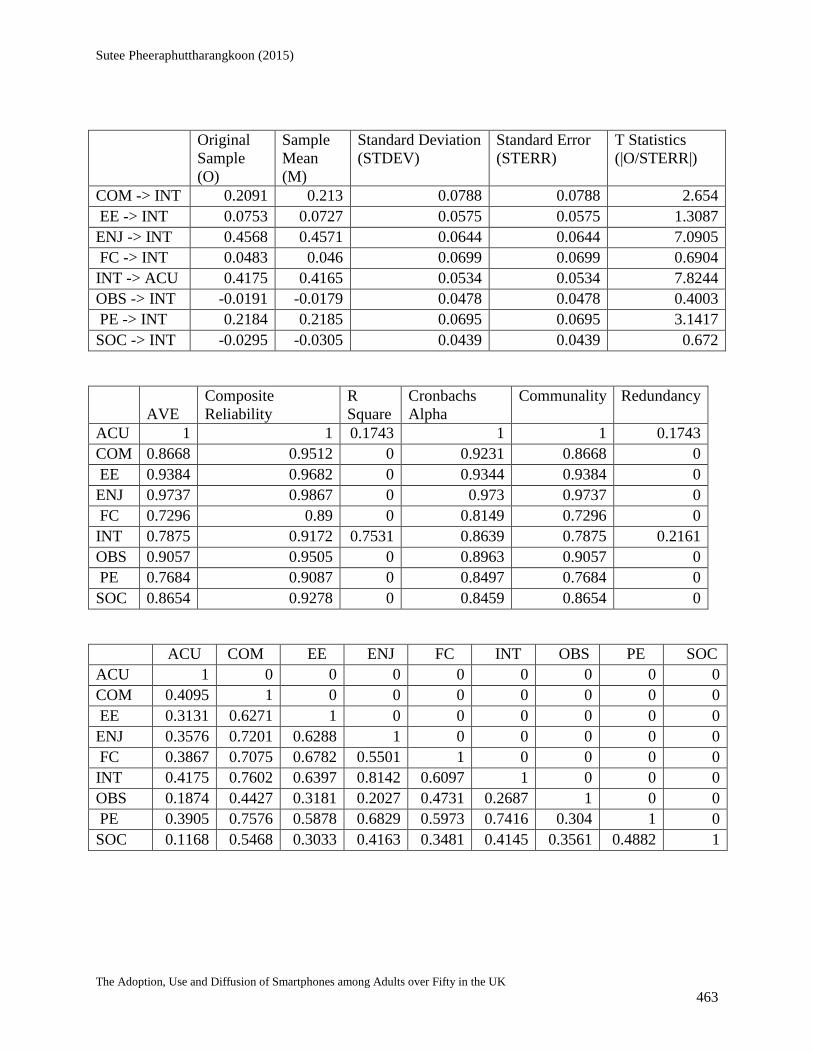
Sutee Pheeraphuttharangkoon (2015)
The Adoption, Use and Diffusion of Smartphones among Adults over Fifty in the UK 463
Original
Sample
(O)
Sample
Mean
(M)
Standard Deviation
(STDEV)
Standard Error
(STERR)
T Statistics
(|O/STERR|)
COM -> INT 0.2091 0.213 0.0788 0.0788 2.654
EE -> INT 0.0753 0.0727 0.0575 0.0575 1.3087
ENJ -> INT 0.4568 0.4571 0.0644 0.0644 7.0905
FC -> INT 0.0483 0.046 0.0699 0.0699 0.6904
INT -> ACU 0.4175 0.4165 0.0534 0.0534 7.8244
OBS -> INT -0.0191 -0.0179 0.0478 0.0478 0.4003
PE -> INT 0.2184 0.2185 0.0695 0.0695 3.1417
SOC -> INT -0.0295 -0.0305 0.0439 0.0439 0.672
AVE
Composite
Reliability
R
Square
Cronbachs
Alpha
Communality Redundancy
ACU 1 1 0.1743 1 1 0.1743
COM 0.8668 0.9512 0 0.9231 0.8668 0
EE 0.9384 0.9682 0 0.9344 0.9384 0
ENJ 0.9737 0.9867 0 0.973 0.9737 0
FC 0.7296 0.89 0 0.8149 0.7296 0
INT 0.7875 0.9172 0.7531 0.8639 0.7875 0.2161
OBS 0.9057 0.9505 0 0.8963 0.9057 0
PE 0.7684 0.9087 0 0.8497 0.7684 0
SOC 0.8654 0.9278 0 0.8459 0.8654 0
ACU COM EE ENJ FC INT OBS PE SOC
ACU 1 0 0 0 0 0 0 0 0
COM 0.4095 1 0 0 0 0 0 0 0
EE 0.3131 0.6271 1 0 0 0 0 0 0
ENJ 0.3576 0.7201 0.6288 1 0 0 0 0 0
FC 0.3867 0.7075 0.6782 0.5501 1 0 0 0 0
INT 0.4175 0.7602 0.6397 0.8142 0.6097 1 0 0 0
OBS 0.1874 0.4427 0.3181 0.2027 0.4731 0.2687 1 0 0
PE 0.3905 0.7576 0.5878 0.6829 0.5973 0.7416 0.304 1 0
SOC 0.1168 0.5468 0.3033 0.4163 0.3481 0.4145 0.3561 0.4882 1

Sutee Pheeraphuttharangkoon (2015)
The Adoption, Use and Diffusion of Smartphones among Adults over Fifty in the UK 464
Compare Education High

Sutee Pheeraphuttharangkoon (2015)
The Adoption, Use and Diffusion of Smartphones among Adults over Fifty in the UK 465
Original
Sample
(O)
Sample
Mean
(M)
Standard Deviation
(STDEV)
Standard Error
(STERR)
T Statistics
(|O/STERR|)
COM -> INT 0.3392 0.3403 0.0826 0.0826 4.1084
EE -> INT 0.0997 0.0984 0.0593 0.0593 1.68
ENJ -> INT 0.3568 0.359 0.0592 0.0592 6.0238
FC -> INT -0.088 -0.087 0.0666 0.0666 1.3205
INT -> ACU 0.5231 0.5233 0.0531 0.0531 9.8474
OBS -> INT 0.0105 0.0119 0.0476 0.0476 0.2211
PE -> INT 0.2631 0.2623 0.0668 0.0668 3.941
SOC -> INT -0.0147 -0.0156 0.0391 0.0391 0.3761
AVE
Composite
Reliability
R
Square
Cronbachs
Alpha
Communality Redundancy
ACU 1 1 0.2736 1 1 0.2736
COM 0.8902 0.9605 0 0.9382 0.8902 0
EE 0.9167 0.9565 0 0.9095 0.9167 0
ENJ 0.9496 0.9742 0 0.947 0.9496 0
FC 0.7237 0.887 0 0.8104 0.7237 0
INT 0.7787 0.9131 0.7186 0.8562 0.7787 0.3031
OBS 0.8956 0.9449 0 0.8834 0.8956 0
PE 0.77 0.9093 0 0.8495 0.77 0
SOC 0.912 0.954 0 0.9036 0.912 0
ACU COM EE ENJ FC INT OBS PE SOC
ACU 1 0 0 0 0 0 0 0 0
COM 0.5227 1 0 0 0 0 0 0 0
EE 0.3779 0.5806 1 0 0 0 0 0 0
ENJ 0.414 0.5923 0.6604 1 0 0 0 0 0
FC 0.3888 0.7252 0.5584 0.4629 1 0 0 0 0
INT 0.5231 0.7411 0.6242 0.7319 0.5266 1 0 0 0
OBS 0.3158 0.5911 0.3739 0.3495 0.5325 0.4342 1 0 0
PE 0.549 0.7451 0.5317 0.5719 0.5552 0.7239 0.4305 1 0
SOC 0.2167 0.3974 0.1909 0.3448 0.2712 0.3268 0.3537 0.3222 1

Sutee Pheeraphuttharangkoon (2015)
The Adoption, Use and Diffusion of Smartphones among Adults over Fifty in the UK 466
Compare Education Low

Sutee Pheeraphuttharangkoon (2015)
The Adoption, Use and Diffusion of Smartphones among Adults over Fifty in the UK 467
Original
Sample
(O)
Sample
Mean
(M)
Standard Deviation
(STDEV)
Standard Error
(STERR)
T Statistics
(|O/STERR|)
COM -> INT 0.216 0.2188 0.0579 0.0579 3.729
EE -> INT 0.0496 0.0472 0.0415 0.0415 1.1968
ENJ -> INT 0.3655 0.3644 0.0483 0.0483 7.576
FC -> INT 0.1989 0.1997 0.054 0.054 3.6869
INT -> ACU 0.404 0.4027 0.051 0.051 7.9226
OBS -> INT -0.0487 -0.0487 0.0352 0.0352 1.3836
PE -> INT 0.2376 0.2375 0.0497 0.0497 4.7832
SOC -> INT -0.0192 -0.0196 0.0262 0.0262 0.7339
AVE
Composite
Reliability
R
Square
Cronbachs
Alpha
Communality Redundancy
ACU 1 1 0.1632 1 1 0.1632
COM 0.8602 0.9486 0 0.9187 0.8602 0
EE 0.9426 0.9705 0 0.9391 0.9426 0
ENJ 0.9706 0.9851 0 0.9697 0.9706 0
FC 0.7451 0.8976 0 0.829 0.7451 0
INT 0.7844 0.9161 0.7903 0.8626 0.7844 0.2286
OBS 0.9065 0.951 0 0.8973 0.9065 0
PE 0.7724 0.9106 0 0.8537 0.7724 0
SOC 0.8652 0.9277 0 0.8451 0.8652 0
ACU COM EE ENJ FC INT OBS PE SOC
ACU 1 0 0 0 0 0 0 0 0
COM 0.3887 1 0 0 0 0 0 0 0
EE 0.2919 0.6053 1 0 0 0 0 0 0
ENJ 0.279 0.6846 0.6421 1 0 0 0 0 0
FC 0.3529 0.7265 0.7068 0.5776 1 0 0 0 0
INT 0.404 0.7825 0.6744 0.7928 0.7207 1 0 0 0
OBS 0.1652 0.5111 0.3409 0.3056 0.5544 0.3919 1 0 0
PE 0.3589 0.7396 0.5852 0.6509 0.6413 0.7627 0.416 1 0
SOC 0.1229 0.4768 0.1957 0.3714 0.3496 0.3908 0.3934 0.4677 1

Sutee Pheeraphuttharangkoon (2015)
The Adoption, Use and Diffusion of Smartphones among Adults over Fifty in the UK 468
Compare Health Good Ex

Sutee Pheeraphuttharangkoon (2015)
The Adoption, Use and Diffusion of Smartphones among Adults over Fifty in the UK 469
Original
Sample
(O)
Sample
Mean
(M)
Standard Deviation
(STDEV)
Standard Error
(STERR)
T Statistics
(|O/STERR|)
COM -> INT 0.2406 0.2413 0.0497 0.0497 4.8423
EE -> INT 0.0852 0.0835 0.0371 0.0371 2.2928
ENJ -> INT 0.3798 0.3798 0.0379 0.0379 10.0101
FC -> INT 0.0892 0.089 0.0437 0.0437 2.0418
INT -> ACU 0.4272 0.4263 0.0395 0.0395 10.8276
OBS -> INT -0.0147 -0.0145 0.0275 0.0275 0.5346
PE -> INT 0.2444 0.2443 0.0417 0.0417 5.8668
SOC -> INT -0.0132 -0.012 0.0239 0.0239 0.5526
AVE
Composite
Reliability
R
Square
Cronbachs
Alpha
Communality Redundancy
ACU 1 1 0.1825 1 1 0.1825
COM 0.8705 0.9527 0 0.9255 0.8705 0
EE 0.9329 0.9653 0 0.9282 0.9329 0
ENJ 0.9606 0.9799 0 0.959 0.9606 0
FC 0.746 0.8981 0 0.8299 0.746 0
INT 0.7793 0.9136 0.752 0.858 0.7793 0.2387
OBS 0.9023 0.9486 0 0.892 0.9023 0
PE 0.7719 0.9102 0 0.8522 0.7719 0
SOC 0.8876 0.9404 0 0.8736 0.8876 0
ACU COM EE ENJ FC INT OBS PE SOC
ACU 1 0 0 0 0 0 0 0 0
COM 0.4101 1 0 0 0 0 0 0 0
EE 0.3136 0.5872 1 0 0 0 0 0 0
ENJ 0.3133 0.6317 0.6479 1 0 0 0 0 0
FC 0.3432 0.7116 0.6415 0.5098 1 0 0 0 0
INT 0.4272 0.7562 0.6562 0.7653 0.6382 1 0 0 0
OBS 0.2161 0.565 0.3413 0.3167 0.5459 0.4131 1 0 0
PE 0.3956 0.7211 0.5474 0.5808 0.5787 0.7256 0.4041 1 0
SOC 0.139 0.4346 0.1709 0.3366 0.2973 0.3509 0.3773 0.3936 1

Sutee Pheeraphuttharangkoon (2015)
The Adoption, Use and Diffusion of Smartphones among Adults over Fifty in the UK 470
Compare Health Poor

Sutee Pheeraphuttharangkoon (2015)
The Adoption, Use and Diffusion of Smartphones among Adults over Fifty in the UK 471
Original
Sample
(O)
Sample
Mean (M)
Standard Deviation
(STDEV)
Standard Error
(STERR)
T Statistics
(|O/STERR|)
COM -> INT 0.3645 0.3596 0.1353 0.1353 2.6948
EE -> INT 0.0782 0.0686 0.0839 0.0839 0.9313
ENJ -> INT 0.4043 0.4073 0.1008 0.1008 4.0102
FC -> INT 0.064 0.0541 0.1607 0.1607 0.3986
INT -> ACU 0.6108 0.6121 0.0943 0.0943 6.4762
OBS -> INT 0.029 0.0335 0.0934 0.0934 0.3105
PE -> INT 0.1094 0.1259 0.1613 0.1613 0.6782
SOC -> INT -0.0865 -0.0835 0.0601 0.0601 1.4385
AVE
Composite
Reliability
R
Square
Cronbachs
Alpha
Communality Redundancy
ACU 1 1 0.3731 1 1 0.3731
COM 0.8948 0.9623 0 0.9411 0.8948 0
EE 0.9378 0.9679 0 0.9337 0.9378 0
ENJ 0.9825 0.9912 0 0.9822 0.9825 0
FC 0.7299 0.8901 0 0.8142 0.7299 0
INT 0.8006 0.9233 0.8141 0.8755 0.8006 0.3889
OBS 0.9133 0.9547 0 0.9051 0.9133 0
PE 0.7769 0.9125 0 0.8573 0.7769 0
SOC 0.8463 0.9167 0 0.8202 0.8463 0
ACU COM EE ENJ FC INT OBS PE SOC
ACU 1 0 0 0 0 0 0 0 0
COM 0.6261 1 0 0 0 0 0 0 0
EE 0.4341 0.6914 1 0 0 0 0 0 0
ENJ 0.5275 0.7844 0.6589 1 0 0 0 0 0
FC 0.5486 0.8216 0.7774 0.6972 1 0 0 0 0
INT 0.6108 0.8487 0.6971 0.84 0.7684 1 0 0 0
OBS 0.2865 0.4375 0.4551 0.3769 0.5753 0.4388 1 0 0
PE 0.5853 0.8843 0.6525 0.8178 0.7868 0.8249 0.5447 1 0
SOC 0.2602 0.567 0.3918 0.54 0.4686 0.4797 0.394 0.6319 1
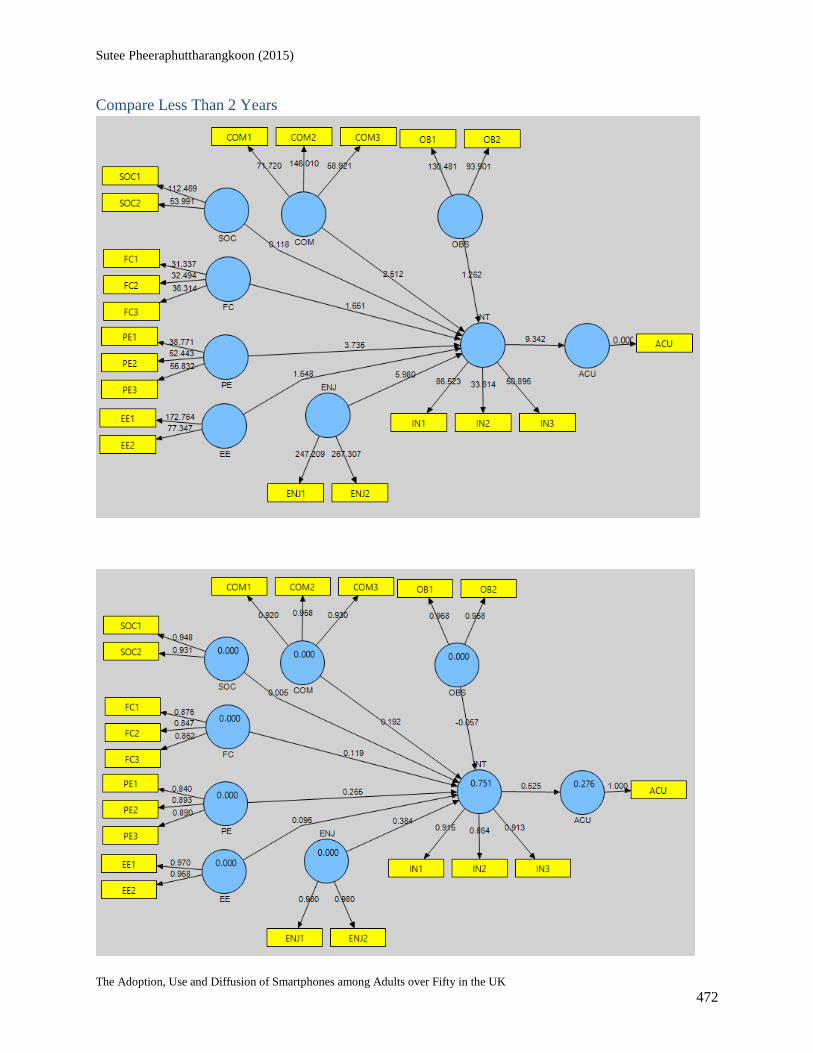
Sutee Pheeraphuttharangkoon (2015)
The Adoption, Use and Diffusion of Smartphones among Adults over Fifty in the UK 472
Compare Less Than 2 Years

Sutee Pheeraphuttharangkoon (2015)
The Adoption, Use and Diffusion of Smartphones among Adults over Fifty in the UK 473
Original
Sample
(O)
Sample
Mean
(M)
Standard Deviation
(STDEV)
Standard Error
(STERR)
T Statistics
(|O/STERR|)
COM -> INT 0.1923 0.1957 0.0765 0.0765 2.5116
EE -> INT 0.0957 0.0941 0.0581 0.0581 1.6477
ENJ -> INT 0.3845 0.3807 0.0643 0.0643 5.9804
FC -> INT 0.1188 0.1188 0.072 0.072 1.6509
INT -> ACU 0.5253 0.5232 0.0562 0.0562 9.3424
OBS -> INT -0.0573 -0.0577 0.0454 0.0454 1.2618
PE -> INT 0.2654 0.2679 0.0711 0.0711 3.7349
SOC -> INT 0.0053 0.0054 0.0451 0.0451 0.1183
AVE
Composite
Reliability
R
Square
Cronbachs
Alpha
Communality Redundancy
ACU 1 1 0.2759 1 1 0.2759
COM 0.8767 0.9552 0 0.9296 0.8767 0
EE 0.9301 0.9638 0 0.9253 0.9301 0
ENJ 0.9603 0.9798 0 0.9587 0.9603 0
FC 0.7427 0.8964 0 0.8268 0.7427 0
INT 0.8055 0.9255 0.7505 0.8794 0.8055 0.1964
OBS 0.9277 0.9625 0 0.9224 0.9277 0
PE 0.765 0.9071 0 0.8462 0.765 0
SOC 0.8827 0.9377 0 0.8678 0.8827 0
ACU COM EE ENJ FC INT OBS PE SOC
ACU 1 0 0 0 0 0 0 0 0
COM 0.501 1 0 0 0 0 0 0 0
EE 0.3703 0.5414 1 0 0 0 0 0 0
ENJ 0.4057 0.6061 0.6365 1 0 0 0 0 0
FC 0.415 0.7101 0.621 0.504 1 0 0 0 0
INT 0.5253 0.7295 0.6346 0.7681 0.6328 1 0 0 0
OBS 0.2228 0.5094 0.2912 0.2446 0.534 0.3178 1 0 0
PE 0.459 0.7327 0.4988 0.5984 0.5768 0.7357 0.338 1 0
SOC 0.2543 0.513 0.1039 0.2823 0.3228 0.3601 0.3916 0.4586 1

Sutee Pheeraphuttharangkoon (2015)
The Adoption, Use and Diffusion of Smartphones among Adults over Fifty in the UK 474
Compare Time more than 2 years

Sutee Pheeraphuttharangkoon (2015)
The Adoption, Use and Diffusion of Smartphones among Adults over Fifty in the UK 475
Original
Sample
(O)
Sample
Mean
(M)
Standard Deviation
(STDEV)
Standard Error
(STERR)
T Statistics
(|O/STERR|)
COM -> INT 0.2874 0.2882 0.0558 0.0558 5.1508
EE -> INT 0.0721 0.0709 0.0399 0.0399 1.8083
ENJ -> INT 0.3785 0.3778 0.0423 0.0423 8.9451
FC -> INT 0.0745 0.0758 0.0536 0.0536 1.3897
INT -> ACU 0.3519 0.3502 0.0497 0.0497 7.0792
OBS -> INT 0.0222 0.023 0.0346 0.0346 0.6422
PE -> INT 0.2035 0.2026 0.0437 0.0437 4.6574
SOC -> INT -0.0323 -0.0319 0.0252 0.0252 1.2818
AVE
Composite
Reliability
R
Square
Cronbachs
Alpha
Communality Redundancy
ACU 1 1 0.1238 1 1 0.1238
COM 0.8518 0.9452 0 0.9129 0.8518 0
EE 0.9278 0.9626 0 0.9222 0.9278 0
ENJ 0.9629 0.9811 0 0.9615 0.9629 0
FC 0.716 0.8831 0 0.8017 0.716 0
INT 0.7431 0.8965 0.7449 0.8263 0.7431 0.2687
OBS 0.8836 0.9382 0 0.8683 0.8836 0
PE 0.7506 0.9002 0 0.8353 0.7506 0
SOC 0.8806 0.9365 0 0.8647 0.8806 0
ACU COM EE ENJ FC INT OBS PE SOC
ACU 1 0 0 0 0 0 0 0 0
COM 0.3413 1 0 0 0 0 0 0 0
EE 0.2347 0.5868 1 0 0 0 0 0 0
ENJ 0.2475 0.6488 0.6171 1 0 0 0 0 0
FC 0.2839 0.7002 0.6434 0.507 1 0 0 0 0
INT 0.3519 0.7723 0.6336 0.76 0.6325 1 0 0 0
OBS 0.1809 0.5307 0.3469 0.3244 0.5222 0.4379 1 0 0
PE 0.3463 0.7173 0.5458 0.5803 0.5715 0.7083 0.4314 1 0
SOC 0.0644 0.4017 0.2326 0.392 0.2951 0.3575 0.3522 0.3901 1
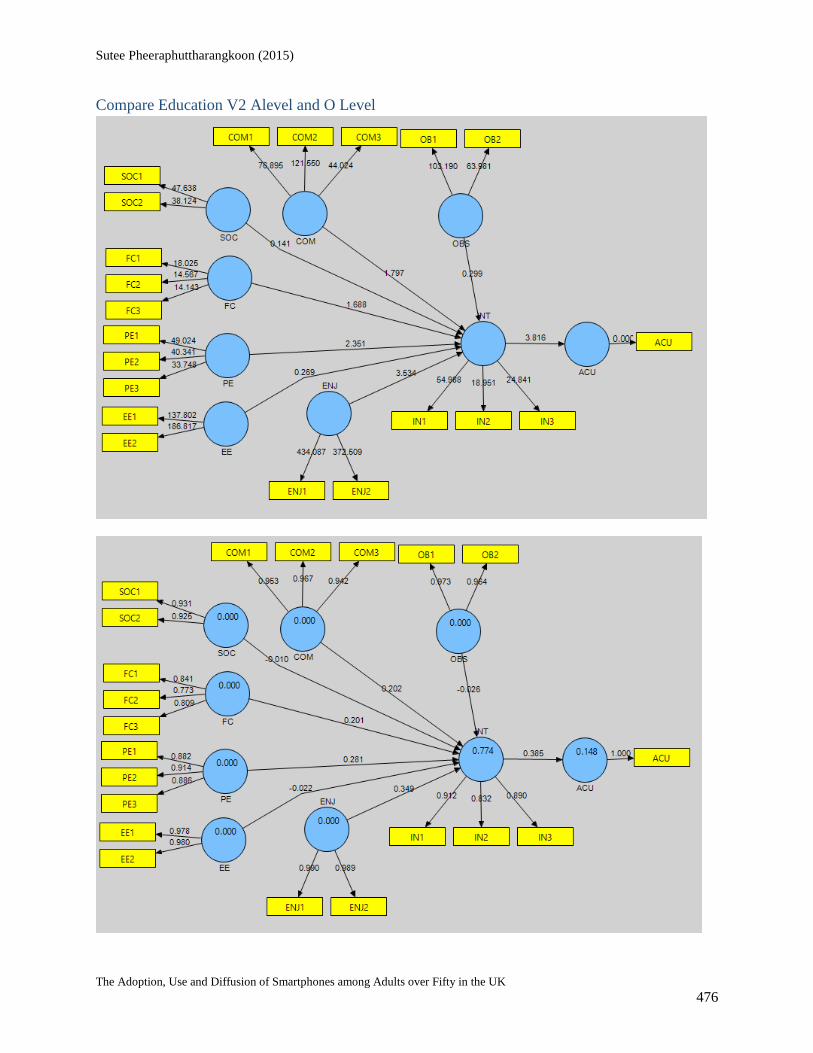
Sutee Pheeraphuttharangkoon (2015)
The Adoption, Use and Diffusion of Smartphones among Adults over Fifty in the UK 476
Compare Education V2 Alevel and O Level

Sutee Pheeraphuttharangkoon (2015)
The Adoption, Use and Diffusion of Smartphones among Adults over Fifty in the UK 477
Original
Sample
(O)
Sample
Mean
(M)
Standard Deviation
(STDEV)
Standard Error
(STERR)
T Statistics
(|O/STERR|)
COM -> INT 0.2021 0.2032 0.1125 0.1125 1.7967
EE -> INT -0.0224 -0.0318 0.0833 0.0833 0.2694
ENJ -> INT 0.3494 0.3472 0.0988 0.0988 3.5344
FC -> INT 0.201 0.2137 0.1191 0.1191 1.6876
INT -> ACU 0.3853 0.3838 0.101 0.101 3.8158
OBS -> INT -0.0264 -0.0284 0.088 0.088 0.2994
PE -> INT 0.2809 0.2794 0.1195 0.1195 2.3507
SOC -> INT -0.0095 -0.0085 0.0674 0.0674 0.1413
AVE
Composite
Reliability
R
Square
Cronbachs
Alpha
Communality Redundancy
ACU 1 1 0.1485 1 1 0.1485
COM 0.9101 0.9681 0 0.9507 0.9101 0
EE 0.9585 0.9788 0 0.9568 0.9585 0
ENJ 0.9792 0.9895 0 0.9788 0.9792 0
FC 0.6535 0.8496 0 0.7345 0.6535 0
INT 0.772 0.9103 0.7737 0.8523 0.772 0.219
OBS 0.9378 0.9679 0 0.9341 0.9378 0
PE 0.7996 0.9229 0 0.8759 0.7996 0
SOC 0.8617 0.9257 0 0.8396 0.8617 0
ACU COM EE ENJ FC INT OBS PE SOC
ACU 1 0 0 0 0 0 0 0 0
COM 0.3568 1 0 0 0 0 0 0 0
EE 0.3297 0.5678 1 0 0 0 0 0 0
ENJ 0.335 0.7699 0.5517 1 0 0 0 0 0
FC 0.4049 0.7651 0.6728 0.6015 1 0 0 0 0
INT 0.3853 0.8062 0.5764 0.7887 0.7251 1 0 0 0
OBS 0.1442 0.4741 0.2789 0.3126 0.5699 0.4098 1 0 0
PE 0.3264 0.7524 0.5899 0.6698 0.6869 0.7749 0.4521 1 0
SOC 0.082 0.501 0.2349 0.4965 0.371 0.4692 0.43 0.5199 1

Sutee Pheeraphuttharangkoon (2015)
The Adoption, Use and Diffusion of Smartphones among Adults over Fifty in the UK 478
Compare Education v2 Higher, First Degree, High and Diploma

Sutee Pheeraphuttharangkoon (2015)
The Adoption, Use and Diffusion of Smartphones among Adults over Fifty in the UK 479
Original
Sample
(O)
Sample
Mean
(M)
Standard Deviation
(STDEV)
Standard Error
(STERR)
T Statistics
(|O/STERR|)
COM -> INT 0.314 0.3177 0.0618 0.0618 5.0817
EE -> INT 0.1152 0.112 0.0487 0.0487 2.3646
ENJ -> INT 0.353 0.3523 0.0479 0.0479 7.3757
FC -> INT 0.023 0.0236 0.0546 0.0546 0.4212
INT -> ACU 0.5033 0.5028 0.0469 0.0469 10.7396
OBS -> INT -0.0209 -0.0217 0.0398 0.0398 0.5256
PE -> INT 0.2189 0.2182 0.0517 0.0517 4.2333
SOC -> INT -0.0121 -0.0109 0.0292 0.0292 0.4147
AVE
Composite
Reliability
R
Square
Cronbachs
Alpha
Communality Redundancy
ACU 1 1 0.2533 1 1 0.2533
COM 0.8862 0.9589 0 0.9357 0.8862 0
EE 0.9204 0.9586 0 0.9138 0.9204 0
ENJ 0.9514 0.9751 0 0.949 0.9514 0
FC 0.7491 0.8995 0 0.8328 0.7491 0
INT 0.774 0.9111 0.7288 0.8529 0.774 0.2911
OBS 0.8891 0.9413 0 0.8755 0.8891 0
PE 0.7691 0.909 0 0.8502 0.7691 0
SOC 0.9064 0.9509 0 0.897 0.9064 0
ACU COM EE ENJ FC INT OBS PE SOC
ACU 1 0 0 0 0 0 0 0 0
COM 0.5123 1 0 0 0 0 0 0 0
EE 0.3291 0.5792 1 0 0 0 0 0 0
ENJ 0.3834 0.6127 0.6495 1 0 0 0 0 0
FC 0.3745 0.7068 0.6139 0.4913 1 0 0 0 0
INT 0.5033 0.7541 0.6437 0.7444 0.5945 1 0 0 0
OBS 0.2916 0.572 0.3898 0.3843 0.5152 0.4411 1 0 0
PE 0.5191 0.7191 0.5166 0.5708 0.5451 0.7053 0.4297 1 0
SOC 0.1855 0.374 0.1405 0.3247 0.2551 0.3055 0.3347 0.322 1

Sutee Pheeraphuttharangkoon (2015)
The Adoption, Use and Diffusion of Smartphones among Adults over Fifty in the UK 480
6-1 OxIS and ONS Probit Analysis Variable Specification
The variables from OxIS and ONS are need to be manipulated before process Probit Analysis
Age 25_34- dummy variable (1: age 25 – 34, 0: Otherwise)
Age 35_49- dummy variable (1: age 35 – 49, 0: Otherwise)
Age50_65- dummy variable (1: age 50 - 65, 0: Otherwise)
Age66plus- dummy variable (1: age more than 66, 0: Otherwise)
Gender-1 is male, 0 is female
Single- dummy variable (1: single, 0: Otherwise)
Married_together- dummy variable (1: married and living with your husband/wife,
0: Otherwise)
Divided_seperated_widowed- dummy variable (1: divorced, widowed, married and
separated from your husband/wife, 0: Otherwise)
Scotland- dummy variable (1: Scotland, 0: Otherwise)
Wales- dummy variable (1: Wales, 0: Otherwise)
North- dummy variable (1: North East, North West, 0: Otherwise)
Midland- dummy variable (1: East Midlands, West Midlands, 0: Otherwise)
South- dummy variable (1: South East, South West, 0: Otherwise)
London- dummy variable (1: London, 0: Otherwise)
Sumgross is annual gross income, this variable used the value that ONS provided
Englishwhite - dummy variable (1: White, 0: Otherwise)
Irish - dummy variable (1: Irish, 0: Otherwise)
Gcse_o_level - dummy variable (1: GSCE and O levels, 0: Otherwise)
A_level - dummy variable (1: A Levels, 0: Otherwise)
Higher_education - dummy variable (1: Higher/ Highest Education, 0: Otherwise)
Degree_level - dummy variable (1: Degree level , 0: Otherwise)
Employed - dummy variable (1: London, 0: Otherwise)
Unemployed - dummy variable (1: London, 0: Otherwise)

Sutee Pheeraphuttharangkoon (2015)
The Adoption, Use and Diffusion of Smartphones among Adults over Fifty in the UK 481
6-2 Evaluation ONS Variables
Dependent Variable
Variable Description Values Appear in Year
Do you use any of the
following mobile devices
to access the internet away
from home or work?
1 Mobile phone or smartphone
2. Portable computer (e.g. laptop, tablet)
3. Other devices (e.g. IPod, handheld games
console, E-Book reader)
4. I don’t access the internet via any mobile
deice away from home or work
2010
2011
2012
2013
In the last 3 months, for
which of the following
activities did you use the
Internet, via a handheld
device, for personal use?
1. Sending and/or receiving emails
2. Reading or downloading online news,
newspapers, news magazines
3. Reading or downloading online books or e-
books
4. Playing or downloading games, images,
video, or music
5. Using podcast service to automatically
receive audio or video files of interest
6. Social networking, using websites such as
Facebook or Twitter
2012
Independent Variable
Variable Description Values Appear in Year
Age of Respondent In years 2010-13
Sex of Respondent 1 Male
2 Female
2010-13
Marital status of
Respondent
1 single, that is never married,
2 married and living with your husband/wife,
3 married and separated from your
husband/wife,
4 divorced,
5 or widowed?
2010-13
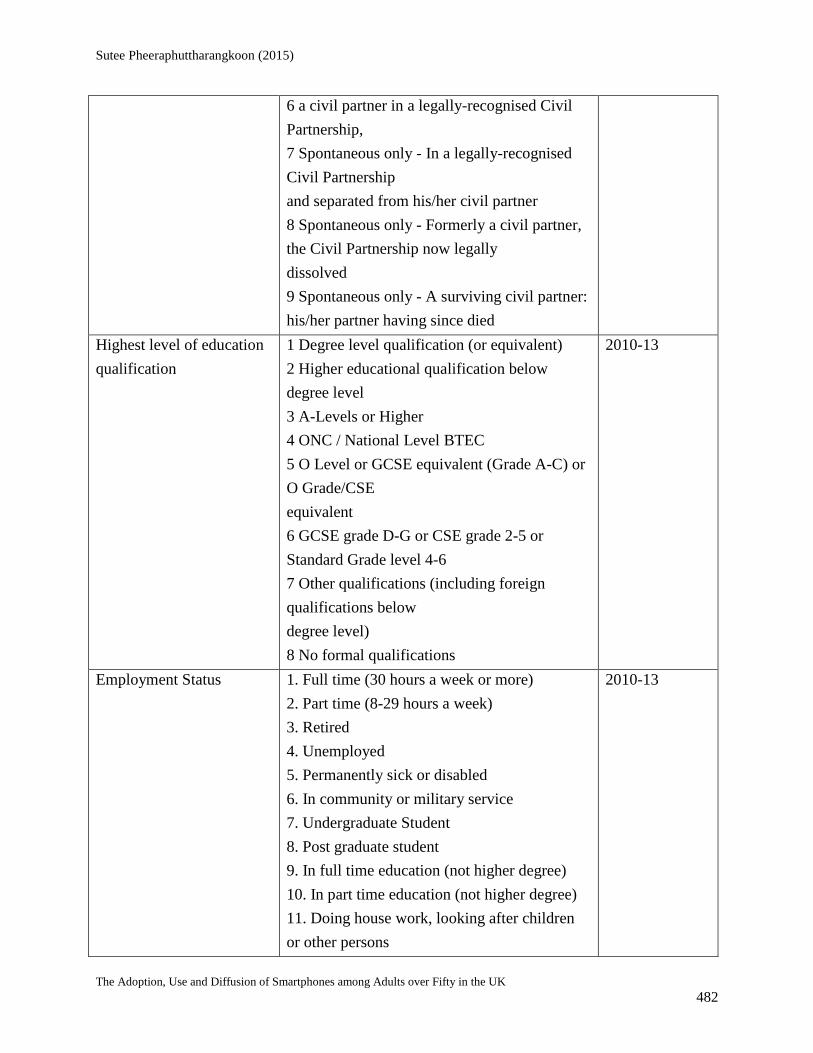
Sutee Pheeraphuttharangkoon (2015)
The Adoption, Use and Diffusion of Smartphones among Adults over Fifty in the UK 482
6 a civil partner in a legally-recognised Civil
Partnership,
7 Spontaneous only - In a legally-recognised
Civil Partnership
and separated from his/her civil partner
8 Spontaneous only - Formerly a civil partner,
the Civil Partnership now legally
dissolved
9 Spontaneous only - A surviving civil partner:
his/her partner having since died
Highest level of education
qualification
1 Degree level qualification (or equivalent)
2 Higher educational qualification below
degree level
3 A-Levels or Higher
4 ONC / National Level BTEC
5 O Level or GCSE equivalent (Grade A-C) or
O Grade/CSE
equivalent
6 GCSE grade D-G or CSE grade 2-5 or
Standard Grade level 4-6
7 Other qualifications (including foreign
qualifications below
degree level)
8 No formal qualifications
2010-13
Employment Status 1. Full time (30 hours a week or more)
2. Part time (8-29 hours a week)
3. Retired
4. Unemployed
5. Permanently sick or disabled
6. In community or military service
7. Undergraduate Student
8. Post graduate student
9. In full time education (not higher degree)
10. In part time education (not higher degree)
11. Doing house work, looking after children
or other persons
2010-13

Sutee Pheeraphuttharangkoon (2015)
The Adoption, Use and Diffusion of Smartphones among Adults over Fifty in the UK 483
Ethnicity 1. White British
2. Any other White background
3. Mixed – White and Black Caribbean
4. Mixed – White and Black African
5. Mixed – White and Asian
6. Any other Mixed background
7. Asian or Asian British – Indian
8. Asian or Asian British – Pakistani
9. Asian or Asian British – Bangladeshi
10. Asian or Asian British – Any other Asian
background
11. Black or Black British – Black Caribbean
12. Black or Black British – Black African
13. Black or Black British – Any other Black
background
14. Chinese
2010
Ethnicity 1. English, Welsh, Scottish, Northern Irish,
British
2. Irish
3. Gypsy or Irish Traveller
4. Any other White background
5. White and Black Caribbean
6. White and Black African
7. White and Asian
8. Any other Mixed/Multiple Ethnic
background
9. Indian
10. Pakistani
11. Bangladeshi
12. Chinese
13. Any other Asian background
14. African
15. Caribbean
16. Any other Black/African/Caribbean
background
17. Arab
2011-2013

Sutee Pheeraphuttharangkoon (2015)
The Adoption, Use and Diffusion of Smartphones among Adults over Fifty in the UK 484
18. Any other Ethnic group
Government Office Region 1 North East
2 North West
3 Yorkshire and the Humber
4 East Midlands
5 West Midlands
6 East of England
7 London
8 South East
9 South West
10 Wales
11 Scotland
2010-13
Annual Gross Income 1 Up to £519
2 £520 up to £1,039
3 £1,040 up to £1,559
4 £1,560 up to £2,079
5 £2,080 up to £2,599
6 £2,600 up to £3,119
7 £3,120 up to £3,639
8 £3,640 up to £4,159
9 £4,160 up to £4,679
10 £4,680 up to £5,199
11 £5,200 up to £6,239
12 £6,240 up to £7,279
13 £7,280 up to £8,319
14 £8,320 up to £9,359
15 £9,360 up to £10,399
16 £10,400 up to £11,439
17 £11,440 up to £12,479
18 £12,480 up to £13,519
19 £13,520 up to £14,559
20 £14,560 up to £15,599
21 £15,600 up to £16,639
22 £16,640 up to £17,679
23 £17,680 up to £18,719
24 £18,720 up to £19,759
2010-13

Sutee Pheeraphuttharangkoon (2015)
The Adoption, Use and Diffusion of Smartphones among Adults over Fifty in the UK 485
25 £19,760 up to £20,799
26 £20,800 up to £23,399
27 £23,400 up to £25,999
28 £26,000 up to £28,599
29 £28,600 up to £31,199
30 £31,200 up to £33,799
31 £33,800 up to £36,399
32 £36,400 up to £38,999
33 £39,000 up to £41,599
34 £41,600 up to £44,199
35 £44,200 up to £46,799
36 £46,800 up to £49,399
37 £49,400 up to £51,999
38 £52,000 or more
Health in general 1 Very Good
2 Good
3 Fair
4 Bad
5 Very Bad
2010-13

Sutee Pheeraphuttharangkoon (2015)
The Adoption, Use and Diffusion of Smartphones among Adults over Fifty in the UK 486
6-3 Evaluation OXiS Variables
Dependent Variable
Variable Description Values Appear in Year
Do you yourself have a
mobile phone?
0 No
1 Yes
2007
2009
2011
Do you use your mobile
phone for …
A. Making phone calls/Talking to others
B. Sending or reading email
C. Sending text messages
D. Playing games
E. Taking photos
F. Sending photos
G. Listening to music
H. Finding direction or location
I. Browse or update a social network site
J. Browse the Internet
2011
How frequently do you use
your mobile phone for …
A. Making phone calls/ Taking to others
B. Sending text messages
C. Playing games
D. Accessing email or the internet
E. Taking photos
F. Sending photos
G. Listening to music (Mp3s)
2009
Besides making phone
calls, do you use your
mobile phone for …
A. Sending text message
B. Playing game
C. Accessing email or the Internet
D. Taking pictures
E. Sending photos
F. Listening to music (Mp3s)
2007
Independent Variable
Variable Description Values Appear in Year
Age of Respondent In years 2007
2009
2011
Region 1. Scotland
2. North West
3. South West
2009
2011

Sutee Pheeraphuttharangkoon (2015)
The Adoption, Use and Diffusion of Smartphones among Adults over Fifty in the UK 487
4. Wales
5. South East
6. London
7. East of England
8. East Midlands
9. West Midlands
10. Yorkshire & the Humber
11. North East
Region 1. Scotland
2. North West
3. South West
4. Wales
5. South
6. South East
7. London
8. Anglia
9. East Midlands
10. West Midlands
11. Yorkshire
12. North East
2007
Gender 0. Male
1. Female
2007
2009
2011
Employment Status 1. Full time (30 hours a week or more)
2. Part time (8-29 hours a week)
3. Retired
4. Unemployed
5. Permanently sick or disabled
6. In community or military service
7. Undergraduate Student
8. Post graduate student
9. In full time education (not higher degree)
10. In part time education (not higher degree)
11. Doing house work, looking after children or
other persons
2007
2009
2011

Sutee Pheeraphuttharangkoon (2015)
The Adoption, Use and Diffusion of Smartphones among Adults over Fifty in the UK 488
Marital Status 1. Single
2. Married
3. Living together with partner
4. Divorced, separated
5. Widowed
2007
2009
2011
Highest Education 0. No qualifications
1. SNQ (Scottish National Qualification)
2. 5 or more GCSE grades A-C
3. 4 or less GCSE grade A-C
4. GCSE grade D-G
5. CSEs
6. 5 or more O Level
7. 4 or less O Level
8. GCE A levels or equivalent
9. NVQ 1 or 2
10. NVQ 3 or 4
11. GNVQ Foundation
12. GNVQ Intermediate
13. GNVQ Advanced
2007
Highest Education In 2009 the following choice were added from 2007
14. Certificate or Diploma of Higher Education
15. Bachelor’s degree
16. Graduate Certificates and Diploma
17. Master Degree
18. Doctoral Degree
2009
Highest Education 0. No qualifications
1. 5 or more GCSE grades A-C
2. 4 or less GCSE grade A-C
3. GCSE grade D-G
4. 5 or more Scottish Standard Grades, grades 1-3
5. 4 or less Scottish Standard Grades, grades 1-3
6. Scottish Standard Grades, grades 4-7
7. Scottish Higher
8. CSEs
9. 5 or more O levels
10. 4 or less O levels
11. GCE A levels or equivalent
12. NVQ 1 or 2
13. NVQ 3 or 4
2011

Sutee Pheeraphuttharangkoon (2015)
The Adoption, Use and Diffusion of Smartphones among Adults over Fifty in the UK 489
14. GNVQ Foundation
15. GNVQ Intermediate
16. GNVQ Advanced
17. Certificate or Diploma of Higher Education
18. Bachelor’s Degree
19. Graduate Certificates and Diploma
20. Master Degree
21. Doctoral Degree
Ethnic group membership 1. Asian: of Indian origin
2. Asian: of Pakistani origin
3. Asian: of Bangladeshi origin
4. Asian: Chinese origin
5. Asian: other origin
6. Black: of African origin 7. Black: of Caribbean origin
8. Black: of other origin
9. White: of British origin
10. White: of other origin
11. Other
2007
2009
2011