Open Source BI Adoption - OW2
28
BI Initiative deliverables OW2 BI Initiative deliverables OS BI Adoption January 13 th , 2009 Author: University of Milan Revision: Engineering, University of Bologna Page: 1/28 Open Source BI Adoption Author: Ernesto Damiani 1 , Fulvio Frati 1 , Cristina Monteverdi 1 1 Department of Information Technology, University of Milan - Italy This work is licensed under the Creative Commons Attribution-Share Alike 3.0 License. To view a copy of this license, visit http://creativecommons.org/licenses/by-sa/3.0/ or send a letter to Creative Commons, 171 Second Street, Suite 300, San Francisco, California, 94105, USA.
-
Upload
khangminh22 -
Category
Documents
-
view
1 -
download
0
Transcript of Open Source BI Adoption - OW2
BI Initiative
deliverables
OW2 BI Initiative deliverables OS BI Adoption January 13th, 2009
Author: University of Milan Revision: Engineering, University of Bologna Page: 1/28
Open Source BI Adoption
Author:
Ernesto Damiani1, Fulvio Frati1, Cristina Monteverdi1
1Department of Information Technology, University of Milan - Italy
This work is licensed under the Creative Commons Attribution-Share Alike 3.0 License.
To view a copy of this license, visit http://creativecommons.org/licenses/by-sa/3.0/ or send a letter to Creative Commons, 171 Second Street, Suite 300, San Francisco, California, 94105, USA.
BI Initiative
deliverables
OW2 BI Initiative deliverables OS BI Adoption January 13th, 2009
Author: University of Milan Revision: Engineering, University of Bologna Page: 2/28
Revision History
Version Lead Author Summary of Changes Date
1.0 Univ. Milan First version release 13/01/2009
Table of Contents
Table of Contents...................................................................................................................2
Abstract ............................................................................................................................................3
About the BI Initiative .....................................................................................................................4
1. Introduction..................................................................................................................................5
2. OS BI architecture........................................................................................................................6
2.1 The Database Layer ...............................................................................................................6
2.2 The Business Intelligence Layer ............................................................................................7
2.3 The Analytics/Performance Management Layer .................................................................12
3. Perspectives and case studied in OS BI adoption ......................................................................15
3.1 Competition data case study ................................................................................................15
4. Cost models for OS BI ...............................................................................................................22
4.1 Categorize and Prioritize the Backlog .................................................................................22
4.2 Embed BI in a Business Application First ...........................................................................23
4.3 Extend Advanced Capabilities to One Business Unit at a Time..........................................23
4.4 Allocate Special Resources for Analysis .............................................................................23
5. Adoption Risks...........................................................................................................................25
6. Conclusion .................................................................................................................................26
References......................................................................................................................................27
OW2 BI Initiative deliverables OS BI Adoption January 13th, 2009
Author: University of Milan Revision: Engineering, University of Bologna Page: 3/28
Abstract
This document aims at briefly introducing the state of the art of Open Source Business Intelligence
(OS BI) adoption as a framework for other deliverables of the BI Initiative.
In the last years many papers and presentations were delivered comparing the different OS BI
solution and approaches. They are market analyst papers (like Gartner, Forrester and The 451
Group), white papers by software integrators, documentation of seminars and trainings. Sometimes
these papers are too much theoretical, sometimes too much market oriented and not independent,
sometimes too much based on a specific technical comparison saying nothing (or too much little)
about market adoption, application scenarios and opportunities for OS BI.
The aim of this document is not to provide one more OS BI survey, but to present a complete view
of tools and frameworks that an organization approaching the Business Intelligence (BI) context
could adopt to cover all the field of business analysis. In particular, this document will cover the
following subjects:
• give a quick introduction to current OS BI solutions and tools, with respect to the different
areas that those tools cover;
• present a real use case useful to highlight the potential of a robust BI solution that could be
implemented using the proposed open source frameworks;
• describe the key aspects correlated to OS BI adoption like cost models and adoption risk.
OW2 BI Initiative deliverables OS BI Adoption January 13th, 2009
Author: University of Milan Revision: Engineering, University of Bologna Page: 4/28
About the BI Initiative
OW2 Initiatives are joint efforts of OW2 Members and not-OW2 Members aiming at facilitating the use of OW2 technologies by mainstream systems integrators, end-users, academia and software vendors. Within an Initiative, participants work together to develop both technical integration between projects and business synergies in order to address specific market needs. The BI Initiative is a join effort set up to: • improve the coordination effort in the OS BI context • increase the use of OS BI solutions at enterprise level • strengthen connections between integrators, vendors, users and the research communities • attract more attention from the research activities to foster innovative BI solutions and practices. Main activities are: • integration of a full stack of OS BI solutions and tools • promotion of a service network to support the entire stack • kick-starting a community contributing to strengthen the current OS BI platforms • creation of a research network on BI topics, fostering a closer cooperation between researchers
and OS BI vendors, to promote the development of a new generation of OS BI platforms. Participants of the BI Initiative are: • Altic, France (www.altic.org) • Artemis Information Management, Luxembourg (www.artemis.lu) • ClaraVista, France (www.claravista.fr) • Engineering Ingegneria Informatica, Italy (www.eng.it) • Ingres, USA (www.ingres.com) • Talend, France (www.talend.com); • DEIS-University of Bologna-Italy (www.eng.unibo.it/PortaleEn/default.htm) • DTI-University of Milan (http://ra.crema.unimi.it), Italy • DISI-University of Trento (www.dit.unitn.it), Italy • OW2 individual members. More information about OW2 BI Initiative: www.ow2.org/view/BusinessIntelligence/ More information about OW2 Consortium: www.ow2.org
OW2 BI Initiative deliverables OS BI Adoption January 13th, 2009
Author: University of Milan Revision: Engineering, University of Bologna Page: 5/28
1. Introduction
Open source business applications have started to mature into robust platforms, serving sales,
finance and operational needs. Recently, OS BI (Open Source Business Intelligence) platforms have
also been gaining attention, as users of proprietary BI applications face increasing licensing costs.
OS BI platforms are usually licensed as COSS (Commercial Open Source Software), a licensing
model similar to the Red Hat one.
COSS companies have developed and imposed the concept of dual licensing, over which their
business plans are based. The dual licensing model is very simple: consisting of both open source
and commercial licensing. Companies drive and manage the open source community to produce
high-quality products that are distribute freely in the network. In addition, they offer an advanced
customers service or additional features to those users who accept to buy such services.
The goal of dual licensing for organizations is twofold: it allows exploiting all the benefits of open
source communities (i.e. agile low-cost developing), with the possibility to gain high return on
investment. From the users side, dual licensing allows to download and use high quality software
without charges, and eventually pay for the addition services.
Most CIOs consider it important for mission-critical software applications to have a well-identified
commercial entity standing behind a software distribution rather than relying on the community
alone. This is seen as a guarantee of quality of the released products, since organizations base their
business activity entirely on their software, defining requirements, milestones, and extensive
functional tests.
In this report, we present an architectural view of OS BI platforms and discuss their adoption in
several real world application scenarios.

OW2 BI Initiative deliverables OS BI Adoption January 13th, 2009
Author: University of Milan Revision: Engineering, University of Bologna Page: 6/28
2. OS BI architecture
At an architectural point of view, an OS BI platform is composed of three major components: a
database layer for storing business data, a business intelligence layer to transform and present
business information, and an analytics/performance management layer to predict business
outcomes and opportunities [1]. Fig. 1 shows these three components and their relationships.
2.1 The Database Layer
The database layer provides access and storage of platform data. Two open source databases
management systems (DBMS) are widely adopted for open source application and, in particular, for
business intelligence: MySQL, PostgreSQL, and Ingres.
MySQL (www.mysql.com) includes all features of commercial enterprise DBMS, including
partitions, triggers, stored procedures and views which can be updated. MySQL also supports
multiple storage engines used for transaction processing and rapid query performing.
Fig. 1: OS BI platform three layers: database layer, business intelligence layer, and
analytics/performance management layer (source: http://www.linux-mag.com/id/6856).
OW2 BI Initiative deliverables OS BI Adoption January 13th, 2009
Author: University of Milan Revision: Engineering, University of Bologna Page: 7/28
PostgreSQL (www.postgresql.org ) is another widespread choice for OS BI. PostgreSQL is a full-
featured DBMS that includes many constructs that are common on proprietary commercial
applications, including tablespaces, temporary tables, inheritance, functions, sequences, triggers and
views.
Ingres (www.ingres.com) is an important player in supporting business critical applications and
helping manage the most demanding enterprise applications. Focused on reliability, security,
scalability, and ease of use, Ingres contains features demanded by the enterprise while providing the
flexibility of Open Source. Core Ingres technology forms the foundation, not only of Ingres
Database, but numerous other industry-leading RDBMS systems as well.
Advanced enterprise features comprise compliance for Sarbanes Oxley and HIPPA regulations,
support for scalability and high availability, and flexible backup and recovery.
Each DBMS include all core features needed for BI. In particular they are good choices for OS BI
since they offer some performance boost features, such as bitmap indexes and materialized views,
very useful for business intelligence analyses.
Bitmap indexes provide a flexible and efficient database indexing technique, where traditional
lightweight index, like for instance the living province or the gender, characterized by a small
number of different values with high occurrences rate, are substituted by bit arrays (bitmaps). They
are indicated for BI applications since the high amount of data and of analysis dimensions managed
are well integrated exploiting bitwise logical operations on bitmap indexes. On the other hand,
materialized views are useful in case of frequent queries on large data warehouses, as in the case of
BI analysis. Traditional DBMS approach calculate each query on tables any time they are requested,
resulting in high wasting of computational resources. DBMS offering materialized view features are
able to cache queries results as a concrete table, which may be updated from the original base tables
from time to time. This enables much more efficient access, at the cost of some data being
potentially out-of-date.
2.2 The Business Intelligence Layer
The core of any BI platform is the organizing data layer, responsible for the business analysis and
the presentation of information in static or dynamic reports. Basic reporting operation could be
performed using common open source products such as the OpenOffice extension Report Builder
[2], provided by Sun Microsystems, or Actuate BIRT [3], but additional features and tools are
OW2 BI Initiative deliverables OS BI Adoption January 13th, 2009
Author: University of Milan Revision: Engineering, University of Bologna Page: 8/28
needed to produce high quality reports and dashboards. In the following sections, we briefly discuss
more complete open source platforms, which include advanced reporting features.
Pentaho
The Pentaho BI Suite [4] is an open source platform that includes Pentaho Data Integration (Kettle),
Pentaho Reporting and Pentaho Analysis (Mondrian). The BI Suite server comes with a starter
application for executing reports and OLAP cubes, and administering server settings and
components.
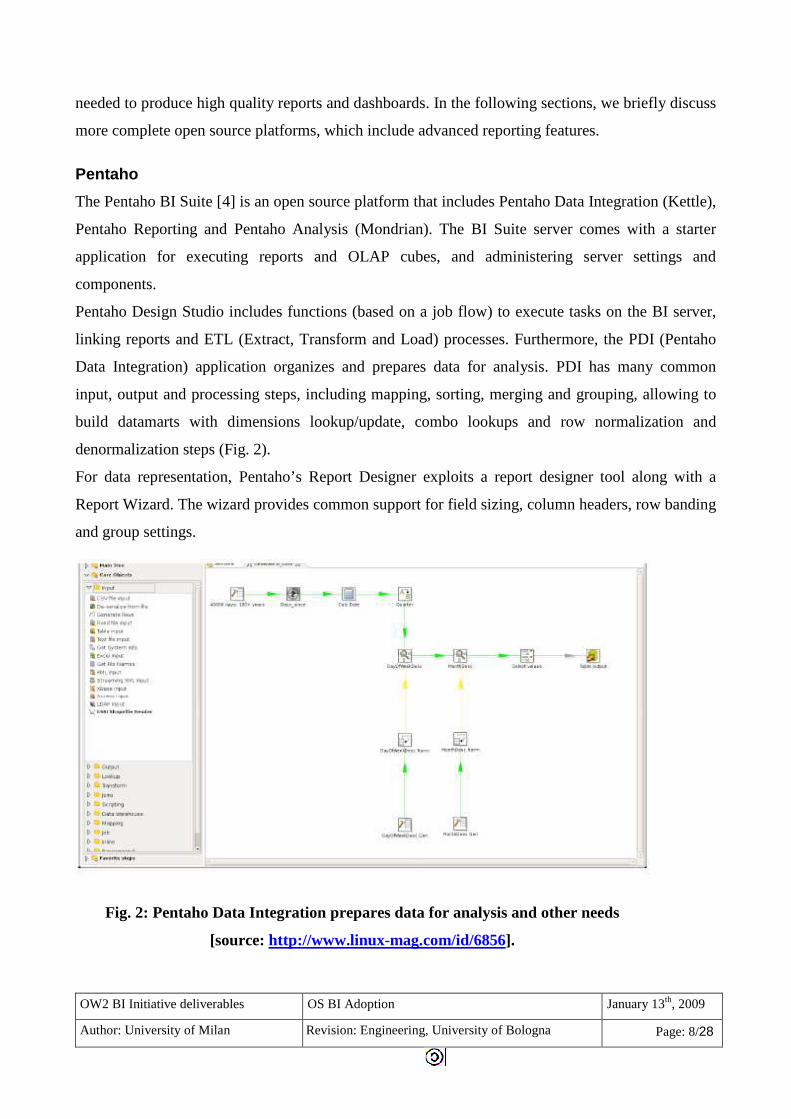
Pentaho Design Studio includes functions (based on a job flow) to execute tasks on the BI server,
linking reports and ETL (Extract, Transform and Load) processes. Furthermore, the PDI (Pentaho
Data Integration) application organizes and prepares data for analysis. PDI has many common
input, output and processing steps, including mapping, sorting, merging and grouping, allowing to
build datamarts with dimensions lookup/update, combo lookups and row normalization and
denormalization steps (Fig. 2).
For data representation, Pentaho’s Report Designer exploits a report designer tool along with a
Report Wizard. The wizard provides common support for field sizing, column headers, row banding
and group settings.
Fig. 2: Pentaho Data Integration prepares data for analysis and other needs
[source: http://www.linux-mag.com/id/6856].

OW2 BI Initiative deliverables OS BI Adoption January 13th, 2009
Author: University of Milan Revision: Engineering, University of Bologna Page: 9/28
In addition to Report Designer, Pentaho includes a tool called Analysis, built on the Mondrian
engine. The embedding of a tool like Mondrian [5] allows the multidimensional analysis of data
retrieved from a common relational DBMS. In particular, Mondrian is an OLAP (On Line
Analytical Processing) engine written in Java; it executes queries written in the MDX
(MultiDimensional Expression) language, reading data from a relational database (RDBMS), and
presents the results in a multidimensional format via a Java API. After publishing the schema to the
Pentaho server, users can drill up and down hierarchies of data to understand the source of data
represented on a report and to investigate more deeply the causes of the reported value. The user
interface lacks modern drag and drop features but the basic interface works well.
JasperSoft
JasperSoft provides a full-scale OS BI suite [6], that incorporates ETL, OLAP and report design
features under a common BI platform. The JasperSoft BI suite includes JasperServer at its core,
JasperETL for data transformations, JasperAnalysis for OLAP analysis (Fig. 3), and JasperStudio
(also known as iReport) for report design. Like Pentaho, JasperAnalysis’s OLAP is powered by the
Mondrian engine. While there are slightly different interfaces for cubes administration,
JasperAnalysis is not much different from Pentaho’s implementation of Mondrian.
To prepare data within the Jasper platform, JasperETL exploits Talend data integration features.
Data integration is the process of moving and combining data across the information system. It
typically consists of extracting data from different sources (databases, files, applications, Web
Services, emails, etc.), applying transformations (join, lookup, de-duplication, calculation, etc.) to
this data and sending the resulting data to target systems. Talend [7] is an open source java-based
application that can retrieve data from the most common systems (i.e. CRM tools, DBMS, MS
Office, etc), supplying high quality data analysis.
OW2 BI Initiative deliverables OS BI Adoption January 13th, 2009
Author: University of Milan Revision: Engineering, University of Bologna Page: 10/28
BIRT (Business Intelligence Reporting Tool) [8] focuses on Reporting, without exploiting ETL or
OLAP functions. BIRT can be used as a common Eclipse plug-in and integrated with Java/J2EE
applications to produce compelling reports. BIRT provides core reporting features such as report
layout, data access and scripting.
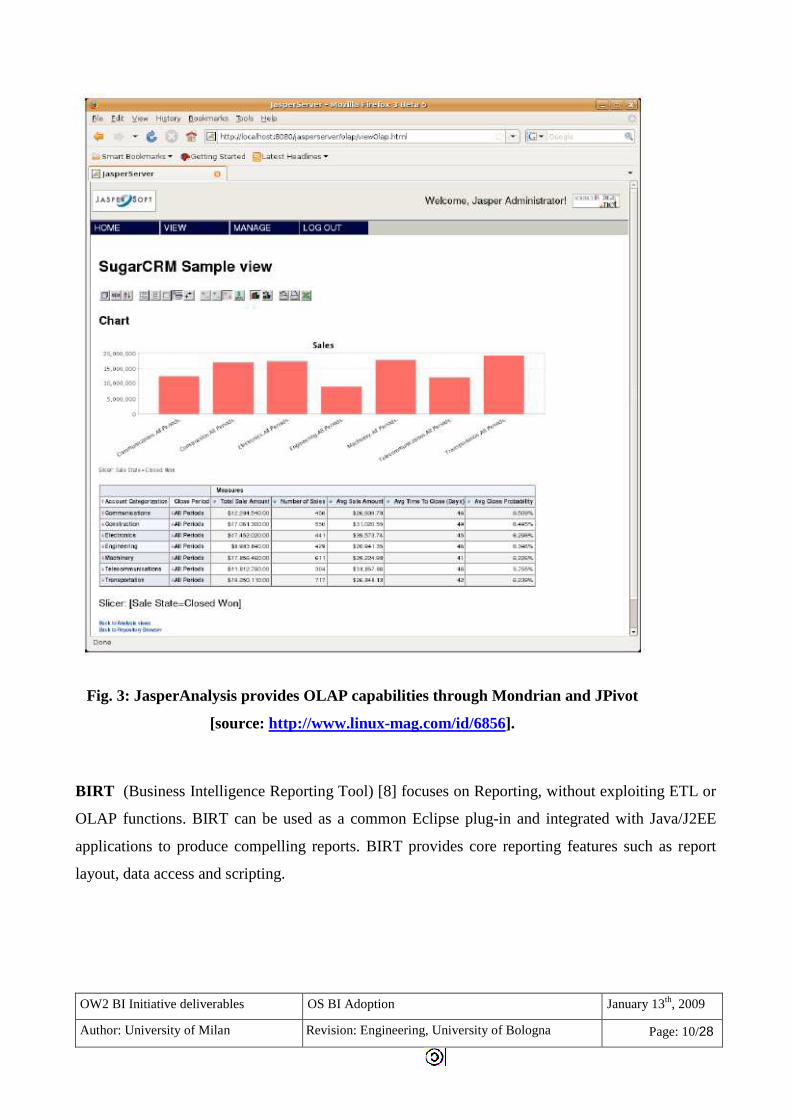
Fig. 3: JasperAnalysis provides OLAP capabilities through Mondrian and JPivot
[source: http://www.linux-mag.com/id/6856].
OW2 BI Initiative deliverables OS BI Adoption January 13th, 2009
Author: University of Milan Revision: Engineering, University of Bologna Page: 11/28
SpagoBI
SpagoBI [9] is a professional Business Intelligence suite entirely developed and released according
to the best Free Open Source Software community's practices.
SpagoBI 2.0 release offers many main modules:
• SpagoBI Server;
• SpagoBI Studio, an integrated development environment;
• SpagoBI Meta, an environment focused on metadata;
• SpagoBI SDK, an integration layer to use SpagoBI from external tools;
• SpagoBI Applications, to collect the vertical analytical models built using SpagoBI.
The Analytical model over which SpagoBI analysis are based, provides solutions for each analytical
area. In particular, it supplies features to produce high-quality reports and dashboards, to navigate
data throw an internal OLAP engine, to build run-time ad-hoc queries. Furthermore, SpagoBI
integrates Talend as the preferential ETL engine to retrieve data from the most common business
tools.
Talend
Data integration is the process of moving and combining data across the information system. It
typically consists of extracting data from different sources (databases, files, applications, Web
Services, emails, etc.), applying transformations (join, lookup, de-duplication, calculation, etc.) to
this data and sending the resulting data to target systems.
Talend provides open source data integration software, and leverages the open source model to
make data integration available to all types of organizations, regardless of their size, level of
expertise or budgetary constraints. Talend’s solutions connect to all source and target systems and
offers data quality solutions, fully complementary to its data integration solutions.
To conclude, both Pentaho and JasperSoft offer solutions that include the core BI suite components,
while BIRT is a competitive reporting tool with many strong features. SpagoBI proposes a complete
set of interconnected technologies to cover all the fields of BI analysis activities, offering the most
complete support and documentation for adopting organizations, and the most flexibility in
producing reports and dashboards, and Talend offers high-level data integration techniques and
tools. Nevertheless, each technology may appeal to a particular business environment based on its
priorities, though analytical reports produced from any will hold up to discerning business users.
OW2 BI Initiative deliverables OS BI Adoption January 13th, 2009
Author: University of Milan Revision: Engineering, University of Bologna Page: 12/28
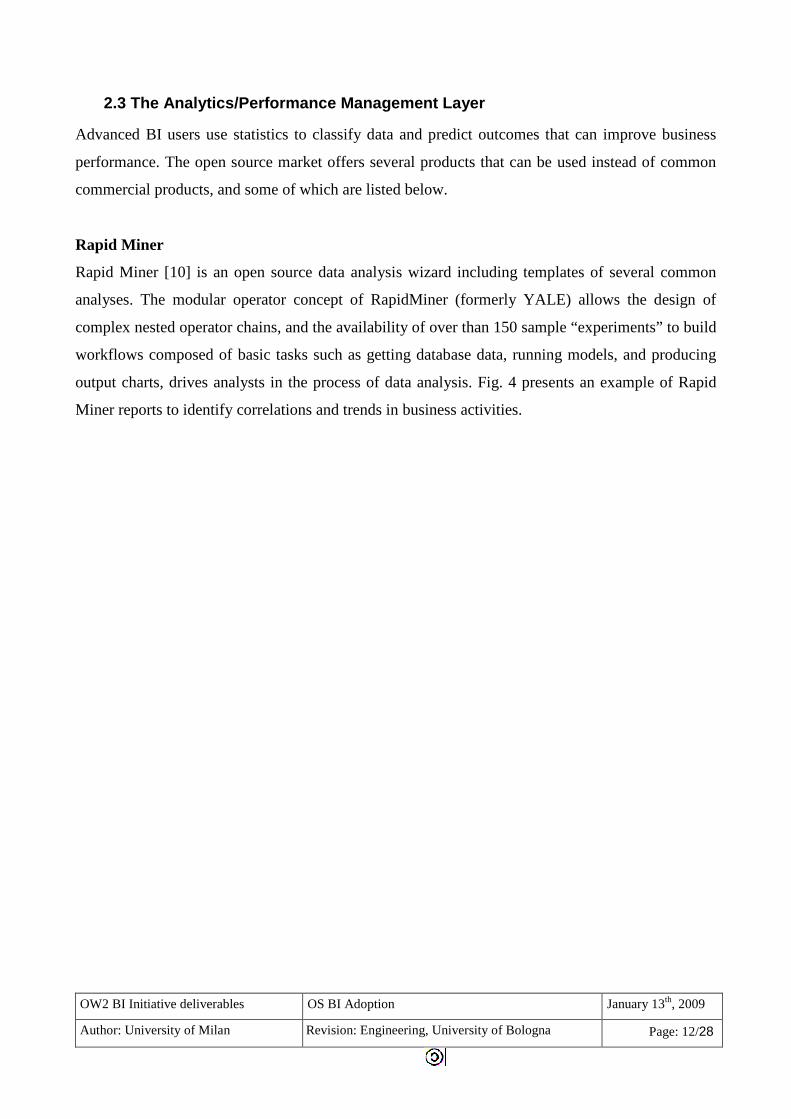
2.3 The Analytics/Performance Management Layer
Advanced BI users use statistics to classify data and predict outcomes that can improve business
performance. The open source market offers several products that can be used instead of common
commercial products, and some of which are listed below.
Rapid Miner
Rapid Miner [10] is an open source data analysis wizard including templates of several common
analyses. The modular operator concept of RapidMiner (formerly YALE) allows the design of
complex nested operator chains, and the availability of over than 150 sample “experiments” to build
workflows composed of basic tasks such as getting database data, running models, and producing
output charts, drives analysts in the process of data analysis. Fig. 4 presents an example of Rapid
Miner reports to identify correlations and trends in business activities.
OW2 BI Initiative deliverables OS BI Adoption January 13th, 2009
Author: University of Milan Revision: Engineering, University of Bologna Page: 13/28
Weka
Weka [11] is an open source project from the University of Waikato, New Zealand, which provides
a drag and drop interface to develop predictive models and scoring, including statistical clusters,
tree based analysis, regressions and Bayesian classifiers.
Fig. 4: Robust graphics in Rapid Miner help analysts identify correlations and trends
[source: http://www.linux-mag.com/id/6856].
OW2 BI Initiative deliverables OS BI Adoption January 13th, 2009
Author: University of Milan Revision: Engineering, University of Bologna Page: 14/28
In particular, Weka is a collection of machine learning algorithms for data mining tasks. The
algorithms can either be applied directly to a dataset or called from your own Java code. It contains
tools for data pre-processing, classification, regression, clustering, association rules, and
visualization. It is also well-suited for developing new machine learning schemes.
R
R [12] is a popular open source statistical package used by many academic researchers. R provides
a wide variety of statistical (linear and nonlinear modelling, classical statistical tests, time-series
analysis, classification, clustering, etc.) and graphical techniques, and is highly extensible. One of
R's strengths is the ease with which well-designed publication-quality plots can be produced,
including mathematical symbols and formulae where needed.
The R Environment is an integrated suite of software facilities for data manipulation, calculation
and graphical display that includes data handling and storage facility, a suite of operators for
calculations on arrays and matrices, an integrated collection of intermediate tools for data analysis,
graphical facilities for data analysis and display either on-screen or on hardcopy, and a
programming language which includes conditionals, loops, user-defined recursive functions and
input and output facilities. The Comprehensive R Archive Network includes more than 1400 freely-
available add-on packages.
OW2 BI Initiative deliverables OS BI Adoption January 13th, 2009
Author: University of Milan Revision: Engineering, University of Bologna Page: 15/28
3. Perspectives and case studied in OS BI adoption
As showed in the section above, open source BI packages offer a complete and competitive set of
features. On the development side, as OS BIs mature, more platforms will move from Java
development tool plug-ins to more specific BI-developer applications.
In the best of our knowledge, in literature case studies on OSBI adoption are not available. In this
section we present an experience, taken from the literature [13], of Business Intelligence analysis
that shows the potential strength and added value of BI adoption and that could be taken as a
roadmap for future OSBI implementation using the OS tools explained in the previous sections.
3.1 Competition data case study
Purposes
The case study we propose is about the application of data mining techniques to allow the execution
of specific technology watches and competitive intelligence studies [13]. In particular, the purpose
of BI adoption explained in this case study, is to analyze the market trends and findings emerging
and profitable technology areas.
The first step is to identify a reliable and consistent knowledge source, such as databases which are
available on-line on the Internet and contain relevant business information or documents. Among
these databases, the case study concentrates on the Derwent database (www.derwent.co.uk) which
collects all the patents registered in all countries in the last ten years. A query in this database (by
subject, by firm, or by year) may cause the mining of hundreds, sometimes thousands, of
documents. Therefore, an automatic processing is necessary to collect and integrates documents
identifying the main thematic areas, emphasizing synergies and relations among different areas, and
analyzing the evolution of the competitor strategy.
The large amount of data in each document and their textual typology make of paramount
importance the use of OS data mining tools. The data mining process requires, in this context, a
special care in the first phases of source detection and document mining, while the pre-processing
part is much less challenging because input databases are already of high quality and well-
organized. In this type of application, the proper technique to use to mine and recovering important
data is a particular clustering technique based on the relational analysis.

OW2 BI Initiative deliverables OS BI Adoption January 13th, 2009
Author: University of Milan Revision: Engineering, University of Bologna Page: 16/28
Before describing via an example the results obtained in the case study, we should explain the
underlying techniques in more detail.
Input data
The data retrieved are usually field-structured text documents. A patent, for example, is a text made
up of some fields: the title, the registering firm (and potential holding), the inventor’s name, the
date of registering, the abstract and some classification codes (see Fig. 5).
These data are often partially overlapped and redundant, so it is not easy, also for an expert, to
recognize the importance of it and its relations with the other ones and with other application areas.
Relational data analysis
The IBM Centre of Applied Mathematics in Paris has carried out a technique to analyze this type of
data based on relational analysis [14].
The content of each document is converted into a binary matrix, where each line represents a patent
and each column represents a descriptive variable (a code, a word contained in the title, the year of
registering, etc.). In every matrix box, a “1” indicates the presence of that specific variable as
descriptive attribute of that specific document, whereas a “0” indicates the absence of that specific
descriptive attribute in the document in question. This matrix is the starting point to correlate
documents. The comparison initially takes place for document couples: a similarity index is
calculated for every couple. This index increases when the 1 values in common increase (that is, it
Fig. 5: Example of information available for every patent
[source: http://www.cineca.it/gai/pagina-dataminoreal.htm].
OW2 BI Initiative deliverables OS BI Adoption January 13th, 2009
Author: University of Milan Revision: Engineering, University of Bologna Page: 17/28
increases when the two documents share the same descriptive attribute) and decreases when the
attributes which differentiate them increase. The segmentation algorithm uses similarity indexes to
detect the best partition, i.e. the partition which causes document groupings internally as
homogeneous as possible and as separated as possible from the other groups. The number of
groupings (or clusters) is not established a priori, as in the case of traditional cluster analysis (see
the traditional K-means method [15]): the groupings implicitly defined in the data are detected
automatically by the algorithm. This allows on the one hand to eliminate any external forcing and
arbitrariness, on the other hand to detect and identify also the smallest groupings which can elude
the analysis and may show market strengths not sufficiently developed. This technique is adaptable
to any data structure thanks to the different parameters in the definition of similarity among
documents:
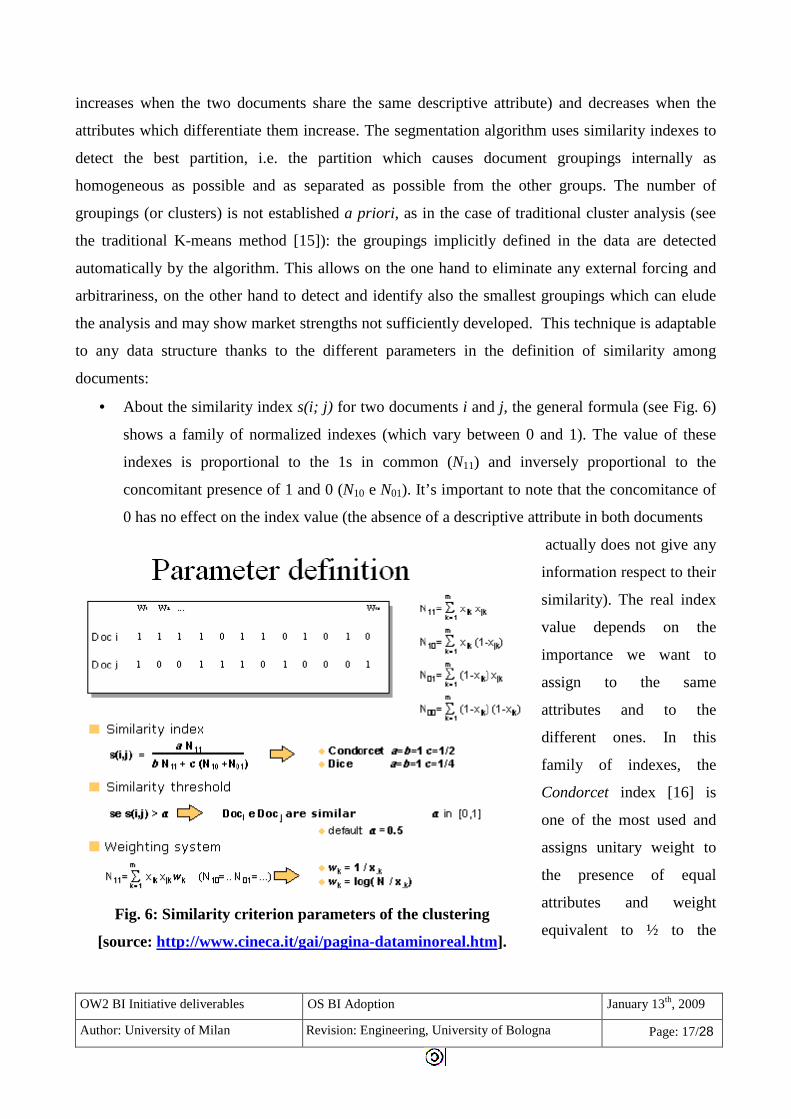
• About the similarity index s(i; j) for two documents i and j, the general formula (see Fig. 6)
shows a family of normalized indexes (which vary between 0 and 1). The value of these
indexes is proportional to the 1s in common (N11) and inversely proportional to the
concomitant presence of 1 and 0 (N10 e N01). It’s important to note that the concomitance of
0 has no effect on the index value (the absence of a descriptive attribute in both documents
actually does not give any
information respect to their
similarity). The real index
value depends on the
importance we want to
assign to the same
attributes and to the
different ones. In this
family of indexes, the
Condorcet index [16] is
one of the most used and
assigns unitary weight to
the presence of equal
attributes and weight
equivalent to ½ to the Fig. 6: Similarity criterion parameters of the clustering
[source: http://www.cineca.it/gai/pagina-dataminoreal.htm].
OW2 BI Initiative deliverables OS BI Adoption January 13th, 2009
Author: University of Milan Revision: Engineering, University of Bologna Page: 18/28
presence of the different ones. Moreover, it is possible to increase or decrease the threshold
which is usually set to 0.5. Two documents are considered similar if the similarity index goes
beyond the threshold value. If we increase this value we can define a less strict criterion; also
this is useless when the binary matrix is spread, i.e. it contains many 0s.
• In the end, a weighting system is used to assign different weights to attributes. The
importance of an attribute is inversely proportional to its frequency in all documents. In the
absence of a weighting system, every attribute (both rare and frequent) has the same
importance in defining the similarity (or dissimilarity) among documents. In our example, to
assign a greater weight to rare attributes: as for instance, the words in titles which rarely
appear should have greater importance in defining groups respect to frequent words.
Once parameters are defined, the real data mining phase starts: it causes the main theme groupings,
which are obtained by detecting word recurrences (in document title) and/or classifier codes.
The next phase of result analysis and valuation process starts from the definition of the cluster map:
a graphic representation of the detected groups which permits to access to the complete description
of each cluster.
An application example
An important French Research Centre in the cosmetics field was interested in knowing the market
developments of the antiseptic plaster (patch technology) [13]. The research of the documents about
the antiseptic plaster has caused the detection of 146 patents. Since this study happened in 1992,
documents are about the 1979-1991 period. The patents had been registered by 105 different firms
in 12 countries and contained 94 different codes of international classification (and 52 Derwent
codes).
The case study has been performed using the GEM service of the CINECA Consortium
(http://www2.eins.org/) based on the MOLE technology [17], that can perform the clustering and
data mining techniques described in the previous section. Even though GEM is not an open source
application, the example is reported to give an idea of the data needed and produced by OS BI
analysis platform, as roadmap for requirement definition and best practices for a correct and
complete business intelligence analysis.
The application of the data mining algorithm [14][17] described before allowed to detect 20 theme
groups, each one representing a document group characterized by an identification number (which
OW2 BI Initiative deliverables OS BI Adoption January 13th, 2009
Author: University of Milan Revision: Engineering, University of Bologna Page: 19/28
indicates the dimension importance), by the number of contained documents, and by the most
frequent words inside the groups that characterize it. Links among groups are represented by lines
whose color and thickness indicate the link’s strength. The map gives a general view of the detected
topics and their relations and a set of interlinked groups represents a macro technology (or macro
area).
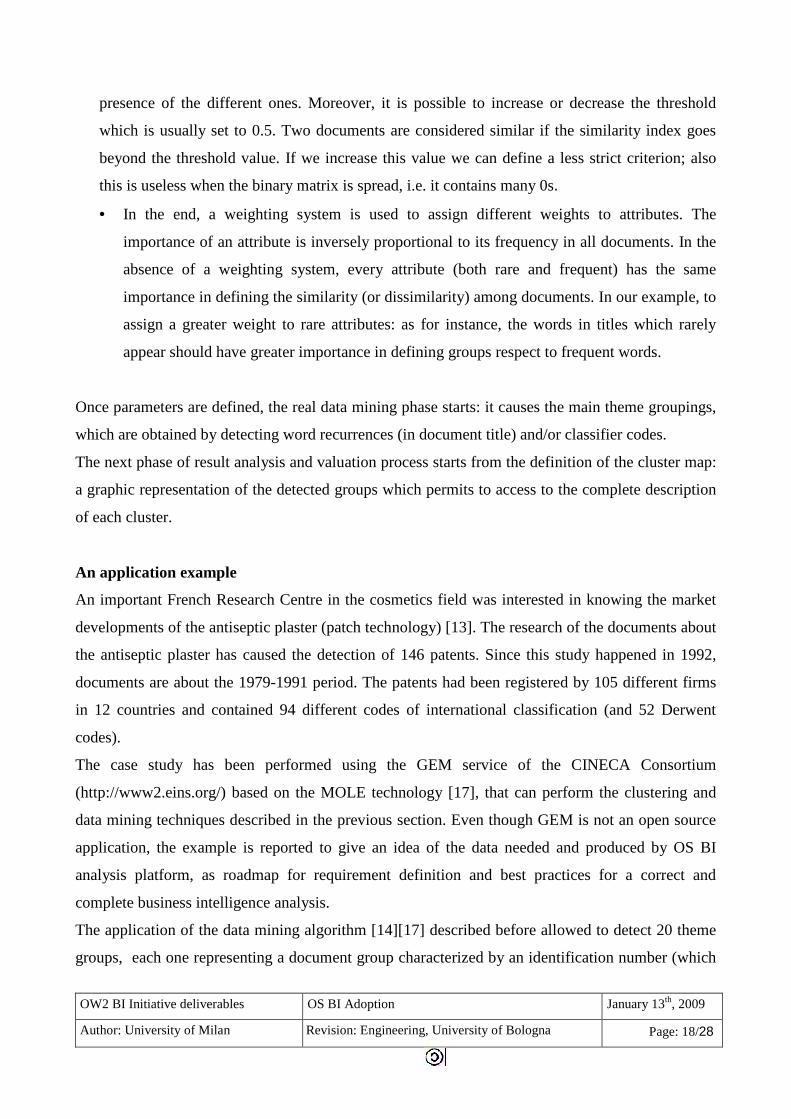
Fig. 7 shows a brief description of a cluster, emphasizing the classification codes (and their
description) which are in this group of documents, the names of firms which have registered patents
and the registering year.
Fig. 7: Description of an example cluster
[source: http://www.cineca.it/gai/pagina-dataminoreal.htm].
The time evolution indicates that the interest in this subject (electrophoresis) is increased over the
years, in fact most of patents have been registered in the last years. This fact indicates that
technology is a growing one. The data mining operation may occur in many ways: examining
closely the cluster content by the exam of single documents, moving on related topics, going back
to the map to select another thematic area or, in the end, analyzing the firm presence in different
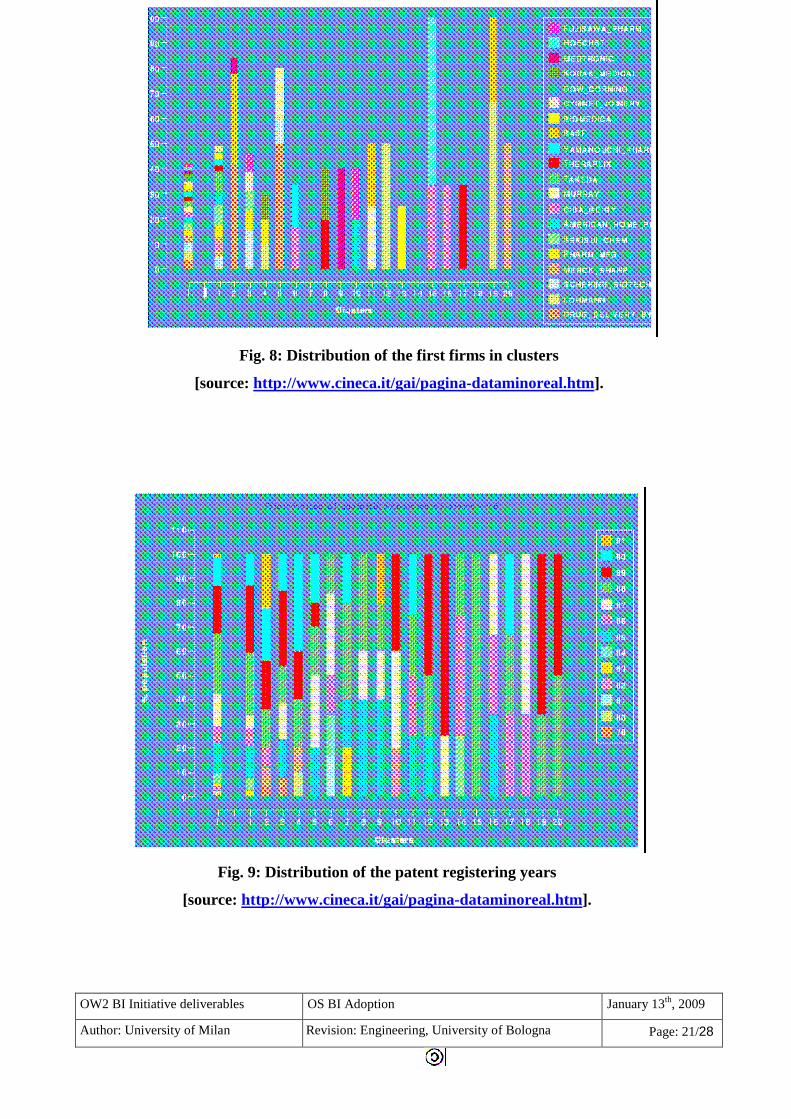
clusters and the timing characterization of each thematic area. Firms are 105 and the algorithm
selects automatically the ones which are more present. The first bar (T) shows the percent
distribution in documents (see Fig. 8), whereas the other ones show their percent distribution inside
every thematic group. The extension of each color indicates the firm percent quote inside the
cluster. You may note that Drug Delivery System (dark orange color), besides in the second cluster,
is also in the fifth one that, as we have seen before, is a related subject. But it is not in other
OW2 BI Initiative deliverables OS BI Adoption January 13th, 2009
Author: University of Milan Revision: Engineering, University of Bologna Page: 20/28
research areas. BASF (bright orange color) is engaged also in the areas identified by clusters
number 11 and 19. Medtronic (dark red color), which is little actor in the electrophoresis field, is
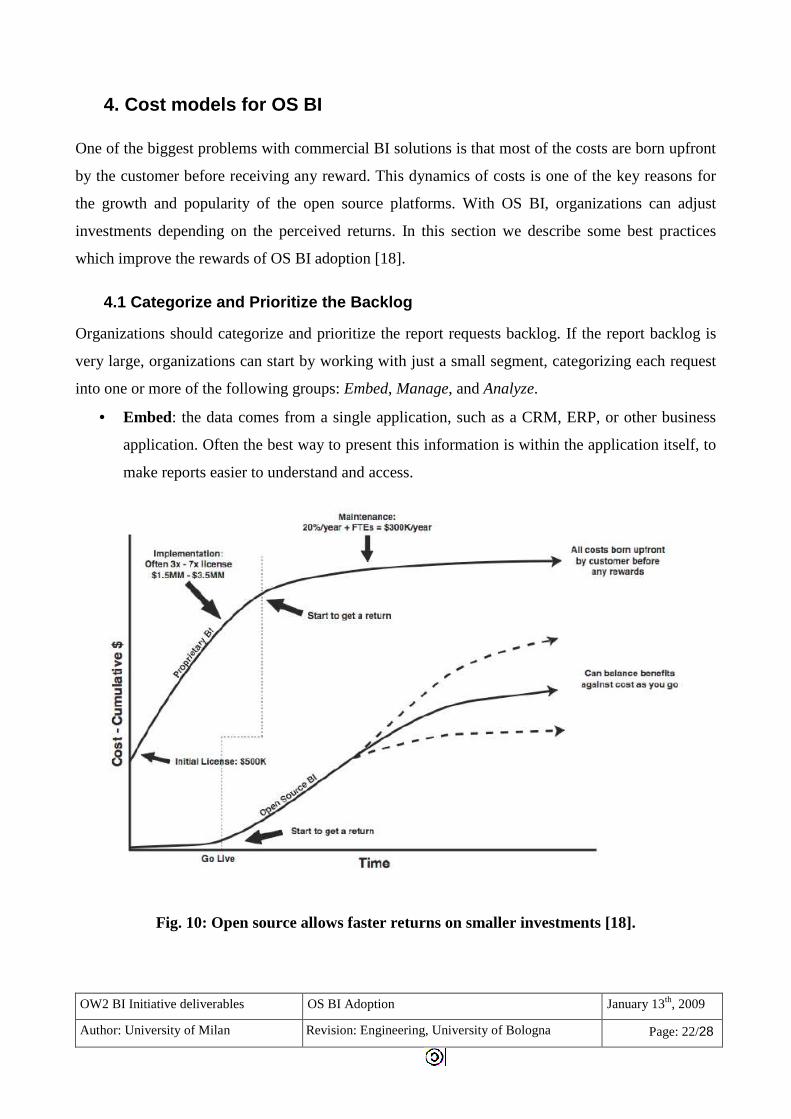
instead engaged in area 9 (polymerization). The distribution of the registering year respect to all
documents (the first left bar in Fig. 9) shows how the most research activities have been executed in
the antiseptic plaster field in the year 88 (dark green) and in the year 89 (red).
The blue and/or ochre color in some clusters shows the latest research areas. The 16 and 18 clusters
represent the research areas which are been probably left (the activity stopped in 1987).
OW2 BI Initiative deliverables OS BI Adoption January 13th, 2009
Author: University of Milan Revision: Engineering, University of Bologna Page: 21/28
Fig. 9: Distribution of the patent registering years
[source: http://www.cineca.it/gai/pagina-dataminoreal.htm].
Fig. 8: Distribution of the first firms in clusters
[source: http://www.cineca.it/gai/pagina-dataminoreal.htm].
OW2 BI Initiative deliverables OS BI Adoption January 13th, 2009
Author: University of Milan Revision: Engineering, University of Bologna Page: 22/28
4. Cost models for OS BI
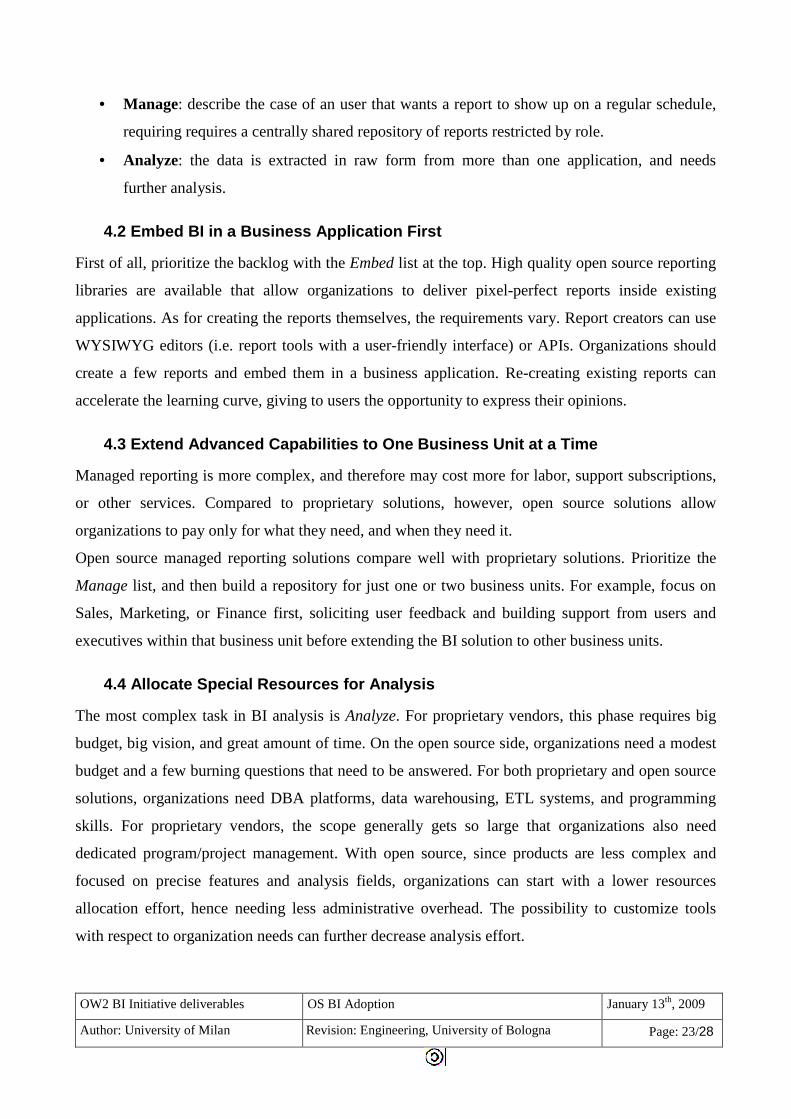
One of the biggest problems with commercial BI solutions is that most of the costs are born upfront
by the customer before receiving any reward. This dynamics of costs is one of the key reasons for
the growth and popularity of the open source platforms. With OS BI, organizations can adjust
investments depending on the perceived returns. In this section we describe some best practices
which improve the rewards of OS BI adoption [18].
4.1 Categorize and Prioritize the Backlog
Organizations should categorize and prioritize the report requests backlog. If the report backlog is
very large, organizations can start by working with just a small segment, categorizing each request
into one or more of the following groups: Embed, Manage, and Analyze.
• Embed: the data comes from a single application, such as a CRM, ERP, or other business
application. Often the best way to present this information is within the application itself, to
make reports easier to understand and access.
Fig. 10: Open source allows faster returns on smaller investments [18].
OW2 BI Initiative deliverables OS BI Adoption January 13th, 2009
Author: University of Milan Revision: Engineering, University of Bologna Page: 23/28
• Manage: describe the case of an user that wants a report to show up on a regular schedule,
requiring requires a centrally shared repository of reports restricted by role.
• Analyze: the data is extracted in raw form from more than one application, and needs
further analysis.
4.2 Embed BI in a Business Application First
First of all, prioritize the backlog with the Embed list at the top. High quality open source reporting
libraries are available that allow organizations to deliver pixel-perfect reports inside existing
applications. As for creating the reports themselves, the requirements vary. Report creators can use
WYSIWYG editors (i.e. report tools with a user-friendly interface) or APIs. Organizations should
create a few reports and embed them in a business application. Re-creating existing reports can
accelerate the learning curve, giving to users the opportunity to express their opinions.
4.3 Extend Advanced Capabilities to One Business Unit at a Time
Managed reporting is more complex, and therefore may cost more for labor, support subscriptions,
or other services. Compared to proprietary solutions, however, open source solutions allow
organizations to pay only for what they need, and when they need it.
Open source managed reporting solutions compare well with proprietary solutions. Prioritize the
Manage list, and then build a repository for just one or two business units. For example, focus on
Sales, Marketing, or Finance first, soliciting user feedback and building support from users and
executives within that business unit before extending the BI solution to other business units.
4.4 Allocate Special Resources for Analysis
The most complex task in BI analysis is Analyze. For proprietary vendors, this phase requires big
budget, big vision, and great amount of time. On the open source side, organizations need a modest
budget and a few burning questions that need to be answered. For both proprietary and open source
solutions, organizations need DBA platforms, data warehousing, ETL systems, and programming
skills. For proprietary vendors, the scope generally gets so large that organizations also need
dedicated program/project management. With open source, since products are less complex and
focused on precise features and analysis fields, organizations can start with a lower resources
allocation effort, hence needing less administrative overhead. The possibility to customize tools
with respect to organization needs can further decrease analysis effort.

OW2 BI Initiative deliverables OS BI Adoption January 13th, 2009
Author: University of Milan Revision: Engineering, University of Bologna Page: 24/28
After that, the keys to success with Analyze are the same for proprietary and open source. Critical to
success is to be aware of the problem that need to be faced, questions that come from the report
requests backlog. Organizations must always keep in mind that the objective is not to “build a data
mart” or “roll out BI,” but to solve business problems. With the right questions, data architects can
model the cube or star schema properly (see Fig. 11).
It is important to note that in the case of star schemas the core is represented by facts and
dimensions. The Fact table will be “tall”, that is it will have many rows, but each row will be small.
Fact tables contain the most detailed information, and the actual size depends on the facts that are
being modeled. A “sales” fact table, for example, will have one row for each order and holds
numerical data for analysis, plus indices. Dimensions constitute the environment information saved
in each row and are used for analysis activities. Dimensions are organized in dimension tables
whose indexes are linked by fact table to allow queries on specific environment data (i.e. date, point
of sale, product, etc).
Fig. 11: Typical star schema for analysis [18].

OW2 BI Initiative deliverables OS BI Adoption January 13th, 2009
Author: University of Milan Revision: Engineering, University of Bologna Page: 25/28
5. Adoption Risks
Despite all its advantages, open source is not risk-free [18]. The major hurdles are skill set, support,
product maturity, and the glut of products to choose from.
Skill Set
Smaller organizations that are priced out of proprietary BI solutions might think that open source BI
is also beyond their reach. This is because they don’t have programmers on staff to evaluate and
deploy open source solutions, and feel open source products as a “backdoor” for potential malicious
users and a source of programming errors and inefficiency.
Support
Many open source projects are part-time projects that are poorly supported or abandoned. This is a
huge risk when building mission-critical systems and applications, since internal developers and
analysts could need support and hints from the developers community. Over the last five years,
proprietary vendors have sponsored many top-tier open source solutions. These vendors offer pay-
as-you-go support subscriptions and services, receive and post bug fixes, receive and implement
new features, and publish a public roadmap developed with community input.
Product Maturity and Selection
Selecting OS BI is a challenging task to accomplish. Organizations such as Open BRR
(http://www.openbrr.org), SpikeSource (http://www.spikesource.com/), and Freshmeat
(http://freshmeat.net/) offer information and services that make it easier to evaluate and implement
open source solutions. Technology industry analysts such as Gartner (http://www.gartner.com/),
Forrester (http://www.forrester.com), and The 451 Group (http://www.the451group.com/) also track
popular open source solutions alongside their proprietary counterparts.
A different role is played by organization like OW2 Consortium (http://www.ow2.org/), a global
open-source software community which goal is the development of open-source distributed
middleware, in the form of flexible and adaptable components. These components range from
specific software frameworks and protocols to integrated platforms. Products distributed by the
OW2 portal are selected and qualitatively certified by the OW2 committee. Organizational
strategies of OW2 are targeted to business applications, over which Ingres, SpagoBI platform and
Talend provide the complete open source stack for Business Intelligence.
OW2 BI Initiative deliverables OS BI Adoption January 13th, 2009
Author: University of Milan Revision: Engineering, University of Bologna Page: 26/28
6. Conclusion
Business Intelligence has been a "high investment/high return" solution for a long time now.
However, the way it was evaluated, sold, and implemented has priced proprietary BI out of the
reach of most organizations. Cost considerations are driving interest in open source BI, but
organizations should adopt new evaluation and implementation best practices to maximize cost
savings and accelerate business benefits.
In this document we presented the state of the art OSBI frameworks, giving a short introduction of
most widespread tools and describing some examples of their use.
Then, we present a case study on a complete business analysis using Gem, a framework provided
by the public consortium CINECA. Although GEM licensing is not entirely open source, this
example shows clearly how a business analysis could be implemented using open standard Business
Intelligence tools, giving at the same time a roadmap for requirement definition and best practices
on how such an analysis could be implemented using the open system described in the document.
Finally, the document gives a description of cost and risk analysis of OSBI frameworks describing
the return that an organization could achieve with their adoption.

OW2 BI Initiative deliverables OS BI Adoption January 13th, 2009
Author: University of Milan Revision: Engineering, University of Bologna Page: 27/28
References
[1] K. Haas. Business Intelligence: Open Source Alternatives. Linux Magazine, September, 2008,
available at: http://www.linux-mag.com/id/6856.
[2] Sun Microsystems, Report Builder. Available at:
http://extensions.services.openoffice.org/project/reportdesign
[3] Actuate. Birt Reports. Available at:
http://www.actuate.com/products/rich-internet-applications/birt-reports
[4] Pentaho Corp. Pentaho BI Suite. Available at: http://www.pentaho.com/the_alternative/
[5] Pentaho Corp. Mondrian Project. Available at: http://mondrian.pentaho.org/
[6] Jaspersoft Corp. Jaspersoft Business Intelligence. Available at: http://www.jaspersoft.com/
[7] Talend. Open Data Solutions. Available at: http://www.talend.com/
[8] BIRT Project. Business Intelligence and Reporting Tools. Available at:
http://www.eclipse.org/birt/phoenix/
[9] Engineering Ingegneria Informatica. SpagoBI - Spago Solutions. Available at:
http://www.spagoworld.org
[10] Rapid – I. Rapid Miner Community Edition. Available at: http://rapid-i.com
[11] University of Waikato. Weka 3: Data Mining Software in Java. Available at:
http://www.cs.waikato.ac.nz/ml/weka/
[12] R Foundation. The R Project for Statistical Computing. Available at:
http://www.r-project.org/
[13] Cineca. Competitive Intelligence - Data Mining, Analisi dei dati. Available at:
http://www.cineca.it/gai/pagina-dataminoreal.htm
[14] S. Sarawagi, S. Thomas, and R. Agrawal. Integrating association rule mining with relational
database systems: alternatives and implications. In Proc. of the 1998 ACM SIGMOD
international conference on Management of data, Seattle, US, pp. 343-354,1998.
[15] J. A. Hartigan and M. A. Wong. A K-Means Clustering Algorithm. Applied Statistics, vol. 28,
n. 1, pp. 100-108, 1979.
OW2 BI Initiative deliverables OS BI Adoption January 13th, 2009
Author: University of Milan Revision: Engineering, University of Bologna Page: 28/28
[16] Ph. J. Boland. Majority systems and the Condorcet Jury Problem. Analysis, n. 8, pp. 181–189,
1989.
[17] M. Fattori, G. Pedrazzi, and R. Turra. Text mining applied to patent mapping: a practical
business case. World Patent Information, vol. 25, n. 4, pp. 335-342, 2003.
[18] B. Klawans. Saving Time and Money-Why Open-Source BI Makes Sense. Business
Intelligence Journal, vol. 11, n. 4, pp. 18-24, 2006.