The intra-firm diffusion of complementary innovations: Evidence from the adoption of management...
14
Research Policy 38 (2009) 1326–1339 Contents lists available at ScienceDirect Research Policy journal homepage: www.elsevier.com/locate/respol The intra-firm diffusion of complementary innovations: Evidence from the adoption of management practices by British establishments Giuliana Battisti a,∗ , Alfonsina Iona b a Industrial Economics Division, Nottingham University Business School, The University of Nottingham, Jubilee Campus, Wollaton Road, Nottingham NG8 1BB, UK b Aston Business School, Aston University, UK article info Article history: Received 27 September 2007 Received in revised form 7 May 2009 Accepted 9 June 2009 JEL classification: O3 L20 Keywords: Intra-firm diffusion Complementarities Management practices Innovations abstract This paper presents a simple profitability-based decision model to show how synergistic gains generated by the joint adoption of complementary innovations may influence the firm’s adoption decision. For this purpose a weighted index of intra-firm diffusion is built to investigate empirically the drivers of the intensity of joint use of a set of complementary innovations. The findings indicate that establishment size, ownership structure and product market concentration are important determinants of the intensity of use. Interestingly, the factors that affect the extent of use of technological innovations do also affect that of clusters of management practices. However, they can explain only part of the heterogeneity of the benefits from joint use. © 2009 Elsevier B.V. All rights reserved. 1. Introduction A growing body of research has emphasised that modern management practices can be regarded as strategic means of com- petitive advantage (Huselid, 1995; Ichniowski et al., 1996, 1997; Capelli and Neumark, 2001; Edwards et al., 2004; Leseure et al., 2004; Porter and Ketels, 2003; Black and Lynch, 2004; Bloom and Van Reenen, 2007). Despite their allegedly importance, there exist a limited number of studies in economics that have looked at their pace of adoption within and across firms and their relationship with firm performance (Bryson et al., 2007). Nevertheless, an extensive management literature has looked at the effects of the adoption of management practices but the outcome has turned out to be quite controversial (see for example Godard, 2004 or Battisti and Iona, 2006 for a survey). Whilst some studies find a positive relationship with productivity, others find a negative or no significant relation- ship at all. We believe that the lack of consensus on the sign of the effect of the adoption of management practices on productivity is often driven either by measurement issues or by the level of anal- ysis. In particular, it depends both on how management practices are defined and on how and at which level management practices are measured. ∗ Corresponding author. Tel.: +44 (0) 115 8466128. E-mail address: [email protected] (G. Battisti). Management practices are multidimensional constructs. They embrace a broad range of managerial and organizational tools (such as operating, monitoring, incentive and target practices) that form the architecture of the company. They account for part of produc- tivity unexplained by the standard measures of inputs, such as capital, labour, skills and technology (Bloom and Van Reenen, 2007). Contrary to traditional technological innovations 1 incorporated into capital goods, they cannot be bought on the market. Conse- quently, they are less exposed to price reduction and this affects the traditional structure of the (capital and non-capital) costs of adoption and use. They require tacit, context-specific know-how for their successful implementation. Moreover, differently from several innovations they cannot be uniquely defined via the adoption of any one single practice. They require a system approach that reflects both the intensity of use of each set of practices and the complex- ity of their combined use. As emphasised by Battisti and Stoneman (2003, 2005), that is quite crucial as the returns from the adoption of an innovation are generated not only by the extensive margin of use (whether adopted) but also by the intensive margin of use by each adopter. Despite this, the majority of the existing studies tend to focus on one set of practices and whether practices are adopted 1 By technological innovations is meant all investments in machinery, equipment – including computer hardware – in connection with product and process innova- tions. 0048-7333/$ – see front matter © 2009 Elsevier B.V. All rights reserved. doi:10.1016/j.respol.2009.06.002
-
Upload
independent -
Category
Documents
-
view
3 -
download
0
Transcript of The intra-firm diffusion of complementary innovations: Evidence from the adoption of management...
Ta
Ga
b
a
ARRA
JOL
KICMI
1
mpC2Vapfimmc2wseoyaa
0d
Research Policy 38 (2009) 1326–1339
Contents lists available at ScienceDirect
Research Policy
journa l homepage: www.e lsev ier .com/ locate / respol
he intra-firm diffusion of complementary innovations: Evidence from thedoption of management practices by British establishments
iuliana Battisti a,∗, Alfonsina Iona b
Industrial Economics Division, Nottingham University Business School, The University of Nottingham, Jubilee Campus, Wollaton Road, Nottingham NG8 1BB, UKAston Business School, Aston University, UK
r t i c l e i n f o
rticle history:eceived 27 September 2007eceived in revised form 7 May 2009ccepted 9 June 2009
EL classification:
a b s t r a c t
This paper presents a simple profitability-based decision model to show how synergistic gains generatedby the joint adoption of complementary innovations may influence the firm’s adoption decision. For thispurpose a weighted index of intra-firm diffusion is built to investigate empirically the drivers of theintensity of joint use of a set of complementary innovations. The findings indicate that establishmentsize, ownership structure and product market concentration are important determinants of the intensityof use. Interestingly, the factors that affect the extent of use of technological innovations do also affect
320
eywords:ntra-firm diffusionomplementarities
that of clusters of management practices. However, they can explain only part of the heterogeneity of thebenefits from joint use.
© 2009 Elsevier B.V. All rights reserved.
of an innovation are generated not only by the extensive margin of
anagement practicesnnovations
. Introduction
A growing body of research has emphasised that modernanagement practices can be regarded as strategic means of com-
etitive advantage (Huselid, 1995; Ichniowski et al., 1996, 1997;apelli and Neumark, 2001; Edwards et al., 2004; Leseure et al.,004; Porter and Ketels, 2003; Black and Lynch, 2004; Bloom andan Reenen, 2007). Despite their allegedly importance, there existlimited number of studies in economics that have looked at theirace of adoption within and across firms and their relationship withrm performance (Bryson et al., 2007). Nevertheless, an extensiveanagement literature has looked at the effects of the adoption ofanagement practices but the outcome has turned out to be quite
ontroversial (see for example Godard, 2004 or Battisti and Iona,006 for a survey). Whilst some studies find a positive relationshipith productivity, others find a negative or no significant relation-
hip at all. We believe that the lack of consensus on the sign of theffect of the adoption of management practices on productivity is
ften driven either by measurement issues or by the level of anal-sis. In particular, it depends both on how management practicesre defined and on how and at which level management practicesre measured.∗ Corresponding author. Tel.: +44 (0) 115 8466128.E-mail address: [email protected] (G. Battisti).
048-7333/$ – see front matter © 2009 Elsevier B.V. All rights reserved.oi:10.1016/j.respol.2009.06.002
Management practices are multidimensional constructs. Theyembrace a broad range of managerial and organizational tools (suchas operating, monitoring, incentive and target practices) that formthe architecture of the company. They account for part of produc-tivity unexplained by the standard measures of inputs, such ascapital, labour, skills and technology (Bloom and Van Reenen, 2007).Contrary to traditional technological innovations1 incorporatedinto capital goods, they cannot be bought on the market. Conse-quently, they are less exposed to price reduction and this affectsthe traditional structure of the (capital and non-capital) costs ofadoption and use. They require tacit, context-specific know-how fortheir successful implementation. Moreover, differently from severalinnovations they cannot be uniquely defined via the adoption of anyone single practice. They require a system approach that reflectsboth the intensity of use of each set of practices and the complex-ity of their combined use. As emphasised by Battisti and Stoneman(2003, 2005), that is quite crucial as the returns from the adoption
use (whether adopted) but also by the intensive margin of use byeach adopter. Despite this, the majority of the existing studies tendto focus on one set of practices and whether practices are adopted
1 By technological innovations is meant all investments in machinery, equipment– including computer hardware – in connection with product and process innova-tions.
ch Pol
(j
tTfccfiRNtpoHCtriaamitcpai
BcitaJsmpbli
ositsto
fFfestip
oSiSo
of intra-firm diffusion of complementary practices in 2004 as wellas the existence of greater benefits derived from a system rather
G. Battisti, A. Iona / Resear
inter-firm diffusion), rather than on the depth and breadth of theiroint adoption across individual users (intra-firm diffusion).
The tendency to examine the adoption of practices in isola-ion can lead to highly misleading results also for another reason.he presence of complementarities among sets of practices in dif-erent spheres of the organizational architecture of a companyan generate synergistic effects and extra gains that may signifi-antly improve productivity, and often result in better corporatenancial performance than more traditional systems (Milgrom andoberts, 1990, 1995; Kandel and Lazear, 1992; Battisti et al., 2006).onetheless, an extensive management literature has emphasised
he unique source of competitive advantage generated by “higherformance workplaces” resulting from the synergic interactionf (complementary) human resource management practices (seeuselid, 1995; Ichniowski et al., 1995, 1996; Black and Lynch, 2004;apelli and Neumark, 2001). In this paper we argue that it is not justhe interaction among human resource management practices butather the synergies generated by a range of management practicesn different spheres of the organization that creates a competitivedvantage. The bundling of say operating and human resource man-gement practices together is not to be seen as an accident. Rather, itay be the result of a coherent adoption strategy by profit maximiz-
ng firms that exploits complementarities. Therefore, any study ofhe impact of the adoption of only one set of management practicesannot be carried out in isolation. Moreover, some managementractices may be meaningful only if jointly used (see Ruigrok etl., 1999; Whittington et al., 1999 for examples of these types ofnnovations).
With very few exceptions (Milgrom and Roberts, 1990, 1995;attisti et al., 2006; Miravete and Pernias, 2006; Love et al., 2006)omplementarities among innovative practices is not investigatedn a robust way. It is not because any two innovations are adoptedhat they are complementary. Association is a necessary but not
sufficient condition for complementarities (see Arora, 1996).oint adoption could simply be driven by a third lurking factor,uch as favourable economic and financial conditions or senioranagement characteristics, rather than by the existence of com-
lementarities between the two practices. Consequently, any studyased upon the profit gain from individual adoption can be mis-
eading. Ad hoc diffusion modelling of clusters of complementarynnovations should be used instead.
The economics of innovation literature has proposed a numberf theoretical models and econometric techniques aimed at mea-uring the speed and the spread of adoption of innovations (mostlyncorporated into capital goods) within and across users. However,he formalized study of the adoption of management practices istill a grey area and even more so is the intra-firm diffusion of clus-ers of complementary innovations in different spheres of the firm’srganization.2
We think that all these facts have important implications. There-ore, we contribute to current research on a number of grounds.irst, we show that in order to understand the dynamic of the dif-usion of individual innovations one needs to take into account thextra gains and the synergies that the complementary nature of
ome innovations can generate. Second, we explore to what extenthe factors explaining the diffusion of technological innovations donfluence the diffusion of (clusters of) management practices. Inarticular, we explore the state of inter and intra-firm adoption of2 The economics of innovation has extensively explored the inter-firm diffusionf mostly technological innovations (see Hall, 2004; Geroski, 2003; Karshenas andtoneman, 1995, for a survey) but studies concerning the intra-firm diffusion ofnnovations are still quite scarce (see Mansfield, 1968; Stoneman, 1981; Battisti andtoneman, 2003, 2005, etc.), let alone studies on the intra-firm diffusion of systemsf complementary innovations.
icy 38 (2009) 1326–1339 1327
a range of management practices believed to form the architectureof a company. Following the revealed preference approach initiallyproposed by Arora (1996) and Arora and Gambardella (1990) weshow how complementarity effects can affect their expected gainsand therefore the firm’s adoption decision. Our presumption is thatthe existence of complementarities among two or more practicesgenerates a pay-off higher than the sum of the pay-offs derivedfrom the adoption of each practice in isolation. By adopting a mixof practices firms can exploit the potential for complementaritiesas this helps to implement their competitive strategy.
We then use a simple decision model, based upon profitabil-ity considerations, showing the conditions under which the firmadopts and uses an innovation. This approach is conceptuallyunderpinned by profitability-based models used in the inter-firm diffusion literature (see for example the profitability-based“stock” and “order” models of Reinganum, 1981 and Fudenbergand Tirole, 1985 or the “rank” approach of David, 1991). In linewith those studies we assume that the gains are firm and sec-tor specific. This approach has the distinct advantage of bringingto the analysis of the diffusion of management practices many ofthe insights developed for the study of the diffusion of techno-logical or “hard” innovations incorporated into capital goods (seeBattisti and Stoneman, 2003, 2005 for similar applications to theintra-firm diffusion). For example, we are able to test empiricallywhether firm characteristics (such as size, age and ownership) ormarket characteristics (such as national or international productmarket or sector competition) that have been proved to affect thediffusion of technological innovations do also affect the adoptiondecision of management practices (see Bryson et al., 2007 for asimilar attempt).
The data we use to test our hypothesis relates to 1238 UK estab-lishments contained in the 2004 Workplace Employment RelationsSurvey (WERS). To account for the fact that management practicesare multidimensional constructs and to pick up the depth of theiradoption, we define each practice via a set of questions (17 in total)on the use of a range of practices relevant to that category. In linewith Bloom and Van Reenen (2007) we focus on four clusters ofmanagement practices namely: Operating (3 questions), Incentives(6 questions), Targets (4 questions) and Monitoring (4 questions).We then explore the state of adoption of the four sets of manage-ment practices in 2004 with reference to both the intensive andthe extensive margin of use across and within industries. Contraryto Bloom and Van Reenen (2007), we also explore the possibilitythat such practices are complementary in that the marginal pay-off of any one practice can increase when any other practice isadopted. We then use that information to construct a weightedindex of the extent of use3 of complementary innovations reflectingthe number of practices adopted and the intensity of their individ-ual use. Finally, we regress the weighted index of the intensity ofjoint adoption on a set of firm specific and market characteristics.This will serve two purposes. First, it allows us to test the validityof the profitability-based decision model in explaining the extent
than individual adoption. Second, it allows us to test whether thefactors supposed to affect the adoption of a technological innova-
3 Although the data we use relates to establishments (or plants) rather than tofirms (which may be multi plant), to connect more closely to the existing literaturewe talk of (intra- and inter-firm) diffusion. It might be more appropriate to considerthat our analysis concerns (intra- and inter-firm) establishment diffusion but, as thisis not common in the literature, we use firm and establishment synonymously. Inan ideal world we would allocate establishments to firms and then analyse intra(inter)-firm diffusion directly. Unfortunately the dataset does not allow us to mapestablishments in to firms, although we know when an establishment belongs to amulti-plant firm and we test its impact in our empirical exercise.
1 ch Pol
tp
ahatatjs
dpmtppste
2
mEtqtlcTmccpummtppp
t1tnatipataiSt
seMt
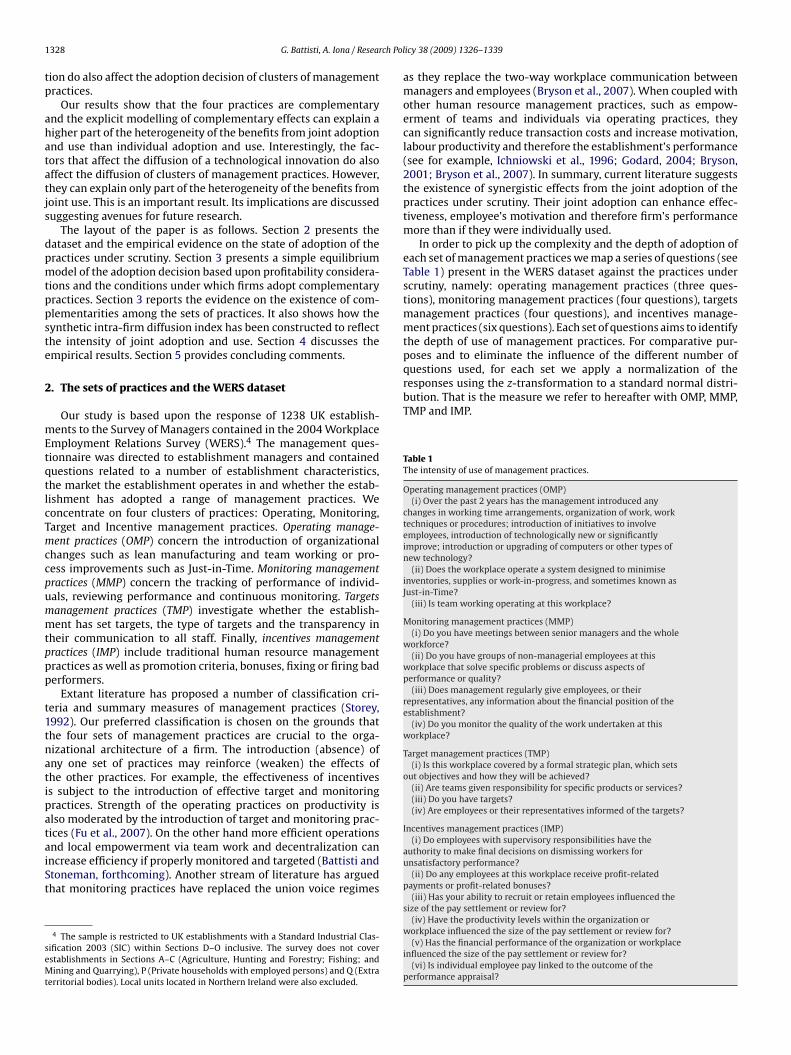
questions used, for each set we apply a normalization of theresponses using the z-transformation to a standard normal distri-bution. That is the measure we refer to hereafter with OMP, MMP,TMP and IMP.
Table 1The intensity of use of management practices.
Operating management practices (OMP)(i) Over the past 2 years has the management introduced any
changes in working time arrangements, organization of work, worktechniques or procedures; introduction of initiatives to involveemployees, introduction of technologically new or significantlyimprove; introduction or upgrading of computers or other types ofnew technology?
(ii) Does the workplace operate a system designed to minimiseinventories, supplies or work-in-progress, and sometimes known asJust-in-Time?
(iii) Is team working operating at this workplace?
Monitoring management practices (MMP)(i) Do you have meetings between senior managers and the whole
workforce?(ii) Do you have groups of non-managerial employees at this
workplace that solve specific problems or discuss aspects ofperformance or quality?
(iii) Does management regularly give employees, or theirrepresentatives, any information about the financial position of theestablishment?
(iv) Do you monitor the quality of the work undertaken at thisworkplace?
Target management practices (TMP)(i) Is this workplace covered by a formal strategic plan, which sets
out objectives and how they will be achieved?(ii) Are teams given responsibility for specific products or services?(iii) Do you have targets?(iv) Are employees or their representatives informed of the targets?
Incentives management practices (IMP)
328 G. Battisti, A. Iona / Resear
ion do also affect the adoption decision of clusters of managementractices.
Our results show that the four practices are complementarynd the explicit modelling of complementary effects can explain aigher part of the heterogeneity of the benefits from joint adoptionnd use than individual adoption and use. Interestingly, the fac-ors that affect the diffusion of a technological innovation do alsoffect the diffusion of clusters of management practices. However,hey can explain only part of the heterogeneity of the benefits fromoint use. This is an important result. Its implications are discusseduggesting avenues for future research.
The layout of the paper is as follows. Section 2 presents theataset and the empirical evidence on the state of adoption of theractices under scrutiny. Section 3 presents a simple equilibriumodel of the adoption decision based upon profitability considera-
ions and the conditions under which firms adopt complementaryractices. Section 3 reports the evidence on the existence of com-lementarities among the sets of practices. It also shows how theynthetic intra-firm diffusion index has been constructed to reflecthe intensity of joint adoption and use. Section 4 discusses thempirical results. Section 5 provides concluding comments.
. The sets of practices and the WERS dataset
Our study is based upon the response of 1238 UK establish-ents to the Survey of Managers contained in the 2004 Workplace
mployment Relations Survey (WERS).4 The management ques-ionnaire was directed to establishment managers and containeduestions related to a number of establishment characteristics,he market the establishment operates in and whether the estab-ishment has adopted a range of management practices. Weoncentrate on four clusters of practices: Operating, Monitoring,arget and Incentive management practices. Operating manage-ent practices (OMP) concern the introduction of organizational
hanges such as lean manufacturing and team working or pro-ess improvements such as Just-in-Time. Monitoring managementractices (MMP) concern the tracking of performance of individ-als, reviewing performance and continuous monitoring. Targetsanagement practices (TMP) investigate whether the establish-ent has set targets, the type of targets and the transparency in
heir communication to all staff. Finally, incentives managementractices (IMP) include traditional human resource managementractices as well as promotion criteria, bonuses, fixing or firing baderformers.
Extant literature has proposed a number of classification cri-eria and summary measures of management practices (Storey,992). Our preferred classification is chosen on the grounds thathe four sets of management practices are crucial to the orga-izational architecture of a firm. The introduction (absence) ofny one set of practices may reinforce (weaken) the effects ofhe other practices. For example, the effectiveness of incentivess subject to the introduction of effective target and monitoringractices. Strength of the operating practices on productivity islso moderated by the introduction of target and monitoring prac-ices (Fu et al., 2007). On the other hand more efficient operations
nd local empowerment via team work and decentralization canncrease efficiency if properly monitored and targeted (Battisti andtoneman, forthcoming). Another stream of literature has arguedhat monitoring practices have replaced the union voice regimes4 The sample is restricted to UK establishments with a Standard Industrial Clas-ification 2003 (SIC) within Sections D–O inclusive. The survey does not coverstablishments in Sections A–C (Agriculture, Hunting and Forestry; Fishing; andining and Quarrying), P (Private households with employed persons) and Q (Extra
erritorial bodies). Local units located in Northern Ireland were also excluded.
icy 38 (2009) 1326–1339
as they replace the two-way workplace communication betweenmanagers and employees (Bryson et al., 2007). When coupled withother human resource management practices, such as empow-erment of teams and individuals via operating practices, theycan significantly reduce transaction costs and increase motivation,labour productivity and therefore the establishment’s performance(see for example, Ichniowski et al., 1996; Godard, 2004; Bryson,2001; Bryson et al., 2007). In summary, current literature suggeststhe existence of synergistic effects from the joint adoption of thepractices under scrutiny. Their joint adoption can enhance effec-tiveness, employee’s motivation and therefore firm’s performancemore than if they were individually used.
In order to pick up the complexity and the depth of adoption ofeach set of management practices we map a series of questions (seeTable 1) present in the WERS dataset against the practices underscrutiny, namely: operating management practices (three ques-tions), monitoring management practices (four questions), targetsmanagement practices (four questions), and incentives manage-ment practices (six questions). Each set of questions aims to identifythe depth of use of management practices. For comparative pur-poses and to eliminate the influence of the different number of
(i) Do employees with supervisory responsibilities have theauthority to make final decisions on dismissing workers forunsatisfactory performance?
(ii) Do any employees at this workplace receive profit-relatedpayments or profit-related bonuses?
(iii) Has your ability to recruit or retain employees influenced thesize of the pay settlement or review for?
(iv) Have the productivity levels within the organization orworkplace influenced the size of the pay settlement or review for?
(v) Has the financial performance of the organization or workplaceinfluenced the size of the pay settlement or review for?
(vi) Is individual employee pay linked to the outcome of theperformance appraisal?
G. Battisti, A. Iona / Research Pol
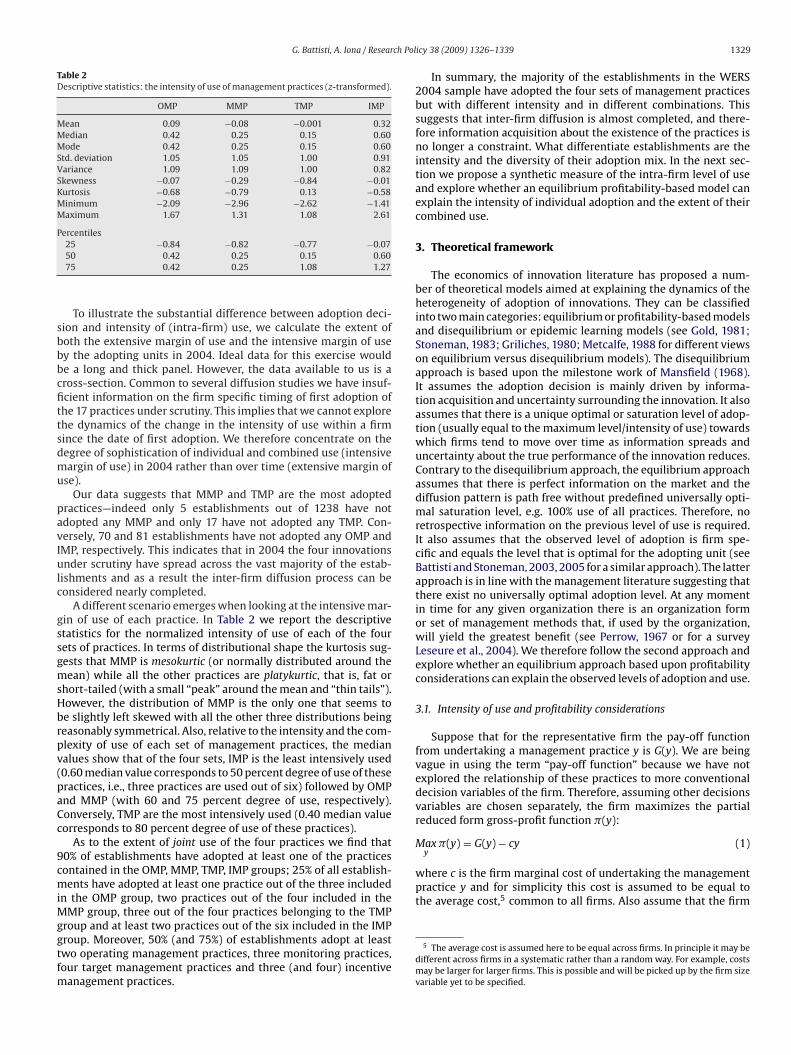
Table 2Descriptive statistics: the intensity of use of management practices (z-transformed).
OMP MMP TMP IMP
Mean 0.09 −0.08 −0.001 0.32Median 0.42 0.25 0.15 0.60Mode 0.42 0.25 0.15 0.60Std. deviation 1.05 1.05 1.00 0.91Variance 1.09 1.09 1.00 0.82Skewness −0.07 −0.29 −0.84 −0.01Kurtosis −0.68 −0.79 0.13 −0.58Minimum −2.09 −2.96 −2.62 −1.41Maximum 1.67 1.31 1.08 2.61
Percentiles
sbbbcfittsdmu
pavIulc
gssgmsHbrpv(paCc
9cmiMggtfm
y
where c is the firm marginal cost of undertaking the managementpractice y and for simplicity this cost is assumed to be equal tothe average cost,5 common to all firms. Also assume that the firm
25 −0.84 −0.82 −0.77 −0.0750 0.42 0.25 0.15 0.6075 0.42 0.25 1.08 1.27
To illustrate the substantial difference between adoption deci-ion and intensity of (intra-firm) use, we calculate the extent ofoth the extensive margin of use and the intensive margin of usey the adopting units in 2004. Ideal data for this exercise woulde a long and thick panel. However, the data available to us is aross-section. Common to several diffusion studies we have insuf-cient information on the firm specific timing of first adoption of
he 17 practices under scrutiny. This implies that we cannot explorehe dynamics of the change in the intensity of use within a firmince the date of first adoption. We therefore concentrate on theegree of sophistication of individual and combined use (intensiveargin of use) in 2004 rather than over time (extensive margin of
se).Our data suggests that MMP and TMP are the most adopted
ractices—indeed only 5 establishments out of 1238 have notdopted any MMP and only 17 have not adopted any TMP. Con-ersely, 70 and 81 establishments have not adopted any OMP andMP, respectively. This indicates that in 2004 the four innovationsnder scrutiny have spread across the vast majority of the estab-
ishments and as a result the inter-firm diffusion process can beonsidered nearly completed.
A different scenario emerges when looking at the intensive mar-in of use of each practice. In Table 2 we report the descriptivetatistics for the normalized intensity of use of each of the fourets of practices. In terms of distributional shape the kurtosis sug-ests that MMP is mesokurtic (or normally distributed around theean) while all the other practices are platykurtic, that is, fat or
hort-tailed (with a small “peak” around the mean and “thin tails”).owever, the distribution of MMP is the only one that seems toe slightly left skewed with all the other three distributions beingeasonably symmetrical. Also, relative to the intensity and the com-lexity of use of each set of management practices, the medianalues show that of the four sets, IMP is the least intensively used0.60 median value corresponds to 50 percent degree of use of theseractices, i.e., three practices are used out of six) followed by OMPnd MMP (with 60 and 75 percent degree of use, respectively).onversely, TMP are the most intensively used (0.40 median valueorresponds to 80 percent degree of use of these practices).
As to the extent of joint use of the four practices we find that0% of establishments have adopted at least one of the practicesontained in the OMP, MMP, TMP, IMP groups; 25% of all establish-ents have adopted at least one practice out of the three included
n the OMP group, two practices out of the four included in theMP group, three out of the four practices belonging to the TMP
roup and at least two practices out of the six included in the IMP
roup. Moreover, 50% (and 75%) of establishments adopt at leastwo operating management practices, three monitoring practices,our target management practices and three (and four) incentiveanagement practices.
icy 38 (2009) 1326–1339 1329
In summary, the majority of the establishments in the WERS2004 sample have adopted the four sets of management practicesbut with different intensity and in different combinations. Thissuggests that inter-firm diffusion is almost completed, and there-fore information acquisition about the existence of the practices isno longer a constraint. What differentiate establishments are theintensity and the diversity of their adoption mix. In the next sec-tion we propose a synthetic measure of the intra-firm level of useand explore whether an equilibrium profitability-based model canexplain the intensity of individual adoption and the extent of theircombined use.
3. Theoretical framework
The economics of innovation literature has proposed a num-ber of theoretical models aimed at explaining the dynamics of theheterogeneity of adoption of innovations. They can be classifiedinto two main categories: equilibrium or profitability-based modelsand disequilibrium or epidemic learning models (see Gold, 1981;Stoneman, 1983; Griliches, 1980; Metcalfe, 1988 for different viewson equilibrium versus disequilibrium models). The disequilibriumapproach is based upon the milestone work of Mansfield (1968).It assumes the adoption decision is mainly driven by informa-tion acquisition and uncertainty surrounding the innovation. It alsoassumes that there is a unique optimal or saturation level of adop-tion (usually equal to the maximum level/intensity of use) towardswhich firms tend to move over time as information spreads anduncertainty about the true performance of the innovation reduces.Contrary to the disequilibrium approach, the equilibrium approachassumes that there is perfect information on the market and thediffusion pattern is path free without predefined universally opti-mal saturation level, e.g. 100% use of all practices. Therefore, noretrospective information on the previous level of use is required.It also assumes that the observed level of adoption is firm spe-cific and equals the level that is optimal for the adopting unit (seeBattisti and Stoneman, 2003, 2005 for a similar approach). The latterapproach is in line with the management literature suggesting thatthere exist no universally optimal adoption level. At any momentin time for any given organization there is an organization formor set of management methods that, if used by the organization,will yield the greatest benefit (see Perrow, 1967 or for a surveyLeseure et al., 2004). We therefore follow the second approach andexplore whether an equilibrium approach based upon profitabilityconsiderations can explain the observed levels of adoption and use.
3.1. Intensity of use and profitability considerations
Suppose that for the representative firm the pay-off functionfrom undertaking a management practice y is G(y). We are beingvague in using the term “pay-off function” because we have notexplored the relationship of these practices to more conventionaldecision variables of the firm. Therefore, assuming other decisionsvariables are chosen separately, the firm maximizes the partialreduced form gross-profit function �(y):
Max �(y) = G(y) − cy (1)
5 The average cost is assumed here to be equal across firms. In principle it may bedifferent across firms in a systematic rather than a random way. For example, costsmay be larger for larger firms. This is possible and will be picked up by the firm sizevariable yet to be specified.
1 ch Pol
hgc
mtgiii
wuroaafts�a
g
da
g
s
y
fspaog“ttoloieoeApl
ia
y
y
wi
better than younger plants (Noteboom, 1993). Nevertheless, olderplants might also be less flexible in introducing innovations due, forexample, to the nature and the age of their existing (human) capitalstock composition (Little and Triest, 1996; Battisti and Stoneman,2003). Ichniowski et al. (1995) underline that the costs of adop-
Table 3Firm specific and market characteristics: variables definition.
Variable Definition Expected sign
Employment Total number of full-timeequivalent employees
+
Age Number of years since theestablishment has been inoperation
?
Independent Establishment Whether the establishment is asingle independent UKestablishment
?
Single Ownership/Control A single individual or familyowns at least 50% of theorganization
?
Foreign Owned/Controlled Whether the establishment ororganization belonging to isowned/controlled by foreignmanagers or shareholders
+
Output Concentration Whether the output of theestablishment is concentratedon one product or service
−
Competition Number of competitors they +
330 G. Battisti, A. Iona / Resear
as myopic expectations about both adoption costs and gross-profitains so that the first order condition of the optimization probleman be written as:
∂G(y)∂y
= c (2)
According to (2) a profit maximizing firm will adopt a givenanagement practice y only if the marginal gross-profit gain from
he adoption or the extent of use of a management practice –(y) = ∂G(y)/∂y – is equal (at least) to its marginal cost. More specif-
cally, the firm will introduce the management practice or enhancets usage only if the pay-off from doing so exceeds its cost—i.e., onlyf g(y) ≥ c.
In line with the “rank” approach (see for example David, 1991)e let the pay-off from adoption and use of an innovation dependpon a number of internal and external factors so that differenteturns g(y) reflect differences across firms and in the market theyperate in. That determines both the “inter-firm” adoption ordernd the “intra-firm” extent of use of an innovation (see Karshenasnd Stoneman, 1995 for the former or Battisti and Stoneman, 2003or the latter). In line with this view, we make the assumption thathe pay-off is a function of the adoption status y and is driven by firmpecific and other environmental or market characteristics � = [�1,2, . . ., �m] so that for the representative firm (2) can be rewrittens:
(y, �) = c (3)
By defining y* as the optimal strategy which satisfies (3), we canerive the marginal net pay-off function of the representative firms:
∗(y∗, �, c) = 0 (4)
o that by inverting the profit function we obtain:
∗ = f (�, c) (5)
To the extent that the actual adoption strategy y does not divergerom the optimal one y*, one may directly apply Eq. (5) to cross-ectional data. If, however, there is some time intensive adjustmentrocess that leads to divergence between y* and y then such anpplication will yield biased estimates. In the absence of any insightr available data that would enable us to explore any such diver-ence we proceed assuming that y* = y. This is in line with theequilibrium approach” to the economics of innovations suggestinghat the diffusion pattern is path free and there is not an adop-ion level of innovations that is universally optimal, e.g. 100% usef all practices, for the firm. On the contrary there is an adoption
evel that is optimal for the firm that is not necessarily 100% usef the practices. This does not necessarily imply that firms use
nnovative practices sub-optimally but rather that the optimal (orquilibrium) level is the observed level. The latter reflects what isptimal for the firm given its current costs and revenue, the own-rship as well as other market and environment characteristics (�).s these internal and external characteristics change, so does therofitability of adoption and, with it, the observed optimal adoption
evel.After a simple re-parameterization and linearization and allow-
ng for a firm specific random error term (e) (5) can be writtens:
= (a + c) + ˇ� + e (6)
Or similarly, as:
= ˛ + ˇ� + e (7)
here y represents for each firm, the best strategy concerning thentensity of adoption of the innovations under scrutiny (i.e. the
icy 38 (2009) 1326–1339
extent of use of complementary innovations), ˛ is equal to a con-stant plus the average cost c, ˇ is the vector of the marginal impactsof the elements of �, while e is a normally distributed random errorterm. The specification of the dependent variable (y) and the set ofcontrol variables (�) that we use to test the model are detailed inthe next section.
3.2. The drivers of the intensity of use: firm specific and marketcharacteristics (�)
In this section we specify the set of firm specific and market char-acteristics � (see (7)) believed to affect the size of the firm’s gain andthe resulting adoption strategy. The criteria used for their inclu-sion is mainly based upon the findings of the existing economicsof innovation literature (see for a survey Hall, 2004; Geroski, 2003;Karshenas and Stoneman, 1995) but it is also partly dictated by dataavailability. Their definition and the expected sign are summarizedin Table 3.
The impact of the size of the company upon the decision to adopta (technological) innovation has been extensively documented boththeoretically and empirically. The most common findings suggestthat large companies are more prone to introduce and handle inno-vations (see early work of Mansfield, 1968; Hannah and McDowell,1984; Karshenas and Stoneman, 1995; Noteboom, 1993 among oth-ers). One explanation for this could be that larger firms are morelikely to be less financially constrained (Hoshi et al., 1991; Kaplanand Zingales, 1997). They may have greater financial resources, bet-ter access to information and can spread the information-gatheringcosts across greater revenues (see for example, Ichniowski et al.,1995; Harrison, 1996). We measure the size of the establishmentvia the total number of full-time equivalent employees (Employ-ment). We expect it to affect significantly the intensity of use ofmanagement practices.
The Age of the establishment is also expected to be a driver ofthe intensity of adoption. Older plants generally have more experi-ence that allows them to assess costs and benefits of any changes
have for their (main) productsor services: none, fewcompetitors, many competitors
Export-Orientation If the product of the firm hasan international market
+
ch Pol
teiwgnpoli
limdwgaititoslazi
ccsiimb
PAottbesmp
toismethpah(d
ip
G. Battisti, A. Iona / Resear
ion of innovative practices should be lower for new plants than forxisting plants for several reasons. First, the initial costs of gather-ng information about the work practices that a new plant incurs
hen designing its original policies should be lower as more firmsain experience with the newer practices. Second, new plants doot face the costs associated with employee resistance to changere-existing practices. Given the contrasting views about the rolef the age in affecting the adoption of management practices, we
eave to the empirics to determine the sign and the significance ofts impact.
Being part of a group rather than a single independent estab-ishment may affect the adoption decision as it would reflect thempact of internally sourced information relating to the perfor-
ance of management practices as well as the complexity of theecisional structure and other human competencies. This is in lineith the findings of Cainarca et al. (1990) who find that “business
roups” compared to “independent firms” do show higher rates ofdoption of flexible automated systems. However, this result is notn line with that of Karshenas and Stoneman (1995) who suggesthat the distinction between establishments and firms is not anmportant one for the inter-firm diffusion of technological innova-ions. The same result can be found in the Dunne’s (1994) studyf a range of innovations in US manufacturing industries, whereingle plant and multi-plant producers utilise innovations at simi-ar frequencies. In our study we specify Independent Establishments taking value one if the establishment is independent and valueero if it is part of a group. We leave to the empirics to determinets sign.
Output Concentration measures whether the production is con-entrated in one product or service. The inclusion of outputoncentration is based upon the evidence that firms more diver-ified in their products are supposedly more likely to engagen wider innovative activities concerning products and processnnovations throughout R&D and management practices imple-
entation (Aghion et al., 2005). Therefore, we expect its sign toe significant and negative.
According to several studies (Vives, 2004; Mork et al., 2005;erez-Gonzales, 2005; Bloom and Van Reenen, 2007; Villalonga andmit, 2006) two factors are strongly associated with the adoptionf management practices: the degree of product market competi-ion and the ownership structure. The more intense the competition,he higher the pressure of new entry and the effort of incum-ent firms to adopt modern management practices to raise thefficiency. In line with these studies, we introduce Competition mea-ured via the number of competitors the firm has to face in thearket for its main products or services. We expect its sign to be
ositive.In addition, we introduce the variable Single Ownership/Control
o indicate that a single individual or family owns at least 50% of therganization the establishment belongs to. The ownership structure
s a crucial variable given the ambiguous effect that family owner-hip and ownership concentration may have on the adoption ofanagement practices. Family firms are the typical form of own-
rship and management in the developing world and especially inhe developed world (La Porta et al., 1999).6 Family ownership couldave beneficial effects on the adoption of productivity-enhancingractices. Ownership concentration allows firms to overcome costs
ssociated with agency problems between managers and share-olders. On the other hand, it could also have the opposite effectssee Bloom and Van Reenen, 2007). We leave to the empirics toetermine its sign.6 La Porta et al. (1999) define “family ownership” firms as those firms where fam-ly controls 20% or more of the equity. These firms are common in the OECD andarticularly in Continental Europe.
icy 38 (2009) 1326–1339 1331
There is evidence showing that foreign-owned companies oper-ating in the UK out-perform UK-owned companies operating underthe same circumstances. One explanation for this may concern thedifferent “cultures” and experience reflected in the effectiveness ofuse of management practices (Porter and Ketels, 2003; Bloom andVan Reenen, 2007). We use the variable Foreign Owned/Controlledto capture the fact that the establishment, or the organization itbelongs to, is owned or controlled by foreign managers or share-holders. In line with the extant literature we expect its sign to bepositive.
Finally, if the firm’s production is directed to international mar-kets it is more likely that it implements innovations. A great dealof economic research has shown that the degree of trade open-ness increases the size of the output market and provides access toimported innovations such as new inputs which embody new tech-nologies and new practices (Harrison, 1996). To capture the impactof this potential driver of the spread of management practices weuse the variable Export-Orientation reflecting whether the outputmarket of the establishment is international. We expect its impactto be positive.
3.3. Measuring the intensity of joint use (y)
3.3.1. Synergistic effects from joint useIn order to identify the factors affecting the intensity of use of the
four practices one could estimate Eq. (7) for each set of practices.However, such an approach would be misleading. If complemen-tarity effects exist among sets of practices, the adoption decision ofany one set of practices would not be independent on the adoptiondecision of another set of practices. The impact of complementar-ity effects among set of practices upon the adoption decision canbe illustrated mathematically.
Let us assume for simplicity that there exist two managementpractices (A and B) and that at any time t the firm can decide toadopt either A only (A), B only (B), neither (N) or both innovations (S)based upon profitability considerations so that the adoption statusis represented by yk where k = A, B, S and N. Let g(yA) and g(yB) bethe annual operating profit gains relative to the profit earned fromthe adoption of A alone and B alone, respectively. Assume againfor simplicity that the marginal cost associated to each innovationequals the average cost of that innovation (ck with k = A, B, S, N). Toconsider the benefits derived from the joint adoption of A and B wefollow Battisti et al. (2006) and Battisti and Stoneman (forthcoming)and we define as complementary innovations those innovations forwhom:
(1) the joint adoption yields benefits higher than when using eachinnovation alone: g(yS) > g(yA) and g(yS) > g(yB)7;
(2) the benefits from joint adoption are greater than the sum of thebenefits derived from the individual adoption: g(yS) = g(yA) +g(yB) + v so that g(yS) > g(yA) + g(yB). Hence, for complemen-tarities to exist v must be positive, v > 0.8
We assume that “v” is generated by the use of complementaryinnovations via say an increase in total labour productivity, andtherefore in total revenue, above the increase in the implementationcosts plus any indirect organizational costs of the new practices.
In this context, the profit maximizing firm will base its invest-ment decision upon the expected net gain from adoption and willjointly adopt more management practices only if (under myopia)the expected net profit gain from joint adoption is non-negative or,7 Note that the benefits from the individual adoption are allowed to be not nec-essarily positive.
8 Rather than negative, as required by (partial) substitutability.
1 ch Pol
ei
a
a
a
twihtuoovig
eivo
BwteftsttigmahdpIataatp
“weHt
Ww
management practices.12 Subsequently, on the basis of the revealedpatterns of joint adoption we draw inference upon the synergisticeffects.
332 G. Battisti, A. Iona / Resear
quivalently, if the marginal gain from adoption is at least as high asts cost (see Eq. (2)).9 Therefore, the following decision rules apply:
dopt A alone if g(yA) − c(yA) ≥ 0 and g(yS) − c(yS) < 0 (8)
dopt B alone if g(yB) − c(yB) ≥ 0 and g(yS) − c(yS) < 0 (9)
adopt both practices if g(yA) + g(yB) + v − c(yS) ≥ 0
or equivalently if g(yS) − c(yS) ≥ 0 (10)
dopt neither if none of the above applies (11)
Expressions (8)–(10) show that in the presence of complemen-ary effects, joint adoption can generate positive pay-offs evenhen the pay-offs generated by individual adoption are not pos-
tive (see Ruigrok et al., 1999 or Whittington et al., 1999). Thatappens as long as the gain (loss) from adopting the complemen-ary innovation j is no less than the benefit generated by the jointse of the two innovations “v”, i.e. if v ≤ g(yj) (see (10)). More-ver, even if individual pay-offs were both positive, the presencef extra gains generated by the complementary nature of the inno-ations “v” would make joint adoption more likely (or faster) thann their absence, i.e. g(yA) + g(yB) + v > g(yA) + g(yB) or similarly(yS) > g(yA) + g(yB).
Condition (10) indicates that in the presence of complementarityffects, looking at the drivers of the extent of adoption of each set insolation can be highly misleading. It could ignore the impact that(i.e. the extra benefits and the positive externalities) could exertn the adoption decision.
The generalization from two to say four sets of practices (j = A,, C and D) is straightforward. However, it is difficult to say ex antehich is the optimal combination of adoption and intensity of use of
he four practices that generates the highest pay-off. Followingthequilibrium modelling, the extent of synergic effects (or extra gains)rom the adoption and use of complementary practices is assumedo be not necessarily monotonic. In other words, it does not neces-arily increase with the number of practices adopted and/or withhe intensity of use of each set of practices. Being distribution free,he best approach to the testing of the existence of complementar-ty effects is by testing the presence and the significance of the extraain v derived from joint adoption (see (10)). That can be done byeans of a structural model (see for example the supermodularity
pproach in Milgrom and Roberts, 1990, 1995). However, we do notave data on the value of each of the four innovative practices, as weo not have data on the “price” of each innovation or on the outputrice.10 This is not an uncommon problem in structural analysis.
n such cases, Arora and Gambardella (1990) suggest an alternativepproach based upon the degree of association between the adop-ion decision of any two allegedly complementary strategies. Thessumption is that any two strategies – or in our case any two man-gement practices – are complementary if and only if an increase inhe adoption or the extent of use of one practice raises the marginal
ay-off of the other practice. Formally, if and only if:∂2G(yj)∂yA∂yB
where j = A, B (12)
9 The adoption decision could be path dependent, in that marginal profit gainsv” from the adoption of B (A) can be greater if A (B) has already been adopted thanhen it has not. Expression (8) makes no distinction as to the adoption order. Could
asily be extended to include such possibility (see for example Battisti et al., 2006).owever, as we do not have longitudinal data to test its dynamics, we have omitted
his scenario from the current model.10 Arguably we could have used as a proxy other performance indicators present in
ERS. However, such information was not publicly available at the time the paperas written.
icy 38 (2009) 1326–1339
Nevertheless, simply looking at the conditional pay-off gener-ated from the joint adoption of A and B, as specified by (12), mightbe misleading. Lurking factors and unobserved heterogeneity canbe a potential source of omitted variable bias.11
In order to verify the presence of complementarities, one has tocontrol for those factors that may simultaneously affect the extentof joint use of the two practices. We model such control factors viaa set of firm specific and market characteristics, � = [�1, �2, . . ., �m]so that (12) becomes:
∂2G(yj, �)∂yA∂yB
≥ 0 where j = A, B (13)
Arora and Gambardella (1990) further show that, assuming thatthe marginal cost of adoption is equal to a fixed (average) cost plusa firm specific normally distributed random error term, condition(13) is satisfied when the covariance between any two adoptionstrategies conditional upon � is positive, i.e. when all off-diagonalelements of the variance-covariance matrix are non-negative:
E[(
yA − E(
yA|�))(
yB − E(yB|�))
/� ≥ 0]
(14)
Notice that:
E(
yA|�)
= yA and E(
yB|�)
= yB (15)
that is, the conditional expected values are the fitted valuesgenerated by the regression of the extent of adoption of each man-agement practice (yA and yB) over a set of firm specific and marketfactors (�) as in (7). By using (15) we can rewrite (14) as:
E[(yA − yA)(yB − yB)] ≥ 0 (16)
The generalization from two to four practices (j = A, B, C and D)is straightforward and would imply rewriting (16) as follows:
E[(yj − yj)(yz − yz)] ≥ 0 with j /= z (17)
Eq. (17) states that for complementarities to exist, i.e. for theextra gain “v” to be significant (see condition (10)), the off-diagonalelements of the variance–covariance matrix (17) must be non-negative. Moreover, (17) holds if and only if the observed firmcharacteristics are uncorrelated with the unobserved stochasticperturbations (see (18)) and if shocks to yj and yz – (ej and ez,respectively) – are uncorrelated (see (19)):
E(ej|�) = 0 (18)
E(ejez |�) = 0 j /= z (19)
In our empirical analysis we test equation (17) as an implicationof the presence of complementarity effect “v” among the four sets of
11 For instance, suppose A and B are complements and there exists an innovationC that is a substitute for A and a complement for B. It is then possible that if Cincreases, A and B move in opposite directions if both are more strongly related toC than to each other. Related to this is another problem: A and B may be relatedto other characteristics of the firm and its environment setting. It is possible, forexample, that A and B are positively correlated because they are strongly correlatedto a particular characteristic of the firm, e.g. size, and they grow as a result of thegrowth in the lurking factors rather than because of a natural association betweenthe two innovations (see Arora, 1996).
12 Note that, in order to derive Eq. (17), we assume that all management prac-tices are pair-wise complements. It is true that one could do with weaker sufficientconditions. However, we carry on with this assumption because such conditionswould require that we put far more structure on the form of the pay-off functionG, whose validity could not be tested since we do not observe the marginal costs ofundertaking the management practices.
ch Pol
3
tioMcppsgctt
ooecepHILsrrwism
eFiad
stcvmuapetcspod
tvoiaeiFaugo
an overall error rate at 5%, we apply the “Bonferroni correctionfactor” to the individual error rate for each pair-wise compari-son concerning the significance of the six estimated covariances.This results in a significance threshold for rejecting the null of zero
G. Battisti, A. Iona / Resear
.3.2. The intensive margin of use of complementary practices (y)The intra-firm technology diffusion literature tends to measure
he intensive margin of use as the proportion of the firm’s cap-tal stock that embodies the new technology, or the proportionf output produced using the new technology (see for exampleansfield, 1968; Battisti and Stoneman, 2003, 2005, etc.). In our
ase, the most obvious extension of this definition would be theroportion of employees involved in the use of each managementractice. However, our data source does not provide information onuch measures but does enable one to consider the intensive mar-in via a different metric, namely the degree of both intensity andomplexity of use of management practices. It is the latter defini-ion that we adopt to define the metric for intra-firm diffusion ofhe four practices under scrutiny.
In Section 2 we have measured the intensity of use of each of setf practice under scrutiny i.e. OMP, MMP, TMP and IMP via a seriesf questions on the adoption of a range of practices that follow inach category (see Table 1) We also argued that the four practicesan be complementary on a number of grounds. Together they cannhance effectiveness, employees’ motivation and therefore firms’erformance more than if they were individually used in isolation.owever, it is difficult to predict the “best” combination of practices.
t is obvious that “more” is not always “better” (see Perrow, 1967 oreseure et al., 2004 for a survey). Companies are heterogeneous ando are their customers and the markets for their final products. As aesult different strategies will be adopted. In line with our equilib-ium approach, we do not assume any “best” adoption structure ande acknowledge the fact that there is no such “one size fits all”. It
s based upon the establishment specific revealed preferences andtrategies that we define our measure of the intensity of use of theanagement practices under scrutiny (y).
Nevertheless, it is difficult to determine ex ante the pay-off forach possible combination of intensity of use of the four practices.or this reason, we limit ourselves to propose a weighted index ofnnovativeness based upon the observed heterogeneity of adoptionnd use without superimposing any ex ante assumption about theesired level of use of the four sets of practices.
We think that using a simple unweighted index, where the inten-ity of the overall use of each practice is linearly added, might beoo over-simplistic because management practices are not inter-hangeable. The actual process (or “doing”) of a practice could beery different and might reflect different ways of organizing work,anaging employees’ expectations, etc. In other words, a simple
nweighted average of the extent of use of different practices wouldssume that practices carry equal weights and generate equal com-lementary effects. To relax this assumption, we first test for thexistence of complementary effects. We then use that informationo derive a firm specific indicator of the intensity of use, which isonstructed recognising that some practices might be more “ver-atile” than others and that their joint adoption can increase theay-off of some complementary practices substantially more thanther practices. This implies that their relative weight could beifferent from that of other practices.
We calculate the relative weights by using the information con-ained in the variance maximizing (varimax) rotation of the originalariable space, which in our case is the variance–covariance matrixf the conditional standardised residuals (see Eq. (17)) reported
n Table 3. This is essentially the Factor Analysis (FA hereafter)pproach to the decomposition of the heterogeneity of joint use notxplained by the set of control factors. If significant complementar-ties exist among the adoption decision of the different practices,A would linearly transforms them to obtain a smaller set of vari-
bles accounting for the largest part of the heterogeneity of theirse. In other words, FA allows us to model and transform the syner-ies among the four practices via a series of latent factors capablef picking up the underlying variability of joint adoption. Of all theicy 38 (2009) 1326–1339 1333
factors the FA can extract, we choose the first one which is the vectorof the coefficients (loadings) of the linear combination of the initialvariables (i.e. the residuals) that explains the largest proportion ofheterogeneity of use of the four practices.
The resulting factor score is what we define the overall index ofintra-firm diffusion:
y = ˙j�jyj with j = OMP, MMP, TMP and IMP (20)
where yj measures the intensity of use of each set of practices while� j accounts for the complexity of the synergistic effects derivedfrom their joint use. That is the measure of the extent of adoption(y) that we use to estimate the diffusion model presented in Section2 [see Eq. (6)]. In line with some other studies (for example, Bloomand Van Reenen, 2007) we have also built an unweighted index ofthe intensity of use of practices. However, we find that the weightedindex performs better than the unweighted index. It is only theformer that we concentrate upon here.13
4. Empirical results
4.1. Complementarity effects
In Table 4 we report the estimated coefficients, obtained byregressing each of the four sets of management practices on a setof control factors (�), as well as the t-ratios and the heteroscedas-ticity consistent t-ratios. The results indicate that the coefficientsof size of the establishment and foreign ownership (or control) aresignificantly positive. On the contrary, being a single independentestablishment and concentrating the production on one good andservice exerts, as expected, a negative and significant impact. Theonly variables not significant are the establishment’s age and thedegree of market competition it faces.
Indeed, Table 4 shows that the firm specific and market charac-teristics explain only a modest fraction of the variance. The adjustedR2 is around 7–19% and it is especially low (5.27%) for IMP. In orderto reduce the unobserved heterogeneity and to pick up possiblenon-linearities generated by economies of scale we have specified aquadratic term for the size of the establishment. However, this termis hardly significant and the adjusted R2 of the four models does notchange substantially, i.e. 8.83%, 19.44%, 19.21% and 6.13% for modelA, B, C and D, respectively. By using industry dummy variables theadjusted R2 of models A, B, C and D only marginally increases to 13%,21.4%, 19.3% and 19.4%. Note however, that, interpreting the signifi-cance of the control factors � as the significance of the drivers of theextent of adoption of each individual practice would be misleading.As we argued above, by focusing on individual adoption one is notpicking up the synergies and the complementarities “v” generatedby the joint adoption of complementary innovations.
In order to test the hypothesis that the four sets of managementpractices are complementary with one another, we carry out thetest based upon revealed preferences. This test is one-sided andbased upon the sign of the variance–covariance matrix of the stan-dardised residuals (RESj = yj − E(yj|�)) of the conditional equationsfor each set of management practices j = OMP, MMP, TMP and IMP(see Eq. (17) in Section 3.3.1).
Table 5 reports the variance–covariance matrix of the standard-ised residuals estimated for the sample of 1238 establishmentspresent in the WERS dataset. In order to maintain the chance of
13 We have also tried extending the FA to the derivation of the intensity of use ofeach set of practices yi without obtaining any significant difference in the final index.
1334 G. Battisti, A. Iona / Research Policy 38 (2009) 1326–1339
Table 4Impact of firm specific and market characteristics.
Variables A B C DCoefficient Coefficient Coefficient Coefficient(t-ratio) (t-ratio) (t-ratio) (t-ratio)[het.c. t-ratio] [het.c. t-ratio] [het.c. t-ratio] [het.c. t-ratio]
Dependent variable OMP MMP TMP IMP
Constant 0.3360 0.1284 0.2802 0.1899(2.43)** (0.99) (2.19)** (1.57)[2.35]** [0.99] [2.16]** [1.52]
Age 0.0028 0.0007 0.0000 −0.0001(2.80)*** (0.70) (−0.05) (−0.09)[2.72]*** [0.73] [−0.04] [−0.09]
Employment 0.0001 0.0003 0.0001 0.0003(2.37)** (5.14)*** (1.77)* (5.03)***
[2.07]** [6.19]*** [1.43] [4.18]***
Independent Establishment −0.3058 −0.4206 −0.5026 −0.1246(−4.25)*** (−6.24)*** (−7.54)*** (−1.98)**[−4.25]*** [−5.85]*** [−6.89]*** [−1.95]*
Single Ownership/Control −0.0115 −0.4457 −0.4968 −0.0497(−0.17) (−7.21)*** (−8.13)*** (−0.86)[−0.17] [−6.86]*** [−7.63]*** [−0.85]
Foreign Owned/Controlled 0.2736 0.2025 0.1409 0.1599(3.09)*** (2.44)** (1.72)* (2.07)**
[3.04]*** [2.66]*** [1.76]* [2.08]**
Output Concentration −02154 −0.2288 −0.1950 −0.1723(−3.62)*** (−4.11)*** (−3.54)*** (−3.31)***
[−3.59]*** [−4.03]*** [−3.52]*** [−3.28]***
Competition −0.0883 0.0234 0.0016 0.0687(−1.76)* (0.50) (0.03) (1.57)[−1.75]* [0.49] [0.03] [1.55]
Adjusted R2 6.87% 18.46% 18.16% 5.27%No. of observations 1238 1238 1238 1238Log-likelihood −1766.59 −1684.41 −1670.82 −1599.34
Note: t-ratio reported in round brackets, heteroscedasticity consistent t-statistics reported* 10% significance level.
** 5% significance level.*** 1% significance level.
Table 5Variance–covariance matrix of standardised residuals RESj , where j = OMP, MMP,TMP, IMP.
RESOMP RESMMP RESTMP RESIMP
RESOMP 1.000RESMMP 0.187* 1.00RESTMP 0.235* 0.310* 1.00R * * *
N
ccon
ttcrihub˛r
ESIMP 0.077 0.167 0.127 1.00
ote: Analysis is based on 1238 establishments.* Statistical significance at the 0.83% Bonferroni-corrected individual error rate.
ovariance not greater than 0.83% (rather than 5%) in each pair-wiseomparison.14 The empirical analysis shows that all the signs of theff-diagonal elements are “Bonferroni corrected” significantly non-egative, proving that (17) holds. Therefore, the decision to adopt
14 Bonferroni argues that every time we test a hypothesis there is the risk ofype I error of rejecting the null hypothesis when instead it is true. Performing rests simultaneously allows this error to increase. The chance that we make theorrect decision each time is P(1st comparison correct) and P(2nd comparison cor-ect) and P(rth comparison correct) and that equals (1 − ˛)r where r = k(k − 1)/2s the number of comparisons and k is the number of practices. In our case, weave to perform r = k(k − 1)/2 = 4(4 − 1)/2 = 6 comparisons. Assuming the individ-al error rate is set at 5%, the overall error rate after the 6 comparisons woulde (1 − 0.95)6 = 0.81 or 81% rather than 95%. However, if the correction factor* = 2˛/k(k − 1) = 0.05/6 = 0.83 is used (instead of 5%), the overall confidence level
emains unchanged, i.e. OER=(1 − 0.0083)6 = 0.95% or 95%.
in square brackets.
one practice is not independent of the decision to adopt anotherpractice. The result is quite robust as it holds after we have con-trolled for the variables directly affecting the intensity of use ofeach practice (see Appendix A) for the correlation matrix of theunconditional adoption decision of the four practices).
Table 5 also shows that the degree of association, i.e. the extentof the complementarity effect “v”, is positive for all pair-wise com-parisons although it differs in intensity and varies from practice topractice. This suggests that there exist positive gains generated byjoint adoption and that some practices are more influential thanothers. For example, MMP are practices that raise the highest pay-off when jointly adopted. The same cannot be said for IMP which arethe least intensively used practices and whose pay-off generated byjoint adoption is indeed the lowest.
The approach we have used to the testing of the existenceof complementary effects allows us to explore the extent of thecovariance after controlling for a number of factors that couldsimultaneously affect the firm’s adoption decision and that couldbe mistaken for evidence of complementarities. However, we wouldlike go back to two crucial assumptions we have made in our theo-retical model [see (18) and (19)]. The first assumption, E(ej|�) = 0,implies that the observed firm characteristics are uncorrelated
with the unobserved stochastic perturbations. This is weaker thanassuming that they are independent. While this is an obviousassumption, there are possible problems arising from the fact thatthere are variables we are unable to include in � but that are actuallyrelated to �. The latter if omitted might induce omitted variable bias.
ch Pol
En1
ireamuiscsihfi(aamotmauT
uowteci
4m
prtotsll�st
y
ahtasaoti
ao
(2003) who suggest that foreign-owned companies operating in theUK out-perform UK-owned companies, operating under the samecircumstances, because of the more intensive and effective use ofmanagement practices.
15 The rational for testing the stability of the estimated regression coefficients to theinclusion of initially omitted variables, is to partially explore the presence of omittedvariable bias. Omitted variables can cause bias in the parameters estimates only ifthe omitted variable(s) is somehow correlated to at least one the variables in theinitial information set i.e. E(e|�) /= 0. This can easily be illustrated in the bivariate
G. Battisti, A. Iona / Resear
xamples are management skills (Porter and Ketels, 2003), orga-izational structure and tacit knowledge (see Nelson and Winter,982 among others).
The second assumption, E(ejez|�) = 0, is a critical one. Withoutt – i.e. if the shocks to yj and yz (ej and ez, respectively) were cor-elated – we might get a correlation between yj and yi with j /= i,ven if there is no systematic relationship among them. While thisssumption is a reasonable one, there are possible pitfalls. Thereay be other important firm specific factors reflected in the resid-
als ej (j = OMP, MMP, TMP, IMP) which we have been unable tonclude in � and that could simultaneously affect the adoptiontrategy of different practices. For this reason the positive asso-iation among revealed preferences (17) is a necessary but not aufficient condition for complementarity. Unobserved heterogene-ty is a common problem in this type of study and several remediesave been suggested to overcome it. They range from modifiedxed effect panel data for unobserved time-invariant heterogeneity
Blundell et al., 1995), simultaneous estimation systems (e.g. Atheynd Stern, 2003) or instrumental variable approach (e.g. Cassimannd Veugelers, 2006). Of all the possible treatments, the instru-ental variable approach would probably be the best solution to
ur case. However, we could not identify any variables (availableo us) to be used as instrument that is related to only one set of
anagement practices but not to the others. The information avail-ble in our dataset does not allow us to appropriately deal withnobserved heterogeneity in a way that would totally rule it out.herefore, we decided not to engage in those exercises.
In summary, while on one hand we are able to reduce thenobserved heterogeneity on the other we are not able to rule itut completely. We therefore decide to proceed by investigatinghether a synthetic index of management practices, based upon
he decomposition of the conditional (residual) covariance gen-rated by the joint adoption of practices and the extent of theirommonality, may to some extent overcome this problem by reduc-ng the degree of unobserved heterogeneity, all else being equal.
.2. The intensity of use of complementary practices: a syntheticeasure
Having established the existence of synergistic effects acrossractices we proceed by linearly transforming them to obtain aeduced form representation that accounts for the largest part ofhe heterogeneity of the joint use (and therefore of the variabilityf the returns from joint adoption). Using the FA decomposition ofhe residual variance–covariance matrix (17) we reduce the dimen-ion of the matrix space to that of a vector of the coefficients of theinear combination of the four practices capable of explaining theargest part (40%) of the total variability in their joint use, i.e., �OMP,MMP, �TMP, and � IMP. The resulting weighted index (y) of the inten-ity of use of management practices (see (20)), is the equivalent ofhe factor score and is calculated as follows:
= 0.599 OMP + 0.714 MMP + 0.720 TMP + 0.462 IMP (21)
The rotated factor loadings reported in (21) confirm that TMPnd MMP are the most influential practices and can generate theighest synergistic effects. On the contrary, OMP and IMP showhe lowest loadings and, as a matter of fact, they are also the leastdopted practices (see Section 3.1). The extent of the shared andpecific variance is also reflected by the ‘uniqueness’ of the four vari-bles (UOMP = 0.61; UMMP = 0.41; UTMP = 0.42; UIMP = 0.74) suggestingnce again that the heterogeneity of use of OMP and in particular
hat of IMP contribute the least to the overall shared variability ofntra-firm adoption and use of the four practices.There are a number of advantages in using this index. First, itllows us to summarize in one synthetic measure both the numberf practices adopted and their intensity of use. Second, the fac-
icy 38 (2009) 1326–1339 1335
tor extraction, and therefore the weighting system, is not basedupon the decomposition of the simple correlation matrix of theadoption statuses. It is calculated from the decomposition of thevariance–covariance matrix of the standardised conditional resid-uals (after controlling for a set of internal and external factors) thatwe report in Table 3. The resulting variance decomposition, beingbased upon the shared variability of joint use of the four practicesaltogether (rather than upon their pair-wise use as in (17)), pro-vides a more robust and accurate indicator of the synergetic effectsamong the practices under scrutiny. It also allows us to reduce theextent of any residual unobserved heterogeneity that might simul-taneously affect the adoption of the four practices, i.e. the factorscontained in the standardised residuals not included in the infor-mation set but somehow correlated to some of its elements. Thatis possible because the factor loadings are calculated by taking intoaccount the shared common variance (also known as commonality)in the structure of the standardised residuals and the uniqueness ofeach set of residuals with respect to the factor extracted. While theformer reflects the proportion of individual variance which is com-mon to the other practices, the latter reflects the extent to whicheach adoption strategy is related to the first latent factor (or toneither of the other factors) extracted. In other words, the unique-ness reflects the share of the individual variability of use that is notaddressed by the factor extracted and that is not just common orshared variance.
4.3. Intensity of adoption and main drivers
In this section we report the estimates of the equilibrium model(7) stating that the driver of the adoption status is the profit derivedfrom the use of the practices and that we model as a function of firmand market characteristics (see Table 3 for a description). The test-ing of the model is carried out by using the information on 1238UK establishments present in the WERS dataset and by perform-ing the OLS cross-sectional estimator as well as the cross-sectionalheteroscedasticity correction.
In column A of Table 6, we report the estimated impact of thedeterminants of the intensity of adoption defined to match thereduced information set used to derive the conditional residualsfrom individual adoption (see Table 5). We also test the robust-ness of our basic model by testing the stability of our regressioncoefficients when initially omitted variables are specified into themodel.15 The results as reported in columns B, C and D of Table 6,respectively.
Our findings show that the estimated coefficients of Employ-ment and Foreign Owned/Controlled are significant and positive inboth models A and B. That supports the prediction that being alarger firm, and/or being owned and controlled by foreign share-holders/managers is positively associated with a more intensive useof management practices. This is also in line with Porter and Ketels
case. An omitted variable X2 can potentially bias (and generate inconsistent) theparameter estimate of X1, if X2 is somehow correlated to X1 and this is reflectedin the significance of ˇ21 in E( ˆ 1) = ˇ + ˇ2ˇ21, where ˇ21 is the coefficient of themarginal impact of X2 on X1. The robustness check can empirically determine theextent of the bias by looking at the parameters stability when new variables areadded/omitted.
1336 G. Battisti, A. Iona / Research Policy 38 (2009) 1326–1339
Table 6Determinants of the intensity of use of management practices.
A B C DCoefficient Coefficient Coefficient Coefficient(t-ratio) (t-ratio) (t-ratio) (t-ratio)[het.c. t-ratio] [het.c. t-ratio] [het.c. t-ratio] [het.c. t-ratio]
Dependent variable Weighted index Weighted index Weighted index Weighted index
Explanatory variablesConstant 0.5825 0.4703 0.5374 0.4338
(2.80)*** (2.27)** (2.59)*** (2.10)**
[2.73]*** [2.22]** [2.54]** [2.06]**
Age 0.0021 0.0015 0.0017 0.0012(1.38) (1.03) (1.11) (0.79)[1.40] [1.05] [1.12] [0.80]
Employment 0.0005 0.0013 0.0004 0.0012(5.37)*** (7.37)*** (4.63)*** (6.83)***
[4.18]*** [7.66]*** [3.70]*** [7.28]***
Independent Establishment −0.9029 −0.8555 −0.9142 −0.8673(−8.34)*** (−7.97)*** (−8.48)*** (−8.10)***
[−7.52]*** [−7.19]*** [−7.64]*** [−7.32]***
Single Ownership/Control −0.7058 −0.6699 −0.7043 −0.6699(−7.11)*** (−6.81)*** (−7.13)*** (−6.83)***
[−6.55]*** [−6.33]*** [−6.56]*** [−6.34]***
Foreign Owned/Controlled 0.4838 0.4500 0.4075 0.3827(3.63)*** (3.41)*** (3.03)*** (2.87)***
[4.00]*** [3.86]*** [3.32]*** [3.23]***
Output Concentration −0.5124 −0.5083 −0.5002 −0.4974(−5.73)*** (−5.74)*** (−5.61)*** (−5.63)***
[−5.70]*** [−5.71]*** [−5.60]*** [−5.61]***
Competition −0.0033 −0.0028 −0.0017 −0.0014(−0.04) (−0.04) (−0.03) (−0.02)[−0.04] [−0.04] [−0.03] [−0.02]
Employment2 −2.484E−07 −2.394E−07(−5.34)*** (−5.15)***
[−4.90]*** [−4.99]***
Export-Orientation 0.3678 0.3305(3.27)*** (2.97)***
[3.28]*** [2.98]***
Adjusted R2 24.10% 25.82% 24.75% 26.34%No. of observations 1238 1238 1238 1238Log-likelihood −2271.01 −2256.83 −2265.64 −2252.41
N
toetTir
EoitTmtmiatd
ote: Heteroscedasticity consistent t-statistics are reported in square brackets.** 5% significance level.
*** 1% significance level.
The negative coefficient of Single Ownership/Control shows thathe intensity of adoption reduces if a single individual or familywns at least 50% of the establishment (or the organization thestablishment belongs to). A more concentrated ownership struc-ure reduces the incentive to enforce the use of innovative practices.his might be due to some extent to a particular risk aversion, stick-
ness, and path dependency common to single proprietor or familyun companies (Bloom and Van Reenen, 2007).
The negative estimated coefficient for the variables Independentstablishment and Output Concentration suggests that the intensityf adoption of management practices reduces with the probabil-
ty of both being a single independent establishment and havinghe production highly concentrated on one output or service.hese may be uncontentious results. An independent establish-ent might have a weaker incentive to adopt innovative practices
han an establishment belonging to a large organization. Establish-
ents that are part of a group can benefit from internal sources ofnformation acquisition that can sensibly reduce the cost of searchnd therefore the uncertainty and the risk associated to the adop-ion decision. The same holds for those establishments that are notiversified in their products.
The coefficient of Age is not statistically significant. That pro-vides no empirical support to the view that older plants are morelikely to introduce changes than younger plants (Noteboom, 1993),or to the view that older plants might be less flexible in intro-ducing innovations (Little and Triest, 1996; Battisti and Stoneman,2003).
The coefficient of Competition is not significant. The numberof competitors in the product market does not significantly affectthe extent of adoption of management practices. Indeed, thisresult does not support the view that growing competitive pres-sure increases the introduction of productivity-enhancing practices(Nickell et al., 2001; Mork et al., 2005; Perez-Gonzales, 2005; Bloomand Van Reenen, 2007). This provides no support also for theopposite view that firms are not motivated to adopt productivityimproving practices since in highly competitive markets the gainsfrom adoption may be short-lived as rival firms mimic innovations
(Ichniowski et al., 1995).However, when the variable Export-Orientation is introduced(see model C in Table 6) it is found that the intensity of use ofmanagement practices increases significantly with the ability of theestablishment to sell its product in international markets.
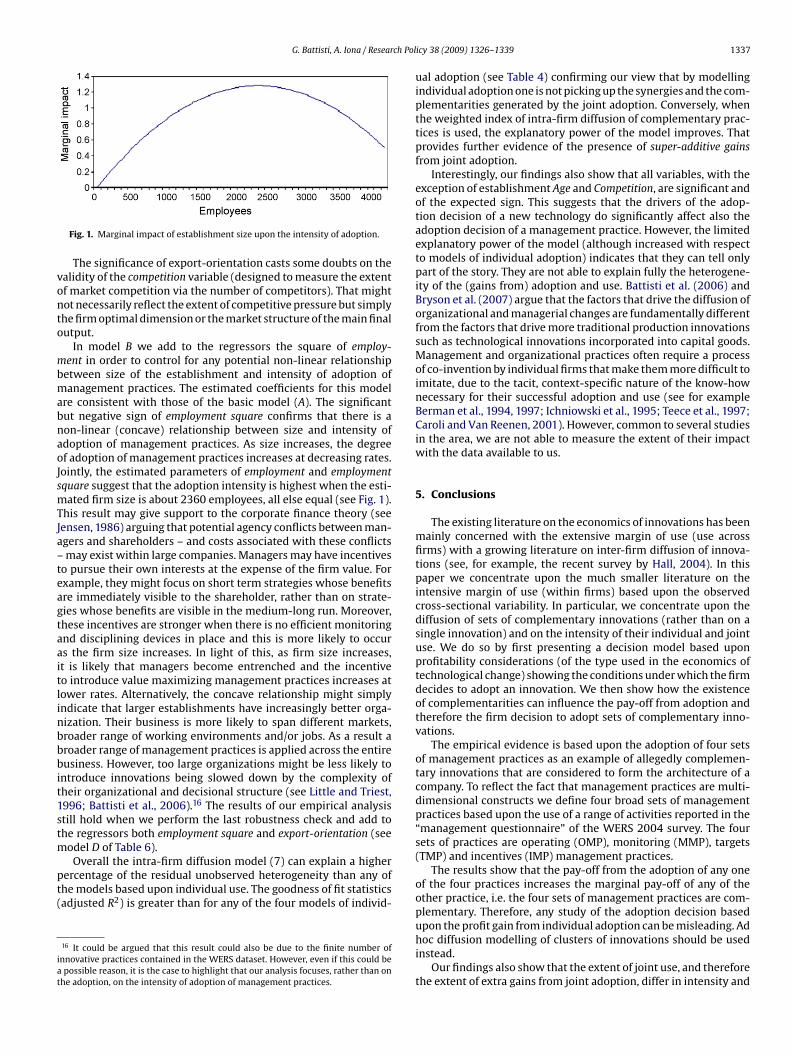
G. Battisti, A. Iona / Research Pol
vonto
mbmabnaoJsmTJa–teagtaaitlinbbbit1stm
pt(
iat
Fig. 1. Marginal impact of establishment size upon the intensity of adoption.
The significance of export-orientation casts some doubts on thealidity of the competition variable (designed to measure the extentf market competition via the number of competitors). That mightot necessarily reflect the extent of competitive pressure but simplyhe firm optimal dimension or the market structure of the main finalutput.
In model B we add to the regressors the square of employ-ent in order to control for any potential non-linear relationship
etween size of the establishment and intensity of adoption ofanagement practices. The estimated coefficients for this model
re consistent with those of the basic model (A). The significantut negative sign of employment square confirms that there is aon-linear (concave) relationship between size and intensity ofdoption of management practices. As size increases, the degreef adoption of management practices increases at decreasing rates.
ointly, the estimated parameters of employment and employmentquare suggest that the adoption intensity is highest when the esti-
ated firm size is about 2360 employees, all else equal (see Fig. 1).his result may give support to the corporate finance theory (seeensen, 1986) arguing that potential agency conflicts between man-gers and shareholders – and costs associated with these conflictsmay exist within large companies. Managers may have incentives
o pursue their own interests at the expense of the firm value. Forxample, they might focus on short term strategies whose benefitsre immediately visible to the shareholder, rather than on strate-ies whose benefits are visible in the medium-long run. Moreover,hese incentives are stronger when there is no efficient monitoringnd disciplining devices in place and this is more likely to occurs the firm size increases. In light of this, as firm size increases,t is likely that managers become entrenched and the incentiveo introduce value maximizing management practices increases atower rates. Alternatively, the concave relationship might simplyndicate that larger establishments have increasingly better orga-ization. Their business is more likely to span different markets,roader range of working environments and/or jobs. As a result aroader range of management practices is applied across the entireusiness. However, too large organizations might be less likely to
ntroduce innovations being slowed down by the complexity ofheir organizational and decisional structure (see Little and Triest,996; Battisti et al., 2006).16 The results of our empirical analysistill hold when we perform the last robustness check and add tohe regressors both employment square and export-orientation (see
odel D of Table 6).
Overall the intra-firm diffusion model (7) can explain a higherercentage of the residual unobserved heterogeneity than any ofhe models based upon individual use. The goodness of fit statisticsadjusted R2) is greater than for any of the four models of individ-
16 It could be argued that this result could also be due to the finite number ofnnovative practices contained in the WERS dataset. However, even if this could bepossible reason, it is the case to highlight that our analysis focuses, rather than on
he adoption, on the intensity of adoption of management practices.
icy 38 (2009) 1326–1339 1337
ual adoption (see Table 4) confirming our view that by modellingindividual adoption one is not picking up the synergies and the com-plementarities generated by the joint adoption. Conversely, whenthe weighted index of intra-firm diffusion of complementary prac-tices is used, the explanatory power of the model improves. Thatprovides further evidence of the presence of super-additive gainsfrom joint adoption.
Interestingly, our findings also show that all variables, with theexception of establishment Age and Competition, are significant andof the expected sign. This suggests that the drivers of the adop-tion decision of a new technology do significantly affect also theadoption decision of a management practice. However, the limitedexplanatory power of the model (although increased with respectto models of individual adoption) indicates that they can tell onlypart of the story. They are not able to explain fully the heterogene-ity of the (gains from) adoption and use. Battisti et al. (2006) andBryson et al. (2007) argue that the factors that drive the diffusion oforganizational and managerial changes are fundamentally differentfrom the factors that drive more traditional production innovationssuch as technological innovations incorporated into capital goods.Management and organizational practices often require a processof co-invention by individual firms that make them more difficult toimitate, due to the tacit, context-specific nature of the know-hownecessary for their successful adoption and use (see for exampleBerman et al., 1994, 1997; Ichniowski et al., 1995; Teece et al., 1997;Caroli and Van Reenen, 2001). However, common to several studiesin the area, we are not able to measure the extent of their impactwith the data available to us.
5. Conclusions
The existing literature on the economics of innovations has beenmainly concerned with the extensive margin of use (use acrossfirms) with a growing literature on inter-firm diffusion of innova-tions (see, for example, the recent survey by Hall, 2004). In thispaper we concentrate upon the much smaller literature on theintensive margin of use (within firms) based upon the observedcross-sectional variability. In particular, we concentrate upon thediffusion of sets of complementary innovations (rather than on asingle innovation) and on the intensity of their individual and jointuse. We do so by first presenting a decision model based uponprofitability considerations (of the type used in the economics oftechnological change) showing the conditions under which the firmdecides to adopt an innovation. We then show how the existenceof complementarities can influence the pay-off from adoption andtherefore the firm decision to adopt sets of complementary inno-vations.
The empirical evidence is based upon the adoption of four setsof management practices as an example of allegedly complemen-tary innovations that are considered to form the architecture of acompany. To reflect the fact that management practices are multi-dimensional constructs we define four broad sets of managementpractices based upon the use of a range of activities reported in the“management questionnaire” of the WERS 2004 survey. The foursets of practices are operating (OMP), monitoring (MMP), targets(TMP) and incentives (IMP) management practices.
The results show that the pay-off from the adoption of any oneof the four practices increases the marginal pay-off of any of theother practice, i.e. the four sets of management practices are com-plementary. Therefore, any study of the adoption decision based
upon the profit gain from individual adoption can be misleading. Adhoc diffusion modelling of clusters of innovations should be usedinstead.Our findings also show that the extent of joint use, and thereforethe extent of extra gains from joint adoption, differ in intensity and
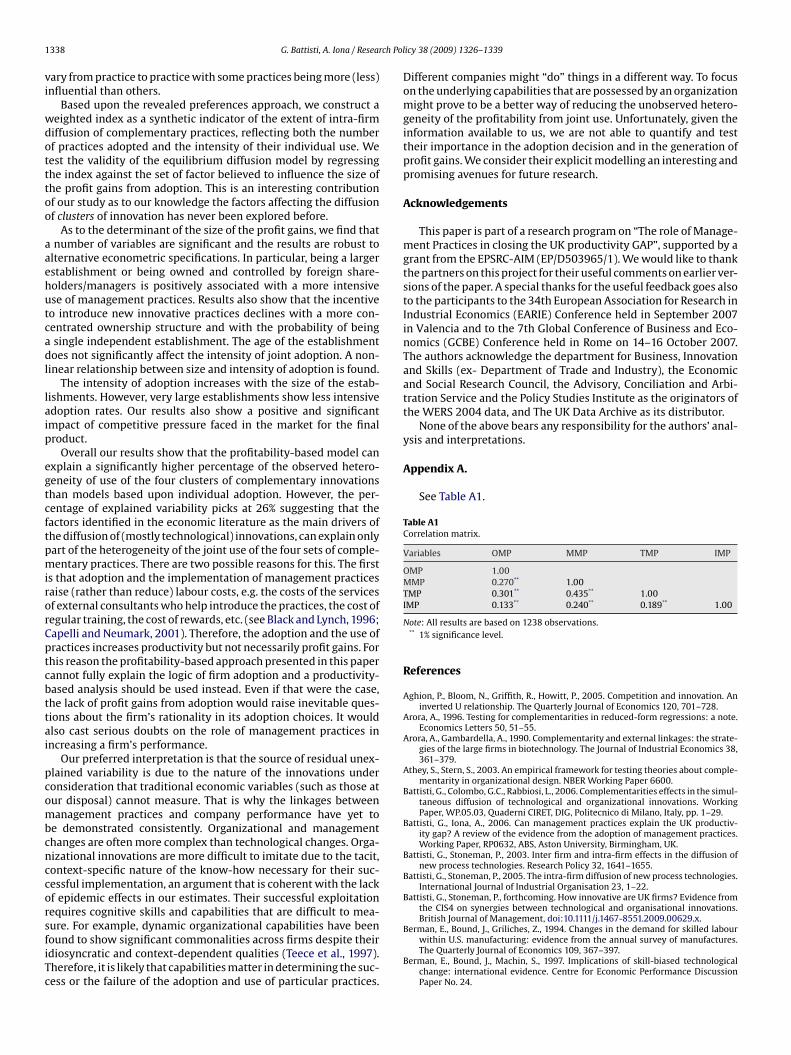
1 ch Pol
vi
wdotttoo
aaehutcadl
laip
egtcftpmirorCptcbttai
pcombcnccorsfiTc
338 G. Battisti, A. Iona / Resear
ary from practice to practice with some practices being more (less)nfluential than others.
Based upon the revealed preferences approach, we construct aeighted index as a synthetic indicator of the extent of intra-firmiffusion of complementary practices, reflecting both the numberf practices adopted and the intensity of their individual use. Weest the validity of the equilibrium diffusion model by regressinghe index against the set of factor believed to influence the size ofhe profit gains from adoption. This is an interesting contributionf our study as to our knowledge the factors affecting the diffusionf clusters of innovation has never been explored before.
As to the determinant of the size of the profit gains, we find thatnumber of variables are significant and the results are robust to
lternative econometric specifications. In particular, being a largerstablishment or being owned and controlled by foreign share-olders/managers is positively associated with a more intensivese of management practices. Results also show that the incentiveo introduce new innovative practices declines with a more con-entrated ownership structure and with the probability of beingsingle independent establishment. The age of the establishmentoes not significantly affect the intensity of joint adoption. A non-
inear relationship between size and intensity of adoption is found.The intensity of adoption increases with the size of the estab-
ishments. However, very large establishments show less intensivedoption rates. Our results also show a positive and significantmpact of competitive pressure faced in the market for the finalroduct.
Overall our results show that the profitability-based model canxplain a significantly higher percentage of the observed hetero-eneity of use of the four clusters of complementary innovationshan models based upon individual adoption. However, the per-entage of explained variability picks at 26% suggesting that theactors identified in the economic literature as the main drivers ofhe diffusion of (mostly technological) innovations, can explain onlyart of the heterogeneity of the joint use of the four sets of comple-entary practices. There are two possible reasons for this. The first
s that adoption and the implementation of management practicesaise (rather than reduce) labour costs, e.g. the costs of the servicesf external consultants who help introduce the practices, the cost ofegular training, the cost of rewards, etc. (see Black and Lynch, 1996;apelli and Neumark, 2001). Therefore, the adoption and the use ofractices increases productivity but not necessarily profit gains. Forhis reason the profitability-based approach presented in this paperannot fully explain the logic of firm adoption and a productivity-ased analysis should be used instead. Even if that were the case,he lack of profit gains from adoption would raise inevitable ques-ions about the firm’s rationality in its adoption choices. It wouldlso cast serious doubts on the role of management practices inncreasing a firm’s performance.
Our preferred interpretation is that the source of residual unex-lained variability is due to the nature of the innovations underonsideration that traditional economic variables (such as those atur disposal) cannot measure. That is why the linkages betweenanagement practices and company performance have yet to
e demonstrated consistently. Organizational and managementhanges are often more complex than technological changes. Orga-izational innovations are more difficult to imitate due to the tacit,ontext-specific nature of the know-how necessary for their suc-essful implementation, an argument that is coherent with the lackf epidemic effects in our estimates. Their successful exploitationequires cognitive skills and capabilities that are difficult to mea-
ure. For example, dynamic organizational capabilities have beenound to show significant commonalities across firms despite theirdiosyncratic and context-dependent qualities (Teece et al., 1997).herefore, it is likely that capabilities matter in determining the suc-ess or the failure of the adoption and use of particular practices.icy 38 (2009) 1326–1339
Different companies might “do” things in a different way. To focuson the underlying capabilities that are possessed by an organizationmight prove to be a better way of reducing the unobserved hetero-geneity of the profitability from joint use. Unfortunately, given theinformation available to us, we are not able to quantify and testtheir importance in the adoption decision and in the generation ofprofit gains. We consider their explicit modelling an interesting andpromising avenues for future research.
Acknowledgements
This paper is part of a research program on “The role of Manage-ment Practices in closing the UK productivity GAP”, supported by agrant from the EPSRC-AIM (EP/D503965/1). We would like to thankthe partners on this project for their useful comments on earlier ver-sions of the paper. A special thanks for the useful feedback goes alsoto the participants to the 34th European Association for Research inIndustrial Economics (EARIE) Conference held in September 2007in Valencia and to the 7th Global Conference of Business and Eco-nomics (GCBE) Conference held in Rome on 14–16 October 2007.The authors acknowledge the department for Business, Innovationand Skills (ex- Department of Trade and Industry), the Economicand Social Research Council, the Advisory, Conciliation and Arbi-tration Service and the Policy Studies Institute as the originators ofthe WERS 2004 data, and The UK Data Archive as its distributor.
None of the above bears any responsibility for the authors’ anal-ysis and interpretations.
Appendix A.
See Table A1.
Table A1Correlation matrix.
Variables OMP MMP TMP IMP
OMP 1.00MMP 0.270** 1.00TMP 0.301** 0.435** 1.00IMP 0.133** 0.240** 0.189** 1.00
Note: All results are based on 1238 observations.** 1% significance level.
References
Aghion, P., Bloom, N., Griffith, R., Howitt, P., 2005. Competition and innovation. Aninverted U relationship. The Quarterly Journal of Economics 120, 701–728.
Arora, A., 1996. Testing for complementarities in reduced-form regressions: a note.Economics Letters 50, 51–55.
Arora, A., Gambardella, A., 1990. Complementarity and external linkages: the strate-gies of the large firms in biotechnology. The Journal of Industrial Economics 38,361–379.
Athey, S., Stern, S., 2003. An empirical framework for testing theories about comple-mentarity in organizational design. NBER Working Paper 6600.
Battisti, G., Colombo, G.C., Rabbiosi, L., 2006. Complementarities effects in the simul-taneous diffusion of technological and organizational innovations. WorkingPaper, WP.05.03, Quaderni CIRET, DIG, Politecnico di Milano, Italy, pp. 1–29.
Battisti, G., Iona, A., 2006. Can management practices explain the UK productiv-ity gap? A review of the evidence from the adoption of management practices.Working Paper, RP0632, ABS, Aston University, Birmingham, UK.
Battisti, G., Stoneman, P., 2003. Inter firm and intra-firm effects in the diffusion ofnew process technologies. Research Policy 32, 1641–1655.
Battisti, G., Stoneman, P., 2005. The intra-firm diffusion of new process technologies.International Journal of Industrial Organisation 23, 1–22.
Battisti, G., Stoneman, P., forthcoming. How innovative are UK firms? Evidence fromthe CIS4 on synergies between technological and organisational innovations.British Journal of Management, doi:10.1111/j.1467-8551.2009.00629.x.
Berman, E., Bound, J., Griliches, Z., 1994. Changes in the demand for skilled labourwithin U.S. manufacturing: evidence from the annual survey of manufactures.The Quarterly Journal of Economics 109, 367–397.
Berman, E., Bound, J., Machin, S., 1997. Implications of skill-biased technologicalchange: international evidence. Centre for Economic Performance DiscussionPaper No. 24.
ch Pol
B
B
B
B
B
B
C
C
C
C
DD
E
F
F
GG
G
GHH
H
H
H
I
I
I
J
K
Villalonga, B., Amit, R., 2006. Ho do family ownership, control and management
G. Battisti, A. Iona / Resear
lack, S.E., Lynch, L.M., 1996. Human capital investments and productivity. AmericanEconomic Review 86, 263–267.
lack, S.E., Lynch, L.M., 2004. What is driving the new economy? The benefits ofworkplace innovation. Economic Journal 114, 97–116.
loom, N., Van Reenen, J., 2007. Measuring and explaining management practicesacross firms and countries. The Quarterly Journal of Economics 122, 1351–1408.
lundell, R., Griffith, R., Van Reenen, J., 1995. Dynamic count data models of techno-logical innovation. Economic Journal 105, 333–334.
ryson, A., Gomez, R., Kretschmer, T., Willman, P., 2007. The diffusion of workplacevoice and high-commitment human resource management practices in Britain1984–1998. Industrial and Corporate Change 16, 395–426.
ryson, A., 2001. Union effects on managerial and employee perceptions of employee.CEP Discussion Paper No. 494.
ainarca, G., Colombo, M.G., Mariotti, S., 1990. Firm size and the adoption of flexibleautomation. Small Business Economics 2, 129–140.
apelli, P., Neumark, D., 2001. Do high performance work practices improveestablishment-level outcomes? Industrial and Labour Reviews 54, 737–775.
aroli, E., Van Reenen, J., 2001. Skill biased organisational change? Evidence froma panel data of British and French establishments. The Quarterly Journal ofEconomics 116, 1447–1492.
assiman, B., Veugelers, R., 2006. In search of complementarity in the innovationstrategy: internal R&D and external knowledge acquisition. Management Sci-ence 52, 68–82.
avid, P., 1991. Behind the Diffusion Curve. Oxford University Press.unne, T., 1994. Plant age and technology use in the U.S. manufacturing industries.
Rand Journal of Economics 52, 488–499.dwards, T., Battisti, G., Neely, A., 2004. Value creation and the UK economy: a review
of strategic options. International Journal of Management Reviews 5, 191–213.u, X., Eisingerich, A., De Hoyos, R., 2007. Clusters of management practices, struc-
tural embeddedness and firm productivity. Oxford University, SLPTMD WorkingPaper No. 009.
udenberg, D., Tirole, J., 1985. Pre-emption and rent equalisation in the adoption ofnew technologies. Review of Economic Studies 45, 383–401.
eroski, P.A., 2003. The Evolution of New Markets. Oxford University Press, Oxford.odard, J., 2004. A critical assessment of the high-performance paradigm. British
Journal of Industrial Relations 42, 349–378.old, B., 1981. Technological diffusion in industry: research needs and shortcomings.
Journal of Industrial Economics 24, 247–269.riliches, Z., 1980. Hybrid corn revisited: a reply. Econometrica 48, 1463–1466.all, B., 2004. Innovation and diffusion. NBER Working Paper No. 10212.annah, T.H., McDowell, J.M., 1984. The determinants of technology adoption: the
case of the banking firm. Rand Journal of Economics 15, 328–335.arrison, A., 1996. Openness and growth: a time-series, cross-country analysis for
developing countries. Journal of Development Economics 48, 419–447.oshi, T., Kashyap, A., Scharfstein, D., 1991. Corporate structure, liquidity and invest-
ment: evidence from Japanese panel data. The Quarterly Journal of Economics106, 33–60.
uselid, M., 1995. The impact of human resources management practices onturnover, productivity and corporate financial performance. Academy of Man-agement Journal 38, 635–872.
chniowski, C., Shaw, K., Crandall, R.W., 1995. Old dogs and new tricks: determinantsof the adoption of productivity-enhancing work practices. In: Brooking Paperson Economic Activity, Special Issue Microeconomics, pp. 1–65.
chniowski, C., Shaw, K., Prennushi, G., 1997. The effects of human resource man-agement practices on productivity: a study of steel finishing lines. AmericanEconomic Review 87, 291–313.
chniowski, T., Kochan, D., Levine, C., Strauss, G., 1996. What works at work: overviewand assessment. Industrial Relations 35, 229–333.
ensen, M.C., 1986. The agency cost of free cash flow, corporate finance and takeovers.American Economic Review 76, 323–339.
andel, E., Lazear, E., 1992. Peer pressure and partnerships. Journal of Political Econ-omy 100, 801–817.
icy 38 (2009) 1326–1339 1339
Kaplan, S.N., Zingales, L., 1997. Do investment-cash flow sensitivities provide use-ful measures of financing constraints? The Quarterly Journal of Economics 112,169–215.
Karshenas, M., Stoneman, P., 1995. Technological diffusion. In: Stoneman, P. (Ed.),Handbook of the Economics of Innovation and Technological Change. Blackwell,Cambridge.
La Porta, R., Lopez-de-Silanes, L., Shleifer, A., 1999. Corporate ownership around theworld. Journal of Finance 54, 471–517.
Leseure, M.J., Bauer, J., Birdi, K., Neely, A., Denyer, D., 2004. Adoption of promisingpractices: a systematic review of the evidence. International Journal of Manage-ment Reviews 5, 169–190.
Little, J.S., Triest, R.K., 1996. Technology diffusion in U.S. manufacturing: the geo-graphic dimension. In: Fuhrer, J.C., Little, J.S. (Eds.), Technology and Growth.Conference Proceedings. Federal Reserve Bank of Boston.
Love, J., Roper, S., Mangiarotti, G., 2006. Organizing innovation: complementaritiesbetween cross-functional teams. Aston University, ABS Research Paper RP 0602.
Mansfield, E., 1968. Industrial Research and Technological Innovation. W.W. Norton,New York.
Metcalfe, J.S., 1988. The diffusion of innovations. In: Dosi, G., Freeman, C., Nelson,R., Silverberg, G., Soete, L. (Eds.), Technical Change and Economic Theory. PinterPublishers, London.
Milgrom, P., Roberts, J., 1995. Complementarities and fit: strategy, structure, andorganizational change in manufacturing. Journal of Accounting and Economics19, 179–208.
Milgrom, P., Roberts, J., 1990. The economics of modern manufacturing: technology,strategy, and organisation. American Economic Review 80, 511–528.
Miravete, E.J., Pernias, J.C., 2006. Innovation complementarity and scale of produc-tion. Journal of Industrial Economics 54, 1–29.
Mork, R., Wolfenzon, D., Yeung, B., 2005. Corporate governance, economics entrench-ment and growth. Journal of Economic Literature 43, 655–720.
Nelson, R.R., Winter, S.G., 1982. An Evolutionary Theory of Economic Change. BelknapPress, Cambridge, MA.
Nickell, S., Nicolitsas, D., Patterson, M., 2001. Does doing bad encourage managementinnovation? Oxford Bulletin of Economics & Statistics 63, 5–24.
Noteboom, B., 1993. Adoption, firm size and risk of implementation. The Economicsof Innovation and New Technology 2, 203–216.
Perez-Gonzales, F., 2005. Inherited Control and Firm Performance. Columbia Univer-sity.
Perrow, C., 1967. A framework for the comparative analysis of organizations. Amer-ican Sociological Review 32, 194–208.
Porter, M., Ketels, C.H.M., 2003. UK competitiveness: moving to the next stage. DTIEconomic Paper 3.
Reinganum, J., 1981. On the diffusion of new technology: a game theoretic approach.Review of Economic Studies 48, 395–405.
Ruigrok, W., Pettigrew, A., Peck, S., Whittington, R., 1999. Corporate restructuringand new forms of organizing: evidence from Europe. Management InternationalReview, Special Issue 199/2, 41–64.
Stoneman, P., 1981. Intra-firm diffusion Bayesian learning and profitability. EconomicJournal 91, 375–388.
Stoneman, P., 1983. The Economic Analysis of Technological Change. Oxford Univer-sity Press.
Storey, J., 1992. Developments in the Management of Human Resources. Blackwell,Oxford.
Teece, D.J., Pisano, G., Shuen, A., 1997. Dynamic capabilities and strategic manage-ment. Strategic Management Journal 18, 509–533.
affect firm value? Journal of Financial Economics 80, 385–417.Vives, X., 2004. Innovation and competitive pressure. CEPR Discussion Paper DP4369.Whittington, R., Pettigrew, A., Peck, S., Fenton, E., Conyon, M., 1999. Change and
complementarities in the new competitive landscape: a European panel study1992–1996. Organisation Science 10, 583–600.