Madras- Report on Housing and Establishments, Part IV-A ...
781
CENSUS OF 1961 VOLUME IX MADRAS FART IV-A REPORT ON HOUSING AND ESTABLISHMENTS P. K. NAMBIAR OF THE INDIAN ADMINISTRATIVE SERVICE SUPERINTENDENT OF CENSUS OPERATIONS. MADRAS 1964
-
Upload
khangminh22 -
Category
Documents
-
view
4 -
download
0
Transcript of Madras- Report on Housing and Establishments, Part IV-A ...
CENSUS OF INDIL~ 1961
VOLUME IX
MADRAS
FART IV-A
REPORT ON HOUSING AND ESTABLISHMENTS
P. K. NAMBIAR OF THE INDIAN ADMINISTRATIVE SERVICE
SUPERINTENDENT OF CENSUS OPERATIONS. MADRAS
1964
17"
N
MADRAS STATE ADMINISTRATIVE DIVISIONS
SCALE
lL~ 20
10 : J. KIlometres 10 \0 41)
MYSORE
KERALA
REFERENCE
II) Siale Boundary
41) 60 MUes
: i i .60 EO 90
78"
ANDHRA PRADESH
PAlk STRAIT
MANA".
Note : ~ The N"",e of the Taluk w~er differs from In Head Qw",nen Is shown wtthln br'lckeu
~~
'" :.;i:,~.~.)
~! CE YLON
"
PREFACE
I consider it a privilege that I could write the first Report on Housing in
Madras State. In October 1960, a Housing Census was conducted for the first time
in the history of this State. The scope of the Housing Census has b~en explained
in the First Chapter of this Report. Sri A. Mitra, Registrar General, India has
given some useful guidance as to how the first Housing Report should be drafted
which benefitted me greatly. Housing is a vast subject which needs much further
study and I hope this Report will stimulate it.
In preparing this volume, I have been ably assisted by Sri S. M. Sulaiman,
Deputy Superintendent of CerJsus Operations and Sri P. Vasudhev, Tabulation Officer.
Sri P. Murari, LA.S. has given me some useful material on the housing conditions
in rural Madras. Sri M. Panchapakesan, Tabulation Officer, has scrutinised the data
and the materials with meticulous care and has made the Report accurate. The
Shanti Press has taken great pains in printing this Report.
In the course of discussion, some views have been expressed by me which are
personal and do not bind the Registrar General or the Government of India or the
Government of Madras.
I have indicated separately the names of persons who have helped me in
compiling this volume with its subsidiary and inset tables, and photographs.
The labour involved in preparing this volume as well as the companion volume
Part IV-B, which contains Tables on which this Report is based, has been much
more arduous than I ever bargained for. I do hope that this volume will prove
interesting not only to. the Government(s) and Planners but also to the general
reader.
Madras, } 16th October 1964.
Po K. N A MBIAR,
Superintendent of Census Operations.
Part
.. *Part .. .. i.
Part
tPart
* Part
*Part
"Part
*Part 'If
Part
Part
Part 'II'
Part
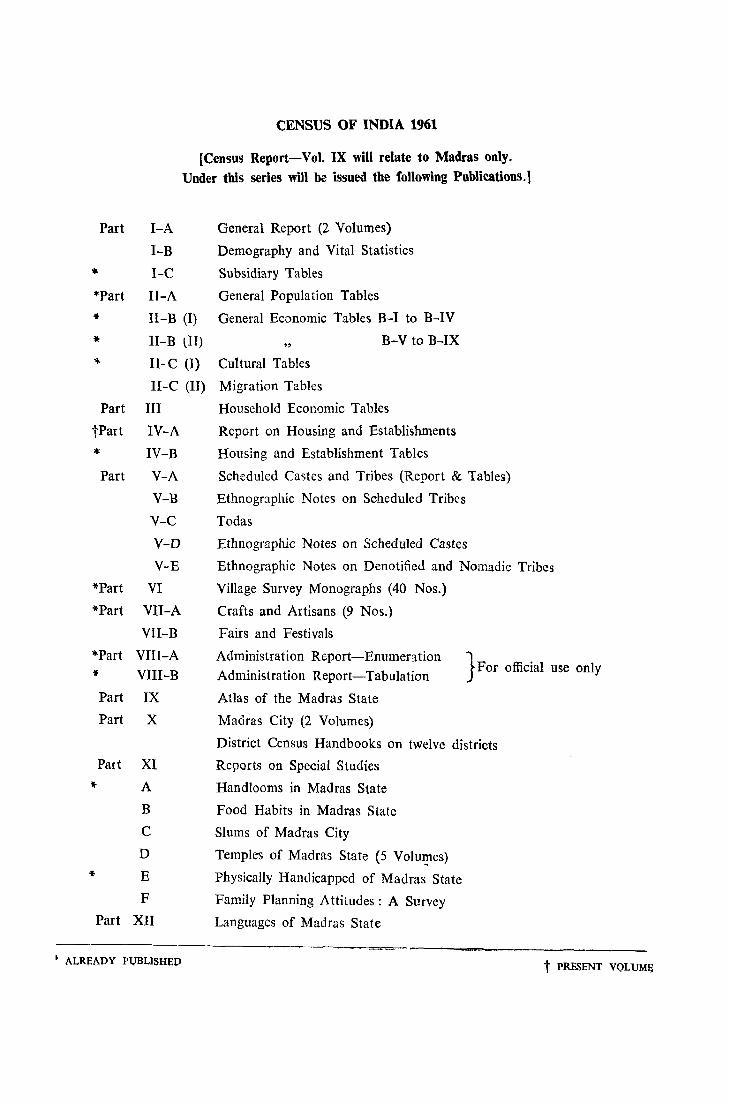
CENSUS OF INDIA 1961
[Census Report-Vol. IX will relate to Madras only.
Under this series will be issued the following Publications.l
I-A
I-B
I-C
II-A
II-B (I)
IJ-B lIT)
II-C (I)
II-C (II)
III
IV-A
IV-B
V-A
V-B
V-C
V-D
V-E
VI
VII-A
VII-B
VIII-A
VIII-B
IX
X
XI
A
B
C
D
E
F
XII
General Report (2 Volumes)
Demography and Vital Statistics
Subsidiary Tables
General Population Tables
General Economic Tables B-1 to B-IV
" Cultural Tables
Migration Tables
B-V to B-IX
Household Economic Tables
Report on Housing and Establishments
Housing and Establishment Tables
Scheduled Castes and Tribes (Report & Tables)
Ethnographic Notes on Scheduled Tribes
Todas
Ethnographic Notes on Scheduled Castes
Ethnographic Notes on Denotified and Nomadic Tribes
Village Survey Monographs (40 Nos.)
Crafts and Artisans (9 Nos.)
Fairs and Festivals
Administration Report-Enumention
Administration Report-Tabulation
Atlas of the Madras State
Madras City (2 Volumes)
'"' J For official use only
District Census Handbooks on twelve districts
Reports on Special Studies
Handlooms in Madras State
Food Habits in Madras State
Slums of Madras City
Temples of Madras State (5 Volu~es)
PhYSically Handicapped of Madras State
Family Planning Attitudes: A Survey
Languages of Madras State
I ALREADY PVBLlSHED t PRESENT VOLUME
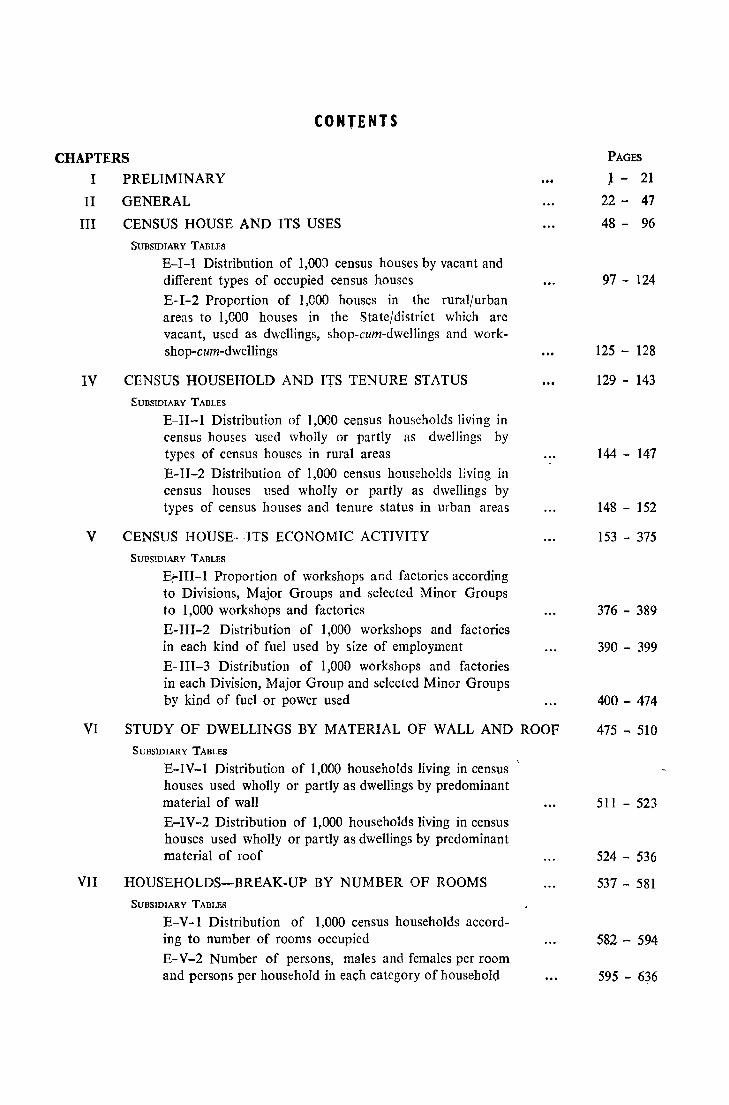
CONTENTS
CHAPTERS
I
II
III
IV
V
VI
VII
PRELIMINARY
GENERAL
CENSUS HOUSE AND ITS USES
SUBSIDIARY TABLES
E-I-1 Distribution of 1,00~ census houses by vacant and different types of occupied census houses
E- 1-2 Proportion of 1,000 houses in the rural/urban areas to 1,000 houses in the State/district which arc vacant, used as dwellings, shop-cum-dwellings and workshop-cum-dwellings
CENSUS HOUSEHOLD AND ITS TENURE STATUS
SUBSIDIARY TABLES
E-II -1 Distribution of 1,000 census households living in census houses used wholly or partly as dwellings by types of census houses in rural areas
E-II-2 Distribution of 1,000 census households Hving in census houses used wholly or partly as dwellings by types of census houses and tenure status in urban areas
CENSUS HOUSE-ITS ECONOMIC ACTIVITY
SUBS!DIARY TABLES
E~In-l Proportion of workshops and factories according to Divisions, Major Groups and selected Minor Groups to 1,000 workshops and factories
E-III-2 Distribution of 1,000 workshops and factories in each kind of fuel used by size of employment
E- III -3 Distribution of 1,000 workshops and factories in each Division, Major Group and selected Minor Groups by kind of fuel or power used
STUDY OF DWELLINGS BY MATERIAL OF WALL AND ROOF
SUBSIDIARY TABLES
E-IV-1 Distribution of 1,000 households living in census ' houses used wholly or partly as dwellings by predominant material of wall
E-IV-2 Distribution of 1,000 households living in census houses used wholly or partly as dwellings by predominant material of roof
HOUSEHOLDS-BREAK-UP BY NUMBER OF ROOMS
SUBSIDIARY TABLES
E-V -1 Distribution of 1,000 census households according to number of rooms occupied
E-V-2 Number of persons, males and females per room and persons per household in each category of household
PAGES
J - 21
22 - 47
48 - 96
97 - 124
125 - 128
129 - 143
144 - 147
148 - 152
153 - 375
376 - 389
390 - 399
400 - 474
475 - 510
511 - 523
524 - 536
537 - 581
582 - 594
595 - 6~6
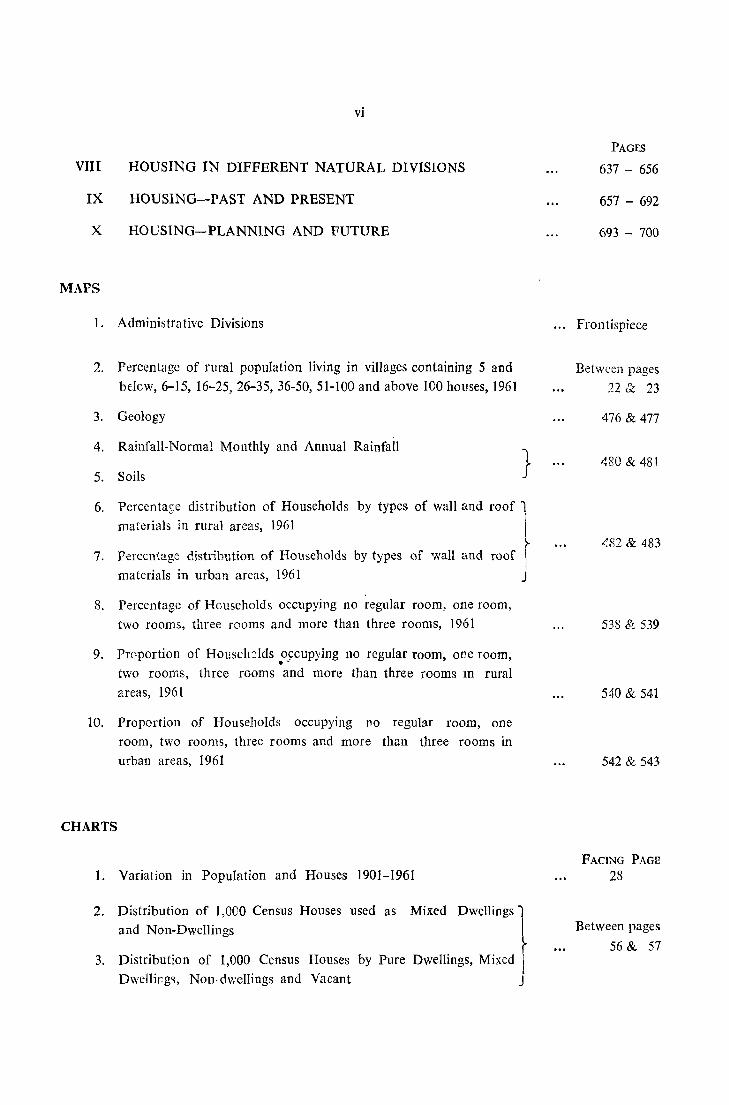
vi
VIn HOUSING IN DIFFERENT NATURAL DIVISIONS
IX HOUSING-PAST AND PRESENT
x HOUSING-PLANNING AND FUTURE
MAPS
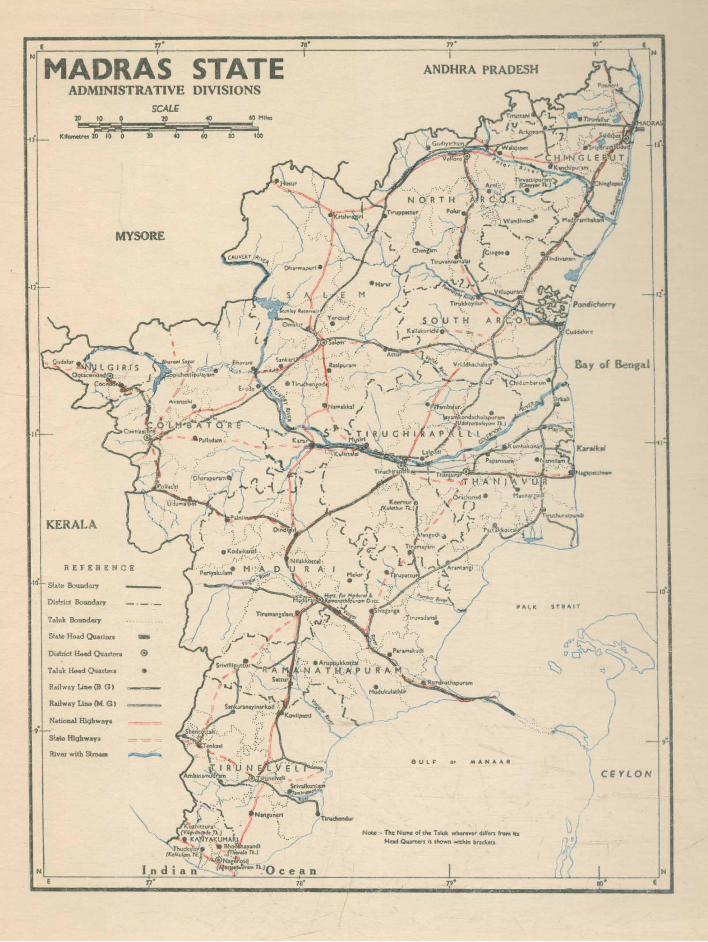
I. Administrative Divisions
2. Percentage of rural population living in villages containing 5 and
below, 6-15, 16-25,26-35,36-50,51-100 and above 100 houses, 1961
3. Geology
4. Rainfall-Normal Monthly and Annual Rainfall
5. Soils }
6. Perccntase distribution of Households by types of wall and roof ! materials in rural areas, 1961 1
>-7. Percentage distribution of Households by types of wall and roof i
materials in urban areas, 1961 J
8. Percentage of Households occupying no regular room, one room,
two rooms, three rooms and more than three rooms, 1961
9. Proportion of Househ::::lds occupying no regular room, one room, . ' two rooms, three rooms and more than three rooms III rural
areas, 1961
10. Proportion of Households occupying no regular room, one
room, two rooms, three rooms and more than three rooms in
urban areas, 1961
CHARTS
1. Variation in Population and Houses 1901-1961
2. Distribution of 1,000 Census Houses used as Mixed Dwellings 1 and Non-Dwellings I
3. Distribution of 1,000 Census Houses by Pure Dwellings, Mixed I Dwellir.g'>, Non·dwellings and Vacant j
PAGES
637 - 656
657 - 692
693 - 700
Frontispiece
Between pages
22 & 23
476 & 477
480 & 481
~82 & 483
538 & 539
540 & 541
542 & 543
FACING PAGE
28
Between pages
56 & 57
vii
PHOTOGRAPHS
'1. The Poor Harijan outside his hut in Periyur village, Madurai 1
I district
2. Dwelling-an artistically built modern house with concrete roof J{ in Kilpauk, Madras City
3. Houses put to different uses (14 photographs)
4. " "
5. Types of dwellings found in the city
6. Slum dwellings
7. Typical Houses in Madras City
8. Houses in selected Socio Economic Survey Villages
(9
(3
(3
(5
(8
9. An Irula Hut of Nellithurai and Hallimoyar (2
APPENDICES
.,
"
"
"
"
"
1. Copy of G.O. No. 2008, Public (Elections) Department dated
the 19th August 1948-(Elections-New Constitution-Adult
Franchise-Draft Preliminary Electoral rolls-Preparation
Orders issued.)
II. Copy of Circular No.3, dated the 27th May 1960
(Census 1961-House-numbering-Instructions)
Ill. Houselist-Origin::tl and Final form
IV. Houselist Abstract
V. Instructions on Houselisting
)
)
)
)
)
VI. G.O. Ms. No. 830, Public (Elections) Department dated the
18th May 1960- (Census 1961-Appointment of Census Officers
under the Census Act 1948-Notification published.)
}
FACING PAGE
50
Between pages 52 & 51
56 & 57
672 & 673
676 & 677
680 & 681
690& 691
PAGES
703 - 709
710 - 713
714 - 715
716
717 - 722
723 - 724
ACKNOWLEDGMENTS
It is my pleasant duty to acknowledge the able assistance given
by the following members of my staff:
Sri P. Murari, I.A.S.
Sri S. M. Sulaiman
Sri M. Panchapakesan
Sri D. Ranganathan
Sri P. Vasudhev
Smt. B. layalakshmi
Kumari M. V. Rajalakshmi
" N. Sarojini
Sri C. Chengalvaraya Reddy
Sri M. Sambhuni
Deputy Superintendent
of Census Operations.
" Tabulatioll Officer
" "
Upper division clerk
" Lower division clerk
Comptist
REPOR T ON HOUSING AND ESTABLISHMENTS
CHAPTER I
PRELIMINARY
IT IS THE tradition of Indian Census to improve on its. previous Censuses. 1961 Census has lived upto this reputation. For the first time in Indian Census history a housing census has been
taken throughout the country. Admittedly a house represents the 1960-Housing Census first of
its kind
basic need of a man, as important as his food and clothing. Proper housing is a primary requirement for healthy living and forms a base of operations for his normal activity. It determines
the welfare of the family as well as the community. In a larger sense a house ultimately determines the development of the economy and the material prosperity of any nation.
1 - 2. The General Assembly of the United Nations Organization has defined a housing census as the total process of collecting, compiling, analysing and publishing statistical data pertain-
U. N. O. definition of Housing Census
ing to a specific time of all housing units and occupants thereof in a country or in a well defined territory for purposes of obtaining information concerning the housing inventory and housing conditions of the population. The United Nations in their Statistical
Series M. No. 28, called "General Principles for Housing Census" have indicated that many Governments would find it necessary and convenient to take housing census in or around 1960 in connection with their population census. It will be desirable at this stage to refer to the general principles laid qown by the United Nations for a Housing Census, with a view to increase the usefulness of the data for national purposes and promote international comparability. It will also be interesting to see how far the principles have been followed in the housing census conducted by the Government of India. The lack of adequate housing has, in the opinion of the United Nations, constituted one of the most serious deficiencies in the standard of living among large sections of the populations of the world and serious social problems are aggravated by the shortage of housing. The displacement of population from rural to urban areas and substantial increase of population growth observed throughout the world in recent decades indicate that unless housing development programme be given momentum, shortage of adequate housing will in future tend to be even greater than what it is at present. The Government are today taking increasing interest and responsibility in the programme of financing housing and community development as they recognise that the well-being of the popUlation depends to a large extent on the quantity and quality of housing available. It is, therefore, desirable that the existing conditions are surveyed and that the present and future needs assessed and for these purposes comparisons among countries and regions are necessary and desirable. Housing census can, therefore, furnish major and basic information required for the formulation and execution of the housing policies of National and Local Governments. It can also supply basic data on a number of housing units classified according to the objective criterion into groups indicating various aspects of housing conditions.
1 - 3. According to the U. N. 0., much progress has been achieved in taking housing census. At least 42 countries have taken housing census during the period 1946-56. Housing census
was taken in India in 1960 in connection with the decennial 1961 1960-Housing CenSQS not census. The population census was taken throughout the country
synchronised simultaneously, 1st March, 1961 being fixed as the reference date. There was no such synchronising as far as the housing census
was concerned because it was left to the discretion of the State Superintendents to decide when
2 REPORT ON HOUSING AND ESTABLISHMENTS
the housing census could be taken. It varied from State to State depending on the local conditions and it was completed in Madras State in October, 1960. It was not synchronised to any definite reference date al'ld was spread over a period of 31 days in that month.
1 - 4. The housing census conducted by the Census Organisation of India 1S 1D a sense an improved form of housing census contemplated by the O.N.O. The census recommended by
Housinl! Census--&:ope and Umitations
them only admitted the collection, compiling, analysing and publishing statistical data pertaining to all housing units or occupants thereof. The Indian housing census admitted the compilation of particulars regarding all the buildings found in the country including houses,
factories and workshops. Thus we have now a complete record of all buildings in the country and the uses to which they are put. But it has its limitation. It has not attempted to elicit any information on the amenities provided in the houses as contemplated by the U. N. O.
I - 5. To understand what was intended by houselisting, I could do no better than reproduce the preliminary instructions issued by the Registrar General, India in 1959. "In order to
meet the wishes of the National Buildings Organisation, it is proposed 1960 Housing Census-Definition to have at the next census information on buildings, a building
and concepts being defined as a separate structure on the ground. The adoption of building will, however, depend on whether it is possible to put
across this concept at the pre-testing stage. If we adopt three sub-numbers for a household, namely building number, census house number and household number, a household may consist of either one number or two numbers or three numbers as explained below. If in a building there are more than one census house and in each of them or in any of them there should be more than one household, the households will be given three sub-numbers-building number, census house number and household number. If, however, a building and a census house are the same and there are a number of households, there will be only two sub-numbers-building number and household number. If in a building there should be only one census house and one household, there will be only one number-the building number. The houselist should be prepared almost simultaneously with house numbering. We should give the number in such a way that it would be easy to distinguish between these three different categories. Arabic numerals could be given to distinguish the buildings, Roman numerals to distinguish the census houses and alphabets to denote the households in which case 4-1-a will denote the first household in the first census house of building No.4". This was the first time that the concept, Census House, was directly introduced in Indian Census and was enumerated as a distinct entity for statistical purposes.
1 - 6. At this stage, it will be interesting to trace the history of collecting data of houses in Madras State. The first census of 1871 collected data on the structural conditions of houses by
classifying them as tiled, thatched or terraced. This was not done Historical background to Housing in any other State. Such information was not obtained in 1881.
Census But since it had some value in indicating the prosperity of the people, information was again obtained in 1891. In the census of
1901, such particulars were not collected. In the census of 1911, in addition to these particulars, data on industrial establishment employing 20 persons or more were collected. Information on the kind of fuel used was also collected. The data were tabulated into two groups, Le., factories and mines in which mechanical power was used, and factories and mines in which mechanical power was not used. Another interesting data collected related to the state of business on the date of census. This was classified as:
PRELIMINARY
(i) much brisker than usual
(ii) brisker than usual
(iii) somewhat brisker than usual
(iv) somewhat slacker than usual
(v) slacker than usual
(vi) much slacker than usual
The number of persons working was tabulated as:
(i) direction
(ii) supervision
(iii) clerical work
(iv) skilled work
(v) unskilled work
3
1· 7. This special industrial census was continued in 1921 also. Information regarding the nature of the roof of the house, terraced, tiled or thatched,
Industrial census of 1921 was also collected. In 1931 a separate houselist was prepared containing the following particulars:
1. Houses ordinarily used as residence
2. Buildings not ordinarily used as residence
3. Name of occupant
4. Remark~ (information whether uninhabited, shop, temple, jail or toddy shop)
1 ·8. The object of houselisting in 1931 was laid down as follows by Mr. Yeatts, the Superintendent of Census Operations, Madras who later became the Registrar General, India.
Houselist was required for three main purposes. Firstly it was Houselisting of 1931-51 wanted to correct the estimate of the number of schedules in each
language required in each taluk and municipality which estimate would be provisionally drawn up on the basis of past Census figures. Secondly it was required as a basis on which various taluks and municipalities would be divided into uniform blocks and circles and thirdly extracts from which would be copied in the block list which every enumeration book would contain and would serve as the chief guide to the enumerators in the primary and final Census. Thus the houselist would be the basis of the whole of the Census Operations. The scope of houselist was widened in 1940. The total number of adults and ch!ldren were separately noted with the religion of the household, population, estimated number of inmates of institutions and of floating population. In addition to these, nature of private buildings was ascertained by classify. ing them into pucca and katcha and then into tiled and thatched. In his instructions, Mr. D. H. Elwin, Superintendent of Census Operations, indicated that the houses that would be entered in the list were houses ordinarily used as residential houses in which human beings lived, took their meals and slept. They were' of two kinds-private buildings and residential public institutions. A separate houselist was prepared for each block. The houselisting was conducted in September, 1940, five months prior to the Census enumeration, but the tabulation of the data was not undertaken because of the World War II. In 1951, it was originally proposed to make a detailed listing of houses. Instructions were actually issued that houselist should be prepared in the following form.
REPORT ON HOUSING AND ESTABLISHMENTS
Serial No. House No. Persons entitled to vote under the franchise containing the following particulars: (a) name (b) father's or husband's name (c) sex
(d) age (e) community, minority and others.
This was not apparently intended as a framework for Census enumeration, but more as a basis for the preparation of electoral rolls. After further consideration, no houselist was actually prepared for any area in Madras State; perhaps it had something to do with the development of house-numbering system which was initiated by Mr. Yeatts, Registrar General in 1948 and which was introduced throughout Madras State by 1950. As such, no houselist was necesssary for the proper enumeration of persons during the 1951 Census.
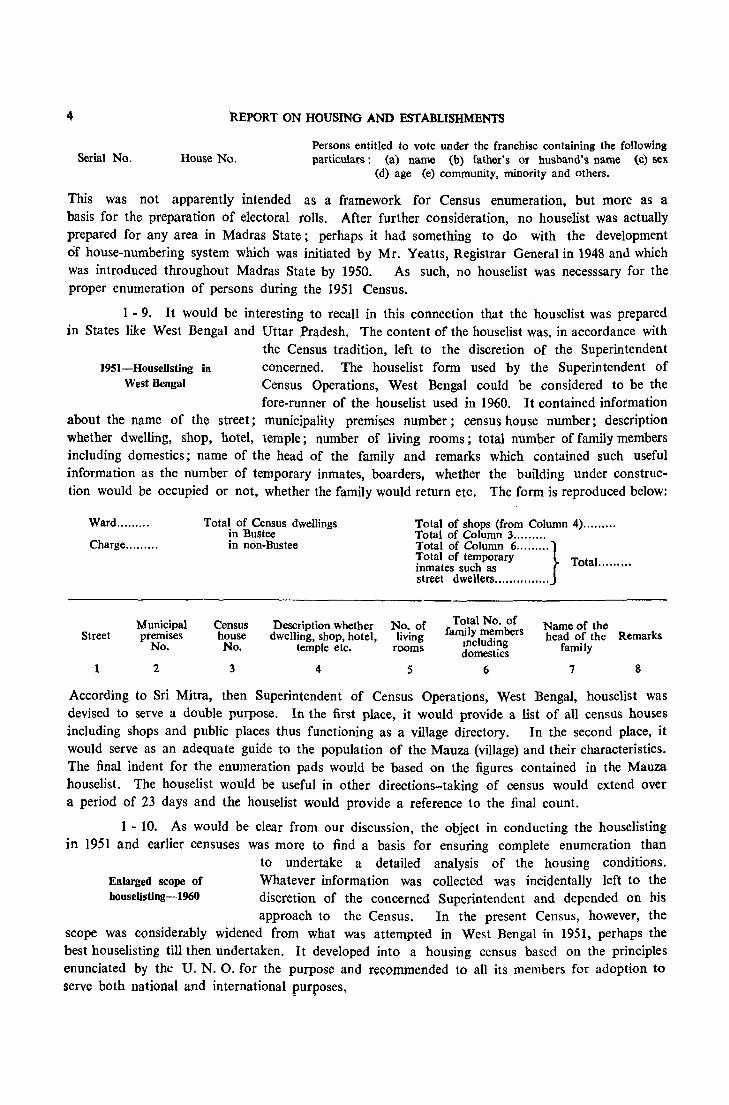
1 - 9. It would be interesting to recall in this connection that the houselist was prepared in States like West Bengal and Uttar Pradesh. The content of the houselist was, in accordance with
1951-Houselisting in West Bengal
the Census tradition, left to the discretion of the Superintendent concerned. The houselist form used by the Superintendent of Census Operations, West Bengal could be considered to be the fore-runner of the houselist used in 1960. It contained information
about the name of the street; municipality premises number; census house number; description whether dwelling, shop, hotel, temple; number of living rooms; total number of family members including domestics; name of the head of the family and remarks which contained such useful information as the number of temporary inmates, boarders, whether the building under construction would be occupied or not, whether the family would return etc. The form is reproduced below:
Ward ........ .
Charge ........ .
Municipal Street premises
No.
1 2
Total of Census dwellings in Bustee in non-Bus tee
Census Description whether house dwelling, shop, hotel, No. temple etc.
3 4
Total of shops (from Column 4) ....... .. Total of Column 3 ........ . Total of Column 6 ......... } Total of temporary T I inmates such as ota ........ . street dwellers ............. ..
No. of Total No. of Name of the living family members head of the Remarks
rooms Including family domestics 5 6 7 8
According to Sri Mitra, then Superintendent of Census Operations, West Bengal, houselist was devised to serve a double purpose. In the first place, it would provide a list of all census houses including shops and public places thus functioning as a village directory. In the second place, it would serve as an adequate guide to the popUlation of the Mauza (village) and their characteristics. The final indent for the enumeration pads would be based on the figures contained in the Mauza houselist. The houselist would be useful in other directions-taking of census would extend over a period of 23 days and the houselist would provide a reference to the final count.
1 - 10. As would be clear from our discussion, the object in conducting the houselisting in 1951 and earlier censuses was more to find a basis for ensuring complete enumeration than
Enlarged scope of houselisting-1960
to undertake a detailed analysis of the housing conditions. Whatever information was collected was incidentally left to the discretion of the concerned Superintendent and depended on his approach to the Census. In the present Census, however, the
scope was considerably widened from what was attempted in West Bengal in 1951, perhaps the best houselisting till then undertaken. I t developed into a housing census based on the principles enunciated by the U. N. O. for the purpose and recommended to all its members for adoption to serve both national and international purposes,
PRELIMINARY
1 - 11. The houselist used in 1961 Census had 17 columns and covered various aspects of buildings in the country. In the instructions issued for houselisting in Madras State, it was made
clear that the object of house1isting was to gather particulars of 1960-HouseHst houses, factories and workshops, products made or serviced and
the number of persons employed and the kind of fuel or power used in the factory or workshop. Details of materials used in the construction of walls and roofs, the number of persons living in the household as well as the number of rooms occupied by them were also collected. Thus the houselist would help us in having a complete record of the bUildings including the uses to which they were put. It would also give us a preliminary idea of the population of Madras State as it existed at the time of houselisting, a few months in advance of actual census enumeration. It was not used to demarcate the areas into blocks and circles as was done by my predecessors as this was completed before houselisting took place. But houselisting has given us a permanent record of all the buildings in each block into which the State was divided for census purposes. It would, therefore, form a proper base for undertaking future sampling surveys of housing conditions in Madras State. In addition to this, a map was prepared for each block indicating the geographical details and this map also has been preserved.
1 - 12. The data collected in the houselist will be useful in the following ways: (1) It provides basic data on housing shortage which will be useful to the Ministry of Works, Housing
and Supply, for formulating housing policies and schemes. (2) Various Houselist : Its possible uses schemes sponsored in accordance with the housing policy are
implemented through the State Government or concerned agencies. In the case of rural housing programme which is limited to a number of selected villages throughout the country, Ministry of Community Development is the central instrument of implementation. Each State Government have set up a Rural Housing Cell for guiding and controlling of housing programmes in the State. The functions of the Rural Housing Cells include preparation of village lay-out, evaluation of economic structure, designs for individual houses having regard to the use of the local materials, climatic conditions and giving technical ,advice to local authorities. The houselist shows at a glance building materials locally available of which maximum use could be made in building construction programme by improving their quality through methods of development under modern research. The data will, therefore, be of great use to National Building Organisation. (3) Village Housing Project Scheme is an overall plan of village development in which housing plays a dominant part. The data collected in the houselist will be helpful in formulating such plans. (4) Based on the houselist, a rough idea could be had of the quantum of building materials like steel, cement, tiles which may be required for reconstruction and future development of housing. (5) The houselist has got an industrial bias 'indicating the location, nature of industries, power houses and size of employment. The extent of fuel or power used in the case of factories and workshops can be assessed as also the number of persons engaged in these workshops and factories. (6) Location of industry as revealed by the houselist will be of use in zoning and marking out residential and non-residential areas. (7) Houselist will form a permanent document of national importance to be maintained at the village or block level. It will be of great use for future reference. No other country has perhaps attempted housing census of such magnitude as has been done in India in 1960 covering both residential and non-residential units.
1 - 13. Ap,art from the potential uses, we indicate below the uses to which Madras houselist can be or has been put so far. It is to be preserved as a basic document at the level of the village or block which can be brought uptodate year after year embodying all the necessary particulars. It will thus give basic information for each village in the State. A proposal is under the consideration of the State Government whether a suitable machinery can be devised
6 REPORT ON HOUSING AND ESTABLISHMENTS
for the purpose of keeping this document uptodate along with the Census Population Record and Household Schedule. It can serve as the base for a number of surveys which can be under
Houselist-Its practical application
taken not only by Census authorities, but also by others interested in such studies. For instance, the Census Department has sO far used houselist for two sample surveys, one on handlooms and the other on food. In both the cases, the houselist has been found
a very useful guide in preparing sample for such surveys. Thirdly the houselist provides basic information which will be useful for understanding the housing pattern and economy of the country. Actually the Town Planning Department has used the information fur,nished in the houselist for this purpose.
1 - 14. The houselist has, however, its limitations. No correlation has been made between the number of members of the family and the number of rooms available in the Census house nor
is the area of the census house known. But it is possible to extract Houselist-Its limitations such information either on a sample basis or for a limited area
and undertake further studies. It will be of use as a base from which more information can be collected. In the international definition, a housing unit is structurally a separate and independent place of abode. It can, therefore, be an occupied or vacant apartment or independent room or group of rooms or an occupied hut, hotel, institution, camp or a meal cafe or any other shelter used as living quarter at the time of the Census. The essential featUres of a housing census are, therefore, separateness and independence. For our definition, a third condition has been added. "It must be a structure on ground which can be distingUished from other units." This has resulted in a census house being slightly larger in conception than what is an international unit. Further, it can contain more than one household, for instance in the international definition, one occupied room is treated as an independent census house while in our definition a number of such rooms are grouped to form a census house and we have separately enumerated the number of families living in that unit. Census house can be a pennanent or semi-permanent structure intended for habitation or for work. Ownership is limited to the question whether it is owned by the resident or not. No attempt has been made to define the ownership among other categories like public authority or firms or enterprise or co-operatives, nor has an attempt been made to collect information on the rent paid for rented houses.
1 - 15. As we have indicated, a new concept-census house-has been introduced in Indian Census in 1961. Whether this concept is known to Indian Census
Census house: A new concept or old wine in new bottle
in the earlier days of its history and whether this concept has been evolved as a matter of tradition will be of interest to a reader.
1 - 16. In 1881, the following was the definition of a house in Madras. "Census house is a dwelling place of one or more families with their servants having a separate principal
entrance from the public way". This was sl~ghtly modified in 1891 1881 to 1911 substituting 'common way' for 'public way'. The object of this
modification was to provide for houses found in certain parts of India situated in a sort of courtyard to which public had no access. Such houses were rare in Madras though frequent in Northern India and the change in the definition affected the classifications of buildings slightly. In 1901 it was modified as follows: "Having a separate principal entrance from the common way". It would be interesting in this connection to recall the observations recorded by Mr. W. Francis, Superintendent of Census Operations, Madras in 1901 on the definition of a house. "The definition of ' house' covered the palace of a Raja and the hut of Kuravan which he carries with him on his head when he changes his quarters and every
t'RELlMINARY , grade and style of residence coming between these two extremes". In 1911 a house was defined as the residence of one or more families and having a separate entrance from the common way. This definition again included alike the Government house and the Kuravan's hut.
1 - 17. No change in definition took place in 1921. According to Mr. Boag, the old definition was sufficiently comprehensive to cover alike the Raja's palace and the portable hut carried
from place to place by a member of the wandering tribe. The object 1921 to 1941 was to deal only with the actual residential unit and to mention
less of the non-residential units. This, however, did not alter the content of the definition in any sense because one or two families residing in the house would be enumerated during the Census. In 1931, the definition was changed to "every dwelling with a separate main entrance." The object of this change was, according to Mr. Yeatts, to eliminate the variability of the definition adopted by Mr. Boag in 1921. Two terms in the definition have been removed-families and common way. Primafacie, it would appear that this change would swell the number of census houses by giving full effect to sub-divisions for buildings; sub-division of independent buildings would count as more than one house. Actually in the rural tracts of the State which accounted for the great bulk of population, we do not find more than one family living in a dwelling. The definition in 1941 was the same as in 1931-" every dwelling with a separate main entrance". This definition contained three criteria-dwelling, separate and main. Dwelling meant a place where human beings had their abode. Thus vacant houses, cattle-sheds, stables and outhouses were excluded, but unoccupied houses fit for occupation and houses under construction and to be probably finished before Census were included. ' Separate' meant that the occupants of the building would not, in order to reach it, have to traverse any room or hall used for living purposes by an occupant of another building. 'Main' meant separate entrance that would be norml:\-lly used by persons entering the dwelling and it would be an entrance of a normal or recognisable type. '
1 - 18. The same definition was continued in 1951 also. Though this definition too~ shape, it is rather doubtful whether this definition was in force strictly in the Censuses of 1931 and
1941. A strict application was rendered possible by the introduc-1951 tion of the permanent scheme of house-numbering in 1948. Till 1951
Census, the definition was limited to the dwelling used as a residence or likely to be used as a residence. But in 1961, both for houselisting and Census, every used building, i.e. building used for residential and non-residential purposes or likely to be used for such purposes were included. Along with this was introduced the concept of the census house. In accordance with the practice followed in other countries, it was defined as a viable unit which could be distinguished. It could be used as a dwelling, a shop-cum-dwelling or a place of business, school or workshop. It could be inhabited or vacant. It could be a structure or part of a structure. As long as it was a unit for purpose of living or work, it was to be treated as a Census house. To what extent the concept which was a modification of the earlier concepts used in Indian Census and which represented a sub-division of the house in the Madras House Numbering System was correctly understood by the enumerators, we would examine in the course of our report. It will be seen that the definition of the term 'census house' did not indicate any substantial modification between the years 1871 and 1931. It was difficult to say whether the concept was, however, properly understood by the enumerators, for instance the number of occupied houses in Madras City decreased from 60,103 in 1891 to 55,665 in 1901. The reason for the decline was recorded in the Census of India, 1901-Volume V-Part II as follows: "The reason for this is that in 1891 long rows of bazaars, smlU single room, facing the street with no cooking or sleeping apartments attached to them which are such a common feature in some of the divisions and in
:RE.PORT ON HOUSiNG AND ESTABLISHMENTS
which no one ever sleeps at night were all numbered as separate houses". Again there was some modification in the concept of census house during 1961 Census. A correct enumeration would, therefore, depend on the extent to which an enumerator could understand this concept. It is likely to vary from place to place and from district to district, from class to class from which the enumerator is drawn. We would in the course of our report make a comparative study of the occupied census house and population for the period 1901 to 1961 with a view to assess the extent to which this concept has been understood by the enumerator in Madras State.
I - 19. It would be interesting at this stage to study the history of Madras House Numbering System. In 1931 the beginnings of Madras House Numbering System started with Mr.
Madras House Numbering System: Early history
Yeatts as Superintendent of Census Operations. Under this system the number was boldly written on the outside of the building. Its chief purpose was to identify the dwelling to the census enumerator. In connection with 1941 Census, the then Registrar General, Mr.
Yeatts, held the view that the houselist should be a maintained document. If it were to be preserved the country would have at any time the substance of a population record and a framework would be available at any time to provide the material on sampling investigations for particular purposes to be carried out for Central and Provincial Governments. Finally the continued existence of a houselist would render possible a staggering of effort throughout the decade instead of immense concentration round the decade which involved pressure and difficulty. He suggested that a houselist should be constructed in urban and rural areas starting from the basic definition that a house was a dwelling with a separate main entrance and that the essence of the house was that it should be identifiable from outside by the number of the house. The name of the head of the household in the dwelling and the number of adults or children present should be detailed. In the preparation of houselist, the root to the matter would be the physical identification of each dwelling. The minimum essential detail was a maintained houselist with permanent numbers on each unit. Apparently, a framework of what was done in 1961 was indicated by Mr. Yeatts in 1941.
1 - 20. In 1947, Mr. Yeatts, Registrar General, India suggested that it would be desirable to have a permanent house-numbering system throughout India which coupled with the location
Madras House Numbering System: Emergence of a permanent system
in 1947
code would help us in identifying any census unit in the country. The Government of Madras accordingly settled the details of the house-numbering scheme in August, 1948 and ordered its implementation. A period of two years was allowed to implement. the instruction which were issued in accordance with the G. o. No.
2008 Public (Elections) dated 19-8-1948 which is reproduced as Appendix I. The intention of the Government was that the house numbers assigned under the scheme should be maintained on a permanent basis and should serve all purposes such as preparation of electoral rolls, assessment of tax by local authorities, for postal purposes and so on. Every dwelling should be readily identifiable from outside by a number which was attached to it and so long as it existed, this number should acquire importance through common use. In Class I panchayats and municipalities and the Corporation of Madras, the responsibility for maintaining house numbers vested with the executive authority and the cost was borne out of the funds of the Local Bodies. The houses were numbered along the streets proceeding from north to south. The house was defined as a structure or part of a structure having an independent main entrance giving an independent access to the common way. Such houses whether occupied or vacant were given a separate number irrespective of the fact whether they formed part of the same building and/or were situated in the same compound or belonged to the same owner of the building, whether
~RELtMINARY
residential or non-residential. So temples, churches, mosques, shops and offices were numbered. The numbers of the locality and street were given on the name plate or board at the entrance of the street and the house number was displayed prominently on the house. As the locality-street system of numbering was suitable only to places where there were well established localities and where the entire area was covered by roads, street lanes and by-lanes, the block system was prescribed for villages and Class II panchayats. Where the houses were found in clusters and in large villages, the entire area was split into blocks having well defined boundaries with about 100 houses in each block. The houses in each block were numbered serially. For house-numbering in small villages, the responsibility for the maintenance of house-numbering vested on the Karnam (village headman) and the cost was met by the Government. The detailed instructions issued for the maintenance of the house-numbering were embodied in Chapter II of the Madras Election Manual. Detailed provisions were made to ensure efficiency in the maintenance of house-numbering. At the end of each year, the Karnam or the executive authority concerned had to verify the com .. pleteness and correctness of house-numbering and furnish a certificate to the next higher authority. A certificate was also furnished after finding out the number ot buildings at the beginning of the year, additions during the year and total number of buildings at the end of the year. In the cas'! of villages and Class II panchayats, Revenue Inspectors and Tahsildars had to check during theh tours the house numbers and submit a completion report to the Collector by 10th of July. The concerned executive authority in Class I panchayat was required to submit a similar certificate. A scrutiny of house-numbering in these areas was also done by the officials of the Local Board in connection with the collection of house tax. Collectors were required to check up whether completion reports were received and submit their consolidated report to the Government by the 15th August every' year. The rules were specific that the numbers once assigned should not be changed unless there were compelling reasons to do so. In such cases, they should be reported to the Govermnernt and prior orders obtained. Houses coming between two numbers should be given alphabetical sub-numbers which could be done immediately. House numbers were periodi .. cally brought uptodate during the intensive revision of electoral rolls by the St~te Government. Maintenance of location code was also an essential part of house-numbering system. Instructions were also issued for the preparation of detailed sketch/map indicating the boundaries of localities and blocks, lay -out of roads and streets and important geographical details. A key to the plan indicating the house numbers allotted in the area, classified by resiqential and non-residential, was also attached to the plan.
t - 21. The house number was evolved in connection with 1951 Census, and was used for the preparation of electoral rolls in 1951. It would be relevant to point out that items of
House numbering continuity maintained
work relatin!; to Census and Electoral Rolls were done by the same officer in Madras State in 1951. An\ intensive revision was undertaken once in five years when the electoral roll was brought uptodate. It had one specific advantage that there was a
continuous maintenance of house-numbering system in Madras State which no other State had attempted. But it had a serious drawback, in that its maintenance was linked with the prepa· ration of electoral rolls and there was a finality in the house-numbering system and changes could not be ordered except under instructions from the Government. I, however, felt that the maintenance of the pe~manent house-numbering system would provide adequate basis for census enumeration because every unit would be readily identifiable by a house number. A review of the system of house-n~mbering came up for discussion in the first Census Conference held in New Delhi in 1959. It was held and correctly too that only in the State of Madras a complete system of municipal and rural house-numbering prevailed throughout the State. It was, therefore, decided to utilise this house-numbering system for the purpose of houselisting in Madras State
H-2

10 REPORt ON HOUSING AND ESTABLISHMBNTS
and no attempt was made to give separate Census numbers to any dwelling. This was. of course, something of a departure from the practice followed in other States. I would, however, indicate what practical difficulties I had in implementing this policy.
1 - 22. The following procedure was followed. The principles on which the existing house-numbering system in Madras State was based would be left in tact. Normally any change
in house-numbering would be made in accordance with the instruc-Review of bouse numbering tions already issued by the Government. But all authorities in
system-procedure adopted in 1960 the State should accept departures suggested by the Superintendent of Census Operations in house-numbering and implement them.
This position was accepted by the Government of Madras. A review of the house-numbering system was therefore, undertaken throughout the State with a view to bringing house-numbering up-to-date as on 30-9-1960 as a preparation for the houselisting to be done in October, 1960.
1 - 23. After intensive tour of the State, I, however, found that there were instances in which the principles enunciated by the Government were not properly understood or implemented
in certain parts of the State. There was also intense house building Check reveals defects- activity throughout the State during 1951-60. As such, it became
how rectified necessary to devote special attention to certain parts of the State with a view to make the house-numbering conform to the standard
prescribed by the Government. For instance, a special revision of house-numbering was done in _ Coimbatore City and Coimbatore taluk. But in ordering changes in certain other municipalities, there were some difficulties encountered by the Census Organisation. According to the Election Manual, the numbers should not be changed without the prior orders of the Government. As such, the view held by some of the local authorities was that for every change, the specific concurrence of the Government should be obtained. This was, to a certain extent, upheld by the ,individual orders issued by the Elections Department of the Government of Madras. The housenumbering system was primarily thought to be necessary for the preparation of electoral rolls and as such there was a bias in favour of election. For election purposes, the house-numbering should be static and should not be changed often. But, for Census, we wanted a house-numbering which was dynamic and in which changes should be incorporated depending on the construction activity in that area. I had. therefore, to address the Madras Government again pointing out these salient facts and they were pleased to issue orders in G. O. Ms. 366 Public (Elections) dated 23-6-1960 permitting the Superintendent of Census Operations to make such changes as
-were necessary in the house-numbering system of Madras State. It would not be necessary for this volume to indicate what exactly was done in pursuance of the G. O. But Circular No. 3 on house numbering would be of interest to any reader and I have reproduced it in Appendix II.
I - 24. 1 would now discuss how houselisting was conducted in Madras State. A draft Schedule was prepared by the Registrar General, India, subject to field test to be conducted by the
State Statistical Bureau. The schedule did not undergo any FinaIisatioD of substantial change by this pre-test. The second pre-test was conduct-houselist form ed in all States in August-September 1959 along with the pre-test
of the enumeration schedule for actual Census. About 5,000 house-holds were selected for the pre-test in the urban and rural areas of the districts of North Arcot,
-Coimbatore, Madurai, Kanyakumari and Madras and the work was entrusted to the school teachers who would form one of the major agencies to be employed for actual Census enumeration. The result of the pre-test was discussed at the Conference of the Superintendents of Census Operations held in New Delhi between 24th September and 1st October, 1959 and houselisting schedule finalised. The Registrar General indicated at the Conference that houselisting and final
PRELIMINARY 11
enumeration should be closely related in time, that the maximum interval between the two periods could be two to three months so that the series of operations beginning with houselisting upto the revisional- round would form a fairly continuous operation. It was decided at the Conference that the houselisting should be in a simple form containing the minimum number of questions. The original and final forms as finalised at the Conference are printed in Appendix III. In the Qriginal form, the tenure status of the household was classified into three categories-fully rented, fully owned and partly rented. This was modified at the Conference into two-owned and rented. In the original form, the number of persons residing in the house was classified into two groups-persons over 21 and persons below 21 years of age. This classification was given up. It was also decided to add an abstract at the conclusion of the houselisting for each enumeration block in the form given in Appendix IV and that houselist should be preserved as a permanent record for which purpose two copies should be made; one to be preserved at the taluk level and the other to be kept in the office of the Superintendent of Census Operations.
1 - 25. At the instance of the Planning Commission, the remarks column of the houseIist was utilised to indicate the households occupied by members of Scheduled Castes and Scheduled
Tribes by writing the word Scheduled Castes and Scheduled Tribes. Notional maps The enumerators were also asked to prepare a notional map for
their blocks marking therein places of importance, geographical details such as roads, streets, rivers, hills, private forests, temples, tanks and other land marks. The map would indicate the houses by numbers. On the map was also given a key to the plan indicating numbers of residential and non-residential buildings in the village or block. This map was attached to the houselist for the village, panchayat or municipality and then stitched with a cover or wrapper on which the following details were recorded:
1. Name of the district and code number. 2. Name of taluk and code number. 3. Name of village or panchayat and code number. 4. Number of blocks for which houselists have been prepared.
Information has been collected in the houselists on the following items:
1. Building number-municipal or local authority. 2. Building number with sub-number for each Census House. 3. Purpose for which the census house is used, i. e., dwelling, 'Shop, shop-cum-dwelling,
business, factory, workshop, school or other institution, jail, hostel etc •. 4. If the census house is used as an establishment, factory or workshop, the name
of establishment or proprietor. 5. Name of products, repair or servicing undertaken. 6. Average number of persons employed during the week preceding the day of visit by
the enumerator including the proprietor or household members, if working. 7. Kind of fuel or power if machinery is used. 8. Material of wall. 9. Material of roof.
10. Name of head of the household. 11. Number of rooms in the census household. 12. Tenure status of houselold-whether owned or rented. 13. Number of persons residing in census household on the day of visit by the
enumerator classified by sex.
12 REPORT ON HOUSING AND ESTABLISHMENTS
1 - 26. The schedule provided essential information which would be useful to study the housing shortage and to some extent the degree of overcrowding. The data collected would not, however, give information on the quality of housing from the point of view of amenities. It is obvious that though the number of rooms is known, the dimensions are not indicated with the result it would be difficult to assess to what extent people would find the house comfortable. It would, of course, have been more valuable if more particulars were collected on the facilities available in each building. But the primary reason which militated against the inclusion of questions relating to amenities in the houslist schedule was the consideration that no census enumerator should be overburdened with too many items. Further, houselisting was only the primary stage in the census. It was considered risky to collect too much material at that stage.
1 ·27. I reproduce as Appendix V the instructions issued on the houselisting in Madras State. As already indicated, the preparation of houselist was the first step in the census operations of 1961. It was spread over the entire month of October, 1960. Then the stage was
set for taking a decision on the question of census hierarchy. The Instructions on houseHstiag State Government issued a notification in May 1960 appointing
officers named therein as Census Officers within their local areas. This notification is reproduced in Appendix VI. Among the officers, the District Collectors were in full charge of the census operations in their respective districts and the City of Madras was left with the Commissioner of Madras Corporation. Each Collector was vested with powers to appoint Deputy Census Officers and was assisted in this work by his Personal Assistant empowered to act on his behalf. The Revenue Divisional Officers were in charge of house listing operations in the respective divisions. Each district was sub-divided into a number of charges and a Charge Officer appointed for each charge. Hewas in complete charge of the houselisiting operations. The Tahsildars were the Charge Officers in the areas within their taluks. Within the taluks, independent subtaluks formed separate charges under the control of Independent Deputy Tahsildars. Municipalities constituted separate charges with concerned Municipal Commissioners as Charge Officers. The TahsiIdars had no jurisdiction over the municipalities in his taluk except for the limited purpose of assigning location code numbers. Each charge was divided into a number of circles and a Supervisor was appointed to each circle. His duty was to assist the Charge Officer in implementing the instructions on the subject and supervise the enumerators working under his control. Each circle was further sub-divided into a number of blocks which formed the basic unit for houselisting. It was something distinct from the block formed for h01:lse-numbering purposes. It did not always coincide with the geographical boundaries of village or panchayat. Every Charge Officer demarcated the blocks taking into consideration the geographical boundaries, the estimated population and the physical features and once it was done. the block was treated as a unit for houseIisting and census enumeration. The City of Madras formed one charge and the City Census Officer was appointed to assist the Commissioner, Corporation of Madras.
1 - 28. The Collectors and the Commissioner were given the discretion to select the proper personnel for houselisting. It was, however, suggested to the Collectors that in rural areas
it was desirable to limit the agency to be employed for houselisting Personnel and training to the Revenue staff. In the ultimate analysis, the staff employed in
houselisting were in a large measure those who were later employed for census operations. A booklet containing instructions for the guidance of those engaged in it was issued. It was printed in four different languages-English, Tamil, Telugu and Malayalam. There were two training classes by each Charge Officer-one in the first week of September and the other during the last week of September 1960. Particulars of the personnel employed for houselisting are furnished in the following Statement: .
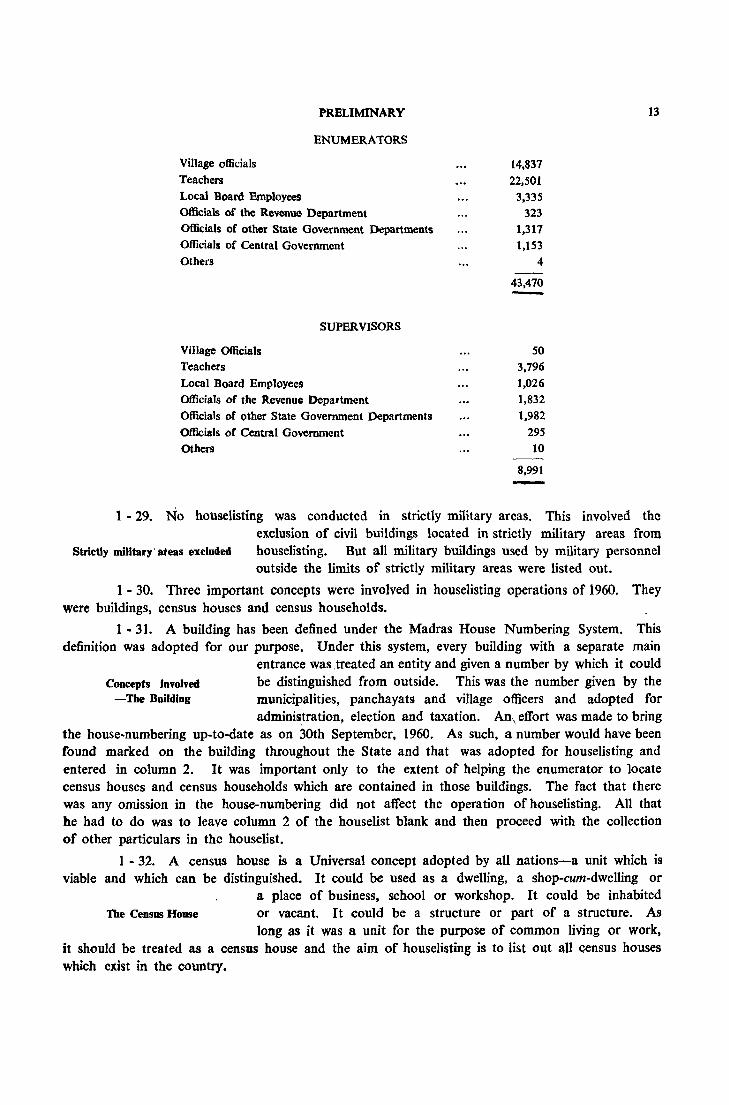
Village officials Teachers
PRELIMINARY
ENUMERATORS
13
Local Board Employees
14.837
22,501
3,335
323
1,317
1,153
4
Officials of the Revenue Oepartment Officials of other State Government Departments Officials of Central Government Others
43,470 -SUPERVISORS
Village Officials Teachers
50
3,796
1,026
1,832
1,982
Local Board Employees Officials of the Revenue Department Officials or other State Government Departments Officials of Central Government 295
10 Others
8,991 -1 - 29. No houselisting was conducted in strictly military areas. This involved the
Strictly military' ateas excluded
exclusion of civil buildings located in strictly military areas from houselisting. But all military buildings used by military personnel outside the limits of strictly military areas were listed out.
I - 30. Three important concepts were involved in houselisting operations of 1960. They were buildings, census houses and census households.
1 - 31. A building has been defined under the Madras House Numbering System. This definition was adopted for our purpose. Under this system, every building with a separate main
Concepts involved -The Building
entrance was ,treated an entity and given a number by which it could be distinguished from outside. This was the number given by the municipalities, panchayats and village officers and adopted for administration, election and taxation. An\ effort was made to bring
the house-numbering up-to-date as on 30th September, 1960. As such, a number would have been found marked on the building throughout the State and that was adopted for houselisting and entered in column 2. It was important only to the extent of helping the enumerator to locate census houses and census households which are contained in those buildings. The fact that there was any omission in the house-numbering did not affect the operation of houselisting. All that he had to do was to leave column 2 of the houselist blank and then proceed with the collection of other particulars in the houselist.
1 - 32. A census house is a Universal concept adopted by all nations-a unit which is viable and which can be distinguished. It could be used as a dwelling, a shop·cum-dwelling or
The Census House
a place of business, school or workshop. It could be inhabited or vacant. It could be a structure or part of a structure. As long as it was a unit for the purpose of common living or work,
it should be treated as a census house and the aim of houselisting is to list out all census houses which exist in the country.
14 REPORT ON HOUSING AND ESTABLISHMENTS
1 - 33. On a closer scrutiny, it will be found that the principles governing the definition of a census house were to a large extent identical with those adopted for the definition of a building
under Madras House Numbering System. But, for a census house, BuJldlng and Census House
The contrast there need not be a separate entrance. Thus a building which had only one separate main entrance could consist of a number of fiats each of which' would be a census house. A part of a
building which had no separate entrance could be used as a workshop or shop in which case each component would constitute a separate census house. As such, a census ho:use was a structure included in the building and functioned as a sub-unit of the building. It could be used for the purpose of living or for work or for living-cum-work. In actual practice, in majority of cases in urban areas and in most cases in rural areas, the census house was identical with a building as defined in Madras House Numbering System. It should be borne in mind that more than one census house would be contained in a building as numbered actually on ground.
I - 34. Census household referred to a group of persons who commonly lived together and took their meals from a common mess unless the exigencies of work prevented any of them from
dQing so. A census house could be occupied by one household or The Census Household more. Institutions, catering houses, boarding houses were also
treated as households where unrelated persons lived together. In our country, as the standard of living is low, good proportion of census houses would be occupied by more than one household and as such a clear distinction had been made between these two concepts-census house and census household-so that a proper assessment of our requirements and conditions of living could be made. A census house referred to a structure while census household referred to a group of persons.
I - 35. The problems found during the actual houselisting are indicated below. Some enumerators had difficulty in understanding the concept of census house properly. It was often
Difficulties encountered in the field
confused with building. They also used wrong abbreviation in numbering census houses. Instructions were that the houses should be noted by the Arabic numerals-I, 2 and 3, households by small alphabets-a, b, c. In few cases, there was an inter-change. Some
difficulty was experienced in defining a room. In few cases cattle sheds, garages, kitchen rooms which formed appendages to a building were treated as census houses. There were difficulty in understanding the concept of establishments covered by columns 5 to 8 of the houselist. The instruction was that where the predominent character of the establishment was manufacturing, processing, repairing or servicing, such establishment should be included. But there were marginal cases, for instance eating houses would be excluded while the same eating houses where • iddly' was' manufactured and sold to outsiders would be included. Another point considered was that the number of persons in the census household on the day of visit of the enumerator was to be entered in columns 15 to 17 of the houselist and casual visitors were to be excluded. It was clarified that if there were no visitors any person who lived elsewhere but who had come on a short visit should also be excluded. In other words, the enumerators were to record the actual number of persons who were normally residing in the house. Similarly, all those persons who had gone out and who were temporarily residing elsewhere were included in the list. Thus, the number of persons recorded during houselisting was on a de jure basis as against de facto basis adopted in actual census enumeration. In houselisting no specific date was fixed on which the information was synchronised. The enumeration was spread over a period of 31 days and, therefore, there would be gaps between the information collected in different parts of the State. It is my view that the training imparted to the enumerators should have been more exhaustive considering that
~R.ELlMtNAR Y is this type of houselisting was done for the first time in Indian Census and the concepts introduced were new and difficult to understand.
1 - 36. The houselisting in Madras State was inaugurated by a broadcast talk over the All India Radio by Sri K. Kamaraj, Chief Minister of Madras, on 30th September, 1960. There was
proper coverage by the Press also. No particular difficulty was Houselisting-The operation experienced in conducting the houselisting operations. The Charge
Officers received thc completed houselists from the Supervisors on or before 15-11-1960 and transmitted one copy of it to the Superintendent of Census Operations soon after the completion of their check. A statement containing the population for each tal uk based on the houselist was prepared by each Charge Officer. They furnished the figures by 20-11-1960 and the information was transmitted to the Registrar General by 25-11-1960. One set of houselist was sent to the Office of the Superintendent of Census Operations for tabulation of the data, the other copy of the houselist being retained at the office of the Charge Officers.
I - 37. The tabulation was centralised in Madras. The houselists from all Charge Officers were received in Madras by the end of November 1960. The houselists were checked with the charge
list with a view to find out omissions, if any. In two instances Tabulation of data in Madurai district, the houselist schedules were not arranged and
centralised stitched according to the location code numbers. The defect was rectified by rearranging and re- stitching the volumes. In a few
instances, breaks were noticed in house-numbering series. The Charge Officers were addressed and they supplied omissions stating that they were due to clerical errors while preparing the duplicate copies. In a few cases, one houselist form contained data relating to more than one house-numbering unit. In such cases, relevant extracts were taken for the second housenumbering unit, !the entry pertaining to them scored off in red ink in the original with the remark that they had been copied and inserted at the appropriate places in the volume and a cross reference was also made in the newly prepared houselists showing the source from which entries have been copied. After this broad primary check, houselists were kept in a serial order for each house-numbering unit. They were stitched into a volume with brown wrappers and- then pages were numbered serially.
1 - 38. The concept of a census house and a building could, to a large extent, be identical as far as Madras State is concerned. As such, it was decided not to make any distinction
Building and Census HouseNo distinction for enumeration
1961
between a census house and building for purpose of popUlation enumeration even though such a distinC\_ion was vital for houselisting. As such, the instructions were slightly modified that in actual census enumeration, the building number could be utilised and the number of households indicated by sub-numbers running
from • a' onwards. Thus in actual Census count of 1961, the number of occupied buildings have been enumerated. I am happy that this was done because it provided a comparative data with figures of previous Censuses.
1 - 39. Then the detailed scrutiny of entries in the houselist was taken up with th(\ object of rectifying errors, omissions and inconsistencies and supplying obvious omissions. As a general rule,
. no entry was corrected unless it was prima-facie a mistake and full Scrutiny of houselists and rectifi- details were available for justifying that correction. The simple
cation of obvious errors mistake that was observed in the houselist was the recording of unnecessary and superfluous details under certain columns. If one
census house was occupied by two households, the entry "dwelling" under column 4 was repeated on
16 REPORT ON HOUSING AND ESTABLISHMENTS
both the lines. Sometimes irrelevant entries were found in columns 5 to 8 even if a census house was not used as a workshop or factory. Such superfluous entries were scored off. In some cases, certain columns were deliberately or unintentionally omitted to be filled in. For example, even though there were clear indications in columns 5 to 8 and 11 to 17 that a census house was used as workshop-cumdwelling, column 4 was omitted, to be filled in as workshop-cum-dwelling. In such cases, omissions were supplied. In column 2 'building number' and column 3 'building number with subnumber' for census house, the same number was entered on the subsequent lines even when there were no separate buildings or census houses. These entries were cancelled. Otherwise they might lead to the inflation of the figures of the total number of buildings and census houses in a particular area. When the census house related to a cattle shed or water pumping ,shed, such entries were eliminated. Similarly, store rooms which are not godowns, kitchens or bed rooms which are necessarily accessories of a house have been treated as separate census houses and in such cases the entries were scored off. Instead of making entries in column 4, information was embodied in the remarks column. The latter entry was scored off and proper entry made in column 4. In som e cases the remark • vacant' in column 4 was followed by entries in columns 11 to 17 clearly indicating that the house was occupied. The entry 'vacant' in column 4 which was an obvious error was corrected as dwelling. Due to misconception of the concept of factory, some -enumerators recorded workshops as factories. A perusal of the entries in columns 6 to 8 confirmed that they were only workshops. The entry in column 4 was suitably corrected. In some cases where the censu s house had been used both as workshp and dwelling, an entry "dwelling" had been made in column 4. Such entries were corrected into workshop-cum-dwelling or factory-cumdwelling as the case may be. Column 5 was intended to record information in the case of factories and workshops where there was processing, repairing or servicing. In some cases, entries were fo\md in column 5, when the house was actually used as a hotel, laundry and photo studio. Such entries were transferred to column 18. In a few cases where one building consisted of more than one house, enumerators had left column 3 blank. Such omissions were supplied. In some cases where one household was in occupation of two census houses, enumerators had repeated in the second line all the entries relating to columns 1 to 17. In these cases, the entries in the second line were scored off. In cases of institutions like schools and colleges, separate blocks belonging to the same institution and housing class-rooms were treated as separate census houses. They were clubbed together to make one house.
1 - 40. I have here indicated in broad categories the nature of mistakes committed by the enumerators, but they formed unly a very small percentage of the total number of entries in
the houselists made by them. This listing of errors should not give High quality work by the reader a biassed idea of the nature of work done by the
enumerators enumerators in houselisting which was of a high quality. In the course of the discussion, I would be showing that the difficult
concept of census house was properly understood by them and the houselisting was thus made a success.
Til bulation-Preparation of Tables prescribed by
Registrar General
After the scrutiny of the houselist was completed, detailed tabulation was begun. According to the programme indicated by Registrar General, the tabulation envisaged the preparation of 5 Tables as follows:
Table I -Census house and the use to which it is put.
Table II -Census households classified by tenure status.

1>RELlMiNARY 11
Table III -Cfmsus houses used as workshops and factories classified by industry power used, no power (with or without machinery) and size of employment.
Table IV -Distribution of Census houses used wholly or partly as dwelling by wall and roof material.
Table V -Households classified by number of members and by number of rooms occupied.
Tables I and III were prepared on full count and others on a 20% sample. Tables I, III and IV were for census houses while Table II and V were for census households.
In addition to these 5 Housing Tables, which conformed to the All India pattern a
Primary houselist abstract-prepared
only in Madras
Primary Houselist Abstract was prepared in Madras State with a view to get details of number of Census buildings, number df censUs houses and households, number of establishments, workshops and factories, number of rooms in the census households and population.
The Primary Houselist Abstract was prepared in the form given below:
District: Taluk: Standard Administration Unit:
City Non-City Urban Rural
Location Name of No. of buildings
No. of Census houses
No. of establish
ments. workshops
and factories
Number of
households
No. of rooms
No. of persons residing in the household
Code the in cens.us households
No. place r- A __ ~
Males Females Total
1 2 3 4 5 6 7 8 9 10
1 - 41. The method indicated by Registrar General for the preparation of tables was known as 'Tally Method'. According to this, a frequency table should be prepared for each
characteristic to be tabulated in a separate sheet of paper. For Tally method of each count, fOllr tally marks would be made with vertical dashes and
abstraction discarded the fifth tally mark with a horizontal dash which would cross all the abbreviations. This gave a round number of 5 and by counting
the number of such units, it was possible to arrive at the total numbe,r of each characteristic. One practical difficulty was experienced in following this method, and that was to check the accuracy of the figures arrived at. Any Supervisor had to repeat the entire procedure with a view to conduct any overcheck and if he detected any discrepancy, to locate it, he had to do the process again. Under this method the work could not be checked at any point with a view to detect mistakes.
1 - 42. This method was not, therefore, followed in Madras State. By scanning through the pages, every characteristic was counted and the total number noted in pencil at the foot of the
page. From this page total, further consolidation was made. In Our method of abstraction . the case of small rural areas which were not divided into blocks
or wards, the consolidated total related to the standard administrative unit. In other cases, the figures were totalled for each enumerator's block or ward or locality from which the figures for each standard unit was built up. Taluk and district table were constructed on the basis of these figures. The tables were prepared in the following order:
H-3
18 REPORT ON HOUSING AND ESTABLISHMENTS
1. Primary Houselist Abstract 2. Table B-1 '3. Table E-II 4. Table E-IV 5. Table E-V 6. Table E-III
Figures were compiled separately:
1. For Cities 2. For non-city urban areas in a taluk 3. For rural areas in a taluk
In order to facilitate preparation of such information, suitable code numbers were given for each particular to be tabulated. This coding was done with a view to facilitate easy counting and to see that no mistake was made by confusing the entries at the tabulation stage. Extra precaution was taken to see that the coding was done accurately. We would indicate briefly how each abstract was prepared.
Primary houselist abstract
1 - 43. After completing the houselisting operation, an abstract was prepared by each enumerator which contained the following details for each enumeration block:
1. No. of census households. 2. No. of establishments, workshops and factories. l. Total number of rooms in all Irouseholds. 4. Males, Females and Total population.
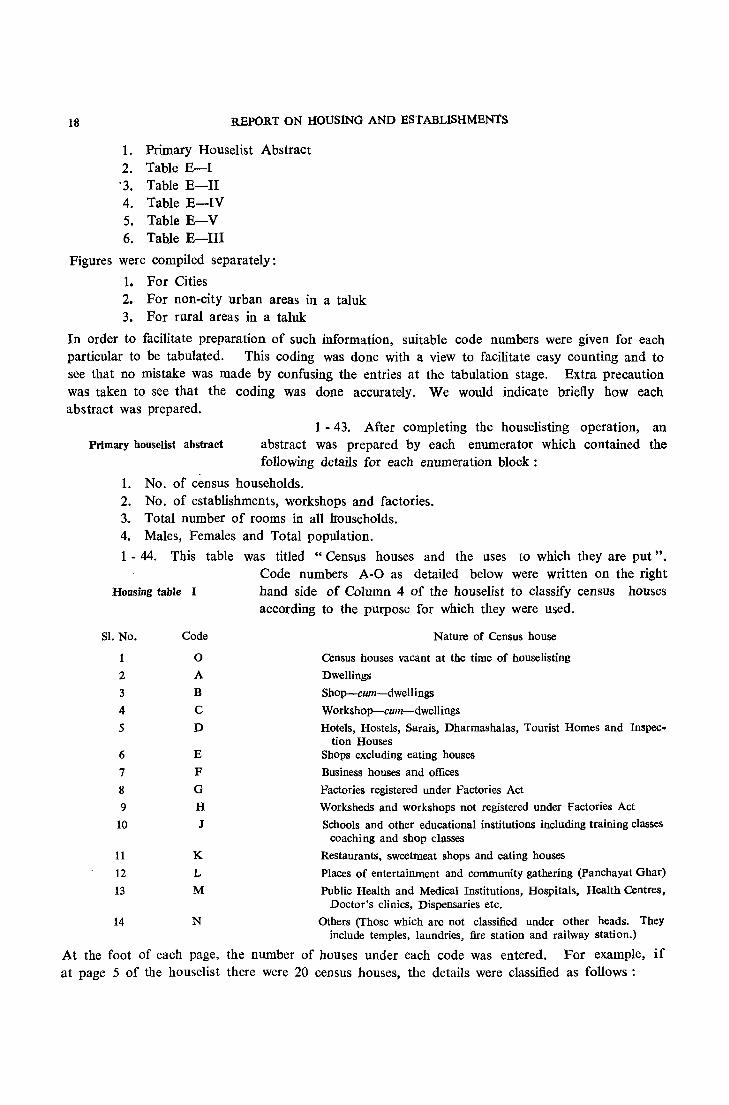
1 - 44. This table was titled "Census houses and the uses to which they are put".
Housing table I
SI. No. Code
1 0
2 A
3 B
4 C
5 D
6 E
7 F
8 G
9 H
10 J
11 K
Code numbers A-O as detailed below were written on the right hand side of Column 4 of the houselist to classify census houses according to the purpose for which they were used.
Nature of Census house
Census houses vacant at the time of houselisting
Dwellings
Shop-cum-dwellings
Workshop-cum-dwellings
Hotels, Hostels, Sarais, Dharmashalas, Tourist Homes and Inspec-tion Houses
Shops excluding eating houses
Business houses and offices
Factories registered under Factories Act
Worksheds and workshops not registered under Factories Act
Schools and other educational institutions including training classes coaching and shop classes
Restaurants, sweetmeat shops and eating houses
12 L Places of entertainment and community gathering (Panchayat Ghar)
13 M Public Health and Medical Institutions, Hospitals, Health Centres, Doctor's clinics, Dispensaries etc.
14 N Others (Those which are not classified under other heads. They include temples, laundries, fire station and railway station.)
At the foot of each page, the number of houses under each code was entered. For example, if at page 5 of the houselist there were 20 census houses, the details were classified as follows:
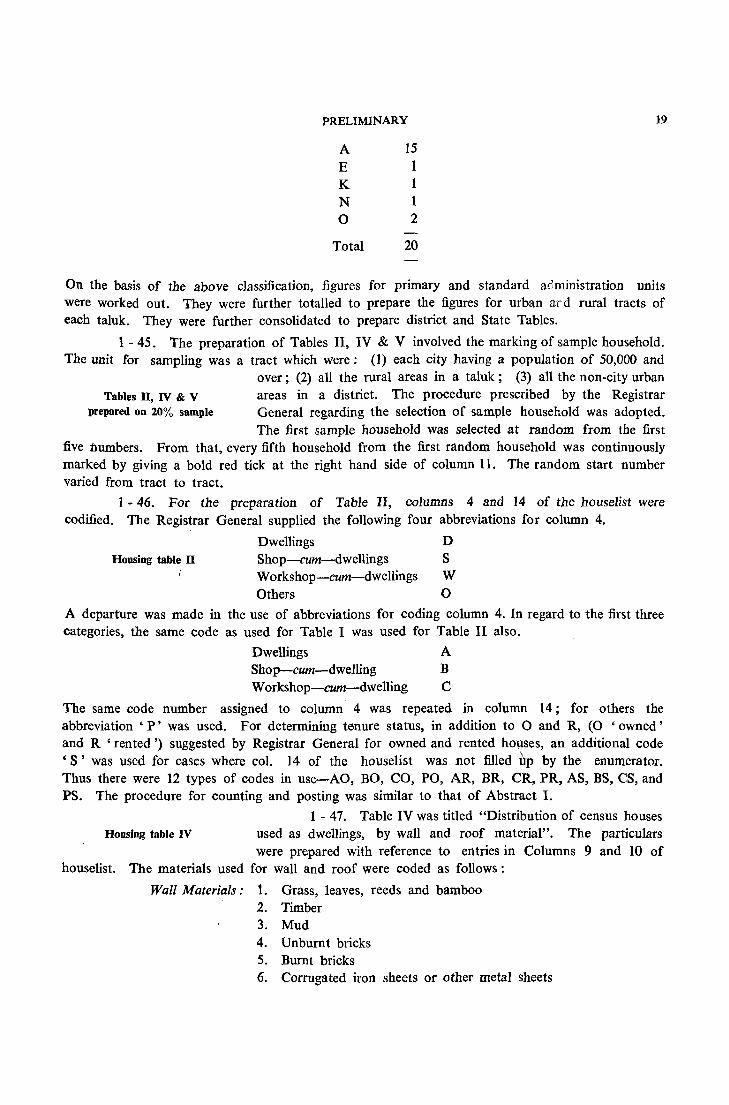
PRELIMINARY 19
A 15
E 1 K 1 N 1 0 2
Total 20
On the basis of the above c1assification, figures for primary and standard administration unhs were worked out. They were further totalled to prepare the figures for urban ard rural tracts of each taluk. They were further consolidated to prepare district and State Tables.
1 - 45. The preparation of Tables II, IV & V involved the marking of sample household. The unit for sampling was a tract which were: (1) each city having a population of 50,000 and
over; (2) all the rural areas in a taluk; (3) all the non-city urban Tables n, IV & V areas in a district. The procedure prescribed by the Registrar
prepared on 20% sample General regarding the selection of sample household was adopted. The first sample household was selected at random from the first
five numbers. From that, every fifth household from the first random household was continuously marked by giving a bold red tick at the right hand side of column 11. The random start number varied from tract to tract.
1 - 46. For the preparation of Table II, columns 4 and 14 of the houselist were codified. The Registrar General supplied the following four abbreviations for column 4.
Dwellings D Housing table n Shop-cum-dwellings S
Workshop-cum-dwellings W Others 0
A departure was made in the use of abbreviations for coding column 4. in regard to the first three categories, the same code as used for Table I was used for Table II also.
Dwellings A Shop-cum-dwelling B Workshop-cum-dwelling C
The same code number assigned to column' 4 was repeated in column 14; for others the abbreviation 'P' was used. For determining tenure status, in addition to ° and R, (0 'owned' and R 'rented ') suggested by Registrar General for owned and rented hOllses, an additional code , S' was used for cases where col. 14 of the houselist was not filled up by the enumerator. Thus there were 12 types of codes in use-AO, BO, CO, PO, AR, BR, CR, PR, AS, BS, CS, and PS. The procedure for counting and posting was similar to that of Abstract I.
1 - 47. Table IV was titled "Distribution of census houses Housing table IV used as dwellings, by wall and roof material". The particulars
were prepared with reference to entries in Columns 9 and 10 of houselist. The materials used for wall and roof were coded as follows:
Wall Materials,' 1. Grass, leaves, reeds and bamboo 2. Timber 3. Mud 4. Unburnt bricks 5. Burnt bricks 6. Corrugated iron sheets or other metal sheets

REPORT ON HOUSlNG AND ESTABLISHMENTS
Roof Materials:
7. Stone 8. Cement concrete 9. All other material
10. Material not stated
Grass, 1eaves, reeds, thatch, wood or bamboo Tiles, slate, shingle Corrugated iron, zinc or other metal sheet Asbestos cement sheet Brick and lime Concrete and stone slabs All other material
A B C D E F G
Material not stated H A table was prepared for the sample households already marked with a Red tick in column 11 from the page totals for columns 9 and 10 of the houselist and the taluk and district figures were arrived at.
I - 48. Table V was entitled "Households classified by number of members and by number of rooms occupied: ".
No codification was done for this Table. Working sheets were used for each location code unit for rural areas and for each enumerators' block in urban areas. Working sheets were
prepared separately for 7 categories viz. households with no Housing table V regular room, households with one room, 2 rooms, 3 rooms, 4
rooms, 5 rooms and above and no. of rooms not stated. In the case of working sheets relating to households with 5 rooms and above, break-up for each case like 5 rooms, 6 rooms and 7 rooms were also noted to arrive at the total number of rooms. The working sheets contained the following columns:
Code No.
Serial number of household
Working sheet Cor abstract V
Admn. Unit
District
Taluk
Std. Admn. Unit
Primary housenumbering Unit
20% Sample
Household with ........................... rooma Number of members
Males
Name
Females
1 - 49. Table III was titled "Census houses used as workshops and factorties classsified by industry, power used, no power (with or without machinery) and size of employment.
The preparation of this Table involved a three fold classification of the establishments, first classification .being the nature of industry, second being kind of fuel or power used and
third being the size of employment. The three digit industrial Housing table m code of the national industrial classification code was entered in
column 6 of the houseUst. In column 7 of the houselist, alphabets A-H as indicated below were added;
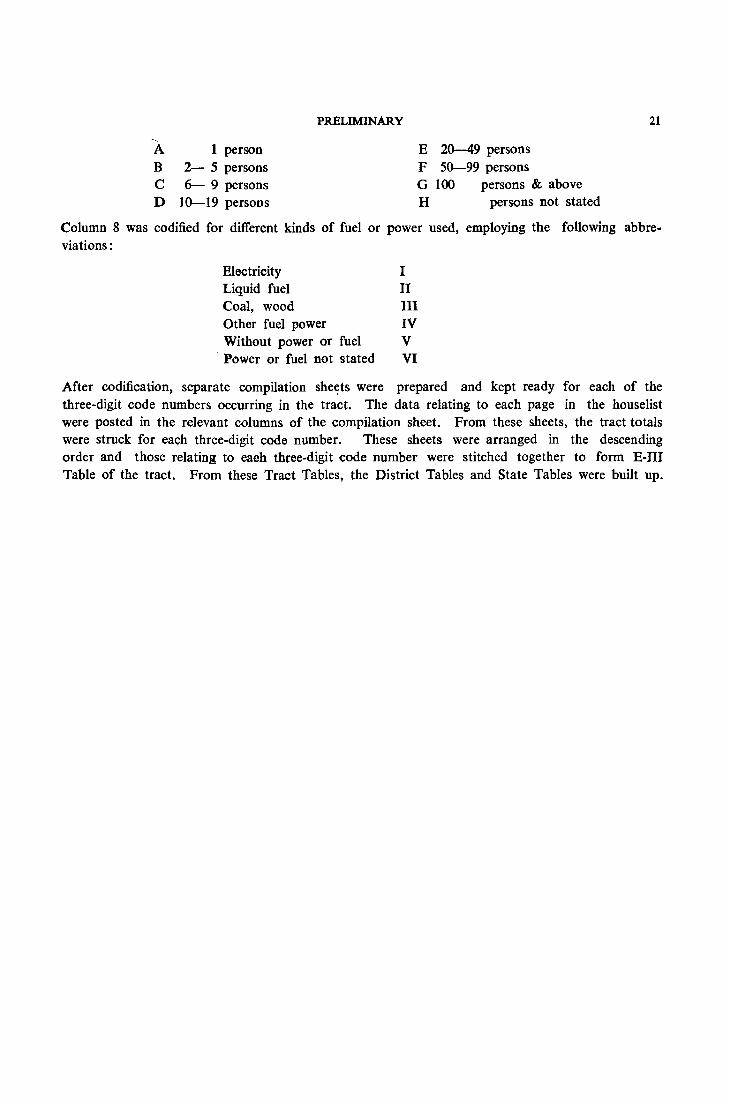
,_
A 1 person B 2- 5 persons C 6- 9 persons D 10-19 persons
PRELIMINARY
E 20-49 persons F 50-99 persons G 100 persons & above H persons not stated
21
Column 8 was codified for different kinds of fuel or power used, employing the following abbreviations:
Electricity I Liquid fuel II Coal, wood III Other fuel power IV Without power or fuel V
- Power or fuel not stated VI
After codification, separate compilation she~ts were prepared and kept ready for each of the three-digit code numbers occurring in the tract. The data relating to each page in the houselist were posted in the relevant columns of the compilation sheet. From these sheets, the tract totals were struck for each three-digit code number. These sheets were arranged in the descending order and those relating to each three-digit code number were stitched together to form E-III Table of the tract. From these Tract Tables, the District Tables and State Tables were built up.
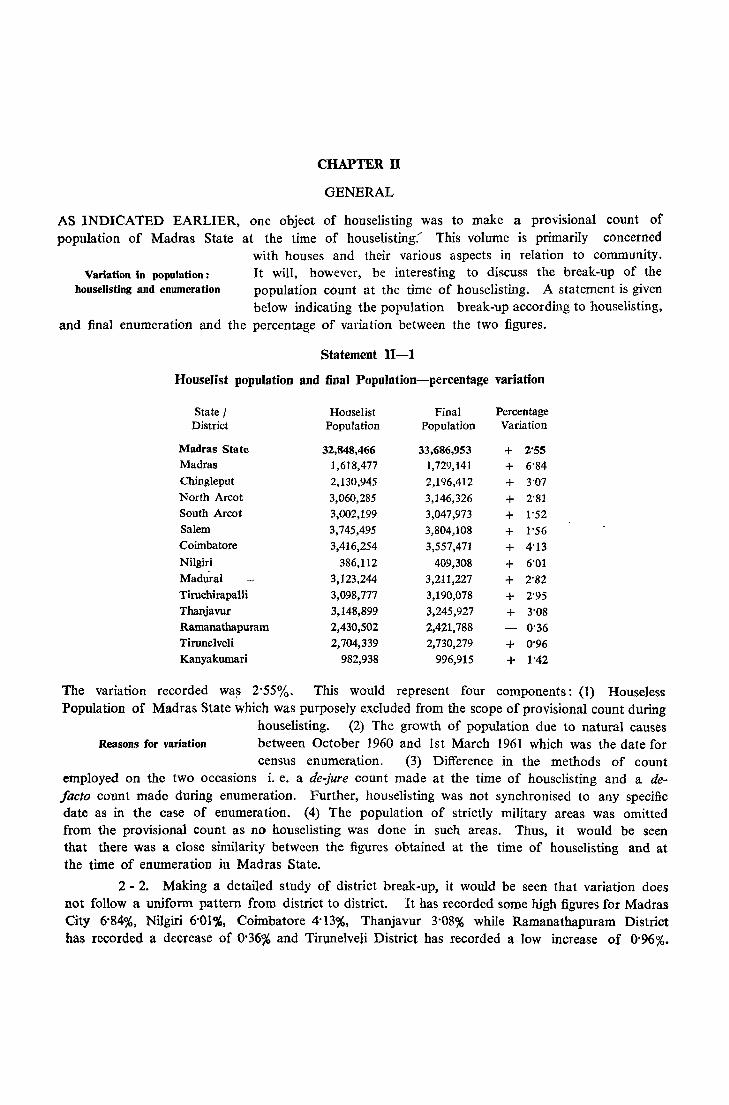
CHAPTER n
GENERAL
AS INDICATED EARLIER, one object of houselisting was to make a provisional count of population of Madras State at the time of houselisting: This volume is primarily concerned
Variation in population: bouseJisting and enumeration
with houses and their various aspects in relation to community. It will, however, be interesting to discuss the break-up of the population count at the time of houselisting. A statement is given below indicating the population break-up according to houselisting,
and final enumeration and the percentage of variation between the two figures.
Statement U-l
Houselist population and final Population-percentage variation
State / Houselist Final Percentage District Population Population Variation
Madras State 32,848,466 33,686,953 + 2'55 Madras 1,618,477 1,729,141 + 6'84 Chingleput 2,130,945 2,196,412 + 3'07 North Areot 3,060,285 3,146,326 + 2'81 South Areot 3,002,199 3,047,973 + 1'52 Salem 3,745,495 3,804,108 + 1'56 Coimbatore 3,416,254 3,557,471 + 4'13 Nilgiri 386,112 409,308 + 6'01 Madurai 3,123,244 3,211,227 + 2'82 Tiruehirapalli 3,098,777 3,190,078 + 2'95 Thanjavur 3,148,899 3,245,927 + 3'08 Ramanathapuram 2,430,502 2,421,788 0'36 Tirunelveli 2,704,339 2,730,279 + 0'96 Kanyakumari 982,938 996,915 + 1'42
The variation recorded wa~ 2'55%. This would represent four components: (1) Houseless Population of Madras State which was purposely excluded from the scope of provisional count during
houselisting. (2) The growth of population due to natural causes Reasons for variation between October 1960 and 1st March 1961 which was the date for
census enumeration, (3) Difference in the methods of count employed on the two occasions 1. e. a de-jure count made at the time of houselisting and a defacto count made during enumeration. Further, houselisting was not synchronised to any specific date as in the case of enumeration. (4) The popUlation of strictly military areas was omitted from the provisional count as no houselisting was done in such areas. Thus, it would be seen that there was a close similarity between the figures obtained at the time of houselisting and at the time of enumeration in Madras State.
2 - 2. Making a detailed study of district break-up, it would be seen that variation does not follow a uniform pattern from district to district. It has recorded some high figures for Madras City 6'84%, Nilgiri 6'01,%, Coimbatore 4'13%, Thanjavur 3'08% while Ramanathapuram District has recorded a decrease of 0'36% and Tirunelveli District has recorded a low increase of 0'96%.
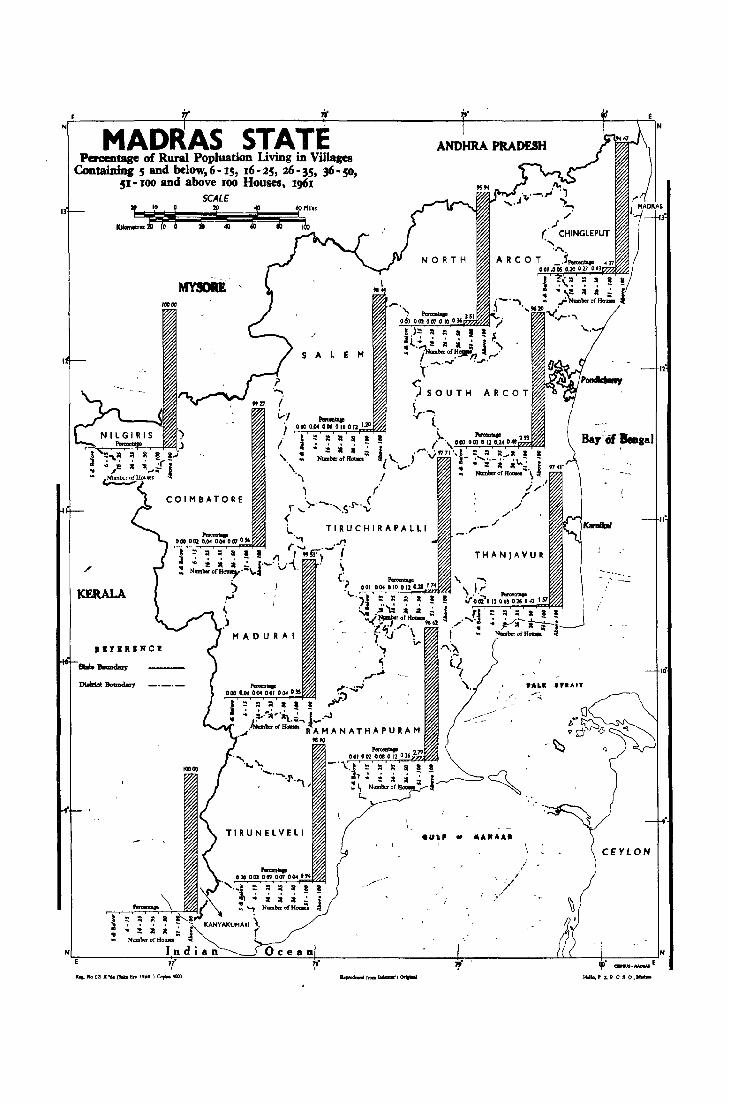
N
MADRAS STATE Percentage of Rural Popluation Living in Villages
Containing 5 and below,6-IS, 16-2S, 26-35, 36-50, 51 ~ 100 and above [00 Houses, 1961
SCAlf
$ ~ 10 0
,~ i £
1110110
/
SAL E M
COIM8ATORE
./
KERALA
RlrlRIJI'CI .. ........,. MADURAI
...... .... '\. ......... ---.,.
'J'.",\ ,
TIRUNELVELI
.;,.
ANDHRA PRADESH
NORTH
.11.0: '.,,.-.,. , ...... J ') .....
,/
(' ,I CHINGLEPUT
'" 'J'\,
ARC 0 T _3,_..... 417 001.005 0.20 OV 0'1
,II .... --.:
CEYlON
II·
N~------------~~V~.~~~~~~~~~~~~--------------------~~~------------~~---±~~--_.~--~E N
.... No9."!1.E·64(1KaHno 1816) CopSft«lOO ~"""ra.s.&or"OrfIiIIII HIII"'_' z,P C so • ....,.
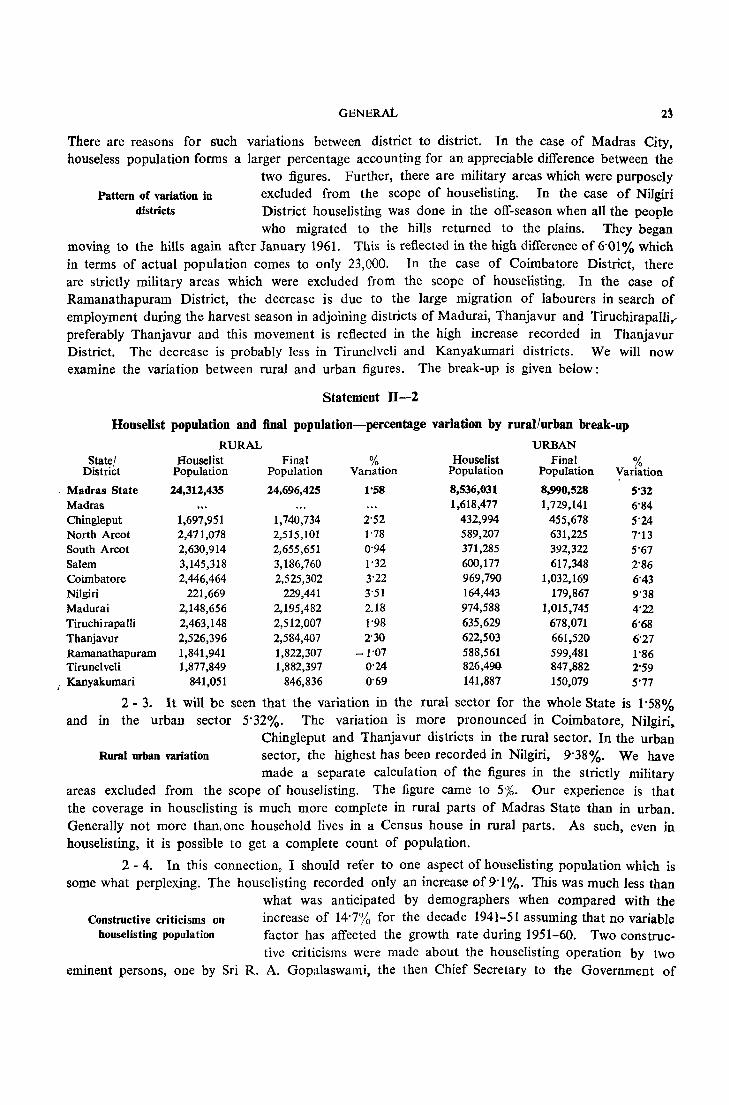
GENERAL 2~
There are reasons for such variations between district to district. In the case of Madras City, houseless population forms a larger percentage accounting for an appreciable difference between the
two figures. Further, there are military areas which were purposely Pattern of variation in excluded from the scope of houselisting. In the case of Nilgiri
districts District houselisting was done in the off-season when aU the people who migrated to the hills returned to the plains. They began
moving to the hills again after January 1961. This is reflected in the high difference of 6'01 % which in terms of actual population comes to only 23,000. In the case of Coimbatore District, there are strictly military areas which were excluded from the scope of houselisting. In the case of Ramanathapuram District, the decrease is due to the large migration of labourers in search of employment during the harvest season in adjoining districts of Madurai, Thanjavur an~ Tiruchirapalli, preferably Thanjavur and this movement is reflected in the high increase recorded in Thanjavur District. The decrease is probably less in Tirunelveli and Kanyakumari districts. We will now examine the variation between rural and urban figures. The break-up is given below:
Statement n-2
Houselist popUlation and final popUlation-percentage variation by rurallurban break-up
RURAL URBAN State! Houselist Final % Houselist Final %
District Population Population Vanation Population Population Variation
- Madras State 24,312,435 24,696,425 1'58 8,536,031 8,990,528 5'32 Madras 1,618,477 1,729,141 6'84 Chingleput 1,697,951 1,740,734 2'52 432,994 455,678 5'24 North Areot 2,471,078 2,515,101 1"78 589,207 631,225 7'13 South Areot 2,630,914 2,655,651 0'94 371,285 392,322 5'67 Salem 3,145,318 3,186,760 1'32 600,117 617,348 2'86 Coimbatore 2,446,464 2,525,302 3'22 969,790 1,032,169 6'43 Nilgiri 221,669 229,441 3'51 164,443 179,867 9'38 Madurai 2,148,656 2,195,482 2.18 974,588 1,015,745 4'22 TiruchirapaIIi 2,463,148 2,512,007 1'98 635,629 678,071 6'68 Thanjavur 2,526,396 2,584,407 2'30 622,503 661,520 6'27 Ramanathapuram 1,841,941 1,822,307 -1'07 588,561 599,481 1'86 Tirunelveli 1,877,849 1,882,397 0'24 826,4~ 847,882 2'59
/ Kanyakumari 841,051 846,836 0'69 141,887 150,079 5'77
2 - 3. It will be seen that the variation in the rural sector for the whole State is 1'58% and in the urban sector 5'32%. The variation is more pronounced in Coimbatore, Nilgiri.
Chingleput and Thanjavur districts in the rural sector. In the urban Rural urban variation sector, the highest has been recorded in Nilgiri, 9'38%. We have
made a separate calculation of the figures in the strictly military areas excluded from the scope of houselisting. The figure came to 5%. Our experience is that the coverage in houselisting is much more complete in rural parts of Madras State than in urban. Generally not more than, one household lives in a Census house in rural parts. As such, even in houselisting, it is possible to get a complete count of population.
2 - 4. In this connection, I should refer to one aspect of houselisting population which is some what perplexing. The house listing recorded only an increase of 9' 1%. This was much less than
what was anticipated by demographers when compared with the Constructive criticisms on increase of 14'7% for the decade 1941-51 assuming that no variable
houselisting population factor has affected the growth rate during 1951-60. Two construc-tive criticisms wcre made about the houselisting operation by two
eminent persons, one by Sri R. A. Gopalaswami, the then Chief Secretary to the Government of
i4 k'EPORt ON HOUSING AND IlST ABLISHMEN'tS
Madras and the previous Registrar General, India and the other by Sri A. ' Mitra, the present Registrar General. The view of Sri Gopalaswami was that there might be an undercount of population during houselisting. According to him, the population of Madras City which was estimated at 1,618,477 during houselisting was a realistic one while the count in the rural sector would require some further examination. A somewhat different approach was made by Sri A. Mitra, Registrar General, India. 'He pointed out that the decade 1951-60 was free from any causes which would contribute to such a reduction i. e., 14'7% to 10% which, according to him, would be the figure for 1951-61 based on the increase in houselisting population. But on the other hand, due to improvement in public health conditions, one would expect some rise compared to the last Censuses. This trend was reflected in the houselisting figures recorded in other States of India where the increase was as high as 20% or more. He, therefore, suggested that I should examine in detail whether the figures were reliable and whether there would be any loophole in the adoption of the already existing house-numbering system by which some of the houses might have been omitted from listing. He thought that though such a thing could not have happened, it would be desirable to have a careful and thorough check-up with the help of the Deputy Superintendents of Census Operations and see that all the houses have been completely listed and that at the enumeration stage, all the house~ were completely coveted. He also suggested that I should request the District Census Officers to undertake intensive tours before enumeration and to see that complete coverage was obtained.
2 - 5. It is not my object to examine the reasons for the low rate of increase recorded in Madras State during 1951-61 in this volume. I will be dealing with the subject in detail in my
My view
report on Demographic Trends and Vital Statistics of Madras State. However, I will briefly indicate the actual position regarding the procedure followed by enumerators in houselisting and I10W far the
constructive criticisms offered by these eminent authorities were helpful in making me see that an accurate count was made in 1961.
2 - 6. The rural population of Madras State has recorded as good an increase in 1951-61 as it had during 1941-51, the rate being 8'4% as against 8'1%. As such the rate of growth has been
Pattern of rural urban increase indicates no omission
maintained. Considering the trend in migration which has been exhibited by Madras State both in the rural and urban sector in the decade 1951-61, and reflected in the figures furnished by other Superintendents of Census Operations and considering that there
is no appreciable variation in the rate of growth that is based on births and de.aths, the increase in the rural sector can be said to be quite reasonable. !n the urban sector, the increase recorded was 16'40% during houselisting. It rose to 22'59% during the actual census count. For the following reasons, an omission could not have taken place from houselisting. The number of households in Madras City increased from 271,885 in 1951 to 328,219. The rate of increase is 20'72% for the period 1951-60. The population increase was only 14'3% for the same period. The number of occupied houses in Madras City rose from 87,888 in 1941 to 108,481 in 1951 and then to 147,694 in 1961. All urban areas have recorded similar increases. As such, there is no reason to hold that any particular household or census house was omitted to be ~overed during houselisting. The number of occupied houses in the Madras State as a whole IlOse by 18'6% during 1951-61 recording 18~6 variation in the State with 14'2% in the rural sector and 37'3% in the urban sector. The rate of increase in the number of occupied buildings has outstripped the increase of population. Further, a specific provision was made in the houselisting manual that whenever a house has not been given a number, it should be marked as X and a scrutiny of the houselist showed that in a number of cases the enumerator had put X in the houselist. Further, the general difficulty in the house-numbering system cannot be assigned as

GENERAl 2S
the reason for the fall in the urban population because the count has differed from town to town in population increase. In some cases, a substantial increase has been recorded while in others a marked fall has been recorded. The following examples will be illustrative:
Town
Coimbatore Salem Erode Tiruppur Ootacamund Madurai Dindigul Tirunelveli Tuticorin Nagercoil Vellore Thanjavur Kumbakonam Nagapattinam
% Variation 1951-60
34'6 20'5 21'3 34'2 12'3 13'9 15'5 IN 21'1 24'5
(-) 2'3 (-) 1'3 (-) 6'1 (-) 4'7
These figures will substantiate the point that the fall in the urban population cannot be attributed to any general cause like omission of household in listing.
2 - 7. It will again be interesting to study this on the basis of households. According to Primary Census Abstract the number of households in Madras State is 7,257,363. This has
recorded an increase of 2'12% over the figure recorded at the time Greater urban variation....,...reasons of houselisting. Breaking the figures into rural and urban, the
increase is 5'71% in the urban sector and 0'92% in the rural sector. It will be seen that the percentage of increase in households is inappreciable in both the sectors. It is likely that thd fact that there was a de-jure count during houselisting has been reflected more in the urban sector which has always a high floating population while such floating population was omitted from houselisting purposely. Any person had to be enumerated in the count if he happened to be at the place on 1st March 1961. This would explain the larger increase recorded in the urban population of Madras State between houselisting and actual enumeration.
As a measure of precaution, however, all Charge Officers were instructed to re-check the house-numbering and to see that no household was omitted from count. The Deputy Superin
tendents of Census Operations were also directed to check the Precautions to ensure houselisting with actual conditions prevailing on ground and to
full count see that no omission takes place. Even if there was an omis-\
sion in house-numbering, instructions issued were made clear that whether the houses have numbers or not, they should be listed and an households enumerated. These instructions were repeated in the Enumeration Manual issued for the guidance of enumerators. It was enjoined on them that whether the building had a number or not was of no material importance for census enumerators.
2 - 8. A circular was issued to all Charge Officers indica- . Personal tetter to Charge Officers ting what should be done to make the enumeration as accurate as
possible. The circular is reproduced below : "I am addressing tJtis personal letter to you with the hope that you will attend to its
contents with all seriousness. It is quite necessary that the figures of population which we furnish for the Madras
State for the enumeration of 1961 should be as accurate as possible. I am confident that you will normally take every step required to see that an accurate return of the population is made. But there are certain aspects of this question which you have to keep in mind. According to the houselisting
H ..... 4
26 REPORT ON HOUSING AND ESTABLISHMENtS
which we conducted in October 1960, we find that the population of Madras State has increased only by 9.1% for the period 1951-60. The figures for the corresponding period 1941-51 was 14'7%. There is a general impression that the variation during the decade 1951-61 should not normally show any decrease over the variation during decade 1941-51. This is based on the following considerations. No serious epidetpic or famine conditions have occurred after 1951. Normally owing to the increase in Public Health activities, death rate should have fallen for the decade. Birth rate can be taken to be the same as the last decade. As such, the same increase or a little more is expected. This is the view held by Demographers. It is necessary to keep this in mind and to attend to the enumeration after taking care to see that no household is omitted from enumeration and that there is no under-count of any household. For this purpose, a complete re-check of the houses and households in your jurisdiction will be necessary.
As a result of the analysis in our office, we find that the rural population of the State has maintained the same increase during 1951·60 as in 1941-51. As such, it is necessary for you to concentrate more on the urban areas which have recorded a substantial fall in the rate of increase.
It is not my intention that any attempt should be made by you to increase the count of population of the State. What is necessary for you is to satisfy yourself that the count is accurate and we are returning by February 1961 the actual population of Madras State. Whether any over count has taken place in 1951 or not will not be our concern at this stage.
I will be happy if I can secure your co-operation in making an accurate return of the population of Madras State in 1961."
2 - 9. I do not propose to discuss any further the reason for the lowest population increase recorded by Madras State, 11'85%. Perhaps the steps taken had some beneficial effects in the urban sector, viz., that the percentage of increase rose from 16'40 to 22'59. This was much less than what was recorded in 1941-51. This difference has been explained on the basis that there is a large scale trend of out-migration from rural to urban sector and that there is a large scale out-migration from both sectors in the decade 1951-61. These aspects would be discussed in a separate volume and no further comments are needed at this stage.
2 - 10. A letter was also issued to all the Collectors to explain the variation observed between houselist population and what was expected to be the population in 1960. Based on
all factors like rural-urban migration, migration of labour population, Personal letter to Collectors growth of industrial townships, settlements and adverse seasonal
conditions, it was pointed out that the examination of the conditions and the reasons for the decrease in the population or for the increase in the popUlation as the case may be, based on the local knowledge of the Collectors and his subordinates would be of interest. We have received some valuable reports from the Collectors, but they will be utilised in the volume on Demographic Trends. The one beneficial effect of all these steps was that every Charge Officer was well aware that the Census Organisation expected them to be on the guard against the omission of any household from enumeration in 1961.
2 - 11. The success of houselisting depends on the extent to which the concept of Census house has been understood by the enumerator. From the definitions given earlier it is obvious that
the census house is a structure included in the building and fune-Proportion of buildings to tioning as a sub-unit. In some cases, the census houses will there-
census houses fore be identical with a building as defined in the Madras House Numbering System. According to the houseIist, Madras State
returned 7,210,283 buildings and 7,799,674 census houses which gives a proportion of 1'08 census houses for every building. The table below indicates the break~up for all the districts:
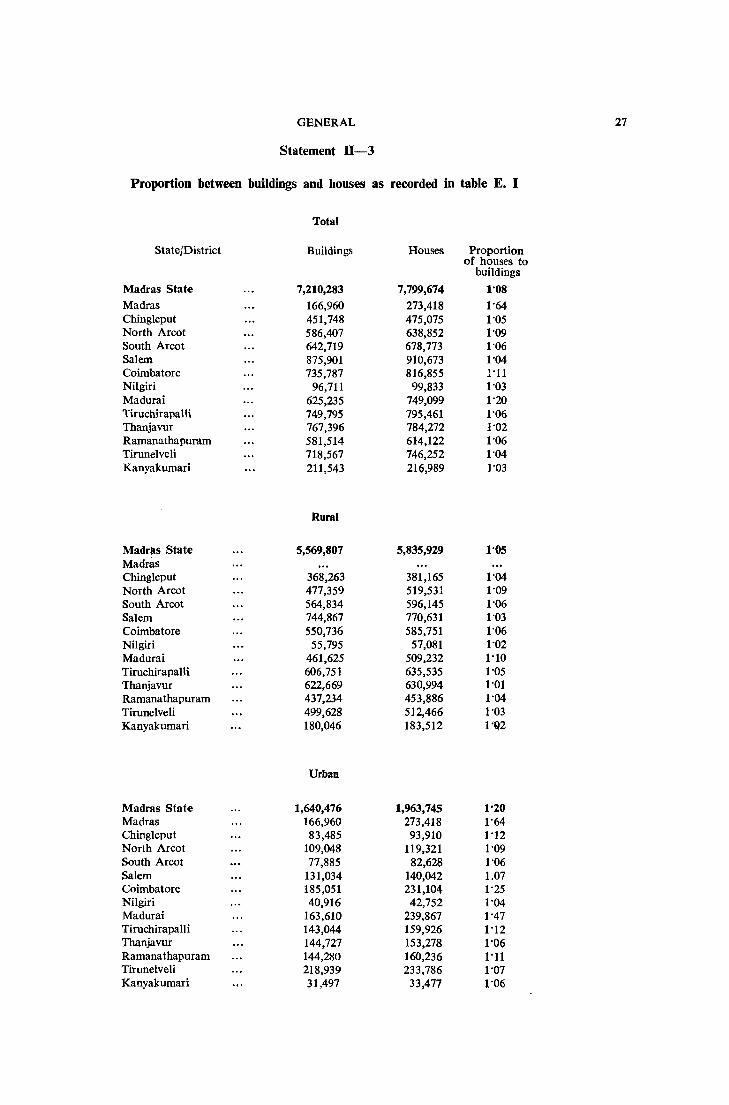
GENERAL 27
Statement ll-3
Proportion between buildings and houses as recorded in table E. I
Total
State/District Buildings Houses Proportion of houses to
buildings
Madras State 7,210,283 7,799,674 1·08
Madras 166,960 273,418 1·64 Chingleput 451,748 475,075 1·05 North Areot 586,407 638,852 1·09 South Areat 642,719 678,773 1·06 Salem 875,901 910,673 1·04 Coimbatore 735,787 816,855 1·11 Nilgiri 96,711 99,833 1·03 Madurai 625,235 749,099 1·20 Tiruehirapalli 749,795 795,461 1·06 Thanjavur 767,396 784,272 1·02 Ramanathapuram 581,514 614,122 1·06 Tirunelveli 718,567 746,252 1·04 Kanyakumari 211,543 216,989 1·03
Rural
Madrlls State 5,569,807 5,835,929 1·05 Madras Chingleput 368,263 381,165 1·04 North Areat 477,359 519,531 1·09 South Areat 564,834 596,145 1·06 Salem 744,867 770,631 1·03 Coimbatore 550,736 585,751 1·06 Nilgiri 55,795 57,081 1·02 Madurai 461,625 509,232 1·10 Tiruehirapalli 606,751 635,535 1·05 Thanjavur 622,669 630,994 1·01 Ramanathapuram 437,234 453,886 1·04 Tirunelveli 499,628 512,466 1·03 Kanyakumari 180,046 183,512 lo'Q2
Urban
Madras State 1,640,476 1,963,745 1·20 Madras 166,960 273,418 1·64 Chingleput 83,485 93,910 1·12 North Areot 109,048 119,321 1·09 South Areat 77,885 82,628 1·06 Salem 131,034 140,042 1.07 Coimbatore 185,051 231,104 1·25 Nilgiri 40,916 42,752 1·04 Madurai 163,610 239,867 1·47 Tiruehirapal1i 143,044 159,926 1·12 Thanjavur 144,727 153,278 1·06 Ramanathapuram 144,280 160,236 1·11 Tirunelveli 218,939 233,786 1·07 Kanyakumari 31,497 33,477 1·06
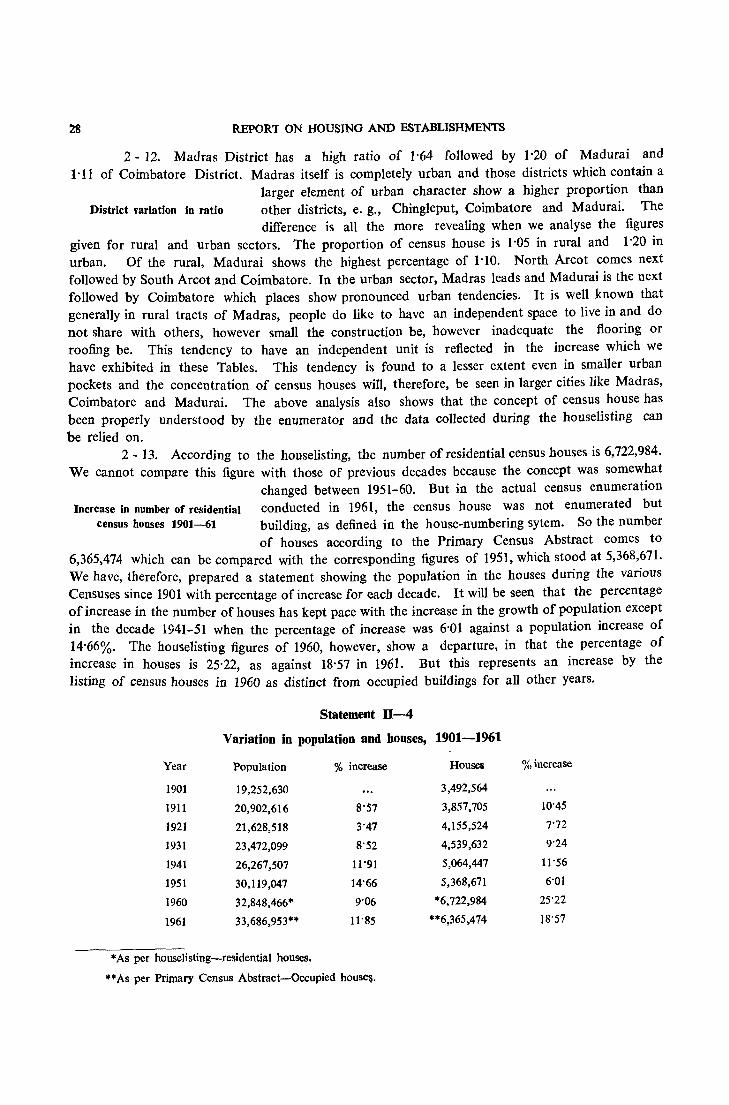
28 REPORT ON HOUSING AND ESTABLISHMENTS
2 - 12. Madras District has a high ratio of 1'64 followed by 1'20 of Madurai and 1'11 of Coimbatore District. Madras itself is completely urban and those districts which contain a
larger element of urban character show a higher proportion than District variation in ratio other districts, e. g., Chingleput, Coimbatore and Madurai. The
difference is all the more revealing when we analyse the figures given for rural and urban sectors. The proportion of census house is 1'05 in rural and 1'20 in urban. Of the rural, Madurai shows the highest percentage of 1'10. North Arcot comes next followed by South Arcot and Coimbatore. In the urban sector, Madras leads and Madurai is the next followed by Coimbatore which places show pronounced urban tendencies. It is well known that generally in rural tracts of Madras, people do like to have an independent space to live in and do not share with others, however small the construction be, however inadequate the flooring or roofing be. This tendency to have an independent unit is reflected in the increase which we have exhibited in these Tables. This tendency is found to a lesser extent even in smaller urban pockets and the concentration of census houses will, therefore, be seen in larger cities like Madras, Coimbatore and Madurai. The above analysis also shows that the concept of census house has been properly understood by the enumerator and the data collected during the houselisting can be relied on.
2 - 13. According to the houselisting, the number of residential census houses is 6,722,984. We cannot compare this figure with those of previous decades because the concept was somewhat
changed between 1951-60. But in the actual census enumeration Increase in number of residential conducted in 1961, the census house was not enumerated but
census houses 1901-61 building, as defined in the house-numbering sytem. So the number of houses according to the Primary Census Abstract comes to
6,365,474 which can be compared with the corresponding figures of 1951, which stood at 5,368,671. We have, therefore, prepared a statement showing the population in the houses during the various Censuses since 1901 with percentage of increase for each decade. It will be seen that the percentage of increase in the number of houses has kept pace with the increase in the growth of population except in the decade 1941-51 when the percentage of increase was 6'01 against a population increase of 14'66%. The houselisting figures of 1960, however, show a departure, in that the percentage of increase in houses is 25'22, as against 18'57 in 1961. But this represents an increase by the listing of census houses in 1960 as distinct from occupied buildings for all other years.
Statement Il-4
Variation in population and houses, 1901-1961
Year Population % increase Houses % increase
1901 19,252,630 3,492,564
1911 20,902,616 8'57 3,857,705 10'45
1921 21,628,518 3'47 4,155,524 7'72
1931 23,472,099 8'52 4,539,632 9'24
1941 26,267,507 11'91 5,064,447 11'56
1951 30,119,047 14'66 5,368,671 6'01
1960 32,848,466'" 9'06 *6,722,984 25'22
1961 33,686,953"'''' 11'85 """6,365,474 18'57
• As per houselisting-residential houses •
• * As per Primary Census Abstract-Occupied houselj.
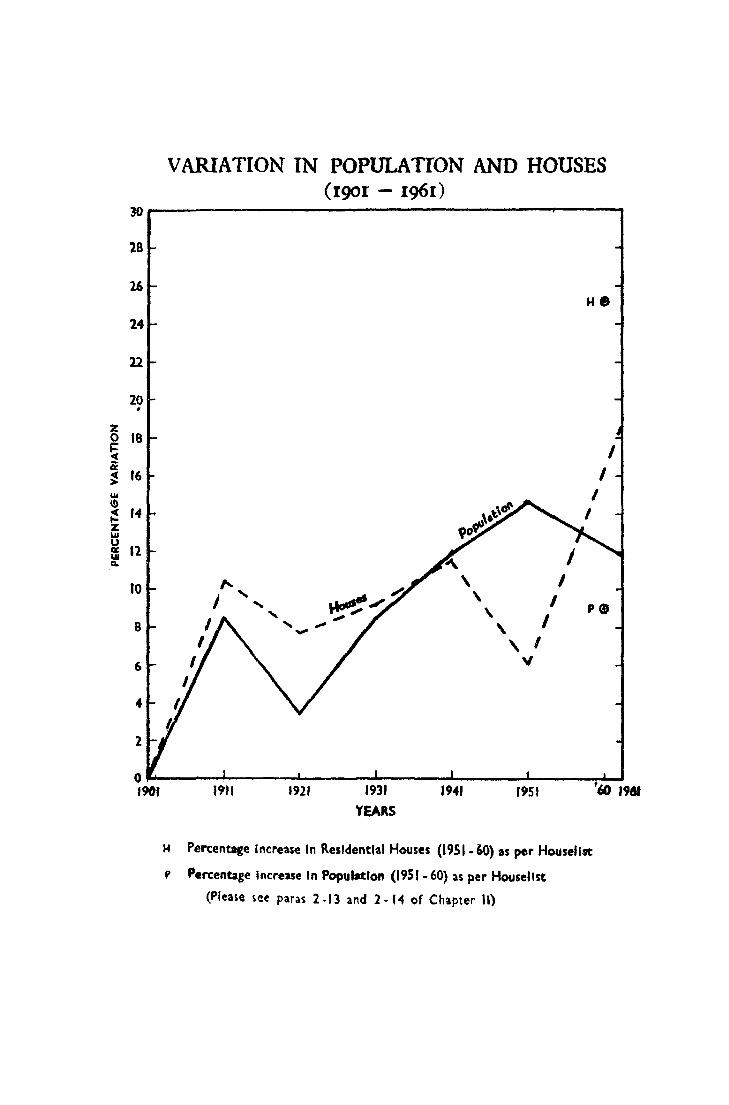
30
28
16
24
22
20 . z 0 18 ~ ii ~ 16 1.11 i,O
14 ~ z loll U
11 CIt UI Q.
10
B
6
4
2
0 ,9&,
VARIATION IN POPULATION AND HOUSES (1901 - I96r)
,... I " ..... .... ,. -
19H 1921 193. '951 YEARS
H Percentace increase In Residential Houses (1951.60) as per HouselJ9t
f' Percentage increase In Popul.-:lon (195 I .60) as per HouseHst
(Please see paras 2 -13 and 2 - 14 of Chapter H)
'~ 1941
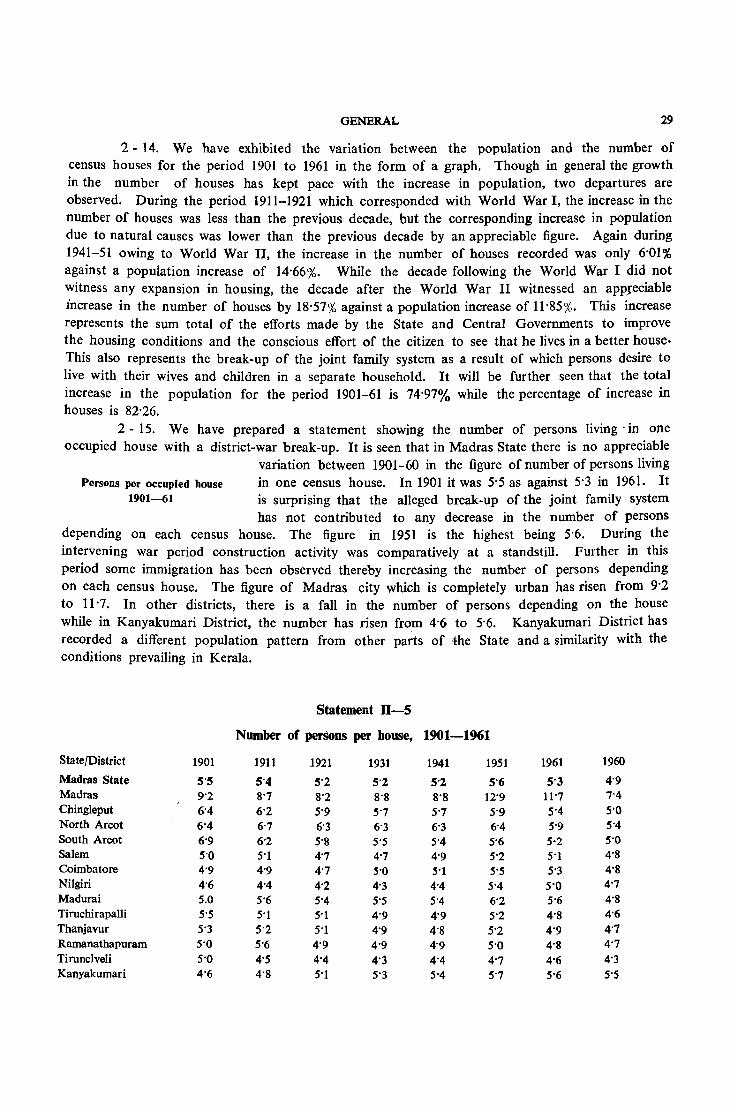
GENERAL 29
2 - 14. We have exhibited the variation between the population and the number of census houses for the period 1901 to 1961 in the form of a graph. Though in general the growth in the number of houses has kept pace with the increase in population, two departures are observed. During the period 1911-1921 which corresponded with World War I, the increase in the number of houses was less than the previous decade, but the corresponding increase in population due to natural causes was lower than the previous decade by an appreciable figure. Again during 1941-51 owing to World War II, the increase in the number of houses recorded was only 6'01% against a population increase of 14'66%. While the decade following the World War I did not witness any expansion in housing, the decade after the World War II witnessed an appreciable increase in the number of houses by 18'57% against a population increase of 11'85%. This increase represents the sum total of the efforts made by the State and Central Governments to improve the housing conditions and the conscious effort of the citizen to see that he lives in a better house. This also represents the break-up of the joint family system as a result of which persons desire to live with their wives and children in a separate household. It will be further seen that the total increase in the population for the period 1901-61 is 74'97% while the percentage of increase in houses is 82'26.
2 - 15. We have prepared a statement showing the number of persons living· in one occupied house with a district-war break-up. It is seen that in Madras State there is no appreciable
Persons per occupied house 1901--61
variation between 1901-60 in the figure of number of persons living in one census house. In 1901 it was 5'5 as against 5'3 in 1961. It is surprising that the alleged break-up of the joint family system has not contributed to any decrease in the number of persons
depending on each census house. The figure in 1951 is the highest being 5'6. During the intervening war period construction activity was comparatively at a standstill. Further in this period some immigration has been observed thereby increasing the number of persons depending on each census house. The figure of Madras city which is completely urban has risen from 9'2 to 11'7. In other districts, there is a fall in the number of persons depending on the house while in Kanyakumari District, the number has risen from 4'6 to 5'6. Kanyakumari District has recorded a different popUlation pattern from other pa~ts of the State and a similarity with the conditions prevailing in Kerala,
Statement II-5
Number of persons per house, 1901-1961
State/District 1901 1911 1921 1931 1941 1951 1961 1960
Madras State 5·5 5'4 5'2 5'2 5'2 5'6 5'3 4'9 Madras 9'2 S'7 S'2 S'S S'8 12'9 11'7 7'4 Ching}eput 6'4 6'2 5'9 5'7 5'7 5'9 5'4 5'0 North Arcot 6'4 6·7 6'3 6'3 6'3 6'4 5'9 N South Arcot 6'9 6'2 S'S 5'5 5'4 5'6 5·2 s·o Salem 5'0 5'1 4'7 4'7 4'9 5'2 5'1 4'S Coimbatore 4'9 4'9 4'7 5'0 5'1 S'S 5'3 4'8 Nilgiri 4'6 4'4 4'2 4'3 4'4 5"4 5'0 4'7 Madurai 5.0 5'6 5'4 5'5 5"4 6·2 5"6 4'8 Tiruchirapalli 5'5 5'1 5'1 4·9 4'9 5'2 4'S 4'6 Thanjavur S·3 S'2 5'1 4'9 4'8 S'2 4'9 4·7 Ramanathapuram 5·0 5'6 4'9 4·9 4'9 S'O 4'8 4'7 Tirunelveli 5'0 4'5 4'4 4'3 4·4 4'7 4'6 4'3 Kanyakumari 4·6 4'S 5'1 5'3 S'4 5·7 5'6 5'5
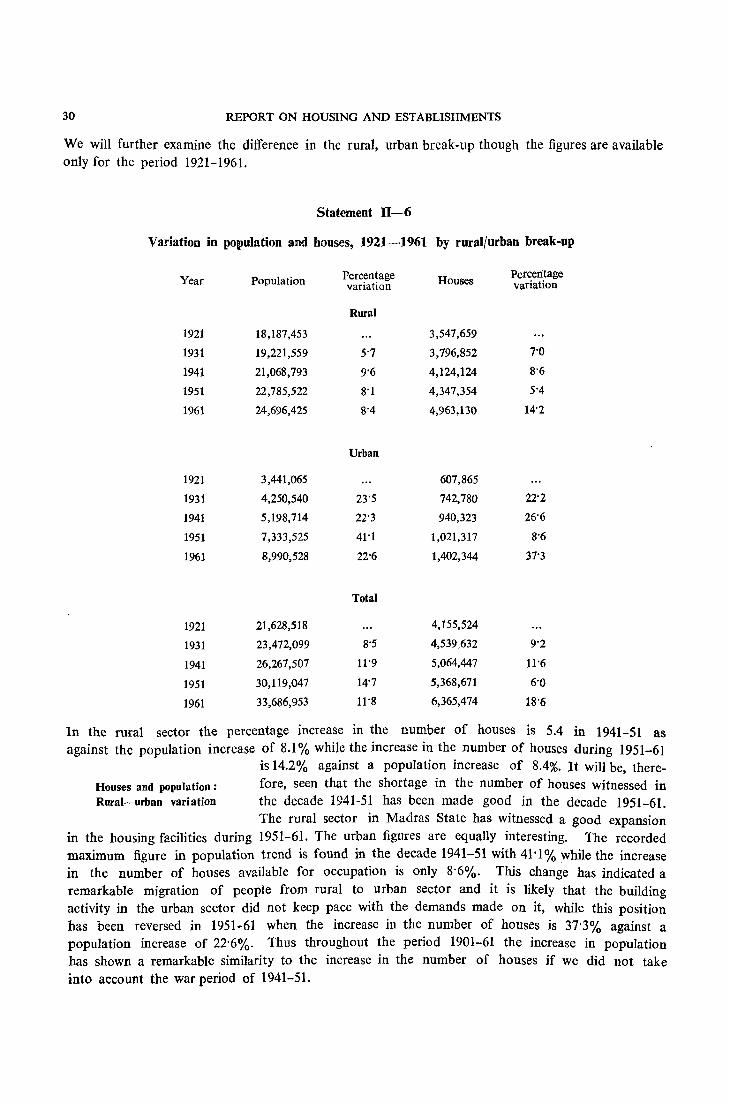
30 REPORT ON HOUSING AND ESTABLISHMENTS
We will further examine the difference in the rural, urban break-up though the figures are available only for the period 1921-1961.
Statement ll-6
Variation in population and houses, 1921-1961 by rural/urban break-up
Year Population
1921 18,187,453
1931 19,221,559
1941 21,068,793
1951 22,785,522
1961 24,696,425
1921 3,441,065
1931 4,250,540
1941 5,198,714
1951 7,333,525
1961 8,990,528
1921 21,628,518
1931 23,472,099
1941 26,267,507
1951 30,119,047
1961 33,686,953
Percentage variation
Rural
5'7
9'6
8'1
8'4
Urban
23'5
22'3
41"1
22'6
Total
8'5
11'9
14'7
11'8
Houses Perceritage variation
3,547,659
3,796,852 7'0
4,124,124 8'6
4,347,354 5'4
4,963,130 14'2
607,865
742,780 22'2
940,323 26'6
1,021,317 8'6
1,402,344 37'3
4,155,524
4,539,632 9'2
5,064,447 11'6
5,368,671 6'0
6,365,474 18'6
In the rural sector the percentage increase in the number of houses is 5.4 in 1941-51 as against the population increase of 8.1 % while the increase in the number of houses during 1951-61
Houses and population: Rural-urban variation
is 14.2% against a population increase of 8.4%. It will be, therefore, seen that the shortage in the number of houses witnessed in the decade 1941-51 has been made good in the decade 1951-61. The rural sector in Madras State has witnessed a good expansion
in the housing facilities during 1951-61. The urban figures are equally interesting. The recorded maximum figure in population trend is found in the decade 1941-51 with 41'1% while the increase in the number of houses available for occupation is only 8'6%. This change has indicated a remarkable migration of people from rural to urban sector and it is likely that the building activity in the urban sector did not keep pace with the demands made on it, while this position has been reversed in 1951-61 when the increase in the number of houses is 37'3% against a popUlation increase of 22'6%. Thus throughout the period 1901-61 the increase in popUlation has shown a remarkable similarity to the increase in the number of houses if we did not take into account the war period of 1941-51.
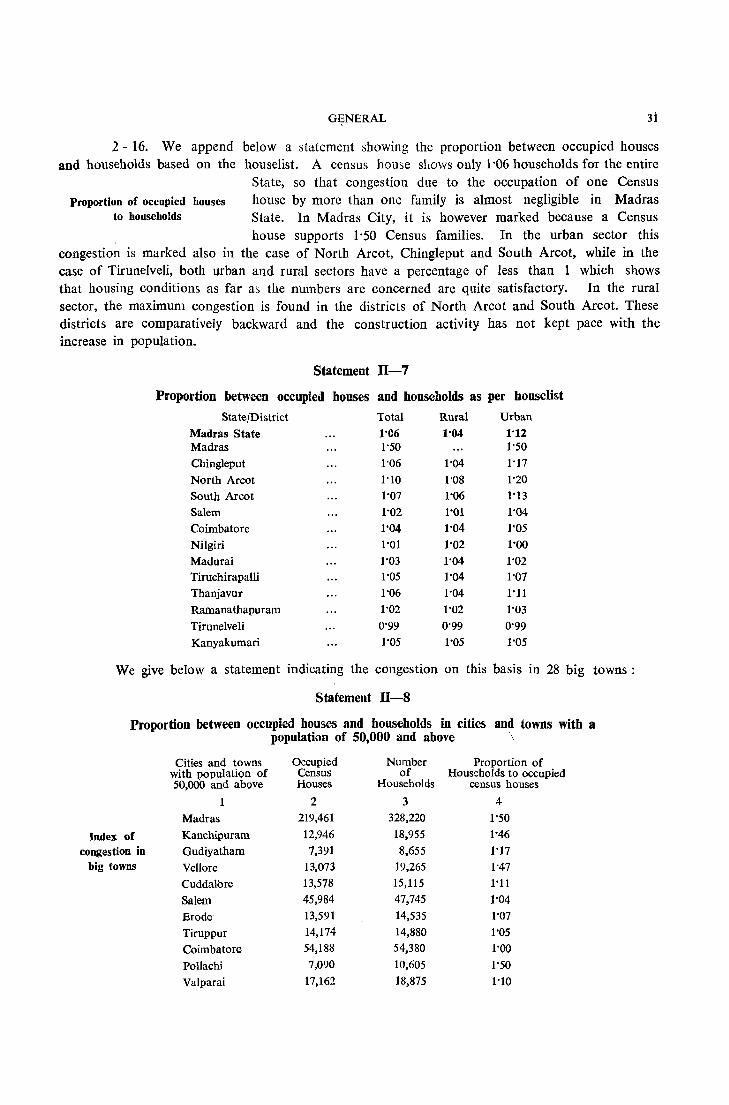
GENERAL 3i
2 - 16, We append below a statement showing the proportion between occupied houses and households based on the houselist. A census house sho"."s only 1-06 households for the entire
State, so that congestion due to the occupation of one Census Proportion of occnpied houses
to households house by more than one family is almost negligible in Madras State, In Madras City, it is however marked because a Census house supports I-50 Census families, In the urban sector this
congestion is marked also in the case of North Arcot, Chingleput and South Arcot, while in the case of Tirunelveli, both urban and rural sectors have a percentage of less than 1 which shows that housing conditions as far as the numbers are concerned are quite satisfactory, In the rural sector, the maximum congestion is found in the districts of North Arcot and South Arcot. These districts are comparatively backward and the construction activity has not kept pace with the increase in population.
Statement 1I-7
Proportion between occupied houses and households as per houselist
State/District Total Rural Urban
Madras State 1'06 1'04 1'12 Madras 1'50 1'50
Chingleput 1'06 1'04 1'17
North Arcot 1'10 1'08 1'20
South Aroot 1'07 1'06 1'13
Salem 1'02 1'01 1'04
Coimbatore 1'04 1'04 1'05
Nilgiri 1'01 1'02 1'00
Madurai 1'03 1'04 1'02 Tiruchirapalli 1'05 1'04 1'07 Thanjavur 1'06 1'04 I'll
Ramanathapuram 1'02 1'02 1'03
Tirunelveli 0'99 0'99 0'99 Kanyakumari 1'05 1'05 1'05
We give below a statement indicating the congestion on this basis in 28 big towns:
Statement 1I-8
Proportion between occupied houses and households in cities and towns with a popUlation of 50,000 and above \
Cities and towns Occupied Number Proportion of with population of Census of Households to occupied 50,000 and above Houses Households census houses
1 2 3 4
Madras 219,461 328,220 1'50
Index of Kanchipuram 12,946 18,955 1'46
congestion in Gudiyatham 7,391 8,655 1'17 big towns Vellore 13,073 19,265 1'47
Cuddalbre 13,578 15,115 I'll
Salem 45,984 47,745 1'04
Erode' 13,591 14,535 1'07
Tiruppur 14,174 14,880 1'05
Coimbatore 54,188 54,380 1'00
Pollachi 7,090 10,605 1'50
Valparai 17,162 18,875 1'10
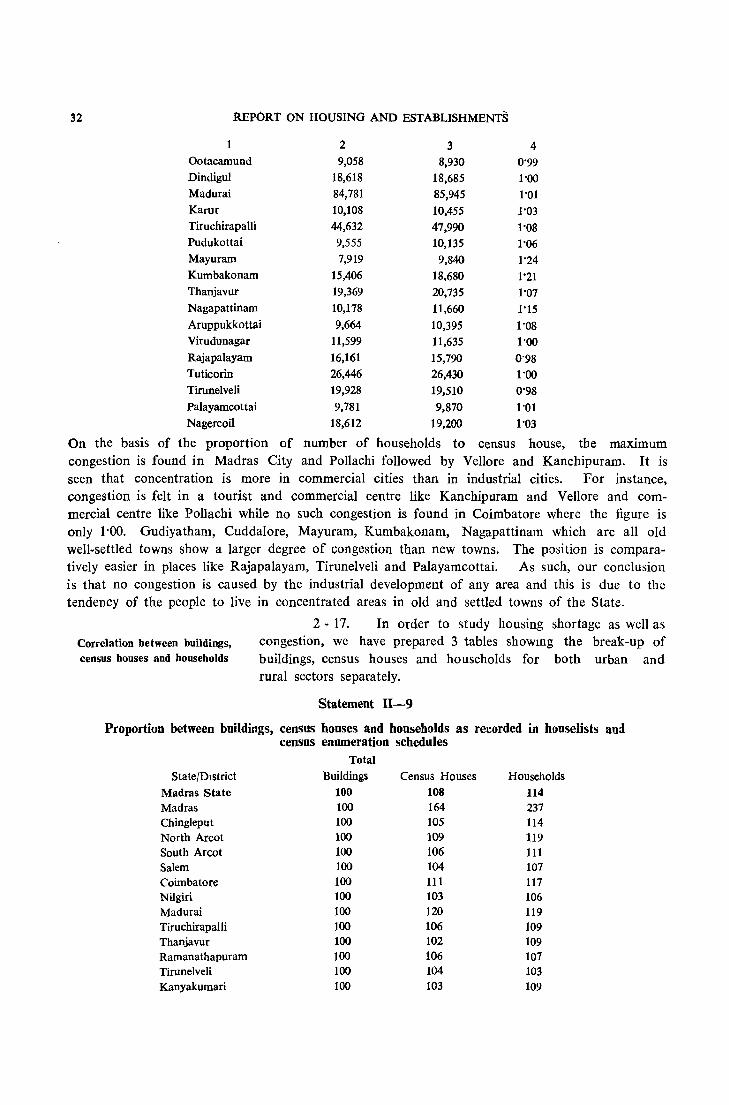
32 REPORT ON HOUSING AND ESTABLISHMENTS
1 2 3 4 Ootacamund 9,058 8,930 0'99 Dindigul 18,618 18,685 1'00 Madurai 84,781 85,945 1'01 Karur 10,108 10,455 1'03 Tiruchirapalli 44,632 47,990 1'08 Pudukottai 9,555 10,135 1'06 Mayuram 7,919 9,840 1'24 Kumbakonam 15,406 18,680 1'21 Thanjavur 19,369 20,735 1'07 Nagapattinam 10,178 11,660 1'15 Aruppukkottai 9,664 10,395 1'08 Virudunagar 11,599 11,635 1'00 Rajapalayam 16,161 15,790 0·98 Tuticorin 26,446 26,430 1'00 Tirunelveli 19,928 19,510 0'98 Palayamcottai 9,781 9,870 1'01 Nagercoil 18,612 19,200 1'03
On the basis of the proportion of number of households to census house, the maximum congestion is found in Madras City and Pollachi followed by Vellore and Kanchipuram. It is seen that concentration is more in commercial cities than in industrial cities. For instance, congestion is felt in a tourist and commercial centre like Kanchipuram and Vellore and commercial centre like Pollachi while no such congestion is found in Coimbatore where the figure is only 1'00. Gudiyatham, Cuddalore, Mayuram, Kumbakonam, Nagapattinam which are all old well-settled towns show a larger degree of congestion than new towns. The p()sition is comparatively easier in places like Rajapalayaro, Tirunelveli and Palayamcottai. As such, our conclusion is that no congestion is caused by the industrial development of any area and this is due to the tendency of the people to live in concentrated areas in old and settled towns of the State.
2 - 17. In order to study housing shortage as well as Correlation between buildings, congestion, we have prepared 3 tables showmg the break-up of census houses and households buildings, census houses and households for both urban and
rural sectors separately.
Statement 11-9
Proportion between buildings, census houses and households as recorded in houselists an;l census enumeration schedules
Total State/District Buildings Census Houses Households
Madras State 100 108 114 Madras 100 164 237 Chingleput 100 105 114 North Arcot 100 109 119 South Arcot 100 106 III Salem 100 104 107 Coimbatore 100 111 117 Nilgiri 100 103 106 Madurai 100 120 119 Tiruchirapalli 100 106 109 Thanjavur 100 102 109 Ramanathapuram 100 106 107 Tirunelveli 100 104 103 Kanyakumari 100 103 109
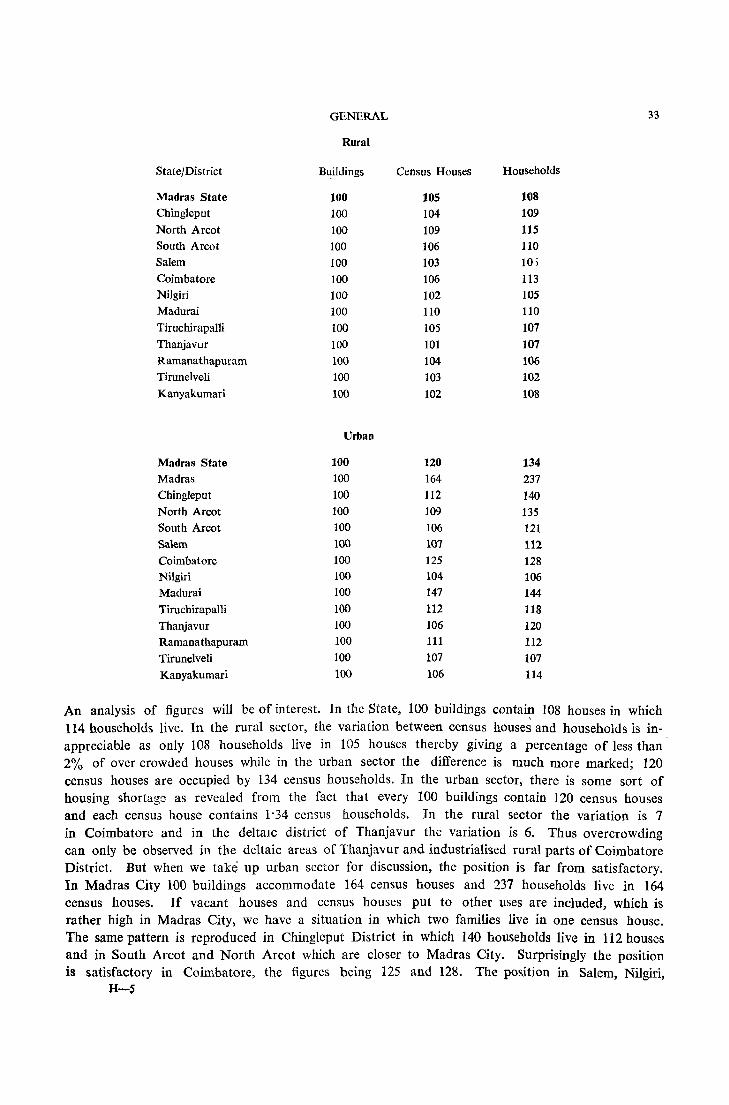
GENERAL 33
Rural
State/District Bl!iIdings Census Houses Households
Madras State 100 105 108 Chingleput 100 104 109 North Arcot 100 109 115 South Arcot 100 106 no Salem 100 103 10) Coimbatore 100 106 113 Nilgiri 100 102 105 Madurai 100 110 110 Tiruchirapalli 100 105 107 Thanjavur 100 101 107 Ramanathapuram 100 104 106 Tirunelveli 100 103 102 Kanyakumari 100 102 108
Urban
Madras State 100 120 134 Madras 100 164 237 Chingleput 100 112 140 North Arcot 100 109 135 South Arcot 100 106 121 Salem 100 107 112
Coimbatore 100 125 128 Nilgiri 100 104 106 Madurai 100 147 144 Tiruchirapalli 100 112 118
Thanjavur 100 106 120 Ramanathapuram 100 111 112 Tirunelveli 100 107 107
Kanyakumari 100 106 114
An analysis of figures will be of interest. In the State, 100 buildings contain 108 houses in which 114 households live. In the rural sector, the variation between census house~ and households is inappreciable as only 108 households live in 105 houses thereby giving a percentage of less than' 2% of over crowded houses while in the urban sector the difference is much more marked; 120 census houses are occupied by 134 census households. In the urban sector, there is some sort of housing shortage as revealed from the fact that every 100 buildings contain 120 census houses and each census house contains 1'34 census households. In the rural sector the variation is 7 in Coimbatore and in the deltaIC district of Thanjavur the variation is 6. Thus overcrowding can only be observed in the deltaic areas of Thanj3.vur and industrialised rural parts of Coimbatore District. But when we take up urban sector for discussion, the position is far from satisfactory. In Madras City 100 buildings accommodate 164 census houses and 237 households live in 164 census houses. If vacant' houses and census houses put to other uses are included, which is rather high in Madras City, we have a situation in which two families live in one census house. The same pattern is reproduced in Chingleput District in which 140 households live in 112 houses and in South Arcot and North Arcot which are closer to Madras City. Surprisingly the position is satisfactory in Coimbatore, the figures being 125 and 128. The position in Salem, Nilgiri,
lI-S
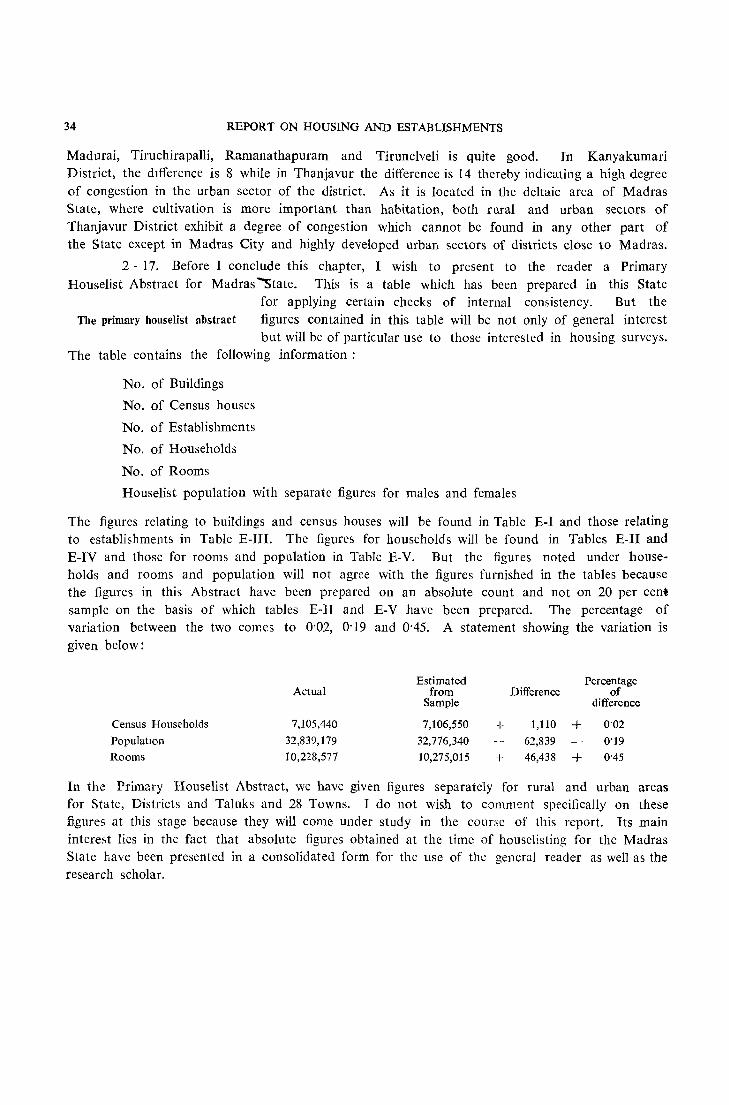
34 REPORT ON HOUSING AND ESTABLISHMENTS
Madurai, Tiruchirapalli, Ramanathapuram and Tirunelveli is quite good. In Kanyakumari District, the dIfference is 8 while in Thanjavur the difference is 14 thereby indicating a high degree of congestion in the urban sector of the district. As it is located in the deltaic area of Madras State, where cultivation is more important than habitation, both rural and urban sectors of Thanjavur District exhibit a degree of congestion which cannot be found in any other part of the State except in Madras City and highly developed urban sectors of districts close to Madras.
2 - 17. Before I conclude this chapter, I wish to present to the reader a Primary Houselist Abstract for Madras ""State. This is a table which has been prepared in this State
for applying certain checks of internal con&istency. But the The primary houselist abstract figures contained in this table will be not only of general interest
but will be of particular use to those interested in housing surveys. The table contains the following information:
No. of Buildings
No. of Census houses
No. of Establishments
No. of Households
No. of Rooms
Houselist population with separate figures for males and females
The figures relating to buildings and census houses wiIl be found in Table E-I and those relating to establishments in Table E-lII. The figures for households will be found in Tables E-Il and E-IV and those for rooms and popUlation in Table E-V. But the figures noted under households and rooms and popUlation will not agree with the figures furnished in the tables because the figures in this Abstract have been prepared on an absolute count and not on 20 per cent sample on the basis of which tables E-U and E-V have been prepared. The percentage of variation between the two comes to 0'02, 0'19 and 0'45. A statement showing the variation is given below:
Estimated Percentage Actual from Difference of
Sample difference
Census Households 7,105,440 7,106,550 + 1,110 + 0'02
PopulatIOn 32,839,179 32,776,340 62,839 0'19
Rooms 10,228,577 10,275,015 + 46,438 + 0'45
In the Primary Houselist Abstract, we have given figures separately for rural and urban areas for State, Districts and Taluks and 28 Towns. I do not wish to comment specifically on these figures at this stage because they will come under study in the course of this report. Its main interest lies in the fact that absolute figures obtained at the time of houselisting for the Madras State have been presented in a consolidated form for the use of the general reader as well as the research scholar.
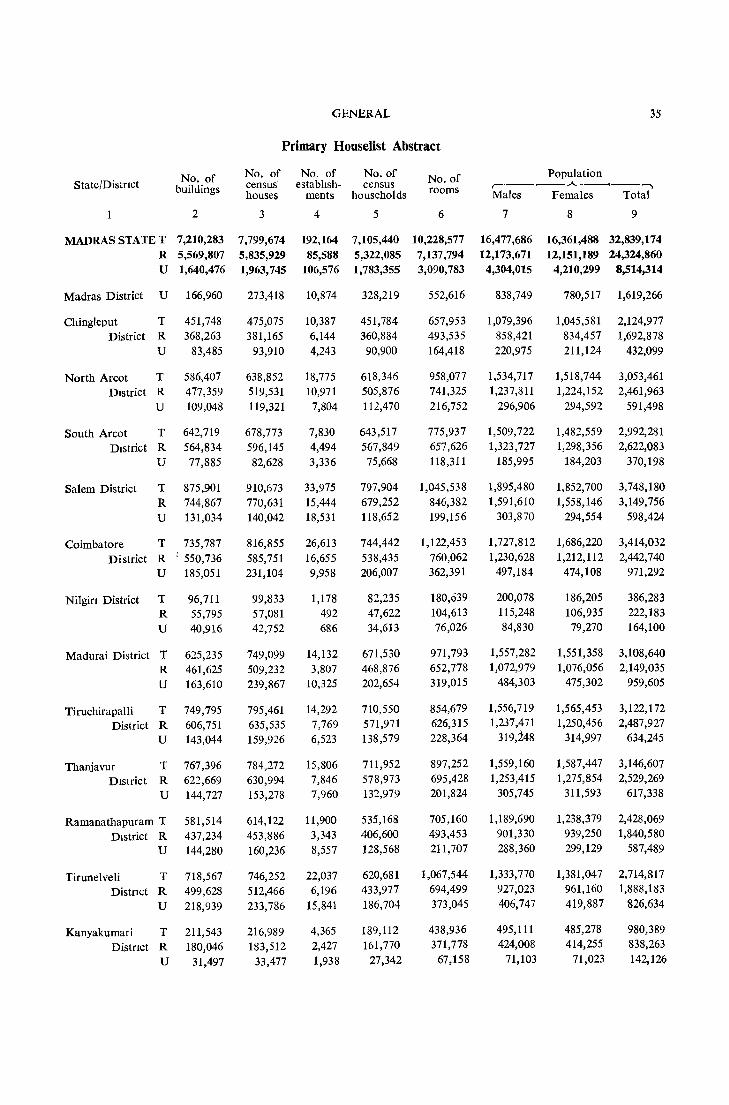
GENERAL 35
Primary Houselist Abstract
No. of No. of No. of No. of No. of Population State/Distnct buildings census' establIsh- census r-'-----"------,
houses ments households rooms Males Females Total
1 2 3 4 5 6 7 8 9
MADRAS STATE T 7,210,283 7,799,674 192,164 7,105,440 10,228,577 16,477,686 16,361,488 32,839,174 R 5,569,807 5,835,929 85,588 5,322,085 7,137,794 12,173,671 12,151,189 24,324,860 U 1,640,476 1,963,745 106,576 1,783,355 3,090,783 4,304,015 4,210,299 8,514,314
Madras District U 166,960 273,418 10,874 328,219 552,616 838,749 780,517 1,619,266
Chingleput T 451,748 475,075 10,387 451,784 657,953 1,079,396 1,045,581 2,124,977
District R 368,263 381,165 6,144 360,884 493,535 858,421 834,457 1,692,878
U 83,485 93,910 4,243 90,900 164,418 220,975 211,124 432,099
North Arcot T 586,407 638,852 18,775 618,346 958,077 1,534,717 1,518,744 3,053,461
DIstrict R 477,359 519,531 10,971 505,876 741,325 1,237,811 1,224,152 2,461,963
U 109,048 119,321 7,804 112,470 216,752 296,906 294,592 591,498
South Arcot T 642,719 678,773 7,830 643,517 775,937 1,509,722 1,482,559 2,992,281
DIstrict R 564,834 596,145 4,494 567,849 657,626 1,323,727 1,298,356 2,622,083
U 77,885 82,628 3,336 75,668 118,311 185,995 184,203 370,198
Salem District T 875,901 910,673 33,975 797,904 1,045,538 1,895,480 1,852,700 3,748,180
R 744,867 770,631 15,444 679,252 846,382 1,591,610 1,558,146 3,149,756
U i31,034 140,042 18,531 118,652 199,156 303,870 294,554 598,424
Coimbatore T 735,787 816,855 26,613 744,442 1,122,453 1,727,812 1,686,220 3,414,032
District R : 550,736 585,751 16,655 538,435 760,062 1,230,628 1,212,112 2,442,740
U 185,051 231,104 9,958 206,007 362,391 497,184 474,108 971,292
Nilgin District T 96,711 99,833 1,178 82,235 180,639 200,078 186,205 386,283
R 55,795 57,081 492 47,622 104,613 115,248 106,935 222,183
U 40,916 42,752 686 34,613 76,026 84,830 79,270 164,100
Madurai District T 625,235 749,099 14,132 671,530 971,793 1,557,282 1,551,358 3,108,640
R 461,625 509,232 3,807 468,876 652,778 1,072,979 1,076,056 2,149,035
U 163,610 239,867 10,325 202,654 319,015 484,303 475,302 959,605
Tiruchira palli T 749,795 795,461 14,292 710,550 854,679 1,556,719 1,565,453 3,122,172
District R 606,751 635,535 7,769 571,971 626,315 1,237,471 1,250,456 2,487,927
U 143,044 159,926 6,523 138,579 228,364 319,248 314,997 634,245
Thanjavur T 767,396 784,272 15,806 711,952 897,252 1,559,160 1,587,447 3,146,607
DIstrict R 622,669 630,994 7,846 578,973 695,428 1,253,415 1,275,854 2,529,269
U 144,727 153,278 7,960 132,979 201,824 305,745 311,593 617,338
Ramanathapuram T 581,514 614,122 11,900 535,168 705,160 1,189,690 1,238,379 2,428,069
DIstrict R 437,234 453,886 3,343 406,600 493,453 901,330 939,250 1,840,580
U 144,280 160,236 8,557 128,568 211,707 288,360 299,129 587,489
Tirunelveli T 718,567 ' 746,252 22,037 620,681 1,067,544 1,333,770 1,381,047 2,714,817
DistrIct R 499,628 512,466 6,196 433,977 694,499 927,023 961,160 1,888,183
U 218,939 233,786 15,841 186,704 373,045 406,747 419,887 826,634
Kanyakumari T 211,543 216,989 4,365 189,112 438,936 495,111 485,278 980,389
Distnct R 180,046 183,512 2,427 161,770 371,778 424,008 414,255 838,263
U 31,497 33,477 1,938 27,342 67,158 71,103 71,023 142,126
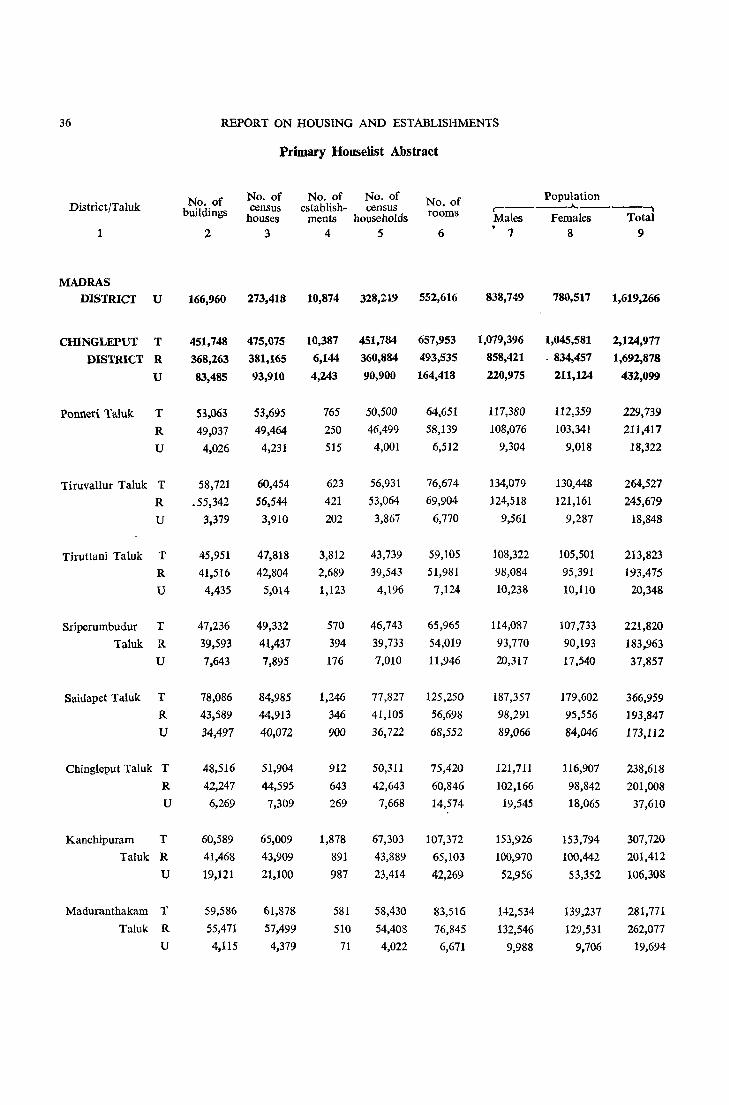
36 REPORT ON HOUSING AND ESTABLISHMENTS
Primary Houselist Abstract
No. of No. of No. of No. of No. of Population District/Taluk buildings census establish- census rooms r------..)...-----~
houses ments households Males Females Total 1 2 3 4 5 6
, 1 8 9
MADRAS DISTRICT U 166,960 273,418 10,874 328,219 552,616 838,749 780,517 1,619,266
CIDNGLEPUT T 451,748 475,075 10,387 451,784 657,953 1,079,396 1,045,581 2,124,977
DISTRICT R 368,263 381,165 6,144 360,884 493,535 858,421 - 834,457 1,692,878
U 83,485 93,910 4,243 90,900 164,418 220,975 211,124 432,099
Penned Taluk T 53,063 53,695 765 50,500 64,651 117,380 112,359 229,739
R 49,037 49,464 250 46,499 58,139 108,076 103,341 211,417
U 4,026 4,231 515 4,001 6,512 9,304 9,018 18,322
Tiruvallur Taluk T 58,721 60,454 623 56,931 76,674 134,079 130,448 264,527
R .55,342 56,544 421 53,064 69,904 124,518 121,161 245,679
U 3,379 3,910 202 3,867 6,770 9,561 9,287 18,848
Tiruttani Taluk T 45,951 47,818 3,812 43,739 59,105 108,322 105,501 213,823
R 41,516 42,804 2,689 39,543 51,981 98,084 95,391 193,475
U 4,435 5,014 1,123 4,196 7,124 10,238 10,110 20,348
Sriperumbudur T 47,236 49,332 570 46,743 65,965 114,087 107,733 221,820
Taluk R 39,593 41,437 394 39,733 54,019 93,770 90,193 183,963
U 7,643 7,895 176 7,010 11,946 20,317 17,540 37,857
Saidapet Taluk T 78,086 84,985 1,246 77,827 125,250 187,357 179,602 366,959
R 43,589 44,913 346 41,105 56,698 98,291 95,556 193,847
U 34,497 40,072 900 36,722 68,552 89,066 84,046 173,112
Chingleput Taluk T 48,516 51,904 912 50,311 75,420 121,711 116,907 238,618
R 42,247 44,595 643 42,643 60,846 102,166 98,842 201,008
U 6,269 7,309 269 7,668 14,574 19,545 18,065 37,610
Kanchipuram T 60,589 65,009 1,878 67,303 107,372 153,926 153,794 307,720
Taluk R 41,468 43,909 891 43,889 65,103 100,970 100,442 201,412
U 19,121 21,100 987 23,414 42,269 52,956 53,352 106,308
Maduranthakam T 59,586 61,878 581 58,430 83,516 142,534 139,237 281,771
Taluk R 55,471 57,499 510 54,408 76,845 132,546 129,531 262,077
U 4,115 4,379 71 4,022 6,671 9,988 9,706 19,694
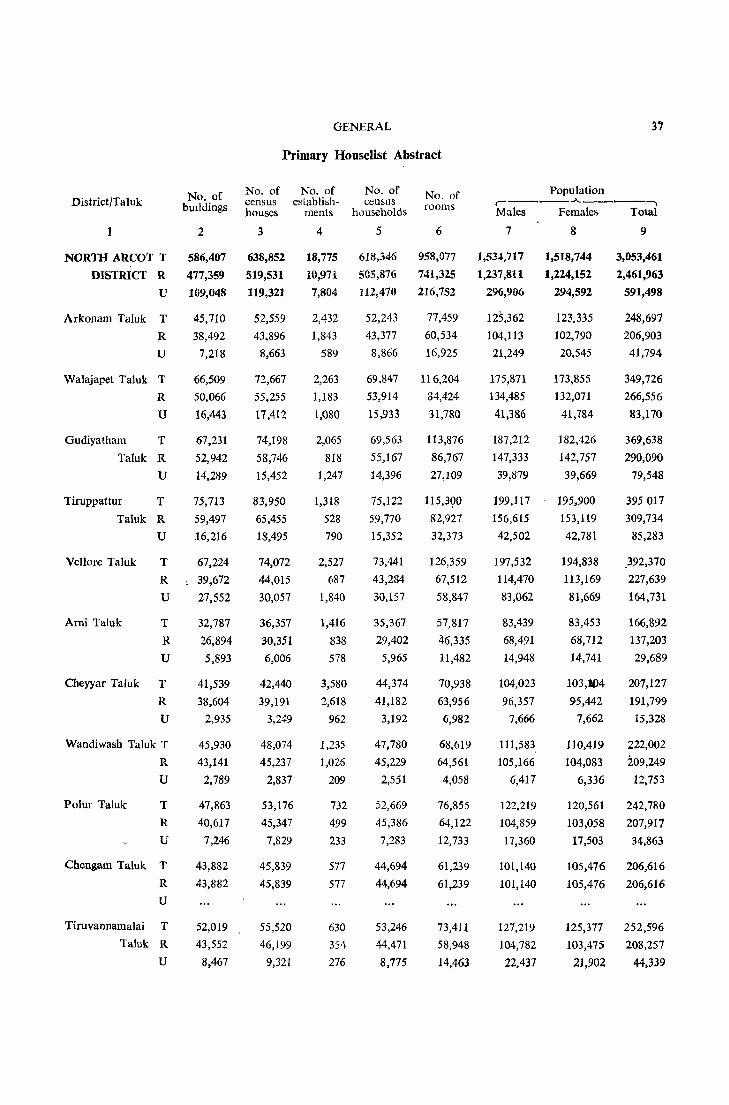
District/Taluk
1
NORTH ARCOT T
DISTRICT R
U
Arkonam Taluk T
R
U
Walajapet Taluk T
R
U
Gudiyatham T
Taluk R
U
Tiruppattur T
Taluk R
U
Vel10re Taluk
Ami Taluk
T
R
U
T
R
U
Cbeyyar Taluk T
R
U
Wandiwash Taluk T
R
U
Polur Taluk T
R
U
Chengam Taluk T
R
U
Tiruvannamalai T
Taluk R
U
No. of bUIldings
2
586,407
477,359
109,048
45,710
38,492
7,218
66,509
50,066
16,443
67,231
52,942
14,289
75,713
59,497
16,216
67,224
39,672
27,552
32,787
26,894
5,893
41,539
38,604
2,935
45,930
43,141
2,789
47,863
40,617
7,246
43,882
43,882
52,019
43,552
8,467
GENERAL
Primary Houselist Abstract
No. of No. of No. of census eslablish- census houses ments households
3
638,852
519,531
119,321
52,559
43,896
8,663
72,667
55,255
17,412
74,198
58,746
15,452
83,950
65,455
18,495
74,072
44,015
30,057
36,357
30,351
6,006
42,440
39,191
3,249
48,074
45,237
2,837
53,176
45,347
7,829
45,839
45,839
55,520
46,199
9,321
4
18,775
10,971
7,804
2,432
1,843
589
2,263
1,183
1,080
2,065
818
1,247
1,318
528
790
2,527
687
1,840
1,416
838
578
3,580
2,618
962
1,235
1,026
209
732
499
233
577
577
630
354-
276
5
618,346
5GS,876
112,470
52,243
43,377
8,866
69.847
53,914
15,933
69,563
55,167
14,396
75,122
59,770
15,352
73,441
43,284
30,157
35,367
29,402
5,965
44,374
41,182
3,192
47,780
45,229
2,551
52,669
45,386
7,283
44,694
44,694
53,246
44,471
8,775
No. of rooms
6
958,077
741,325
216,752
77,459
60,534
16,925
116,204
84,424
31,780
113,876
86,767
27,109
115,390
82,927
32,373
126,359
67,512
58,847
57,817
46,335
11,482
70,938
63,956
6,982
68,619
64,561
4,058
76,855
64,122
12,733
61,239
61,239
73,411
58,948
14,463
3'1
Population .-----........ _--, Males Females Total
7
1,534,717
1,237,811
296,906
125,362
104,113
21,249
175,871
134,485
41,386
187,212
147,333
39,879
199,117
156,615
42,502
197,532
114,470
83,062
83,439
68,491
14,948
104,023
96,357
7,666
111,583,
105,166
6,417
122,219
104,859
17,360
101,140
101,140
127,219
104,782
22,437
8
1,518,744
1,224,152
294,592
123,335
102,790
20,545
173,855
132,071
41,784
182,426
142,757
39,669
195,900
153,119
42,781
194,838
113,169
81,669
83,453
68,712
14,741
103,lM
95,442
7,662
110,419
104,083
6,336
120,561
103,058
17,503
9
3,053,461
2,461,963
591,498
248,697
206,903
41,794
349,726
266,556
83,170
369,638
290,090
79,548
395017
309,734
85,283
_392,370
227,639
164,731
166,892
137,203
29,689
207,127
191,799
15,328
222,002
209,249
12,753
242,780
207,917
34,863
105,476 206,616
105,476 206,616
125,377 252,596
103,475
21,902
208,257
44,339

38 REPORT ON HOUSING AND ESTABLISHMENTS
Primary Houselist Abstract
No. of No. of No. of No. of No. of Population Dlstrict/Taluk bUlldmgs census establish- census rooms houses ments households Males Females Total
2 3 4 5 6 7 8 9
SOUTH ARCOT T 642,719 678,773 7,830 643,517 775,937 1,509,722 1,482,559 2,992,281
DISTRICT R 564,834 596,145 4,494 567,849 657,626 1,323,727 1,298,356 2,622,083
U 77,885 82,628 3,336 75,668 118,311 185,995 184,203 370,198
Gingee Taluk T 50,837 55,450 584 53,924 75,952 128,554 125,435 253,989
R 50,837 55,450 584 53,924 75,952 128,554 125,435 253,989
U
Tindivanam Taluk T 75,836 79,287 629 73,382 99,044 175,306 171,767 347,073
R 67,816 70,621 337 65,197 85,624 155,372 151,534 306,906
U 8,020 8,666 292 8,185 13,420 19,934 20,233 40,167
VI1lupuram Taluk T 70,363 74,908 687 71,868 99,026 175,262 170,085 345,347
R 60,191 64,097 292 62,114 81,823 150,577 145,970 296,547
U 10,172 10,811 395 9,754 17,203 24,685 24,115 48,800
Tirukkoyilur Taluk T 90,258 92,316 633 84,852 84,848 201,822 196,786 398,608
R 85,661 87,543 500 80,689 78,929 191,864 186,932 378,796
U 4,597 4,773 133 4,163 5,919 9,958 9,854 19,812
Kallakurichl Taluk T 85,257 90,313 394 82,176 71,327 188,954 187,203 376,157
R 79,831 84,435 281 77,244 67,171 177,272 175,763 353,035
U 5,426 5,878 113 4,932 4,156 11,682 11,440 23,122
Vriddhachalam T 76,273 81,234 451 79,385 90,267 177,324 174,662 351,986
Taluk R 71,625 76,348 311 75,006 84,570 167,101 164,735 331,836
U 4,648 4,886 140 4,379 5,697 10,223 9,927 20,150
Cuddalore Taluk T 102,332 107,885 2,734 104,188 143,691 250,198 245,298 495,496
R 74,759 78,729 1,542 77,002 97,493 182,084 178,209 360,293
U 27,573 29,156 1,192 27,186 46,198 68,114 67,089 135,203
Chidambaram T 91,563 97,380 1,718 93,742 111,782 212,302 211,323 423,625
TaJuk R 74,114 78,922 647 76,673 86,064 170,903 169,778 340,681
U 17,449 18,458 1,071 17,069 25,718 41,399 41,545 82,944
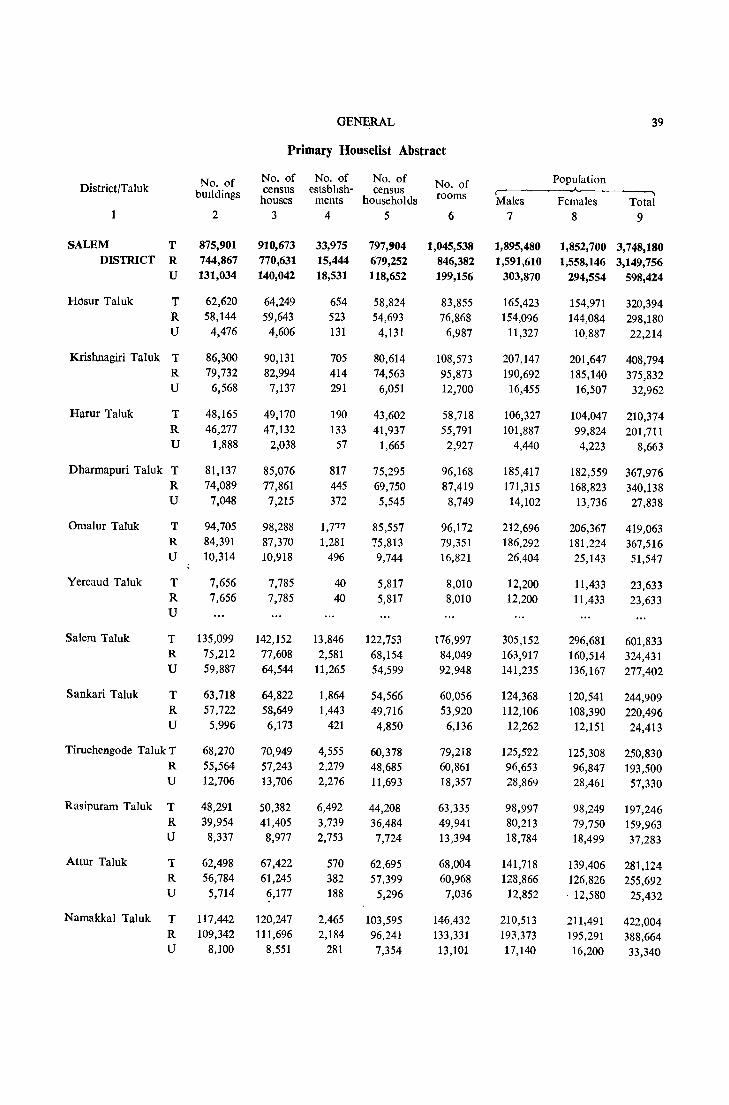
GENERAL 39
Primary Houselist Abstract
No. of No. of No. of No. of No. of Population District/Taluk census estsbltsh- census .A..-----bUildings houses ments households rooms Males Females Total
2 3 4 5 6 7 8 9
SALEM T 875,901 910,673 33,975 797,904 1,045,538 1,895,480 1,852,700 3,748,180 DISTRICT R 744,867 770,631 15,444 679,252 846,382 1,591,610 1,558,146 3,149,756
U 131,034 140,042 18,531 118,652 199,156 303,870 294,554 598,424
Hosur Taluk T 62,620 64,249 654 58,824 83,855 165,423 154,971 320,394 R 58,144 59,643 523 54,693 76,868 154,096 144,084 298,180 U 4,476 4,606 131 4,131 6,987 11,327 10,887 22,214
Krishnagiri Taluk T 86,300 90,131 705 80,614 108,573 207,147 201,647 408,794 R 79,732 82,994 414 74,563 95,873 190,692 185,140 375,832 U 6,568 7,137 291 6,051 12,700 16,455 16,507 32,962
Harur Taluk T 48,165 49,170 190 43,602 58,718 106,327 104,047 210,374 R 46,277 47,132 133 41,937 55,791 101,887 99,824 201,711 U 1,888 2,038 57 1,665 2,927 4,440 4,223 8,663
Dharmapuri Taluk T 81,137 85,076 817 75,295 96,168 185,417 182,559 367,976 R 74,089 77,861 445 69,750 87,419 171,315 168,823 340,138 U 7,048 7,215 372 5,545 8,749 14,lO2 13,736 27,838
Omalur Taluk T 94,705 98,288 1,777 85,557 96,172 212,696 206,367 419,Q63 R 84,391 87,370 1,281 75,813 79,351 186,292 181,224 367,516 U 10,314 10,918 496 9,744 16,821 26,404 25,143 51,547
Yercaud Taluk T 7,656 7,785 40 5,817 8,010 12,200 11,433 23,633 R 7,656 7,785 40 5,817 8,010 12,200 11 ,433 23,633 U
Salem Taluk T 135,099 142,152 13,846 122,753 176,997 305,152 296,681 601,833 R 75,212 77,608 2,581 68,154 84,049 163,917 160,514 324,431 U 59,887 64,544 11,265 54,599 92,948 141,235 136,167 277,402
Sankari Taluk T 63,718 64,822 1,864 54,566 60,056 124,368 120,541 244,909 R 57,722 58,649 1,443 49,716 53,920 112,106 108,390 220,496 U 5,996 6,173 421 4,850 6,136 12,262 12,151 24,413
Tiruchengode Taluk T 68,270 70,949 4,555 60,378 79,218 125,522 125,308 250,830 R 55,564 57,243 2,279 48,685 60,861 96,653 96,847 193,500 U 12,706 13,706 2,276 11,693 18,357 28,869 28,461 57,330
Rasipuram Taluk T 48,291 50,382 6,492 44,208 63,335 98,997 98,249 197,246 R 39,954 41,405 3,739 36,484 49,941 80,213 79,750 159,963 U 8,337 8,977 2,753 7,724 13,394 18,784 18,499 37,283
Attur Taluk T 62,498 67,422 570 62,695 68.004 141.718 139,406 281,124 R 56.784 61,245 382 57,399 60,968 128,866 126,826 255,692 U 5,714 6,177 188 5,296 7,036 12,852 ' 12,580 25,432
Namakkal Taluk T 117.442 120,247 2,465 103,595 146,432 210,513 211,491 422,004 R 109,342 111,696 2,184 96,241 133,331 193,373 195,291 388,664 U 8,100 8,551 281 7,354 13,101 17,140 16,200 33,340
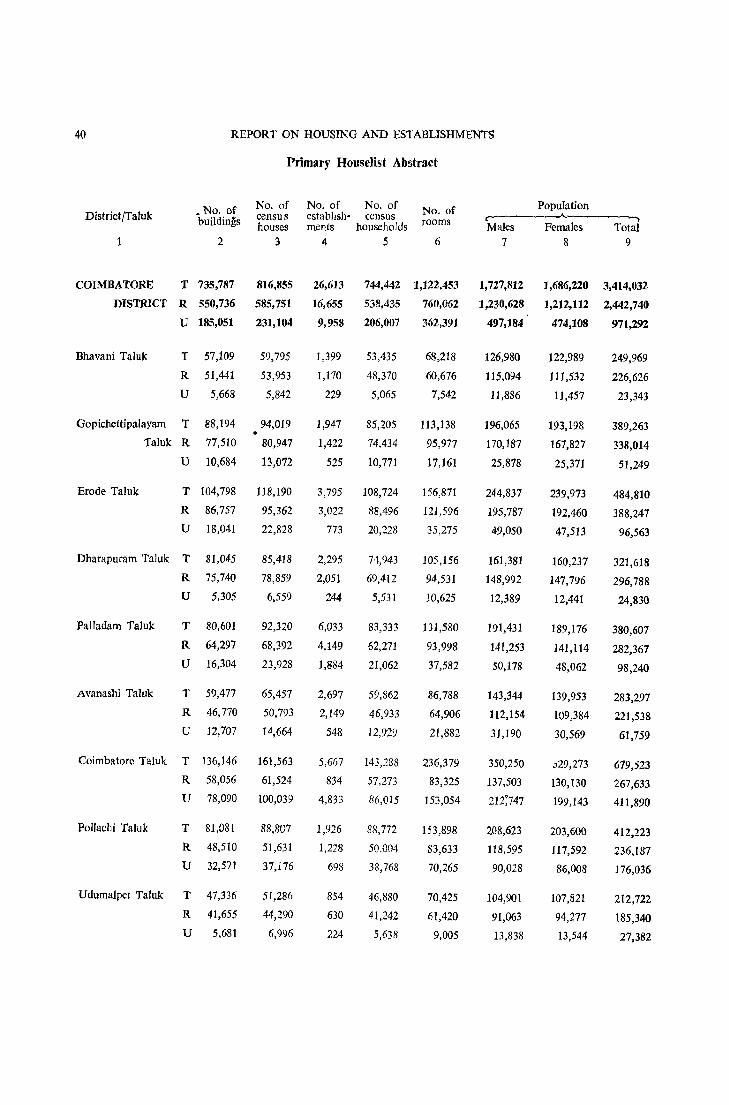
40 REPORT ON HOUSING AND ESTABLISHMENTS
Primary Houselist Ab§tract
• No. of No. of No. of No. of No. of Population District/Taluk buildings census establIsh- census rooms c-
houses ments households Males Females Total 2 3 4 5 6 7 8 9
COIMBATORE T 735,787 816,855 26,6]3 744,442 1,122,453 1,727,812 1,686,220 3,414,032
DISTRICT R 550,736 585,751 16,655 531l,435 760,062 1,230,628 1,212,112 2,442,740
U 18."i,051 231,104 9,958 206,007 362,391 497,184 474,108 971,292
Bhavani Taluk T 57,109 59,795 1,399 53,435 68,218 126,980 122,989 249,969
R 51,441 53,953 1,170 48,370 60,676 115,094 111,532 226,626
U 5,668 5,842 229 5,065 7,542 ]1,886 11,457 23,343
Gopichettipalayam T 88,194 94,019 1,947 85,205 113,138 196,065 193,198 389,263 Taluk R 77,510 80,947 1,422 74,434 95,977 170,187 167,827 338,014
U 10,684 13,072 525 10,771 17,161 25,878 25,371 51,249
Erode Taluk T 104,798 118,190 3,795 108,724 156,871 244,837 239,973 484,810 R 86,757 95,362 3,022 88,496 121,596 195,787 192,460 388,247 U 18,041 22,828 773 20,228 35,275 49,050 47,513 96,563
Dharapuram Taluk T 81,045 85,418 2,295 74,943 105,156 161,381 160,237 321,618 R 75,740 78,859 2,051 69,412 94,531 148,992 147,796 296,788 U 5,305 6,559 244 5,531 10,625 12,389 12,441 24,830
Palladam Taluk T 80,601 92,320 6,033 83,333 131,580 191,431 189,176 380,607 R 64,297 68,392 4,149 62,271 93,998 141,253 141,114 282,367 U 16,304 23,928 1,884 21,062 37,582 50,178 48,062 98,240
Avanashi Taluk T 59,477 65,457 2,697 59,862 86,788 143,344 139,953 283,297 R 46,770 50,793 2,149 46,933 64,906 112,154 109,384 221,538 U 12,707 14,664 548 12,929 21,882 31,190 30,569 61,759
Coimbatore Taluk T 136,146 161,563 5,667 143,288 236,379 350,250 j29,273 679,:m R 58,056 61,524 834 57,273 83,325 137,503 130,130 267,633 U 78,090 100,039 4,833 86,015 153,054 212;747 199,143 411,890
Pollachi Taluk T 81,081 88,807 1,926 88,772 153,898 208,623 203,60{) 412,223 R 48,510 51,631 1,228 50.004 83,633 118,595 117,592 236,187 U 32,571 37,176 698 38,768 70,265 90,028 86,008 176,036
Udumalpet Taluk T 47,336 51,286 854 46,880 70,425 104,901 107,821 212,722 R 41,655 44,290 630 41,242 61,420 91,063 94,277 185,340 U 5,681 6,996 224 5,638 9,005 13,838 13,544 27,382
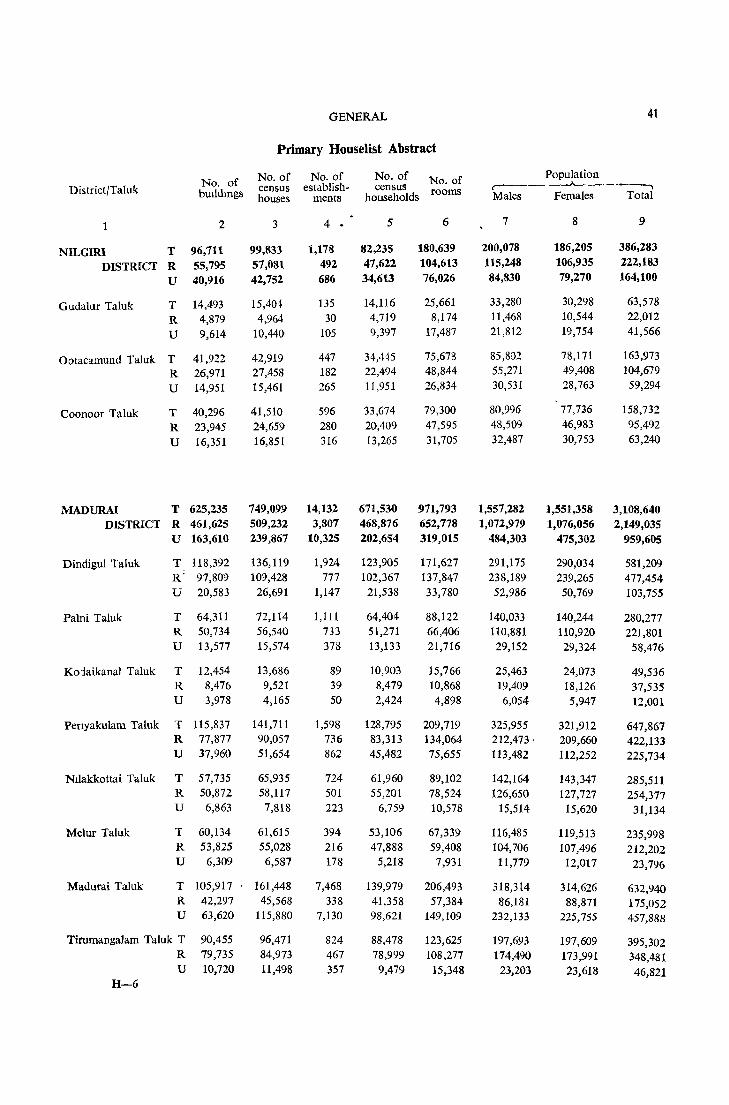
GENERAL 41
Primary Houselist Abstract
No. of No. of No. of No. of No. of Population
District/Taluk bUlldmgs census establish- census rooms ,....---_ ----..A ,
houses ments households Males Females Total
2 3 4 - 5 6 7 8 9
NILGIRI T 96,711 99,833 1,178 82,235 180,639 200,078 186,205 386,283
DISTRICT R 55,795 57,031 492 47,622 104,613 115,248 106,935 222,183
U 40,916 42,752 686 34,613 76,026 84,830 79,270 164,100
Gudalur Taluk T 14,493 15,404 135 14,116 25,661 33,280 30,298 63,578
R 4,879 4,964 30 4,719 8,174 11,468 10,544 22,012
U 9,614 10,440 105 9,397 17,487 21,812 19,754 41,566
Ootacamund Taluk T 41,922 42,919 447 34,445 75,678 85,802 78,171 163,973
R 26,971 27,458 182 22,494 48,844 55,271 49,408 104,679
U 14,951 15,461 265 11,951 26,834 30,531 28,763 59,294
Coonoor Taluk T 40,296 41,510 596 33,674 79,300 80,996 77,736 158,732
R 23,945 24,659 280 20,409 47,595 48,509 46,983 95,492
U 16,351 16,851 316 13,265 31,705 32,487 30,753 63,240
MADURA! T 625,235 749,099 14,132 671,530 971,793 1,557,282 1,551,358 3,108,640 DISTRICT R 461,625 509,232 3,807 468,876 652,778 1,072,979 1,076,056 2,149,035
U 163,610 239,867 10,325 202,654 319,015 484,303 475,302 959,605
Dindigul Taluk T 118,392 136,119 1,924 123,905 171,627 291,175 290,034 581,209 R: 97,809 109,428 777 102,367 137,847 238,189 239,265 477,454 U 20,583 26,691 1,147 21,538 33,780 52,986 50,769 103,755
Palni Taluk T 64,311 72,114 1,111 64,404 88,122 140,033 140,244 280,277 R 50,734 56,540 733 51,271 66,406 110,881 110,920 221,801 U 13,577 15,574 378 13,133 21,716 29,152 29,324 58,476
Koiaikanal Taluk T 12,454 13,686 89 10,903 15,766 25,463 24,073 49,536 R 8,476 9,521 39 8,479 10,868 19,409 18,126 37,535 U 3,978 4,165 50 2,424 4,898 6,054 5,947 12,001
Penyakulam Taluk T 115,837 141,711 1,598 128,795 209,719 325,955 321,912 647,867 R 77,877 90,057 736 83,313 134,064 212,473 ' 209,660 422,133 U 37,960 51,654 862 45,482 75,655 113,482 112,252 225,734
Nllakkottai Taluk T 57,735 65,935 724 61,960 89,102 142,164 143,347 285,511 R 50,872 58,117 501 55,201 78,524 126,650 127,727 254,377 U 6,863 7,818 223 6,759 10,578 15,514 15,620 31,134
Melur Taluk T 60,134 61,615 394 53,106 67,339 116,485 119,513 235,998 R 53,825 55,028 216 47,888 59,408 104,706 107,496 212,202 U 6,309 6,587 178 5,218 7,931 11,779 12,017 23,796
Madurai Taluk T 105,917 161,448 7,468 139,979 206,493 318,314 314,626 632,940 R 42,297 45,568 338 41,358 57,384 86,181 88,871 175,052 U 63,620 115,880 7,130 98,621 149,109 232,133 225,755 457,888
Tirumangalam Taluk T 90,455 96,471 824 88,478 123,625 197,693 197,609 395,302 R 79,735 84,973 467 78,999 108,277 174,490 173,991 348,481 U 10,720 11,498 357 9,479 15,348 23,203 23,618 46,821
H-6

42 REPORT ON HOUSING AND ESTABLISHMENTS
Primary Houselist Abstract
No. of No. of No. of No. of No. of Population
Dlstrict/Taluk buIldings census establish census rooms ..A.. ___ ~
houses ments households Males Females Total
1 2 3 4 • 5 6 7 8 9
TIRUCHIRAPALU T 749,795 795,461 14,292 710,550 854,679 1,556,719 1,565,453 3,122,172
DISTRICT R 606,751 635,535 7,769 571,971 626,315 1,237,471 1,250,456 2,487,927
U 143,044 159,926 6,523 138,579 228,364 319,248 314,997 634,245
Perambalur Taluk T 62,488 66,988 340 65,233 52,210 141,610 141,456 283,066
R 59,325 63,561 255 61,879 48,003 133,549 134,065 267,614
U 3,163 3,427 85 3,354 4,207 8,061 7,391 15,452
U daiyarpalaya m T 94,011 100,257 2,005 99,064 89,574 217,190 213,808 430,998
Taluk R 86,415 92,285 1,475 92,023 81,638 200,797 198,057 398,854
U 7,596 7,972 530 7,041 7,936 16,393 15,751 32,144
Lalgudi Tal uk T 67,489 71,030 1,260 63,626 83,471 127,171 131,222 258,393
R 57,776 60,813 894 54,763 70,694 108,293 112,583 220,876
U 9,713 10,217 366 8,863 12,777 18,878 18,639 37,517
Musin Taluk T 101,334 106,800 2,676 90,773 123,337 186,700 188,519 375,219
R 85,620 90,236 1,784 77,406 101,118 157,252 159,543 316,795
U 15,714 16,564 892 13,367 22,219 29,448 28,976 58,424
Karur Taluk T 84,094 90,326 1,819 79,537 111,018 170,147 172,700 342,847
R 67,411 70,751 927 62,872 82,983 132,014 134,327 266,341
U 16,683 19,575 892 16,665 28,035 38,133 38,373 76,506
Kulittalai Taluk T 104,113 108,026 1,052 93,435 108,082 218,219 217,021 435,240
R 99,062 102,597 900 89,025 102,173 208,383 207,512 415,895
U 5,051 5,429 152 4,410 5,909 9,836 9,509 19,345
Tiruchirapalli Taluk T 106,833 118,404 3,270 103,538 160,595 239,008 235,749 474,757
R 42,042 42,865 566 36,785 42,099 80,419 80,096 160,515
U 64,791 75,539 2,704 66,753 118,496 158,589 155,653 314,242
Kulathur Taluk T 43,400 44,726 450 36,729 28,117 86,779 86,027 172,806
R 43,400 44,726 450 36,729 28,117 86,779 86,027 172,806
U
Alangudi Taluk T 42,112 43,661 834 39,151 48,197 92,916 92,684 185,600
R 27,780 28,796 205 26,928 29,776 64,213 64,510 128,723
U 14,332 14,865 629 12,223 18,421 28,703 28,174 56,877
Tirumayam Taluk T 43,921 45,243 586 39,464 50,078 76,979 86,267 163,246
R 37,920 38,905 313 33,561 39,714 65,772 73,736 139,508
U 6,001 6,338 273 5,903 10,364 11,207 12,531 23,738
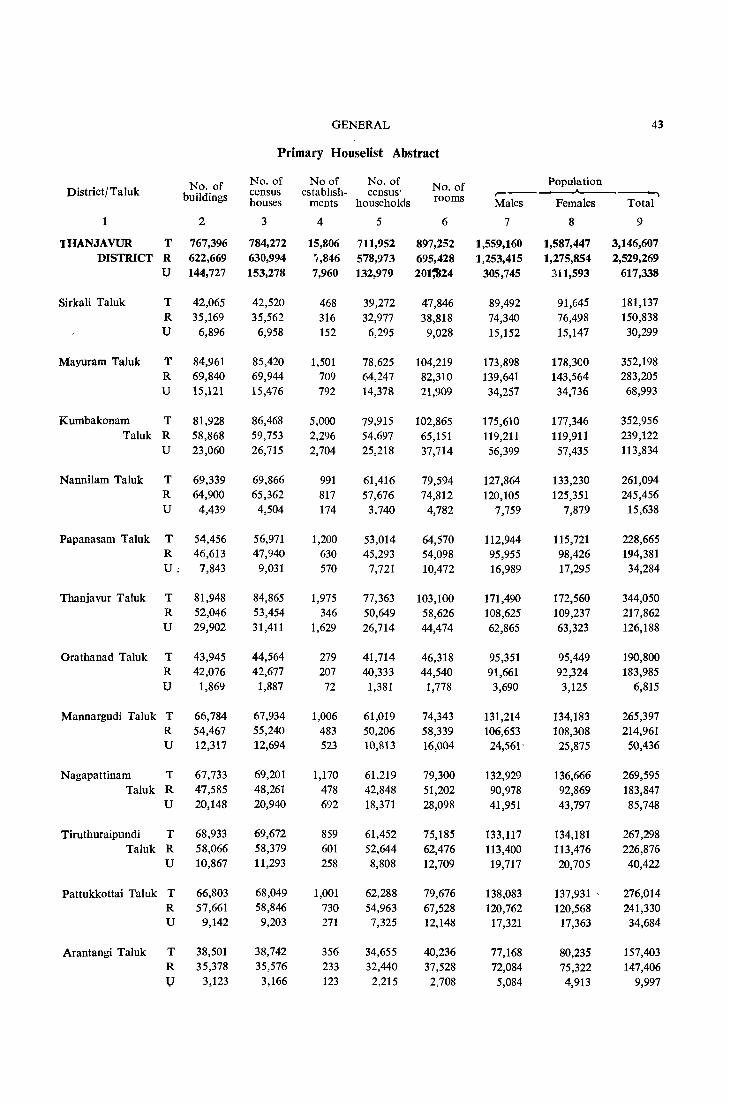
GENERAL 43
Primary Houselist Abstract
No. of No. of Noof No. of No. of Population District/ Taluk buildings census estabhsh- census' rooms
r--- _o------A..------, houses ments households Males Females Total
2 3 4 5 6 7 8 9
lHANJAVUR T 767,396 784,272 15,806 711,952 897,252 1,559,160 1,587,447 3,146,607 DISTRICT R 622,669 630,994 ',,846 578,973 695,428 1,253,415 1,275,854 2,529,269
U 144,727 153,278 7,960 132,979 201~24 305,745 311,593 617,338
Sirkali Taluk T 42,065 42,520 468 39,272 47,846 89,492 91,645 181,137 R 35,169 35,562 316 32,977 38,818 74,340 76,498 150,838 U 6,896 6,958 152 6,295 9,028 15,152 15,147 30,299
Mayuram Taluk T 84,961 85,420 1,501 78,625 104,219 173,898 178,300 352,198 R 69,840 69,944 709 64,247 82,310 139,641 143,564 283,205 U 15,121 15,476 792 14,378 21,909 34,257 34,736 68,993
Kumbakonam T 81,928 86,468 5,000 79,915 102,865 175,610 177,346 352,956 Taluk R 58,868 59,753 2,296 54,697 65,151 119,211 119,911 239,122
U 23,060 26,715 2,704 25,218 37,714 56,399 57,435 113,834
Nannilam Taluk T 69,339 69,866 991 61,416 79,594 127,864 133,230 261,094 R 64,900 65,362 817 57,676 74,812 120,105 125,351 245,456 U 4,439 4,504 174 3,740 4,782 7,759 7,879 15,638
Papanasam Taluk T 54,456 56,971 1,200 53,014 64,570 112,944 115,721 228,665 R 46,613 47,940 630 45,293 54,098 95,955 98,426 194,381 U: 7,843 9,031 570 7,721 10,472 16,989 17,295 34,284
Thanjavur Taluk T 81,948 84,865 1,975 77,363 103,100 171,490 172,560 344,050 R 52,046 53,454 346 50,649 58,626 108,625 109,237 217,862 U 29,902 31,411 1,629 26,714 44,474 62,865 63,323 126,188
Orathanad Taluk T 43,945 44,564 279 41,714 46,318 95,351 95,449 190,800 R 42,076 42,677 207 40,333 44,540 91,661 92,324 183,985 U 1,869 1,887 72 1,381 1,778 3,690 3,125 6,815
Mannargudi Taluk T 66,784 67,934 1,006 61,019 74,343 131,214 134,183 265,397 R 54,467 55,240 483 50,206 58,339 106,653 108,308 214,961 U 12,317 12,694 523 10,813 16,004 24,561 ' 25,875 50,436
Nagapattinam T 67,733 69,201 1,170 61,219 79,300 132,929 136,666 269,595 Taluk R 47,585 48,261 478 42,848 51,202 90,978 92,869 183,847
U 20,148 20,940 692 18,371 28,098 41,951 43,797 85,748
Tiruthuraipundi T 68,933 69,672 859 61,452 75,185 133,117 134,181 267,298 Taluk R 58,066 58,379 601 52,644 62,476 113,400 113,476 226,876
U 10,867 11,293 258 8,808 12,709 19,717 20,705 40,422
Pattukkottai Taluk T 66,803 68,049 1,001 62,288 79,676 138,083 137,931 ' 276,014 R 57,661 58,846 730 54,963 67,528 120,762 120,568 241,330 U 9,142 9,203 271 7,325 12,148 17,321 17,363 34,684
Arantangi Taluk T 38,501 38,742 356 34,655 40,236 77,168 80,235 157,403 R 35,378 35,576 233 32,440 37,528 72,084 75,322 147,406 V 3,123 3,166 123 2,215 2,708 5,084 4,913 9,997
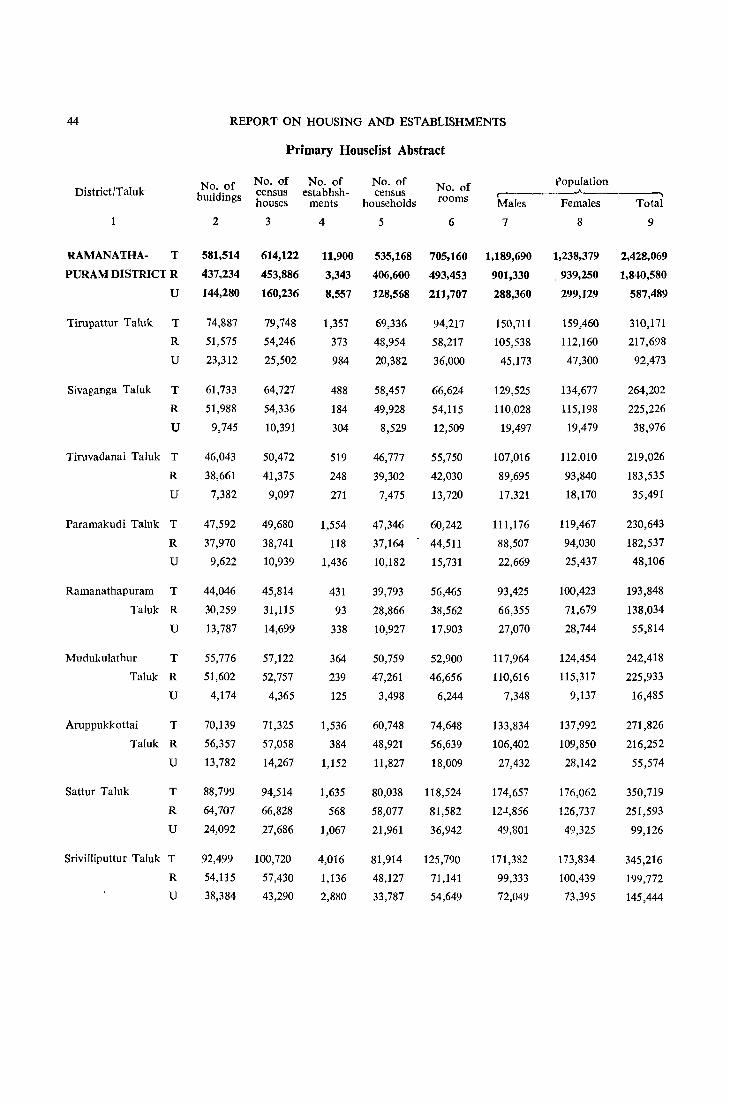
44
District/Taluk
RAMANATHA- T
PURAM DISTRICT R
U
Tirupattur Taluk T
R
U
Sivaganga Taluk T
R
U
Tiruvadanai Taluk T
R
U
Paramakudi Taluk T
R
U
Ramanathapuram T
Taluk R
U
Mudukulathur T
Taluk R
U
Aruppukkottai T
Sattur Taluk
Taluk R
U
T
R
U
Srivilliputtur Taluk T
R
U
REPORT ON HOUSING AND ESTABLISHMENTS
Primary Houselist Abstract
Population No. of bUIldings
No. of census houses
No. of establIsh
ments
No. of census
households
No. of rooms
r---- .A.._ ___ ,
2
581,514
437,234
144,280
74,887
51,575
23,312
61,733
51,988
9,745
46,043
38,661
7,382
47,592
37,970
9,622
44,046
30,259
13,787
55,776
51,602
4,174
70,139
56,357
13,782
88,799
64,707
24,092
3
614,122
453,886
160,236
79,748
54,246
25,502
64,727
54,336
10,391
50,472
41,375
9,097
49,680
38,741
10,939
45,814
31,115
14,699
57,122
52,757
4,365
71,325
57,058
14,267
94,514
66,828
27,686
92,499 100,720
54,115 57,430
38,384 43,290
4
11,900
3,343
8,557
1,357
373
984
488
184
304
519
248
271
1,554
118
1,436
431
93
338
364
239
125
1,536
384
1,152
1,635
568
1,067
4,016
1,136
2,880
Males Females
5 6 7
535,168 705,160 1,189,690
406,600 493,453 901,330
128,5fl8 211,707 288,360
69,336
48,954
20,382
58,457
49,928
8,529
46,777
39,302
7,475
47,346
37,164
10,182
39,793
28,866
10,927
50,759
47,261
3,498
60,748
48,921
11,827
94,217
58,217
36,000
66,624
54,115
12,509
55,750
42,030
13,720
60,242
44,511
15,731
56,465
38,562
17,903
52,900
46,656
6,244
74,648
56,639
18,009
80,038 118,524
58,077 81,582
21,961 36,942
81,914 125,790
48,127 71,141
33,787 54,649
150,711
105,538
45,173
129,525
110,D28
19,497
107,016
89,695
17,321
111,176
88,507
22,669
93,425
66,355
27,070
117,964
110,616
7,348
133,834
106,402
27,432
174,657
n.1.,856
49,801
171,332
99,333
72,049
8
1,238,379
, 939,250
299,129
159,460
112,160
47,300
134,677
115,198
19,479
112,010
93,840
18,170
119,467
94,030
25,437
100,423
71,679
28,744
124,454
115,317
9,137
137,992
109,850
28,142
176,062
126,737
49,325
173,834
100,439
73,395
Total
9
2,428,069
1,840,580
587,489
310,171
217,698
92,473
264,202
225,226
38,976
219,026
183,535
35,491
230,643
182,537
48,106
193,848
138,034
55,814
242,418
225,933
16,485
271,826
216,252
55,574
350,719
251,593
99,126
345,216
199,772
145,444
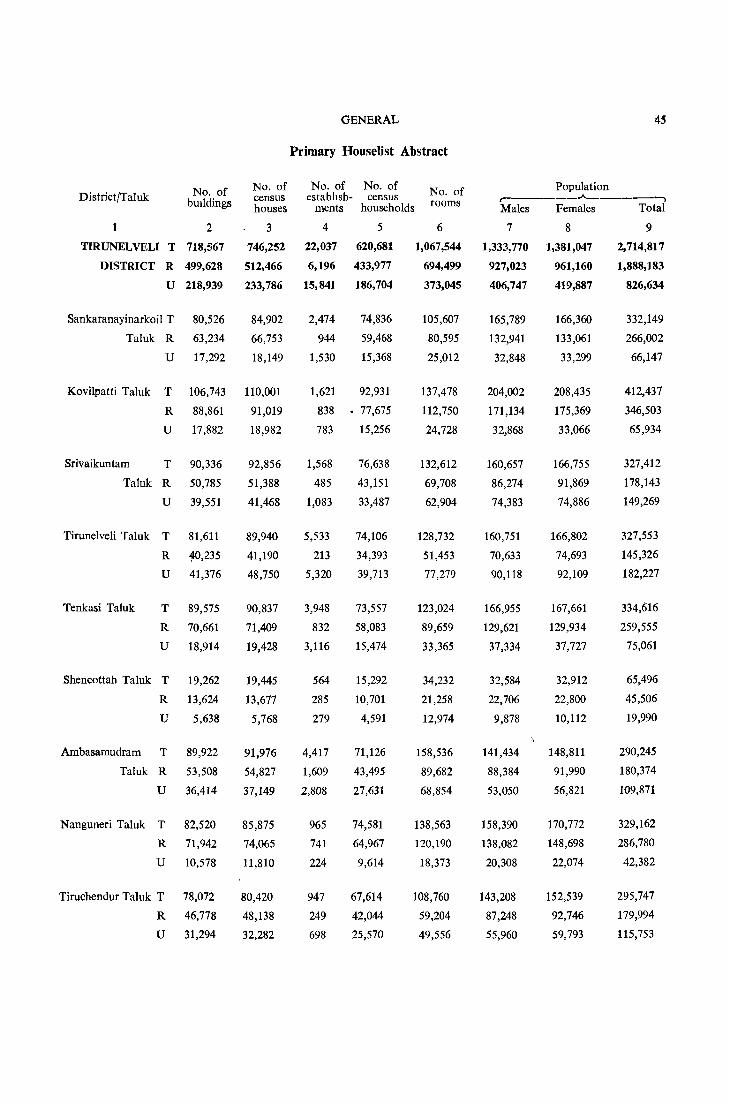
D istrictfTaluk No. of bUIldings
2
TIRUNELVELI T 718,567
DISTRICT R 499,628
U 218,939
Sankaranayinarkoil T
Taluk R
U
Kovilpatti Taluk T
R
U
Srivaikuntam T
Taluk R
U
Tirunelveli Taluk T
R
U
80,526
63,234
17,292
106,743
88,861
17,882
90,336
50,785
39,551
81,611
to,235
41,376
Tenkasi Taluk T 89,575
R 70,661
U 18,914
Shencottah Taluk T 19,262
R 13,624
U 5,638
Ambasamudram T 89,922
Taluk R 53,508
U 36,414
Nanguneri Taluk T 82,520
R 71,942
U 10,578
Tiruchendur Taluk T 78,072
R 46,778
U 31,294
No. of census houses
3
746,252
512,466
233,786
84,902
66,753
18,149
110,001
91,019
18,982
92,856
51,388
41,468
89,940
41,190
48,750
90,837
71,409
19,428
19,445
13,677
5,768
91,976
54,827
37,149
85,875
74,065
11,810
80,420
48,138
32,282
GENERAL
Primary Houselist Abstract
No. of No. of estabhsh- census
ments households
No. of rooms
4 5
22,037 620,681
6,196 433,977
15,841 186,704
2,474
944
1,530
1,621
838
783
1,568
485
1,083
5,533
213
5,320
3,948
832
3,116
74,836
59,468
15,368
92,931
• 77,675
15,256
76,638
43,151
33,487
74,106
34,393
39,713
73,557
58,083
15,474
564 15,292
285 10,701
279 4,591
4,417 71,126
1,609 43,495
2,808 27,631
965 74,581
741 64,967
224 9,614
947 67,614
249 42,044
698 25,570
6
1,067,544
694,499
373,045
105,607
80,595
25,012
137,478
112,750
24,728
132,612
69,708
62,904
128,732
51,453
77,279
123,024
89,659
33,365
34,232
21,258
12,974
158,536
89,682
68,854
138,563
120,190
18,373
108,760
59,204
49,556
4S
Population c-------"-------, Males Females Total
7
1,333,770
927,023
406,747
165,789
132,941
32,848
204,002
171,134
32,868
160,657
86,274
74,383
160,751
70,633
90,118
166,955
129,621
37,334
32,584
22,706
9,878
141,434
88,384
53,050
158,390
138,082
20,308
143,208
87,248
55,960
8
1,381,047
961,160
419,887
166,360
133,061
33,299
208,435
175,369
33,066
166,755
91,869
74,886
166,802
74,693
92,109
167,661
129,934
37,727
32,912
22,800
10,112
148,811
91,990
56,821
170,772
148,698
22,074
152,539
92,746
59,793
9
2,714,817
1,888,183
826,634
332,149
266,002
66,147
412,437
346,503
65,934
327,412
178,143
149,269
327,553
145,326
182,227
334,616
259,555
75,061
65,496
45,506
19,990
290,245
180,374
109,871
329,162
286,780
42,382
295,747
179,994
115,753
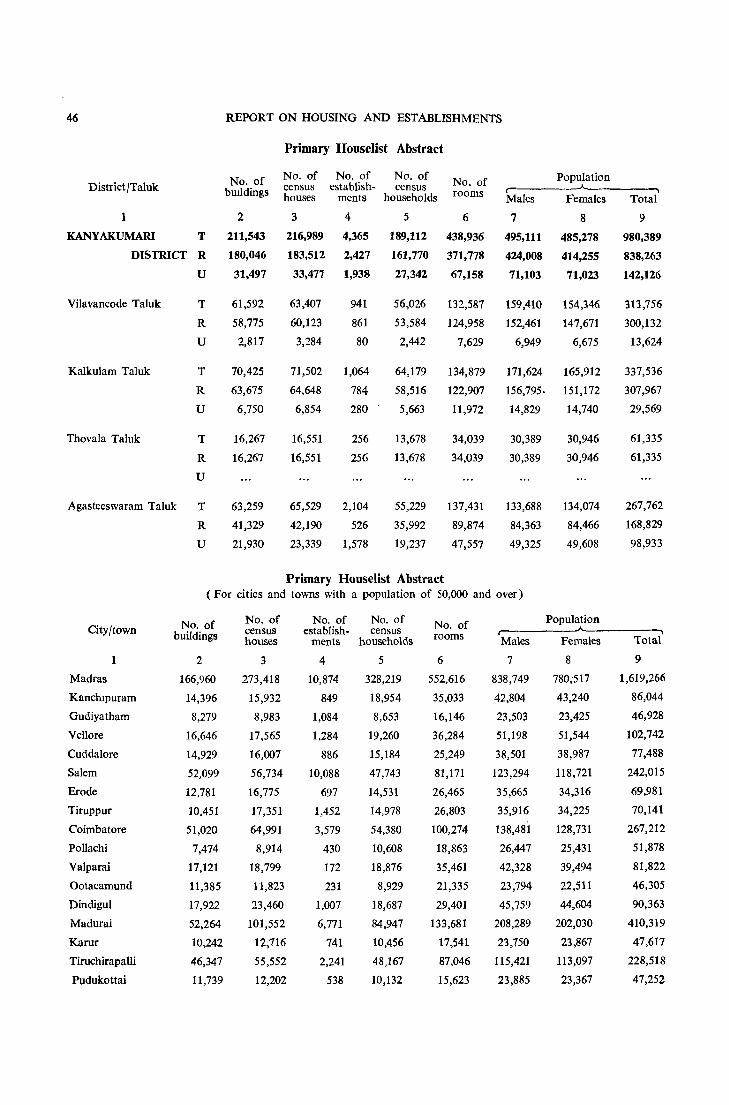
46 REPORT ON HOUSING AND ESTABLISHMENTS
Primary Houselist Abstract
No. of No. of No. of Population DistrictlTaiuk No. of
buildings census establish- census houses ments households
No. of rooms ~'--------~-------~
Males Females Total
1
KANYAKUMAID T
DISTRICT R
Vilavancode Taluk
Kalkulam Taluk
Thovala Taluk
U
T
R
U
T
R
U
T
R
U
Agasteeswaram Taluk T
R
U
2
211,543
180,046
31,497
61,592
58,775
2,817
70,425
63,675
6,750
16,267
16,267
63,259
41,329
21,930
3 4 5
216,989 4,365 189,112
183,512 2,427 161,770
33,477 1,938 27,342
63,407
60,123
3,284
71,502
64,648
6,854
16,551
16,551
941
861
80
1,064
784
280
256
256
56,026
53,584
2,442
64,179
58,516
5,663
13,678
13,678
6
438,936
371,778
67,158
7
495,111
424,008
71,103
8
485,278
414,255
71,023
132,587 159,410 154,346
124,958 152,461 147,671
7,629 6,949 6,675
134,879 171,624 165,912
122,907 156,795. 151,172
11,972
34,039
34,039
14,829
30,389
30,389
14,740
30,946
30,946
65,529 2,104 55,229 137,431 133,688
84,363
49,325
134,074
84,466
49,608
42,190 526 35,992 89,874
23,339 1,578 19,237 47,557
Primary Houselist Abstract
City/town
Madras
Kanchlpuram
Gudiyatham
Vellore
Cuddalore
Salem
Erode
Tiruppur
Coimbatore
Pollachi
Valparai
Ootacamund
Dindigul
Madurai
Karur
Tiruchirapalli
Pudukottai
(For cities and towns with a population of 50,000 and over)
No. of buildings
2
No. of census houses
3
166,960 273,418
14,396 15,932
8,279 8,983
16,646 17,565
14,929 16,007
52,099 56,734
12,781 16,775
10,451 17,351
51,020 64,991
7,474 8,914
17,121 18,799
11,385 11,823
17,922 23,460
52,264 101,552
10,242 12,716
46,347 55,552
11,739 12,202
No. of No. of establish- census
ments households
4 5
10,874 328,219
849 18,954
1,084 8,653
1,284 19,260
886 15,184
10,088 47,743
697 14,531
1,452 14,978
3,579 54,380
430 10,608
172 18,876
231 8,929
1,007 18,687
6,771 84,947
741 10,456
2,241 48)67
538 10,132
No. of rooms
6
552,616
35,033
16,146
36,284
25,249
81,171
26,465
26,803
100,274
18,863
35,461
21,335
29,401
133,681
17,541
87.046
15,623
Population
Males Females
7 8
838,749 780;517
42,804 43,240
23,503 23,425
51,198 51,544
38,501 38,987
123,294 118,721
35,665 34,316
35,916 34,225
138,481 128,731
26,447 25,431
42,328 39,494
23,794 22,511
45,759 44,604
208,289 202,030
23,750 23,867
115,421 113,097
23,885 23,367
9
980,389
838,263
142,126
313,756
300,132
13,624
337,536
307,967
29,569
61,335
61,335
267,762
168,829
98,933
Total
9
1,619,266
86,044
46,928
102,742
77,488
242,015
69,981
70,141
267,212
51,878
81,822
46,305
90,363
410,319
47,617
228,518
47,252
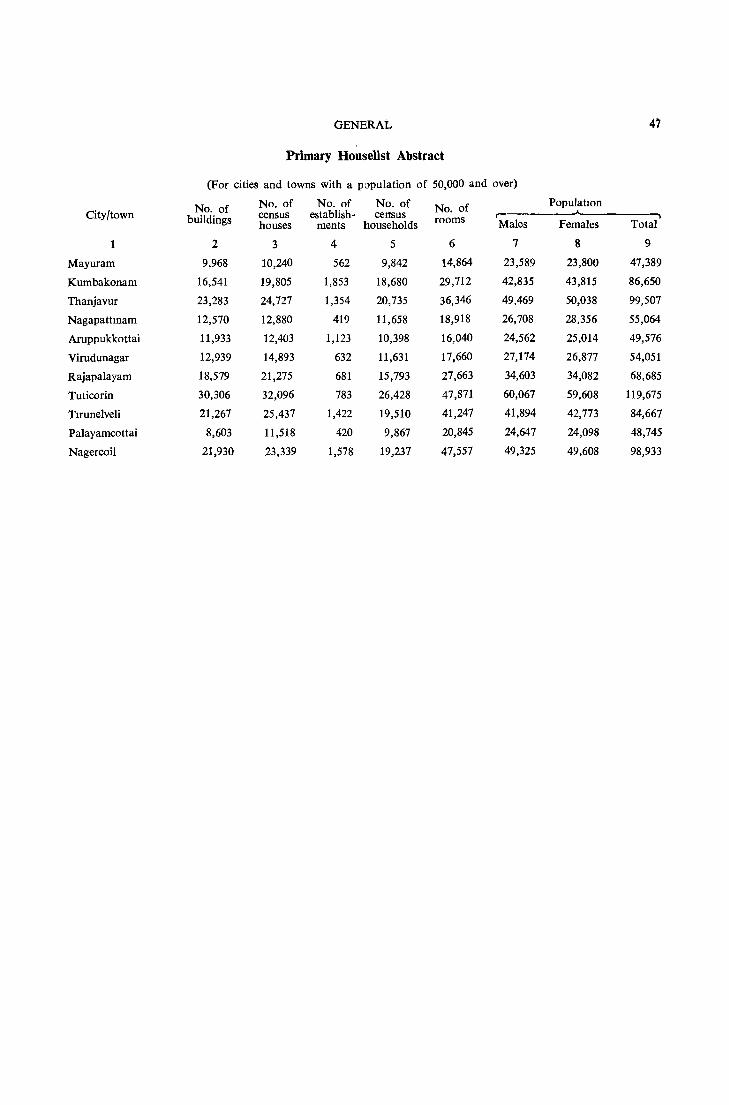
GENERAL 47
Primary Houselist Abstract
(For cities and towns with a population of 50,000 and over)
No. of No. of No. of No. of No. of PopulatIOn City/town buildings census establish- census rooms r-
houses ments households Males Females Total
1 2 3 4 5 6 7 8 9
Mayuram 9,968 10,240 562 9,842 14,864 23,589 23,800 47,389
Kumbakonam 16,541 19,805 1,853 18,680 29,712 42,835 43,815 86,650
Thanjavur 23,283 24,727 1,354 20,735 36,346 49,469 50,038 99,507
Nagapattmam 12,570 12,880 419 11,658 18,918 26,708 28,356 55,064
Aruppukkottai 11,933 12,403 1,123 10,398 16,040 24,562 25,014 49,576
Virudunagar 12,939 14,893 632 11,631 17,660 27,174 26,877 54,051
Rajapalayam 18,579 21,275 681 15,793 27,663 34,603 34,082 68,685
Tuticorin 30,306 32,096 783 26,428 47,871 60,067 59,608 119,675
Tuunelveli 21,267 25,437 1,422 19,510 41,247 41,894 42,773 84,667
Palayamcottai 8,603 11,518 420 9,867 20,845 24,647 24,098 48,745
Nagercoil 21,930 23,339 1,578 19,237 47,557 49,325 49,608 98,933

CHAPTER III
CENSUS HOUSE AND ITS USES
3 - I, In order to appreciate a discussion relating to census houses and to a lesser extent to all other aspects of housing, it is necessary to have an idea of the, breakup of working
population of Madras State, Ultimately, the pattern of housing
Pattern of housing dependent on is dependent on the worker who earns to maintain the family and working population builds the house. We append three statements indicating the
percentage of workers by category and the t()tal workers for the whole State for urban area and rural area, The salient features are indicated below:
3 - 2, 60'5% of the workers depend on agriculture for their livelihood, 15'4% on other services, 7'9% on household industry, 5'5% on manufacturing, 4'9% on trade and commerce,
2'8% on mining, 1'7% on transport and 1'3% on construction,
Distribution of working population Other services include major group 89, Casual labourers, who form in categories 52'91% of the total of other services. In the rural sector the per-
centage rises to 65'47% while in the urban it is 31'28%, In the rural sector, the emphasis being more on agriculture, 72'8% depend on agriculture, 12'2% on other services, household industry 6'8%, manufacturing 2'2%, mining 2'5;~ and trade and commerce 2'3%, The position is, however, appreciably different in the urban sector where the most important category is 'other services' 28'0%, manufacturing 18'6%, trade 'and commerce 15'4%, household industry 12'3%, Only 11'8% depend on agriculture, Transport engages 6'5% of the workers. Madras State being essentially agncultural, the number of dwellings will be higher, The working force in industrial sector, is 13'4% in Madras State represented by manufacturing and household industry, But in the rural sector, it is only 9'0% while in the urban it rises to 30'9%, The workers engaged in other services are 28'0% in urban sector as against 12'2% in the rural sector, A background of the economic factors prevalent in Madras State is necessary for a reader to appreciate the discussions in this volume. We will also have occasion to refer to these three tables whenever any variations are discussed at district and at taluk levels,
Industrial Madras Category State~
2
CultIvator 42'1
Agricultu -ralLabou-rer 18'4
Other Ser-vices 15'4
Household Industry 7'9
Manufac-tUrIng 5'5
Statement Ill-I
Percentage of workers in each category to the total workers in the State and in the districts
Chingle- North South Salem Coimba- N~l: Mad,u- Tiruchi- '!han- Ra::;_~~ Madras put Arcot Arcot tore gm ral rapalh Javur na a puram
3 4 5 6 7 8 9 10 11 12 13 N 35'2 51'4 49'5 54'7 30'3 18'9 39'0 54'8 36'3 53'0
N 25'3 17'1 28'7 12'8 15'7 1l'O 20'1 16'3 32'7 14'4
36'4 14'9 12'4 9'8 12'0 21'2 27'6 18'8 11'6 12'9 12'3
2'5 8'6 7'0 4'0 10'5 11'0 0'7 4'8 4'9 38 7'9
24'S 6'1 4'4 1'6 3'2 8'5 4'7 5'8 4'7 3'8 4'4
Tlrtl-Kanya-nel-kumari veli
14 15
35'2 20'7
16,1 8'9
15'0 26'6
IS'S 21'9
6'1 5'1
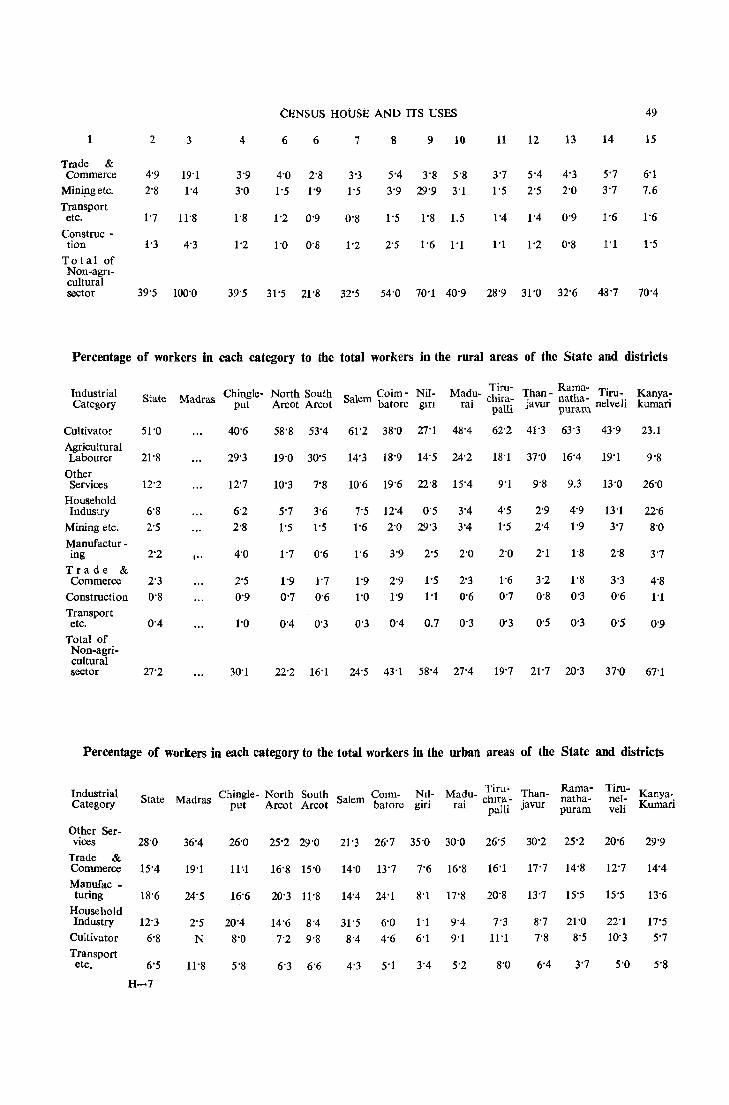
Trade & Commerce
Mining etc,
Transport etc,
Construc -tion
To tal of Non-agncultural sector
2 3
1'7 11'8
39'S 100'0
CENSUS HOUSE AND ITS USES 49
4
3'9
3'0
1'8
1'2
6 6 7
4'0 2'8
1'5 1'9
1'2 0'9 0'8
1'0 O'S 1'2
39'S 31'S 21'8 32'S
8 9 10
5'4 3'8 5'8 3'9 29'9 3'1
1'5 1'8 1.5
2'S 1'6 1'1
11 12 13
3'7 5'4 4'3
1'5 2'5 2'0
1'1 1'2 O'S
14
5'7
3'7
1'1
15
6'1 7,6
1'6
1'5
54'0 70'1 40'9 28'9 31'0 32'6 48'7 70'4
Percentage of workers in each category to the total workers in the rural areas of the State and districts
Industrial Category State
Cultivator 51'0
Agricultural Labourer 21 '8
Other Services 12'2
Household Industry 6'8
Mining etc, 2'5
Manufactur -ing 2'2
Trade & Commerce 2'3
Construction 0'8
Transport etc,
Total of Non-agricultural sector
0'4
27'2
Madras Chingle- North South Coim - Nil-put Arcot Arcot Salem batore gm
Mad,u- c1l~= Than - Rama- Tiru- Kanya-ral palli javur ~~~~~ nelveli kumari
t ..
40'6
29'3
12'7
6'2
2'8
4'0
2'5
0'9
1'0
30'1
58'S 53'4 61'2 38'0 27'1 4S'4
19'0 30'S 14'3 18'9 14'5 24'2
10'3 7'8 10'6 19'6 22'S 15'4
5'7 3'6 7'5 12'4 0'5 3'4
1'5 1'5 1'6 2'0 29'3 3'4
1'7 0'6 1'6 3'9 2'S 2'0
1'9 2'9 1'5 2'3
1'0 1'9 1'1 0'6
62'2 41'3 63'3 43'9 23,1
IS' 1 37'0 16'4 19'1 9'8
9'1 9'8 9,3 13'0 26'0
4'5 2'9 4'9 13'1 22'6
1'5 2'4 1'9 3'7 8'0
2'0
1'6
0'7
2'1 I'S
3'2 1'8
0'8 0'3
2'8
3'3
0'6
3'7
4'8
1'1
0'4 0'3 0'3 0'4 0,7 0'3 0'3 0'5 0'3 O'S 0'9
22'2 16'1 24'S 43'1 58'4 27'4 19'7 21'7 20'3 37'0 67'1
Percentage of workers in each category to the total workers in the urban areas of the State and districts
Industrial Category
Chingle- North South COIffi- NIl- Madu- Tiru- Th Rama-State Madras put Arcot Arcot Salem batore giri rai c~~l~i- jav:- ;~~~
Tiru-nel- Kanya. veli Kumari
Other Ser-vices 28'0
Trade & Commerce 15' 4
Manufac -turing IS'6
Household Industry 12'3
Cultivator 6'S Transport etc. 6'5
36'4
19'1
24'S
2'5
N
11'8
26'0
IN
16'6
20'4
8'0
5'8
25'2 29'0
16'8 15'0
20'3 11'S
14'6 S'4
7'2 9'S
6'3 6'6
21'3 26'7 35'0 30'0
14'0 13'7 7'6 16'8
14'4 24'1 8'1 17'8
31'S 6'0 1'1 9'4
8'4 4'6 6'1 9'1
4'3 5'1 3'4 5'2
26'S 30'2 25'2 20'6 29'9
16'1 17'7 14'8 12'7 14'4
20'8 13'7 IS'S IS'S 13'6
7'3 S'7 21'0 22'1 17'5
11'1 1'8 8'5 10'3 5'7
8'0 3'7 5'0 S'S

50 REPORT ON HOUSING AND ESTABLISHMENTS
1 2 3 4 5 6 7 8 9 10 11 12 13 14 15
Agricultu -ral Labou-rer 5'0 N S'S 5"S 10'2 2'7 S'O S'6 6'8 S'S 8'3 5'9 7'5 3'3
Mining etc. 4'1 1'4 3'7 1'4 5'7 0'9 10'5 30'S 2'3 1'5 3'5 2"4 3'7 5'3
Constru -ction 3'3 4'3 2.9 2'7 3'5 2'5 4'3 2'3 2·6 3'2 3"7 3·0 2·6 4·5
Total of Non-agri-cultural sector 88·2 100'0 86'5 87'3 80'0 88'9 90'4 88'3 84'1 83"4 83'9 85'6 82'2 91'0
N: Denotes negligible figures.
3 - 3. 39'5 percent of the workers in the State participate in non-agricultural actiVIty. This is 88'2% in the urban sector and 27'2% in the rural sector. The dIstricts in which the per
centage of non-agricultural workers is high are Madras City, Kanya-Workers in non-agricultural kumari, Nilgiri, Coimbatore and Tirunelveli. In the urban sector,
activities non-agricultural activities are high in all the districts. In the rural, more non-agricultural activities are recorded in Kanyakumari,
Nilgiri and Coimbatore. We should, therefore, expect greater activity based on Census house in the districts of Kanyakumari, Nilgiri, Coimbatore and to a lesser extent in Tirunelveli.
3 - 4. For instance, the State of Madras has recorded 863 pure dwellings in the rural sector. In the whole State, Kanyakumari has recorded 831, Tirunelveli 838, Nilgiri 811 which
indicate that the number of pure dwellings decreases with the Pure dwellings decrease with in- greater non-agricultural activity. Coimbatore may appear to be
crease in non-agricultural activities an exception to this rule. But in Coimbatore, there is as much agricultural activity as non-agricultural. Actually this distcrit
represents a proper synthesis of agricultural as well as non-agricultural activities.
3 - 5. We have exhibited all the Census houses found in Madras State classified into 12 broad categories in Table E-I depending on the use to which census houses are put. We must
once again emphasise that each census house is a unit for work or Census house treated only as a living and the classification has been made without any reference
unit of work or living to its size, utility or importance. This unit is a variable one. It has been so defined that a census house need not have walls. It,
therefore, represents a varied pattern. It will vary not only from the poor and the rich but also from caste to caste. As an illustrative example, we show two photographs-one that of a Harijan living in Periyur village of Madurai District and the other a modern house constructed in Madras City. Again a pan-shop conducted by a small shop-keeper is as much a unit as the spacious Spencer's buildings in Madras City. Our discussion is based on a number of census units without any reference to the quality. Again in a census house are included a large number of units which are important by themselves, for instance, in Spencer's there are a number of departments independently working but they are to be grouped together in one census house. So, whenever a discussion is based on the number of such shops available in different parts of the country without any reference to its size or the nature of articles dealt with or sold, the picture is somewhat likely to be lopsided. But for a comparison of the conditions in different parts of the country in urban and rural sectors the data collected on the same basis will, we hope, be an useful guide.
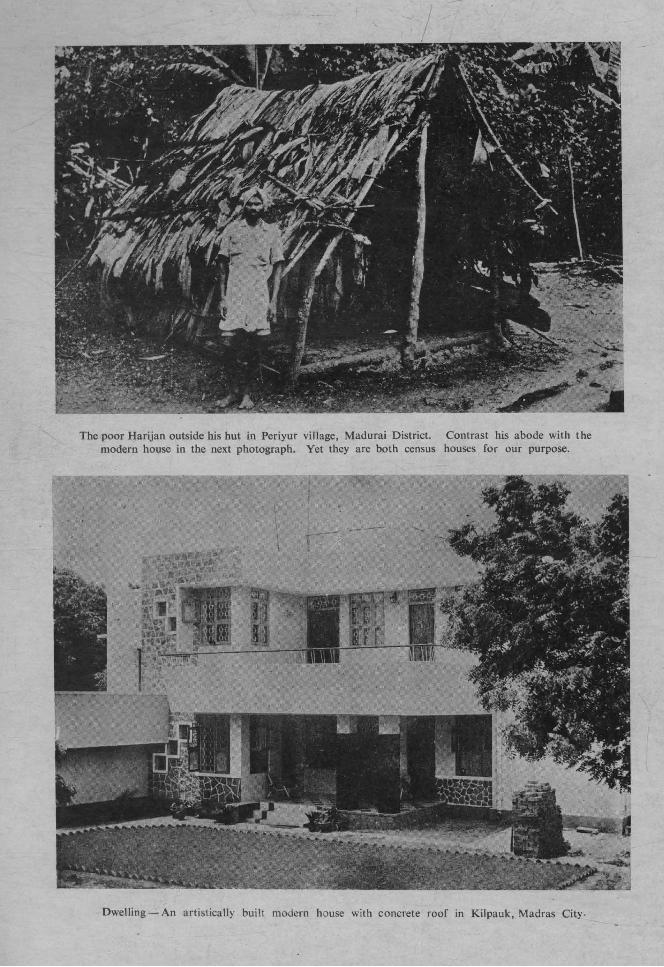
The poor Harijan outside his hut in Periyur village, Madurai District. Contrast his abode with the modern house in the next photograph. Yet they are both census houses for our purpose.
Dwelling - An artistically built modern house with concrete roof in Kilpauk, Madras City.

CENSUS HOUSE AND ITS USES 51
Table E-I Census hOl!ses divided: 3 - 6. The census houses have been divided for the into twelve broad categories purpose of this table into 12 general categories: They are:
1. Dwellings, i.e., houses solely used as residences.
2. Shop-cum-dwelling: A house in which a portion is used as a shop and the other portion is used as a residence. Such census houses belong to this category which are engaged in petty trade located in the premises in which persons live.
3. Workshop-cum-dwelling: If a portion of a residence is utilised by the owner or any other person as a workshop, it becomes a workshop-cum-dwelling. It shoud be dIstinctly understood that the nature of activity in that census house should refer to manufacturing, processing or repairing or servicing of an article. Then only, the census house will become a workshopcum-dwelling.
4. Hotels: They also include Dharmshalas, Tourist Homes and Inspection Houses.
5. Shops: These are places where sale or purchase in retail or wholesale is made. Further, eating houses including all restaurants are excluded from this category.
6. Business house and office: They include all Government offices, Banks and Firms.
7. Workshop.and Factories: This category covers Factories, Workshops and Worksheds. All census houses in which productIOn, processing or repairing or servicing is effected whether on a large scale or small scale are included in this category. For this purpose no distinction has been made between regIstered and unregistered factories. It will be useful to define a factory at this stage because in our discussion of the data relating to Tables I to V we will have occasion to refer to factories. Factory is any premises where 10 or more workers are employed, o,r have worked on any day of the preceding 12 months and in which the manufacturing process is conducted with the aid of power or where 20 or more persons are so employed and the manufacturing etc., is conducted without the aid of power. It will not include a mine coming under the Indian Mines Act XXXV of 1952. All units whether they are covered by the Factories Act or not, are listed in this category. Workshop is a place where any processing or repairing is carried on and workshed refers to a small unit run on the lines of a household industry.
8. Schools, Colleges, Tutorial Colleges and other Educational Institutions: Training and Coaching Institutions, Typewriting and Shorthand Institutions are also grouped with this category.
9. Restaurants and Eating Houses: They must be clearly distinguished from hotels under category (4). Hotels are eating houses with facilities for boarding and lodging while restaurants refer to eating houses without any facility for lodging.
10. Places of entertainment and community gathering: They include Sabhas, Music or Drama Halls.
11. Public Health and Medical Institutions: Hospitals, Health Centres, Doctor's clinics, Dispensaries etc., are inclUded in this category.
12. Others: All other purposes for which houses could be used and which could not be put under any of the above categories are shown in this category.
This table also shows the number of census houses vacant at the time of Houselisting. It exhibits the actual condition at that time without any reference to the possibility that it would be occupied in the near future. The table furnishes figures separately for rural and urban sectors of each taluk. The figures of each city and town with a population 50,000 or more have also been shown. Two Subsidiary tables have been given. E I-I shows the distribution of 1,000 census houses classified into 12 categories of occupied houses. E 1-2 shows the proportion of 1,000 houses in the rural and urban sector. The figures in each sector are
52 REPORT ON HOUSING AND ESTABLlSHMEN1S
classified in three categories-Dwellings, Shop-cum-Dwellings and Workshop-culII-Dwellings. Our discussion will be based mainly on the two SubsidIary Tables.
3 - 7. We now produce for the benefit of our readers a series of photographs illustrating the various types of Census Houses according to the use to which they were put. As will be
evident from the Illustrations they range from the modern office Pictorial panorama of building in Madras City to the sombre brickned Taluk office in the
census houses districts or the semi modern Panchayat office in the village; from the huge Factory with all amenities provided for the workers in
the City to the small Flour Mill factory in smaller urban area; from the Workshed in an urhan area to a Rice Mill or a blacksmith's hut in a village; from the brightly lit Cinema Theatre in the city to the thatched Touring Talkies of the village; from the imposing educational institution of the city to the humble village school. In addition we pictorially present typical specimens of hostels, shops, shop-cum-dwellings, workshop-cum-dwellings and places of worship. These photographs, it is hoped, will help readers in understanding the discussion which follows.
3 - 8. 7,799,674 Census houses have been listed in Madras State in October, 1960. Of these, 5,835,929 i.e., 74'8% arc found in rural und 1,963,745 or
Rural urban distribution of 25'2% are in urban areas. The proportion of rural and urban census bouses population in Madras State is 73'31 and 26'69. Of the total
number of urban houses, 941,387 or 47'9% are in cities and towns with a population of 50,000 and over and cover a population of 13'86% in the State.
3 - 9. Out of every thousand houses in the State, 68 are vacant and others put to different uses. 841 are used as dwellings, 7 as shop-cum-dwellings and 14 as workshop-cum-dwellings.
Census houses: uses to which they are put
Out of 932 occupied census houses, 862 representing 92% are used as mixed dwellings only. 24 houses fall under the miscellaneous group. Others are put to use which are not specified in our table. Two graphs have been prepared indicating the break up of census
houses district by district one for mixed dwellings and non-dwellings and the other for census houses classified as dwellings, mixed dwellings, non-dwellings and vacant. The break-up for 46 non-residential houses which forms a comparatively small percentage is as follows:
Shops 20
Workshops and Factories 10
Business Houses and Office 4 Schools 4 Restaurants 4 Hotels 2 Entertainment places 1 Hospitals etc. 1
46
3 - 10. 71 vacant houses are found in rural areas and 57 in urban. In cities and towns with a population of 50,000 and above, 23 out of 28 have recorded less number of vacant houses
than the average 57. The five towns in which the number of vacant Vacancy of houses houses exceed 57 are Ootacamund 128, Rajapalayam 123, Pudu-
kottai 88, Thanjavur 60 and Aruppukkotai 60. Thanjavur and Aruppukkottai have definite rural characteristics. A number of houses are owned by mirasdars living in the rural parts and kept vacant. Ootacamund as a hill station becomes active only during summer months. As the houselisting was done in the month of October, large number of
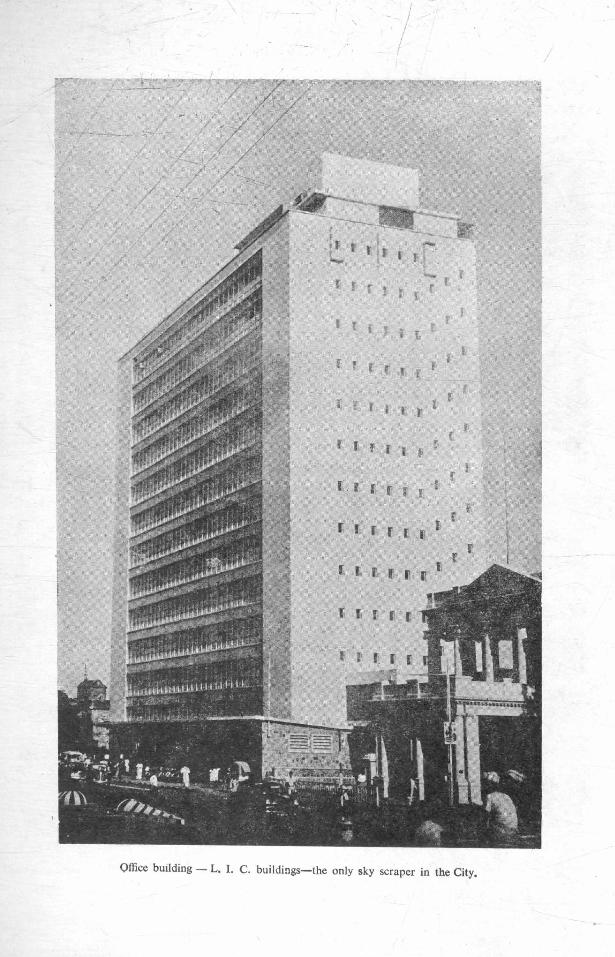
..I I' I' r
t r r
F t I
'!" • if J
r ( f
f , f r
r ( r
r r r
r Ii [
r I
, /
r
/ /
I
r t I
• ' I
r r
r r
r (
r II
r
r
r ! [
[ , t r
i
~ I
f f
~ f f
J.
I t r
r
f f I' t
f
11 t )',
Office building - L. I. C. buildings-the only sky scraper in the City.

Office building - An old standard type Taluk Office building.
Office building - The much talked about Panchayat Uqion ~ Office.
I /
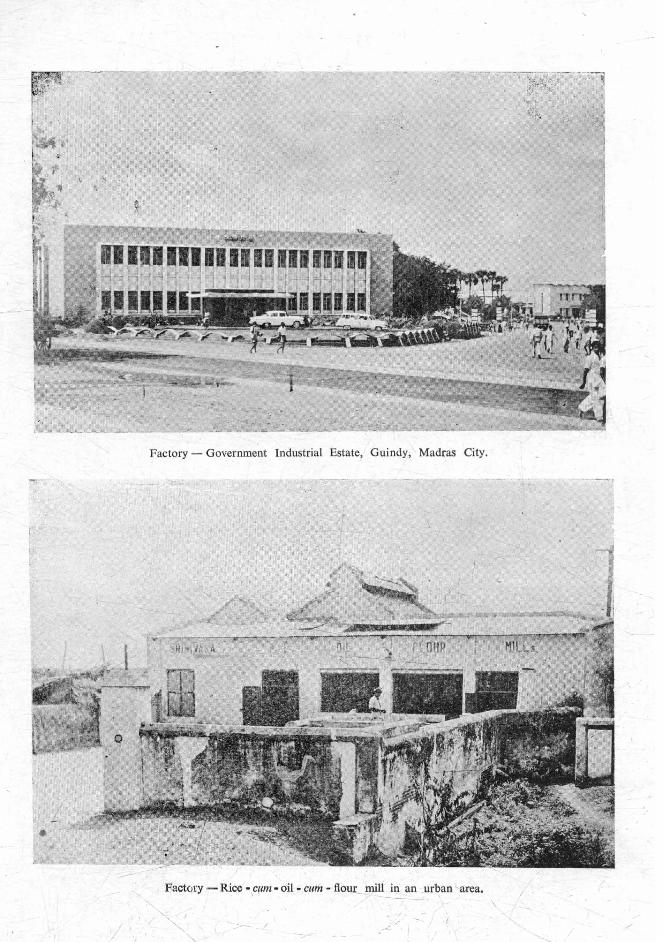
Factory - Government Industrial Estate, Guindy, Madras City.
----,
Fact(Jry - Rice· CIlJn· oil • clIm - flouL mill in an urban ' area. \ -_ ---~
., /

Workshed - Tinkering works in an urban area.
Workshop - A discontinued rice tpiU in a villase. I
/ I
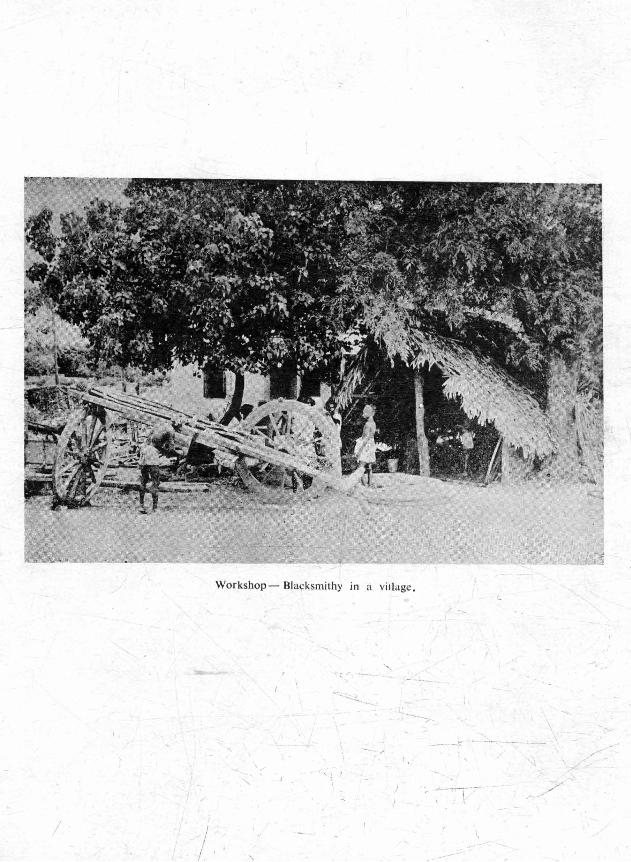
/
/
Workshop- Blacksmithy in a village.
",I I
J I
'_
L_
\ ____ t::
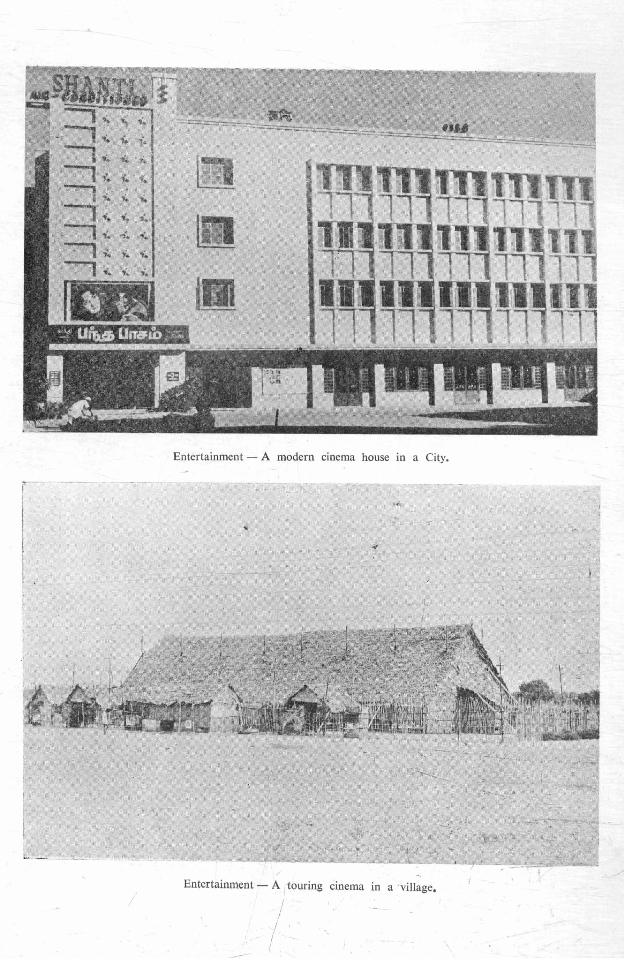
i.. '1~
,:,. ;..
;. ~ t~ i.
·i • ,:,. • ;..
":. .,.
111
Entertainment - A modern cinema house in a City.
Entertainment - A touring cinema in a 'village.
/
/ "

I I I
I 1 i ,
.~-~
Educational Institution - Presidency College, Madras
Educational Institution - A village Elementary School - old building

Dwelling - A Government hostel for students recently built.
/ A modern hotel-~ on western ~tYle/in Madras City.
/
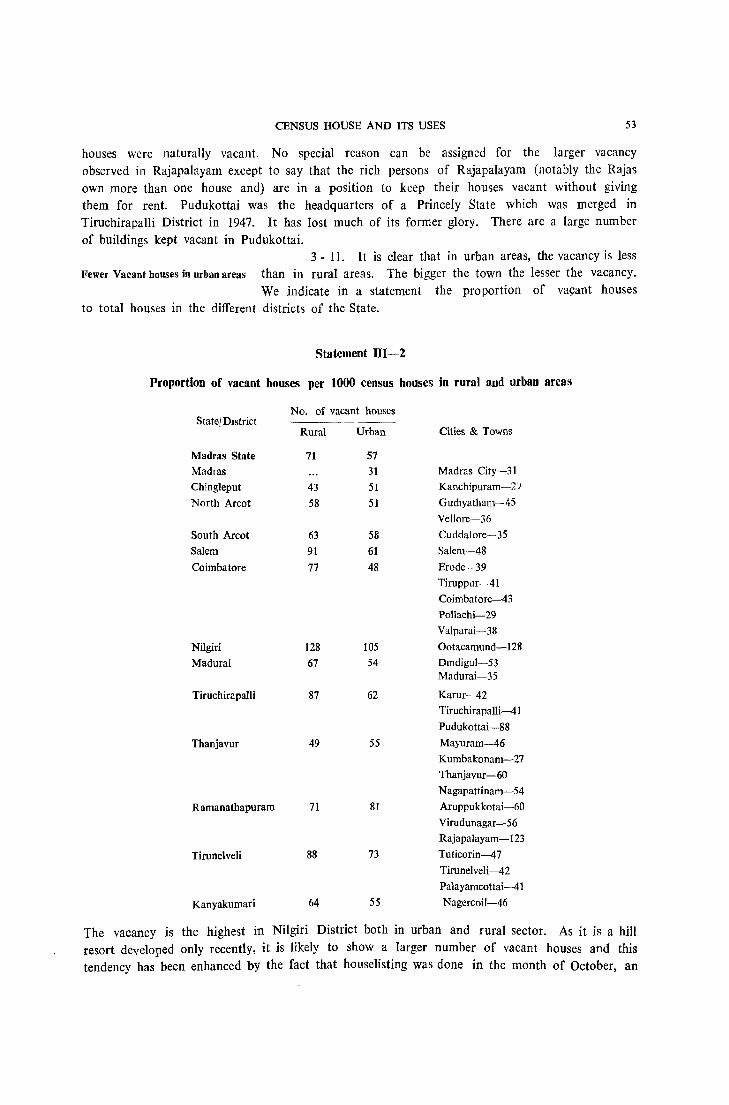
CENSUS HOUSE AND ITS USES 53
houses were naturally vacant. No special reason can be assigned for the larger vacancy observed in Rajapalayam except to say that the rich persons of Rajapalayam (notably the Rajas own more than one house and) are in a position to keep their houses vacant without giving them for rent. Pudukottai was the headquarters of a Princely State which was merged in Tiruchirapalli District in 1947. It has lost much of its former glory. There are a large number of buildings kept vacant in Pudukottai.
3 - 11. It is clear that in urban areas, the vacancy is less Fewer Vacant houses in urban areas than in rural areas. The bigger the town the lesser the vacancy.
We indicate in a statement the proportion of va9ant houses to total houses in the different districts of the State.
Statement 111-2
Proportion of vacant houses per 1000 census houses in rural and urban areas
State/DIstrict
Madras State Madras Chingleput
North Arcot
South Arcot
Salem
Coimbatore
Nilgiri
Madurai
Tiruchirapalli
Thanjavur
Ramanathapuram
Tirunelveli
Kanyakumari
No. of vacant houses
Rural
71
43
58
63 91
77
128 67
87
49
71
88
64
Urban
57
31
51
51
58
61
48
105 54
62
55
81
73
55
Cities & Towns
Madras City-31 Kanchipuram-2'}
Gudlyatham-I,S
Vellore-36
Cuddalore-35
Salem-48
Erode-39
Tiruppllr-41
Coimbatore-43 Pollachi-29
Valparai-38
Ootacamund-128 Dmdigul-53 Madurai-35
Karur-42 Tiruchirapalli-41
Pudukottai-88
Mayuram-46 Kumbakonam-27 Thanjavur-60 Nagapattinam-54
Aruppukkotai-60
Virudunagar-56 Rajapalayam-123
Tuticorin-47
Tirunelveli-42 Palayamcottai-41
Nagercoil-46
The vacancy is the highest in Nilgiri District both in urban and rural sector. As it is a hill resort developed only recently, it is likely to show a larger number of vacant houses and this tendency has been enhanced by the fact that houselisting was done in the month of October, an
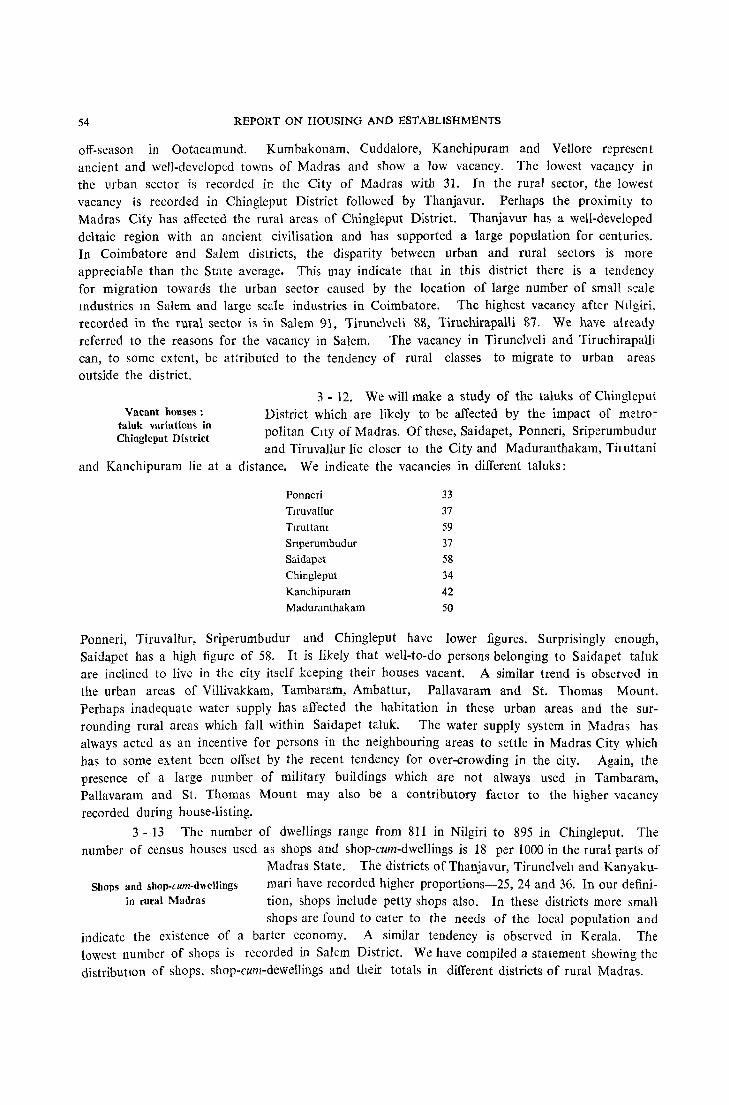
54 REPORT ON HOUSING AND ESTABLISHMENTS
off-season in Ootacamund. Kumbakonam, Cuddalore, Kanchipuram and VeIl ore represent ancient and well-developed towm of Madras and show a low vacancy. The lowest vacancy in the llrban sector is recorded in the City of Madras with 31. In the rural sector, the lowest vacancy is recorded in Chingleput District followed by Thanjavur. Perhaps the proximity to Madras City has affected the rural areas of Chingleput District. Thanjavur has a well-developed deltaic region with an ancient civilisation and has supported a large population for centuries. In Coimbatore and Salem districts, the disparity between urban and rural sectors is more appreciable than the State average. This may indicate that in this district there is a tendency for migration towards the urban sector caused by the location of large number of small s<;;ale llldustries 111 Salem and large scale industries in Coimbatore. The highest vacancy after Nllgiri, recorded in the rural sector is in Salem 91, Tirunelveli 88, TiIUchirapalli 87. We have already referred to the reasons for the vacancy in Salem. The vacancy in Tirunelveli and Tiruchirapalli can, to some extent, be attributed to the tendency of rural classes to migrate to urban areas outside the district.
Vacant houses: taluk variation .. in Chingieput District
3 - 12. We will make a study of the taluks of Chingleput District which are likely to be affected by the impact of metropolitan CIty of Madras. Of these, Saidapet, Ponneri, Sriperumbudur and Tiruvallur lie closer to the City and Maduranthakam, Til uttani
and Kanchipuram lie at a distance. We indicate the vacancies in different taluks:
Ponneri 33
Tlruvallur 37
Tlruttam 59
Srtperumbudur 37
Saidapet 58
Chingleput 34
Kanchipuram 42
Maduranthakam 50
Ponneri, Tiruvallur, Sriperumbudur and Chingleput have lower figures. Surprisingly enough, Saidapet has a high figure of 58. It is likely that well-to-do persons belonging to Saidapet taluk are inclined to live in the city itself keeping their houses vacant. A similar trend is observed in the urban areas of Villivakkam, Tambaram, Ambattur, Pallavaram and St. Thomas Mount. Perhaps inadequate water supply has affected the habitation in these urban areas and the surrounding rural areas which fall within Saidapet taluk. The water supply system in Madras has always acted as an incentive for persons in the neighbouring areas to settle in Madras City which has to some extent been offset by the recent tendency for over-crowding in the city. Again, the presence of a large number of military buildings which are not always used in Tambaram, Pallavaram and St. Thomas Mount may also be a contributory factor to the higher vacancy recorded during house-listing.
3 - 13 The number of dwellings range from 811 in Nilgiri to 895 in ChingJeput. The number of census houses used as shops and shop-cum-dwellings is 18 per 1000 in the rural parts of
Madras State. The districts of Thanjavur, Tirunelveh and Kanyaku-Shops and shop-cum-d~cllings mari have recorded higher proportions-25, 24 and 36. In our defini-
in rural Madras tion, shops include petty shops also. In these districts more small shops are found to cater to the needs of the local popUlation and
indicate the existence of a barter economy. A similar tendency is observed in Kerala. The lowest number of shops is recorded in Salem District. We have compiled a statement showing the distributIOn of shops, shop-cum-dewellings and their totals in different districts of rural Madras.

CENSUS HOUSE AND ITS USES 55
Statement 111-3
Proportion of houses used as shops and shop-cum-dwellings per 1000 census houses in rural areas
State/District Shop Shop-cum- Total dwellIng
1 2 3 4
Madras State 11 7 18
Chingleput 9 7 16 North Arcot 9 9 18 South Arcot 7 7 14 Salem 4 6 10
Coimbatore 5 8 13
Nilgiri 9 6 15
Madurai 10 8 18 Tiruchirapalh 8 5 13
Thanjavur 18 7 25 Ramanathapuram 14 5 19 Tirunelveli 18 6 24 Kanyakumari 32 4 36
In shop-cum-dwellings, North Arcot leads followed by COlmbatore and Madurai. The lowest number is recorded in Kanyakumari District which has also the highest number of shops. This reflects a tendency of the inhabitant of Kanyakumari District to treat his house as a dIstinct unit to b~ kept independently of any trade.
3 - 14. Another statement has been prepared indicating the number of factories and workshops found in different districts.
Statement 111-4
Proportion of houses used as workshop-cum-dwellings and factories and workshops per 1000 census houses in rural areas
State/District Workshop- Factol ies and Total cum-dwelhng workshops
Madras State 10 5 15 Chmgleput 12 5 17 North Arcot 16 5 21 South Arcot 5 3 8 Salem 14 6 20 COlmbatore 23 5 28 NIlgin 2 7 9
Madural 4 3 7 Tiruchirapalli 8 5 13
ThanJavur 6 6 12 Ramanathapuram 3 4 7
Tirunelveh 8 4 12 Kanyakuman 4 9 13
The pattern observed is somewhat different from the pattern in shop and shop-cum-dwelling. We may also study the mdustrial growth with reference to the dispersal of factories and work-
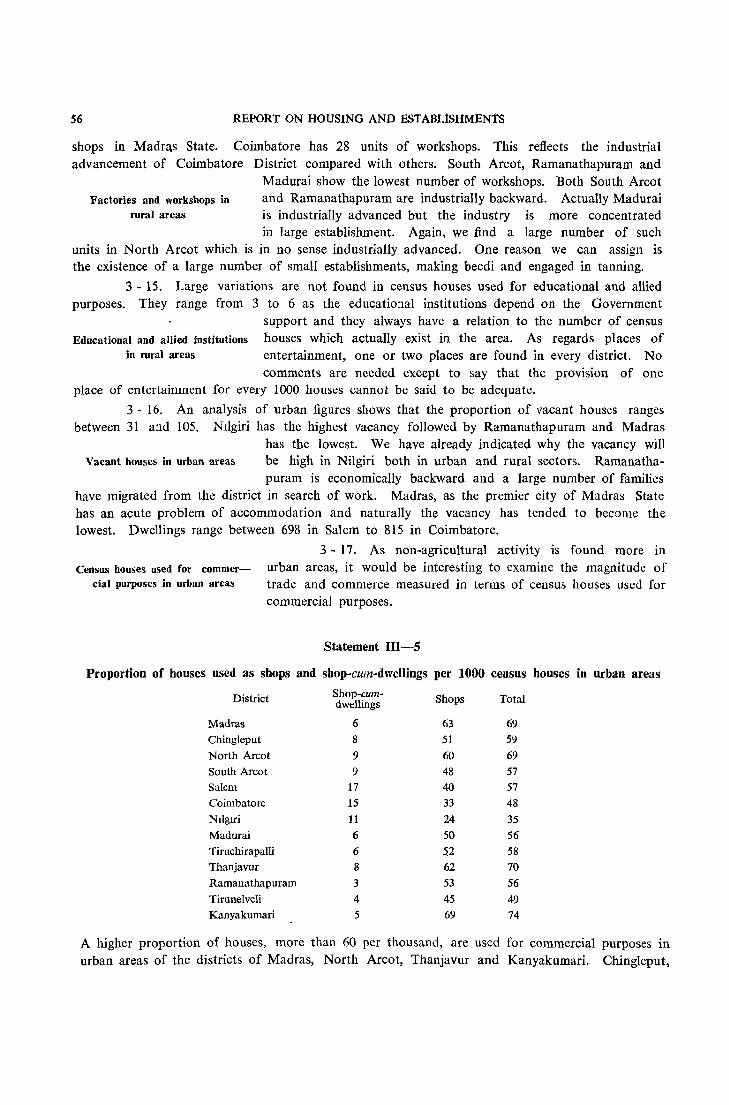
56 REPORT ON HOUSING AND ESTABLlSHMENTS
shops in Madra,s State. Coimbatore has 28 units of workshops. This reflects the industrial advancement of Coimbatore District compared with others. South Arcot, Ramanathapuram and
Madurai show the lowest number of workshops. Both South Arcot Factories and workshops in and Ramanathapuram are industrially backward. Actually Madurai
rural areas is industrially advanced but the industry is more concentrated in large establishment. Again, we find a large number of such
units in North Arcot which is in no sense industrially advanced. One reason we can assign is the existence of a large number of small establishments, making beedi and engaged in tanning.
3 - 15. Large variations are not found in census houses used for educational and allied purposes. They range from 3 to 6 as the educational institutions depend on the Government
support and they always have a relation to the number of census Educational and allied institutions houses which actually exist in the area. As regards places of
in rural areas entertainment, one or two places are found in every district. No comments are needed except to say that the provision of one
place of entertainment for every 1000 houses cannot be said to be adequate.
3 - 16. An analysis of urban figures shows that the proportion of vacant houses ranges between 31 and 105. Nllgiri has the highest vacancy followed by Ramanathapuram and Madras
has the lowest. We have already indicated why the vacancy will Vacant houses in urban areas be high in Nilgiri both in urban and rural sectors. Ramanatha-
puram is economically backward and a large number of families have migrated from the district in search of work. Madras, as the premier city of Madras State has an acute problem of accommodation and naturally the vacancy has tended to become the lowest. Dwellings range between 698 in Salem to 815 in Coimbatore.
3 - 17. As non-agricultural activity is found more in Census houses used for commer- urban areas, it would be interesting to examine the magnitude of
cial purposes in urban areas trade and commerce measured in terms of census houses used for commercial purposes.
Statement 111-5
Proportion of houses used as shops and shop-cum-dwellings per 1000 census houses in urban areas
District Shop-cum- Shops Total dwellings
Madras 6 63 69 Chingleput 8 51 59 North Arcot 9 60 69 South Arcot 9 48 57 Salem 17 40 57 Coimbatore 15 33 48 NIlgiri 11 24 35 Madurai 6 50 56 Tiruchirapalli 6 52 58 Thanjavur 8 62 70 Ramanathapuram 3 53 56 Tirunelveli 4 45 49 Kanyakumari 5 69 74
A higher proportion of houses, more than 60 per thousand, are used for commercial purposes in urban areas of the districts of Madras, North Arcot, Thanjavur and Kanyakumari. Chingleput,
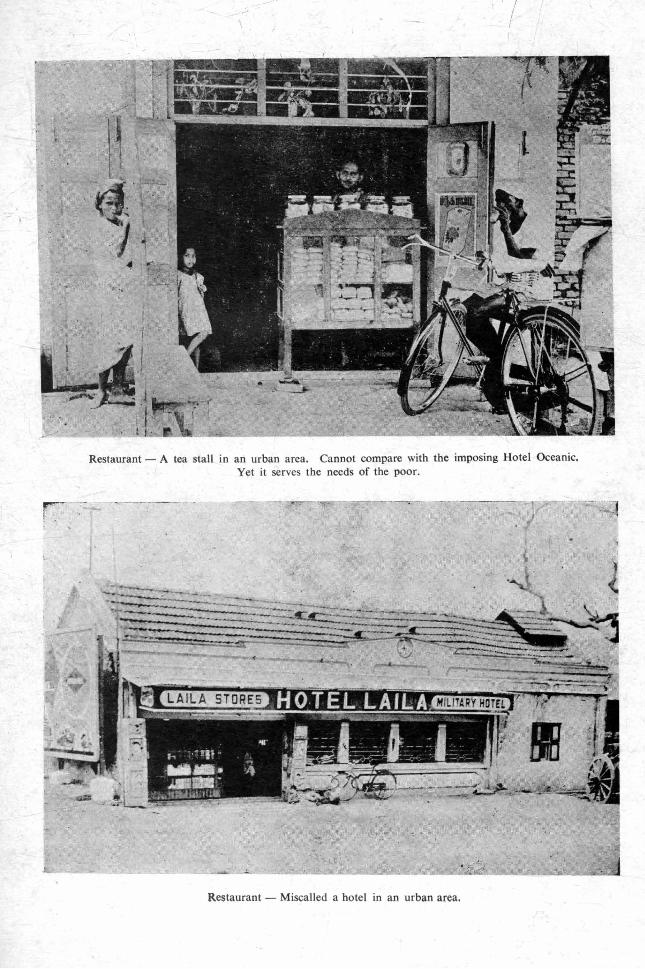
I
Restaurant - A tea stall in an urban area. Cannot compare with the imposing Hotel Oceanic. Yet it serves the needs of the poor.
Restaurant - Miscalled a hotel in an urban area.
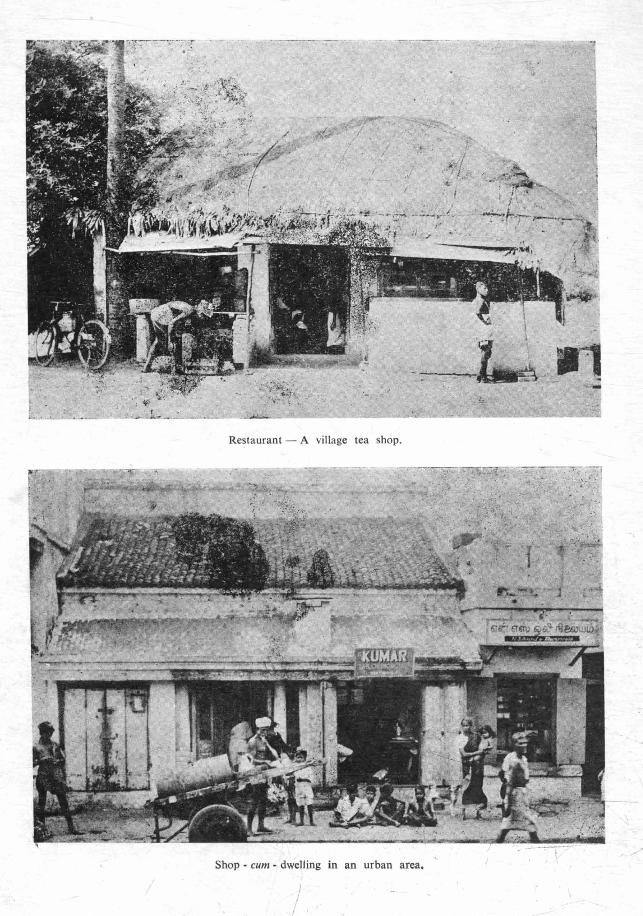
! ) • ~ I
I
Restaurant - A village tea shop.
Shop - cum - dwelling in an urban area.
I /
t idl
.' I •. : .
... f
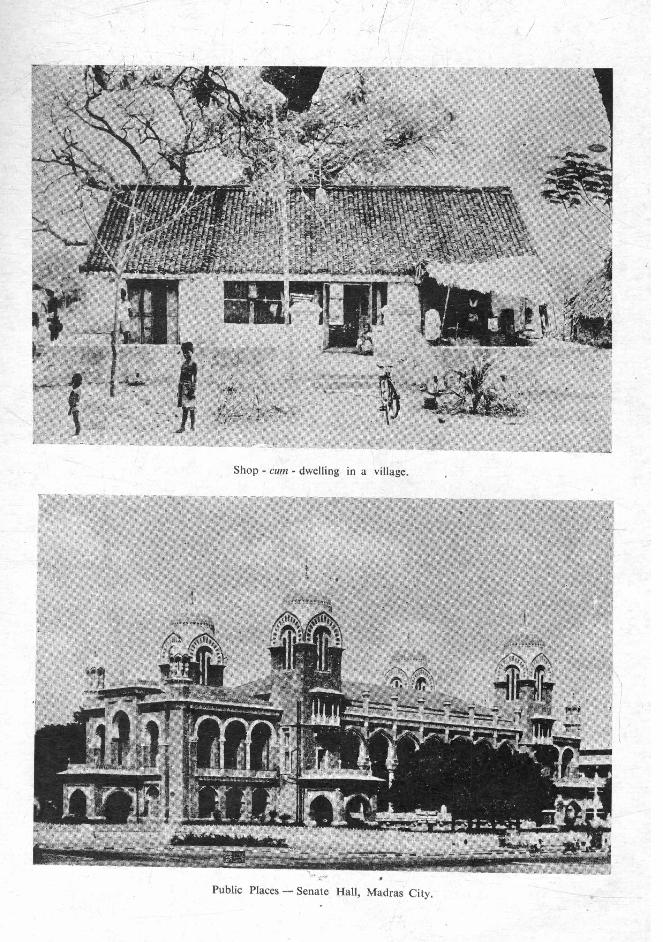
I
Shop - cum - dwelling in a village .
•
Public Places - Senate Hall, Madras City.
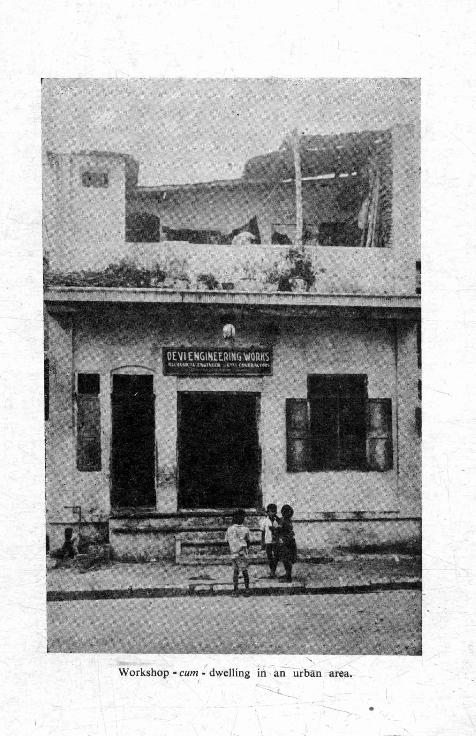
Workshop· cum : dwelling hi ':-an'urb~n ,1irea. I
•
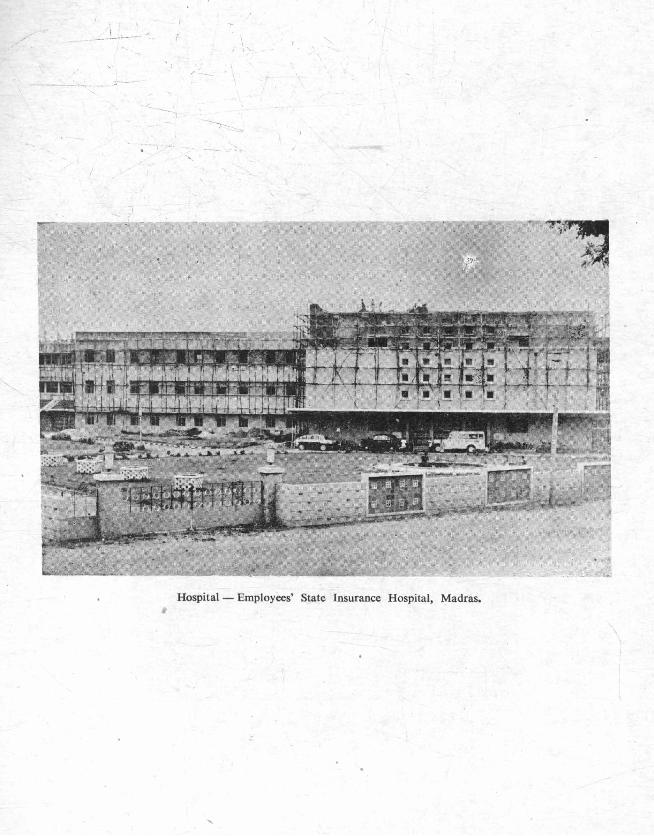
\ , --~---
;,.-- -
"_ --. ( / -_
, \
, I
Hospital - Employees' State Insurance Hospital, Madras.
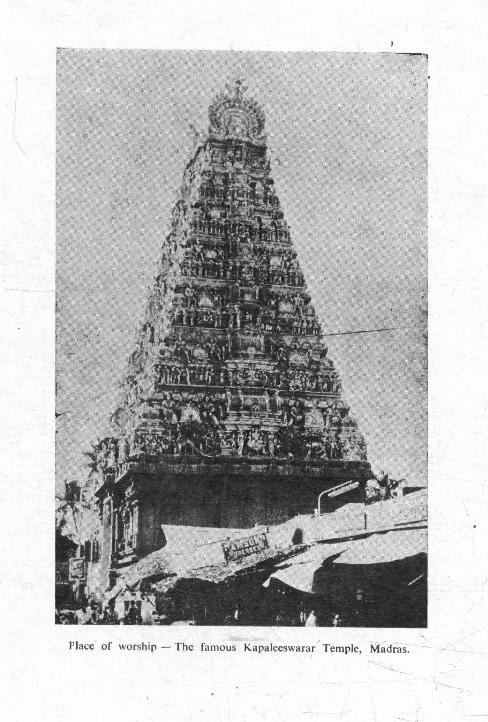
Place of worship - The famous Kapaleeswarar ' Temple, Madras. I

VI \D Z :J _, LIl
~ o o LIl X
~ VI -< O(/) lilt!) CII Z ::l _ _, VI_' WW VI~ ::JO O· :I:Z Ul O ::JZ (/)0 Zz tj< o o o
LL o z o 5 m Ci2 t; C
~ Ii; i til :a: ~ D
~
!5 8 l5 :E ~ ... w u :i ... '" '" " -< 0(
~ ~ ~ 0 0 g z
:! !!! 3 ::i '" :E :::J ii2 '" ... ::>
~ w -< ~ 9
0(
=< ~ ::J ... ~ D 0( ::J w ~ z ~ a: Z ... z ~ -<
" 5: 0(
~ ::> ~ j: a:
8 u j: Z ::J '" z ~ 1= -<
~
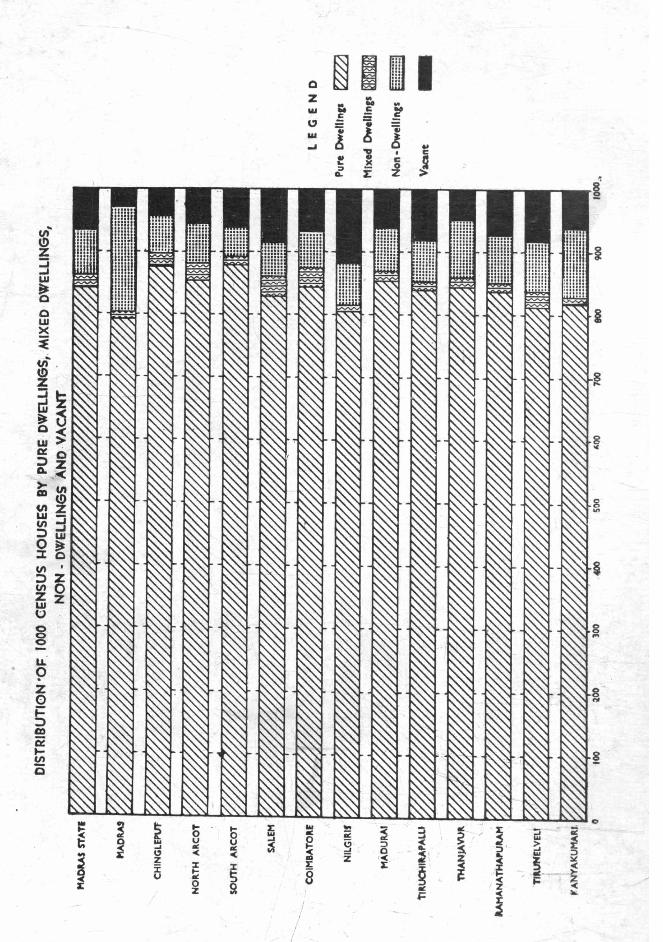
~ .. Z ::; ...I W
~ o w x i
~' ::;~
~~ 0<> W . 0:0 :;'z 0. ,,< lii (It w
LL'
9 z 0 i= ::> m ~ .... V)
C
III 3 ~ t-~ t- o t u
~ ... u -' '" ac ... " < <
j Z . ::t 5 :x: t-v '" 0 ~ z
1: &II ... ~
I I
I
/
Q
Z WI
" au _,
... ac e < IIQ
1:
8
... iiC g Z
"
3 :; ~- :i ~ ... &II « « ~ J: ::> &. ::> a
~ ' ... .< Z § :ot X
~ « ~ ~ ac ·
t: ~ "" ~ l=
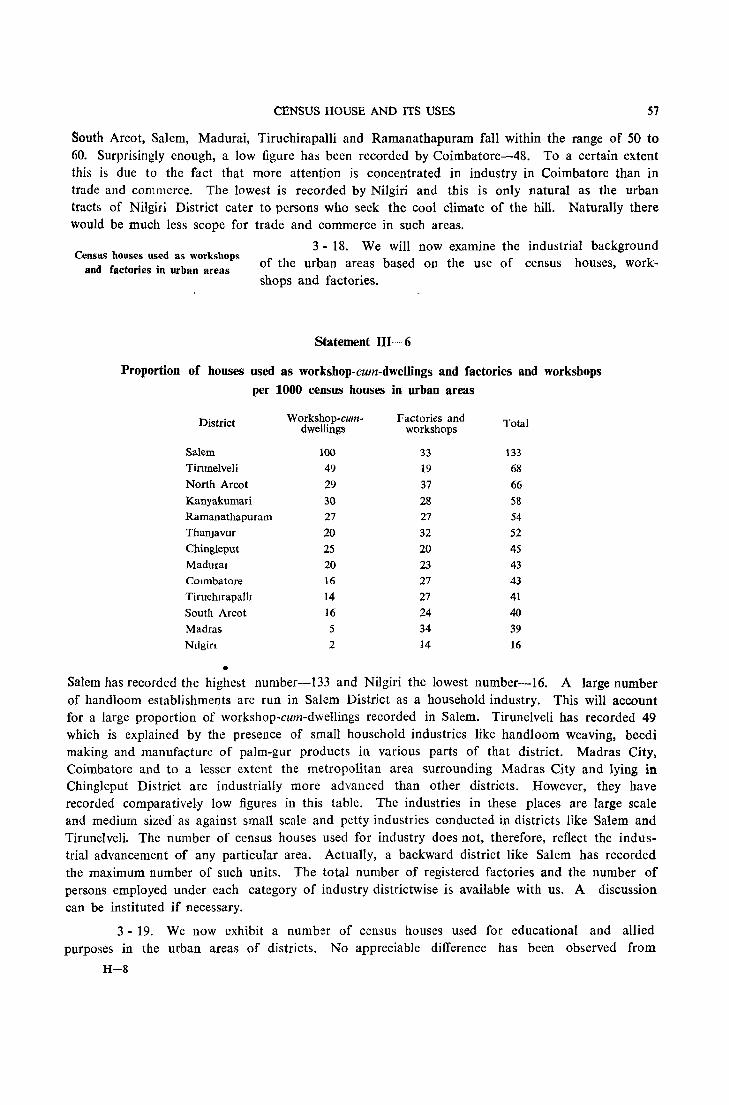
CENSUS HOUSE AND ITS USES 57
South Arcot, Salem, Madurai, Tiruchirapalli and Ramanathapuram fall within the range of 50 to 60. Surprisingly enough, a low figure has been recorded by Coimbatore-48. To a certain extent this is due to the fact that more attention is concentrated in industry in Coimbatore than in trade and commerce. The lowest is recorded by Nilgiri and this is only natural as the urban tracts of Nilgiri District cater to persons who seek the cool climate of the hill. Naturally there would be much less scope for trade and commerce in such areas.
3 - 18. We will now examine the industrial background Census houses used as workshops
of the urban areas based on the use of census houses, workand factories in urban areas shops and factories.
Statement 1II-6
Proportion of houses used as workshop-cum-dwellings and factories and workshops
per 1000 census houses in urban areas
District Workshop-cum- Factories and Total dwellings workshops
Salem 100 33 133 Tirunelveli 49 19 68 North Arcot 29 37 66 Kanyakumari 30 28 58 Ramanathapuram 27 27 54 ThanJavur 20 32 52 Chingleput 25 20 45
Madural 20 23 43
COImbatore 16 27 43
Tiruchlrapalll 14 27 41
South Arcot 16 24 40
Madras 5 34 39 Ntlgin 2 14 16
• Salem has recorded the highest number-133 and Nilgiri the lowest number-I 6. A large number of handloom establishments are run in Salem District as a household industry. This will account for a large proportion of workshop-cum-dwellings recorded in Salem. Tirunelveli has recorded 49 which is explained by the presence of small household industries like handloom weaving, beedi making and manufacture of palm-gur products in various parts of that district. Madras City, Coimbatore and to a lesser extent the metropolitan area surrounding Madras City and lying in Chingleput District are industrially more advanced than other districts. However, they have recorded comparatively low figures in this table. The industries in these places are large scale and medium sized as against small scale and petty industries conducted in districts like Salem and Tirunelveli. The number of census houses used for industry does not, therefore, reflect the industrial advancement of any particular area. Actually, a backward district like Salem has recorded the maximum number of such units. The total number of registered factories and the number of persons employed under each category of industry districtwise is available with us. A discussion can be instituted if necessary.
3 - 19. We now exhibit a number of census houses used for educational and allied purposes in the urban areas of districts. No appreciable difference has been observed from
H-8
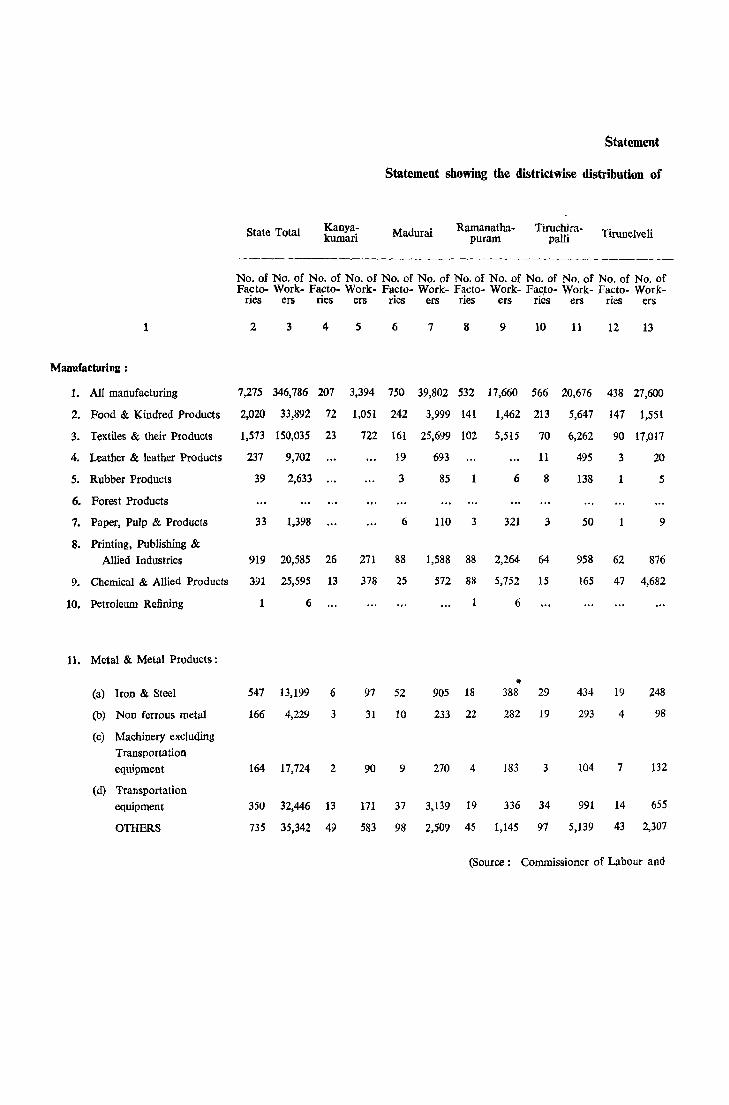
Manufacturing:
1. AIl manufacturing
State Total Kanyakumari
Statement
Statement showing the districtwise distribution of
Madurai Ramanathapuram
Tiruchirapalli Tirunelveli
No. of No. of No. of No. of No. of No. of No. of No. of No. of No. of No. of No. of Facto- Work- Facto- Work- Facto- Work- Facto- Work- Facto- Work- Facto- Work~ ~ ~ ~ ~ ~ ~ ~ ~ ~ ~ ~
2 3 4 5 6 7 8 9 10 11 12 13
7,275 346,786 207 3,394 750 39,802 532 17,660 566 20,676 438 27,600
2. Food & Kindred Products 2,020 33,892 72 1,051 242 3,999 141 1,462 213 5,647 147 1,551
3. Textiles & their Products
4. Leather & leather Products
5. Rubber Products
6. Forest Products
7. Paper, Pulp & Products
8. Printing, Publishing &
1,573 150,035 23
237
39
9,702
2,633
33 1,398
Allied Industries 919 20,585 26
9. Chemical & Allied Products 391 25,595 13
10. Petroleum Refining 1 6
11. Metal & Metal Products:
(a) Iron & Steel 547 13,199 6
(b) NOD ferrous metal 166 4,229 3
(c) Machinery excluding
Transportation
equipment 164 17,724 2
(d) Transportation
equipment 350 32,446 13
OTHERS 735 35,342 49
722 161 25,699 102 5,515 70 6,262 90 17,017
19
3
6
693
85
110 3
6
321
11
8
3
271 88 1,588 88 2,264 64
378 25 572 88 5,752 15
6
• 97 52 905 18 388 29
31 10 233 22 282 19
90 9 270 4 183 3
171 37 3,139 19 336 34
583 98 2,509 45 1,145 97
495
138
50
3
1
1
20
5
9
958 62 876
165 47 4,682
434 19 248
293 4 98
104 7 132
991 14 655
5,139 43 2,307
(Source : Commissioner of Labour and
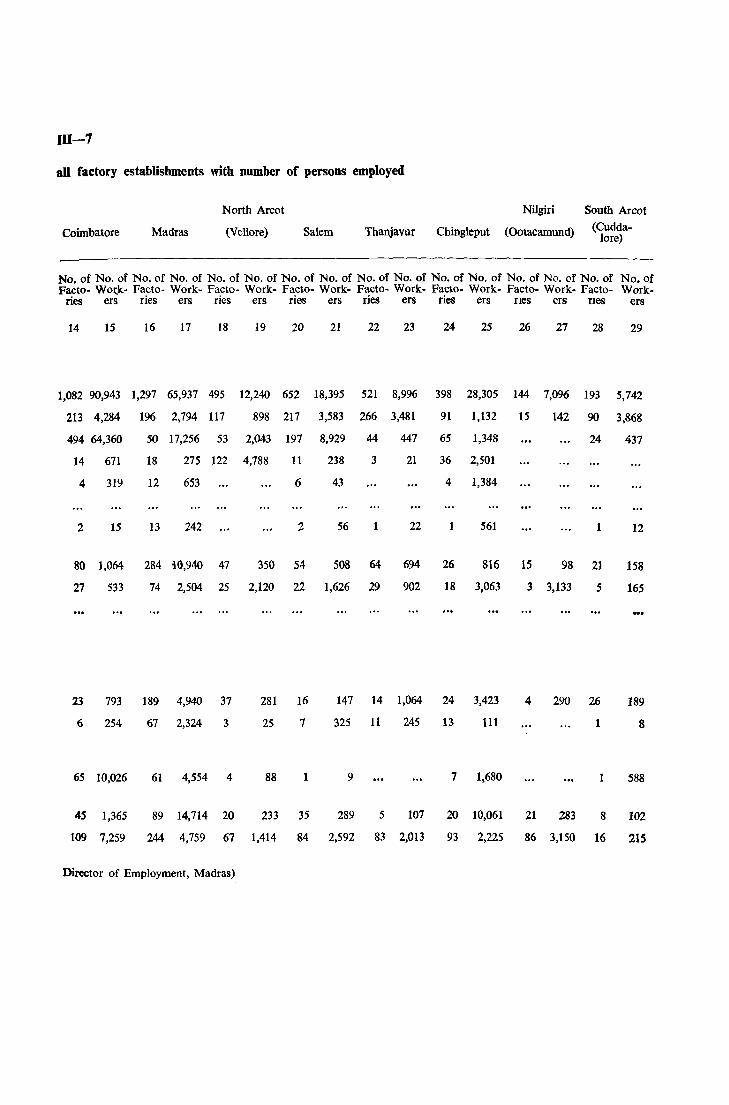
111-7
aU factory establishments with number of persons employed
North Arcot
Coimbatore Madras (Vellore) Salem Thanjavur Chingleput
Nilgiri
(Ootaeamund)
South Areot (Cudda
lore)
No. of No. of No. of No. of No. of No. of No. of No. of No. of No. of No. of No. of No. of No. of No. of No. of Facto- W01:.k- Facto- Work- Facto- Work- Facto- Work- Facto- Work- Facto- Work- Facto- Work- Facto- Work~ ~ ~ ~ ~ ~ ~ m ~ ~ ~ m ~ m ~ ~
14 15 16 17 18 19 20 21 22 23 24 25 26 27 28
1,082 90,943 1,297 65,937 495 12,240 652 18,395 521 8,996 398 28,305 144 7,096 193
213 4,284 196 2,794 117 898 217 3,583 266 3,481 91 1,132 15 142 90
494 64,360 50 17,256 53 2,043 197 8,929 44 447 65 1,348 24
14 671 18 275 122 4,788 11 238 3 21 36 2,501
4 319 12 653 6 43 4 1,384
2 15 13 242 2 56 1 22 1 561 1
80 1,064 284 iO,940 47 350 54 508 64 694 26 816 15 98 21
27 533 74 2,504 25 2,120 22 1,626 29 902 18 3,063 3 3,133 5
23 793 189 4,940 37 281 16 147 14 1,064 24 3,423 4 290 26
6 254 67 2,324 3 25 7 325 11 245 13 111 1
65 10,026 61 4,554 4 88 1 9 7 1,680 1
45 1,365 89 14,714 20 233 35 289 5 107 20 10,061 21 283 8
109 7,259 244 4,759 67 1,414 84 2,592 83 2,013 93 2,225 86 3,150 16
Director of Employment, Madras)
29
5,742
3,&68
437
12
158
165
189
8
588
102
215
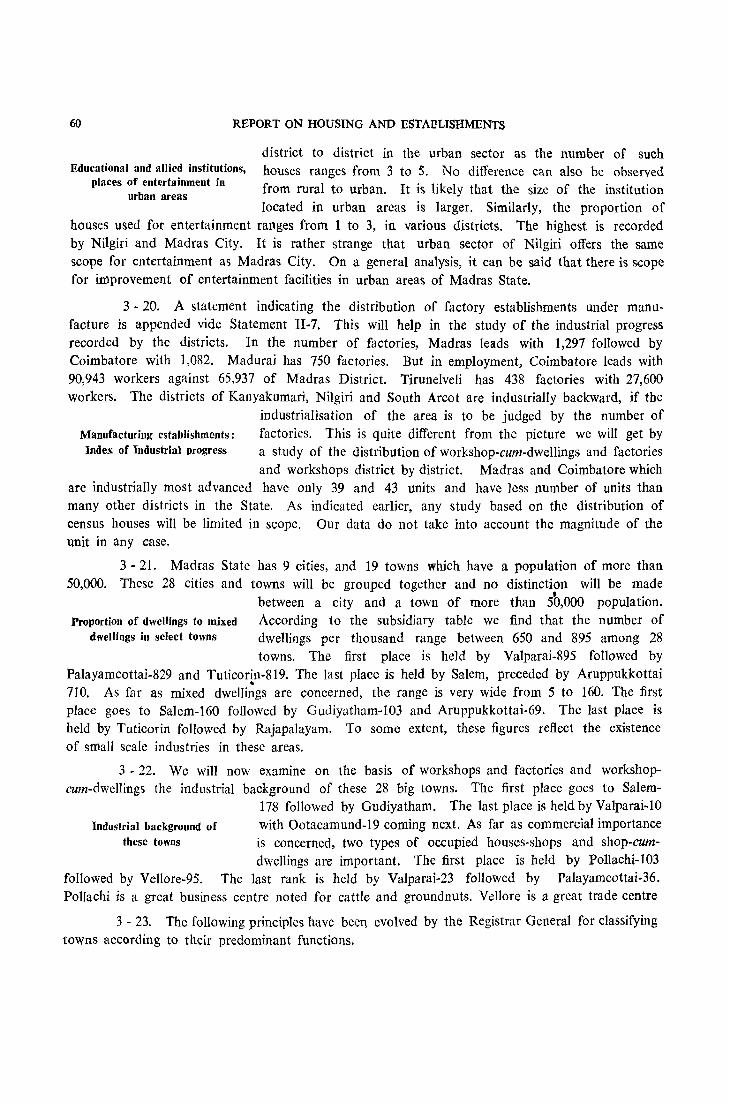
60 REPORT ON HOUSING AND ESTABLISHMENTS
Educational and allied institutions, places of entertainment in
urban areas
district to district in the urban sector as the number of such houses ranges from 3 to 5. No difference can also be observed from rural to urban. It is likely that the size of the institution located in urban areas is larger. Similarly, the proportion of
houses used for entertainment ranges from 1 to 3, in various districts. The highest is recorded by Nilgiri and Madras City. It is rather strange that urban sector of Nilgiri offers the same scope for entertainment as Madras City. On a general analysis, it can be said that there is scope for improvement of entertainment facilities in urban areas of Madras State.
3 • 20. A statement indicating the distribution of factory establishments under manu· facture is appended vide Statement II-7. This will help in the study of the industrial progress recorded by the districts. ln the number of factories, Madras leads with 1,297 followed by Coimbatore with 1,082. Madurai has 750 factories. But in employment, Coimbatore leads with 90,943 workers against 65,937 of Madras District. Tirunelveli has 438 factories with 27,600 workers. The districts of Kanyakumari, Nilgiri and South Arcot are industrially backward, if the
industrialisation of the area is to be judged by the number of Manufacturing establishments: factories. This is quite different from the picture we will get by Index of Industrial progress a study of the distribution of workshop-cum-dwellings and factories
and workshops district by district. Madras and Coimbatore which are industrially most advanced have only 39 and 43 units and have less number of units than many other districts in the State. As indicated earlier, any study based on the distribution of census houses will be limited in scope. Our data do not take into account the magnitude of the unit in any case.
3 ~ 21. Madras State has 9 cities, and 19 towns which have a popUlation of more than 50,000. These 28 cities and towns will be grouped together and no distinction will be made
between a city and a town of more than 5b,000 population. Proportion of dwellings to mixed According to the subsidiary table we find that the number of
dwellings in select towns dwellings per thousand range between 650 and 895 among 28 towns. The first place is held by Valparai-895 followed by
Palayamcottai-829 and Tuticorin-8l9. The last place is held by Salem, preceded by Aruppukkottai 710. As far as mixed dwelIi~gs are concerned, the range is very wide from 5 to 160. The first place goes to Salem-160 followed by Gwliyatham-l03 and Aruppukkottai-69. The last place is held by Tuticorin followed by Rajapalayam. To some extent, these figures reflect the existence of small scale industries in these areas.
3 - 22. We will now examine on the basis of workshops and factories and workshopcum-dwellings the industrial background of these 28 big towns. The first place goes to Salem·
178 followed by Gudiyatham. The last place is held by Valparai·lO Industrial background of with Ootacamund-19 coming next. As far as commercial importance
these towns is concerned, two types of occupied houses-shops and shop-cum-dwellings are important. The first place is held by PolIachi-103
followed by VeIlore·95. The last rank is held by Valparai-23 followed by Palayamcottai-36. Pollachi is a great business centre noted for cattle and ground nuts. Vellore is a great trade centre
3 - 23. The following principles have been evolved by the Registrar General for classifying towns according to their predominant functions.

CENSUS HOUSE AND ITS USES 61
Economic sector Industrial categories
A. Pnmary I. Cultivator II. Agricultural Labourer
III. Mining & Quarrying
B. Industries including workshop IV Household Industry
V. Manufacturmg other than House-hold Industry
VI. ConstructIOn
C. Commerce & Trade VII. Trade & Commerce
D. Transport, Storage & Commu-nications VIII. Transport, Storage and Commu-
nication
E. Others Services IX. Other Service
If more than 40% of the workers are employed in any of the five economic activities detailed above, then the town is categorised in that occupation. If the number of workers
is less than 40%, the next predominant occupation will be taken Principles e\'olved in functional into account and if they exceed 60% the town will be designated
classifications of towns as Industry-cunt-Service, Service-cum-Transport town, as the case may be. If the total of the two occupations do not add upto
more than 60% then the third predominant occupation \\i1l be considered and the town will be designated by three group classification.
3 - 24. The statement below classifies the cities and towns in the State as Industrial and Industries-cum-Service and so on. All cities and towns other than Valparai, Ootaca
mund and Palayamcottai fall under the group wholly Industrial Functional classification ~f towns or Industries-clim-service. I n the case of excepted towns,
the number of houses used as workshops and factories per thousand houses is comparitively low, i.e., 7, 17 and 18 respectively. This shows that these three towns qualify to be so treated only by virtue of their population and not by the pattern of their livelihood. Of these, Ootacamund is a hill station, Valparai is located on the hills and is the centre of plantation industries. A large area has been grouped together to form Valparai thereby giving it a population of more than 50,000 without having any definite industrial background. Palayamcottai has no industrial or commercial importance. From a perusal of the Primary Census Abstract it is found that workers in the primary sector form 10'4% of the total workers. In the secondary sector it is 21'5%. In the category Other Services it is 43'7%. Palayamcottai is mostly a residential and educational centre having a nu~ber of Government Offices (Perumalpuram), Colleges, Schools with a number of residences to accomodate the staff.
Statement llI-8
Statement showing the predominant functions in the important cities of Madras State
No. of workers per 1,000 workers
Primary Industrial Trade and Transport Other Name of city and Commu-sector sector Commerce nicatlOns Services
1 2 3 4 5 6
1. Madras City (Other services-cum-Industry) 14 313 191 118 364 2. Kanchipuram (Industrial) 48 593 146 30 183 3, Gudiyatham (Industrial) 69 630 105 25 171
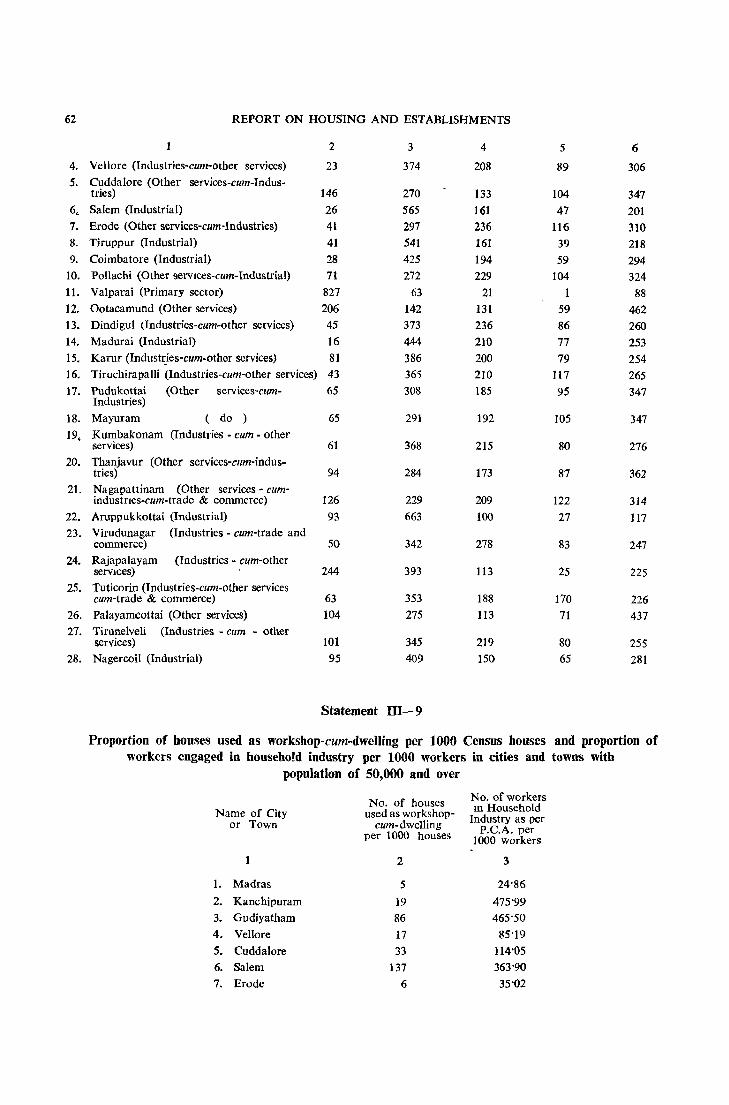
62
4.
5.
6,
7.
8.
9.
10.
It. 12.
13. 14.
15. 16.
17.
18.
19,
20.
21.
22.
23.
24.
25.
26. 27.
28.
REPORT ON HOUSING AND ESTABLISHMENTS
2 3 4 5 6
Vellore (Industries-cum-other services) 23 374 208 89 306 Cuddalore (Other services-cum-Indus-tries) 146 270 133 104 347 Salem (Industrial) 26 565 161 47 201 Erode (Other services-cum-Industries) 41 297 236 116 310 Tiruppur (Industrial) 41 541 161 39 218 Coimbatore (Industrial) 28 425 194 59 294 Pollachi (Other servlces-cum-Industrial) 71 272 229 104 324 Valparai (Primary sector) 827 63 21 1 88 Ootacamund (Other services) 206 142 131 59 462 Dindigul (Industries-cum-other services) 45 373 236 86 260 Madurai (Industrial) 16 444 210 77 253 Karur (Industr,:ies-cum-other services) 81 386 200 79 254 Tiruchirapalli (Industries-cum-other services) 43 36'5 210 117 265 Pudukottai (Other services-cum- 65 308 185 95 347 Industries)
Mayuram do ) 65 291 192 105 347 Kumbakonam (Industries - cum - other services) 61 368 215 80 276 Thanjavur (Other services-cum-indus-tries) 94 284 173 87 362 Nagapattinam (Other services - cllm-industnes-cum-trade & commerce) 126 229 209 122 314 Aruppukkottai (Industrial) 93 663 100 27 117 Virudunagar (Industries - cum-trade and commerce) 50 342 278 83 247 Rajapalayam (Industries - cum-other servlces) 244 393 113 25 225 Tuticorin (Industries-cum-other services cllm-trade & commerce) 63 353 188 170 226 Palayamcottai (Other services) 104 275 113 71 437 Tirunelveli (Industries - cum - other services) 101 345 219 80 255 Nagercoil (Industrial) 95 409 150 65 281
Statement DI-9
Proportion of houses used as workshop-cum-dwelling per 1000 Census houses and proportion of workers engaged in household industry per 1000 workers in cities and towns with
population of 50,000 and over
No. of houses No. of workers
Name of City used as workshop- III Household Industry as per or Town cum-dwelling P.C.A. per per 1000 houses 1000 workers
1 2 3
1. Madras 5 24'86
2. Kanchipuram 19 475'99 3. Gudiyatham 86 465'50
4. Vellore 17 85'19
5. Cuddalore 33 114'05 6. Salem 137 363'90
7. Erode 6 35'02

CENSUS HOUSE AND ITS USES 63
1 2 3
8, Tiruppur 40 127'57 9, Coimbatore 23 72'06
10, Pollachi 12 41'02 11. Valparai 3 1'91 12, Ootacamund 2 10'69 13, Dindigul 10 94'98 14, Madurai 38 124'78 15, Kamr 10 38'67 16, Ti~chirapalli 9 71'09 17. Pudukottai 17 33'26 18, Mayuram 12 64'17 19. Kumbakonam 44 125'67 20, Thanjavur 23 89'11 21. Nagapattinam 3 36'93 22. Aruppukkottai 64 588'24 23. Virudunagar 10 33'65 24. Rajapalayam 3 137'62 25, Tuticorin 13'01 26. Tirunel veli 24 123'63 27, Palayamcott\li 18 111'10 28. Nagercoil 38 195'67
3 - 25. We have added a statement in which we have attempted a correlation between the number of houses used as workshop-cum-dwelling and the number of workers in the
Workshop-cum-dwelling and household industry workers: a correlation for select towns
household industry as per p.e.A. per 1,000 workers. We find it difficult to see any pattern or correlation between these figures, It will be found difficult to find any correlation because it depends on the type of household industry, the manner in which it is conducted in each town and the number
of persons employed in each establishment. Even in handloom weaving the number of workers can range from 1 to 9, Again, a clear distinction was made in census Enumaration between rural and urban areas in defining a household industry, In the urban area, the household industry should be run in the house in which the worker lives, In rural areas, it can be conducted anywhere within the limits of the village. In urban areas a number of workers who would normally be classified under Household Industry in rural areas are likely to be not included as workers in household industry, For instance a large number of worke~s with handloom as industry have not been included as coming under Household Industry, As such, it is difficult to find any correlation between the proportion of houses used as workshop-cum-dwelling and that of the workers engaged in household indJlstry.
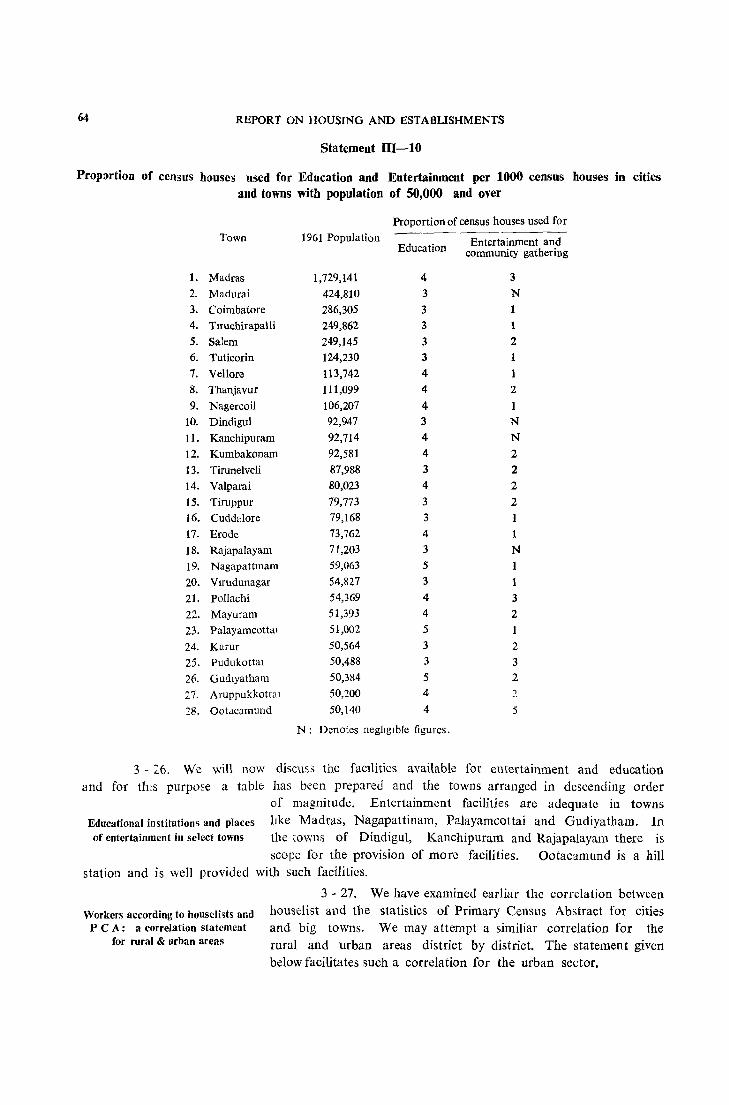
64 REPORT ON HOUSING AND ESTABLISHMENTS
Statement ID-10
Propr>rtion of census houses used for Education and Entertainment per 1000 census houses in cities and towns with population of 50,000 and over
Proportion of census houses used for
Town 1961 Population Entertainment and Education community gathering
1. Madras 1,729,141 4 3
2. Madurai 424,810 3 N
3. Coimbatore 286,305 3 4. Trruchirapalli 249,862 3 1
5. Salem 249,145 3 2
6. Tuticorin 124,230 3 1
7. Vellore 113,742 4 1 8. Thanjavur 111,099 4 2
9. Nagercoil 106,207 4 1 10. Dindigul 92,947 3 N 11. Kanchipuram 92,714 4 N 12. Kumbakonam 92,581 4 2
13. Tirunelveli 87,988 3 2 14. Valparai 80,023 4 2
15. Tiruppur 79,773 3 2
16. Cuddalore 79,168 3 1 17. Erode 73,762 4 1
18. Rajapalayam 71,203 3 N
19. Nagapattmam 59,063 5
20. Vlrudunagar 54,827 3
21. Pollachi 54,369 4 3
22. Mayuram 51,393 4 2
23. Palayamcottal 51,002 5
24. Karur 50,564 3 2
25. Pudukottal 50,488 3 3
26. Gudlyatham 50,384 5 2
27. Aruppukkottal 50,200 4 .. 28. Ootacamund 50,140 4 5
N: Denotes negligible figures.
3 - 26. We will now discus; the facIlities available for entertainment and education and for thIs purpo~e a table has been prepared and the towns arranged in descending order
of magnitude. Entertainment facilities are adequate in towns Educational institutions and places lIke Madras, Nagapattinam, Palayamcottai and Gudiyatham. In of entertainment in select towns the towns of Dindigul, Kanchipuram and RajapaJayam there is
scope for the provision of more facilities. Ootacamund is a hill station and is well provided with such facilities.
Workers according to honseli~ts and P C A: a correlation statement
for rural & urban areas
3 - 27. We have examined earliar thc correlation between houselist and the statistics of Primary Census Abstract for cities and big towns. We may attempt a similiar correlation for the rural and urban areas district by district. The statement given below facilitates such a correlation for the urban sector,

CENSUS HOUSE AND ITS USES 65
Statement III-ll
Distribution of 1,000 workers among the Economic sectors in urban areas
Agricultural and Industrial Sector Trade Transport & Other Name of District Its allied includmg & Communi- Services activities ConstructIOn Commerce cations
Madras 14 313 191 118 364 Chmgleput 172 399 111 58 260 North Arcot 141 376 168 63 252 South Arcot 257 237 150 66 290 Salem 120 484 140 43 213 Coimbatore 201 344 137 51 267 Nilgiri 4:!5 115 76 34 350 Madurai 182 298 168 52 300 Tiruchirapalli 181 313 161 80 265 Thanjavur 196 261 177 64 302 Ramanathapuram 168 395 148 37 252 Tirunelveh 215 402 127 50 206 Kanyakumari 143 356 144 • 58 299
The Statement below gives the figures for rural areas.
Statement 111-12
Distribution of 1,000 workers among the Economic sectors in rural areas
Agricultural Industrial Trade Transport Other District and its allied Sector includmg & & Services activities Construction Commerce Communications
Chingleput 727 III 25 10 127 North Arcot 793 81 19 40 103 South Arcot 854 48 17 ' 3 78 Salem 771 101 19 3 106 Coimbatore 589 182 29 4 196 Nilgiri 709 41 15 7 228 Madural 760 60 23 3 154 TiruchirapaIIi 818 72 16 3 91 Thanjavur 807 58 32 5 98 Ramanathapuram 816 70 18 3 93 Tirunelveli 667 165 33 5 130 Kanyakumari 409 274 48 9 260
It is seen that in all districts more than 40% of the workers are employed in agricultural and allied activities. This percentage varies from 40'9 of Kanyakumari to 85'4 of South Arcot District. A very high proportion is recorded by deltaic districts like Tiruchirapalli and Thanjavur. The
H-9
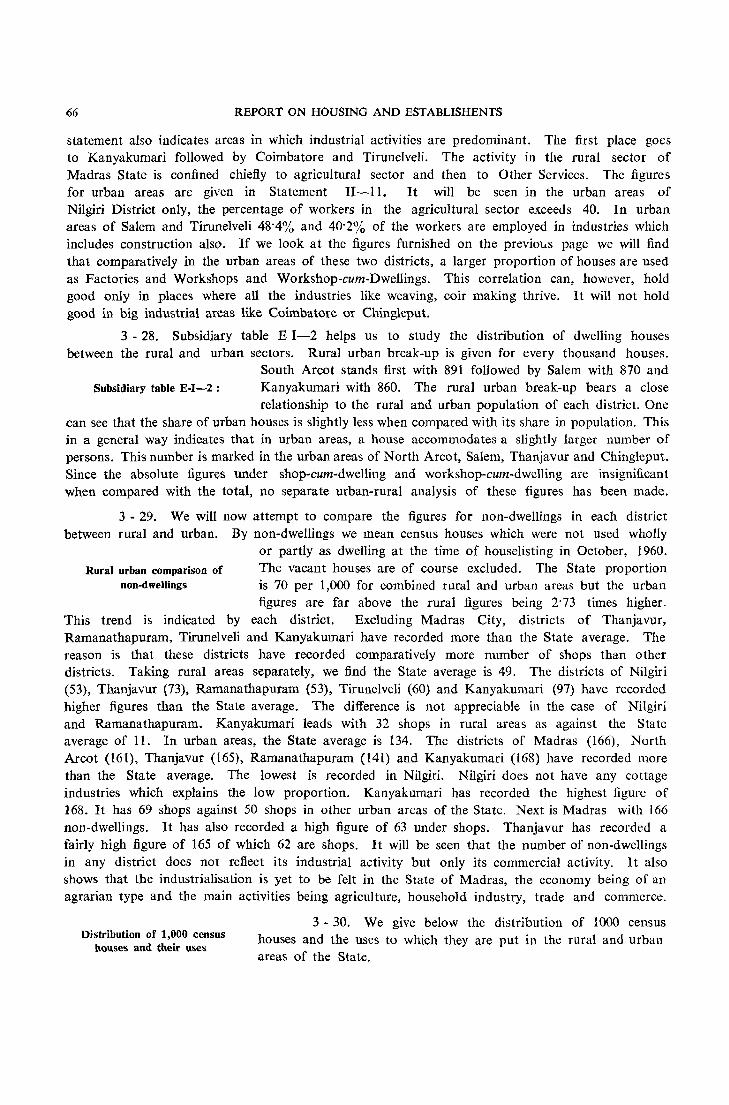
66 REPORT ON HOUSING AND ESTABLISHENTS
statement also indicates areas in which industrial activities are predominant. The first place goes to Kanyakumari followed by Coimbatore and Tirunelveli. The activity in the rural sector of Madras State is confined chiefly to agricultural sector and then to Other Services. The figures for urban areas are given in Statement II-II. It will be seen in the urban areas of Nilgiri District only, the percentage of workers in the agricultural sector exceeds 40. In urban areas of Salem and Tirunelveli 48'4% and 40'2% of the workers are employed in industries which includes construction also. If we look at the figures furnished on the previous page we will find that comparatively in the urban areas of these two districts, a larger proportion of houses are used as Factories and Workshops and Workshop-cum-Dwellings. This correlation can, however, hold good only in places where all the industries like weaving, coir making thrive. It will not hold good in big industrial areas like Coimbatore or Chingleput.
3 - 28. Subsidiary table E 1-2 helps us to study the distribution of dwelling houses between the rural and urban sectors. Rural urban break-up is given for every thousand houses.
South Arcot stands first with 891 followed by Salem with 870 and Subsidiary table E-I-2 : Kanyakumari with 860. The rural urban break-up bears a close
relationship to the rural and urban population of each district. One can see that the share of urban houses is slightly less when compared with its share in popUlation. This in a general way indicates that in urban areas, a house accommodates a slightly larger number of persons. This number is marked in the urban areas of North Arcot, Salem, Thanjavur and Chingleput. Since the absolute figures under shop-cum-dwelling and workshop-cum-dwelling are insignificant when compared with the total, no separate urban-rural analysis of these figures has been made.
3 - 29. We will now attempt to compare the figures for non-dwellings in each district between rural and urban. By non-dwellings we mean census houses which were not used wholly
or partly as dwelling at the time of houselisting in October, 1960. Rural urban comparison of
non.dwellings The vacant houses are of course excluded. The State proportion is 70 per 1,000 for combined rural and urban areas but the urban figures are far above the rural figures being 2'73 times higher.
This trend is indicated by each district. Excluding Madras City, districts of Thanjavur, Ramanathapuram, Tirunelveli and Kanyakumari have recorded more than the State average. The reason is that these districts have recorded comparatively more number of shops than other districts. Taking rural areas separately, we find the State average is 49. The districts of Nilgiri (53), Thanjavur (73), Ramanathapuram (53), Tirunelveli (60) and Kanyakumari (97) have recorded higher figures than the State average. The difference is not appreciable in the case of Nilgiri and Ramanathapuram. Kanyakumari leads with 32 shops in rural areas as against the State average of 11. In urban areas, the State average is 134. The districts of Madras (166), North Arcot (161), Thanjavur (165), Ramanathapuram (141) and Kanyakumari (168) have recorded more than the State average. The lowest is recorded in Nilgiri. Nilgiri does not have any cottage industries which explains the low proportion. Kanyakumari has recorded the highest figure of 168. It has 69 shops against 50 shops in other urban areas of the State. Next is Madras with 166 non-dwellings. It has also recorded a high figure of 63 under shops. Thanjavur has recorded a fairly high figure of 165 of which 62 are shops. It will be seen that the number of non-dwellings in any district does not reflect its industrial activity but only its commercial activity. It also shows that the industrialisation is yet to be felt in the State of Madras, the economy being of an agrarian type and the main activities being agriculture, household industry, trade and commerce.
Distribution of 1,000 census houses and their uses
3 - 30. We give below the distribution of 1000 census houses and the uses to which they are put in the rural and urban areas of the State.
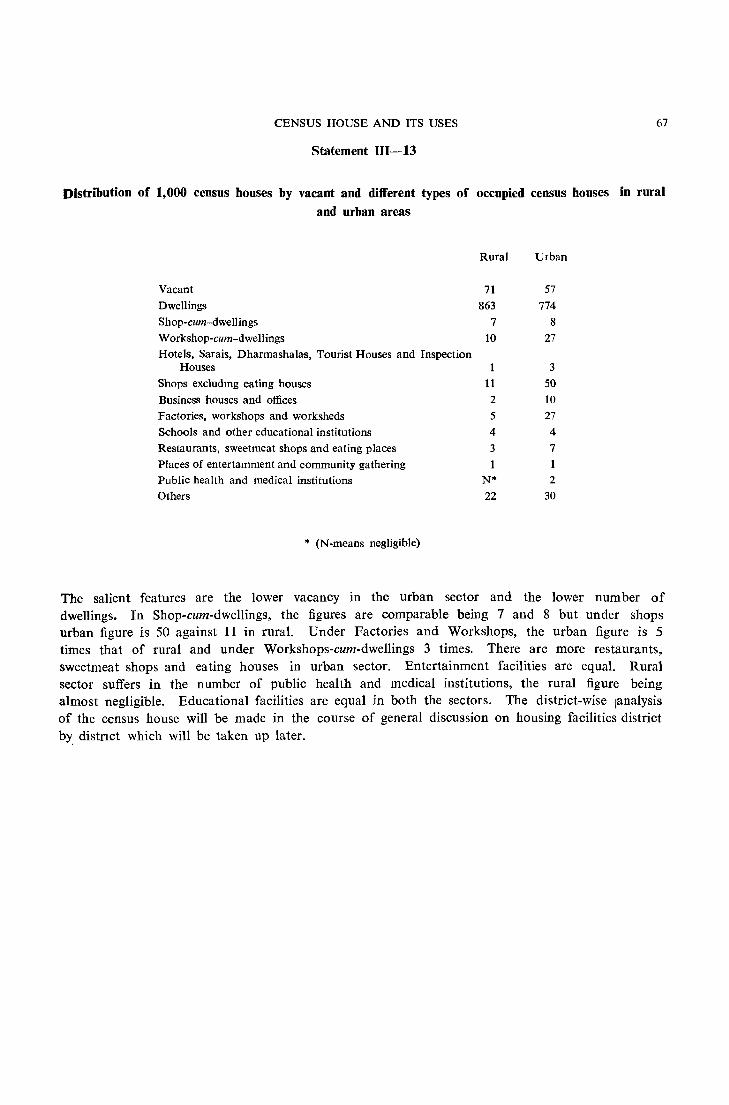
CENSUS HOUSE AND ITS USES 67
Statement 111-13
,Distribution of 1,000 census houses by vacant and different types of occupied census houses in rural
and urban areas
Rural Urban
Vacant 71 57 Dwellings 863 774 Shop-cum-dwellings 7 8
Workshop-cum-dwellings 10 27 Hotels, Sarais, Dharmashalas, Tourist Houses and Inspection
Houses 1 3
Shops excludmg eating houses 11 50
Business houses and offices 2 10
Factories, workshops and worksheds 5 27 Schools and other educational institutions 4 4
Restaurants, sweetmeat shops and eating places 3 7 Places of entertamment and community gathering 1
Public health and medical institutions N* 2
Others 22 30
* (N-means negligible)
The salient features are the lower vacancy in the urban sector and the lower num ber of dwellings. In Shop-cum-dwellings, the figures are comparable being 7 and 8 but under shops urban figure is 50 against 11 in rural. Under Factories and Workshops, the urban figure is 5 times that of rural and under Workshops-cum-dwellings 3 times. There are more restaurants, sweetmeat shops and eating houses in urban sector. Entertainment facilities are equal. Rural sector suffers in the number of public health and medical institutions, the rural figure being almost negligible. Educational facilities are equal in both the sectors. The district-wise ,analysis of the census house will be made in the course of general discussion on housing facilities district by, distnct which will be taken up later.
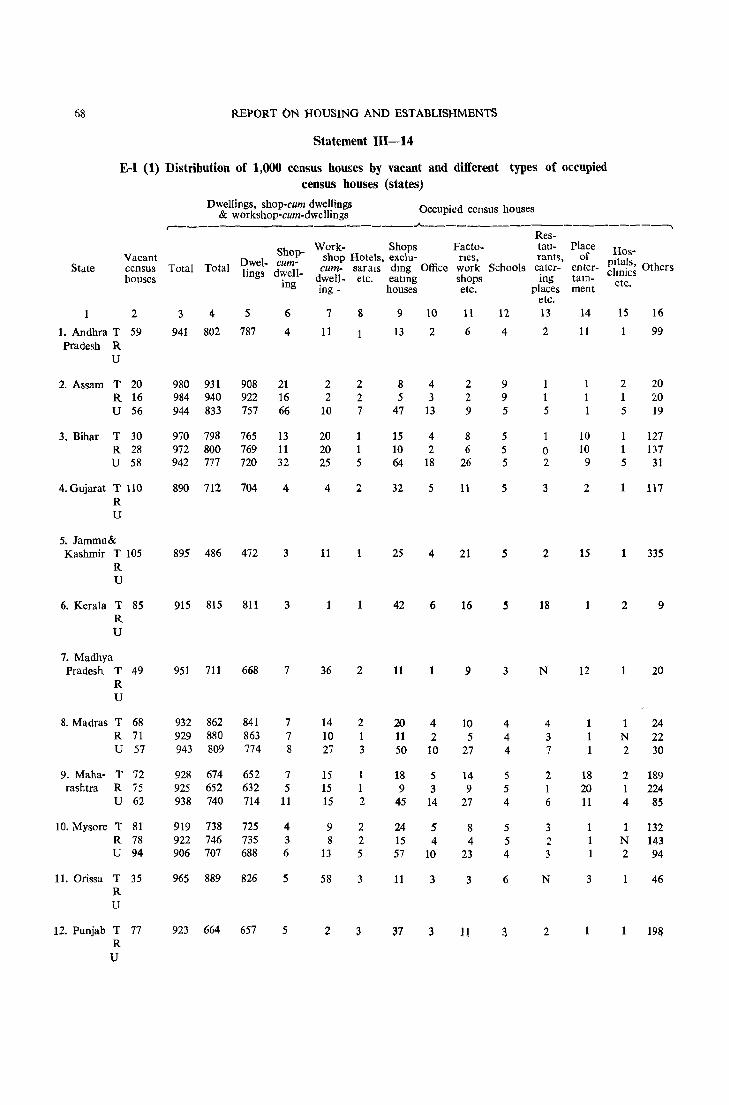
68 REPORT ON HOUSING AND ESTABLISHMENTS
Statement IU-14
E-I (1) Distribution of 1,000 census houses by vacant and different types of occupied census houses (states)
Dwellings, shop-cum dwellings Occupied census houses & workshop-cum-dwellings , __ - ___ .A.--___________________
Res-
Shop- Work- Shops Facto- tau- Place Hos-Vacant Dwel- cum- shop Hotels, exclu- nes, rants, of
pita!s, Others State census Total Total cum- saralS dIng Office work Schools cater- enter-houses
lings dwell- dwell- etc. eatIng shops ing tam- clImes ing ing - houses etc. places ment etc.
etc. 2 3 4 5 6 7 8 9 10 11 12 13 14 15 16
1. Andhra T 59 941 802 787 4 11 13 2 6 4 2 11 99 Pradesh R
U
2. Assam T 20 980 931 908 21 2 2 8 4 2 9 1 2 20 R 16 984 940 922 16 2 2 5 3 2 9 1 1 1 20 U 56 944 833 757 66 10 7 47 13 9 5 5 1 5 19
3. Bihar T 30 970 798 765 13 20 1 15 4 8 5 10 1 127 R 28 972 800 769 11 20 1 10 2 6 5 0 10 1 137 U 58 942 777 720 32 25 5 64 18 26 5 2 9 5 31
4. Gujarat T 110 890 712 704 4 4 2 32 5 11 5 3 2 1 117 R U
5. Jammu& Kashmir T 105 895 486 472 3 11 25 4 21 5 2 15 335
R U
6. Kerala T 85 915 815 811 3 42 6 16 18 2 9 R U
7. Madhya Pradesh T 49 951 711 668 7 36 2 11 1 9 3 N 12 1 20
R U
8. Madras T 68 932 862 841 7 14 2 20 4 10 4 4 1 24 R 71 929 880 863 7 10 1 11 2 5 4 3 1 N 22 U 57 943 809 774 8 27 3 50 10 27 4 7 1 2 30
9. Maha- T 72 928 674 652 7 15 1 18 5 14 5 2 18 2 189 rashtra R 75 925 652 632 5 15 1 9 3 9 5 1 20 1 224
U 62 938 740 714 11 15 2 45 14 27 4 6 11 4 85
10. Mysore T 81 919 738 725 4 9 2 24 5 8 5 3 132 R 78 922 746 735 3 8 2 15 4 4 5 2 N 143 U 94 906 707 688 6 13 5 57 10 23 4 3 2 94
11. Orissa T 35 965 889 826 5 58 3 11 3 3 6 N 3 46 R U
12. Punjab T 77 923 664 657 5 2 3 37 3 1l 2 1911 R U
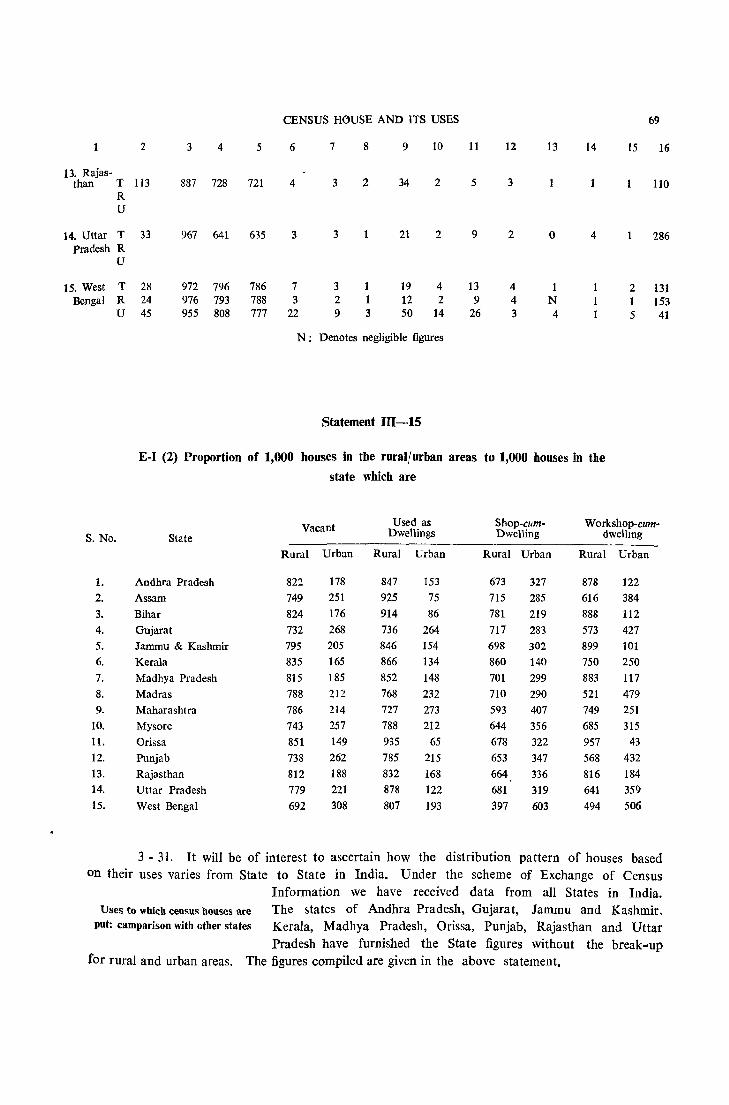
CENSUS HOUSE AND ITS USES 69
2 3 4 5 6 7 8 9 10 11 12 13 14 15 16
13. Rajas-than T 113 887 728 721 4 3 2 34 2 5 3 110
R U
14. Uttar T 33 967 641 635 3 3 1 21 2 9 2 0 4 1 286 Pradesh R
U
15. West T 28 972 796 786 7 3 1 19 4 13 4 1 2 131 Bengal R 24 976 793 788 3 2 1 12 2 9 4 N 1 153
U 45 955 808 777 22 9 3 50 14 26 3 4 5 41
N: Denotes negligible figures
Statement 111-15
E-I (2) Proportion of 1,000 houses in tbe rural(urban areas to 1,000 houses in the
state which are
Vacant Used as Shop-cllm- Workshop-cum-S. No. State Dwellings Dwelling dwellIng
Rural Urban Rural Urban Rural Urban Rural Urban
1. Andhra Pradesh 822 178 847 153 673 327 878 122 2. Assam 749 251 925 75 715 285 616 384 3. Bihar 824 176 914 86 781 219 888 112 4. Gujarat 732 268 736 264 717 283 573 427 5. Jammu & Kashmir 795 205 846 154 698 302 899 101 6. Kerala 835 165 866 134 860 140 750 250 7. Madhya Pradesh 815 185 852 148 701 299 883 117 8. Madras 788 212 768 232 710 290 521 479 9. Maharashtra 786 214 727 273 593 407 749 251
10. Mysore 743 257 788 212 644 356 685 315 11. Orissa 851 149 935 65 678 322 957 43 12. Punjab 738 262 785 215 653 347 568 432 13. Rajasthan 812 188 832 168 664 336 816 184 14. Uttar Pradesh 779 221 878 122 681 319 641 359 15. West Bengal 692 308 807 193 397 603 494 506
3 - 31. It will be of interest to ascertain how the distribution pattern of houses based on their uses varies from State to State in India. Under the scheme of Exchange of Census
Information we have received data from all States in India. Uses to whicll census bouses are The states of Andhra Pradesh, Gujarat, Jammu and Kashmir,
put: camparison with other states Kerala, Madhya Pradesh, Orissa, Punjab, Rajasthan and Uttar Pradesh have furnished the State figures without the break-up
for rural and urban areas. The figures compiled are given in the above statement.
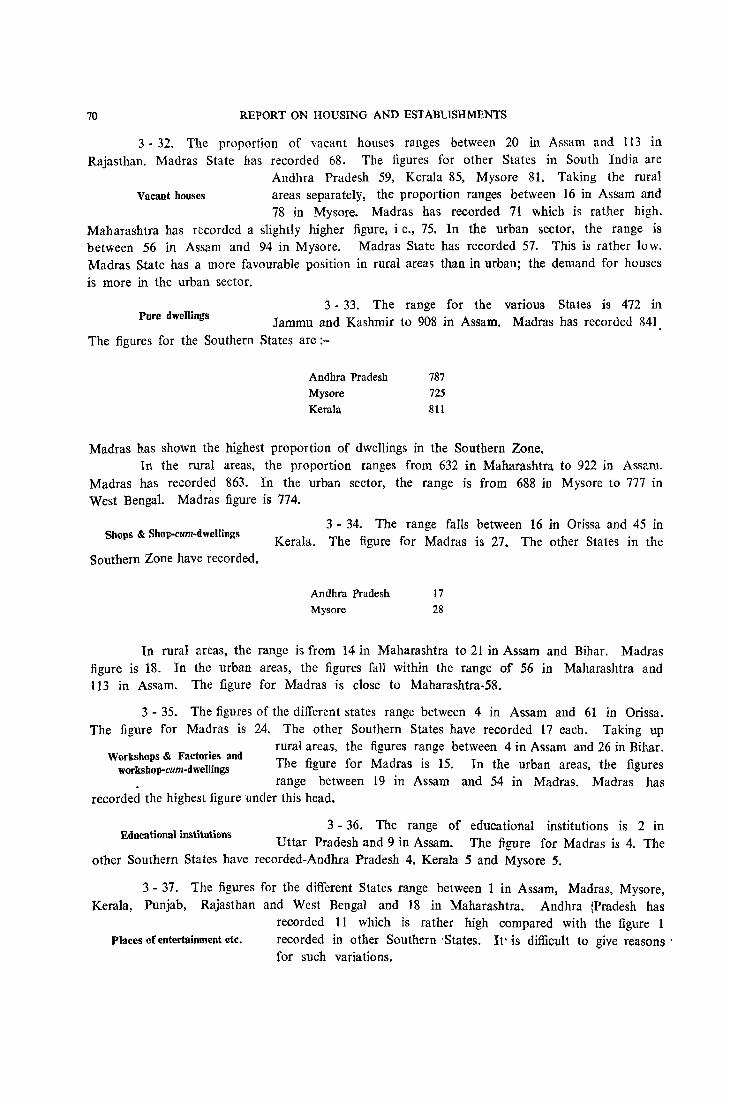
70 REPORT ON HOUSING AND ESTABLISHMENTS
3 • 32. The proportion of vacant houses ranges between 20 in Assam and 113 in Rajasthan. Madras State has recorded 68. The figures for other States in South India are
Andhra Pradesh 59, Kerala 85, Mysore 81. Taking the rural Vacant houses areas separately, the proportion ranges between 16 in Assam and
78 in Mysore. Madras has recorded 71 which is rather high. Maharashtra has recorded a slightly higher figure, i e., 75. In the urban sector, the range is between 56 in Assam and 94 in Mysore. Madras State has recorded 57. This is rather low. Madras State has a more favourable position in rural areas than in urban; the demand for houses is more in the urban sector.
Pure dwellings 3 • 33. The range for the various States is 472 in
Jammu and Kashmir to 908 in Assam. Madras has recorded 841 The figures for the Southern States are:-
Andhra Pradesh 787
Mysore 725 Kerala 811
Madras has shown the highest proportion of dwellings in the Southern Zone. In the rural areas, the proportion ranges from 632 in Maharashtra to 922 in Assam.
Madras has recorded 863. In the urban sector, the range is from 688 in Mysore to 777 in West Bengal. Madras figure is 774.
Shops & Shop-cum-dwellings
Southern Zone have recorded.
3 • 34. The range falls between 16 in Orissa and 45 in Kerala. The figure for Madras is 27. The other States in the
Andhra Pradesh 17 Mysore 28
Tn rural areas, the range is from 14 in Maharashtra to 2J in Assam and Bihar. Madras figure is 18. In the urban areas, the figures fall within the range of 56 in Maharashtra and 113 in Assam. The figure for Madras is close to Maharashtra-58.
3 • 35. The figures of the different states range between 4 in Assam and 61 in Orissa. The figure for Madras is 24. The other Southern States have recorded 17 each. Taking up
Workshops & Factories and worksbop-cum-dwellings
rural areas, the figures range between 4 in Assam and 26 in Bihar. The figure for Madras is 15. In the urban areas, the figures range between 19 in Assam and 54 in Madras. Madras has
recorded the highest figure under this head.
Educational institutions 3 - 36. The range of educational institutions is 2 in
Uttar Pradesh and 9 in Assam. The figure for Madras is 4. The other Southern States have recorded-Andhra Pradesh 4, Kera1a 5 and Mysore 5.
3· 37. The figures for the different States range between 1 in Assam, Madras, Mysore, Kerala, Punjab, Rajasthan and West Bengal and 18 in Maharashtra. Andhra [Pradesh has
recorded 11 which is rather high compared with the figure 1 Places ofentertainment etc. recorded in other Southern 'States. It· is difficult to give reasons'
for such variations.
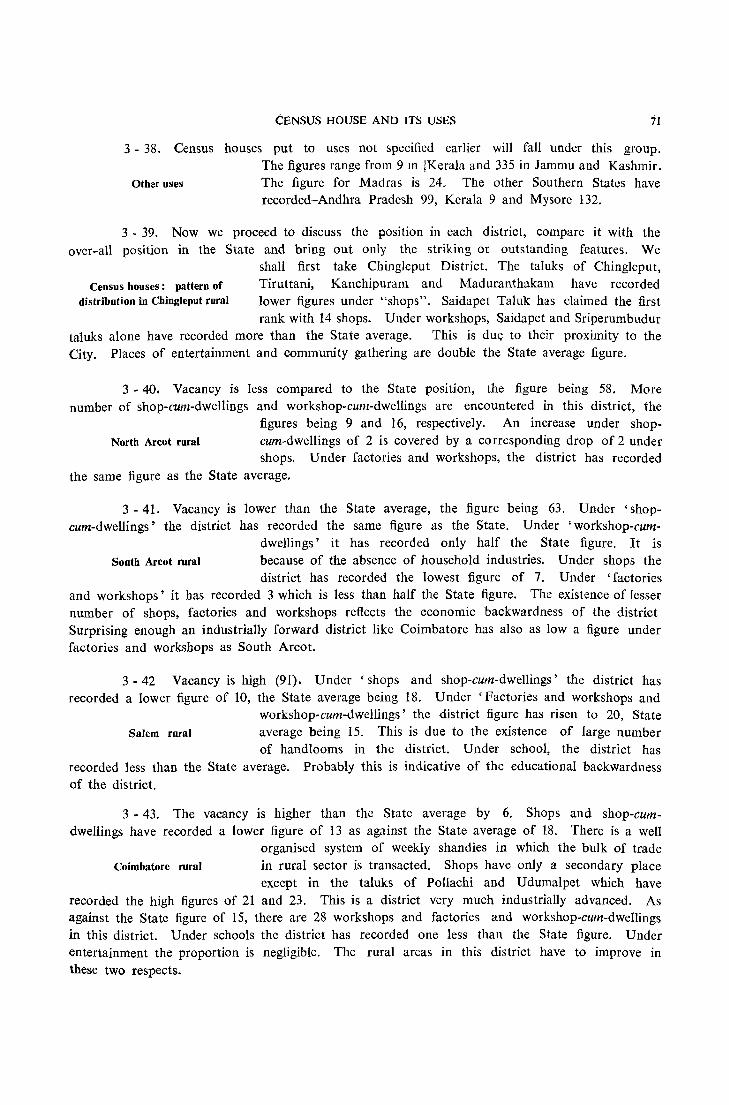
CENSUS HOUSE AND ITS USES 71
3 - 38. Census houses put to uses not specified earlier will fall under this group. The figures range from 9 In iKerala and 335 in Jammu and Kashmir.
Other uses The figure for Madras is 24. The other Southern States have recorded-Andhra Pradesh 99, Kerala 9 and Mysore 132.
3 - 39. Now we proceed to discuss the position in each district, compare it with the over-all position in the State and bring out only the striking or outstanding features. We
shall first take Chingleput District. The taluks of Chingleput,
Census houses: pattern of distribution in Chingleput rural
Tiruttani, Kanchipuram and Maduranthakam have recorded lower figures under "shops". Saidapet Taluk has claimed the first rank with 14 shops. Under workshops, Saidapet and Sriperumbudur
taluks alone have recorded more than the State average. This is du~ to their proximity to the City. Places of entertainment and community gathering are double the State average figure.
3 - 40. Vacancy is less compared to the State position, the figure being 58. More number of shop-cum-dwellings and workshop-cum-dwellings are encountered in this district, the
figures being 9 and 16, respectively. An increase under shop-North Arcot rural cum-dwellings of 2 is covered by a corresponding drop of 2 under
shops. Under factories and workshops, the district has recorded the same figure as the State average.
3 - 41. Vacancy is lower than the State average, the figure being 63. Under 'shopcum-dwellings' the district has recorded the same figure as the State. Under 'workshop-cum
dwellings' it has recorded only half the State figure. It is South Arcot rural because of the absence of household industries. Under shops the
district has recorded the lowest figure of 7. Under 'factories and workshops' it has recorded 3 which is less than half the State figure. The existence of lesser number of shops, factories and workshops reflects the economic backwardness of the district Surprising enough an industrially forward district like Coimbatore has also as low a figure under factories and workshops as South Arcot.
3 - 42 Vacancy is high (91). Under 'shops and shop-cum-dwellings' the district has recorded a lower figure of 10, the State average being 18. Under' Factories and workshops and
workshop-cum-dwellings' the district figure has risen to 20, State Salem rural average being 15. This is due to the existence of large number
of handlooms in the district. Under school, the district has recorded less than the State average. Probably this is indicative of the educational backwardness of the district.
3 - 43. The vacancy is higher than the State average by 6. Shops and shop-cumdwellings have recorded a lower figure of 13 as against the State average of 18. There is a well
organised system of weekly shandies in which the bulk of trade Coimbatore rural in rural sector is transacted. Shops have only a secondary place
except in the taluks of Pollachi and Udumalpet which have recorded the high figures of 21 and 23. This is a district very much industrially advanced. As against the State figure of 15, there are 28 workshops and factories and workshop-cum-dwellings in this district. Under schools the district has recorded one less than the State figure. Under entertainment the proportion is negligible. The rural areas in this district have to improve in these two respects.
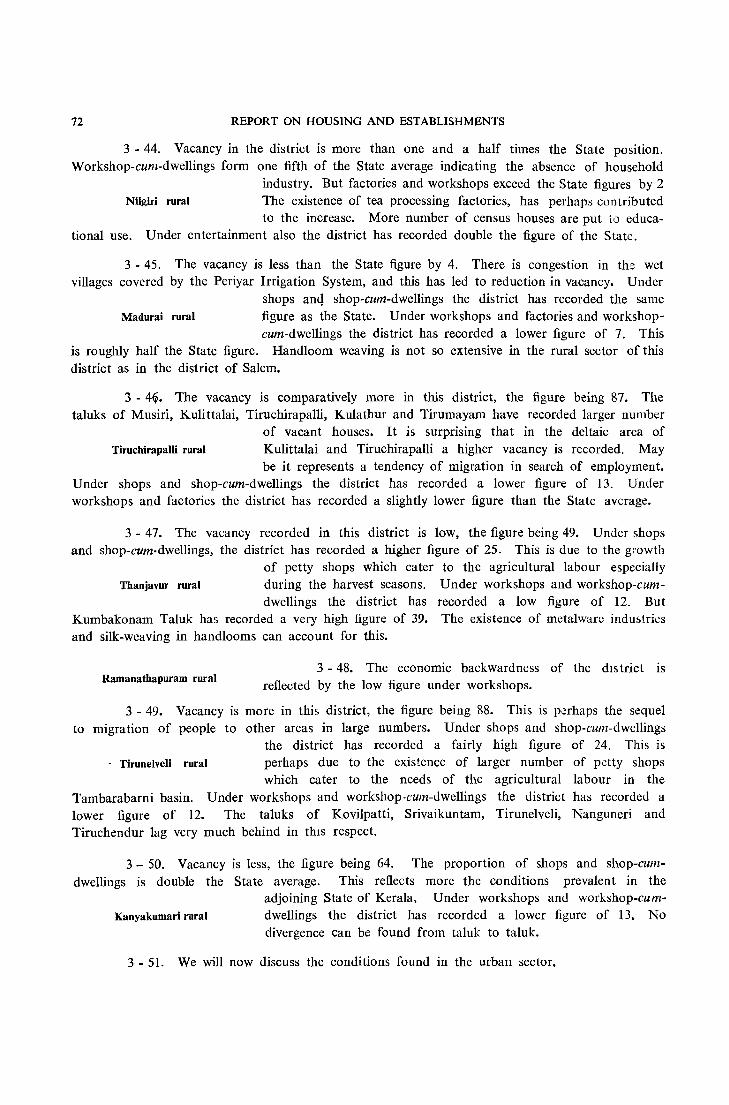
72 REPORT ON HOUSING AND ESTABLISHMENTS
3 - 44. Vacancy in the district is more than one and a half times the State position. Workshop-cum-dwellings form one fifth of the State average indicating the absence of household
industry. But factories and workshops exceed the State figures by 2 Nilgiri rural The existence of tea processing factories, has perhaps contributed
to the increase. More number of census houses are put to educational use. Under entertainment also the district has recorded double the figure of the State.
3 - 45. The vacancy is less than the State figure by 4. There is congestion in the wet villages covered by the Periyar Irrigation System, and this has led to reduction in vacancy. Under
shops anq shop-cum-dwellings the district has recorded the same Madurai rural figure as the State. Under workshops and factories and workshop-
cum-dwellings the district has recorded a lower figure of 7. This is roughly half the State figure. Handloom weaving is not so extensive in the rural sector of this district as in the district of Salem.
3 - 4~. The vacancy is comparatively more in this district, the figure being 87. The taluks of Musiri, Kulittalai, Tiruchirapalli, Kulathur and Tirumayam have recorded larger number
of vacant houses. It is surprising that in the deltaic area of Tiruchirapalli rural Kulittalai and Tiruchirapalli a higher vacancy is recorded. May
be it represents a tendency of migration in search of employment. Under shops and shop-cum-dwellings the district has recorded a lower figure of 13. Under workshops and factories the district has recorded a slightly lower figure than the State average.
3 - 47. The vacancy recorded in this district is low, the figure being 49. Under shops and shop-cum· dwellings, the district has recorded a higher figure of 25. This is due to the growth
of petty shops which cater to the agricultural labour especially Thanjavur rural during the harvest seasons. Under workshops and workshop-cum-
dwellings the district has recorded a low figure of 12. But Kumbakonam Taluk has recorded a very high figure of 39. The existence of metalware industries and silk-weaving in handlooms can account for this.
Ramanathapuram rural 3 - 48. The economic backwardness of the dIS trict IS
reflected by the low figure under workshops.
3 - 49. Vacancy is more in this district, the figure being 88. This is p . .!rhaps the sequel to migration of people to other areas in large numbers. Under shops and shop-cum-dwellings
the district has recorded a fairly high figure of 24. This is - Tirunelveli rural perhaps due to the existence of larger number of petty shops
which cater to the needs of the agricultural labour in the Tambarabarni basin. Under workshops and workshop·cum-dwellings the district has recorded a lower figure of 12. The taluks of Kovilpatti, Srivaikuntam, Tirunelveli, Nanguneri and Tiruchendur lag very much behind in thIS respect.
3 - 50. Vacancy is less, the figure being 64. The proportion of shops and shop-cumdwellings is double the State average. This reflects more the conditions prevalent in the
adjoining State of Kerala. Under workshops and workshop-cum-Kanyakumari rural dwellings the district has recorded a lower figure of 13, No
divergence can be found from taluk to tal uk.
3 - 51. We will now discuss the conditions found in the urban sector.
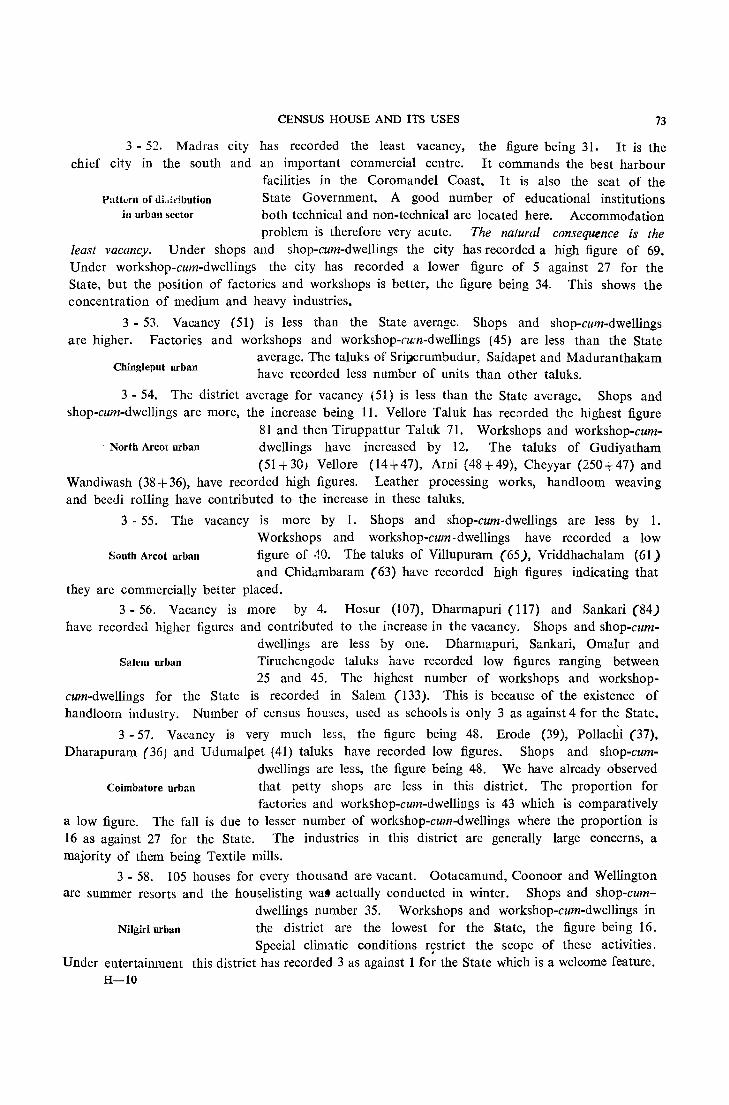
CENSUS HOUSE AND ITS USES 73
3 - 52. Madras city has recorded the least vacancy, the figure being 31. It is the chief city in the south and an important commercial centre. It commands the best harbour
facilities in the Coromandel Coast. It is also the seat of the Patkrn of uLidbution
in urban sector State Government. A good number of educational institutions both technical and non-technical are located here. Accommodation problem is therefore very acute. The natural consequence is the
least vacancy. Under shops and shop-cum-dwellings the city has recorded a high figure of 69. Under workshop-cum-dwellings thc city has recorded a lower figure of 5 against 27 for the State, but the position of factories and workshops is better, the figure being 34. This shows the concentration of medium and heavy industries.
3 - 53. Vacancy (51) is less than the State average. Shops and shop-cum-dwellings are higher. Factories and workshops and workshop-ru:n-dwellings (45) are less than the State
Chingleput urban average. The taluks of Sriperumbudur, Saidapet and Maduranthakam have recorded less number of units than other taluks.
3 - 54. The district average for vacancy (51) is less than the State average. Shops and shop-cum-dwellings are more, the increase being 11. Vellore Taluk has rec::>rded the highest figure
, North Areot urban 81 and then Tiruppattur Taluk 71. Workshops and workshop-cumdwellings have increased by 12. The taluks of Gudiyatham (51+30; Vellore (14+47), Arni (48+49), Cheyyar (250+47) and
Wandiwash (38+36), have recorded high figures. Leather processing works, handloom weaving and beedi rolling have contributed to the increase in these taluks.
3 .. 55. The vacancy is more by 1. Shops and shop-cum-dwellings are less by 1.
South Areot urban
Workshops and workshop-cum-dwellings have recorded a low figure of 40. The taluks of Villupuram (65), Vriddhachalam (61) and Chidambaram (63) have recorded high figures indicating that
they are commercially better placed.
3 - 56. Vacancy is more by 4. Rosur (107), Dharmapuri (117) and Sankari (84) have recorded higher figures and contributed to the increase in the vacancy. Shops and shop-cum
dwellings are less by one. Dharmapuri, Sankari, Omalur and Salem urban Tiruchengode taluks have recorded low figures ranging between
25 and 45. The highest number of workshops and workshopcum-dwellings for the State is recorded in Salem (133). This is because of the existence of hand loom industry. Number of census houses, used as schools is only 3 as against 4 for the State.
3 - 57. Vacancy is very much less, the figure being 48. Erode (39), Pollachi (37), Dharapuram (36) and Udumalpet (41) taluks have recorded low figures. Shops and shop-cum
dwellings are less, the figure being 48. We have already observed Coimbatore urban that peHy shops are less in this district. The proportion for
factories and workshop-cum-dwellings is 43 which is comparatively a low figure. The fall is due to lesser number of workshop-cum-dwellings where the proportion is 16 as against 27 for the State. The industries in this district are generally large concerns, a majority of them being Textile mills.
3 - 58. 105 houses for every thousand are vacant. Ootacamund, Coonoor and Wellington are summer resorts and the houselisting wa§ actually conducted in winter. Shops and shop-cum
dwellings number 35. Workshops and workshop-cum-dwellings in Nilgiri urban the district are the lowest for the ~tate, the figure being 16.
Special climatic conditions r~strict the scope of these activities. Under entertainment this district has recorded 3 as against 1 for the State which is a welcome feature.
H-IO
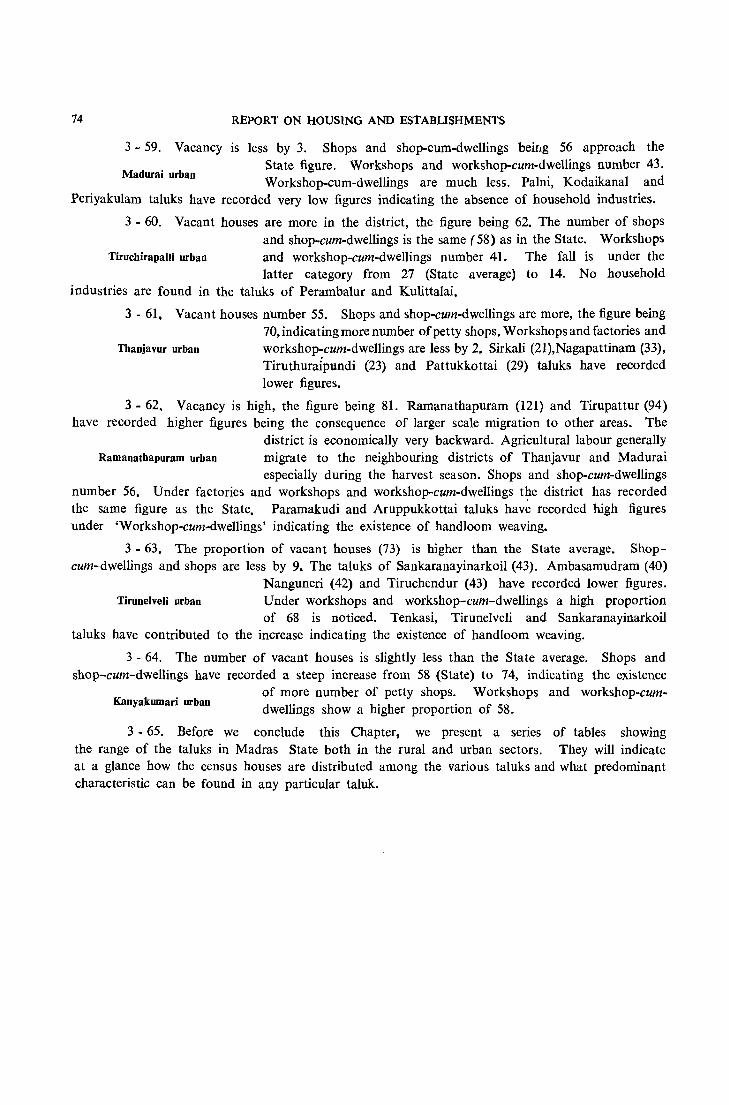
74 REPORT ON HOUSING AND EStABLISHMENTS
3 ~ 59. Vacancy is less by 3. Shops and shop~cum~dwellings being 56 approach the
Madurai urban State figure. Workshops and workshop~cum~dwellings number 43. Workshop~cum-dwellings are much less. Palni, Kodaikanal and
Periyakulam taluks have recorded very low figures indicating the absence of household industries.
3 - 60. Vacant houses are more in the district, the figure being 62. The number of shops and shop~cum-dwellings is the same (58) as in the State. Workshops
TiruchirapaUi orban and workshop~cum-dwellings number 41. The fall is under the latter category from 27 (State average) to 14. No household
industries are found in the taluks of Perambalur and Kulittalai.
3 - 61, Vacant houses number 55. Shops and shop-cum~dwellings are more, the figure being 70, indicating more number of petty shops. Workshops and factories and
Thaojavur urban workshop-cum-dwellings are less by 2. Sirkali (21),Nagapattinam (33). Tiruthura{pundi (23) and Pattukkottai (29) taluks have recorded lower figures.
3 - 62. Vacancy is high, the figure being 81. Ramanathapuram (121) and Tirupattur (94) have recorded higher figures being the consequence of larger scale migration to other areas. The
district is economically very backward. Agricultural labour generally Ramanathapuram urban migrate to the neighbouring districts of Thanjavur and Madurai
especially during the harvest season. Shops and shop-cum-dwellings number 56. Under factories and workshops and workshop-cum-dwellings t~e district has recorded the same figure as the State. Paramakudi and Aruppukkottai taluks have recorded high figures under 'Workshop-cum~dwellings' indicating the existence of handloom weaving.
3 ~ 63, The proportion of vacant houses (73) is higher than the State average. Shopcum-dwellings and shops are less by 9. The taluks of Sankaranayinarkoil (43). Ambasamudram (40)
Tirunelveli urban
Nanguneri (42) and Tiruchendur (43) have recorded lower figures. Under workshops and workshop-cum-dwellings a high proportion of 68 is noticed. Tenkasi, Tirunelveli and Sankaranayinarkoil
taluks have contributed to the increase indicating the existence of handloom weaving.
3 - 64. The number of vacant houses is slightly less than the State average. Shops and shop-cum-dwellings have recorded a steep increase from 58 (State) to 74, indicating the existence
Kanyakumari urban of more number of petty shops. Workshops and workshop-cumdwellings show a higher proportion of 58.
3 - 65. Before we conclude this Chapter, we present a series of tables showing the range of the taluks in Madras State both in the rural and urban sectors. They will indicate at a glance how the census houses are distributed among the various taluks and what predominant characteristic can be found in any particular taluIc.

J .S
.... 0\ -.B §
8 -.B -co
o co
.8
-'"
-v
-....
--
o -
0\
co
r-
'"
e o ~ .D 8 ·0 V
't:I I::: ::I ... 80 roO OQ roo -0 8u
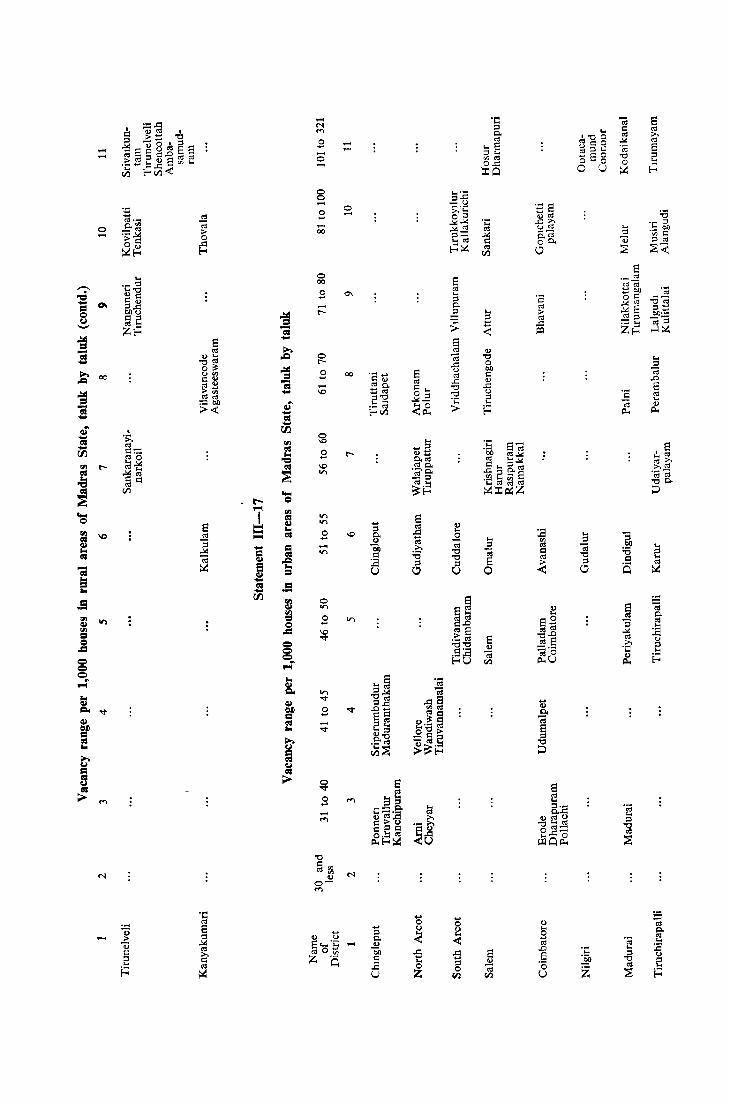
o .....
~oe
~ -i ~ l"'-
i '8
~ ~
-; ... = ...
'8
~ ~ = = . ..
-N M
,9 ..... o .....
o o -.8 ..... 00
o 00
,9
o r-
.8 ..... '0
I/") I/")
.8 -I/")
..... .....
o .....
00
:a
j
<!) .... .8 o:s
.D E '0 U

.~
J
V) 0\ 00
o .... 'D tOO
V) tOO
B -V) 00
~ 00
B 'D N 00
V) N 00
B -o 00
8 00
o .... 'D tt-
V) tt-
B -V) t-
V) N t-o .... 0\ 0\ 'D
~ ..c:: 1:: o Z
... ... ;:1 ;:1-",01 08 P=:O
CI)
'" o bJl I'::
i E:::
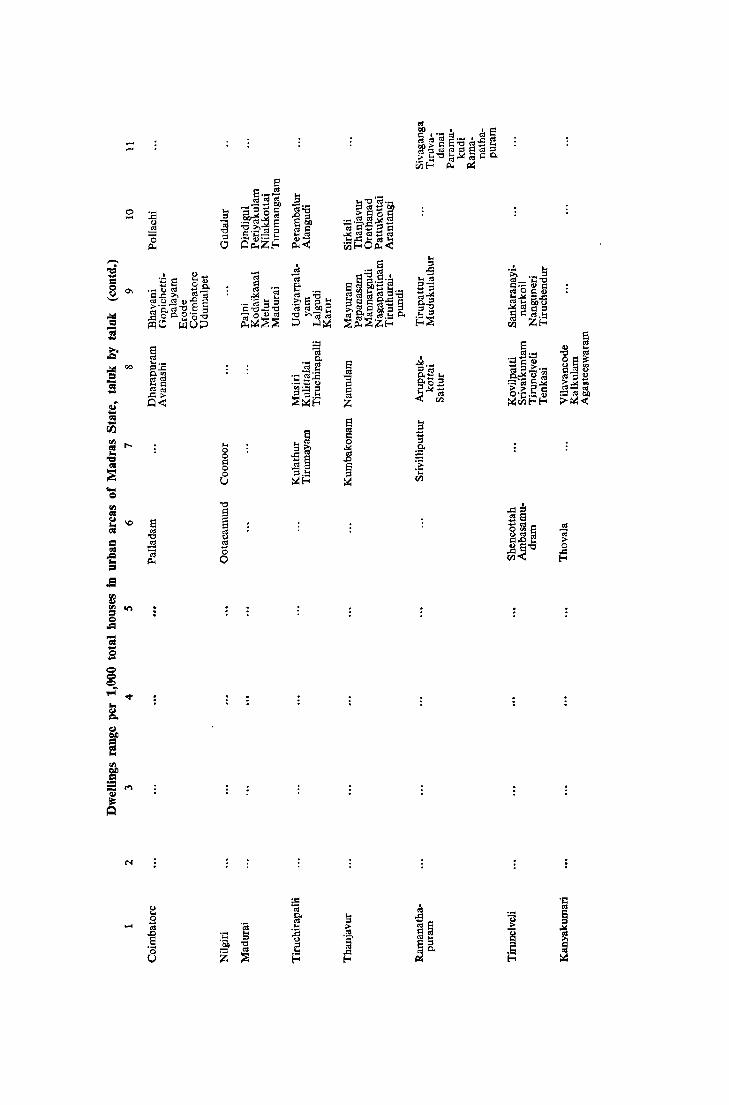
• ~ t· ... .:s Js 8 - os os os 8· ... t.t:i oj .-< ~~§os-g~~3
;. .... "O:,;,.I<!ojQO' i;il~ p... ~
El 8'e;.E! !:l ,,~'§'6b oj os
c:::> ... _~~bl) "a;o - :E ~
~~o§ il~ ;;.. e'O Q
<..I :.a ~~ 8 =.~~~.s .E! .S·5~ e ~la C'jc;d"'~= '0 ;::S <1)- ~..c:=e~e ~ C1 o~z~ ~< ~E-<O~<
,..... :.a~
...
~ t Q ta ~ -5 .~ J..t
'Be: c;~ 8 ~.s·a ... os ~~ .1:-6 ~ Po ::J-
! 0'1 .~ 0 clj 1d~ ~ :; ~ § 1ll"'~3'''' ...,::l c· ... <I) e 1Hi ~ ,D os ~ o:S ...,,.:.: o:SOCQ
._.~ :; S S :g ~ gooB 'g !l.g "'~::l..c: ;;.. .... -~ 8 S .... ~~::l <II ... bO <..I
~ os §'~o,,,,.g c:i"C)_"O ~;;...- ... ;;...llQQIl2::l 2::l ~'" c::l -oalro ~QZ~ = ~O ~0::> ~~::E~ ::> ..:3;:2 ~~~Z~ 0. ~::s '3 E ;:.., e s 8 <I)
oj ... ,Q os <IS;:l "0 os os .~ ~ t
~ 00 S:E s ~'a "E§ Q oS~ «1 ... «S ,.E: ..... l:!o:!~ = 0.'" '0 g:.a ~ g:~ ~ o.~ <I) '" ~~~ 'a
<ISo:! :-;::0; d~ ... c:: .~_ to)
2~~ .... «1o:! :g;..::: 2 e ~·~.5 is os_ Ol
.c;. ~~~ Ol < ~ ~~< i' 0< Z ~Ill!-<E-<
(II
§ .... ... (/)
... ~ ~ fIl c::
I'- ... 0 (II 0 ::l2 ~ :§' lot 0
~~ <IS
"CI § .0 ~ = ~ :a 0 ~~ .;::
U III ... = fIl "0 :!I = c:: is <U 10 S
::l
; 8 'O1ll§ oj ~ ~ ..,<Il t;
= ~ os CoO ... :>
= ..... jlS"O 0
of '" 0 ~ ~ 0 III <
= .S fIl ~ fIl on g .= "; 'S .... c::> c::> ~ 1"'( v
i i lot
i ... - '" Qi it: ~
N
= '1:: II) Cd ~ Ol ... .- S 0 go 3 ,<:l ~ .... ~ 'e .... t; ~§ ;;..
~ .0
~ :g ] S ::l .§' Ol ...
'0 "0 .5 S::l e § o:S 010.
V Z ~ !-' ~ ~ ~ ~
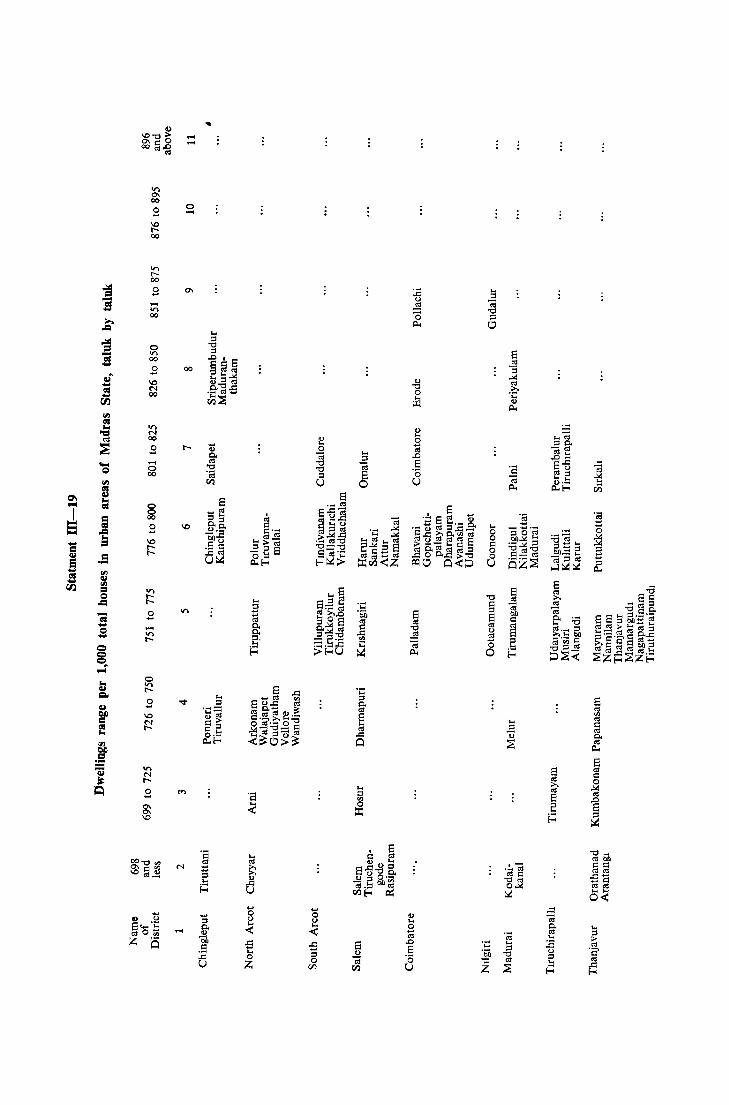
.... o
'" ~ j = ...
-or, 00
o or, 00
.8 \0 N 00
or, N 00
.8 -o 00
~ o .....
-
.. --o -
a-
..... § <
e o ~
:§ o U
Q) ... o ~
:§ o U
... g I:: o 8
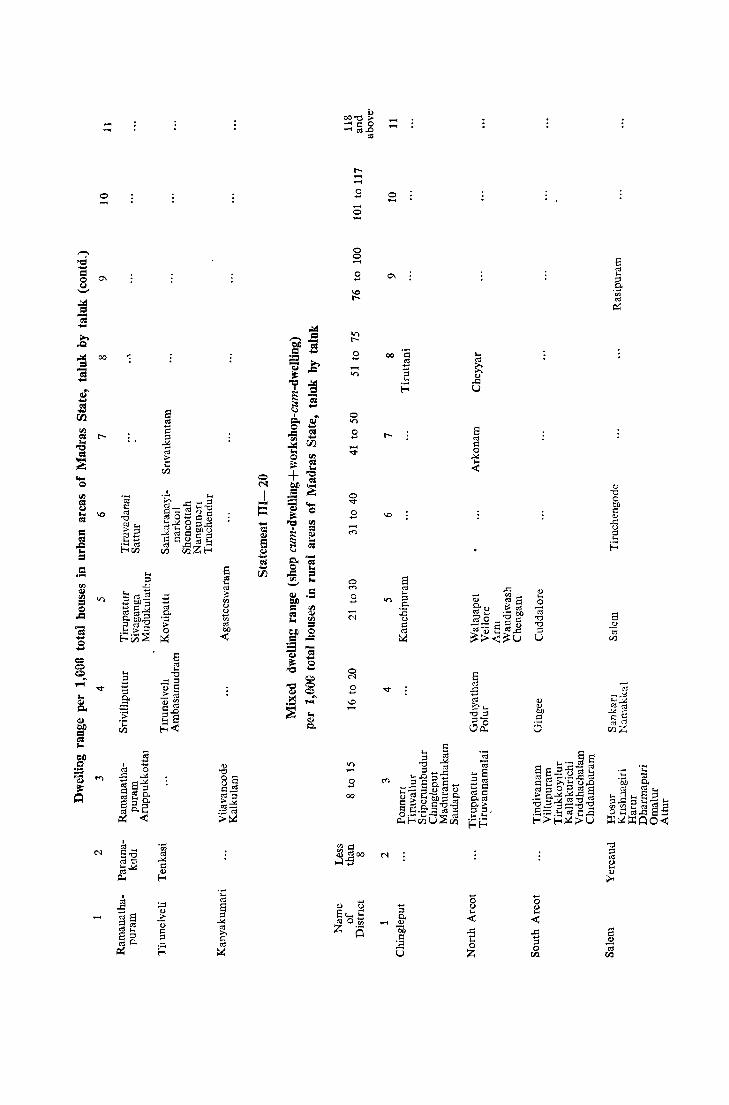
o ...... o
o o ......
B 00
...... ......
o ......
\0
.s .... o Z
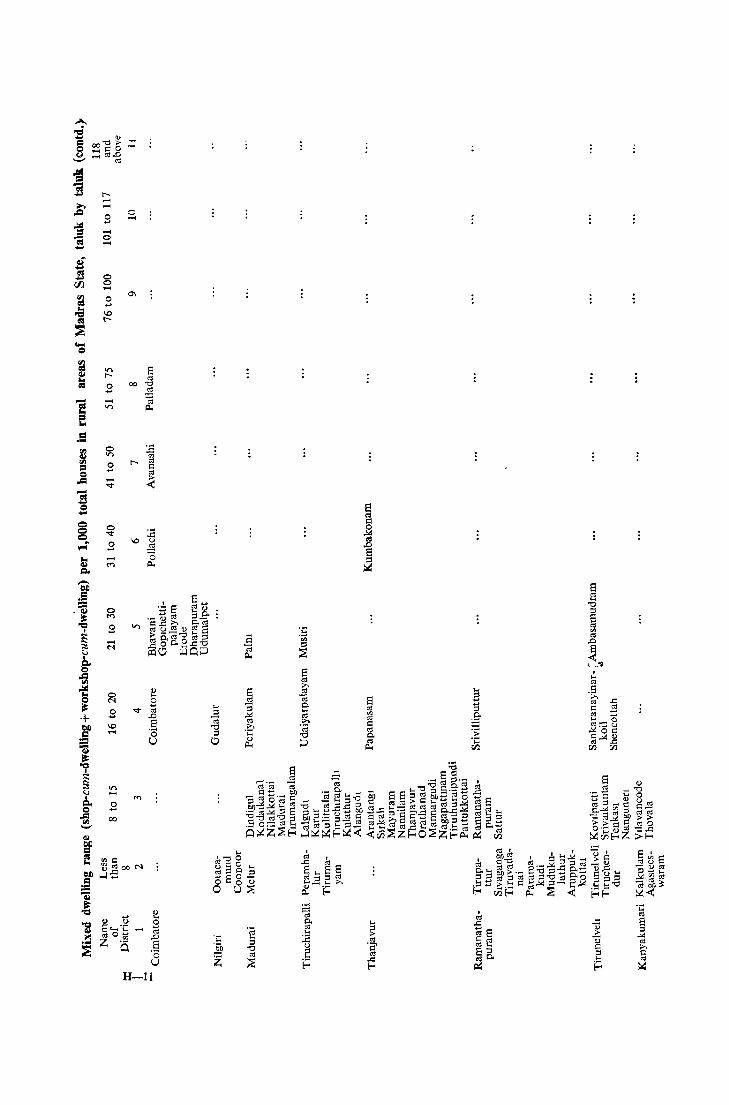
t--0 .... -0 -0
~ 0 .... ID t-
'" t-
0 .... -; e -'" = ...
0
'" £ ~
0 '<t
£ -<"l
0 <"l
0 .... -<'I
0 <'I
£ ID -
£ 00
0 -
0\
00
t-
ID
'"
'<t
E OS
"" ~ -; ~
:E '" OS P OS
<
:E 0
~ 0 ~
, 8 .... '';:: 8 S g.
'E~ ~ g:~ ~ ~~~ S 8 os 0. il 0 os.g
..=: 0 ,-,..PO ~'" J.l.lO
Q) .... 0 ~ ..c 8 '0 U
e £ oj
..c ,§ o u
H-ll
2 -; p..
8 ~ .... ::s
.8 .l<i OJ '" "0 ,0 ::I ....
'" ~
... '''Cl 0 ~ § g .... .':l a 0 ::s o 0 ~ o u"'"
,!:: '" ::s ~
8 ~
~ ca 0. .... o:!
~ 0
8 ~ p 0
.l<i ~
,D
El ::s ~
e os .... "0 ::I 8 os '" os
,D
a < l __ 1 , .... os .... ,5
8 .a ;>-.
3 ';j os oj p
'" ,8- o! .... oj ... 0 p := ~~g o:! :~ 0. ;.l<i~
~ .... rI.l rI.l rI.l
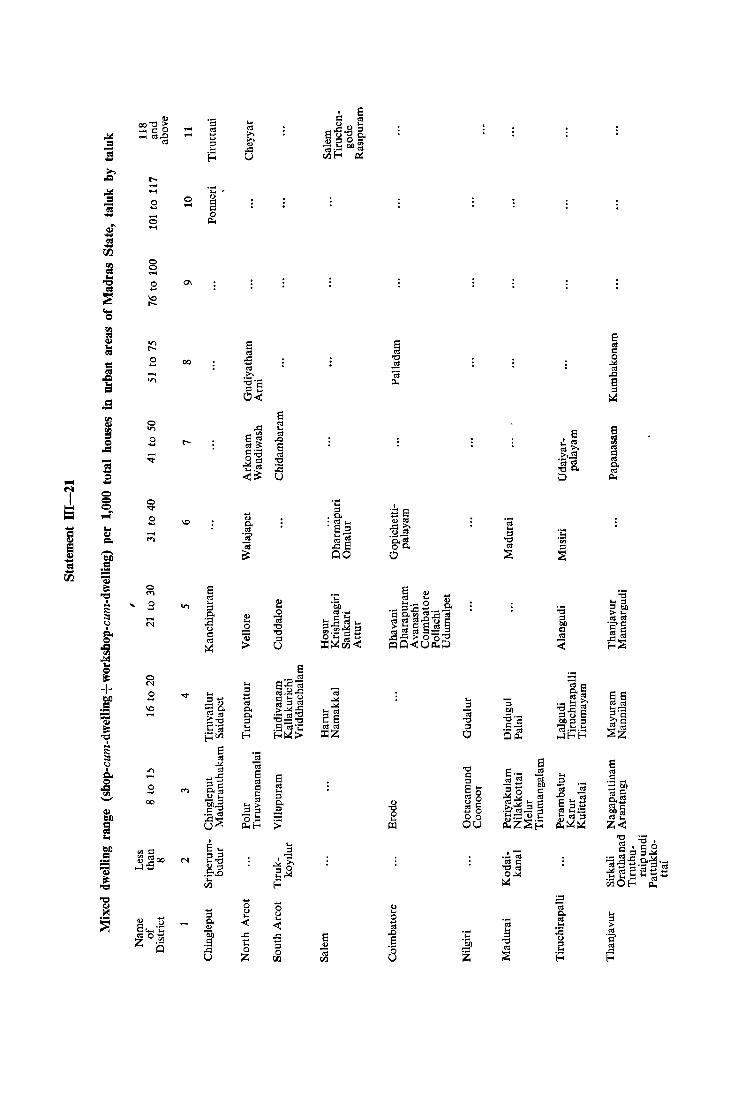
t----.8 -o -8 -.8 ~
o ('<)
.8 N
o -
co
':i
~ .S ..<:: U
8 OJ (ij rIl
e o ] . 9 8
't:I § 8 .... roO 0 0 !Sa 00 cu
.~ .... ~ Z
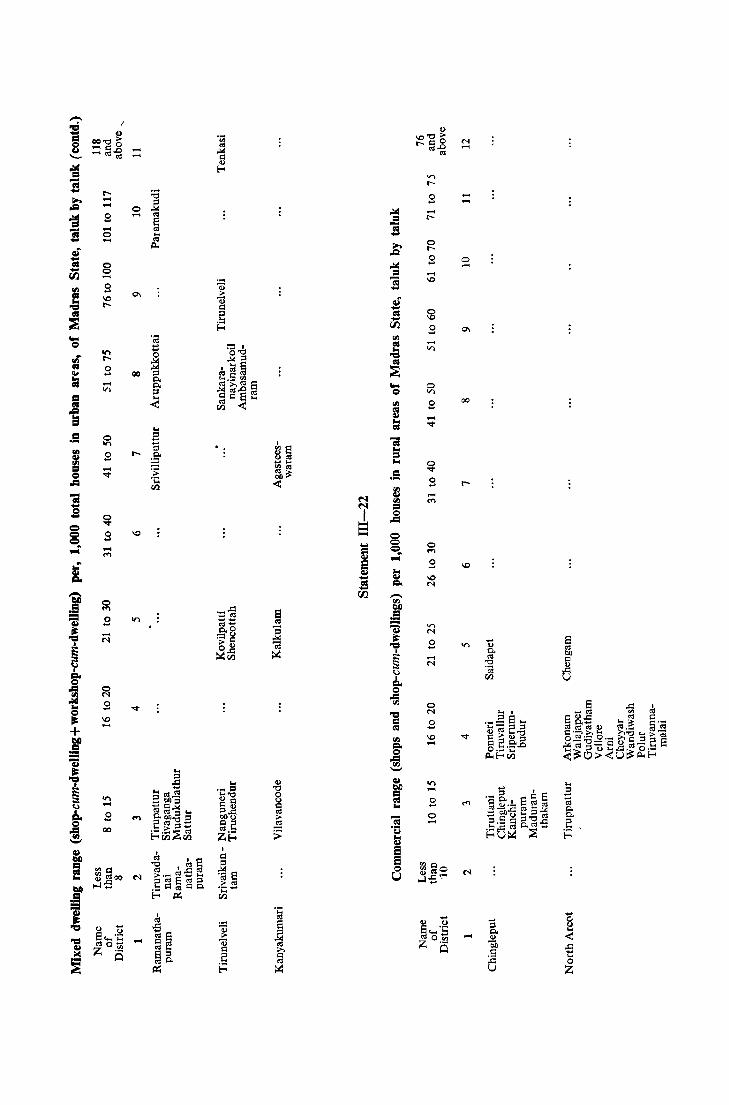
8 ..... g \0 I"'-
.e
<r)
I"'-
o ... ..... I"'-
g o ...
..... \0
..... <r)
o <r)
g
o ..... o ...
<r) N
o .... ..... <'l
o N
g \0 .....
on ..... o ... o .....
... Q) 0 s .... ·;:: ~o~ Z .-Q
N ......
..... .....
o ....
.....
... c. u .( -5 o z
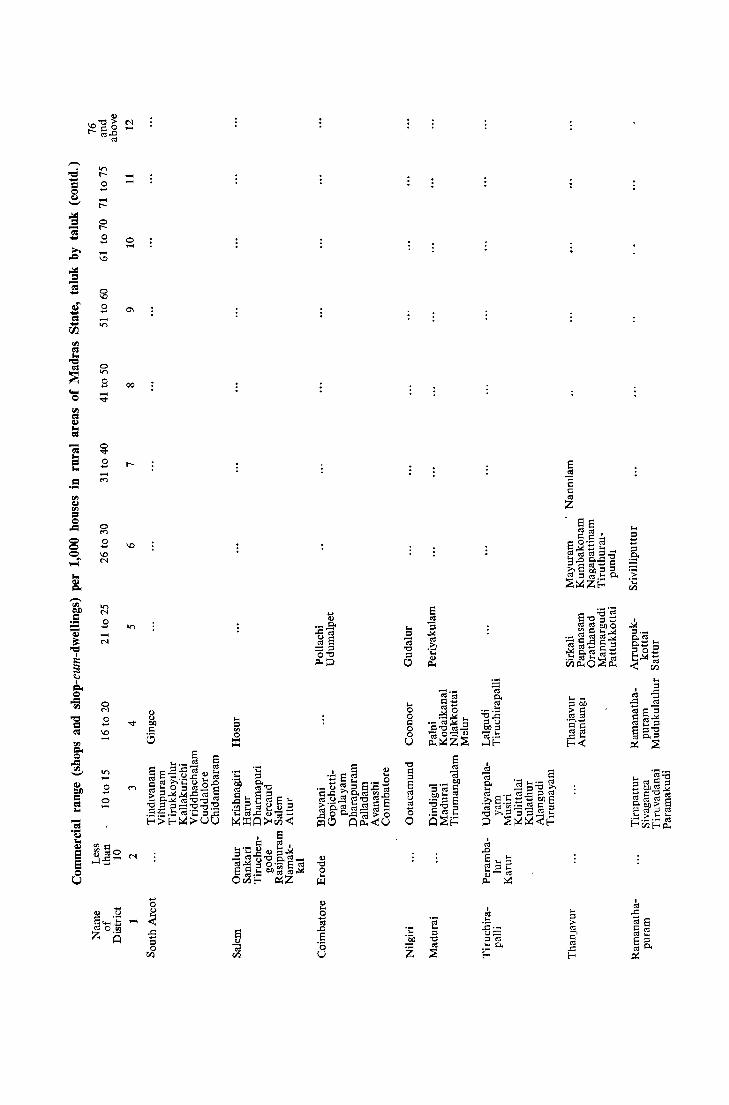
] ~
= ...
V'l t-o ...... -t-
-ID
g £ -V'l
o V'l
o ...... -'<t
o -
00
e o ~
] o U
... o o Q o
8
·c ~ Z
I ro ''; ... :.a ._ ... ::l u::::
"0 ::l'" ro .... 0. ;:?1 1=
E ro c c ro Z
.... ::l ;> cO
2' ro ..c: b
I ro ..c: ~8 Cro ro .... 8::l roo. ~

l = ....
II"> r-.8 -r-
-II">
o II">
o .....
--o -
0..
00
'" ~
~ .... o
'" ~ ~
i = ....
II"> r-o ..... -r-o r-
.8 -1.0
g o ... -II">
o II">
o .....
~ o r..... -M
o M
o 1.0 .....
II">
o ..... o -
..... o ~ < -:S .... o Z
,S ",,,, ........ ",::>
.<::0-A
..,
.... o ~ J;)
S ·0 u
"0 § S .... ~g "'~ ..... 0 00 OU
.... ·Sn Z
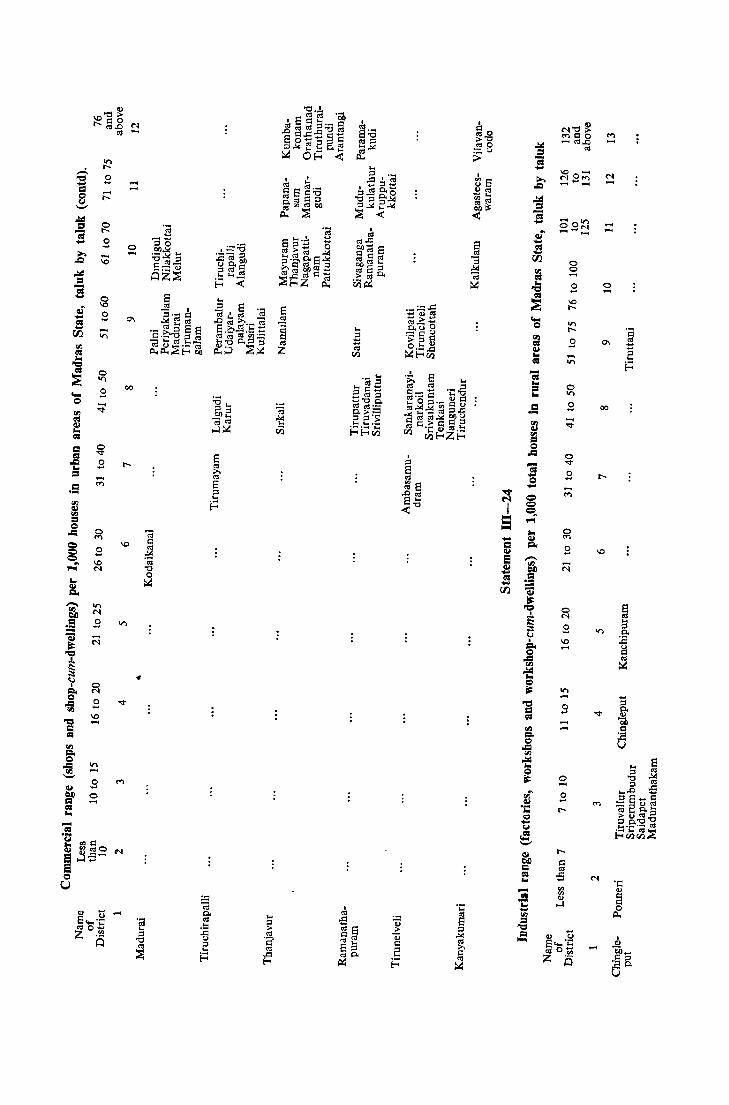
.... .....
o .....
00
.. I -00
o o ....
o '" S
o M
S ..... N
o .... .... ....
o ..... o ...
N .....
..... .....
o ....
00
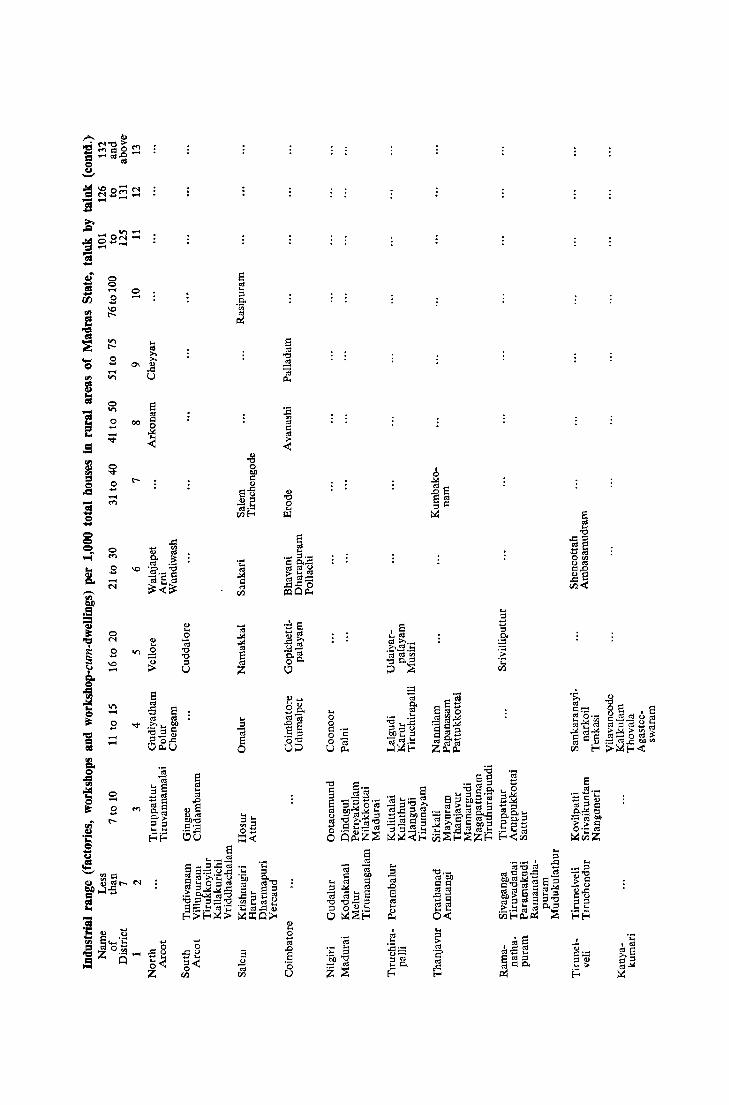
'<;
I 1 = ...
o on o ..... ~
..... o ""'u _ ...
g< rIl
...
i o
~ o -; .D E 8
... o g o '2 8~
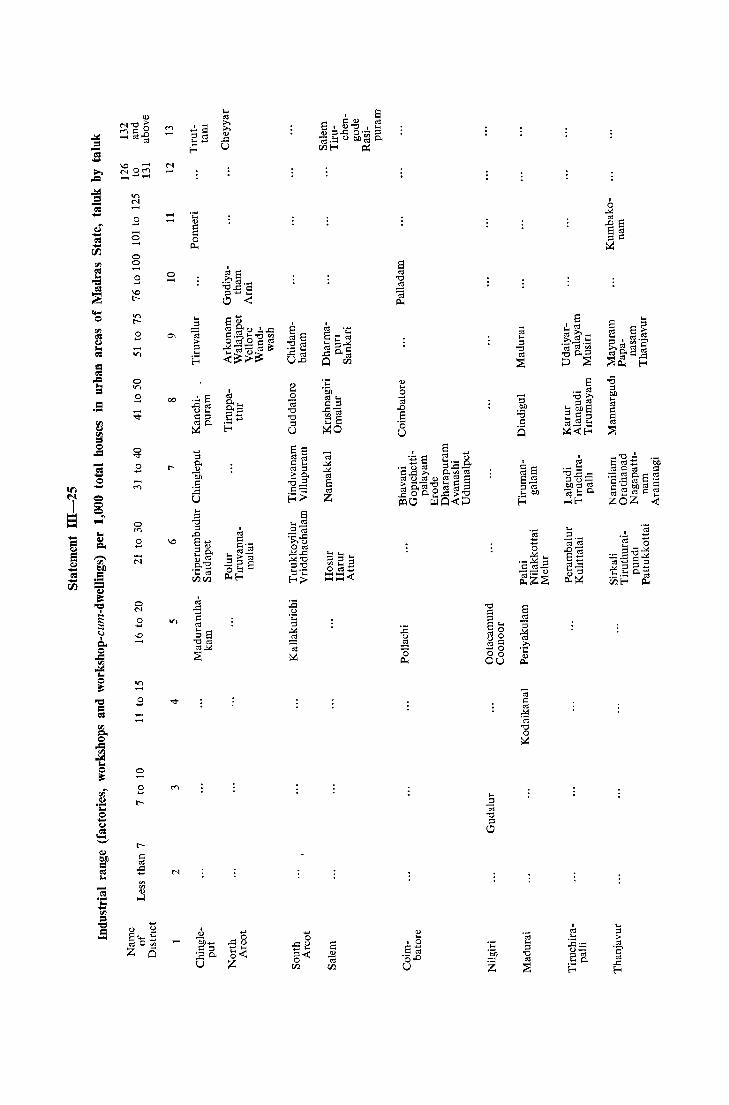
I()
I == j .... .s 00
-; .... .. .... 00 = :5
.8 o -o o -.8 \0 t-
V)
t-
O .... -V)
o V)
9
~ .8 \0
V) -o .... -""' o
.8 t-
m
""'
o -
00
\0
....
~ " ..c U
~8 "00:1 .- ... ..co:l U..c
~ .0 8-;;;
·OoD U
"0 e:: ::l 8 .... 0;0 u O 0:Ie:: .... 0 00 ou
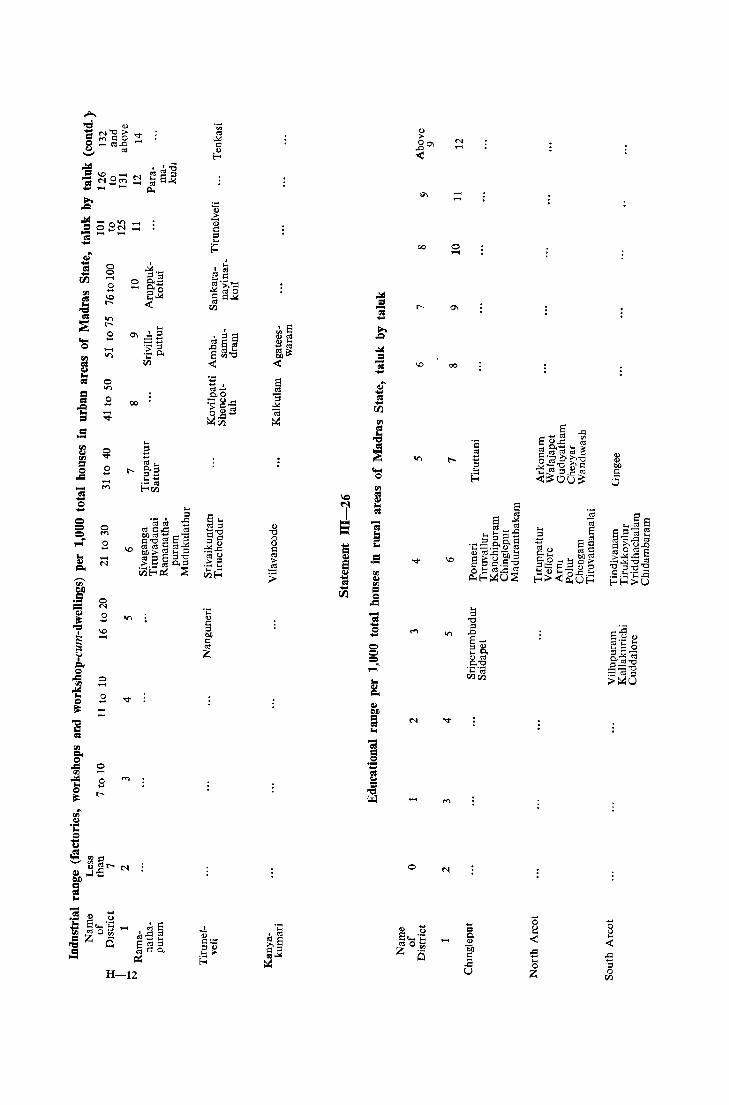
.$
o '" .8 ..... -.r
00
H-12
o
00
N .....
o ,..,
10
..... o ~
<t:
-5 :l o
lZI
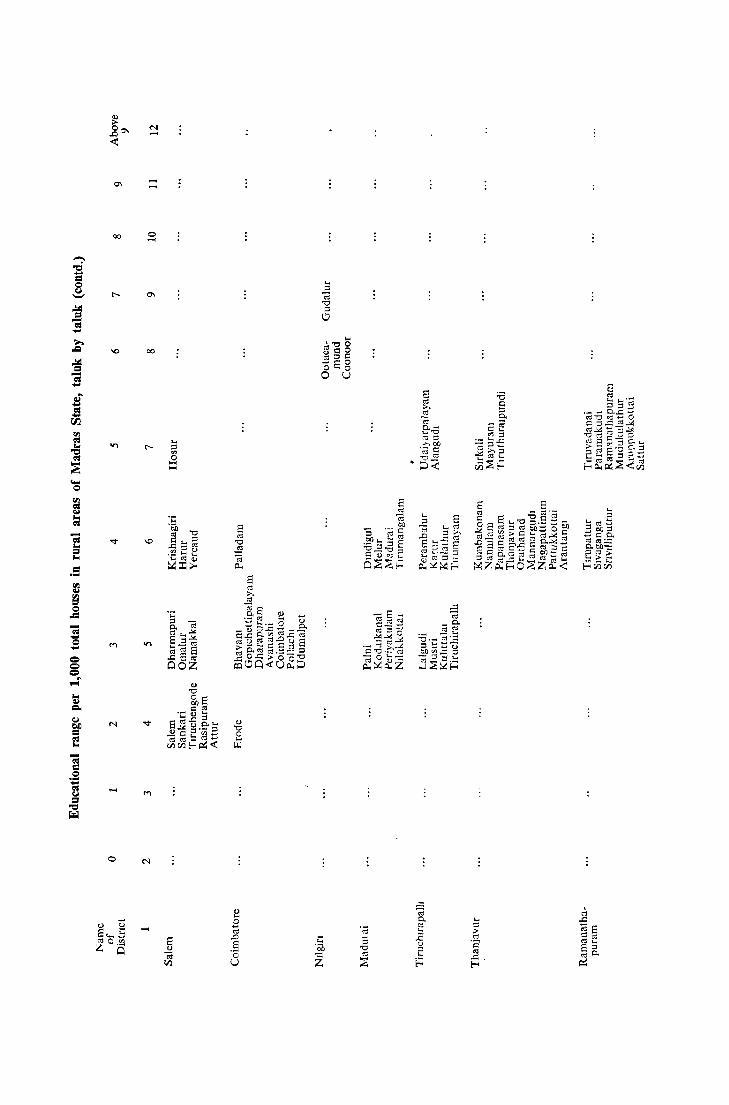
.S
~ ..80\ <
0\
00
M -..... .....
o .....
00
o M
..... ~ B ttl
.0 8 '0 U
.... '''Ij 0 g§8 .soo 0"'0 o u

00
.51
o
N .....
-..... o -
00
.6
o
..... .....
o
00
.... fr bh Q
:.a U
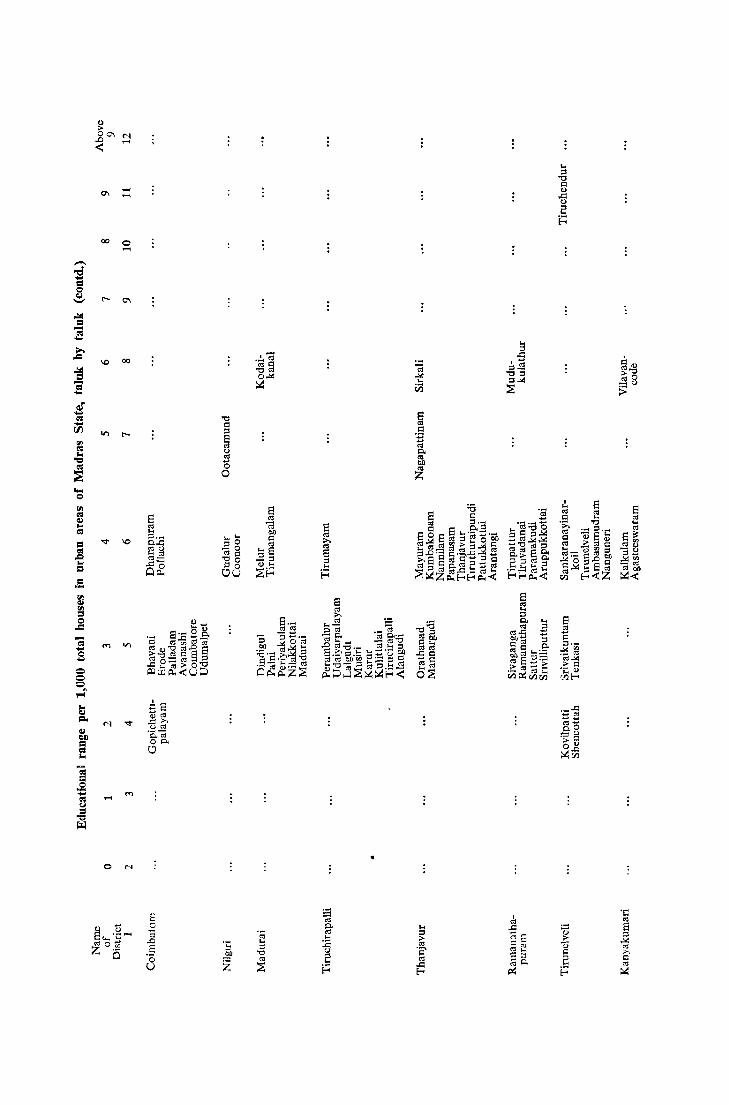
..... .....
00 0 .....
o N
.... .... ~ 0 -0 "'I':: "00 ~ 0 C>u
.~ .... On
i
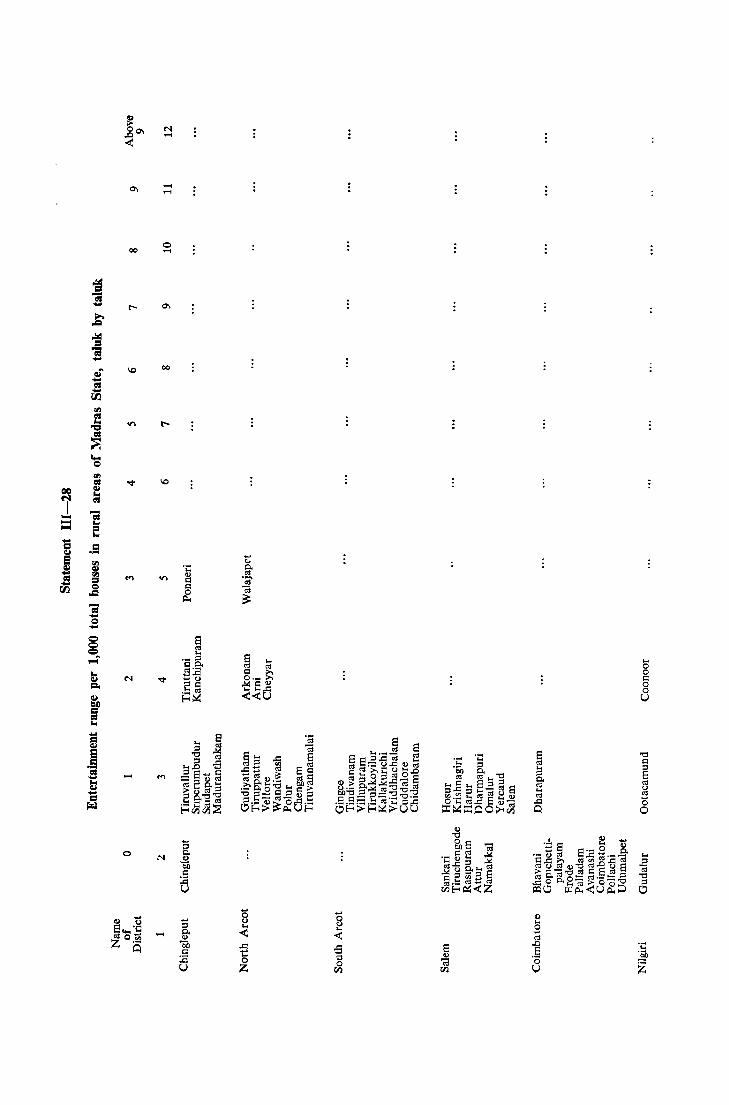
-= -; .... ~
-= -; .... ~ = .... r.n rIl = ~
~ ""' Q
rIl = 00 ~
lot
'I = .... -; ..... !:j 1-4 lot ....
5S = .• S rIl
~ ~ rIl
S = r.n Q .c -= .... Q .... § ,..;-
t g,
~ t)I)
= = lot .... 5S e
.S = i .... = IiJ;l
0\
00
10
('l
N
-
o
(I) "0 8 .-ro'+-t b Z o.~
Q
--o -0\
00
10
'0
"<t
N
.;:: (I) Q c:: 0
j:I.j
8 e ~~ .... <.)
8 Q
E::~
... o o Q o 8
'"Cl 1'1
! "0 o
:5 ~ Z
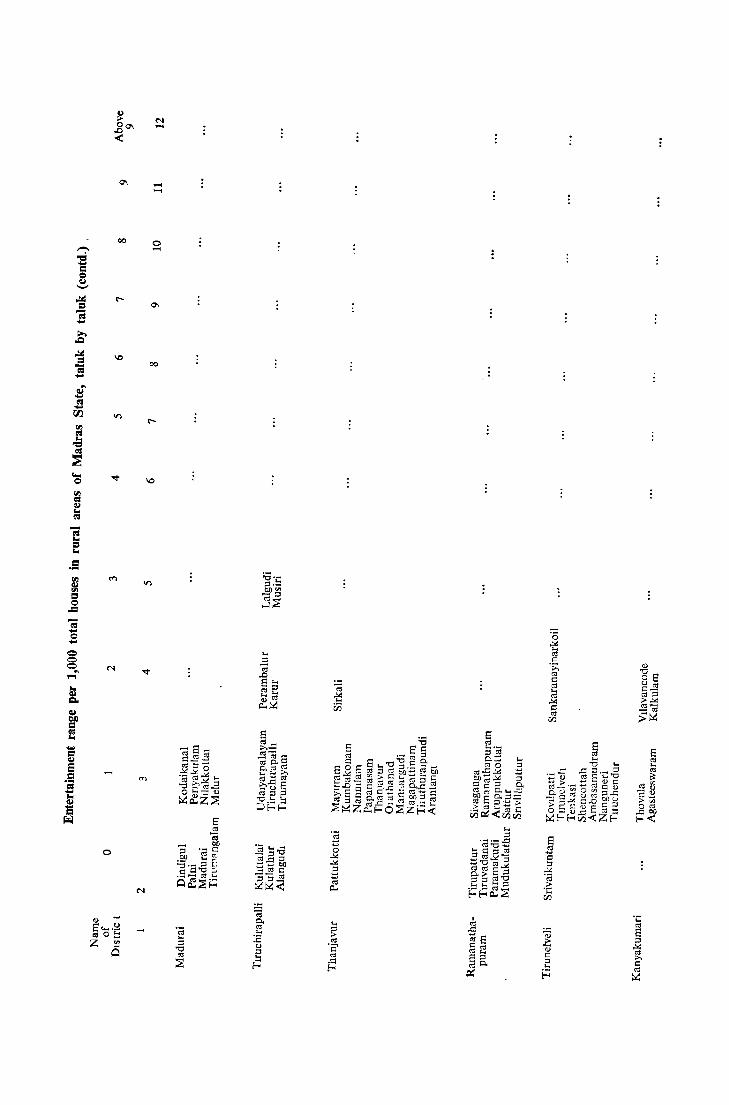
.s
00
o
o .... 8 ..... ·~ mO!:: Z 6
-..... o -
00
\0

"-' >-0",
on <C
0\
00
o
"" ....
..... ....
o .....
00
.... 8 .( .s l-< o Z
B .8 ell
,D
.§ 8
.... o g o o U
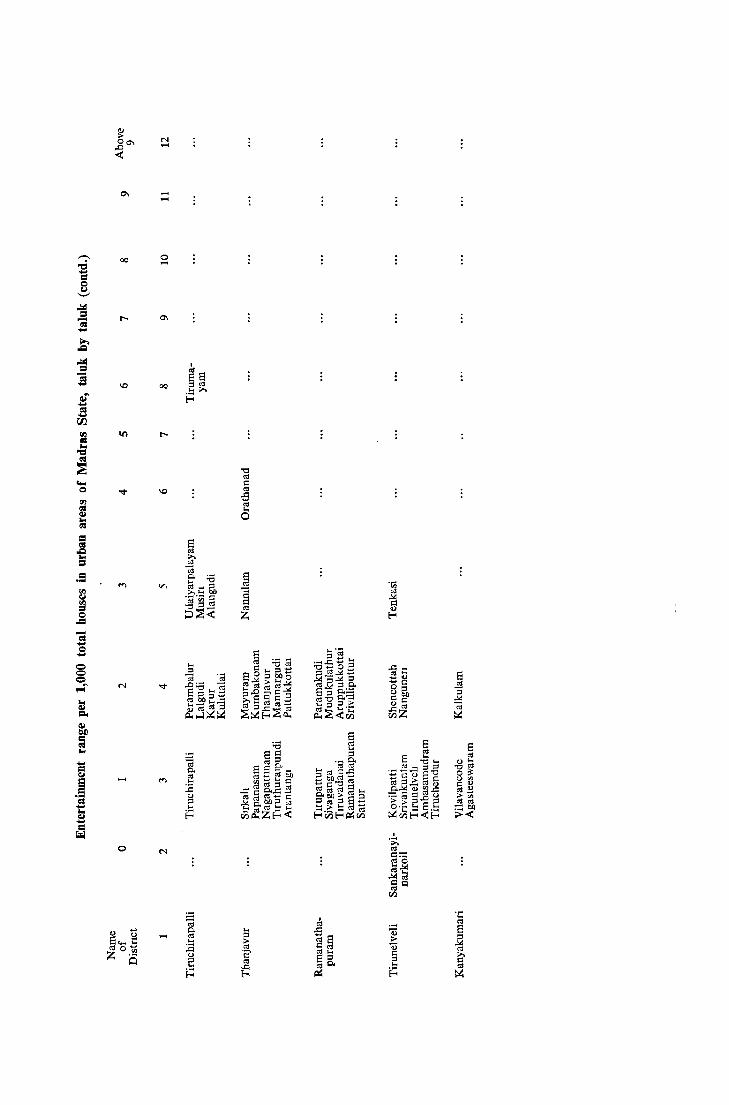
00
I()
.....
o
N .....
..... .....
o .....
00
\l)
.....
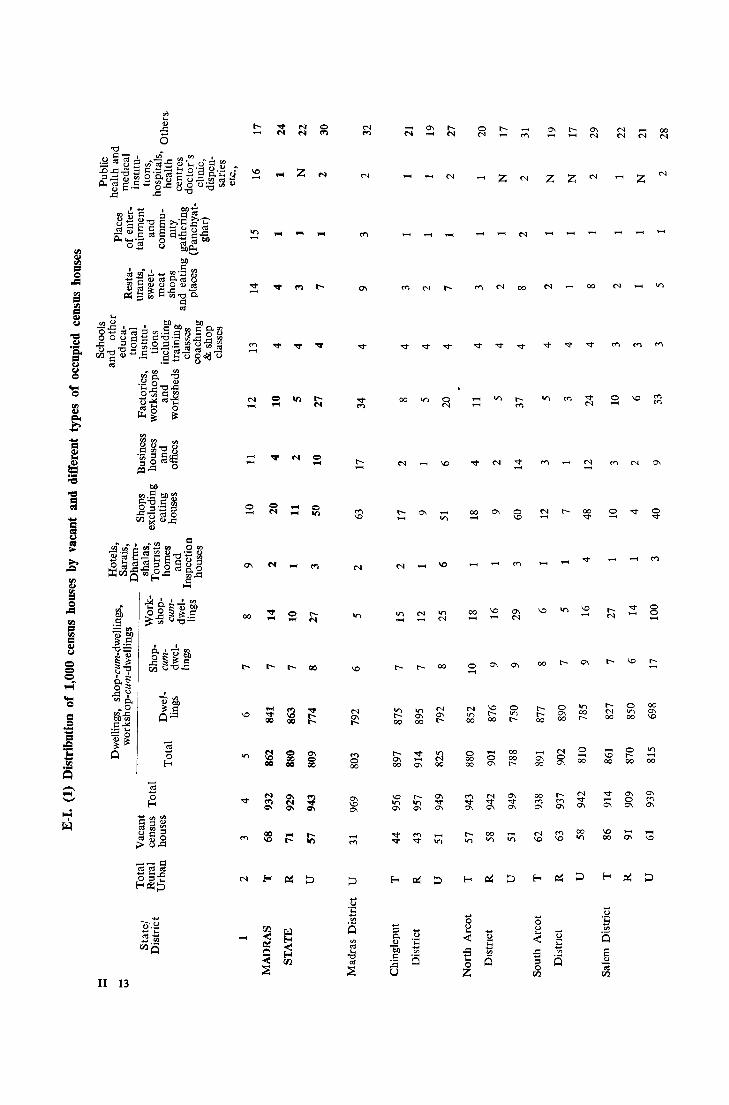
o ....
00
....
H 13
....
"'" ....
N N
N
.... ....
....
<::> ....
....
<::> ....
0\ <::> 00
r-....
"" ~
"" o 00
..... o ] .ra Q
.... N
00
'" r--00
I"-0\ 00
.... '"
00
'" N 00
.... ....
00 ....
00
o ....
N
'" 00
o 00 00
.... M
.... N
N 00
~ I"-00
8 0\
v ....
o '" I"-
00 00 I"-
........
00 I"-
I"- 0 I"- 0\ 00 00
00
00 v
;:; 00
00
'"
l"N 00
.... ~ 00
~ 00
"0 '5 en
is
N N
.... N
z
00 N
............
o '" 00
o I"-00
'" o 0\
.... 0\
8 ....
00
$
'" .... 00
.... ~
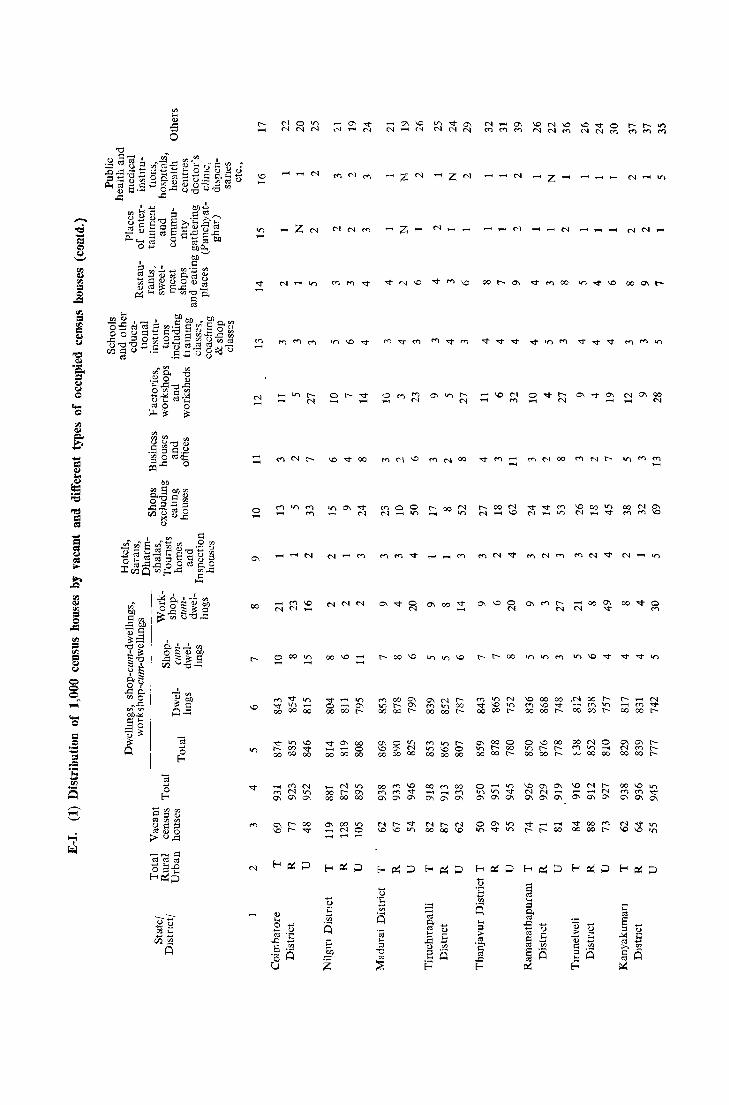
, -eJ) Q}bJJ \$\::
c.4"::
..;-....
<'., ....
.... -
co
0['-";....
... u '5
eJ)
C5
-z-
N[,-N CO CO 10
00['-01
.... _ ....
co..;-o <')

-e
..... .....
o .....
00
....
<::> ....
<::> on
on
.... ~
....
00
....
....
~ .... tn ~
..... <'1
.....
'<t .....
o
r'
..... .....
N ..-0\
..... N 0\
.... M
....
00
o <'1
'<t ....
00 _ - '"
_ M
N .... 00
t--0\ 00
0\ o 0\
0\ 0'1
0\ 00 o N 0\ t--
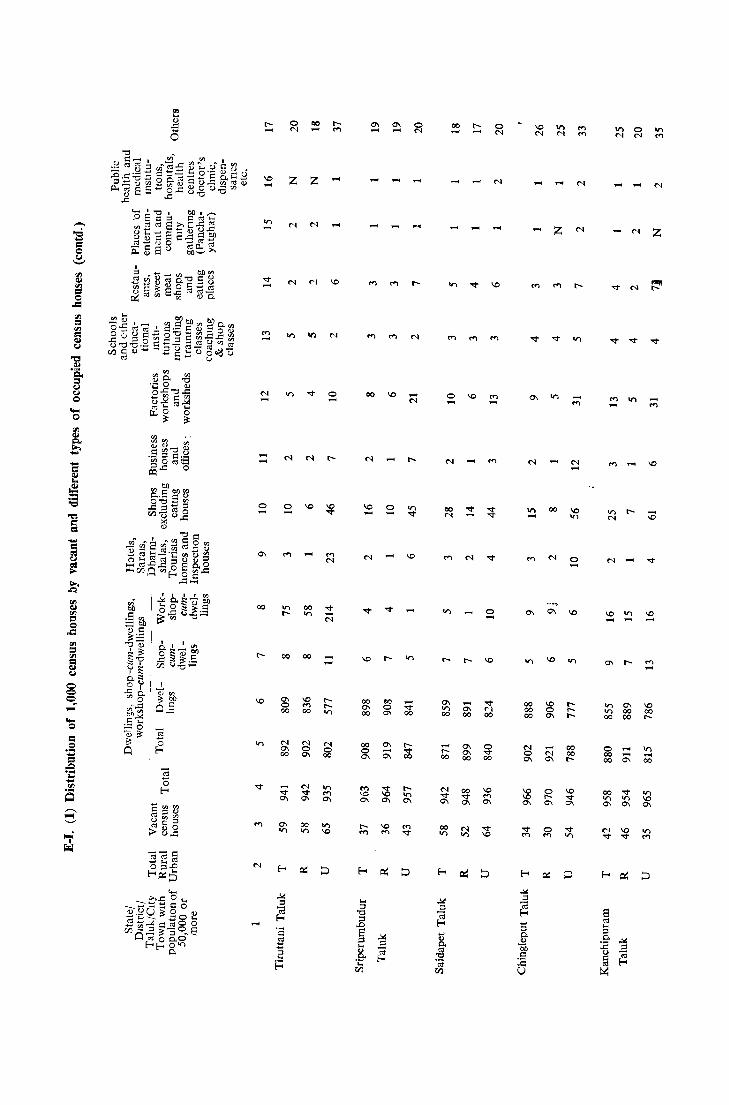
r--\0
II") -
M -<'1 ---o -
00
\0
-
z Z .....
o -
00
0\ o 00
<'1 0\ 00
-'<t 0\
0\ II")
\0
00 II")
00
\0 M 00
<'1 o 0\
00 II")
-
o -
-.....
N o 00
II") M 0\
II") \0
.....
00 \0
....
\0 o .....
-
-<'1
\0
-
00 r-- 0 ......... N
o
00 N
0\ II") 00
-r--00
\0
'<t ....
-0\ 00
0\ 0\ 00
\0
M ....
o -\0
10 .....
..... <'1
z
00
\0
\0 o 0\
..... <'1 0\
-M
<'1 .....
\0 IF)
\0
M .....
\0 II")
II") 0\ II") 00 00 00
o ..... 00 ..... 00 0\
00 '<t II") II") 0\ 0\
z
..... M
\0
\0
\0 00 r--
II") -00
II") \0 0\
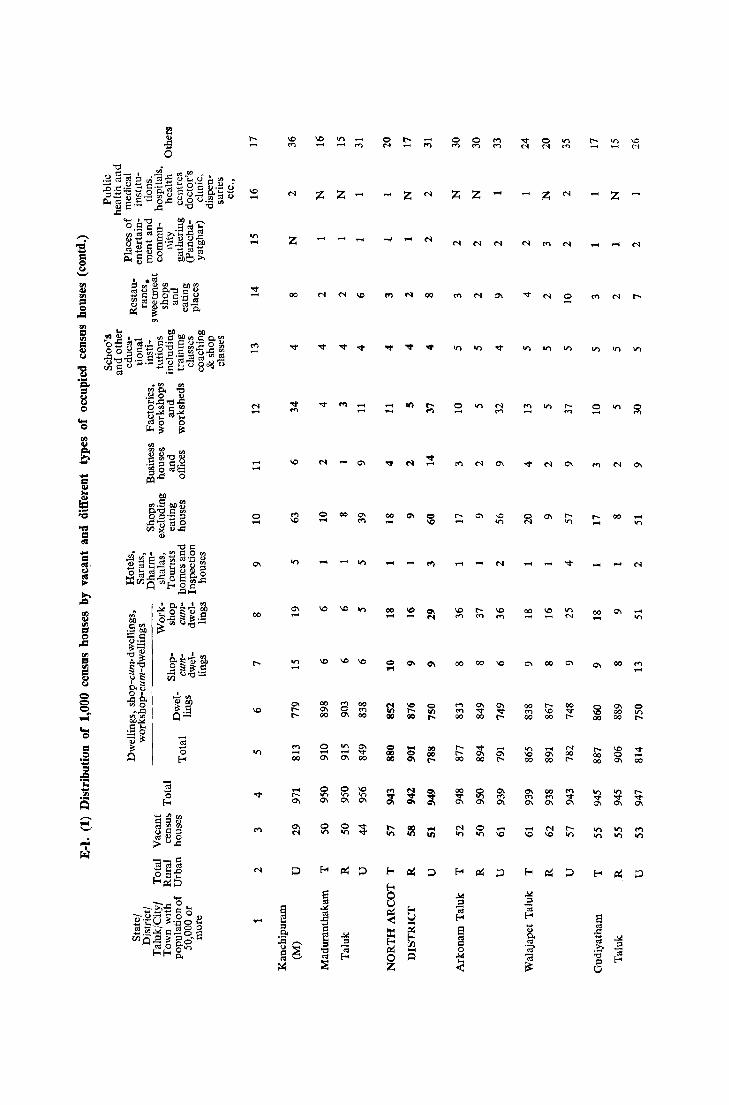
t--.....
.... .....
M ....
.... ....
o -
00
....
z
co
0\ .....
..,
..... 00
.... t--0\
0\ N
\0 II'> _
..... ..... M
z z
........
o ....
co 0'1 00
o -0\
M ... .....
... 0\
co 0'1 ..,
o \0 ..... ..... 0'1 0\
..... M
co
...
00 ....
z Z ....
M M M
o .....
r-.....
00
M M 00
00
Z N
'<t N 0 -
co -
V'I \0 00
0\ .., 0'1
..... \0
00
'" N
N 00 r--
o ....
00 .....
0\
t-CO 00
Z .....
00
.....
0\
00
0\ 00 00
\0 o 0\
o ....,
0\
..... I()
.... .....
.... -00
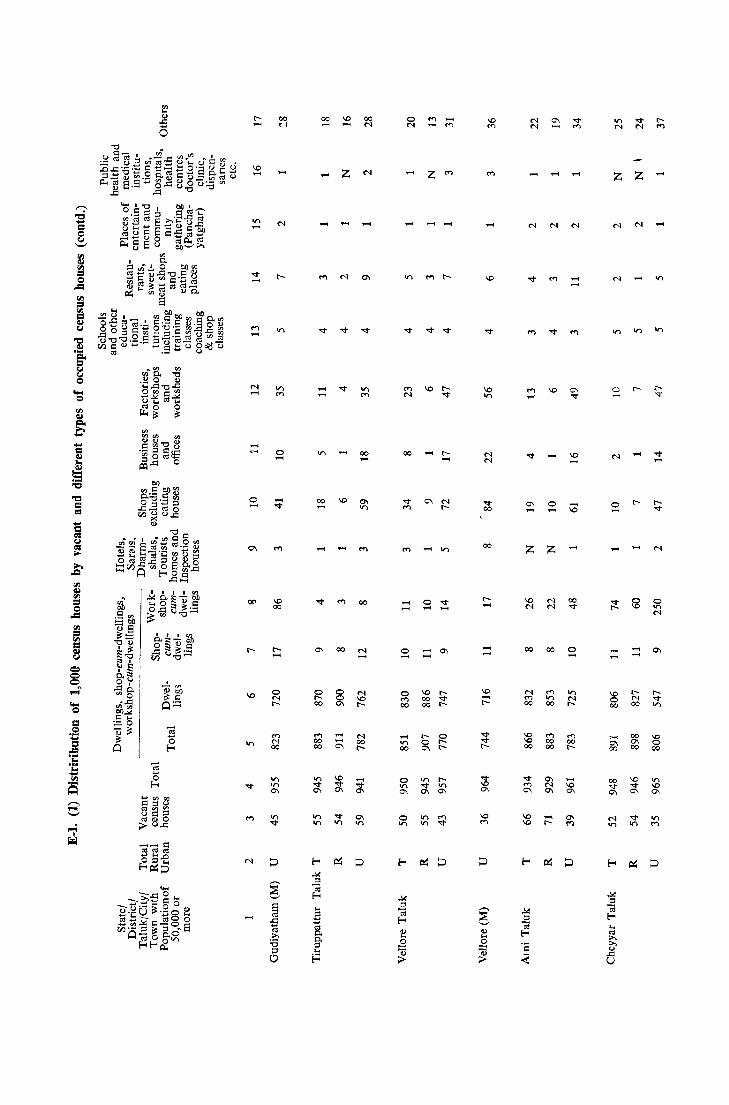
-~
N ......
o ......
0\
N
N
o ......
\0 00
I"'-......
...... Z
00 ......
......
0\
g 00
<"l 00 00
......
00
......
...... 0\
0\
00 ......
0\ on
00
N ......
N 00 I"'-
o N
Z <"l
..................
<"l N
00
...... ......
o ......
o <"l 00
...... I/') 00
o on 0\
...... I"'-......
...... I/')
o ...". ............
...... 0\ ......
N N
...". 00
00
I"'......
\0 ..... I"'-
N N
...... ....
N N N
0\ ......
z
\0 N
00
N <"l 00
\0 \0 00
o ......
z
00
<"l I/') 00
00 ...".
o .....
z z
o
o .....
\0 o 00
,... 0\ 00
l"'N 00
00 0\ 00
......
o on N
0\
\0 o 00
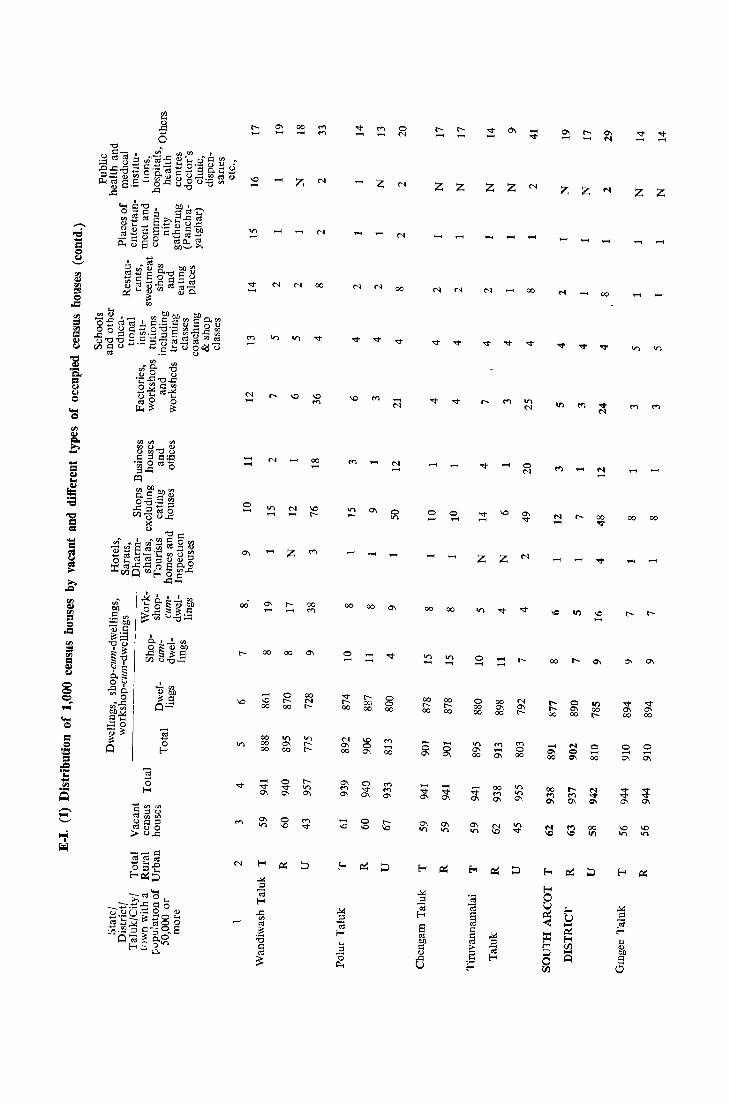
t....
\0 ....
'<I" .-.
.... ....
o ....
\0
00
.... \0 00
00 00 00
.-. '<I" 0'1
.... z
....
00
\0 \0 <'l
z
00
V) 0\ 00
00
00 M
V) rr-
\0
V) .-.
00
o .-.
N 0\ 00
0\ <'l 0'1
.-. \0
00
rOO 00
\0 o 0\
z
.-.
o N
00
.-. N
N .-.
o o 00
M ..... 00
M M 0'1
z
o
00
00 rOO
z
....
o .-.
00
00 rOO
z z
z
o ....
o 00 00
V) 0\ 00
\0
z
00 0\ 00
<'l .... 0\
00 <'l 0\
N \0
....
00
o N
M o 00
V) V) 0'1
00
ttOO
Q'I .-.
z z
....
III
00
\0 ....
III 00 t-
o .... 00
z z
00
....
....
co
....
o .... 0\
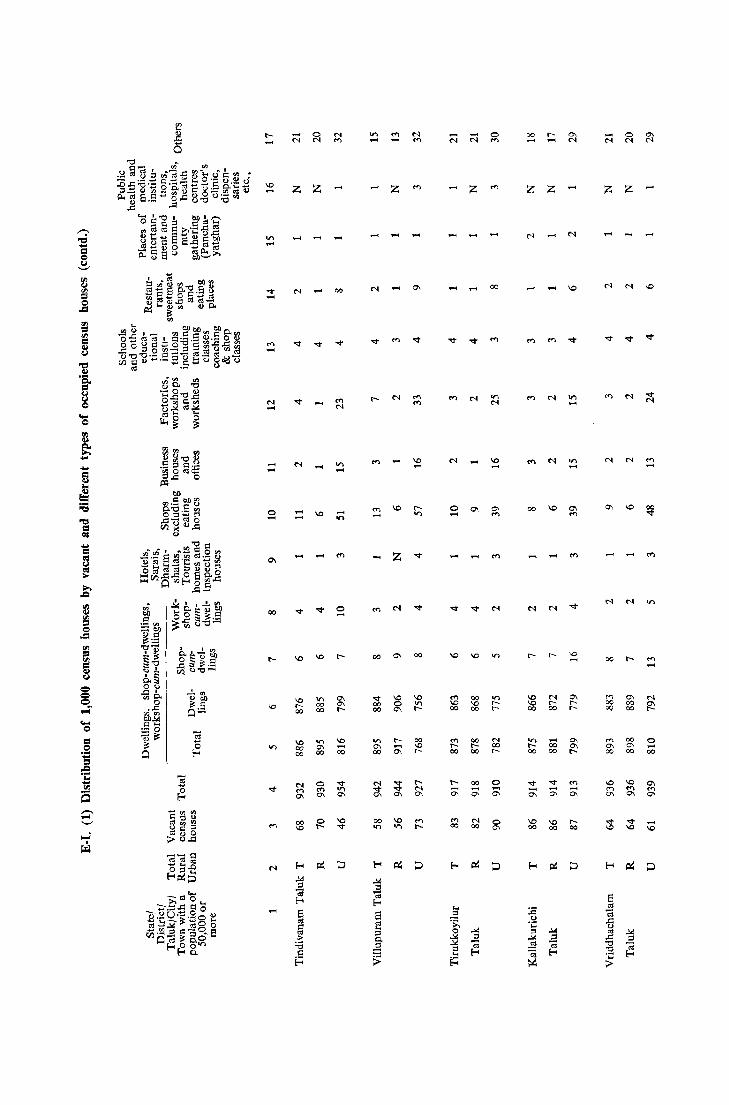
N .....
..... .....
o .....
0'1
00
..... 0 N N
z z
..... .....
\0
'" 00 00
00
-'"
o .....
0'1 0\ r--
\0 .... 00
M .... N <'>
Z <'>
...............
00
'<I' 00 00
or. 0\ 00
\0 .....
Z '<I'
00
00 \0 r--
o .....
.....
M \0 00
M r--00
o M
Z M
..... .....
.....
00 \0 00
00 r--00
00 ... 0\
N 00
00
\0 ...
0\ <'>
'" r--r--
N 00 r--
o ... 0\
00 r-.....
z Z
00
'<I' ...... 0\
\0 00
N r--00
... 00 00
'<I' ...... 0\
\0 00
.,.,
.....
0\ ..... .....
<'> ..... 0\
r--00
.N
o N
Z Z
N
N
00
\0 M 0\
"" 00 00
00
"" 00
"" N
o ... 00
"" M 0\
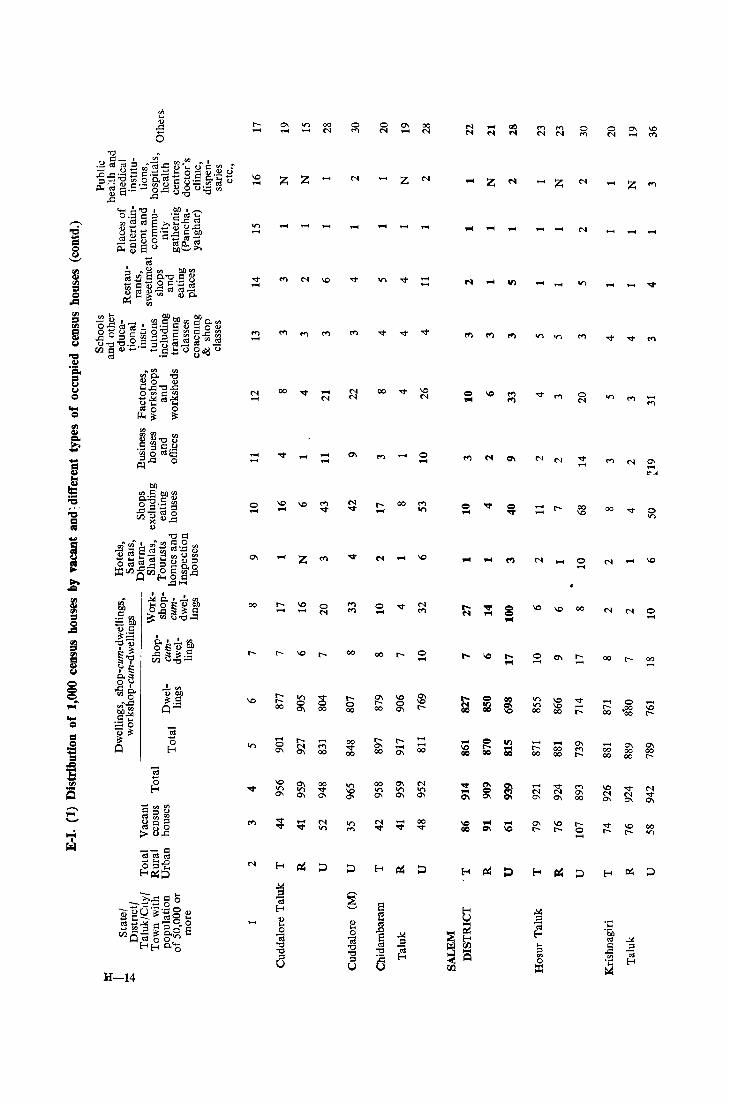
H-14
11'\ .....
.... .....
M ....
N ....
.... ....
o ....
00
z z
00
r-....
....
....
z
....
.... N
--
-M 00
o M
00
r-o 00
00 .... 00
o N
....
00
r-....
o ....
00
0\ r--00
r--0\ 00
00 11'\ 0\
....
....
00
....
r-.... 0\
0\ 11'\ 0\
.... ....
....
-....
o ....
.... .... 00
e ...
...
.... ...
.... Z
- ....
..... .....
o .....
11'\ 11'\ 00
-r--00
..... N 0\
0\ r--
....
10
o N
.... -
o ....
00
M 0\ 00
r-o -
Z M
....
..... .....
00
N ....
00 r--
..... 0 ~ .gg
- 0\ 00 00 00 00
0\ .... "' ...
o ....
00
0\ 00 r--
00 11'\

til .... ..8 (5
r....
\J:) ....
<"l ....
N ....
-.... o ....
00
....
-....
00
-00
<"l rOO
N 00 00
z
....
....
rrOO
rn 00 00
.... N 0'\
00
rn 0'\ r-
-.... 00
z
00
....
tr> 'D 00
tr> rOO
00
z
rrOO
rn 00 00
0'\ .... 0'\
.... 00
o <"l
00 N
<"l 00 00
r.... .....
z
00
z
o -
0'\ '<I" 00
<"l \0 00
N .... 0'\
00 00
z
z
ro 0'\
- -
z
ro 00
<"l 0'\ -
z
s 00
--
....
00 '<I" 00
00 N 0'\
N r-
z
-
o ....
z
<"l rOO
o .... 0'\
\0 <"l -
00 .... 00
o rn 0'\
o rn
o <"l
00
o rn 'D
8 00
00 '<I"
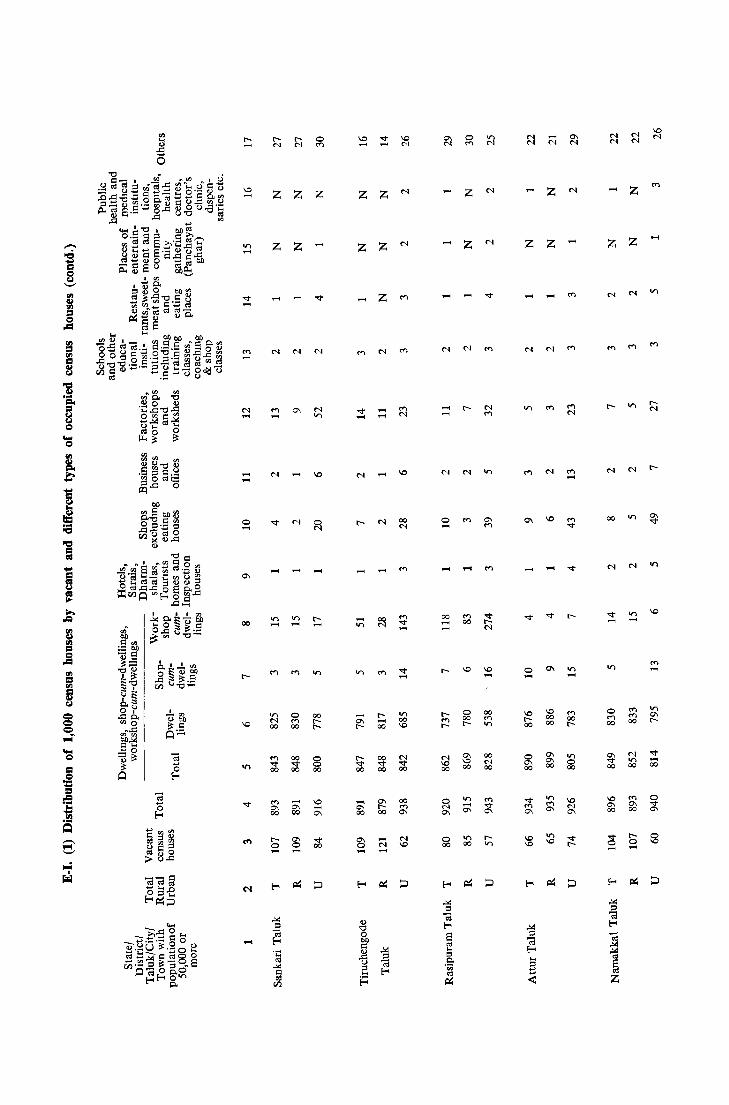
\0 ...
It"> ...
'" ...
'" ...
... ...
o ...
00
....
z
z
...
...
It"> ...
It">
'" 00
'" C\ 00
t-o ...
z
z
...
...
It"> ...
o '" 00
00 '<t 00
... C\ 00
g ...
o M
z
...
...
t-...
00 t-t--
g 00
\0 -'" '<t 00
z
z
...
... It">
-< C\ t--
... C\ 00
0\ o -
z
z
z
... ...
...
...
00
'"
t-... 00
00 '<t 00
... '" ...
\0 N
00
'"
00 M
'"
...
...
... ...
o ...
...
00 ... ...
'" \0 00
o N C\
o 00
o M
z
z
....
o 00 t--
'" \0 00
It"> ... 0\
It"> 00
\0 ...
00 M It">
00 N 00
t-It">
...
z
...
o ...
\0 t--00
\0 \0
... '"
z
z
...
-
\0 00 00
'" C\ 00
...
'" ...
'" 00 t--
...
z
00
o M 00
\0
'" 00
'<t o ...
z
z
'" It"> 00
M 0\ 00
t-o ...
It"> 0\ t--
'<t ... 00
o '<t
'"
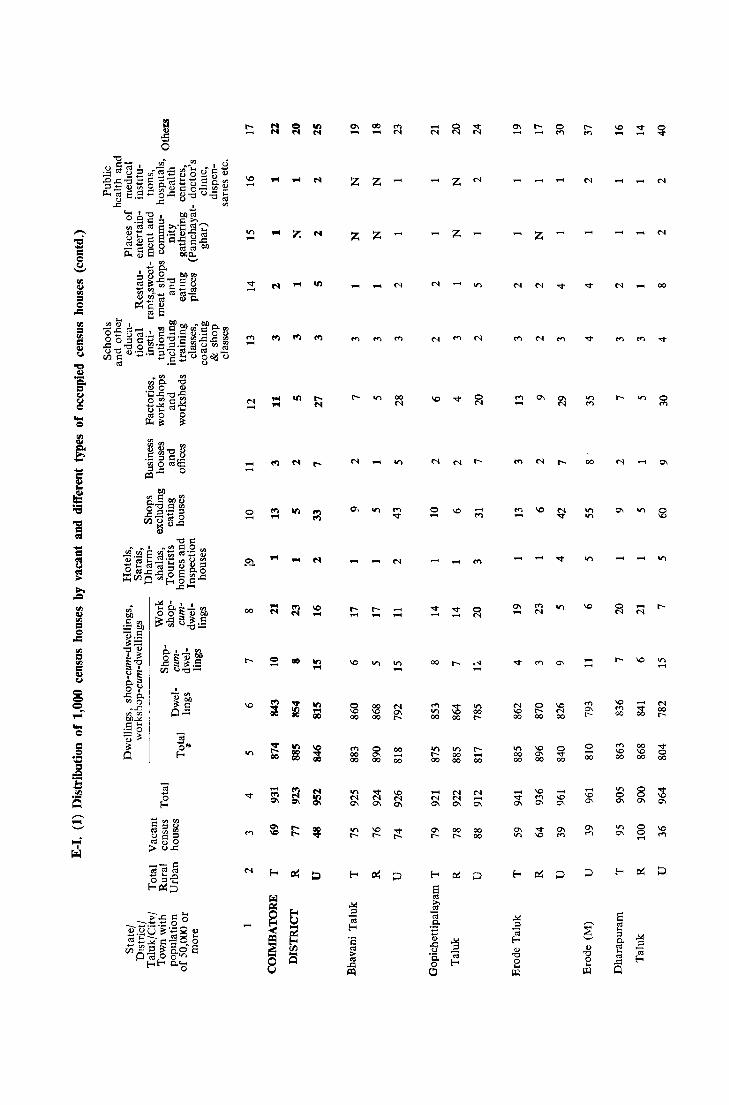
\0 ....
'<t ....
N ....
.... ....
o ....
00
....
... N
= ....
z
III
III
\0 ...
III ...
III ... go
0\ ....
z
z
....
I....
g 00
t")
00 00
It') N 0\
It') I-
00 t") .... N
z
z
....
....
I....
00 \0 00
-
-....
00 .... 00
-M
o ....
'<t ....
00
t") It') 00
It') I-00
-N 0\
0\ I-
z
z
-
-
;$ 00
It') 00 00
M N 0\
00 I-
.... t")
,"I -It') 00 I-
I--00
M .... 0\
00 00
0\ I........
-
0\ ....
N \0 00
It') 00 00
.... """ 0\
0\ It')
z
0\
-
g 00
\0 0\ 00
o t")
-
.... \0 0\
00
-....
o ...... 00
...... \0 0\
\0 ....
\0 <"l CO
<"l \0 00
on o 0\
It') 0\
""" ....
-
--N
00 \0 00
8 0\
8 ....
00
o <"l
N 00 I-
'<t o 00
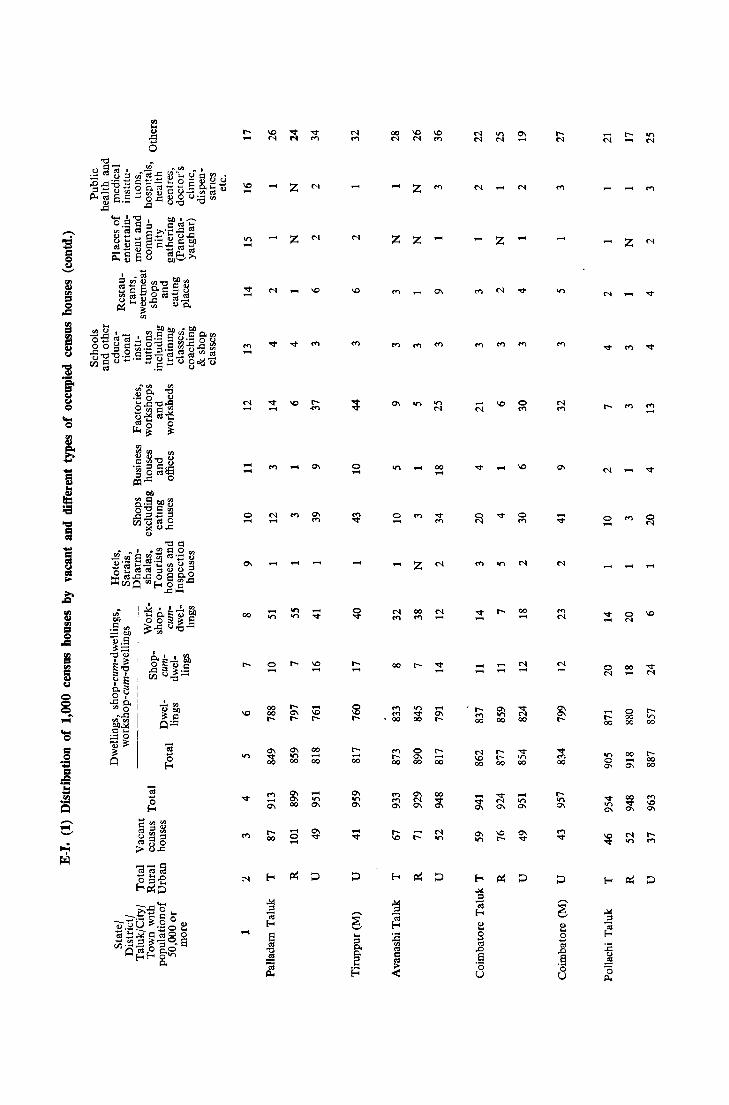
\0 ......
II'> ......
"<t .....
M .....
..... .....
o .....
00
\0
\0 M
Z M
Z M
M \0
"<t ......
M .....
.....
..... II'>
o .....
00 00 t"-
\0
.....
.....
on II'>
C\ II'> 00
.....
-"<t
\0 .....
..... \0 t"-
00 -00
..... on C\
.....
o .....
.....
t".....
t"-00
..... "<t
00 M
..... Z ""
Z Z .....
o -
00
.....
Z
00
""
II'> M
00 .....
M .....
"<t .....
-C\ t"-
II'> M
..... Z
-M
"<t .....
..... .....
\0
.....
..... .....
C\ on 00
.....
o ""
\0
o ""
00 .....
M ...... M ......
~ e o d .0 .§ 8
-M
o .....
...... t"oo
on o C\
Z
.....
......
00 -
00 .... C\
"" .....
.....
\0
t"on 00
t"oo 00

\0 ....
VI ....
M ....
N ....
.... ....
o ....
0'1
00
\0
.... VI
M \0
o ....
N ....
VI 0'1 I-
.... I-0'1
00 ....
00
,.., 0'1 00
00 M
z z
M ....
I....
VI VI 00
<"l 00 00
....
\0
I....
\0 \0 00
o ....
00 ....
III .... -....
\0 ....
N I-00
o 0'1 00
\0
\0 ....
0'1 00 00
00 o 0'1
.... \0 0'1
\0
<"l ....
....
\0
N 00 00
\0
"d
J o o
<"l o 00
M I() ....
00 N
o
\0 \0 I-
00 lI-
VI I-00
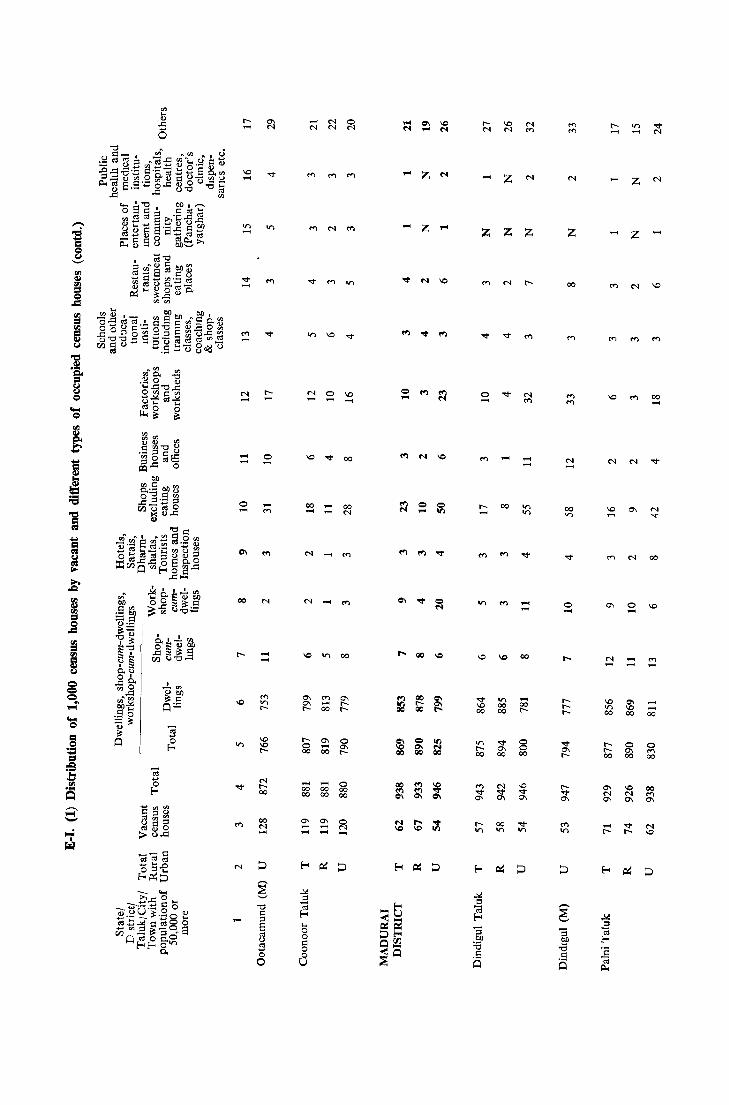
I.-.
\0 .-.
.,.,
.-.
M .....
.-. .....
o .-.
00
.-.
I.....
o .....
..... '"
.....
00 M .-.
.-. M
.,., \0
M 0 ..........
00 ..... ..........
M .-.
0\ '" 0\ ..... I- 00
I- 0\ o ..... 00 00
.-. ..... 00 00 00 00
0\ 0\ ..... ..... ..... .-.
:9 ~ 8 o s:: o o U
o M
00
00 M
00
o 0\ I-
o 00 00
.... M
....
= ....
z
= ....
....
= III
z
o .....
\0
""'" \0 00
.,., I-00
Z M
z
.-.
00
.,., 00 00
""'" 0\ 00
Z
..... .....
.-. .....
00
..... 00 I-
8 00
Z
00
M .....
00
'"
o .....
\0
M .....
\0
'" 00
lI-00
0\ M 0\
..... I-
Z M
Z
M
o .....
..... .....
0\ \0 00
o 0\ 00
\0 M 0\
\0
00
00
..... 00
o "" 00
00
'" 0\

~
-d -i '" ilJ
'" = o .c ",= ~ ~ of o
os ~
£:
'" .....
..r .....
N .....
..... .....
o ....
00
.....
.....
00
@ ....
.....
....
00
..... .....
..... .... 0'1
0'1 00
....
00
o .....
....
N 00
'"
'" 00
'"
..... N ,...
r.....
...............
.....
00
..... roo
..r 00 00
.....
..... .....
\0 00 00
00
..r .,., 00
N
'" 0'1
.....
z
00
00 \0 00
0'1 roo
00 .... 0'1
.....
,... .....
o 00 00
..... 0'1 00
.....
00 ......
.....
r
'" 00
00 o 0'1
o .....
z
00 ..... 00
o '" 00
o '" 0\
o '"
0\ .....
z
00
z
o ..r
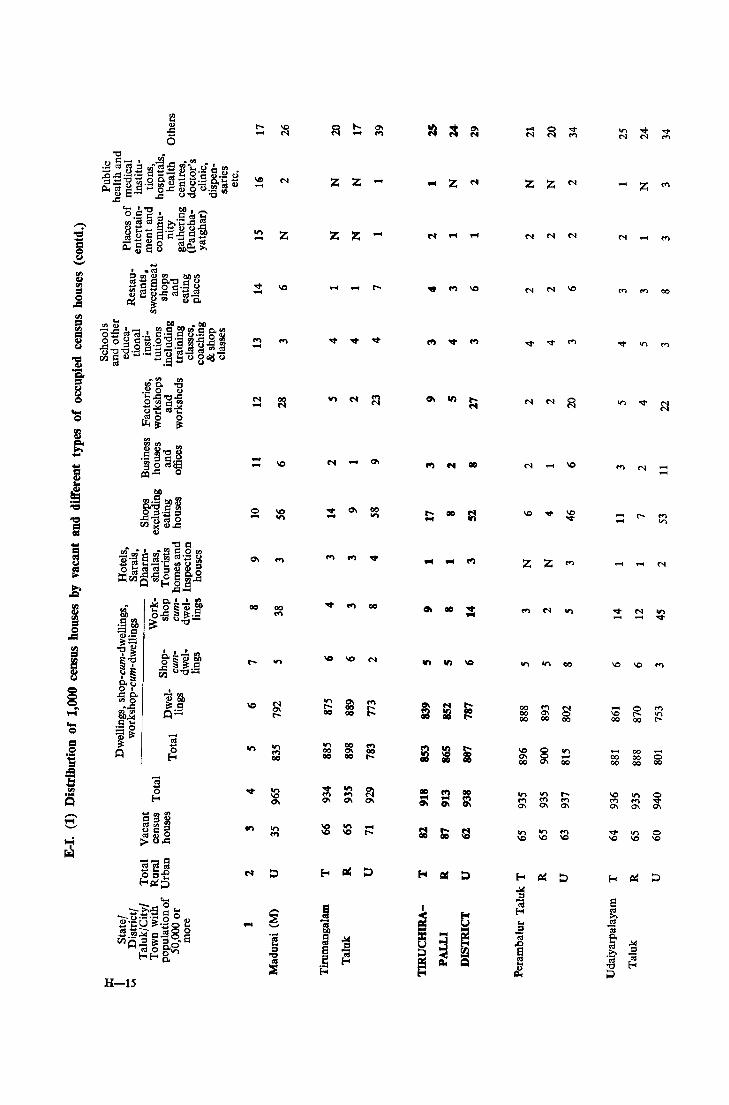
H-lS
...,. -.... -N ....
-.... o -CI\
00
z
.,., .... 00
z
z
....
...,. ....
.,., 00 00
z
....
V'I .... CI\
on "\Q
.... r--
.... ... Z
00
... ...
00 ...,. ...
... N
z
z
gg 00
\0 0'1 00
.,., M 0'1
.,., \0
z
-
z
.,., M 0'1
.,., \0
.,., -00
.... Z
.... ....
....
...,. ....
.... 00 00
\0 M 0'1
....
....
N ....
00 00 00
.,., M 0'1
.,., \0
00
.... ....
M .,.,
8 00
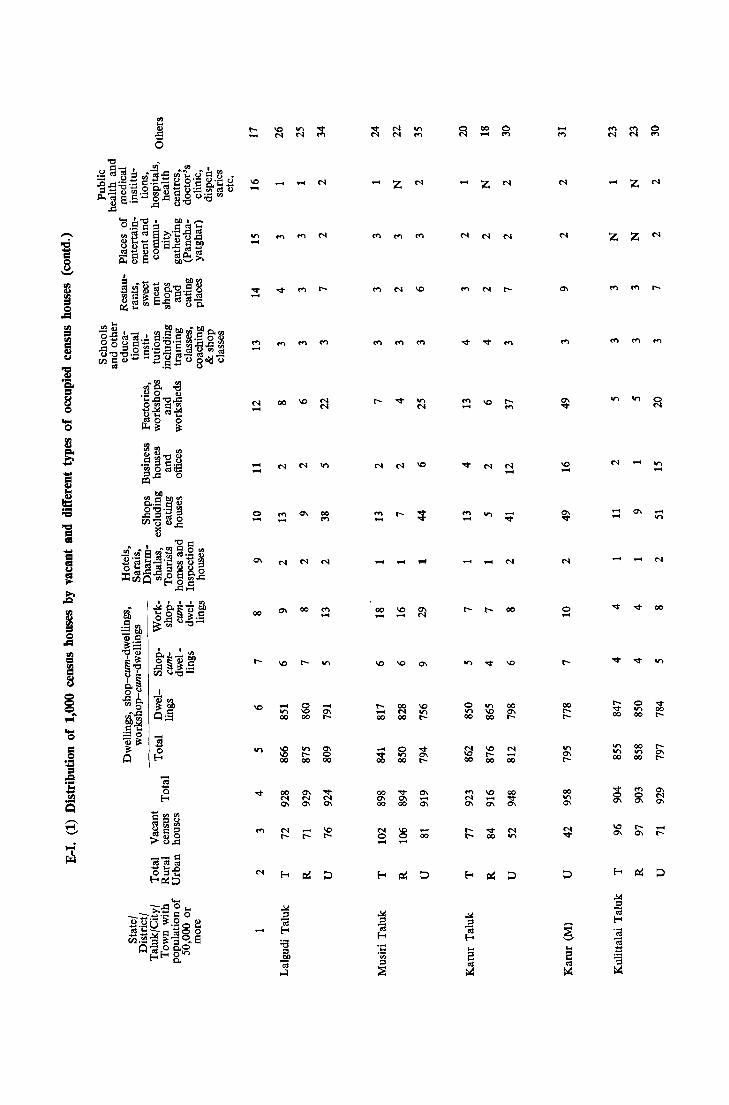
10 -on ....
.". -
... ...
M ....
.... ....
o ....
00
10
....
10
.... on 00
10
'"
00
g 00
on r--00
00 ... .... ...
...
00 ...
10
r--.... 00
....
.". 00
00
'" 00
8 ...
z
...
10 ....
10
00 M 00
o on 00
.".
'" 00
10 on I'
'" ... '" ... 00
...
... ....
.... ....
...
o on 00
I' r--
00 ...
z
10
10 r--00
10 ... '" .". 00
M -
00
00
'" I'
M ... 00
... ....
10 -
o ...
00 on
'"
...
.... ....
....
In on 00
z
...
...
o on 00
00 on 00
o ...
on ...
.... on
00
.". 00 I'
I' 0\ I'
.... I'
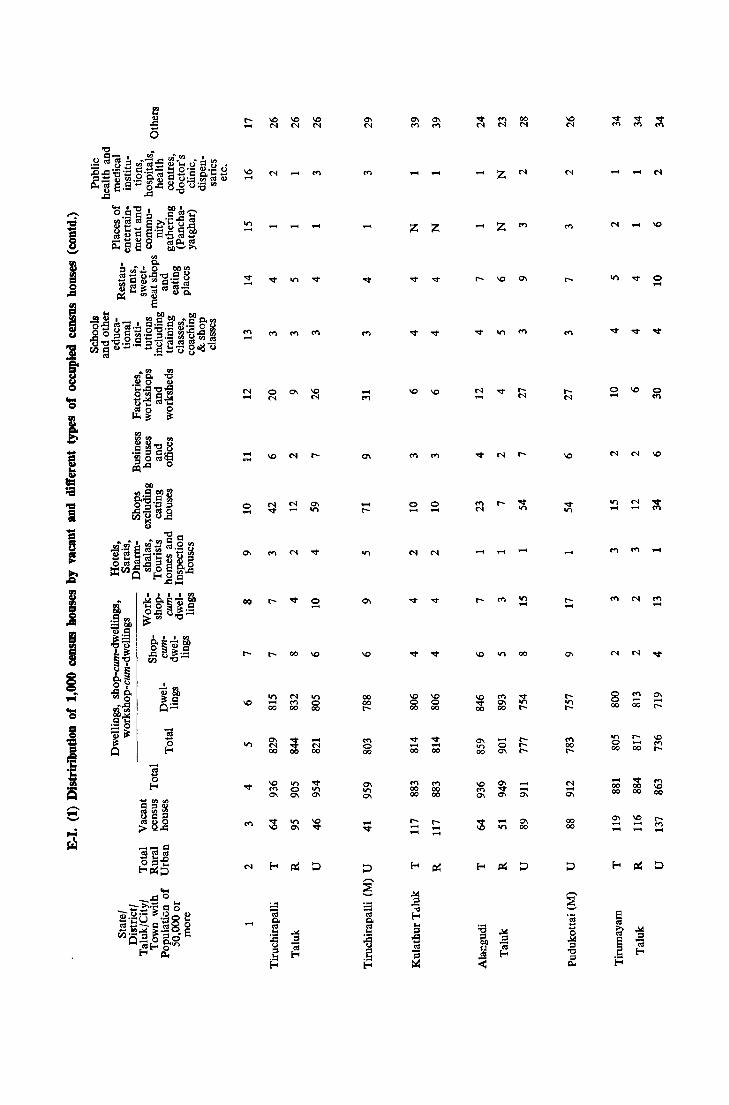
r-.. ....
\Q ....
""" ....
N ....
.... .,..
o ....
00
....
....
o N
....
00
N .... 00
....
0\ on
o ....
.... N 00
.... M
-r-..
00 00 r-..
M o 00
.... """
........
z
o ....
""" .... 00
.... 00 00
r-.. .... ....
z
o ....
""" .... 00
.... 00 00
r-.. .... ....
.... Z N
....
....
0\ on 00
z
....
.... 0\ 00
.... o 0\
.... on
0\
....
on ....
00
.... .... 0\
0\ 00
....
r-.. ....
N .... 0\
00 00
o ....
on ....
8 00
10 o 00
.... 00 00
0\ .... ....
....
N ....
.... .... 00
r-.. .... 00
""" 00 00
\Q .... ....
o ....
o ....
....
.... ....
r-.. .... ....
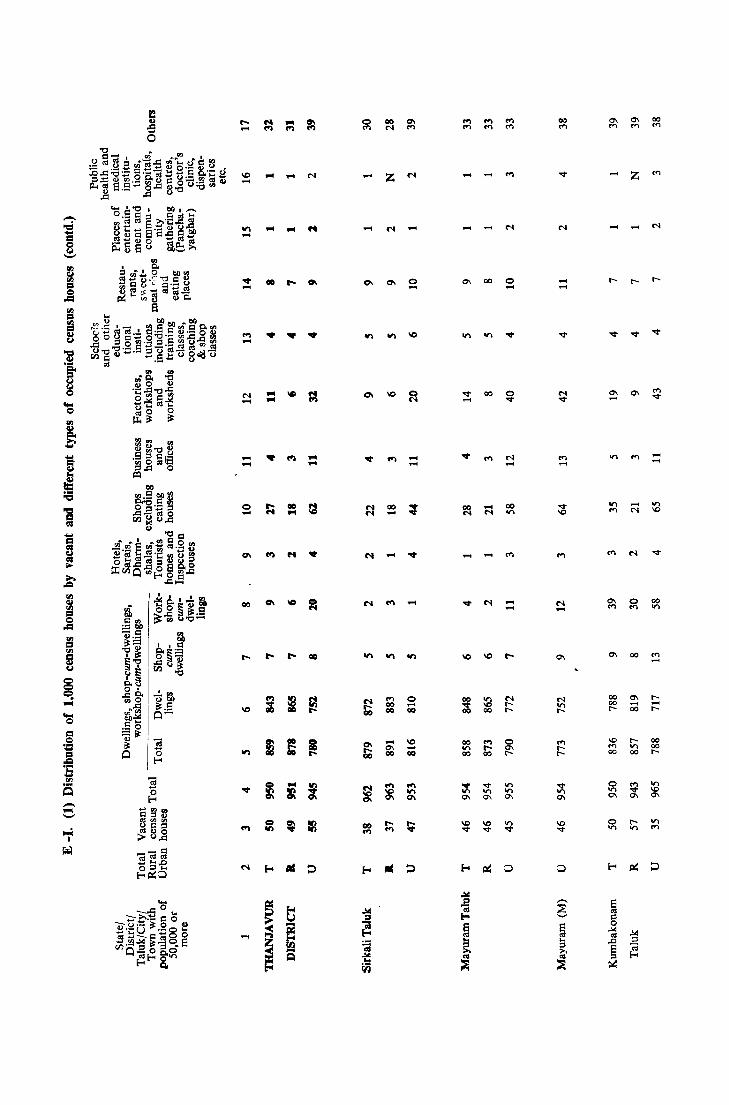
-1 -
-..... -
~ o
10 ...
on ....... ...
"'It ....
.... ....
M ...
... ...
o ....
00 ...
.. ..
.. ..
0\ t") N ..
co
... 00
....
-
0\ ..... co
0\ ....
Z M
0\
00 ...
.... co co
.... 0\ 00
o ....
... ...
...
o ... 00
10 .... 00
0\
"'It ...
00 on 00
.......
... M
00
00
... M
o ...
M ...
co on
... ...
M rr-
... ...
.... ...
M ...
0\
M on r-
.... rr-
0'1 ....
... z
0'1 ...
0'1
00 00 r-
10 .... 00
o on 0'1
o 10
0'1
.... N
o ....
00
0'1 .... 00
ron 00
rIO
00 ....
.... ....
00 on
.... ....
r... r-
00 00 r-
on 10 0'1

\0 -.,., -~ -.... -N -
--o -
00
-
N --r--
-- -'" 0 -
o -
o .... 00
-~ 00
--
0\ N
r---00 ~
-
_ N
-
\0 -
00
o -
--
- - -
~ -
\0 N
-
00
\0 00 00
r-'" 00
'" -
.... 00 r--
\0 \0 .,., -
00 -
.... r--00
N 00 00
-v -
-00 00
~ -8 -
-
r-'" \0
-12
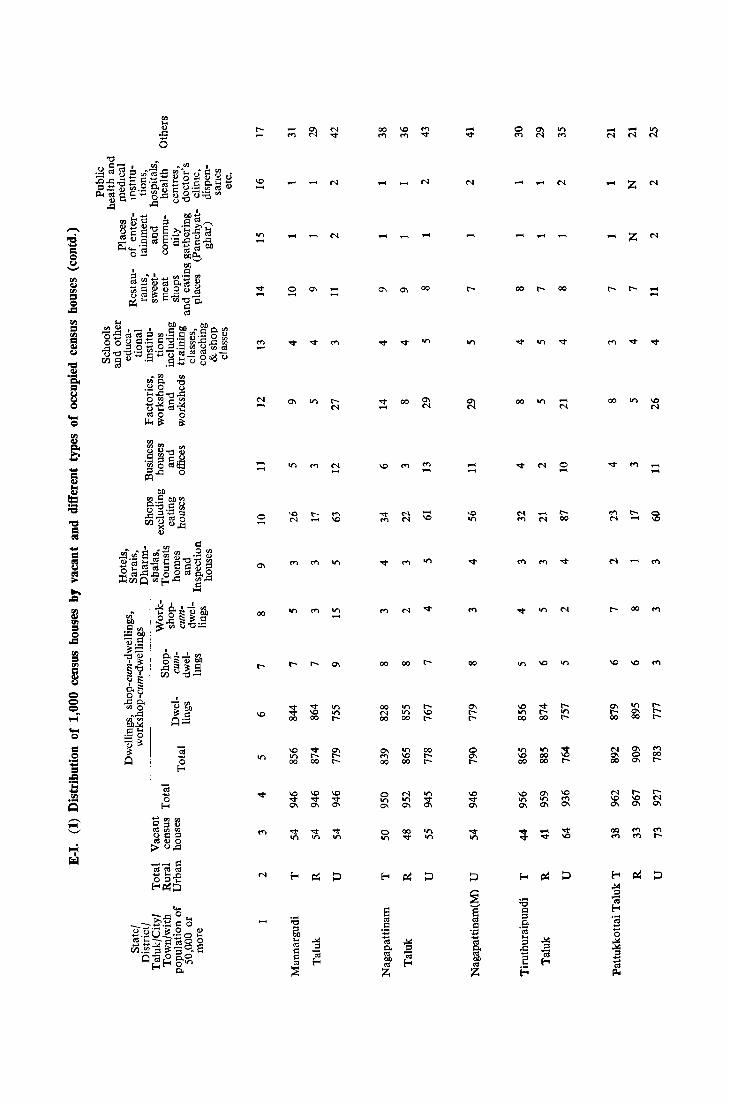
'" ... <1)
-B o
'<I" .....
...... ......
o .....
00 II) .....
00 M
...... ...... ,....,
00
00 N 00
0'1 M 00
o on 0'1
o on
00
00
on on CXl
on \0 CXl
M .....
...... \0
I"\0 I"-
CXl l"I"-
.... .....
00
...............
00 I"- 00
00 lI)
-N
..... N
o ....
...... N
00 II) \0 N
.....
00
..... .....
M I"-

\0 ....
N ....
.... ....
o ....
00
00 N
Z <"l
.... .... ....
r....
....
.... rOO
o 00 00
.... ....
00 00 00
r-0\ 00
o on 0\
o VI
o ....
.... ....
., 00
o ....
\0 r\0
N 00 00
00 .... ....
.... Z ....
.... N
N ....
.... N
r<"l 00
Z
o ....
N
<"l reo
rreo
N <"l 0\
eo \0
eo
.... ....
\0 N
....
Z
r- 0\ ....
.... Z
N ....
r- N r- 0 eo 0\
<"l reo 0 eo 0\
\0 .... v on 0\ 0\
o ....
on N
o
.... on r-
o \0 r-
N N
z Z
Z Z
eo
N 00 eo
0\ eo eo
....
.... o 0\
eo o 0\
....
.... o eo
eo eo
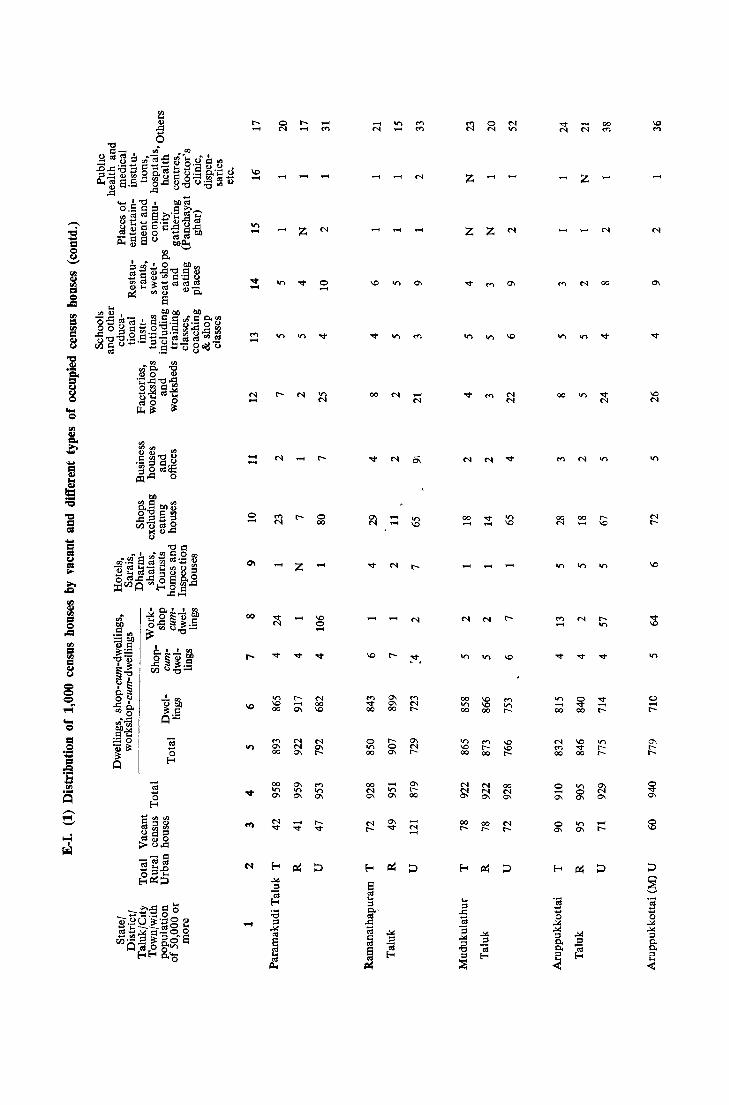
I',...,
\0 ,...,
'" ,...,
.... ....
t'I ....
.... ....
o -
00
\0
-....
,...,
.,., \0 00
.... 0\ 00
00 .,., 0\
,...,
z
-
z
I',..., 0\
0\ .,., 0\
-.... ,...,
o ,...,
o 00
,...,
\0 o ,...,
t'I 00 \0
t'I 0\ I'-
.... .,., 0\
-\0
00
,...,
o .,., 00
.,., ....
,..., -
,...,
0\ 0\ 00
8 0\
,..., .,., 0\
-0\
.... t'I
.,., \0
0\ I'-00
,..., '" ....
z
z
00 -
00 .,., 00
.,., \0 00
00 I'-
-z
"<t -,...,
\0 \0 00
.... I'-00
00 I'-
\0
.,., \0
,...,
\0 \0 I'-
00
'" 0\
00
00
'"
.... ....
.,., ,..., 00
'" <')
00
o .... 0\
o 0\
z
00 ....
\0 "<t 00
.,., 0\
00
-I'-
o ,..., I'-
0\ I'I'-
o \0
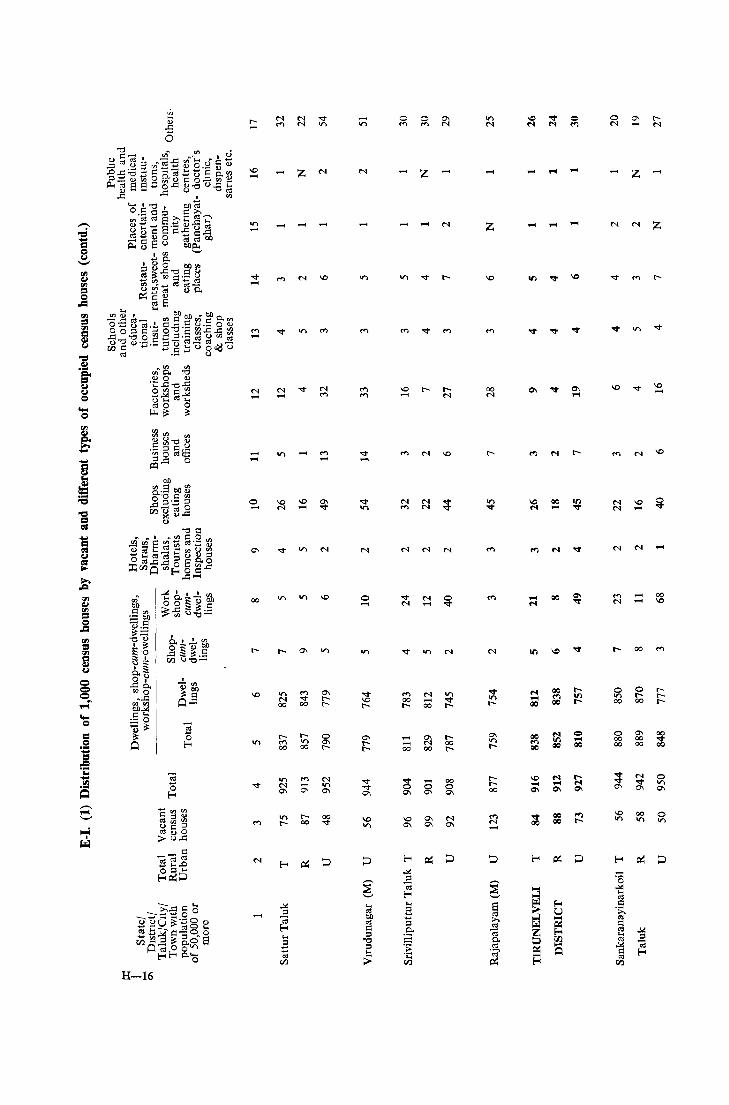
H-16
3 o
E-<
r.....
'" .....
M .....
..... .....
o .....
00
.....
.....
z
.....
.....
'" .....
.....
0\ Ir-
o 0\ r-
.....
o .....
1.0 on
o 0 M M
.....
'" .....
M 00 I-
..... ..... 00
'" 0\
z
.....
M .....
0\ 0\
00 o 0\
M 0\
z
00 M
rroo
....
....
I()
.... N
I()
...
....
o M
M M
0\ .....
z
'" .....
..... .....
00
g 00
0\ 00 00
00 on
.....
z
'" .....
.....
00
'"
00 ..". 00
o on 0\
o on
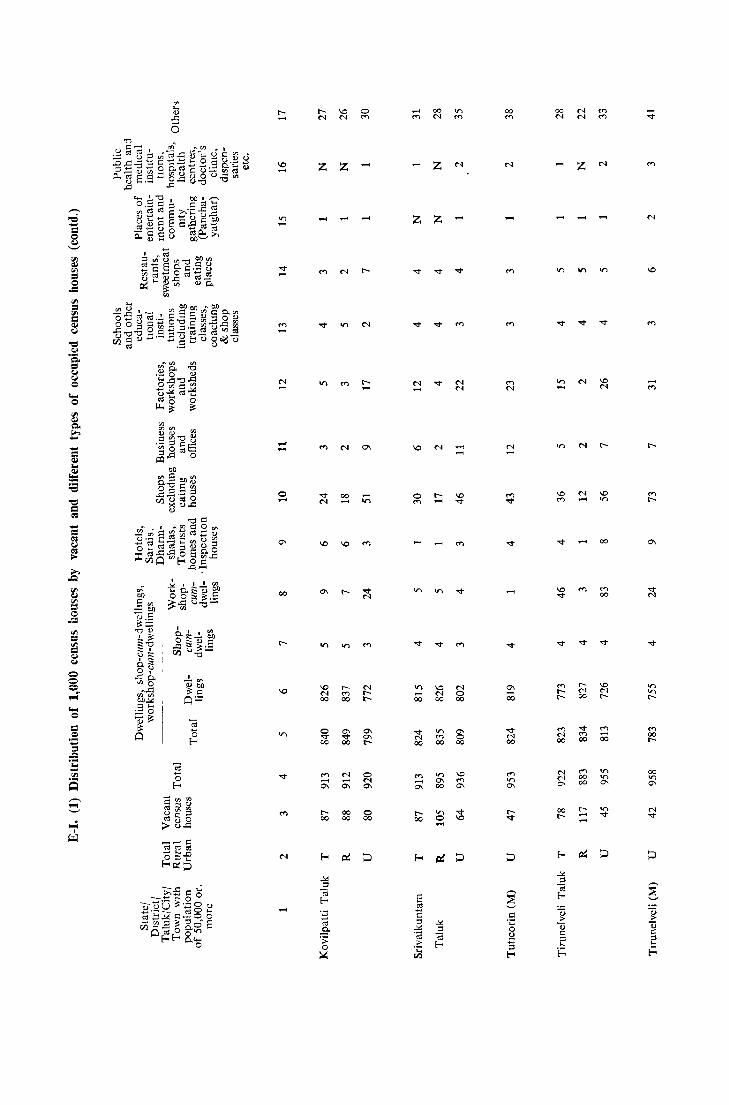
," .... t- o ..., 00 <u t- 1.0 tr> 00 00 N M ~ ..<:i N N <'l <') N <') <'l N N <')
(5 .,.,
U CC;I ..22.... t,,)"' ~rJ) r. I ._ cd (.) ;::::s ~ cd...c (j) H U c: t/) •
:O,..d.a -;; t:: t:: ~ 1- 0 S g_.~ B 1.0 Z Z ..., ..., Z N Z N ::l~ voo 0 Aro'Et);..:: Gf.l ~ (1) ..., Il..roSO':::"'<U<UO U -", J:l ,_ .2..<:i U"O "0
.... '"0 I Ofjl-0,5 I': ::s oro'"' - ",roro S .c';::: fJ,;g -ci ~1J~ sa.s~~ on z z ..... ....
= P:;~S 8 ~e:,» 0 e.I '-' , OJ rIl ;j~~v~""tj~~ CI.l riJ _ I': S 0. 1':,- (.)
"""" <'l N r-
"""" """" """" tr> .,., tr>
= rJ)cd1j O d'd cd .... 0 ~ ... ~~ <up' .c
'" til t tlOen"b/} = rIl $..c:, .......... rnt::orJ}QCl.rn
= o .... ~ cd ,.!. §..a - ~.E 0 <l) CI.l o 0 ::s c ~ _ ;::::s.s rJ) u...c:: ~ <')
"""" .,., N
"""" """" <'l
"""" """" """" e.I ,c"O"O sa I':"'_ ro..:::! ro '" ro .... -=
u I': <u ... ,_ B u ... U 0 o<! U CI.l
r:J"1 cd .S..... u os.
• <Il '" = .~ ~ ~ e.I U ... ,c"O,c N 0 .8~~~
tr> <') r- N
"""" N <') tr> N 1.0 ..... ..., .... .... N N N <'l .... gs 0 0
til p;., ~ ~
CI.l '" =- "'''' .... <u <1) '" ..... ~~"O~
..... 'iii g ~~ .... ""' N 0"1 1.0 N N tr> N r-
= ~,c 0 .... ....
CI.l .... ~
OJ)
GIlSon!"/} :a 0."0 0 :;;;
]..=!-e:::s 0
"""" 00 .... 0 r- 1.0 <'l 1.0 N 1.0 '" -= qJ ~n:l.2 .... N .... .,.,
'" ...,
"""" """" '" .... tr> r-
= <u t':I "01': ..... '" .' .... 00 C 0 r;/l I: ~.~ § ~ E cd.g ~ t':I e.I O~cd~~~Q);::::S 1.0 \0 ffl '" """"
.... 00 0\ t':I ::t::roi3~os~.2 ..
f/l E-<Ol': >.
,c ...... .,Q
~, .!..~r/} rIl '" .... 0.""<U~ 00 0\ r-
"""" tr> .,.,
"""" \0 <') ..,
"""" CI.l OJ) rIl E~
~ 0 ::: 9:,- N """"
00 N
= ~~'\j_"
.8 -0
~S '"
.,.,., &' I rJ'.) ::I sk~ o §"O ~ rIl ,"0
~<:i~;'::: .,., tr> ffl
"""" """" '" """" """" """" = :::' CI.l ,,;: e.I ' ' i 0.:::
0 0';'
0 ..<:io. , "'0 -'" 0 <u0J) \0 N V) <') r- \0 tr> .,c 9:0
r- \0 N 0\ ,.; "'''' N '" r- ..... N 0 ..... l:- N <'I on
tlJ,;,:i 0= 00 00 r- OO 00 00 00 r- OO l:- I:-
.... 0 ....
0 ~~ = ~ t; 0 0 -0 0 0\ 0-
"""" .,., 0-
"""" '" """" <') '" 0,0 E-< """" """"
0\ N <') 0 M N <'> 00 00 00 00 r- OO 00 00 00 00 00 r-
::t :S .... t;; -rIl 0 '" N 0 '" tr> \0 '" N <') on 00
S ~ ..... N '""' 0- M tr> N 00 on tr>
E-< 0- 0- 0- 00 0- 0- 0- 00 0- 0\ - d~~ ,...; '-' ""en'" r- OO 0
"""" 00 t- V"> N U",::s r- tr> r-
ro<u O 00 00 00 00 0 \0
"""" I:-
..., """" """" .... ><.),c ..... ...,
~ __ I':
roO"lro ....... ..0 E-< ~ :::J E-< ~ :::J :::J E-< ~ :::J :::J O::s .... E-<P:::::J
,;,:i .!4
~-:S c:: s..: ::s .z '"' ;§ ~
ro :;E __ .......... 0° S E-< ~.~Q ~.-gg ~
'-' .... ro '-' ~
,_ cd.!:'~C:'_'OO '';: 1:: 1::1
., -'~:::l:::::So'S (;j ::s .!4 ';::: ,?; ~ rn 0 Cd 0 §'<r> .E- ,;,:i ::s 0 <u
'~ Cd u I': I': E-< E-< 0.'0 ';; § ::s ::s
0 > E-< ~ ~ ';::: ~ Vol E-<
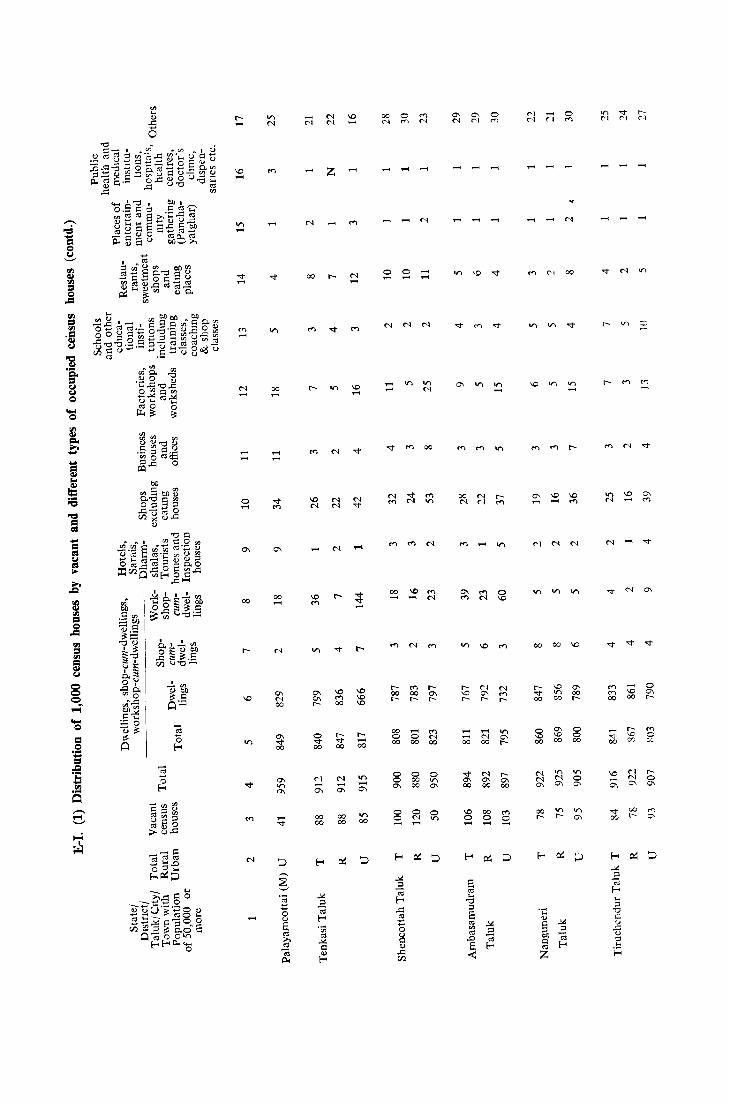
\0 ......
II"> ......
o ......
co
['
......
......
co
...... ......
co
...... z ......
\0 M
co CO
N ...... 0'1
co CO
....
[' ...... CO
II"> co
...... ............
co ......
[' 00 <-
co o 00
8 0'1
8 ......
N
M CO <-
...... o CO
o co co
co
[' 0'1 ['
M N co
o II"> 0'1
o II">
co N N <'I
...... co
'<t 0'1 co
\0 o ......
......
N 0'1 ['
...... N co
N 0'1 00
co o ......
o \0
II"> 0'1 ['
<-0'1 co
M o ......
co
co ['
N
co
\0 II"> co
0'1 \0 co
t-
0'1 co t-
o o co
'" o 0\
......
.q co
\0
0'1
tID 00
o 0'1 t-
to 0'1
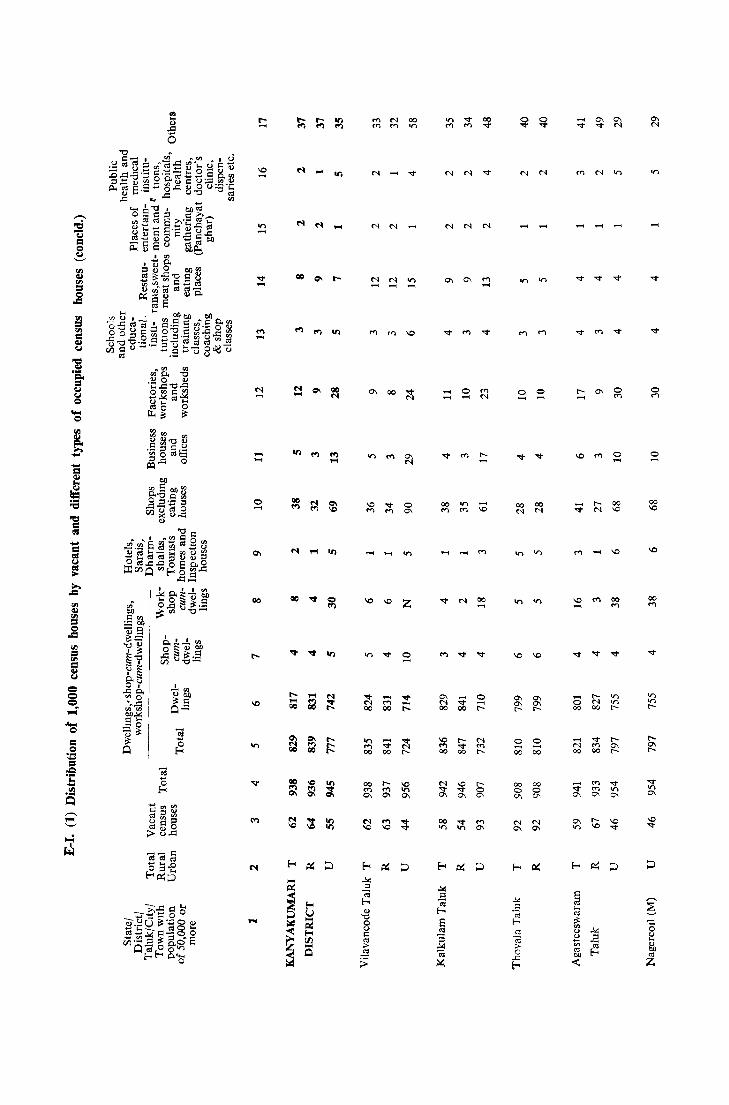
1.0 .....
II'l .....
..... .....
<:) .....
00
....
III
III
III
oc N
III
III
00 on
'" '" II'l ...............
.....
..... "" 00
..... -.r 00
z
- <:) - .....
00 .....
o -
00 N
o 00
00 .....
00
'"
s: 00
00 o 0\
1.0 .....
..... o 00
..... N 00
-.r "" 00
.....
<:)
""
o .....
00 1.0
00
""
.....
o ""
o .....
00 1.0
00
""

E-I. (2) Proportion of 1,000 houses in the rural/urban areas to 1,000 houses in the
State/District which are:
Vacant Used as dwellings Used as Used as Workshop-cum State/District Shop-cum-dwellings dwelling_s _
Rural Urban Rural Urban Rural Urban Rural Urban
2 3 4 5 6 7 8 9
MADRAS STATE 788 212 768 232 710 290 521 479
Madras District 0 1,000 0 1,000 0 1,000 0 1,000
Chingleput District 772 228 821 179 786 214 657 343
North Arcot District 830 170 836 164 817 183 710 290
South Arcot District 886 114 891 109 855 145 684 316
Salem District 892 108 870 130 639 361 444 556 Coimbatore District 802 198 726 274 596 404 784 216
Nilgiri District 619 381 577 423 426 574 462 538
Madurai District 724 276 700 300 718 282 308 692
TiruchirapallI District 848 152 811 189 763 237 679 321
ThanJavur Distnct 786 214 826 174 777 223 565 435
Ramanathapuram District 713 287 767 233 797 203 266 734
Tirunelveli District 725 275 708 292 759 241 267 733
Kanyakuman DIstrict 863 137 860 140 825 175 424 576
E-I. (2) Proportion of 1,000 houses in the rural/urban areas to 1,000 houses in the
State/District/Taluk which are:
Vacant Used as dwellings Used as Used as workshop. State/District/Taluk shop-cum-dwellings clim-dwellmgs
Rural Urban Rural Urban Rural Urban Rural Urban
1 2 3 4 5 6 7 8 9
MADRAS STATE 788 212 768 232 710 290 521 479
MADRAS DISTRICT 0 1,000 0 1,000 0 1,000 0 1,000
CHINGLEPUT DISTRICT 772 228 821 179 786 214 657 343
Ponneri Taluk 926 74 936 64 924 76 197 803
Tiruvallur Taluk 932 68 948 52 936 64 846 154
Tiruttani Taluk 884 116 925 75 864 136 699 301
Sriperumbudur Taluk 814 186 850 150 881 119 955 45
Saidapet Taluk 478 522 548 452 551 449 133 867
Chingleput Taluk 772 228 877 123 865 135 903 97
Kanchipuram Taluk 735 265 702 298 550 450 662 338
Maduranthakam Taluk 938 62 934 66 930 70 938 62
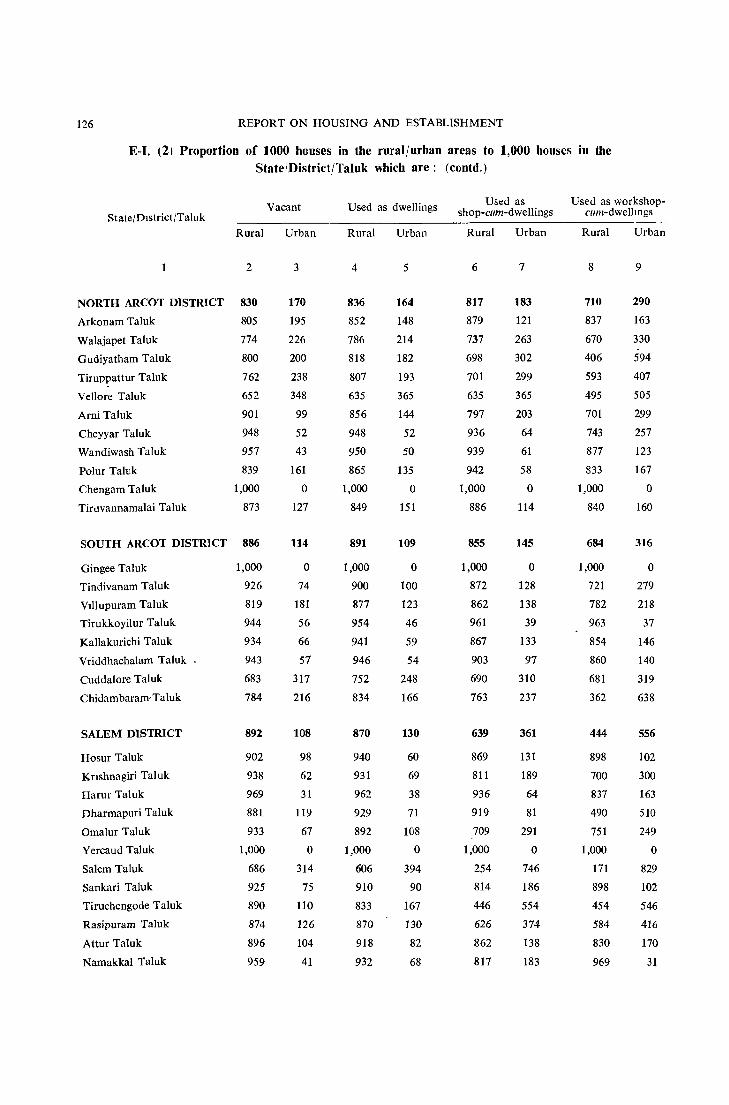
126 REPORT ON HOUSING AND ESTABLISHMENT
E-I, (2) Proportion of 1000 houses in the rural/urban areas to 1,000 hOllses ill the State/District/Taluk which are: (contd.)
Vacant Used as dwellings Used as Used as workshop-
State/Dlstrict/Taluk
Rural Urban
2 3
NORTH ARCOT DISTRICT 830
Arkonam Taluk 805
Walajapet Taluk 774
Gudiyatham Taluk 800
Tiruppattnr Talnk 762
Vellore Talnk 652
Ami Taluk 901
Cheyyar Taluk 948
Wandiwash Talnk 957
Polur Taluk 839
Chengam Taluk 1,000
Tirllvannamalai Taluk 873
SOUTH ARCOT DISTRICT 886
Gingee Taluk 1,000
Tindivanam Taluk 926
VIllupuram Taluk 819
Tirukkoyilur Taluk 944
Kallakurichi Taluk 934
Vriddhachalam Talnk 943
Cuddalore Taluk 683
Chidambaram-Taluk 784
SALEM DISTRICT 892
Hosur Taluk 902
Knshnagiri Taluk 938
Harur Talnk 969
Dharmapuri Taluk 881
Omalur Talnk 933
Yercaud Taluk 1,000
Salem Taluk 686
Sankari Taluk 925
Tiruchengode Taluk 890
Rasipnram Talnk 874
Attnr Taluk 896
Namakkal Taluk 959
170
195
226
200
238
348
99
52
43
161
o 127
114
o 74
181
56
66
57
317
216
108
98
62
31
119
67
o 314
75
110
126
104
41
Rnral Urban
4 5
836
852
786
818
807
635
856
948
950
865
1,000
849
891
1,000
900
877
954
941
946
752
834
870
940
931
962
929
892
1,000
606
910
833
870
918
932
164
148
214
182
193
365
144
52
50
135
o 151
109
o 100
123
46
59
54
248
166
130
60
69
38
71
108
o 394
90
167
130
82
68
shop-cum-dwellings cum-dwelhngs
Rural Urban
6 7
817
879
737
698
701
635
797
936
939
942
1,000
886
855
1,000
872
862
961
867
903
690
763
639
869
811
936
919
709
1,000
254
814
446
626
862
817
183
121
263
302
299
365
203
64
61
58
o 114
145
o 128
138
39
133
97
310
237
361
131
189
64
81
291
o 746
186
554
374
138
183
Rural
8
710
837
670
406
593
495
701
743
877
833
1,000
840
684
1,000
721
782
963
854
860
681
362
444
898
700
837
490
751
1,000
171
898
454
584
830
969
Urban
9
290
163
330
594
407
505
299
257
123
167
o 160
316
o 279
218
37
146
140
319
638
556
102
300
163
510
249
o 829
102
546
416
170
31
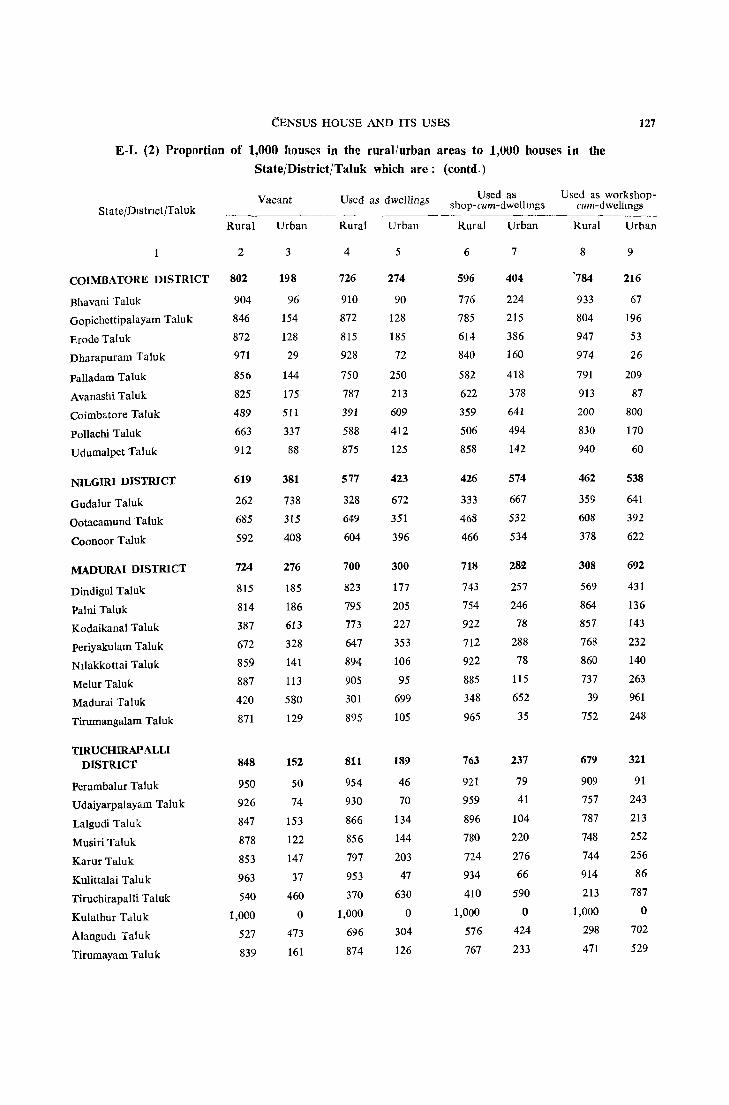
CENSUS HOUSE AND ITS USES 127
E-L (2) Proportion of 1,000 houses in the rural/urban areas to 1,000 houses in the State/Distriet/Taluk whieh are: (eontd.)
State/Dlstnct/Taluk
COIMBATORE DISTRICT
Bhavani Taluk
Gopichettipalayam Taluk
Erode Taluk
Dharapuram Taluk
Palladam Taluk
Avanashi Taluk
Coimbatore Taluk
Pollachi Taluk
Udumalpet Taluk
NILGIRI DISTRICT
Gudalur Taluk
Ootacamund Taluk
Coonoor Taluk
MADURAI DISTRICT
Dindigul Talul(
Palui Taluk
Kodaikanal Taluk
periyakulam Taluk
Nllakkottai Taluk
Melur Taluk
Madurai Taluk
Tirumangalam Taluk
TIRUCHIRAP ALL! DISTRICT
Perambalur Taluk
Udaiyarpalayam Taluk
Lalgudi Taluk
Musiri Taluk
Karur Taluk
Kulittalai Taluk
Tiruchirapalli Taluk
Kulathur T aluk
Alangudl Taluk
Tirumayam Taluk
Vacant
Rural Urban
2 3
802
904
846
872
971
856
825
489
663
912
619
262
685
592
724
815
814
387
672
859
887
420
871
848
950
926
847
878
853
963
540
1,000
527
839
198
96
154
128
29
144
175
511
337
88
381
738
315
408
276
185
186
613
328
141
113
580
129
152
50
74
153
122
147
37
460
o 473
161
Used as dwellings
Rural Urban
4 5
726
910
872
815
928
750
787
391
588
875
577
328
649
604
700
823
795
773
647
894
905
301
895
811
954
930
866
856
797
953
370
1.000
696
874
274
90
128
185
72
250
213
609
412
125
423
672
351
396
300
177
205
227
353
106
95
699
105
189
46
70
134
144
203
47
630
o 304
126
Used as Used as workshop-shop-cum-dwellmgs cum-dwcllmgs
Rural Urban
6 7
596
776
785
614
840
582
622
359
506
858
426
333
468
466
718
743
754
922
712
922
885
348
965
763
921
959
896
780
724
934
410
1,000
576
767
404
224
215
386
160
418
378
641
494
142
574
667
532
534
282
257
246
78
288
78
115
652
35
237
79
41
104
220
276
66
590
o 424
233
Rural
8
'784
933
804
947
974
791
913
200
830
940
462
359
608
378
308
569
864
857
768
860
737
39
752
679
909
757
787
748
744
914
213
1,000
298
471
Urban
9
216
67
196
53
26
209
87
800
170
60
538
641
392
622
692
431
136
143
232
140
263
961
248
321
91
243
213
252
256
86
787
o 702
529

128 REPORT ON HOUSING AND ESTABLISHMENTS
E-I. (2) Proportion of 1,000 houses in the rural/urban areas to 1,000 houses in the State/District/Taluk which are: (concld)
State/Distnct/Taluk
THANJAVUR DISTRICT
Sirkali Taluk
Mayuram Taluk
Kumbakonam Taluk
Nannilam Taluk
P apanasam Taluk
Thanjavur Taluk
Orathanad Taluk
Mannargudl Taluk
Nagapattinam Taluk
Tiruthuraipundl Taluk
Pattukkottai Taluk
Arantangi Taluk
RAMANATHAPURAM DISTRICT
Tirupattur Taluk
Sivaganga Taluk
Tiruvadanai Taluk
Paramakudi Taluk
Ramanathapuram Taluk
Mudukulathur Taluk
Aruppukkottai Taluk
Sattur Taluk
Srivilliputtur Taluk
TIRUNELVELI DISTRICT
Sankaranayinarkoil Taluk
Kovilpatti Taluk
Srivaikuntam Taluk
Tlrunelveli Taluk
Tenkasi Taluk
Shencottah Taluk
Ambasamudram Taluk
Nanguneri Taluk
Tlruchendur Taluk
KANYAKUMARI DISTRICT
V ilavancode Taluk
Kalkulam Taluk
Thovala Taluk
Agasteeswaram Taluk
Vacant
Rural Urban 2
786
801
823
786
929
843
599
945
811
668
766
742
828
713
605
752
705
755
460
929
842
815
588
725
809
841
672
684
793
850
607
831
558
863
964
847
1,000
725
3
214
199
177
214
71
157
401
55
189
332
234
258
172
287
395
248
295
245
540
71
158
185
412
275
191
159
328
316
207
150
393
169
442
137
36
153
o 275
Used as dwellings
Rural Urban 4
826
848
835
719
941
862
666
966
833
720
856
880
937
767
710
863
838
827
725
933
825
723
591
708
805
839
561
490
822
700
615
872
619
860
955
918
1,000
664
5
174
152
165
281
59
138
334
34
167
280
144
120
63
233
290
137
162
173
275
67
175
277
409
292
195
161
439
510
178
300
385
128
381
140
45
82
o 336
Used as Used as workshop-shop-cum-dwellmgs cum-dwcllmgs
Rural 6
777
842
778
592
914
806
654
980
755
694
853
931
932
797
597
799
912
766
767
916
792
807
771
759 902
896
563
489
695
660
728
890
634
825
881
909
1,000
637
Urban 7
223
158
222
408
86
194
346
20
245
306
147
69
68
203
403
201
88
234
233
84
208
193
229
241
98
104
437
511
305
340
272
110
366
175 119
91
o 363
Rural
8
565
904
474
534
831
522
204
973
493
592
930
944
785
266
250
643
622
27
509
744
135
645
293
267
364
571
611
28
145
617
368
877
235
424
995
534
1,000
129
Urban 9
435
96
)26
466
169
478
796
27
507
408
70
56
215
734
750
357
378
973
491
256
865
355
707
733
636
429
389
972
855
383
632
123
765
576
5
466
o 871

CHAPTER IV
CENSUS HOUSEHOLD AND ITS TENURE STATUS
4 - 1. In the earlier Chapter, I have discussed the manner in which census houses are utilised in this State. In this Chapter, I propose to discuss the tenure status of households who
reside in census houses. I may make it clear that in a few cases Introduction in rural Madras and in a somewhat large number of cases in
urban Madras, more than one household will be occupying a census house.
4 - 2. In Table E-II the tenure status of households has been exihibited. The tenure has been diVIded into two main categories. A third category of classification "partly owned
and partly rented" was considered originally but as a result of Contents of table E-II pretest, this category was dropped. In actual tabulatlOn, we have
added a third column to indicate unspecified tenure because in some cases, the enumerator did not indicate the tenure status in the houselist.
4 - 3. The classification 'owned' and 'rented' will, primafacie, appear to be simple. But on a detailed analysis, they present certain practical difficulties and the basis on which these • difficulties have been solved will be indicated at this stage. A Owned or rented: a dissertation residence has been classified as 'owned' if the superstructure is
the prope{ty of a person residing in that census house. It can happen that the land on wh~ch the superstructure stands is not owned by the resident. It can also happen that the superstructure has been constructed either by encroaching on Government land ,or on other people's land and that person is liable to be evicted at any time by any proceeding initiated by the Government under Land Encroachment Act or by due process in a Court of Law. It is also likely that the permission of an oral nature has been given to the owner of the house to build it by the owner of the land. There are also instances where some tribes and castes who live by moving from place to place carry the materials required for the construction of house from place to plave. All these categories have been classified as 'owned'. The majority of the slums found in the City of Madras falls under this category because the superstructure is owned by the resident. The huts built by the tribes living in forest land fall under this category though the land is owned by the Forest Department. Nowadays such persons are not likely to be evicted from the place where they have constructed their residence. It, therefore, follows that ownership is much more realistic than we associate with it normally. For our definition, the ownership of the superstructure should, however, remain undisputed. We also find some difficulty in classifying shop-cum-dwelling and workshop-cum-dwJIling in which the
. residence portion will be owned by one person and the shop or workshop rented by another and vice-versa. The classification in such cases will to some extent depend on the imagination of the enumerator, whether he considers the dwelling or the shop more important. These remarks apply to shop-cum-workshop also. This limited scope of the difinition 'owned' has to be understood, if a proper study of the tables is to be made. ' Rented' is more easy of definition. It also includes rent-free dwelling to which normally rent will be payable, but for which rent is not paid for certain considerations. All houses which are allotted to persons under certain conditions that
H-17
130 REPORT ON HOUSING AND ESTABUSHMENTS
they will become their own after a number of years by a Co-operative Society or the State Government have been classified as 'owned' though they are technically only rented till the period of repayment is over.
4 - 4. Two subsidiary tables, one for rural and the other for urban have been prepared. They are the tables suggested by Registrar General, India. In addition to these, we have prepared
a third table to indicate the tenure status of rural houses because Subsidiary tables to E-n subsidiary table for rural does not indicate tenure status. The
distribution of thousand houseshold by types of census dwelling houses is indicated in the first subsidiary table. In the second, the proportion of households in owned and rented houses by types per thousand is indicated.
4 - 5. The tenure status of a household is more significant in urban areas than in rural. The percentage of households residing in owned houses is 48% in urban while in rural it is as
high as 90%. There are many reasons for the high proportion of
Tenure status more significant in urban areas
owned houses in rural parts of the State. The land values are comparatively low and people have, therefore, a larger tract in which they can build their own houses. No tradition of building
houses and renting them out has been developed. So the general tendency has been to allot a piece of land to any person who wishes to build his own house. Further, persons residing in the rural parts have been settled in the respective areas for a longer period and as such are likely to own their houses. The rural parts of Madras are also predominantly agrarian. In addition to this, cottage industries like handloom weaving are practised which are located in the house or based on the house. The agrarian community should always have a suitable place where they can store their articles. These factors are responsible for the larger percentage of owned houses prevalent in many rural parts of Madras State. While in urban areas land value is comparatively high, the people have migrated to the place only recently and have no inclination to settle down in the place because they have come in search of work.
4 - 6. The proportion of households residing in owned houses in the various districts of Madras. State is highest in Kanyakumari district with 89'3% households residing in owned houses.
The lowest percentage of 26'1 is found in Madras City and then District variation in owned houses in Nilgiri. Except for these two districts, the figures of other
districts vary from 73'7% to 89'3%. The general reasons for these variations are obvious. Nilgiri is a newly developed district in which a large number of plantations are found. Plantation workers generally live in houses constructed by the management. Again'places like Ootacamund, Wellington and Coonoor have developed in recent years and this is due to the influx of enterprising people from plains to the hills. Along with them has come the tendency to build houses and rent them to others for occupation. This accounts for the lower percentage of owned houses in Nilgiri. Madras City is an area which has grown more appreciably in the last 30 years. The percentage of increase in popUlation in the decade 1941-51 was 60'64 while the corresponding increase in the number of houses was only 10.38%. This has made people invest in buildings, so that they can be rented out at a profit to others. Also the floating population which depend on the City have no interest in owning property. The 4igh cost of house site and building are also reasons which have weighed against building their own houses in Madras. This explains why the number of owned houses in Madras City is the lowest on record in the State.
4 - 7. The same tendency is observed in the rural sector of the districts also. The highest percentage of ownership in urban areas is 68'0 in Kanyakumari and the lowest 22'8 in Nilgiri district. The highest in rural is recorded in North Arcot with 93'2 and the lowest in Nilgiri with 43'6. One important point to be observed is that the number of owned houses in
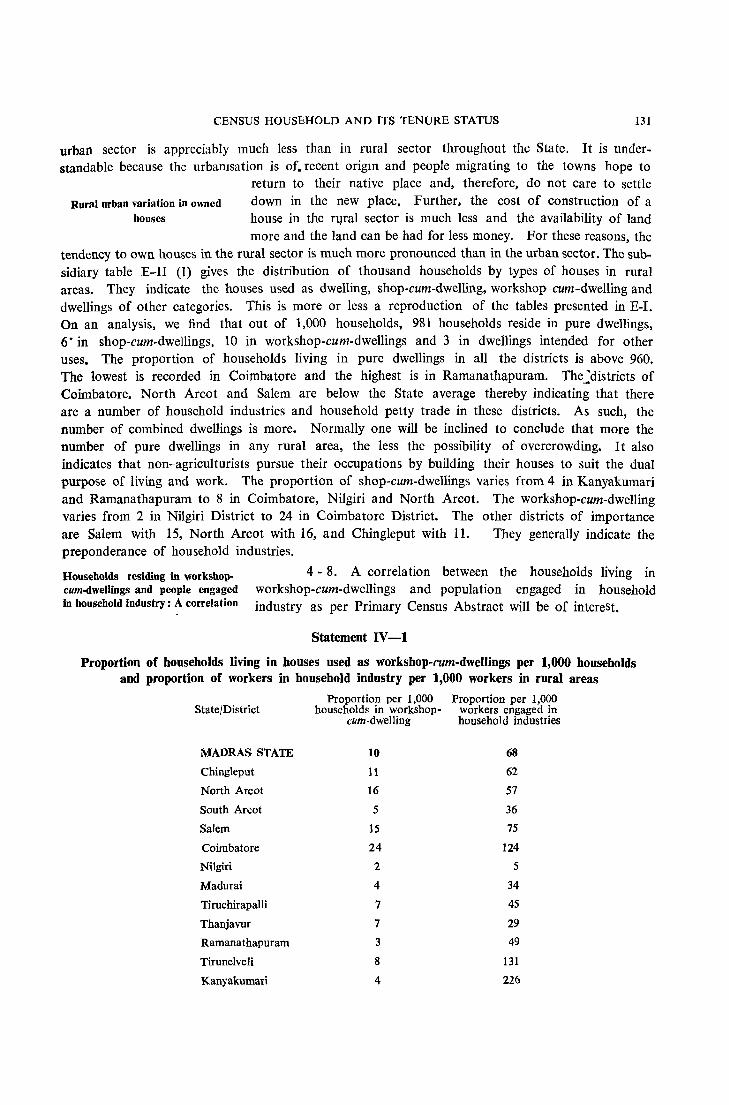
CENSUS HOUSEHOLD AND ITS TENURE STATUS 131
urban sector is appreciably much less than in rural sector throughout the State. It is understandable because the urbamsation is of. recent origIn and people migrating to the towns hope to
return to their native place and, therefore, do not care to settle Rural urban variation in owned down in the new place. Further, the cost of construction of a
houses house in the fl:)ral sector is much less and the availability of land more and the land can be had for less money. For these reasons, the
tendency to own houses in the rural sector is much more pronounced than in the urban sector. The subsidiary table E-II (1) gives the distribution of thousand households by types of houses in rural areas. They indicate the houses used as dwelling, shop-cum-dwelling, workshop-cum-dwelling and dwellings of other categories. This is more or less a reproduction of the tables presented in E-I. On an analysis, we find that out of 1,000 households, 981 households reside in pure dwellings, 6" in shop-cum-dwellings, 10 in workshop-cum-dwellings and 3 in dwellings intended for other uses. The proportion of households living in pure dwellings in all the districts is above 960. The lowest is recorded in Coimbatore and the highest is in Ramanathapuram. The~districts of Coimbatore. North Arcot and Salem are below the State average thereby indicating that there are a number of household industries and household petty trade in these districts. As such, the number of combined dwellings is more. Normally one will be inclined to conclude that more the number of pure dwellings in any rural area, the less the possibility of overcrowding. It also indicates that non-agriculturists pursue their occupations by building their houses to suit the dual purpose of living and work. The proportion of shop-cum-dwellings varies from 4 in Kanyakumari and Ramanathapuram to 8 in Coimbatore, Nilgiri and North Arcot. The workshop-cum-dwelling varies from 2 in Nilgiri District to 24 in Coimbatore District. The other districts of importance are Salem with 15, North Arcot with 16, and Chingleput with 11. They generally indicate the preponderance of household industries.
Households residing in workshopcum-dwellings and people engaged in household industry: A correlation
4 - 8. A correlation between the households living in workshop-cum-dwellings and population engaged in household industry as per Primary Census Abstract will be of interest.
Statement IV-1
Proportion of households living in houses used as workshop-cum-dwellings per 1,000 households and proportion of workers in household industry per 1,000 workers in rural areas
Proportion per 1,000 Proportion per 1,000 State/District households in workshop- workers engaged in
cum-dwelling household industries
MADRAS STATE 10 68
Chingteput 11 62
North Areot 16 57
South Ar.:ot 5 36
Salem 15 75
Coimbatore 24 124
Nilgiri, 2 5
Madurai 4 34
Tiruchirapalli 7 45
Thanjavur 7 29
Ramanathapuram 3 49
Tirunelveli 8 131
Kanyakumari 4 226
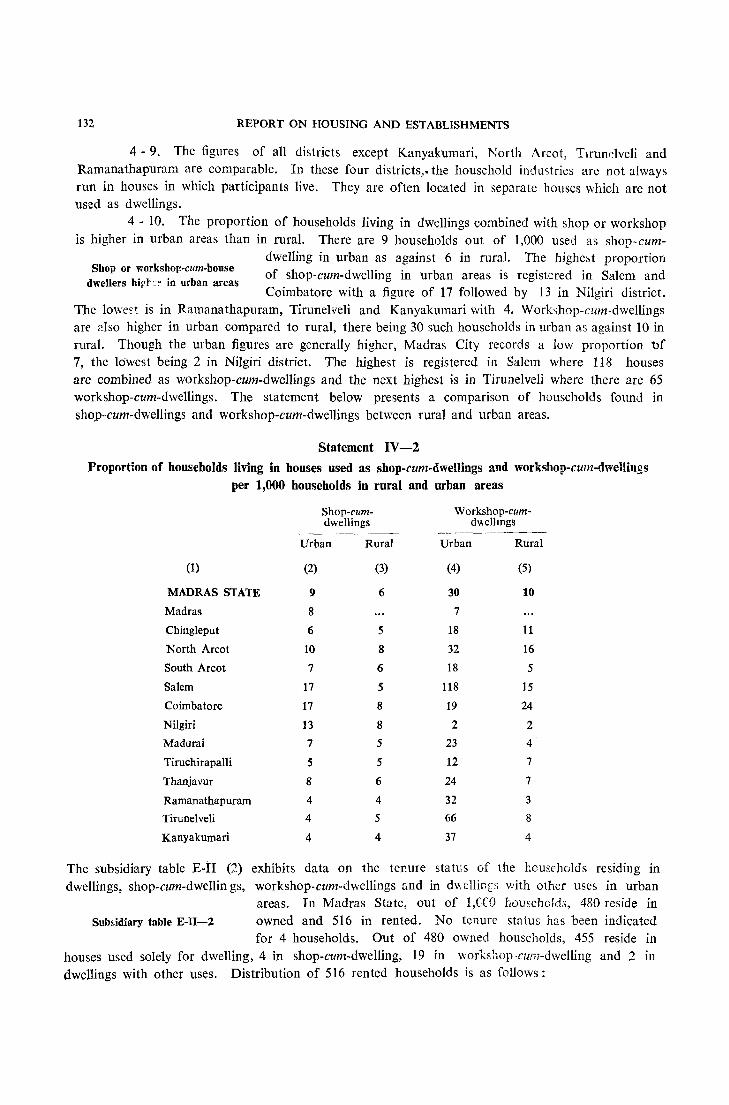
132 REPORT ON HOUSING AND ESTABLISHMENTS
4 - 9. The figures of all districts except Kanyakumari, North Afcot, Tlfundveli and Ramanathapuram are comparable. In these four districts,. the household industries are not always run in houses in which participants live. They are often located in separate houses which are not used as dwellings.
4 - 10. The proportion of households living in dwellings combined with shop or workshop is higher in urban areas than in rural. There are 9 households out of 1,000 used as shop-cum
Shop or workshop-cllm-house dwellers hirl':~ in urban areas
dwelling in urban as against 6 in rural. The highe5t proportion of shop-cum-dwelling in urban areas is registered in Salem and Coimbatore with a figure of 17 followed by 13 in Nilgiri district.
The lo\ve,t is in Ramanathapuram, Tirune1veli and Kanyakumari with 4. Workshop-cum-dwellings are 2.1so higher in urban compared to rural, there being 30 such households in urban as against 10 in rural. Though the urban figures are generally higher, Madras City records a low proportion 't)f 7, the lowest being 2 in Nilgiri district. The highest is registered in Salem where 118 houses are combined as workshop-cum-dwellings and the next highest is in Tirunelveli where there are 65 workshop-cum-dwellings. The statement below presents a comparison of households found in shop-cum-dwellings and workshop-cum-dwellings between rural and urban areas.
Statement IV-2
Proportion of households living in houses used as shop-cum-dwel!ings and workshop-cum-dwellings per 1,000 households in rural and urban areas
Shop-cum- Workshop-cum-dwellings d"ellmgs
Urban Rural Urban Rural
(1) (2) (3) (4) (5)
MADRAS STATE 9 6 30 10
Madras 8 7
Chingleput 6 5 18 11
North Arcot 10 8 32 16
South Arcot 7 6 18 5
Salem 17 5 118 15
Coimbatore 17 8 19 24
Nilgiri 13 8 2 2 Madurai 7 5 23 4
Tiruchirapalli 5 5 12 7
Thanjavur 8 6 24 7
Ramanathapuram 4 4 32 3
Tirunelveli 4 5 66 8
Kanyakumari 4 4 37 4
The subsidiary table E-II (2) exhibits data on the ter-me statES (if the households residing in dwellings, shop-cum-dwellin gs, workshop-cum-dwellings and in d", ellin[s with other uses in urban
areas. In Madras State, out of I,C(O f,ollsehoIds, 480 reside in Subsidiary table E-1I-2 owned and 516 in rented. No tenure status has been indicated
for 4 households. Out of 480 owned households, 455 reside in houses used solely for dwelling, 4 in shop-cum-dwelling, 19 in workshop-eum-dwelling and 2 in dwellings with other uses. Distribution of 516 rented households is as follows:
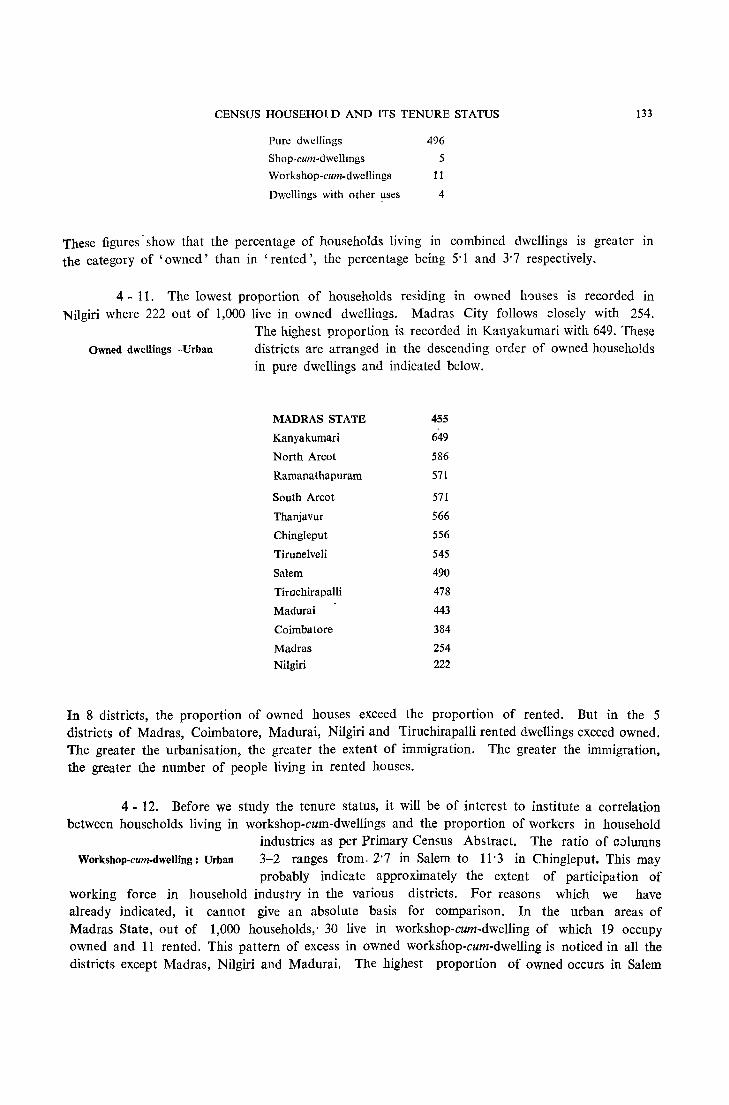
CENSUS HOUSEHOLD AND ITS TENURE STATUS 133
Pure dwellings 496
Shop-cum-dwellmgs 5
Workshop-cum-dwellings 11
Dwellings with other ~ses 4
These figures -show that the percentage of households living in combined dwellings is greater in the category of 'owned' than in 'rented', the percentage being 5'1 and 3'7 respectively.
4 - 11. The lowest proportion of households residing in owned h':mses is recorded in Nilgiri where 222 out of 1,000 live in owned dwellings. Madras City follows dosely with 254.
The highest proportion is recorded in Kanyakumari with 649. These Owned dwellings-Urban districts are arranged in the descending order of owned households
in pure dwellings and indicated below.
MADRAS STATE 455
Kanyakumari 649
North Arcot 586
Ramanathapuram 571
South Arcot 571
Thanjavur 566
Chingleput 556
Tirunelveli 545
Salem 490
Tiruchirapalli 478
Madurai 443
Coimbatore 384
Madras 254
Nilgiri 222
In 8 districts, the proportion of owned houses exceed the proportion of rented. But in the 5 districts of Madras, Coimbatore, Madurai, Nilgiri and Tiruchirapalli rented dwellings exceed owned. The greater the urbanisation, the greater the extent of immigration. The greater the immigration, the greater the number of people living in rented houses.
4 - 12. Before we study the tenure status, it will be of interest to institute a correlation between households living in workshop-cum-dwellings and the proportion of workers in household
industries as per Primary Census Abstract. The ratio of columns Workshop-cum-dwelling: Urban 3-2 ranges from. 2'7 in Salem to 11'3 in Chingleput. This may
probably indicate approximately the extent of participation of working force in household industry in the various districts. For reasons which we have already indicated, it cannot give an absolute basis for comparison. In the urban areas of Madras State, out of 1,000 households; 30 live in workshop-cum-dwelling of which 19 occupy owned and 11 rented. This pattern of excess in owned workshop-cum-dwelling is noticed in all the districts except Madras, Nilgiri and Madurai. The highest proportion of owned occurs in Salem
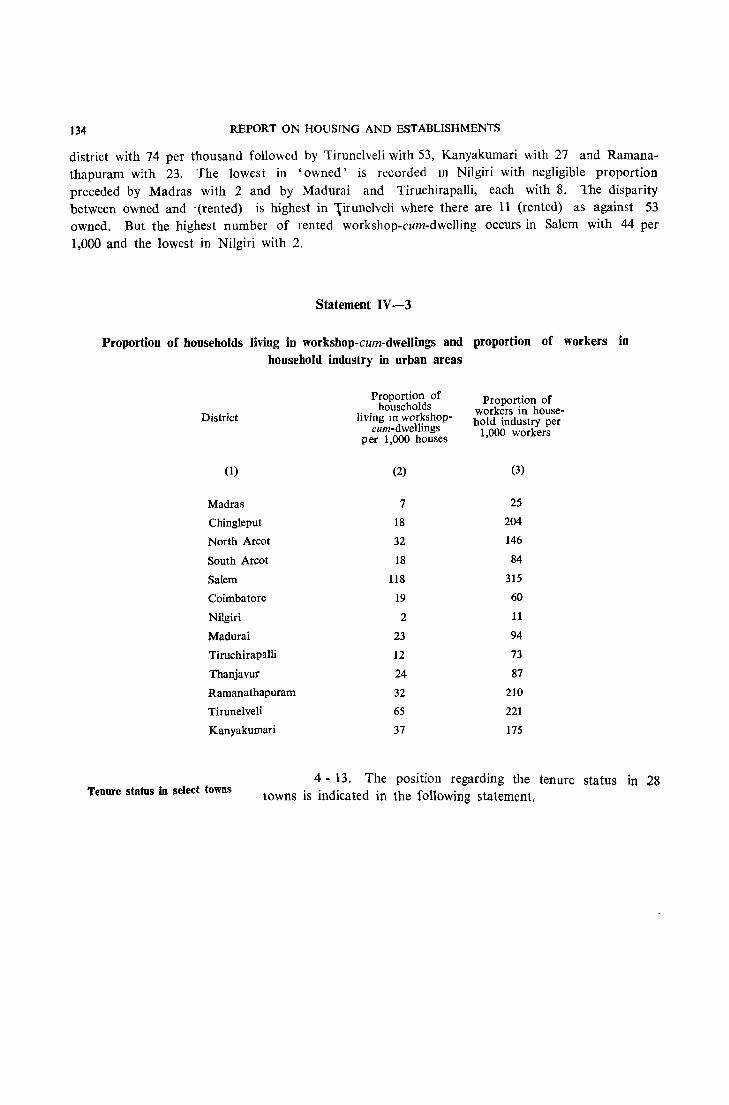
134 REPORT ON HOUSING AND ESTABLISHMENTS
district with 74 per thousand followed by Tirunelveli with 53, Kanyakumari with 27 and Ramanathapuram with 23. The lowest in 'owned' is recorded III Nilgiri with negligible proportion preceded by Madras with 2 and by Madurai and Tiruchirapalli, each with 8. The disparity between owned and '(rented) is highest in 1irunelveli where there are 11 (rented) as against 53 owned. But the highest number of rented workshop-cum-dwelling occurs in Salem with 44 per 1,000 and the lowest in Nilgiri with 2.
Statement IV-3
Proportion of households living in workshop-cum-dwellings and proportion of workers in household industry in urban areas
District
(1)
Madras
Chingleput
North Arcot
South Areot
Salem
Coimbatore
Nilgiri
Madurai
Tiruehirapalli
Thanjavur
Ramanathapuram
Tirunelveli
Kanyakumari
Proportion of households
living In workshopcum-dwellings
per 1,000 houses
(2)
7
18
32
18
118
19
2
23
12
24
32
65
37
Proportion of workers in household industry per
1,000 workers
(3)
25
204
146
84
315
60
11
94
73
87
210
221
175
Tenure status in select towns 4 - 13. The position regarding the tenure status in 28
towns is indicated in the following statement.
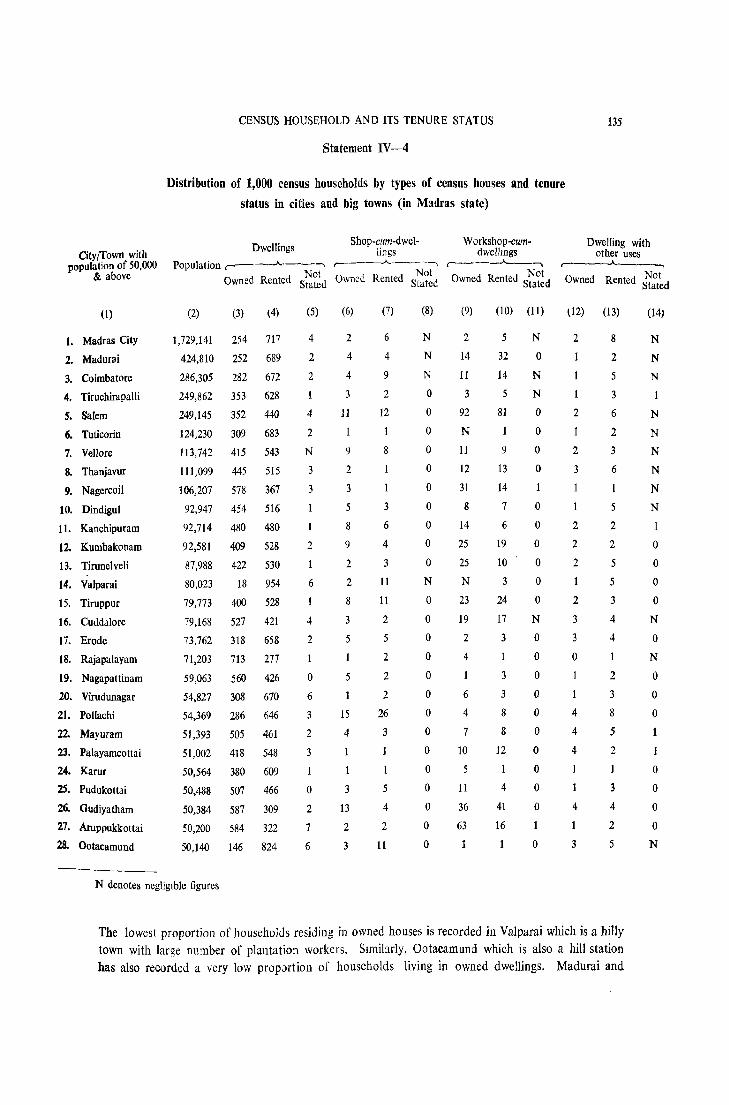
City(Town with population of 50,000
& above
(1)
1. Madras City
2. Madurai
3. Coimbatore
4. Tiruchirapalli
S. Salem
6. Tuticorin
7. Vellore
8. Thanjavur
9. Nagercoil
10. Dindigul
11. Kanchipuram
12. Kumbakonam
13. Tirunel veli
14. Valparai
15. Tiruppur
16. Cuddalore
17. Erode
18. Rajapalayam
19. Nagapattinam
20. Virudunagar
21. Po lIachi
22. Mayuram
23. Palayamcottai
24. Karur
25. Pudukottai
26. Gudiyatham
27. Aruppukkottai
28. Ootacamund
CENSUS HOUSEHOLD AND ITS TENURE STATUS
Statement IV-4
Distribution of 1,000 census households by types of census houses and tenure
status in cities and big towns (in Madras state)
Shop-cum-dwellings
Population ,..--__ -A-__ -, r----..A..----, Not Not
Dwellings
(2)
1,729,141
424,810
286,305
249,862
249,145
124,230
113,742
111,099
106,207
92,947
92,714
92,581
87,988
80,023
79,773
79,168
73,762
71,203
59,063
54,827
54,369
51,393
51,002
50,564
50,488
50,384
50,200
50,140
Owned Rented Stated Owned Rented Stated
(3) ~4)
254 717
252 689
282 672
353 628
352 440
309 683
415 543
445 515
578 367
454 516
480 480
409 528
422 530
18 954
400 528
527 421
318 658
713 277
560 426
308 670
286 646
505 461
418 548
380 609
507 466
587 309
584 322
146 824
(5)
4
2
2
4
2
N
3
3
2
6
4
2
o 6
3
2
3
o 2
7
6
(6)
2
4
4
11
9
2
3
5
8
9
2
2
8
3
5
1
5
15
4
1
3
13
2
3
(7)
6
4
9
2
12
1
8
3
6
4
3
11
11
2
5
2
2
2
26
3
5
4
2
11
(8)
N
N
N
o o o o o o o o o o N
o o o o o o o o o o o o o o
Workshop-cumdwellmgs
r--~--';""'_--'
O d Not wne Rented Stated
(9)
2
14
11
3
92
N
11
12
31
8
14
25
25
N
23
19
2
4
1
6
4
7
10
5
11
36
63
1
(10)
5
32
14
5
81
1
9
13
14
7
6
19
10
3
24
17
3
1
3
3
8
8
12
1
4
41
16
(11)
N
o N
N
o o o o 1
o o o o o o
N
o o o o o o o o o o
o
N denotes negligible figures
135
Dwelling with other uses .,
O d R d Not wne ente Stated
t12)
2
2
1
2
3
1
2
2
2
2
3
o 1
1
4
4
4
4
1
3
(13)
8
2
5
3
6
2
3
6
5
2
2
5
5
3
4
4
1
2
3
8
5
2
1
3
4
2
5
(14)
N
N
N
N
N
N
N
N
N
o o o o
N
o N
o o o 1
o o o o
N
The lowest proportion of households residing in owned houses is recorded in Valparai which is a hilly town with Jarge number of plantation workers. Sllnihrly, Ootacamund which is also a hill station has also recorded a very low propJrtion of households living in owned dwellings. Madurai and
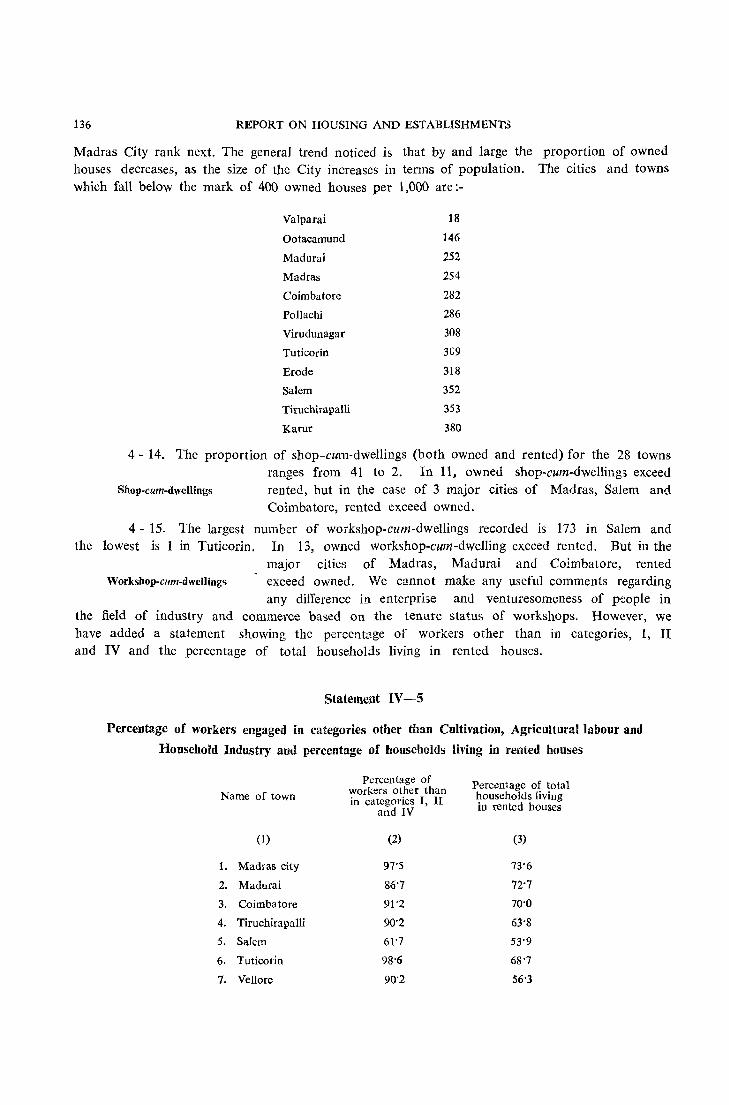
136 REPORT ON HOUSING AND ESTABLISHMENTS
Madras City rank next. The general trend noticed is that by and large the proportion of owned houses decreases, as the size of the City increases in terms of population. The cities and towns which fall below the mark of 400 owned houses per 1,000 are:-
Valparai 18
Ootacarnund 146
Madurai 252
Madras 254
Coimbatore 282
Pollachi 286
Virudunagar 308
Tuticorin 3G9
Erode 318
Salem 352
Tiruchirapalli 353
Karur 380
4 - 14. The proportion of shop-cum-dwellings (both owned and rented) for the 28 towns ranges from 41 to 2. In 11. owned shop-cum-dwellings exceed
Shop-cum-dwellings rented, but in the case of 3 major cities of Madras, Salem and Coimbatore, rented exceed owned.
4 - 15. The largest number of workshop-cum-dwellings recorded is 173 in Salem and the lowest is 1 in Tuticorin. In 13, owned workshop-cum-dwelling exceed rented. But in the
major cities of Madras, Madurai and Coimbatore, renied Workshop-cum-dwellings exceed owned. We cannot make any useful comments regarding
any difference in enterprise and venturesomeness of people in the field of industry and commerce based on the tenure status of workshops. However, we have added a statement showing the percentnge of workers other than in categories, I, II and IV and the percentage of total households living in rented houses.
Stateme~lt IV-5
Percentage of workers engaged in categories other than Cultivation, Agricultural labour and
Household Industry and percentage of housebolds living in rented houses
Percentage of Percentage of total workers other than Name of town in categories I, II households living
and IV in rented houses
(1) (2) (3)
1. Madras city 97'5 73'6
2. Madurai 86'7 72'7
3. Coimbatore 91'2 70'0
4. Tiruchirapalli 90'2 63'8
5. Salem 61'7 53'9
6. Tuticorin 98'6 68'7
7. Vellore 90'2 56'3

CENSUS HOUSEHOLD AND ITS TENURE STATUS
Percentage of workers engaged in categories other than Cultivation, Agricultural Labour and Household Industry .. nd percentage of households living in rented houses
Percentage of Percentage of total Name of town workers other than households living
in categories I, II in rented houses and IV
1 2 3
8. Thanjavur 83"4 53'5
9. Nagercoil 72'2 38'3
10. Dindigul 87'8 53'1
11. Kanchipuram 48'S 49"4
12. Kumbakonam 82'7 55'3
13. Tirunelveli 78'S 54'8
14. Valparai 99'8 97'3
15. Tiruppur 83'5 56'6
16. Cuddalore 79'8 44"4
17. Erode 93'7 67'0
18. Rajapalayam 64'2 28'1
19. Nagapattinam 93'2 43'3
20. Virudunagar 93'0 67'8
21. Pollachi 89'6 68'8
22. Mayuram 88'2 47'7
23. Palayamcottai 81'1 56'3
24, Karur 89"2 61'2
25. Pudukottai 91'9 47'8
26. Gudiyatham 47'1 35'8
27, Aruppukkottai 32'6 34'2
28. Ootacamund 82'3 84'1
137
Occupational and spatial mobility are large in categories other than agriculture a1}d household industry, Rented bouses are greater wher~ver workers of categories III and V to IX live, The greater the percentage of workers in these categories, the greater the percentage of households living in rented houses.
4 - 16. No subsidiary table was designed by Registrar General to indicate tenure status in rural areas for. the reason that such data would be of significance only in urban sector.
However, in order to have a general idea of the tenure status in Tenure status in rural sector rural areas and to know how it compares with that in urban, we
have prepared 3 statements, (1) A comparative statement showing the distribution of 1,000 census houses and the type of census houses and tenure status both in urban and rural areas (2) A statement showing the percentage of owned shop-cum-dwellings to total shop-cum-dwellings and (3) A similar statement for workshop-cum-dwellings,
H-IS
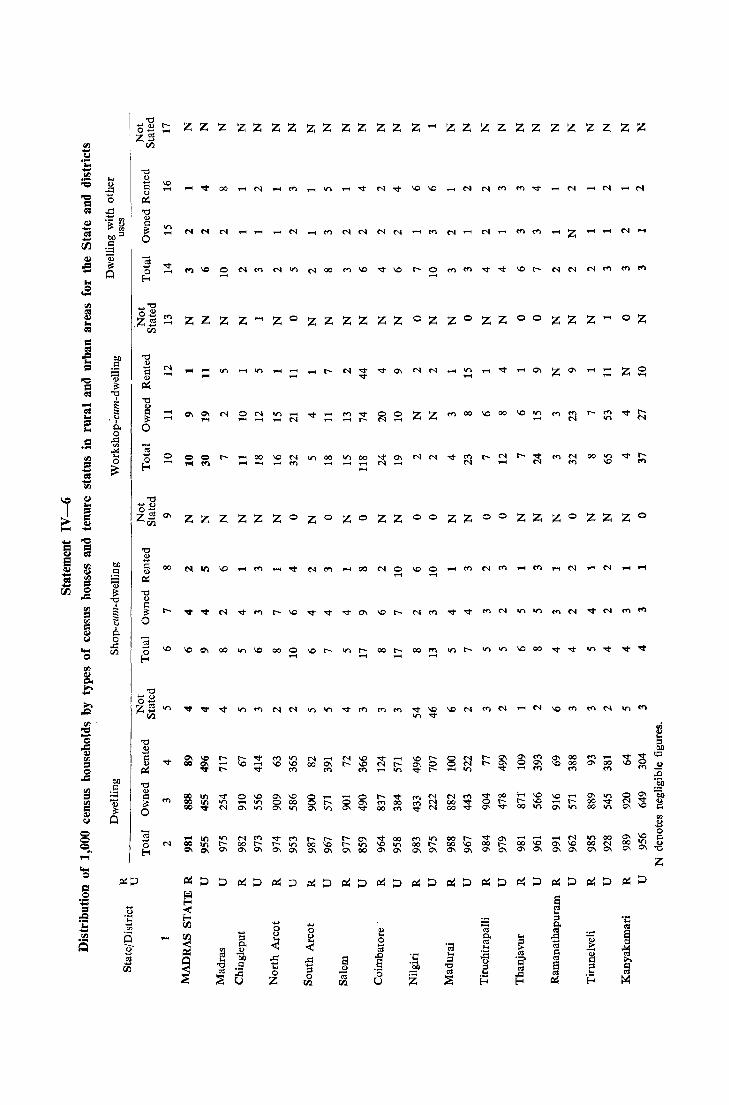
"C) z ...... <1.) r- Z Z Z Z Z Z Z Z Z Z Z Z Z .... Z Z Z Z Z Z Z Z Z Z Z Z 0 ...... .... z.s rIl til .... (j .... ... .... "C) rIl
:a .... ~ \0 <1.) '<I' ~ <1.)
.... ... 00 ..... N ,...., <f'l ..... on .... "'" N "'" \0 \0 ..... N N <f'l <f'l V ..... N ..... N .... M
-= "0 Il4 ::= ~ ..c "C)
.~fJ} <1.) ~ ~1A I'l on .... ~ M M N N .... IlS tlJ);:J
..... ..... .... ..... <f'l N N N M ..... <f'l M ..... N ..... <f'l <f'l ..... Z ..... ..... N .... 0 rfl ] ~ OJ t;
oS ~ 0 V !'l \0 0 N <f'l M on N <f'l \0 V \0 r-- 0 <f'l V "'" \0 r- N <f'l <f'l <f'l
Q ..... 00 <f'l N N E-< ..... ..... ...
oS rIl ...... "C) IlS 02 ~
.z~ <f'l Z Z Z Z ... Z 0 Z Z Z Z Z Z 0 Z Z 0 Z Z 0 0 Z Z Z .... oZ :; .....
::= IlS
of tlJ) "C)
::= .5 ~ N .... ... I/') .... I/') .... .... r- N v V 0'1 M N II') ..... "'" ..... 0'1 Z 0'1 ..... ..... Z 0 ~
..... .... -= <1.) ... ..... v .... .... .... ~ ~ Il4
"C) - ~ "C)
IlS ::: ~ .... C\ 0'1 M 0 N II') .... v .... <f'l V 0 0 Z Z <f'l 00 \0 00 \0 ..., <f'l <f'l r- '" V N ... ,'\' ~ .... ::= ... ..... .... .... N .... .... r- N .... .... N II')
... 0.. 0 0
::= ..c .... '" -;;; .l<: rIl .... 0 0 c::> c::> r- ..... 00 \0 N I/') 00 II') 00 V 0'1 N N V <f'l r- N r-- t!i <f'l N 00 II') v r-::= 0 .... !'l ..... <f'l .... .... .... N M .... <f'l \0 «) .... :::.: E-< ..... ~
I.e ~ "C)
J ... ....<1.)
5 0 .... z.s 0'1 Z Z Z Z Z Z 0 Z 0 Z 0 Z Z 0 0 z z 0 0 Z Z Z 0 Z Z Z 0 til
~ .... .... -= ~ ~ "C)
<1.)
~ ~ tlJ) i:l 00 M III \0 .... <f'l .... v N N M ,.., M N ..... N ........ Q <1.) N .... .... 00 0 \0 0 .... M ,.., ....
g$ ~ ~ .... .....
~ .... rLJ. j ~ "C)
"C) <1.)
gj . J:1 § ~ r-- '<I' '<I' N V .... r- \0 v "'" "'" 0'1 \0 r- N <"l V V '" N I/') ..., <"l N V N <"l <f'l
rIl 0
~ " 6-0 -;;; ... ..c
~ \0 \0 0'1 00 ..., \0 0 r-- II') on \0 00 "'" v II') "'" v "'" til 00 \0 r-- II') r- oo r- oo .... I/')
Q .... ,...., .... .... rIl ~ g..
.e- "C) ...... <1.) ... 0 .....
,&). z.s 10 '<I' '<I' "'" Vl <f'l N N I/') Vl V <') '" .... "'" \0 \0 N (') N .... N \0 (') t<'\ N 10«\ til 10 "'" 00" ,,; -= - <1.)
0 "C) ....
i <1.) ~ ...... "'"
q:; gj I'l 0'1 IC r- r- V <"l II') N .... N \0 V .... \0 r- 8 N r- 0'1 0'1 <"l 0'1 00 <"l ..... "'" Q.) v 00 0'1 .... \0 .... \0 \0 00 0'1 r- \0 N r- 0'1 0 N r- ~ 0 0'1 \0 00 0'1 00 \0 0 <1.)
j ~ '<I' r- v <"l <"l <"l .... II') v r- .... 10 .... M <"l <"l .... :0
tlJ)
~ "d 'co
rn <1.) ~ ::I I'l 00 III "'" 0 \0 0'1 \0 0 .... ,...., 0 r- "'" <". N N <"l V 00 .... \0 \0 .... 0'1 10 0 a-
~ OJ ~ «'\ 00 11'1 .,., 0::
..., 0 00 0 t- o 0'1 <"l 00 <"l N 00 ~ 0 r- r- \0 .... r- oo "'" <'1 "'" .. ~ 0
00 .... N on a- 10 0'1 10 0'1 V 00 <"l "'" N 00 0'1 "'" 00 ..., 0'1 10 00 .,., 0'1 \0 t:l ClI Q '" Col ~
= OJ .... II') '" \0 0
= 0 III N "'" <"l r- r-- r- 0'1 "'" 00 <"l 10 00 r- v 0'1 .... .... .... N ..., 00 0'1 '" = N 00 11'1 r- oo r- r- IO 00 \0 r- I/') \0 I/') 00 r- oo \0 00 r- oo \0 a- \0 00 N 00 10 <1.)
,..; E-< 0'1 0'1 a- a- 0'1 a- 0'1 0'1 0'1 0'1 co 0'1 0'1 0'1 0'1 0'1 0'1 a- 0'1 a- 0'1 0'1 0'1 0'1 0'1 0'1 0'1 "0
Z ... 0
P:;:l ~ ::J ;:J ::= ;:J ~ ;:J ~ p ~ p ~ p ~ ::J ~ ::J ~ P ~ ;:l ~ ::> ~ p ~ ::> ~
.S 1:1 § .... .... ::I (,) -< ,.Q ·c E-< ... .... S ;:J ·c
!: .... 00 '0 .... ~ '" 0 ~ o;S C!I rIl 0 00 E 0 0 0.. ....
~ ~ 8 .... -< 0.. ... ... 0 o;S ~ ;:J
~ 0> -< < ~ .....
~ '" Q.) ~ :S .l<: -;;; ~ ~ €
.0 'C o;S t:l 8 C!I 0 -5 8 ;:J 'a' o;S :>.
iI5 ~ .S <1.) 8 ]l "C) .§ 8 ::I Q
C!I e 0 ;:J OJ '0 o;S o;S
«I .!:: «I
~ 0 Z ~ Z r/l r/l U ~ E-< ~ E-< ~

CENSUS HOUSEHOLD AND ITS TENURE STATUS 139
In tenure status, Nilgiri is a class by itself. The reason for this is its abundance of estates where labour is provided with free or rented accommodation. Towns like Ootacamund, Coonoor
and Wellington are summer resorts which attract migrants from Special features of the Nilgiri outside the district who do not wish to settle down there
permanently in view of the peculiar climatic conditions. Further, building materials are difficult to get and the cost of labour high and there is much less tendency to build houses for their own use. It may, however, be observed that the n_,-,ive people of the Nilgiri own their own houses. It is only the estate workers and Cordite Factory workers who live in rented houses. In their cases, houses are provided by the management. In the urbaN. areas including Madras City, the highest proportion of pure own dwelling (M1) is recorded in Kanyakumari and the lowest (222) in Nilgiri. The intermediary range is 384 in Coimbatore and 586 in North Arcot District. In rural areas, the proportion of owned dwellings is nearly double the urban. The lowest proportion of 433 is recorded in Nilgiri. The proportion for other districts is much higher ranging between 837 in Coimbatore and 920 in Kanyakumari.
Statement IV-7
Percentage of households living in owned houses used as shop-cum-dwellings
in rural and urban areas
State I District
MADRAS STATE
Chingleput
North Areot
South Areot
Salem
Coimbatore
Nilgiri
Madurai
Tiruehirapalli
Thanjavur
Ramanathapuram
Tirunelveli
Kanyakumari
No. of owned shop-cum-dwelJings for every 100 shop-cum-dwellings in
Rural areas Urban areas
75'6 46'5
77'0 51'4
85'8 59'7
73'1 56'3
75'2 53'7
70'0 40'7
31'6 22'8
74'2 58·5
67'2 46'8
75'4 66'2
84'1 48'0
84'8 59'1
74'8 66'7
Note: excludes households whose tenure status has not been stated.
4-17. The ownership in rural areas ranges from 31'6 to 85'8. As already indicated, Nilgiri is an exception to the rule. In urban areas, range is between 22'8 and 66'7. In rural
areas the proportion of owned shop-cum-dwellings exceed that Tenure status of shop-cum-dwellings in urban areas in every district. Some reasons can be given for
this. 1. Greater mobility in urban areas and consequent unsettled character of business people. 2. Higher cost of building materials and labour. In a village, a shop which is generally of a petty nature can be located in the front portion of any house, but in a town, it has to be located in a bazaar or on a main road. This is an important reason for the greater number of owned shop-cum-dwelling in rural areas than in urban areas. For the same
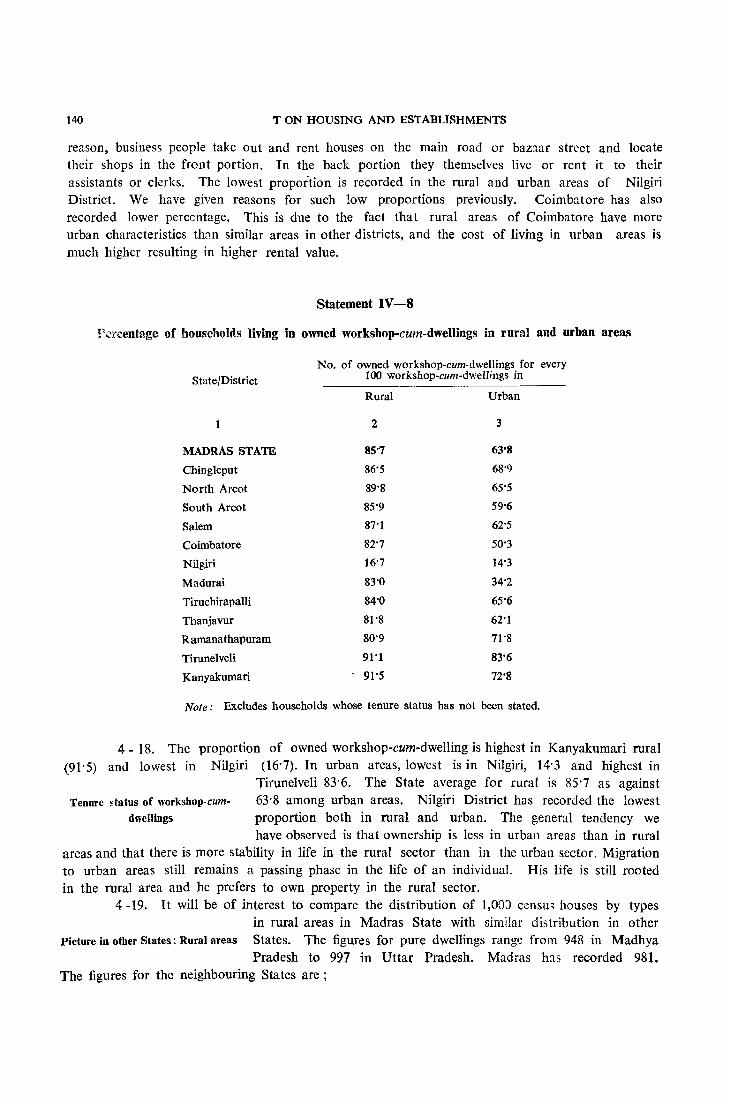
140 T ON HOUSING AND ESTABLISHMENTS
reason, business people take out and rent houses on the main road or baz1ar street and locate their shops in the front portion. In the back portion they themselves live or rent it to their assistants or clerks. The lowest proportion is recorded in the rural and urban areas of Nilgiri District. We have given reasons for such low proportions previously. Coimbatore has also recorded lower percentage. This is due to the fact that rural arcas of Coimbatore have more urban characteristics than similar areas in other districts, and the cost of living in urban areas is much higher resulting in higher rental value.
Statement IV-8
I\~rcentage of households living in owned workshop-cum-dwellings in rural and urban areas
No. of owned workshop-cum·dwellings for every State/District 100 workshop-cum-dwellings in
Rural Urban
2 3
MADRAS STATE 85'7 63'8
Chingleput 86'5 68'9
North Arcot 89'8 65'5
South Arcot 85'9 59'6
Salem 87'1 62'5
Coimbatore 82'7 50'3
Nilgiri 16'7 14'3
Madurai 83'0 34'2
Tiruchirapalli 84'0 65'6
Thanjavur 81'8 62'1
Ramanathapuram 80'9 71'S
Tirunelveli 91'1 83'6
Kanyakumarl 91'5 72'8
Note: Excludes households whose tenure status has not been stated.
4 - 18. The proportion of owned workshop-cum-dwelling is highest in Kanyakumari rural (91'5) and lowest in Nilgiri (16'7). In urban areas, lowest is in Nilgiri, 14'3 and highest in
Tenure ~tatus of workshop-cumdwellings
Tirunelveli 83'6. The State average for rural is 85'7 as against 63'8 among urban areas. Nilgiri District has recorded the lowest proportion both in rural and urban. The general tendency we have observed is that ownership is less in urban areas than in rural
areas and that there is more stability in life in the rural sector than in the urban sector. Migration to urban areas still remains a passing phase in the life of an individual. His life is still rooted in the rural area and he prefers to own property in the rural sector.
4 -19. It will be of interest to compare the distribution of 1,003 censm houses by types in rural areas in Ma.dras State with similar distribution in other
Picture in other States: Rural areas States. The figures for pure dwellings range from 948 in Madhya Pradesh to 997 in Uttar Pradesh. Madras has recorded 981.
The figures for the neighbouring States are;
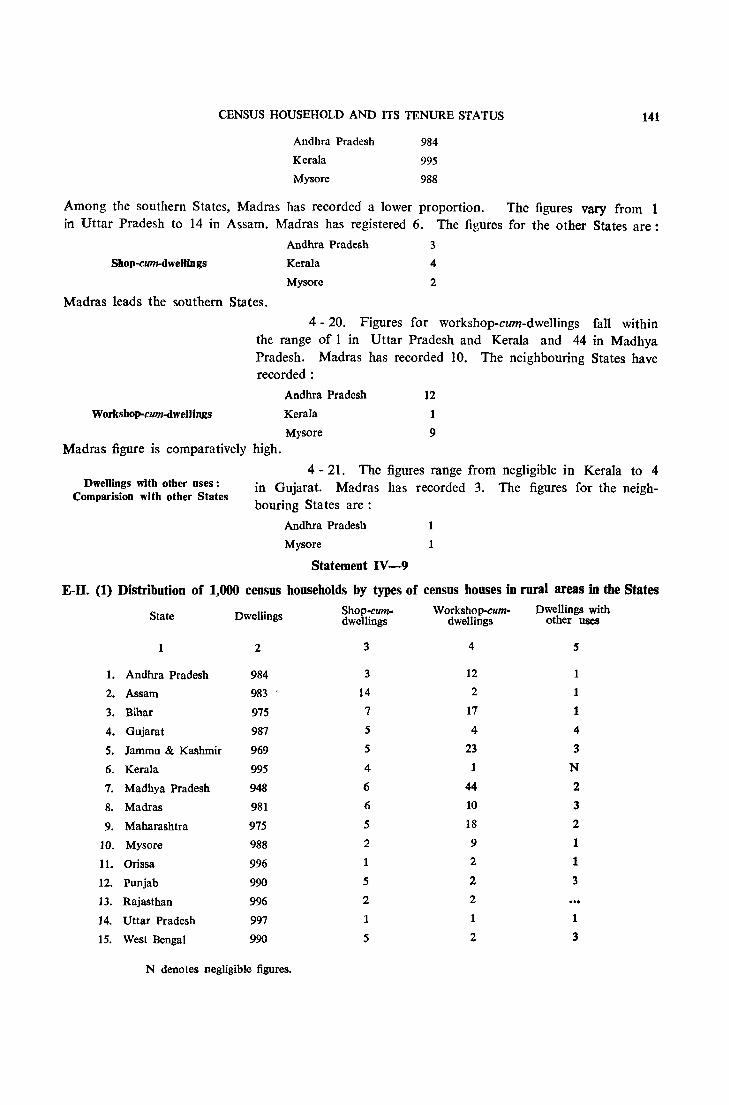
CENSUS HOUSEHOLD AND ITS TENURE STATUS 141
Andhra Pradesh 984
Kerala 995
Mysore 988
Among the southern States, Madras has recorded a lower proportion. The figures vary from 1 in Uttar Pradesh to 14 in Assam. Madras has registered 6. The figures for the other States are:
Shop-cum-dwelHngs
Andhra Pradesh
Kerala
Mysore
3
4
2
Madras leads the southern States.
Workshop-cum-dwe)Jjngs
4 - 20. Figures for workshop-cwn-dweIIings fall within the range of 1 in Uttar Pradesh and Kerala and 44 in Madhya Pradesh. Madras has recorded 10. The neighbouring States have recorded:
Andhra Pradesh 12
Kerala
Mysore
Madras figure is comparatively high.
1
9
Dwellings with other uses: Comparision with other States
4 - 21. The figures range from negligible in Kerala to 4 in Gujarat. Madras has recorded 3. The figures for the neighbouring States are:
Andhra Pradesh
Mysore 1
Statement IV-9
E-II. (1) Distribution of 1,000 census households by types of census houses in rural areas in the States
State Dwellings Shop-cum- Workshop-cum- Dwellings with dwellings dwellings other uses
2 3 4 5
1. Andhra Pradesh 984 3 12 1
2. Assam 983 14 2 1
3. Bihar 975 7 17 1
4. Gujarat 987 5 4 4
5. Jammu & Kashmir 969 5 23 3
6. Kerala 995 4 1 N
7. Madhya Pradesh 948 6 44 2
8. Madras 981 6 10 3
9. Maharashtra 975 5 18 2
10. Mysore 988 2 9 1
11. Orissa 996 1 2 1
12. Punjab 990 5 2 3
13. Rajasthan 996 2 2
14. Uttar Pradesh 997 1 1 1
15. West Bengal 990 5 2 3
N denote& negligible figures.
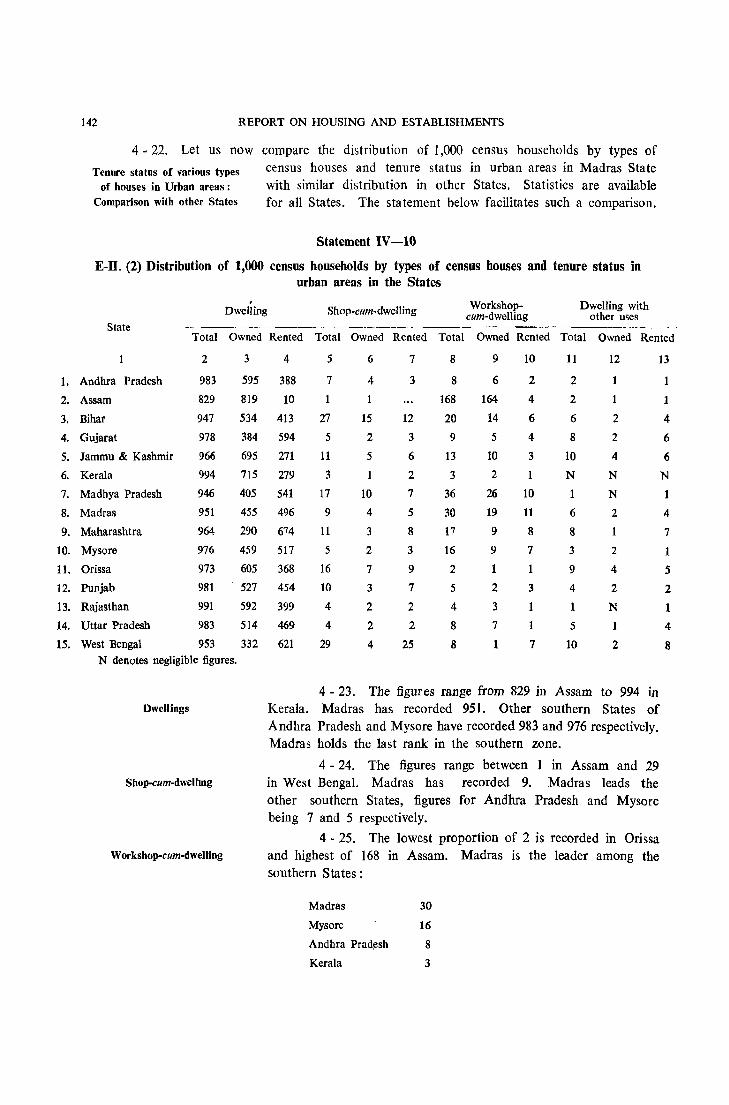
1.
2.
3.
4.
5.
6.
7.
8.
9.
10.
11.
12.
13.
14.
15.
142 REPORT ON HOUSING AND ESTABLISHMENTS
4·22. Let us now compare the distribution of 1,000 census households by types of
Tenure status of various types census houses and tenure status in urban areas in Madras State of houses in Urban areas: with similar distribution in other States. Statistics are available
Comparison with other States for all States. The statement below facilitates such a comparison.
Statement IV-tO
E-n. (2) Distribution of 1,000 census households by types of census houses and tenure status in urban areas in the States
Dwelling Shop-cum-dwelling Workshop- Dwelling with cum-dwelling other uses
State Total Owned Rented Total Owned Rented Total Owned Rented Total Owned Rented
2 3
Andhra Pradesh 983 595
Assam 829 819
Bihar 947 534
Gujarat 978 384
Jammu & Kashmir 966 695
Kerala 994 715
Madhya Pradesh 946 405
Madras 951 455
Maharashtra 964 290
Mysore 976 459
Orissa 973 605
Punjab 981 - 527
Rajasthan 991 592
Uttar Pradesh 983 514
West Bengal 953 332 N denotes negligible figures.
Dwellings
Shop-cum-dwelhng
Workshop-cum-dwelling
4 5 6 7 8 9 10 11 12 13
388 7 4 3 8 6 2 2
10 168 164 4 2 1
413 27 15 12 20 14 6 6 2
594 5 2 3 9 5 4 8 2
271 11 5 6 13 10 3 10 4
279 3 2 3 2 1 N N 541 17 10 7 36 26 10 1 N 496 9 4 5 30 19 11 6 2
674 11 3 8 17 9 8 8 1
517 5 2 3 16 9 7 3 2
368 16 7 9 2 1 1 9 4 454 10 3 7 5 2 3 4 2
399 4 2 2 4 3 1 1 N 469 4 2 2 8 7 1 5 1
621 29 4 25 8 1 7 10 2
4 - 23. The figur es range from 829 in Assam to 994 in Kerala. Madras has recorded 951. Other southern States of Andhra Pradesh and Mysore have recorded 983 and 976 respectively. Madras holds the last rank in the southern zone.
4 - 24. The figures range between 1 in Assam and 29 in West Bengal. Madras has recorded 9. Madras leads the other southern States, figures for Andhra Pradesh and Mysore being 7 and 5 respectively.
4 - 25. The lowest proportion of 2 is recorded in Orissa and highest of 168 in Assam. Madras is the leader among the southern States:
Madras 30
Mysore 16
Andhra Pradesh 8
Kerala 3
1
1
4
6
6
N 1
4
7
1
5
2
1
4
8
Dwellings with other uses
Pure Dwellings (Owned)
CENSUS HOUSEHOLD AND ITS TENURE STATUS 143
4 - 26. The range is from negligible in Kerala to 10 in Jammu and Kashmir. Among the southern States, Madras has recorded 6, followed by Mysore 3 and Andhra Pradesh 2.
4 - 27. Owned dwellings range between 290 in Maharashtra and 819 in Assam. Madras has recorded 455. The neighbouring States have recorded higher figures than Madras.
Andhra Pradesh 595
Kerala 715
~ysore 459
4 - 28. The proportion ranges from 1 in Assam and Shop-cum-dwelling (Owned) Kerala to 15 in Bihar. Madras has recorded 4. Other southern
States have recorded - Andhra Pradesh 4 and Mysore 2.
4 - 29. Assam records 164. The last position goes to Workshop-cum-dwelling (Owned) Orissa and West Bengal with 1. The proportion of 19 recorded
by Madras is fairly high. The figures recorded by other southern States are:
Andhra Pradesh 6
Kerala 2
~ysore 9
4 - 30. The figures range from negligible in Kerala, Dwellings with other uses (Owned) Madhaya Predesh and Rajasthan to 4 in Orissa and Jammu and
Kashmir. Madras has recorded 2. The figures for Andhra Pradesh and Mysore are 1 and 2 respectively.
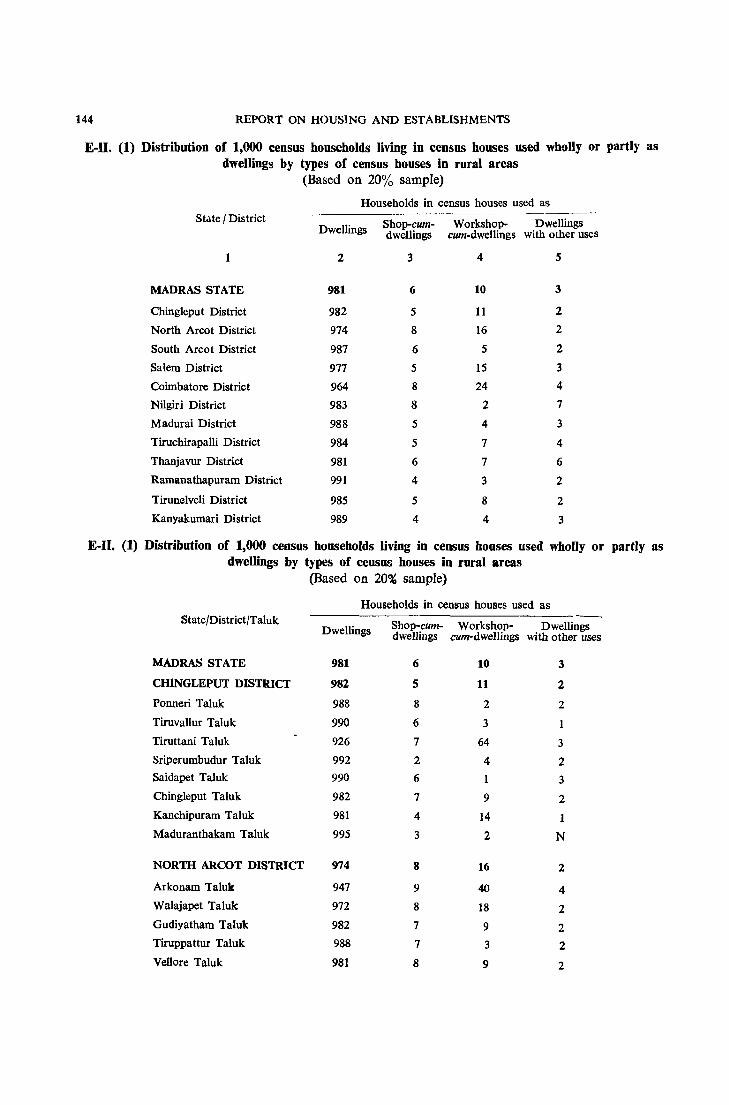
144 REPORT ON HOUSING AND ESTABLISHMENTS
E-lI. (1) Distribution of 1,000 census households living in census houses used wholly or partly as dwellings by types of census houses in rural areas
(Based on 20% sample)
Households in census houses used as State f District Shop-cum- Workshop- Dwellings Dwellings dwellings cum-dwellings with other uses
1 2 3 4 S
MADRAS STATE 981 6 10 3
Chingleput District 982 5 11 2
North Aroot District 974 8 16 2
South Arcot District 987 6 5 2
Sa lem District 977 5 15 3
Coimbatore District 964 8 24 4
Nilgiri District 983 8 2 7
Madurai District 988 5 4 3
Tiruchirapalli District 984 5 7 4
Thanjavur District 981 6 7 6
Ramanathapuram District 991 4 3 2
Tirunelveli District 985 5 8 2 Kanyakumari District 989 4 4 3
E-II. (1) Distribution of 1,000 census households living in census houses used wholly or partly as dwellings by types of ceusus houses in rural areas
(Based on 20% sample)
Households in census houses used as StatefDistrictfTaluk Shop-cum- Workshop- Dwellings Dwellings dwellings cum-dwellings with other uses
MADRAS STATE 981 6 10 3
CHINGLEPUT DISTRICT 982 5 11 2
Ponneri Taluk 988 8 2 2
Tiruvallur Taluk 990 6 3 Tiruttani Taluk 926 7 64 3 Sriperumbudur Taluk 992 2 4 2 Saidapet Taluk 990 6 ] 3 Chingleput Taluk 982 7 9 2 Kanchipuram Taluk 981 4 14 1 Maduranthakam Taluk 995 3 2 N
NORTH ARCOT DISTRICT 974 8 16 2
Arkonam Taluk 947 9 40 4 Walajapet Talule 972 8 18 2 Gudiyatham TaMe 982 7 9 2 Tiruppattur Taluk 988 7 3 2 Vellore Taluk 981 8 9 2
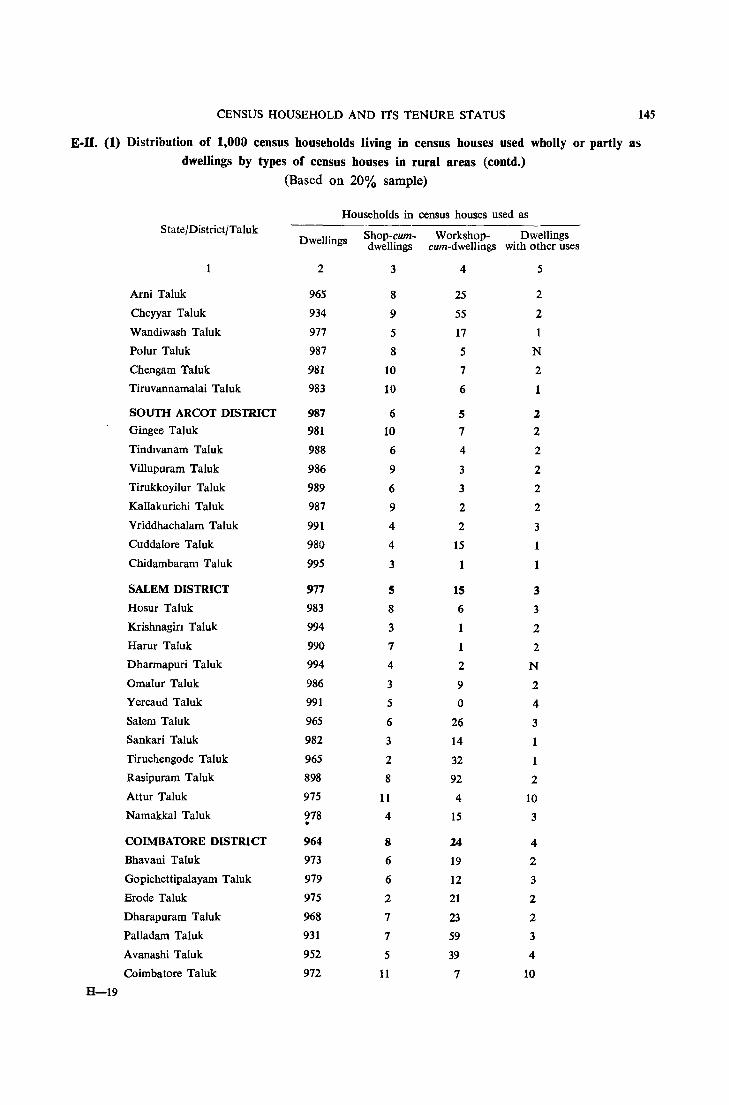
CENSUS HOUSEHOLD AND ITS TENURE STATUS 145
E-n. (1) Distribution of 1,000 census households living in census houses used wholly or partly as
dwellings by types of census houses in rural areas (contd.)
(Based on 20% sample)
Households in census houses used as State/DistrictjTaluk Shop-cum- Workshop- Dwellings Dwellings dwellings cum-dwellings with other uses
1 2 3 4 5
Arni Taluk 965 8 25 2
Cheyyar Taluk 934 9 55 2
Wandiwash Taluk 917 5 17 1
Polur Taluk 987 8 5 N
Chengam Taluk 981 10 7 2 Tiruvannamalai Taluk 983 10 6 1
SOUTH ARCOT DISTRICT 987 6 5 2
Gingee Taluk 981 10 7 2 TindlVanam Taluk 988 6 4 2
Villupuram Taluk 986 9 3 2 Tirukkoyilur Taluk 989 6 3 2 Kallakurichi Taluk 987 9 2 2 Vriddhachalam Taluk 991 4 2 3 Cuddalore Taluk 980 4 15 1
Chidambaram Taluk 995 3 1 1
SALEM DISTRICT 977 S 15 3
Hosur Taluk 983 8 6 3 Krishnagin Taluk 994 3 1 2 Harur Taluk 990 7 1 2 Dharmapuri Taluk 994 4 2 N
Omalur Taluk 986 3 9 2 Yercaud Taluk 991 5 0 4 Salem Taluk 965 6 26 3 Sankari Taluk 982 3 14 1 Tiruchengode Taluk 965 2 32 1 Rasipuram Taluk 898 8 92 2 Attur Taluk 975 11 4 10 Namakkal Taluk 978 4 15 3 . COIMBATORE DISTRICT 964 8 24 4
Bhavani Taluk 973 6 19 2 Gopichettipalayam Taluk 979 6 12 3
Erode Taluk 975 2 21 2 Dharapuram Taluk 968 7 23 2
Palladam Taluk 931 7 59 3
Avanashi Taluk 952 5 39 4
Coimbatore Taluk 972 11 7 10
H-19
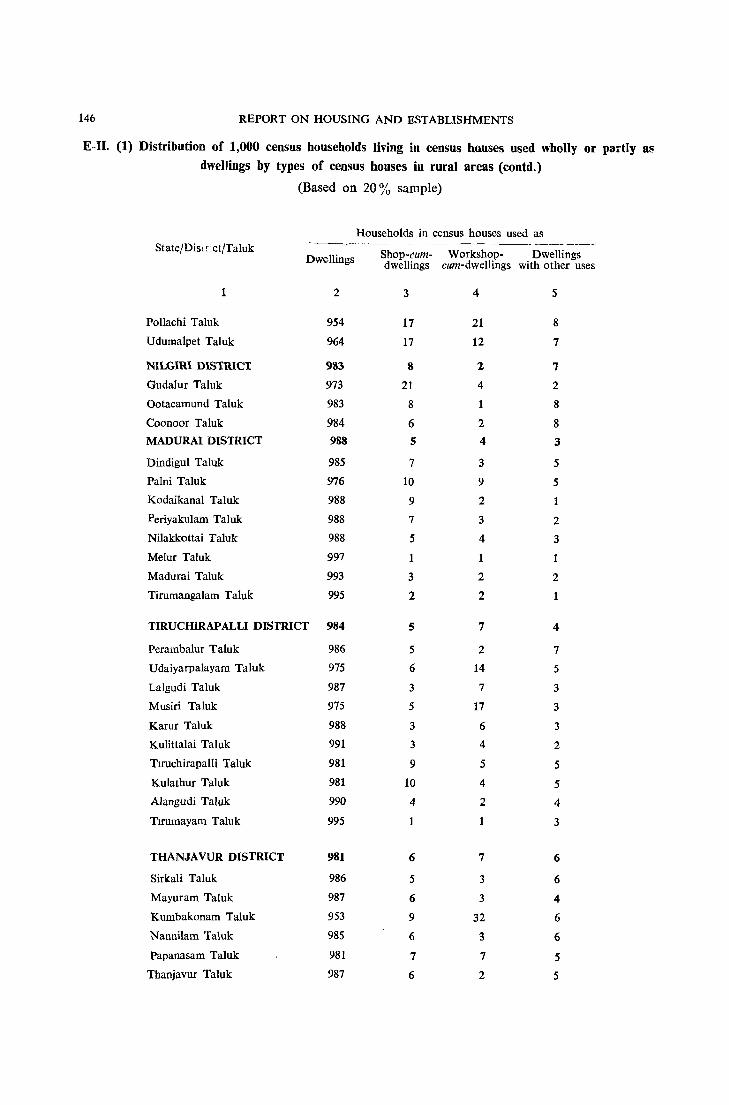
146 REPORT ON HOUSING AND ESTABLISHMENTS
E-I1. (1) Distribution of 1,000 census households living in census houses used wholly or partIy as dwellings by types of census houses in rural areas (eontd.)
(Based on 20 % sample)
Households in census houses used as State/Dist'-lct/Taluk ----- ---- _--- ~--
Shop-cum- Workshop- Dwellings Dwellings dwellings cum-dwellings with other uses
1 2 3 4 5
Pollachi Taluk 954 17 21 8
Udumalpet Taluk 964 17 12 7
NILGIRI DISTRICT 983 8 2 7
Gudalur Taluk 973 21 4 2
Ootacamund Taluk 983 8 1 8
Coonoor Taluk 984 6 2 8 MADURAI DISTIUCT 988 5 4 3
Dindigul Taluk 985 7 3 5
Palni Taluk 976 10 9 5
KodaikanaI Taluk 988 9 2
Periyakulam Taluk 988 7 3 2
Nilakkottai Taluk 988 5 4 3
Melur Taluk 997 1 1
Madurai Taluk 993 3 2 2
Tirumangalam Taluk 995 2 2 1
TIRUCIDRAPALLI DISTRICT 984 5 7 4
Perambalur Taluk 986 5 2 7
Udaiyarpalayam Taluk 975 6 14 5
Lalgudi Taluk 987 3 7 3
Musiri Taluk 975 5 17 3
Karur Taluk 988 3 6 3
Kulittalai Taluk 991 3 4 2
Tlruchirapalli Taluk 981 9 5 5
Kulathur Taluk 981 10 4 5 Alangudi Taluk 990 4 2 4
Tlrumayam Taluk 995 1 1 3
THANJAVUR DISTRICT 981 6 7 6
Sirkali Taluk 986 5 3 6
Mayuram Taluk 987 6 3 4
Kumbakonam Taluk 953 9 32 6
Nannilam Taluk 985 6 3 6
Papanasam Taluk 981 7 7 5 Thanjavur Taluk 987 6 2 5
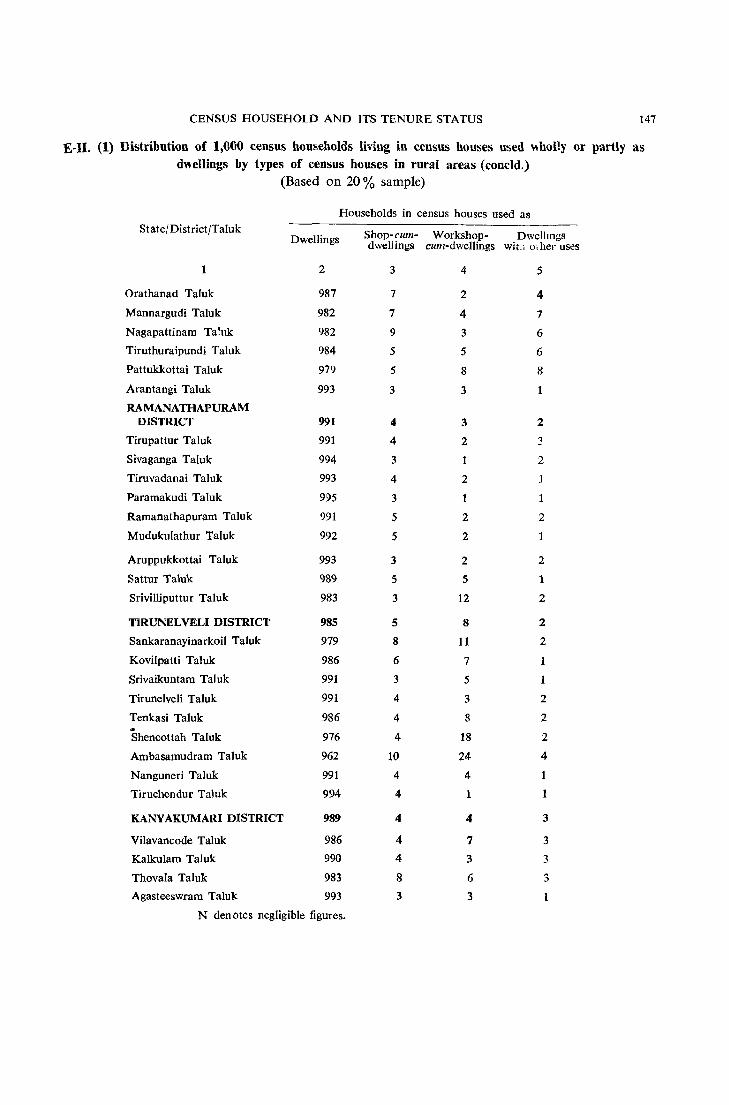
CENSUS HOUSEHOLD AND ITS TENURE STATUS 147
E-I1. (1) Distributi<m of 1,000 census households living in census houses used wholly or partly as dwellings by types of census houses in rural areas (concld.)
(Based on 20 % sample)
Households in census houses used as
State/District/Taluk
1
Orathanad Taluk
Mannargudi Taluk
Nagapattinam Talllk
Tiruthuraipundi Taluk
Pattukkottai Taluk
Arantangi Taluk
RAMANATHAPURAM DISTRICT
Tirupattur Taluk
Sivaganga Taluk
Tiruvadanai Taluk
Paramakudi Taluk
Ramanathapuram Taluk
Mudukulathur Taluk
Aruppukkottai Taluk
SaUuI Taluk
Srivilliputtur Taluk
TlRUNELVELI DISTRICT
Sankaranayinarkoil Taluk
Kovilpatti Taluk
Srivaikuntam Taluk
Tirunelveli Taluk
Tenkasi Taluk ~
Shencottah Taluk
Ambasamudram Taluk
Nanguneri Taluk
Tiruchendur Taluk
KANYAKUMARI DISTRICT
Vilavancode Taluk
Kalkulam Taluk
Thovala Taluk
Dwellings
2
987
982
982
984
979
993
991
991
994
993
995
991
992
993
989
983
985
979
986
991
991
986
976
962
991
994
989
986
990
983
Agasteeswram Taluk 993
N den otes negligible figures.
Shop-cum- Workshop- Dwellmgs dwellings cum-dwellings wit:, olher uses
3
7
7
9
5
5
3
4
4
3
4
3
5
5
3
5
3
5
8
6
3
4
4
4
10
4
4
4
4
4
8
3
4
2
4
3
5
8
3
3
2
2
1
2
2
2
5
12
8
11
7
5
3
8
18
24
4
1
4
7
3
6
3
5
4
7
6
6
8
1
2
3
2
1
1
2
1
2
1
2
2
2
2
2
2
4
3
3
3
3
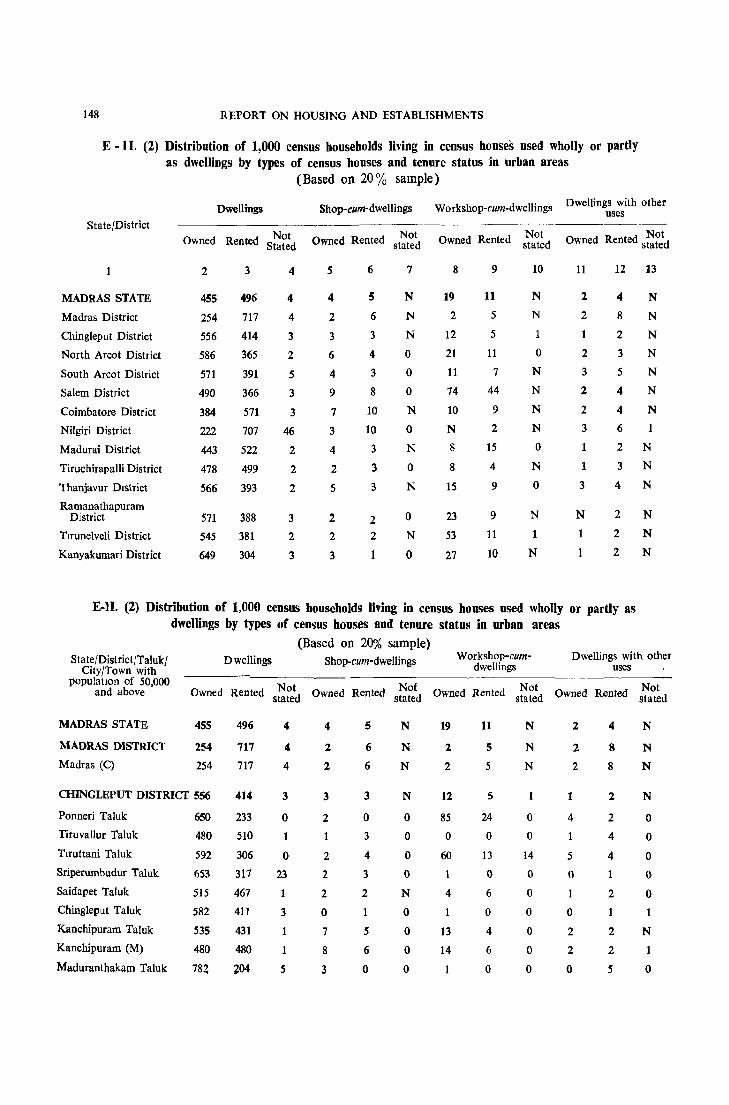
148 REPORT ON HOUSING AND ESTABLISHMENTS
E - II. (2) Distribution of 1,000 census households living in census houses used wholly or partly as dwellings by types of census houses and tenure status in urban areas
State/District
MADRAS STATE
Madras District
Chingleput District
North Arcot District
South Arcot District
Salem District
Coimbatore District
Nilgiri District
Madurai District
Tiruchirapalli District
Thanjavur District
Ramanathapuram District
Tlrunelveli District
Kanyakumari District
Dwellings
Not Owned Rented Stated
2
455
254
556
586
571
490
384
222
443
478
566
571
545
649
3
496
717
414
365
391
366
571
707
522
499
393
388
381
304
4
4
4
3
2
5
3
3
46
2
2
2
3
2
3
(Based on 20 % sample)
Shop-cum-dwellings Workshop-rum-dwellings Dwellings with other uses
~----~~ ~--------
Not Owned Rented stated
5
4
2
3
6
4
9
7
3
4
2
5
2
2
3
6
5
6
3
4
3
8
10
10
3
3
3
2
2
1
7
N
N
N
o o o N
o N
o N
o N
o
Not Owned Rented stated
8
19
2
12
21
11
74
10
N
8
8
15
23
53
27
9
11
5
5
11
7
44
9
2
15
4
9
9
11
10
10
N
N
1
o N
N
N
N
o N
o
N
1
N
d Not Owned Rente stated
11
2
2
2
3
2
2
3
1
1
3
N
12 13
4 N 8 N
2 N
3 N
5 N
4 N
4 N 6
2 N
3 N
4 N
2 N
2
2
N
N
E-ll. (2) Distribution of 1,000 census households living in census houses used wholly or partly as dwellings by types of census houses and tenure status in urban areas
(Based on 20% sample) Dwellings Shop-cum-dwellings Workshop-cum
dwellings Dwellings with other
uses State/District/Taluk/
City/Town with population of 50,000
and above Not Not Not Not Owned Rented stated Owned Rented stated Owned Rented stated Owned Rented stated
MADRAS STATE
MADRAS DISTRICT
Madras (C)
455
254
254
CHINGLEPUT DISTRICT 556
Ponneri Taluk
Tiruvallur Taluk
Tlruttani Taluk
Sriperumbudur Taluk
Saidapet Taluk
Chingleput Taluk
Kanchipuram Taluk
Kanchipuram (M)
Maduranthakam Taluk
650
480
592
653
515
582
535
480
784
496
717
717
414
233
510
306
317
467
411
431
480
Z04
4
4
4
3
o 1
o 23
1
3
5
4
2
2
3
2
1
2
2
2
o 7
8
3
5
6
6
3
o 3
4
3
2
5
6
o
N
N
N
N
o o o o N
o o o o
19
2
2
12
85
o 60
1
4
13
14
1
11
5
5
5
24
o 13
o 6
o 4
6
o
N
N
N
1
o o
14
o o o o o o
2
2
2
1
4
5
o 1
o 2
2
o
4
8
8
2
2
4
4
1
2
1
2
2
5
N
N
N
N
o o o o o 1
N
o
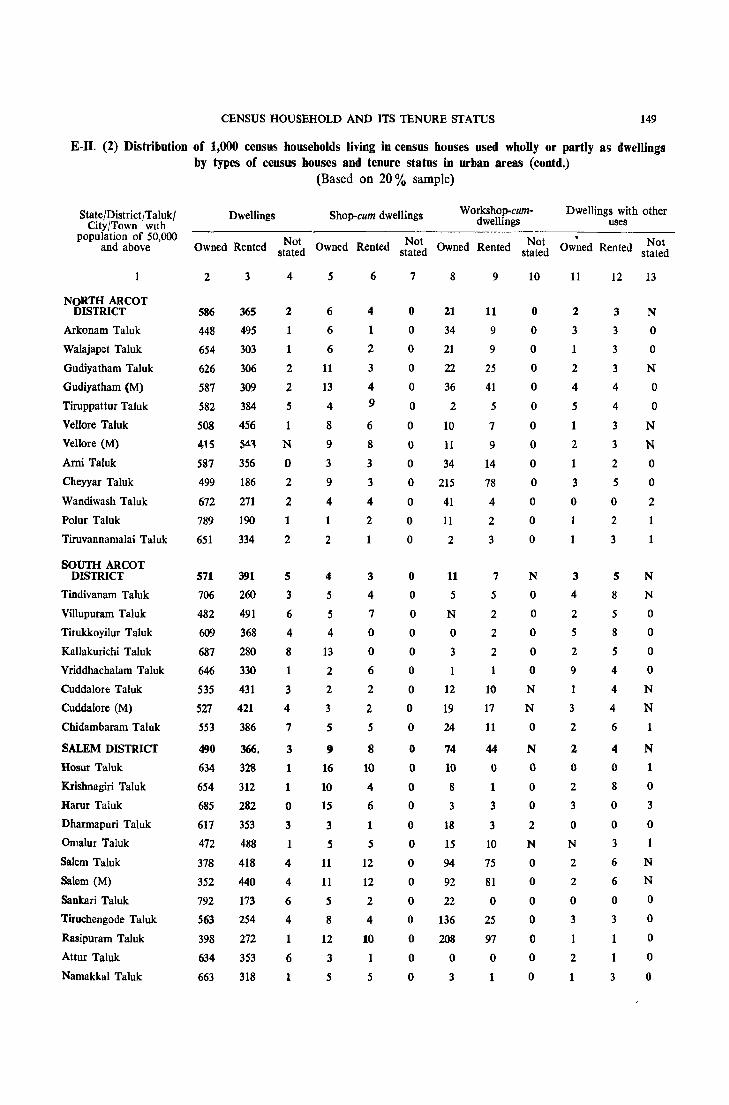
CENSUS HOUSEHOLD AND ITS TENURE STATUS 149
E-II. (2) Distribution of 1,000 census households living in census houses used wholly or partly as dwellings by types of census houses and tenure status in urban areas (contd.)
State/District/Taluk/ City/Town WIth
population of 50,000 and above
NORTH ARCOT DISTRICT
Arkonam Taluk
Walajapet Taluk
Gudiyatham Taluk
Gudiyatham (M)
Tiruppattur Taluk
VeUore Taluk
Vellore (M)
Ami Taluk
Cheyyar Taluk
Wandiwash Taluk
Polur Taluk
Tiruvannamalai Taluk
SOUTH ARCOT DISTRICT
Tindivanam Taluk
ViIlupuram Taluk
Tirukkoyilur Taluk
Kallakurichi Taluk
Vriddhachalam Taluk
Cuddalore Taluk
Cuddalore (M)
Chidambaram Taluk
SALEM DISTRICT
Hosur Taluk
Krishnagiri Taluk
Harur Taluk
Dharmapuri Taluk
Omalur Taluk
Salem Taluk
Salem (M)
Sankari Taluk
Tiruchengode Taluk
Rasipuram Taluk
Attur Taluk
Namakkal Taluk
(Based on 20 % sample)
Dwellings Shop-cum dwellings Workshop-cumdwellings
Dwellings with other uses
Not Not Not Not Owned Rented stated Owned Rented stated Owned Rented stated Owned Rented stated
2 3
586 365
448 495
654 303
626 306
587 309
582 384
508 456
415 541
587 356
499 186
672 271
789 190
651 334
571 391
706 260
482 491
609 368
687 280
646 330
535 431
527 421
553
490
634
654
685
617
472
378
352
792
563
398
634
663
386
366,
328
312
282
353
488
418
440
173
254
272
353
318
4
2
1
2
2
5
1
N
o 2
2
1
2
5
3
6
4
8
1
3
4
7
3
1
1
o 3
1
4
4
6
4
1
6
1
5
6
6
6
11
13
4
8
9
3
9
4
2
4
5
5
4
13
2
2
3
5
9
16
10
15
3
5
11
11
5
8
12
3
5
6
4
1
2
3
4 9
6
8
3
3
4
2
3
4
7
o o 6
2
2
5
8
10
4
6
1
5
12
12
2
4
10
1
5
7
o o o o o o o o o o o o o
o o o o o o o o o o o o o o o o o o o o o o
8
21
34
21
22
36
2
10
11
34
215
41
11
2
11
5
N
o 3
12
19
24
9
11
9
9
25
41
5
7
9
14
78
4
2
3
7
5
2
2
2
1
10
17
11
74 44
10 0
8 1
3 3
18 3
15 '10
94 75
92 81
22 0
136 25
208 97
o 0
3 1
10
o o o o o o o o o o o o o
N
o o o o o N
N
o N
o o o 2
N
o o o o o o o
11
2
3
1
2
4
5
1
2
1
3
o
3
4
2
5
2
9
1
3
2
2
o 2
3
o N
2
2
o 3
2
1
12
3
3
3
3
4
4
3
3
2
5
o 2
3
5
8
5
8
5
4
4
4
6
4
o 8
o o 3
6
6
o 3
1
3
13
N
o o
N
o o
N
N
o o 2
1
1
N
N
o o o o
N
N
N
1
o 3
o 1
N
N
o o o o o

150 REPORT ON HOUSING AND ESTABLISHMENTS
E-ll. (2) Distribution of 1,000 census households living in census houses used wholly or partly as dwellings by types of census houses and tenure status in urban areas (contd.)
(Based on 20% sample)
Dwellings Shop-cum-dwellings Workshop-cumdwellings
Dwellings with other uses
State{District/Taluk/ City/Town with
population of 50,000 and above d Not Not d Not Not
Owned Rente stated Owned Rented stated Owne Rented stated Owned Rented stated
1 2
COIMBATORE DISTRICT 384
Bhavani Taluk 578
3
571
391
4
3
2
Gopichettipalayam Taluk
Erode Taluk
Erode (M)
Dharapuram Taluk
PaJ1adam Taluk
Tiruppur (M)
Avanashi Taluk
Coimbatore Taluk
Coimbatore (M)
PoJ1achi Taluk
Pollachi (M)
Valparai (P)
Udumalpet Taluk
NILGIRI DISTRICT
Gudalur Taluk
Ootacamund Taluk
Oota~'amund (M)
Coonoor Taluk
MADURAI DISTRICT
Dindigul Taluk
Dindigul (M)
Palni Taluk
Kodaikanal Taluk
Periyakulam Taluk
Nilakkottai Taluk
Melur Taluk
Madurai Taluk
Madurai (M)
Tirumangalam Taluk
TRIUCHIRAPALU DISTRICT
Perambalur Taluk
Udaiyarpalayam Taluk
534 430
420 561 2
318 658 2
561 402 1
466 464 2
400 528 1
515 444 6
358 595 3
282 672 2
233 721 4
786 646 3
18 954 6
443 497 28
222 707 46
258 603 110
145 824 6
146 824 6
265 675 36
443 522 2
468 501 1
454 516 1
624 348 2
298 678 14
636 353 N
612 376
622 362
285 662 2
252 689 2
668
478
750
720
317
499
221
214
3
2
9
o
5
7
14
6
4
5
20
9
8
7
5
4
9
15
2
9
3
2
5
3
2
4
5
5
9
2
4
2
1
3
4
2
2
4
2
6
10
3
8
4
5
5
9
11
8
9
9
19
26
11
11
10
13
9
11
9
3
3
3
5
2
2
3
4
N
3
6
1
7
N
o
o o o o o o o
N
N
N
o N
o
o o o o o
N
o o o o
N
o N
N
o
o o o
8
10
3
7
2
2
3
27
23
7
12
11
2
4
N
3
N
o 1
N
8
8
8
3
o 2
2
4
13
14
5
8
o 50
9
9
4
9
2
3
2
19
24
6
13
14
4
8
3
3
2
2
2
15
8
7
3
2
N
o 1
29
32
3
4
3
6
10
N
o
o o o o o o N
N
o o o o
N
o o o 1
o o o o o o o o o o o
N
o o
11
2
3
o 2
J
4
1
2
2
2
4
2
3
4
3
3
3
1
1
3
2
1
1
2
1
1
4
12
4
2
4
3
4
2
3
3
5
4
5
6
8
5
4
6
8
6
5
6
2
5
5
3
2
2
3
6
2
2
3
6
2
13
N
o
o o o o o o o N
N
o o o o
1
o N
N
N
N
N
o o
N
1
o N
N
. 0
N
o
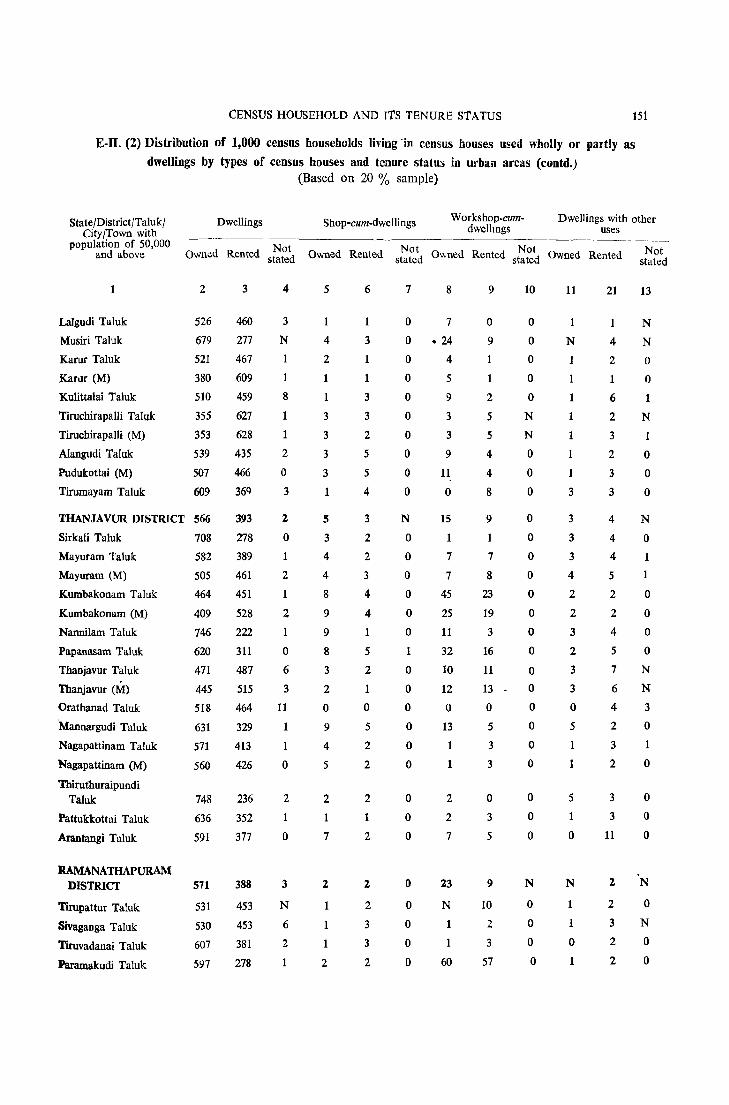
CENSUS HOUSEHOLD AND I1'S TENURE 81 ATUS 151
E-U. (2) Distribution of 1,000 census households living in census houses used wholly or partly as
dwellings by types of census houses and tenure status in urban areas (contd.)
Dwellings State/District/Taluk/ City/Town with
population of 50,000 and above Not
Owned Rented stated
Lalgudi Taluk
Musiri Taluk
Karur Taluk
Kamf (M)
Kulittalai Taluk
Tiruchirapalli Taluk
Tiruchirapalli (M)
Alangudi Taluk
Pudukottai (M)
Tirumayam Taluk
2
526
679
521
380
510
355
353
539
507
609
THANJA VUR DISTRICT 566
Sirkali Taluk 708
Mayuram Taluk 582
Mayuram (M) 505
Kumbakonam Taluk 464
Kumbakonam (M) 409
Nannilam Taluk 746
Papanasam Taluk 620
Thanjavur Taluk 471
Thanjavur eM:) 445
Orathanad Taluk 518
Mannargudi Taluk 631
Nagapattinam Taluk 571
Nagapattinam (M) 560
Thiruthuraipundi Taluk
Pattukkottai TaIuk
Arantangi TaIuk
RAMANATHAPURAM DISTRICT
Tirupattur Taluk
Sivaganga TaIuk
Tiruvadanai Taluk
Paramakudi Taluk
748
636
591
571
531
530
607
597
3
460
277
467
609
459
627
628
435
466
36Q
393
278
389
461
451
528
222
311
487
515
464
329
413
426
236
352
377
388
453
453
381
278
4
3
N
1
1
8
1
1
2
o 3
2
o 1
2
1
2
1
o 6
3
11
1
o
2
1
o
3
N
6
2
1
(Based on 20 % sample)
Shop-cum·dwellings Workshop·cumdwellmgs
Dwellings with other uses
Owned Rented Not Not stated O\\ned Rented stated Owned Rented Not
stated
5
1
4
2
1
1
3
3
3
3
5
3
4
4
8
9
9
8
3
2
o 9
4
5
2
1
7
2
1
1
1
2
6
1
3
1
3
3
2
5
5
4
3
2
2
3
4
4
1
5
2
1
o 5
2
2
2
1
2
2
2
3
3
2
7 8
o 7
o .24
o 4
o 5
o 9
o 3
o 3
o 9
o 11
o 0
N
o o o o o o 1
o o o o o o
o o o
o o o o o
15
1
7
7
45
25
11
32
10
12
o 13
1
1
2
2
7
23
N
1
1
60
9
o 9
1
1
2
5
5
4
4
8
10
o o o o o
N
N
o o o
9 0
o 7 0
8 0
23 0
19 0
3 0
16 0
11 0
13. 0
o 0
5 0
3 0
3 0
o 3
5
9
10
2
3
57
o o o
N
o o o o
11
1
N
1
1
1
1
1
1
1
3
3
3
3
4
2
2
3
2
3
3
o 5
1
1
5
1
o
N
1
1
o 1
21
1
4
2
1
6
2
3
2
3
3
4
4
4
5
2
2
4
5
7
6
4
2
3
2
3
3
11
2
2
3
2
2
13
N
N
o o
N
1
o o o
N
o
o o o o N
N
3
o 1
o
o o o
N
o N
o o
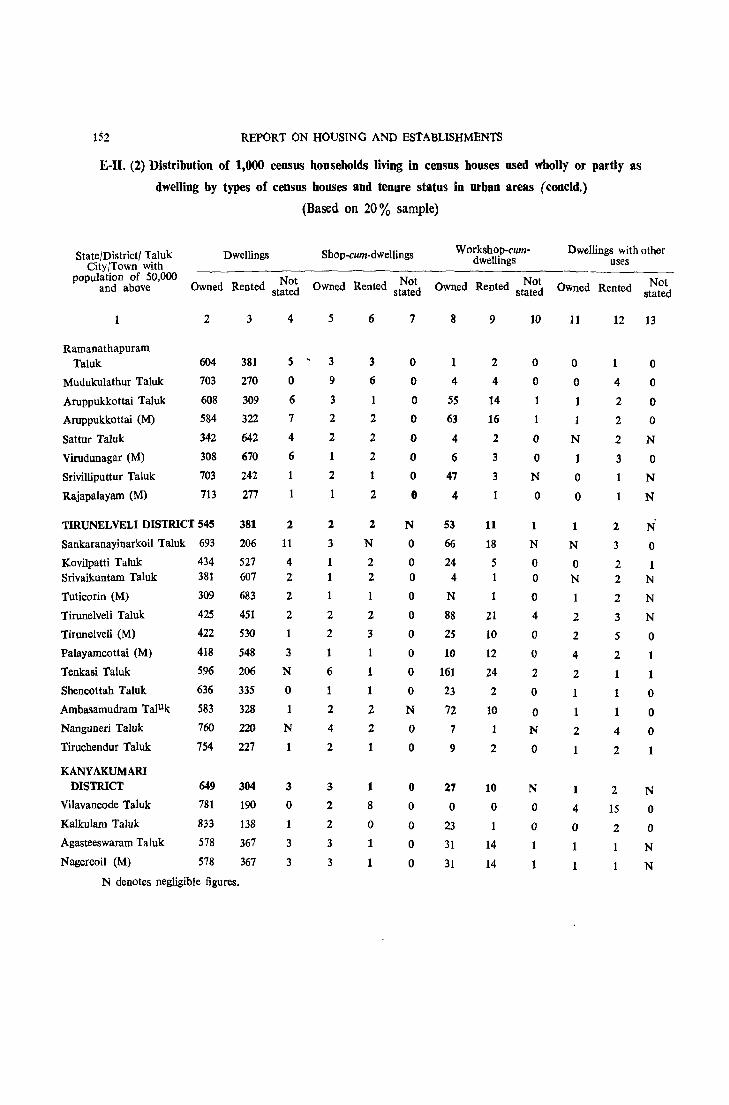
152 REPORT ON HOUSING AND ESTABLISHMENTS
E-I1. (2) Distribution of 1,000 census households living in census houses used wholly or partly as
dwelling by types of census houses and tenure status in urban areas (concld.)
(Based on 20% sample)
Dwellings Shop-cum·dwellings State/District/ Taluk City/Town with
population of 50,000 and above d Not R d Not
Owned Rente stated Owned ente stated
Ramanathapuram Taluk
Mudukulathur Taluk
Aruppukkottai Taluk
Aruppukkottai (M)
Sattur Taluk
Virudunagar (M)
Srivilliputtur Taluk
Rajapalayam (M)
2
604
703
608
584
342
308
703
713
TIRUNELVELI DISTRICT 545
Sankaranayinarkoil Taluk 693
Kovilpatti Taluk 434 Srivaikuntam Taluk 381
Tuticorin (M) 309
Tirunelveli Taluk 425
TirunelveJi (M) 422
Palayamcottai (M)
Tenkasi Taluk
Shencottah Taluk
Ambasamudram Taluk
Nanguneri Taluk
Tiruchendur Taluk
KANYAKUMARI DISTRICT
Vilavancode Taluk
Kalkulam Taluk
Agasteeswaram Ta tuk
Nagercoil (M)
418
596
636
583
760
754
649
781
833
578
578
3
381
270
309
322
642
670
242
277
381
206
527 607
683
451
530
548
206
335
328
220
227
304
190
138
367
367
N denotes negligible figures.
4
5
o 6
7
4
6
1
1
2
11
4 2
2
2
1
3
N
o 1
N
1
3
o
3
3
5
3
9
3
2
2
2
2
3
1
1
2
2
1
6
1
2
4
2
3
2
2
3
3
6
3
6
2
2
2
2
2
N
2 2
1
2
3
1
1
1
2
2
1
1
8
o 1
1
7
o o o o o o o o
N
o o o o o o o o o N
o o
o o o o o
Workshop-cumdwellings
R d Not Owned ente stated
8
4
5S
63
4
6
47
4
53
66
24 4
N
88
25
10
161
23
72
7
9
27
o 23
31
31
9
2
4
14
16
2
3
3
1
11
18
5
21
10
12
24
2
10
1
2
10
o
14
14
10
o o
o o
N
o
1
N
o o o 4
o o 2
o o N
o
N
o o 1
1
Dwellings with other uses
Not Owned Rented stated
11
o o 1
N
1
o o
1
N
o N
2
2
4
2
1
1
2
1
1
4
o 1
1
12 13
1
4
2
2
2
3
1
1
2
3
2 2
2
3
5
2
1
1
1
4
2
2
15
2
1
1
o o o o
N
o N
N
N
o 1
N
N
N
o
1
o o o 1
N
o o
N
N

CHAPTER V
CENSUS HOUSE-ITS ECONOMIC ACTIVITY
5 • I. This is an important Chapter in which the economic significance of the Census houses will be discussed based on the Table E·III. Table E·IIl had a limited scope originally.
This Table IS based on columns 5 to 8 of the househst. They were Introducing Table E-III to be filled in only in cases where the Census house was used as an
establishment, workshop or factory, i.e., where some kind of production, processing, repair or servicing was undertaken or where goods were made or manufactured and sold. In all other cases, 'X' was to be written in columns 5-8 of the houselist form. In col. 5, name of establishment or proprietor was written and in column 6, name of product, repair or servicing undertaken. In column 7 was recorded average number of persons employed daily during the previous week including the proprietor or members of his household. In column 8, the kind of fuel or power was to be indicated, if machinery was used in such production, servicing or repair. In all other cases, a 'nil' return was made. E-III was intended to exhibit Census houses used as factories and workshops classified by industry, power used and size of employment. It would, therefore, mean that such factories and workshops which employed machinery would be included in this Table as using power.
5 ~ 2. The scope of the Table was considerably widened during tabulation. All establishments listed in column 5 were coded and classified though it meant that the original purpose
for which the Table was intended was departed from. It enabled Scope of Table E-III us to have a classification of workshops and factories based on
the use of power, but as the original entries regarding fuel were made only in cases where machinery was used it could result in fuel not being stated even in cases fuel was actually used. This complete tabulation would no doubt help us to discuss the dispersal of establishments, factories and workshops in the State classified by industries and occupation. It would be a useful discussion. But it would not give us a complete picture of the use of power in various occupations and industries, such information being limited to those in which machinery was an integral part. At the same time, it would give us an idea of the manpower employed in the various industries, workshops and establishments.
5 - 3. Table E-llI shows the Census houses used as factories and workshops classified by industry, power and size of employment. It was prepared on a full count basis. We have
already explained in the earlier Chapter how a factory is to be Contents of E-I1I distinguished from a workshop. Regarding the exhibition of
power, it has to be pointed out that power was elicited only in cases where a machinery was actually used in the workshop or factory. As such, in those cases where no machinery and power was used, such cases would not be exhibited in the table, but would be group be grouped under "no fuel".
5 - 4. Industry has been classified based on the Standard Industrial Classification of all economic activity prepared by the Government of India for being used by its various Fact
Finding Agencies. Code numbers have been devised for each Classification of Industry industrial group on what is known as the 3-digit system. It is
closely related to international usage as recommended by the International Labour Organisation.
H-20

154 REPORT ON HOUSING AND ESTABLISHMENTS
5 - 5. To understand the Table, it is necessary to distinguish between the concept of industy and of occupation. Industry means the sector of economic activity in which the earner
Industry distinct from occupation
is engaged i. e. textile industry, automobile industry and so on whereas occupation describes the exact function which an individual performs in that sector, viz. fitter, carpenter. In the three
digit code, the first digit represents the division under which that activity is classified. Each division is then divided into a number of major groups which are indicated by the second digit. Each major group is again sub-divided into number of minor groups which are indicated by the third digit.
5 - 6. manufacturing. description are
For the purpose of this Table, we are concerned with the division 2 and 3 i. e. The major groups and minor groups that comprise this division and their
reproduced below.
Division 2 & 3: Manufacturing
Major S.
Minor Group Group (Code) No. (Code)
20. FOODSTUFFS:
1. production of rice, atta, flour, etc. by
milling, dehusking and processing of crops and foodgrains 200
2. production of sugar and syrup from sugarcane in mills 201
3. production of indigenous sugar, gur from sugarcane or palm juice and production
of candy 202 4. Production of fruit products such as jam,
jelly, sauce and canning and preserva-tion of fruits 203
5. Slaughtering, preservation of meat and fish and canning of fish 204
6. Production of bread, biscuits, cake and other bakery products 205
7. Production of butter, ghee, cheese and other dairy products 206
8. Production of edible fats and oil (other than hydrogenated oil) 207
9. Production of hydrogenated oil (Vanas-
~ij D 10. Production of other food products such
as sweet-meat and condiments, muri,
murki, chira, khoi, cocoa, chocolate, toffee, lozenge 209
21. BEVERAGES:
1. Production of distilled spirits, wines, liquor from alcoholic malt, fl uits and malts in distillery and brewery 210
Major S.
MInor Group
No. Group
(Code) (Code)
2. Production of country liquor 211 3. Production of indigenous liquor such as
toddy, liquor from mahua, palm Juice 212 4. Production of other liquors not covered
above 213 5. Production of aerated and mineral water 214 6. Production of ice 215 7. Production of ice cream 216 8. Production of tea in factories 217 9. Processing of coffee in curing works 218
10. Production of other beverages 219
22. TOBACCO PRODUCTS:
1. Manufacture of bidi 220 2. Manufacture of cigars and cheroots 221 3 Manufacture of cigarette & cig. tobacco 222 4. Manufacture of hookah tobacco 223
5. Manufacture of snuff 224 6. Manufacture of jerda and other chewing
tobacco 225 7. Manufacture of other tobacco products 226
23. TEXTILES - Cotton;
1. Cotton ginning, cleaning, pressing and baling 230
2. Cotton spinning (other than in mills) 3. Cotton spinning and weaving in mills 4. Cotton dyeing, bleaching 5. Cotton weaving in power looms 6. Cotton weaving in handlooms
231 232 233 234
235

CENSUS HOUSE-ITS ECONOMIC ACTIVITY 155
Division 2 & 3: Manufacturing (contd.)
Major s. Group (Code) No.
Minor Major S. Group Group (Code) (Code) No.
Minor Group (Code)
7. Manufacture of Khadi textiles in hand-
looms 236
8. Printing of cotton textile 237
9. Manufacturing of cotton nets 238
10. Manufacturing of cotton, cordage, rope
and twme 239
24. TEXTILE - Jute:
1. Jute pressing and baling 240
2. Jute spmning and weaving 241
3. Dyeing and bleaching of jute 242
4. Printing of jute textile 243
5. Manufacture of other products like rope,
cordage from jute and similar fibre such
as hemp, mesta 244
2<. TEXTILE - Wool:
1. Wool baling and pressing 2. Wool cleaning and processing (scouring)
3. Wool spinning and weaving in mill
4. Wool spinning other than in mills
5. Wool weaving in power 100m
250 251 252 253
254
6. Wool weaving in handloom 255
7. Embroidery and art work in woollen
textile 256
26. TEXTILE - Silk:
1. Spinning and weaving of silk textile in
~ll 2m 2. Dyemg and bleaching of silk 261 3. Spinmng of silk other than in mills 262
4. Weaving of silk textile by power 100m 263
5. Weaving of silk textile by handloom 264
6. Printing of silk textile 265 7. Manufacture of silk cordage, rope and twine 266
27. TEXTILE - MISCELLANEOUS:
1. Manufacture of carpet and all other
similar type of textile products 270
2. Manufacture of hosiery and other knitted
fabrics and garments 271
3. Embroidery and makmg of crepe lace
and fringes 272
4. Making of textile garments including rain
coats and headgear 273
5. Manufacture of madeup textile goods
except wearing apparel such as curtains,
pillow cases, bedding materials, mattress,
textile bags
6. Manufacture of waterproof textile pro-
274
ducts such as oil cloth, tarpaulin 275
7. Manufacture and recovery of all types
of fibres for purposes of padding, wad-ding and upholstery filling 276
8. Manufacture of COlr and coir products 277
9. Manufacture of umbrellas 278
10. Processing and manufacture of textile
products not covered above
28. MANUFACTURE OF WOOD AND
WOODEN PRODUCTS:
1. Sawing and planing of wood
2. Manufacture of wooden furniture and
279
280
fixtures 281
3. Manufacture of structural wooden goods (including treated limber) such as
beams, posts, doors, wmdows 282
4. Manufacture of wooden industrial goods
other than transport equipment such as
bobbin and similar equipment and
fixtures 283
5. Manufacture of other wooden products such as utensils, toys artwares 284
6. Manufacture of veneer and plywood 285
7. Manufacture of plywood products such
as tea chest 286
8. Manufacture of boxes and packing cases
other than plywood 287
9. Manufacture of materials from cork,
bamboo, cane, leaves and other allied
products 288
10. Manufacture of other wood and allied
products not covered above 289

156 REPORT ON HOUSING AND ESTABLISHMENTS
Division 2 & 3: Manufacturing (eontd.)
Malor s. Group (Code) No
Mmor Major S Minor Group (Code)
Group Group (Code) (Code) No.
29. PAPER AND PAPER PRODUCTS:
1. Manufacture of pulp from wood, rags, wastepaper and other fibres and the converSion of such pulp into any kind
of paper and paper board in mill 290 2. Manufacture of pulp from wood, rags,
wastepaper and other fibres and the conversion of such pulp into any kind of paper and paper board handmade 291
3. Manufacture of products such as paper bags, boxes, cards, envelopes and moulded pulp goods from paper, paper board
and pulp 292 30. PRINTING AND PUBLISHING:
1. Printing and pubhshmg of newspapers
and penodicals 2. Printing and publishmg of books
3. All other types of printing Including lithography, engraving, etchIng, block making and other work connected with
300 301
printIng industry 302 4. All types of binding, stitching, SIzing
and other allied work connected WIth binding industry
31. LEATHER AND LEATHER PRODUCTS:
1. Currying, tanning and finishing of hides and skms and preparatIOn of fimshed
303
leather 310 2. Manufacture of shoes and other leather
footwear 3 I I 3. Manufacture of clothing and wearing
appaJel (except footwear) made of leather
and fur 312 4. Manufacture of leather products (except
those covered by code No. 311, 312) such as leather upholstery, suitcases,
pocket books, cigarette and key cases, purses, saddlery, whIp and 0ther articles 313
5. Repair of shoes and other leather foot· wear 314
32. RUBBER, PETROLEUM AND COAL PRODUCTS:
1. Manufacture of tyres and tubes 320
2. Manufacture of rubber footwear 321 3. Manufacture of rubber goods used for
industrir,1 purpose 322
4. Manufacture of all kinds of other rubber products from natural or synthetic rubber includmg rubber raincoat 323
5. ProductIOn of petroleum, kerosene and other petroleum products in petroleum refinenes 324
6. ProductIOn of coaltar and coke in coke oven 325
7. Manufacture of other coal and coaltar products not covered elsewhere 326
33. CHEMICALS AND CHEMICAL PRODUCTS:
1. Manufacture of bm,ic industrial chemicals such as acids, alkalis and their salts not elsewhere specified 330
2. Manufacture of dyes, paints, colours and
varnishes 331 3. Manufacture of fertilisers 332
4. Manufacture of ammunition, explosives and fireworks 333
5. Manufacture of matches 6. Manufacture of medicines, pharmaceutical
preparations, perfumes, cosmetics and
334
other toilet preparations except soap 335 7. Manufacture of soda and other washing
and cleaning compounds
8. Manufacture of turpentine, synthetic, resin and plastic products and materials
336
(including synthetic rubber) 337
9. Manufacture of common salt 338 10. Manufacture of other chemicals and
chemical products not covered above (including inedIble OIls and fats) 339
34. NON-METALLIC MINERAL PRODUCTS
OTHER THAN PETROLEUM AND COAL:
6. Repair of all other leather products I, Manufacture of structural clay products except foo.twear 315 such as bricks, tiles 340
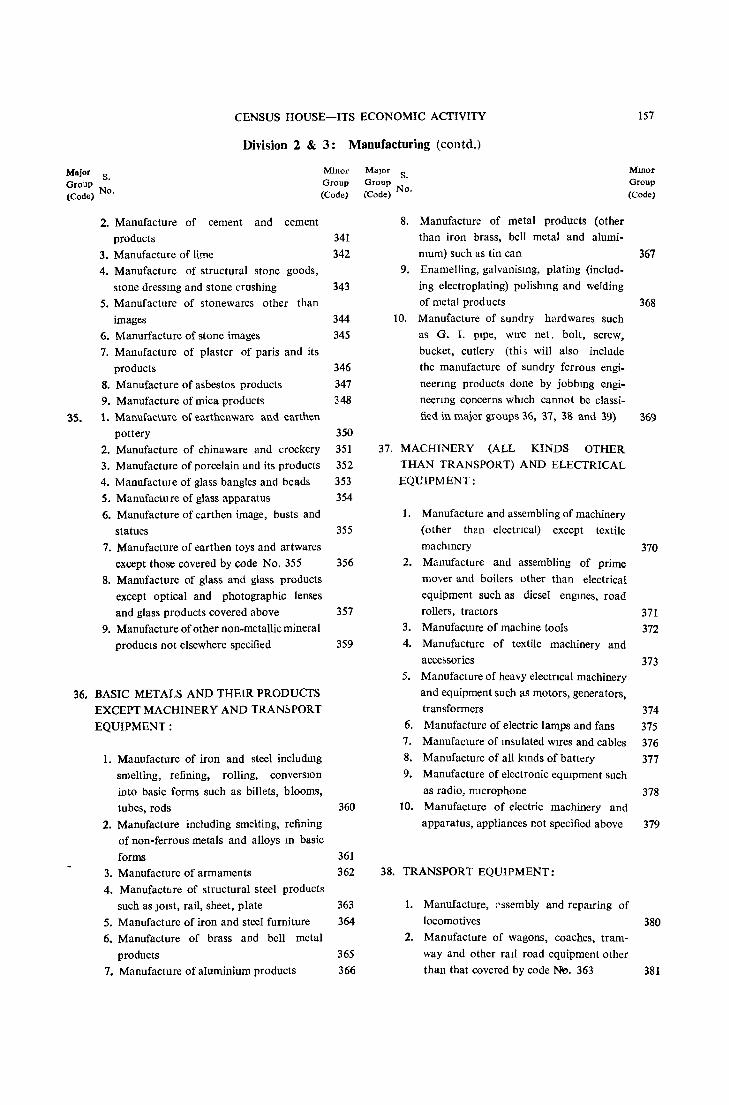
CENSUS HOUSE-ITS ECONOMIC ACTIVITY 157
Division 2 & 3: Manufacturing (contd.)
Major S. Group (Code) No.
Minor Group (Code)
35.
2. Manufacture of cement and cement products 341
3. Manufacture of lime 342 4. Manufacture of structural stone goods,
stone dressmg and stone crushing 343 5. Manufacture of stonewares other than
images 344 6. Manurfacture of stone images 345
7. Manufacture of plaster of paris and its products 346
8. Manufacture of asbestos products 347 9. Manufacture of mica products 348 1. Manufacture of earthenware and earthen
pottery 350
2. Manufacture of chinaware and crockery 351 3. Manufacture of porcelain and its products 352
4. Manufacture of glass bangles and beads 353 5. Manufacture of glass apparatus 354
6. Manufacture of earthen image, busts and
statues 355 7. Manufacture of earthen toys and artwares
except those covered by code No. 355 356 8. Manufacture of glass and glass products
except optical and photographic lenses and glass products covered above 357
9. Manufacture of other non-metallic mineral products not elsewhere specified 359
36. BASIC METALS AND THEIR PRODUCTS EXCEPT MACHINERY AND TRAN~PORT
EQUIPMENT:
1. Manufacture of iron and steel includmg smelting, refining, rolling, conversIOn
into basic forms such as billets, blooms, tubes, rods 360
2. Manufacture including smelting, refining of non-ferrous metals and alloys m basic
forms 361
3. Manufacture of armaments 362
4. ManufactlJre of structural steel products such as JOist, rail, sheet, plate 363
5. Manufacture of iron and steel furniture 364 6. Manufacture of brass and bell metal
products 365 7. Manufacture of aluminium products 366
Major S. Group (Code) No.
8. Manufacture of metal products (other than iron brass, bell metal and alumi-
Mmor Group
(Code)
mum) such as tin can 367 9. Enamelling, galvanismg, plating (includ
ing electroplating) polishmg and welding of metal products 368
10. Manufacture of sundry hardwares such as G. 1. pipe, wire net. bolt, screw, bucket, cutlery (this will also include the manufacture of sundry ferrous engineenng products done by jobbmg engineerIng concerns which cannot be classi-
fied in major grcups 36, 37, 38 and 39) 369
37. MACHINERY (ALL KINDS OTHER THAN TRANSPORT) AND ELECTRICAL EQUIPMENT:
1. Manufacture and assembling of machinery (other than electncal) except textile
machmery 370 2. Manufacture and assembling of prime
mover and boilers other than electrical
equipment such as diesel engmes, road rollers, tractors 371
3. Manufacture of machine tools 372 4. Manufacture of textile machinery and
accessories 373 5. Manufacture of heavy electncal machinery
and equipment such as motors, generators, transformers 374
6. Manufacture of electric lamps and fans 375 7. Manufacture of msulated wires and cables 376 8. Manufacture of all kmds of battery 377 9. Manufacture of electronic eqUipment such
as radio, microphone 378 10. Manufacture of electric machinery and
apparatus, appliances not specified above 379
38. TRANSPORT EQUIPMENT:
1. Manufacture, :'ssembly and repairing of
locomotives 380 2. Manufacture of wagons, coaches, tram
way and other raIL road equipment other than that covered by code 1'«1. 363 381
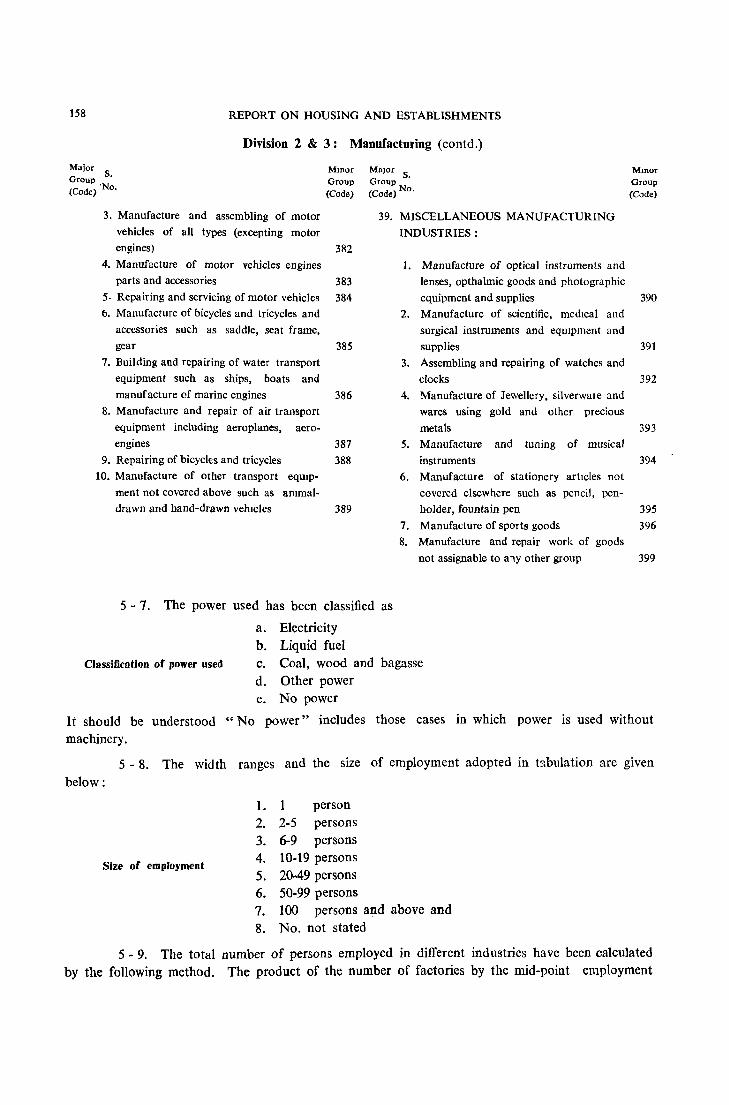
158 REPORT ON HOUSING AND ESTABLISHMENTS
Division 2 & 3: Manufacturing (contd.)
Major S Group . (Code) 'No.
Mmor Group (Code)
Major S. Group (Code) No,
Mmor Group (Code)
3. Manufacture and assembling of motor 39. MISCELLANEOUS MANUFACTURING vehicles of all types (excepting motor INDUSTRIES: engines) 382
4. Manufacture of motor vehicles engines parts and accessories 383
5· Repairing and servicing of motor vehicles 384 t>. Manufacture of bicycles and tricycles and
accessories sueh as saddle, seat frame, gear 385
7. Building and repairing of water transport equipment such as ships, boats and
manufacture of marine engines 386 8. Manufacture and repair of air transport
equipment including aeroplanes, aero-
~~~s 3n 9. Repairing of bicycles and tricycles 388
10. Manufacture of other transport eqUIpment not covered above such as ammal-drawn and hand-drawn vehIcles 389
5 - 7. The power used has been classified as
a. Electricity b. Liquid fuel
1. Manufacture of optical instruments and lenses, opthalmic goods and photographic
equipment and supplies 390 2. Manufacture of scientific, medIcal and
surgical instruments and eqUIpment and supplies 391
3. Assembling and repairing of watches and clocks 392
4. Manufacture of Jewellery. silverwale and wares using gold and other precious
metals 393 5. Manufacture and tuning of musical
instruments 394 6. Manufacture of stationery articles not
covered elsewhere such as pencil, pen-holder, fountain pen 395
7. Manufacture of sports goods 396 8. Manufacture and repair work of goods
not assignable to any other group 399
Classification of power used c. Coal, wood and bagasse d. Other power e. No power
It should be understood "No power" includes those cases in which power is used without machinery.
5 - 8. The width ranges and the size of employment adopted III tabulation are given below:
1. 1 person 2. 2-5 persons 3. 6-9 persons 4. 10-19 persons 5. 20-49 persons
Size of employment
6. 50-99 persons 7. 100 persons and above and 8. No. not stated
5 - 9. The total number of persons employed in different industries have been calculated by the following method. The product of the number of factories by the mid-point employment

CENSUS HOUSE-ITS ECONOM1C ACTlV1TY 159
of each range has been summed up. The mid-point has been worked out on the following principle. The first and last numbers have been added and divided by 2. Thus, the mid-point
used is 3'5 in the range 2 to 5 persons, 7'5 in the range 6 to 9 Total employments method of persons, 14'5 in the range 10 to 19 persons, 34'5 in the range 20
calculation to 49 persons and 74'5 in the range 50 to 99 persons. For units employing more than 100 persons, original houselists have been
perused and actual number of persons employed in each unit compute~. No doubt, the information wIll be approximate. But it will form a useful guide for the purpose of discussion in this report. The units as in Table E. II have been adopted for this table also. In order to economise in printing, we have not, however, presented taluk figures in this report. The table relates both to small-scale manufacturing, repairing, processing or service establishments, workshops and large-scale factories. Details of the products manufactured, processed or repaired under the 3 digit code of r.S.I.C. along with the number of workshops and factories and their distribution according to difference in sizes of employment using various kinds of fuel or power have been furnished.
5 - 10. This is perhaps the first time when informltion on the total numbu of workshops and factories in the country classified on the above basis has been made available to the
reader. This information will also be useful to the Ministries E-III: Its uses dealing with the industry as well as fuel and power. This Table
will provide a frame for the collection of all basic industrial statistics.
5 - 11. Three subsidiary tables have been prepared. E. III-l shows the number of workshops and factories according to division and major groups and selected minor groups to
1000 workshops and factories in the State as well as the districts Subsidiary tables to E-III with rural/urban break-up. Minor groups which have recorded
a proportion of 1 and more have been picked out and shown as selected minor groups. E.III-2 shows the distribution of thousand workshops and factories with each kind of fuel used by size of employment in tlte State, district, rural and urban, City and Town with population of 50,000 and above. E.III-3 shows the distribution of thousand workshops and factories in each division, major group and selected minor group3 by kind of fuel used for the same units as in E.III-2.
5 - 12. At the outset, we wish to give a general idea of the importance of industries in the State based on the number of Factories and Workshops classified according to the projuct
Important industries in urban sector
manufactured, processed, repaired or serviced. OUf dis;;usston will be first based on E.TII-I. No attempt has been made in E.I11 table to present data for the whole State. They have been presented for rural and urban tracts separately. As such,
our analysis will be made separately for the two sectors. In the urban sector of the State, out of every thousand workshops-
406 are under minor group 235· Handlooms.
110 are under minor group 273 - Making of textile garments.
73 are under minor group, 393 - Manufacture of jewellery, silverware etc.
56 are under minor group 388 - Repairing of bicycles, and tricycles.
40 are under minor group /,00 - Processing of foodgrains.
32· are under minor group 369 - Manufacture of sundry hardwares.
24 are under minor group 264 - Weaving of silk textile by handloom.

160 REPORT ON HOUSING AND ESTABLISHMENTS
21 are under minor group 220 - Manufacture of bidi. 16 are under minor group 384 - Repairing and servicing of motor vehicles. 12 are under minor group 205 - Production of bread, biscuits, etc.
In the 12 are under minor group 302 - All other types of printing like engraving, lithography. rural sector, the break-up is as follows:
489 are under minor group 235 - Handlooms. Important industries in rural
sector 62 are under minor group 369 - Manufacture of sundry hardwares.
56 are under mmor group 393 - Jewellery. 54 are under minor group 200 - Processing of foodgrains. 53 are under minor group 273 - Making of textile garments. 52 are under minor group 388 - Repairing of bicycles and tricycles. 32 are under minor group 350 - Manufacture of earthenware and earthen pottery. 27 are under minor group 264 - Weaving of silk textile by handloom. 27 are under minor group 288 - Manufacture of materials from cork, bamb(Jo, cane,
leaves etc. 19 are under minor group 282 - Manufacture of structural wooden goods. 10 are under minor group 220 - Manufacture of bidi.
5 - 13. We give another statement indicating the number of workers employed in these industries.
Statement V-l
Number of units and number of workers in important industries in the State
Proportion for Actual No. Actual No. of Description Code No. of units of units workers
No. ,...-.A... __ , ,--_.A. ___ , .----"----, Urban Rural Urban Rural Urban Rural
Handloom 235 406 489 43,228 41,857 130,228 108,933 Tailoring 273 110 53 11,748 4,537 11,398 2,618 Jewellery 393 73 56 7,797 4,777 24,254 11,596 Cycle repairs 388 56 52 5,937 4'477 6,\\9 3,212 Foodgrains 200 40 54 4,229 4,607 25,651 22,097 Sundry hardware 369 32 62 3,438 5,283 16,164 11,000 Silk Handloom 264 24 27 2,567 2,326 8,508 7,679 Bidl Manufacturing 220 21 10 2,257 871 20,085 8,050 Motor Vehicles 384 16 1,653 69 22,492 1,094 Bakery 205 12 3 1,269 271 4,461 984 Pnnting 302 12 1 1,314 43 15,069 270 Pottery 350 6 32 620 2,773 1,672 7,076 Cork bamboo 288 5 27 513 2,282 1,463 4,974 Carpentry 282 7 19 704 1,647 2,543 3,317
Total 820 886 87,274 75,820 290,107 192,900
Total for all the industries in the State 106,576 85,588 532,595 282,463
Note: \
The No. of workers shown above excludes thost: employed in census houses used as factories and work-shops for which the number of persons WOlkmg have not been returned.
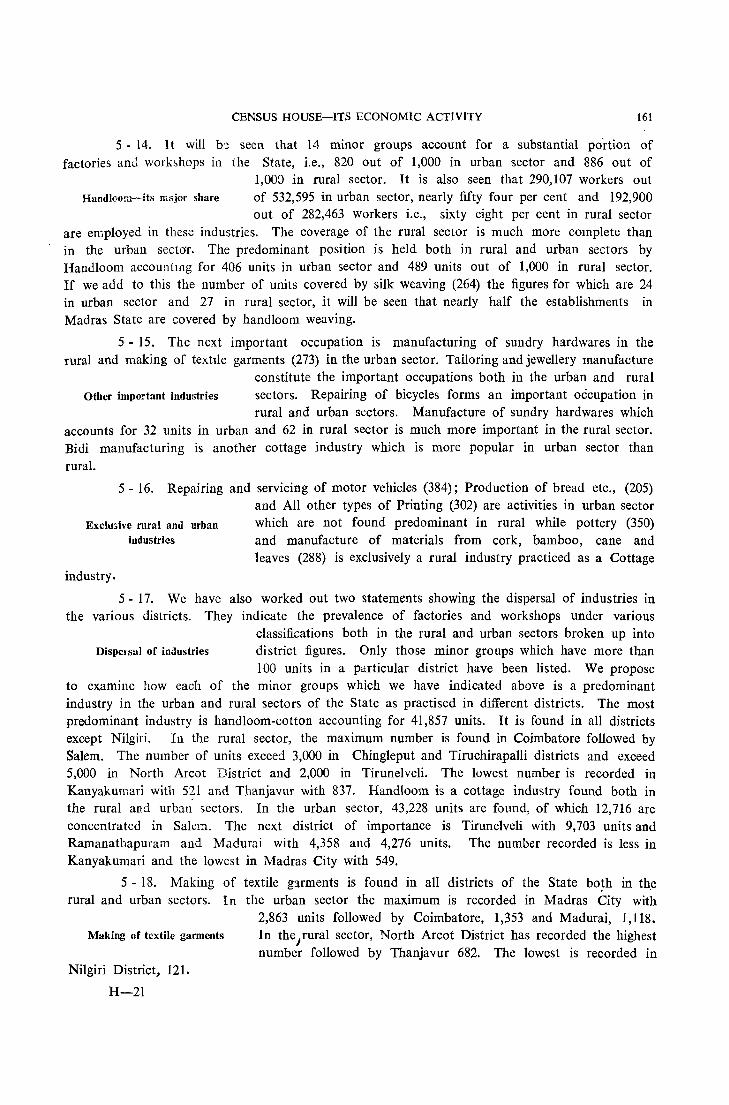
CENSUS HOUSE-ITS ECONOMIC ACTIVITY 161
5 - 14. It will b'! seen that 14 minor groups account for a substantial po'rtion of factories and worhhops in the State, i.e., 820 out of 1,000 in urban sector and 886 out of
1,000 in rural sector. It is also seen that 290,107 workers out Handloom-its major share of 532,595 in urban sector, nearly fifty four per cent and 192,900
out of 282,463 workers i.e., sixty eight per cent in rural sector are employed in these industries. The coverage of the rural sector is much more complete than in the urban sectar. The predominant position is held both in rural and urban sectors by Handloom accountH1g for 406 units in urban sector and 489 units out of 1,000 in rural sector. If we add to this the number of units covered by silk weaving (264) the figures for which are 24 in urban sector and 27 in rural sector, it will be seen that nearly half the establishments in Madras State are covered by handloom weaving.
5 - 15. The next important occupation is manufacturing of sundry hard wares in the rural and making of textile garments (273) in the urban sector. Tailoring and jewellery manufacture
constitute the important occupations both in the urban and rural Other important industries sectors. Repairing of bicycles forms an important occupation in
rural and urban sectors. Manufacture of sundry hard wares which accounts for 32 units in urban and 62 in rural sector is much more important in the rural sector. Bidi manufacturing is another cottage industry which is more popular in urban sector than rural.
5 - 16. Repairing and servicing of motor vehicles (384); Production of bread etc., (205) and All other types of Printing (302) are activities in urban sector
Exclusive rural and urban which are not found predominant in rural while pottery (350)
industry.
industries and manufacture of materials from cork, bamboo, cane and leaves (288) is exclusively a rural industry practiced as a Cottage
5 - 17. We have also worked out two statements showing the dispersal of industries in the various districts. They indicate the prevalence of factories and workshops under various
classifications both in the rural and urban sectors broken up into Dispersal of industries district figures. Only those minor groups which have more than
100 units in a particular district have been listed. We propose to examine how each of the minor groups which we have indicated above is a predominant industry in the urban and rural sectors of the State as practised in different districts. The most predominant industry is hand loom-cotton accounting for 41,857 unit~. It is found in all districts except Nilgiri. In the rural sector, the maximum number is found in Coimbatore followed by Salem. The number of units exceed 3,000 in Chingleput and Tiruchirapalli districts and exceed 5,000 in North Arcot District and 2,000 in Tirunelveli. The lowest number is recorded in Kanyakumari with 5?1 and Thanjavur with 837. Handloom is a cottage industry found both in the rural and urban sectors. In the urban sector, 43,228 units are found, of which 12,716 are concentrated in Salerno The next district of importance is Tirunelveli with 9,703 units and Ramanathapuram and Madurai with 4,358 and 4,276 units. The number recorded is less in Kanyakumari and the lowest in Madras City with 549.
5 - 18. Making of textile g:lfments is found in all districts of the State bo~h in th,e rural and urban sectors. I n the urban sector the maximum is recorded in Madras City with
2,863 units followed by Coimbatore, 1,353 and Madurai, 1,118. Making of textile garments In the Jrural sector, North Arcot District has recorded the highest
number followed by Thanjavur 682. The lowest is recorded in Nilgiri District, 121-
H-21
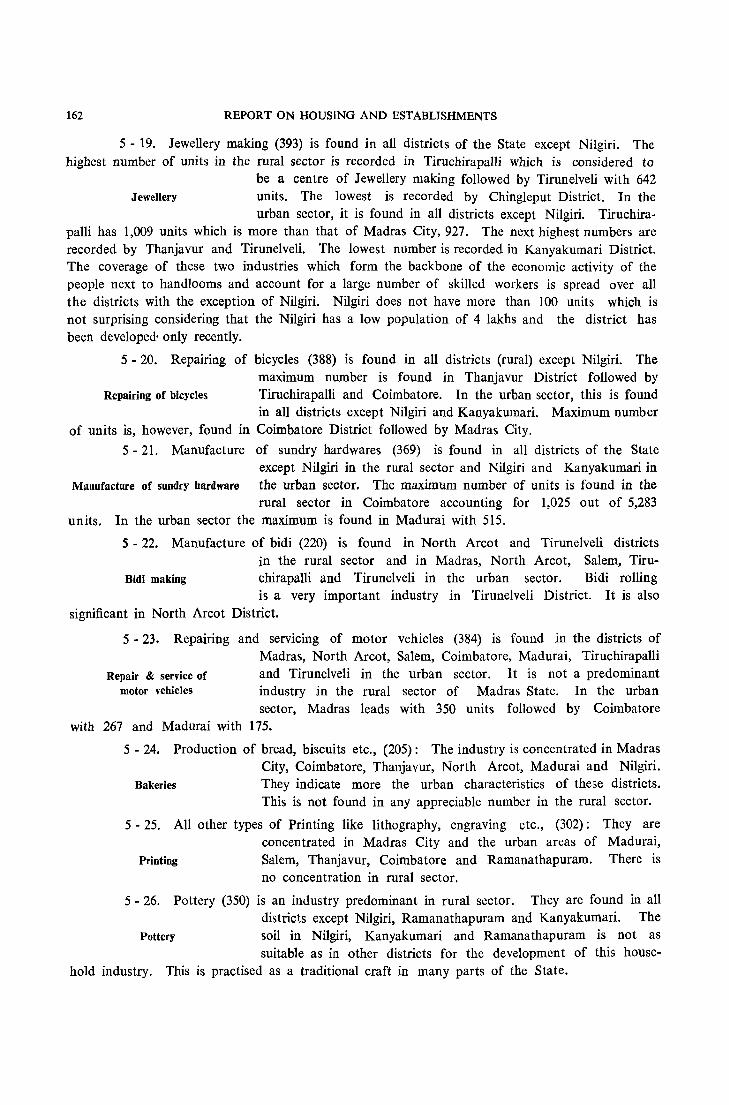
162 REPORT ON HOUSING AND ESTABLISHMENTS
5 - 19. Jewellery making (393) is found in all districts of the State except Nilgiri. The highest number of units in the rural sector is recorded in TiruchirapaUi which is considered to
be a centre of Jewellery making followed by Tirunelveli with 642 Jewellery units. The lowest is recorded by Chingleput District. In the
urban sector, it is found in all districts except Nilgiri. Tiruchirapalli has 1,009 units which is more than that of Madras City, 927. The next highest numbers are recorded by Thanjavur and Tirunelveli. The lowest number is recorded in Kanyakumari District. The coverage of these two industries which form the backbone of the economic activity of the people next to handlooms and account for a large number of skilled workers is spread over all the districts with the exception of Nilgiri. Nilgiri does not have more than 100 units which is not surprising considering that the Nilgiri has a low population of 4 lakhs and the district has been developed· only recently.
5 - 20. Repairing of bicycles (388) is found in all districts (rural) except Nilgiri. The maximum number is found in Thanjavur District followed by
Repairing of bicycles Tiruchirapalli and Coimbatore. In the urban sector, this is found in all districts except Nilgiri and Kanyakumari. Maximum number
of units is, however, found in Coimbatore District followed by Madras City.
5 - 21. Manufacture of sundry hardwares (369) is found in all districts of the State except Nilgiri in the rural sector and Nilgiri and Kanyakumari in
Manufacture of sundry hardware the urban sector. The maximum number of units is found in the rural sector in Coimbatore accounting for 1,025 out of 5,283
units. In the urban sector the maximum is found in Madurai with 515.
5 - 22. Manufacture of bidi (220) is found in North Arcot and Tirunelveli districts in the rural sector and in Madras, North Arcot, Salem, Tiru-
Bidi making chirapalli and Tirunelveli in the urban sector. Bidi rolling is a very important industry in Tirunelveli District. It is also
significant in North Arcot District.
5 - 23. Repairing and servicing of motor vehicles (384) is found in the districts of Madras, North Arcot, Salem, Coimbatore, Madurai, Tiruchirapalli
Repair & service of motor vehicles
and Tirunelveli in the urban sector. It is not a predominant industry in the rural sector of Madras State. In the urban sector, Madras leads with 350 units followed by Coimbatore
with 267 and Madurai with 175.
5 - 24. Production of bread, biscuits etc., (205): The industry is concentrated in Madras City, Coimbatore, Thanjavur, North Arcot, Madurai and Nilgiri.
Bakeries They indicate more the urban characteristics of these districts. This is not found in any appreciable number in the rural sector.
5 - 25. All other types of Printing like lithography, engraving etc., (302): They are concentrated in Madras City and the urban areas of Madurai,
Printing Salem, Thanjavur, Coimbatore and Ramanathapuram. There is no concentration in rural sector.
5 - 26. Pottery (350) is an industry predominant in rural sector. They are found in all districts except Nilgiri, Ramanathapuram and Kanyakumari. The
Pottery soil in Nilgiri, Kanyakumari and Ramanathapuram is not as suitable as in other districts for the development of this house
hold industry. This is practised as a traditional craft in many parts of the State.

CENSUS HOUSE-ITS ECONOMIC ACTIVITY 163
5 - 27. Manufacture of materials from cork, bamboo etc., (288) is another industry predominantly found in the rural sector in the districts of Chingleput, North Arcot, South Arcot,
Salem, Madurai, Tiruchirapalli, Thanjavur and Tirunelveli. This is Cork & bamboo products a local handicraft in which articles are manufactured from raw
materials locally available like bamboo, .cane and leaves. This industry is not found in the urban parts of the State except in Tirunelveli District.
5 - 28. We have tried to give a general background of the pattern of workshops and factories and their coverage in different parts of the State. There
Disposal of other industries 'are certain industries which are not covered by this discussion but which still play a prominent part in the economy of certain
districts. They are briefly indicated below:
5 - 29. Production of indigenous sugar (202), is found in rural sector of the districts of Coimbatore and Kanyakumari. Production of edible fats and oil (207) is found in the rural sector of the district of Coimbatore and in the urban sector of Madras, North Arcot, Madurai and Ramanathapuram. Production of aerated and mineral water (214) is found in North Arcot and Thanjavur rural areas and in the urban areas of Chingleput and Thanjavur. Manufacture of Khadi textiles in handlooms (236) is found in 0>imbatore rural areas. Manufacture of carpet (270) is found in the rural sector of the districts of Salem and Coimbatore. Manufacture of made-up textile goods (274) is found in the district of North Arcot and in urban Coimbatore and Tirunelveli. Manufacture of wooden furniture and fixtures (281) is found in the districts of North Arcot, Tiruchirapalli and Thanjavur rural and in Madras City. Manufacture of structural wooden goods such as beams, posts {282) is found in all districts except Chingleput, Nilgiri and Kanyakumari rural and in Salem and Ramanathapuram urban. Manufacture of shoes and leather footwear (311) is found in Timchirapalli rural and in Madras. Manufacture of brass and bell metal products (365) is found in Coimbatore rural and in the urban North Arcot, Coimbatore, Madurai and Tirunelveli. Manufacture of other transport equipments such as animal drawn and hand-drawn vehicles (389) is found in Coimbatore rural. Production of other food products such as sweatmeat and condiments etc., (209) are found in the urban areas of Coimbatore and Madurai.
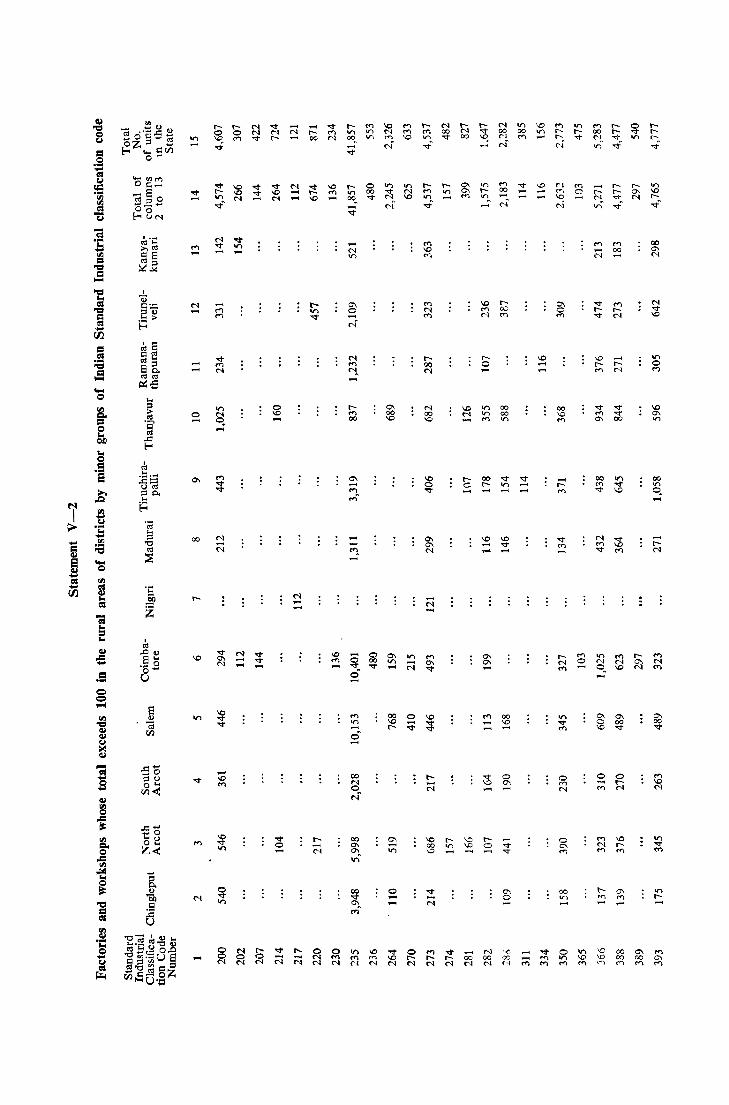
. ~ == bO
i
,.c: .... ... 0 ;:IU 0'" 1Il<
on ....
"'" ....
M ....
N ....
o ....
0\
00
....
N .... ....
N o N
@ ....
"'" -N
........ N t
O<>
N .... ....
o M N
t- 0 V) 00
00, "'"
~
.... N V)
tM 00
0\ .... M M'
.... "'l. ....
.... 0
~ ~ 0' ....
M V) ..... o ....
00 0'1 0'1 vi'
0'1 or. ....
0'1 .... or.
o .... ....
.... <'l ....
10 00 10
N 00
"'"
tV)
.... 00 C"l
tO ....
00 t-
10 ..... -
00 00 V)
M 00 .... 10 ....
N 00 N
0'1 o
"'" .... ....
'" ..... ....
'" ....
.... tM
M o
M o ....
10 tM
o .... ""
M 00
.... tN
0'1 CO M
00 V)
0,
V) t-

J
I :9 ~ z
..c:: ..... t:8 0"" z<
N ---o
0\
00
.....
~$~r:r::;;~~ NN(..()\OO\NMt-.;...; N
10 o -
'<I' --
It) 0\
- oro ... 0\ N
co o M
~5~~~~§ N
N -.... N
... co
--t--'<I' -.
.0 :r:
co --co ... N
eo o ....
..... 0\ .....
\0 o -M N ...
10 -.... 10 '<I' -
o 10 M _ -
8 .....
0 .... 0 ::;!,'<I'-,,_It)
.... It) .....
..... o ....
o It) -
0\0 0-o. -

166 REPORT ON HOUSING AND ESTABLISHMENTS
Dispersal of predominant industries in districts: Chingleput
5-30. We will now examine how the predominant industries get themselves dispersed among the various taluks in each district both in the rural and urban sectors.
5 - 31. 'Handloom weaving' has a major share among the different types of industrial units. In the rural areas next in importance is the minor group 200 'processing of foodgrains'. In the urban areas, the second place is held by the minor group 273 'making of textile garments'. In the rural areas, the third place is occupied by the minor group 273 'making of textile garments'. In the urban areas, the third place goes to 200 'processing of foodgrains'. Thus it may be seen that the minor groups 200, 235 and 273 are of significance at the district level both in the rural and urban areas.
5 - 32. The statement given below furnishes the taluk-war break-up for the industrial units coming under the predominant mii-wr groups.
5 - 33. The salient features may now be referred to: Rural areas Out of 3,948 units under' handloom weaving (cotton)' 2,500 units
are located in Tiruttani Taluk. Kanchipuram is noted for 264 'weaving of silk by handloom '. 288-out of 109 units, Kanchipuram claims 76 units:
Chingleput - Rural
Code Total Units Sriperum- Saidapet Chingle- Kanchi- Maduran-100 Panned Tiruvallur Tiruttani
No. and over budur put puram thakam
200 540 58 81 34 72 72 70 67 86 235 3,948 63 89 2,500 163 39 398 489 207 264 110 110 273 214 7 38 23 22 40 38 34 12
288 109 6 '5 8 76 14 350 158 20 53 20 4 2 10 18 31 369 137 11 16 10 23 19 11 17 30 388 139 6 23 5 22 31 19 15 18
393 175 29 20 26 15 5 36 12 32
5 - 34. ' Processing of foodgrains' (200): Kanchipuram Urban areas and Saidapef have recorded significant figures of 95 and 60.
, Handloom weaving' (235); Tiruttani accounts for 1,073 units out of a total of 2,112 units in the district.
5 - 35. The picture that emerges is that Maduranthakam is backward in industries. Next comes Ponneri. Tiruttani has only 'handloom weaving'. Saidapet, Chingleput and Kanchipuram present rather a bright picture.
Chingleput - Urban
Code Total units Sriperum- Saidapet Chingle- Kanchi- Maduran-100 Ponneri Tiruvallur Tiruttani No. and over budur put puram thakam
200 246 14 18 11 11 60 27 95 10
214 123 9 13 1 17 30 12 40 1
235 2,112 448 1,073 5 313 49 222 2
273 448 5 78 6 70 107 31 147 4
369 101 2 4 6 7 39 12 25 6
388 208 6 9 3 22 56 16 86 10
393 217 8 16 9 13 32 28 96 1~
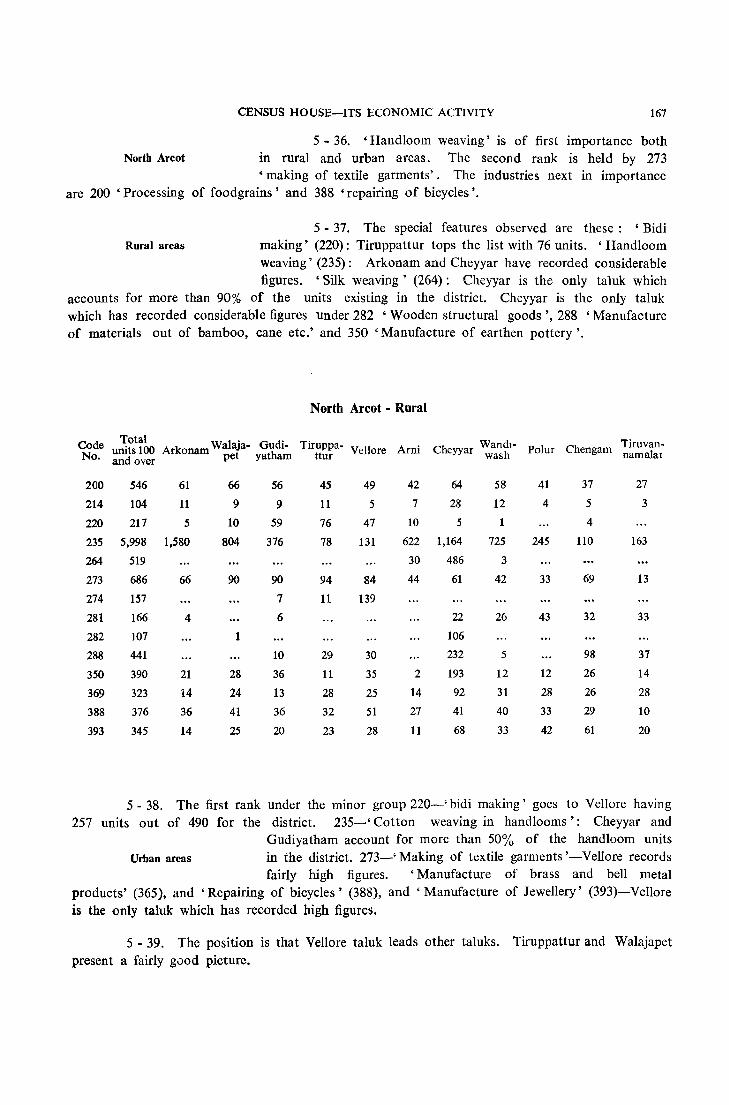
CENSUS HOUSE-ITS ECONOMIC ACTIVITY 167
5 - 36. 'Handloom weaving' is of first importance both North Areot in rural and urban areas. The second rank is held by 273
'making of textile garments'. The industries next in importance are 200 'Processing of foodgrains' and 388 • repairing of bicycles'.
5 - 37. The special features observed are these: 'Bidi Rural areas making' (220): Tiruppattur tops the list with 76 units. 'Handloom
weaving' (235) : Arkonam and Cheyyar have recorded considerable figures. 'Silk weaving' (264): Cheyyar is the only taluk which
accounts for more than 90% of the units existing in the district. Cheyyar is the only taluk which has recorded considerable figures under 282 'Wooden structural goods', 288 'Manufacture of materials out of bamboo, cane etc.' and 350 'Manufacture of earthen pottery'.
North Arcot - Rural
Code Total Arkonam Walaja- Gudi- Tiruppa- Cheyyar Wandl- Tiruvan-units 100 Vellore Ami Polur Chengam No. and over pet yatham ttur wash namalal
200 546 61 66 56 45 49 42 64 58 41 37 27
214 104 11 9 9 11 5 7 28 12 4 5 3
220 217 5 10 59 76 47 10 5 1 4
235 5,998 1,580 804 376 78 131 622 1,164 725 245 110 163
264 519 30 486 3
273 686 66 90 90 94 84 44 61 42 33 69 13
274 157 7 11 139
281 166 4 6 22 26 43 32 33
282 107 1 106
288 441 10 29 30 232 5 98 37
350 390 21 28 36 11 35 2 193 12 12 26 14
369 323 14 24 13 28 25 14 92 31 28 26 28
388 376 36 41 36 32 51 27 41 40 33 29 10
393 345 14 25 20 23 28 11 68 33 42 61 20
5 - 38. The first rank under the minor group 220-' bidi making' goes to Vellore having 257 units out of 490 for the district. 235~' Cotton weaving in handlooms': Cheyyar and
Gudiyatham account for more than 50% of the handloom units Urban areas in the district. 273-' Making of textile garments' - Vellore records
fairly high figures. ' Manufacture of brass and bell metal products' (365), and' Repairing of bicycles' (388), and' Manufacture of Jewellery' (393)-Vellore is the only taluk which has recorded high figures.
5 - 39. The position is that Vellore taluk leads other taluks. Tiruppattur and Walajapet present a fairly good picture.
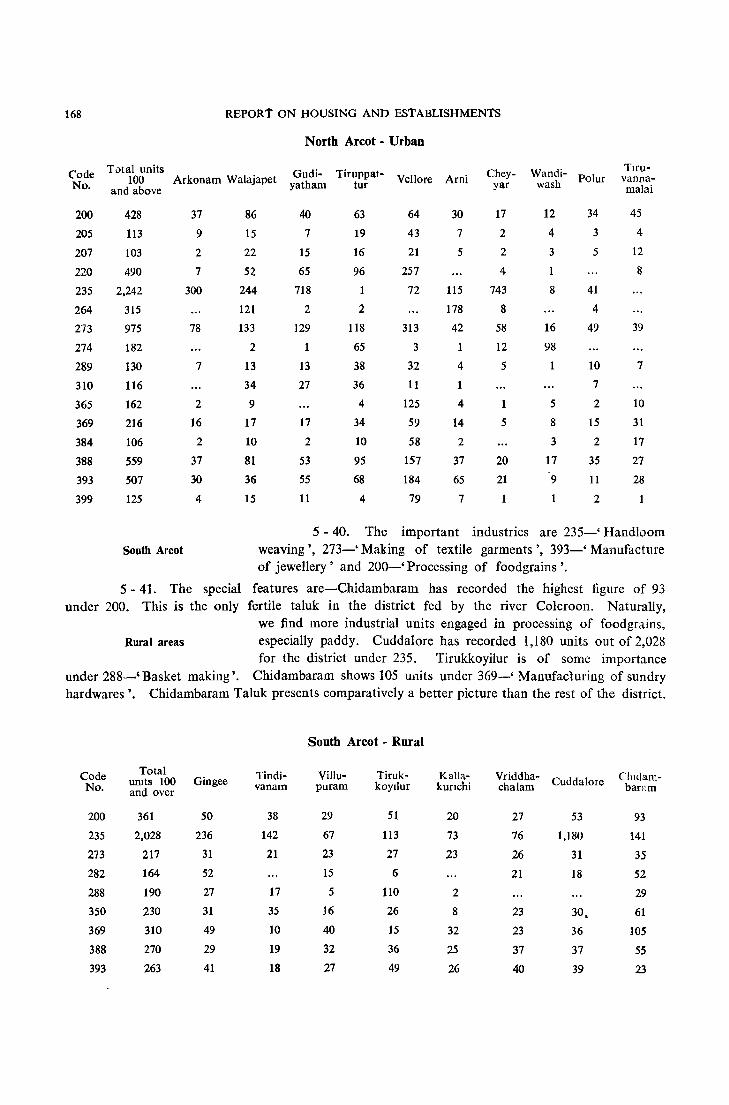
168
Code No.
200
205
207
220
235
264
273
274
289
310
365
369
384
388
393
399
REPORT ON HOUSING AND EsTABLISHMENTS
North Areot - Urban
Total units Gudi- Tiruppat- Chey- Wandi- Tlm-100 Arkonam Walajapet Vellore Arni Polur vanna-
and above yatham tur yar wash maJai
428 37 86 40 63 64 30 17 12 34 45
113 9 15 7 19 43 7 2 4 3 4
103 2 22 15 16 21 5 2 3 5 12
490 7 52 65 96 257 4 8
2,242 300 244 718 1 72 115 743 8 41
315 121 2 2 178 8 4
975 78 133 129 118 313 42 511 16 49 39
182 2 1 65 3 1 12 98
130 7 13 13 38 32 4 5 1 10 7
116 34 27 36 11 7
162 2 9 4 125 4 1 5 2 10
216 16 17 17 34 59 14 5 8 15 31
106 2 10 2 10 58 2 3 2 17
559 37 81 53 95 157 37 20 17 35 27
507 30 36 55 68 184 65 21 9 11 28
125 4 15 11 4 79 7 2
5 - 40. The important industries are 235-' Handloom South Areot weaving', 273-' Making of textile garments', 393-' Manufacture
of jewellery' and 200-' Processing of foodgrains'.
5 - 41. The special features are-Chidambaram has recorded the highest figure of 93 under 200. This is the only fertile taluk in the district fed by the river Colerooll. Naturally,
we find more industrial units engaged in processing of food grains, Rural areas especially paddy. Cuddalore has recorded 1,180 units out of 2,028
for the district under 235. Tirukkoyilur is of some importance under 288-' Basket making'. Chidambaram shows 105 units under 369-' Manufacturing of sundry hardwares'. Chidambaram Taluk presents comparatively a better picture than the rest of the district.
South Areot - Rural
Code Total Tindi- Villu- Tiruk- Kalla- Vriddha- C1udam-No. umts 100 Gingee vanam puram koyilur kunchi chalam Cuddalore ban:m and over
200 361 50 38 29 51 20 27 53 93
235 2,028 236 142 67 113 73 76 1,180 141
273 217 31 21 23 27 23 26 31 35
282 164 52 15 6 21 18 52
288 190 27 17 5 110 2 29
350 230 31 35 16 26 8 23 30, 61
369 310 49 10 40 15 32 23 36 105
388 270 29 19 32 36 25 37 37 55
393 263 41 18 27 49 26 40 39 23
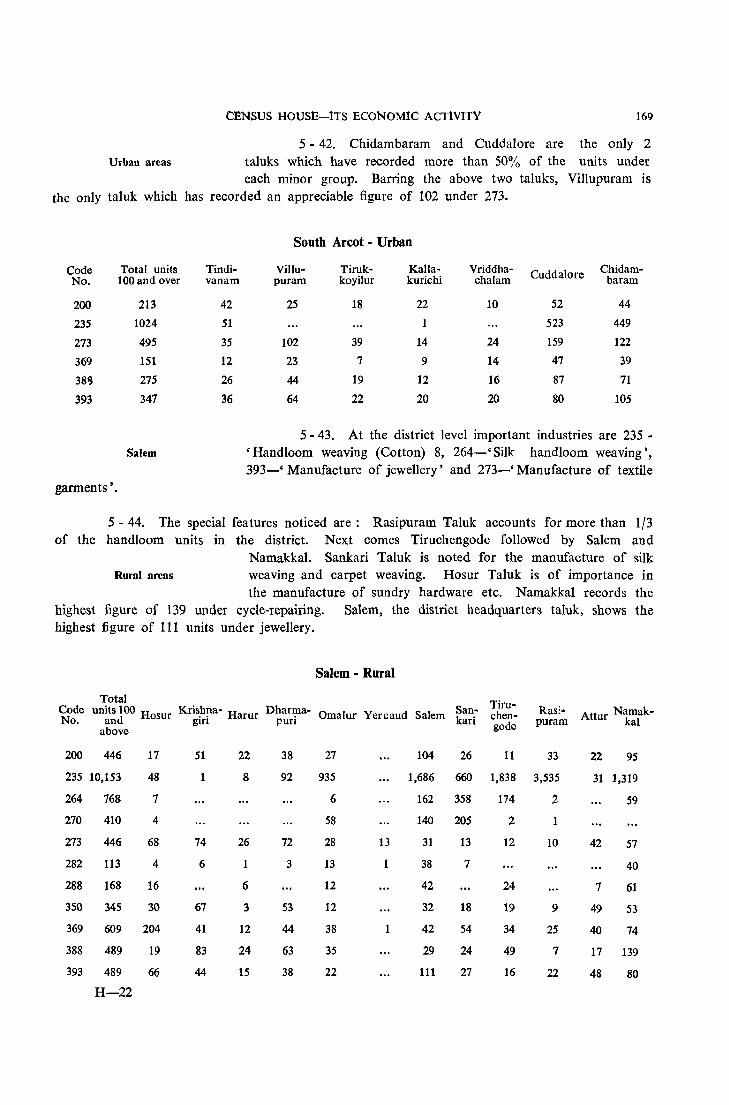
CENSUS HOUSE-ITs ECONOMIC ACTiVITY 169
5 - 42. Chidambaram and Cuddalore are the only 2 Urban areas taluks which have recorded more than 50'% of the units under
each minor group. Barring the above two taluks, Villupuram is the only taluk which has recorded an appreciable figure of 102 under 273.
South Arcot - Urban
Code Total units Tindi- Villu- Tiruk- Kalla- Vriddha- Cuddalore Chidam-No. 100 and over vanam puram koyilur kurichi chalam baram
200 213 42 25 18 22 10 52 44
235 1024 51 1 523 449
273 495 35 102 39 14 24 159 122
369 151 12 23 7 9 14 47 39
38!J 275 26 44 19 12 16 87 71
393 347 36 64 22 20 20 80 105
5 - 43. At the district level important industries are 235 -Salem 'Handloom weaving (Cotton) 8, 264-' Silk handloom weaving',
393-' Manufacture of jewellery' and 273-' Manufacture of textile garments'.
5 - 44. The special features noticed are: Rasipuram Taluk accounts for more than 1/3 of the handloom units in the district. Next comes Tiruchengode followed by Salem and
Namakkal. Sankari Taluk is noted for the manufacture of silk Rural areas weaving and carpet weaving. Hosur Taluk is of importance in
the manufacture of sundry hardware etc. Namakkal records the highest figure of 139 under cycle-repairing. Salem, the district headquarters taluk, shows the highest figure of 111 units under jewellery.
Salem· Rural
Total Tim-Code units 100 Hosur Kris.h!la- Harur DharJ?a- Omalur Yercaud Salem San- chen-No. and glfl pun kari
above gode
200 446
235 10,153
264 768
270 410
273 446
282 113
288 168
350 345
369 609
388 489
393 489
H-22
17
48
7
4
68
4
16
30
204
19
66
51
74
6
67
41
83
44
22
8
26
1
6
3
12
24
15
38
92
72
3
53
44
63
38
27
935
6
58
28
13
12
12
38
35
22
13
1
1
104
1,686
162
140
31
38
42
32
42
29
111
26 11
660 1,838
358 174
205 2
13 12
7
24
18 19
54 34
24 49
27 16
Rasipuram
33
3,535
2
1
10
9
25
7
22
Attur Namakkal
22 9S
31 1,319
59
42 57
40
7 61
49 53
40 74
17 139
48 80

170 REPORT ON HOUSING AND ESTABLISHMENTS
5 - 45. Salem accounts for more than 50% of the handloom weaving units in the district. The second and third ranks are held by Rasipuram and Tiruchengode. Salem is the only taluk
which is of importance in all the remaining minor groups. Urban areas Namakkal deserves mention with reference to repairing of bicycles.
The figures establish beyond doubt that most of the industries are concentrated in and around Salem City.
Salem-Urban
Total Cod;} units 100 Hosur Krishna- Harur Dharma- Omalur Salem No. and over giri puri
TiruSankari chen
gode Rasi- Attur Namak-puram kat
200
220
230
233
377
148
137
164
11
7
32
It}
4
2
29
3
185
95
122
110
16
6
22
1
1
15
19
9
9
20
24
4
2
15
1
235 12,716 8
2
18
5
1
198
20
4
3
12
273
10
7,682
182
554
107
402
271 1,862 2,398 1 18
263
264
270
273
282
302
369
384
388
393
210
610
107
669
108
146
240
141
510
709
14
1
7
2
13
15
2
34
11
3
11
9
46
40
11
4
14
7
17
3
S
14
10
23
24
2
46
2
7
1
30
17
51
74
116
78
227
491
14
3
1
7
5
9
15
30
36
20
7
14
5
40
32
1
3
42
15
53
8
5
34
37
18
2
15
5
18
26
1
35
2
1
41
22
60
11
5 - 46. At the district level, the industries in the order Coimbatore of importance are cotton handloom weaving, making of textile
garments, bicycle-repairing and jewellery. In rural areas manufacture of sundry hardware n. e. c. is also of some significance.
5 - 47. The salient features are: Palladam, Erode and Avanashi are noted for cotton handloom weaving; Palladam and Gopichettipalayam for Khadi weaving. Tiruppur is an imporlant
khadi centre in the State. Bhavani accounts for more than 90% Rural areas of the units under carpet making. In the making of textile
garments, Coimbatore and Pollachi are of importance. In the making of earthen ware, Palladam is of importance. Manufacture of sundry hardware n. e. c. is pronounced in Palladam and Pollachi. Repairing of bicycles is of importance in Erode, Dharapuram and Coimbatore. In the manufacture of transport equipment, Erode leads with 94 units. In jewellery making also Erode has recorded an appreciable figure of 115.
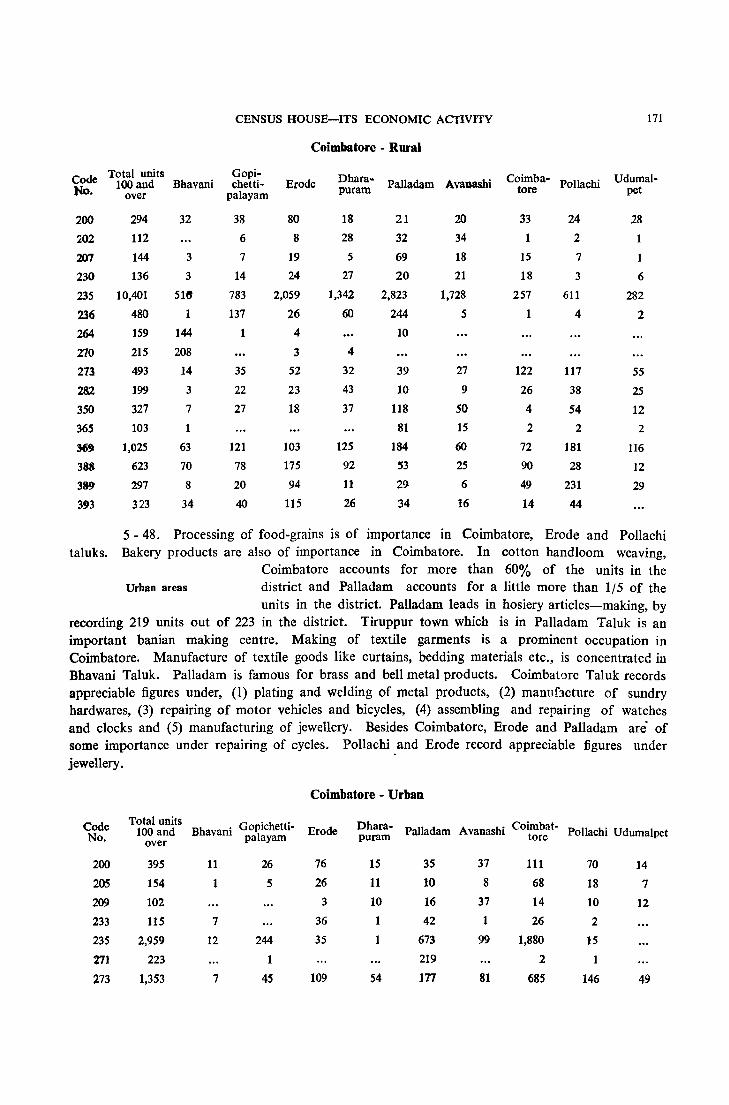
CENSUS HOUSE-ITS ECONOMIC ACTIVITY 171
Coimbatore - Rural
Code Total units Gopi- Dhara- Coimba- Udumal-100 and Bhavani chetti- Erode Palladam Avaoasbi PolJachi No. over palayam puram tore pet
200 294 32 38 80 18 21 20 33 24 28
202 112 6 8 28 32 34 1 2
207 144 3 7 19 5 69 18 15 7 1
230 136 3 14 24 27 20 21 18 3 6
235 10,401 511' 783 2,059 1,342 2,823 1,728 257 611 282
236 480 1 137 26 60 244 5 1 4 2
264 159 144 4 10
270 215 208 3 4
271 493 14 35 52 32 39 27 122 117 55
282 199 3 22 23 43 10 9 26 38 25
350 327 7 27 18 37 118 50 4 54 12
365 103 81 15 2 2 2
36~ 1,025 63 121 103 125 184 60 72 181 116
388 623 70 78 175 92 53 25 90 28 12
389 297 8 20 94 11 29 6 49 231 29
3'3 323 34 40 115 26 34 16 14 44
5 - 48. Processing of food-grains is of importance in Coimbatore, Erode and Pollachi taluks. Bakery products are also of importance in Coimbatore. In cotton handloom weaving,
Coimbatore accounts for more than 60% of the units in the Urban areas district and Palladam accounts for a little more than 1/5 of the
units in the district. Palladam leads in hosiery articles-making, by recording 219 units out of 223 in the district. Tiruppur town which is in Palladam Taluk is an important banian making centre. Making of textile garments is a prominent occupation in Coimbatore. Manufacture of textile goods like curtains, bedding materials etc., is concentrated in Bhavani Taluk. Palladam is famous for brass and bell metal products. Coimbatore Taluk records appreciable figures under, (I) plating and welding of metal products, (2) mannflcture of sundry hardwares, (3) repairing of motor vehicles and bicycles, (4) assembling and repairing of watches and clocks and (5) manufacturing of jewellery. Besides Coimbatore, Erode and Palladam are' of some importance under repairing of cycles. Pollachi .and Erode record appreciable figures under jewellery.
Coimbatore - Urban
Code Total units Bhavan' Gopichetti- Dhara- Avanashi Coimbat-100 and Erode Palladam Pollachi Udumalpet No. over 1 palayam puram tore
200 395 11 26 76 15 35 37 111 70 14
205 154 1 5 26 11 10 8 68 18 7
209 102 3 10 16 37 14 10 12
233 115 7 36 1 42 1 26 2
235 2,959 12 244 35 1 673 99 1,880 15
271 223 1 219 2 I
273 1,353 7 45 109 54 In 81 685 146 49
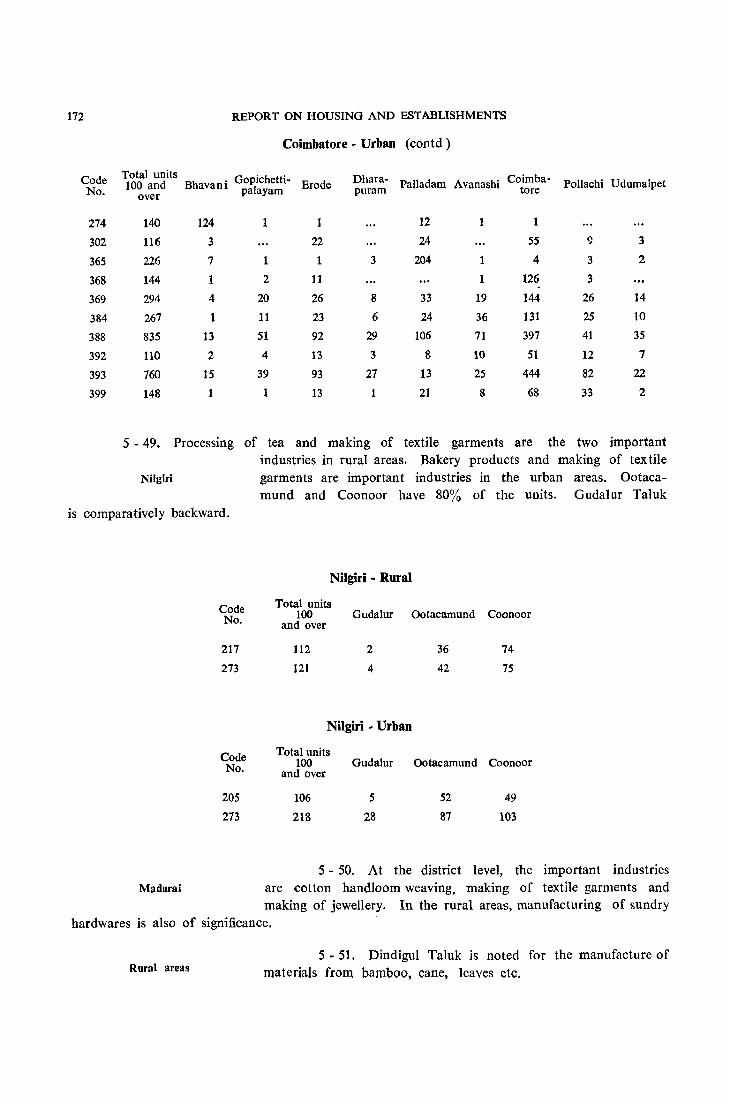
172 REPORT ON HOUSING AND ESTABLISHMENTS
Coimbatore - Urban (contd)
Code Total units Bhavani Gopichetti- Dhara- Coimba-
No. 100 and palayam Erode puram Palladam Avanashi tore Pollachi Udumalpet over
274 140 124 1 1 12 1
302 116 3 22 24 55 9 3
365 226 7 1 1 3 204 1 4 3 2
368 144 1 2 11 1 126 3
369 294 4 20 26 8 33 19 144 26 14
384 267 1 11 23 6 24 36 131 25 10
388 835 13 51 92 29 106 71 397 41 35
392 110 2 4 13 3 8 10 51 12 7
393 760 15 39 93 27 13 25 444 82 22
399 148 1 13 21 8 68 33 2
5 - 49. Processing of tea and making of textile garments are the two important
industries in rural areas. Bakery products and making of textile
Nilgiri garments are important industries in the urban areas. Ootaca-
mund and Coonoor have 80% of the units. Gudalur Taluk
is comparatively backward.
Nilgiri - Rural
Code Total units No. 100 Gudalur Ootacamund Coonoor
and over
217 112 2 36 74
273 121 4 42 75
Nilgiri • Urban
Code Total units No. 100 Gudalur Ootacamund Coonoor
and over
205 106 5 52 49
273 218 28 87 103
5 - 50. At the district level, the important industries
Madurai are cotton handloom weaving, making of textile garments and making of jewellery. In the rural areas, manufacturing of sundry
hardwares is also of significance.
Rural areas 5 • 51. Dindigul Taluk is noted for the manufacture of
materials from bamboo, cane, leaves etc.
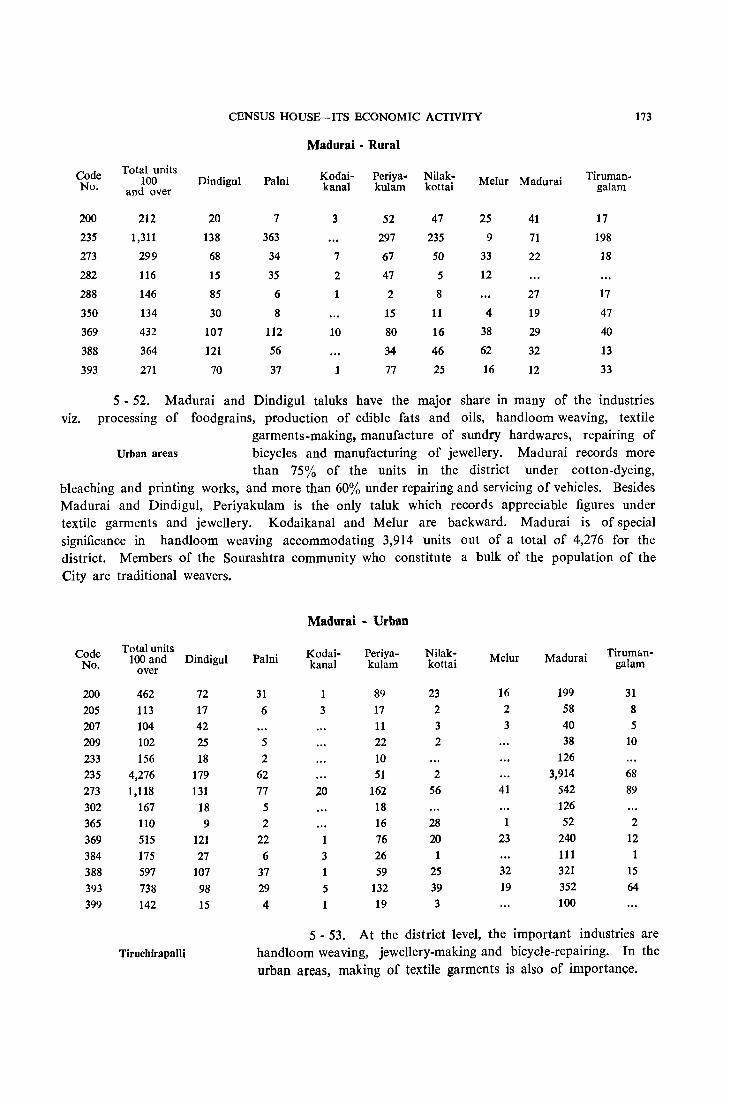
CENSUS HOUSE-ITS ECONOMIC ACTIVITY 173
Madurai - Rural
Code Total units Kodai- Periya- Nilak- Tiruman-100 Dindigul Palni Melur Madurai No. and over kanal kulam kottai galam
200 212 20 7 3 52 47 25 41 17
235 1,311 138 363 297 235 9 71 198
273 299 68 34 7 67 50 33 22 18
282 116 15 35 2 47 5 12
288 146 85 6 1 2 8 27 17
350 134 30 8 15 11 4 19 47
369 432 107 112 10 80 16 38 29 40
388 364 121 56 34 46 62 32 13
393 271 70 37 1 77 25 16 12 33
5 - 52. Madurai and Dindigul taluks have the major share in many of the industries viz. processing of food grains, production of edible fats and oils, handloom weaving, textile
garments-making, manufacture of sundry hardwares, repairing of Urban areas bicycles and manufacturing of jewellery. Madurai records more
than 75% of the units in the district under cotton-dyeing, bleaching and printing works, and more than 60% under repairing and servicing of vehicles. Besides Madurai and Dindigul, Periyakulam is the only taluk which records appreciable figures under textile garments and jewellery. Kodaikanal and Melur are backward. Madurai is of special significance in handloom weaving accommodating 3,914 units out of a total of 4,276 for the district. Members of the Sourashtra community who constitute a bulk of the popUlation of the City are traditional weavers.
Madurai - Urban
Code Total units Kodai- Periya- Nilak- Tirum&n-No. 100 and Dindigul Palni kanal kulam kottai Melur Madurai galam over
200 462 72 31 1 89 23 16 199 31 205 113 17 6 3 17 2 2 58 8 207 104 42 11 3 3 40 5 209 102 25 5 22 2 38 10 233 156 18 2 10 126 235 4,276 179 62 51 2 3,914 68 273 1,118 131 77 20 162 56 41 542 89 302 167 18 5 18 126 365 110 9 2 16 28 1 52 2 369 515 121 22 1 76 20 23 240 12 384 175 27 6 3 26 111 1
388 597 107 37 1 59 25 32 321 15 393 738 98 29 5 132 39 19 352 64 399 142 15 4 1 19 3 100
5·53. At the district level, the important industries are Tiruchirapalli handloom weaving, jewellery-making and bicycle-repairing. In the
urban areas, making of textile garments is also of importance.
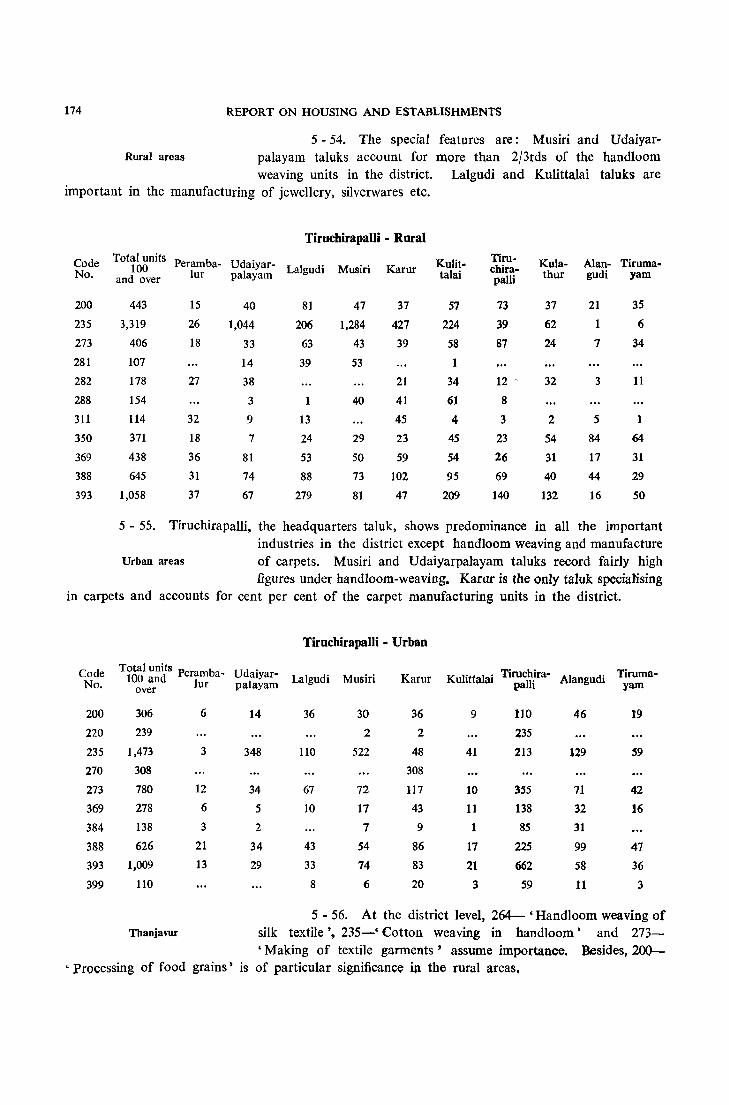
174 REPORT ON HOUSING AND ESTABLISHMENTS
5 - 54. The special features are: Musiri and Udaiyar-Rural areas palayam taluks account for more than 2/3rds of the handloom
weaving units in the district. Lalgudi and Kulittalai taluks are important in the manufacturing of jewellery, silverwares etc.
Code No.
200
235
273
281
282
288
311
350
369
388
393
Tiruchirapalli - Rural
Total units Peramba- Ud . 100 alyar- Lalgudi and over lur palayam Musiri Karur
443
3,319
406
107
178
154
114
371
438
645
1,058
15
26
18
27
32
18
36
31
37
40
1,044
33
14
38
3
9
7
81
74
67
81
206
63
39
1
13
24
53
88
279
47
1,284
43
53
40
29
50
73
81
37
427
39
21
41
45
23
59
102
47
KuIittalai
57
224
58
1
34
61
4
45
54
95
209
TIrucrurapalli
73
39
87
12 '
8
3
23
26
69
140
Kulathur
37
62
24
32
2
54
31
40
132
Alan- Tiruma-gudi yam
21
1
7
3
5
84
17
44
16
35
6
34
11
1
64
31
29
50
5 - 55. Tiruchirapalli, the headquarters tal uk, shows predominance in all the important industries in the district except handloom weaving and manufacture
Urban areas of carpets. Musiri and Udaiyarpalayam taluks record fairly high figures under hand loom-weaving. Karur is the only taluk specialising
in carpets and accounts for cent per cent of the carpet manufacturing units in the district.
Code No.
200
220
235
270
273
369
384
388
393
399
Tirochirapalli - Urban
Total units Peramba- Udaiyar-100 and lur paJayam Lalgudi Musiri
over Karur
306
239
1,473
308
780
278
138
626
1,009
110
6
3
12
6
3
21
13
14
348
34
5
2
34
29
36
110
67
10
43
33
8
30
2
522
72
17
7
54
74
6
36
2
48
308
117
43
9
86
83
20
Kulittalai Tiruchira- Alangudi Tiruma-palli yam
9
41
10
11
1
17
21
3
tIO 235
213
355
138
85
225
662
59
46
129
11
32
31
99
58
11
19
59
42
16
47
36
3
5 - 56. At the district level, 264- 'Handloom weaving of Thaniavur silk textile', 235-' Cotton weaving in handloom' and 273-
'Making of textile garments' assume importance. Besides, 200-'Processing of food grains' is of particular significanc~ in the rural areas.
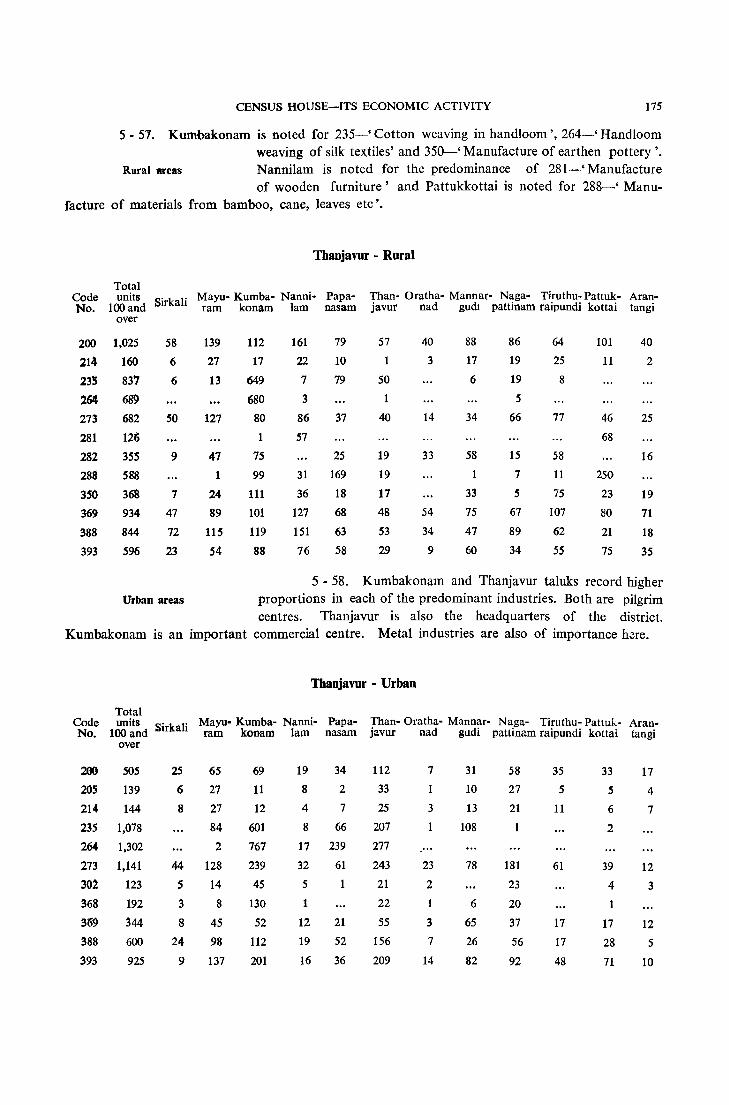
CENSUS HOUSE-ITS ECONOMIC ACTIVITY 175
5 - 57. Kumbakonam is noted for 235-' Cotton weaving in handloom " 264-' Handloom weaving of silk textiles' and 350-' Manufacture of earthen pottery'.
Rural anas Nannilam is noted for the predominance of 281-' Manufacture of wooden furniture' and Pattukkottai is noted for 288-' Manu-
facture of materials from bamboo, cane, leaves etc'.
Thanjavur - Rural
Total Code units Sirkali Mayu- Kumba- Nanni- Papa- Than- Oratha- Mannar- Naga- Tiruthu- Pattuk- Aran-No. 100 and ram konam lam nasam javur nad gudl pattinam raipundi kottai tangi
over
200 1,025 58 139 112 161 79 57 40 88 86 64 101 40
214 160 6 27 17 22 10 1 3 17 19 25 11 2
235 83'7 6 13 649 7 79 50 6 19 8
264 689 680 3 1 5
273 682 50 127 80 86 37 40 14 34 66 77 46 25
281 12'6 1 57 68
282 355 9 47 75 25 19 33 58 15 58 16
288 588 1 99 31 169 19 1 7 11 250
3~O 368 7 24 111 36 18 17 33 5 75 23 19
369 934 47 89 101 127 68 48 54 75 67 107 80 71
388 844 72 115 119 151 63 53 34 47 89 62 21 18
393 596 23 54 88 76 58 29 9 60 34 55 75 35
5 - 58. Kumbakonam and Thanjavur taluks record higher Urban areas proportions in each of the predominant industries. Both are pilgrim
centres. Thanjavur is also the headquarters of the district. Kumbakonam is an important commercial centre. Metal industries are also of importance h.:!re.
Thanjavur - Urban
Total Code units Sirkali Mayu- Kumba- Nanni- Papa- Than- Oratha- Mannar- Naga- Tiruthu- Pattuk- Aran-No. 100 and ram konam lam nasam javur nad gudi pattinam raipundi kottai tangi
over
200 505 25 65 69 19 34 112 7 31 58 35 33 17
20S 139 6 27 11 8 2 33 10 27 5 5 4 214 144 8 27 12 4 7 25 3 13 21 11 6 7
235 1,078 84 601 8 66 207 1 108 1 2
264 1,302 2 167 17 239 277 ... 273 1,141 44 128 239 32 61 243 23 78 181 61 39 12 302 123 5 14 45 5 1 21 2 23 4 3 368 192 3 8 130 1 22 1 6 20 1
369 344 8 45 52 12 21 55 3 65 37 17 17 12 388 600 24 98 112 19 52 156 7 26 56 17 28 5 393 925 9 137 201 16 36 209 14 82 92 48 71 10
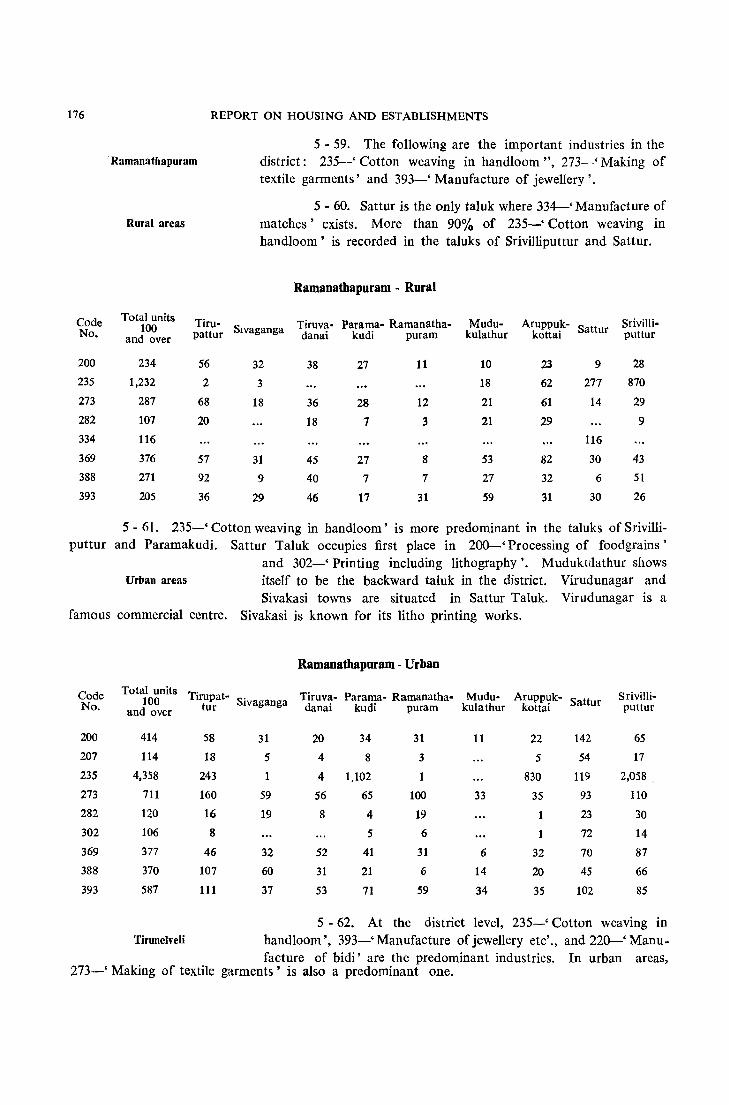
176 REPORT ON HOUSING AND ESTABLISHMENTS
Code No.
200
235
273
282
334
369
388
393
5 - 59. The following are the important industries in the 'Ramanathapuram district: 235-' Cotton weaving in handloom ", 273-' Making of
textile garments' and 393-' Manufacture of jewellery'.
5 - 60. Sattur is the only taluk where 334--' Manufacture of Rural areas matches' exists. More than 90% of 235-' Cotton weaving in
handloom' is recorded in the taluks of Srivilliputtur and Sattur.
Total units 100
and over
234
1,232
287
107
116
376
271
205
Ramanathapuram - Rural
Tiru- S Tiruva- Parama- Ramanatha- Mudu- Aruppuk- SaUur Srivilli-pattur Ivaganga danai kudi puram kulathur kottai puttur
56
2
68
20
57
92
36
32
3
18
31
9
29
38
36
18
45
40
46
27
28
7
27
7
17
11
12
3
8
7
31
10
18
21
21
53
27
59
23
62
61
29
82
32
31
9
277
14
116
30
6
30
28
870
29
9
43
51
26
5 - 61. 235-' Cotton weaving in handloom' is more predominant in the taluks of Srivilliputtur and Paramakudi. Sattur Taluk occupies first place in 200-' Processing of foodgrains'
and 302-' Printing including lithography'. Mudukulathur shows Urban areas itself to be the backward taluk in the district. Virudunagar and
Sivakasi towns are situated in Sattur Taluk. Virudunagar is a famous commercial centre. Sivakasi is known for its litho printing works.
Code No.
200
207
235
273
282
302
369
388
393
Ramanatbapuram - Urban
Total units T' t Tl'ruva- Parama- Ramanatha-100 lrupa - Sivaganga and over tur danai kudi puram
414
114
4,358
711
120
106
377
370
587
58
18
243
160
16
8
46
107
111
31
5
1
59
19
32
60
37
20 34
4 8
4 1,102
56 65
8 4
5
52 41
31 21
53 71
31
3
1
100
19
6
31
6
59
Mudu- Aruppuk- Sattur kulathur kottai
11
33
6
14
34
22
5
830
35
1
1
32
20
35
142
54
119
93
23
72
70
4S
102
Srivilliputtur
65
17
2,058 ,
110
30
14
87
66
85
5 - 62. At the district level, 235-' Cotton weaving in Tirunelveli hand loom " 393-' Manufacture of jewellery etc'., and 220-' Manu-
facture of bidi' are the predominant industries. In urban areas, 273-' Making of textile garments' is also a predominant one.
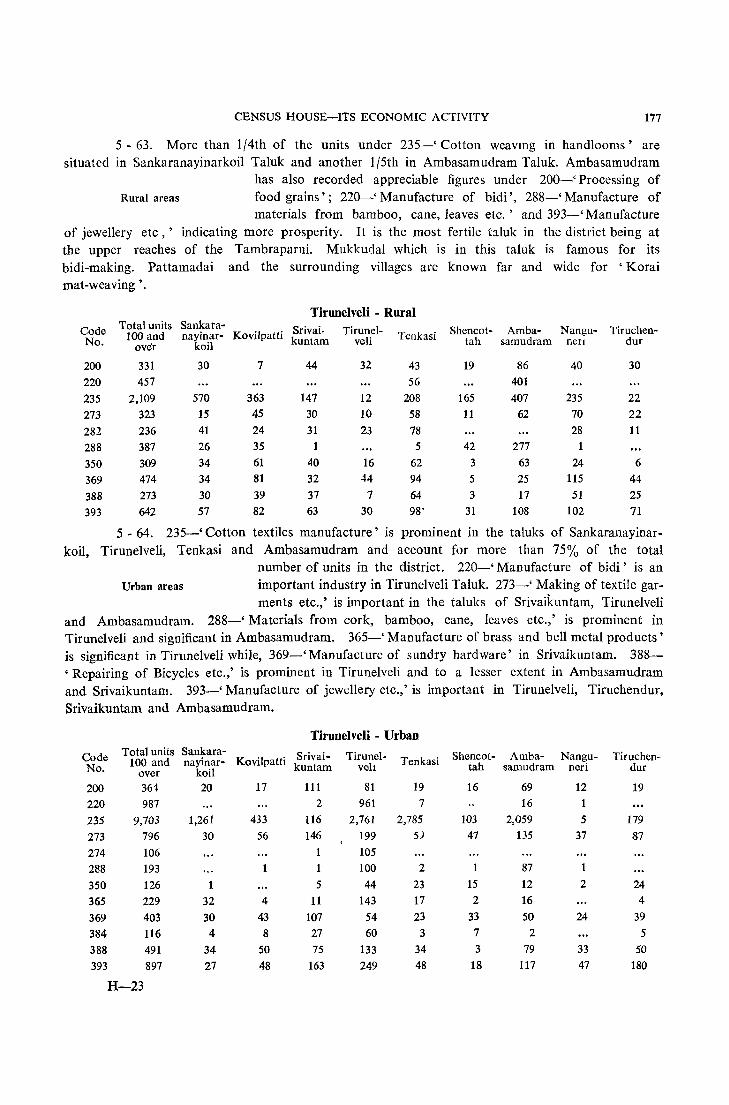
CENSUS HOUSE-ITS ECONOMIC ACTIVITY 177
5 ~ 63. More than 1/4th of the units under 235-' Cotton weavmg in handlooms' are situated in Sankaranayinarkoil Taluk and another 1/5th in Ambasamudram Taluk. Ambasamudram
has also recorded appreciable figures under 200-' Processing of Rural areas food grains'; 220-' Manufacture of bidi', 288-' Manufacture of
materials from bamboo, cane, leaves etc.' and 393-' Manufacture of jewellery etc,' indicating more prosperity. It is the most fertile taluk in the district being at the upper reaches of the Tambraparni. Mukkudal which is in this taluk is famous for its bidi~making. Pattamadai and the surrounding villages are known far and wide for 'Korai mat-weaving' .
Code No.
200 220 235 273 282 288 350 369 388
393
Tirunelveli - Rural Total units Sankara- Srivai.
100 and nayinar- Kovilpatti kuntam over koil
331 30 7 44 457
2,109 570 363 147 323 15 45 30 236 41 24 31 387 26 35 1 309 34 61 40 474 34 81 32 273 30 39 37 642 57 82 63
Tirunelveli
32
12 10 23
16 44
7 30
Tenkasi
43 56
208 58 78 5
62 94 64 98-
Shencot- Amba- Nangu- Tiruchen-tah samudram nen dur
19 86 40 30 401
165 407 235 22 11 62 70 22
28 11 42 277 1
3 63 24 6 5 25 115 44 3 17 51 25
31 108 102 71
5 - 64. 235-' Cotton textiles manufacture' is prominent in the taluks of Sankaranayinar-
koil, Tirunelveli, Tenkasi and Ambasamudram and account for more than 75% of the total number of units in the district. 220-' Manufacture of bidi' is an
Urban areas important industry in Tirunelveli Taluk. 273-' Making of textile gar-ments etc.,' is important in the taluks of Srivailcuntam, Tirunelveli
and Ambasamudram. 288-' Materials from cork, bamboo, cane, leaves etc.,' is prominent in Tirunelveli and significant in Ambasamudram. 365-' Manufacture of brass and bell metal products' is significant in Tirunelveli while, 369-' Manufacture of sundry hardware' in Srivaikuntam. 388-'Repairing of Bicycles etc.,' is prominent in Tirunelveli and to a lesser extent in Ambasamudram and Srivaikuntam. 393-' Manufacture of jewellery etc.,' is important in Tirunelveli, Tiruchendur, Srivaikuntam and Ambasamudram.
Code Total units Sankara-100 and nayinar-No. over koil
200 361 20 220 987 235 9,703 1,261 273 796 30 274 106 288 193 350 126 1 365 229 32 369 403 30 384 116 4 388 491 34 393 897 27
H-23
Tirunelveli - Urban
Kovilpatti Srivaikuntam
17 111 2
433 116 56 146
1
1
5
4 11
43 107 8 27
50 75 48 163
Tirunel- Tenkasi veh
81 19 961 7
2,761 2,785 199 5)
105 100 2 44 23
143 17 54 23 60 3
133 34 249 48
Shencot- Amba- Nangu- Tiruchen-tah samudram neri dur
16 69 12 19 16
103 2,059 5 179 47 135 37 87
87 1 15 12 2 24 2 16 4
33 50 24 39 7 2 5 3 79 33 50
18 117 47 180
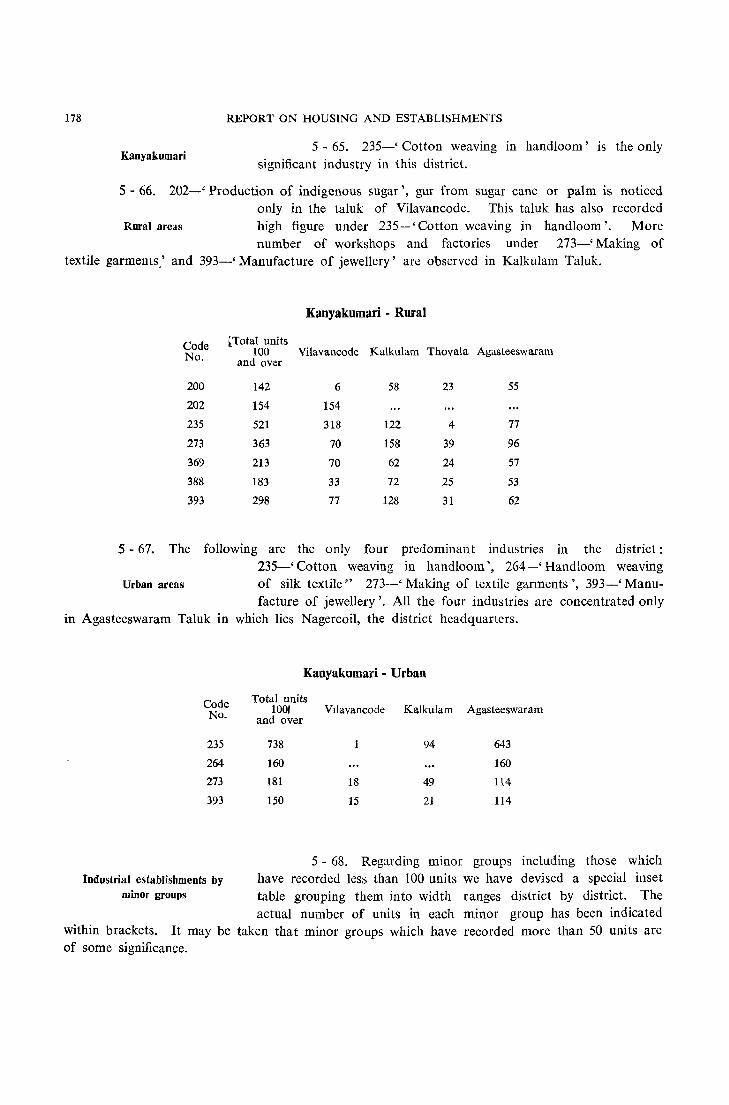
178
Kanyakumari
REPORT ON HOUSING AND ESTABLISHMENTS
5 - 65. 235-' Cotton weaving III hand loom ' IS the only significant industry in this district.
S - 66. 202-' Production of indigenous sugar', gur from sugar cane or palm is noticed only in the taluk of Vilavancode. This taluk has also recorded
Rural areas high figure under 235-'Cotton weaving in handloom'. More number of workshops and factories under 273-' Making of
textile garments.' and 393-' Manufacture of jewellery' an:: observed in Kalkulam Taluk.
Kanyakumari - Rural
Code ~TotaI units Agasteeswaram No. 100 Vilavancode Kalkulam Thovala
and over
200 142 6 58 23 55
202 154 154
235 521 318 122 4 77
273 363 70 158 39 96
369 213 70 62 24 57
388 183 33 72 25 53
393 298 77 128 31 62
5 - 67. The following are the only four predominant industries in the district: 235-' Cotton weaving in handloom', 264-' Handloom weaving
Urban areas of silk textile" 273-' Making of textile garments', 393-' Manu-facture of jewellery'. All the four industries are concentrated only
in Agasteeswaram Taluk in which lies Nagercoil, the district headquarters.
Kanyakumari - Urban
Code Total units No. 1001 Vrlavancode Kalkulam Agasteeswaram
and over
235 738 1 94 643
264 160 160
273 181 18 49 114
393 150 15 21 114
5 - 68. Regarding minor groups including those which Industrial establishments by have recorded less than 100 units we have devised a special inset
minor groups table grouping them into width ranges district by district. The actual number of units in each minor group has been indicated
within brackets. It may be taken that minor groups which have recorded more than 50 units are of some significance.
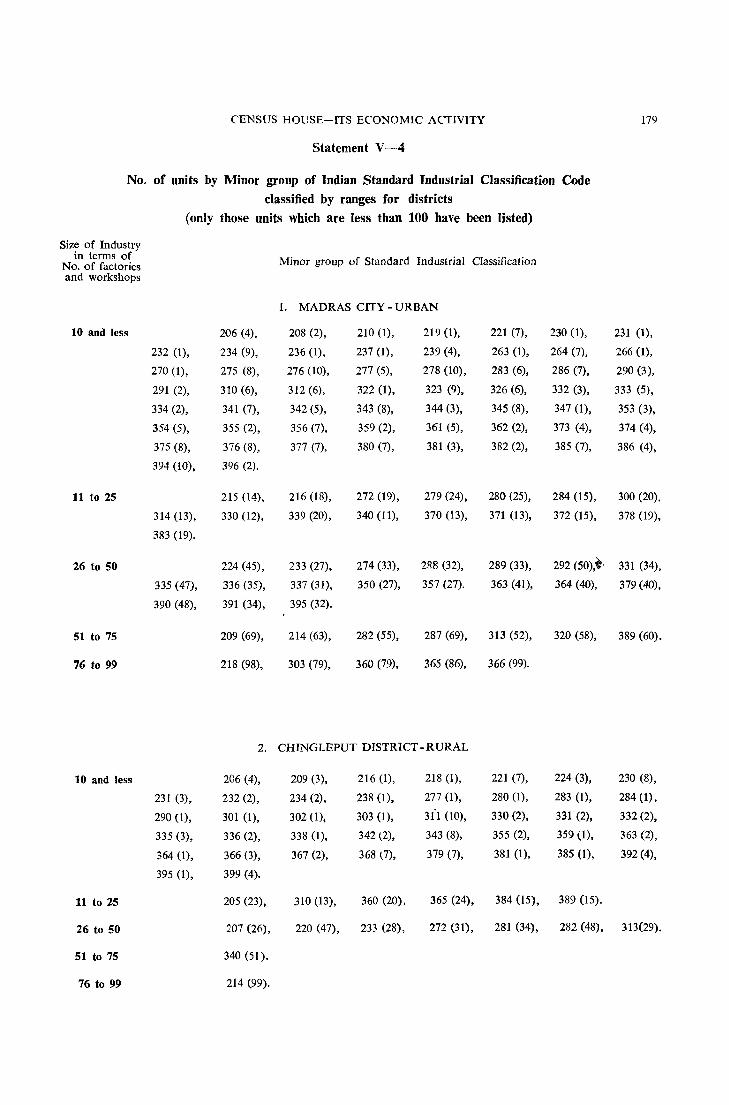
CENSUS HOUSE-ITS ECONOMIC ACTIVITY 179
Statement V-4
No. of units by Minor group of Indian Standard Industrial Classification Code classified by ranges for districts
(only those units which are less than 100 have been listed)
Size of Industry in terms of Minor group of Standard Industrial Classification No. of factories
and workshops
1. MADRAS CITY - URBAN
10 and less 206 (4), 208 (2), 210 (1), 219 (I), 221 (7), 2300), 231 (1),
232 (1), 234 (9), 236 (1), 237 (1), 239 (4), 263 (1), 264 (7), 266 (1),
270 (1), 275 (8), 276 (10), 277 (5), 278 (10), 283 (6), 286 (7), 290 (3),
291 (2), 310 (6), 312 (6), 322 (1), 323 (9), 326 (6), 332 (3), 333 (5),
334 (2), 341 (7), 342 (5), 343 (8), 344 (3), 345 (8), 347 (1), 353 (3),
354 (5), 355 (2), 356 (7), 359 (2), 361 (5), 362 (2), 373 (4), 374 (4),
375 (8), 376 (8), 377 (7), 380 (7), 381 (3), 382 (2), 385 (7), 386 (4),
394 (10), 396 (2).
11 to 25 215 (14), 216 (18), 272 (19), 279 (24), 280 (25), 284 (15), 300 (20),
314 (13), 330 (12), 339 (20), 340 (11), 370 (13), 371 (13), 372 (15), 378 (19),
383 (19).
26 to 50 224 (45), 233 (27), 274 (33), 288 (32), 289 (33), 292 (50),t, 331 (34),
335 (47), 336 (35), 337 (31), 350 (27), 357 (27). 363 (41), 364 (40), 379 (40),
390 (48), 391 (34), 395 (32).
51 to 75 209 (69), 214 (63), 282 (55), 287 (69), 313 (52), 320 (58), 389 (60).
76 to 99 218 (98), 303 (79), 360 (79), 365 (86), 366 (99).
2. CHINGLEPUT DISTRICT-RURAL
10 and less 206 (4), 209 (3), 216 (1), 218 (1), 221 (7), 224 (3), 230 (8),
231 (3), 232 (2), 234 (2), 238 (1), 277 (1), 280 (1), 283 (1), 284 (1),
290 (1), 301 (1), 302 (1), 303 (1), 311 (10), 330 (2), 331 (2), 332 (2),
335 (3), 336 (2), 338 (1), 342 {2), 343 (8), 355 (2), 359 (1), 363 (2),
364 (1), 366 (3), 367 (2), 368 (7), 379 (7), 381 (1), 385 (I), 392 (4),
395 (1), 399 (4).
11 to 25 205 (23), 310 (13), 360 (20), 365 (24), 384 (15), 389 (15).
26 to 50 207 (26), 220 (47), 233 (28), 272 (31), 281 (34), 282 (48), 313(29).
51 to 75 340 (51).
76 to 99 214 (99).
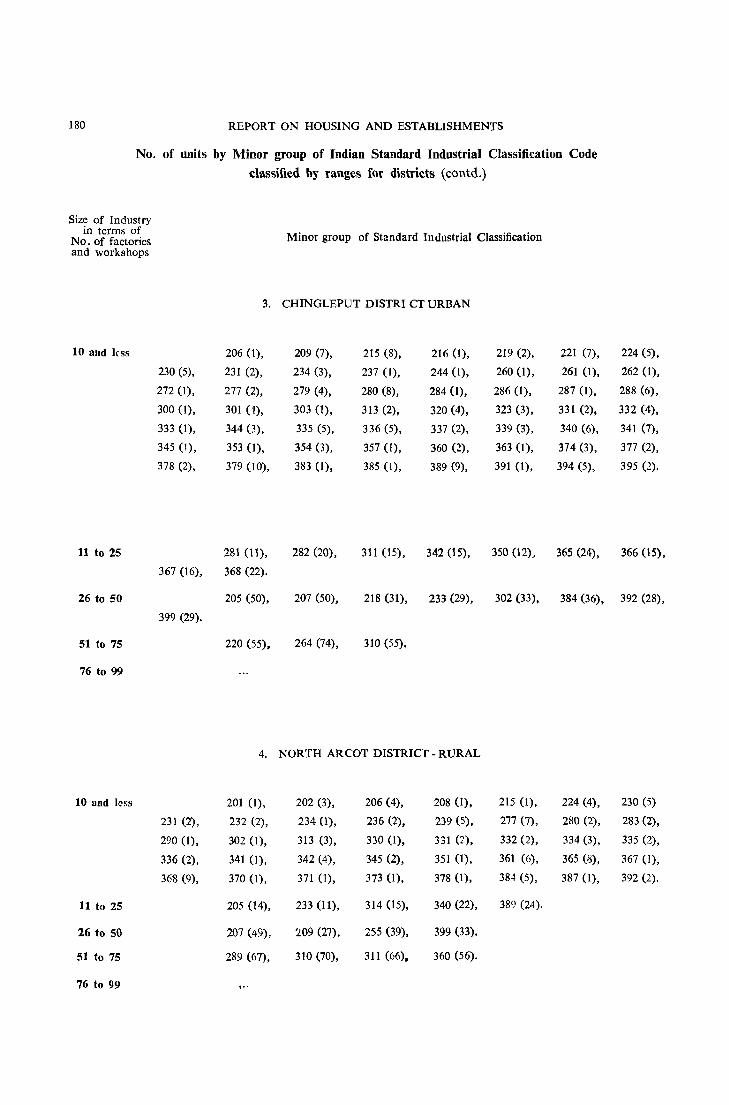
180 REPORT ON HOUSING AND ESTABLISHMENTS
No. of units by Minor group of Indian Standard Industrial Classification Code
classified by ranges for districts (contd.)
Size of Industry in terms of
No. of factories and workshops
10 and less
11 to 25
26 to 50
51 to 75
76 to 99
10 and less
11 to 25
26 to 50
51 to 75
76 to 99
230 (5),
272 (1),
300 (l),
333 (1),
345 (1),
378 (2),
367 (16),
399 (29).
231 (2),
290 (1),
336 (2),
368 (9),
3.
206 (1),
231 (2),
277 (2),
301 (4),
344 (3),
353 (1),
379(10),
281 (11),
368 (22).
205 (50),
220 (55),
4.
201 (1),
232 (2),
302 (1),
341 (1),
370 (I),
205 (14),
207 (49),
289 (67),
Minor group of Standard Industrial Classification
CHINGLEPUT DISTRI CT URBAN
209 (7), 215 (8), 216 (1), 219 (2), 221 (7),
234 (3), 237 (1), 244 (1), 260 (1), 261 (1),
279 (4), 280 (8), 284 (1), 286 (1), 287 (1),
303 (1), 313 (2), 320 (4), 323 (3), 331 (2),
335 (5), 336 (5), 337 (2), 339 (3), 340 (6),
354 (3), 357 (I), 360 (2), 363 (1), 374 (3),
383 (I), 385 (I), 389 (9), 391 (1), 394 (5),
282 (20), 311 (15), 342 (15), 350 (12), 365 (24),
207 (50), 218 (31), 233 (29), 302 (33), 384 (36),
264 (74), 310 (55).
NORTH ARCOT DISTRICT-RURAL
202 (3), 206 (4), 208 (1), 215 (1), 224 (4),
234 (1), 236 (2), 239 (5), 277 (7), 280 (2),
313 (3), 330 (1), 331 (2), 332 (2), 334 (3),
342 (4), 345 (2), 351 (1), 361 (6), 365 (8),
371 (1), 373 (1), 378 (1), 384 (5), 387 (1),
233 (11), 314 (15), 340 (22), 389 (24).
209 (27), 255 (39), 399 (33).
310 (70), 311 (66), 360 (56).
224 (5),
262 (1),
288 (6),
332 (4),
341 (7),
377 (2),
395 (2).
366 (15),
392 (28),
230 (5)
283 (2),
335 (2),
367 (I),
392 (2).
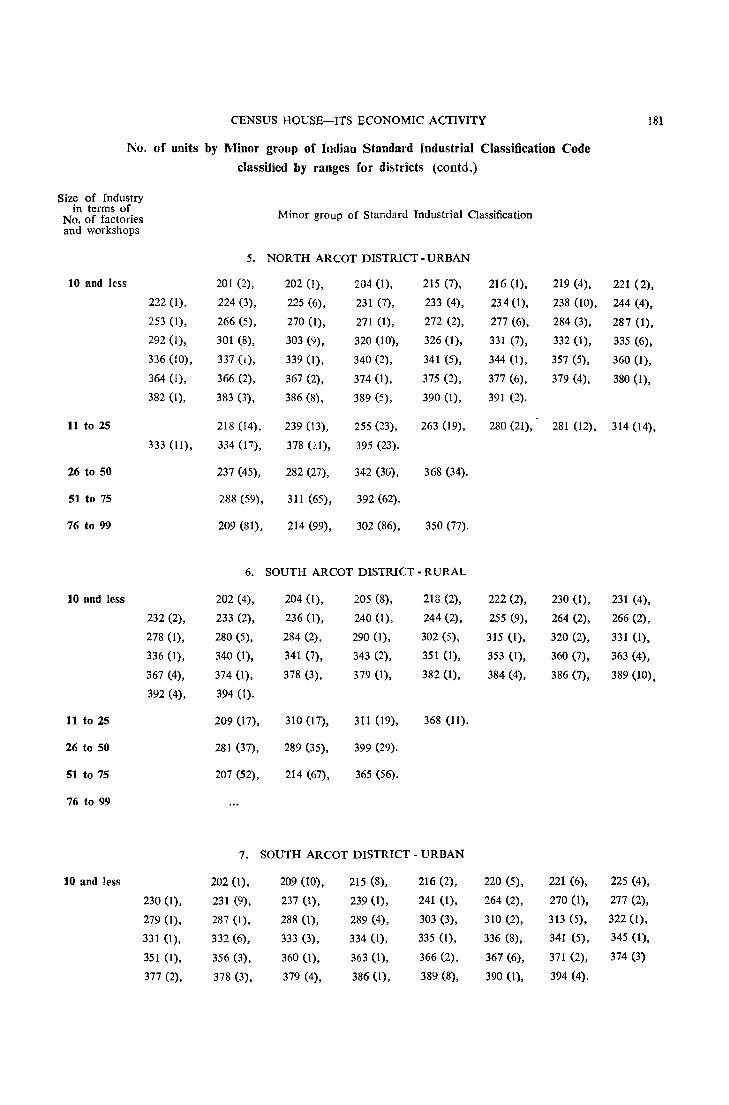
CENSUS HOUSE-ITS ECONOMIC ACTIVITY 181
No. of units by Minor group of Indian Standard Industrial Classification Code
classified by ranges for di1>tricts (contd.)
Size of Industry in terms of
Minor group of Standard Industrial Classification No. of factories and workshops
5. NORTH ARCOT DISTRICT - URBAN
10 and less 201 (2), 202 (I), 204 (1), 215 (7), 216 (1), 219 (4), 221 (2),
222 (I), 224 (3), 225 (6), 231 (7), 233 (4), 234 (1), 238 (10), 244 (4),
253 (I), 266 (5), 270 (1), 271 (1), 272 (2), 277 (6), 284 (3), 287 (1),
292 (1), 301 (8), 303 (9), 320 (10), 326 (1), 331 (7), 332 (1), 335 (6),
336 (10), 337 (I), 339 (1), 340 (2), 341 (5), 344 (I), 357 (5), 360 (1),
364 (I), 366 (2), 367 (2), 374 (I), 375 (2), 377 (6), 379 (4), 380 (I),
382 (1), 383 (3), 386 (8), 389 (5), 390 (1), 391 (2).
11 to 25 218 (14), 239 (13), 255 (23), 263 (19), 280 (21), 281 (12), 314 (14),
333 (11), 334 (17), 378 (21), 395 (23).
26 to 50 237 (45), 282 (27), 342 (30), 368 (34).
51 to 75 288 (59), 311 (65), 392 (62).
76 to 99 209 (81), 214 (99), 302 (86), 350 (77).
6. SOUTH ARCOT DISTRICT - RURAL
10 and less 202 (4), 204 0), 205 (8), 218 (2), 222 (2), 230 (I), 231 (4),
232 (2), 233 (2), 236 (I), 240 (1), 244 (2), 255 (9), 264 (2), 266 (2),
278 (I), 280 (5), 284 (2), 290 (I), 302 (5), 315 (1), 320 (2), 331 (I),
336 (I), 340 (I), 341 (7), 343 (2), 351 (I), 353 (1), 360 (7), 363 (4),
367 (4), 374 (1), 378 (3), 379 (1), 382 (1), 384 (4), 386 (7), 389 (10),
392 (4), 394 (I).
11 to 25 209 (17), 310 (17), 311 (19), 368 (11).
26 to 50 281 (37), 289 (35), 399 (29).
51 to 75 207 (52), 214 (67), 365 (56).
76 to 99
7. SOUTH ARCOT DISTRICT - URBAN
10 and less 202 (1), 209 (10), 215 (8), 216 (2), 220 (5), 221 (6), 225 (4),
230(1), 231 (9), 237 (1), 239 (1), 241 (I), 264 (2), 270 (1), 277 (2),
279 (1), 287 (1), 288 (1), 289 (4), 303 (3), 310 (2), 313 (5), 322 (I),
331 (I), 332 (6), 333 (3), 334 (I), 335 (1), 336 (8), 341 (5), 345 (I),
351 (1), 356 (3), 360 (I), 363 (1), 366 (2), 367 (6), 371 (2), 374 (3)
377 (2), 378 (3), 379 (4), 386 (I), 389 (8), 390 (1), 394 (4).
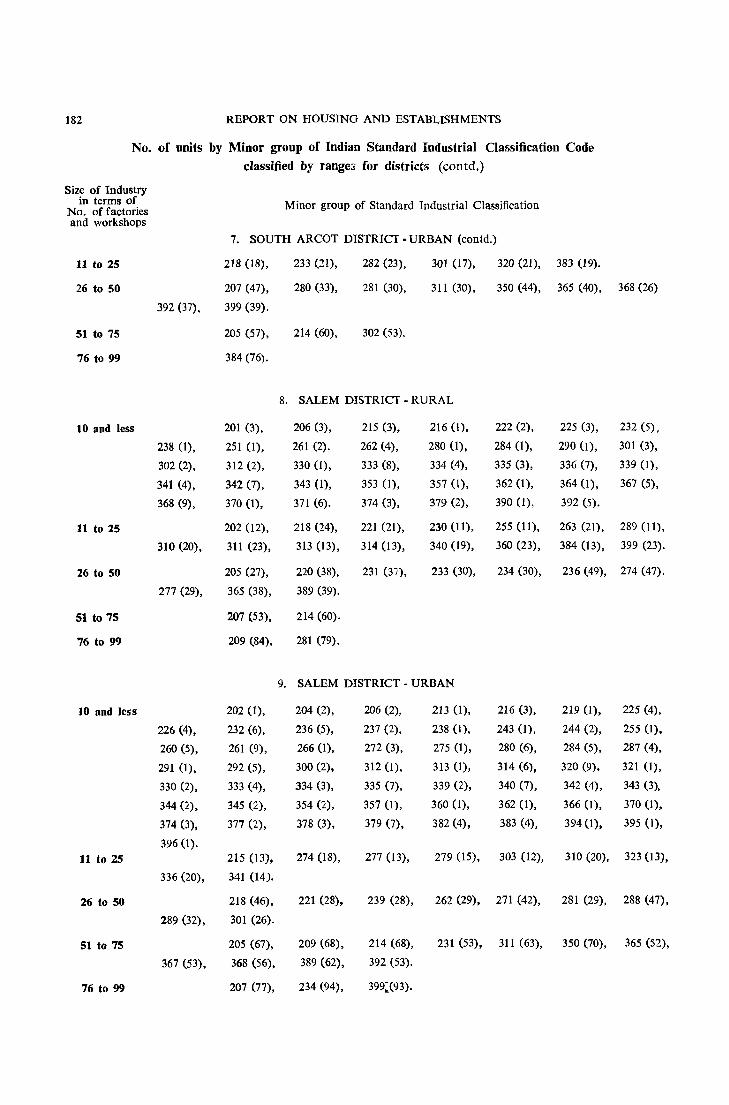
182 REPORT ON HOUSING AND ESTABLISHMENTS
No. of units by Minor group of Indian Standard Industrial Classification Code classified by range:> for districts (contd.)
Size of Industry in terms of Minor group of Standard Industrial Classification No. of factories
and workshops
7. SOUTH ARCOT DISTRICT· URBAN (contd.)
11 to 25 218 (18), 233 (21), 282 (23), 301 (17), 320 (21), 383 (19).
26 to 50 207 (47), 280 (33), 281 (30), 311 (30), 350 (44), 365 (40), 368 (26)
392 (37), 399 (39).
51 to 75 205 (57), 214 (60), 302 (53).
76 to 99 384 (76).
8. SALEM DISTRICT· RURAL
10 and less 201 (3), 206 (3), 215 (3), 216 (I), 222 (2), 225 (3), 232 (5),
238 (1), 251 (1), 261 (2). 262 (4), 280 (1), 284 0), 290 (1), 301 (3),
302 (2), 312 (2), 330 (1), 333 (8), 334 (4), 335 (3), 336 (7), 339 (I),
341 (4), 342 (7), 343 (1), 353 (1), 357 (I), 362 (1), 364 (1), 367 (5),
368 (9), 370 (I), 371 (6). 374 (3), 379 (2), 390 (1), 392 (5).
11 to 25 202 (12), 218 (24), 221 (21), 230 (11), 255 (11), 263 (21), 289 (11),
310 (20), 311 (23), 313 (13), 314 (13), 340 (19), 360 (23), 384 (13), 399 (23).
26 to 50 205 (27), 220 (38), 231 (37), 233 (30), 234 (30), 236 (49), 274 (47).
277 (29), 365 (38), 389 (39).
51 to 75 207 (53), 214 (60).
76 to 99 209 (84), 281 (79).
9. SALEM DISTRICT - URBAN
10 and less 202 (I), 204 (2), 206 (2), 213 (I), 216 (3), 219 (1), 225 (4),
226 (4), 232 (6), 236 (5), 237 (2), 238 (I), 243 (1), 244 (2), 255 (1),
260 (5), 261 (9), 266 (I), 272 (3), 275 (I), 280 (6), 284 (5), 287 (4),
291 (I), 292 (5), 300 (2). 312 (I), 313 (I), 314 (6), 320 (9). 321 (I),
330 (2), 333 (4). 334 (3), 335 (7), 339 (2), 340 (7), 342 (4), 343 (3).
344 (2), 345 (2), 354 (2), 357 0), 360 (1), 362 (I), 366 (I), 370 (I),
374 (3), 377 (2), 378 (3), 379 (7), 382 (4), 383 (4), 394 (I), 395 (I),
396 (1).
11 to 25 215 (13). 274 (18), 277 (13), 279 (15), 303 (12), 310 (20), 323 (13),
336 (20), 341 (14).
26 to 50 218 (46), 221 (28), 239 (28), 262 (29), 271 (42), 281 (29). 288 (47),
289 (32), 301 (26).
51 to 75 205 (67). 209 (68), 214 (68), 231 (53), 311 (63), 350 (70), 365 (52),
367 (53), 368 (56), 389 (62), 392 (53).
76 to 99 207 (77), 234 (94), 399:(93).
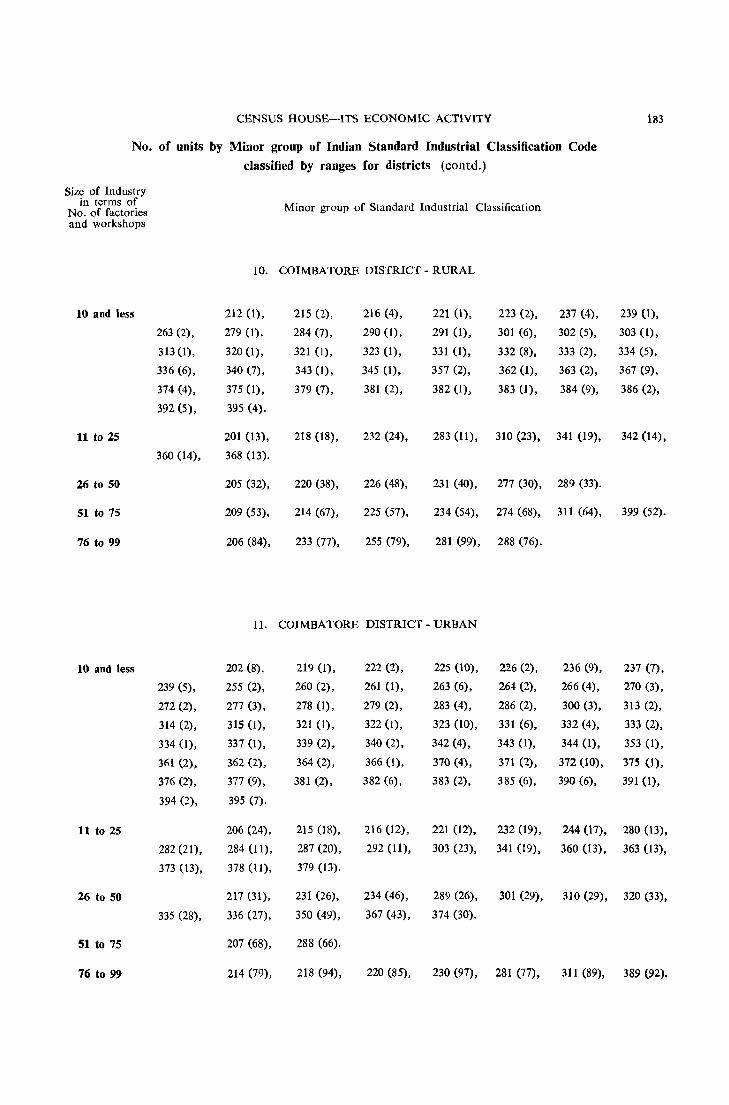
CENSUS HOUSE-ITS ECONOMIC ACTIVITY 183
No. of units by Minor group of Indian Standard Industrial Classification Code
classified by ranges for districts (contd.)
Size of Industry in terms of Minor group of Standard Industrial Classification No. of factories
and workshops
10. COIMBATORE DISTRICT - RURAL
10 and less 212 (1), 215 (2), 216 (4), 221 (1), 223 (2), 237 (4), 239 (1),
263 (2), 279 (I), 284 (7), 290 (1), 291 (I), 301 (6), 302 (5), 303 (1),
313 (I), 320(1), 321 (I), 323 (1), 331 (1), 332 (8), 333 (2), 334 (5),
336 (6), 340 (7), 343 (1), 345 (1), 357 (2), 362 (1), 363 (2), 367 (9),
374 (4), 375 (I), 379 (7), 381 (2), 382 (1), 383 (1), 384 (9), 386 (2),
392 (5), 395 (4).
11 to 25 201 (13), 218 (18), 232 (24), 283 (11), 310 (23), 341 (19), 342 (14),
360 (14), 368 (13).
26 to 50 205 (32), 220 (38), 226 (48), 231 (40), 277 (30), 289 (33).
51 to 75 209 (53), 214 (67), 225 (57), 234 (54), 274 (68), 311 (64), 399 (52).
76 to 99 206 (84), 233 (77), 255 (79), 281 (99), 288 (76).
11. COIMBATORE DISTRICT - URBAN
10 and less 202 (8), 219 (1), 222 (2), 225 (10), 226 (2), 236 (9), 237 (7).
239 (5), 255 (2). 260 (2), 261 (1), 263 (6), 264 (2), 266 (4), 270 (3).
272 (2), 277 (3), 278 (I), 279 (2), 283 (4), 286 (2), 300 (3), 313 (2),
314 (2), 315 (I), 321 (1), 322 (I), 323 (10), 331 (6), 332 (4), 333 (2),
334 (I), 337 (1), 339 (2), 340 (2), 342 (4), 343 (1), 344 (1), 353 (I),
3(;1 (2), 362 (2), 364 (2), 366 (1), 370 (4), 371 (2), 372 (10), 375 (1),
376 (2), 377 (9), 381 (2), 382 (6), 383 (2), 385 (6), 390 (6), 391 (1),
394 (2), 395 (7).
11 to 25 206 (24), 215 (18), 216 (12), 221 (12), 232 (19), 244 (17), 280 (13),
282 (21), 284 (11), 287 (20), 292(11), 303 (23), 341 (19), 360 (13), 363 (13),
373 (13). 378 (11), 379 (13).
26 to 50 217 (31), 231 (26), 234 (46), 289 (26), 301 (29), 310 (29), 320 (33),
335 (28), 336 (27), 350 (49), 367 (43), 374 (30).
51 to 75 207 (68), 288 (66).
76 to 99 214 (79), 218 (94), 220 (85), 230 (97), 281 (77), 311 (89), 389 (92).
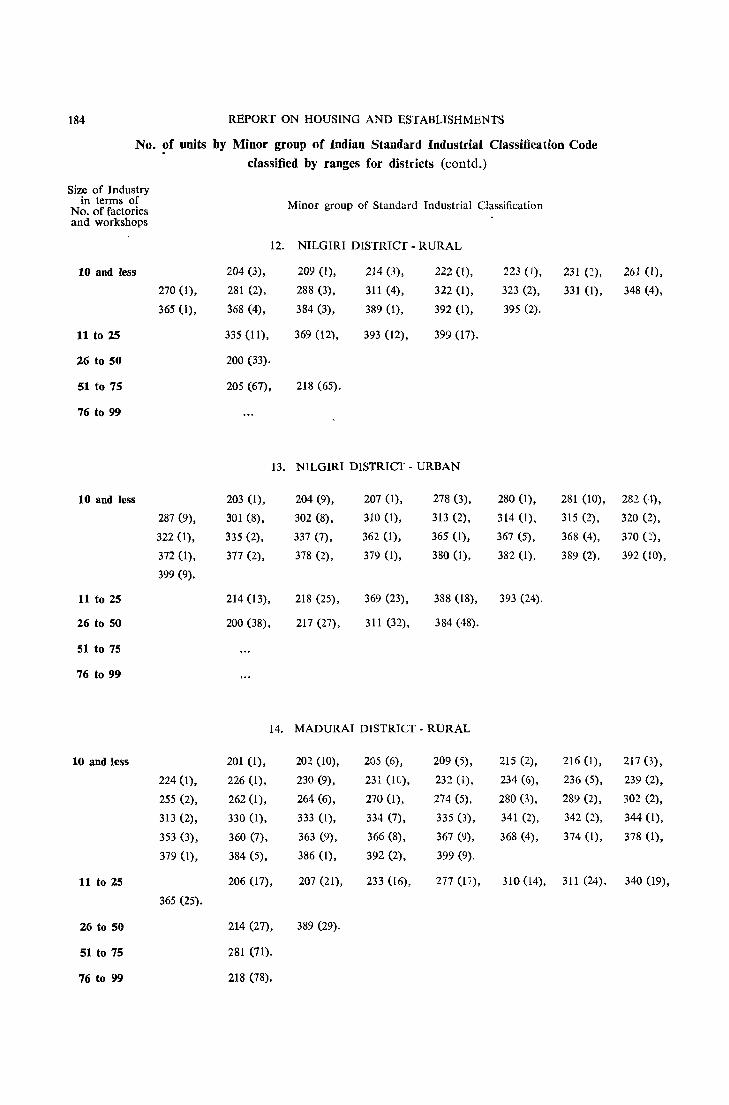
184 REPORT ON HOUSING AND ESTABLISHMENTS
No. ?f units by Minor group of Indian Standard Industrial Classification Code
classified by ranges for districts (eontd.)
Size of Industry in terms of
No. of factories and workshops
10 and Jess
11 to 25
26 to 50
51 to 75
76 to 99
10 and less
11 to 25
26 to 50
51 to 75
76 to 99
10 and less
11 to 25
26 to 50
51 to 75
76 to 99
270 (I),
365 (I),
287 (9),
322 (I),
372 (1),
399 (9).
224 (1),
255 (2),
313 (2),
353 (3),
379 (1),
365 (25).
Minor group of Standard Industrial Classification
12. NILGIRI DISTRICT - RURAL
204 (3), 209 (1), 214 (3). 222 (I), 223 (I), 231 c:~).
281 (2), 288 (3). 311 (4). 322 (1), 323 (2), 331 (1),
368 (4). 384 (3), 389 (1), 392 (1), 395 (2).
335 (11), 369 (12), 393 (12), 399 (17).
200 (33).
205 (67), 218 (65).
13. NILGIRI DISTRICT - URBAN
203 (1), 204 (9), 207 (1), 278 (3), 280 (1), 281 (10),
301 (8), 302 (8), 310 (I), 313 (2), 314(1), 315 (2),
335 (2), 337 (7), 362 (1), 365 (I), 367 (5), 368 (4),
377 (2), 378 (2), 379 (1), 380 (1), 382 (I), 389 (2),
214 (13), 218 (25), 369 (23), 388 (18), 393 (24).
200 (38), 217 (27), 311 (32), 384 (48).
14. MADURAI DISTRICT - RURAL
201 (1), 202 (10), 205 (6), 209 (5), 215 (2), 216 (I),
226 (1), 230 (9), 231 (Ie), 232 (1), 234 (6), 236 (5),
262 (I), 264 (6), 270 (1), 274 (5), 280 (3), 289 (2),
330 (\), 333 (I), 334 (7), 335 (3), 341 (2), 342 (2),
360 (7), 363 (9), 366 (8), 367 (9), 368 (4), 374 (1),
384 (5), 386 (1), 392 (2), 399 (9).
206 (17), 207 (21), 233 (16), 277 (17), 310 (l4), 311 (24).
214 (27), 389 (29).
281 (71).
218 (78).
261 (I),
348 (4).
282 (4),
320 (2),
370 C),
392 (10),
217 (3),
239 (2),
302 (2),
344 (1),
378 (1),
340 (19),
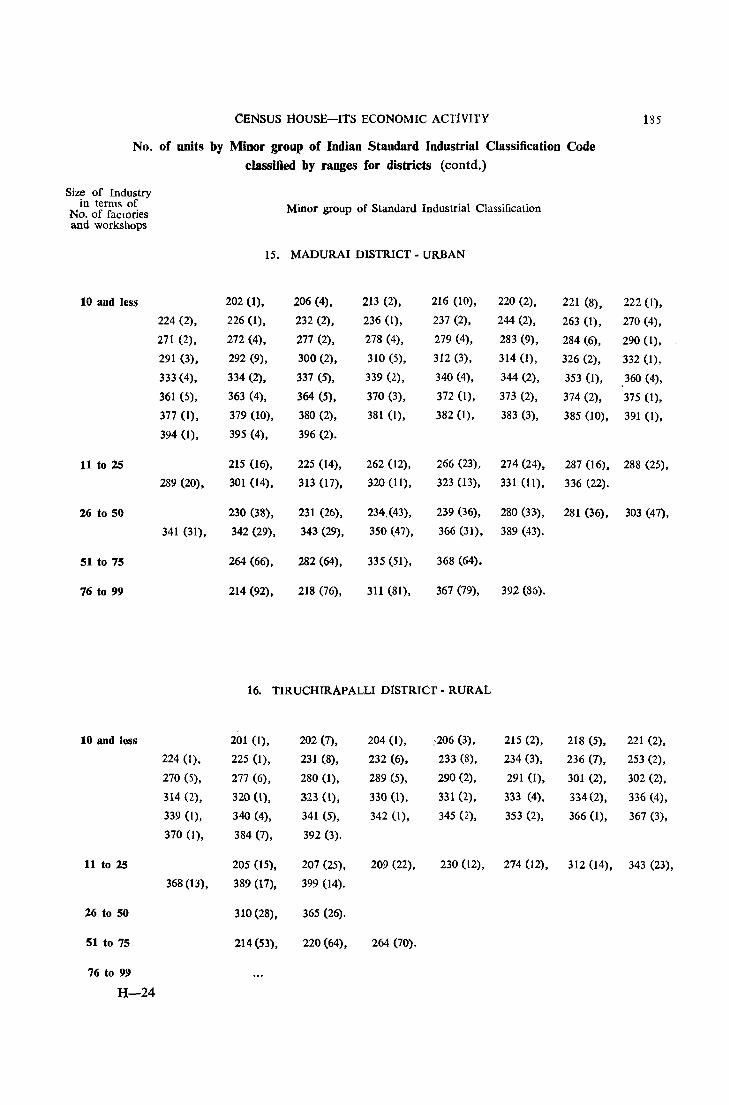
CENSUS HOUSE-ITS ECONOMIC ACTiVITY 185
No. of units by Minor group of Indian Standard Industrial Classification Code classified by ranges for districts (contd.)
Size of Industry in terms of Minor group of Standard Industrial Classification No. of fac!Ories
and workshops
15. MADURAI DISTRICT - URBAN
10 and less 202 (1), 206 (4), 213 (2), 216 (10), 220 (2), 221 (8), 222 (I),
224 (2), 226 (1), 232 (2), 236 (I), 237 (2), 244 (2), 263 (1), 270 (4),
271 (2), 272 (4), 277 (2), 278 (4), 279 (4), 283 (9), 284 (6), 290 (I), -
291 (3), 292 (9), 300 (2), 310 (5), 312 (3), 314 (1), 326 (2), 332 (1),
333 (4), 334 (2), 337 (5), 339 (2), 340 (4), 344 (2), 353 (I), 360 (4),
361 (5), 363 (4), 364 (5), 370 (3), 372 (I), 373 (2), 374 (2), 375 (1),
377 (1), 379 (10), 380 (2), 381 (I), 382 (1), 383 (3), 385 (10), 391 (1),
394 (1), 395 (4), 396 (2).
11 to 2S 215 (16), 225 (14), 262(12), 266 (23), 274 (24), 287 (16), 288 (25),
289 (20), 301 (14), 313 (17), 320 (11), 323 (13), 331 (11), 336 (22).
26 to 50 230 (38), 231 (26), 234,(43), 239 (36), 280 (33), 281 (36), 303 (47),
341 (31), 342 (29), 343 (29), 350 (47), 366 (31), 389 (43).
51 to 75 264 (66), 282 (64), 335 (51), 368 (64).
76 to 99 214 (92), 218 (76), 311 (81), 367 (79), 392 (86).
16. TIRUCHIRApALLI DISTRICT - RURAL
10 and less 201 (1), 202 (7), 204 (I), :·206 (3), 215 (2), 218 (5), 221 (2),
224 (I), 225 (1), 231 (8), 232 (6), 233 (8), 234 (3), 236 (7), 253 (2),
270 (5), 277 (6), 280 (1), 289 (5), 290 (2), 291 (1), 301 (2), 302 (2),
314 (2), 320 (I), 323 (I), 330 (1), 331 (2), 333 (4), 334 (2), 336 (4),
339 (I), 340 (4), 341 (5), 342 (I), 345 (2), 353 (2), 366 (1), 367 (3),
370 (I), 384 (7), 392 (3).
11 to 25 205 (15), 207 (25), 209 (22), 230 (12), 274 (12), 312 (14), 343 (23),
368 (13), 389 (17), 399 (14).
26 to 50 310 (28), 365 (26).
51 to 75 214 (53), 220 (64), 264 (70).
76 to 99
H-24
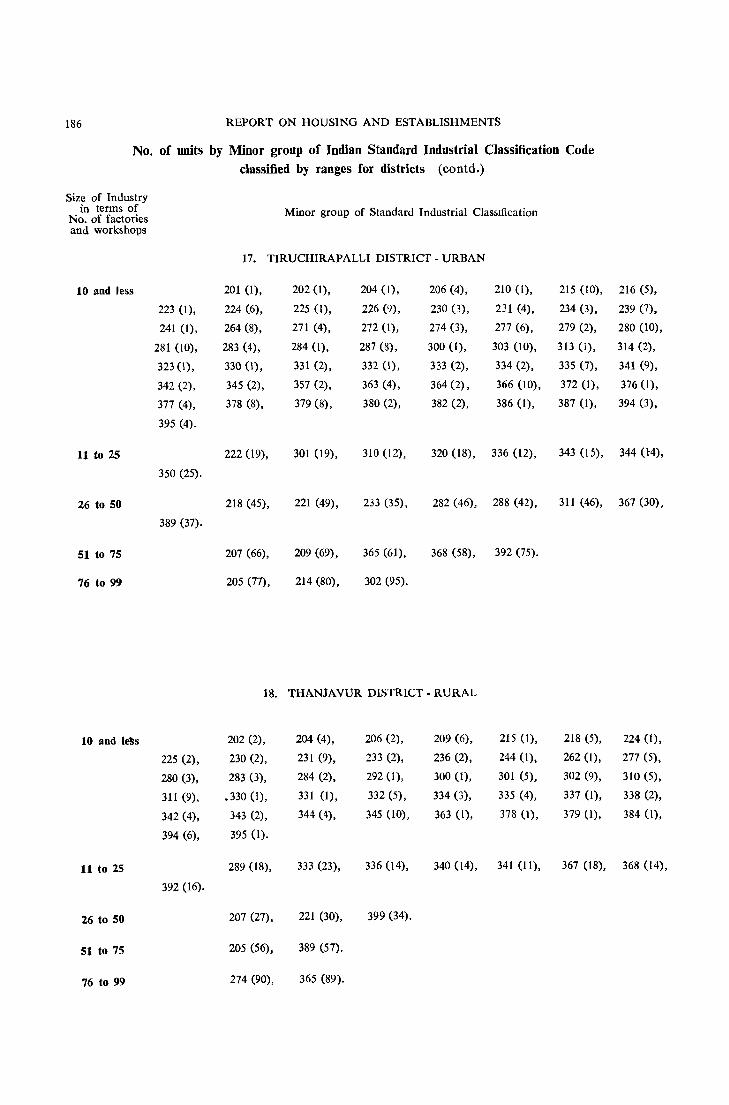
186 REPORT ON HOUSING AND ESTABLISHMENTS
No. of units by Minor group of Indian Standard Industrial Classification Code classified by ranges for districts (contd.)
Size of Industry in terms of Minor group of Standard Industrial Classification
No. of factories and workshops
17. TlRUCHIRAPALLI DISTRICT - URBAN
10 and less 201 (1), 202 (I), 204 (I), 206 (4), 210 (I), 215 (10), 216 (5),
223 (I), 224 (6), 225 (I), 226 (9), 230 (3), 231 (4), 234 (3), 239 (7),
241 (I), 264 (8), 271 (4), 272 (1), 274 (3), 277 (6), 279 (2), 280 (10),
281 (10), 283 (4), 284 (1), 287 (8), 300 (I), 303 (10), 313 (I), 314 (2),
323 (I), 330 (I), 331 (2), 332 (1), 333 (2), 334 (2), 335 (7), 341 (9),
342 (2), 345 (2), 357 (2), 363 (4), 364 (2), 366 (10), 372 (I), 376 (I),
377 (4), 378 (8), 379 (8), 380 (2), 382 (2), 386 (I), 387 (I), 394 (3),
395 (4).
11 to 25 222 (19), 301 (19), 310 (12), 320 (18), 336 (12), 343 (15), 344 (H),
350 (25).
26 to 50 218 (45), 221 (49), 233 (35), 282 (46), 288 (42), 311 (46), 367 (30),
389 (37).
51 to 75 207 (66), 209 (69), 365 (61), 368 (58), 392 (75).
76 to 99 205 (77), 214 (80), 302 (95).
18. THANJAVUR DISTRICT - RURAL
10 and le'Ss 202 (2), 204 (4), 206 (2), 209 (6), 215 (I), 218 (5), 224 (1),
225 (2), 230 (2), 231 (9), 233 (2), 236 (2), 244 (I), 262 (I), 277 (5),
280 (3), 283 (3), 284 (2), 292 (I), 300 (I), 301 (5), 302 (9), 310 (5),
311 (9), .330 (I), 331 (I), 332 (5), 334 (3), 335 (4), 337 (I), 338 (2),
342 (4), 343 (2), 344 (4), 345 (10), 363 (1), 378 (1), 379 (1), 384 (I),
394 (6), 395 (I).
11 to 25 289 (18), 333 (23), 336 (14), 340 (14), 341 (11), 367 (18), 368 (14),
392 (16).
26 to 50 207 (27), 221 (30), 399 (34).
51 to 75 205 (56), 389 (57).
76 to 99 274 (90), 365 (89).
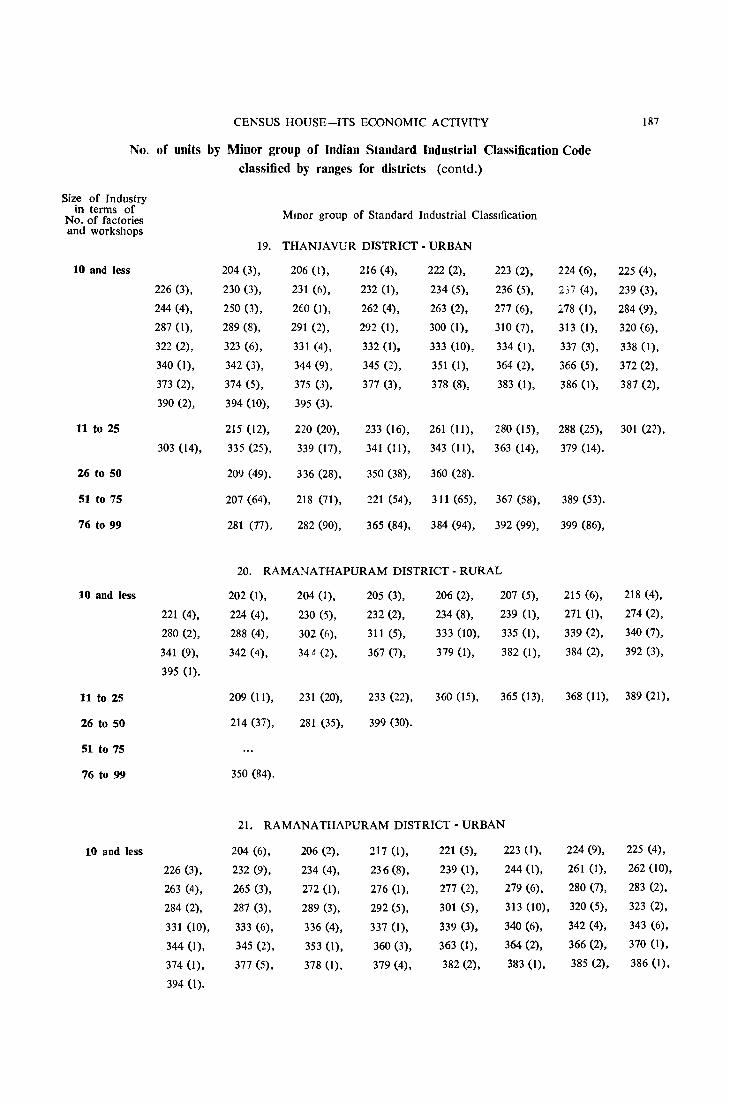
CENSUS HOUSE-ITS ECONOMIC ACTIVITY 187
No. of units by Minor group of Indian Standard Industrial Classification Code classified by ranges for districts (contd.)
Size of Industry in terms of Mmor group of Standard Industrial Classification No. of factories
and workshops 19. THANJAVUR DISTRICT - URBAN
10 and less 204 (3), 206 (I), 216 (4), 222 (2), 223 (2), 224 (6), 225 (4),
226 (3), 230 (3), 231 (6), 232 (1), 234 (5), 236 (5), 237 (4), 239 (3),
244 (4), 250 (3), 2tD (1), 262 (4), 263 (2), 277 (6), ~78 (1), 284 (9),
287 (1), 289 (8), 291 (2), 292 (I), 300 (I), 310 (7), 313 (I), 320 (6),
322 (2), 323 (6), 331 (4), 332 (I), 333 (10), 334 (I), 337 (3), 338 (I),
340 (I), 342 (3), 344 (9), 345 (2), 351 (I), 364 (2), 366 (5), 372 (2),
373 (2), 374 (5), 375 (3), 377 (3), 378 (8), 383 (I), 386 (1), 387 (2),
390 (2), 394 (10), 395 (3).
11 to 25 215 (I2), 220 (20), 233 (16), 261 (11), 280 (15), 288 (25), 301 (22),
303 (\4), 335 (25), 339 (17), 341 (ll), 343 (11), 363 (14), 379 (14).
26 to 50 209 (49), 336 (28), 350 (38), 360 (28).
51 to 75 207 (64), 218 (71), 221 (54), 311 (65), 367 (58), 389 (53).
76 to 99 281 (77), 282 (90), 365 (84), 384 (94), 392 (99), 399 (86),
20. RAMANATHAPURAM DISTRICT - RURAL
10 and less 202 (I), 204 (I), 205 (3), 206 (2), 207 (5), 215 (6), 218 (4),
221 (4), 224 (4), 230 (5), 232 (2), 234 (8), 239 (1), 271 (l), 274 (2),
280 (2), 288 (4), 302 (6), 311 (5), 333 (10), 335 (I), 339 (2), 340 (7),
341 (9), 342 (4), 34<1 (2), 367 (7), 379 (1), 382 (1), 384 (2), 392 (3),
395 (1).
11 to 25 209 (11), 231 (20), 233 (22), 360 (15), 365 (13). 368 (11), 389 (21),
26 to 50 214 (37), 281 (35), 399 (30).
51 to 75
76 to 99 350 (84).
21. RA MANATHAPURAM DISTRICT - URBAN
10 and less 204 (6), 206 (2), 217 (1), 221 (5), 223 (1), 224 (9), 225 (4),
226 (3), 232 (9), 234 (4), 236(8), 239 (1), 244 (1), 261 (1), 262 (10),
263 (4), 265 (3), 272 (1), 276 (l), 277 (2), 279 (6), 280 (7), 283 (2),
284 (2), 287 (3), 289 (3), 292 (5), 301 (5), 313 (10), 320 (5), 323 (2),
331 (10), 333 (6), 336 (4), 337 (I), 339 (3), 340 (6), 342 (4), 343 (6),
344 (I), 345 (2), 353 (1), 360 (3), 363 (1), 364 (2), 366 (2), 370 (1),
374 (1), 377 (5), 378 (I), 379 (4), 382 (2), 383 (1), 385 (2). 386 (1),
394 (1).
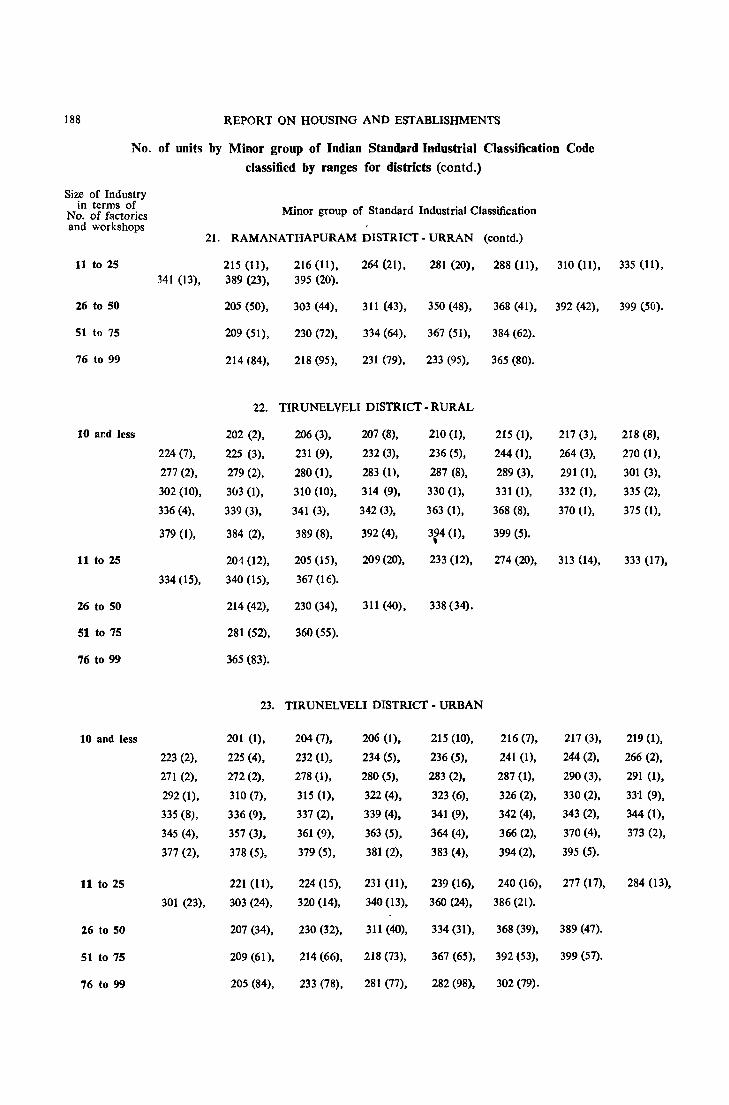
188 REPORT ON HOUSING AND ESTABLISHMENTS
No. of units by Minor group of Indian Stand,ard Industrial Classification Code
classified by ranges for districts (contd.)
Size of Industry in terms of Minor group of Standard Industrial Classification No. of factories
and workshops 21. RAMANATHAPURAM DISTRICT - URRAN (contd.)
11 to 25 215 (11), 216 (11), 264 (21), 281 (20), 288 (11), 310 (11), 335 (11), 341 (13), 389 (23), 395 (20).
26 to 50 205 (50), 303 (44), 311 (43), 350 (48), 368 (41), 392 (42), 399 (50).
51 to 75 209 (51), 230 (72), 334 (64), 367 (51), 384 (62).
76 to 99 214 (84), 218 (95), 231 (79), 233 (95), 365 (80).
22. TIRUNELVELI DISTRlcr - RURAL
10 and less 202 (2), 206 (3), 207 (8), 210 (1), 215 (l), 217(3), 218 (8),
224 (7), 225 (3), 231 (9), 232 (3), 236 (5), 244 (I), 264 (3), 270 (1),
277 (2), 279 (2), 280 (1), 283 (l), 287 (8), 289 (3), 291 (1), 301 (3),
302 (10), 3(13 (1), 310 (10), 314 (9), 330 (1), 331 (I), 332 (I), 335 (2),
336 (4), 339 (3), 341 (3), 342 (3), 363 (1), 368 (8), 370 (1), 375 (I),
379 (1), 384 (2), 389 (8), 392 (4), 3~4 (1), 399 (5).
11 to 25 201 (12), 205 (15), 209 (20), 233 (12), 274 (20), 313 (14), 333 (17),
334 (15), 340 (15), 367 (16).
26 to 50 214 (42), 230 (34), 311 (40), 338 (34).
51 to 75 281 (52), 360 (55).
76 to 99 365 (83).
23. TIRUNELVELI DISTRICT - URBAN
10 and less 201 (1), 204 (7), 206 (1). 215 (10), 216 (7), 217 (3), 219 (1),
223 (2), 225 (4), 232 (1), 234 (5). 236 (5), 241 (I), 244 (2), 266 (2).
271 (2), 272 (2), 278 (1). 280 (5), 283 (2), 287 (1), 290 (3), 291 (1),
292 (1), 310 (7), 315 (I), 322 (4), 323 (6), 326 (2), 330 (2), 33-1 (9),
335 (8), 336 (9), 337 (2), 339 (4), 341 (9), 342 (4), 343 (2), 344 (1),
345 (4), 357 (3), 361 (9), 363 (5), 364 (4), 366 (2), 370 (4), 373 (2),
377 (2), 378 (5), 379 (5), 381 (2), 383 (4), 394 (2), 395 (5).
11 to 25 221 (11), 224 (15), 231 (11), 239 (16), 240 (16), 277 (17), 284 (13),
301 (23), 303 (24), 320 (14), 340 (13), 360 (24), 386 (21).
26 to SO 207 (34), 230 (32), 311 (40), 334 (31), 368 (39), 389 (47).
51 to 75 209 (61), 214 (66), 218 (73), 367 (65), 392 (53), 399 (57).
76 to 99 205 (84), 233 (78), 281 (77), 282 (98), 302 (79).
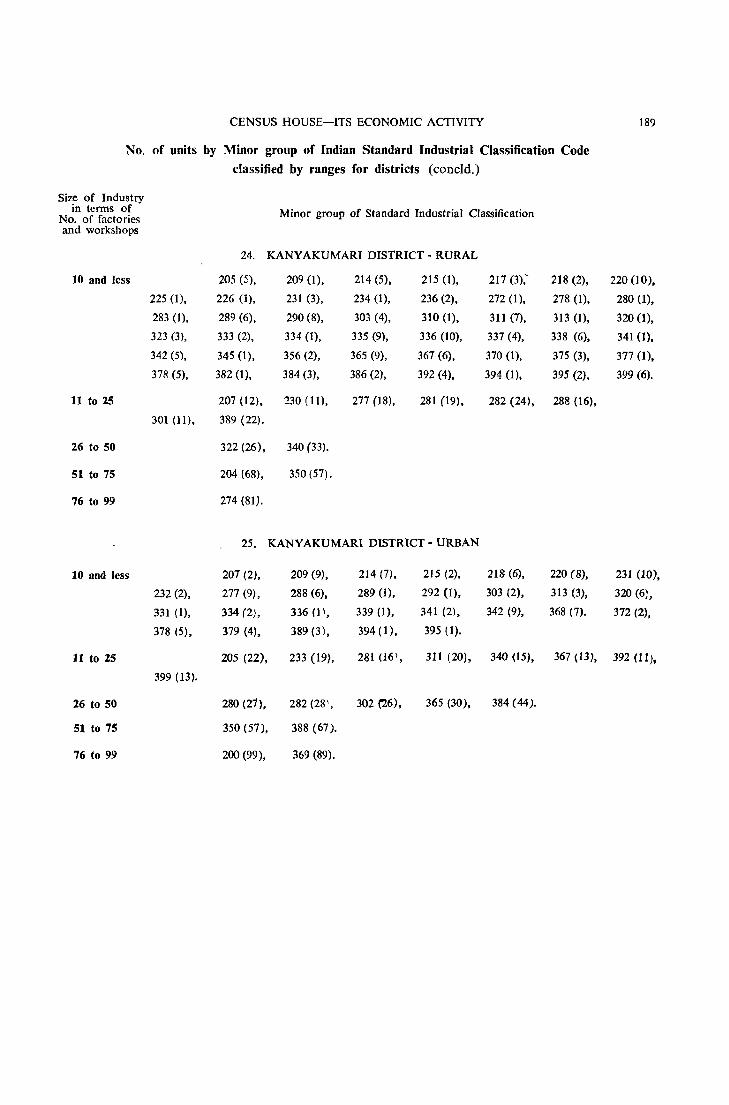
CENSUS HOUSE-ITS ECONOMIC ACTIVITY 189
No. of units by Minor group of Indian Standard Industrial Classification Code
classified by ranges for districts (concId.)
Size of Industry in terms of Minor group of Standard Industrial Classification No. of factories
and workshops
24. KANYAKUMARI DISTRICT - RURAL
10 and less 205 (5), 2090), 214 (5), 215 (I), 217 (3).~ 218 (2), 220 (10),
225 (1), 226 (1), 231 (3), 234 (1), 236 (2), 272 (1), 278 (1), 280 (1),
283 0), 289 (6), 290 (8), 303 (4), 310 (1), 311 (7), 3130), 320 (1),
323 (3), 333 (2), 334 (1), 335 (9), 336 (10), 337 (4), 338 (6), 341 (I),
342 (5), 345 (1), 356 (2), 365 (9), 367 (6), 370 (1), 375 (3), 377 (1),
378 (5), 382 (I), 384 (3), 386 (2), 392 (4), 394 (1), 395 (2), 399 (6).
11 to 25 207 (12), 230 (11), 277 (18), 281 (19), 282 (24), 288 (16),
301 (11), 389 (22).
26 to 50 322 (26), 340 (33).
51 to 75 204 (68), 350 (57).
76 to 99 274 (81).
25. KANYAKUMARI DISTRICT - URBAN
10 and less 207 (2), 209 (9), 214 (7), 215 (2), 218 (6), 220 (8), 231 (10),
232 (2), 277 (9), 288 (6), 289 (1), 292 (I), 303 (2), 313 (3), 320 (6~,
331 (1), 334 (2), 336 (1 I, 339 (1), 341 (2), 342 (9), 368 (7). 372 (2),
378 (5), 379 (4). 389 (3), 394 (1), 395 (1).
11 to 25 205 (22), 233 (19), 281 (16\, 311 (20), 340 (IS), 367 (13], 392 (11),
399 (13).
26 to 50 280 (21), 282 (28 1, 302 ('26), 365 (30), 384 (44).
51 to 75 350 (57), 388 (67).
76 to 99 200 (99), 369 (89).
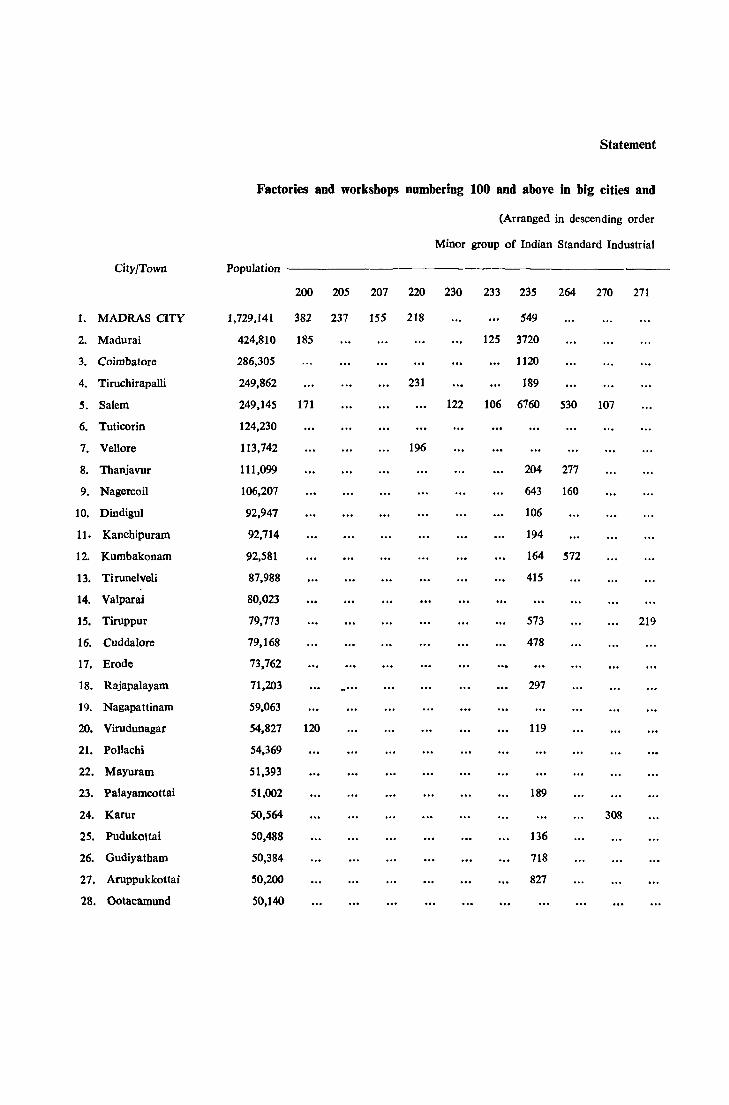
Statement
Factories and workshops numbering 100 and above in big cities and
(Arranged in descending order
Minor group of Indian Standard Industrial
City/Town Population
200 205 207 220 230 233 235 264 270 271
1. MADRAS CITY 1,729.141 382 237 155 218 549
2. Madurai 424,810 185 125 3720
3. Coimbatore 286,305 1120
4. Tiruchirapalli 249,862 231 189
5. Salem 249,145 171 122 106 6760 530 107
6. Tuticorin 124,230
7. Vellore 113,742 196
8. Thanjavur 1ll,099 204 277
9. Nagercoil 106,207 643 160
10. Dindigul 92,947 106
11. Kanchipuram 92,714 194
12. Kumbakonam 92,581 164 572
13. Tirunelveli 87,988 415
14. Valparai 80,023
15. Tiruppur 79,773 573 219
16. Cuddalore 79,168 478
17. Erode 73,762
18. Rajapalayam 71,203 .. ... 297
19. Nagapattinam 59,063
20. Virudunagar 54,827 120 119
21. Pollachi 54,369
22. Mayuram 51,393
23. Palayamcottai 51,002 189
24. Karur 50.564 308
25. Pudukottai 50,488 136
26. Gudiyatham 50,384 718
27. Aruppukkottai 50,200 827
28. Ootacamund 50,140
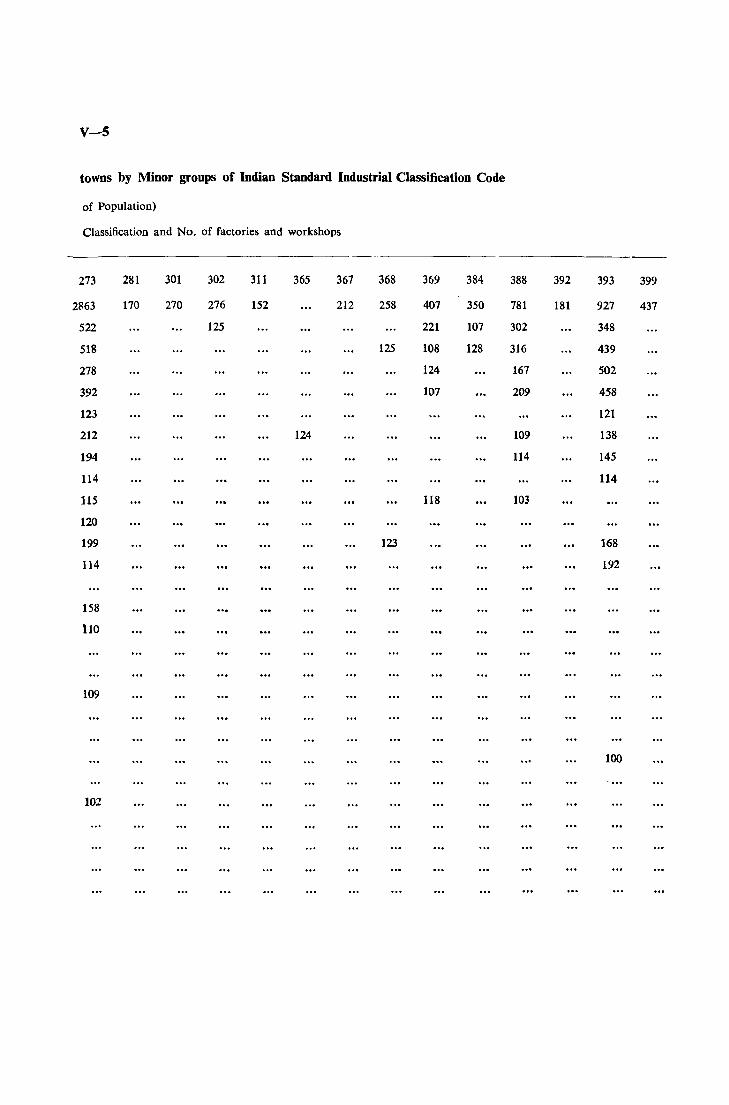
v-s
towns by Minor groups of Indian Standard Industrial Classification Code
of Population)
Classification and No. of factories and workshops
273 281 301 302 311 365 367 368 369 384
2863 170 270 276 152 212 258 407 350
522 125 221 107
518 125 108 128
278 124
392 107
123
212 124
194
114
115 118
120
199 123
114
158
110
109
102
388 392
781 181
302
316
167
209
109
114
103
393 399
927 437
348
439
502
458
121
138
145
114
168
192
100
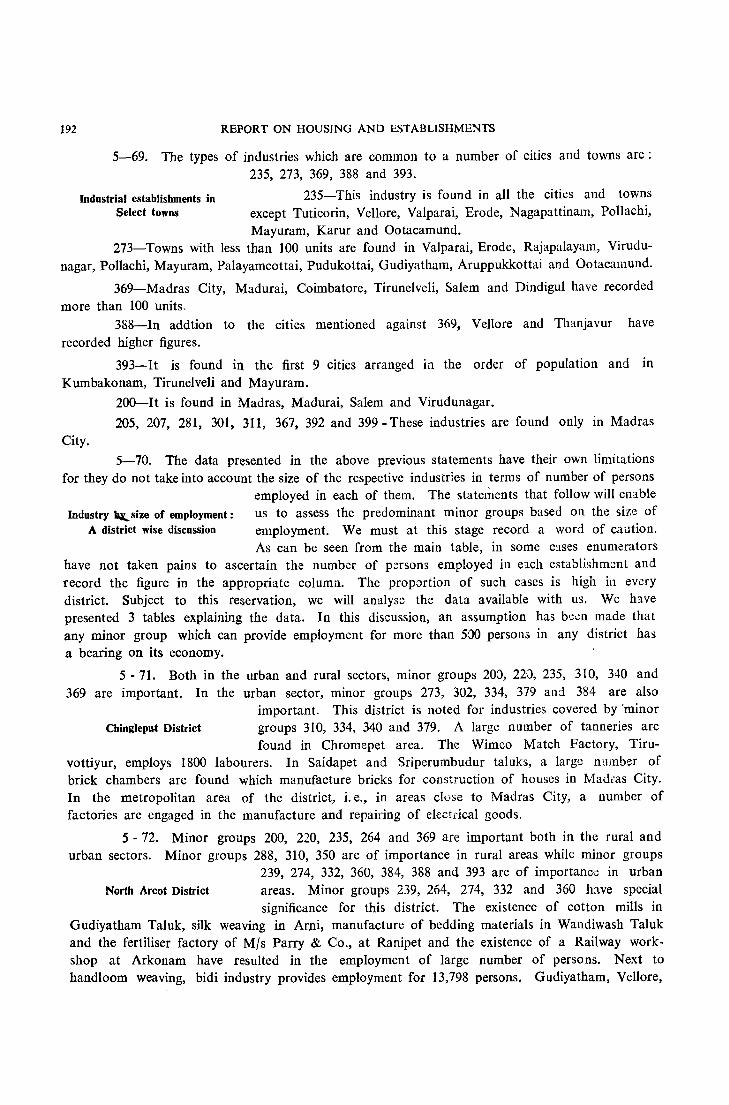
192 REPORT ON HOUSING AND ESTABLISHMENTS
5-69. The types of industries which are common to a number of cities and towns are: 235, 273, 369, 388 and 393.
Industrial establishments in 235-This industry is found in all the cities and towns Select towns except Tuticorin, Vellore, Valparai, Erode, Nagapattinam, Pollachi,
Mayuram, Karur and Ootacamund. 273-Towns with less than 100 units are found in Valparai, Erode, Raj apalayam , Virudu
nagar, Pollachi, Mayuram, Palayamcottai, PudukoHai, Gudiyatham, Aruppukkottai and Ootacamund.
369-Madras City, Madurai, Coimbatore, Tirunelveli, Salem and Dindigul have recorded more than 100 units.
388-ln addtion to the cities mentioned against 369, Vellore and Thanjavur have recorded higher figures.
393-It is found in the first 9 cities arranged in the order of population and in Kumbakonam, Tirunelveli and Mayuram.
200-It is found in Madras, Madurai, Salem and Virudunagar.
205, 207, 281, 301, 311, 367, 392 and 399 - These industries are found only in Madras City.
5-70. The data presented in the above previous statements have their own limitations for they do not take into account the size of the respective industries in terms of number of persons
employed in each of them. The staternents that follow will emble Industry ~size of employment: us to assess the predominant minor groups based on the size of
A district wise discussion employment. We must at this stage record a word of caution. As can be seen from the main table, in some c~ses enumerators
have not taken pains to ascertain the number of p:!rsons employed in elch establishment and record the figure in the appropriate column. The proportion of such cases is high in every district. Subject to this re:servation, we will analyse the data available with us. We hwe presented 3 tables explaining the data. In this discussion, an assumption has been made that any minor group which can provide employment for more than 500 persons in any district has a bearing on its economy.
5 • 71. Both in the urban and rural sectors, minor groups 200, 220, 235, 310, 340 and 369 are important. In the urban sector, minor groups 273, 302, 334, 379 and 384 are also
important. This district is noted for industries covered by 'minor Chingleput District groups 310, 334, 340 and 379. A large number of tanneries are
found in Chromepet area. The Wimco Match Factory, Tiruvottiyur, employs 1800 labourers. In Saidapet and Sriperumbudur taluks, a large number of brick chambers are found which manufacture bricks for construction of houses in Madras City. In the metropolitan area of the district, i. e., in areas c1c.se to Madras City, a number of factories are engaged in the manufacture and repairing of electrical goods.
5 - 72. Minor groups 200, 220, 235, 264 and 369 are important both in the rural and urban sectors. Minor groups 288, 310, 350 are of importance in rural areas while minor groups
239, 274, 332, 360, 384, 388 and 393 are of importance in urban North Arcot District areas. Minor groups 239, 264, 274, 332 and 360 h:we special
significance for this district. The existence of cotton mills in Gudiyatham Taluk, silk weaving in Arni, manufacture of bedding materials in Wandiwash Taluk and the fertiliser factory of MIs Parry & Co., at Ranipet and the existence of a Railway workshop at Arkonam have resulted in the employment of large number of persons. Next to handloom weaving, bidi industry provides employment for 13,798 persons. Gudiyatham, Vellore,
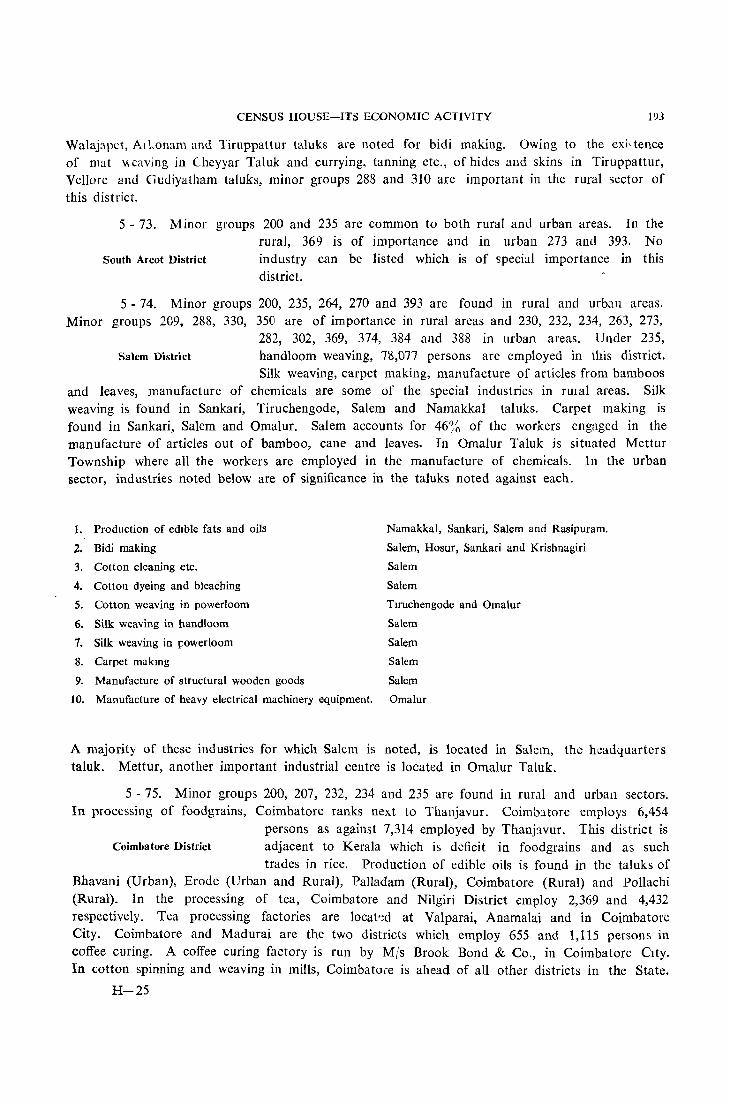
CENSUS HOUSE-ITS ECONOMIC ACTIVITY 193
Walajapct, Al honam and Tiruppattur taluks are noted for bidi making. Owing to the exi,tence of mat v. caving in Cheyyar Taluk and currying, tanning etc., of hides and skins in Tiruppattur, Vellore and Gudiyatham taluks, minor groups 288 and 310 are important in the rural sector of this district.
5 - 73. Minor groups 200 and 235 are common to both rural and urban areas. In the rural, 369 is of importance and in urban 273 and 393. No
South Arcot District industry can be listed which is of special importance in this district.
5 - 74. Minor groups 200, 235, 264, 270 and 393 are found in rural and urban areas. Minor groups 209, 288, 330, 350 are of importance in rural areas and 230, 232, 234, 263, 273,
282, 302, 369, 374, 384 and 388 in urban areas. Under 235, Salem District handloom weaving, 18,077 persons are employed in this district.
Silk weaving, carpet making, manufacture of articles from bamboos and leaves, manufacture of chemicals are some of the special industries in rUial areas. Silk weaving is found in Sankari, Tiruchengode, Salem and Namakkal taluks. Carpet making is found in Sankari, Salem and Omalur. Salem accounts for 46% of the workers engaged in the manufacture of articles out of bamboo, cane and leaves. In Omalur Taluk is situated Mettur Township where all the workers are employed in the manufacture of chemicals. In the urban sector, industries noted below are of significance in the taluks noted against each.
1. Production of edIble fats and oils
2. Bidi making
3. Cotton cleaning etc.
4. Cotton dyeing and bleaching
5. Cotton weaving in powerloom
6. Silk weaving in handloom
7. Silk weaving in r;owerloom
8. Carpet makmg
9. Manufacture of structural wooden goods
10. Manufacture of heavy electrical machinery equipment.
Namakkal, Sankari, Salem and Rasipuram.
Salem, Hosur, Sankari and Krishnagiri
Salem
Salem
Tlruchengode and Omalur
Salem
Salem
Salem
Salem
Omalur
A majority of these industries for which Salem is noted, is located in Salem, the headquarters taluk. Mettur, another important industrial centre is located in Omalur Taluk.
5 - 75. Minor groups 200, 207, 232, 234 and 235 are found in rural and urban sectors. In processing of foodgrains, Coimbatore ranks next to Thanjavur. Coimb3.tore employs 6,454
persons as against 7,314 employed by Thanjwur. This district is Coimbatore District adjacent to Kerala which is deficit in foodgrains and as such
trades in rice. Production of edible oils is found in the taluks of Bhavani (Urban), Erode (Urban and Rural), Palladam (Rural), Coimbatore (Rural) and Pollachi (Rural). In the processing of tea, Coimbatore and Nilgiri District employ 2,369 and 4,432 respectively. Tea processing factories are locat~d at Valparai, Anamalai and in Coimbatore City. Coimbatore and Madurai are the two districts which employ 655 and 1,115 persons in coffee curing. A coffee curing factory is run by Mis Brook Bond & Co., in Coimbatore CIty. In cotton spinning and weaving in mills, Coimbatofe is ahead of all other districts in the State.
H-25
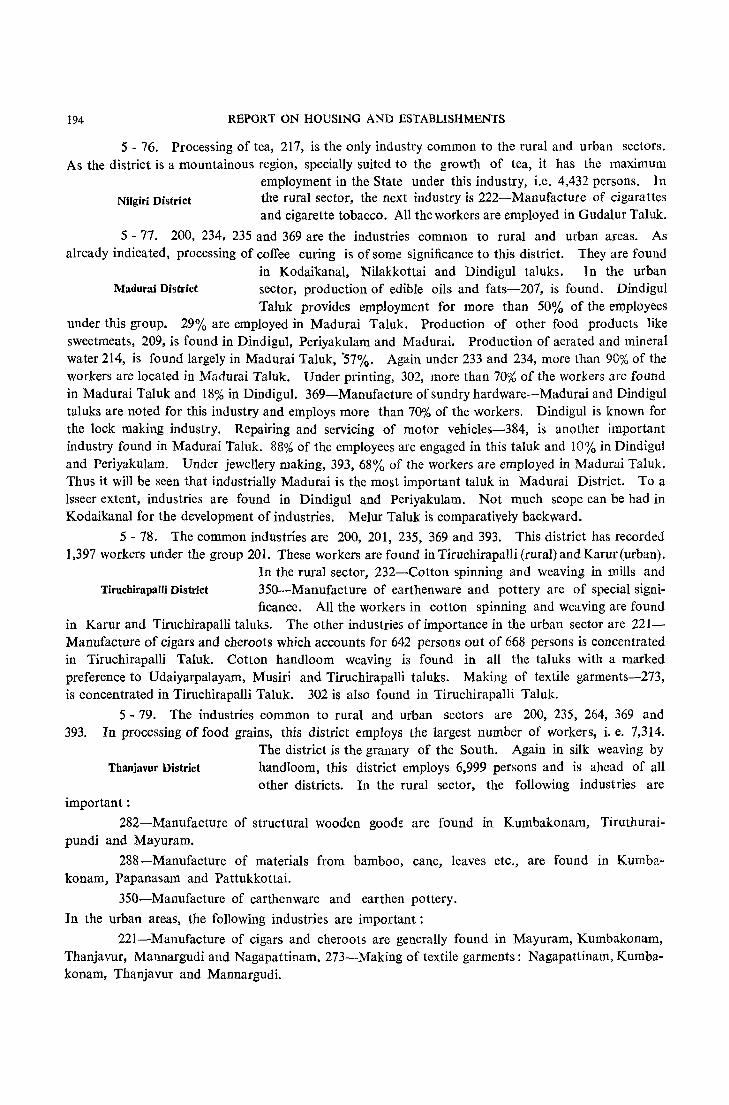
194 REPORT ON HOUSING AND ESTABLISHMENTS
S - 76. Processing of tea, 217, is the only industry common to the rural and urban sectors. As the district is a mountainous region, specially suited to the growth of tea, it has the maximum
employment in the State under this industry, i.e. 4,432 persons. In Nilgiri District the rural sector, the next industry is 222-Manufactute of cigarattes
and cigarette tobacco. All the workers are employed in Gudalur Taluk.
S - 77. 200, 234. 235 and 369 are the industries common to rural and urban areas. As already indica ted, processing of coffee curing is of some Significance to this district. They are found
in Kodaikanal, Nilakkottai and Dindigul taluks. In the urban Madutai District sector, production of edible oils and fats-207, is found. Dindigul
Taluk provides employment for more than 50% of the employees under this group. 29% are employed in Madurai Taluk. Production of other food products like sweetmeats, 209, is found in Dindigul, Periyakulam and Madurai. Production of aerated and mineral water 214, is found largely in Madurai Taluk, '57%. Again under 233 and 234, more than 90% of the workers are located in Madurai Taluk. Under printing, 302, more than 70% of the workers are found in Madurai Taluk and 18% in Dindigul. 369-Manufacture of sundry hardware-Madurai and Dindigul taluks are noted for this industry and employs more than 70% of the workers. Dindigul is known for the lock making industry. Repairing and servicing of motor vehicles-384, is another important industry found in Madurai Taluk. 88% of the employees are engaged in this taluk and 10% in Dindigul and Periyakulam. Under jewellery making, 393, 68% of the workers are employed in Madurai Taluk. Thus it will be seen that industrially Madurai is the most important taluk in Madurai District. To a Is seer extent, industries are found in Dindigul and Periyakulam. Not much scope can be had in Kodaikanal for the development of industries. Melur Taluk is comparatively backward.
S - 78. The common industries are 200, 201, 235, 369 and 393. This district has recorded 1,397 workers under the group 201. These workers are found in Tiruchirapalli (rural) and Karur(urban).
In the rural sector, 232-Cotton spinning and weaving in mills and Tiruchirapalli District 350-Manufacture of earthenware and pottery are of special signi-
ficance. All the workers in cotton spinning and weaving are found in Karur and TiruchirapalIi taluks. The other industries of importance in the urban sector are 221-Manufacture of cigars and cheroots which accounts for 642 persons out of 668 persons is concentrated in TiruchirapaUi Taluk. Cotton handloom weaving is found in all the taluks with a marked preference to Udaiyarpalayam, Musiri and Tiruchirapalli taluks. Making of textile garments-273, is concentrated in Tiruchirapalli Taluk. 302 is also found in Tiruchirapalli Taluk.
5 - 79. The industries common to rural and urban sectors are 200, 235, 264, 369 and 393. In processing of food grains, this district employs the largest number of workers, i. e. 7,314.
The district is the granary of the South. Again in silk weaving by Thanjavur District handloom, this district employs 6,999 persons and is ahead, of all
other districts. In the rural sector, the following industries are important:
282-Manufacture of structural wooden goods are found in Kumbakonam, Tiruthuraipundi and Mayuram.
288-Manufacture of materials from bamboo, cane, leaves etc., are found in Kumbakonam, Papanasam and Pattukkottai.
350-Manufacture of earthenware and earthen pottery.
In the urban areas, the following industries are important:
221-Manufacture of cigars and cheroots are generally found in Mayuram, Kumbakonam, Thanjavur, Mannargudi and Nagapattinam. 273-Making of textile garments: Nagapattinam, Kumbakonam, Thanjavur and Mannargudi.
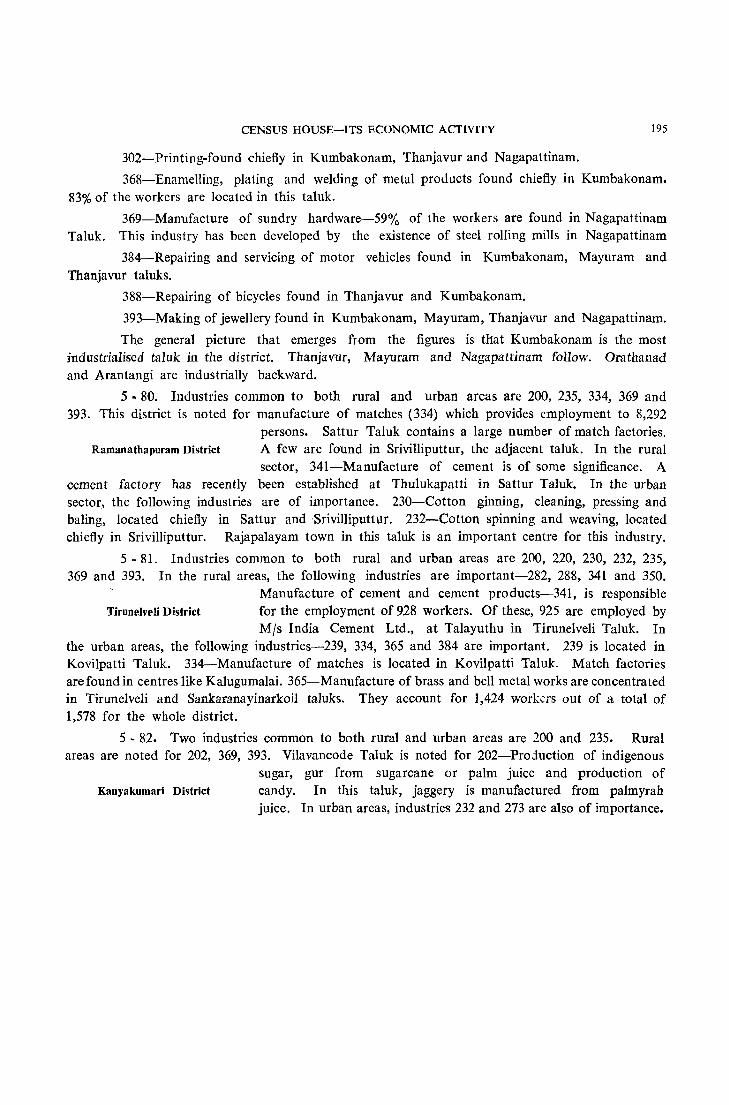
CENSUS HOUSE-ITS ECONOMIC ACTIViTY 195
302-Printing-found chiefly in Kumbakonam, Thanjavur and Nagapattinam.
368-Enamelling, plating and welding of metal products found chiefly in Kumbakonam. 83% of the workers are located in this taluk.
369-Manufacture of sundry hardware-59% of the workers are found in Nagapattinam Taluk. This industry has been developed by the existence of steel rolling mills in Nagapattinam
384-Repairing and servicing of motor vehicles found in Kumbakonam, Mayuram and Thanjavur taluks.
388-Repairing of bicycles found in Thanjavur and Kumbakonam.
393-Making of jewellery found in Kumbakonam, Mayuram, Thanjavur and Nagapattinam.
The general picture that emerges from the figures is that Kumbakonam is the most industrialised taluk in the district. Thanjavur, Mayuram and Nagapattinam follow. Orathanad and Arantangi are industrially backward.
5 • 80. Industries common to both rural and urban areas are 200, 235, 334, 369 and 393. This district is noted for manufac~ure of matches (334) which provides employment to 8,292
persons. Sattur Taluk contains a large number of match factories. Ramanatbapuram District A few are found in Srivilliputtur, the adjacent taluk. In the rural
sector, 341-Manufacture of cement is of some significance. A cement factory has recently been established at Thulukapatti in Sattur Taluk. In the urban sector, the following industries are of importance. 230-Cotton ginning, cleaning, pressing and baling, located chiefly in Sattur and 'Srivilliputtur. 232-Cotton spinning and weaving, located chiefly in Srivilliputtur. Rajapalayam town in this taluk is an important centre for this industry.
5 - 81. Industries common to both rural and urban areas are 200, 220, 230, 232, 235, 369 and 393. In the rural areas, the following industries are important-282, 288, 341 and 350.
Manufacture of cement and cement pro ducts-341 , is responsible Tirunelveli District for the employment of 928 workers. Of these, 925 are employed by
MIs India Cement Ltd., at Talayuthu in Tirunelveli Taluk. In the urban areas, the following industries-239, 334, 365 and 384 are important. 239 is located in Kovilpatti Taluk. 334-Manufacture of matches is located in Kovilpatti Taluk. Match factories are found in centres like Kalugumalai. 365-Manufacture of brass and bell metal works are concentrated in Tirunelveli and Sankaranayinarkoil taluks. They account for 1,424 workers out of a total of 1,578 for the whole district.
5 - 82. Two industries common to both rural and urban areas are 200 and 235. Rural areas are noted for 202, 369, 393. Vilavancode Taluk is noted for 202-Projuction of indigenous
sugar, gur from sugarcane or palm juice and production of Kanyakumari District candy. In this taluk, jaggery is manufactured from palmyrah
juice. In urban areas, industries 232 and 273 are also of importance.

Statement
Minor group of Indian Standard Industrial Classification Code where the number of persons
Standard Industrial District and Classification
code No. Total Chingleput North Arcot South Arcat Salem Coimbatore
2 3 4 5 6 7
200 22,063 2,211 1,945 1,462 3,150 3,112
201 661
202 1,647 1.015
207 843 843
209 1,065 1,065
217 2,930
218 853
220 6,851 732 3,952
222 678
230 1,923 1,393
231 1,338 1,338
232 15,712 6,978
234 2,351 799
235 108,933 9,710 12,710 4,196 31,593 29,006
236 1,624 1,624
264 7,086 1,219 3,468
270 3,038 2,153 885
274 576 576
282 1,263
288 3,801 1,021 528
310 2,355 529 1,826
330 5,000 5,000
334 3,970
340 3,178 3,178
341 3,908 2,216
350 5,890 816 716 910
365 531 531
369 10,953 563 576 753 1,464 2,101
389 832 832
393 9,951 1,055
399 521 1,320 521
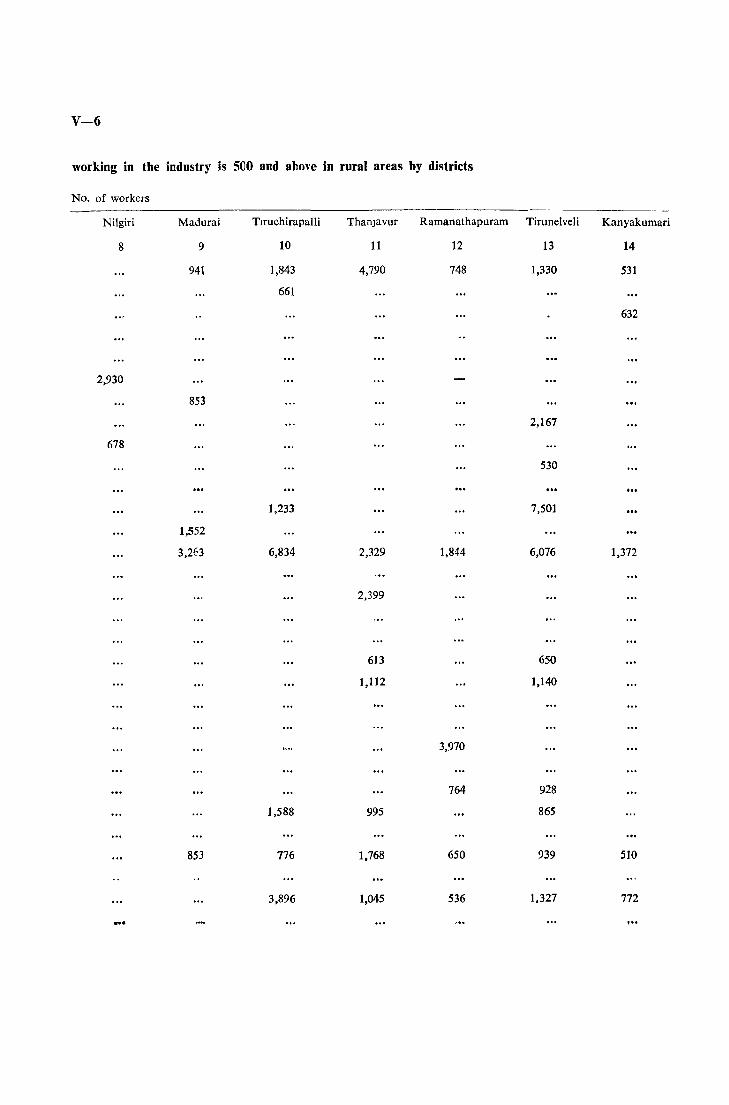
V-6
working in the industry is 5(JO and above in rural areas by districts
No. of workers
Nilgiri
8
2,930
678
Madurai
9
941
853
1,552
3,263
853
Tlruchirapalli
10
1,843
661
1,233
6,834
1,588
776
3,896
ThanJavur Ramanathapuram Tirunelveli
11 12 13
4,790
2,329
2,399
613
1,112
995
1,768
1,045
748
1,844
3,970
764
650
536
1,330
2,167
530
7,501
6,076
650
1,140
928
865
939
1,327
Kanyakumari
14
531
632
1,372
510
772
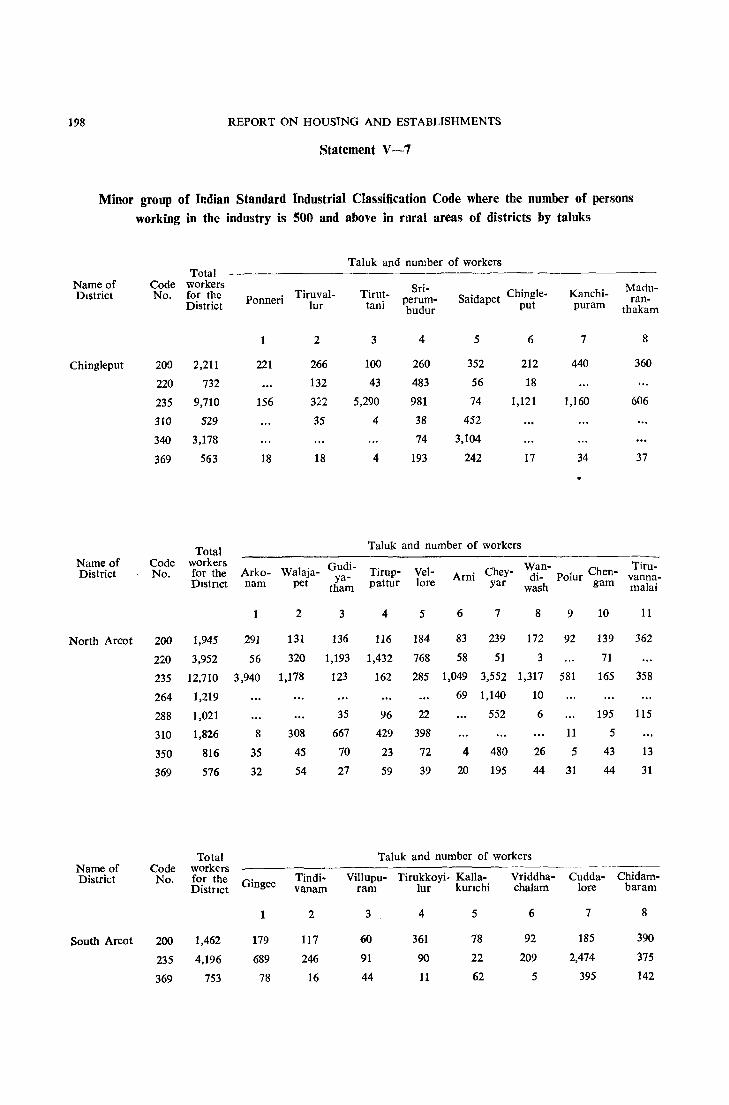
198 REPORT ON HOUSING AND ESTABLISHMENTS
Statement V-7
Minor group of Indian Standard Industrial Classification Code where the number of persons
working in the industry is 500 and above in rural areas of districts by taIuks
Taluk and number of workers Total
Name of Code workers Sri- Madu-District No. for the Ponneri Timval- Timt- perum- Saidapet Chingle- Kanchi- ran-
District lur tani budur put puram thakam
2 3 4 5 6 7 8
Chingleput 200 2,211 221 266 100 260 352 212 440 360
220 732 132 43 483 56 18
235 9,710 156 322 5,290 981 74 1,121 1,160 606
310 529 35 4 38 452
340 3,178 74 3,104
369 563 18 18 4 193 242 17 34 37
Total Taluk and number of workers
Name of Code workers Gudi- Wan- Tiru-District No. for the Arko- Walaja- ya- Tirup- Vel- Ami Chey- di- Polur Chen- vanna-
Dlstnct nam pet tham pattur lore yar wash gam malai
1 2 3 4 5 6 7 8 9 10 11
North Arcot 200 1,945 291 131 136 116 184 83 239 172 92 139 362
220 3,952 56 320 1,193 1,432 768 58 51 3 71
235 12,710 3,940 1,178 123 162 285 1,049 3,552 1,317 581 165 358
264 1,219 69 1,140 10
288 1,021 35 96 22 552 6 195 115
310 1,826 8 308 667 429 398 11 5
350 816 35 4S 70 23 72 4 480 26 5 43 13
369 576 32 54 27 59 39 20 195 44 31 44 31
Total Taluk and number of workers Name of Code workers District No. for the Gingee Tindi- Villupu- Tirukkoyi- Kalla- Vriddha- Cudda- Chidam-
Distnct vanam ram lur kunchi ehalam lore baram
1 2 3 4 5 6 7 8
South Areot 200 1,462 179 117 60 361 78 92 185 390
235 4.196 689 246 91 90 22 209 2,474 375
369 753 78 16 44 11 62 5 395 142
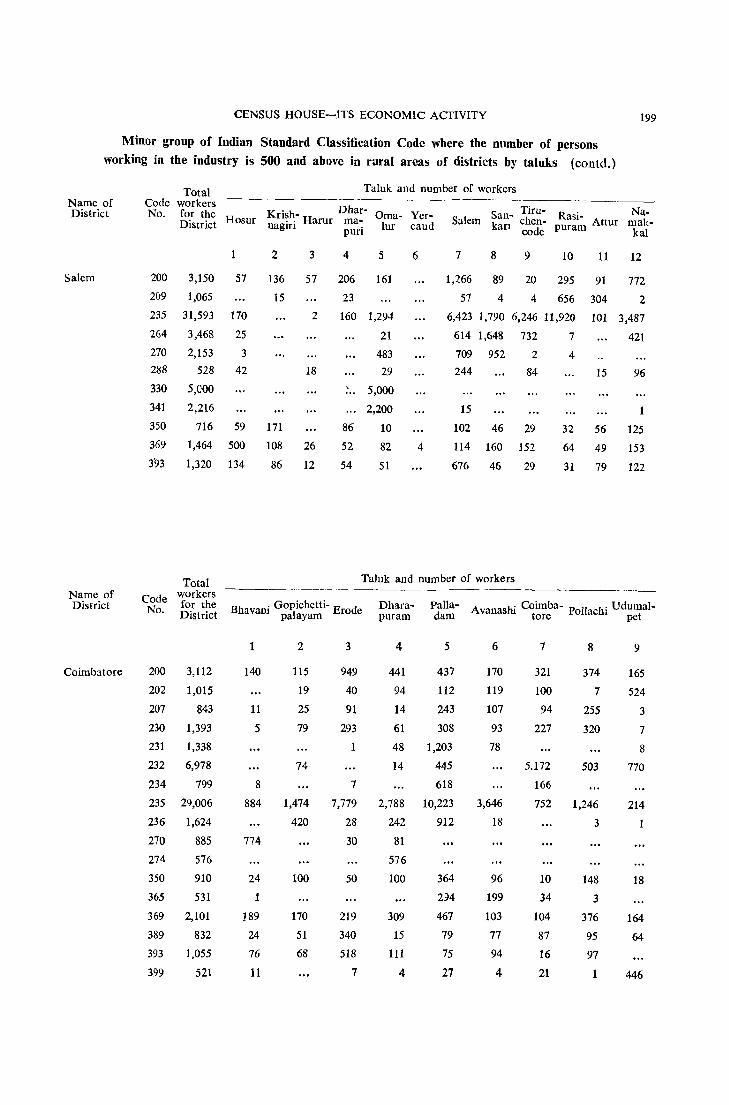
CENSUS HOUSE-ITS ECONOMIC ACTIVITY 199
Minor group of Indian Standard Classification Code where the number of persons
working in the industry is 500 and above in rural areas of districts by taluks (contd.)
Name of District
Salem
Name of District
Coimbatore
Taluk and number of workers Total Code workers N f th K . h Dhar-
o. or e H n~ .- Harur ma-District osur Oma- Yer
lur caud San- Tiru- R . Na-
Salem karl chen- aSI- Attur mak-naglfl puri
200
209
235
264
3,150
1,065
31,593
3,468
57
170
25
270 2,153 3
288 528 42
330 5,000
341 2,216
2
136
15
350 716 59 171
3
57
2
18
369 1,464 500 108 26
3'93 1,320 134 86 12
4 5
206 161
23
160 1,294
21
483
29
'" 5,000
86
52
54
2,200
10
82
51
6
4
code puram kal
7 8 9 10
1,266 89 20 295
57 4 4 656
6,423 1,790 6,246 11 ,920
614 1,648 732 7
709 952 2 4
244 84
15
11 12
91 772
304 2
101 3,487
421
15 96
1
102 46 29
114 160 152
676 46 29
32 56 125
64 49 153
31 79 122
Total Code workers
for the No. District
Taluk and number of workers
200 3,112
202 1,015
207 843
230 1,393
231 1,338
232 6,978
234 799
235 29,006
236 1,624
270 885
274 576
350 910
365 531
369 2,101
389 832
393 1,055
399 521
. GopichettiBhavam palayam Erode
1
140
11
5
8
884
774
24
1
189
24
76
11
2
115
19
25
79
74
1,474
420
100
170
51
68
3
949
40
91
293
1
7
7,779
28
30
50
219
340
518
7
Dharapuram
Palla- Avanashi Coimba- Pollachi Udumal-dam tore pet
4
441
94
14
61
48
14
5
437
112
243
308
1,203
445 618
2,788 10,223
242 912
81
576
100
309
15
111
4
364
294
467
79
75
27
6
170
119
107
93
78
3,646
18
96
199
103
77
94
4
7
321
100
94
227
5.172
166
752
10
34
104
87
16
21
8
374
7
255
320
503
1,246
3
148
3
376
95
97
1
9
165
524
3
7
8
770
214
18
164
64
446

200 REPORT ON HOUSING AND ESTABLISHMENTS
Minor group of Indian Standard Industrial Classification Code where the number of persons
working in the industry is 500 and above in rural areas of districts by taluks (contd.)
Name of District
Nilgiri
Name of District
Madurai
Name of District
Taluk and number of workers ~---------
Total Code workers No. for the
District Gudalur Ootacamund Coonoor
217
222
Code No.
200
218
234 235
369
Code No.
2,930
678
Total workers for the District
941
853
1,552
3,263
853
89
678
Dindigul
1
64
220
332
177
Palni
2
12
100
936
265
Total workers for the Peram~ Udaiyar~ LaL
pala- ..-Distnct balur yam gudi
1 2 3
2
903
3
1,938
Taluk and numbers of workers
Kodalkanal
3
8
162
15
Periyakulam
4
174
805
201
Nllakkottai
5
419
456
532
60
Melur
6
86
4
26
64
Taluk and number of workers
Musiri Karur Kulit- Tiruchi- Kula~ talai rapalh thur
4 5 6 7 8
Madurai
7
123
7
1,451
102
35
Tiru~ man~
galam
8
55
4
530
36
Alan~- Tirugudi mayam
9 10
Tiruchirapalli 200 1,843 35 118 433 126 120 195 482 87 116 131
Name of District
Thanjavur
201 661
232 1,233
235 6,834
350
369
393
1,588
776
3,896
Total Code workers No. for the
District
200
235
264 282
288
350
369
393
4,790
2,329
2,399
613
1,112
995
1,768
1,045
2
26 24
28
521
772 513 2,634 1,996
10 63
109 97
72 1,051
58
86
164
53
118
52
661 677
576 97 158
125 55 145
119 60 77
930 1,043 421
Taluk and number of workers
4
816
34
28
35
82
237
52
107
Sir~ Mayu- Kumba- Nan- Papa- Than- Ora- Man- Nag~- Tiru- Pat- At kali ram konam nilam nasaro JOavur tha- nar- pattl- thural- tuk- an~
1
181
5
6
15
84
36
2 3
658 459
23 1,911
94
4
73
171
107
2,369 165
234
368
250
199
4
1,0.18
11
14
23 79
258
116
Dad gUdl nam pundl kottal tmgl
5 6 7 8 9 10 11
334 234 137 231 674 221 495
196 146 11
8
18 8
44 26
286 23 53 43
96 126
106 50
8
48 61 18
4 10
45 7
72 126 108
13 81 41
131
30 498
276 29
262 189
88 152
12
128
20
7
26
56

CENSUS HOUSE-ITS ECONOMIC ACTIVITY 201
Minor group of Indian Standard Industrial Classification Code where the number of persons working in the industry is 500 and above in rural areas of districts by taluks (conc1d.)
Name of District
Ramanathapuram
Name of District
Tirunelveli
Name of District
Kanyakumari
Total Code workers No. for the
DIstrict
200
235
334
341
369
393
Code No.
200
220
230
232
235
282
288
341
350
369
393
Code No.
200
202
235
369
393
748
1,844
3,970
764
650
536
Total workers for the District
1,330
2,167
530
7,501
6,076
650
1,140
928
865
939
1,327
Total workers for the Distnct
531
632
1,372
510
772
H-26
Tirupat- Siva-tur ganga
152
26
76
64
2
122
34
64
70
Sankarana- Kovil-yinarkOiI patti
1 2
150 68
158 331
500
1,874 1,061
65 56
81 109
105 162
81 106
109 133
Vilavancodc
1
25
632
833
120
177
Taluk and number of workers
Tiruva- Parama- Ramana- Mudu- Arup-k 1 h puk-
danai kudl thapuram u at ur kottai
3
140
66
88
4
72
18
18
5
35
16
61
6
28
57
44
105
7
62
4
86
51
Taluk and number of workers
Srivai- Tirunel- Tenkasi Shen- Ambasa-kuntam ,eli cottah mudram
3 4 5 6 7
129 100 160 55 379
892 1,275
22 1
713 6,288
36 150 456 601 1,046
54 42 185
179 87 680
925 3
128 54 J74 8 164
70 77 203 10 67
140 40 208 66 231
'Caluk and number of work~rs
Kalkulam Thovala
2 3
172 100
380 4
170 55
385 60
SriSattur villI
puttur
8
15
955
3.970
700
80
44
Nangun-eri
8
175
18
728
40
4
70
202
195
9
122
828
3
200
35
TIru-chendur
9
114
124
208
123
205
Agastees-waram
4
234
155
165
150

202 REPORT ON HOUSING AND ESTABLISHMENTS
Statement V-8
Minor group of Standard Industrial Classification Code where the number of persobs
working in the industry is less than 500
Size of Industry in terms of Minor group of Standard Industrial Classification Code and number of persons working
No. of persons employed
1. MADRAS CITY - URBAN
Below 50 210 (1), 219 (8), 230 (34), 232 (34), 234 (4), 239 (12), 263 (4),
266 (14), 270 (3), 276 (32), 283 (12), 286 (12), 291 (3), 314 (22), 322 (8),
326 (21), 332 (8), 333 (11), 334 (38), 343 (38), 344 (21), 345 (27), 353 (4),
355 (7), 356 (10), 373 (14), 377 (24), 394 (20).
50 to 99 215 (63), 216 (87), 221 (94), 264 (56), 272 (61), 275 (85), 277 (67),
323 (74), 341 (51), 342 (60), 350 (77), 354 (55), 359 (78), 376 (91), 386 (60).
100 to 199 233 (120), 274 (107), 278 (124), 279 (104), 280 (178), 282 (155), 288 (151),
289 (127), 290 (124), 310 (164), 312 (163), 337 (196), 339 (131), 340 (120), 357 (181),
372 (192), 374 (131).
200 to 299 218 (224), 284 (272), 320 (221), 336 (226), 347 (213), 389 (225), 390 (279),
392 (210). ,
300 to 399 206 (356), 214 (395), 287 (360), 292 (304). 311 (304), 313 (317), 370(323).
400 to 499 208 (480). 303 (447), 378 (440), 385 (426), 395 (488).
2. CHINGLEPUT DISTRICT-RURAL
Below 50 205 (42), 206 (9), 209 (39), 216 (1), 221 (48), 224 (21), l30 (23).
231 (18), 277 (14), 2800), 281 (44), 282 (40), 283 (1), 284 (3), 301 (4),
302 (3), 303 (3), 313 (7), 331 (34), 332 (22), 338 (14), 342 (1), 343 (1),
355 (4), 359 (3), 363 (7), 364 (34), 367 (4), 368 (17), 379 (44), 385 (4),
389 (47), 392 (15).
50 to 99 207 (75), 234 (76), 365 (53), 399 (76).
100 to 199 272 (138), 335 (143), 336 (443), 340 (110), 360 (109), 366 (110), 384 (117),
395 (193).
200 to 299 214 (237), 264 (207), 273 (252), 288 (227), 311 (206), 330 (224), 350 (281),
388 (266).
300 to 399 233 (368), 393 (324).
400 to 499 232 (416).
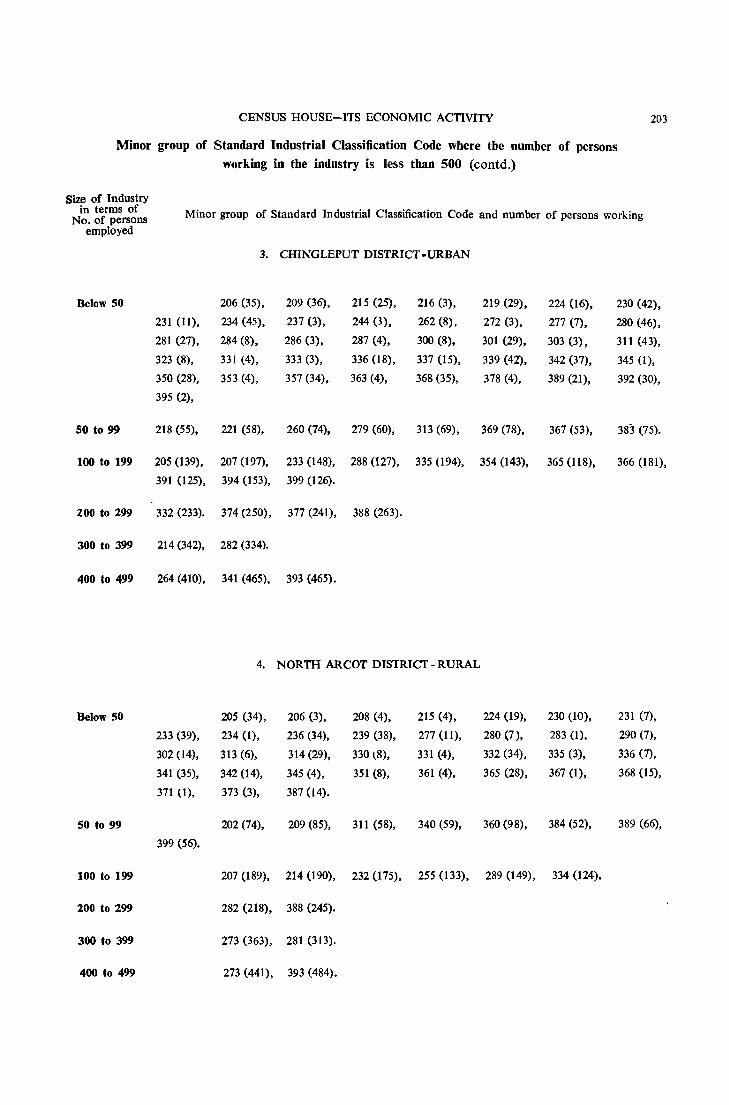
CENSUS HOUSE-ITS ECONOMIC ACTIVITY 203
Minor group of Standard Industrial Classification Code where the number of persons working in the industry is less than 500 (contd.)
Size of Industry in terms of Minor group of Standard Industrial Classification Code and number of persons working No. of persons
employed
3. CHINGLEPUT DISTRICT· URBAN
Below 50 206 (35), 209 (36), 215 (25), 216 (3), 219 (29), 224 (16), 230 (42).
231 (11), 234 (45), 237 (3), 244 (3), 262 (8), 272 (3). 277 (7), 280 (46),
281 (27), 284 (8), 286 (3). 287 (4), 300 (8). 301 (29), 303 (3), 311 (43),
323 (8), 331 (4), 333 (3), 336 (18), 337 (15), 339 (42), 342 (37), 345 (1),
350 (28), 353 (4), 357 (34), 363 (4), 368 (35), 378 (4), 389 (21), 392 (30),
395 (2),
50 to 99 218 (55), 221 (58), 260 (74). 279 (60), 313 (69), 369 (78), 367 (53), 383 (75).
100 to 199 205 (139), 207 (197), 233 (148), 288 (127), 335 (194), 354 (143), 365 (118), 366 (181),
391 (125), 394 (153), 399 (126).
200 to 299 332 (233). 374 (250), 377 (241), 388 (263).
300 to 399 214 (342), 282 (334).
400 to 499 264 (410), 341 (465), 393 (465).
4. NORTH ARCOT DISTRICT - RURAL
Below 50 205 (34), 206 (3), 208 (4), 215 (4), 224 (19), 230 (10), 231 (7),
233 (39), 234 (1), 236 (34), 239 (38), 277 (11), 280 (7), 283 (I), 290 (7),
302 (14), 313 (6), 314 (29), 330 t8), 331 (4), 332 (34), 335 (3), 336 (7),
341 (35), 342 (14), 345 (4), 351 (8), 361 (4), 365 (28), 367 (1), 368 (15),
371 (1), 373 (3), 387 (4).
SO to 99 202 (74), 209 (85), 311 (58), 340 (59), 360 (98), 384 (52), 389 (66),
399 (56).
100 to 199 207 (189), 214 (190), 232 (175), 255 (133), 289 (149), 334 (124).
200 to 299 282 (218), 388 (245).
300 to 399 273 (363), 281 (313).
400 to 499 273 (441), 393 (484).

204 REPORT ON HOUSING AND ESTABLISHMENTS
Minor group of Standard Industrial Clas')ification Code where the number of persons
working in the industry is less than 500 (eontd.)
Size of Industry in terms of Mmor group of Standard Industrial Classification Code and number of persons working No. of persons employed
5. NORTH ARCOT DISTRICT - URBAN
Below 50 201 (7), 202 (4), 215 (20), 216 (4). 218 (23), 219 (4). 221 (22),
222 (1), 224 (6), 233 (17). 234 (8), 238 (31), 244 (8), 253 (4), 270 (4).
271 (8), 272 (4), 277 (25), 281 (36), 284 (19). 287 (3), 292 (1), 303 (30),
314 (26), 320 (10), 326 (4), 331 (10), 333 (24), 337 (3), 340 (15), 341 (13),
344 (3), 357 (18), 364 (4), 366 (2), 367 (7), 374 (4), 375 (2), 377 (15),
378 (40), 379 (15), 382 (1), 383 (12), 386 (26), 389 (14), 390 (1).
50 to 99 225 (63), 231 (5::), 255 (75), 266 (67), 280 (80), 335 (61), 336 (84).
342 (87), 368 (93), 392 (81), 395 (80).
100 to 199 237 (197), 263 (199), 282 (170), 301 (111), 311 (168).
200 to 299 209 (211), 289 (293), 350 (286), 391 (220).
300 to 399 207 (398), 214 (336), 288 (338), 399 (326).
400 to 499 205 (420), 302 (486), 334 (419), 365 (4~4).
6. SOUTH ARCOT DISTRICT - RURAL
Below 50 202 (22), 205 (22), 218 (3), 230 (8), 231 (34), 233 (14), 236 (3).
240 (35), 244 (7), 255 (4), 266 (22), 280 (15). 284 (14), 289 (47), 302 (11)
310 (26), 311 (14), 315 (4), 320 (14), 331 (8), 336 (3), 3·W (14), 341 (20),
360 (9), 363 (7), 367 (5), 368 (17), 374 (7). 379 (8). 382 (3), 384 (7).
386 (24), 3?9 (26), 392 (2), 399 (14),
50 to 99 281 (70).
100 to 199 214 (155), 232 (109), 273 (172), 288 (tOl), 351 (171), 365 (160), 388 (166).
200 to 299 282 (283).
300 to 399 350 (360), 393 (344).
400 to 499 207 (416). 209 (423).
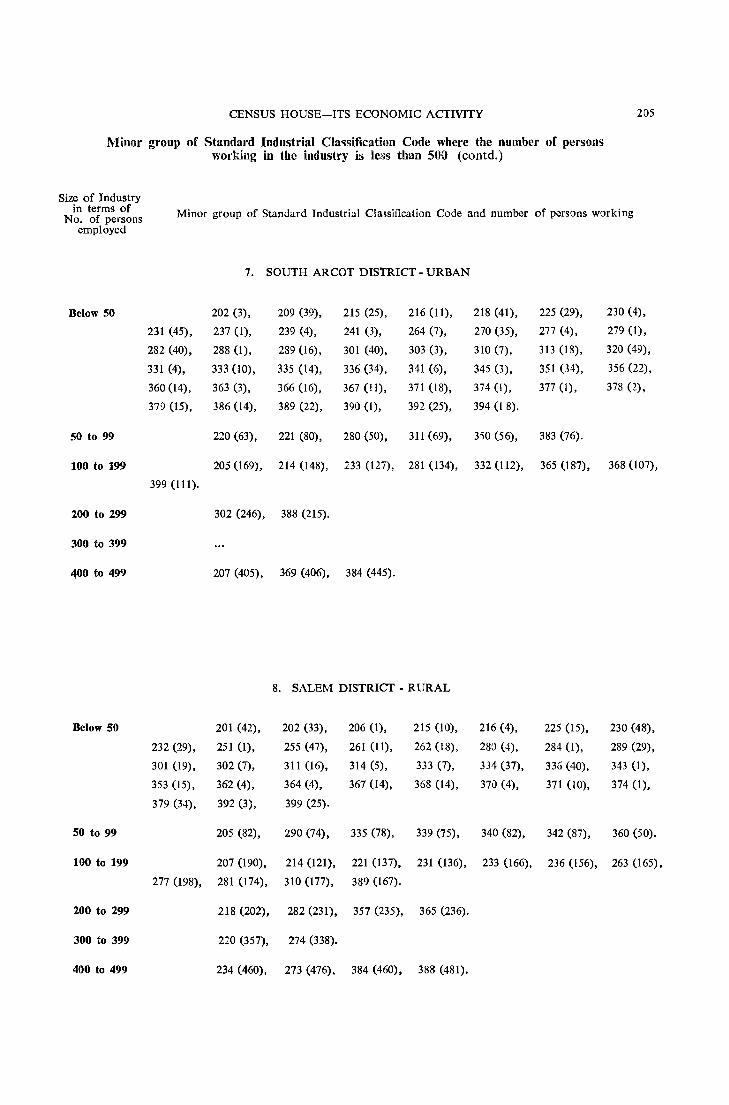
CENSUS HOUSE-ITS ECONOMIC ACTIVITY
Minor group of Standard Industrial Cla'Ssification Code where the number of persons working in the industry is less than 500 (eontd.)
205
Size of Industry in terms of
No. of persons employed
Minor group of Standard Industrbl Classification Code and number of persons working
7. SOUTH ARCOT DISTRICT - URBAN
Below 50 202 (3), 209 (39), 215 (25), 216 (11), 218 (41), 225 (29), 230 (4),
231 (45), 237 (I), 239 (4), 241 (3), 264 (7), 270 (35), 277 (4), 279 (I),
282 (40), 288 (1), 289 (16), 301 (40), 303 (3), 310 (7), 313 (18), 320 (49),
331 (4), 333 (10), 335 (14), 336 (34), 341 (6), 345 0), 351 (34), 356 (22),
360 (14), 363 (3), 366 (16), 367(11), 371 (18), 374 (I), 377 (I), 378 (2),
379 (15). 386 (14), 389 (22), 390 (I), 392 (25), 394 (l 8).
50 to 99 220 (63), 221 (80), 280 (50), 311 (69), 3)0 (56), 3S3 (76).
100 to 199 205 (169), 214 (148), 233 (127), 281 (134), 332 (112), 365 (187), 368 (107),
399 (111).
200 to 299 302 (246), 388 (215).
300 to 399
400 to 499 207 (405), 369 (406), 384 (445).
8. SALEM DISTRICT - RURAL
Below 50 201 (42), 202 (33), 206 (1), 215 (10), 216 (4), 225 (15), 230 (48),
232 (29), 251 (1), 255 (47), 261 (11), 262 (18), 280 (4), 284 (1), 289 (29),
301 (19), 302 (7), 311 (16), 314 (5), 333 (7), 334 (37), 336 (40), 343 (1),
353 (15), 362 (4), 364 (4), 367 (14), 368 (14), 370 (4), 371 (lO), 374 (1),
379 (34), 392 (3), 399 (25).
50 to 99 205 (82), :l90 (74), 335 (78), 339 (75), 340 (82), 342 (87), 360 (50).
100 to 199 207 (190), 214 (121), 221 (137), 231 (136), 233 (166), 236 (156), 263 (l65),
277 (198), 281 (174), 310 (177), 389 (167).
200 to 299 218 (202), 282 (231), 357 (235), 365 (236).
300 to 399 220 (357), 274 (338).
400 to 499 234 (460), 273 (476), 384 (460), 388 (481).

206 REPORT ON HOUSING AND ESTABLISHMENTS
Minor group of Standard Industrial Classification Code where the number of persons working in the industry is less than 500 (eontd.)
Size of Industry in terms of
No. of persons employed
Below 50
50 to 99
100 to 199
200 to 299
300 to 399
400 to 499
Below 50
50 to 99
100 to 199
200 to 299
300 to 399
400 to 499
Minor group of Standard Industrial Classification Code and number of persons working
9. SALEM DISTRICT - URBAN
202 (4), 204 (14), 206 (38), 215 (43), 216 (3), 219 (14), 225 (7),
226 (40), 236 (26), 237 (7), 238 (3), 243 (1), 244 (3), 255 (34), 261 (29),
266 (4), 272 (4), 275 (15), 280 (29), 284 (15), 287 (11), 291 (8), 292 (42),
300 (38), 312 (15), 313 (1), 314 (18), 320 (21), 321 (3), 330 (5), 333 (10),
334 (8), 339 (7), 340 (26), 341 (42), 342 (16), 343 (21), 344 (5), 345 (2),
357 (3), 360 (14), 362 (4), 370 (4), 377 (7), 378 (3). 379 (15), 382 (16),
394 (1), 395 (4), 3960).
260 (78), 301 (62), 303 (59), 323 (52), 335 (78), 354 (89), 366 (74),
383 (50), 392 (76).
214 (186), 218 (168), 262 (126), 274 (167), 288 (151). 289 (114), 310 (120),
336 (196), 350 (178), 367 (127), 389 (187).
205 (234), 221 (223), 231 (248), 239 (253), 271 (267), 281 (233), 3li (202),
368 (238), 399 (241).
277 (300), 279 (360), 365 (323).
209 (482).
10. COIMBATORE DISTRICT - RURAL
201 (32), 215 (7), 216 (49), 218 (48), 221 (14), 223 (38), 234 (4),
239 (4), 263 (7), 279 (34), 283 (29), 284 (4), 290 (34), 291 (1), 301 (27),
302 (14), 303 (8), 313 (15), 321 (I), 323 (35), 331 (4), 336 (22), 342 (32),
343 (1), 345 (3). 360 (20), 362 (4), 363 (4), 367 (19), 368 (30), 381 (11),
383 (4), 386 (7), 392 (3).
237 (60), 289 (70), 334 (77), 340 (76), 341 (92), 357 (75), 375 (74),
379 (84).
209 (161), 214 (151), 264 (193), 277 (120), 288 (174), 311 (106), 374 (111),
384 (133).
205 (282), 206 (206), 226 (223), 255 (218), 273 (236), 281 (241), 310 (201),
332 (230).
225 (388), 395 (369).
220 (425), 233 (445), 282 (494), 388 (498).
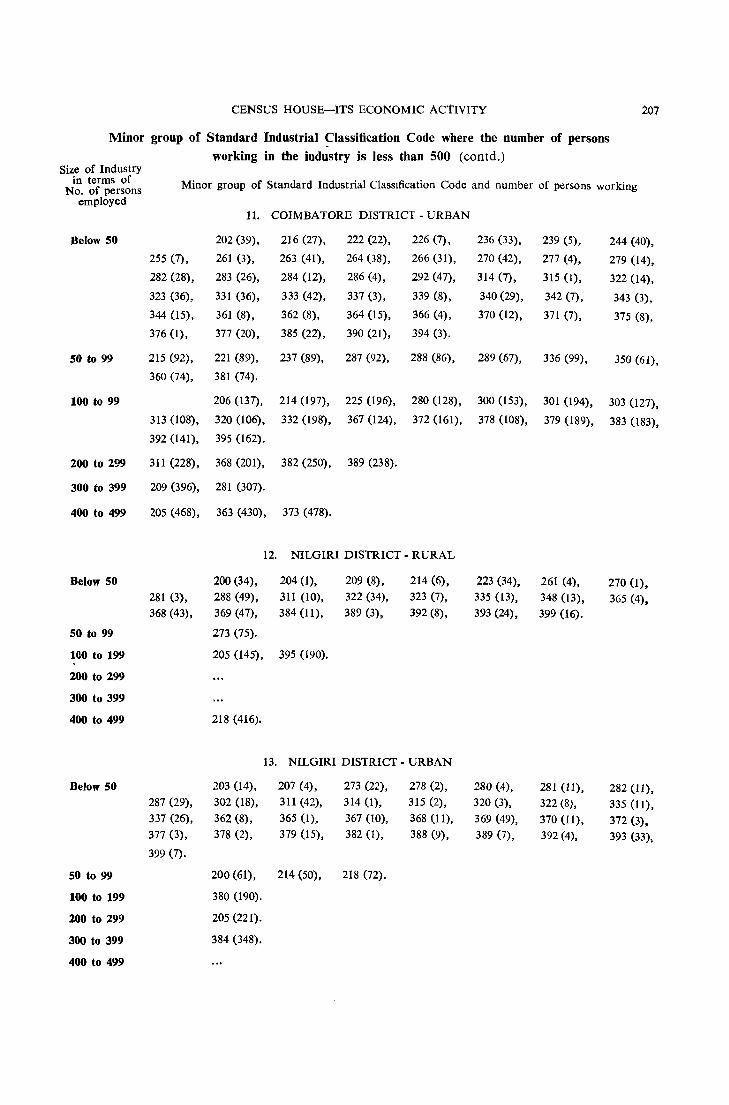
CENSUS HOUSE-ITS ECONOMIC ACTIVITY 207
Minor group of Standard Industrial ~lassification Code where the number of persons working in the industry is less than 500 (eontd.)
Size of Industry in terms of Minor group of Standard Industrial Classification Code and number of persons working No. of persons employed
11. COIMBATORE DISTRICT - URBAN
Below 50 202 (39), 216 (27), 222 (22), 226 (7), 236 (33), 239 (5), 244 (40),
255 (7), 261 (3), 263 (41), 264 (38), 266 (31), 270 (42), 277 (4), 279 (14),
282 (28), 283 (26), 284 (12), 286 (4), 292 (47), 314 (7), 315 (1), 322 (14),
323 (36), 331 (36), 333 (42), 337 (3), 339 (8), 340 (29), 342 (7), 343 (3),
344 (15), 361 (8), 362 (8), 364 (15), 366 (4), 370 (12), 371 (7), 375 (8),
376 (1), 377 (20), 385 (22), 390 (21), 394 (3).
50 to 99 215 (92), 221 (89), 237 (89), 287 (92), 288 (86), 289 (67), 336 (99), 350 (61),
360 (74), 381 (74).
100 to 99 206 (137), 214 (197), 225 (196), 280 (128), 300 (153), 301 (194), 303 (127),
313 (108), 320 (106), 332 (198), 367 (124), 372 (161), 378 (108), 379 (189), 383 (183),
392 (141), 395 (162).
200 to 299 311 (228), 368 (201), 382 (250), 389 (238).
300 to 399 209 (396), 281 (307).
400 to 499 205 (468), 363 (430), 373 (478).
12. NILGIRI DISTRICT - RURAL
Below 50 200 (34), 204 (1), 209 (8), 214 (6), 223 (34), 261 (4), 270 (1), 281 (3), 288 (49), 311 (10), 322 (34), 323 (7), 335 (13), 348 (13), 365 (4), 368 (43), 369 (47), 384 (11), 389 (3), 392 (8), 393 (24), 399 (16).
50 to 99 273 (75).
100 to 199 205 (145), 395 (190).
200 to 299
300 to 399
400 to 499 218 (416).
13. NILGIRI DISTRICT - URBAN
Below 50 203 (14), 207 (4), 273 (22), 278 (2), 280 (4), 281 (11), 282 (11), 287 (29), 302 (18), 311 (42), 314 (1), 315 (2), 320 (3), 322 (8), 335(11), 337 (26), 362 (8), 365 (1), 367 (to), 368 (11), 369 (49), 370 (11), 372 (3), 377 (3), 378 (2), 379 (15), 382 (1), 388 (9), 389 (7), 392 (4), 393 (33),
399 (7).
50 to 99 200 (61), 214 (50), 218 (72).
100 to 199 380 (190).
200 to 299 205 (221).
300 to 399 384 (348).
400 to 499
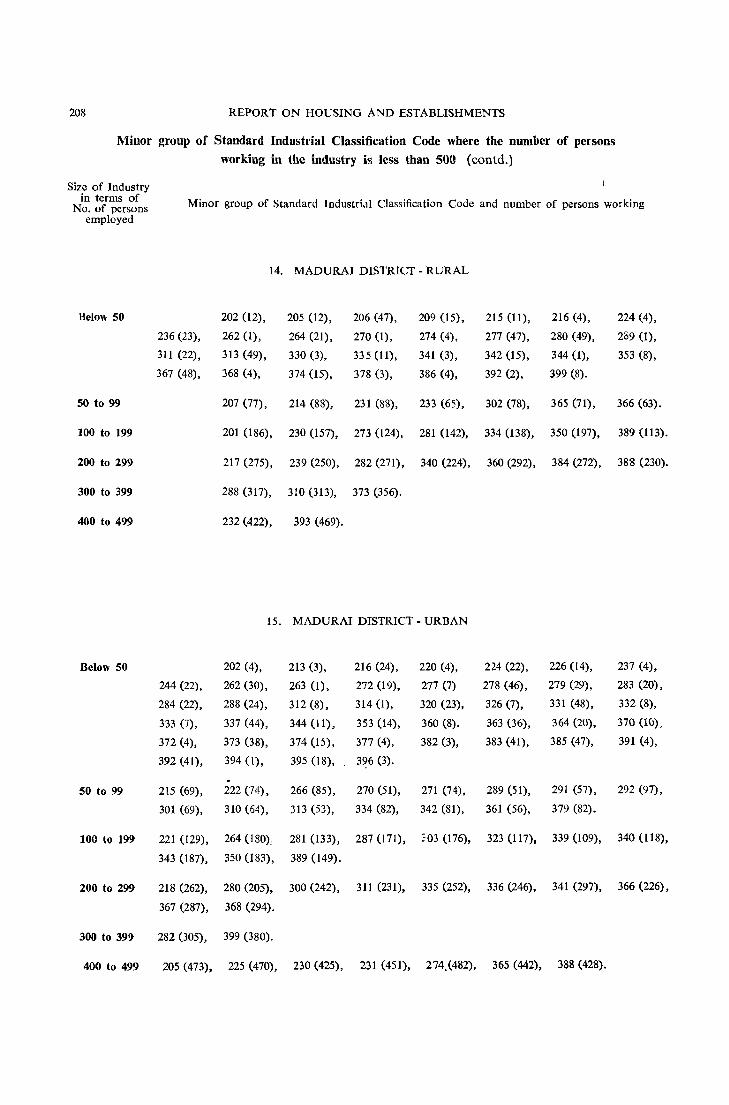
208 REPORT ON HOUSING AND ESTABLISHMENTS
Minor group of Staudard Industrial Classification Code where the number of persons working in the industry is less than 500 (contd.)
Size of Industry in terms of
No. of persons employed
Minor group of Standard Industrial Classification Code and number of persons working
14. MADURAI DISTRICT - RURAL
Belo,~ 50 202 (12), 205 (12), 206 (47), 209 (15), 215 (11), 216 (4), 224 (4),
236 (23), 262 (1), 264 (21), 270 (1), 274 (4). 277 (47), 280 (49), 289 (1),
311 (22), 313 (49), 330 (3), 335(11). 341 (3), 342 (15), 344 (1), 353 (8),
367 (48), 368 (4), 374 (15), 378 (3), 386 (4), 392 (2), 399 (8).
50 to 99 207 (77), 214 (88), 231 (88), 233 (65), 302 (78), 365 (71), 366 (63).
100 to 199 201 (186), 230 (157), 273 (124), 281 (142), 334 (138), 350 (197), 389 (113).
200 to 299 217 (275), 239 (250), 282 (271), 340 (224), 360 (292), 384 (272), 388 (230).
300 to 399 288 (317), 310 (313), 373 (356).
400 to 499 232 (422), 393 (469).
15. MADURAI DISTRICT - URBAN
Below 50 202 (4), 213 (3), 216 (24), 220 (4), 224 (22), 226 (14), 237 (4),
244 (22), 262 (30), 263 (1), 272 (19), 277 (7) 278 (46), 279 (29), 283 (20),
284 (22), 288 (24), 312(8), 314 (1), 320 (23), 326 (7), 331 (48), 332 (8),
333 (7), 337 (44), 344 (11), 353 (14), 360 (8). 363 (36), 364 (20), 370 (10»
372 (4), 373 (38), 374 (15), 377 (4), 382 (3), 383 (41), 385 (47), 391 (4),
392 (41), 394 (1), 395 (18), 3~6 (3).
. 50 to 99 215 (69), 222 (74), 266 (85), 270 (51), 271 (74), 289 (51), 291 (57), 292 (97),
301 (69), 310 (64), 313 (53), 334 (82), 342 (81), 361 (56), 379 (82).
100 to 199 221 (129), 264 (180), 281 (133), 287 (171), :03 (176), 323 (117), 339 (109), 340 (l18),
343 (187), 350 (183), 389 (149).
200 to 299 218 (262), 280 (205), 300 (242), 311 (231), 335 (252), 336 (246), 341 (297), 366 (226),
367 (287), 368 (294).
300 to 399 282 (305), 399 (380).
400 to 499 205 (473), 225 (470), 230 (425), 231 (451), 274.(482), 365 (442), 388 (428).
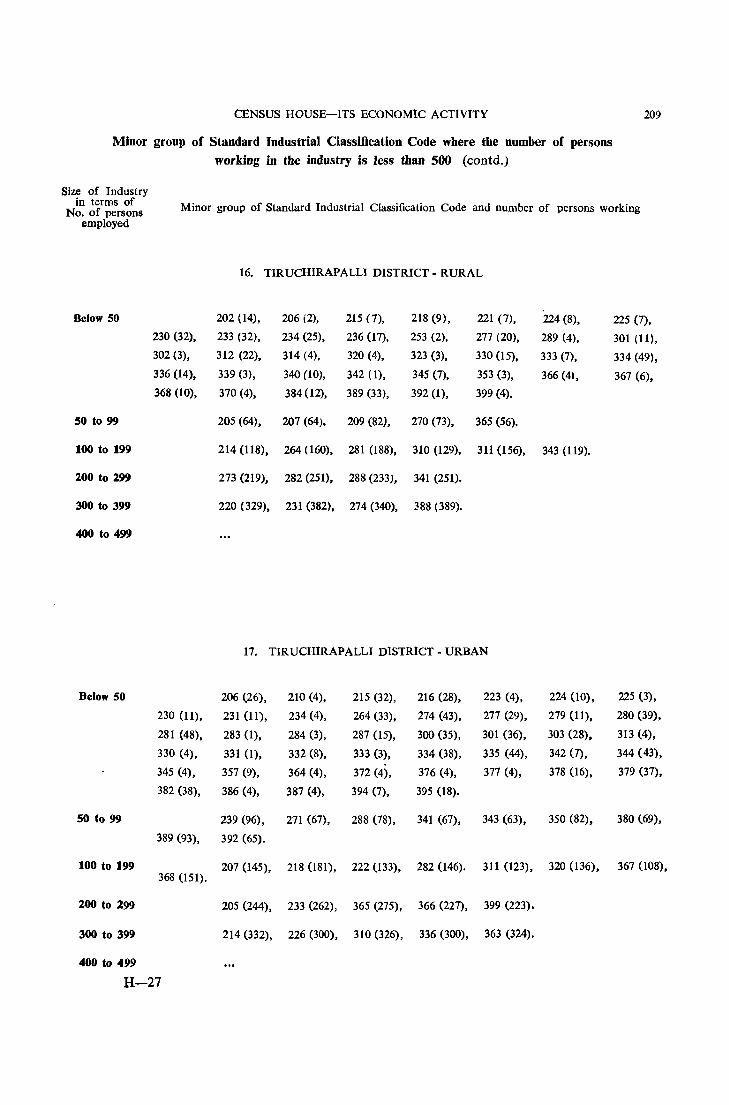
CENSUS HOUSE-ITS ECONOMIC ACTIVITY
Minor group of Standard Industrial Classification Code where the number of persons working in the industry is Jess than 500 (contd.)
209
Size of Industry in terms of
No. of persons employed
Minor group of Standard Industrial Classification Code and number of persons working
16. TIRUCHIRAPALLI DISTRICT - RURAL
Below 50 202 (14), 206 (2), 215 (7), 218 (9), 221 (7), 224 (8). 225 (7).
230 (32). 233 (32). 234 (25). 236 (17). 253 (2). 277 (20). 289 (4), 301 (11).
302 (3). 312 (22), 314 (4), 320 (4), 323 (3). 330 (15). 333 (7). 334 (49),
336 (14). 339 (3). 340 (10). 342 (1). 345 (7). 353 (3). 366 (4). 367 (6).
368 (10), 370 (4), 384 (12). 389 (33). 392 (1). 399 (4).
SO to 99 205 (64), 207 (64), 209 (82). 270 (73). 365 (56).
100 to 199 214 (118). 264 (60). 281 (188). 310 (129), 311 (156). 343 (119).
200 to 299 273 (219), 282 (251), 288 (233), 341 (251).
300 to 399 220 (329), 231 (382), 274 (340). 388 (389).
400 to 499
17. TIRUCHIRAPALLI DISTRICT - URBAN
Below 50 206 (26). 210 (4). 215 (32), 216 (28). 223 (4), 224 (lO). 225 (3).
230 (11). 231 (II). 234 (4). 264 (33). 274 (43). 277 (29). 279 (11), 280 (39).
281 (48), 283 (1), 284 (3), 287 (15). 300 (35). 301 (36). 303 (28), 313 (4),
330 (4), 331 (1), 332 (8), 333 (3), 334 (38), 335 (44), 342 (7), 344 (43),
345 (4), 357 (9), 364 (4), 372 (4), 376 (4), 377 (4), 378 (16), 379 (37),
382 (38). 386 (4), 387 (4), 394 (7), 395 (18).
SO to 99 239 (96), 271 (67), 288 (78), 341 (67), 343 (63), 350 (82), 380 (69),
389 (93), 392 (65).
100 to 199 207 (145), 368 (151).
218 (l81), 222 (133), 282 (146). 311 (123), 320 (136), 367 (108),
200 to 299 205 (244), 233 (262), 365 (275), 366 (227), 399 (223).
300 to 399 214 (332), 226 (300), 310 (326), 336 (300), 363 (324).
400 to 499
H-27

210 REPORT ON HOUSING AND ESTABLISHMENTS
Minor group of Standard Industrial Classification Code where the number of persons working in the industry is less than 500 (eontd.)
Size of Industry in terms of
No. of persons employed
Below 50
50 to 99
100 to 199
200 to 299
300 to 399
400 to 499
Below 50
50 to 99
100 to 199
200 to "299
300 to 399
400 to 499
Minor group of Standard Industrial Classification Code and number of persons working
18. THANJAVUR DISTRICT· RURAL
204 (3). 215 (3), 218 (18), 224 (3), 225 (15), 231 (40), 236 (2),
244 (3), 262 (35), 277 (14), 280 (8), 283 (8), 284 (7), 289 (30), 292 (1),
301 (29), 302 (21), 310 0), 311 (17), 331 (4), 334 (38), 335 (11), 336 (39),
337 (3), 338 (38), 341 (23), 342 (3), 344 (11), 345 (32), 363 (1), 367 (34),
368 (20), 379 (1), 392 (5), 394 (14), 395 (3).
206 (75), 207 (87), 209 (60), 274 (63), 332 (52), 333 (78), 399 (64).
221 (154), 281 (184), 340 (159), 389 (146).
201 (225), 205 (218), 273 (282).
214 (366).
365 (407), 388 (456).
19. THANJAVUR DISTRICT· URBAN
215 (22), 216 (26), 222 (34), 224 (12), 226 (22), 230 (12), 231 (31),
231 (35), 236 (48), 237 (14), 239 (10), 244 (12), 250 (10), 260 (14), 261 (29),
262 (16), 263 (22), 280 (40), 287 (4), 289 (10), 291 (38), 292 (4), 300 (1),
303 (22), 310 (26), 313 (4), 320 (15), 322 (3), 323 (8), 331 (8), 332 (34),
333 (28), 338 (14), 340 (4), 342 (11), 343 (38), 344 (37), 345 (7), 351 (3),
364 (7), 366 (15), 372 (4), 373 (1), 374 (6), 375 (41), 377 (3), 378 (6),
383 (3), 386 (4), 390 (5), 394 (18), 395 (45).
225 (87), 233 (91), 277 (59), 284 (57), 337 (86), 341 (63), 350 (73),
363 (87), 392 (84).
223 (115), 234 (129), 288 (116), 311 (160), 339 (140), 360 (101), 367 (111),
389 (l05).
207 (281), 218 (209), 282 (211), 301 (204), 335 (233), 336 (223), 365 (278),
379 (204).
209 (379), 220 (375), 281 (370), 399 (330).
205 (419), 214 (440).
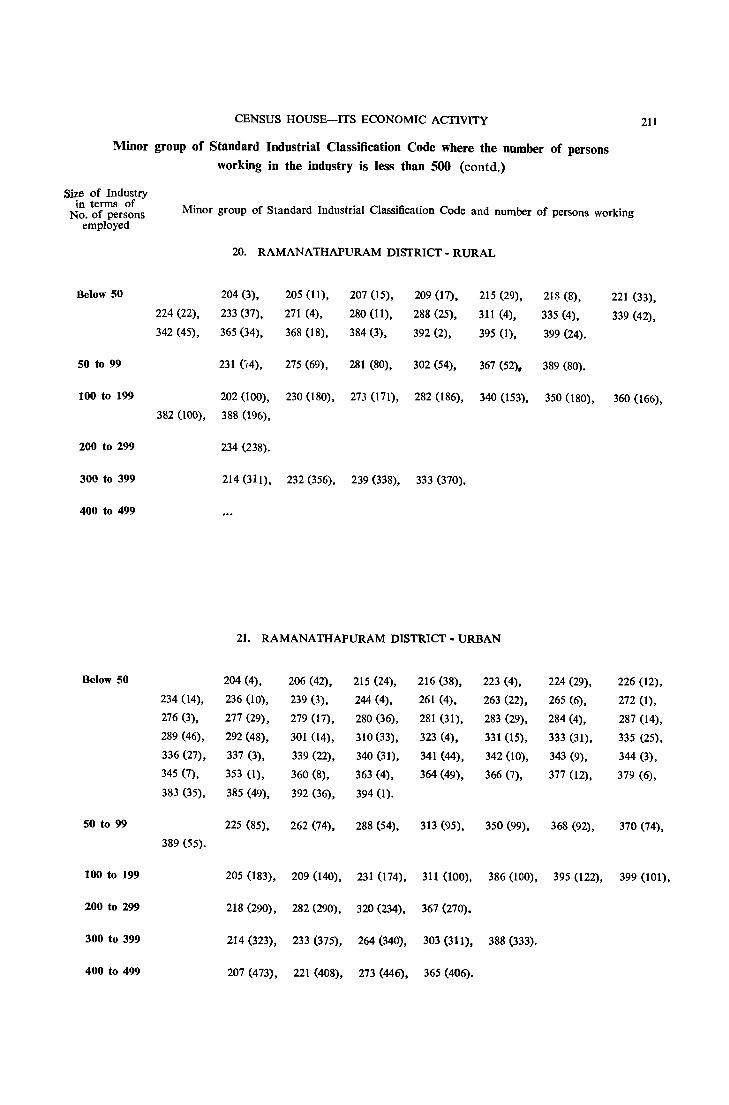
CENSUS HOUSE-ITS ECONOMIC ACTIVITY
Minor group of Standard Industrial Classification Code where the number of persons working in the industry is less than 500 (contd.)
211
Size of Industry in terms of
No. of persons employed
Minor group of Standard Industrial Classification Code and number of persons working
20. RAMANATHAPURAM DISTRICT - RURAL
Below 50 204 (3), 205 (11), 207 (15), 209 (17), 215 (29), 218 (8), 221 (33),
224 (22), 233 (37), 271 (4), 280 (11), 288 (25). 311 (4), 335 (4), 339 (42),
342 (45), 365 (34), 368 (18), 384 (3), 392 (2), 395 (1). 399 (24).
50 to 99 231 (4), 275 (69), 281 (80). 302 (54). 367 (52). 389 (80).
100 to 199 202 (100), 230 (180), 273 (171), 282 (186), 340 (153), 350 (180), 360 (166),
382 (100), 388 (196),
200 to 299 234 (238).
300 to 399 214 (311), 232 (356), 239 (338), 333 (370).
400 to 499
21. RAMANATHAPURAM DISTRICT - URBAN
Below 50 204 (4), 206 (42), 215 (24), 216 (38). 223 (4). 224 (29), 226 (12),
234 (14), 236 (10), 239 (3), 244 (4), 261 (4). 263 (22). 265 (6), 272 (1),
276 (3), 277 (29), 279 (17), 280 (36), 281 (31), 283 (29). 284 (4), 287 (14),
289 (46), 292 (48), 301 (14), 310 (33), 323 (4). 331 (15), 333 (31), 335 (25),
336 (27), 337 (3), 339 (22), 340 (31), 341 (44), 342 (10), 343 (9), 344 (3),
345 (7), 353 (1), 360 (8), 363 (4). 364 (49), 366 (7), 377 (12), 379 (6),
383 (35), 385 (49), 392 (36), 394 (1).
50 to 99 225 (85). 262 (74). 288 (54), 313 (95), 350 (99), 368 (92), 370 (74),
389 (55).
100 to 199 205 (183), 209 (140), 231 (174), 311 (100), 386 (100), 395 (122), 399 (101),
200 to 299 218 (290), 282 (290), 320 (234), 367 (270).
300 to 399 214 (323), 233 (375), 264 (340), 303 (311). 388 (333).
400 to 499 207 (473), 221 (408), 273 (446), 365 (406).

212 REPORT ON HOUSING AND ESTABLISHMENTS
Minor group of Stand~rd Industrial Classification Code where the number of persons working in the industry is less than 500 (eontd.)
Size of Industry in terms of
No. of persons employed
Minor group of Standard Industrial Classification Code and number of persons working
22. TIRUNELVELI DISTR[CT-RURAL
Below SO 202 (7), 206 (4), 207 (26), 215 (1), 218 (15), 224 (38), 225 (10),
231 (44), 236 (45), 244 (4), 264 (12), 270 (34), 277 (4), 283 (8), 287 (8),
289 (19), 291 (1), 303 (3), 310 (12), 313 (12), 314 (42), 332 (8), 333 (42),
335 (4), 336 (15), 338 (26), 342 (4), 363 (34), 368 (23), 370 (34), 384 (16),
392 (3), 394 (3).
SO to 99 204 (51), 205 (60), 209 (86), 233 (57), 274 (56), 301 (90), 302 (65),
311 (58), 360 (15), 367 (72), 389 (50).
100 to 199 214 (121), 217 (1135, 273 (145), 281 (122), 388 (180).
200 to 299 339 (201), 340 (253), 365 (291).
300 to 399 334 (343).
400 to 499
23. TIR UNELVELI DISTRICT - URBAN
Below SO 201 (4), 206 (3), 215 (32), 216 (28), 217 (4), 219 (4), 223 (7),
234 (44), 241 (34), 244 (7), 266 (22), 271 (18), 272 (1), 278 (1), 283 (4),
284 (33), 287 (4), 291 (I), 292 (3), 310 (24), 315 (4), 320 (46), 322 (2),
323 (8), 331 (40), 337 (7), 339 (14), 342 (25), 343 (4), 344 (4), 345 (9),
357 (10), 361 (36), 363 (22), 364 (14), 366 (11), 370 (9), 373 (7), 377 (7),
378 (8), 379 (34), 381 (35), 394 (3), 395 (25).
50 to 99 204 (58), 221 (96), 236 (63), 280 (71), 290 (50), 301 (96), 303 (98),
336 (95), 341 (60), 360 (66), 368 (88), 383 (53), 392 (73).
100 to 199 224 (lO6), 225 (161), 240 (179), 311 (110), 330 (104), 335 (102), 340 (173),
389 (115), 399 (130).
200 to 299 207 (228), 218 (252), 274 (242), 281 (236), 282 (226), 367 (274).
300 to 399 205 (366), 209 (375), 214 (300), 273 (355), 277 (373), 288 (321), 350 (391),
386 (361), 388 (379).
400 to 499 233 (412), 302 (492).
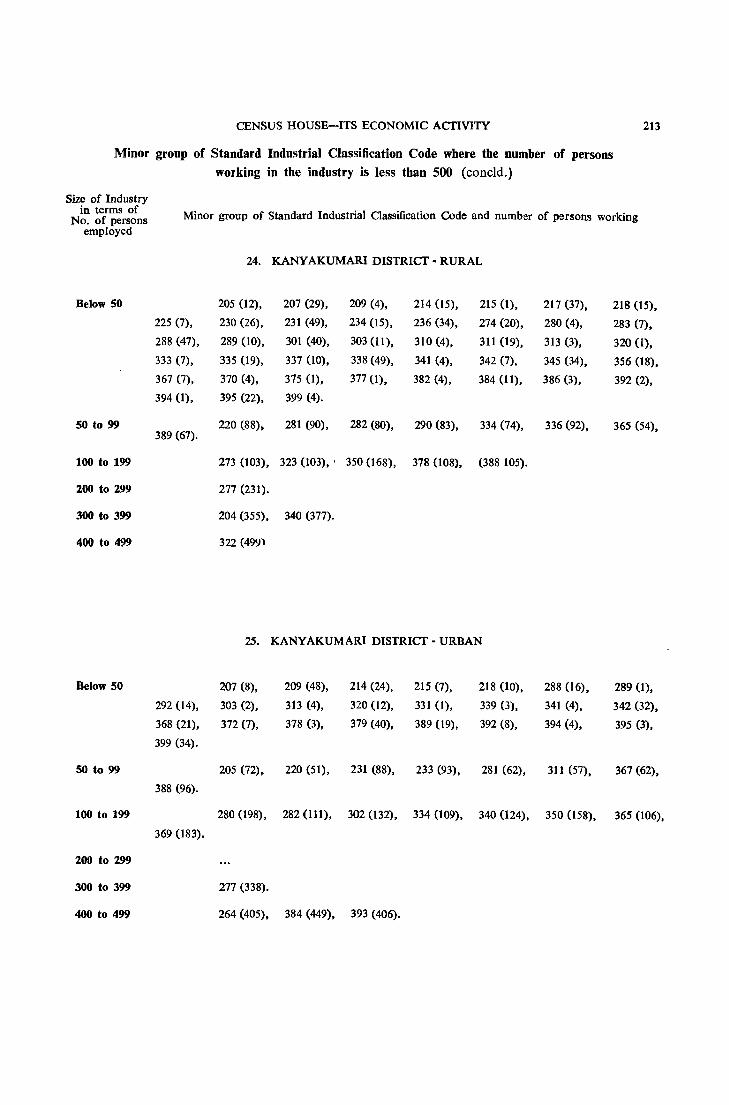
CENSUS HOUSE-ITS ECONOMIC ACTIVITY
Minor group of Standard Industrial Classification Code where the number of persons working in the industry is less than 500 (coneld.)
213
Size of Industry in terms of
No. of persons employed
Minor group of Standard Industrial Classification Code and number of persons working
24. KANYAKUMARI DISTRICT - RURAL
Below 50 205 (12), 207 (29), 209 (4), 214 (15), 215 (1), 217 (37). 218 (15),
225 (7), 230 (26), 231 (49), 234 (15), 236 (34), 274 (20), 280 (4), 283 (7),
288 (47), 289 (10), 301 (40), 303 (II), 310 (4), 311 (19), 313 (3), 320 (1),
333 (7), 335 (19), 337 (10), 338 (49), 341 (4). 342 (7). 345 (34), 356 (18),
367 (7). 370 (4). 375 (1), 377 (1), 382 (4). 384 (11), 386 (3), 392 (2),
394 (1). 395 (22). 399 (4).
50 to 99 389 (67).
220 (88), 281 (90). 282 (80), 290 (83), 334 (74). 336 (92), 365 (54),
100 to 199 273 (103). 323 (103). ' 350 (168). 378 (l08), (388105).
200 to 299 277 (231).
300 to 399 204 (355). 340 (377).
400 to 499 322 (499)
25. KANYAKUMARI DISTRICT - URBAN
Below 50 207 (8), 209 (48). 214 (24). 215 (7). 218 (10). 288 (16), 289 (1),
292 (14), 303 (2). 313 (4). 320 (12), 331 (I). 339 (3), 341 (4). 342 (32),
368 (21), 372 (7), 378 (3), 379 (40), 389 (19), 392 (8), 394 (4), 395 (3),
399 (34).
50 to 99 205 (72), 220 (51). 231 (88), 233 (93), 281 (62), 311 (57), 367 (62).
388 (96).
100 to 199 280 (198). 282 (111). 302 (132). 334 (109), 340 (124), 350 (158), 365 (106),
369 (183).
200 to 299
300 to 399 277 (338).
400 to 499 264 (405), 384 (449), 393 (406).

STATEMENT
Minor group of Indian Standard Industrial Classification Code where the number of persons
UR
District and number Standard Industrial Classification Code Total Madras North South No. City Chingleput Areot Areot Salem Coimbatore
1 2 3 4 5 6 7 8
200 25,590 1,879 1,122 1,825 891 2,298 3,342
201 736
205 1,053 1,053
207 2,784 784 535 696
209 2,526 900
214 500
217 3,871 2,369
218 607 607
220 19,592 1,819 700 9,846 1,380 1,007
221 1,448
224 666 666
230 9,659 702 6,247
231 14,421 13,416
232 26,167 714 9,932
233 2,683 896 916
234 18,442 1,989 14,339
235 130,228 1,722 2,937 3,804 3,441 46,483 8,589
239 3,059 1,356
263 1,342 1,342
264 7,039 956 1,483
270 5,150 832
271 2,511 2,511
273 10,575 3,002 972 1,289 947 936 958
274 2,034 616 1,418
281 703 703
282 516 516
300 911 911
301 2,350 2,350
302 13,695 7,577 765 613 813
310 4,957 1,285 2,937 735
320 998 998
330 712 712
331 586 586
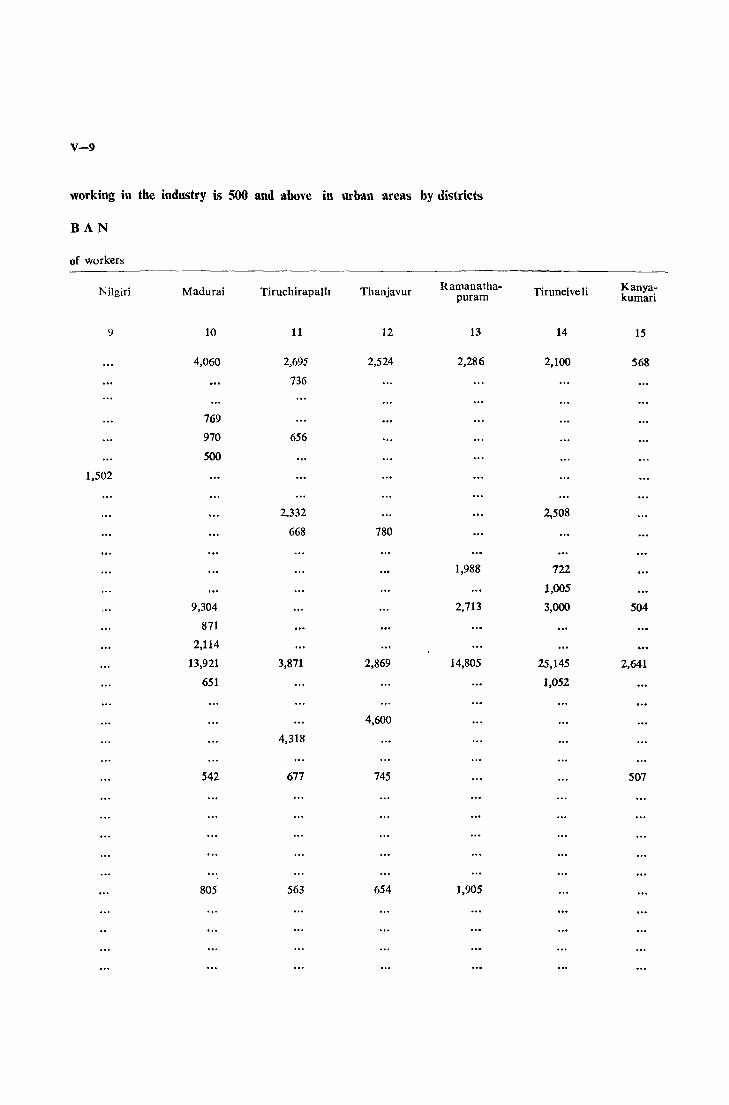
V-9
working in the industry is 500 and above in urban areas by districts
BAN
of workers
Nilgiri Madurai Tiruchirapalh Thanjavur Ramanatha- Tirunelveli Kanya-puram kumari
9 10 11 12 13 14 15
4,060 2,695 2,524 2,286 2,100 568
736
769
970 656
500
1,502
2.332 2,508
668 780
1,988 722
1,005
9,304 2,713 3,000 504
871
2,114
13,921 3,871 2,869 14,805 25,145 2,641
651 1,052
4,600
4,318
542 677 745 507
805 563 654 1,905
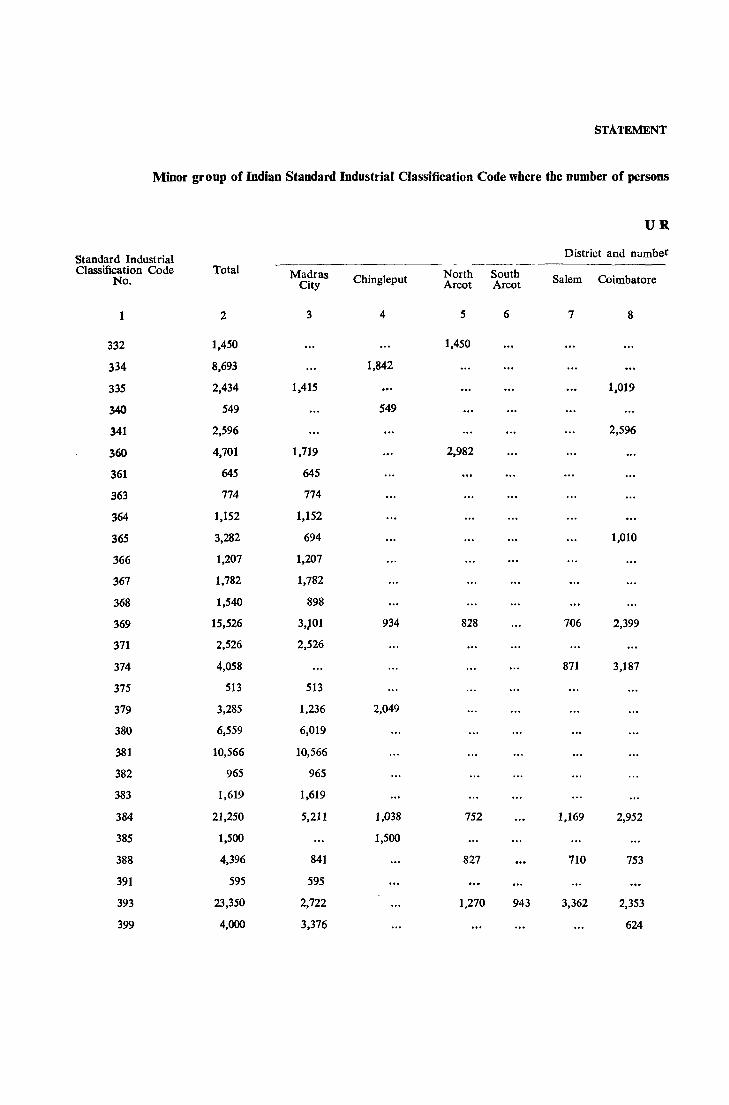
STATEMENT
Minor group of Indian Standard Industrial Classification Code where the number of persons
UR
Standard Industrial District and number
Classification Code Total -----~--
Madras North South No. City Chingleput Arcot Aroot Salem Coimbatore
1 2 3 4 5 6 7 8
332 1,450 1,450
334 ~,693 1,842
335 2,434 1,415 1,019
340 549 549
341 2,596 2,596
360 4,701 1,719 2,982
361 645 645
363 774 774
364 1,152 1,152
365 3,282 694 1,010
366 1,207 1,207
367 1,782 1,782
368 1,540 898
369 15,526 3,}01 934 828 706 2,399
371 2,526 2,526
374 4,058 871 3,187
375 513 513
379 3,285 1,236 2,049
380 6,559 6,019
381 10,566 10,566
382 965 965
383 1,619 1,619
384 21,250 5,211 1,038 752 1,169 2,952
385 1,500 1,500
388 4,396 841 827 710 753
391 595 595
393 23,350 2,722 1,270 943 3,362 2,353
399 4,000 3,376 624
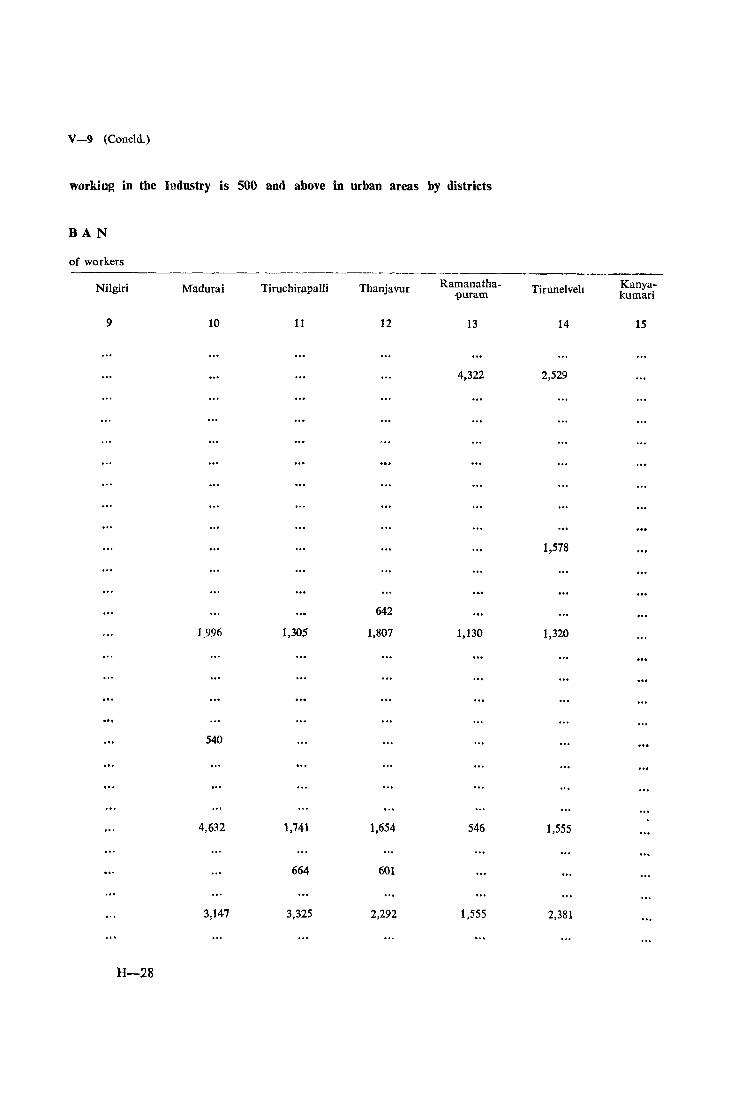
V-9 (Coneld.)
working in the Industry is 500 and above in urban areas by districts
BA N
of workers
Nilgiri Madurai Tiruchirapalli
9 10 11
1_996 1,305
540
4,632 1,741
664
3,147 3,325
H-28
Thanjavur
12
642
1,807
1,654
601
2,292
------~------_-----
Ramanatha-puram
13
Tirunelveh
14
4,322 2,529
1,578
1,130 1,320
546 1,555
1,555 2,381
Kanyakumari
15
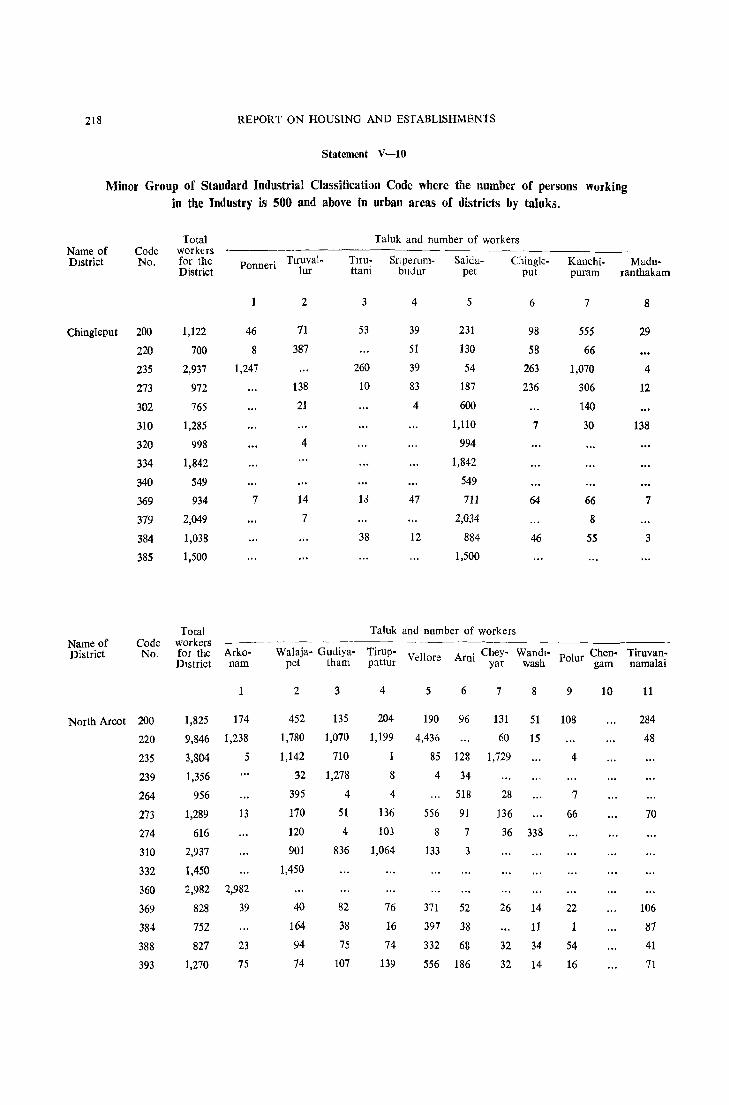
218 REPORT ON HOUSING AND ESTABLlSHMENTS
Statement V-IO
Minor Group of Standard Industrial Classification Code where the number of persons working in the Industry is 500 and above in urban areas of districts by taluks.
Total Taluk and number of workers Name of Code workers DIstrict No. for the Ponneri Tlruval- Tuu- Snperum- Saida- Chingle- Kanchi- Madu-
District lur ttani buJur pet put puram ranthakam
1 2 3 4 5 6 7 8
Chingleput 200 1,122 46 71 53 39 231 98 555 29
220 700 8 387 51 130 58 66
235 2,937 1,247 260 39 54 263 1,070 4
273 972 138 10 83 187 236 306 12
302 765 21 4 600 140
310 1,285 1,110 7 30 138
320 998 4 994
334 1,842 1,842
340 549 549
369 934 7 14 13 47 711 64 66 7
379 2,049 7 2,034 8
384 1,038 38 12 884 46 55 3
385 1,500 1,500
Total Taluk and number of workers Name of Code workers District No. for the Arko- Walaja- Gudiya- Tirup-
Veil ore Ar . Chey- Wandl- Polur Chen- Tiruvan-DIstrict nam pet tham pattur III yar wash gam namalai
2 3 4 5 6 7 8 9 10 11
North Aroot 200 1,825 174 452 135 204 190 96 131 51 108 284
220 9,846 1,238 1,780 1,070 1,199 4,436 60 15 48
235 3,804 5 1,142 710 1 85 128 1,729 4
239 1,356 32 1,278 8 4 34
264 956 395 4 4 518 28 7
273 1,289 13 170 51 136 556 91 136 66 70
274 616 120 4 103 8 7 36 338
310 2,937 901 836 1,064 133 3
332 1,450 1,450
360 2,982 2,982
369 828 39 40 82 76 371 52 26 14 22 106
384 752 164 38 16 397 38 11 1 87
388 827 23 94 75 74 332 68 32 34 54 41
393 1,270 75 74 107 139 556 186 32 14 16 71
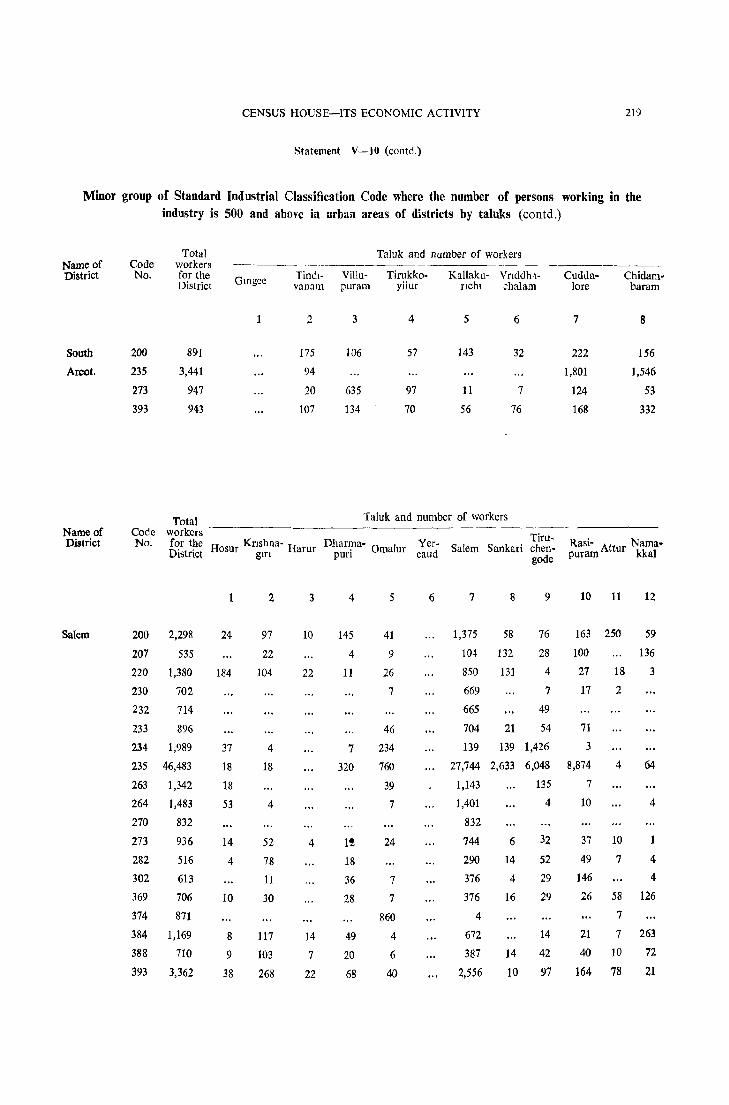
CENSUS HOUSE-ITS ECONOMIC ACTIVITY 219
Statement V-IO (contd.)
Minor group of Standard Industrial Classification Code where the number of persons working in the industry is 500 and above hl urbaa areas of districts by taluks (contd.)
Total Taluk and number of workers Name of Code workers ----
District No. for the Glngee Tindl- Villu- Timkko- Kallaku- Vnddh1- Cudda- Chidam-District vanam puram yilur nchl chalam lore baram
2 3 4 5 6 7 8
South 200 891 175 106 57 143 32 222 156
Arcot. 235 3,441 94 1,801 1,546
273 947 20 635 97 11 7 124 53
393 943 107 134 70 56 76 168 332
Total Taluk and number of workers
Name of Code workers Tim-District No. for the Hosur Knshna- Harur Dharma- Yer- Salem Sankari chen- Rasi- A Nama-District glfl puri Omalur caud gode
puram ttur kkal
2 3 4 5 6 7 8 9 10 11 12
Salem 200 2,298 24 97 10 145 41 1,375 58 76 163 250 59
207 535 22 4 9 104 132 28 100 136
220 1,380 184 104 22 11 26 850 131 4 27 18 3
230 702 7 669 7 17 2
232 714 665 49
233 896 46 704 21 54 71
234 1,989 37 4 7 234 139 139 1,426 3
235 46,483 18 18 320 760 27,744 2,633 6,048 8,874 4 64
263 1,342 18 39 1,143 135 7
264 1,483 53 4 7 1,401 4 10 4
270 832 832
273 936 14 52 4 I! 24 744 6 32 37 10 1
282 516 4 78 18 290 14 52 49 7 4
302 613 11 36 7 376 4 29 146 4
369 706 10 30 28 7 376 16 29 26 58 126
374 871 860 4 7
384 1,169 8 117 14 49 4 672 14 21 7 263
388 710 9 103 7 20 6 387 14 42 40 10 72
393 3,362 38 268 22 68 40 2,556 10 97 164 78 21

220 REPORT ON HOUSING AND ESTABLISHMENTS
Statement V-10 (contd.)
Minor group of Standard Industrial Classification Code where the number of persons working in the industry is 500 and above in urban areas of districts by taluks (contd.)
Total Taluk and number of workers Name of Code workers District No. for the Bhavani Gopichetti- Erode Dhara- Palla- Avana- Coimba- Polla- Udumal-
District palayam puram dam shi tore chi pet
1 2 3 4 5 6 7 8 9
Coimbatore 200 3,342 52 290 570 119 674 202 453 808 174
207 696 224 8 256 4 21 26 74 83
217 2,369 14 474 1,881
218 607 3 9 16 28 31 88 404 25 3
220 1,007 36 154 7 172 11 400 176 51
230 6,247 15 126 29 2,770 308 2,832 153 14
231 13,416 4 12,131 1,281
232 9,932 350 9,582
233 916 29 158 7 340 202 169 11
234 14,339 3 534 3,295 10,407 100
235 8,589 85 608 292 3 1,186 154 6,214 47
271 2,511 2,492 15 4
273 958 4 30 20 15 64 51 670 104
274 1,418 1,262 4 149 3
302 813 71 236 436 41 29
310 735 4 321 14 396
335 1,019 25 15 40 939
341 2,596 4 8 10 11 2,562
365 1,010 22 165 4 10 788 9 10 2
369 2,399 8 64 121 14 108 20 1,940 106 18
374 3,187 7 23 3,146 11
384 2,952 4 64 193 119 160 237 1,850 281 44
388 753 21 59 34 16 72 78 390 32 51
393 2,353 35 122 464 72 23 63 1,286 239 49
399 624 4 86 1 186 4 249 91 3
Total Taluk and number of workers Name of Code workers District No. for the Gudalur Oot3camund Coonor District
2 3
Nilgiri 217 1,502 680 275 547
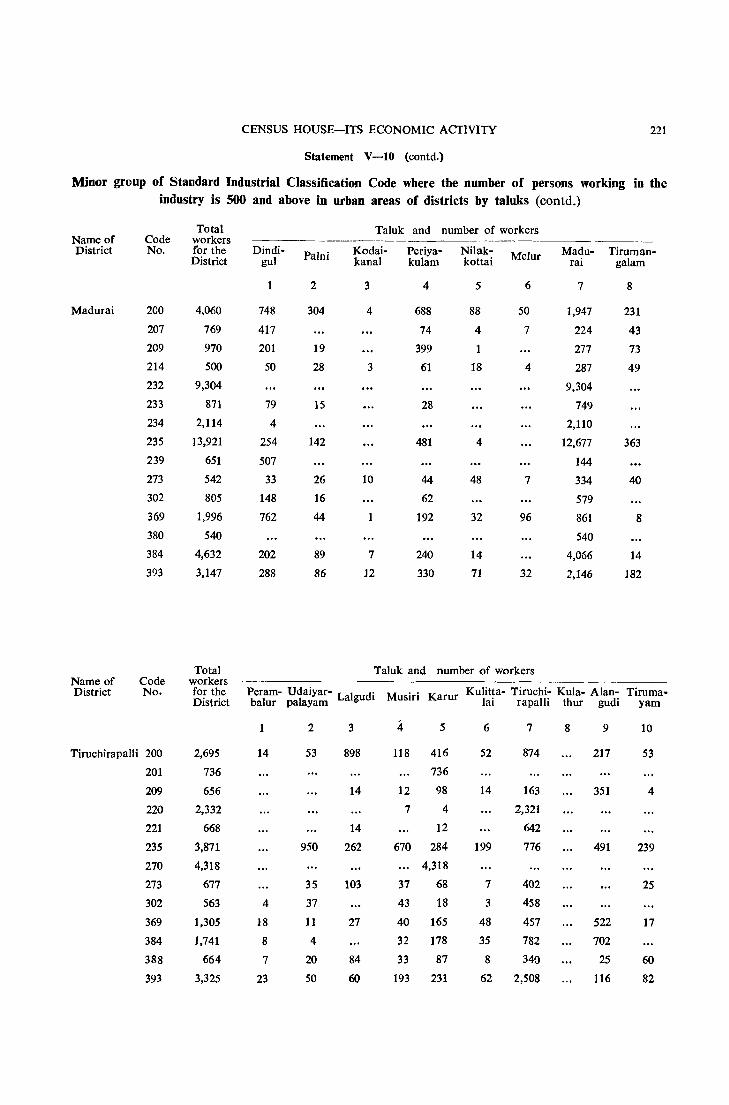
CENSUS HOUSE-ITS ECONOMIC ACTIVITY 221
Statement V-IO (contd.)
Minor group of Standard Industrial Classification Code where the number of persons working in the industry is 500 and above in urban areas of districts by taluks (contd.)
Total Taluk and number of workers Name of Code workers District No. for the Dindi- Palni Kodai- Periya- Nilak- Melur Madu- Tiruman-
District guJ kanal kulam kottai rai gaiam
2 3 4 5 6 7 8
Madurai 200 4,060 748 304 4 688 88 50 1,947 231
207 769 417 74 4 7 224 43
209 970 201 19 399 1 277 73
214 500 50 28 3 61 18 4 287 49
232 9,304 9,304
233 871 79 15 28 749
234 2,114 4 2,110
235 13,921 254 142 481 4 12,677 363
239 651 507 144
273 542 33 26 10 44 48 7 334 40
302 805 148 16 62 579
369 1,996 762 44 192 32 96 861 8
380 540 540
384 4,632 202 89 7 240 14 4,066 14
393 3,147 288 86 12 330 71 32 2,146 182
Total Taluk and number of workers Name of Code workers District No. for the Peram- Udaiyar- Lalgudi Musiri Karur Kulitta- Tiruchi- Kula- Alan- Tiruma-
District balur palayam lai rapalli thur gudi yam
2 3 4 5 6 7 8 9 10
Tiruchirapalli 200 2,695 14 53 898 118 416 52 874 217 53
201 736 736
209 656 14 12 98 14 163 351 4
220 2,332 7 4 2,321
221 668 14 12 642
235 3,871 950 262 670 284 199 776 491 239
270 4,318 4,318
273 677 35 103 37 68 7 402 25
302 563 4 37 43 18 3 458
369 1,305 18 11 27 40 165 48 457 522 17
384 1,741 8 4 32 178 35 782 702
388 664 7 20 84 33 87 8 340 25 60
393 3,325 23 50 60 193 231 62 2,508 116 82
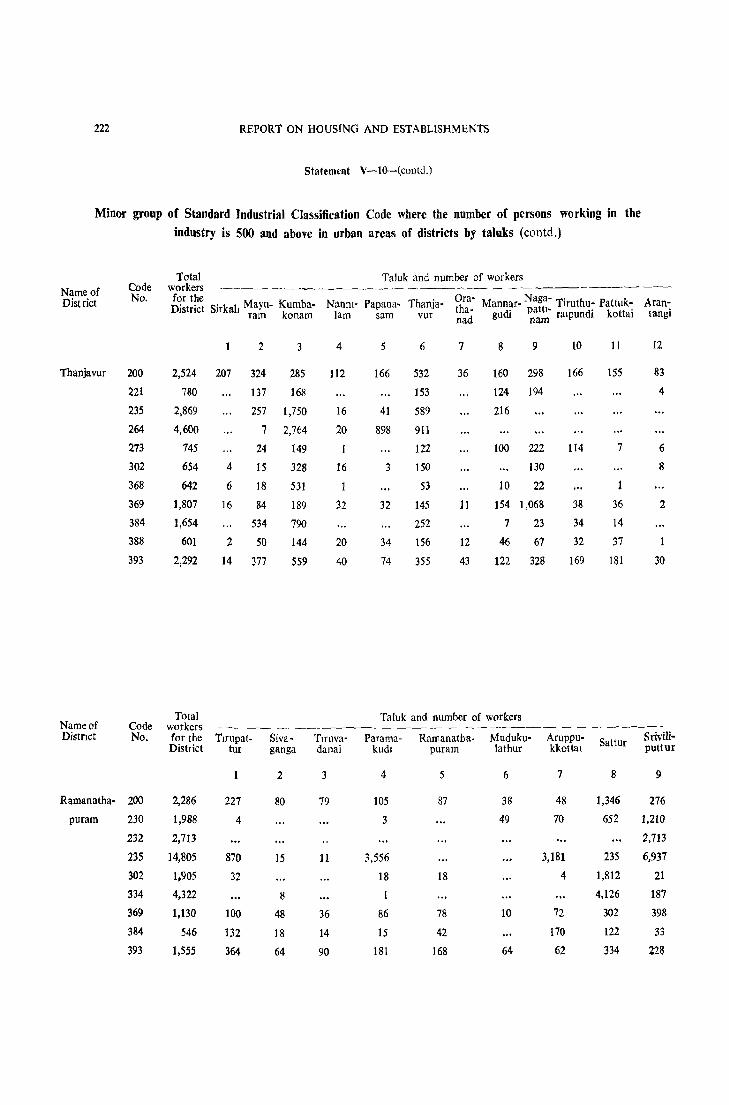
222 REPORT ON HOUSING AND ESTABLISHMENTS
Statement V-10-(contd.)
Minor group of Standard Industrial Classification Code where the number of persons working in tbe
industry is 500 and above in urban areas of districts by taluks (contd.)
Total Taluk and number of workers Name of Code workers
No. for the ?h"a- Mannar- Nafr Tiruthu- Pattuk-District District Sirkah MaYll- Kumba- Nanm- Papana- Thanja' Aran-ram konam lam sam vur n:d gudi ~aa~- ralpundi kottai tangi
2 3 4 5 6 7 8 9 10 11 12
Thanjavur 200 2,524 207 324 285 112 166 532 36 160 298 166 155 83
221 780 137 168 153 124 194 4
235 2,869 257 1,750 16 41 589 216
264 4,600 7 2,764 20 898 911
273 745 24 149 122 100 222 114 7 6
302 654 4 15 328 16 3 150 130 8
368 642 6 18 531 1 53 10 22
369 1,807 16 84 189 32 32 145 11 154 1,068 38 36 2
384 1,654 534 790 252 7 23 34 14
388 601 2 50 144 20 34 156 12 46 67 32 37 1
393 2,292 14 377 559 40 74 355 43 122 328 169 181 30
Total Taluk and number of workers Name of Code workers District No. for the Tlrupat- Siva- TlfUva- Parama- Ramanatha- Muduku- Aruppu- Sattur Srivilj-
District tur ganga danai kudl puram tathur kkottal puttur
2 3 4 5 6 7 8 9
Ramanatha- 200 2,286 227 80 79 105 87 38 48 1,346 276
puram 230 1,988 4 3 49 70 652 1,210
232 2,713 2,713
235 14,805 870 15 11 3,556 3,181 235 6,937
302 1,905 32 18 18 4 1,812 21
334 4,322 8 1 4,126 187
369 1,130 100 48 36 86 78 10 72 302 398
384 546 132 18 14 15 42 170 122 33
393 1,555 364 64 90 181 168 64 62 334 228

CENSUS HOUSE-ITS ECONOMIC ACTlVll Y 223
Statement V-IO (coneld.)
Minor group of Standard Industrial Classification Code where the number of persons working in the industry is 500 and above in urban areas of districts by taluks (concld.)
Name of Code District No.
Tirunelveh 200
220
230
231
232
235
239
334
365
369
384
393
Name of Code District No.
Kanya
kumari
200
232
235
273
Total workers for the Dlstllct
2,100
2,508
722
1,005
3,000
25,145
1,052
2,529
1,578
1,320
1,555
2,381
Total workers for the
District
568
504
2,641
507
Taluk and number of workers
Sankarna- Kovll- Sri Val-ymarkoll patti
2
144 74
75 408
18 957
4,529 182
961
133 2,313
654 12
65 150
4 90
61 133
Vilavancode
4
4
15
299
kunlam
3
716
11
221
3,000
240
15
11
56
716
101
474
------_-Tlrunel- Ten- Shenco- Ambasa-
Vell kasi Hah mudram
4 5 6 7
473 65 48 306
2,175 143 165
7 4
22
6,937 9,283 233 3,338
68 7 1
770 44 4 34
118 36 42 96
1,305 8 22 7
716 122 38 275
Taluk and number of workers
Kalkulam
2
19
270
8
Thovala
3
----Nangu-
nen
8
126
14
7
6
26
104
Tlruchen-dur
9
148
8
397
72
4
71
18
458
Agastees waram
4
545
500
2,356
200
5 - 83. It would be good to have an idea of the power resources of Madras State, so that the discussion can be appreciated in its proper perspective. Madras State does not possess
No coal deposit in Madras State
any coal (black) deposits. Whatever coal is required is imported from West Bengal and Bihar over a distance of 1,000 miles entailing heavy freight charges. This void will perhaps to
some extent be filled in by the Neyveli Thermal Station which will have 7 generators with an aggregate capacity of 4 lakhs kilowatts. It will be the biggest Thermal Power Station in the whole of India. Madras State is also not endowed with natural and synthetic oils essential to the establishment of modern industries. So any industrial development of Madras State, whether small-scale or large-scale has depended in the past on electricity and has to do so in future.
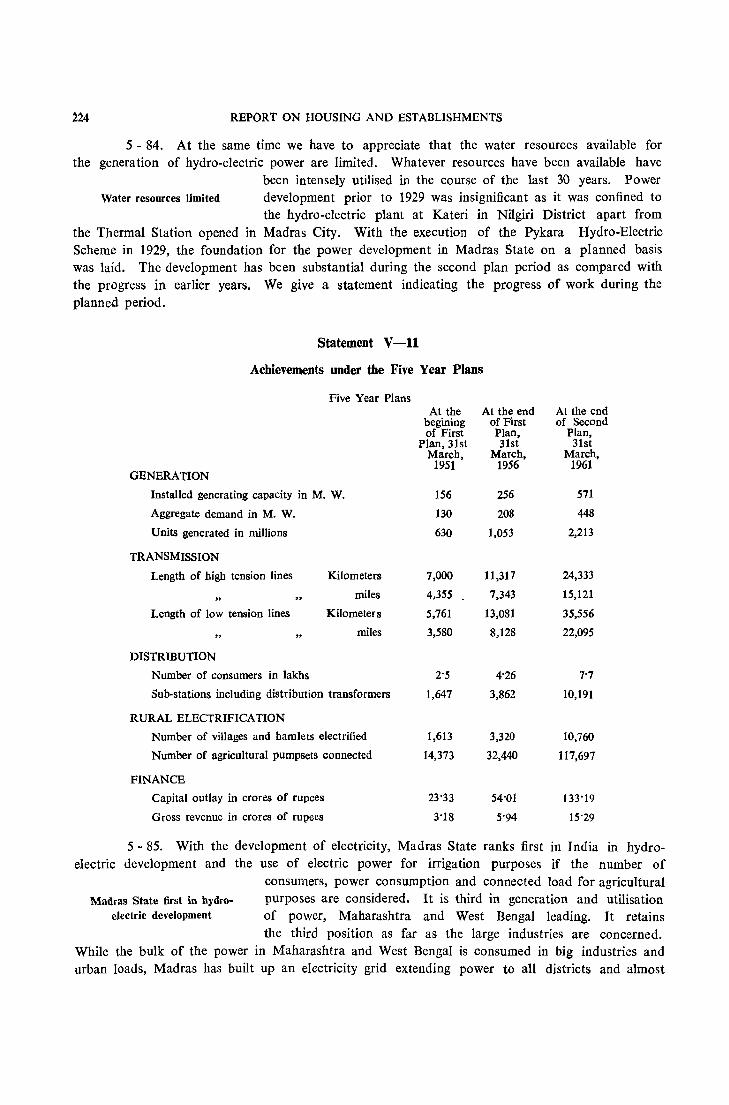
224 REPORT ON HOUSING AND ESTABLISHMENTS
5 - 84. At the same time we have to appreciate that the water resources available for the generation of hydro-electric power are limited. Whatever resources have been available have
been intensely utilised in the course of the last 30 years. Power Water resources limited development prior to 1929 was insignificant as it was confined to
the hydro-electric plant at Kateri in Nilgiri District apart from the Thermal Station opened in Madras City. With the execution of the Pykara Hydro-Electric Scheme in 1929, the foundation for the power development in Madras State on a planned basis was laid. The development has been substantial during the second plan period as compared with the progress in earlier years. We give a statement indicating the progress of work during the planned period.
Statement V-11
Achievements under the Five Year Plans
Five Year Plans
GENERATION
Installed generating capacity in M. W.
Aggregate demand in M. W.
Units generated in millions
TRANSMISSION
Length of bigh tension lines Kilometers
" miles
Length of low tension lines Kilometers
" miles
DISTRmUTION
Number of consumers in lakhs
Sub·stations including distribution transformers
RURAL ELECTRIFICATION
Number of villages and hamlets electrified
Number of agricultural pumpsets connected
FINANCE
Capital outlay in crores of rupees
Gross revenue in crores of rupees
At the begining of First
Plan, 31st March,
1951
156
130
630
7,000
4,355
5,761
3,580
2'5
1,647
1,613
14,373
23'33
3'18
At the end of First Plan, 31st
March, 1956
256
208
1,053
11,317
7,343
13,081
8,128
4'26
3,862
3,320
32,440
54'01
5'94
At the end of Second
Plan, 31st
March, 1961
571
448
2,213
24,333
15,121
35,556
22,095
7'7
10,191
10,760
117,697
133'19
15'29
5 - 85. With the development of electricity, Madras State ranks first in India in hydroelectric development and the use of electric power for irrigation purposes if the number of
consumers, power consumption and connected load for agricultural Madras State first in hydro- purposes are considered. It is third in generation and utilisation
electric development of power, Maharashtra and West Bengal leading. It retains the third position as far as the large industries are concerned.
While the bulk of the power in Maharashtra and West Bengal is consumed in big industries and urban loads, Madras has built up an electricity grid ex.tending power to all districts and almost
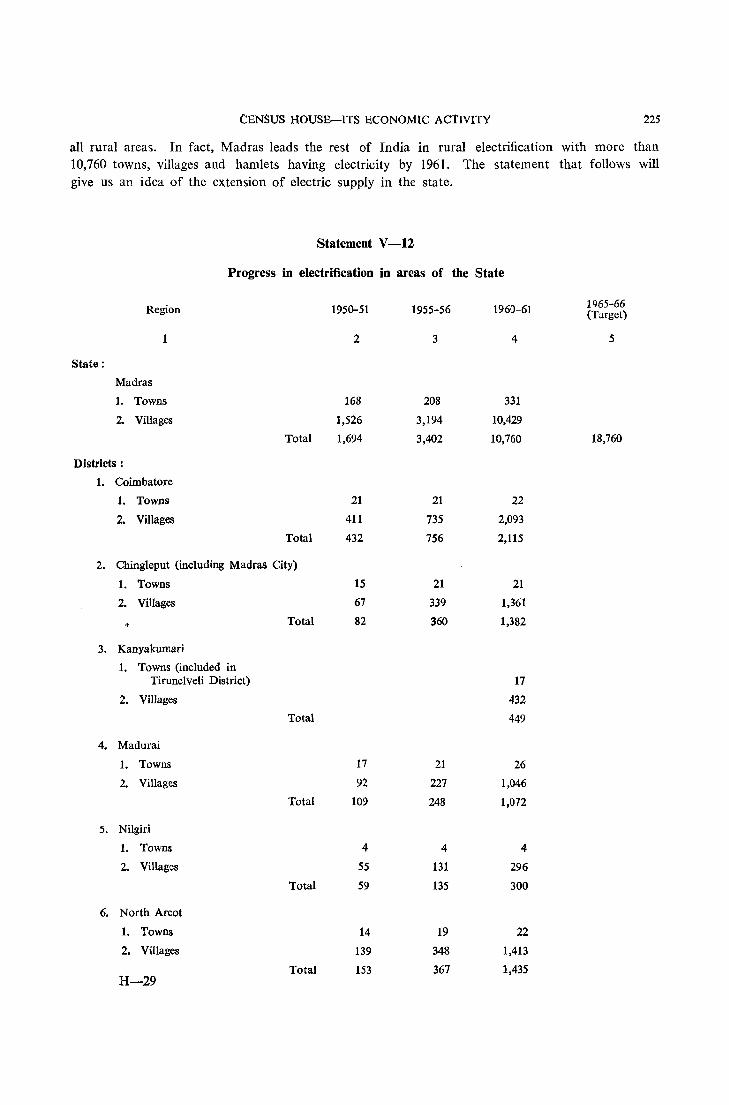
CENSUS HOUSE-ITS ECONOMIC ACtIVITY ~25
all rural areas. In fact, Madras leads the rest of India in rural electrification with more than 10,760 towns, villages and hamlets having electricity by 1961. The statement that follows will give us an idea of the extension of electric supply in the state.
Statement V -12
Progress in electrification in areas of the State
Region 1950-51 1955-56 1960-61 1965-66 (Target)
1 2 3 4 5
State:
Madras
1. Towns 168 208 331
2. Villages 1,526 3,194 10,429
Total 1,694 3,402 10,760 18,760
Districts:
1. Coimbatore
1. Towns 21 21 22
2. Villages 411 735 2,093
Total 432 756 2,115
2. Chingleput (including Madras City)
1. Towns 15 21 21
2. Villages 67 339 1,361
Total 82 360 1,382
3. Kanyakumari
1. Towns (included in Tirunelveli District) 17
.. Villages 432 .t:..
Total 449
4. Madurai
1. Towns 17 21 26
2. Villages 92 227 1,046
Total 109 248 1,072
J. Nilgiri
1. Towns 4 4 4
2. Villages 55 131 296
Total 59 135 300
6. North Areot
1. Towns 14 19 22
2. Villages 139 348 1,413
Total 153 367 1,435 H-29

226
7.
8.
9.
10.
11.
12.
REPORT ON HOUSING AND ESTABLISHMENTS
Progress in electrification in areas of the State (concld.)
1 2 3 4
Ramanathapuram
1. Towns 24 27 32 2. Villages 110 252 700
Total 134 279 732
Salem
1. Towns 13 13 19
2. Villages 93 149 862 Total 106 162 881
South Arcot
1. Towns 12 15 18 2. Villages 91 122 554
Total 103 137 572
Tirunelveli
1. Towns 8 24 47 2 Villages 71 246 748
Total 79· 270· 795
Tiruchirapalli
1. Towns 17 18 28 2. Villages 171 278 464
Total 188 296 492
Tanjore
1. Towns 23 25 29 2. Villages 226 367 506
Total 249 392 535
• includes the areas under present Kanyakumari District
5 - 86. The Madras Power Grid comprises 7 Hydro-Electric Power Stations:
Pykara
Moyar
k.w.
70,200
36,000
40,000
28,000
The Madras Power Grid
Mettur
Papanasam
Periyar
Kundah No. I
105,000
40,000
(2 Thermal Power Stations)
Madras
Madurai
98,500
14,000
571,700
5

CENSUS HOUSE-ITS ECONOMIC ACTIVITY 22.,
The total power generated in all the power stations of the grid during the year 1960-61 was 2213'478 million units with an average generation of 101'123 million units per month. The demand of the power in the State has grown in the previous decade and continues to grow with the industrial awakening. Several new industries are being planned to be started all over the State and power is to be provided from the Madras Grid. The sub-joined statement will show the enormous increase in the consumption of electricity for commercial and industrial purposes that has taken place since the beginning of the First Plan.
Year (at the end of)
1951
1956
1961
Statement V -13
Utilisation of electricity in Madras State (connected load in k. watts)
Domestic Commercial Railways fuel and Municipalities Licencees and industrial & lighting use tractIOn
54,580 43,212 130,419 115,669 24,660
118,118 39,341 167,936 178,895 31,14J
209,842 46,013 146,335 402,885 33,345
Others
60,651
135,062
456,123
5 - 87. To meet the ever-increasing demand, an ambitious programme has been drawn Statement below
Future plans for power expansion up for implementation in the Third Plan period. gives the details of the Third Plan Schemes.
A.
B.
Statement V-14
Third Plan Power Schemes
Serial number and name of Project
Continuing schemes:
1. Periyar Hydro-Electric Scheme
2. Kundah Hydro-Electric Scheme (I & II stage)
3. Sandynallah Reservoir Scheme
New schemes:
1. Mettur Tunnel Hydro-Electric Scheme
2. Kundah Hydro-Electric Scheme (III stage)
3. Periyar HydrO-Electric Scheme (II stage)
4. Anamalai Project (Parambikulam)
5. Transmission and Distribution
6. Rural electrification
7. Loans to licencees
8. Investigation of new Schemes
Provision for 1961-66 Benefits in (in crores of rupees) Third Plan M.W
0'12
2'48
0'59
5'80 100
23'06 240
0'94 35
5'00 95
30'00
30'00
2'00
0'20
100'19
Note: This does not include the power benefit that will be made available from the Neyveli Thermal Station falling under the Central Section.
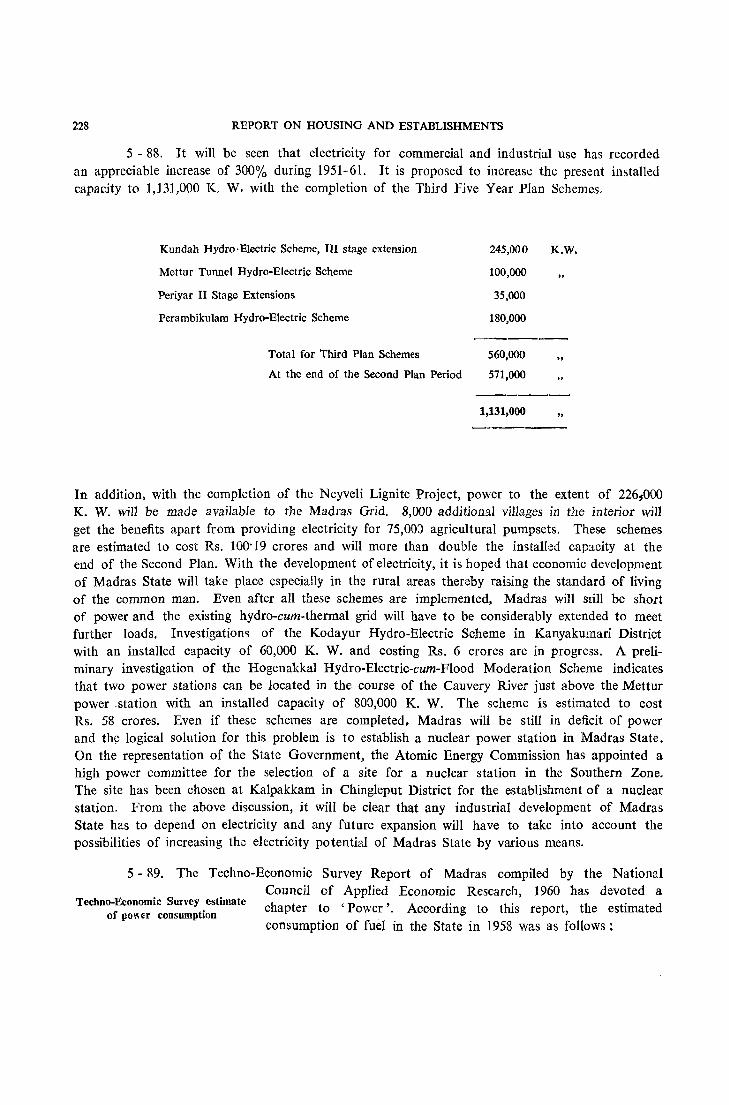
228 REPORT ON HOUSING AND ESTABLISHMENTS
5 - 88. It will be seen that electricity for commercial and industrial use has recorded an appreciable increase of 300% during 1951-61. It is proposed to increase the present installed capadty to 1,131,000 K W. with the completion of the Third Five Year Plan Schemes.
Kundah Hydro·Electric Scheme, III stage extension
Mettur Tunnel Hydro-Electric Scheme
Periyar II Stage Extensions
Perambikulam Hydro-Electric Scheme
Total for Third Plan Schemes
At the end of the Second Plan Period
245,000
100,000
35,000
180,000
560,000
571,000
1,131,000
K.W.
"
"
"
In addition, with the completion of the Neyveli Lignite Project, power to the extent of 2261000 K. W. will be made available to the Madras Grid. 8,000 additional villages in the interior will get the benefits apart from providing electricity for 75,00:) agricultural pumpsets. These schemes are estimated to cost Rs. 100'19 crores and will more than double the installed capacity at the end of the Second Plan. With the development of electricity, it is hoped that economic development of Madras State will take place especially in the rural areas thereby raising the standard of living of the common man. Even after all these schemes are implemented, Madras will still be short of power and the existing hydro-cum-thermal grid will have to be considerably extended to meet further loads. Investigations of the Kodayur Hydro-Electric Scheme in Kanyakumari District with an installed capacity of 60,000 K. W. and costing Rs. 6 crores are in progress. A preliminary investigation of the Hogenakkal Hydro-Electric-cum-Flood Moderation Scheme indicates that two power stations can be located in the course of the Cauvery River just above the Mettur power -station with an installed capacity of 800,000 K. W. The scheme is estimated to cost Rs. 58 crores. Even if these schemes are completed, Madras will be still in deficit of power and th~ logical solution for this problem is to establish a nuclear power station in Madras State. On the representation of the State Government, the Atomic Energy Commission has appointed a high power committee for the selection of a site for a nuclear station in the Southern Zone. The site has been chosen at Kalpakkam in Chingleput District for the establishment of a nuclear station. From the above discussion, it will be clear that any industrial development of Madras State has to depend on electricity and any future expansion will have to take into account the possibilities of increasing the electricity potential of Madras State by various means.
5 - 89. The Techno-Economic Survey Report of Madras compiled by the National Council of Applied Economic Research, 1960 has devoted a
Techno-Economic Survey estimate chapter to 'Power'. According to this report, the estimated of pO\H'r consumption consumption of fuel in the State in 1958 was as follows:

CENSUS HOUSE-ITS ECONOMIC ACTIVITY
Statement V -15
Types of fuels, their main use and their annual consumption
Type of fuel
Coal
Wood
Charcoal
Furnace oil
Diesel, gasoline and kerosene
Hydro-electricity
Main use
Railways
Thermal stations
Industry
Industry
Domestic
Domestic and industry
Industry, transport & domestic
"
Annual consumption (tons)
1,500,000
360,000
400,000
2,260,000
40,000
1,000,000
1,040,000
400,000
100,000
75,000
175,000
1,020 million kwh.
229
It will be noticed that of the total consumption of 2·26 million tons of coal, two thirds are consumed by the Railway alone. This is radically different from the pattern of consumption in the country as a whole where approximately one third of the total consumption is taken up by railways and an equal proportion by indu~trles. The consumption of coal in non-railway sector in Madras is, however, restricted by inadequate transport facilities. It has been estimated that another million tons of coal could be absorbed in industry and other uses in the State if adequate transport facilities were available. This would restore the balance in the pattern of coal consumption in the State.
5 - 90. The coal requirements (excluding coal consumed by the railways) of the State are met by three main sources; Bengal-BAhar coal fields (40%), Singareni coal fields (40%), and
Pench coal fields (20%). The price of coal in the State is naturally Coal requirements of the State higher than that ruling at the collieries and varies according to
the distance of the haul and the type of transport used. For instance, transport by ship is more expensive than by railway. This has its adverse effect on the economic deVelopment of the State. All industries for which coal is used cannot be developed because of the inadquate supply and high cost of the coal. The existing industries which depend on coal have to face the vicissitudes caused by the dislocation in the movement of wagons or pay a high price for the coal imported through sea.
5 - 91. The rate at which industrial consumption of coal in India is likely to grow in the next 15 years (1960-75) has been estimated by NCAER at approximately 50% for each five
year period. In Madras, however, the industrial requirement for Industrial demand of coal coal is not likely - to grow at the same rate as in India. The
largest industrial consumers of coal. are metallurgical industries. By 1970-71, India is expected to produce 20 million tons of steel. Madras may by then produce ;WO,OOO tons of steel at the most, i.e. 1 % of all India output. Coal is also required in large

230 REPORT ON HOUSING AND ESTABLISHMENTS
quantities for power generation. Considering the pr:::scnt resources for thermal power in Madras and the possible development of nuclear power, coal requirement for power generation in Madras is lIkely to increase at a lower rate than in the rest of India. Keeping these factors in mind, total industrial requirements of coal in Madras by 197] may be put at 2 million tons per annum or an additional 1-2 million tons during 1961-71.
5 - 92. Lignite is the only source of commercial fuel in the State. Large deposits of lignite-a low grade fuel-have been found in the South Arcot District. Known reserves are
estimated at 2,000 million tons located in an area of 100 sq. The Neyveli Lignite Project miles. The more easily workable deposits with reserves of 200
million tons are spread over an area of 51 sq. miles in Neyveli. It is in this area that mining operations under the lignite project are going on. The lignite project for the present envisages mining of 3-5 million tons of lignite annually to be utilised in the Thermal Power Plant to generate a capacity of 250 M. W., (2) in fertiliser plant and (3) in the production of 380,000 tons of carbonised briquettes which would be available for domestic as well as industrial purposes. As fuel, 2'5 tons of lignite are equal to one ton in thermal power. Since raw lignite cannot be used directly as fuel, briquetting is essential. Lignite briquettes would be a cheaper fuel compared with Bihar coal and would compete with Singareni coal on account of their better size and combustibility. It has been estimated that per capita requirement for domestic fuel in India as a whole is 0-25 ton of coal equivalent per year. In Madras on account of its warmer climate, it is likely to be less, say, 0-2 ton per year. Assuming that the rural requirement for domestic fuel is met by firewood and cowdung, the urban population (1 of the total popUlation in 1951) which in 1971 is expected to be in the neighbourhood of 10 millions will need 2 million tons of coal equivalent per year. It would appear that while lignite project provides substantial assistance to the State economy in other directions, it cannot be said to co_ntribute much to ease the existing situation with regard to industrial and domestic supplies. Much of the coal required in Madras will have to come from external sources thereby increasing the uncertainty in the supply position and the cost of supply.
5 - 93. We will now discuss the role of wood and charcoal in the industrial development of Madras which presumably can be produced locally. The estimated current consumption of
fuels in the State is given below:
Role of wood-charcoal in industrial development
Type of fud
Wood
Charcoal
Furnace 011
Diesel, gasoline and kerosene
Industry
Domestic
Main use
Domestic & industry
Industry, transport and domestic
Annual consumption
40,000
1,000,000
400,000
100,000
75,000
The last two items are imported. There is a possibility that oil may be struck in Cauvery Basin and unless this is done, every ton of oil needed for industrial development has to be imported from outside_ Regarding the production of wood and charcoal within the State, it is relevant to consider the area under forest in Madras State. Against 28'1% of forest in India, the present State of Madras has only 13-7% of its land area under forest. The area under forest was 17'1% in 1949-50 which rose to 17·7% in 1951-52. After separation of Andhra, it fell to 15'7% in 1954-55 and 14% in 1955-56. The State of Madras again lost forest during the linguistic
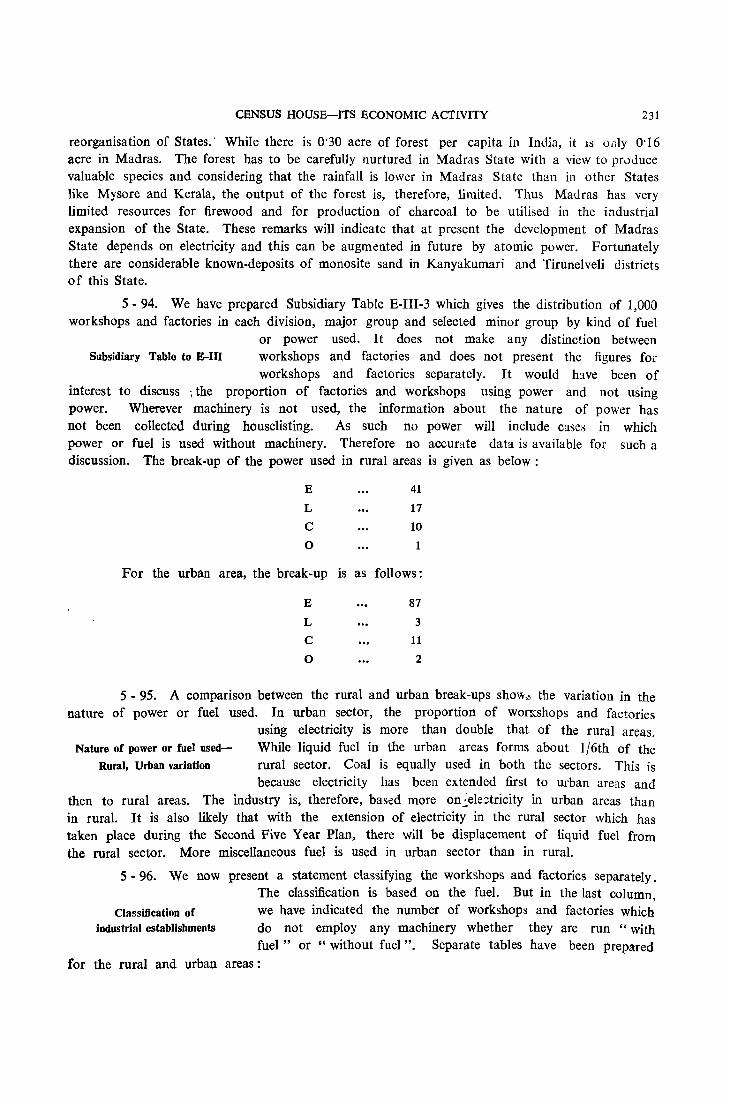
CENSUS HOUSE-ITS ECONOMIC ACTIVITY 231
reorganisation of States.' While there is 0'30 acre of forest per capita in India, it is 0,11y 0'16 acre in Madras. The forest has to be carefully nurtured in Madras State with a view to prvJuce valuable species and considering that the rainfall is lower in Madras State than in other States like Mysore and Kerala, the output of the forest is, therefore, limited. Thus Madras has very limited resources for firewood and for production of charcoal to be utilised in the industrial expansion of the State. These remarks will indicate that at present the development of Madras State depends on electricity and this can be augmented in future by atomic power. Fortunately there are considerable known-deposits of mono site sand in Kanyakumari and Tirunelveli districts of this State.
5 - 94. We have prepared Subsidiary Table E-III-3 which gives the distribution of 1,000 workshops and factories in each division, major group and selected minor group by kind of fuel
or power used. It does not make any distinction between Subsidiary Table to E-III workshops and factories and does not present the figures fm
workshops and factories separately. It would hwe been of interest to discuss ; the proportion of factories and workshops using power and not using power. Wherever machinery is not used, the information about the nature of power has not been collected during houselisting. As such no power will include cases in which power or fuel is used without machinery. Therefore no accurate data is available for such a discussion. The break-up of the power used in rural areas is given as below:
E 41
L 17
C 10
0 1
For the urban area, the break-up is as follows:
E 87
L 3
C 11
0 2
5 - 95. A comparison between the rural and urban break-ups sho",~ the variation in the nature of power or fuel used. In urban sector, the proportion of WOITcshops and factories
using electricity is more than double that of the rural areas. Nature of power or fuel used- While liquid fuel in the urban areas forms about 1/6th of the
Rural, Urban variation rural sector. Coal is equally used in both the sectors. This is because electricity has been extended first to urban areas and
then to rural areas. The industry is, therefore, based more on ~ele~tricity in urban areas than in rural. It is also likely that with the extension of electricity in the rural sector which has taken place during the Second Five Year Plan, there will be displacement of liquid fuel from the rural sector. More miscellaneous fuel is used in urban sector than in rural.
5 - 96. We now present a statement classifying the workshops and factories separately. The classification is based on the fuel. But in the last column,
Classification of we have indicated the number of workshops and factories which industrial establishments do not employ any machinery whether they are run "with
fuel" or "without fuel ". Separate tables have been prepared for the rural and urban areas:
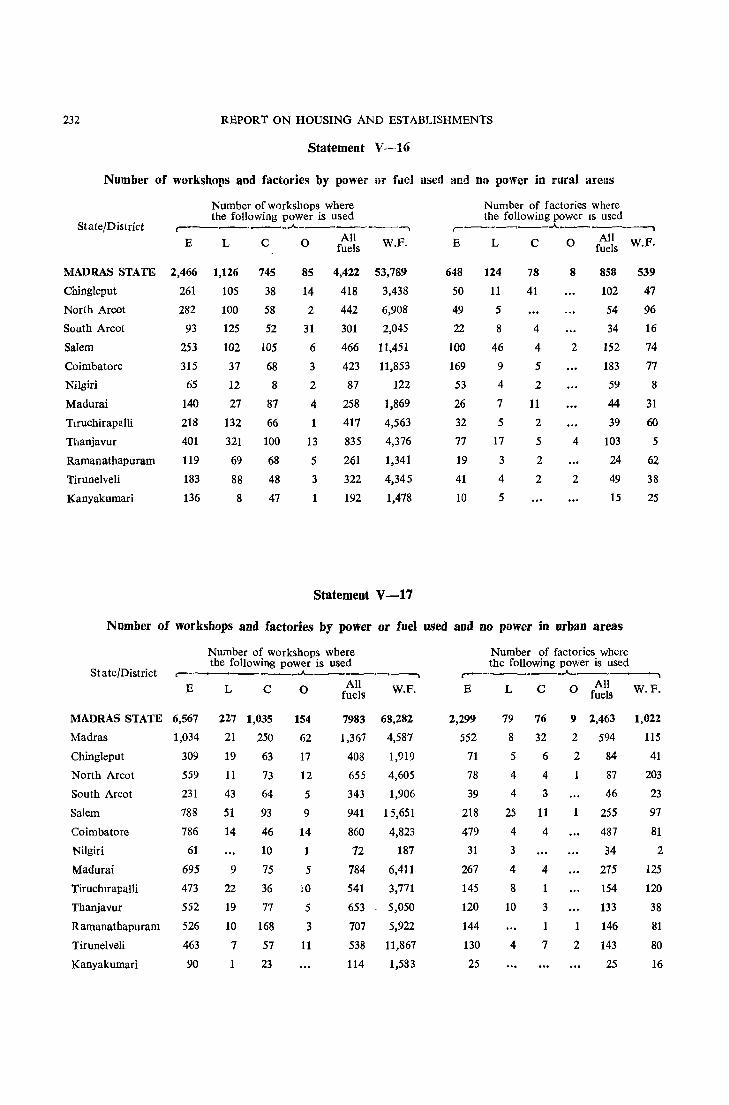
232 REPORT ON HOUSING AND ESTABLISHMENTS
Statement V-16
Number of workshops and factories by power or fuel used and no power in rural areas
Number of workshops where the following power is used
State/District ,--------'---------, E
MADRAS STATE 2,466
Chingleput 261
North Arcot
South Areot
Salem
Coimbatore
Nilgiri
Madurai
Tlruehirapalli
Thanjavur
Ramanathapuram
Tirunelveli
Kanyakumari
282
93
253
315
65
140 218
401
119
183
136
L
1,126
105
100
C
745
38
58
125 52
102 105
37
12
27
68
8
87
132 66
321 100
69 68
88 48
8 47
o
85
14
2
31
6
3
2
4
13
5
3
1
All fuels
4,422
418
442
W.F.
53,789
3,438
6,908
301 2,045
466 11,451
423 11,853
87 122
258 1,869
417
835
261
322
192
4,563
4,376
1,341
4,345
1,478
Statement V-17
Number of factories where the following power IS used
,.--"~--....... ----,____..., All
E L C 0 fuels W.F.
648
50
49
22
100
169
53
26
32
77
19
41
10
124
11
5
8
46
9
4
7
5
17
3
4
5
78
41
4
4
5
2
11
2
5
2
2
8
2
4
2
858
102
54
34
152
183
59
44
39
103
24
49
15
539
47
96
16
74
77
8
31
60
5
62
38
25
Number of workshops and factories by polter or fuel used and no power in urban areas
Number of workshops where the following power is used
St ate/District r-~-~. _.A-____ .----,
E
MADRAS STATE 6,567
Madras 1,034
Chingleput 309
North Areot 559
South Areot 231
Salem 788
Coimbatore
Nilgiri
Madurai
786
61
695
Tiruerurapalli 473
Thanjavur 552
Ramanathapuram 526
Tirunelveli 463
Kanyakumari 90
L C
227 1,035
21 250
19 63
11 73
43 64
51 93
14
9
22
19
10
7
1
46
10
75
36
77
168
57
23
o
154
62
17
12
5
9
14
5
10
5
3
11
All fuelS
7983
1,367
408
655
343
941
860
72
784
W.P.
68,282
4,587
1,919
4,605
1,906
15,651
4,823
187
6,411
541 3,771
653 5,050
707 5,922
538 11,867
114 1,583
Number of factories where the following power is used
,..--__ ~ __ ~.A.. .~~~ .....
E
2,299
552
71
78
39
218
479
31
267
145
120
144
130
25
L
79
8
5
4
4
25
4
3
4
8
10
4
C
76
32
6
4
" 11
4
4
3
1
7
All o fuels
9 2,463
2 594
2 84
87
46
1 255
487
34
275
154
133
1 146
2 143
25
W.F.
1,022
115
41
203
23
97
81
2
125
120
38
81
80
16
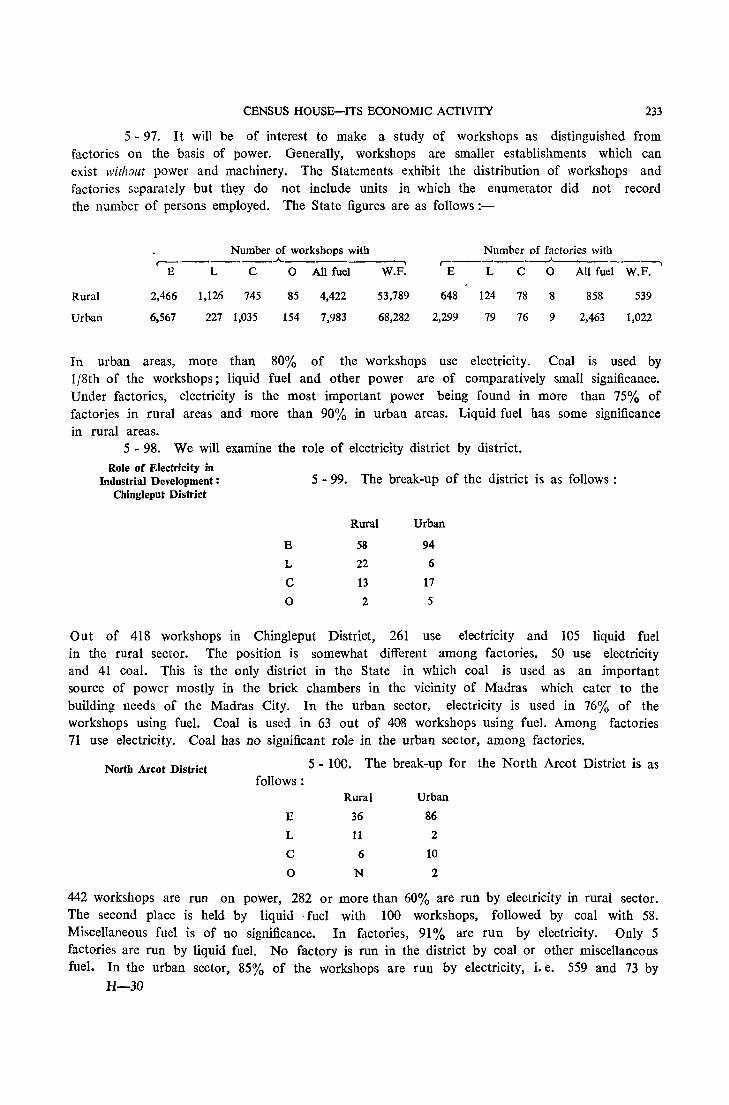
CENSUS HOUSE-ITS ECONOMIC ACTIVITY 233
5 - 97. It will be of interest to make a study of workshops as distinguished from factories on the basis of power. Generally, workshops are smaller establishments which can exist without power and machinery. The Statements exhibit the distribution of workshops and factories separately but th~y do not include units in which the enumerator did not record the number of persons employed. The State figures are as follows:-
Number of workshops with Number of factories with r---------.A.----------. ~------~-------,
E L C 0 All fuel W.P. E L C 0 All fuel W.P.
Rural 2,466 1,126 745 85 4,422 53,789 648 124 78 8 858 539
Urban 6,567 221 1,035 154 7,983 68,282 2,299 19 76 9 2,463 1,022
In urban areas, more than 80% of the workshops use electricity. Coal is used by 1/8th of the workshops; liquid fuel and other power are of comparatively small significance. Under factories, electricity is the most important power being found in more than 75% of factories in rural areas and more than 90% in urban areas. Liquid fuel has some significance in rural areas.
5 - 98. We will examine the role of electricity district by district. Role of Electricity in
Industrial Development: Chingleput District
E
L
C
o
5 - 99. The break-up of the district is as follows:
Rural Urban
58
22
13
2
94
6
17
5
Out of 418 workshops in Chingleput District, 261 use electricity and 105 liquid fuel in the rural sector. The position is somewhat different among factories. 50 use electricity and 41 coal. This is the only district in the State in which coal is used as an important source of power mostly in the brick chambers in the vicinity of Madras which cater to the building needs of the Madras City. In the urban sector, electricity is used in 76% of the workshops using fuel. Coal is used in 63 out of 408 workshops using fuel. Among factories 71 use electricity. Coal has no significant role in the urban sector, among factories.
North Arcot District 5 - 100. The break-up for the North Arcot District is as follows:
Rural Urban
E 36 86
L 11 2
C 6 10
0 N 2
442 workshops are run on power, 282 or more than 60% are run by electricity in rural sector. The second place is held by liquid ,fuel with 100 workshops, followed by coal with 58. Miscellaneous fuel is of no significance. In factories, 91% are run by electricity. Only 5 factories are run by liquid fuel. No factory is run in the district by coal or other miscellaneous fuel. In the urban sector, 85% of the workshops are run by electricity, i. e. 559 and 73 by
H-30
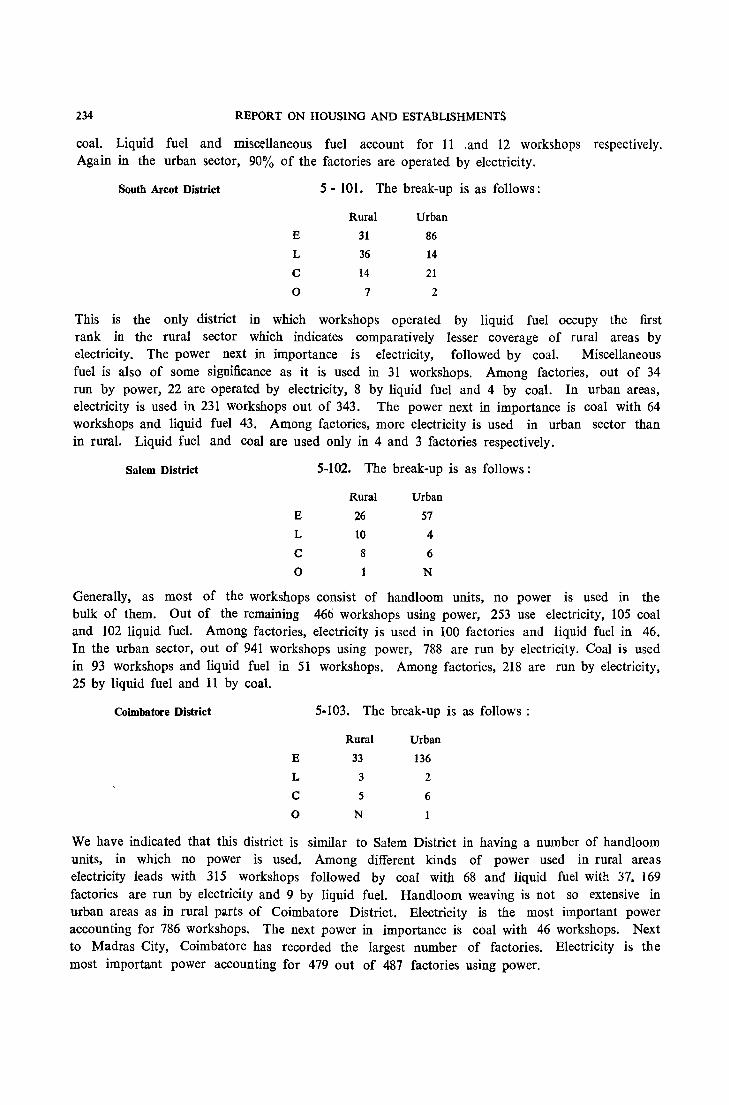
234 REPORT ON HOUSING AND ESTABLISHMENTS
coal. Liquid fuel and miscellaneous fuel account for 11 .and 12 workshops respectively. Again in the urban sector, 90% of the factories are operated by electricity.
South Arcot District 5 - 101. The break-up is as follows:
Rural Urban
E 31 86
L 36 14
C 14 21
0 7 2
This is the only district in which workshops operated by liquid fuel occupy the first rank in the rural sector which indicates comparatively lesser coverage of rural areas by electricity. The power next in importance is electricity, followed by coal. Miscellaneous fuel is also of some significance as it is used in 31 workshops. Among factories, out of 34 run by power, 22 are operated by electricity, 8 by liquid fuel and 4 by coal. In urban areas, electricity is used in 231 workshops out of 343. The power next in importance is coal with 64 workshops and liquid fuel 43. Among factories, more electricity is used in urban sector than in rural. Liquid fuel and coal are used only in 4 and 3 factories respectively.
Salem District 5-102. The break-up is as follows:
Rural Urban
E 26 57
L 10 4
C 8 6
0 1 N
Generally, as most of the workshops consist of handloom units, no power is used in the bulk of them. Out of the remaining 466 workshops using power, 253 use electricity, 105 coal and 102 liquid fuel. Among factories, electricity is used in 100 factories and liquid fuel in 46. In the urban sector, out of 941 workshops using power, 788 are run by electricity. Coal is used in 93 workshops and liquid fuel in 51 workshops. Among factories, 218 are run by electricity, 25 by liquid fuel and 11 by coal.
Coimbatore District
E
L
C
5-103. The break-up is as follows:
Rural Urban
33
3
5
136
2
6
o N
We have indicated that this district is similar to Salem District in having a number of handloom units, in which no power is used. Among different kinds of power used in rural areas electricity leads with 315 workshops followed by coal with 68 and liquid fuel with 37. ) 69 factories are run by electricity and 9 by liquid fuel. Handloom weaving is not so extensive in urban areas as in rural parts of Coimbatore District. Electricity is the most important power accounting for 786 workshops. The next power in importance is coal with 46 workshops. Next to Madras City, Coimbatore has recorded the largest number of factories. Electricity is the most important power accounting for 479 out of 487 factories using power.
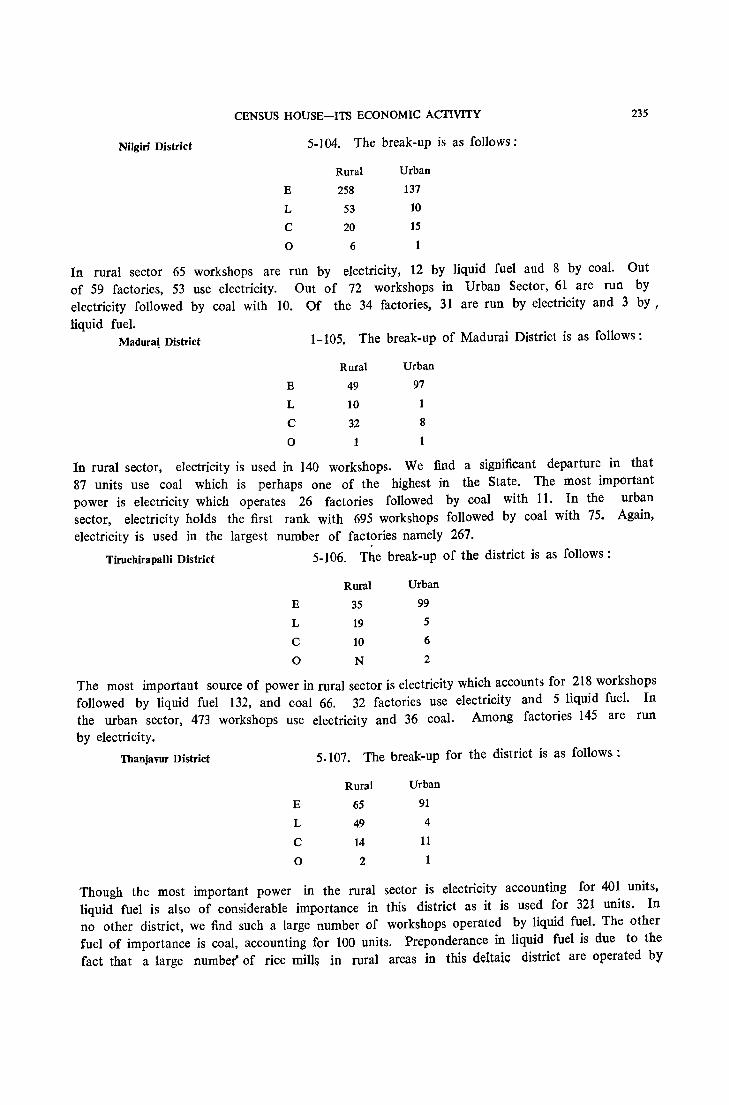
CENSUS HOUSE-ITS ECONOMIC ACTIVITY 235
Nilgiri District 5-104. The break-up is as follows:
Rural Urban
E 258 137
L 53 10
C 20 15
0 6
In rural sector 65 workshops are run by electricity, 12 by liquid fuel and 8 by coal. Out of 59 factories, 53 use electricity. Out of 72 workshops in Urban Sector, 61 are run by electricity followed by coal with 10. Of the 34 factories, 31 are run by electricity and 3 by ,
liquid fuel. Madura~ District 1-105, The break-up of Madurai District is as follows:
Rural Urban
E 49 97
L 10 1
C 32 8
0 1
In rural sector, electricity is used in 140 workshops. We find a significant departure in that 87 units use coal which is perhaps one of the highest in the State. The most important power is electricity which operates 26 factories followed by coal with II. In the urban sector, electricity holds the first rank with 695 workshops followed by coal with 75. Again, electricity is used in the largest number of factories namely 267.
Tiruchirapalli District 5-106. The break-up of the district is as follows:
Rural Urban
E 35 99
L 19 5
C 10 6
0 N 2
The most important source of power in rural sector is electricity which accounts for 218 workshops followed by liquid fuel 132, and coal 66. 32 factories use electricity and 5 liquid fuel. In the urban sector, 473 workshops use electricity and 36 coal. Among factories 145 are run by electricity.
Thanjavur District
E
L
C
o
5.107. The break-up for the district is as follows:
Rural Urban
65
49
14
2
91
4
11
Though the most important power in the rural sector is electricity accounting for 401 units, liquid fuel is also of considerable importance in this district as it is used for 321 units. In no other district, we find such a large number of workshops operated by liquid fuel. The other fuel of importance is coal, accounting for 100 units. Preponderance in liquid fuel is due to the fact that a large number' of rice mills in rural areas in this deltaic district are operated by

236 REPORT ON HOUSING AND ESTABLISHMENTS
liquid fuel. Out of 103 units of factories run by power or fuel 77 and 17 are using electricity and liquid fuel respectively. In the urban sector, 552 workshops are run by electricity and 77 by coal. Among factories, electricity is significant accounting for 120 units.
Ramanathapuram District 5~108. The break-up is as follows:
Rural Urban
E 44 82
L 25 1
C 23 21
0 1 N
In rural areas the most important power is electricity which operates 119 workshops. Liquid fuel and coal are more or less of equal importance. The significant feature observed in this district is that large number of factories are run without power. This is due to the existence of a number of match factories which do not use any power. Electricity is the most important power accounting for 19 out of 24 units. Among workshops, 526 units use electdcity and 168 coal in the urban sector. And 144 factories use electricity and 2 account for all other fuels.
Tirunelveli District 5-109. The break-up is as follows:
Rural Urban
E 41 39
L 16 1
C 9 4
0 1 1
In rural. areas electricity is the most important- power as it is used to run 183 workshops followed by liquid fuel 88 and coal 48. In factories, 41 use electricity. Again, in the urban sector, handloom weaving exists in Melapalayam, Kadayanallur, mat-weaving in Pattamadai and bidi-making in Mukkudal and a large number of workshops are run without power. Among the different kinds of power used, electricity tops the list with 463 workshops followed by coal 57. Again, electricity operates 130 factories, and coal 7.
Kanyakumari District 5 - 110. The break-up is as follows:
Rural Urban
E 61 63
L 6 N
C 20 12
0 N 0
In rural sector 136 workshops use electricity and 47 coal. And 10 factories use electricity and 5 liquid fuel. In the urban sector, the important sources of power are electricity and coal which account for 90 and 23 workshops while all the factories run by power are operated by electricity.
5 - 111. The following discussion shows the significant role played by electricity in running workshops and factories. The relative importance of different kinds of power or fuel used
can be assessed from a different angle with reference to the Role of different types of power number of persons working in the industries classified by power
or fuel used. The statements that follow serve the purpose. A study of the comparative importance of different kinds of power or fuel used will be possible on the basis of percentage break-up. We have accordingly worked out the percentages, leaving out of consideration the persons employed in workshops and factories which do not use any machinery.
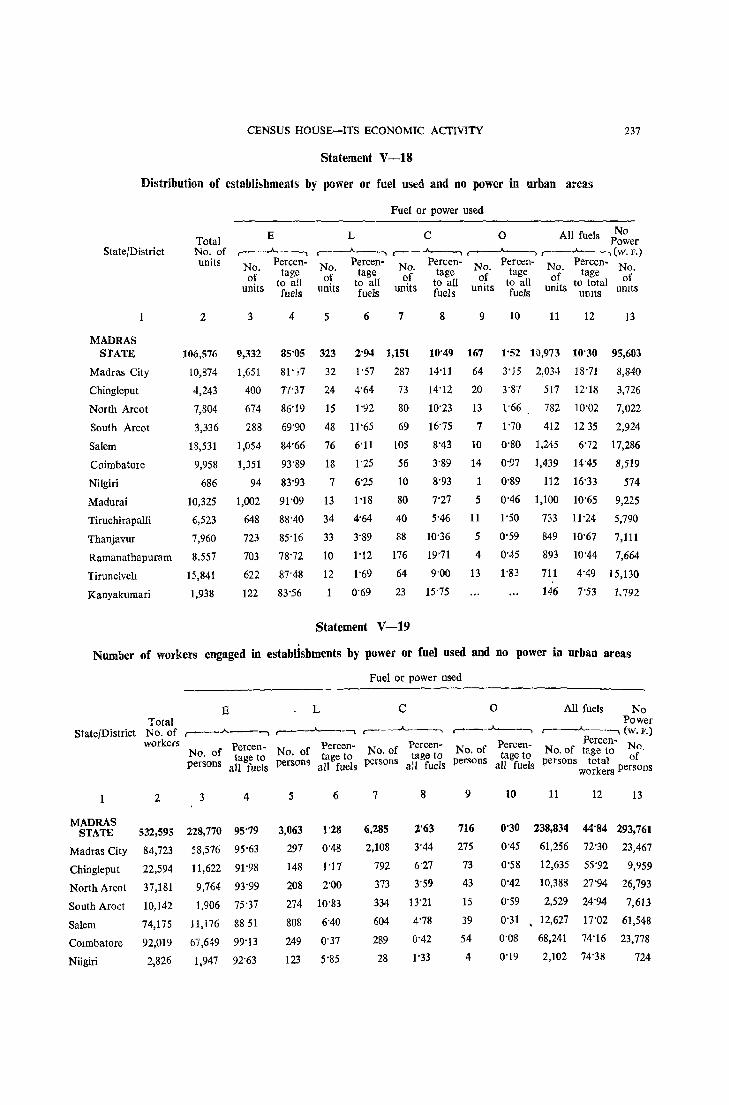
CENSUS HOUSE-ITS ECONOMIC ACTIVITY 237
Statement V-1S
Distribution of establi~hments by power or fuel used and no power in urban areas
State/District
MADRAS STATE
Madras City
Chingleput
North Areot
South Areot
Salem
Coimbatore
Nilgiri
Madurai
Total No, of units
2
106,576
10,874
4,243
7,804
3,336
18,531
9,958
686
10,325
Tiruchirapalli 6,523
Thanjavur 7,960
Ramanathapuram 8.557
Tirunelveh 15,841
Kanyakumari 1,938
E
,------..A---------, Percen-
No, tage of
units to all fuels
3
9,332
1,651
400
674
288
1,054
1,351
94
1,002
648
723
703
622
122
4
85'05
81']7
77'37
86'19
69'90
84'66
93'89
83'93
91'09
88'40
85'16
78'72
87"48
83'56
Fuel or power used
L C 0 All fuels P~~er .---"---., .---~ ~ ,~(w, F,) No Percen- No Pereen- No Percen- N Pereen- N of' tage of' tage of' tage oCt tage of'
units to all units to all units to all it to total t fuels fuels fuels un s umts U11l s
5
323
32
24
15
48
76
18
7
13
34
33
10
12
1
6 7
2'94 1,151
1'57 287
4'64 73
1'92 80
11'65
6'11
1"25
6'25
1'18
4'64
3'89
1'12
1'69
0'69
69
105
56
10
80
40
88
176
64
23
Statement V -19
8 9
10'49 167
14'11 64
14'12 20
10'23 13
16'75
8'43
3'89
8'93
7'27
5'46
10'36
19'71
9'00
15'75
7
10
14
1
5
11
5
4
13
10 11 12 13
1'52 13,973 10'30
3'J5 2,034 18'71
95,603
8,840
3,726
7,022
2,924
3'87 517 12'18
1'66 782 10'02
1'70 412
O'SO 1,245
0'97 1,439
0'89 112
0'46 1,100
1'50
0'59
0'45
1'83
733
849
893
711
146
1235
6'72
14'45
16'33
10'65
17,286
8,519
574
9,225
11'24 5,790
10'67 7,111
10'44 7,664
4'49 15,130
7'53 1,792
Number of workers engaged in establishments by power or fuel used and no power in urban areas
Fuel or power used
E L C o All fuels No Total
State/District No, of ,--.A. __ -.., ,--~-....... r-~-' c--"'--., Power
,--~-....... (w, F,) Percen-
MADRAS STATE
Madras City
Chingleput
North Areot
South Aroet
Salem
COlmbatore
Nilgiri
workers P P P N f Percen- No, of ereen- No, of ereen- No, of ercen- No, of tage to No,
2
532,595
84,723
22,594
37,181
10,142
74,175
92,019
2,826
0, 0 tage to tage to tage to tage to persons all fuels persons all fuels persons all fuels persons all fuels persons total of
workers persons
3 4
228,770 95'79
58,576 95'63
11,622 91'98
9,764 93'99
1,906 75'37
11,176 8851
67,649 99'13
1,947 92'63
5
3,063
297
148
208
274
808
249
123
6
1'28
0'48
1'17
2'00
10'83
6'40
0'37
S'85
7
6,285
2,108
792
373
334
604
289
28
8
2'63
3'44
6'27
3'59
13'21
4'78
0'42
1'33
9
716
275
73
43
15
39
54
4
10 11
0'30 238,834
0'45 61,256
0'58 12,635
0'42 10,388
0'59 2,529
0'31 • 12,627
0'08 68,241
0'19 2,102
12 13
44'84 293,761
72'30 23,467
55'92 9,959
27'94 26,793
24'94 7,613
17'02 61,548
74'16 23,778
74'38 724

238 REPORT ON HOUSING AND ESTABLISHMENTS
Statement V-19 (contd.)
Number of workers engaged in establishme nts by power or fuel used and no power in urban areas
Fuel or power used
No.
Total E L C 0 All fuels Power
No. of (w. F.)
State/DIstrict workers ,.-----..A._...--.." ,..--A.-,...._..._..., r---..A..---;..-~ ,.--.A.-.,____...._, r-~
Percen- No of Percen- Person- No. of Percen-Percen- No.
No. of tage to No. of tage to No. of tage to of ' tage to persons persons tage to persons total persons <:11 fuels pel sons all fuels all fuels all fuels workers persons
2 3 4 5 6 7 8 9 10 11 12 13
Madural 54,746 24,944 97'96 138 0'54 363 1'43 19 0'07 25,464 46'51 29,282
Tiruchira-palli 28,926 8,294 93'76 362 4'09 147 1'66 43 0'49 8,846 30'58 20,080
Thanjavur 25,874 7,445 92'11 318 3'93 310 3'84 10 0'12 8,083 31'24 17,791
Ramanatha-puram 38,257 11,905 94'96 30 0'24 557 4'44 45 0'36 12,537 32'77 25,720
Tirunelveli 53,287 12,143 96'00 100 0'79 310 2'45 96 0'76 12,649 23'74 40,638
Kanyakumari 7,845 1,399 94'72 8 0'54 70 4'74 1,477 18'83 6,368
Statement V-20
Distribution of establishments by power or fuel used and no power in rural areas
State/District Total
No. of units
2
E
r----'------, Percen-
No. tage of
units to all fuels
3 4
L
~ Percen-
No. tage of to all
umts fuels
5 6
Fuel or power used
C
r---..A.--~ Percen-
No. tage of
units to all fuels
7 8
o
r---.A--, Percen-
No. tage of
units to all fuels
9 10
All fuels
, __ .A._---,
No Percen-. tage
Of to total UllltS units
11 12
No Power (w. F.)
No. of
units
13
MADRAS STATE 85,588 3,477 58'96 1,418 24'05 903 15,31 99 1'68 5,897 6'89 79,691
Chingleput 6,144 353 60'55 135 23'16 81 13'89 14 2'40 583 9'49 5,561
North Arcot 10,971 400 68'85 116 19'97 63 10'84 2 0'34 581 5'30 10,390
South Arcot 4,494 137 34'51 162 40'81 65 16'37 33 8'31 397 8'83 4,097
Salem 15,444 396 57'31 163 23'59 121 17'51 11 1'59 691 4'47 14,753
Coimbatore 16,655 544 80'47 50 7'40 79 11'69 3 0'44 676 4'06 15,979
Nilgiri
Madurai
TiruchirapaIIi
492
3,807
7,769
127 76'51
188 53'56
274 55'35
26 15'66
38 10'83
147 29'70
10 6'02
121 34'47
73 14'75
3 1'81
4 1'14
1 0'20
166 33'74
351 9"22
495 6'37
326
3,456
7,274
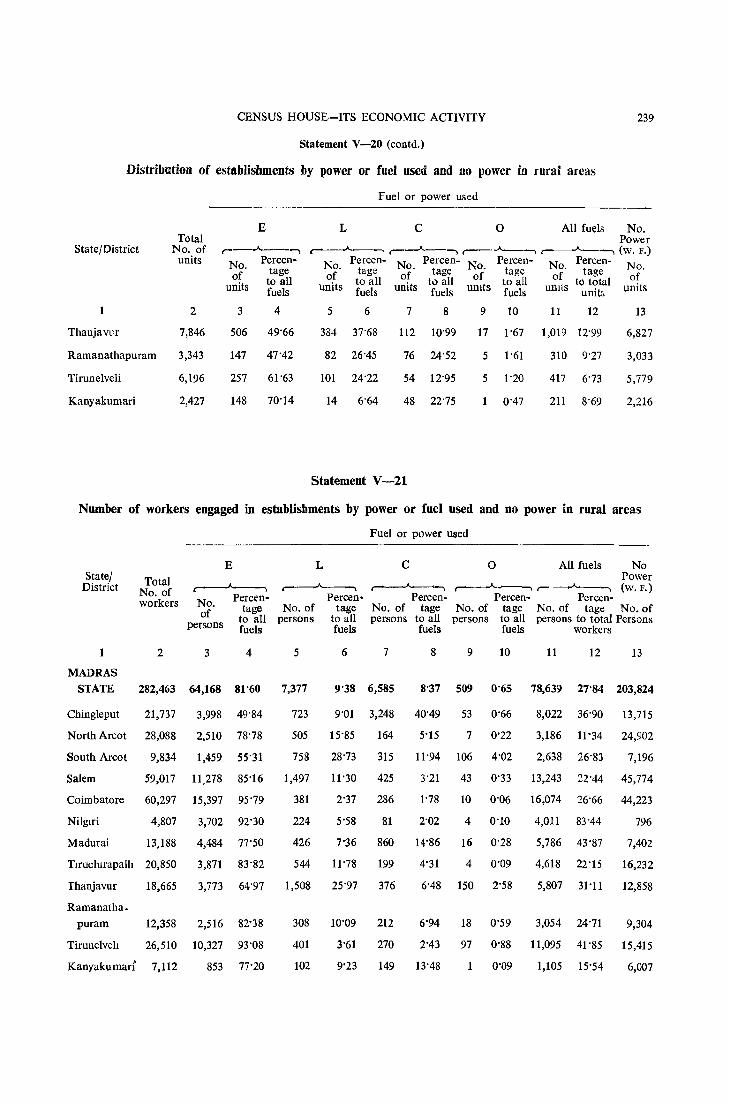
CENSUS HOUSE-ITS ECONOMIC ACTIVITY 239
Statement V-20 (contd,)
Distribution of establishments by power or fuel used and no power in rural areas
State/District
1
ThanjaVllr
Total No, of
units
E
,--"---., No, of
units
3
Percentage
to all fuels
4
506 49'66
Fuel or power used
L C 0 All fuels No, Power
c-----"----., ,_--A._-., ,--"-------.. r-------.A~--. (w, F,) No Percen- No Percen- No Percen- No Percen- N
f ' tage f' tage f' tage f' tage 0, 0, to all 0, to all 0 to all 0 to total of
umts fuels UDlts fuels umts fuels umts unit, umts
5 6 7 8 9 10 11 12
112 10'99 17 1'67 1,019 12'99
Ramanathapuram
2
7,846
3,343
6,196
2,427
147 47'42
384 37'68
82 26'45
101 24'22
76 24'52
54 12'95
48 22'75
5 1'61
5 1'20
1 0'47
310 9'27
417 6'73
211 8'69
13
6,827
3,033
5,779
2,216
Tirunelveli 257 61'63
Kanyakumari 148 70'14 14 6'64
Statement V -21
Number of workers engaged in establisbments by power or fuel used and no power in rural areas
State/ District
1
MADRAS
Total No, of workers
2
E
c-----"---. No Percen-
of' t~~~1 persons fuels
3 4
L
,~
Percen-No, of tage
persons to all fuels
5 6
Fuel or power used
C
~ Percen
No. of tage persons to all
fuels
7 8
o All fuels
,-----..A---, r-~ Percen- Percen-
No Power (w, F,)
No. of tage No, of tage No. of persons to all persons to total Persons
fuels workers
9 10 11 12 13
STATE 282,463 64,168 81'60 7,377 9'38 6,585 8'37 509 0'65 78,639 27'84 203,824
Cbingleput 21,737 3,998 49'84 723 9'01 3,248
North Arcot 28,088 2,510 78'78 505 15'85 164
South Arcot 9,834 1,459 55'31 758 28'73 315
Salem 59,017 11,278 85'16 1,497 11'30 425
Coimbatore 60,297 15,397 95'79 381 2'37 286
Nilglri 4,807 3,702 92'30 224 S'58 81
Madurai 13,188 4,484 77'50 426 7'36 860
Tlruchlrapalh 20,850 3,871 83'82 544 11'78 199
Thanjavur
Ramanatba-
18,665 3,773 64'97 1,508 25'97 376
40'49 53 0'66 8,022 36'90 13,715
5'15 7 0'22 3,186 11'34 24,902
11'94 106 4'02 2,638 26'83 7,196
3'21 43 0'33 13,243 22'44 45,774
1'78 10 0'06 16,074 26'66 44,223
2'02 4 0'10 4,011 83'44 796
14'86 16 0'28 5,786 43'87 7,402
4'31 4 0'09 4,618 22'15 16,232
6'48 150 2'58 5,807 31'11 12,858
puram 12,358 2,516 82'38 308 10'09 212 6'94 18 0'59 3,054 24'71 9,304
Tirunelveh 26,510 10,327 93'08
Kanyakumarl 7,112 853 77'20
401 3'61 270 2'43 97 0'88 11,095 41'85 15,415
102 9'23 149 13'48 1 0'09 1,105 15'54 6,007
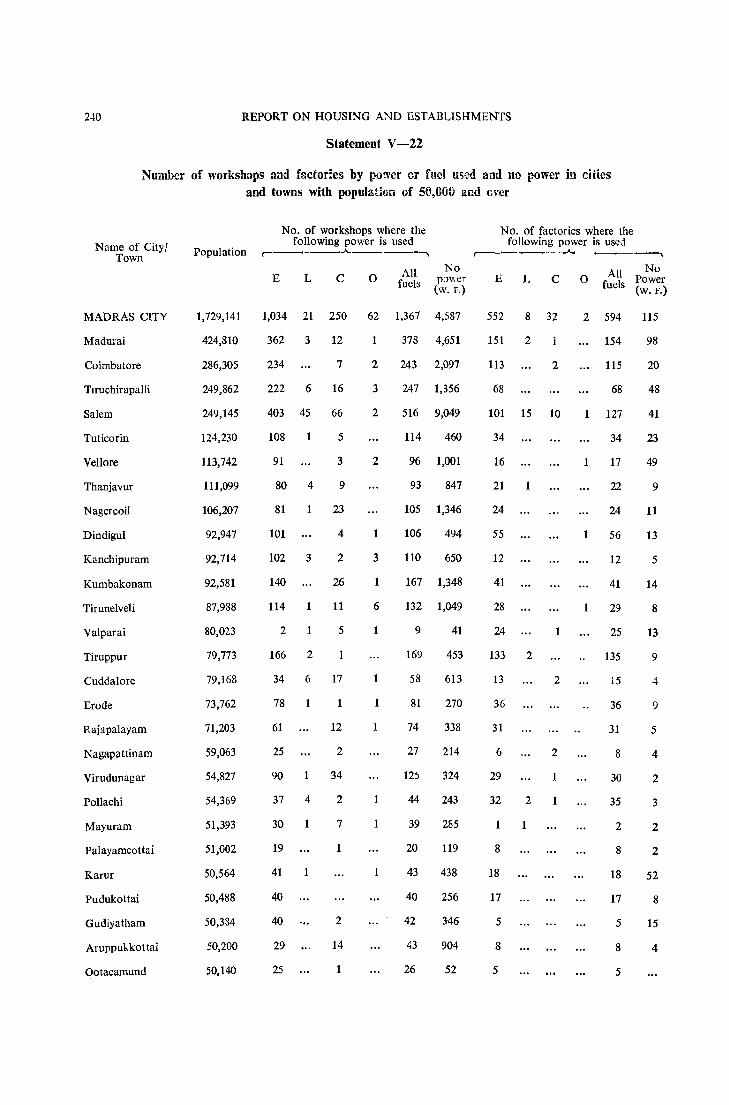
2-10 REPORT ON HOUSING MoJD ESTA!3LISHMENTS
Statement V-22
Number of workshops and factories by power or fuel used and no power in cities and towns with population of 50,GOO and ever
Name of City/ Town
MADRAS CITY
Madurai
Coimbatore
TlruchirapaHi
Salem
Tuticorin
Vellore
Thanjavur
Nagercoil
Dindigul
Kanchipuram
Kumbakonam
Tirunelveli
Valparai
Tiruppur
Cuddalore
Erode
Rajapalayam
Nagapattinam
Virudunagar
Pollachi
Mayuram
Palayamcottai
Karur
Pudukottai
Gudiyatham
Aruppukkottai
Ootacamund
No. of workshops where the following power is used
Population r------..A..-----,
1,729,141
424,810
286,305
249,862
249,145
124,230
113,742
111,099
106,207
92,947
92,714
92,581
87,988
80,023
79,773
79,168
73,762
71,203
59,063
54,827
54,369
51,393
51,002
50,564
50,488
50,384
50,200
50,140
E L C o All fuels
No po\\er
(w. F.)
1,034 21 250 62 1,367 4,587
362 3
234
222 6
12
7
16
403 45 66
108
91
1
80 4
81
101
1
102 3
140
114
2
166 2
5
3
9
23
4
2
26
11
5
34 6 17
78
61
25
90
37 4
30
19
41
40
40
29
25
1
12
2
34
2
7
1
2
14
1
2
3
2
2
1
3
6
1
1
1
1
378 4,651
243 2,097
247 1,356
516 9,049
114 460
96 1,001
93 847
105 1,346
106
110
494
650
167 1,348
132 1,049
9 41
169
58
81
74
27
125
44
39
20
43
40
42
43
26
453
613
270
338
214
324
243
285
119
438
256
346
904
52
No. of factories where the following power is used
E L C
552 8 32
151
113
68
2
2
101 15 10
34
16
21
24
55
12
41
28
24
1
133 2
13
36
31
6
29
32
1
8
18
17
5
8
5
2
2
2
1
All No o fuels Power
(w. F.)
2 594 115
154
115
68
1 127
34
1 17
22
24
1 56
12
41
29
25
135
15
36
31
8
30
35
2
8
18
17
5
8
5
98
20
48
41
23
49
9
11
13
5
14
8
13
9
4
9
5
4
2
3
2
2
52
8
15
4

CENSUS HOUSE-ITS ECONOMIC ACTIVITY 241
Statement V -23
Distribution of 1,000 workshops and factories by power and no power in cities and towns with popUlation 50,000 and over
Name of City I Population Fuel or power used
Town All No Power
E L C a fuels (w. F.) Used
MADRAS CITY 1,729,141 152 3 26 6 187 813
Madurai 421,810 78 1 2 N 81 919
Coimbatore 286,305 105 0 3 109 891
Tiruchirapalli 249,862 134 3 8 146 854
Salem 249,145 51 6 8 N 65 935
Tuticorin 124,230 189 1 7 0 1'97 803
Vellore 113,742 83 0 3 2 88 912
Thanjavur 111,099 81 4 10 0 95 905
Nagercoil 106,207 70 1 14 0 85 915
Dindigul 92,947 156 0 4 2 162 838
Kanchipuram 92,714 135 4 2 4 145 855
Kumbakonam 92,581 101 1 14 N 116 884
Tirunelveli 87,988 105 1 8 5 119 881
Valparai 80,023 180 6 41 6 233 767
Tiruppur 79,773 215 3 1 0 219 781
Cuddalore 79,168 56 7 22 1 86 914
Erode 73,762 174 2 4 181 819
Rajapalayam 71,203 141 0 25 167 833
Nagapattinam 59,063 91 0 9 0 100 900
Virudunagar 54,827 204 2 58 0 264 736
Pollachi 54,369 168 14 9 2 193 807
Mayuram 51,393 75 3 14 2 94 906
Palayamcottai 51,002 64 0 3 0 67 933
Karur 50,564 80 1 0 1 82 918
Pudukottai 50,488 121 0 0 0 121 879
Gudlyatham 50,384 42 0 2 0 44 956
Aruppukkottai 50,200 35 0 12 0 47 953
Ootacamund 50,140 130 0 4 0 134 866
H-31
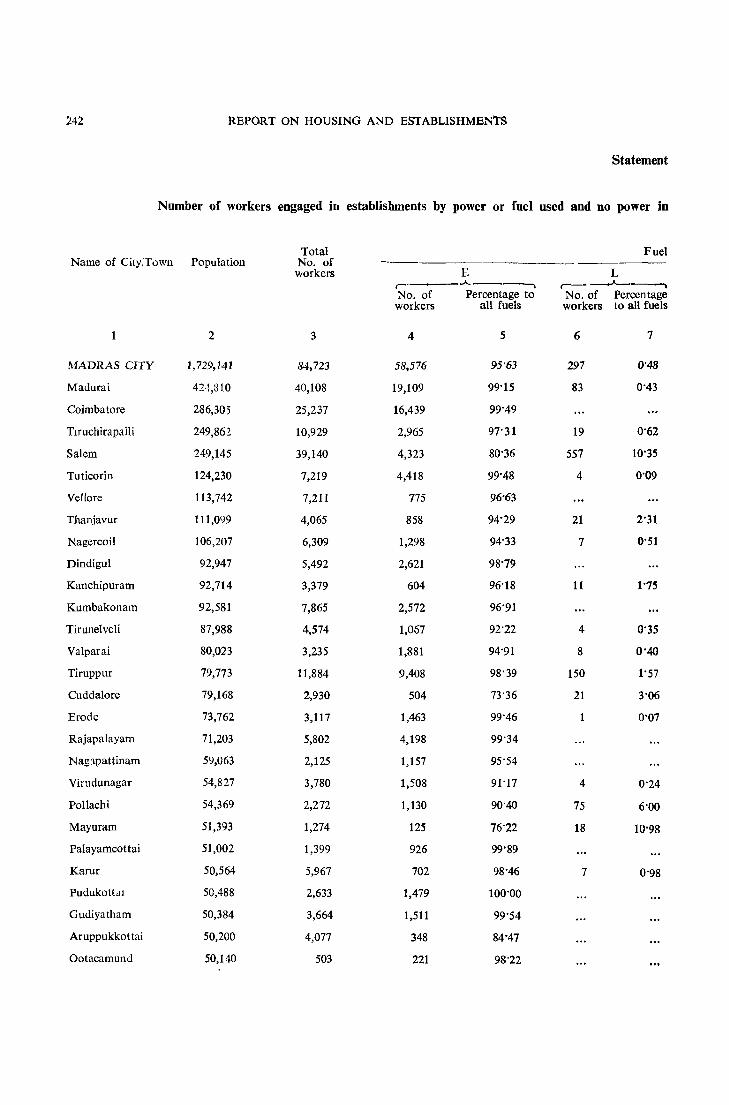
242 REPORT ON HOUSING AND ESTABLISHMENtS
Statement
Number of workers engaged in establishments by power or fuel used and no power in
Total Fuel Name of City/Town Population No, of
workers E L r-
.A.. __ ----., ,--- ----'-----,
No, of Percentage to No, of Percentage workers all fuels workers to all fuels
2 3 4 5 6 7
MADRAS CITY 1,729,141 84,723 58,576 95'63 297 0'48
Madurai 424,810 40,108 19,109 99'15 83 0'43
Coimbatore 286,305 25,237 16,439 99'49
Tlruchirapalli 249,862 10,929 2,965 97'31 19 0'62
Salem 249,145 39,140 4,323 80'36 557 10'35
Tuticorin 124,230 7,219 4,418 99'48 4 0'09
Vellore 113,742 7,211 775 96'63
Thanjavur 111,099 4,065 858 94'29 21 2'31
Nagercoil 106,207 6,309 1,298 94'33 7 0'51
Dindigul 92,947 5,492 2,621 98'79
Kanchipuram 92,714 3,379 604 96'18 11 1'75
Kumbakonam 92,581 7,865 2,572 96'91
Tirunelveli 87,988 4,574 1,057 92'22 4 0'35
Valparai 80,023 3,235 1,881 94'91 8 0'40
Tiruppur 79,773 11,884 9,408 98'39 150 1'57
Cuddalore 79,168 2,930 504 73'36 21 3'06
Erode 73,762 3,117 1,463 99'46 1 0'07
Rajapalayam 71,203 5,802 4,198 99'34
Nag:lpattinam 59,063 2,125 1,157 95'54
Virudunagar 54,827 3,780 1,508 91'17 4 0'24
Pollachi 54,369 2,272 1,130 90'40 75 6'00
Mayuram 51,393 1,274 125 76'22 18 10'98
Palayamcottai 51,002 1,399 926 99'89
Karur 50,564 5,967 702 98'46 7 0'98
Pudukottm 50,488 2,633 1,479 100'00
Gudiyatham 50,384 3,664 1,511 99'54
Aruppukkottai 50,200 4,077 348 84'47
Ootacamund 50,140 503 221 98'22
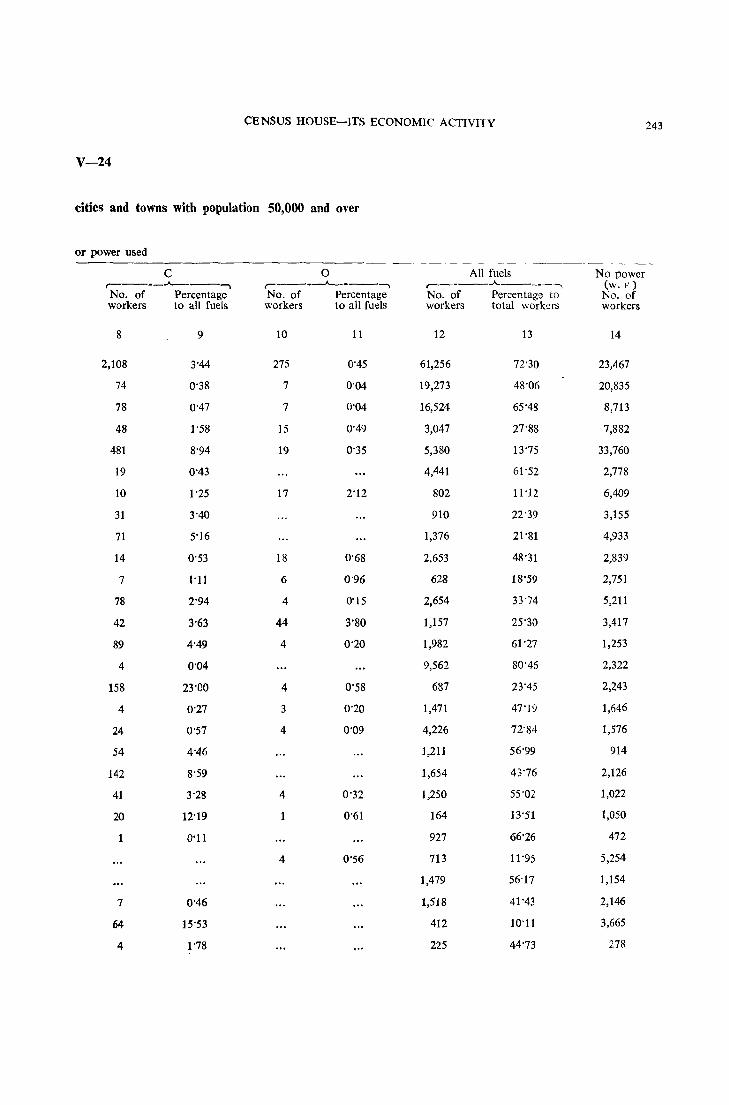
{:ENSUS HOUSE-ITS ECONOMIC ACTIVITY 243
V-24
cities and towns with population 50,000 and Oyer
or power used -~---- --------~-
C 0 All fuels No power r----..A.-----, r-------A------, ~---_-..A.-----~ (w, F) No, of Percentage No, of Percentage No, of Percentage to No, of workers to all fuels workers to all fuels workers total workers workers
8 9 10 11 12 13 14
2,108 3'44 275 0'45 61,256 72'30 23,467
74 0'38 7 0'04 19,273 48'06 20,835
78 0'47 7 0'04 16,524 65'48 8,713
48 ]'58 ]5 0'49 3,047 27'88 7,882
481 8'94 19 0'35 5,380 13'75 33,760
19 0'43 4,441 61'52 2,778
10 1'25 17 2'12 802 11'12 6,409
31 3'40 910 22'39 3,155
71 5'16 1,376 21'S1 4,933
14 0'53 18 0'68 2,653 48'31 2,839
7 I'll 6 0'96 628 18'59 2,751
78 2'94 4 0'15 2,654 33'74 5,211
42 3'63 44 3'80 1,157 25'30 3,417
89 4'49 4 0'20 1,982 61'27 1,253
4 0'04 9,562 80'46 2,322
158 23'00 4 0'58 687 23'45 2,243
4 0'27 3 0'20 1,471 47'19 1,646
24 0'57 4 0'09 4,226 72'84 1,576
54 4'46 1,211 56'99 914
142 8'59 1,654 43'76 2,126
41 3'28 4 0'32 1,250 55'02 1,022
20 12'19 1 0'61 164 13'51 1,050
1 0'11 927 66'26 472
4 0'56 713 11'95 5,254
1,479 56-17 1,154
7 0'46 1,518 41'43 2,146
64 15'53 412 10'11 3,665
4 1'78 225 44'73 278
244 REPORT ON HOUSING AND ESTABLISHMENTS
5 - 112. The first place goes to Coimbatore with 99'13%. The percentages of districts of North Areot, Madurai, TiruchirapaUi, Ramanathapuram, Tirunelvcli and Kanyakumari
range between 93'76 and 97'96. The districts of Chingleput, Electricity-Urban Nilgiri and Thanjavur have recorded percentages between 91 and
93. The district of South Arcot has recorded the lowest percentage of 75'37 preceded by Salem with 88'51.
5 - 113. The following districts have recorded percentages exceeding 5.
Liquid fuel
South Arcot
Salem
Nilgiri
10'83
6'40
5'85
5 - 114. The following districts have recorded more than 5%.
COllI, wood, bagllsse
Otber fuel
Chiogleput
South Areot
6'27
13'21
5 - 115. In all the districts, the percentage of other fuel
is less than 1.
5 - 116. Coal is used in the City and in the neighbouring districts of Chingleput and South Arcot in large quantities. Liquid fuel is found in South Arcot, Salem and Nilgiri which are comparatively inaccessible districts.
5 - 117. A comparison of the rural and urban percentages reveals that in every district, the urban areas use electricity more extensively than rural areas. In the rural sector
More electricity in urban sector
the first place goes to Coimbatore with 95'79% and the last place to South Arcot with 55'31%. In Nilgiri District, the disparity between the rural and urban percentages is not much which factor
shows that in mountainous regions both the rural and the urban areas depend on electricity and that the urban areas exhibit more rural characteristics. Except the districts of Coimbatore and Nilgiri, Tirunelveli is the only district which has recorded a percentage of 93'08. While the districts of North Areot, Salem, Madurai, Tiruchirapalli and Ramanathapuram have recorded percentages between 77'50 and 85'16, Kanyakumari has recorded a percentage of 77'20. Thanjavur and Chingleput have recorded 64'97% and 49'84%. It may be observed that in these two districts, the disparity between the rural and urban areas. is marked indicating the backwardness of thy rural areas.
5 - 118. At the State level, we find that while the urban areas have recorded a percentage of 1'28, the rural areas have recorded 9'38. In the absence of electricity, people in
rural areas have to use liquid fuel. The districts of South Areot Liquid fuel and Thanjavur have recorded percentages exceeding 25. The
former is the most backward district in electricity and has necessarily to go in for liquid fuel. Thanjavur is a deltaic tract where a number of rice mills ~xist in rural areas usin~ liquid fuel.
CENSUS HOUSE-ITS ECONOMIC ACTIVITY 245
5 - 119. In rural sector Chingleput District leads with 40'49%. In the sub-urban areas In Saidapet Taluk we find a large number of brick chambers which use coal and wood. South
Areot, Madurai and Kanyakumari have each recorded more than Coal, Wood, Bagasse 10%. We have extensive casurina plantations in South Arcot
District which are diverted for industrial uses. Madurai and Kanyakumari have forest areas which provide wood.
5 - 120. Among the different types of fuel used, electricity is the most _common in all the cities and towns. Tiruppur has the distinction of possessing the highest proportion of
workshops and factories using electricity, there being 215 units Type of power used in per 1,000 using electricity. The other important towns are
towns - Electricity Virudunagar-204, Tuticorin-189 and Valparai-180. The use .of electricity is restricted to a low proportion of 35 in Aruppukkottai
and 42 in Gudiyatham. Surprisingly enough, Madras City ranks 8th 1ll regard to the number of establishments using electricity.
5 - 121. Liquid fuel is utilised in only 18 cities and towns out of 28. Even among these 18, only two towns have recorded fairly high proportions.
Liquid fuel Pollachi has 14 and Cuddalore has 7 workshops and factories using liquid fuel per 1,000. In all other cases, the proportions are negligible.
5 - 122. Coal, wood or bagasse are used as fuel in workshops and factories in all except two towns. Exceptions are Karur and Pudukottai. Of the remaining 26 towns, Virudu-
nagar has recorded the highest proportion of 58. The next Coal etc., highest proportion is in Valparai with 41. It is only 26 in Madras
City followed by Rajapalayam 25, Cuddalore 22, Mayuram 14, Kumbakonam and Nagercoil with 14 each, Aruppukkottai 12 aad Thanjavur 10. The other types of fuel used in industrial establishments constitute very low proportions.
5 - 123. The pattern of distribution by type of fuel among workshops is discussed below. Electricity is the most important type of fuel in all the cities and towns. In Madras City,
1,034 units use electricity and in Salem 403. But in Valparai, Fuel used in Workshops coal, wood and bagasse are much more important than even
electricity. Five workshops use this kind of fuel and only 2 use electricity. Liquid fuel is used in 17 towns with the maximum number recorded in Salem where 45 workshops are using this fuel followed by Madras 21. Coimbatore, Vellore, Dindigul, Kumbakonam, Rajapa1ayam, Nagapattinam, Palayamcottai, Pudukottai, Gudiyatham and Aruppukkottai and Ootacamund are not using this kind of fuel. Coal, wood and bagasse are used in 26 out of 28 cities and towns with maximum number of workshops in Madras City where 250 units use this type of fuel. Karur and Pudukottai are the only two towns which do not possess any workshop using this fuel. Next to Madras City, Salem, Virudunagar, Kumbakonam and Nagercoil are the other important towns using this fuel. Madras City alone records a fairly good number of workshops using other types of fuel. In all the other towns, the figures are very low.
5 - 124. Among the different kinds of fuel used, electricity is the most important as far as factories are concerned. Madras City leads all the other towns followed by Madurai, Tiruppur,
Coimb<;ttore and Salem. Liquid fuel i3 used in factories to a very Fuel used in Factories limited extent and there are only 31 factories distributed among
7 towns using liquid fuel. Of these, the bulk of them have been recorded in Salem and Madras City. In the other 21 towns, no factory is run on liquid fuel. Coal, wood and bagasse are used in 9 towns and Madras City has the first place in using this

246 REPORT ON HOUSING AND ESTABLISHMENTS
kind of fuel. There are 32 such factories in M_tdras Clty and the next highest is 10 at Salem. The relative importance of different kind'S of power and fuel can be studied with the help of the fonowing statements. All the cities and towns except Salem, Cuddalore, Mayuram and Aruppukkottai use electricity exceeding 90%. Salem and Aruppukkottai are important handloom weaving centres. In Mayuram, liquid fuel, coal, wood and bagasse are of some significance. Liquid fuel is used in Salem, Mayuram, Cuddalore and Pollachi. Coal, wood and bagasse are used in Madras City, Salem, Nagercoil, Vellore, Cuddalore, Virudunagar, Mayuram and Aruppukkottai.
5 - 125. We now propose to discuss how power is distributed among various types of industries found in Madras State. This analysis is based on the Subsidiary Table E. III-3. We
have in this discussion made an attempt to distinguish between Subsidiary Table E. I1I-3- units based on power or fuel and based on no fuel. It is quite
A discussion likely that items under no fuel will include items which use some power without machinery and this should be kept in mind.
But normally any large scale industry using power will have some machinery or other. Hence the discussion on this basis will be realistic enough.
5 - 126. At the State level in the rural areas, electricity leads with 432 units followed by liquid fuel 209 and no power 347. In the urban areas, electriclty leads with 566 units but
no power has the second place with 393 and liquid fuel has 22. Major Group 20- Electricity is the cheapest power available in Madras State and
Foodstuffs the people wish to switch over to electricity from other kinds of power at the earliest opportunity. As urban sector is better
covered by electricity, more units are found in that sector which use electricity. The shortfall in electricity is made up by liquid fuel in the rural sector. The selected minor groups for discussion are 200, 205 and 207.
200-Production of rice, atta, flour, etc., by milling, debusking and processing of crops and foodgrains
5 - 127. The State figures are given below:
Electricity
Liquid fuel
Coal, wood and bagasse
Other fuel
No power
Rural Urban
529
273
6
3
189
780
33
2
184
Liquid fuel is very popular in the rural sector. The following districts :deviate considerably from the State pattern:
Electricity Liquid fuel
Coimbatore 752 123
Madurai 613 127
Nilgiri 545 61
South Arcot 302 421
Thanjavur 439 372
Ramanathapuram 483 346
CENSUS HOUSE-ITS ECONOMIC ACTIVITY 247
tn Madurai and Coimbatore, electricity is preferred to liquid fuel. Thanjavur and Ramanathapuram however, have recorded larger number of units under liquid fuel. In South Arcot District, units using liquid fuel are in excess of those using electricity. We are, therefore, led to the conclusion that the electricity coverage i:; less in the districts of Thanjavur, Ramanathapuram and South Arcot.
5 - 128. The following districts in the urban sector exhibit pattern different from that of the State:
South Arcot
Ramanathapuram
Thanjavur
ElectriCity
638
681
768
Liquid fuel
169
17
56
In comparison with the rural sector, coverage of electricity in urban sector is better in Thanjavur. However, the districts of South Arcot and Ramanathapuram have lesser number of units using electricity than Thanjavur.
207-Production of edible fats and oil (other than Hydrogenated oil)
5 - 129. The State proportions are given below:
Rural
Electricity 325
Liquid fuel 12
Coal, wood and bagasse 0
Other fuel 2
No Power 661
In the urban areas, the proportion under this minor group is less significant.
5 - 130. The districts of Salem, Nilgiri, Thanjavur, Ramanathapuram, Tirunelveli and Kanyakumari have recorded negligible figures. The proportion of
Rural areas no power is very high in ChingIeput and South Arcot. The districts of Coimbatore, Madurai and Tiruchirapalli have recorded
more than 50% under no power.
5 - 131. Only the districts of North Arcot, Madurai and Ramanathapuram have recorded more than 100 workshops and factories under 207.
Urban areas In North Arcot and Ramanathapuram districts, electricity dominates with a proportion of more than 65%. In Madurai,
the percentage is 48. The next important category is no power.
20S-Production of bread, biscuits, cake and other bakery products
5 - 132. The State proportions are given below:
Urban
Electricity 11
Liquid fuel 1
Coal, wood and bagasse 56
Other fuel 5
No Power 927
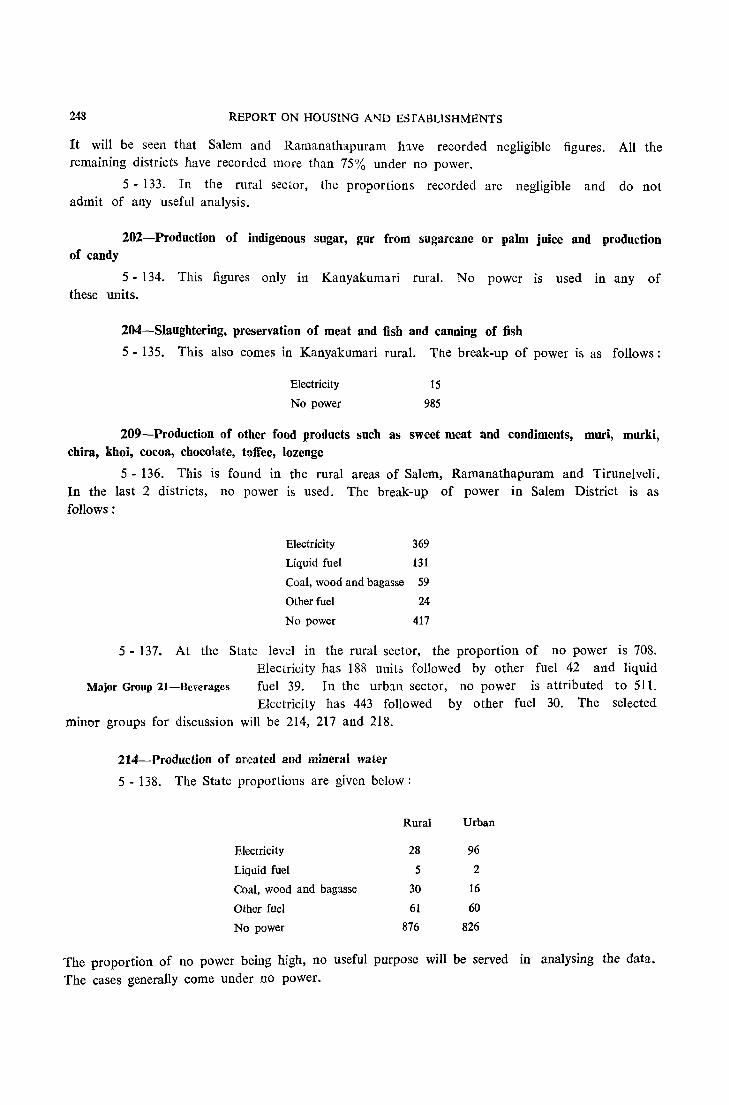
248 REPORT ON HOUSING A~i) ESfABLlSHMENtS
It will be seen that Salem and Ramanathapuram lnve recorded negligible figures. All the remaining districts have recorded more than 75% under no power.
5 - 133. In the rural sector, the proportions recorded are negligible and do not admit of any useful analysis.
202-Production of indigenous sugar, gur from sugarcane or palm juice and production of candy
5 - 134. This figures only in Kanyakumari rural. No power is used in any of these units.
204-Slaughtering, preservation of meat and fish and canning of fish
5 - 135. This also comes in Kanyakumari rural. The break-up of power i::. as follows:
Electricity
No power
15
985
209-Production of other food products such as sweet meat and condiments, muri, murki, chira, khoi, cocoa, chocolate, toffee, lozenge
5 - 136. This is found in the rural areas of Salem, Ramanathapuram and Tirunelveli. In the last 2 districts, no power is used. The break-up of power in Salem District is as follows:
Electricity 369
Liquid fuel 131
Coal, wood and bagasse 59
Other fuel 24
No power 417
5 - 137. At the State level in the rural sector, the proportion of no power is 708. Electricity has 188 unit,:; followed by other fuel 42 and liquid
Major Group 21-Beverages fuel 39. In the urb:m sector, no power is attributed to 511. Electricity has 443 followed by other fuel 30. The selected
minor groups for discussion will be 214, 217 and 218.
214-Production of area ted and mineral water
5 - 138. The State proportions are given below:
Rural Urban
Electricity 28 96
Liquid fuel 5 2
Coal, wood and bagasse 30 16
Other fuel 61 60
No power 876 826
The proportion of no power being high, no useful purpose will be served in analysing the data.
The cases generally come under no power.

CENSUS HOUSE-IT;:; ECONOMIC ACTIVITY
218-ProcessSng of coffee in curing works
5 - 139. The State proportions are given below:
Electricity
LiqUid fuel
Coal, wood and bagasse
Other fuel
No power
Rural Urban"
278
113
0
5
604
739
10
7
o 244
249
5 - 140. In the rural sector, Coimbatore, Tiruchirapalli, Thanjavur and Tirundveli are the districts which have recorded less than 50% under no power. We therefore confine the analysis only to those districts:
Electricity No Power
Coimbatore 889 111
TlIuchirapalli 800 200
Thanjavur 1,000 0
Tirunelveli 875 125
Electricity is the main power on which the minor group relies.
5 - 141. In the urban arcas, in all the districts except Nilgiri, electricity predominates to a great extent. The proportion for electricity is 160 in Nilgiri District and that for liquid fuel 240. Apparently, in the inaccessible areas, where coffee curing works are located, it is not possible to secure electricity easily.
217-Processing of tea in factories
5 - 142. This figures in Nilgiri rural as well as urban. The break-up of power is given below:
Maj{)~ group 22-Tobacco Products
Rural Urban
Electricity 857 889
Liquid fuel 80 37
Coal, wood and bagasse 27 0
No Power 36 74
5 - 143. At the State level, in rural sector the proportion of no power is high (973) and electricity 27. The selected minor groups will be 220 to 226.
220-Manufac!ure of bidi
5 - 144. In rural, 29 units use electricity and in urb::m 3 units use electricity. Others do not use any other power, except coal which is used in ne21igible proportion 111 urban sector.
221-l'v'Ianufacture of cigars and cheroots
5 - 145. 5 units use liquid fuel in urban areas and others are run without any power.
225-Manufacture of jerda and other chewing tobacco
5 - 146. In rural sector, 30 units use electricity and others are run without any power.
H-32
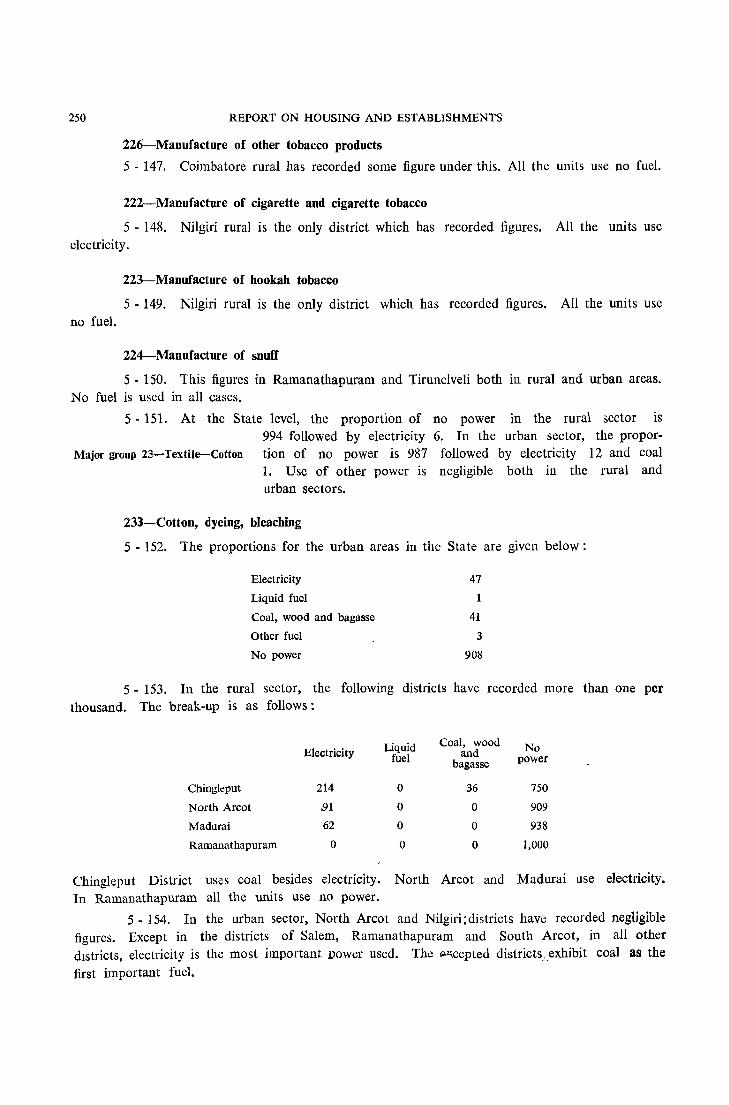
250 REPORT ON HOUSING AND ESTABLISHMENTS
226-Manufacture of other tobacco products
5 - 147. Coimbatore rural has recorded some figure under this. All the units use no fuel.
222-ManuCacture of cigarette and cigarette tobacco
5 - 148. Nilgiri rural is the only district which has recorded figures. All the units use electricity.
223-Manufacture of hookah tobacco
5 - 149. Nilgiri rural is the only district which has recorded figures. All the units use no fuel.
224-Manufacture of snuff
5 - 150. This figures in Ramanathapuram and Tirunelveli both in rural and urban areas. No fuel is used in all cases.
5 - 151. At the State level, the proportion of no power in the rural sector is 994 followed by electricity 6. In the urban sector, the propor
Major group 23-TextiJe-Cotton tion of no power is 987 followed by electricity 12 and coal 1. Use of other power is negligible both in the rural and urban sectors.
233-Cotton, dyeing, bleaching
5 - 152. The proportions for the urban areas in the Slate are given below:
Electricity
Liquid fuel
Coal, wood and bagasse
Other fuel
No power
47
1
41
3
908
5 - 153. In the rural sector, the following districts have recorded more than one per thousand. The break-up is as follows:
Liquid Coal, wood No Electricity and fuel bagasse power
Chingleput 214 0 36 750
North Arcot 91 0 0 909
Madurai 62 0 0 938
Ramanathapuram 0 0 0 1,000
Chingleput District uses coal besides electricity. North Arcot and Madurai use electricity. In Ramanathapuram all the units use no power.
5 - 154. In the urban sector, North Arcot and Nilgiri:districts have recorded negligible figures. Except in the districts of Salem, Ramanathapuram and South Arcot, in all other dIstricts, electricity is the most important Dower used. The "",,cepted districtsJ_exhibit coal as the first important fuel.
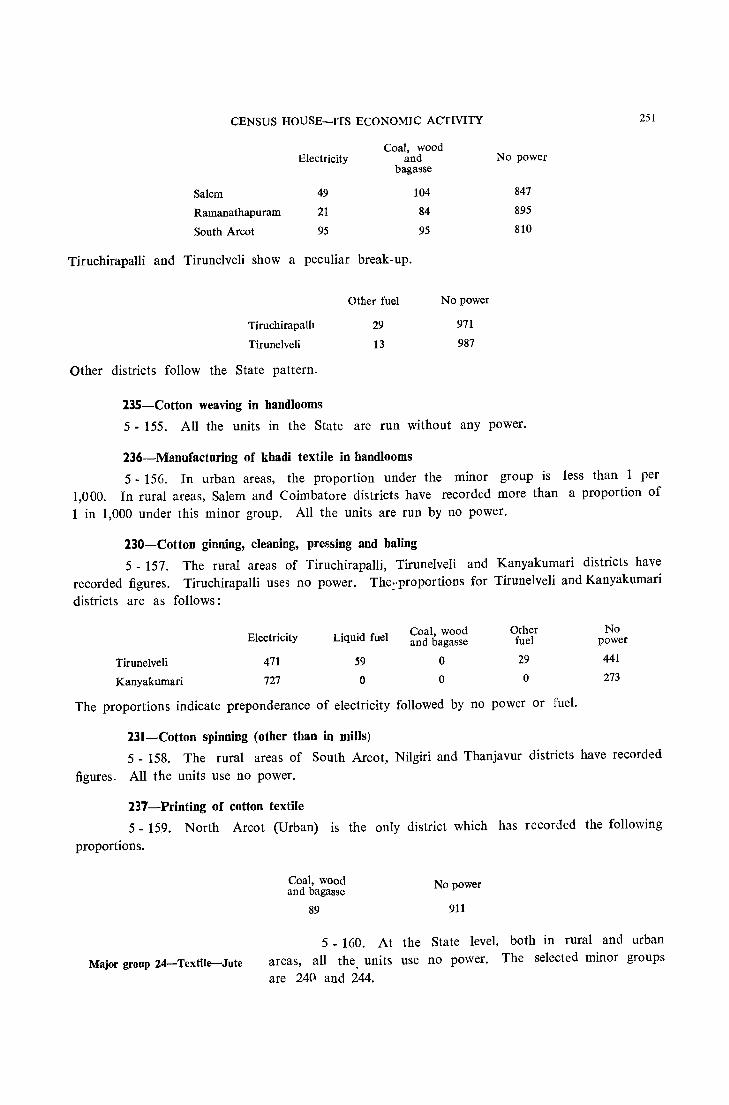
CENSUS HOUSE-ITS ECONOMIC ACTIVITY
Coal, wood Electricity and
bagasse
Salem 49 104
Ramanathapuram 21 84
South Arcot 95 95
Tiruchirapalli and Tirunelveli show a peculiar break-up.
Tiruchirapalh
Tirunelveli
Other districts follow the State pattern.
23S-Cotton weaving in handlooms
Other fuel
29
13
No power
971
987
No power
847
895
810
5 - 155. All the units in the State are run without any power.
236-Manufacturing of kbadi textile in handlooms
251
5 - 156. In urban areas, the proportion under the minor group is less than 1 per 1,000. In rural areas, Salem and Coimbatore districts have recorded more than a proportion of 1 in 1,000 under this minor group. All the units are run by no power.
230-Cotton ginning, cleaning, pressing and baling
5 - 157. The rural areas of Tiruchirapalli, Tirunelveli and Kanyakumari districts have recorded figures. Tiruchirapalli uses no power. The~.proportions for Tirunelveli and Kanyakumari
districts are as follows:
Electricity Liquid fuel Coal, wood Other No and bagasse fuel power
Tirunelveli 471 59 0 29 441
Kanyakumari 727 0 0 0 273
The proportions indicate preponderance of electricity followed by no power or fuel.
231-Cotton spinning (other than in mills)
5 - 158. The rural areas of South Arcot, Nilgiri and Thanjavur districts have recorded
figures. All the units use no power.
237-Printing of cotton textile
5 - 159. North Arcot (Urban) is the only district which has recorded the following
proportions.
Major group 24-Textile-Jute
Coal, wood and bagasse
89
No power
911
5 _ 160. At the State level, both in rural and urban areas, all the. units use no power. The selected minor groups
are 24Cl and 244.
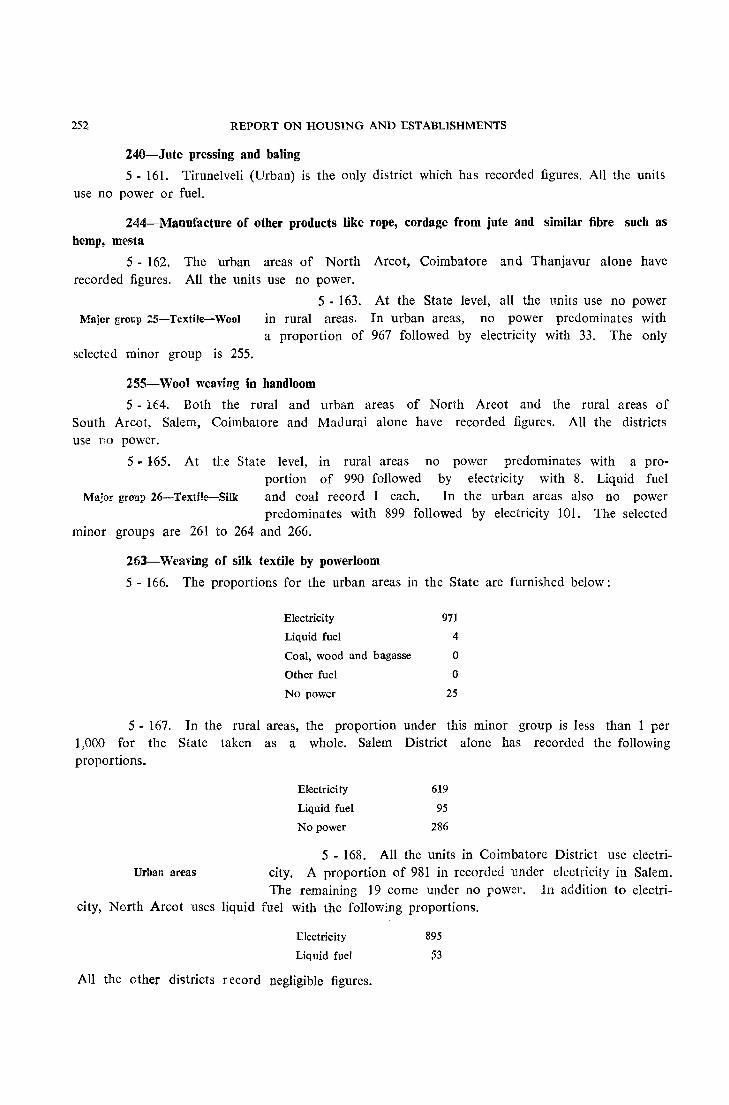
252 REPORT ON HOUSING AND ESTABLISHMENTS
240-Jute pressing and baling
5 - 161. Tirunelveli (Urban) is the only district which has recorded figures. AU the units use no power or fuel.
244--Manufacture of other products like rope, cordage from jute and similar fibre such as hemp, mesta
5 - 162. The urban areas of North Arcot, Coimbatore and Thanjavur alone have recorded figures. All the units use no power.
Major grOGJ.l Z5-Tcxtile-Wool
selected minor group is 255.
5 - 163. At the State level, all the units use no power in rural areas. In urban areas, no power predominates with a proportion of 967 followed by electricity with 33. The only
255-Wool weaving in handloom
5 - 164. Both the rural and urban areas of North Arcot and the rural areas of South Arcot, Salem, Coimbatore and Mauurai alone have recorded figures. All the districts use no power.
5 - 165. At tte State level, in rural areas no power predominates with a proportion of 990 followed by electricity with 8. Liquid fuel
Ma!or group 26-Textile-Silk and coal record 1 each. In the urban areas also no power predominates with 899 followed by electricity 101. The selected
minor groups are 261 to 264 and 266.
263-Weaving of silk textile by powerloom
5 - 166. The proportions for the urban areas in the State are furnished below:
Electricity 971
Liquid fuel 4
Coal, wood and bagasse 0
Other fuel 0
No power 25
5 - 167. In the rural areas, the proportion under this minor group is less than 1 per 1,000 for the State taken as a whole. Salem District alone has recorded the following proportions.
Electrici ty
Liquid fuel
No power
619
95
286
5 - 168. All the units in Coimbatore District use electri-Urban areas city. A proportion of 981 in recorded under electricity in Salem.
The remaining 19 come under no rower. In addition to electricity, North Arcot uses liquid fuel with the following proportions.
Electricity
Liquid fuel
All the other districts record negligible figures.
895
53
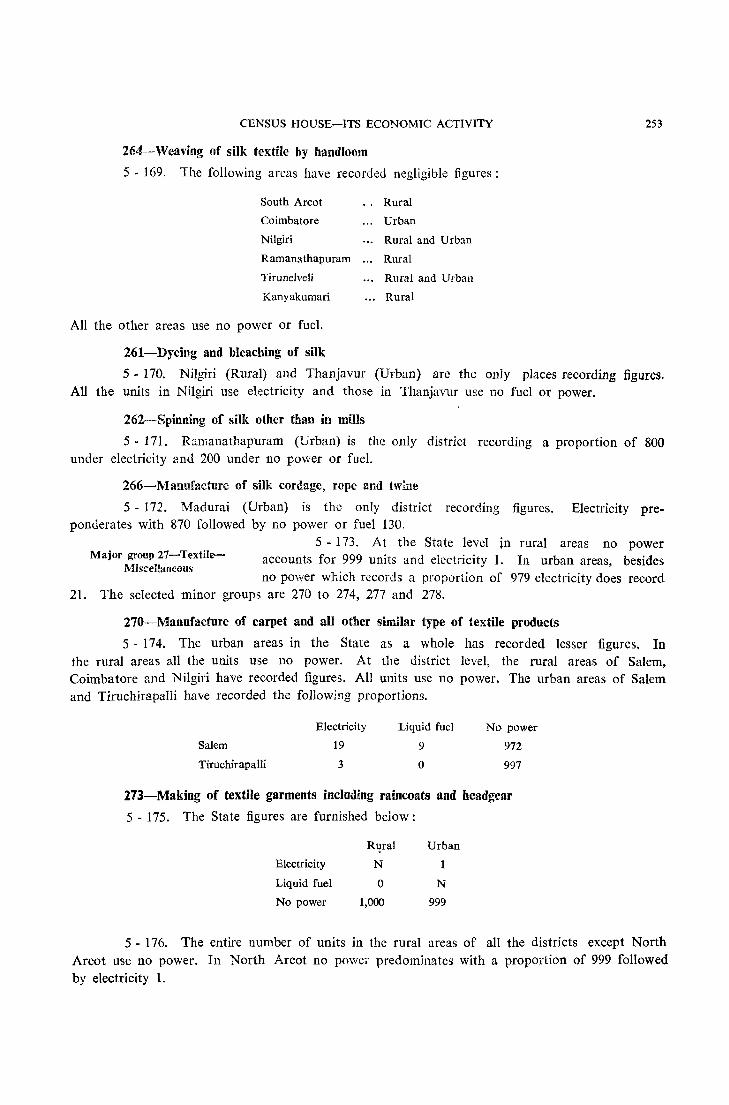
CENSUS HOUSE-ITS ECONOMIC ACTIVITY
264--Weaving of silk textile by hand loom
5 - 169. The following areas have recorded negligible figures:
South Areot
Coimbatore
Nilgiri
Ramanathapuram
Tirunelveli
Kanyakumari
All the other areas use no power or fuel.
261-Dyeing and bleaching of silk
Rural
Urban
Rural and Urban
Rural
Rural and Urban
Rural
253
5 - 170. Nilgiri (Rural) and Thanjavur (Urban) are the only places recording figures. All the units in Nilgiri use electricity and those in Thanjavur use no fuel or power.
262-Spinning of silk other than in mills
5 - 171. Ramanathapuram (Urban) is the only district recording a proportion of 800 under electricity and 200 under no power or fuel.
266-Mallufacfure of silk cordage, rope and twine
5 - 172. Madurai (Urban) is the only district recording figures. Electricity preponderates with 870 followed by no power or fuel 130.
Major group 27-TextileMiscellaneous
5 - 173. At the State level in rural areas no power accounts for 999 units and electricity 1. In urban areas, besides no power which records a proportion of 979 electricity does record
21. The selected minor groups are 270 to 274, 277 and 278.
270-Manufacture of carpet and aU other similar type of textile products
5 - 174. The urban areas in the State as a whole has recorded lesser figures. In the rural areas all the units use no power. At the district level, the rural areas of Salem, Coimbatore and Nilgiri have recorded figures. All units use no power. The urban areas of Salem and Tiruchirapalli have recorded the following proportions.
Salem
Tiruchirapalli
Electricity
19
3
Liquid fuel
9
o
No power
972
997
273-Making of textile garments including raincoats and headgear
5 - 175. The State figures are furnished below:
Rl!ral Urban
Electricity N
Liquid fuel 0 N
No power 1,000 999
5 - 176. The entire number of units in the rural areas of all the districts except North Arcot use no power. In North Arcot no powe,' predominates with a proportion of 999 followed by electricity 1.
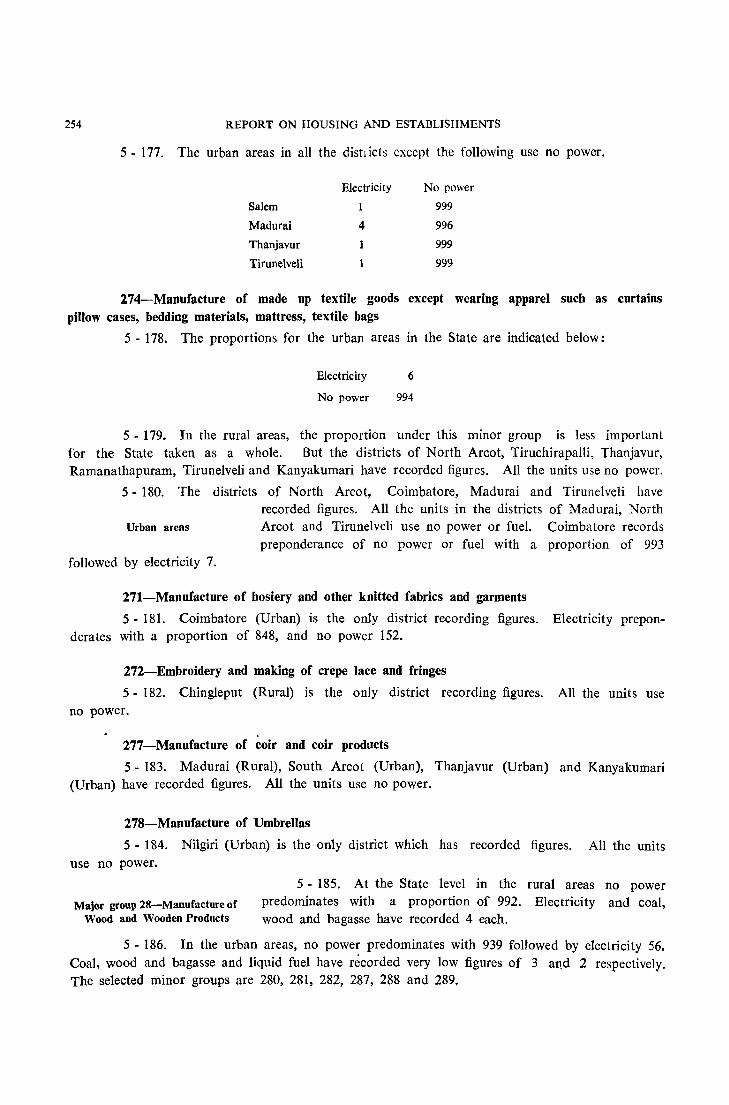
254 REPORT ON HOUSING AND ESTABLISHMENTS
5 - 177. The urban areas in all the distlicts except the following use no power.
Electricity No power
Salem 1 999
Madurai 4 996
Thanjavur 1 999
Tirunelveli 1 999
274--~anufacture of made up textile goods except wearing apparel such as curtains pillow cases, bedding materials, mattress, textile bags
5 - 178. The proportions for the urban areas in the State are indicated below:
Electricity 6
No power 994
5 - 179. In the rural areas, the proportion under this minor group is less important for the State taken as a whole. But the districts of North Arcot, Tiruchirapalli, Thanjavur, Ramanathapuram, Tirunelveli and Kanyakumari have recorded figures. All the units use no power.
5 - 180. The districts of North Arcot, Coimbatore, ~adurai and Tirunelveli have recorded figures. All the units in the districts of Madurai, North
Urban areas Arcot and Tirunelveli use no power or fuel. Coimbatore records preponderance of no power or fuel with a proportion of 993
followed by electricity 7.
271--~anufacture of hosiery and other knitted fabrics and garments
5 - 181. Coimbatore (Urban) is the only district recording figures. Electricity preponderates with a proportion of 848, and no power 152.
272--Embroidery and making of crepe lace and fringes
5 - 182. Chingleput (Rural) is the only district recording figures. All the units use no power.
277--~anufacture of coir and coir products
5 - 183. Madurai (Rural), South Arcot (Urban), Thanjavur (Urban) and Kanyakumari (Urban) have recorded figures. All the units use no power.
278--Manufacture of Umbrellas
5 - 184. Nilgiri (Urban) is the only district which has recorded figures. All the units use no power.
Major group 28-Manufacture of Wood and Wooden Products
5 - 185. At the State level in the rural areas no power predominates with a proportion of 992. Electricity and coal, wood and bagasse have recorded 4 each.
5 - 186. In the urban areas, no power predominates with 939 foHowed by electricity 56. Coal, wood and bagasse and liquid fuel have recorded very low figures of 3 and 2 respectively. The selected minor groups are 280, 281, 282, 287, 288 and 289.
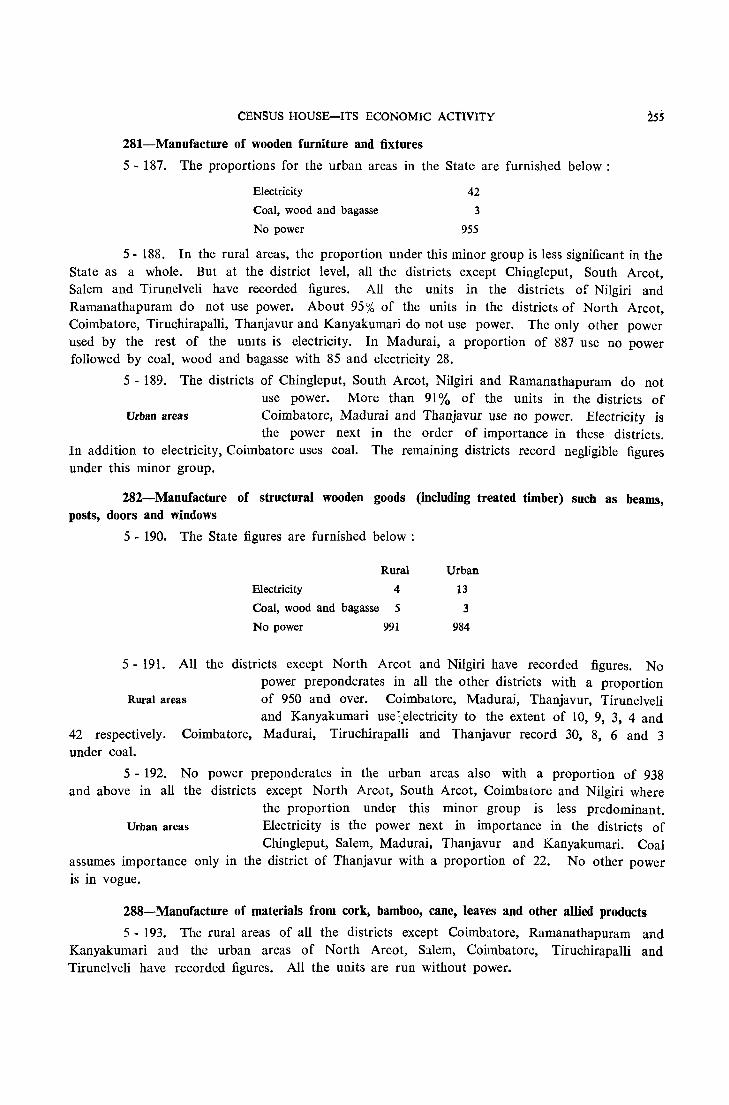
CENSUS HOUSE-ITS ECONOMIC ACTIVITY
2S1-Manufacture of wooden furniture and fixtures
5 - 187. The proportions for the urban areas in the State are furnished below:
Electricity
Coal, wood and bagasse
No power
42
3
955
255
5 - 188. In the rural areas, the proportion under this minor group is less significant in the State as a whole. But at the district level, all the districts except Chingleput, South Arcot, Salem and Tirunelveli have recorded figures. All the units in the districts of Nilgiri and Ramanathapuram do not use power. About 95% of the units in the districts of North Arcot, Coimbatore, Tirm,hirapalli, Thanjavur and Kanyakumari do not use power. The only other power used by the rest of the umts is electricity. In Madurai, a proportion of 887 use no power followed by coal, wood and bagasse with 85 and electricity 28.
5 - 189. The districts of Chingleput, South Arcot, Nilgiri and Ramanathapuram do not use power. More than 91 % of the units in the districts of
Urban areas Coimbatore, Madurai and Thanjavur use no power. Electricity is the power next in the order of importance in these districts.
In addition to electricity, Coimbatore uses coal. The remaining districts record negligible figures under this minor group.
282-Manufacture of structural wooden goods (including treated timber) such as beams, posts, doors and windows
5 - 190. The State figures are furnished below:
Rural Urban
Electricity 4 13
Coal, wood and bagasse 5 3
No power 991 984
5 - 191. All the districts except North Arcot and Nilgiri have recorded figures. No power preponderates in all the other districts with a proportion
Rural areas of 950 and over. Coimbatore, Madurai, Thanjavur, Tirunelveli and Kanyakumari use Lelectricity to the extent of 10, 9, 3, 4 and
42 respectively. Coimbatore, Madurai, Tiruchirapalli and Thanjavur record 30, 8, 6 and 3 under coal.
5 - 192. No power preponderates in the urban areas also with a proportion of 938 and above in all the districts except North Arcut, South Arcot, Coimbatore and Nilgiri where
the proportion under this minor group is less predominant. Urban areas Electricity is the power next in importance in the districts of
Chingleput, Salem, Madurai, Thanjavur and Kanyakumari. Coal assumes importance only in the district of Thanjavur with a proportion of 22. No other power is in vogue.
288-Manufacture of materials from cork, bamboo, cane, leaves and other allied products
5 - 193. The rural areas of all the districts except Coimbatore, Ramanathapuram and Kanyakumari and the urban areas of North Arcot, SJ.lem, Coimbatore, TiruchirapalIi and Tirunelveli have recorded figures. All the units are run without power.
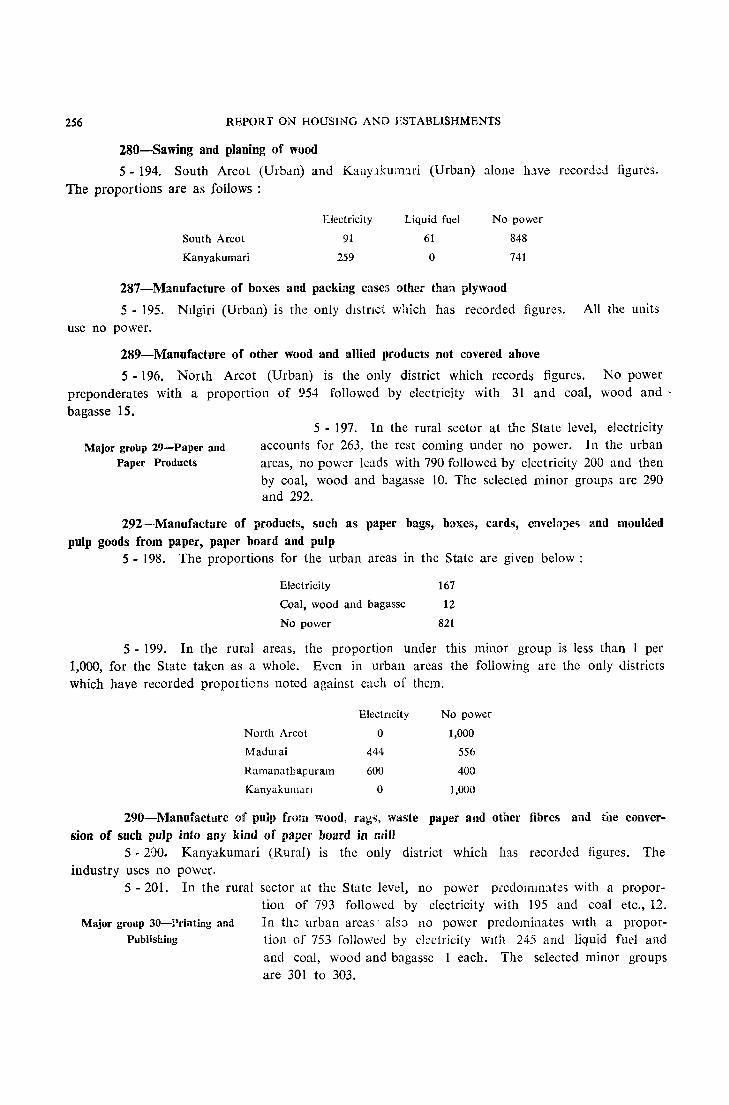
256 REPORT ON HOUSING AND ESTABLISHMENTS
280-Sawing and planing of wood
5 ~ 194. South Arcot (Urban) and Kai1y~kum:lri (Urban) alone luve rccord~d figures.
The proportions are as follows :
South Arcot
Kanyakumari
Electricity
91
259
Liquid fuel
61
o
No power
848
741
287-Manufacture of boxes and packing cases other than plywood
5 ~ 195. NIlgiri (Urban) is the only dIstnct which has recorded figures. All the units
use no power.
289-Manufacture of other wood and allied products not covered above
5 - 196. North Arcot (Urban) is the only district which records figures. preponderates with a proportion of 954 followed by electricity with 31 and coal,
bagasse 15.
No power wood and·
Major group 29-Paper and Paper Products
5 - 197. In the rural sector at the State level, electricity accounts for 263, the rest coming under no power. In the urban areas, no power leads with 790 followed by electricity 200 and then by coal, wood and bagasse 10. The selected minor groups are 290 and 292.
292-Manufacture of products, such as paper bags, boxes, cards, envel()~e'l and moulded pulp goods from paper, paper board and pulp
5 - 198. The proportions for the urban areas in the State are given below:
Electricity 167
Coal, wood and bagasse 12
No power 821
5 - 199. In the rural areas, the proportion under this minor group is less than 1 pel" 1,000, for the State taken as a whole. Even in urban areas the following are the only districts which have recorded proportions noted against each of them.
Electncity No power
North Arcot 0 1,000
MadUiai 444 556
Ramanathapuram 600 400
Kanyaku1l1<lfl 0 J,OOO
290-Manufacture of pulp from wood, rag'>, waste paper and other fibres and tue conversion of such pulp into any kind of paper board in mill
5 - 200. Kanyakumari (Rural) is the only district which has recorded figures. The industry uses no power.
5 - 201. In the rural sector at the State level, no power picdomlll:ltes with a proportion of 793 followed by electricity with 195 and coal etc., 12.
Major group 30-l'rinting and In the urban arcas· als:) no power predominates WIth a propor-Publishing tion of 753 followed by electricity WIth 245 and liquid fuel and
and coal, wood and bagasse 1 each. The selected minor groups are 301 to 303.
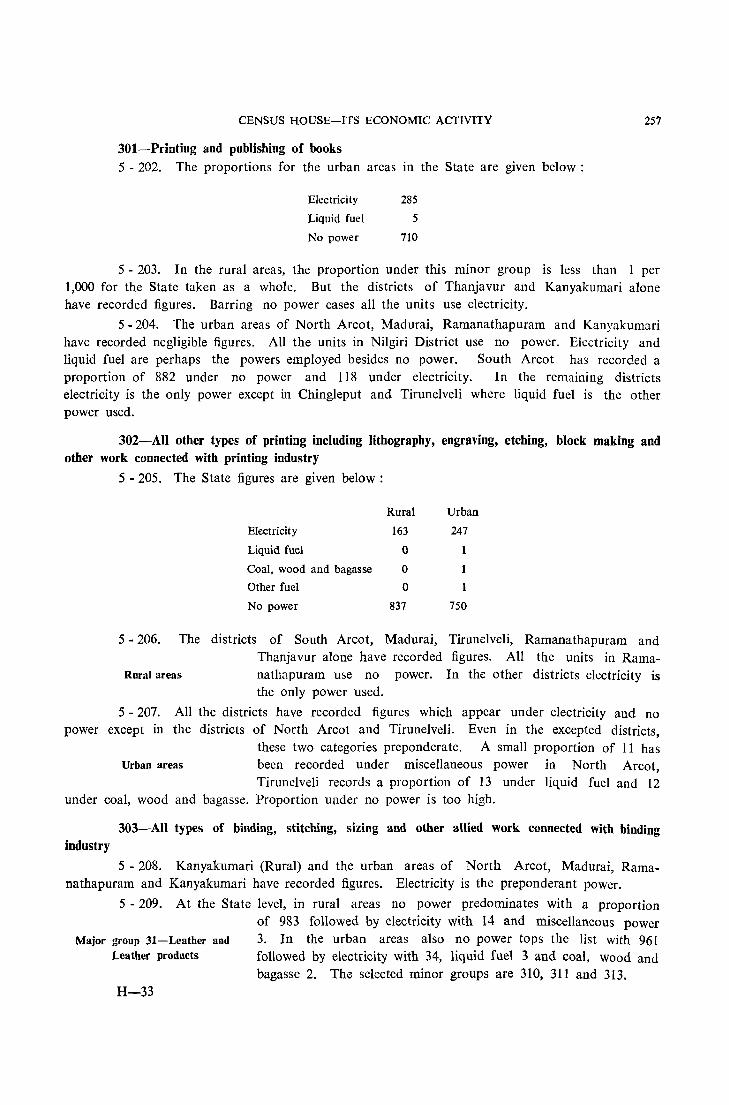
CENSUS HOUSE-ITS ECONOMIC ACTIVITY 257
30t-Printing and publishing of books 5 - 202. The proportions for the urban areas in the State are given below:
Electricity 285
Liquid fuel 5
No power 710
5 - 203. In the rural areas, the proportion under this minor group is less than 1 per 1,000 for the State taken as a whole. But the districts of Thanjavur and Kanyakumari alone have recorded figures. Barring no power cases all the units use electricity.
5 - 204. The urban areas of North Arcot, Madurai, Ramanathapuram and Kanyakumari have recorded negligible figures. All the units in Nilgiri District use no power. Electricity and liquid fuel are perhaps the powers employed besides no power. South Arcot has recorded a proportion of 882 under no power and 118 under electricity. In the remaining districts electricity is the only power except in Chingleput and Tirunelveli where liquid fuel is the other power used.
302-AU other types of printing including lithography, engraving, etching, block making and other work connected with printing industry
5 - 205. The State figures are given below:
Rural Urban
Electricity 163 247
Liquid fuel 0 1
Coal, wood and bagasse 0
Other fuel 0 1
No power 837 750
5 - 206. The districts of South Arcot, Madurai, Tirunelveli, Ramanathapuram and Thanjavur alone have recorded figures. All the units in Rama-
Rural areas nathapuram use no power. In the other districts electricity is the only power used.
5 - 207. All the districts have recorded figures which appear under electricity and no power except in the districts of North Arcot and Tirunelveli. Even in the excepted districts,
these two categories preponderate. A small proportion of 11 has Urban areas been recorded under miscellaneous power in North Arcot,
Tirunelveli records a proportion of 13 under liquid fuel and 12 under coal, wood and bagasse. Proportion under no power is too high.
303-All types of binding, stitching, sizing and other allied work connected with binding industry
5 - 208. Kanyakumari (Rural) and the urban areas of North Arcot, Madurai, Ramanathapuram and Kanyakumari have recorded figures. Electricity is the preponderant power.
5 - 209. At the State level, in rural areas no power predominates with a proportion of 983 followed by electricity with 14 and miscellaneous power
Major group :31-Leather and 3. In the urban areas also no power tops the list with 961 Leather products followed by electricity with 34, liquid fuel 3 and coal, wood and
bagasse 2. The selected minor groups are 310, 311 and 313. H-33

258 REPORT ON HOUSING AND ESTABLlSftMENTS
310- Currying, tanning and finishing of hides and skins and preparation of finished leather
5 - 210. The State proportions are indicated below:
Rural Urban
Electricity 35 118
Liquid fuel 0 11
Coal, wood and bagasse 0 4
Other fuel 10 0
No power 955 867
5 - 211. All the districts except Chingleput, Nilgiri, Ramanathapuram, Tirunelveli and Kanyakumari have recorded figures. All the units in South Arcot, Madurai, Tiruchirapalli and
Thanjavur use no power. North Arcot and Coimbatore indicate Rural areas preponderance of no power followed by electricity. No power
predominates in Salem also but the second power in order of importance is miscellaneous power with a proportion of 100 followed by electricity 50.
5 - 212. All the districts except South Arcot, Nilgiri, Madurai, Tirunelveli and • Kanyakumari have recorded figures. All the units in Salem and
Urban areas Thanjavur use no power. No power predominates in all the other districts followed by electricity. In addition, North Arcot has
recorded small proportions of 17 and 9 under liquid fuel and coal respectively and in Chingleput liquid fuel has recorded 18.
311-Manufacture of shoes and other leather footwear
5 - 213. All the districts except Chingleput (Rural) have recorded figures. All the units except those in Madurai (Rural) and Coimbatore (Rural and Urban) use no power. Small proportions of 42, 16 and 11 respectively use electricity in these excepted areas.
313-ManuCacture of leather products (except those covered by code Nos. 311, 312), such as l~ather upholstery, suit cases, pocket books, cigarette and key cases, purses} saddlery, whip and
other articles
5 - 214. All the units in Tirunelveli (Rural), Madurai (Urban), South Arcot (Urban), Kanyakumari (Urban) and Nilgiri (Urban) use no power while in Ramanathapuram a proportion of 91 occurs under electricity in addition to no power. Other areas have recorded negligible figures. The general conclusion is that no power is used in this industry.
5 - 215. At the State level, in rural areas no power predominates with a proportion of 775 followed by electricity and liquid fuel with 75 each; coal,
Major group 32-Rubber, wood and bagasse with 50 and miscellaneous power 25. In the Petroleum and Coal Products urban areas no power tops the list with 643 followed by
electricity 223, coal, wood and bagasse 67, liquid fuel 56 and miscellaneous power 11. The selected minor groups are 320, 322 and 323.
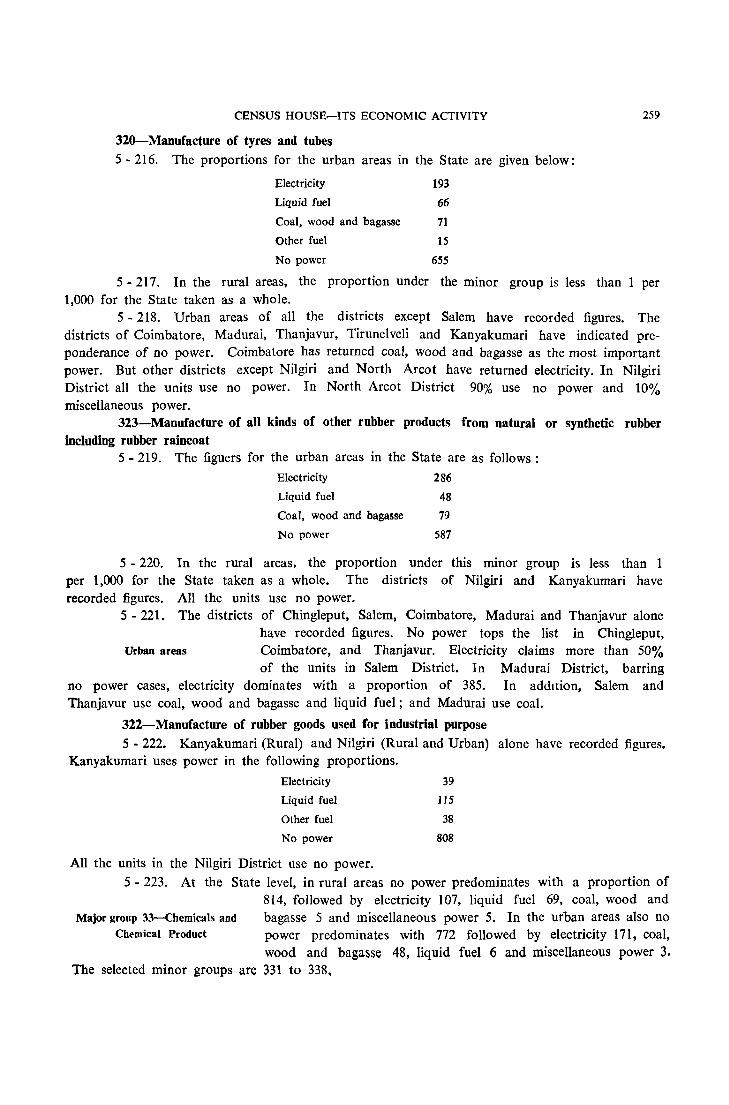
CENSUS HOUSE-ITS ECONOMIC ACTIVITY
320-Manufacture of tyres and tubes 5 ·216. The proportions for the urban areas in the State are given below:
Electricity 193
Liquid fuel 66
Coal, wood and bagasse 71
Other fuel 15
No power 655
259
5 - 217. In the rural areas, the proportion under the minor group is less than 1 per 1,000 for the State taken as a whole.
5 - 218. Urban areas of all the districts except Salem have recorded figures. The districts of Coimbatore, Madurai, Thanjavur, Tirunelveli and Kanyakumari have indicated preponderance of no power. Coimbatore has returned coal, wood and bagasse as the most important power. But other districts except Nilgiri and North Arcot have returned electricity. In Nilgiri District all the units use no power. In North Arcot District 90% use no power and 10%
miscellaneous power. 323-Manufacture of all kinds of other rubber products from natural or synthetic rubber
including rubber raincoat 5 - 219. The figuers for the urban areas in the State are as follows:
Electricity 286
Liquid fuel 48
Coal, wood and bagasse 79
No power 587
5 - 220. In the rural areas, the proportion under this minor group is less than 1 per 1,000 for the State taken as a whole. The districts of Nilgiri and Kanyakumari have recorded figures. All the units use no power.
5 - 221. The districts of Chingleput, Salem, Coimbatore, Madurai and Thanjavur alone have recorded figures. No power tops the list in Chingleput,
Urban areas Coimbatore, and Thanjavur. Electricity claims more than 50%
of the units in Salem District. In Madurai District, barring no power cases, electricity dominates with a proportion of 385. In addItion, Salem and Thanjavur use coal, wood and bagasse and liquid fuel; and Madurai use coal.
322-Manufacture of rubber goods used for industrial purpose 5 - 222. Kanyakumari (Rural) and Nilgiri (Rural and Urban) alone have recorded figures.
Kanyakumari uses power in the following proportions.
Electricity
Liquid fuel
Other fuel
No power
All the units in the Nilgiri District use no power.
39
115
38
808
5 . 223. At the State level, in rural areas no power predominates with a proportion of 814, followed by electricity 107, liquid fuel 69, coal, wood and
Major group 33-Chemicals and bagasse 5 and miscellaneous power 5. In the urban areas also no Chemical Product power predominates with 772 followed by electricity 171, coal,
wood and bagasse 48, liquid fuel 6 and miscellaneous power 3. The selected minor groups are 331 to 338,

260 REPORT ON HOUSING AND ESTABLISHMENTS
333-Manufacture of ammunition, explosives and fire works
5 - 224. All the units in the rural areas in the State appear under no power. The rural areas of Salem, Tiruchirapalli, Thanjavur, Ramanathapuram and Tirunelveli have alone recorded figures.
5 - 225. In the urban areas, the proportion under this minor group is less than 1 per 1,000 for the State taken as a whole. North Arcot is the only district which has recorded figures. All the units come under no power.
334-Manufacture of matches
5 - 226. The proportions for the rural areas of the State are:
ElectricIty 19
Liquid fuel 13
Coal, wood and bagasse 6
No power 962
The districts of Madurai and Ramanathapuram alone have recorded figures. All the units in Ramanathapuram use no power. In Madurai barring no power cases, electricity and liquid fuel are of equal importance recording 14 . 3% each.
5 - 227. In the urban areas, the proportion under this minor group is less than 2 per 1,000 for the State taken as a whole. But the following districts have recorded figures.
Electricity
Kanyakumari 500
Tirunelveli 194
Ramanathapuram 141
North Arcot 0
Coal, wood and bagasse
0
0
0
59
No power
500
806
859
941
335-Manufacture of medicines, pbarmaceutical preparations, perfumes, cosmetics and other toilet preparations except soap
5 - 228. The proportions for the urban areas in the State are as follows:
Electricity 182
Liquid fuel 5
Coal, wood and bagasse 55
No power 758
5 - 229. In the rural areas, the proportion under this minor group is less than 1 per 1,000 for the State taken as a whole. But the districts of Nilgiri, Madurai and Kanyakumari have recorded figures. All the units in Madurai use no power. Excluding no power cases all the units use electricity in Kanyakumari and miscellaneous power in Nilgiri.
5 - 230. All the districts except North Arcot, South Arcot, Salem, Tirunelveli and Kanyakumari have recorded figures. Electricity claims 80% of the units in Chinglep'.lt District. No
power predominates in the districts of Coimbatore, Madurai, Urban areas Tiruchirapalli, Thanjavur and Ramanathapuram. Barring no power
cases, the remaining units in Nilgiri District use only coal, wood and bagasse. Coimbatore, Madurai and Ramanathapuram districts use coal, wood and ba$asse but only to a very small extent.
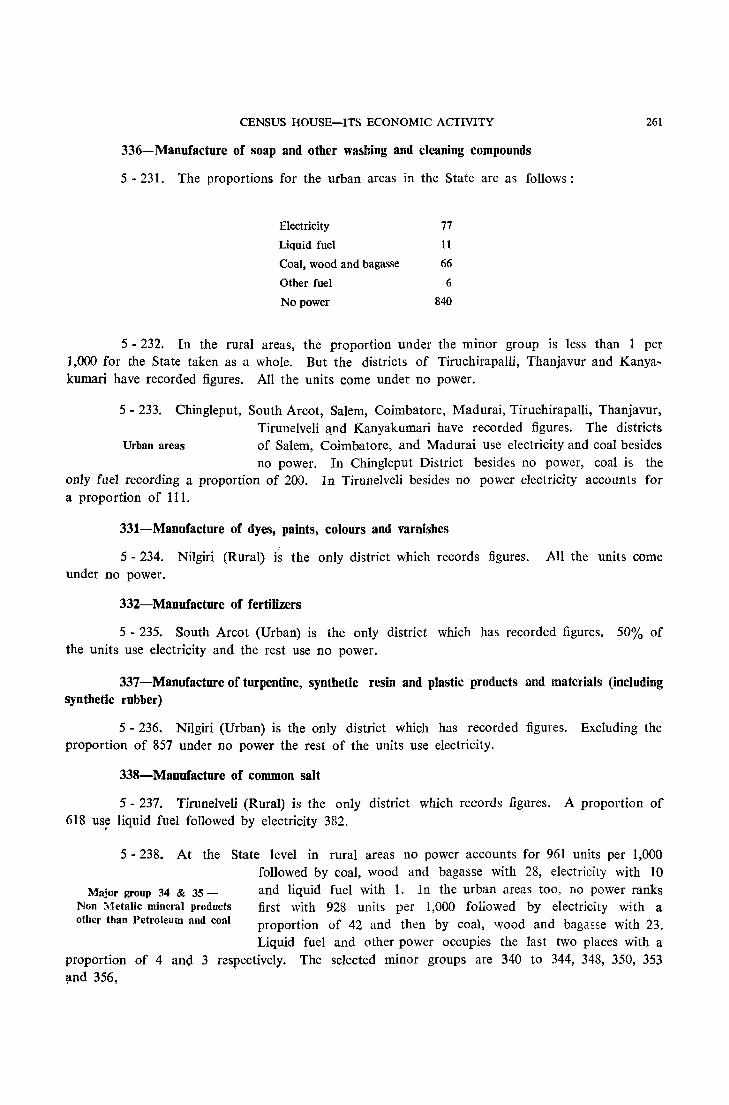
CENSUS HOUSE-ITS ECONOMIC ACTIVITY 261
336-Manufacture of soap and other washing and cleaning compounds
5 - 231. The proportions for the urban areas in the State are as follows:
Electricity 77
Liquid fuel 11
Coal, wood and bagasse 66
Other fuel 6
No power 840
5 - 232. In the rural areas, the proportion under the minor group is less than 1 per 1,000 for the State taken as a whole. But the districts of Tiruchirapalli, Thanjavur and Kanyakumari have recorded figures. All the units come under no power.
5 - 233. Chingleput, South Arcot, Salem, Coimbatore, Madurai, Tiruchirapalli, Thanjavur, Tirunelveli qnd Kanyakumari have recorded figures. The districts
Urban areas of Salem, Coimbatore, and Madurai use electricity and coal besides no power. In Chingleput District besides no power, coal is the
only fuel recording a proportion of 200. In Tirunelveli besides no power electricity accounts for a proportion of 111.
331-Manufacture of dyes, paints, colours and varnishes
5 - 234. Nilgiri (Rural) is the only district which records figures. All the units come under no power.
332-Manufacture of fertilizers
5 - 235. South Arcot (Urban) is the only district which has recorded figures. 50% of the units use electricity and the rest use no power.
337-Manufacture of turpentine, synthetic resin and plastic products and materials (including synthetic rubber)
5 - 236. Nilgiri (Urban) is the only district which has recorded figures. Excluding the proportion of 857 under no power the rest of the units use electricity.
338-Manufacture of common salt
5 - 237. Tirunelveli (Rural) is the only district which records figures. A proportion of 618 us~ liquid fuel followed by electricity 382.
5 - 238. At the State level in rural areas no power accounts for 961 units per 1,000
Major group 34 & 35-Non Metalic mineral products other than Petroleum and coal
followed by coal, wood and bagasse with 28, electricity with 10 and liquid fuel with I. In the urban areas too, no power ranks first with 928 units per 1,000 folio wed by electricity with a proportion of 42 and then by coal, wood and bagasse with 23. Liquid fuel and other power occupies the last two places with a
proportion of 4 and 3 respectively. The selected minor groups are 340 to 344, 348, 350, 353 ~nd 356,
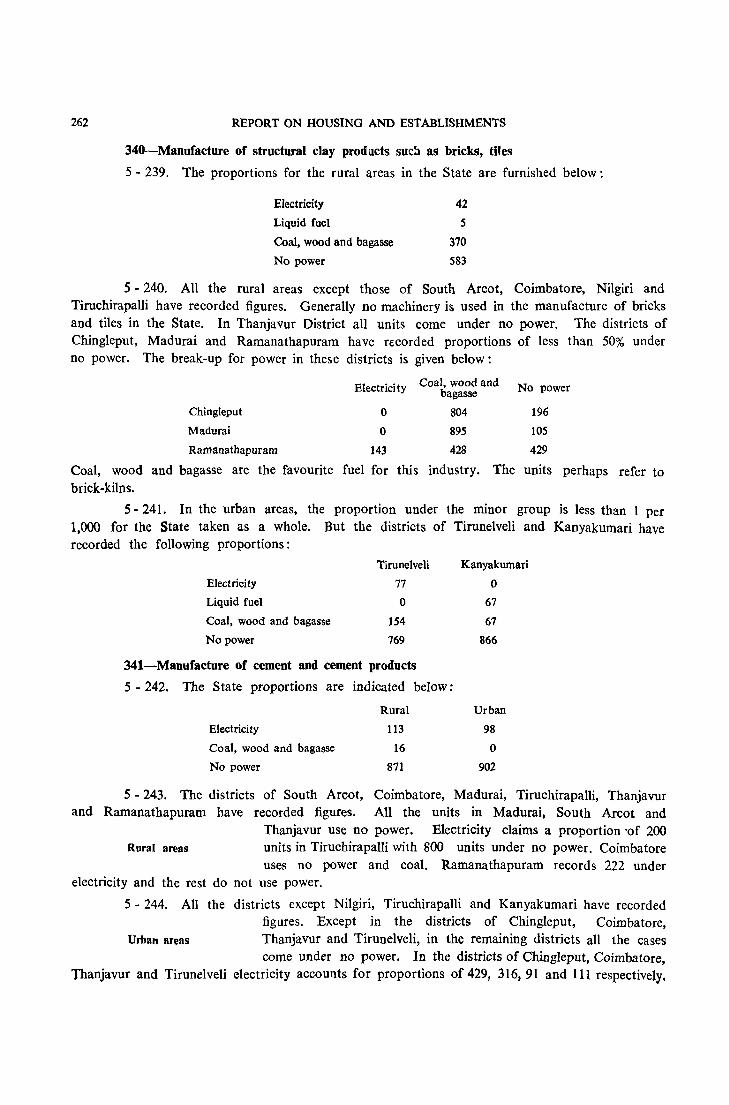
262 REPORT ON HOUSING AND ESTABLISHMENTS
340-Manufacture of structural clay products such as bricks, ti1es
5 - 239. The proportions for the rural areas in the State are furnished below:
Electricity 42
Liquid fuel 5
Coal, wood and bagasse 370
No power 583
5 - 240. All the rural areas except those of South Arcot, Coimbatore, Nilgiri and Tiruchirapalli have recorded figures. Generally no machinery is used in the manufacture of bricks and tiles in the State. In Thanjavur District all units come under no power. The districts of Chingleput, Madurai and Ramanathapuram have recorded proportions of less than 50% under no power. The break-up for power in these districts is given below:
Electricity Coal, wood and No power bagasse
Chingleput o 804 196
Madurai 0 895 105
Ramanathapurarn 143 428 429
Coal, wood and bagasse are the favourite fuel for this industry. The units perhaps refer to brick-kilns.
5 - 241. In the urban areas, the proportion under the minor group is less than 1 per 1,000 for the State taken as a whole. But the districts of Tirunelveli and Kanyakumari have recorded the following proportions:
Tirunelveli
Electricity 77
Liquid fuel 0
Coal, wood and bagasse 154
No power 769
341-Manufacture of cement and cement products
5 - 242. The State proportions are indicated below:
Electricity
Coal, wood and bagasse
No power
Rural
113
16
871
Kanyakurnari
0
67
67
866
Urban
98
o 902
5 - 243. The districts of South Arcot, Coimbatore, Madurai, Tiruchirapalli, Thanjavur and Ramanathapuram have recorded figures. All the units in Madurai, South Arcot and
Thanjavur use no power. Electricity claims a proportion 'of 200 Rural areas units in Tiruchirapalli with 800 units under no power. Coimbatore
uses no power and coal. Ramanathapuram records 222 under electricity and the rest do not use power.
S - 244. All the districts except Nilgiri, Tiruchirapalli and Kanyakumari have recorded figures. Except in the districts of Chingleput, Coimbatore,
Urbatt areas Thanjavur and Tirunelveli, in the remaining districts all the cases come under no power. In the districts of Chingleput, COimbatore,
Thanjavur and Tirunelveli electricity accounts for proportions of 429, 316, 91 and 111 respectively.
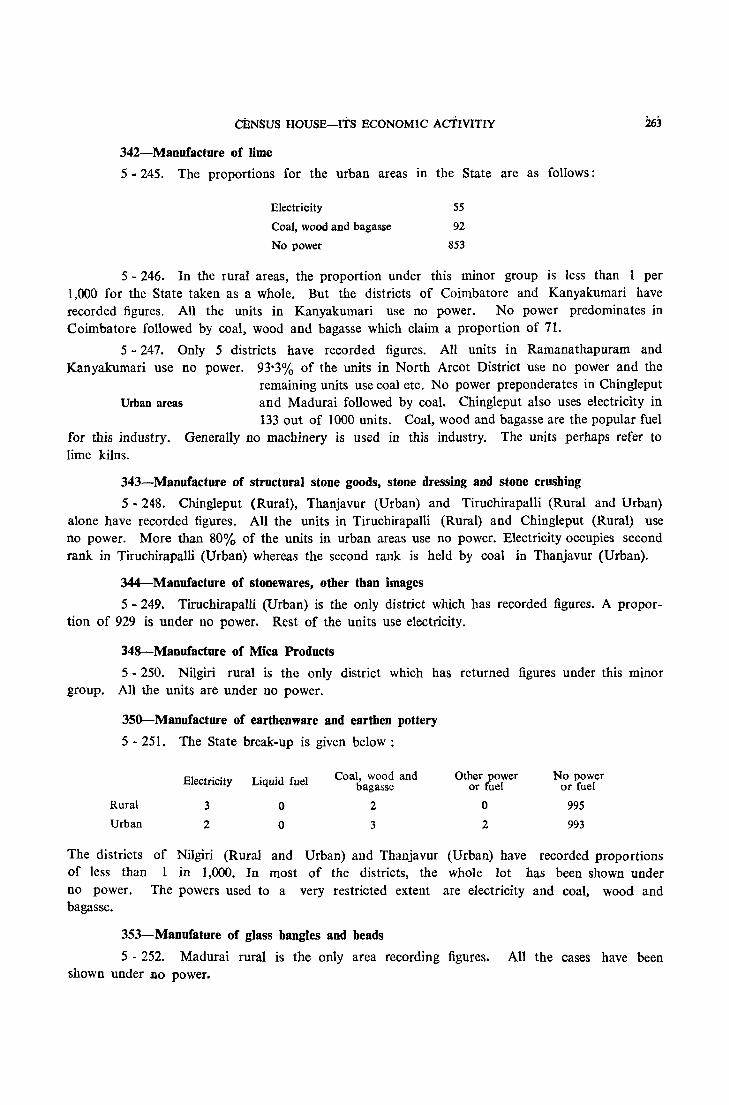
CENSUS HOUSE-ITS ECONOMIC ACTIVITIY
342-Manufacture of lime
5 - 245. The proportions for the urban areas in the State are as follows:
Electricity 55
Coal, wood and bagasse 92
No power 853
5 - 246. In the rural areas, the proportion under this minor group is less than 1 per 1,000 for the State taken as a whole. But the districts of Coimbatore and Kanyakumari have recorded figures. All the units in Kanyakumari use no power. No power predominates in Coimbatore followed by coal, wood and bagasse which claim a proportion of 71.
5 - 247. Only 5 districts have recorded figures. All units in Ramanathapuram and Kanyakumari use no power. 93'3% of the units in North Arcot District use no power and the
remaining units use coal etc. No power preponderates in Chingleput Urban areas and Madurai followed by coal. Chingleput also uses electricity in
133 out of 1000 uni ts. Coal, wood and bagasse are the popular fuel for this industry. Generally no machinery is used in this industry. The units perhaps refer to lime kilns.
343-Manufacture of structural stone goods, stone dressing and stone crushing
5 - 248. Chingleput (Rural), Thanjavur (Urban) and Tiruchirapalli (Rural and Urban) alone have recorded figures. All the units in Tiruchirapalli (Rural) and Chingleput (Rural) use no power. More than 80% of the units in urban areas use no power. Electricity occupies second rank in Tiruchirapalli (Urban) whereas the second rank is held by coal in Thanjavur (Urban).
344-Manufacture of stonewares, other than images
5 - 249. Tiruchirapalli (Urban) is the only district which has recorded figures. A proportion of 929 is under no power. Rest of the units use electricity.
348-Manufacture of Mica Products
5 - 250. Nilgiri rural is the only district which has returned figures under this minor group. All the units are under no power.
350-Manufacture of earthenware and earthen pottery
5 - 251. The State break-up is given below:
Rural
Urban
Electricity Liquid fuel
3
2
o o
Coal, wood and bagasse
2
3
Other power or fuel
o 2
No power or fuel
995
993
The districts of Nilgiri (Rural and Urban) and Thanjavur (Urban) have recorded proportions of less than 1 in 1,000. In most of the districts, the whole lot has been shown under no power. The powers used to a very restricted extent are electricity and coal, wood and bagasse.
353-Manufature of glass bangles and beads
5 - 252. Madurai rural is the only area recording figures. All the cases have been shown under no power.
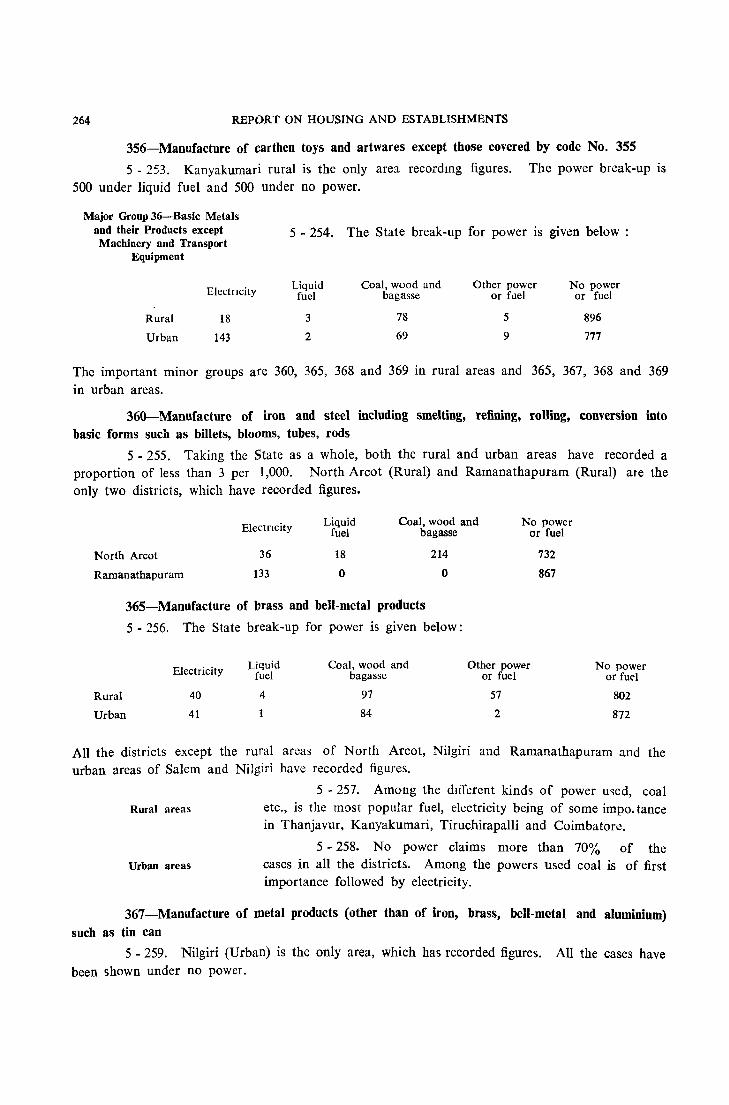
264 REPORT ON HOUSING AND ESTABLISHMENTS
356-Manufacture of earthen toys and art wares except those covered by code No. 355
5 - 253. Kanyakumari rural is the only area recordmg figures. The power break-up is 500 under liquid fuel and 500 under no power.
Major Group 36-Basic Metals and their Products except Machinery and Transport
Equipment
5 - 254. The State break-up for power is given below:
ElectrIcity Liquid fuel
Coal, wood and bagasse
Other power or fllel
No power or fuel
Rural
Urban
18
143
3
2
78
69
5
9
896
777
The important minor groups are 360, 365, 368 and 369 in rural areas and 365, 367, 368 and 369 in urban areas.
360-Manufacture of iron and steel including smelting, refining, rolling, conversion into basic forms such as billets, bloQms, tubes, rods
5 - 255. Taking the State as a whole, both the rural and urban areas have recorded a proportion of less than 3 per 1,000. North Arcot (Rural) and Ramanathapuram (Rural) ate the only two districts, which have recorded figures.
ElectrIcity Liquid Coal, wood and No power fuel bagasse or fuel
North Arcot 36 18 214 732
Ramanathapuram 133 0 0 867
365-Manufacture of brass and bell-metal products
Rural
Urban
5 - 256. The State break-up for power is given below:
Electricity
40
41
Liquid fuel
4
Coal, wood and bagasse
97
84
Other power or fuel
57
2
No power or fud
802
872
All the districts except the rural areas of North Arcot, Nilgiri and Ramanathapuram and the urban areas of Salem and Nilgiri have recorded figures.
Rural areas
Urban areas
5 - 257. Among the dIfferent kinds of power used, coal etc., is the most popular fuel, electricity being of some impo. tance in Thanjavur, Kanyakumari, Tiruchirapalli and Coimbatore.
5 - 258. No power claims more than 70% of the cases in all the districts. Among the powers used coal is of first importance followed by electricity.
367-Manufacture of metal products (other than of iron, brass, bell-metal and aluminium) such as tin can
5 - 259. Nilgiri (Urban) is the only area, which has recorded figures. All the cases have been shown under no power.
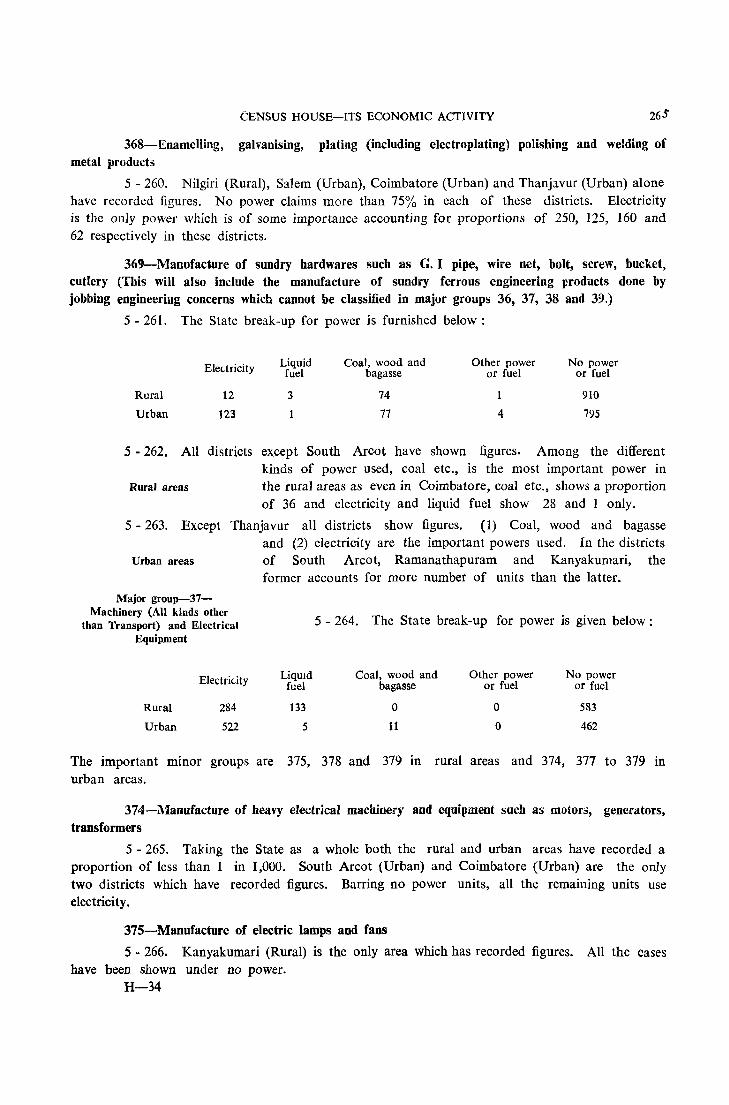
CENSUS HOUSE-ITS ECONOMIC ACTIVITY
368-Enamelling, galvanising, plating (including electroplating) polishing and welding of metal products
5 - 260. Nilgiri (Rural), Salem (Urban), Coimbatore (Urban) and Thanjavur (Urban) alone have recorded figures. No power claims more than 75% in each of these districts. Electricity is the only power which is of some importance accounting for proportions of 250, 125, 160 and 62 respectively in these districts.
369-Manufaciure of sundry hard wares such as G. I pipe, wire net, bolt, screw, bucket, cutlery (This will also include the manufacture of sundry ferrous engineering products done by jobbing engineering concerns which cannot be classified in major groups 36, 37, 38 and 39.)
5 - 261. The State break-up for power is furnished below:
Rural
Urban
Elec.tricity
12
123
Liquid fuel
3
1
Coal, wood and bagasse
74
77
Other power or fuel
1
4
No power or fuel
910
795
5 - 262. All districts except South Arcot have shown figures. Among the different kinds of power used, coal etc., is the most important power in
Rura) areas the rural areas as even in Coimbatore, coal etc., shows a proportion of 36 and electricity and liquid fuel show 28 and 1 only.
5 - 263. Except Thanjavur all districts show figures. (1) Coal, wood and bagasse and (2) electricity are the important powers used. In the districts
Urban areas of South Arcot, Ramanathapuram and Kanyakumari, the former accounts for more number of units than the latter.
Major group-37-Machinery (AU kinds other
than Transport) and Electrical Equipment
Rural
Urban
Electric.ity
284
522
LiqUid fuel
133
5
5 - 264. The State break-up for power is given below:
Coal, wood and bagasse
o 11
Other power or fuel
o o
No power or fuel
583
462
The important minor groups are 375, 378 and 379 in rural areas and 374, 377 to 379 in urban areas.
374-Manufacture of heavy electrical machinery and equipment such as motors, generators, transformers
5 - 265. Taking the State as a whole both the rural and urban areas have recorded a proportion of less than 1 in 1,000. South Arcot (Urban) and Coimbatore (Urban) are the only two districts which have recorded figures. Barring no power units, all the remaining units use electricity.
375-Manufacture of electric lamps and fans
5 - 266. Kanyakumari (Rural) is the only area which has recorded figures. All the cases have been shown under no power.
H-34
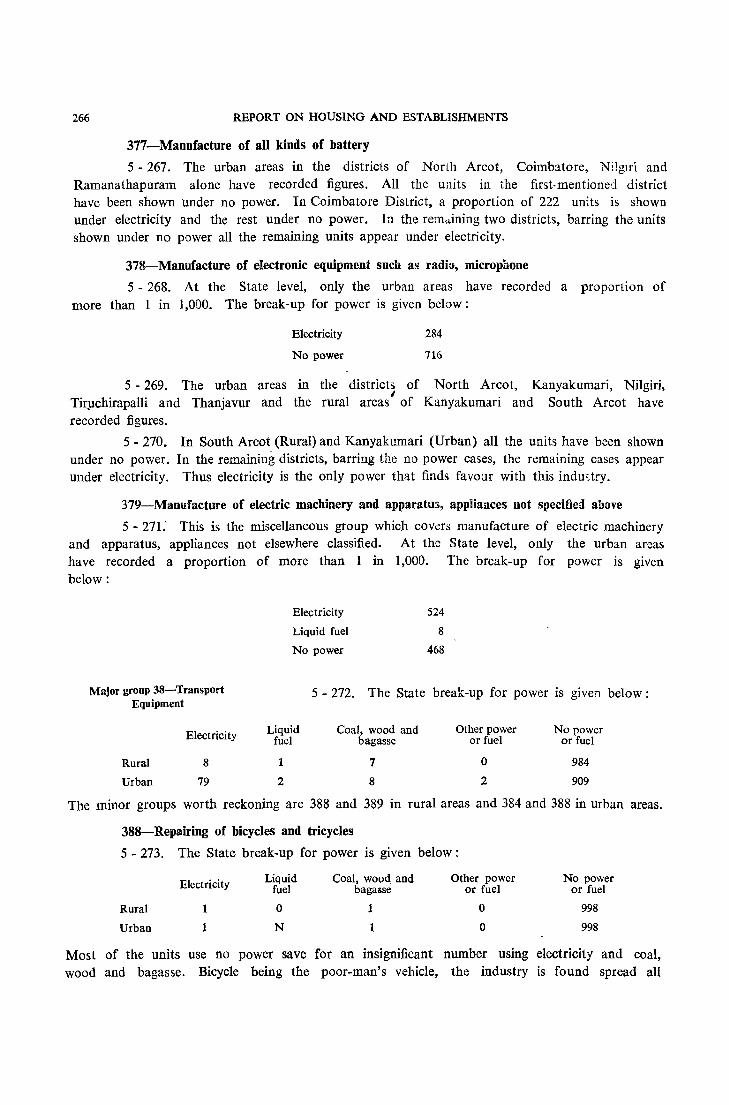
266 REPORT ON HOUSING AND EStABLISHMENTS
377-Manufacture of all kinds of battery
5 - 267. The urban areas in the districts of Norlh Arcot, Coimbatore, Nilglri and Ramanathapuram alone have recorded figures. All the units in the first-mentioned district have been shown under no power. In Coimbatore District, a proportion of 222 units is shown under electricity and the rest under no power. In the remaining two districts, barring the units shown under no power all the remaining units appear under electricity.
378-Manufacture of electronic equipment such as radio, microphone
5 - 268. At the State level, only the urban areas have recorded a proportion of more than 1 in 1,000. The break-up for power is given below:
Electricity
No power
284
716
5 - 269. The urban areas in the districts of North Areot, Kanyakumari, Nilgiri, Tir!lchirapalli and Thanjavur and the rural areas' of Kanyakumari and South Arcot have recorded figures.
5 - 270. In South Arcot (Rural) and Kanyakumari (Urban) all the units have been shown under no power. In the remaining districts, barring the no power cases, the remaining cases appear under electricity. Thus electricity is the only power that finds favour with this industry.
379-Manufacture of electric machinery and apparatus, appliances not specified above
5 - 271: This is the miscellaneous group which covers manufacture of electric machinery and apparatus, appliances not elsewhere classified. At the State level, only the urban areas have recorded a proportion of more than 1 in 1,000. The break-up for power is given below:
Major group 38-Transport Equipment
Electricity
Rural 8
Urban 79
Electricity
Liquid fuel
No power
5 - 272. The State
Liquid Coal, wood and fuel bagasse
7
2 8
524
8
468
break-up for power is given below:
Other power No power or fuel or fuel
0 984
2 909
The minor groups worth reckoning are 388 and 389 in rural areas and 384 and 388 in urban areas.
388-Repairing of bicycles and tricycles
5 - 273. The State break-up for power is given below:
Rural
Urban
Electricity
1
1
Liquid fuel
o N
Coal, wood, and bagasse
1
1
Other power or fuel
o o
No power or fuel
998
998
Most of the units use no power save for an insignificant number using electricity and coal, wood and bagasse. Bicycle being the poor-man's vehicle, the industry is found spread all
CENSUS HOUSE-ITS ECONOMIC ACTIVITY 267
over the State. The districts of Chingleput (Urban), South Arcot (Urban), Salem (Rural), Nilgiri (Urban), Madurai (Rural), Thanjavur (Rural), Ramanathapuram (Rural & Urban \, Tirunelveli (Urban) and Kanyakumari (Urban) use exclusively no power.
389-Manufacture of other transport equipment not covered above such as animal drawn and band-drawn vehicles
5 - 274. Manufacture of other transport equipment not elsewhere classified, is a miscellaneous group and a districtwise analysis may not be worth it.
384-Repairing and servicing of motor vehicles
5 - 275. Taking the State as a whole the rural areas have recorded a proportion of less than 1 in I,GOO. The urban break-up for power is given below:
Electricity
Liquid fuel
Coal, wood and bagasse
Other power or fuel
No power or fuel
336
7
8
7
642
The rural areas in the districts of Chingleput and Nilgiri alone have recorded figures.
5 - 276. Among the different kinds of power used, electricity is the most important power in all the districts indicating the special suitability of this power to conduct this industry. Only a limited number of units use either (1) liquid fuel or (2) coal, wood and bagasse or (3) other miscellaneous fuel.
Major group 39-Miscellaneous Manufacturiug Industries
5 - 277. The State proportions are given below:
Rural Urban
Electricity 7 49
Liquid fuel 4 7
Coal, wood and bagasse 37 34
Other power or fuel 0
No power or fuel 952 909
Among the powers used, coal, wood and bagasse lead in rural areas whereas electricity leads in urban areas, relegating coal, wood and bagasse to the second place. The minor groups of importance are 392, 3S3 and 399.
392-Assembling and repairing of watches and clocks
5 - 278. Taking the State as a whole - both the rural and urban areas have not recorded a proportion of importance. However the urban areas in the districts of Chingleput, South Arcot, Coi:nbatore, Nilgiri, Tiruchirapalli, Thanjavur an::! Tirunelveli have recorded more than 1 in 1,000. No power predominates in all the districts claiming either the whole lot or more than 96%. Electricity is of some importance in the urban areas of Coimbatore and Tirunelveli claiming proportions of 18 and 38 respectively.
5 - 279. Among the rural areas, Chingleput is the district which has recorded a proportion of more than 1 in 1,000 under this minor group. All the units use no power.
268 REPORT ON HOUSING AND ESTABLISHMENTS
393-Manufacture of jewellery, silverware and wares using gold and other precious metals
5 - 280. The State proportions are given below:
Electricity Liquid Coat, wood and Other power No power fuel bagasse or fuel or fuel
Rural 4 38 0 957 Urban 20 8 41 N 931
All the districts (both Rural and Urban) have recorded figures indicating the ubiqutous nature of the industry.
5 - 281. No power claims more than 86% in all the districts. Both in the rural and urban areas among the different kinds of fuel used, coal, wood and bagafse, by and large, claim tile largest proportion. Electricity is the next important power and it is of significance only in certain areas. Liquid fuel is used to a limited extent in the districts of South Arcot, Salem, Coimbatore, Madurai and Tiruchirapalli.
399-Manufacture and repair work of goods not assignable to any other group
5 - 282. The State proportions are given below:
Rural
Urban
Electricity
94
199
Liquid fuel
4
6
Coal, wood and bagasse
15
12
Other power or fuel
o 4
No power or fuel
887
779
This minor group covers the manufacture and repair work of goods not elsewhere classified and as such is an omnibus one. This. is the last refuge of the investigators who may not take adequate pains to assign the correct description.
5 - 283. The minor groups which do not record a propor-My inference: Industrial minor tion of more than 1 in 1,000 either in the rural or urban
groups in towns sector in any of the districts but which does in cities and towns are listed below:
234-Cotton weaving in powerlooms
5 - 284. The industry exists only in the towns of Pudukottai and Thanjavur. All the units are run by electricity.
241-Jute spinning and weaving
5 - 285. There is no large-scale industry in this State which either spins or weaves jute in order to manufacture gunnies. But mending of old jute gunny b:lgs is attended to by gunny merchants a'> well as single workers who purchase old gunnies from various sou:-ces, mend them and sell them to gunny merchants. The two cities which have recorded a proportion of more than 1 in 1,000 are Tiruchirapalli and Tuticorin. No power is exclusively used.
279-Processing and manufacture of textile products not covered above
5 - 286. This industry appears in the following cities and towns with the following
proportions. City/Town Electricity No power
cr fuel
Kanchipuram 750 250
Cuddalore 0 1,000
Tiruchirapalli 1,000 0
A ruppukkottai 250 750
CENSUS HOUSE-ITS ECONOMIC ACTIVITY 269
283-Manufacture of wooden industrirl goods other than transport equipment sucb as bobbin and similar equipment and fixtures
5 - 287. This industry figures only in Karur. All the units use no power.
284-Manufacture of other wooden products such as utensils, toys, artwares
5 - 288. This industry figures only in Thanjavur town. The break-up for power is electricity 167 and no power 833.
291-Manufacture of pulp from wood, rags, waste-paper and otber fibres and the conversion of sucb pulp into any kind of paper and paper board bandmade
5 - 289. This minor group occurs in the following cities and towns.
City/Town Electricity No power or fuel
Madurai 1,000 0
Thanjavur 0 1,000
Tirunelveli 0 1.000
314-Repair of shoes and leather footware
5 - 290. This industry appears in the cities of Vellore, Coimbatore and Tiruchirapalli. All the units are shown under no power.
339-Manufacture of chemicals and chemical products not covered above (including in~dible oils and fats)
5 - 291. This industry appears only in the towns of Nagapattinam and NagercoiI. All the units use no power.
345-Manufacture of stone images
5 - 292. Kumbakonam and Tirunelveli are the places where this industry has been recorded. No power is used.
351-Manufacture of chinaware and crockery
5 - 293. Thanjavur is the only city recording figures. No power is used to operate this industry.
370-Manufacture and assembling of machinery (other than electrical) except textile machinery
5 - 294. This industry figures in Dindigul and Tuticorin. All the units in Tuticorin use no power. 50% of the units in Dindigul use electricity and the rest no power.
373-Manufacture of textile machinery and accessories
5 - 295. Coimbatore, Tiruppur, Thanjavur and Madurai have recorded figures. All the units in Tiruppur and Madurai use electricity. 40 X, of the units in Coimbatore use electricity. The rest of the units use no power or fuel. All the units in Thanj ., lr use no power.
.... Power used and employment-
a correlation
5 - 296. Subsidiary table E (lI-2 will enable us to examine the relationship between power used and size ranges of employment.
270 REPORT ON HOUSING AND ESTABLISHMENTS
5 - 297. Taking the rural areas in the Stdte, we find that more than 50% of the workshops and factories employ each 2- 5 persons. Single member establishment constitute
a percentage of 9 and qualify themselves for the seeond rank. Electricity-Rural areas There is not much divergence among the groups 6-9, 10-19 and
20-49. But there is a perceptible drop in the proportion of units employing 50 persons and above. Only a proportion of 44 per 1,000 units employ 50 persons and above.
5 - 298. Here also the group 2-5 predominates but it is a little less than 50 %. Unlike in the rural areas, the second rank is held by the group 6-9 and the
Urban areas third rank by 10·19. A proportion of 54 per 1,000 units employ 50 persons and above. Thus it is observed that in urban areas there
are workshops and factories whi~h are comparatively bigger in size measured in terms of the number of persons employed in each.
5 - 299. The group 2·5 accounts for a proportion of 654. Beyond the group 10-19 there is a drop, the proportion dwindling nearly to half in the next higher
Liquid fuel-Rural areas group 20-49. This is indicative of the tendency among the people to employ less than 20 persons in workshops to escape the provisions of
the Factories Act. The drop beyond the group 20-49, is far too steep pointing to the conclusion that major establishments prefer electricity to liquid fuel.
5 - 300. The proportion in the group 2-5 falls down to 489 as against 654 in rural areas. Correspondingly, there is an increase in the proportion in each of the groups of establishments
employing more than 5 persons. The drop from the group 10-19 to Urban areas the group 20-49 noticed in the rural areas also exists in the urban
areas. The proponion of establishments employing 50 persons and more gets itself doubled up in the urban areas.
5 - 301. The group 2·5 accounts for a proportion of 544. The next group 6-9 accounts for 45. Thereafter, the proportion drops down to 29. There is
Coal etc.-Rural areas not much divergence among the groups employing 10 and more persons.
5 - 302. Unlike in the case of electricity and liquid fuel where the proportion in the group 2·5 is lesser in urban areas, here the proportion increases from 544 to 638. The drop
noticed in rural areas from the group 6-9 to the group 10-19 Urban areas is also observed in the urban areas. In the groups 20 and above,
the proportion in the urban areas is far less than in the rural areas which indicates two things (1) easy availability of electricity in urban areas and (2) easy availability of wood and bagasse in rural areas.
5 - 303. Here also the preponderance is in the group 2-5. The significant features noticed are that the proportions are much less in urban areas in higher groups
Other types of fuel and that in the group 100 and above there is no establishment either in rural or urban areas using miscellaneous fuel.
5 - 304. The special features noticed are discussed below:
(1) The districts of Chingkput, Coimbatore, Nilgiri, Madurai and Ramanathapuram have recorded comparatively higher proportions of factories employing
Use of electricity-special features 100 persons and above. Coimbatore contains major textile mills. In the metropolitan region of Chingleput District larger factories are
encountered. In the coastal taluks there are salt factories. In Madurai Districfwe have big textile mills. In Ramanathapuram, there are big match factories. In Nilgiri District there llre tea-processing factories.
CENSUS HOUSE-ITS ECONOMIC ACTIVITY 271
(2) In all the districts except South Arcot, Salem, Madurai, Tiruchirap'lUi. R:.tmanathapuram and Tirunelveli, high proportions of factories employing more than 100 persons are found in the rural areas. This shows that the good old practice of confining big factories to urban areas is disappearing.
(3) Kallyakumari rural is significant for the absence of factories employing 100 persons and above. So also South Arcot urban. These two districts have to make up lee-way by di3playing enterprenuership in organising large-scale industries.
5 - 305. The groups 2-5 and 6-9 preponderate in rural areas. It is significant that there are no establishments in the single-member group in the districts of Nilgiri and Kanyakumari and the group 100 and above in the districts of Chingleput, South Arcot, Tiruchirapalli,
Thanjavur, Ramanathapuram and Tirunelveli. In urban areas of Liquid fuel Nilgiri District, there is no establishment in the groups 1 person,
2-5 and 6-9 persons. In the urban areas of Ramanathapuram District there is no establishment at all in the groups 6-9 onwards. In Kanyakumari District urban all the units are concentrated in 6-9 group and there are no units in the other groups at all. In the category of 100 and above, there are no establishments using liquid fuel in Chingleput, South Arcot, Madurai, Tiruchirapalli, Thanjavur, Ramanathapuram and Tirunelveli districts.
5 - 306. In all the districts in both rural and urban, preponderance is found in the group 2-5. There are no establishments using this fuel and employing
Coal, ~ood and bagasse more than 100 persons in the districts of Salem, Coimbatore, Nilgiri, Tiruchirapalli, Thanjavur, RamanathaIfuram and Kanya
kumari. The data lead to the inference that the fuels coal, wood and bagasse are unsuited for working bigger establishments.
5 - 307. We have so far discussed the relative importance of each industry with reference to the number of units and the number of persons employed in each. We have also given the break up for every 1,000 units classified on the basis of power and commented on the importance of the power or fuel used in each industry. The statement that follows gives the actual number of workers employed in each of the minor groups of standard industrial classification code based on the kind of power or fuel used and thus will help us in having an idea of the comparative importance of industry with reference to the power or fuel used assuming that if an industry employs 500 or more under a particular power or fuel, it can be deemed to be important under that power or fuel. On this basis, we now proceed to evaluate the position in the rural and urban areas of the State separately power by power.

Statement V-2S
Important industries using (1) Electricity, (2) Liquid fuel and (3) Coal, wood and bagasse where 500 and more persons are engaged in rural areas of the State
Minor group of I. S. I. C.
232 200
330
341 234 217 230 231 369
202
201 201 310
209
DescriptIOn of the Industry
No. of persons engaged in the
ELECTRICITY
Cotton spmmng and we.wing III mtlls PwductlOn of rice. atta, flour etc., by millmg, dehusking, and processing
of crops and food grams
Manufacture of basic Industrial Chemicals such as acids, alkalis and their salts
Manufacture of cement and cement products
Cotton weavmg in powerlooms
Processing of tea in factories
Cotton ginning, cleaning, pressmg and baling
Cotton spinning other than in mills
Manufacture of sundry hardwares such as G. I. pipe, wire net, bolt, screw, bucket, cutlery
Produc'ion of indigenous sugal', gur from sugarcane or palm juice and production of candy
ProductIOn of edible fats and oils (other than Hydrogenated 011)
Production of sugar and syrup from sugarcane in mills
Currying, tanning and finishing of hides and skins and preparation of finished leather
Production of other food products such as sweetmeat and condiments
Industry
17,141
14,491
5,242 4,146
3,060
3,016
1,720
1,533
1,076
982 958
881
843 784
395 Manufacture of stationery artIcles not covered elsewhere such as pencil, pen
222 239
218
200
340
369
holder, f('antain pen
Manufacture of cigarette and cigarette tobacco
Manufacturing of cotton, cordage, rope and twine
Processing of coffee in curing works
LIQUID FUEL
Production of flce, atta, flour etc.
COAL, WOOD, AND BAGASSE
Manufacture of structural clay products sueh as bricks, tiles
ManufactUie of sundry hardwares such as G. I. pipe, wire net, bolt, scr~w, bucket, cutlery
711 678
592
536
5,641
3,398
1,217
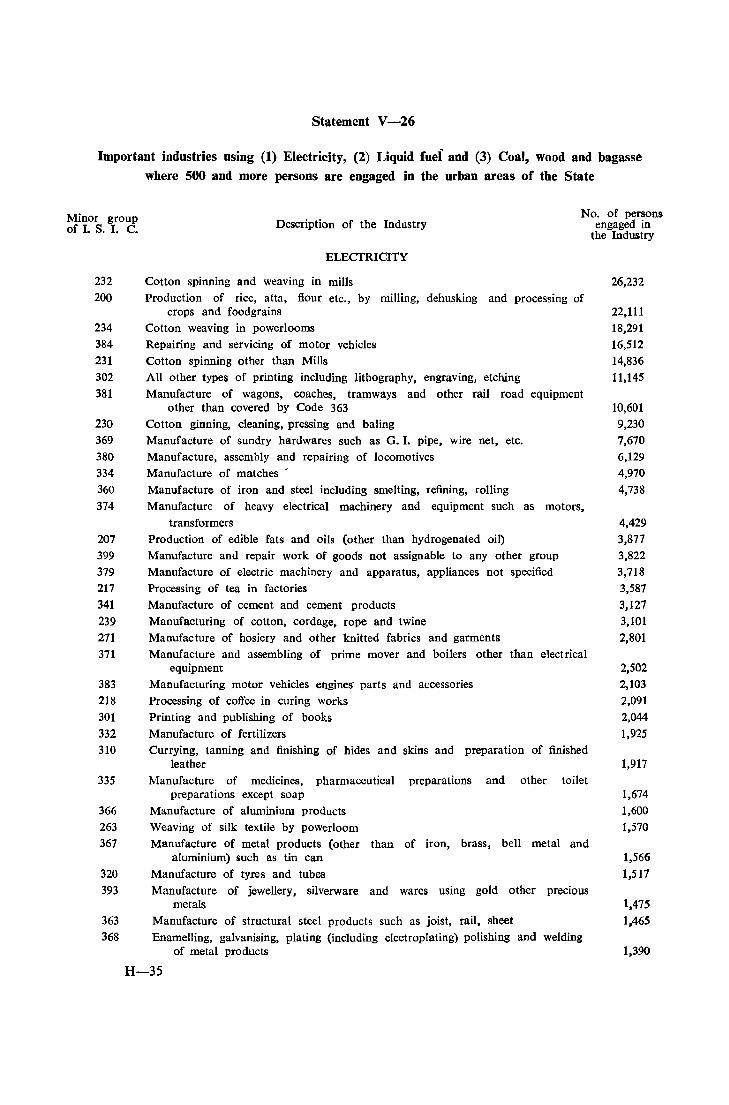
Statement V -26
Important industries using (1) Electricity, (2) Liquid fuei aod (3) Coal, wood and bagasse where 500 and more persons are engaged in the orban areas of the State
Minor group of I. S. I. C.
232
200
234
384
231 302 381
230 369
380 334 360
374
207 399
379 217 341
239
271
371
383 218 301
332
310
335
366
263 367
320
Description of the Industry No. of persons
engaged in the Industry
ELECTRICITY
Cotton spinning and weaving in mills Production of rice, atta, flour etc., by milling, dehusking and processing of
crops and foodgrains Cotton weaving in powerlooms Repairing and servicing of motor vehicles Cotton spinning other than Mills All other types of printing including lithography, engraving, etching Manufacture of wagons, coaches, tramways and other rail road equipment
other than covered by Code 363 Cotton ginning, cleaning, pressing and baling Manufacture of sundry hardwares such as G. I. pipe, wire net, etc. Manufacture, assembly and repairing of locomotives Manufacture of matches /
Manufacture of iron and steel including smelting, refining, rolling Manufacture of heavy electrical machinery and equipment such as motors,
transformers Production of edible fats and oils (other than hydrogenated oil) Manufacture and repair work of goods not assignable to any other group Manufacture of electric machinery and apparatus, appliances not specified Processing of tea in factories Manufacture of cement and cement products Manufacturing of cotton, cordage, rope and twine Manufacture of hosiery and other knitted fabrics and garments Manufacture and assembling of prime mover and boilers other than electrical
equipment Manufacturing motor vehicles engines· parts and accessories Processing of coffee in curing works Printing and publishing of books Manufacture of fertilizers Currying, tanning and finishing of hides and skins and preparation of finished
leather Manufacture of medicines, pharmaceutical preparations and other toilet
preparations except soap
Manufacture of aluminium products Weaving of silk textile by powerloom Manufacture of metal products (other than of iron, brass, bell metal and
aluminium) such as tin can
Manufacture of tyres and tubes
26,232
22,111 18,291
16,512 14,836
11,145
10,601
9,230
7,670
6,129
4,970
4,738
4,429
3,877 3,822
3,718
3,587
3,127
3,101
2,801
2,502 2,103
2,091
2,044
1,925
1,917
1,674 1,600
1,570
1,566 1,517
393 Manufacture of jewellery, silverware and wares using gold other precious
363 368
metals Manufacture of structural steel products such as joist, rail, sheet Enamelling, galvanising, plating (including electroplating) polishing and welding
of metal products
H-35
1,475
1,465
1,390
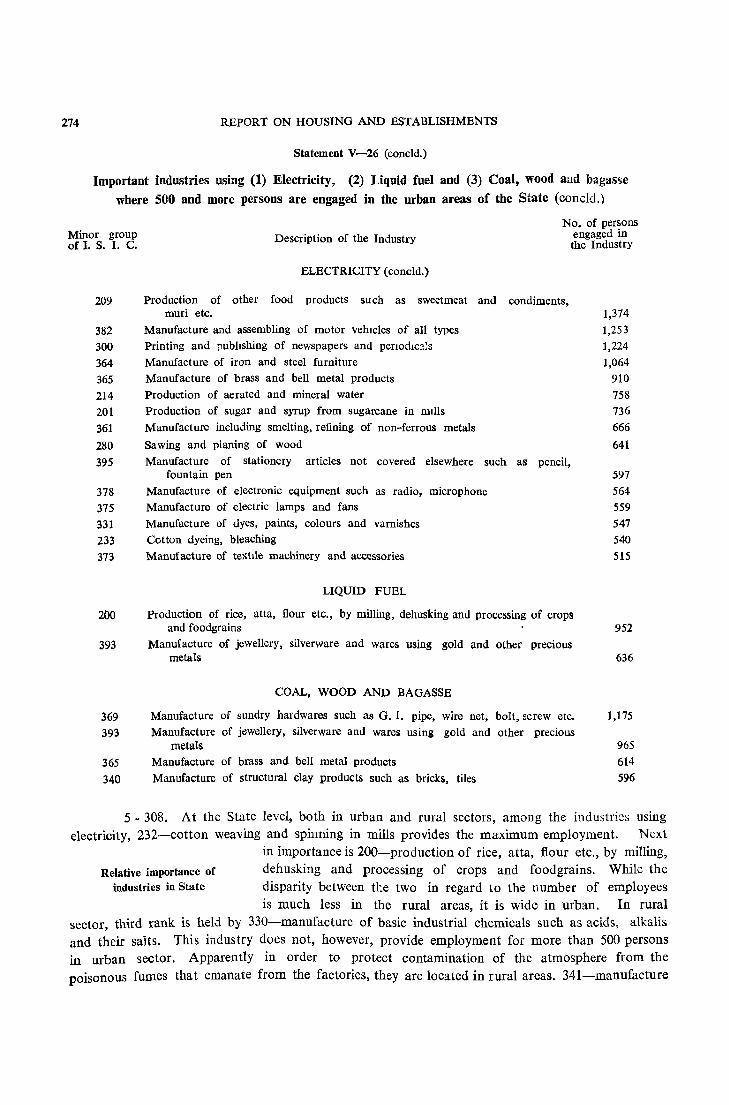
274 REPORT ON HOUSING AND ESTABLISHMENTS
Statement V-26 (concld.)
Important industries using (1) Electricity, (2) Liquid fuel and (3) Coal, wood and bagasse
where 500 and more persons are engaged in the urban areas of the State (coneld.)
Minor group of I. S. I. C.
Description of the Industry No. of persons
engaged in the Industry
ELECTRICITY (coneld.)
209 Production of other food products such as sweetmeat and condiments,
382 300 364 365 214 201 361
280 395
378 375 331 233 373
200
393
369
393
365 340
muri etc. Manufacture and assembling of motor vehicles of all types Printing and publIshing of newspapers and penodlc:!!S Manufacture of iron and steel furniture Manufacture of brass and bell metal products Production of aerated and mineral water Production of sugar and syrup from sugarcane in mills Manufacture including smelting, refining of non-ferrous metals
Sawing and planing of wood Manufacture of stationery articles not covered elsewhere such as pencil,
fountain pen Manufacture of electronic equipment such as radio, microphone Manufacture of electric lamps and fans Manufacture of dyes, paints, colours and varnishes Cotton dyeing, bleaching Manufacture of textile machinery and accessories
LIQUID FUEL
Production of rice, atta, flour etc., by milling, dehusking and processing of crops and foodgrains
Manufacture of jewellery, silverware and wares using gold and other precious metals
COAL, WOOD AND BAGASSE
Manufacture of sundry hardwares such as G. I. pipe, wire net, bolt, screw etc. Manufacture of jewellery, silverware and wares using gold and other precious
metals Manufacture of brass and bell metal products Manufacture of structural clay products such as bricks, tiles
1,374 1,253 1,224 1,064
910 758 736 666 641
597 564 559 547 540 515
952
636
1,175
965 614 596
5 - 308. At the State level, both in urban and rural sectors, among the industries using electricity, 232-cotton weaving and spinning in mills provides the maximum employment. Next
Relative importance of industries in State
in importance is 200-production of rice, atta, flour etc., by milling, dehusking and processing of crops and foodgrains. While the disparity between tl:e two in r-egard to the number of employees is much less in the rural areas, it is wide in urban. In rural
sector, third rank is held by 330-manufacture of basic industrial chemicals such as acids, alkalis and their salts. This industry does not, however, provide employment for more than 500 persons in urban sector. Apparently in order to protect contamination of the atmosphere from the poisonous fumes that emanate from the factories, they are located in rural areas. 341-manufacture
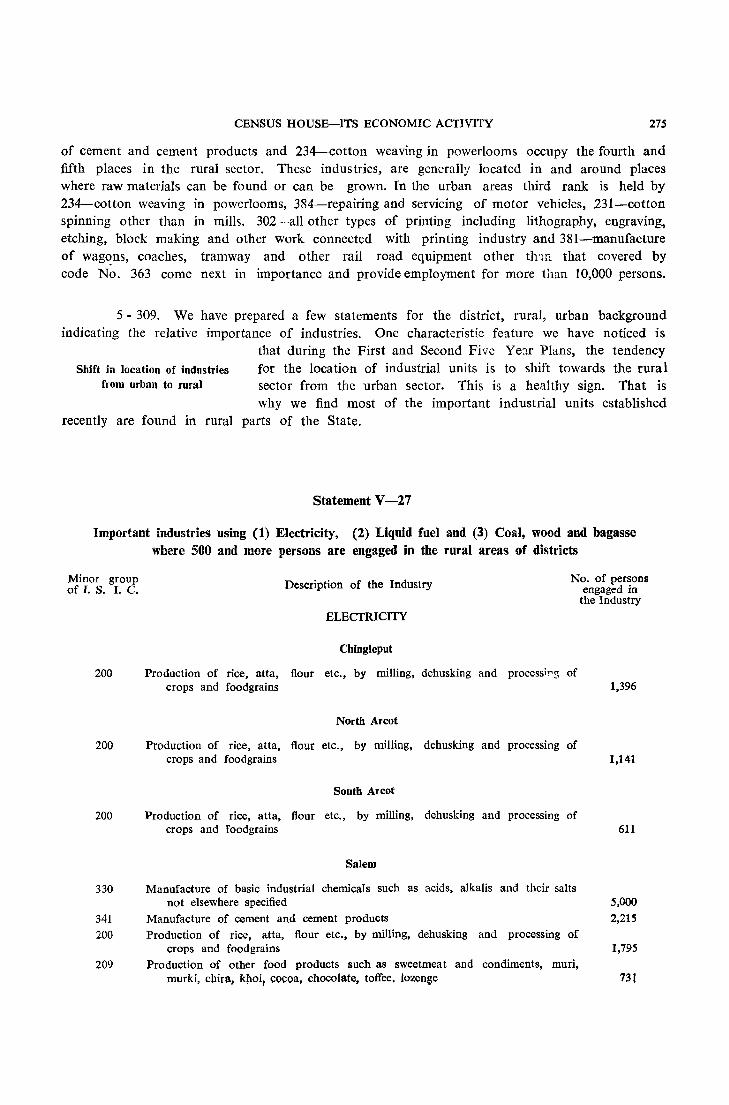
CENSUS HOUSE-ITS ECONOMIC ACTIVITY 275
of cement and cement products and 234-cotton weaving in powerlooms occupy the fourth and fifth places in the rural sector. These industries, are generally located in and around places where raw materials can be found or can be grown. In the urban areas third rank is held by 234-cotton weaving in powerlooms, 384-repairing and servicing of motor vehicles, 231-cotton spinning other than in mills. 302-all other types of printing including lithography, engraving, etching, block making and other work connected with printing industry and 381-manufacture of wag~ns, coaches, tramway and other rail road equipment other thin that covered by code No. 363 come next in importance and provide employment for more than 10,000 persons.
5 - 309. We have prepared a few statements for the district, rural, urban background indicating the relative importance of industries. One characteristic feature we have noticed is
that during the First and Second Five Year Plans, the tendency Shift in location of industries for the location of industrial units is to shift towards the rural
from urban to rural sector from the urban sector. This is a healthy sign. That is why we find most of the important industrial units established
recently are found in rural parts of the State.
Statement V -27
Important industries using (1) Electricity, (2) Liquid fuel and (3) Coal, wood and bagasse where 500 and more persons are engaged in tbe rural areas of districts
Minor group of I. S. I. C.
200
200
200
330
341
200
209
Description of the Industry No. of persons engaged in
the Industry ELECTRICITY
Cbingleput
Production of rice, atta, flour etc., by milling, dehusking and processif'g of crops and foodgrains
North Arcot
Production of rice, atta, flour etc., by milling, dehusking and processing of crops and foodgrains
Soutb Arcot
Production of rice, atta, flour etc., by milling, dehusking and processing of crops and foodgrains
Salem
Manufacture of basic industrial chemicals such as acids, alkalis and their salts not elsewhere specified
Manufacture of cement and cement products Production of rice, atta, flour etc., by milling, dehusking and processing of
crops and food grains Production of other food products such as sweetmeat and condiments, muri,
murki, chira, kpoi, cocoa, chocolate, toffee, lozense
1,396
1,141
611
5,000
2,215
1,795
73t

276 REPORT ON HOUSING AND ESTABLISHMENTS
Statement V-27 (contd.)
Important industries using (1) Electricity, (2) Liquid fuel and (3) Coal, wood and bagasse where 500 and more persons are engaged in the rural areas of districts (eontd.)
Minor group of I. S. I. Co
232
200
231 230 234
202
217
222
234 200
200
232 201
200
341
232
341
200
200
200
Description of the Industry No. of persons
engaged in the Industry
ELECTRICITY (contd.)
Coimbatore Cotton spinning and weaving in mills
Production of rice, atta, flour etc., by milling, dehusking and processing of crops and foodgrains
Cotton spinning (other than in mills) Cotton ginning, cleaning, pressing and baling Cotton weaving in powerlooms
ProductIOn of mdigenous sugar, gur from sugarcane or palm juice and production of candy
Nilgiri Proces;;ing of tea in factories
anufacture of cigarette and cigarette tobacco
Madurai
Cotton weaving in powerlooms Production of rice, atta, flour etc., by milling, dehusking and processing of crops
and foodgrains
Timchirapalli
Production of rice, atta, flour etc., by milling, dehusking and processing of crops and food grains
Cotton spinning and weaving in mills Production of sugar and syrup from sugarcane in mills
Thanjavur
Production of rice, aUa, flour etc., by milling, dehusking and processing of crops and foodgrains
Ramanathapuram
Manufacture of cement and cement products
Tirunelveli
Cotton spinning and weaving in mIlls Manufacture of cement and cement po ducts Production of rice, atta, flour etc., by milling, dehusking and processing of crops
and fooctgrains
LIQUID FUEL
Thanjavur
Production of rice, atta, flour etc., by milling, dehusking and processing of crops and foodgrains
Salem
Production of rice, atta, flour etc., by milling, dehusking and processing of crops and foodgrains
6,935
2,757
1,199
1,119
795
646
2,741
678
1,552
718
1,256
1,233
661
3,056
734
7,501 925
849
1,466
997
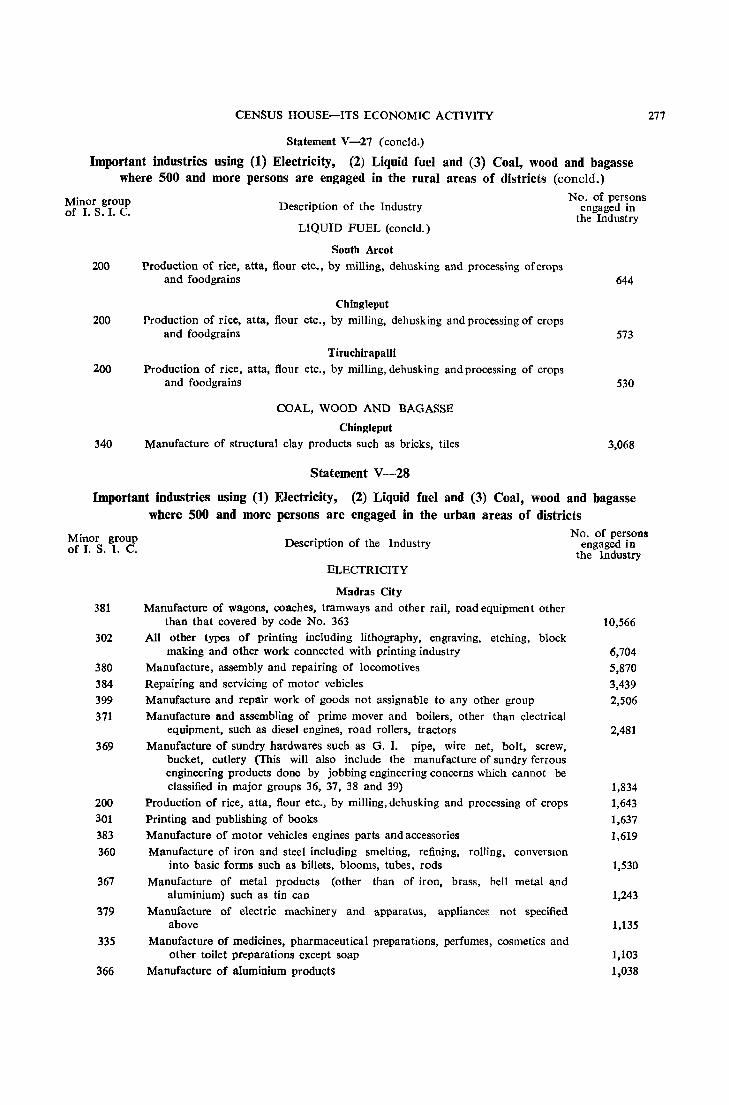
CENSUS HOUSE-ITS ECONOMIC ACTIVITY
Statement V-27 (coneld.)
Important industries using (1) Electricity, (2) Liquid fuel and (3) Coal, wood and bagasse where 500 and more persons are engaged in the rural areas of districts (coneld.)
Minor group of I. S. I. C.
200
200
200
340
Description of the Industry
LIQUID FUEL (coneld.)
South Arcot Production of rice, atta, flour etc., by milling, dehusking and processing of crops
and foodgrains
Chingleput
Production of rice, atta, flour etc., by milling, dehusking and processing of crops and foodgrains
TiruchirapalJi Production of rice, atta, flour etc., by milling, dehusking and processing of crops
and food grains
COAL, WOOD AND BAGASSE
Chingleput Manufacture of structural clay products such as bricks, tiles
Statement V -28
No. of persons engaged in
the Industry
644
573
530
3,068
Important industries using (1) Electricity, (2) Liquid fuel and (3) Coal, wood and bagasse where 500 and more persons are engaged in the urban areas of districts
Minor group of I. S. 1. C.
381
302
380
384 399
371
369
200 301
383 360
367
379
335
366
Description of the Industry
ELECTRICITY
Madras City Manufacture of wagons, coaches, tramways and other rail, road equipment other
than that covered by code No. 363 All other types of printing including lithography, engraving, etching, block
making and other work connected with printing industry Manufacture, assembly and repairing of locomotives Repairing and servicing of motor vehicles Manufacture and repair work of goods not assignable to any other group
Manufacture and assembling of prime mover and boilers, other than electrical equipment, such as diesel engines, road rollers, tractors
Manufacture of sundry hardwares such as G. I. pipe, wire net, bolt, screw, bucket, cutlery (This will also include the manufacture of sundry ferrous engineering products done by jobbing engineering concerns which cannot be classified in major groups 36, 37, 38 and 39)
Production of rice, atta, flour etc., by milling, dehusking and processing of crops Printing and publishing of books Manufacture of motor vehicles engines parts and accessories Manufacture of iron and steel ineluding smelting, refining, rolling, converSIOn
into basic forms such as billets, blooms, tubes, rods
Manufacture of metal products (other than of iron, brass, bell metal and aluminium) such as tin can
Manufacture of electric machinery and apparatus, appliances not specified above
Manufacture of medicines, pharmaceutical preparations, perfumes, cosmetics and other toilet preparations except soap
Manufacture of aluminium products
No. of persons engaged in
the Industry
10,566
6,704
5,870
3,439
2,506
2,481
1,834
1,643 1,637
1,619
1,530
1,243
1,135
1,103
1,038
277

278 REPORT ON. HOUSING AND ESTABLISHMENTS
Statement V-28 (contd.)
Important industries using (1) Electricity, (2) Liquid fuel and (3) Coal, wood and bagasse where 500 and more persons are engaged in the urban areas of districts (contd )
Minor group of I. S. I C. Description of the Industry
No. of persons engaged in the Industry
ELECTRICITY (contd.) 364 Manufacture of iron and steel fumitures 382
300 207 393
361
363 368
331 375
379 334 320 384 310
200
302
369
360
200
332 239
200
200
234
263 374
384 ·232
Manufacture and assembling of motor vehicles of all types (excepting motor engines)
Printing and publishing of newspapers and periodicals Production of edible fats and oils (other than hydrogenated oil) Manufacture of Jewellery, silverwares and wares using gold and other precious
metals Manufacture including smelting, refining of non-ferrous metals and alloys in
basic forms Manufacture of structural steel products such as joist, rail, sheet, plate Enamelling, galvanising, plating (including electro-plating) polishing and
welding of metal products Manufacture of dyes, paints, colours and varnishes Manufacture of electric lamps and fans
Chingleput Manufacture of electric machinery and apparatus, appliances not specified above Manufacture of matches Manufacture of tyres and tubes Repairing and servicing of motor vehicles Currying, tanning and finishing of hides and skins and preparation of
fimshed leather Production of rice, atta, flour etc., by milling, dehusking and processing of crops
and food grains All other types of printing including lithography, engraving, etching, block
making and other work connected with printing industry Manufacture of sundry hardwares such as G. 1. pipe, wire net, bolt, screw,
bucket, cutlery (ThlS will also include the manufacture of sundry ferrous engineering products done by jobbing engineering concerns which cannot be classified in major groups 36, 37, 38 and 39)
North Arcot Manufacture of iron and steel includmg smelting, refining, rolling, conversion
mto basic forms such as billets, blooms, tubes, rods Production of rice, atta, flour etc., by miIitng, dehusking and processing of
crops Manufacture of fertilizers Manufacturing of cotton, cordage, rope and twine
South Areot Production of rice, atta, flour etc., by milling, dehusking and proceSSing of crops
and foodgrams Salem
Production of rice, atta, flour etc., by mIlling, dehusking and processing of crops and food grains
Cotton weaving in powerlooms Weaving of silk textile by powerloom Manufacture of heavy electrical machinery and equipment such as motors,
generators, transformers Repairing and servicing of motor vehicles Cotton spinning and weaving in mills
1,001
965 751 737
683
634 630
524
536 513
2,039 1.842
994 932
907
883
631
558
2,982
1,634 1,450
1,285
660
1,996 1,981
1,328
868 843 714
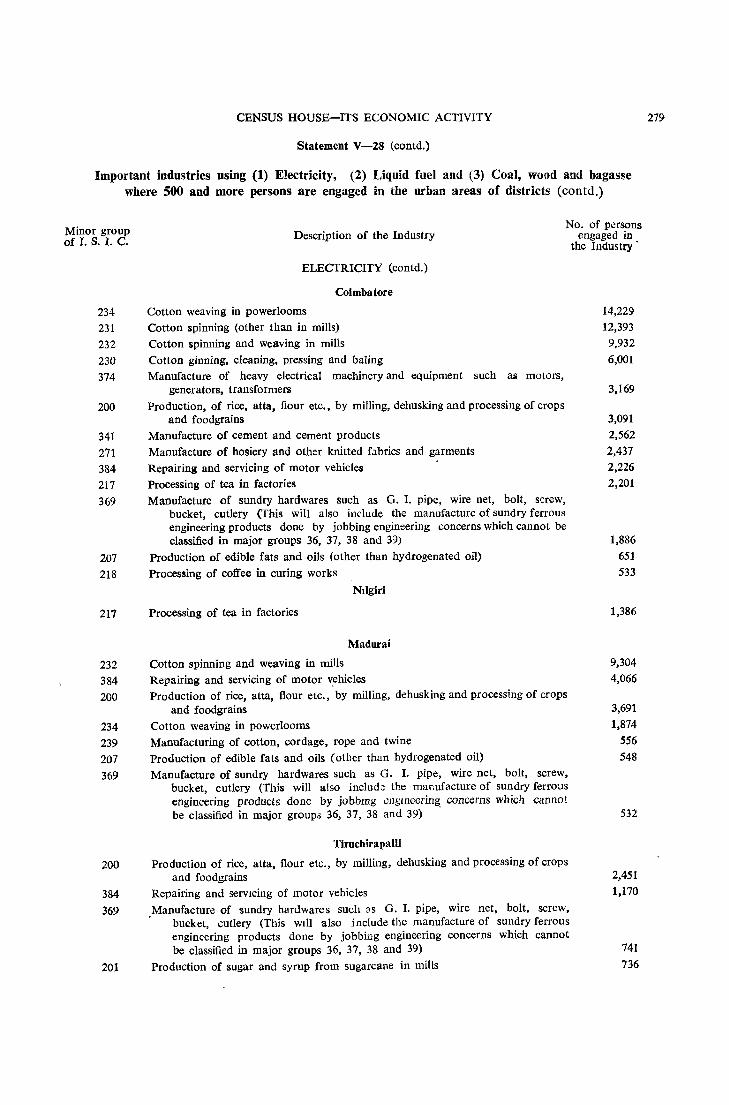
CENSUS HOUSE-ITS ECONOMIC ACTIVITY
Statement V-2S (contd.)
Important industries using (1) Electricity, (2) Liquid fuel and (3) Coal, wood and bagasse where 500 and more persons are engaged in the urban areas of districts (contd.)
Minor group of 1. S. I. C.
234 231 232 230 374
200
341 271 384 217 369
207 218
217
232 384 200
234 239 207 369
200
384
369
201
Description of the Industry No. of persons
engaged in the Industry'
ELECTRICITY (contd.)
Coimbatore
Cotton weaving in powerlooms Cotton spinning (other than in mills) Cotton spinning and weaving in mills Cotton ginning, cleaning, pressing and baling Manufacture of heavy electrical machinery and equipment such as motors,
generators, transformers Production, of rice, atta, flour etc., by milling, dehusking and processing of crops
and food grains Manufacture of cement and cement products Manufacture of hosiery and other knitted fabrics and garments Repairing and servicing of motor vehicles Processing of tea in factories Manufacture of sundry hardwares such as G. 1. pipe, wire net, bolt, screw,
bucket, cutlery (This will also indude the manufacture of sundry ferrous engineering products done by jobbing engineering concerns which cannot be classified in major groups 36, 37, 38 and 39)
Production of edible fats and oils (other than hydrogenated oil)
Processing of coffee in curing works
Ndgiri
Processing of tea in factories
Madurai
Cotton spinning and weaving in mills Repairing and servicing of motor v_ehicles Production of rice, atta, flour etc., by milling, dehusking and processing of crops
and foodgrains Cotton weaving in powerloorns Manufacturing of cotton, cordage, rope and twine Production of edible fats and oils (other than hydrogenated oil) Manufacture of sundry hardwares such as G. I. pipe, wire net, bolt, screw,
bucket, cutlery (This will also incIud~ the manufacture of sundry ferrous engineering products done by jobbmg engIneering concerns which cannot be classified in major groupa 36, 37, 38 and 39) .
Tiruchira paUi
Production of rice, atta, flour etc., by milling, dehusking and processing of crops and foodgrains
Repairing and serVicing of motor vehicles Manufacture of sundry hardwares such 3S G. I. pipe, wire net, bolt, screw, , bucket, cutlery (This Will also include the manufacture of sundry ferrous
engineering products done by jobbing engineering concerns which cannot be classified in major groups 36, 37, 38 and 39)
Production of sugar and syrup from sugarcane in mills
14,229 12,393 9,932
6,001
3,169
3,091 2,562 2,437 2,226 2,201
1,886 651 533
1,386
9,304 4,066
3,691 1,874
556
548
532
2,451 1,170
741
736
279
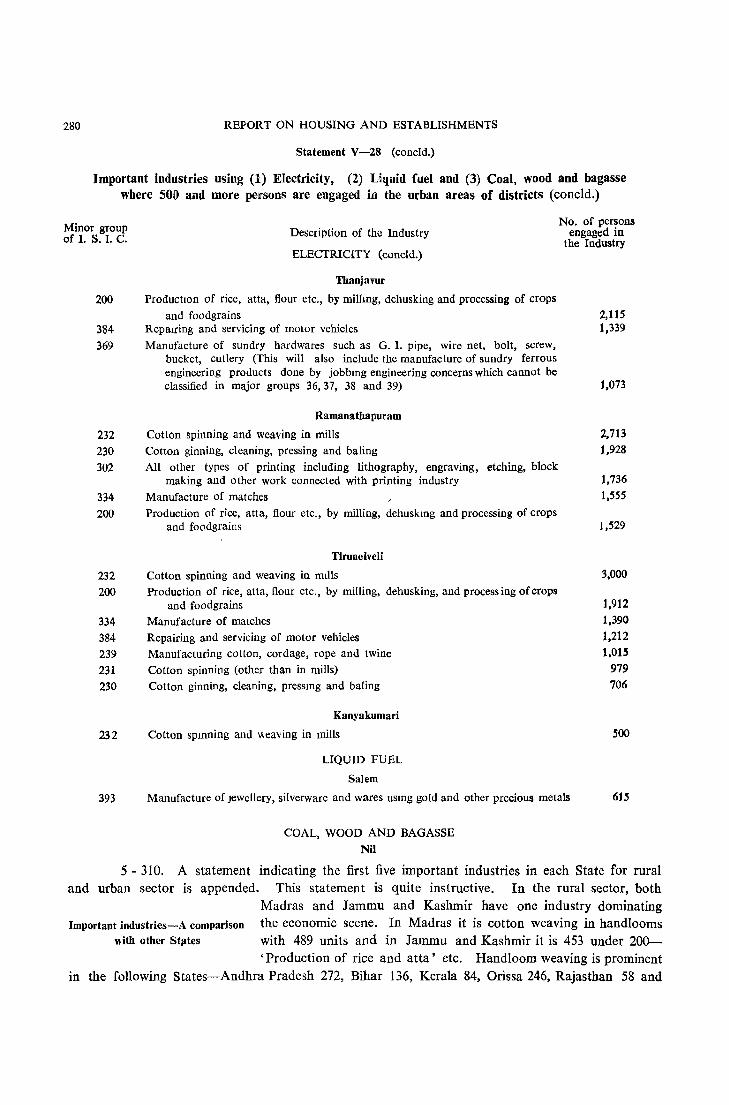
280 REPORT ON HOUSING AND ESTABLISHMENTS
Statement V-2S (concld.)
Important industries using (1) Electricity, (2) Liquid fuel and (3) Coal, wood and bagasse where 500 and more persons are engaged in the urban areas of districts (concld.)
Minor group of I. S. I. C. Description of the Industry
ELECTRICITY (concld.)
No. of persons engaged in
the Industry
Tbanjavur
200 ProductIOn of rice, atta, flour etc., by millmg, dehusking and processing of crops
384
369
232
230
302
334 200
232
200
334 384 239
231
230
232
393
and foodgrains Repairing and servicing of motor vehicles Manufacture of sundry hardwares such as G. 1. pipe, wire net. bolt, screw,
bucket, cutlery (This will also include the manufacture of sundry ferrous engineering products done by jobbmg engineering concerns which cannot be classified in major groups 36,37, 38 and 39)
Ramanathapuram
Cotton spinning and weaving in mills Cotton ginning, cleaning, pressing and baling All other types of printing including lithography, engraving, etching, block
making and other work connected with printing industry Manufacture of matches Production of rice, atta, flour etc., by milling, dehuskmg and processing of crops
and foodgrains
Tirunelveli
Cotton spinning and weaving in mtlls Production of rice, atta, flour etc., by milling, dehusking, and process ing of crops
and foodgrains Manufacture of matches Repairing and servicing of motor vehicles Manufacturing cotton, cordage, rope and twine Cotton spinning (other than in mills) Cotton ginning, cleaning, pressmg and baling
Kanyakumari
Cotton spmning and \\eaving in mills
LIQUID FUEL
Salem
Manufacture of Jewellery, silverware and wares usmg gold and other precious metals
COAL, WOOD AND BAGASSE Nil
2,115 1,339
1,073
2,713
1,928
1,736
1,555
1,529
3,000
1,912
1,390
1,212
1,015
979
706
500
615
5 - 310. A statement indicating the first five important industries in each State for rural
and urban sector is appended. This statement is quite instructive. In the rural sector, both
Madras and Jammu and Kashmir have one industry dominating
Important industries-A comparison the economic scene. In Madras it is cotton weaving in handlooms ",itb other Stlltes with 489 units and in Jammu and Kashmir it is 4S3 under 200-
'Production of rice and atta' etc. Handloom weaving is prominent
in the following States-Andhra Pradesh 272, Bihar 136, Kerala 84, Orissa 246, Rajasthan S8 and
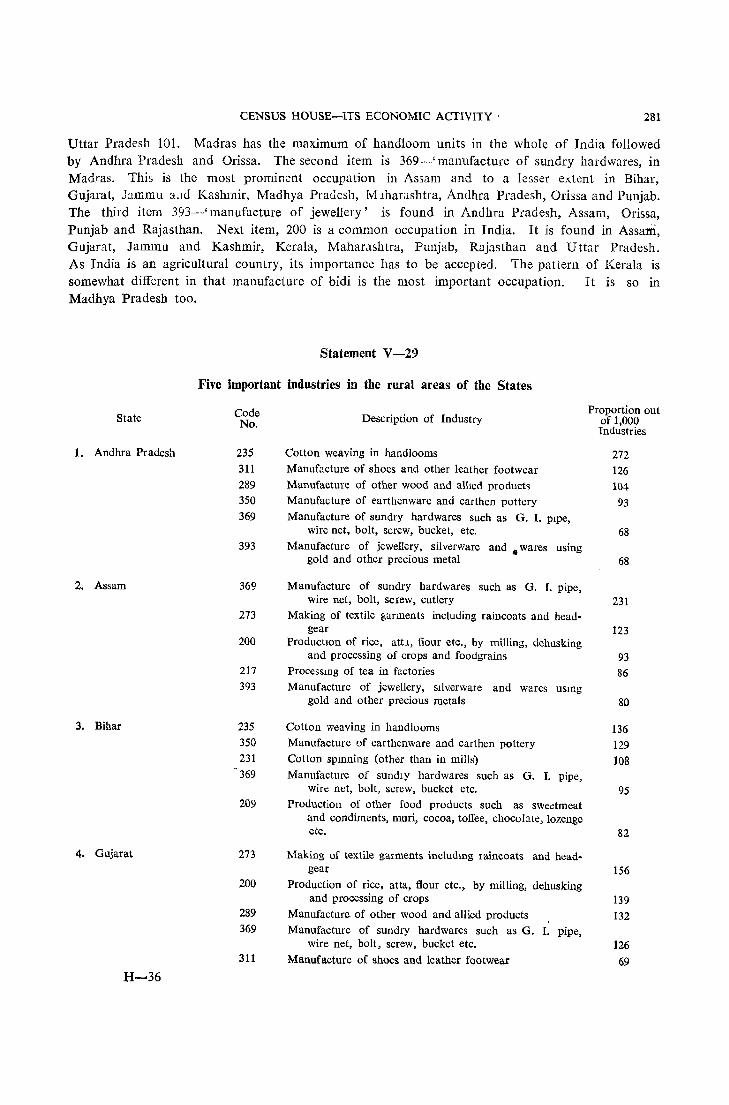
CENSUS HOUSE-ITS ECONOMIC ACTIVITY , 281
Uttar Pradesh 101. Madras has the maximum of handloom units in the whole of India followed by Andhra Pradesh and Orissa. The second item is 369-' manufacture of sundry hard wares, in Madras. This is the most prominent occupation in Assam and to a lesser extent in Bihar, Gujarat, hmmu a.ld Kashmir, Madhya Pradesh, Mlharashtra, Andhra Pradesh, Orissa and Punjab. The third item 393-' manufacture of jewellery' is found in Andhra Pradesh, Assam, Orissa, Punjab and Rajasthan. Next item, 200 is a common occupation in India. It is found in Assam, Gujarat, Jammu and Kashmir, Kerala, Mahar.lshtra, Punjab, Rajasthan and Uttar Pradesh. As India is an agricultural country, its importance has to be accepted. The pattern of Kerala is somewhat different in that manufacture of bidi is the most important occupation. It is so in Madhya Pradesh too.
State
1. Andhra Pradesh
2. Assam
3. Bihar
4. Gujarat
H-36
Statement V -29
Five important industries in the rural areas of the States
Code No.
235 311
289 350 369
393
369
273
200
217 393
235 350
231 369
209
273
200
289 369
311
Description of Industry
Cotton weaving in handlooms
Manufacture of shoes and other leather footwear Manufacture of other wood and allied products Manufacture of earthenware and earthen pottery Manufacture of sundry hardwares such as G. I. pIpe,
wire net, bolt, screw, bucket, etc. Manufacture of jewellery. silverware and" wares using
gold and other precious metal
Manufacture of sundry hardwares such as G. I. pipe, wire net, bolt, screw, cutlery
Making of textile garments including raincoats and headgear
Producllon of rice, attl, flour etc., by milling, dehusking and processing of crops and foodgrains
Processmg of tea in factories Manufacture of jewellery, SIlverware and wares usmg
gold and other precious metals
Cotton weaving in handlooms Manufacture of earthenware and earthen pottery Cotton splllning (other than in mills)
Manufacture of SUridlY hard wares such as G. I. pipe, wire net, bolt, screw, bucket etc.
Production of other food products such as sweetmeat and condiments, muri, cocoa, toffee, chocolate, lozenge etc.
Making of textile garments includmg raincoats and headgear
Production of rice, aHa, flour etc., by milling, dehusking and processing of crops
Manufacture of other wood and allied products Manufacture of sundry hardwares such as G. I. pipe,
wire net, bolt, screw, bucket etc.
Manufacture of shoes and leather footwear
Proportion out of 1,000 Industries
272
126 104
93
68
68
231
123
93 86
80
136 129 108
95
82
156
139 132
126 69
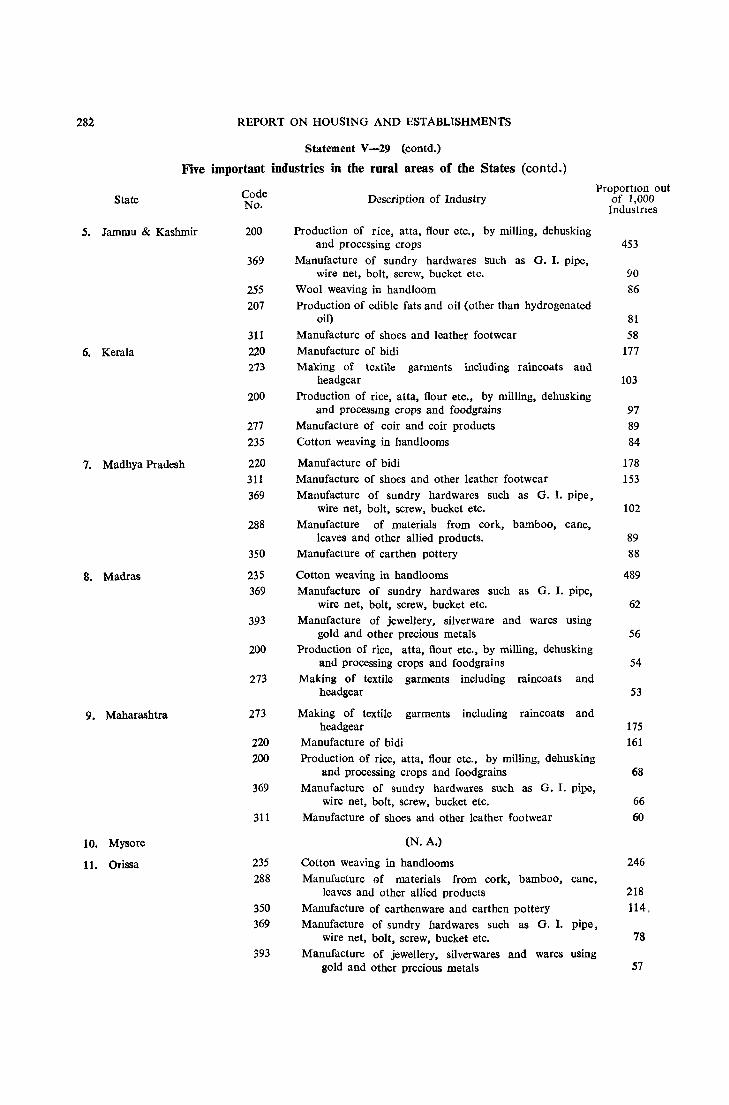
282 REPORT ON HOUSING AND ESTABLISHMENTS
Statement V-29 (contd.)
Five important industries in the rural areas of the States (contd.)
State
5. Jammu & Kashmir
6. Kerala
7. Madhya Pradesh
8. Madras
9. Maharashtra
10. Mysore
11. Orissa
Code No.
200
369
255 207
311 220 273
200
277 235
220 311 369
288
350
235 369
393
200
273
273
220 200
369
311
235 288
350 369
393
ProportIon out Description of Industry of 1,000
Industnes
Production of rice, atta, flour etc., by milling, dehusking and processing crops 453
Manufacture of sundry hardwares such as G. I. pipe, wire net, bolt, screw, bucket etc. 90
Wool weaving in handloom 86 Production of edible fats and oil (other than hydrogenated
oil) 81
Manufacture of shoes and leather footwear 58 Manufacture of bidi 177 Making of textile garments including raincoats and
headgear
Production of rice, atta, flour etc., by milling, dehusking and processmg crops and foodgrains
Manufacture of coir and coir products Cotton weaving in handlooms
Manufacture of bidi Manufacture of shoes and other leather footwear Manufacture of sundry hardwares such as G. I. pipe,
wire net, bolt, screw, bucket etc. Manufacture of materials from cork, bamboo, cane,
leaves and other allied products. Manufacture of earthen pottery
Cotton weaving in handlooms Manufacture of sundry hard wares such as G. I. pipe,
wire net, bolt, screw, bucket etc. Manufacture of jewellery, silverware and wares using
gold and other precious metals Production of rice, atta, flour etc., by milling, dehusking
and processing crops and foodgrains Making of textile garments including raincoats and
headgear
Making of textile garments including raincoats and headgear
Manufacture of bidi Production of rice, atta, flour etc., by milling, dehusking
and processing crops and foodgrains Manufacture of sundry hardwares such as G. 1. pipe,
wire net, bolt, screw, bucket etc. Manufacture of shoes and other leather footwear
(N. A.)
Cotton weaving in handlooms Manufacture of materials from cork, bamboo, cane,
leaves and other allied products Manufacture of earthenware and earthen pottery Manufacture of sundry hardwares such as G. I. pipe,
wire net, bolt, screw, bucket etc. Manufacture of jewellery, silverwares and wares using
gold and other precious metals
103
97 89 84
178 153
102
89 88
489
62
56
54
53
175 161
68
66 60
246
218 114.
78
57
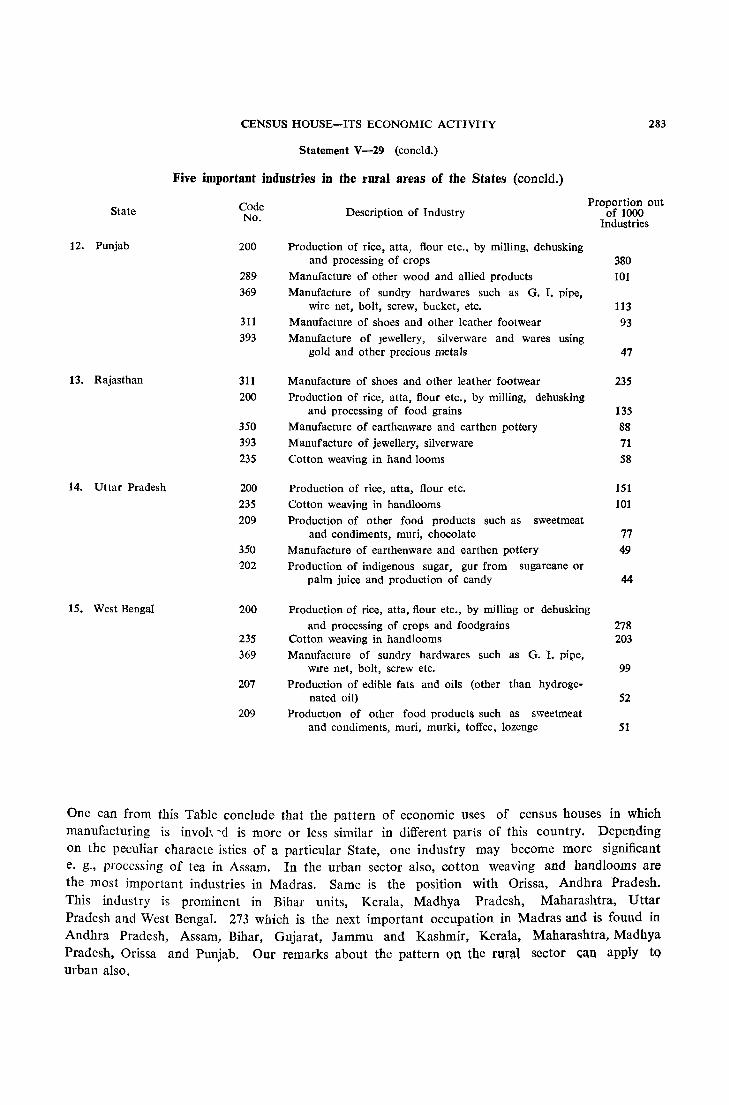
State
12. Punjab
13. Rajasthan
14. Uttar Pradesh
15. West Bengal
CENSUS HOUSE-ITS ECONOMIC ACTIVITY
Statement V-29 (coneld.)
Five important industries in the rural areas of the States (concld.)
Code No.
200
289 369
311
393
311
200
350 393 235
200 235 209
350 202
Description of Industry
production of rice, atta, flour etc., by milling, dehusking and processing of crops
Manufacture of other wood and allied products Manufacture of sundry hardwares such as G. I. pipe,
wire net, bolt, screw, bucket, etc. Manufacture of shoes and other leather footwear Manufacture of Jewellery, silverware and wares using
gold and other precious metals
Manufacture of shoes and other leather footwear Production of rice, atta, flour etc., by milling, dehusking
and processing of food grains Manufacture of earthenware and earthen pottery Manufacture of jewellery, silverware Cotton weaving in hand looms
Production of rice, atta, flour etc. Cotton weaving in handlooms Production of other food products such as sweetmeat
and condiments, muri, chocolate Manufacture of earthenware and earthen pottery Production of indigenous sugar, gur from sugarcane or
palm juice and production of candy
283
Proportion out of 1000
Industries
380 101
113
93
47
235
135 88 71 58
151 101
77 49
44
200 Production of rice, atta, flour etc., by milling or dehusking and processing of crops and foodgrains 278
203 235 369
207
209
Cotton weaving in handlooms Manufacture of sundry hardwares such as G. I. pipe,
wIre net, bolt, screw etc. Production of edible fats and oils (other than hydroge
nated oil) ProductIOn of other food products such as sweetmeat
and condiments, muri, murki, toffee, lozenge
99
52
51
One can from this Table conclude that the pattern of economic uses of census houses in which manufacturing is invoh'd is more or less similar in different parts of this country. Depending on the peculiar characte istics of a particular State, one industry may become more significant e. g., processing of tea in Assam. In the urban sector also, cotton weaving and handlooms are the most important industries in Madras. Same is the position with Orissa, Andhra Pradesh. This industry is prominent in Bihar units, Kerala, Madhya Pradesh, Maharashtra, Uttar Pradesh and West Bengal. 273 which is the next important occupation in Madras and is found in Andhra Pradesh, Assam, Bihar, Gujarat, Jammu and Kashmir, Kerala, Maharashtra, Madhya Pradesh, Orissa and Punjab. Our remarks about the pattern on the :f\~ral sector can apply to urban also.
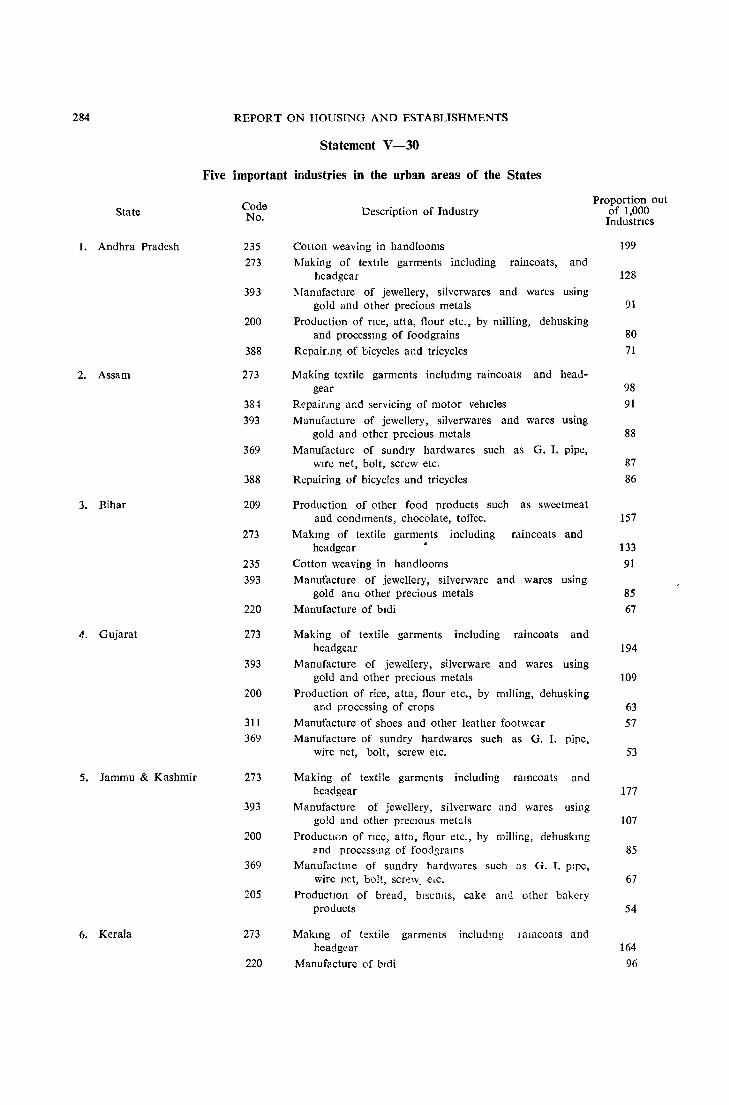
284
State
1. Andhra Pradesh
2. Assam
3. Bihar
4. Gujarat
5. Jammu & Kashmir
6. Kerala
REPOR T ON HOUSING AND EST ABLlSHMENTS
Statement V-30
Five important industries in the urban areas of the States
Code No.
235 273
393
200
388
273
381
393
369
388
209
273
235 393
220
273
393
200
311
369
273
393
200
369
205
273
220
Description of Industry
Cotton weaving in hand looms
Making of textile garments including raincoats, and headgear
Manufacture of jewellery, silverwares and wares using gold and other precious metals
Production of nce, atta, flour etc., by milling, dehusking and processing of foodgrains
RepairIng of bicycles and tricycles
Making textile garments includIng raincoats and headgear
Rcpairmg and servicing of motor vehicles
Manufacture of jewellery, silverwares and wares using gold and other precious metals
Manufacture of sundry hardwares such as G. I. pipe, wire net, bolt, screw etc.
Repairing of bicycles and tricycles
Production of other food products such as sweetmeat and condiments, chocolate, toffee.
MakIng of textile garments including raincoats and headgear
Cotton weaving in handlooms
Manufacture of jewellery, silverware and wares using gold and other precious metals
Manufacture of bldi
Making of textile garments including raincoats and headgear
Manufacture of jewellery, silverware and wares using gold and other precious metals
Production of rice, atta, flour etc., by milling, dehusking and processing of crops
Manufacture of shoes and other leather footwear Manufacture of sundry hardwares such as G. I. pipe,
wire net, bolt, screw etc.
Making of textile garments including raIncoats and headgear
Manufacture of jewellery, silverwarc and wares using gold and other precIOus metals
ProductIOn of nce, atta, flour etc., by milling, dehuskmg ,llld proccssmg of food~rams
Manufactme of sundry bardwares such as G. I. pipe, wire net, bolt, screw, eLC.
ProductIOn of bread, biSCUits, cake and other bakery products
MakIng of textile garments includmg IaIncoats and headgear
Manufacture of bldi
Proportion out of 1,000 Industries
199
128
91
80
71
98 91
88
87 86
157
133 91
85
67
194
109
63
57
53
177
107
85
67
54
164
96
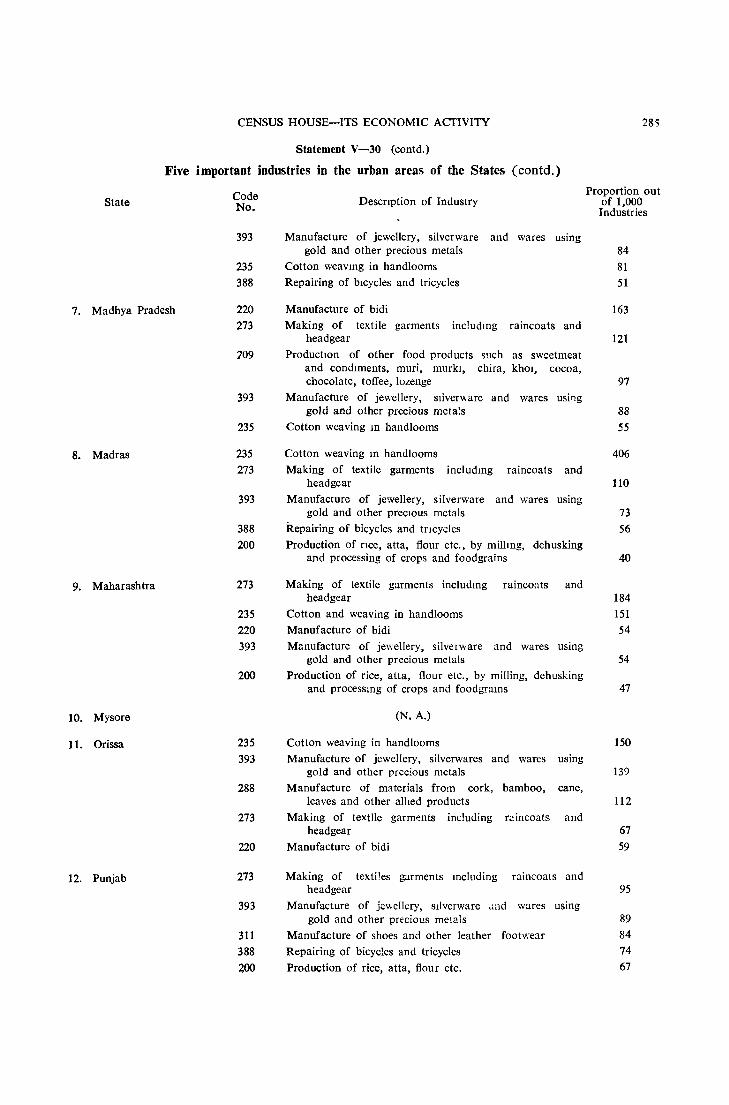
CENSUS HOUSE-ITS ECONOMIC ACTIVITY
Statement V-30 (contd.)
Five important industries in the urban areas of the States (contd.)
State
7. Madhya Pradesh
8. Madras
9. Maharashtra
10. Mysore
11. Orissa
12. Punjab
Code No.
393
235
388
220
273
709
393
235
235
273
393
388
200
273
235
220
393
200
235
393
288
273
220
273
393
311
388
200
Descnption of Industry
Manufacture of jewellery, silverware and wares using gold and other precious metals
Cotton weaving in hand looms
Repairing of bicycles and tricycles
Manufacture of bidi
Making of textile garments includmg raincoats and headgear
ProductIOn of other food products such as sweetmeat and condiments, muri, murkl, chira, khol, cocoa, chocolate, toffee, lozenge
Manufacture of jewellery, silverware and wares using gold and other precious meta~s
Cotton weaving In handlooms
Cotton weaving In handlooms
Making of textile garments including raincoats and headgear
Manufacture of jewellery, silverware and wares using gold and other precIOus metals
Repairing of bicycles and tflcycles
Production of nce, atta, flour etc., by millIng, dehusking and processing of crops and food grains
Making of textile garments including raincoats and headgear
Cotton and weaving in handlooms
Manufacture of bidi
Manufacture of jewellery, silverware and wares using gold and other precious metals
Production of rice, atta, flour etc., by milling, dehusking and processmg of crops and foodgrams
(N. A.)
Cotton weaving in handlooms Manufacture of jewellery, silverwares and wares using
gold and other precious metals
Manufacture of materials from cork, bamboo, cane, leaves and other allied products
Making of textile garm~nts including raincoats and headgear
Manufacture of bidi
Making of textiles garments mcluding raincoats and headgear
Manufacture of je'.'ellery, Silverware "nd wares using gold and other precious metals
Manufacture of shoes and other leather footwear
Repairing of bicycles and tricycles
Production of rice, atta, flour etc.
285
Proportion out of 1,000 Industries
84
81
51
163
121
97
88 55
406
110
73
56
40
184
151
54
54
47
150
139
112
67
59
95
89
84 74
67
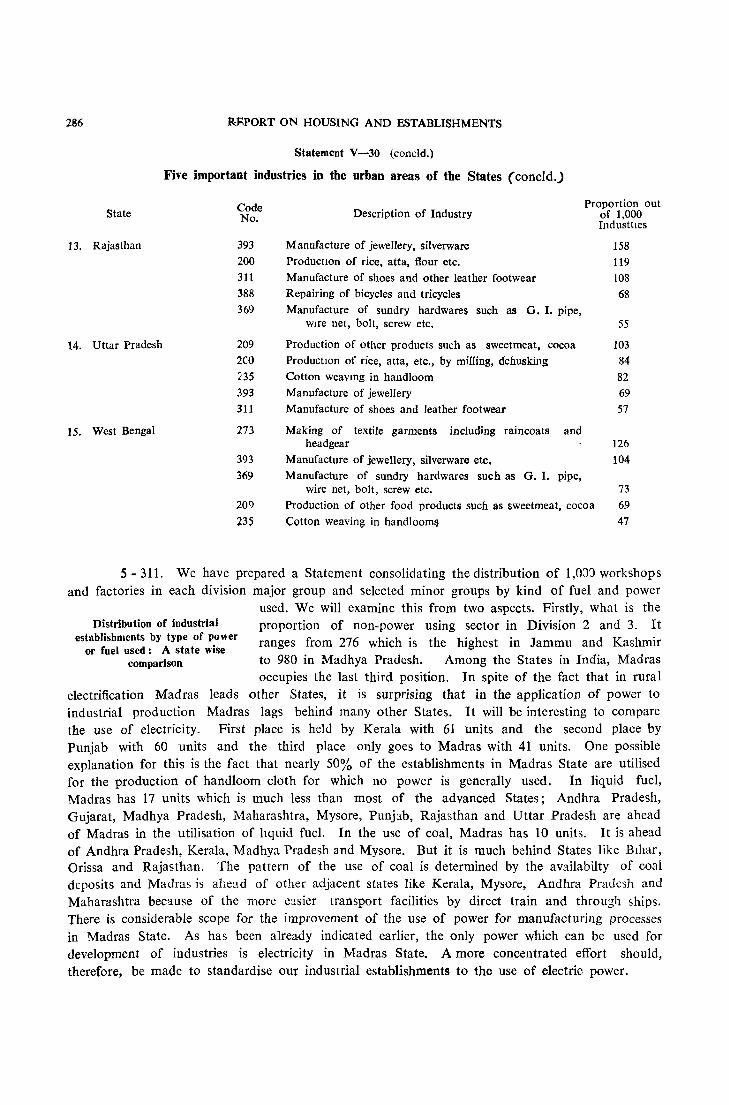
286 :R:BPORT ON HOUSING AND ESTABLISHMENTS
Statement V-30 (coneld.)
Five important industries in the urban areas of the States (concld.)
State Code No. Description of Industry
Proportion out of 1,000 IndusttJes
13. Rajasthan
14. Uttar Pradesh
15. West Bengal
393 200 311
388 369
209 2CO 235 393 311
273
393 369
209
235
Manufacture of jewellery, silverware
ProductIOn of rice, atta, flour etc.
Manufacture of shoes and other leather footwear
Repairing of bicycles and tricycles
Manufacture of sundry hardwares such as G. I. pipe, wIre net, bolt, screw etc.
Production of other products such as sweetmeat, cocoa
ProductIOn of rice, atta, etc., by milling, dehusking
Cotton weavmg in handloom Manufacture of jewellery
Manufacture of shoes and leather footwear
Making of textile garments including raincoats and headgear
Manufacture of jewellery, silverware etc.
Manufacture of sundry hardwares such as G. I. pipe, wire net, bolt, screw etc.
Production of other food products such as sweetmeat, cocoa
Cotton weaving in handlooms
158
119 108
68
55
103 84
82
69 57
126 104
73
69 47
5 - 311. We have prepared a Statement consolidating the distribution of 1,0::l~ workshops and factories in each division major group and selected minor groups by kind of fuel and power
Distribution of industrial establishments by type of power
or fuel used: A state wise comparison
used. We will examine this from two aspects. Firstly, what is the proportion of non-power using sector in Division 2 and 3. It ranges from 276 which is the highest in Jammu and Kashmir to 980 in Madhya Pradesh. Among the States in India, Madras occupies the last third position. In spite of the fact that in rural
electrification Madras leads other States, it is surprising that in the application of power to industrial production Madras lags behind many other States. It will be interesting to compare the use of electricity. First place is held by Kerala with 61 units and the second place by Punjab with 60 units and the third place only goes to Madras with 41 units. One possible explanation for this is the fact that nearly 50% of the establishments in Madras State are utilised for the production of handloom cloth for which no power is generally used. In liquid fuel, Madras has 17 units which is much less than most of the advanced States; Andhra Pradesh, Gujarat, Madhya Pradesh, Maharashtra, Mysore, Punjab, Rajasthan and Uttar Pradesh are ahead of Madras in the utilisation of liquid fuel. In the use of coal, Madras has 10 units. It is ahead of Andhra Pradesh, Kerala, Madhya Pradesh and Mysore. But it is much behind States like BIhar, Orissa and Rajasthan. The pattern of the use of coal is determined by the availabilty of coal deposits and Madras is ahead of other adjacent states like Kerala, Mysore, Andhra Pradesh and Maharashtra because of the more easier transport facilities by direct train and through ships. There is considerable scope for the improvement of the use of power for manufacturing processes in Madras State. As has been alrea<iy indicated earlier, the only power which can be used for development of industries is electricity in Madras State. A more concentrated effort should, therefore, be made to standardise our industrial establishments to the use of electric power.
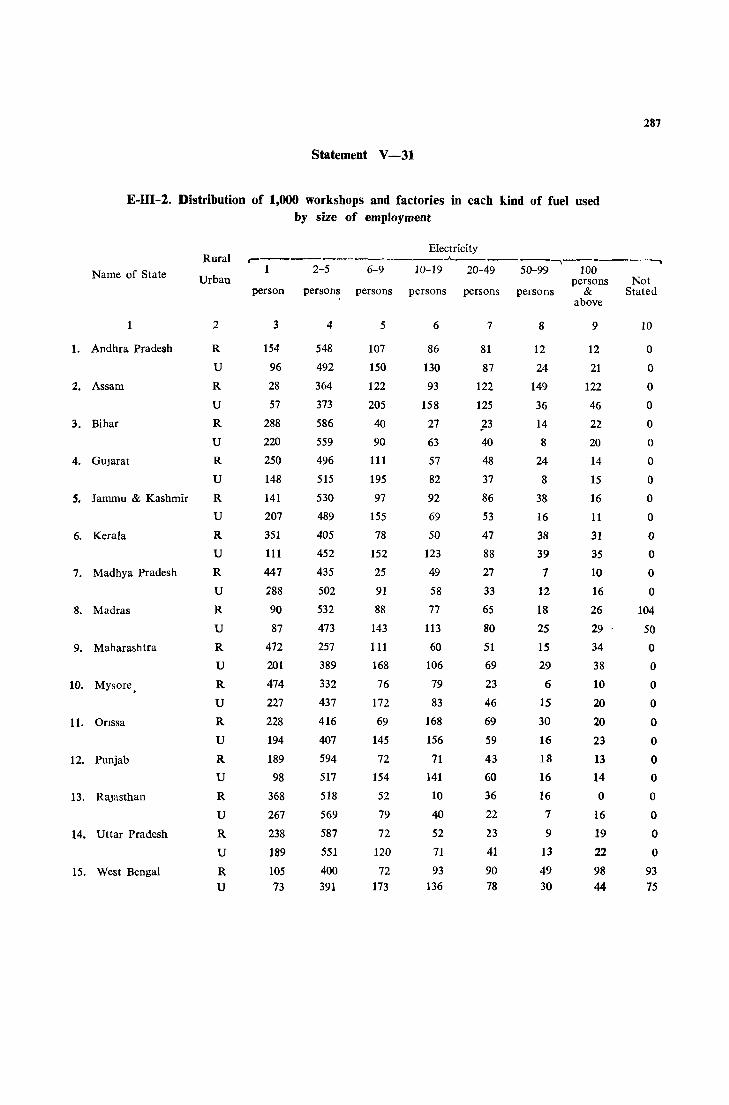
287
Statement V-31
E-III-2. Distribution of 1,000 workshops and factories in each kind of fuel used by size of employment
Rural Electricity r---------.---.A.-------,---__ ,_____._,
Name of State 1 2-5 6-9 10-19 20-49 50-99 100 Urban persons Not
person persons persons persons persons persons & Stated above
1 2 3 4 5 6 7 8 9 10
l. Andhra Pradesh R 154 548 107 86 81 12 12 0
U 96 492 150 130 87 24 21 0
2. Assam R 28 364 122 93 122 149 122 0
U 57 373 205 158 125 36 46 0
3. Bihar R 288 586 40 27 P 14 22 0
U 220 559 90 63 40 8 20 0
4. GUJarat R 250 496 111 57 48 24 14 0
U 148 515 195 82 37 8 15 0
S. Jammu & Kashmir R 141 530 97 92 86 38 16 0
U 207 489 155 69 53 16 11 0
6. Kerala R 351 405 78 50 47 38 31 0
U 111 452 152 123 88 39 35 0
7. Madhya Pradesh R 447 435 25 49 27 7 10 0
U 288 502 91 58 33 12 16 0
8. Madras R 90 532 88 77 65 18 26 104
U 87 473 143 113 80 25 29 50
9. Maharashtra R 472 257 111 60 51 15 34 0
U 201 389 168 106 69 29 38 0
10. Mysore, R 474 332 76 79 23 6 10 0
U 227 437 172 83 46 15 20 0
11. Onssa R 228 416 69 168 69 30 20 0
U 194 407 145 156 59 16 23 0
12. Punjab R 189 594 72 71 43 1R 13 0
U 98 517 154 141 60 16 14 0
13. Rajasthan R 368 518 52 10 36 16 0 0
U 267 569 79 40 22 7 16 0
14. Uttar Pradesh R 238 587 72 52 23 9 19 0
U 189 551 120 71 41 13 22 0
15. West Bengal R 105 400 72 93 90 49 98 93 U 73 391 173 136 78 30 44 75
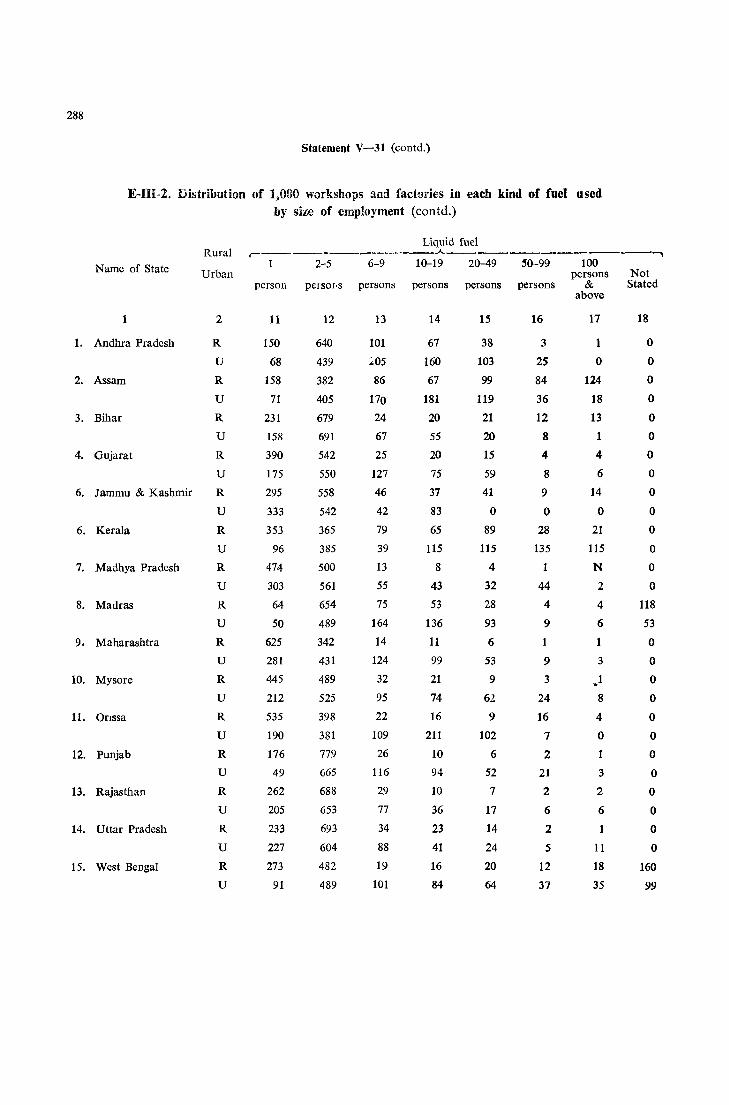
288
Statement V-31 (eontd.)
E-HI-2. Distribution of 1,000 workshops and factories in each kind of fuel used by size of employment (contd.)
Liquid fuel Rural ,.. ____________ .A. ____________ ......
1 2-5 6-9 10-19 20-49 50-99 100 Name of State Urban persons Not person persoI<S persons persons persons persons & Stated
1 2
1. Andhra Pradesh R
U
2. Assam R
U
3. Bihar R
U
4. Gujarat R
U
6. Jammu & Kashmir R
U
6. Kerala R
U
7. Madhya Pradesh R
U
8. Madras R
U
9. Maharashtra R
U
10. Mysore R
U
11. Onssa R
U
12. Punjab R
U
13. Rajasthan R
U
14. Uttar Pradesh R
U
15. West Bengal R
U
11
150
68
158
71
231
158
390
175
295
333
353
96
474
303
64
50
625
281
445
212
535
190
176
49
262
205
233
227
273
91
12
640
439
382
405
679
691
542
550
558
542
365
385
500
561
654
489
342
431
489
525
398
381
779
665
688
653
693
604
482
489
13
101
:05
86
170
24
67
25
127
46
42
79
39
13
55
75
164
14
124
32
95
22
109
26
116
29
77
34
88
19
101
14
67
160
67
181
20
55
20
75
37
83
65
115
8
43
53
136
11
99
21
74
16
211
10
94
10
36
23
41
16
84
15
38
103
99
119
21
20
15
59
41
o 89
115
4
32
28
93
6
53
9
62
9
102
6
52
7
17
14
24
20
64
16
3
25
84
36
12
8
4
8
9
o 28
135
1
44
4
9
1
9
3
24
16
7
2
21
2
6
2
5
12
37
above
17
o 124
18
13
1
4
6
14
o 21
115
N
2
4
6
1
3
",1
8
4
o
3
2
6
1
11
18
35
18
o o o o o o o o o o o o o o
118
53
o o o o o o o o o o o o
160
99
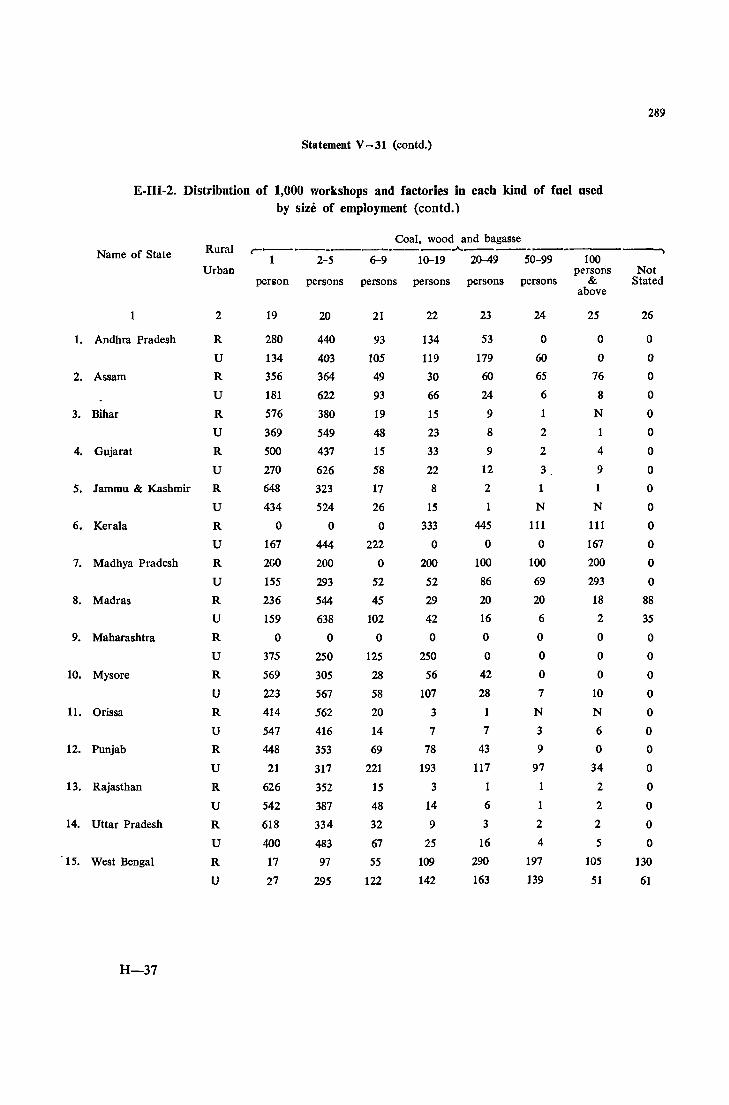
Statement V - 31 (contd.)
E-III-2. Distribution of 1,000 workshops and factories in each kind of fuel used by size of employment (eontd.)
Coal, wood and bagasse
289
Name of State Rural r-----.--__,_------..A.-------------....... Urban
1 2
1. Andhra Pradesh R
U
2. Assam R
U
3. Bihar R
U
4. Gujarat R
U
5. Jammu & Kashmir R
U
6. Keraia R
U
7. Madhya Pradesh R
U
8. Madras R
U
9. Maharashtra R
U
10. Mysore R
U
11. Orissa R
U
12. Punjab R
U
13. Rajasthan R
U
14. Uttar Pradesh R
U
15. West Bengal R
U
H-37
1 2-5 6-9 10-19 20-49 50-99 100
penon
19
280
134
356
181
576
369
500
270
648
434
o 167
200
155
236
159
o 375
569
223
414
547
448
21
626
542
618
400
17
27
persons
20
440
403
364
622
380
549
437
626
323
524
o 444
200
293
544
638
o 250
305
567
562
416
353
317
352
387
334
483
97
295
persons persons persons persons
21
93
105
49
93
19
48
15
58
17
26
o 222
o 52
45
102
o 125
28
58
20
14
69
221
15
48
32
67
55
122
22
134
119
30
66
15
23
33
22
8
15
333
o 200
52
29
42
o 250
56
107
3
7
78
193
3
14
9
25
109
142
23
53
179
60
24
9
8
9
12
2
1
445
o 100
86
20
16
o o
42
28
7
43
117
1
6
3
16
290
163
24
o 60
65
6
1
2
2
3
1
N
111
o 100
69
20
6
o o o 7
N
3
9
97
1
1
2
4
197
139
persons &
above
25
o o
76
8
N
1
4
9
N
111
167
200
293
18
2
o o o
10
N
6
o 34
2
2
2
5
105
51
Not Stated
26
o o o o o o o o o o o o o o
88
35
o o o o o o o o o o o o
130
61
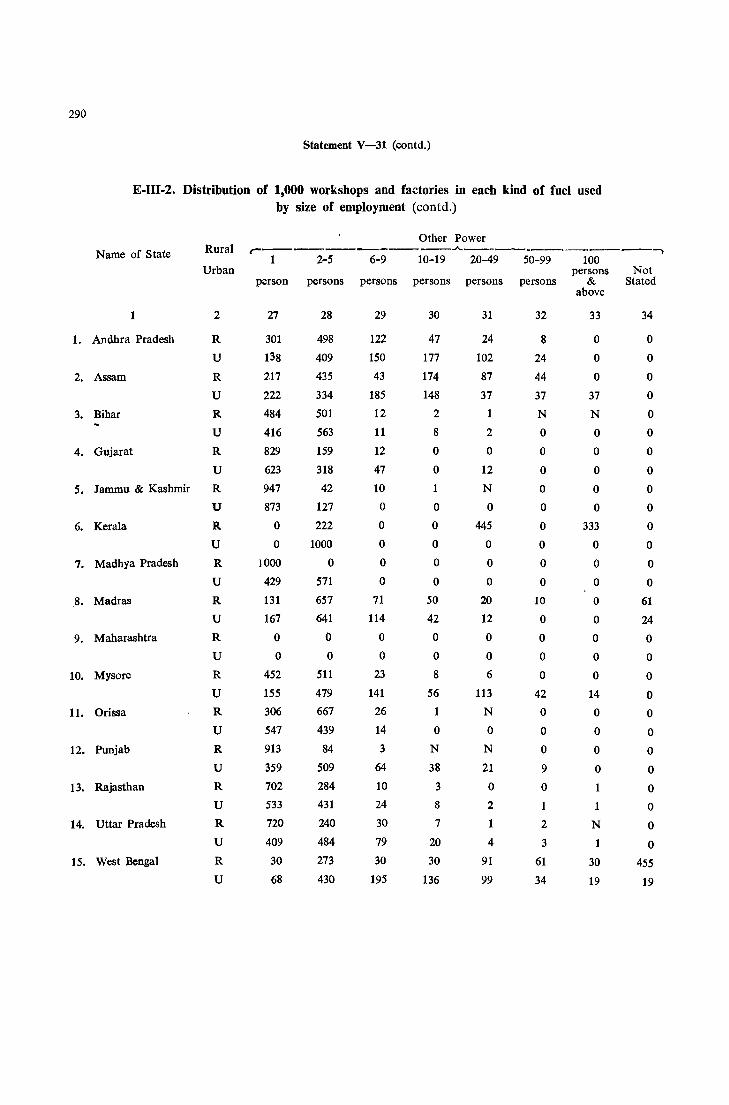
290
Statement V-31 (contd.)
E-Ill-2. Distribution of 1,000 workshops and factories in each kind of fuel used by size of employment (eontd.)
Other Power Name of State Rural r-------------..A.----.--~----_,
1 2-5 6-9 10-19 20-49 50-99 100 Urban persons Not
person persons persons persons persons persons & Stated above
2 27 28 29 30 31 32 33 34
1. Andhra Pradesh R
U
2. Assam R
U
3. Bihar R
U
4. Gujarat R
U
5. Jammu & Kashmir R
U
6. Kerala R
U
7. Madhya Pradesh R
U
,8. Madras R
U
9. Maharashtra R
U
10. Mysore R
U
11. Orissa R
U
12. Punjab R
U
13. Rajasthan R
U
14. Uttar Pradesh R
U
15. West Bengal R
U
301
138
217
222
484
416
829
623
947
873
o o
1000
429
131
167
o o
452
155
306
547
913
359
702
533
720
409
30
68
498
409
435
334
501
563
159
318
42
127
222
1000
o 571
657
641
o o
511
479
667
439
84
509
284
431
240
484
273
430
122
150
43
185
12
11
12
47
10
o o o o o
71
114
o o
23
141
26
14
3
64
10
24
30
79
30
195
47
177
174
148
2
8
o o 1
o o o o o
50
42
o o 8
56
1
o N
38
3
8
7
20
30
136
24
102
87
37
1
2
o 12
N
o 445
o o o
20
12
o o 6
113
N
o N
21
o 2
1
4
91
99
8
24
44
37
N
o o o o o o o o o
10
o o o o
42
o o o 9
o
2
3
61
34
o o o
37
N
o o o o o
333
o o o o o o o o
14
o o o o
1
N
1
30
19
o o o o o o o o o o o o o o
61
24
o o o o o o o o o o o o
455
19

29{
Statement V-31 (coneld.)
E-III-2. Distribution of 1,000 workshops and factories in each kind of fuel used by size of employment (coneld.)
No Power (with or without machinery) Name of State Rural r---.-----------.A.---------.-----~
1 2-5 6-9 10-19 20-49 50-9) 100 Urban persons Not
person persons persons persons persons persons & Stated above
2 35 36 37 38 39 40 41 42
1. Andhra Pradesh R 738 247 8 3 3 1 N 0
U 440 476 51 19 8 4 2 0
2. Assam R 363 525 57 34 16 4 1 0
U 220 583 114 54 19 4 6 0
3. Bihar R 628 352 14 5 1 N N 0
U 403 525 38 24 7 2 1 0
4. Gujarat R 580 387 16 12 5 N N 0
U 439 508 29 17 5 1 0
5. Jammu & Kashmir R 784 190 17 6 2 1 N 0
U 405 490 S9 30 10 4 2 0
6. Kerala R 405 469 64 40 15 3 4 0
U 292 577 72 37 15 4 3 0
7. Madhya Pradesh R 659 333 5 2 1 N N 0
U 462 496 24 11 5 1 1 0
8. Madras R 183 439 38 15 5 1 318
U 180 465 47 22 8 2 1 275
9. Maharashtra R 646 335 9 4 5 N 0
U 460 440 60 27 8 3 2 0
10. Mysore R 466 498 25 8 3 N N 0
U 371 551 46 20 9 2 0
11. Orissa R 358 614 25 3 N N 0 0
U 420 540 28 7 4 1 N 0
12. Punjab R 724 259 10 6 1 N N 0
U 438 492 45 18 6 1 N 0
13. Rajasthan R 624 354 17 4 1 N N 0
U 473 450 42 23 8 2 2 0
14. Uttar Pradesh R 598 340 45 12 3 2 N 0
U 455 463 56 21 4 1 N 0
15. West Bengal R 272 327 33 19 6 1 N 342
U 156 463 89 45 13 4 1 229
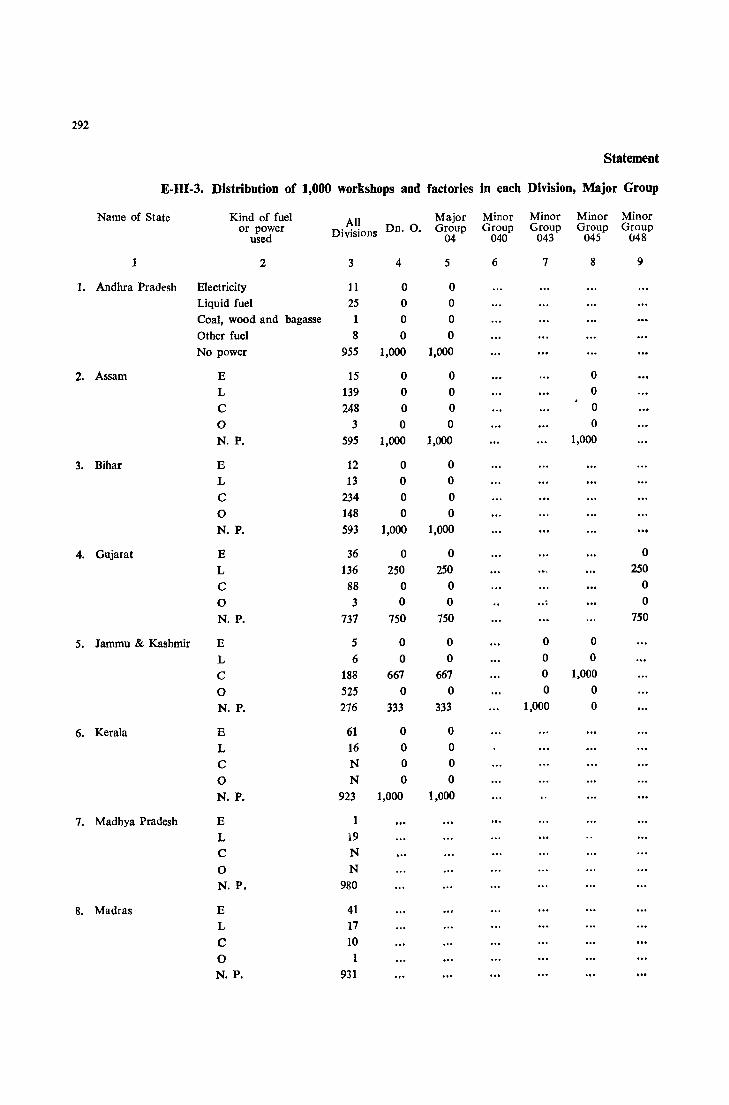
292
Statement
E-HI-3. Distribution of 1,000 workshops and factories in each Division, Major Group
Name of State Kind of fuel All Major Minor Minor Minor Minor or power Divisions Dn. O. Group Group Group Group Group
used 04 040 043 045 048
1 2 3 4 5 6 7 8 9
1. Andhra Pradesh Electricity 11 0 0 Liquid fuel 25 0 0
Coal, wood and bagasse 1 0 0
Other fuel 8 0 0
No power 955 1,000 1.000
2. Assam E 15 0 0 0
L 139 0 0 0
C 248 0 0 0
0 3 0 0 0
N. P. 595 1,000 1,000 1,000
3. Bihar E 12 0 0
L 13 0 0
C 234 0 0
0 148 0 0
N. P. 593 1,000 1,000
4. Gujarat E 36 0 0 0
L 136 250 250 250
C 88 0 0 0
0 3 0 0 ... 0
N. P. 737 750 750 750
5. Jammu & Kashmir E 5 0 0 0 0
L 6 0 0 0 0
C 188 667 667 0 1,000
0 525 0 0 0 0
N. P. 276 333 333 1,000 0
6. Kerala E 61 0 0
L 16 0 0
C N 0 0
0 N 0 0
N. P. 923 1,000 1,000
7. Madhya Pradesh E 1
L 19
C N
0 N
N. P. 980
8. Madras E 41
L 17
C 10 0 1
N. P. 931
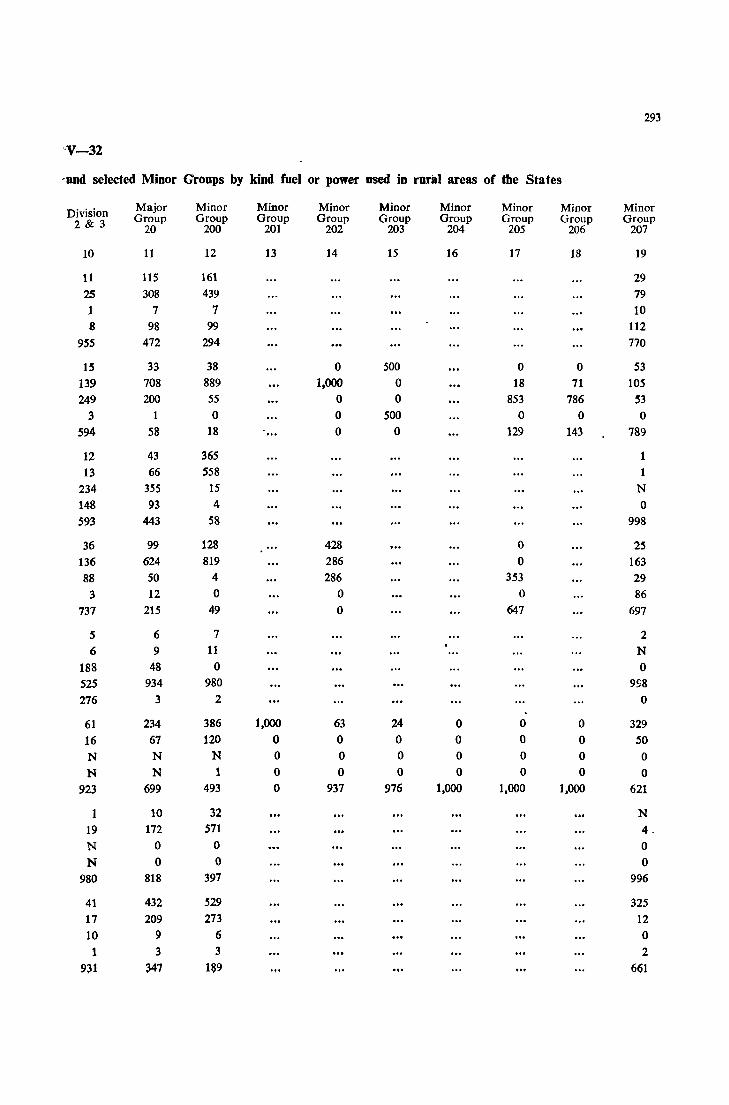
293
"V-32
'and selected Minor Groups by kind fuel or power used in roral areas of the States
Division Major Minor Minor Minor Minor Minor Minor Minor Minor
2 & 3 Group Group Group Group Group Group Group Group Group 20 200 201 202 203 204 205 206 207
10 11 12 13 14 15 16 17 18 19
11 115 161 29 25 308 439 79 1 7 7 10 8 98 99 112
955 472 294 770
15 33 38 0 500 0 0 53 139 708 889 1,000 0 18 71 105 249 200 55 0 0 853 786 53
3 1 0 0 500 0 0 0 594 58 18 0 0 129 143 789
12 43 365 1 13 66 558 1
234 355 15 N 148 93 4 0 593 443 58 998
36 99 128 428 0 2S 136 624 819 286 0 163 88 50 4 286 353 29
3 12 0 0 0 86 737 215 49 0 647 697
5 6 7 2 6 9 11 N
188 48 0 0 525 934 980 998 276 3 2 0
61 234 386 1,000 63 24 0 0 0 329 16 67 120 0 0 0 0 0 0 50 N N N 0 0 0 0 0 0 0 N N 1 0 0 0 0 0 0 0
923 699 493 0 937 976 1,000 1,000 1,000 621
10 32 N 19 172 571 4. N 0 0 0 N 0 0 0
980 818 397 996
41 432 529 325 17 209 273 12 10 9 6 0 1 3 3 2
931 347 189 661

294
Statement
E·m-3. Distribution of 1,000 workshops and factories in each Division, Major Group
Kind of fuel Minor Minor Major Minor Minor Minor Minor Name of State or power Group Group Group Group Group Group Group
used 208 209 21 210 211 212 213
1 2 20 21 22 23 24 25 26
1. Andhra Pradesh Electricity 39 Liquid fuel 0 Coal, wood and bagasse 0 Other fuel 0 No power 961
2. Assam E 48 26 0 L 0 382 0 C 809 586 938 0 0 0 0 N. P. 143 6 92
3. Bihar E 0 9 0 L N N 0
C 781 40 0
0 207 8 7
N. P. 12 943 993
4. Gujarat E 500 3 178 L 0 5 48 C 0 358 0 0 0 0 0 N. P. 500 634 774
S. Jammu & Kashmir E 0 0
L 0 0 C 1,000 333 0 0 0 N. P. 0 667
6. Kerala E 106 1,000 L 82 0 C 7 0
0 7 0 N. P. 798 0
7. Madhya Pradesh E 0 6 L 0 0 C 0 0 0 0 2 N. P. 1,000 992
8. Madras E 188 L 39 C 23 0 42
N. P. 708
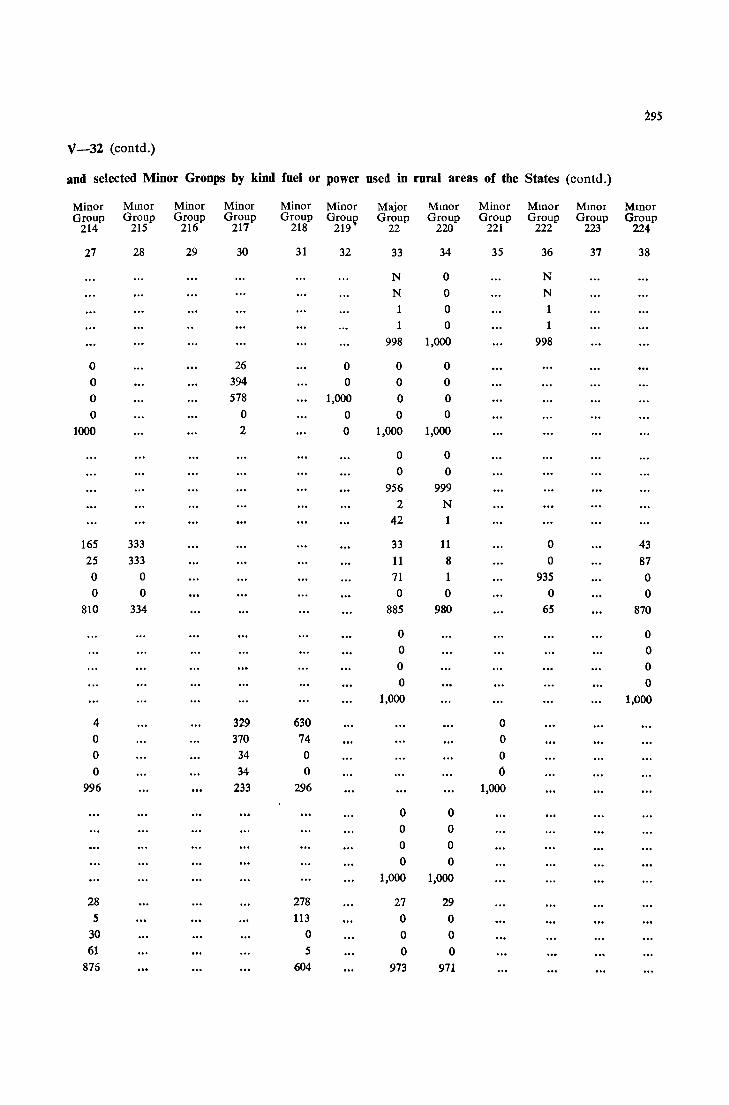
295
V-32 (eontd.)
and selected Minor Gronps by kind fuel or power used in rural areas of the States (eontd.)
Minor Mmor Minor Minor Minor Minor Major Mmor Minor MlOor Mmor Mlllor Group Group Group Group Group Groul;> Group Group Group Group Group Group
214 215 216 217 218 219 22 220 221 222 223 224
27 28 29 30 31 32 33 34 35 36 37 38
N 0 N
N 0 N
1 0 1 1 0 1
998 1,000 998
0 26 0 0 0 0 394 0 0 0 0 578 1,000 0 0 0 0 0 0 0
1000 2 0 1,000 1,000
0 0 0 0
956 999 2 N
42 1
165 333 33 11 0 43 25 333 11 8 0 87 0 0 71 1 935 0 0 0 0 0 0 0
810 334 885 980 65 870
0 0 0 0 0 0 0 0
1,000 1,000
4 329 630 0 0 370 74 0 0 34 0 0 0 34 0 0
996 233 296 1,000
0 0 0 0 0 0 0 0
1,000 1,000
28 278 27 29 5 113 0 0
30 0 0 0 61 5 0 0
875 604 973 971
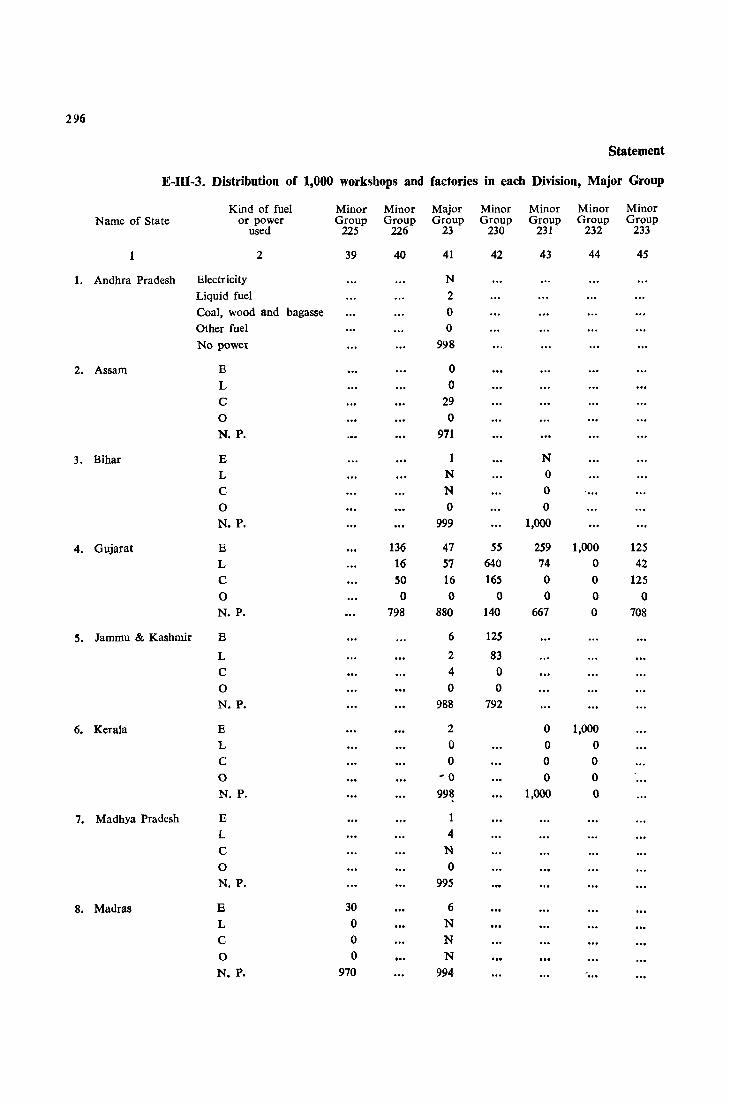
296
Statement
E-I11-3. Distribution of 1,000 workshops and factories in each Division, Major Group
Kind of fuel Minor Minor Major Minor Minor Minor Minor Name of State or power Group Group Group Group Group Group Group
used 225 226 23 230 231 232 233
2 39 40 41 42 43 44 45
1. Andhra Pradesh Electricity N Liquid fuel 2 Coal, wood and bagasse 0 Other fuel 0 No power 998
2. Assam E 0
L 0
C 29 0 0 N. P. 971
3. Bihar E 1 N
L N 0 C N 0 0 0 0
N. P. 999 1,000
4. Gujarat E 136 47 55 259 1,000 125 L 16 57 640 74 0 42 C 50 16 165 0 0 125 0 0 0 0 0 0 0 N. P. 798 880 140 667 0 708
5. Jammu & Kashmir E 6 125
L 2 83 C 4 0 0 0 0
N. P. 988 792
6. Kerala E 2 0 1,000
L 0 0 0 C 0 0 0
0 '0 0 0 N. P. 998 1,000 0
7. Madhya Pradesh E 1 L 4 C N
0 0 N. P. 995
8. Madras E 30 6
L 0 N
C 0 N
0 0 N N. P. 970 994 ...
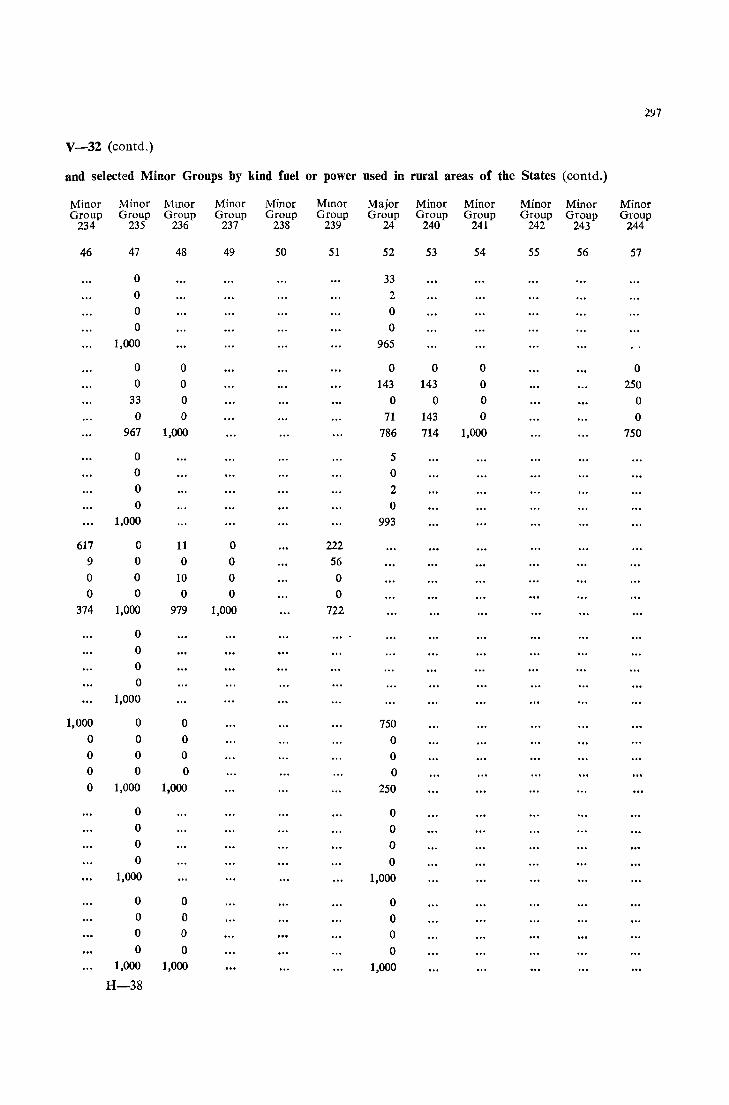
297
V-32 (contd.)
and selected Minor Groups by kind fuel or power used in rural areas of the States (contd.)
Minor Minor Mmor Minor Minor MInor Major Minor Minor Minor Minor Minor Group Group Group Group Group Group Group Group Group Group Group Group
234 235 236 237 238 239 24 240 241 242 243 244
46 47 48 49 50 51 52 53 54 55 56 57
0 33 0 2 0 0 0 0
1,000 965
0 0 0 0 0 0 0 0 143 143 0 250
33 0 0 0 0 0 0 0 71 143 0 0
967 1,000 786 714 1,000 750
0 5 0 0 0 2 0 0
1.000 993
617 0 11 0 222 9 0 0 0 56 0 0 10 0 0 0 0 0 0 0
374 1,000 979 1,000 722
0 0 0 0
1,000
1,000 0 0 750 0 0 0 0 0 0 0 0 0 0 0 0 0 1,000 1,000 250
0 0 0 0 0 0 0 0
1,000 1,000
0 0 0 0 0 0 0 0 0 0 0 0
1,000 1,000 1,000
H-38

298
Statement
E-III-3. Distribution of 1,000 workshops and factories in each Division,.-Major Group
Kind of fuel Major Minor Minor Minor Minor Mmor Minor Name of State or power Group Group Group Group Group Group Group
used 25 250 251 252 253 254 255
1 2 58 59 60 61 62 63 64
1. Andhra Pradesh Electricity 0 0 Liquid fuel 0 ° Coal, wood and bagasse 0 ° Other fuel 0 0 No power 1,000 1,000
2. Assam E L
C
0 N. P.
3. Bihar E 216 L 2 C 0 0 0 N. P. 782
4. Gujarat E ° ° L 0 0 C 0 0 0 0 0 N. P. 1,000 1,000
5. Jammu & Kashmir E 0 L 0 0 C 0 0 0 0 0 N. P. 999 1,000
6. Kerala E L C 0 N. P.
7. Madhya Pradesh E 0 L 0 ° C 0 ° 0 0 ° N. P. 9~9 1,000
8. Madras E ° 0 L 0 0 C 0 0 0 0 ° N. P. 1,000 1,000

299
V-32 (contd.)
and selected Minor Groups by kind fuel or power used in rural areas of the States (contd.)
Minor Major Minor Minor Minor Minor Minor Minor Minor Major Minor Minor Group Group Group Group Group Group Group Group Group Group Group Group
256 26 260 261 262 263 264 265 266 27 270 271
65 66 67 68 69 70 71 72 73 74 75 76
26 0 0
0 0 0
0 0 0
0 0 0
974 1,000 1,000
0 0 0 0
125 200 0 0
125 200 0 0
125 200 0 0
625 400 1,000 1,000
4 N
0 0
0 0
0 0
996 1,000
595 1,000 979 0 500 6
12 0 21 0 0 13
0 0 0 0 0 1
0 0 0 0 0 0
393 0 0 1,000 500 980
458 1,000 0 0
0 0 0 0
0 0 0 0
... 0 0 0 0
542 0 1,000 1,GOO
0 12
0 2
0 0
0 0
1,000 986
0 0
40 0
0 0
0 0
960 1,000
8 0 1 0
1 0 0 0
1 0 0 0
0 0 0 0
990 1,000 999 1,000

300
Statement
E-III-3. Distribution of 1,000 workshops and factories in each Division, Major Group
Kind of fuel Minor Minor Minor Mmor Minor Minor Minor Name of State or power Group Group GJOup Group Group Group Group
used 272 273 274 275 276 277 278
1 2 77 78 79 80 81 82 83
1. Andhra Pradesh Electricity 0
Liquid fuel 0
Coal, wood and bagasse 0
Other fuel 0
No power 1,000
2. Assam E 0 0
L 0 0
C 0 0
0 0 0
N. P. 1,000 1,000
3. Bihar E N
L 0
C 0
0 0
N. P. 1,000
4. Gujarat E 135 3
L 0 12
C 0 1
0 0 0
N. P. 865 984
5. Jammu & Kashmir E 0 0
L 0 0
C 0 0
0 0 0
N. P. 1,000 1,000
6. Kerala E 26 20
L 3 0
C 0 0
0 0 0
N. P. 971 980
7. Madbya Pradesh E 0
L 0
C 0
0 0
N. P. 1,000
8. Madras E N L 0
C 0
0 0 N. P. 1,000
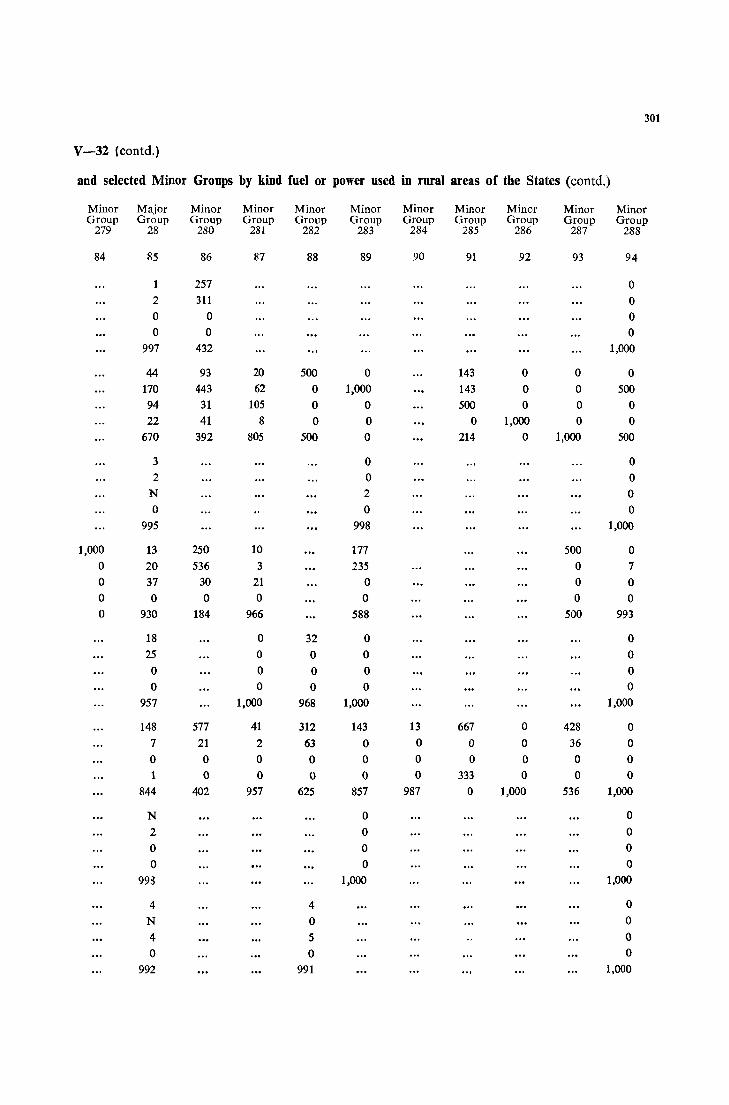
301
V-32 (contd.)
and selected Minor Groups by kind fuel or power used in rural areas of the States (contd.)
Minor Major Minor Minor Minor Minor Minor Minor Minor Minor Minor Group Group Group Group Group Group Group Group Group Group Group
279 28 280 281 282 283 284 285 286 287 288
84 85 86 87 88 89 90 91 92 93 94
1 257 0 2 311 0 0 0 0 0 0 0
997 432 1,000
44 93 20 500 0 143 0 0 0 170 443 62 0 1,000 143 0 0 500 94 31 105 0 0 500 0 0 0 22 41 8 0 0 0 1,000 0 0
670 392 805 500 0 214 0 1,000 500
3 0 0 2 0 0
N 2 0 0 0 0
995 998 1,000
1,000 13 250 10 177 500 0 0 20 536 3 235 0 7 0 37 30 21 0 0 0 0 0 0 0 0 0 0 0 930 184 966 588 500 993
18 0 32 0 0 25 0 0 0 0 0 0 0 0 0 0 0 0 0 0
957 1,000 968 1,000 1,000
148 577 41 312 143 13 667 0 428 0 7 21 2 63 0 0 0 0 36 0
0 0 0 0 0 0 0 0 0 0 1 0 0 0 0 0 333 0 0 0
844 402 957 625 857 987 0 1,000 536 1,000
N 0 0 2 0 0 0 0 0 0 0 0
998 1,000 1,000
4 4 0 N 0 0 4 5 0 0 0 0
992 991 1,000
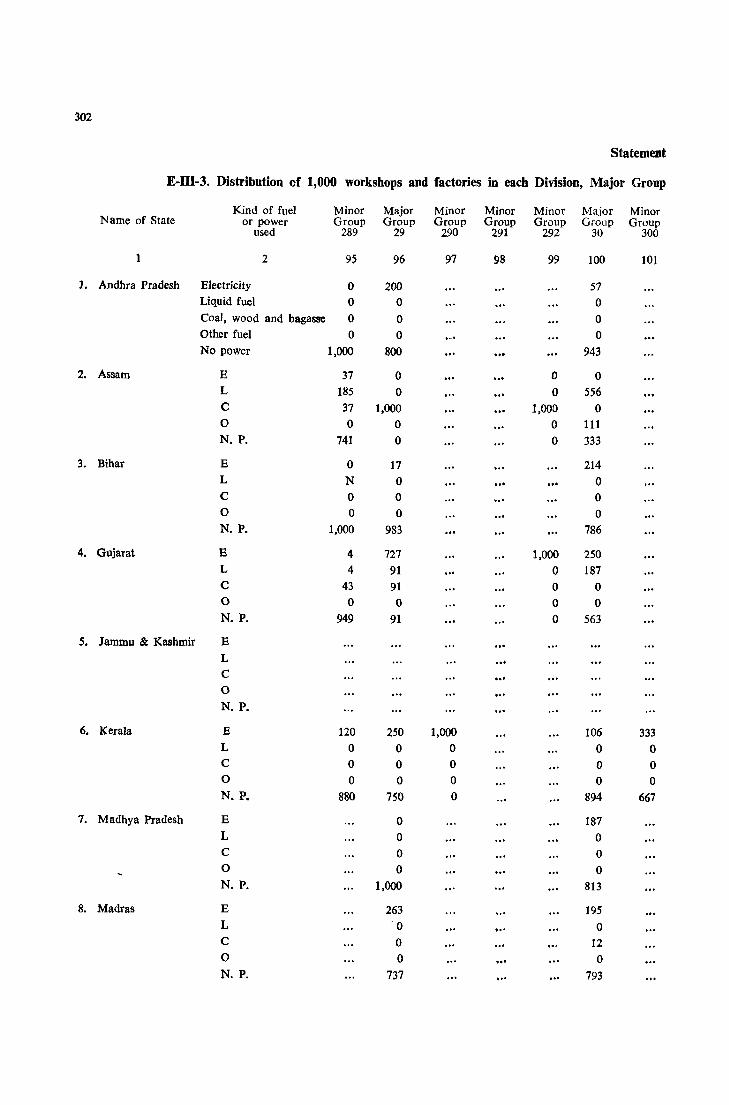
302
Statemeat
E-llI-3. Distribution of 1,000 workshops and factories in each Division, Major Group
Kind of fuel Minor Major Minor Minor Minor Major Minor Name of State or power Group Group Group Group Group Group Group
used 289 29 290 291 292 30 300
1 2 95 96 97 98 99 100 101
1. Andhra Pradesh Electricity 0 200 57 Liquid fuel 0 0 0 Coal, wood and bagasse 0 0 0 Other fuel 0 0 0 No power 1,000 800 943
2. Assam E 37 0 0 0 L 185 0 0 556 C 37 1,000 1,000 0 0 0 0 0 111 N. P. 741 0 0 333
3. Bihar E 0 17 214 L N 0 0 C 0 0 0 0 0 0 0 N. P. 1,000 983 786
4. Gujarat E 4 727 1,000 250 L 4 91 0 187 C 43 91 0 0 0 0 0 0 0 N. P. 949 91 0 563
5. Jammu & Kashmir E
L C 0
N. P.
6. Kerala E 120 250 1,000 106 333 L 0 0 0 0 0 C 0 0 0 0 0 0 0 0 0 0 0 N. P. 880 750 0 894 667
7. Madhya Pradesh E 0 187 L 0 0 C 0 0 0 0 0 N. P. 1,000 813
8. Madras E 263 195 L 0 0 C 0 12 0 0 0 N. P. 737 793
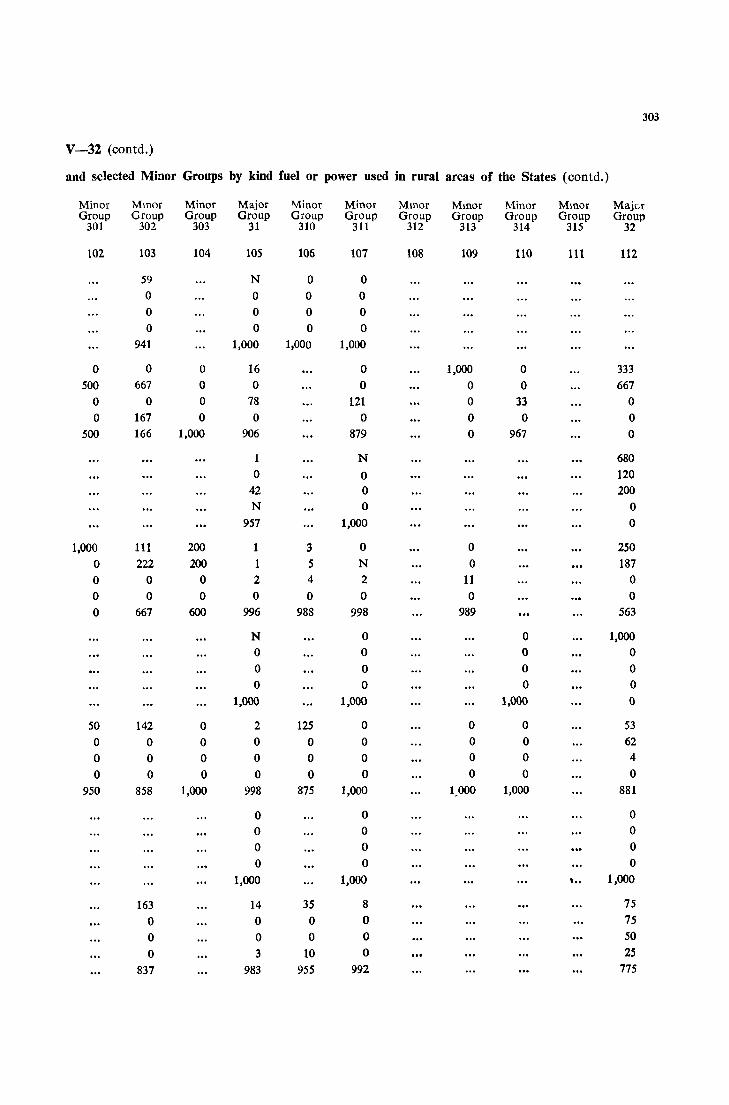
303
V-32 (eontd.)
and selected Minor Groups by kind fuel or power used in rural areas of the States (eontd.)
Minor Mmor Minor Major Minor Minor Mmor Mmor Minor Mmor Major Group Group Group Group Group Group Group Group Group Group Group
301 302 303 31 310 311 312 313 314 315 32
t02 103 104 105 106 107 108 109 110 111 112
59 N 0 0 0 0 0 0 0 0 0 0 0 0 0 0
941 1,000 1,000 1,000
0 0 0 16 0 1,000 0 333 500 667 0 0 0 0 0 667
° 0 0 78 121 0 33 0 0 167 0 ° 0 ° ° 0
500 166 1,000 906 879 ° 967 ° 1 N 680
° 0 120 42 0 200 N 0 0
957 1,000 0
1,000 111 200 3 0 ° 250 0 222 200 1 5 N 0 187
° 0 0 2 4 2 11 0
° 0 0 0 0 0 ° 0 0 667 600 996 988 998 989 563
N 0 0 1,000 0 0 0 0 0 0 0 0 0 0 ° 0
1,000 1,000 1,000 0
50 142 0 2 125 0 0 0 53
° 0 ° 0 0 0 0 0 62
° 0 0 0 0 0 0 0 4 0 0 0 0 0 0 0 0 0
950 858 1,000 998 875 1,000 1,000 1,000 881
0 0 0
° 0 0 0 0 0 0 0 0
1,000 1,000 \ .. 1,000
163 14 35 8 75
0 0 0 0 75 0 0 0 0 50
0 3 10 0 25
837 983 955 992 775
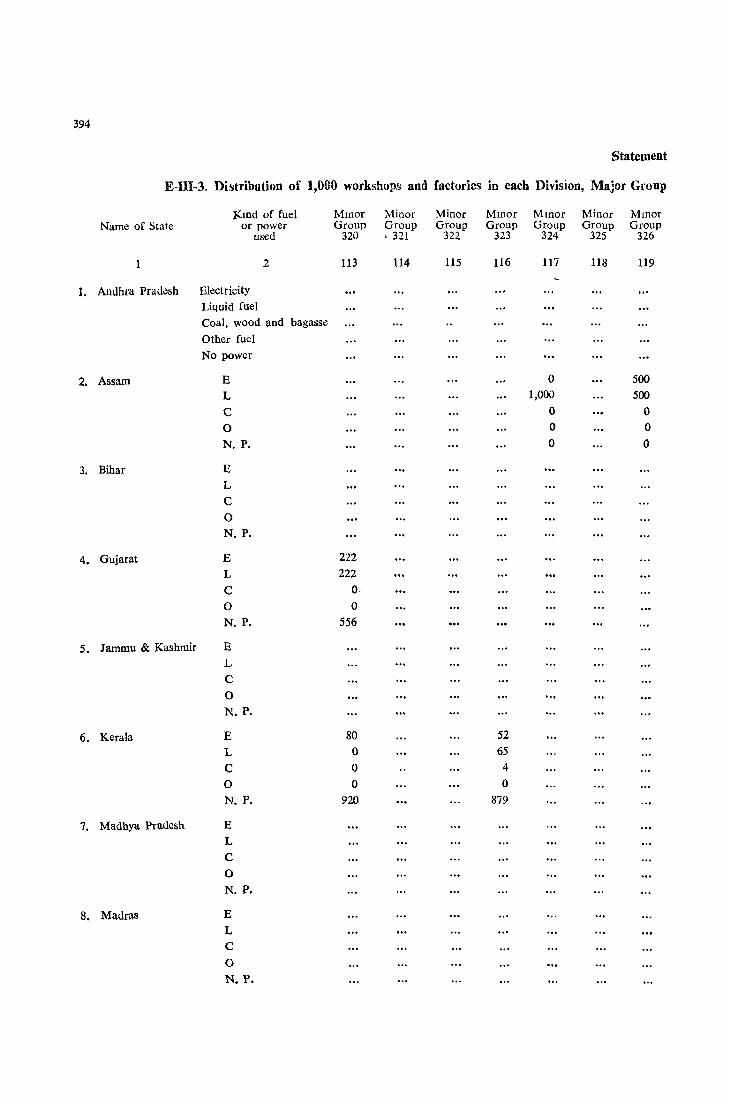
394
Statement
E-III-3. Distribution of 1,000 workshops and factories in each Division, Major Group
J{md of fuel Millar Minor Minor Millar Mmor Minor Millar Name of State or power Group Group Group Group Group Group Group
used 320 '. 321 322 323 324 325 326
2 113 114 115 116 117 118 119
1. Andhra Pradesh Electricity Liquid fuel Coal, wood and bagasse
Other fuel No power
2. Assam E ° 500 L 1,000 500 C ° 0 0 ° ° N. P. 0 0
3. Bihar E L C 0 N. P.
4. Gujarat E 222 L 222
C O. 0 ° N. P. 556
5. Jammu & Kashmir E L
C 0 N. P.
6. Kerala E 80 52 L ° 65 C 0 4 0 0 0 N. P. 920 879
7. Madhya Pradesh E L C
0 N. P.
8. Madras E L C 0
N. P.
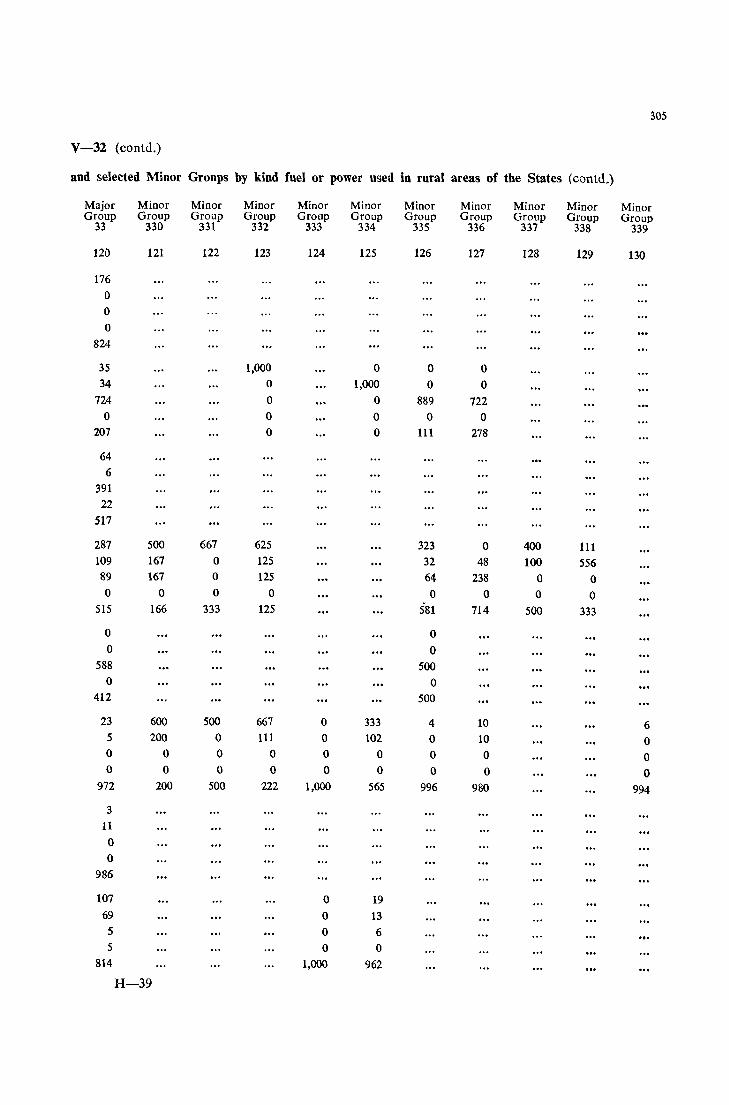
305
V-32 (contd.)
and selected Minor Gronps by kind fuel or power used in rural areas of the States (contd.)
Major Minor Minor Minor Minor Minor Minor Minor Minor Minor Minor Group Group Group Group Group Group Group Group Group Group Group
33 330 331 332 333 334 335 336 337 338 339
120 121 122 123 124 125 126 127 128 129 130
176 0 0 0
824
35 1,000 0 0 0 34 0 1,000 0 0
724 0 0 889 722 0 0 0 0 0
207 0 0 111 278
64 6
391 22
517
287 500 667 625 323 0 400 111 109 167 0 125 32 48 100 556 89 167 0 125 64 238 0 0 0 0 0 0 0 0 0 0
515 166 333 125 581 714 500 333
0 0 0 0
588 500 0 0
412 500
23 600 500 667 0 333 4 10 6 5 200 0 III 0 102 0 10 0 0 0 0 0 0 0 0 0 0 0 0 0 0 0 0 0 0 0
972 200 500 222 1,000 565 996 980 994
3
11 0 0
986
107 0 19 69 0 13 5 0 6 5 0 0
814 1,000 962
H-39
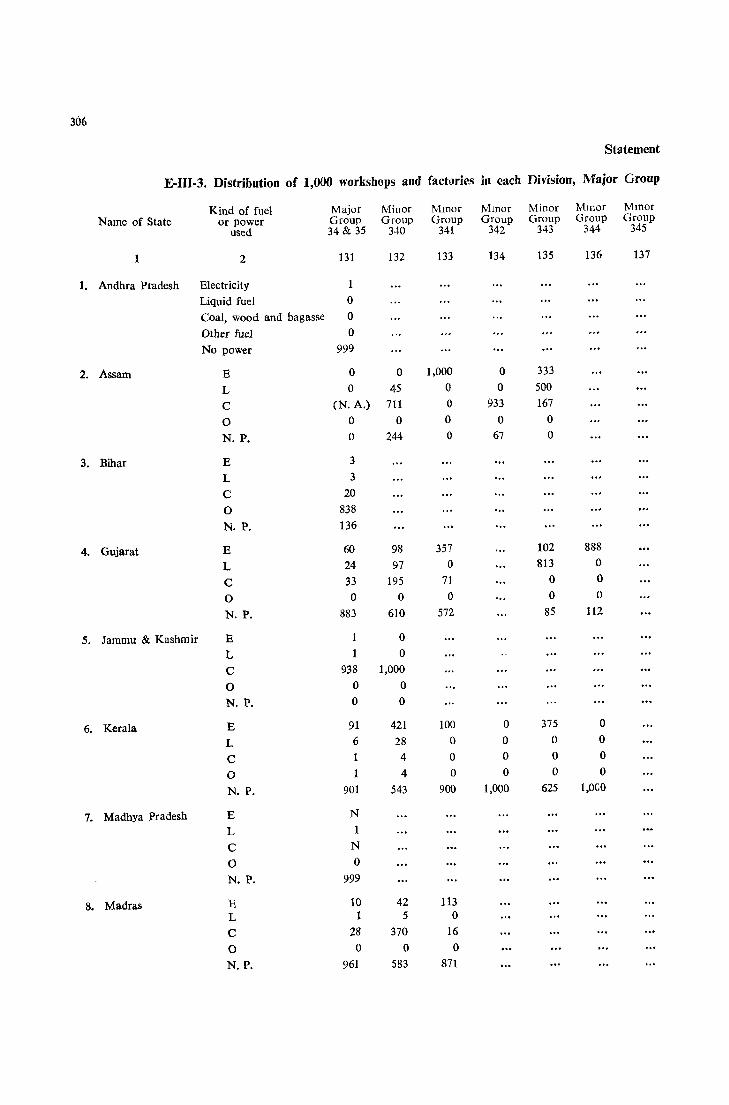
306
Statement
E-III-3. Distribution of 1,000 workshops and factories in each Division, Major Group
Kind of fuel Major Minor Mmor Mmor Minor Mlllor Mmor Name of State or power Group Group Group Group Group Group Group
used 34 & 35 340 341 342 343 344 345
2 131 132 133 134 135 136 137
1. Andhra Pradesh Electricity
Liquid fuel 0 Coal, wood and bagasse 0
Other fuel 0 No power 999
2. Assam E 0 0 1,000 0 333
L 0 45 0 0 500
C (N. A.) 711 0 933 167
0 0 0 0 0 0
N. P. 0 244 0 67 0
3. Bihar E 3
L 3
C 20
0 838
N. P. 136
4. Gujarat E 60 98 357 102 888
L 24 97 0 813 0
C 33 195 71 0 0
0 0 0 0 0 0
N. P. 883 610 572 85 112
5. Jammu & Kashmir E 1 0
L 1 0
C 938 1,000
0 0 0
N. P. 0 0
6. Kerala E 91 421 100 0 375 0
L 6 28 0 0 0 0
C 1 4 0 0 0 0
0 4 0 0 0 0
N. P. 901 543 900 1,000 625 l,OeO
7. Madhya Pradesh E N
L 1
C N
0 0
N. P. 999
8. Madras E 10 42 113 L 1 5 0
C 28 370 16
0 0 0 0
N.P. 961 583 871
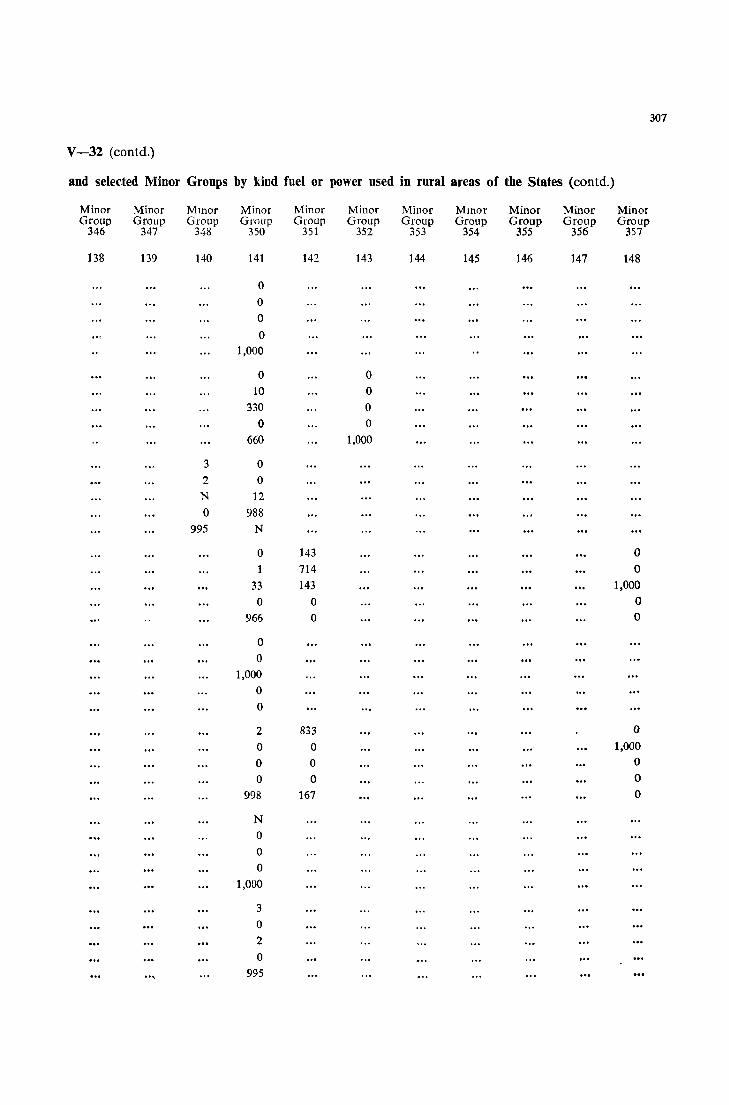
V-32 (contd.)
and selected Minor Groups by kind fuel or power used in rural areas of the States (contd.)
Minor Group
346
138
Minor Group
347
139
Mmor Group
348
140
Minor Group
350
141
o o o o
1,000
o 10
330
o 660
3 0
2 0 N 12
o 988
995 N
o 1
33
o 966
o o
1,000
o o
2 o o o
998
N o o o
1,000
3
o 2
o 995
Minor Group
351
142
143 714 143
o o
833 o o o
167
Minor Group
352
143
o o o o
1,000
Minor Group
353
144
Mmor Group
354
145
Minor Group
355
146
Minor Group
356
147
Minor Group
357
148
o o
1,000
o o
o 1,000
o o o
307
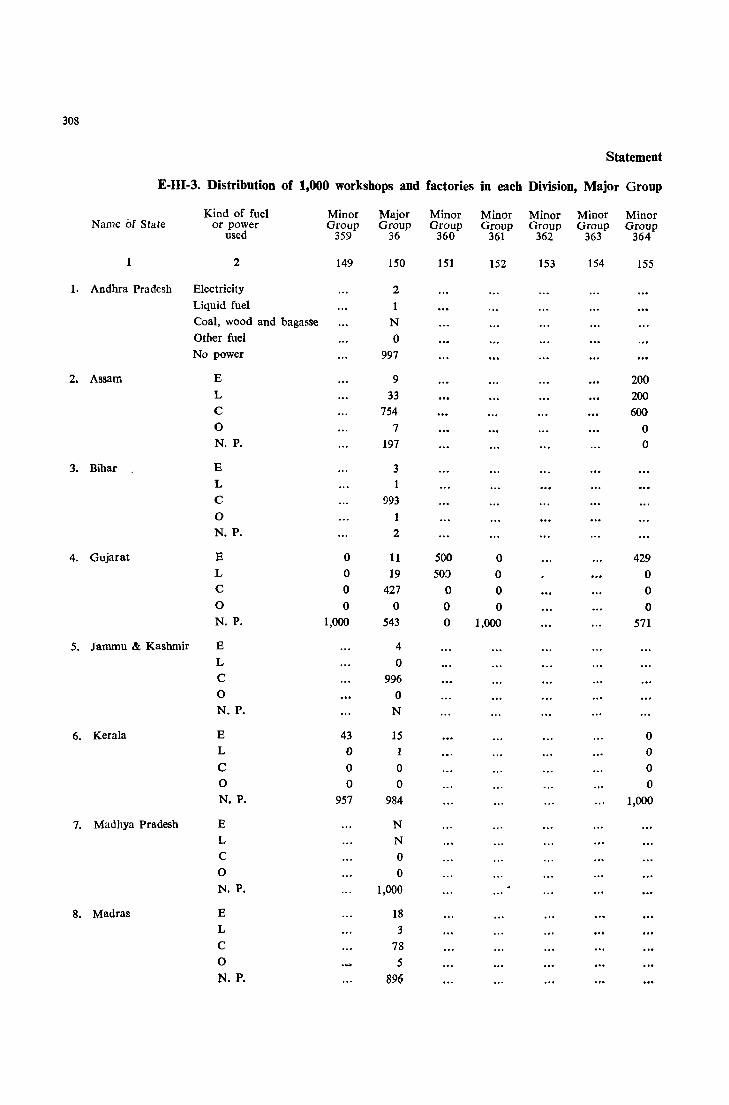
308
Statement
E-UI-3. Distribution of 1,000 workshops and factories in each Division, Major Group
Kind of fuel Minor Major Minor Minor Minor Minor Minor Name of State or power Group Group Group Group Group Group Group
used 359 36 360 361 362 363 364
2 149 150 151 152 153 154 155
1- Andhra Pradesh Electricity 2 Liquid fuel 1 Coal, wood and bagasse N Other fuel 0 No power 997
2. Assam E 9 200 L 33 200 C 754 600 0 7 0 N. P. 197 0
3. Bihar - E 3 L
C 993 0 N. P. 2
4. Gujarat E 0 11 500 0 429 L 0 19 50!) 0 0 C 0 427 0 0 0 0 0 0 0 0 0 N. P. 1,000 543 0 1,000 571
5. Jammu & Kashmir E 4 L 0 C 996 0 0 N. P. N
6. Kerala E 43 15 0 L 0 1 0 C 0 0 0 0 0 0 0 N. P. 957 984 1,000
7. Madhya Pradesh E N L N C 0 0 0 N. P. 1,000
8. Madras E 18 L 3 C 78 0 5 N. P. 896 ...
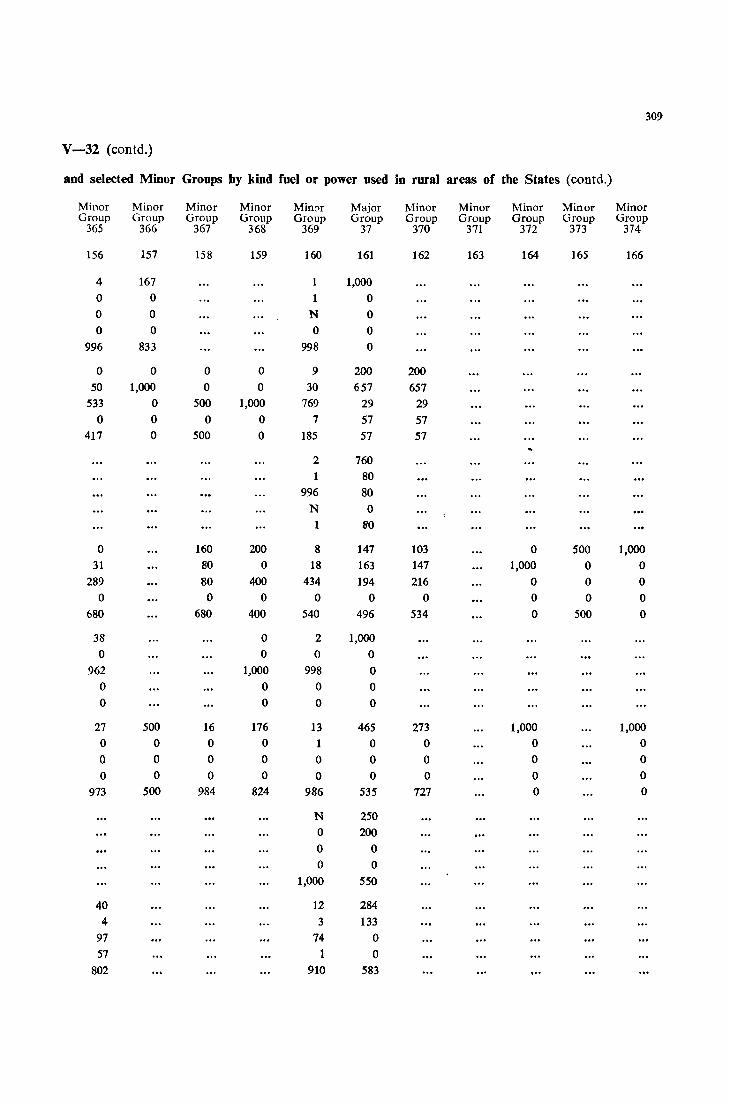
309
V-32 (eontd.)
and selected Minor Groups by kind fuel or power used in rural areas of the States (eontd.)
Minor Minor Minor Minor Mine>r Major Minor Minor Minor Minor Minor Group Group Group Group Group Group Group Group Group Group Group
365 366 367 368 369 37 370 371 372 373 374
156 157 158 159 160 161 162 163 164 165 166
4 167 1 1,000 0 0 0 0 0 N 0 0 0 0 0
996 833 998 0
0 0 0 0 9 200 200 50 1,000 0 0 30 657 657
533 0 500 1,000 769 29 29 0 0 0 0 7 57 57
417 0 500 0 185 57 57
2 760 80
996 80 N 0 1 80
0 160 200 8 147 103 0 500 1,000 31 80 0 18 163 147 1,000 0 0
289 80 400 434 194 216 0 0 0 0 0 0 0 0 0 0 0 0
680 680 400 540 496 534 0 500 0
38 0 2 1,000 0 0 0 0
962 1,000 998 0 0 0 0 0 0 0 0 0
27 500 16 176 13 465 273 1,000 1,000 0 0 0 0 1 0 0 0 0 0 0 0 0 0 0 0 0 0 0 0 0 0 0 0 0 0 0
973 500 984 824 986 535 727 0 0
N 250 0 200 0 0 0 0
1,000 550
40 12 284 4 3 133
97 74 0 57 1 0
802 910 583
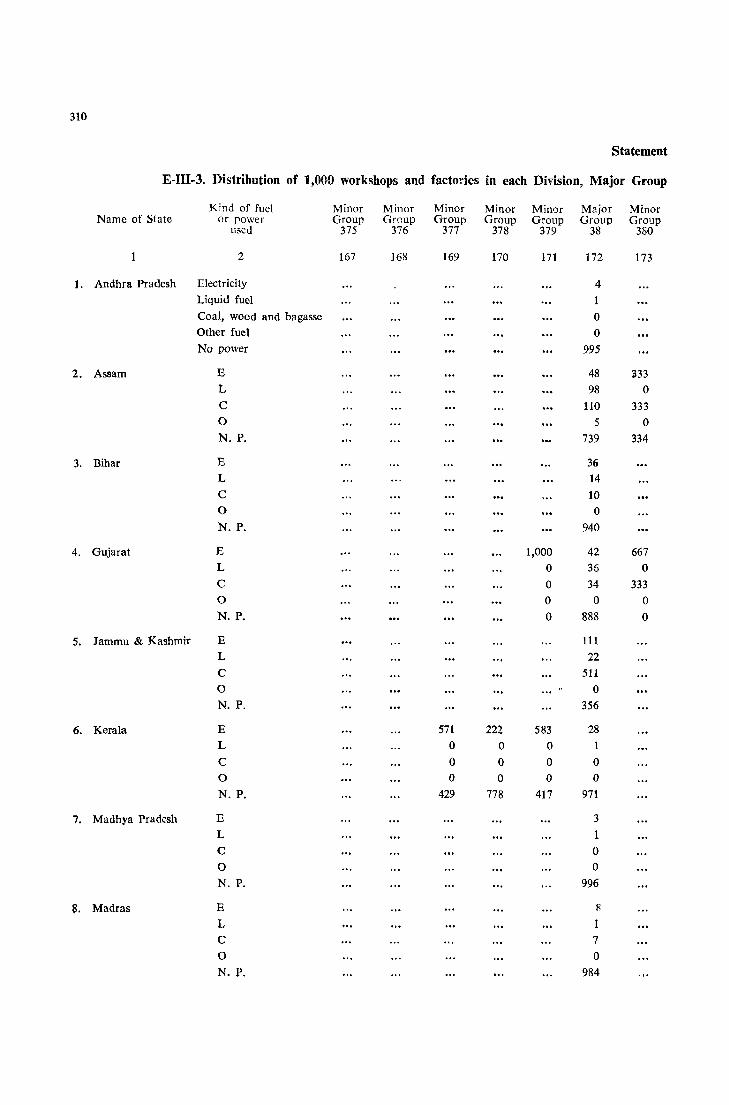
310
Statement
E-Ill-3. Distribution of 1,000 workshops and factories in each Division, Major Group
Kind of fuel Minor Minor Minor Minor Minor Major Minor Name of State or power Group Group Group Group Group Group Group
llsed 375 376 377 378 379 38 380
1 2 167 168 169 170 171 172 173
1. Andhra Pradesh Electricity 4 Liquid fuel 1 Coal, wood and bagasse 0 Other fuel 0 No power 995
2. Assam E 48 333 L 98 0 C 110 333 0 5 0 N. P. 739 334
3. Bihar E 36 L 14 C 10 0 0 N. P. 940
4. Gujarat E 1,000 42 667 L 0 36 0
C 0 34 333 0 0 0 0 N. P. 0 888 0
5. Jammu & Kashmir E 111 L 22 C 511 0 0 N. P. 356
6. Kerala E 571 222 583 28 L 0 0 0 1
C 0 0 0 0 0 0 0 0 0
N. P. 429 778 417 971
7. Madhya Pradesh E 3 L 1 C 0 0 0 N. P. 996
8. Madras E II
L 1 C 7 0 0 N. P. 984

311
V-32 (eoutd.)
and selected Minor Groups by kind fuel or power used in rural areas of the States (eoutd.)
Mmor ]."linor Minor Minor Minor Minor Mlilor Mmor Mmor Major Minor Group Group Group Group Group Grcup Group Group Group Group Group
381 382 383 384 385 386 387 388 389 39 390
174 175 176 177 178 179 180 181 182 183 184
67 0 3 33 0 2 0 0 N
0 0 N
900 1,000 995
145 0 4 12 258 1,000 28 3 274 0 38 635
8 0 3 3 315 0 927 347
4 N
912 1
83
3(0 139 0 19 4 334 0 250 13 19 37 333
600 0 9 10 141 0 0 0 0 0 0 0
1(0 611 978 952 818 333
0 13 0 1
543 978 0 0
457· 8
1,000 134 1,000 182 0 0 0 6 0 0 0 0 0 0 0 0 0 0 0 0 0 0 0 0 0 0 0 0 860 0 818 1,000 1.000 999
0 N
0 2 0 N
0 0 1,000 998
4 7 0 4 4 1 57 37 0 0 0
998 935 952
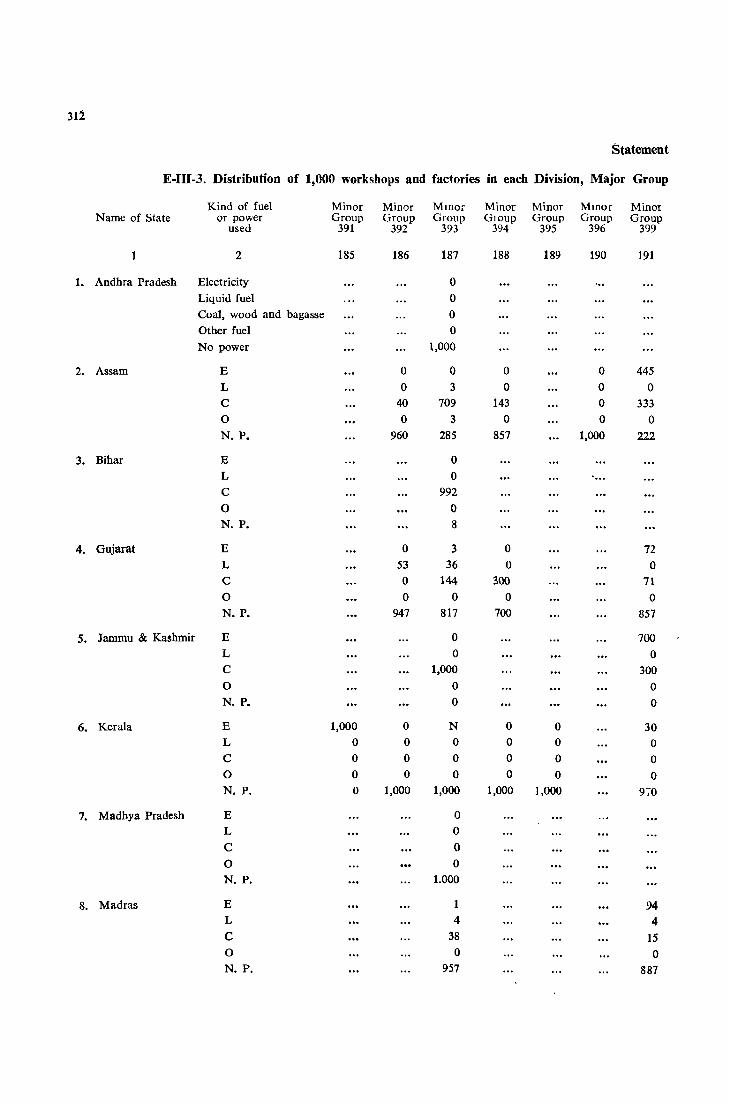
312
Statement
E-III-3. Distribution of 1,000 workshops and factories in each Division, Major Group
Kind of fuel Minor Minor Mlllor Minor Minor Mmor Minor Name of State or power Group Group Group G10Up Group Group Group
used 391 392 393 394 395 396 399
1 2 185 186 187 188 189 190 191
1. Andhra Pradesh Electricity 0 Liquid fuel 0 Coal, wood and bagasse 0 Other fuel 0 No power 1,000
2. Assam E 0 0 0 0 445 L 0 3 0 0 0 C 40 709 143 0 333 0 0 3 0 0 0 N. P. 960 285 857 1,000 222
3. Bihar E 0 L 0 ... C 992
0 0 N. P. 8
4. Gujarat E 0 3 0 72
L 53 36 0 0 C 0 144 300 71 0 0 0 0 0 N. P. 947 817 700 857
5. Jammu & Kashmir E 0 700 L 0 0 C 1,000 300 0 0 0 N. P. 0 0
6. Kerala E 1,000 0 N 0 0 30 L 0 0 0 0 0 0 C 0 0 0 0 0 0 0 0 0 0 0 0 0 N. P. 0 1,000 1,000 1,000 1,000 970
7. Madhya Pradesh E 0 L 0
C 0 0 0 N. P. 1.000
8. Madras E 94 L 4 4 C 38 15 0 0 0 N. P. 957 887
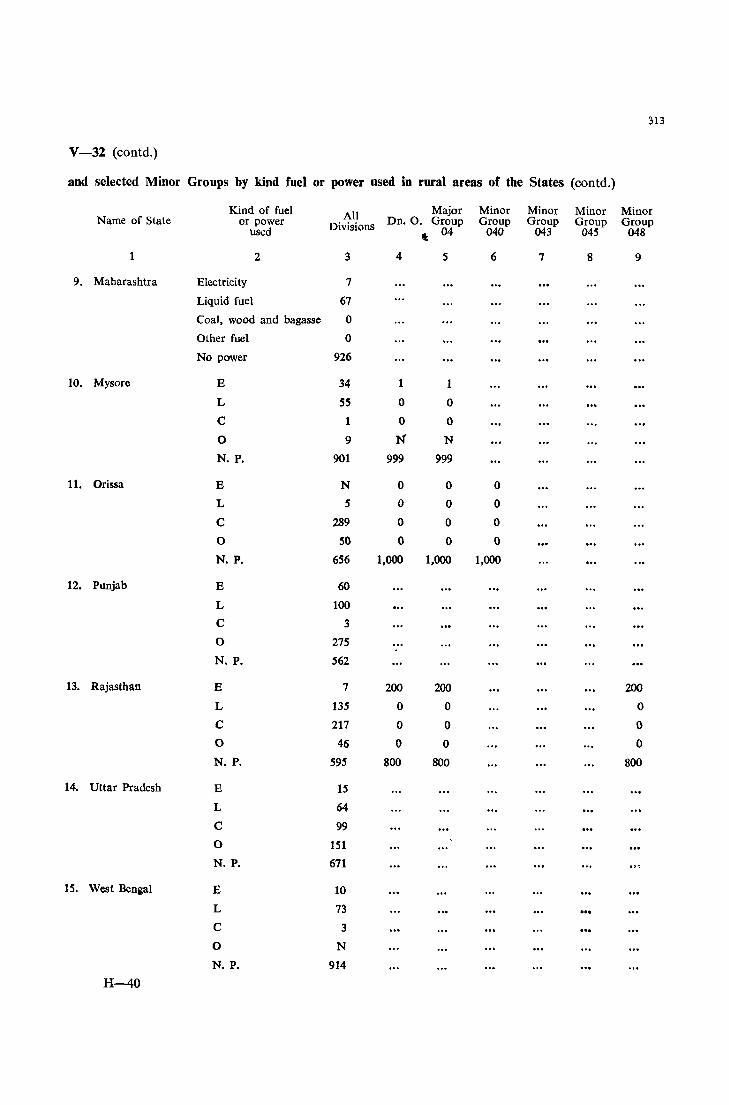
:n~
V-32 (eontd.)
and selected Minor Groups by kind fuel or power used in rural areas of the States (eontd.)
Kind of fuel All Major Minor Minor Minor Minor Name of State or power Divisions Dn. O. Group Group Group Group Group
used t: 04 040 043 045 048
1 2 3 4 5 6 7 8 9
9. Mabarashtra Electricity 7
Liquid fuel 67
Coal, wood and bagasse 0
Other fuel 0
No power 926
10. Mysore E 34 1 1
L S5 0 0
C 1 0 0
0 9 N N
N. P. 901 999 999
11. Orissa E N 0 0 0
L 5 0 0 0
C 289 0 0 0
0 SO 0 0 0
N. P. 656 1,000 1,000 1,000
12. Punjab E 60
L 100
C 3
0 275 ... N. P. 562
13. Rajasthan E 7 200 200 200
L 135 0 0 0
C 217 0 0 0
0 46 0 0 0
N. P. 595 800 800 800
14. Uttar Pradesh E 15
L 64
C 99
0 151
N. P. 671
15. West Bengal E 10
L 73 ... C 3
0 N
N. P. 914
H-40
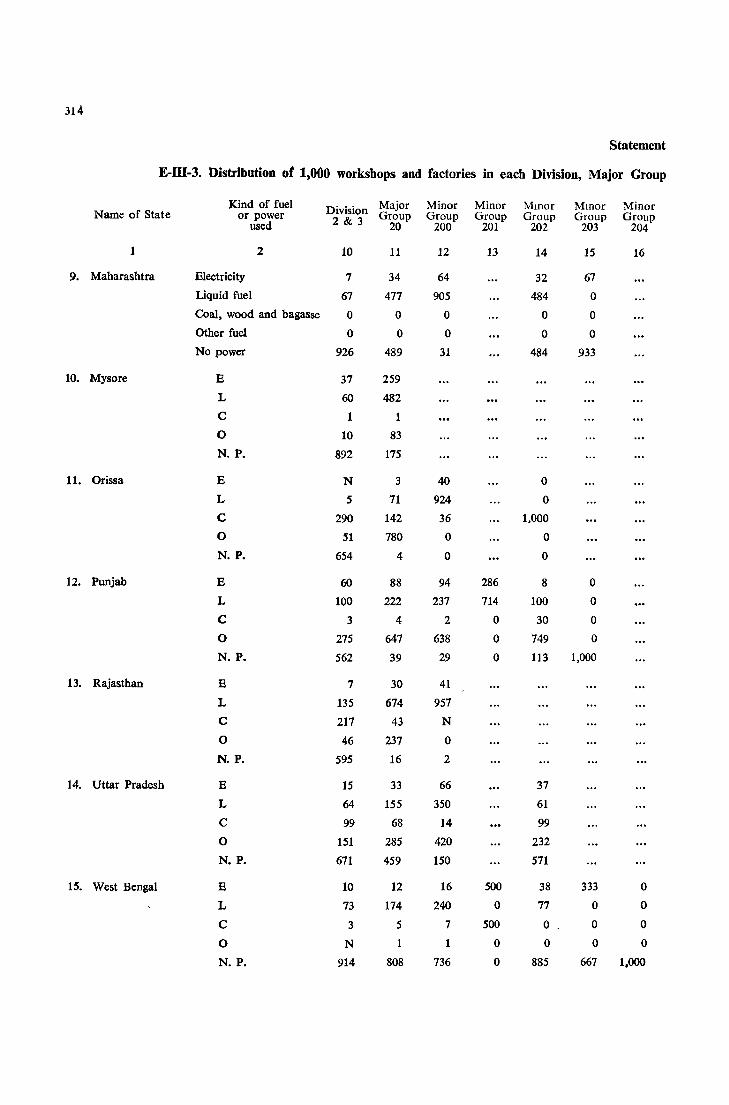
314
Statement
E-III-3. Distribution or 1,000 workshops and factories in each Division, Major Group
Kind of fuel Division Major Minor Minor Mmor Mmor Minor Name of State or power 2 & 3 Group Group Group Group Group Group
used 20 200 201 202 203 204
1 2 10 11 12 13 14 15 16
9. Maharashtra Electricity 7 34 64 32 67
Liquid fuel 67 477 905 484 0
Coal. wood and bagasse 0 0 0 0 0
Other fuel 0 0 0 0 0
No power 926 489 31 484 933
10. Mysore E 37 259
L 60 482
C 1 1
0 10 83
N. P. 892 175
11. Orissa E N 3 40 0
L 5 71 924 0
C 290 142 36 1,000
0 51 780 0 0
N. P. 654 4 0 0
12. Punjab E 60 88 94 286 8 0
L 100 222 237 714 100 0
C 3 4 2 0 30 0
0 275 647 638 0 749 0
N. P. 562 39 29 0 113 1,000
13. Rajasthan E 7 30 41
L 135 674 957
C 217 43 N
0 46 237 0
N. P. 595 16 2
14. Uttar Pradesh E 15 33 66 37
L 64 155 350 61
C 99 68 14 99
0 151 285 420 232
N. P. 671 459 150 571
15. West Bengal E 10 12 16 500 38 333 0
L 73 174 240 0 77 0 0
C 3 5 7 500 o _ 0 0
0 N 1 0 0 0 0
N. P. 914 808 736 0 885 667 1,000
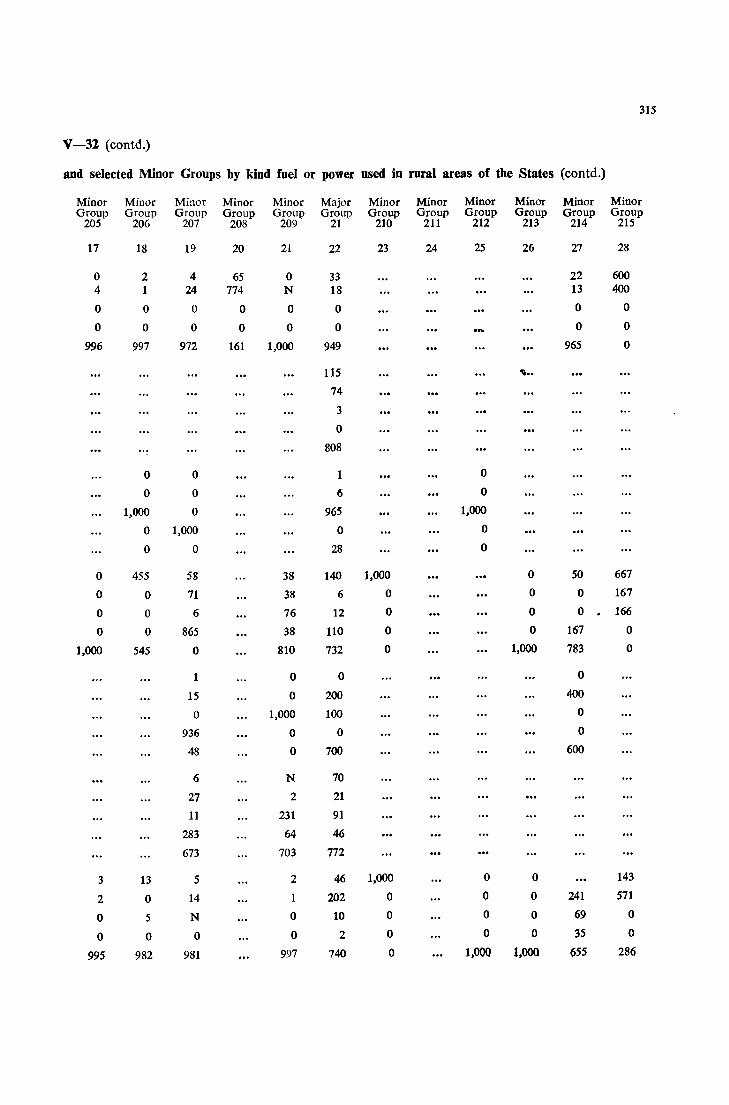
315
V-32 (eontd.)
and selected Minor Groups by kind fuel or power used in rural areas of the States (eontd.)
Minor Minor Minor Minor Minor Major Minor Minor Minor Minor Minor Minor Group Group Group Group Group Group Group Group Group Group Group Group
205 206 207 208 209 21 210 211 212 213 214 215
17 18 19 20 21 22 23 24 25 26 27 28
0 2 4 65 0 33 22 600 4 1 24 774 N 18 13 400
0 0 0 0 0 0 0 0
0 0 0 0 0 0 0 0
996 997 972 161 1,000 949 965 0
115 ..... 74
3
0
808
0 0 1 0
0 0 6 0
1,000 0 965 1,000
0 1,000 0 0
0 0 28 0
0 455 58 38 140 1,000 0 50 667
0 0 71 38 6 0 0 0 167
0 0 6 76 12 0 0 0 . 166
0 0 865 38 110 0 0 167 0
1,000 545 0 810 732 0 1,000 783 0
1 0 0 0
15 0 200 400
0 1,000 100 0
936 0 0 0
48 0 700 600
6 N 70
27 2 21
11 231 91
283 64 46
673 703 772
3 13 5 2 46 1,000 0 0 143
2 0 14 1 202 0 0 0 241 571
0 5 N 0 10 0 0 0 69 0
0 0 0 0 2 0 0 0 35 0
995 982 981 997 740 0 1,000 1.000 655 286

316
Statement
E-IU-3. Distribution of 1,000 workshops and factories in each Division, Major Group
Kind of fuel Minor Minor Minor Minor Major Minor Minor Name of State or power Group Group Group Group Group Group Group
used 216 217 218 219 22 220 221
1 2 29 30 31 32 33 34 35
9. Maharashtra Electricity 167
Liquid fuel 0
Coal, wood and bagasse 0
Other fuel 0
No power 833
10. Mysore E 1
L 0
C 1
0 0
N. P. 998
11. Orissa E 0 0
L 0 0
C 6 1
0 0 0
N. P. 994 999
12. Punjab E 192 130 0 0
L 0 0 0 0 C 0 15 0 0
0 231 29 0 0
N. P. 577 826 1,000 1,000
13. Rajasthan E 18 18 L 0 0
C 0 0
0 0 0
N. P. 982 982
14. Uttar Pradesh E 6 5
L 12 11
C 8 4
0 23 10
N. P. 951 970
15. West Bengal E 300 167 0 0
L 250 797 0 0
C 0 36 0 0
0 50 0 0 0
N. P. 40() 0 1,000 1,000
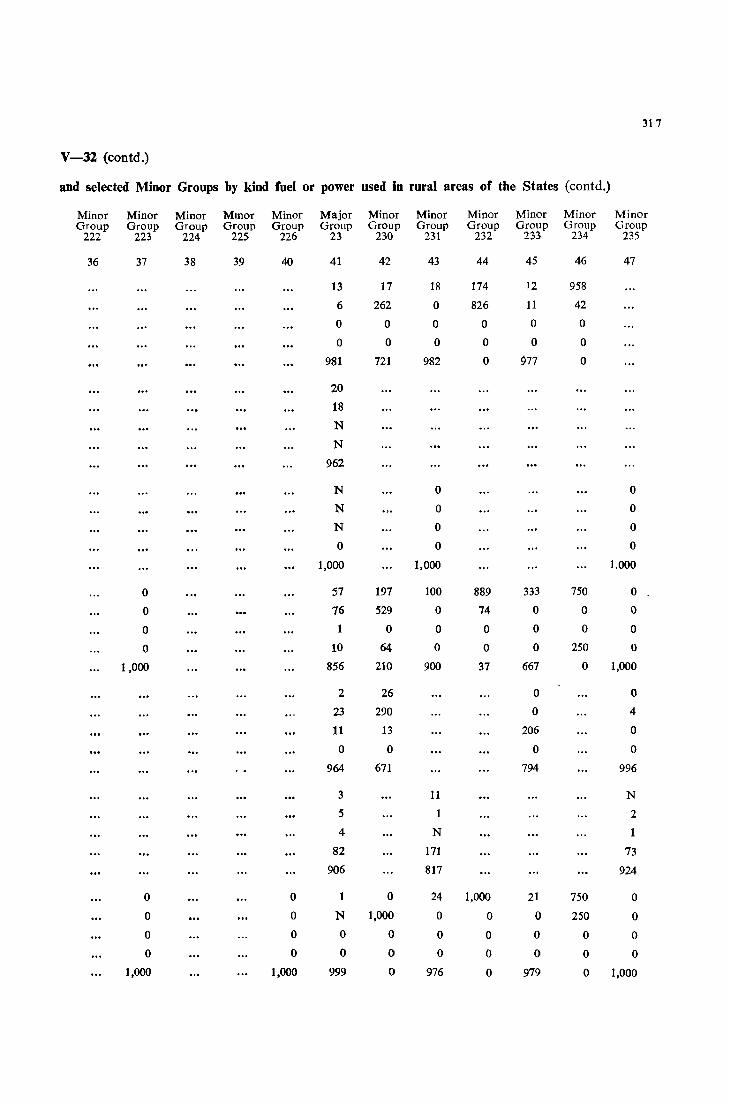
317
V-32 (contd.)
and selected Minor Groups by kind fuel or power used in rural areas of the States (eontd.)
Minor Minor Minor MInor Minor Major Minor Minor Minor Minor Minor Minor Group Group Group Group Group Group Group Group Group Group Group Group
222 223 224 225 226 23 230 231 232 233 234 235
36 37 38 39 40 41 42 43 44 45 46 47
13 17 18 174 12 958
6 262 0 826 11 42
0 0 0 0 0 0
0 0 0 0 0 0
981 721 982 0 977 0
20
18
N
N
962
N 0 0
N 0 0
N 0 0
0 0 0
1,000 1,000 1.000
0 57 197 100 889 333 750 0
0 76 529 0 74 0 0 0
0 1 0 0 0 0 0 0
0 10 64 0 0 0 250 0
1,000 856 210 900 37 667 0 1,000
2 26 0 0
23 290 0 4
11 13 206 0
0 0 0 0
964 671 794 996
3 11 N
5 1 2
4 N 1
82 171 73
906 817 924
0 0 1 0 24 1,000 21 750 0
0 0 N 1,000 0 0 0 250 0
0 0 0 0 0 0 0 0 0
0 0 0 0 0 0 0 0 0
1,000 1,000 999 0 976 0 979 0 1,000
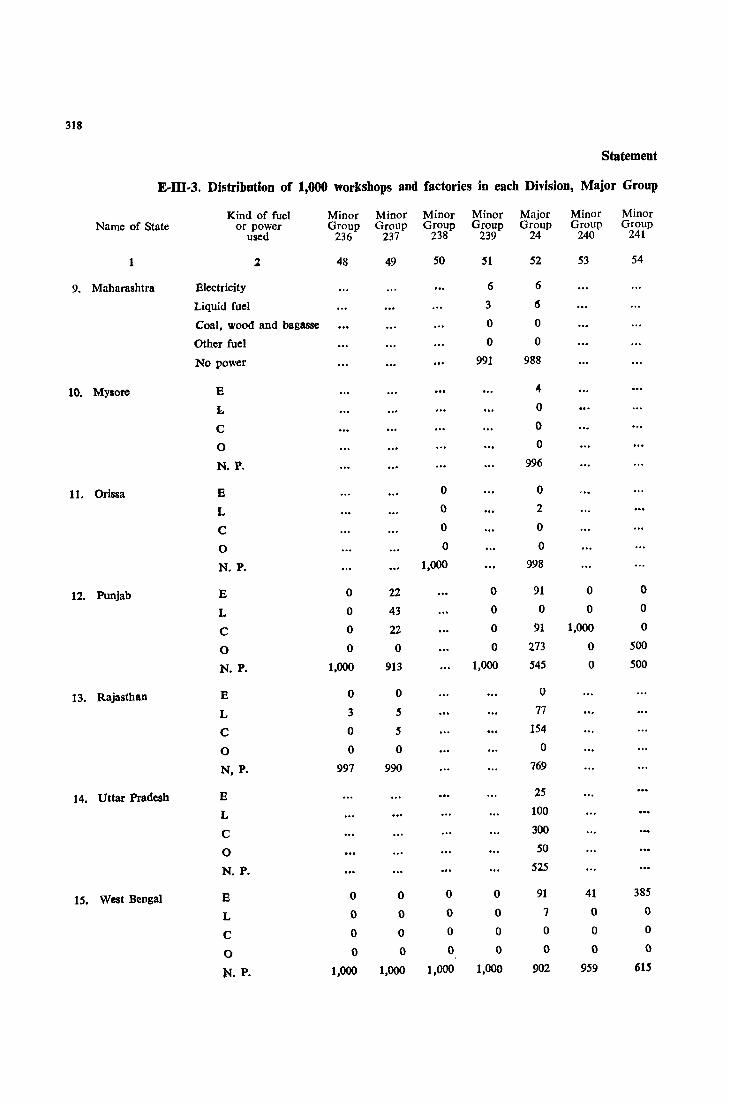
318
Statement
E-III-3. Distribution of 1,000 workshops and factories in each Division, Major Group
Kind of fuel Minor Minor Minor Minor Major Minor Minor Name of State or power Group Group Group Group Group Group Group
used 236 237 238 239 24 240 241
1 1 48 49 50 51 52 53 54
9. Maharashtra Electricity 6 6
Liquid fuel 3 (5
Coal, wood and bagasse 0 0
Other fuel 0 0
No power 991 988
10. Mysore E 4
1.. 0
C 0
0 0
N. P. 996
11. Orissa E 0 0
L 0 2
C 0 0
0 0 0
N. P. 1,000 998
12. Punjab E 0 22 0 91 0 0
L 0 43 0 0 0 0
C 0 22 0 91 1,000 0
0 0 0 0 273 0 500
N. P. 1,000 913 1,000 545 0 500
13. Rajasthan E 0 0 0
L 3 5 77
C 0 5 154
0 0 0 0
N, P. 997 990 769
14. Uttar Pradesh E 25
L 100
C 300
0 50
N. P. 525
15. West Bengal E 0 0 0 0 91 41 385
L 0 0 0 0 7 0 0
C 0 0 0 0 0 0 0
0 0 0 0 0 0 0 0
N. P. 1,000 1,000 1,000 1,000 902 959 615
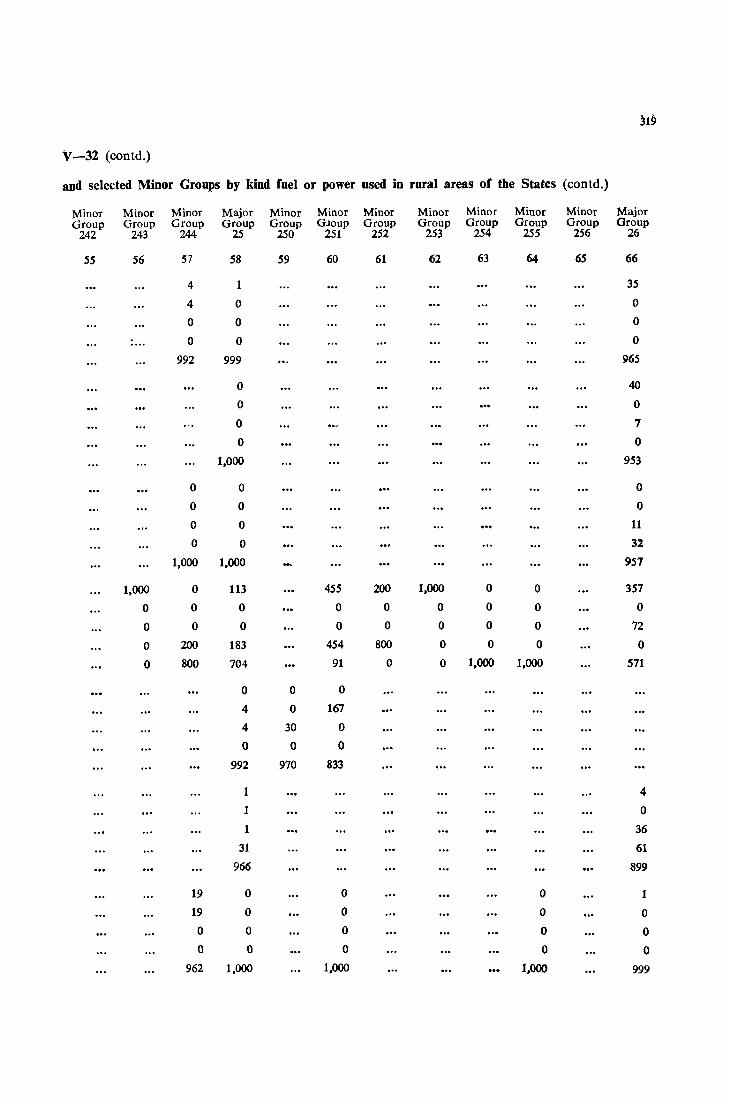
319
\,-32 (contd.)
and selected Minor Groups by kind fuel or power used in rural areas of the States (contd.)
Minor Minor Minor Major Minor Minor Minor Minor Minor Minor Minor Major Group Group Group Group Group Gloup Group Group Group Group Group Group
242 243 244 25 250 251 252 253 254 255 256 26
55 56 57 58 59 60 61 62 63 64 65 66
4 1 35
4 0 0
0 0 0
..... 0 0 0
992 999 965
0 40
0 0
0 7
0 0
1,000 953
0 0 0
0 0 0
0 0 11
0 0 32
1,000 1,000 957
1,000 0 113 455 200 1,000 0 0 357
0 0 0 0 0 0 0 0 0
0 0 0 0 0 0 0 0 72
0 200 183 454 800 0 0 0 0
0 800 704 91 0 0 1,000 1,000 571
0 0 0
4 0 167
4 30 0
0 0 0
992 970 833
1 4
1 0
1 36
31 61
966 899
19 0 0 0 1
19 0 0 0 0
0 0 0 0 0
0 0 0 0 0
962 1,000 1,000 1,000 999
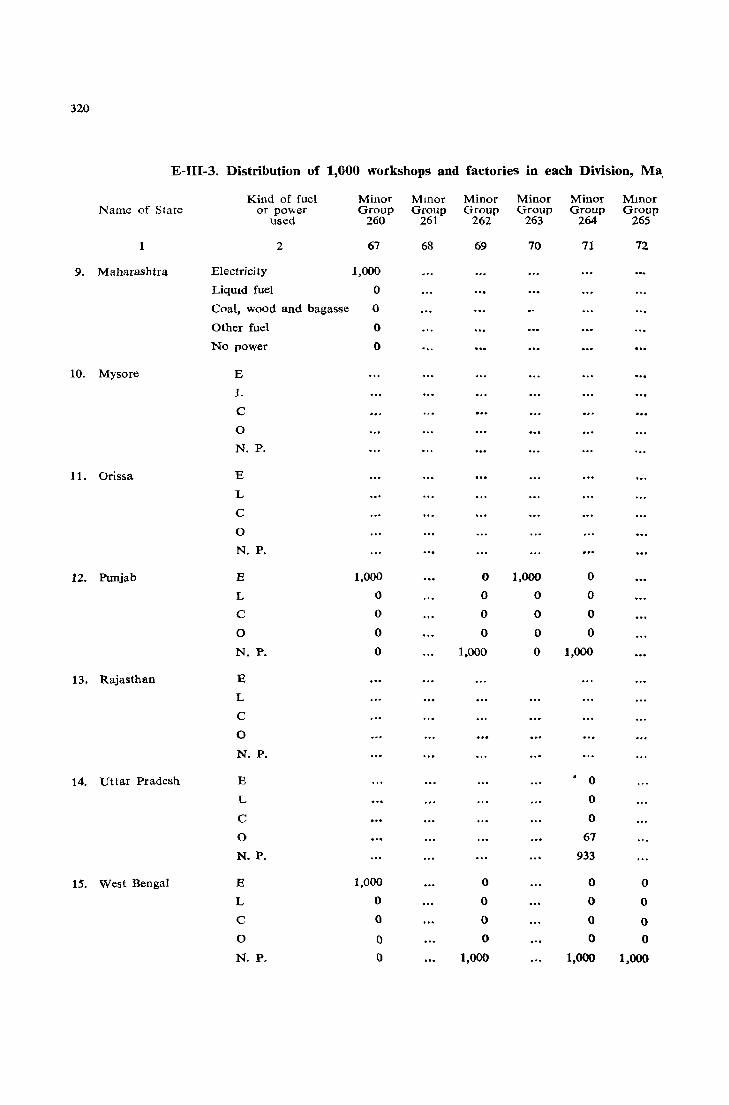
320
E-III-3. Distribution of 1,000 workshops and factories in each Division, Ma,
Kind of fuel Minor Mmor Minor Minor Minor Mmor Name of State or power Group Group Group Group Group Group
used 260 261 262 263 264 265
1 2 67 68 69 70 71 72
9. Maharasbtra Electricity 1,000
LiqUId fuel 0
Coal, wood and bagasse 0
Other fuel 0
No power 0
10. Mysore E
L
C
0
N. P.
11. Orissa E
L
C
0
N. P.
12. Punjab E 1,000 0 1,000 0
L 0 0 0 0
C 0 0 0 0
0 0 0 0 0
N. P. 0 1,000 0 1,000
13. Rajasthan E
L
C
0
N. P.
14. Uttar Pradesh E . 0
L 0
C 0
0 61
N. P. 933
15. West Bengal E 1,000 0 0 0
L 0 0 0 0
C 0 0 0 0
0 0 0 0 0
N. P. 0 1,000 1,000 1,000

321
V-32 (contd.)
and selected Minor Groups by kind of fuel or power used in rural areas of the States (contd.)
Major Minor Minor Minor Minor Minor Minor Minor Millor Minor Minor Major Group Group Group Group Group Group Group Group Group Group Group Group
27 270 271 272 273 274 275 276 277 278 279 28
74 75 76 77 78 79 80 81 82 83 84 85
N 6 0 N 108 219 2 N 0 200 N 0 31 3 0 0 0 0 0 0 0 0 0 0 0 0 0 0
1,000 994 800 1,000 892 750 995
1 5 0 3 0 0 0 0
999 992
0 0 0 1 0 0 0 N
0 0 0 N
0 0 0 0 1,000 1,000 1,000 999
17 83 127 600 7 1,000 0 34 38 c
1 0 16 0 0 0 0 0 25 0 0 0 0 0 0 0 0 6 2 0 32 0 0 0 0 17 7
980 917 825 400 993 0 1,000 949 924
1 0 0 0 3 4 0 4 0 6 1 67 0 0 1 0 0 0 0 0
994 933 996 1,000 990
3 0 1 7 3 0 3 7 8 33 3 5
'"57 33 63 67 929 934 930 914
500 12 0 0 0 0 0 333 19-1 0 0 11 0 0 0 100 0 30 0 0 0 0 0 0 0 0 0 1
N 0 12 '0 0 0 0 0 0 0 998 500 976 989 1,000 1,000 1,000 900 667 950
H-41
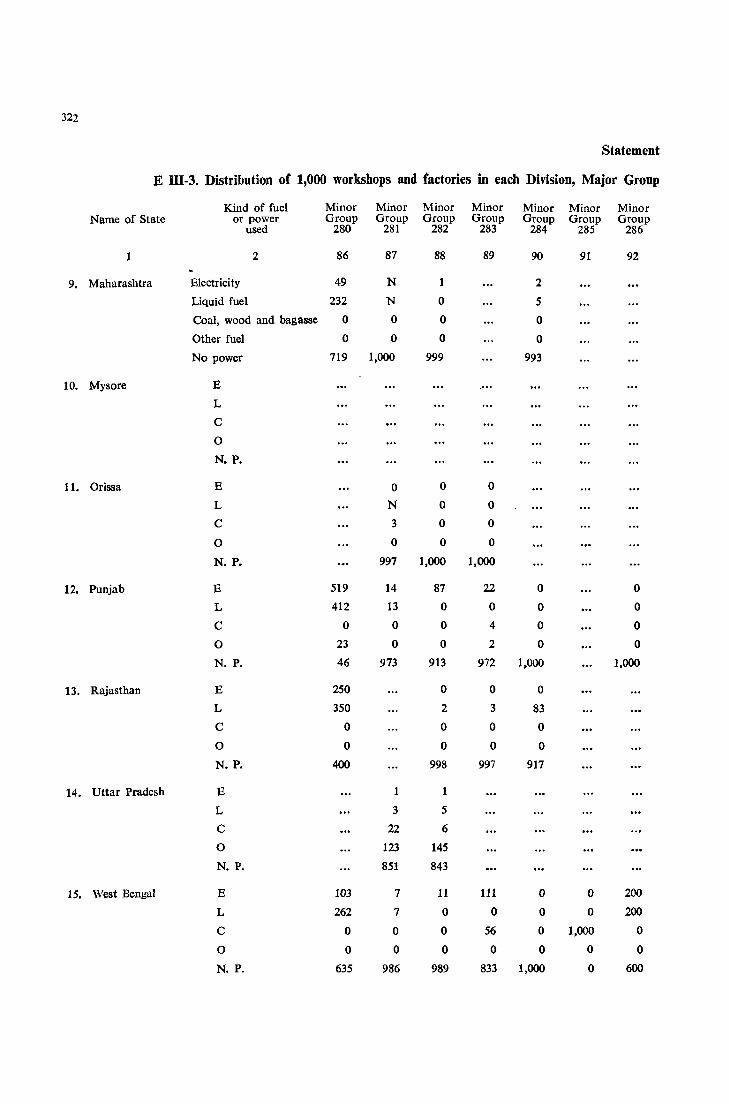
322
Statement
E llI-3. Distribution of 1,000 workshops and factories in each Division, Major Group
Kind of fuel Minor Minor Minor Minor Minor Minor Minor Name of State or power Group Group Group Group Group Group Group
used 280 281 282 283 284 285 286
1 2 86 87 88 89 90 91 92
9. Maharashtra Electricity 49 N 1 2
Liquid fuel 232 N 0 5
Coal, wood and bagasse 0 0 0 0
Other fuel 0 0 0 0
No power 719 1,000 999 993
10. Mysore E
L
C
0
N. P.
11. Orissa E 0 0 0
L N 0 0
C 3 0 0
0 0 0 0
N. P. 997 1,000 1,000
12. Punjab E 519 14 87 22 0 0
L 412 13 0 0 0 0
C 0 0 0 4 0 0
0 23 0 0 2 0 0
N. P. 46 973 913 972 1,000 1,000
13. Rajasthan E 250 0 0 0
L 350 2 3 83
C 0 0 0 0
0 0 0 0 0
N. P. 400 998 997 917
14. Uttar Pradesh E 1 1
L 3 5
C 22 6
0 123 145
N. P. 851 843
15. West Bengal E 103 7 11 111 0 0 200
L 262 7 0 0 0 0 200
C 0 0 0 56 0 1,000 0
0 0 0 0 0 0 0 0
N. P. 635 986 989 833 1,000 0 600
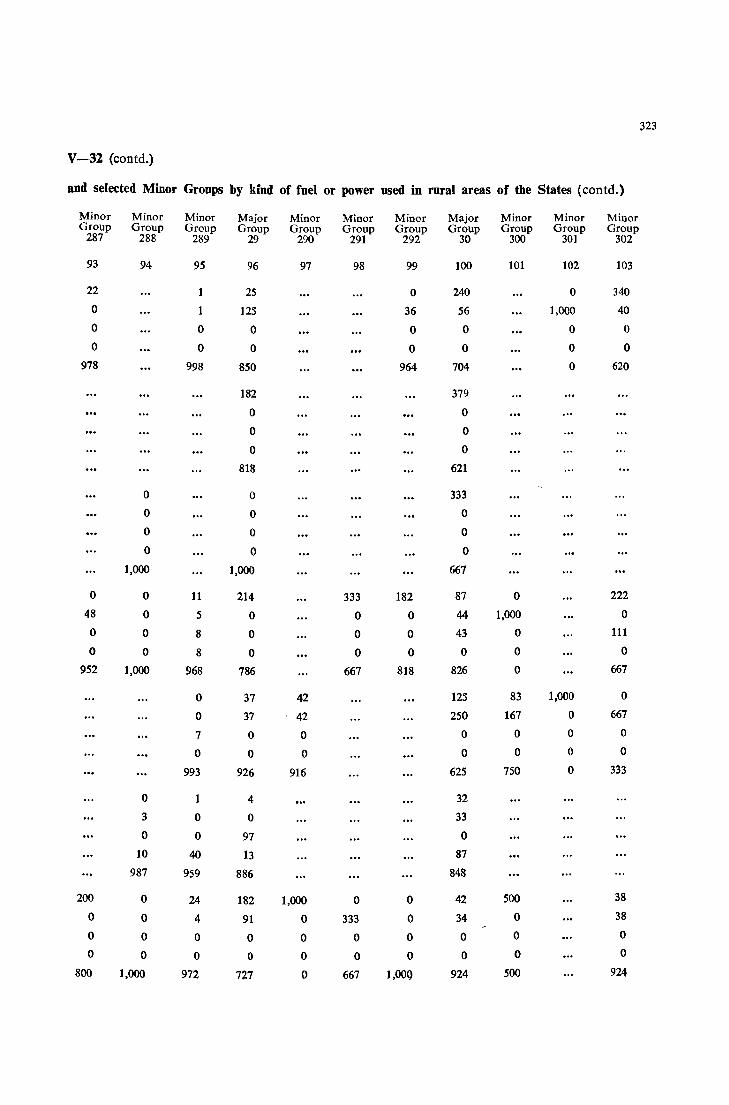
323
V-32 (contd.)
and selected Minor Groups by kind of fuel or power used in rural areas of the States (contd.)
Minor Minor Minor Major Minor Minor Minor Major Minor Minor Minor Group Group Group Group Group Group Group Group Group Group Group
287 288 289 29 290 291 292 30 300 301 302
93 94 95 96 97 98 99 100 101 102 103
22 1 25 0 240 0 340
0 1 125 36 56 1,000 40
0 0 0 0 0 0 0
0 0 0 0 0 0 0
978 998 850 964 704 0 620
182 379
0 0
0 0
0 0
818 621
0 a 333
0 a 0
0 0 0
0 0 0
1,000 1,000 667
0 0 11 214 333 182 87 0 222
48 0 5 0 0 0 44 1,000 0
0 0 8 0 0 0 43 0 111
0 0 8 0 0 0 0 0 0
952 1,000 968 786 667 818 826 0 667
0 37 42 125 83 1,000 0
0 37 42 250 167 0 667
7 0 0 0 0 0 0
0 0 0 0 0 0 0
993 926 916 625 750 0 333
0 1 4 32
3 0 0 33
0 0 97 0
10 40 13 87
987 959 886 848
200 0 24 182 1,000 0 0 42 500 38
0 0 4 91 0 333 0 34 0 38
0 0 0 0 0 0 0 0 0 0
0 0 0 0 0 0 0 0 0 0
800 1,000 972 727 0 667 I,OOQ 924 500 924
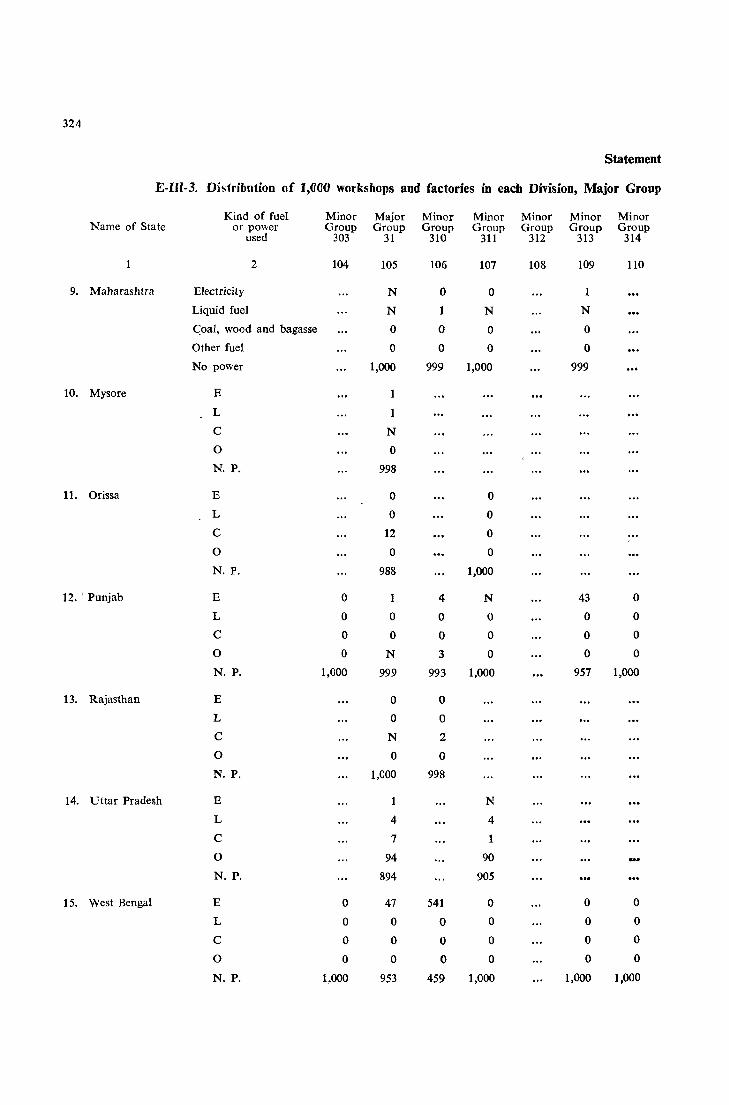
324
Statement
E-IJI-3. Dis(ribution of 1,(lCO workshops and factories in each Division, Major Group
Kind of fuel Minor Major Minor Minor Minor Minor Minor Name of State or pO,ver Group Group Group Group Group Group Group
used 303 31 310 311 312 313 314
2 104 105 106 107 108 109 110
9. Maharashtra Electricity N 0 0
Liquid fuel N 1 N N
<:;oal, wood and bagasse 0 0 0 0
Other fuel 0 0 0 0
No power 1,000 999 1,000 999
10. Mysore E 1
L 1
C N
0 0
N. P. 998
11. Orissa E 0 0
L 0 0
C 12 0
0 0 0
N. P. 988 1,000
12. ' Punjab E 0 4 N 43 0
L 0 0 0 0 0 0
C 0 0 0 0 0 0
0 0 N 3 0 0 0
N. P. 1,000 999 993 1,000 957 1,000
13. Rajasthan E 0 0
L 0 0
C N 2
0 0 0
N. P. 1,000 998
14. Uttar Pradesh E N
L 4 4
C 7
0 94 90 ... N. P. 894 905
15. West Bengal E 0 47 541 0 0 0
L 0 0 0 0 0 0
C 0 0 0 0 0 0
0 0 0 0 0 0 0
N. P. 1,000 953 459 1,000 1,000 1,000
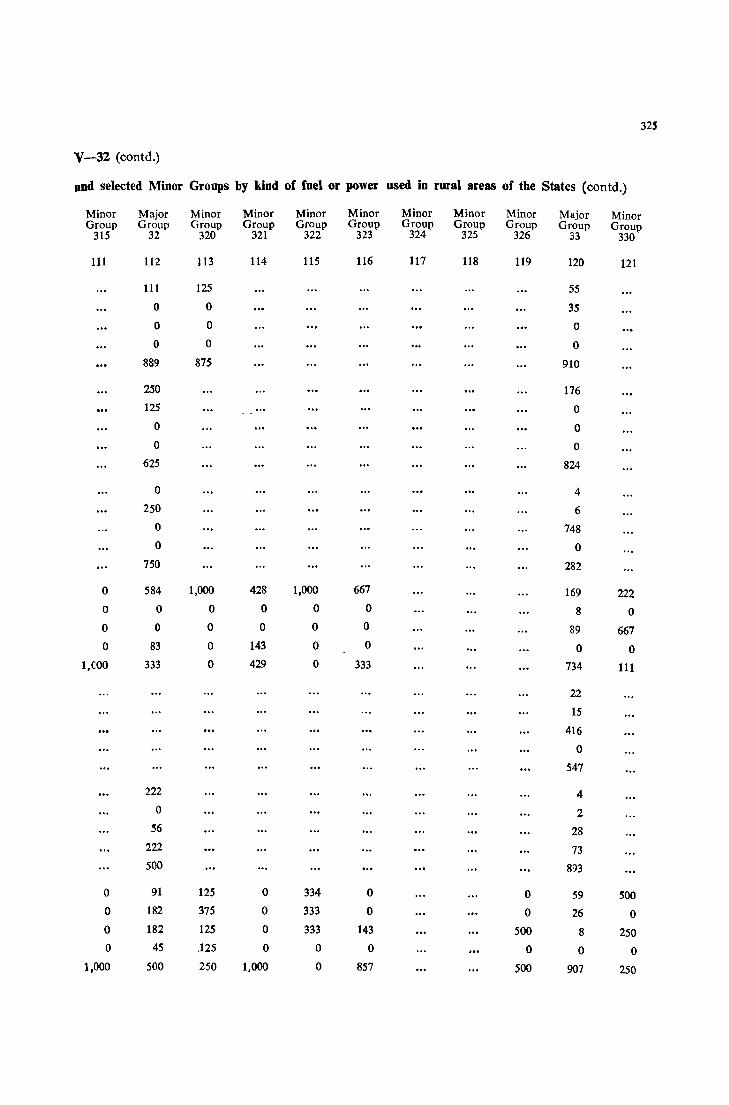
32S
V-32 (eontd.)
and selected Minor Groups by kind of fuel or power used in rural areas of the States (eontd.)
Minor Major Minor Minor Minor Minor Minor Minor Minor Major Minor Group Group Group Group Group Group Group Grou? Group Group Group
315 32 320 321 322 323 324 325 326 33 330
111 112 113 114 115 116 117 118 119 120 121
111 125 55
0 0 35
0 0 0
0 0 0
889 875 910
250 176 125 0
0 0 0 0
625 824
0 4 250 6
0 748 0 0
750 282
0 584 1,000 428 1,000 667 169 222 0 0 0 0 0 0 8 0
0 0 0 0 0 0 89 667 0 83 0 143 0 0 0 0
I,COO 333 0 429 0 333 734 111
22
15
416
0
547
222 4 0 2
56 28 222 73 500 893
0 91 125 0 334 0 0 59 500 0 182 375 0 333 0 0 26 0 0 182 125 0 333 143 500 8 250 0 45 .125 0 0 0 0 0 0
1,000 500 250 1,000 0 857 500 907 250
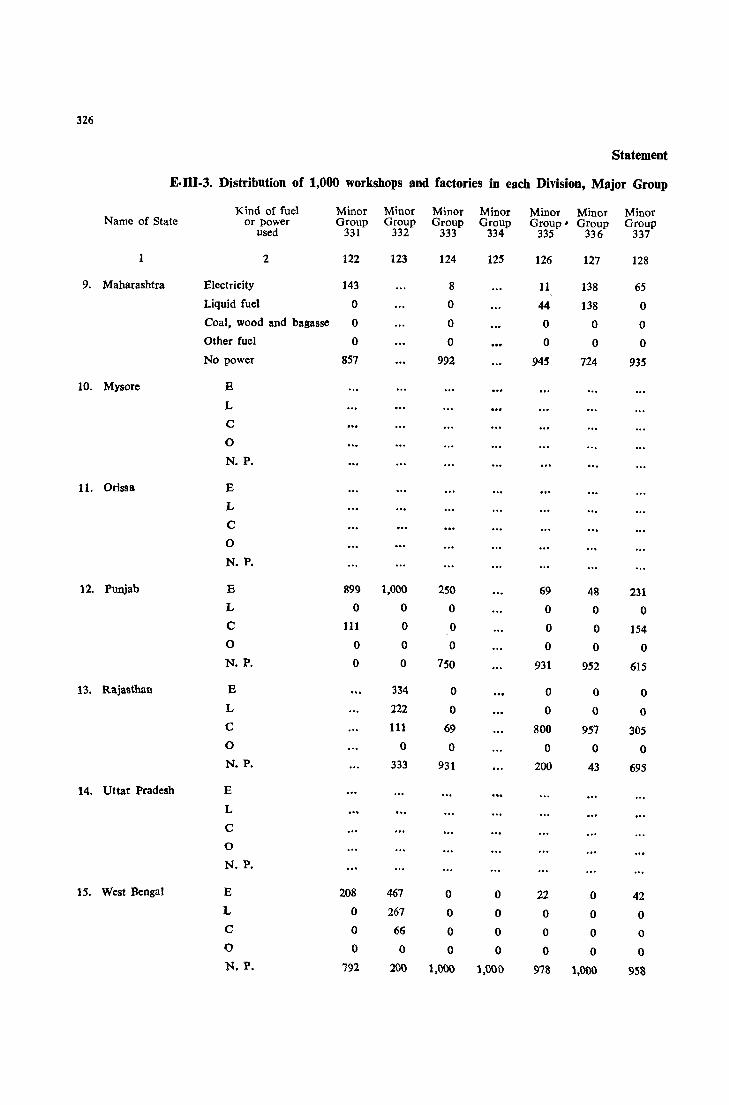
326
Statement
E·nI-3. Distribution of 1,000 workshops and factories in each Division, Major Group
Kind of fuel Minor Minor Minor Minor Minor Minor Minor Name of State or power Group Group Group Group Group' Group Group
used 331 332 333 334 335 336 337
1 2 122 123 124 125 126 127 128
9. Maharashtra Electricity 143 8 11 138 65 Liquid fuel 0 0 44 138 0 Coal, wood and bagasse 0 0 0 0 0 Other fuel 0 0 0 0 0 No power 857 992 945 724 935
10. Mysorc E
L
C
0
N. P.
11. Orissa E
L
C
0
N. P.
12. Punjab E 899 1,000 250 69 48 231 L 0 0 0 0 0 0 C 111 0 0 0 0 154 0 0 0 0 0 0 0 N. P. 0 0 750 931 952 615
13. Rajasthan E 334 0 0 0 0 L 222 0 0 0 0 C 111 69 800 957 305 0 0 0 0 0 0 N. P. 333 931 200 43 695
14. Uttar Pradesh E
L
C
0
N. P.
15. West Bengal E 208 467 0 0 22 0 42 L 0 267 0 0 0 0 0 C 0 66 0 0 0 0 0 0 0 0 0 0 0 0 0 N. P. 792 200 1,000 1,001) 978 1,000 958
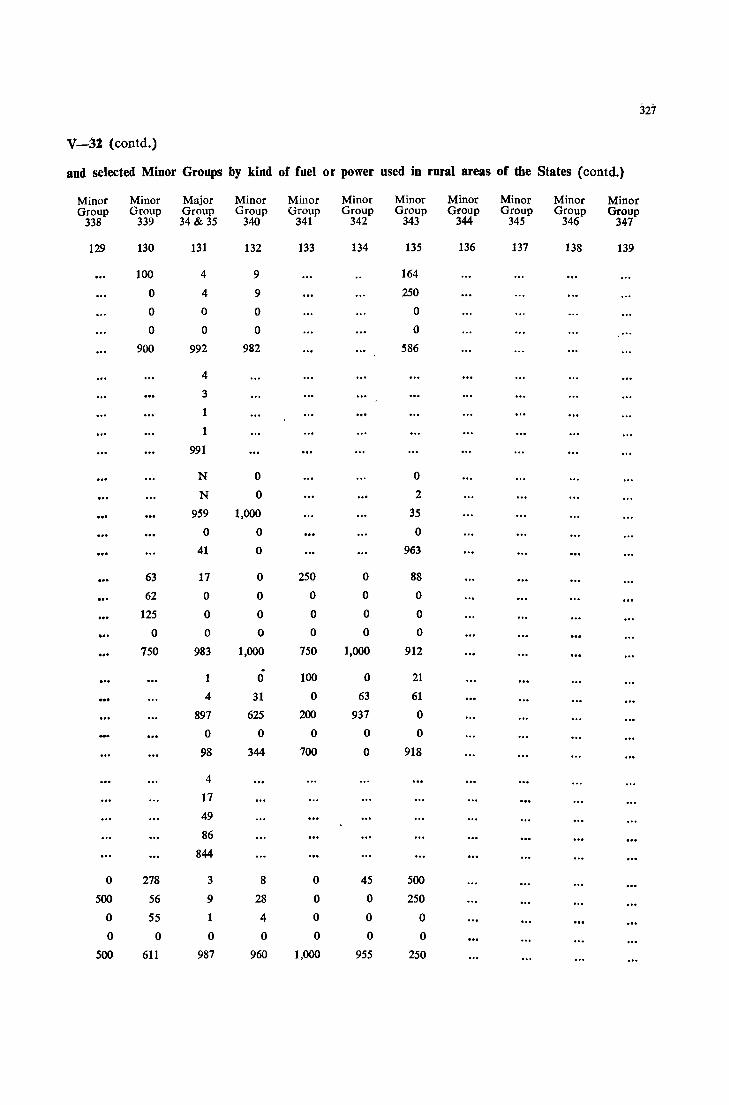
327
V-31 (eontd.)
and selected Minor Groups by kind of fuel or power used in rural areas of the States (eontd.)
Minor Minor Major Minor Minor Minor Minor Minor Minor Minor Minor Group Group Group Group Group Group Group Group Group Group Group
338 339 34& 35 340 341 342 343 344 345 346 347
129 130 131 132 133 134 135 136 137 138 139
100 4 9 164
0 4 9 250
0 0 0 0
0 0 0 0
900 992 982 586
4
3
1
1
991
N 0 0
N 0 2
959 1,000 35
0 0 0
41 0 963
63 17 0 250 0 88
62 0 0 0 0 0
125 0 0 0 0 0
0 0 0 0 0 0
750 983 1,000 750 1,000 912
1 0 100 0 21
4 31 0 63 61
897 625 200 937 0
0 0 0 0 0
98 344 700 0 918
4
17
49
86
844
0 278 3 8 0 45 500
500 56 9 28 0 0 250
0 55 1 4 0 0 0
0 0 0 0 0 0 0
500 611 987 960 1,000 955 250
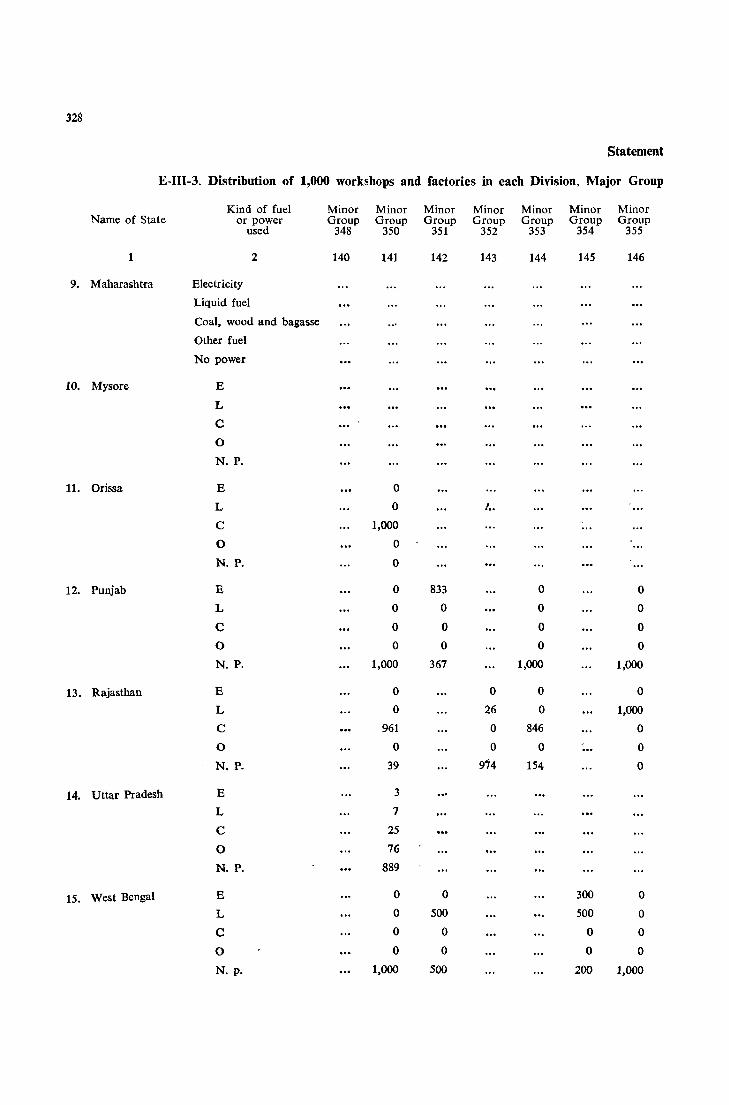
328
Statement
E-III-3. Distribution of 1,000 workshops and factories in each Division, Major Group
Kind of fuel Minor Minor Minor Minor Minor Minor Minor Name of State or power Group Group Group Group Group Group Group
used 348 350 351 352 353 354 355
1 2 140 141 142 143 144 145 146
9. Maharashtra Electricity
Liquid fuel
Coal, wood and bagasse
Other fuel
No power
10. Mysore E
L
C
0
N. P.
11. Orissa E 0
L 0 I ..
C 1,000
0 0
N. P. 0
12. Punjab E 0 833 0 0
L 0 0 0 0
C 0 0 0 0
0 0 0 0 0
N. P. 1,000 367 1,000 1,000
13. Rajasthan E 0 0 0 0
L 0 26 0 1,000
C 961 0 846 0
0 0 0 0 0
N. P. 39 974 154 0
14. Uttar Pradesh E 3
L 7
C 25
0 76
N. P. 889
15. West Bengal E 0 0 300 0
L 0 500 500 0
C 0 0 0 0
0 0 0 0 0
N. p. 1,000 500 200 1,000
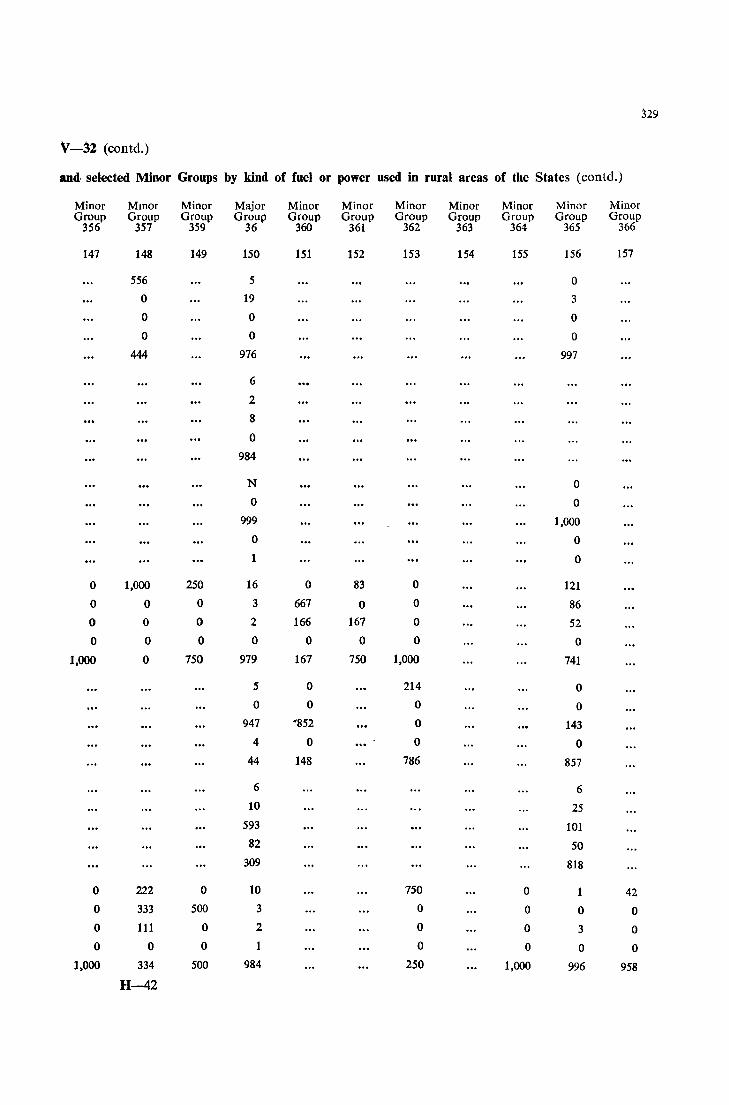
329
\1-32 (eontd.)
and· selected Minor Groups by kind of fuel or power used in rural areas of the States {eontd.}
Minor Mmor Minor Major Minor Minor Minor Minor Minor Minor Minor Group Group Group Group Group Group Group Group Group Group Group
356 357 359 36 360 361 362 363 364 365 366
147 148 149 150 151 152 153 154 155 156 157
556 5 0
0 19 3
0 0 0
0 0 0
444 976 997
6
2
8
0
984
N 0
0 0
999 1,000
0 0
1 0
0 1,000 250 16 0 83 0 121
0 0 0 3 667 0 0 86
0 0 0 2 166 167 0 52
0 0 0 0 0 0 0 0
1,000 0 750 979 167 750 1,000 741
5 0 214 0 0 0 0 0
947 ·852 0 143 4 0 0 0
44 148 786 857
6 6 10 25
593 101 82 50
309 818
0 222 0 10 750 0 1 42 0 333 500 3 0 0 0 0 0 111 0 2 0 0 3 0 0 0 0 1 0 0 0 0
1,000 334 500 984 250 1,000 996 958
H-42
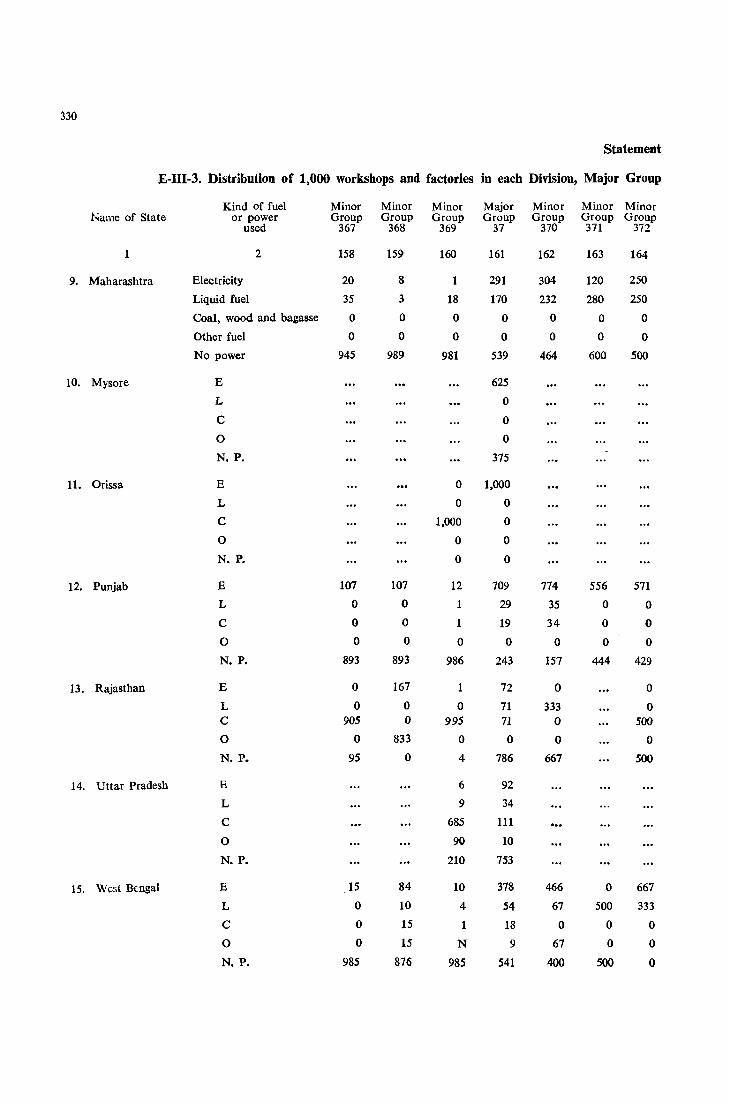
330
Statement
E-III-3. Distribution of 1,000 workshops and factories in each Division, Major Group
Kind of fuel Minor Minor Minor Major Minor Minor Minor Name of State or power Group Group Group Group Group Group Group
used 367 368 369 37 370 371 372
1 2 158 159 160 161 162 163 164
9. Maharashtra Electricity 20 8 1 291 304 120 250
Liquid fuel 35 3 18 170 232 280 250
Coal, wood and bagasse 0 0 0 0 0 0 0
Other fuel 0 0 0 0 0 0 0
No power 945 989 981 539 464 600 500
10. Mysore E 625
L 0
C 0
0 0
N. P. 375
11. Orissa E 0 1,000
L 0 0
C 1,000 0
0 0 0
N. P. 0 0
12. Punjab E 107 107 12 709 774 556 571
L 0 0 1 29 35 0 0
C G 0 1 19 34 0 0
0 0 0 0 0 0 0 0
N. P. 893 893 986 243 157 444 429
13. Rajasthan E 0 167 1 72 0 0
L 0 0 0 71 333 0 C 905 0 995 71 0 500
0 0 833 0 0 0 0
N. P. 95 0 4 786 667 500
14. Uttar Pradesh E 6 92
L 9 34
C 685 111
0 90 10
N. P. 210 753
15. W(:st Bengal E 15 84 10 378 466 0 667
L 0 10 4 54 67 500 333
C 0 15 1 18 0 0 0
0 0 15 N 9 67 0 0
N. P. 985 876 985 541 400 500 0
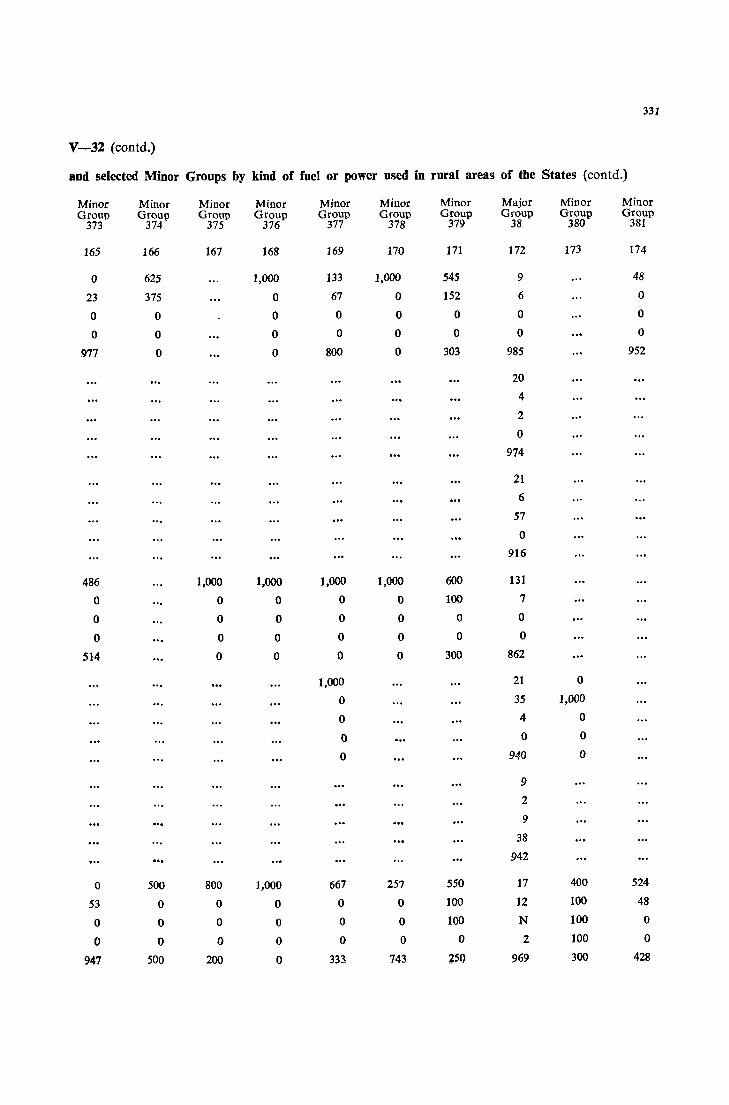
331
V-32 (contd.)
and selected Minor Groups by kind of fuel or power used in rural areas of the States (contd.)
Minor Minor Minor Minor Minor Minor Minor Major Minor Minor Group Group Group Group Group Group Group Group Group Group
373 374 375 376 377 378 379 38 380 381
165 166 167 168 169 170 171 172 173 174
0 625 1,000 133 1,000 545 9 48
23 375 0 67 0 152 6 0
0 0 0 0 0 0 0 0
0 0 0 0 0 0 0 0
977 0 0 800 0 303 985 952
20
4
2
0
974
21
6
57
0
916
486 1,000 1,000 1,000 1,000 600 131
0 0 0 0 0 100 7
0 0 0 0 0 0 0
0 0 0 0 0 0 0
514 0 0 0 0 300 862
1,000 21 0
0 35 1,000
0 4 0
0 0 0
0 940 0
9
2
9
38
942
0 500 800 1,000 667 257 550 17 400 524
53 0 0 0 0 0 100 12 100 48
0 0 0 0 0 0 100 N 100 0
0 0 0 0 0 0 0 2 100 0
947 500 200 0 333, 743 ~5Q 969 300 428
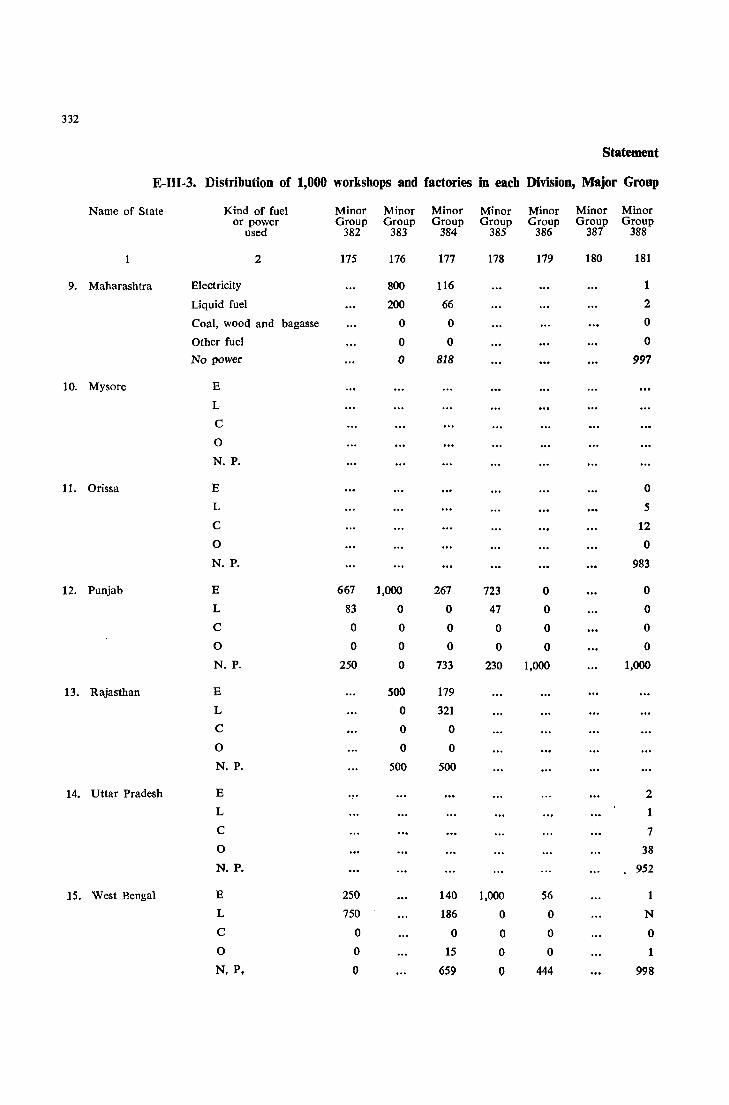
332
Statement
E-III-3. Distribution of 1,000 workshops and factories in each Division, Major Group
Name of State Kind of fuel Minor Minor Minor Minor Minor Minor Minor or power Group Group Group Group Group Group Group
used 382 383 384 385 386 387 388
2 175 176 177 178 179 180 181
9. Maharashtra Electricity 800 116 1
Liquid fuel 200 66 2
Coal, wood and bagasse 0 0 0
Other fuel 0 0 0
No power 0 818 997
10. Mysore E
L
C
0
N. P.
11. Orissa E 0
L 5
C 12
0 0
N. P. 983
12. Punjab E 667 1,000 267 723 0 0
L 83 0 0 47 0 0
C 0 0 0 0 0 0
0 0 0 0 0 0 0
N. P. 250 0 733 230 1,000 1,000
13. Rajasthan E 500 179
L 0 321
C 0 0
0 0 0
N. P. 500 500
14. Uttar Pradesh E 2
L 1
C 7
0 38
N. P. 952
15. West Bengal E 250 140 1,000 56 1
L 750 186 0 0 N
C 0 0 0 0 0
0 0 15 0 0 1
N. P, 0 659 0 444 998
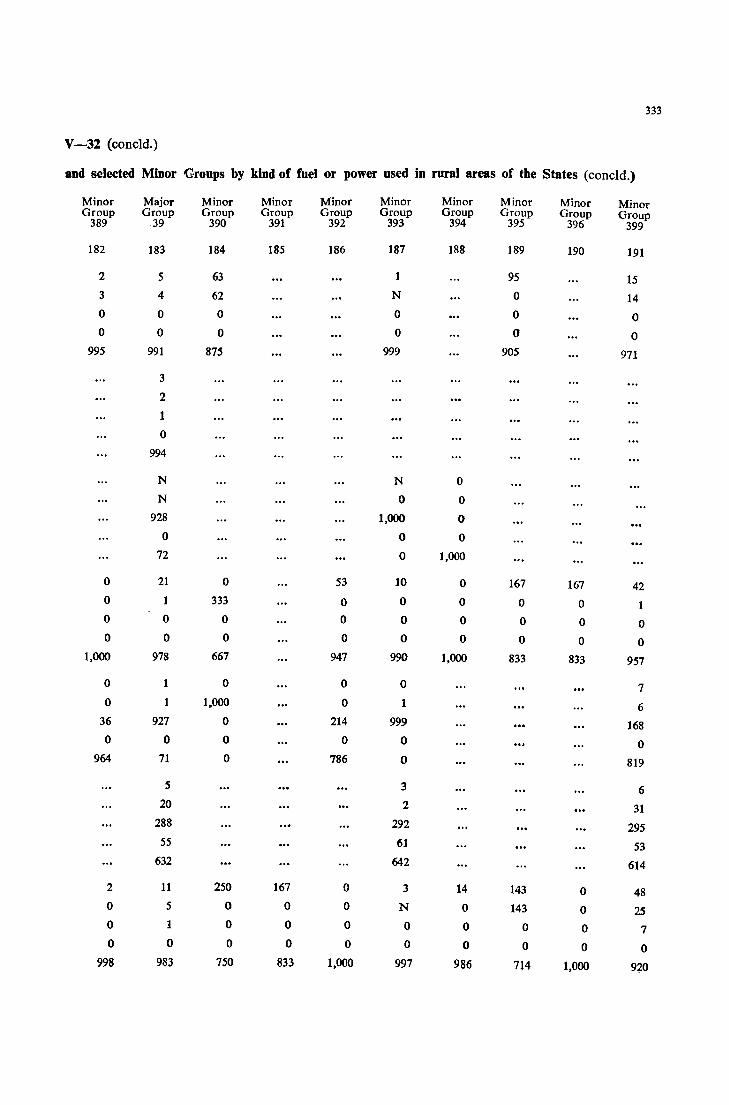
333
V -32 (concld.)
aDd selected Minor Groups by kind of fuel or power used in rural areas of the States (concld.)
Minor Major Minor Minor Minor Minor Minor Minor Minor Minor Group Group Group Group Group Group Group Group Group Group
389 -39 390 391 392 393 394 395 396 399
182 183 184 185 186 187 188 189 190 191
2 5 63 1 95 15 3 4 62 N 0 14 0 0 0 0 0 0 0 0 0 0 0 0
995 991 875 999 905 971
3
2
1
0
994
N N 0
N 0 0 928 1,000 0
0 0 0
72 0 1,000
0 21 0 53 10 0 167 167 42 0 1 333 0 0 0 0 0 0 0 0 0 0 0 0 0 0 0 0 0 0 0 0 0 0 0
1,000 978 667 947 990 1,000 833 833 957
0 1 0 0 0 7 0 1 1,000 0 1 6
36 927 0 214 999 168 0 0 0 0 0 0
964 71 0 786 0 819
5 3 6 20 2 31
288 292 295 55 61 53
632 642 614
2 11 250 167 0 3 14 143 0 48 0 5 0 0 0 N 0 143 0 25 0 1 0 0 0 0 0 0 0 7 0 0 0 0 0 0 0 0 0 0
998 983 750 833 1,000 997 986 714 1,000 9fO
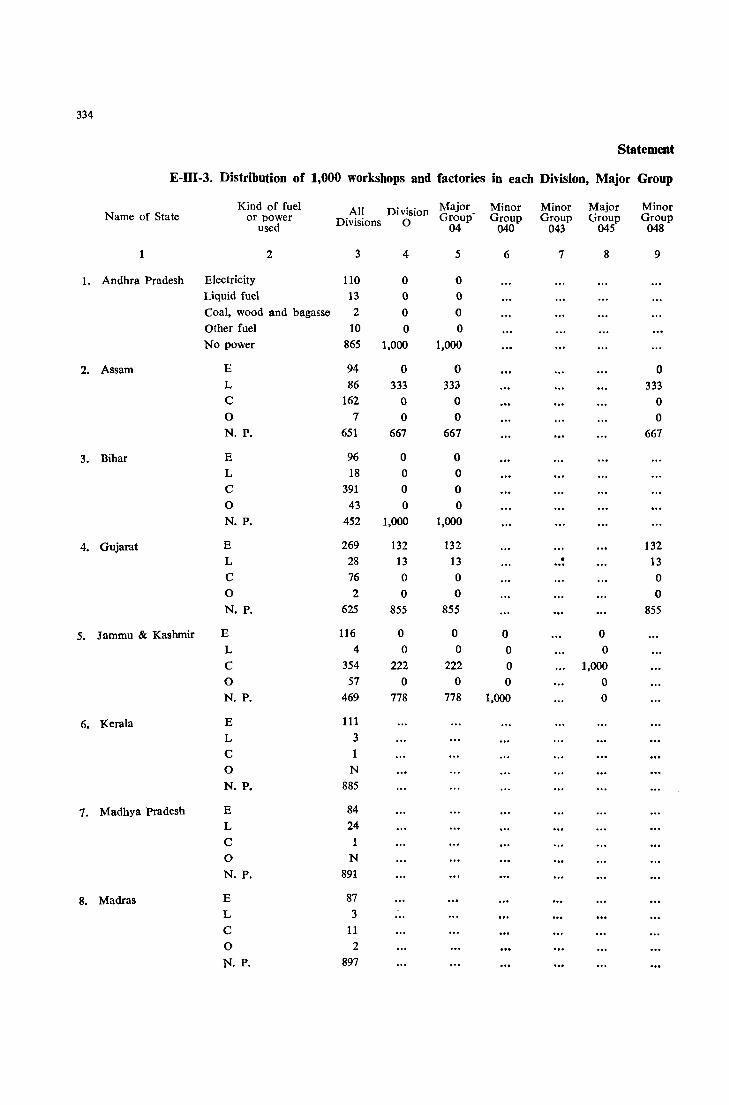
334
Statement
E-III-3. Distribution of 1,000 workshops and factories in each Division, Major Group
Kind of fuel All Division Major: Minor Minor Major Minor Name of State or power Divisions 0 Group Group Group Group Group
used 04 040 043 045 048
1 2 3 4 5 6 7 8 9
1. Andhra Pradesh Electricity 110 0 0 Liquid fuel 13 0 0 Coal, wood and bagasse 2 0 0 Other fuel 10 0 0 No power 865 1,000 1,000
2. Assam E 94 0 0 0 L 86 333 333 333 C 162 0 0 0 0 1 0 0 0 N. P. 651 667 661 667
3. Bihar E 96 0 0 L 18 0 0
C 391 0 0 0 43 0 0 N. P. 452 1,000 1,000
4. Gujarat E 269 132 132 132 L 28 13 13 . 13 ... C 76 0 0 0 0 2 0 0 0 N. P. 625 855 855 855
5. Jammu & Kashmir E 116 0 0 0 0 L 4 0 0 0 0 C 354 222 222 0 1,000 0 57 0 0 0 0 N. P. 469 778 778 1,000 0
6. Kerala E 111 L 3 C 0 N N. P. 885
7. Madhya Pradesh E 84 L 24 C 1 0 N N. P. 891
8. Madras E 87 L 3 C 11
0 2
N. P. 897
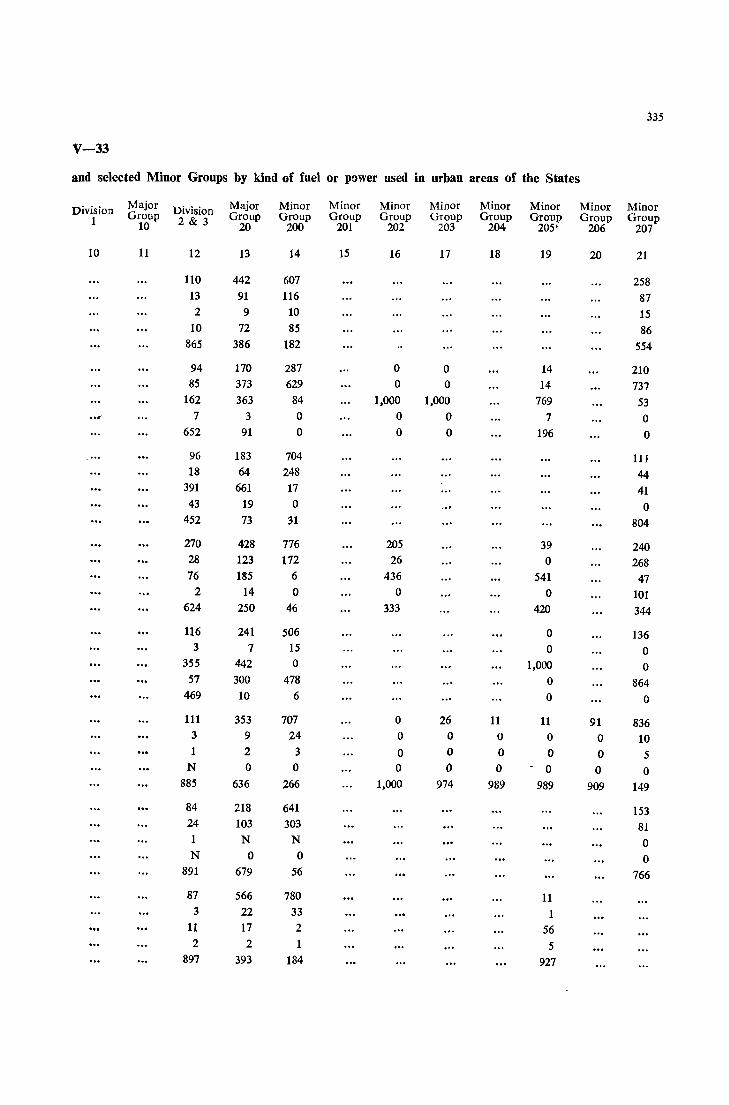
335
V-33
and selected Minor Groups by kind of fuel or power used in urban areas of the States
Division Major Division Major Minor Minor Minor Minor Minor Minor Minor Minor 1 Group 2 & 3 Group Group Group Group Group Group Group Group Group
10 20 200 201 202 203 204 205' 206 207
10 11 12 13 14 15 16 17 18 19 20 21
110 442 607 258 13 91 116 87 2 9 10 15
10 72 85 86 865 386 182 554
94 170 287 0 0 14 210 85 373 629 0 0 14 737
162 363 84 1,000 1,000 769 53 .... 7 3 0 0 0 7 0 652 91 0 0 0 196 0
96 183 704 111 18 64 248 44
391 661 17 41 43 19 0 0
452 73 31 804
270 428 776 205 39 240 28 123 172 26 0 268 76 !t!5 6 436 541 47
2 14 0 0 0 101 624 250 46 333 420 344
116 241 506 0 136 3 7 15 0 0
355 442 0 1,000 0 57 300 478 0 864
469 10 6 0 0
111 353 707 0 26 11 11 91 836 3 9 24 0 0 0 0 0 10 1 2 3 0 0 0 0 0 5
N 0 0 0 0 0 - 0 0 0 885 636 266 1,000 974 989 989 909 149
84 218 641 153 24 103 303 81 1 N N 0 N 0 0 0
891 679 56 766
87 566 780 11 3 22 33 1
11 17 2 56 2 2 1 5
897 393 184 927

336
Statement
E-III-3. Distribution of 1,000 workshops and factories in each Division Major Group
Kind of fuel Minor Minor Major Minor Minor Minor Minor Name of State or power Group Group Group Group Group Group Group
used 208 209 21 210 211 212 213
1 2 22 23 24 25 26 27 28
1. Andhra Pradesh Electricity 376 Liquid fuel 0 Coal, wood and bagasse 0 Other fuel 0 No power 624
2. Assam E 63 128 0 L 0 103 0 C 500 538 1,000
0 0 77 0
N. P. 437 154 0
3. Bihar E 1 224 0 L 0 11 0 C 966 54 0 0 30 4 0 N. P. 3 707 1,000
4. Gujarat E 800 51 595 L 200 5 100
C 0 457 13 0 0 0 0 N. P. 0 487 292
5. Jammu & Kashrnir E 0 475 L 0 0 C 1,000 25 0 0 0 N. P. 0 500
6. Kerala E 1,000 273 0
L 0 0 0 C 0 0 0 0 0 0 0 N. P. 0 727 1,000
7. Madhya Pradesh E 2 410 L 0 55 C 0 7 0 0 74 N. P. 998 454
8. Madras E 443 L 5 C 11
0 30 N. P. 511
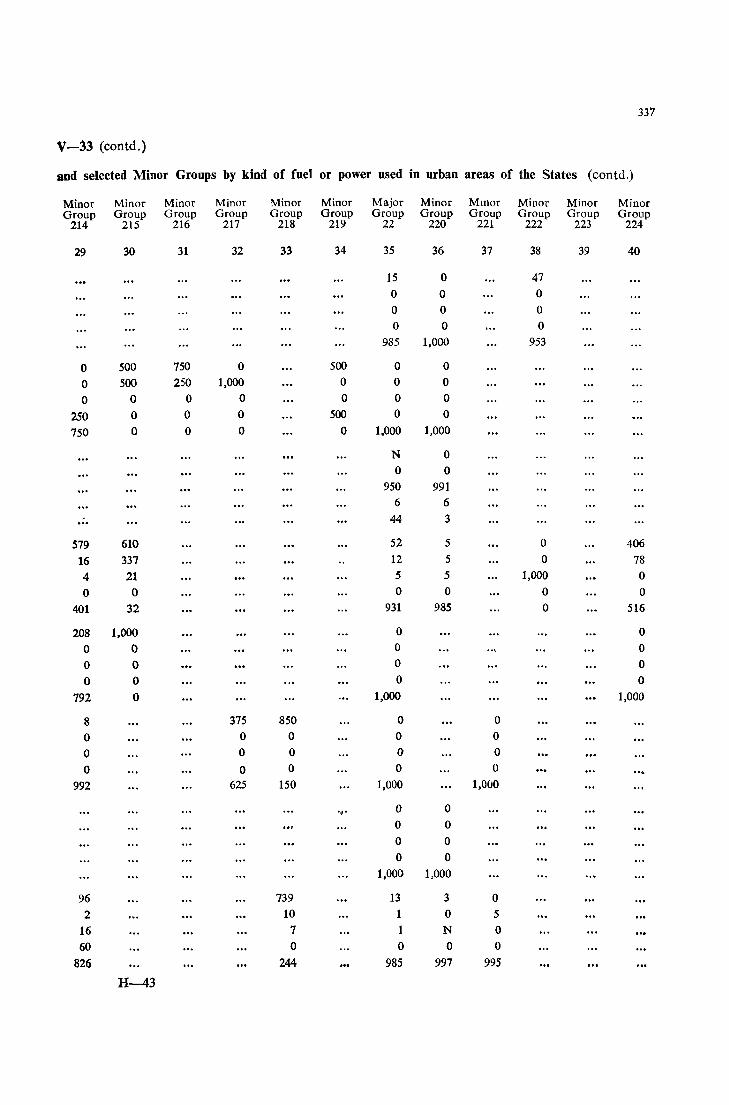
337
V-33 (contd,)
and selected Minor Groups by kind of fuel or power used in urban areas of the States (contd.)
Minor Minor Minor Minor Minor Minor Major Minor Mmor Minor Minor Minor Group Group Group Group Group Group Group Group Group Group Group Group
214 215 216 217 218 219 22 220 221 222 223 224
29 30 31 32 33 34 35 36 37 38 39 40
15 0 47 0 0 0 0 0 0 0 0 0
985 1,000 953
0 500 750 0 500 0 0
0 500 250 1,000 0 0 0
0 0 0 0 0 0 0
250 0 0 0 500 0 0
750 0 0 0 0 1,000 1,000
N 0 0 0
950 991 6 6
... 44 3
579 610 52 5 0 406
16 337 12 5 0 78 4 21 5 5 1,000 0
0 0 0 0 0 0
401 32 931 985 0 516
208 1,000 0 0
0 0 0 0 0 0 0 0 0 0 0 0
792 0 1,000 1,000
8 375 850 0 0
0 0 0 0 0
0 0 0 0 0
0 0 0 0 0
992 625 150 1,000 1,000
'" 0 0 0 0 0 0 0 0
1,000 1,000
96 739 13 3 0 2 10 1 0 5
16 7 1 N 0 60 0 0 0 0
826 244 985 997 995
H-43
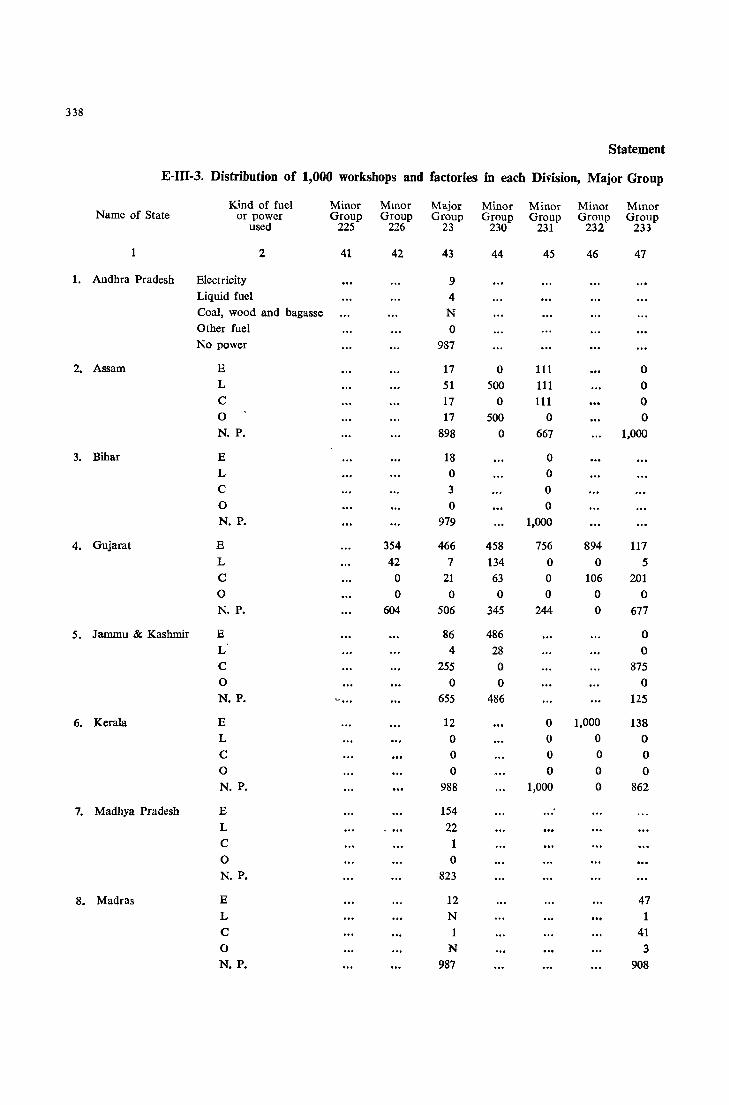
338
Statement
E-III-3. Distribution of 1,000 workshops and factories in each Division, Major Group
Kind of fuel Minor Mmor Major Minor Minor Minor Mmor Name of State or power Group Group Group Group Group Group Group
used 225 226 23 230 231 232 233
1 2 41 42 43 44 45 46 47
1. Andhra Pradesh Electricity 9 Liquid fuel 4 Coal, wood and bagasse N Other fuel 0 No power 987
2. Assam E 17 0 111 0 L 51 500 111 0 C 17 0 111 0 0 17 500 0 0 N. P. 898 0 667 1,000
3. Bihar E 18 0 L 0 0 C 3 0 0 0 0 N. P. 979 1,000
4. Gujarat E 354 466 458 756 894 117 L 42 7 134 0 0 5 C 0 21 63 0 106 201 0 0 0 0 0 0 0 N. P. 604 506 345 244 0 677
5. Jammu & Kashmir E 86 486 0 L 4 28 0 C 255 0 875 0 0 0 0 N. P. ~ ... 655 486 125
6. Kerala E 12 0 1,000 138 L 0 0 0 0
C 0 0 0 0 0 0 0 0 0 N. P. 988 1,000 0 862
7. Madhya Pradesh E 154 L 22 C 1 0 0 N. P. 823
8. Madras E 12 47 L N 1 C 1 41 0 N 3 N. P. 987 908
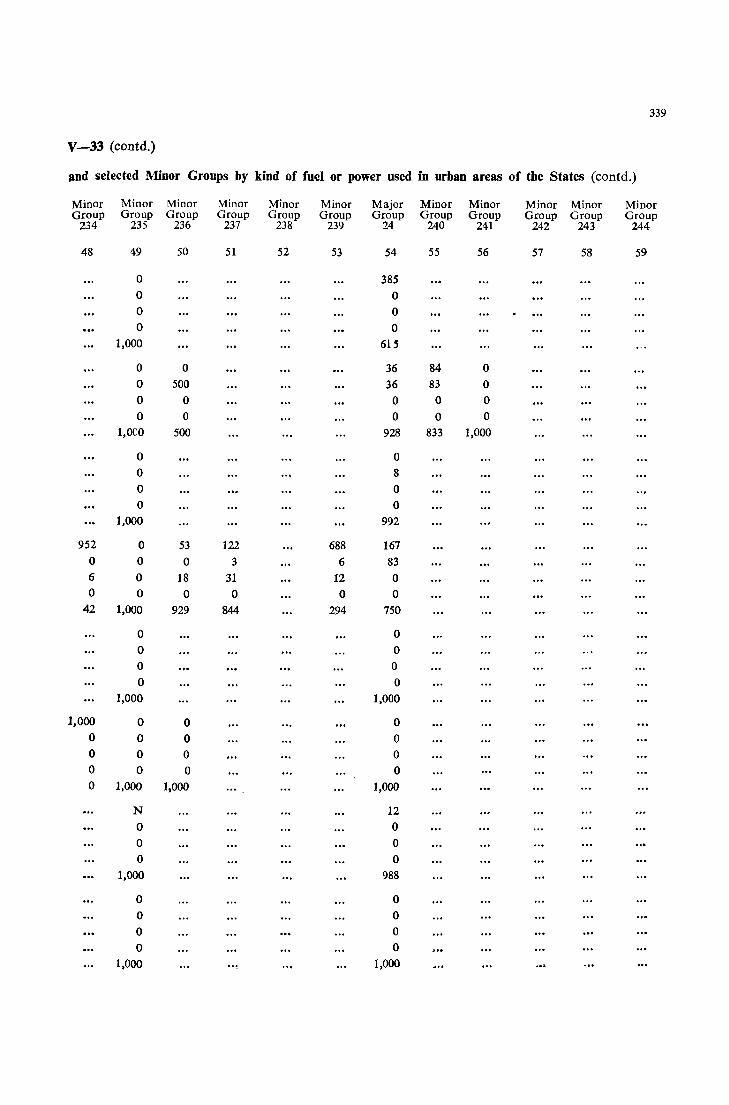
339
V-33 (eontd.)
Ilnd selected Minor Groups by kind of fuel or power used in urban areas of the States (eontd.)
Minor Minor Minor Minor Minor Minor Major Minor Minor Minor Minor Minor Group Group Group Group Group Group Group Group Group Group Group Group
234 235 236 237 238 239 24 240 241 242 243 244
48 49 50 51 52 53 54 55 56 57 58 59
0 385 0 0 0 0 0 0
1,000 615
0 0 36 84 0 0 500 36 83 0 0 0 0 0 0 0 0 0 0 0
1,OCO 500 928 833 1,000
0 0 0 8 0 0 0 0
1,000 992
952 0 53 122 688 167 0 0 0 3 6 83 6 0 18 31 12 0 0 0 0 0 0 0
42 1,000 929 844 294 750
0 0 0 0 0 0 0 0
1,000 1,000
1,000 0 0 0 0 0 0 0 0 0 0 0 0 0 0 0 0 1,000 1,000 1,000
N 12 0 0 0 0 0 0
1,000 988
0 0 0 0 0 0 0 0
1,000 1,000
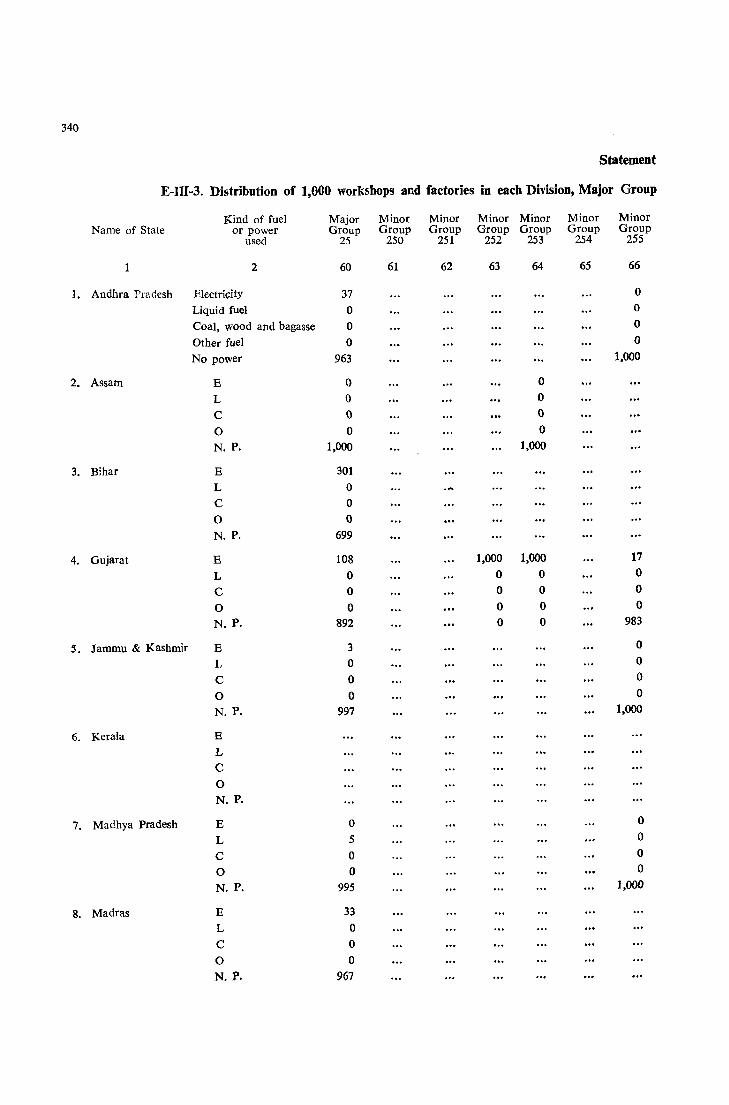
340
Statement
E-III~3. Distribution of 1,000 workshops and factories in each Division, Major Group
Kind of fuel Major Minor Minor Minor Minor Minor Minor Name of State or power Group Group Group Group Group Group Group
used 25 250 251 252 253 254 255
1 2 60 61 62 63 64 65 66
1. Andhra Pradesh Electricity 37 0
Liquid fuel 0 0
Coal, wood and bagasse 0 0
Other fuel 0 0
No power 963 1,000
2. Assam E 0 0
L 0 0
C 0 0
0 0 0
N. P. 1,000 1,000
3. Bihar E 301
L 0
C 0
0 0
N. P. 699
4. Gujarat E 108 1,000 1,000 17
L 0 0 0 0
C 0 0 0 0
0 0 0 0 0
N. P. 892 0 0 983
5. Jammu & Kashmir E 3 0
L 0 0
C 0 0
0 0 0
N. P. 997 1,000
6. Kerala E
L
C
0 N. P.
7. Madhya Pradesh E 0 0
L 5 0
C 0 0
0 0 0
N. P. 995 1,000
8. Madras E 33
L 0
C 0
0 0
N. P. 967

341
V-33 (contd.)
and selected Miner Groups by kind of fuel or )lClller used in urban areas of the States (contd.)
Minor Major Minor Minor Minor Minor Minor Minor Minor Major Minor Minor Group Group Group Group Group Group Group Group Group Group Group Group
256 26 260 261 262 263 264 265 266 27 270 271
67 68 69 70 71 72 73 74 75 76 77 78
47 0 3 0 0 0 0 0 0 0 0 0
953 1,000 997
0 0 0 83 0 19 1,000 0 167 667 0 0 0 83 0
0 0 0 0 0
981 0 1,000 667 333
67 1
0 0
0 0 0 0
933 998
835 964 943 167 884 136 4 9 28 0 0 4 0 0 0 0 0 3
0 0 0 0 0 0
161 27 29 833 116 857
0 387 1,000 0 4
0 0 0 0 0 0 9 0 0 0
0 0 0 0 0
1,000 604 0 1,000 996
13 2
N 0
985
97 6
0 0 0 0
0 0 903 994
101 971 0 21 N 4 0 N
0 0 0 N
N 0 0 0 899 2$ 1,000 979
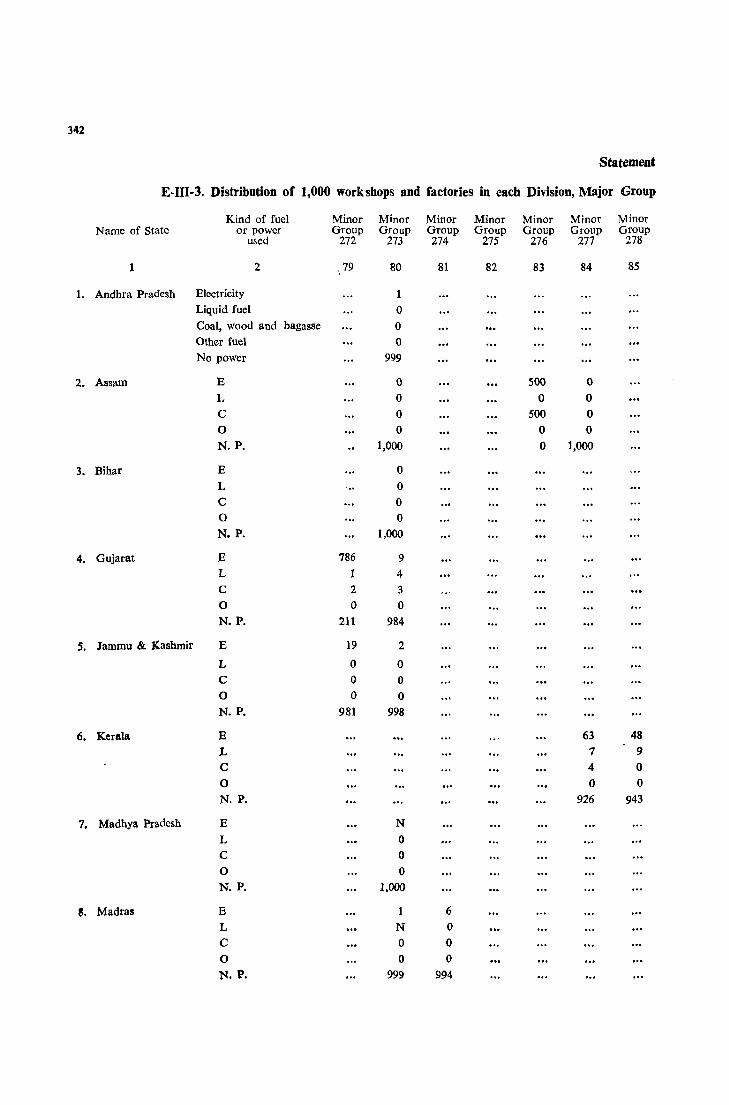
342
Statement
E-III·3. Distribution of 1,000 workshops and factories in each Division, Major Group
Kind of fuel Minor Minor Minor Minor Minor Minor Minor Name of State or power Group Group Group Group Group Group Group
used 272 273 274 275 276 277 278
1 2 \ 79 80 81 82 83 84 85
1. Andhra Pradesh Electricity 1 Liquid fuel 0 Coal, wood and bagasse 0 Other fuel 0 No power 999
2. Assam E 0 500 0 L 0 0 0 C 0 500 0
0 0 0 0
N. P. 1,000 0 1,000
3. Bihar E 0 L 0 C 0 0 0 N. P. 1,000
4. Gujarat E 786 9 L 1 4 C 2 3 0 0 0 N.P. 211 984
S. Jammu & I{ashmir E 19 2
L 0 0 C 0 0
0 0 0 N. P. 981 998
6. Kerala E 63 48 L 7 9 C 4 0
0 0 0 N. P. 926 943
7. Madhya Pradesh E N L 0 C 0 0 0 N. P. 1,000
S. Madras E 1 6 L N 0 C 0 0 0 0 0
N. P. 999 994
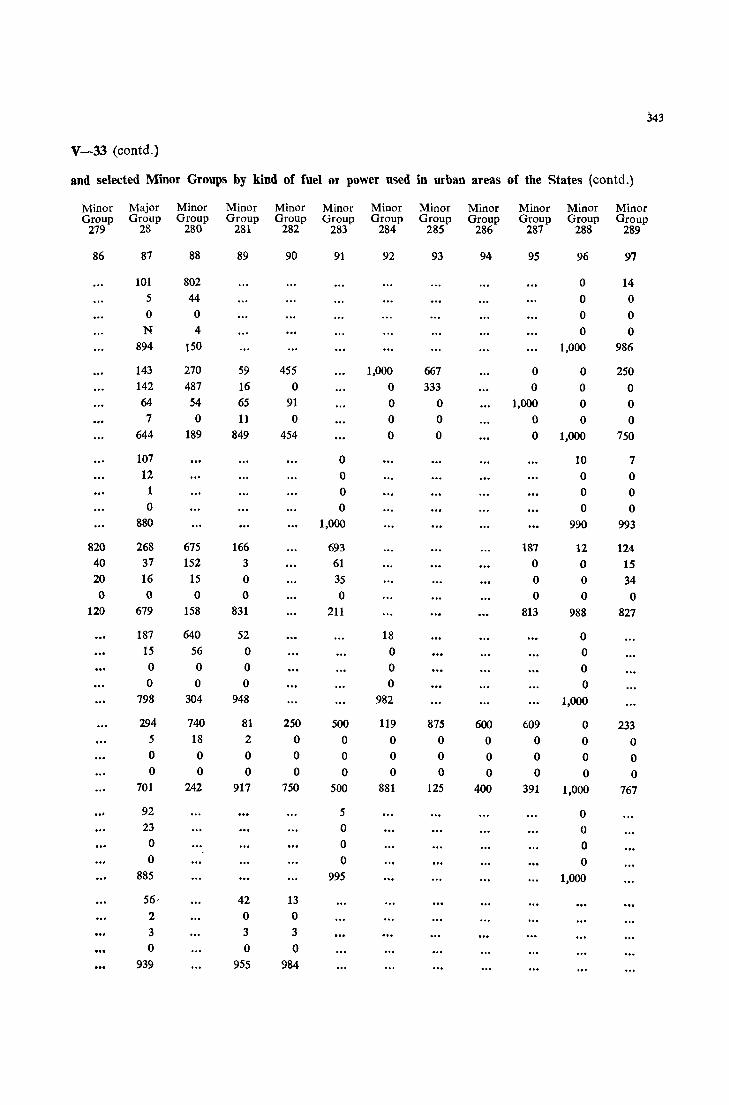
343
V~33 (contd.)
and selected Minor Groups by kind of fuel or power used in urban areas of the States (contd.)
Minor Major Minor Minor Minor Minor Minor Minor Minor Minor Minor Minor Group Group Group Group Group Group Group Group Group Group Group Group
279 28 280 281 282 283 284 285 286 287 288 289
86 87 88 89 90 91 92 93 94 95 96 97
101 802 0 14 5 44 0 0 0 0 0 0 N 4 0 0
894 {50 1,000 986
143 270 59 455 1,000 667 0 0 250 142 487 16 0 0 333 0 0 0 64 54 65 91 0 0 1,000 0 0 7 0 11 0 0 0 0 0 0
644 189 849 454 0 0 0 1,000 750
107 0 10 7 12 0 0 0 1 0 0 0 0 0 0 0
880 1,000 990 993
820 268 675 166 693 187 12 124 40 37 152 3 61 0 0 15 20 16 15 0 35 0 0 34 0 0 0 0 0 0 0 0
120 679 158 831 211 813 988 827
187 640 52 18 0 15 56 0 0 0 0 0 0 0 0 0 0 0 0 0
798 304 948 982 1,000
294 740 81 250 500 119 875 600 609 0 233 5 18 2 0 0 0 0 0 0 0 0 0 0 0 0 0 0 0 0 0 0 0 0 0 0 0 0 0 0 0 0 0 0
701 242 917 750 500 881 125 400 391 1,000 767
92 5 0 23 0 0 0 0 0 0 0 0
885 995 1,000
56· 42 13 2 0 0 3 3 3 0 0 0
939 955 984
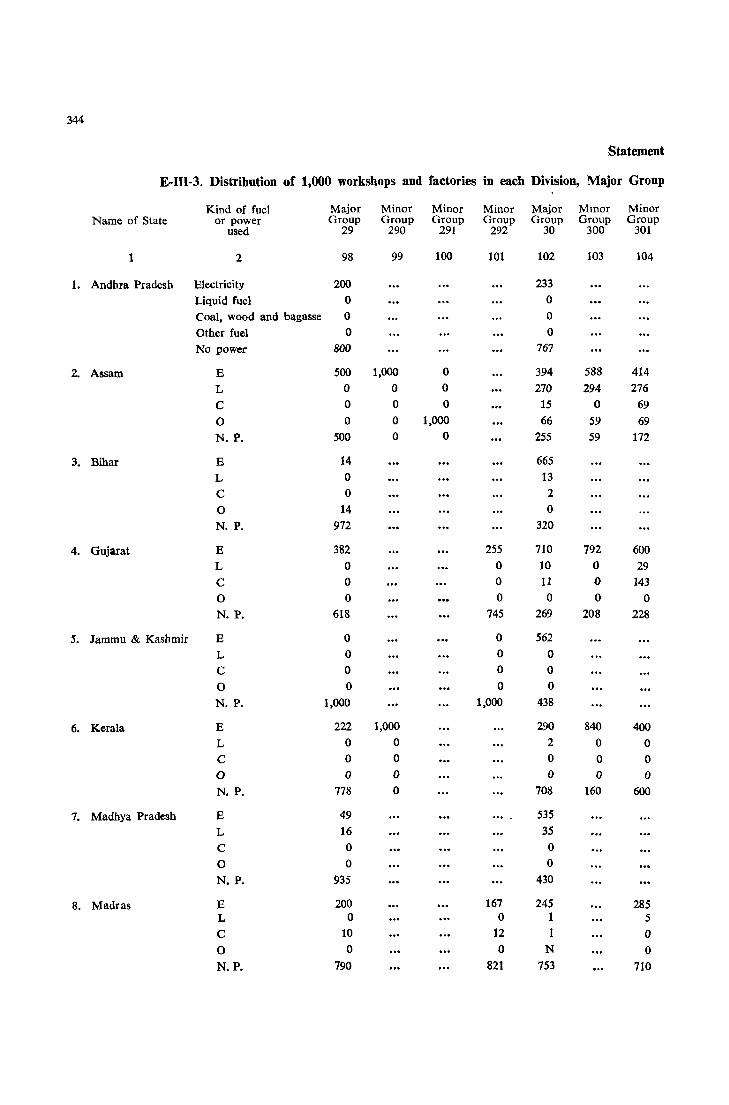
344
Statement
E-III-3. Distribution of 1,000 workshops and factories in each Division, Major Group
Kind of fuel Major Minor Minor Minor Major Mmor Minor Name of State or power Group Group Group Group Group Group Group
used 29 290 291 292 30 300 301
1 2 98 99 100 101 102 103 104
1. Andhra Pradesh Electricity 200 233 Liquid fuel 0 0 Coal, wood and bagasse 0 0 Other fuel 0 0 No power 800 767
2. Assam E 500 1,000 0 394 588 414 L 0 0 0 270 294 276
C 0 0 0 15 0 69 0 0 0 1,000 66 59 69 N. P. 500 0 0 255 59 172
3. Bihar E 14 665 L 0 13 C 0 2 0 14 0 N. P. 972 320
4. Gujarat E 382 255 710 792 600 L 0 0 10 0 29 C 0 0 11 0 143 0 0 0 0 0 0 N. P. 618 745 269 208 228
5. Jammu & Kashmir E 0 0 562 L 0 0 0
C 0 0 0
0 0 0 0 N. P. 1,000 1,000 438
6. Kerala E 222 1,000 290 840 400 L 0 0 2 0 0 C 0 0 0 0 0 0 0 0 0 0 0
N. P. 778 0 708 160 600
7. Madhya Pradesh E 49 535
L 16 35
C 0 0
0 0 0 N. P. 935 430
8. Madras E 200 167 245 285 L 0 0 1 5 C 10 12 1 0 0 0 0 N 0
N.P. 790 821 753 710
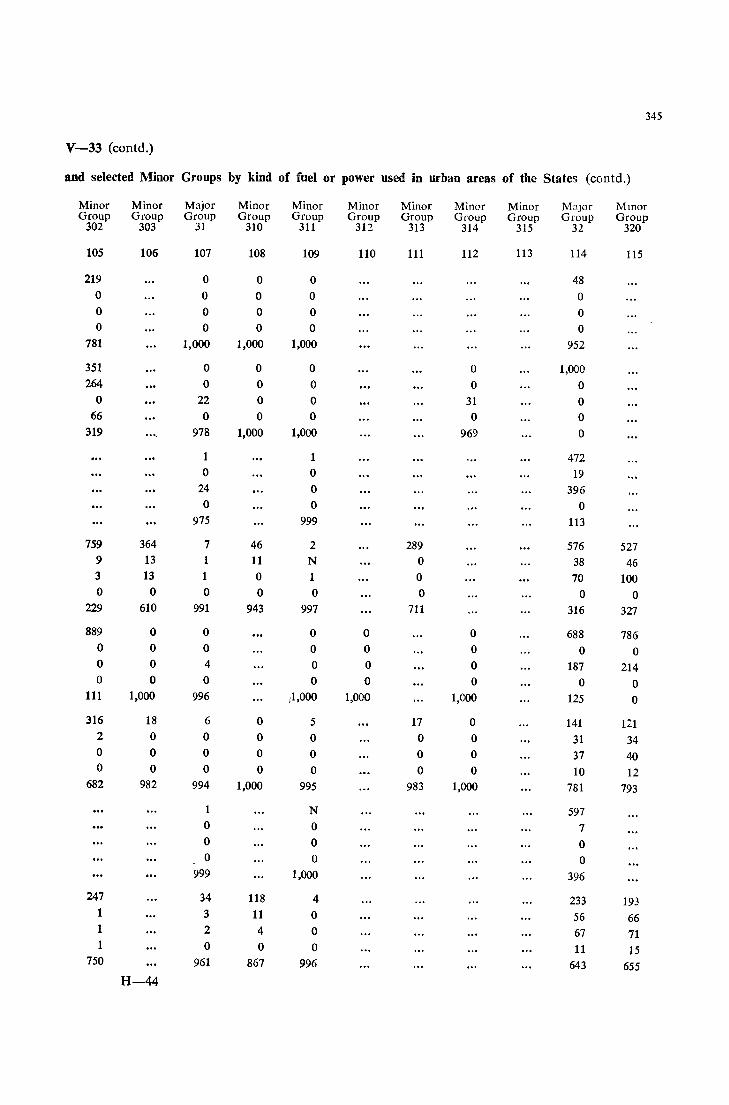
345
V-33 (eontd.)
and selected Minor Groups by kind of fuel or power used in urban areas of the States (eontd.)
Minor Minor Major Minor Minor Minor Minor Minor Minor M~Jor MInor Group Group Group Group Group Group Group Group Group Group Group
302 303 31 310 311 312 313 314 315 32 320
105 106 107 108 109 110 111 112 113 114 115
219 0 0 0 48 0 0 0 0 0 0 0 0 0 0 0 0 0 0 0
781 1,000 1,000 1,000 952
351 0 0 0 0 1,000 264 0 0 0 0 0
0 22 0 0 31 0 66 0 0 0 0 0
319 978 1,000 1,000 969 0
1 1 472 0 0 19
24 0 396 0 0 0
975 999 113
759 364 7 46 2 289 576 527 9 13 11 N 0 38 46 3 13 1 0 1 0 70 100 0 0 0 0 0 0 0 0
229 610 991 943 997 711 316 327
889 0 0 0 0 0 688 786 0 0 0 0 0 0 0 0 0 0 4 0 0 0 187 214 0 0 0 0 0 0 0 0
111 1,000 996 ;1,000 1,000 1,000 125 0
316 18 6 0 5 17 0 141 121 2 0 0 0 0 0 0 31 34 0 0 0 0 0 0 0 37 40 0 0 0 0 0 0 0 10 12
682 982 994 1,000 995 983 1,000 781 793
N 597 0 0 7 0 0 0 0 0 0
999 1,000 396
247 34 118 4 233 193 1 3 11 0 56 66 1 2 4 0 67 71 1 0 0 0 11 15
750 961 867 996 643 655 H-44
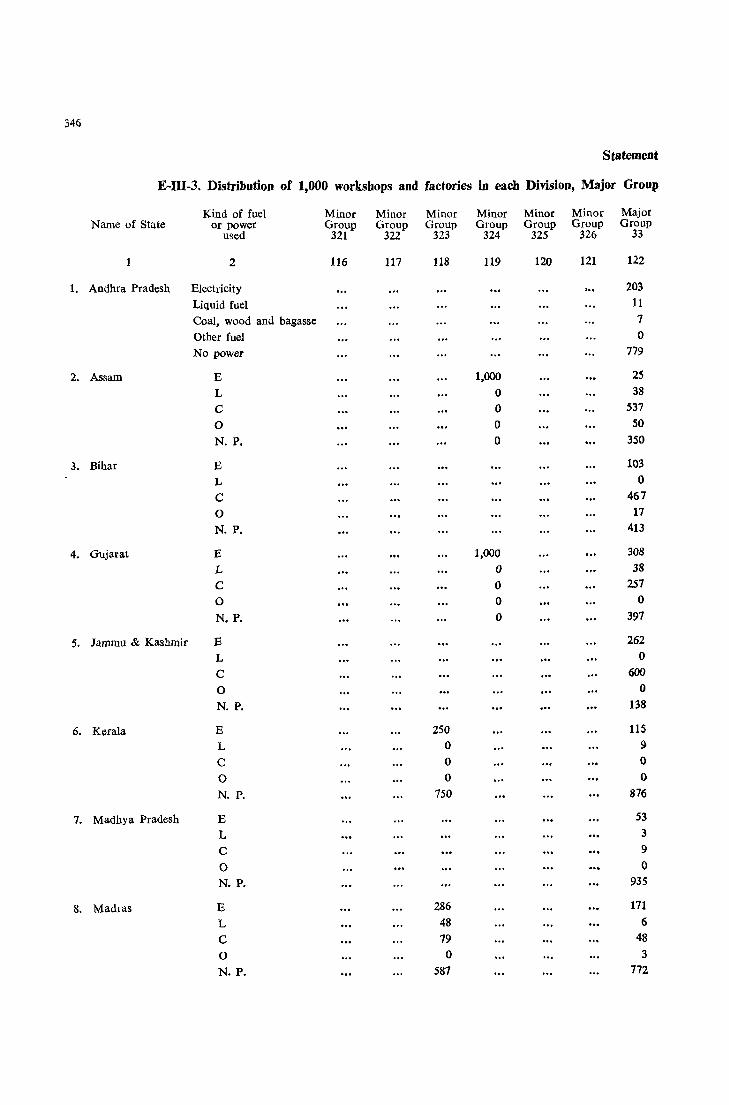
346
Statement
E-III-3. Distribution of 1,000 workshops and factories in each Division, Major Group
Kind of fuel Minor Minor Minor Minor Minor Minor Major Name of State or power Group Group Group Group Group Group Group
used 321 322 323 324 325 326 33
2 116 117 118 119 120 121 122
1. Andhra Pradesh Electricity '" 203
Liquid fuel 11
Coal, wood and bagasse 7
Other fuel 0
No power 779
2. Assam E 1,000 25
L 0 38
C 0 537
0 0 SO N. P. 0 350
3. Bihar E 103
L 0
C 467
0 17
N. P. 413
4. Gujarat E 1,000 308
L 0 38
C 0 257
0 0 0
N. P. 0 397
5. Jammu & Kashmir E 262
L 0
C 600
0 0
N. P. 138
6. Kerala E 250 115 L 0 9
C 0 0
0 0 0
N. P. 750 876
7. Madhya Pradesh E 53
L 3
C 9
0 0 N. P. 935
8. Madlas E 286 171 L 48 6
C 79 48
0 0 3 N. P. 587 772

347
V-33 (contd.)
and selected Minor Groups by kind of fuel or power used in urban areas of the States (contd.)
Minor Minor Minor Minor Minor Minor Minor Minor Minor Minor Major Group Group Grou,;> Group Group Group Group Group Group Group Group
330 331 332 333 334 335 336 337 338 339 34 & 35
123 124 125 126 127 128 129 130 131 132 133
52 0 0 0
948
0 333 0 14 0 ... 0 0 333 28 0
0 0 333 583 0 N.A. 0 333 0 42 0
1,000 334 334 333 1,000
16 0
60 637 287
318 584 375 372 89 805 500 327
136 83 125 98 18 9 0 27
182 83 125 59 457 0 0 71 0 0 0 0 0 0 0 0
364 250 37S 471 436 186 500 575
615 0 67 0 0 11
77 1,000 911 0 0 0
308 0 11
0 67 333 0 628 33 66 158 127
333 0 0 0 39 0 0 53 16
0 0 0 0 0 0 0 0 0
0 0 0 0 0 0 0 0 0
667 933 667 1,000 333 967 934 789 857
10 3 5 0
982
182 77 42 5 11 4
5S 66 23 0 6 3
758 840 928
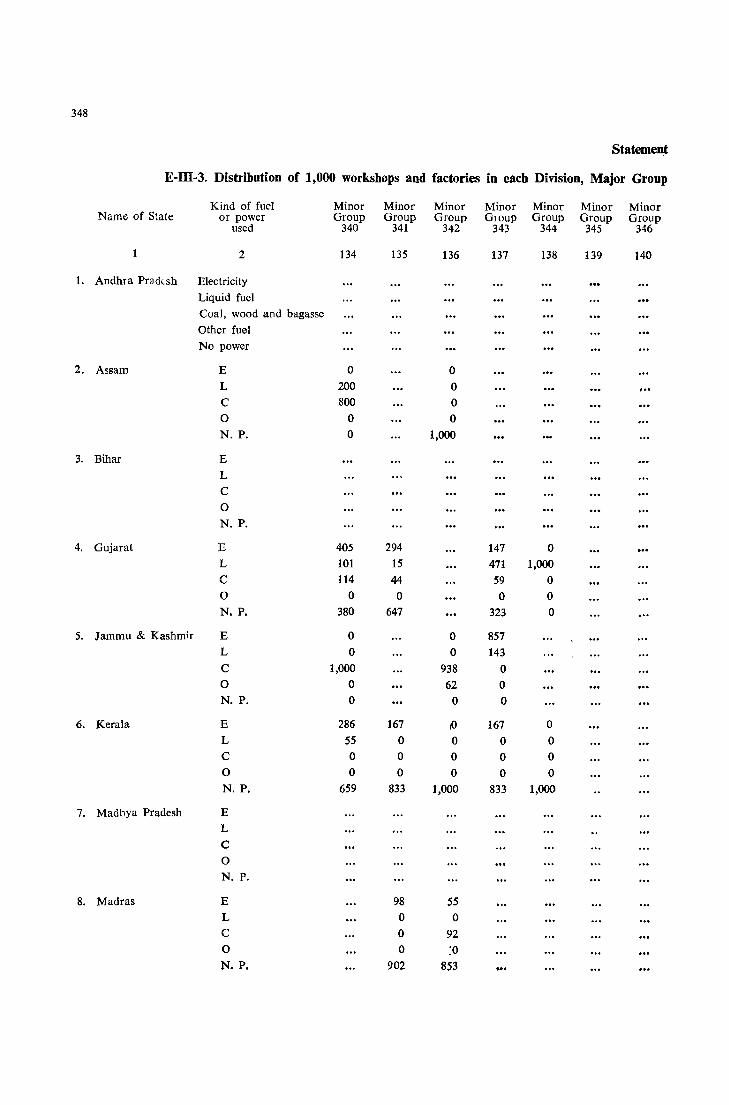
348
Statemen,t
E-III-3. Distribution of l~OOO workshops and factories in each Division, Major Group
Kind of fuel Minor Minor Minor Minor Minor Minor Minor Name of State or power Group Group Group GIOUp Group Group Group
used 340 341 342 343 344 345 346
1 2 134 135 136 137 138 139 140
1. Andhra Pradu,h Electricity Liquid fuel Coal, wood and bagasse Other fuel No power
2. Assam E 0 0 L 200 0 C 800 0 0 0 0 N. P. 0 1,000
3. Bihar E L C 0 N. P.
4. Gujarat E 405 294 147 0 L 101 15 471 1,000 C 114 44 S9 0 0 0 0 0 0 N. P. 380 647 323 0
5. Jammu & Kashmir E 0 0 8S7 L 0 0 143 C 1,000 938 0 0 0 62 0 N. P. 0 0 0
6. Kerala E 286 167 10 167 0 L 55 0 0 0 0 C 0 0 0 0 0 0 0 0 0 0 0 N. P. 659 833 1,000 833 1,000
7. Madhya Pradesh E L C 0
N. P.
8. Madras E 98 55 L 0 0 C 0 92 0 0 :0 N. P. 902 853
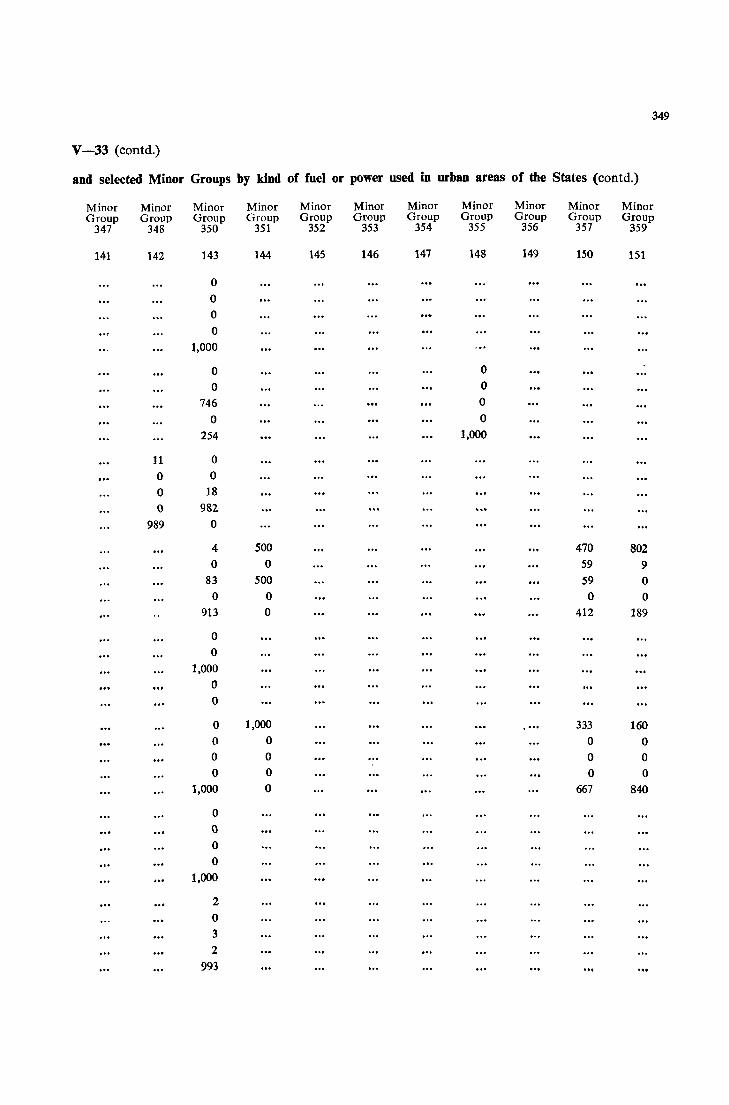
349
V-33 (contd.)
and selected Minor Groups by kind of fuel or power used in urban areas of the States (contd.)
Minor Minor Minor Minor Minor Minor Minor Minor Minor Minor Minor Group Group Group Group Group Group Group Group Group Group Group
347 348 350 351 352 353 354 355 356 357 359
141 142 143 144 145 146 147 148 149 150 151
0 0 0 0
1,000
0 0 0 0
746 0
0 0 254 1,000
11 0 0 0 0 18 () 982
989 0
4 500 470 802 0 0 59 9
83 500 59 0 0 0 0 0
913 0 412 189
0 0
1,000 0 ()
0 1,000 .... 333 160 0 0 0 0 0 0 0 0 0 0 0 0
1,000 0 667 840
0 ()
0 0
1,000
2 0 3 2
993 .. ,
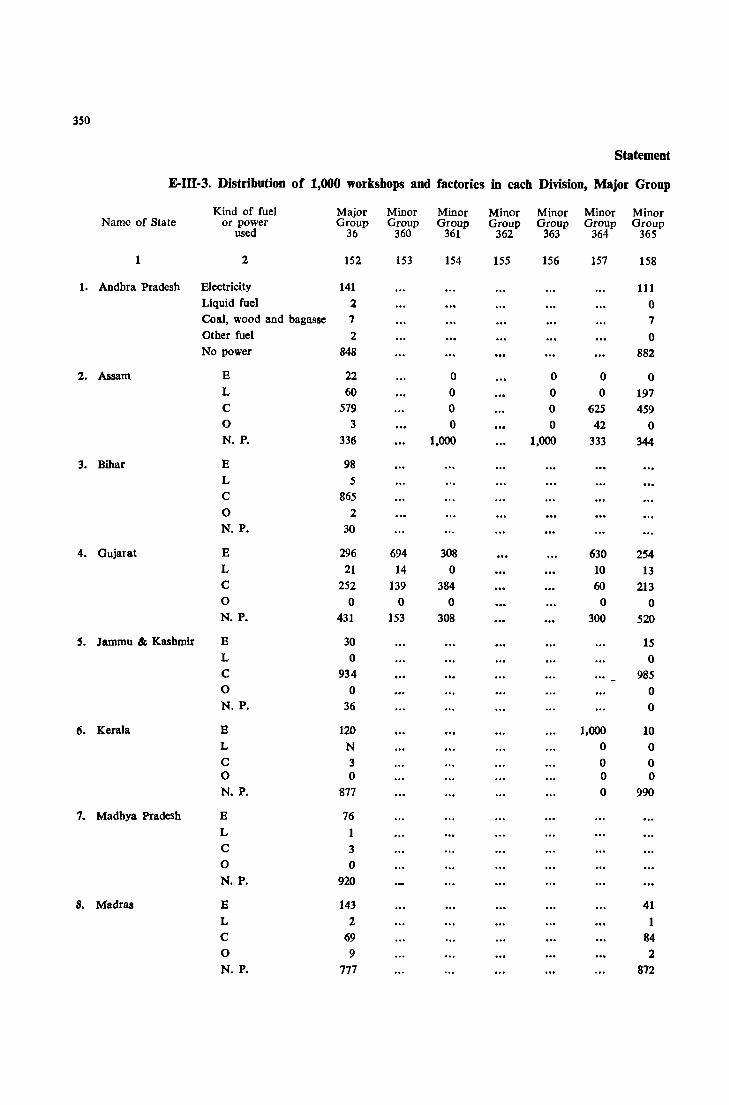
350
Statement
E-III·3. Distribution of 1,000 workshops and factories in each Division, Major Group
Kind of fuel Major Minor Minor Minor Minor Minor Minor Name of State or power Group Group Group Group Group Group Group
used 36 360 361 362 363 364 365
1 2 152 153 154 155 156 157 158
1. Andhra Pradesh Electricity 141 111 Liquid fuel l 0 Coal, wood and bagasse 7 7 Other fuel 2 0 No power 848 882
2. Assam B 22 0 0 0 0 L 60 0 0 0 197 C 579 0 0 625 459 0 3 0 0 42 0 N. P. 336 1,000 1,000 333 344
3. Bihar B 98 L 5 C 865 0 2 N. P. 30
4. Gujarat B 296 694 308 630 254 L 21 14 0 10 13 C 252 139 384 60 213 0 0 0 0 0 0 N. P. 431 153 308 300 520
,. Jammu & Kashmir B 30 15 L 0 0 C 934 985 0 0 0 N. P. 36 0
6. Kerala B 120 1,000 10 L N 0 0 C 3 0 0 0 0 0 0 N. P. 877 0 990
7. Madhya Pradesh E 76 L 1 C 3 0 0 N. P. 920
8. Madras E 143 41 L 2 1 C 69 84 0 9 2 N. P. 777 872
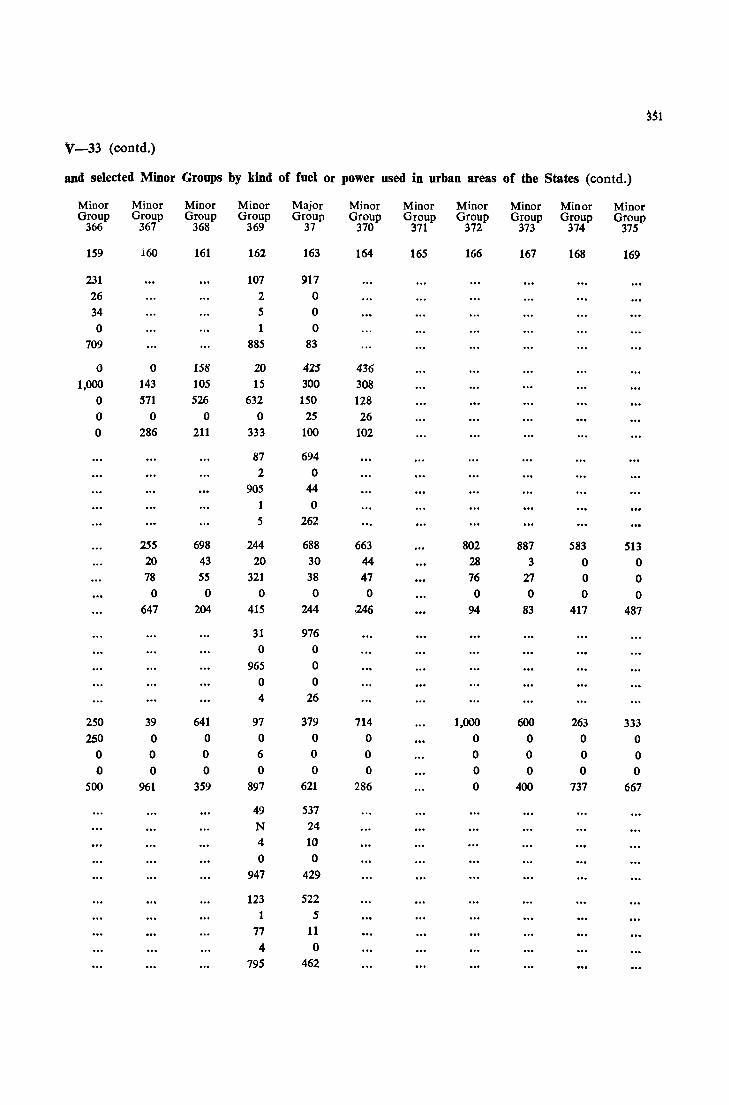
3~i
\7-33 (contd.)
and selected Minor Groups by kind of fuel or power used in urban areas of the States (contd.)
Minor Minor Minor Minor Major Minor Minor Minor Minor Minor Minor Group Group Group Group Group Group Group Group Group Group Group
366 367 368 369 37 370 371 372 373 374 375
159 160 161 162 163 164 165 166 167 168 169
231 107 917 26 2 0 34 5 0 0 1 0
709 885 83
0 0 158 20 415 436 1,000 143 105 15 300 308
0 571 526 632 150 128 0 0 0 0 25 26 0 286 211 333 100 102
87 694 2 0
905 44 1 0 5 262
2S5 698 244 688 663 802 887 583 513 20 43 20 30 44 28 3 0 0 78 55 321 38 47 76 27 0 0
0 0 0 0 0 0 0 0 0 647 204 415 244 :246 94 83 417 487
31 976 0 0
965 0 0 0 4 26
250 39 641 97 379 714 1,000 600 263 333 250 0 0 0 0 0 0 0 0 0
0 0 0 6 0 0 0 0 0 0 0 0 0 0 0 0 0 0 0 0
500 961 359 897 621 286 0 400 737 667
49 537 N 24
4 10 0 0
947 429
123 522 5
77 11 4 0
795 462

352
Statement
E-IH-3. Distribution of 1,000 workshops and factories in each Division, Major Group
Kind of fuel Minor Minor Minor Minor Major Minor Mmor Name of State or power Group Group Group Group Group Group Group
used 376 377 378 379 38 380 3111
1 2 170 171 172 173 174 175 176
1. Andhra Pradesh Electricity 55 Liquid fuel 2 Coal, wood and bagasse Other fuel 0 No power 942
2. Assam E 0 261 445 1,000 L 0 108 0 0 C 1,000 85 222 0 0 0 0 0 0 N. P. 0 546 333 0
3. Bihar E 190 L 9 C 26 0 1 N. P. 744
4. Gujarat E 424 737 134 412 304 L 6 18 17 29 22 C 0 17 20 441 283 0 0 0 0 0 0 N. P. 570 228 829 118 391
5. Jammu & Kashmir E 1,000 394 L 0 9 C 0 270 0 0 0 N. P. 0 327
6. Kerala E 442 239 346 108 L 0 0 0 2 C 0 0 0 0 0 0 0 0 N. P. 558 761 654 889
7. Madhya Pradesh E 80 L 4 C 2 0 N N. P. 914
8. Madras E 284 524 79 L 0 8 2 C 0 0 8 0 0 0 2 N. P. 716 468 909

353
V-33 (contd.)
and selected Minor Groups by kind of fuel or power used in urban areas of the S{~tes (contd.)
Minor Minor Minor Minor Minor Minor Minor Minor Major Minor Group Group Group Group Group Group Group Group Group Group
382 383 384 385 386 387 388 389 39 390
177 178 179 180 181 182 183 134 185 186
217 N 35
5 0 N
4 0 N
0 0 0
774 1,000 965
444 1,000 1,000 20 1,000 77 357
193 0 0 12 0 26 0
85 0 0 81 0 345 0
0 0 0 0 0 11 71
278 0 0 887 0 541 572
21 4
795 0
180
411 24 115 125 753 39 9 0 13 0
22 3 39 131 0
0 0 0 0 0
528 964 846 731 247
757 0 36
17 0 1
52 503 842
0 0 0
174 497 121
867 237 500 389 2 0 18
0 4 0 0 0 0 N
0 2 0 0 0 0 0
0 0 0 0 0 0 0
133 757 500 611 993 1,000 982
2 16 0 1 0 1 0 0
993 982
336 1 49
7 N 7
8 1 34
7 0 1
642 998 909
H-45
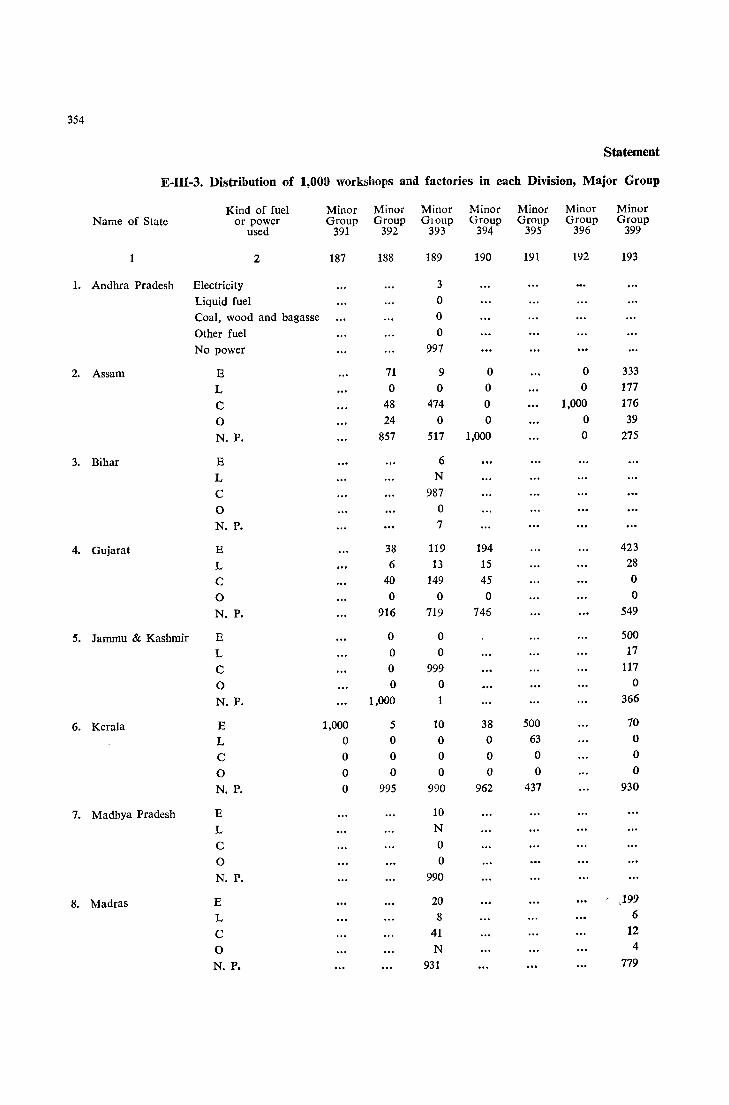
354
Statement
E-III-3. Distribution of 1,000 workshops and factories in each Division, Major Group
Kind of fuel Minor Minor Minor Minor Minor Minor Minor Name of State or power Group Group GIOUp Group Group Group Group
used 391 392 393 394 395 396 399
1 2 187 188 189 190 191 192 193
1. Andhra Pradesh Electricity 3 Liquid fuel 0 Coal, wood and bagasse 0 Other fuel 0 No power 997
2. Assam E 71 9 0 0 333
L 0 0 0 0 177
C 48 474 0 1,000 176
0 24 0 0 0 39
N. P. 857 517 1,000 0 275
3. Bihar E 6 L N
C 987
0 0 N. P. 7
4. Gujarat E 38 119 194 423
L 6 13 15 28
C 40 149 45 0
0 0 0 0 0
N. P. 916 719 746 549
5. Jammu & Kashmir E 0 0 500
L 0 0 17
C 0 999 117
0 0 0 0
N. P. 1,000 366
6. Kerala E 1,000 5 10 38 500 70
L 0 0 0 0 63 0
C 0 0 0 0 0 0
0 0 0 0 0 0 0
N. P. 0 995 990 962 437 930
7. Madhya Pradesh E 10
L N
C 0 0 0 N. P. 990
8. Madras E 20 .199
L 8 6
C 41 12
0 N 4
N. P. 931 779
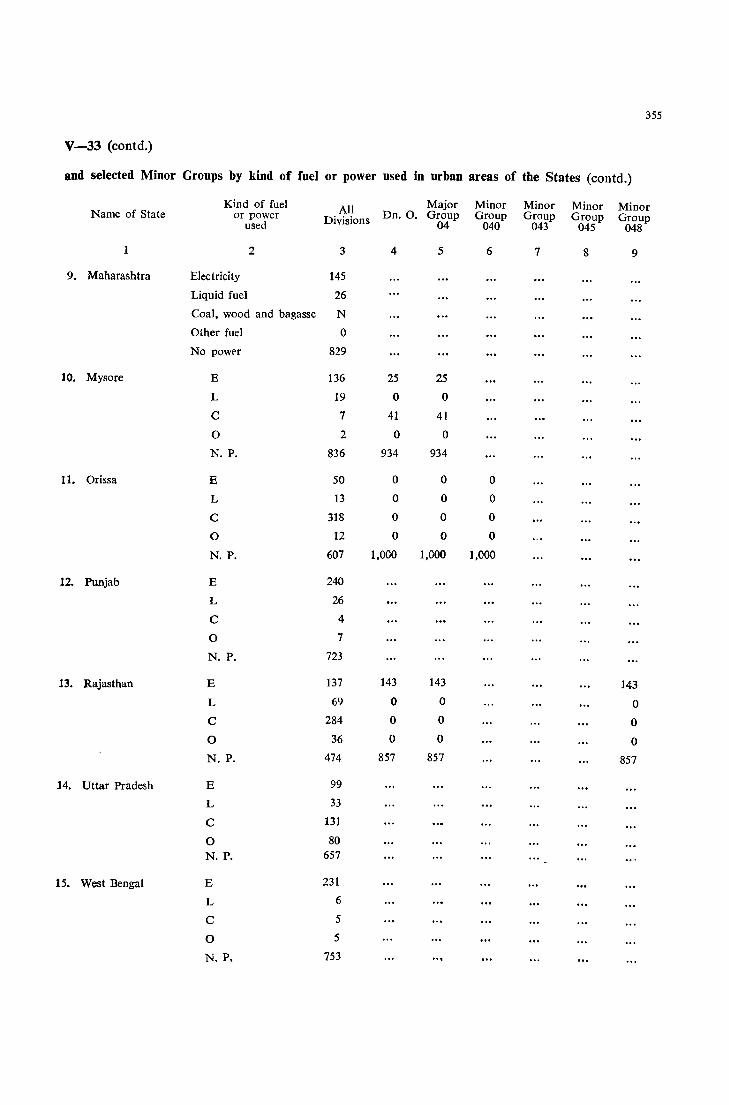
355
V-33 (eontd.)
and selected Minor Groups by kind of fuel or power used in urban areas of the States (eontd.)
Kind of fuel All Major Minor Minor Minor Minor Name of State or power Divisions Dn. O. Group Group Group Group Group
used 04 040 043 045 048
1 2 3 4 5 6 7 8 9
9. Maharashtra Electricity 145
Liquid fuel 26
Coal, wood and bagasse N
Other fuel 0
No pow('r 829
10. Mysore E 136 25 25
L 19 0 0
C 7 41 41
0 2 0 0
N. P. 836 934 934
11. Orissa E 50 0 0 0
L 13 0 0 0
C 318 0 0 0
0 12 0 0 0
N. P. 607 1,000 1,000 1,000
12. Punjab E 240
L 26
C 4
0 7
N. P. 723
13. Rajasthan E 137 143 143 143 L 69 0 0 0 C 284 0 0 0
0 36 0 0 0 N. P. 474 857 857 857
14. Uttar Pradesh E 99
L 33
C 131
0 80 N. P. 657
15. West Bengal E 231
L 6
C 5
0 5
N. p, 753 .. ,
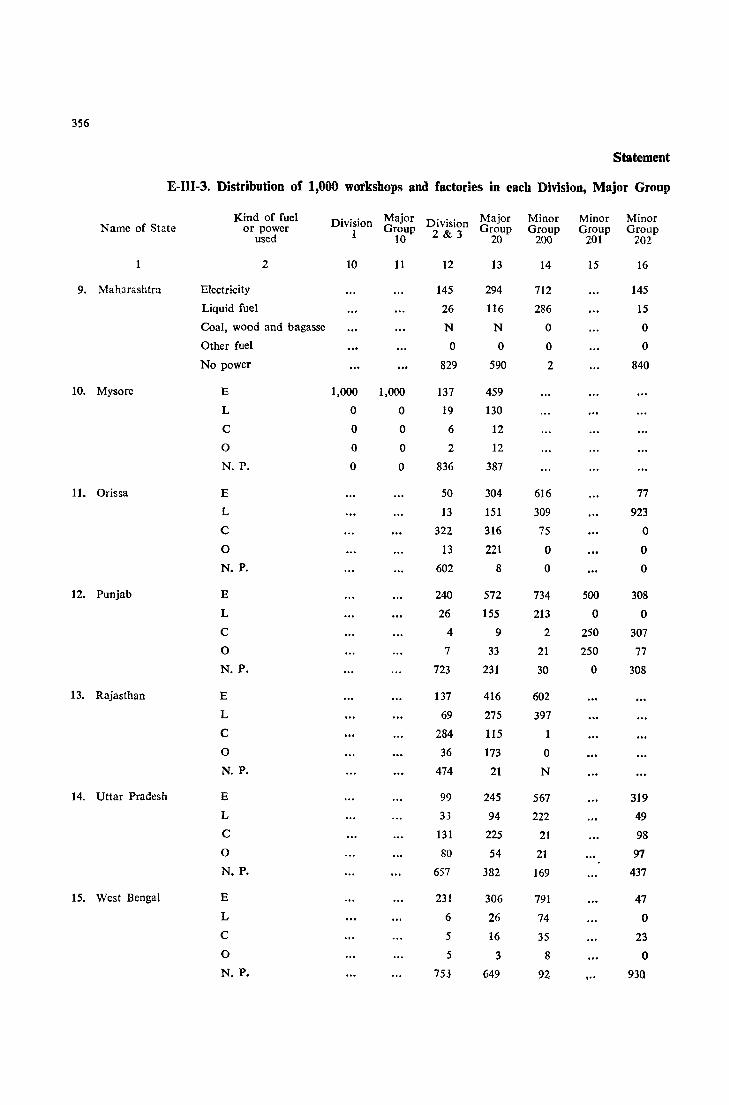
356
Statement
E-IlI-3. Distribution of 1,000 workshops and factories in each Division, Major Group
Kind of fuel Division Major Division Major Minor Minor Minor Name of State or power
1 Group 2&3 Group Group Group Group used 10 20 200 201 202
2 10 11 12 13 14 15 16
9. Mahorashtra Electricity 145 294 712 145
Liquid fuel 26 116 286 15
Coal, wood and bagasse N N 0 0
Other fuel 0 0 0 0
No power 829 590 2 840
10. Mysore E 1,000 1,000 137 459
L 0 0 19 130
C 0 0 6 12
0 0 0 2 12
N. P. 0 0 836 387
11. Orissa E 50 304 616 77
L 13 151 309 923
C 322 316 75 0
0 13 221 0 0
N. P. 602 8 0 0
12. Punjab E 240 572 734 500 308
L 26 155 213 0 0
C 4 9 2 250 307
0 7 33 21 250 77
N. P. 723 231 30 0 308
13. Rajasthan E 137 416 602
L 69 275 397
C 284 115 1
0 36 173 0
N. P. 474 21 N
14. Uttar Pradesh E 99 245 567 319
L 33 94 222 49 C 131 225 21 98 0 80 54 21 97 N. P. 657 382 169 437
15. West Bengal E 231 306 791 47 L 6 26 74 0
C 5 16 35 23 0 5 3 8 0
N. P. 753 649 94 , .. 930
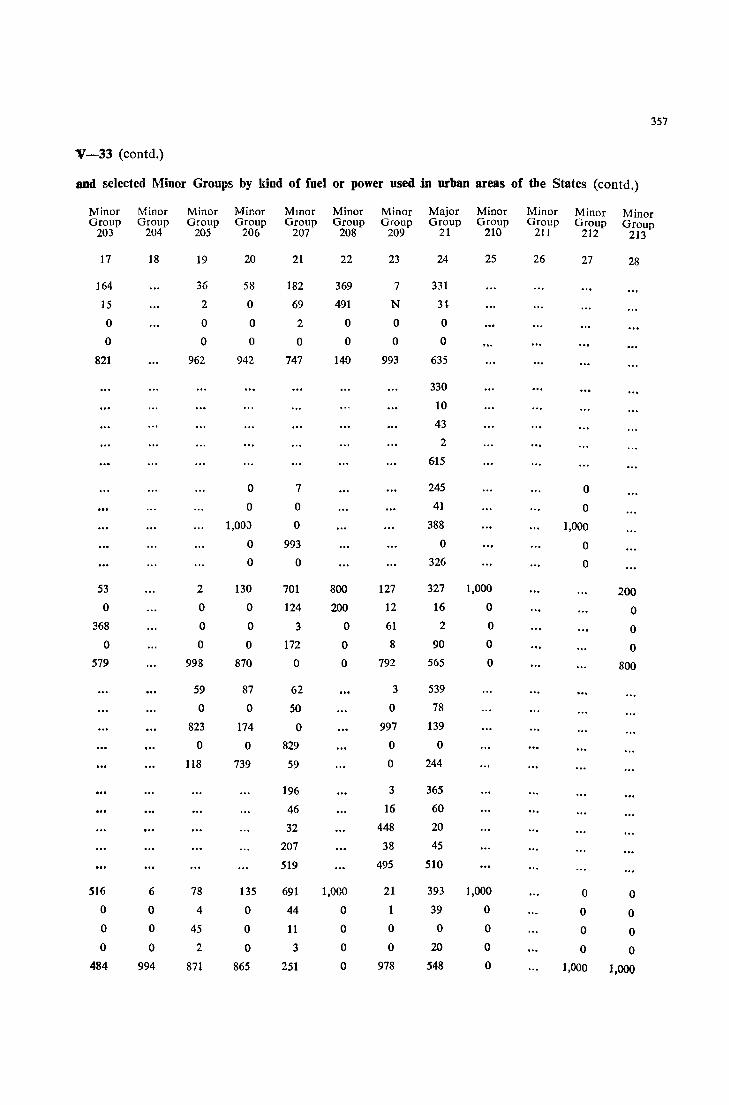
357
V-33 (contd.)
and selected Minor Groups by kind of fuel or power used in urban areas of the States (contd.)
Minor Minor Minor Minor Mmor Minor Minor Major Minor Minor Minor Minor Group Group Group Group Group Group Group Group Group Group Group Group
203 204 205 206 207 208 209 21 210 211 212 213
17 18 19 20 21 22 23 24 25 26 27 28
164 36 58 182 369 7 331
15 2 0 69 491 N 3~
0 0 0 2 0 0 0
0 0 0 0 0 0 0
821 962 942 747 140 993 635
330
10
43
2
615
0 7 245 0 0 0 41 0
1,00;) 0 388 1,000
0 993 0 0 0 0 326 0
53 2 130 701 800 127 327 1,000 200 0 0 0 124 200 12 16 0 0
368 0 0 3 0 61 2 0 0 0 0 0 172 0 8 90 0 0
579 998 870 0 0 792 565 0 800
59 87 62 3 539
0 0 50 0 78
823 174 0 997 139
0 0 829 0 0
118 739 59 0 244
196 3 365
46 16 60
32 448 20
207 38 45
519 495 510
516 6 78 135 691 1,000 21 393 1,000 0 0 0 0 4 0 44 0 1 39 0 0 0 0 0 45 0 11 0 0 0 0 0 0 0 0 2 0 3 0 0 20 0 0 0
484 994 871 865 251 0 978 548 0 1,000 1,000
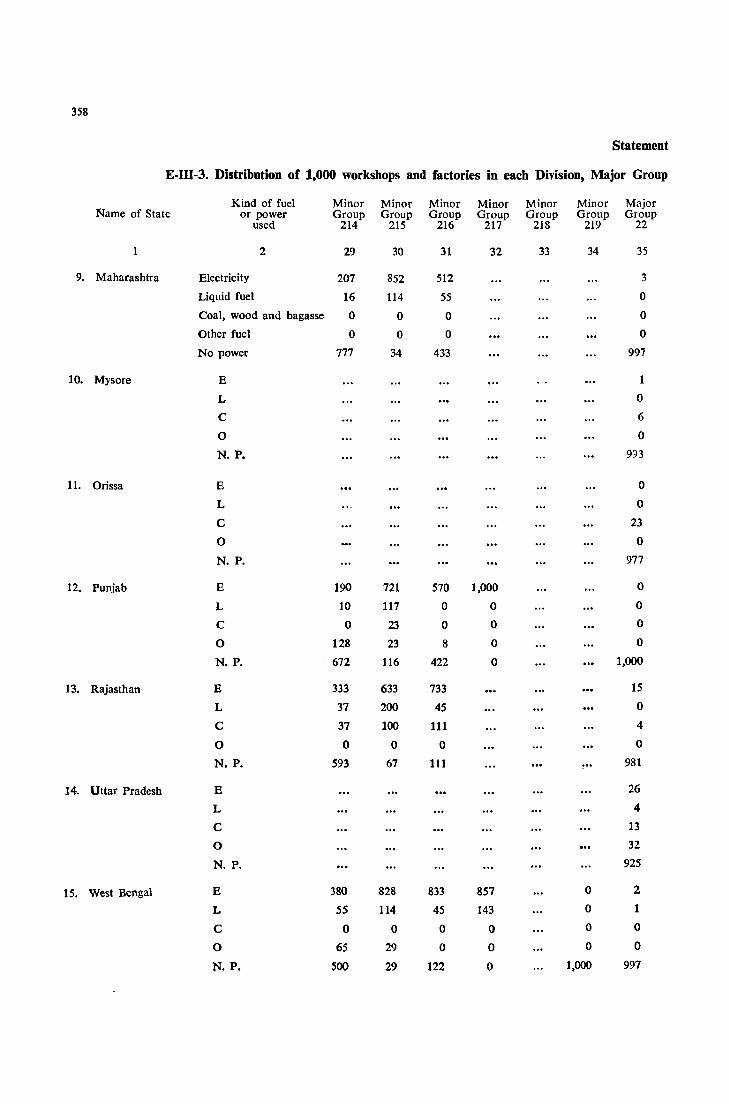
358
Statement
E-UI-3. Distribution of 1.000 workshops and factories in each Division, Major Group
Kind of fuel Minor Minor Minor Minor Minor Minor Major Name of State or power Group Group Group Group Group Group Group
used 214 215 216 217 218 219 22
1 2 29 30 31 32 33 34 35
9. Maharashtra Electricity 207 852 512 3
Liquid fuel 16 114 55 0
Coal, wood and bagasse 0 0 0 0
Other fuel 0 0 0 0
No power 777 34 433 997
10. Mysore E 1
L 0
C 6
0 0
N. P. 993
11. Orissa E 0
L 0
C 23
0 0
N. P. 977
12. Punjab E 190 721 570 1,000 0
L 10 117 0 0 0
C 0 23 0 0 0
0 128 23 8 0 0
N. P. 672 116 422 0 1,000
13. Rajasthan E 333 633 733 15
L 37 200 45 0
C 37 100 111 4
0 0 0 0 0
N. P. 593 67 111 981
14. Uttar Pradesh E 26
L 4
C 13
0 32
N. P. 925
15. West Bengal E 380 828 833 857 0 2
L S5 114 45 143 0 1
C 0 0 0 0 0 0
0 65 29 0 0 0 0
N. p. 500 29 122 0 1,000 997

359
V-33 (contd.)
and selected Minor Groups by kind of fuel or power used in urban areas of the States (contd.)
Minor Minor Minor Minor Minor Mmor Minor Major Minor Minor Minor Minor Group Group Group Group Group Group Group Group Group Group Group Group
220 221 222 223 224 225 226 23 230 231 2:U 233
36 37 38 39 40 41 42 43 44 45 46 47
68 35 156 264 35 983 126
0 .0 36 88 7 17 10
0 0 N 5 0 0 0
0 0 0 0 0 0 0
932 965 808 643 958 0 8G4
130
11
N
2
857
5 0
0 0
3 0
0 0
992 1,000
0 0 0 0 302 629 275 961 192
0 0 0 0 23 181 0 0 8
0 0 0 0 11 63 100 0 0
0 0 0 0 5 19 0 0 0
1,000 1,000 1,000 1,000 659 108 625 39 800
67 221 257 733 47
37 208 0 0 0
29 22 0 0 132
0 a 0 0 0
867 549 743 267 821
22 35 22
5 19 2
15 8 4 35 94 68
923 844 904
0 1,000 0 0 45 167 75 667 211 1,000 255 0 0 111 0 0 0 N 0 0 0 0 0 0 0 0 a 0 N 0 0 0 18
0 0 0 0 0 0 0 0 0 0 0
1,000 0 889 1,000 955 833 925 333 789 0 727
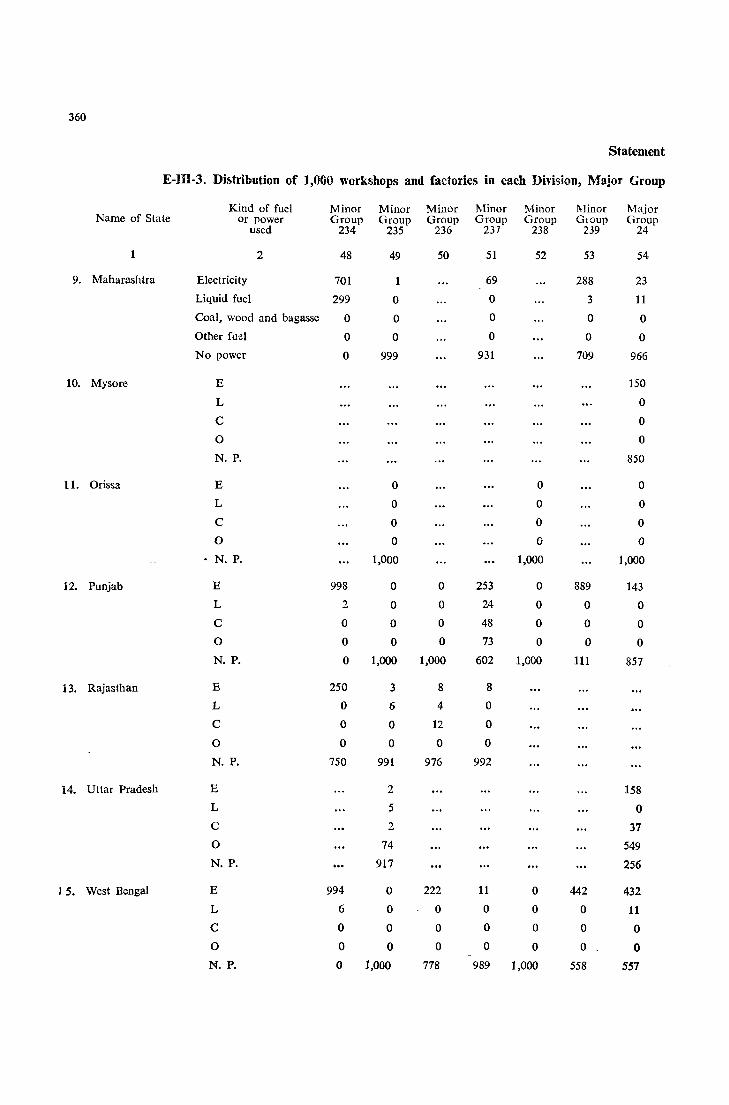
360
Statement
E-III-3. Distribution of 1,000 workshops and factories in each Division, Major Group
Kind of fuel Minor Minor Minor Minor Minor l\Iinor Major Name of State or power Group Group Group Group Group GlOup Group
used 234 235 236 237 238 239 24
1 2 48 49 50 51 52 53 54
9. Maharashtra Electricity 701 1 69 288 23
Liquid fuel 299 0 0 3 11
Coal, wood and bagasse 0 0 0 0 0
Other fuel 0 0 0 0 0 No power 0 999 931 709 966
10. Mysore E 150
L 0
C 0
0 0
N. P. 850
11. Orissa E 0 0 0
L 0 0 0
C 0 0 0
0 0 0 0
• N. P. 1,000 1,000 1,000
12. Punjab E 998 0 0 253 0 389 143
L 2 0 0 24 0 0 0
C 0 0 0 48 0 0 0
0 0 0 0 73 0 0 0
N. P. 0 1,000 1,000 602 1,000 111 857
13. Rajasthan E 250 3 8 8
L 0 6 4 0
C ° ° 12 ° 0 0 0 0 0
N. P. 750 991 976 992
14. Uttar Pradesh E 2 158 L 5 0 C 2 37 0 74 549 N. P. 917 256
15. West Bengal E 994 0 222 11 0 442 432
L 6 ° 0 0 0 0 11 ·C ° ° 0 ° 0 0 0
0 ° ° ° 0 0 0 0
N. P. 0 1,000 778 989 J,OOO 558 551

361
V-33 (contd.)
and selected Minor Groups by kind of fuel or power used in urban areas of the States (contd.)
Minor Minor MUlOr Minor Minor Major Minor Minor Minor Minor Minor Minor Group Group Group Group Group Group Group Group Group GIOUp Group Group
240 241 242 243 244 25 250 251 252 253 254 255
55 56 57 58 59 60 61 62 63 64 65 66
0 14 63
95 0 0
0 0 0
0 0 0
905 986 937
6
0
0
0
994
0
0
0
0
1,000
143 640 333 480 1,000 250 1,000 15
0 16 0 120 0 0 0 14
0 12 333 40 0 0 0 0
0 4 167 0 0 0 0 0
857 328 167 360 0 750 0 971
165 308 173 1,000
6 77 0 0
34 77 38 0
0 0 0 0
795 538 789 0
71
32
19
194
684
149 1,000 750 0 141 52 0 1,000 1,000 0
0 0 250 0 13 0 0 0 0 0
0 0 0 0 0 0 0 0 0 0
0 0 0 0 0 0 0 0 0 0
851 0 0 1,000 846 948 1,000 0 0 1,000
H-46

362
Statement
E-III-3. Distribution of 1,000 workshops and factories in cadI Division, Major Group
Kind of fuel Minor Major Minor Minor Minor Minor Minor Name of State or power Group Group Group Grollp Group Group Group
used 256 26 260 261 262 263 264
1 2 67 68 69 70 71 72 73
9. Maharashtra Electricity 459 987 11
Liquid fuel 5 13 0
Coal, wood and bagasse 0 0 0
Other fuel 0 0 0
No power 536 0 989
10. Mysore E 464
L 1
C 2
0 0
N. P. 533
11. Orissa E 0
L 0
C 0
0 0
N. P. 1,000
12. Punjab E 600 883 1,000 522 0 1,000 0
L 0 0 0 0 0 0 0
C 0 19 0 217 0 0 0
0 0 0 0 0 0 0 0
N. P. 400 98 0 261 1,000 a 1,000
13. Rajasthan E 0
L 43
C 174
0 0
N. P. 783
14. Uttar Pradesh E 5 6
L 0
C 1 0
0 326 378
N. P. 667 616
15. West Bengal E 0 30 1,000 a 0 1,000 0
L 0 0 0 0 0 0 0
C 0 0 0 0 0 0 0
0 0 0 0 0 0 0 0
N. p. 1,000 970 0 1,000 1,000 0 1,000
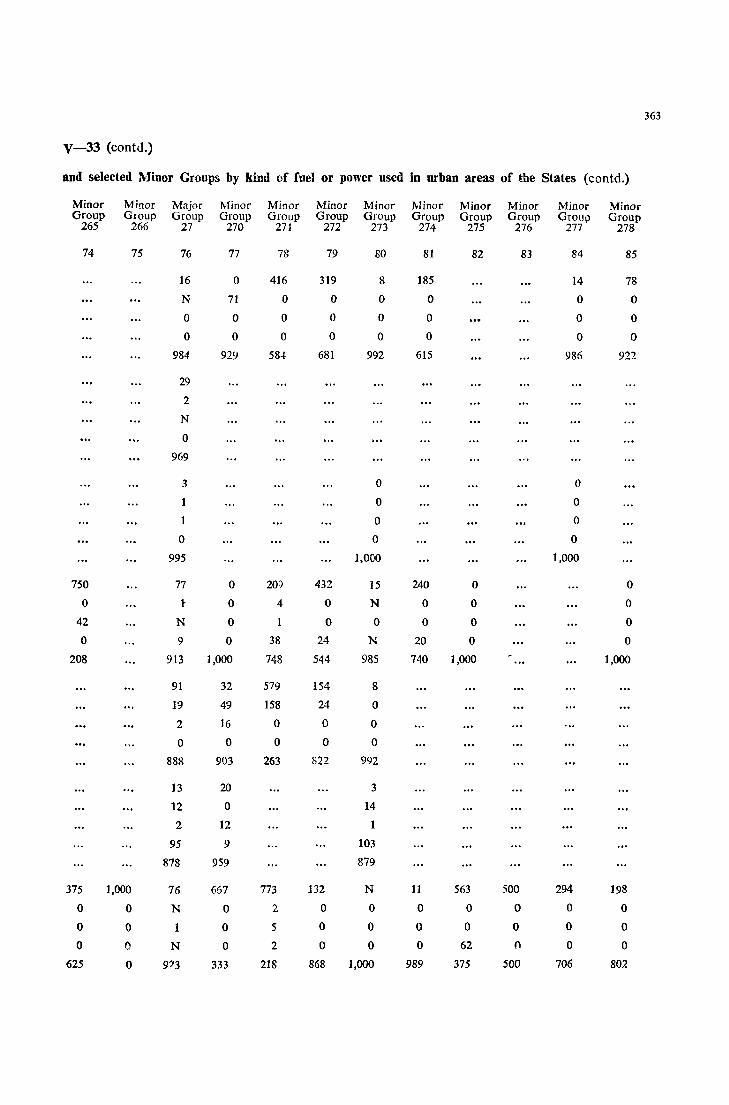
363
V-33 (eontd.)
and selected Minor Groups by kind of fuel or power used in urban areas of the States (eontd.)
Minor Minor Major Minor Minor Minor Minor Minor Minor Minor Minor Minor Group Group Group Group Group Group Group Group Group Group Group Group
265 266 27 270 271 272 273 274 275 276 277 278
74 75 76 77 78 79 80 81 82 83 84 85
16 0 416 319 8 185 14 78
N 71 0 0 0 0 0 0
0 0 0 0 0 0 0 0
0 0 0 0 0 0 0 0
984 929 58.t 681 992 615 986 922
29
2
N
0
969
3 0 0
1 0 0
1 0 0
0 0 0
995 1,000 1,000
750 77 0 20:) 432 15 240 0 0
0 1:' 0 4 0 N 0 0 0
42 N 0 0 0 0 0 0
0 9 0 38 24 N 20 0 0
208 913 1,000 748 544 985 740 1,000 1,000
91 32 579 154 8
19 49 158 24 0
2 16 0 0 0
0 0 0 0 0
888 903 263 822 992
13 20 3
12 0 14
2 12 1
95 9 103
878 959 879
375 1,000 76 667 773 132 N 11 563 500 294 198
0 0 N 0 2 0 0 0 0 0 0 0
0 0 0 5 0 0 0 0 0 0 0
0 C N 0 2 0 0 0 62 0 0 0
625 0 9'3 333 218 868 1,000 989 375 500 706 80~
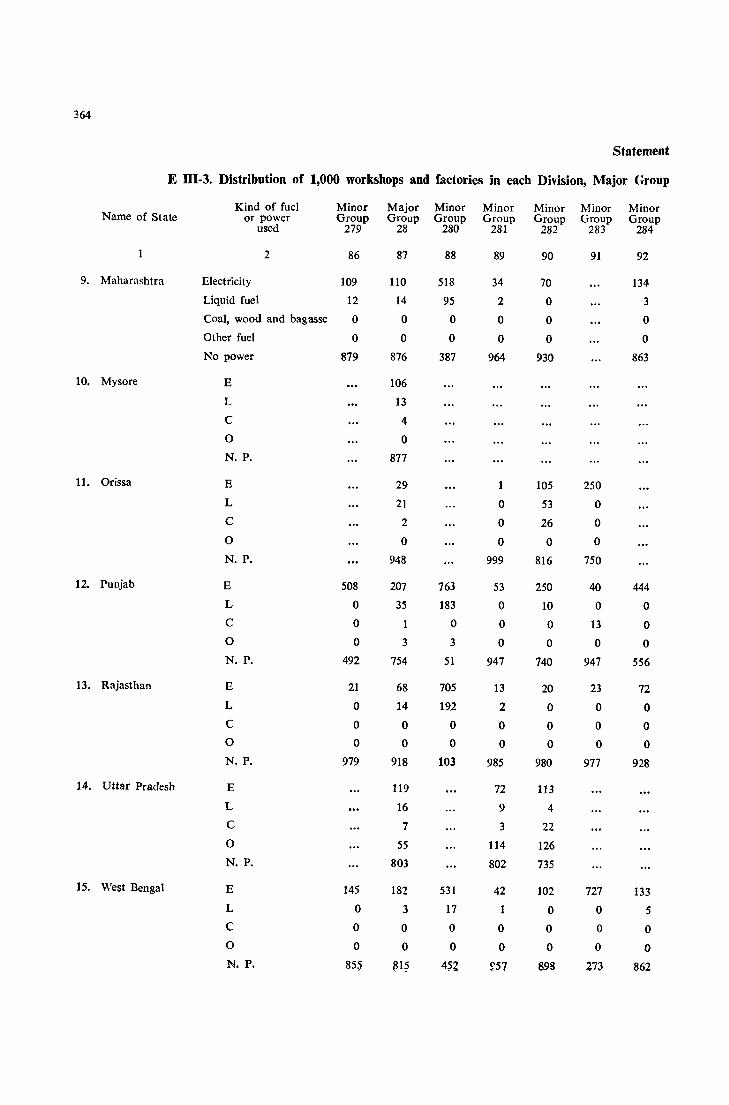
364
Statement
E 111-3. Distribution of 1,000 workshops and factories in each Division, Major (;roup
Kind of fuel Minor Major Minor Minor Minor Minor Minor Name of State or power Group Group Group Group Group Group Group
used 279 28 280 281 282 283 284
2 86 87 88 89 90 91 92
9. Maharashtra Electricity 109 110 518 34 70 134 LiqUid fuel 12 14 95 2 0 3 Coal, wood and bagasse 0 0 0 0 0 0
Other fuel 0 0 0 0 0 0 No power 879 876 387 964 930 863
10. Mysore E 106
L 13
C 4
0 0
N. P. 877
11. Orissa E 29 1 105 250 L 21 0 53 0 C 2 0 26 0
0 0 0 0 0
N. P. 948 999 816 750
12. Punjab E 508 207 763 53 250 40 444 L 0 35 183 0 10 0 0 C 0 1 0 0 0 13 0 0 0 3 3 0 0 0 0 N. P. 492 754 51 947 740 947 556
13. Rajasthan E 21 68 705 13 20 23 72 L 0 14 192 2 0 0 0 C 0 0 0 0 0 0 0 0 0 0 0 0 0 0 0 N. P. 979 918 103 985 980 977 928
14. Uttar Pradesh E 119 72 113 L 16 9 4
C 7 3 22 0 55 114 126 N. P. 803 802 735
15. West Bengal E 145 182 531 42 102 727 133 L 0 3 17 0 0 5 C 0 0 0 0 0 0 0 0 0 0 0 0 0 0 0 N. P. 85~ ~15 4~2 ~57 898 273 862
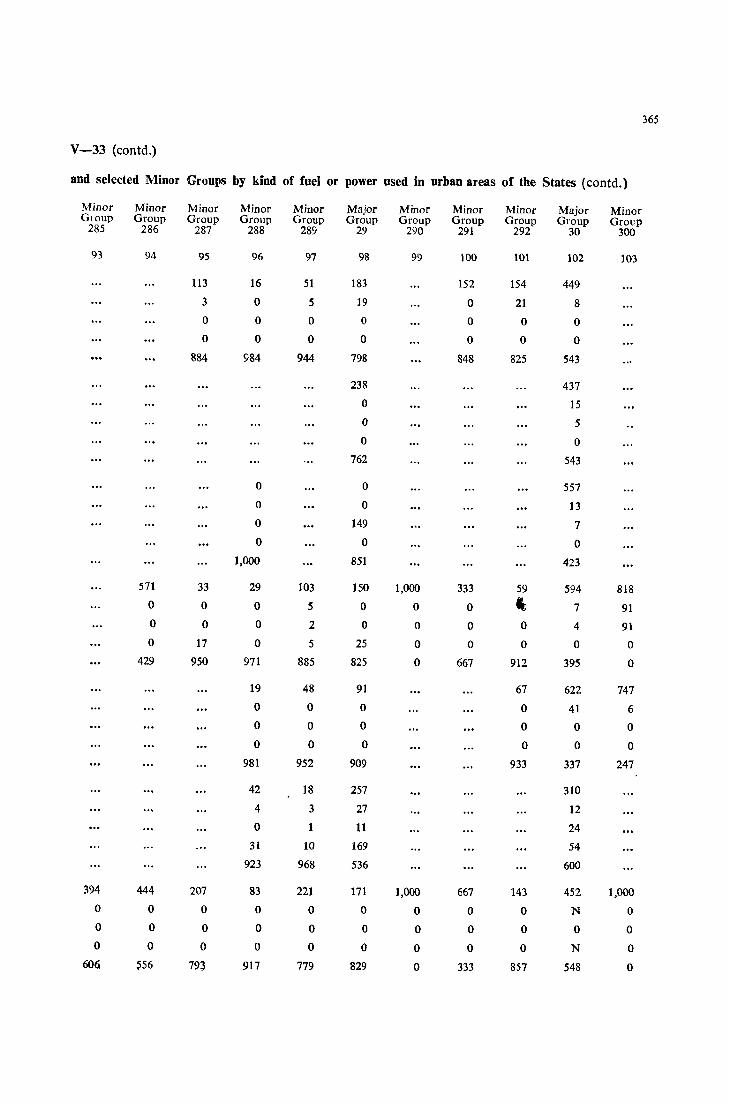
365
V-33 (contd.)
and selected Minor Groups by kind of fuel or power used in urban areas of the States (eontd.)
Minor Minor Minor Minor Minor Major Minor Minor Minor Major Minor GIOUp Group Group Group Group Group Group Group Group Group GrolJp
285 286 287 288 289 29 290 291 292 30 300
93 94 95 96 97 98 99 100 101 102 103
113 16 51 183 152 154 449 3 0 5 19 0 21 8 0 0 0 0 0 0 0 0 0 0 0 0 0 0
884 984 944 798 848 825 543
238 437
0 15
0 5 0 0
762 543
0 0 557
0 0 13 0 149 7 0 0 0
1,000 851 423
571 33 29 103 150 1,000 333 59 594 818 0 0 0 5 0 0 0
, 7 91
0 0 0 2 0 0 0 0 4 91 0 17 0 5 25 0 0 0 0 0
429 950 971 885 825 0 667 912 395 0
19 48 91 67 622 747 0 0 0 0 41 6 0 0 0 0 0 0 0 0 0 0 0 0
981 952 909 933 337 247
42 18 257 310
4 3 27 12 0 11 24
31 10 169 54
923 968 536 600
394 444 207 83 221 171 1,000 667 143 452 1,000
0 0 0 0 0 0 0 0 0 N 0 0 0 0 0 0 0 0 0 0 0 0 0 0 0 0 0 0 0 0 0 N 0
606 ~56 793 917 779 829 0 333 857 548 0

366
Statement
E-III-3. Distribution of 1,000 workshops and factories in each Division, Major Group
Kind of fuel Minor Minor Minor Major Minor Minor Mmor Name of State or power Group Group Group Group Gwup Group Group
used 301 302 303 31 310 311 312
1 2 104 105 106 107 108 109 110
9. Maharashtra Electricity 963 487 92 10 13 4
Liquid fuel 37 6 0 0 0 0
Coal, wood and bagasse 0 0 0 0 0 0
Other fuel 0 0 0 0 0 0
No power 0 507 908 990 987 996
10. Mysore E 22
L 0
C 6
0 0
N. P. 972
11. Orissa E 3 0
L 0 0
C 0 0
0 0 0
N. P. 997 1,000
12. Punjab E 811 711 38 17 5 16
L 0 8 0 0 0 0
C 0 2 0 0 0 0
0 0 0 0 0 0 0
N. P. 189 279 962 983 995 984
13. Rajasthan E 644 551 275 1 0
L 68 92 0 0 0
C 0 0 0 2 34
0 0 0 0 0 0
N. P. 288 357 725 997 966
14. Uttar Pradesh E 7 2
L 3 3
C 2 1
0 58 44
N. P. 930 940
15. West Bengal E 847 597 24 44 306 3 0
L 0 1 0 N 6 0 0
C 0 0 0 0 0 0 0
0 0 N 0 0 0 \) 0
N. P. 153 402 976 956 688 997 1,000
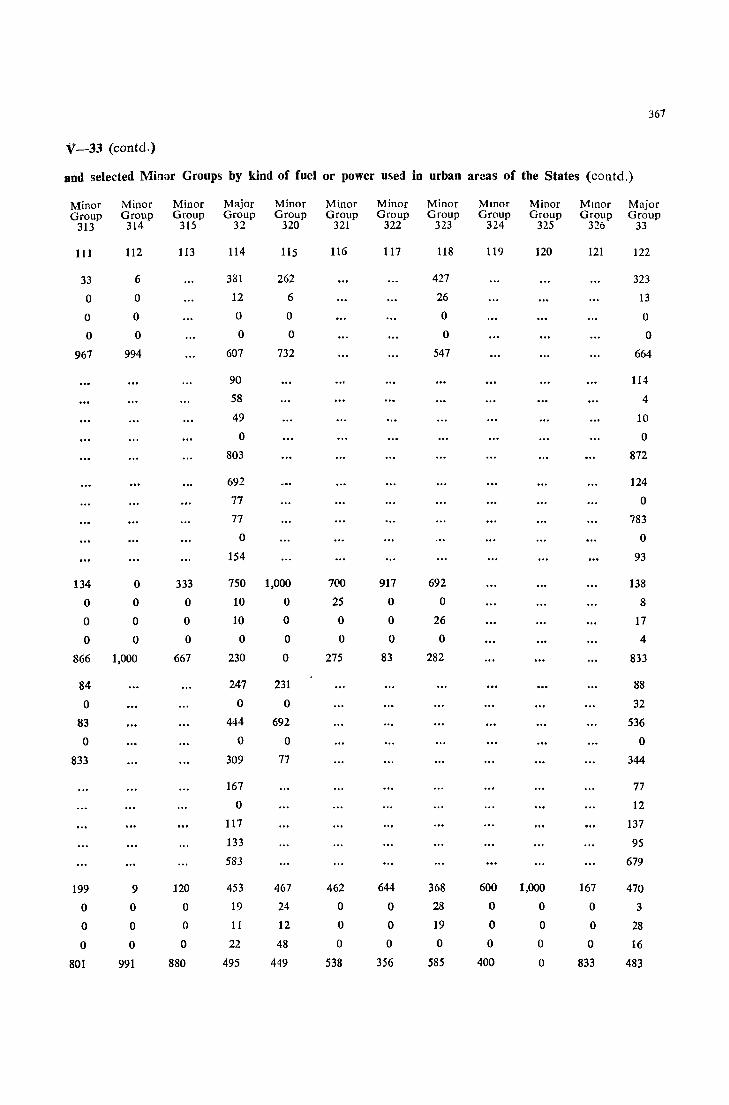
367
V-33 (contd.)
and selected Minor Groups by kind of fuel or power used in urban areas of the States (contd.)
Minor Minor Minor Major Minor Minor Minor Minor Mmor Minor Mmor Major Group Group Group Group Group Group Group Group Group Group Group Group
313 314 315 32 320 321 322 323 324 325 3'" 33 _0
111 112 113 114 115 116 117 118 119 120 121 122
33 6 381 262 427 323
0 0 12 6 26 13
0 0 0 0 0 0
0 0 0 0 0 0
967 994 607 732 547 664
90 114
58 4
49 10
0 0
803 872
692 124
77 0
77 783
0 0
154 93
134 0 333 750 1,000 700 917 692 138
0 0 0 10 0 25 0 0 8
0 0 0 10 0 0 0 26 17
0 0 0 0 0 0 0 0 4
866 1,000 667 230 0 275 83 282 833
84 247 231 88
0 0 0 32
83 444 692 536
0 0 0 0
833 309 77 344
167 77
0 12
117 137
133 95
583 679
199 9 120 453 467 462 644 368 600 1,000 167 470
0 0 0 19 24 0 0 28 0 0 0 3
0 0 0 11 12 0 0 19 0 0 0 28
0 0 0 22 48 0 0 0 0 0 0 16
801 991 880 495 449 538 356 585 400 0 833 483
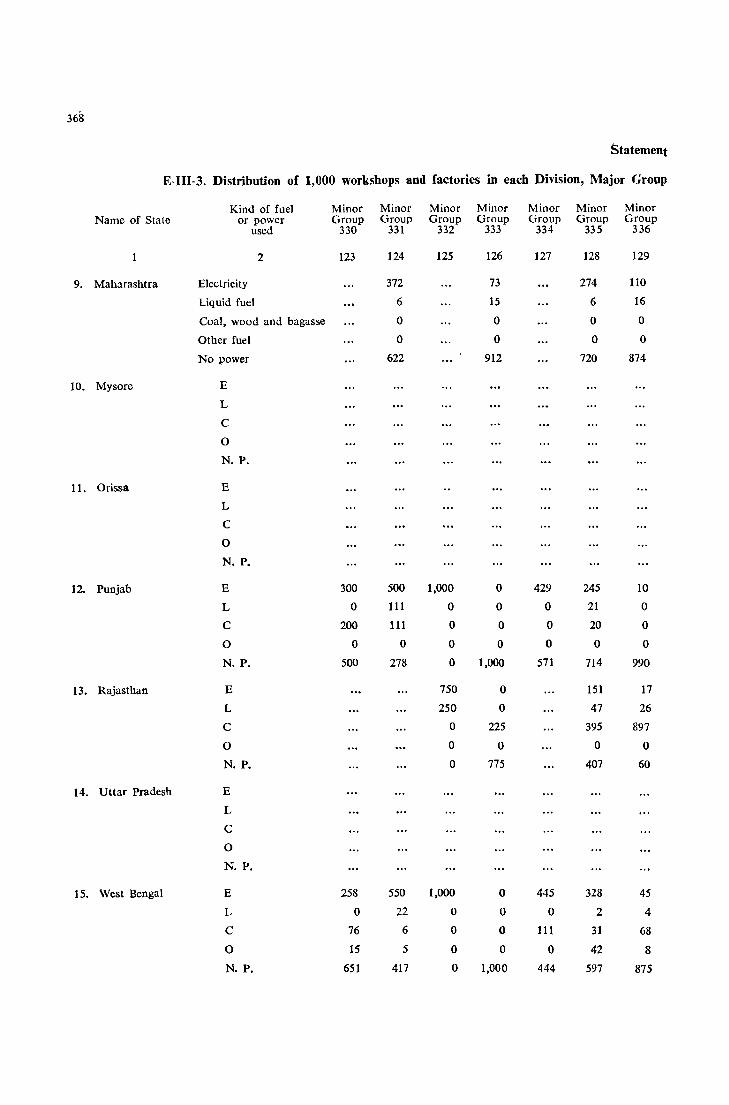
368
Statement
E-I11-3. Distribution of 1,000 workshops and factories in each Division, Major Group
Kind of fuel Minor Minor Minor Minor Minor Minor Minor Name of Stale or power Group Group Group Group Group Group Group
used 330 331 332 333 334 335 336
2 123 124 125 126 127 128 129
9. Maharashtra Electricity 372 73 274 110
Liquid fuel 6 15 6 16
Coal, wood and bagasse 0 0 0 0
Other fuel 0 0 0 0
No power 622 912 720 874
10_ Mysore E
L
C
0
N. P.
11. Orissa E
L
C
0
N. P.
12. Punjab E 300 500 1,000 0 429 245 10
L 0 111 0 0 0 21 0
C 200 111 0 0 0 20 0
0 0 0 0 0 0 0 0
N. P. 500 278 0 1,000 571 714 990
13. Rajasthan E 750 0 151 17
L 250 0 47 26
C 0 225 395 897
0 0 0 0 0
N. P. 0 775 407 60
14. Uttar Pradesh E
L
C
0
N. P.
15. West Bengal E 258 550 1,000 0 445 328 45
L 0 22 0 0 0 2 4
C 76 6 0 0 111 31 68
0 15 5 0 0 0 42 8
N. P. 651 417 0 1,000 444 597 875
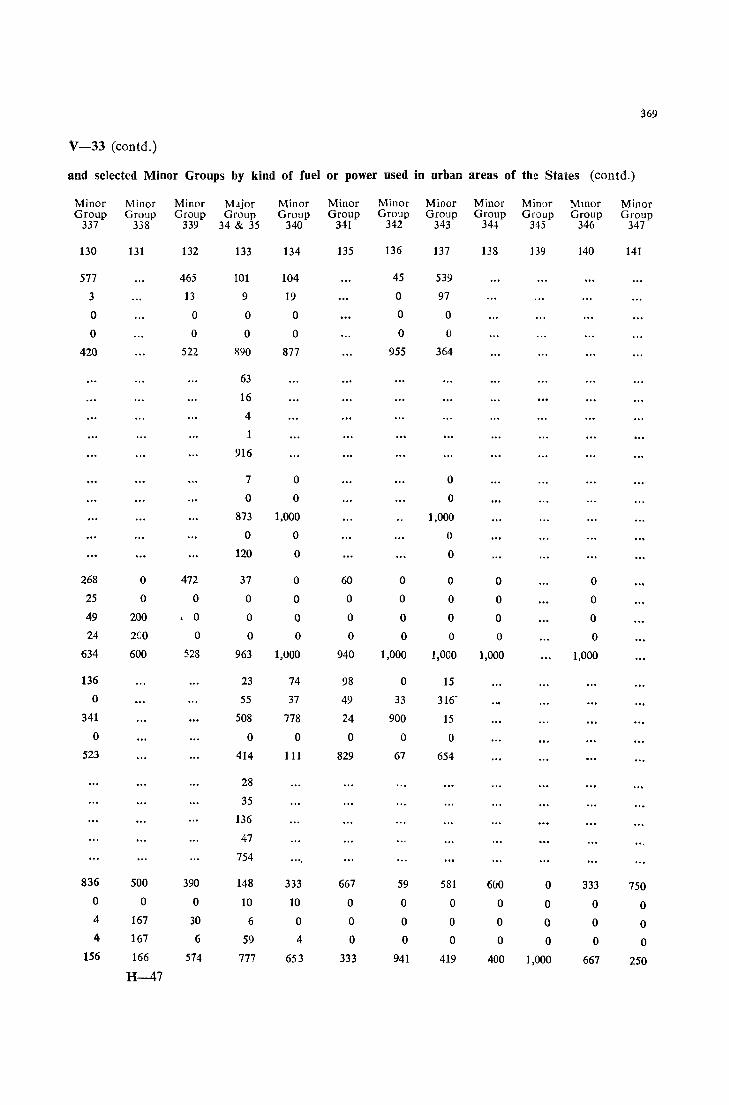
369
\'-33 (contd.)
and selected Minor Groups by kind of fuel or power used in urban areas of thtl States (contd.)
Minor Minor Minor Major Minor Minor Minor Minor Minor Minor Mmor Minor Group Group Group Group Group Group Group Group Group Group Group Group
337 338 339 34 & 35 340 341 342 343 344 345 346 347
130 131 132 133 134 135 136 137 138 139 140 141
577 465 101 104 45 539
3 13 9 19 0 97
0 0 0 0 0 0
0 0 0 0 0 0
420 522 1190 877 955 364
63
16
4
1
916
7 0 0
0 0 0
873 1,000 1,000
0 0 0
120 0 0
268 0 472 37 0 60 0 0 0 0 25 0 0 0 0 0 0 0 0 0 49 200 , 0 0 0 0 0 0 0 0
24 2eo 0 0 0 0 0 0 0 0 634 600 528 963 1,000 940 1,000 1,000 1,000 1,000
136 23 74 98 0 15 0 55 37 49 33 316'
341 508 778 24 900 15 0 0 0 0 0 0
523 414 111 829 67 654
28
35
136
47
754
836 500 390 148 333 667 59 581 600 0 333 750 0 0 0 10 10 0 0 0 0 0 0 0 4 167 30 6 0 0 0 0 0 0 0 0 4 167 6 59 4 0 0 0 0 0 0 0
156 166 574 777 653 333 941 419 400 1,000 667 250 H-47
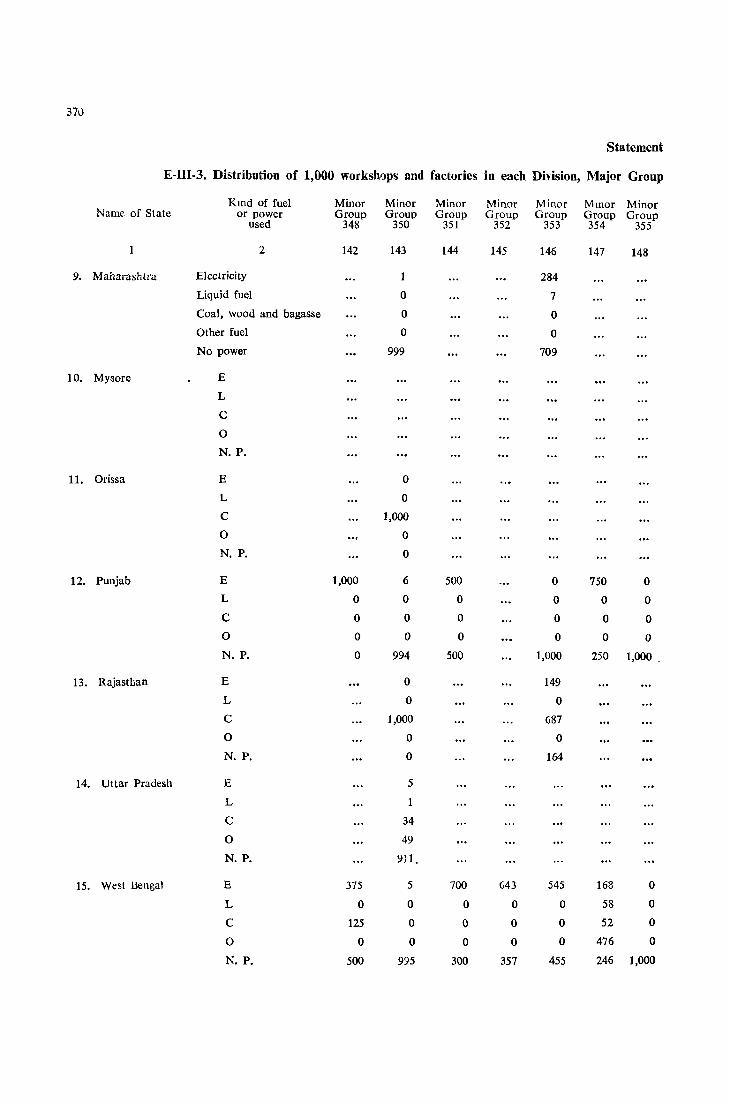
370
Statement
E-lII-3. Distribution of 1,000 workshQPs and factories in each Division, Major Group
Kmd of fuel Minor Minor Minor Minor Minor Mmor Minor Name of State or power Group Group Group Group Group Group Group
used 348 350 351 352 353 354 355
2 142 143 144 145 146 147 148
9. Maharashtra Electricity 284 Liquid fuel 0 7
Coal, wood and bagasse 0 0 Other fuel 0 0 No power 999 709
10. Mysore E
L
C
0
N. P.
11. Orissa E 0
L 0
C 1,000
0 0
N. P. 0
12. Punjab E 1,000 6 500 0 750 0 L 0 0 0 0 0 0
C 0 0 0 0 0 0 0 0 0 0 0 0 0
N. P. 0 994 500 1,000 250 1,000 _
13. Rajasthan E 0 149
L 0 0
C 1,000 687
0 0 0
N. P. 0 164
14. Uttar Pradesh E 5
L
C 34
0 49
N. P. 911.
15. West Bengal E 375 5 700 643 545 168 0
L 0 0 0 0 0 58 0
C 125 0 0 0 0 52 0
0 0 0 0 0 0 476 0
N. P. 500 995 300 357 455 246 1,000
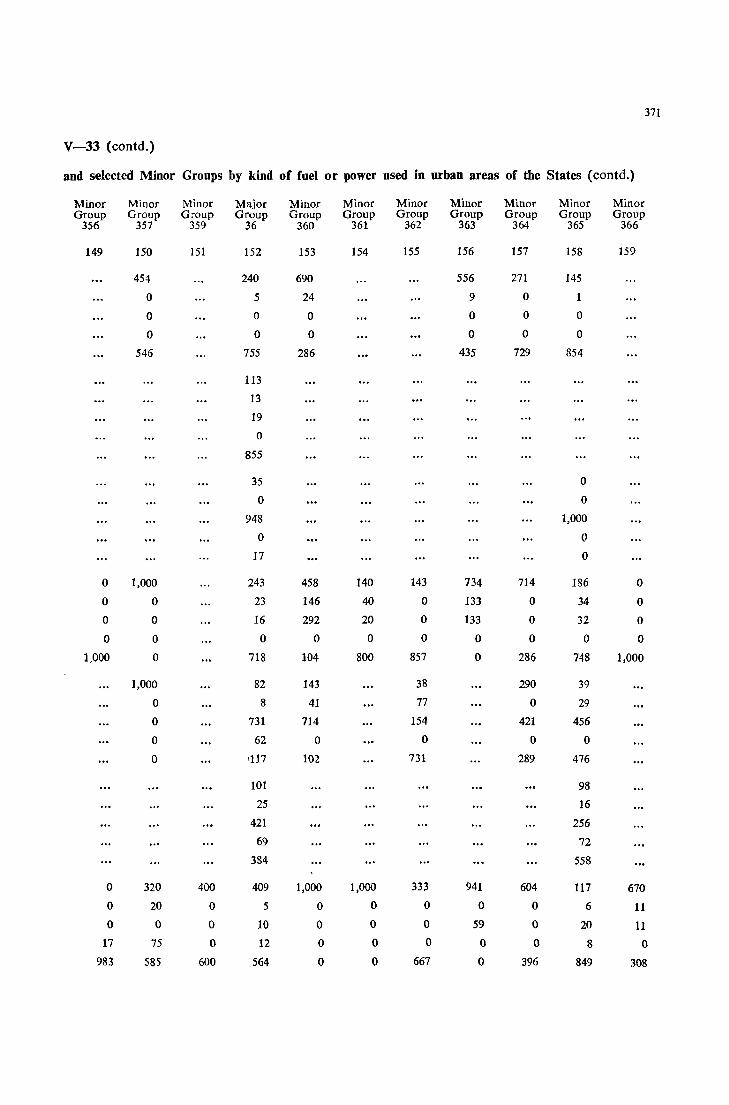
371
V-33 (contd.)
and selected Minor Groups by kind of fuel or power used in urban areas of the States (contd.)
Minor Minor Minor Major Minor Minor Minor Minor Minor Minor Minor Group Group Group Group Group Group Group Group Group Group Group
356 357 359 36 360 361 362 363 364 365 366
149 150 151 152 153 154 155 156 157 158 159
454 240 690 556 271 145
0 5 24 9 0
0 0 0 0 0 0
0 0 0 0 0 0
546 755 286 435 729 854
113
13
19
0
855
35 0
0 0
948 1,000
0 0
17 0
0 1,000 243 458 140 143 734 714 186 0
0 0 23 146 40 0 133 0 34 0
0 0 16 292 20 0 133 0 32 0
0 0 0 0 0 0 0 0 0 0
1,000 ° 718 104 800 857 0 286 748 1,000
1,000 82 143 38 290 39
0 8 41 77 0 29
0 731 714 154 421 456
° 62 0 ° ° 0
0 '117 102 731 289 476
101 98
25 16
421 256
69 72
384 558
0 320 400 409 1,000 1,000 333 941 604 117 670 0 20 0 5 0 0 0 0 0 6 11 0 0 0 10 0 0 0 59 0 20 11
17 75 0 12 0 0 0 0 0 8 0
983 585 600 564 0 0 667 0 396 849 308

372
Statement
E-III-3. Distribution of 1,000 workshops and factories in each Division, Major Group
Kind of fuel Minor Minor Minor Major Mmor Major Minor Name of State or power Group Group Group Group Group Group Group
used 367 368 369 37 370 371 372
2 160 161 162 163 164 165 166
9. Maharashtra Electricity 145 387 197 719 584 677 739 Liquid fuel 6 5 3 30 64 130 11 Coal, wood and bagasse 0 0 0 0 0 0 0
Other fuel 0 0 0 0 0 0 0 No power 849 608 800 251 352 193 250
10. Mysore E 494
L 29
C 6
0 0
N. P. 471
11. Orissa E 27 909
L 0 0
C 973 61
0 0 0
N. P. 0 30
12. Punjab E 34 494 243 751 744 814 764
L 0 20 18 37 65 0 36
C 7 3 7 1 0 0 0
0 0 0 0 0 0 0 0
N. P. 959 483 732 211 191 186 200
13. Rajasthan E 89 275 56 514 364 655
L 0 8 1 17 61 0
C 178 0 943 61 333 17
0 0 717 0 0 0 0
N. P. 733 0 0 408 242 328
14. Uttar Pradesh E 64 476
L 23 9
C 640 37
0 83 36
N. P. 90 442
15. West Bengal E 211 550 441 727 959 790 941
L 1 8 5 2 14 0 0
C 0 6 11 2 0 105 5
0 7 ~3 10 2 9 0 0
N. P. 781 403 533 267 18 105 54
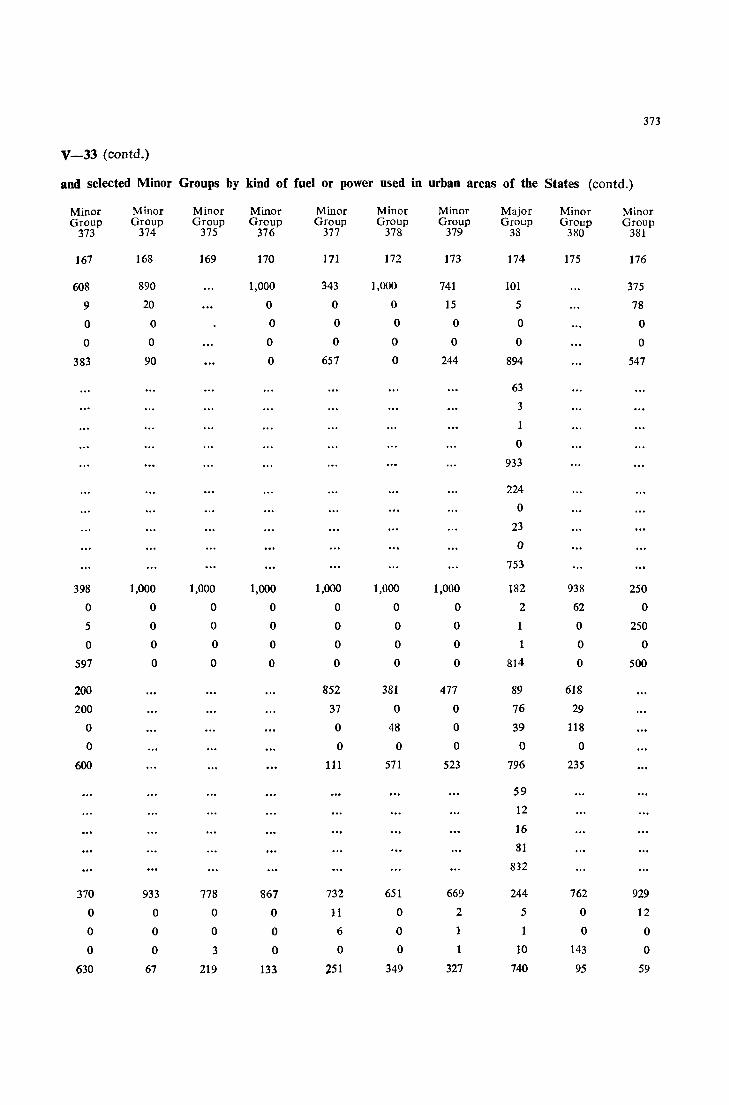
373
V-33 (contd.)
and selected Minor Groups by kind of fuel or power used in urban areas of the States (contd.)
Minor Minor Minor Minor Minor Minor Minor Major Minor Minor Group Group Group Group Group Group Group Group Group Group
373 374 375 376 377 378 379 38 380 381
167 168 169 170 171 172 173 174 175 176
608 890 1,000 343 1,000 741 101 375
9 20 0 0 a 15 5 78
0 0 0 0 0 a a 0
0 a 0 0 0 0 a a 383 90 0 657 0 244 894 547
63
3
0
933
224
0
23
0
753
398 1,000 1,000 1,000 1,000 1,000 1,000 182 938 250
0 0 0 0 0 0 0 2 62 0
5 0 0 0 0 0 0 0 250
0 0 0 0 0 0 0 1 0 0
597 0 0 0 0 0 0 814 0 500
200 852 381 477 89 618
200 37 0 0 76 29
0 0 48 0 39 118
0 0 0 0 0 0
600 111 571 523 796 235
59
12
16
81
832
370 933 778 867 732 651 669 244 762 929
0 0 0 0 11 0 2 5 0 12
0 0 0 0 6 0 1 1 0 0
0 0 3 0 0 0 1 10 143 0
630 67 219 133 lSI 349 327 740 95 59
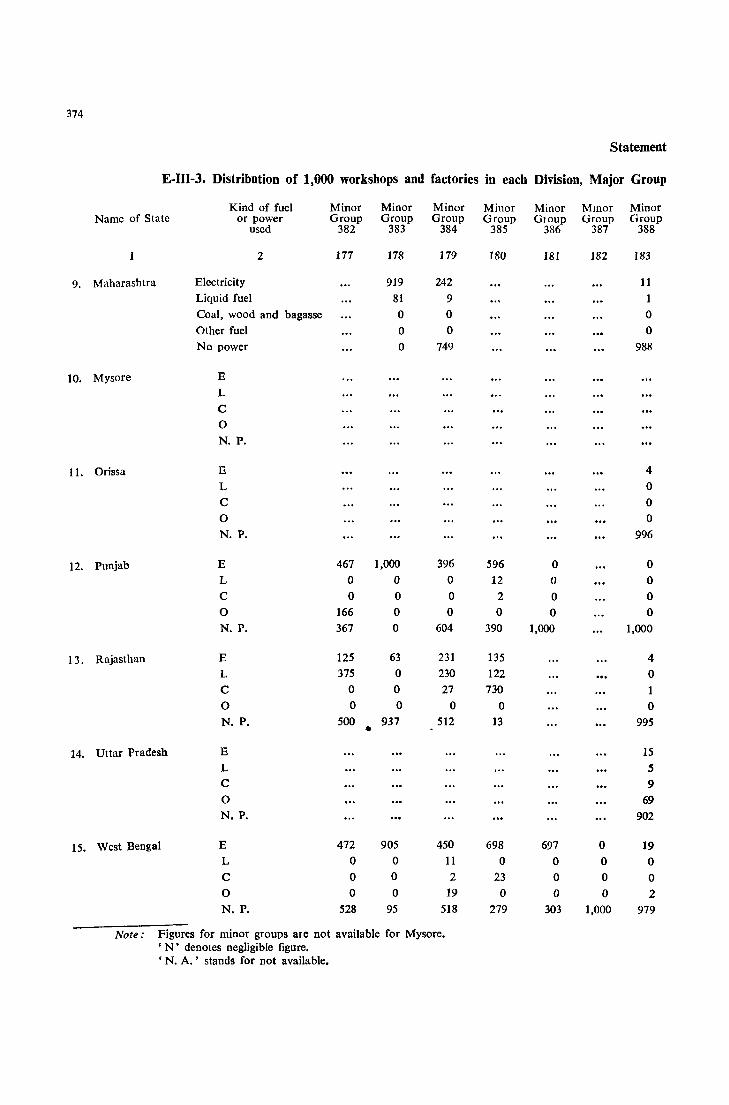
374
Statement
E-III-3. Distribution of 1,000 workshops and factories in each Division, Major Group
Kind of fuel Minor Minor Minor Minor Minor Mmor Minor Namc of State or power Group Group Group Group GIOUp Group Group
used 382 383 384 385 386 387 388
1 2 177 178 179 180 181 182 183
9. Maharashtra Electricity 919 242 11
Liquid fuel 81 9 1 Coal, wood and bagasse 0 0 0 Other fuel 0 0 0 No power 0 749 988
10. Mysore E
L
C 0 N. P.
11. Orissa E 4 L 0 C 0 0 0 N. P. 996
12. Punjab E 467 1,000 396 596 0 0 L 0 0 0 12 0 0 C 0 0 0 2 0 0 0 166 0 0 0 0 0 N. P. 367 0 604 390 1,000 1,000
13. Rajasthan E 125 63 231 135 4 L 375 0 230 122 0 C 0 0 27 730 1 0 0 0 0 0 0 N. P. 500 937 • 512 13 995
14. Uttar Pradesh E 15 L 5 C 9 0 69 N. P. 902
15. West Bengal E 472 905 450 698 697 0 19 L 0 0 11 0 0 0 0 C 0 0 2 23 0 0 0 0 0 0 19 0 0 0 2 N. P. 528 95 518 279 303 1,000 979
Note: Figures for minor groups are not available for Mysore. , N' denotes negligible figure. 'N. A.' stands for not available.
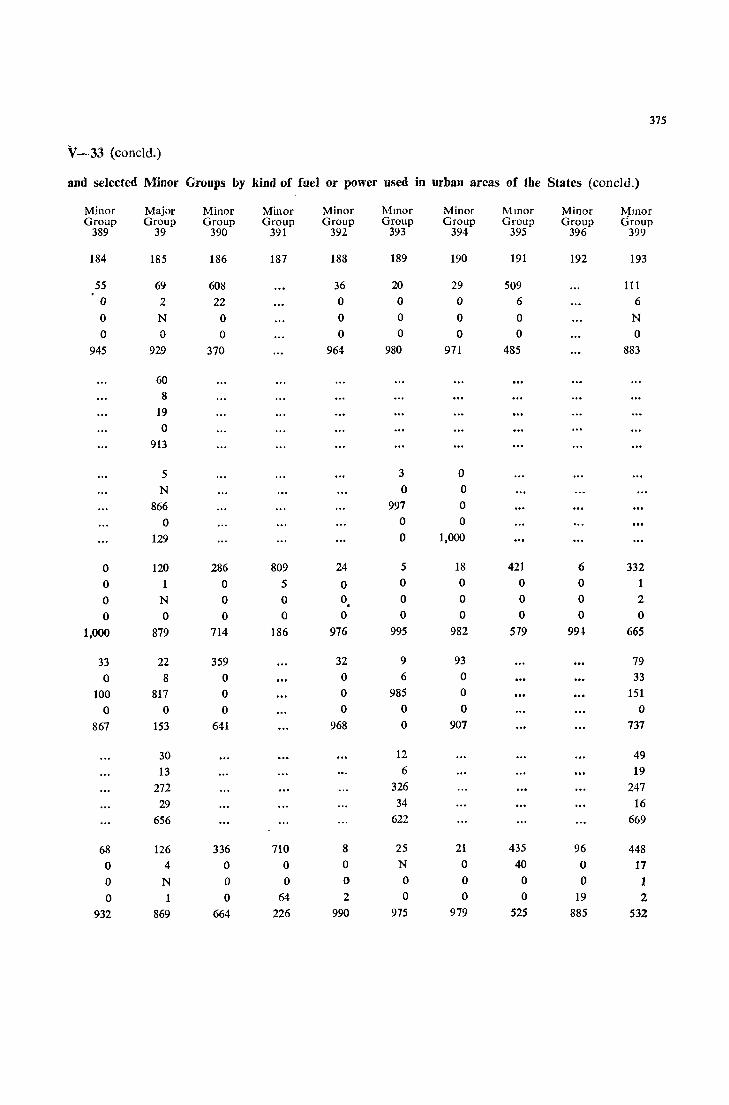
315
V -33 (coneld.)
and selected Minor Groups by kind of fuel or power used in urban areas of the States (coneld.)
Minor Major Minor Minor Minor Mmor Minor Mmor Minor Mmor Group Group Group Group Group Group Group Group Group Group
389 39 390 391 392 393 394 395 396 399
184 185 186 187 188 189 190 191 192 193
55 69 608 36 20 29 509 111 0 2 22 0 0 0 6 6 0 N 0 0 0 0 0 N
0 0 0 0 0 0 0 0 945 929 370 964 980 971 485 883
60 8
19 0
913
5 3 0
N 0 0 866 997 0
0 0 0
129 0 1,000
0 120 286 809 24 5 18 421 6 332 0 1 0 5 0 0 0 0 0 1 0 N 0 0 0 . 0 0 0 0 2 0 0 0 0 0 0 0 0 0 0
1,000 879 714 186 976 995 982 579 99-l 665
33 22 359 32 9 93 79
0 8 0 0 6 0 33 100 817 0 0 985 0 151
0 0 0 0 0 0 0
867 153 641 968 0 907 737
30 12 49 13 6 19
272 326 247 29 34 16
656 622 669
68 126 336 710 8 25 21 435 96 448 0 4 0 0 0 N 0 40 0 17 0 N 0 0 0 0 0 0 0 1
0 1 0 64 2 0 0 0 19 2 932 869 664 226 990 975 979 525 885 532
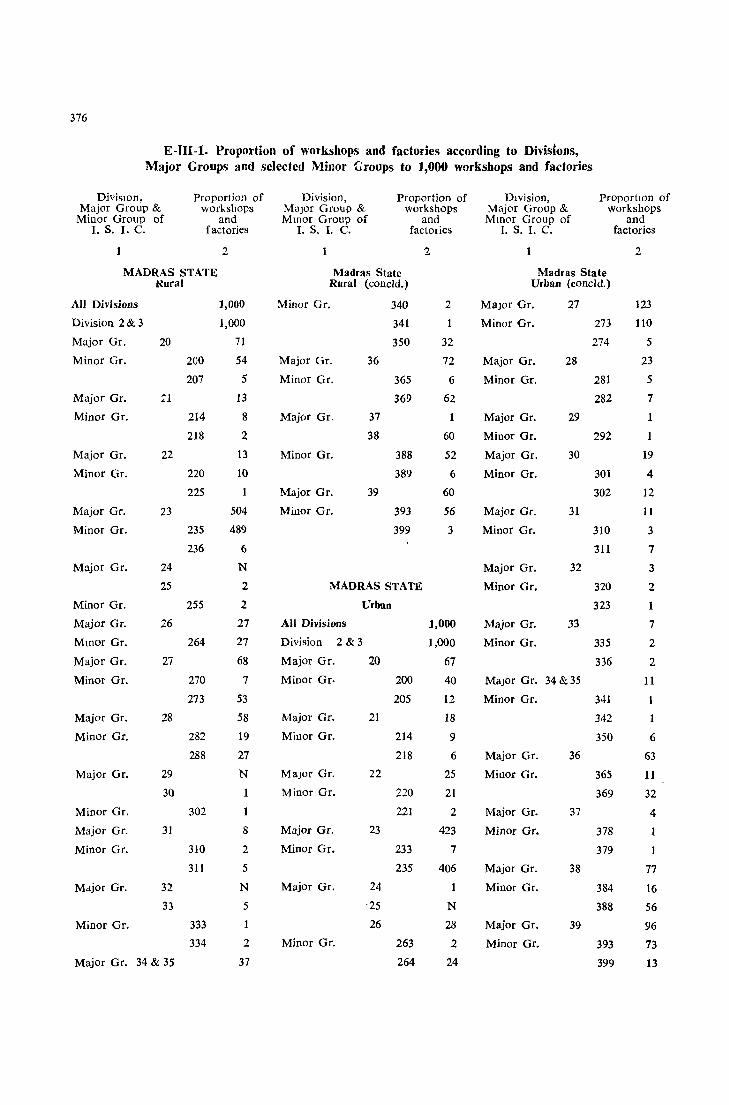
376
E-Ill-l. Proportion of workshops and factories according to Divisions, Major Groups and selected Minor Groups to 1,000 workshops and factories
DivisIOn, Proportion of Division, Proportion of DIvision, ProportIOn of Major Group & workshops Major Group & workshops Major Group & workshops
Minor Group of and Mmor Group of and Mmor Group of and I. S. I. C. factories l. S. I. C. factories I. S. I. C. factories
2 1 2 1 2
MADRAS STATE Madras State Madras State Rural Rural (coneld.) Urban (coneld.)
All Divisions 1,000 Minor Gr. 340 2 Major Gr. 27 123
Division 2 & 3 1,000 341 1 Minor Gr. 273 110
Major Gr. 20 71 350 32 274 5
Minor Gr. 200 54 Major Gr. 36 72 Major Gr. 28 23
207 5 Minor Gr. 365 6 Minor Gr. 281 5
Major Gr. 21 13 369 62 282 7
Minor Gr. 214 8 Majur Gr. 37 1 Major Gr. 29 1
218 2 38 60 Minor Gr. 292
Major Gr. 22 13 Minor Gr. 388 52 Major Gr. 30 19
Minor Gr. 220 10 389 6 Minor Gr. 301 4
225 Major Gr. 39 60 302 12
Major Gr. 23 504 Minor Gr. 393 56 Major Gr. 31 11
Minor Gr. 235 489 399 3 Minor Gr. 310 3
236 6 311 7
Major Gr. 24 N Major Gr. 32 3
25 2 MADRAS STATE Minor Gr. 320 2
Minor Gr. 255 2 Urban 323 1
Major Gr. 26 27 All Divisions 1,000 Major Gr. 33 7
Mmor Gr. 264 27 Division 2&3 1,000 Minor Gr. 335 2
Major Gr. 27 68 Major Gr. 20 67 336 2
Minor Gr. 270 7 Minor Gr. 200 40 Major Gr. 34&35 11
273 53 205 12 Minor Gr. 341
Major Gr. 28 58 Major Gr. 21 18 342
Minor Gr. 282 19 Minor Gr. 214 9 350 6
288 27 218 6 Major Gr. 36 63
Major Gr. 29 N Major Gr. 22 25 Minor Gr. 365 11
30 1 Minor Gr. 220 21 369 32
Minor Gr. 302 221 2 Major Gr. 37 4
Major Gr. 31 8 Major Gr. 23 423 Minor Gr. 378 1
Minor Gr. 310 2 Minor Gr. 233 7 379 1
311 5 235 406 Major Gr. 38 77
Major Gr. 32 N Major Gr. 24 1 Minor Gr. 384 16
33 5 25 N 388 56
Minor Gr. 333 1 26 28 Major Gr. 39 96
334 2 Minor Gr. 263 2 Minor Gr. 393 73
Major Gr. 34 & 35 37 264 24 399 13
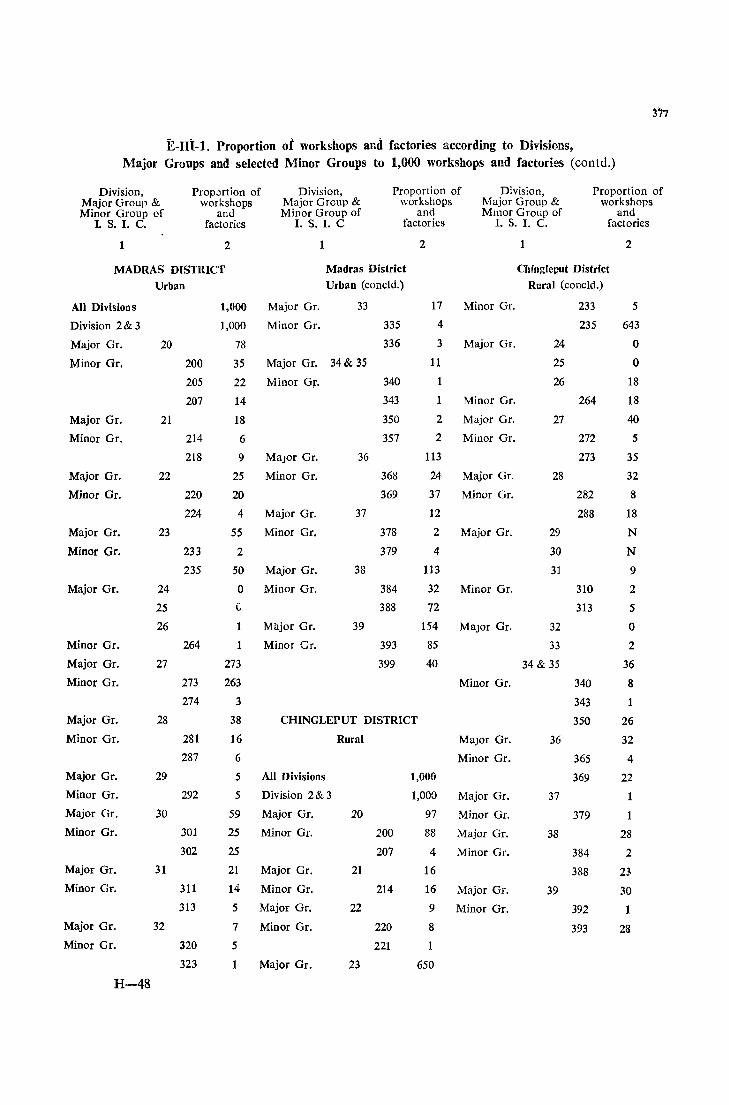
377
E-llt-l. Proportion of workshops and factories according to Divisions, Major Groups and selected Minor Groups to 1,000 workshops and factories (eontd.)
Division, Prop;Jrtion of Division, Proportion of Division, Proportion of Major Group & workshops Major Group & workshops Major Group & workshops Minor Group of and Minor Group of and Mmor Group of and
I. S. I. C. factories I. S. I. C factories I. S. I. C. factories
1 2 1 2 1 2
MADRAS DISTRICT Madras District Chingleput District
Urban Urban (coneld.) Rural (coneld.)
All Division s 1,000 Major Gr. 33 17 Minor Gr. 233 5
Division 2 & 3 1,000 Minor Gr. 335 4 235 643
Major Gr. 20 78 336 3 Major Gr. 24 0
Minor Gr. 200 35 Major Gr. 34& 35 11 25 0
205 22 Minor Gr. 340 26 18
207 14 343 1 Minor Gr. 264 18
Major Gr. 21 18 350 2 Major Gr. 27 40
Minor Gr. 214 6 357 2 Minor Gr. 272 5
218 9 Major Gr. 36 113 273 35
Major Gr. 22 25 Minor Gr. 368 24 Major Gr. 28 32
Minor Gr. 220 20 369 37 Minor Gr. 282 8
224 4 Major Gr. 37 12 288 18
Major Gr. 23 55 Minor Gr. 378 2 Major Gr. 29 N
Minor Gr. 233 2 379 4 30 N
235 50 Major Gr. 38 113 31 9
Major Gr. 24 0 Minor Gr. 384 32 Minor Gr. 310 2
25 (, 388 72 313 5
26 1 Major Gr. 39 154 Major Gr. 32 0
Minor Gr. 264 1 Minor Gr. 393 85 33 2
Major Gr. 27 273 399 40 34& 35 36
Minor Gr. 273 263 Minor Gr. 340 8
274 3 343 1
Major Gr. 28 38 CHINGLEPUT DISTRICT 350 26
Minor Gr. 281 16 Rural Major Gr. 36 32
287 6 Minor Gr. 365 4
Major Gr. 29 5 All Divisions 1,000 369 22
Minor Gr. 292 5 Division 2 & 3 1,000 Major Gr. 37 1
Major Gr. 30 59 Major Gr. 20 97 Minor Gr. 379 1
Minor Gr. 301 25 Minor Gr. 200 88 Major Gr. 38 28
302 25 207 4 Minor Gr. 384 2
Major Gr. 31 21 Major Gr. 21 16 388 2J
Minor Gr. 311 14 Minor Gr. 214 16 Major Gr. 39 30
313 5 Major Gr. 22 9 Minor Gr. 392 1
Major Gr. 32 7 Minor Gr. 220 8 393 28 Minor Gr. 320 5 221 1
323 Major Gr. 23 650
H-48
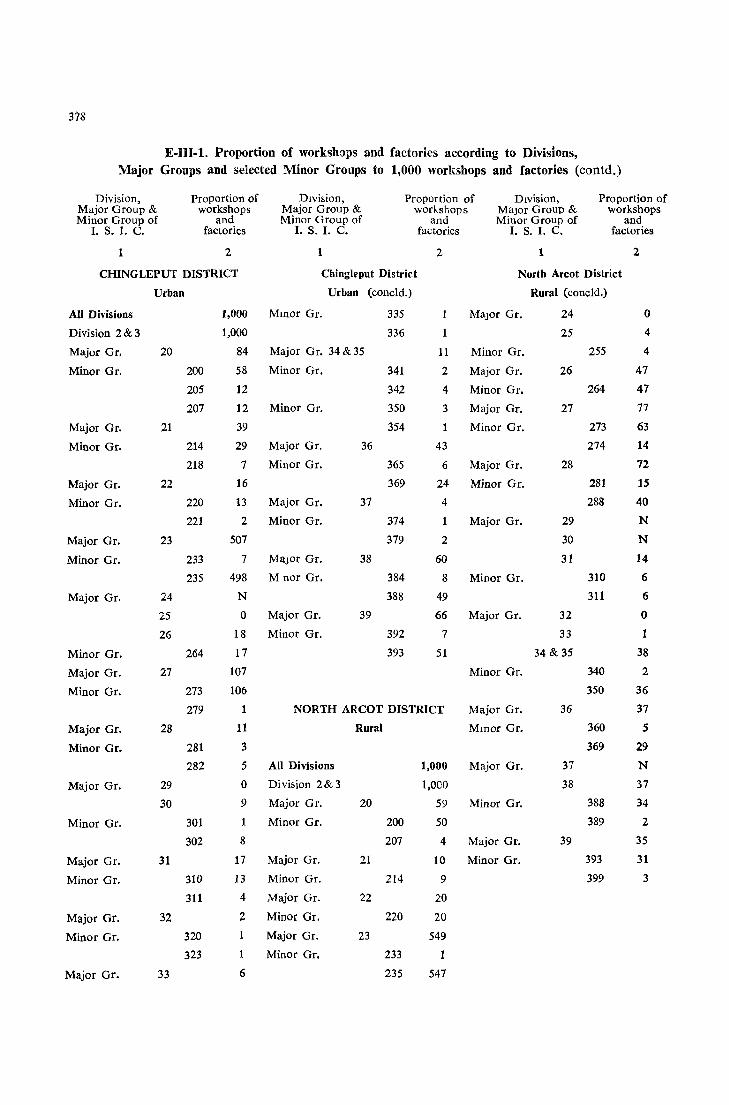
3',8
E-III-1. Proportion of workshops and factories according to Divisions, Major Groups and selected Minor Groups to 1,000 workshops and factories (eoutd.)
Division, Proportion of Division, Proportion of Division, Proportion of Major Group & workshops Major Group & workshops Major Group & workshops Minor Group of and Minor Group of and Minor Group of and
I. S. 1. C. factories I. S. I. C. factories I. S. I. C. factories
1 2 1 2 1 2
CHINGLEPUT DISTRICT Chingleput District North Arcot District
Urban Urban (concld.) Rural (concld.)
All Divisions 1,000 Mmor Gr. 335 1 Major Gr. 24 0
Division 2 & 3 1,000 336 1 25 4
Major Gr. 20 84 Major Gr. 34 & 35 11 Minor Gr. 255 4
Minor Gr. 200 58 Minor Gr. 341 2 Major Gr. 26 47
205 12 342 4 Minor Gr. 264 47
207 12 Minor Gr. 350 3 Major Gr. 27 77
Major Gr. 21 39 354 Minor Gr. 273 63
Minor Gr. 214 29 Major Gr. 36 43 274 14
218 7 Minor Gr. 365 6 Major Gr. 28 72
Major Gr. 22 16 369 24 Minor Gr. 281 15
Minor Gr. 220 13 Major Gr. 37 4 288 40
221 2 Minor Gr. 374 1 Major Gr. 29 N
Major Gr. 23 507 379 2 30 N
Minor Gr. 233 7 Major Gr. 38 60 31 14
235 498 M nor Gr. 384 8 Minor Gr. 310 6
Major Gr. 24 N 388 49 311 6
25 0 Major Gr. 39 66 Major Gr. 32 0
26 18 Minor Gr. 392 7 33 1
Minor Gr. 264 17 393 51 34 & 35 38
Major Gr. 27 107 Minor Gr. 340 2
Minor Gr. 273 106 350 36
279 1 NORTH ARCOT DISTRICT Major Gr. 36 37
Major Gr. 28 11 Rural Mmor Gr. 360 5
Minor Gr. 281 3 369 29
282 5 All Divisions 1,000 Major Gr. 37 N
Major Gr. 29 0 Di vision 2 & 3 1,000 38 37
30 9 Major Gr. 20 59 Minor Gr. 388 34
Minor Gr. 301 Minor Gr. 200 50 389 2
302 8 207 4 Major Gr. 39 35
Major Gr. 31 17 Major Gr. 21 10 Minor Gr. 393 31
Minor Gr. 310 13 Minor Gr. 214 9 399 3
311 4 Major Gr. 22 20
Major Gr. 32 2 Minor Gr. 220 20
Minor Gr. 320 1 Major Gr. 23 549
323 Minor Gr. 233 1
Major Gr. 33 6 235 547

379
E-Ill-l. Proportion of worksbops and factories according to Divisions, Major Groups and selected Minor Groups to 1,000 workshops and factories (contd.)
Division, Proportion of Division, Proportion of Division, Proportion of Major Group & workshops Major Group & workshops Major Group & workshops Minor Group of and Mmor Group of and Minor Group of and
I. S. I. C. factories I. S. I. C. factories I. S. I. C. factories
1 2 1 2 1 2
NORTH ARCOT DISTRICT North Arcot District South Arcot District
Urban Urban (coneld.) Rural (~oncld.)
All Dh-isions 1,000 Minor Gr. 320 Minor Gr. 235 451
Division 2& 3 1,000 Major Gr. 33 7 Major Gr. 24 1
Major Gr. 20 93 Minor Gr. 333 1 25 2
Minor Gr. 200 55 334 2 Minor Gr. 255 2
205 14 Major Gr. 26
207 13 Major Gr. 34 & 35 15 27 49
Major Gr. 21 16 Minor Gr. 341 1 Minor Gr. 273 48
Minor Gr. 214 13 342 4 Major Gr. 28 96
218 2 Minor Gr. 350 10 Minor Gr. 282 36
Major Gr. 22 64 Major Gr. 36 54 288 42
Minor Gr. 220 63 Minor Gr. 365 21 Major Gr. 29 N
225 369 28 30 1
Major Gr. 23 298 Major Gr. 37 4 Minor Gr. 302 1
Minor Gr. 235 287 Minor Gr. 377 1 Major_ Gr. 31 8
237 6 378 3 inor Gr. 310 4
Major Gr. 24 Major Gr. 38 88 311 4
Minor Gr. 244 1 Minor Gr. 384 14 Major Gr. 32 1
Major Gr. 25 3 388 72 33 N
Minor Gr. 255 3 Major Gr. 39 92 34& 35 54
Major Gr. 26 44 Minor Gr. 393 65 Minor Gr. 341 2
Minor Gr. 263 2 399 16 350 51
264 40 Major Gr. 36 87
Major Gr. 27 150 Minor Gr. 365 12
Minor Gr. 273 125 SOUTH ARCOT DISTRICT 369 69
274 23 Rural Major Gr. 37 1
Major Gr. 28 32 Minor Gr. 378 1
Minor Gr. 288 8 All Divisions 1,000 Major Gr. 38 65
289 17 Division 2& 3 1,000 Minor Gr. 388 60
Major Gr. 29 N Major Gr. 20 99 389 2
30 13 Minor Gr. 200 80 Major Gr. 39 66
Minor Gr. 302 11 207 12 Minor Gr. 393 59
303 Major Gr. 21 15 399 6
Major Gr. 31 25 Minor Gr. 214 15
Minor Gr. 310 15 Major Gr. 22 N
311 8 23 454
Major Gr. 32 1 Minor Gr. 231 1
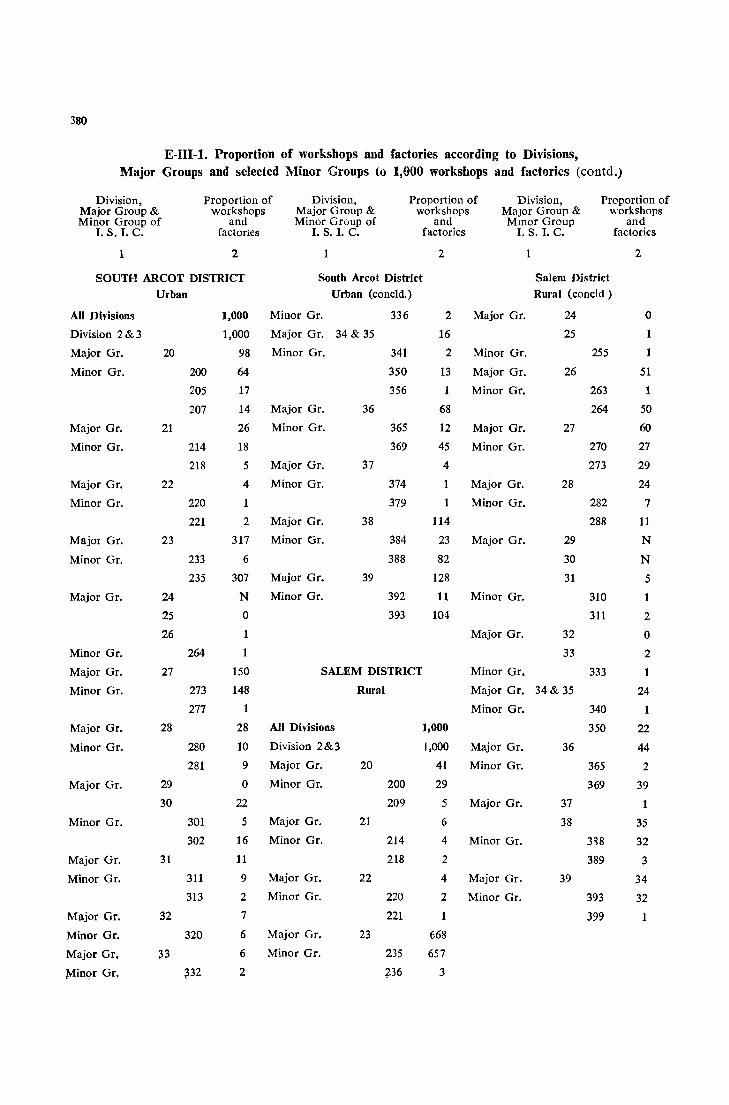
380
E-Ill-l. Proportion of workshops and factories according to Divisions,
Major Groups and selected Minor Groups to 1,000 workshops and factories (contd.)
Division, Proportion of Division, Proportion of Division, Proportion of Major Group & workshops Major Group & workshops Major Group & workshops Minor Group of and Minor Group of and Mmor Group and
I. S. I. C. factones I. S. I. C. factories I. S. I. C. factories
1 2 1 2 1 2
SOUTH AReOT DISTRICT South Arcot District Salem District
Urban Urban (concld.) Rural (coneld)
All Divisions 1,000 Minor Gr. 336 2 Major Gr. 24 0
Division 2 & 3 1,000 Major Gr. 34 & 35 16 25 1
Major Gr. 20 98 Minor Gr. 341 2 Minor Gr. 255 1
Minor Gr. 200 64 350 13 Major Gr. 26 51
205 17 356 Minor Gr. 263 1
207 14 Major Gr. 36 68 264 50
Major Gr. 21 26 Minor Gr. 365 12 Major Gr. 27 60
Minor Gr. 214 18 369 45 Minor Gr. 270 27
218 5 Major Gr. 37 4 273 29
Major Gr. 22 4 Minor Gr. 374 Major Gr. 28 24
Minor Gr. 220 379 1 Minor Gr. 282 7
221 2 Major Gr. 38 114 288 11
Major Gr. 23 317 Minor Gr. 384 23 Major Gr. 29 N
Minor Gr. 233 6 388 82 30 N
235 307 Major Gr. 39 128 31 5
Major Gr. 24 N Minor Gr. 392 11 Minor Gr. 310 1
25 0 393 104 311 2
26 1 Major Gr. 32 0
Minor Gr. 264 33 2
Major Gr. 27 150 SALEM DISTRICT Minor Gr. 333 1
Minor Gr. 273 148 Rural Major Gr. 34 & 35 24
277 1 Minor Gr. 340 1
Major Gr. 28 28 All Divisions 1,000 350 22
Minor Gr. 280 10 Division 2&3 1,000 Major Gr. 36 44
281 9 Major Gr. 20 41 Minor Gr. 365 2
Major Gr. 29 0 Minor Gr. 200 29 369 39
30 22 209 5 Major Gr. 37 1
Minor Gr. 301 5 Major Gr. 21 6 38 35
302 16 Minor Gr. 214 4 Minor Gr. 3::)8 32
Major Gr. 31 11 218 2 389 3
Minor Gr. 311 9 Major Gr. 22 4 Major Gr. 39 34
313 2 Minor Gr. 220 2 Minor Gr. 393 32
Major Gr. 32 7 221 1 399 1
Minor Gr. 320 6 Major Gr. 23 668
Major Gr. 33 6 Minor Gr. 235 657
Minqr Gr. ~32 2 ~36 3
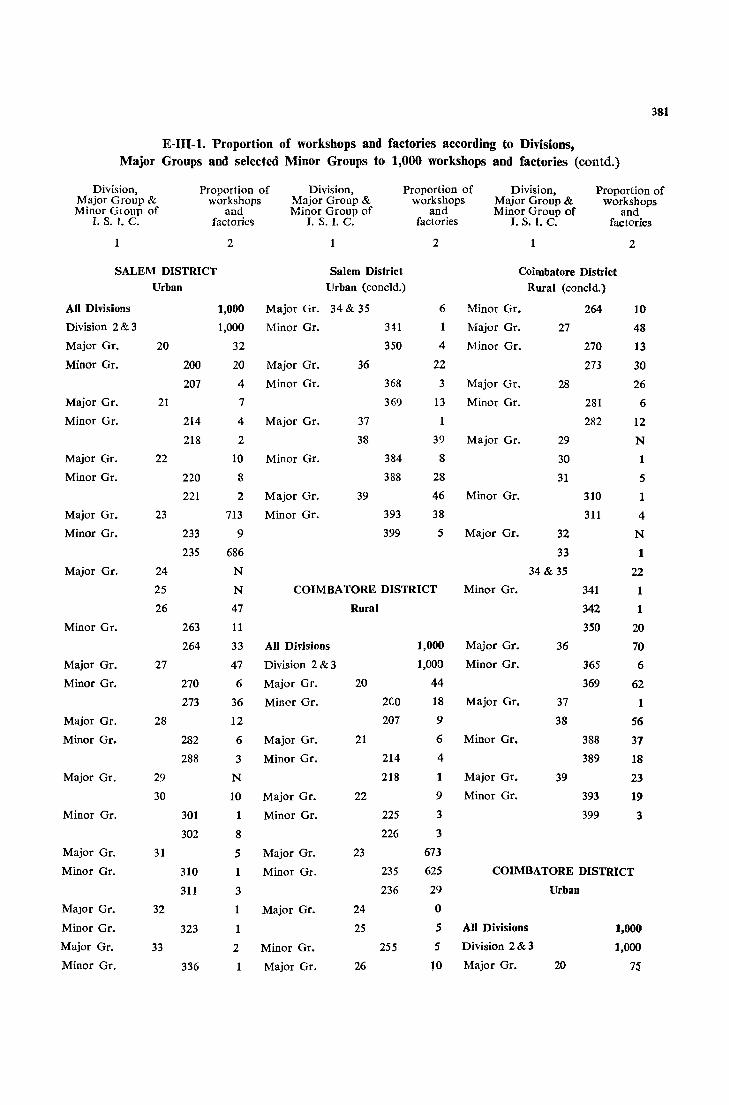
331
E-III-1. Proportion of workshops and factories according to Divisions,
Major Groups and selected Minor Groups to 1,000 workshops and factories (contd.)
Division, Proportion of Division, Proportion of Division, Proportion of Major Group & workshops Major Group & workshops Major Group & workshops Minor GlOup of and Minor Group of and Minor Group of and
I. S. l. C. factories I. S.l. C. factories I. S. l. C. factories
2 1 2 1 2
SALEM DISTRICT Salem District Coimbatore District Urban Urban (coneld.) Rural (coneld.)
All Divisions 1,000 Major Gr. 34& 35 6 Minor Gr. 264 10 Division 2 & 3 1,000 Minor Gr. 341 1 Major Gr. 27 48 Major Gr. 20 32 350 4 Minor Gr. 270 13
Minor Gr. 200 20 Major Gr. 36 22 273 30
207 4 Minor Gr. 368 3 Major Gr. 28 26
Major Gr. 21 7 369 13 Minor Gr. 281 6
Minor Gr. 214 4 Major Gr. 37 1 282 12
218 2 38 39 Major Gr. 29 N
Major Gr. 22 10 Minor Gr. 384 8 30 1
Minor Gr. 220 8 388 28 31 5
221 2 Major Gr. 39 46 Minor Gr. 310 1
Major Gr. 23 713 Minor Gr. 393 38 311 4 Minor Gr. 233 9 399 5 Major Gr. 32 N
235 686 33 1
Major Gr. 24 N 34 & 35 22
25 N COIMBATORE DISTRICT Minor Gr. 341 1
26 47 Rural 342 1
Minor Gr. 263 11 350 20
264 33 All Divisions 1,000 Major Gr. 36 70
Major Gr. 27 47 Division 2 & 3 1,000 Minor Gr. 365 6
Minor Gr. 270 6 Major Gr. 20 44 369 62
273 36 Minor Gr. 2eO 18 Major Gr. 37 1
Major Gr. 28 12 207 9 38 56
Minor Gr. 282 6 Major Gr. 21 6 Minor Gr. 388 37
288 3 Minor Gr. 214 4 389 18
Major Gr. 29 N 218 1 Major Gr. 39 23
30 10 Major Gr. 22 9 Minor Gr. 393 19
Minor Gr. 301 1 Minor Gr. 225 3 399 3
302 8 226 3
Major Gr. 31 5 Major Gr. 23 673
Minor Gr. 310 1 Minor Gr. 235 625 COIMBATORE DISTRICT
311 3 236 29 Urban
Major Gr. 32 1 Major Gr. 24 0
Minor Gr. 323 1 25 5 All Divisions 1,000
Major Gr. 33 2 Minor Gr. 255 5 Division 2 & 3 1,000
Minor Gr. 336 1 Major Gr. 26 10 Major Gr. 20 7S
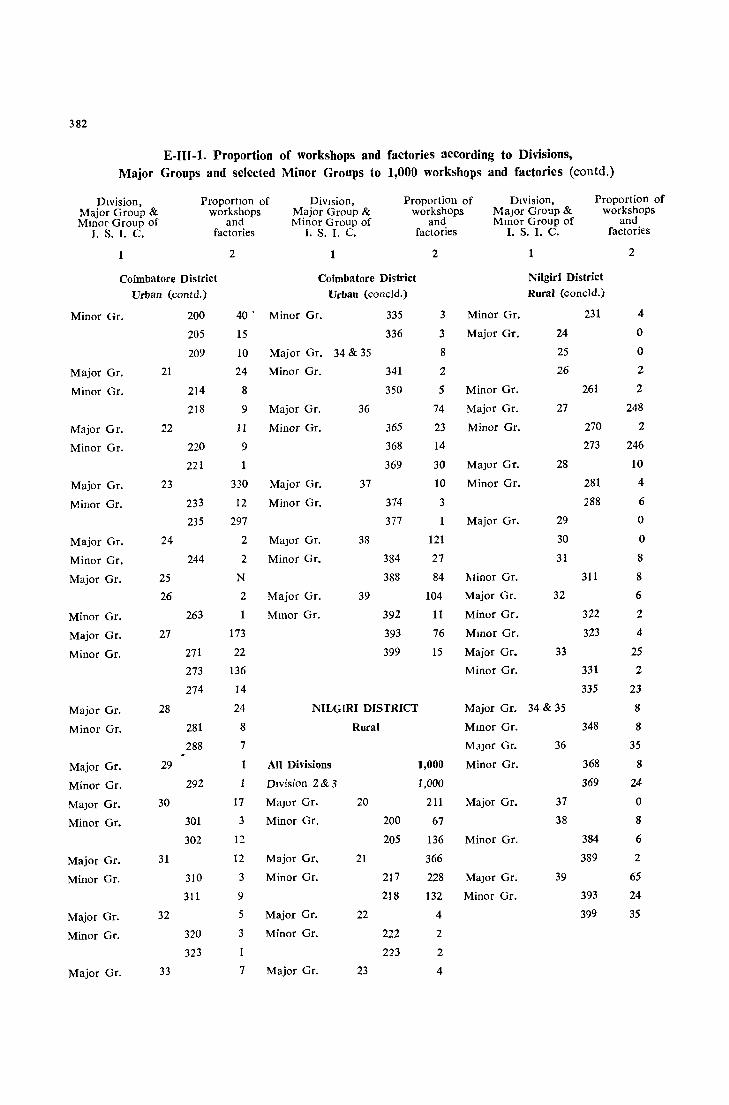
382
E-IU-l. Proportion of workshops and factories according to Divisions, Major Groups and selected Minor Groups to 1,000 workshops and factories (contd.)
Division, ProportIOn of Division, Proportion of Division, Proportion of Major Group & workshops Major Group & workshops Major Group & workshops Mmor Group of and Minor Group of and Mmor Group of and
I. S. I. C. factories I. S. I. C. factories I. S. I. C. factories
2 1 2 1 2
Coimbatore District Coimbatore District Nilgiri District
Urban (contd.) Urban (coneld.) Rural (coneld.)
Minor Gr. 200 40 . Minor Gr. 335 3 Minor Gr. 231 4
205 15 336 3 Major Gr. 24 0
209 10 Major Gr. 34 & 35 8 25 0
Major Gr. 21 24 Minor Gr. 341 2 26 2
Minor Gr. 214 8 350 5 Minor Gr. 261 2
218 9 Major Gr. 36 74 Major Gr. 27 248
Major Gr. 22 11 Minor Gr. 365 23 Minor Gr. 270 2
Minor Gr. 220 9 368 14 273 246
221 1 369 30 Major Gr. 28 10
Major Gr. 23 330 Major Gr. 37 10 Minor Gr. 281 4
Minor Gr. 233 12 Minor Gr. 314 3 288 6
235 297 377 Major Gr. 29 0
Major Gr. 24 2 Major Gr. 38 121 30 0
Minor Gr. 244 2 Minor Gr. 384 27 31 8
Major Gr. 25 N 388 84 Minor Gr. 311 8
26 2 Major Gr. 39 104 Major Gr. 32 6
Minor Gr. 263 Mmor Gr. 392 11 Minor Gr. 322 2
Major Gr. 27 173 393 76 Mmor Gr. 323 4
Minor Gr. 271 22 399 15 Major Gr. 33 25
273 136 Minor Gr. 331 2
274 14 335 23
Major Gr. 28 24 NILGIRI DISTRICT Major Gr. 34& 35 8
Minor Gr. 281 8 Rural Mmor Gr. 348 8
288 7 Major Gr. 36 35
Major Gr. 29 All Divisions 1,00i) Minor Gr. 368 8
Minor Gr. 292 Division 2 & 3 1,000 369 24
Major Gr. 30 17 Major Gr. 20 211 Major Gr. 37 0
Minor Gr. 301 3 Minor Gr. 200 67 38 8
302 12 205 136 Minor Gr. 384 6
Major Gr. 31 12 Major Gr. 21 366 389 2
Minor Gr. 310 3 Minor Gr. 217 228 Major Gr. 39 65
311 9 218 132 Minor Gr. 393 24
Major Gr. 32 5 Major Gr. 22 4 399 35
Minor Gr. 320 3 Minor Gr. 222 2
323 1 223 2
Major Gr. 33 7 Major Gr. 23 4
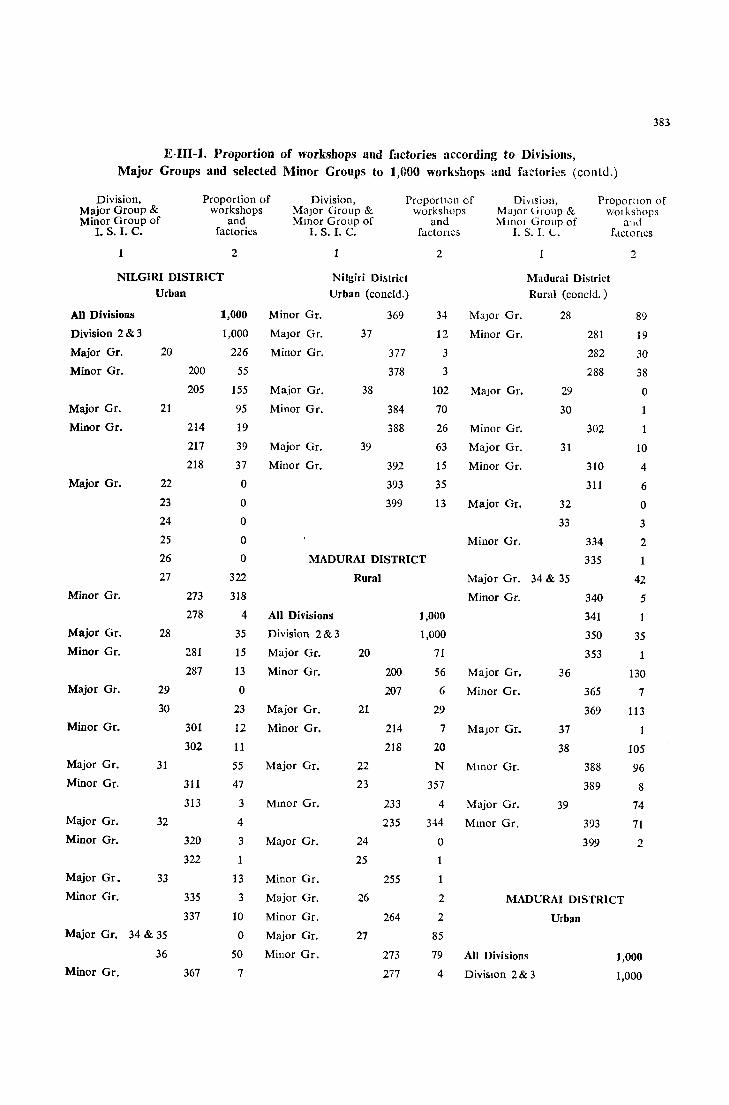
383
E-Ill-l. Proportion of workshops and factories according to Divi~ions, Major Groups and selected Minor Groups to 1,000 workshops and factories (contd.)
Division, Proportion of Division, ProportIOn of DivIsion, ProportIon of Major Group & workshops Major Group & workshops Major Group & wOlkshops Minor Group of and Mmor Group of and MInOl Group of Ulhl
I. S. I. C. factories I. S. I. C. factoncs 1. S. 1. L. fdctoncs
2 2 2
NILGlRI DISTRICT Nilgiri Dhtrict Madurai District Urban Urban (coneld.) Rural (coneld.)
All Divisions 1,000 Minor Gr. 369 34 Major Gr. 28 89
Division 2 & 3 1,000 Major Gr. 37 12 Minor Gr. 281 19
Major Gr. 20 226 Minor Gr. 377 3 282 30
Minor Gr. 200 55 378 3 288 38
205 155 Major Gr. 38 102 Major Gr. 29 0
Major Gr. 21 95 Minor Gr. 384 70 30 1
Minor Gr. 214 19 388 26 Minor Gr. 302
217 39 Major Gr. 39 63 Major Gr. 31 10
218 37 Minor Gr. 392 15 Minor Gr. 310 4
Major Gr. 22 0 393 35 311 6
23 0 399 13 Major Gr. 32 0
24 0 33 3
25 0 Minor Gr. 334 2
26 0 MADURAI DISTRICT 335
27 322 Rural Major Gr. 34 & 35 42
Minor Gr. 273 318 Minor Gr. 340 5
278 4 All Divisions 1,000 341
Major Gr. 28 35 Division 2 & 3 1,000 350 35 Minor Gr. 281 15 Major Gr. 20 71 353 1
287 13 Minor Gr. 200 56 Major Gr. 36 130 Major Gr. 29 0 207 6 Minor Gr. 365 7
30 23 Major Gr. 21 29 369 113
Minor Gr. 301 12 Minor Gr. 214 7 Major Gr. 37 1
302 11 218 20 38 105 Major Gr. 31 55 Major Gr. 22 N Mmor Gr. 388 96 Minor Gr. 311 47 23 357 389 8
313 3 Mmor Gr. 233 4 Major Gr. 39 74 Major Gr. 32 4 235 344 Mmor Gr. 393 71
Minor Gr. 320 3 Major Gr. 24 0 399 2
322 25
Major Gr. 33 13 Minor Gr. 255
Minor Gr. 335 3 Major Gr. 26 2 MADURAI DISTRICT
337 10 Minor Gr. 264 2 Urban
Major Gr. 34 & 35 0 Major Gr. 27 85
36 50 Minor Gr. 273 79 All Divisions 1,000 Minor Gr. 367 7 277 4 DiviSIOn 2 & 3 1,000
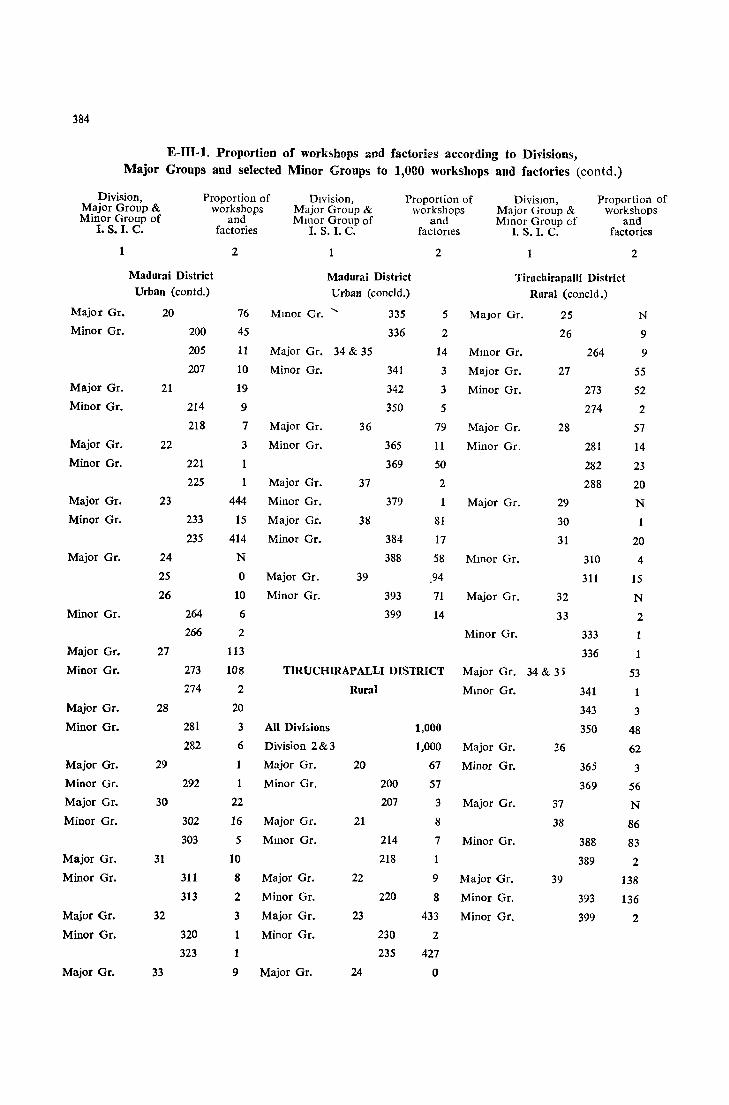
384
E-Ill-l. Proportion of work5>hops and factories according to Divisions, Major Groups and selected Minor Groups to 1,000 workshops and factories (contd.)
Division, Proportion of Division, Proportion of DivisIOn, Proportion of Major Group & workshops Major Group & workshops Major Group & workshops Minor Group of and Mmor Group of and Millor Group of and
I. S. I. C. factories I. S. I. C. factones I. S. I. C. factories
1 2 1 2 1 2
Madurai District Madurai District Tirucbirapalli District Urban (conld.) Urban (coneld.) Rural (coneld.)
Major Gr. 20 76 Mmor Gr. ...... 335 5 Major Gr. 25 N
Minor Gr. 200 45 336 2 26 9 205 11 Major Gr. 34 & 35 14 Mmor Gr. 264 9 207 10 Minor Gr. 341 3 Major Gr. 27 55
Major Gr. 21 19 342 3 Minor Gr. 273 52 Minor Gr. 214 9 350 5 274 2
218 7 Major Gr. 36 79 Major Gr. 28 57 Major Gr. 22 3 Minor Gr. 365 11 Minor Gr. 281 14 Minor Gr. 221 369 50 282 23
225 Major Gr. 37 2 288 20 Major Gr. 23 444 Minor Gr. 379 1 Major Gr. 29 N
Minor Gr. 233 15 Major Gr. 3S 81 30 235 414 Minor Gr. 384 17 31 20
Major Gr. 24 N 388 58 Mmor Gr. 310 4 25 0 Major Gr. 39 94 311 15 26 10 Minor Gr. 393 71 Major Gr. 32 N
Minor Gr. 264 6 399 14 33 2 266 2 Minor Gr. 333 1
Major Gr. 27 113 336 1 Minor Gr. 273 108 TlRUCHIRAPALLI DISTRICT Major Gr. 34 & 35 53
274 2 Rural Mmor Gr. 341 1 Major Gr. 28 20 343 3 Minor Gr. 281 3 All Divi~ions 1,000 350 48
282 6 Division 2 & 3 1,000 Major Gr. 36 62 Major Gr. 29 Major Gr. 20 67 Minor Gr. 365 3 Minor Gr. 292 Minor Gr. 200 57 369 56 Major Gr. 30 22 207 3 Major Gr. 37 N Minor Gr. 302 16 Major Gr. 21 8 38 86
303 5 Mmor Gr. 214 7 Minor Gr. 388 83 Major Gr. 31 10 218 389 2 Minor Gr. 311 8 Major Gr. 22 9 Major Gr. 39 138
313 2 Minor Gr. 220 8 Minor Gr. 393 136 Major Gr. 32 3 Major Gr. 23 433 Minor Gr. 399 2 Minor Gr. 320 1 Minor Gr. 230 2
323 1 235 427
Major Gr. 33 9 Major Gr. 24 0
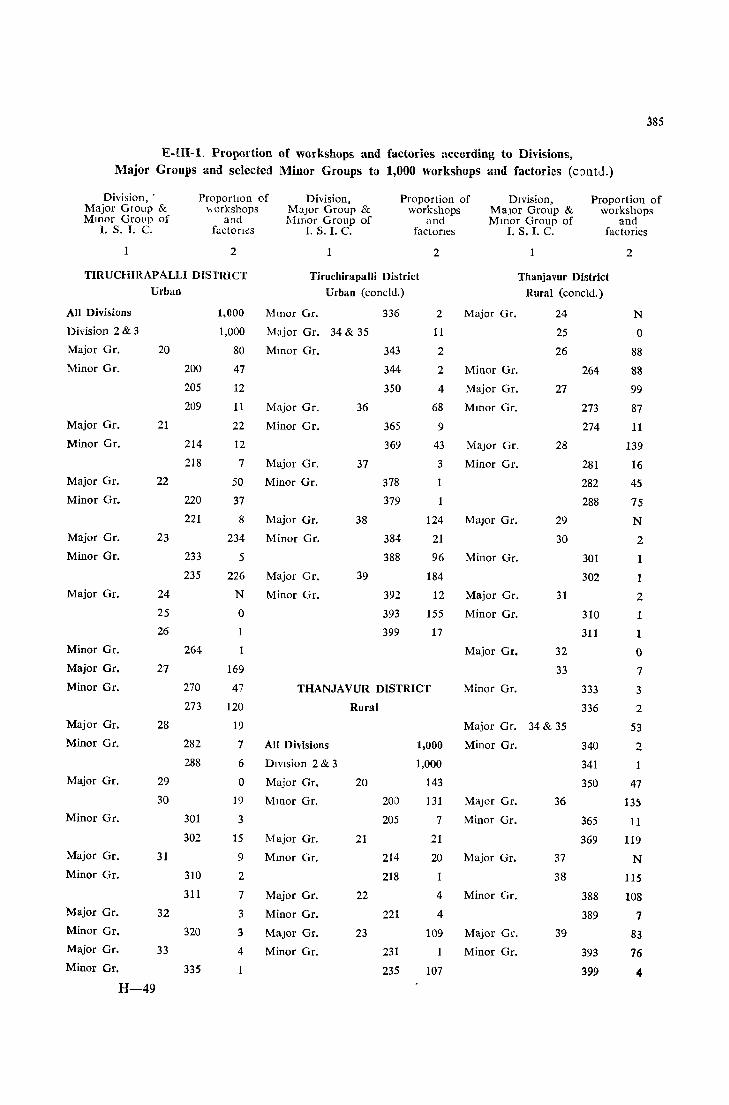
385
t<:-lII-l. Proportion of workshops and factories according to Divisions, Major Groups and selected Minor Groups to 1,000 workshops and factories (cJl1td.)
Division, . ProportIOn of Division, Proportion of DIvision, Proportion of Major Group & ",orkshops Major Group & workshops Major Group & workshops Mmor Grol1p of and l\1mor Group of and Mmor Group of and
I. S. I. C. facton-:s I. S. I. C. faclones 1. S. I. C. factories
1 2 2 2
TIRUCHIRAPALLI DISTRICT Tiruchirapalli District Thanjavur District Urban Urban (coneld.) Rural (coneld.)
All Djyisions 1.000 Mmor Gr. 336 2 Major Gr. 24 N
Division 2 & 3 1,000 Major Gr. 34 & 35 11 25 0 Major Gr. 20 80 Mmor Gr. 343 2 26 88 Minor Gr. 200 47 344 2 Minor Gr. 264 88
205 12 350 4 Major Gr. 27 99 209 11 Major Gr. 36 68 Mmor Gr. 273 87
Major Gr. 21 22 Minor Gr. 365 9 274 11 Minor Gr. 214 12 369 43 Major Gr. 28 139
218 7 Major Gr. 37 3 Minor Gr. 281 16 Major Gr. 22 50 Minor Gr. 378 282 45 Minor Gr. 220 37 379 288 7'5
221 8 Major Gr. 38 124 Major Gr. 29 N Major Gr. 23 234 Minor Gr. 384 21 30 2 Minor Gr. 233 5 388 96 Minor Gr. 301 1
235 226 Major Gr. 39 184 302 1 Major Gr. 24 N Minor Gr. 392 12 Major Gr. 31 2
25 0 393 155 Minor Gr. 310 1 26 399 17 311 1
Minor Gr. 264 1 Major Gr. 32 0 Major Gr. 27 169 33 7 Minor Gr. 270 47 THANJA VUR DISTRICT Minor Gr. 333 3
273 120 Rural 336 2 Major Gr. 28 19 Major Gr. 34 & 35 53 Minor Gr. 282 7 All Dhisions 1,000 Minor Gr. 340 2
288 6 DlVIsion 2 & 3 1,000 341 1 Major Gr. 29 0 Major Gr. 20 143 350 47
30 19 Mmor Gr. 200 131 Major Gr. 36 135 Minor Gr. 301 3 205 7 Minor Gr. 365 11
302 15 Major Gr. 21 21 369 119 Major Gr. 31 9 Mmor Gr. 214 20 Major Gr. 37 N Minor Gr. 310 2 218 1 38 115
311 7 Major Gr. 22 4 Minor Gr. 388 108 Major Gr. 32 3 Minor Gr. 221 4 389 7 Minor Gr. 320 3 Major Gr. 23 109 Major Gr. 39 83 Major Gr. 33 4 Minor Gr. 231 Minor Gr. 393 76 Minor Gr. 335 1 235 107 399 4
H-49
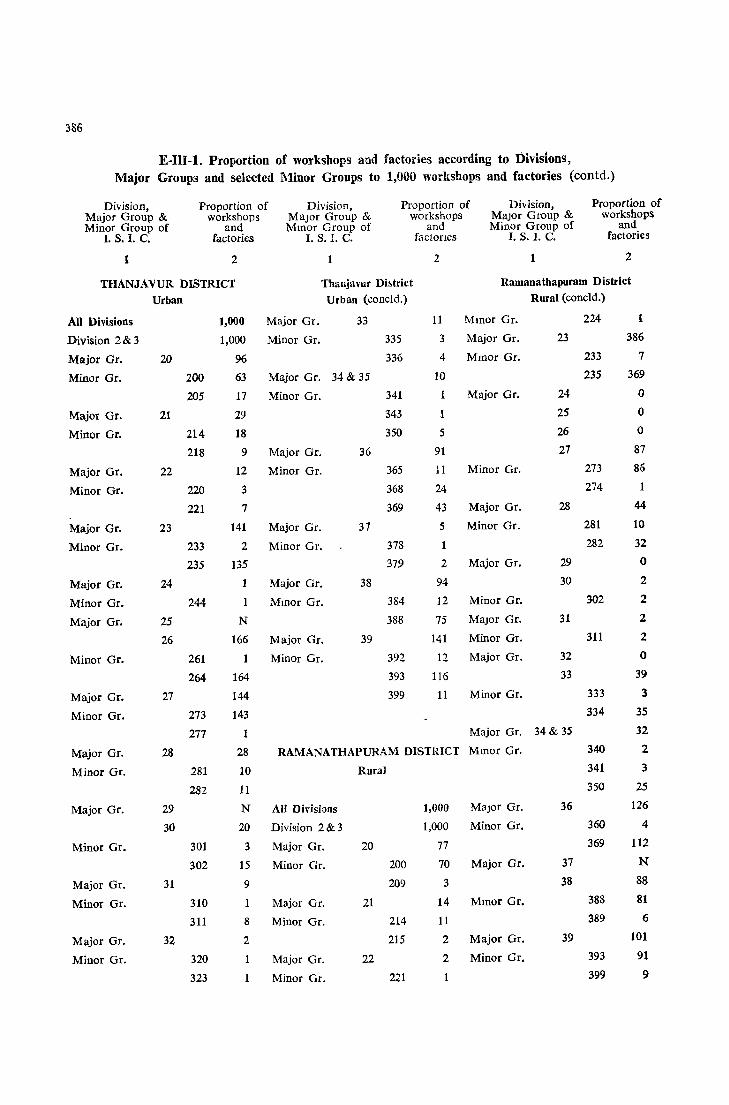
:586
E-Ill-l. Proportion of workshops and factories according to Divisions, Major Groups and selected Minor Groups to 1,000 workshops and factories (contd.)
Division, Proportion of Division, Proportion of Division, Proportion of Major Group & workshops Major Group & workshops Major Group & workshops Minor Group of and Mmor Group of and Minor Group of and
I. S. I. C. factories I. S. 1. C. factones I. S. I. C. factories
1 2 1 2 1 2
THANJAVUR DISTRICT Thanjavur Dhtriet Ramanathapuram District
Urban Urban (coneld.) Rural (coneld.)
All Divisions 1,000 Major Gr. 33 11 Mmor Gr. 224 1
Division 2 & 3 1,000 Minor Gr. 335 3 Major Gr. 23 386
Major Gr. 20 96 336 4 Mmor Gr. 233 7
Minor Gr. 200 63 Major Gr. 34 & 35 10 235 369
205 17 Minor Gr. 341 1 Major Gr. 24 0
Major Gr. 21 29 343 1 25 0
Minor Gr. 214 18 350 5 26 0
218 9 Major Gr. 36 91 27 87
Major Gr. 22 12 Minor Gr. 365 11 Minor Gr. 273 86
Minor Gr. 220 3 368 24 274 1
221 7 369 43 Major Gr. 28 44
Major Gr. 23 141 Major Gr. 37 5 Minor Gr. 281 10
Minor Gr. 233 2 Minor Gr. 378 1 282 32
235 135 379 2 Major Gr. 29 0
Major Gr. 24 1 Major Gr. 38 94 30 2
Minor Gr. 244 1 Mmor Gr. 384 12 Minor Gr. 302 2
Major Gr. 25 N 388 75 Major Gr. 31 2
26 166 Major Gr. 39 141 Minor Gr. 311 2
Minor Gr. 261 1 Minor Gr. 392 12 Major Gr. 32 0
264 164 393 116 33 39
Major Gr. 27 144 399 11 Minor Gr. 333 3
Minor Gr. 273 143 334 35
277 1 Major Gr. 34& 35 32
Major Gr. 28 28 RAMANATHAPURAM DISTlHCT Mmof Gr. 340 2
Minor Gr. 281 10 Rural 341 3
282 11 350 25
Major Gr. 29 N All Divisions 1,000 Major Gr. 36 126
30 20 Division 2 & 3 1,000 Minor Gr. 360 4
Minor Gr. 301 3 Major Gr. 20 77 369 112
302 15 Minor Gr. 200 70 Major Gr. 37 N
Major Gr. 31 9 209 3 38 88
Minor Gr. 310 1 Major Gr. 21 14 Mmor Gr. 388 81
311 8 Minor Gr. 214 11 389 6
Major Gr. 32 2 215 2 Major Gr. 39 101
Minor Gr. 320 1 Major Gr. 22 2 Minor Gr. 393 91
323 Minor Gr. 221 399 9
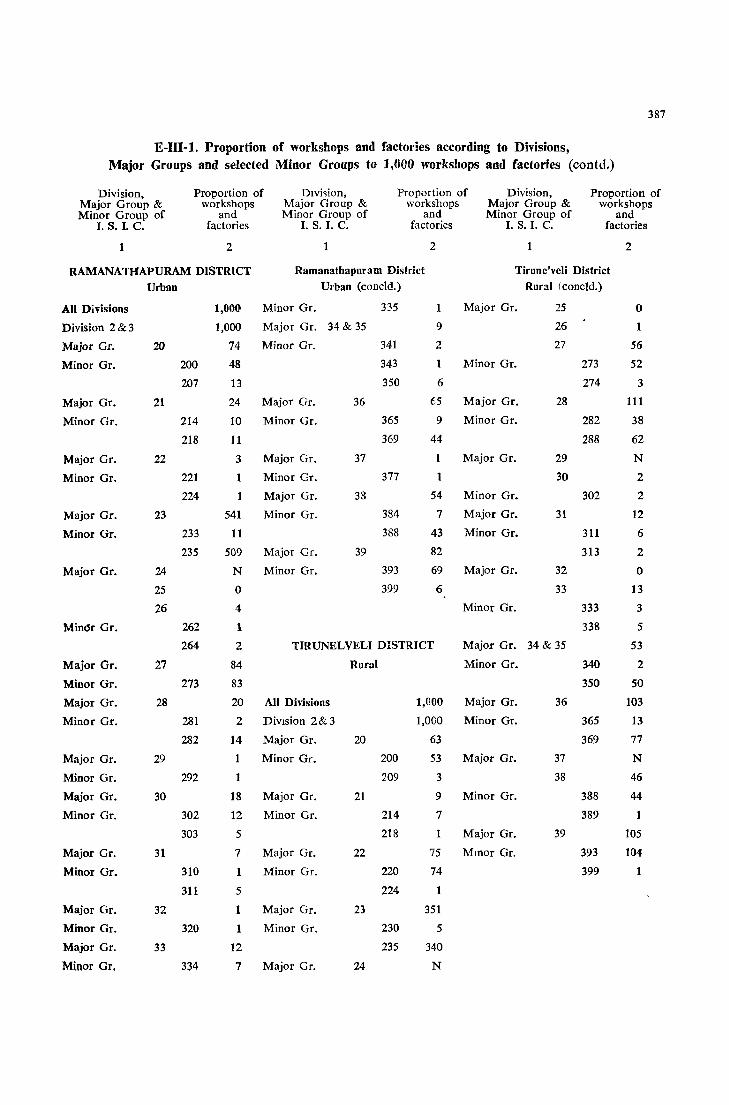
387
E-Ill-l. Proportion of workshops and factories according to Divisions, Major Groups and selected Minor Groups to 1,000 workshops and factories (contd.)
Division, Proportion of Dlvi~ion, Proportion of Division, Proportion of Major Group & workshops Major Group & workshops Major Group & workshops Minor Group of and Minor Group of and Minor Group of and
I. S. I. C. factories I. S. I. C. factories I. S. I. C. factories
1 2 2 1 2
RAMANATHAPURAM DISTRICT Ramanathapuram District Tirune'veli District
Urban Urban (concId.) Rural (concld.)
All Divisions 1,000 Minor Gr. 335 1 Major Gr. 25 0
Division 2 & 3 1,000 Major Gr. 34 & 35 9 26 1
Major Gr. 20 74 Minor Gr. 341 2 27 56
Minor Gr. 200 48 343 1 Minor Gr. 273 52
207 13 350 6 274 3
Major Gr. 21 24 Major Gr. 36 65 Major Gr. 28 111
Minor Gr. 214 10 Minor Gr. 365 9 Minor Gr. 282 38
218 11 369 44 288 62
Major Gr. 22 3 Major Gr. 37 1 Major Gr. 29 N
Minor Gr. 221 1 Minor Gr. 377 1 30 2
224 Major Gr. 38 54 Minor Gr. 302 2
Major Gr. 23 541 Minor Gr. 384 7 Major Gr. 31 12
Minor Gr. 233 11 388 43 Minor Gr. 311 6
235 509 Major Gr. 39 82 313 2
Major Gr. 24 N Minor Gr. 393 69 Major Gr. 32 0
25 0 399 6 33 13
26 4 Minor Gr. 333 3
Mindr Gr. 262 1 338 5
264 2 TIRUNELVELI DISTRICT Major Gr. 34 & 35 53
Major Gr. 27 84 Rural Minor Gr. 340 2
Minor Gr. 273 83 350 50
Major Gr. 28 20 All Divisions I,COO Major Gr. 36 103
Minor Gr. 281 2 DiVIsion 2 & 3 1,000 Minor Gr. 365 13
282 14 Major Gr. 20 63 369 77
Major Gr. 29 1 Minor Gr. 200 53 Major Gr. 37 N
Minor Gr. 292 1 209 3 38 46
Major Gr. 30 18 Major Gr. 21 9 Minor Gr. 388 44
Minor Gr. 302 12 Minor Gr. 214 7 389 1
303 5 218 1 Major Gr. 39 105
Major Gr. 31 7 Major Gr. 22 75 Mmor Gr. 393 104
Minor Gr. 310 1 Minor Gr. 220 74 399 1
311 5 224 1
Major Gr. 32 1 Major Gr. 23 351
Minor Gr. 320 1 Minor Gr. 230 5
Major Gr. 33 12 235 340
Minor Gr. 334 7 Major Gr. 24 N

388
E-Ill-l. Proportion of workshops and factories according to Divisions, Major Groups and selected Minor Groups to 1,000 workshops and factories (contd)
Division, Major Group & Mmor Group of
I. S. I. C.
1
Proportion of workshops
and factones
2
Division, Major Group & Minor Group of
1. S. I. C.
1
ProportIOn of workshops
and factories
2
DiVIsion, Major Group & Mmor Group of
I. S. I. C.
1
Prcportion of workshops
and factories
2
TJRUNELVELI DISTRICT
Urban Tirunelveli District
Urban (coneld.)
Kanyakumari District
Rural (coneld.)
All Divisions
Division 2 & 3
Major Gr.
Minor Gr.
Major Gr.
Minor Gr.
Major Gr.
Minor Gr.
Major Gr.
Minor Gr.
Major Gr.
Minor Gr.
Major Gr.
Minor Gr.
Major Gr.
Minor Gr.
Major Gr.
Minor Gr.
Major Gr.
Minor Gr.
Major Gr.
Minor Gr.
Major Gr.
Minor Gr.
20
21
22
23
24
25
26
27
28
29
30
31
32
33
Major Gr. 34 & 35
200
205
214
218
220
224
233
235
240
·273
274
282
288
301
302
311
320
334
336
1,000
1,000
35
23
5
10
4
5
64
62
1
622
5
613
1
o N
59
50
7
25
6
12
N
8
2
5
3
3
2
1
4
2
10
Minor Gr.
Major Gr.
Mmor Gr.
Major Gr.
Minor Gr.
Major Gr.
Minor Gr.
36
37
38
39
340
341
350
365
369
384
388
392
393
1
8
49
14
25
43
7
31
64
3
57
KANYAKUMARI DISTRICT
Rural
All Divisions
Division 2 & 3
Major Gr. 20
Minor Gr.
Major Gr.
Minor Gr.
Major Gr.
Minor Gr.
Major Gr.
Mmor Gr.
Major Gr.
21
22
23
24
25
26
27
200
202
204
214
217
220
230
235
1,000
1,000
157
59
63
28
5
2
1
5
4
222
5
215
o o o
191
Minor Gr.
Major Gr.
Minor Gr.
Major Gr.
Minor Gr.
Major Gr.
Mmor Gr.
Major Gr.
Minor Gr.
Major Gr.
Minor Gr.
Major Gr.
Minor Gr.
28
29
30
31
32
33
Major Gr. 34 & 35
Minor Gr.
Major Gr.
Minor Gr.
Major Gr.
Minor Gr.
Major Gr.
Minor Gr.
Major Gr.
Minor Gr.
36
37
38
39
273
274
281
282
290
301
303
311
322
323
335
336
340
342
350
356
365
369
375
378
388
389
393
399
150
33
28
8
10
3
3
6
4
2
4
3
12
11
13
3
41
14
2
23
1
94
4
88
4
1
2
87
75
9
128
123
2
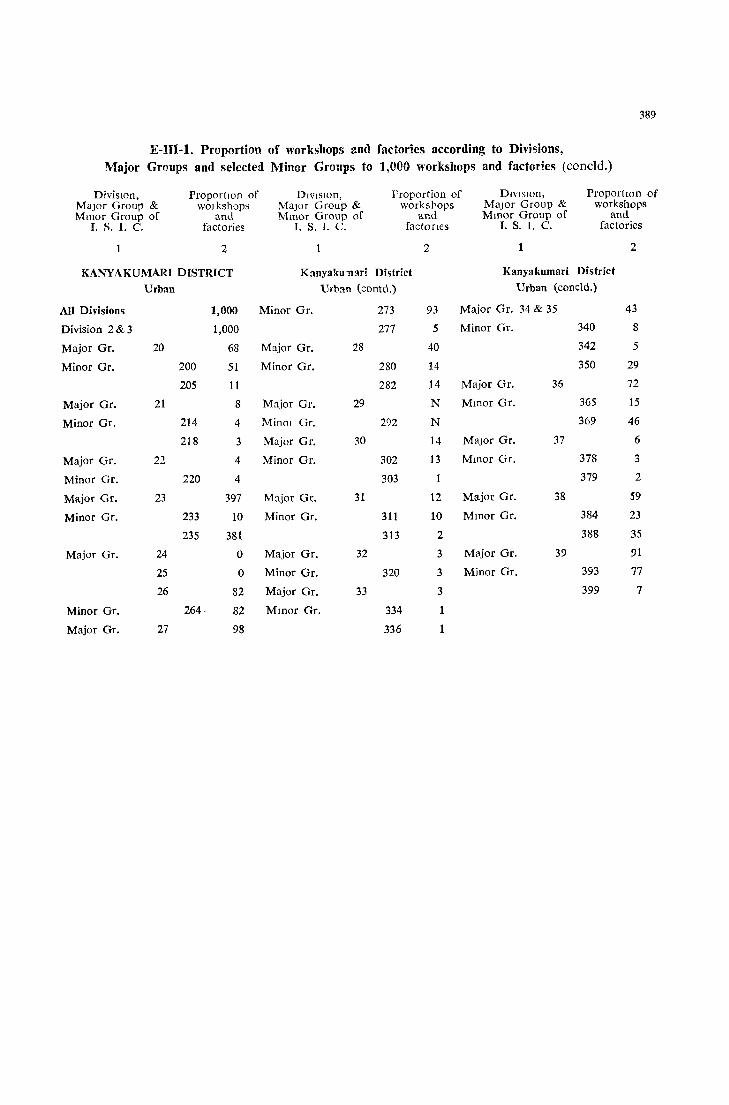
389
E-nI-1. Proportion of workshops aml factories according to Divisions, Major Groups and selcctcd Minor Groups to 1,000 workshops and factories (concId.)
DivisIOn, Proportion of DIvIsion, rroportion of DIvIsIOn, Proportwn of Major Group & WOlksh()ps Major Group & works!'ops Major Group & workshops Minor Group of and Mmor Group of and Mmor Group of and
I. S. I. C. factories I. S. I. C. factones 1. S. I. C. factories
2 2 2
KANYAKUMARI DISTRICT K::myaku-nari District Kanyakumari District
Urban Urban (contd.) Urban (coneld.)
All Divisions 1,000 Minor Gr. 273 93 Major Gr. 34 & 35 43
Division 2 & 3 1,000 277 5 Minor Gr. 340 8
Major Gr. 20 68 Major Gr. 28 40 342 5
Minor Gr. 200 51 Minor Gr. 280 14 350 29
205 11 282 14 Major Gr. 36 72
Major Gr. 21 8 Major Gr. 29 N Mmor Gr. 365 15
Minor Gr. 214 4 MinO! Gr. 292 N 369 46
218 3 Major Gr. 30 14 Major Gr. 37 6
Major Gr. 22 4 Minor Gr. 302 13 Mmor Gr. 378 3
Minor Gr. 220 4 303 1 379 2
Major Gr. 23 397 Major Gr. 31 12 Major Gr. 38 59
Minor Gr. 233 10 Minor Gr. 311 10 Mmor Gr. 384 23
235 381 313 2 388 3S
Major Gr. 24 0 Major Gr. 32 3 Major Gr. 39 91
2S 0 Minor Gr. 320 3 Minor Gr. 393 77
26 82 Major Gr. 33 3 399 7
Minor Gr. 264- 82 Mmor Gr. 334 1
Major Gr. 27 98 336 1

390
E-III-2. Dislribution of 1,000 workshops and factories in each kind of fuel used by size of employment
State/District! City/Town
with population of 50,000 and above
1
MADRAS STATE
Madras District
Chingleput District
Kanchipuram (M)
North Arcot District
Gudiyatham (M)
Vellore (M)
South Arcot District
Cuddalore (M)
Salem District
Salem (M)
Coimbatore District
Erode (M)
Tiruppur (M)
Coimbatore (M)
Pollachi (M)
Valparai (P)
Nilgiri District
Ootacamund (M)
Madurai District
Rural
Urban
2
R
u
u
R
u
U
R
U
U
U
R
U
U
R
u
u
R
u
u
U
U
u
U
R
U
U
R
U
Electricity .-____________ ..A. ________ ~ __ ---,
100 2-5 6-9 10-19 20-49 50-99 persons Not
& Stated person persons persons persons persons persons above
3
90
87
58
71
115
78
98
124
87
103
15
83
120
101
93
87
86
83
66
45
64
125
o
95
266
300
85
68
4
532
473
411
521
560
687
540
598
674
580
540
587
500
462
486
506
417
327
231
272
416
306
32
181
245
333
596
486
5
83
143
158
147
98
122
68
107
109
168
124
132
60
76
169
188
75
172
347
215
141
83:
32
236
139
200
64
139
6
77
113
146
65
73
87
75
70
22
84
73
73
100
114
130
122
98
144
149
176
130
264
65
126
117
67
37
119
7
65
80
107
37
45
17
32
30
43
56
58
56
140
103
58
60
118
101
116
176
74
111
161
142
138
100
21
108
8
18
25
39
12
17
o
7
4
o
9
15
7
20
23
10
4
39
45
33
35
42
55
291
102
21
o
16
24
9
26
29
42
28
42
o
7
12
43
o
15
o
o
13
8
10
57
64
o
39
53
14
258
47
53
o
64
16
10
104
50
39
119
50
9
173
55
22
o
160
62
60
108
46
23
110
64
58
42
80
42
161
71
21
o
117
40
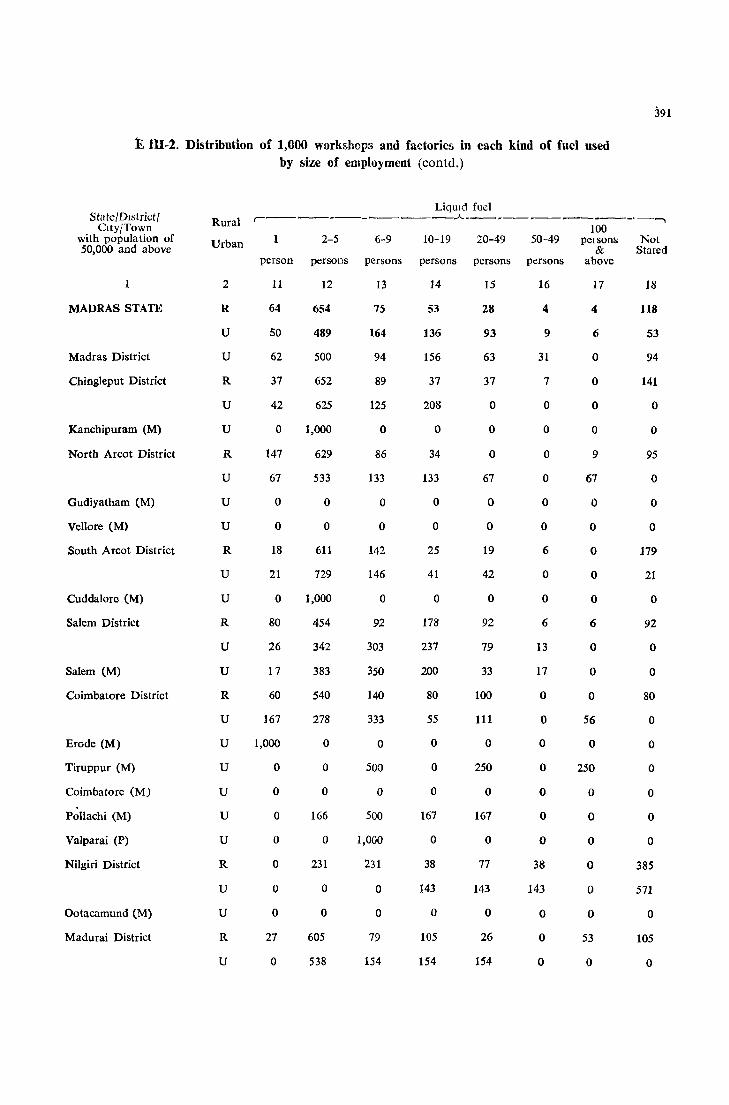
391
E 111-2. Distribution of 1,000 workshops and factories in each kind of fuel used by size of employment (contd.)
State/District! City/Town
with population of 50,000 and above
MADRAS STATE
Madras District
ChingJeput District
Kanchipuram (M)
North Arcot District
Gudiyatham (M)
Vellore (M)
South Arcot District
Cuddalore (M)
Salem District
Salem (M)
Coimbatore District
Erode (M)
Tiruppur (M)
Coimbatore (MJ
Pollachi (M)
Valparai (P)
Nilgiri District
Ootacamund (M)
Madurai District
Rural
Urban
2
R
U
U
R
U
U
R
U
U
u
R
U
U
R
U
U
R
u
u
u
u
u
U
R
u
u
R
u
Liquid fuel ,--~------------"-----------------.-......
100 1 2-5 6-9 10-19 20-49 50-49 pel sons Not
& Stated person persons persons persons persons persons above
11
64
50
62
37
42
o
147
67
o
o
18
21
o
80
26
17
60
167
1,000
o
o
o
o
o
o
o
27
o
12
654
489
500
652
625
1,000
629
533
o
o
611
729
1,000
454
342
383
540
278
o
o
o
166
o
231
o
o
605
538
13
75
164
94
89
125
o
86
133
o
o
142
146
o
92
303
350
140
333
o
500
o
500
1,000
231
o
o
79
154
14
53
136
156
37
208
° 34
133
o
o
25
41
o
178
237
200
80
55
o
o
o
167
o
38
143
o
105
154
15
28
93
63
37
° ° o
67
o
o
19
42
o
92
79
33
100
111
o
250
o
167
o
77
143
° 26
154
16
4
9
31
7
o
o
o
o
o
° 6
o
° 6
13
17
° o
° o
o
o
o
38
143
o
o
o
17
4
6
o
o
o
° 9
67
o
o
o
o
o
6
o
o
o 56
o
2S0
o
o
o
o
o
o
53
o
18
118
53
94
141
o
° 95
o
o
° 179
21
o
92
o
o
80
° o o
o
o
o
385
571
o
105
o
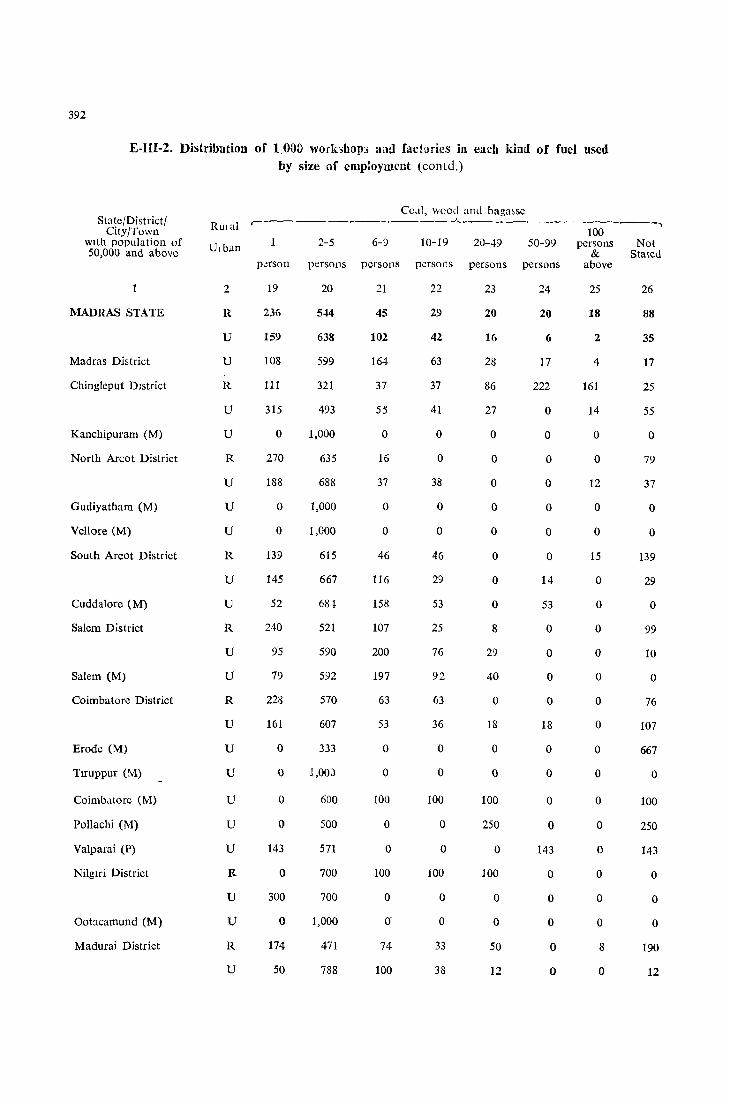
392
E-lII-2. Distribution of 1,001) workshops anit factories ill eacb kind of fuel used by size of employment (conld.)
State/District/ City/Town
with population of 50,000 and above
MADRAS STATE
Madras District
Chingleput DJstrict
Kanehipuram (M)
North Areot District
Gudiyatham (M)
Vellore (M)
South Areot District
Cuddalore (M)
Salem District
Salem (M)
Coimbatorc District
Erode (M)
Tlruppur (M)
Coimbatore (M)
Pollaehi (M)
Valparai (P)
Nilglri District
Ootaeamund (M)
Madurai District
Rutal
2
u
u
R
u
u
R
u
u
u R
u
U
R
U
U
R
U
U
U
u
u
u
R
u
u
R
U
CO,l], wood ar.d bagasse .-_________________ -A-________ ~_--_______ _.
100 1 2-5 6-9 10-19 20-49 50-99 persons Not
& Stated p~rson persons persons persons persons persons above
19
236
159
108
111
315
o 270
188
o
o
139
145
52
240
95
79
228
161
o
o
o
o
143
o
300
o
174
50
20
544
638
599
321
493
1,000
635
688
1,000
1,000
615
667
684
521
590
592
570
607
333
1,00;)
600
500
571
700
700
1,000
471
788
21
45
102
164
37
55
o
16
37
o
o
46
116
158
107
200
197
63
53
o
o
100
o
o
100
o
o
74
100
22
29
42
63
37
41
o
o
38
o
o
46
29
53
25
76
92
63
36
o
o
100
o
o
100
o
o
33
38
23
20
16
28
86
27
o
o
o
o
o
o
o
o
8
29
40
o
18
o
o
100
250
o
100
o
o
50
12
24
20
6
17
222
o
o
o
o
o
o
o
14
53
o
o
o
o
18
o
o
o
o
143
o
o
o
o
o
25
18
2
4
161
14
o
o
12
o
o
15
o
o
o
o
o
o
o
o
o
o
o
o
o
o
o
8
o
26
88
35
17
25
55
o
79
37
o
o
139
29
o
99
10
o
76
107
667
o
100
250
143
o
o
o
190
12
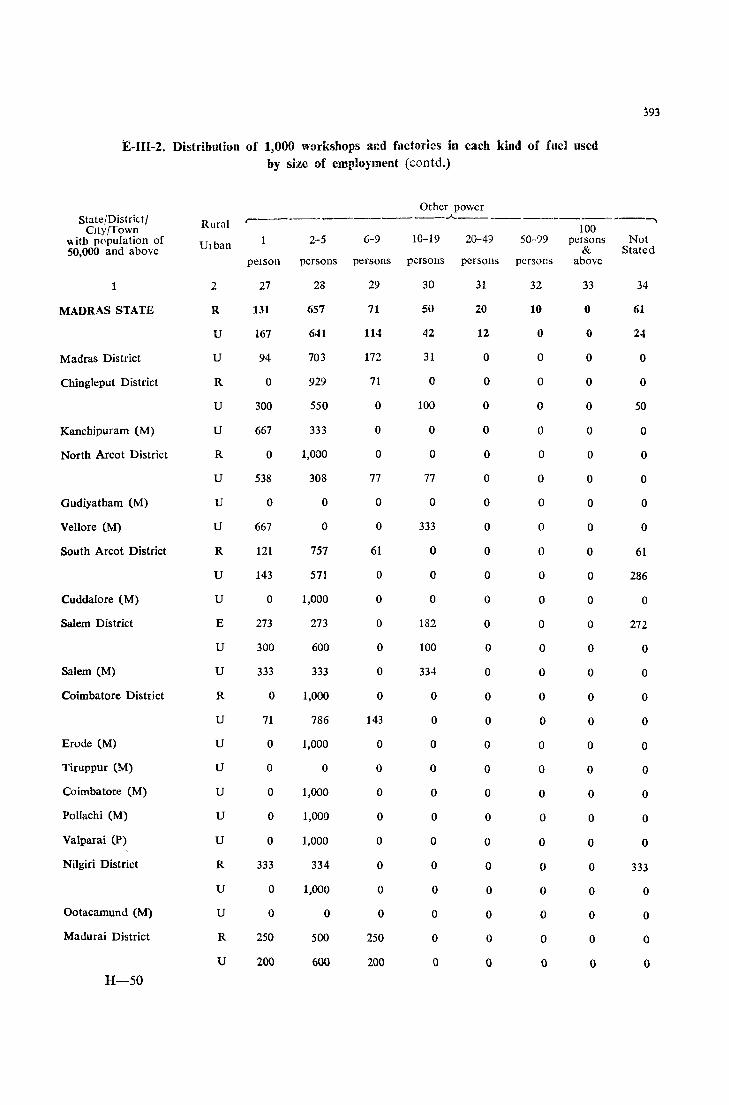
393
~-1I1-2. Distribution of 1,000 workshops and factories in each kind of fuel used by size of employment (contd.)
State/Distrkt/ CIty/Town
VI ith population of 50,000 and above
MADRAS STATE
Madras District
Chingleput District
Kanchipuram (M)
North Arcot District
Gudiyatham (M)
Vellore (M)
South Arcot District
Cuddalore (M)
Salem District
Salem (M)
Coimbatore District
Erode (M)
Tiruppur (M)
Coimbatore (M)
Pollachi (M)
Valparai (P)
Nilgiri District
Ootacamund (M)
Madurai District
H-50
Rural
Ulban
2
R
U
U
R
U
U
R
U
U
U
R
U
U
E
U
U
R
U
U
U
U
U
U
R
U
U
R
U
Other power r----------------"--- ------.---------,
100 2-5 <J-9 10-19 20-49 50-99 persons Not
& Stated pelson persons persons persons persons persons above
27
1.31
167
94
a
300
667
o
538
o
667
121
143
a
273
300
333
o
71
o
o
o
o
o
333
o
o
250
200
28
657
641
703
929
550
333
1,000
308
o
o
757
571
1,000
273
600
333
1,000
786
1,000
o
1,000
1,000
1,000
334
1,000
o
500
600
29
71
114
172
71
o
o
o
77
o
o
61
o
o
o
o
o
o
143
o
o
o
o
o
o
o
o
250
200
30
50
42
31
o
100
o
o
77
o
333
o
o
o
182
100
334
o
o
o
o
o
o
o
o
o
o
o
a
31
20
12
o
o
o
o
o
o
o
o
o
o
o
o
o
o
o
o
o
o
o
o
o
o
o
o
o
o
32
10
o
o
o
o
o
o
o
o
o
o
o
o
o
o
o
o
o
o
o
o
o
o
o
o
o
o
o
33
o
o
o
o
o
o
o
o
o
o
o
o
o
o
o
o
o
o
o
o
o
o
o
o
o
o
o
o
34
61
24
o
o
50
o
o
o
o
o
61
286
o
272
o
o
o
o
o
o
o
o
o
333
o
o
o
o
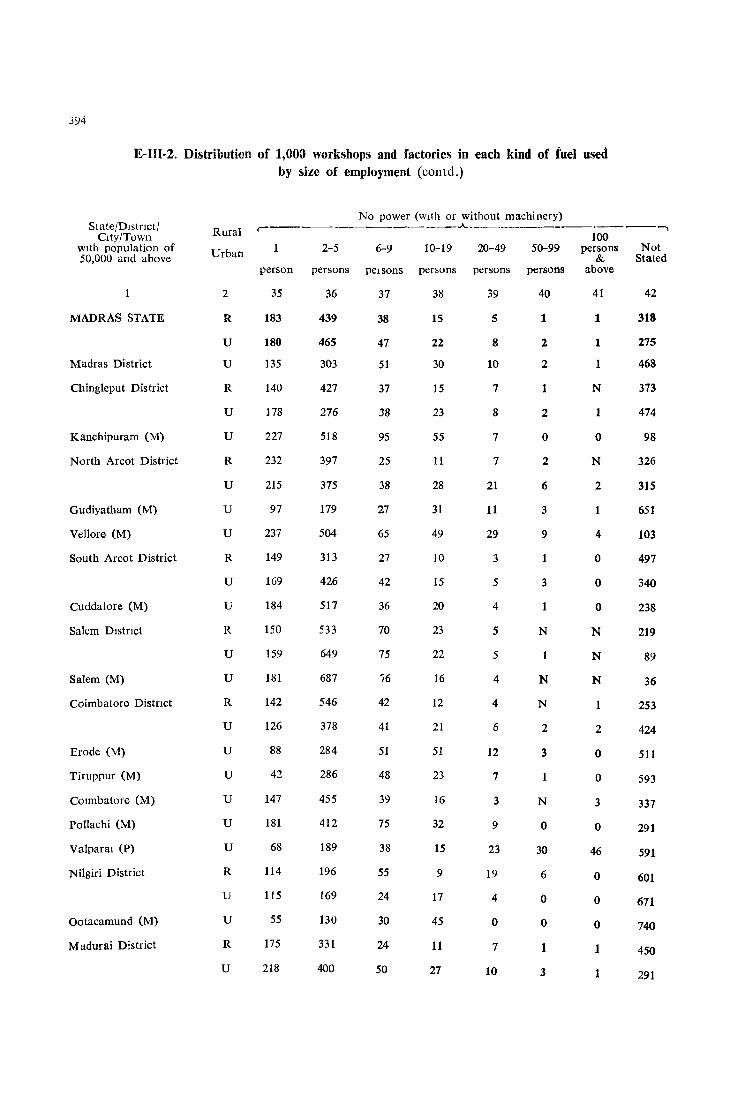
394
E-IU-2. Distribution of 1,000 workshops and factories in each kind of Cuel used by size of employment (contd.)
StatejDlstflctj CIty/Towll
with population of 50,000 and above
1
MADRAS STATE
Madras District
Chingleput District
Kanchipuram (M)
North Arcot District
Gudiyatham (M)
VeIl ore (M)
South Arcot District
Cuddalore (M)
Salem Dlstnct
Salem (M)
Coimbatore Distnct
Erode (M)
Tiruppur (M)
COlmbatore (M)
Pollachi (M)
Valparal (P)
Nilgiri District
Ootacamund (M)
Madurai District
Rural
Urban
2
R
u
U
R
u
u
R
U
u
u
R
U
U
R
U
U
R
U
U
U
U
U
U
R
U
U
R
U
No power (wIth or without machinery) c-------~------.A------------.-----_..,
100 2-5 6-9 10-19 20-49 50-99 persons Not
& Stated person persons pel sons persons persons persons above
35
183
180
135
140
178
227
232
215
97
237
149
IG9
184
150
159
181
142
126
88
42
147
181
68
114
115
55
175
218
36
439
465
303
427
276
518
397
375
179
504
313
426
517
533
649
687
546
378
284
286
455
412
189
196
169
130
331
400
37
38
47
51
37
38
95
25
38
27
65
27
42
36
70
75
76
42
41
51
48
39
75
38
55
24
30
24
50
38
15
22
30
15
23
55
11
28
31
49
10
15
20
23
22
16
12
21
51
23
16
32
15
9
17
45
11
27
39
5
8
10
7
8
7
7
21
11
29
3
5
4
5
5
4
4
6
12
7
3
9
23
19
4
o
7
10
40
1
2
2
1
2
o
2
6
3
9
1
3
1
N
N
N
2
3
N
o
30
6
o
o
1
3
41
1
1
1
N
o
N
2
4
o
o
o
N
N
N
2
o
o
3
o
46
o
o
o
1
1
42
318
275
468
373
474
98
326
315
651
103
497
340
238
219
89
36
253
424
511
593
337
291
591
601
671
740
450
291
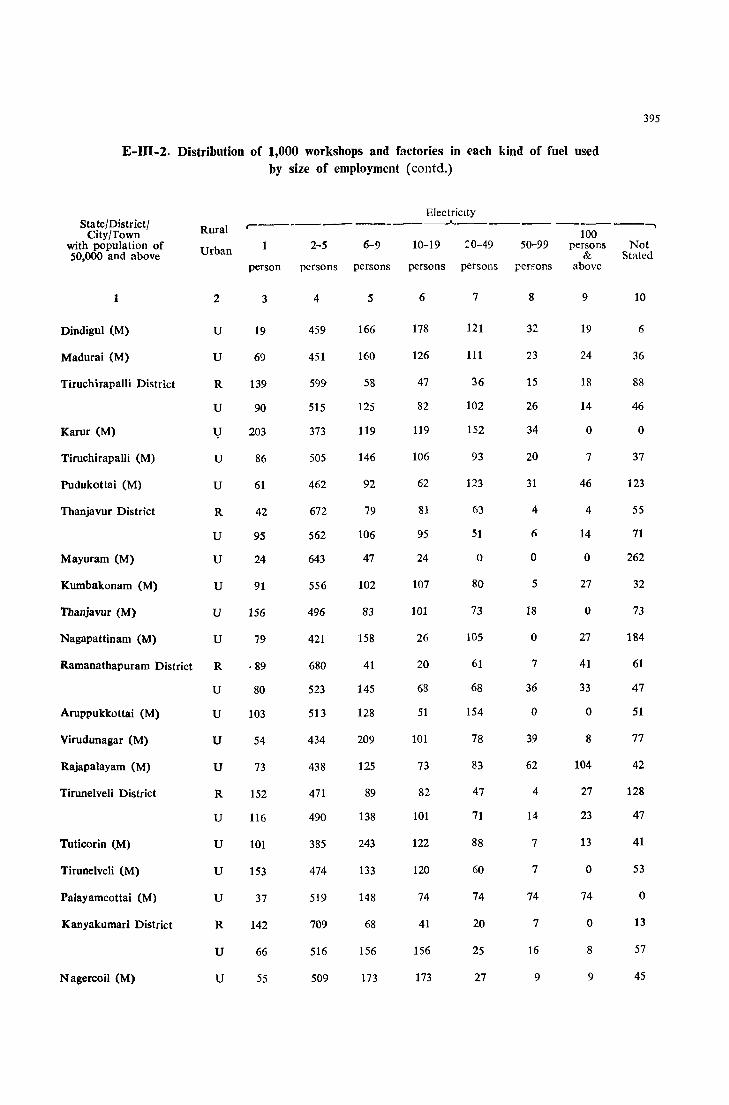
395
E-III.2. Distribution of 1,000 workshops and factories in each kind of fuel used by size of employment (contd.)
State/District! City/Town
with population of 50,000 and above
1
Dindigul (M)
Madurai (M)
Tiruchirapalli District
Karur (M)
Tiruchirapalli (M)
Pudukottai (M)
Thanjavur District
Rural
Urban
2
U
U
R
U
lJ
U
U
R
U
Mayuram (M) U
Kumbakonam (M) U
Thanjavur (M) U
Nagapattinam (M) U
Ramanathapuram District R
Aruppukkottai (M)
Virudunagar (M)
Rajapalayam (M)
Tirunelveli District
Tuticorin (M)
Tirunelveli (M)
Palayamcottai (M)
K anyakumari District
N agercoil (M)
U
U
U
U
R
U
U
U
U
R
U
u
Electricity r------------~------ -------,
100 1 2-5 6-9 10-19 ::0-49 50-99 persons Not
& Stated person persons persons persons persons pcrsons abovc
3
19
69
139
90
203
86
61
42
95
24
91
156
79
·89
80
103
54
73
152
116
101
153
37
142
66
55
4
459
451
599
515
373
505
462
672
562
643
556
496
421
680
523
513
434
438
471
490
385
474
519
709
516
509
5
166
160
58
125
119
146
92
79
106
47
102
83
158
41
145
128
209
125
89
138
243
133
148
68
156
173
6
178
126
47
82
119
106
62
81
95
24
107
101
26
20
68
51
101
73
82
101
122
120
74
41
156
173
7
121
111
36
102
152
93
123
63
51
o
80
73
105
61
68
154
78
83
47
71
88
60
74
20
25
27
8
32
23
15
26
34
20
31
4
o
5
18
o
7
36
o
39
62
4
14
7
7
74
7
16
9
9
19
24
18
14
o
7
46
4
14
o
27
° 27
41
33
o
8
104
27
23
13
o
74
o
8
9
10
6
36
88
46
o
37
123
55
71
262
32
73
184
61
47
51
77
42
128
47
41
53
o
13
57
45
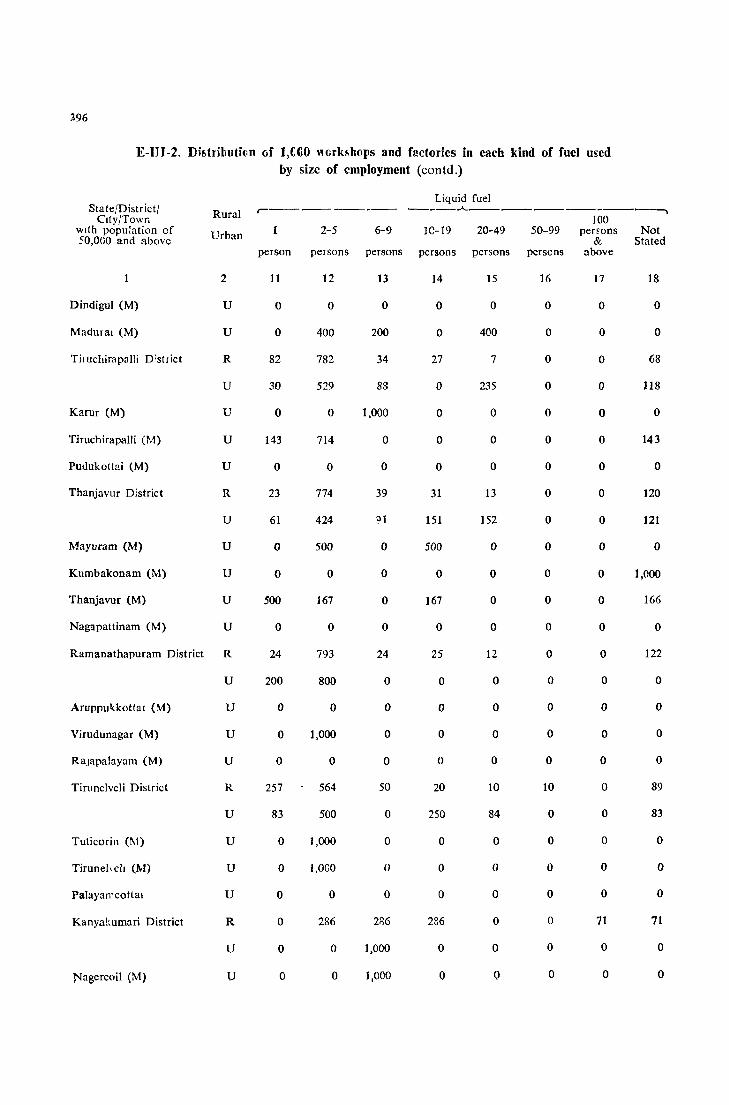
196
E-IlI-2. Di!>tributi(ln of 1,CCO l,crkshops and factories in each kind of fuel u~ed
by size of employment (contd.)
Sta te/District/ CIty/Town
with population of 50,000 and above
Dindigul (M)
Madural (M)
Til uchirapal!i D:strict
Karur (M)
Tiruchirapalli (M)
Pudukottai (M)
Thanjavur District
Rural
Urban
2
U
U
R
U
U
U
U
R
U
Mayuram (M) U
Kumbakonam (M) U
Thanjavur (M) U
Nagapattinam (M) U
Ramanathapuram District R
U
AruppuHottal (M) U
Virudunagar (M) U
RaJapalayam (M) U
Tirunelveli District R
U
Tuticorin (1\1) U
Tirunel, ell (M) U
Palayan'cottal U
Kanya!:umari District R
U
Nagercoil (M) u
Liquid fuel r--------- ----'------------.--,
100 1 2-5 6-9 1C-19 20-49 50-99 perwns Not
& Stated person persons persons persons persons persens above
11 12 13 14 IS 16 17 18
o o o o o o o o
o 400 200 o 400 o o o
82 782 34 27 7 o o 68
30 529 83 o 235 o o 118
o o 1,000 o ° o o o
143 714 o o o o o 143
o o o o o o o o
23 774 39 31 13 o o 120
61 424 91 lSI 152 o o 121
o 500 o 500 o o o o
o o o o o o o 1,000
500 167 o 167 o o o 166
o o o o o o o o
24 793 24 25 12 o o 122
200 800 o o o o o o
o o o o o o o o
o 1,000 o o o o o o
o o o o o o o o
257 564 50 20 10 10 o 89
83 500 o 250 84 o o 83
° 1,000 o o o o o o
o l,oeo o o o o o o
o o o o o o o o
o 286 2R6 286 o o 71 71
o o 1,000 o o o o o
o o I,eoo o o o o o
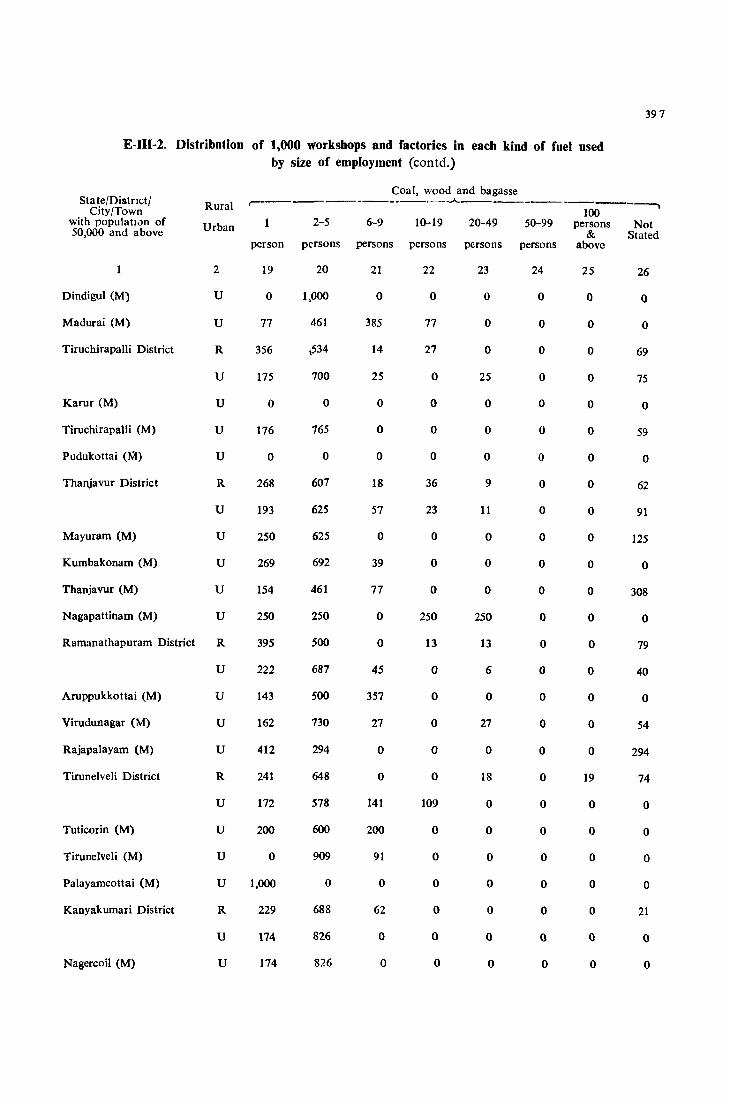
397
E-I1I-2. Distribution of 1,000 workshops and factories in each kind of fuel used by size of employment (contd.)
State/DistrIct/ City/Town
with populatl0n of 50,000 and above
1
Dindigul (M)
Madurai (M)
Tiruchirapalli District
Karur (M)
Tiruchirapalli (M)
Pudukottai (M)
Thanjavur District
Rural
Urban
2
U
U
R
U
U
U
U
R
U
Mayuram (M) U
Kumbakonam (M) U
Thanjavur (M) U
Nagapattinam (M) U
Ramanathapuram District R
U
Aruppukkottai (M) U
Virudunagar (M) U
Rajapalayam (M) U
Tirunelveli District R
U
Tuticorin (M) U
Tirunelveli (M) U
Palayamcottai (M) U
Kanyakumari District R
u
Nagercoil (M) U
Coal, wood and bagasse r------------>-.A..---------___ ---, 100
1 2-5 6-9 10-19 20-49 50-99 persons Not & Stated
person persons persons persons persons persons above
19 20 21 22 23 24 25 26
o 1,000 o o o o o o
77 461 385 77 o o o o
356 14 27 o o o 69
175 700 25 o 25 o o 75
o o o o o o o o
176 765 o o o o o 59
o o o o o o o o
268 607 18 36 9 o o 62
193 625 57 23 11 o o 91
250 625 o o o o o 125
269 692 39 o o o o o
154 461 77 o o o o 308
250 250 o 250 250 o o o
395 500 o 13 13 o o 79
222 687 45 o 6 o o 40
143 500 357 o o o o o
162 730 27 o 27 o o 54
412 294 o o o o o 294
241 648 o o 18 o 19 74
172 578 141 109 o o o o
200 600 200 o o o o o
o 909 91 o o o o o
1,000 o o o o o o o
229 688 62 o o o o 21
174 826 o o o o o o
174 826 o o o o o o
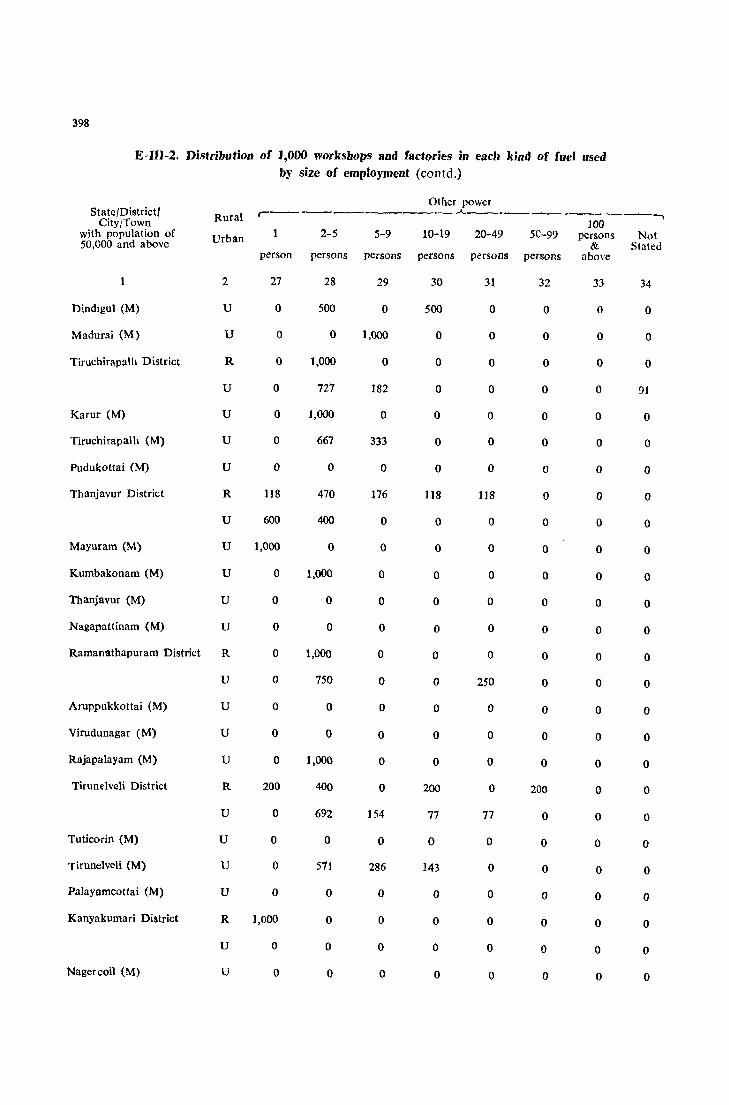
398
E-IIl-2. Distribution of 1,000 worksbops and factories in each kind of fuel used by size of employment (contd.)
State/District1 City/Town
with population of 50,000 and above
Dindlgul (M)
Madurai (M)
Tiruchirapalh District
Karur (M)
Tiruchirapalh (M)
Pudukottai (M)
Thanjavur District
Rural
Urban
2
U
u
R
U
U
U
u
R
U
Mayuram (M) U
Kumbakonam (M) U
Thanjavur (M) U
Nagapattinam (M) U
Ramanathapuram District R
u
Aruppukkottai (M) u
Virudunagar (M) u
Rajapalayam (M) U
Tirunelveli District R
u
Tuticorin (M) u
Tirunelveli (M) u
Palayamcottai (M) u
Kanyakumari District R
u
Nager coil (M) u
Other power ,-----________ ~A.. __ • _____ • __ ~ __ __.
100 1 2-5 5-9 10-19 20-49 5C-99 persons Not
& Stated person persons persons persons persons persons above
27
o
o
o
o
o
o
o
118
600
1,000
o
o
o
o
o
o
o
o
200
o
o
o
o
],000
o
o
28
500
o
],000
727
],000
667
o
470
400
o
],000
o
o
1,000
750
o
o
1,000
400
692
o
571
o
o
o
o
29
o
1,000
o
182
o
333
o
176
o
o
o
o
o
o
o
o
o
o
o
154
o
286
o
o
o
o
30 31 32 33 34
500 o o o o
o o o o o
o o o o o
o o o o 91
o o o o o
o o o o o
o o o o o
118 118 o o o
o o o o o
o o o o o
o o o o o
o o o o o
o o o o o
o o o o o
o 250 o o o
o o o o o
o o o o o
o o o o o
200 o 200 o o
77 77 o o o
o o o o o
143 o o o o
o o o o o
o o o o o o o o o o
o o o o o
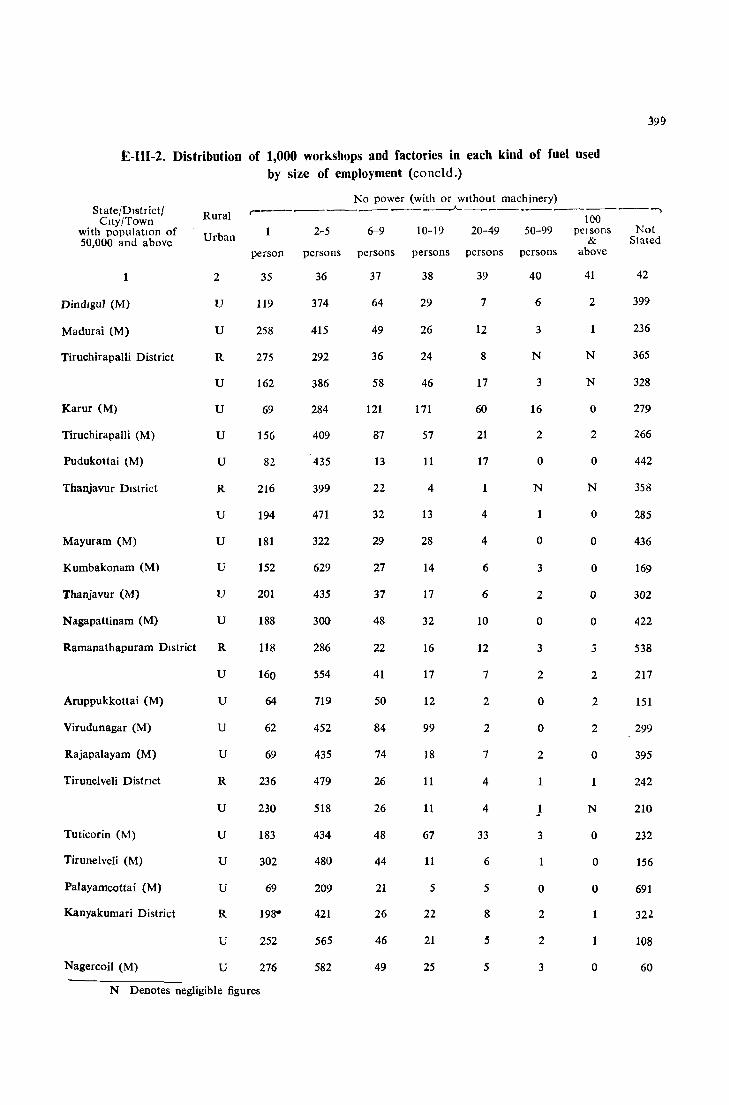
1£-111-2. Distribution of 1,000 workshops and factories in each kind of fuel used by size of employment (concld.)
State/DIstrict/ City/Town
with populatIon of 50,000 and above
1
DindJguJ (M)
Madurai (M)
Tiruchirapalli District
Karur (M)
TiruchirapaIli (M)
Pudukottai (M)
Thanjavur DIstrict
Rural
Urban
2
U
U
R
U
U
U
u
R
U
Mayuram (M) U
Kumbakonam (M) U
Thanjavur (M) U
Nagapattinam (M) U
Ramanathapuram DIstrict R
U
Aruppukkottai (M) U
Virudunagar (M) U
Rajapalayam (M) U
Tirunelveli Distnct R
U
Tuticorin (M) U
Tirunelveli (M) U
Palayamcottai (M) u
Kanyakumari District R
U
Nagercoil (M) U
No power (with or wIthout machinery) r------------~----------------.,
100 2-5 6-9 10-19 20-49 50-99 persons Not
& Stated person persons persons persons persons persons above
35
119
258
275
162
69
156
82
216
194
181
152
201
188
118
160
64
62
69
236
230
183
302
69
198"
252
276
36
374
415
292
386
284
409
435
399
471
322
629
435
300
286
554
719
452
435
479
518
434
480
209
421
565
582
37 38
64 29
49 26
36 24
58 46
121 171
87 57
13 11
22 4
32 13
29 28
27 14
37 17
48 32
22 16
41 17
50 12
84 99
74 18
26 11
26 11
48 67
44 11
21 5
26 22
46 21
49 25
39 40 41 42
7 6 2 399
12 3 236
8 N N 365
17 3 N 328
60 16 o 279
21 2 2 266
17 o o 442
N N 358
4 1 o 285
4 o o 436
6 3 o 169
6 2 o 302
10 o o 422
12 3 538
7 2 2 217
2 o 2 151
2 o 2 299
7 2 o 395
4 1 242
4 N 210
33 3 o 232
6 o 156
5 o o 691
8 2 1 322
5 2 1 108
5 3 o 60
N Denotes negligible figures
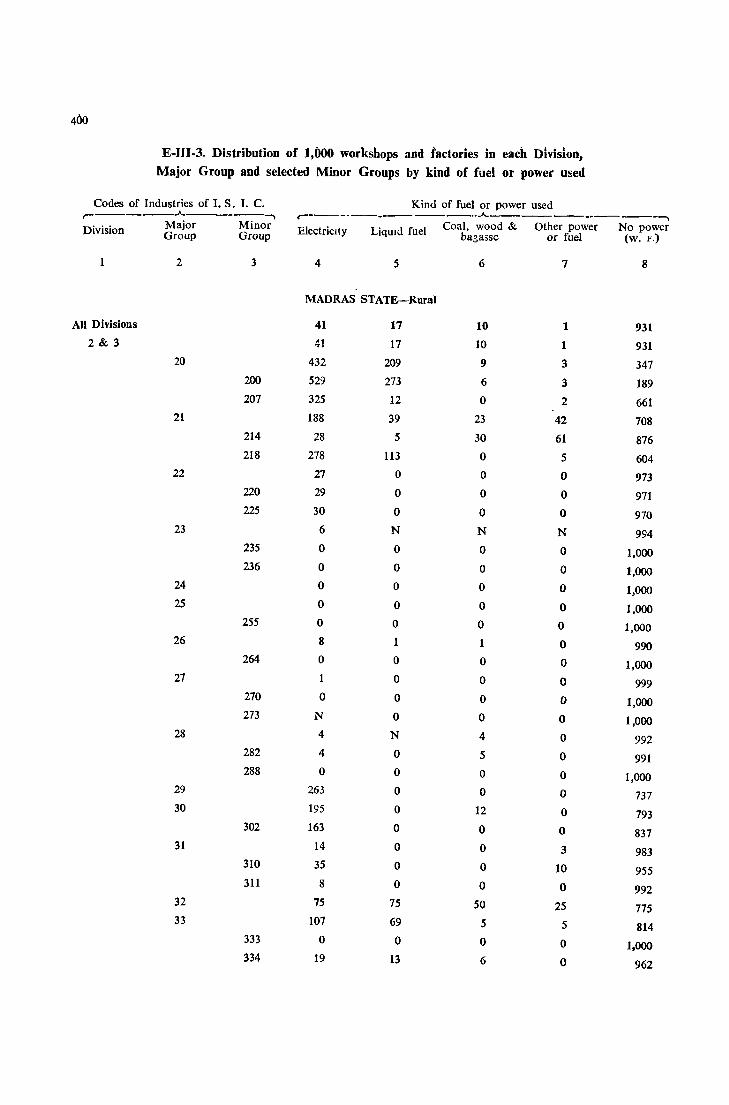
400
E-III-3. Distribution of t,OOO workshops and lactories in each nlviston, Major Group and selected Minor Groups by kind of fuel or power used
Codes of Industries of 1. S. I. C. Kind of fuel or power used ,..-_______ ..A.. ----, r----.--_______ ..A.. _____________ -,
Division Major Minor ElectricIty LiqUId fuel Coal, wood & Other power No power Group Group bagasse or fuel (w. F.)
2 3 4 5 6 7 8
MADRAS STATE-Rural
All Divisions 41 17 10 1 931 2&3 41 17 10 1 931
20 432 209 9 3 347 200 529 273 6 3 189 207 325 12 0 2 661
21 188 39 23 42 708 214 28 5 30 61 876 218 278 113 0 5 604
22 27 0 0 0 973 220 29 0 0 0 971 225 30 0 0 0 970
23 6 N N N 994 235 0 0 0 0 1,000 236 0 0 0 0 1,000
24 0 0 0 0 1,000 25 0 0 0 0 1,000
255 0 0 0 0 1,000 26 8 1 0 990
264 0 0 0 0 1,000 27 1 0 0 0 999
270 0 0 0 0 1,000 273 N 0 0 0 1,000
28 4 N 4 0 992 282 4 0 5 0 991 288 0 0 0 0 1,000
29 263 0 0 0 737 30 195 0 12 0 793
302 163 0 0 0 837 31 14 0 0 3 983
310 35 0 0 10 955 311 8 0 0 0 992
32 75 75 50 25 775 33 107 69 5 5 814
333 0 0 0 0 1,000 334 19 13 6 0 962
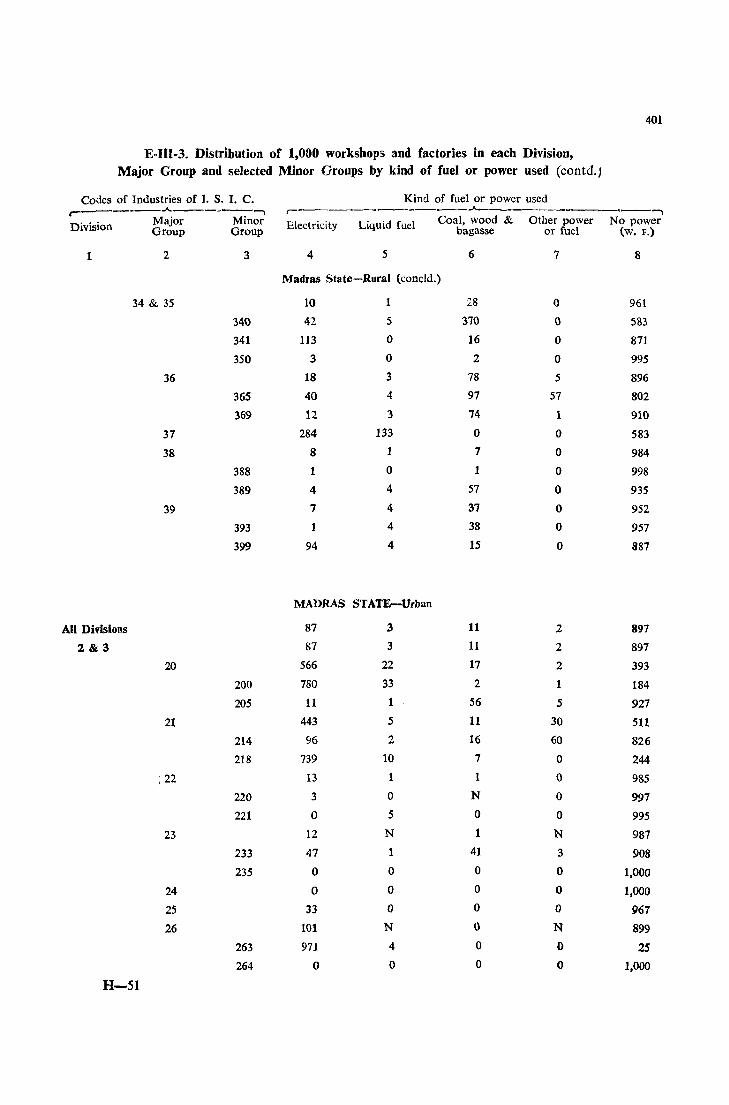
401
E-III-3. Distribution of 1,000 workshops and factories in each Division, Major Group and selected Minor Groups by kind of fuel or power used (contd.J
Codes of Industries of I. S. I. C. Kind of fuel or power used ~ _____ .A. ______ __,
r- ----_.___---,---~----,
Division Major Minor Electricity Liquid fuel Coal, wood & Other power No power Group Group bagasse or fuel (w. F.)
1 2 3 4 5 6 7 8
Madras State-Rural (coneld.)
34 & 35 10 1 28 0 961
340 42 5 370 0 583
341 113 0 16 0 871
350 3 0 2 0 995
36 18 3 78 5 896
365 40 4 97 57 802
369 12 3 74 1 910
37 284 133 0 0 583
38 8 1 7 0 984
388 1 0 1 0 998
389 4 4 57 0 935
39 7 4 37 0 952
393 1 4 38 0 957
399 94 4 15 0 887
MADRAS STATE-Urban
All Divisions 87 3 11 2 897
2&3 87 3 11 2 897
20 566 22 17 2 393
200 780 33 2 1 184
205 11 1 56 5 927
21 443 5 11 30 511
214 96 2 16 60 826
218 739 10 7 0 244
~ 22 13 1 1 0 985
220 3 0 N 0 997
221 0 5 0 0 995
23 12 N 1 N 987
233 47 1 41 3 908
235 0 0 0 0 1,000
24 0 0 0 0 1,000
25 33 0 0 0 967
26 101 N 0 N 899
263 971 4 0 0 25
264 0 a 0 0 1,000
H-51

402
E-III-:l Distribution of 1,000 workshops and factories in each Division, Major Group and selected Minor Groups by kind of fuel or power used (coutd.)
Codes of Industries of I. S. Y. C. Kind of fuel or power used r----'~-- --.. r--~------------.A..--__________ --.. Division Major Minor Electricity Liquid fuel Coal, wood & Other power No power
Group Group bagasse or fuel (w. p.)
2 3 4 5 6 7 8
Madras State-Urban (coneld.)
27 21 N N 0 979 273 1 N 0 0 999 274 6 0 0 0 994
28 56 2 3 0 939 281 42 0 3 0 >55 282 13 0 3 0 984
29 200 0 10 0 790 292 167 0 12 0 821
30 245 1 1 N 753 301 285 5 0 0 710 302 247 1 1 1 750
31 34 3 2 0 961 310 118 11 4 0 367 311 4 0 0 0 996
32 223 56 67 1l 643 320 193 66 71 15 655 323 286 48 79 0 587
33 171 6 48 3 772 335 182 5 55 0 758 336 77 11 66 6 840
34 & 35 42 4 23 3 928 341 98 0 0 0 902 342 55 0 92 0 853 350 2 0 3 2 993
36 143 2 69 9 7;7 365 41 1 84 2 872 369 123 1 77 4 795
37 522 5 11 0 462 378 284 0 0 0 716 379 524 8 0 0 468
38 79 2 8 2 909 384 336 7 8 7 642 388 1 N 1 0 998
39 49 7 34 1 909 393 20 8 41 N 931 399 199 6 12 4 779

403
E-III-3. Distribution of 1,000 workshops and factories in each Division, Major Group and selected Minor Groups by kind of fuel or power used (contd.)
Codes of Industries of J. S. I. c. Kind of fuel or power used r- ..A_ r------__ ~ ____ ..A_ ----, Division Major Minor Electricity Liquid fuel Coal, wood & Other power No power
Group Group bagasse or fuel (w. F.)
1 2 3 4 5 6 7 8
MADRAS DISTRICT-Urban
All Divisions 152 3 26 6 813
2&3 152 3 26 6 813
20 498 4 20 7 471
200 704 3 0 0 293 205 17 8 72 21 8'32 207 852 0 0 6 142
21 580 0 5 15 4~,0
214 317 0 0 48 635
218 622 0 0 0 378
22 41 4 11 0 944 220 5 0 4 0 991 224 222 22 45 0 711
23 8 0 5 0 987 233 37 0 111 0 852 235 0 0 0 0 1,000
26 0 0 0 0 1,000 264 0 ° 0 ° 1,000
27 6 1 ° ° 993 273 3 1 ° 0 996 274 30 0 0 ° 970
28 85 0 5 0 910 281 29 0 6 0 965 287 72 0 0 0 928
29 127 0 18 0 855 292 100 0 20 0 880
30 318 0 0 0 682 301 344 0 0 0 656 302 322 0 0 0 678
31 35 0 0 0 965 311 13 0 0 0 987 313 19 0 0 0 981
32 149 122 27 13 689 320 69 ISS 35 17 724 323 333 0 0 0 667
13 249 21 101 5 624

404
E-III-3. Distribution of 1,000 workshops and factories in each Division, Major Group and selected Minor Groups by kind of fuel or power used (contd.)
Codes of Industries of I. S. I. C. ~
Division
All Divisions
2&3
Major Group
2
34 & 35
36
37
38
39
20
21
22
23
--, Minor Group
3
335
336
340
343
350
357
368
369
378
379
384
388
393
399
200
207
214
220
221
233
235
Kind of fuel or power used _.A-. __ • . __ ~ ____ -...
Elect) icity Liquid fuel Coal, wood & Other power No power bagasse or fuel (w. F.)
4 5
Madras District-Urban (coneld.)
319
114
129
545
125
o 37
328
326
332
603
368
550
88
217
1
99
39
199
o 57
9
o o o o 3
o 3
8
o o
3
o 2
o 9
CHINGLEPUT DISTRICT-Rural
58 22
58 22
510 218
548 239
231 38
59 0
40 0
0 0
0 0
6 0
2 0
214 0
0 Q
6
64
86
17
o o o o
114
39
147
23
o o
13
11
4
47
67
21
13
13
8
6
0
20
20
0
0
0
N
36
0
7
o o
17
o o o
37
37
46
22
o o o 4
9
o 1
o 2
2
2
0
0
0
139
142
0
0
0
0
0
Q
&
617
743
828
455
875
1,000
926
518
589
496
366
632
450
894
760
995
851
894
769
905
905
264
207
731
782
798
1,000
1,000
1,000
998
750
1,000
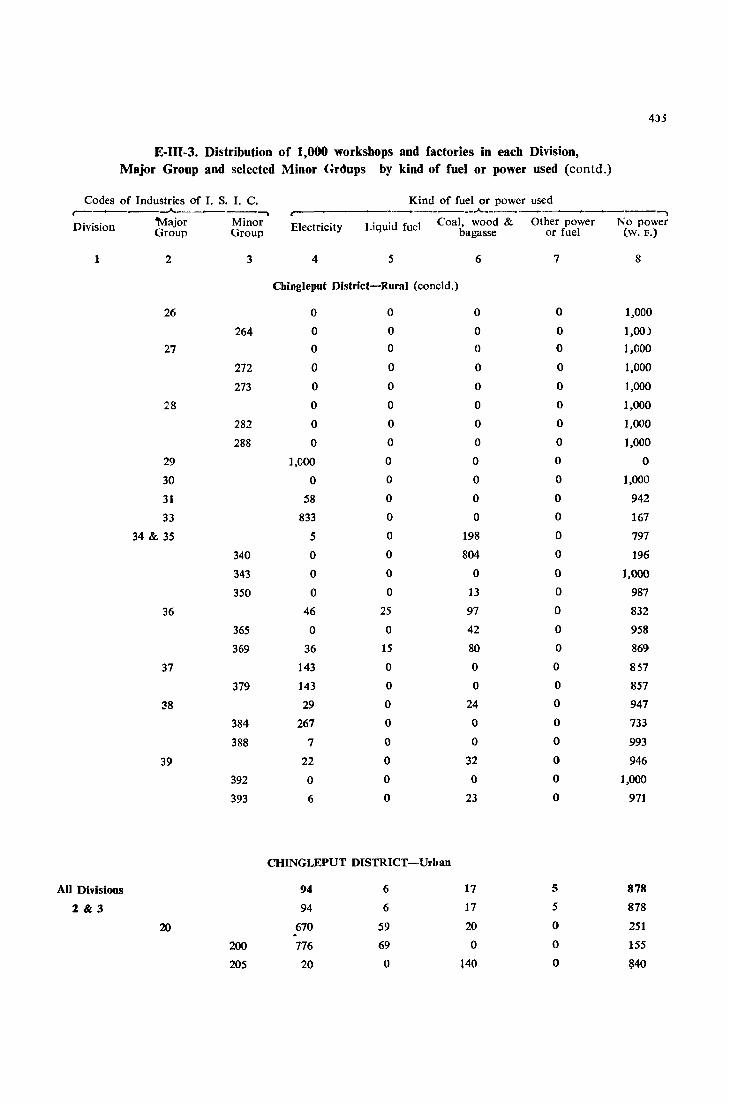
403
E-III-3. Distribution of 1,000 workshops and factories in each Division, Major Group and selected Minor (;r~ups by kind of fuel or power used (contd.)
Codes of Industries of I. S. I. C. Kind of fuel or power used r--~--__"_-~---"l
_______ .A. __ ------.., Division "Major Minor Electricity Liquid fuel Coal, wood & Other power No power
Group Group bagasse or fuel (w. F.)
1 2 3 4 5 6 7 8
Chingleput District-Rural (coneld.)
26 0 0 0 0 1,000
264 0 0 0 0 1,00)
27 0 0 0 0 1,000
272 0 0 0 0 1,000
273 0 0 0 0 1,000
28 0 0 0 0 1,000
282 0 0 0 0 1,000
288 0 0 0 0 1,000
29 1,000 0 0 0 0
30 0 0 0 0 1,000
31 58 0 0 0 942
33 833 0 0 0 167
34 & 35 5 0 198 0 797
340 0 0 804 0 196
343 0 0 0 0 1,000
350 0 0 13 0 987
36 46 25 97 0 832
365 0 0 42 0 958
369 36 15 80 0 869
37 143 0 0 0 857
379 143 0 0 0 857
38 29 0 24 0 947
384 267 0 0 0 733
388 7 0 0 0 993
39 22 0 32 0 946
392 0 0 0 0 1,000
393 6 0 23 0 971
CHINGLEPUT DISTRICT-Urban
All Divisions 94 6 17 5 878
2&3 94 6 17 5 878
20 670 59 20 0 251 . 200 776 69 0 0 155
205 20 0 140 0 ~40
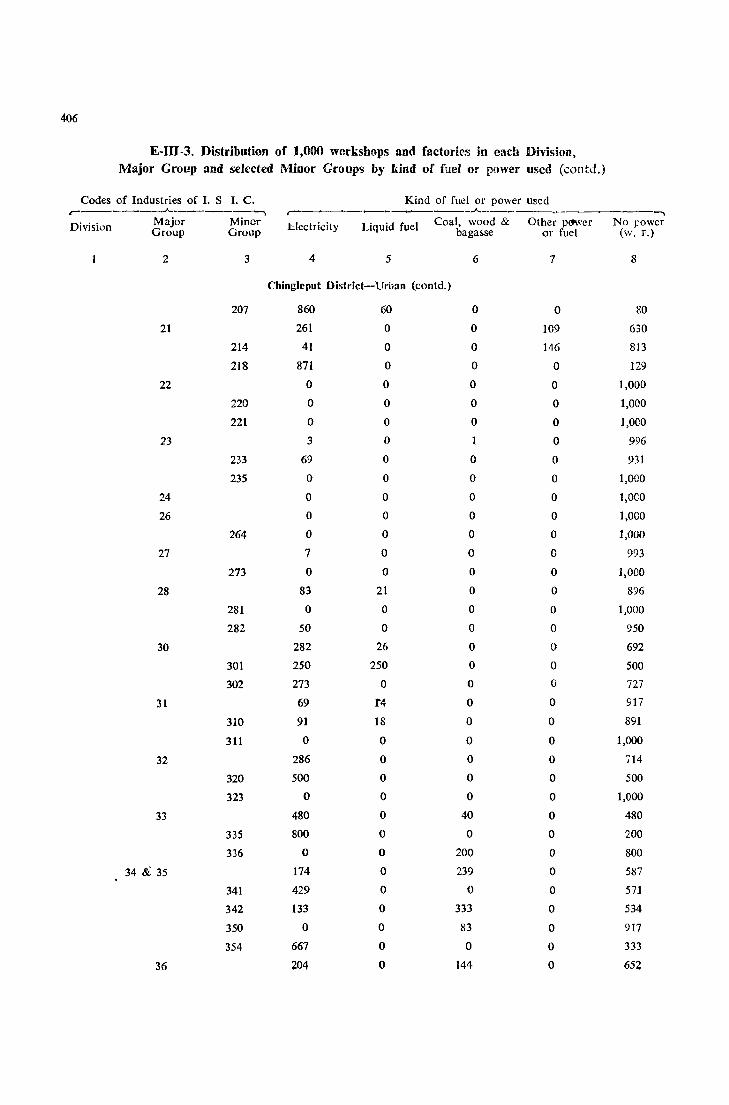
406
E-III -3. Distribution of 1,000 workshops amI factories in each Division, Major Group and selected Minor Groups by Idnd of fuel or power used (colltd.)
Codes of Industries of 1. S I. C. Kind of fuel or power used r------~.A.-----..___,
~ _____ _A__~ ______
-.. Divisil)fi Major Minor Electricity Liquid fuel Coal, wood & Other p<'Wer No rower
Group Group bagasse or fuel (w. F.)
2 3 4 5 6 7 8
ChingJeput District-Urban (contd.)
207 860 60 0 0 80
21 261 0 0 109 630
214 41 0 0 146 813
218 871 0 0 0 129
22 0 0 0 0 1,000
220 0 0 0 0 1,000
221 0 0 0 0 1,000
23 3 0 0 996
233 69 0 0 0 931
235 0 0 0 0 1,000
24 0 0 0 0 1,0eO
26 0 0 0 0 1,000
264 0 0 0 0 1,000
27 7 0 0 0 993
273 0 0 0 0 1,000
28 83 21 0 0 896
281 0 0 0 0 1,000
282 50 0 0 0 950
30 282 26 0 0 692
301 250 250 0 0 500
302 273 0 0 0 727
31 69 r4 0 0 917
310 91 18 0 0 891
311 0 0 0 0 1,000
32 286 0 0 0 ,14
320 500 0 0 0 500
323 0 0 0 0 1,000
33 480 0 40 0 480
335 800 0 0 0 200
336 0 0 200 0 800
34 8i 35 174 0 239 0 587
341 429 0 0 0 571
342 133 0 333 0 534
350 0 0 83 0 917
354 667 0 0 0 333
36 204 0 144 0 652
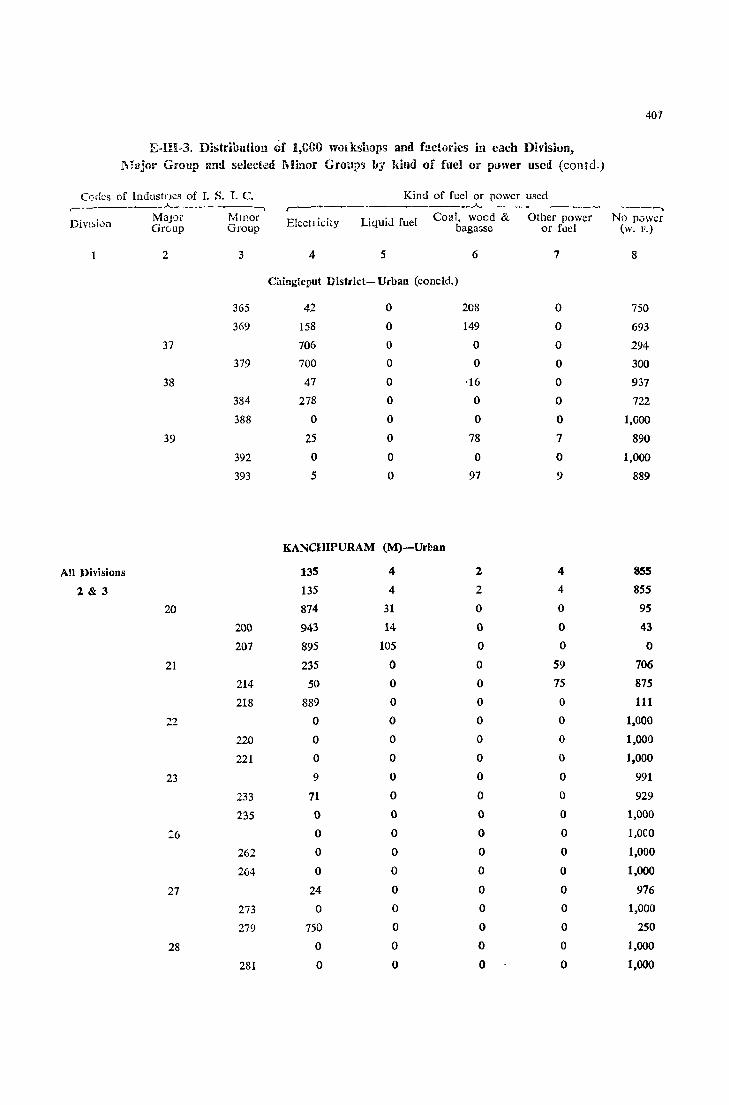
407
E-UI-3. Distrihution of 1,GGO wmkshops and facturies in each Division, f1!ajor Group amI seleci<!d Minor Groups by l{ind of fuel or power used (contd.)
Codes of Industnes of I. S. Y. C. • ______ ~_.A.__....____.....__ __ _,
Major Mmor Gr0up Group Divl~j0n
2 3
365
369
37
379
38
384
388
39
392
393
All Divisions
2&3
20
200
207
21
214
218
22
220
221
23
233
235
:6
262
264
27
273
279
28
281
Kind of fuel or Dower used --~--~---~.--~--~ r----"
EleeD icity Liquid fuel Coal, wood & Other power No power bagasse or fuel (IV. Y.)
4 5 6 7 8
Cilinglcput District-Urban (eoneld.)
42 0 208 0 750
158 0 149 0 693
706 0 0 0 294
700 0 ° 0 300
47 0 ·16 0 937
278 0 0 0 722
0 0 0 0 1,000
25 0 78 7 890
0 0 ° 0 1,000
5 0 97 9 889
KANCHIPURAM (M)-Urban
135 4 2 4 855
135 4 2 4 855
874 31 0 0 95
943 14 0 0 43
895 105 0 0 0
235 0 ° 59 706
50 0 0 75 875
889 ° 0 ° 111
° 0 0 0 1.000
0 ° ° ° 1,000
0 0 0 0 1,000
9 0 ° 0 991
71 0 0 0 929
0 0 (} 0 1,000
0 0 0 0 1.0CO
0 0 0 ° 1,000
0 0 0 0 1,000
24 0 0 0 976
0 0 0 0 1,000
750 0 0 0 250
0 0 0 0 1,000
0 0 0 0 1,000
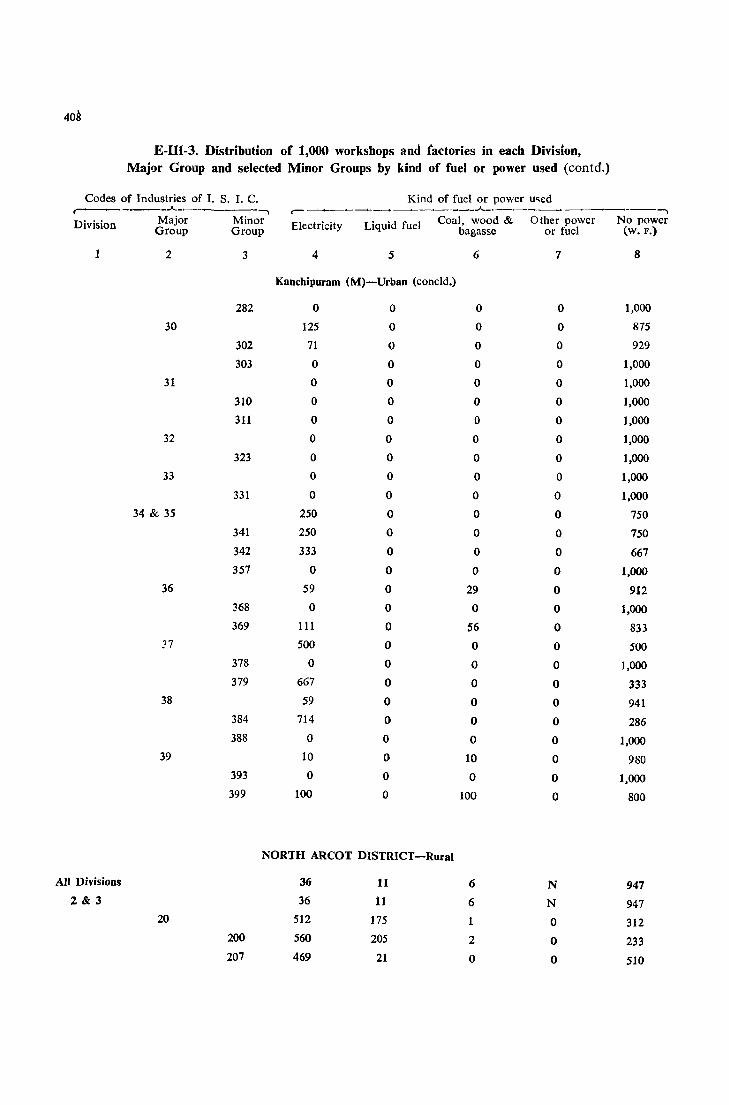
408
E-III-3. Distribution of 1,000 workshops and factories in each Division, Major Group and selected Minor Groups by kind of fuel or power used (contd.)
Codes of Industries of I. S. I. c. Kind of fuel or power u~ed ____ .A.._
-.... ~
____..A-_~_~ __ ~ __ ~ ___ _.... Division Major Minor Electricity Liquid fuel Coal, wood & Other power No power
Group Group bagasse or fuel (w. F.)
1 2 3 4 5 6 7 8
Kancbipuram (M)-Urban (concld.)
282 0 0 0 0 1,000
30 125 0 0 0 875
302 71 0 0 0 929
303 0 0 0 0 1,000
31 0 0 0 0 1,000
310 0 0 0 0 1,000
311 0 0 0 0 1,000
32 0 0 0 0 1,000
323 0 0 0 0 1,000
33 0 0 0 0 1,000
331 0 0 0 0 1,000 34 & 35 250 0 0 0 750
341 250 0 0 0 750
342 333 0 0 0 667 357 0 0 0 0 1,000
36 59 0 29 0 912 368 0 0 0 0 1,000 369 111 0 56 0 833
:7 500 0 0 0 500 378 0 0 0 0 1,000 379 667 0 0 0 333
38 59 0 0 0 941 384 714 0 0 0 286 388 0 0 0 0 1,000
39 10 0 10 0 980 393 0 0 0 0 1,000 399 100 0 100 0 800
NORTH ARCOT DISTRICT-Rural
All Divisions 36 11 6 N 947 2 & 3 36 11 6 N 947
20 512 175 0 312 200 560 205 2 0 233 207 469 21 0 0 510
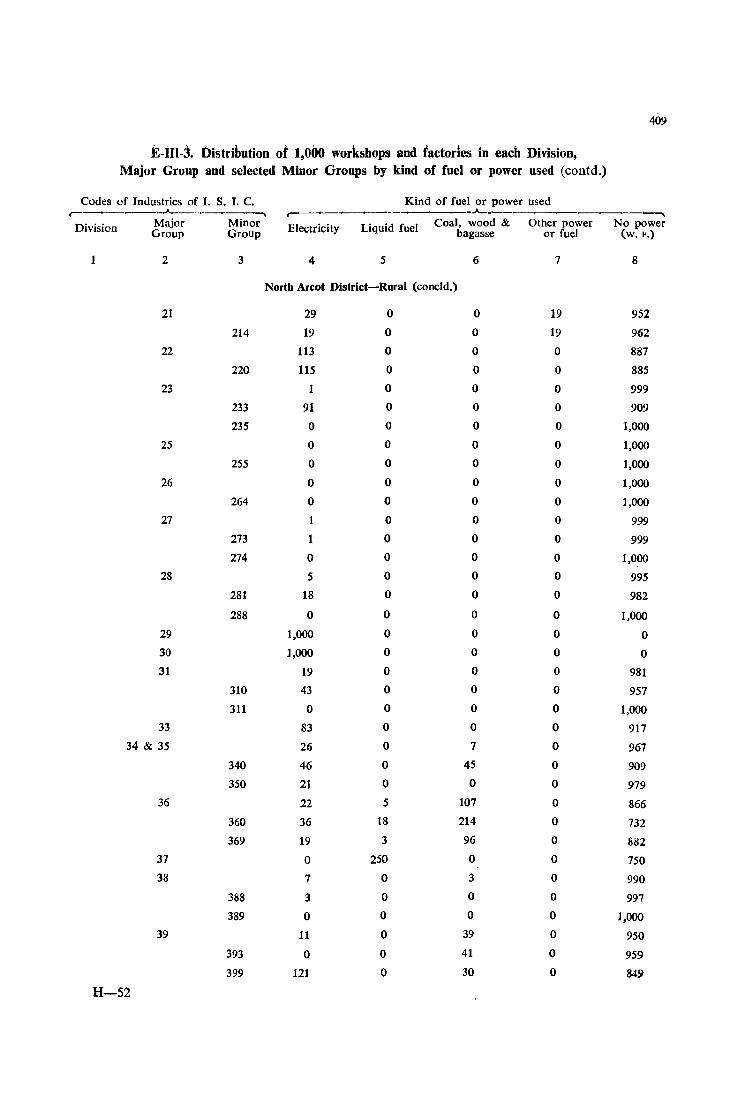
409
E-lIl-l Distribution ot 1,000 workshops and lactories in each Division, Major Group and selected Minor Groups by kind of fuel or power used (coutd.)
Codes of Industries of 1. S. I. C. Kind of fuel or power used ,-____ .A. __ • --"-- ~
Division Major Minor Electricity Liquid fuel Coal, wood & Other power No power Group Group bagasse or fuel (w. F.)
1 2 3 4 5 6 7 8
North Arcot District-Rural (concld.)
21 29 0 0 19 952
214 19 0 0 19 962
22 113 0 0 0 887
220 115 0 0 0 885
23 1 0 0 0 999
233 91 0 0 0 909
235 0 0 0 0 1,000
25 0 0 0 0 1,000
255 0 0 0 0 1,000
26 0 0 0 0 1,000
264 0 0 0 0 1,000
27 1 0 0 0 999
273 1 0 0 0 999
274 0 0 0 0 1,000
28 5 0 0 0 995
281 18 0 0 0 982
288 0 0 ° 0 1,000
29 1,000 0 ° 0 0 30 1,000 0 ° 0 0
31 19 0 ° 0 981
310 43 0 0 0 957
311 0 0 ° 0 1,000
33 83 0 0 0 917
34 & 35 26 0 7 0 967
340 46 0 45 0 909
350 21 0 0 0 979 36 22 5 107 0 866
360 36 18 214 0 732
369 19 3 96 0 882 37 0 250 0 0 750
38 7 0 3 0 990
388 3 0 0 0 997
389 0 0 0 0 1,000
39 11 0 39 0 950
393 0 0 41 0 959
399 121 0 30 0 849
H-S2
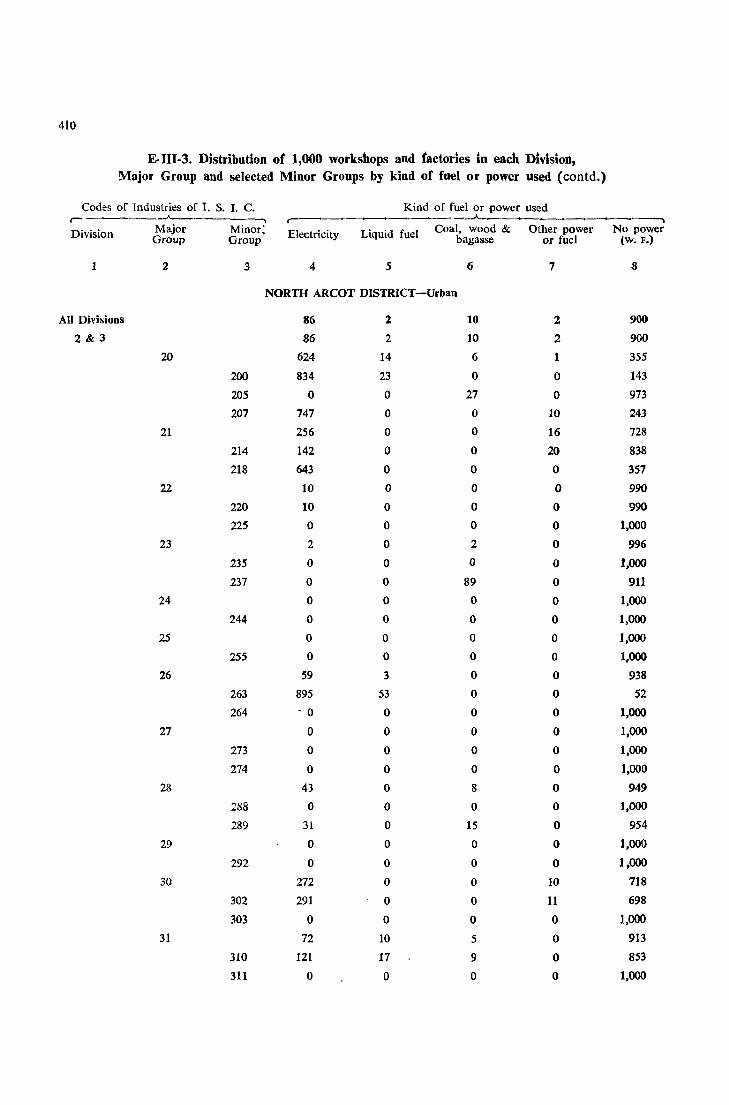
410
E· III -3. Distribution of 1,000 workshops and tactories in each Dlvision, Major Group and selected Minor Groups by kind of fuel or power used (contd.)
Codes of Industries of I. S. 1. C. Kind of fuel or power used r- --"- r-
__ ..A-------,
Division Major Minor: Electricity Liquid fuel Coal, wood & Other power No power Group Group bagasse or fuel (w. F.)
1 2 3 4 5 6 7 8
NORTH ARCOT DISTRICT-Urban
All Divisions 86 2 10 2 900
2&3 86 2 10 2 900
20 624 14 6 1 355
200 834 23 0 0 143
205 0 0 27 0 973
207 747 0 0 10 243
21 256 0 0 16 728
214 142 0 0 20 838
218 643 0 0 0 357
22 10 0 0 0 990
220 10 0 0 0 990
225 0 0 0 0 1,000
23 2 0 2 0 996
235 0 0 0 0 1,000
237 0 0 89 0 911
24 0 0 0 0 1,000
244 0 0 0 0 1,000
25 0 0 0 0 1,000
255 0 0 0 0 1,000
26 59 3 0 0 938
263 895 53 0 0 52
264 - 0 0 0 0 1,000
27 0 0 0 0 1,000
273 0 0 0 0 1,000
274 0 0 0 0 1,000
28 43 0 8 0 949
288 0 0 0 0 1,000
289 31 0 15 0 954
29 0 0 0 0 1,000
292 0 0 0 0 1,000
30 272 0 0 10 718
302 291 0 0 11 698
303 0 0 0 0 1,000
31 72 10 5 0 913
310 121 17 9 0 853
311 0 0 0 0 1,000
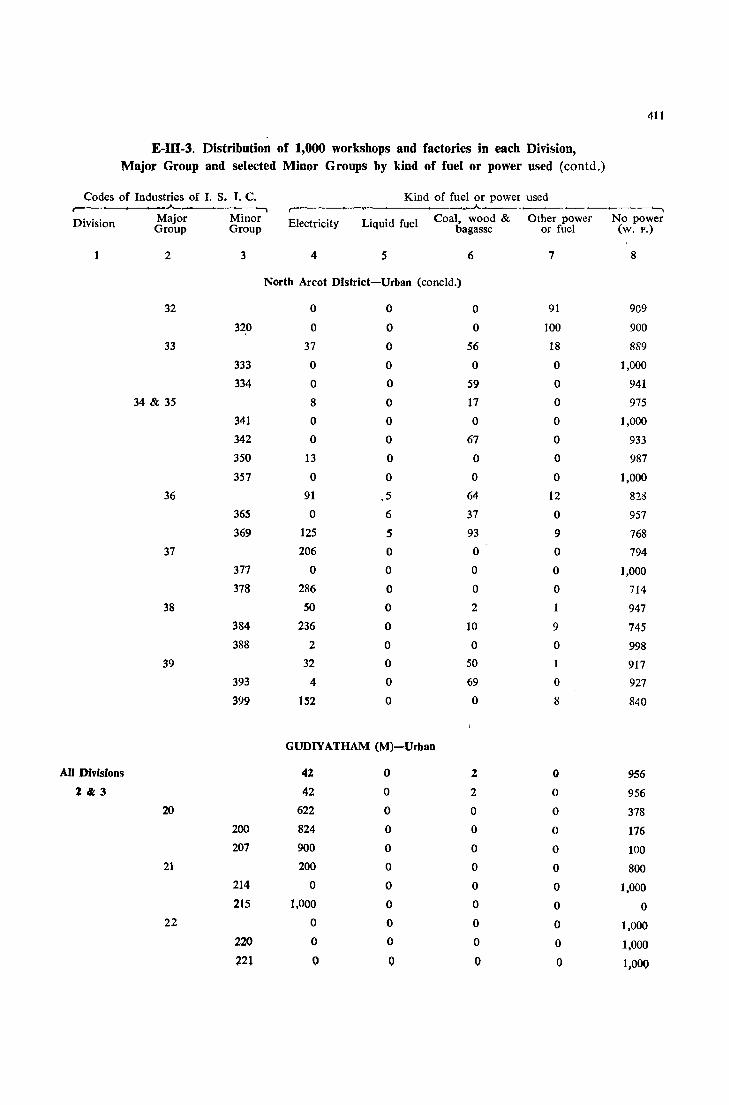
411
E-III-3. Distribution of 1,000 workshops and factories in each Division, Major Group and selected Minor Groups by kind of fuel or power used (contd.)
Codes of Industries of I. S. I. C. Kind of fuel or power used __ J.-
,~ _~.A-__ ------.,
Division Major Minor Electricity Liquid fuel Coal, wood & Other power No power Group Group bagasse or fuel (w. F.)
1 2 3 4 5 6 7 8
North Arcot District-Urban (concld.)
32 0 0 0 91 909
320 0 0 0 100 900
33 37 0 56 18 889
333 0 0 0 0 ],000
334 0 0 59 0 941
34 & 35 8 0 17 0 975
341 0 0 0 0 1,000
342 0 0 67 0 933
350 13 0 0 0 987
357 0 0 0 0 1,000
36 91 .5 64 12 828
365 0 6 37 0 957
369 125 5 93 9 768
37 206 0 0 0 794
377 0 0 0 0 1,000
378 286 0 0 0 714
38 50 0 2 1 947
384 236 0 10 9 745 388 2 0 0 0 998
39 32 0 50 1 917 393 4 0 69 0 927
399 lS2 0 0 8 840
GUDIYATHAM (M)-Urban
All Divisions 42 0 2 0 956
2&3 42 0 2 0 956 20 622 0 0 0 378
200 824 0 0 0 176 207 900 0 0 0 100
21 200 0 0 0 800 214 0 0 0 0 1,000 215 1,000 0 0 0 0
22 0 0 0 0 1,000 220 0 0 0 0 1,000 22t 0 0 0 0 1,000

412
E-III-3. Distribution of 1,000 workshops and factories in each Division, Major Group and selected Minor Groups by kind of fuel or power used (coutd.)
Codes of Industries of J. S. I. C. Kind of fuel or power used r--- _.A- r--~ --"-----. Division Major Minor Electricity Liquid fuel Coal, wood & Other power No power
Group Group bagasse or fuel (w. F.)
1 2 3 4 5 6 7 8
Gudiyatbam (M)-Urban (concJd.)
23 3 0 0 0 997
235 0 0 0 0 1,000
237 0 0 0 0 1,000
24 0 0 0 0 1,000
244 0 0 0 0 1,000
25 0 0 0 0 1,000
255 0 0 0 0 1,000
26 0 O. 0 0 1,000
264 0 0 0 0 1,000
27 0 0 0 0 I,COO
273 0 0 0 0 1,000
274 0 0 0 0 1,000
28 71 0 0 0 929
280 250 0 0 0 750
289 0 0 0 0 1,000
30 625 0 0 0 375
302 625 0 0 0 375
31 0 0 0 0 1,000
310 0 0 0 0 1,000
33 0 0 0 0 1,000
334 0 0 0 0 1,000
34 & 35 0 0 0 0 1,000
341 0 0 0 0 1,000
342 0 0 0 0 1,000
350 0 0 0 0 1,000
36 417 0 83 0 500
368 0 0 0 0 1,000
369 364 0 91 0 545
37 750 0 0 0 250
378 1,000 0 0 0 0
38 65 0 0 0 935 386 500 0 0 0 500 388 0 0 0 0 1,000
39 58 0 19 0 923 393 0 0 24 0 976
~99 500 Q Q 0 500
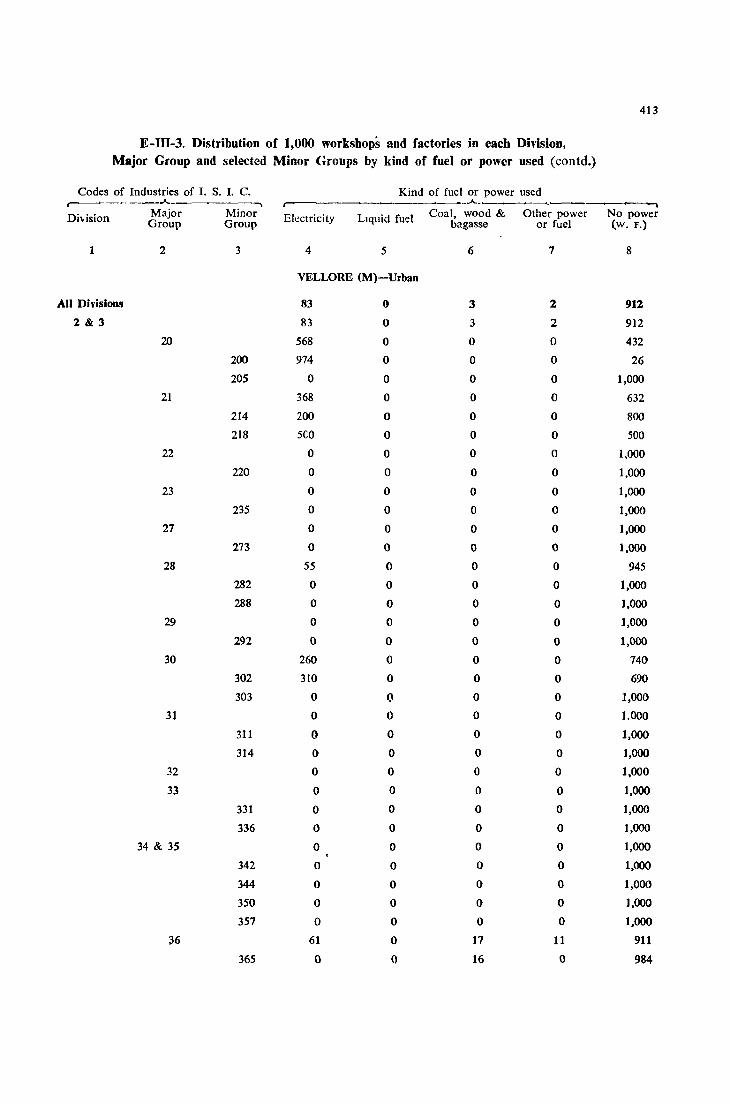
413
E-III-3. Distribution of 1,000 workshops and factories in each Division, Major Group and selected Minor Groups by kind of fuel or power used (contd.)
Codes of Industries of 1. S. I. C. Kind of fuel or power used ...-----____ .A._ , r- .A..
Dhision Major Minor Electricity LIquid fuel Coal, wood & Other power No power Group Group bagasse or fuel (w. F.)
1 2 3 4 5 6 7 8
VELLORE (M)-Urban
All Divisions 83 0 3 2 912
2&3 83 0 3 2 912
20 568 0 0 0 432
200 974 0 0 0 26
205 0 0 0 0 1,000
21 368 0 0 0 632
214 200 0 0 0 800
218 5eO 0 0 0 500
22 0 0 0 0 1.000
220 0 0 0 0 1,000
23 0 0 0 0 1,000
235 0 0 0 0 1,000
27 0 0 0 0 1,000
273 0 0 0 0 1,000
28 55 0 0 0 945
282 0 0 0 0 1,000
288 0 0 0 0 1,000
29 0 0 0 0 1,000
292 0 0 0 0 1,000
30 260 0 0 0 740
302 310 0 0 0 690
303 0 (l 0 0 1,000
31 0 0 0 0 1.000
311 0 0 0 0 1,000
314 0 0 0 0 1,000
32 0 0 0 0 1,000
33 0 0 0 0 1,000
331 0 0 0 0 1,000
336 0 0 0 0 1,000
34 & 35 0 0 0 0 1,000
342 0 0 0 0 1,000
344 0 0 0 0 1,000
350 0 0 0 0 1,000
357 0 0 0 0 1,000
36 61 0 17 11 911
365 0 0 16 0 984

414
£-111-3. Distribution of 1,000 workshops and factories in each Division, Major Group and selected Minor Groups by kind of fuel or power used (contd.)
Codes of Industries of 1. S. I. C. Kind of fuel or power used --A._ ----., r-
___ ..A..-1
Division Major Minor Ele;tricity Liquid fuel Coal, wood & Other power No power Group Group bagasse or fuel (W. F.)
1 2 3 4 5 6 7 8
VeUore (M)-Urban (coneld.)
369 212 0 30 0 758
38 94 0 0 6 900
"384 291 0 0 18 691
388 0 0 0 0 1,000
39 31 0 0 0 969
393 7 0 0 0 993
399 85 0 0 0 915
SOUTH ARCOT DISTRICT-Rural
All Divisions 31 36 14 7 912
2&3 31 36 14 7 912
20 266 348 27 0 359
200 302 421 30 0 247
207 135 38 0 0 827 21 29 15 72 72 812
214 15 15 74 75 821
22 0 0 0 0 1,000
23 N 0 0 0 1,000
231 0 0 0 0 1,000
235 0 0 0 0 1,000 24 0 0 0 0 1,000 25 0 0 0 0 1,000
255 0 0 0 0 1,000 26 0 0 500' 0 500 27 0 0 0 0 1,000
273 0 0 0 0 1,000 28 0 0 0 0 1,000
282 0 0 0 0 1,000 288 0 o· 0 0 1,000
29 0 0 0 0 1,000 30 400 0 0 0 600
302 400 0 0 0 600 31 0 0 0 0 1,000
310 0 0 0 0 1,000

41s
E-II! -3. Distribution of 1,000 workshops and factories in each Division, Major Group and selected Minor Groups by kind of fuel or power used (contd.)
Codes of Industries of I. S. 1. C. Kind of fuel or power used .A-_ -------.. r------+----------.----t----...)t........_-..... _~ __ ------..
DivIsion Major Minor Electricity LIquid fuel Coal, wood & Other power No power Group Group bagasse or fuel (w. F.)
1 2 3 4 5 6 7 8
South Arcot District-Rural (concld.)
311 0 0 0 0 1,000
32 500 0 0 0 500
33 0 0 0 0 1,000
34 & 3S 4 0 4 0 992
341 0 0 0 0 1,000
3S0 0 0 4 0 996
36 18 ~ 13 92 71 806
365 0 36 53 482 429
37 0 200 0 0 800
378 0 0 0 0 1,000
38. 10 3 7 0 980
388 4 0 0 0 996
389 0 0 200 0 800
39 7 0 23 0 970
393 0 0 27 0 973
399 6~ 0 0 0 931
SOUTH ARCOT DISTRICT-Urban
All Divisions 86 14 21 2 877
2-& 3 86 14 21 2 877
20 S09 116 21 6 348
200 638 169 0 S 188
20S 0 0 70 0 930
207 596 43 21 21 319
21 273 1 34 43 649
214 0 0 SO 67 883
218 778 0 0 0 222
22 67 0 0 0 933
220 0 0 0 0 1,000
221 0 0 0 0 1,000
23 3 0 2 0 995
233 9S 0 95 0 810
235 0 0 0 0 1,000
24 0 0 0 0 1,000
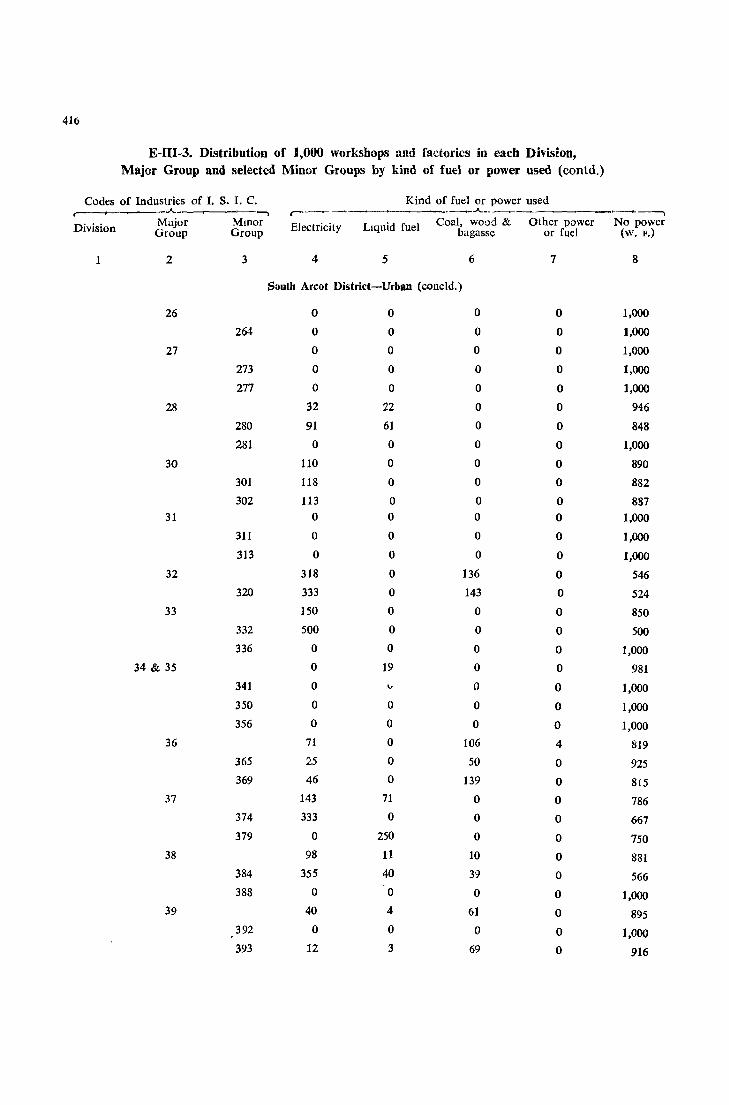
416
E-III-3. Distribution of 1,000 workshops and factories in each Division, Major Group and selected Minor Groups by kind of fuel or power used (coutd.)
Codes of Industries of 1. S. 1. C. Kind of fuel or power used .A-_ ........ r-~
_" __ .A-__ ~------.,
Division Major Mmor Electricity Liquid fuel Coal, wood & Other power No power Group Group bagasse or fuel (w. F.)
1 2 3 4 5 6 7 8
South Arcot District-Urban (concld.)
26 0 0 0 0 1,000
264 0 0 0 0 1,000
27 0 0 0 0 1,000
273 0 0 0 0 1,000
277 0 0 0 0 1,000
28 32 22 0 0 946
280 91 61 0 0 848
281 0 0 0 0 1,000
30 110 0 0 0 890
301 118 0 0 0 882
302 113 0 0 0 887 31 0 0 0 0 1,000
311 0 0 0 0 1,000
313 0 0 0 0 1,000
32 318 0 136 0 546 320 333 0 143 0 524
33 150 0 0 0 850 332 500 0 0 0 500 336 0 0 0 0 1,000
34 & 35 0 19 0 0 981 341 0 " ° 0 1,000 350 0 0 ° 0 1,000 356 ° ° ° 0 1,000
36 71 0 106 4 819 365 25 0 50 0 925 369 46 0 139 0 815
37 143 71 0 0 786 374 333 0 0 0 667 379 0 250 0 0 750
38 98 11 10 0 881 384 355 40 39 0 566 388 0 0 0 0 1,000
39 40 4 61 0 895 392 0 ° 0 0 1,000 393 12 3 69 0 916
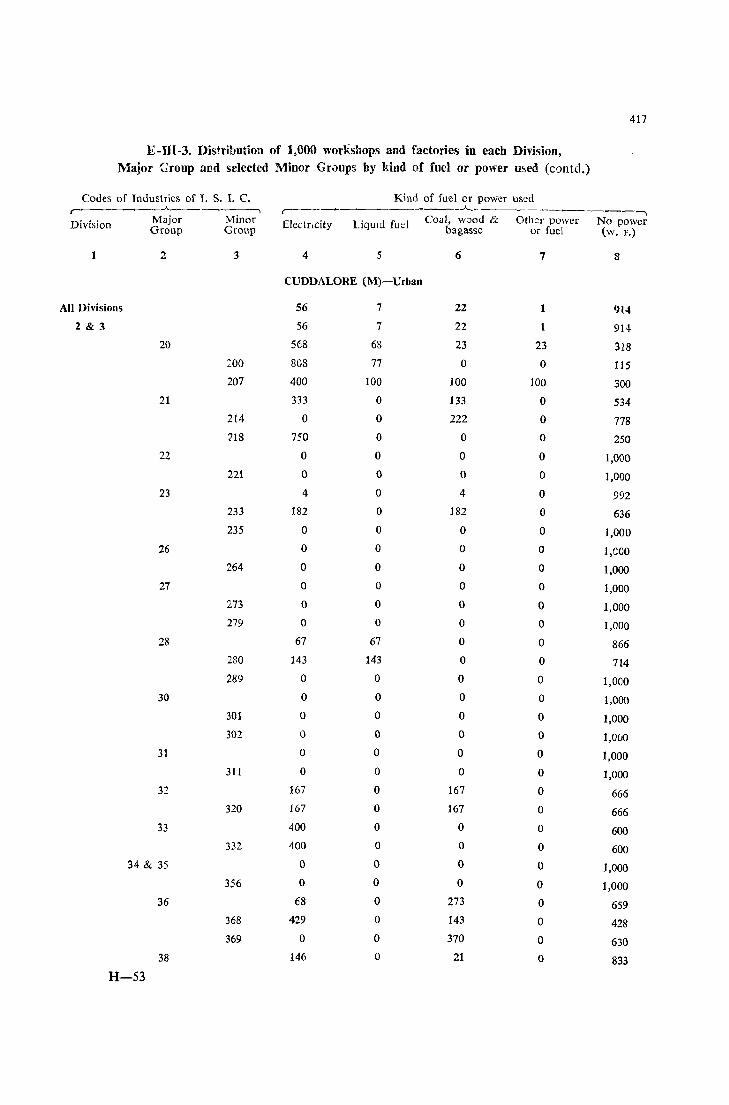
417
E-IlI-3. Distribution of 1,000 workshops and factories in each Division, Major {;roup and selected Minor Gr.Jups by kind of fuel or power u~ed (contd.)
Codes of Industries of I. S. I. C. Kind of fuel or power used r- ..A.. r---~--------_-_A .... _~ __ - _____ """"\
Division Major Minor ElectrIcity Liquid fuel Coal, wood & Other power No power Group Group bagasse or fuel (W. F.)
2 3 4 5 6 7 8
CUDDALORE (M)-Urban
All Divisions 56 7 22 1 914 2 & 3 56 7 22 914
20 568 68 23 23 318 ::'00 808 77 ° 0 115 207 400 100 100 100 300
21 333 0 133 0 534 214 0 0 222 0 778 218 750 0 0 0 250
22 0 0 0 0 1,000 221 0 0 0 0 1,000
23 4 a 4 0 992 233 182 a 182 0 636 235 0 a 0 0 1,000
26 0 0 0 0 1,000 264 0 0 0 0 1,000
27 0 0 0 0 1,000 273 0 0 0 0 1,000 279 0 0 ° 0 1,000
28 67 67 0 0 866 280 143 143 0 0 714 289 0 0 0 0 1,000
30 0 0 0 0 1,000 301 0 0 0 0 1,000 302 0 0 0 0 1,0UO
31 0 0 0 0 1,000 311 0 0 0 0 1,000
32 167 0 167 0 666 320 167 0 167 0 666
33 400 0 0 0 600 332 400 0 0 0 600
34 & 35 0 0 0 0 1,000 356 0 ° 0 0 1,000
36 68 0 273 0 659 368 429 ° 143 0 428 369 a 0 370 0 630
38 146 0 21 0 833 H-53

418
E-tIl-3. bistribution of 1,000 workshops amI fuctorics in each Dhhimi, Major Gr()up and selected Min()f Gwups by k~nd ()f fuel Of power used (colltd,)
Codes of Industries of I. S. I. C.
Division
All Divisions
2&3
_.A._._~_ """ Major Minor Group Group
2
39
20
21
22
23
25
26
27
28
29
30
3
384
388
393
399
200
209
214
218
220
221
235
236
255
263
26.t
270
273
282
288
Kind Gf fuel or pot'.er used r--~-------~ __ ..A..----.-~_~ ____ •• ___ ........,
Electricity • . 1 r 1 Coal, \\-ood & Othcl P( \ Cl' 1'0 I'CQ _, Llqull! U~ bagasse 01 fuel (-,,J. i )
4 5
Cuddalore (M)-Urban (coneld.)
584
° 56
o 267
° °
H
o 67
SALEM DISTRICT-Ruml
26 10
26 10
486 212
563 269
369 131
136 57
17 17
291 167
16 0
0 0
0 0
4 0
0 0
° 0
° 0
0 0
21 3
619 95
0 0
0 0
0 0
° 0
° 0
0 0
0 0
1,000 0
200 0
6
83
o 14
o 66
8
8
28
9
59
57
83
0
0
0
0
N
0
0
0
0
° 0
0
0
0
0
3
0
0
0
0
7
o o o o o
1
1
8
7
24
4S
66
0
0
0
0
0
0
° ° 0
0
0
0
0
° ° 0
0
0
0
0
8
333
1,000
916
1,000
600
955
955
266
152
417
705
817
542
984
1,000
1,000
996
1,000
1,000
1,000
1,000
976
286
J,OOO
1,000
1,000
1,000
997
1,000
1,000
0
800
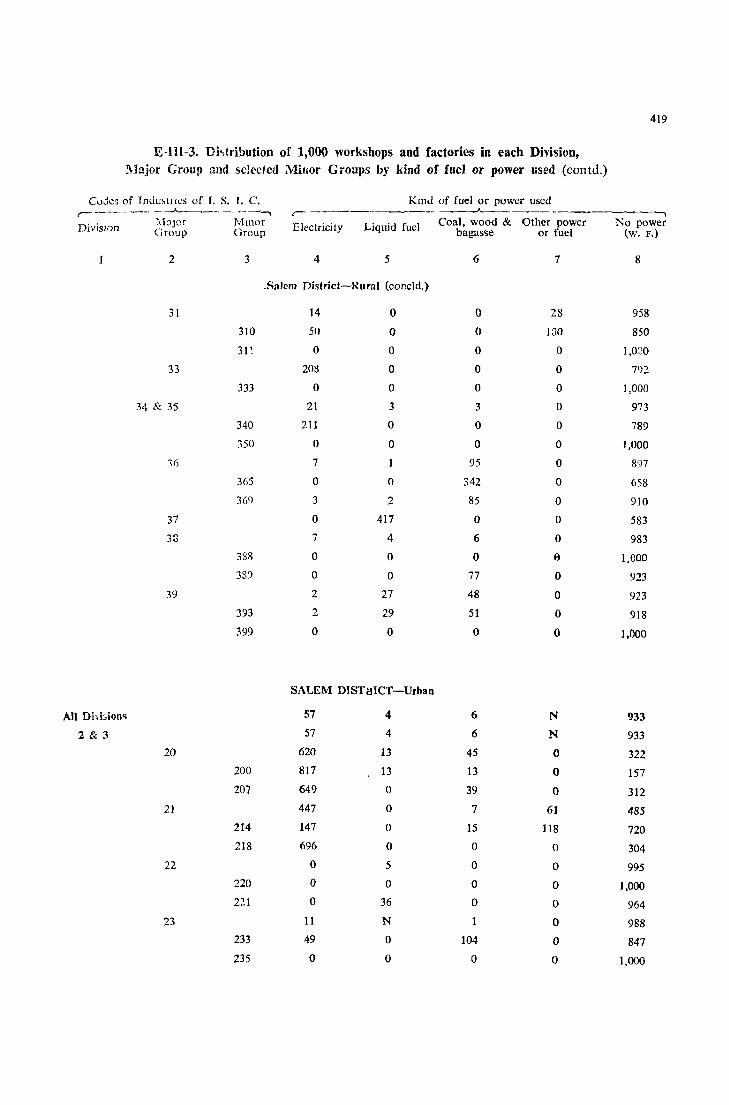
419
E-IH-3. Dhtribution of 1,000 workshops and factories in each Division, Major Group and selecteil Minor Groups by kind of fuel or power llsed (contd.)
Cojes of Inuw,(II':s of J. S. I. C. Kmd of fuel or power used r- ------- __ .A...-__ ~--.. _--__ ~__,_A.
DivisIOn !,bJor Mmor Electricity Liquid fuel Coal, wood & Other power No power Group Group bagasse or fuel (w. F.)
2 3 4 5 6 7 8
.Salem District-Rural (concld.)
31 14 0 0 28 958
310 50 0 0 100 850
31 ~ 0 0 0 ° I,O:}O
33 208 0 0 0 792
333 0 0 0 0 1,000
34 & 35 21 3 3 0 973
340 211 0 0 0 789
350 0 0 0 0 1,000
,() 7 95 0 897
365 0 0 342 0 658
36<) 3 2 8S 0 910
37 0 417 0 0 583
33 7 4 6 0 983
3SS 0 0 0 A 1.000 38') 0 0 77 0 923
39 2 27 48 0 923
393 2 29 51 0 918
399 0 0 0 0 1,000
SALEM DISnlICT-Urban
All Dhhions 57 4 6 N 933
2&3 57 4 6 N 933
20 620 13 45 0 322 200 817 13 13 0 157 207 649 0 39 0 312
21 447 0 7 61 485 214 147 0 15 118 720 218 696 0 0 0 304
22 0 S 0 0 995 220 0 0 0 0 1,000 221 0 36 0 0 964
23 11 N 1 0 988 233 49 0 104 0 847
235 0 0 0 0 1,000
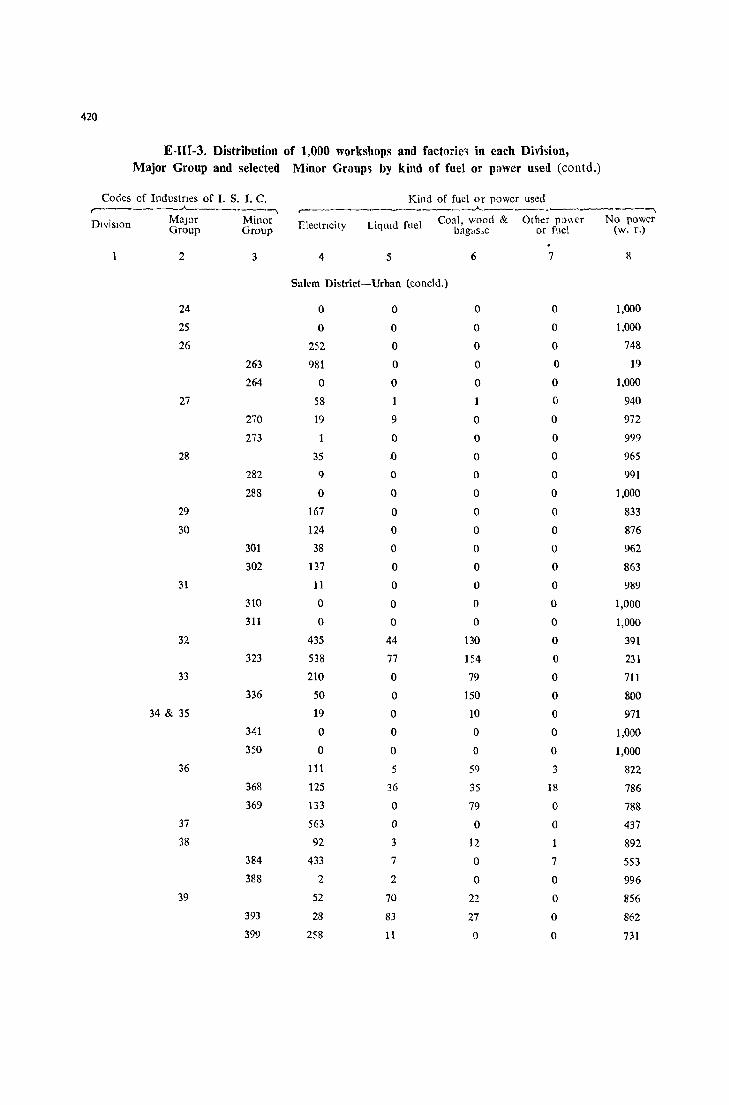
420
E-III-3. Distribution of 1,000 workshops and factorie'O in each Dlvision, Major Group and selected Minor Group, by kind of fuel or pawer used (contd.)
Codes of Industnes of I. S. 1. C. Kind of fucl or power used ,-______ .A.~_~ ____ _. r----~-----------"-----.-------_.
DlvislOn Major Minor ElectrIcity liquid fuel Coal, wood & Other po\\cr No power Group Group bagas,e or fuel (w. r.)
2 3 4 5 6 7 8
Salem District-Urban (condo.)
24 0 0 0 0 1,000
25 0 0 0 0 1,000
26 252 0 0 0 748
263 981 0 0 0 19
264 0 0 0 0 1,000
27 58 1 0 940
270 19 9 0 0 972
273 1 0 0 0 999
28 35 0 0 0 965
282 9 0 0 0 991
288 0 0 0 0 1,000
29 167 0 0 0 833
30 124 0 0 0 876
301 38 0 0 0 962
302 137 0 0 0 863
31 11 0 0 0 989
310 0 0 0 0 1,000
311 0 0 0 0 1,000
32 435 44 130 0 391
323 538 77 154 0 231
33 210 0 79 0 711
336 50 0 150 0 800
34 & 35 19 0 10 0 971
341 0 0 0 0 1,000
350 0 0 0 0 1,000
36 111 5 59 3 822
368 125 36 35 18 786
369 133 0 79 0 788
37 563 0 0 0 437
38 92 3 12 892
384 433 7 0 7 553
388 2 2 0 0 996
39 52 70 22 0 856
393 28 83 27 0 862
399 258 11 0 0 731

421
E-III-3. Distribution of 1,000 workshops and factories in eacb Division, Major Group and selected Minor Groups by kind of fuel or power used (eontd.)
Codes of lndustnes of I. S. I. c. Kind of fuel or power used ,-______ ..A. ______ -, ,-----.------.-----"----------~~----,
Division Major Minor Electricity Liquid fuel Coal, wood & Other power No power Group Group bagasse or fuel (w. F.)
2 3 4 5 6 7 8
SALEM (M)-Urban
All Divisions 51 6 8 N 935
2&3 51 6 8 N 935
20 567 8 49 0 376
200 760 12 29 0 199
205 0 0 200 0 800
21 575 0 0 50 375
214 118 0 0 117 765
218 929 0 0 0 71
22 0 0 0 0 1,000
220 0 0 0 0 1,000
221 0 0 0 0 1,000
23 8 0 2 0 990
230 74 0 0 0 926
235 0 0 0 0 1,000
24 0 0 0 0 1,000
244 0 0 0 0 1,000
25 0 0 0 0 1,000
255 0 0 0 0 1,000
26 161 0 0 0 839
263 1,000 0 0 0 0
264 0 0 0 0 1,000
27 66 2 2 0 930
270 19 9 0 0 972
273 3 0 0 0 997
28 51 0 0 0 949
282 0 0 0 0 1,000
289 34 0 0 0 966
29 167 0 0 0 833
292 200 0 0 0 800
30 156 0 0 0 844
301 100 0 0 0 900
302 162 0 0 0 838
31 24 0 0 0 976
310 0 0 0 0 1,000
311 0 0 0 0 1,000
32 438 63 187 I,) 312
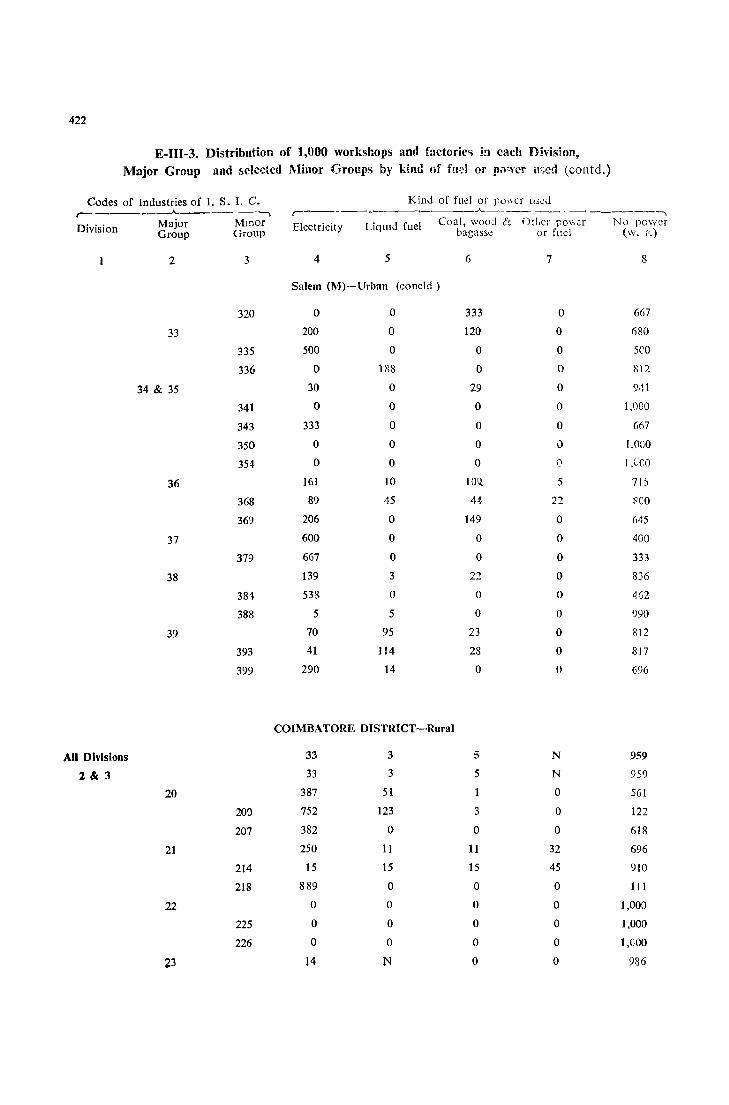
422
E-III-3. Distribution of 1,000 workshops and factorie'i in each Division, Major Group and 5clccled Minor Groups by kind of fud or po)"I'cr ilsed (contd.)
Codes of Industries of I. S. I. C. r------.---'------ ---, Division
1
All Divisions
2 & 3
Major Mmor Group Group
2
33
34 & 35
36
37
38
39
20
21
22
23
3
320
335
336
341
343
350
354
368
369
379
384
388
393
399
20a
207
214
218
225
226
Kind of fuel or po\\cr us.::d ,--.----------~'----- -- ~___. -------, Electricity Liqllld fuel Coal, wood [:, Od,er pO\',cr N,) power
bagasse or fuel (w. r.)
4 5
Salem (M)-UrlJan (concld)
o 200
500
o 30
o 333
o o
161
89
206
600
667
139
538
5
70
41
290
o o o
188
o o o o o
10
45
o o o 3
o 5
95
114
14
COIMBATORE DISTRICT-Rural
33 3
33 3
387 51
752 123
382 0
250 11
15 15
889 0
0 0
0 0
0 0
14 N
6
333
120
o o
29
o o o o
lOll.
44
149
o o
22
o o
23
28
o
5
5
1
3
0
11
15
0
0
0
0
0
7
o o o o o o o o ('
5
22
o o o o o o o o o
N
N
0
0
0
32
45
0
0
0
0
0
8
667
1i80
5('0
812
941
1,000
667
1,000
I ,ceo 7])
lIeo
645
400
333
836
4G2
990
812
817
696
959
959
561
122
618
696
910
111
1,000
1,000
1,COO
936
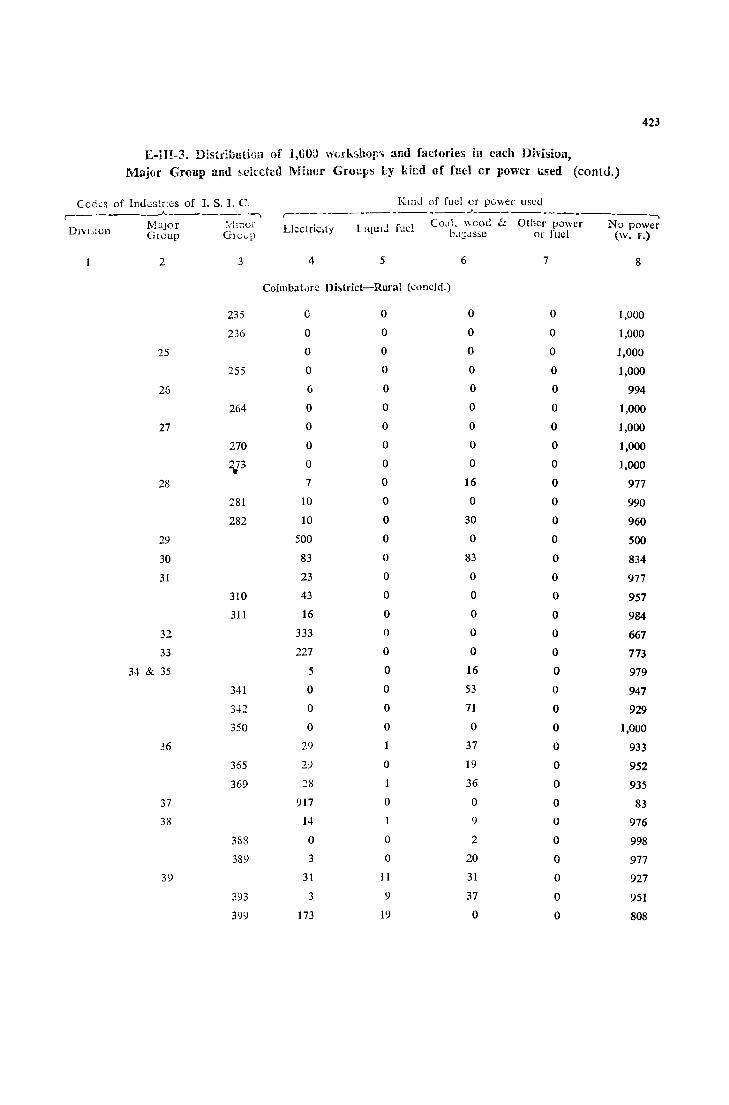
423
E-II!-3. Distl'Hmtiun of 1,lJO;} w\lfk"hop,> and factories in each Division,
Major Group and M.:kctcd l'vHucr CrOcIJs Ly kh:d of fuo::l or power l;sed (contd.)
Codes of Ind.Jstr:es of I. S. I. C. Kmd of fucl cr pc\\er uscd "' ______ ...A.. _______ -,
r----------------'~-------------,
D1VloWI1 Major !{llnof Llcctric,ty llqUIJ fuel Co,d. \\ood &. Othcr power No power GlOup GlUc1[l L',I:;<.lS,e or fuel (\Y. F.)
2 3 4 5 6 7 8
C(}imbaLHc Dhtrict-Rural (concld.)
235 0 0 0 0 1,000
236 0 0 0 0 1,000
25 0 0 0 0 1,000
255 0 0 0 0 1,000
26 6 0 0 0 994
264 0 0 0 0 1,000
27 0 0 0 0 1,000
170 0 0 0 0 1,000
2J3 0 0 0 0 1,000
28 7 0 16 0 977
281 10 0 0 0 990
282 10 0 30 0 960
29 500 0 0 0 500
30 83 0 83 0 834
31 23 0 0 0 977
310 43 0 0 0 957
311 16 0 0 0 984
32 333 0 0 0 667
33 227 0 0 0 773
34 & 35 5 0 16 0 979
341 0 0 53 0 947
342 0 0 71 0 929
350 0 0 0 0 1,000
36 29 37 0 933
365 29 0 19 0 952
369 28 36 0 935
37 917 0 0 0 83
38 14 9 0 976
3&8 0 0 2 0 998
389 3 0 20 0 977
39 31 11 31 0 927
393 3 ') 37 0 951
399 173 19 0 0 808
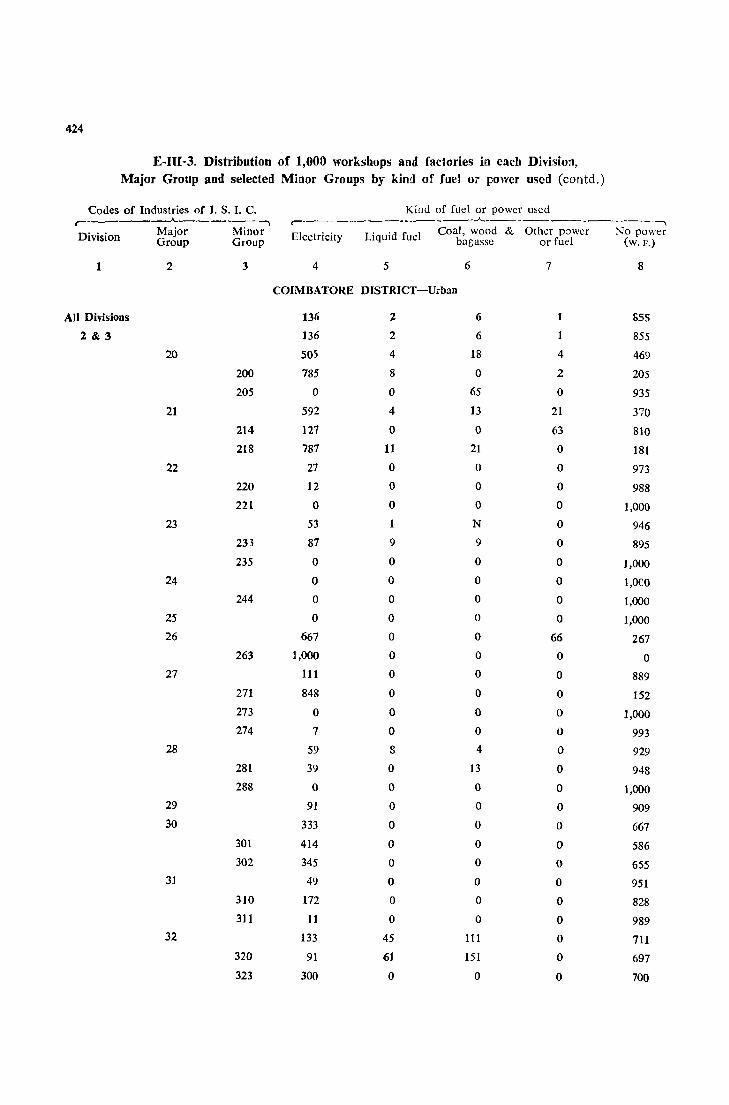
424
E-IU-3. Distribution of 1,000 workshops and factories in each Division, Major Group and selected Minor Groups by kind of fuel or power used (contd.)
Codes of Industries of I. S. I. C. Kind of fuel or power llsed , _____ ..A.. _____ ........ ,. _____________ ..A.. _________ .-__ -_ ........
Division Major Minor Electricity Liquid fuel Coal, wood & Other power No power Group Group bagasse or fuel (w. P.)
1 2 3 4 5 6 7 8
COIMBATORE DISTRICT-Urban
All Divisions 136 2 6 1 1>55
2 & 3 136 2 6 1 855
20 505 4 18 4 469
200 785 8 0 2 205
205 0 0 65 0 935
21 592 4 13 21 370
214 127 0 0 63 810
218 787 11 21 0 181
22 27 0 0 0 973
220 12 0 0 0 988 221 0 0 0 0 1,000
23 53 1 N 0 946 233 87 9 9 0 895
235 0 0 0 0 1,000 24 0 0 0 0 1,0CO
244 0 0 0 0 1,000 25 0 0 0 0 1,000 26 667 ° ° 66 267
263 1,000 0 0 0 0 27 III 0 0 0 889
271 848 0 ° 0 152 273 0 0 0 0 1,000 274 7 0 0 0 993
28 59 8 4 0 929 281 39 0 13 0 948 288 0 0 0 0 1,000
29 91 0 0 0 909 30 333 0 0 0 667
301 414 0 0 0 586 302 345 0 0 0 655
31 49 0 0 0 951 310 172 0 0 0 828 311 11 0 0 0 989
32 133 45 III 0 711 320 91 61 151 0 697 323 300 0 0 0 700

425
E-HI-3. Distribution of 1,00) work"u.:>ps an:! fa<;:tories in cacil DivisioiJ, r"tajor Group amI seleded Minor Gr,!)ups by kind of fl1~l or p:nver m;~j (coatd.)
Cod<;~ of Industri~s of 1. S. I. C. Kind of fuel or power lised .-_______ ..A...
-------, .-____________ ..A... ____________ -,
Division Major ivlinor Ekctncily LiqUId fuel Co~l, wood & Otilcr po~cr No power Group Group lJagassJ or fuel (w. p.)
2 3 4 5 6 7 8
Coimbatole District--Urban (concld.)
33 169 0 85 0 746
335 179 0 107 0 714
336 74 0 III 0 815
34 & 35 104 0 26 13 857
341 316 0 0 0 684
350 0 0 0 20 980
36 139 0 19 3 839
365 9 0 0 0 991
363 160 0 0 7 833
369 191 0 41 3 765
37 674 0 10 0 316
374 933 0 0 0 67 377 222 0 0 0 778
38 106 6 0 2 886
384 434 4 \) 8 554
389 33 (5 0 0 902
39 54 0 9 0 937
392 18 0 0 0 982
393 4 0 12 0 984
ERODE (M)-Urban
All Divisions 174 2 4 1 819
2&3 174 2 4 819 20 515 0 15 0 470
200 639 0 0 0 361 205 0 0 83 0 917
21 364 0 0 0 636 214 77 0 0 0 913 218 750 0 0 0 250
22 0 0 0 0 1,000 220 0 0 0 0 1,000 221 0 ° 0 0 1,000
23 207 0 0 0 793 233 97 ° 0 0 903
H-54
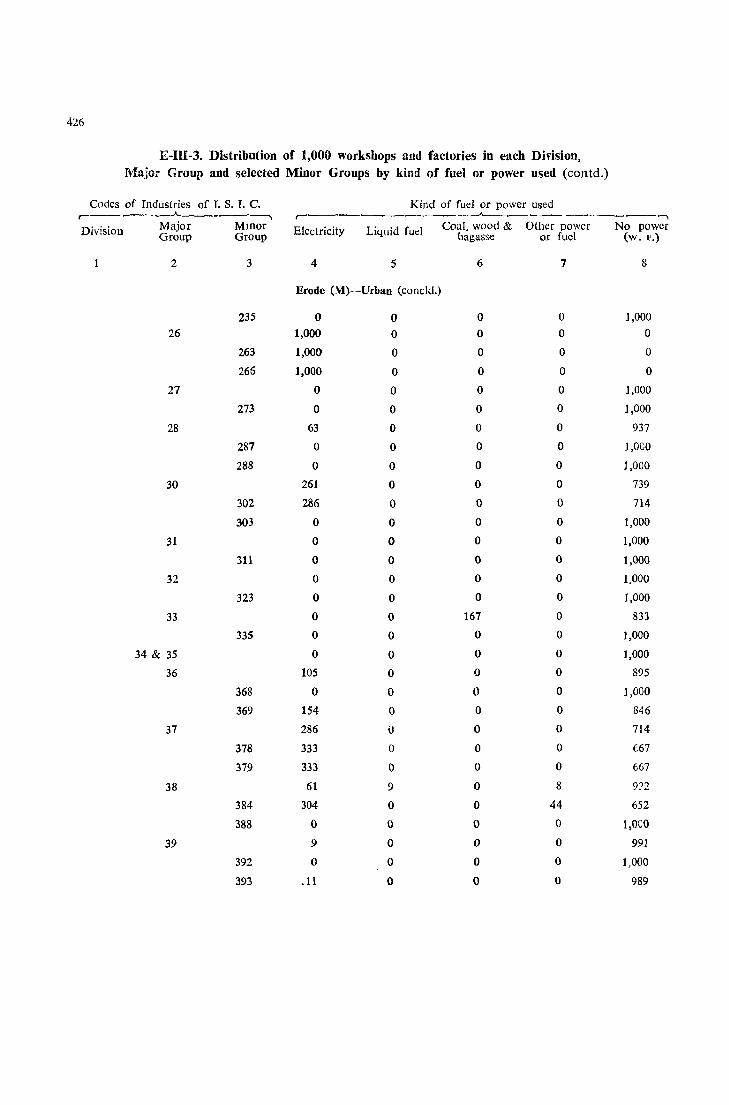
426
E-III-3. Distribution of 1,000 workshops and factories in each Division, Major Group and selected Minor Groups by kind of fuel or power used (coutd.)
Codes of Industries of r. S. T. C. Kind of fuel or power used .-___ - __ .A. _____ --, r- ---~, ---------..,
Division Major Mmor Electricity Liquid fuel Coal, wood & Other power No power Group Group bagasse or fuel (w. F.)
2 3 4 5 6 7 8
Erode (.\1)~Urban (concld.)
235 0 0 0 0 1,000 26 1,000 0 0 0 0
263 1,000 0 0 0 0
266 1,000 0 0 0 0
27 0 0 0 0 1,000
273 0 0 0 0 1,000
28 63 0 0 0 937
287 0 0 0 0 1,0CO
288 0 0 0 0 1,000
30 261 0 0 0 739
302 286 0 0 0 714
303 0 0 0 0 1,000
31 0 0 0 0 1,000
311 0 0 0 0 1,000
32 0 0 0 0 1,000
323 0 0 0 0 1,000
33 0 0 167 ° 833
335 0 0 0 ° 1,000
34 & 35 0 0 0 0 1,000
36 105 0 0 0 895
368 0 0 0 0 1,000
369 154 0 0 0 846
37 286 0 0 0 714
378 333 0 0 0 t67
379 333 0 0 0 667
38 61 9 0 8 971
384 304 0 0 44 652
388 0 0 0 0 1,0CO
39 9 0 0 ° 991
392 0 0 0 0 1,000
393 .11 0 0 0 989
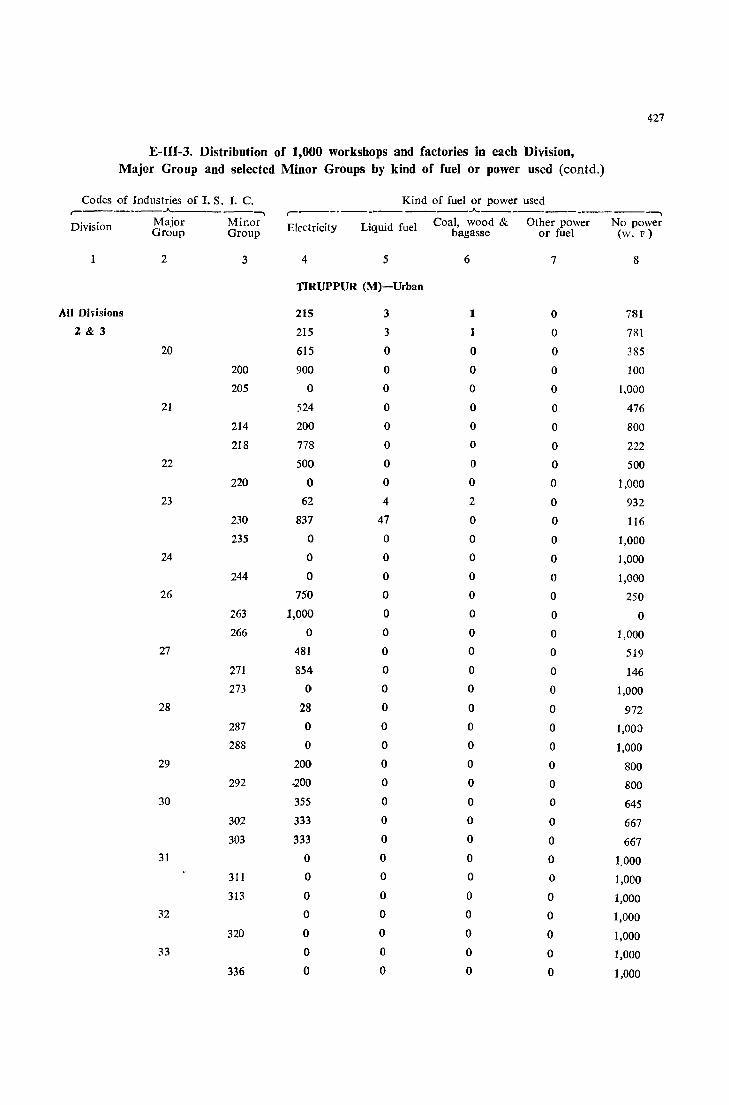
427
E-III-3. Distribution of 1,000 workshops and factories in each Division, Major Group and selected Minor Groups by kind of fuel or power used (contd.)
Codes of Industries of 1. S. I. C. Kind of fuel or power used r-----.--.A. -----, r----.--.------.A.-----------------, Division Major Minor Electricity Liquid fuel Coal, wood & Other power No power
Group Group bagasse or fuel (w. F)
1 2 3 4 5 6 7 8
TIRUPPUR (M)-Urban
All Divisions 215 3 1 0 781
2&3 215 3 0 781
20 615 0 0 0 385
200 900 0 0 0 100
205 0 ° 0 0 1,000
21 524 0 0 0 476
214 200 0 0 0 800
218 778 0 0 0 222 22 500 0 0 0 500
220 0 0 0 0 1,000 23 62 4 2 0 932
230 837 47 0 0 116 235 0 0 0 0 1,000
24 0 0 0 0 1,000
244 0 0 0 0 1,000 26 750 0 ° ° 250
263 1,000 0 0 0 0 266 0 0 0 ° 1,000
27 481 0 0 0 519 271 854 0 ° ° 146 273 0 ° 0 0 1,000
28 28 0 0 0 972 287 0 0 0 0 1,000 288 0 0 0 0 1,000
29 200 ° ° 0 800 292 .200 ° 0 0 800
30 355 ° 0 a 645 302 333 0 0 0 667 303 333 0 0 0 667
31 0 0 0 0 1,000 311 0 0 ° 0 1,000 313 0 ° 0 0 1,000
32 0 0 0 0 1,000 320 ° 0 ° 0 1,000
33 0 0 0 0 1,000 336 0 0 0 0 1,000
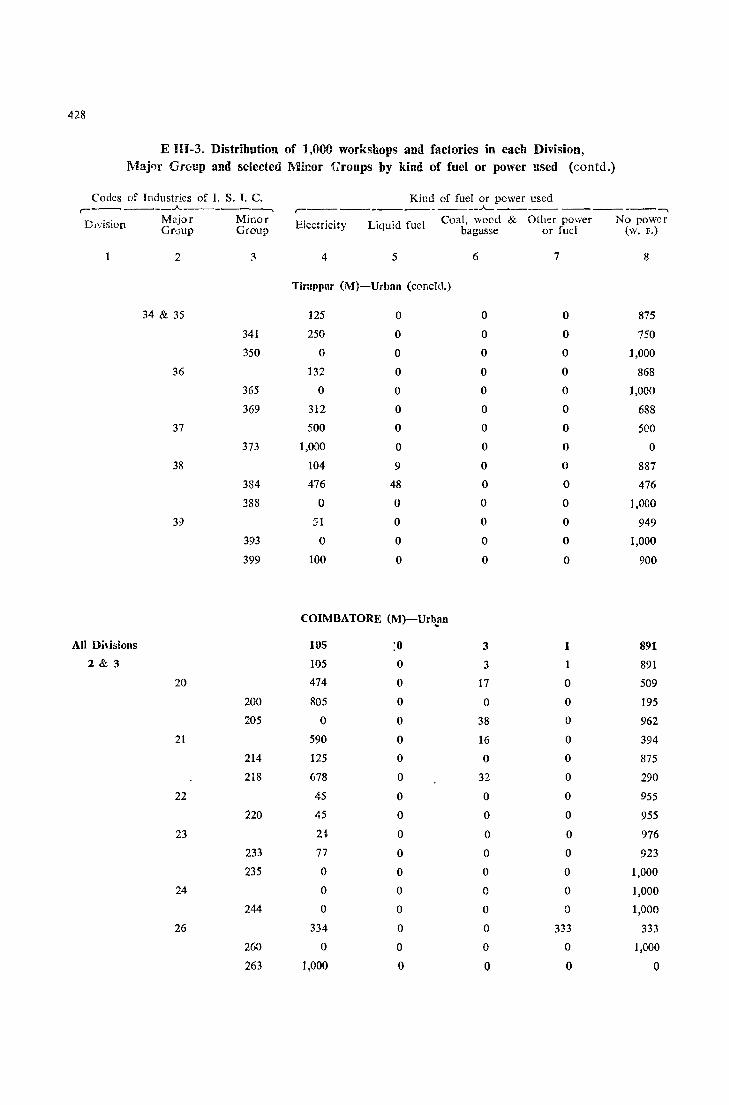
428
E lU-3. Distribution of 1,000 workshops and factories in each Division, Maj'Jf GrutlP and selected Minor 'Croups by kind of fuel or power used (contd.)
Codes of Industries of I. S. I. C. Kind of fuel or power used r--- ____ .A. _____ ___, r--------.------...A..------------, DIvision Mnjor Minor
Group Group Electricity Liquid fuel Coal, \vood & Other power No power
bagasse or fuel (w. F.)
2 4 5 6 7 8
Tiruppur (M)-Urban (concld.)
34 & 35 125 0 0 0 875
341 250 0 0 0 750
350 0 0 0 0 1,000
36 132 0 0 0 868
365 0 0 0 0 1,000
369 312 0 0 0 688
37 500 0 0 0 500
373 1,000 0 0 0 0
38 104 9 0 0 887
384 476 48 a 0 476
388 0 0 0 0 1,000
31 0 0 0 949
393 0 0 0 0 1,000
399 100 0 0 0 900
COIMBATORE (M)-Urb_an
All Dhisions 105 :0 3 1 891
2&3 105 0 3 1 891
20 474 0 17 0 509
200 805 0 0 0 195
205 0 0 38 0 962
21 590 0 16 0 394
214 125 0 0 0 875
218 678 0 32 0 290
22 45 0 0 0 955
220 45 0 0 0 955
23 24- 0 0 0 976
233 77 0 0 0 923
235 0 0 0 0 1,000
24 0 0 0 0 1,000
244 0 0 0 0 1,000
26 334 0 0 333 333
260 0 0 0 0 ],000
263 1,000 0 0 0 0
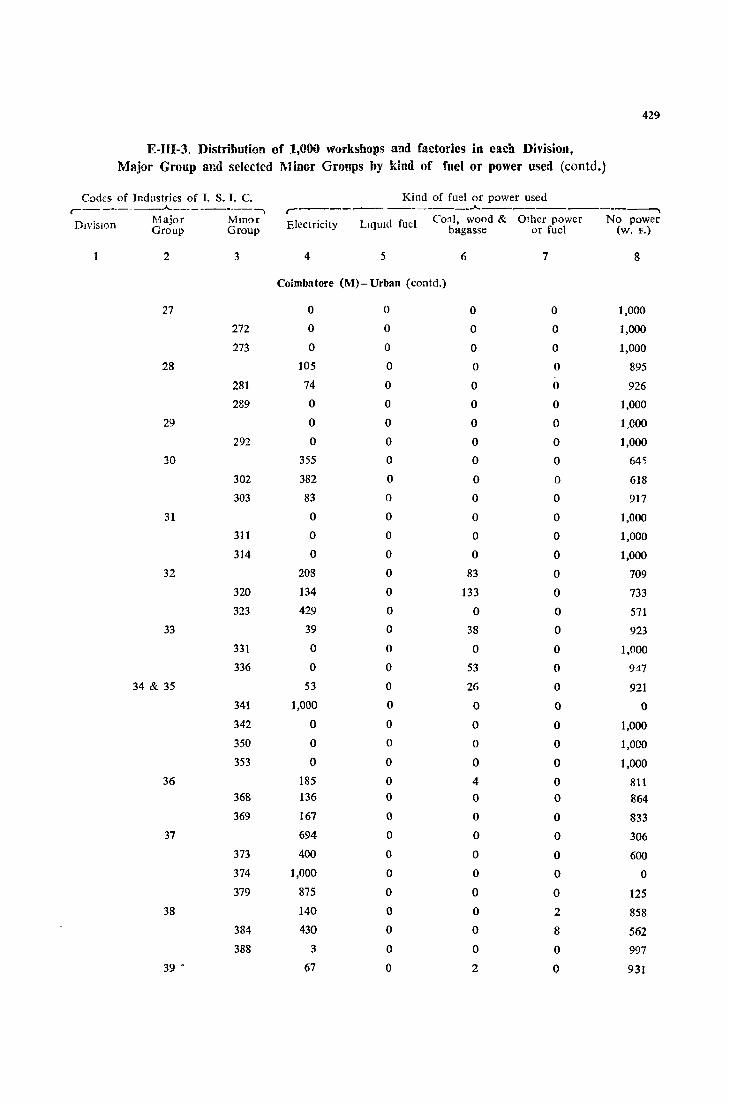
429
E-IU-3. Distribution of 1,000 workshops and factories in ellch Division, Major Group and selected Minor Groups by kind of fuel or power used (contd.)
Codes of Industries of I. S. I. C. Kind of fuel or power used r--- _. ____ ...A-_______ , ...-_____________ .A. _______ - ____ --.,
DIviSIOn r..1ajor Mmor Electricity LIqUId fuel Co~I, wood & Other power No power Group Group bagasse or fuel (w. F.)
2 3 4 5 6 7 8
Coimbatore (M)- Urban (contd.)
27 0 0 0 0 1,000
272 0 0 0 0 1,000
273 0 0 0 0 1,000
28 105 0 0 0 895
281 74 0 0 0 926
289 0 0 0 0 1,000
29 0 0 0 0 1,000
292 0 0 0 0 ],000
30 355 0 0 0 645
302 382 0 0 0 618
303 83 0 0 0 917
31 0 0 0 0 1,000
311 0 0 0 0 1,000
314 0 0 0 0 1,000
32 208 0 83 0 709
320 134 0 133 0 733
323 429 0 0 0 571
33 39 0 38 0 923
331 0 0 0 0 1,000
336 0 0 53 0 947
34 & 35 53 0 26 0 921
341 1,000 0 0 0 0
342 0 0 0 0 1,000
350 0 0 0 0 1,000
353 0 0 0 0 1,000
36 185 0 4 0 811 368 136 0 0 0 864
369 167 0 0 0 833 37 694 0 0 0 306
373 400 0 0 0 600
374 1,000 0 0 0 0
379 875 0 0 0 125 38 140 0 0 2 858
384 430 0 0 8 562
388 3 0 0 0 997 39 ' 67 0 2 0 931
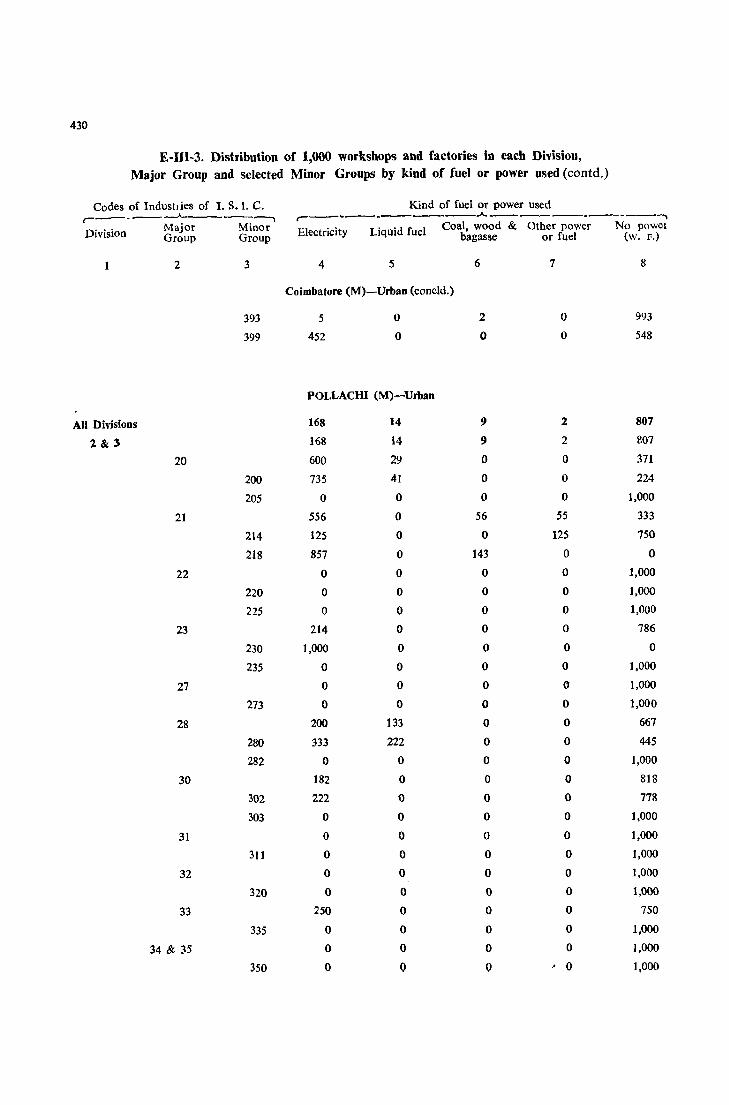
430
E-IU-3. Distribution of 1,000 workshops and factories in each Division, Major Group and selected Minor Groups by kind of fuel or power used (eontd.)
Codes of IndustJ ies of I. S. 1. C. ,_ .. _---"----- .............
Division
1
All Divisions
2&3
Major Minor Group Group
2
20
21
22
23
27
2&
30
31
32
33
34 &. 35
3
393
399
200
205
214
218
220
225
230
235
273
280
282
302
303
311
320
335
350
Kind of fuel or power used r-------------.A.------------""""" Electricity Liquid fuel Coal, wood & Other power No powel
bagasse or fuel (w. F.)
4 5
Coimbatore (M)-Urban (coneld.)
5
452
o o
POLLACHI (M)-Urban
168 14
168 14
600 29
735 41
0 0
556 0
125 0
857 0
0 0
0 0
0 0
214 0
1,000 0
0 0
0 0
0 0
200 133
333 222
0 0
182 0
222 0
0 0
0 0
0 0
0 0
0 0
250 0
0 0
0 0
0 0
6
2
o
9
9
0
0
0
56
0
143
0
0
0
0
0
0
0
0
0
0
0
0
0
0
0
0
0
0
0
0
0
0
7
o o
2
2
0
0
0
55
125
0
0
0
0
0
0
0
0
0
0
0
0
0
0
0
0
0
0
0
0
0
0
' 0
8
993
548
807
807
371
224
1,000
333
750
0
1,000
1,000
1,000
786
0
1,000
1,000
1,000
667
445
1,000
818
778
1,000
1,000
1,000
1,000
1,000
750
1,000
1,000
1,000
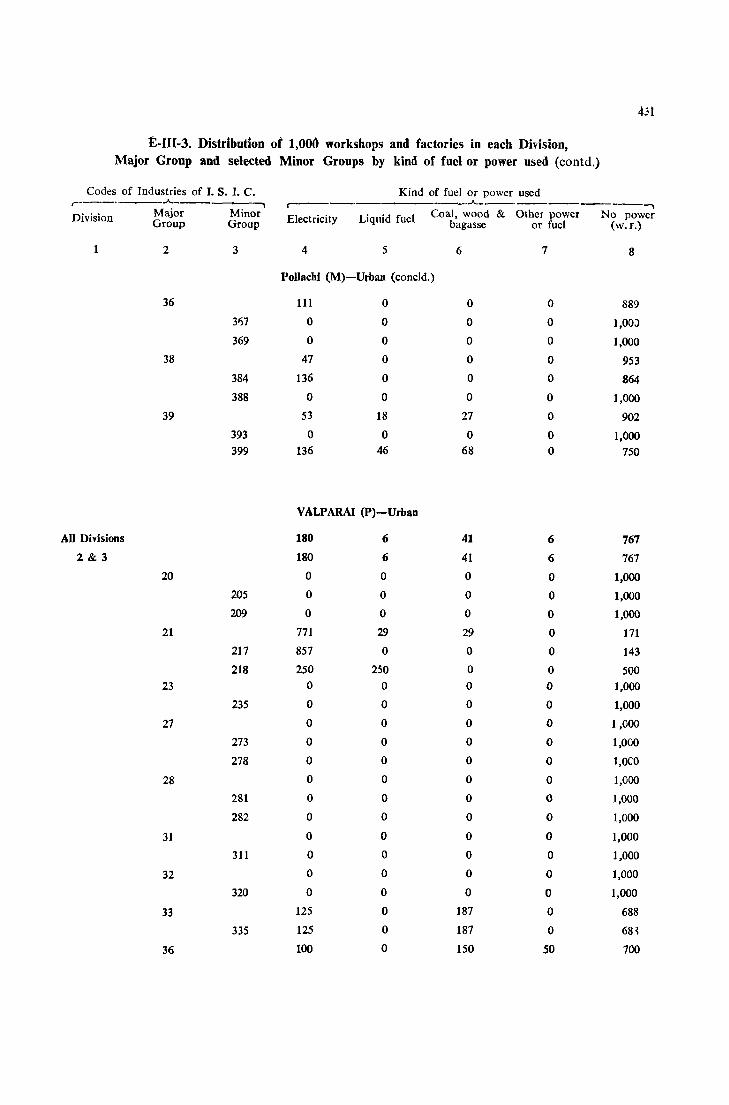
£-111-3. Distribution of 1,000 workshops and factories in each Division, Major Group and selected Minor Groups by kind of fuel or power used (contd.)
Codes of Industries of I. S. I. C. Kind of fuel or power used
431
r--" ,.A_ r----- ---"-------------. Major Minor Division Electricity Liquid fuel Coal, wood & Other power No power Group Group bagasse or fuel (W.F.)
1 2 3 4 5 6 7 8
Pollachi (M)-Urban (coneld.)
36 111 0 0 0 889
367 0 0 0 0 1,00:>
369 0 0 0 0 1,000
38 47 0 0 0 953
384 136 0 0 0 864
388 0 0 0 0 1,000
39 53 18 27 0 902
393 0 0 0 0 1,000 399 136 46 68 0 750
VALPARAI (P)-Urban
All Divisions 180 6 41 6 767
2&3 180 6 41 6 767
20 0 0 0 0 1,000
205 0 0 0 0 1,000
209 0 0 0 0 1,000
21 771 29 29 0 171 217 857 0 0 0 143
218 250 250 0 0 500 23 0 0 0 0 1,000
235 0 0 0 0 1,000
27 0 0 0 0 1 ,000
273 0 0 0 0 1,000
278 0 0 0 0 I,oeo 28 0 0 0 0 1,000
281 0 0 0 0 1,000
282 0 0 0 0 1,000
31 0 0 0 0 1,000
311 0 0 0 0 1,000
32 0 0 0 0 1,000
320 0 0 0 0 1,000
33 125 0 187 0 688
335 125 0 187 0 68~
36 100 0 150 50 700
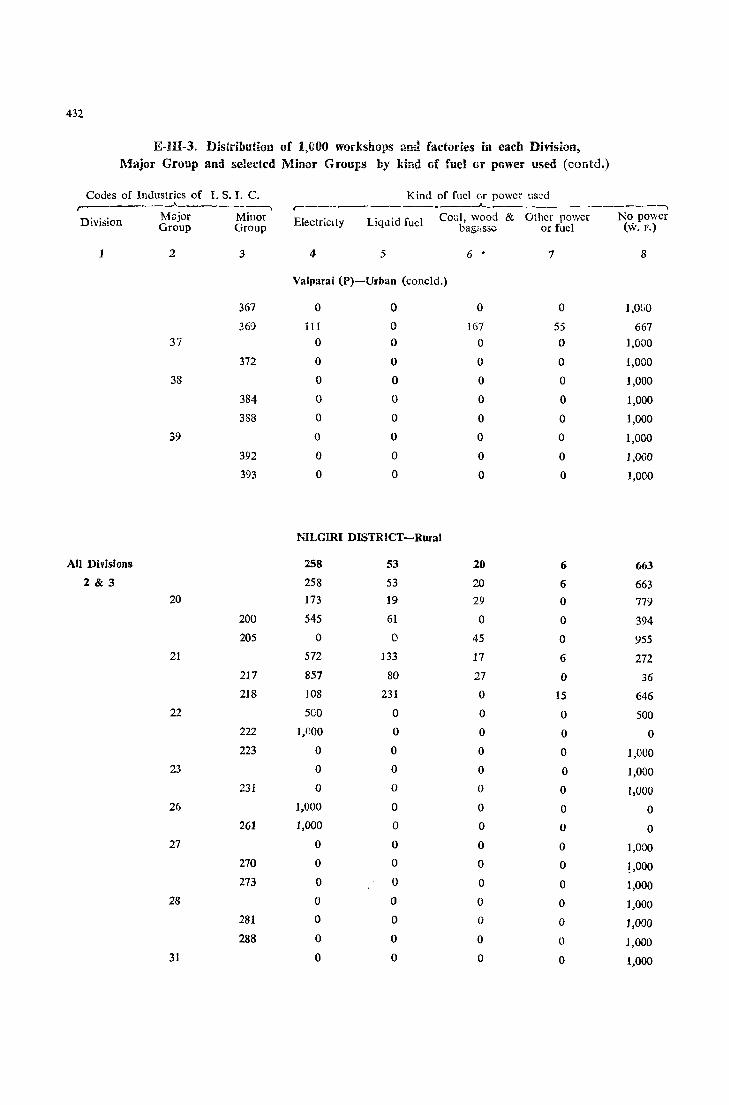
432
E-UI-3. Distribution of 1,000 wor.kshoils and factories in each Division) Major Group and se!ectcd Minor GrouFs by kind Gf fucl or power used (contd.)
Codes of Industries of I. s. 1. C. Kind of fuel or power used ,-___ ~_.A_ _____ ____, ,-_____________ .A_ _______________ -,
Liquid fuel Co:::l, wood & Other powcr No power bag"sse or fuel (w. F.) Electricity MOljor Minor
Group Group Division
1 2 3 4 5 6 • 7 8
Valparai (P)-Urban (concld.)
367 0 0 0 0 I,OGO
369 ill 0 167 55 667 37 ° 0 ° 0 1,000
372 0 0 0 0 1,000
38 0 0 0 0 1,000
384 0 0 0 0 1,000
383 0 0 ° ° 1,000
39 0 0 0 0 1,000
392 ° 0 0 0 I,ODO
393 0 0 ° 0 1,000
NIL GIRl DISTRICT-Rural
All Divisions 258 53 20 6 663
2&3 258 53 20 6 663 20 173 19 29 0 779
200 545 61 0 ° 394
205 0 0 45 ° 955
21 572 133 17 6 272
217 857 80 27 0 36
218 108 231 0 15 646
22 500 0 0 0 500
222 1,000 0 ° ° ° 223 ° ° 0 ° 1,000
23 ° 0 ° ° 1,000
231 0 0 0 0 1,000
26 1,000 0 0 ° 0
261 1,000 0 0 0 0 27 0 0 0 0 1,000
270 0 0 0 0 !,OOO 273 0 C 0 0 1,000
28 0 0 0 0 1,000
281 0 0 0 0 1,000 288 ° 0 0 0 1,000
31 ° 0 0 ° 1,000
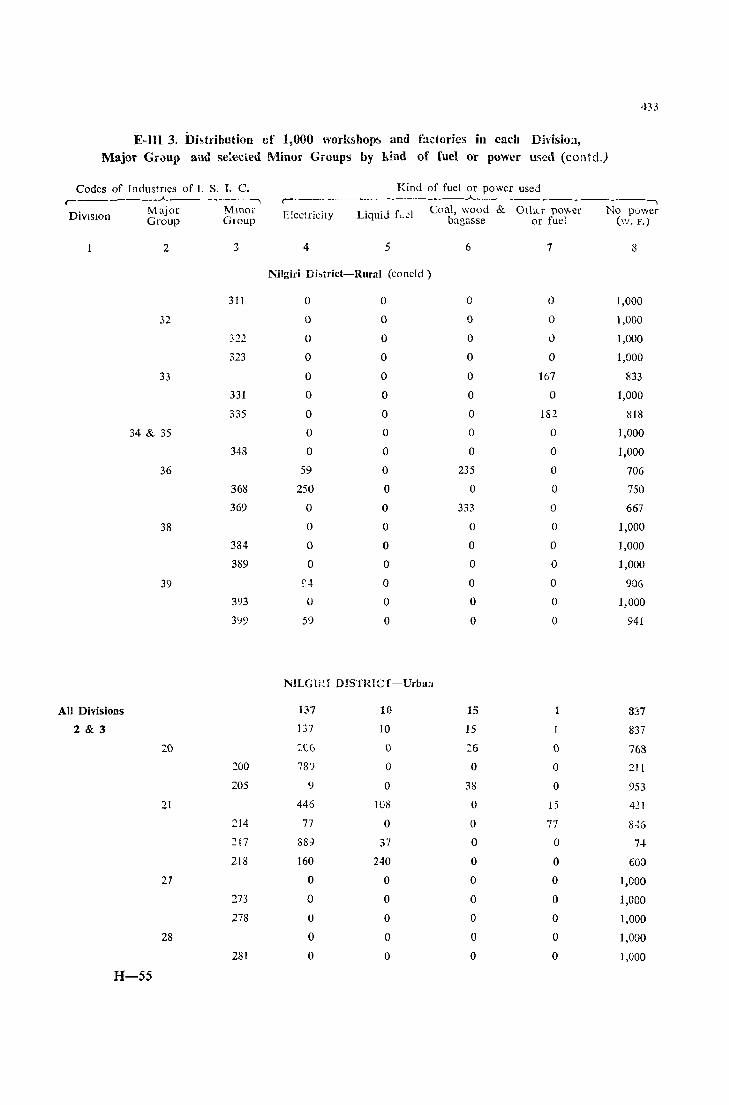
433
E-Ill 3. Dhtribulion of 1,000 workshop~ and factories in each Divisio:l, Major Gr;,)up and se:ected Minor Groups by kind of fuel or power used (contd.)
Codes of Industries of T. S. T. C. Kind of fuel or power used ,--------'----------, ,' ________ • _____ ..A.. ________ • __ • __ ,
DivIsIon Major Minor Electricity Liquid L~l C"al, wood & Othlf po\\cr No power Group GIOUp bagasse or fuel (w. F.)
2 3 4 5 6 1 8
Nilgiri Dbtrict-Rural (conc1d)
311 0 0 0 0 1,000
32 0 0 0 0 1,000
322 0 0 0 () 1,000
323 0 0 0 0 1,000
33 0 0 0 167 833
331 0 0 0 0 1,000
335 0 0 0 182 818
34 & 35 0 0 0 0 1,000
348 0 0 0 0 1,000
36 59 0 235 0 706
368 250 0 0 0 750
369 0 0 333 0 667
38 0 0 0 0 1,000
384 0 0 0 0 1,000
389 0 0 0 0 1,000
39 :4 0 0 0 90G
393 0 0 0 0 1,000
3'19 59 0 0 0 941
NILGH:.I DISTRICf-Urba:J
All Divisions 137 10 15 1 337
2 & 3 137 10 15 837
:::0 :C6 0 :::6 0 768 200 78') 0 0 0 211
205 9 0 38 0 953
21 446 108 0 15 431
214 77 0 0 77 846
217 889 37 0 0 7..J.
218 160 240 0 0 600
27 0 0 0 0 1,000
273 0 0 0 0 I,OCO
278 0 0 0 0 1,000
28 0 0 0 0 1,000
281 0 0 0 0 1,000
H-55
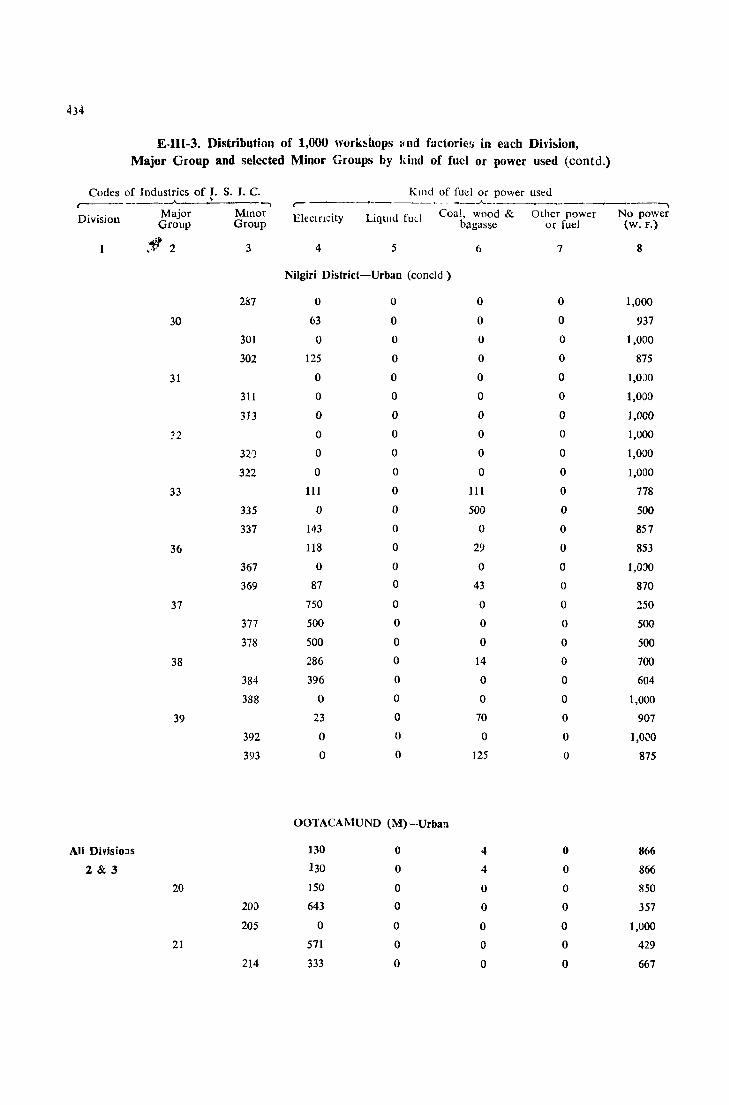
434
E-III-3. Distribution of 1,000 workshops lIud factories ill each Divi!o.ion, Major Group and selected Minor Groups by kind of fuel or power used (contd.)
Codes of Industries of I. S. I. C. Kmd of fud or power used -----"-- > ~-_____ ~ __ _.A.__~ ______ -+-_ .... ~~~~ ___ -.. -.. ~
Division Major MInor Electflcity LiqUid fuel Coal, wood & Other power No power Group Group bagasse or fuel (w. F.)
,1' 2 3 4 5 6 7 8
Nilgiri District-Urban (eoneld )
287 0 0 0 0 1,000
30 63 0 0 0 937
301 0 0 0 0 1,000
302 125 0 0 0 875
31 0 0 0 0 1,OJO
311 0 0 0 0 1,000
313 0 0 0 0 1,000
:>2 0 0 0 0 1,000
32') 0 0 0 0 1,000
322 0 0 0 0 1,000
33 111 0 111 0 778
335 0 0 500 0 500
337 143 0 0 0 857
36 118 0 29 0 853
367 0 0 0 0 1,030
369 87 0 43 0 870
37 750 0 0 0 250
377 500 0 0 0 500
378 500 0 0 0 500
38 286 0 14 0 700
384 396 0 0 0 604
388 0 0 0 0 1,000
39 23 0 70 0 907
392 0 0 0 0 1,0(10
393 0 0 125 0 875
OOTACAMUND (M)-Vrball
All Divisioas 130 0 4 0 866
2&3 130 0 4 0 866
20 150 0 0 0 850
20:) 643 0 0 0 357
205 0 0 0 0 1,000
21 571 0 0 0 429
214 333 0 0 0 667
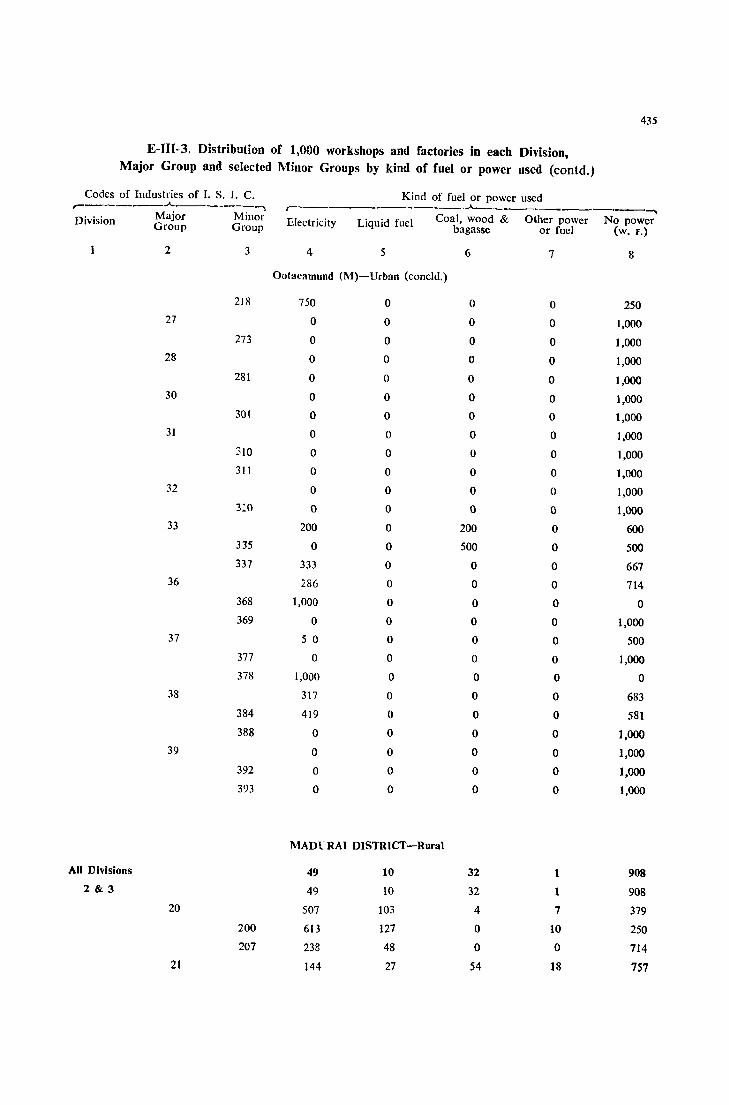
435
E-JII-3. Distribution of 1,000 workshops and factories in each Division, Major Group and selected Minor Groups by kind of fuel or power used (contd.)
Codes of Industries of I. S. I. C. Kind of fuel or power used r--------....... --------, r--------------.A-___._ _________ ~ __ """ Division Major Minor Electricity Liquid fuel Coal, wood & Oiher power No power Group Group bagasse or fuel (w. F.)
2 3 4 5 6 7 8
Ootacamund (M)-Urban (coneld.)
218 750 0 0 0 250 27 0 0 0 0 1,000
273 0 0 0 0 1,000 28 0 0 0 0 1,000
281 0 0 0 0 1,000 30 0 0 0 0 1,000
301 0 0 0 0 1,000 31 0 0 0 0 1,000
310 ° 0 0 0 1,000 311 0 0 0 0 1,000
32 0 0 0 0 1,000 3:0 0 0 0 0 1,000
33 200 0 200 0 600 335 0 0 500 0 500
337 333 0 0 0 667 36 286 0 0 0 714
368 1,000 0 0 0 0
369 0 0 0 0 1,000 37 5 0 0 0 0 500
377 0 0 0 0 1,000
378 1,000 ° 0 0 0 38 317 0 0 0 683
384 419 0 0 0 581
388 0 0 0 0 1,000 39 ° 0 0 0 1,000
392 0 0 0 0 1,000
393 0 0 0 0 1,000
MAD1-RAI DISTRICT-Rural
All Divisions 49 10 32 1 908 2&3 49 10 32 1 908
20 507 103 4 7 379
200 613 127 0 10 250
207 238 48 0 0 714
21 144 27 54 18 757
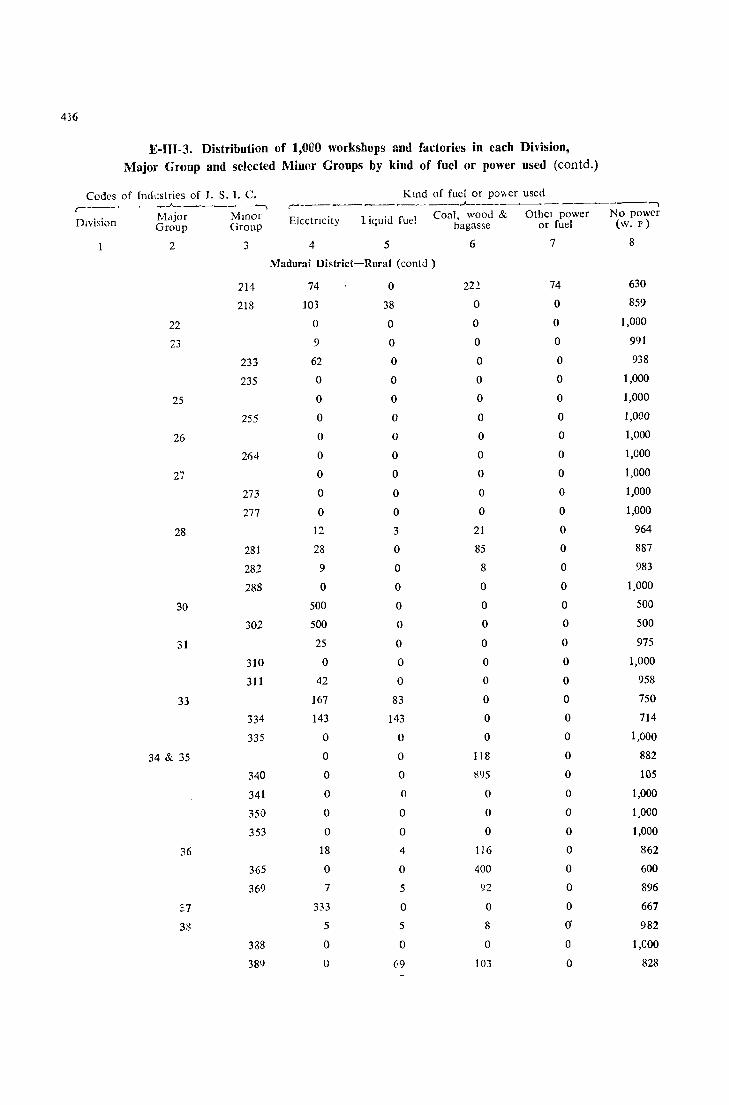
436
E-IH-3. Distribution of 1,000 workshops and factories in each Division, Major Group and selected Minor Groups by kind of fuel or power used (eontd.)
Codes of IndLlstries of J. S. 1. C. Kllld of fuel or po\\er uscd ,-- ..A. _____ -------, c---------------"--------------., Division
r-,Ltjor Mmor Electricity 1 iquid fuel Coal, wood & Othel power No power Group Group bagasse or fuel (w. F)
2 3 4 5 6 7 8
Madurai District-Rural (eontd )
214 74 0 222 74 630
218 103 38 0 0 859
22 0 0 0 0 1,000
23 9 0 0 0 991
233 62 0 0 0 938
235 0 0 0 0 1,000
25 0 0 0 0 ],000
255 0 0 0 0 ],000
26 0 0 0 0 1,000
264 0 0 0 0 ],COO
27 0 0 0 0 1,000
273 0 0 0 0 1,000
277 0 0 0 0 1,000
28 12 3 21 0 964
281 28 0 85 0 887
282 9 0 8 0 983
288 0 0 0 0 ],000
30 500 0 0 0 500
302 500 0 0 0 500
31 25 0 0 0 975
3]0 0 0 0 0 1,000
311 42 0 a 0 958
33 167 83 0 0 750
334 143 ]43 0 0 714
335 0 0 0 0 1,000
34 & 35 0 0 118 0 882
340 0 0 895 0 105
341 0 0 0 0 1,000
350 0 0 0 0 l,OCO
353 0 0 0 0 1,000
36 18 4 116 0 862
365 0 0 400 0 600
369 7 5 92 0 896
:'7 333 0 0 0 667
38 5 5 8 O· 982
338 0 0 0 0 ] ,COO
389 0 69 103 0 828

437
E-III-3. Distribution of 1,000 workshops and factories in each Division, Major Group and selected Minor Groups by kind of fuel or power used (contd.)
Codes of Industries of I. S. r. C. ,-__ ~" ___ ..A. ___ ~ __ .-.,
DIvisIOn
All Divisions
2 & 3
Major Minor Group Group
2
39
20
21
22
23
24
26
27
28
29
30
3
393
399
200
25
207
214
218
221
225
233
235
264
266
273
274
281
282
292
302
Kind of fuel or power used r---------- __ ..A.__ -~---"--~-_ __,
Electricity Liquid fuel Coal, wood & Other power No power bagasse or fuel (w. F.)
4 5
Madurai District-Rural (coneld.)
7
o 222
MADURAI
97
97
585
F38
27
481
469
120
724
]07
0
214
16
38
0
0
284
0
870
6
4
0
86
83
62
615
4-'14
109
102
4
4
o
DISTRICT-Urban
1
1
10
17
0
0
0
0
0
0
0
0
0
0
0
0
0
0
0
0
0
0
0
0
0
0
0
0
6
99
103
o
8
8
J3
4
35
0
36
65
13
0
0
0
u
0
J
0
0
0
0
0
0
0
0
0
0
0
0
0
0
7
o o o
1
0
0
0
0
0
0
0
0
0
0 (J
U
0
0
0
0
0
0
0
0
0
0
0
0
0
0
0
8
890
893
778
893
893
392
141
938
519
495
815
263
893
I,COO
786
983
962
I,COO
1,000
716
1,000
130
994
996
1,000
914
917
938
385
556
891
898
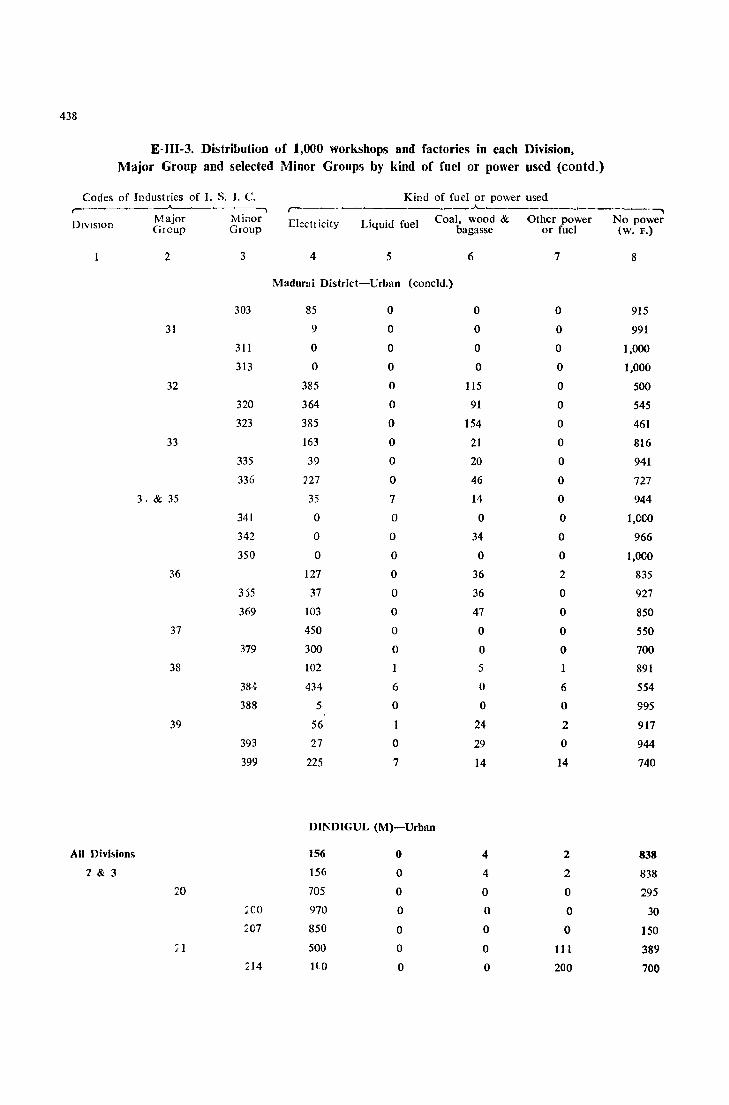
438
E-1I1-3. Distribution of 1,000 workshops and factories in each Division, Major Group and selected Minor Groups by kind of fuel or power used (contd.)
Codes of Industries of 1. S. J. C. Kind of fuel or power used .-------~~----------, ---"----~--- .. ---- -~
Major Minor DIvISion OIOUP Group
2
31
32
33
3, & 35
36
37
38
39
All nivi~ions
'1 & 3
20
; 1
3
303
311
313
320
323
335
336
341
342
350
355
369
379
384
388
393
399
~co
:07
214
E1ectl icity Liquid fuel Coal, wood & Other power
4 5
Madurai District-Urban (concld.)
85
9
o o
385
364
385
163
39
227
35
o o o
127
37
103
450
300
102
434
5
56
27
225
o o o o o o o o o o 7
o o o o o o o o 1
6
o
o 7
DIl"DlGUL (M)-Urban
156 0
156 0
705 0
970 0
850 0
500 0
1(0 0
bagasse or fuel
6
o o o o
115
91
154
21
20
46
14
o 34
o 36
36
47
o o 5
o o
24
29
14
4
4
0
0
0
0
0
7
o o o o o o o o o o o o o o 2
o o o o 1
6
o 2
o 14
2
2
0
0
0
III 200
No power (W. F.)
8
915
991
1,000
1,000
500
545
461
816
941
727
944
I,OCO
966
1,000
835
927
850
550
700
891
554
995
917
944
740
838
838
295
30
150
389
700

439
E-III-3. Distribution of 1,000 work5hop,> and fact()ries in each Divi'Sion, Major Group and selected Minor Groups by kind of fuel or pGwer used (contd.)
Codes of Industries of I. S. I. C. Kmd of fuel or power used --"-_ . ------., ,-~ ____ ~ _~ ____ _J...__ ___ .~-----...-___ ~ __ -------,
DiVIsion Major Mmor Electricity LIqUId fuel CO.tl, \\ood & Other power No power Group Group bJgas:::c or fuel (w. F)
2 3 4 5 6 7 8
Diudigul (M)-Urbau (coutd.)
218 1,000 0 0 0 0
22 ·143 0 0 0 857
221 0 0 0 0 1,000
225 214 0 0 0 786
23 9 0 0 0 991
233 0 0 0 0 1,000
235 0 0 0 0 1,000
27 0 0 0 0 1,000
273 0 0 0 0 1,000
28 75 0 0 0 925
282 143 0 0 0 857
289 0 0 0 0 1,000
29 0 0 0 0 1,000
292 0 0 0 0 1,000
30 125 0 0 0 875
302 118 0 0 0 882
303 0 0 0 ° 1,000
31 16 0 0 0 984
311 0 0 0 0 1,000
313 0 0 0 ° 1,000
32 250 0 0 0 750
323 0 0 0 0 1,000
33 111 0 0 0 889
331 0 0 0 0 1,000
335 0 0 0 0 1,000
31 .R~ 35 38 0 0 0 962
341 ° 0 a ° 1,000
343 77 0 0 0 923
350 0 0 0 0 1,000
36 97 0 24 0 879
367 0 0 0 0 1000
369 93 0 26 0 881
37 500 0 0 0 500
370 500 0 0 0 :00
38 80 0 0 0 92)
384 407 0 0 0 593
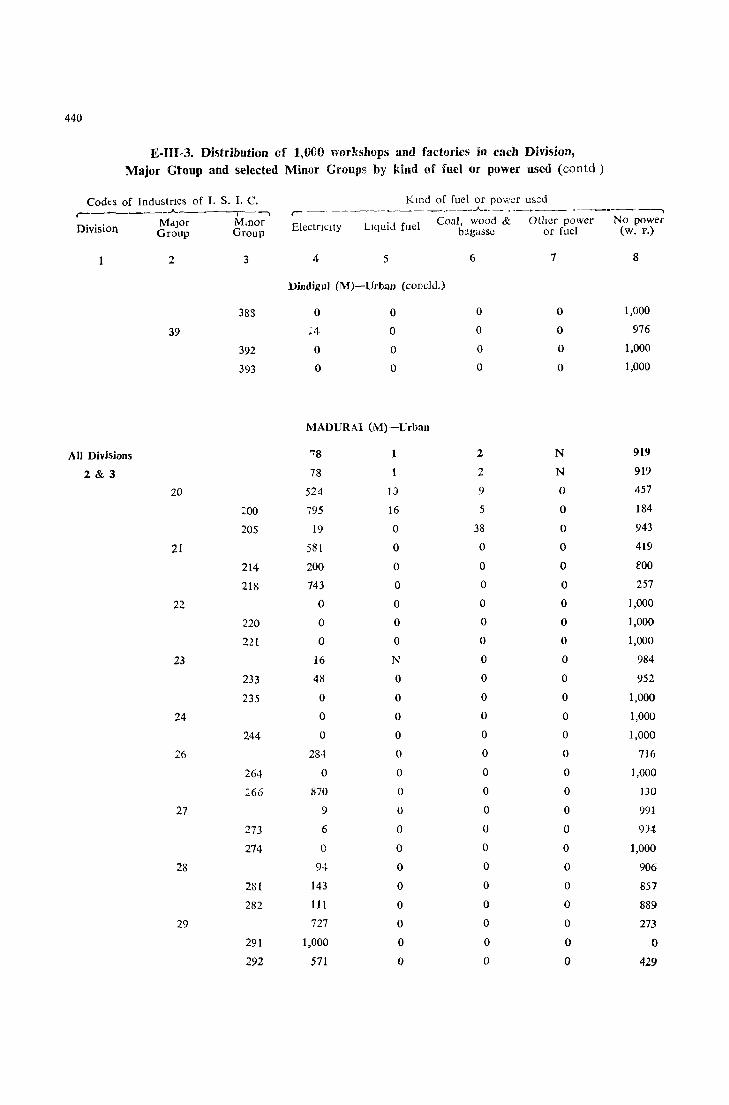
440
E-IlI-3. Distribution of I,OuO worlishops and factories in each Division, Major Gtoup and selected Minor Groups by kind of fuel or power used (contd)
Codes of Industnes of 1. S. 1. C. Kind of fuel or power us~d , ___________ • ___ ..A.. __ ~ __ ~------- _____
Liquid fuel Coal, wood & Other power No power b~gasse or fuel (w. F.) Eleetnclty
~ _________ ..A..-____ --~--~
Major Minor Group Group Division
2 3 4 5 6 7 8
DindiguJ (M)-Urban (collcld.)
383 0 0 0 0 1,000
39 :4 0 0 0 976
392 0 0 0 0 1,000
393 0 0 0 0 1,000
MADURAI (M)-Urban
All Divisions 78 1 2 N 919
2&3 78 1 2 N 919
20 524 IJ 9 0 457
:200 795 16 5 0 184
205 19 0 38 0 943
21 581 0 0 0 419
214 200 0 0 0 fOO
218 743 0 0 0 257
22 0 0 0 0 1,000
220 0 0 0 0 1,000
221 0 0 0 0 1,000
23 16 N 0 0 984
233 48 0 0 0 952
235 0 0 0 0 1,000
24 0 0 0 0 1,000
244 0 0 0 0 1,000
26 284 0 0 0 716
264 0 0 0 0 1,000
266 870 0 0 0 130
27 9 0 0 0 991
273 6 0 0 0 9J-t
274 0 0 0 0 1,000
28 94 0 0 0 906
281 143 0 0 0 857
282 111 0 0 0 889
29 727 0 0 0 273
291 1,000 0 0 0 0
292 571 0 0 0 429
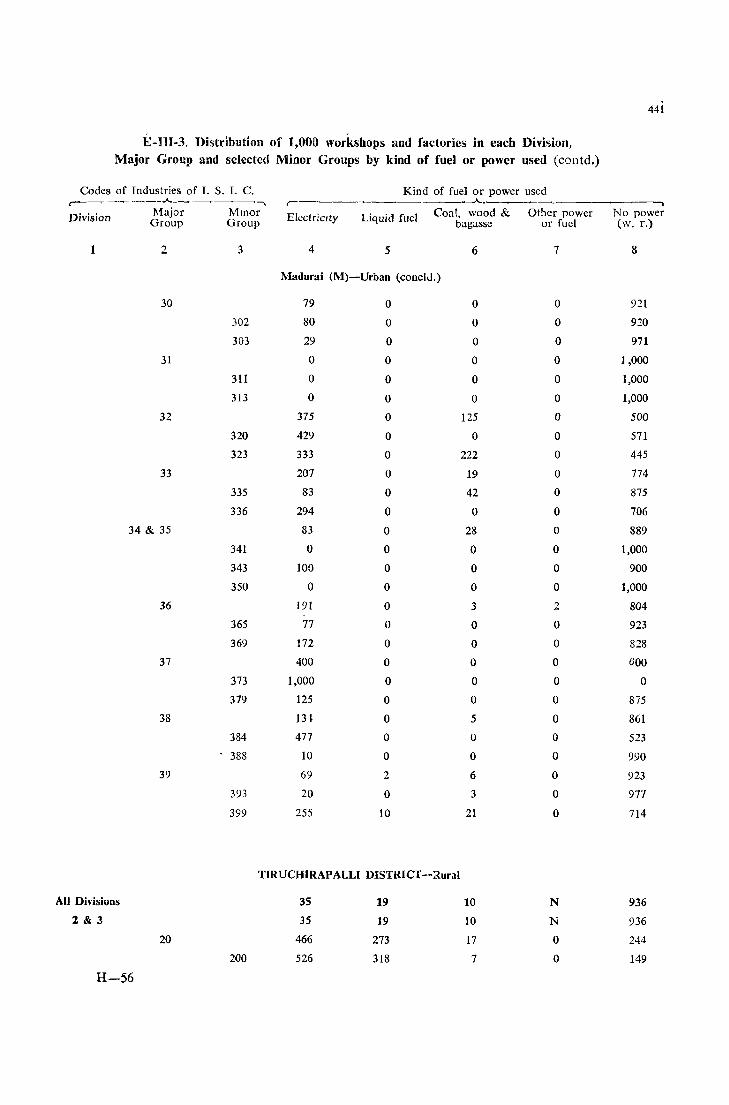
441
E-IlI-3. Distribution of 1,000 workshops and factories in each Division, Major Group and selected Minor Groups by kind of fuel or power used (contd.)
Codes of Industries of I. S. I. C. Kind of fuel or power used ~ __ ~ __ ..A.. __ ~ ____ ,
r- ------"-.
Division ]\1ajor Mlllor Electricity Liquid fuel Coal, wood & Other power No power Group Group bagasse or fuel (w. r.)
1 2 3 4 5 6 7 8
Madurai (M)-Urban (coneld.)
30 79 0 0 0 921
302 80 0 0 0 920
303 29 0 0 0 971
31 0 0 0 0 I ,000
311 0 0 0 0 1,000
313 0 0 0 0 1,000
32 375 0 125 0 500
320 429 0 0 0 571
323 333 0 222 0 445
33 207 0 19 0 774
335 83 0 42 0 875
336 294 0 0 0 706
34 & 35 83 0 28 0 889
341 0 0 0 0 1,000
343 100 0 0 0 900
350 0 0 0 0 1,000
36 191 0 3 2 804
365 77 0 0 0 923
369 172 0 0 0 828
37 400 0 0 0 600
373 1,000 0 0 0 0
379 125 0 0 0 875
33 13l 0 5 0 361
384 477 0 0 0 523
338 10 0 0 0 990
39 69 2 6 0 923
393 20 0 3 0 91'1
399 255 10 21 0 714
TIRUCHIRAPALLI DISTRICT-Rural
All Divisions 3S 19 10 N 936
2 & 3 35 19 10 N 936
20 466 273 17 0 244
200 526 313 7 0 149
H-56
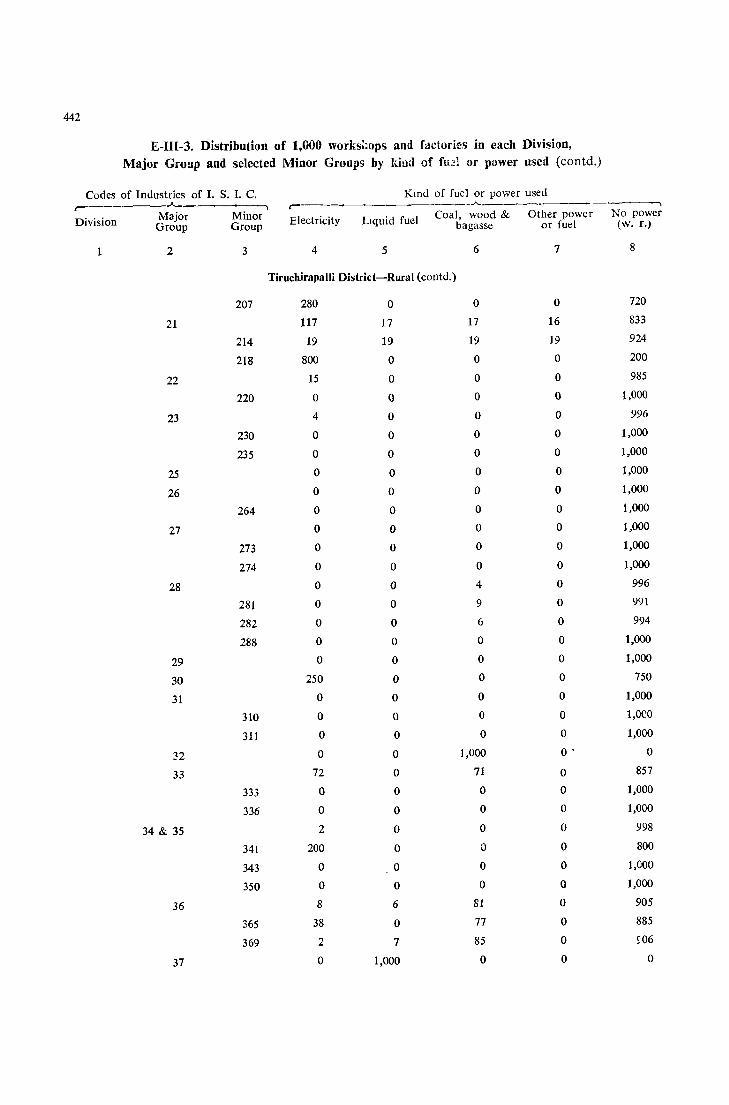
442
E-IH-3. Distribution of 1,000 works;'ops and factories in each Division, Major Group and selected Minor Groups by kind of flld or power used (eontd.)
Codes of Industries of I. S. I. C. Kmd of fuel or power used r--- --"- .----~
_.A. ___ - __ ~_
Division Major Minor Electricity LIquid fuel Coal, wood & Other power No power Group Group bagasse or fuel (W. F.)
1 2 3 4 5 6 7 8
TiruchirapalIi District-Rural (contd.)
207 280 0 0 0 720
21 117 17 17 16 833
214 19 19 19 19 924
218 800 0 0 0 200
22 15 0 0 0 985
220 0 0 0 0 1,000
23 4 0 0 0 996
230 0 0 0 0 1,000
235 0 0 0 0 1,000
25 0 0 0 0 1,000
26 0 0 0 0 1,000
264 0 0 0 0 1,000
27 0 0 0 0 1,000
273 0 0 0 0 1,000
274 0 0 0 0 1,000
28 0 0 4 0 996
281 0 0 9 0 991
282 0 0 6 0 994
288 0 0 0 0 1,000
29 0 0 0 0 1,000
30 250 0 0 0 750
31 0 0 0 0 1,000
310 0 0 0 0 1,OCO
311 0 0 0 0 1,000
~2 0 0 1,000 o· 0
33 72 0 71 0 857
333 0 0 0 0 1,000
336 0 0 0 0 1,000
34 & 35 2 0 0 0 998
341 200 0 0 0 800
343 0 0 0 0 1,000
350 0 0 0 0 1,000
36 8 6 81 0 905
365 38 0 77 0 885
369 2 7 85 0 ~06
37 0 1,000 0 0 0
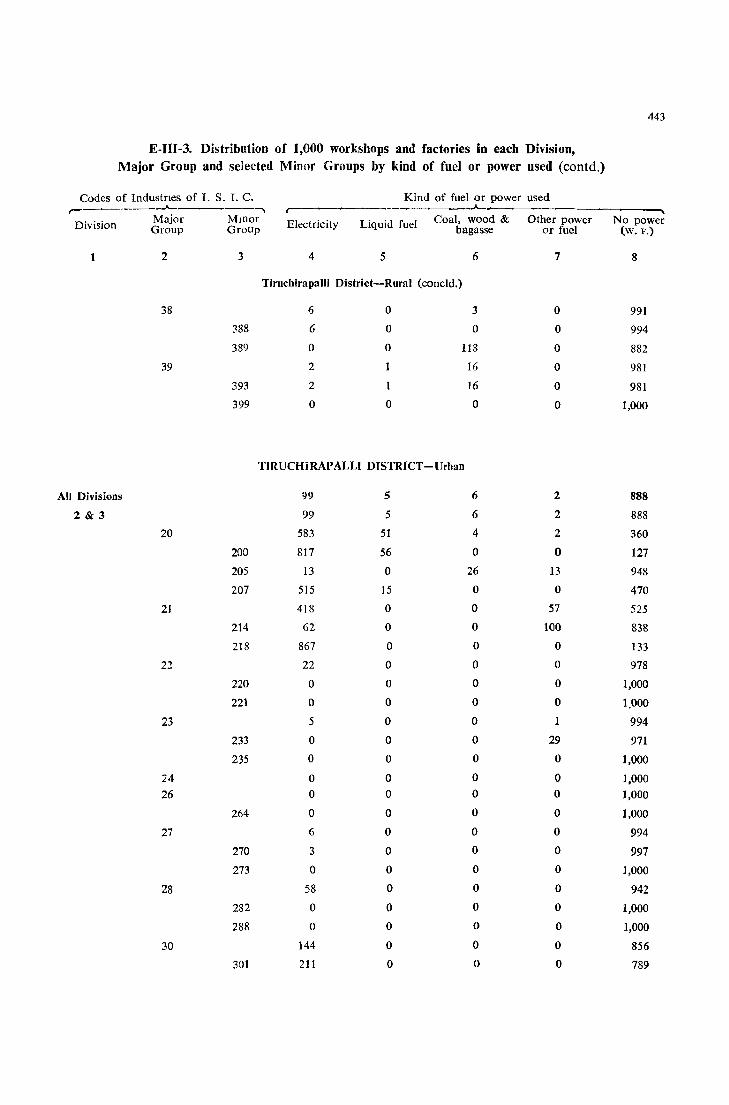
E-III-3. Distribution of 1,000 workshops and factories in each Division, Major Group and selected Minor Groups by kind of fuel or power used (contd.)
Codes of Industnes of L S. I. C. Kind of fuel or power used r---~-------~----------' ,'~ ..A..-_ D' . . Major Mmor Electricity Liquid fuel Coal, wood & Other power
IVlSlOn Group Group bagasse or fuel
1 2 3 4 5 6 7
Tiruchirapalli District-Rural (coneld.)
38 6 0 3 0
:188 6 0 0 0
389 0 0 118 0
39 2 1 16 0
393 2 16 0
399 0 0 0 0
TIRUCHiRAPALLI DISTRICT-Urban
All Divisions 99 5 6 2
2&3 99 5 6 2
20 583 51 4 2
200 817 56 0 0
205 13 0 26 13
207 515 15 0 0
21 418 0 0 57
214 62 0 0 100
218 867 0 0 0
22 22 0 0 0
220 0 0 0 0
221 0 0 0 0
23 5 0 0
233 0 0 0 29
235 0 0 0 0
24 0 0 0 0 26 0 0 0 0
264 0 0 0 0
27 6 0 0 0
270 3 0 0 0
273 0 0 0 0
28 58 0 0 0
282 0 0 0 0
288 0 0 0 0
30 144 0 0 0
301 211 0 0 0
443
No power (w. F.)
8
991
994
882
981
981
1,000
888
888
360
127
948
470
525
838
133
978
1,000
1.000
994
971
1,000
1,000 1,000
1,000
994
997
1,000
942
1,000
1,000
856
789
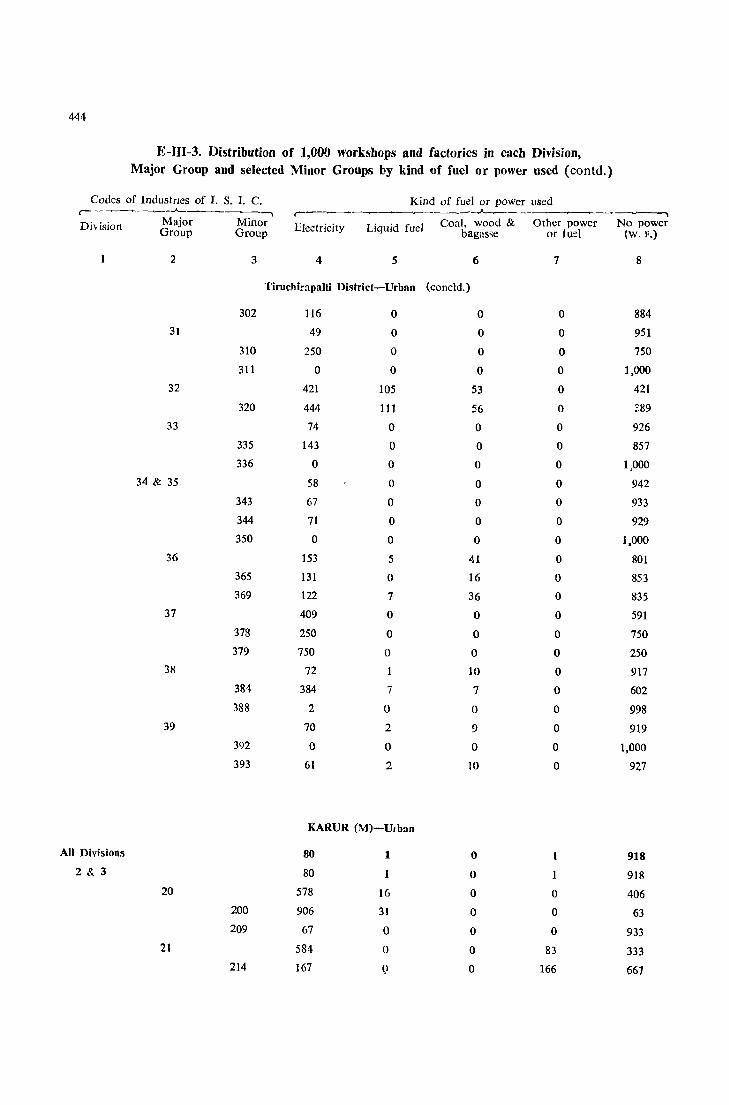
444
E-lII-3. Distribution of 1,000 workshops and factories in eacb Division, Major Group and selected Minor Groups by kind of fuel or power used (contd.)
Codes of Industnes of I. S. I. C. Kind of fuel or power used r- _ .j._-----------. r- ~_~_.A_ _
~
Division Major Minor Electricity Liquid fuel Coal, wood & Other power No power Group Group bagasse or luei (w. F.)
2 3 4 5 6 7 8
Tiruchirapalli District-Urban (concld.)
302 116 ° ° 0 884 31 49 0 0 0 951
310 250 0 0 0 750
311 0 0 0 0 1,000
32 421 105 53 0 421
320 444 III 56 0 289
33 74 0 0 0 926
335 143 0 0 0 857
336 0 0 0 0 1,000 34 & 35 58 0 0 0 942
343 67 0 0 0 933
344 71 0 0 ° 929 350 0 0 0 0 1,000
36 153 5 41 0 801 365 131 0 16 0 853 369 122 7 36 0 835
37 409 0 0 0 591 378 250 0 0 0 750 379 750 0 0 0 250
38 72 1 10 0 917 384 384 7 7 0 602 388 2 0 0 0 998
39 70 2 9 0 919 392 0 0 0 0 1,000 393 61 2 10 0 927
KARUR (M)-UJban
All Divisions 80 1 0 1 918 28.3 80 1 0 1 918
20 578 16 0 0 406 200 906 31 0 0 63 209 67 0 0 0 933
?1 584 0 0 83 333 214 167 0 0 166 667
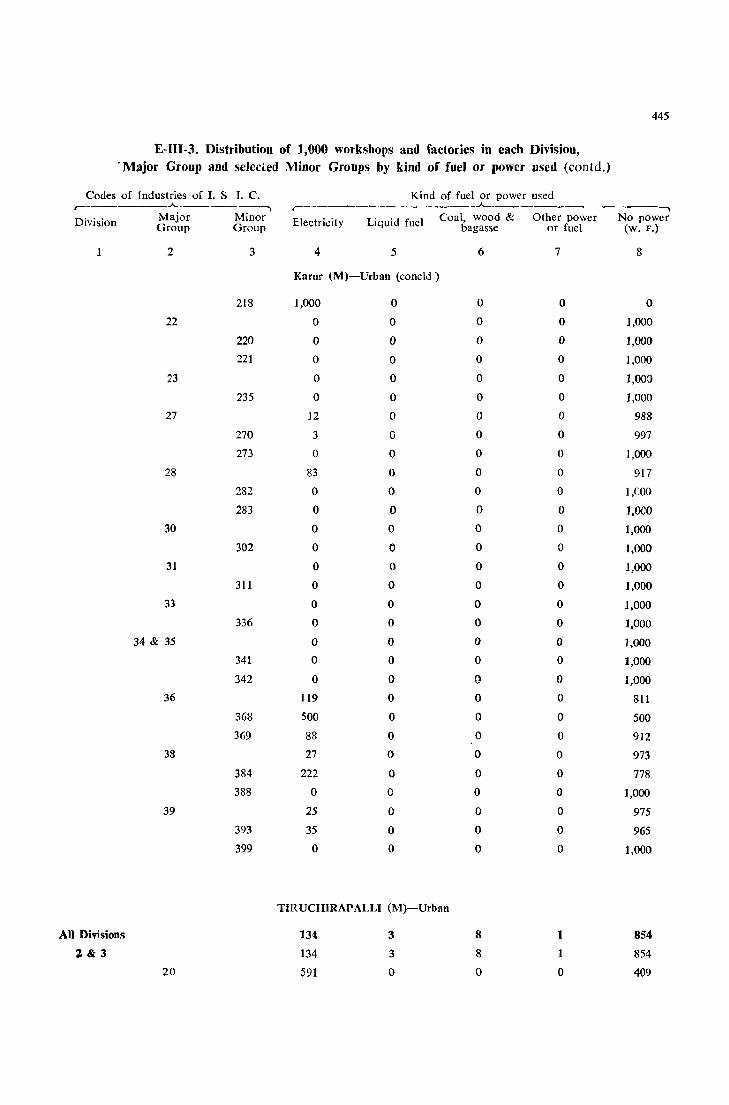
t-III-3. Distribution of 1,000 workshops and factories in each Division, . Major Group and selected Minor Groups by kind of fuel or power used (contd.)
Codes of Industries of I. S I. c. Kind of fuel or power used .-______ .A. ______ --------.
r-________ ..A-________
Division Major Minor Electricity Liquid fuel Coal, wood & Other power Group Group bagasse or fuel
2 3 4 5 6 7
Karur (M)-Urban (coneld )
218 1,000 0 0 0
22 0 0 0 0
220 0 0 0 0
221 0 0 0 0
,3 0 0 0 0
235 0 0 0 0
27 12 0 0 0
270 3 0 0 0
273 0 0 0 0
28 83 0 0 0
282 0 0 0 0
283 0 0 0 0
30 0 0 0 0
302 0 0 0 0
31 0 0 0 0
311 0 0 0 0
33 0 0 0 0
336 0 0 0 0
34 & 35 0 0 0 0
341 0 0 0 0
342 0 0 0 0
36 119 0 0 0
368 500 0 0 0
369 88 0 0 0
38 27 0 0 0
384 222 0 0 0
388 0 0 0 0
39 25 0 0 0
393 35 0 0 0
399 0 0 0 0
TIRUCHIRAPALLI (M)-Urban
All Divisions
2&3
20
134
134
591
3
3
o
8
8
o
1
o
445
-; No power
(w. F.)
8
0
1,000
1,000
1,000
1,000
1,000
988
997
1,000
917
I,COO
1,OCO
1,000
1,000
1,000
1,000
1,000
1,000
1,000
1,000
1,000
811
500
912
973
778
1,000
975
965
1,000
854
854
409
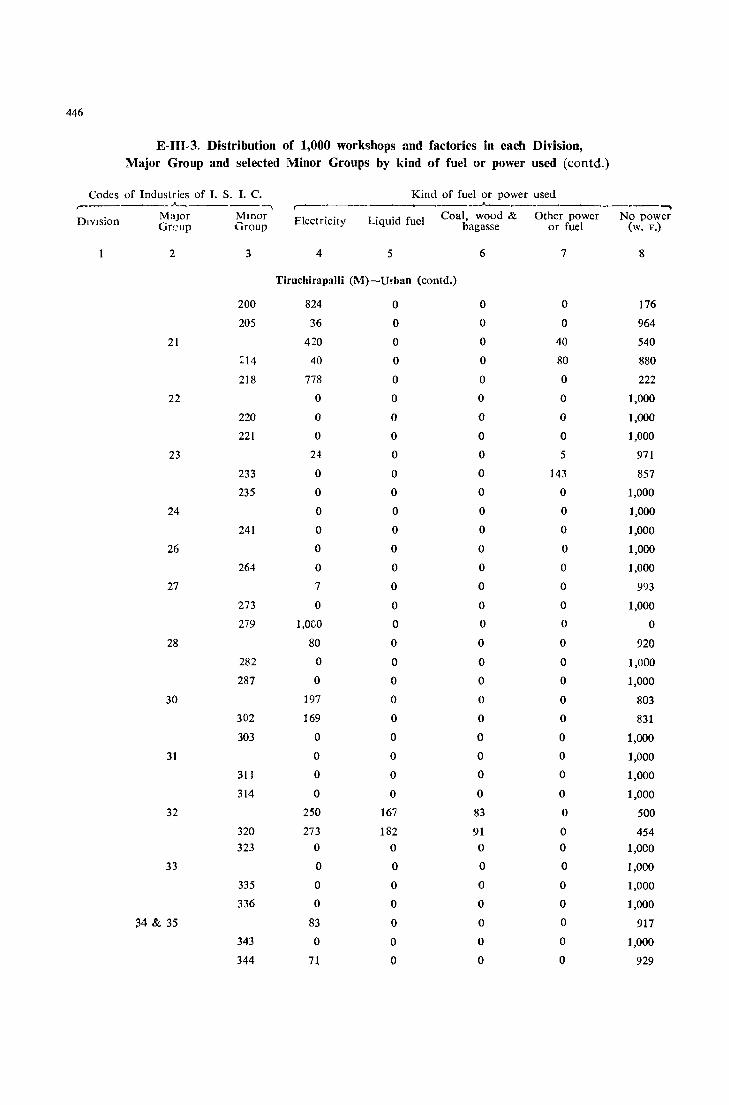
446
E-III-3. Distribution of 1,000 workshops and factories in each Division, Major Group and selected Minor Groups by kind of fuel or power used (contd.)
Codes of Industries of J. S. J. C. Kind of fuel or power used .A.._ --., ,--~
__ .A.--___ ------. DIvision Major Minor Electricity Liquid fuel Coal, wood & Other power No power
Grcup Group bagasse or fuel (w. F.)
2 3 4 5 6 7 8
Tiruchirapalli (M)-Urban (contd.)
200 824 0 0 0 176
205 36 0 0 0 964
21 420 0 0 40 540
:::14 40 0 0 80 880
218 778 0 0 0 222
22 0 0 0 0 1,000
220 0 0 0 0 1,000
221 0 0 0 0 1,000
23 24 0 0 5 971
233 0 0 0 143 857
235 0 0 0 0 1,000
24 0 0 0 0 1,000
241 0 0 0 0 1,000
26 0 0 0 0 1,000
264 0 0 0 0 1,000
27 7 0 0 0 993
273 0 0 0 0 1,000
279 1,OCO 0 0 0 0
28 80 0 0 0 920
282 0 0 0 0 1,000
287 0 0 0 0 1,000
30 197 0 0 0 803
302 169 0 0 0 831
303 0 0 0 0 1,000
31 0 0 0 0 1,000
311 0 0 0 0 1,000
314 0 0 0 0 1,000
32 250 167 83 0 500
320 273 182 91 0 454 323 0 0 0 0 1,000
33 0 0 0 0 1,000
335 0 0 0 0 1,000
336 0 0 0 0 1,000
34 & 35 83 0 0 0 917
343 0 0 0 0 1,000
344 7l 0 0 0 929

44/
1:-111-3. Distribution of 1,000 workshops and factories in each Divbion, Major Group and selected Minor Groups by kind of fuel or power used (contd.)
Codes of Industries of I. S. I. C. Kmd of fuel or power used -,
,-________ • _____ ..A.. ______________ -,
Division Major Minor I.:Jectriclty Liquid fuel Coal, wood & Other power No pJwcr Group Group bagasse or fuel (w. F)
2 3 4 5 6 7 8
Tiruchirapalli (M)-Ulban (concld.)
357 500 0 0 0 500
36 211 10 35 0 744
368 382 0 30 0 588
369 169 16 16 0 799
37 400 0 0 0 600
377 ° ° 0 ° 1,000
379 1,000 0 0 0 0
38 157 4 26 0 813
384 458 12 12 0 518
388 6 0 0 0 994
39 116 4 3 0 877
393 106 4 4 0 886
399 250 0 0 0 750
PUDUKOTTAI (M)-Urban
All Divisions 121 0 0 0 879
2&3 121 0 0 0 879
20 554 0 0 0 446
200 840 0 0 0 160
207 267 0 0 0 733
21 250 0 0 0 750
214 0 0 0 0 1,000
215 1,000 0 0 0 0
22 1,000 0 0 0 0
226 1,000 0 0 0 0
23 7 0 0 0 993
234 1,000 0 0 0 0
235 0 0 0 0 1,000
27 0 0 0 ° 1,0CO
273 0 0 0 0 1,000
28 400 0 0 0 600
280 1,000 0 0 0 0
281 0 0 0 0 1,000
30 143 0 0 0 857
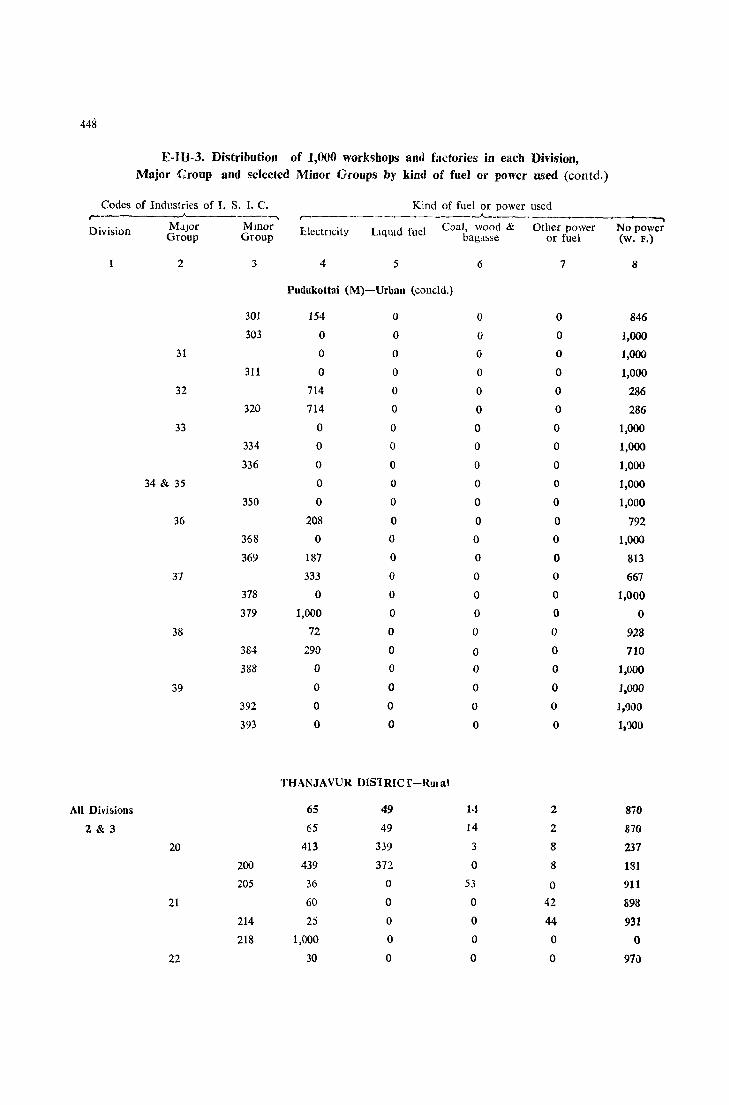
448
E-JII-3. Distribution of 1,000 workshops and factories in each Division, Major Croup and selected Minor Groups by kind of fuel or power used (contd.)
Codes of Industries of I. S. 1. C. Kind of fuel or power used r- -----,
____ ..A-___ •
Division Major Mmor :Ucctncity LiqUId fuel Coal, wood & Other power No power Group Group bagd~se or fuel (w. F.)
2 3 4 5 6 7 8
Pudukottai (M)-Urban (concld.)
301 154 0 0 0 846
303 0 0 0 0 1,000
31 0 0 0 0 1,000
311 0 0 0 0 1,000
32 714 a 0 0 286
320 714 a 0 0 286
33 0 0 0 0 1,000
334 0 0 0 0 1,000
336 0 0 0 0 1,000
34 & 35 0 0 0 0 1,000
350 0 0 0 0 1,000
36 208 0 0 0 792
368 0 0 0 0 1,000
369 187 0 0 0 813
37 333 0 0 0 667
378 0 0 0 0 1,000
379 1,000 0 0 0 0
38 72 0 0 0 928
384 290 0 0 0 710
388 0 0 0 0 1,000
39 0 0 0 0 1,000
392 0 0 0 0 1,1J00
393 0 0 0 0 1,')00
THANJA VUR DIS] RIC r -Rul al
All Divi~ions 65 49 1.' 2 870
2&3 65 49 14 2 870
20 413 339 3 8 237
200 439 372 0 8 181
205 36 0 53 0 911
21 60 0 0 42 898
214 25 0 0 44 931
218 1,000 0 0 0 0
22 30 0 0 0 97iJ
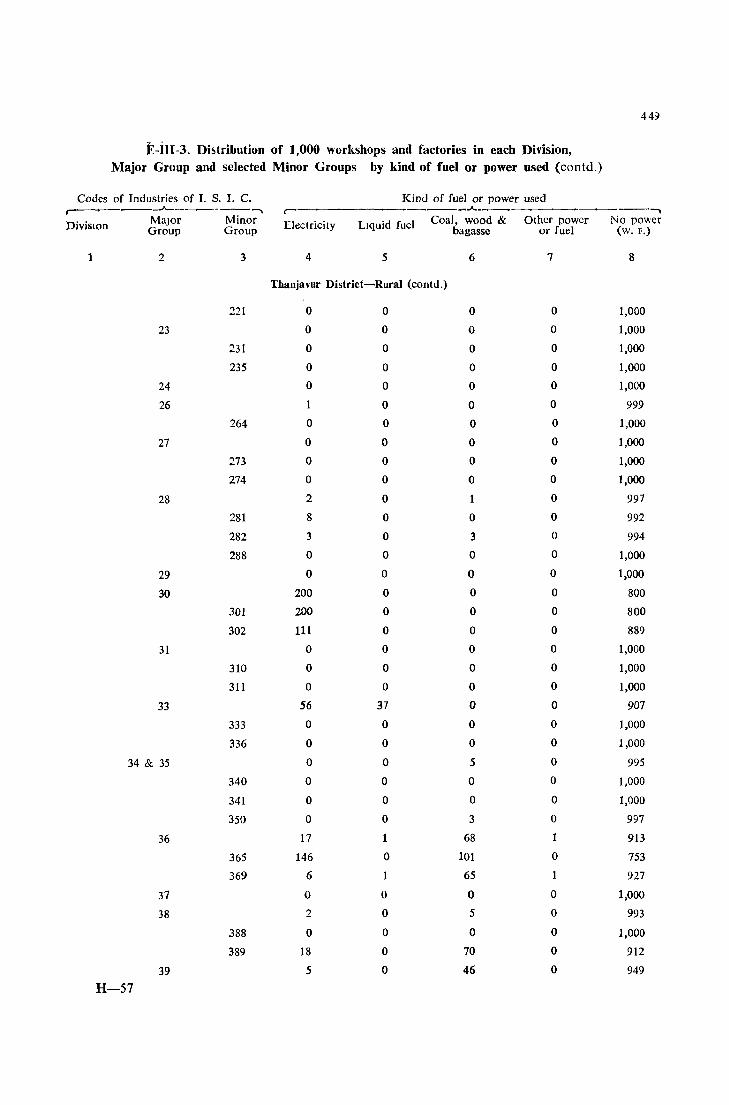
449
E-iu-3. Distribution of 1,000 workshops and factories in each Division, Major Group and selected Minor Groups by kind of fuel or power used (contd.)
Codes of Industries of I. S. I. C. Kind of fuel or power used ..-~---"""__-----. .------ __ ..A.. __ .., DivisIOn Major Minor Electricity LIquid fuel Coal, wood & Other power No power
Group Group bagasse or fuel (w. F.)
1 2 3 4 5 6 7 8
Thanjavur District-Rural (contd.)
221 0 0 0 0 1,000
23 0 0 0 0 1,000
231 0 0 0 0 1,000
235 0 0 0 0 1,000
24 0 0 0 0 1,000
26 0 0 0 999
264 a 0 0 0 1,000
27 0 0 0 0 1,000
273 0 0 0 0 1,000
274 0 0 0 0 1,000
28 2 0 0 997
281 8 0 0 0 992
282 3 0 3 0 994
288 0 0 0 0 1,000
29 0 0 0 0 1,000
30 200 0 0 0 800
301 200 0 0 0 800
302 111 0 0 0 889
31 0 0 0 0 1,000
310 0 0 0 0 1,000
311 0 0 0 0 1,000
33 56 37 0 0 907
333 0 0 0 0 1,000
336 0 0 0 0 1,000
34 & 35 0 0 5 0 995
340 0 0 0 0 1,000
341 0 0 0 0 1,000
350 0 0 3 0 997
36 17 1 68 913
365 146 0 101 0 753
369 6 1 65 1 927
37 0 0 0 0 1,000
38 2 0 5 0 993
388 0 0 0 0 1,000
389 18 0 70 0 912
39 5 0 46 0 949
H-57

450
E-iII-3. Distribution of 1,000 workshops and factories in each Divi<;iol!, Major Group and selected Minor Groups by kind of fuel or power u~ed (contd.)
Codes of Industries of I. S. I. C. r---------~ ~----------~
Division
1
All Divisions
2&3
Major Group
2
20
21
22
23
24
25
26
27
28
29
30
Minor Group
3
393
399
200
205
214
218
220
221
233
235
244
261
264
273
277
281
282
301
302
Kind of fuel or pow~r us;)d r---~--~. ______ ..A..~ ____________ ~~ __ _,
Electncity Liquid fuel Coal, wood & Other power No p::)\ver bagasse or fuel (w. F.)
4 5
Ihanjavur District-Rural (concld.)
o 88
o o
THANJA VUR DISTRICT-Urban
91 4
91 4
573 37
768 56
14 0
342 0
28 0
831 0
33 0
0 0
0 0
9 0
187 0
0 0
0 0
0 0
333 0
3 0
0 0
0 0
0
0
0 0
71 0
65 0
22 0
0 0
319 0
227 0
358 0
6
49
30
11
11
5
0
22
4
7
0
0
0
0
0
0
0
0
0
0
0
0
0
0
0
0
9
0
22
0
0
0
0
7
o o
1
1
0
0
0
9
14
0
0
0
0
0
0
0
0
0
0
0
0
0
0
0
0
0
0
0
0
0
0
0
8
951
882
893
893
385
176
964
645
951
169
967
1,0GO
1,000
991
813
1,000
1,000
1,000
667
997
1,000
I,COO
999
999
1,000
920
935
956
1,000
681
773
642
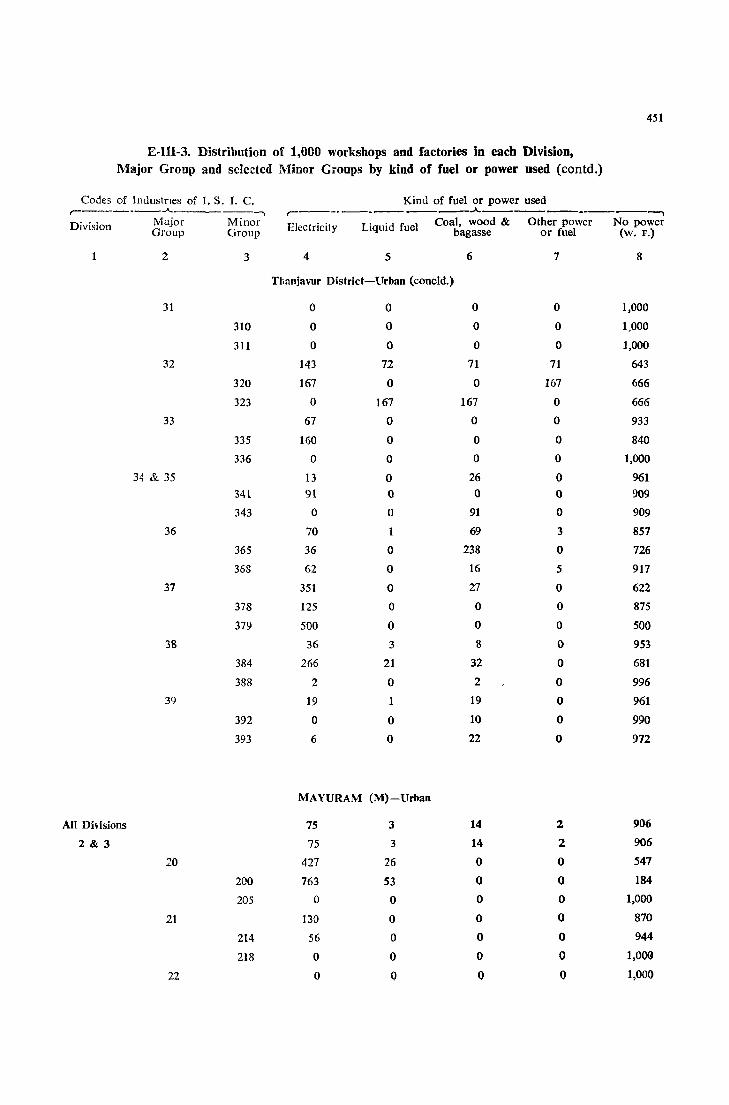
451
E-IIl-3. Distribution of 1,000 workshops and factories in each Division, Major Group and selected Minor Groups by kind of fuel or power used (contd.)
Codes of Industries of 1. S. 1. C. Kind of fuel or power used r-------..A. -,
r----. -----____ .A. ____________ --"\
Division Major Minor Electricily Liquid fuel Coal, wood & Other power No power Group Group bagasse or fuel (w. F.)
2 3 4 5 6 7 8
Th::mjavur District-Urban (coneld.)
31 0 0 0 0 1,000
310 0 0 0 0 1.000
311 0 0 0 0 1,000
32 143 72 71 71 643
320 167 0 0 167 666
323 0 167 167 0 666
33 67 0 0 0 933
335 160 0 0 0 840
336 0 0 0 0 1,000
34 & 35 13 ° 26 ° 961 341 91 0 0 0 909
343 0 0 91 0 909
36 70 69 3 857
365 36 0 238 0 726
368 62 0 16 5 917
37 351 0 27 0 622
378 125 0 0 0 875
379 500 0 0 0 500
38 36 3 8 0 953
384 266 21 32 0 681
388 2 0 2 0 996
39 19 1 19 0 961
392 0 0 10 0 990
393 6 0 22 0 972
MAYURAM (M)-Urban
All Divisions 75 3 14 2. 906
2 & 3 75 3 14 2 906
20 427 26 0 0 547
200 763 53 0 0 184
205 0 0 0 0 1,000
21 130 0 0 0 870
214 56 0 0 0 944
218 0 0 ° 0 1,000
22 0 Q 0 0 1,000
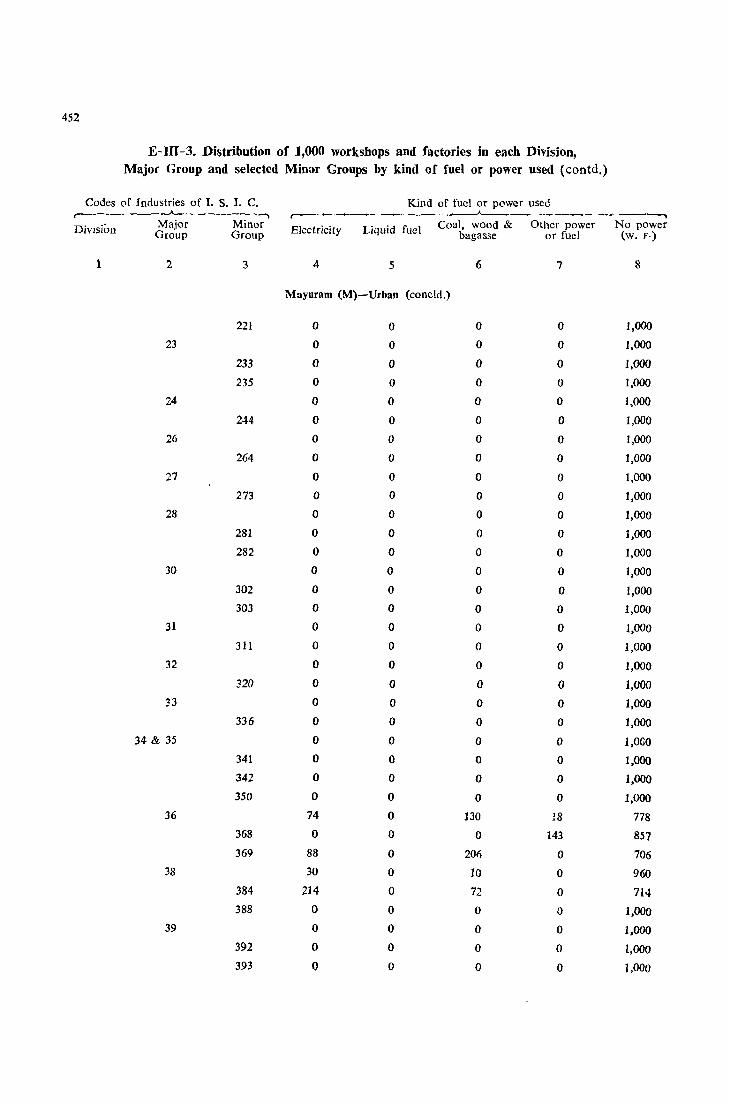
452
E-JII-3. Distribution or 1,000 workshops and factories in each Division, Major Group and selected Minor Groups by kind of fuel or power used {contd.}
Codes of Industries of I. S. I. C. .. ~ ______ ..A-___ ., ,,' Major Minor
DIVISIon Group Group
1 2
23
24
26
27
28
30
31
32
33
34 & 35
36
38
39
3
221
233
235
244
264
273
281
282
302
303
311
320
336
341
342
350
368
369
384
388
392
393
Kind of fuel or power used r-'-~~'-~-'---~---.,A..._...... --~, ---~
EI t "t LI'qUl'd fllel Coal, wood & Other power No power cc flCI Y bagasse or fuel (w. F.)
4 5
Mayuram (M)-Urban (concld.)
o o o o o o o o o o o o o o o o o o o o o o o o o o
74
o 88
30
214
o o o o
o o o o o o o o o o o o o o o o o o o o o o o o o o o o o o o o o o o
6
o o o o o o o o o o o o o o o o o o o o o o o o o o
130
o 201)
10
72
o o o o
7
o o o o o o o o o o o o o o o o o o o Q
o o o o o o
18
143
o o o o o o o
8
1,000
1,000
1,000
1,000
1,000
1,000
1,000
1,000
1,000
1,000
1,000
1,000
1,000
1,000
1,000
1,000
1,000
1,000
1,000
1,000
1,000
1,000
1,000
1,000
1,000
1,000
778
857
706
960
714
1,000
1,000
1,000
1,000
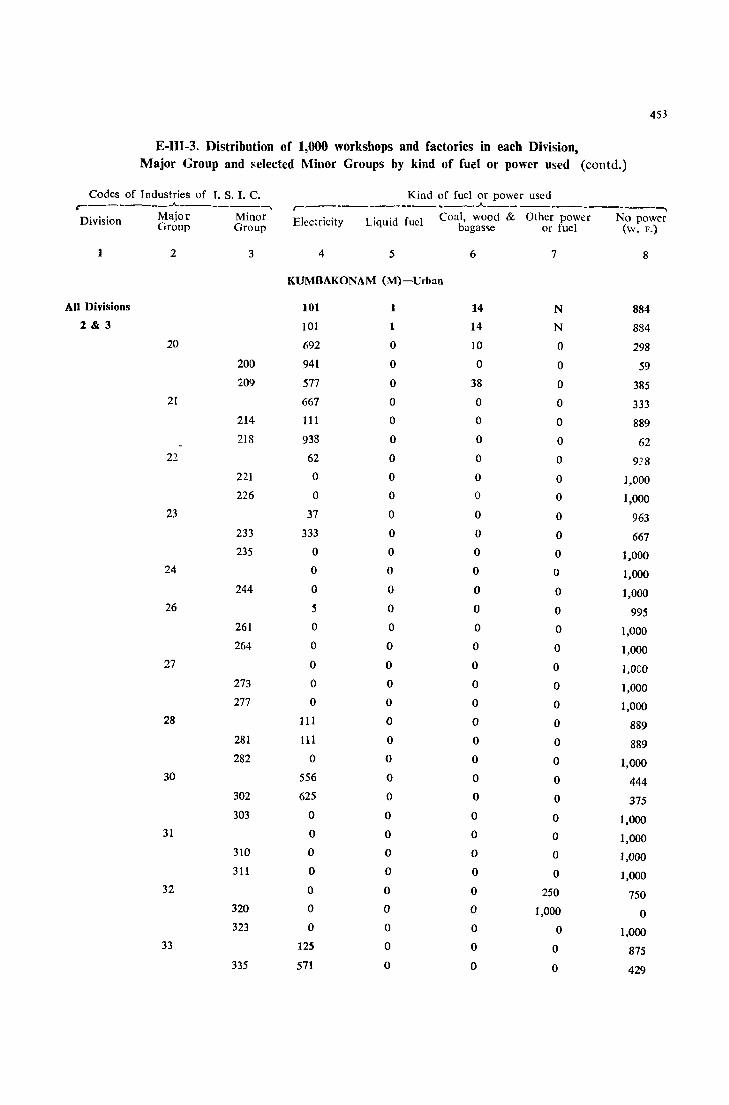
453
E-1I1-3. Distribution of 1,000 workshops and factories in each Division, Major C:;roup and selected Minor Groups by kind of fUel or power used (contd.)
Codes of r ndustries of r. s. I. C. Kind of fuel or power used r---------A--------...... r--------------"-------------...... Division Major Minor Electricity Liquid fuel Coal, wood & Other power No power
Group Group bagasse or fuel (w. F.)
1 2 3 4 5 6 7 8
KUMBAKONAM (M)-Urban
All Divisions 101 1 14 N 884 2&3 101 1 14 N 884
20 692 0 10 0 298
200 941 0 0 0 59 209 577 0 38 0 385
21 667 0 0 0 333 214 111 0 0 0 889 218 938 0 0 0 62
22 62 0 0 0 928 221 0 0 0 0 1,000 226 0 0 0 0 1,000
23 37 0 0 0 963 233 333 0 0 0 667 235 0 0 0 0 1,000
24 0 0 0 0 1,000 244 0 0 0 0 1,000
26 5 0 0 0 995 261 0 0 0 0 1,000 264 0 0 0 0 1,000
27 0 0 0 0 1,OCO 273 0 0 0 0 1,000 277 0 0 0 0 1,000
28 111 0 0 0 889 281 III 0 0 0 889 282 0 0 0 0 1,000
30 556 0 0 0 444 302 625 0 0 0 375 303 0 0 0 0 1,000
31 0 0 0 0 1,000 310 0 0 0 0 1,000 311 0 0 0 0 1,000
32 0 0 0 250 750 320 0 0 0 1,000 0 323 0 0 0 0 1,000
33 125 0 0 0 875 335 571 0 0 0 429

454
E-III-3. Distribution of 1,000 workshops and factories in each Division, Major Group and selected Minor Groups by kind of fuel or power used (contd.)
Codes of Industries of I. S. I. C. Kmd of fuel or power used • ~ _____ ~--..A-_____ ,_--.. • _____ • _______ .A-.--_____ .~ . 1
Division Major Mmcr Electricity Liquid fuel Coal, wood & Other pawer No power Grcup Group bagasse or fuel (wo F.)
1 2 3 4 5 6 7 8
Kumbakonum (M)-Urhan (coneld.)
337 0 0 0 0 1,000
34 & 35 0 0 143 0 857
343 0 0 250 0 750
345 0 0 0 0 1,000
350 0 0 0 0 1,000
36 111 0 36 0 853
368 81 0 16 ° 903
369 171 ° 57 0 772
37 615 0 77 ° 308
374 250 0 ° 0 750
379 833 0 0 0 167
38 61 0 31 0 903
384 250 0 36 0 714
388 0 0 12 0 988
39 ~2 5 52 0 891
392 0 0 0 0 1,000
393 12 0 65 0 923
THANJAVUR (M)-Urban
All Divisions 81 4 10 0 90S
2&3 81 4 10 0 905
20 525 33 8 0 434
200 729 49 0 0 222
205 0 0 36 0 964
21 367 0 33 0 600
214 0 0 53 0 947
218 1,000 0 0 0 0
22 50 0 () 0 950
220 0 0 0 0 1,000
221 0 0 0 0 1,000
23 10 0 ° 0 99J
234 1,000 0 O. 0 0
235 ° 0 0 0 1,000
24 0 0 0 0 1,000

455
E-IH-3. Distiibutiol1 of 1,00;) work"~l~pS ~n!l factories in each Divisbll. Major Group anj selected Minor Groups bJ b!ml of fuel or p~?'er used (contd)
Codes ')f In,!ustnes (ilf I. S. I. C. KlI1d cf fuel or pO\\cr used .-~----- ---"----~-~-, r--___..-----------~ ~J_ ---~- ---------------,
Division Major Minor Electnclty LIquId fuel Coal, \\ood & Other pov.er No p:n\cr Group Group bagasse or fuel (w. F.)
1 2 3 4 5 6 7 8
Thanjavur (M)-Urban (contd.)
24-l 0 0 0 0 1,000
26 0 0 0 0 1,000
262 0 0 0 0 1,000
264 0 0 0 0 1,000
27 0 0 0 0 I,COO
273 0 0 0 0 1,000
28 125 0 125 0 750
282 0 0 500 0 500
284 167 0 0 0 833
29 0 0 0 0 1,000
291 0 0 0 0 1,000
292 0 0 0 0 1,000
30 3~3 0 0 0 667
302 333 0 0 0 667
303 200 0 0 0 800
31 0 0 0 0 1,000
311 0 0 0 0 1,000
32 0 250 250 0 500
322 0 0 0 0 1,000
323 0 334 333 0 333
33 111 0 0 0 889
335 0 0 0 0 1,000
336 0 0 0 0 1,0aO
34 & 35 77 0 0 0 923
341 333 0 0 0 667
343 0 0 0 0 1,000
351 0 0 0 0 I,COO
36 97 0 97 0 806
368 0 0 0 0 1,000
36:;> 189 0 135 0 676
37 0 0 0 0 1,000
373 0 0 0 0 1,000
377 0 0 0 0 1,000
38 60 7 6 0 927
384 273 30 30 0 667
388 0 0 0 0 1,000
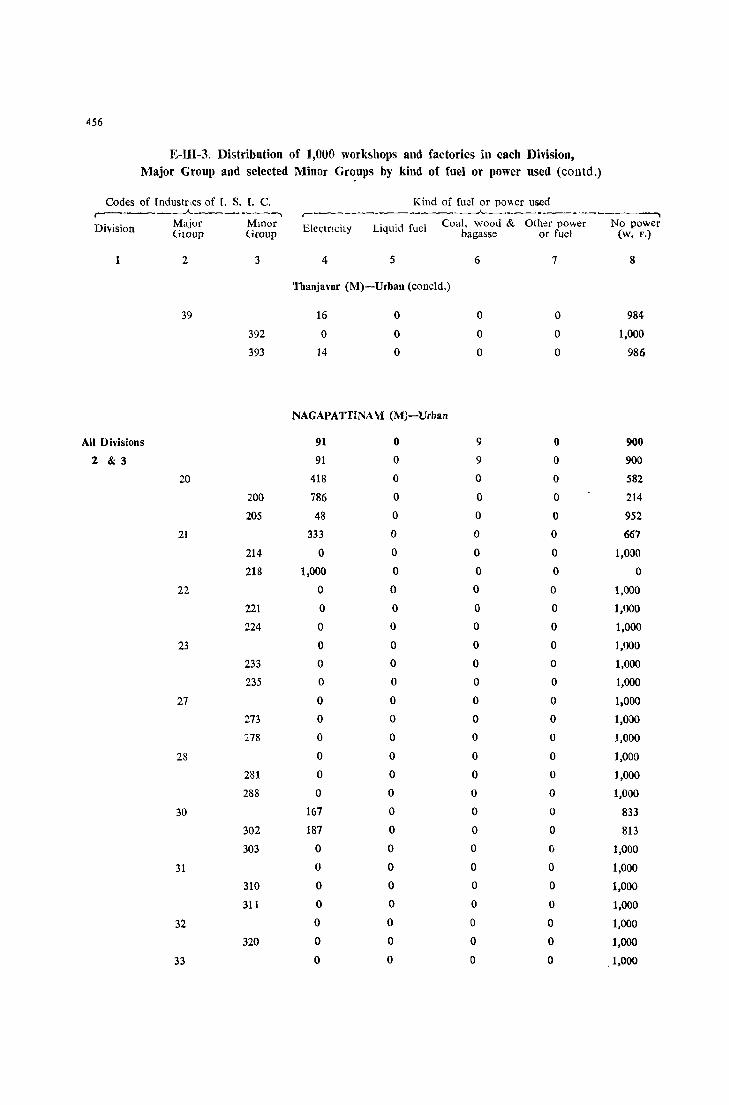
456
E-III-3. Distribution of 1,000 work!>hops and factories in each Division, Major Group and selected Minor Gr~ups by kind of fuel or power used (contd.)
Codes of Industr,cs of I. S. I. C. , ______ ..A. ______ --,
Division
1
All Divisions
2 & 3
Major Mmor GIOUp Group
2
39
20
21
22
23
27
28
30
31
32
33
3
392
393
200
205
214
218
221
224
233
235
273
278
281
288
302
303
310
311
320
Kind of fuel or po\\cr used r----------------"------------------, Elcctncity Liquid fuel Coal, wood & Other power No power
bagasse or fuel (w. F.)
4 5
ThanjavlI[ (M)-Urban (coneld.)
16
o 14
o o o
NAGAPATTINA \i (M)-Urban
91 0
91 0
418 0
786 0
48 0
333 0
0 0
1,000 ° 0 0
0 0
° ° 0 ° 0 0
0 ° ° 0
° 0
0 0
° 0
0 0
0 0
167 0
187 0
0 0
0 0
0 0
0 0
0 0
0 0
0 0
6
o o o
9
9
0
0
0
0
0
0
° 0
° 0
0
° 0
° ° ° 0
0
0
0
0
0
0
0
a 0
0
7
o o o
0
0
0
0
0
0
0
0
0
0
0
0
0
0
0
0
0
0
0
0
0
0
0
0
0
° 0
0
0
8
984
1,000
986
900
900
582
214
952
667
1,000
0
1,000
1,000
1,000
1,000
1,000
1,000
1,000
l,OGO
1,000
1,000
1,000
1,000
833
813
1,000
1,000
1,000
1,000
1,000
1,000
,1,000
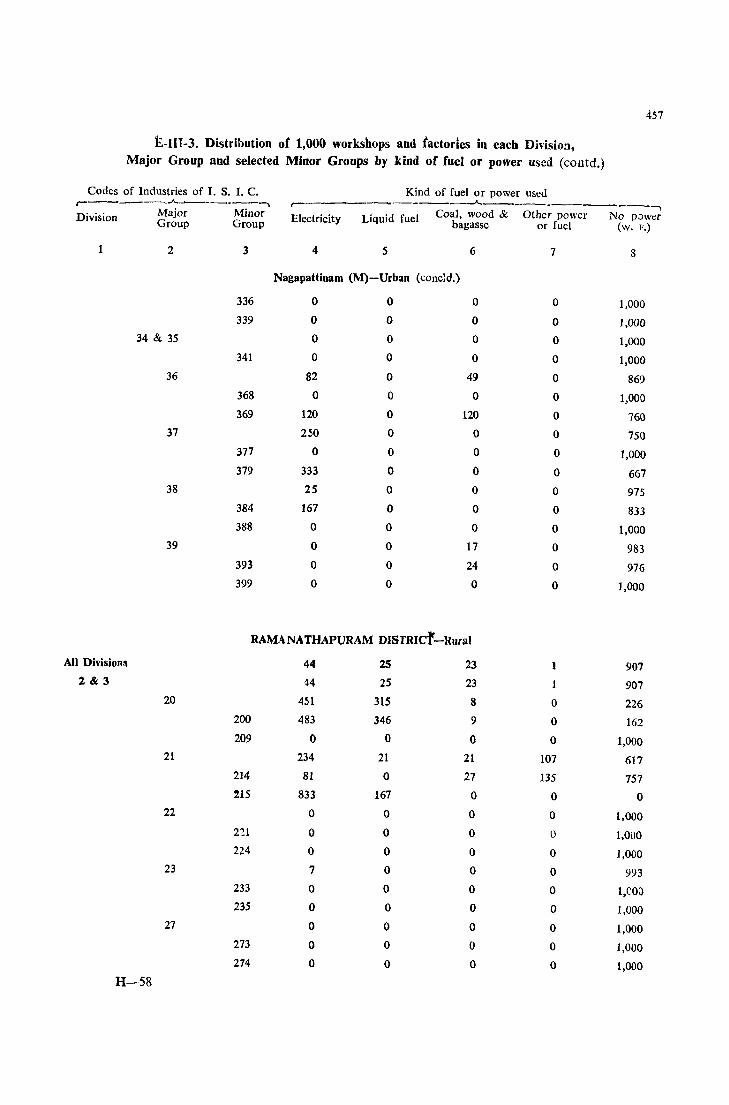
457
E-IIT-3. Distribution or 1,000 workshops and factories in each Division, Major Group and selected Minor Groups by kind of fuel or power us~d (contd.)
Codes of Industries of I. S. I. C. Kind of fuel or power used r-
_...A.-.---_____ ., _-___ .--..A. ____ • ______ .,
Division Major Minor Electricity Liquid fuel Coal, wood & Other power No power Group Group bagasse or fuel (w. F.)
1 2 3 4 5 6 7 8
Nagapattinam (M)-Urban (conc]d.)
336 0 0 0 0 1,000 339 0 0 0 0 1,000
34 & 35 0 0 0 0 1,000 341 0 0 0 0 1,000
36 82 0 49 0 869 368 0 0 0 0 1,000 369 120 0 120 0 760
37 250 0 0 0 750 377 0 0 0 0 1,000 379 333 0 0 0 667
38 2S 0 0 0 975 384 167 0 0 0 833 388 0 0 0 0 1,000
39 0 0 17 0 983 393 0 0 24 0 976 399 0 0 0 0 1,000
RAMA NATHAPURAM DISTRICf'-Rural
All Divisions 44 25 23 1 907 2.&3 44 2S 23 907
20 451 315 8 0 226 200 483 346 9 0 162 209 0 0 0 0 1,000
21 234 21 21 107 617 214 81 0 27 135 757 215 833 167 0 0 0
22 0 0 0 0 1,000 211 0 0 0 0 1,000 224 0 0 0 0 1,000
23 7 0 0 0 993 233 0 0 0 0 I,COO 235 0 0 0 0 1,000
27 0 0 0 0 1,000 273 0 0 0 0 1,000 274 0 0 0 0 1,000
H-58

458
E-UI-3. Distrib:Jtion of 1,000 workshops and factories in each DivisioIl, Major Group and selected Minor Groups by kind of fuel or power used (contd.)
Codes of Industries of 1. S. I. C. Kind of fuel or power used ,--__ • __ __.A.._-___ ~ ,--__ • __ • ___ - __ ..A.. ________ • _____ ,
Divlsion Major Minor Electnclty Llqllld fuel Coal, wood & Other power No power Group Group bagasse or fuel (w. F.)
2 3 4 5 6 7 8
Ramanathapuram District-Rural (coneld.)
28 7 0 0 0 993
281 0 0 0 0 1,000
282 0 0 0 0 1,000
30 0 0 0 0 1,000
302 0 0 0 0 1,000
31 0 0 0 0 1,000
311 0 0 0 0 1,000
3} 0 0 0 0 1,000
333 0 0 0 0 1,000
334 0 0 ° 0 1,000
34 & 35 38 0 56 0 906
340 143 ° 428 ° 429
341 222 ° ° ° 778
350 ° ° 36 ° 964
36 12 ° 107 ° 881
360 133 0 ° 0 867
369 3 0 104 0 893
37 0 0 0 0 1,000
38 4 0 3 0 993
388 0 0 0 0 1,000
389 0 0 43 0 952
39 0 0 62 ° 938
393 0 0 69 ° 931
399 0 0 0 0 1,000
RAMANATHAPURAM DISTRICT-Urban
All Divisions 82 1 21 N 896
2&3 82 1 21 N 896
20 567 11 30 0 392
200 681 17 0 0 302
207 667 0 0 0 333
21 485 5 25 15 470
214 83 12 36 36 833
218 726 0 21 ° 253
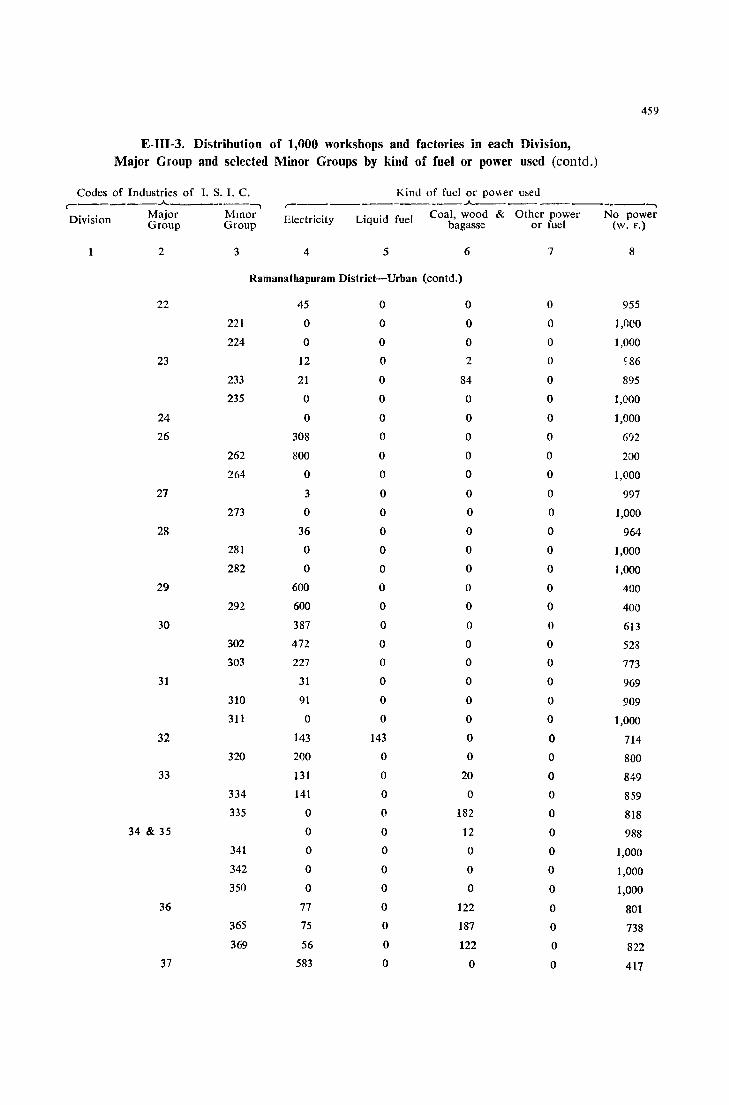
459
E-III-3. Distribution of 1,000 workshops and factories in each Division, Major Group and se1ccted Minor Groups by kind of fuel or power used (eontd.)
Codes of Industries of 1. s. I. C. Kind of fuel or po\\er used ~ _____ .A..
-----, .-____________ .A.. ____________ -,
Division Major Mmor Electricity Liquid fuel Coal, wood & Other power No power Group Group bagasse or fuel (w. F.)
2 3 4 5 6 7 8
Ramanathapuram District-Urban (contd.)
22 45 0 0 0 955
221 0 0 0 0 1,000
224 0 0 0 0 ],000
23 12 0 2 0 586
233 21 0 84 0 895
235 0 0 0 0 ],000
24 0 0 0 0 ],000
26 308 0 0 0 692
262 800 0 0 0 200
264 0 0 0 0 1,000
27 3 0 0 0 997
273 0 0 0 0 1,000
28 36 0 0 0 964
281 0 0 0 0 1,000
282 0 0 0 0 1,000
29 600 0 0 0 400
292 600 0 0 0 400
30 387 0 0 0 613
302 472 0 0 0 523
303 227 0 0 0 773
31 31 0 0 0 969
310 91 0 0 0 909
311 0 0 0 0 1,000
32 143 143 0 0 714 320 200 0 0 0 800
33 131 0 20 0 849 334 141 0 0 0 859 335 0 0 182 0 818
34 & 35 0 0 12 0 988 341 0 0 0 0 1,000
342 0 0 0 0 1,000 350 0 0 0 0 1,000
36 77 0 122 0 801 365 75 0 187 0 738 369 56 0 122 0 822
37 583 0 0 0 417
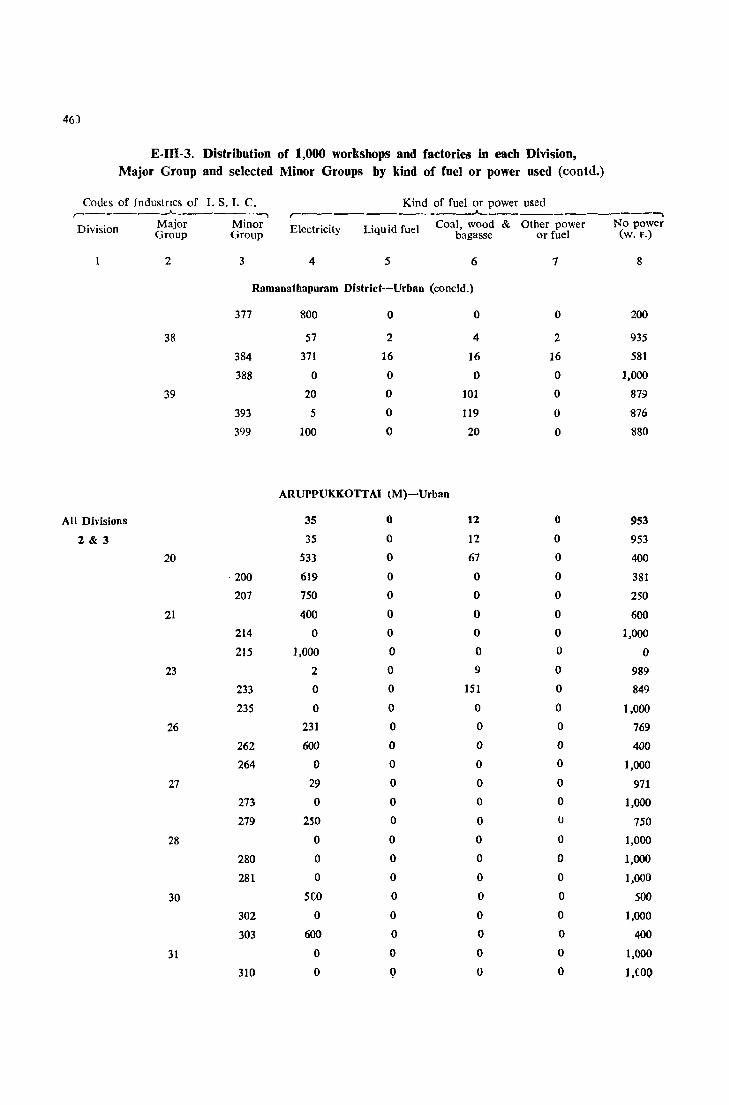
46)
E-III-3. Distribution of 1,000 workshops and factories in each Division, Major Group and selected Minor Groups by kind of fuel or power used (contd.)
Codes of Industnes of 1. s. I. C. Kind of fuel or power used r-------.A-
,..-_________ ..A.,_
Division Major Minor Electricity Liquid fuel Coal, wood & Other power Group Group bagasse or fuel
2 3 4 5 6 7
Ramanathapuram Distrid--Urban (coneld.)
377 800 0 0 0
38 57 2 4 2
384 371 16 16 16
388 0 0 0 0
39 20 0 101 0
393 5 0 119 0
399 100 0 20 0
ARUPPUKKOTTAI lM)-Urban
All Divisions 35 0 12 0
2 & 3 35 0 12 0
20 533 0 67 0
·200 619 0 0 0
207 750 0 0 0
21 400 0 0 0
214 0 0 0 0
215 1,000 0 0 0
23 2 0 9 0
233 0 0 151 0
235 0 0 0 0
26 231 0 0 0
262 600 0 0 0
264 0 0 0 0
27 29 0 0 0
273 0 0 0 0
279 250 0 0 (J
28 0 0 0 0
280 0 0 0 0
281 0 0 0 0
30 seo 0 0 0
302 0 0 0 0
303 600 0 0 0
31 0 0 0 0
310 0 Q 0 0
-, No power
(w. F.)
8
200
935
581
1.000
879
876
880
953
953
400
381
250
600
1,000
0
989
849
1,000
769
400
1,000
971
1,000
750
1,000
1,000
1,000
500
1,000
400
1,000
I,COO

461
E-I1I-J. Distribution of 1,000 workshops and factories in each Division, Major Group and seJected Minor Groups by kind of fuel or power used (contd.)
Codes of Industries of I. S. I. C. Kind of fuel or power used r---
.A. ________ ~ , ________ ~ ____ .A._-___ ~ _______ ~
Division Major Minor Electricity Liquid fuel Coal, wood & Other power No power Group Group bagasse or fuel (w. F.)
2 3 4 5 6 7 8
Aruppukkottai (M)- Urban (coneld.)
311 0 0 0 0 1,000
34 & 35 0 0 0 0 1,000
343 0 0 0 0 1,000
350 0 0 0 0 1,000
36 S6 0 83 0 861
360 1,000 0 0 0 0
369 0 0 34 0 966
38 292 0 0 0 708
384 700 0 0 0 300
388 0 0 0 0 1,000
39 31 0 31 0 938
393 0 0 33 0 967
399 500 0 0 (} 500
VIRUDUNAGAR (M)-Urban
All Divisions 204 2 58 0 736
2&3 204 2 58 0 736
20 486 0 6 0 508
200 350 0 0 0 650
207 902 0 0 0 98
21 649 0 54 0 297
214 500 0 250 0 250
218 678 0 32 0 290
22 0 0 0 0 1,000
221 0 0 0 0 1,000
23 82 0 0 0 918 .. 230 786 0 0 0 214
235 0 0 0 0 1,000
24 0 0 0 0 1,000
244 0 0 0 0 1,000
27 0 0 0 0 1,000
273 0 0 0 0 1,000
277 0 0 0 0 1,000
f8 0 0 0 0 I,OOQ
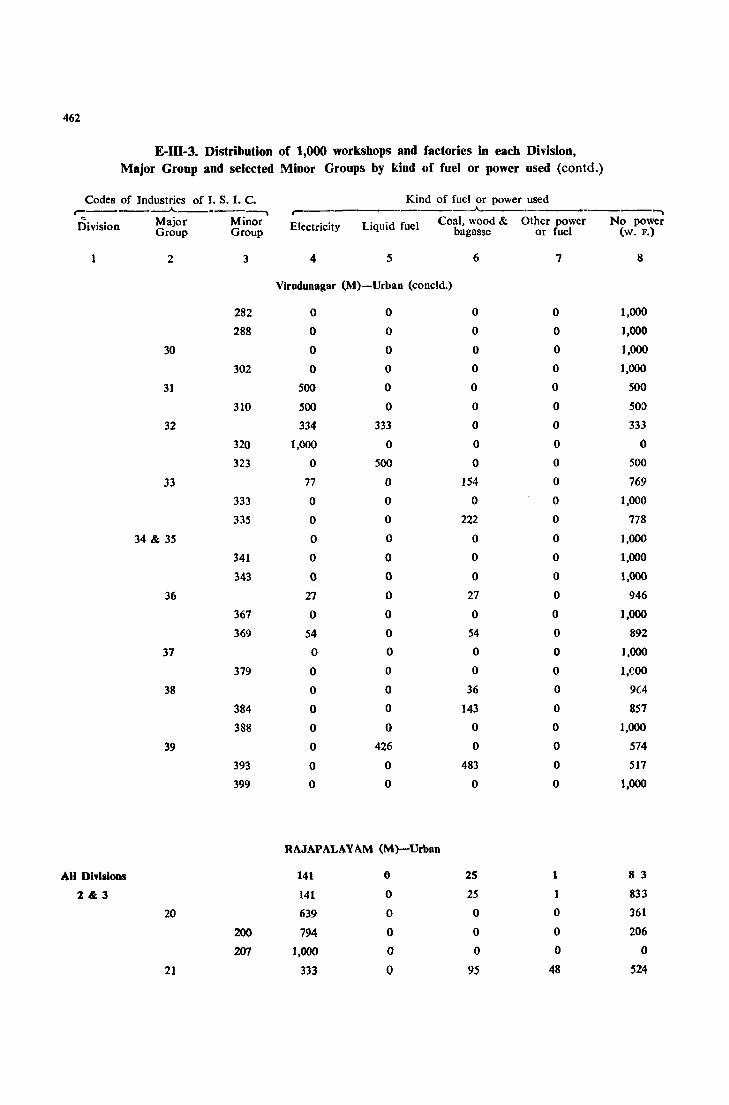
462
E-III-3. Distribution of 1,000 workshops and factories in each Division, Major Group and selected Minor Groups by kind of fuel or power used (eontd.)
Codes of Industries of J. S. I. C. Kind of fuel or power used r-------A.-----~ r- ---- --A..-_________ "-I
Division Major Minor Electricity Liquid fuel Coal, wood & Other power No power Group Group bagasse or fuel (w. F.)
2
30
31
32
33
34 & 35
36
37
38
39
All Divisions
2&3
20
21
3
282
288
302
310
320
323
333
335
341
343
367
369
379
384
388
393
399
200
207
4 5
Virudunagar (M)-Urban (concld.)
o o o o
500
500
334
1,000
o 77
o o o o o
27
o 54
o o o o o o o o
o o o o o o
333
o 500
o o o o o o o o o o o o o o
426
o o
RAJAPALAYAM (M)-Urban
141 0
141 0
639 0
794 0
1,000 0
333 0
6
o o o o o o o o o
154
o 222
o o o
27
o 54
o o
36
143
o o
483
o
25
25
0
0
0
95
7
o o o o o o o o o o o o o o o o o o o o o o o o o o
1
1
0
0
0
48
8
1,000
1,000
].000
1,000
500
500
333
o 500
769
1,000
778
1,000
1,000
1,000
946
1,000
892
1,000
I,COO
9(4
857
1,000
574
517
1,000
8 3
833
361
206
0
524
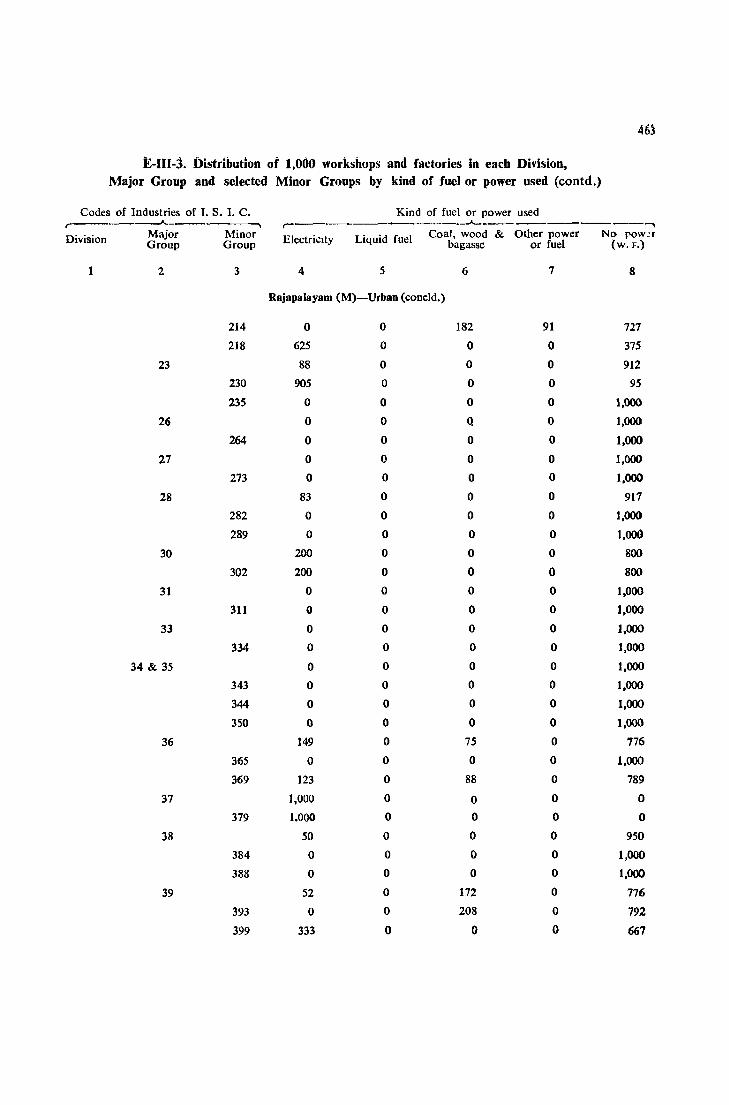
4gj
E-1I1-3. Distribution of 1,000 workshops and factories in each Division, Major Group and selected Minor Groups by kind of fuel or power used (contd.)
Codes of Industries of I. S. I. C. Kind of fuel or power used ..A. ,-
__ .A..-___________ """'"
Division Major Minor Electricity Liquid fuel Coal, wood & Other power No row:r Group Group bagasse or fuel (w. F.)
1 2 3 4 5 6 7 8
Rajapalayam (M)-Urban (coneld.)
214 0 0 182 91 727
218 625 0 0 0 375
23 88 0 0 0 912
230 905 0 0 0 95
235 0 0 0 0 1,000
26 0 0 Q 0 1,000
264 0 0 0 0 1,000
27 0 0 0 0 1,000
273 0 0 0 0 1,000
28 83 0 0 0 917
282 0 0 0 0 1,000
289 0 0 0 0 1,000
30 200 0 0 0 800
302 200 0 0 0 800
31 0 0 0 0 1,000
311 0 0 0 0 1,000
33 0 0 0 0 1,000
334 0 0 0 0 1,000
34 & 35 0 0 0 0 1,000
343 0 0 0 0 1,000
344 0 0 0 0 1,000
350 0 0 0 0 1,000
36 149 0 75 0 776
365 0 0 0 0 1,000
369 123 0 88 0 789
37 1,000 0 0 0 0
379 1.000 0 0 0 0
38 50 0 0 0 950
384 0 0 0 0 1,000
388 0 0 0 0 1,000
39 52 0 172 0 776
393 0 0 208 0 792
399 333 0 0 0 667
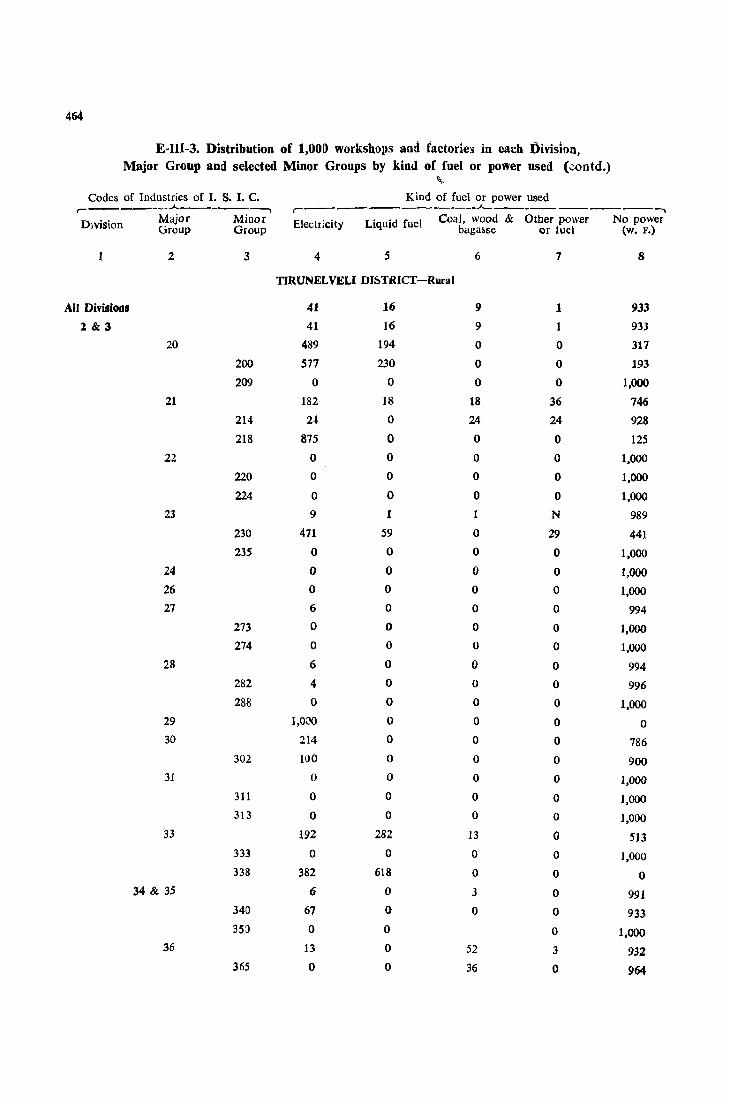
464
E-UI-3. Distribution of 1,001) workshops and factories in each Division, Major Group and selected Minor Groups by kind of fuel or power used (.::ontd.)
\.
Codes of Industries of I. S. I. C. Kind of fuel or power used , ______ .A. _____ ---, ,------------"------------, DIVision Major Minor Electricity Liquid fuel Coal, wood & Other power No power
Group Group bagasse or Iuel (w. F.)
1 2 3 4 5 6 7 8
TIRUNELVELI DI5TRICT-Rural
All Divisions 41 16 9 1 933
2&3 41 16 9 1 933
20 489 194 0 0 317
200 S77 230 0 0 193
209 0 0 0 0 1,000
21 182 18 18 36 746
214 2" 0 24 24 928
218 875 0 0 0 125
22 0 0 0 0 1,000
220 0 0 0 0 1,000
224 0 0 0 0 1,000
23 9 1 1 N 989
230 471 59 0 29 441
235 0 0 0 0 1,000
24 0 0 0 0 1,000
26 0 0 0 ° 1,000 27 6 ° ° 0 994
273 0 0 ° ° 1,000
274 0 0 ° 0 1,000 28 6 0 0 0 994
282 4 0 0 0 996 288 0 0 0 0 1,000
29 1,0;)0 0 0 0 0 30 214 0 0 0 786
302 100 0 0 0 900 31 0 0 0 0 1,000
311 0 0 0 0 1,000 313 0 0 0 0 1,000
33 192 282 13 0 513 333 0 0 0 0 1,000 338 382 618 0 0 0
34 & 35 6 0 3 0 991 340 67 0 0 0 933 35J 0 0 0 1,000
36 13 0 52 3 932 365 0 0 36 0 964
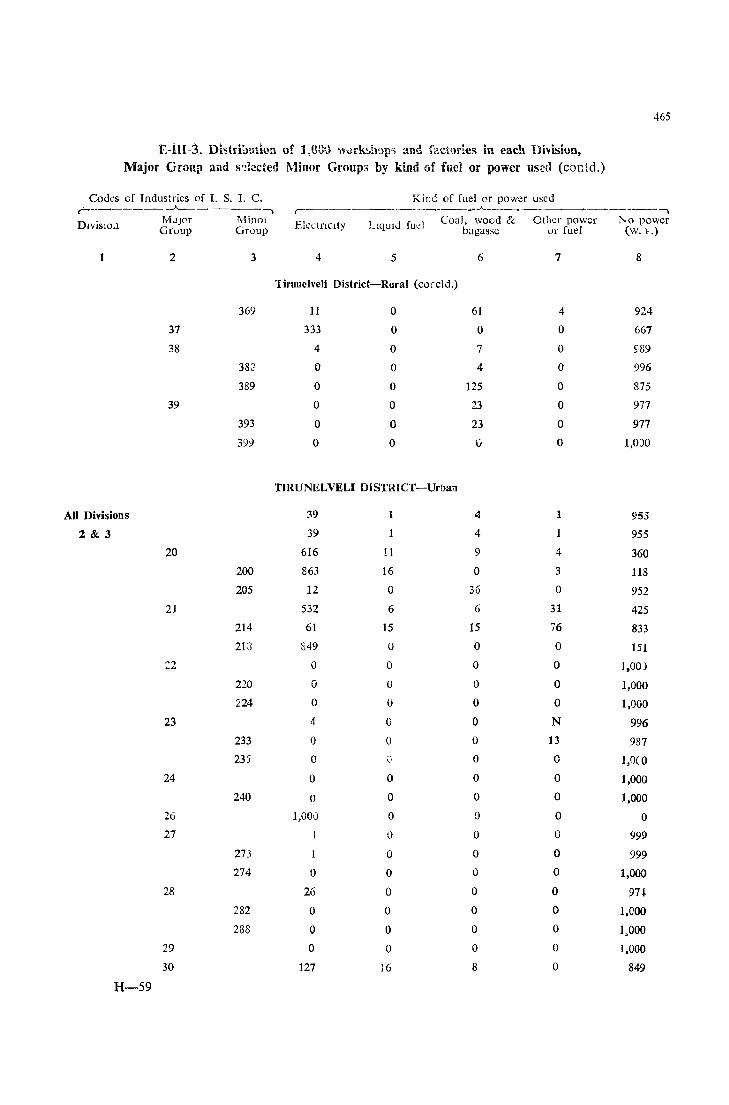
465
'f.-1H-:5. D~strilmtil)n of 1,03'.) wurk:,h'.}ps and \'act,)l'ies in each Division, Major Group and §~l~cted Minor Groups by kind of fuel or power us~d (contd.)
Codes of Industries of I. S. I. C. Kind of fuel or power used r----- _J..__~_"_"~ ___ -, r--~--------~--- .. --A.----~--~ ~----,
DlyislO.l MJJor MinOi Elcctnclty LlqUlJ fud Coal, wood & Other power ~o power Group Group bagasse or fuel (w. F.)
1 2 3 4 5 6 7 8
'Iirunelveli Distdct-Rural (corel d.)
369 11 0 61 4 924
37 333 0 0 0 667
38 4 0 7 0 S89
382 0 0 4 0 996
389 0 0 125 0 875
39 0 0 23 0 977
393 0 0 23 0 977
399 0 0 I) 0 1,0)0
TIRUNELVELI DISTRICT-Urban
All Divisions 39 1 4 1 955
2 & 3 39 1 4 1 955
20 616 11 9 4 360
200 863 16 0 3 118
205 12 0 36 0 952
2J 532 6 6 31 425
214 61 15 15 76 833
213 849 0 0 0 151
:2 0 0 0 0 1,00)
220 0 0 0 0 1,000
224 0 0 0 0 1,000
23 4 0 0 N 996
233 0 0 0 13 987
235 0 ~; 0 0 1,0(0
24 0 0 0 0 1,000
240 0 0 0 0 1,000
26 1,000 0 0 0 0 27 0 0 0 999
273 0 0 0 999
274 0 0 0 ° 1,000
28 26 0 0 0 97-t.
282 0 0 0 0 1,000
288 0 0 0 0 1,000
29 0 0 0 0 1,000
30 127 16 8 0 849
H-59

<66
E-III-3. Distribution of 1,000 workshops and factories in eacb Division, Major Group and selected Minor Groups by kind of fuel or power used (eoutd.)
Codes of Tndustries of I. S. I. C. Kind of fuel or power use.:! r-------..A..--------, r--------------..A--------------------, Division Major Minor Electncity Liquid fuel Coal, wood & Other power No power
Group Group bagasse or fuel (w. F.)
2 3 4 5 6 7 8
Tirunelveli District-Urban (condd.)
301 174 43 0 0 783
302 152 13 12 0 823
31 0 0 21 0 979
311 0 0 0 0 1,000
32 192 0 39 0 769
320 357 0 72 0 571
33 185 15 15 0 785
334 194 0 0 0 806
336 111 0 0 0 889
34 & 35 25 0 12 0 963
340 77 0 154 0 769
341 111 0 a 0 889
350 0 0 0 0 1,000
36 55 1 37 3 904
365 44 0 74 4 878
369 30 0 20 0 950
37 333 0 0 0 667
38 63 2 10 3 922
384 336 9 0 17 638
388 0 0 0 0 1,000
39 14 0 16 969
392 38 0 0 0 962
393 1 0 18 0 981
TUTICORIN (M)-Urban
All Divisions 189 1 7 0 803
2 & 3 189 1 7 0 E03
20 674 0 0 0 326 200 839 0 0 0 161 205 59 0 0 0 941
21 556 37 0 0 407 214 167 83 0 0 750 218 909 0 0 0 91
22 0 0 0 0 1,000
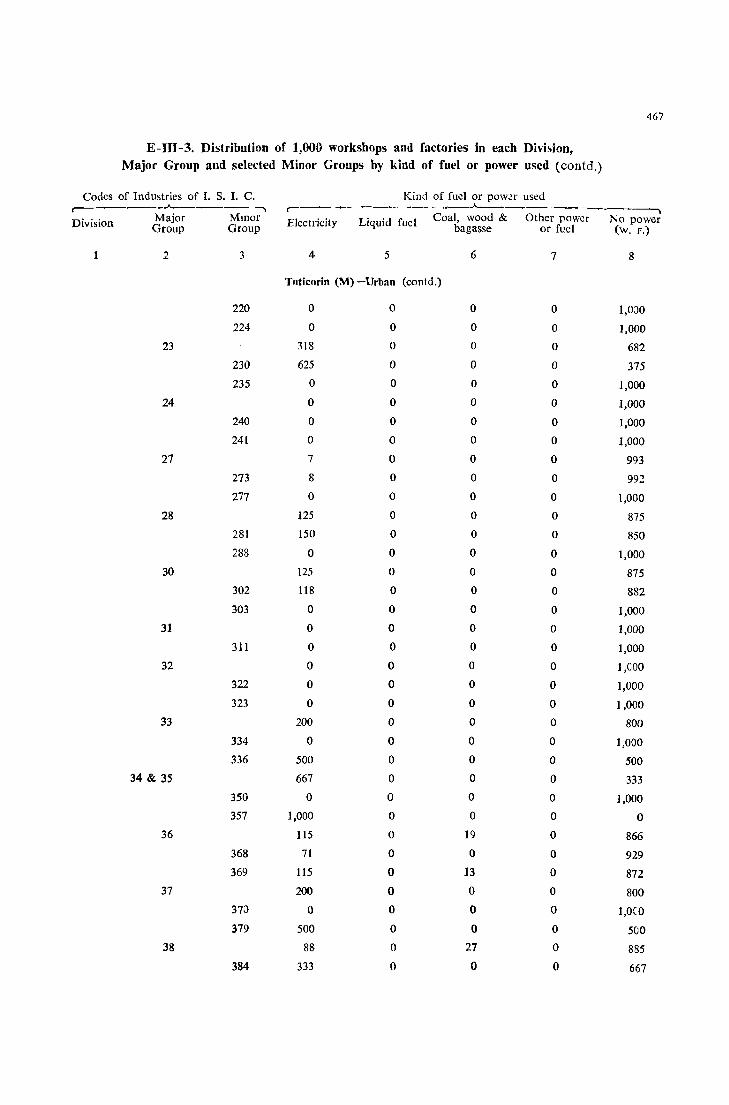
E-JIJ-3. Distribution of 1,000 workshops and factories in each Divh.ion, Major Group and selected Minor Groups by kind of fuel or power used (contd.)
467
Codes of Industries of I. S. 1. C. Kind of fuel or pow.)[ used
Division
1
_..A-,___ -., Major Mlllor Group Group
2
23
24
27
28
30
31
32
33
34 & 35
36
37
38
3
220
224
230
235
240
241
273
277
281
288
302
303
311
322
323
334
336
350
357
368
369
37J
379
384
r------~- __ ..A......-__ --~ __ ' ___ -.
Electricity Liquid fuel Coal, wood & Other power No power
4 5
Tllticorin (M)-Urban (conld.)
o o
318
625
o o o o 7
8
o 125
150
o 125
118
o o o o o o
200
o 500
667
o 1,000
115
71
115
200
o 500
88
333
o o o o o o o o o o o o o o o o o o o o o o o o o o o o o o o o o o o
o
bagasse or fuel (w. F.)
6
o o o o o o o o o o o o o o o o o o o o o o o o o o o o
19
o 13
o o o
27
o
7
o o o o o o o o o o o o o o o o o o o o o o o o o o o o o o o o o o o o
8
1,0)0
1,000
682
375
1,000
1,000
1,000
1,000
993
99:!
1,000
875
850
1,000
875
882
1,000
1,000
1,000
I,GOO
1,000
1,000
800
1,000
500
333
1,000
o 866
929
872
800
1,0CO
500
885
667
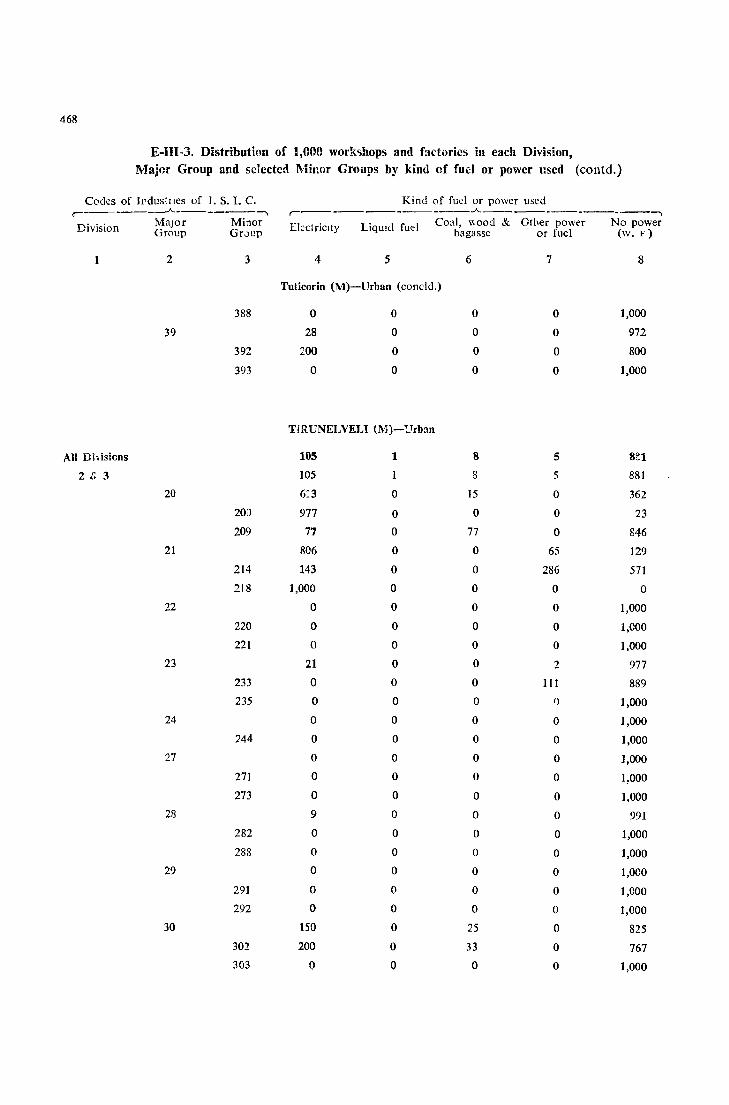
468
E-III-3. Distribution of 1,000 work.,hops and fa dories in each Division, Major Group and selected Minor Groups by kind of fuel or power l:sed (coutd.)
Codes of Irdus!lIes of 1. S. I. C. Kind of fuel or power used ...--------"-----------. . Major Minor Division Group Gr0up
,----------------"---------------, ElectricIty LiqUlcJ fuel Coal, \\ood & Other power No power
bagasse or fuel (w. F)
1 2 3 4 5 6 7 8
Tuticorin (M)-Urban (coneld.)
388 0 0 0 0 1,000
39 28 0 0 0 972
392 200 0 0 0 800
393 0 0 0 0 1,000
TIRUNELVELl (M)-~rban
All Dhisi(]ns 105 1 8 5 set
2 [; 3 105 1 8 5 881
20 6:3 0 15 0 362
20ll 977 0 0 0 23
209 77 0 77 0 846 21 806 0 0 65 129
214 143 0 0 286 571
218 1,000 0 0 0 0
22 0 0 0 0 1,000
220 0 0 0 0 1,000
221 0 0 0 0 1,000
23 21 0 0 2 977
233 0 0 0 111 889
235 0 0 0 I) 1,000
24 0 0 0 0 1,000
244 0 0 0 0 1,000
27 0 0 0 0 1,000
271 0 0 0 0 1,000
273 0 0 0 0 1,000
28 9 0 0 0 991
282 0 0 0 0 1,000
288 0 0 0 0 1,000
29 0 0 0 0 1,000
291 0 0 0 0 1,000
292 0 0 0 0 1,000
30 150 0 25 0 825
302 200 0 33 0 767
303 0 0 0 0 1,000

469
E-IIl-3. Distribution of 1,000 workshops and factories in each Division, Major Group and selected Minor Groups by kind of fuel or power used (contd.)
Codes of Industries of I. S. 1. C. Kind of fuel or power used --"-----------., ~~ ~---.A..-___ - ..,
Division Major Minor Electr;city Liquld fuel Coal, wood & Other power No power Group Group Ingasse or fuel (W. F.)
2 3 4 5 6 7 ,8
Tirunelvcli (M)-Urban (conc1d.)
31 0 0 o. 0 1,000
3!0 0 0 0 0 1,000
3H 0 0 0 0 I,COO
32 313 0 62 0 625
320 385 0 77- 0 538
322 0 0 0 0 1,000
33 250 125 125 ° 500
331 ° ° 333 ° 667
337 1,000 0 0 0 0
34 & 35 0 ° 0 0 1,000
341 0 0 0 0 1,000
345 0 0 0 0 1,000
350 0 0 0 .0 1,000
36 140 0 36 5 819
365 93 0 51 0 856
367 0 0 0 0 1,000
37 1,000 0 0 -0 0
377 1,000 0 0 0 0
378 1,000 ° 0 0 0
38 175 0 0 17 808
384 391 0 0 44 565
388 0 ° 0 0 1,000
39 30 0 0 4 965
393 5 0 0 0 995
399 200 0 0 33 767
PALAYAMCOTTAI (M)-Urban
All DiVisions 64 0 3 0 933
2&3 64 ° 3 ° 933
20 536 0 0 .(j 464
200 882 0 0 0 118
205 0 0 0 0 1,000
21 273 0 91 tJ 636
214 0 0 167 Q 833
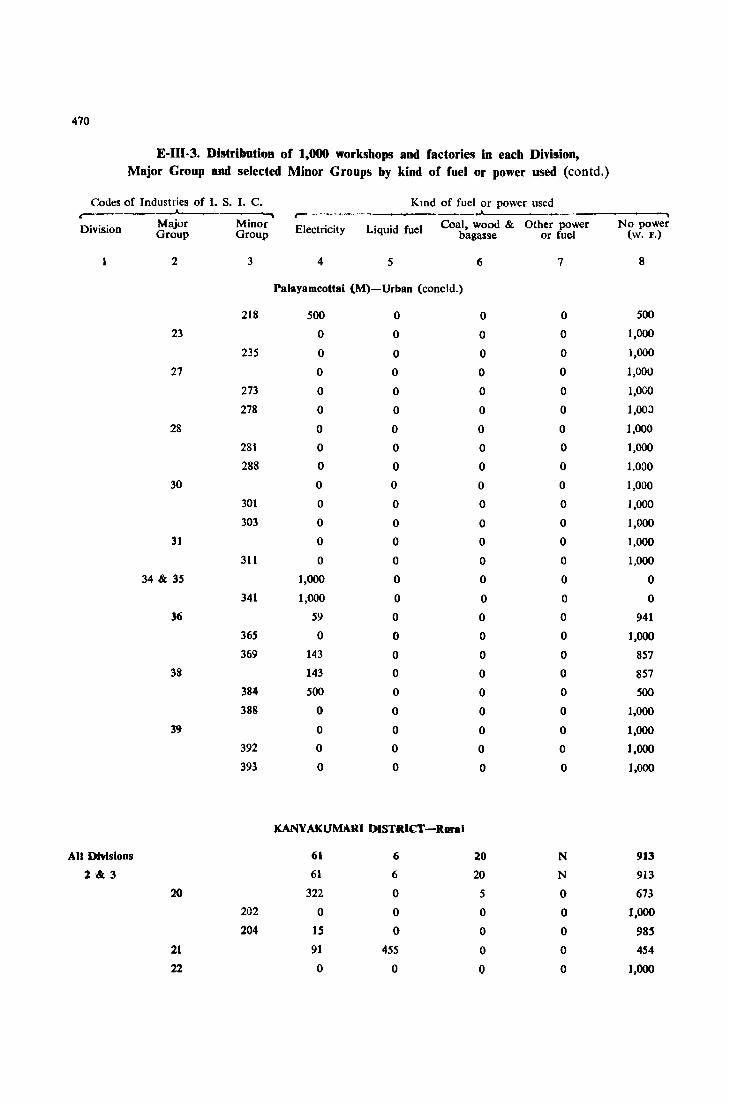
470
E-III-3. Distribution of 1,000 workshops and factories in each Division, Major Group and selected Minor Groups by kind of fuel or power used (contd.)
Codes of Industries of I. S. I. C. Kmd of fuel or power used -"--_ ~--"-
Division Major Minor Electricity Liquid fuel Coal, wood & Other power No power Group Group bagasge or fuel (w. F.)
2 3 4 5 6 7 8
Palayamcottai (M)-Urbao (coneld.)
218 500 0 0 0 500
23 0 0 0 0 1,000
235 0 0 0 0 1,000
27 0 0 0 0 1,000
273 0 0 0 0 1,000
278 0 0 0 0 I,OOJ
28 0 0 0 0 1,000
281 0 0 0 0 1,000
288 0 0 0 0 1.0GO
30 0 0 0 0 1,000
301 0 0 0 0 ],000
303 0 0 0 0 1,000
31 0 0 0 0 ],000
311 0 0 0 0 1,000
34 & 35 1,000 0 0 0 0
341 1,000 0 0 0 0
16 59 0 0 0 941
365 0 0 0 0 1,000
369 143 0 0 0 857
38 143 0 0 0 857
384 500 0 0 0 500
388 0 0 0 0 1,000
39 0 0 0 0 1,000
392 0 0 0 0 1,000
393 0 0 0 0 1,000
KANYAKUMARI DISTRICT-Raral
All DhisioDS 61 6 20 N 913
1&3 61 6 20 N 913
20 322 0 5 0 673
202 0 0 0 0 1,000
204 IS 0 0 0 985
21 91 455 0 0 454
22 0 0 0 0 1,000
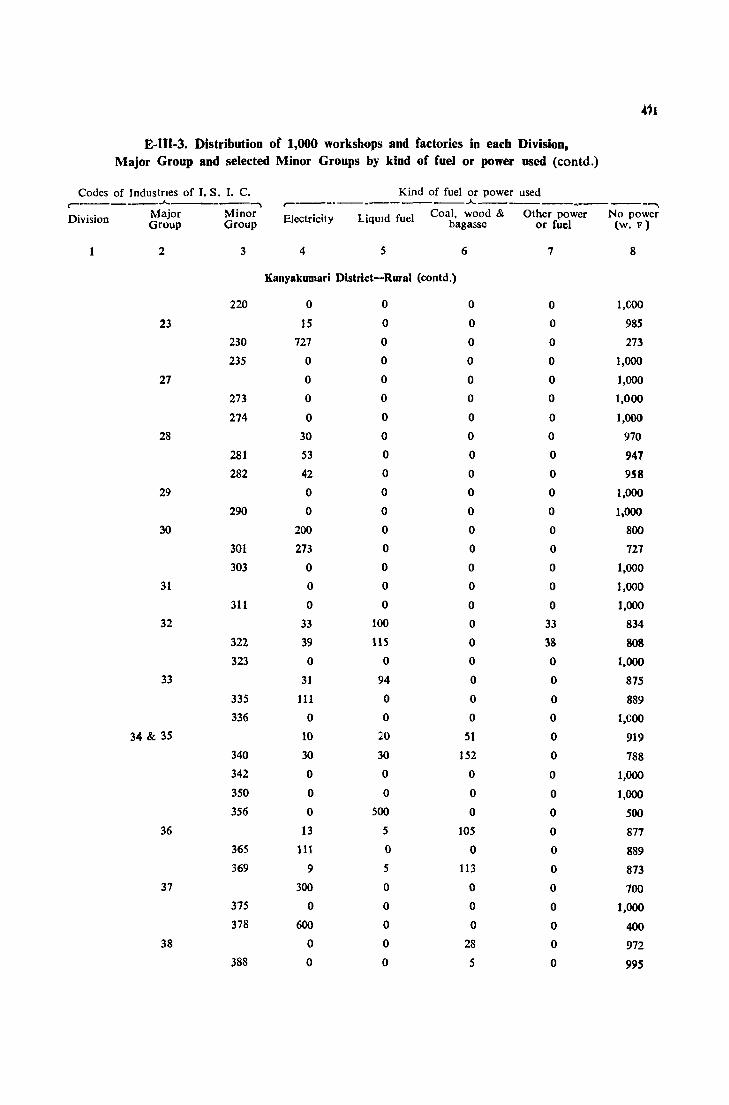
"'I E-ttl-3. Distribution of 1,000 workshops and factories in each Division,
Major Group and selected Minor Groups by kind of fuel or power used (contd.)
Codes of Industries of I. S. I. C. Kind of fuel or power used r--------"- ---""""\ r---- o -----------"-------__ - ___ """"\
Division Major Minor Electricify Liquid fuel Coal. wood & Other power No power Group Group bagasse or fuel (w. F)
1 2 3 4 5 6 7 8
Kanyakumari District-Rural (contd.)
220 0 0 0 0 I,COO
23 15 0 0 0 985
230 727 0 0 0 273
235 0 0 0 0 1,000
27 0 0 0 0 1,000
273 0 0 0 0 1,000
274 0 0 0 0 1,000
28 30 0 0 0 970
281 53 0 0 0 947
282 42 0 0 0 958
29 0 0 0 0 1,000
290 0 0 0 0 1,000
30 200 0 0 0 800
301 273 0 0 0 727
303 0 0 0 0 1,000
31 0 0 0 0 1,000
311 0 0 0 0 1,000
32 33 100 0 33 834
322 39 115 0 38 80S
323 0 0 0 0 1,000
33 31 94 0 0 875
335 111 0 0 0 889 336 0 0 0 0 I,COO
34 & 35 10 20 51 0 919 340 30 30 152 0 788 342 0 0 0 0 1,000 350 0 0 0 0 1,000 356 0 500 0 0 500
36 13 5 105 0 877 365 111 0 0 0 889 369 9 5 113 0 873
37 300 0 0 0 700 375 0 0 0 0 1,000 378 600 0 0 0 400
38 0 0 28 0 972 388 0 0 5 0 995
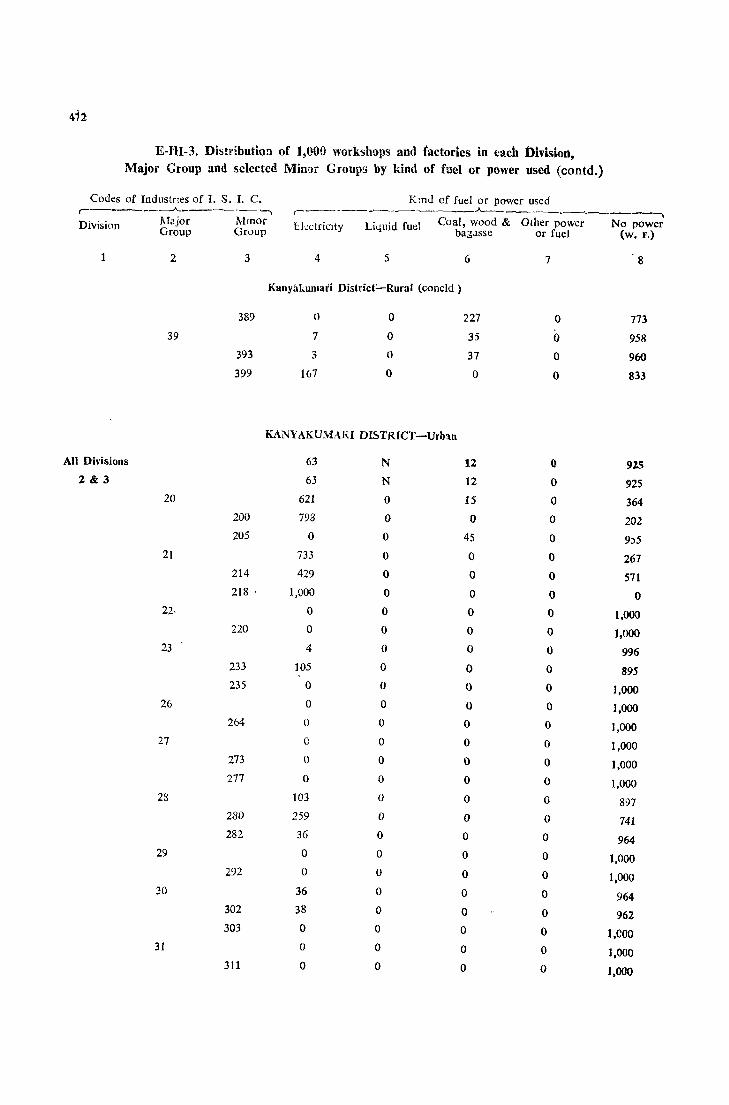
E-IU-3. Distribution of 1,000 workshops and factories in each Division, Major Group llnd selected Minor Groups by kind of fuel or power used (contd.)
Codes of Industnes of 1. S. I. C. K:nd of fuel or power used ,----.----'------.~-,
Division Major Mmor
.-______ ~ ______ _,A___ ______ ~.-___ •
EkctricIty LillUid fuel Coal, wood & Other power No power Group Group ba3JSSe or fuel (w. F.)
1 2 3 4 5 6 7 8
KanyakuOlari District'-Rural (coneld)
389 0 0 227 0 773 39 7 0 35 0 958
393 3 0 37 0 960 399 167 0 0 0 833
KANYAKUMARI DISTRICT-Urban
All Divisions 63 N 12 0 92..'i 2&3 63 N 12 0 ns
20 621 0 15 0 364 200 793 0 0 0 20Z 205 0 0 45 0 9.)5
21 733 0 0 0 267 214 429 0 0 0 571 218 ' 1,000 0 0 0 0
22· 0 0 0 0 J,OOG 220 0 0 0 0 1,000
23 4 0 0 0 996 233 105 0 0 0 895 235 0 0 0 0 J,OOO
26 0 0 0 0 J,ooo 264 0 0 0 0 1,000
27 0 0 0 0 1,000 273 0 0 0 0 1,000 277 0 0 0 0 1,000
23 103 0 0 0 897 280 259 0 0 0 741 282 36 0 0 0 964
29 0 0 0 0 1,000 292 0 0 0 0 1,000
30 36 0 0 0 964 302 38 ° 0 0 962 303 0 0 0 0 I,COO
31 0 0 0 0 ],000 311 0 0 0 0 1,000
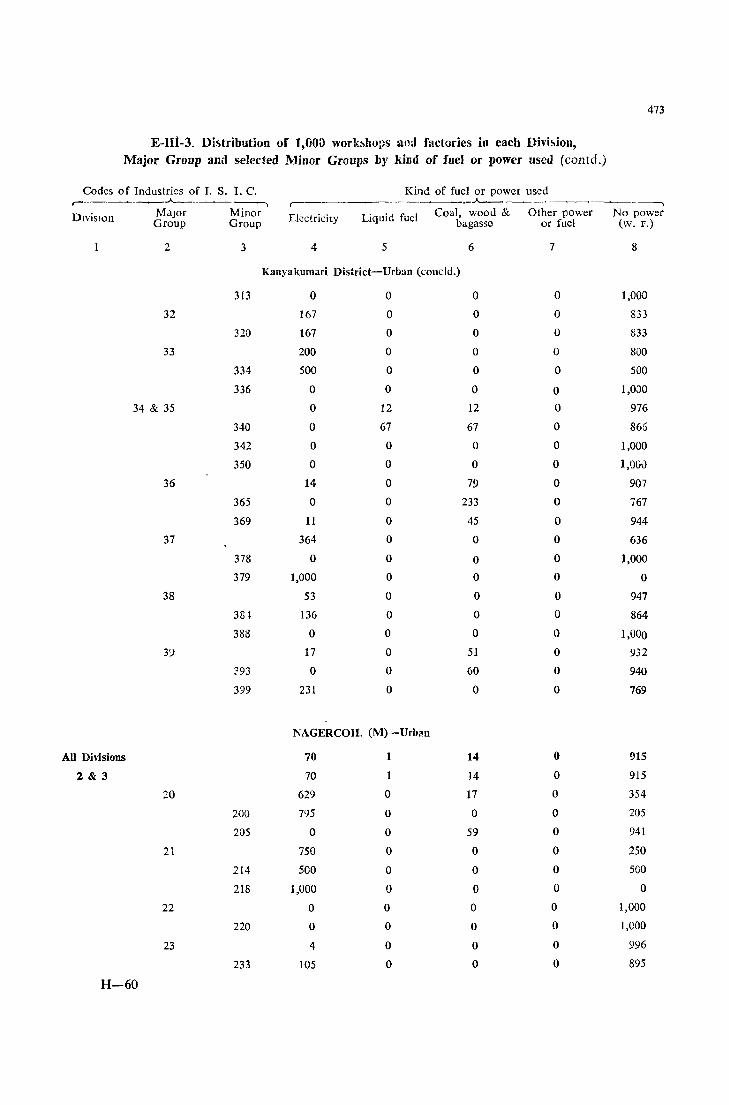
473
E-Ut-3. Distribution of 1,00;) work~hops ami factories in each Divif,ion, Major Group and selected Minor Groups by kind of fuel or power used (contd.)
Codes 0 f Industries of I. S. I. C. Kind of fuel or power used r------___ .A. -., r---
__ ..A. __ ---.,
DivisIon Major Minor Llcctricity Liquid fuel Coal, wood & Other power No power Group Group bagasse or fuel (w. F.)
2 3 4 5 6 7 8
Kanyakumari District-Urban (concld.)
313 0 0 0 0 1,000
32 167 0 0 0 833
320 167 0 0 0 833
33 200 0 0 0 800
334 500 0 0 0 500
336 0 0 0 0 1,000
34 & 35 0 12 12 0 976
340 0 67 67 0 866
342 0 0 0 0 1,000
350 0 0 0 0 1,000
36 14 0 79 0 907
365 0 0 233 0 767
369 11 0 45 0 944
37 364 0 0 0 636
378 0 0 0 0 1,000
379 1,000 0 0 0 0
38 53 0 0 0 947
381 136 0 0 0 864
388 0 0 0 0 1,000
39 17 0 51 0 932
:93 0 0 60 0 940
399 231 0 0 0 769
l\'AGERCOIL (M)-Urban
All Divisions 70 1 14 0 915
2&3 70 14 0 915
20 629 0 17 0 354
200 795 0 0 0 205
205 0 0 59 0 941
21 750 0 0 0 250
214 500 0 0 0 500
218 1,000 0 0 0 0
22 0 0 0 0 1,000
220 0 0 0 0 1,000
23 4 0 0 0 996
233 105 0 0 0 895
H-60

414
E-III-3. Distribution of 1,000 worl,shops and factories in each })ivision, Major Group and selected Minor Groups by kind of fuel or power used (coneld.)
Codes of Industries of I. S. I. C • Kll1d of fuel or power used r--- ..A-__ ~_______., r----- __ . _____ .J.._ _____ ~ --. DIvision Major Mmor Electricity liquid fue'] Coal, wood & Other power No power
Group Group bagasse or fuel (w. F.)
1 2 3 4 5 6 7 8
Nagercoil (M)-Urlian (coodd.)
235 0 0 0 0 1,000
26 0 0 0 0 1,000
264 0 0 0 0 1,000
27 0 0 0 0 1,000
273 0 0 0 O. 1,000
277 0 0 0 0 1,000
28 114 0 0 0 886
280 259 0 0 0 741
282 36 0 0 0 964
29 0 0 0 0 1,000
30 56 0 0 0 944
302 62 0 0 0 938
303 0 0 0 0 1,000
31 0 0 0 0 1,000
311 0 0 0 0 1,000
32 250 0 0 0 750
320 250 0 0 0 750
33 0 0 0 0 1,000
336 0 0 0 0 1,000
339 0 0 0 0 1,000
34 & 35 0 16 16 0 963
340 0 67 66 0 867
341 0 0 0 0 1,000
350 0 0 0 0 1,000
36 17 0 94 0 889
365 0 0 241 0 759
369 14 0 55 0 931
37 1,000 0 0 0 0
379 1,000 0 0 0 0
38 82 0 0 0 918
384 154 0 0 0 846
388 0 0 0 0 1,000
39 22 0 67 0 911
393 0 0 79 0 921
399 231 0 0 0 769
N: denotes negligible figures.
CHAPTER VI
STUDY OF DWELLINGS BY MATERIAL OF WALL AND ROOF
6 - 1. In this Chapter I propose to analys~ the structure of the Census houses on the basis of material used for the construction of the wall and of the roof. It is my view that the
quality of housing is to a large extent determined by the material Qnality of housing dependant used for the construction of houses either on the basis of the
on constructional material number of people who have to reside in it or on the basis of the use to which the Census house is to be put. More so is the
case with Census houses \\'hich are used as dwellmgs. As such, any improvement in the economic standard of the owner is reflected by his desire to us';: better quality material in the construction of his house both for wall and for roof. As such, any dIscussion based on the material of the wall and roof will throw considerable light on the standard of habitation available in different parts of Madras State. I have, therefore, devoted a lengthy chapter on this subject in which various aspects of housing will be discussed.
6 - 2 Table E-IV shows the distribution of Census houses used wholly or partly as dwellmgs cIassifi,_:cl separately by wall and roof material. It has
Table E-IV been prepared on a 20% sample. But in order to have a proper appreciation of this Table, it is desirable to have a general
knowledge of the geography, rainfall, temperature and soils of Madras State.
6 - 3. Madras is the southernmost State in India. Its area is about 50,000 square miles. It has the Bay.of Bengal and the Gulf of Mannar as its eastern boundry. To the north lie the
States of Mysore and Andhra Pradesh and on the west lies Boundaries of Madras State the Western Ghats separating it from Kerala except for a portion
of the Kanyakumari District which is on the western side of Western Ghats. Kanyakumari has therefore characteristics generally, found in the southern Travancore though it is a continuation of the Tirunelveli, in many respects.
6 - 4. Running parallel to the coast to a distance of 62:) miles from Pulicat lake in the north to Cape Comorin in the south is a broad strip of plain country gradually rising
away from it. It can be divided into three sub-regions: the The Coastal Plain Northern Plain, the Cauvery Delta and the Southern Plain. The
Northern Plain comprises Chingleput District, a major part of South Arcot District, the eastern part of North Arcot District, and northern part of Tiruchirapalli District. It is 50 to 60 miles wide with an average height of 250'. The plain fringing the Eastern Ghats is relatively high, its average altitude being 250' to 500' (75 metres to 150 metres). It is considered to be a marine crosin-surface. The rest of the plain is young with a thick cover of alluvium. It is below 250' (75 ms.), but its evenness is broken by the outcrop of old rocks. The immediate Coastal Plain is very narrow though accretion is
taking place through marine an9 aeolian deposition.
476 REPORT ON HOUSING AND ESTABLISHMENTS
6 - 5. The Cauvery Delt::t consists of Thanjavur and part of TiruchirapaUi District. The delta-head at Tiruchirapalli is Oil 2S()' contour and is
Cauvery Delta about 80 miles away from the sea. The slope is slightly steep for the delta having a fall of about 3' per mile.
6 - 6. The Southern Coastal Plain is shared by Ramanathapuram, Tirunelveli and Kanyakumari districts. It is covered with alluvium, mJrine and aeolian deposits. The coast
as a whole shows a strong evidence of both prograding Svuth Coastal Plain and uplift. There are extensive outcrops of marine sandstone, in
places limestone outcrops gently dip seaward. South of the river Tambraparni, these outcrops are concealed by aeolian deposit'). TIle area between the Varshaial :1nd Vaippar is monotonously flat, the only noticeable elevations are the tank bunds.
6 - 7. Between the rivers Palar and Cauvery, the Coastal Plain is backed by a discontinuous line of hills-the J::lVadis, Shevaroys, Kalrayans and Pachaimalais and Kollimalais.
North of the Palar, smaller and even more broken hills The Eastern Ghat~ arc linkd with the tail of Cuddapah in the Nagari hil15. Across
the Cauvery, furthcr detached massifs lead on to the long Varmhanud-Andipatti range and then to Cardamom hIlls in Madurai District. This line of discontmuous hills is known as the Eastern Ghats. It rises steeply above the plateau level to 3£00' to 38CO' in the Iavadis and 5000' to 5400' in the Shevaroys.
6 - 8. Between the Eastern and Western Gluts lies the plateau area with an elevation between 500' and 2000'. Hence the topography is undulating. In the west lies the
broad Palghut gap betwecn the Nilgiri and the Anaimalai The Plateau Area hills. Between the Cauve,y and the Palghat lies an extensive low
plateau rising gradually from 400' to 600' along the river to 1200' in the west, broken occasionally by granitic and, gllei~sic monadnocks. From the Nilgiris and Anaimalais, the Bhavani, the Noyil and the Amaravathi take their rise and flow through mature valleys across the plateau. The width of the plateau narrows down gradually from 72 miles near Palghat gap in the north to 14 miles near Shencottah gap in the south. The Cauvery diviJl':s the plateau into two parts, one eompnsmg most of Salem District and part of North Arcot District. and the other comprising most of Coimbatore District.
6 - 9. The plateau is fringed on the cast by a group of high hills known as the Western Ghats. On either side of the PaIghat g;:;p, the highest mountains of the Peninsula
dominate. They are the Nilgiris in the north and the Anaimalai-The Western Ghats Palni - Cardamom hills in the south. The Nilgiris form a
compact plateau of lOCO sq. mIles with summit level of 6000' to 8000' rising with extreme abruptness on all sides. lhe other group contains Anaimalai, the highest peak of the peninsula-8841'. This peak is, however, IOC:ltcd outside the boundary of the State. Its front to the Palghat ghat is remarkably steep. The S01lth-eastern flanks of the Palnis overlooking the Vaigai are remarkably abrupt as arc the Cardamom and their outliers (Varuchanad hills) south of the Vaigai. Between 10° Nand Shcncottah gap lie Cardamom hills with an elevation above 6000' where the a::tive streall1~ of the exposd Arabian sea-front have cut back the watershed 4 - 5 miles of the eastern edge of the hills.
6 - 10. The climate is tropical, b'Jt more eqmble th~n in North India. The summers are not as hot nor the winters as cold. Th~ maximum temperature is rarely above 110° F (43" C)

Ii
II'
MADRAS STATE GEOLOGY
SCALE
k~~'~D~~9iiiiiii~;:::2~,O ~;:::~~"'[ ;:::~~'i' 2M""
- ~ 201 ,l 60' ",i '"00 Kdometr~ 20 10 0 ......
MYSORE
KERALA
REFERENCE
Stat. Boundary
Dislnci Boundary
Cretaceous
Upper Gondwanas
Dharw.n
,. Charl'locklces
-SO
UneMFerentlatedCrymlllnM
Grarllt!;:
kaIt, Uhra.-oa$lc Intrusive and CuddOlpah Trap
Indian Ocean
,,'
----,..---79"
N
ANDHRA PRADESH
12-
Bay of Bengal
GUl~ O~ MAHAAR CEYLON
" N
He'IO, P 7 f ,C.5,0 I M.dl~·.

STUDY OF DWELLINGS BY MATERIAL OF WALL AND ROOF 477
and the minimum seldom below 65° F (18° C). The district of Nilgiri and some hilly areas like Kodaikanal Taluk of Madurai District and Yercaud of Salem District record a lower tempera·
lure. The average maximum temperature in Nilgiri District varie Climate from 60° 10 75° F while the average minimum temperature is
between 45° to 500 F. The climate is always cool. The coastal belt gets the benefit of the sea-breeze which to some extent reduces the temperature.
6 - 11. The State is more benefitted by the north-east monsoon than by the southwest monsoon. The State has three distinct seasons-I. Advancing
Rainfall monsoon season (south-west winds) - June to September, 2. Retreating monsoon season (north-east winds) - October to
January and 3. Transitional dry season-February to May.
6 - 12. The average rainfall of the State varies from area to area over a wide range· of 25" to 75". (See the map attached). For the larger part of the State, the average rainfall is low Nearly three fourths of the State falls within an annual range of 20" to 40" per year resulting in semi-arid conditions. The mountainous region and in particular the Nilgiri, accounts for the maximum rain, most of it from the south-west monsoon. Kanyakumari also gets relatively high rainfall on account of precipit:ltion during the two monsoon periods as well as in summer. Of the remaining area, the Coromandal CO:lst has the highest rainfall of 40" to 50". It decreases westward in the plateau and southward along the coastal plain, Coimbatorc and southern districts of Ramanathapuram and TirunelveIi, having the lowest. Broadly, north-eastern districts-Thanjavur, South Arcot, Chingleput and North Areot get a fairly distributed rainfall from both monsoons. The total rainfall in these districts is also higher than all other districts except Nilgiri and Kanyakumari. Tirunclveli, Coimbatore, Tiruchirapalli and Ramanathapuram get less rain than other districts with a major portion of it from the north-east monsoon.
6 - 13. Broadly speaking, soils in Madras State have the same characteristics as of similar soils in India as a whole. There are three main types of soils in Madras State - red, black,
alluvial of which red soils are predominant. Some patches of Soils arenaceous soils are also found along the coast line. Almost all
alluvium soils in the State' are concentrated in the delta of Cauvery in Thanjl vur and in a belt along its bank in Tiruchirapal1i. The alluvium soils of Tambraparni river in Tirullelveli District are black loam. They cover less than 25% of the area and are to be found in most districts of the State, but chiefly in Ramanathapuram, South Areat Tirunelveli and Thanjavur. They are also found in the southern part of Tirumangalam Taluk of Madurai District. Red soils arc found in every district of the State occupying nearly 2/3rds of the cultivable area. They vary greatly from one region to another. The red soil in North Areot tends to be sandy, in South Arcot loamy and in Coimbatore clayey.
6 - 14. The wall material has been tabulated as follows:
Wall materials
2. Timber
3. Mud
4. Unburnt bricks
5. Burnt bricks
1. Grass, leaves, reed or bamboo. In this State grass, cocoanut leaves, pa1myrah leaves, reeds and bamboo are covered by this head.
6. C. I. Sheets or other metal sheets. The Qth~r !llet~ls we fHnd in the State are canisters beaten flat
478 REPORT ON HOUSING AND ESTABLISHMENTS
7. Stones
8. Cement concrete
9. All other material
6 - 15. The roof material has been classified into 7 categories.
1. Grass, leaves, reeds, thatch, wood or bamboo-Items Roof mat('fials generally found in the State are grass, cocoanut leaves, palmyrah
leaves, cholam and varagu stalks, paddy straw, casuarina and , agathi' stalks, bamboo and other miscellaneous wooden poles.
2. Tiles, slate, shingle-The important item in the State is only tiles which are broadly divided into Mangalore and country tiles. The former is gradually replacing the latter.
3. C. 1., zinc or other metal sheets - Under this item will aho come canisters beaten fiat, used by poor people.
4. Asbestos cement sheets.
5. Brick and lime - The builder in Madras has developed a form of brick roof which withstands tropical climate bettcr than most flat rcofs. It is known as Madras Terraced Roof. The method by which this roof is made will be of interest to the reader. The basis of the roof is a series of horizontal wooden joists laid fairly close together with the edges running into walls. Upon these joists shallow bricks are laid in diagonal formation. Each brick rests on its narrow side upon the joists and its fbt side rests in a vertical position against the next brick ",here it is secured by mortar. A honzontal wall of single brick is thus built right across the joists. When this foundation has had time to dry, thick pulp of cement, sand and broken brick is spread on top. This mixture is laid to a thickness of about 6" or more. It is then rammed with implements hke butchers' choppers but made of wood. This process is continued for several hours until every inch of the ceiling has been b\:aten and the mixture becomes thoroughly integrated and solid.
6. Concrete and stone slabs - The stone slabs are generally found in temples and mosques and other communal buildings like 'Matams '. Dwelling houses generally have concrete roofs.
7. All other material - In certain C:1ses the roof and wall material have not been indicated by the enumerator.
An additional column has been opened for material 'not stated '.
6 - ] 6. Two subsidiary Tables have been prepared. E-IV-l shows the distribution of 1,000 households living in Census houses used wholly or partly as dwellings by wall
material. E-IV-2 is a similar table for roof material. In Subsidiary Tables to E-IV both the main and subsidiary Tables, data have been furnished
for each district and taluk with the rural-urban break-up. The figures for cities and towns having a population of 50,000 and above have been entered in indented lines under the taluks in which they are situated. The overall picture of the State in the order of importance of ",all and roof material is indicated below:
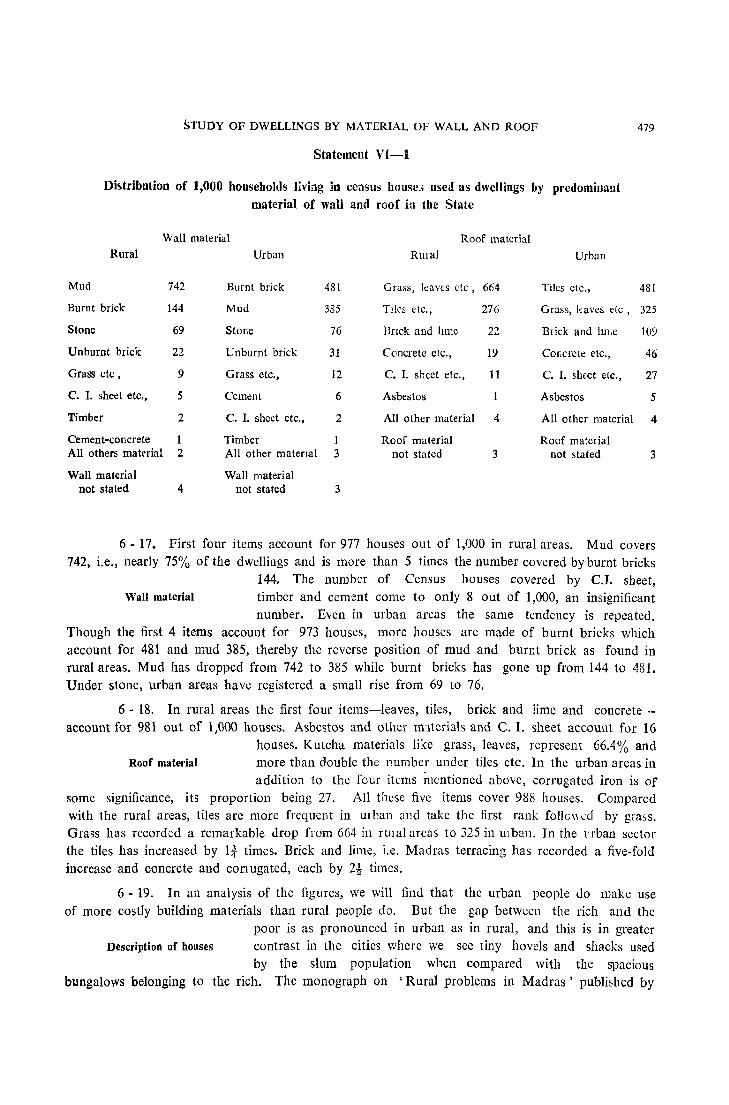
SiUDY OF DWELLINGS BY MATERIAL OF WALL AND ROOF
Statement VI-l
Distribution of 1,000 households living in census house:> used as dwellings by predominant material of wall and roof in the State
Wall material Roof material Rural Urban RUlai Urban
Mud 742 Burnt brick 481 Grass, leaves etc, 664 Tiles etc.,
Burnt brick 144 Mud 385 TIles etc., 276 Grass, kaves etc,
Stone 69 Stone 76 Bnck and lime 22 Brick and Im,e
Unburnt brick 22 Unburnt brick 31 Concrete etc., 19 Cor;crcte etc.,
Grass etc, 9 Grass etc., 12 C. 1. sheet etc., 11 C. I. sheet etc.,
C. I. sheet etc., 5 Cement 6 Asbestos 1 Asbestos
Timber 2 C. I. sheet etc., 2 All other material 4 All other material
Cement-concrete 1 Timber 1 Roof material Roof material All others material 2 All other material 3 not stated 3 not stated
Wall material Wall material not stated 4 not stated 3
479
481
325
109
46
27
5
4
3
6 - 17. First four items account for 977 houses out of 1,000 in rural areas. Mud covers 742, i.e., nearly 75% of the dwellings and is more than 5 times the number covered by burnt bricks
144. The number of Census houses covered by C.l. sheet, Wall material timber and cement come to only 8 out of 1,000, an insignificant
number. Even in urban areas the same tendency is repeated. Though the first 4 items account for 973 houses, more houses are made of burnt bricks which account for 481 and mud 385, thereby the reverse position of mud and burnt brick as found in rural areas. Mud has dropped from 742 to 385 while burnt bricks has gone up from 144 to 481. Under stone, urban areas have registered a small rise from 69 to 76.
6 - 18. In rural areas the first four items-leaves, tiles, brick and lime and concreteaccount for 981 out of 1,000 houses. Asbestos and other m1tcri315 and C. I. sheet account for 16
houses. Kutcha materials like grass, leaves, represent 66.4% and Roof material more than double the number under tiles etc. In the urban areas in
addition 10 the four it(ms inentioned above, corrugated iron is of some significance, its proportion being 27. All these five items cover 988 houses. Compared with the rural areas, tiles are more frequent in U1 ban and take thc first rank folIc" cd by grass. Grass has recorded a remarkable drop from 664 in rUJal areas to 325 in ulban. In the rrban sector the tiles has increased by tt times. Brick and lime, i.e. Madras terracing has recorded a five-fold increase and concrete and con ugated, each by 2} times.
6 - 19. In an analysis of the figures, we will find that the urban people do make use of more costly building materials than rural people do. But the gap between the rich and the
poor is as pronounced in urban as in rural, and this is in greater Description of houses contrast in the cities where we see tiny hovels and shacks used
by the slum population when compared with the spacious bungalows belonging to the rich. The monograph on 'Rural problems in Madras' published by

480 REPORT ON HOUSING AND ESTABLISHMENTS
the Government of Madras contains a description of the houses in rural areas of the State. "Houses in rural areas fall into two broad classes, viz., 1. labourers' houses 2. ryots' houses. The former is usually built of mud and has a roof of palmyrah thatch. In front there is a verandah or pial also of mud and the interior consists of a single room. In many cases even the pial is absent. The dwelling of the average ryot is also usually built of mud but the roof is thatched with bamboo and straw or is sometimes tiled. The pial is raised higher above the ground and the interior consists of four or five rooms opening 011 to a verandah which surrounds a small courtyard. One of the 1'001115 is used as a kitchen, one as a store-room for grain and other property and the rest as sleeping apartment. The cattle are som'!tirnes perhaps often, tethered in the courtyard at night though usually they are lodged under a sloping roof outside the walls of the house. The houses of even the richer villagers are much the same in form though the rooms nlly be somewhat larger and more numerous while the courtyard may contain a well or sometimes a cess-pool in close proximity. Houses of more than one storey are seldom found in villages anj are not numerous even in towns. As a rule, the houses are ill-lighted and ill-ventilated and window opening, are either too few and narrow or totally absent. Wint is r.;:;kond as a hOllse for C~ll3US purp:>ses is not a house in the sense that it provides th~ accommojation, floor space or livillg room reasonably required for its inmates. Though on an average, the census figures indicate that there is one hl'use for about 5 individuals the living r;);)m available in th~ h()us~ is totally in adequate for even a much smaller number and when conJitions other than space are considered, p~rhap3 90% of the rural houses will be ..condemned without hesitation as unfit for human habitation. The flooring is damp, the walls are deeply indented, light and air practically absent, roofing low and flimsy, and in short all the conditions exist which make for sickness and disease. And when it is remembered that the size of the family usually increases as one go~s down the social scale, it will be seen that the poor mln with a large family inhlbits the smlllest hut and to the other evils mentioned above, the evil of overcrowding is also added".
6 - 20. There is a saying by Avvayar in Tamil to the effect Thaium Masium vaiagathu
urangu "fia)JljU./lD LDff<!i1UjW roruUJl»fo!fjJ/DtN(§". During Thai and Masi which correspond to the perid mid-January to mid-March, nights will be chiller with dewfall.
Pattern of housing dependant on The poetess suggests that it is b:!tter to sleep in houses with grass roof physical and economic factors during this period. We know that the kutcha roofs made of
grass, leaves and thatch are more tolerable in sum'ller than tile and tin-roofed houses. During the winter m::>nths also, th~y are warm. Owing to the general poverty of the villagers, they are not able to rais~ th-:: w:tlls to the optimum height whieh will afford them protection from heat. If in such a c::mdition th~y put up tiled or tin -roofs, the heat will be unbearable in summ;;r. This and their pov~rty induc;::s them to have kutchJ. roofs. There should have been another reason I!l the P1St, tInt a thief could easily remove a few tiles from the loof and drop into the hOL1:;c. Su;h an entry w.)uld be difficult in the cas;:: of a thatched roof without creating noise. Such roofs arc, however, easily combustible and liable to catch fire and with the huts closely packed, once a fire accident occurs, it is difficult to control it and the poor lose all that they have. With the growing security in villages, people now-a-days tend to prefer tiled roofs. The country tiles are a little better as far as protection from heat is concerned "than Mangalorc tiles. But they arc expensive as they have to be spread in two layers. The beams have also to be made stronger to carry the additional load. So the people are compelled to prefer Mangalore tiles and the manufacture of country tiles which was a local industry has plactically come to a stop.

MADRAS STATE
I
A-
RAINFALL Normal Monthly & Annual Rainfall
20 10 0
~~ Kilometres 20 10 0
SCALE 20
MYSORE
i £
~Il~
I
I i
I
I
KERALA
REFERENCE
State Boundary
IlAINFALL IN MILLIMETRGS
600 & below
600 - 700
700 - IlOO
IlOO - 900
900 1000
1000 - 1200
1200 - 1400
1400 - 1600
1000 - 2000
2000 & above
mill ' ....... . .........
1----:_-<J ~ V7T//1 1111111111111111
1- cl
IT:=J ~Ml 1111111111111111
n. Tot~1 A_I R.i"I.U 01 eedt ".ti_ i.
MI_ til. """. witltr" "-chI,.
Indian
rm"- ()(,'O
i 60 Miles I
I 80 100
o c e a n
ANDHRA PRADESH
Bay of Bengal
PALk STRAIT
GULF Of M.ANAAR
SCALE FOI. ANNUAL RAINFALL CEYLON
(i"
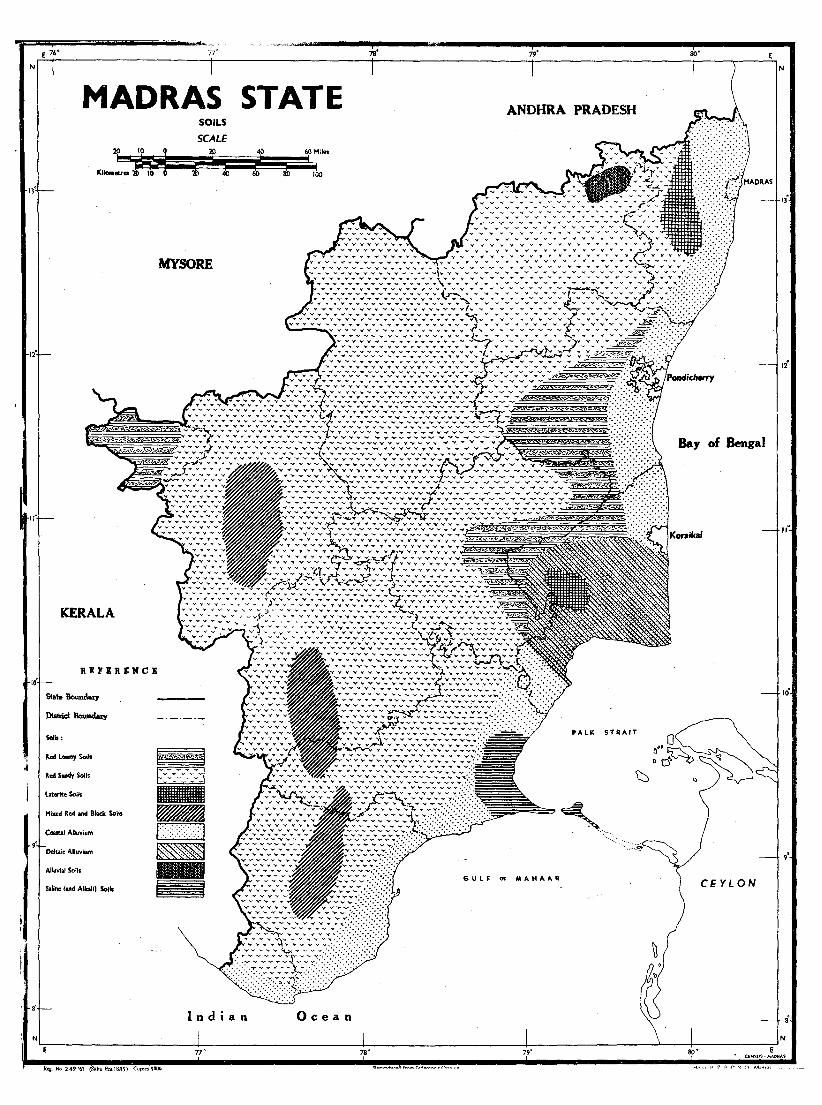
MADRAS STATE ANDHRA PRADESH
~ 20 10 ~ -~--
Kilometres 10 10
SOILS
SCALE
!~;:=~4P~; ;;;~~f>O~1 Miles ~ k Jo ~ I~
MYSORE
K.£RALA
REFERENCE
Soib:
,.<11 Loomy Soih
,,<II Sandy Soils
Laterite Soils
Mixed Red and Black Soli.
Coastal Alluvium
Deltaic Alluvium
Alluvial Soils
S.line land Aiblil SoIh
Reg. No 249 '63 (Saka Era1885) C'()pi~s9000
v~v~vvvv~vvvvvvvv
VVVVVVVVVVVYV~VVVv
vv~~vv~v~¥vv¥v¥vv
vvvvvvvVvvvvvvvvv~
VVVVVVVVVvvvvvvVv vvvvvvvvvvvvvvvvvv VVVVVyvvvvvvvVVYV vvvvvvvvvvvvv~vvv .v ...•.. ~_.v .. __ _ vv~_VVV~YV~vvvvv
vvvvvvVvvvvvvvvvv vvvvvvv~v~vvvvvv~ vv.,_ .... ..,. ........... vv .... v ..... ..., .... ..., vvvvvvvvvvvvvvvv_~
V TV., ......... vvv...,vvvv·..,v...,.. .... ..,..
v_v .... v .... v...,""':.,v ...... vvv...,.."'v..,v."v'V.."v-y..."v ......... --: ...,-... -...,-
V'v v ... v ...... v v v v V V V V V V V V ...,.
GULF co M"""AR
PALK STRAIT
12
Bay of Bengal
II·
CEYLON
8'
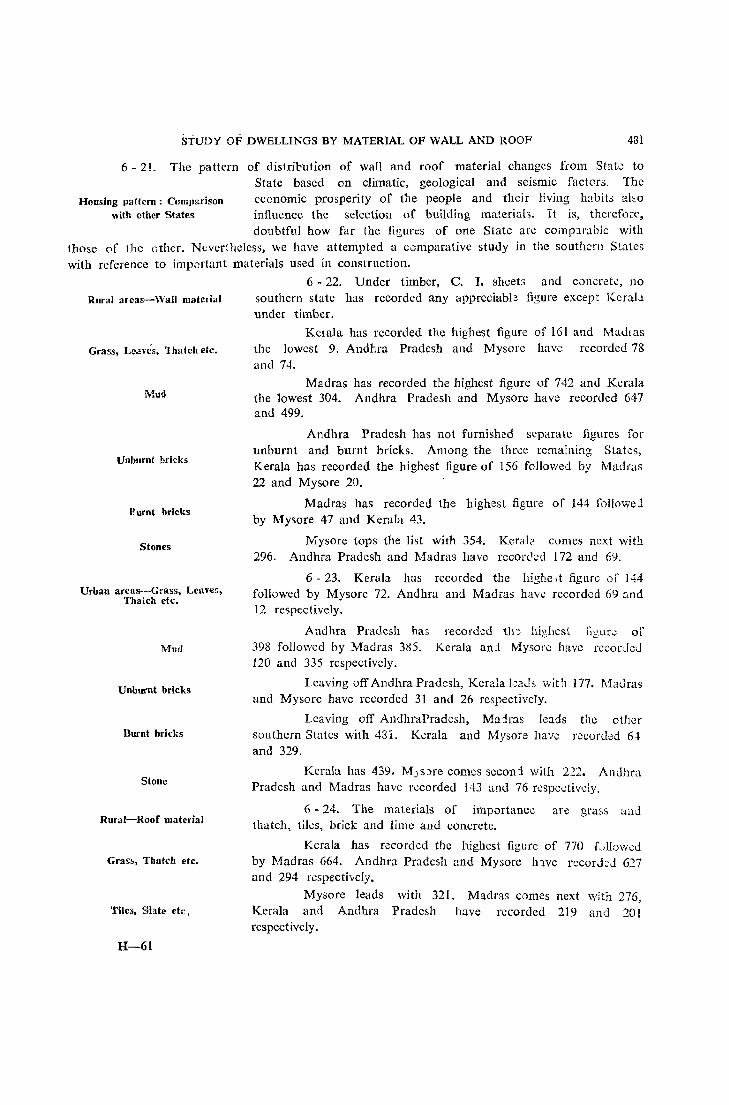
STUDY OF DWELLINGS BY MATERIAL OF WALL AND ROOF 481
6 - 21. The pattern of distribution of wall and roof material changes [fom State to
Housing pattern: Comparison with ether States
State based on climatic, geological and seismic factors. The economic prosperity of the people and their living habits also influence the selection of building materiah. It is, therefo;:e, doubtful how far the figmes of one State arc compJl':1blc with
those of the other. Nevertheless, we have attempted a c0mparative study in the southern SLates with reference to important materials used in construction.
Rural arcas-'Vall matcrial
Grass, Leaves, Thatch etc.
Mud
Unburn! brkks
Furnt bricks
Stones
Urban areas---Grass, Leaves, Thatch etc.
Mud
Unburnt bricks
Burnt bricks
Stone
Rural-Roof material
Gras~, Thatch etc.
Tiles, Slate etc.
H-61
6 - 22. Under timber, C. I. sheets and concr.:!tc, no southern state has recorded any appreciabb figure except KeraLt under timber.
Ketala has recorded the highest figure of 161 and Mad!as the lowest 9. Andhra Pradesh and Mysore have rcconled 78 and 74.
Madras has recorded the highest figure of 742 and Kerala the lowest 304. Andhra Pradesh and Mysorc have recordcd 647 and 499.
Andhra Pradesh has not furnished separate figures for unburnt and burnt bricks. Among the three remaining States, Kerala has recorded the highest figure of 156 followed by Madr'as 22 and Mysore 20.
Madras has recorded the highest figure of 144 foliowe1 by Mysore 47 and Kerala 43.
Mysore tops the list with 354. Kcrala comes next witIl 296. Andhra Pradesh and :Madras have reCOft1ed 172 and 69.
6 - 23. Kerala has recordcd the highcJt figure of 144 followed by Mysore 72. Andhra and Madras haw recorded 69 ~md 12 respectively.
Andhra Pradesh has 398 followed by Madras 385. 120 and 335 respectively.
recorded th~ highest fi:;:,urc or Kcrala an1 Mysore have rccorJeJ
Leaving off Andhra Pradesh, Kerala lcaJs with 177. Madras and Mysorc have recorded 31 and 26 respectively.
Leaving off AndhraPradesh, Ma1ras leads the other southern States with 481. Kerala and Mysore lta'le rccord~d 6-l and 329.
Kerala has 439. M)s)re comes secon:l with 222. Andhra Pradesh and Madras have r...:corded 143 and 76 respeetivdy.
6 - 24. The materials of importanc0 are grass and thatch, tiles, brick and lime and concrete.
Kerala has recorded the highest figure of 770 Llluwd by 1\1adras 664. Andhr3 Pradesh and Mysore lnvc rccorJ:J 627 and 294 respectively.
Mysore leads with 321. Madras comes next with 276, Kerala and Andhra Pradesh have recorded 219 and 201 respcctively.
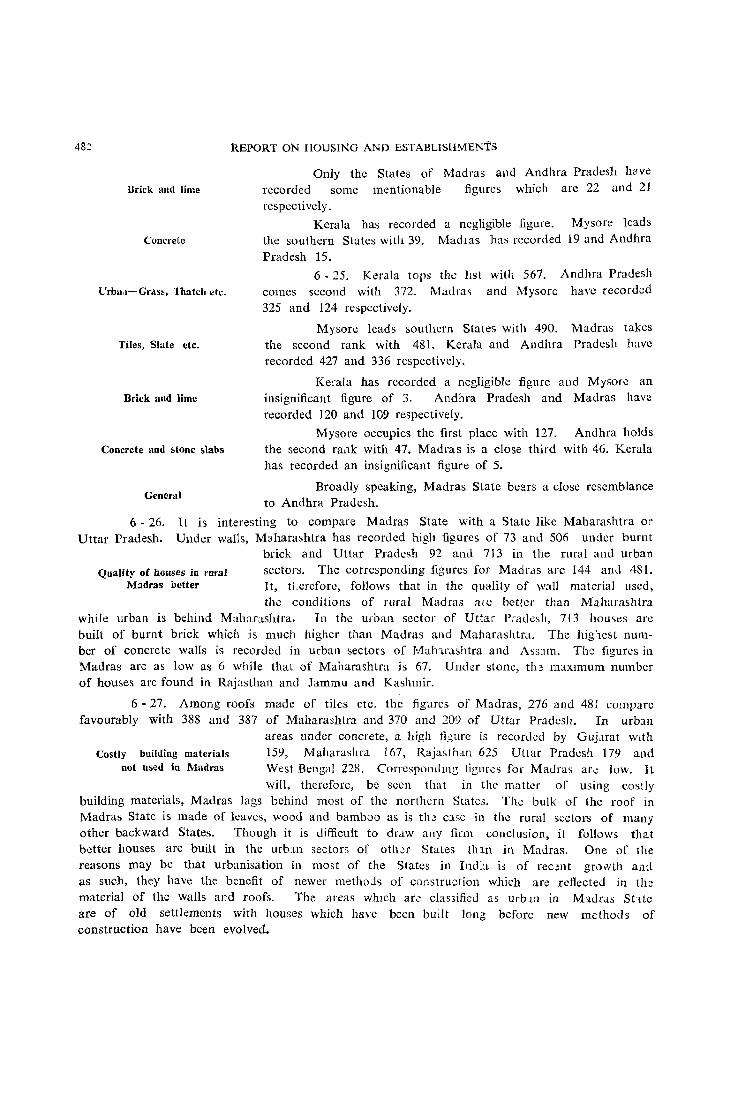
482
Brick and lime
Concrete
t.:rba.l-Grass, Thatch ctc.
Tiles, Slate etc.
Brick and lime
Concrete and stone slabs
General
REPORT ON HOUSING AND ESTABLISHMENfs
Only the States of Madras and Andhra Pradesh have recorded some mentionable figures which are 22 and 21 respectively.
Kerala has recorded a negligible figure. Mysore leads the southern States with 39. MadIas has recorded 19 and Andhra
Pradesh 15.
6 - 25. Kerala tops the 11st with 561. Andhra Pradesh comes second with 372. Madras and Mysore have recorded 325 and 124 respectively.
Mysorc leads southern States with 490. Madras takes the second rank with 481. Kerala and Andhra Pradesh have recorded 427 and 336 respectively.
Kerala has recorded a negligible figure and Mysore an insignificant figure of 3. Andhra Pradesh and Madras have recorded 120 and 109 respectively.
Mysore occupies the first place with 127. Andhra holds the second ra,lk with 47. Madras is a close third with 46. Kcrala has recorded an insignificant figure of 5.
Broadly speaking, Madras State bears a close resemblance to Andhra Pradesh.
6 - 26. It is interesting to compare Madras State with a State like Maharashtra or Uttar Pradesh. Under walls, Maharashtra has recorded high figures of 73 and 506 under burnt
brick and Uttar Pradesh 92 and 713 in the rural and urban
Quality of houses in rural Madras better
sectors. Thc corresponding figures for Madras arc 144 and 481. It, tLerefore, follows that in the quality of waH material used, the conditions of rural Madras ate bettcr than Maharashtra
while urban is behind Maharashtra. In the urban sector of Uttar Pradesh, 713 houses are built of burnt brick which is much higher than Madras and Maharashtrd. The hig:1est number of concrete walls is recorded in urban sectors of f.,1alnrashtra and Assam. The figures in Madras are as low as 6 while that of Maharashtra is 67. Under stone, tlu maXimum number of houses are found in Rajasthan and Jammu and Kashmir.
6 - 27. Among roofs made of tiles etc. the figures of Madras, 276 and 481 compare favourably with 388 and 387 of Maharashtra and 370 and 209 of Uttar Pradcsh. In urban
Costly building materials not used in Madras
areas under concrete, a high figure is recorded by Guj.lrat wIth 159, Maharashra 167, Rajasthan 625 Uttar Pradesh 179 and West Bengal 228. Correspol1lhng figures for Madras are low. It will, thereforc, be scen that in thc matter of using costly
building materials, Madras lags behind most of the northern States. The bulk of the roof in Madras State is made of leaws, wood and bamboo as is the C:lse in the rural sectors of many other backward States. Though it is difficult to draw any firm conclusion, it follows that better houses are built in the urb:m sectors of other States tl11.n in Madras. One of the reasons may be that urbanisation in most of the States in India is of rec;:nt grovYth and as such, they have the benefit of newer methoJs of construction which are reflected in the material of the walls and roofs. The areas which ar._: c1as3ifieJ as urb~n m Mldras St'tte are of old settlements with houses which have been built long before new methods of construction have been evolved.
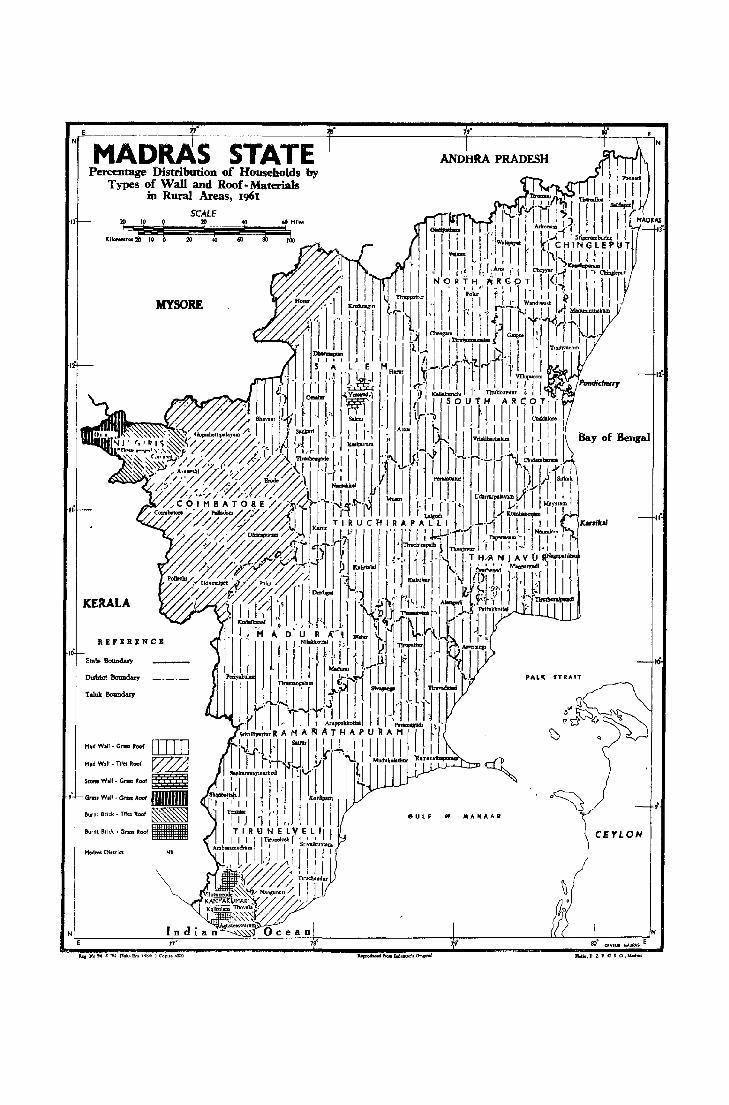
STATE Percentage Distribution of Households by
Types of Wall and Roof-Materials in Rural Areas, ICJ6I
SCALf 20 10 ~ 20 40 .0 Miles H;J:I t _!t I
K'Iomo< .... 20 I~ ~ 1 l £ ,~
MYSORE
KERALA
REFERENCE
Talul, Boundary
Mud Wan - Gras Roo( rnIJ Mud Walt-Tiles Roof ~
Stone Wall - Gnus Roof ~
Wall - Gnn Rcof DIIB Burnt 8rick - Trn ftaof ~
Burnt Brick· Gra$'$ Roof _
Madras Dirtrlct NIL
ANDffRA PRADESH
eUl~ • MANAAR
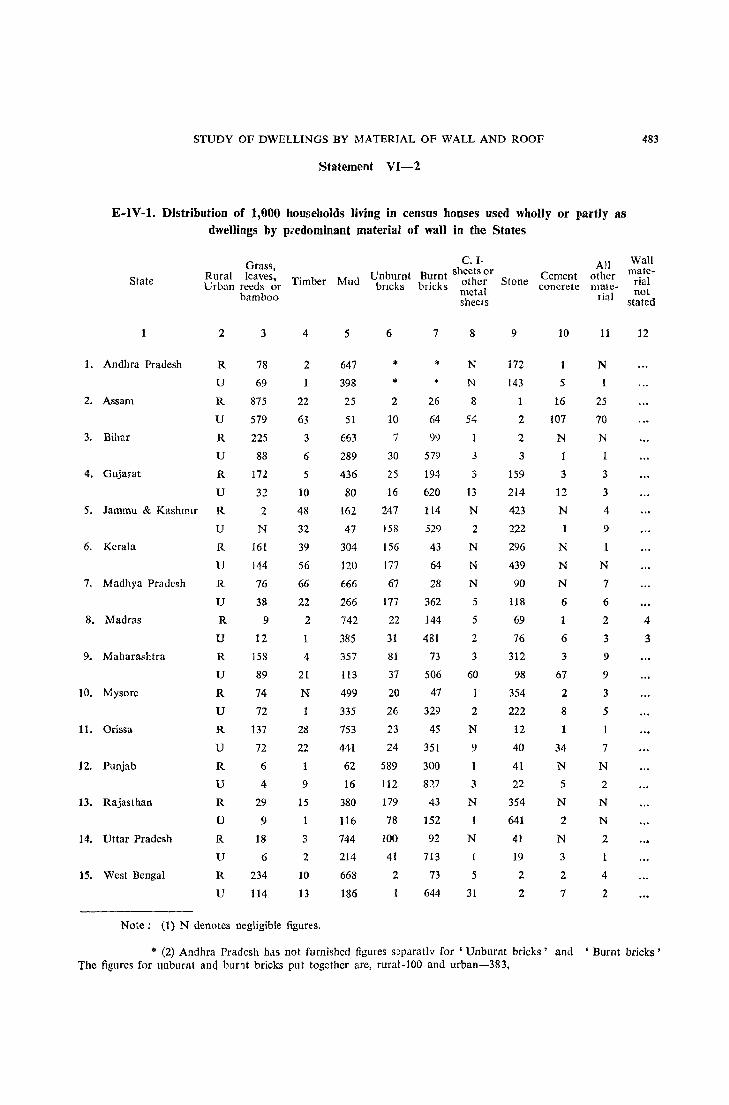
STUDY OF DWELLINGS BY MATERIAL OF WALL AND ROOF
Statement VI-2
E-IV-1. Distribution of 1,000 households living in census houses used wholly or partly as dwellings by p;'edominant material of wall in the States
Grass,
State Rural leaves, Unburnt Urban reeds or Timber Mud bncks
1
1. Andhra Pradesh
2
R
U
2. Assam R
U
3. Bihar R
U
4. Gujarat R
U
5. Jammu & KashmIr R
U
6. Kerala R
7. Madhya Pradesh
8. Madras
9. Maharashtra
10. Mysore
11. Orissa
12. Punjab
13. Rajasthan
14. Uttar Pradesh
15. West Bengal
U
R
U
R
U
R
U
R
U
R
U
R
U
R
U
R
U
R
U
bamboo
3
78
69
875
579
225
88
172
32
2
N
161
144
76
38
9
12
I5S
89
74
72
137
72
6
4
29
9
18
6
234
114
4
2
22
63
3
6
5
10
48
32
39
56
66
22
2
4
2l
N
28
22
1
9
15
1
3
2
10
13
Note: (1) N denotes negligible figures.
5
647
398
25
51
663
289
436
80
162
47
304
120
666
266
742
385
357
113
499
335
753
441
62
16
380
116
744
214
668
186
6
".
2
10
7
30
25
16
247
158
156
177
67
177
22
31
81
37
20
26
23
24
589
112
179
78
100
41
2
C. I· Burnt sheets or bricks other
metal sheets
7
* *
26
64
99
579
194
620
114
529
43
64
28
362
144
481
73
506
47
329
45
351
300
827
43
152
92
713
73
644
8
N
N
8
54
1
3
3
13
N
2
N
N
N
5
5
2
3
60
1
2
N
9
1
3
N
1
N
5
31
Stone
9
i72
143
1
2
2
3
159
214
423
222
296
439
90
118
69
76
312
98
354
222
12
40
41
22
354
641
41
19
2
2
Cement concrete
10
5
16
107
N
3
12
N
1
N
N
N
6
6
3
67
2
8
34
N
5
N
2
N
3
2
7
All other mate
rial
11
N
25
70
N
3
3
4
9
1
N
7
6
2
3
9
9
3
5
7
N
2
N
N
2
1
4
2
483
Wall mate
rial not
stated
12
4
3
'" (2) Andhra Pradesh has not furnished figures s~paratlv for' Unburnt bricks' and 'Burnt brieks' The fi/:iurcs for llnburnt and burnt bricks put together are, rural-IOO and urban-383,

484 REPORT ON HOUSING AND ESTABLISHMENTS
Statement VI-3
£-IV-2. Distribution of 1,000 households living in census houses used wholly or partly as dwellings by predominant material of roof in the States
1
l. Andhra Pradesh
2. Assam
3. Bihar
4. Gu;ant
,
Grass, leaves, Corrugated Asbestos Brick Concrete Rural reeds. thatch Tiles, slate iron, ZlllC cement and and Urban wood or shingle or other sheets hme stone
2
R
U
R
U
R
U
R
U
bamboo metal sheets slabs
3
627
372
847
373
446
125
104
4
201
336
N
16
522
524
735
430
5
4
27
11')
561
8
41
147
2<)9
6
1
9
9
15
21
7
21
120
12
22
8
15
47
5
1
6
10
5. Jammu & Kashmir R
92
889
485
770
567
123
15 16
187
6
2
14
N
2
5
N
4
49
283
N
2
3
159
N
25
N
5
6. Kerala
7. Madhya Pradesh
8. Madras
9. Maharashtra
10. Mysore
11. Ori~sa
12. Punjab
13. Rajasthan
14. Uttar Pradesh
15. West I?enga1
u R
U
R
U
R
U
R
U
R
U
R
U
R
U
R
U
R
U
R
U
60
664
325
322
117
294
124
837
495
857
623
400
137
206
66
731
92
2i8
219
427
800
564
276
481
388
387
321
490
149
240
63
75
402
118
370
209
108
323
24
161
11
~7
180
244
19
55
9
96
8
30
18
70
5
32
112
200
5
1
16
6
32
3
5
7
N
8
5
25
52
N
N
4
23
22
109
2
29
N
3
25
55
169
15
38
22
285
19
179
23
1:7
19
46
21
167
39
127
2
95
14
94
162
625
6
179
20
~28
All other mateflal
9
131
89
23
18
N
N
2
4
77
31
N
o 22
16
4
4
86
40
326
195
1
17
N
4
2
5
391
221
5
3
Roof mate
rial not stated
10
3
3
STUDY OF DWELLINGS BY MATERIAL OF WALL AND ROOF 485
6 - 28. A statistical analysis of the use of wall and roof materials will now be attempted. The wall materials of importance in the State are: ). Mud
Roof and wall materillJ- 2. Burnt bricks and 3. Stone. The districts of Nilgiri, A statistical analysis Tirunelveli and Kanyakumari have recorded figures of 60, 26 and
41 under grass and thatch. Under unburnt bricks, the following districts have recorded appreciable figures:
Thanjavur
TirunelveU
Kanyakumari
45
73
262
C.1. sheets are found chiefly in the districts of Coim':)ltor~ and Nilgiri, the figures being 31 and 56. The figUies of other districts are inappreciable.
6 - 29. In the rural sector, th:! range for mud is from 90 in Nilgiri to 834 in South ArcClt District. Th: distrkts of Chingleput, North Arc:)t, S'Juth ArcJt, S:llem, M_ldurai,
Tiruchirapalli, Thanjavur and Ramanathapuram have recorded Rural areas more than the State average of 742 the range being 757 to
834. Apparently the conditions of housing are better in the districts of Nilgiri, Coimbatore, Tirune1veli and Kanyakumari. Again if more number of houses are built with walls of burnt bricks and stone, the economic prosperity is indicated. The State average is 213 (144+69), NiIgiri 717 (487+230), Kanyakumari 391 (345+46), Coimbatore 297 (33+264), Tirunelveli 278 (170 + 108), North Arcot 222 (214+8). In the remaining districts the range is from 157 in South Arcot to 201 in Salem.
6 - 30. In the urban sector, the range for mud is from 104 in Nilgiri to 545 in South Arcot District. As in the case of rural areas, the
Urbau areas districts of Nilgiri, Coimbatore, Tirunelveli and Kanyakumari have recorded less than the State average of 385 thereby
indicating that their economic prosperity is superior to other districts. Under burnt brick and stone, the following districts have recorded more than the State average -of 557 (481 + 76).
Nilgiri 801 (621 + 180)
Madras City 685 (675+10)
Coimbatore 598 (299+299)
The range for the remammg districts is 380 in South Areot to 550 in TiruchirapaUi. The figures for Kunyakumari and Tirunelveli arc 548 and 546.
6 - 31. At the district level, the roof materials of importance are kutcha, tiles and brick and lime. Under C.r. sheets the districts of Nilgiri and
Roof materials Madurai have recorded figures of 166 and 79. Under concrete, Madras City, Madurai, Tirunelveli and Ramanathapuram have
recorded 95, 60, 50 and 49 respectively. Other roof materials are comparatively unknowll.

486 REPORT ON HOUSING AND ESTABLTSHMENTS
6 - 32. The range for kutcha roof is from 127 in Nilgiri to 848 in South Arcot. The districts of Coimbatore, Tirunelveli, Madurai, Kanyakumari and Ramanathapuram have also
recorded less than the State average of 664, th:: range being Rural areas- 318 to 612. Less kutcha roofs are found in the districts of Kutcha Roof Nilgiri and Coimbatore. Under tiles the range is from 122 in
South Arcot to 672 in Coimbatore. The districts of Coim-batorc, Nilgiri, Kanyakumari and Tirune1veli have recorded more than the State average of 276.
Brick and lime
6 - 33. More roofs are found in the districts of Madurai, Ramanathapuram and Tirunelveli which have figures of 87, 56 and 44 respectively. The State average is only 22.
6 - 34. In the urban sector, the range for kutch a roof is 107 in Nilgiri to 565 in South Arcot. The districts of Coimbatore, Kanyakumari, Tirune1veli, Ramanathapuram, Madras
and Madurai have recorded less than the State Average of 325 Urban areas ranging between 142 and 311. Under tiles the range is from 321
in South Arcot to 741 in Coimbatore. The districts of Coimbatore, Nilgiri, Kanyakumari, Salem, North Arcot and Tirune1veli have recorded more than the State average of 481. Under brick and lime the range is from negligible in Nilgiri to 180 in Madurai. Ti:e following districts deserve mention as they have recorded more than the State average of 109.
Madras City 172
Madurai 180
Tiruchirapalli 141
Ramanathapuram 162
Tirunelvcll 131
6 - 35. It can be assumed that more the number of houses with walls built of burnt brick and stones, the less the number of houses \-vith kutcha roof indicate the economic prosperity of the district. On this basis rural areas of the State will rank themselves as indicate below:
Proportion of Proportion of burnt bnck& kuteha
stone walls roofs
1. Nilgiri 717 127
2. Coimbatore 297 318
3. Tirunelveli 278 543
4. Kanyakumari 391 576
5. Salem 201 707
6. Madurai 188 571
7. NQrth Areot 222 733
8. Ramanathapuram 171 612
9. Tiruchirapalli 159 771
Ie. Chingleput 199 785
11. Thanjavur 165 780
t 2. South Arcot 157 848
STUDY OF DWELLINGS BY MATERiAL OF W Al.L AND ROOF 437
6 - 36. The ranking for urban areas will be as follows:
Proportion of Froportion of burnt briek & kt;teha
stone walls roofs
1. Nllgiri 801 107
2. COImbatore 598 142
3. Madras CIty 685 310
4. Kanyakumari 548 269
5. Tlrunelveli 546 285
6. Ramanathapuram 540 304
7. Madurai 517 311
8. North Areot 524 378
9. Salem 481 328
10. Tlruchirapalli 550 425
11. Chingleput 503 3)5
12. Thanjavur 457 483
13. South Areot 380 565
6 - 37. The general nature of the terrain consists of a level plain with a few outcrops of jutting hills in the southern parts of the district. All the three predominant soils, red, black
and arenaceous are found in this district. As the district does ChingJeput District 110t possess prominent ranges of hills or large rivers, there is no
sharp local variation in rainfall distribution. The mean annual rainfall is 1,404.4 millimetres. The black and red earth which form the predominant soil types are increasingly used as wall material which explains the predominance of mud walls and those using burnt bricks. Taking taluks as the unit, the abundance of red clay soil and sandy soil in Ponneri Taluk explains the use of mud and burnt bricks m::mufactured out of red clay and sand. This is also the case in Chingleput, Kanchipuram, Maduranthakam and Tiruvallur taluks. Since sedimentary rock types, sand stones and slates predominate in Sriperumbudur Taluk, stone walls arc more prominent among houses found in this taluk than elsewhete in the district. To a certain extent, Saidapet Taluk also uses stones because of th~ quarries found near Pallavaram.
6 - 38. The State average of 742.
Rural areasWall material
district has recorded a higher proportion of 788 under mud against the The highest proportion is recorded in Paaneri Taluk with 875. The pro
portion of houses with mud wall exceeds 700 in all taluks ranging from 717 in Sriperumbudur to 875 in Ponneri. Next item of material is burnt bricks. The range is from 11) in Panneri to 20 l in Kal1chipuram. Madural1thakam has also recorded a low propor
tion of 122. The proportions recorded by Tiruttani, Sriperumbudur and Saidapet arc: high. These facts indicate th'lt the taluks of Ponneri, and Maduranthakam are backward in housin,j and taluks of Kanchipuram, Tiruttani, Sriperumbudur an::! Saidapet have better houses. It is seen that a large number of houses with stone walls are found in Sriperumbudur and Saidapet taluks-S5 and 68. They lie partly in the metropolitan region of Madras city. Though Ponneri and Madur.l11thaka n contain hills. they have recorded the low figures of 11 and 13 thereby indicJ.ting the economic backwardness of the people. Under unburnt bricks, Kanchipuram Taluk h1.s recorde::! 38. It is a silk weaving centre. In order to ensure the s:lfety of the looms, the weaving fa:11ilies
prefer burnt bricks to mud walls.
488 REPORT ON HOUSiNG Al'-ID ESTABLisHMENTS
6 - 39. Under roof material, the district has recorded a higher proportion of 785 under kutcha roof against 664 for the State. The proportion of houses with kutcha roofs range from
687 in Sriperumbudur to 861 in Maduranthakam. Panneri has also Roof material recorded a high propo;:tion of 860. KanchipUl am and SaidDpet
have recorded comparatively low figures of 708 and 741. The other material in the order of importance is tiles. The range is from 123 in Ponneri and Maduranthakam to 291 in Sriperumbudur. Saidapet and Kanchipuram have recorded high figures of 215 and 276. The above facts indicate that the condition of housing in ChingJeput district is more backward than other districts in the State. In the district itself Ponneri and Maduranthakam represent the most backward areas. Concrete roof is found in Slidapet an:i Chingleput with figures of 29 and 20.
6 - 40. Under wall materials, the urban sector has recorJed 467 under mud walls as against 385 for the State. Again under burnt bricks, the district has recorded 437 as against
481 for the State indicating the lower st:mdards for the district. Urban areasWall material
The proportion of mud walls ranges from 333 in Chingleput taluk to 761 in Maduranth:lbm. Tiruvallur, Sriperumbudur, Chingleput and Saidapet have recorded comparatively low figures
ranging from 333 to 435. Under burnt .bricks, the range is fro;n 12l in Srip:::rumbudur to 642 in Tiruvallur Taluk. Maduranthakam has recorded a low figure of 209. The other taluks have recorded figures ranging between 415 and 625. More stones are found in Sriperumbudur in contrast to its position under burnt bricks. The next important wall material is stone. Srip~rum
budur is far ahead of other taluks recording a high figure of 357 followed by Ponncri with 76 and Saidapet 66. Under unburnt bricks, 54 units are recorded in Sriperumbudur Taluk.
6 41. The district has recorded a higher proportion of 395 under kutch a ro::>[ as against 325 for the State. Again under tiles and Madras terrace, it has recorded lower figur~s.
Thus the district has shown itself to be backward in housing. Roof mutcdal The largest number of units are recorded under tiled roof. The
range is from 180 in Maduranthakam to 688 in Kanchipuram. The next material in the order of importnnce is kutcha, the range being 208 in Kanchipuram to 743 in Maduranthakam. In addition to Maduranthakam, PO:111eri Taluk has shown more than 50% under kutcha roof. Thus it follows that these taluks arc backward. Madras tcrrac~
ranges from 37 in Ponned to 148 in Tiruvallur. Tiruttani, Kanchipuram, S~idapet and Chingleput have recorded fairly high figures varying from 82 to 95. Under concre~e roof, figures of 64 and 43 have been recorded in ChingJeput and Saidapet. The general picture that ,emerges from this discussion is that the conditions of housing in Kanchipuram, Saidapet, Sripefumbuduf and Chingleput are comparatively better.
6 - 42. The western terrain of the di<;trict is a flat plain running upto Javadi hills; the northern and eastern parts are mostly lliIIy. The most important soils of the district are red
soil, loamy, sandy and also black soil. The district is character;sed North Arcot District by the presence of burnt brick walIs and mud walls. Iavadi h lls
which starts a few miles south-east of VeJlore and passing through Palur, Chengam and Tiruppattur provide the necessary raw material for the construction of stGne walls. The district is more or less a dry area, the mean annual rainfall being 946.7 millimetres. Therefore, mud walls and burnt brick walls predomimte in this district to a l¥ge extent. Only in Polur Taluk of the district, we find walls made: of timber, sinc~ a large p!:>rtion of taluk is covered with forests. Among other taluks except Vcllore wh:ch has both mud and burnt brick walls in fairly equal proportions, mud walls predominate. The availability of clay in
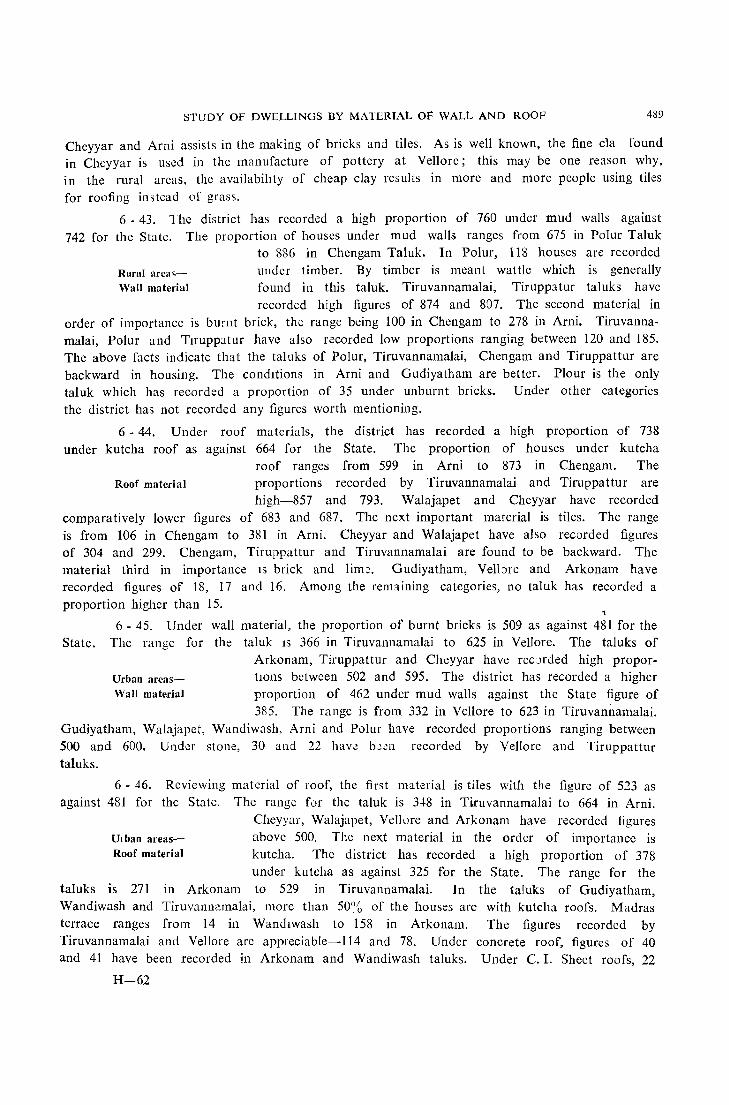
STUDY OF DWELLINGS BY MATERIAL OF WALL AND ROOF 489
Cheyyar and Arni assists in the making of bricks and tiles. As is well known, the fine c1a found in Cheyyar is used in the manufacture of pottery at Vellore; this may be one reason why, in the rural areas, the availabilIty of cheap clay results in more and more people using tiles for roofing instead of grass.
6 - 43. The district has recorded a high proportion of 760 undcr mud walls against 742 for the State. The proportion of houscs under mud walls ranges from 675 in Polur Taluk
to 886 in Chengam Taluk. In Polur, 118 houses are recorded
Rural area~Wall material
under timber. By timber is meant wattle which is generally found in this taluk. Tiruvannamalai, Tiruppatur taluks have recorded high figures of 874 and 807. The sccond material in
order of importance is burnt brick, the range being 100 in Chengam to 278 in Ami. Tiruvannamalai, Polur and Tlruppatur have also recorded low proportions ranging bctween 120 and 185. The above facts indicate that the taluks of Polur, Tiruvannamalai, Chengam and Tiruppattur are backward in housing. The condItions in Ami and Gudiyatham are better. Plour is the only taluk which has recorded a proportion of 35 under unburnt bricks. Under other categories the district has not recorded any figures worth mentioning.
6 - 44. Under roof materials, the district has recorded a high proportion of 738 under kutcha roof as against 664 for the State. The proportion of houses under kutcha
roof ranges from 599 in Ami to 873 in Chengam. The Roof material proportions recorded by Tiruvannamalai and Tiruppattur are
high-857 and 793. Walajapet and Cheyyar have recorded comparatively lower figures of 683 and 687. The next important material is tiles. The range is from 106 in Chengam to 381 in Ami. Cheyyar and Walajapet have also recorded figures of 304 and 299. Chengam, Tiruppattur and Tiruvannamalai are found to be backward. The material third in importance IS brick and lime. Gudiyatham, Vellore and Arkonam have recorded figures of 18, 17 and 16. Among the remaining categories, no taluk has recorded a proportion higher than 15. ...
6 - 45. Under wall material, the proportion of burnt bricks is 509 as against 481 for the State. The range for the taluk IS 366 in Tiruvannamalai to 625 in Vellore. The taluks of
Urban areasWall material
Arkonam, Tiruppattur and Cheyyar have rec:)fded high proportIOns between 502 and 595. The district has recorded a higher proportion of 462 under mud walls against the State figure of 385. The range is from 332 in Vellore to 623 in Tiruvannamalai.
Gudiyatham, Walajapet, Wandiwash, Arni and Polur have recorded proportions ranging between 500 and 600. Under stone, 30 and 22 hav.;: b~.;:n recorded by Vellore and Tiruppattur taluks.
6 - 46. Reviewing material of roof, the first material is tiles with the figure of 523 as against 481 for the State. The range for the taluk is Ji8 in Ti.ruvannamalai to 664 in Arni.
Utban areasRoof material
Cheyyar, Walajapet, Vellore and Arkonam have recorded figures above 500. The next material in the order of importance is kutcha. The district has recorded a high proportion of 378 under kutcha as against 325 for the State. The range for the
taluks is 271 in Arkonam to 529 in Tiruvannamalai. In the taluks of Gudiyatham, Wandiwash and Tiruvannamalai, more than 50% of the houses are with kutcha roofs. Madras terrace ranges from 14 in Wandlwash to 158 in Arkonam. The figures recorded by Tiruvannamalai and Vellore are appreciable-114 and 78. Under concrete roof, figures of 40 and 41 have been recorded in Arkonam and Wandiwash taluks. Under C.1. Sheet roofs, 22
H-62
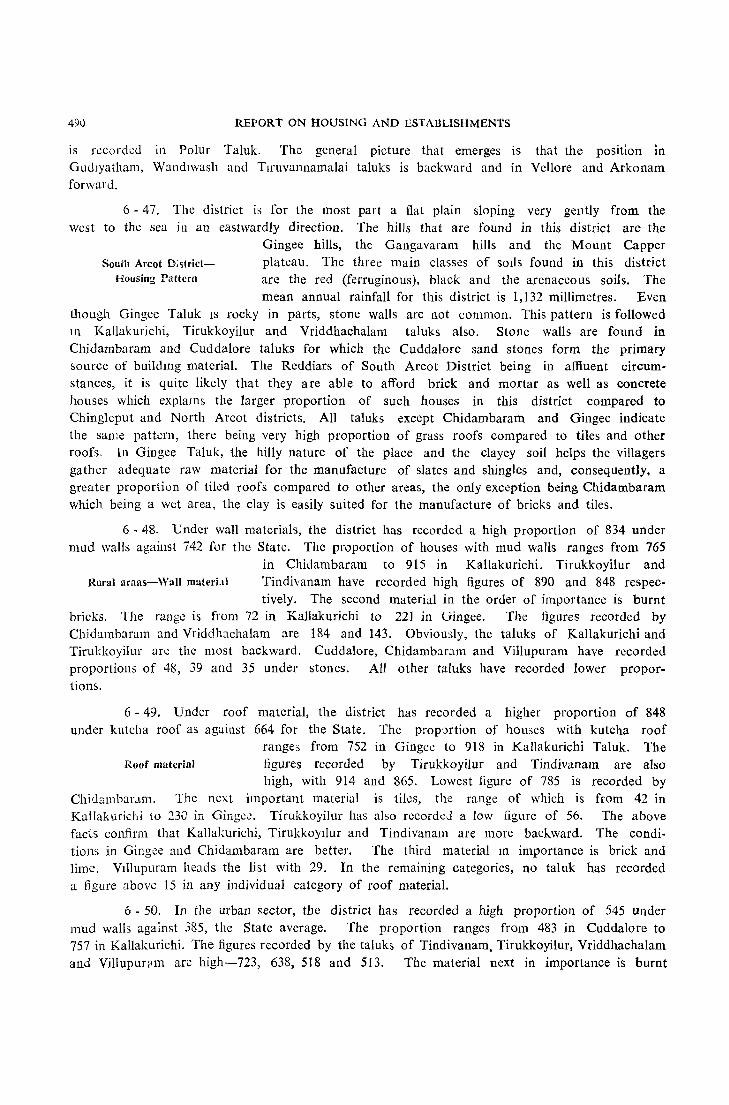
490 REPORT ON HOUSING AND ESTABLISHMENtS
is recorded in Polur Taluk. The general picture that emerges is that the position in Gudlyatham, Wandlwash and Tlruvannamalai taluks is backward and in Vellore and Arkonam forward.
6 - 47. The district is for the most part a flat plain sloping very gently from the west to the sea it} an eastwardly direction. The hills that are found in this district are the
Gingee hills, the Gangavaram hills and the Mount Capper South Arcot District- plateau. The three main classes of sods found in this district
Housing Pattern are the red (ferruginous), black and the arenaceous soils. The mean annual rainfall for this district is 1,132 millimetres. Even
though Gingec Taluk IS rocky in parts, stone walls are not common. This pattern is followed ill Kallakurichi, Tirukkoyilur and Vriddhachalam taluks also. StOlle walls are found in Chidambaram and Cuddalore taluks for which the Cuddalore sand stones form the primary source of buildmg material. The Reddiars of South Arcot District being in affluent circumstances, it is quite likely that they are able to afford brick and mortar as well as concrete houses which explams the larger proportion of such houses in this district compared to Chingleput and North Arcot districts. All taluks except Chidambaram and Gingee indicate the same pattern, there being very high proportion of grass roofs compared to tiles and other roofs. In Gingee Taluk, the hilly nature of the place and the clayey soil helps the villagers gather adequate raw material for the manufacture of slates and shingles and, consequently, a greater proportion of tiled roofs compared to other areas, the only exception being Chidambaram which being a wet area, the clay is easily suited for the manufacture of bricks and tiles.
6 - 48. Under wall materials, the district has recorded a high proportion of 834 under mud walls against 742 for the State. The proportion of houses with mud walls ranges from 765
in Chidambaram to 915 in Kallakurichi. Tirukkoyilur and Rural araas-Wall materi.ll Tindivanam have recorded high figures of 890 and 848 respec-
tively. The second material in the order of importance is bUrnt bricks. The range is from 72 in Kallakurichi to 221 in Gingee. The figures recorded by Chidambaram and Vriddhachalam are 184 and 143. Obviously, the taluks of Kallakurichi and Tirukkoyilur are the most backward. Cuddalore, Chidambaram and Villupuram have recorded proportions of 48, 39 and 35 under stones. All other taluks have recorded lower proportions.
6 - 49. Under roof material, the <.listrict has recorded a higher proportion of 848 under kutcha roof as against 664 for the State. The prop8rtion of houses with kutcha roof
ranges from 752 in Gingee to 918 in Kallakurichi Taluk. The Roof material figures recorded by Tirukkoyilur and Tindivanam are also
high, with 914 and 865. Lowest figure of 785 is recorded by Chidambaram. The next important material is tiles, the range of which is from 42 in Kallakurichi to 230 in Gingec. Tirukkoyilur has also recorded a low figure of 56. The above faeis confirm that Kallakurichi, TirukkoYllur and Tindivanam are more backward. The conditions in Gingee and Chidambaram are better. The third material 111 importance is brick and lime. Vl11upuram heads the list with 29. In the remaining categories, no taluk has recorded a figure above 15 in any individual category of roof material.
6 - 50. In the urban sector, the district has recorded a high proportion of 545 under mud walls against 385, the State average. The proportion ranges from 483 in Cuddalore to 757 in Kallakurichi. The figures recorded by the taluks of Tindivanam, Tirukkoyilur, Vriddhachalam and Villupur?m are high-723, 638, 518 and 513. The material next in importance is burnt
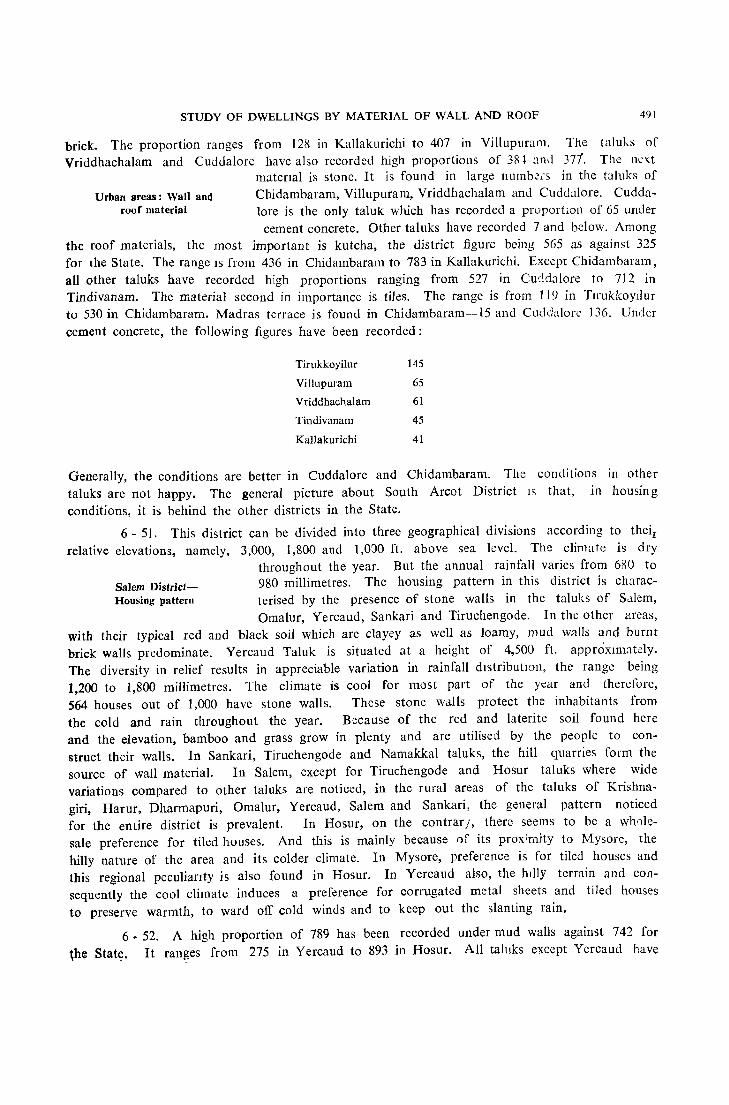
STUDY OF DWELLINGS BY MATERIAL OF WALL AND ROOF 491
brick. The proportion ranges from 128 in Kallakurichi to 407 in Villupuram. The taluks of Vriddhachalam and Cuddalore have also recorded high proportions of 38-+ anel 371. The next
matenal is stone. It is found in large numbeis in the taluks of Urban areas: Wall and Chidambaram, Villupural11, Vriddhachalam and CudJalore. Cudda-
roof material lore is the only taluk which has recorded a proportlOn of 65 under cement concrete. Other taluks have recorded 7 and below. Among
the roof materials, the most important is kutcha, the district figure being 565 as against 325 for the State. The range IS from 436 in Chidambaram to 783 in Kallakurichi. Except Chidambaram, all other taluks have recorded high proportions ranging from 527 in Cuddalore to 712 in Tindivanam. The material second in importance is tiles. The range is from 119 in TlrukkoyIlur to 530 in Chidambaram. Madras terrace is found in Chidambaram-15 and Cuddalore 136. Under cement concrete, the following figures have been recorded:
Tirukkoyilur 145
Villupuram 65
Vriddhachalam 61
Tindivanam 45
Kall akurichi 41
Generally, the conditions are better in Cuddalore and Chidambaram. The conditions in other taluks are not happy. The general picture about South Areot District IS that, in housing conditions, it is behind the other districts in the State.
6 - 51. This district can be divided into three geographical divisions according to their relative elevations, namely, 3,000, 1,800 and 1,0:)0 ft. above sea level. The climate is dry
throughout the year. But the annual rainfall varies from 680 to Salem District- 980 millimetres. The housing pattern in this district is charac-Housing pattern terised by the presence of stone walls in the taluks of Salem,
Omalur, Ye rcaud, Sankari and Tiruchengode. In the other areas, with their typical red and black soil which are clayey as well as loamy, mud walls and burnt brick walls predominate. Yercaud Taluk is situated at a height of 4,500 ft. approxll1l[l,tdy. The diversity in relief results in appreciable variation in rainfall dIstributIOn, the range being 1,200 to 1,800 millimetres. The climate is cool for most part of the year and therefore, 564 houses out of 1,000 have stone walls. These stone walls protect the inhabitants from the cold and rain throughout the year. Because of the red and laterite soil found here and the elevation, bamboo and grass grow in plenty and are utilised by the people to construct their walls. In Sankari, Tiruchengode and Namakkal taluks, the hill quarries form the source of wall material. In Salem, except for Tiruchengode and Hosur taluks where wide variations compared to other taluks are noticed, in the rural areas of the taluks of Kri~hnagiri, Harur, Dharmapuri, Omalur, Yercaud, Salem and Sankari, the general pattern noticed for the entire district is prevalent. In Hosur, on the contrarj, there seems to be a wholesale preference for tiled houses. And this is mainly because I)f its prox;mity to M'ysore, the hilly nature of the area and its colder climate. In Mysore, preference is for tiled houses and this regional peculianty is also found in Hosur. In Yercaud also, the hllly terrain and COll
sequently the cool climate induces a preference for corrugated metal sheets and tiled houses to preserve warmth, to ward off cold winds and to keep out the slanting rain.
6 • 52. A high proportion of 789 has been recorded under mud walls against 742 for the State. It ranges from 275 in Yercaud to 893 in Hosur. All taluks except Yercaud have

492 REPORT ON HOUSING AND ESTABLISHMENTS
recorded 642 and more under mud walls. The figures in the taluk<; of Dharmapuri, Harur, Attur, Raslpuram and Krishnagiri are higher. The second material in the order of Importance is
Rural areasWall and roof material
burnt bricks. The range is from 4 in Yercaud to 176 in Krishnaglri. The third material is stone. It is more often found in Omalur, Yercaud, Salem, Sankari, Tiruchengode and Namakkal with figures of 284, 564, 122, 152, 85 and 59. In
Yercaud 154 units are under grass. Under roof materials, the district has recorded a high proportion of 707 under kutcha roof as against 664 for the State. The proportion of houses with kutch a roof ranges from 298 in Hosur to 851 III Omalur and S:mk::tri. The proportions recorded by all taluks exeept Hosur are high. The next important material IS tiles. The range is from 139 in Sankari to 702 in Hosur. The presence of tIled houses is a conspicuous feature in Hosur Taluk. Yercaud has recorded a high proportion of 138 under corrugated iron sheets. It is a hilly area where the building materials commonly us~d are stones for walls and corrugated iron sheets and grass for roofs. It is difficult to transport burnt bricks from the plains. Madras terracing is not resorted to because of the difficulty in getting burnt bricks and lime mortar or cement from the plains. Further heavy and continuous rains will damp~n it. Corrugated iron sheets suit such areas because they are eaSIly transportable and da not absorb moisture and it is easy to drain the rain water. The figure under corruglteJ iron sheets for other taluks in the distnct does not exc~ed 3. The g~neral picture ab:mt th:! rural sector is that the conditions of housing in Yercau:l are goo::!. DharmlPuri, Hlrur and Attur
. are the most backward. Hosur presents a peculilr picture. Mu:! walls predominlte With 893, but 702 houses are tile-roofed. The tiles are e:lsily procured from the n;;ighbo:1rmg State of Mysore. The climate being comparatively milder, the people wlll not suffer from heat during summer months jf tiled roof is used. Further, shortage of palmyrah and cocoanut leaves hlS also forced people to take to tiles.
6 - 53. In the urban sector, the district has recorded a high proport.iOn of 504 under mud walls against the State average of 385. The range is from 413 in Salem to 868 in Hosur.
Urban areasWall and roof material
The next material is burnt brick. It ranges from 130 in Hosur to 549 in Salem. The next important material is stone, which is generally found in the taluks of Omalur, Sankari, Tiruchengode and Namakka1. Under roof material, the first is tiles, the district
figure being 619 against 481 for the State. The range for the taluks is 463 in Attur to 924 in Hosur. The figures recorded by Krishnagiri, Salem and Rasipuram arc proportionately higher, 704, 640 and 638. Generally more than half the houses have tiled roofs in all the taluks except Attur, Harur and Sankari. The next important m3.terial is kutcha. The proportion ranges from 33 in Hosur to 503 in Sankari. More houses with brick and lIme roof is found in Krishnagiri. A fairly high proportion is also noticed in the talub of Attur an1 Namakkal. The general picture is that the position in Salem and Krishmgiri i~ better thll1 the other taluks. The most backward are Sankari, Dharmapuri and Attur.
6 - 54. This district exhibits a diversified geographicl1 relief. The northern portion of Gopichettipalayam hlS an elevation of 2,0)0 to 3,0)0 ft. With hill r:mges extending to the Mysore
plateau. The Anaimalais form PHt of the Western Ghats and are Coimbatore District- connected to the Palni hills of Madurai. The predominant soils
Housing pattern of the district are red, sandy and gravel with portions having red and black loamy soil. The average rainfall of this district ranges
between 20 to 25 inches. Coimbatore District, unlIke other distncts except NIIgiri, indicates a trend entirely different from that prevalent in other districts. Here, in rural areas, thatch is not

STUDY OF DWELLINGS BY MATERIAL OF WALL AND ROOF 493
as widely preferred as tiles. The reason is not the availability of clay or the increased m:mufac· ture of bncks but mamly the comparative affluence of the people especially Vannia GounJ~rs
who are as agrIculturists more affluent than those ryots elsewhere in the State and, therefore, prefer to display their wealth in the form of brick built houses in rural areas.
6 - 55. The picture in the rural sector differs from the districts so far discussed. It has recorded a lower proportion of 643 under mud walls as against 742 for the State. The
proportion of houses with mud walls ranges from 512 in Pollachi Rural areas
Wall and roof material
Taluk to 813 in Dharapuram. Avanashi and Erode have also recorded high figures of 689 and 665 respectively. The second material in order of importance is stone. It ranges from 1 in
Pollachi to 407 in Palladam. The taluks of Gopichettipalayam, Udumalpet and Erode have also recorded high proportion of 333, 319 and 304. Pollachi has recorded a high proportion of 452 under corrugated iron sheets. The hilly areas in the taluk prefer this kll1d of roof more because of the heavy rains occurring in this area. Burnt brick ranges from 2 in Erode to 173 in Coimbatore. Under roof materiall., the district has recorded a high proportion of 672 under tiles as against 276 for the State. The proportion of houses with tiles ranges from 305 in Bhavani to 876 in Palladam. The next lower figure of 599 is recorded in Erode. Udumalpet, Avanashi and Coimbatore have recorded high proportions of 794, 787 and 774 respectively. The next material is kutcha roof. The range is from 119 in Pfllladam to 682 in Bhavani. The general picture is that the conditions of housing are generally better in Coimbatore and that Dharapuram and Erode are the most backward taluks.
6 - 56. Under wall materials, the district has ·recorded a lower proportion of 361 under kutcha as against the State figure of 385. The range is from 202 in Pollachi to 571 in Gopi-
Urban areasWall material
chettipalayam. Burnt brick and stone are of eqmJ importance in the district, each recording 299. The taluk range for burnt brick is from 37 in Palla dam to 520 in Erode. More burnt brick is found in Dharapuram and Coimbatore taluks while they
are comparatively rare in Udumalpet, Pollachi and Bhavani. The proportion for stone ranges from 42 in Dharapuram to 677 in Pollachi. As rocks are found in these taluks, Palhdam, Udumalpet and Gopichettipalayam have recorded high proportions of 476, 407 and 207.
6 - 57. The district has recorded 741 under tiles as against 481 for the State. The taluk range is 530 in Bhavani to 905 in Palladam. In all the taluks tiled roofing comes to
more than 50%. Next material is kutcha. The taluk figure Roof material ranges from 59 in Palladam to 407 in Bhavani. Erode also
records a high proportion of 259. Corrugated iron sheet IS
found in Pollachi with 191 and in Avanashi with 53. Again Pollachi records a proportion of 88 under asbestos. Erode records a proportion of 81 under brick and lime and Dharapuram and Erode record 34 and 33 respectively under cement concrete. The general picture is that the conditions of housing in urban sector are much better than in any other district we have so far discussed.
6 - 58. This is the pride and glory of Madras State with the plateau rising shear upwards from the plains. It is a place abounding in lovely blue peaks, where the
Western Ghats tower at their most majestic. Because of the Nilgiri District mountainous terrain, there is a large variation in rainfall. The
mean annual rainfall for the district IS 1,868 millimetres. Gudalur Taluk and the western part of Ootacamund Taluk being on the windward side receive the maximum amount of rainfall namely more than 2,000 millimetres while the eastern part

494 REPORT ON HOUSING AND ESTABLISHMENTS
of Ootaeamund Taluk and Coonoor Taluk being on the leeward side receive the minimum of rainfall. There are 4 types of ~oll winch can b~ dlstll1guishcd as black, brown, yellow and red. The major type of soil found ll1 the distnct C:l11 be classed in the category of laterite variety Because of the variations in climate, mud walls are not preferred to here. In order to protect the inmates from the vagaries of the climate, stones, burnt bricks bamboos and metal sheets are largely used for constructing the walls. Further, the type of the soil and local conditions also regulate the use of the constructional material. For instance, the yellow soil found III the district allows the luxuriant growth of grass and timber used as wall material; red and laterite soil is used for the manufacture of burnt bncks. In Ootacamund Tnluk, to ward off the severe cold, metal sheets are used. Gudalur Talllk IS
characterised by the presence of burnt brick walls and to a lesser extent thos..! constructed out of grass, reeds and bamboos.
6 - 59. This district is a mountainous region which gets heavy rains from south-west and north-east monsoons. It enjoys a cool climate. It is difficult to transport m:lterials
from the plains. Further in any construction, the w:I11 and roof Rural areas- materials should be able to resist moisture. The roof materials Wall material should also be light. As such, it is the usual pattern in this
district to use burnt brick and stone for walls and slates, tiles, C.l. sheets and grass for roofs. Stone can be found locally. For foundation and upto basement level for walls, stones are preferred. Above the basement level, better class of people use burnt brick and others stone. Burnt brick is the best material for the con3truction of hearths. Again burnt brick plastered with lime mortar helps in keeping the house warm. Most of the wall portions will be covered by wooden frames fitted with glass with a view to admit light in foggy weather. Thus the use of burnt brick is restricted. In the rural sector, the district has recorded a high proportion of 487 under burnt bricks against 144 for the State. Highest proportion is recorded in Coonoor with 621. The proportion in Gudalur is low with 23l. The next important wall material is stone. It is more or less evenly dlstrL buted in the three taluks with figures of 264, 236 and 51 for Coonoor, Ootacamund and Gudalur respectively. Corrugated iron she~t is an important item and Ootac:1mund has recorded a high proportion of 190. It is comparatively unknown in Coonoor and Gud:llur. Mud wall which is the predominant wall matenal in other districts has only the fourth rank in Nilgiri District. Gudalur is the taluk in which we find a high proportion of 199 houses with mud walls while the corresponding figures arc 78 for Coonoor and 77 for Ootacamund. The other important materials in use for construction of walls are grass, leaves, reeds or bamboo and unburnt bricks. The proportions recorded are high in Gudalur with 402 and 103.
6 - 60. Under roof material, the district has recorded a high proportion of 650 under tiles, slate and shingle as against 276 for the State. The highest proportion is recorded in
Coonoor with 800 followed by Ootacamund with 592. The roofs Roof material protected by a layer of tiles will be helpful in cooler climates
facilitating the draining of rain water immediately. The next important material is corrugated iron sheet. A high proportion is recorded in Ootacamund with 288. More number of kutcha roofs are found in Gudalur Taluk (654). The general comment we can make is that the housl11g conditions in Gudalur Taluk are most backward in the district and the conditions in Coonoor and Ootacamund compare favourably with other areas in the State.
6 - 61. Rural pattern of burnt bricks is noticed in the urban sector also. The district average of 621 is much above the State average of 481. Qotacamund and Coonoor have recorded
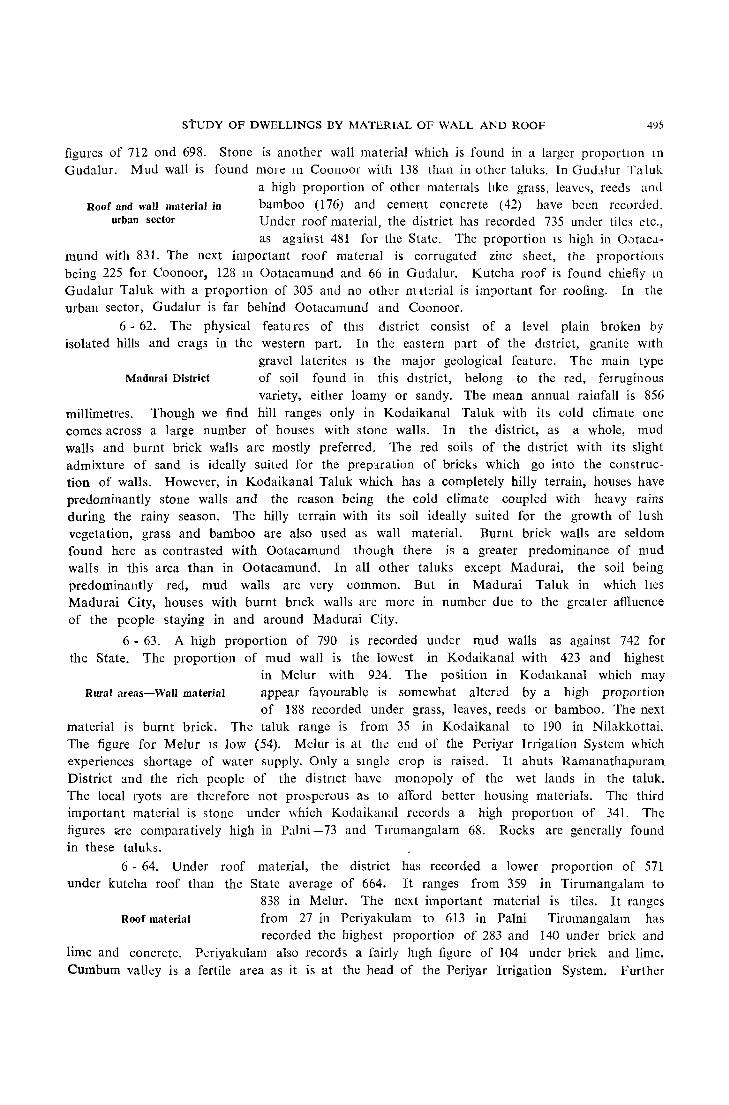
stUDY OF DWELLlNGS BY MATERIAL OF WALL AND ROOF 495
figures of 712 ond 698. Stone is another wall material which is found in a larger proportIOn 111
Gudalur. Mud wall is found more ll1 Coonaar with 138 than in other taluks. In GUlLllur Ta Iuk a high proportion of other matenals lIke grass, leave,>, reeds amI
Roof and wall material in bamboo (176) and cement concrete (42) have been recorded. urban sector Under roof material, the district has recorded 735 under tiles etc.,
as ag'linst 481 for the State. The proportion IS high in OotacZlmund with 831. The next important roof matenal is corrugated zinc sheet, the proportions being 225 for Coonoor, 12g ill Ootacamund and 66 in Gudalur. Kutcha roof is found chiefly III
Gudalur Taluk with a proportion of 305 and no other m Iterial is important for roofing. In tl1e urban sector, Gudalur is far behind Ootacamund and Coonoor.
6 - 62. The physical featu res of tlus district consist of a level plain broken by isolated hills and crags in the western part. In the eastern p3.rt of the district, granite With
gravel laterites IS the major geological feature. The main type Madurai District of soil found in this district, belong to the red, ferruginous
variety. either loamy or sandy. The mean annual rainfall is 856 millimetres. Though we find hill ranges only in Kodaikanal Taluk with its cold climate one comes across a large number of houses with stone walls. In the district, as a whole, mud walls and burnt brick walls are mostly preferred. The red soils of the district with its slight admixture of sand is ideally suited for the preparation of bricks which go into the construe· tion of walls. However, in Kodaikanal Taluk which has a completely hilly terrain, houses have predominantly stone walls and the reason being the cold climate coupled with heavy rains during the rainy season. The hilly terrain with its soil ideally suited for the growth of lush vegetation, grass and bamboo are also used as wall material. Burnt brick: walls are seldom found here as contrasted with Ootacamund though there is a greater predominance of mud walls in this area than in Ootacamund. In all other taluks except Madurai, the soil being predominantly red, mud walls arc very common. But in Madurai Taluk in which lies Madurai City, houses with burnt bnck walls are more in number due to the );reater affluence of the people staying in and around Madurai City.
6 - 63. A high proportion of 790 is recorded under mud walls as against 742 for the State. The proportion of mud wall is the lowest in Kodaikanal with 423 and highest
in Melur with 924. The position in Kodalkanal which may Rural areas-Wall material appear favourable is somewhat altered by a high proportion
of 188 recorded under grass, leaves, reeds or bamboo. The next material is burnt brick. The taluk range is from 35 in Kodaikanal to 190 in Nilakkottai. The figure for Melur IS low (54). MeJur is at the end of the Periyar Irrigation System which experiences shortage of water supply. Only a slllgic crop is raised. It abuts Ramanathapuram District and the rich people of the distnct have monopoly of the wet lands in the taluk. The local ryots are therefore not prosperous as to afford better housing materials. The third important material is stone under which Kodaikanal records a high proportIOn of 341. The figures :tre comparatively high in Palni-73 and Tlrumangalam 68. Rocks are generally found in these taluks.
6 - 64. Under roof material, the district has recorded a lower proportion of 571 under kutcha roof than the State average of 664. It ranges from 359 in Tirumangalam to
838 in Melur. The next important material is tiles. It ranges Roof material from 27 in Periyakulam to 613 in Palni Tirumangalam has
recorded the highest proportion of 283 and 140 under brick and lime and concrete. Pcriyakulam also records a fairly 111gh figure of 104 under brick and lime. Cumbum valley is a fertile area as it is at the head of the Periyar Irrigation System. Further
496 REPORT ON HOUSiNG AND EStAl3L1SHMENTS
the cardamom and coffee plantations on the nearby mountains facilitates the prosperity of the people. Corrugated iron is the next important material. The taluks of Periyakulam and Kodaikanal record high proportions of 281 and 270 under this category. Kodaibnal is a mountainous region. Periyakulam is at the foot of the Western Ghats. It also contains Varushanad hills and Highway mountains. In these hilly areas, C. 1. sheets are generally preferred. The general picture that emerges is that Melur is the most backward taluk in the di~tnct.
6 - 65. Under wall material, burnt brick is most important. The district has recorded a proportion of 501 under this category as against 481 for the State. The taluk range is from 0
Urban arcasWall and roof material
in Kodaikanal Tal uk to 665 in Madurai. Tirumangalam has recorded a high proportion of 560. Kodaikanal has, howevl.':r, recorded 911 under stone. The next important material is mud wall. It ranges from 85 in Kodaikanal to 730 in Palni. The figures
recorded by Periyakulam and Melur are high with 682 and 648. Under roof material, the district has recorded 346 for tiles. The range is from 27 in Kodaikanal to 759 in Palni. Periyakulam and Nilakkottai have also recorded low figures of 30 and 95. Evcnthough Kodaikanal has recorded the lowest proportion under this category, it has the highest figure of 787 under corrugated iron sheet. The next material in order of importance is kutcha roof. The tal uk range is 178 in Kodaikanal to 566 in Melur. Nilakkottai and Periyakulam have also recorded high figures of 511 and 463. Tirumangalam and Madurai have high proportions of 253 and 234 under brick and lime. Tirumangalam has also recorded a higher proportion of 190 under concrete. An analysis confirms the fact that Melur is most backward taluk in the district.
6 - 66. The district for the most part is fiat, undulating gently from the North-We<;i to the South-East except for the upland tracts near the Pachamalai hills in Musiri and
Perambalur taluks. A few isolated rock masses are found near TiruchirapalJi District Tiruchirapalli and Golden Rock. The predominant soil types of
the district are red, black and alluvium. The red soil covers more than 60% of the total area. The mean annual rainfall for the district is found to be 855.3 millimetres. Since the land is for the most part fiat and red soil predominates in the district, we find mud walls are more common followed closely by burnt brick walls. Thus. in many taluks, VIZ., in Perambalur, Udaiyarpalayam, Musiri, Karur, Kulittalai, Kulathur and Alangudi taluks, mud walls predominate followed closely by burnt brick walls. But in Lalgudi Tuluk, we find that stone walls are also common than in other taluks. This is because of the availability of stone as raw material. In Tiruchirapalli Tal uk, however, burnt brick walls are as much preferred as mud walls.
6 - 67. Under wall materials this district has recorded a higher proportion than the State average of 742, i.e. 832 for mud waJls. It ranges from 735 in Lalgudi
Rural areas- to 906 in Kulittalai. The figures are comparatively higher in Wall material Alangudi. Kulathur and lower in Tirumayam and Tiruchira,
palh. The range of burnt brick is from 73 III Alangudi to 208 in Tirumayam. Lower figures are recorded in Kulathur and Kulittalai. Stones are used III Lalgudi, Perambalur and Karur which have returned figures of 116, 49 and 43.
6 - 68. This district has recorded a higher proportion of 771 under kutcha roof as against 664 for the State. The range is from 722 in Musiri and Karur to 870 in Alangudi.
Higher proportion are found in Kulathur and Kultttalal with Roof material 827 and 799 whereas lower proportions are found in Tiruchira-
paIli and Tirumayam with 730 and 73~. The range of tiles which is the next impOl tant item is 123 in Alangudi to 250 in Karur. Brick and hme is found in Tiruchirapalli, Lalgudi and Perambalur. The figures are 67, 24 and 23. Under
STUDY OF DWELLINGS BY MATERIAL OF WALL AND ROOF 497
concrete, figures are recorded in Lalgudi and Tlruchirap.:illi with 31 and 27. Corrugated iron sheet is found in Musiri with 56. The general conclusion which one can draw is that the housing conditions in Alangudl, Kulathur and Kulittalai are worse than the other taluks and Tirumayam and Tiruchirapalli are ahead.
6 - 69. Under wall material, burnt brick is the most important. This district has recorded a high proportion of 523 as against 481 for the State. The range is from 99 in
Udaiyarpalayam to 637 in Tiruchirapalli. Alangudi and Tiru-Urban sector- mayam have recorded high proportions of 632 and 625. The Wall material next material is mud wall which ranges from 307 in Tiruchirapalli
to 882 in Udaiyarpalayam. In the taluks of Udaiyarpalayam, Musiri, Perambalur and Kuhttalai, more than 50% of the houses are constructed with mud walls. The figures recorded in Tiruchirapalli, Tirumayam and Alangudi are lower. In Lalgudi and Tiruchirapalli are founl stones with 107 and 39. Cement concrete is also found in Lalgudi. The next material in the order of importance is unburnt brick. Perambalur, Musiri, Lalgudi and Tirumayam have recorded figures within the range of 67 and 43. Musiri has recorded 33 under timber.
6 - 70. Kutcha is the most important material. The district has recorded 425 against 325 for the State. The range varies from 335 in Tirumayam to 601 in Musiri. In the taluks
of Lalgudi, Udaiyarpalayam, Perambalur and Kulittalai, more than Roof material 50% of the houses are constructed with kutcha roof. Tiruchira-
palli has recorded a low figure of 336. The next material is tiles. The range is from 276 in Perambalur to 578 in Tirumayam. The proportions are fairly high in Alangudi, Udaiyarpalayam and Tiruchirapalli. Brick and lime is found mostly in Tiruchirapalli with 200. The figures are comparatively lower in Udaiyarpalayam 7, Lalgudi 24, Kulittalai 49 and Musiri 58. Kulittalai, Lalgudi and Tiruchirapalli have recorded figures of 110, 66, and 56 under concrete and Musiri 37 under C.L sheets. The general picture is that the urban areas of Musiri and Udaiyarpalayam are backward and Tirumayam, Tiruchirapalli and Alangudi forward.
6 - 71. The district consists of two natural divisions namely deltaic area and the uplands. The upland area comprises of the southern parts of Thanjavur Taluk, north-west and south
west parts of Pattukkottai Taluk and a major portion of Thanjavur District Arantangi Taluk. The deltaic area consists of the lands
irrigated by the river Cauvery and its tributaries and the area irrigated by the Grand Anicut Canal and the branches covered by the Cauvery-Mettur Project. There are practically no hillocks in this district. The average annual rainfall in this district is 1,118 millimetres. The soils in this district may be divided into 4 broad categories, alluvium, black or rcgar, red and arenaceous. Alluvium and black soils cover a major portion of the district. From the nature of the terrain, the climatic conditions and the nature the of soil, it would be readily apparent that mud walls and burnt brick walls are very widely prevalent in all the rural areas of the district with slight local variations. However, where the soil is more arenaceous and ferruginous, there is a slight departure from this general pattern. Mud walls arc prominent in the taluks of Sirkali, Mayuram and Nannilam. The red loamy and black clayey soil are ideally suited for the construction of mud walls. Further, they are also used in the manufacture of burnt bricks which are also commonly used as wall material in this area but the number of houses using burnt bricks for walls is slightly higher in the taluks of Kumbakonam, Papanasam and Thanjavur which lie within the deltaic area of the Cauvery and where the people are more well-to-do than in other taluks
H-63

498 REPORT ON HOUSING AND ESTABLISHMENTS
In Orathanad, it is found that mud walls predominate to a very large extent. WIth the number of tanh in the area and the soil permitting f,fowth of reeds and bamboo, it is found that the latter lS used as wall matenal. In Tlruthur~lIpundl and Pattukkottai taluks \\ here bamboo, grass and others well thnve in the typic..!l soil and clllnatic condlllons obtaining In that region, their use as wall matenal is not Clrcumscnbed.
6 - 72. TIllS IS a fertile district which is the granary of South India. it does not have facilIties of gettll1g stone. It has, therefore, recorded a high proportion of 757 under
mud walls against 742 for the State. The proportion of houses Rural areas-Wall material with mud walls ranges from 671 In THuthuraipundi to 891 in
Arantangi Taluk. The taluks of Onthanad, Mannargudi, Thanjavur and Sirkali have recorded high figures of 865, 856, 796 and 795. The proportions recorded by Kumbakonam and Mayuram are much lower with 683 and 704. Arantangi is a dry tract, a small part of which is covered by Cauveri-Mettur project. The soil is not fertile and econOlTIlcally the people are backward. The second material is burnt brick. The range is from 57 in Arantangi to 223 in Papanasam. Other taluks which have recorded low proportions are Orathanad and Pattukkottai WIth 75 and 91. Kumbakonam and Nannilam have recorded higher proportions of 205 and 198. Next to Arantangi, the two backward taluks in the district are Pattukkottal and Orathanad. The third material is unburnt brick. The range for the taluks is 1 in Nagapattinam to 91 in Mayuram. Very low proportions are notIced in the taluks of Tiruthuraipundi, Orathanad and Mannargudi. The remaining taluks record 28 and above. Stone is found m Mayuram and Kumbakonam with 61 and 44. Under kutcha walls are recorded figures of 57, 55 and 33 in the taluks of Tiruthuraipundl, Pattukkottai and Orathanad.
6 - 73. Again the district has recorded a high proportion of 780 under kutch a roof as against 664 for the State. This has been to a certam e'"{tent ll1fluenced by the ,the easy
availability of cocoanut palms in the district. The proportion Roof material ranges from 689 in Nannilam to 888 III Tlruthuraipundi. The
proportions recorded by Mayuram and Kumb.lkonam are lower with 696 and 706. The material second in the order of Importance is tiles. The range for the taluks is 106 in Tiruthuraipundi to 297 in Nannilam. Mayuram and Kumbakonam have recorded high figures of 291 and 273. In Thanjavur Taluk, we find fIgures of 41 and 16, under concrete and brick and lime. Kumbakonam has recorded a higher proportion of 16 under concrete. As materials are not avallable in the rural sectors of the other taluks, the general pIcture is that Arantangi is the most backward taluk und Kumb.lkonam and Mayuram are ahead.
6 - 74. In the urban areas, the picture IS repeated, in that mud wall accounts for a high proportion of 455 against the State awrage of 385. The proportions range from 296
in Kumb llonam to 672 III Mannargudl. Mayur.ll11 has recorded Urban areas-Roof and Viall material a low proportion of 302 whIle the taluks of Arantangi, Pattukkottai,
Orathanad and NanllllaI1l have recorded higher proportion of 659, 648, 645 and 630. The next important wall material is burnt brick. The taluks of Kumbakonam, Mayuram and Nagapattlllam have recorded more than 50 % under this category. They are the richer taluks of the distnct. Low proportions are recorded in the taluks of Pattukkottai, Sirkali, Arantangi and Orathanad. Unburnt brick is one of the 1110st important wall material noticed m Thanjavur District. The range for the taluks is from 7 in Mannargudi to 169 in Papanasam. Except for the taluks of Mannargudl, Kumbakonam, Tiruthuraipundi and Nannilam all other taluks have recorded more than 28. Under grass,
STUDY OF DWELLINGS BY MATERIAL OF WALL AND ROOF 499
leaves, reeds and bamboo, a proportton of 125 has been recorded in Tiruthuraipundi. The first roof matcnal IS kutcha, the Ji~tnct having rccordcd a proportion of 483 against the State average of 325. The range for the taluks is from 375 III Mayuram to 743 in TIruthuraipundi. Kumbakonam, Nagapattinam and Thanjavur have recorded lower figures. The next material, tiles, ranges from 208 in Tlruthuraipundi to 585 III Mayufam. The proportIOns in Nagapattinam and Kumbakonam are also higher. Pattukkottai and Nannilam have recorded lower figures. Thanjavur and Kumbakonam have proportions of 132 and 76 under bnck and lime. Concrete is found in Pattukkottai and Tiruthuraipundi with 4'5 and 38 respectively. The gencral position is that in the taluks of Mayuram and Kumbakonam. housmg conditions are bettcr and in the taluks of Pattukkottai, Arantangi and TiruthuralpunJi they are worse.
6 - 75. This district forms part of great plain stretching from th~ Western Ghats to the Bay of Bengal mtcrspersed by a few broken and detached hills in Srivllliputtur T.tluk. The
predominant sOIl of the district is black or regar which covers Ramanathapuram District
Housing Pattern more than 60% of the land area. The re~t is covered by red soIl with the coastal belt being arenaceous in character. The mean annual rainfall for this district amounts to 860 mdlImetres.
Only dry cultivation is normally practised. The predominant wall materials used in this district are mud and burnt bricks. The predominant type of h,)lBes are those constructed out of mud in almost all the taluks e'(cept Ramanathapuram. Though mud walls account for 662 houses, unllke in other taluk~, we find 143 house, having grass, reds an:! bamb::lO walls. In Sattur, houses with stone walls arc found. Thi~ is because of the avalbbility of laterite sandrocks. Generally, not much of variation in housc types can be found 111 this district.
6 - 76. As a backward distnct, Ramanathapuram has recorded a proporti,)l1 of 791 under mud walls a~ agall1st 742 for the State. Th~ range is fro:n 676 in Srivilliputtur to 900 in
Tiruvadanai. The proportions ,recorded by Mudukuhthur, Para-Rural areas-Wall material makudi and Sivaganga are higher. Sattur and Snvilliputtur taluks
have recorded low and high proportions under burnt brick V1Z., 39
in Sattur and 236 in Snvllliputtur. The highest proportIOn under stone is recorded in S.lttur-214. Low figures of 53, 57 and 79 under burnt brick have been recorded in the t:tluks of Mudukulathur, Ramanathapuram and Tlruvadanal. The next important material IS stone. The taluks of SaHur, Aruppukkottai, Srivilltputtur and Ramanathapuram arc noted for stone with figures of 214, 72, 59 and 49.
6 - 77. The district has recorded a low proportion of 612 under kutcha roof than the State average of 664. The range is from 431 in Aruppukkottai to 773 in Tiruvadanai Taluk.
The conditions in Sattur and Srivilliputtur are better. High pro-Roof material portIOns are again recorded 111 the taluks of Tlrupattur, Ramana-
thapuram and Sivaganga. The range for tiles is from 146 in Srivilliputtur to 433 in Mudukulathur. The proportions recorded by AruplJukkottai, Sattur and Tiruvadanal are comparatIvely lower. Though Sattur and Srivilliputtur have recorded low figures under tiles, it has recorded higher figures under brick and lime and CO:lcrete. Sattur has recorded 67 under bri<.:k and lime, 150 under concrete and 30 under corrugated iron sheets. Srivilliputtur has recorded 177, 107 and 47 under the above mcntioned three categories. Aruppukkottai has recorded 155 under brick and lime and 88 under concrete. The general picture is that the position in Tlruvadanat is backward and that in S:1ttur and Srivllhputtur forward. Mudukulathur IS backward in wall material, but in roof mlterial, some lmprovement has been noticed to a certain extent due to the welfare schemes sponsored by the Government under the Harijan and ex-Tribe Grants. In the wake of the cyclone and floods of 1955 and the Marava
500 REPORT ON HOUSING AND ESTABLISHMENTS
Harijan rioting in 1957, the Government took special interest in improving th,;: hOUSIng conditions and the people have to some extent replaced the th:ttched roof of their homes with tiled roof to escape mischief by arson. In the arid and backw.ud district of Ramanathapuram, the taluks of Sattur and Srivilliputtur are economically better. Slttur i<; forgoing ahead in industrial development. SriviIliputtur is more fertile as it is flanked by mountains on the west and served by streams.
6 - 78. Under wall material, burnt brick is important with a propDrtion of 489 as against 48 J for the State. The range is from 239 in Ram~lnathapuram to 74l in Paramakudi.
Sattur, Srivilliputtur and Aruppukkottai hwe recorded less than Urban areas-Wall material 50% under this category. The low figure of Sattur under burnt
brick has been counter-balanced by a fairly high proportion under stone with 154. The proportion of mud wall ranges from 236 Paramakudi to 596 in Aruppukkottai. Low figures are found in Sattur and Tiruvadanai. Ramanathapuram has recorded a fairly high proportion under stone (126) and grass, leaves, reeds or bamboo (49). Tlrupattur has recorded 51 under stone.
6 - 79. Tile is a most important material. The district average is 457 as against 481 for the State. The taluk proportiol13 range from 128 in Srivilliputtur to 767 in Paramakudi.
Sivaganga has recorded a proportion slightlY less than 500 i.e. Roof material 492. High proportions of 699 and 599 are found in Tiruvadanai
and Tirupattur. The next material, kutcha, is found from 125 in Paramakudi to 460 in Srivilliputtur. The figures recorded by Rlmlnlthapuram and Tirupattur are high with 387 and 339. Low figures are recorded by Mudukulathur, Aruppukkottai and Sattur. Brick and lime is third in order of importance. The taluk range is from 22 in Tirupattur to 318 in Srivilliputtur. Under concrete except Tiruvadanai, all other taluks h:l.Ve recorded figures ranging from 31 to 83. Mudukulathur has recorded 83 under asbe3tos. The general picture of the urban sector is that Rlmanathapuram and Srivilliputtur are backward and Paramakudi and Sattur forward.
6 • 80. This district is boxed in by the Western Ghats on the one side and the land slope gently down to the east. We find smlll isolated hillo;::ks dotting the land-scape
in this district. The' abundance of forests provides a pleasing effect and so the climate differs from the rest of the State. Tirunelveli District
Housing pattern The district is blessed with average intensity of rainfall and an
equable temperature. The western taluks of Ambasamudram, Tenkasi and Shencottah and the western parts of Sankaranayinarkoil and Nanguneri taluks record the maximum rainfall. Along the foot of the ghats, there exists a belt 10 to 20 miles in width cosisting of light loamy and sandy soil and along the coast to the east a belt of arenlceOllS soil. 'In between black loam covers the major portion of Kovilpatti, Sankaranayinarkoil and Srivaikuntam taluks. The rest is covered by red loam. The wall rmuerials commJnly used in this district are burnt bricks, mud, unburnt bricks, stones, grass, reeds, bamboos etc. The red loamy and sandy soils are used in the construction of mud, burnt brick and un~urnt brick walls. In Sankaranayinarkoil and Kovilpatti taluks, mud wall predominate. Burnt brick walls are used to slight extent only in Sankaranayinarkoil but they form an insignificant proportion to the total in Kovilpatt i Taluk. In both taluks, stone walls are largely prevalent, the sand stone hillocks coming in very handy as a ready source of supply of raw material. Ston~ walls and walls made up of reeds, grass or bamboo are widely in vogue in Srivaikuntam Taluk. Stone walls are used in houses due to the availability of laterite s~md stones and the igneous rock type being utilised for extractin~ the necessary raw material. Mu:! waJls are ffilinly found in rural areas though burnt
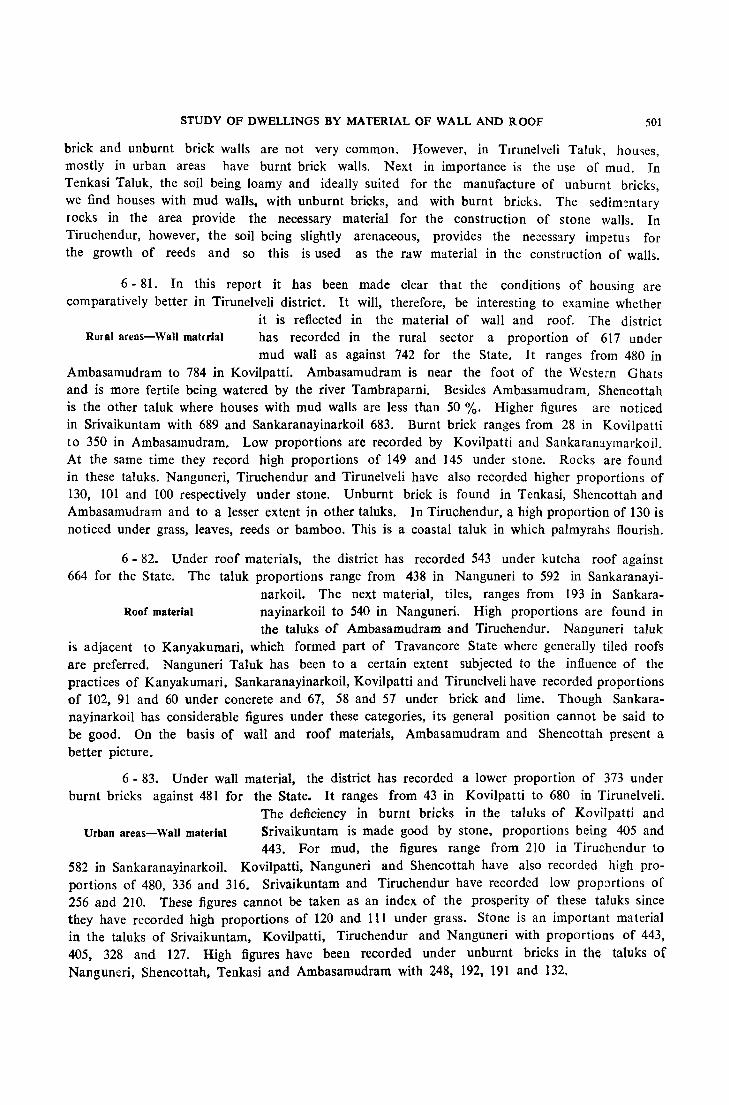
STUDY OF DWELLINGS BY MATERIAL OF WALL AND ROOF 501
brick and unburnt brick walls are not very common. However, in Tlrunelveli Taluk, houses, mostly in urban areas have burnt brick walls. Next in importance is the use of mud. In Tenkasi Taluk, the soil being loamy and ideally suited for the manufacture of unburnt bricks, we find houses with mud walls, with unburnt bricks, and with burnt bricks. The sedim~ntary
rocks in the area provide the necessary material for the construction of stone walls. In Tiruchendur, however, the soil being slightly arenaceous, provides the ne;:essary impetus for the growth of reeds and so this is used as the raw material in the construction of walls.
6 - 81. In this report it has been made clear that the conditions of housing are comparatively better in Tirunelveli district. It will, therefore, be interesting to examine whether
it is reflected in the material of wall and roof. The district Rural areas-Wall material has recorded in the rural sector a proportion of 617 under
mud wall as against 742 for the State. It ranges from 480 in Ambasamudram to 784 in Kovilpatti. Ambasamudram is near the foot of the Western Ghats and is more fertile being watered by the river Tambraparni. Besides Ambasamudram, Shencottah is the other taluk where houses with mud walls are less than 50 %. Higher figures are noticed in Srivaikuntam with 689 and Sankaranayinarkoil 683. Burnt brick ranges from 28 in Kovilpatti to 350 in Ambasamudram. Low proportions are recorded by Kovilpatti and SankaralllymarkoiI. At the same time they record high proportions of 149 and 145 under stone. Rocks are found in these taluks. Nanguneri, Tiruchendur and Tirunelveli have also recorded higher proportions of 130, 101 and 100 respectively under stone. Unburnt brick is found in Tenkasi, Shencottah and Ambasamudram and to a lesser extent in other taluks. In Tiruchendur, a high proportion of 130 is noticed under grass, leaves, reeds or bamboo. This is a coastal taluk in which palmyrahs flourish.
6 - 82. Under roof materials, the district has recorded 543 under kutcha roof against 664 for the State. The taluk proportions range from 438 in Nanguneri to 592 in Sankaranayi
narkoil. The next material, tiles, ranges from 193 in Sankara-Roof material nayinarkoil to 540 in Nanguneri. High proportions are found in
the taluks of Ambasamudram and Tiruchendur. Nanguneri taluk is adjacent to Kanyakumari, which formed part of Travancore State where generally tiled roofs are preferred. Nanguneri Taluk has been to a certain extent subjected to the influence of the practices of Kanyakumari. Sankaranayinarkoil, Kovilpatti and Tirunelveli have recorded proportions of 102, 91 and 60 under concrete and 67, 58 and 57 under brick and lime. Though Sankaranayinarkoil has considerable figures under these categories, its general position cannot be said to be good. On the basis of wall and roof materials, Ambasamudram and Shencottah present a better picture.
6 - 83. Under wall material, the district has recorded a lower proportion of 373 under burnt bricks against 481 for the State. It ranges from 43 in KoviIpatti to 680 in Tirunelveli.
The deficiency in burnt bricks in the taluks of Kovilpatti and Urban areas-Wall material Srivaikuntam is made good by stone, proportions being 405 and
443. For mud, the figures range from 210 in Tiruchendur to 582 in Sankaranayinarkoil. Kovilpatti, Nanguneri and Shencottah have also recorded high proportions of 480, 336 and 316. Srivaikuntam and Tiruchendur have recorded low prop:Jrtions of 256 and 210. These figures cannot be taken as an index of the prosperity of these taluks since they have recorded high proportions of 120 and III under grass. Stone is an important material in the taluks of Srivaikuntam, Kovilpatti, Tiruchendur and Nanguneri with proportions of 443, 405. 328 and 127. High figures have been recorded under unburnt bricks in the taluks of Nanguneri, Shencottah, Tenkasi and Ambasamudram with 248, 192, 191 and 132,
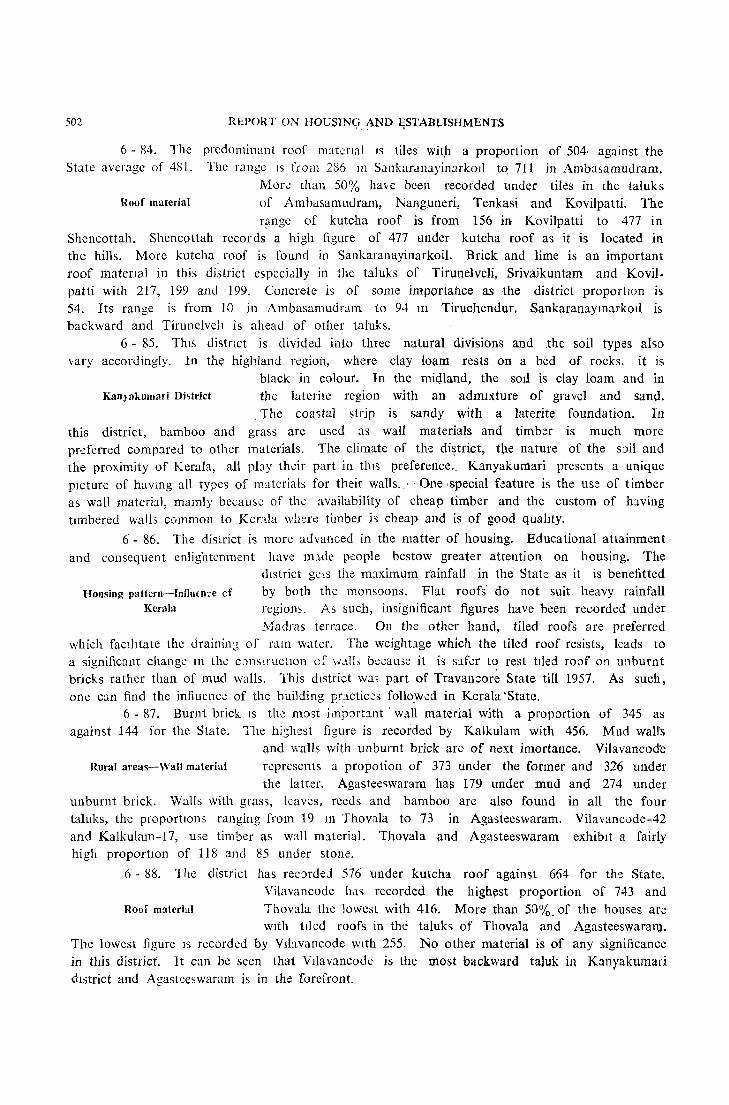
502 REPORT ON HOUSING, AND 9STAB~ISHMENTS
6 - 84. The predominant roof m:ltcnal IS tiles wit), a proportion of 504 against the State average of 4Sl. The range IS from 2S6 ]J1 Sallkar<.l11uyinarkoII tq 711 in Ambasamudram.
More than 50% have been recorded under tiles in the taluks Roof material of Ambasamudram, Nang,uneri, Tenkasi and Kovilpatti. The
range of kutcha roof is from 156 in Kovilpatti to 477 in Shencottah. Shencottah records a high figure of 477 under kutcha roof as it is located in the hills. More kutcha roof is found in Sankaranayinarkoil. Brick and lime is an important roof matenal in this district especially in the taluks of Tirunelveli, Srivaikuntam and Kovilpatti with 217, 199 and 199. Concrete is of some importance as the district proportIOn is 54. Its range is from 10 in Ambasamudram to 94 III Tiruohendur. SankaranaymarkOlI is backward and Tirunelveh is ahead of other taluks.
6 - 85. ThIs distnct is divided into three natural divisions and the soil types also vary accordingly. In the highland regioil, where clay loltro rests on a bed of rocks. it is
black in colour. In the midland, the sot! is clay loam and in KalJJakumari Dbtrict the laterite region with an admIxture of gravel and sand.
,The coastal strip is sandy with a laterite foundation. In this district, bamboo and grass are used as wall materials and timber is much more preferred compared to other materials. The climate of the di~trict, tb.e nature of the s:)il and the proximity of Kerala, aU pby their part in tIm preference._ Kanyakumari presents a unique pIcture of havmg all types of materials for their walls. _' ' One ,s.pecial f~ature is the us:: of timber as wall materi:ll, malllly because of the availability of cheap, timber and the custom of h:wing tImbered walls common to Kerala where timber is cheap and is of good qualIty.
6 - 86. The disLrict is more advanced in the matter of housing. Educational attainment and consequent enlightenment have mldc people bestow greater attention on housing. The
district gets the mJ.ximum (ainfa11 in the State as it is benefitted Housing patteru-Influ{D~e cf by both the monsoons. Flat roofs' do not suit heavy rainfall
Kerala regions. As such, insignificant figures have been recorded under Madras terrace. On the other hand, tiled roofs are preferred
which faClhtate the drainin3 of ralll water. The weight.lge which the tiled roof resists, leads to a significant change 111 the C')l1S'_t"Uct!on of \-,'cllI, became it is nfer to rest tlled roof on unburnt bricks rather than of mud walls. This district wa; part of TravanGore State till 1957. As such, one can find the infiuence of the building pr~lcticcs followed in Kerara "State.
6 - 87. Burnt brick IS the most importJ.nt 'wall material with a proportion of 345 as against 144 for the State. The hi~hest figure is recorded by Kalkulam with 456. Mud walls
and ,valls with unburnt brick are of next imortance. Vilavancod'e Rural areas-Wall material represents a propotion of 373 under the former and 326 under
the latter. Agasteeswaram has 179 under mud and 274 under unburnt brick. Walls with grass, leaves, reeds and bamboo are also found in all the four taluks, the proportIOns ranging from 19 111 Thovala to 73 in Agasteeswaram. Vilavancode-42 and Kalkulam-17, use timber as wall mJ.terial. Thovala and Agasteeswaram exhibIt a fairly high proportIOn of 118 and 85 under stone,
6 - 88. The district has recorded 576 under kutcha roof again'St 664 for th~ State. Vilavancode hets recorded the highest proportion of 743 and
Roof material Tl10vala the lowest with 416. More than 50%. of the houses are wIth tiled roofs in the taluks of Thovala and AgasteeswaraDJ.
The lowest figure IS recorded by VIhvancode WIth 255. No other material is of any significance in this district. It can be seen that Vilavancode is the most backward taluk in K::myakumari dIstrict and Agas1eeswaram is in the forefront.
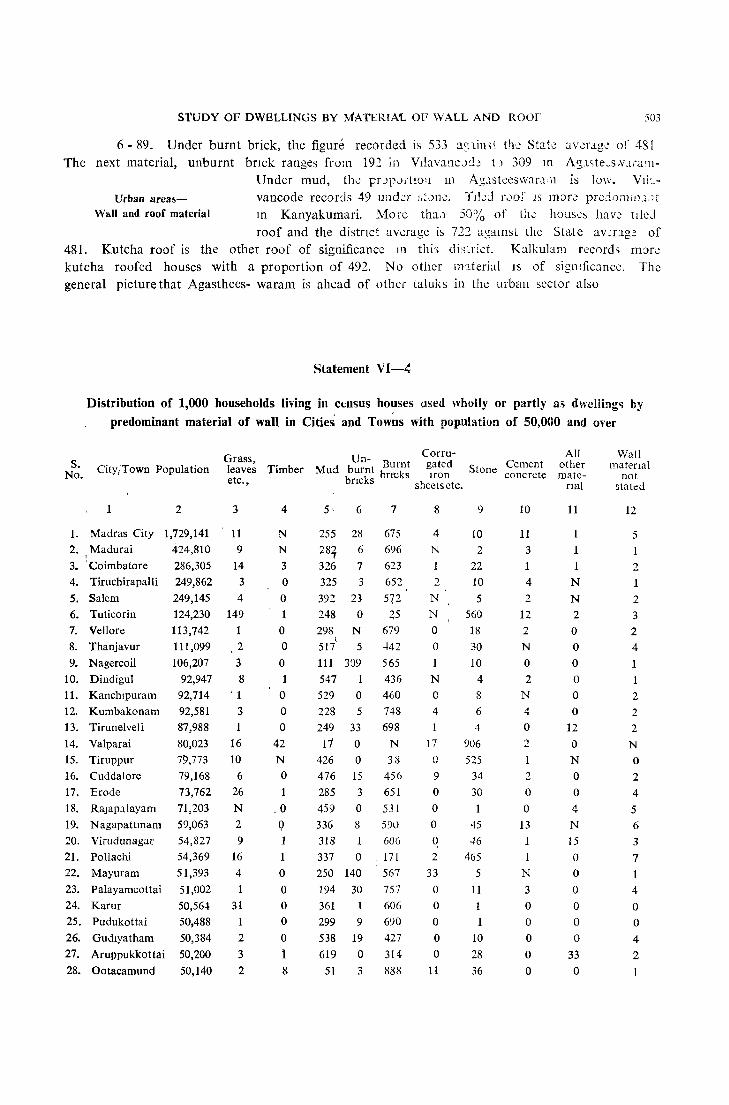
STUDY OF DWELLINGS BY MATERIAL OF WALL AND ROOF
6 - 89. Under burnt brick, the figure recorded is 533 a~nimt th~ State The next material, unburnt bnck ranges from 19~ in VIlavancJd: 1 J 309 III
503
J.v.:;rag.: of 431 A$l<;te~s N.lt"J.l11-
is low. VI!:_-
Urban area!>Wall and roof material
Under mud, the pr JpJitlO 11 111
vancode rccods 49 under ~,~0ne.
III Kanyakumari. Morc tha,1
rfllcd roof IS 1110r.:: prCd0n11Iu,lt
50% of the hous·~~ haw tdcJ roof and the distrIct average is 722 asalllsL the State av:r:tg'~ of
481. Kutcha roof is the other roof of significance 111 this dis~rict. Kalkulam records more
kutcha roofed houses with a proportion of 492. No other m:lterial IS of siglllficance. The general picture that Agasthees- waram is ahead of other laluks in the urban sector also
Statement VI-~
Distribution of 1,000 households living in ctnsus houses (lsed wholly or partly as dwellings by
predominant material of wall in Cities and Towns with population of 50,000 and over
S. No. CityjTown Population
2
1. Madras City 1,729,141
2. Madurai
3. I Coimbatore
4. TiruchirapalJi
5. Salem
6. Tuticorill
7. Vellore
8. Thanjavur
9. Nagercoil
10. Dindigul
11. Kanchlpuram
12. Kumbakonam
13. Tirunelveli
14. Valparai
15. Tiruppur
16. Cuddalore
17. Erode
18. RaJapalayam
19. Nagapattmam
20. Virudunagar
21. Pollachi
22. Mayuram
23. Palayamcottai
24. Karur
25. Pudukottai
26. Gudlyatham
27. Aruppukkottai
28. Ootacamund
424,810
286,305
249,862
249,145
124,230
113,742
111 ,099
106,207
92,947
92,714
92,581
87,988
80,023
79,773
79,168
73,762
71,203
59,063
54,827
54,369
51,393
51,002
50,564
50,488
50,384
50,200
50,140
Corm-Grass, Mud bUn-t Burnt gated C t leaves Timber urn bncks )fon Stone co~~~~te etc., bncks sheets etc.
3
11
9
14
3
4
149
1 2
3
8 '1
3
1
16
10
6
26
N 2
9
16
4
31
1
2
3
2
4
N N
3
o o 1 o o o
o o o
42
N o 1
.0 o 1
1
o o o o o 1 8
5, 6
255 28
28~ 6 326 7
325 3
392 23
248 0
298 N
517' 5
111 309 547 1
529 0 228 5 249 33
11 0
426 0
476 15
285 3 459 0 336 8 318
337 0
250 140
194 30
361 1
299 9
538 19
619 0
51 3
7
675
696
623
652
5"(2
25 679
..)42
565
436
460
748
698
N
38
456
651
531
5')0
606
, 171
567
757
606
690
427
314
888
8
4
N
2
N
N
o o 1
N
o 4
17
o 9
o o o o 2
33
o o o o o
11
9
10
2
22
10
5
560
18
30
10
4
8
6
4
906
525
34
30
1
45
46
465
5
11
1
10
28 36
10
11
3
4
2 12
2
N
o 2
N
4
o 2
2
o o
13
N
3
o o o o o
All other mate
nal
11
1
1
1
N
N
2
o o o o o o
12
o N
o o 4
N
15
o o o o o o
33
o
Wall materIal
not stated
12
5
1
2
2
3
2
4
1
2
2
2
N
o 2
4
5
6
3
7
1
4
o o 4
2
1
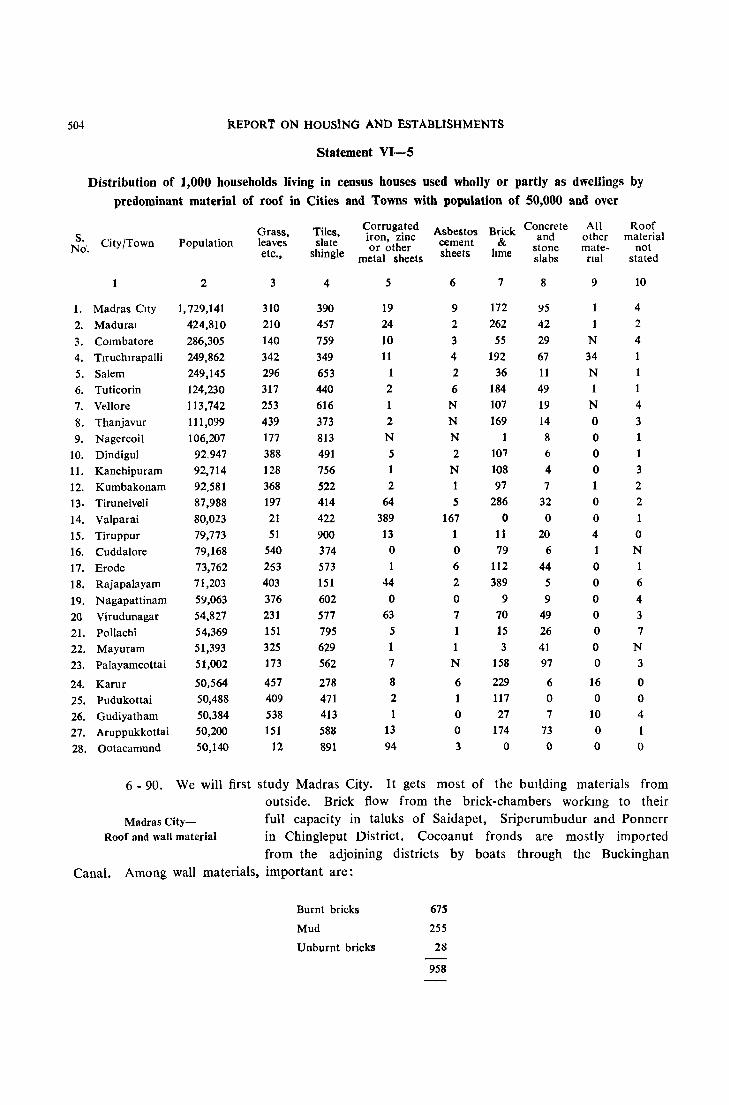
504 REPORT ON HOUslNG AND ESTABLlSHMENTS
Statement VI-5
Distribution of 1,000 households living in census houses used wholly or partly as dwellings by
predominant material of roof in Cities and Towns with population of 50,000 and over
S. City/Town No'.
1
1. Madras City
2. Madural
3. COlmbatore
4. TlruchuapaJli
5. Salem
6. Tuticorin
7. Vellore
8. Thanjavur
9. Nagercoil
10. Dindigul
11. Kanchipuram
12. Kumbakonam
13. Tirunelveli
14. Valparai
15. Tiruppur
16. Cuddalore
17. Erode
18. Rajapalayam
19. Nagapattinam
20 Virudunagar
21. PolJachi
22. Mayuram
23. Palayamcottai
24. Karur
25. Pudukottai
26. Gudiyatham
27. Aruppukkottai
28. Ootacamund
Population
2
1,729,141
424,810
286,305
249,862
249,145
124,230
113,742
111,099
106,207
92,947
92,714
92,581
87,988
80,023
79,773
79,168
73,762
71,203
59,063
54,827
54,369
51,393
51,002
50,564
50,488
50,384
50,200
50,140
Grass, leaves etc.,
3
310
210
140
342
296
317
253
439
177
388
128
368
197
21
51
540
253 403
376
231 151
325
173
457
409
538
151
12
Tiles, slate
shingle
4
390
457
759
349
653
440 616
373
813
491
756
522 414 422
900
374
573
151 602
577
795
629
562
278
471
413 588 891
Corrugated iron, zinc or other
metal sheets
5
19
24
10
11
2
1
2 N 5
1
2 64
389
13
o 1
44 o
63
5
1 7
8
2
13 94
Asbestos Brick Concrete cement & and sheets lIme stone
slabs
6
9 2
3 4
2
6 N
N N
2 N 1 5
167
1
o 6
2
o 7 1 1 N
6
o o 3
7
172
262
55 192
36
184
107
169
101
108
97
286 o
11 79
112
389
9
70
15 3
158
229 117
27
174 o
8
95
42
29
67
11
49
19
14
8 6
4
7
32
o 20
6
44 5
9 49
26
41 97
6
o 7
73
o
All other mate-nal
9
1
1 N 34
N
1
N
o o o o 1 o o 4
1 o o o o o o o
16
o 10
o o
Roof material
not stated
10
4
2
4 1
1
4 3 1 1 3
2
2
1 o N
1 6
4
3
7
N
3
o o 4
1
o
6 - 90. We will first study Madras City. It gets most of the buIlding materials from outside. Brick flow from the brick-chambers workmg to their
Madras City- full capacity in taluks of Saidapet, Sriperumbudur and Ponnerr Roof and wall material in Chingleput District. Cocoanut fronds are mostly imported
from the adjoining districts by boats through the Buckinghan Canal. Among wall materials, important are:
Burnt bricks 675
Mud 255
Unburnt bricks 28
958
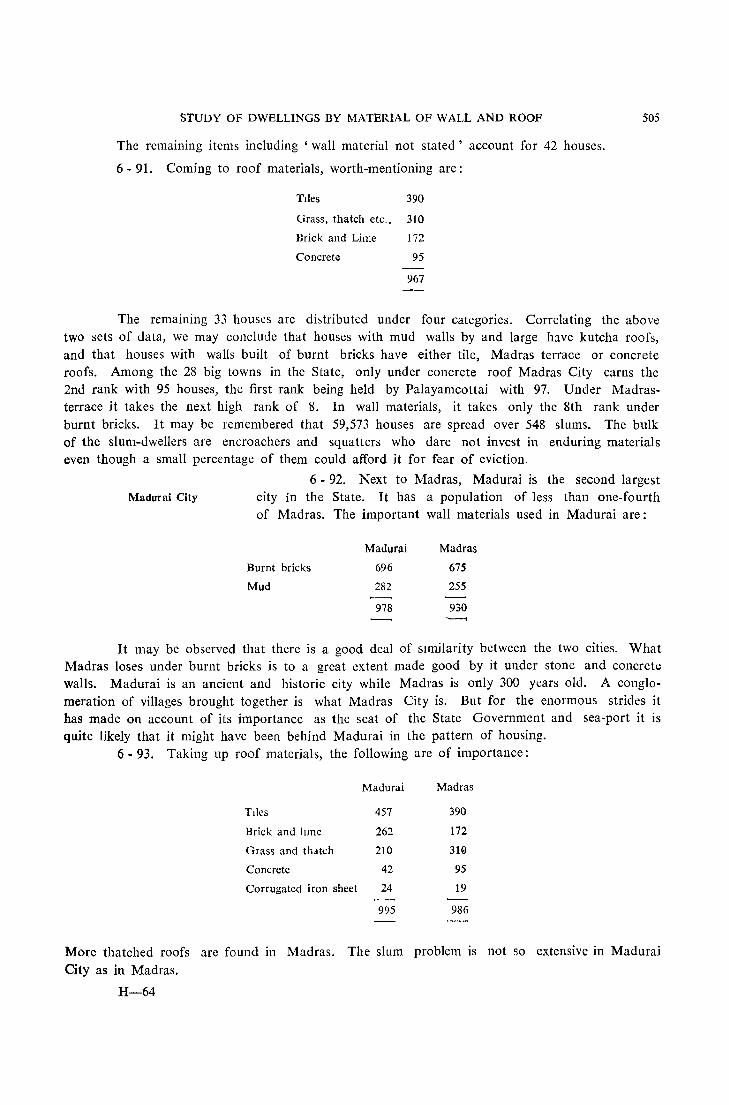
STUDY OF DWELLINGS BY MATERIAL OF WALL AND ROOF
The remaining items including , wall material not stated' account for 42 houses.
6 - 91. Coming to roof materials, worth-mentioning are:
Tiles 390
Grass, thatch etc., 310
Brick and LilY.e 172
Concrete 95
967
505
The remaining 33 houses are di,tributed under four categories. Correlating the above two sets of data, we may conclude that houses with mud walls by and large have kutch a roofs, and that houses with walls built of burnt bricks have either tile, Madras terrace or concrete roofs. Among the 28 big towns in the State, only under concrete roof Madras City earns the 2nd rank with 95 houses, the first rank being held by Palayamcottai with 97. Under Madrasterrace it takes the next high rank of 8. In wall materials, it takes only the 8th rank under burnt bricks. It may be remembered that 59,573 houses are spread over 548 slums. The bulk of the slum-dwellers are encroachers and squatters who dare not invest in enduring materials even though a small percentage of them could afford it for fear of eviction.
6 - 92. Next to Madras, Madurai is the second largest Madurai City city in the State. It has a popUlation of less than one-fourth
of Madras. The important wall materials used in Madurai are:
Burnt bricks
Mud
Madurai
696
282
Madras
675
255
978 930
It may be observed that there is a good deal of similarity between the two cities. What Madras loses under burnt bricks is to a great extent made good by it under stone and concrete walls. Madurai is an ancient and historic city while Madras is only 300 years old. A conglomeration of villages brought together is what Madras City is. But for the enormous strides it has made on account of its importance as the seat of the State Government and sea-port it is quite likely that it might have been behind Madurai in the pattern of housing.
6 - 93. Taking up roof materials, the following are of importance:
Madurai Madras
Tiles 457 390
Brick and lune 262 172
Grass and thatch 210 31@
Concrete 42 95
Corrugated iron sheet 24 19
995 986
More thatched roofs are found in Madras. The slum problem is not so extensive in Madurai City as in Madras.
H-64

506 REPORT ON HOUSING AND ESTABLISHMENTS
6 - 94. Coimbatore, Tiruchiraralli, and Salem belong to Cities \\ith a popu'ation of 2-3 lakhs this group. They exhibit preponderance in the following wall
materials:
COlmbatore Tiruchlrapalli Salem
Burnt bIicks 623 652 572
MuJ 326 325 392
Stone 22 10 5
971 987 >69
There is a close similanty in the pattern presented by these cities. Salem City is not so prosperous as the other two. It has recorded about 65 houses more under mud walls than Tiruchirapalli and there IS a corresponding drop under burnt bricks. Under stone, Coimbatore leads due to local occurrence of rocks. Industrial establishments like factories, workshops and foundaries prefer stone walls. Tiruchirapalli leads in burnt bricks. When the river Cauvery is in spate that part of Tlfuchirapalli City abutting the river gets inundated. People are therefore compelled to make use of burnt bricks.
6 - 95. The pattern in regard to roof materials shows some di\'ergence among these cities:
Coimbatore Salem Tiruchirapalli
Tiles 759 653 349
Grass and thatch 140 296 342
Brick and lIme 55 36 192
Concrete 29 11 67
983 996 950
Coimbatore makes itself promment by recording more than three-fourths of the houses under tile roofs. Next come!> Salem with 653 tile-roofed houses. Tiruchirapalli records roughly half the number of Coimbatore under tiles. We may examine whether temperature has anything to do with thIS divergence.
CJty
COlmbatore
Salem
TiruchIrapalli
Mean temperature
April r-----A.------, MaxImum Mmmmm
96·5
101·4
73·6
76-5
780
May r----.A..----- --Maximum Mmlmum
94·4
99·3
101·4
736
77.0
79-2
June r----.A..·----, Maximum Mmimum
88-8
95·3
98·7
71-9
74·9
78·9
Coimbatoro.:; enjoys compar~tively a milder climate. Next comes Salem. Hence, tile-roofed houses may be tolerable during the peak of summer. Further, Coimbatore and Salem are nearer to Calicut (Kozhikode) which is a tile-producing centre. Tiruchirapalli is on the bank of the Cauvery, the margins of which abound in cocoanut palms. Cocoanut 'keeths' can be easily purchased at competitive prices. Hence, we find more number of houses with thatched roofs.
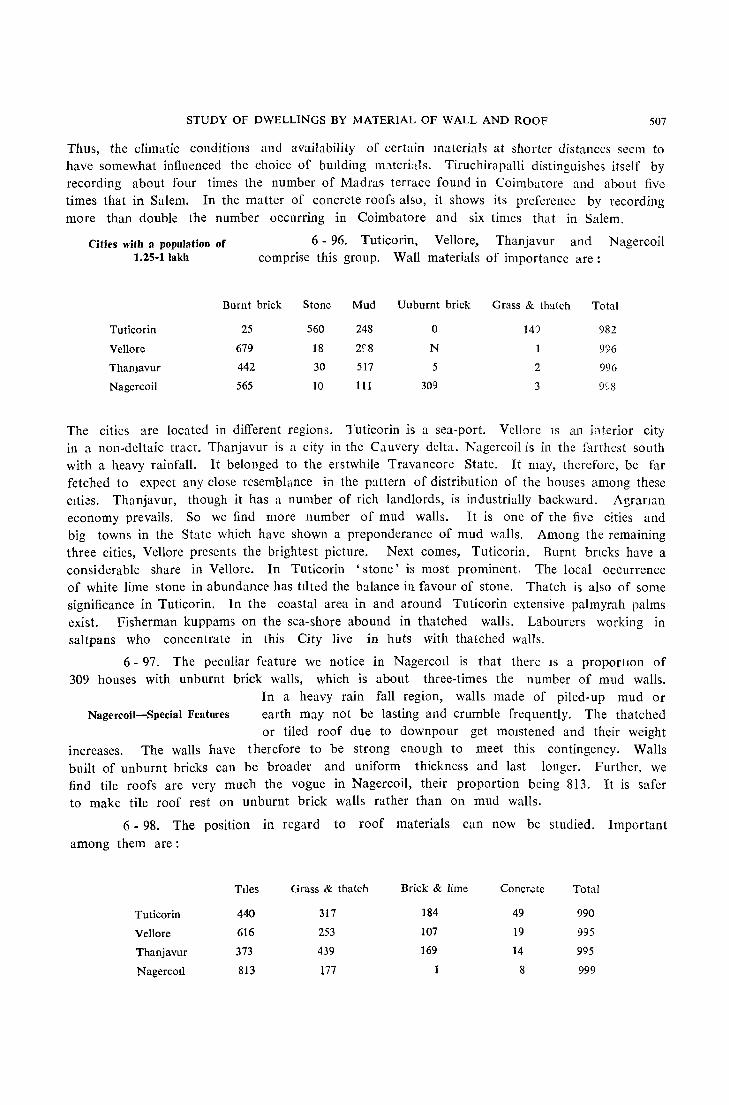
STUDY OF DWELLINGS BY MATERIAL OF WALL AND ROOF 507
Thus, the climatic conditions and availability of certain materials at shorter distances seem to have somewhat influenced the choice of bUilding m:lterials. Tiruchirapalli distinguishes itself by recording about four times the number of Madras terrace found in Coimbatore and about five times that in Salem. In the matter of concrete roofs also, it shows its preference by recording more than double the number occurring in Coimbatore and six times that in Salem.
Cities with a popUlation of 1.25-1Iakh
6 - 96. Tuticorin, Vellore, Thanjavur and Nagercoil comprise this group. Wall materials of importance are:
Burnt brick Stone Mud Uuburnt brick Grass & thatch Total
Tuticorin 25 560 248 0 14') 982
Vellore 619 18 2"8 N 996
ThanJavur 442 30 517 5 2 996
Nagercoil 565 10 III 309 3 9S8
The cities are located in different regions. Tuticorin is a sea-port. Veil ore lS an interior city in a non-deltaic tract. Thanjavur is a city in the Cauvery delta. Nagercoij is in the farthest south with a heavy rainfall. It belonged to the erstwhile Travancore State. It may, therefore, be far fetched to expect any close resemblance in the pattern of distribution of the houses among these clti~s. Thanjavur, though it has a number of rich landlords, is industrially backward. Agranan economy prevails. So we find more number of mud walls. It is one of the five cities and big towns in the State which have shown a preponderance of mud walls. Among the remaining three cities, Vellore presents the brightest picture. Next comes, Tuticorin. Burnt bncks have a considerable share in Vellore. In Tuticorin 'stone' is most prominent. The local occurrence of white lime stone in abundanc<.' has tilted the balance in favour of stone. Thatch is also of some significance in Tuticorin. In the coastal area in and around Tuticorin extensive palmyrah palms exist. Fisherman kuppams on the sea-shore abound in thatched walls. Labourers working in saltpans who concentrate in this City live in huts with thatched walls.
6 - 97. The peculiar feature we notice in NagercOlI is that there is a proportlon of 309 houses with unburnt brick walls, which is about three-times the number of mud walls.
In a heavy rain fall region, walls made of piled-up mud or Nagercoil-Special Features earth may not be lasting and crumble frequently. The thatched
or tiled roof due to downpour get mOlstened and their weight increases. The walls have therefore to be strong enough to meet this contingency. Walls built of unburnt bricks can be broader and uniform thickness and last longer. Further, we find tile roofs are very much the vogue in Nagercoil, their proportion being 813. It is safer to make tile roof rest on unburnt brick walls rather than on mud walls.
6 - 98. The position in regard to roof materials can now be studied. Important
among them are:
Tiles Grass & thatch Brick & lime Concrete Total
Tuticorin 440 317 184 49 990
Vellore 616 253 107 19 995
Thanjavur 373 439 169 14 995
NagercOlI 813 177 1 8 999
508 REPORT ON HOUSING AND ESTABLISHMENTS
6 - 99. Thanj:wur has the large,t number of houses with thatched ro:)f'). In Nagercoil tile roofs are popular accounting a proportion of 813. It is significant Madras terrace
is practically unknown in Nagercoil. We ·h.we stated that Roof material Tamilnad is justly famous for Madras terrace. Nagercoil
formerly of the Travancore State perhaps did not take to Madras terrace which is a tradition in Tamilnad but follows Travancore in building practices. Its high rainfall makes tile roof a necessity for the town. Between Tuticorin and Vellore, the former outstrips the latter in all categories except tiles. Tuticorin is on the Bay coast and is vulnerable to cyclonic storms. Mangalore tile roofs may be blown off during storms and gusty winds. Perhaps that is the reason which has persuaded people to prefer Madras terrace and concrete to tiles. We have already said palmyrah leaves are grown in plenty in Tuticorin area within the economic reach of the poor. This is reflected in the increase in thatch in Tuticorin.
6 - 100. Seven towns fall under this group. Of these, Valparai is on the mountain.
Cities with a population (If 75,000 to one Jakh
So it will proper study it along with Ootacamund. a hill station. Among the remaining towns, Kumbakonam is in the Cauvery delta while Tirunelveli is in the Tambraparni basin. Cuddalore is a sea-coast town. Dindigul, Kanchipuram and Tiruppur
are interior towns in dry tracts.
6 - 101. The following are the important wall materials in these towns:
Burnt brick Mud Stone Total
Dindigul 436 547 4 987
Kanchipuram 460 529 8 997
Wall material Tiruppur 38 426 525 989
Cuddalore 456 476 34 966
Kumbakonam 748 228 6 982
Tirunelveli 698 249 4 951
6 - 102, Dindigul and Kanchipuram have recorded more than 50% of the houses under mud walls. But the latter has more tile roofs. Tiruppur although situated in a dry tract is an industrial centre with more economic prosperity. But the peculiar feature noticed is that more than 50% of the houses have stone walls. This is due to the local occurrence of rocks. The area is gravelly and clay is in short supply. Further industrial establishments prefer stone walls. Cuddalore has also recorded a high proportion of 476 under mud walls indicating low prosperity. The proportion of enduring materials does not exceed 50%. Kumbakonam and Tirunelveli resemble each other; but there is a slight increase und~r 'burnt bricks' in Kumbakonam. It is a low lying town amidst wet fields. The Arasalar, the branch river of the Cauvery, flows right through the heart of the town. These factors are restJonsible for the increase in burnt brick walls.
6 - 103. Roof materials of importance are:

STUDY OF DWELLINGS BY MATERIAL OF WALL AND ROOF 509
Tiles Gr,\ss & thatch Brick & hlllc Total
Dindlgul 491 388 107 986 Kanchlpuram 756 128 108 992
Roof m~terial Tlruppur 900 51 11 962 Cuddalore 374 540 79 993 Kumbakonam 522 368 97 987 Tirunelvelt 414 197 286 897
6 - 104. Tiruppur leads in tiles wIth 900. A comparative study of the figures in the other towns in Coimbatore district i~ rewarding. Coimbatore, Erode and Pollachi have recorded 759, 573 and 795 respectively. Erode would have recorded much more b"lt for its proportion of 112 under bnck and lime. Further, it is not so industrblly forward as Coimbatore, Tiruppur or Pollachi. The towns in this district show a special bias for tiles in tune with the practice obtained in Kerala State whose influence is perceptibly more m this dlstr:ct being closer to Kerala. Further, Calicut (Kozhikode), the tile producing centre, is at a shorter di3L,nce. Kanchipuram also shows a bias for tile rook The rea'Da is not far to seck. It is fam0us for its silk handloom weaVll1g. To ensure the safety of the looms in the event of fire accidents the people scem to have taken to tile roofs. Betvieen Kumbakonam and Tlrunelveli, the latter provides evidence of better housing by recordmg more under tiles, Madras-terrae,;; and concrete put together We will see later while discussing room accommodation th:1t the tendency to have better houses is more pronounced in Tirunelveli Di5trict. Further, Tirunelveli is the district headquarters whereas Kumbakonam does not enjoy such a statu~. Cuddalore town h:!s recorded. more than 50% of the houses under thatch. The availability of cocoanut keeths and casuarina poles in plenty in and around the town (being a coastal area) coupled with the economic backwardness of the people has made 'thatch' popular in the town.
6 - 105. A dozen towns fall under this group. Of these, we shall study Ootacamund separately with Valparai. In the remaining towns the following are important wall materials.
Town
Erode
Rajapalayam
Nagapattinam
Virudunagar
Towns with a population of Pollachi 50,000 to 75,000 Mayuram
Palayamcottai
Karur
Pudukottai
Gudiyatham
A ruppukkottai
Burnt brick
651
531
590
606
171
567
757
606
690
427
314
Mud
285
459
336
318
337
250
194
361
299
538
619
Stone
30
45
46
465
5
11
10
28
6 - 106. Gudiyatham and Aruppukkottai record more than 50% of the houses under mud walls. But the latter has 588 houses with tile roofs. In Gudiy.ltham more than half the houses have kutcha roof. Thus it has shown to be very backward. Palayamcottai, Pudukottai, and Erode have recorded fairly high figures under burnt bricks. In fact, Palayamcottai occupies the second place among the 28 cities and towns. Next come Virudunagar, Nagapattinam and Pollachi which together with the figures recorded under 'stone' show a better picture. Pollachi has recorded 465 ho"uses with ston!:; walls,
510 REPORT ON HOUSiNG AND ESTABLISHMENTS
6 - 107. Among roof materials, important arc:
Town Tiles Grass & thatch Brick & lime Concrete Erode 573 263 112 44 Rajapalayam 151 403 389 5
Nagapattinam 602 376 9 9 Vlrudunagar 577 231 70 49 Pollachi 795 151 15 26 Mayuram 629 325 3 41 Palayamcottal 562 173 158 97 Karur 278 457 229 6
Pudukottai 471 409 117 0 Gudiyatham 413 538 27 7 Aruppukkott:li 588 151 174 73
6 - 108. We have already said that Gudiyatham has recorded more than 53% of the houses under kutcha roof. Pollachi, Mayuram and Nagapattinam have shown more than 60% of the houses under tiles. In East Thanjavur District, the tradition has been to use country tiles. Bamboo reapers arc availablc locally over which country tiles can be spread. Hrode, Virudunagar, Palayamcottai and Aruppukkottai also exhibit a better standard if we consider Madras terrace and concrete roof with tile roof.
6 - 109. Rajapalayam deserves special mention. Although it has recorded a proportion of 403 houses under th3-tchcd roof, the honour of occupying the first rank among the 28 cities
and towns in regard to Madras terrace goes to it. The members of Rajapalayam-Special Feature the 'Raja', a special community, who give the name to the town
are in affluent circumstances. They invest a good deal in housing.
6 - 110. The towns of Ootacamund and Valparai will now be discussed. The former is at a height of 7,150 ft. The latter is at an altitude of 3,800 ft. Ootacamund is the main hln
station in the South and it has rightly earned the sobriquet Ootacarnund and Valparai ' Queen among the hill stations'. The aristocratic and enlightened
section of the people have their bungalows in Ootacamund. The City is of considerable tourist importance being a beauty spot. Valparai is not a hill resort. It is important because of the tea estates which nestle in and around it. It shelters the estate labour.
6 - Ill. The important wall material~ used in these two towns are:
Valparai Ootacamund
Stone
906 36
Burnt brick
N
888
Mud
17 51
G. I. sheet
17 11
6 - 112. Stone is preferred at Valparai but at Ootacamund it is burnt brick. Stone IS m short supply in the latter. We have already said that Ootacamund is a summer resort and that Valparai is of importance only from the point of view of estate labour. Burnt brick walls plastered with lim~ or cement mortar will be better from the aesthetic point of view and for chiller climate.
6 - 113. Among roof materials worth mentioning are:
Valparai Ootacamund
Tiles, Slate & shingle
422 891
G. 1. sheets
389 94
Asbestos
167 3
Grass
21 12
6 - 114. In hilly regions light-roofs are preferred in view of the transportation difficulties. These towns receive high rainfall and flat roofs are not conducive to drain off rain water instantaneously. Tiles, G. I. sheets, Asbestos roofs which contain slopes, therefore are preferred.

511
E-IV-t. Distribution of 1,000 households living in census houses used wholly or partly as dwellings by predominant material of wall
(Based on '20~ ~ Sample) Corrugated
State/District Total Grass,leaves, Un- Burnt llon sheets Rural reeds or Timber Mud burnt brIcks or other Urban bamboo bncks mctdl
MADRAS STATE
Madras District
Chingleput Dlstrict
North Arcot District
South Arcot District
Salem District
Coimbatore District
Nilgiri District
Madurai Distnct
Tiruchirapalli District
2
T
R
U
U
T
R
U
T
R
U
T
R
U
T
R
U
T
R
U
T
R
U
T
R
U
T
R
U
Thanjavur District T
R
U
Ramanathapuram DIstnct T
R
U
Tirunelveli District
Kanyakumari Distnct
T
R
U
T
R
U
3
10
9
12
11
2
N
9
N
N
2
1
4
3
3
2
9
7
14
60 61
60
7
7
5
2
2
5
15
16
12
14
17
7
26
20
39
41
46
12
4 5
2 652
2 742
1 385
N 255
N 724
N 788
N 467
9 706
11 760
o 462
N 800
N 834
o 545
N 746
N 789
o 504
2 565
N 643
5 361
8 96
6 90
10 104
N 693
N 790
N 469
750
N 832
3 413
6 7
24 229
22 144
31 431
28 675
8 219
8 164
7 437
6 267
5 214
9 509
8 155
3 133
44 324
6 167
5 120
10 438
8 107
7 33
13 299
15 544
24 487
4 621
3 252
3 145
4 501
7 205
4 128
19 523
701 45
1 757 41
o 455 61
N 7C4 7
N 791 6 118
N 426 11 489
N 525 73 231
N 617 69 170
N 312 84 373
18 262 262 372
20 283 256 345
3 139 297 533
&heel,
8
5
5
2
4
N
N
N
N
N
1
N
N
2
N
N
N
31
42
2
56
90
9
N
N
N
N
3
1
N
6
N
N
N
1
N
N
N
Stone
9
70
69
76
10
41
35
66
10
8
15
28
24
56
76
81
43
273
264
299
209
230
180
35
43
16
31
31
27
19
21
15
53
53
51
128
108
173
41
46
15
Wall Cement All mate
con- other I w.l crete mate- not
nal st"t<.;u
10
2
1
()
11
6
N
4
2
24
N
N
1
2
N
5
8
4
12
4
5
2
1
6
1
N
2
2
2
2
2
2
3
o
11
2
2
3
N
N
N
N
N
o N
N
N
N
N
N
N
N
N
2
5
o 3
4
N
N
N
N
N
N
9
9
12
12
11
13
2
2
N
12
4
-1
3
5
5
4
8
2
2
2
3
3
1
2
2
2
3
4
2
2
3
N
3
3
2
2
2
17
20 7
4
4
2
2
2
2
1
1
1
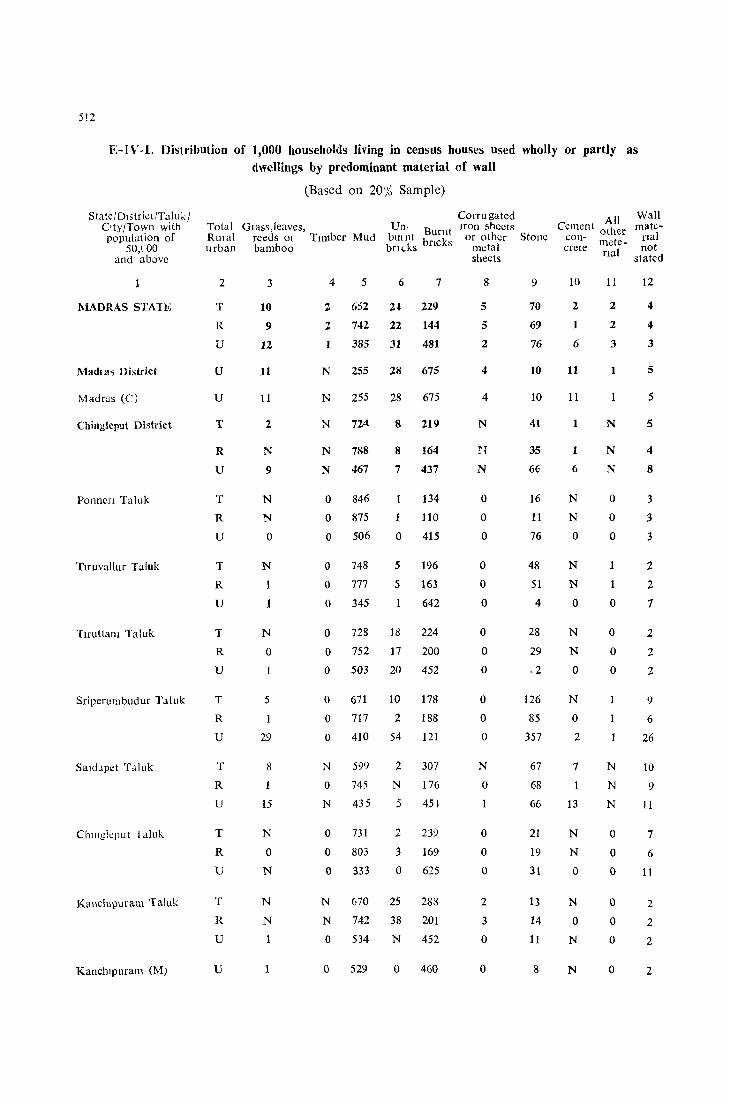
512
E-IV-I. Dist ribution of 1,000 households Jiving in census houses used wholly or partly as dwellings by predominant material of wall
State/DI5trictITaJuk/ Oty/Town with population of
50,('00 and above
MADRAS STATE
Madia, District
Madras (C)
Chinglcput District
Ponnen Taluk
TlruvaUur Taluk
Tlfuttal1l Taluk
Sriperumbudur Taluk
SaH.i..lpct T"luk
Chlllgkput Taluk
Kanchlpuram Taluk
Kanchlpuram (M)
(Based on 20% Sample)
Corru gated All Wall Total Glass,leaves, Un, Burnt Iron sheets Cement other mate-Rural reeds 01 Tuuber Mud bUlnt or other Stone con- mete- rIal urban bamboo bn('ks bncks metal (;fete nal not
sheets stated
2
T
R
U
u
u
T
R
U
T
R
U
T
R
U
T
R
U
T
R
U
T
R
U
T
R
U
T
R
U
u
3
10
9
12
11
11
2
N
9
N
N
o
N
1
1
N
o
5
29
8
15
N
o N
N
N
1
1
4 5 6 7
2 652 2,1 229
2 742 22 144
1 385 31 481
N 255 28 675
N 255
N 788
N 467
o 846
o 875
o 506
o 748
o 777
o 345
o 728
28 675
8 219
8 164
7 437
134
1 110
o 415
5 196
5 163
642
18 224
o 752 17 200
o 503 20 452
o 671 10 178
o 717 2 188
o 410 54 121
N 599 2 307
o 745 N 176
N 435 5 45 ~
o 731 2 239
o 803 3 169
o 333 o 625
N 670 25 283
N 742 38 201
o 534 N 452
o 529 o 460
8
5
5
2
4
4
N
N
o o o
o o o
o o o
o o o
N
o
o o o
2
3
o
o
9
70
69
76
10
10
41
35
66
16
11
76
48
51
4
28
29
.2
126
85
357
67
68
66
21
19
31
13
14
11
8
10
2
1
6
11
11
1
1
6
N
N
o
N
N
o
N
N
o
N
o 2
7
1
13
N
N
o
N
o N
N
11
2
2
3
1
N
N
N
o o o
o
o o o
1
1
N
N
N
o o o
o o o
o
12
4
4
3
5
5
5
4
8
3
3
3
2
2
7
2
2
2
9
6
26
10
9
11
7
6
11
2
2
2
2

E-IV-l. Distribution of 1,000 households Ihing in census houses used wholly or partly as dwellings by predominant material of wall (contd.)
State/Distt tet/Taluk/ City/Town wtth populatIOn of
50,000 and above
Maduranthakam Taluk
NORTH ARCOT
DISTRICT
Arkonam T aluk
Walajapet Taluk
Gudiyatham Taluk
Gudiyatham (M)
Tiruppaltur Taluk
Vellore Taluk
Vellore (M)
Arni Taluk
Cheyyar Taluk
Wandiwash Taluk
H-65
Total Grass,leaves, R ural reeds or Urb,m bamboo
2
T
R
U
T
R
U
T
R
U
T
R
U
T
R
U
U
T
R
U
T
R
U
U
T
R
U
T
R
U
T
R
U
3
N
N
o
N
N
1
N
o
N
o N
N
N
2
2
N
N
o
N
o
o o o
N
N
o
N
N
o
(Based on 20% Sample)
Tnllbcr Mud ~l~'~l ~ur~: bncks fie'
4 5
o 853
o 860
o 761
9 706
11 760
o 462
N 681
N
o 740
392
6 7
1 128
1 122
209
6 267
5 214
9 509
5 294
5
4
233
595
o 703 3 281
o 748 2 237
o 550 7 431
o 678 7 303
o 719 5 263
o 518 19 453
o 538 19 427
o 728 4 257
o 807 2 185
o
o o o
o
o
422
557
714
332
298
673
o 708
o 500
3 717
3 736
o 481
o 723
o 732
o 551
11
6
5
7
N
5
538
416
270
625
679
311
5 278
8 473
N 275
N 257
3 502
N 272
N 262
2 445
Corrugated Iron sheets
or other metal l>hects
8
o o o
N
N
1
o o o
o o o
o o o
o
1
1
5
o o o
o
o o o
o o o
o o o
All Cement other
Stone eon- mate-cn .. te f1al
9
14
13
26
10
8
15
16
19
2
10
10
7
10
11
6
10
9
5
22
18
10
30
18
9
7
17
5
4
11
4
5
2
10
o
N
N
1
2
N
7
1
1
3
N
N
N
o
o o o
o
2
N
N
N
N
o
o o o
11
o o o
N
N
o
N
N
o
N
N
o
o o o
o
o o o
o o o
o
N
N
o
o o o
o o o
513
Wall ma(e
fJ,t] not
staled
12
3
3
3
2
2
2
2
2
o
2
2
2
2
2
2
4
N
2
2
1
4
2
2
2
N
o 3
1
1
o

)14
1~-IV-1. Distribution of 1,000 housebolds Jiving ill census houses used whQlly Qr partly as dwellings by predominant material of wall (contd.)
State/DIstrict/Tal uk! CIty/Town wIth
populatIOn of 50,000
and above
Polur Taluk
Chengam Taluk
Tiruvannamalai Taluk
SOUTH AReOT
DISTRICT
Gingee Taluk
Tmdivanam Taluk
VIIlupuram Taluk
Tirukkoyllur Taluk
KallakUlIc1l1 Taluk
Vnddhacllalam Taluk
Cuddalore Taluk
Cuddalore (M)
(Based on 20~6 Sample)
Total Grass,leaves, Un-Rural reeds or TImber Mud burnt BUril(
bncks brll;ks Urban bamboo
2
T
R
U
T
R
T
R
U
T
R
U
T
R
T
R
U
T
R
U
T
R
U
T
R
U
T
R
U
T
R
U
u
3
2
2
2
2
N
N
o
2
1
4
2
2
3
2
6
2
N
N
o
N
N
2
10
3
2
4
6
4 5 6 7
102 665 32 192
118 675 35 163
o 600 14 378
o 886 N 100
o 886 N 100
o 832 1 161
o 874 N 120
o 623 2 365
N 800 8 155
N 834 3 133
o 545 44 324
o o
767
767
o 834
o 848
o 723
o 774
o 815
o 513
N 877
N 890
° 638
o 905
o 915
o 757
o 807
o 823
o 518
o 736
o 825
o 483
o 476
221
221
3 143
3 129
N 255
3 177
2 141
11 407
5 96
2 86
46 304
8 76
2 72
93 128
8 156
8 143
18 384
8 187
2 120
26 377
15 456
Corrug:lted Iron sheets or other
metal sheets
8
N
o
o o
o o o
N
N
2
o o
o o o
o o o
o o o
N
N
o
o o o
1
N
5
9
All Cement other
Stone eOD- mate _ crete rIal
9
6
5
7
10
10
4
4
9
28
24
56
6
6
14
15
10
40
35
68
19
19
12
7
6
18
20
17
61
46
48
39
34
10
N
N
o
o o
o o o
4
2
24
N
N
N
N
3
:2
2
o
o o o
o 1
o
7
7
7
18
1
65
2
11
o o o
o o
o o o
N
N
N
o J
N
N
o o o
N
N
o
o o o
N
N
o
N
N
o
o
Wall mate
f1a! not
stated
12
o
2
2
2
2
o
3
3
1
3
3
3
3
2
3
3
o
3
3
o
4
4
2
1
2
1
2
2
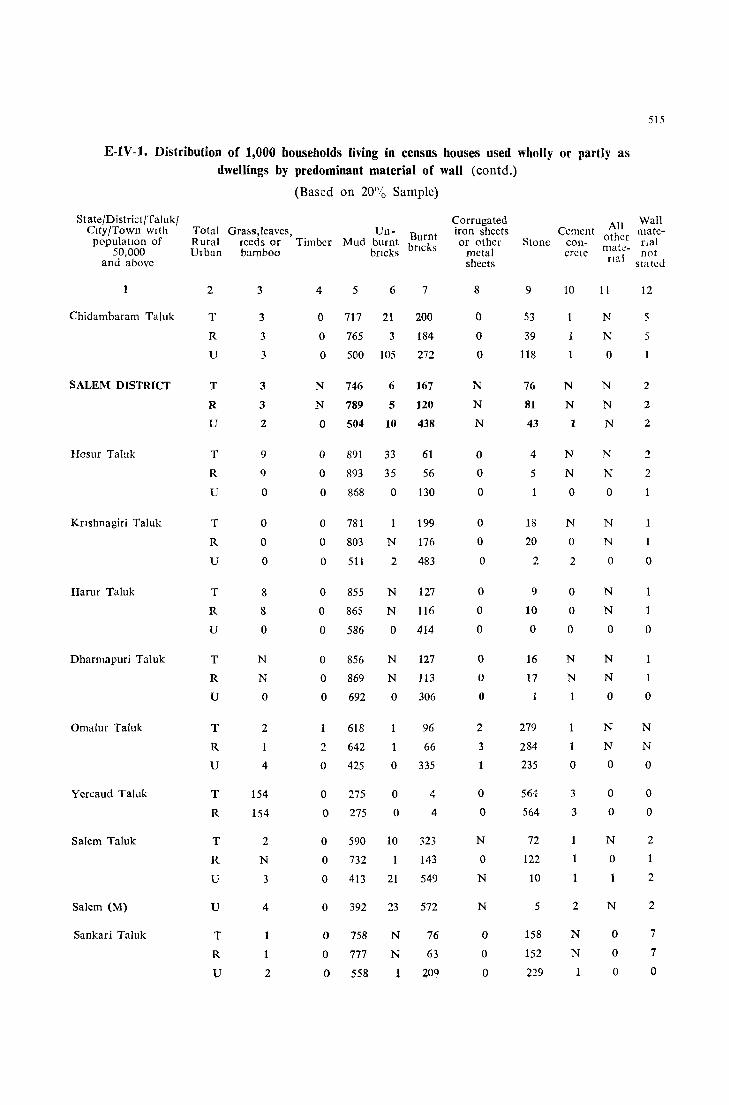
E-IV-l. Distribution of 1,000 households living in census houses used wholly or partly as dwellings by predominant material of wall (contd.)
StatejDistrictjTalukj City/Town with
populatIOn of 50,000
and above
Chidambaram Taluk
SALEM DISTRICT
Hosur Taluk
Knshnagiri Taluk
Harur Taluk
Dharmapuri Taluk
Omalur Taluk
Yereaud Taluk
Salem Taluk
Salem (M)
Sankari Taluk
(Based on 20% Sample)
Total Gra~s,leaves, Un-Rural reeds or Timber Mud burnt !~~C: Urban bamboo bncks
2
T
R
U
T
R
U
T
R
U
T
R
U
T
R
U
T
R
U
T
R
U
T
R
T
R
U
u
T
R
U
3
3
3
3
3
3
2
9
9
o
o o o
8
8
o
N
N
o
2
4
154
154
2
N
3
4
1
2
4 5 6 7
o 717 21
o 765 3
200
184
272 o 500 ]05
N 746
N 789
o 504
o 891
o 893
o 868
o 781
o 803
o 511
o 855
o 865
o 586
o 856
° 869 o 692
618
2 642
o 425
6 167
5 120
10 438
33 61
35 56
° N
130
199
176
2 483
N 127
N 116
o 414
N 127
N 113
o 306
°
96
66
335
o 275 0 4
° 275 0 4
o 590 10 323
o 732 1 143
° 413 21 549
° 392 23 572
o 758 N 76
o 777 N 63
o 558 409
Corrugated iron sheets or other
metal sheets
8
o o o
N
N
N
o o
° ° o
° o o o
o
° o
2
3
o o
N
o N
N
o
° o
All Cement other
Stone con- mat~-crete flal
9
53
39
118
76
81
43
4
5
18
20
2
9
10
o
16
17
279
284
235
564
564
72
122
10
5
158
152
229
10
N
N
1
N
N
o
N
o 2
o o o
N
N
1
1
o
3
3
1
1
2
N
N
11
N
N
o
N
N
N
N
N
o
N
N
o
N
N
o
N
N
o
N
N
o
o o
N
o 1
N
o o o
515
Wall materml not
stat..:d
12
5
5
2
2
2
2
o
1
o
1
o
N
N
o
o o
2
1
2
2
7
7
o

516
E-IV -1. Distribution of 1,000 households living in census houses used wholly or partly as dwellings by predominant material of wall (contd.)
State/DistnctjTaluk/ CIty/Town wIth populatIOn of
~O,OOO and above
Tiruchengode Taluk
Rasipuram Taluk
Attur Taluk
Namakkal Taluk
COIMBATORE
DISTRICT
Bhavani Taluk
Total Rural Urban
2
T
R
U
T
R
U
T
R
U
T
R
U
T
R
U
T
R
U
Gopichettipala) am Taluk T
R
U
Erode Taluk
Erode (M)
Dharapuram Taluk
Palladam Taluk
T
R
U
u
T
R
U
T
R
U
(Based on 20% Sample)
Grass,leaves, Un-reeds or TImber Mud burnt Burnt bamboo bncks bricks
3
N
N
o
2
2
o
N
N
o
9
7
14
4
4
1
20
21
13
6
3
23
26
1
1
2
N
7
4
N
N
o
5
758
799
586
o 779
o 804
o 659
o 790
o 808
o 589
6
N
3
7
157
113
343
20 189
24 158
o 338
N 187
1 167
o 399
o 775 2 164
o 794 2 143
o 524 0 430
2 565 8 107
N 643 7 33
5 361 13 299
N 584 31 57
1 602 2
o 408 309
1 618 11
1 624 13
o 571 0
N 609 17
o 665 18
1 360 9
285 3
o 783 12
o 813 10
o 407 33
N 559 0
N 586 0
N 480 0
53
94
28
6
179
98
2
520
651
59
23
514
14
6
37
Corrugated All Iron sheets Cement other
or other Stone con- mate-metal crete IIal sheets
8
N
o 1
N
N
o
o o o
o o o
31
42
2
o o o
o o o
N
o N
o
N
o 3
o o o
9
80
85
59
11
13
3
16
17
7
58
59
45
273
264
299
320
334
181
317
333
207
262
304
81
30
137
145
42
424
407
476
10
N
N
o o o
N
N
N
N
2
N
5
o o o
3
o 26
o 3
o
N
N
o
N
N
N
11
N
o
N
N
o
N
N
o
o o o
N
N
N
N
o 4
o o o
N
N
o
o
2
2
o
N
o N
Wall material not
stated
12
3
2
5
1
o
5
5
4
2
o
3
4
2
4
4
3
2
2
4
7
8
3
4
6
6
o
1
1
o
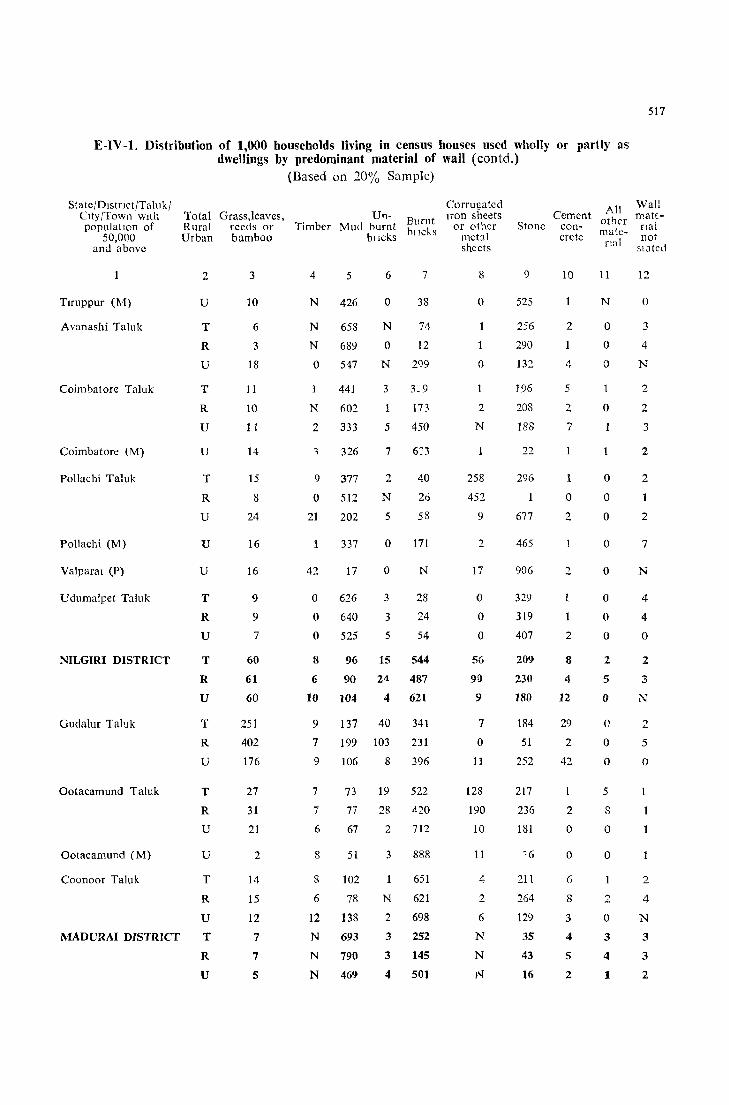
517
E-IV -1. Distribution of 1,000 households living in census houses used wholly or partly as dwellings by predominant material of wall (con td.)
State/Dlstnct/Taluk/ CIty/Town wIth populatIOn of
50,000 and above
Tlruppur (M)
Avanashi Talllk
Coimbatore Taluk
Coimbatort: (M)
Pollachi Taluk
Pollachi (M)
Valparal (P)
Udumalpet Taluk
NILGIRI DISTRICT
Gudalur Taluk
Ootacamund Taluk
Ootacamund (M)
Coonoor Taluk
Total Grass,leaves, Rural reeds or Urban bamboo
2
U
T
R
U
T
R
U
U
T
R
U
U
U
T
R
U
T
R
U
T
R
U
T
R
U
U
T
R
U
3
10
6
3
18
11
10
11
14
15
8
24
16
16
9
9
7
60
61
60
251
402
176
27
31
21
2
14
15
12
MADURAI DISTRICT T 7
7
5
R
U
(Based on 20% Sample)
U'1- Burnt Timber Mud burnt hllcks
bllCks
4 5
N 426
N 658
N 689
o 547
N
2
441
602
333
326
9 377
o 512
21 202
337
42 17
o 626
o 640
o 525
96
6
o
N
o N
3
7
38
74
12
2')9
173
5 450
7
2
N
5
o
o
3
3
5
6:'3
40
26
58
171
N
28
24
54
15 544 8
6
10
90 2-1 487
104 4 621
9 137 40
7 199 103
9 106 8
341
231
396
7
7
6
8
8
6
12
73
77
67
51
102
78
138
N 693
N 790
N 469
19 522
28 <120
2 712
3 888
651
N 621
2 698
3
3
252
145
4 501
Corrugated Iron sllcets
or other met:!! sheets
8
o
o
2
N
258
452
9
2
17
o o o
56
90
9
7
o 11
128
190
10
11
4
2
6
N
N
J'!
Stone
9
525
256
290
132.
196
208
188
22
296
677
465
906
329
319
407
209
230
180
184
51
252
217
236
181
211
264
129
3S
43
16
All Wall Cement other mate-
con- mate- f1a! crete nal not
5l.1tC<1
10
2
1
4
5
2
7
o 2
1
1
2
8
4
12
29
2
42
2
o
o
6
8
3
4
5
2
11
N
o o o
o
o o o
o
o
o o o
2
5
o
c o o
5
S
o
o
2
o 3
4
1
12
o
3
4
N
2
2
3
2
2
2
7
N
4
4
o
2
3
N
2
5
(J
1
2
4
N
3
3
2

518
E-IV-1. Distribution of 1,000 households living in census houses used wholly or partly as dwellings by predominant material of wall (contd.)
StatejDistrictjTaluk/ City/Town with population of
50,000 and above
Dindlgul Taluk
Dmdigul (M)
Palm TaJuk
Kodaikanal Taluk
Periyakulam Taluk
Nilakkottai TaJuk
Melur Taluk
Madurai Taluk
Madural (M)
Tlrumangalam Taluk
TIR UCHIRAPALLI
DISTRICT
PerambaJur Taluk
(Based on 20% Sample)
Total Grass,leaves, Un. B Rural reeds or Timber Mud burnt l!rnt Urban bamboo bncks bncks
2
T
R
U
U
T
R
U
T
R
U
T
R
U
T
R
U
T
R
U
T
R
U
U
T
R
U
T
R
U
T
u
3
3
2
7
8
4
5
4
147
188
4
4
5
N
9
11
1
2
2
4
6
2
8
9
N
N
2
2
5
1
5
4
N
N
1
5
795
840
582
547
N 774
o 785
N 730
2 348
3 423
o 85
N 746
o 781
N 682
N
N
o
739
762
547
o 897
o 924
o 648
N 441
6 7
N 179
N 132
402
436
4 147
5 121
2
3
o
251
27
35
o
225
1 179
2 311
1
1
o
215
190
416
1 81
1 54
o 328
9 519
o 753 15 170
N 310 6 665
N 282 6 696
N 702 1 206
N 737 2 163
o 410 0 ~60
1 750 7 205
N 832 4 128
3 413 19 523
N 770 10 166
N 780 7 156
o 578 67 340
Corrugated 'iron sheets
or other metal sheets
8
N
N
N
N
1
1
o
o
N
N
o o o
o o o
N
1
N
N
o o o
1
N
3
o o o
Stone
9
18
22
4
4
60
73
9
468
341
911
20
29
2
19
20
9
16
16
17
16
42
5
2
63
68
18
31
31
2.7
46
49
10
Cement All con- other crete matc
nal
10
1
N
2
2
3
3
2
3
o
N
1
N
2
1
1
5
9
3
3
19
21
8
1
1
6
1
1
o
11
2
2
o
o
4
5
o
2
2
o
2
3
1
9
8
24
1
1
o
1
2
1
7
7
o
N
N
N
N
N
o
Wall matenal not
stated
12
2
2
3
2
4
o
N
2
7
8
1
2
3
6
2
2
2
3
2
2
1
6
6
o
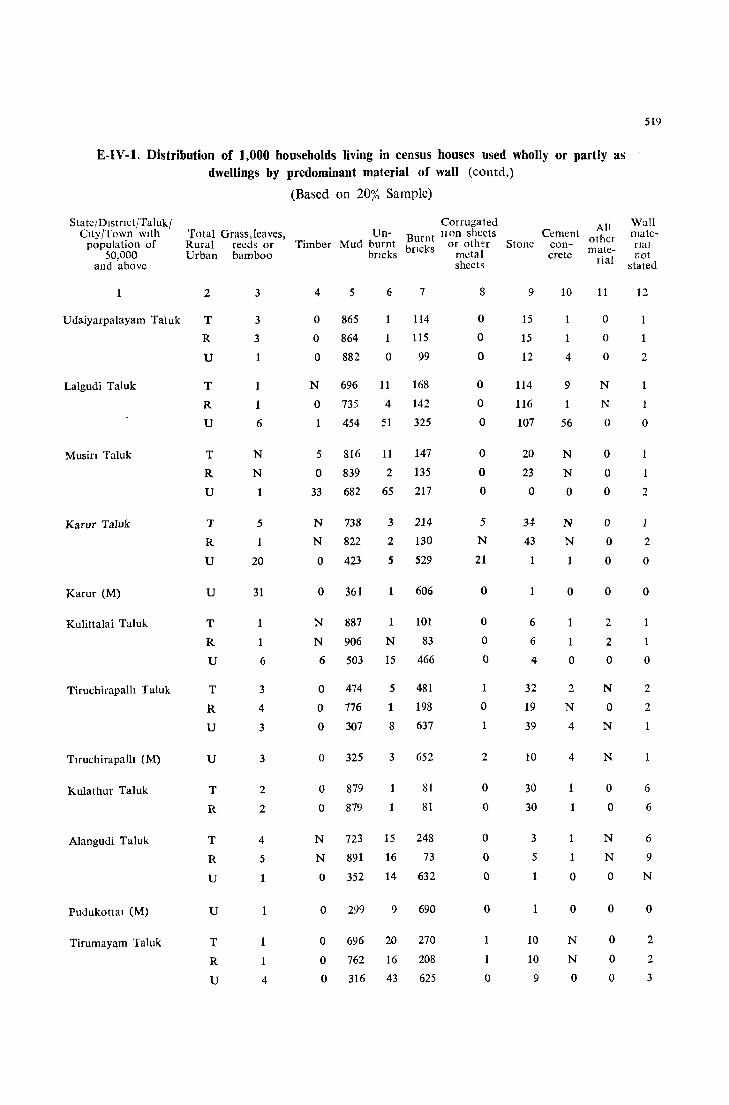
E-IV-l. Distribution of 1,000 households living in census houses used wholly or partly as dwellings by predominant material of wall (contd.)
State/Dlstnct/Ta1uk/ City/Town with
population of 50,000
and above
Total Grass,leaves, Rural reeds or Urban bamboo
2 3
Udaiyarpa1ayam Taluk T 3
3
1
R
U
Lalgudi Taluk T
Musin Taluk
Karur Taluk
Karur (M)
Kulittalai Taluk
Tiruchirapalh Taluk
Tlruchirapalh (M)
Kulathur Taluk
Alangudi Taluk
Pudukottal (M)
Tirumayarn Taluk
R
U
T
R
U
T
R
U
u
T
R
U
T
R
U
u
T
R
T
R
U
u
T
R
U
1
1
6
N
N
1
5
1
20
31
1
6
3
4
3
3
2
2
4
5
1
4
(Based on 20% Sample)
UnTimber Mud burnt
bncks
Corrugated Burnt 11 on sheets b k or oth~r
fie s metal
4 5 6 7
o 865 114
o 864 1 115
o 882 0 99
N 696 11 168
o 735 4 142
454 51 325
5 816
o 839
33 682
N 738
N 822
o 423
o 361
N 887
N 906
6 503
o 474
o 776
o 307
o 325
o 879
o 879
11
2
65
147
135
217
3 214
2 130
5 529
N
15
606
101
83
466
5 481
1 198
8
3
637
652
81
81
N 723 15 248
N 891 16 73
o 352 14 632
o 299 9
o 696 20
o 762 16
o 316 43
690
270
208
625
sheets
8
o o o
o o o
o o o
5
N
21
o
o o o
1
o 1
2
o o
o o o
o
o
All Cement other
Stone con-crete mate
rial
9
15
15
12
114
116
107
20
23
o
3~
43
6
6
4
32
19
39
10
30
30
3
5
10
10
9
10
1
4
9
56
N
N
o
N
N
o
o
2
N
4
4
o
o
N
N
o
11
o o o
N
N
o
o o o
o o o
o
2
2
o
N
o N
N
o o
N
N
o
o
o o o
519
Wall materIal not
stated
12
2
o
2
2
o
o
o
2
2
6
6
6
9
N
o
2
2
3

520
E-IY-l. DistrHmtion of 1,O(}O housdwlds living in census hou~es u"ed wholly or partly as
dwellings by predominant material of wall (conto.)
St,ltc:DI-;tnct, T,t1uk: Clly ,'To ,\ n wIth p0pula:lO!1 of
50,000 ami ab0Y<:
THANJAVUR
DlSTRlC'T
Sit leah T ,lluk
Mayuram Taluk
Mayuram (M)
Kumbakonam Taluk
Kumbakonam (M)
Nanmlam Taluk
Papanasam Taluk
Tb;lllJa.UI (M)
Ora,h.lnad Taluk
Mannargudi Taluk
(Based on 20/~ Sample)
TOI al Gr,l>s.]c,I\CS, Un-J{ul~d reed, or TImber Mud burnt Burnt
bllcb brick> Ulb,m bambou
2
T
R
U
T
R
U
T
R
U
u
T
R
U
u
T
R
U
T
R
U
T
R
u
u
T
R
U
T
R
U
3
15
16
12
1
2
1
1
3
4
2
3
3
4
3
3
3
2
2
33
o
4
5
4
1
1
o
o o o
o o o
o
o o o
o
o
5
701
757
455
6
45
41
61
758 51
795 30
5('8 160
631 104
704 91
302 162
250 140
561
683
296
228
713
47
66
8
5
61
o 718 63
o 630 28
o o o
o o o
o
o o o
N
N
o
699
732
43
28
502 169
501
517
857
865
G45
823
856
672
3')
38
5
9
7
65
8
8
7
7
200
144
442
164
153
221
208
142
505
567
355
205
680
748
205
198
316
237
223
317
137
419
442
82
75
286
159
124
317
Cortuga(cd II-Oil L,'"",(" CLlllc'nt All
u ,~ 0 other or Ot:1LI StUll\.- COll- n1:tt(;-
111clal elct..: !lal sheets
8
1
N
6
o o o
4
o 23
33
o 3
4
N
N
o
o o o
5
o 13
o
o o o
o o o
9
19
21
15
22
20
33
51
61
3
5
31
44
5
6
20
20
21
11
12
8
23
23
24
30
J2
12
o
2
3
N
10
1
N
2
2
N
8
N
N
N
N
3
4
N
N
o
N
N
o
N
N
N
N
N
o 4
N
o
11
N
N
N
N
N
o o o
o
N
N
o
o
o o o
o o o
N
N
o
o
N
o
o o o
Wall maletldl not
stated
12
17
20
7
2
7
2
2
2
N
N
2
2
2
2
3
4
7
8
o
4
4
2
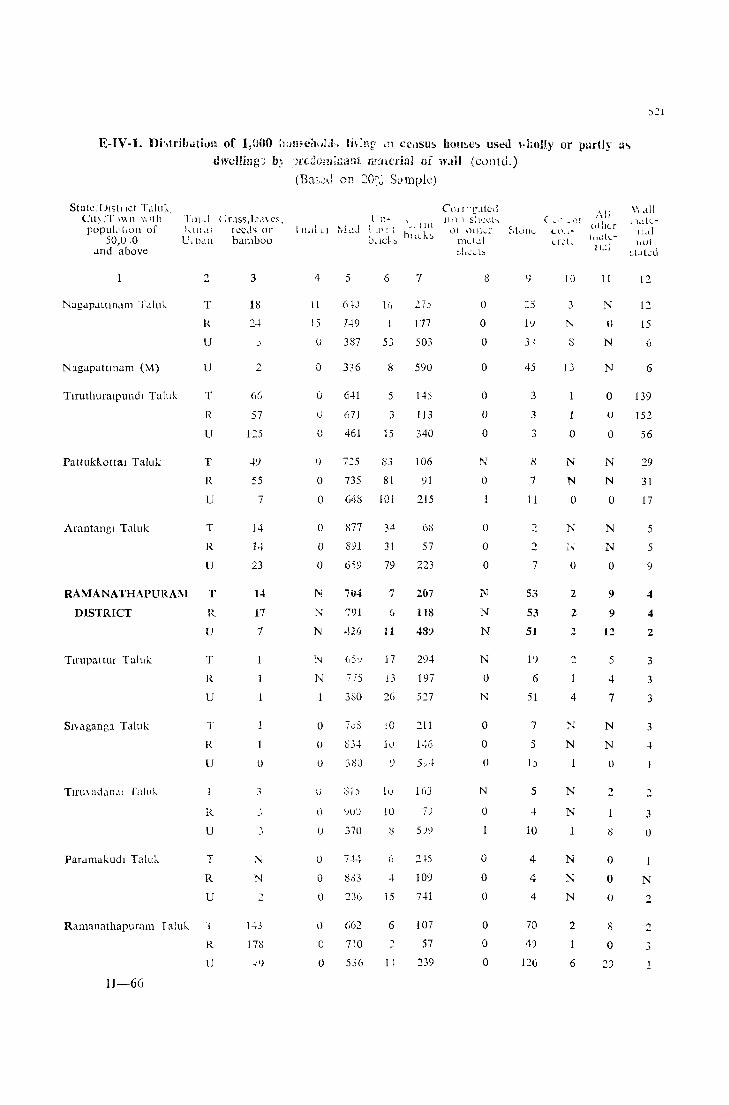
E-IV-l. Dhtritmtiun of 1,000 '~iJ!l,e;luhL h\:nr ,!l ~r!lSU:-' home:, useu ,.holly or purtly a., dwelling; b:, ;]J'c::!cm;mmt fi?::ncrbl of w:lll (c011td,)
Stalc,'UI'itllct, T,liuk, Clt~/T )WI1 \\1111
pOPUl.I (,Oll of 50,0.0
Tlll,,1 Cr.lSs,12,ncs, I,Ul,t\ IceJ, or L', LJdll bamboo
dnd above
Nagap.lltm,lm T .lluk
Nagapattlnam (M)
Tlruthuratpumli Taluk
Pattukkottal Taluk
Arantangl T.11uk
RAMANATHAPURA~I
DISTRICT
Tlrupattur Taluk
Slvaganga Taluk
Paramakudl Taluk
2
T
R
U
u
T
R
U
T
R
u
T
R
U
T
R
U
T
R
U
T
R
U
T
R
u
Ramanathapuram r aluk T
H-66
R
U
3
18
2
66
57
125
-19
55
7
14-
1-1
23
U
17
7
o
.1
N
2
I-D
178
(I3as.:d on 20~~ S~)mplc)
4
11
15
U
o
o
()
o o o
o o o
N
N
N
N
o LJ
U
LJ
o o o
o o
5
61:)
7-19
387
336
6-11
671
461
6
5J
8
5
3
15
735 81
(iff0 101
877
891
tiS9
7U'"
7 75
380
70S
'" , okl-+
"U'j
370
7-\4
23G
G62
7!O
536
3i!
31
79
7
11
17
13
26
10
10
10
o
6
4
15
6
1 !
7
177
503
590
145
113
340
106
91
215
68
57
223
207
118
48')
294
197
527
211
163
7)
5')
2-15
109
741
107
57
239
Cu,l"f·1tcd lll) I) S~1..:~t')
J11C t ,t1 ~!ICLl~
o o o
o
o o o
N
o 1
o o o
1\:
N
N
N
o N
o o o
N
o
o o o
o o o
( ,_,' ~ lIt
~,tl)I1L oLllJi-
9
::5
1')
45
3
3
3
8
7
11
::.
7
53
53
51
1')
6
51
7
5
1)
5
-I
10
4
4
4
70
4')
12G
cf: [_
10
3
N
JJ
o
N
N
o
N
o
2
2
4
N
N
1
N
N
N
N
N
2
6
AlJ (,tlH..f lllJ.tL
II,,)
11
N
o N
N
o o o
N
N
o
N
N
o
9
9
12
5
4
7
N
N
o
2
o o o
8
o 29
\\ dl1 I -t~"!. tl-
11,.1 Ilut
"t"ted
12
12
15
6
6
139
152
56
29
31
17
5
5
9
4
4
2
3
3
3
3
-+
2
3
o
N
2
2
3
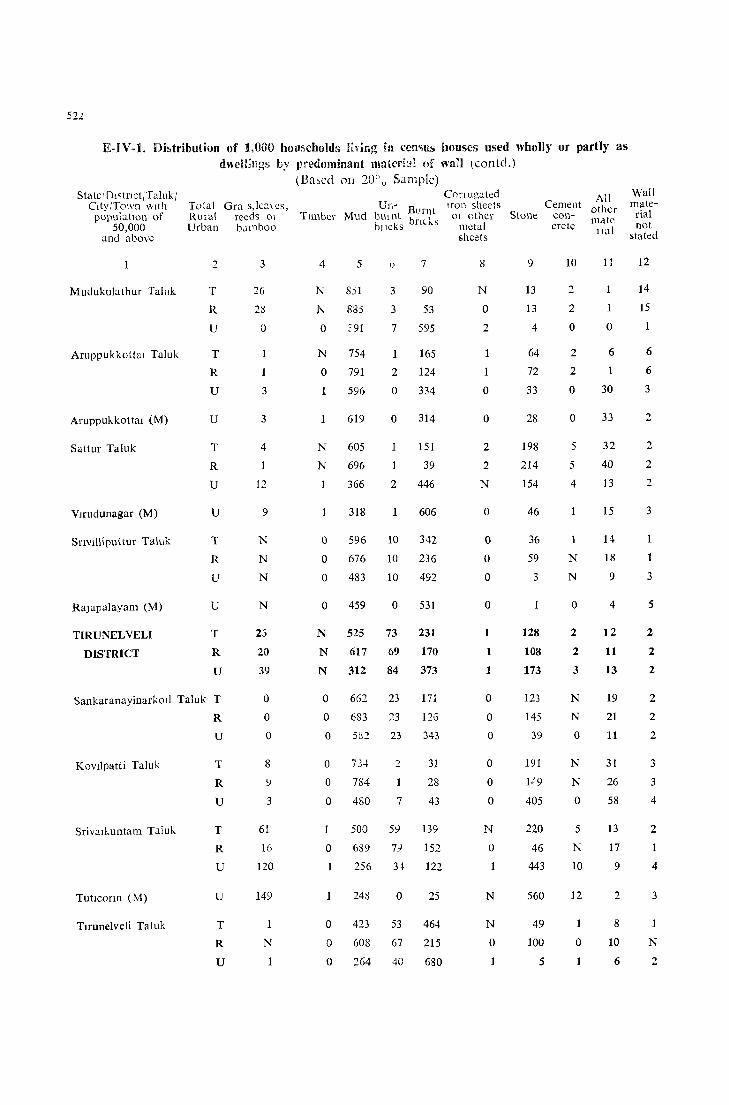
522
E-IV-l. Di~tribution of 1,000 households Hving in cen"ll5 houses used wholly or partly as d"clEn~s by predominant mut('r1~1 of wall (contd.)
State' [)1~tnctiTalllk/ City/Town ~Ith
populatIOn of 50,000
Total Gra s,lcl\cs, Rural reeds 01 Urban bJmboo
and above
Muuukulathur Talllk
Aruppukkottal Taluk
Aruppukkottal (M)
Sattur Taluk
Vlrudunagar (M)
SrlVl11iputtur Taluk
RaJapalayam (M)
TIRUNELVELI
DISTRICT
2
T
R
U
T
R
U
U
T
R
U
u
T
R
U
u
T
R
U
Sankaranayinarkoll Taluk T
R
U
Kovtlpatti Taluk
Srivalkuntam Taiuk.
TutJconn (M)
Tlrunelveli Taluk
T
R
U
T
R
U
U
T
R
U
3
26
28
o
3
3
4
12
9
N
N
N
N
25
20
39
o o o
8
3
61
16
120
149
1
N
(Ba~ed on 20" u Sample)
Un-, Bl'rnt Tlmbcr Mud bllll1l b I
bllcks fll,S
4
N
N
o
N
o 1
N
N
o o o
o
5
851
885
~9I
754
791
596
619
605
696
366
318
596
676
483
459
\)
3
3
7
1
2
o
o
2
10
10
10
o
7
90
53
595
165
124
334
314
15[
39
446
606
342
236
492
531
N 525 73 231
N 617 69 170
N 312 84 373
o 662 23
o 683 23
o 582 23
o 73--1 2
o 704
o 480 7
500 59
171
126
343
31
28
43
139
o 639 79 152
256 34 122
o o o
248
423
608
264
o
53
67
40
25
Con ugated All Iron sheets Cement other
01 other Slone con- mate metal crete Iial sheets
8
N
o 2
o
o
2
2
N
o
o o o
o
1
1
1
o o o
o o o
N
o
N
N
o
9
13
13
4
64
72
33
28
198
214
154
46
36
59
3
128
108
173
123
145
39
191
1L9
405
220
46
443
560
49
100
5
10
2
2
o
2
2
o
o
5
5
4
N
N
o
2
2
3
N
N
o
N
N
o
5
N
10
12
o
11
1
o
6
30
33
32
40
13
15
14
18
9
4
12
11
13
19
21
11
31
26
58
13
17
9
2
8
10
6
Wall material not
stated
12
14
15
1
6
6
3
2
2
2
2
3
1
1
3
5
2
2
2
2
2
2
3
3
4
2
4
3
N
2
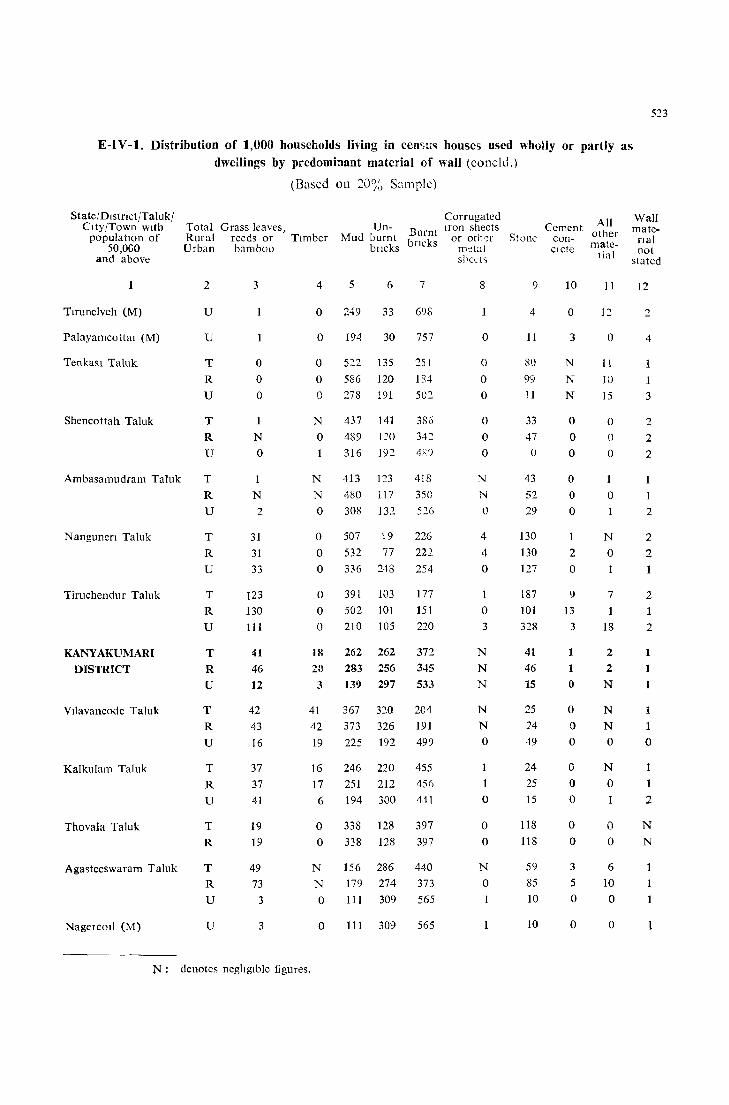
5~3
E-IV-l. Distribution of 1,000 households living in cen<;u,\ house,> used wholly or partly as dwellings by predominant material of wall (concld.)
State/DIstnct/Talukf CIty/Town wIth
populatIOn of 50,OGO
and above
1
Tlrunelveh (M)
Paiayamcottm (M)
TenkaSl Taluk
Shencottah Taluk
Ambasamudram Taluk
N angunen Taluk
Tiruchendur Taluk
KANYAKUMARI
DISTRICT
Vilavancode Taluk
Kalkulam Taluk
Thovala Taluk
Agasteeswaram Taluk
NagercOil (M)
(Based on 20% Sample)
Total Grass leaves, Corrugated All
Rural reeds or TImber Un- Burnt Han sheets Cement other
Mud burnt brIcks or othc;r Stone con-bIlcks m~tal cicte mate-Urban bamboo
2
U
U
T
R
U
T
R
U
T
R
U
T
R U
T
R
U
T
R
U
T
R
U
T
R
U
T
R
T
R
U
U
3
o o o
N
o
N
2
31 31 33
I23
130
111
41 46 12
42
43
16
37 37 41
19
19
49
73 3
3
4 5 6 7
o 249 33 698
o 194 30 757
o 522 135 25l o 586 120 184
o 278 191 502
N 437 141 386 o 489 I~O 342
316 192 489
N 413 123 418
N 480 117 350
o 308 132 526
o 507 S9 226 o 532 77 222
o 336 248 254
o 391 103 177
o 502 101 151
o 210 105 220
18 262 262 372
23 283 256 345
3 139 297 533
41 367 320 204 42 373 326 191 19 225 192 499
16 246 220 455 17 251 212 456
6 194 300 441
o 338 128 397 o 338 128 397
N 156 286 440
N 179 274 373 o 111 309 565
o 111 309 565
Sbcct5 1Ial
8
o
o o o
o o o
N
N
o
4
4
o
o 3
N
N
N
N
N o
1
1
o
o o
N
o
9
4
11
80
99
11
33 47
o
43
52 29
130
130
127
187 101 328
41
46 15
25 24 49
24 25 15
118
118
59
85 10
10
10
o
3
N
N
N
o o o
o o o
1
2 o
9
13
3
1
1
o
o o o
o o o
o o
3
5
o
o
11
12
o
11 10
15
o o o
o
N
o
7
1 18
2
2
N
N
N
o
N
o
o o
6
10
o
o
N: denotes negligIble figures.
Wall mate
fIal not
stated
12
2
4
1
3
2
2
2
1
2
2
2 1
2
1
2
1
1
1
1
1
o
2
N
N
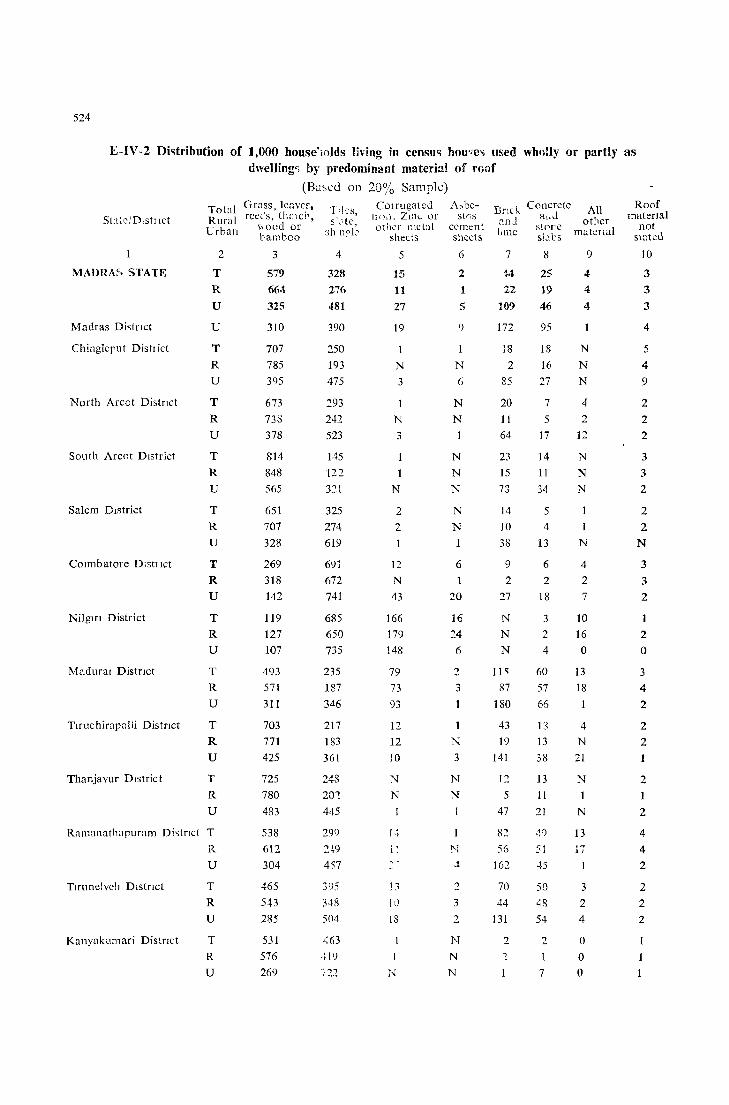
524
E-IV-2 Di~tribution of 1,000 house'lOlds living in census hou~e" used whlllly or partly as dwelling'} by predominant material of roof
(Based on 20% Sample)
Sta~e,'D,st!lct
MADRA~ STATE
Madras DistrIct
Chinglerut Dis!1 ict
North Arcot Distnct
South Arcot District
Salem District
COImbatore Dlstllct
Nilgm District
Madura! Distnct
TIrtlc hirapalli Distnct
Thanjavur District
Total Grass, leave" Rural rccc's, th,l1cr, Urban \'Ioocl or
t'amboo
2
T R
U
U
T
R
U
T R U
T
R
U
T R U
T
R
U
T
R
U
T
R
U
T
R U
T
R
U
3
579
66·1
325
310
707 785 395
673 738 378
814 848 565
651 707 328
269 318 142
119
127 107
493 571 311
703 771
425
725 780 483
Ramanathapuram Di,tnct T
R
U
538 612 304
TlrunelvclI DistrIct
Kanyakumari Distnct
T
R
U
T
R
U
465 543
285
531 576 269
T!ks, s' "tt",
sh n~k
4
328
276 481
390
250 193 475
~93
242 523
145 122
321
325 274 619
691 672 741
685 650 735
235 187 346
217 183 361
248 20'"!
445
299
4<;7
395
348
504
<63 ·1l9
COlruga(ecl 1I <),1, ZI!1L or other lJ1ctal
shec:s
5
15
11
27
19
N
3
N
3
N
2
2
12
N
43
166 179 148
79 73
93
12
12 ]0
N
N
1
1-,
13
10
18
N
sIns cc-ment sheets
6
2
1
5
9
N
6
N
N
1
N
N
N
N
N
6
20
16 24
6
2
3
N
3
N
N
N
2
3
2
N
N
N
Bmk Concrete All <'nd a,ld other Lmc storc matcTlal
sb\:s
7
14 12
10~
172
18
2
85
20 11 64
23 15 73
14
10 38
9
2
'27
N
N
N
11<;
87 180
43
19 141
1'2 5
47
82 56
16'2
70 44
131
'2
8
25 19
46
95
18
16 27
7 5
17
14
11
5
4
13
6 2
18
3
2
4
60 57 66
13
13 38
13
11 21
40
51
45
50
~8
54
2
7
9
4
4
4
N
N
N
4
2
12
N
N
N
1
N
4
2
7
10
16 o
13 18
1
4
N
21
N
1
N
13 ,~
1,
3
2 4
o o o
Roof material
not s(:lteu
10
3
3
3
4
5
4
9
2 2
2
3
3
2
2
2
N
3 3
2
2
o 3
4
2
2
2
2
2
4
4
2
2
2
2
1
1

525
E-IV-2. Distribution of 1,000 households living in census house" used wholly or partly as dwellings by predominant material of roof
State/Dlstnct/Taluk/ Clty/ Iown With population of
50,000 or more
MADRAS STATE
MADRAS DlSTRICT
Madras (C)
CHTNGLEPUT
DISTRICT
Ponncri Taluk
Tiruvallur Taluk
Tiruttani Taluk
Sriperumbudur Taluk
Saidapet Taluk
Chmgleput Taluk
Kanchipuram Taluk
Kanchipuram (M)
(Based on 20% Sample)
Total Grass, leaves, Rural reeds, thatch, Urban wood or
bamboo
2
T
R
U
u
u
T
R
U
T
R
U
T
R
U
T
R
U
T
R
U
T
R
U
T
R
U
T
R
U
u
3
579
664
325
310
310
707
785
395
832
860
508
771
801
358
758
793
434
645
687
405
617
741
477
720
791
?23
534
708
208
128
Tiles, sl..lte, shmgle
4
328
276
481
390
390
250
193
475
147
123
424
199
178
486
215
188
465
319
291
477
286
215
366
235
182
524
419
276
688
756
Corrugated 11 on, Zmc or other metal
sheet,
5
15
11
27
19
19
1
N
3
N
N
o
N
N
o
N
N
1
1
N
6
3
N
6
o
N
Asbes- Brick Concrete tos and and
cement lime stonc shects slabs
6
2
5
9
9
1
N
6
N
N
o
N
N
o
N
N
o
o o o
8
2
15
N
N
o
N
o N
N
7
44
22
109
172
172
18
2
85
4
37
10
o 148
9
o 91
10
N
66
39
N
83
13
82
39
9
96
108
8
25
19
46
95
95
18
16
27
14
13
27
16
17
3
16
17
7
15
16
9
36
29
43
26
20
64
5
6
5
4
All other
matenal
9
4
4
4
1
N
N
N
o o o
N
N
o o o
N
o 1
N
o N
o o o
o o o
o
Roof material
not stated
10
3
3
3
4
4
5
4
9
3
3
4
4
4
4
2
2
2
10
6
36
11
13
10
5
5
7
2
2
3
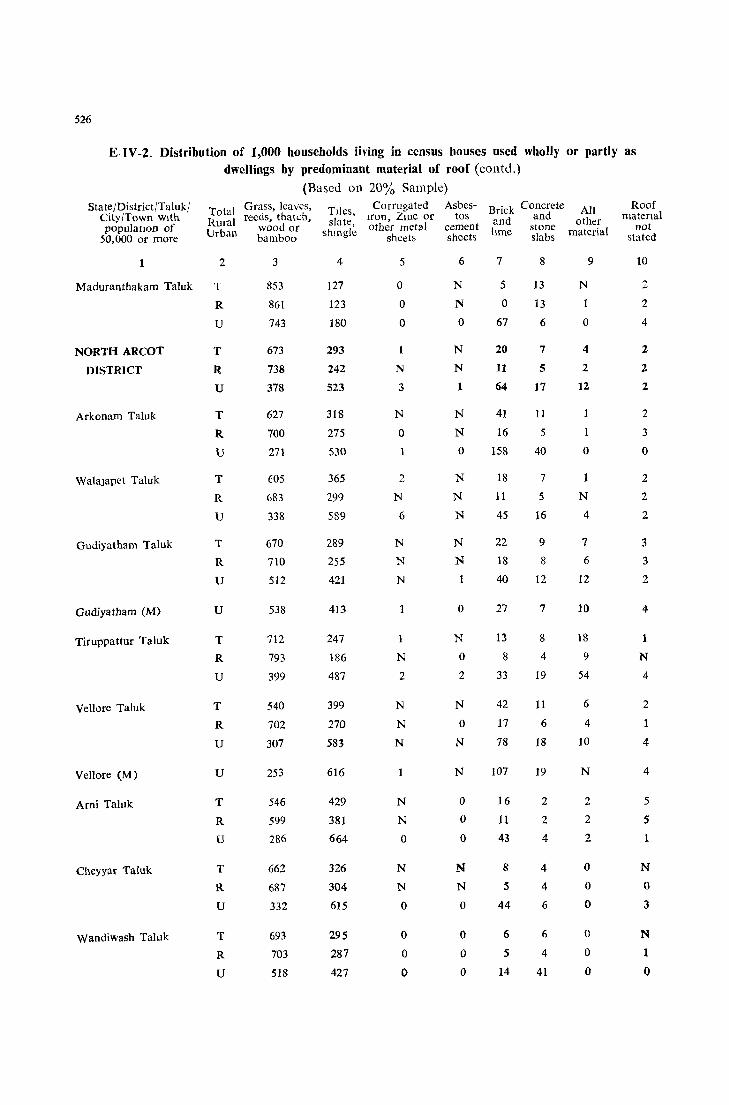
526
E- IV -2. Distribution of 1,000 households living in census houses used wholly or partly as dwellings by predominant material of roof (eontd.)
(Based on 20% Sample) State/District/Taluk/
City/Town With populatIOn of
50,000 or more
T tal Grass, leaves, R~r~l reeds, thatch, U b,m wood or
r bamboo
1 2 3
Maduranthakam Taluk T
NORTH ARCOT
DISTRICT
Arkonam Taluk
Walajapet Taluk
Gudiyatham Taluk
Gudiyatham (M)
Tiruppattur Taluk
VeJIore Taluk
VeJIore (M)
Arni Taluk
Cheyyar Taluk
Wandiwash Taluk
R
U
T
R
U
T
R
U
T
R
U
T
R
U
u
T
R
U
T
R
U
u
T
R
U
T
R
U
T
R
U
853
861
743
673
738
378
627
700
271
C05
683
338
670
710
512
538
712
793
399
540
702
307
253
546
599
286
662
687
332
693
703
518
TIles, slate,
shmgle
4
127
123
180
293
242
523
318
275
530
365
299
589
289
255
421
413
247
186
487
399
270
583
616
429
381
664
326
304
615
295
287
427
Corrugated Iron, ZIllC or other metal
sheets
5
o o o
1
N
3
N
o
2
N
6
N
N
N
1
N
2
N
N
N
N
N
o
N
N
o
o o o
Asbestos
cement sheets
6
N
N
o
N
N
1
N
N
o
N
N
N
N
N
o
N
o 2
N
o N
N
o o o
N
N
o
o o o
Brick Concrete and and lime stone
slabs
7
5
o 67
20
11
64
41
16
158
18
11
45
22
18
40
27
13
8
33
42
17
78
107
16
11
43
8
5
44
6
5
14
8
13
13
6
7
5
17
11
5
40
7
5
16
9
8
12
7
8
4
19
11
6
18
19
2
2
4
4
4
6
fi
4
41
All other
material
9
N
o
4
2
12
o
1
N
4
7
6
12
10
18
9
54
6
4
10
N
2
2
2
o o o
o o o
Roof matenal
not stated
10
2
4
2
2
2
2
3
o
2
2
2
3
3
2
4
1
N
4
2
1
4
4
5
5
1
N
o 3
N
o

521
E-IV-2. Distribution of 1,000 households living in census houses used wholly or partly as dwellings by predominant material of roof (contd.)
StatejDlstrlct/Taluk City/Town With population of
50,000 or more
PoIur TaIuk
Chengam Taluk
Tiruvannamalai Taluk
SOUTH ARCOT
DISTRICT
Gingee Taluk
Tindivanam TaIuk
Villupuram Taluk
Tlrukkoyilur Taluk
Kallakurichl Taluk
VriddhachaIam Taluk
Cuddalore Taluk
CuddaIore (M)
(Based on 20~~ Sample)
Total Grass, leaves R '11 reeds, thatch,
ur, wood or Urban bamboo
2
T
R
U
T
R
T
R
U
T
R
U
T
R
T
R
U
T
R
U
T
R
U
T
R
U
T
R
U
T
R
U
u
3
714
757
449
873
873
803
857
529
814
848
565
752
752
848
865
712
806
844
566
904
914
710
910
918
783
829
839
643
754
834
527
540
Tiles, slate,
shmgle
4
268
231
496
106
106
164
127
34'l
145
122
321
230
230
111
100
197
128
110
245
59
56
119
48
42
147
137
130
264
189
140
327
374
Corrugated Iron, ZinC or othel metal
sheets
5
3
o 22
o o o
1
1
N
N
N
o o o
N
o N
N
o 1
o o o
5
6
o
N
N
N
o
Asbcs- Bnck Concrete tos and and
cement ltmc stone sh~ets slabs
6
N
o
2
2
o o o
N
N
N
o o
N
o
o o o
o I}
o
o o o
1
o
N
N
o
o
7
10
8
23
9
9
26
9
114
23
15
78
7
7
22
19
42
8
2
2
3
3
3
5
5
8
14
11
34
9
9
17
13
45
42 21
29 14
124 65
17 17
17 10
21 145
20 16
19 15
27 41
13
12
30
46
14
136
79
14
11
61
10
10
9
6
All other
materIal
9
o 5
2
2
N
o 1
N
N
N
o o
N
N
1
N
N
o
o N
o
N
N
o
o o o
N
N
N
Roof matenal
not stated
10
2
2
4
4
2
2
o
3
3
2
2
2
2
3
2
3
3
o
3
3
4
6
6
2
1
2
1
2
1
N

528
E-IV-2. Distribution of 1,000 hou~ehold~ living in censu.., houses used wholly or partly as dwellings by predominant material of roof (contu.)
(Based on 20% Sample)
State! Dlstnct!Taluk/ Total Gr JSS, leaves, TileS, Corrugated Asbes- Blick Concrete All Roof CIty/To\\n \\lth Rurd reeds, thatch, sbtc, Iron, Zmc or tos and and otl.u llldtcnal
population of Urban wood or shwglc other metal cement h rll'~ stone m.ltcmtf not 50,000 or marc bambuo sheets &heets sl.lb; stated
~ 3 4 5 6 7 8 9 1)
Chldambaram Taluk T 721 259 N N 9 7 0 4
R 785 198 N N 7 6 0 4 U -+36 530 N N 15 16 0 3
SALEM DISTRICT T 651 325 2 N 14 5 1 2
R 7n7 274 2 N 10 4 1 2
U 328 619 1 1 38 13 N N
Hosur Taluk T '::.72 718 N N 3 3 2 2
R 290 702 N 0 N 3 3 :2
U 33 924 0 35 6 0
Krishnaglri Taluk T 675 305 N 2 15 2 N
R 715 273 N 2 7 2 N
U 184 704 0 103 8 0 0
Harur Taluk T 718 267 0 0 9 5 N
R 728 258 0 0 9 4 N
U 462 478 0 0 15 45 0 0
Dharmapun Taluk T 676 308 N N 12 3 N
R 703 283 N 0 10 3 N 1
U 337 611 0 37 14 0 0
Omalur Taluk T 794 195 N N 7 3 N
R 851 1-10 N N 5 2 1
U 351 619 N 19 10 0 0
Yercaud Taluk T 631 220 lJ:l 7 2 0
R 631 220 138 7 2 0
Salem Taluk T 541 4"" k_ 2 1 26 7 N
R 727 248 3 N 19 2 N 1
U 309 6~0 1 35 13 N
Salem (M) U 2'.16 653 2 36 11 N
Sankan Taluk T 820 170 N N 3 N 6
R 851 139 N N 3 N 6
U 503 483 0 0 7 7 0 0
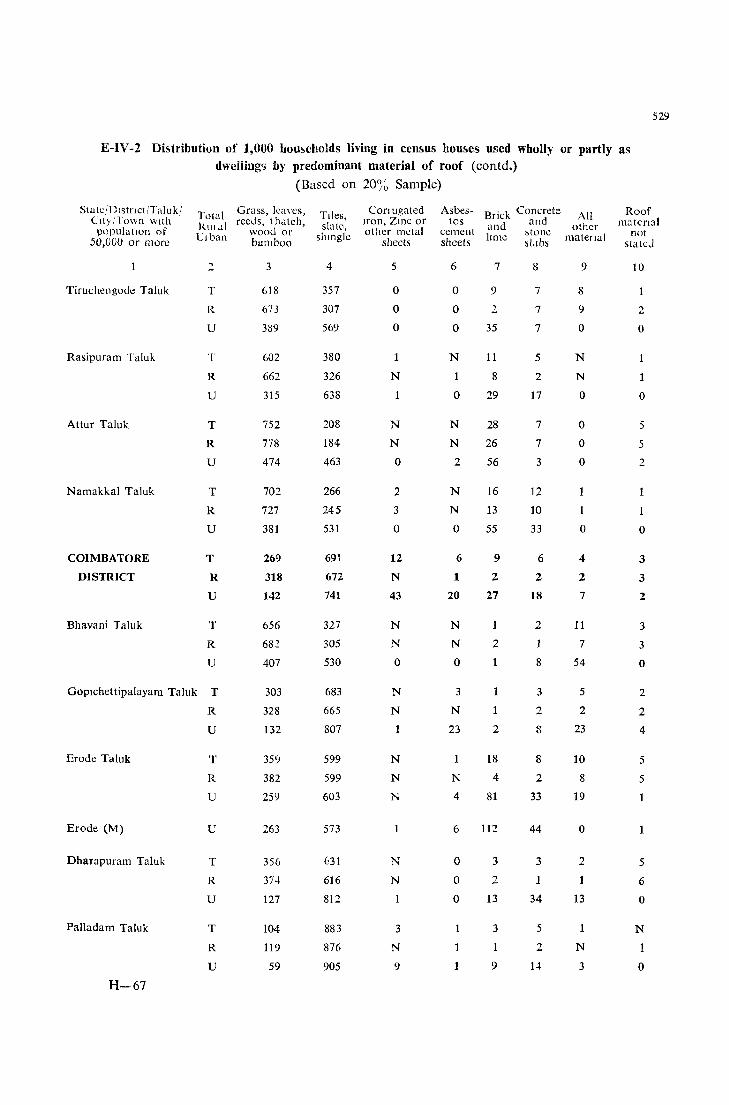
529
E-IV-2 Di~tribution of 1,000 households living in census houses used wholly or partly as dwellings by predominant material of roof (contd.)
(Based on 20% Sample)
Statc/Dlstnct/Taluk/ City/Town wIth
populatIOn of 50,000 or more
Tiruchengode Taluk
Rasipuram Taluk
Attur Taluk
Namakkal Taluk
COIMBATORE
DISTRICT
Bhavani Taluk
Total Grass, leaves, J.tuldl reeds, thdtch,
woou or Ulban bamboo
2
T
R
U
T
R
U
T
R
U
T
R
U
T
R
U
T
R
U
3
618
673
3~9
602
662
315
752
778
474
702
727
381
269
318
142
656
682
407
Goplchettipalayam Taluk T
R
U
303
328
132
Erode Taluk
Erode (M)
Dharapuram Taluk
Palladam Taluk
H-67
T
R
U
u
T
R
U
T
R
U
359
382
259
263
356
3H
127
104
119
59
TIles, slate,
shIngle
4
357
307
569
380
326
638
208
184
463
266
245
531
691
672
741
327
305
530
683
665
807
599
599
603
573
631
616
812
883
876
905
Conugated Iron, ZIne or otlIer metal
shects
5
o o o
1
N
N
N
o
2
3
o
12
N
43
N
N
o
N
N
N
N
N
1
N
N
3
N
9
Asbes- Brick Concrete All tos and and other
cement lln1e ,tone t 1 sheets Sldbs ma ena
6
o o o
N
o
N
N
2
N
N
o
6
1
20
N
N
o
3
N
23
1
N
4
6
o o o
1
7
9
2.
35
11
8
29
28
26
56
16
13
55
9
2
27
1
2
1
1
2
18
4
81
112
3
2
13
3
1
9
8
7
7
7
5
2
17
7
7
3
12
10
33
6
2
18
2
8
3
2
S
8
2
33
44
3
1
34
5
2
14
9
8
9
o
N
N
o
o o o
o
4
2
7
11
7
54
5
2
23
10
8
19
o
2
13
1
N
3
Roof ll1:.Jten:.Jl
not statcJ
10
2
o
o
5
5
2
o
3
3
2
3
3
o
2
2
4
5
5
1
5
6
o
N
1
o
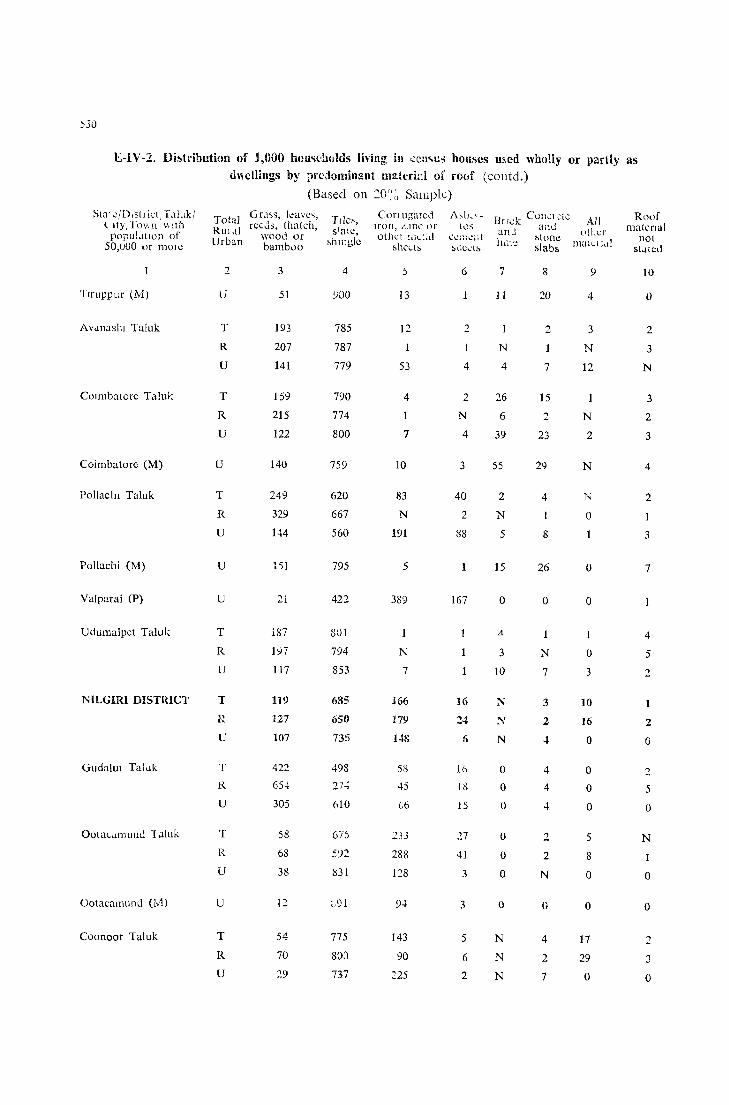
E-IV-2. Di!'!tribution of 1,000 hou'ichulds living ill ':Cll"t:~ houses med wholly or partly as d\~clHngs by prcJominant material of rouf (colltd.)
Sla' "/D,sll iel , T .. lIukl t Ily/Tov,n \\Ith
POPUl..lllOl1 of 50,UOO or mOlc
Tlruppur (M)
AV<lnaslll Taluk
COll1lbatore Taluk
Coil1lbatorc (M)
Pollachl Taluk
Pollachi (M)
Valparai (P)
Uuumalpct Taluk
NILGIRI DISTRICT
GudalUl Taluk
Ootac .. tnlUllll I.1luk
Ootacamuml (M)
Coonoor Taluk
(Based on 20(:~ Sample)
Gr .. l,\5, kavc~, Total reeds, thatch, RUI .. tl wood or Urban bamb00
2
U
T
R
U
T
R
U
U
T
R
U
U
U
T
R
U
T
R
u
T
R
U
T
R
U
u
T
R
U
3
51
193
207
141
159
215
122
140
249
329
144
1'51
21
187
197
117
1]<)
127
107
422
65,,[
305
58
68
38
12
54
70
29
Tile>, slate,
~hlllgic
4
YOU
785
787
779
790
774
800
759
620
667
560
795
422
801
794
853
685
650
735
498
274
610
67S
!>31
1:,91
775
80:)
737
Con ugatcd Hon, LIne or olhl:1 EK: .. tI
~hC(..ls
5
13
12
53
4
1
7
10
83
N
191
5
389
N
7
166
179
148
58
45
(,6
233
288
128
143
90
225
i\"lJ_ .. -tc)S
CCllllOll t SlICc:("
6
2
4
2
N
4
3
40
2
88
167
16
6
16
18
15
27
41
3
3
5
6
2
B[lck Con-':IC(c All anJ ami otill:r 11;;1'.) ,tonc malLlJ,11
slabs
7
11
N
4
26
6
39
55
2
N
5
15
o
3
10
N
N
N
o o o
o o o
o
N
N
N
8
20
2
7
15
2
23
29
4
8
26
o
N
7
3
2
.. 4
4
-I
2
2
N
o
4
2
7
9
4
3
N
12
N
2
N
o 1
o
o
1
o 3
10
16
o
o o o
5
8
o
o
17
29
o
Roof matcnal
not slaled
10
o
2
3
N
3
2
3
4
2
3
7
4
5
2
1
2
o
2
5
o
N
o
o
3
o
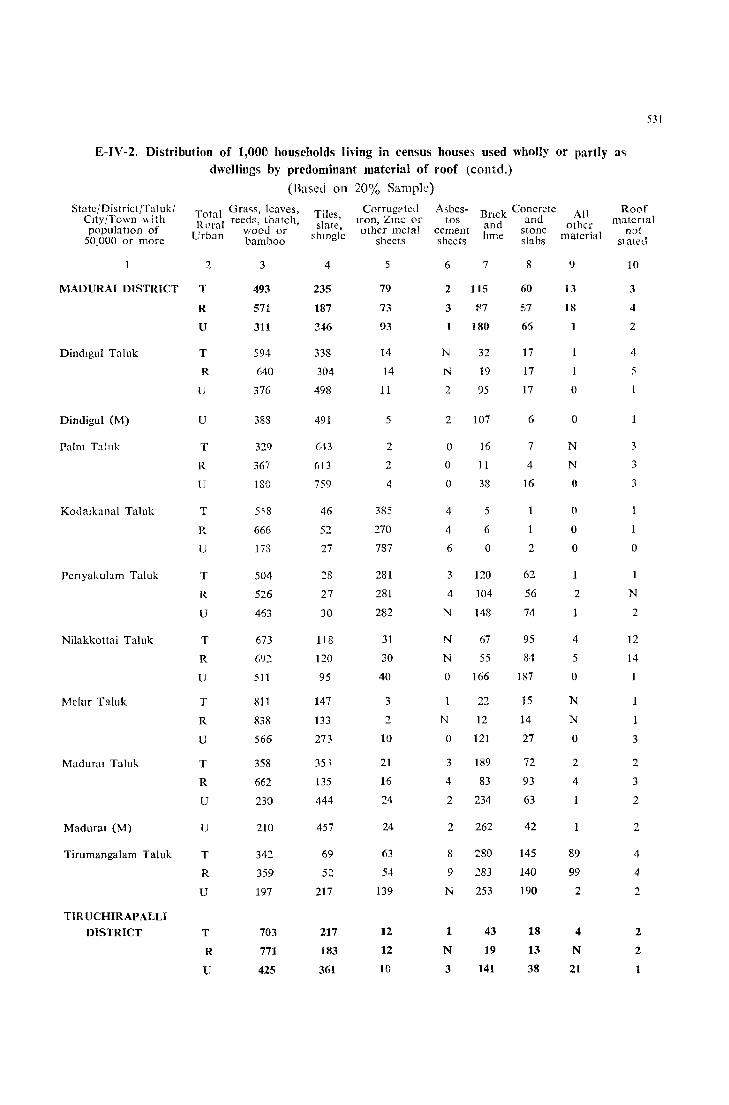
531
E-IV-2. Distribution of 1,000 households living in census houses used wholly or partly a" dwellings by predominant material of roof (contd.)
(Based on 20% Sample)
StatejDistrictjTalukj City/Town \\ ilh populatIOn of
50,000 or more
Total Gra~s, leaves, Rl'ral reeds, thatch,
Urban wood or bamboo
2 3
MADURAI DISTRICT T 493
5n 311
Dindlgul Taluk
Dindigul (M)
Palm Tal11k
Koda!kanal Taluk
Penyakulam Taluk
Nilakkottai Taluk
Melur Taluk
Madura! Taluk
Madurat (M)
Tirumangalam Taluk
TIR UCHIRAPALLI
DISTRICT
R
U
T
R
U
U
T
R
U
T
R
U
T
R
U
T
R
U
T
R
U
T
R
U
u
T
R
U
T
R
U
594
640
376
383
329
367
180
666
173
504
526
463
673
692
511
811
838
566
358
662
230
210
342
359
197
703
771
425
Tiles, slate,
$hmgle
4
235
187
346
338
304
498
491
643
613
759
46
52
27
28
27
30
118
120
95
147
133
273
35-'
135
444
457
69
52
217
217
183
361
Corrug?teLl Iron, ZlllC or other metal
shects
5
79
73
93
14
14
11
5
2
2
<1
385
270
787
281
281
282
31
30
40
3
2
10
21
16
24
24
63
54
139
12
12
10
Asbestos
cement sheets
6
Bnck Concrcte All and and other lime stone material
slabs
7 8 9
2 115 60 13
18
1
3
N
N
2
2
o o o
4
4
6
3
4
N
N
N
o
N
o
3
4
2
2
8
9
N
1
N
3
87
180
32
19
95
107
16
11
38
5
6
o
120
]04
148
67
55
166
22
12
121
189
83
234
262
280
283
253
43
19
141
57
66
17
17
17
6
7
4
16
2
62
56
74
95
84
187
15
14
27
72
93
63
42
145
140
190
18
13
38
o
o
N
N
o
o o o
2
4
5
o
N
N
o
2
4
89
99
2
4
N
21
Roof matenal
not stated
10
::\
4
2
4
3
3 ~
.>
o
N
2
12
14
3
2
3
2
2
4
4
2
2
2
1

532
E-IV-2. Distribution of 1,000 households Jiving in census houses used wholly or partly as dwellings by predominant material of roof (contd_)
(Based on 20% Sample)
StatejDistnet ITalnkj City/Town with
populatIOn of 50,000 or more
Total Grass, leaves, Rural reeds, thatch,
UI ban wood Of bamt-oo
2 3
PerambaJUl Taluk T 771
782
554
R
U
Udaiyarralayam Taluk T
R
U
Lalgudi Talllk T
Mu~iri Taluk
Karuf Taluk
Karur (M)
Kulittalai Taluk.
TlruehlrapaJli Taluk
Tlfuchirapalli (M)
Kulathur Taluk
Alangudi Taluk
Pudukottai (M)
Tirumayam Taluk
R
U
T
R
U
T
R
U
u
T
R
U
T
R
U
u
T
R
T
R
U
u
T
R
U
781
796
585
734
756
597
704
722
601
664
722
446
457
786
799
524
476
730
336
342
827
827
736
870
441
409
678
738
335
Tiles, slate,
shingle
4
171
J 66
276
207
192
398
188
170
301
199
184
287
260
250
301
278
168
162
304
296
164
368
349
143
143
225
123
448
471
298
249
578
Corrugated Asbes- Br-ek Concrete All
1~~~~rZ~eCta~r ce~:nt ~~d s~~~c other sheets sheets lime slabs material
5
8
9
2
2
1
4
17
17
12
53
56
37
2
5
8
4
3
8
10
10
11
2
2
I
2
2
N
N
1
6
o
N
N
1
N
N
o
N
N
4
6
N
5
3
4
4
N
o
o o o
7
31
23
168
3
3
7
24
24
24
27
21
58
47
19
152
229
22
21
49
153
67
200
192
12
12
34
107
117
20
10
76
8
12
13
o
6
7
4
36
31
66
14
14
16
8
6
14
6
18
14
110
45
27
56
67
10
10
3
4
o
3
2
8
9
o
o o o
N
N
o
o
17
N
78
16
o o o
16
N
25
34
o o
N
N
o
o
o o J
Roof materIal
not stated
10
5
5
o
1
1
1
2
o
2
o
o
1
o
1
1
5
5
1
o
o
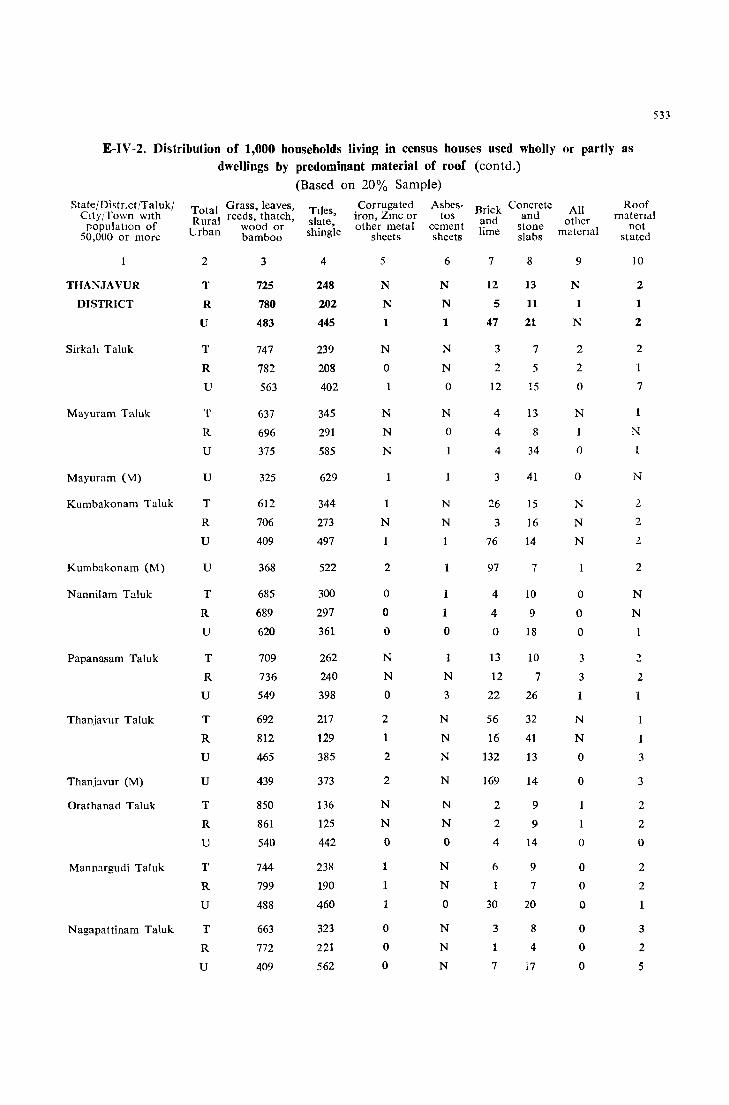
533
E-IV -2. Distribution of 1,000 households living in census houses used wholly or partly as dwellings by predominant material of roof (contd.)
State/DistLctITaluk/ CIty/Town with
population of 50,000 or more
THANJAVUR
DISTRICT
Sirkalt Taluk
Mayuram Taluk
Mayuram (l\1)
Kumbakonam Taluk
Kumbakonam (M)
Nannilam Taluk
Papanasam Taluk
Thanjavur Taluk
Thanjavur (M)
Orathanad Taluk
Mannargudi Taluk
Nagapattinam Taluk
Total Grass, leaves, Rural reeds, thatch,
Urban wood or bamboo
2
T
R
U
T
R
U
T
R
U
u
T
R
U
U
T
R
U
T
R
U
T
R
U
U
T
R
U
T
R
U
T
R
U
3
725
780
483
747
782
563
637
696
375
325
612
706
409
368
685
689
620
709
736
549
692
812
465
439
850
861
540
744
799
488
663
772
409
(Based on 20% Sample)
Tiles, slate, shingle
4
248
202
445
239
208
402
345
291
585
629
344
273
497
522
300
297
361
262
240
398
217
129
385
373
136
125
442
238
190
460
323
221
562
Corrugated iron, Zmc or other metal
sheets
5
N
N
1
N
o
N
N
N
1
N
1
2
o o o
N
N
o
2
1
2
2
N
N
o
o o o
Asbes- Brick Concrete tos and and
cement lime slone sheets slabs
6
N
N
1
N
N
o
N
o
N
N
1
1
o
N
3
N
N
N
N
N
N
o
N
N
o
N
N
N
7
12
5
47
3
2
12
4
4
4
3
26
3
76
97
4
4
o
13
12
22
56
16
132
169
2
2
4
6
1
30
3
7
8
13
11
21
7
5
15
13
8
34
41
15
16
14
7
10
9
18
10
7
26
32
41
13
14
9
9
14
9
7
20
8
4
17
All other
material
9
N
1
N
2
2
o
N
o
o
N
N
N
o o o
3
3
1
N
N
o
o
o
o o o
o o o
Roof matendl
not stated
10
2
1
2
2
7
1
N
N
2
2
2
N
N
2
1
3
3
2
2
o
2
2
3
2
5
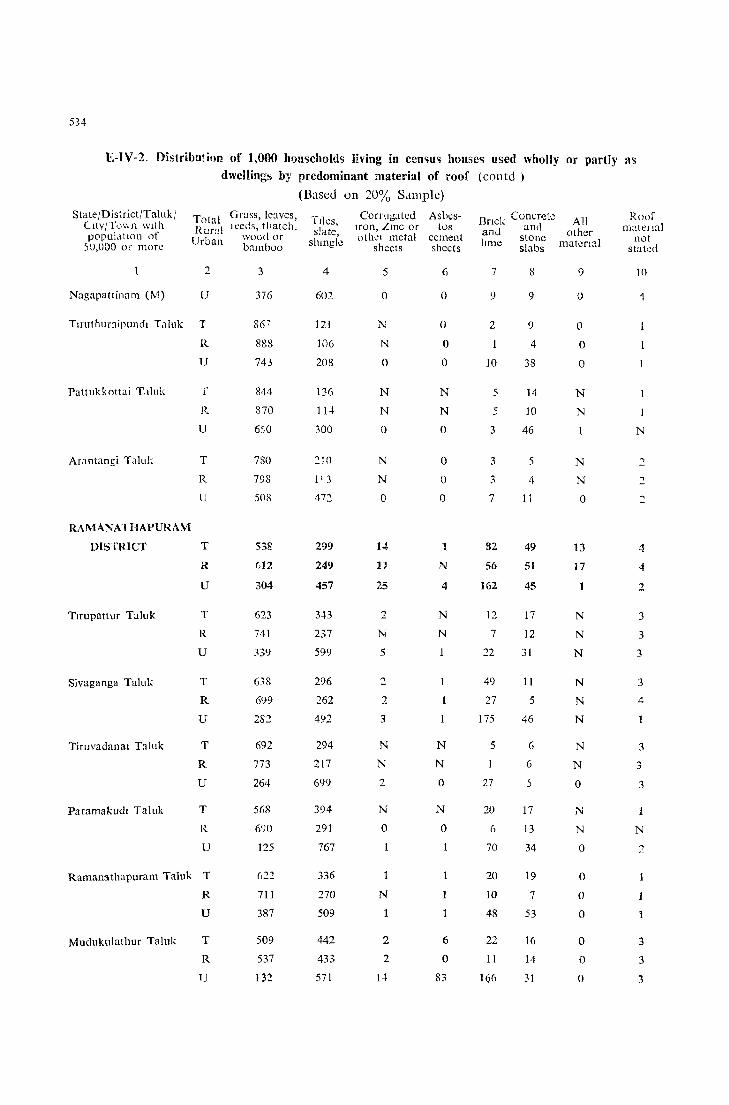
534
E-IV-2. Distribution of 1,000 bousehold" living in cen"u .. houses used wholly or partly as dwellings by predominant material of roof (contd)
State/DislrictjTalukj Clty/T.)v,n wltll populatIOn of
50,000 or more
Total Grass, leaves, Rural leeds, thatch,
Urban wood or bamboo
2
Nagapattinam eM) u
Tlruthur:lipundl T.1luk T
It
U
Pattukkottai T,llnk
Ar:mtangi Taluk
RAMANATHAPURAM
DISTRICT
Tlrupattur Taluk
Siva ganga Taluk
Timvadanal Taluk
Paramakudl Taluk
T
R
U
T
R
U
T
R
U
T
R
U
T
R
U
T
R
U
T
R
u
Ramanathapuram Taluk T
R
U
Mudukulathur Taluk T
R
1]
3
376
86 7
888
743
844
870
650
780
798
508
538
G12
304
623
741
339
638
699
282
692
773
264
568
690
125
622
711
387
509
537
132
(Based on 20% Salllple)
Tllcs, slate,
shmgle
4
602
121
lQ6
208
136
IU
300
210
1'3
4.., ... 1-
299
249
457
3-1-3
237
599
296
162
492
294
217
699
394
291
767
336
270
509
442
433
571
Corrugated Iron, .lme or olh\!1 metal
sheets
5
o
N
N
o
N
N
o
N
N
o
14
11
25
2
N
5
2
3
N
N
2
N
o
1
N
1
2
2
l-l
Ashestos
cement sheets
6
o
o o o
N
N
o
o o o
1
N
4
N
N
N
N
o
N
o 1
1
6
o 83
Bnck Concrete and and ltme stone
slabs
7
9
2
10
5
5
3
3
3
7
32
56
162
12
7
22
49
27
175
5
27
20
6
70
20
10
48
22
11
1<56
8
9
9
4
38
14
10
46
5
If
11
49
5t
45
17
12
31
11
5
46
6
6
5
17
13
34
19
7
53
16
14
31
All other
matcrIal
9
o
o o o
N
N
N
N
o
13
17
1
N
N
N
N
N
N
N
N
o
N
N
o
o o o
o o o
Roof m~tell:ll
not stated
10
N
2
4
4
2
3
3
3
3
3
3
3
N
3
3
3
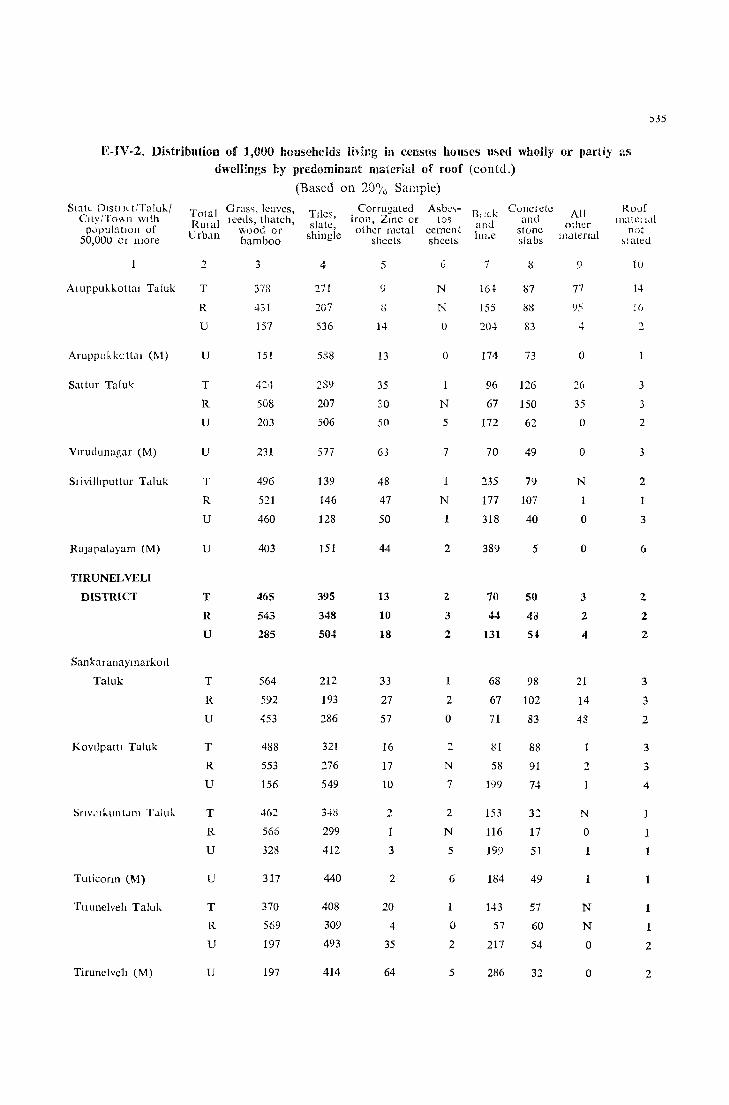
£-IV-2. Distribution of 1,000 households lhing in census homes used wholly or partiy as dwellings by predominant material of roof (eontd.)
Stat<-, DIstIll t,'Taluk/ City,'Tov.ll wIth
pc1j)1llatloll of 50,000 cr more
Aruppukkottal Taluk
Aruppukkc ((<.II (M)
Sattur Talulc
Vlfudunagar (M)
Stivilhputtur T<.Iluk
R(lJapaiayam (M)
TIRUNELVELI
DISTRICT
Sankal anaymarkoll
Taluk
KovIlpattl Taluk
Tuticonn (M)
Tuunclveh Taluk
Tirunclveh (M)
Total Grass, leaves, RUlal lceds, \hatch,
Urb n WOOL, or d bamboo
2
T
R
U
U
T
R
U
u
T
R
U
u
T
R
U
T
R
U
T
R
U
T
R
U
u
T
R
U
U
3
378
431
157
151
4:4
508
203
231
496
521
460
403
465
543
285
564
592
453
488
553
156
462
566
328
317
370
569
197
197
(Based on 20'/0 Samp1e)
TIles, slate,
shingle
4
271
207
536
588
289
207
506
577
139
146
128
151
395
348
504
212
193
286
321
276
549
348
299
412
440
408
309
493
414
Corrugated iron, Zwc or other metal
sheets
5
" <)
14
13
35
20
50
63
48
47
50
44
13
10
18
33
27
57
16
17
10
2
3
2
20
4
35
64
Asbe'>tos
cemcnt sheets
G
N
N
l)
o
N
5
7
N
2
2
3
2
2
o
N
7
2
N
5
6
o 2
5
B,ick and lIllIe
7
16 l-
155
204
174
96
67
172
70
235
177
318
389
70
44
131
68
67
71
81
58
199
153
116
199
184
143
57
217
286
Conctctc and
stunc slabs
8
87
88
83
73
126
150
62
49
79
107
40
5
98
102
83
88
91
74
17
51
49
57
60
54
32
All oll1':r
llklle[l(ll
9
77
95 , ..,
o
26
35
o
o
N
1
o
o
3
2
4
21
14
43
2
N
o 1
N
N
o
o
Roof
not ,:ated
10
14
2
3
3
2
3
2
1
3
6
2
2
2
3
3
2
3
3
4
1
2
2

536
E-IV -2. Distribution of 1,0(;0 hou~cholds living in cen~us houses used wholly or partly as dwellings by predominant material of roof (concld.)
State/DIstncl/T.lluk/ City/Town with populatIOn of
50,000 or more
Palayamcottai (1\1)
Tenka~l Taluk
Shcncottah Taluk
Tot 1 Glass, leaves, R ; I reeds, thatch,
lJ a wood or Urban bamboo
2
u
T
R
U
T
R U
3
173
514
569
305
532
555 477
Ambasamudram Taluk T 38G
491
204
R
U
Nangunen Taluk T
R
U
Tiruchendur Taluk T
KANYAKVMARI
DISTRICT
Vllavancode Tal uk
Kalkulam Taluk
Thovala Taluk
Agasteeswaram Taluk
Nagercoil (M)
R
U
T
R
U
T
R
U
T
R
U
T
R
T
R
U
u
419
438
291
509
590
376
531
576
269
732
743
475
531
535
492
416
416
358
454
177
177
N denotes negligible figures.
(Based on 20% Sample)
Tiles, slate,
shmgl.:
4
562
402
355
578
386
367 430
543
437
711
550
540
621
407
382
448
463
419
722
267
255
517
467
463
504
554
554
635
540
813
813
Corrugated Iron, Zmc or other metal
sheets
5
7
13
11
24
9
11 7
13
11
16
N
N
2
2
2
1
1
N
N
1
o
N
N
o
8
8
N
N
N
N
Asbes- BrIck Concrete All tos and and other
ccmcnt Illne stone matenal slleeLs slabs
6
N
N
N
N
N
o
14
22
N
N
N
o
N
o N
N
N
N
N
N
o
N
o
o o
N
N
N
7
158
26
20
46
41
37 49
41
31
57
13
7
51
32
3
79
2
2
1
N
N
2
N
N
o
16
16
1
N
1
8
97
4~
44
43
28
25 36
8
7
10
15
12
34
49
22
94
2
1
7
N
N
6
1
2
6
6
5
3
8
8
9
o
N
N
()
3
4 o
N
N
o
o o o
o o o
o o o
o o o
o o o
o o
o o o
o
Roof m::ltcrmI
not stilted
10
3
4
o
2
3
3
1
2
1
1
o
o o
2
CHAPTER VII
HOUSEHOLDS-BREAK-UP BY NUMBER OF ROOMS
7 - 1. In this Chapter, the composition of households on the basis of the number of members and by the number of rooms occupied by each household will be examined. This has
a direct bearing on the congestion in households, a subject to Limitation of data which much thought has not been devoted in this State. No
house has been planned on the basis that it should accommodate an optimum number of members. In this analysis, there is one important limitation i.e., the actual area of the rooms is not known. As such, it is d1fficult to say on a statistical basis whether a particular house is overcrowded, nor has :1n analysis been made, with a view to correlate the number of rooms and the number of p~rsons in a household with the result it will be diftkuIt to say whether any particular category of house having a certa1l1 number of rooms is overcrowded or not.
Scope of Table E-V
7 - 2. Table E-V exhibits households classified by number of members and by number of rooms occupied by each household. The rooms have been classified under 7 categories:
1. No regular room
2. 1 room
3. 2 rooms
4. 3 rooms
5. 4 rooms
6. 5 rooms and above
7. No. of fooms not ,tatt:d
The number of households and the number of members by sex have also been furnished under each category. It is not, however, necess~ry for our dIscussion to refer to t110 sex brea\-up of each household because th1s information does not help us in deciding whether a particular household is overcrowded or 110t.
7 - 3. This table has been prepared on the basis of 20 % sample households. The figures are furni~hed with rural-urban break-up for
Manner of preparation each taluk. The 11l1e for urban shows total urban figures. In ~cparate indenteu lines the lumes and figure3 of each city and town
with a populatIOn of 50,000 and more are given.
7 - 4. Two subsidiary tables have been prepared. E.V-l shows th~ distribution of 1,0~O
Census households 011 the basis of the number of rooms occupied by each household. E.V-2 shows the number of persons-males and females per ro.)m and
Definition of Room persons per household in each category of household. For a proper appreciation the tables presented, it is necessary to
understand the precise significance of room and no rcg:.rlar room used in these tables. According to the definitIOn adopted for houselisting, a room should usually have four walls with a doorway and with roof overhead and should be wide enough to enable a man to sleep in
H-68

538 REPORT ON HOUSING AND ESTABLISHMENTS
it, i.e., it should be at least 5' long. Unenclosed verandahs, kitchens, store rooms, garages, cattle sheds, latrines and bath rooms were not treated as rooms. However, any enclosed space which was used for living, dining, storing and cooking was recorded as a room if no other room was found in that enclosure.
7 - 5. It is obvious that our definition has certain limitations. Actually the definition of a room is much more precise than the definition of a Census house. Any enclosure or
structure on ground which is used for living or for work is Limitations in definition treated as a Census house while a room should have at least 5'
of length. This has resulted in a number of Census houses not having any regular room in which the households could live. Actually some of the Census houses occupied by the Scheduled Tribes of this State do not have any walls at all while they are treated for purpose of definition as Census house; they are returned as having 'no room' at all. The other limitation of our data is that no measurements of the rooms are given in the houselists. It is likely, therefore, that the data may not present an exact picture of what is existing in the State. It is, however, reasonable to presume that more the number of rooms, more is the accommodation provided for the household and as such, a discussion on prorata basis may represent in an approximate manner the actual condition obtaining in the State.
7 - 6. Enclosed or unenclosed spaces where people live, but which did not fall within the scope of the definition of the term, room given above were treated as no regular room.
This did not include pavements where houseless people live. It Households with no regular is easy to have a clear conception of Census house without room
rOOm because the persons treated it as a permanent residence while in the case of pavement dwellers, there was no specific space to
which they were attached. We had also cases in which enumerators failed to record the number of rooms occupied by a household and they have been separately classified under 'Not stated'. The tables do not of course give an exact idea of the convenience enjoyed by each household. Still we consider a discussion of the data presented in these tables will help us in a general way to appreciate the availability of accommodation and magnitude of overcrowding.
7 - 7. For this purpose, we have to adopt certain assumptions which on a closer scrutiny may not be strictly relevant. For instance, we have assumed that as the average
size of the household in Madras State is 4.62, any house which Overcrowding-How defined does not provide accommodation at the rate of one room for
every two persons can be said to involve overcrowding. Accordingly a house with three rooms will provide sufficient accommodation for a family in Madras State. Actually the urban household IS sl:ghtly bigger than the rural household. Therefore, three rooms in a household have been assumed to be a reasonable requirement if privacy is to be maintained irrespective of the manner in which these rooms are used. We are well aware that in certam cases, three rooms may provide less accommodation than two rooms or one room. But in a dIscussion based on the data which do not give us the total area available, no other approach is possible.
Districtwise pattern of
accommOdation
7 - 8. Households in occupation of no regular room and one room, prima jacie, suffer from overcrowding. We have prepared a table analysing the position in the different districts for rural and urban areas.

MADRAS STATE PERCENTAGE OF HOUSEHOLDS OCCUPYING NO REGULAR ROOM
ONE ROOM, TWO ROOMS, THREE ROOMS AND MORE THAN THREE ROOMS 1961
I SCA'=E-'-
20 ;
)(;!ometres 20 10 0 1 ;:.,---
MYSORE
KERALA
REFERENCE
Stat. Boundary
Diotrict Boundary
Indian Ocean
No. alO "CO
ANDHRA PRADESH
Bay of Bengal
I'ALK STRAIT
'';::'' . .... :
GULF OF "'ANAAR
TOTAL NUMa~R OF HOUS'HOLDS IN TH' DISTRICT CEYLON
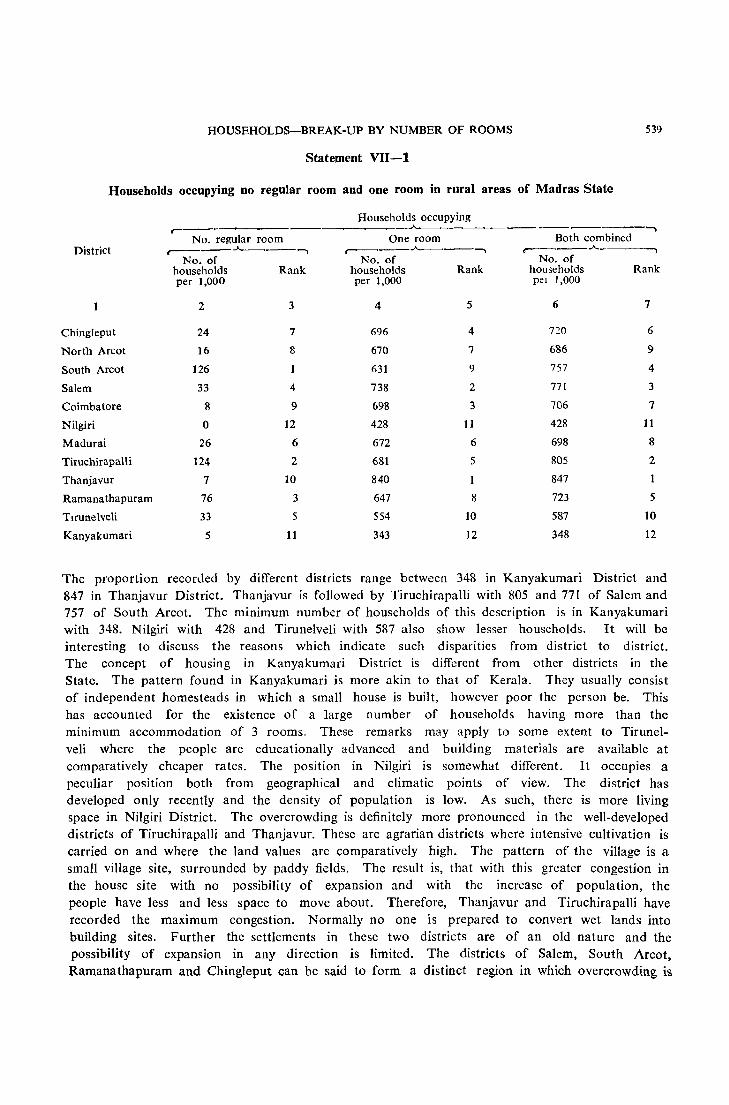
HOUSEHOLDS-BREAK-UP BY NUMBER OF ROOMS 539
Statement VII-l
Households occupying no regular room and one room in rural areas of Madras State
Households occupying r- ..A.-----. --.-- -.
No. regular room One room Both combined District r-----J<----., r-----.A.-----., r------'--.A. ..
No. of No. of No. of households Rank households Rank households Rank per ],000 per 1,000 pel 1,000
2 3 4 5 6 7
Chingleput 24 7 696 4 720 6
North Arcot 16 8 670 7 686 9
South Arcot 126 1 631 9 757 4
Salem 33 4 738 2 771 3
Coimbatore 8 9 698 3 706 7
Nilgiri 0 12 428 11 428 11
Madurai 26 6 672 6 698 8
Tiruchirapalli 124 2 681 5 805 2
Thanjavur 7 10 840 847 1
Ramanathapuram 76 3 647 8 723 5
Tlrunelveli 33 5 554 10 587 10
Kanyakumari 5 11 343 12 348 12
The proportion recorded by different districts range between 348 in Kanyakumari District and 847 in Thanjavur District. Thanjavur is followed by Tiruchirapalli with 805 and 771 of Salem and 757 of South Arcot. The minimum number of households of this description is in Kanyakumari with 348. Nilgiri with 428 and Tirunelveli with 587 also show lesser households. It will be interesting to discuss the reasons which indicate such disparities from district to district. The concept of housing in Kanyakumari District is different from other districts in the State. The pattern found in Kanyakumari is more akin to that of Kerala. They usually consist of independent homesteads in which a small house is built, however poor the person be. This has accounted for the existence of a large number of households having more than the minimum accommodation of 3 rooms. These remarks may apply to some extent to Tirunelveli where the people are educationally advanced and building materials are available at comparatively cheaper rates. The position in Nilgiri is somewhat different. It occupies a peculiar position both from geographical and climatic points of view. The district has developed only recently and the density of population is low. As such, there is more living space in Nilgiri District. The overcrowding is definitely more pronounced in the well-developed districts of Tiruchirapalli and Thanjavur. These are agrarian districts where intensive cultivation is carried on and where the land values are comparatively high. The pattern of the village is a small village site, surrounded by paddy fields. The result is, that with this grcatcr congestion in the house site with no possibility of expansion and with the increase of popUlation, the people have less and less space to move about. Therefore, Thanjavur and Tiruchirapalli have recorded the maximum congestion. Normally no one is prepared to convert wet lands into building sites. Further the settlements in these two districts are of an old nature and the possibility of expansion in any direction is limited. The districts of Salem, South Arcot, Ramanathapuram and Chingleput can be said to form a distinct region in which overcrowding is

540 REPORT ON HOUSING AND ESTABLISHMENTS
less pronounc~d than in Thanjavur and Tirucbirapalli di~trict~. Their density is lower and the people are not economically so prosperous. Among these four districts, Chingleput presents a comparatively better picture. Taluks of Sriperumbudur, Saidapet, Chingleput, Kanchipuram and Maduranthabm have recorded lower figures than the district average and contributed to case the sItuation. The dIstricts of Coimbatore, Madurai and North Arcot come next With less overcrowding, the figures ~anging bet-ween 706 and 686. These districts arc economically bettcr oIT whcre people could afford to lllVC5t marc in building.
7 - 9. households in
It would also be interesting to discuss the these districts. South Arcot has recorded
position of no rcgular room a figure of 126 followed by
TimchirapallI 124. These houses are generally found in the drier Overcrowding \is-a vi~ tracts of these two districts where the people are not eCOllO-
no regular room mlcally capablc of putting up any proper house. Ndgifl has rccordcd no such case partly because the clImatc doc') not
make it possible for anyone to survivc there without a proper house. Ramanathapuram has recorded 76 while Madurai has recorded 26. Generally it is found that no rcguLlr room households live in the drier tracts of the different districts in Madras State. This a ~p~ct will be more elaborated when we discuss thc variation from taluk to taluk.
Statement VII-2
Households occupying no regular room and one room in urban areas of ~ladras State
Households occupying --- ------ -_ --- -~- -. - ~ -- - - _- ----
No regular room Onc room Both combmed Dlstnct
, ____ .A. , ___ .A. ___ -----, r----------l--"'---.----, No. of No. of No. of
households Rank households Rank households Rank per 1,000 per 1,000 per 1,000
2 :1 4 5 6 7
Madras 3 10 675 2 678 2
Chmgleput 13 5 544 9 557 9
North Arcot 4 9 520 10 524 10
South Areot 48 585 6 633 5
Salem 21 4 582 8 603 8
COimbatore 2 II 603 5 605 7
Nilgin ° 13 459 12 459 12
Madural 5 7 645 3 {SO 3
Tiruehlwpalli 27 3 607 4 634 4
Thanjavuf 2 12 689 1 G91
Ramanathapnram 31 2 585 7 616 6
Tlrunelveh 13 6 485 II 498 11
Kanyakuman 4 8 339 13 343 13
7 - 10. The proportions recorded by the various districts fall within the range of 343 in Kanyakumari to 691 in Thanjavur. It is sigmficant that as in the case of rural areas, the districts of Kanyakuman, NilglTi and Ttrunelveli arc comparatively better off m the matter of overcrowding. The position in Thanjavur Distnct is the worst. The same rcason whIch we havG
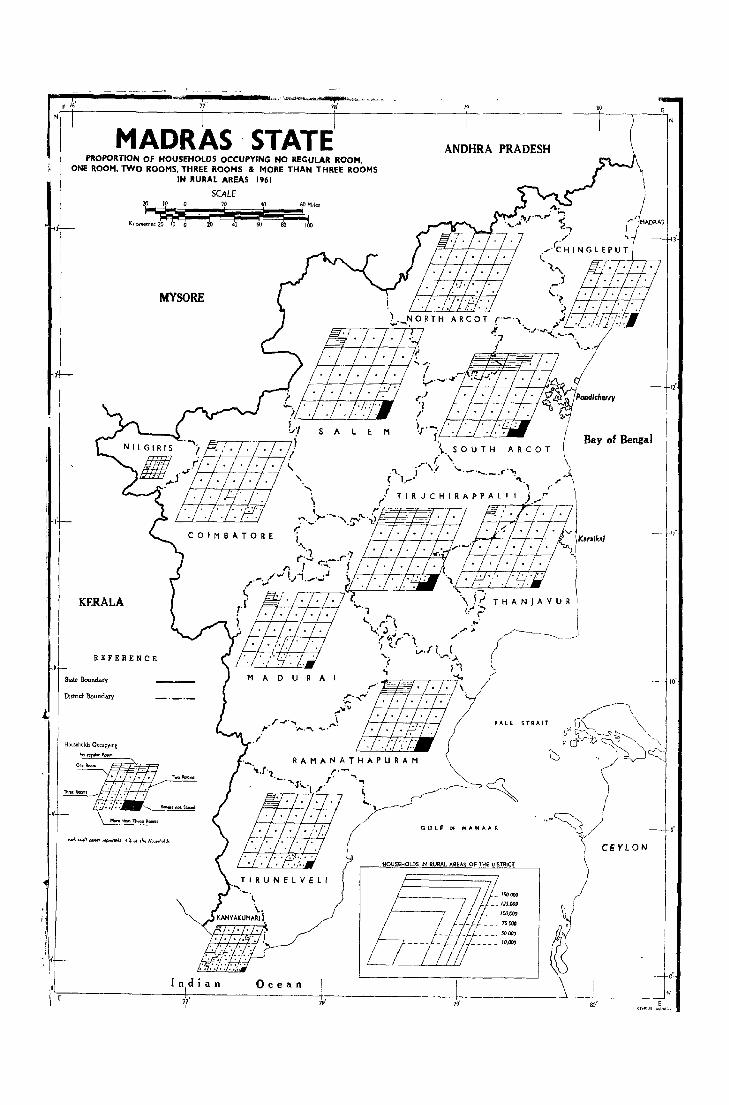
- - -------- -_-" .... -,.------iiiiii-_.-·7""i'------"'w..."~~·'''"..,--'''-'1"1 MADRAs· STATE
1
,.
11'
12'
ill'
PROPORTION OF HOUSEHOLDS OCCUPYING NO RECULAR ROOM. ONE ROOM. TWO ROOMS, THREE ROOMS 8< MORE THAN THREE ROOMS
IN RURAL AREAS 1961
SCALf
MYSORE
KERALA
I· REFERENCE
lor State Boundary
llistnc\ Boundary
~ .~'",'
,.,"";\1
r--·.... i ',...""\. "\,..,..... rlou>tholds O(aJp~mg
ANDHRA PRADESH
GULF ~ MA.NAA,R
UOUS8HOLDS IN RURAl. AREAS OF TLI~ DISTRI<;T
N
Ii
Bay of Bengal
CEYLON
i ,I 1
J
\
-"'''"' )
~ lndian o c e a n
L-_--:_-~_-~ J { : I ~£;--------------,7,f-:(-------- --'7l!f-:,-----------,+.·----------'--·-oo':,-----,-,_-,,-; 7!~~~,
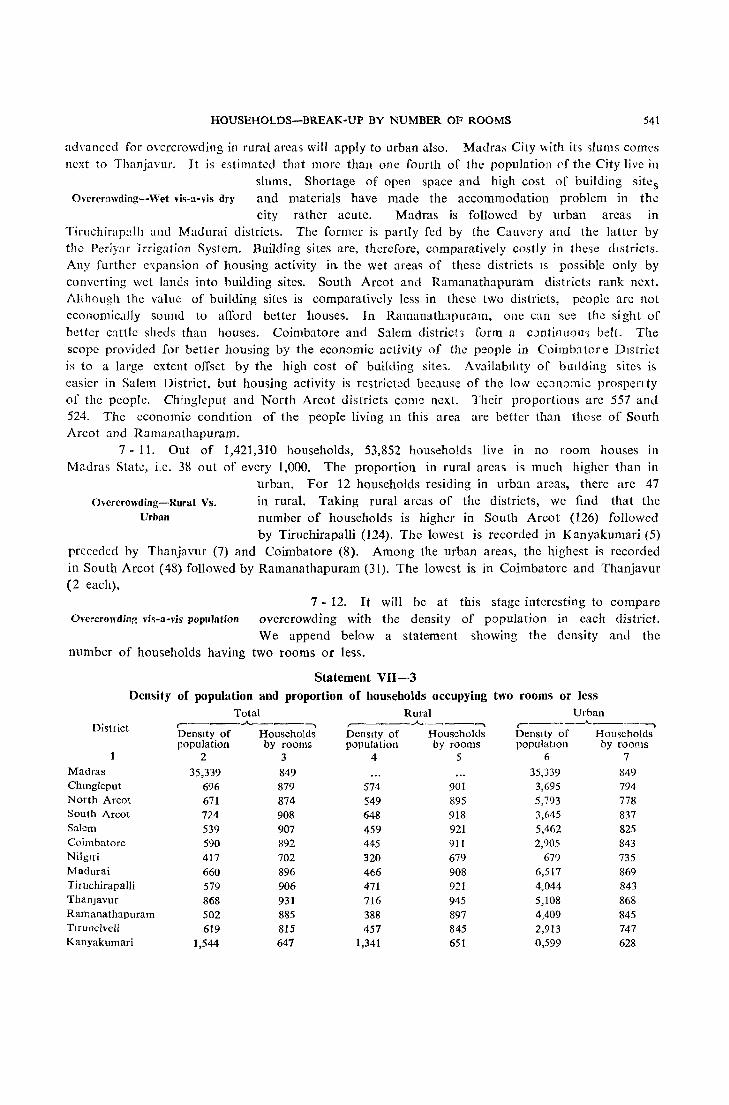
HOUSEHOLDS-BREAK-UP BY NUMBER OF ROOMS 541
advanced for overcrowding in rural areas wiII apply to urban also. Madras City ",ith its slullls comes next to Thanjavur. It is estimated that more than one fourth of the population ('f the City live in
slums. Shortage of open space and high cost of building sites Overrrowding-Wet vis-a-vis dry and materials have made the accommodation problem in the
city rather acute. Madras is followed by urban areas in Tiruchirap:.lIh and Madurai districts. The former is partly fed by the Cauvery and the latter by the Periyar Irrigation Systcm. Building sites are, therefore, comparatively costly in these dIstricts. Any furthcr c·'pansion of housing activity in the wet area'> of these districts IS possible only by converting wet lands into building sites. South Arcot and Ramanathapuram districts rank next. Although the value of building sites is comparatively less in these two districts, people arc not economic.1Ily sound to afTord better houses. In Ramanathapuram, one can see the sight of bettcr cattle sheds than houses. Coimbatore and Salem districts form a cJlltinuou'i belt. The scope provided for better housing by the economic activity of the people in Coimb:.ttore DIstrict is to a large extent offset by the high cost of building sites. A vailablllty of budding sites is easier in Salem Oistrict, but housing activity is regtrieted because of the low cCJnomic prospen ty of the people. Chingleput and North Arcot districts com:! next. Their proportions arc 557 and 524. The economic condItion of the people living 111 this area are better than those of SOllth Areot and Ramanathapuram.
7 - 11. Out of 1,421,310 households, 53,852 households live in no room houses in Madras Stat.:, i.e. 38 out of every 1,000. The proportion in rural areas is much higher than in
urban. For 12 households residing in urban areas, there are 47 Overcrowding-Rural Vs. in rural. Taking rural areas of the districts, we find that the
Urban number of households is higher in South Areot (126) followed by Tiruchirapalli (124). The lowest is recorded in Kanyakumari (5)
preceded by Thanjavur (7) and Coimbatore (8). Among the urban areas, the highest is recorded in South Arcot (48) followed by Ramanathapuram (31). The lowest is in Coimbatore and Thanjavur (2 each).
7 - 12. It will be at this stage interesting to compare OvercrowdinG vis-a-vis population overcrowding with the density of population in each district.
We append below a statement showing the density and the number of households having two rooms or less.
Statement VII --3
Density of populution and proportion of households occupying two rooms or less Total Rural Urban
District ,~ ____ ..A...--__ .. ,....---__ .A.~ ____ ..
'--~---'---'-----. DenSIty of Households Denslty of Households Denslty of Hou~eholds population by room~ population by rooms population by rooms
2 3 4 5 6 7 Madras 35,339 849 35,339 849 ChlUgleput 696 879 574 901 3,695 794 North Arcot 671 874 549 895 5,793 778 South Arcot 724 908 648 918 3,645 837 Salem 539 907 459 921 5,462 825 Coimbatore 590 892 445 911 2,905 843 Nilglri 417 702 320 679 679 735 Madurai 660 896 466 908 6,517 869 Tiruchirapalli 579 906 471 921 4,044 843 ThallJavur 868 931 716 945 5,108 868 Ramanathapuram 502 885 388 897 4,409 845 TIruneiveli 619 815 457 845 2,913 747 Kanyakumari 1,544 647 1,341 651 0,599 628
542 REPORT ON HOUSING AND ESTABLISHMENTS
7 - ] 3. We cannot draw any firm conclusion from the data that overcrowding either in the urban or rural sector is a result of density of population. Actually the densest area in
urban sector i:s Madras CIty and Kanyakumari, both in urban Density and overcrowding
No correlation and rural sectors. We find the conditions of living are comparatively easier in these two districts. So the reason for overcrowding has to be sought in other factors like availability of land,
economic standard of the households and the economic background of the area in which these households are found.
7 - 14. Now we will study the pattern of households occupying two rooms. We have chosen to examine this separately, because, we feel that this pattern of housing is what will be generally found among the lower middle class people of the State. 187 households out of 1,000 live in two rooms. In the rural areas, the number is only 176 while in urban it is 217. The housing position seems to be happier in urban areas. This is reasonable because the middle class people who generally occupy these houses are better off in urban areas than in the rural parts. They are also persons who are engaged in services which category is the most economically sound in the whole State.
7 - 15. The district figures fluctuate between 113 in District ranges Thanjavur and 300 in Kanyakumari District. The remaining
districts can be grouped into ranges as shown below:
Width Range District
134 Tiruchirapalli
151 to 2QO
201 to 250
251 to 261
Madras, Chinglcput, South Arcot, Salem and Ramanathapuram
North Areot, Coimbatore and Madurai
Nilgili and Tlfunelveli
We find an interesting reversal of pattern except in Kanyakumari and Tirunelveli; in other districts, rural proportion is less than urban. In these two districts, the rural proportion is higher. This perhaps shows that the conditions of housing found in the rural sectors of Kanyakumari and Tirunelveli districts are better than in the corresponding areas of other districts. We have indicated reasons for this variation when we discussed overcrowding in these districts and there is no need to repeat those observations.
7 - 16. The range in the rural areas varies from 98 in Thanjavur to 303 in Kanyakumari District. The districts of Salem, South Arcot, Tiruchira-
Rural ranges palli, Thanjavur and Ramanathapuram have recorded less than the State average.
Width Range District
116 to 150 Salem and Tiruchirapalli 151 to 200 Chingleput, South Arcot and Ramanathapuram
201 to 258 North Arcot, Coimbatore, Nilgiri, Madurai and Tirunelveli
7 - 17. The range for the urban areas is from 171 Urban ranges in Madras to 285 in Kanyakumari. The remaining districts can
be grouped as shown below:
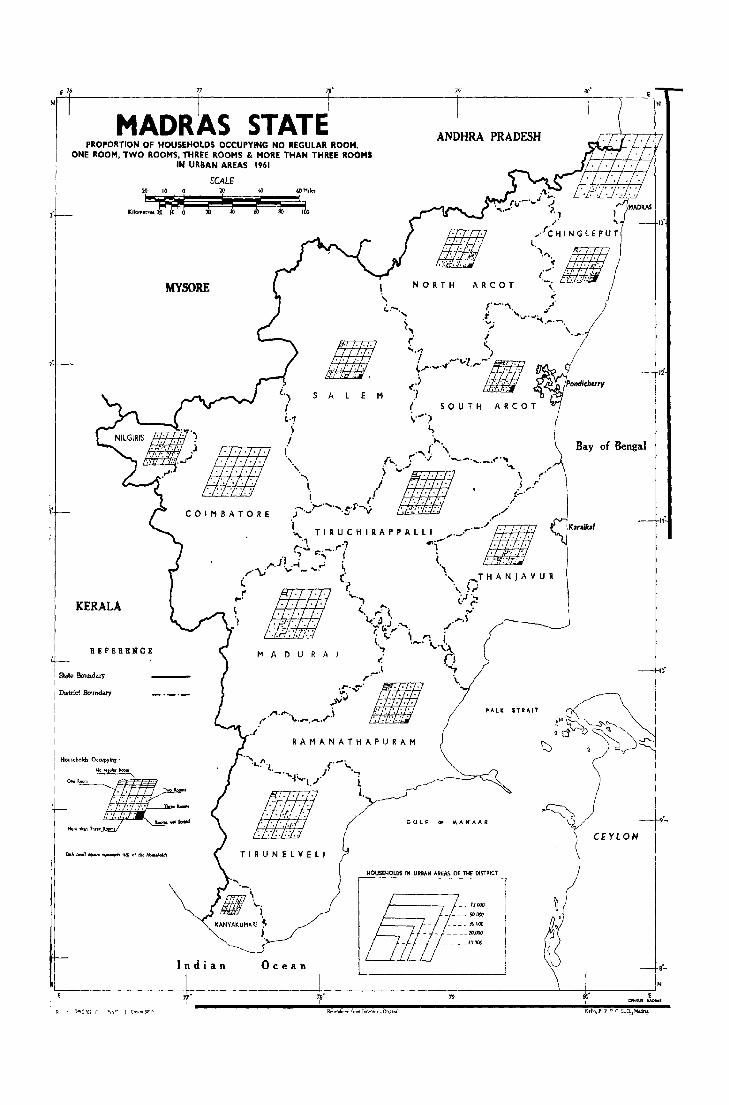
N
E I. 77
MADRAS STATE ANDHRA PRADESH PROPORTION OF HOUSEHOLDS OCCUPYING NO REGULAR ROOM.
ONE ROOM. TWO ROOMS. THREE ROOMS & MORE THAN THREE ROOMS IN URBAN AREAS 1961
!:CALf 10
; 10 10 0
~ ..,
; .'1 • , •• - ..... .1 ') . ." " "'\..... ("'1 ,,' , . . J' H I N G l E PUT
t. / ""''''111' .... ~ .. ,'. ARC 0 T 1.'; .. :,: .. ::.;."
< r-·..... ~.". ·t. " . ...,."":..c..,..-"'. j' \.~.
III ~ .;. ....... ')
! ..,·-·'·/l ,..·~III· .. . ~""'-" .. . .> '.:':- : ..
t.) 5 A E M.(,l ....
i i SOUTH i.·1 \ ..... _) \ ~
MYSORE NOR T H
i ~. ,. ... ..1. \ . li.... t"'J ._.-. (' ...
Bay of Bengal
I .I. . . . . .>,....r ~ (I.' .: ._' ,,' ._' I'~'
COIMBATORE
\\., .~ "l1l1I.) .... ....._.. .... \ (/
) ·~·~·'·""·SS'~·'; '. ::':.;::: "./
KERALA
REFERENCE
State Boundary
Dlstrict Boundary
Households Occupying'
",,~N''''.'''''' ": • • Two
... -. ... "*-" . - .. ,
•••• t.oc.N notkned
ti:I,..,t'-anThl't'£J.gpm,
Indian
.!.._ T I Rue H I RAP PAL L I ,.,.._r._.6!f/ ....... .. "'7 .o( ... . r.;..:. ro._·r!. .. :',.'.
il' "'! . l ' ". :". ' 1"' •. -1 ... ~ " .r·V '" _.". c' " T HAN J A V U R
,.~ /II' . .'. i',-. ., ..... '~.J~ .... (..r:{ .,..
. :". '. '. ~:...;).;' .-... ............ 1 . .. .. ," ( "" i. . • '. . • • .. • ,,' 1 ~ I
I . .., ._ ..... \.\ MADURAI .... n
.M f/iI!·'\ /' \"._."".1" •.. 0,
PALl( STRAIT
J RAMANATHAPURAM
MANAAR
TIRUNELVELI
o c e a n
I-IOI)SEI-IOLDS iN URBAN ARE .... S 01: TH~ DISTRICT
1!ff!lI_. 75000 __ 5I)!II'JO
__ 30000
__ 20,000
__ IO,{)()(J
CE YLON
II'
8'-

HOUSEHOLDS-BREAK-UP BY NUMBER OF ROOMS
Width Range District
177 to 200 Thanjavur
201 to 250 South Arcot, Madurai, Chingleput, Ramanathapuram
Tiruchirapalli, Salem, Coimbatore and Tirunclveli
251 to 276 North Arcot and Nilgiri
The districts of Madras, South Arcot, Tiruchirap::tlli and Thanjavur have recorded figures which are less than the State average of 217. This reflects also the general trend in overctowding which we have indicated earlier. Madras was an exception to the general observation, but it will be seen that the persons employed in services will find it much more difficult to get two-room accommodation in Madras City because of the high rent prevailing in the area. As such, these classes of people live in comparatively less accommodation in Madras City than other urban parts of the State. The disparity between rural and urban figures is more in the following districts.
District Rural Urban
Tiruchirapalli 116 209
Thanjavur 98 177
Salem 150 222
while the disparity is less than 25 in the following districts:
Tirunelveli 258 249
Kanyakurnari 303 285
Madurai 210 219
Nilgiri 251 276
In the districts of Tiruchirapalli and Thanjavur there is more congestion in the rural sector which is reflected in the comparatively lower figure. In Salem, most of the households have handloom as an industry and it is not always that the handloom weavers are economically quite prosperous. No disparity is generally observed when the conditions of housing found in rural areas are more or less similar to those found in urban. They are Tirunelveli, Kanyakumari and Nilgiri. In the case of Madurai District, as we had OccaSIOn to observe, the conditions of housing in the urban sector is not as good as it should be. Therefore, the disparity between urban and rural areas is less marked.
7 - 18. According to our assumption, households in possession of three rooms and more can generally be assumed to have adequate accommodation for a comfortable living. We should
sound a note of caution that no cross tabulation has been made Bigger households between the size of families and the number of rooms. As
such, it is likely that in a three-roomed Census house a large family consisting of more than 10 members may be residing in which the conditions of living will not be quite comfortable. But generally this assumption will hold good with a few exceptions. We append below a tabl~ showing the households occupying three rooms, 4 rooms and 5 rooms and above in rural areas of Madras State.
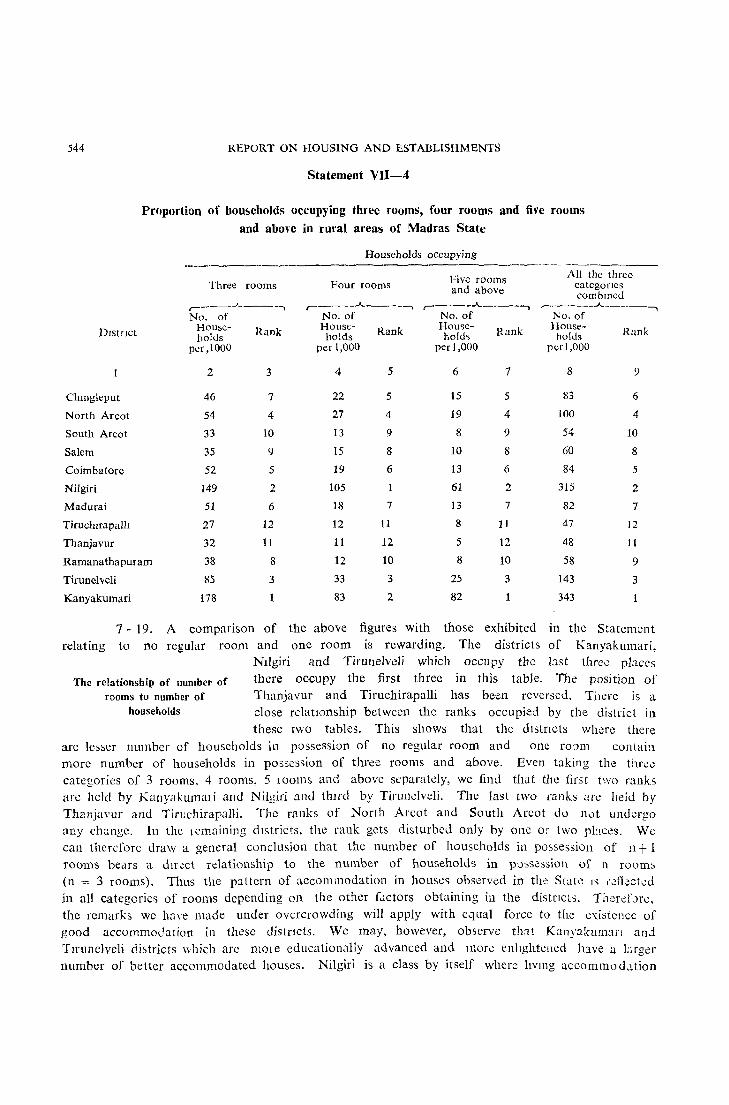
544 REPORT ON HOUSING AND ESTABLISHMENTS
Statement VII-4
Proportion of bou~eholds occupying three rooms, four rooms and five rooms
and above in rural areas of Madras State
DlstrJct
Chmgleput
North Areot
South Arcot
Salem
Coimbatore
Nilgiri
Madurai
Tiruchlrapalh
Thanjavur
Ramanathapuram
Tiruneheli
Kanyakumari
7 - 19. A
Three rooms
,-_~_J ___ -,
No. of Households
per ,1000
2
46
54
33
35
52
149
51
27
32
38
8S
178
comparison
Rank
3
7
4
10
9
5
2
6
12
11
8
3
1
of the
Households occupying
Four rooms Five rooms and above
,------"-----, ,-___ .A. ___ -,
No. of Households
per 1,000
4
22
27
13
15
19
105
18
12
11
12
33
83
above
Rank
5
5
4
9
8
6
7
11
12
10
3
2
figures with
No. of Household~
per 1,000
6
15
19
8
10
13
61
13
8
5
8
25
82
those
Rank
7
5
4
9
8
6
2
7
11
12
10
3
1
exhibited
All the three categones eomblI1ed
r- j\;o~---"----'~---,
Households
perl,OOO
8
83
100
54
60
84
315
82
47
48
58
143
343
in the
Rank
9
6
4
10
8
5
2
7
12
11
9
3
1
Statement relating to no regular room and one room IS rewarding. The districts of Kanyakumari,
NIlgiri and Tirunelveli which occupy the bst three plaees
The relationship of number of there occupy the first three in this table. The position of rooms to number of Thanjavur and Tiruchirapalli has bcen revcrscd. There is a
households elose relatIOnship between the ranks occupied by the district in these two tables. This shows that the dlstncts where there
are lcs~cr number of households in possession of no regular room and one rO']111 conluia more number of households in possession of three rooms and above. Even taking the three categories of 3 rooms, 4 rooms, 5 100111S and above separately, we find that the first two ranks are held by Kanyakumari and NiIgiri and tlurd by Tirun-::lveli. The last two ranks are held by Thanjuvur and Tin:chirapalJi. The ranks of North Arcot and South Areot do not undergo any change. In the lcmaining dIstricts, the rank gets disturbed only hy one or two pbccs. We can therefore draw a general conclusion that the number of households in po~session of n + 1 rooms bears a dm:ct relationship to the number of households in possession of n rooms (n = 3 rooms). Thus the pattern of accommodation in house" observed in the State IS r~iL:cted
in all categories of rooms depending 011 the other Lctors obtaining in the districts. TilCrcfJrc, the remarks we have made under overcrowding will apply with equal force to the e'{istcnce of good accommodation in these distncts. We may, however, observe th:1t Kallyakuman anj TJnll1elveli districts which are mOle educationally advanced and more enlightened have a l~;rger
number of better accommodated houses. Nilgiri is a class by itself where hVll1g aceommo u.ltion

HOUSEHOLDS-BREAK-lJP BY NUMBER OF ROOMS 545
is always favourabic. North Arcot, Coimbatore, Chinglcput and Madurai form one group where the figures range betwcen 82 and 100. That part of Chmgleput District lying withm the metropolitan region of Madras City is economically more advanced. The distncts of Salem, Ramanathapuram and South Arcot which arc economically backward have low figures of 54-60.
Statement VJI-5
Proportion of hou.,d:olds occupying three rooms, four rooms and fiye rooms and above in urban areas of Madras State
Dlstnct
Madras
Chingleput
North Areot
South Arcot
Salem
Coimbatore
Nilglri
Madural
Tiruehirapalll
Thanjavur
Ramanathapuram
Tirunelveli
Kanyakuman
Three 1001llS
c----..A.----~
No. of Households
per 1,000
2
72
89
94
76
85
W
122
71
75
70
81
130
171
Rank
3
11
5
4
9
6
8
3
12
10
13
7
2
Households occupymg ...... ___ ..A.. _________ ~~_
Four rooms Five rooms and All the three above categones combmed ,-____ ..A. __ --, ,-____ .A. ___ ,
,----"-~......,----,
No. of No. of No. of House- Rank House- Rank House- Rank holds holds holds
per 1,000 per 1,000 per I,COO
4 5 6 7 8 9
37 8 42 6 151 9
56 5 44 5 189 5
67 2 56 4 217 4
34 11 29 11 139 11
44 6 33 10 162 6
36 9 40 7 156 7
61 4 80 2 263 2
30 13 27 12 128 12
42 7 37 8 154 8
32 12 23 13 125 13
35 10 34 9 150 10
63 3 57 3 250 3
SIS 104 370 1
7 - 20. The pattern observed 111 the rural s:ctor of Ntlgm, Kanyakumari and Tirunclveh distrIcts is repeated in urban arcas thc(cby indlcatmg the eXistence of good accommodation through-
out district. Thanjavur occupies the last place precedcd by Madurai-Its congestion Madurai. Wc havc alteady indicated the reasons for the housing
shortage in Thanjavuf District. Madurai is a city of antiquity which is surrounded on all "ides by 'Wet fields which prevent the growth of towns in all directions. No liOEbt the satellite towns lIke Tirupparankunram Town-group and Thallakulam Town-group have sprung up in the nClghbourhood of M:lllLlrai. Let us examinc thc population and housing figures of Madurai District - Ulb,lll and Madurai City With its satellIte towns.
H-69

546 REpORT ON HOUSING AND ESTABLISHMENTS
Area PopulatIOn ~s per No. of houses as 1961 CensLls PCI P. C. A.
1. Madural dlstllCt Urban 1,015,745 146,545
2. Madura! cIty 424,810 5U,243
3. Tlfupparankunram Town-group 57,748 '),647
4. Thallakulam Town-group 8,324 1,736
48% of the Madurai District urban population hve 111 the CllY of Madural anJ its sJtelhte towns with 42 % of the total urban houses. As such, ther..: is c()ngc~tlOn 111 the Cl ty 0;'
Madurai. This is reflected in the city havll1g le~s tlnn norm.ll accommouatlOll. South Areot and Ramanathapuram districts come next with figures of 139 and 150. They are economically backward districts. Madras City comcs next with 151. Appro,imately one fourth of its population live in slums and as such its posItion regardlllg accommod21ioll CJnnot be s2tlsfactory in spite of the city having a good number of fine houses. Salem, Connbatore and TlrUehliap:llli form the next group, their figures ranging bet.veen 154 and 162. Coimbatore IS cconomlc211y forward. Salem District which has a large number of households It\·jng in no lcgubr room and one room in rural areas, has done well in urban areas. The urban figures reveal that the taluks of Krishllagiri and Namakkal have recorded a large number of houscholds hVll1g ill 3 room" and above compared to the dIstrict urban average. Tiruchirapalli City is also better off 111 its urban sector while the district average for urban arcJ.s is 154. Tlruchirapalh City lu3 recorded a figure of 195 and Tiruchirapalli Taluk urban area, 18·1-. Chmgleput and North Arcot districts form one group, their figures being 189 and 217. They are also contiguous areas. Urban areas in the taluks of Sriperumbudur, Saidapet, Chingleput an.] Kanchlpuram have rccorded hlgher figures than the district average. The economic condition of North Arcot is better than that of Ramanathapuram and South Arcot.
Accommodation Talukwar 7-26. We now propose to diSCUSS the accommodatIOn
on the basis of tainks.
Statement VII-6
Proportion of households occupying 3 and more rOullls per 1,000 houschohls in taluks
District Rural Urban Dlstnct Rural Urban
2 3 2 3
CHINGLEPUT DISTRICT 83 189 NdlUH ARU.H DlSfRICr 100 2.17
1. Ponneri 52 139 Y. ArkclTlam ')2 225
2. Tiruvallur 79 181 10. \V,\]Jppct 121 237
3. Tlruttani 68 137 11. GUdlY,ltilam 129 1')5
4. Snperumbudur 99 205 12. Tn upp.tttLlr 77 259
5. Saldapet 93 193 13. Vcllolc 121 233
6. Chingleput 86 221 14. Allll 126 251
7. Kanchipuram 123 197 15. Cheyyar 121 206
8. Maduranthakam 74 129 16. Wandlwash 102 139
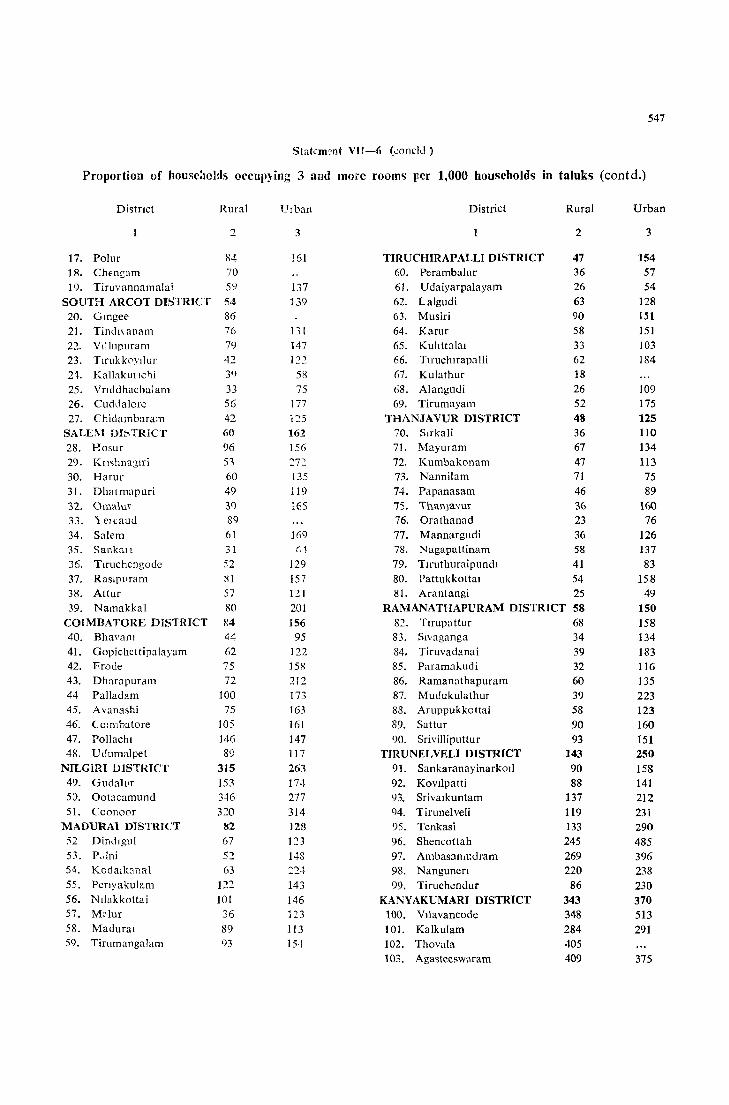
547
Statcm~lIt VJI-6 (c-oncld)
Proportion of house:lOlds O('cul,}ing 3 and more rooms per 1,000 households in taluks (contd.)
Distnct Rural
1 ~
17. Polur S'+ 18. ChEnGam 70
19. Tiruvannamalai 5LJ SOUTH ARCOT DISTRICT 54
20. Gmgee 86 21. Tindl\ anam 76 22. Vtllupuram 79 23. TIl'ukk0yilur 42 24. KallakUllchi 3') 25. Vnddhachalam 33
26. Cuddalore 56 27. Chidambaram 42
SALEM m~TRICT 60 28. Hosur 96 29. Kmhna~lri S1 30. Harur 60 31. Dhmmapuri 49 32. Omall1r 3<) 33. 1 clcaud 89
34. Salem 61 35. SankUlI 31 36. Tlruchengodc 52 37. RaslpJlram 81 38. Attur 57 39. Namakkal 80
COIMBATORE DISTRICT 114 40. Bhavam 44 41. Gopichcttipalayam 62 42. Erode 75 43. Dharapuram 72 44 Palladam 100 45. Avanashi 46. (_olmbatore 47. Pollachl 48. Udumalpct
NILGIRI DISTRICT 49. Gudah'r 5:). Ootacamund 51. Coonoor
MADURAI DlSTRICT 52 Dindlgul
53. P"lni 54. Kodatk::mal 55. Penyakulam 56. Nllakkottai 57. M',lur 58. Madural 59. Tirnmangahlm
75 105 146 89
315 153 346 320 ~2
67 52 63
1~2
101
36 89 03
Urban
3
161
137 139
131 147 122
58 75
177 i:!5
162 156 272 135 119 165
169
129 157 121 201 156
95 122 158 212 173 163
161 147 117 263 J7·t 277 314 128 123 148 224 143 146 123 113 15·!
District
1
TIRUCHIRAPALU DISTRICT 60. Perambalur 61. Udaiyarpalayam 62. Lalgudi 63. Musiri 64. Karur 65. Kuhttahll 66. TlfUchlrapalli 67. Kulathur 68. Alangudi 69. Tirumayam
THANJA VUR DISTRICT 70. Strkali 71. Mayuram 72. Kumbakonam 73. Nannilam 74. Papanasam 75. Than}avur 76. Orathanad 77. Mannargudi 78. Nagapattinam 79. Tlruthuraipundl 80. Pattukkottal
Rural
2
47 36 26 63 90 58 33 62 18 26 52 48 36 67 47 71 46 36 23 36 58 41 54
81. Arantangi 25 RAMANATHAPl'RAM DISTRICT 58
8:!. Tlrupattur 83. Slvaganga 84. Tiruvadanai 85. Paramakudi 86. Ramanathapuram 87. Mudukulathur 88. Aruppukkottai 89. Sattur 90. Srivilliputtur
TIRUNELVELI DISTRICT 91. SankaranayinarkOlI 92. KovIlpatti 93. Srivalkuntam 94. Tirunelveli 95. Tcnkasi 96. Shencottah 97. Ambasarrlcdram 98. Nangunen 99. Tiruchendur
KANYAKUMARI DISTRICT 100. Vilavancode 101. Ka lkulam 102. Thovala 103. Agasteeswaram
68 34 39 32 60 39 58 90 93
143 90 88
137 119 133 245 269 220 86
343 348 284 405 409
Urban
3
154 57 54
128 151 151 103 184
109 175 125 110 134 113
75 89
160 76
126 137 83
158 49
150 158 134 183 116 135 223 123 160 151 250 158 141 212 231 290 485 396 238 230 370 513 291
375
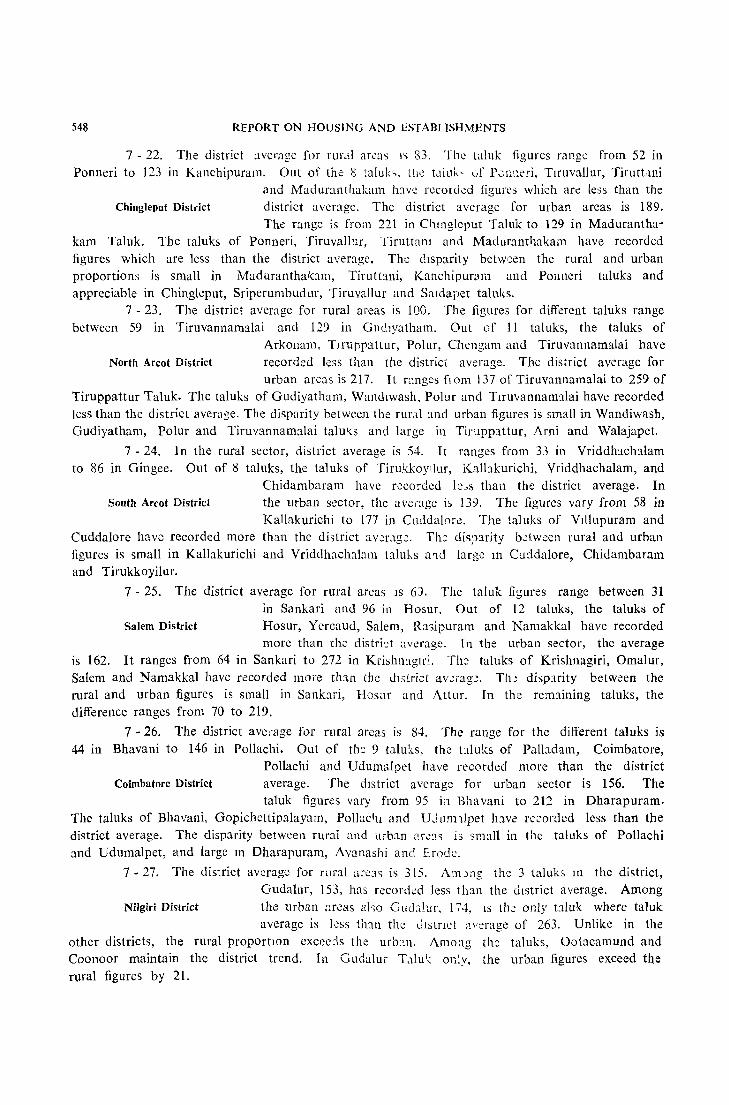
548 REPORT ON HOUSING AND ESTABLISHMENTS
7 - 22. The district :wernge for rur,il arl?<!" I" 83. Th\! talllk figures range from 52 in Ponneri to 123 in Kanc:hipuram. Out of the g taluh. UtC Lliuk, (If Pvr;l~e!'i, Tlrllvallnr, Tiruttdni
and Maduranthakam have rccord~d figures which are less than the Chingleput District district average. The district average for urban areas is 189.
The range is from 221 in C1ungleput Taluk to 129 in Maduranthakam Taluk. The taluks of Ponneri, Tiruvalbr, Tiruttatll and Maduranthakam have recorded figures which are less than the district average. The disparity betw'Jcn the rural and urban proportions is small in Maduranthakam, Tiruit:lI1i, Kanchipur31i1 and Ponneri talukii and appreciable in Chinglcput, Sriperumbudur, Tiruvallur and Saldapet taluks.
7 - 23. The district average for rural areas is 100. The figures for different taluks range between 59 in Tiruvannamalai and 129 in Glldlyatham. Out of II taluks, the taluks of
Arkonam. TJruppattur, Polur, Chengam and Tiruvannamalai have North Arcot District recorded less than the district average. The district average for
urban areas is 217. It r2.nges flom l37 of Tiruvannamalai to 259 of Tiruppattur Taluk. The taluks of Gudiyatham, Wandl\vash, Polur and TlruVannam:llai have recorded less than the district average. The disparity between the rural and urban figures is small in Wandiwash, Gudiyatham, Polur and Tiruvannamalai ta1u,<s and large in Tiruppattur, Ami and Walajapet.
7 - 24. In the rural sector, district average is 54. It ranges from 33 in Vriddhach:llam to 86 in Gingee. Out of 8 taluks, the taluks of Tirui(koy!lur, Kallakurichi, Vriddhachalam, and
Chidambaram have recorded le]s than the district average. In South Arro! District the urban s~ctor, the aVC(:lgc is 139. The figurcs vary from 58 in
Kallakurichi to 177 in CU!.ldalor~. The taluks of Vl11upuram and Cuddalore have recorded more than the district :lv.cr.lg.c. Th:: dis}1:lrity b~tween rural and urban figures is small in Kallakurichi and Vriddhachalam taluks a'1d large 111 Cuddalore, ChiJambaram amI Tirukkoyilur.
7 - 25. The district average for rural areas IS 6). The taluk figures range between 31 in Sankari and 96 in Hosur. Out of 12 taluks, the taluks of
Salem District Hosur, Yercaud, Salem, Rasipuram and Namakkal have recorded more than the district average. Tn the urban sector, the average
is 162. It ranges from 64 in Sankari to 272 in Krishmglri. Th:: taluks of Krishnagiri, Omalur, Salem and Namakkal have recorded more tlnn the J15trizt avetag~. TIn disp:lrity between the rural and urban figures is small in Sankari, Hos;}[ and Attur. In the rem1ining taluks, the difference ranges from 70 to 219.
7 • 26. The district average for rural areas is 84. The range for the different taluks is 44 in Bhavani to 146 in Pollachi. Out of the 9 talub, the t:tluks of Palladam, Coimbatore,
Pollachi and Udumalpet have recorded more than the district Coimbatore District average. The district average for urban sector is 156. The
taluk figures vary from 95 in Ella vani to 212 in Dharapuram. The taluks of Bhavani, Gopichettipalayam, PolIaclJ.l and U j urn 11pet h:lVc recorded less than the district average. The disparity between rural Qnd urban [1_r~:lS i3 small in the taluks of Pollachi and Udumalpet, and large 111 Dharapuram, Avanashi and Erode.
7·27. The district average for rural arcas is 3l5. Am)ng th,;:: 3 taluks In the district, Gudalur, 153, has recorded less than the district average. Among
Nilgiri District the urban areas also Gud::tlur. 174, IS th~ only t::tluk where taluk average is kss th:m the ulstnct <lVerage of 263. Unlike in the
other districts, the rural proportIOn exccds the urb::n. Amoag the taluks, Ootacamund and Coonoor maintain the district trend. In Gudalur Tcllu l( only, the urban figures exceed the rural figures by 21.

HOUSEHOLDS-BREAK-UP BY NUMBER OF ROOMS 549
7 - 28. The dIstnct figure for rural areas is 82. The range for all the taIuks is 36 in Melur and 122 in Periyakulam. Out of eIght taluks, the taluks of Dindigul, PaIni, Kodaikanal
and Melur have recorded less than the distnct average. The district Madurai District average for urban areas is 128. The range for the taIuks IS between
113 in Madurai and 224 in Kodaikanal. The taluks of Dindigul, Melur and Madurai have recorded less than the district average. The disparity between the rural and urban figures ranges between 21 in Periyakulam and 161 in Kodaibnal.
7 - 29. The district average for rural areas is 47. The figures recorded by the taluks vary from 18 in Kulathur to 90 in Musiri. Out of the 10 taluks, the taluks of Lalgudi, Musiri,
Karur, Tiruchirapalli and Tirumayam have recorded more than Tirucbirapalli District the district average. The district figure for urban areas jg 154.
The figures recorded by the tainks range b~tween 54 111
Udaiyarpalayam and 184 in Tiruchirapalli. The taluks of Tiru~hir,lpallI and Tlrumayam alone have recorded more than the district average. The disparity between the rural and urban figures is well pronounced in thIS district except in the taIuks of Pcombalur an:l U JaiyarpaLlyam. All the other taluks have recordd high ddferen:::.!s ranging between 61 in Musiri and 123 in Tirumayam.
7 - 30. The district average in the rural sector' is 48. It varies from 23 in Orathanad and 71 in Nannilam. Out of 12 taluks, the taluks of M.lyuram, Nannilam,
Nagapa ttinam and Pattukkottai have recorded more than the Thanjavur District district average. In the urban sector, the average is 125. The
figures fall within the range of 49 in Arantangi and 160 in Thanjavur. The taluks of Mayuram, Thanjavur, M~ll1nargudj, N.lgap:1ttinam and Pattukkottai have recorded more than the district average. The disparity between rural and urban figures is small in the taluks of Nannilam and Arantangi and larg'.! 111 the taluks of Thanjavur, Pattukkottai and Mannargudi.
7 - 31. The district average for the rural are:ts IS 53. The highest and lowest figures recorded in the taluks are 93 in Srivilliputtur and 32 in Paramakudi. Among th:: 9
taluks, the taluks of Sivaganga, Tiruvadanai, P.lf.lmabldi and Ramanathapuram District Mudukulathur have recorded less than the district average!. In
the urban sector, the average is 150. The highest and lowest figures recorded in the taluks are 223 in Mudukulathur and 116 in Paramakudi. The taluks of Sivaganga, Paramakudi, Ramanathapuram anj Aruppukkottai have recorded less than the district average. The disparity between the rural and urb:ll1 figures is not considerable in the taluks of Srivil1iputtur and Aruppukkottai. In the remlinig taluks, the differen::e ranges from 70 in Sattur to 184 in Mudukulathur.
7 - 32. The district average for the rural sector is 143. They range from 86 in Tiruchendur to 269 in Ambasamudram. Out of 9 taluks, the taluks of Shenc::>ttah, Ambas:tmu
dram and Nanguneri have recorded more than th; district Tirunelveli District average. The district average for the urban area is 250. The
taluk figures range from 141 in Kovilpatti to 485 in Shencottah. The taluks of Tenkasi, Shencottah and Amb.lsamudram hwc recorded more than the district average. The disparity between the rural and urban figures is very high in th~ taluks of Tirunelveli, Tenkasi, Ambasamudram, Tiruchendur and Shencottah ranging between 112 and 240. J)) the remainin$ taluks, it ranges from 18 in Nanguneri to 75 in Srivalkuntam.
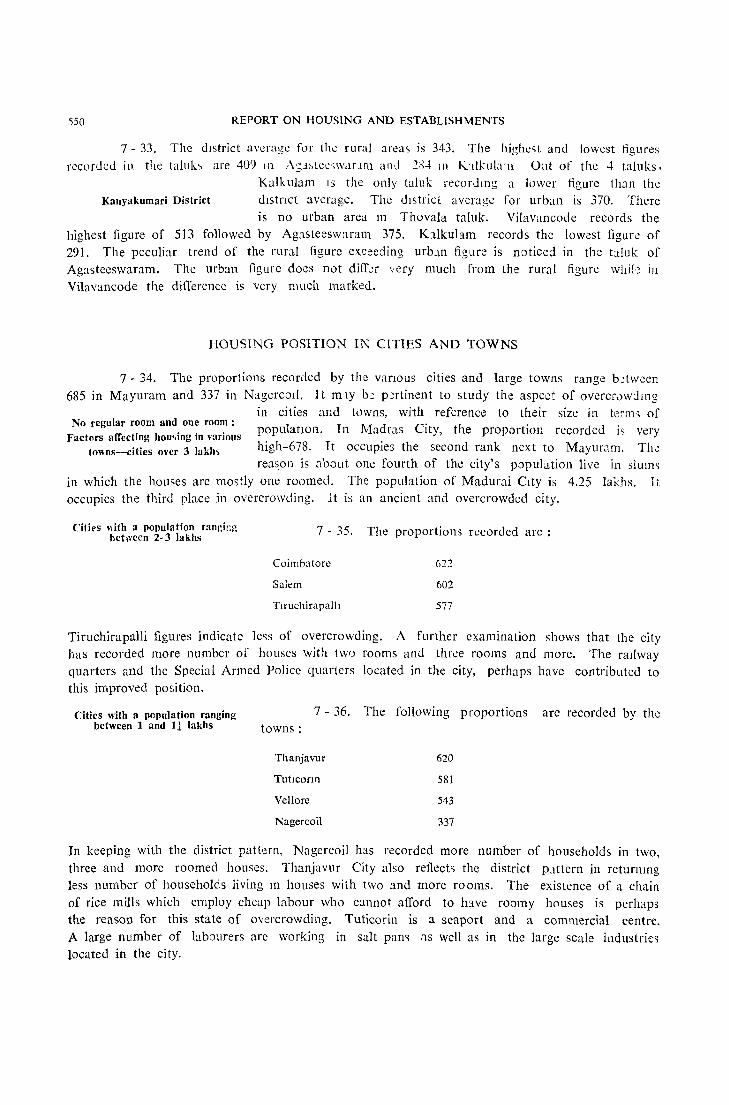
550 REPORT ON HOUSING AND ESTABLISHMENTS
7 - 33. The dIstrict average for the rural area'S is 343. The highe~t and lowest tlgures recorded in the talub are 409 In 1\:;a,tcc~;wdLtm and 2::)'+ III K'tlkula;n Out of the 4 taluks,
Kalkulam IS the only taluk record1l1g a lower figure than the Kanyakumari District dIstnct average. The district average for urban is 370. There
is no urban area 111 Thovala taIuk. Vilavancode records the highest figure of 513 followed by Agasteeswaram 375. K:tlkulam records the lowest figure of 291. The peculiar trend of the rural figure exceeding urb_lll figure is noticed in the t:lluk of Agasteeswaram. The urban figure does not differ very much from the rural figure whit,? in Vilavancode the difference is very much marked.
HOUSING POSITION IN ClTIES AND TOWNS
7 - 34. The proportions recorded by the vanous cities and large towns range b~twcen 685 in Mayuram and 337 in Nagercoll. 1 t m ly b;! p.?rtinent to study the aspeet of ovcrcr0w::ltng
in cities and towns, with reference to their size in tenm of No regular room and one room: C· populatIOn. In Madras lty, the proportion recorded is very
Factors affecting hou~ing in various towns-cities over 3 lakh5 high-678. It occupies the second rank next to Mayuram. The
rea~on is about one fourth of the city's popUlation live in slUlm
in which the houses are mostly one roomed. The popUlation of Madurai CIty is 4.25 lakhs. It occupies the third place in overcrowding. It is an ancient and overcrowded city.
Citit's vlith a population r::ID~ir.g between 2-3 lakhs 7 - 35. The proportions recorded are:
Coimbatorc 622
Salem 602
Tlruchirapalh 577
Tiruchirapalli figures indicate less of overcrowding. A further examination shows that the city has recorded more number o[ houses with tWI) rooms and three rooms and more. The raIlway quarters and the Special Armed Police quarters located in the city, perhaps have contributed to this improved position.
Cities with a population ranging between 1 :.Ind 1 t lakhs
7 - 36. The following proportions are recorded by the towns:
Thanjavur
TutIconn
Vellore
l'\agercoil
620
581
543
337
In keeping with the district pattern, Nagercoil has recorded more number of households in two, three and more roomed houses. Thanjavur City also reflects the district p.tttern in returnlllg less number of households living In houses with two and more rooms. The existence of a chain of rice mills which employ cheap labour who cannot afford to h:lVe roomy houses is perhaps the reason for this state of overcrowding. Tuticorin is a seaport and a commercial centre. A large number of bbourers arc working in salt pam rts well as in thc large scale industries located in the city.

i-IOUSEHOLDS-BRl:AK-UI' BY NUMBER OF ROOMS 5si
Towns having a population of 75,000 to one lakh 7 - 37. The proportions recorded are:
Kumbilkonam 662
Dmdigul 661
CuddaJore 637
TlfUPPur 506
Kanchlpuram 553
VaJparal 5-i3
Tlrunelvell 470
Kwnbakonam is surrounded on all sidcs by wet field~. It is aho a commercial and nee·mlliing centre. Thcsc factors are responsible for overcrowding III the town. Water i) a problem in Dll1dlgul city. It is a rocky arca where water tabk is vcry low, and it is expcllsive to sink a well. Perpaps, this factor ha5 compelled people to live in a limited are::l without expandIng in dlfferent directions. Also lock-making run on a small scale industry basis and ml11ufacture of cigJ.r and chewing tobacco attract cheap Ltbour. Compared to other towns, CudJalore is economically backward. In Tirunelveli overcrowdmg is the le.lst among the cities under the group. Apart from the fact that people are educated and want to have cemfortable acc'.)mmodatlOll , the growth of satellite towns hke Palayamcotta1, Pettai and Melapalayam has its due sharc in m1l1imising overcrowding in Tiruneivell.
Town& "ith a population of 50,\)00 to 75,000
7 - 38. The following are the proportions recorded by the towns in this range.
Mayuram 685
Virudunagar 670
Pudukottai 661
Karur 642
Nagapattmam 629
Po Ilachi 629
Aruppukkottai 594
Erode 576
RaJapalayam 558
PaLiyamcO!tal 524
Gudlyatham 518
Ootacamund 4i8
Mayuram IS surrounded by wet fields. It 1S a f1ce mlllm~ centre. Vlrudunagar 1" a commercL:d cenlIe situated in a dry tract. The surroundll1g arcJ. l~ econorlllccllly backward. The rurdl folk who migrate to Virudunagar 111 search of employment connected with commerce could not lIvc ill propcr houses. Pudukottai IS in the mldst of an artll tract. The pcoplc a'c not economIcally prospcrous. Karur is a handloom weavll1g centre. The economical plight of handloolU weavers is well known. Nagapattmam is a scaport in a dcltalc tiact. Pollachi is a comlllcrcial ccntre. Agricultural lands in the surrounding regions are aho l1lJrc costly as thcy arc emmcntly suited for growing the commercial crop, groundnut. Thc posItIOn in the rcmaining towns is comparatively better. Ootacamund occupies the lowest rank. It IS a hIlly station. Its population is the lowest. To protect themselves from the rigours of the cold climate, people are compelled to bUlld fairly large houses.
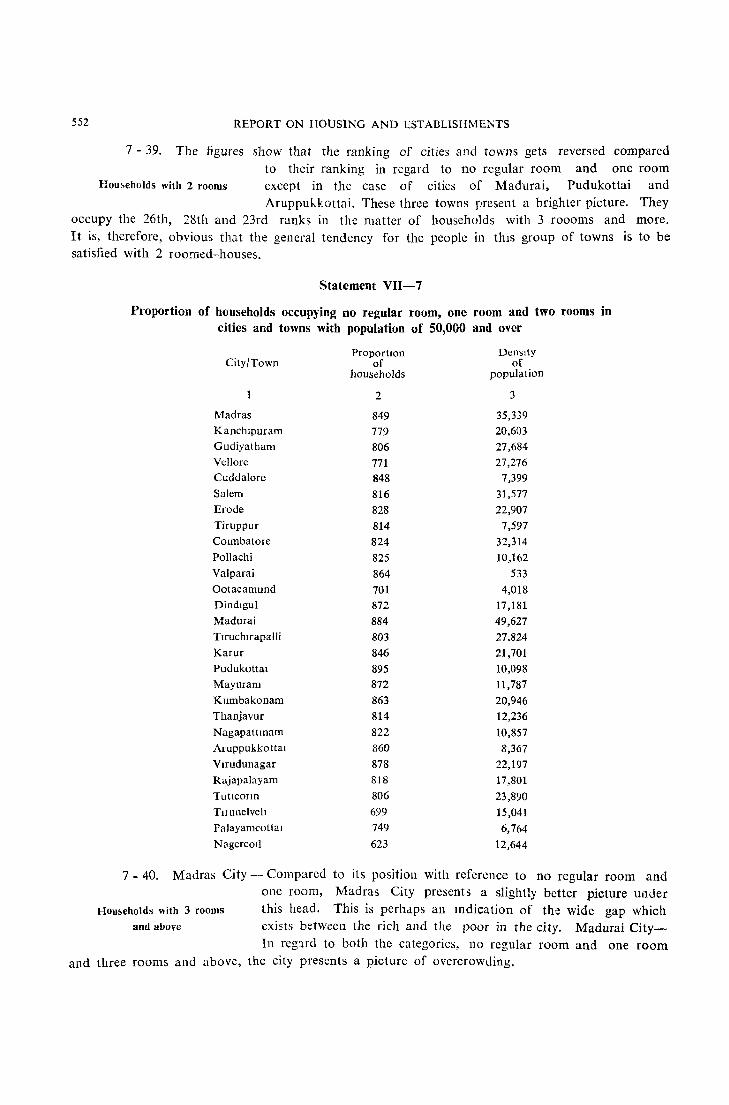
552 REPORT ON HOUSING AND ESTABLISIIMEl'<TS
7 - 39. The figures show that the ranking of cities and towns gets reversed compared to their ranking in regard to no regular room and one room
Hou&eholds with 2 rooms except in the case of cities of Madurai, Pudukottai and Aruppukkottai. These three towns present a brighter picture. They
occupy the 26th, 28th and 23rd ranks in the matter of households with 3 roooms and more. H is, therefore, obvious that the general tendency for the people in this group of towns is to be satisfied with 2 roomed-houses.
Statement VIl-7
Proportion of households occupying no regular room, one room and two rooms in cities and towns with population of 50,000 and over
City/Town
Madras
Kanchlpuram
Gudiyatham
Vellore
Cuddalore
Salem
Erode
Tiruppur
COImbatore
Pollachi
Valparai
Ootacamund
Dindlgul
Madurai Tlruchlrapalli
Karur
Pudukottal
Mayuram
Kumbakonam
Thanjavur
Nagapattmam Aruppukkottal
Vlrudunagar
Rajapalayam
Tuttconn
THunelvelt
Palayamcottal
NagercOII
ProportIOn of
households
2
849
779
806
771 848
816
828
814
824
825
864
701
872
884
803
846
895
872
863
814
822
860
878
818
806
699
749
623
DensIty of
population
3
35,339
20,603
27,684
27,276
7,399
31,577
22,907
7,597
32,314
10,162
533
4,018 17,181
49,627
27.824
21,701
10,098
11,787
20,946
12,236
10,857
8,367
22,197
17,801
23,890
15,041
6,764
12,644
7 - 40. Madras City - Compared to its position with reference to no regular room and one room, Madras City presents a slightly better picture ullder
Hou~eholds with 3 rooms this head. This is perhaps an llldication of the wide gap which and above exists between the rich and the poor in the city. Madurai City-
Tn reg:trd to both the categories, no regular room and one room and three rooms and above, the city presents a picture of overcrowding.
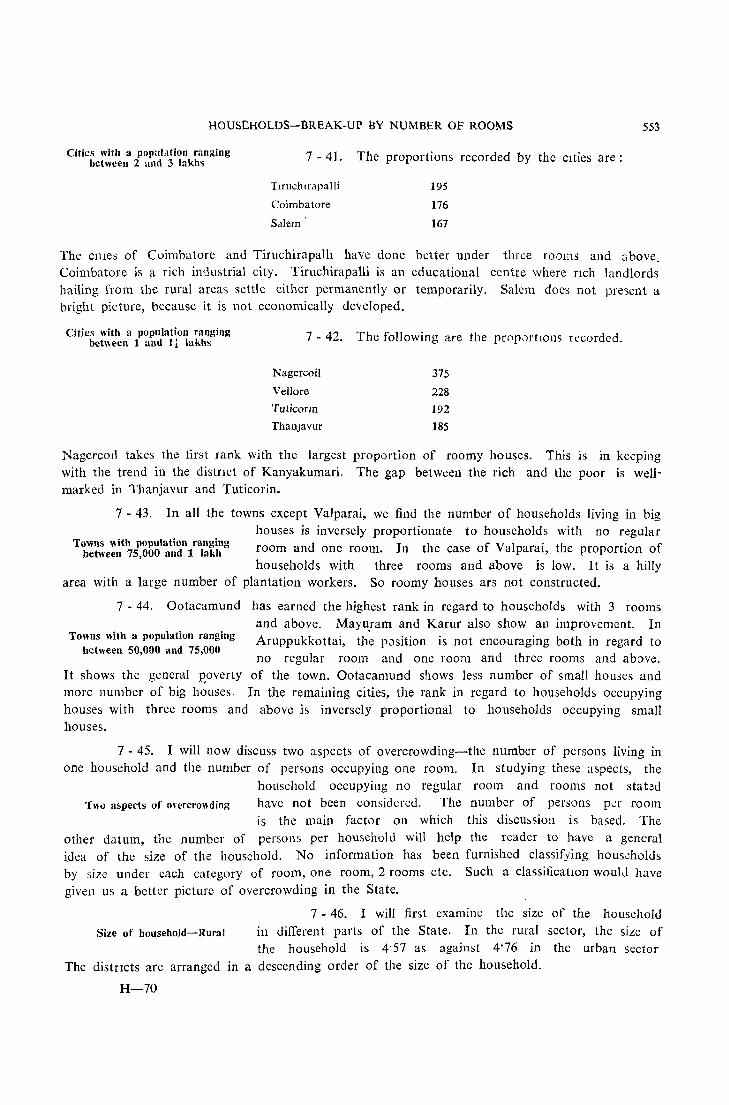
HOUSEHOLDS-BREAK-UP BY NUMBER OF ROOMS 553
Cities with a population ranging between 2 and 3 lakhs 7 - 41. The proportions recorded by the cIties are:
TlfUchlrapaIli
Coimbatore
Salem
195
176
167
The Cllles of Coimbatore and Tiruchirapalh have done better under three rOOE1S and above. Coimbatore is a rich industrial city. Tiruchirapalli is an educational centre where nch landlords hailing from the rural areas settle either permanently or temporarily. Salem does not present a bright picture, because it is not economically developed.
Cities with a population ranging bet"een 1 and Ii lakhs 7 - 42. The following are tbe prOp,)rtlOlls recorded.
Nagercoil 375
Vellore 228 Tuticonn 192 ThanJavur 185
NagercOlI takes the first rank with the largest proportion of roomy houses. This is in keeping with the trend in the distnct of Kanyakumari. The gap between the rich and the poor is wellmarked in Thanjavur and Tuticorin.
7 - 43. In all the towns except Valparai, we find the number of households living in big
Towns ¥lith population ranging between 75,000 and 1 lakh
houses is inversely proportionate to households with no regular room and one room. In the case of Valparai, the proportion of households with three rooms and above is low. It is a hilly
area with a large number of plantation workers. So roomy houses ars not constructed.
7 - 44. Ootacamund has earned the highest rank in regard to households with 3 rooms
Towns \\ith a population ranging between 50,000 and 75,000
and above. Mayu.ram and Karur also show an improvement. In Aruppukkottai, the pJsition is not encouraging both in regard to no regular room and one room and three rooms and above.
It shows the general p,overty of the town. Ootacamund shows less number of small houses and more number of big houses. In the remaining cities, the rank in regard to households occupying houses with three rooms and above is inversely proportional to households occupying small houses.
7 - 45. I will now discuss two aspects of overcrowding-the number of persons living in one household and the number of persons occupying one room. In studying these aspects, the
household occupying no regular room and rooms not stat~d
Two aspects of overcrowding have not been considered. The number of persons per room is the main factor on which this di5cmsiol1 is based. The
other datum, the number of persons per household will help the reader to have a general i.dea of the size of the household. No information has been furnished classifying hous~holds
by size under each category of room, one room, 2 rooms etc. Such a classificatIOn woulJ have given us a bettcr picture of overcrowding in the State.
7 - 46. I will first examine the size of the household Size of household-Rural in different parts of the State. In the rural sector, the size of
the household is 4·57 as against 4·76 in the urban sector The distrIcts are arranged in a descending order of the size of the household.
H-70
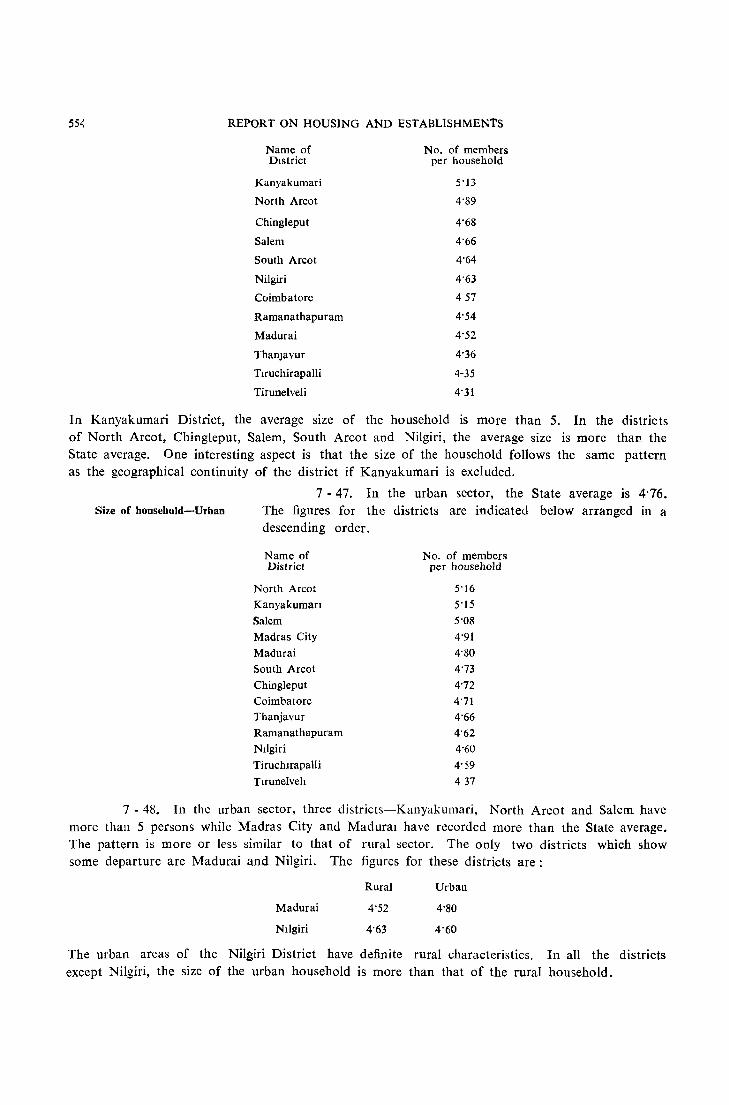
55< REPORT ON HOUSING AND EsTABLISHMENTS
Name of No, of members District per household
Kanyakumari 5'13
North Areot 4'89
Chingleput 4'68
Salem 4'66
South Areot 4'64
Nilgiri 4'63
Coimbatore 457
Ramanathapuram 4'54
Madurai 4'52
ThaDJavur 4'36
Tlruehirapalli 4-35
Tirunelveli 4'31
In Kanyakumari District, the average size of the household is more than 5, In the districts of North Arcot, Chingleput, Salem, South Arcot and Nilgiri, the average size is more thaI:! the State average, One interesting aspect is that the size of the household follows the same pattern as the geographical continuity of the district if Kanyakumari is excluded,
Size of household-Urban
7 - 47. In the urban sector, the State average is 4'76. The figures for the districts are indicated below arranged in a descending order.
Name of No, of members District per household
North Areot 5'16
Kanyakuman 5'15
Salem 5'08
Madras City 4'91
Madurai 4'80
South Areot 4'73
Chingleput 4'72 Coimbatore 4'71 Thanjavur 4'66 Ramanathapuram 4'62 NIIgiri 4'60
Tiruehlrapalli 4'59
Tlrunelveh 437
7 - 48. In the urban sector, three districts-Kanyakumari, North Arcot and Salem have more than 5 persons while Madras City and Madura! have recorded more than the State average. The pattern is more or less similar to that of rural sector, The only two districts which show some departure are Madurai and Nilgiri. The figures for these districts are:
Madurai
NIIgiri
Rural Urban
4'52
4'63
4'80
4'60
The urban areas of the Nilgiri District have definite rural characteristics, In all the districts except Nilgiri, the size of the urban household is more than that of the rural household.
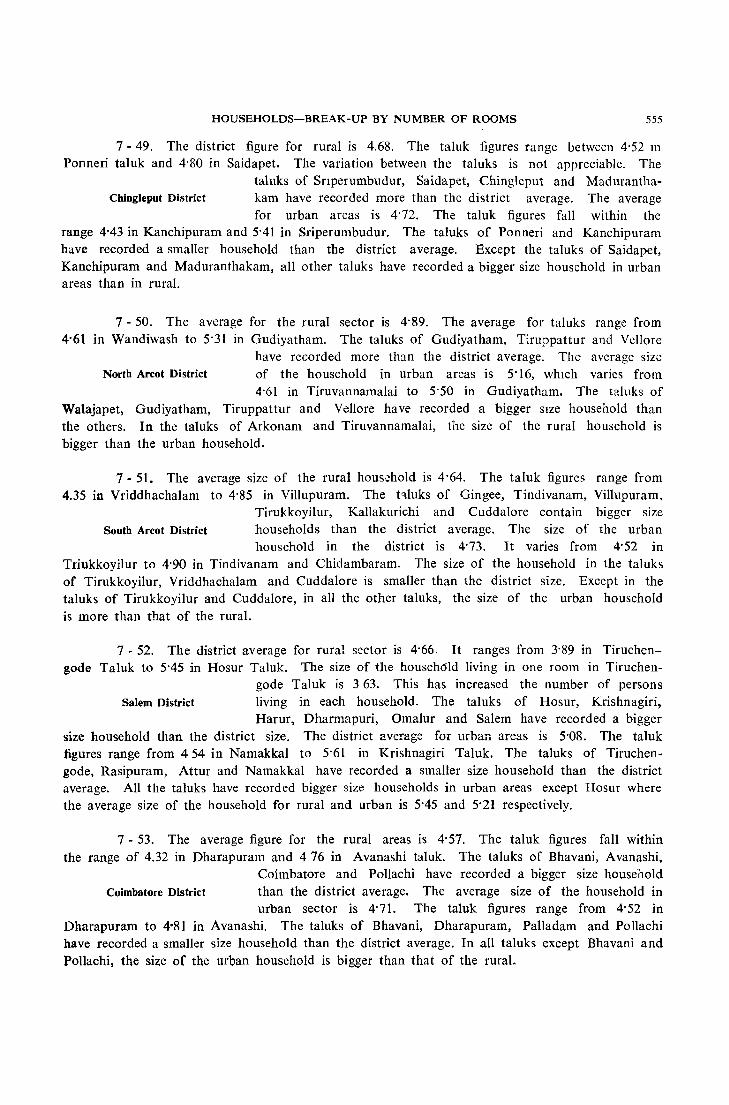
HOUSEHOLDS-BREAK-UP BY NUMBER OF ROOMS 555
7 - 49, The district figure for rural is 4,68, The taluk figures range between 4'52 In
Ponneri taluk and 4'80 in Saidapet. The variation between the taluks is not appreciable, The taluks of Snperumbudur, Saidapet, Chinglcput and Madurantha-
Cbingleput District kam have recorded more than the district average, The average for urban areas is 4'72, The taluk figures fall within the
range 4'43 in Kanchipuram and 5'41 in Sriperumbudur, The taluks of Ponneri and Kanchipuram have recorded a smaller household than the district average. Except the taluks of Saidapet, Kanchipuram and Maduranthakam, all other taluks have recorded a bigger size household in urban areas than in rural.
7 - 50, The average for the rural sector is 4'89, The average for taluks range from 4'61 in Wandiwash to 5'31 m Gudiyatham, The taluks of Gudiyatham, Tiruppattur and Vellore
have recorded more than the district average, The average sizc North Arcot District of the household in urban areas is 5'16, which varies from
4'61 in Tiruvannamalai to 5'50 in Gudiyatham. The taluks of Walajapet, Gudiyatham, Tiruppattur and Vellore have recorded a bigger size household than the others, In the taluks of Arkonam and Tiruvannamalai, the size of the rural household is bigger than the urban household.
7 - 51. The average size of the rural hous.::hold is 4'64, The taluk figures range from 4,35 in Vriddhachalam to 4'85 in Villupuram. The t<lluks of Gingee, Tindivanam, Villupuram,
Tirukkoyilur, Kallakurichi and Cuddalore contain bigger size South Arcot District households than the district average. The size of the urban
household in the district is 4'73. It varies from 4'52 in Triukkoyilur to 4'90 in Tindivanam and Chidambaram. The size of the household in the taluks of Tirukkoyilur, Vriddhachalam and Cuddalore is smaller than the district size, Except in the taluks of Tirukkoyilur and Cuddalore, in all the other taluks, the size of the urban household is more than that of the rural.
7 - 52. The district average for rural sector is 4'66, It ranges from 3-89 in Tiruchengode Taluk to 5'45 in Hosur Taluk. The size of the househ6ld living in one room in Tiruchen
gode Taluk is 3 63. This has increased the number of persons Salem District living in each household. The taluks of Hosur, Krishnagiri,
Harm, Dharmupuri, Omalur and Salem have recorded a bigger size household than the district size. The district average for urban areas is 5'08. The taluk figures range from 454 in Namakkal to 5'61 in Krishnagiri Taluk. The taluks of Tiruchengode, Rasipuram, Attur and Namakkal have recorded a smaller size household than the district average. All the taluks have recorded bigger size households in urban areas except Hosur where the average size of the household for rural and urban is 5'45 and 5'21 respectively,
7 - 53. The average figure for the rural areas is 4'57. The tal uk figures fall within the range of 4.32 in Dharapuram and 476 in Avanashi taluk. The taluks of Bhavani, Avanashi,
Coimbatore and Pollachi have recorded a bigger size household Coimbatore District than the district average. The average size of the household in
urban sector is 4'71. The taluk figures range from 4'52 in Dharapuram to 4'81 in Avanashi, The taluks of Bhavani, Dharapuram, Palladam and Pollachi have recorded a smaller size household than the district average. In all taluks except Bhavani and Pollachi, the size of the urban household is bigger than that of the rural.
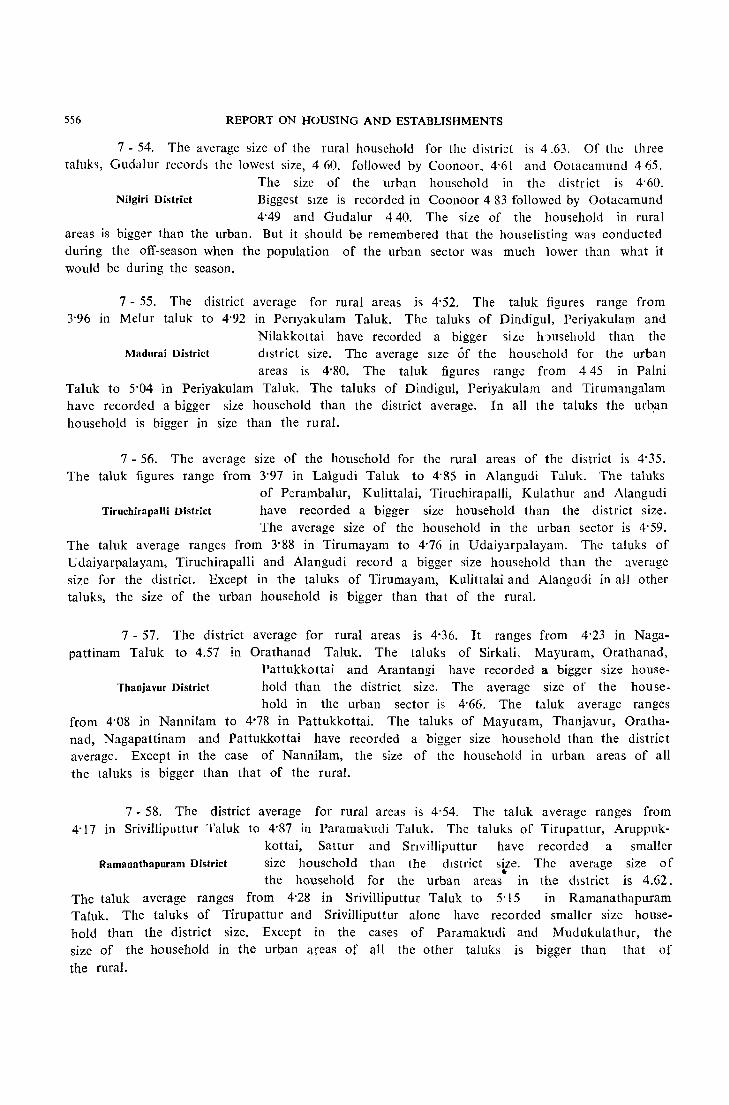
556 REPORT ON HOUSING AND ESTABLISHMENTS
7 - 54, The average size of the rural household for the distri:.:t is 4,63, Of the three taluks, Gudalur records the lowest size, 460, followed by Coonoor, 4'61 and Ootacamund 465,
The size of the urban household in the district is 4'60, Nilgiri District Biggest SIze is recorded in Coonoor 4 83 followed by Ootacamund
4'49 and Gudalur 440, The size of the household in rural areas is bigger than the urban, But it should be remembered that the houselisting was conducted during the off-season when the population of the urban sector was much lower than wh3.t it would be during the season,
7 - 55, The district average for rural areas is 4'52, The taluk figures range from 3'96 in Melur taluk to 4'92 in Penyakulam Taluk, The taluks of Dindigul, Periyakulam and
Nilakkottai have recorded a bigger size h 1usehold than the Madurai District dIstrict size, The average SIze of the homehold for the urban
areas is 4'80. The taluk figures range from 4 45 in Palni Taluk to 5'04 in Periyakulam Taluk, The taluks of Dindigul, Periyakulam and Tirumangalam have recorded a bigger size household than the district average. In all the taluks the urban household is bigger in size than the rural.
7 - 56. The average size of the household for the rural areas of the district is 4'35. The taluk figures range from 3'97 in Lalgudi Taluk to 4'85 in Alangudi Taluk, The taluks
of Perambalur, Kulittalai, Tiruchirapalli, Kulathur and Alangudi Tiruchirapalli District have recorded a bigger size household than the district size.
The average size of the household in the urban sector is 4'59, The taluk average ranges from 3'88 in Tirumayam to 4'76 in Udaiyarpalayam, The taluks of Udaiyarpalayam, Tiruchirapalli and Alangudi record a bigger size household than the average size for the district, Except in the taluks of Tirumayam, Kulittalai and Alangudi in all other taluks, the size of the urban household is bigger than that of the rural.
7 - 57, The district average for rural areas is 4'36, It ranges from 4'23 in Nagapattinam Taluk to 4.57 in Orathanad Taluk. The taluks of Sirkali, Mayuram, Orathanad,
Pattukkottai and Arantangi have recorded a big;ger size house-Tbanjavur District hold than the district size, The average size of the house-
hold in the urban sector is 4'66, The tal uk average ranges from 4'08 in Nannilam to 4'78 in Pattukkottai. The taluks of Mayuram, Thanjavur, Orathanad, Nagapattinam and Pattukkottai have recorded a bigger size household than the district average, Except in the case of Nannilam, the size of the household in urban areas of all the taluks is bigger than that of the rural.
7 - 58, The district average for rural areas is 4'54, The taluk average ranges from 4'17 in Srivilliputtur Taluk to 4'87 in Parama1.;:udi Taluk. The taluks of Tirupattur, Aruppuk-
kottai, Sattur and Snvilliputtur have recorded a smaller Ramanathapuram District size household than the district size, The average size of • the household for the urban areas in the dIstrict is 4,62.
The taluk average ranges from 4'28 in Srivilliputtur Taluk to 5'15 in Ramanathapuram Taluk, The taluks of Tirupattur and Srivilliputtur alone have recorded smaller size household than the district size. Except in the cases of Paramakudi and Mudukulathur, the size of the household in the urban &;cas of &11 the other taluks is bigger than that of the rural.
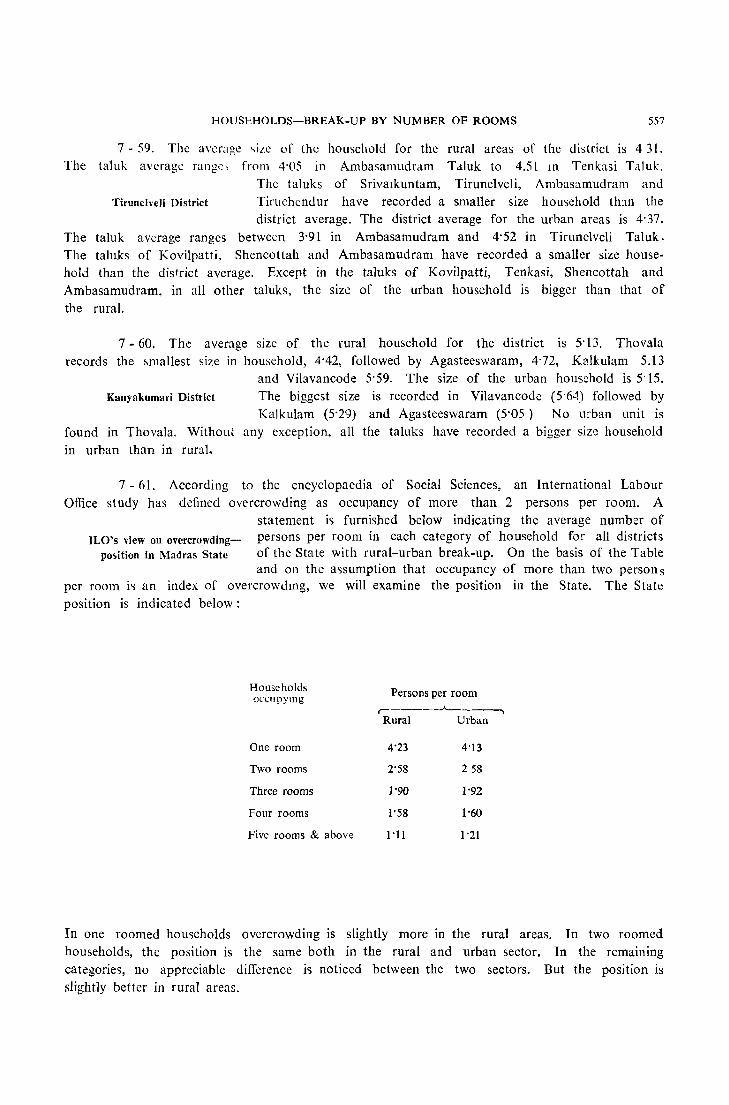
HOUSEHOLDS-BREAK-UP BY NUMBER OF ROOMS 557
7 - 59. The average ~izc of the household for the rural areas of the district is 4 31. The taluk average range', from 4'05 in Ambasamudram Tdluk to 4.51 111 Tenkasi Taluk.
The taluks of Srivalkuntam, Tirunelveli, Ambasamudram and Tirunelyeli District Tiruchendur have recorded a smaller size household th:1I1 the
district average. The district average for the urban areas is 4'37. The taluk average ranges between 3'91 in Ambasamudram and 4'S2 in Tirunelveli Taluk. The taluks of Kovilpatti, Shencottah and Ambasamudram have recorded a smaller size household than the district average. Except in the taluks of Kovilpatti, Tenkasi, Shencottah and Ambasamudram, in all other taluks, the size of the urban household is bigger than that of the rural.
7 - 60. The average size of the rural household for the district is S·13. Thovala records the 5mallest size in household, 4'42, followed by Agasteeswaram, 4'72, Kalkulam S.13
and Vilavancode S·S9. The size of the urban household is S·lS. Kanyakumari District The biggest size is recorded in Vilavancode (S'64) followed by
Kalkulam (S'29) and Agasteeswaram (5'05) No urban unit is found in Thovala. Without any exception, all the taluks have recorded a bigger size household 111 urban than in rural.
7 - 61. According to the encyclopaedia of Social Sciences, an International Labour Office study has defined overcrowding as occupancy of more than 2 persons per room. A
statement is furnished below indicating the average number of lLO's yiew on overcrowding- persons per room in each category of household for all districts
position in Madras State of the State with rural-urban break-up. On the basis of the Table and 011 the a5sumption that occupancy of more than two person s
per room i5 an index of overcrowdmg, we will examine the position in the State. The State position is indicated below:
Households Persons per room occupymg .-_____ .A. __ ----,
Rural Urban
One room 4'23 4'13
Two rooms 2'58 258
Three rooms 1'90 1'92
Four rooms 1 '58 1 '60
Five rooms & abov<: 1'11 1'21
In one roomed households overcrowding is slightly more in the rural areas. In two roomed households, the position is the same both in the rural and urban sector. In the remaining categories, no appreciable difference is noticed between the two sectors. But the position is slightly better in rural areas.
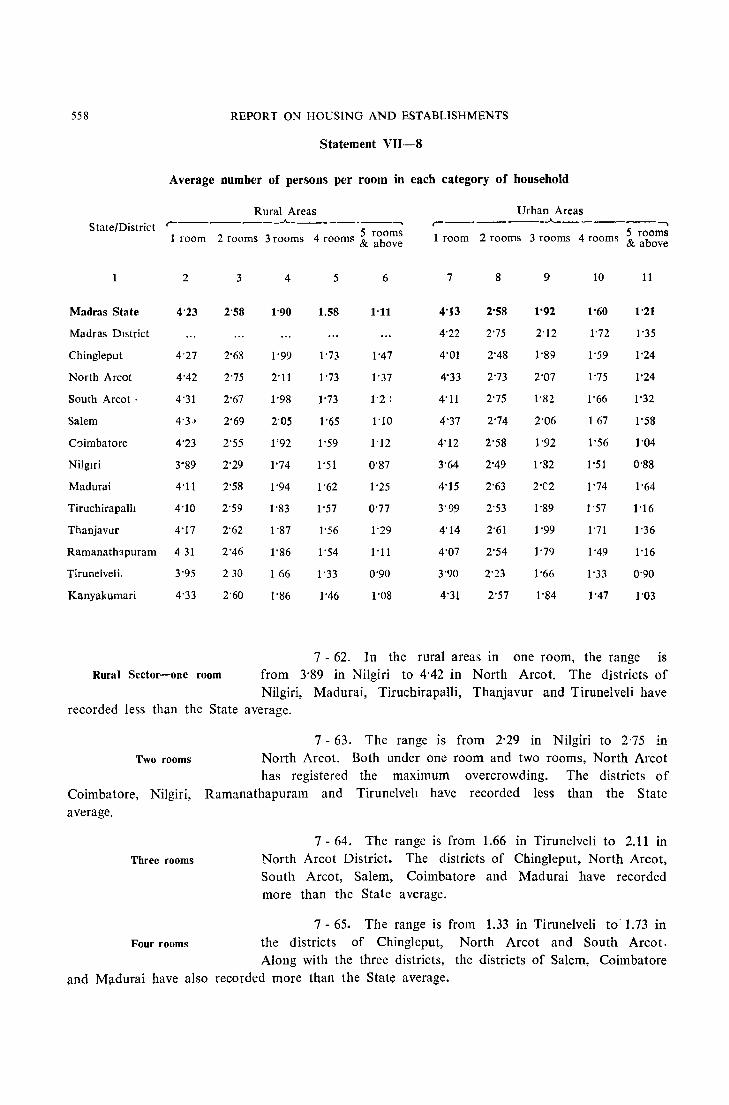
558 REPORT ON HOUSING AND ESTABLISHMENTS
Statement VIl-8
Average number of persons per room in each category of household
Rural Areas Urban Areas
State/District r--------....A...-----.---. .-________ ..A.. _______ -.,
5 rooms 5 roomS 1 room 2 rooms 3 rooms 4 rooms & above 1 room 2 rooms 3 rooms 4 room~ & above
1 2 3 4 5 6 7 8 9 10 11
Madras State 4'23 2'58 1'90 1.58 1-11 4'13 2'58 1'92 1'60 1'21
Madras District 4'22 2'75 2'12 1'72 1'35
Chingleput 4'27 2'63 1'99 1'73 1'47 4'01 2'48 1'89 1'59 1'24
North Areot 4'42 2'75 2'11 1'73 1'37 4'33 2'73 2'07 1'75 1'24
South Areot ' 4'31 2'67 1'98 1'73 1'2 ) 4'11 2'75 1'82 1'66 1'32
Salem 4'3J 2'69 2'05 1'65 1'10 4'37 2'74 2'06 t 67 1'58
C~imbatore 4'23 2'55 1'92 1'59 1'12 4'12 2'58 1'92 1'56 1'04
Nilgtri 3'89 2'29 1'74 1'51 0'87 3'64 2'49 1'82 1'51 0'88
Madurai 4'11 2'58 1'94 1'62 1'25 4'15 2'63 2'C2 1'74 1'64
Tiruehirapalh 4'10 2'59 1'83 1'57 0'77 3'99 2'53 1'89 1'57 1'16
Thanjavur 4'17 2'62 1'87 1'56 1'29 4'14 2'61 1'99 1'71 1'36
Ramanathapuram 4 31 2'46 1'86 1'54 I'll 4'07 2'54 1'79 1'49 1'16
Tirunelveli, 3'95 230 166 1'33 0'90 3'90 2'23 1'66 1'33 0'90
Kanyakumari 4'33 2'60 1'86 1'46 1'08 4'31 2'S7 1'84 1'47 1'03
7 - 62. In the rural areas in one room, the range is Rural Sector-one room from 3'89 in Nilgiri to 4'42 in North Arcot. The districts of
Nilgiri, Madurai, Tiruchirapalli, Thanjavur and Tirunelveli have recorded less than the State average,
7 - 63, The range is from 2'29 in Nilgiri to 2'75 in Two rooms North Areot. Both under one room and two rooms, North Areot
has registered the maximum overcrowding, The districts of Coimbatore, Nilgiri, Ramanathapuram and Tirunelveh have recorded less than the State average,
Three rooms
7 - 64, The range is from 1.66 in Tirunelveli to 2,11 in North Arcot District, The districts of Chingleput, North Areot, South Areot, Salem, Coimbatore and Madurai have recorded more than the State average,
7 - 65, The range is from 1.33 in Tirunelveli to' 1.73 in Four rooms the districts of Chingleput, North Arcot and South Arcot,
Along with the three districts, the districts of Salem, Coimbatore and Madurai have also recorded more than the State average,
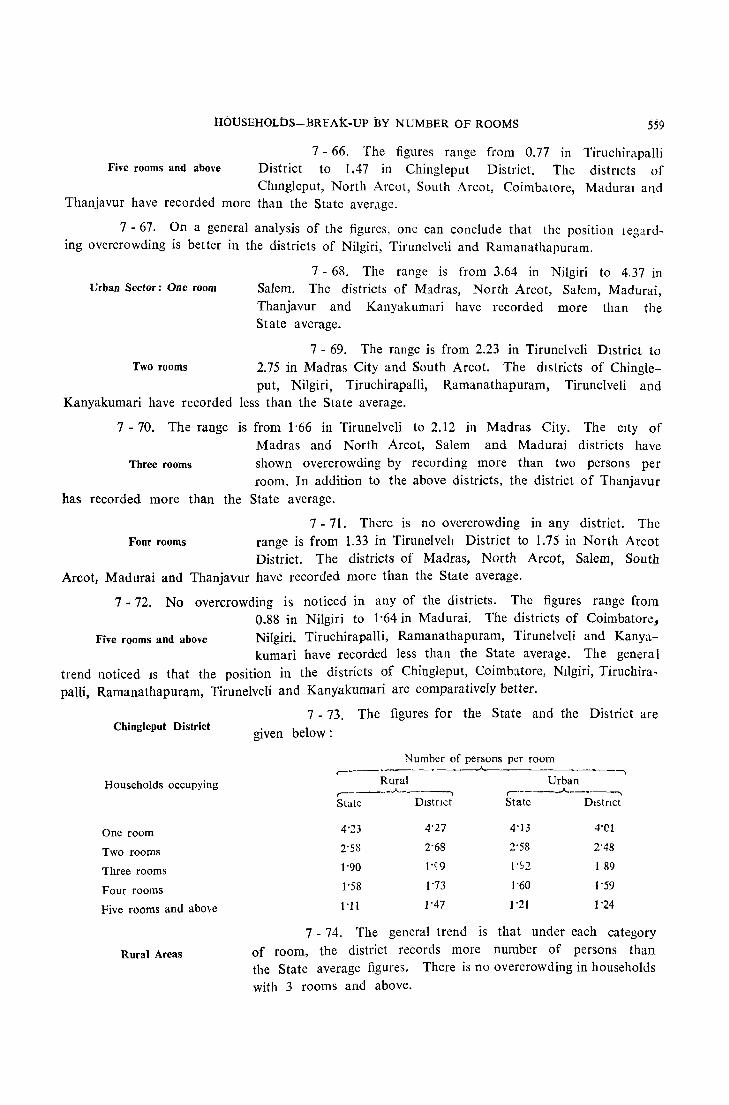
HOUSEHOLbS-BREAk-up BY NUMBER OF ROOMS .55<)
7 - 66. The figures range from 0.77 In Tiruchirapalli Five rooms and above District to 1.47 in Chingleput District. The distrIcts of
Chmgleput, North Arcot, South Arcot, Coimbatore, Madural and Thanjavur have recorded more than the State average.
7 - 67. On a general analysis of the figures, one can conclude that the position legarding overcrowding is better in the districts of Nilgiri, Tirunelveli and Ramanathapuram.
7 - 68. The range is from 3.64 in Nilgiri to 4,37 in Urban Sector: One room Salem. The districts of Madras, North Arcot, Salem, Madurai,
Thanjavur and Kanyakumari have recorded more than the State average.
7 - 69. The range is from 2.23 in Tirunelveli DIstrict to Two rooms 2.75 in Madras City and South Arcot. The dIstricts of Chingle-
put, Nilgiri, Tiruchirapalli, Ramanathapuram, Tirunelveli and Kanyakumari have recorded less than the State average.
7 - 70. The range is from 1'66 in Tirunelveli to 2.12 in Madras City. The cIty of Madras and North Arcot, Salem and Madurai districts have
Three rooms shown overcrowding by recording more than two persons per room. In addition to the above districts, the district of Thanjavur
has recorded more than the State average.
7 - 71. There is no overcrowding in any district. The Four rooms range is from 1.33 in Tirunelvell District to 1.75 in North Arcot
District. The districts of Madras, North Arcot, Salem, South Arcot, Madurai and Thanjavur have recorded more than the State average.
7 - 72. No overcrowding is noticed in any of the districts. The figures range from 0.88 in Nilgiri to 1'64 in Madurai. The districts of Coimbatore,
Five rooms and above Nilgiri, Tiruchirapalli, Ramanathapuram, Tirunelveli and Kanya-kumari have recorded less than the State average. The general
trend noticed IS that the posItIOn in the districts of Chingleput, Coimbatore, NIlgiri, Tiruchirapalli, Ramanathapuram, Tirunelveli and Kanyakumari are comparatively better.
Chingleput District
Households occupying
One room
Two rooms
Three rooms
Four rooms
Five rooms and above
Rural Areas
7 - 73. The figures for the State and the District are
given below:
Number of persons per room ,-~.
Rural Urban r----- .. __,.._- .. -~ r-'--~--_..J...._-.. ---., State Dlstnct State Dlstnct
4'23 4'27 4'13 4'Cl
2'58 2'68 2'58 2'48
1'90 1'~9 1'>2 1 89
1'58 1'73 1'60 1'59
I'll 1'47 1'21 1'24
7 - 74. The general trend is that under each category of room, the district records more number of persons than the State average figures. There is no overcrowding in households
with 3 rooms and above.

560 R.EPORT ON HOUSING AND ESTABLISHMENTS
7 - 75. There is no taluk without overcrowding in one roomed households. The taluk figures range from 4.12 in Tiruttani Taluk to 4.35 in Maduranthakum Taluk. The taluks of Ponneri, Tiruvallur, Saidapet, Chingleput and Maduranthakam ~how more overcrowding. In the case of 2 roomed households also, overcrowding exists in all the taluks. The taluk figures vary
from 2.56 in Sriperumbudur to 2.87 in Tiruttani. The taluks of TlfUvallur, Tiruttani and
Maduranthakam show more overcrowding. Among 3 roomed households, there is overcrowding only in the taluks of Ponneri, Tiruttani, Saidapet and Maduranthakam. Among 5 roomed households slIght overcrowding is noticed only in Sriperumbudur Taluk, the number of persons per
room being 2.04.
7 - 76. The general trend is that in all the categories of Urban Areas rooms except the category 5 r00111S and above, the district records
less number of persons than the State average figures. There is
no overcrowding in households with 3 rooms and above.
7 - 77. There is no taluk without overcrowding III one roomed households. The taluk
figures range from 3.66 in Kanchipuram to 4.44 in Tiruvallur. The taluk<; of Chingleput and Kanchipuram show less overcrowding. In the case of 2 roomed households also, overcrowding exists
in all the taluks. The taluk figures vary from 2.42 in Sriperumbudur to 2.66 in Tiruvallur. The taluks of Sriperumbudur, Saidapet and Kanchipuram show less overcrowding. Among 3 roomed households, there IS overcrowding only in the taluks of Ponneri, Snperumbudur and Maduranthakam. Among 4 and 5 roomed households, no overcrowding is noticed in
any taluk.
North Arcot District
Households occupymg
One room
Two rooms
Three rooms
Four rooms
Frve rooms and above
Rural Areas
7 - 78. The figures for the State and the District are given below:
Number of persons per room ,..-________ ~_.A. __________ -,
Rural Urban __ .A-__ .____, ,..-___ • .A._~.----------,
State Dlstnct State Dlstnct
4'23 4'42 4'13 433
2'58 2'75 2'58 2'73
1'90 2'11 1'92 2'07
1'58 1'73 1 60 1'75
1'11 1 37 1'21 1'24
7 - 79 The general trcnll 1~ that under each category of room, the district records marc numba of persons than the State average figures. There IS no overcrowding in households with 4 rooms and above.
7 - 80. There is no taluk without overcrowding in one roomcll households. The taluk figures range from 4.07 in Wandiwash to 4.68 in Tiruppattur. The taluks of Gudiyatham,
Tiruppattur, VeIlore, Chengam and Tiruvannamalai show more ovcrcrowdmg, In the case of 2
roomed households also, overcrowding exists in all the taluh. The taluk figures 5wmg between 2.57 in Ami and 3.05 in Tiruppattur. The taluks of Gudiyatham, Tlruppattur and Vellore show more overcrowding, Among 3 roomed households, there is overcrowding in Arkonam, Walajapet,
Gudiyatham, Tlruppattur, Vellore, Chengam and Tiruvannamalai. Among 4 and 5 roomed
households, no overcrowding is noticed in any taluk.
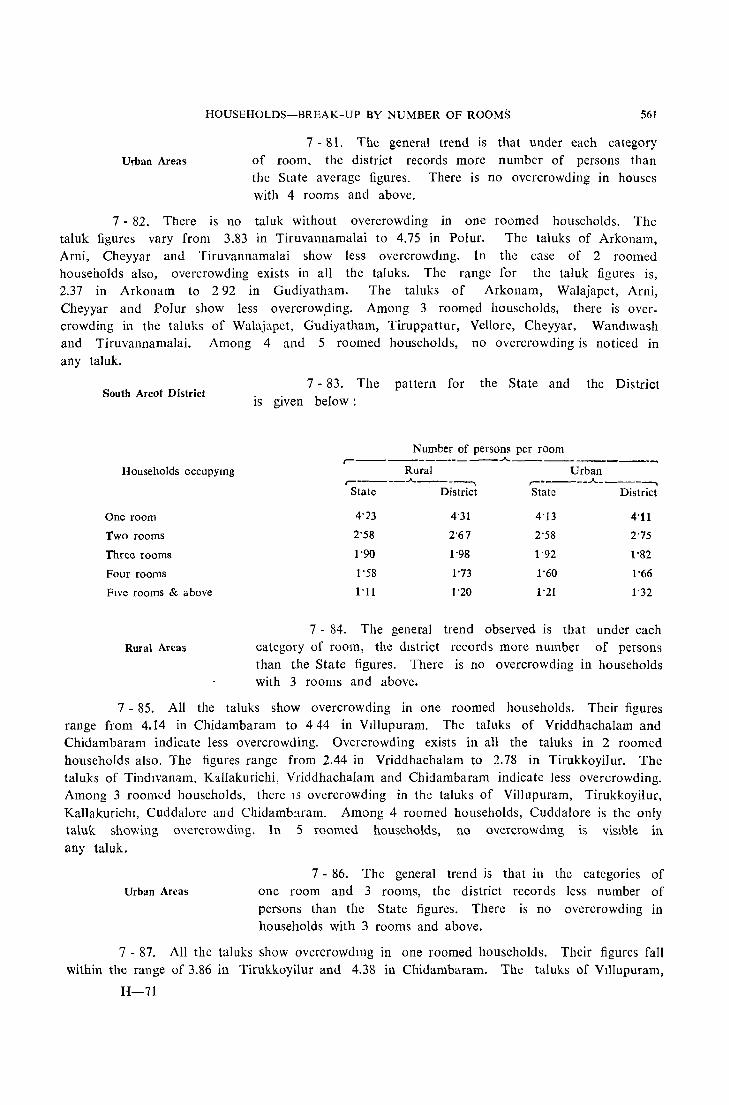
HOUSEHOLDS-BREAK-UP BY NUMBER OF ROOMS 561
Urban Areas
7 - 81. The general trend is that under each category of room, the district records more number of persons than the State average figures. There is no overcrowding in houses with 4 rooms and above.
7 - 82. There is no taluk without overcrowding in one roomed households. The taluk figures vary from 3.83 in Tiruvannamalai to 4.75 in Polur. The taluks of Arkonam, Ami, Cheyyar and Tiruvannamalai show less overcrowdmg. In the case of 2 roomed households also, overcrowding exists in all the taluks. The range for the taluk figures is, 2.37 in Arkonam to 2 92 in Gudiyatham. The taluks of Arkonam, Walajapet, Arni, Cheyyar and Polur show less overcrow~ing. Among 3 roomed households, there is over. crowding in the taluks of Walajapct, Gudiyatham, Tiruppattur, Vellorc, Cheyyar, Wandlwash and Tiruvannamalai. Among 4 and 5 roomed households, no overcrowding is noticed in any taluk.
South Arcot District
Households occupymg
One room
Two rooms
Three rooms
Four rooms
Five rooms & above
Rural Areas
7 - 83. The pattern for the State and the District is given below:
Number of person~ per rOom .. ______ ~ ____ ..A. __________ ~
Rural Urban ,-----"-------, ,------"------,
State District State District
4'23 4'31 4'13 4'11
2'58 2'67 2'58 2'75
1'90 1'98 1'92 1'82
1'58 1'73 1'60 1'66
l'll 1'20 1'21 1'32
7 - 84. The general trend observed is that under each category of room, the dIstrict records more number of persons than the State figures. There is no overcrowding in households with 3 rooms and above.
7 - 85. All the taluks show overcrowding in one roomed households. Their figures range from 4.14 in Chidambaram to 444 in VJllupuram. The taluks of Vriddhachalam and Chidambaram indicate less overcrowding. Overcrowding exists in all the taluks in 2 roomed households also. The figures range from 2.44 in Vriddhachalam to 2.78 in Tirukkoyilur. The taluks of Tindlvanam, Kallakurichi, Vriddhachalam and Chidambaram indicate less overcrowding. Among 3 roomed households, there IS overcrowding in the taluks of Villupuram, Tirukkoyiiur, Kallakurichl, Cuddalorc and Chidamb:1fam. Among 4 roomed households, Cuddalore is the only taluk showing overcrowding. In 5 roomed households, no overcrowdmg 15 viSible in any taluk.
Urban Areas
7 - 86. The general trend is that in the categories of one room and 3 rooms, the district records less number of persons than the State figures. There is no overcrowding in households with 3 rooms and above.
7 - 87. All the taluks show overcrowdmg in one roomed households. Their figures fall within the range of 3.86 in Tirukkoyilur and 4.38 in Chidambaram. The taluks of Vlllupuram,
H-71
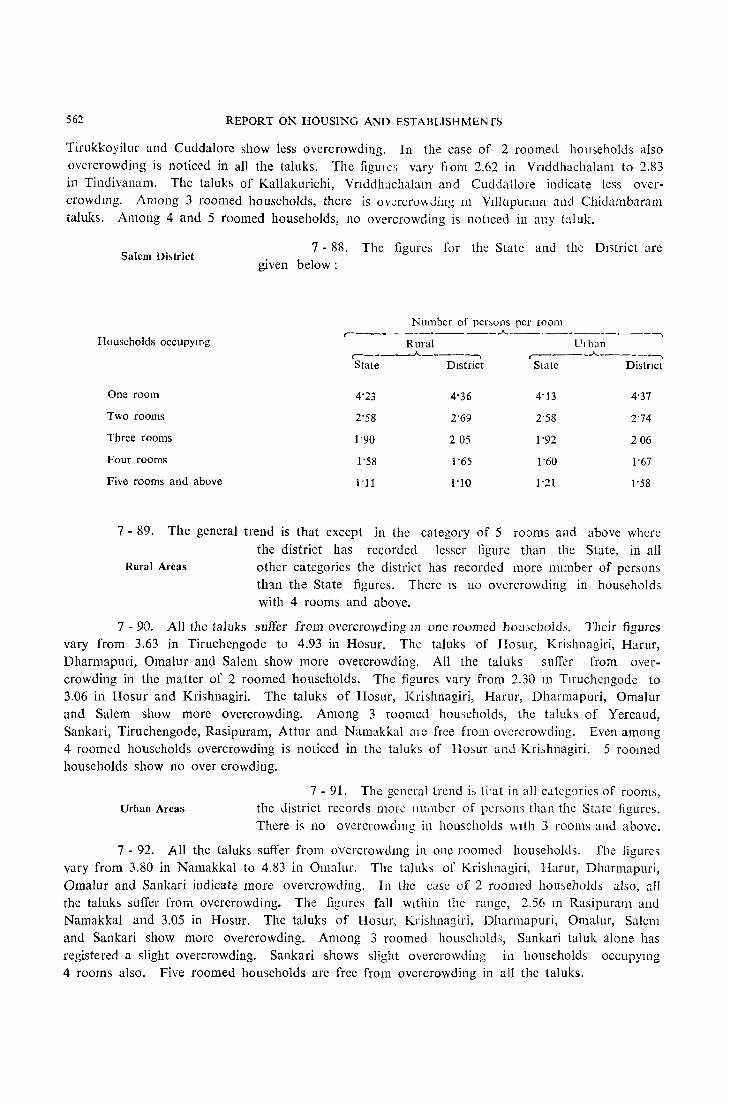
562 REPORT ON HOUSING AND ESTABLlSHMENfS
Tirukkoyilur and Cuddalore show less overcrowding. In the case of 2 roomed households also overcrowding is noticed in all the taluks. The figUl cs vary flOm 2.62 in Vnddhachalal11 to 2.83 in Tindivanam. The taluks of Kallakurichi, Vnddhach,llam and Cuddallore indicate less overcrowd mg. Among 3 roomed households, there is overcrowding 111 VIllnpuram and Chidambaram taluks. Among 4 and 5 roomed households, no overcrowding is noticed in any t:lluk.
Salem Dbtriet
Households OCCUPYlDg
One room
Two rooms
Three rooms
Four rooms
Five rooms and above
1 - 88. The figurcs for the State and the District are given below:
Number of pen,ons per room .-___________ .A.. ________ • ___ __;
Rural Ulban r-~----.A-----__;
State District
4'23
2'58
1'90
1'58
I'll
4'36
2'69
205
1'65
1'10
.-____ .A. ______ -..
State DistrIct
4'13
2'58
1'92
1'60
1'21
4'37
2'74
206
1'67
1'58
7 - 89. The general trend is that except in the category of 5 rooms and above where
the district has recorded lesser figure than the State, in all Rural Areas other categories the district has recorded more number of persons
than the State figures. There IS no overcrowding in households with 4 rooms and above.
7 - 90. All the taluks suffer from ovcrcrowding 1J] one roomed houscl101ds. Their figurcs vary from 3.63 in Tiruchengode to 4.93 in Hosur, The taluks of Hosur, Krishnagiri, Harur, Dharmapuri, Omalur and Salem show more overcrowding, All the taluks sufIer from overcrowding in the matter of 2 roomed households. The figures vary from 2.30 ill Tiruchengode to 3,06 in Hosur and Krishnagiri. The taluks of Hosur, Kri~hnagiri, Harur, Dharmapuri, Omalur and Salem show more overcrowding. Among 3 roomed households, the taluks of Yercaud, Sankari, Tiruchengode, Rasipuram, Attur and Namakkal aJ e free fro111 overcrowding, Even among 4 roomed households overcrowding is noticed in the taluks of 1l0~ur unci Kri~hnagiri, 5 roomed households show no over crowding.
Urban Areas
7 - 91, The general trend is tl'at in all cdteg()[ics of rooms, the district records morc Ilutnber of pcr~om than the State figures. There is no overcrowdl11g in households 'Mth 3 rooms and above.
7 - 92. All the taluks suffer fro111 overerowc1mg in one roomed householos, The figures vary from 3.80 in Namakkal to 4,83 in Omaluf. The taluks of Krishnagiri, Harur, Dhannapuri, Omalur and Sankari indicate more over.::rowding, In the case of 2 roomed hou~cholds also, all the taluks suffer from overcrowding. The figures fall Within the range, 2.56 III Rasipuram and Namakkal and 3.05 in Hosur. The taluks of Hosur, Krishnagiri, Dhannapuri, Omalur, Salem and Sankari show more overcrowding. Among 3 roomed household3, Sankari taluk alone has registered a slight overcrowding. Sankari shows slight overcrowding in households occupylllg 4 rooms also. Five roomed households are free from overcrowding in all the taluks.
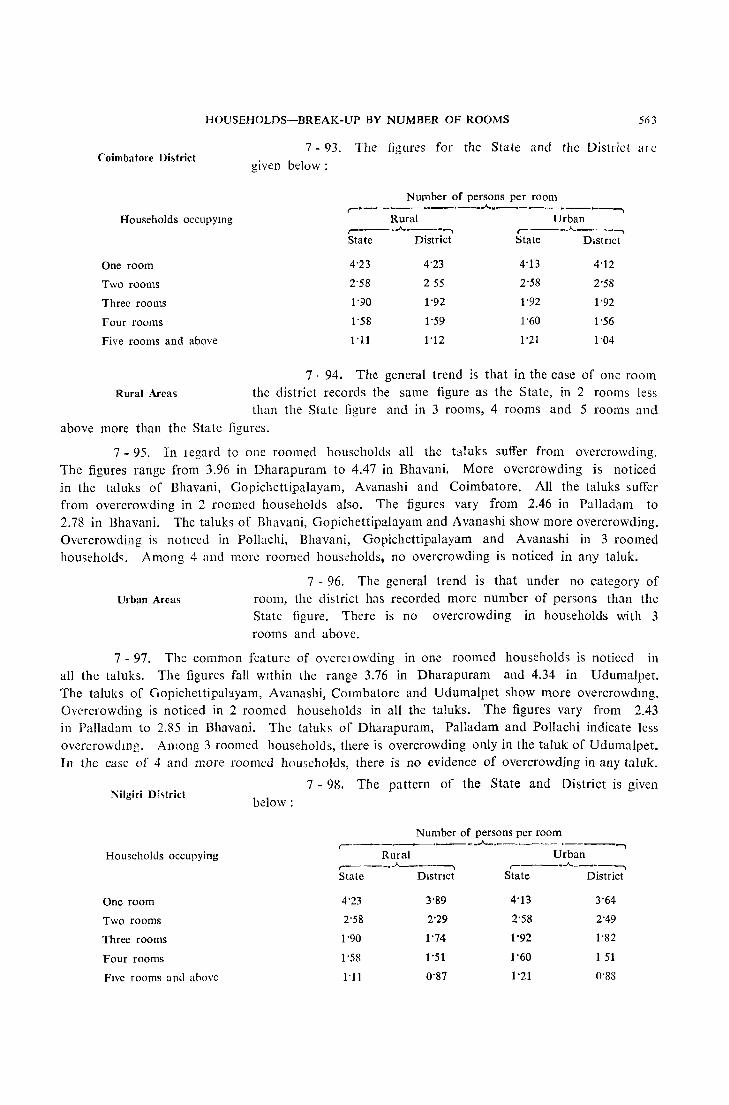
HOUSEHOLDS-BREAK-UP BY NUMBER OF ROOMS 5('3
Coimbatore Dhtrict
Households occupytng
One room
Two rooms
Threc rooms
Four rooms
Five rooms and above
7 - 93, Thc figurcs for the State and thc District arc given bdow:
Number of persons per room ,~------~--"-.--------~---,
Rural Urban , ___ • .A.. ____ -, ,..----"-----,
State District State Dlstnct
4'23 4'23 4'13 4'12
2'58 255 2'58 2'58
1'90 1'92 1'92 1'92
1'58 1'59 1'60 1'56
I'll 1'12 1'21 1'04
7· 94. The general trend is that in the case of one room Rural Areas the district records the same figure as the State, in 2 rooms less
than the State figure and in 3 rooms, 4 rooms and 5 rooms and above more than the Statc figures,
7 - 95, In legard to one roomed households all the taluks suffer from overcrowding, The figures range from 3,96 in Dharapuram to 4.47 in Bhavani, More overcrowding is noticed in the taluks of Bhavani, Gopichettipalayam, Avanashi and Coimbatore, All the taluks suffer from overcrowding in 2 roomed households also, The figures vary from 2.46 in Palla dam to 2,78 in Bhavani. The taluks of nhavani, Gopichettipalayam and Avanashi show more overcrowding, Overcrowding is noticed in Pollachi, Bhavani, Gopichettipalayam and Avanashi in 3 roomed households, Among 4 and more roomed households, no overcrowding is noticed in any taluk,
Urban Areas
7 - 96, The general trend is that under no category of room, the district has recorded more number of persons than the State figure, There is no overcrowding in households with 3 rooms and above,
7 - 97, The common feature of overclowding in one roomed households is noticed in all the taluks, The figures fall wIthin the range 3,76 in Dharapuram and 4,34 in Udumalpet. The taluks of Gopichettipahyam, Avanashi, COlmbatore and Udumalpet show more overcrowdmg, Overcrowding is noticed in 2 roomed households in all the taluks. The figures vary from 2.43 in Palladam to 2,85 in Bhavani, The taluks of Dharapuram, Palladam and Pollachi indicate less overcrowdmg, Among 3 roomed households, there is overcrowding only in the taluk of Udumalpet. In the case of 4 and more roomed households, there is no evidence of overcrowding in any tal uk,
Nilgiri Di~trict
Households occupying
One room
Two rooms
Three rooms
Four rooms
FIVc rooms and above
below: 7 - 98. The pattern of the State and District is given
Number of persons per room ,--~ ---"--.~-----~---,
Rural Urban ,-"--------, ---"---------,
State Dlstnct State District
4'23 3'89 4'13 3'64
2'58 2'29 2'58 2'49
1'90 1'74 1'92 1'82
1'58 1'51 1'60 1 51
I'll 0'87 1'21 0'88
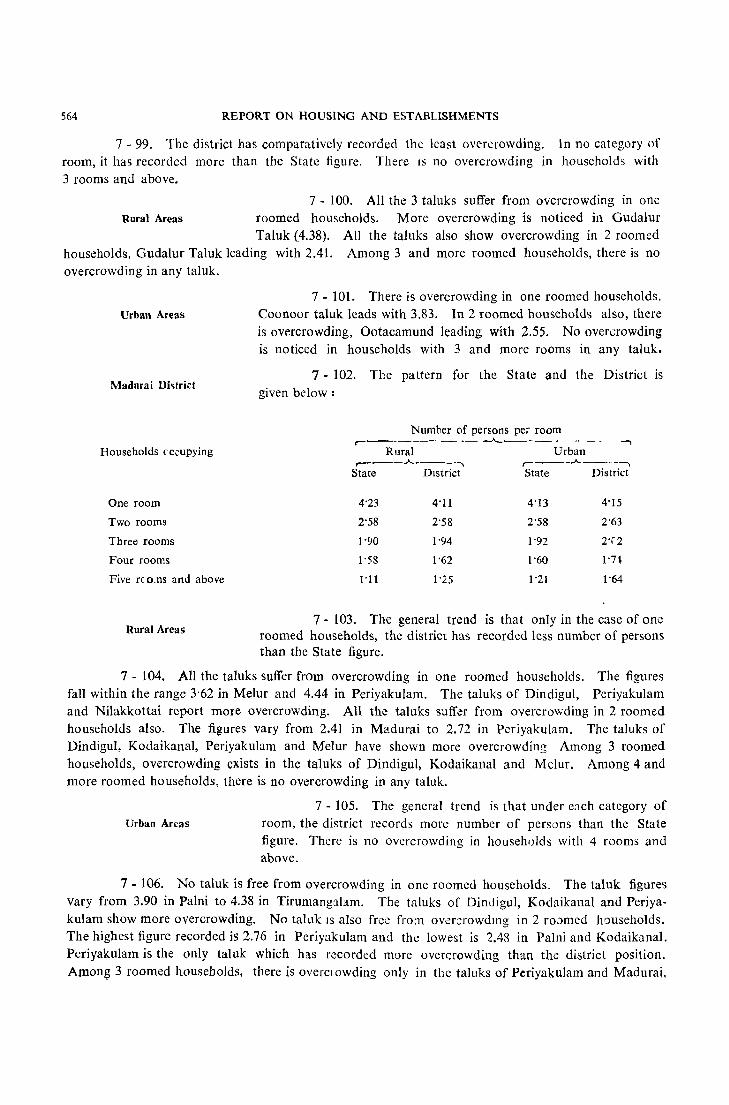
564 REPORT ON HOUSING AND ESTABLISHMENTS
7 - 99. The district has comparatively recorded the least overcrowding. In no category of room, it has recorded more than the State figure. There IS no overcrowding in households with 3 rooms and above.
7 - 100. All the 3 taluks suffer from overcrowding in one Rural Areas roomed households. More overcrowding is noticed in Gudalur
Taluk (4.38). All the taluks also show overcrowding in 2 roomed households, Gudalur Taluk leading with 2.41. Among 3 and more roomed households, there is no overcrowding in any tal uk.
Urban Areas
Madurai Dhtrict
Households (ccupying
One room
Two rooms
Three rooms
Four rooms
Five rc o.ns and above
Rural Areas
7 - 101. There is overcrowding in one roomed households. Coonoor taluk leads with 3.83. In 2 roomed households also, there is overcrowding, Ootacamund leading with 2.55. No overcrowding is noticed in households with 3 and more rooms in any taluk.
7 - 102. The pattern for the State and the District is given below:
Number of persons per room ,.-_________ .A.._ _______"
Rural Urban ,-----"-------, ,.-----"-----.,
State DIstrict State District
4'23 4'11 4'13 4'15
2'58 2'58 2'58 2'63
1'90 1'94 1'92 2'r2
1'58 1'62 1'60 1'74
I'll 1'25 1'21 1'64
7 - 103. The general trend is that only in the case of one roomed households, the district: has recorded less number of persons than the State figure.
7 - 104. All the taluks suffer from overcrowding in one roomed households. The figures fall within the range 3'62 in Melur and 4.44 in Periyakulam. The taluks of Dindigul, Periyakulam and Nilakkottai report more overcrowding. All the taluks suffer from overcrowding in 2 roomed households also. The figures vary from 2.41 in Madurai to 2.72 in Periyakulam. The taluks of Dindigul, Kodaikanal, Periyakulam and Melur have shown more overcrowding Among 3 roomed households, overcrowding exists in the taluks of Dindigul, Kodaikanal and Melur. Among 4 and more roomed households, there is no overcrowding in any taluk.
Urban Areas
7 - 105. The general trend is that under each category of room, the district records more number of persons than the State figure. There is no overcrowding in households with 4 rooms and above.
7 - 106. No taluk is free from overcrowding in one roomed households. The taluk figures vary from 3.90 in Palni to 4.38 in Tirumangalam. The taluks of Dindigul, Kodaikanal and Periyakulam show more overcrowding. No taluk IS also free fro:n ovcr;::rowdlllg in 2 ro.)med households. The highest figure recorded is 2.76 in Periyakulam and the lowest is 2.48 in Palni and Kodaikanal. Periyakulam is the only taluk which has recorded more overc::rowding than the district position. Among 3 roomed households, there is overCJ owding only in thc taluks of Periyakulam and Madurai.
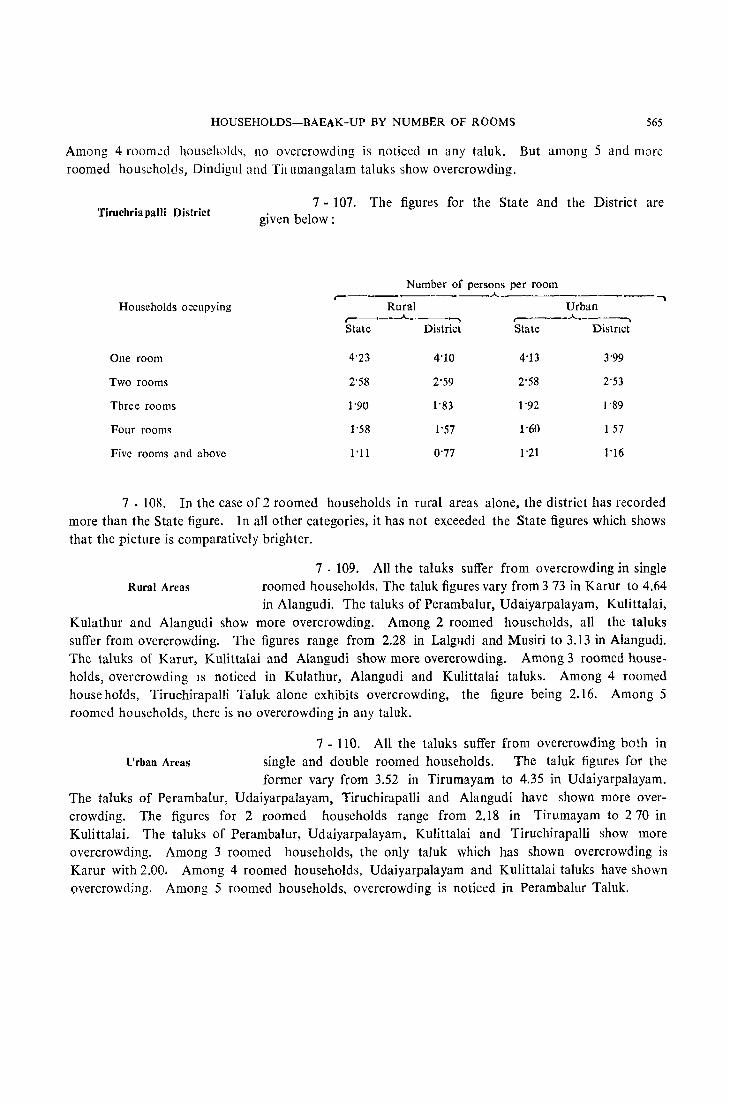
HOUSEHOLDS-BAEAK-UP BY NUMBER OF ROOMS 565
Among 4 room...:d households, no overcrowding is noticed In any taluk. But among 5 and morc roomed households, Dindiglll and Tit llmangalam taluks show overcrowding.
Tiruchria palJi District
Households occupying
One room
Two rooms
Three rooms
Four rooms
Five rooms and abovc
7 - 107. The figures for the State and the District are given below:
Number of persons per room .----______ • __ .A. ___ ~ ......,
Rural Urban ~---""'_-.------, r------.A.---------, State District State Distnct
4'23 4'10 4'13 3'99
2'58 2'59 2'58 2'53
1'90 1'83 1'92 )'89
1'58 1'57 1'60 1 57
1'11 0'77 1'21 1'16
7 - 108, In the case of 2 roomed households in rural areas alone, the district has recorded more than the State figure. In all other categories, it has not exceeded the State figures which shows that the picture is comparatively brighter.
7 ,109. All the taluks suffer from overcrowding in single Rural Areas roomed households. The taluk figures vary from 373 in Karur to 4.64
in Alangudi. The taluks of Perambalur, Udaiyarpalayam, Kulittalai, Kulathur and Alangudi show more overcrowding. Among 2 roomed households, all the taluks suffer from overcrowding. The figures range from 2.28 in Lalglldi and Musiri to 3.13 in Alangudi. The taluks of Karur, Kulittalai and Alangudi show more overcrowding. Among 3 roomed households, overcrowding IS noticed in Kulathur, Alangudi and Kulittalai taluks. Among 4 roomed house holds, Tiruchirapalli Taluk alone exhibits overcrowding, the figure being 2.16. Among 5 roomed households, there is no overcrowding in any tal uk.
7 - 110. All the taluks suffer from overcrowding both in Prban Areas single and double roomed households. The taluk figures for the
former vary from 3.52 in Tirumayam to 4.35 in Udaiyarpalayam. The taluks of Perambalur, Udaiyarpalayam, Tiruchirapalli and Alangudi have shown more overcrowding. The figures for 2 roomed households range from 2.18 in Tirumayam to 270 in Kulittalai. The taluks of Perambalur, Udaiyarpalayam, Kulittalai and Tiruchirapalli show more overcrowding. Among 3 roomed households, the only taluk which has shown overcrowding is Karur with 2.00. Among 4 roomed households, Udaiyarpalayam and Kulittalai taluks have shown overcrowding, Among 5 roomed households, overcrowding is noticed in Perambalur Taluk.
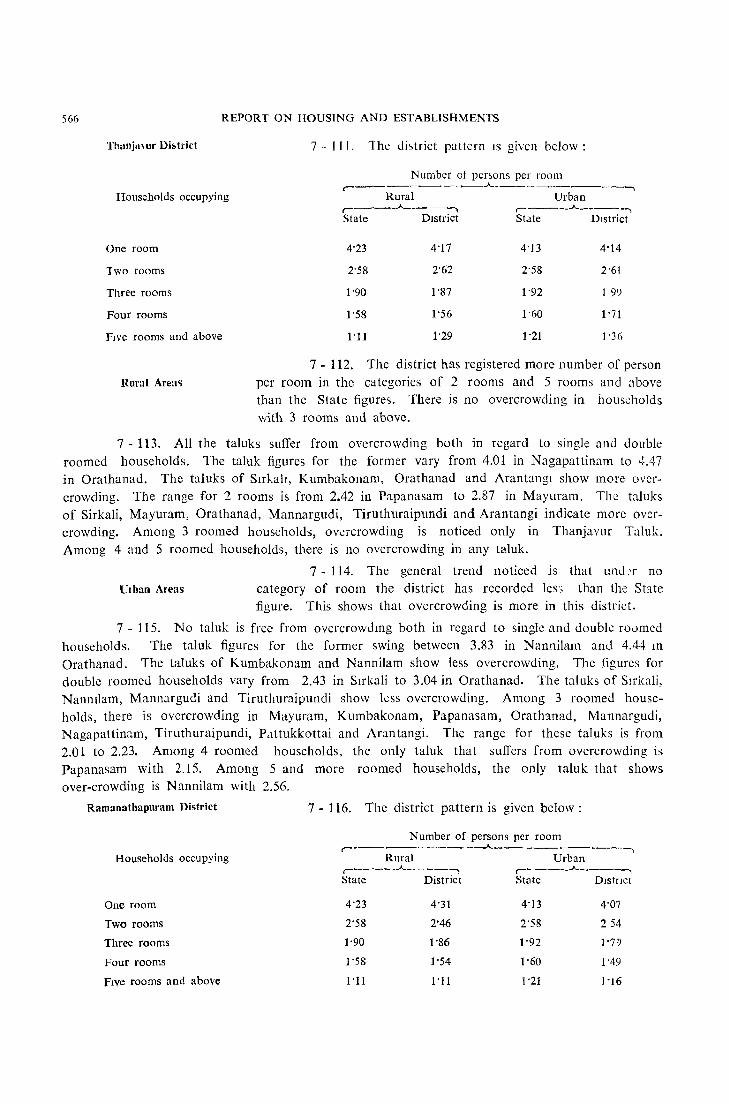
566 REPORT ON HOUSING AND ESTABLISHMENTS
Thunja, ur Dbtrict
Households occupying
One room
1wo rooms
Three rooms
Four rooms
FlYe rooms and above
Rural Areas
7 - III, The di~trict pattern IS given helow :
Number 01 pen,ons per room ,----~.--.;~--------.-"-----------.,
Rural Urban , ____ .A-__ ------"")
State District
4'23
2'58
1'90
1'58
I'll
4'17
2'62
1'87
1'56
1'29
, ____ .A. _____ .,
State District
4'13
2'58
1'92
1'60
1'21
4'14
2'61
1 9'.)
1 '71
1'36
7 - 112. The district has registered more number of person
per room in thc categories of 2 rooms and 5 rooms and above than the State figure5. There is no overcrowding in households
with 3 rooms and above.
7 - 113. All the taluks suffer from overcrowding both in regard to single and double
roomed households. The taluk figures for the former vary from 4.01 in Nagapattinam to '-1.47 in Orathanad. The taluks of Slrkalr, Kumbakonam, Orathanad and Arantangl show more overcrowding. The range for 2 rooms is from 2.42 in Papanasam to 2,87 in Mayuram, The taluks
of Sirkali, Mayuram, Orathanad, Mannargudi, Tiruthuraipundi and Arantangi indicate more overcrowding. Among 3 roomed households, overcrowding is noticed only in Thanjavur Taluk,
Among 4 and 5 roomed households, there is no overcrowding in any taluk.
7 - 114, The general trend noticed is that unJ:r no
Ulb:m Areas category of room the district has recorded les3 than the State figure. This shows that overcrowding is more in this district.
7 - 115. No taluk is free from overcrowdmg both in regard to single and double roumed
households. The taluk figures for the former swing between 3.83 in Nannilam and 4.44 111
Orathanad. The taluks of Kumbakonam and Nannilam show less overcrowding. The figures for double roomed households vary from 2.43 in Slrkali to 3.04 in Orathanad. The taluks of Sirkali, Nanllllam, Mannargudi and TirutllUraipundi show less overcrowding. Among 3 roomed households, there is overcrowding in Mayuram, Kumbakonam, Papanasam, Orathanad, Mannargudi, Nagapattinam, Tiruthuraipundi, Pclttukkottai and Arantangi, The range for these taluks is from 2.01 to 2.23. Among 4 roomed households, the only taluk that suffers from overcrowding is
Papanasam with 2,15. Among 5 and more roomed households, the only taluk that shows over-crowding is Nannilam with 2.56.
Ramanathapuram District
Households occupying
One room
Two rooms
Three rooms
Four rooms
FIVe rooms and above
7 - 116. The district pattern is given below:
Number of persons per room , _________ --.A. ________ _,
Rural Urban , _____ .A. _____ ., ,~ ___ .A._, __ _,
State District State DistrIct
4'23 4'31 4'13 4'07
2'58 2'46 2'58 254
1'90 1'86 1'92 1'79
1'58 1'54 1'60 1'49
l'U 1'11 1 '21 1'16
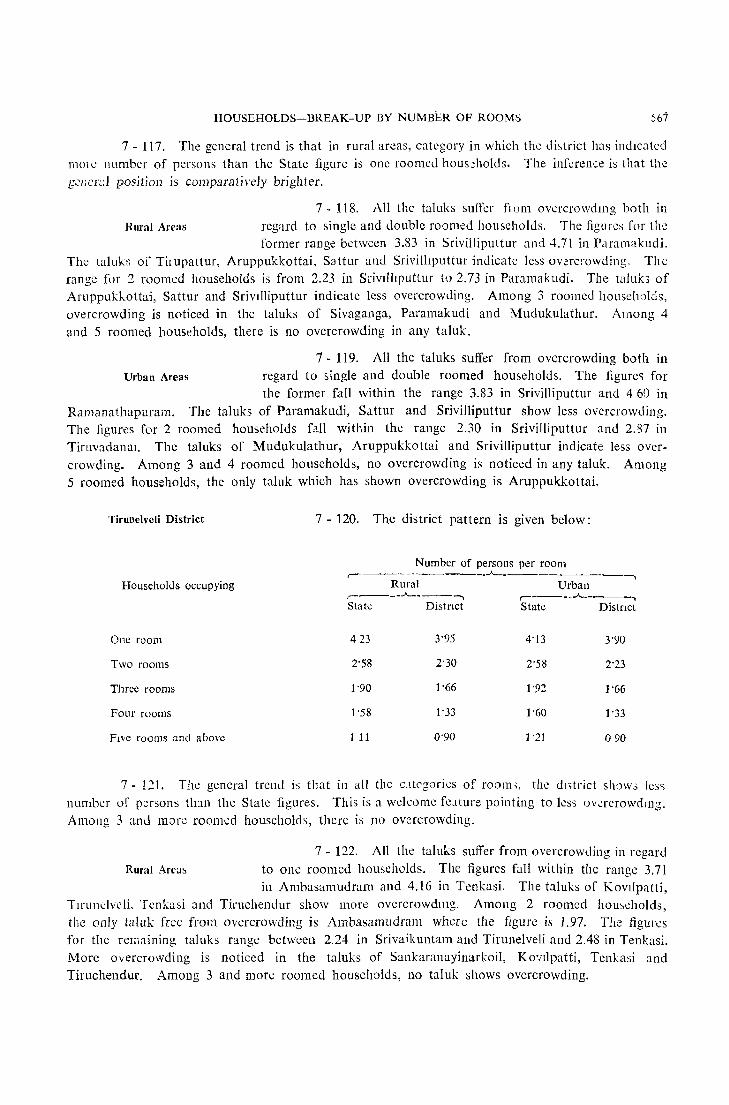
HOUSEHOLDS-BREAK-UP BY NUMBER OF ROOMS 567
7 - 117. The general trend is that in rural areas, category in which the di5trict has indICated 11101 e Humber of persons than the State figure is one roomed hous:::holds. The infcrem:e is that the gC/lcr:.:.l position is comparatively brighter.
7 - 118. All the taluks suffer flom overcrowdlllg both in Rural Areas regard to single and double roomed households. The figurcs for the
former range between 3.83 in Srivilliputtur and 4.71 in Paramakudi. The tal lib of Tirupattur, Arllppukkottai, S3ttllr and Srivilliputtur indicate le~s onrcrowding, Tile range for 2 roomed households is from 2.23 in Srivllhputtur to 2.73 in Paramakudi. The talub of Aruppllkkottai, Sattur and SrivIlliputtur indicate less overcrowding. Among 3 roomed households, overcrowding is noticed in the taluks of Sivaganga, Paramakudi and Mudukulathur. Among 4 and 5 roomed households, there is no overcrowding in any taluk.
7 - 119. All the taluks suffer from overcrowding both in Urban Areas regard to 5ingle and double roomed households. The figure" for
the former fall within the range 3.83 in Srivilliputtur and 4 60 in Ramanathapuram. The taluks of Paramakudi, Sattur and Srivilliputtur show less overcrowding. The figures for 2 roomed households fall within the range 2,30 in Srivilliputtur and 2.87 in TiruvudanaI. The taluks of Mudukulathur, Aruppukkottai and Srivilliputtur indicate less overcrowding. Among 3 and 4 roomed households, no overcrowding is noticed in any taIllk. Among 5 roomed households, the only tal uk which has shown overcrowding is Aruppukkottai.
Tirunelveli District 7 - 120. The district pattern is given below:
Number of persons per room ,-_ _ ___ .-A.__ _ ____ ~
Households occupying Rural Urban , ______ ...A.. ____ , ,-____ -A.. ___ -..
State Distnct State DistrIct
One room 423 3'95 4'13 3'90
Two rooms 2'58 2'30 2'58 2'23
Three rooms 1'90 1'66 1'92 1'66
Four rooms 1'58 1'33 1'60 1'33
FI\'e rooms and above 1 11 0'90 1'21 090
7 - 121. The general trend is that in all the C,ttcgories of room.;, the dl,trict show.; les') number of p;::rsons tinn the State figures. This is a welcome feJ.tllre pointing to less ov.::rcrowdIl13. Among 3 and more roomed households, there is no overcrowding.
7 - 122, All the taluks suffer from overcrowding in regard Rural Area~ to one roomed households. The figures fall within the range 3.71
in Ambasumudram and 4,16 in Tenkasi. The taluks of Kovl1patti, TlfUIlC\wli, Tenkasi and Tiruchendur show more overcrowdmg, Among 2 roomed hou5cholds, the only taluk frcc from overcrowding is Ambasamudram where the figure is 1,97. The figures for the remaining taluks range between 2.24 in Srivaikuntam and Tirunelveli and 2.48 in Tenkasi. More overcrowding is noticed in the taluks of Sal1karanayinarkoil, KO'111patti, Tenkasi and Tiruchendur. Among 3 and more roomed households, no tal uk shows overcrowding.
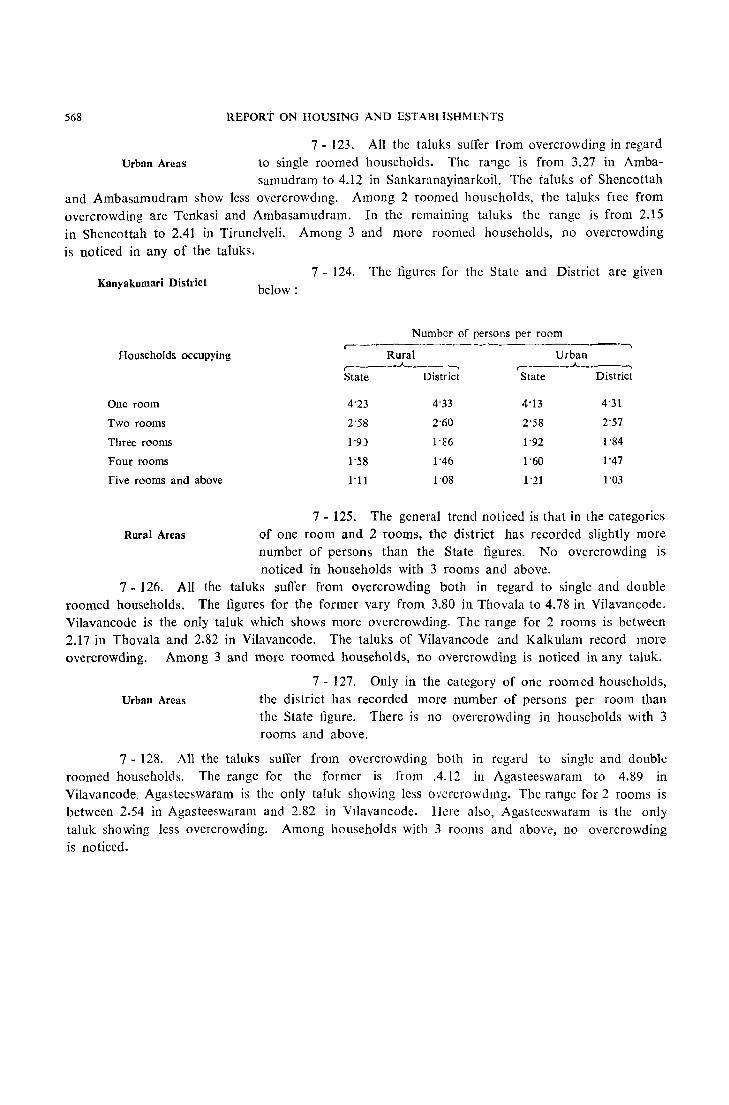
568 RBPORT ON HOUSING AND ESTABLISHMENTS
7 - 123. All the taluks suffer from overcrowding in regard Urban Areas to single roomed households. The ral1ge is from 3.27 in Amba-
samudram to 4.12 in Sankaranayinarkoil. The taJuks of Shencottah and Ambasamudram show less overcrowdmg. Among 2 roomed households, the taluks flee from overcrowding are Tenkasi and Ambasamudram. In the remaining taluks the range is from 2.15 in Shencottah to 2.41 in Tirunelveli. Among 3 and more roomed households, no overcrowding is noticed in any of the taluks.
Kanyakumari District
Households occupying
One room
Two rooms
Three rooms
Four rooms
Five rooms and above
Rural Areas
7 - 124. The figures for the State and District are given below:
Number of persons per room .-~------~-'------------,
Rural Urban ,-____ A ___ ~~ r-~---.. wA..---~
State District State District
4'23 4"33 4'13 4'31
2'58 2'60 2'58 2'57
1'9) l'E6 1'92 1'84
1'58 1'46 1'60 1'47
I'll 1'08 1'21 1'03
7 - 125, The general trend noticed is that in the categories of one room and 2 rooms, the district has recorded slightly more number of persons than the State figures, No overcrowding is noticed in households with 3 rooms and above,
7 - 126, All the taluks suffer from overcrowding both in regard to single and double roomed households. The figures for the former vary from 3.80 in Thovala to 4.78 in Vilavancode, Vilavancode is the only tal uk which shows more overcrowding, The range for 2 rooms is between 2.17 in Thovala and 2.82 in Vilavancode. The taluks of Vilavancode and Kalkulam record more overcrowding. Among 3 and more roomed households, no overcrowding is noticed in any taluk.
Urban Areas
7 - 127, Only in the category of one roomed households, the district has recorded more number of persons per room than the State figure, There is no overcrowding in households with 3 rooms and above,
7 - 128, All the taluks suffer from overcrowding both in regard to single and double roomed households, The range for the former is from .4,12 in Agasteeswaram to 4.89 in Vilavancode. Agasteeswaram is the only taluk showing less ovcrcrowdmg. The range for 2 rooms is between 2.54 in Agasteeswaram and 2,82 in VIlavancode. Here also, Agasteeswaram is the only taluk showing less overcrowding. Among households with 3 rooms and above, no overcrowding is noticed.
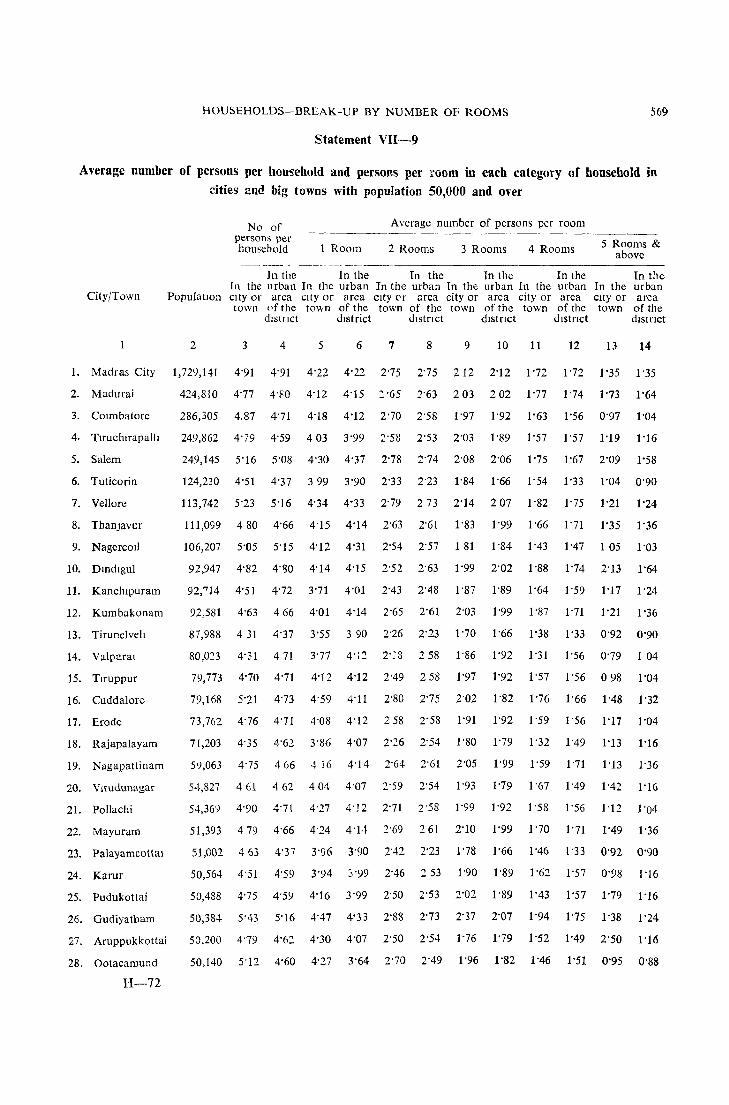
HOUSEHOLDS-BREAK-UP BY NUMBER OF ROOMS 569
Statement VII-9
Average number of persons per household and persons per room in each category of household in cities and big towns with population 50,000 and over
City/Town PopulatIOn
2
No of persons per household 1 Room
Average number of persons per room
2 Rooms 3 Rooms 4 Rooms 5 Rooms & above
--------~-----------------------
In the I n the In the In the In the Tn the urban In the urban In the urban In the urban In the urban city or area City or area city or area city or area city or area town of the town of the town of the town of the town of the
dlstllCt district distrIct dlstnct dlstnct
3 4 5 6 7 8 9 10 11 12
In the In the urban city or area town of the
distrIct
13 14
1. Madras City 1,729,141 4'91 4'91 4'22 4°22 2'75 2'75 Z 12 2°12 Ion 1°72 1°35 1°35
2. Madurai 424,810 4°77 4°1'0 4°12 4°15 :: °65 2°63 203 202 1°77 1°74 1°73 1°64
3o COllnbatore 286,305 4.87 4'71 4°18 4°12 2'70 2'5S 1°97 1°92 1°63 1'56 0'97 1°04
4o Tlruchlrapalh 249,862 4°79 4'59 403 3°99 2'58 2'53 2'03 1°89 1'57 1'57 1°19 1°16
50 Salem 249,145 5'16 5°08 4°30 4'37 2'78 2°74 2'08 2'06 1'75 1'67 2'09 1'58
6o Tuticorin 124,230 4°51 4'37 399 3°90 2°33 2'23 1'84 1°66 1°54 1°33 1°04 0'90
7o Vellore 113,742 5"23 5°16 4"34 4'33 2'79 273 2'14 207 1'82 1°75 1°21 1°24
8. TbanJavur 111,099 480 4'66 4°15 4'14 2'63 2'61 1'83 1'99 1°66 1'71 1°35 1°36
9. Nagercoll 106,207 5'05 5°15 4'12 4°31 2°54 2'57 181 1'84 1°43 1'47 105 1°03
10. Dmdlgul 92,947 4'82 4, slQ 4'14 4'15 2°52 2'63 1'99 2'02 1°88 1'74 2'13 1'64
11. Kanchlpuram 92,'714 4'51 4'72 3°71 4'01 2°43 2'48 1°87 1'89 1°64 1'59 1'17 1'24
12. Kumbakonam 92,581 4°63 466 4'01 4'14 2°65 2°61 2'03 1°99 1'87 1'71 1°21 1°36
13. Tirunclveh 87,988 431 4'37 3°55 390 2°26 2°23 1°70 1'66 1'38 1°33 0°92 0'90
14. Valparal 80,023 4'31 471 3'77 4';2 2°:8 258 1'86 1°92 1'31 1'56 0°79 104
15. Tlruppur 79,773 4°70 4'71 4°12 4'12 2'49 258 1'97 1°92 1°57 1'56 098 1'04
16o Cuddalore 79,168 5°21 4'73 4°59 4'11 2'80 2°75 2'02 1'82 1'76 1'66 1'48 1'32
17o Erode 73,762 4°76 4°71 4'08 4'12 258 2°58 1'91 1'92 1°59 1'56 1'17 1°04
18o Rajapalayam 71,203 4'35 4'62 3'86 4'07 2°26 2°54 1°80 1°79 1'32 1'49 1°13 1°16
19o Nagapattinam 59,063 4'75 466 4 16 4'14 2'64 2'61 2°05 1'99 1'59 1'71 1'13 1°36
20o Vlrudunagar 5"1-,827 461 462 404 4'07 2'59 2'54 1'93 1'79 1'67 1'49 1'42 1°16
21. Pollachi 54,369 4'90 4'71 4'27 4°12 2°71 2°58 1'99 1°92 1'58 1'56 1'12 1'04
22o Mayuram 51,393 479 4'66 4°24 4'14 2'69 261 2'10 1'99 1'70 1'71 1'49 1°36
23. Palayamcottal 51,002 463 4'37 3°96 3'90 2"42 2°23 1°78 1°66 1°46 1'33 0°92 0°90
24. Karur 50,564 4'51 4'59 3°94 :'l'99 2°46 253 1°90 1'89 1°62 1'57 0'98 1°16
25. Pudukottai 50,488 4'75 4'5,) 4'16 3°99 2°50 2'53 2°02 1'89 1'43 1°57 1°79 1°16
26o Gudiyatham 50,384 5'43 5'16 4'47 4'33 20S8 2'73 2"37 2°07 1°94 1'75 1°38 1'24
27o Aruppukkottai 50,200 4'79 4°62 4°30 4°07 2'50 2°54 1°76 1°79 1'52 1"49 2'50 1°16
28o Ootacamund 50,140 5'12 4'60 4°27 3°64 2°70 2°49 1°96 1'82 1°46 1°51 0°95 0°88
H-72
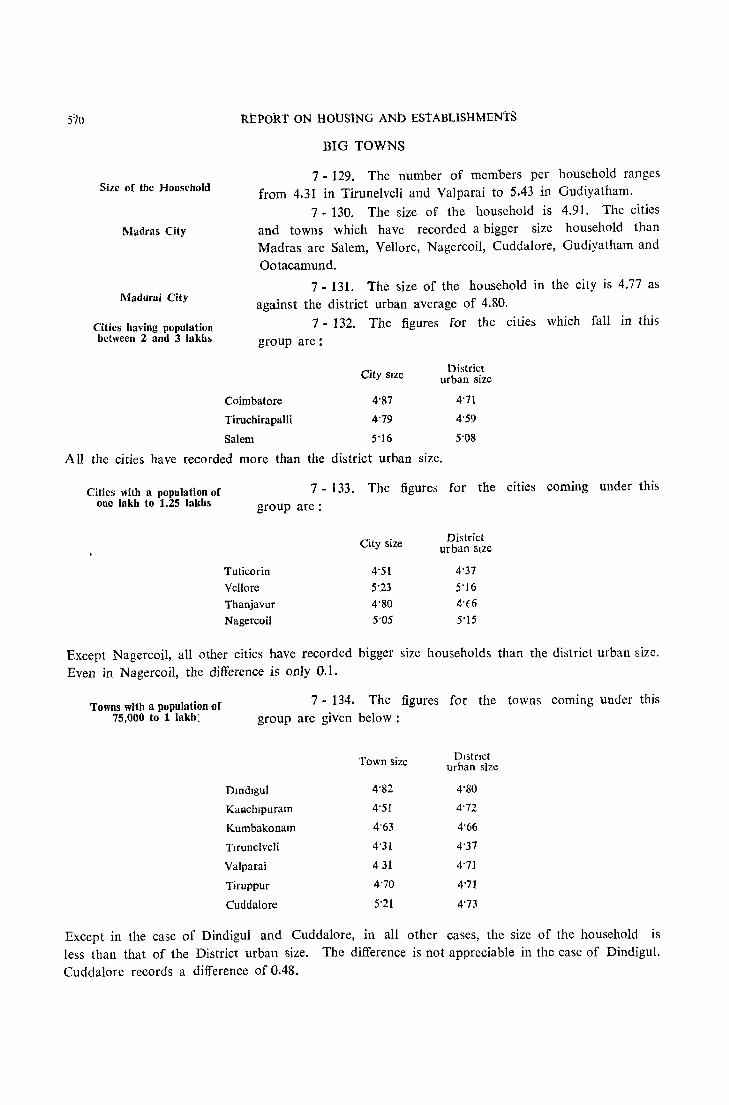
570
SiLC of the Household
Madras City
Madurai City
Citics having population between 2 and 3 lakhs
REPORT ON ilOtJSING ANb EStABLISilMEN'tS
BIG TOWNS
7 - 129. The number of members per household ranges from 4.31 in Tirunelveli and Valparai to 5.43 in Gudiyatham.
7 - 130. The size of the household is 4.91. The cities and towns which have recorded a bigger size household than Madras are Salem, Vellore, Nagercoil, Cuddalore, Gudiyatham and
Ootacamund.
7 - 131. The size of the household in the city is 4.77 as against the district urban average of 4.80.
7 - 132. The figures for the cities which fall in this
group are:
City size District urban size
Coimbatore 4'87 4'71
Tiruchirapalli 4'79 4'59
Salem 5'16 5'08
All the cities have recorded more than the district urban size.
Cities with a population of one lakh to 1.25 lakhs
7 - 133. The figures for the cities coming under this
group are:
City size District urban size
Tuticorin 4'51 4'37
Vellore 5'23 5'16
Thanjavur 4'80 4'(6
Nagercoil 5'05 5'15
Except Nagercoil, all other cities have recorded bigger size households than the district urban size. Even in Nagercoil, the difference is only 0.1.
Towns with a population of 75,000 to 1 lakh:
7 - 134. The figures for the towns coming under this group are given below :
Town size Dlstnct urban size
Dmdlgul 4'82 4'80
KaAchlpuram 4'51 4'72
Kumbakonam 4'63 4'66
Tlrunelveli 4'31 4'37
Valparai 431 4'71
Tiruppur 4'70 4'71
Cuddalore 5'21 4'73
Except in the case of Dindigul and Cuddalore, in all other cases, the size of the household is less than that of the District urban size. The difference is not appreciable in the case of Dindigul. Cuddalore records a difference of 0.48.
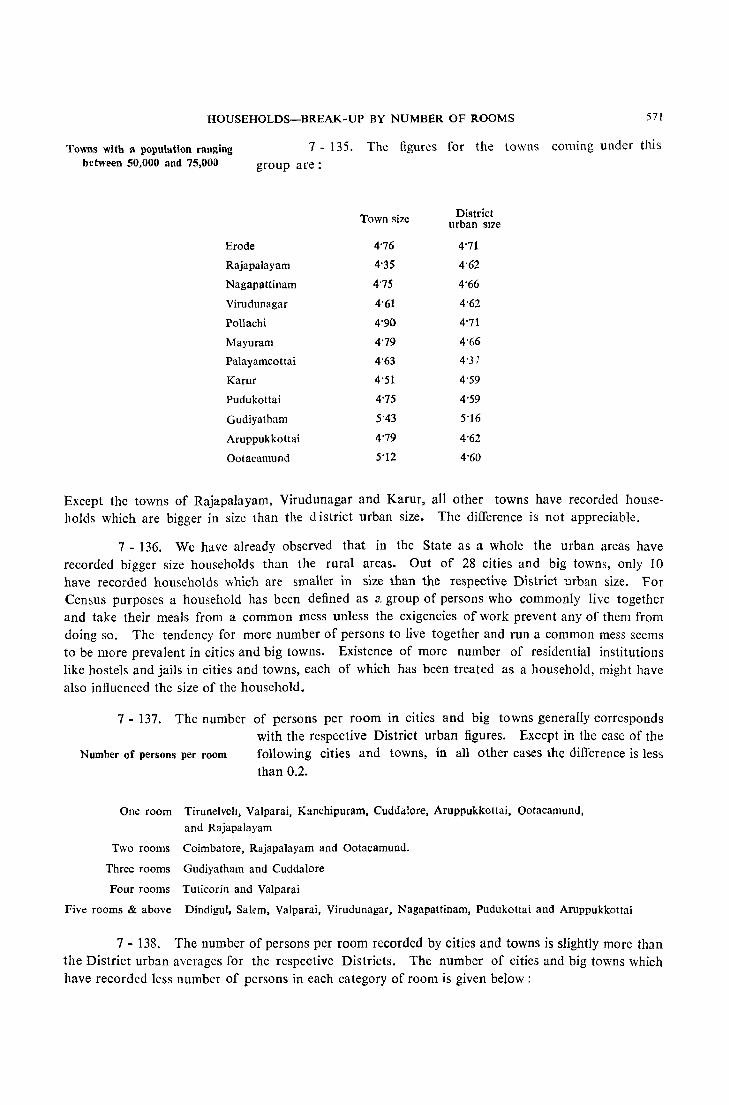
HOUSEHOLDS-BREAK-UP BY NUMBER OF ROOMS 571
Towns with a population ranging between 50,000 and 75,000
7 - 135. The figures for the towns coming under this group are:
Town size District urban S17e
Erode 4'76 4'71
Rajapalayam 4'35 4'62
Nagapattinam 4'75 4'66
Virudunagar 4'61 4'62
PolJachi 4'90 4'71
Mayuram 4'79 4'66
Palayamcottai 4'63 4'37
Karur 4'51 4'59
Pudukottai 4'75 4'59
Gudiyatham 5"43 5'16
Aruppukkottai 4'79 4'62
Ootacamund 5'12 4'60
Except the towns of Rajapalayam, Virudunagar and Karur, all other towns have recorded households which are bigger in size than the district urban size. The difference is not appreciable.
7 - 136. We have already observed that in the State as a whole the urban areas have recorded bigger size households than the rural areas. Out of 28 cities and big towns, only 10 have recorded households which are smaller in size than the respective District urban size. For Census purposes a household has been defined as s. group of persons who commonly live together and take their meals from a common mess unless the exigencies of work prevent any of them from doing so. The tendency for more number of persons to live together and run a common mess seems to be more prevalent in cities and big towns. Existence of more number of residential institutions like hostels and jails in cities and towns, each of which has been treated as a household, might have also influenced the size of the household.
7 - 137. The number of persons per room in cities and big towns generally corresponds with the respective District urban figures. Except in the case of the
Number of persons per room following cities and towns, in all other cases the difference is less than 0.2.
One room Tirunelveh, Valparai, Kanchipuram, Cuddalore, Aruppukkottai, Ootacamund,
and Rajapalayam
Two rooms Coimbatore, Rajapalayam and Ootacamuud.
Three rooms Gudiyatham and Cuddalore
Four rooms Tuticorin and Valparai
Five rooms & above Dindigul, Salem, Valparai, Virudunagar, Nagapattinam, Pudukottai and Aruppukkottai
7 - 138. The number of persons per room recorded by cities and towns is slightly more than the District urban averages for the respective Districts. The number of cities and big towns which have recorded less number of persons in each category of room is given below:
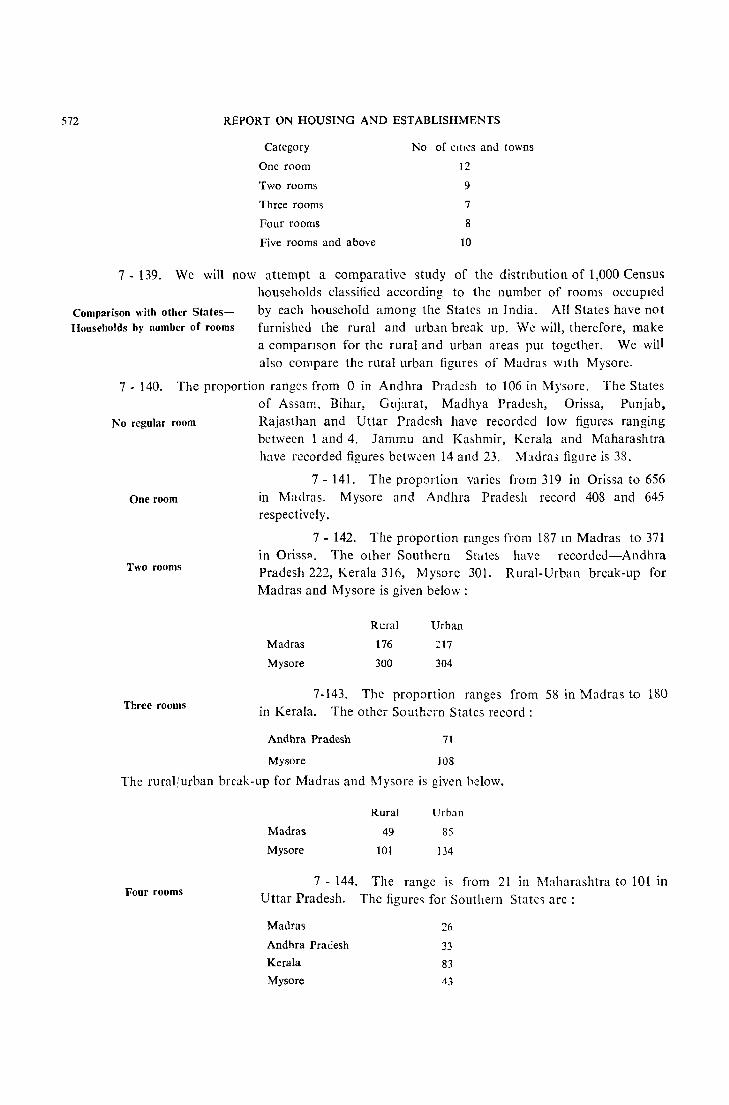
572
7 - 139.
REPORT ON HOUSING AND ESTABLISHMENTS
Category
One room
Two rooms
Three rooms
Four rooms
Five rooms and above
No of cItIes and towns
12
9
7
8
10
We will now attempt a comparative study of the distribution of 1,000 Census households classified according to the number of rooms occupied
Comparison with other StatesHouseholds by number of rooms
by each household among the States 111 India. All States have not furnished the rural and urban break up. We will, therefore, make a comparIson for the rural and urban areas put together. We will also compare the rural urban figures of Madras with Mysore.
7 - 140. The proportion ranges from 0 in Andhra Pradesh to 106 in Mysore. The States of Assam, Bihar, Gujarat, Madhya Pradesh, Orissa, Punjab,
I"o regular room Rajasthan and Uttar Pradesh have recorded low figures ranging between 1 and 4. Jammu and Ka5hmir, Kerala and Maharashtra have recorded figures betw~en 14 and 23. Ivbdra; figure is 38.
One room
Two rooms
Three rooms
7 - 141. The proportion varies from 319 in Orissa to 656 in Madras. Mysore and Andhra Pradesh record 408 and 645 respeetivcly.
7 - 142. The proportion ranges from 187 111 Madras to 371 in Oriss:>. The other Southern States have reeorded-Andhra Pradesh 222, Kerala 316, Mysore 30[, Rural-Urban break-up for Madras and Mysore is given below:
Madras
Mysore
Rural Urban
176
300
:17
304
7-143. The proportion ranges from 58 in Madras to 180 in Kerala. The other Southern States record:
Andhra Pradesh
Mysore
71
108
The rural!urban break-up for Madras and Mysore is given below.
Four rooms
Madras
Mysore
Rural Urban
49
101
85
134
7 - 144. The range is from 21 in l\1aharashtra to 101 in Uttar Pradesh. The figure" for Southern State~ are:
Madras
Andhra Pradesh
Kerala
Mysore
33
83
43
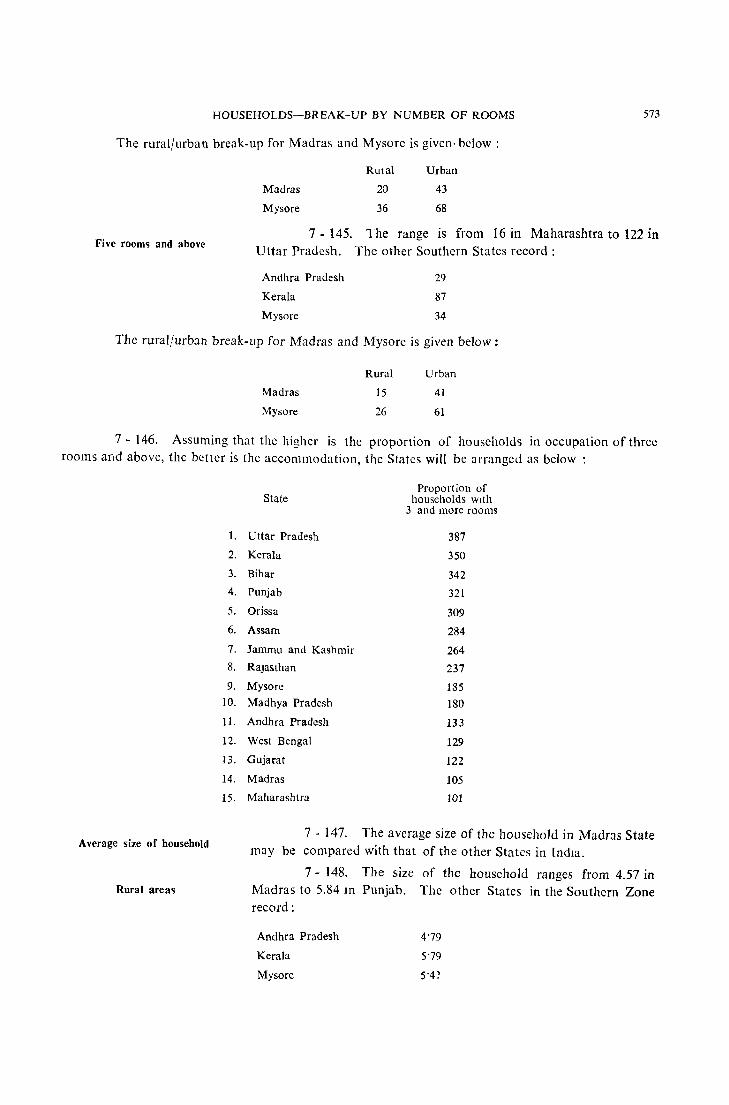
HOUSEHOLDS-BREAK-UP BY NUMBER OF ROOMS 573
The rural/urban break-up for Madras and Mysore is given' below:
Five room'> and above
Madras
Mysore
Rural Urban
2D
36
43
68
7 - 145, The range is from 16 in Maharashtra to 122 in Uttar Pradesh. The other Southern States record:
Andhra Pradesh
Kerala
Mysore
29
87
34
The rural/urban break-up for Madras and Mysore is given below:
Madras
Mysore
Rural Urban
15
26
41
61
7 - 146. Assuming that the higher is the proportion of households in occupation of three rooms and above, the better is the accommodation, the States wilt be arranged as below:
1.
2.
3.
4.
5.
6.
7.
8.
9.
10.
11.
12.
13.
14.
15,
Average size of household
Rural area'>
Proportion of State households with
3 and more rooms
Uttar Pradesh 387
Kerala 350
Bihar 342
Punjab 321
Orissa 309
Assam 284
Jammu and Kashmir 264
Rajasthan 237
Mysorc 185
Madhya Pradesh 180
Andhra Pradesh 133
West Bengal 129
Gujarat 122
Madras 105
Maharashtra 101
7 - 147. The average size of the household in Madras State may be compared with that of the other States in India.
7 - 148. The size of the household ranges from 4.57 in Madras to 5.84 In Punjab. The other States in the Southern Zone record:
Andhra Pradesh
Kerala
Mysorc
4'79
5'79
5'41
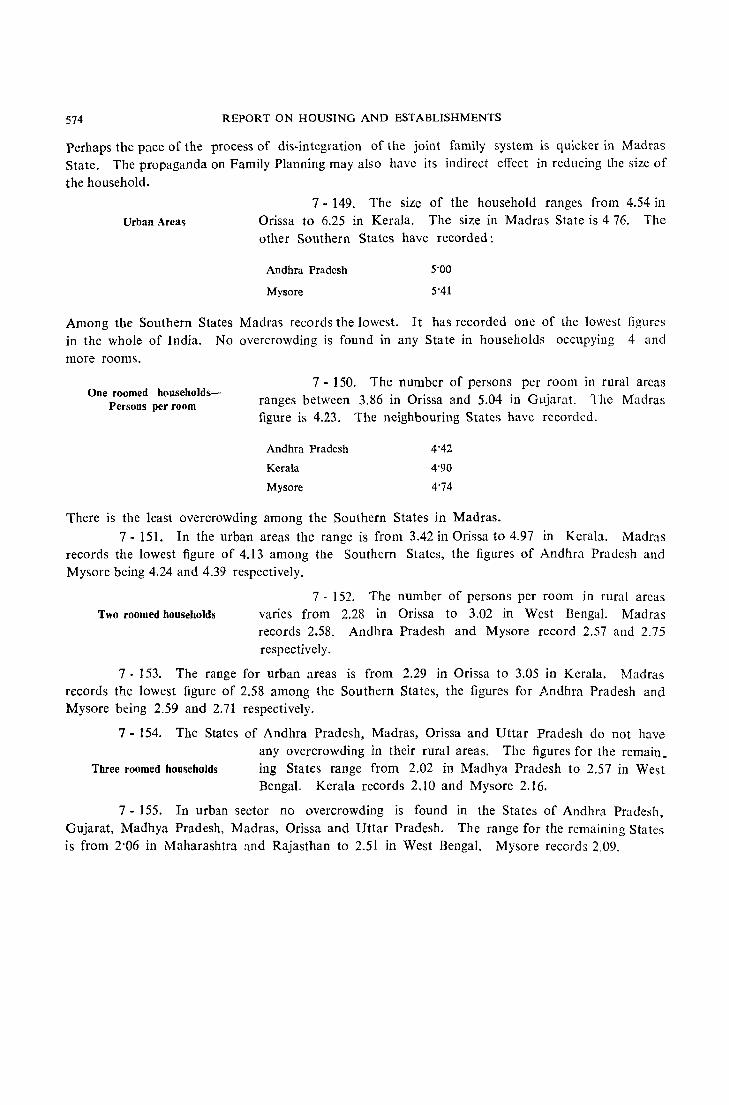
574 REPORT ON HOUSING AND ESTABLISHMENTS
Perhaps the pace of the process of dis-integration of the joint family system is quicker in Madras State. The propaganda on Family Planning may also have its indirect effect in reducing the size of
the household.
Urban Area'!
7 - 149. The size of the household ranges from 4.54 in Orissa to 6.25 in Kerala. The size in Madras State is 4 76. The other Southern States have recorded:
Andhra Pradesh
Mysore
5'00
5"41
Among the Southern States Madras records the lowest. It has recorded one of the lowest figures in the whole of India. No overcrowding is found in any State in households occupying 4 and more rooms.
One roomed householdsPersons per room
7 - 150. The number of persons per room in rural areas ranges between 3.86 in Orissa and 5.04 in Gujarat. The Madras figure is 4.23. The neighbouring States have recorded.
Andhra Pradesh
Kerala
Mysore
4'42
4'90
4'74
There is the least overcrowding among the Southern States in Madras. 7 - 151. In the urban areas the range is from 3.42 in Orissa to 4.97 in Kerala. Madras
records the lowest figure of 4. 13 among the Southern States, the figures of Andhra Pradesh and Mysore being 4.24 and 4.39 respectively.
Two roomed households
7 . 152. The number of persons per room in rural areas varies from 2.28 in Orissa to 3.02 in West Bengal. Madras records 2.58. Andhra Pradesh and Mysore record 2.57 and 2.75 respectively.
7· 153. The range for urban areas is from 2.29 in Orissa to 3.05 in Kerala. Madras records the lowest figure of 2.58 among the Southern States, the figures for Andhra Pradesh and Mysore being 2.59 and 2.71 respectively.
7 - 154. The States of Andhra Pradesh, Madras, Orissa and Uttar Pradesh do not have
Three roomed households
any overcrowding in their rural areas. The figures for the remain_ ing States range from 2.02 in Madhya Pradesh to 2.57 in West Bengal. Kerala records 2.10 and Mysore 2.16.
7 - 155. In urban sector no overcrowding is found in the States of Andhra Pradesh, Gujarat, Madhya Pradesh, Madras, Orissa and Uttar Pradesh. The range for the remaining States is from 2'06 in Maharashtra and Rajasthan to 2.51 in West Bengal. Mysore records 2.09.
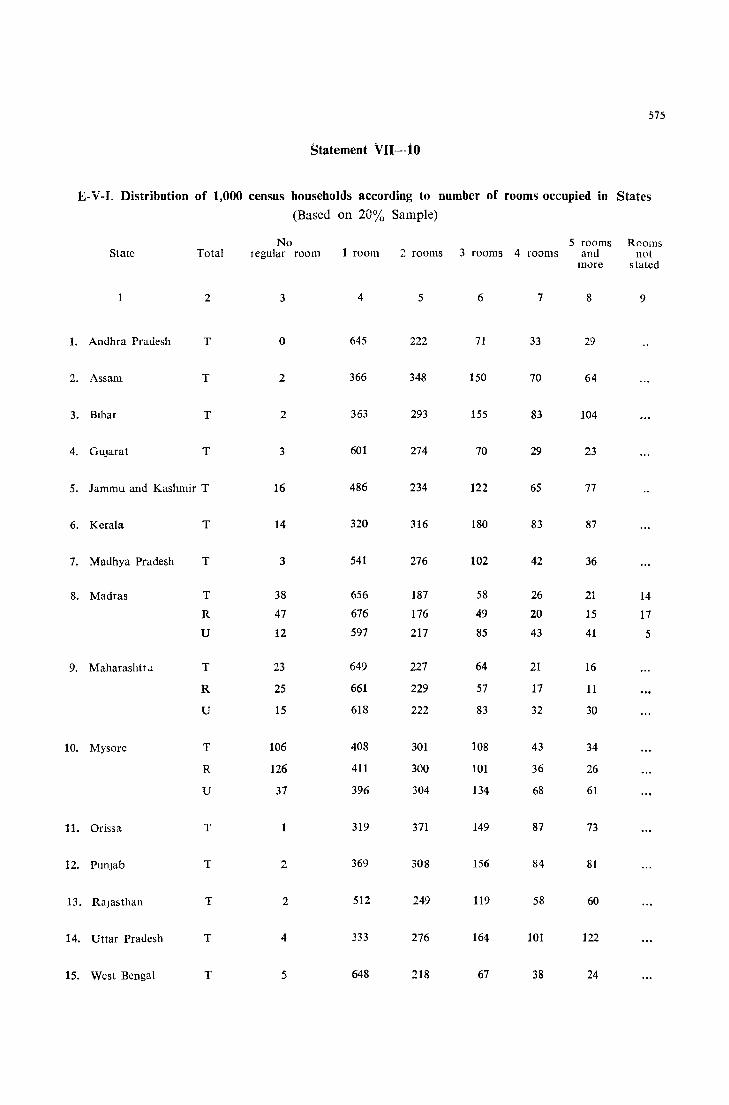
575
Statement VII--io
E-V -I. Distribution of 1,000 census households according to number of rooms occupied in States (Based on 20% Sample)
No 5 rooms Rooms State Total I egular room 1 room Z rooms 3 rooms 4 rooms and not
mure stated
1 2 3 4 5 6 7 8 9
1. Andhra Pradesh T 0 645 222 71 33 29
2. Assam T 2 366 348 150 70 64
3. BIhar T 2 363 293 155 83 104
4. GUjarat T 3 601 274 70 29 23
5. Jammu and Kashmir T 16 486 234 122 65 77
6. Kerala T 14 320 316 180 83 87
7. Madhya Pradesh T 3 541 276 102 42 36
8. Madras T 38 656 187 58 26 21 14
R 47 676 176 49 20 15 17
U 12 597 217 85 43 41 5
9. Maharashtr .l T 23 649 227 64 21 16
R 25 661 229 57 17 11
U 15 618 222 83 32 30
10. Mysore T 106 408 301 108 43 34
R 126 411 300 101 36 26
U 37 396 304 134 68 61
11. Orissa T 319 371 149 87 73
12. Punjab T 2 369 308 156 84 81
13. Rajasthan T 2 512 249 119 58 60
14. Uttar Pradesh T 4 333 276 164 101 122
15. West Bengal T 5 648 218 67 38 24

576
Statement VIl-l1
E-V-2, Number of persons, males and females per room and persons per household in
each category of household in States (contd,)
(Based on 20~~ Sample)
Total* One room Two rooms r---..A.....----. r-,.---,~--A--~----,
, ______ .A. _______ ---,
No, of Average Average
Total No, of persons No, of No, of
State Rural persons per Pcrso:1s Males Females persons P';)rsons Males Females persons
Urban per hou~e·
per per room hold house- house-
hold hold
1 2 3 4 5 6 7 8 9 10 11 12
1. Andhra
Pradesh T 2'95 4'82 4'39 2'21 2'18 4'39 2'57 1'30 1'27 5'14
R 3'05 4'79 4'42 223 2'19 4'42 2'57 1'31 1'26 5'13
U 2'54 5'00 4'24 2'13 2'11 4'24 2'59 1'31 1'28 5'18
2, Assam T 2'42 5 34 4'17 2'24 1'93 4'17 2'55 1'35 1'20 5'10
R 2'43 5'36 4'23 2'23 2'00 4,23 2'55 1'34 1'21 5'10
U 2-37 5'11 3'65 2'30 1'35 3'65 2'51 1'44 1,07 5'02
3, Bihar T 2'30 5'57 4'11 2'08 203 4'11 2'63 1'32 1'31 5'25
R 2'29 5'58 4'13 2'07 206 4'13 2'62 1'31 1 31 5'23
U 2'43 5'49 4'00 2'24 1'76 4'00 2'75 1'47 1'28 5'51
4, Gujarat T 3'27 5'30 ';'91 2'53 238 491 2'80 1'44 1'36 5'61
R 3'49 5'35 5'04 2'58 2'45 5'04 2'83 1'45 1'38 9'56
U 2'76 5'15 4'49 2'37 2'12 4'49 2'73 1'42 1'31 5'45
5, Jammu &
Kashmir T 2'66 5'60 485 :; 58 2'27 4'85 2 '75 1'48 127 5'50
R 2'83 5'51 4'89 ':"60 2'29 4'89 2'75 1'48 1'27 5'50
U Z'05 6'12 4'48 245 2'03 448 2'76 1'47 1'29 5'53
6, Kerala T 2'44 5'RS 4'91 242 2'49 4'91 2'91 1'44 1'47 581
R 2'47 5'79 4'90 ':"41 2'49 4'90 2'89 1'42 1'47 5'77
U 2'28 6'25 4'97 2'45 ::52 4'97 3'05 1'51 1'54 6'19
7, Madhya
Pradesh T 2'68 4'82 4'08 2'09 1'99 4'08 2'54 1'30 1'24 5'08
R 2'75 4'84 4'15 2'11 2'04 4'15 2'56 1'30 1'26 5'12
U 2'33 4'70 3'64 1'98 1'66 3'64 2'44 1'29 1'15 4'98
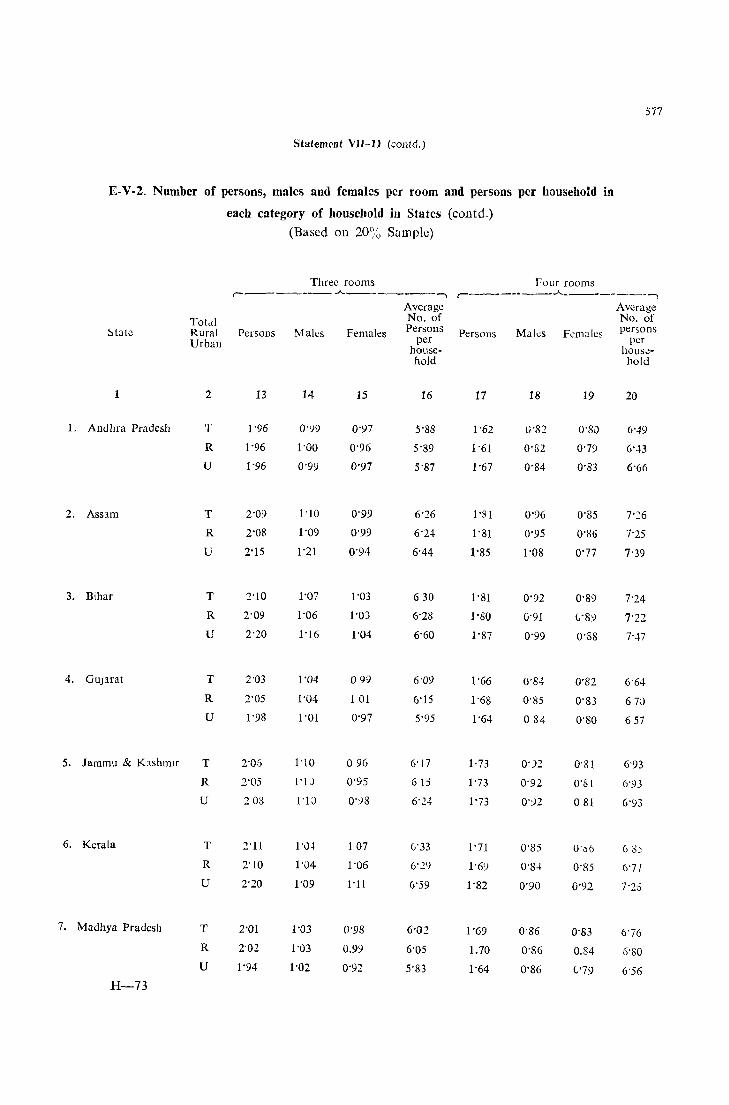
577
Statement VU-ll (contd,)
E-V-2, Number of persons, males and females per room and persons per household in
each category of household ill States (contd,)
(Based on 20% Sample)
Three rooms Four rooms r------- -"--------., r-----------"--------,
Average Average Totdl No, of No, of
~tate Rural Persons Males Females Persons Persons Maks Females persons Urban per per
house- hous.:-hold hold
1 2 13 14 15 16 17 18 19 20
1. Andhra Pradesh T 1'96 0'99 0'97 5'88 1'62 0'82 O'Si) 6'49
R 1'96 1'00 0'96 5'89 1'61 0'82 0'79 6',D
U 1'96 0'99 0'97 5'87 1'67 0'84 0'83 6'66
2, Assam T 2'09 1'10 0'99 6'26 1'81 0'96 0'S5 7'26
R 2'08 1'09 0'99 6'24- 1'81 0'95 0'86 7'25
U 2'15 1'21 0'94 6'44 1'85 1'08 0'77 7'39
3, Bihar T 2'10 1'07 1'03 630 1'81 0'91 0'89 7'24
R 2'09 1'06 1'03 6'28 1'80 (j'91 V8:> 7'22
U 2'20 1'16 1'04 6'60 l'S7 0'99 0'S8 7'47
4, GUJarat T 2'03 1'04 099 6'09 1'66 0'84 0'82 6'64
R 2'05 1'04 1 01 6'15 1'68 0'S5 0'S3 670
U 1'98 1'01 0'97 5'95 1'64 084 O'SO 657
5, Jammu & Kashmir T 2'06 1'10 096 6'17 1'73 0')2 O'SI 6'93
R 2'05 1'1 J 0'95 615 1'73 0'92 0'81 6'93
U 208 1'10 0'98 6'24 1'73 0'92 081 6'93
6, Kerala T 2'11 l\H 107 6'33 1'71 0'S5 0'.)6 () ::;~
R 2'10 1'04 1'06 6'29 1'6') 0'S4 0'85 6'7/
U 2'20 1'09 I'll G'59 1'82 0'90 0'92 7'215
7. Madhya Pradesh T 2'01 1'03 0'98 6'02 1'69 0'86 0'83 6'76 R 2'02 1'03 0,99 6'05 1. 70 0'S6 0,84 6'80 U 1'94 1'02 0'92 5'83 1'64 0'S6 (:79 6'56
H-73
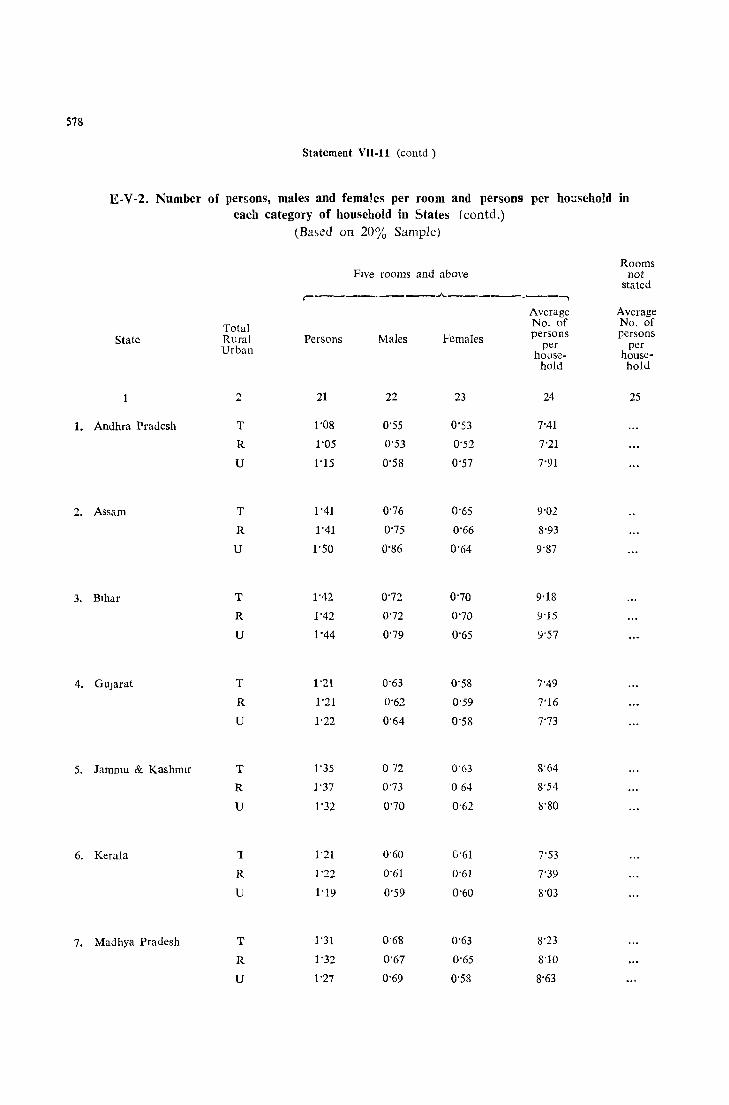
578
Statement VII-l1 (contd)
E-V-2. Number of persons, males and females per room and persons per household in each category of household in States (contd.)
(Based on 20% Sample)
Rooms FIve rooms and above not
stated .-______ __.... ___ .A. ______ ,______._.__._~
Average Average
Total No. of No. of
State Rural Persons Males Females persons persons
Urban per per house- house-
hold hold
2 21 22 23 24 25
1. Andhra Pradesh T 1'08 0'55 0'53 7"41
R 1'05 0'53 0'52 7"21
U 1'15 0'58 0'57 7'91
2, Assam T 1'41 0'76 0'65 9'02
R 1'41 0'75 0'66 S'93
U 1'50 0'86 0'64 9'87
3, BIhar T 1'42 0'72 0'70 9'18
R 1'42 0'72 0'70 <)'15
U 1'44 0'79 0'65 9'57
4, GUJarat T 1'21 0'63 0'58 7'49
R 1'21 0'62 0'59 7'16
U 1'22 0'64 0'58 7'73
5. Jammu & KashmIr T 1'35 072 0'63 S'64
R 1'37 0'73 o 6~ S'54
U 1'32 0'70 0'62 8'80
6. Kerala "I 1'21 0'60 G'61 7'53
R 1'22 0'61 0'61 7'39
U 1'19 0'59 0'60 S'03
7, Madhya Pradesh T 1'31 0'6S 0'63 8'23
R 1'32 0'67 0'65 S'lO
U 1'27 0'69 0'58 8'63

579
Statement VII-ll (eontd,)
E-V-2, Number of persons, males and females per room and persons per household in
each category of household in States (contd,)
State
8, Madra~
Total Rural Urban
2
Total r-~..A.---,
No, of No, of persons persons
per per oom house-
r hold
3 4
T 3'03 4'62
4'57
4'76
R 3'17
U 2'70
9, Maharashtra T 3'38 5'12
5 11
5°15
10, Mysore
11. Onssa
t~, Punjab
13, Rajasthan
14, Uttar
Pradesh
15. West
Bengal
R 3'50
U 3'12
T 1'81
R
U
2'92
2'50
T 2'07
R
U
2'08
1 99
T 247
R 2'46
u 2'47
T 2'65
R 2'74
U 2'29
T 2'02
R 1'98
U 2'33
T
R
U
329
3'38
3'04
5'42
5'42
5'41
4'81
483
4'54
5'71
5'84
5'21
5'30
532
5'21
5°15
5'17
5'03
5'28
5'38
4'97
(Based on 20% Sample)
One room Two rooms ,..--_______ ..A. ________ -, , ______ ..A. _______ --,
Persons Males Females
5
4'21
4'23
4°13
4°67
4'69
5'61
4'67
4'74
4'39
3°82
3'86
342
4'62
4'78
4'18
4'53
4'61
4'04
3'99
3'99
3'98
4'34
4'51
3'88
6
2'10
2'11
2'08
2'42
2'36
2'57
2'37
2'40
2'26
1 91
1'91
1 89
2'52
258
2'35
2'38
242
: '18
2'13
2'11
2'22
2'32
2'31
2'38
7
2'11
2'12
2'05
2'25
2'33
2'04
2'30
2'34
2'13
1'91
1'95
1'53
2'10
2'20
1'83
2'14
2'19
1'86
1°86
1'88
1'76
2'02
2'20
1 50
Average Average No, of No, of
persons Persons per
house-hold
8
4'21
4'23
4'13
4'67
4'69
4'61
4'67
4'74
4'39
3'82
3'86
342
4'62
4'78
4'18
4'53
4,61
4'04
3'99
3'99
3'98
4'34
4'51
3'S8
9
2'58
2'58
2'58
2'80
2'81
2'75
2'74
2'75
2'71
2'28
2'28
229
2'81
2'84
2'70
2'70
2'71
2'66
2'43
2'40
2'63
3'02
3'02
302
Males Female" persons pcr
10
1'30
1'30
1'30
1'42
1'41
1'45
1'40
1'40
1'88
1'14
1'14
1'21
1'50
1'52
1'44
1'42
1'43
1'39
1'28
1'26
1'42
1'57
1'55
1'64
11
1.28
1'28
1'28
1'38
1'40
1'30
1'34
1'35
1'33
1'14
1'14
l'G8
1'31
1'32
1'26
1'29
1'29
1'27
1'15
1'14
1'21
1'45
1'47
1'38
household
12
5'16
5'16
5'17
5'59
5'63
5'51
5'48
5'50
5'42
4'56
4'56
4'58
5'62
5'67
5'40
5'41
5'43
5'33
4'86
4'80
5'27
6'04
6'04
6'04
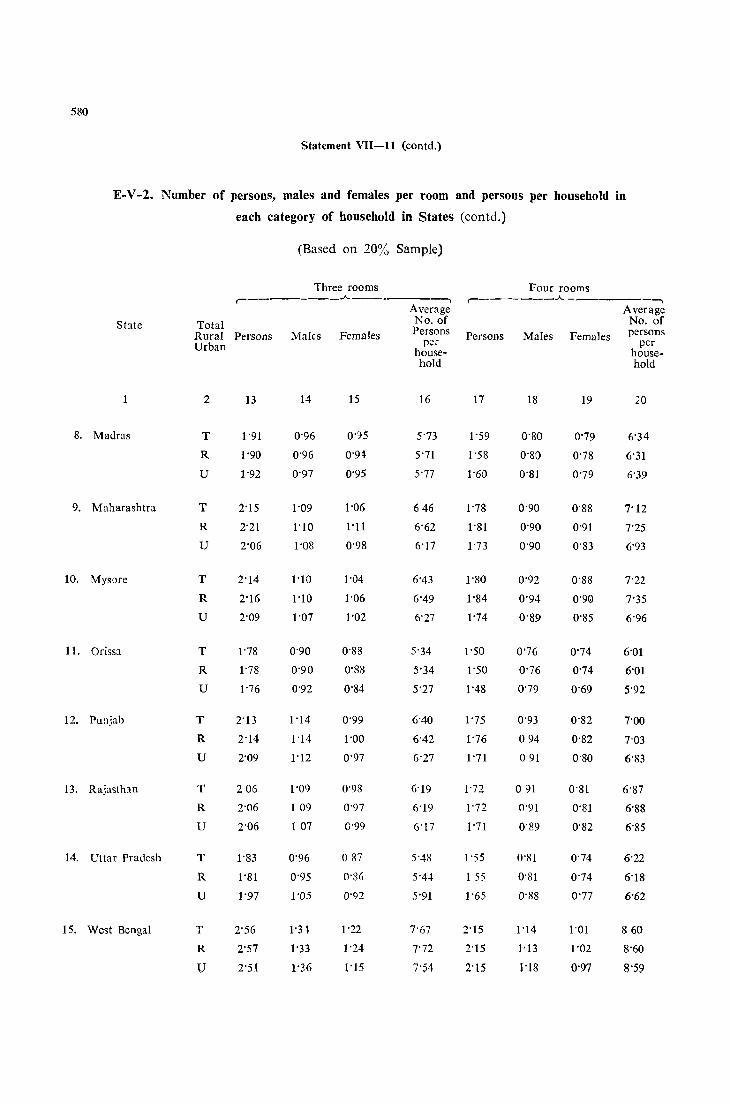
580
Statement VII-ll (contd.)
E-V-2. Number of persons, males and females per room and persons per household in
each category of household in States (contd,)
(Based on 20% Sample)
Three rooms Four rooms ,-_____ - __ .A. __ • -,
,-___ ~ __ .A. _ ...... Average Average
State Total No. of No, of Rural Persons Males Females Persons Persons Males Females persons Urban per per
house- house-hold hold
2 13 14 15 16 17 18 19 20
8. Madras T 1'91 0'96 0'::>5 5'73 1'59 0'80 0'79 6'34
R 1'90 0'96 0'9t 5'71 1'58 0'80 0'78 6'31
U 1'92 0'97 0'95 5'77 1'60 0'81 0'79 6'39
9, Maharashtra T 2'15 1'09 1'06 646 1'78 0'90 0'88 7'12
R 2'21 1'10 I'll 6'62 1'81 0'90 0'91 7'25
U 2'06 1'08 0'98 6'17 1'73 0'90 0'83 6'93
10, Mysore T 2'14 1'10 1'04 6'43 1'80 0'92 0'88 7'22
R 2'16 1'10 1'06 6'49 1'84 0'94 0'99 7'35
U 2'09 1'07 1'02 6'27 1'74 0'89 0'85 6'96
11. Orissa T 1'78 0'90 0'88 5'34 1'50 0'76 0'74 6'01
R 1'78 0'90 0'88 5'34 1'50 0'76 0'74 6'01
U 1'76 0'92 0'84 5'27 1'48 0'79 0'69 5'92
12, Punjab T 2'13 1'14 0'99 6'40 1'75 0'93 0'82 7'00
R 2'14 1'14 1'00 6'42 1'76 094 0'82 7'03
U 2'09 1'12 0'97 6'27 1'71 091 0'80 6'83
13. Rajasthan T 206 1'09 0'98 6'19 1'72 091 0'81 6'87
R 2'06 1 09 0'97 6'19 1'72 0'91 0'81 6'88
U 2'06 1 07 0'99 6'17 1'71 0'89 0'82 6'85
14. Uttar Pradesh T 1'83 0'96 087 5'43 1'55 0'81 0'74 6'22
R 1'81 0'95 0'86 5'44 1 55 0'81 0'74 6'18
U 1'97 1'05 0'92 5'91 1'65 0'88 0'77 6'62
IS, West Bengal T 2'56 1'3-1- 1'22 7'67 2'15 1'14 1'01 860
R 2'57 1'33 1'24 7'72 2'15 1'13 1'02 8'60
U 2'51 1'36 1'15 7'54 2'15 1'18 0'97 8'59
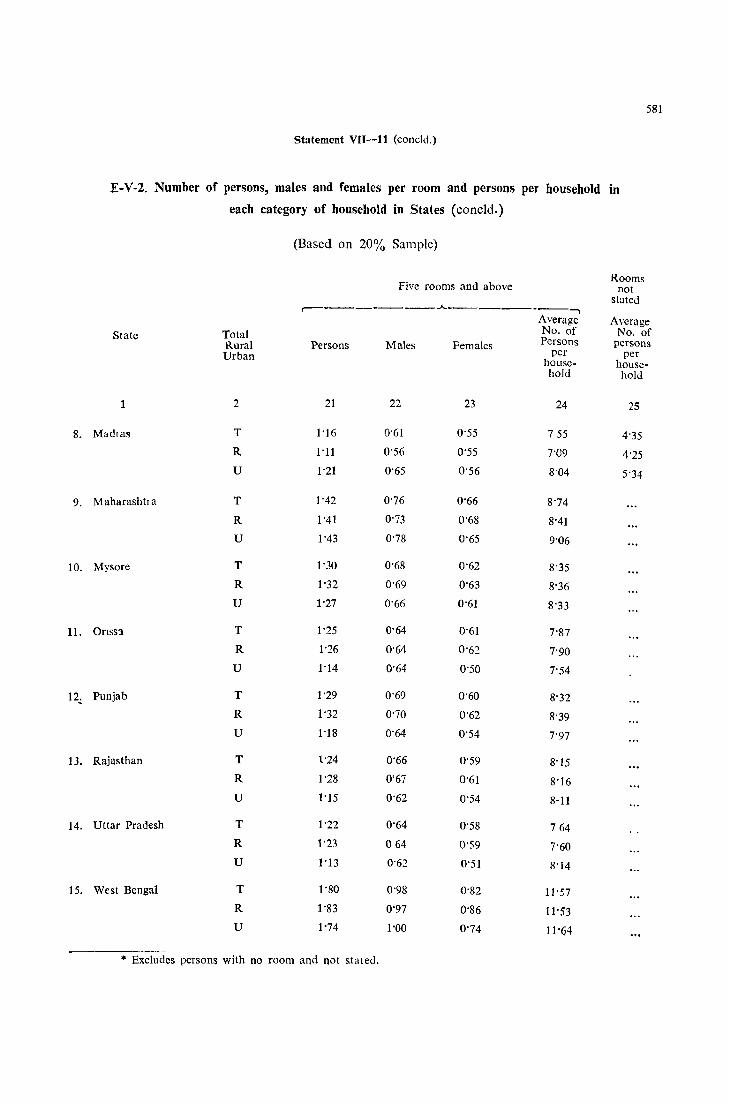
8.
9,
10,
11.
12,
13,
14,
IS,
581
Statement VII-ll (concld,)
E-V-2, Number of persons, males and females per room and persons per household in
each category of household in States (concId.)
(Based on 20% Sample)
Five rooms and above Rooms
not stated ,..--________ ..A. _________ ,
Average Average State Total No. of No. of
Rural Persons Males Females Persons persons Urban per per
housc- house-hold hold
1 2 21 22 23 24 25
Mfldlas T 1'16 0'61 0'55 755 4'35
R I'll 0'56 0'55 7'09 4'25
U 1'21 0'65 0'56 8'04 5'34
M aharashtra T 1'42 0'76 0'66 8'74
R 1'41 0'73 0'68 8'41
U 1'43 0'78 0'65 9'06
Mysore T 1'30 0'68 0'62 8'35
R 1'32 0'69 0'63 8'36
U 1'27 0'66 0'61 8'33
OrIss:! T 1'25 0'64 0'61 7'87
R 1'26 0'64 0'62 7'90
U 1'14 0'64 0'50 7'54
Punjab T 1'29 0'69 0'60 8'32
R 1'32 0'70 0'62 8'39
U 1'18 0'64 0'54 7'97
Rajasthan T \'24 0'66 0'59 8'15
R 1'28 0'67 0'61 8'16
U 1'15 0'62 0'54 8-11
Uttar Pradesh T 1'22 0'64 0'58 764
R 1'23 064 0'59 7'60
U 1'13 0'62 0'51 S'14
West Bengal T l'SO 0'98 O'S2 11'57
R 1'83 0'97 0'86 11'53
U 1'74 1'00 0'74 11'64
* Excludes persons with no room and not stated.
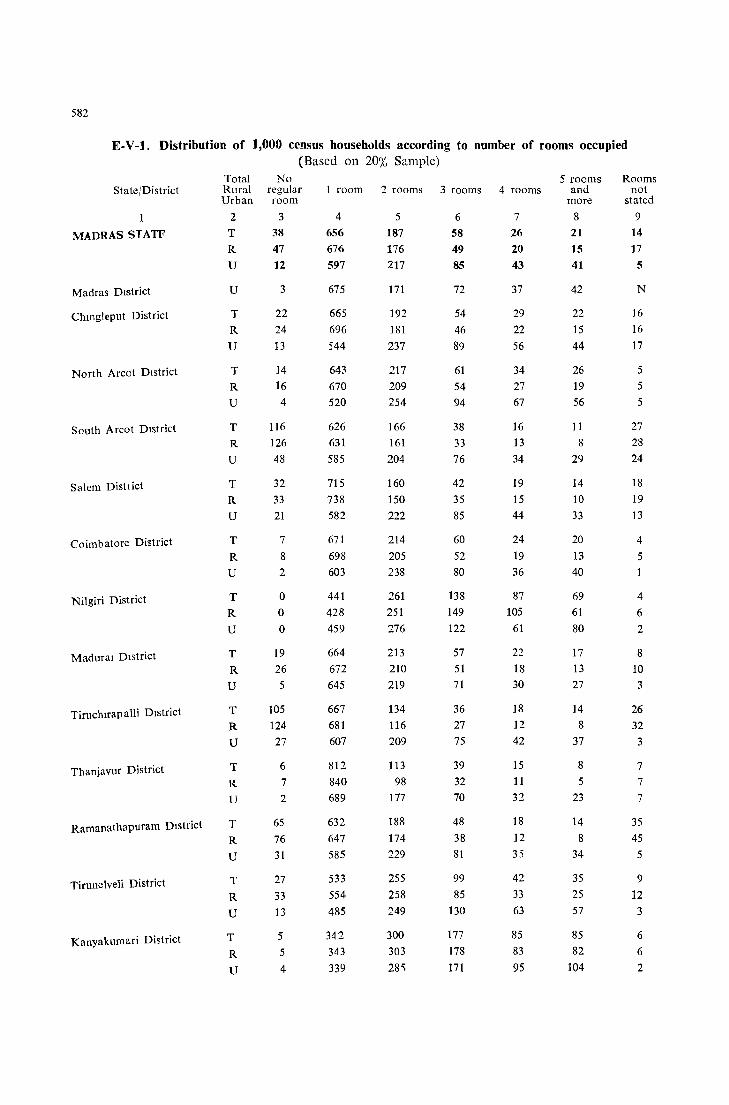
582
E-V-l. Distribution of 1,000 census househulds according to number of rooms occupied (Based on 20% Sample)
State/District
1
MADR AS ST ATF
Madras District
Chmgleput District
North Arcot District
South Arcot District
Salem Dish ict
Coimbatore District
Nilgiri District
Madural District
Tiruchlrapalli District
Thanjavur District
Ramanathapuram District
Tirunelveli District
Kanyakumari District
Total Rural Urban
2
T
R
U
U
T
R
U
T
R
U
T
R
U
T
R
U
T
R
U
T
R
U
T
R
U
T R
U
T
R
U
T
R
U
T
R
U
T
R
U
No regular room
3
38
47
12
3
22
24 13
14 16 4
116
126 48
32 33
21
7
8
2
o o o
19
26 5
105 124 27
6
7
2
65 76
31
27 33
13
5
5
4
1 room
4 656 676 597
675
665 696 544
643 670 520
626 631 585
715 738 582
671
698 603
441 428 459
664
672
645
667 681 607
812 840 689
632 647
585
533
554
485
342 343
339
2 rooms
5
187 176 217
171
192 181 237
217 209 254
166 161
204
160 150 222
214 205 238
261 251 276
213
210 219
134
116
209
113 98
177
188 174 229
255
258 249
300 303
28'i
3 rooms
6 58 49 85
72
54 46 89
61 54 94
38 33 76
42 35 85
60 52 80
138 149 122
57 51 71
36 27 75
39 32
70
48 38 81
99
85 130
177
178
171
4 rooms
7
26 20 43
37
29 22 56
34 27 67
16 13 34
19 15 44
24 19 36
87 105
61
22
18 30
18 12 42
15 11
32
18 12 35
42 33
63
85 83
95
5 rooms and
more
8 21 15 41
42
22
15 44
26 19
56
11
8
29
14 10 33
20 13
40
69 61
80
17
13 27
14 8
37
8
5
23
14 8
34
35 25 57
85 82
104
Rooms not
stated
9
14 17
5
N
16 16 17
5
5 5
27 28 24
18 19
13
4
5
4
6
2
8 10 3
26 32
3
7 7
7
35 45
5
9
12 3
6
6
2
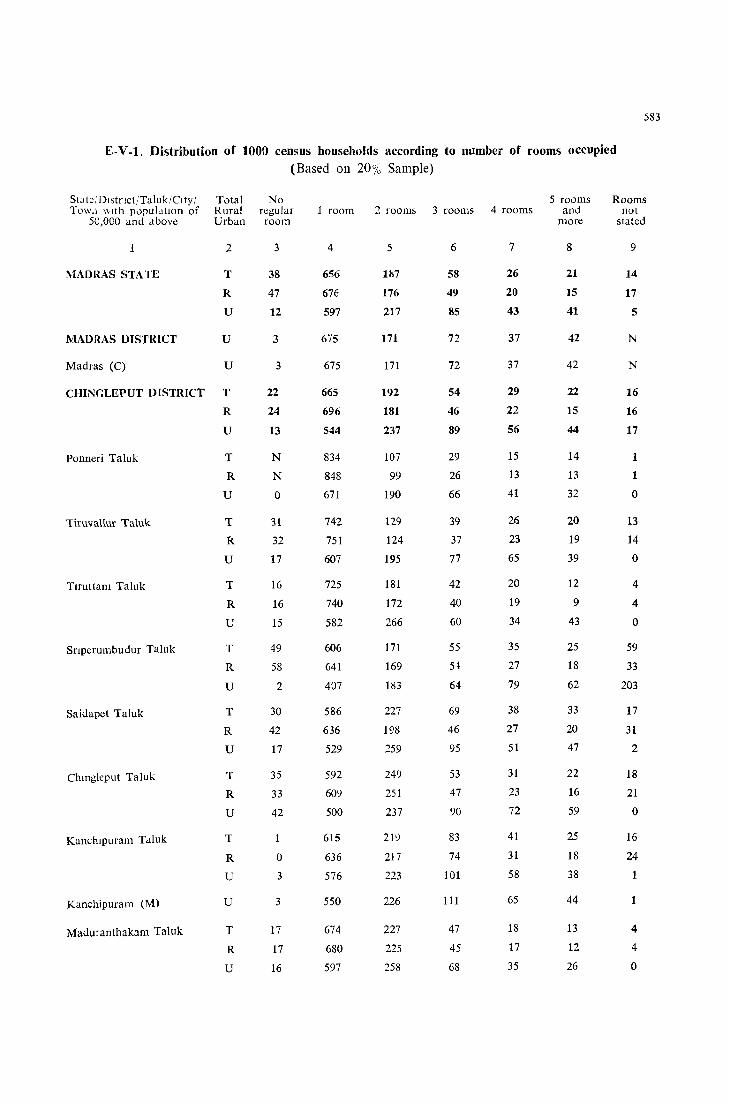
583
E-V -1. Distribution of 1000 census households according to number of rooms occupied (Based on 20% Sample)
State: Dlstnct/Taluk 10 ty / Tow,; \"lth populdtIon of
50,000 and .,tbovc
MADRAS STA TE
Total Rural Urban
2
T
R
U
MADRAS OISTRlCT U
Madras (C) U
CHINnLEPUT DISTRICT T
Ponneri Taluk
TiruvaUur Taluk
Tlruttam Taluk
Snperumbudur Taluk
Saidapet Taluk
Chmgleput Taluk
Kanchlpuram Taluk
Kanchipuram (M)
Maduranthakam Taluk
R
U
T
R
U
T
R
U
T
R
U
T
R
U
T
R
U
T
R
U
T
R
U
U
T
R
U
No regular room
3
38
47
12
3
3
22
24
13
N
N
o
31
32
17
16
16
15
49
58
2
30
42
17
35
33
42
o 3
3
17
17
16
1 room
4
656
676
597
675
675
665
696
544
834
848
671
742
751
607
725
740
582
606
641
407
586
636
529
592
609
500
615
636
576
550
674
680
597
2 rooms
5
1&7
176
217
171
171
192
181
237
107
99
190
129
124
195
181
172
266
171
169
183
227
198
259
249
251
237
219
217
223
226
227
225
258
3 rooms
6
58
49
85
72
72
54
46
89
29
26
66
39
37
77
42
40
60
55
5-l
64
69
46
95
53
47
90
83
74
101
111
47
45
68
4 rooms
7
26
20
43
37
37
29
22
56
15
13
41
26
23
65
20
19
34
35
27
79
38
27
51
31
23
72
41
31
58
65
18
17
35
5 rooms and
more
8
21
15
41
42
42
22
15
44
14
13
32
20
19
39
12
9
43
25
18
62
33
20
47
22
16
59
25
18
38
44
13
12
26
Rooms not
stated
9
14
17
5
N
N
16
16
17
1
o
13
14
o
4
4
o
59
33
203
17
31
2
18
21
o
16
24
1
4
4
o

5l!4
E-V-l. Distribution of 1,000 census households according to number of rooms occupied (contd.)
(Based on 20% Sample)
StatejDlstnetjTalukjCityj Town wIth populatIon of
50,000 and above
1
Total RUial Urban
2
NORTH ARCOT DISTRICT T
R
U
Arkonam Taluk
WalaJapet Taluk
Gudlyatham Taluk
Gudlyatham (M)
Tlfuppattur Taluk
Vellore Taluk
Vellore (M)
Ami Taluk
Cheyyar Taluk
Wandlwash Taluk
Polur Taluk
T
R
U
T
R
U
T
R
U
u
T
R
U
T
R
U
u
T
R
U
T
R
U
T
R
U
T
R
U
No regular room
3
14
16
4
18
21
4
7
10
o
15
17
5
6
8
10
o
3
4
2
o
N
3
10
11
o
50
52
2
10
12
1
1 room
4
643
670
520
676
710
509
608
642
494
593
612
519
512
680
731
480
588
635
522
543
614
639
490
628
637
518
607
606
625
696
717
568
5
217
209
254
191
177
261
236
225
269
247
240
272
288
193
177
257
240
240
239
228
230
230
230
230
227
274
213
213
220
194
183
262
3 rooms
6
61
54
94
63
52
116
70
61
101
72
69
87
84
53
39
108
77
66
94
98
69
62
105
69
65
111
61
60
71
47
44
67
4 rooms
7
34
27
67
31
26
57
42
35
66
37
31
57
57
33
20
82
50
31
177
71
44
37
77
38
36
61
28
27
41
29
24
56
5 rooms and
more
8
26
19
56
21
14
52
35
25
70
33
29
51
45
29
18
69
40
24
62
59
34
27
69
22
20
34
15
15
27
19
16
38
Rooms not
stated
9
5
5
5
N
N
2
2
N
3
2
9
8
4
5
4
2
N
4
8
5
26
3
4
2
26
27
14
5
4
8
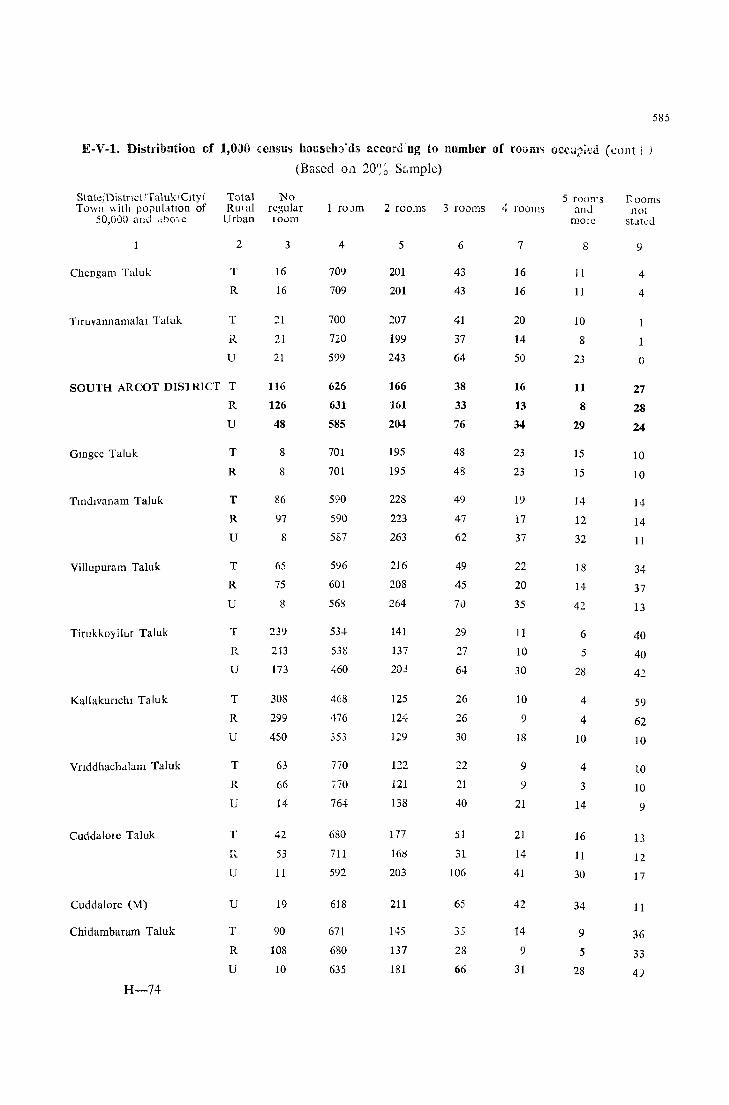
585
E-V-l. Distribation of 1,OaO (easu') hOlisch:.>'d3 acconl"ng to number of rOGm~ occu;_):~d (cant i )
(Based 0(1 20;~ Silmple)
State/Distnct ITalukf City I Town \\ ith populatIOn of
50,000 and "bo',e
Total No R u' al regular
Urban 100m
Chengam Taluk
TlfUvannamalal TaJuk
2
T
R
T
R
U
SOUTH ARCOT DIS1 RICT T
R
U
Gtngee Taluk
TmdlVanam Taluk
Villupuram Taluk
Tirukkoyilur Taluk
KaIIakunchl Taluk
Vnddhachalam Taluk
CuddalolC Taluk
Cuddalore (M)
Chidambaram Taluk
H-74
T
R
T
R
U
T
R
U
T
R
U
T
R
U
T
R
U
T
u
u
T
R
U
3
16
16
21
21
21
116
126
48
8
8
86
97
8
65
75
8
239
243
173
308
299
450
63
66
14
42
53
11
19
90
108
10
1 rOJm
4
709
709
700
720
599
626
631
585
701
701
590
590
587
596
601
568
534
538
460
468
476
353
770
,70
764
680
711
592
618
671
680
635
2 rooms
5
201
201
207
199
243
166
161
204
195
195
228
223
263
216
208
264
141
137
203
125
124
129
122
121
138
177
168
203
211
145
137
181
3 rOams
6
43
43
41
37
64
38
33
76
48
48
49
47
62
49
45
70
29
27
64
26
26
30
22
21
40
51
31
106
65
35
28
66
4 rooms
7
16
16
20
14
50
16
13
34
23
23
19
17
37
22
20
35
11
10
30
10
9
18
9
9
21
21
14
41
42
14
9
31
5 roan's and
male
8
11
11
10
8
23
11
8
29
15
15
14
12
32
18
14
42
6
5
28
4
4
10
4
3
14
16
11
30
34
9
5
28
rooms not
st.lkJ
9
4
4
1
1
o
27
28
24
10
10
14
14
11
34
37
13
40
40
42
59
62
10
10
10
9
13
12
17
11
36
33
49

586
E-V-l. Distributio:l of 1,000 census households a;:cording to number of rooms occupied (contd.)
(Based on 20~~ Sample)
State (Dis t r lct/T<11ukl en), I Total No 5 rooms Rooms Town wlll1 POpuhtlO:1 of Rural regular room 2 rooms 3 roams 4 rooms and not
50,000 and above Urban room more stated
2 3 4 5 6 7 8 9
SALEM DISTRICT T 32 715 160 42 19 14 18
R 33 738 150 35 15 10 19
U 21 582 222 85 4" 33 13
Hosur Taluk T N 690 207 61 24 15 3
R 0 697 204 59 23 14 3
U 598 244 86 46 24 1
Krishnagm Taluk T 20 763 147 34 19 17 N
R 21 788 138 27 14 12 N
U 2 459 262 119 79 74 5
Harur Taluk T 0 781 156 35 13 15 0
R 0 788 152 33 13 14 0
U 0 592 273 72 24 39 0
Dharmapufl Taluk T 17 776 138 28 17 10 14
R 17 787 134 26 15 8 13
U 22 642 192 53 35 31 25
Omalur Taluk T 26 781 138 31 14 9
R 26 812 123 24 9 6 N
U 28 537 262 84 53 28 8
Yercaud Taluk T 78 690 143 34 27 28 0
R 78 690 143 34 27 28 0
Salem Taluk T 51 6-1-4 181 60 28 22 14
R 82 690 153 35 15 11 14
U 14 586 216 90 43 36 15
Salem (M) U 7 595 214 89 43 35 17
Sankan Taluk T 10 788 87 19 10 5 81
R 0 799 81 17 9 5 89 U 110 671 155 33 25 6 0
Tiruchengode Taluk T 3 751 159 38 17 11 21
R 0 774 150 32 13 7 24
U 12 654 198 65 35 29 7
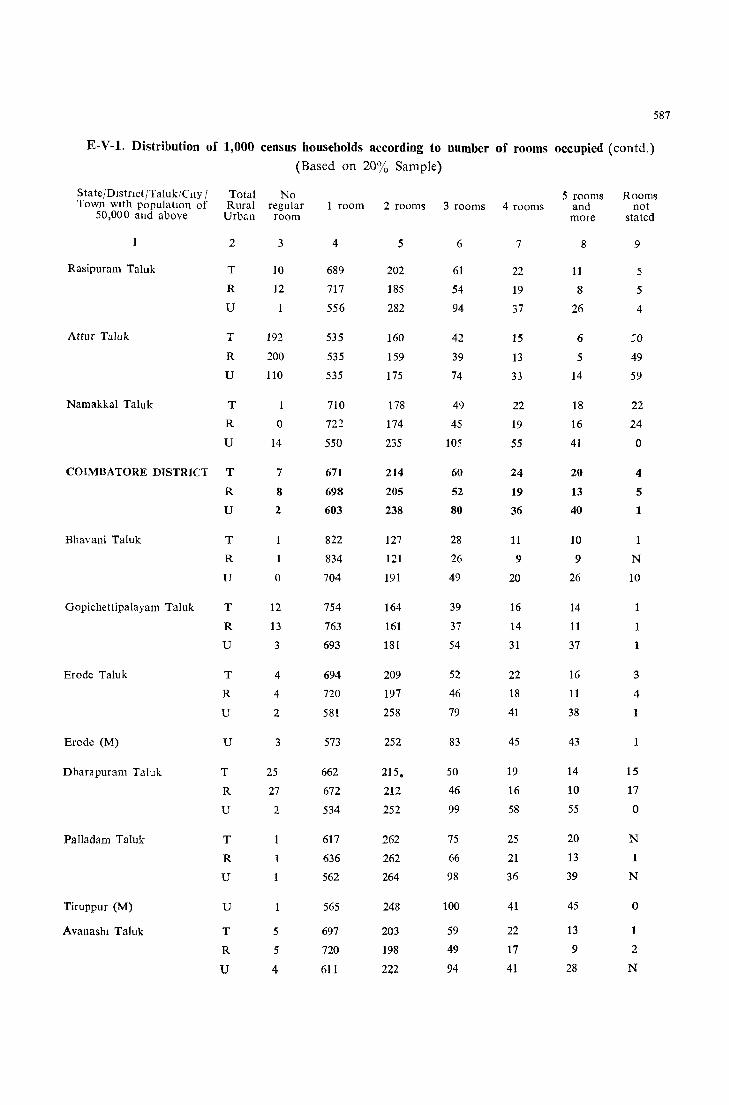
587
E-V-l. Distribution of 1,000 census households according to number of rooms occupied (contd.)
(Based on 20% Sample)
State/Dlstnct/Taluk/Clty / Total No 5 rooms Rooms Town with populatiOn of Rural regular 1 room 2 rooms 3 rooms 4 rooms and not
50,000 and above Urban room mOle stated
2 3 4 5 6 7 8 9
Rasipuram Taluk T 10 689 202 61 22 11 5 R 12 717 185 54 19 8 5
U 1 556 282 94 37 26 4
Attur Taluk T 192 535 160 42 15 6 '::0
R 200 535 159 39 13 5 49
U 110 535 175 74 33 14 59
Namakkal Taluk T 710 178 49 22 18 22
R 0 722 174 4S 19 16 24
U 14 550 235 105 55 41 0
COIMBATORE DiSTRICT T 7 671 214 60 24 20 4
R 8 698 205 52 19 13 5
U 2 603 238 80 36 40 1
Bhavani Taluk T 822 127 28 11 10
R 834 121 26 9 9 N
U 0 704 191 49 20 26 10
Gopichettipalayam Taluk T 12 754 164 39 16 14
R 13 763 161 37 14 11 1
U 3 693 18! 54 31 37
Erode Taluk T 4 694 209 52 22 16 3
R 4 720 197 46 18 11 4
U 2 58t 258 79 41 38 1
Erode (M) U 3 573 252 83 45 43 1
Dharapuram Taluk T 25 662 215. 50 19 14 15
R 27 672 212 46 16 10 17
U 2 534 252 99 58 55 0
Palla dam Taluk T 617 262 75 25 20 N
R 636 262 66 21 13 1
U 562 264 98 36 39 N
Tiruppur (M) U 565 248 100 41 45 0
Avanashl Taluk T 5 697 203 59 22 13
R 5 720 198 49 17 9 2
U 4 611 222 94 41 28 N
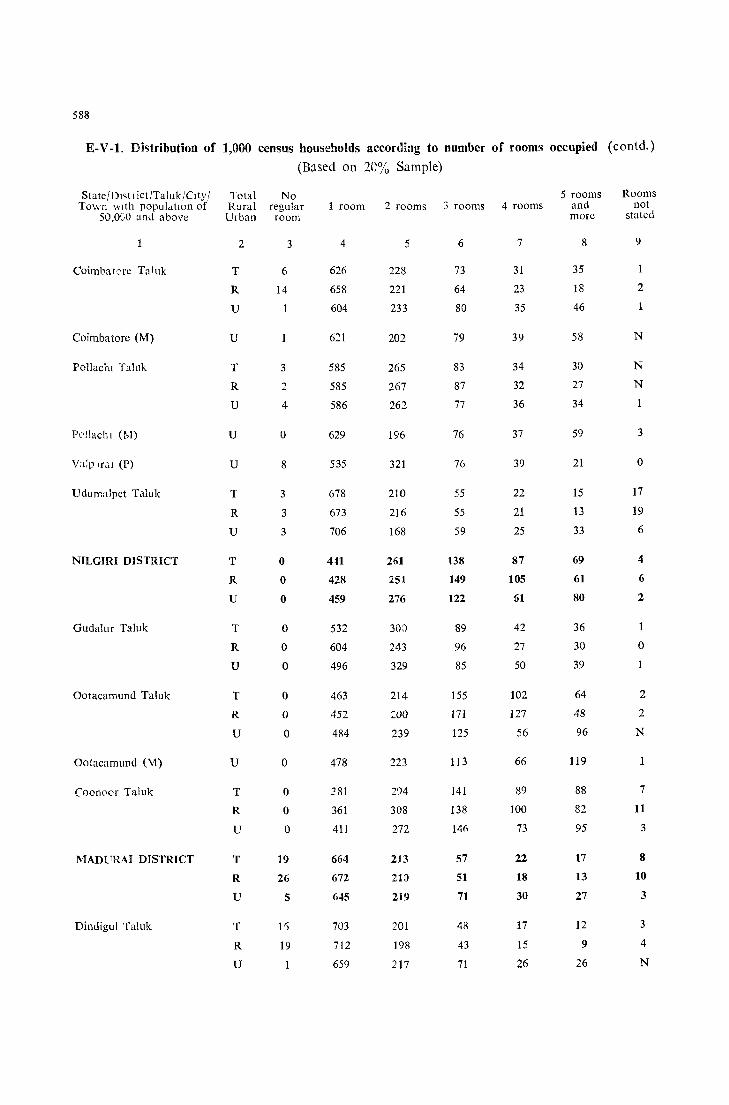
588
E-V -1. Di<;tribution of 1,000 census households according to number of rooms occupied (contd.)
(Based on 20% Sample)
State/Dlst I ict/TalukjClty I Town with populatIon of
50,OGO and above
Coimbat0rc Ta111k
Coimbatore (M)
Pollachl Talllk
Pcllachl (M)
Y.'llp 'fcH (P)
Udllmalpet Talllk
NILGIRI DISTRICT
Gudalllf Taluk
Ootacamund Tall1k
Ootacamllnd ("1)
CoonC'or Tall1k
MADURA I DISTRICT
Dindigul Talllk
Total No Rural regular Urban roorr;
2
T
R
U
u
T
R
U
U
u
T
R
U
T
R
U
T
R
U
T
R
U
u
T
R
U
T
R
U
T
R
U
3
6
14
3
2
4
° 8
3
3
3
o o o
o o o
o
° o
o
° o o
19
26
5
1'5
19
1 foam
4
626
658
604
6~1
585
585
586
629
535
678
673
706
4:U
428
459
532
604
496
463
452
484
478
281
361
411
664
672
645
703
712
659
2 rooms
5
228
221
233
202
265
267
262
196
321
210
216
168
261
251
276
30:)
243
329
214
:00
239
223
294
308
272
213
210
219
201
198
217
3 rooms
6
73
64
80
79
83
87
77
76
76
55
55
59
\38
149
122
89
96
85
155
171
125
113
141
138
146
57
51
71
48
43
71
4 rooms
7
31
23
35
39
34
32
36
37
39
22
21
25
87
105
61
42
27
50
102
127
56
66
89
100
73
22
18
30
17
15
26
5 rooms and marc
8
35
18
46
58
30
27
34
59
21
15
13
33
69
61
80
36
30
39
64
48
96
119
88
82
95
17
13
27
12
9
26
Rooms not
stated
9
2
1
N
N
N
3
° 17
19
6
4
6
2
°
2
2
N
1
7
11
3
8
10
3
3
4
N
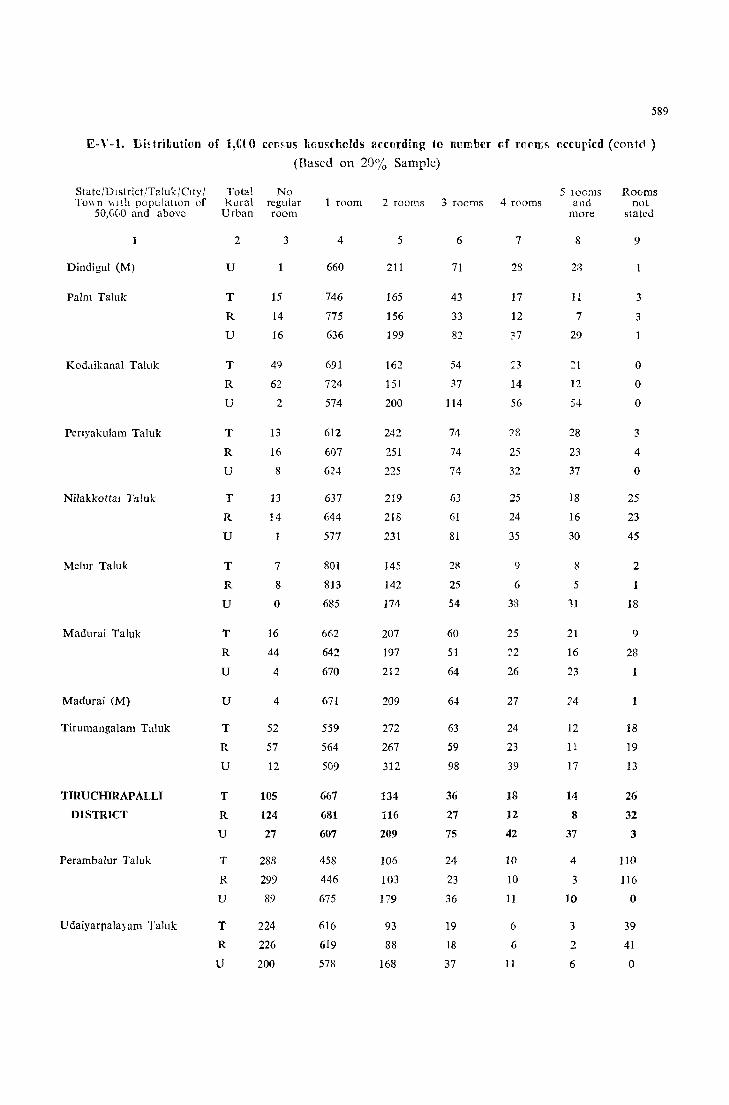
589
E-Y -1. Di~trituti()n of i,C( 0 C(:p~us l!cuseholds according to number f.f fC}('rr.!'> cccuried (contcl )
(Based on 20% Sample)
StatejD J sl rict!T :oIuk! CIty! To\\n \\'lth populatIOn of
50,CC>O and above
Dindigul (M)
Palm Taluk
Kodaikanal Ta!lIk
Penyaklilam Taluk
Nilakkottm Taluk
Melur Taluk
Madurai Taluk
Madurai (M)
Tirumangalam Taluk
TIRUCHIRAPALLI
DISTRICT
Perambalur Taluk
Udaiyarpala)am Taluk
Total Rural
Urban
2
U
T
R
U
T
R
U
T
R
U
T
R
U
T
R
U
T
R
U
U
T
R
U
T
R
U
T
R
U
T
R
U
No regular room
15
14
16
49
62
2
13
16
8
13
14
7
8
o
16
44
4
4
52
57
12
105
124
27
288
299
89
224
226
200
3
1 room
4
660
746
775
636
691
724
574
612
607
624
637
644
577
801
813
685
662
642
670
671
559
564
509
667
681
607
458
446
675
616
619
578
2 rooms
5
211
165
156
199
162
151
200
242
251
225
219
218
231
145
142
174
207
197
212
209
272
267
312
134
116
209
106
103
179
93
88
168
3 rooms
6
71
43
33
82
54
?7
114
74
74
74
63
61
81
28
25
54
60
51
64
6-1
63
59
98
36
27
75
24
23
36
19
18
37
4 rooms
7
28
17
12
?-7
:3 14
56
28
25
32
25
24
35
9
6
38
25
~2
26
27
24
23
39
18
12
42
10
10
11
6
6
11
5 lOems and
more
8
11
7
29
21
12
54
28
23
37
18
16
30
8
5
11
21
16
23
74
12
11
17
14
8
37
4
3
10
3
2
6
Rooms not
stated
9
3
3
o o o
3
4
o
25
23
45
2
18
9
28
18
19
13
26
32
3
110
116
o
39
41
o

590
E-v-t. Distribution of 1,000 censu" households according to number of rooms occupied (contd.)
(Based on 20% Sample)
State/Distnct)Taluk)Clty/ Town with populatlon or
50,000 and above
Lalgudi Taluk
Musiri Taluk
Karur Taluk
Karur (M)
Kulittalai Taluk
Total Rural
Urban
2
T
R
U
T
R
U
T
R
U
U
T
R
U
Tiruchirapal1i Taluk T
R
U
TiruchirapaUi (M) U
Kulathur Taluk T
R
Alangudi Taluk T
R
U
Pudukottai (M) U
Ttrumayam Taluk T
R
U
THANJAVUR DISTRICT T
R
U
Sirkali Taluk T
R
U
No regular room
3
17
19
68
77
13
o 3
o
50
47
111
48
128
4
4
340
340
11
o 36
o
103
102
III
6
7
2
o o o
1 room
4
757
770
683
643
647
623
760
796
625
642
803
811
650
6(4
633
588
573
526
526
777
846
626
661
722
754
540
812
840
689
829
849
725
2 rooms
5
144
1~7
183
178
173
:04
153
136
217
204
107
106
136
192
135
223
226
69
69
130
85
229
234
100
87
169
113
98
177
113
107
147
3 rooms
6
39
36
60
55
52
77
41
33
72
70
21
19
61
67
31
87
94
12
12
31
17
62
59
27
21
64
39
32
70
31
24
65
4 rooms
7
20
16
42
24
21
40
21
15
43
45
9
8
30
39
18
51
49
4
6
12
6
24
23
20
15
48
15
11
32
13
9
33
5 rooms and
more
8
13
11
26
20
17
34
15
10
36
38
6
6
12
34
13
46
52
2
2
9
3
23
23
23
16
63
8
5
23
4
3
12
Rooms not
stated
9
10
11
5
12
13
9
9
10
4
4
3
o
16
42
1
2
47
47
30
43
o
o
5
5
5
7
7
7
10
8
18
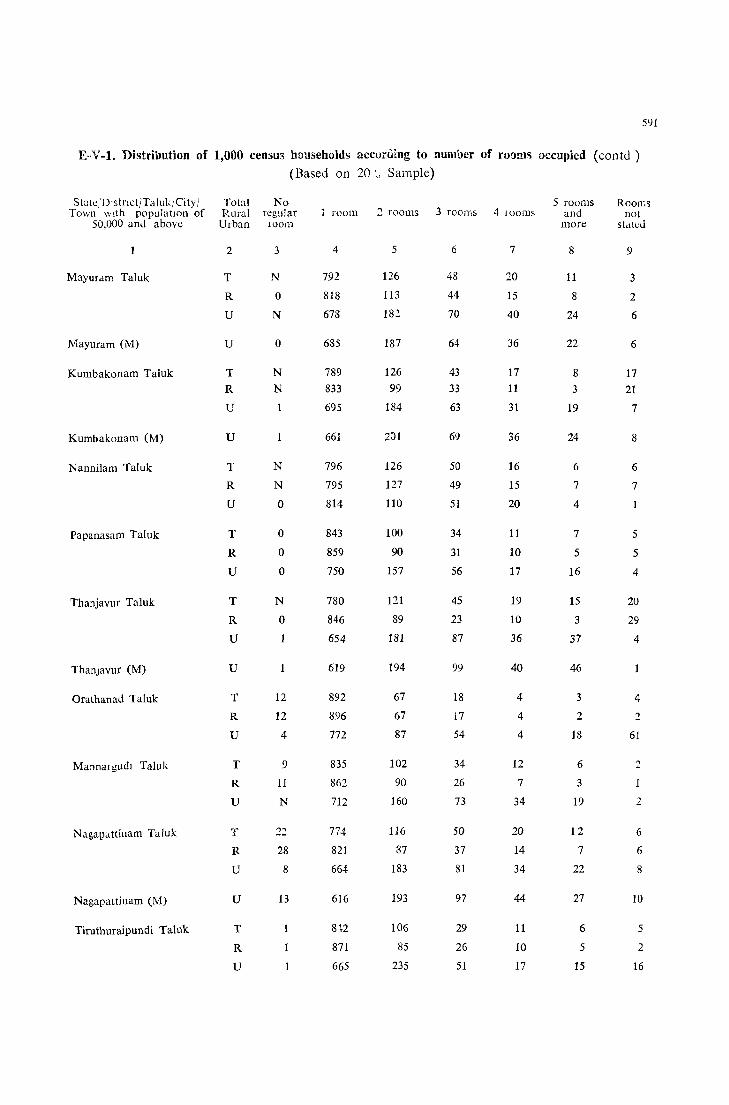
5lJ1
E··" -1. Distribution of 1,000 census households according to DUluDer of rooms occupied (contd ) (Based on 20'0 Sample)
Stnle:O'stnctITaJukICity/ Total No 5 rooms Rooms Town wrth populatIOn of Rural regular room 2 rooms 3 rooms 4 looms and not
50,000 and above Urban loom more stated
2 3 4 5 6 7 8 9
Mayuram Taluk T N 792 126 48 20 11 3
R 0 818 113 44 15 8 2
U N 678 182 70 40 24 6
Mayuram (M) U 0 685 187 64 36 22 6
Kumbakonam Taluk T N 789 126 43 17 g 17 R N 833 99 33 11 3 21
U 695 184 63 31 19 7
Kumbakonam (M) U 661 2uI 69 36 24 8
Nannilam Taluk T N 796 126 50 16 6 6
R N 795 127 49 15 7 7
U 0 814 110 51 20 4
Papanasam Taluk T 0 843 100 34 11 7 5
R 0 859 90 31 10 5 5
U 0 750 157 56 17 16 4
Thanjavur Taluk T N 780 121 45 19 15 20
R 0 846 89 23 10 3 29
U 654 181 87 36 37 4
ThanJavur (M) U 619 194 99 40 46
Orathanad Taluk T 12 892 67 18 4 3 4
R 12 896 67 17 4 2 2
U 4 772 87 54 4 18 61
Mannal gUdl Taluk T 9 835 102 34 12 6 2
R 11 862 90 26 7 3 1
U N 712 160 73 34 19 2
Nagapattinam Taluk "f "', 774 116 50 20 12 6
R 28 821 87 37 14 7 6
U 8 664 183 81 34 22 8
Nagapattinam (M) U 13 616 193 97 44 27 10
Tiruthuraipundi Taluk T 842 106 29 11 6 5
R 871 85 26 10 5 2
U 665 235 51 17 15 16

5'12
E-V -1. Distributiull of 1,00:.1 CCH3Cl."i hou~(;:l()!ds according to number of fQ,)ms occl.!p;ed (contd)
(B..lsd on 20% Sample)
St:ite/Dlstnct/Taluk/Cltj! To(a l No Town \~ltlI a POpuLI(!on of R':l \1 rcguJ, r
50,000 :.md above U rbdll room
Pattukkottal Taluk
Arantangi Taluk
RAMANATHAPURAM
DISTRICT
Tiruppattur Taluk
Slvaganga Taluk
Tll'uvadanai Taluk
Paramakudl Taluk
Ramanathapuram faluk
MudllkulJthur Talu!;:
Aruppukkottat Taluk
Aruppukkott:.1I (1\1)
2 3
T
R
U
T
R
U
}{
U
T
R
U
T
R
U
T
R
U
T
R
U
T
R
U
T
R
U
T
R
U
u
32
o
2
o
65
76
31
115
144
43
68
64
92
148
158
94
5
5
5
2
2
3
175
181
86
7
o 38
19
5 rooms 1 rOO!.1 :2 rooms 3 roOIllS 4 rooms and
l1lo,e
4 5 6 7 8
770
786
655
894
899
817
632
6J,7
585
636
6·+3
621
768
796
605
618
634
538
792
842
6\:'9
717
760
601
542
552
409
557
557
557
575
134
127
179
77
74
120
188
174
229
134
117
173
99
87
167
148
142
177
152
121
264
199
177
256
159
150
279
:07
191
271
266
41
36
80
10
15
29
48
38
81
40
59
28
21
72
33
24
76
31
65
41
65
33
27
123
46
38
83
86
15
12
38
7
7
11
18
12
35
24
17
42
11
7
34
14
10
36
12
7
32
19
12
38
11
8
50
Iii
13
26
27
10
6
40
4
3
9
14
8
34
30
19
57
9
6
28
15
5
71
6
3
19
14
7
32
7
4
50
8
7
14
15
Rooms not
stated
9
2
8
14
35
45
5
21
28
5
17
19
2
27
8
2
N
6
2
5
73
78
3
159
194
11
12
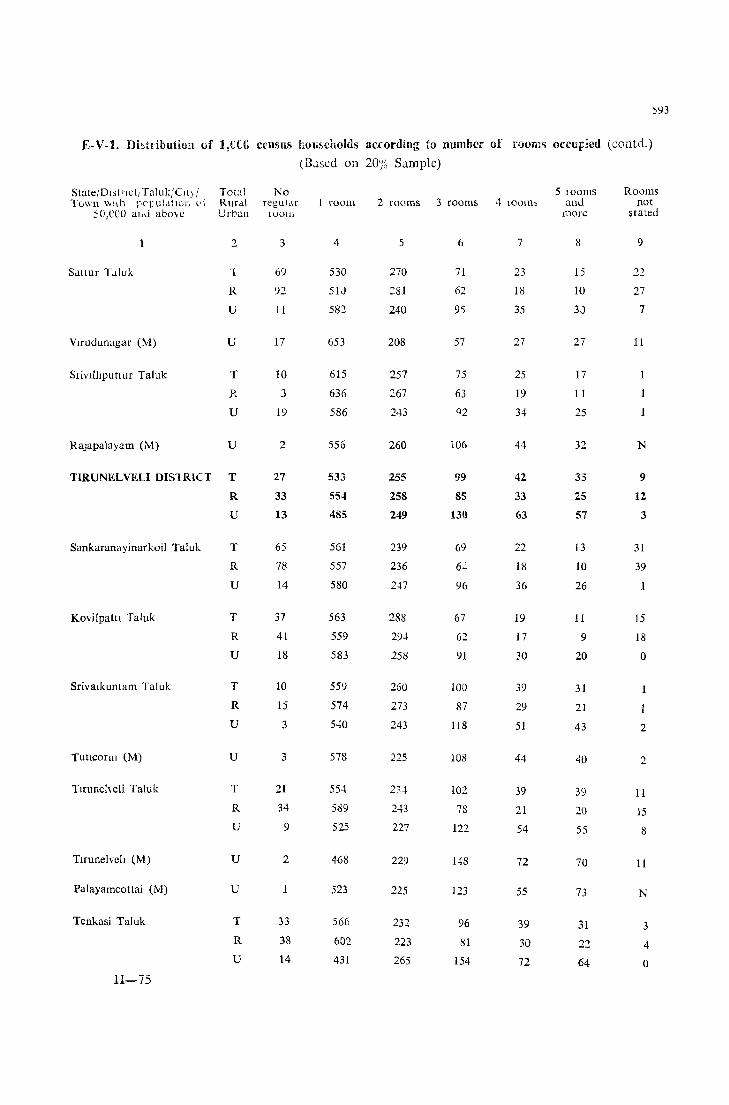
,93
E- V -1. Di"ttibution of 1,t(;1) census hOli~eholds according to number of rooms Occur!ed (contd.)
(Il.lsed on 20% Sample)
State/DIstrIct; Taluk/CIt) / Total No 5 lOoms Rooms Town \~llh r.Cj:U!.ltlon d Rural regu),I[ 1 room 2 rooms 3 rooms 4 loom~ and not
SO,CCO auLl abo\c Urban 100111 1110rc stated
2 3 4 5 6 7 8 9
SaUur T,duk 1 69 530 270 71 23 15 22
R 92 5IJ 281 62 18 10 27
U 11 582 240 9S 35 3J 7
Vlfudunagar (M) U 17 653 208 57 27 27 11
Srivllhputtur Taluk T 10 615 257 75 25 17 1
R J 636 267 63 19 11 1
U 19 586 243 Q2 34 25 1
RaJupalayam (M) U 2 556 260 i06 44 32 N
TIRUNELVELI DIS1RICT T 27 533 255 99 42 33 9
R 33 554 258 85 33 25 12
U 13 485 249 130 63 57 3
Sankaranayinarkoil Taluk T 65 561 239 69 22 13 31
R 78 557 236 6.! 18 10 39
U 14 580 2.f7 96 36 26
Kovilpattl Taluk T 37 563 288 67 19 11 15
R 41 559 294 62 17 9 18
U 18 583 258 91 30 20 0
Srivalkuntam Tal uk T 10 559 260 100 39 31
R 15 574 273 87 29 21
U 3 540 243 118 51 43 2
Tullconu (M) U 3 578 225 108 44 40 2
Tlruneheli Taluk T 21 554 234 102 39 39 11 R 34 589 243 78 21 20 IS
U 9 525 227 122 54 55 8
Tlrunelvch (M) U 2 468 229 148 72 70 Ii
Palayamcottai (M) U 1 523 225 123 55 73 N
Tenkasi Taluk T 33 566 232 96 39 31 3 R 38 602 223 81 30 22 4 U 14 431 265 154 72 64 0
H-75
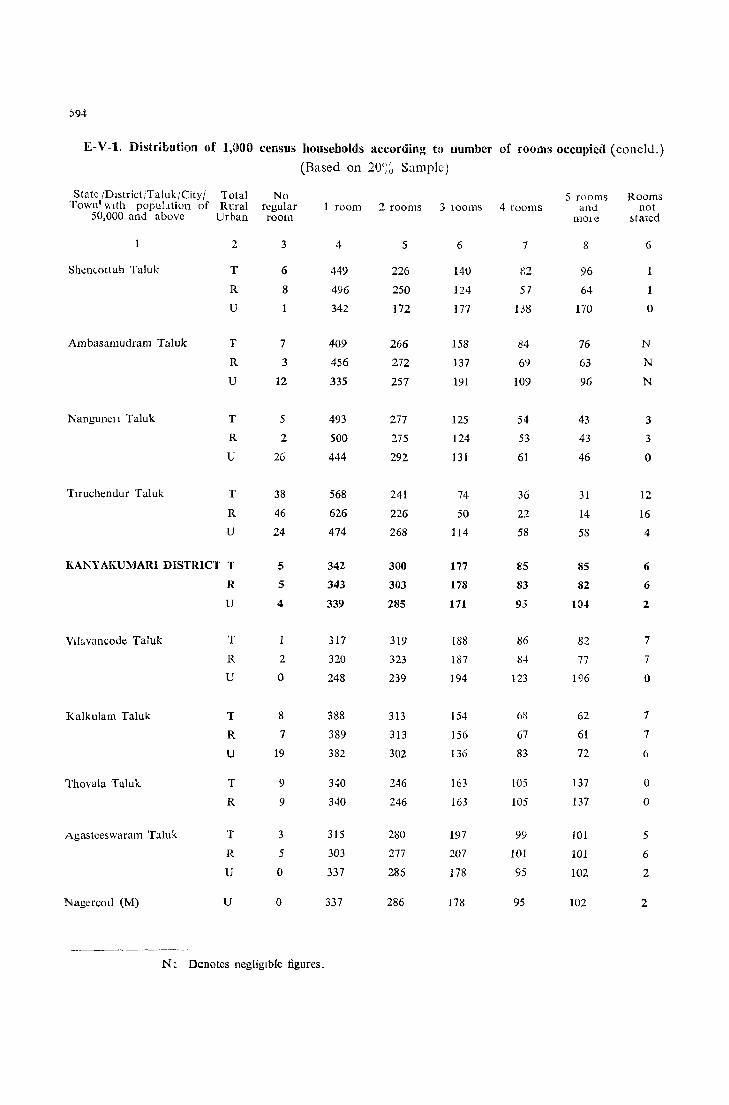
:'94
E-V-l. Distribution of 1,000 census households according tn number of rooms occupied (conclu.) (Based on 20(;~ Sample)
State /DlstrictjTalukjCity/ lotal No 5 fooms Rooms Townlwlth popuLltion of Rural regular 1 room 2 rooms 3 looms 4 rooms anci not
50,000 and above Urban room mOle ~tatcd
2 3 4 5 6 7 8 6
Sht:nwtlah TaJuk T 6 449 226 140 ~2 96 1
R 8 496 250 124 57 64
U 1 342 172 177 138 170 0
Ambasamudram TaJuk T 7 409 266 158 84 76 N
R 3 456 272 137 69 63 N
U 12 335 257 191 109 96 N
Nangunell Taluk T 5 493 277 125 54 43 3
R 2 500 275 124 53 43 3
U 26 444 292 131 61 46 0
Tlfuchendur Taluk T 38 568 241 74 36 31 12
R 46 626 226 50 22 14 16
U 24 474 268 114 58 58 4
KANYAKUMARI DISTRICT T 5 342 300 177 85 85 6
R 5 343 303 178 83 82 6
U 4 339 285 171 95 104 2
Vlbvancode Taluk T 317 319 188 86 82 7
R 2 320 323 187 84 77 7
U 0 248 239 194 123 196 0
KaJkulam Taluk T 8 388 313 154 63 62 7
R 7 389 313 156 67 61 7
U 19 382 302 136 83 72 6
Thovala Taluk T 9 340 246 163 105 137 0
R 9 340 246 163 105 137 0
Agasteeswaram Taluk T 3 315 280 197 99 101 5
R 5 303 277 207 101 101 6
U 0 337 286 178 95 102 2
NagercOil (M) U 0 337 286 178 95 102 2
N: Denotes negligible figures.
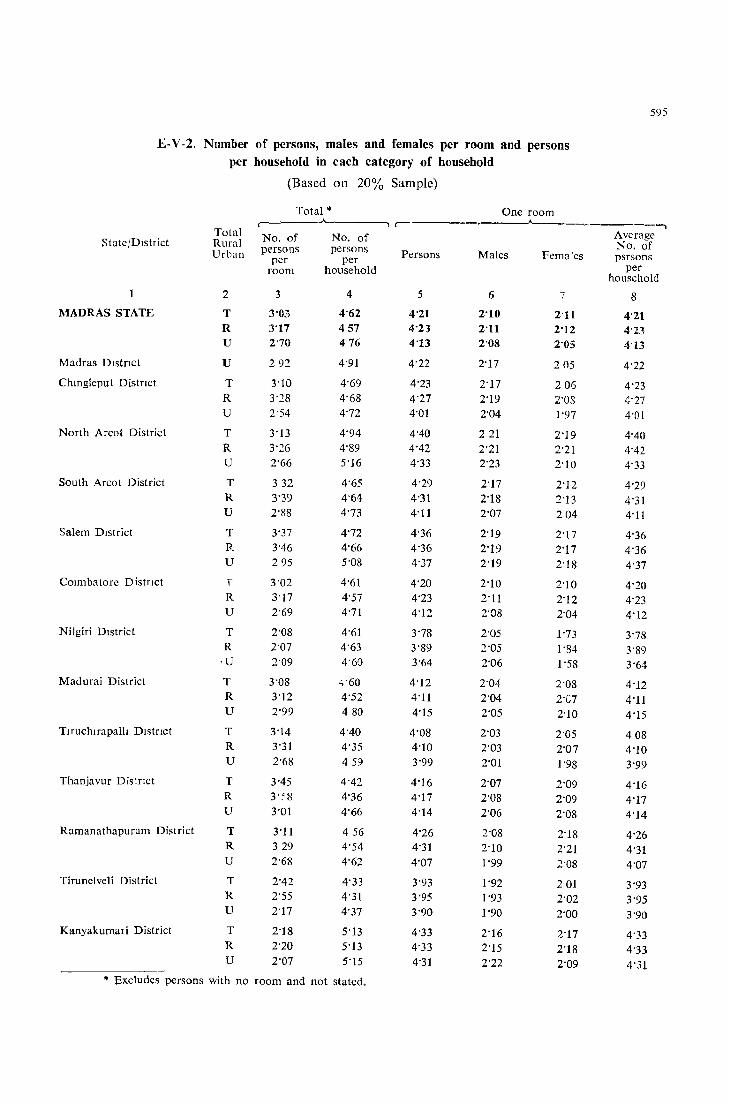
E-V-2, Number of persons, males and females per room and persons per household in each category of household
(Based on 20% Sample)
Total * One room
595
Total Rural Urban
r--~--..A..-----. r---~-- .---'----~---- -,
State/District
MADRAS STATE
Madras DIstnct
Chmgleput Distnct
North Arcot District
South Arcot District
Salem District
COImbatore Distnct
Nilgiri DIstrict
Madurai District
Tlfuchlrapalh Dlstnct
Thanjavur Dis~flct
Ramanathapuram District
Tirunelveli District
Kanyakumari District
2
T R U
U
T R U
T R U
T
R U
T R U
r R
U
T R
'U
T R
U
T R U
T R
U
T R U
T R
U
T R
U
No, of persons
per room
3
3'03 3'17 2'70
292
3'10 3'28 2'54
3'13 3'26 2'66
332 3'39 2'88
3'37 3'46 295
3'02 3'17 2'69
2'08
2'07 2'09
3'08 3'12 2'99
3'14 3'31 2'68
3'45 3'~8
3'01
3'11 329 2'68
2'42 2'55 2'17
2'18 2'20 2'07
No, of persons
per household
4
4'62 457 476
4'91
4'69 4'68 4'72
4'94 4'89 5'16
4'65 4'64 4'73
4'72 4'66 5'08
4'61 4'57 4'71
4'61 4'63 4'60
4'60 4'52 480
4'40 4'35 45:)
4'42 4'36 4'66
456 4'54 4'62
4'33 4'31 4'37
5'13 5'13 5'15
* Excludes persons with no room and not stated.
Persons
5
4'21 4'23 4'13
4'22
4'23 4'27 4'01
4'40 4'42 4'33
4'29 4'31 4'11
4'36 4'36 4'37
4'20 4'23 4'12
3'78 3'89 3'64
4'12 4'11 4'15
4'08 4'10 3'99
4'16 4'17 4'14
4'26 4'31 4'07
3'93 3'95 3'90
4'33 4'33 4'31
Males
6
2'10 2'11 2'08
2'17
2'17 2'19 2'04
221 2'21 2'23
2'17 2'18 2'07
2'19 2'19 2'19
2'10 2'11 2'08
2'05 2'05 2'06
2'04 2'04 2'05
2'03 2'03 2'01
2'07 2'08 2'06
2'08 2'10 1'99
1'92 1'93 1'90
2'16 2'15 2'22
Fema'es
7
2'11 2'12 2'05
205
206
2'08
1'97
2'19 2'21
2'10
2'12 2'13 204
2'17 2'17 2'18
2'10 2'12 2'04
1'73 1'84 1'58
2'08
2'G7 2'10
2'05 2'07 1'98
2'09 2'09 2'08
2'18 2'21 2'08
201 2'02
2'00
2'17 2'18 2'09
Average No, of psrsons
per household
8
4'21 4'23
4'13
4'22
4'23 4'27 4'01
4'40 4'42 4'33
4'29 4'31 4'11
4'36 4'36 4'37
4'20 4'23 4'12
3'78 3'89 3'64
4'12 4'11 4'15
408 4'10 3'99
4'16 4'17 4'14
4'26 4'31 4'07
3'93 3'95 3'90
4'33 4'33 4'31
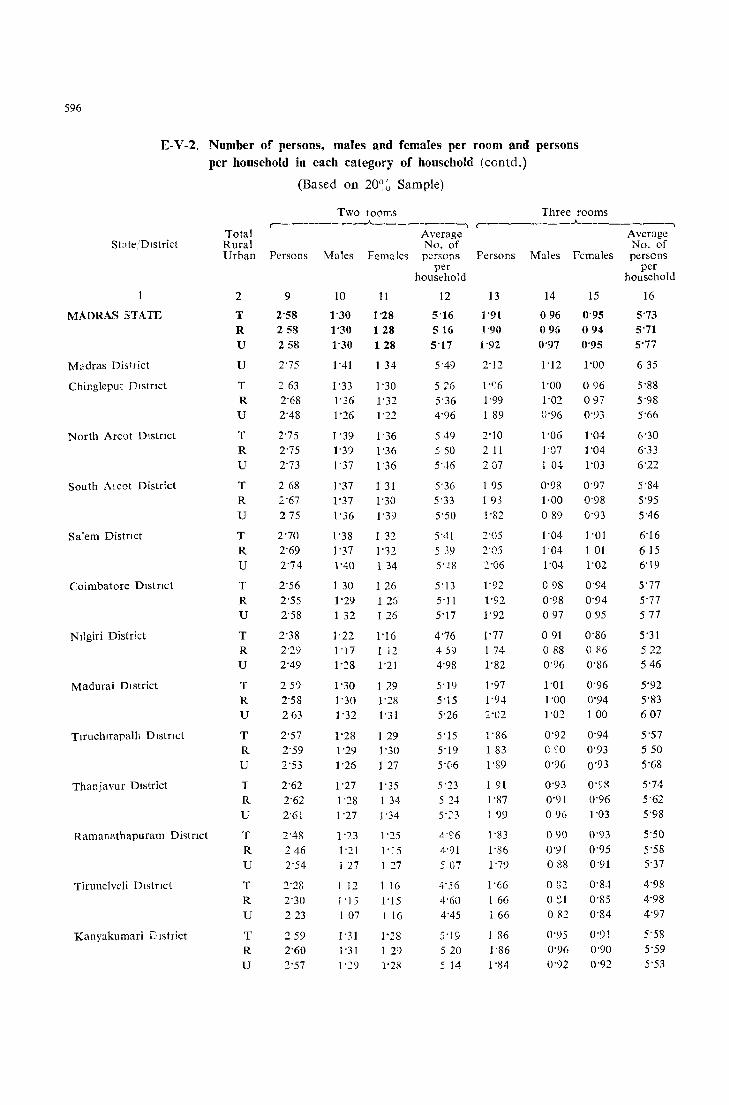
596
E-V-2, Number of persons, males and females per room and persons per household in each category of household (contd.)
St~te,'Dlstrict
MADRAS STATE
Madras District
Chingleput Dlstnct
North Arcat Dlstnct
South Arcat District
Salem Distnct
Coimbatore DIstrict
NIlgiri District
Madurai DIstrict
Tlruchlrapalli DIstrIct
Thanjavur District
Ramanathapuram Di~tnct
Tirunelvdi Dlstflct
Kanyakumari ['Istrict
Total Rural Urban
2
T R
U
U
T R U
T R
U
T R
U
T R U
T R U
T R
U
T R U
T R
U
T R
U
T R
U
T
R
U
T R U
(Based on 20~~ Sample)
Two lOOms ,-----~----"----------,
Average No, of
Persons Males Females persons per
househo~d
9
2'58 258 258
2'75
263 2'68 2'48
2'75 2'75 2'73
268 :.'67
275
2'70 2'69 2'74
2'56 2'55 2'58
2'38 2'29 2'49
25')
2'58 263
2'57 2'59 2'53
2'62 2'62 2'61
2'48
246 2'54
2'28 2'30 223
259 2'60 2'57
10
1'30
11
1'28 1'30 128
1'30 128
1'41 1 34
I' 33 1 '30 1'36 1'32 1'26 1'22
1'39 1'36 1'39 1'36 1'37 1'36
1'37 1 31 1'37
1'36
1'30
1'39
1'38 1 32 1'37 1''32
1'40 134
1 30 1 26 1'29 1 25 1 32 1 26
1'22 1'16 1'17 1'28
1'30 1'30 1'32
1'28 1'29 1'26
1'27 1'28 1'27
1 12 1'21
129 1'28 1'31
1 29 1'30
1 27
I' 35 I 34
1'34
1 '23 1'25
1'21 1-=5 1 27 1 27
1 12 1 16
l'I5 1'15 1 07 1 16
1'31 1'28 i '31 I 29 1'~9 1'28
12
5'16 516 5'17
5'49
526 5'36 4'96
549 :; 50
5'46
5'36 5'33
5'50
5'41 5 39 5'~8
5']3
5'11 5'17
4'76 459 4'98
5'19 5'15 5'26
5'15 5'19 5'(16
5'23
5 24 5':::3
4'%
4'91 507
4'56
4'60 4'45
5'19 520 5 14
Three rooms r--------_}.._------~
Average No, of
Persons Males Females persons per
household
13
1'91 1'90 1'92
1'<;'6
1'99 1 89
2'10 211 207
1 95 1 93 1'82
2'05
2'05 2'06
1'92 1'92 1'92
1'77 1 74 1'82
1'97 1'94
1'86 1 83 1'89
1 91 1'87
1 99
1'83
1'86 1'79
1 '66 1 66 1 66
1 86 1'86 1'84
14
096
15
0'95
096 094 0'97 0'95
1'12 1'00
1'00 096 1'02 097 0'96 0'93
1'06 1'04 1'07 1 '04 I 04 1'03
0'98 0'97 1,00
089
1'04 1 '04 1-04
098 0'98 097
091 088 0'96
0'98
0'93
1 '01 1 01 1'02
0'94 0'94 095
0'86 086 0'86
1'01 0'96 1'00 0'94
0'92 o SO
0'96
0'93 0'91 096
O'S8
0'96 1'03
090 0'93 0'91 0'95 o 88 0'91
032 0'84 o ~I 0'85 082 0'84
0'95 0'91 0'96 0'90
0'92 0'92
16
5'73 S'il
5'77
635
5'S8 5'98 5'66
6'30 6'33 6'22
5'84 5'95 5'46
6'16 615 6'19
5'77 5'77 577
5'31 522 546
S'92 5'83 607
5'57 550 5'68
5'74 5'62 5'98
5'50
5'58 5'37
4'98 4'98 4'97
5'58 5'59 5'53

E-V-2. Number or per<;ons, m3les and fernllle .. p~r .. oorn amI person" per household in each C3tC60fY of homehold (concld,)
(Based on 20~~ Sample)
Four rooms Five rooms r---- ,, __ -------....A.. ________ - --" r-------- _..A... ________ ~
Total A \t~l a~r: A ver<!gc S t:t t,~ /DI ~trJct Rural ]"0, ('1 No, of
\_'\b;m rer\5ons Males F~\""',~:"s P"L~:'S F:.<;<)ns Mal"::> Fem,\\es persons
MADRAS STATE
Madras Dlstnct
Chmglepnt District
North Arcot District
South Arcot District
Sakm Dlstnct
Coimbatore District
Nilglri District
2
T R U
U
T R
U
T R
U
T R lJ
T R U
T
R U
T R U
Madurai Dlstnct T R
U
Tiruchirapalh District T R U
Thanjavur DistrIct T R U
Ramanathapur::nn District T R U
Tlnmelvch District T R
U
KanyakumaJ I Drstnct T R U
17
l'S?
153 1'60
172
1'67 1'73 1 50
1-74
1-75
1 -71
1 T>'
1 66
18 19
0-80 0'79
080 0'73 G 31 079
098 0'32
0'85 032 O'SS 085 O'Rl () 78
0-138 o· '~6 033 O'S" 0'87 03'3
0'84 0'87 0'86 0'S7 O-SI 0-S5
1'66 0'S7 0'79 1 65 0'87 0'73 1'67 0'87 0'80
1 '58 0'81 0'77 1'59 0'31 0'78 1'56 O-SO 0'76
1'51 0'78 0'73 1 51 1 51
1'67 1 '62 1 74
1'57 1 57 1'57
1'62 1'55 1-71
1'52 1 54 1 49
I 33 1'33 1'33
1-46
1'46 1 '47
0'76 G 84 067
035 082 o 83 0-70 0'88 086
078 079 0'77 030 080 0'77
o 79 :, 83 0'76 0 80 0'84 087
075 077 0-76 C'78
C 74 0'75
066 0-67 {:l'66 067 0'65 C 68
0'74 0 72 0-74 0'72 0'75 0'72
pcr pcr hom;~hold household
20
(, 31 (, :'>1
639
6'S7
6-70
691 6 37
691
700
6'36 6'94 6'61
6'64 6'Gt 660
632 0'37 6'26
6'03 603 6'04
£'69
649 697
627 6'26
648 624 685
606 6'17 595
5'33 534 5'31
5 35 585 5'89
21
l'H
111 I 2!
1-35
137
1 '.7 1'2~
1'32 1'37 1'2~
1-~3
1 20 1 32
1'26
1 10 1'58
1'08 1'12 1'04
0'88 O,r..,
u I
088
1'44 1'25 1'64
095 077 1 16
1'33
1'29 1'36
1'13 1'11 1 16
090 0'90
090
1'07 1'08 103
22
(J'(il
n 56 () 63
071
075 0'79
0'70
0'66 o 6:)
(J 63
058
23
055 0'55
G%
0'6: 0'63 0'54
066 068 0':;1
065 0'58 0'62 0'60 0-72
0'69 057 057 0-53 094 0'64
056 0'52
0'58 0'5 ~ 0'54 0'5J
0-45 0'43 046 041 044 0'44
0'81 063 C 63 062 1 00 064
050 0'45 0'38 0 39 063 053
070 063
0'68 061 071 065
0'63 0'50 0'60 051 0'67 0'49
G ·14 046 () 43 {H7 0'-15 045
0-53 0'5<1 054 0'54 0'52 0'51
24
7'S5 709 0'0-1
9 (>1
8'22 821 822
7'78 '7-97
7 SO
760 761 7-58
8'60 7'91 ~r82
7'19 6'99 7-36
6'21 6'08 635
903 7'53
10'65
7'14 6'59 762
8'16 739 885
777 7 l8
8'00
5'71 577 5'66
6'54 6'52 6-64
597
Rooms not stated
Average No. of p~lsons
pcr household
25
4-35
4-25
534
2248
5'60 4'38
10'16
4'57 4'69 4-06
4'33 435 4'09
4'15
409 4'68
4-07
4'09 3'86
4'34 CO 5'10
4-01
401 3-98
427 428 4'06
390 4'01 3'45
425 4'25 4'10
4'28 4'29 4'17
4'58 4'64 3"69
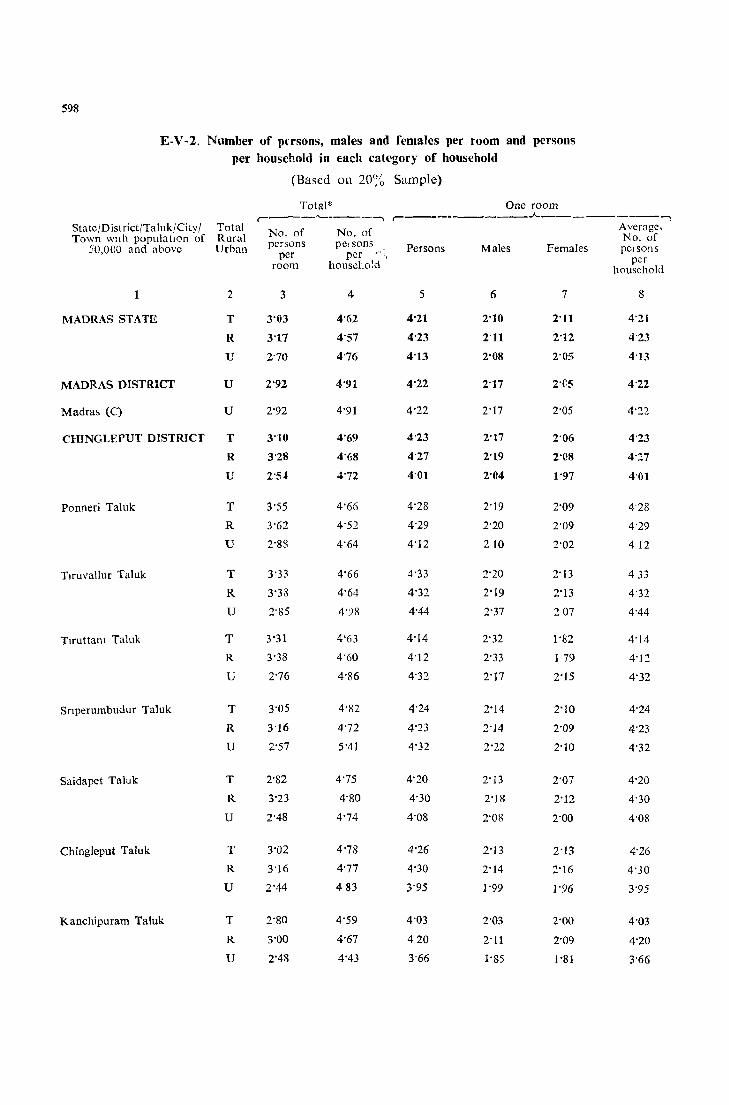
598
E-V-2, Number of persons, males and females per room and persons per household in each category of household
(Based on 20% Sample)
Total* One room r---"-_ .. ----,
, ___ • _____ ..A. ________ -,
StatcJDistrictJTalukJCityJ Total No, of No, of Average, Town WlI h popl1la tlOn of Rural No, of
50,000 and above Urban persons pe, sons Persons Males Females PCI sons per per """';1 room houseto!d per
household
1 2 3 4 5 6 7 8
MADRAS STATE T 3'03 4'62 4'21 2'10 2'11 4'21
R 3'17 4'57 4'23 2'11 2'12 4'23
U 2'70 4'76 4'13 2'08 2'05 4'13
MADRAS DISTRICT U 2'92 4'91 4'22 2'17 2'C5 4'22
Madras (C) U 2'92 4'91 4'22 2'11 2'05 4'~"
CHINGLEPUT DISTRICT T 3'10 4'69 4'23 2'17 2'06 4'23
R 3'28 4'68 4'27 2'19 2'08 4'Z7
U 2'54 4'72 4'01 2'04 1'97 4'01
Ponneri Taluk T 3'55 4'66 4'28 2'19 2'09 4'28
R 3'62 4'52 4'29 2'20 2'09 4'29
U 2'8S 4'64 4'12 210 2'02 412
Tlruvallur TaJuk T 3'33 4"66 4'33 2'20 2'13 433
R 3'38 4'64 4'32 2'19 2'13 4'32
U 2'85 4'98 4'44 2'31 201 4'44
Tlfuttam Taluk T 3"31 4"63 4'14 2'32 1'82 4'14
R 3'38 4'60 4'12 2'33 1 79 4'12
U 2'76 4'86 4'32 2'11 2'15 4'32
Snperumbudur Taluk T 3'05 4'82 4'24 2"14 2'10 4'24
R 3'16 4'72 4'23 2'14 2'09 4'23
U 2'57 5'41 4'32 2'22 2'10 4'32
Saidapet Taluk T 2'82 4'75 4'20 2'13 2'01 4'20
R 3'23 4'80 4'30 2'18 2'12 4'30
U 2'48 4'74 4'08 2'08 2'00 4'03
Chingleput Taluk T 3'02 4'78 4'26 2'13 2'13 4'26
R 3'16 4'77 4'30 2'14 2'16 4'30
U 2'44 483 3'95 1'99 1'96 3'95
Kanchipuram Taluk T 2'80 4'59 4'03 2'03 2'00 4'03
R 3'00 4'67 420 2'11 2'09 4'20
U 2'48 4'43 3'66 1'85 1'81 3'66

599
E-V -2, Number of persons, males and females per room and per~ons
per household in each category of household (contd,)
State/DlstrictjTalukjCityl Town with populatIOn of
50,000 and above
MADRAS STATE
MADRAS DISTRICT
Madlas (C)
CHINGLEPUT DISTRICT
Ponnen Taluk
Tlruvallur Taluk
Tlruttal1l Taluk
Sirperumbudur Taluk
Saluapet Taluk
Chm~lcput Taluk
Kanchipuram Taluk
Total Rural
(Based on 20% Sample)
Two rooms r---~~-----..A---------,
Averdge
Urban Persons Males Femulcs No. of persons
2
T
R
U
T
U
T
R
U
T
R
U
T
R
U
T
R
U
T
R
U
T
R
U
T
R
U
T
R
U
9
2'58
2'58
2'58
2'75
2'75
2'63
2'68
2'48
2'61
2'62
2'55
2'71
2'71
2'66
2'83
2'87
2'56
2'54
2'56
2'42
2'55
2'66
2'46
2'64
266
2'53
2'52
2'57
2'44
10
1'30
1'30
1'30
1'41
1'41
133
1'36
1'26
1'35
1'37
1'25
1'39
1'39
1'36
1'45
1'47
1'32
1'27
1'28
1'23
1'30
1'36
1'25
1'34
1'35
1'30
1'27
1'29
1-24
11
1'28
1'23
1'28
1'34
1'34
1'30
1.32
1'22
1'26
1'25
1'30
1'32
1'32
1'30
1'38
1'4U
1'24
1'27
1'28
1'19
1'2:'
1'30
1'21
1'30
1'31
1'23
1'25
1'28
1'20
per household
12
5'16
5'16
5'17
5'49
5'49
5'26
5'36
4'96
5'22
5'24
5'11
5'41
5'42
5'32
5'66
5'75
5'11
5'08
5 12
4'84
5'10
5'31
4'92
5'28
5'31
5'06
5'05
5'14
4'88
Three room" r-------.A----------~-~
/\ \ ~I dbe t"o, of
Persons Males i-cmales pawns
13
1'91
1'90
1'92
14
0'96
0,96
0'97
2'12 1'12
2'12 1'12
1'96 1'00
1.99 1'02
1'89
2'05
2'02
2'18
1'98
1'99
1'93
2'12
0'96
1'04
1'01
1'17
1'00
1'01
0'94
1'08
2'14 1'10
1'96 0'95
1'96 1'01
1'94 101
2'06 0'99
1'92 0'':)8
2'lU
1'82
1'06
0'94
1'91 0'98
1'92 0'97
1'89
1'89
1'89
1'89
1"03
0'94
0'95
0'93
15
095
0'94
0'95
1'00
1'00
0'96
0'97
0'93
1'01
1'01
1.01
0'98
098
0'99
1'04
1'04
1'01
0'95
0'93
1'07
0'94
1'04
0'S8
0'93
0'95
0'86
0'95
0'94
0'96
per hc)usc'lOIG
16
5'73
5'71
5'77
6'35
6'35
5'88
5'98
5'66
6'16
6'07
6'55
5'94
5'96
5'78
6'35
6'42
5.88
5'87
5'81
6'18
5'75
629
5'45
574
5'76
5'66
5'68
5'67
5'68

600
E-V-2. Number of perscns, males and fC':I~les per room and person" per household in Lidl categJcy of IDusehold (contd.)
CCased on 20% Sample)
Four looms Fi\C rooms anJ above r------"--A---------- --, r----~--.A.------.--- --,
R.:JOnJS nol &laleu
State/Dlstnct/Taluk/Cltyf Total h\<:rarr'3 Avewge Avera"'e Town with populatiOn of Rural No_ of No, (,f No, ~f
50,000 and above Urban P"lsons Males Females pel sons Persons Males Females pel sons persons
MADRAS ~TATE
MADRAS DISTRICr
Madras (C)
2
T
R
U
u
u
CHll'.GLEPUT DISTRICT T
R
U
Ponneri Taluk
Ttruvallur Taluk
1 iruttam Taluk
Srircrumbudur Taluk
Saldapc;t Taluk
Clllng!eput Taluk
Kanchlpuram Taluk
T
R
U
T
R
U
T
R
U
T
R
U
T
R
U
T
R
U
T
R
U
17 18 19
0'79
c'so O1'J
O'8i 0'79
1'72 o 9() 0-82
0'90
1'67 OES 082
1,73 0'3;; 0'85
1'59 0 81 0'78
1'71 0'86 0 85
1'75 0'88 0-87
1'56 080 0'76
1-60 O-SO G'80
1'59 O'SO 0'79
1'67 0-81 0-86
1 -S5 0'97 0-S8
1'85 0 95 0'90
1'84104080
163
1'66
1'57
085 0-78
(-SG 0 80
084 0-73
164083081
1'57 0'79 0 78
1-77 0'87 0 90
1 90 093 0'97
1'53 0'76 0 77
1710870'84
1'80 090 0'90
1'61 0'83 0-78
pel per per household household household
20
(; 39
6'87
6'87
6'70
6-91
0'37
6'84
7'01
6'24
6'41
6-36
6'63
652
703
(, 27
708
7-61
1)'11
682
7'19
21
1'16
1-11
1'21.
1-33
)'35
1'04
1'51
1-(9
1", _ ..
:'0)
1 -, .)-
1 37
1'23
1'26
1'21
22 23
(r6l OS5
0'56 0'55
0-65 0'56
0'71
0-71
0'75 0'62
079 0'68
0'70 0'5-1
0'52 0-_;2
076 0'75
056 053
0'60 0'67
0-60 0'68
0-59 0-65
0'65 0'61
0-72 069
053 0'49
1'23 077
132 0 n 1 08 085
0,77 053
I-OS 079
068 044
0'75 059
067 065
01>5 052
0'62 0'61
0-63
0'61
0-63
0'60
7'55
709
8'01
9'61
822
S-U
8-22
8'04
S'28
6'88
7'32
7-32
7-33
7'96
836
717
]2'33
12-27
12'44
841
9 18
803
765
702
8'57
7-17
7'21
7'12
25
4-35
425
5-34
22'48
22'48
5'60
438
10'16
3-71
3-71
o
4-63
4-63
o
4'52
452
o
757
428
1060
429
437
3 OJ
4-18
4-18
o
436
4-38
3-33
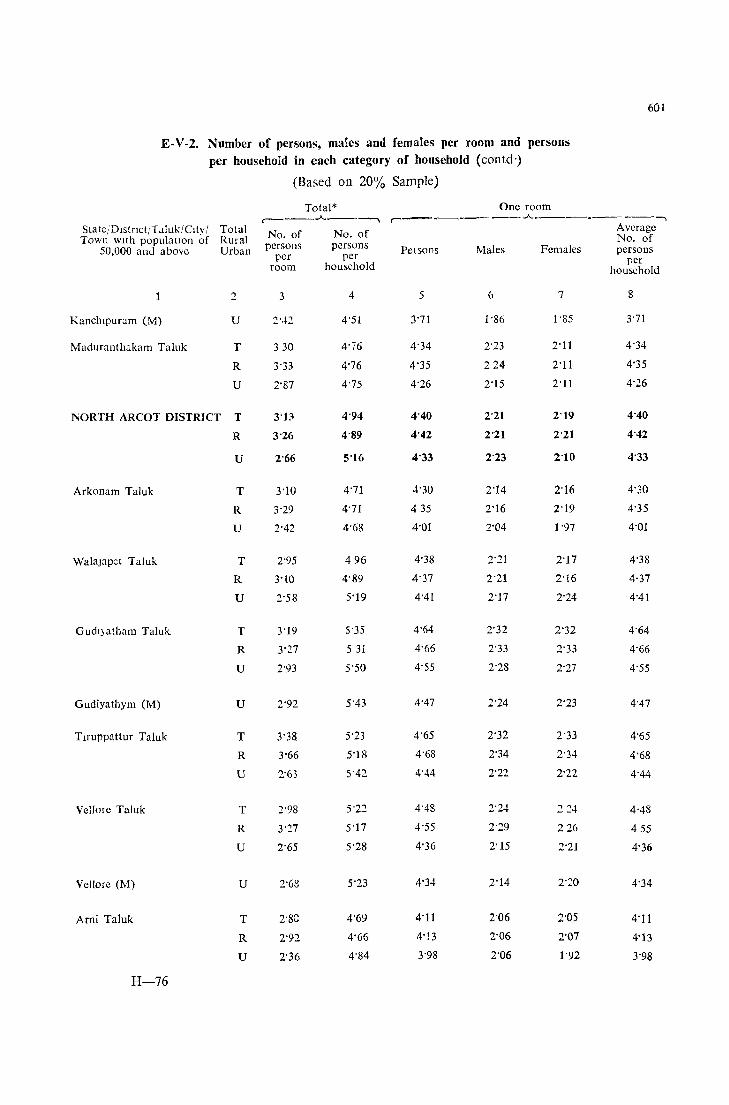
601
E-V-2, Number of persons, males and females per room and persons per household in each category of household (coutd')
(Based on 20% Sample)
Total* One room .-___ ..A. __ ---..
.-__ ~ ____ .A. __________ _,
State/Dlstnct/T.1luk/CIty/ Total No, of No, of Average Town wIth populatIon of Rural No, of
50,000 and above Urban persons persons Pel sons Males Females persons per per
rOO111 household per
household
2 3 4 5 6 7 8
Kanchipuram (M) u :;'42 4'51 3'71 1'86 1'85 3'71
Maduranthakam Taluk T 33O 4'76 4'34 2'23 2'11 4'34
R 3'33 4'76 4'35 224 2'11 4'35
U 2'87 4'75 4'26 2'15 2'11 4'26
NORTH ARCOT DISTRICT T 3'1;l 4'94 4'40 2'21 2'19 4'40
R 3'26 4'89 4'42 2'21 2'21 4'42
U 2'66 5'16 4'33 2'23 2'10 4'33
Arkonam Taluk T 3'10 4'71 4'30 2'14 2'16 4'30
R 3'29 4'71 435 2'16 2'19 4'35
U 2'42 4'68 4'01 2'04 1'97 4'01
Waia]apct Taluk T 2'95 496 4'38 2'21 2'17 4'38
R 3'10 4'89 4'37 2'21 2'16 4'37
U 2'58 5'19 4'41 2'17 2'24 4'41
GudI)atham Taluk T 3'19 5'35 4'64 2'32 2'32 4'64
R 3'27 5 31 4'66 2'33 2'33 4'66
U 2'93 5'50 4'55 2'28 2'27 4'55
Gudiyathym (M) U 2'92 5'43 4'47 2'24 2'23 4'47
Tlfuppattur Taluk T 3'38 5'23 4'65 2'32 2'33 4'65
R 3'66 5'18 4'68 2'34 2'34 4'68
U 2'63 5'42 4'44 2'22 2'22 4'44
Vellore Taluk T 2'98 5'22 4'48 2'24 224 4'48
R 3"27 5'17 4'55 2'29 226 455
U 2'65 5'28 4'36 2'15 2'21 4'36
VeJ]ore (M) U 2'68 5'23 4'34 2'14 2'20 4'34
Arni Taluk T 2'8\; 4'69 4'11 2'06 2'05 4'11
R 2'92 4'66 4'13 2'06 2'07 4'13
U 2'36 4'84 3'98 2'06 1'92 3'98
H-76

602
E-V-2. Number of persons, males and females per room and persons per hou"ehold in each cat('gory of household (eontd.)
(Based on 20(:~ Sample)
Tv.o rooms Three rooms r---------"--- -------, r-----"--- --.-A.-__________
~tak/ [listrict/ r.lluk/CIty I Total A\crage Average Town with populatlOn of Rural Nv. of No. of
50,000 .md above Urban Persons Males F<.:m~l]es PCI sons PClsons Males Fcmales persons per per
hou>ehold household
2 9 10 11 12 13 14 15 16
Kanchlpuram (M) U 2"43 1'22 1'21 4-86 1'87 0'92 0'95 5'61
Maduranthakam Taluk T 2'75 1'38 1'37 5'50 2'06 1'07 0'99 6'17
R 2'77 1'39 1'38 5'54 2'06 1'08 0'98 6'18
U 2'53 1'29 1'24 5'06 2'02 0'98 1'04 6'07
NORTH ARCOT DISTRICT T 2'75 1'39 1'36 5· ... 9 210 1'06 1'04 0'30
R 2'75 1'39 1'36 550 2'11 1'07 1'04 6'33
U 2'73 1'37 1'36 5'46 2'07 1'04 1'03 6'22
Arkonam Taluk T 2'60 1'34 1'26 5'20 1'95 099 096 584
R 2'67 1'36 1'31 5'34 2'00 099 1'01 6'01
U 2'37 1'26 I'll 4'75 1'82 0'96 0'86 5'47
WalaJapet Taluk T 2'71 1'35 1'36 5'42 206 1'04 1'02 6·18
R 2'73 1'37 1'36 5'45 2'08 1'06 1'02 6'23
U 2'66 1'31 1'35 5'32 2'02 1'01 1'01 6'07
GUdly~thum Tal uk T 2'92 1'50 1'42 583 2'33 1'18 1'15 6,98
R 2'92 1'50 1'42 5'83 2'33 1 18 1'15 6'99
U 2'92 1'48 1'44 583 2'32 1'17 1'15 6,95
Gudlyathum (M) U 2:88 1'46 1'42 575 2'37 ,1'2l 1'16 7'10
TIfUPPdttUr Taluk T 3'00 1'50 1'50 5 )') 228 1'15 1'13 6'83
R 3'05 1'52 1'53 G 10 238 1 21 1'17 7'15
U 2:85 1'43 142 5'70 2'13 1'(\5 1'08 638
Vellolc T:.lluk T :2 87 1.41 1'46 573 ::: 19 1'11 1'08 6'58
R 2'91 1'43 1'48 5'82 2'27 1'16 I'll 6'80
1) 280 1'38 1'42 5,60 2'12 1'07 1'05 6'36
Vellorc (M) U 2'79 1'38 1'41 5'57 2'14 1'09 1'05 6'42
Ami Taluk T 2'S8 1 30 1'28 5'16 1'92 0'94 0'98 5'75
R 2'S7 }'31 1'26 5'14 1'92 0'95 0'97 S'77
U 2'64 1'27 1'37 5'27 1'90 0'91 0'99 5'71
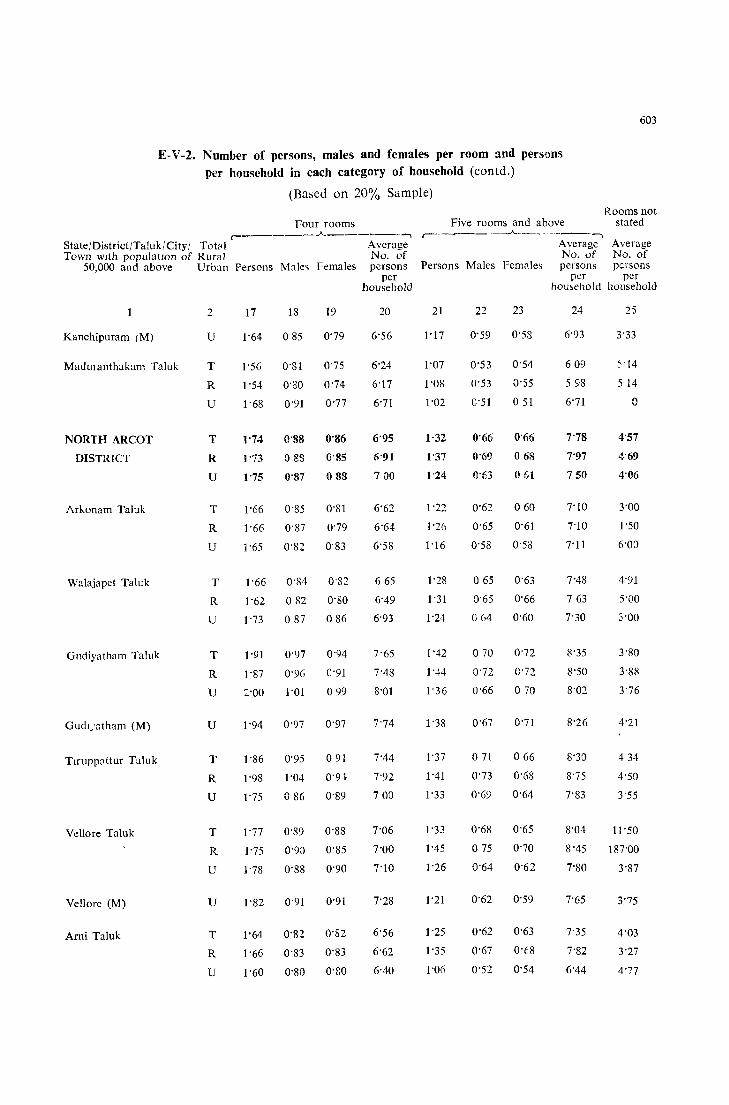
603
E-V -2. Number of persons, males and females per room and persons per household in each category of household (contd,)
(Based on 20% Sample)
Four rooms ,-_____ -.A ___ • __ "'""'
State/District/Tal uk/ City! TOt81 Average Town wIth populatIon of Rural No, of
50,000 and above Urban Persons Malc~ Females persons
Kanchipuram (M)
Madlllanthakam Taluk
NORTH ARCOT
DISTRICT
Arkonam Taluk
Walajapet Taluk
Gudiyatham Taluk
TIrupp~ttur Taluk
Vellore Taluk
VeIl ore CM)
Arni Taluk
2
u
T
R
U
T
R
U
T
R
U
T
R
U
T
R
U
u
T
R
U
T
R
U
u
T
R
U
17 18 19
1'64 085 0'79
1'56 O'SI 0'75
1'54 0'80 0'74
1'68 0'91 0'77
1'74 O'S8 0'86
1'73 088 O'S5
1'75 0'87 0 88
1'66 0'85 0'81
1'66 0'87 0'79
j'65 0'82 0'83
1'66 0'84
1'62 0 82 0'80
1'73 0 87 086
1'91 0'97
I'S7 0'96
:;"00 1'01
0'94
0'91
099
1'94 0 '97 0'97
1'86 0'95 0 91
1'98 1'04 0'9-1
1'75 0 86 0'89
1'77 0'89 0'88
1'75 0'9::> 0'85
1'78 0'88 0'90
1'82 0'91 0'91
1'64 0'82 0'82
1'66 0'83 0'83
1'60 0'80 O'gO
per household
20
6'56
6'24
6'17
6'71
6'95
6'91
700
6'62
6'64
6'58
665
6'49
6'93
7'65
7'48
8'01
7'74
7'44
7'92
700
7'06
7'00
7'10
7'28
6'56
6'62
6'40
Five rooms and above Rooms not
stated r--~--.A--~---,
Average Average No, of No, of
Persons Males Females persons persons
21
1'17
1'07
1'08
1'02
1,32
1'37
1'24
1'22
1'26
1'16
1'28
1'31
1'24
1'42
1',,\4
1'36
1'38
1'37
1'41
1'33
1'33
1'45
1'26
1'21
1'25
1'35
1'06
22 23
0'59 0'58
0'53 0'54
0'53
0'51
~'55
051
0'66 0'66
0'69 068
0'63 061
0'62 060
0'65 0'61
0'58 0'53
065 0'63
0'65 0'66
064 0'60
070 0'72
0'72
0'66
0'72
070
0'67 0'71
071 066
0'73 0'68
0'69 0'64
0'68 0'65
075 0'70
0'64 0'62
0'62 0'59
0'62 0'63
0'67 O'E8
0'52 0'54
per per homehold household
24
6'93
609
598
6'71
7'78
7'97
750
7'10
7'10
7'11
7'48
763
7'30
8'35
8'50
8'02
8'26
8'30
8'75
7'83
8'04
8'45
7'80
7'65
7'35
7'82
6'44
25
3'33
."14
514
o
4'57
4'69
4'06
3'00
1'50
6'00
4'91
5'00
3'00
3'80
3'88
3'76
4'21
434
4'50
3'55
11'50
187'00
3'87
3'75
4'03
3'27
4'77
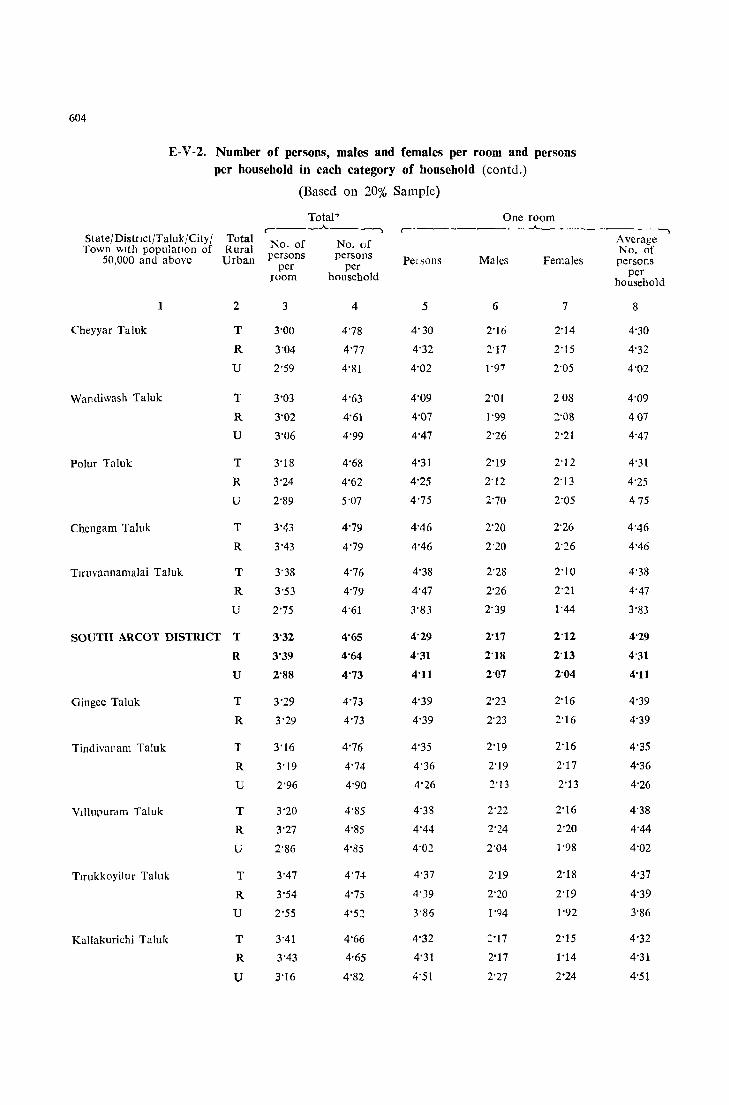
604
E-V-2, Number of persons, males and females per room and persons per household in each category of household (contd,)
(Based on 20'1{, Sample)
Total" One room , ___ .1>.. __ --, ,-- ---'--------------.,
State/Distnct/Taluk/City/ Total No, of No, of Average Town wIth populallon of Rural No, of
50,000 and above Urban persons persons PCI sons Males Females persons per per
,room houschold per household
1 2 3 4 5 6 7 8
Cheyyar Taluk T 3'00 4'78 4' 30 2'16 2'14 4'30
R 3'04 4'77 4'32 2'17 2'15 4'32
U 2'59 4'81 4'02 1'97 2'05 4'02
Wandiwash Taluk T 3'03 4'63 4'09 2'01 208 4'09
R 3'02 4'61 4'07 1'99 Z'08 407
U 3'06 4'99 4'47 2'26 2'21 4'47
Polur Taluk T 3'18 4'68 4'31 2'19 2'12 4'31
R 3'24 4'62 4'25 2'12 2'13 4'25
U 2'89 5-07 4'75 2'70 2'05 475
Cheng am Taluk T 3'43 4'79 4'46 2'20 2'26 4'46
R 3'43 4'79 4'46 2'20 2'26 4'46
TlfllVannamalai Taluk T 3'38 4'76 4'38 2'28 2'10 4'38
R 3'53 4'79 4'47 2'26 2'21 4'47
U 2'75 4'61 3'83 2'39 1'44 3'83
SOUTH ARCOT DISTRICT T 3'32 4'65 4'29 2'17 2'12 4'29
R 3'39 4'64 4'31 2'18 2'13 4'31
U 2'88 4'73 4'11 2'07 2'04 4'11
Gingee Taluk T 3'29 4'73 4'39 2'23 2'16 4'39
R 3'29 4'73 4'39 2'23 2'16 4'39
TindivaI'am Taluk T 3'16 4'76 4'35 2'19 2'16 4'35
R 3'19 4'74 4'36 2'19 2'17 4'36
U 2'96 4'90 4'26 2'13 2'13 4'26
VlIlupuram Taluk T 3'20 4'85 4'38 2'22 2'16 4'38
R 3'27 4'85 4'44 2'24 2'20 4'44
U 2'86 4'85 4'02 2'04 1'98 4'02
Tlrukkoyilur Taluk T 3'47 4'74 4'37 2'19 2'18 4'37
R 3'54 4'75 4'39 2'20 2'19 4'39
U 2'55 4'52 3'86 1'94 1'92 3'86
Kallakurichi Taluk T 3'41 4'66 4'32 2'17 2'15 4'32
R 3'43 4'65 4'31 2'17 1'14 4'31
U 3'16 4'82 4'51 2'27 2'24 4'51
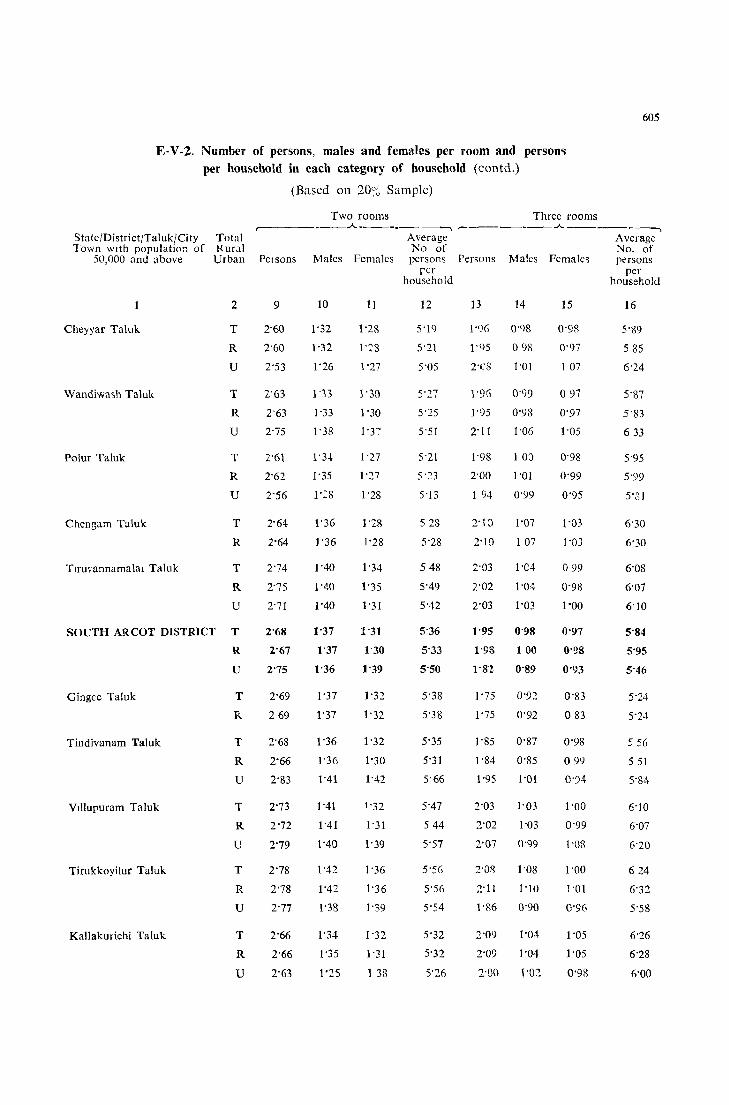
605
E-V-2. Number of persons, males and females per room and person", per household in each category of household (contd.)
State/DistrictJTalukJCity Town wIth population of
50,000 and above
Cheyyar Taluk
Wandiwash Taluk
Polur Taluk
Chengam Taluk
TIrUl'annamalai Taluk
Total Rur.:l1
Urban
2
T
R
U
T
R
U
T
R
U
T
R
T
R
U
SOUTH ARCOT DISTRICT T
R
U
Gingee Taluk
Tindivanam Taluk
Villupuram Taluk
Tirukkoyilur Taluk
Kallakurichi Taluk
T
R
T
R
U
T
R
U
T
R
U
T
R
U
(Based on 20~::, Sample)
Two rooms Three rooms r----~----.A.-----~ ----.., ,.-______ ..A.. -----_____
Average Average No of No. of
Pel sons Males Females persons Persons Males Female, persons
9
2'60
2'60
2'53
2'63
2'63
2'75
2'61
2'62
2'56
2'64
2'64
2'74
2'75
2'71
2'68
2'67
2'75
2'69
269
2'68
2'66
2'83
2'73
2'72
2'79
2'78
2'78
2'77
2'66
2'66
2'63
10
1'32
1'32
1'26
1 '33
1'33
l' 38
1'36
1'36
1'40
1'40
1'40
1'37
1'37
1'36
1'37
1'37
1'36
1'36
1'41
1'41
1'41
1'40
1'42
1'42
1'38
1'34
1'35
1'25
11
1'28
1'27
1'30
1'30
1'37
1'27
1'27
1'28
1'28
1'28
1'34
1'35
1'31
1'31
1'30
1'39
1'32
1'32
1'32
1'30
1'42
1'32
1'31
1'39
1'36
1'36
1'39
1'32
1'31
1 38
rer per household household
12
5'19
5'21
5'05
5'27
5'25
5'51
5'21
5'13
528
5'28
548
5'49
5'42
5'36
5'33
5'50
5'38
5'38
5'35
5'31
5'66
5'47
544
5'57
5'56
5'56
5'54
5'32
5'32
5'26
13 14
1'')6 0'<)8
1'95 098
2'':8 1'01
1'9G 0'99
1'95
2'11
1'98
2'00
I 94
2'1 :)
2'10
2'03
2'02
2'03
1'95
0'98
1'06
1 0;)
1'01
0'99
1'07
107
I'C4
1'04
1'03
0'98
1'98 100
l'S'l 0'89
1'75
1'75
1'85
0'92
0'92
0'87
1'84 0'85
1'95 1'01
2'03
2:02 1'03
2'07 0'99
2'09
1'08
1'10
0'90
1'04
2'09 1'04
2'00 1'02
15
0'98
0'97
1 07
097
0'97
1'05
0'98
0'99
0'95
1'03
l'OJ
099
0'98
1'00
0'97
0'98
0'93
0'83
083
0'98
099
0'')4
1'00
0'99
1'08
1'00
1'01
0'96
1'05
1'05
0'98
16
5'89
585
6'24
5'87
S'S3
633
5'95
5'99
5'31
6'30
6'30
6'08
6'07
6'10
5'84
5'95
5'46
5'24
5'24
5" 56
551
5'84
6'10
6'07
6'20
624
6'32
5'58
6'26
6'28
6'00
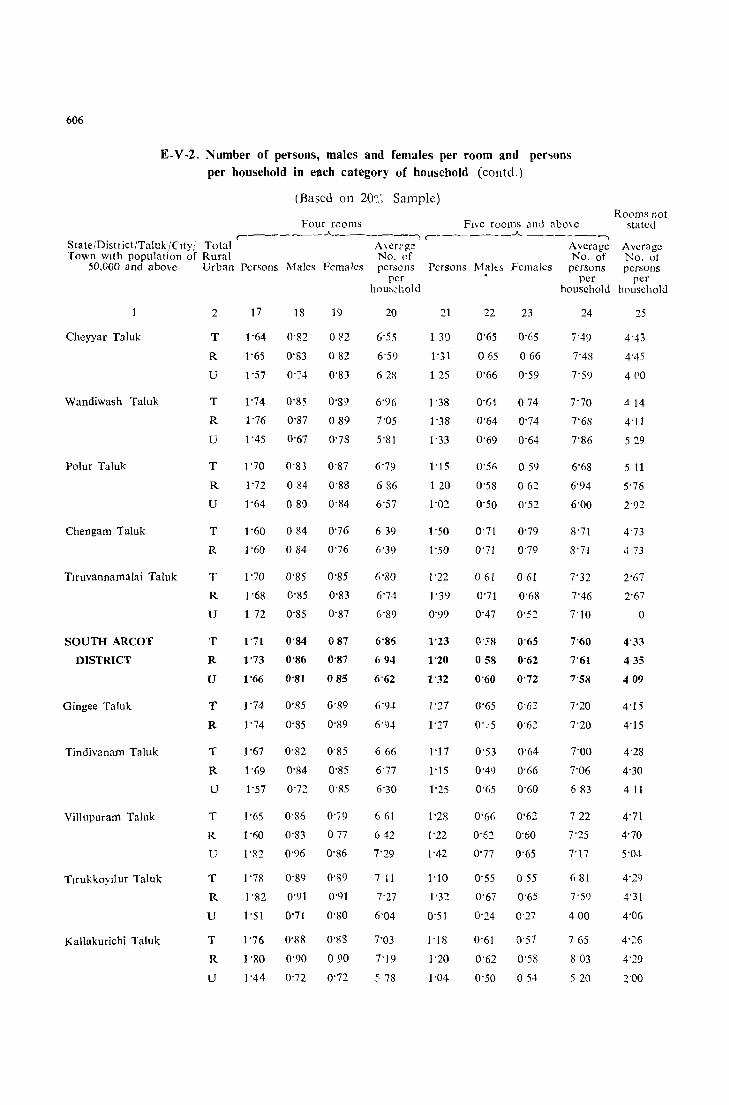
606
E-V -2. Number of persons, males and females per room and per'ions per household in each category of household (contd.)
(Based on 20~,~ Sample)
Four rooms Five rooms ,md above , ______ ..A. _____ --., , ______ ..A. _____ -,
State/Distriet/Taluk/Clty! Total A\(~r;'gc Average Town with population of Rural No. of No. of
Rooms not stated
Average 1'\0, 01
50,000 and above Urban Persons Males Females persons Persons Males Females persons persons
Cheyyar Taluk
Wandiwash Taluk
Polur Taluk
Chengam Taluk
Tlruvannarnalai Taluk
SOUTH ARCOT
DISTRICT
Gingee Taluk
Tindivanarn Taluk
Villupurarn Taluk
TlrukkoYllur Taluk
Kallakurichi Taluk
2
T
R
U
T
R
U
T
R
U
T
R
T
R
U
T
R
U
T
R
T
R
U
T
R
U
T
R
U
T
R
U
18 19
1'64 0'82 o !l2
1'65 0'83 0 82
1'57 0'74 0'83
1'74
1'76
1'45
0'85
0'87
0'67
0'89
089
0'78
1'70 0'83 0'S7
1'72 0 84 0'88
1'64 0 8') 0'84
1'60 0 84 0'76
1'60 0 84 0'76
1'70 0'85 0'85
1'68 0'85 0'83
1 72 0'85 0'87
1'71
1'73
1'66
0'84 087
0'86 0'87
0'81 085
1'74 0'85 0'89
1'74 0'85 0'89
1'67 0'82 0'85
1'69 0'84 0'85
1'57 0'12 0'85
0'86
0'S3
0'96
0'79
077
0'86
1 '78 0'S9 0'S9
l'S2 0'91 0'91
1'51 0'71 O'SO
1'76 0'S8 0'88
1 'SO 0'90 0 90
1'44 0'72 o'n
per • per per hou>chold household household
20
6'55
6'59
628
6'96
7'05
5'81
6'79
686
6'57
639
1)'39
(,'80
6'74
6'S9
6'86
694
6'62
666
6'77
6'30
661
642
7'29
711
7'27
6'04
7'03
7'19
578
21
1 3')
1'31
1 25
1'38
1'38
1'33
1'15
1 20
1'02
1'50
1'50
1'22
1'39
0'99
1'23
1'20
1'32
1'27
1'27
1'17
1'15
1'25
1'28
1'22
1'42
1'10
1'32
0'51
1'18
]'20
1'04
22 23
0'65 0'65
065 066
0'66 0'59
0'64 074
0'64 0'74
0'69 0'64
0'511 059
0'58 0 62
0'50 0'52
0'71
0'71
061
0'79
0'79
061
0'71 0'68
0'.'8
058
0'60
0'65
0'62
0'72
0'65 0'62
0' .'5 0'62
0'53 0'64
0'49 0'66
0'65
0'66
0'62
0'77
0'60
0'62
0'60
0'65
0'55 055
0'67 0'65
0'24 0'27
0'61 0'57
0'62 0'58
0'50 054
24
7'49
7'48
7'59
7'70
7'68
7'86
6'68
6'94
6'00
S'71
8'71
7'32
7'46
7'10
7'60
7'61
7'58
7'20
7'20
7'00
7'06
683
722
7'25
7'17
681
7'59
400
765
803
520
25
4'43
4'45
400
d 14
4 'II
529
5 11
5'76
2'92
4'73
473
2'67
o
4'33
435
409
4'15
4'15
4'28
4'30
4 11
4'71
4'70
5'04
4'29
4'31
4'06
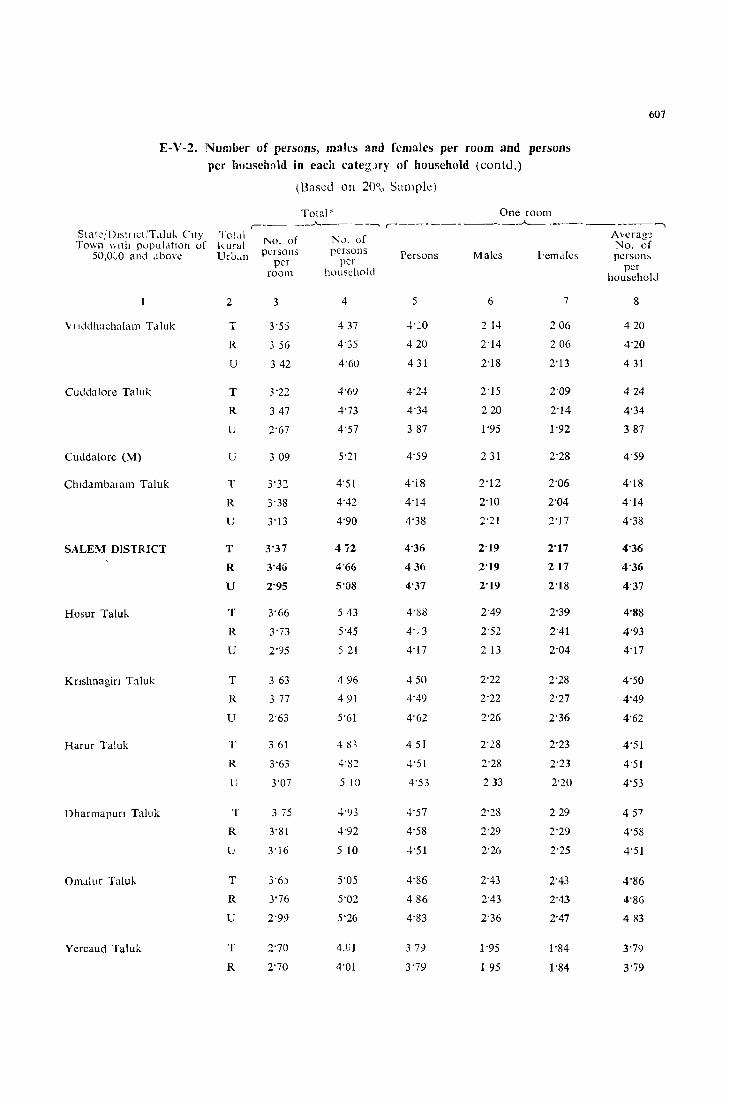
607
E-V-2, Number of persons, males and females per room and persons per hU:lsch:Jld in each catc6Jry of household (contd,)
(Based on 20~o Sampk)
Total' One room .------'------.... r------------.-"-- .---------,
Stak,'Dlstttct:T,tluk CIty Tol,d No, of N,), of Avcrag'~ Town \lllh pupuldtlon of 1<, ural No, of
50,OvO and dbovc UrU,t11 p<:rsons persons Persons Males Femdlcs person, per per per
room household household
2 3 4 5 6 7 8
Vtlddhachalam Taluk T 3'55 437 4'20 2 14 206 420
R 3 56 4'35 420 2'14 206 4'20
U 342 4'60 431 2'18 2'13 431
Cuddalore Taluk T 3'22 4'69 4'24 2'15 2'09 424
R 347 4'73 4'34 220 2'14 4'34
U 2:67 4'57 387 1'95 1'92 387
Cuddalore (M) U 309 5'21 4'59 231 2'28 4'59
Chidambaiam Taluk T 3'3~ 4'51 4'18 2'12 2'06 4'18
R 3'38 4'42 4'14 2'10 2'04 4'14
U 3'13 4'90 4'38 2'21 2'17 4'38
SALEM DISTRICT T 3'37 4i2 4'36 2'19 2'17 4'36
R 3'46 4'66 436 2'19 217 4'36
U 2'95 5'08 4'37 2'19 2'18 4'37
Hosur Talu!.. T 3'66 543 4'08 2'49 2'39 4'88
R 3'73 5'45 4',3 2'52 2'41 4'93
U 2'95 5 21 4'17 213 2'04 4'17
Knshnagin Taluk T 363 496 450 2'22 2'28 4'50
R 377 491 4'49 2'22 2'27 4'49
U 2'63 5'61 4'62 2'26 2'36 4'62
Harur Taluk T 361 483 451 2'28 2'23 4'51
R 3'63 4'8~ 4'51 2'28 2'23 4'51
U 3'07 5 10 4'53 233 2'20 4'53
Dharmapun Taluk T 3 75 4'93 4'57 2'28 229 45 7
R 3'81 4'92 4'58 2'29 2'29 4'58
U 3'16 5 10 4'51 2'26 2'25 4'51
Omdlur Talu!.. T 3'6) 5'05 4'86 2'43 2'43 4'86
R 3'76 5'02 486 2'43 2'43 4'86
U 2'99 5'26 4'83 2'36 2'47 483
Yercaud Taluk T 2'70 4,01 379 1'95 1'84 3'79
R 2'70 4'01 3'79 1 95 1'84 3'i9
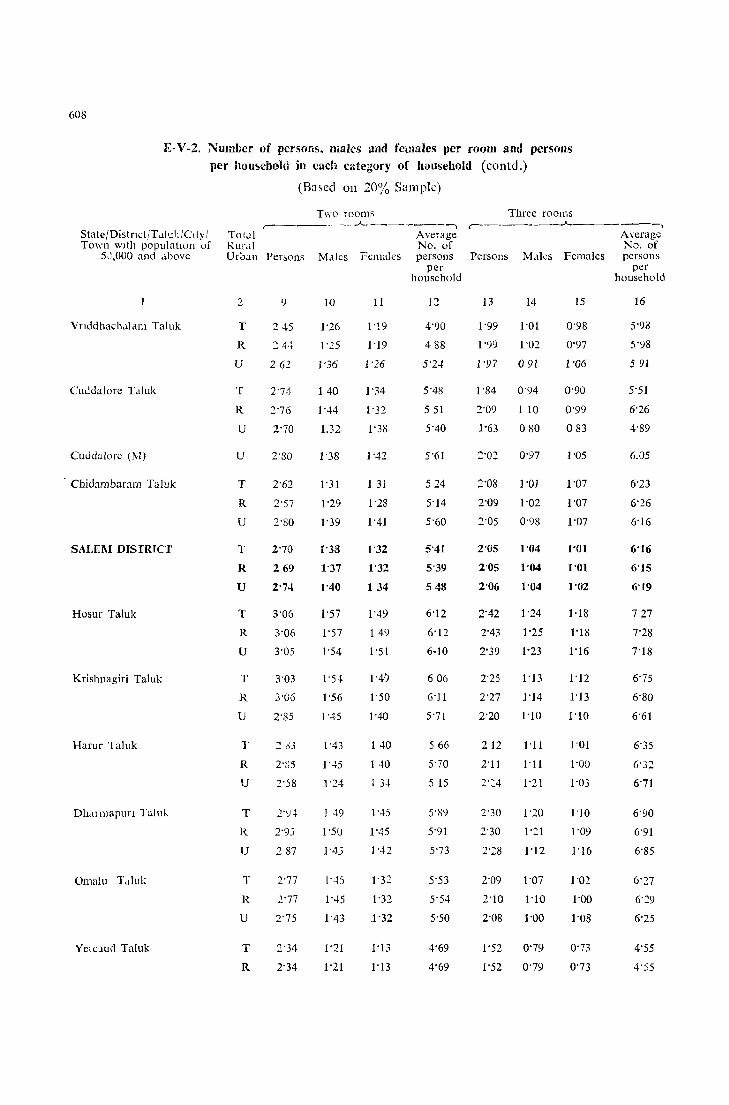
608
E- V -2, Number of persons. males and females per room and persons per hou!>chold in each category of household (contd,)
StatefDistnctfT ..tlukfCI ty f Town wIth populatmn of
5J,OOO and ..tbovc
Vnddhach,llal1l Taluk
ClIddalore Talllk
Cuddalore (I\!)
, Chidambaram Taluk
SALEM DISTRICT
Hosur Taluk
Krishnagiri Taluk
Harur Taluk
Dhal mapun Taluk
Omalu T,duk
YCIC:lllrl Taluk
TOl..tl Rur,ll
(Ba~cd on 20% Sample)
Two rooms r------ _.A.~_~ ___ --,
Average
U [ban Per~ons Males Fcmales No_ of persons
T
R
U
T
R
U
u
T
R
U
T
R
U
T
R
U
T
R
U
T
R
U
T
R
U
T
R
U
T
R
9
245
262
2'74
2'76
2'70
2'80
2'62
2'57
2'80
2'70
269
2'7~
3'06
3'06
3'05
3'03
2'85
.2 33
2'S5
2'58
287
2'77
2'77
2'75
2'34
2'34
10
1'26
1'25
1 '36
140
1'44
1.32
1'38
1'31
1'29
1'39
1'38
1'37
1'40
1'57
1'57
1'54
1'54
1'56
1'45
I 49
1'5U
1 A:;
1'4)
1'45
1'43
1'21
1'21
11
1'19
1'19
1'26
1'34
1'32
1'38
1'42
1 31
1"28
1'41
1'32
1'32
134
1'49
1 49
1'5 [
1'49
1'50
1'40
1 40
140
1 34
1'45
1'45
1'42
1'32
1'32
1'32
1'13
1'13
per household
12
4'90
488
5'24
5'48
551
5'40
5'61
524
5'14
5'60
5'41
5'39
548
6'12
6'12
6-10
606
6'l1
5'71
566
5'70
5 15
5'89
5'91
5'73
5'53
5'54
5'50
4'69
4'69
Three rooms r--------'"---------,
Average No, of
Persons Males Females persons
13 14
1'99 1'01
1-99 1'02
1'97 091
1'84 0'94
2'09 1 10
j'63 080
~:02
2'08
2'09
2'05
0'97
1'01
1'02
0'98
2'05 1'04
2'05 1'04
2'06 1'04
2'42 1'24
2'43
2'39
1'25
1'23
2'25 1'13
2'27 1'14
2'20 1'10
212 I'll
2'11 I'll
1'21
2'30 1'20
2'30 1'21
2'28 1'12
2'09 1'07
2'10 1'10
2'08 1'00
1'52 0'79
1'52 0'79
15
0'98
0'97
1"06
0'90
0'99
083
1'05
1'07
1'07
1'07
1'01
1'01
1'02
1'18
1'18
1'16
1'12
1'13
1'10
J'Ol
1'00
1'03
1'10
1'09
1'16
1'02
1'00
1'08
0'73
0'73
per household
16
5'98
5'98
591
5'51
6'26
4'89
6,05
6'23
6'26
6'16
6"16
6'15
6'19
7-27
7'28
7'18
6'75
6'80
6'61
6'35
6'32
6'71
6'90
6'91
6'85
6'27
6'29
6'25
4'55
4'55
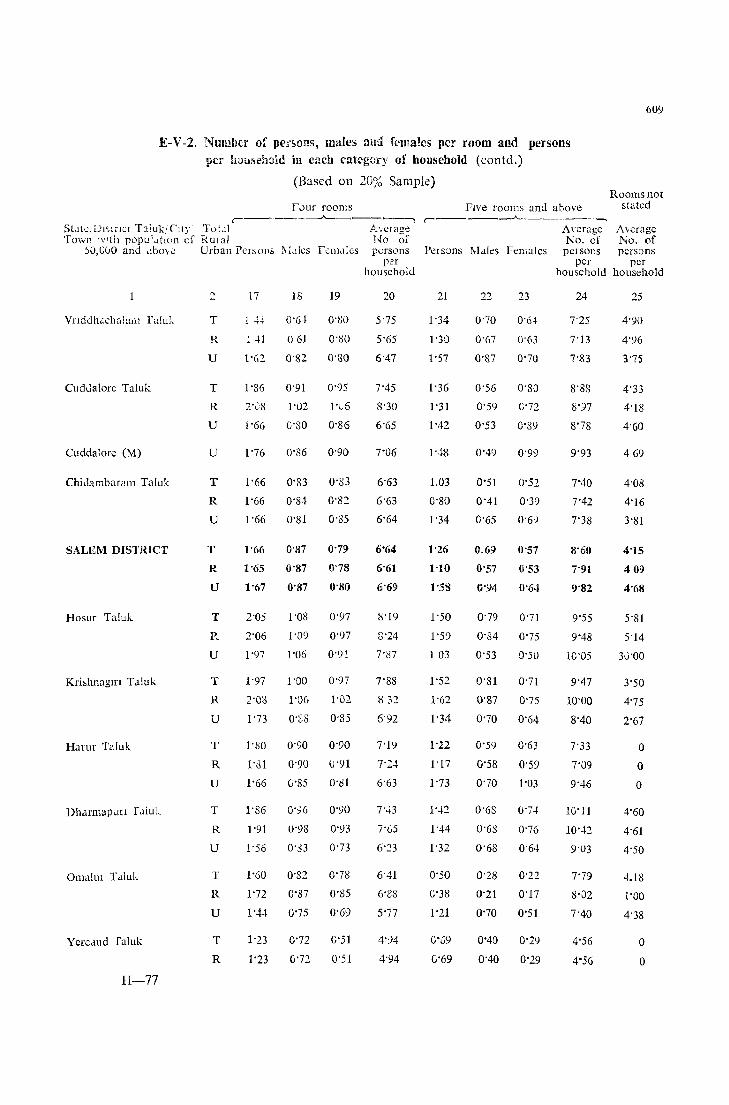
60(J
E-V -2, Number of pCi':;ons, males mid females per room and persons per huusc:wld in each category of household (contd,)
(Based 011 20% Sample)
lour rooms r---~-__A_-~--'_____"
5t.1tc, DI<;mct T:l}uk/ ('tIl" Totell I\"'CI age Town '','Itll popu\(tJon of KUla! No of
)0,0(;0 and ..:bov,:: Urban PCrSO]1;, l\l.1lcs tctlldles persons
Vnddh.;;chalam faluk
CudJalore Taluk
Cuddalore (M)
ChiJambaram Taluk
SALEM DISTRICT
Hosur Taluk
Krishnaglfl Taluk
Harur Taluk
Dharmap;m r.:liul,
OmalUl TalnL
Yercaud Taluk
H-77
T
u
T
R
U
u
T
R
U
T
R
u
T
R
U
T
R
U
T
R
U
T
R
U
T
R
U
T
R
17 18 19
o'so :4[ 061 0'80
l'6::? 0'82 O'SO
1'86 0'91 0'95
2'08 1'02 h,6
1'66 O'SO O'S6
1'76 O'S6 0'90
1'66 O'S3 O'S3
1'66 0'84
1'66 O'SI
1'66 0'87
0'82
0'85
0'79
1'65 0 '87 0'78
1'67 O'S7 0'80
2'05
2'06
1'97
1'08
1'09
1'06
0'97
0'97
0'91
1'97 1'00 0'97
2'08 1'06 1'02
1'73 O,gS O'S5
1'SO 0'90 0'')0
1';31 0'90 U '<)1
1'66 O'S5 O'Sl
1'86 0'96 0'90
1'91 1)'98 O'Y3
! '56 0'33 0'73
1'60 0'82 0'78
1'72 O'S7
1'44 0'75
O'S5
0'69
1'23 0'72 0'51
1'23 0'72 0'51
per household
20
5'75
5'65
6'47
7'45
8'30
6'65
7'06
6'63
6'63
6'64
6'64
6'61
6'69
S'19
8'24
7'S7
7'S8
6'63
7''';3
7'65
6'23
6'41
6'88
5'77
4':)4
4'94
Five rooms and above Rooms not
stated r------,.A._-______ ~
Average Average No, of };o, of
Persons M.lks Fcmales persons persons
21
1'34
1'30
1'57
1'36
1'31
1'42
1'48
1.03
0'80
1'34
1'26
1'10
1'58
1'50
1'59
1 03
1'52
1'62
1'34
1'42
1'44
1'32
0'50
0'38
1'21
O'U9
0'69
22
0'70
0'67
O'S7
23
O'6~
0'63
0'70
0'56 0'80
0'59 0'72
0'53 0'89
0'49 0'99
0'51 0'52
0'41 0'39
0'65 0'69
0,6:)
0'57
()'94
O'S7
0'53
0'64
0'79 0'71
0'84 0'75
0'53 0'50
O'SI 0'71
0'87 0'75
0'70 0'64
0'59 0'63
O'5S 0'59
0'70 1'03
0'G3 0'74
O'G8 0'76
0'68 0'64
0'28 0'22
0'21
0'70
0'17
0'51
0'40 0'29
0'40 0'29
per per household household
24
7'25
7'13
7'83
S'S?,
s'n 8'7S
9'93
7'40
7'42
7'3S
8'60
7'91
9'S2
9'55
9'48
lC'05
9'47
10'00
8'40
7'33
7'09
9'46
10'11
10'42
9'03
7'79
S'02
7'40
4'56
4"56
25
4'90
4'96
3'7S
4'33
4'18
4'60
469
4'08
4'16
3'81
4'15
409
4'68
5'81
5'14
30'00
3'50
4'75
2'67
o o o
4'60
4'61
4'50
4,18
1'00
4'38
o o
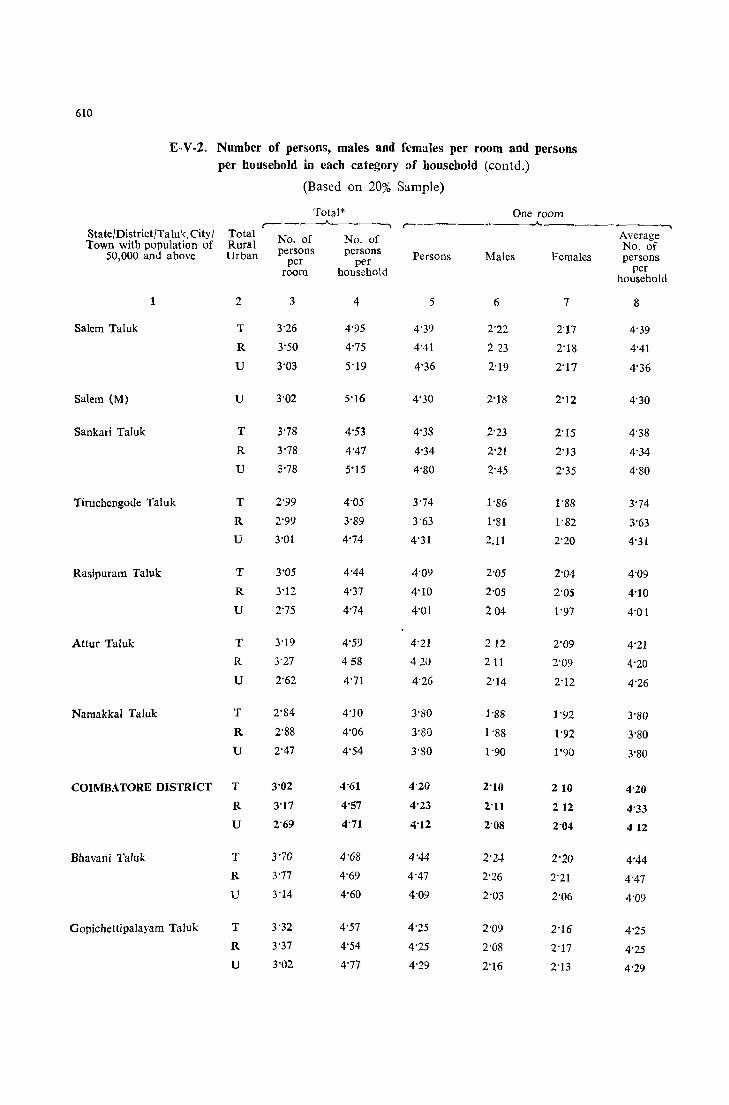
610
E-V-2, Number of persons, males and females per room and persons per household in each category of household (contd,)
(Based on 20% Sample)
Total* One room r----~~------, r-.-----.
State/District/Talu k I City / Total No, of No, of Average Town with population of Rural persons persons No, of
50,000 and above Urban per per Persons Males Females persons room household per
household
1 2 3 4 5 6 7 8
Salem Taluk T 3'26 4'95 4'39 2'22 2'17 4'39
R 3'50 4'75 4'41 223 2'18 4'41
U 3'03 5'19 4'36 2'19 2'17 4'36
Salem (M) U 3'02 5'16 4'30 2'18 2'12 4'30
Sankari Taluk T 3'78 4'53 4'38 2'23 2'15 4'38
R 3'78 4'47 4'34 2'21 2'13 4'34
U 3'78 5'15 4'80 2'45 2'35 4'80
Tiruchengode Taluk T 2'99 4'05 3'74 1'S6 l'SS 3'74
R 2'99 3'S9 3'63 l'Sl I'S2 3'63
U 3'01 4'74 4'31 2,11 2'20 4'31
Rasipuram Taluk T 3'05 4'44 4'09 2'05 2'04 4'09
R 3'12 4'37 4'10 2'05 2'05 4'10
U 2'75 4'74 4'01 204 1'97 4'01
Attur Taluk T 3'19 4'59 4'21 212 2'09 4'21
R 3'27 458 420 211 2'09 4'20
U 2'62 4'71 4'26 2'14 2'12 4'26
Namakkal Taluk T 2'84 4'10 3'80 ] '88 1'92 3'SO
R 2'88 4'06 3'80 1'88 1'92 3'80
U 2'47 4'54 3'SO 1'90 1'90 3'80
COIMBATORE DISTRICT T 3'02 4'61 4'20 2'10 210 4'20
R 3'17 4'57 4'23 2'11 212 4'33
U 2'69 4'71 4'12 2'08 2'04 412
Bhavani Taluk T 3'70 4'68 4'44 2'2-1- 2'20 4'44 R 3'77 4'69 4'47 2'26 2'21 4'47
U 3'14 4'60 4'09 2'03 2'06 4'09
Gopichettipalayam Taluk T 3'32 4'57 4'25 2'09 2'16 4'25 R 3'37 4'54 4'25 2'08 2'17 4'25 U 3'02 4'77 4'29 2'16 2'13 4'29

611
E-V-2, Number of persons, males and females per room and persons per household in each category of household (contd,)
(Based on 20% Sample)
Two rooms Three rooms ,..--_~_._.A. --,
,~ ____ '_"...A..-.. ___ .~--,
State/District/Taluk/City I Total Average Average Town with populatlon of Rural No, of No, of
50,000 and above Urban Persons Males Females persons Persons Males Females persons per per
household household
2 9 10 11 12 13 14 15 16
Salem Taluk T 2'75 1'40 1'35 5'49 2'C9 1'06 1'03 6'27
R 2'71 1'39 1'32 5'43 2'15 ('07 l'OS 6'45
U 2'78 1'41 1'37 5'55 2'06 1'05 1'01 6'18
Salem (M) U 2'78 1'41 1'37 5'55 2'08 1'06 1'02 6'23
Sankari Taluk T 2'61 1'33 1'28 5'21 1'99 1'02 0'97 5'98
R 2'55 1'30 1'25 5'10 1'96 1'00 0'96 5'89
U 2'91 1'46 1'45 5'83 216 1'12 1'04 6'47
Tiruchengode Taluk T 2'37 1'20 1'17 4'75 1'91 0'96 0'95 S'73
R 2'30 1'15 1'15 4'59 1'86 0'93 0'93 5'58
U 2'61 1'34 1'27 5'23 2'01 1'02 0'99 6'03
Rasipuram Taluk T 2'45 1'26 1'19 4'91 1'84 0'93 0'91 5'53
R 2'42 1'22 1'20 4'84 1'80 0'91 0'89 5'41
U 2'56 1'40 1'16 5'11 1'95 0'97 0'98 5'86
Attur Taluk T 2'63 1'32 1'31 5'26 1'95 0'96 0'99 5'86
R 2'63 1'32 1'31 5'26 1'99 0'99 1'00 5'96
U 2'64 1'34 1'30 5'28 1'78 O'S8 0'90 5'33
Namakkal Taluk T 2'35 1'18 1'17 4'70 1 '76 0'89 0'87 5'27
R 2'33 1'17 1'16 4'66 1'72 0'87 0'85 5'17
U 2'56 1'26 1'30 5'12 1'94 0'97 0'97 5'81
COIMBATORE DISTRICT T 2'56 1'30 1'26 5'13 1'92 0'98 0'94 5'77
R 2'55 1'29 1'26 5'11 1'92 0,98 0'94 5'77
U 2'58 1'32 1'26 5'17 1'92 0'97 0'95 5'77
Bhavam Tahlk T 2'79 1'43 1'36 5'57 2'06 1'08 0'98 6'19
R 2'78 1'42 1'36 5'55 2'13 I'll 1'02 6'39
U 2'85 1'50 1'35 5'70 1'73 0'95 0'78 5'18
Gopichettipalayam Taluk T 2'67 1'34 1'33 5'33 2'01 1'01 1'00 6'04
R 2'66 1'35 1'31 5'32 2'02 1'01 1'01 6'06
U 2'70 1'32 1'38 5'40 1'97 1'02 0'95 5'91
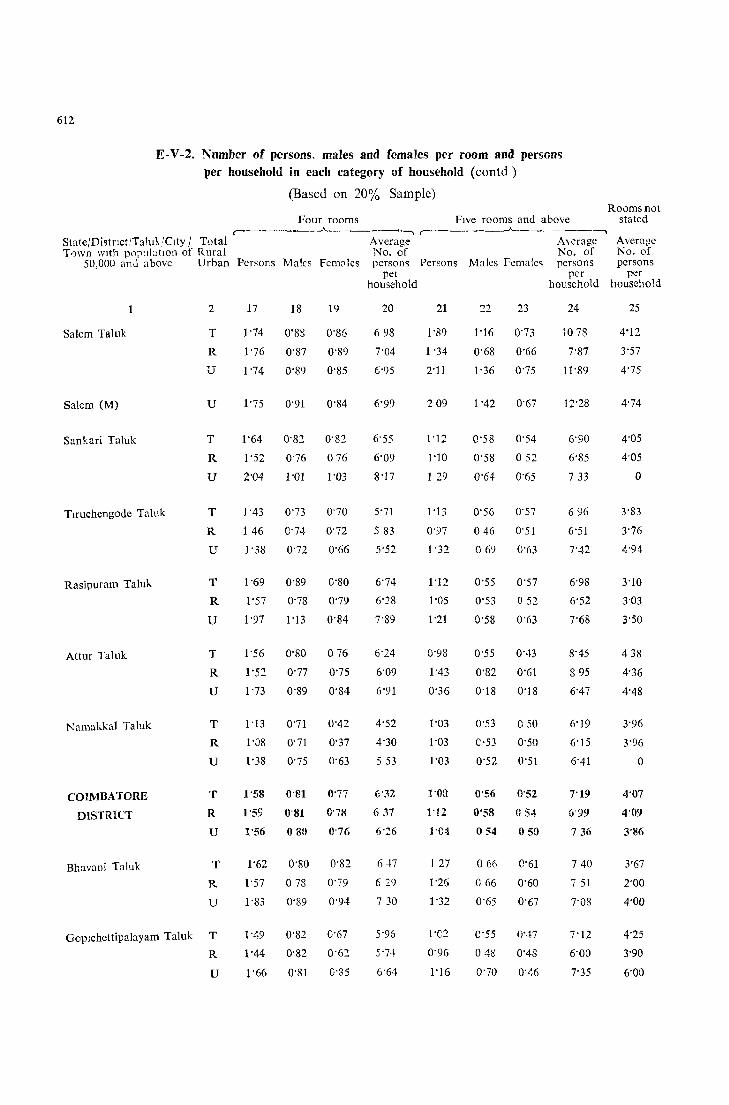
612
E-V-2, Number of persons. males and females per room and persons per household in each category of household (contd)
(Based on 20% Sample)
Four rooms Five rooms and above r--------.A..---~-_, ,-_____ .A.. ______ ---,
StatejDistrlct/T:lluk/Ctty / Total Average A,crage T0wn with pn;lu]atlOl1 of Rural No, of No, of
50,OO(l anc} above Urban Persons Males Fem<'les persons Persons Males Femalc~ persons
Salem Taluk
Salem (M)
Sankari Taluk
Tlruchengode Taluk
Rasipuram Taluk
Attur Taluk
l"amakkal Taluk
COIMBATORE
DISTRICT
Bhavani Taluk
2
T
R
D
u
T
R
U
T
R
U
T
R
U
T
R
U
T
R
U
T
R
U
T
R
u
Goplchettipalayam Taluk T
R
U
17 18 19
1'74 O'8S 0'86
1'76 0'87 0'89
1 '74 0'89 0'85
1'75 0'91 0'84
1'64 0'82 0'82
1'52
2'04
0'76 076
1'01 1'03
1 '43 0'73 0'70
1 46 0'74 0'72
1'38 0'72 0'66
1 '69 0'89 0'80
1'57 0'78 0'79
1'97 1'13 0'84
1'56 0'80 0 76
1'52 0'77 0'75
1'73 0'89 0'84
1'13 0'71 0'42
J'08 0'71 0'37
1'38 0'75 0'63
1'58 0'81 0'77
1'59 0'81 0'78
1'56 080 0'76
1'62 O'SO 0'82
1'57 078 0'79
1'83 0'89 0'94
1'49 0'82 C'67
1'44 0'82 0'62
1'66 0'81 0'S5
pel per household household
20
698
7'04
(;'95
6'99
6'55
6'09
S'17
5'71
583
5'52
6'74
6'28
7'89
6'24
6'09
6'91
4'52
4'30
5 53
6'32
637
647
629
730
5'96
5'74
6'64
21
1'89
1 '34
2'11
209
1'12
1'10
1 29
1'13
0'97
1'32
1'12
1'05
1'21
0'98
1'43
0'36
1'03
1'03
1'03
1'03
1'12
1·{):t
127
1'26
1'32
l'C2
0'96
1'16
22 23
1'16 0'73
0'68 0'66
1'36 0'75
1 '42 0'67
0'58 0'54
0'58 052
0'64 0'65
0'56 0'57
046 0'51
069 0'63
0'55 0'57
0'53 0 52
0'58 0'63
0'55 0'43
0'82 0'61
0'18 0'18
0'53 050
C'53 0'50
0'52 0'51
0'56 0'52
0'58 054
054
066
066
0'65
0'55
050
0'61
0'60
0'67
0'47
041) 0'48
0'70 0'''',6
24
1078
7'87
11'89
12'28
6'90
6'85
733
696
6'51
7'42
6'98
6'52
7'68
8'45
895
6'47
6'19
6'15
6'41
7'19
6'':)9
736
740
7 51
7'08
7'12
6'00
7'35
Rooms not stated
Average No, of persons
per household
25
4'12
3'57
4'75
4'74
4'05
4'05
o
3'83
3'76
4'9~
3'10
3'03
3'50
438
4'36
4'48
3'96
3'96
o
4'07
4'09
3'86
3'67
2'00
4'00
4'25
3'90
6'00
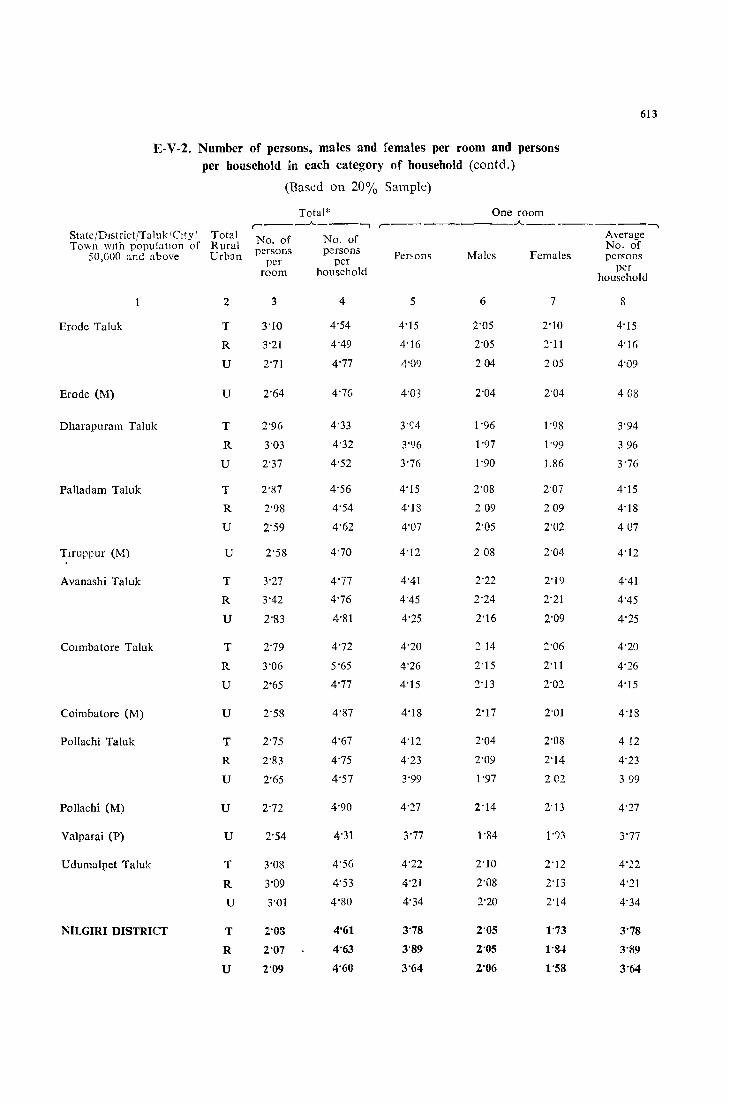
613
E-V-2, Number of persons, males and females per room and persons per household in each category of household (contd,)
(Based on 20% Sample)
Total* One room r-----"-----, r------ --"-------------,
State/Dlstrict/TalukIClty/ Total No, of No, of Average TO'o'n wIth populatIOn of Rural No, of
50,000 and above Urban persons persons Pen,om Males Females persons per per room household per
household
2 3 4 5 6 7 8
Erode Taluk T 3'10 4'54 4'15 2'05 2'10 4'15
R 3'21 4'49 4'16 2'05 2'11 4'16
U 2'71 4'77 4'09 204 205 4'09
Erode (M) U 2'64 4'7(; 4'03 2'04 2'04 408
Dharapuram Taluk T 2'96 4'33 3'94 1'96 1'98 3'94
R 3'03 4'32 3'96 1'97 1'99 396
U 2'37 4'52 3'76 1'90 1.86 3'76
Palladam Taluk T 2'87 4'56 4'15 2'08 2'07 4'15
R 2'98 4'54 4'18 209 209 4'18
U 2'59 4'62 4'07 2'05 2'02 407
Tlfuppur (M) U 2'58 4'70 4'12 208 2'04 4'12
Avanashi Taluk T 3'27 4'77 4'41 2'22 2'19 4'41
R 3'42 4'76 4'45 2'24 2'21 4'45
U 2'83 4'81 4'25 2'16 2'09 4'25
COl mba tore Taluk T 2'79 4'72 4'20 2 14 2'06 4'20
R 3'06 5'65 4'26 2'15 2'11 4'26
U 2'65 4'77 4'15 2'13 2'02 4'15
Coimbatore (M) U 2'58 4'87 4'18 2'17 2'01 4'18
Pollachi Taluk T 2'75 4'67 4'12 2'04 2'08 4 12
R 2'83 4'75 4'23 2'09 2'14 4'23
U 2'65 4'57 3'99 1'97 202 399
Pollachi (M) U 2'72 4'90 4'27 2'14 2'13 4'27
Valparai (P) U 2'54 4'31 3'77 1'84 1'')3 3'77
Udumalpet Taluk T 3'08 4'56 4'22 2'10 2'12 4'22
R 3'09 4'53 4'21 2'08 2'13 4'21
U 3'01 4'80 4'34 2'20 2'14 4'34
NILGIRI DISTRICT T Z'OS 4'61 3'78 2'05 1'73 3'78
R 2'07 4'63 3'89 2'05 1'&4 3'89
U 2'09 4'60 3'64 2'06 1'58 3'64
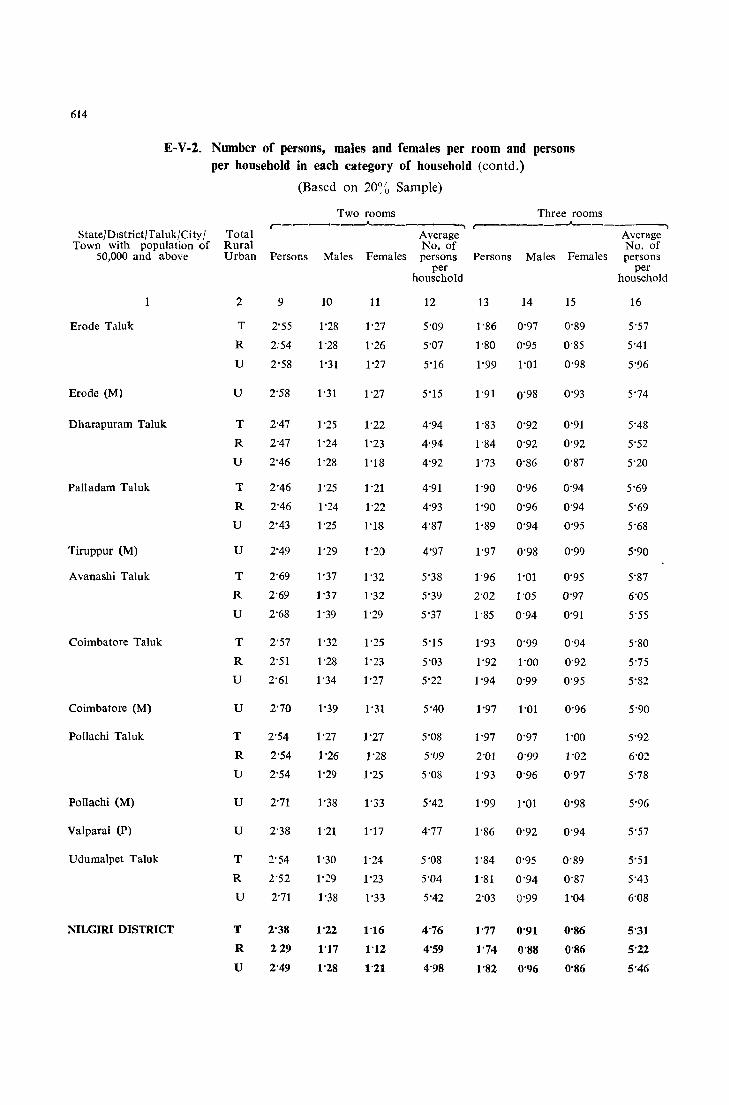
614
E-V-2, Number of persons, males and females per room and persons per household in each category of household (contd,)
StateJDlstrict/Taluk/Ci ty / Town with population of
50,000 and above
Erode Taluk
Erode (M)
Dharapuram Taluk
Palladam Taluk
Tiruppur (M)
Avanashi Taluk
Coimbatore Taluk
Coimbatore (M)
Pollachi Taluk
Pollachi (M)
Valparai (P)
Udumalpet Taluk
NILGIRI DISTRICT
(Based on 20~ ~ Sample)
Two rooms Three rooms r---~--......A. r--------..A.-----~
Total Average Rural No, of Urban Persons Males Females persons Persons
per
Average No, of
Males Females persons per
household
2
T
R
U
U
T
R
U
T
R
U
U
T
R
U
T
R
U
U
T
R
lJ
U
u
T
R
U
T
R
U
9
2'55
2:54
2'58
2'58
2'47
2'47
2'46
2'46
2'46
2'43
2'49
2'69
2'69
2'68
2'57
2'51
2'61
2'70
2'54
2'54
2'54
2'71
2'38
2'54
2'52
2'71
2'38
229
2'49
10
1'28
1'28
1'31
1'31
1'25
1'24
1'28
1'25
1'24
1'25
1'29
1'37
1'37
1'39
1'32
1'28
1'34
1'39
1'27
1'26
1'29
1'38
1'21
1'30
1'29
1'38
1'22
1'17
1'28
11
1'27
1'26
1'27
1'27
1'22
1'23
1'18
1'21
1'22
1'18
1'20
1'32
1'32
1'29
1'25
1'23
1'27
1'31
1'27
1'28
1'25
1'33
1'17
1'24
1'23
1'33
1'16
1'12
1'21
household
12
5'09
5'07
5'16
5'15
4'94
4'94
4'92
4'91
4'93
4'87
4'97
5'38
5'39
5'37
5'15
5'03
5'22
5'40
5'08
5'09
5'08
5'42
4'77
5'08
5'04
5'42
4'76
4'59
4'98
13 14
1'86 0'97
1'80 0'95
1'99 1'01
1'91 0'98
1'83 0'92
1'84 0'92
1'73 0'86
1'90 0'96
1'90 0'96
1'89 0'94
1'97 0'98
1'96 1'01
2'02 1'05
1'85 0'94
1'93 0'99
1'92 1'00
1'94 0'99
1'97 1'01
1'97 0'97
2'01 0'99
1'93 0'96
1'99 1'01
1'86 0'92
1'84 0'95
1'81 0'94
2'03 0'99
1'77 0'91
1'74 0'88
1'82 0'96
15
0'89
0'85
0'98
0'93
0'91
0'92
0'87
0'94
0'94
0'95
0'99
0'95
0'97
0'91
0'94
0'92
0'95
0'96
1'00
1'02
0'97
0'98
0'94
0'89
0'87
1'04
0'86
0'86
0'86
16
5'57
5'41
5'96
5'74
5'48
5'52
5'20
5'69
5'69
5'68
5'90
5'87
6'05
5'55
5'80
5'75
5'82
5'90
5'92
6'02
5'78
5'96
5'57
5'51
5'43
6'08
5'31
5'22
5'46

E-V-2, Number of persons, males and females per room and persons per household in each category of household (contd,)
(Based on 20% Sample)
Four rooms FIve rooms and above .-___ I .. _ __.A... ______ ~ r---------A-------~
StatcjDlstncljTaluk/Ciiy! Total Average Average Town with populatIOn of Rural No, of No, of
50,000 and above Urban Persons Males Females persons Persons Males Females persons
Erode Taluk
Erode (M)
Dharapuram Taluk
Palladam Taluk
Tiruppur (M)
Avanashl Taluk
Coimbatore Taluk
Coimbatore (M)
Pollachi Taluk
Pollachl (M)
Valparai (P)
Udumalpet Taluk
NILGIRI DISTRICT
2
T
R
U
T
T
R
U
T
R
U
U
T
R
U
T
R
U
U
T
R
U
U
U
T
R
U
T
R
U
17 18 19
1'68 0,84 0'84
1'74 0'85
1'56 0'84
0'89
O'7l
1'59 0'85 0'74
1'54 0'76 0'78
1'54 0'75 0'79
1'54 0'80 0'74
1'62 0'84 0'78
1'65 0 '88 0'77
I' 58 0'79 0'79
1'57 0'79 0'78
1'60 0'83 0'77
1'57 0'82 0'75
1'65 0'85 0'80
1'59 0'82 0'77
1'60 0'83 0'77
I' 59 0'82 0'77
1'63 0'84 0'79
1'52 0'77 0'75
1'57 0'78 0'79
1'45 0'75 0'70
1'58 0'82 0'76
1'31 0'69 0'62
1'53 0'75 0'78
1'53 0'75 0'78
1'53 0'72 081
1'51 0'78 0'73
1'51 0'76 0'75
1'51 0'84 0'67
per per household household
20
6'71
6'97
6'22
6'36
6'17
6'18
6'14
6'48
6'59
6'30
6'27
6'40
6'29
6'58
6'37
6'41
6'35
6'53
6'06
6'29
5'81
6'31
5'22
6'11
6'11
6'11
603
6'03
6'04
21
1'28
1'31
1'25
1'17
1'10
1'08
1'16
0'98
0'94
1'02
0';8
I'll
1'14
1'08
1'05
1'29
1'00
0'97
1'03
1'09
0'98
1'12
0'79
1'05
1'04
1'05
0'88
087
0'88
22 23
0'64 0'64
0'67 0'64
0'61 0'64
0'59 0'58
0'57 0'53
0'56 0'52
0'60 0'56
0'49 0'49
0'45 0'49
0'52 0'50
0'49 0'49
0'59 0'52
0'61 0'53
0'57 0'51
0'55
0'71
0'50
0'58
0'52 0'48
0,50 0'47
0'53 0'50
0'55 0'54
0'51 0'47
0'58 0'54
0'41 0'38
0'52 0'53
0'51 053
053 0'52
045 0'43
0'46 0'41
0'44 0'44
24
8'04
7'78
8'39
S'05
6'94
6'83
7'20
6'01
5'42
6'61
6'47
6'96
6'70
7'26
7'73
8'19
7'61
7'86
6'57
6'69
6'44
7'60
4'64
6'91
6'42
8'32
6'21
6'08
6'35
615
Rooms not stated
Average No, of pel sons
per household
25
4'36
4'27
5'75
5'75
3'96
3'96
o
3'50
3'50
3'50
o
4'41
4'38
5'00
3'57
3'64
3'47
4'60
2'67
3'00
2'63
2'57
o
4'32
4'32
4'14
4'34
4'20
5'10
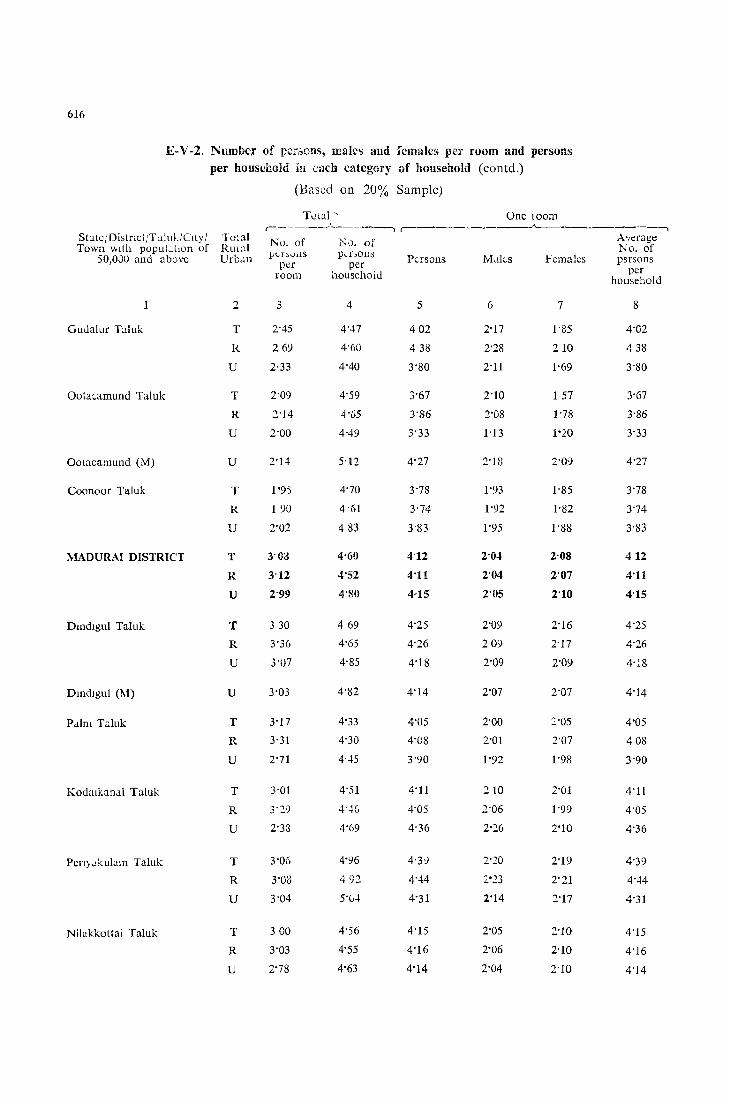
616
E-V -2, Number of p~ri>DnS, males and females per room and persons per household in each category of household (contd,)
(Based on 20% Sample)
T0(al ~ One loom ,------'-------, r- ___ ---A-----,_____, ____ - __ ~
StatcjDistnctjTaluk/CJty/ Total ]\;0, of 1',), of A'ferage
Town '.'.Jth popuLtIon of RUlal No, of 50,0;)0 and above Urb.m pLf~0ilS p,-fGOns Persons M<lks Females psrsons Pi;!{ per
room househoid per household
2 3 4 5 6 7 8
Gudalur Taluk T 2'45 4'47 402 2'17 1'85 4'02
1<. 269 4'60 438 2'28 210 438
U 2'33 4'40 3'80 2'11 1-69 3'80
Ootac,arnund Taluk T 2'09 4'59 3'67 2'10 157 3'67
R 2'14 4'u5 3'86 2'08 1'78 3'86
U 2'00 4'49 3'33 1'13 1'20 3'33
Ootacamund (M) U 2'14 5'12 4'27 2'18 2'09 4'27
Coonoor Taluk T 1'9,) 4'70 3'78 1'93 1'85 3'78
R 1 90 4'61 3'74 1'92 1'82 3'74
U 2'02 483 3'83 1'95 1'88 3'83
MADURAI DISTRICT T 3'0::1 4'00 4'12 2'04 2'08 412
R 3'12 4'52 4'11 2'04 2'07 4'11
U 2'99 4'80 4-15 2'05 2'10 4'15
Dmdlgul Taluk T 330 469 4'25 2'09 2'16 4'25
R 3'36 4'65 4'26 209 2'17 4'26
U 3'07 4'85 4'18 2'09 2'09 4'18
Dmdlgul (1\1) U 3'03 4'82 4'14 2'07 2'07 4'14
Palm Taluk T 3'17 4'33 4'05 2'00 2'05 4'05
R 3'31 4'30 4'08 2'01 2'07 408
U 2'71 4'45 3'90 1'92 1'98 3'90
Kodalkanal Taluk T 3'01 4'51 4'11 210 2'01 4'11
R 3'2') 4'46 4'05 2'06 1'99 4'05
U 2'33 4'69 4'36 2'26 2'10 4'36
PeflY<l~ulam Taluk T 3'06 4'% 4'39 2'20 2'19 4'39
R 3'08 492 4'44 2,'23 2'21 4'44
U 3'04 5'(;.f 4'31 2'14 2'17 4'31
Nilakkottai Taluk T 300 4'56 4'15 2'05 2'10 4'15
R 3'03 4'55 4'16 2'06 2'10 4'16
U 2'78 4'63 4'14 2'04 2'10 4'14
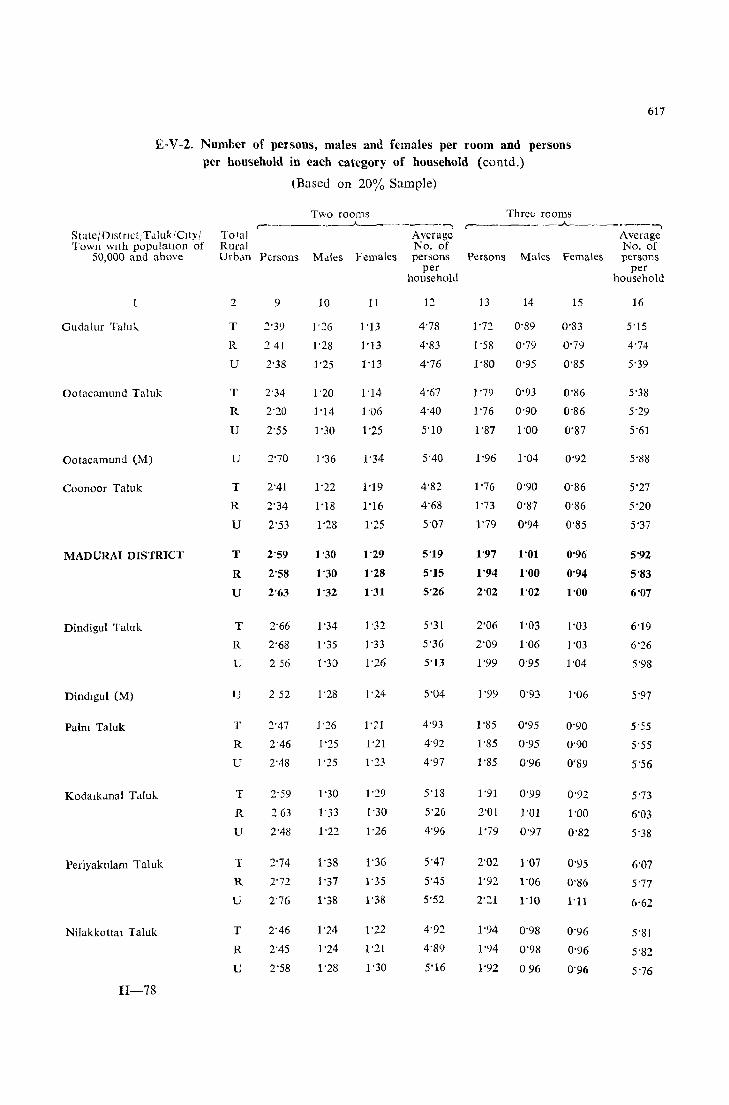
617
£-V -2, Number of persons, males and females per room and persons per household in each category of household (contd,)
State/Dlstnct:T ,lluk ICity I Town with populatIOn of
50,000 and above
Gudaiur Taluh
Ootacamund Taluk
Ootacamund (M)
Coonoor Taluk
MADURAI DISTRICT
Dindigul Taluk
Dindlgul (M)
Palm Taluk
Periyaklllam Taluk
Nilakkottat Taluk
H-78
Total Rural
(Based on 20% Sample)
Two rooms r->--------.A-,___,_------,
Average
Urban Persons Males Females No, of persons
2
T
R
U
T
R
U
u
T
R
U
T
R
U
T
R
U
1J
T
R
U
T
R
U
T
R
U
T
R
U
9
2'39
241
2'38
2-34
2-20
2'55
2'70
2'41
2'34
2'53
2'59
2'58
2'63
2'66
2'68
256
252
2'47
2'46
2'48
2'59
:2 63
2'48
2'74
2'72
2'76
2'46
2'45
2'58
10
1'26
1'28
1'25
1'20
1'14
1'30
1'36
1'22
1'18
1'28
1'30
1'30
1'32
1'34
1 '35
1'30
1'26
1'25
1'25
1'30
1'33
1'22
1'38
1'37
1'38
1'24
1'24
1'28
11
1'13
1'13
1'13
1'14
1'06
1'25
1'34
1'19
1'16
1'25
1'29
1'28
1'31
1'32
1'33
1'26
1'24
1'21
1'21
1'23
1'29
1'30
1'26
1'36
1'35
1'38
1'22
1'21
1'30
per householLl
12
4'78
4'83
4'76
4'67
4'40
5'10
5'40
4'82
4'68
5'07
5'19
5'15
5'26
5'31
5'36
5'13
5'04
4'93
4'92
4'97
5'18
5'26
4'96
5'47
5'45
5'52
4'92
4'89
5'16
Three rooms ,~ _______ ..A.. ______ -,
Average No, of
Persons Males Females persons
13 14
1'72 0'89
1 '58 0'79
1'80 0'95
1'79 0'93
1'76 0'90
1'87 1'00
1'96 1'04
1'76 0'90
1'73 0'87
1'79 0'94
1'97 1'01
1'94 1'00
2'02 1'02
2'06 1'03
2'09 1'06
1'99 0'95
1'99 0'93
1'85 0'95
1'85 0'95
1'85 0'96
1'91 0'99
2'01 1'01
1'79
2'02
1'92
2'21
1'94
0'97
1'07
1'06
1'10
0'98
1'94 0'98
1'92 096
15
0'83
0'79
0'85
0'86
0'86
0'87
0'92
0'86
0'86
0'85
0'96
0'94
1'00
1'03
1'03
1'04
1'06
0'90
0'90
0'89
0'92
1'00
0'82
0'95
0'86
I'll
0'96
0'96
0'96
per household
16
5'15
4'74
5'39
5'38
5'29
5'61
5'88
5·27
5'20
5'37
5'92
5'S3
6'07
6'19
6'26
5'98
5'97
5'55
5'55
5'56
5'73
6'03
5'38
6'07
5'77
6'62
5'81
5'82
5'76

E-V -2. Number of persons, males and females per room and persons per household in each category of household (contd.)
(Based on ~O~~ Sample)
Four rooms ,. __ ~_~.A-_ ___ ",
State! Distl ict/Taluk/ City / Total Average Town wlth populatIOn of RLllal No. ot
50,000 and abOve Urban Persons Males Females pel sons
Gudalur IaJuk
Ootucamund Taluk
Ootacamund (M)
Coonoor Taluk
MADURAI DISTRICT
Dmdlgul Taluk
Dmdigul (M)
Palm Taluk
Kod.ul,anal Talul-;_
Pellyakulam l<lluk
Nilakkottar Taluk
2
T
R
U
T
R
U
u
T
R
U
T
R
U
T
R
U
u
T
R
U
T
R
lJ
T
R
U
T
R
U
17 18 19
1'47 0'76 0'71
1'57 O'SO 0'77
1'44 0'75 0'69
1'54 0'79 0'75
1'57 0'80 0 77
1'42 0'77 0'65
1'46 O'SO 0'66
1 48 0'78 0'70
1'41 0'71 0'70
1'60 0'92 0'68
1'67 0'85 0'82
1'62 0'83 0'79
1'74 083 0'86
I'SO 0'91 0'89
1'76 0'87 0'89
}'91 1'01 0'90
1'88 O'9j 0 89
1'53 0'74 0'79
1'50 0'74 0'76
1'56 0'74 0'82
1'62 0'87 075
186 1'05 0'81
1'40 0'71 0'69
1'69 0'92 077
1'57 O'S7 0 70
1'87 1 '00 0'87
1'65
1'69
1'45
0'85 O'SO
O'S6 O'S3
0'79 0'66
per household
20
5'88
6'27
5'78
6'17
6'28
5'67
5'83
5'90
5'66
6'42
G'69
6'49
6'97
7'22
706
7'65
7'53
6'10
6'01
623
6'47
7'46
5'59
6'78
6'28
7'48
6'60
6'75
5"7')
nv" lOom~ and abo\..:: Rooms not
stdtt::d ,.. ______ A _________ ~__,
, A\el.tge Average No, of No. of
P~rsons Males Females pel sons persol'ls
21
0'72
0'72
072
0'98
1'05
0'94
0'95
083
0'19
O'S8
1'44
1'25
1'64
1'64
1'36
2'10
2'13
I'll
103
1'17
1'61
O'u[
1'41
1'28
1'56
1'34
1'42
1'01
22 23
0'40 0'32
0'40 0'32
0'40 0'32
0'50 0'48
0'55 0'50
0'47 0'47
0'47 0'48
0'42 O'·ll
0'41 038
0'44 0'44
081 0'63
0'63 0'62
1'00 064
0'95 069
0'68 0'68
1'40 0'70
1'45 0'68
0'57 0'54
O··HI 0'55
0'64 0'53
0'53 047
o 86 0'75
0'32 0'2')
0'12 0'69
0'6-+ 0'64
0'82 0'74
0'69 0'65
0'74 6'68
0'47 0'54
per per household household
24
5'14
5'36
5'05
6'58
6'43
6'72
6'88
6'12
5'92
6'40
9'03
7'53
10'65
10'02
S'13
13'21
l3'59
6'79
6'10
7'42
7'30
10'55
4'81
8'37
7'71
9'13
7'37
7'74
5'70
25
1'50
o 1'50
3'00
2'09
13'00
l3'OO
4'78
4'74
5'00
4'01
4'01
3'98
4'19
4'24
2'50
2'50
3'03
3'20
1'33
o o o
3'95
3'95
o
4'25
4'39
3'67
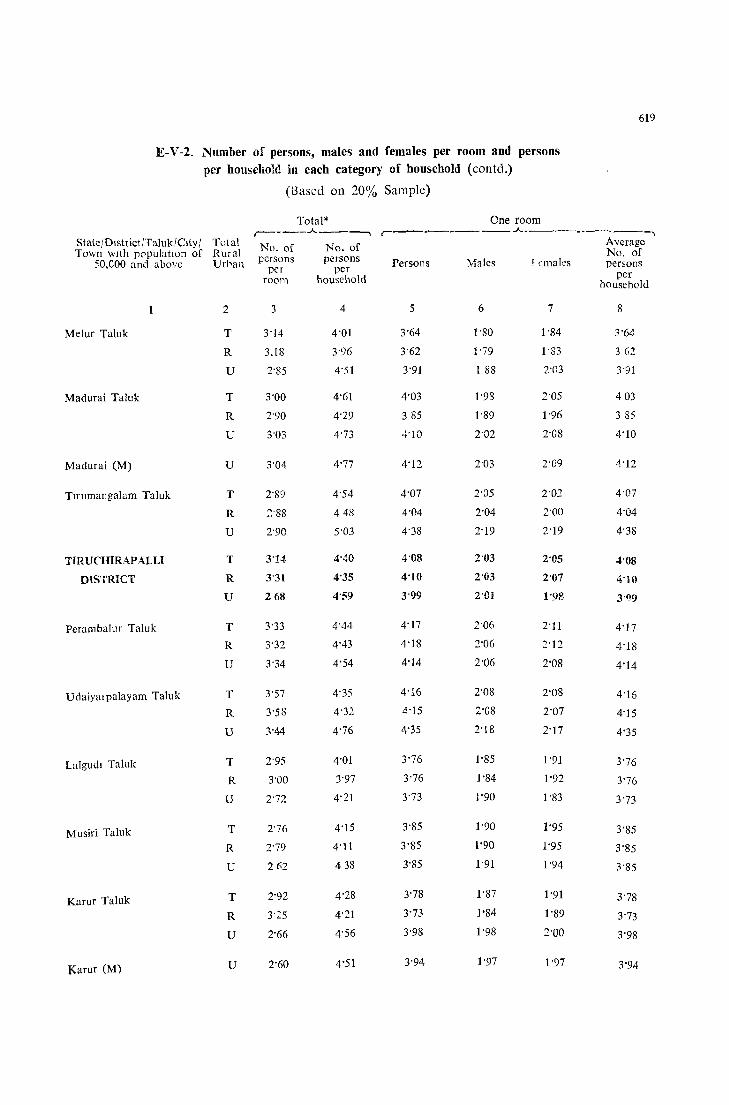
619
E-V-2, Number of persons, males and females per room and persons
per household in each category of household (contd,)
(Based on 20% Sample)
Total* One room .-----"-----,
• __ .~ ____ .A. __________ -,
State/District ITaluklClty / Total No, of No, of Average Town wIth populatIOn of Rural No, of
50,000 and above Urban persons persons Persons Males ! cmaks persons per per room household per
household
2 3 4 5 6 7 8
Melur Taluk T 3'14 4'01 3'64 1'80 1'84 3'64
R 3.18 3'96 3'62 1',9 I'S3 362
U 2"85 4'51 3'91 1 88 2'03 3'91
Madurai Taluk T 3'00 4'61 4'03 1'98 2'05 403
R 2'90 4'29 385 1'89 1'96 385
U 3'03 4'73 4'W 2'02 2'08 4'10
Madurai (M) U 3'04 4'77 4'12 2'03 2'09 4'12
TUllmangalam Taluk T 2'89 4'54 4'07 2'05 2'02 4'07
R :'88 448 4'04 2'04 2"00 4'04
U 2'90 5'03 4'38 2'19 2'19 4"38
TIR UCHIRAP ALL! T 3'14 4'40 4'08 2'03 2'05 4'08
DISTRICT R 3'31 4'35 4'10 2'03 2'07 4'10
U 268 4'59 3'99 2'01 1'98 3'99
Perambalur Taluk T 3'33 4'44 4'17 2'06 2'11 4'17
R 3'32 4'43 4'18 2'06 2'12 4'18
U 3'34 4'54 4'14 2'06 2'OS 4'14
UdaiYaIpalayam Taluk T 3'57 4'35 4'16 2'08 2'08 4'16
R 3'58 4'32 4'15 Z'08 2'07 4'15
U 3"44 4'76 4'35 2'18 2'17 4'35
Lalgudl Taluk T 2'95 4'01 3'76 1'85 1'91 3'76
R 3'00 3'97 3'76 1'84 1'92 3'76
U 2'72 4'21 3'73 1'90 1'83 3'73
Musiri Taluk T 2'76 4'15 3'85 1'90 1'95 3'S5
R 2'79 4'11 3'85 1'90 1'95 3'85
U 2 £'2 438 3'85 1'91 1'94 3'85
Karur Taluk T 2'92 4'28 3'78 1'87 1'91 3"78
R 3'25 4'21 3'73 1'84 1'89 3'73
U 2'66 4'56 3'98 1'98 2'00 3'98
Karur (M) U 2'60 4'51 3'94 1'97 1'97 3'94
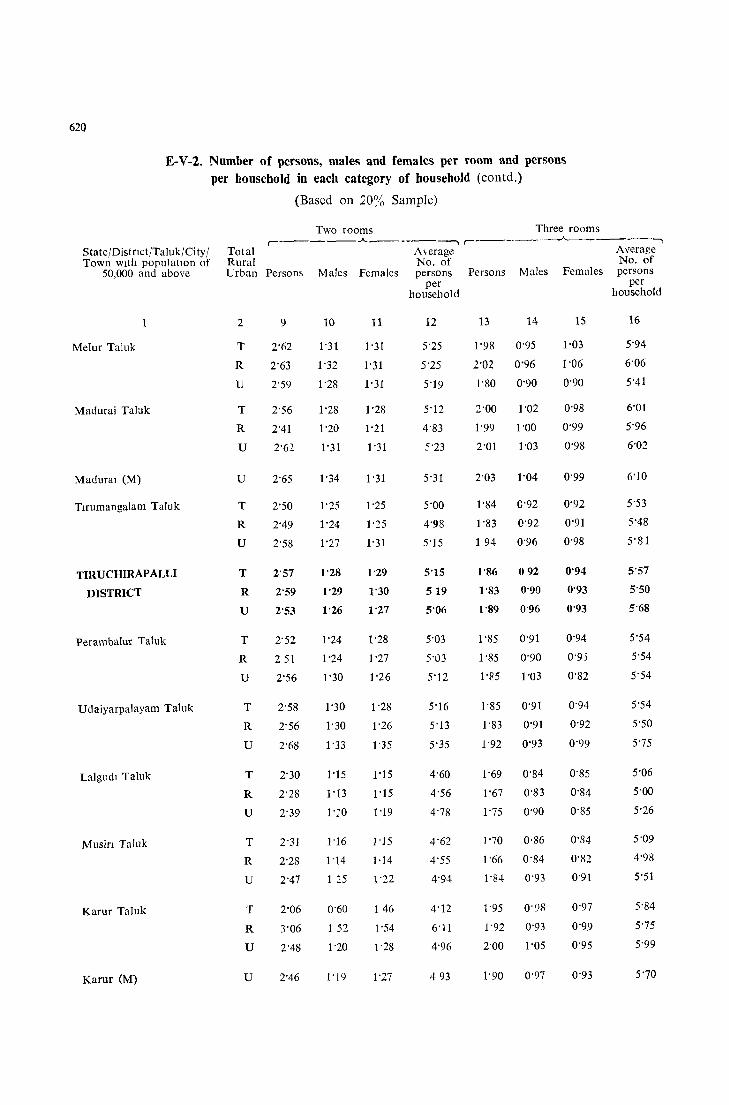
620
E-V-2, Number of persons, males and females per room and persons per household in each category of household (contd,)
StatejDistnct/TalukjCity j Town with populatIOn of
50,000 and above
Melur Taluk
Madurai Talak
Madur31 (M)
Tlfumangalam Taluk
TlRUCHIRAPALLI
DISTRICT
Perambalur Taluk
Udaiyarpalayam Taluk
LaIgudl Taluk
Musin TaJuk
Karur Taluk
Karur (M)
Total Rural
(Based on 20% Sample)
Two rooms Three rooms ,-_______ ..A.._- _____ -, ,-____ • ___ --"-~ ____ ~-,
A\erage Average No, of No, of
Urban Persons Males Females persons per
household
Persons Males Females persons per
household
2
T
R
U
T
R
U
U
T
R
U
T
R
U
T
R
U
T
R
U
T
R
U
T
R
U
T
R
U
U
9
2'62
2"63
2'59
2'56
2'41
2'62
2'65
2'50
2'49
2'58
2'57
2'59
2'53
2'52
251
2'56
2'58
2'56
2'68
2'30
2'28
2'39
2'31
2'28
2'47
2'06
3'06
2'48
2'46
10
1'31
1'32
1'28
1'28
] '20
1'31
1'34
1'25
1'24
1'27
1'28
1'29
1'26
1'24
1'24
1'30
1'30
1'30
1'33
1'15
1'13
1'20
1'16
1'14
1 25
0'60
] 52
1'20
I' J 9
11
1'31
1'31
1'31
1'28
1'21
1'31
1'31
1'25
1'25
1'31
1'29
1'30
1'27
1'28
1'27
1'26
1'28
1'26
1'35
1'15
1'15
1'19
] '15
1,14
1'22
1 46
1'54
1'28
1'27
12
5'25
5'25
5'19
5'12
4'83
5'23
5'31
5'00
4'98
5'15
5'15
519
5'06
5'03
5'03
5'12
5']6
5'13
5'35
4'60
4'56
4'78
4'62
4'55
4'94
4'12
6'i1
4'96
493
13 14
1'98 0'95
2'02 0'96
1'80 0'90
2'00 1'02
1'99 1'00
2'01 1'03
2'03 1'04
1'84 0'92
1'83 0'92
1 94 0'96
1'86 092
1'83 0'90
1'89 0'96
1'85 0'91
1'85 0'90
1'85 1'03
1'85 0'91
1'83 0'91
1'92 0'93
1'69 0'84
1'67 0'83
1'75 0'90
]'70 0,86
1'66 0'84
1'84 0'93
1'95 0'98
1'92 0'93
2'00 1'05
1'90 0'97
15
1'03
1'06
0'90
0'98
0'99
0'98
0'99
0'92
0'91
0'98
0'94
0'93
0'93
0'94
0'95
0'82
0'94
0'92
0'99
0'85
0'84
0'85
0'84
0'82
0'91
0'97
0'99
0'95
0'93
16
5'94
6'06
5'41
6'01
5'96
6'02
6'10
5'53
5'48
5'81
5'57
5'50
5'68
5'54
5'54
5'54
5'54
5'50
5'75
5'06
5'00
5'26
5'09
4'98
5'51
5'84
5'75
5'99
5'70
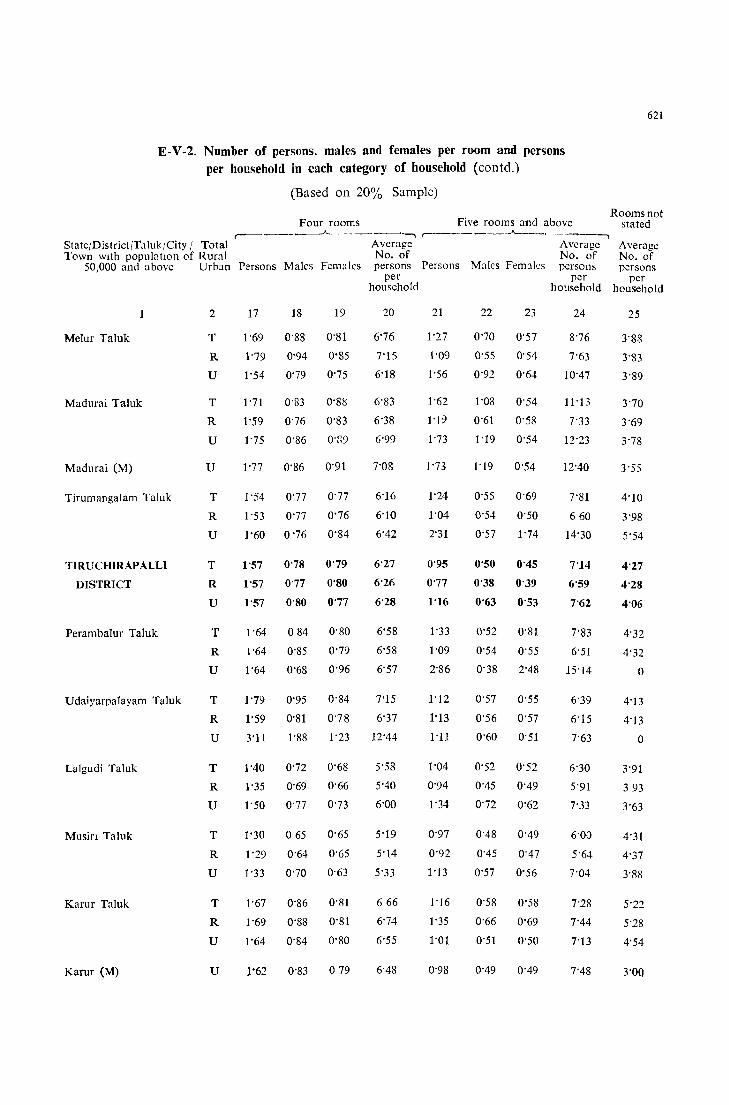
E-V-2, Number of persons, males and females per room and persons per household in each category of household (contd,)
(Based on 20% Sample)
Four rooms Five rooms and above r--------_A_~----_, ,-_____ .A. ___ ~ ___ ~
StateJDistrictfT.llukJCity J Total Average Average Town wIth populatIon of Rural No, of No. of
50,000 and above Urban Persons Males Females persons Persons Males Females persons
Melur Taluk
Madurai Taluk
Madurai (M)
Tirumangalam Taluk
TIRUCHIRAPALLl
DISTRICT
Perambalur Taluk
Udaiyarpalayam Taluk
Lalgudi Taluk
Musin Taluk
Karur Taluk
Karur (M)
2
T
R
U
T
R
U
U
T
R
U
T
R
U
T
R
U
T
R
U
T
R
U
T
R
U
T
R
U
u
17
1'69
18
0'88
19
0'81
1'79 0'94 0'85
I' 54 0'79 0'75
1'71
1'59
1'75
O'S3 O'8~
0'76 0'83
0'86 0'89
1'77 0'86 0'91
1'54 0'77 0'77
1'53 0'77
1'60 0 '76
0'76
0'84
1'57 0'78 0'79
1'57 0'77 0'80
1'57 0'80 0'77
1'64 084 0'80
1'64 0'85
1'64 0'68
0'79
0'96
1'79 0'95 0'84
1'59 0'81 0'78
3'11 1'88 1'23
1'40 0'72 0'68
1'35 0'69 0'66
1'50 0'77 0'73
1'30 065 0'65
1'29 0'64 0'65
1'33 0'70 0'63
1'67 0'86 O'lll
1'69 0'88 0'81
1'64 0'84 0'80
1'62 0'83 0 79
per per household household
20
6'76
7'15
6'18
6'83
6'38
6'99
7'08
6'16
6'10
6'42
6'27
6'26
6'28
6'58
6'58
6'57
7'15
6'37
12'44
5'58
5'40
6'00
5'19
5'14
5'33
666
6'74
6'55
6'48
21
1'27
1'09
1'56
1'62
I'P
1'73
1'73
1'24
1'04
2'31
0'95
0'77
1'16
1'33
1'09
2'86
1'12
1'13
I'll
1'04
0'94
1'34
0'97
0'92
1'13
1'16
1'35
1'01
0'98
22 23
0'70 0'57
0'55 0'54
0'92 0'64
1'08 0'54
0'61 0'58
1'19 0'54
1'19 0'54
0'55 0'69
0'54 0'50
0'57 1'74
0'50 0'45
0'38 0'39
0'63 0'53
0'52 0'81
0'54 0'55
0'38 2'48
0'57 0'55
0'56 0'57
0'60 0'51
0'52 0'52
0'45 0'49
0'72 0'62
0'48 0'49
0'45 0'47
0'57 0'56
0'58 0'58
0'66 0'69
0'51 0'50
0'49 0'49
24
8'76
7'63
10'47
11'13
7'33
12'23
12'40
7'81
660
14'30
7'14
6'59
7'62
7'83
6'51
15'14
6'39
6'15
7'63
6'30
5'91
7'33
6'00
5'M
7'04
7'28
7'44
7'13
7'48
621
Rooms not stated
Average No, of persons
per household
25
3'88
3'83
3'89
3'70
3'69
3'78
3'55
4'10
3'98
5'54
4'27
4'28
4'06
4'32
4'32
o
4'13
4'13
o
3'91
393
3'63
4'31
4'37
3'88
5'22
5'28
4'54
3'00

622
E-V-2. Number of persons, males and femai om and persons p('r household in each category of household (contd.)
(Based on 20% Sample)
Total* One room ,.----"----, ,--_______ .A. __________ -,
State /District/Taluk/ CIt y / Total No. of No. of Average To~ n \\lth population of Rural persons persons No. of
50,00U and :,bovc lJlball per per Persons Males Females per,ons room household per
household
2 3 4 5 6 7 8
Kuhttalai Taluk T 3'68 468 4'43 2'21 2'22 4'43
R 371 4'69 4'45 2'22 2'23 4'45
U 3'13 4'54 3'96 2'02 1'94 3'96
Tiruclllfapalh Taluk T 2'66 4'62 4'05 2'03 202 d'05
R 2'78 4'43 4'07 2'02 2'05 407
U 2'61 4'71 4'03 2'03 2'00 4'03
Tlruchirapalh (M) U 2'59 4'79 4'03 2'05 1'98 4'03
Kulathur Taluk T 3'01 4'C~ 4'43 2'24 2'19 4'43
R 3'1)1 4'64 4'43 2'24 2'19 4'43
Alanglldi Taluk T 3'72 4'81 4'52 2'25 2'27 4'52
R 4'20 4'85 4'64 2'32 2'32 4'64
U 295 4'74 4'16 2'05 2'11 4'16
Plldllkottai (M) U 299 4'75 4'16 2"05 2'11 4'16
Tirumayam Taluk T 2'95 4'15 4'00 1'95 2'05 4'00
R 3'20 4'20 4'06 1'96 2'10 4'06
U 1'99 3'SS 3'52 l'S7 1'65 3'52
THANJAVUR DISTRICT T 3'45 4'42 4'16 2'07 2'09 4'16
R 3'58 4'36 4'17 2'08 2'09 4'17
U 3'01 4'66 4'14 2'06 2'08 4'14
Strkali Taluk T 3'70 4'57 4'39 2'19 2"20 4'39
R 3'81 4'56 4'41 2'19 2'~'" -~ 4"41
U 3'20 4'60 4'28 2'16 2'12 4'28
Mayuram Taluk T 3'38 4°51 4°17 2°06 20ll 417
R 3"47 4'46 4'17 2'06 2'11 4'17
U 3'03 4'75 4'16 2'09 2'07 4'16
MaYliram (M) U 3'11 4'79 4'24 2'11 2'13 4'24
Kumbakonam Taluk T 3'35 4'41 4'13 2'06 2'07 4'13
R 3'55 4'32 4'18 2'10 2'08 4'18
U 3"02 4'58 4'03 1'99 2'04 4'03
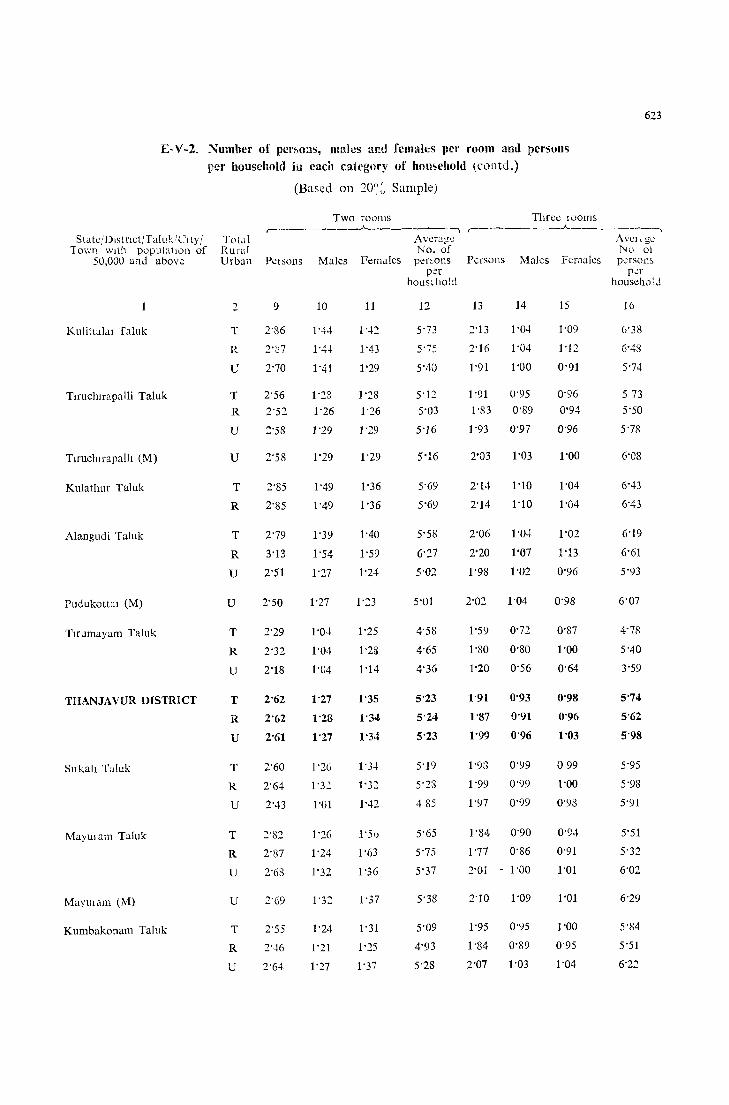
623
E- V-20 Number of pel"1>OllS, males mIt] females per room amI persons per household in cadI category of hou~ehold \contdo)
Slate/Dlstrlct/Talnk leI ty / T own WIth populallOl1 of
50,000 and above
Kuliltal,\l Taluk
Tlruchlrapalli Taluk
Tlruchlrapallt (M)
Kulathur Taluk
Alangudi Taluk
Pudukott"l (M)
Tlrumayam Taluk
THANJAVUR DISTRICT
Snkait Taluk
MaYlilam Taluk
MaYUlam (M)
Kumbakonam Taluk
(Based on 20~ ~ Sample)
Two roollls r----<---..A...------~
Total Rural Urban
AveragG Noo of
Peisons Males Females per,ons p~r
hOllsd!Old
T
R
C
9
2°86
2°70
T 2°56
R 2°52
U :°58
U 2°58
T 2°85
R 2°85
T 2°79
R 3°13
U 2°51
U 2°50
T 2°29
R 2°32
U
T
R
U
T
R
U
T
R
U
u
T
R
U
2°18
2°62
2°62
2"61
2°60
2°64
2"43
2°S2
20S7
2°6S
2°69
2°55
2:46
2°64
10
1°44
1°44
1°41
1°23
1'26
1'29
1°29
1°49
1°49
1'39
1'54
1'27
1'27
1'04
1°04
1'04
1'27
1'28
1°27
1'26
1'01
1'26
1'24
1'32
1'24
1'21
1°27
11
1°42
1'43
1'29
1°28
1'26
1°29
1'29
1'36
1'36
1°40
1'59
1°24
1°23
1'25
l'2S
1'14
1'.}2
1'42
loS\)
1°63
1°36
1°37
1°31
1'25
1°37
12
5"73
5°75
50 110
5"12
5"03
5°16
5'16
5'69
5'69
5'58
6°27
5°02
5°01
4°58
4°65
4°36
5°23
5°24
5°23
5" 19
5"28
485
5'65
5°75
5°37
5°38
5°09
4°93
5°28
Three lOoms ,.. _________ ..A.. ___________ ~
Avc],gc: No oj
Persons Males Females persons p~r
househoIj
13
2°16
1°91
14
1°04
1°04
1'00
15
J'09
1°12
0°91
1°91 0'95 0'96
1°83 0°89 0'94
1 °93 0°97 0°96
2'03 1°03 1'00
2°14 1°10 1°04
2°14 1°10 1°04
2°06 1°04 1°02
2'20 1'07 1'13
1°98 1°02 0°96
2°02 1°04 0°98
1'59 0'72 00S7
10S0 OoSO 1 °00
1'20 0°56
1°91 0'93
10S7 0°91
1°99 0'96
1°93 0'')9
1°99 0°99
1°')7 0'99
loS4 0'90
1°77 0°86
2°01 - 1°00
2'10 1°09
1°95 0°95
1°84 0°89
2°07 1°03
0°64
0°98
0°96
1'03
099
1°00
0°98
0°94
0°91
1°01
1'01
1°00
0°95
1°04
16
CdS
6°48
5°74
573
5°50
5°78
60 0S
6'43
6°43
6°19
6'61
5°93
6°07
4°78
5°40
3°59
5°74
5'62
5°98
5°95
5 0 9S
5"91
5°51
5°32
6°02
6°29
5'84
5°51
6°22
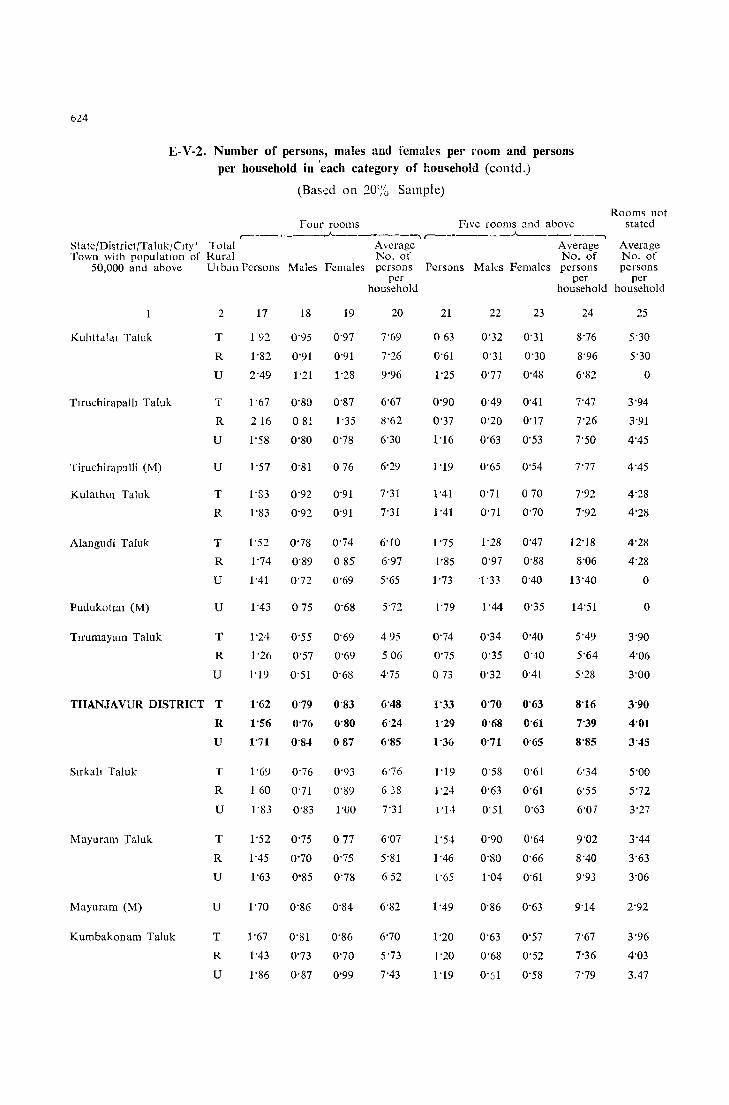
624
E-V-2. Number of persons, males and females per room and persons per household in 'each category of hou'iehold (contd,)
(Based on 20% Sample)
Four rooms Five rooms and above r---~ ,, __ ~..A.. _______ ~ r-------_J...___--.--~
State/District/TalukjClty' Total Average Average Town with populatIOn of Rural No, of No, of
50,000 and above VI ban Persons Males Females persons Persons Males Females persons
Kuhttalal Taluk
Tlfllchirapalh Taluk
Tiruehirap:llli (M)
Kulathul Taluk
Alangudi Taluk
Pudukottal (M)
Tlfllmayam Taluk
2
T
R
U
T
R
U
u
T
R
T
R
U
u
T
R
U
THANJAVUR DISTRICT T
R
U
Slrkah Taluk
Mayuram Taluk
Mayuram (M)
Kumbakonam Taluk
T
R
U
T
R
U
u
T
R
U
17 18 19
1 92 0'95 0'97
1'82 0'91 0'91
2'49 1'21 1'28
1'67 O'SO 0'87
2 16 081 1'35
I' 58 0'80 0'78
1'570'81076
I'S3 0'92 0'91
1'83 0'92 0'91
1'52 0'78 0'74
1'74 0'89 085
1'41 0'72 0'69
1'43 075 0'68
1'24 0'55 0'69
1'26 0'57 0'69
1'19 0'51 0'68
1'62 0'79 0'83
1'56 0'76 0'80
1'71 O'S4 087
1'6~ 0'76 0'')3
1 60 0'71 0'89
1'83 0'83 1'00
1'52 0'75 077
1'45 0'70 0'75
1'63 0'85 0'78
1'70 0'86 0'84
1'67 0'81 0'86
1'43 0'73 0'70
1'86 0'87 0'99
per per household household
20
7'69
7'26
9'96
6'67
8'62
6'30
6'29
7'31
7'31
6'10
6'97
5'65
5'72
495
506
4'75
6'48
6'24
6'85
6'76
638
7'31
6'07
5'81
652
6'82
6'70
5'73
7'43
21
o 63
0'61
1'25
0'90
0'37
1'16
1'19
1'41
1'41
1'75
1'85
1'73
1'79
0'74
0'75
073
1'33
1'29
1'36
1'19
1'24
1'14
1'54
1'46
1'65
1'49
1'20
1'20
1'19
22 23
0'32 0'31
0'31 0'30
0'77 0'48
0'49 0'41
0'20 0'17
0'63 0'53
0'65 0'54
0'71 070
0'71 0'70
1'28 0'47
0'97 0'88
'1'33 0'40
1'44 0'35
0'34 0'40
0'35 0'40
0'32 0'41
0'70 0'63
0'68 0'61
0'71 0'65
0'58 0'61
0'63 0'61
0' 51 0'63
0'90 0'64
0'80 0'66
1'04 0'61
0'86 0'63
0'63 0'57
0'68 0'52
0'51 0'58
24
8'76
8'96
6'82
7'47
7'26
7'50
7'77
7'92
7'92
12'18
8'06
13'40
14'51
5'49
5'64
5'28
8'16
7'39
8'85
G'34
6'55
6'07
9'02
8'40
9'93
9'14
7'67
7'36
7'79
Room~ not stated
Average No, of persons
per household
25
5'30
5'30
o
3'94
3'91
4'45
4'45
4'28
4'28
4'28
4'28
o
o
3'90
4'06
3'00
3'90
4'01
3'45
5'00
5'72
3'27
3'44
3'63
3'06
2'92
3'96
4'03
3,47
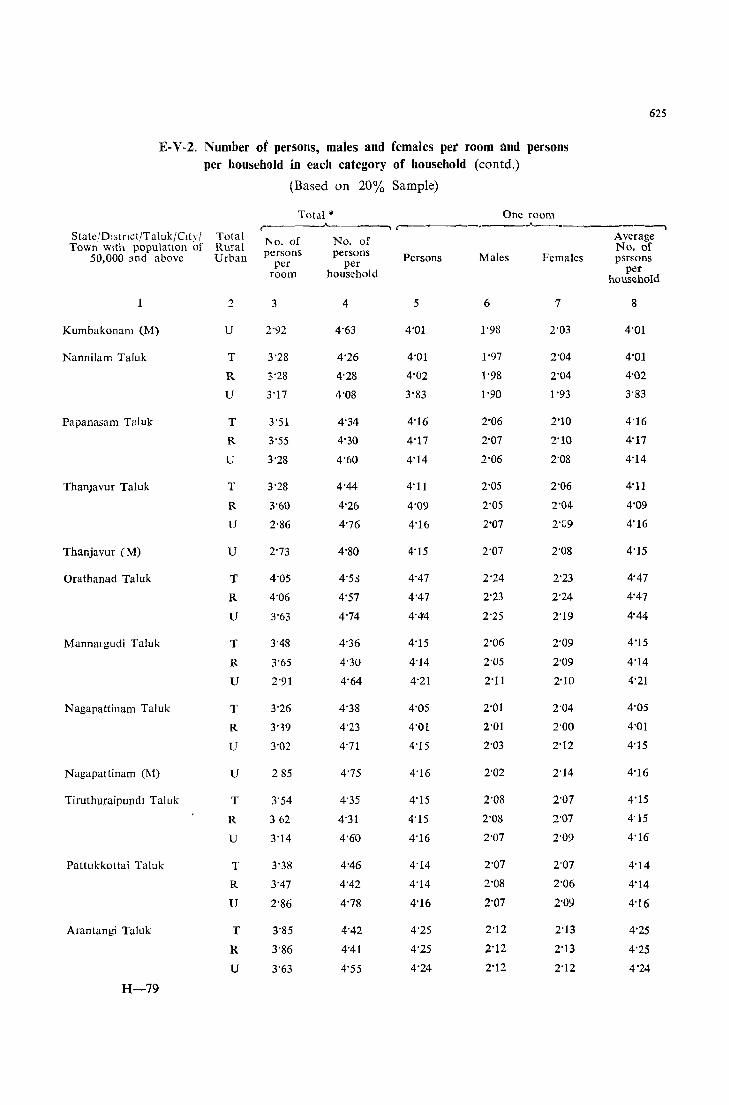
625
E-V -2. Number of persons, mates and females pet room and persons per household in each category of household (contd.)
(Based on 20% Sample)
Tot.!i .. One room r~---"--'__~ .----"-----~-------,
Statc/Dlstnct/Taluk/Clty/ Total No. of No. of Average Town with populatlOn of Rural No, of
50,000 and above Urban persons persons Persons Males Females psrsons per per room household per
household
1 2 3 4 5 6 7 8
Kumbakonam (M) U 2'92 4'63 4'01 1'98 2'03 4'01
Nannilam Taluk T 3'28 4'26 4'01 1'97 2'04 4'01
R 3'28 4'28 4'02 1'98 2'04 4'02
U 3'17 4'08 3'83 1-90 1'93 3'83
Papanasam Taluk T 3'51 4'34 4'16 2·06 2'10 4'16
R 3'55 4'30 4'17 2·07 2'10 4'17
U 3'28 4'60 4'14 2'06 2'08 4'14
ThanJavur Taluk T 3'28 4'44 4'11 2'05 2'06 4'11
R 3'60 4'26 4'09 2'05 2'04- 4'09
U 2-86 4'76 4'16 2'07 2'(;9 4'16
Thanjavur (M) U 2'73 4'SO 4'15 2'07 2'OS 4'15
Orathanad Taluk T 4'05 4'53 4'47 2'24 2'23 4'47
R 4'06 4'57 4'47 2'23 2'24 4'47
U 3'63 4'74 4'<f4 2'25 2'19 4'44
Mannmgudi Taluk T 3'48 4'36 4'15 2'06 2'09 4'15
R 3'65 4'30 4'14 2'05 2'09 4'14
U 2'91 4'64 4'21 2'11 2'10 4'21
Nagapattinam Taluk T 3'26 4'38 4'05 2'01 2'04 4'05
R 3'W 4'23 4'01 2'01 2'00 4'01
U 3'02 4'71 4'15 2'03 2'12 4'15
Nagapattinam (M) U 285 4'75 4'16 2'02 2'14 4'16
Tiruthuraipundl Taluk T 3'54 4'35 4'15 2'08 2'07 4'15
R 362 4'31 4'15 2'08 2'07 4'15
U 3'14 4'60 4'16 2'07 2'09 4'16
Pattukkottai Taluk T 3'38 4'46 4'14 2'07 2'07 4'14
R 3'47 4'42 4'14 2'08 2'06 4'14
U 2'S6 4'78 4'16 2'07 2'09 4'16
Arantangi Taluk T 3'85 4'42 4'25 2'12 2'13 4'25
R 3'86 4'41 4'25 2'12 2'13 4'25
U 3'63 4'55 4'24 2'12 2'12 4'24
H-79
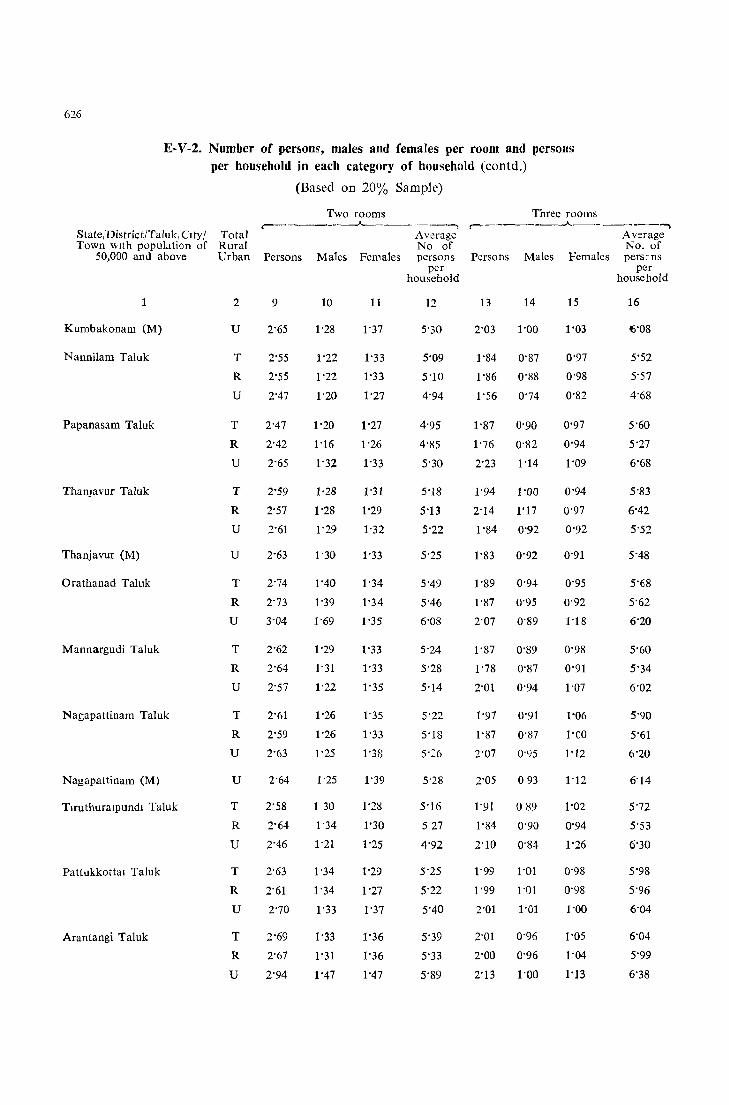
626
E· V-2. Number of persons, males and females per room and persons per household in each category of household (eontd,)
State/District/Taluk,'CIty( Total Town with population of Rural
50,000 and above Urban
1
Kumbakonam (M)
Nannilam Taluk
Papanasam Taluk
ThanJavur Taluk
Thanjavur (M)
Orathanad Taluk
Mannargudi Taluk
Nagapattinam Taluk
Nagapattinam (M)
Tltuthuralpundl Taluk
Pattukkottal Taluk
Arantangi Taluk
2
U
T
R
U
T
R
U
T
R
U
U
T
R
U
T
R
U
T
R
U
U
T
R
U
T
R
U
T
R
U
(Based on 20% Sample)
Two rooms ~ _____ ... _..A- . __ ~
Average No of
Persons Males Females persons
9
2'65
2'55
2'55
2'47
2'47
2'42
2'65
2'59
2'57
2'61
2'63
2'74
2'73
3'04
2'62
2'M
2'57
2'61
2'59
2'63
2'64
2'S8
2'64
2'46
2'63
2"61
2'70
2'69
2'67
2'94
10
1'28
1'22
1'22
1'20
1'20
1'16
1'32
1'28
1'28
1'29
1'30
1'40
1'39
1'69
1'29
1'31
1'22
1'26
1'26
1'25
1'25
130
1'34
1'21
1'34
1'34
1'33
1'33
1'31
1'47
11
1'37
1'33
1'33
1'27
1'27
1'26
1'33
1'31
1'29
1'32
1'33
1'34
1'34
1'35
1'33
1'33
1'35
1'35
1'33
1'38
1'39
1'28
1'30
1'25
1'29
1'27
1'37
1'36
1'36
1'47
per household
12
5'30
5'09
5'10
4'94
4'95
4'85
5'30
5'18
5'13
5'22
5'25
5'49
5'46
6'08
5'24
5'28
5'14
5'22
5'18
5':6
5'28
5'16
527
4'92
5'25
5'22
5'40
5'39
5'33
5'89
Three rooms c-~~-----.A-----.--.
Average No, of
Persons Males Females pers:ns per
household
13 14
2'03 1'00
1'84 0'87
1'86 0'88
1'56 0'74
1'87
1'76 0'82
2'23 1'14
1'94
2'14
1'00
1'17
1'84 0'92
1'83 0'92
1'89 0'94
1'87 0'95
2'07 0'89
1'87 0'89
1'78 0'87
2'01 0'94
1'97 0'91
1'87 0'87
2'07 0'95
2"05 093
1'91 0 89
1'84
2'10
1'99
1'99
2'01
2'01
2'00
2'13
0'90
0'84
1'01
1'01
1'01
0'96
0'96
1'00
15
1'03
0'97
0'98
0'82
0'97
0'94
1'09
0'94
0'97
0'92
0'91
0'95
0'92
1'18
0'98
0'91
1'07
1'06
l'CO
1'12
1'12
1'02
0'94
1'26
0'98
0'98
1'00
1'05
1'04
1'13
16
6'08
5'52
5'57
4'68
5'60
5'27
6'68
5'83
6'42
5'52
5'48
5'68
5'62
6'20
5'60
5'34
6'02
5'90
5'61
6'20
6'14
5'72
5'53
6'30
5'98
5'96
6'04
6'04
5'99
6'38

E-V-2, Number of persons, males and females per room and persons per household in each category of househ91d (eontd,)
(Based on 20% Sample)
Four rooms Five rooms and above r------..A.-----, r-------..A.-----, State/Dlstrict/Taluk/City/ Total Average Average Town with population of Rural No, of No, of
627
Rooms not stated
Average No, of
50,000 and above Urban Persons Males Females persons Persons Males Females persons persons
1
Kumbakonam (M)
Nanmlam Taluk
Papanasam Taluk
Thanjavur Taluk
ThanJavur (M)
Orathanad Taluk
Mannargudi Taluk
N1gapattinam Taluk
Nagapattmam (M)
Tiruthuraipundl Taluk
Pattukkottai Taluk
Arantangi T aluk
2
u
T
R
U
T
R
U
T
R
U
U
T
R
U
T
R
U
T
R
U
U
T
R
U
T
R
U
T
R
U
17 18 19
1'87 0'86 1'01
1'5, 0'70 0'83
1'53 0'69 0'84
1'57 O'SO 0'77
1'63 0'83 0'80
1'48
2'15
0'68 0'80
1'36 0'79
1'56 0'74 0'82
1'44 0'67 0'77
1'63 0'79 0'84
1'66 0'79 0'87
1'68 0'85 0'83
1'67 0·85
1'75 0'75
1'59 0'75
0'82
1'00
0'84
1'62 0'76 0'86
1'56 0'73 0'83
1'71
1'63
1'79
0'83
0'76
0'90
0'88
0'87
0'89
1'59 0'74 0'85
1'48 0'80 0'68
1'39 0'78 0'61
1'81 0'85 0'96
1'68 0'88 0'80
1'74 0'92 0'82
1'52 0'76 0'76
2'30 1'10 1'20
2"40 1'15 1'25
1'45 0'70 0'75
per per per household household household
20
7'49
6'l3
6'12
6'27
6'51
5'94
8'62
6'24
5'76
6'51
6'64
6'71
6'70
7'00
6'36
6'48
6'23
6'83
6'50
7'15
6'37
5'92
5'54
7'23
6'70
6'96
6'09
9'21
9'60
5'80
21
1'21
1'08
1'02
2'56
1'29
1'28
1'30
1'46
1'07
1'51
1'35
1'37
1'43
1'15
0'84
1'06
0'76
1'23
1'06
1'37
1'13
1'41
1'18
1'87
1'53
1'70
1'35
1'60
1'64
1'33
22 23
0'61 0'60
0'54 0'54
0'50 0'52
1'62 0'94
0'61 0'68
0'58 0'70
0'67 0'63
072 0'74
0'56 0'51
0'74 0'77
0'55 0'80
0'71 0'66
0'74
0'59
0'42
0'69
0'56
0'42
0'54 0'52
0'37 0'39
0'65
0'52
0'75
0'58
0'54
0'62
0'56 0'57
0'60 0'81
0'56 0'62
0'69 1'18
0'96 0'57
1'09 0'61
0'82 0'53
0'78 0'82
0'82 0'82
C'57 0'76
24
7'92
5'89
5'5S
13'67
7'70
7'45
S'21
9'24
6'11
9'69
8'49
7"80
S'20
6'20
7'11
5'68
8'20
7'34
6'39
S'10
6'67
7'96
6'SO
10"11
9'07
9'57
8'49
10'04
10'62
7'00
25
3'32
4'01
1'00
3'98
3'90
4'50
3'77
3'80
3·21
1'00
4'13
3'93
4'29
4'53
5'17
3'00
3'58
3'55
3'62
3'67
3'54
3'64
3'43
3'27
3'90
2'75
3·57
2'00
3'83
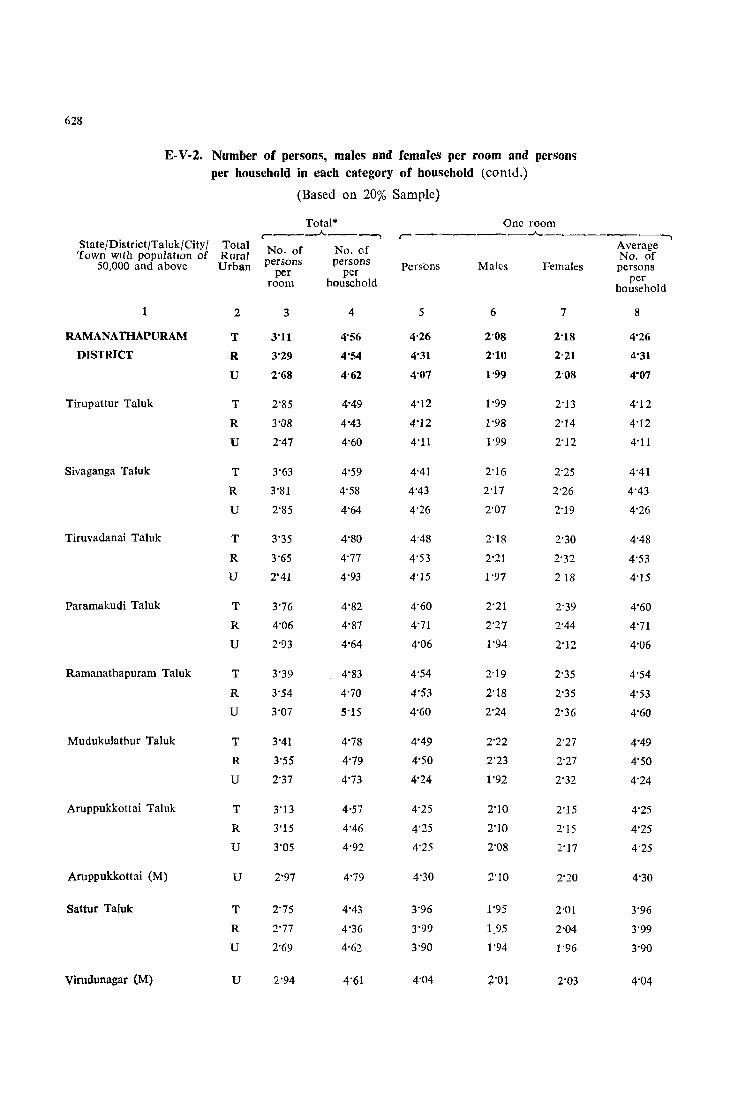
628
E-V-2, Number of persons, males and females per room and persons per household in each category of household (contd,)
(Based on 20% Sample)
Total* One room ~ ___ .A. ___ ~ .. ---A--____________ ~
State/District/Taluk/City/ Total No, of No, of Average Town with populatIOn of Rural No, of
50,000 and above Urban persons persons Persons Males Females persons per per per room household household
1 2 3 4 5 6 7 8
RAMANATHAPURAM T 3'11 4'56 4'26 2'08 2'18 4'26
DISTRICT R 3'29 4'54 4'31 2'10 2'21 4'31
U 2'68 4'62 4'07 1'99 2'08 4'07
Tirupattur Taluk T 2"85 4'49 4'12 1'99 2'13 4'12
R 3'08 4'43 4'12 1'98 2'14 4'12
U 2'47 4'60 4'11 1'99 2'12 4'11
Sivaganga Taluk T 3'63 4'59 4'41 2'16 2'25 4'41
R 3'81 4'58 4'43 2'17 2'26 4'43
U 2"85 4'64 4'26 2'07 2'19 4'26
Tiruvadanai Taluk T 3'35 4'80 4'48 2'18 2'30 4'48
R 3'65 4'77 4'53 2'21 2'32 4'53
U 2'41 4'93 4'15 1'97 218 4'15
Paramakudi Taluk T 3'76 4'82 4'60 2'21 2'39 4'60
R 4'06 4'87 4'71 2'27 2'44 4'71
U 2'93 4'64 4'06 1'94 2'12 4'06
Ramanathapuram Taluk T 3'39 4'83 4'54 2'19 2'35 4'54
R 3'54 4'70 4'53 2'18 2'35 4'53
U 3'07 5'15 4'60 2'24 2'36 4'60
Mudukulathur Taluk T 3'41 4'78 4'49 2'22 2'27 4'49
R 3'55 4'79 4'50 2'23 2'27 4'50
U 2'37 4'73 4'24 1'92 2'32 4'24
Aruppukkottai Taluk T 3'13 4'57 4'25 2'10 2'15 4'25
R 3'15 4'46 4'25 2'10 2'15 4'25
U 3'05 4'92 4'25 2'08 2'17 4'25
Aruppukkottai (M) U 2'97 4'79 4'30 2'10 2'20 4'30
SaHur Taluk T 2'75 4'43 3'96 1'95 2'01 3'96
R 2'77 4'36 3'99 1.95 2'04 3'99
U 2'69 4'62 3'90 1'94 1'96 3'90
Virudunagar (M) U 2'94 4'61 4'04 Z'OI 2'03 4'04
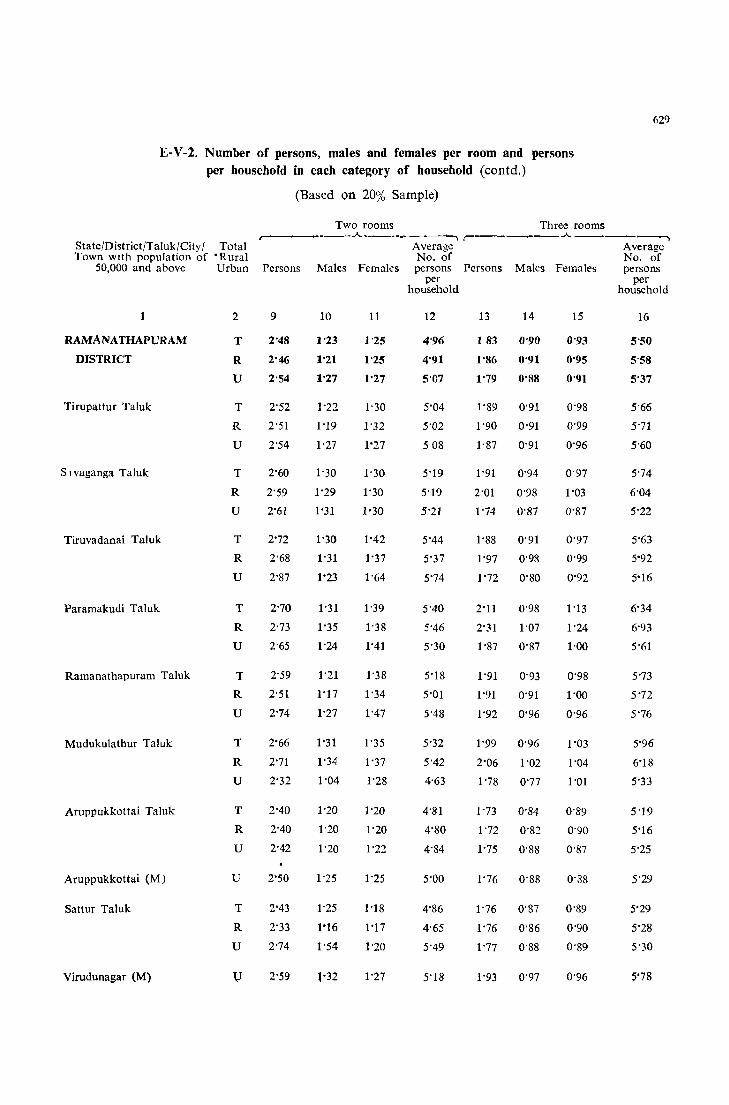
629
E-V-2, Number of persons, males and females per room and persons per household in each category of household (contd,)
State/District/Taluk/City / Total Town wIth population of • Rural
(Based on 20% Sample)
Two rooms Three rooms ~ ______ .A. ___ ._~---, , ___ ~ ___ .A. ____ ----,
Average Average No, of No, of
50,000 and above Urban Persons Males Females persons Persons Males Females persons
1
RAMANATHAPVRAM
DISTRICT
Ti rupattur Taluk
S I vaganga Taluk
Tiruvadanai Taluk
Paramakudi Taluk
Ramanathapuram Taluk
Mudukulathur Taluk
Aruppukkottai Taluk
Aruppukkottai (M)
Sattur Taluk
Virudunagar (M)
2
T
R
U
T
R
U
T
R
U
T
R
U
T
R
U
T
R
U
T
R
U
T
R
U
U
T
R
U
9
2'48
2'46
2'54
2'52
2'51
2'54
2'60
2'59
2'61
2'72
2'68
2'87
2'70
2'73
2'65
2'59
2'51
2'74
2'66
2'71
2'32
2'40
2'40
2'42
2'50
2'43
2'33
2'74
2'59
10
1'23
1'21
1'27
1'19
1'27
1'30
1'29
1'31
1'30
1'31
1'23
}'31
1'35
1'24
1'21
1'17
1'27
1'31
1'34
}'04
1'20
1'20
}'20
1'25
1'25
1'16
1'54
1'32
11
1'25
1'25
1'27
1'30
1'32
1'27
1'30
1'30
1'30
1'42
1'37
1'64
1'39
1'38
1'41
1'38
1'34
1'47
1'35
1'37
1'28
1'20
1'20
1'22
1'25
1'18
1'17
1'20
1'27
per per household household
12
4'96
4'91
5'07
5'04
5'02
508
5'19
5'19
5'21
5'44
5'37
5'74
5'40
5'46
5'30
5'18
5'01
5'48
5'32
5'42
4'63
4'81
4'80
4'84
5'00
4'86
4'65
5'49
5'18
13 14
183 0'90
1'86 0'91
1'79 0'88
1'89 0'91
1'90 0'91
1'87 0'91
1'91 0'94
2'01 0'98
1'74 0'87
1'88 0'91
1'97 0'98
1'72 0'80
2'11
2'31
1'87
0'98
1'07
0'87
1'91 0'93
1'91 0'91
1'92 0'96
1'99 0'96
2'06
1'78
1'02
0'77
1'73 0'84
1'72 0'82
1'75 0'88
1'76 0'88
1'76 0'87
1'76 0'86
1'77 0'88
1'93 0'97
15
0'93
0'95
0'91
0'98
0'99
0'96
0'97
1'03
0'87
0'97
0'99
0'92
1'13
1'24
1'00
0'98
1'00
0'96
1'03
1'04
1'01
0'89
0'90
0'87
0'88
0'89
0'90
0'89
0'96
16
5'50
5'58
5'37
5'66
5'71
5'60
5'74
6'04
5'22
5'63
5'92
5'16
6'34
6'93
5'61
5'73
5'72
5'76
5'96
6'18
5'33
5'19
5'16
5'25
5'29
5'29
5'28
5'30
S'78
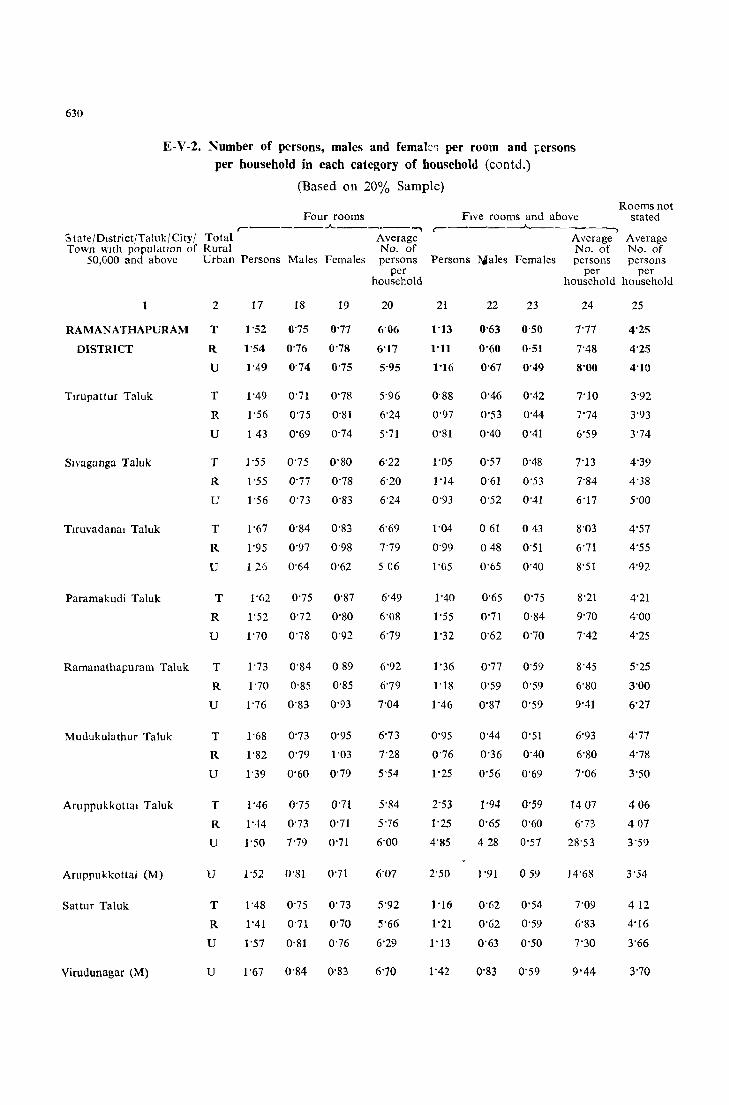
630
E-V-2. Number of persons, males and female,> per room and ~ersons per household in each category of household (eontd.)
(Based on 20% Sample)
Four rooms r------.A..------,
5tateJDlstrictfTalukfCityJ Total Average Town with populatIOn of Rural No. of
50,000 and above Urban Persons Males Females persons
2
RAMANATHAPURAM T
DISTRICT R
U
Tlrupattur Taluk T
Smlganga Taluk
Tlfuvadanal Taluk
R
U
T
R
U
T
R
U
Paramakudi Taluk T
R
U
Ramanathapuram Taluk T
Mudukulathur Taluk
Aruppukkottal Taluk
Aruppukkottai (M)
Sattur Taluk
Virudunagar (M)
R
U
T
R
U
T
R
U
u
T
R
U
u
17 18 19
J '52 0'75 0'77
1'54 0'76 0'78
1'49 0'74 0'75
1'49 0'71 0'78
1'56 0'75 0'81
1 43 0'69 0'74
]'55 0'75 0'80
1'55 0'77 0'78
0'83 1'56 0'73
1'67
1'95
0'84 0'83
0'97 0'98
126 0'64 0'62
1'62 0'75 0'87
1'52 0'72 0'80
1'70 0'78 0'92
1'73 0'84 0 89
1'70 0'85 0'85
1'76 0'83 0'93
1'68 0'73 0'95
1'82 0'79 1'03
1'39 0'60 0'79
1'46 0'75 0'71
1'-14 0'73 0'71
1'50 7'79 0'71
1'52 0'81 0'71
1'48 0'75 0' 73
1'41 0'71 0'70
1'57 0'81 0'76
1'67 0'84 0'83
per household
20
6'06
6'17
5'95
5'96
6'24
5'71
6'22
6'20
6'24
6'69
7'79
506
6'49
6'08
6'79
6'92
6'79
7"04
6'73
7'28
5'54
5'84
5'76
6'00
6'07
5'92
5'66
6'29
6'70
Rooms not Five rooms and above stated
r-.------'-----------A verage Average No. of Nv. of
Persons ~ales Females persons persons
21
1'13
I'll
1'16
0'88
0'97
0'81
1'05
1'14
0'93
1'04
0'99
1'05
1'40
1'55
1'32
1'36
1'18
1'46
0'95
0'76
1'25
2'53
1'25
4'85
2'50
1'16
1'21
1'13
1'42
22 23
0'63 0'50
0'60 0,51
0'67 0'49
0'46 0'42
0'53 0'44
0'40 0'41
0'57 0'48
0'61 0'53
0'52 0'41
o 61 043
048 0'51
0'65 0'40
0'65 0'75
0'71 0'84
0'62 0'70
0'77 0'59
0'59 0'59
0'87 0'59
0'44 0'51
0'36 0'40
0'56 0'69
1'94 0'59
0'65 0'60
428 0'57
1'91 059
0'62 0'54
0'62 0'59
0'63 0'50
0'83 0'59
per per household household
24
7'77
7'48
8'00
7'10
7'74
6'59
7'13
7'84
6'17
8'03
6'71
8'51
8'21
9'70
7"42
8'45
6'80
9'-11
6'93
6'80
7'06
1407
6'73
28'53
14'68
7'09
6'83
7'30
9'44
25
4'25
4'25
4'10
3'92
3'93
3'74
4'39
4'38
5'00
4'57
4'55
4'92
4'21
4'00
4'25
5'25
3'00
6'27
4'77
4'78
3'50
406
407
3'59
3'54
412
4'16
3'66
3'70
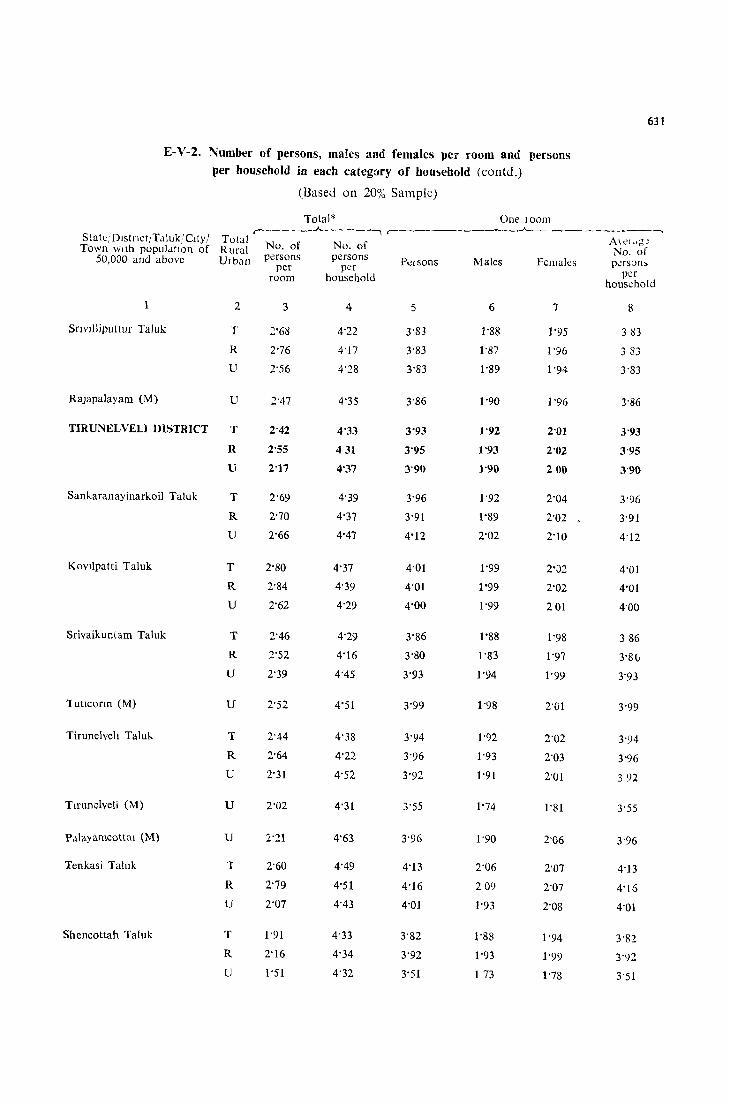
631
E-V-2, Number of persons, males and femalcs pcr room and persons per bouschold in cach category of bou!tcbold (contu,)
(Based on 20% Sample)
Total* One 100m ,------"-------1 r----------.J-_ ----------.
State,' Dlstnct/T .11 uki Clty/ Total No, of No, of A\eI .. !g: Town wIth popul<ltlon of Rural No, of
50,ODO and above Ulban persons persons Persons Males Fcmales p"rsan~ per per per room household household
1 2 3 4 5 6 7 8
SrlVllliputtuf Taluk T 2'68 4'22 3'83 1'88 j'95 383
R 2'76 4'17 3'83 1'87 1'96 383
U 2'56 4'28 3'83 1'89 1'94 3'83
RaJapalayam (M) U 2'47 4'35 3"86 1'90 1'96 3"86
TIRUNELVELI DISTRICT T 2"42 4'33 3'93 1'92 2'01 3'93
R 2'55 431 3'95 1'93 2'02 3'95
U 2'17 4'37 3'90 1'90 200 3'90
Sankaranayinarkoil Taluk T 2'69 4'39 3'96 1'92 2'04 3'96
R 2'70 4'37 3'91 1'89 2'02 3'91
U 2'66 4'47 4'12 2'02 2'10 4'12
Kovilpatti Taluk T 2'80 4'37 4'01 1'99 2'J2 4'01
R 2'84 4"39 4'01 1'99 2'02 4'01
U 2'62 4'29 4'00 1'99 201 4'00
Srivaikunlam Taluk T 2'46 4'29 3'86 1'88 1'98 386
R 2'52 4'16 3'80 I'S3 1'97 3'8(1
U 2'39 4'45 3'93 1'94 1'99 3'93
1utlconn (M) U 2'52 4'51 3'99 1'98 2'01 3'99
Tirunelveh Taluk T 2'44 4'38 3'94 1'92 2'02 3"94 R 2'64 4'22 3'96 1'93 2'03 3-96
U 2'31 4'52 3'92 1'91 2'01 392
Tlrunelveli (M) U 2'02 4'31 3'55 1'74 1'81 3'55
P.llayamcottal (M) U 2'21 4'63 3'96 1'90 2'06 3'96
Tenkasi Taluk i 2'60 4'49 4'13 2'06 2'07 4'13
R 2'79 4'51 4'16 209 2'07 4'16 U 2'07 4'43 4'01 1'93 2'08 4'01
Shencottah Taluk T 1'91 4'33 3'82 1'88 1'94 3'82 R 2'16 4'34 3'92 1'93 1'99 3'92 U 1'51 4'32 3'51 1 73 1'78 3'51
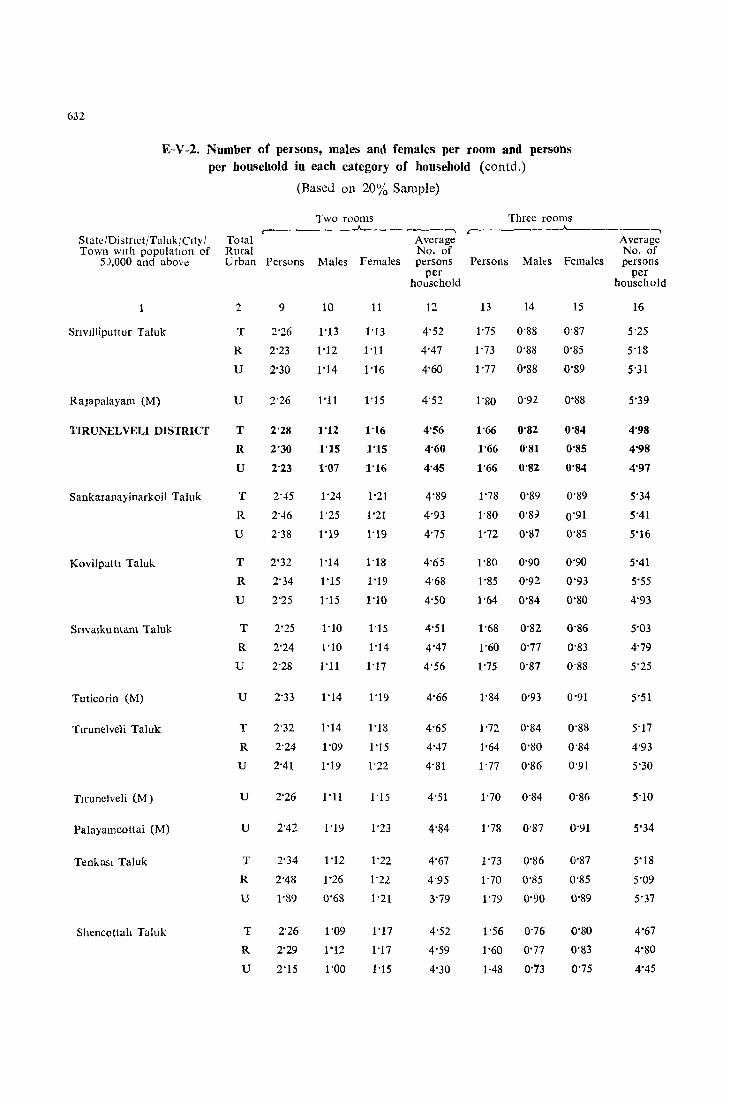
632
E-V-2, Number of persons, males and females per room and persons per household in each category of household (contd,)
(Based on 20% Sample)
Two rooms Three rooms r-------"'---.----_, r-----~--"-----------_,
State/Distnct/Taluk iCity I Total Average Average Town wIth populatIOn of Rural No, of No, of
5J,000 and above Urban Persons Males Females persons Persons Males Females persons per per
household household
1 2 9 10 11 12 13 14 15 16
Snv!lliputtur Taluk T 2-26 1'13 1'13 4'52 1'75 0-88 0-87 5'25
R 2'23 1'12 l-ll 4-47 1-73 0-88 0'85 5-18
U 2'30 1'14 1'16 4'60 1-77 0'88 0'89 5-31
RaJapalayam (M) U 2-26 I'll 1'15 4-52 1'80 0'92 0'88 5'39
TIRUNELVELI DISTRICT T 2'28 1'12 1-16 4'56 1'66 0'82 0'84 4'98
R 2'30 1'15 1'15 4'60 1'66 0-81 0'85 4'98
U 2'23 1-07 1'16 4'45 1'66 0-82 0'84 4'97
Sankaranayinarkoil Taluk T 2--15 1'24 1'21 4'89 1'78 0-89 0-89 5'34
R 2'-16 1-25 1'21 4'93 1'80 0'8:;) 0'91 5'41
U 2'38 1'19 1'19 4'75 1'72 0-87 0'85 5'16
Kovilpath Taluk T 2'32 1'14 1-18 4'65 1'80 0'90 0'90 5'41
R 2'34 1'15 1'19 4-68 1-85 0'92 0'93 5'55
U 2'25 1'15 1'10 4-50 1'64 0'84 0'80 4'93
Snvalkuntam Taluk T 2'25 1'10 I-IS 4'51 1'68 0-82 0'86 5'03
R 2-24 1'10 1'14 4-47 1'60 0'77 0-83 4'79
U 2-28 I'll 1-17 4-56 1'75 0'87 0-88 5'25
Tuticorin (M) U 2-33 1'14 1'19 4'66 1'84 0'93 0'91 5'51
Tlrunelveli Taluk T 2-32 1-14 1-18 4'65 ]'72 0-84 0-88 5'17
R 2-24 1'09 1'15 4'47 1'64 0'80 0-84 4'93
U 2"41 1'19 1-22 4-81 1-77 0'86 0'91 5'30
Tlrunelveli (M) U 2'26 I'll 1-15 4-51 1-70 0'84 0-86 5'10
Palayamcottai (M) U 2'42 1'19 1'23 4'84 1'78 0'87 0'91 5'34
Tenkasl Taluk T 2'34 1'12 1'22 4'67 1'73 0'86 0'87 5'18
R 2'48 1'26 1'22 4'95 1'70 0'85 0'85 5'09
U 1'89 0'68 1'21 3'79 1'79 0'90 0'89 5'37
Shencottah Taluk T 2'26 1'09 1'17 4'52 1'56 0'76 0'80 4'67
R 2'29 1'12 1'17 4'59 1'60 0'77 0'83 4'80
U 2'15 1'00 1'15 4'30 1,48 0'73 0'75 4'45
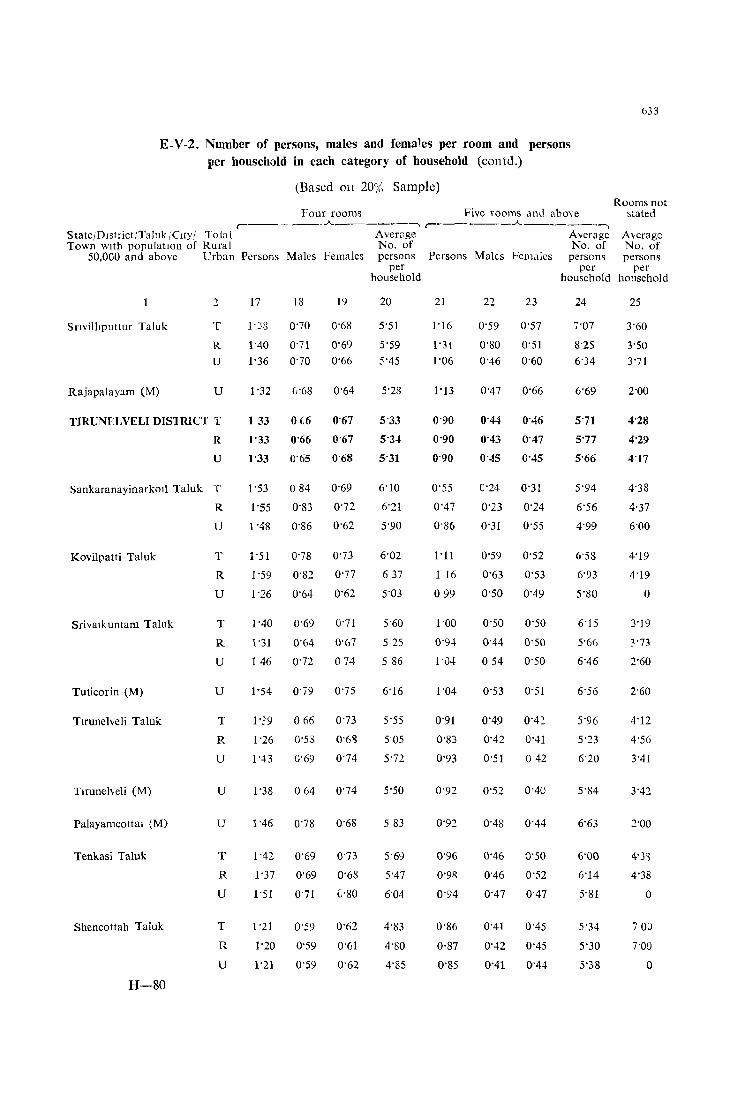
E-V -2, Number of persons, males and females per room and persons per household in each category of household (contd,)
(Based on 20% Sample)
Four rooms Five rooms and above , _____ .A._-___ --, , ______ .A. _____ -,
State/Dlstrict/Taluk/Clty/ Total Aven1ge Average Town wIth populatJOn of Rural No, of No, of
633
Rooms not stated
Average No, of
50,000 and above Urban Persons Males Females persons per
household
Persons Males Females persons persons
Snvilhputtur Taluk
Rajapalayam (M)
2
T
R
U
u
TIRUNELVELI DIS1RICT T
R
U
Sankaranayinarkoll Taluk T
R
U
Kovilpatti Taluk
Srivmkuntam Taluk
Tuticorin (M)
Tlruneheli Taluk
Tlrunelveli (M)
PalayamcottaJ (M)
Tenkasi Taluk
Shencottah Taluk
H-80
T
R
U
T
R
U
u
T
R
U
u
u
T
R
U
T
R
u
17 18 19
I'J8 0'70 0'68
1'40 0'71 0'69
1'36 0'70 0'66
1'32 (;'68 0'64
133 0 (;6 0'67
1'33 0'66 0'67
1'33 0'65 0'68
1'53 084 0'69
1'55 0'83 0'72
1 '48 0'86 0'62
1'51 0'78 0'73
1'59 0'82 0'77
1'26 0'64 0'62
1'40 0'69 0'71
1'31 0'64 0'67
146 0'72 074
1'54 0'79 0'75
1'::9 066 0'73
1'26 0'53
1'43 (j'69
0'613
0'74
1'38 0 64 0'74
1'46 0'78 0'68
1'42 0'69 0'73
1'37 0'69 0'68
1'51 0'71 (,'80
1 '21 0'59 0'62
1'20 0'59 0'61
1'21 0'59 0'62
20
5'51
5'59
5'45
5'28
S'33
5'3~
S'31
6'10
6'21
5'90
6'02
637
5'03
5'60
5 25
586
6'16
5'55
5'05
5'72
5'50
5 83
5'69
5'47
6'04
4'83
4'80
4'85
21
1'16
1'3 !
1'06
1'13
0'90
0'90
0'90
0'55
0'47
0'86
I'll
I 16
099
1'00
0'94
1'04
0'91
0'83
0'93
0'92
0'92
0'96
O'9il
0'94
0'86
0·87
0'85
22 23
0'59 0'57
0'80 0'51
0'46 0'60
0'47 0'66
0'44 0'46
0'43 0'47
0'45 0'45
C'24 0'31
0'23 0'24
0'31 0'55
0'59 0'52
0'63 0'53
0'50 0'49
0'50 0'50
0'44 0'50
054 0'50
0'53 0'51
0'49 0'42
0'42 0'41
0'51 042
0'52 0'40
0'48 0'44
0'46 Q'SO
0'46 0'52
0'47 0'47
0'41 0'45
0'42 0'45
0'41 0'44
per per household household
24
,'07
8'25
6'34
6'69
5'71
5'77
5'66
5'94
6'56
4'99
6'58
6'93
5'80
6'15
5'66
6'46
6'56
5'96
5'23
6'20
5'84
6'63
6'00
6'14
5'81
5'34
5'30
5'38
25
3'60
3'50
3'71
2'00
4'28
4'29
4'17
4'38
4'37
6'00
4'19
4'19
o
3'19
3'73
2'60
2'60
4'12
4'56
3'41
3"42
2'00
4'3')
4'38
o
700
7'00
o
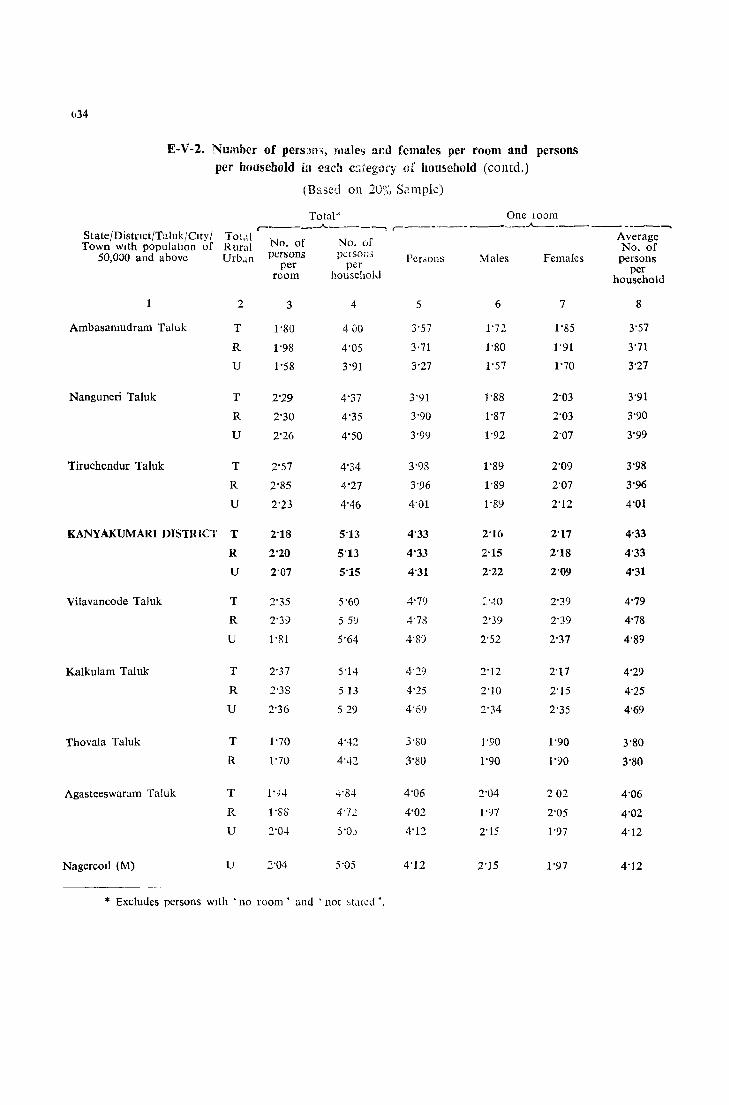
tl34
E-V-2, Number of pers:)[l', males :.md females per room and persons per household in each c:ttcgo!'y of household (contd,)
(Based on 20~:, Sample)
Tot::tl~ One 100m
State/Distnct/Taluk ICtty I r---_-..A.-----., r--- ---____ . ..A..-, __ ------......
Tot,l! No, of No, of Average Town wIth population of Rural No, of
50,000 and above Urb.m persons PCISOllS Pcrool1s Males Females persons per per per room household household
2 3 4 5 6 7 8
Ambasamudram Taluk T 1'80 400 3'57 1'72 1'85 3'57
R 1'98 4'05 3,71 1'80 1'91 3'71
U 1'58 3'91 3'27 1'57 1'70 3'27
Nanguneri Taluk T 2'29 4'37 3'91 1'88 2'03 3'91
R 2'30 4'35 3'90 1'87 2'03 3'90
U 2'26 4'50 3'99 1'92 2'07 3'99
Tiruchendur Taluk T 2'57 4'34 3'98 1'89 2'09 3'98
R 2'85 4'27 3'96 1'89 2'07 3'96
U 2'23 4'46 4'01 1'89 2'12 4'01
KANYAKUMARI DISTRICT T 2'18 5'13 4'33 2'16 2'17 4'33
R 2'20 5'13 4'33 2'15 2'18 4'33
U 2'07 5'15 4'31 2'22 2'09 4'31
Vilavancode TaJuk T 2'35 5'60 4'79 :"-10 2'39 4'79
R 2'39 55') 4'78 2'39 2'39 4'78
U l'SI 5'64 4'89 2'52 2'37 4'89
Kalkulam Taluk T 2'37 5'14- 4'29 2'12 2'17 4'29
R 2'38 513 4'25 2'10 2'15 4'25
U 2'36 529 4'69 2'34 2'35 4'69
Thovala Taluk T 1'70 4'42 3'80 1'90 1'90 3'80
R 1'70 4'42 3'80 1'90 1'90 3'80
Agasteeswaram Taluk T 1';i4 4'84 4'06 2'04 202 4'06
R l'SS 4'72 4'02 1'97 2'05 4'02
U 2'04- YOJ 4'12 2'15 1'97 4'12
NagercoIl (M) U 2'04 5'05 4'12 2'15 1'97 4'12
* Excludes persons WIth . no room' and . not st,ll.::d .,
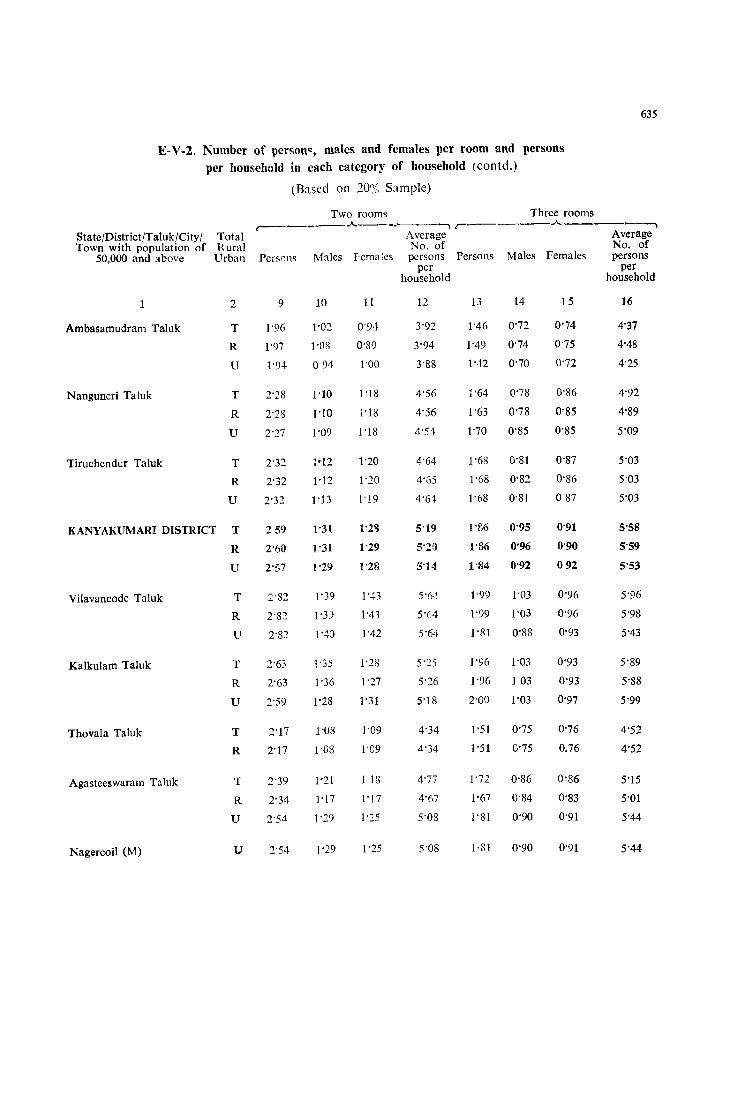
635
E-V-2, Number of person", males and females per room and persons per household in eaeh category of household (eontd,)
(Based on 20% Sample)
Two rooms Three rooms .A. _____ ~_____. , _______ .A. _____ ----.
State/District/Taluk/City/ Total Average Average Town with population of Rural No, of No, of
50,000 and above Urban Persons Males Females persons Persons Males Females persons per per
household household
1 2 9 10 11 12 13 14 15 16
Ambasamudram Taluk T 1'96 1'02 0'94 3'92 1'46 0'72 0'74 4'37
R 1'97 1'08 0'89 3'94 1'49 0'74 0'75 4'48
U 1'94 094 1'00 3'88 l',U 0'70 0'72 4'25
Nanguneri Taluk T 2'28 1'10 1'18 4'56 1'64 0'78 0'86 4'92
R 2'28 1'10 1'18 4'56 1'63 0'78 0'85 4'89
U 2'27 1'09 1'18 4'54 1'70 0'85 0'85 5'09
Tiruchendur Taluk T 2'32 1-12 1'20 4'64 1'68 0'81 0'87 5'03
R 2'32 1'12 1'20 4'65 1'68 0'82 0'86 5'03
U 2'32 1'13 1'19 4'6l 1'68 0'81 087 5'03
KANYAKUMARI DISTRICT T 259 1'31 1'211 5'19 l'S6 0'95 0'91 5'58
R 2'60 1'31 1'29 5';:0 1'86 0'96 0'90 5'59
U 2'S7 1'29 1'28 S']4 1'84 0'92 092 5'53
Vilavancode Taluk T 2'82 1'39 1'43 S·6 .. t 1 '99 1'03 0'96 5'96
R 2'8:! 1'3] 1'41 5'64 1'99 1'03 0'96 5'98
U 2'82 1'40 1'42 5'64 1 '81 0'88 0'93 5'43
Kalkulam TaJuk T 2'63 1'35 1'28 5'25 1'96 1'03 0'93 5'89
R 2'63 1'36 1'27 5'26 1'96 1 03 0'93 5'88
U 2'59 1'28 1'31 5'18 2'00 1'03 0'97 5'99
ThovaJa Taluk T 2'17 1'08 1'09 4'34 1'51 0'75 0'76 4'52
R 2'17 1'08 I'C9 4'34 1'51 0'75 0,76 4'52
Agastceswaram Taluk T 2'39 1'21 1 18 4'77 1'72 0'86 0'86 5'15
R 2'34 1'17 1'17 4'67 1'67 0'84 0'83 5'01
U 2'54 1'29 1'25 5'08 1'81 0'90 0'91 5'44
Nagercoil (1\1) U 2'54 1'29 1'25 5'08 1,81 0'90 0'91 5'44

636
E-V-2, Number of persons, males and females per room and persons per household in each category of household (concld.)
(Based on 20% Sample) Rooms not
Four rooms Five rooms and above stated r------..A..---.---, r------..A..
State/Distnct/Taluk/City( Total Average Average Average Town with populatIOn of Rural No. of No. of No. of
50,000 a1d above Urban Persons Males Females persons Persons Males Females persons persons per per per
household hou~ehold household
1 2 17 18 19 20 21 22 23 24 25
Ambasamudl am Taluk T 1'16 0'56 0'60 4'66 0'86 0'40 0'46 5'08 13'71
R 1'19 0'59 0'60 4'78 094 0'45 0'49 5'30 5'50
U 1'14 0'55 0'59 4'54 0'78 0'36 0'42 4'85 24'67
Nanguncn Taluk T 1'28 0'62 0'66 5'13 0'99 0'47 0'52 5'84 3'42
R 1'27 0'62 0'65 5'10 0'98 0'47 0'51 5'73 3'42
U 1'32 0'65 0'67 5'30 1'08 0'50 0'53 6'54 0
Tiruchcndur Taluk T 1'37 0'68 0'69 5'49 0'92 0'44 0'48 5'73 4'26
R 1'49 0'73 0'76 5'97 1'01 0'47 0'54 6'48 4'29
U 1'29 0'65 0'64 5'18 0'88 0'43 0'45 5'44 4'09
KANYAKUMARI T 1'46 0'74 0'72 5'85 1'07 0'53 0'54 6'54 4'58
DISTRICT R 1'46 0'74 0'72 5'85 ]'08 0'5"; 0'54 6'52 4'64
U 1'47 0'75 0'72 5'89 1'03 0'52 0'51 6'64 3'69
Vllavancode Taluk T 1'60 0'82 0'78 ,)'40 1'13 0'57 056 6'Il6 4'53
R 1 '61 0'83 0'78 6'43 1'15 0'58 0'57 6'89 4'53
U 1'49 0'76 0'73 5'97 0'98 0'51 0'47 6'58 0
Kalkulum Taluk T 1'52 0'7') 0'73 6'09 1'12 0'54 0'58 6'98 4'65
R 1'51 0'79 0'72 6'06 1'14 0'55 0'59 7'06 4'71
U 1'60 O'SO 0'80 6'41 0'98 0'50 0'48 6'32 4'00
Thovala Taluk T 1'25 0'61 0'64- 5'00 0'91 0'45 0'46 5'51 0
R 1'25 0'61 0'64 5'00 0'91 045 0'46 5'51 a
Agastecswaram Taluk T 1'35 0'68 0'67 5'41 1'03 0'52 0'51 6'30 4'56
R 1'31 0'64 0'67 5'24 1'02 0'52 0'50 6'07 4'72
U 1'43 0'74 0'69 5'74 1'05 0'53 0'52 6'72 3'33
Nagercoll (M) U 1'43 0'74 0'69 5'N 1'05 0'53 0'52 6'72 3'33
CHAPTER VIII
HOUSING IN DIFFERENT NATURAL DIVISIONS
8 - 1. It has been the practice from 1911 Census to divide the States into natural divisions for purposes of Census tabulation with a view to facihtate the review of the data.
Two conditions should be satisfied. Each division must be fairly The natural divisions- homogeneous and there must be subst2.ntial uniformity in the areas
Previous practice comprising the division in natural conditlOns which have a bearing on population. There must be significant diJ'ference 1!1 this respect
from one division to another. Till 1951 the divisions so far as they rehte to the present Madras State were as follows: East coast central division consisting of Madras, Chingleput, North Arcot Salem, Coimbatore, South Arcot. East Coast South division-Thanjavur, Tiruchirapal1i, Madurai Ramanathapuram and Tirunelveli. West coast division consisting of the Nilgiri now in }\1adras State, but grouped with Malabar and South Canara districts. With somc mod!ficatioll, 5 divisions were formed in 1951.
8 - 2 Subsequent to 1951 Census, States reorganisation has taken place. Many areas in the former Madras State have been transferred to Andhra Pradesh, Mysore and Kera1a. Some
new areas have also come into the Madras State. Though Tamil Present divisions is the regional language in all the pbces in the present Madras
State, culture, social customs and habits, literacy, agricultural practice, inclination for hard work and seasonal condions vary from area to ;::rea. As a result of these, population trends, sex ratios, responsibility for developmental activit:es, economic conditions, general standard of living are affected. It will be, therefore, inlcresting to consolidate the Census data on the basis of natural divisions. For this purpose, the State can be divided into the following divisions. 1. Metropolitan Division consisting of Madras City and Saidapet Taluk. It is the most urbanised having 89.84~~ of urban population. Actually it forms a distinct part of the Greater Madras City. 2. Palar South Pennar Division consisting of Chingleput District except Saidapet Taluk, NO£th Arcot District, South Arcot District except Chidambarm Taluk, northern taluks of Krishnagiri, Hosur, Dharmapuri and Harur of Salem District, Perambalur and Udaiyarpalayam of Tiruchirapalli District. This area is predominantly occupied by Vanniyas. This area has remnants of Pallava culture. 3. Cauvery Basm Division consIsting of Chidambaram Taluk of South Arcot DIstrict, Thanjavur District and deltaic taluks of Tiruchirapalli, Lalgudi, Musiri and Kulittalai. It has a predominance of Chola culture. 4. Kongunad Division consisting of the southern taluks of OmaIur, Salem, Yercaud, Attur, Rasipuram, Namakkal, Tiruchengode and Sankari of Salem District, Coimbatore DIstrict, Karur Taluk of Tiruchirapalli District and Palni Taluk of Madurai District. This area is predominantly occupied by Veil ala Goundars. 5. Southern Division consisting of southern taluks of Alangudi, Kulathur, Tirumayam of Tiruchirapalli DIstrict, Madurai District except Palni Taluk, Ramanathapuram District and Tirunelveli District. It is predominantly occupied by Mukkulathars and the culture is Pandyan. 6. Kanyakumari Division consisting of the whole of Kanyakumari district. It has become part of Madras State as a result of States Reorganisation. Its climatic conditions are totally different from the rest of the Madras State. It is ll1fluenced both by Chera and Pandya cultures.
638 REPORT ON HOUSING AND ESTABLISHMENTS
7. Nilgiri Division-whole of Nilgin-It is :1 mountainous tract and used to be considered as part of the Western division along with Malabar. It is now treated as a separate unit in Madras State.
8 - 3. A statement indicating the area, population and density of natural divisions is given below.
Statement VIII-l
Area, density and population by natural divisions
State/Natural Division Density Area in sq. Population miles
2 3 4
State 672 50,154'7 33,686,953
Metropolitan Division 7689 276'1 2,123,027
Palar·South Pennar Division 58t 16,567'6 9,619,510
Cauvery Basin Division '827 6,384'4 5,277,971
Kongunad Division 629 10,593'5 6,663,299
Southern Division 585 14,705'9 8,596,923
Kanyakumari Division 1543 645'5 996,915
Nilgiri Division 417 981'7 409,308
8 - 4. It will be interesting to stedy the housing .conditions of these areas and see whether any appreciable variations can be found from one area to another. We have prepared
a series of Table5 (Statements VIllA to 12) giving figures for Comparative study of rural the rural sectors of these nreas. We also attach a statement housing in various divisions showing the prc'portlJn of urban areas in these divisions and their
population. As the general characteristics found in these divisions
as far as urban areas are concerned are simIlar and have been discussed in detail, we propose to confine our further di:;cussion to the rural are~\s only. It is interesting to note that Palar South Pennar division has only an urban population of 14.11 ~; ani Kanyakumari division has 15.05%. Nilgiri has recorded a high proportion of '13.94%. Among the three natural divisions, Cauvery Basin, Kongunad and Southern, maximum mban popUlation is found in Southern with 28.92%.
Statement VIII-2
Total population, urban population and percentage of urban population to
total population in natural divisions
Total Urban Percentage of urban DiviSIOn populatIOn populatIOn populatIOn to total
population
1 2 3 4
Metropolitan 2,123,027 1,907,308 89'84
Palar-South Pennar 9,619,510 1,357,633 14'11
Cauvery 5,277,971 1,214,018 23'00
Kongunad 6,663,299 1,695,551 25'45
Southern 8,596,923 2,486,072 28'92
Kanyakumari 996,915 150,079 15'05
Nilgiri 409,308 179,867 43'94
HOUSING IN DIPFERLNT NATURAL DIVISIONS 639
8 - 5. The maximum vacancy IS seen in NIlglfi DivIsion. Kongunad has the next higher vacancy. In the MetropolItan Divi~I0n, the lu,Jl aila has been influenced by the Impact of the urban sector with the result that the 10\\'e5t vacancy of 52 IS recorded. Maximum number of dwellings are found in Palar South Pennar Basill. Kongunad has recorded the maximum of shop-Gum-dwellings and workshop-Gum-dwellings. Actually the number of shop-Gum-dwellings in Palar South Pennar Basin and MetropolItan Di\ision is the same as Kongunad Division, but in workshop-cum-dwelling, Kongunad is far ahcad of all other rc,gions. Kanyak1ll11ari has recorded the lowest number of shop-culJl-dwclhngs and J:~t1g,lri the lowest number of workshop-cumdwellings. In shops etc., Kanyakumari DiviSIOn has a proportion of 32 while MetropolItan, Cauvery Basin and Southern dIvisions record 14 each. Kongunad records the lowest among the divisions. Nilgiri Division occupies the first place in houses used as business houses and offices with a proportion of 4, followed by Kanyakumari Division with a proportion of 3. Amoung houses used as factories etc., Kanyakumari stands first with a proportion of 9 followed by Nilgiri with 7. Metropolitan, Cauvery Basin and Kongunad divisions share the third place with a proportion of 6 each. FacIlities regarding public health and medical institutions are found to be negligible in the four m.ajor (hvisions of the State, Palar South Pennar, Cauvery, Kongunad and Southern. Similarly, the places of entertainment in community are negligible in Kongunad Division. All these areas are wen provided with schools and other educational institutions. Nllgiri is leading.
8 - 6. When we scrutinise the Table under Tenure Status, we find Kanyakumari has the maximum number of dwellings which are owned. Palar South Pennar Basin is close to Kanyakumari in the number of owned dwellings. Metropolitan, Cauvery, Kongunad and Southern have a high proportion of owned dwellings while Nilgiri has recorded the lowest. Nilgiri Division reflects the impact of provision of low rent housing or rent free accomodation made available to plantation labourers which industry is a predominant onc in this dIvision as also the tendency on the part of outside persons who come and lIve in tll1S dIstrict not to own houses. The same pattern is more or less maintained in shop-cum-dwelling alld workshop-cum-dwelling.
8 - 7. As has been indicated earlIer, 235-handloom weaving, is the most predominant industry in the State. This predominance is maintained in the rural sectors of all the natural
divisions, except in MetlOpolitan and Nligiri divisions. The only Industrial housing variation we find is that Kongunad has 657 units out of 1,000
under handloom and Palar South Pennar Basin has 545. The second industry is 200-Production of rice, atta etc., in Palar South Pennar Basin and Cauvery Basin. This is not a prominent industry in Kongunad while in Southern and Kanyakumari, it takes the sixth rank and in Nilgin fourth. 273-Manufacture of textile garments is the predominant industry in Nilgiri Division while in Kanyakumari it is thc second major one. In Palar South Pennar and Metropolitan divisions thIS industry occupic~ the third pOSitIOn .. This industry ranks 11fth in Kongunad and Southern divisions and holds the sixlh place in Cauvery Basin Division. 369-Manufacture of sundry hard wares is another industry \\ LlCh IS found in all divisions. Exccpt for small variations from division to division, the general trend of indu"tri..;s seems to be preserved in all the divisions except that there is a concentraLOE of ha110100111 in Kongunad and Palar South Pennar.
8 - 8. We will now exammc the d;stributtOll of work shops and factories by the kind of fuel used. As is to be expected, Metropohtan DJvi~i0n is aheJ_d of other areas in the use of
powe," closely followed by Nilgiri. This is to a certain extent
Distribution on basis of fuel used
explained by the absence of handloom establisiJments in Nilgiri for which no power is generally used. In all the industries put together 183 units are covered by electricity in Metropolitan area.
Liquid fuel is not of much slgnificance whil:.: 162 units are accounted for by coal etc. In the Pa1ar South Pennar Division which is industriaI1y most backward, the maximum number of units

640 REPORT ON HOUSING AND ESTABLISHMENTS
without power are seen, 935, While electrIcity is comparatively more prominent as will be seen from the figures of elcctricity and liqi.tid fuel which are 38 and 18, a large number of units in this division me covered by hand loom and it is not unreasonable to expect smaller use of power in this division. The same position IS repeated in Cauvery Basin, the use of electricity being a little more than in the previous divi~ious. Cauvery Basm has fewer handloom units, but it reprcsents an agncullural sector and as such the use of power is limited. In the Kongunad, non·fuel unils arc higher, 961. TI1lS is due to the fact that the maximum number of handloom units are found in this area. Electricity is the dominant power used. It may, however, be added that in this is included some of the highly industrialised centres of the State like Coimbatore and this table does not adequately reflect the importance of heavy and medium scale mdustries found in different parts of the State. In the Southern Division, electricity is more prominent than liquid fuel and coal. Non-power using units are more in Southern Division. Generally this area is full of cottage industries umts for which no power is normally used. Kanyakumari repeats the pattern of Southern DivislOn in this matter. NIlgiri has got a separate pattern even in the rural scctor-258 units are run by electricity. Liquid fuel has 53 units. This is largely due to the existence of a number of tea factories in the rural sector of this district as well as the availability of electricity as it is near the electricity producing centres. It will be thus seen that the use of power reflects the pattern of the natural divisions, more electricity being consumed in centres which are more urbanised. The fact that a large number of units in the Madras State are either cottage llldustnes or small scale industries is reflected in the presence of a large number of units using no power.
8 . 9. We will now discuss the wall material and roof material on the basis of Tables prepared by us. In Metropolltan Division, out of every 1,000 houses 176 are bUllt of burnt
bncks and 745 of mud. There are 68 houses built of stone and Variation in materials used for construction
1 of cement concrete. Most of the mud houses are found in the vdlages far away from Madras. Houses which have walls built of bUlnt bncks are found near Madras and this is due to the
proximity of the brick kilns and chambers in and around Madras City. Maximum number of mud walls are found in the Palar South Pennar Division, there being 810 houses using mud as wall material closely followed by Cauvery Basin with 779 houses out of 1,000 and the Southern Division with 739 per 1,000. The Pa1ar South Pennar Basin consists for a major part arid and dry tracts cond ucive to the growth of millet and does not possess the rich alluvial soil of the Cauvery RlV(;r Basin. They have, therefore, to live frugally. That is why mud wall IS preferred in these regions. Burnt bricks follow next in importance, there belllg 158, 143 and 144 m the three diVisions mentioned above. However, one significant difference can be obsern:d in the use of un burnt bncks. In the Palar South Pennar Division, burnt bricks are preferred mOl e than the unburnt bricks, there being 6 houses per 1,000 using unb:ml! bricks as against 158 houses usmg burnt bricks. In the Cauvery Basin, 27 houses have unburnt brIcks ccmparcJ With 143 under burntbncks and III the Southern Division 25 houses are of Lll1burnt bl1ck~ and 144 of burnt bricks. A change in preference is, however, seen in Kongul1G.d Division WhICh 15 plcdoll1111antly occupied by Vellalas. Even though mud is preferred as wall material there being 704 houses usmg mud; burnt bricks do not seem to be preferred as much as in the other three rhvlsions, there being 78 houses using them as wall material. Unburnt bricks are also rarely preferred, only 5 out of 1,000 showing this as the wall material. On the contrary, stone houses seem to be preferred next to mud, 184 houses having stone walls. This has also been noticed in the rural areas of Saidapct taluk, there being a number of stone quarries near Kanclupuram and Saidapet from which stones could be brought cheaply and used as building material. The proXimity of stone quarries and the availability of cheap granite stones have led
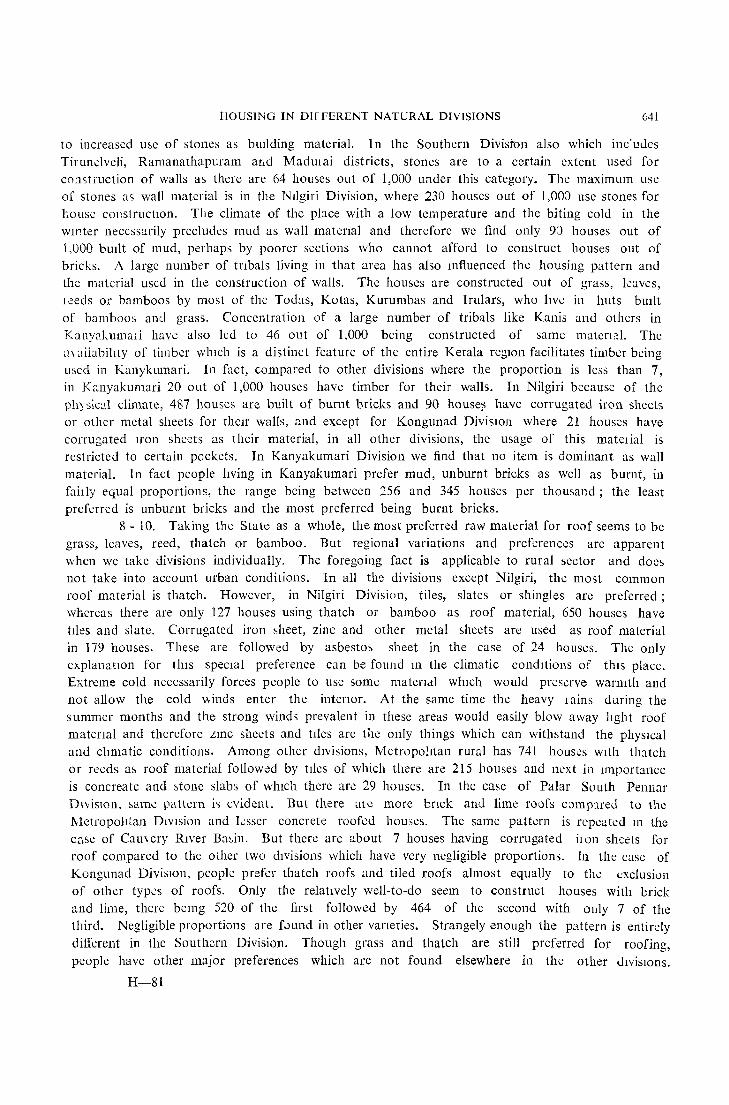
HOUSING IN DIfFERENT NATURAL DIVISIONS 641
to increased u&e of stones as bUilding material. In the Southern Division also which inc'uucs Tirunelveli, Ramanathapuram ar,d Madmai districts, stones are to a certain extent used for cO:15truction of walls as there are 64 houses out of 1,000 under this category. The maximum use of stones a<; wall material is in the NIlgiri Division, where 230 houses out of 1,00:) use stones for touse COlls(rucllOn. The climate of the place with a low temperature and the biting cold in the wmter necessarily precludes mud as wall matcnal and therefore we find only 9) houses out of 1,000 bUIlt of mud, perhaps by poorer sections who cannot afford to construct houses out of bricks. A large number of tnbals living in that area has also lllfiuenced the housing pattern and the material used in the construction of walls. The houses are constructed out of grass, kaves, leeds or bamboos by most of the Todas, Kotas, Kurumbas and Irulars, who live in huts bullt of bamboos and grass. Concentration of a large number of tribals like Kanis and others in Kanyakumaii have also led to 46 out of 1,000 being constructed of same matenaJ. The m ailabihty of timber w hlCh is a distinct feature of the entire Kerala regIOn facilitates timber being used in Kanykumari. In fact, compared to other divisions where the proportion is less than 7, in Kanyakumari 20 out of 1,000 houses have timber for their walls. In Nilgiri because of the physical climate, 487 houses are built of burnt bricks and 90 house~ have corrugated iron sheets or other metal sheets for thclr walls, ::md except for Kongunad DivisIOn where 21 houses have corrugated Iron sheets as their material, in all other divisions, the usage of this mateIial is restricted to certain pockets. In Kanyakumari Division we find that no item is dominant as wall material. In fact people hving in Kanyakumari prefer mud, unburnt bricks as well as burnt, in faidy equal proportions, the range being between 256 and 345 houses per thousand; the least preferred is unburnt bricks and the most preferred being burnt bricks.
8 - 10. Taking the State as a whole, the most preferred raw material for roof seems to be grass, leaves, reed, thatch or bamboo. But regional variations and preferences are apparent when we take divisions individually. The foregoing fact is applicable to rural sector and does not take into account urban conditions. In all the divisions except Nilgiri, the most common roof material is thatch. However, in Nilgiri Division, tiles, slates or shingles arc preferred; whereas there are only 127 houses using thatch or bamboo as roof material, 650 houses have tIles and slate. Corrugated iron sheet, zinc and other metal &hects are used as roof material in 179 houses. These are followed by asbest05 sheet in the case of 24 houses. The only explanatIon for tIllS speCIal preference can be found 111 the climatic conditions of thIS place. Extreme cold necessarily forces people to use somc materldl WhICh would pres.:rve warmth and not allow the cold 'Winds enter the intenor. At the same time the heavy I ains during the summer months and the strong winds prevalent in these areas would easily blow away lIght roof matenal and therefore Zll1C sheets and tIles are thc only things which can withstand the phYSical and clImatic conditions. Among other dIvisions, Metropo!Itan rural has 741 houses wlth ll1:1tch or reeds as roof material follow~d by tiles of which there are 215 houses and next in Importance is concreate and ~tone slabs of whIch there are 29 houses. In the case of Palar South Pennar DI,;isIOn, same pattern i'> evident. But there ale more bnck and lime roofs comp:lred to the MetropolItan DIVIsion and Jesser concrete roofed houses. The same pattern is repeated 111 the case of Camcry RIver Ba~in. But there arc about 7 houses having corrugated ilOn shedS for roof compared to the other two dIvisions which have very negligible proportions. In the case of Kongunad DiviSIOn, people prefer thatch roofs and tiled roofs almost equally to the exclusion of other types of roofs. Only the relatIVely well-to-do seem to construct houses with brick and lime, there bell1g 520 of the first followed by 464 of the second with oIlly 7 of the third. Negligible proportions are f.:mnd in other vaneties. Strangely enough the pattern is entirely different in the Southern Division. Though grass and thatch are still preferred for roofing, people have other major preferences which are not found elsewhere in the other divislons.
H-Sl
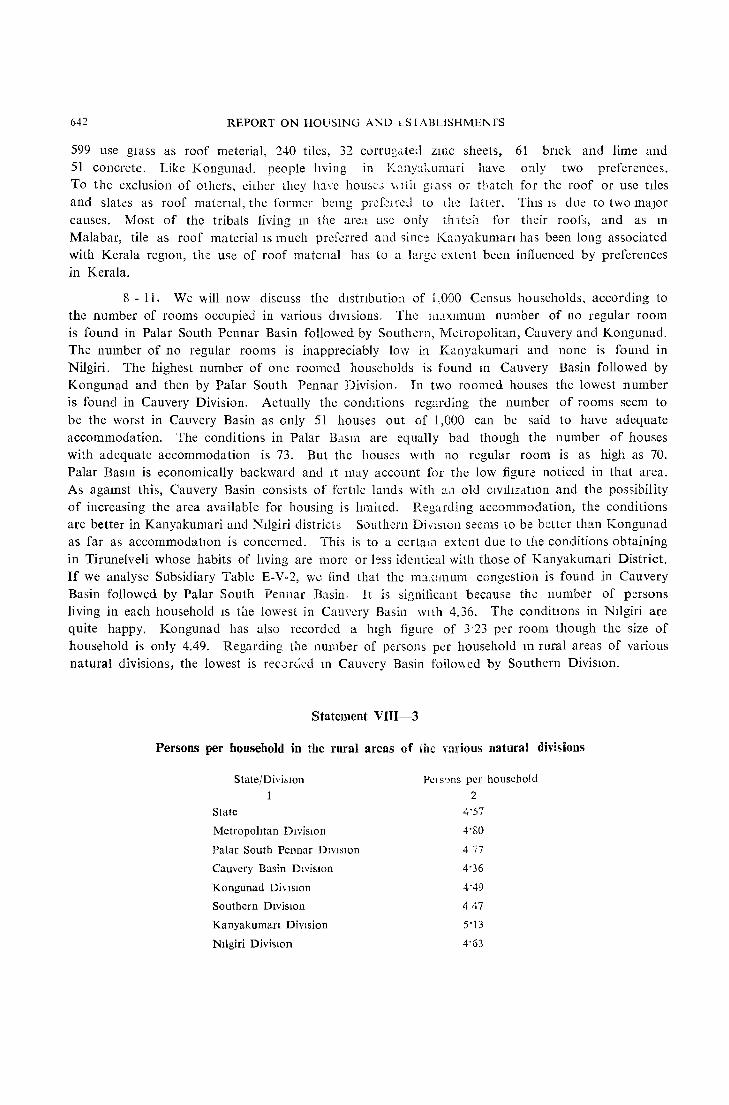
642 REPORT ON HOUSiNG AND LSIA8USHMENfS
599 use glass as roof meterial, 240 tiles, 32 corrugdted Zll1C sheets, 61 bnck and lime and 51 concrete. Like Kongunad, people hving in K::mY:li,umari have only two preferences. To the exclusion of others, eilher they haw housc,; \Iltlt gla5<; 0,' thatch for the roof or use tIles and slates as roof matcnal, the former bell1g prcf~l rd to the latter. TillS IS due to two major causes. Most of the tribals living 111 the area use only til 1tL::l for their rools, and as 111
Malabar, tile as roof material IS much preferred and "inc'.:: Kaayakuman has been long associated with Kerala regLOn, the use of roof materIal has to a htrge extent been influenced by preferences in Kerala.
8 - 11. We will now discuss the dIstrIbution of 1,000 Census households, according to the number of rooms occupied in various dIVIsions. The llUXlmUll1 number of no regular room is found in Palar South Pennar Basin followed by Southern, Metropolitan, Cauvery and Kongunad. The number of no regular rooms is inappreciably low in K8.nyakumari and none is found in Nilgiri. The highest number of one roomed households is found III Cauvery Basin followed by Kongunad and then by Palar South Pennar Division. In two roomed houses the lowest number is found in Cauvery Division. Actually the condItions reg,sding the number of rooms seem to be the worst in Cauvery Basin as only 51 houses out of 1,000 can be said to have adequate accommodation. The conditions in Palar BetSill are equally bad though the number of houses with adequate accommodation is 73. But the houses With no regular room is as high as 70. Palar Basll1 is economically backward and It may account for the low figure noticed in that area. As agall1st this, Cauvery Basin consists of fertIle lands with a,l old ctvlhzatlOn and the possibility of increasing the area available for housing is lImiLed. Regarding accommodation, the conditions are better in Kanyakumari and Nllgiri districts Southern DivlSlon seems 1.0 be better than Kongunad as far as accommodatIOn is concerned. This is to a cerium extent due to the conditions obtaining
in Tirunelveli whose habits of hving are more or less identical with those of Kal1yakumari District. If we analyse Subsidiary Table E-V-2, we find that the m:L\Il11Um congestion is found in Cauvery Basin followed by Palar Souih Pennar Basin. It is significant because the number of persons living in each household IS the lowest in Cauvery Basin With 4.36. The conditions in NIlgiri are quite happy. Kongunad has also recorded a hIgh figure of 3-23 pt'r room though the size of household is only 4.49. Regarding the number of persons per household 111 rural areas of various natural divisions, the lowest is rec0r~ed 111 Cauvery Basin foilo\\ ed by Southern DiviSIOn.
Statement VIII-3
Persons per household in the rural areas of the various natural divisions
StatejDivislOn
1
State
Metropolitan DiViSIOn
Palar South Pennar DIVISIon
Cauvery Basin DiviSIOn
Kongunad DivlSlon
Southern DiviSIOn
Kanyakuman DiVision
Nilgiri DiviSIOn
PCI s'Jns per household
2
4'57
4'SO
477
4'36
4'49
447
5"13
4'63
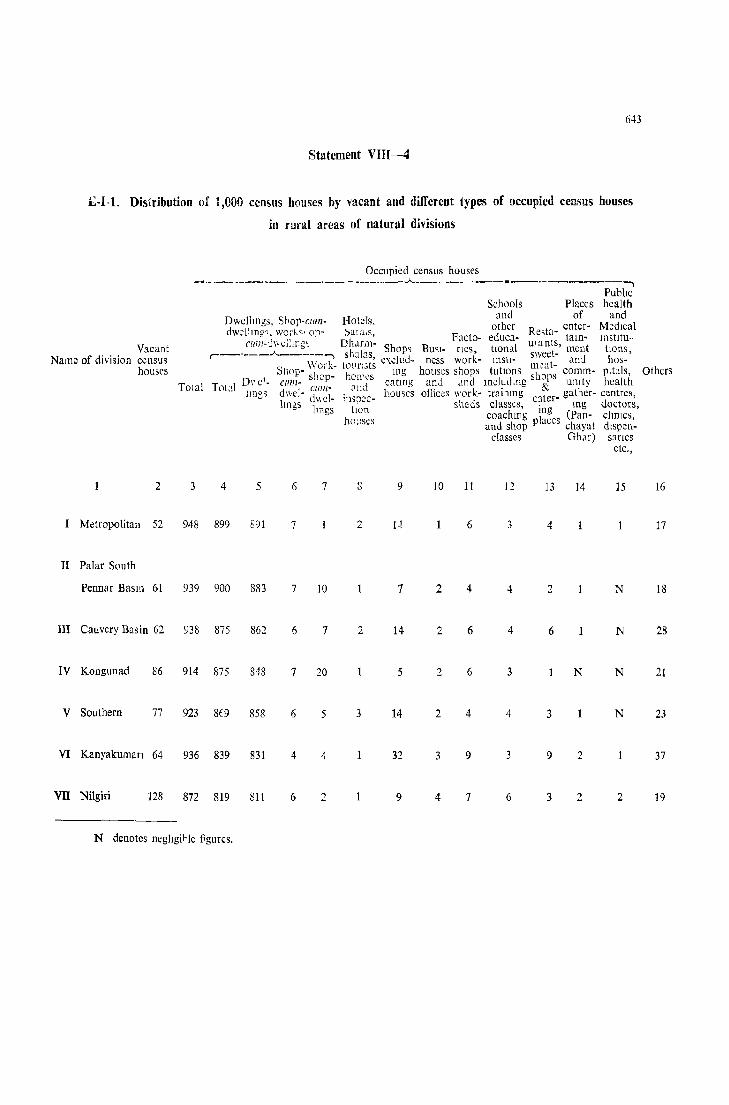
643
Statement VIH-4
£-1-1. Distribution of 1,000 census houses by vacant and different types of occupied census houses
in rural areas of natural divisions
Vacant Name of division census
houses
2
I Metropolitan 52
II Palar South
Pennar Basm 61
III Cauvery Basin 62
IV Kongunad 86
V Southern 77
VI Kanyakuman 64
VII Nilgiri 128
Occupied census houses ______________ - ... ____ .A. __ ~ ___ .. __ ~
Schools and
Places of Dwellmgs, SIlop-cum- Hotels,
dwellIng" works, op- Sal a,s, other Resta- enter-
Publtc health
and MedIcal
1 "J Facto- educa- tam- mstltu· cum-'_\\~Llng" 0 ]Mal- Shop~ Busl- nes, tlOnal wants, ment tlons, , __ -___ A ______ --., slnl~s sweet-
Work- toLlfl:;t~ c'\cJud- ness work- 111stl- m~at- an::! hosSioop- shop- hOl1'es mg houses shops tulIons <ho' s comm- pltals,
DI' e'- ClIlIl- ',11',,' eating an.J and mclud.ng u &p unity health Total Tot~l jIll,"" d 1 CliJIl- "1 ffi k t . tl t - _' ll\n~es- d\\ cl- h;pcc- 10uses 0 fleeS Ilh'or. - ra
l wing c3ter- ga ler- clen tres ,
g lmgs tlon SI ells C asses, 'og lUg C oc ors, ]loCises coachmg p~accs (Pan- chmcs,
and shop chayat dlspeo-classes Gh,u) sanes
etc.,
3 4 5 6 7 8 9 10 11 12 13 14 15
948 899 S91 7 2 1.1 6 3 4
939 900 883 7 10 7 2 4 2
938 875 862 6 7 2 14 2 6 4 6 N
914 875 848 7 20 5 2 6 3 N N
923 8(9 858 6 5 3 14 2 4 4 3 N
936 839 831 4 4 32 3 9 3 9 2
872 819 811 6 2 9 4 7 6 3 2 2
N denotes negllgi1-Je figures.
Others
16
17
18
28
21
23
37
19
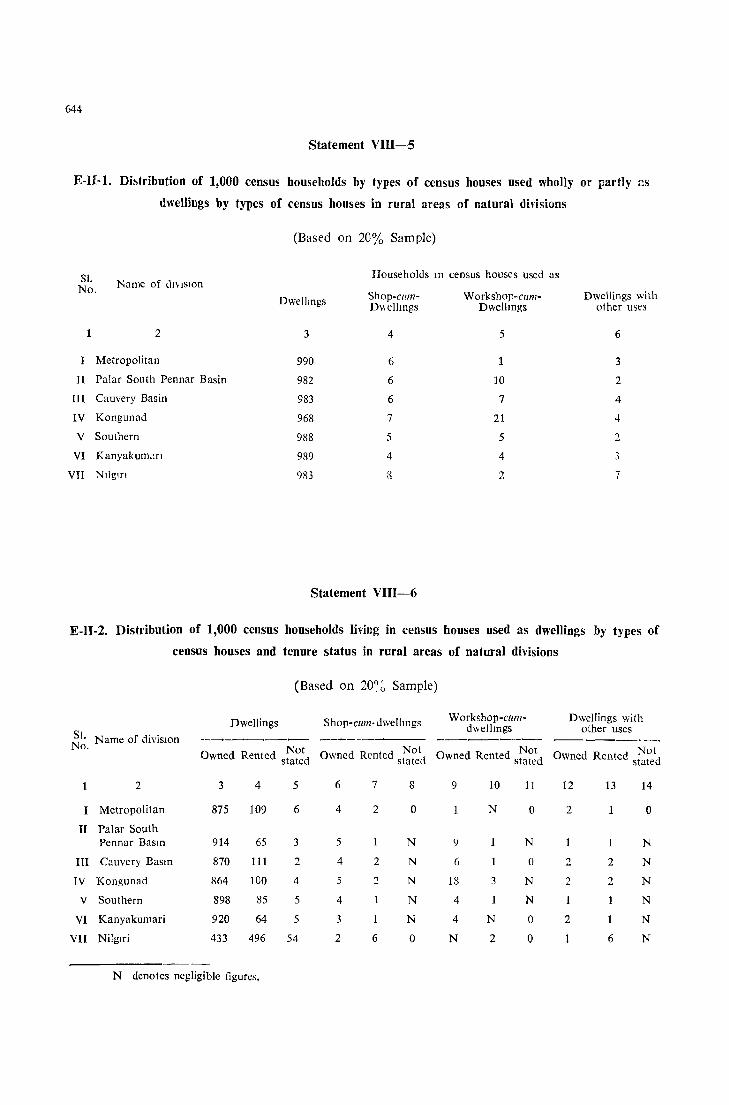
644
Statement VIII-5
E-JI-1. Distribution of 1,000 census households by types of census houses used wholly or partly :lS
dwellings by types of census houses in rural areas of natural divisions
(Based on 20% Sample)
SI. Households m census houses used as
No. Name of dlV ISlOn
Dwellmgs Shop-cum- Workshop-cum- Dwellings with Dv,ellmgs Dwellmgs other uses
1 2 3 4 5 6
I Metropolitan 990 6 1 3
II Palar South Pennar Basin 982 6 10 2
III Cauvery Basin 983 6 7 4
IV Kongunad 968 7 21 '-I
V Southern 988 5 5 2
VI Kanyakum:.!fJ 989 4 4 3
VII NIlgtr! 983 S 2 7
Statement VIII-6
E-U-2. Distribution of 1,000 census households living in census houses used as dwellings by types of
census houses and tenure status in rural areas of natural divisions
(Based on 20~~ Sample)
Dwellings Shop-cum- dwellIngs Workshop-cum- Dwellings with dwellmgs other uses
~l. Name of divisIOn ---- ---- ---------- ------,~
o. Not Not d Not Owned Rented s~~etd Owned Rented stated Owned Rented stated Owned Rente stated
2 3 4 5 6 7 8 9 10 11 12 13 14
I Metropolitan 875 109 6 4 2 0 N 0 2 1 0
n Palar South Pennar BasIn 914 65 3 5 N 9 N N
III Cauvery BasIn 870 III 2 4 2 N 6 0 2 2 N
IV Kongunad 864 100 4 5 2 N 18 3 N 2 2 N
V Southern 898 85 5 4 N 4 N N
VI Kanyakumari 920 64 5 3 N 4 N 0 2 N
VII Nilglri 433 496 54 2 6 0 N 2 0 6 N
N denotes negligible figures,
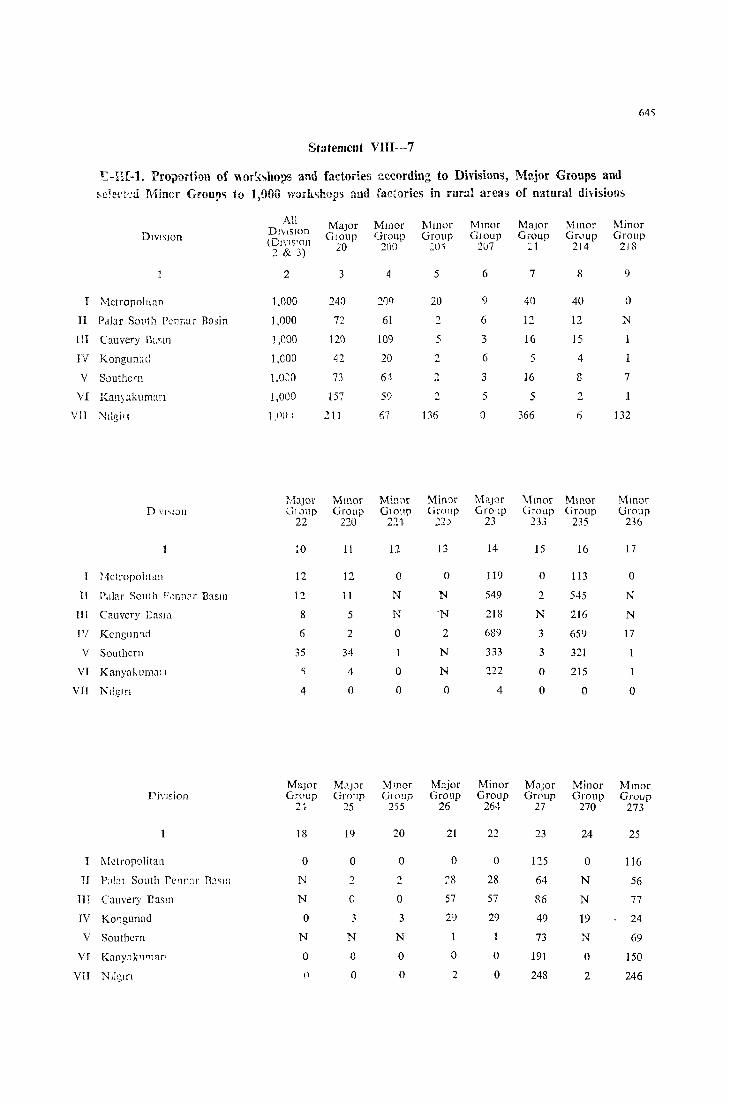
645
Statement VHI-7
I::-HI-l. ProJ)\)rtiou of "ork~ho,s and facim:ies ~ccordin~ to Divisions, Major Groups and
M:~~rtcd Minor Grou!>" to 1/100 worl,<;hops and factories in rUf!lJ areas of natural divisions
All Major MIl10r ]\1inor Mmor Major Mmor Minor DIVISIon DIvISIOn (DlvIS'on GlOup Group Group GIOUp Group Grc1Up Grollp
2 & 3) 20 200 ;:0<; 2u7 :1 214 218
2 3 4 5 6 7 8 9
I Metropolitan 1,000 24Q 2f)9 20 9 40 40 0
II Pdlar Sovth P':nr,ar Basin 1,000 72 61 2 6 12 12 N
III Cauvery n~,W1 1,COO 12f) 109 5 3 16 ]5 1
IV Kongunali I,COO 42 20 2 6 5 4
V Southern 1,0::0 73 6J, 2 3 16 [) 7
VI Kan) :tkum::trl J,OOO 157 5') 2 5 5 2 1
VlT NIlgirt l,nO: 211 67 13() 0 366 fj 132
HJJor Mmor Min~r MinClr Mi\Jor "Mmor Mmor Minor D \'I"on GIJUp Group GIOUp Groop uro'IV Group Group Group
22 220 224 22) 23 233 235 236
:0 11 12 13 14 15 16 17
Metropolitan 12 12 0 0 119 0 113 0
II l'.tlar South F"nn?f BaSIn 12 II N N 549 2 545 N
HI Cauvery EaSl,1 8 5 N 'N 218 N 216 N
1'/ Kongun:ld 6 2 0 2 689 3 659 17
V Southern 35 34 N 333 3 321
VI Kanyahum<lll ~ 4 0 N 222 0 215
VII NJlgm 4 0 0 0 4 0 0 0
Major Major MInor Major Minor Major Minor MInor I'i'/l~ion Group Gro'lp Gln!lp Group Group Grpup Group Group
2t 25 255 26 264 27 270 273
18 19 20 21 22 23 24 25
I l'vlctropolitan 0 0 0 0 0 125 0 116
n P:1l::!l South rel1p~r B:1~111 N 2 2 ~8 28 64 N 56
III Cauvery BaslI1 N 0 0 57 57 R6 N 77
IV KOllgllnad 0 ;I 3 20 29 49 19 24
V Southern N N N 73 N 69
VI Kanyakll l11ufI 0 0 0 0 0 191 0 150
VII Nlh;If1 0 0 0 2 0 248 2 246
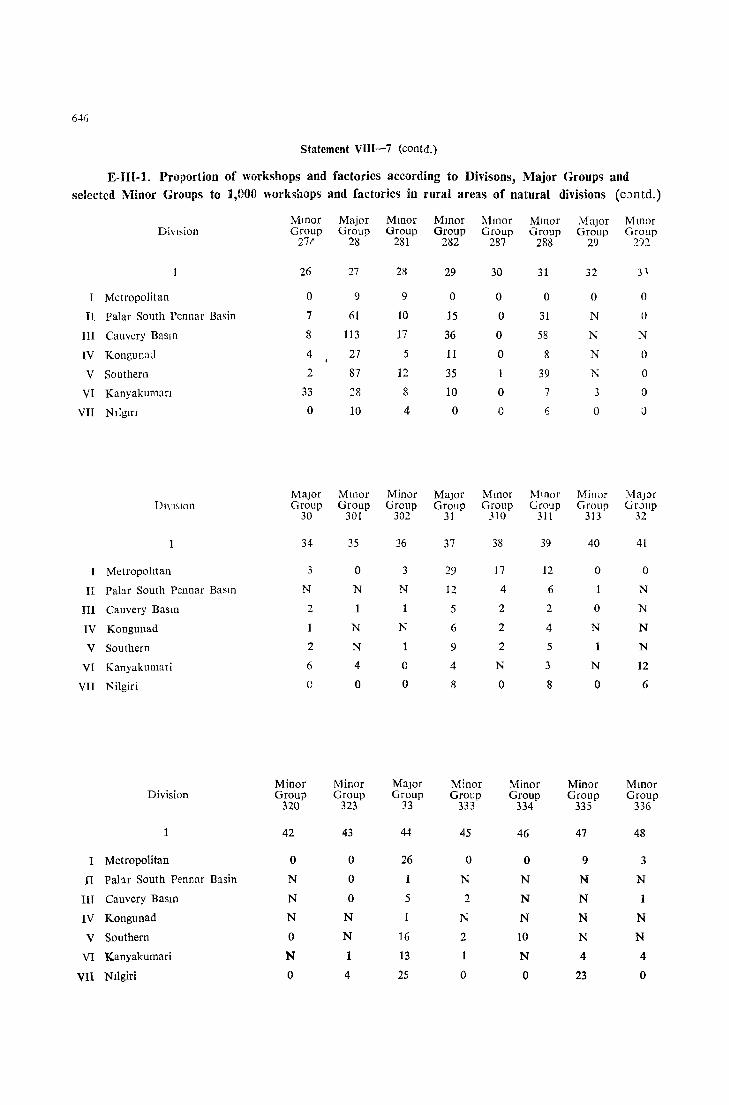
6~(j
Statement VIlI-7 (contd.)
E-III-i. Proportion of workshops and factories according to Divisons, Major Groups and
selected Minor Groups to 1,000 workshops and factorie5 in rural areas of natural divisions (c.:mtd.)
Mmor Major Mmor Mmor "lmor Mll10r Major Mmor Di~lsion Group Group Group Group Group Group Group Group
27t 28 281 282 287 288 29 2')2
26 27 28 29 30 31 32 31
Metropolitan 0 9 9 0 0 0 0 0
H Palar South Pennar Basin 7 61 10 15 0 31 N 0
III Cauvery Basll1 8 113 17 36 0 58 N N
IV Kongunau 4 27 5 11 0 8 N 0
V Southern 2 87 12 35 39 N 0
VI Kanyakuman 33 ~8 8 10 0 7 3 0
VII Ntlgm 0 10 4 0 0 6 0 0
Major Mmor Minor Major Mmor Minor Minor Major Dlvl,lon Group Group Group Group Group Group Group GrJup
30 301 302 31 310 311 313 32
34 35 36 37 38 39 40 41
I Metropolttan 3 0 3 29 17 12 0 0
II Palar South Pennar BaSIn N N N 12 4 6 1 N
!II Cauvery Basm 2 1 5 2 2 0 N
IV Kongunad N N 6 2 4 N N
V Southern 2 N 9 2 5 1 N
VI Kanyakumari 6 4 0 4 N 3 N 12
VII Nilgiri 0 0 0 8 0 8 0 6
Minor Minor Major Minor Minor Minor Mmor Division Group Group Group Group Group Group Group
320 323 n 333 334 335 336
1 42 43 44 45 46 47 48
I Metropolitan 0 0 26 0 0 9 3
II Pabr South Pennar Basin N 0 1 N N N N
III Cauvery BaSIn N 0 5 2 N N 1
IV Kongunad N N N N N N
V Southern 0 N 16 2 10 N N
VI Kanyakumari N 1 13 N 4 4
VII Nllgiri 0 4 25 0 0 23 0
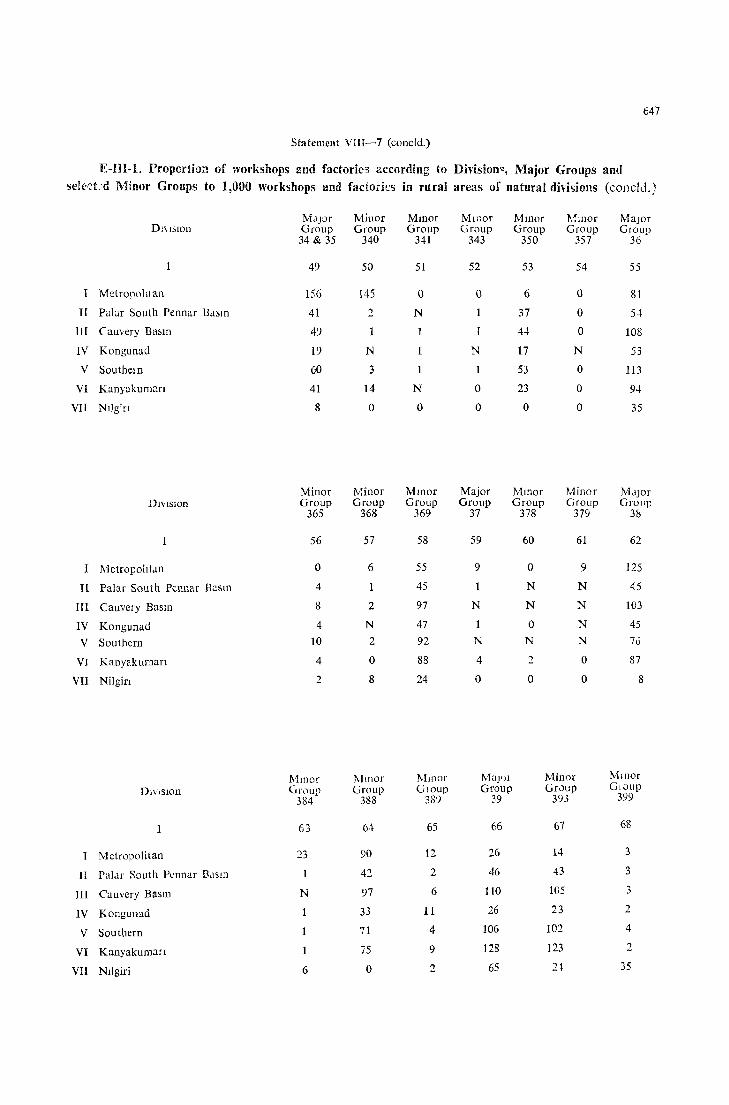
t47
Statement VIH-7 (concld.)
E-HI-1. I'roportion of workshops and factories zccording to Division" Major Groups and se!cc:t:d Minor Groups to J,OOO workshops and factories in rural areas of natural divisions (concld.}
Major Minor Mmor Minor Mmor ~,~li1or Major DI\lSlOn Group Group Group Group Group Group Group
34 & 35 340 341 343 350 357 36
1 49 50 51 52 53 54 55
I Metropolitan 156 145 0 0 6 0 81
II Palar South Pennar Bdsm 41 2 N 37 0 5~
III Cauvery Ba~In 49 44 0 108
IV Kongunad 19 N 1 N 17 N 53
V Southe1l1 60 3 1 53 0 113
VI Kanyakum::!n 41 14 N 0 23 0 9~
VII Nllgin 8 0 0 0 0 0 35
Minor Minor Mmor Major Mmor Minor M,lJor DIVISIOn Group Group Group Group Group Group Group
365 368 369 37 378 379 38
56 57 58 59 60 61 62
I Metropoht,m 0 6 55 9 0 9 125
II Palar South Pennar Basm 4 45 N N 45
III Cauvery Baslll 8 2 97 N N N 103
IV Kongunad 4 N 47 1 0 N 45
V Southern 10 2 92 N N N 70
VI Kanyakuman 4 0 88 4 2 0 87
VII Nilgin 2 8 24 0 0 0 8
Mmor ]\1 Blor Mmor Maj'll Minor Minor
Dl\'lSIOn Gr,'Up Group GtOUP Group Gr,)Up G10UP 384 388 389 39 393 399
63 6·1 65 66 67 68
Metropolitan 23 90 12 26 14 3
II Palar South P.:nnar B,IS!:l 42 2 46 43 3
HI Cauvery Basli1 N 97 6 110 105 3
IV Kongunad 33 11 26 23 2
V Southern 71 4 106 102 4
VI Kanyakuman 75 9 128 123 :2
VII Nilgiri 6 0 2 65 21 35
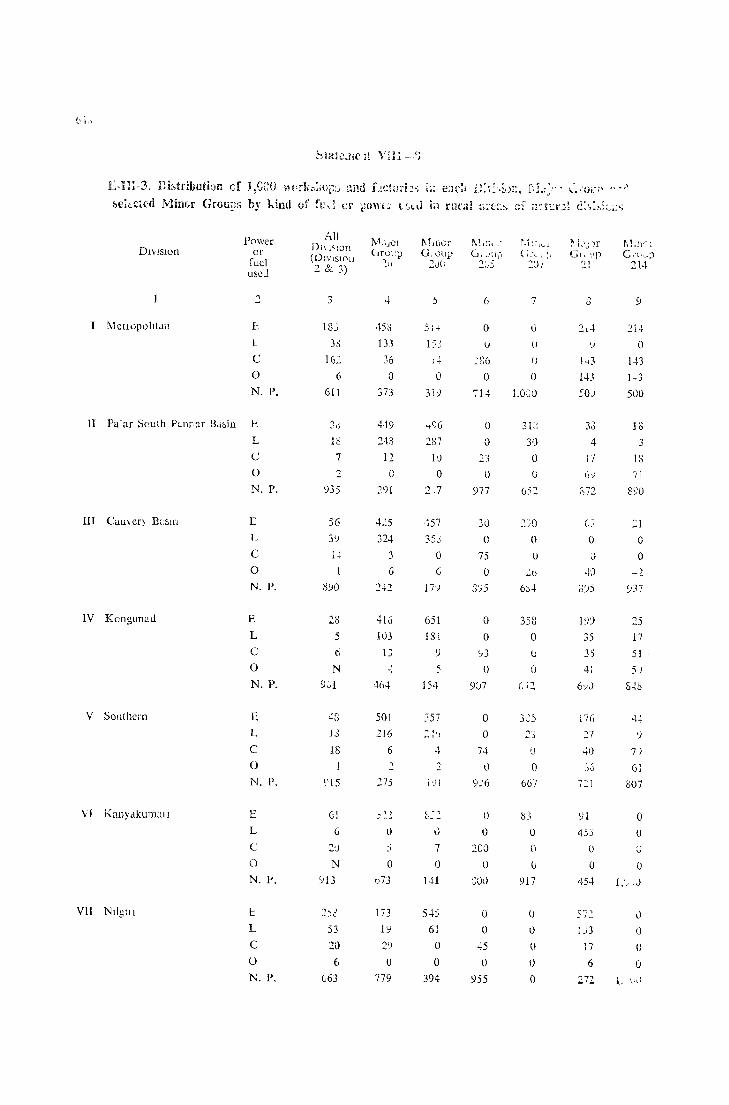
E-I~r-3. I:~hJtr:bution cf J,CrO ~,prk:i:iO~:_) ~nd f.lcto:i::s Ii; e~lc!l ~;:;:'.f\)!:~ r.t:~~,· (,'t"Oi';\ ,~ .. .-'
~Cid:l{'d Min(}f Groll~s hy hind ef t't::,~ cr ;)ow\.:· I..~AJ i;j rural. ":'(:'~" cf ;~~.tt:r.}~ c:,;,.:L::';
DlV1Slon Power
or fuel USI!J
l\1ctlopohtJl1 L
L
C
o N. P.
II Palar South Pcunar B&in E
L
C
o
IV Kongunad
V Southern
VI KanYdkumal1
VII NtlglJ I
N. P.
E
L
c o N. P.
E
L
C
o N. P.
E
L
C
o N. P.
E
L
C
o N. I'.
E'
L
C
o N. P.
All DI\I'IOn
(OI\'lSIC'11
2 & :.)
3
18.:;
33
162
6
611
10
7
:2
935
5G
1·1
I 8';0
28 5
ci
N
4S
13
18
I
~' 15
61
G
N
53
20 6
663
Mc:JOI GfllL:p
Iv
45~
133
36
o 373
449 248
12
o 291
4.25 324
3
G
242
416
103
464
501
216
6
:: 275
o :i
o 073
173
1'1
29
o 719
1\ itnof G;oup
20()
5
1 J"f
\)
319
457 353
o 6
17')
651
lSi
')
5
154
:: Ul
7
U
141
54)
61
o o
394
1\! dl~ J'
G. c':1I)
2"J~
6
o u
o 714
o o
23
o 977
30
o 75
o 8')5
o o
'>3
o 9'07
o o
74 \)
926
o II
200
U
SOL)
o o
45
o 955
i~1 :l .. v 1
li; ... L:J
2'Jl
7
\)
lJ
(J
o LOCO
318
31)
o o
:::;0
o (J
~-Q j)o
o o ()
()
o 667
b3
o (1
lJ
917
o t)
o o o
~ L'.: Jr
Gr. l'P 21
n <:>
'}
50'J
33
4
17
c.~
o II
0)5
j')9
35
35 4,
6,;J
176
::7 ";0
7:1
')l
453
()
o 454
1.;3
J7
6
272
r,!.lY! C,u.J;)
214
9
2i4
13
3
l~
71
SSO
:::1 G
o -2
')37
25 17
51
SJ
S~O
4,)
'J
7)
61
c07
o o J
o
J
\)
o o

649
Statement VIlI-B leontd.)
E.IlI-3. Distribution of 1,000 workshops and factories in each Division, Major Group and selected Minor Groups by kind of fuel or power used in rural areas of natural divisions (eolltd.)
MUlOr Group
218
10
o o o o o
750
o o o
250
889 o o o
111
512 93 o o
395
213 34 o o
753
o 1,000
o o o
108 231
o 15
646
Major Group
22
11
o o o o
1,000
91 o o o
909
20 o o o
980
o o o o
1,000
o o o o
1,000
o o o o
1,000
500 o o o
500
H-82
Mmor GlOup
220
12
o o o o
1,000
93
o o o
907
o o o o
1,000
o o o o
1,000
o o o o
1,000
o o o o
1,000
o o o o o
Mmor Group
224
13
o o o o o
o o o o
1,000
500 o o o
500
o o o o o
o o o o
1,000
o o o o o
o o o o o
Minor GIOUp
225
14
o o o o o
1,000
o o o o
500 o o o
500
o o o o
1,000
o o o o
1,000
o o o o
1,000
o o o o o
Major Group
23
15
49
o o o
951
1
o N o
999
1 o o o
S99
9
N N
o 991
9
1
N N
990
15
o o o
985
o o o o
1,000
Minor Group
233
16
o o o o o
156
o 22 o
822
o o o o
1,000
9
18
27
o 946
21
o 21 o
958
o o o o o
o o o o o
Mmor Group
235
17
o o o o
1,000
o o o o
1,000
o o o o
1,000
o o o o
1,000
o o o o
1,000
o o o o
1,000
o o o o o
Minor Group
236
18
o o o o o
o o o o
1,000
o o o o
1,000
o o o o
1,000
o o o o
1,000
o o o o
1,000
o o o o o
Major Group
24
19
o o o o o
o o o o
1,000
o o o o
1,000
o o o o o
o o o o
1,000
o o o o o
o o o a o
Major Group
25
20
o o o o o
o o o o
1,000
o o o o o
o o o o
1,000
o o o o
1,000
o o o o o
o o o o o
Mmol' Group
255
21
o o o o o
o o o o
1,000
o o o o o
o o o o
1,000
o o o o
1,000
o o o o o
o o o o o
Major Group
26
22
o o o o o
o o 3
o 997
o o o
999
19 2
o o
979
o o o o
1,000
o o o o o
1,000
o o o o
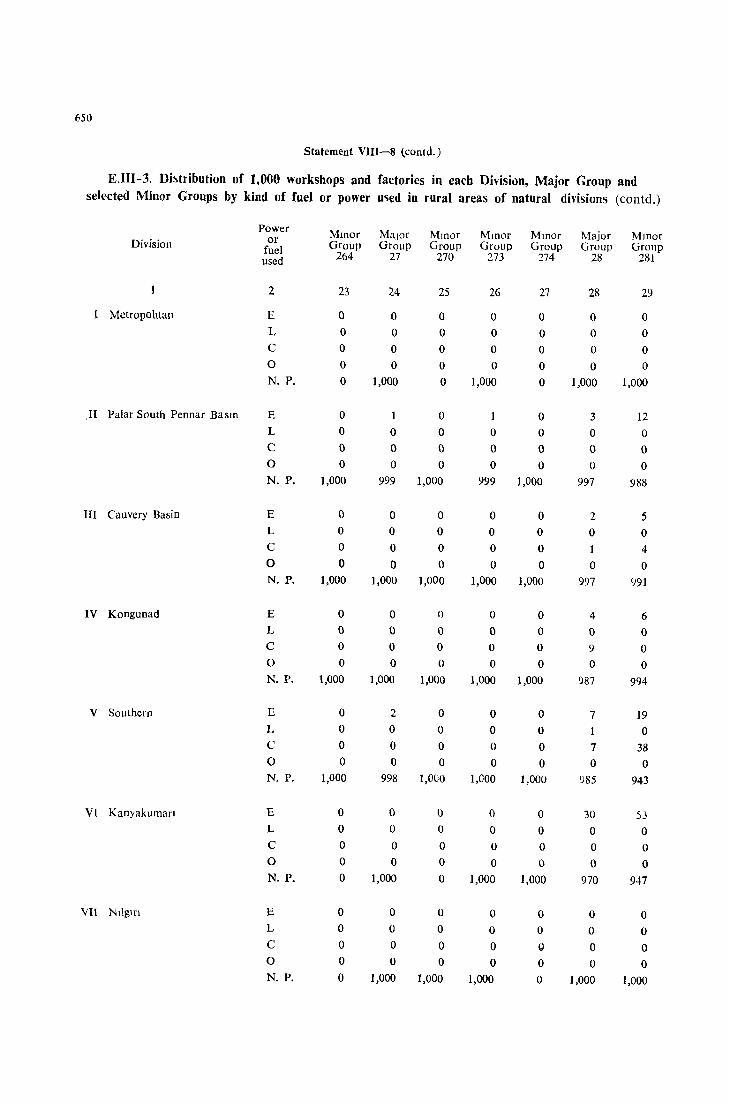
650
Statement VlII-8 (contd.)
E.lII-3. Di!ltribution of 1.000 workshops and factories in each Divisiun, Major Group and
selected Minor Groups by kind of fuel or power u~ed in rural areas of natural divisions (contd.)
Power MInor Major Millar Millar Millar Major Millar or Division fuel Group Group Group Group Group Group Gronp used 264 27 270 273 274 28 281
2 23 24 2S 26 27 28 29
Metropolitan E 0 0 0 0 0 0 0 L 0 0 0 0 0 0 0 C 0 0 0 0 0 0 0 0 0 0 0 0 0 0 0 N. P. 0 1,000 0 1,000 0 1,000 1,000
II Palar South Pennar Basill E 0 0 0 3 12 L 0 0 0 ° 0 0 0 C 0 0 0 0 0 0 0 0 0 0 0 0 0 0 0 N. P. 1,000 999 1,000 999 1,000 997 988
III Cauvery Basin E a 0 0 0 0 2 5 L 0 0 0 0 0 0 0 c 0 0 0 0 0 1 4 0 0 0 0 0 0 0 a N. P. 1,000 1,000 1,000 1,000 1,000 997 <.191
IV Kongunad E 0 0 () ° ° 4 6 L 0 0 0 0 0 0 0 C 0 0 0 0 0 9 0 0 0 0 0 0 0 0 0 N. P. 1,000 1,000 1,000 1,000 1,000 987 994
V Southern E 0 2 0 0 0 7 19 L 0 0 0 ° 0 1 0 C ° a ° 0 0 7 38 0 ° 0 0 0 0 ° 0 N. P. 1,000 998 1,000 1,000 1,000 985 943
VI Kanyakumart E 0 0 a 0 0 30 53 L 0 0 0 a 0 0 0 C 0 0 0 0 0 0 0 0 0 0 0 0 0 0 0 N. P. 0 1,000 0 1,000 1,000 970 947
VII N1Igin E 0 0 0 0 0 0 0 L 0 0 a 0 a 0 0 C 0 a 0 0 Q 0 a 0 0 0 0 0 0 0 0 N. P. 0 1,000 1,000 1,000 0 1,000 1,000
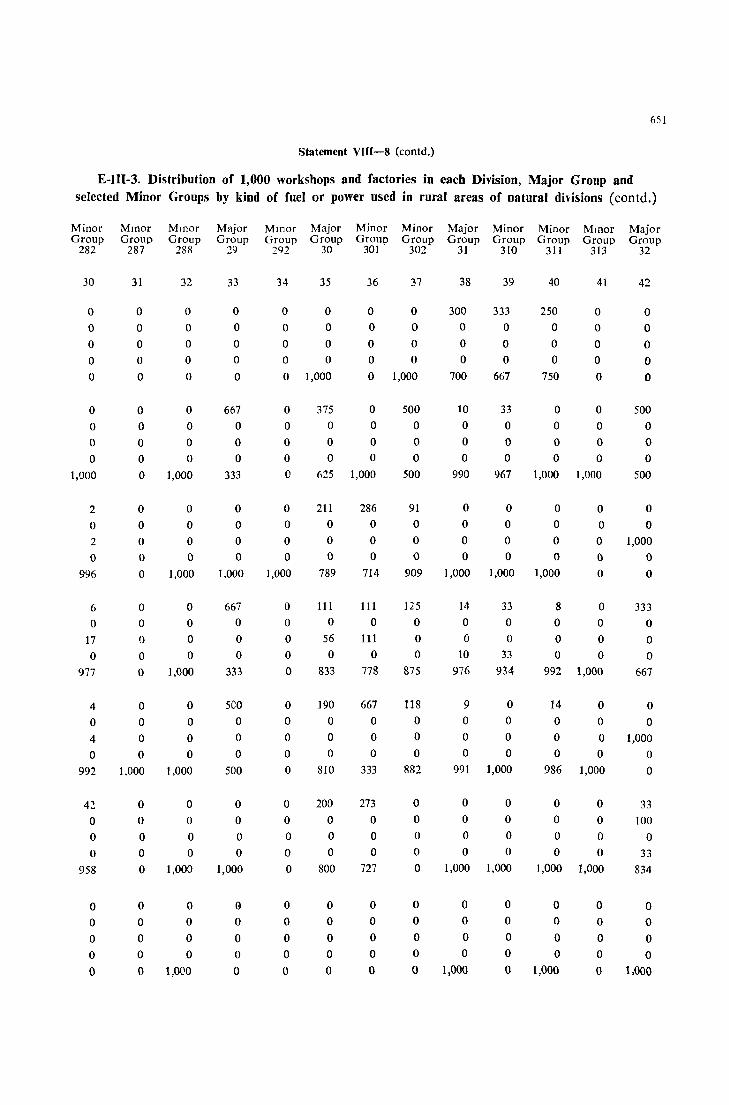
651
Statement VIII-8 (contd.)
E-III-3. Distribution of 1,000 workshops and factories in each Division, Major Group and selected Minor Groups by kind of fuel or power used in rural areas of natural dhisions (contd.)
Minor Group
282
30
o o o o o
o o o o
1,000
2
o 2
o 996
6
o 17
o 977
4
o 4
o 992
4~
o o o
958
o o o o o
Mmor Group
287
31
o o o o o
o o o o o
o o o o o
o o o o o
o o o o
1,000
o o o o o
o o o o o
Mmor Group
288
32
o o o o o
o o o o
1,000
o o o o
1,000
o o o o
1,000
o o o o
1,000
o o o o
1,000
o o o o
1,0(10
Major Group
29
33
o o o o o
667 o o o
333
o o o o
1,000
667 o o o
333
5eo o o o
500
o o o o
1,000
G o o o o
Minor Group
292
34
o o o o o
o o o o o
o o o o
1,000
o o o o o
o o o o o
o o o o o
o o o o o
Major Group
30
35
o o o o
1,000
375
o o o
625
211
o o o
789
111 o
56 o
833
190 o o o
810
200
o o o
800
o o o o o
Minor Group
301
36
o o o o o
o o o o
1,000
286 o o o
714
III o
III o
778
667 o o o
333
273 o o o
727
o o o o o
Minor Group
302
37
o o o o
1,000
500
o o o
500
91 o o o
909
125 o o o
875
118
o o o
882
o o o o o
o o o o o
Major Group
31
38
300 o o o
700
to o o o
990
o o o o
1,000
14
o o
10
976
9 o o o
991
o o o o
1,000
o o o o
1,000
Minor Group
310
39
333 o o o
667
33 o o o
967
o o o o
1,000
33 o o
33 934
o o o o
1,000
o o o o
1,000
o o o o o
Minor Group
311
40
250 o o o
750
o o o o
1,000
o o o o
],000
8 o o o
992
14 o o o
986
o o o o
1,000
o o o o
1,000
Mmor Group
313
41
o o o o o
o o o o
1,000
o o o o o
o o o o
1,000
o o o o
1,000
o o o o
1,000
o o o o o
Major Group
32
42
o o o o o
500 o o o
500
o o
1,000
o o
333
o o o
667
o o
1,000
o o
33
100
o 33
834
o o o o
1,000
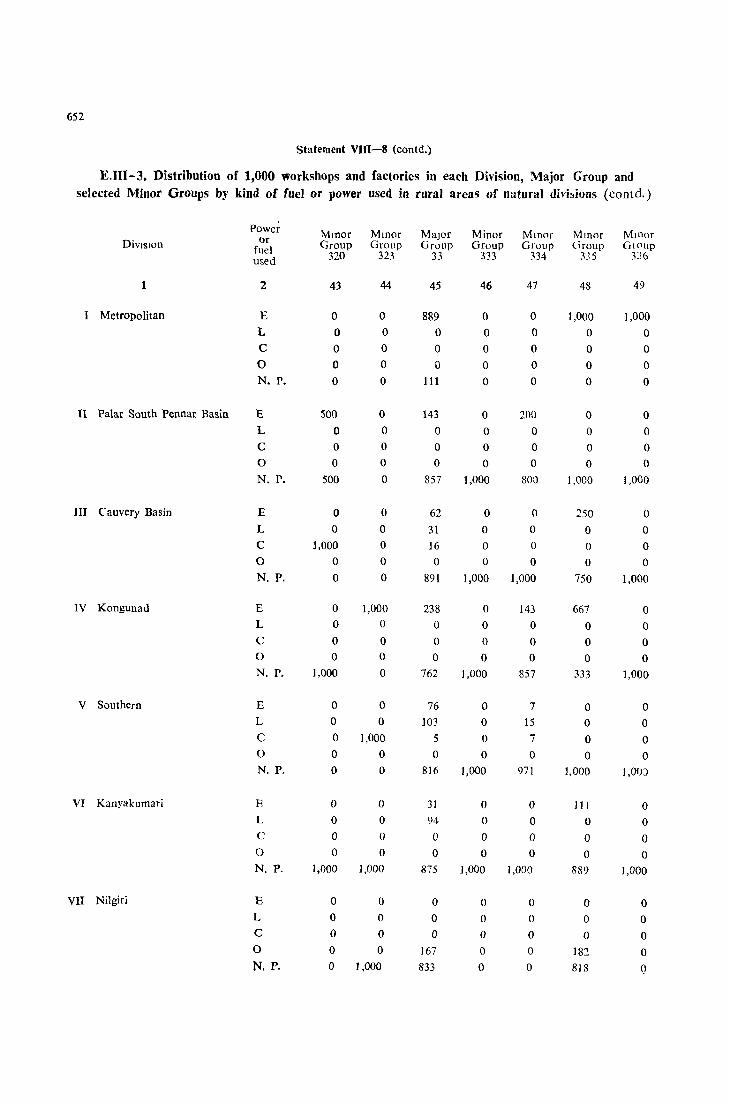
652
Statement VIII-8 (conld.)
E.III-3. Distribution of 1,000 workshops and factories in each Division, Major Group and selected Minor Groups by kind of fuel or power used in rural areas of natural divisions (contd.)
Powe~ Millor Mmor Major Minor Mmor Mmor MJ110r or DivISIon fuel Group Group Group Group Group (iroup GJ011p
used 320 323 33 333 334 335 336
1 2 43 44 45 46 47 48 49
I Metropolitan E 0 0 889 0 0 1,000 1,000
L 0 0 0 0 0 0 0 C 0 0 0 0 0 0 0
0 0 0 0 0 0 0 0 N. P. 0 0 111 0 0 0 0
11 Palar South Pennar Basin E SOO 0 143 0 200 0 0 L 0 0 0 0 0 0 0 C 0 0 0 0 0 0 0 0 0 0 0 0 0 0 0
N. P. 500 0 857 1,000 800 1,000 1,000
III Cauvery Basin E 0 0 62 0 0 250 0 L 0 0 31 0 0 0 0 C 1,000 0 16 0 0 0 0 0 0 0 0 0 0 0 0 N. P. 0 0 891 1,000 1,000 750 1,000
IV Kongunad E 0 1,000 238 0 143 667 0 L 0 0 0 0 0 0 0 C 0 0 0 0 0 0 0 0 0 0 0 0 0 0 0 N. P. 1,000 0 762 1,000 857 333 1,000
V Southern E 0 0 76 0 7 0 0 L 0 0 103 0 15 0 0 C 0 1,000 5 0 7 0 0 0 0 0 0 0 0 0 0 N. P. 0 0 816 1,000 971 1,000 I,Of))
VI Kanyakumari E 0 0 31 0 0 III 0 L 0 0 94 0 0 0 0 C 0 0 0 0 0 0 0 0 0 0 0 0 0 0 0 N. P. 1,000 1,000 875 1,000 1,000 889 1,000
VII Nilgiri E 0 0 0 0 0 0 0 L 0 0 0 0 0 0 0 C 0 0 0 0 0 0 0 0 0 0 167 0 0 182 0 N. P. 0 1,000 833 0 0 818 Q
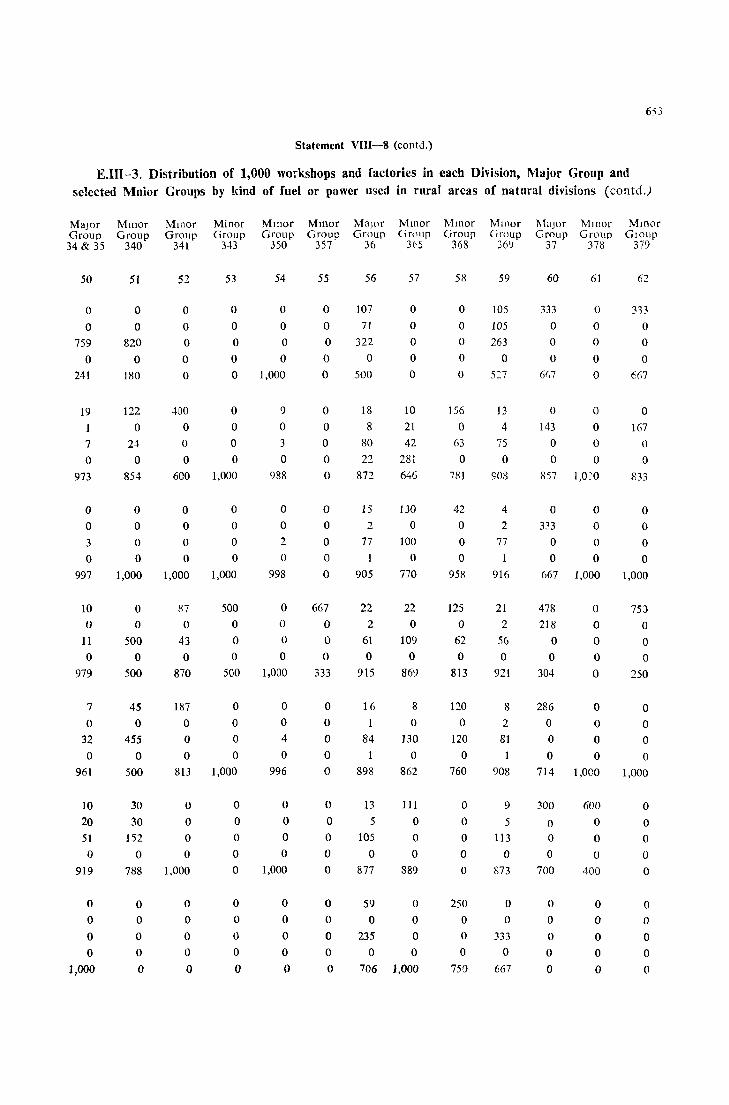
653
Statement VIII-8 (contd.)
E.III-3. Distribution of 1,000 workshops and factories in each Division, Major Group and selected Mnior Groups by kind of fuel or power used in rural areas of natural divisions (contd.)
Major Group 34 & 35
50
o o
759 o
241
19 1
7
o 973
o o 3
o 997
10 o
11 o
979
7
o 32
o 961
10 20
51 o
919
o o o o
1,000
MLl10r Group
340
51
o o
820
o 180
122 o
24 o
854
o o o o
1,000
o o
500 o
500
45 o
455 o
500
30
30
152
o 788
o o o o o
Mmor Group
341
52
o o o o o
400 o o o
600
o o o o
1,000
87 o
43 o
870
187 o o o
813
o o o o
1.000
o o o o o
Minor Group
3-B
53
o o o o o
o o o o
1,000
o o o o
1,000
500 o o o
500
o o o o
1,000
o o o o o
o o o o o
Mmor Group
350
54
o o o o
1,000
9
o 3
o 988
o o 2
o 998
o o o o
1,000
o o 4
o 996
o o o o
1,000
o o o o o
Mmor Grouo
357-
55
o o o o o
o o o o o
o o o o o
667
o o o
333
o o o o o
o o o o o
o o o o o
Major Group
36
56
107
71
322 o
500
18
8 80 22
872
15
2
77
905
22 2
61
o 915
16
1
84
898
13
5
105
o 877
59 o
235 o
706
Mmor Grnup
3('5
57
o o o o o
10 21 42
281 646
130
o 100
o 770
22 o
109 o
869
8
o 130
o 862
111
o o o
889
o o o o
1,000
Mmor Group
368
58
o o o o o
156 o
63
o 781
42 o o o
958
125 o
62 o
813
120 o
120
o 760
o o o o o
250
o o o
750
Millar Group
36'J
59
105 105
263 o
5:7
13 4
75
o 908
4
2
77
1
916
21 2
56 o
921
8
2
81
908
9
5 113
o 873
o o
333
o 667
l\ LljOr Group
37
60
333
o o o
6(,7
o 143
o o
857
o 333
o o
667
478
218
o o
304
286
o o o
714
300
o o o
700
o o o o o
Mmor Group
378
61
o o o o o
o o o o
1,020
o o o o
1,000
o o o o o
o o o o
1,000
600 o o o
400
o o o o o
Mmor GlOUp
379
62
313 o o o
6(-,7
o 167
o o
833
o o o o
1,000
75J
o o o
250
o o o o
1,000
o o o o o
o o o o Q
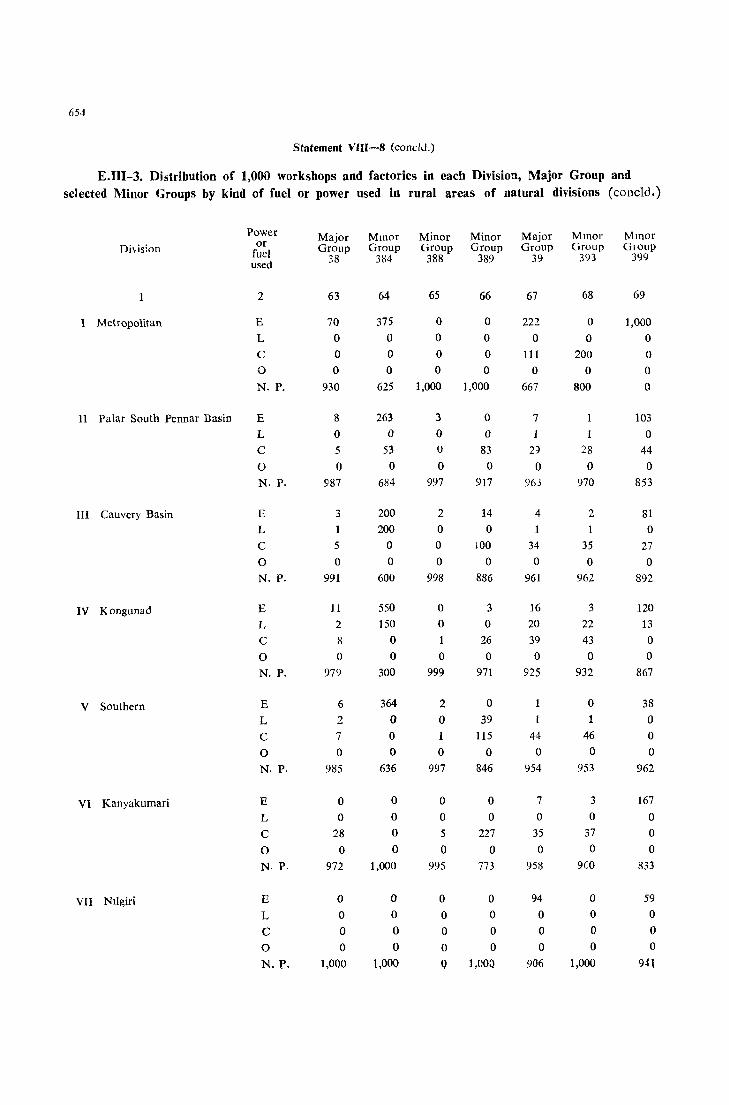
654
Statement VIIl-8 (coneld.)
E.IU-3. Distribution of 1,000 workshops and factories in each Division, Major Group and sel eeted Minor Groups by kind of fuel or power used in rural areas of natural divisions (coneld.)
Power Major Mmor Minor Minor Major Mmor Mmor Di\ision or Group Group Group Group Group Group Group
fuel used 38 384 388 389 39 393 399
2 63 64 65 66 67 68 69
I Metropolitan E 70 375 0 0 222 0 1,000 L 0 0 0 0 0 0 0 C 0 0 0 0 111 200 0 0 0 0 0 0 0 0 0 N. P. 930 625 1,000 1,000 667 800 0
II Palar South Pennar Basin E 8 263 3 0 7 103 L 0 0 0 0 0 C 5 53 0 83 2J 28 44 0 0 0 0 0 0 0 0 N. p. 987 684 997 917 963 970 853
III Cauvery Basin E 3 200 2 14 4 2 81 L 1 200 0 0 0 C 5 0 0 100 34 35 27 0 0 0 0 0 0 0 0 N. P. 991 600 998 886 961 962 892
IV Kongunad E 11 550 0 3 16 3 120
L 2 150 0 0 20 22 13
C 8 0 26 39 43 0
0 0 0 0 0 0 0 0
N. P. 979 300 999 971 925 932 867
V Southern E 6 364 2 0 1 0 38
L 2 0 a 39 1 0
C 7 0 115 44 46 0
0 0 0 0 0 0 0 0
N. P. 985 636 997 846 954 953 962
VI Kanyakumari E 0 0 0 0 7 3 167
L 0 0 0 0 0 0 0
C 28 0 5 227 35 37 0
0 0 0 0 0 0 0 0
N. P. 972 1,000 995 773 958 9(0 833
VII Nllgiri E 0 0 0 0 94 0 59
L 0 0 0 0 0 0 0
C 0 0 0 0 0 0 0
0 0 0 0 0 0 0 0
N. P. 1,OQO 1.000 Q 1,000 906 1,000 941
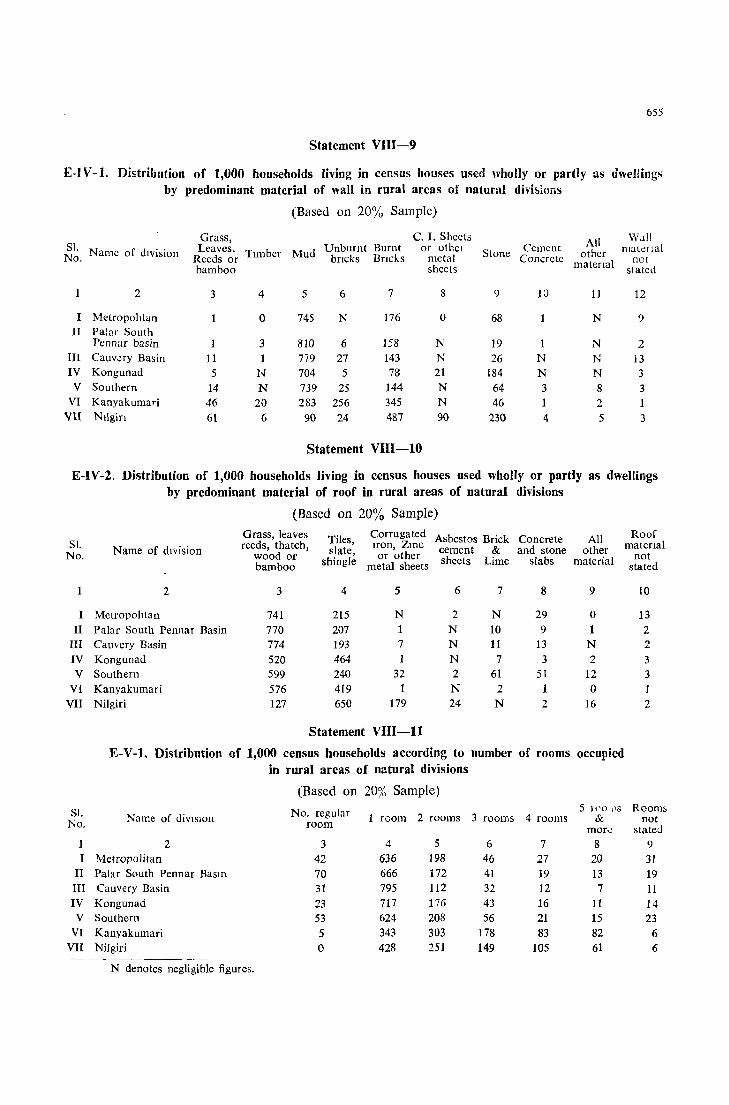
655
Statement VlIl-9
E-IV-I. Distribution of 1,000 households living in census houses used wholly or partly as dwellings by predominant material of waH in rural areas of natural divi1>ions
(Based on 20% Sample)
Grass, e. I. Sheets All Wall
SI. Name of dIvision Leaves, Tunber Mud Unburnt Burnt or othel Stone Cemcnt other material No. Reeds or bncks Bncks metal Concrete matenal not
bamboo shects siated
2 3 4 5 6 7 8 9 FJ 11 12
I Metropolttan 0 745 N 176 0 68 N ')
II Palar South Pcnnar basin 3 810 6 158 N 19 N 2
III Cauv.!ry Basin 11 1 779 27 143 N 26 N N 13 IV Kongunad 5 N 704 5 78 21 184 N N 3
V Southern 14 N 739 25 144 N 64 3 8 3 VI Kanyakumari 46 20 283 256 345 N 46 2
Vll Nllgin 61 6 90 24 487 90 230 4 5 3
Statement VIII-1O
E-IV-2. Distribution of 1,000 households living in census houses used wholly or partly as dwellings by predominant material of roof in rural areas of natural divisions
(Based on 20% Sample)
Grass, leaves Tiles, Corrugated Asbestos B 'ck Concrete All Roof SI. Name of division reeds, thatch, slate, Iron, Zmc cement 1 and stone other matenal
No. wood or or other h . not bamboo shingle metal sheets s eets Lime slabs material stated
2 3 4 5 6 7 8 9 10
I MetropoiItan 741 215 N 2 N 29 0 13 II Palar South Pennar Basin 770 207 1 N 10 9 1 2
III Cau"ery Basin 774 193 7 N 11 13 N 2 IV Kongunad 520 464 N 7 3 2 3 V Southern 599 240 32 2 61 51 12 3
Vi Kanyakumari 576 419 1 N 2 1 0 VII Nilgiri 127 650 179 24 N 2 16 2
Statement VIII-ll
E-V -I. Distribution of 1,000 census households according to number of rooms occupied in rural areas of natural divisions
(Based on 20% Sample)
S1. No. regular 5 Il'O 1'8 Room; Name of diVISIOn room 2 rooms 3 rooms 4 rooms & not No. room mOf';; stated
1 2 3 4 5 6 7 8 9 I Metropolitan 42 636 198 46 27 20 31
II Palar South Pennar BaSin 70 666 172 41 19 13 19 III Cauvery Basin 31 795 112 32 12 7 11 IV Kongunad 23 717 176 43 16 11 14 V Southern 53 624 208 56 21 15 23
VI Kanyakumari 5 343 303 178 83 82 6 VII Nilgiri 0 428 251 149 105 61 6
N denotes negligible figures.
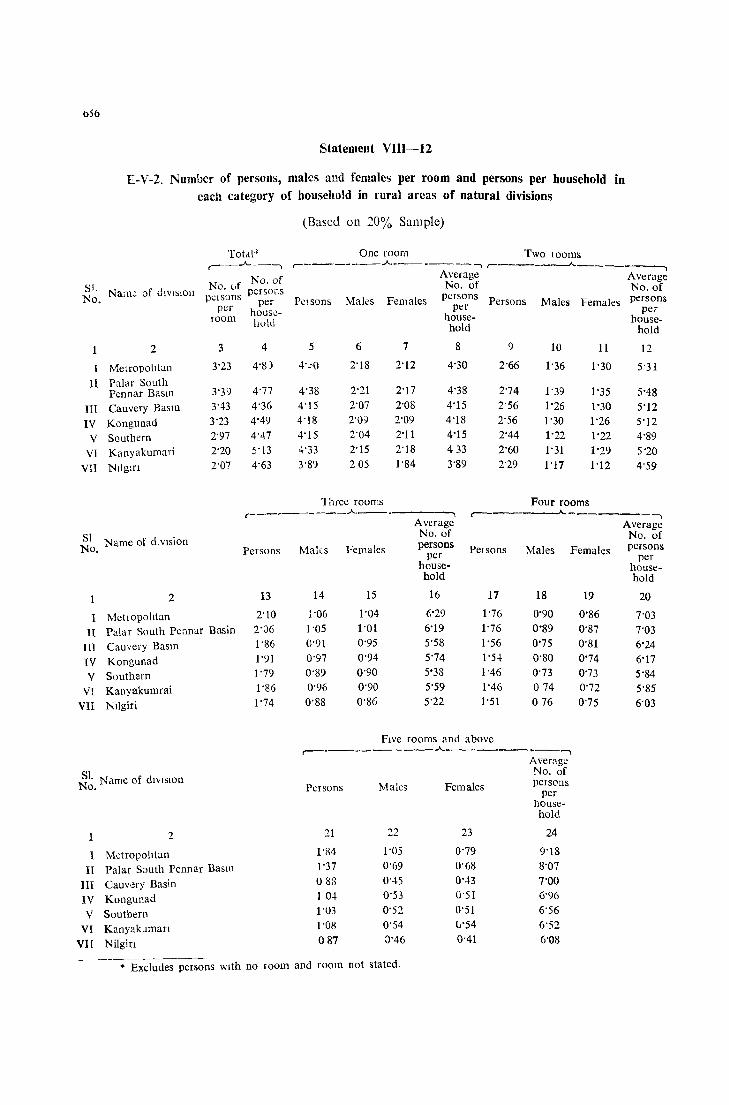
bSb
Statement VIU-12
E-V-2, Num\)cr of persons, males and females per room and persons per household in each category of household in rural areas of natural divisions
(Based on 20% Sample)
Total~ One room Two looms ,-,---"---, ,--------J....--- .. ----1 r--------"--------,
No. of No. of Average Average SI. Nam;: of (.l!vlslon pcrsons No, of No, of No. pt!lsons per PClsons Males Females persons Persons Males Females persons
per hous(!- per per room hold house- house-
hold hold
1 2 3 4 5 6 7 8 9 10 11 12
I Melropoiltan 3'23 4'8 ) 4'-'0 2'18 2'12 4'30 2'66 1'36 1'30 5'31
11 Palar South Pennar BaSIn 3'39 4'77 4'38 2'21 2'17 4'38 2'74 1'39 1'35 5"48
III Cauvery BaSIn 3"43 4'36 4'15 2'07 2'08 4'15 2'56 1'26 1'30 5'12
IV Kongunad 3'23 4'49 4'18 2'09 2'09 4'18 2'56 1'30 1'26 5'12
V Southern 2'97 4'47 4'15 2'04 2'11 4'15 2'44 1'22 1'22 4'89
VI Kanyakumari 2'20 5"13 4'33 2'15 2'18 433 2'60 1'31 1'29 5'20
VII NIlgm 2'07 4'63 3'89 205 1'84 3'89 2'29 1'17 1'12 4'59
1 hree rooms Four rooms ,-___ -_-__ ..A-__ • ----, .-- ..A.._ .,
NSI Name of d,Vlsion
0,
1 2
I MctLopolttan
11 Patar South Pennar Basin
III Cauvery BaSin
IV Kongunad
V Southern
VI Kanyakumrai
VII Nligiri
NSI. Name of diVISIOn
0,
1 2
I Metropolitan II Palar South Pennar Basm
III Cauvery Basin IV Kongunad V Southern
VI Kanyakuman
VII Nitgin
Persons
13
2'10 2'06 1'86 1'91 1'79 1'86 1'74
Average No. of
Malcs Females persons Petsons Males Females per house-hold
14 15 16 17 18 19
1'06 1'04 6'29 1'76 0'90 0'86 1'05 1'01 6'19 1'76 0'89 0'87 0'91 0'95 5'58 1'56 0'75 0'81 0'97 0'94 5'74 1·5..J. 0'80 0'74 0'89 0'90 5'38 1'46 0'73 0'73 0'96 0'90 5'59 1'46 074 0'72 0'88 0'86 5'22 1'51 076 0'75
Five rooms and above ,-_~ _______ .A. __________ ,
Average No, of
Persons Males Females persons per
house-hold
21 22 23 24
1'84 1'05 0'79 9'18 1'37 0'69 0'68 8'07
088 0'45 0·..J.3 7'00
1 04 0'53 0'51 6'96
1'03 0'52 0'51 6'56
1'08 0'54 lJ'54 6'52
087 ;)'46 0'41 6'08
* Excludes persons With no room and room not stated.
Average No. of persons
per house-hold
20
7'03 7'03 6'24 6'17 5'84 5'85 6'03

CHAPTER IX
HOUSING-PAST AND PRESENT
9 - 1. A housmg unit represents a v:lried pattern. It wIll dijTer not only from the poor to the rich, but abo from caste to caste. This is true of even of well developed village or township,
whcre the pattern of the house varies from caste to caste. As the
General factors gG'tcrning housing pattern
people are orthodox, age-old customs do not dIe and as the construction of houses is bound by considerations which are not relevant to proper living, very little change has been llltroduccd in homing.
Further the amount spent on housing is probably much less than in other countries and even in other parts of the country. The climate is congenial. It has an even temperature throughout the year thollgh inclined to be hot. The major part of the State has only an annual rainfall of 40". Generally the people build houses ,,,ith whatever material that is locally available with minimum cost. They prefer to sleep in open in summer and use the house for storage of articles they possess. That is why 111 the majority of the houses til Madras State materials such as thatch and mud are used for the construction of houses. In certain parts of Madras State like Ramanathapuram, more attention is devoted to the construction of a cattle pen than the housc. This is because cattle constitute an important element of their property. Though variations can be found from the general pattern from district to dIstrict, the baSIC prinCIple is the same, viz. that there must be a shelter to which people can go and where they can store their artIcles.
9 - 2. The conditions of housing werc the worst in Madras State during 1941-51 because of the war conditions. No new houses were built and owing to the prevalence of statutory
In two decades
rationing and the famine condItIOns in the rural parts of the State, there was a tendency on the part of th0 people to migrate to towns and the increase in urban popUlation recorded as high
a figure as .t I'; ~. The conditIons Inve been reversed in 1951-61. The people find the living conditions in rural ar.:a~ luppicr and WIth th.: avatlabLl.ty of more ",ark 111 the rural ~ector ami more urban faCIlities, the tendency to migrate to the urban areas has to a large extent been checked. This has no doubt improved the housing conditions in the towns. Generally more thought IS given to the housmg problem in urban areas, probably due to the fact that congestion and its attendant evils in urban areas aUract the attention of Sociologists and Town Fathers immediately. But in recent years with the ever incrca~il1g population, amelioration of housing conditions in lUral parts has assumed equal impoi tancc. Contrary to the general Impression, congestIon and overcrowding in villagcs is greater than 111 some tovvllS, e~pecially in the deltaic tracts of TlruclurapaIli, Thanjavur and Tirunc1veli districts. But the unfortunate aspect i3 not the overcrowding nor tlle number of persons reSiding in one household, but the quaIrty of the housing and the area of habItable space avail abe to the inmates.
9 - 3. Housing 111 rural al ea~ is goyerned by dIfferent factors hke clllnatic condllIOns, nature of the terrain, cconomic conditions of the household and to a lesser extent the commu
nity at large, the type of family living in the house and occupa-The influence of natural factors hon of the particular household. The type of house depends to
on housing pattern a large extent on the phYSical setting and the clImate of the
place. In places where extremes of climate are felt ltke in Nilgiri housing will have to be conditioned according 10 the weather. As su~h, a thatched housc cannot be built in the NIlglri DIstnct where the monsoon is fierce during the summcr months. The
H-83

653 REPORT ON HOUSING AND ESTABLISHMENTS
roof ~:~'d \\ all rnatenals should be so designed as to keep out the cold and the rain. Again the (.k~lgn of tl,,- hou~c should b~ such as to allow the maX1mum of sunlight to penetrate and to keep out til.:; cclJ \\ md. In placc~ ~ubjccted to fierce heat, homes should be 50 de,igned as to make the intenor ""l1tllah~d aEd airy. FUl ther the roof sLould be so com,truct.::u as to allow the 1l1:lXinllw: C1r.:ubtioll of cool alr and hence bamboo or palmyrah thatched roofs and mud walls art.: preferred [,mong the poor and hlgh cCllll1g!> ~m; mo,,: cemmon among 111.: v,ell-to-do.
9 - 4. Housll1g is also dependent on the nature of the soil and the avallablltty of raw matcti,:l. For example, wherc gral1lte is avaIlable 111 plenty, It is futile 10 c"\pect the people to
have brick kilns and prepare their own backs and construct
The inf.uence of :nailab!e raw materials
tIled houses with bncks for walls. Instead, stone houses will
be more common. Nor IS it po~sible to transport bricks from a distant place for the construction of the houses. Simil:lrly
where timber is avaibble in plenty, as in Kanyakumari Distnct, or in aJ'eas adjacent to tLICk forests, people prefer to use tImber for their houses. Where there is plenty of red
soil cr clay whieh facIhtates the making of bricks, bnck kilns crop up in the surrounding arcas and the houses are built of bncks. In villages WhlCh have lakes, tanks or rivers in
the vicinity, the fore shores and banks of which abound in grass, people use thatch for roofs. The reofs are all thatched \\lith grass and the walls are made of mud. The growth of palmyrah trees facilitates the fixing of rafters made of palmyrah.
9 - 5. The type of family also conditions the nature and size of the house. Before the introduction of Pax Bnttanica and the consequent legislation for divi~lOn of property, the
Hindu undivided family was a meful lllshtutlOl1. Property was
Type of family vis-a-ds nature of house
not sub-divided or fragmeilted and was commonly enjoyed by all members of the household. It was qUlte natmal for grown- up sons to be married, have children and yet Jive in the same house
':;jjoying the produce flam land and property jointly and acb10wlcdging thr: eldest male member us t1:e head 01 the household. However, g;adual awareness of legal rights led to the dISIntegration or this uniled f:.m,]Jj He and the ll1stitu1ion of Jomt family is slo\\ ly disappearing from the fnJian ~::cnc. The tendency is now for more and more familIes to b-.:: separated and to hve in
another house as sao a as they get marned.
9 - 6. Tbe size of the house and design also vary with the type of occupation of the household. The pL·Jblem IS simp!.; III the case of agrieultur.:tl classes except for the fact that he
neecls a place where he can store the grains and his agricultural
Occupati9n of hOllseh'Jhleffect on iIousing
Implements. He docs not n,-e~l any spec],d room to pursue his
speciabsed avocation. In the C3SC of aglll:u1[unsts, the house will con~ist of a single room \\ Hi! palmyrah thatch on the top, one
corner of the 1'00,11 0eil1g p;::rtilioned for sleeping and another corner partitlOned for cooking. In m<:"l~r C:lS';S t!le1"; may n0t be even an openmg in the rO-')111 to let out ::lcrid smoke which WIll
pcrva,;.: the entire place. OthefWIS'::: among wdl-lo-do agn,:ultunsb thei\.: may be one room to b~ used 2.S kItchell :1.110 [mother roo;n for sleeping at l1Ji;hl WIt:l pOSSibly a central lull. Among
those GVvni1l3 C:lttle, the hitter is often tethered in the courtyard at nights or lodged under a 51opll1g roof Just oPPo3ilC tile house. No proper system of draillage exists. But in the case of tl:o~e \\il0 pl:rsuc sp,;ouhsed occupation like han(1100111 weaVlllg or carpet weaving, rooms will have to be set ap:11 t and speCIally designed for the fixing up of the looms. The rooms will also
h~ve to be ventilated to let III the maximum light. Thus in certain cases or in villages whIch 11u\c a concentratIOll of comll1ul1lties spe:::Ial!smg in such avocations, the houses conform to a
distinc t pattern.
HOUSING-PAST AND PRESENT 659
9 - 7. Lastly, housing depends to a certain extent on the economic condition of the person constructing the house. A poor man 1S satisfied wIth a small hut and he spends the
minimum on the construction of the house. But the influentd
Economic factors affecti!lg and wealthy man attempts to build a house which IS bigger than housing the other houses. So the size and the materials which go mto
the construction of a house depend to a large extent on the comparative affiuence of the hOllse owner. These general remarks wIll h:lVe ~o be borne H1
mind whTlc: appreciating the housing conditions III rural areas of the Stale. Honses m nIl'al areas fall into two broad classes, viz., those of agricultural labourers :.mJ cultlvator5. The
former inclllJes 111 addition to agricultural labourers a majority of the poore: section of the community, VIZ., the Harijans hving 111 the 'Cheris' as well as general b1::ourer:;, The l:'i~ler not only mclude well-to-do agneultun~ts, but also others pursuing dIfferent occupatIOns ,- 'ld \"]10 arc in receipt of !',teady income above the marginal level. The former type is l1sa:-liy belllt ('I r,llld and has a roof w;th either palmyr:;!l or (Nanal) thatch. In a few cases, ,;t t11C front theJ e is a verandah or a pial, also of mud, and the interior consists of a single room. The d\vcll~ng of
the average agriculturist is built or mud, but the roof is thatched with bamboo and straw or sometimes even tiled. The pial is rais.:;J above the ground and the Interior conslsts of 2--3 rooms with a cenhal courtyard. One room is med as kitchen, O,IC a~ store room for the blalns
and the remaining as a sleeping apartment. The cattI:: are sometimes tethered in this courtyard during nights. The house of rich villagers almost conform to the same pa!tern, but the rooms may be shgl:tly brger and there may be even one or more extra dlning halls anri tl1e:-e might bc a well with1l1 the house which provides drink1l1g wat.;;r. Houses of more than one storey are not common in villag.:s. Gener,lIly the houses are ill-ventilated and window openmgs are not
normally seen. Thou:;;h Cemus figures would indic:lte there is not much overcrowdmg 111 rural areas, there bell1g only 5-6 persons on al1 average in every house, yet if sal1ltary facilities, !i vmg space, vel1ulation. and other factors are taken mto consideration, most of these houses s;1Juld be treated as of sub-standard level.
9 - 8. Houses have also been built with an eye on the minimum reqlllrements by tribals also. Their constructIOns arc governed by several factors lik'~ utilIty, ability to buIld houses.
availabIlity of materials and clIm:lte. They arc gene,-nlly poor Tribal housing pattern and cannot invest large sums 111 the construction of houses.
Further their homes are in interior fore5ts and th~y cannot Det the services of skilled workers. They also h:lve difficultIes in getting housing materials like bricks and tiles. Many tribes have, therefore, acqUired a certain amount of skill to build their houses in theIr typical way, making use of whatever materials that are available indigeno'lsly. In fact, some of them have specialised 111 huilding intricate types of houses whIch cannot be built by the ordinary house making masons or carpenters of the plains. The conventional Toda helt can be bUIlt only by Todas. It is so constructed that it IS most comfortable in the cool clll:1ate of NIl~m hills, The cat1,edral type cOl1lcal roofed hu~s of th~ Peria Malayaliil IS another example. The house of the Irula is so constructed that it fo"m') a natur.-:_! paUern in the forest in \\ hIch he is required to lIve and acts as a protectIOn a.:-;ainst wild beasts whieh
cannot distinguish It from the forest. It is this local genius which dlstmguishes the pattern of each tribe. The designs are handed down from generation to generatIOn and the skill
also transmltted from fa"Lher to sen. In hou~e construction, the most proficient of the tribes are Kotas \\ho are good carpenters, brick layers and masons. Next to them rank the Todas and Malayalis. The Muduvars and Kanis are good in building huts out of Ithai leave3 and
lthai twigs (Ithai is a kind of reed of bamboo variety which grows in abundance in the rain fed forests). The same material is used both for the walls and for the roofs. The
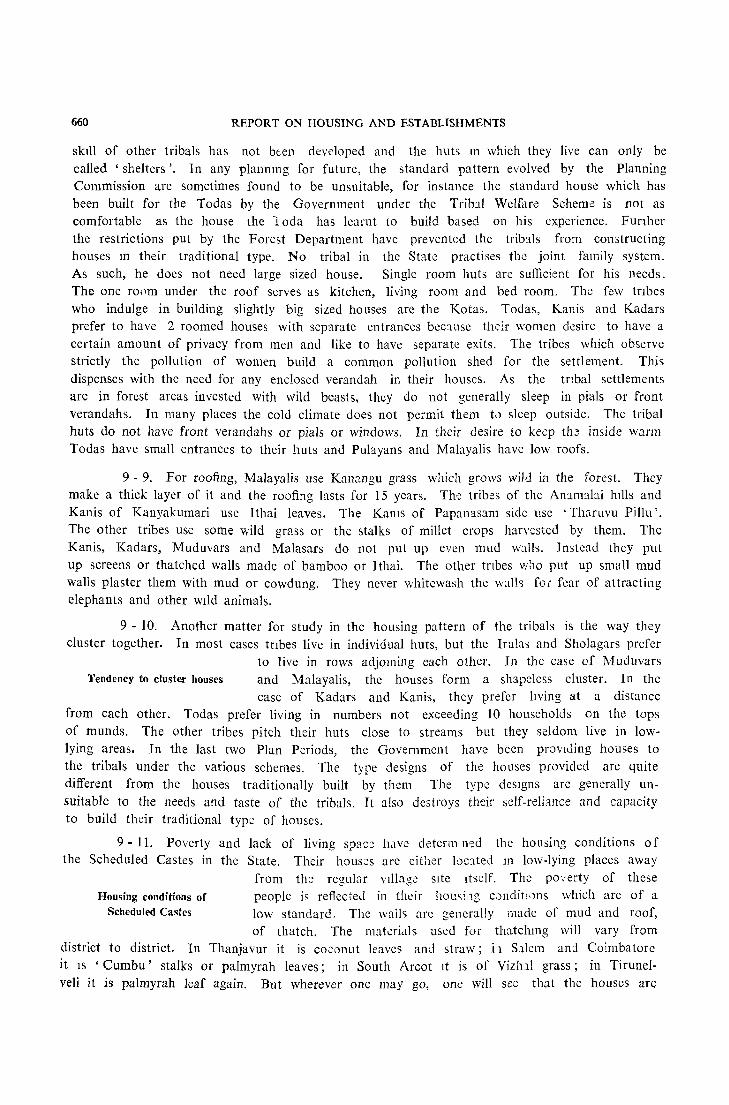
660 REPORT ON HOUSING AND ESTABLISHMENTS
sktll of other tribals has not been developed and the huts III which they live can only be called 'shelters '. In any plannmg for future, the standard pattern evolved by the Planning Commission are sometimes found to be unsuitable, for instance the standard house which has been built for the Todas by the Government under the Trib:tl Welfare Scheme is not as comfortable as the house the] oda has learnt to build based on his experience. Further the restrictions put by the Fore~t Department have prevented the trib:tls from constructing houses 111 their traditional type. No tribal in the State practises the joint family system. As such, he does not need large sized house. Single room huts are sufficient for his needs. The one rOi1m under the roof serves as kitchen, living room and bed room. The few tnbes who indulge in building slightly big sized houses are the Kotas. Todas, Kanis and Kadars prefer to have 2 roomed houses with separate entrances beCluse their women desire to have a certain amount of privacy from men and like to have separate exits. The tribes which observe strictly the pollution of women build a common pollution shed for the settlement. This dispenses with the need for any enclosed verandah in their houses. As the tnbal settlements are in forest areas invested with wild beasts, they do not generally sleep in pials or front verandahs. In many places the cold climate does not permit them to sleep outside. The tribal huts do not have front verandahs or pials or windows. In their desire to keep th~ inside warm Todas have small entrances to their huts and Pulayans and Malayalis have low roofs.
9 "9. For roofing, Malayalis use Kanangu grass which grows wild in the forest. They make a thick layer of it and the roofing lasts for 15 years. The tribes of the Ammahi hills and Kanis of Kanyakumari use !thai leaves. The KalliS of Papanasam side use 'Tharuvu pinu'. The other tribes use some wild grass or the stalks of millet crops harvested by them. The Kanis, Kadars, Muduvars and Malasars do not put up even mud walls. Instead they put up screens or thatched walls made of bamboo or !thai. The other tribes 'who put up small mud walls plaster them with mud or cowdung. They never whitewash the walls foc fear of attracting elephants and other Wild animals.
9 - 10. Another matter for study in the housing pattern of the tribals is the way they cluster together. In most cases tnbes live in individual huts, but the lrulas and Sholagars prefer
to live in rows adjoll1ing each other. In the case of Muduvars Tendency to cluster houses and Malayalis, the houses form a shapeless cluster. In the
case of Kadars and Kanis, they prefer hving at a distance from each other. Todas prefer living in numbers not exceeding 10 households on the tops of munds. The other tribes pitch their huts close to streams but they seldom live in lowlying areas. In the last two Plan Periods, the Government have been prOViding houses to the tribals under the various schemes. The type designs of the houses provided are quite different from the houses traditionally built by them The type deSigns are generally unsuitable to the needs and taste of the tribals. It also destroys their sclf-reliance and capacity to build their traditional type of houses.
9 - 11. Poverty and lack of living spac~ helve determll1<;:d the housing conditions 0 f the Scheduled Castes in the State. Their houses are citiler locJ.ted In low-lying places away
from the regular Village site ttself. The poverty of these Housing conditions of people is reflected in their homi,1g c.:)l1ditl,ms which are of a
Scheduled Castes low standard. The wall., are generally made of mud and roof, of thatch. The materials used for thatchmg will vary from
district to district. In Thanjavur it is C020nut leaves and straw; Ll S11em ani Coimbatore it IS 'Cumbu' stalks or palmyrah leaves; in South Areot It is of Vizlul grass; in TiruneIveli it is palmyrah leaf again. But wherever one may go, one will see that the houses are
HOUSING-PAST AND PRESENT 661
constructed in a slip-shod manner. They do not have any natural taste like tnbals in constructing their houses. Neither do they have resources to eng:1ge skilled labourers. The net result is that they live in some huts which are Ill-shaped and badly constructed. Their houses are mostly one-roomed with a verandah III front. The inside of the house is used fvf keeping their belongings and the front verandah for living and sleeping.
9 - 12. The nomadic tribes of the State generally are Naribravars. They do not have any housing problem because when t:l~y shift from one place
The housing of nomads to another, they carry their tents whish are pitched on ground not higher than 3'. The tents are nude of cloth and
made to stand on wooden pegs. They generally creep inside the tent~ for sleeping.
9 - 13. It is our view that the housing conditIOns in M ,~lfls St:lte lnve not improve] appreciably in the course of the last 60 years. In support of our view, we reproduce below
extracts from Distnct G:lZetteers on ddf~re:1 t dlstr;cts in
No improvement in housing in Madras State
which the existing housing condltions hwe b~en d::<;crib::!d by their authors. It will be seen th:1t th;: co:1iltio:1s ar.:: more or less reproduced today and the remarks :1pply with eqll::l force
to most of the houses found in the State except for a small percentage of variatlOn.
9 - 14. We have shown in this report that the number of rooms avalbble 111 th~ house does not depend on the number of members of the f..lmily. In Mlciras Silte generally a house
is only a place where the belo:1gi'lgs are st'Jred and ne'/et is
House 'a necessity' and not a a house so designed as to make the living comfortable. Not " comfort" much appreciable difference can b; seen from c'om')1Unity to
community except that some castes like S:hcduled Castes are poorer and cannot afford to build houses. Between the rich and the p00r, ~0111'~ diffaence in housing is found, in that more money is spent on the house of the rich, but it C2nl1ot be said that thIs money has been spent wIsely in order to provide suffici";llt ltvll1g accJmmod:ltion of a high standard for the inmates.
9 - 15. The other factor which vve observed is the variation found in the hous~s of a Brahmin and a Paraya. There is something distinct about the construction of their houses.
Tradition has also forbidden the c0pymg of the pattern of the The role of Caste house of a High Caste Hindu by a low caste Hll1du. This IS
also reflected in the manner in which building nuteriClls are used. In certain parts of Kanyakumari District, teak cannot be used by some of the low caste people and the types of material to be used arc restricted to a gre2t extent. These traditional practices which have been handed from generation to g~neratJOI1 h1Vc not un,:krg)l1;: su~st:ll1ti:ll
changes so far.
9 - 16. Another factor which affects the development of homll1g in this State is superstitious beliefs and customs which matter much in the construction of th,~ houses. Even
today certain out-moded beliefs as to the direction of th ~ house Superstition vi~-a-vis housing to be built, the month in which the construction w0,k sllOuld
commence are followed all over the State. Som~ of them arc quite reasonable, but many of them are n)t. Ther..:[ore, any sci':ntific dev.::lop"TI?nt of housmg suited to the need of the people has been ruled out by the desire of the community to follow what has been laId down by the orthodoxy in the past. The construction of the house has generally been the monopoly of a particular community called Kammalars who have done their best to preserve 1t as a secret of the community and hwe not encouraged any deviation from
the past practices.
662 REPORT ON HOUSING AND ESTABLISHMENTS
(I) SOUTH ARCOT (Extract from the Madras DIstrIct Gazetteers-South Ar~0t hy W. FrancIs, I. C. S.-,
1906 Volume l-p. 90
"The houses in South Arcot do not differ from those in the other southern districts. They are of all sorts and sizes, from the movable bamboo kennel in which the wandenng Kuravan resIdes and whieh he carries wIth him on his back when he changes his scene of operations, to the two storeyed residence of the big land-holder or sowear in whi.::h all the arrangements arc excellent except the inevitable corkscrew stalfcase. Earth which will make tiles is common and tiled dwellings are increasing in numbers. These roof<, a;'o often decorated with geometrical patterns executed in whitewash. In outward appearance a M:us,alman's house does not differ from a Hindu's except Elat the former ha~ usually a gunny curtam hung across the door to guard the privacy of the women. The Brahma!1~ of the town" arc no longer very particular about living in the Brahman street. Their dwellings d!tTer from tho~e of the average Sudra in containing a corner set apart for the household objects of worshIp (a li;lgam, Salagramam or an image of one of the gods) and In possessing arrangement') fOi the complete segregation of the women at certain seasons.
The ordinary middle-class house has a tulasi plant on a lIttle altar in the midJle of its central court; the string of mango leaves over the doorway which was placed there on the laSt festive occasion; niches on each side of the doorway for tIle burning of lIght;; (e~pcclally 1t1 the month of Kartigm when the great festivol takes place at the Tiruvannamalai te:llple); traces at tl10 foot of its outer door-posts of the kun!{uill:.tm and saffron whIch are put there en:y Fnday by the ladies of the household in honour of L::lkshmi; and, before the threshold, the pJtterns done in flce-flour (kolam) the origin and meaning of which is so obs:::nre a:1d the absence of which is a sign of mourning. In the eVIl month of Margali (Deccmber-Janm:'Y) when IUllll IS
especially lIahle to happen, little balls of cow-dung e:lch topped WIth a pumpkin blo:;s;),n ale dotted about in the early morning among the nee-flour patterns and removd as SO,)l1 ?.', the sun is well up. They ward off danger. The cowdung is kept and dried and i, either burnt Into ash for sect marks or uscd for boiling the rice at the ensuing thankssivlllg of Pongrtl. To avert the evils of this month, offerings are also made at th~ temples at the fint' streak of dawn, some of the people go round the villaglOs singing sacred songs and the Budubudukahs, th~ Tad:m" and the Dasaris go from house to house at day-break prophesying good to the inmates. "
(II) TRICHINOPOL Y (Extract from the Madras DIstrIct Gazettcers-Tnchmopo!y by F. R. Hemtnsv.ay, I. C. S.
1907-Pagcs 81-82.)
"The villages arc generally open, without defensive walls and WIth comparatively broad streets. The houses are generally bUilt in stleets and not scattered. The Brahman, Sudr.l and Panehama quarters are separate and in the la~t of these, the PaHans, P.:traiY:llls and Chakklhyans live in separate btrects. Many vIllages with a claim to antiqmty have four or more boundary stones, the number varying with the size of the village. Kannanur in Musiri taluk has as many a:; 32. These are supposed to demarcate the junsdiction of the village goddess and a g'Jd called Karupran is supposed to rc,>ide in each. They are held in great vcneratio:1 :l11J are ano1J1ted and worshipped at the time of the vilhge goddess, festival. They can be e1s11y identlfid by their shortness and the oily incrustation on them, In many viilages large upright slabs called NATTUKKALS are found. Some people declare these are merely intended for animals to rub themselves against; but others say that a sheep is saCrIficed to them 11l tImes of drought il1 order to bring rain. Every village has the usual raIsed platform round a banY,11l or ICCHI tree, where the village gossips and assemblies meet.
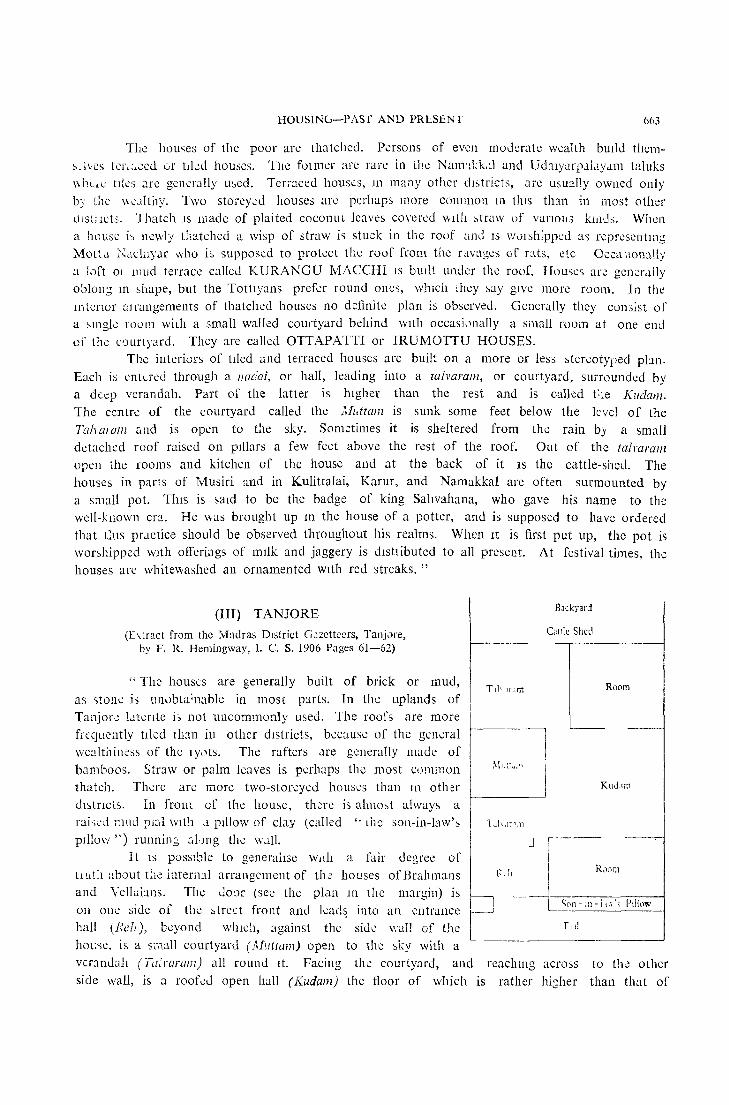
HOUSING-PASr AND PRl::SENT 663
The houses of the poor are thatched. Persons of even moderate weallh buIld them
~~lves tCL:.-.:ed (lr tJLd houses. The fGlmer arc rarc in the Nam1tbl and Ud~llyaqll1.!ydlll t~duks "hL,\: tlks are generally u~ed. Terraced houst,s, 111 many other dbtricts, arc usually owned only
by [he \\t~c1Hi1y. Two storeyed house:; are perhaps more cOlllmon lfi t1m than in most other
Ulst; lets. Thatch IS made of plaited coconut leaves covered v.HIt ~traw of vanOll3 klll.Js. \Vhen
a house i~ newly thatched a wisp of straw i5 stuck in the roof and IS w01sh:pped a') representli1s Mottll l':achryar \\<ilo i~ supposed to protect till' roof from the ravages of rats, etc Oec~non:.llly
a 10[t 01 mud terrace calle.l KURANGU MACCHI IS bUlli under the roof. Houses arc gencrully oblong ll1 shape, but the Tottiyans prefer round 011e5, WhiCh they say give more 1'00111. ] n the
mienor ::l.l rangements of thatched houses no deilnite plan is observed. Generally they consist of
a ~l1lg1c 1'00111 wich a small walled cou[tyard behind WIth occasi,'nally a small room at one end
or the l"Jurlyard. They are called OTTAPATTI or IRUMOTTU HOUSES.
The interiors of tiled and terraced houses are built on a more or less &tereotyped pb11.
Each is entered through a naaoi, or hall, leading into a ralvaralll, or courtyard, surrounded by
a du:p verandah. Part of the latter is hlgher than the rest and is called t;:e Kudam. The centre of the courtyard called the Midtam is sunk some feet below the level of the
Talw/(/i71 and is open to the sky. Sometimes it is sheltered from the rain by a small
detached roof raised on pillars a few feet above the rest of the roof. Out of the tairaram open the rooms and kitchen of the house and at the back of it IS the cattle-shed. The
houses in parts of Musiri and in Kulittalai, Karur, and Namakkal are often surmounted by
a small pot. ThiS is ~aJd to be the badge of king Saltvahana, who gave his name to the
well-hnown era. He was brought up 111 the house of a potter, and is supposed to have ordered
that thiS pr,lctice should be observed throughout his realms. When It is first put up, the pot is wor~hipped wlth offerings of Imlk and jaggery is distlibuted to all present. At festival times, the
houses are whitewashed an ornamented WIth red streaks. "
(III) T ANJORE
(£ \tract from the Madras DIstrict Gazetteers, Tanjare, by F. R. Hemingway, 1. C. s. 1906 Pages 61-62)
"The houses are generally built of brick or mud,
as ')tone is unubta'nable in mOSt parts. In the uplands of
Tanjor-: latente i~ not uncommonly used. The roofs are more
frequently tJled 1h:111 in other dIstricts, because of the general
wealthiness of the lyutS. The rafters are generally made of
bamboos. Straw or palm leaves is perhaps the most c()mmon
thatch. There arc more two-storeyed houses than III other
dbtncts. In front of the house, th.::re is almo~t always a raisd 1;1Ud plal WIth J. pillow of clay (called ,. Lhe son-in-Iaw'~
plllow ,.) runnin3 ::ll,)ng the w.111.
It IS pOSSIble to generalise WILl! a fair degree of
tlLLth about t;,c intennl arrangement of 1il;: houses of Brahmans
and Vellabns. The Joor (sec the plan ll1 the margin) is
on one side of the street front and lcad~ into an cntrance hall (Ref,), b:yond wInch, against the side wall of the
h01.;.;;e, is a sii1all courtyaru (l.J,l(lam) open to the :o.ky with a
BJckyard
Cattle Shed
Room
'---- -
~_::__J KudJm
I 1 JI\,"',11
~~:- J I ~---R"0m ~------.-
~ -L<;on~ln~i"\\ Ptll"w
[:_. _____ f_I1_1 ______ -J
verandah (la:I'aram) all round It. Facing the courtyard, and rcachmg across to the other
side wall, is a roofed open hall (Kudam) the floor of which is rather hi~her than that of
664 REPORT ON HOUSING AND ESTABLISHMENTS
the verandah. III front of and belllnd the Kuc/alll and opening out of It, are two rooms
occupying the f(ont and hack corncr~ of the home, the former of which is generally a living room and the latter a kitchen. BehInd the housl:. there is a cattle shed and then a back
yard. Great varieties arc found in the hOU'ses of other castes, but the one-roomed circular huts found in some other dl~tllCts are seldom bUllt, and even the poorer class of residence contains a
hall and one or two rooms. The houses of low castes in rural tracts are often covered wIth creepers. As In other dl~tncts there is a special SCience (Mwzai Sastram) connected with the proper tlmc and ~ltuatlOn in which a new hOll~e should be bUIlt. The Kammalans generally profess and are consulted on tIllS SCIl:nee .. ,
(IV) MADURAI
(ExtldCt frem {I.e Madras DlstrKt GJLcttccrs-~ladurai-by W. Flancls, I.eS. 1906-Pdges 81-82) .
•. Houses are much the same as elsewhere. Where thc Kallans are most numerous, the
fear of inccndlaw,m induces people to try to afford a tiled or terraced roof instead of bemg content WIth thatch. But as a rule, the ryots seem to believe In the poetess Auvaiyar's saying "Build small and prosper greatly" and outside the towns the stranger is struck WIth the meanness of the average type of house. The cattle are always tied up 111 the houses at night. Fear of the Kallans prevents them from being left 111 the fields, and they may be seen coming into the villages every evenmg in scores, chokmg everyone with the dust they kick up, and polluting
the VIllage site (mstead of manuring the land) for twelve hours out of every twepty-four. Buffaloes are tied up outsidl: the homes. Kallans do not care to steal them, as they are of llttle value, are very troublesome when a ~tranger tries to handle them, and cannot travel fast or far enough to be out of reach of dctection by day break.
In the Palani Taluk there are fewer Kallans and the ryots are much keener farmers than elsewhere in the district and there the cattle are very usually penned in the fields at night. Pecple who have a well generally have a house next It, in addItion to their ordinary dwelling in the VIllage site and thus they can stay out on their land at 111ght to watch over the cattle
penned on it."
(V) SALEM
(Extract ftOm thc Madras Dlstnct Gazdtcers-Salem-by RILhards, I. e S., Volume I Pdrt-I, 1918 Pages 108-109)
'" Mo::.t of the rural populcltion hve~ ]J1 hied or tlutched housl:s, a terraced house being
rc:.-:,arded as the mark of a wealthy man. Houses of more lIun one storey are rare. Thatched hou~;cs predGJ1unale in the Tabghat and 011 th~ h:ll~ and tiled houses elsewhere. The favourite thatclllllg matcil~,l i~ k:lmbu straw; paddy "traw; cholam stalks, palmyra leaves and cocoanut kitlzs arc also used when aVUllable, and, 111 the vicll1ity of the hills, coarse jungle grasses. The
POUl"cst clZ,5SCS ha\c to content themselves WIth an one-room hut, about 10' square, but most people of the ryot class have at least two rooms; a sleeping-room opening into the street, and a
cook-room opening into the sleeping-room and also a front \ crandah. In Hosur VIllages, the cattle are often accommod:1ted in th~ 5leepmg apartment and in the cook-room are kept three or four In!J,c earthenware jars of gram. An improvement on thiS arrangement is to have the c()w-hou~e opposite to and equal in length to, the dwelling house, with a n:!rrow
yard, fenced at either end, lllterVenll1g. Town houses are more elaborate. A new house is usually "warmed" by giving a feast to f!"lends and relatives before it is occupied and s.)me
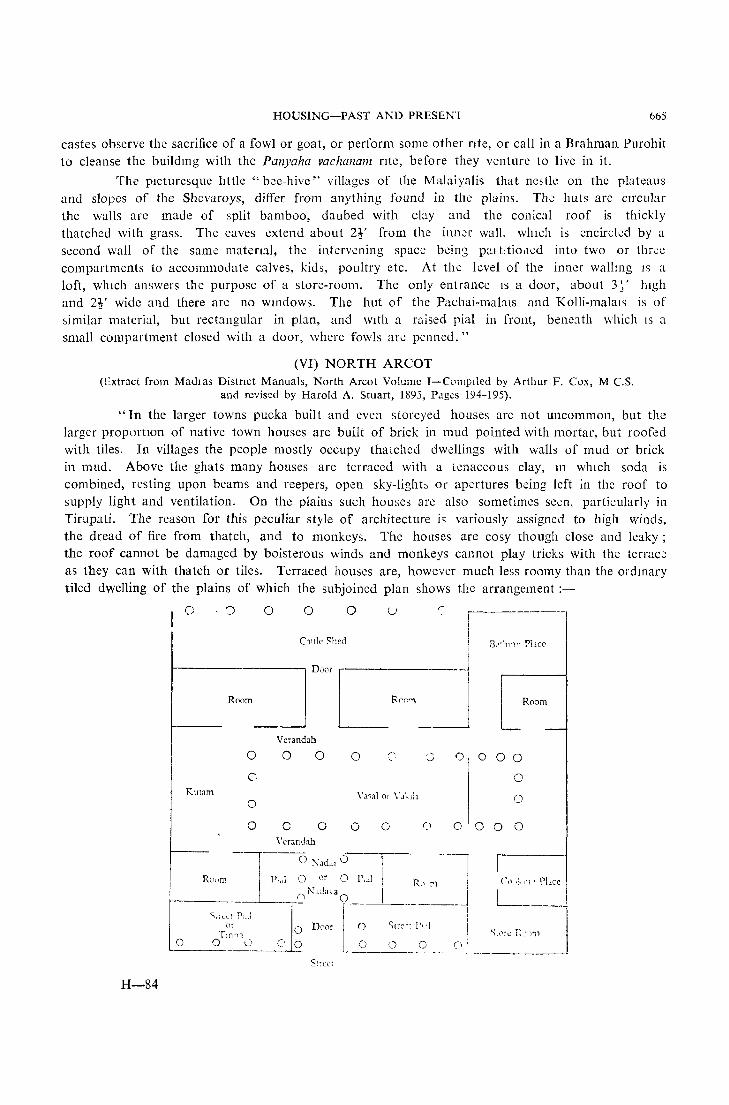
HOUSING-PAST AND PRESENl 665
castes observe the sacrifice of a fowl or goat, or perform some other flte, or call in a Brahman Purohit to cleanse the build1l1g with the Panyaha-vaclzanam rIte, before they venture to live in it.
The pIcturesque lIttle" bce-hive" villages of the Malaiyalis that nestle on the plateaus and slopes of the Shevaroys, differ from anything found in the plains. The huts are CIrcular the walls are made of split bamboo, daubed with clay and the conical roof is thickly thatched with grass. The caves extend about 2r from the inn-.:r wall, which is encircled by a second wall of the same matenal, the intervening space bcins pal tltio11cd into two or threc compartments to accommodate calves, kids, poultry etc. At the level of the inner wallll1g IS a loft, whIch answers the purpose of a store-room. The only entrance IS a door, about 3 ~' hIgh and 2r wide and there arc no w111dows. The hut of the Pachai-mal:_us and KolIi-malals is of ~imilar material, but rectangular in plan, and WIth a raised pial in front, beneath which IS a small compartment closed with a door, where fowls are penneu. "
(VI) NORTH ARCOT (Extract from Madlas Distnct Manuals, North Arcot Volume I-ComplIed by Arthur F. Cox, M C.S.
and revised by Harold A. Stuart, 1895, P.lg~s 194-195).
"In the larger towns pucka built and even storeyed houses are not uncommon, but the larger proportion of native town houses are built of brick in mud pointed with mortar, but roofed with tiles. In villages the people mostly occupy thatched dwellings with walls of mud or brick in mud. Above the ghats many houses are terraced with a tenaceous clay, 111 which soda is combined, resting upon beams and reepers, open sky-lighb or apertures being left in the roof to supply light and ventilation. On the plains such houses arc also sometimes seen, particularly in Tirupati. The reason for this peculiar style of architecture is variously assigned to high winds. the dread of fire from thatch, and to monkeys. The houses arc cosy though close and leaky; the roof cannot be damaged by boisterous winds and monkeys cannot play tricks with the terrace as they can with thatch or tiles. Terraced houses are, however much less roomy than the ordll1ary tiled dwelling of the plains of which the subjoined plan shows the arrangement:-
H-S4
o I ·0 0 o o u -------1
I 8."1111" ?Iace C1ttle Shed
i Door ,-- j
f----- R(\Om ___ ..J L_R'"~_j Room
Kutam
o (',
Verandah
o o
SI,eCi
o c' o
666 REPORT ON HOUSING AND ESTABLISHMENTS
This represents a large and comfortable house having two kattus or compartments, tha to the left being for general use while that to the right is used by the women. The street pial or lounge is generally allowed to be occupied by anyone. The inner or nadai pial is for friends, as is the kutam or covered hall where visitors are received and feasts given. The vasal (Tam) or Vakili (Tel) is open to the sky and lights the whole dwelling, the rooms of which have no windows or only very small ones. The vasal extends to the second or women's compartment, but a wall divides it and the covered verandah which surrounds it has generally screens placed behind the open spaces at the ends of the wall to secure the privacy of the women. Many or most houses have no second compartment, and sometimes several brothers occupy various parts of a large building, cooking and messing separately. Each dwelling has a backyard in which cattle are tied, but not un frequently these are admitted into the interior of the bUIlding. The floors are usually of beaten clay daily washed with a mixture of cowdung and water.
The furniture of a well-to-do town resident is of course superior to that of a villager. The former possesses one or more cots of wood or bamboo, a low three-legged table (mukkal pita) or two, several boxes, some chairs and occasionally a press for linen. The wealthy even indulge in sofas, easy-chairs, mirrors, chandeliers and wall-shades. In villages the requirements of the people are more simple. They sleep upon mats or wooden planks with low legs (vissa palaka) and beyond a few benches and boxes they have and need no other furniture. They generally use feeble oil lamps a wick burning in a brass saucer of oil upon a pedestal or in small earthenware saucers placed in a niche in the wall, but kerosene lamps are now becoming common in towns."
(VII) TINNEVELL Y
(Extract from Madras District Gazetteers-Tinnevelly-Volume I by H. R. Pate, I.C.S. 1917 Pages 101-103).
"The villages of the district conform as a rule to a more or less umform type, consisting of blocks of houses, each inhabited by different castes and divided from one another by streets and lanes, which usually run from east to west or north to south. If the vlllage possess a tank or is situated near a river or channel, the houses cluster as far as possible, near the waterside, with every facility at hand for bathing and drinking and for washing clothes. The house of the Brahmans (if there are any) stand in one block, arranged as a rule in double rows facing one another across the street. Unlike the Vishnu temple which looks down the street the temple of Siva should be a little distance away and is usually found in the north-east corner of the village. The Sudra houses grouped two or three together in separate compounds, form a compact block. If any particular caste is found in large numbers, it has its own distinct quarter; otherwise, Vellalans, Idaiyans, Maravans and so on inhabit the same region. The "half-polluting" castes, :>uch as Iluvans and Shanans, always have their separate habitations just outside the mam villages; PaHans and Paraiyans live in a still remoter site or Cheri consisting In the river valley, of a mound of dry land surrounded by the wet fields in which they labour.
The Parava villages of the coast such as Manappad, Alantalai and Virapandyanpatnam stand in a class by themselves and resemble rather small European towns than Indian villages.
In the river valley tiled houses are almost the rule, only the houses of the poorer labourers being thatched. Even in Paracheris tiled ropfs are occasionally to be seen; and the thatched roofs of the prverbially poor weavers are rapidly disappearing. In the Tenkasi Taluk and in all villages lying along the foot of the hills in this and other taluks, in many of the richer villages in central and south-east Nanguneri, thatch has for many years past gradually been giving place to tiles. And this means, of course, that walls and ceiling must be substantial.
HOUSING-PAST AND PRESENT 667
All the better houses, most numelous in the rich villages of the river valley, are founded on a solid basement, the walls being made either of stone (especially when, as in the Ambasamudram Taluk, stone is plentIful and is quarried above the ground) or of bricks and mud. Kongu (Hopea parviflora), a timber which possesses a peculiar fascination for the people of this district is largely used, even in preference to teak, for rafters the latter wood serving for door-frames and windows. In the towns and in the smaller villages in which a good deal of wealth is concentrated (Brahmadesam is a good example) houses run often to two or three storeys al1d are finished with great elaborateness. In the black soil country, where incendiarism is too common a pastime, substantial houses With Mangalore tiles are constantly replacing the old mud walls and thatch of cumbu stalks. In the ordinary unpretentious houses of the less well-to-do palmyrahs provide the rafters, • mud the walls and an upper storey is rarer; the roof may be either thatched or tiled. The labouring classes everywhere and most of the poorer agriculturists live in small houses of mud and thatch.
When it is remembered that to a great extent every domestic act of a Hindu, especially of a Brahman, forms part of a prl!scribed ritual, it is not surprising to find that the houses of the Brahmans, on the one hand and of the Sudras on the other, conform as a rule to a defined type. In a Brahman house, the pial or raised verandah faces the street. This is often fenced in from the roof LO the ground with a lattice of wood or iron, a row of houses presenting often the appearance of a series of menageric cages. The front door opens from the street into a room (Ulluthinnai) along the one side of which there is often a raised platform (thinnai). Behind this comes a series of small rooms or compartments a door on one side of the Ulluthinnai leading into the first reli, or haH, to the other side of which are a couple of store rooms; from the first reli, a door opens into the second reli which occupies the whole width of the house, and behind this IS the kitchen on one side and on the other side the nalam vasal or lobby, leading to a small courtyard (mittam) open to the sky. Beyond this is a room (pattasalai) which serves as the women's apartment and next behind them live the cattle, which come in by the compound at the back. The pial is surrounded by a slanting roof and over the Ulluthinnai and the first reli is usually an upper room; half of the second reli is often terraced, the other half supporting a small attic. The upstair-rooms are used as grain stores.
The feature which at once distinguishes a Sudra house is the absence of a regular verandah in front. A doorway wall leads into an open courtyard (mittam) which is common to a number of houses and within it, facing the house is a raised platform (kudam) with a pentroof which serves as the general lounge. The internal arrangements differ but only slightly from those of the houses of Brahmans.
The houses of the labouring and poorer classes are little more than square huts with one or two rooms. The front door of almost every house, whatever caste may inhabit it, is daubed with numerous impressions of the open hand-palm, fingers and thumb. This decoration, which is laid on with flour paste, is said to commemorate Mahabali Raja, "The Giat King". The God Vishnu, according to the familiar story, once appeared before Mah:lbali as a dwarf and craved three feet of the earth's space. The request was granted and Vishnu once more a God, proceeded to measure out hIS allotment. Two feet measured the whole length of the earth and as the God sought to measure out the third, he thrust Mahabali down to the underworld, Pathalam. Once a year, however, by the favour of Vishnu, this king is allowed to re-appear on earth, and in the month of Kartigai, when his visit is expected, Hindus renew the impressions on their front-doors and light up their houses and streets. The impression of the hand, this seems to be the storyis sure evidence that the Raja has pushed open the door and entered."
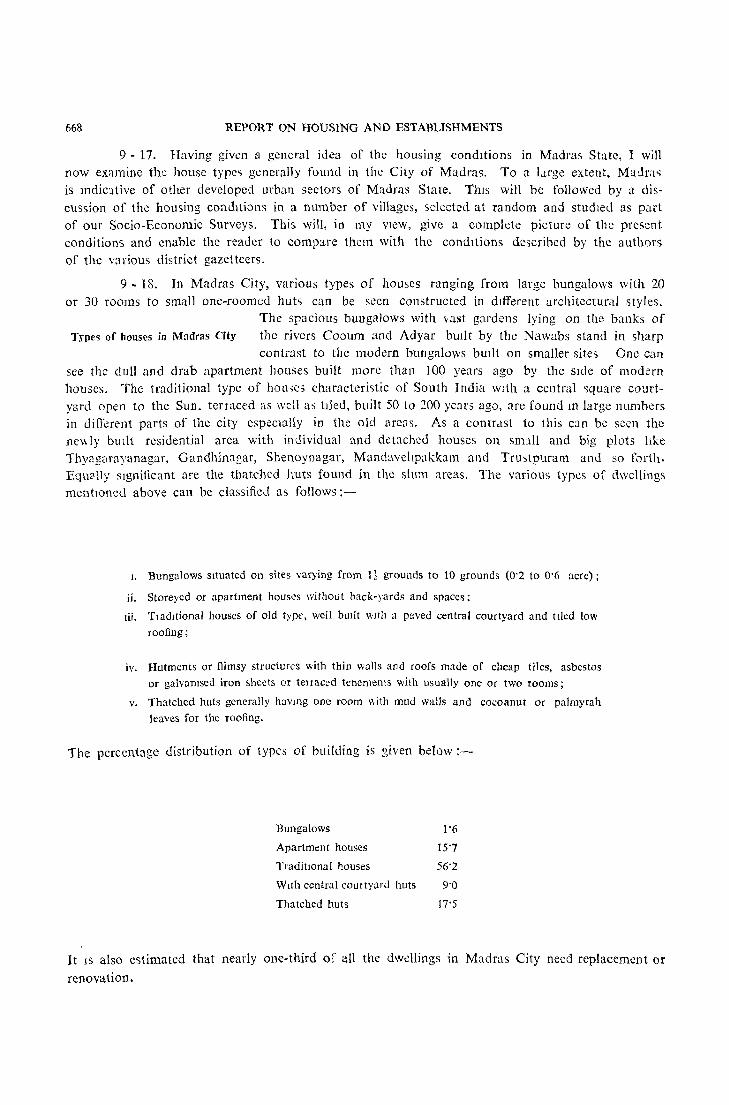
668 REPORT ON HOUSING AND ESTABLISHMENTS
9 - 17. Having given a general idea of the housing condItions in Madras State, I will now examine the house types generally found in the City of Madras. To a LU'ge extent, Maura,> is mdic1tive of other developed urban sectors of Madras State. TillS will be followed by a discussion of the housing condItions in a number of villages, selectee! at random and studIed as part of our Socio-Economic Surveys. This will, in my VIew, give a complete picture of the present conditions and enable the reader to compare them with the condItions described by the authors of the various district gazetteers.
9 - 18. In Madras City, various types of houses ranging from large bungalows with 20 or 30 rooms to small one-roomed huts can be seen constructed in dIfferent architectural styles.
The spacious bungalows with vast gardens lying on the banks of Type~ of houses in Madras City the rivers Cooum and Adyar bUIlt by the Nawabs stand in sharp
contrast to the modern bungalows bUIlt on smaller sites One call see the dull and drab apartment houses built more than 100 years ago by the SIde of modern houses. The traditional type of hoU)(:s characteristic of South India WIth a central square courtyard open to the Sun, terraced as well as tIled, built 50 to 200 years ago, are found In large numbers in different parts of the city especIally in the old areas. As a contrdst to this can be seen the ne\\ly bUllt residential area with inLlividual and detached houses on snull and big plots like Thyugarayanagar, Gandhinar,ar, Shenoynagar, Manuavehpakkam and Trustpuram and so forth. Equ~lly sIgnificant are the thatched huts found in the slum areas. The various types of dwellings mentIoned above can be classified as follows;-
I. Bungalows sItuated on sites varying from 11 grounds to 10 grounds (0'2 to 0'6 acre);
ii. Storeyed or apartment houses without back-yards and spaces;
Iii. Tladltional houses of old type, well bUllt With a paved central courtyard and tiled low
roofing;
iv. Hutments or flimsy structures with thin walls and roofs made of cheap tiles, asbestos
or galvamsed iron sheets or tetraced tenements with usually one or two rooms;
v. Thatched huts generally haviDg one room \\ith mud walls and COGoanut or palmyrah
leaves for the roofing.
The percentage distribution of types of building is given below;-
Bungalows 1'6
Apartment houses 15"7
TraditIOnal houses 56'2
With central courtyaru huts 9-0
Thatched huts 17'5
It IS also estimated that nearly one-third of all the dwellings in Madras City need replacement or
renovation.
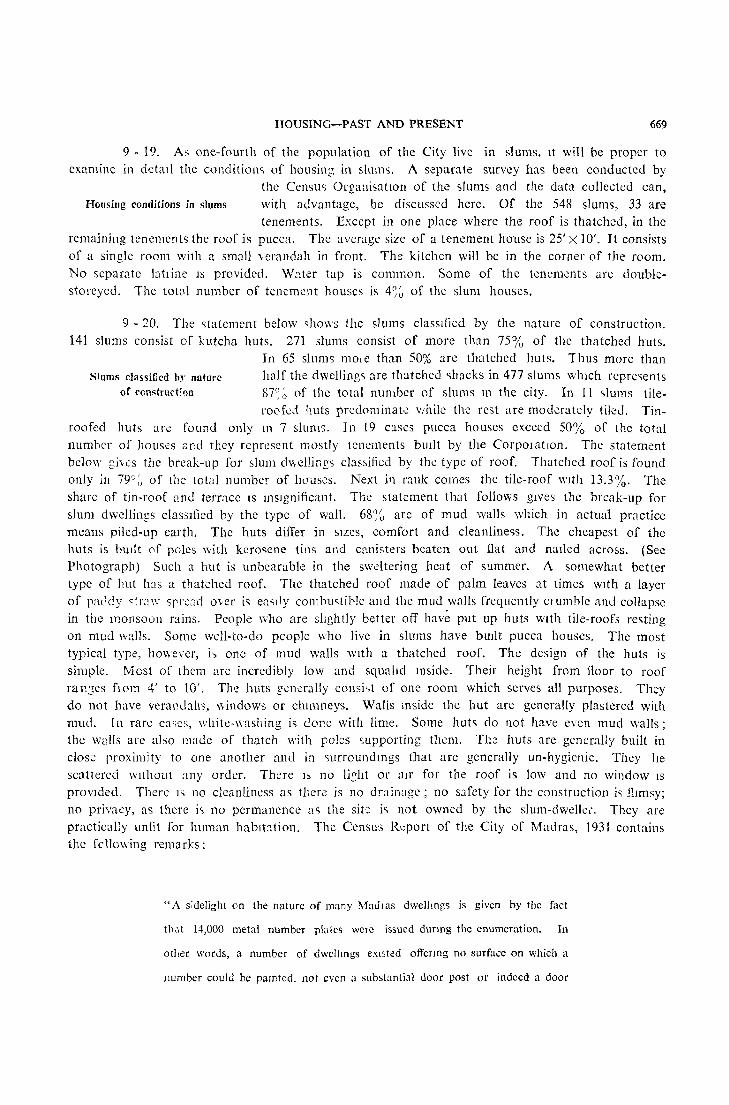
HOUSING-PAST AND PRESENT 669
9 - 19. As one-fourth of the population of the City live in slums, 1t will be proper to examine in dctall the condition,> of housing in sIUl1l'>. A separate survey has been conducted by
the Census Organisation of the slums and the data collected can, Housing conditions in slums with advantage, be discussed here. Of the 548 slums, 33 are
tenements. Except in one place where the roof is thatched, in the remaining tenement, the roof is pucca. The average size of a tenement house is 25' X 10'. It consists of a single room with a small verandah in front. The kitchen will be in the corner of the room. No separate hltJinc 15 provided. W;lter tap is common. Some of the tenements are doubJestoreyed. The tot0l number of tenement houses is 4~~ of the slum houses.
9 - 20. The ,>tatement below ,hows the slums classified by the nature of construction. 141 slums consist of kutcha huts. 271 slums consist of more than 75% of the thatched huts.
Slums c1as~if]cd by nature of construction
In 65 slums mo,e than 50% are thatched huts. Thus more than half the dwellings are thatched "hacks in 477 slums which repre'>ents 87~;) of the total number of slums 111 the city. In II 'ilums tile-roofd huts predominat~ while the rest are moderately tiled. Tin
roofed huts are found only m 7 slums. In 19 C:lses pucca houses exceed 50% of the total number of houses &rd they represent mostly tenements bUllt by the CorpOlatJOn. The statement below gi\cs the break-up for slum d\\eJlinr:~ classified by the type of roof. Thatched roof is found only in 79° ~ of the totd number of houses. Next ill rank comes the tile-roof WJth 13.3%. The share of tin-roof and terrace IS 1I1sJgnifieant. The statement that follows gives the break-up for slum dwellings classIfied by the type of wall. 68% arc of mud walls which in actual practice means piled-up earth. The huts differ in S1zes, comfort and cleanliness. The cheapest of the huts is bUIlt of pclcs with kerosene tins and canisters beaten out fiat and n:111cd across. (See Photograph) Such a hut is unbearable in the swdtering heat of summer. A somewhat better type of hut has a thatched roof. The thatched roof made of palm leaves at times With a layer of pa(ldy '~r:,\\' srread over i~ ensdy comhmtil::-Ie and the mud walls frequently clumble and collapse in the monsoon rains. People \vho are slightly better off have put up huts WIth tile-roofs resting on mud \v::llls. Some well-to-do people who live in slums have bUIlt pucca houses. The most typical type, however, i~ one of mud \valls wlth a thatched roof. The design of the huts is simple. Most of them are incredibly low and squahd Inside. Their height from floor to roof ran::;cs fJom 4' to 10'. Thi~ huts gcnerally consi~t of one room which serves all purposes. They do not have veraEuahs, \\indows or clllmneys. Walls lfiside the hut are generally plastered with mud. In rare cases, white-washing is done with lime. Some huts do not have even mud walls; the walls are also made of thatch with poles supporting them. Th;3 huts arc generally built in close proximity to one another and in surroundmgs that arc generally un-hygienic. They he scattered Without any order. There b no li.';'"ht or :ur for the roof is low and no window IS
provJded. There 1<; no cleanliness as tl~ere is no drainage; no safety for the construction is flJmsy; no privacy, as there is no permanence a ~ the sit~ i'i not owned by the slum-dwellCi. They are practically unfit for human hablt:1tion. The Ccnsu~ R(;port of the City of Madras, 1931 contains the fc Hawing remarks:
"A s;delight on the nature of many MauIas dwelliOg~ is given by the fact
th,lt 14,000 metal number plates were issued durmg the enumeration. In
other words, a number of dwcllmgs eXlsted offerIng no surface on which a
number could be pamted, not even a substantial door post or indeed a door

670 REPORT ON HOUSING AND ESTABLISHMENTS
at all. They consist generally of a low mud wall plus a palm thatch and can
be found in ro\\s In the heart of the city and on Its margl11~, gencraUy
associated with the dqlfessed classes and often bearing rents of surpnsmg
dimensions" .
The practice of supplying number plates still contmues. Only the number of slums has increased.
9 - 21. The Madras Sanitary Welfare Le:lgue \vhich made a general survey of the conditions of the slums in the City in 1933 bas alluded to the ill-planned and Ill-kept slum houses in the following words:
"The" cheries" are characterised by certain very definite feature. The first
of these is the hopeless state of the dwelling. The huts, which are generally
mad0 of mud and thatch or of old k<:losene tms, are low hovels, without any
aperture for light or air except a doorway so small that one has to stoop to
enter. The average size is 8 ft. by 9 ft. though many arc smaller. In some
"cheries" the huts are bUllt back to back, or are separated only by the
narrowest aUeys, with the result that there IS overcrowdmg 0f the very
worst kind. In most cases, the houses are so flimsy that they afford no
effective shelter dther in the monsoon or in the hot weather".
Statement IX-l
Slums clas!'>ificd by the nature of house construction
NaIll! e of contJlJctwn No. of slums
1
1. Thatched huts cent percent
2. Thatched huts above 75"u
2
141
271
3. (a) Thatched huts abo~e 50°:, & tIle roofed hut5 above 25°0 46
(b) Thatchcd huts above 50° ~ & tin-roofed huts above 25 ":, 5
: (c) Other cases-thatched huts above :O~u 14
4. Tiled huts above 75~~ 11
5. (a) TIled huts above 5W:) & thatched huts above 25,,, 19
(b) TIled huts above 50", & tin-roofed [Juts above 25",~
(c) Other cases-tIled huts above 5()"~ 4
6. Till roofed huts above 75~:, 3
7. (a) Till roofed huts abO\c 50":, & thatched huts ilbovc 25°:, 3
(b) Till roofed huts above 50":. & tile-roofed huts aho',e 25(",
(c) Other cascs-tm-roofed huts above 50" ~ 1
8. Huts WIth thatched. tiled and tin wofs abm e 50° v 10
9. Pucca houses cent percent 11
10. Pucca houses above 75"(, 5
11. Pucca houses above 50";, 3

HOUSING-PAST AND PRESENT
Statement IX-2
Type of roof in 5.lums
Type of lOof Number Percentage of houses
2 3
Total number of houses 59,573 100'0
Houses with thatched roof 46,934 78'8
Houses wnh tiled roof 7,940 13'3
Houses with tm lOof 1,294 2'2
Houses with oth~r roof 3,405 5'7
Statement IX-3
Type of wall ill slums
Type of wa I Number of houses Percentage
2 3
Total No, of houses 59,573 100'00
Mud 40,505 67'99
LTnburat brick 1,261 2'12
Burnt bnck 14,144 23'74
ethers 3,663 6'15
9 - 22, The iIlu~lrative photographs which follow will give the reader a visual inSIght into the type of dwellmgs found in the City bringing out shods of contrast. I now describe
a few typicdl houses of the Madras City which will be of interest Some typical houses to the reader. Their photographs are also enclosed, They
represent the various types of houses which can be found in different parts of Madras City, These houses can also be found in the other urban areas of Madras State,
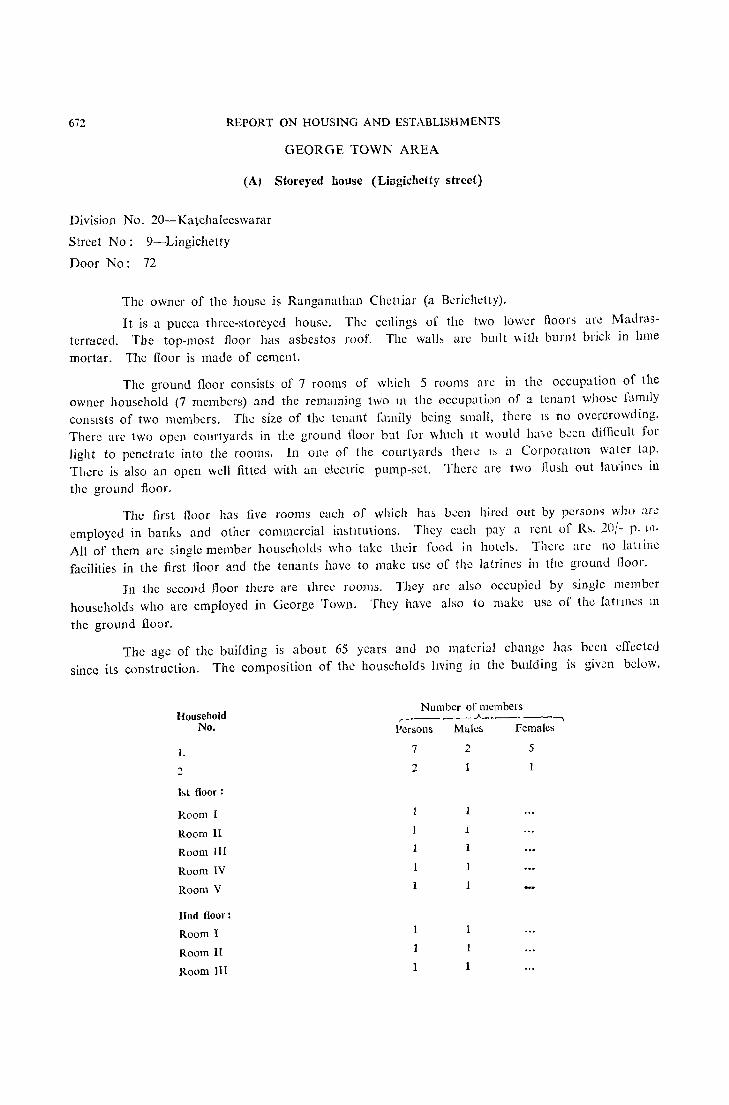
672 REPORT ON HOUSING AND ESTABLISHMENTS
GEORGE TOWN AREA
(AI Storeyed house (Lingichctty street)
Division No. 20-Katehaleeswarar
Street No: 9-Lingichetty
Door No: 72
The owner of the house is Ranganathan Chettiar (a Berichetty).
It is a pucca three-storeyed house. The ceIlings of the two lower floors arc Madrasterraced. The top-most floor has asbestos roof. The wal}:' arc bUIlt with burnt brick in lll1le
mortar. The floor is made of cement.
The ground floor consists of 7 rooms of which 5 rooms are in the occupation of the owner household (7 members) and the remaming two III the occupation of a tenant whose famIly consIsts of two members. The size of the tenant family being small, there IS no overcrowding. There are two open courtyards in the ground floor but for whleh It would ha've been difficult for light to penetrate into the rooms. In one of the courtyards theu: I, a CorporallOn watcr tap. There is also an open well fitted with an electric pump-set. There are two J1ush out latrine~ in
the ground floor.
The first floor has five rooms each of which has b-:en hired out by person<; who arG
employed in banks and other commercial instItutions. They each pay a rent of R~. 20/- p. Ill.
All of them arc single member households who take their food in hotels. Ther.; arc no latl ine facilities in the first floor and the tenants have to make usc of the latrines ill the ground noor.
J 11 the second floor there are three rooms. They arc also occupied by single member households who afe employed in George Town. They have also 10 make use of the latrmcs III
the ground floor.
The agc of the building is about 65 years and no material changc has been effected since its construction. The composition of the households hving in the buIlding is given below.
Household No.
1.
2
ht floor:
Room I
Room II
Room III
Room IV
Room V
lInd floor:
Room I
Room II
Room III
Number of members .-__ ~ __ .A-____ ---,
Persons Males Females
7
2
1
1
1
2
1
1
1
1
5
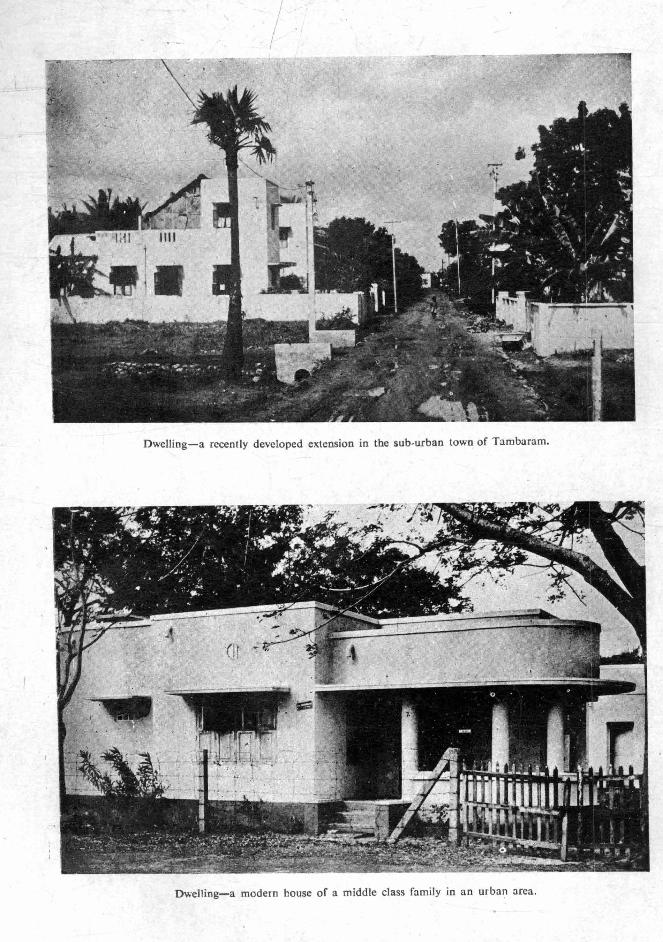
/ / I
DwelliDg-a recently developed extension in the sub-urban town of Tambaram.
Dwel1ing-a modern house of a middle class family in an urban area.
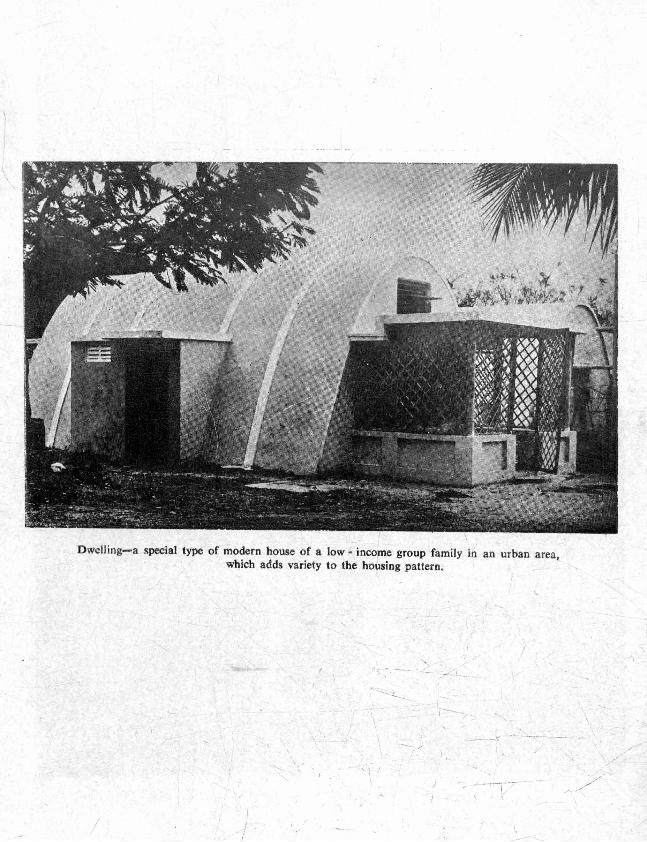
Dwell ing-a special type of modern house of a low - income group -family in an urban area, which adds variety to the ho~sing pattern.
I / /
"',1 I \
I -....._-;..-
--~
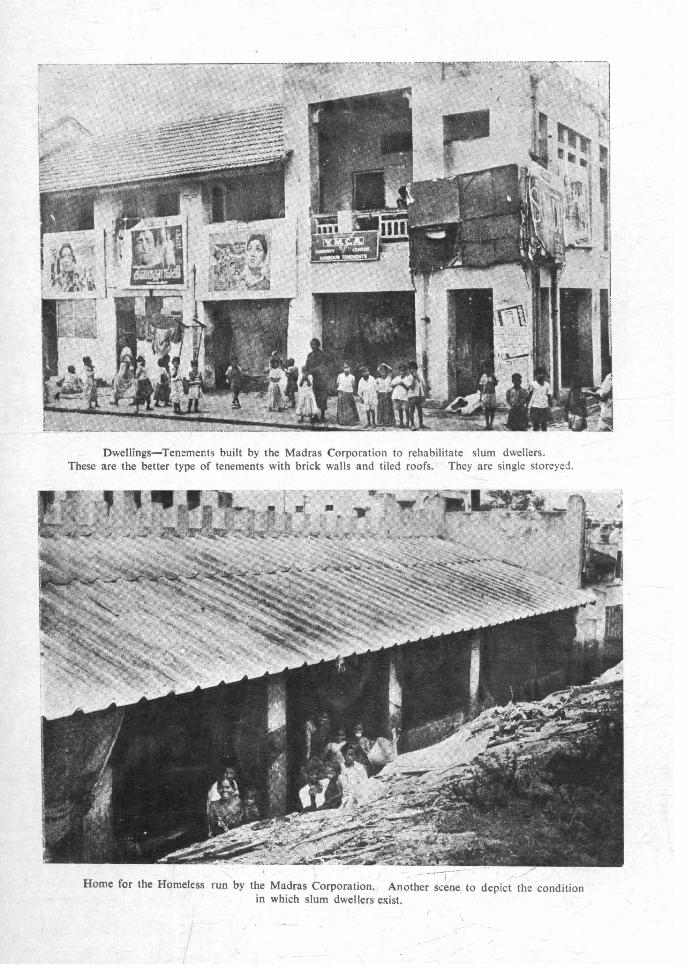
Dwellings-Tenements built by the Madras Corporation to rehabilitate slum dwellers. These are the better type of tenements with brick walls and tiled roofs. They are single storeyed.
; -""'\-Home for the Homeless run by the Madras Corporation. , Another scene. to depict the condition
in which slum dwellers exist.
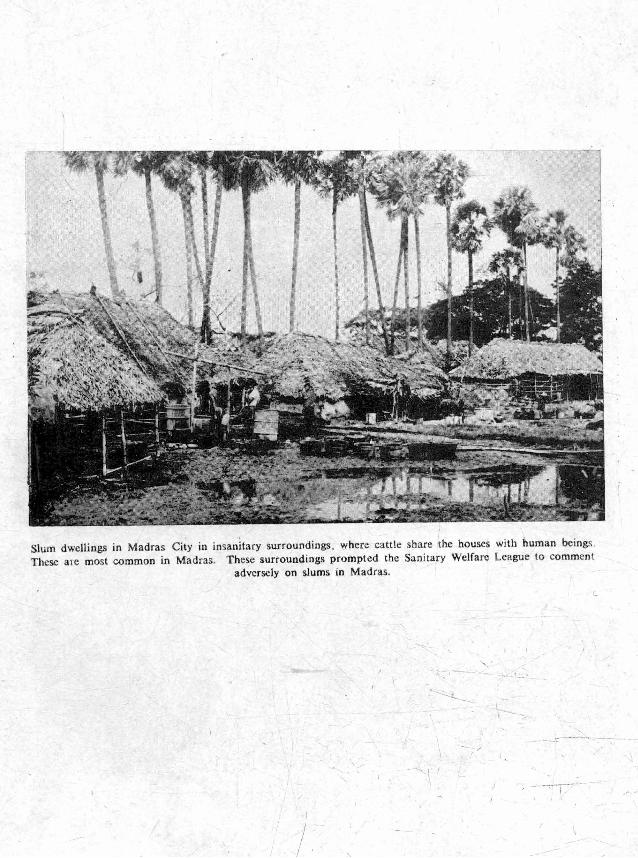
Slum dwell ings in Madras City in insanita ry surround ings , where cattle share the houses with human beings . These are most common in Madras. These surtoundings prompted the Sanitary Welfare League to comment
adversely on slums in Madras.
/
- '. I I \
._
--->::: -~.--,---.---
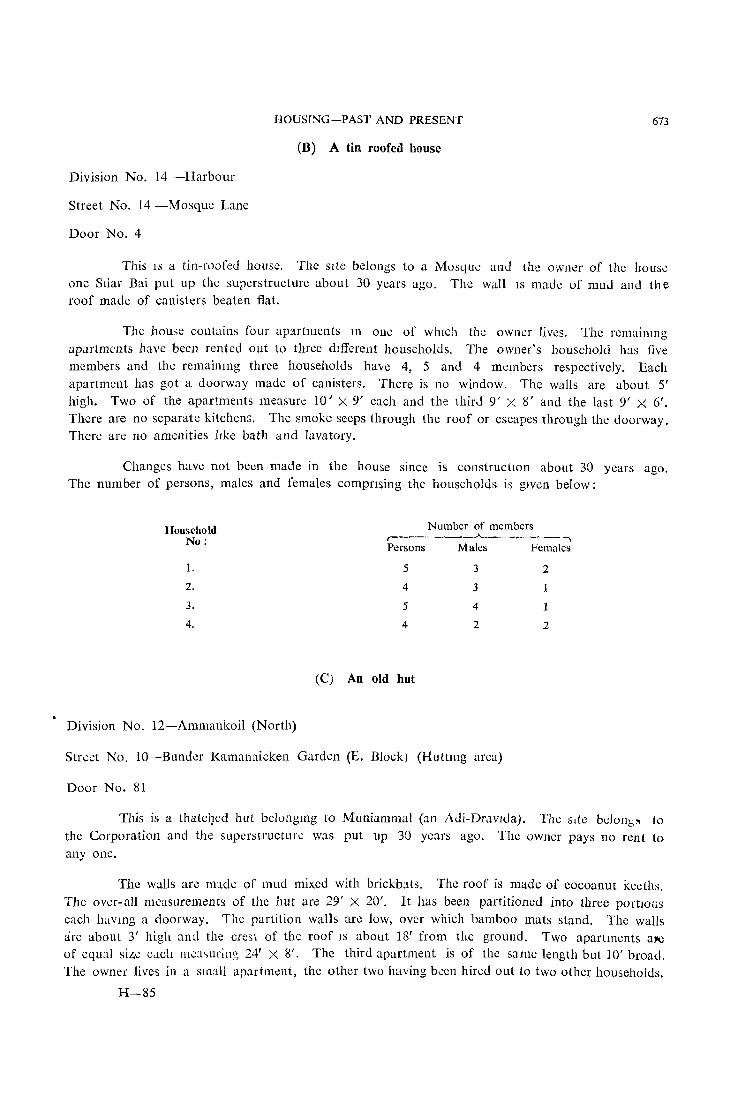
HOUSING-PAST AND PRESENT 673
(B) A tin roofed house
Division No. 14 -Harbour
Street No. 14 -Mosque Lane
Door No.4
This IS a tin-roofed house. The sIte belongs to a Mosque anJ the owner of the house one Sliar Bai put up the superstructure about 30 years ago. The wall IS made of mud and th e roof made of canisters beaten flat.
The house contains four ap::utments 111 one of whIch the owner liws. The remainmg apartments have been rented out to three dIfferent households. The owner's household has five members and the remail11ng three households have 4, 5 and 4 members respectively. Each apartment has got a doorway made of canisters. There is no window. The walls are about 5' high. Two of the apartments measure 10' X 9' each and the third 9' X 8' and the last 9' X 6'. There are no separate kitchens. The ~moke seeps through the roof or escapes through the doorway. There are no amenities like bath and lavatory.
Changes have not been made in the house since is constructIOn about 30 years ago. The number of persons, males and females compnsing the households is gIven below:
Household Number of members No: r------.A..-~ -.,
Persons Males Fcmalc~
1. 5 3 2
2. 4 3 1
3. 5 4 1
4. 4 2 2
(C) An old hut
Division No. 12-Ammankoil (North)
Street No. lO-Bunder Kamal1aicken Garden (E. Block) (Huttmg area)
Door No. 81
This is a thatc.l]ed hut belong1l1g to Muniammal (an AJi-Dr.:lV1da). The site bdonp to the Corporation and the superstructun; was put up 30 years ago. The owner pays 110 rent to anyone.
The walls are mldc of mud mixed with brickbats. The roof is made of cocoanut kl:eths. The over-all measurements of the hut are 29' X 20'. It has been partitioned into three portIOns each havmg a doorway. The partition walls are low, over which bamboo mats stand. The walls arc about 3' high and the crest of the roof IS about 18' from the ground. Two apartments aJIC of equal size eclch me:.t~ur;ng 24' X 8'. The third apartment is of the same length but 10' broad. The owner lives in a small apartment, the other two having been hired out to two other households.
H-85
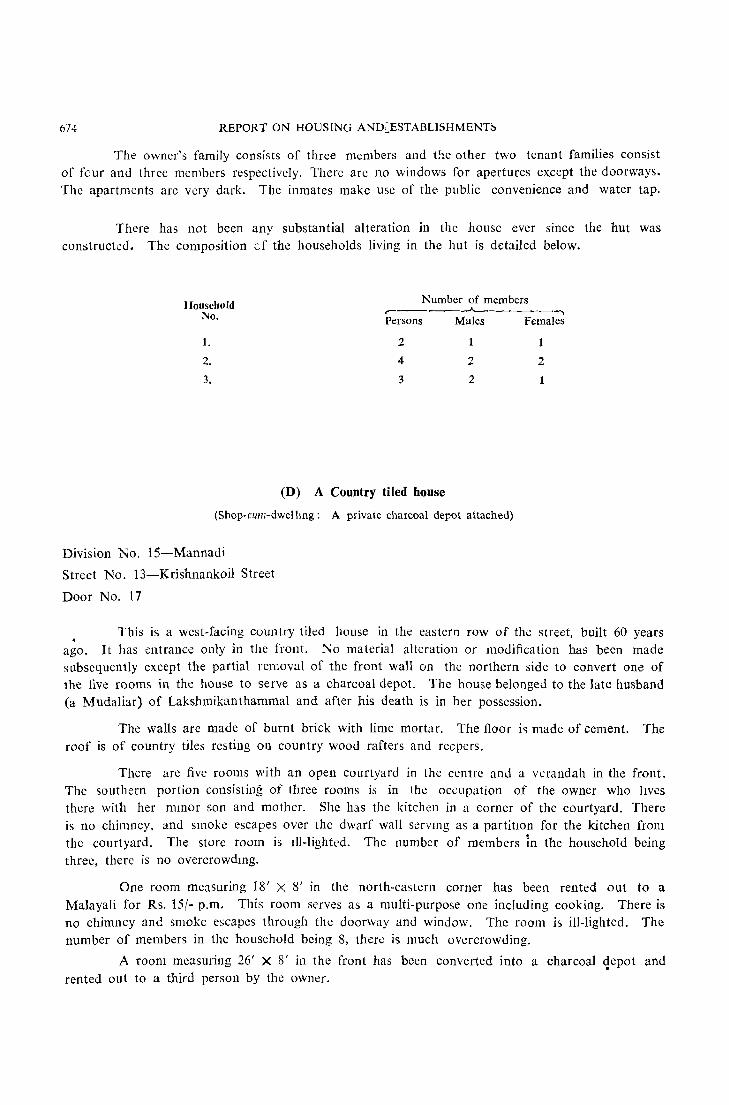
674 REPORT ON HOUSING AND~ESTABLlSHMENT~
The owner's family consists of three members and the other two tenant families consist of four and three members respectively. There are no windows for apertures except the doorways. The apartments are very dark. The inmates make use of the public convenience and water tap.
There has not been any substantial alteration in the house ever since the hut was constructed. The composition c.f the households living in the hut is detailed below.
Household No.
1.
2.
3.
Number of members ,..-_____ ..A.. ______ -,
Persons Males Females
2
4
3
(D) A Country tiled house
2
2
1
2
1
(Shop-cum-dwelhng: A private charcoal depot attached)
Division No. 15-Mannadi
Street No. 13-Krishnankoil Street
Door No. 17
This is a west-facing country tiled house in the eastern row of the street, built 60 years ago. It has entrance only in the front. No material alteration or modification has been made subsequently except the partial removal of the front wall on the northern side to convert one of the five rooms in the house to serve as a charcoal depot. The house belonged to the late husband (a Mudaliar) of Lakshmikanthammal and after his death is in her possession.
The walls are made of burnt brick with lime mortar. The floor i<; made of cement. The roof is of country tiles resting on country wood rafters and recpers.
There are five rooms with an open courtyard in the centre and a verandah in the front. The southern portion consisting of three rooms is in the occupation of the owner who lIves there with her mmor son and mother. She has the kitchen in a corner of the courtyard. There is no chimney, and smoke escapes over the dwarf wall servll1g as a partitIOn for the kitchen from the courtyard. The store room is Ill-lighted. The number of members in the household being three, there is no overcrowdmg.
One room measuring 18' X 8' in the north-eastern corner has been rented out to a Malayali for Rs. 15/- p.m. This room serves as a multi-purpose one including cooking. There is no chimney and smoke escapes through the doorway and window. The room is ill-lighted. The number of members in the household being 8, there is much overcrowding.
A room measuring 26' X 8' in the front has been converted into a charcoal qepot and rented out to a third person by the owner.
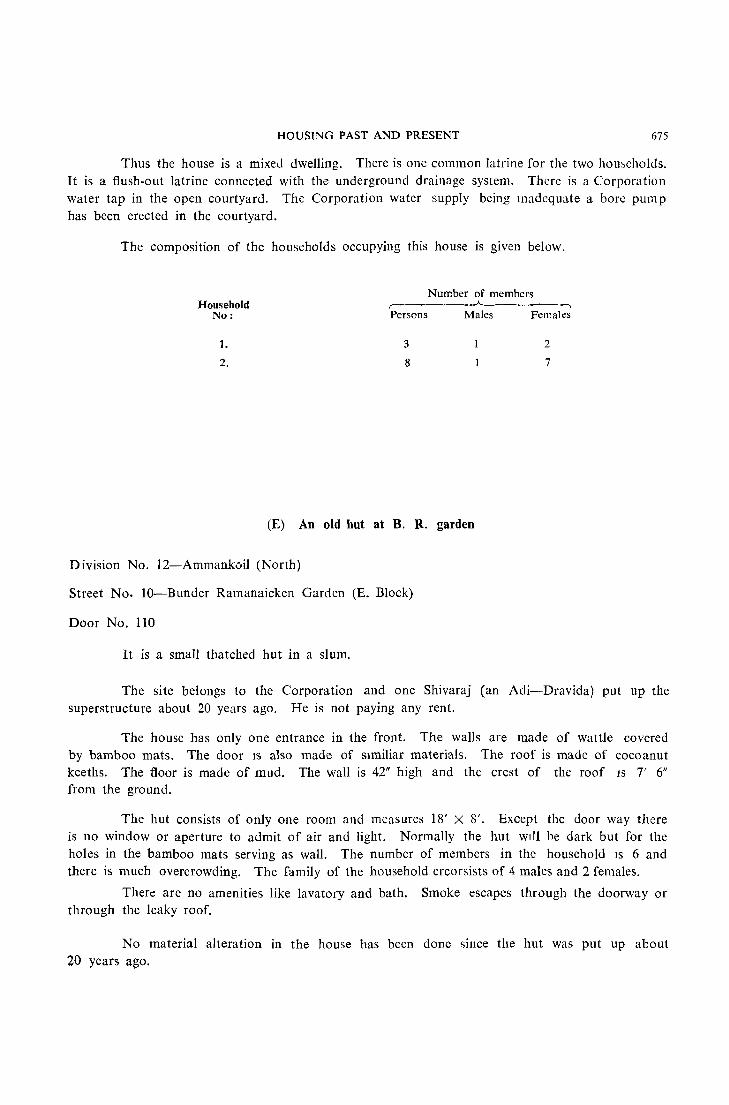
HOUSING PAST AND PRESENT 675
Thus the house is a mixed dwelling. There is one common latrine for the two hou~eholds. It is a flush-out latrine connected with the underground drainage system. There is a Corporation water tap in the open courtyard. The Corporation water supply being lI1adequate a bore pump has been erected in the courtyard.
The composition of the households occupying this house is given below.
Household No:
1.
2.
Number of members r-~-~----.A.------ -, Persons Males Females
3
8
2
7
(E) An old hut at B. R. garden
Division No. l2-Ammankoil (North)
Street No. lO-Bunder Ramanaicken Garden (E. Block)
Door No. 110
It is a small thatched hut in a slum.
The site belongs to the Corporation and one Shivaraj (an Adi-Dravida) put up the superstructure about 20 years ago. He is not paying any rent.
The house has only one entrance in the front. The walls are made of wattle covered by bamboo mats. The door IS also made of slmiliar materials. The roof is made of cocoanut keeths. The floor is made of mud. The wall is 42" high and the crest of the roof IS 7' 6" from the ground.
The hut consists of only one room and measures 18' X 8'. Except the door way there is no window or aperture to admit of air and light. Normally the hut WIll be dark but for the holes in the bamboo mats serving as wall. The number of members in the household IS 6 and there is much overcrowding. The family of the household ercorsists of 4 males and 2 females.
There are no amenities like lavatory and bath. Smoke escapes through the doorway or through the leaky roof.
No material alteration in the house has been done since the hut was put up about 20 years ago.
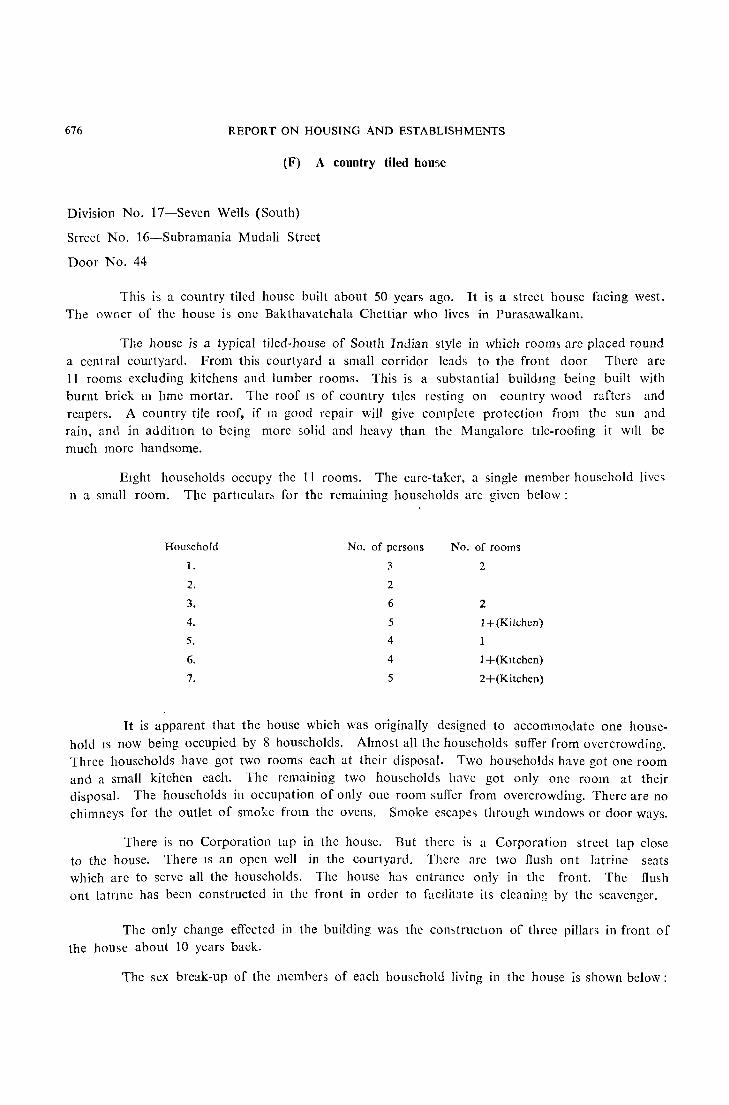
676 REPORT ON HOUSING AND ESTABLISHMENTS
(F) A country tiled house
Division No. 17-Seven Wells (South)
Street No. 16-Subramania Mudali Street
Door No. 44
This is a country tiled house built about 50 years ago. It is a street house facing west. The owner of the house is one Bakthavatchala Chettiar who lives in Purasawalkam.
The house is a typical tiled-house of South Indian style in which rooms are placed round a central courtyard. From this courtyard a small corridor leads to the front door There are 11 rooms excluding kitchens and lumber rooms. This is a sub~tantial buildIng being built with burnt brick 111 lIme mortar. The roof IS of country tIles resting on country wood rafters and reapers. A country tile roof, if III good repair will give complete proteclion from the sun and rain, and in additIOn to being more solid and heavy than the Mangalore hIe-roofing it WIll be much more handsome.
EIght households occupy the 11 rooms. The care-taker, a single member household lives n a small room. The partleular~ for the remaining households are given below:
Household No. of persons No. of rooms
1. 3 2
2. 2
3. 6 2
4. 5 1 + (K itchcn)
5. 4 1
6. 4 1 +(Kltchen)
7. 5 2+(Kitchen)
It is apparent that the house which was originally designed to accommodate one household IS now being occupied by 8 households. Almost all the households suffer from overcrowding. Three households have got two rooms each at their disposal. Two hou'ieholds have got one room and a small kitchen each. The remaining two households have got only one room at their disposal. The households in occupation of only one room suffer from overcrowding. There are no chimneys for the outlet of smoke from the ovens. Smoke escapes through wmdows or door ways.
There is no Corporation tap in the house. But there is a Corporation street tap close to the house. There IS an open well in the courtyard. There are two flush ont latrine seats which arc to serve all the households. The house ha<; entrance only in the front. The flush ant latrme has been constructed in the front in order to facilitate its cleaning by the scavenger.
The only change effected in the building was the COI1'>tructIOn of three pillars in front of the house about 10 years back.
The sex break-up of the memhers of each household living 111 the house is shown below:
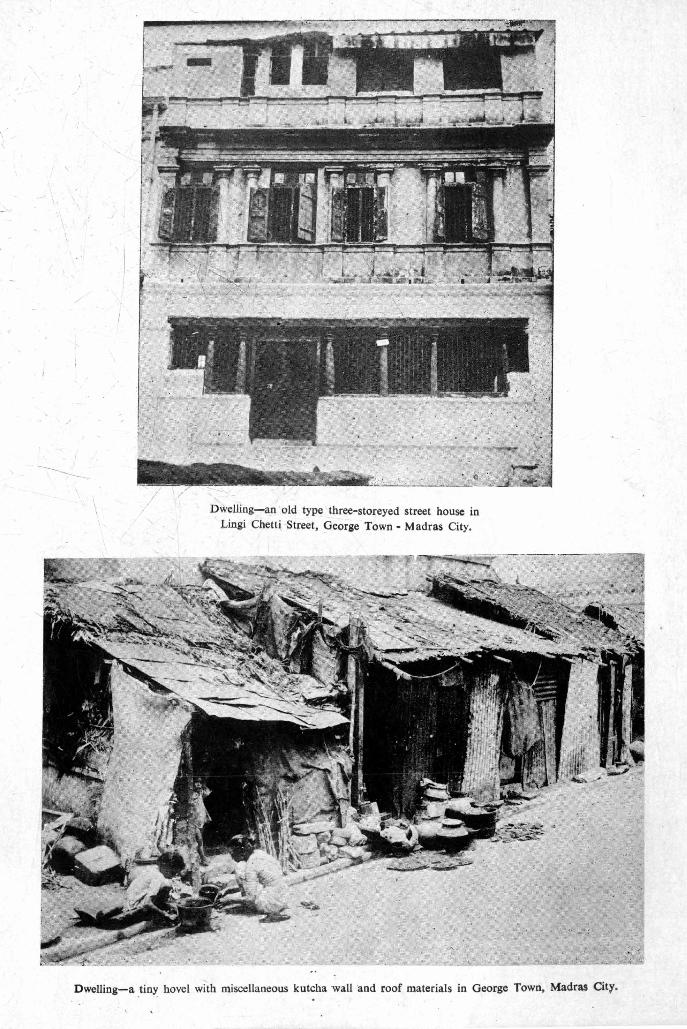
,-
"-Dwelling-an old type three-storeyed street house in \
Lingi Chett\ Street, George Town - Madras City.
Dwelling-a ,tin>: hovel with miscellaneous kutcha wall 'and roof materials in George Town, Madras Cit)'.

.Dwelling-a thatched house in a slum in George Town, Madras City (Roof material-Cocoanut keeths)'.
Dwelling-a' typical South Indian country - tile roofed house in George Town, Madras City accommodating eight households.
\
~\ 1
\ \
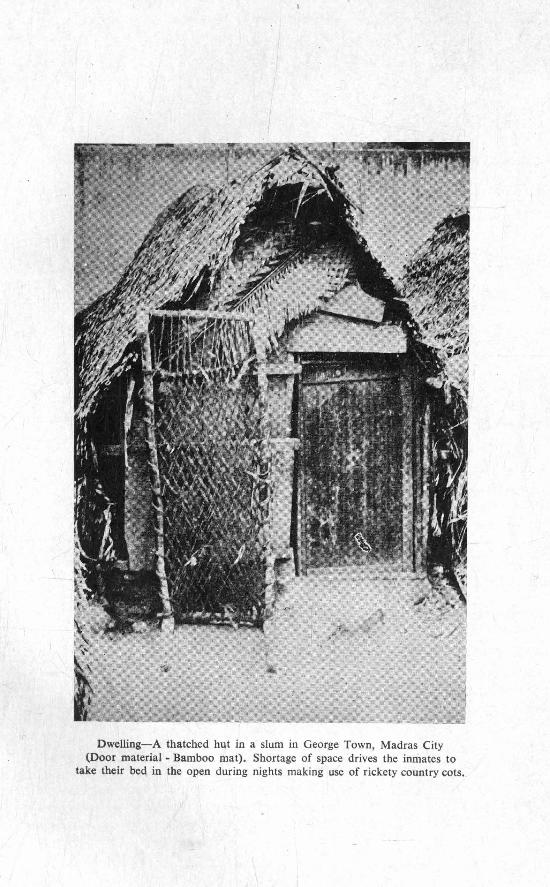
Dwelling-A thatched hut in a slum in George Town, Madras City (Door material - Bamboo mat). Shortage of space drives the inmates to
take their bed in the open during nights making use of rickety country cots.

HOUSING-PAST AND PRESENT
Household No.
1.
2.
3.
4.
5.
6.
7.
R.
Number of members r----->------"-.-------.. Persons Males Females
3
2
6
5
4
4
5
1
1
3
3
3
2
3
1
2
3
2
2
2
(G) A Modern bouse in Kilpauk
Division No. 52-Kilpauk
Street No. 39-Gajapathy Road
Door No. 4-A
677
The twentieth century man caught in the midst of a complex society and tremendolls technological advancement expects the house to serve much more than a mere protection against the elements. The house should reconcile and resolve all of his diverse requirements-economic, social and psychological. He, therefore, bestows considerable t):ought on evolving a proper design before buildmg a new house. He wants to make a departure from the traditional design and to achieve this end he tums to architects for professional advice.
To be of good design a house should be so planned and built that it will accommodate in the best manner possible all of the various and sundry activities that go on in it. This is what is meant by functional design. Beyond that, the house should give the appearance not only to its occup:lI~ts but alsJ to others, of being simple, comfortable, and interesting rather than ornate or disruptIve.
The modern house which we have chosen is a bungalow type house and it combines comforts with aesthetics. It is not traditional in design. Built in a four ground* plot in aeroplane shape in the year 1961 it aims at satisfying all the requirements of the famIly including provIsion for accommoc1ating domestic servants and guests. It IS aesthetically pleasing III appearance both inside and outside.
The bUIlding IS two st'Jreyed. In the ground floor there are four room<; anu a kitchen. The; rooms are airy and well lighted. The modern trend is to have a bath attached to every bed room. This principle has bcen observed. ConSIderable thought has been bestowed on the construction of the kItchen 111 which women spend much of their time. The kitchen has been so located in a corner to avoid any nuisance arising from the oven fclt in other parts of the house. There is aha a garage.
---------------.. A ground measures 60' X 10'.
678 REPORT ON HOUSING AND ESTABLISHMENTS
In the first floor there are five rooms. Here also the bed room has an attached bath.
The house has enough space in the backyard to raise a kitchen garden In fact there is a kitchen garden well maintained. In the front there is a small lawn.
The owner himself lives in the house. His family consists of five members and a domestic servant. "A man's house is his castle" is more than true in this case.
9 - 23. I will now take up for discussion the actual housing conditions in certain villages of Madras State. As far as possible, the villages selected are typical of the taluk in which they are located. Certain villages have been specifically selected as they represent peculiarities in regard to location. For instance, they are situated on the banks of a river or in the midst of a forest or on a hilly terrain and have a concentration of certain select tribes or castes. The discussion on these lines will, it is hoped, give a panoramic view of the housing conditions in rural Madras.
9 - 24. We may first take the case of Ayyangarkulam village in Chingleput District. This village is situated 50 miles south~west of the City of Madras in Kanchipuram Taluk of Chingleput
District about a mile away from the banks of the Palar river. Housing in Anangarkulam village The village is set amidst a level plain with wet fields around it.
The lands are mostly tank-fed. This village is one of the strongholds of Senguntha Mudaliars, a prominent silk and cotton weaving community. Other communitles living in this village consist of the Nattars and the Valluva Pandarams, a Scheduled Caste. There are two distinct types of dwellings in the village. One is the hut of the Valluva Panda ram constructed with mud walls and mud flooring and having a roof of palmyrah thatch or straw. In front of this hut is a tiny verandah which is usually an oblong mound of earth flattened to provide seating space. The interior of the hut consists of a single room. At one corner, we find a hearth which acts as a make-shift kitchen. The other portion is used for sleeping-cumsitting. The lighting and ventilation inside the hut are poor and the flooring being made of mud is usually damp. The roofing is also low and always leaky during the rainy season. Th'~ cost of each hut ranges from Rs. 600 to Rs. 800.
9 - 25. The other type of dwelling is the house built with kiln-burnt brick,> and flooring made either of cement or mud. The roofing consists of country tiles whICh are placed over the country wood rafters and walls are plastered with cement mortar. The value of the site is usually anything between Rs. 400 and Rs. 600 and the cost of construction of ea~h house is in the range of Rs. 10,000 to Rs. 12,000. Materials for building are, however, very eaSily available locally. The bamboo thatch and bricks and tiles are manufactured in the Village itself, the latter being made in country brick kilns. Cement can be had only from Kanchipuram town.
9 - 26. The house of Senguntha Mudahars in this village is architecturally conditioned by his occupation of weaving and so the room in the front portion has to be set apart for fixing
a loom. A pucca cement plastered verandah is invarIably found Houses of Scnguntha Mudaliars in the houses of these Mudaliars. Next to thiS verandah, there is
another room which IS used for the purpose of fixing a loom and for storing implements needed for silk weaving. This room has two apertures to let in light and air. The courtyard on the side with a hall and another room is used as a kitchen completing the ground plan of the house. The hall is used as a sleeping apartment. Thus, the contention held earlier in this report that the size of the house and its plan depend also on the type of occupation practised by the household is borne out by the example of the house of the Senguntha Mudaliar. The VIllage is clearly segmented into well-defined units indicative of the relative prosperity of the various communities as also within each community. Thus, in the village, we come across segments in which Senguntha Mudaliars live in three streets, Kil theru, Nadu theru

HOUSING-PAST AND PRESENT 679
and Mel theru. Mudaliars living in Nadu theru have terraced houses with walls constructed of bricks and flooring of cemcnt. Mudaliars lIVing in Kil theru have houses built of mud with palmyrah thatch though we find occasionally a house or two tiled, with walls built of brick. Mudaliars living in Mel theru, though prosperous, have not attained the standard of living compared to those located in Nadu theru but still possess houses tIled and built of bricks. In the streets occupied by the Nattar commumty almost all the houses are constructed of mud with mud floonng. In the Valluva Pandaram colony, for instance, all live in huts constructed of mud with palmyrah thatch. Thus, it IS apparent that the housing conditions depend to a large extent on the relative prosperity of the occupant and his own personal inclinations.
9 - 27. Coming next to North Arcot District, we have Paravakkal village in Gudiyatham Taluk. Paravakkal means literally a place strewn with stones. Situated on a plain it is
surrounded by numerous hillocks varying in height from 100 to Paravakkal village of North GOO feet. These hillocks have little or no vegetation. Boulders
Arcot District of various sizes and shapes lie scattered all around the vlllage. The flora of the village is also not varied and is monotonous.
Neem, tamarind, palmyrah and cocoanut trees sparsely dot the landscape. With a scanty ram fall of 33 inches annually, the village has very little to boast by way of vegetation. A forest stream runs through the Village and virtually bisects the area into two distinct segments. On the southern side of the stream, the high caste Kammas who are the most economically forward of the communities extant in this place live. On the other side of i.t live the communities like the Madaris, 'Oddars and Parayans. Kammas live in well-built brick houses and in the main village there is no other caste except a member belonging to the Pillai community. The majority of the other people belonging to the various communities live in houses built of mud, stone, bamboo, leaves or grass. All the building materials except mud and grass are obtained from the nearby Gudiyatham town, 5 miles away from the village. At times, during the non-rainy season, the soil is utilised to manufacture country bricks and tiles which are required for construction of pucca houses. However, all the locals are unskilled workmen and the services of masons have to be obtained from outsipe. Only in the case of pucca houses, plans are drawn and foundations laid with brick or blue metal mixed with hme. The buildmgs have two, four or six rooms surrounding a single or double open courtyard. A long verandah runs around the courtyard connecting the various rooms in the house. The other kutcha houses have no plans and are having single rooms. The pucca houses are built of bricks and are cement or lime plastered. Floors are of cement and the roofs are terraced or tIled. Kutcha houses have walls of mud with bamboo covered with either grass, hay or palmyrah leaves. The mud flooring of these houses is smeared with cow-dung once a week to make it smooth and hard. In constructing these huts, household members take active part and often neighbours lend a helping hand. Of the 218 houses in Paravakkal, only 6 are rented, but others are owned. There are 36 brick houses with tiled roofs and of the remaining kutcha houses, 103 have palmyrah thatch, 41 cocoal1ut thatch and 27 grass thatch. All the kutcha houses have mud walls and mud floors. This is almost the normal pattern obtaining in North Arcot District.
9-28. Coming to South Arcot DIstrict, we have Lakkinayakkanpatti of Kallakuriclu Taluk. This village is primarily agricultural. Situated at the foot of the Kalrayan group of hills, It is one of the most underdeveloped villages in Kallakurichi Taluk. On the east and south, tile Rangappanur Reserve Forest forms the natural boundary. Kalrayan hills look down upon this VIllage In its northern extremity and to the west, Mukunda Nadhi meanders its way past the village. This IS a remote VIllage away from any means of transport and communication. PrimarIly rocky, the soil is not fertile and rainfall rarely exceeds 30 ll1ches at any time.
680 REPORT ON HOUSING AND EST ABLlSHMENTS
Only dry cultivation is possible, as the Mukunda Nadhi remains dry for the greater part of the year, i.e., cholam, ragi and cumbu are cultivated. Sandal wood, tamarind, necm, bamboo
and a number of forest trees grow abundantly in Kalrayan hills Lakkinayakkanpatti of to the north of the village. Therefore, bamboo, country wood, grass
South Arcot District and mud form the chief raw materials that go to make the hut in this vmage. For the vertical supports and beams, country wood
is used. Bamboo is bought from the Kalrayan hills after paying a nommal toll of 25 nP. per head load. Country wood beams are illiCitly plocured from the reserve forest. Mud i~ dug from the local tank. Cement, bricks, tiles and lime mortar are rarely used. In Lakkinayakkanpatti, except for six bnck houses, all others are huts. The huts are arranged on either sidc of the broad streets. The walls are mud-built. Tn some cases, straw is mixed with mud to reinforce the structural material and to prevent cracks in country wood beams, bamboo rafters are laid at intervals of 1 ~ inches. 1 he bamboo roof work is covered wi th a local variety of grass known as "VIZHAL ". Cocoanut and palmyrah trees are scarce and thatched roofs are uncommon. Depending upon the type of construction, the houses in Lakkinayakkanpatti may bc classified into three broad groups. First are those huts which house only one household each; second, those huts which house many households and third those huts which house only one household each and have an additional provision for a cattle shed either at the front or in the back yard. The first type of houses are 15 to 25 feet long and 15 feet broad. Again these can be sub-divided into two categories, one which has a pial or verandah in front and the other which docs not have this. The second type of huts are those used by the poorer sections of the population who cannot afford individual houses. Here three or four families arc huddled togcth..:r and they unitedly construct a long hall shaped hut. Later, this hall is partitioned and separate entrances are provided in front. Houses of this type easily excced 50 feet in length and 12 to 13 feet broad. The ceiling is constructed at a height cf 12 to 13 feet. The third type of houses are owned by the people of well-to-do sections of the population. They have a verandah, kitchen with a cattle shed at the back or in front. Small lanes on either side of the house facilitates the movement of cattle to and fro. No plans are drawn before construction and yet houses are similar in type. Cement is not used and white washing is rare. The foundation consists only of rubble stones. Tbe roofing is re-done once in five years. The majonty of the houses have no doors nor a window and have small circular vents which acts as substitutes to regular windows. It costs about Rs. 60 to Rs. 100 to construct a medium sized hut. Big huts cost as much as Rs. 300. The mud from the local tank, the straw from the recent harvest, the bamboo and other country wood from the adjoining reserve fore3ts are heavily indented upon which keeps down the cost to the minimum. Even the usc of tron n:111s is rare. Regardll1g congestion, it is found that the pattcrn is the same obtaining everywhere Of the 391 households in Lakkinayakkanpatti, 93 per cent or 364 livc in smgle rooms formltlg 91 per cent of the total population. 21 households live in two rooms and 4 in three looms. They form only 7 per cent and 1.3 per cent of the total popUlation rcspectlvdy. On an averagl.:, each household has 1.1 room for the entire village and in cach room 4.5 persons live.
9-29. Moving towards Thanjavur District, we have Vilangulam a coa~tal v!Ilage si,uated in Pattukkottai Taluk. It is located at a distance of 59 miles from Thanjavur, the dlstnct headquarters,
and 29 miles from Pattukkottai, the taluk headquarters. Vilangulam ViIangulam in Thanjavur is an interior Village not connected either by bus or by rail. This
Di~trict Village is situated 11 miles from the Bay of Bengal. The soil here IS arenaccous and, therefore, is worthy of spec!:!l ~tudy as far as
housing conditions go. The village is blessed with an equable climate with an annual average ralllf.tli of 40inches and temperature ranging from 76°F to 90°F. The following commUnIties live in this villag.::
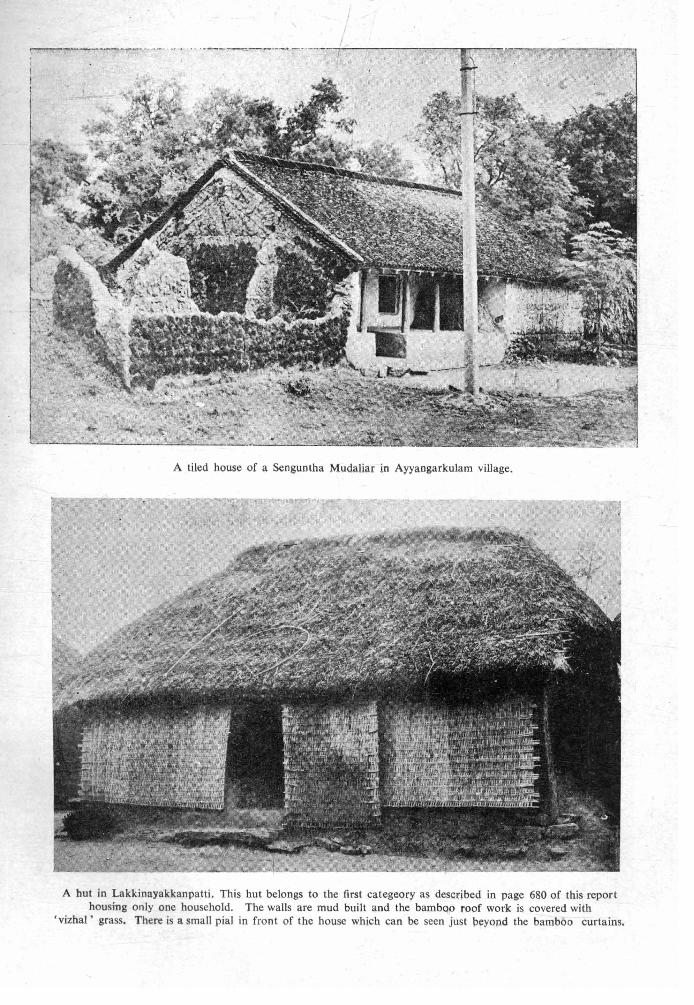
A tiled house of a Senguntha Mudaliar in Ayyangarkulam village.
A hut in Lakkinayakkanpatti. This hut belongs to the first categeory as described in page 680 of this report housing only one household. The walls are mud built and the bambQo roof work is covered with
'vizhal' grass. There is a small pial in front of the house which can be seen just peyopd the bamboo curtains.
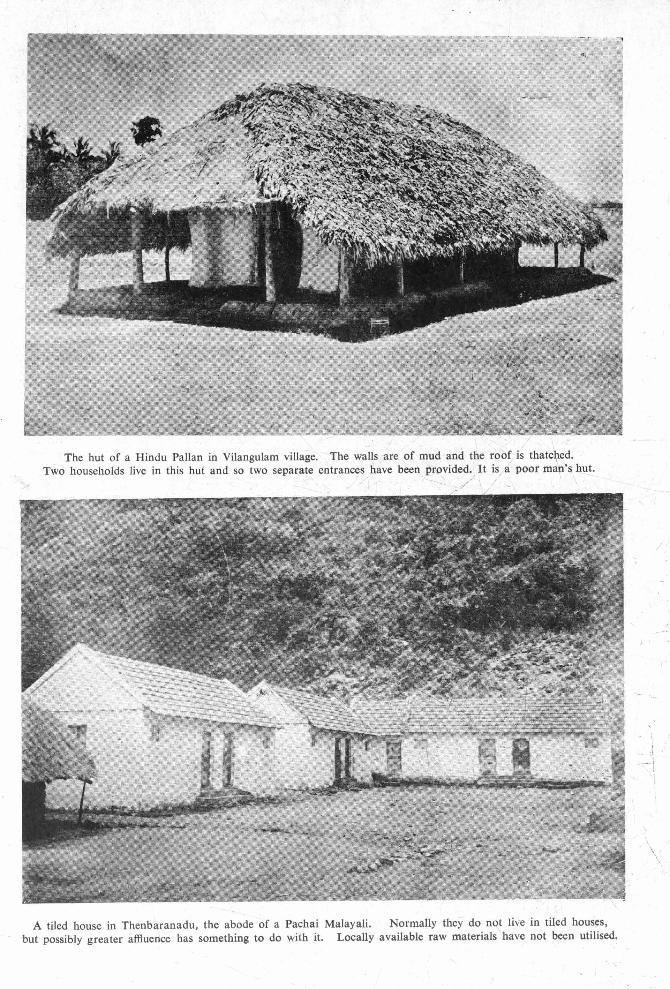
The hut of a Hindu Pallan in Vilangulam village. The walls are of mud and the roof is thatcQ.ed. Two households live in this hut and so two separate entrances have been prpvided. It is a poor ma'n's hut.
_. - -- ,/ // ' '- /" , '-.
/
~\ I
\ \
A tiled house in Thenbaranadu, the abode of a Pachai Malayali. Normally they' do not live in tiled houses, but possibly greater affluence has something to do with it. Locally available raw materials ' have not been utilised.

The hut of the plantation lobourer and the Chakkilians. These are single roomed and the walls are of bomboo poles and banana bark. Roof is of cocoanut leaves and grass.
A stone walled and Mangalore tiled house in Sirumalai. Stone walls are uncommon and Mangalore tiled roofs are the preserve of a few rich planters as tiles and stones have to be transported from the plains and quarries
at great cost.

A Scheduled Caste hut in Thiruvalavayana Ilur village of Madurai District. Flooring is of mud and the walls are of mud too. Palmyrah thatch is used for the roof.
A hut of the Pachai Malayali of Pappanaickenpatti villag~. Salem District. Th6 roofing IS' of Kan~~gu gra~/ Walls and flooring are of mud. Ba~boo chicks partiti~n ,the front portion into ' a verandah. '
/
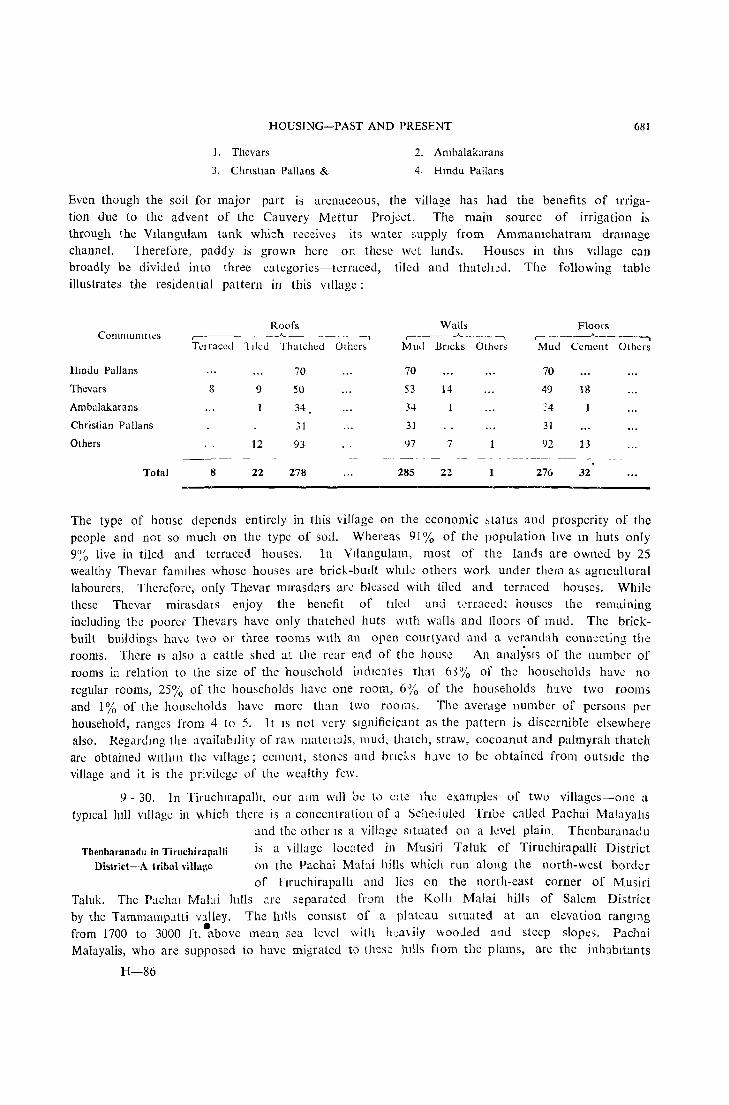
HOUSING-PAST AND PRESENT
1. Thcvars
3. Chnstlan Pall,ms &
2. Ambalakarans
4. Hmdu Pallnns
6~1
Even though the soil for major part is arenaceous, the village has had the benefits of lrrigation due to the advent of the Cauvery Mettur Project. The main source of irrigation i~
through the VIlangulam tank which n::ceivcs its water supply from Ammamchatram dramage channel. ] herefore, paddy is grown here on these wet lands. Houses in thJS vlliage can broadly b~ divided into three categories-terraced, tiled and thatched. The following table illustrates the residential pattern in this vIllage:
Roofs Walls Floors Commul1lt'.:s ,.----~---
__ ._A._ ___ -, ,.-__ ..A_ • __ ~-, r- _~ _ __A_ ___ _.
TClraccd Tiled Thatched Other, Mud Bncks Others Mud Cement Others
IIlDdu PaHans 70 70 70
Thevars 8 9 50 S3 14 49 18
Ambalakarans 34 34 :'4
Christian Pallans 31 31 31
Others 12 93 97 7 92 13 ----- - -_------ ------
Total 8 22 278 285 22 1 276 32
The type of house depends entirely in this village on the economic ~tatus and prosperity of the people and not so much on the type of SOlI. Whereas 91 % of the population Itve 111 huts only 9~~ live in tiled and terraced houses. In Vllangulam, most of the lands are owned by 2S wealthy Thevar familIes whose houses arc brick-built whIle others work under thel11 as agrIcultural labourers. Therefore, only Thevar ITIlrasdars arc blessed with tiled and terraced houses. While these Thevar mirasdat s enjoy the benefit of ttled and t,;rraced: houses the remaining including the poorer Thevars have only thatched huts With walls and floors of mud. The brickbuilt buildings have t,,/o or three rooms With an open courtY,lrd and a verandah connecting the rooms. There I~ also a cattle shed at the rCar end of the house An analYSIS of the number of rooms in relation to the size of the household indicates that 63% of the households have no regular rooms, 25% of the households have one room, 6% of the households hwe two rooms and 1 % of the households have more than two rooms. The average number of persons per household, ranges from 4 to 5. ]t IS not very slgnificicant as the pattern i~ discernible elsewhere also. }{egarumg the availabIlity of r3\\ matellals, mud, thatch, straw, cocoanut and palmyrah thatch are obtained wltJlln the village; cement, stones and brICks luve to be obtained from outsIde the village and it i'> the privilege of the wealthy few.
9 - 30. In Tiruc1mapalb, our aIm WIll be to clte the examples of two villages-one a tYPJCal lull Village in which there is a concentration of a Scheduled Tnbe called Pachai MaJayahs
and the other IS a village situated on a lcvd plain. Thenbaranac1u
Thenbaranadu in Tiruchirapalli is a village located in Musiri Taluk of TiruchirapaUi District Distl"ict-A tribal village on the Pachai Malai hills which run along the north-west border
of Tlruchirapalh and lies on the north-east corner of Musiri Taluk. The Pachal Mabi hills arc separated from the Koll! Malai hills of Salem District by the Tammamp.ltti valley. The hills consist of a pl:lleau situated at an ckvation rangmg from 1700 to 3000 ft. ·above mean sea level with h~a\ily wooded and steep slopes. Pachai Malayalis, who are supposed to have migrated to th~sc hills flOm the plams, are the inhabItants
H-86

682 REPORT ON HOUSING AND ESTABLISHMENTS
of this village. The village is purely tribal in character and is not easily accessible by moderrt means of transportation. The flora of this village is mostly mountainous in variety and as the village is surrounded by thick forests, rare medicmal plants and herb~ are available in plenty. The climate is not hot but rather warm is summer and very cool in the months of October to December. The Village is blessed with heavy rainfall mostly during the north-east monsoon between November and January. The soil is mostly red-clay and loamy. The houses in this village being entirely constructed by the Pachai Malayalis are based to large extent on the climatic conditions and economic status of the inhabitants. People in this VIllage live in houses WhICh may be mistaken at a distance for huts. On a closer scrutiny, it is found that they are neither a pucca house nor a hut as the term is meant to usually convey in villages elsewhere. Their houses are mid· way between the common hut and its ncher cOllsin, the brick-built building. Generally, houses in Thenbaranadu do not possess a number of rooms. A kitchen is marked out by having a partition in the room. People sleep and live in the other portion. The door-way of the hut is very low and even those who are sub-normal 1Il height have to bend their bodies almost double in order to enter the huts. Outside these huts, on both sides of the doorway, there are raised platforms in each house which are used for sitting. In all these huts, there are lofts constructed of bamboo poles placed lengthwise on the beams and tied with twigs so that it could be used as a strore-house. Each house has a bamboo ladder to climb to this loft. There are very small apertures in the window; a large window is an impediment to preserve warmth in the interior. Regarding building matcrials which go into the construction of the house, the basement and walls are constructed with rubble stones which are not properly dressed and clay bricks are not used at all. Generally, lime is not used as a c~menting material and neither is cement used. However, there are a few instances, depending on the economic status, where cement or lime mortar is used for flooring of the house. After the walls are initially constructed, they are plastered with mud and painted with clay plaster. Sometimes, the red soil available is mixed with water and used for the purpose. The windows and doors are made of country wood and occasionally of teak which is available in the forest nearby. The remarkable feature about the houses in Thenbaranadu is, apart from a few iron nails, screws, bolts and nuts on the doors and windows, no other Iron and steel artIcles are used in any form during construption. The windows and doors are made of wood; windows and doors are ~eldom painted. A few wealthy Pachai Malayalis raise platforms outside, which are cemented, the majority of the houses having only mud platforms. The doors and windows are also made of country wood. The roof is constructed by tying bamboo and country wO:Jd rafters together with a kind of a twig locally available. Afterwards a kind of grass called "SEEVU" is cut from the adjoining places and sprcad on the frame work and once again tied with this. This superstructure- acts as a kind of air-conditionlllg to keep the interior of the room warm during the rainy and cold seasons. Thus, it IS found that the building materials are available to the villagers locally and are acquired WIthout greater effort or incurring much expenditure. Bamboo, country wood, mud, rubble, twigs, and wild grass-all these materials are gathered from the adjoining forests and patta lands. Only such of those who can afford to do so, buy cement, lIme mortar and costly timber to make windows and doors. The stone and tiled houses are not preferred due to the superstitious belief that Gods would get angry; out of 382 houses only 14 are tiled, the rest are thatched. Thatched houses are preferred to tiled houses in this village mainly because of the cold and the belief that the thatched houses preserve more warmih than tiled ones. Regardmg living condItions in this village, 397 households live "'in 405 rooms; this works out to an average of one room per household. But it is not indicative of congestion as people mlll:.lgc to !lve as comfortably as possible within the room. The richer the household, the m'Jre comfortable they live.
HOUSING-PAST AND PRESENT 683
Thus, 12 households with a total of 72 persons have 2 rooms each, 2 households with a total of 10 people have three rooms each. But the general economic status being one of low incomes, people live only in one-roomed houses. Sinee the climate is not too severe, there is not much of rainfall. The roof and wall materials of the houses are not the same as we are likely to come across in Nilgiri District or in Kodaikanal Taluk of Madurai District and Yercaud Taluk of Salem District. But, since the village is situated at an elevation of 3,000 feet, with climatic conditions differing considerably from the plains, the types of houses differ to a· certain extent from those in the plains but only to a slight extent.
9-31. Coming next to a village in Tiruchirappalli District situated on the plains, we may take the case of Ariyur. It is situated 12t miles south - west of; Karur, the taluk head
quarters. The village extends over a total area of 3,492 acres Ariyur in TiruchirapalJi
District
of which 2,787 acres are rain-fed and about 500 acres are irrigable with well water. There are no rivers or canals to irri-gate the land. The village is situated on plains without any
hills or forests nearby. The village is blessed with a dry climate and the annual rainfall is about 15 inches. The village consists of red soil of differing qualIties. There are trees lIke the neem, tamarind, palmyrah and cocoanut in this village. Agriculture is the predominant occupation of the majority of the people in this village. Since the soil consists of red loam, paddy, tobacco, chillies and millets are grown.
9-32. All the materials used in the construction of houses are not locally available to the villagers. The materials used for walls are mud, granite stones, bricks, lime, sand and cement. Materials used for roofing are Mangalore tiles, bricks and lime and thatch. The flooring is usually a thick layer of mud plastered with cowdung; occasionally, cement is also used for flooring. The timber used for roofing is taken from the surrounding trees like the neem, tamarind and palmyrah and bamboo. Granite stones are occasionally used. But these have to be procured from outside though the mud used both in the wall and roof is locally available. Bricks are, however, locally available by using the soil for the manufacture of this item in country brick-kilns. Tiles have, however, to be procured either in Karur or from Kangayam which is about 30 to 40 mIles away from the village. Cement is also procurable from Karur. The constru:tion of houses follow the same pattern as found elsewhere in the State and there are no peculiar variations. There are about 40 houses with tiled roofs, and houses with brick walls and tiled roofs are mostly found among the cultivating class. But the majority of the houses are thatched with mud walls. Of the houses of Scheduled Caste popUlation, they have thatched roofs with mud walls; but the houses of Vannia Gounders, the land owning class in this VIllage, are of the mixed type, the poorer among the Vannia Gounders possessing houses like the Scheduled Castes where as the richer people, about 40 of them, owning brick houses. It is found that of 404 households in the village, 308 households are single roomed. 79 households have two rooms and 9 households have about three rooms and 5 households occupy four and more rooms.
9-33. From Tiruehirapalli District we proceed southwards to study housing conditions in Madurai DIstrict by taking a sample of two representative villages, one located in
hilly terrain and the other on a level plain. We shall first Sirumalai village of take the example of the village nestling on a hilly terrain.
Madurai District The Sirumalai hills known for the richness and variety of its plantains lie 16 miles north of Madurai City, in Dindigul
Taluk of Madurai District. On a plateau in the:;e hills, the village of Sirumalai nestles at an altitude of nearly 4,000' above sea level. The terrain being hilly, the village enjoys a
684 REPORT ON HOUSING AND ESTABLISHMENTS
moist, cool climate. Red sand and red lo::tm mostly are the soil varieties found here. The soil is fertile and ideally suited for the growth of plantation crops like the banana, coffee and citrus fruits lIke lemons and oranges. The houses here are found in clusters but are scattered over dIfferent slopes of th;; hills except in one hamlet called Chakkilipatti which is populated, as is evident by the name, by the ScheJuled Caste of Chlkkiliars where the houses are clustered close together. The following table indicates the types of dwellIngs III
SirumalaJ.
Wall r---~- __.i~"
Matenal No. of houses
Mud
Stone
Plantain bark
Bncks
Total
328
43
34
13
418
Roof r-------..A.. .. -----,
Matenal No. of houses
Thatch
Tm sheet
Tile
Total
293
86
39
418
9 - 34. It is obvious from the figures quoted above that the majority of the houses are constructed of mud walls with thatched roofs. Stone walls account for 43 or 10.3%. It was found that only well-to-do planters own these stone houses. Stones are quarried only from the adjoining hills and the lack of proper e::>mmunieatio:1 facilities leads to the high co,t of transportation and, therefore, even though people prefer to have stone walls, the prohibitIve cost precludes the majority from constructing thIS type of houses and they have to be content WIth mud houses. Since the main plantation crop in this village is banana, poor people like plantation coolies use plantain barks as roof matenal, since they are obtained locally, and free of cost. There are only 13 houses or 3% with brick walls as bricks are manufactured only in the plains below and have to be brought up at high cost. III regard to roofing materials, thatch predominates to a considerable extent. Thatch includes banana barks, cocoanut leaves, grass etc. Tin sheet is also used as roofing material in 20.6% of the houses. This type of roofing is ideally suited to protect the interior from the howling winds and the heavy and contmuous downpour of rains during the monsoon season. Wood obtained locally from forest is used for the construction of rafters
9-35. Nearly three fourth of the houses are single roomed ones. Houses with 2 or 3 rooms r.re found in the hamlets attached to the main Village. In the hamlet of Chakkilipatti occupIed by the Chakkihars, a Scheduled Caste, all the houses are mud huts having only one room. The houses are generally medium SIzed and only a few estate owners possess big stone houses. The plinth area of a house in tl1JS village is correlated to lhe average size of the household.
P1mth area of the house No. of houses With Average No. of members (in Sq. ft.) Percentage pcr household
Up to 50 5 (10 0) l·S
51 - 100 35 (8"~) 3'2
101 - 200 160 (38~~) 4'2
201 - 300 77 (18"v) 5'0
301 - 500 59 (l4~:,) 4'9
501 - 1000 57 (14",,) S'2
1001 - 2000 19 (5~~) 6'5
Above 2000 6 (2%) 6'9
HOUSING-PAST AND PRESENT 685
From this Table we see that 40 houses or 9% of the total are having a floor area of 100 sq ft or less and the plinth area of as many as 160 houses -ranges from 101-200 sq. ft. Only 25 houses have a plmth area exceeding 1,000 sq. ft. It is noted with lllterest that the average size of the household increases generally with the plinth area and therefore in this VIllage at least It IS
evident that overcrowding is not common.
9 - 36. We next take the case of another village situated on the plains. 13 miles from Madural CIty lies the village of Thiruvalavayanallur, close to the Madurai-Dindlgul trunk road.
Thiru\alava:\,anallur-Madurai
District
The VIllage is situated on a plain which lles in the driest taluk of the district, viz., Nilakkottai. The avcrage rainfall here is 30" and the rainfall occurs during the north-east monsoon period. The soil is red with a slight admixture of lime which prevents the effectIve
growth of paddy. The houses 111 Thiruvalavayanallur can be divlded into three main categorieshuts, cottages and brick built houses. The brick bUllt houses are the sole monopoly of the Muslims and the Vellala PIIlais. The cottages are owned by the Rowthar Muslims as distinct
from the Pathani Muslims and also by the poorer section of the Vellala Pillms, wl1Jle the huts are entirely owned by the other poorer Hindus and the Scheduled Castes. GIven below i~ a Table
indicating the type of houses in the village.
Roof Wall Floor CommunIty ,.-----"-~---, ,.-~-"---, .----'--"------,
Terraced Tiled Thatched Mud BrIck Mud Cement Oth:)rs
Pllials 7 5 21 26 7 23 3 7
Mcsltms 10 6 15 18 13 22 8
Others 2 4 22 25 3 25 3
Scheduled Castes 37 37 37 1 -- ----
Total 19 16 95 106 24 107 4 19
9 - 37. From this Table we find that 14.6~ ~ of the houses are terrace:l Wl111t: a further 12.3~ ~ 11:lye tlled roofs. Most of th('·~.o ;lre Mang:llore tIled. 90% of thc3e tiled houses belong to the Pillais and the MuslllTIS. Among the thatched roofs, there are two c:ltegones. The CQlLlges of the Rov"thars 3nu PIlJais are sturdy and arc well bUllt, but the huts of the Scheduled Castes as well as the other poor caste Hindus are not sturdy and are flimsy. 18.5 ',; of the houses are built with brick of which nearly 82% of these belong to the Pillais and the Muslims and the rest are built WIth mud. In the case of cottag:3, 5un-burnt mud slabs are used for the construction of walls and adds necessary firmness to these cottages. In the case of Scheduled Castes' huts, the flooring is generally of mud and only mud pack WIth an inner coat of rubble stones are used. The Village has to import all housing matenals except in the case of mud houses. 13ncks, tiles and cement are brought from Madurai CIty or Nilakkottai. Even the wood necessary for wmdoVvs and doors have to be brought from the surrounding villages. Commonly, m:l11go or tamarind wood is used for thIS purpose. Only mud and palmyrah or cocoanut thatch is available locally. Regardmg the size of household and the number of rooms, it is found th:lt the average number of rooms p-::r ho:;<;chold 111 this village works out to 2.13. 44% of the housd101ds live
in single rooJ:led quarters. These are generally huts and about 4% on an average lIve 111 IWts. The affluent communities who live in comfort seem to be the .Plllals and the Muslims, for about 25 households among Pillais and 10 households among the MuslIms lIve in houses WIth two or three rooms whereas 9 households among Pillais and 16 households among Muslims live in
686 REPORT ON HOUSING AND ESTABLISHMENTS
houses with 4 or more rooms. Therefore, the size of the house is conditioned by the economic ',tatus of the people in the village and as the Pillais and Musluns are the economically dominant communitlCs, they arc able to own bigger and better types of houses.
9 - 38. Let us take the case of a village in Ramanathapuram DIstrict. Golwarpatti in ~attur Taluk is a fairly typical Harijan village situated in the west Ramanathapuram region predomi
nantly occupied by the Scheduled Caste of Pallars. This village lies
Golwarpatti in Ramanathapuram District
on the bank of Arjuna river, 8 miles north-east of Sattur, the taluk headquarters, and 17 miles south of Virudunagar. The terrain surrounding this village is a monotonous plain presenting very little
by way of natural scenery except perhaps the Arjuna river and the huge Golwarpatti tank. The land IS innocent of lush vegetation except for clusters of palmyrah trees and occasIOnally, thorny acacia bushes. The climate is essentially hot, the hottest part of the year being between the months of April and June. The rainfall is adequate and is brought in by the north-east monsoon from October to January. However, thanks to the Arjuna river and the Golwarpatti tank, the village is blessed with irrigation facilities and the soil is fertile. The area abounding in black cotton soil IS ideally suited for the growth of cotton. The black soil has substratum of clay underneath it and is 1m gc1y used for the construction of mud walls of the dwellings of the villagers in Golwarpatti. Paddy, millets and cotton are the main crops grown in this area and the straw of paddy and millets are used as roofing material. A vast majority of the Pallan dwellmgs are nothing but tiny huts with low mud walls raised to the height of 3-5' plus a thatch for roof. The houses of caste Hindus are generally of stone or brick with tiled or thatched roofs. Only country bricks are used in the constructIOn. Storeyed houses are rare in this village. Out of a a total of 499 houses, 435 houses are mud houses, the percentage working to 87. Only 62 houses have stone walls and brick walls are found in 2 houses. Stones 8nd bricks are not locally available and are brought from outside. As regards the roof, 87% of the houses have thatched roofs, the leaves of palmyrah, straw of paddy and mIllets being utilised for this purpos:::. TIled houses number 28 WhIle zinc sheet is used as roof matenal H1 25 houses. As a rule, almost all the houses in Golwarpatti are single roomed. As many as 461 hO'.l,es out of 499 have only one room with no separate kitchen, and 37 houses have 2 rooms; only one house has 3 rooms. Almost all the Pallans in the village stay in one roomed huts. Only the caste Hindus live in houses with:; rooms. The pllllth area of the houses are between 101 to 500 sq.ft. there being 427 houses III this category and there are 61 houses with a plinth area or 51-100 sq.ft. Only 10 hous:::s, all of them belonging to caste Hindus have a plinth area of over 500 sq.ft. Thus, the vilbge predominantly occupied by poor Pallans presents one more Instance of how housing conditions are influenced by economic status and aVaIlability of raw materials.
9 - 39· In Tlrunelveli District we have taken as an example a village called Alwarkarkulam situated In Srivaikuntam Taluk of Tirunelveli District. This village is sItuated about
14 miles to the east of Tirunelveli and about one mile to
Ahvarkarkulam in Tirunelveli Di5trict
the main road connecting Tirunelveli and Tiruchendur. The village is about 11; miles south of the Vallanattu Paruchi hIlls. The village site is situated on rocky soil. The dwellings are thus not built on
even ground, but undulates up and down. Alwarkarkulam village is sitmted amidst green paddy fields. Out of a total area of 1,017 acres, wet lands consist of 495 aCf0S or nearly 49~~ of the total. The soil IS very good, i.e., black loam, suitable for the cultivatlOn of paddy. Garden lands are cultivated WIth millets. The other types of soil found here are red sand and red gravel. There IS a reserve forest to the north of this VIllage from which timber is procured. Of the 386 houses in this village, 281 are thatched, 66 are tiled and 39 are terraced. 291 of these houses have rou d

HOUSING-PAST AND PRESENT 687
walls, 94 are brick walled and only 1 has leaves for its wall. The hard red soIl with Its
admixture of gravel and clay is ide:llly suited for the making of country bncks. A number 0f palmyrah trees supply palmyrah thatch and a nearby forest supplies the villagers with timber and leaves for their rafters and for the roofing material. Since burnt bricks are not used, tiles, laue
and mortar and cement for floring have to be procured from outside. Red sand and clay with an admixture of gravel are used for mud walls. Houses with single rooms are morc co:nl1101l in this village. The Pallans and some of the Maravars and Konars live in houses wIth mud floor and thatched roof having only a single r00111. But a small portioll of the populJ.tion, mostly Brahmins, Pillais, Illaththu PIllais live more conveniently in houses brick-built and tiled having more than 2 rooms. 'Especially in the Pallacheri, overcrowding is very pronounceJ. Here again is an example of the nature of terrain, the economic status of the commul1ltie3 and the availability of raw materials influencing the design and construction of houses.
9 - 40. We now come to the interesting study of housing conditions in Kanyakumari District. For this study, we have selected Thalakulam village in Kalkulam Taluk, situated 3
miles south of Eraniel a famous handloom centre of Kanyakumari
Thalakulam of Kanyakumari District. The village lies 8 miles north-east of Thakkalai, the District taluk headquarters and 11 miles away from Nagercoil, the
District headquarters. In its physical setting, Thalakulam IS
located amidst green fields of paddy, bordered on all sides by the graceful cocoanuts, addmg beauty and enchantment to the environment. The whole appearance of the village is that of an emerald, sent into earth. The soil fabric consists of clay loam mixed with alluvium soil suited for the cultivation of paddy, and cocoanut. The mixture of black and white soil avaibble in the Thalakulam tank facilitates the manufacture of pottery and hence the predominance of the pottery industry in this viliage. The climate of this village is salubrious with heavy rainfall during the monsoon. The rainfall is poor in the months of January and February, but heavy
during the months of April to June and October to December. In addition to its cocoanut trees, the flora includes trees like the Indian Portia, Neem, Pipal and Jack fruit.
9 - 41. Housing materials whether, for the humble hut or the pucca house are easily
available Vvithin the village limits or just on the outskirts. The clay used as wall material is dug out of Thalakulam tank on th:: eastern side of the village. The trunk of
cocoanut tree is used for the manufacture of rafters for roof material. Ready made rafters are also available in the nearby Monday market. For pucca houses granite stones are obtained from a quarry, a mile away to the east of this village. Timber, logs and planks for doors and windows as well as tiles for roofing are available at Eraniel. Lime for mortar is also locally available from a Parava household, a traditional lime baker, in the village. Of the 394 houses, 173 have thatched roofs, 176 are tiled and 45 of the houses have brick walls or stone walls. Most of the big buildings are owned by the Chettis. They are
spacious and cemented, double storeyed and are roofed with Mangalore tiles. The housc3 of the Panikkars and thc Kulalars, potters of the village are also tiled with long halls, but arc not
as palatial and big as the Chettis. The huts of the Sambavars, the Scheduled elste of the village are like any other hut elsewhere in the State, being constructed with mud and cocoanut
thatch for the roof. Following are the measurements of some of the typical houses of various communities in the village.
RIch Chettls
l\l!ddle Income Chettls
Kulalars or potters
Sambavars
100' X 40' X 30'
30' X 15' X 20'
20' X 15' X 15'
18' X 15' X 12'
6~g REPORT ON HOUSING AND ESTABLISHMEN"IS
A ddaiicd survey reveals the fact that 267 households live in 477 rooms. Slllgle roomed houses arc more common than other Jarger houses and are mo~tly occupicd by the S2l11b:1Vars and the potter community. Large houses with more than 2 rooms are the privilege of the neh Chctus. 0\ crcrowding 15 as much a problem here as elsewhere in the country. The VIllage is a typical example of VIllages in Kallyakumari Distnct, the preference being for tileJ houses as compared to thatched houses whereas a different trend IS noticeable in otllet Ji~t!"lc(s of the
State. 9 - 42. Having conducted our ~urvey, takll1g typical VIllages for a deLulcd ~urvey of
housing conditions with special reference to economic status of cOl11mulllties, availabIlity of local material, climatic condltions, type of soil etc., we now proc<2ed in
The Westew dbtricts-Kumbalam a westward direction from Madras City and attempt to study the of Salem Dbtriet housing conditlOns in tile western districts of Salem, Coimbatore
and Nilgiri. Kumbalam, a vtlbge lying in the north-eils~ern
corner of Hosur Taluk of Salem District is situated almost on the Mysore-Madras border. It lies at an elevation of about 3000' above mean sea level and enjoys a pleasant clImate and good rainfall throughout the year. The vegetation is not lush, but abounds in a number of thorny bushes. The hills are craggy Without much vegetation rangll1g between 1,000 to 5,000' in heIght The SOlI i5 red loam with an admixture of sand. The area is a dry belt and the prll1Clpal agricultUial produce are millets like ragi, cumbu, and cholam. The village is popnbted by people belonging to various commullltles hke Nmdus, Kurubas, Lingayats and Parayas. The village With it'S plethora of tiled houses presents an entirely different picture from the rest of the district where we are able to find mo~tly thatched huts. It is stated that due to the cool clim:lte prevailing in this region, VIllagers have to lIve in tiled house') and tlus is a future of the surrounding VIllages also. The houses in Kumb.llam belong to dIfferent types 1'lom a ~ll1gl~
roomed hut to multi-roomed houses. The roofs are t!led In brick homes and for mud hou~es
they are of straw or grass. Country tiles or Mangalore tiles ale avaIlable at Bcrigal, 8 miks from this vtllage or at Hosur. The floating and walls arc mostly of r,1Ud and in the case of mud \%11s, rubble stones are used to rellnpose the structure. Out of a total of 185 houses, 65 are hIed Wlllle the rest are thatched. In the case of other houses, the mam hVlI1g pOI tlons have thatched roofs. 170 of the homes Inve mud walls and the rest arc bric~(-built. Mud i, the main material med for flooring. The economic conditIOn of the people along with the chm:;_te of the place arc the deeidl11g factors III the type of hous~, constructed b~' th~ nriou5 communitIes. Thus among the L1l1gayats, 7 houses are tiled and only one thateh;:J whaeas 3 have brick-b:lilt walI~ and 5 mud walls Among the NUldu<;, 22 hous~s ar'~ tiled and 37 thatched and al11l1ng Kurubars, 24 arc tded and 24 thatched Thus the economIC conditIon of the Lingayat~, Naidus and Kurubars being better than that of Par.lyas <l11d oll:er communltle~, tiles and bricks are more common than mud or grass. The houses are, however, in the majOlity ~inglc roomed ones ",ith a small \erandah III front. Tile houses are low roofed and do not po~sess any wlI1oows. In tlw; village, the SilC of the house doe~ not depcnd upon the size of the family, but only 011 thc economic condllio11 of the i~llnJ[y and even where the number of family mel11ber~ IS rather large, they have to huJdk together 111 a single hut. 12 I llou:,eholds with 57% of (he popUlation lIve in sIllgle roomed huts and 46 households with 30% of thc populatioll live in 2 rooms. Only 19 households Wltll 13% of ~he population live in hous~s with 3 rooms and more. Here again the economically superIor commJnlti,:s hk;; LlI1!;w.yats, KUrubcHs :wd Naidus live in fairly big houses ,,\illk the re,t live ill simpIc :lllJ single roo1l1;:;ci hc)~bCS.
62·5'; \) of the Lingayat houses have 3 rooms and more. The other backw,lfd comll~ul1,ties lIke tlIe Parayas li\e only In one roomed houses. The avclage number of persons per room IS only 2 III
the case of Lingayats, 4 in thc case of Kurubars and N,lidus and 5 111 the case of Parayas. Tllis
HOUSING-PAST AND PRESENT 68LJ
proves that thc Size of the famIly 111 no way determincs the size of the dwelling. Overcrowdmg IS common among the Parayas since they arc economically poor. The matenals used 1I1 the constl uction of houses are obtamed locally as well as from outSIde. The tiles, country as well as M:lI~galore tiles, are purchased at Bengal or Hosur. The bricks are made locally. The gras, or roof materials, m05ily eholam or eumbu straw and country grass are obtained from the nearby arc,):,. Thc &peeifieation of a typical hut in this VIllage is as follows:
FounddtlOn
Basement
Superstl UCtLli e
Roofing
Random Rubble masony III clay Width, 1'-0" depth 1'-0"
Mud wall alround Width 1'-0" heIght 1'-0"
Mud wall thickness 1'-0" height 4'-G"
Roofing vdth cocoanut lea\cs over bamboo raftcrs
9 - 43. Pappanaickenpatti, another village in Salem District lies in the northern pari of Attur Taluk, flanked on the south, and north by the Kalrayan hIlls. The adjacent forest areas
abound in bamboos, gall nuts and other trees. Gallnut, charcoal Pappanaickenpatti of and firewood are the chief forest produce obtamed fl0m this
Salem District forest. Due to its elevatIOn, the village experiences a cool clImate especially during the W1I1ter months of November to January. The
chief crops produced here are ragi, cumbu, cholam and tenai. The predominant community of this village IS the HIll Malayali. The dwellings of the Malayalis ate smull, simple and uniform in size. The houses are constructed in rows, one oPPosIte the other with a clear space between two houses which acts as a passage. The normal dimensions of a Malayali hut are 1 SO X 18'. The mterior consists of a hall and a small verandah in the front. The matenals used in the construction of a hut are locally available at cheap rates. All the huts are thatched, the favourite roofing material being the 'Kanangu grass' available in plenty in the nearby forest. The walls and flooring are invariably bUIlt of mud. The mud flooring is strengthened by frequent smcaring \\itb cowdung paste. SlI1ce the Malayalis bcheve that livlllg in a tiled hut may invoke the wrath of their Gods, all their houses have thatched roofs except for one tJ'lba I who has violated tnbal convention. The Malayalis ~tart constructing their dwelling by creclll1g 6 pillars and raising a mud wall to the height of 6'. Then the ccilll1g is constructed with thatch over bamboo rafters. The mterior is partitIOned into a hall Inside with a snl111 verandah. The insIde hall is used for cookmg, dining and for all other purposes. Besides the Malayalis, Gollas, MuslIms and ChettIars are found in thIS villagc. The houses of these communities vary In
design, type and size according to the economic condition of the owner. Gollas lrve in tiled houses with bnck walls and lime and mortar floors, Cemcnt is also used for f1oormg. Some of the houses ha\c also a&hestos roof. These bricks and country tiles are manufactured locally whenever required. But asbestos shcds and Mangalorc tiIes have to be procured from AttuI'. The n:mainmg matcnals are available wlthll1 tbe village Itself.
9 - 44. At the foot of the famous Nilgll'i hills lies the village of Nellithurai, III ,\vana~l:1
Taluk of Coimbatorc DIstnct, a few nules outside Mettupalayam. Bhavani river on the south, Coonoor river on the east, Manar river on the west and Bhabsura
Ncllithurai of Coimbatorc hills on the north form the natural boundaries of the vilb::,:':. Til: District natl1lC of the terram is sueh that three fourth of the village ~llea is
~ituatcd over hll!~ and valle) s of heIghts rangll1g between 1000 to 3000' abovc SC_l lc\cl. The fore~t area here IS neh In vegetation aboundlJ1g In t<:ak, sanJal wood and other trees Yleldmg rich tlmbcr. Thc vIllage expcriences extremes of cIiJ1lc:te, cold in winter
H-87
690 REPORT ON HOUSING AND ESTABLISHMENTS
and very hot in summer due to the radiation from the surrounding hills. The village is populated by Irulas, Valayans and Chakkilians as well as Okklhga Goundars. The dwelhngs of the !rulas who live in the arecanut groves surrounding this village dlffer slightly from their counterparts living in forest areas. The type and size of the dwellings are the same, but the materials used in construction vary to suit the local availabilJty of raw materials. They use reepers made of the trunks of arecanut trees instead of the dry sticks and arecanut leaves instead of the country grass compared to their wilder cousins living in the forest. Flooring is invariably of mud. This type of hut is suited to the climate of the place, the grass thatch keeping the interior cool in summer and the low ceiling and the thick outer cOYer of thatch warding off the heavy rains and keeping the interior warm in winter. The houses of the Valayans and Chettiars are similar in design with a single room and a small verandah in front. But these are bigger than the lruia hut. The material used for wall and floor is mud and the roofing is of grass thatch. On the contrary, the dwellings of Okkiligas and higher caste Hindus are fairly big and more spacious. They live in houses tiled and walls are made of brick and plastered with cement or lime and mortar. The ceiling is constructed over bamboo rafters. The house possesses wooden doors and windows. The dweI1ings of Irulas who live in forest areas are small, simple and uniform in design. They live in settlements of 8-10 houses amidst ltlaccessible forests. The houses are constructed in rows with a common open space in front for the use of the residents of the settlement. The construction of a Irula dwelling is a simple affair, the hut having a low roof and a single room, almost circular in size, the size of the hut measuring 8' X 12'. Walls are made of dry sticks interwoven and plastered with mud on the inside. The flooring is also of mUd. The lrulas do not whitewash their dwellings. The roofing materiel is always country grass which lS available in plenty in the forest. The rafters and the wood used for doors are taken from the trees growing in the forests. The doors are either of wood or bamboo sticks. The opening is small and does not allow a person to enter inside without bending his head. The following is a statement of the type of households found in Nellithurai village.
Households with Households with Households with Households WIth Households with Total no regular room one room 2 rooms 3 rooms 4 or more rooms
"No. of r---"---~, r----"---, r---..A.._--.. r---.A.-.-------, r-------..A..-.........--...-Commumty house- Total Total Total Total Total
holds House- No. of House- No. of HOllse- No. of HOllse- No. of House- No. of holds famIly holds family holds famIly holds family holds family
members members members members members
lrulas 153 10 40 143 534
Chakkihars 7 7 29
Kuravars 3 3 2 6
OkkJligas 63 4 36 135 12 50 9 44 5 36
Others 30 2 9 24 89 3 17 1 9 - ------~-
Total 256 14 56 212 793 15 67 9 44 6 45
9 - 45. The facts reveal that materials used lin construction depend upon the local availability to a very great extent. Only the well-to-do like the Okkillgas can get the tiles and bncks manufactured locally or from Mettupalayam whenever required. The economic status has a lot to do with the size of the house and only Okkillgas, as the richer section of the population, can afford houses with 3 or 4 rooms compared to Irulas and other Scheduled Castes and Tribes.
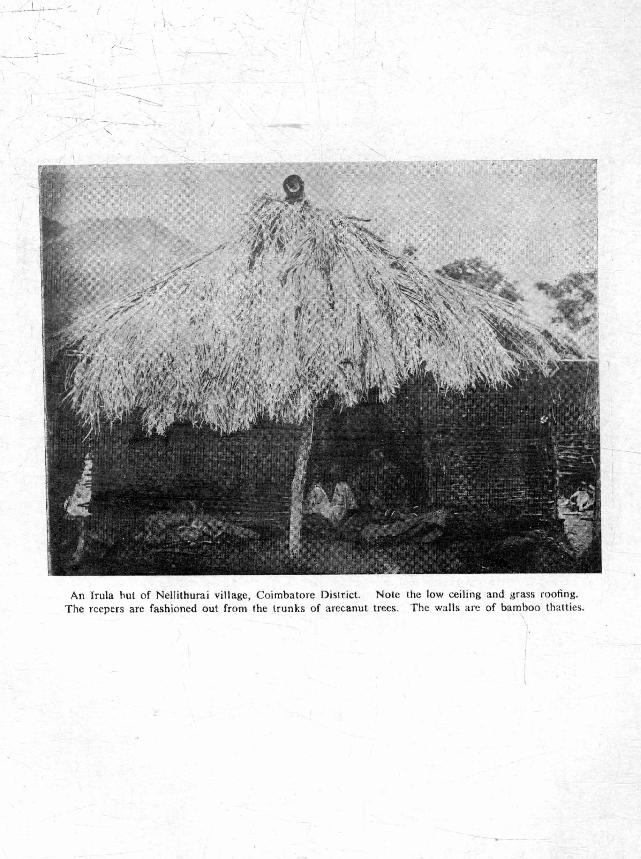
". .:. __
~-- --~
An Irula hut of Nellithurai village, Coi mbatore Dislrict. Notc the low ceiling and grass roofing. The reepers are fashioned out from the trunks of arecanut trees. The wall s arc of bamboo that ties.

· An Irula hut of Hallimoyar situated in Nilgiri District. This photograph depicts a large sized hut with two rooms where two households live in juxtaposition. Roof is of thatch and the walls are of mud.
/
/ "
;: -
--t....
'I , I
---->::
HOUSING-PAST AND PRESENT 691
9 - 46. Irulas form the dominant community of Hallimoyar, a tribal village situated on the eastern slopes of Nilgiri District amidst thick jungles. Nestling at an altitude of only ] 500'
Hallimoyar of Nilgiri District above mean sea level, this village does not enjoy the salubrious climate associated with the Nilgiri. Though located in Nilgiri District, this village is accessible only from the Coimbatore
side. It is one of the main villages where Irulas have settled down as tillers of the soil, lying on the northern side of the Nilgiri mountains. The rainfall rarely exceeds 30" annually. Watered by the Moyar river, paddy and cholam are raised as wet crops. Bamboos, sandal wood and cinchona trees grow in ""ild profusion in the forests surrounding this village.
9 - 47. Accustomed to a life spent amidst wild animals, lruIas have not paid much attention to their housing condItions even when settled down as agriculturists. Constructed commonly out of local materials, their huts remain cool in summer and warm in winter. Except for about 20 brick houses constructed by the Tribal Welfare Department at a cost of Rs. 21),000(for the use of Irulas all the other houses in this village are completely thatched. The 20 brick houses built in two rows of 10 houses each on either side with a cemented pathway lend a touch of modernity to this tribal village. Irula huts are constructed facing each other in two distinct rows. Okkiligas, the other community, live in a separate cluster at the north-western corner of the village. Bamboos are largely used for posts and for the framework on which the thatch is laid. Over the bamboo rafters, a variety of grass and hay from the harvest are spread out thickly and tied in position with cocoanut fibre. Just before the north-east monsoon, a stout rope is passed over the roof at a numher of places and the ends are weighted down WIth stoncs. The height of a hut is just adequate to permit the standing erect of an average sized person. Of the 44 houses in this village, only 20, constructed by the Tribal Welfare Department have Mangalore tiles and one has country tiles and the remaining 23 have thatched roofs. In the case of the huts, walls are constructed only after the roof work is completed. A mat like framework is then made out of bamboo twigs and arranged and plastered heavily with mud. The walls arc constructed out of this framework and the gaps are further sealed with mud. This makes the walls heat proof. The bamboo, grass and mud which are good for the making of !rula huts are available locally. Since the Government have permitted the Irulas to make use of the reserved forests, the entire community joins in the construction of the hut. Each hut remains secure for two years when the roofing has to be redone and the walls plastered again with fresh mud. Whitewashing is abhored by the lrulas, There is not much congestion in this village. In the 65 rooms, 191 persons live working out to an average of 3 persons per room. This is much less than what is common in other areas of the State.
9 - 48. We have so far studied both in a general way and with reference to individual villages about variations in housing conditions according to the nature of terrain, type of soil, climatic conditions, economic status of the community and individual, avatlability of raw material locally and to a limited extent the type of occupation of a particular person, and also the nature of overcrowding and the size of the house in relati0n to the size of household. It still remains to be seen whether housing conditions in rural areas are affected to a considerable extent by the type of families living in houses.
9 - 49. Separate Tables have been prepared correlating the type of family whether simple, intermediate or joint and the number of rooms occupied by the households for all the villages
The effects of the type of family on housing
which have been quoted in this report. It is evident from these tables that, the type of family bears no relation to the number of rooms occupied, in rural areas. In fact, single member households occupy houses with one room as much as joint families or
intermediate families. Therefore, it is evident that the overcrowding or the size of house is not based even to a limited extent on the type of family occupyin~ the house.

692 REPORT ON HOUSING AND ESTABLISHMENTS
9 - 50. The minimum standards necessary for the construction of dwelling houses and
the materials to be used in such a construetlOu were considered by a Sub-Committee of the Public Health Department formed in connection with the post-war development of Madras State
i. e. after 1945. The Sub-Committee made the following recommendations.
1. A house has an average of 5 inmates. At the rate of 70 sq. ft. for each member.
the minimum floor space reqUIred for a dwelling homc can be fixed at 340 sq. ft. which wilt
Include even verandahs.
2. Thc mmimum floor area in any living r00111 should not be less th:lll 120'. The
height of thc room shOUld not be less than 9'.
3. Adequate ventilation should be provided for every room and there should be as many windows as possible with ventJlalors.
4. A small compound attached to the house is necessary with an independent open bath and a latrine, preferably of the flush-out type, should be provided at the corner of the
compound.
5. Regarding deSIgn, to ensure comfort and reasonable healthy liVIng conditIOns, there should be one mam room of 100 sq. ft. and a separate kitchen of 60 sq. ft. fully walled. The remainmg area may be used for living space adequately protected from the vagancs of the weather.
6. The materials suitable for the construction wi!! be those :1vaihblc locally. Brick or stone should be available and would make suitable matcrial for the wall.
7. Plastering is essential and should be 111 lime cement combination.
8. Roofing may be of Mangalore tIles over wooden or palmyrah rafters
9 - 51. These recommendations of the Sub-Committee were not implemented 111 any
case. But it gives an Illsight into what are conSIdered as minimum reqUIrements in housing conditions in rural areas to ensure reasonable healthy hying. From the foregoing discussions, in districts as well as in individual villages, it is apparent that only In very few cases are these
mll111nUm reqUIrements satIsfied and that too Imperfectly. By this tohn, the l1l:ljority of huts and houses in this State should be rased to the ground and new cOl1structiom erected. However, considering the lack of proper survey of housing conditIons, the lack of space, poverty of the people, It WIll be a long, long time before the minimum requirements laid down by this Sub
Committee are satisfied to any appreciable extent.

CHAPTER X
HOUSING-PLANNING AND FUTURE
10 - 1. I have already indicated that construction activity in the era 1951-61 has been much more intense than in the previous decade. 1 will now examine Vvhat k,s been done by the Government in solving this housing problem.
10 - 2. The Madras Buildings (Lease and Rent Control) Act, 1949 was passed \'vlth a view to regulate the letting of residential and non-residential buildings in the State of Madras to
control rents fl1[, such buildings and to prevent unreasonable
The role of GoYcrl'mc!1t eviction of tenants therefrom. A new enactment was passed in 1960 replacing the earlier enactment, i.e, the Matlras Buildings
Lease and Rent Control Act, 1960. This Act applIes to all municipalIties and selected major panchayats of the State. One import:.1l1t aspect of the Act is the allotment of buildings which come withll1 the purview of the Act to any Government official or imtitutiOl1. The period withm wIuch building5 should be taken over under Section 3 (3) of the Act is limited to 7 days. If 1here is no response from any Government offiCIal or instItution. the buildmgs are released to the landlords as not required for Government purp05es. The buildings are also released to the landlords for their own occupation or for private lease on specific requests made by landlords. Part1culars of buildings di5posed of in accordance with the provisions of the Act durins the ye::tr 1961--62 will he of interest.
Total number of houses notified
1'0. of home~ allotted to Government servants
No. of hou~cs released for pnvatc lease
No of houses released for owner's occupatIOn
No. of houses rel;;as:d for want of consent
1,474
499
38
139
798
10- 3. The number of Government officials who got their names regi~tered for allotment of houses dUrIng the year 1961 is 1,296. There has been a fall in the allotment of bUlldll1gs to Government officials dunng the year. The main causes that contrihuted to ~uch a decIll1e in the allotment of buildings are as follows· The liberal prOVisions in the Act viz.
(i) Section 3 (10) (c) of the Act conferrIng benefit on the landlords in respect of residential bUIldmg'> wherem landlords arc occupying portions.
(ii) Section 30 (i) of the Act granting exemption to buildings the construction of whIch was eomplet.:u after the commencement of the Act.
(iii) Section 30 (ii) and 30 (iii) of the Act exempting buildings the rental value of which exceeds Rs. 2S0,'- per mensem for residentIal buildmgs and Rs. 400/- p. m. for non-resIdential
buildings.
10 - 4. It w]l] also be of interest to ~ee the rent control work in Madras City. The
Rent Control in Madras City consolidated statIstics of the aetivltles of Rent Control Courts for the year 1961-62 arc furni shed below;

694 REPORT ON HOUSING AND ESTABLISHMENTS
Receipt and disposal of cases
Eviction Fair rent Restoration of amenities InterIm applIcations Total (----"--~~ r-_____._,A.._'_--~
Receipt Disposed Receipt Disposed ,-___ .A._ ----, ,-___ .A-___ --, r--~-.A-----~
Receipt Disposed Receipt DIsposed ReceIpt DI~posed
4,773 5,340 267 385 171 182 931 1,003 6,142 6,910
This Act has helped in keeping the rent within reasonable limits throughout the State. At the same time, it has acted as a hindrance to the construction of new houses as the landlords found any investment in new construction not paying. Two steps have been taken with a view to liberalise the provisions. One is to exempt the first tenancy in any new construction from the provlsions of the Act. The other is to exempt all buildings constructed after 1-10-1960 from the provislOns of the Act. The statistics reveal that the policy of the Government has been to see that the minimum number of buildings are kept within the control of the Accommodation Controller for release to Government servants and institutions.
10 - 5. The problem of the shortage of houses has become more acute with the development of our economy. The migration of people from rural parts to the metropolitan cities in
search of employment, growth of factories and population, lack Shortage of houses-Its acuteness of adequate supply of developed plots, existence of old and
uneconomic buildings, and shortage of raw materials have aggravated the problem still further. It will be difficult for the middle and lower illcomc groups to construct new houses or purchase even house sites without Government assistance. The Government of Madras realis~d the seriousness of the problem and advanced loans to private persons to constr!lct houses mainly through co-operative societies; during the First Plan period, the Low Income Group Housing Scheme and Subsidised Industrial Housll1g Scheme were implemented in this State. In the Second Plan, Governmental assistance for housing schemes increased still further. The Government of India, the State Government, Co-operative Housing Socleties, Life Insurance Corporation are some of the parties who have developed numerous housing schemes in this State. In Madras, the City Improvement Trust was estabhshed in 1945 which granted loans for constructing houses in the City. Even prior to the introduction of planning, the State budget set apart Rs. 20 to 30 lakhs per year for providing loans and grants to Co-operative Housing Societies w~ich enabled them to construct houses in different parts of the State. These societies usually glVe loans to private parties for the construction of houses. The First Plan period provided Rs. 189'61 lakhs for housing schemes in the State. The total expenditure for different housing schemes at the end of the Plan amounted to Rs. 128' 83 lakhs. Two important housing schemes implemented in the First Plan period were the Subsidised Industrial Housing Scheme and the Low Income Group Housing Scheme. The Subsidlsed Industnal Housing Scheme is a centrally assisted scheme for workers in private industrial establishments. The Central Government gives under the scheme to all State Governments, State Housing Boards and Municipal Boards assistance to meet 50% of the cost as loan and 50% as subsidy. The Goyernment of lndia also gives financial assistance to the extent of 75~~ and 90% of the total cost to industrial employers and co-operative societies of industrial workers respectively, the extent of subsidy in both the cases being 25%. For helping the industrial workers still further, the Government of India have already allowed the industrial workers to draw non-repayable 10:1ns from the Provident Fund account to meet the remaining 10% of the cost. Under thlS scheme, 936 houses were completed during the First Plan period in Madras State.
10 - 6. The Low Income Group Scheme implemented in 1954 is another type of centrally assisted housing scheme. In this Scheme, financial aSslstance in the form of joan is
HOUSING-PLANNING AND PlJTURE 695
granted up to 80% of the cost of dwelling subject to the maximum of Rs. 8,000 to a person whose income does not exceed Rs. 6,000 per annum. Under this scheme, Central Government also gives
financial assistance to Local Bodies, Public Institutions run on no Low income group schl'me profit no loss basis, recognised health, charitable and educational
institutions and co-operative societies. Under these schemes, about 850 houses were constructed during the First Plan period which includes some of the house~ since completed during the Second Plan period. It was during the Second Plan th1t Significant development took place in this sphere. A sum of Rs. 286'67 lakhs was provided during the Second Plan for housing schemes. Besides, Rs. 3'46 lakhs was provided for Plantation Labour Housll1g Scheme. At the end of the Plan period, the total expendIture on all schemes amountd to Rs. 401-41 laths of which Rs. 359'81 lakhs formed the capital expenditure. The detaikJ financial assistance of Subsidised Industrial Housing Scheme and Low Income Group Housing scheme are given in Statement X-I.
10 - 7. The actual expenditure during the Plan period of the two schemes exceeded the Plan provision by a little more than one crore; under the subsidised industrial housing schemes, 1,850
houses were constructed under the Low Income Group Housing Expenditure on housing Scheme. Co-operative Societies, City Improvement Trust, Local
Bodies and Madras Corporation engaged themselves in the construction of houses and a total of 3,173 houses were constructed. Besides 487 house sites were developed.
10 - 8. There are two important housing schemes in the State which are assisted or sponsored by the Central and State Government-Plan schemes and Non-plan schemes. The following are the Plan schemes:
1. Subsidised Industrial Housing Scheme.
2. Low Income Group Housing Scheme.
3. Slum Clearance Scheme.
Plan Schemes 4. Plantation Labour Housing Scheme.
5. Village Housing Project Scheme.
6. Land Acquisition and Development Scheme.
7. Housing Scheme for Handloom Weavers.
The following are the Non-plan schemes.
Non-plan schemes
1. Middle Income Group Housing Scheme.
2. Rental Housing Scheme for Low Paid employees of the State Government.
3. Urban Housing Scheme.
4. Rural Housing Scheme.
5. State Housing Board.
6. The Co-operative House Mortgage Bank.
10 - 9. The financial provisions and expenditure on the seven plan schemes in the Second and Third Plan periods are given in Statement X-3. The Plantation Labour Act 1951 and the rules framed under that Act require theat every employer of plantation should provide facilities to his employees at the rate of 8~ ~ of the worker's cost every year. The Plantation L:lbour Housing Scheme was introciuced in 1956 to help small employers to comply with the Act of 1951. According to tl1JS scheme, loans are given to the extent of 80% of the cost of the dwelling
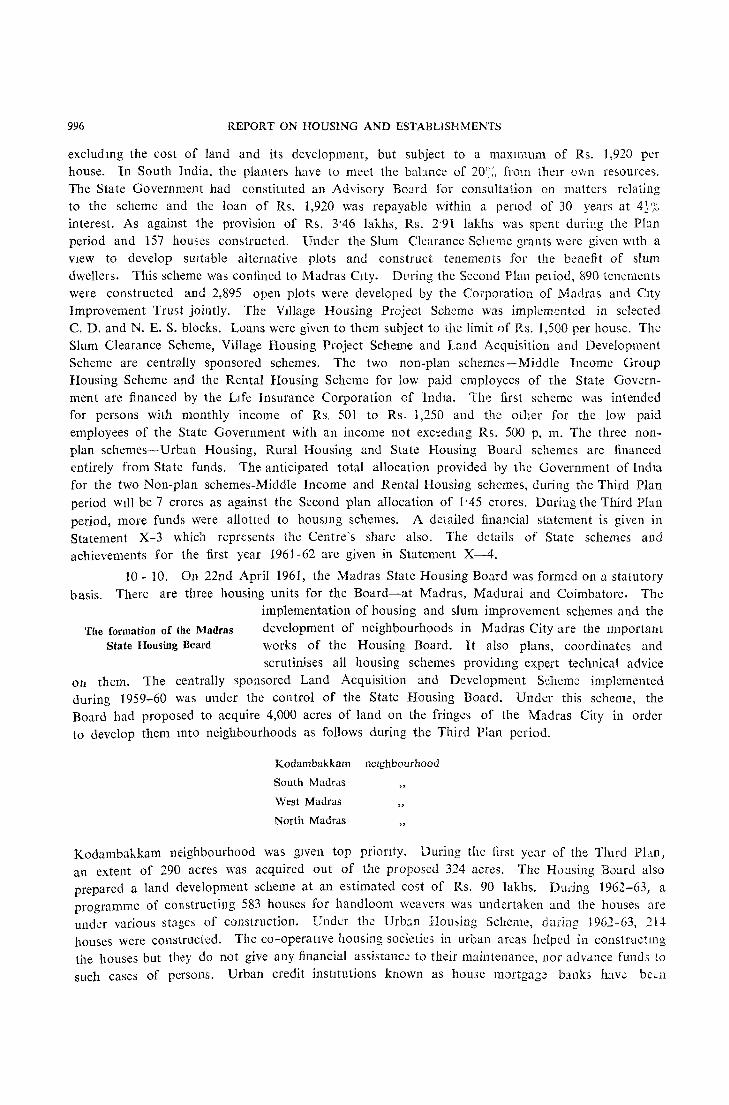
996 REPORT ON HOUSING AND ESTABLISHMENTS
exclud mg the cost of land and its development, but subject to a maxuuum of Rs. 1,920 per house. In South India, the planters have to meet the bahnce of 20~:, frorn theu OVill resources. The State Governn,ent had constituted an Advisory Board for consultation on matters relating to the scheme and the loan of Rs. 1,920 was repayable within a penod of 30 years at 4!'Jb interest. As against the provision of Rs. 3'46 lakhs, Rs. 2'91 lakhs was spent during the Plan period and 157 houses constructed. Under the Slum Clearance Scheme grants w(;re given wIth a view to develop sllltable alternative plots and construct tenements for the benefit of slum dwellers. This scheme was confined to Madras CIty. Dl'ring the Second Plan peliod, 890 tenements were constructed and 2,895 open plots were developed by the Corporation of Madras and CIty Improvement Trust jointly. The Village Housing Project Scheme was implemented in selected C. D. and N. E. S. blocks. Loans were giwn to them subject to the limit I)f Rs. 1,500 per house. The Slum Clearance Scheme, Village Housing Project Scheme and Land Acquisition and Development Scheme are centrally sponsored schemes. The two non-plan schemes-Middle Income Group Housing Scheme and the Rental Housing Scheme for low paid employees of the State Government are financed by the LIfe Insurance Corporation of India. The first scheme was intended for persons with monthly income of Rs. 501 to Rs. ] ,250 and the otl~er for the low paid employees of the State Government with an income not exc~edJllg Rs. 500 p. 111. The three nonplan schemes-Urban Housing, Rural Housing and State Housing BoarJ schemes are financed entirely from State funds. The anticipated total allocation provided by the Government of India for the two Non-plan schemes-Middle Income and Rental Housing schemes, during t11e Third Plan period wIll be 7 crores as against the Second plan allocation of 1'45 crores. Duri,lg the Third Plan period, more funds were allotted to hous111g schemes. A detailed financial statement is given in Statement X-3 which represents the Centre's share also. The details of State schemes and achievements for the first year 1961-62 are given in Statement X-4.
10 - 10. On 22nd April 1961, the Madras State Housing Board was formed on a statutory basis. There are three housing units for the Board-at Madras, Madurai and Coimbatore. The
implementation of housing and slum improvement schemes and the The formation of the Madras development of neighbourhoods in Madras City are the Important
State Housing Board works of the Housing Board. It also plans, coordinates and scrutinises all housing schemes providmg expert technical advice
on them. The centrally sponsored Land Acquisition and Development Scheme implemented during 1959-60 was under the control of the State Housing Board. Under this scheme, the Board had proposed to acquire 4,000 acres of land on the fringes of the Madras City in order to develop them 111to neighbourhoods as follows during the Third Plan period.
Kodambakkam neighbourhood
South MadraS
West Madras
North Madras
Kodambakkam neighbourhood was glven top prionty. During the tirst year of the Thud PLln, an extent of 290 acres was acquired out of the proposed 324 acres. The Housing Board also prepared a land development scheme at an estimated cost of Rs. 90 lakhs. Duling 1962-63, a programme of constructing 583 houses for hand 100m weavers was undertaken and the houses are under various stages of construction. Undt:r the Urb~n Hou~ing Scheme, during 1962-63, 21.1-houses were constructed. The co-operative housing societies in urban areas helped in constructl11g the houses but they do not give any financial assistanc,; to their maintenance, nor advance funds to such cases of persons. Urban credit institutions known as house lllortga3~ b:lI1ks haw beta

HOUSING-PLANNING AND FUTURE 697
instituted in the State. A Central Housing Mortgage Bank was formed to render a5S1,;1.111ce to the Primary Mortgage Banks. There are at present 31 Primary House Mortgage Banks III the State. The 'State Government have invested Rs. 5 lakhs in the share capital of the Central Hou&ing Mortgage Bank. With the completion of the scheme contemplated in the Tlllfd PL:tn, the problem of providmg houses at low cost wIll be met to some extent. An Important factor in the constructlOn of houses is the rising cost and unless the cost of constructIon i3 reJ,jc.::d by adopting new methods, much headway cannot be made especially when the cost of bUlldmg matenals lIke bricks, cement, steel has shown an upward trend.
10 - 9. The foregoing dIScussion will &how that the State Goverl1ll1ent have taken adequate interest to stimuldte housing activity in the State. The magllltudc of achievement 111
the form of number of houses constructed m::,y not have any Some sugge~tions specific and direct bearing on the houslllg conJItions in the SLitC.
But they represent a very important gesture which will luv..: 111 the long run a far-reaching effect on the housing conditions. One point has to be observed. The co~t involved in providing houses for all the people in the State IS enormous. No Government can undertake to finance this venture, nor has much attention becn devoted to povlde addItional facilities to the existing houses. Therefore, a somewhat bolder approach to the problem, i.e., that the houses in the State can be improved and developed only on the b::lSlS of self-help must be made. There must be a concentrated effort to keep dOWll the cost of housing as well as to raise the general economic standard of the house owner, so that he can by hllnself undertake the improvement of the house. What the State Government in any Plan can provide is the technical advice as well as necessary finance to undertake such improvement.
10 - 10. We cannot close this chapter without obscrvins that the aClivity of the State Government under the Plans has no doubt increased the cost of rent and cost of building.
Consequent increase of cost of building and rent
Something must be done to counteract It. Another aspect which we may point out IS the tendency to introduce standard form of houses throughout the State, especially 111 the rural sector. We had occasion to point out in the course of this report that
the bulk of the hou~es 111 the State are constructed with the raw materials aVJ.ILlble lxally and WIth a view to WIthstand the clImatic conditions and as such in any approach to solve tile 110using problem, in the State, a realIstic approach ha.:; to be made by seeing that more raw l1nterials locally avaIlable are utIlised and that the houses are made a5 comfortable as poss~ble. Wint we can achieve in the process will be to improve the quality of the houses constructed loc:llly and to provide adequate finance for the poorer sections of the people to see t~lat some h0uses are constructed by them. The third factor which IS Important is that for any hou:,ing scheme to be successful, the person must have the feelmg that the house is his own. For this purp;)sc, 111 all the subsidlsed schemes under the industrial sector, an effort should be made to make every person own his OW11 house.
10 - 11. It is the endeavour of the State anu Ulllon Governments to prc'/id..:: proper housing to every CItizen. According to Sir John Newman, Chief Medical Officer of the Ulllted
Kingdom, a sanitary house should be free froll1 senou~ d-lmpncss. What the aim should be It should be satisfactonly lIghted and ventIlated. It sllOuld be
properly drained and provide with adequate sanitary conv_;nicnce. It should be in good repair and should have a satisfactory water supply, adeqwlte wa~':lllg
accommodation, adequate facIlities for preparing and cookmg f('od and \Veil ventIlated S~Jrc
for fooJ. If these standards arc applied, we have to conceive that most of the houses found in the State cannot be claSSIfied as satisfactory. Even on a liberal estimate, the number of
H~88
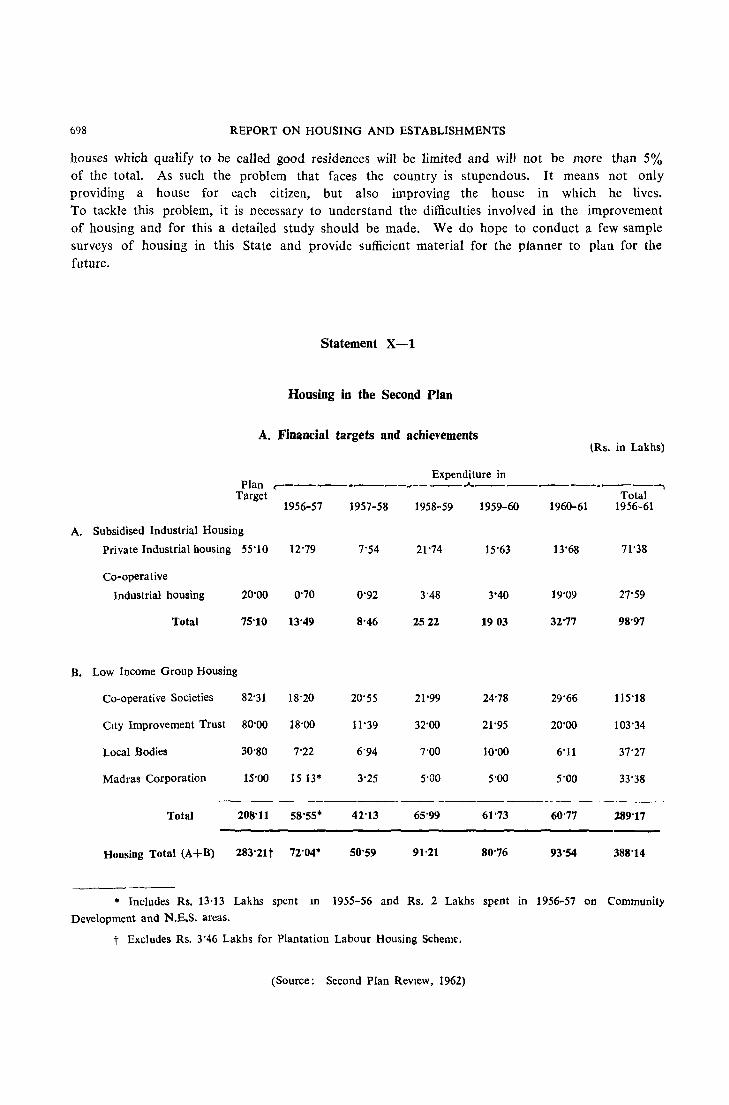
698 REPORT ON HOUSING AND ESTABLISHMENTS
houses which qualify to be called good residences will be limited and will not be more than 5% of the total. As such the problem that faces the country is stupendous, It means not only providing a house for each citizen, but also improving the house in which he lives, To tackle this problem, it is necessary to understand the difficulties involved in the improvement of housing and for this a detailed study should be made, We do hope to conduct a few sample surveys of housing in this State and provide sufficient material for the planner to plan for the future,
Statement X-I
Housing in the Second Plan
A. Financial targets and achievements lRs. in Lakhs)
Plan Expenditure in
r-------~_~~-.A.------------_, Target Total
1956-57 1957-58 1958-59 1959-60 1960-61 1956-61
A. Subsidised Industrial Housing
Private Industrial housing 55'10 12'79 7'54 21'74 15'63 13'68 71'38
Co-operative
Industrial housing 20'00 0'70 0'92 3-48 3'40 19'09 27'59
Total 75'10 13"49 8'46 2522 1903 32'77 98'97
B. Low Income Group Housing
Co-operative Societies 82'31 18'20 20'55 21'99 24'78 29'66 115'18
City Improvement Trust 80'00 18'00 11'39 32'00 21'95 20'00 103'34
Local Bodies 30'SO 7'22 6'94 7'00 10'00 6'11 37'27
Madras Corporation 1S'00 15 13* 3'25 5'00 5'00 5'00 33'38
Total 208'11 58'55* 42'13 65'99 61'73 60'77 289'17
Housing Total (A+B) 283'21t 72'04* 50'59 91'21 80'76 93'54 388'14
• Includes Rs. 13'13 Lakhs spent m 1955-56 and Rs. 2 Lakhs spent in 1956-57 on Community
Development and N.E.S, areas,
t Excludes Rs, 3'46 Lakhs for Plantation Labour Housing Scheme.
(Source: Second Plan ReView, 1962)

Private Industrial housing
houses constructed (No.)
Co-operative Industrial
housing tenements (No.)
Co. operative Societies
HOUSING-PLANNING AND FUTURE
Statement X-2
Housing in the Second Plan
B. Physical targets and achievements
Plan Target 1956-57 1957-58 1958-59 1959-60
1,700 512 386
674 4 60
1960-61
$648
699
Total 1956-61
1,138 §§
7,12$
houses (No.) 1,300 104 282 272 274 536 1,468 (752 houses under
City Improvement Trust
houses (No.)
House Sites (No.)
Local Bodies houses (No.)
731
765
1,421
225
395 236
73
404
211
278
63
126
various stages of construction)
67
20
94
§§ In addition, 131 houses were completed upto plinth level and 58 houses upto roof level.
$ In addition, 200 houses were under construction.
(Source: Second Plan Review, 1962)
Statement .X-3
Plan schemes on housing
643
487
1,062
(Rs in Lakhs) Total plan Actual Total plan RevIsed Budget
Name of scheme provisIOn expenditure provision estimate (RevIsed) 1956-61 1956-61 1961-66 1961-62 1962-63
1. Subsidised Industrial
Housing Scheme 75'00 98·97 200'00 25'83 46'00
2. Low Income Group
Housing Scheme 208'11 289'17 320'00 56'25 60'00
3. Plantation Labour
Housing Scheme 3"46 2·91 5'00 0'20 1'75
4. Slum Clearance Scheme 168'00 90'85 300'00 55'00 56'25
5. ViIIage Housing Project Scheme IS'oo 12'87 25,00 6'77 9'46
f. Housing Scheme for Weavers 74'29 66'08 100'00 23'11 25'00
7. Bulk requisition of lands for
housing schemes 24'25 17"85 170'00 100'00 70'00
Total 568'11 578'70 1,120'00 267'16 26846

7JO REPORT ON HOUSING AND ESTABLISHMENTS
Statement X--4
State schemes and achievements for the first year
(Rs_ in Lakhs)
Provision Actuals Third Achievement Centrally Assisted schemes In the for plan in
ThIrd plan 1961-62 Target 1961-62
I Sub~ldlsed Industrial Housing
(a) Government Projects 125-00 12'31 ") 218 I 4,239 (170 incomplete)
(b) Co-operative Projects 50'00 13'00 ~ houses 405 I (263 incomplete)
(c) rrivate Industnal Projects 25'00 1'85 J 54 (52 Incomplete)
II PlantatiOn Labour Housing 5'00 0-19 26 houses 20 (mcomplete)
III VIlbge Hou~Ing Project schemes 25'00 S'18 1,497 houses 555
IV L('w Tl'come Group hOUSIng schemes
Madras Housing Unit ") 25'00 (28 incomplete) I 525
Co-operative SOCietIes ~ 320'00 25'00 I 546 (mcou-,pIete)
LccaI BodIes J 6'25 63
Centrally Sponsored schemes
I Slum Clearance Scheme 75'00 8'70 9,000 2,014 plots
II Land Acquisition & Development Scheme (Cost met under central plan) 4,000 (tenements)
Total housing 625'00 100'48
<;()UICC: Third five year plan. Madras State. ReView of progress for 1961-62 and programme for 19S2-63,

APPENDICES

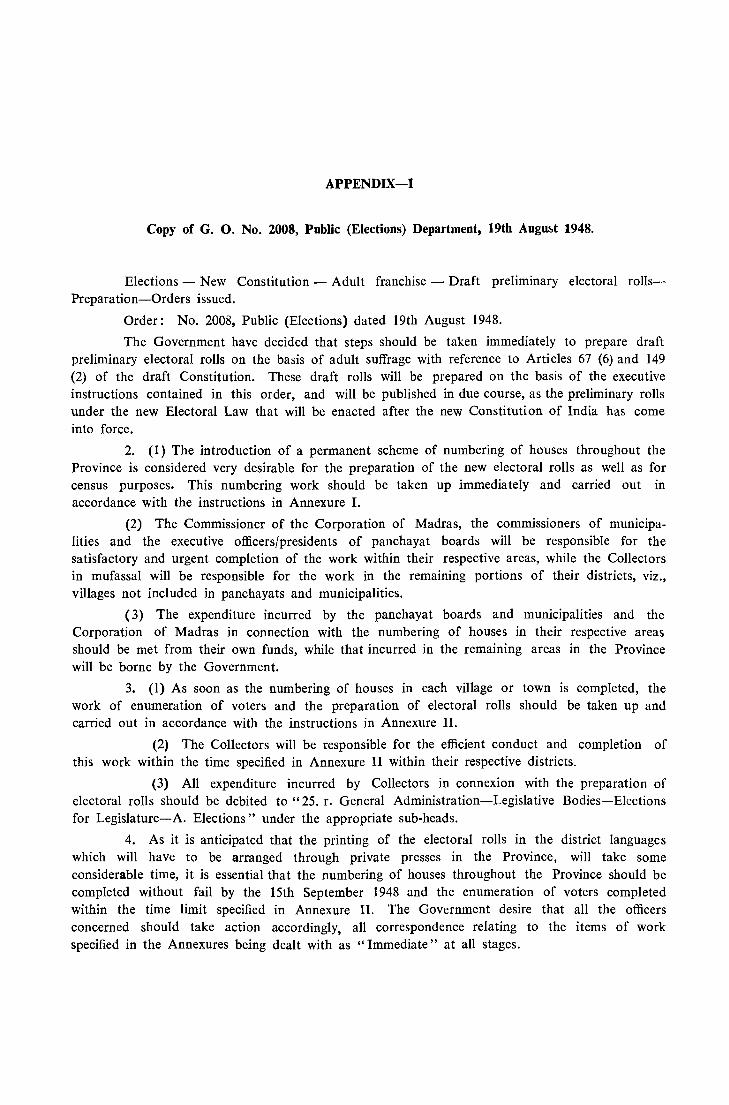
APPENDIX-I
Copy of G. O. No. 2008, Public (Elections) Department, 19th Augu~t 1948.
Elections - New Constitution - Adult franchise - Draft preliminary electoral rollsPreparation-Orders issued.
Order: No. 2008, Public (Elections) dated 19th August 1948.
The Government have decided that steps should be taken immediately to prepare draft preliminary electoral rolls on the basis of adult suffrage with reference to Articles 67 (6) and 149 (2) of the draft Constitution. These draft rolls will be prepared on the basis of the executive instructions contained in this order, and will be published in due course, as the preliminary rolls under the new Electoral Law that will be enacted after the new Constitution of India has come into force.
2. (1) The introduction of a permanent scheme of numbering of houses throughout the Province is considered very desirable for the preparation of the new electoral rolls as well as for census purposes. This numbering work should be taken up immediately and carried out in accordance with the instructions in Annexure I.
(2) The Commissioner of the Corporation of Madras, the commissioners of municipalities and the executive officers/presidents of panchayat boards will be responsible for the satisfactory and urgent completion of the work within their respective areas, while the Collectors in mufassal will be responsible for the work in the remaining portions of their districts, viz., villages not included in panchayats and municipalities.
(3) The expenditure incurred by the panchayat boards and municipalities and the Corporation of Madras in connection with the numbering of houses in their respective areas should be met from their own funds, while that incurred in the remaining areas in the Province will be borne by the Government.
3. (I) As soon as the numbering of houses in each village or town is completed, the work of enumeration of voters and the preparation of electoral rolls should be taken up and carried out in accordance with the instructions in Annexure II.
(2) The Collectors will be responsible for the efficient conduct and completion of this work within the time specified in Annexure II within their respective districts.
(3) All expenditure incurred by Collectors in connexion with the preparation of electoral rolls should be debited to" 25. r. General Administration-Legislative Bodies-Elections for Legislature-A. Elections" under the appropriate sub-heads.
4. As it is anticipated that the printing of the electoral rolls in the district languages which will have to be arranged through private presses in the Province, will take some considerable time, it is essential that the numbering of houses throughout the Province should be completed without fail by the 15th September 1948 and the enumeration of voters completed within the time limit specified in Annexure II. The Government desire that all the officers concerned should take action accordingly, all correspondence relating to the items of work specified in the Annexures being dealt with as "Immediate" at all stages.
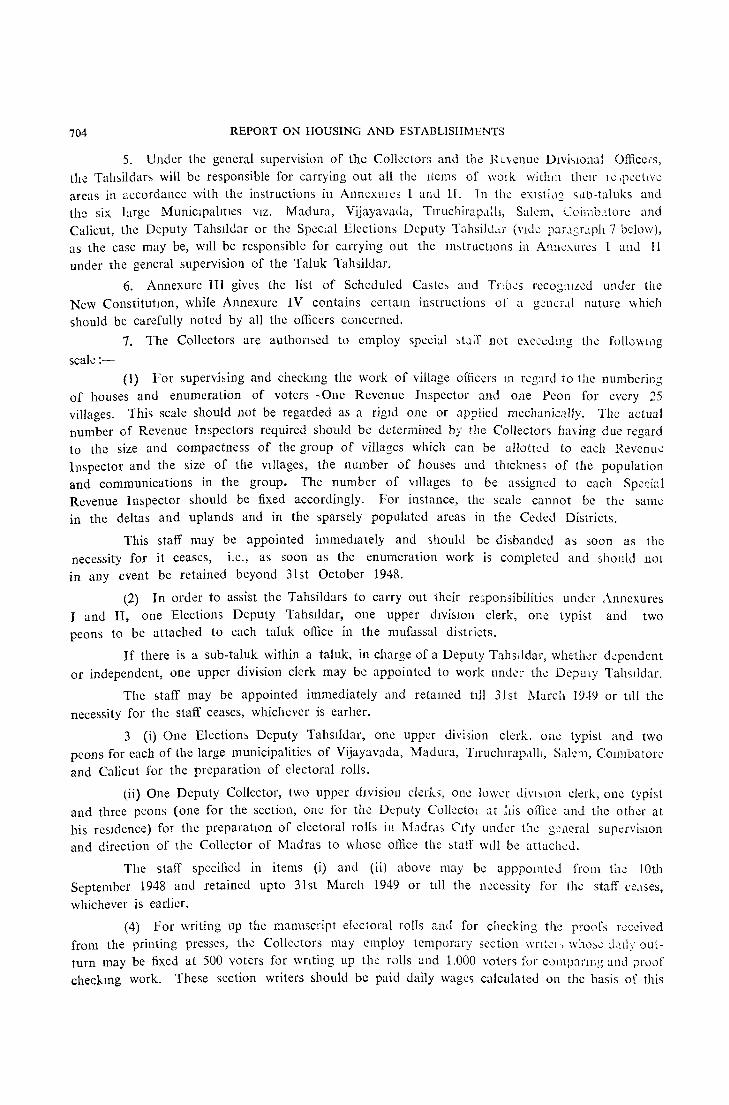
704 REPORT ON HOUSING AND ESTABLISHMENTS
5. Under the general supervision of the Collectors and the RLvenuc Dlvi~lO;}al Officeis,
the Tah~ildar~ will be responsible for carrying out all the items of \VOl k withlll their Ie ,pectlve
areas in <lccordance with the instructions in Anncxlli es I and IT. 1 n the eXIstid:;'; sLlb-taluks and
the six large MuniCIpalItIes VIZ. Madura, VijayavaJa, TlruchirapJ:II, Salem, Coi],1o<,tore and
Calicut, the Deputy Tahslldar or the Special Elections Deputy TahsiJu.,r (Vide par,\~r.tph 7 below),
as the case may be, WIll be responsible for carrying out the lll~tructlOns in An:1C,\Ures I alh.l 11
under the general supervision of the Taluk Tahsildar.
6. Annexure III gives the list of Schcduled Caste~ and Tnb..:s n:cognlled under the
New ConstitutIOn, while Annexure IV contains certall1 instructions of a gener.11 nature which
should be carefully noted by all the officers concerned.
7. The Collectors are authomed to employ speebl ::,t.lIT not ell.cccomg the: follvwlI1g
scale:-
(1) For supervising and checkll1g the work of village officers JJ1 rcg:lrd to the numbering
of houses and enumeration of voters-One Revenue Inspector and one Peon for every 25
villages. This scale should not be regarded as a rigId one or applied mechanically. The actual
number of Revenue Inspectors required should be determined by the Collector, having due regard
to the size and compactness of the group of villages which can be allotted to each Revenue
Inspector and the size of the VIllages, the number of houses and tllIcknes', of the population
and communications in the group. The number of Villages to be assignt:d to each Spccinl
Revenue Inspector should be fixed accordingly. For instance, the scale cannot be the saml!
in the deltas and uplands and in the sparsely popUlated areas in the Ceded Districts.
This staff may be appointed immediately and 5hould be disbanded as soon as the
necessity for it ceases, i.e., as soon as the enumeration work is completed and should not
in any event be retained beyond 31st October 1948.
(2) r n order to assist the Tahsildars to carry out their responsibilities under Anncxures
I and II, one Elections Deputy Tahslldar, one upper dlvi:-'lOn clerk, one lypi:-.t and two
peons to be attached to each taluk office in the J1lufassal districts.
1f there is a sub-taluk within a taluk, in charge of a Deputy Tahslldar, whether dependent
or independent, one upper division clerk may be appointed to work under the DepUlY Tahslldar.
The :-.taff may be appointed immediately and retall1cd tIll 31st March 19~9 or till the
necessity for the staff ceases, whichever is earher.
3 (i) One Electiom Deputy Tal1Slldar, one upper div15ioll clerk, one typist and two
peons for each of the large municipalities of Vijayavada, Madura, Tll'uclllrapdlh, Salem, COlmiJatore
and Calicut for the preparation of electoral rolls.
(ii) One Deputy Collector, two upper dIvision clerks, one lower di\'l~lOn clerk, one typist
and three peons (one for the section, one for the Deputy ColkctOl at :lis office anJ the other at
his reSIdence) for the preparatIon of electoral rolls in !vIadrJ.5 City under tIle g211ewl supc:rvislOll
and direction of the Collector of Madras to "hosc office the ~ta1T Will be attached.
The staff specified in items (i) and (ii) above may be apPpoll1teJ from t11':: 10th
September 1948 and retained upto 31st March 1949 or till the necessity for the staff CC<lses,
whichever is earlier.
(4) For writing up the manuscript electoral rolls and for checking the p:'oofs received
from the printing presses, the Collectors may employ temporary section wn~el" \Vh0~-: d,,[I), OUl
turn may be fixed at 500 voters for wnting up the rolls and 1.000 voters for compcmng and ;;roof
checkmg work. These section writers should be paid daily wage,> calculated on the basis of this
APPENDIX I (contd.) 705
outtUfJ1, the ratc of daily wagcs being fixed by the Collcdor having regard to the Icmunercltion
which is paid to clerks locally for doing such simple scriptory work.
8. SanctIOn is accorded for the payment of remuneration on the follow:ng scale for
village officers and menials for their work in connexion with the numbering of houses and
enumeration of voters ll1 villages and minor panchayats:-
Number of houses in the village or mmor panchayat
250 & below
Abo\e 250
Lumpsum remuneratIOn to b:: shared by the village officers
domg the work
Rs.
5
7
Lumpsull1 rCOlunel atlOD to be shaled by thelt
village I:lcnrals I
Rs.
3
4
This remuneration should be paid in respect of each village on the satisfactory
completion of the work of enumeration of voters in it.
9. Sanction is also accorded for the payment of an advance of Rs. 1,000 to each Collector in the mufassal for meeting the contingent expenditure on chunnam, Llr, stencils, brush, etc., in conncxion with the numbering of houses in villages. This advance should be accounted
for with the necessary vouchers in due course.
10. The special Revenue Inspectors and the Elections Deputy Tahsiidars attached to Taluk Offices will be entitled to travelling allowance on the same scale as Firka Revenue
Inspectors and Deputy Tahsildars like Wells Deputy Tahsildars who have to tour throughout the tal uk, respectively.
11. As soon as the Special Revenue Inspectors are appointed, the Tal uk Tahsildar should hold a cla&s for them at the Taluk Headquarters and they should be instructed fully as to their duties in connexion with the numbering of houses and the preparatlOn of electoral
rolls. Similarly, the Special Revenue Inspectors should, as soon as they reach the areas allotted to them, collect at convenient centres, the village officers in those areas and ll1struct them fully as to thor duties under Annexures I and II.
These Special Revenue Inspectors should, after they have seen the compIction of the numbering work check the enumeration work of the village officers. They should check a faIr number of cases in each village in regard to numbering as well as enumeration. The
enumeration forms will be available in the Villages till 1st October 1948 and thereafter they can use the VIllage copy of the lIst of persons enumerated prescribed 1Il Annexure II.
12. Thc Inspector-General of Registration is requested to instruct the Registrars of Blrihs to give all facIlItIes to Tahslld;lrs and Deputy Tai1sJldars to consult the BIrth rcgi~ters in connexion with the inquines into the age of voters 1Il doubtful cases reserved for their decision as set out in Annexure II.
13. The attention of the Superintendent, Government Press is invited to the Enumerc.tion
Form prescribed in Annexnre II and he is requested to arrange immediately for the pnnting
of 33 mIllion numbers of this form in all, in the main languages of the Province, viz., TamIl, Te1ugu, Malayalam and Kanarese, and for the direct supply of the same as qUickly as possible to all Tahsildars and Deputy Tahsildars in accordance with the indents and
despatch instructions received from the Collectors. The indents prepared by the Collectors
H-89
706 REPORT ON HOUSING AND ESTABLISHMENTS
in accordance with the instructions contained in Annexure II will specify the number of forms to be printed in each language for use in the distnct and also the dlstributlCln of the forms among t~e Tahsildars and Deputy Tahsildars. The Collectors are requested to prepare and send these indents so as to reach the Superintendent, Government Press not later than the 1st September 1948 and to send copies of these indents to the Government for information.
14. The Superintendent of Stationery is requested to supply immediately the quantity of paper required by the Superintendent, Government Press, for printing the enumeratIOn forms.
15. The Provincial Elections Commissioner will tour the districts as much pos,ible for discussing any difficulties on the spot with the Collectors, Commissioners of munlcipahties and the Executive Officers of panchayat boards and for ascertaining the progress made in implementing the orders issued by the Government in connexion with the preparatIOn of electocal rolls.
(By order of His Excellency the Governor)
To
All Collectors.
" Revenue Divisional Officers.
The Commissioners of Municipal Councils
(through Chairmen). The Commissioner, Corporation of Madras
(through Mayor).
The Executive Officers of Panchayat Boards.
All District Panchayat Officers.
The Superintendent, Government Press.
The Superintendent of Stationery.
The Board of Revenue.
All Heads of Departments.
The Education and Public Health, Revenue, Local Administration and Finance Departments.
The Accountant-General (through Finance).
Annexure I
S. Venkateswaran,
Additional Secretary to Government
1. (1) The Government have decided that, in the Corporation of Madras, municipalities and major panchayats the existing house numbers should be adopted as explcuned below:-
(2) In minor panchayats and villages, there is no satisfactory numbering of houses, apart, perhaps, from some traces of the old Census numbers. The Government have therefore decided that, .in these areas, the houses should be numbered afresh in some logical way as described below:
APPENDIX I (contd.) 707
2. Definition of' house '-Every dwelling with a separate main entrance should be treated as a distinct house, and numbered accordmgly irrespective of the number of persons residing in It. A dwellmg may harbour more than one family, but unless each of the families has independent access outside, it should be treated as a single house.
3. (I) Each panchayat and municipality will be a separate unit, both for the purposes of the numbering scheme as well as for the preparation of the electoral rolls.
(2) Each revenue village or portion of a revenue village which lies outside the limits of panchayats or municipalities, should be treated as a separate area for both purposes.
4. Villages and minor panchayats : (I) The area should be split up into compact blocks with 100 houses 111 each block (or slightly more or less), and the houses numbered in one series in each block. A block will consist of a group of adjoining streets or other compact local area with well-defined boundanes. The numbering may be done clockwise if the houses are scattered, or by streets, proceeding from north to south (or east to west), the numbering in each street being done from east to west (or north to south), odd numbers being given to the houses on the right and even numbers to those on the left. Thus, the house number 5-15 marked on a house wIll denote house No. 15 in Block No.5. In a small village, the numbering could be done in one senes throughout the village, But numbering by blocks will be necessary for the larger villages and VIllages WIth hamlets.
(2) The best place to mark the house number is the centre of the lintel of the front door of the house, or the number may be marked on the front door itself or next to it on the wall.
Where there IS no durable door worth the name, as for instance, in huts, a small portion of the wall near the entrance to the house should be white-washed, if this has not already been done by the owner, and the number stencilled on the white-washed portion.
If the owners provide metal plates with the numbers painted on them, they may be gladly accepted.
(3) The numbers given will be permanent and will be maintained.
(4) The number should be half an inch thick and two and a half inches hIgh, coal-tar being used for markmg the numbers.
(5) The Collectors should arrange immediately for the supply of the necessary number of tin or zinc stencils. The Collectors should arrange locally for the supply of these stencils, but if they are not to be had locally. they should report the fact to the Government immediately so that supplies can be arranged from Madras.
(6) The Karnams should be made responsible for completing the numbering of the houses in their villages WIth the assistance of the village menials. If the Headman is competent enough, the Tahsildar should direct the Karnam and the Headman to attend to separate blocks in the village WIth a view to the expeditious completion of the work. If, as in the case in some proprietary villages, the existing village officers are not quite competent for this work, it will be the Tahsildar's duty to take particular care to depute a competent Headman or Karnam from some adjoming village to do the work after he has completed the work in his own village.
(7) The numbering work should be taken up at once and completed by the 15th September in all minor panchayats and villages.
(8) In the Excluded Areas, namely, the Amindivi and the Laccadive Islands, this work can be taken up only after the communication with the islands becomes possible, i.e., in October after the south-west monsoon is over. In these islands., th.~ numbering of houses and the
708 REPORT ON HOUSING AND ESTABLISHMENTS
enumeration of voters can be attended to side by side and special dates will be fixed for them. The amins will, of course, have to make the necessary arrangements for carrying out the work.
The Collectors of South Kanara and Malabar are being addressed separately in the matter.
(9) A rough plan of the village-this need not be to scale-should be prepared in duplicate showing the location of the blocks, the streets and the house numbers in each street and block. The Karnam should prepare this plan. One copy of the plan should be retained by the Karnam and the other sent to the Taluk Office. A key to the plan in the following form should be recorded on the plan itself:,,-
Number of the block in senal
order
1
2
Name of the street or streets comprismg the block III column (1)
2
A. B.
C. D.
House Nos. in the blocks (by streets)
3
1 to 2S
1 to 50
Total No. of houses In the block (by streets)
4
2S
50
The Taluk office copy of the plan should be made available to Polling Officers for reference at the time of election.
5. Major Panchayats, municipalities and the Corporation of Madras :-( I) The existing arrangement in these areas is that the houses in each street have been numbered in one series, irrespective of the size of the street. This arrangement will be left undisturbed. Old houses that have been omitted to be numbered or new houses which have since sprung up, should b~ given sub-numbers, or fresh numbers, in continuation, according to the existing plan of numbering, with reference to the location of the houses in the street in which they are situated.
(2) The existing wards and divisions will probably have to be changed with reference to the large size of the new electorate for elections to local bodies under adult suffrage. It i<;, therefore, considered that the new electoral rolls should not be prepared with reference to the existing wards and divisions. As the name in the new rolls will be written separately for each street, the new rolls can be conveniently combined for the purpose of elections to the local body with reference to the wards and divisions that may be fixed after the introduction of adult suffrage.
But for the purpose of easy identification of the voters, it is considered very desirable that the well-established existing localities like Mylapore, Triplicane, Royapetta, etc., in Madras City, Brodiepet and Arundelpet in Guntur town and Vannarpet in Palamcottah Municipality should be duly taken into account and preserved in the new scheme of numbering. Under the new scheme, these well· known localities should accordingly first be numbered in one series for the whole town. Thus, Adyar may be numbered as No.1, Mylapore No.2, Royapetta No.3, and so on. The streets which are now known only by their names should then be numbered in one series, separately for each locality. Any new streets in the locality should be duly numbered according to their location therein. The existing numbers marked on the houses will remain unchanged. Thus, under this scheme, house No. 5-10-25 will mean house No. 25, in street No. 10, m Locality No.5 and this is sufficient to locate the house exactly. The number (5-10 in the illustration) which helps to locate the street should be painted on the name plate or board at the entrance to the street, this would obviate the need for marking the additional number (5-10 in the illustration) on every house in that street.
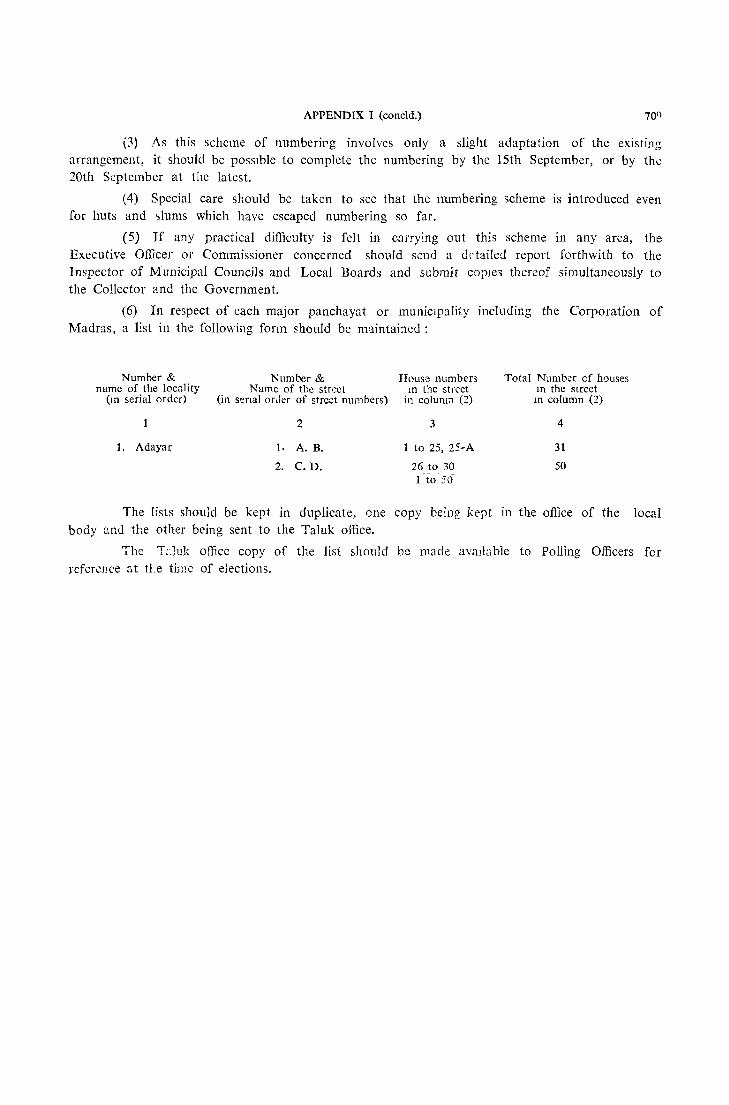
APPENDIX I (coneld.)
(3) As this scheme of numberirg involves only a slight adapta~ion of the existing arrangement, it should be possible to complete the numbering by the 15th September, or by the 20th September at the latest.
(4) Special care should be taken to see that the numbering scheme is introduced even for huts and slums which have escaped numbering so far.
(5) If any practical difficulty is feIt in carrying out this scheme in any area, the Executive Officer or Commissioner concerned should send a dt'tailed report forthwith to the Inspector of Municipal Councils and Local Boards and submit coples thereof simultaneously to the Collector and the Government.
(6) In respect of each major panchayat or municlpality including the Corporation of Madras, a Est in the following form should be maintai:led:
Number & name of the locality
(m serial order)
1. Adayar
Number & Name of the street
(in senal order of stre~t numbers)
2
1. A. B.
2. C.D.
House numbers In the street
in colunm (2)
3
to 25, 25-A
26 to 30 I-to 50
Total Number of houses In the street In column (2)
4
31
50
The lists should be kept in duplicate, one copy being kept in the office of the local body and the other being sent to the Taluk office.
The T~Juk office copy of the list should be made aV311a ble to Polling Officers for reference at tte time of elections.
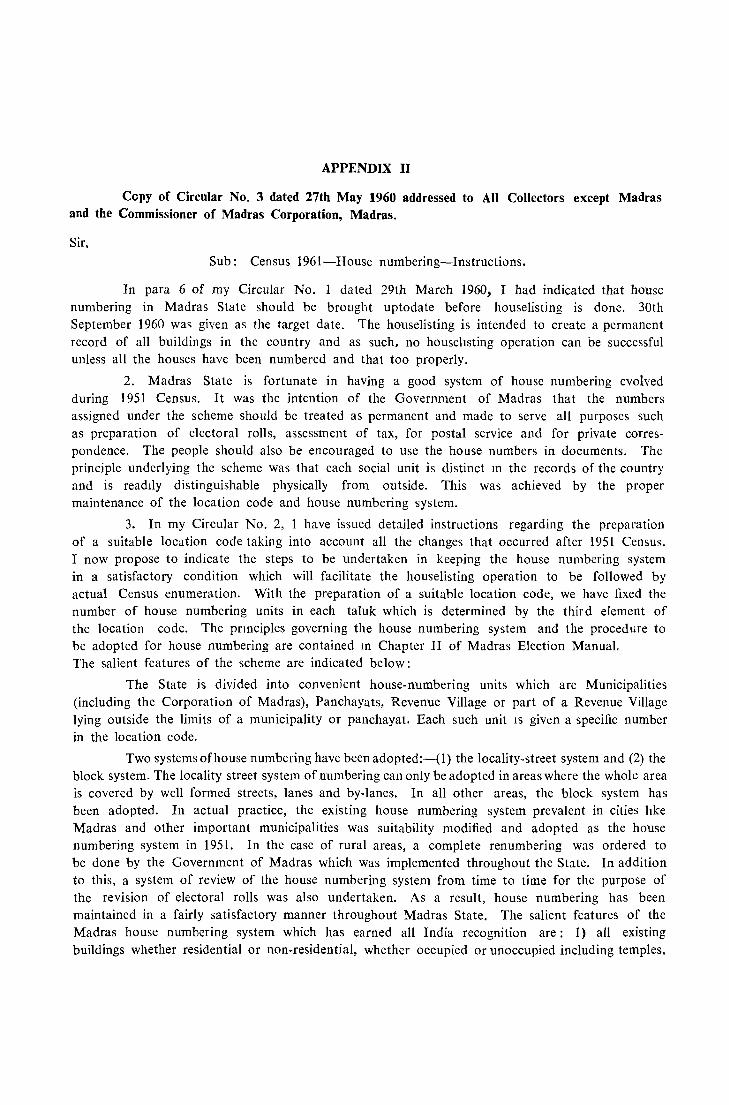
APPENDIX II
Copy of Circular No. 3 dated 27th May 1960 addressed to All Collectors except Madras and the Commissioner of Madras Corporation, Madras.
Sir,
Sub: Census 1961-House numbering-Instructions.
In para 6 of my Circular No. 1 dated 29th March 1960, I had indicated that house numbering in Madras State should be brought uptodate before houselisting is done. 30th September 1960 was given as the target date. The houselisting is intended to create a permanent record of all buildings in the country and as such. no househsting operation can be successful unless all the houses have been numbered and that too properly.
2. Madras State is fortunate in having a good system of house numbering evolved during 1951 Census. It was the intention of the Government of Madras that the numbers assigned under the scheme should be treated as permanent and made to serve all purposes such as preparation of electoral rolls, assessment of tax, for postal service and for private correspondence. The people should also be encouraged to use the house numbers in documents. The principle underlying the scheme was that each social unit is distinct m the records of the country and is readIly distinguishable physically from outside. This was achieved by the proper maintenance of the location code and house numbering system.
3. In my Circular No.2, 1 have issued detailed instructions regarding the preparation of a suitable location code taking into account all the changes that occurred after 1951 Census. I now propose to indicate the steps to be undertaken in keeping the house numbering system in a satisfactory condition which will facilitate the houselisting operation to be followed by actual Census enumeration. With the preparation of a suitable location code, we have fixed the number of house numbering units in each taluk which is determined by the third element of the location code. The pnnciples governing the house numbering system and the procedure to be adopted for house numbering are contained m Chapter II of Madras Election Manual. The salient features of the scheme are indicated below:
The State is divided into convenient house-numbering units which are Municipalities (including the Corporation of Madras), Panchayats, Revenue Village or part of a Revenue Village lying outside the limits of a municipality or panchayat. Each such unit IS given a specific number in the location code.
Two systems of house numbering have been adopted:-(l) the locality-street system and (2) the block system. The locality street system of numbering can only be adopted in areas where the whole area is covered by well formed streets, lanes and by-lanes. In all other areas, the block system has been adopted. In actual practice, the existing house numbering system prevalent in cities lIke Madras and other important municipalities was suitability modified and adopted as the house numbering system in 1951. In the case of rural areas, a complete renumbering was ordered to be done by the Government of Madras which was implemented throughout the State. In addition to this, a system of review of the house numbering system from time to time for the purpose of the revision of electoral rolls was also undertaken. As a result, house numbering has been maintained in a fairly satisfactory manner throughout Madras State. The salient features of the Madras house numbering system which has earned all India recognition are: 1) all existing buildings whether residential or non-residential, whether occupied or unoccupied including temples,
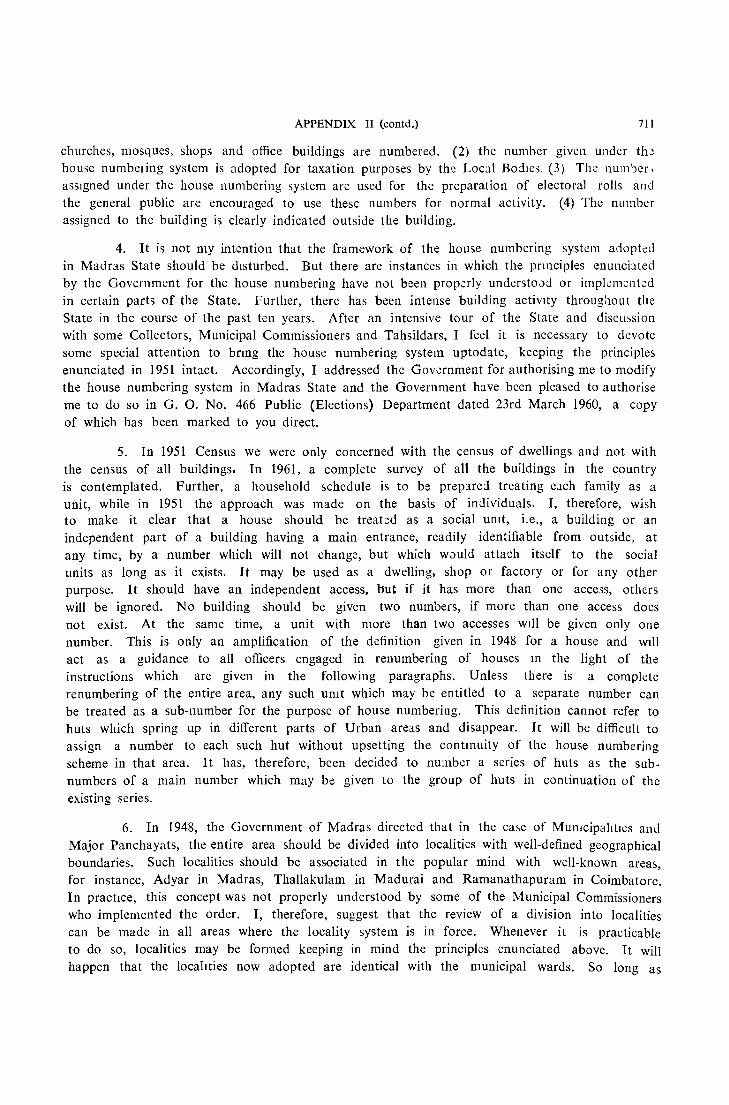
APPENDIX II (contd.) 711
churches, mosques, shops and office buildings are numbered. (2) the number given under th~
house numbeIing system is adopted for taxation purposes by the Local BodIes. (3) The num 'Jcr, assIgned under the house numbering system are used for the preparation of electoral rolls and the general public are encouraged to use these numbers for normal activity. (4) The number assigned to the building is clearly indicated outside the building.
4. It is not my intention that the framework of the house numbering system adopted in Madras State should be disturbed. But there are instances in which the prmciples enunciated by the Government for the house numbering have not been propJrly understouu or implemented in certain parts of the State. Further, there has been intense building activity throughout the State in the course of the past ten years. After an intensive tour of the State and discu:,sion with some Collectors, Municipal Commissioners and Tahsildars, I feel it is necessary to devote some special attention to bnng the house numbering system uptodate, keeping the principles enunciated in 1951 intact. Accordingly, I addressed the Government for authorising me to modify the house numbering system in Madras State and the Government have been pleased to authorise me to do so in G. O. No. 466 Public (Elections) Department dated 23rd March 1960, a copy of which has been marked to you direct.
5. In 1951 Census we were only concerned with the census of dwellings and not with the census of all buildings. In 1961, a complete survey of all the buildings in the country is contemplated. Further, a household schedule is to be prep:r.red treating e.lch family as a unit, while in 1951 the approach was made on the basis of individuals. r, therefore, wish to make it clear that a house should be treated as a social umt, i.e., a building or an independent part of a building having a main entrance, readily identifiable from outside, at any time, by a number which will not change, but which wuuld attach itself to the social units as long as it exists. It may be used as a dwelling, shop or factory or for any other purpose. It should have an independent access, but if it has more than one access, oth(;rs will be ignored. No building should be given two numbers, if more than one access does not exist. At the same time, a unit with more than two accesses WIll be given only one number. This is only an amplification of the definition given in 1948 for a house and WIll act as a guidance to all officers engaged in renumbering of houses 111 the light of the instructions which are given in the following paragraphs. Unless there is a complete renumbering of the entire area, any such umt which may be entitled to a separate number can be treated as a sub-number for the purpose of house numbering. This definition cannot refer to huts which spring up in different parts of Urban areas and disappear. It will be difficult to assign a number to each such hut without upsetting the contllluity of the house numbering scheme in that area. It has, therefore, been decided to number a series of huts as the subnumbers of a main number which may be given to the group of huts in continuation of the existing series.
6. In 1948, the Government of Madras directed that in the ca~e of MUlllcipalrtlcs and Major Panchayats, the entire area should be divided into localities with well-defined geographical boundaries. Such localities should be associated in the popular mind with well-known areas, for instance, Adyar in Madras, Thallakulam in Madurai and Ramanathapuram in Coimbatorc. In practice, this concept was not properly understood by some of the Municipal Commissioners who implemented the order. I, therefore, suggest that the review of a division into localities can be made in all areas where the locality system is in force. Whenever it is practicable to do so, localities may be formed keeping in mind the principles enunciated above. It will happen that the localIties now adopted are identical with the municipal wards. So long as
712 REPORT ON HOUSING AND ESTABLISHMENTS
such wards have wcll defined geographical boundaries, thcre is no nece<;sity to regroup locilh(ie~.
In some cases, the localIty will represel1t only a conception and not a reality in the senSe
that a particular area is notlOnally dlvlded mto a lar~e number of 10callties with no local name or habitation. It Wlll bc necessary to undertake a revision of such locaWy and evolve a suitable and scientific pattern for the formation of loealitles.
7. It will be difficult to lay down a uniform procedure for renumberins of housts throughout the Stolte. In speclfic imtances, I h:ue indlcatEd a complde renumbering should be
done ~lS in Coimbatore City and Coimb1torc tal uk. In the ca'5C of M:ldural City, I have sllg'Seskd the regrouping of locahttes and a partial renumbering. In all cases where any specific problem is raised by the OJTicer responslble for the maintenance of the house numbering, sUltable ll1struc
tions will be i~sued by me in due eoursc. In those case'> where there has been intense building activity and where the addition of new numbers have affected the existing numbering system and no geographical contigUlty has been maintained, it may be de~irabIe to undertake a renumbering of houses. Again, where new Municipalities or Panchayats have been formed, it is nec~s'Sary to
undertake a complete renumbering. Such cases can be listed by you and a report sent to me by 30th June 1960. Meanwhile, ",etlon n12Y be taken to renumber the houses in that area wah a view to conform to the principles enunciated in this Circular. I had occasion to discuss specifi
cally the approach to be made to thc house numbenng prevalent in rural areas. In some di~tricts, the Tahsildars were of the opinion that a renumbering was necessary while in some districts they did not think so. However, the final decision can be left to you, but the important point for
consideration is th::t the numbenng must conform to the principles, enunciated in 1943 and with a view to conform to those principles it is necessary to undertake a renumbering.
8. In any numbering scheme, thc most important point as far as Censuo is c')ncerncd
is that the number should be prol1ll11cntly exhibited on the buildmg. The manner in which It Can be done has bcen mdicated in Chapter II of the Madras Election Manual. It is necessary at this stage to see that all the numbers have been properly exhibited on all the buildings we have
in the State. For this purpose, a compJek inspection of the area under your control will b~ required. In the case of municipalitJcs, It IS also de5ll'able to "ee that the locdlity and the strect numbers are c)l.hibltcd on the name pIa tc or board at the entrance to the streets and roads ill all arC2.S. I hope that a compicte renumbcflng of houses 111 the Statc cJ.n be done by 30th September
winch I have fixed as the target date. Meanwhile, I would very much appreciate that an interim report is sent to me by 30th June 1960 indicating the major changes WlllCh you propose to undertak.e in the area uncler your control.
9. In the course of my tour, I \\i11 be inspecting t!1C hous~ numbcnng sy.,t\::m in varioU'i
parts of the Statc. I wlil also bc sendIng my Dcputy Supenntcl1cent who has recently joincll duty on lDspectlOl1 work. But \\hat wc can do at our kvel 15 \cry lImited. We, therefor...:, expect
that the R. D. Os who have playcd an impoi tant role for the succcssful compiction of 1951 Census v"ill dc\ ote personal ~ttention to this Item of work and see that the housing numberins is main
tained properly in thClr cllvi~ions. For thi~ PUlPOSC, I shall be happy if you can in5truct your R. D. Os. to indlcate 111 their dIan~s itcms of Census work they nttend to 111 the course of theIr
tour.
10. I do not think 1 C~lll cover all the points that are invol\'cd in the Improvemcnt of
the hOllse numbering system by a general Circubr. I, therefDre, tn:Sl that you and yo,;!' Ofliccl's wIll de\ ote pei sonal attention to tIllS importJ;1t question and bring tv my attcntIOll such points
on which further clanficution IS require\.1. i have no doubt in my mind that with the expcrieace
of the staff under control, it will be posslble for us to evolve a complete and up-to-date systcm
of !lumbering which will earn all-India recognition.
APPENDIX 11 (concld) 713
11. I may add that the Government of Madras ha've been pleased to accept in full the content of lhi~ Cncular. They have also accepted the followl11g principles.
"The localities formed in some of the Municipalities of the Madras State in 1951 do not conform to the pnnciples enunciated by the Government of Madras. As the house numbenng is to be retamcd as a permanent feature in Madras State and has to become the pattern for all-India, localIties should have geographical boundaries which will remain unchanged irre~pective
of the re\ ision in the electoral wards. Wherever electoral wards have well defined geographical boundaries they can be accepted as localities, as m the case of Madras CIty. To the extent possIble efforts should be made even at this stage to see that electoral wards are more or less identical with localities provIded they have well defined geographIcal boundant:s. ThIS can be achieved in gradual stages. Where'ver possible localities can therefore be refcrmed keepll1g III
mind the boundancs of the existmg electoral wards so that minimum dIslocation may be caused.
The Census OperatIOns cannot function on the principlc of statusquo because we have to take m10 account all the changes that have taken place upto the date which we have fixed, viz., 30th September 1960 for houselisting and 28th February 1961 for enumeration. Any changes we make in the house numbering are bound to affect the content of the electoral rolls which the Governmcnt publi~h at great cost, but it is inevitable. As such, what we can do is to minimise the number of changes that have to be made. The Superintendent of Census OperatIOns should, therefore, have the right to make such changes as are necessary with a view to makc the House numbermg system of Madras State perfect and facIlitate proper enumeratIOn of the buildings and of the people in the State".
12. In their Memoranda No. 4910/60-1 dated 24th May 1960 and 5281/60-2 dated 25th May 1960 the Government of Madrac nave issued detailed instructIOns for making the house numbering system as perfect as possib'e. My purpose will be achieved if the instructions contained in the Madras Election Manual, Chapter II and issued by the Government from time to time are implemented in full by the various authorities. In individual cases specific instructions will be issued by me in due course.
I will also be keeping the Governmcnt informed of all the changc~ I suggest 111 the House numbering system in Madras State.
The receipt of this Circular may please be acknowledged.
H-90
Yours faithfully,
(Sd) P. K. NAMBIAR
Superintendellt of Census Operations.
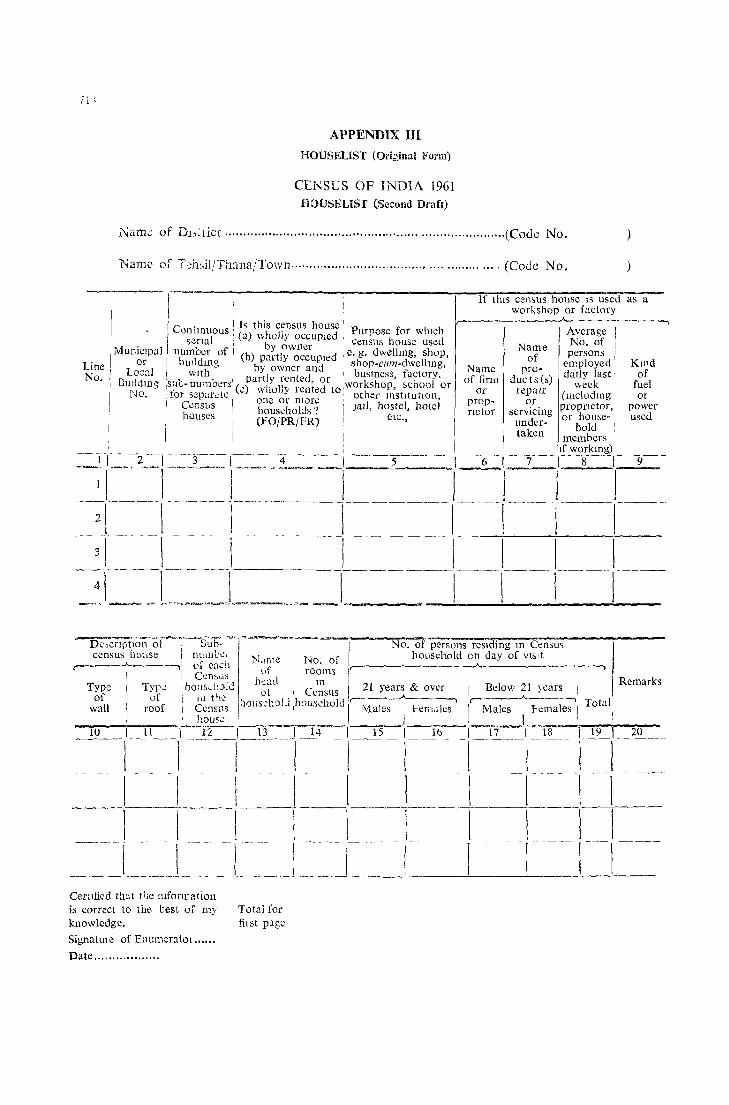
APPENDIX III
HOUSELIST (Ori2ina\ Form)
CENSUS OF INDIA 1961 HOUSELIST (Second Draft)
NalTI': of Db:lict ............................................................................ (Cod.: 1\[0.
Name of T,:h:,il/Th::ma/Towl1 ...................................................... (Code No. )
----------'------------------------------------~---l~f~t~ll1-s-c-e-n'-u-s~h-o-us~e-I-s-u-sp-~d~as--a--I : I I workshop or factory , ,ro Is this census house p ,- 1------. ~onlmuous : (a) hoJly occ p d urpose for which Average
s;;nal : W b own'ru
Ie cenSllS house used Name No. of 1
Municipal number of I (b) painy oc~uP ed ! e. g. dwelling, shop, of persons I
Line or bUlldmg I bv owner andl
I shop-curn-dwcllmg, Name pre- employed No. Local With 1 partly r' lted or I bUSIness, factory, of fina ducts (8) dally last'
I Buddm:; !s~t.-numbcrs'(.;:)' wh n\;r rent d to,workshop, school or or \vcck No. tor :cparcllc o nco o~ m0r~ 'other instItUtion, repmr (mcludmg
CcDS1,S ! housdlOlds? JaIl, hostel, hotel i{c~g; scr~~ing proprIetor, houses (FO/PR/FR) etc., under- or house-
hold : I ,I taken members
KInd of
fuel or
power used
I If workmg) -11-2~'---3---1--~4----'c-1- 5 I 6 I 7 ,;--08;----="---;9c;----
-~11·--' ,-~ol '~'~---'-l-~o-- --------1---' I , 1 ___ _ ~!--I ---'-~--I--- --------~l -I~ --, ----- -! I --3\ \ I I - -- - -I ! I ! _-_~.I=.=[=~~]._ .. ~_~, ___ -._ ~JM I--I--l---I~
Type of
wall
Typo: of
foof
CertIfied that the mforma tion is correct to the test of my knowledge.
SignatUle of EnUn1Cfa(ol ......
Date ................. .
Total for fil st pitse
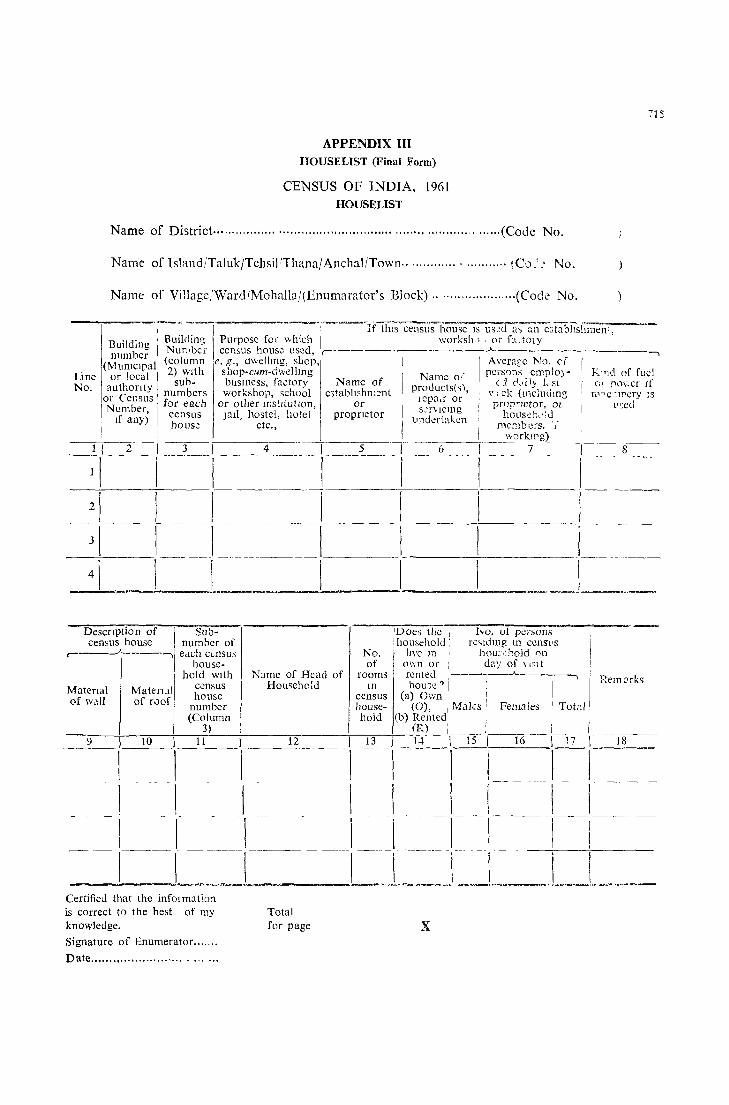
APPENDIX III HOUSELIST (Final Form)
CENSUS OF INDIA, 1961 HOUSELIST
Name of District· .......................................................................... (Code No.
Name of Island/TalukjTehsilIThana/Anch::tl/Town .......................... (OJ,',' No.
Name of Villagc/Wardl:Mohallaf(Enumarator's Block) ................. " ... (Cod~ No.
:15
- ---------·-----I--~-~I{tl1iSCe'ii'SllSh.Ouse IS us:d a~Q;-1-e:;tabi7sl1men', Building ,Building Purpose fo. v.hich worksll<) , Of f:U01Y number I NUf',ber census house used, ,-.-------.-~---"---------.-----,
(M I (column e. g., dwellmg, ShOP'I' I Avcfa[c No. ,f UTIlClpa 2) With shop·cum-dwelling pcrs,):lS emplo'- v'n,d of fuel Line or local I b Name or' 0 1'_
No. authonty, SUb
- busmehss, fa-:tjory Nbameh
of products(~), (j c.,i Iy 1.'st (Jl [lm-.cr If or Cel~sus! num ers works op, sClOol I c3ta I1s mcnt Icpa,r or \' tck (ll1clulimg n,Cc::lf'Cry IS Number, I for each or other mstJtut1on, or s~r\rlcmg pr0[l"letor, 01 Peed
If any) I cemus J~lll, hostel, ho~el propnetor I undertaken hot1sd:chl
I ' house etc., I I members. 'j'
, WOrkll'g) 1 I 2 I 3' 4 , 5 '6 7- ----,-~ 8
-l-I~- j-------I -------- r------- r I ------~------~,
21 I I j! j
-~-I- - f ___ J _________ '-___ =-'- -1----------4\ 1 I __ ~~._i I---;----.~_r--~_=
DeSCription of Sub- [ 'Does tIle I No, ot perwns census house number of ! household: re'idmg In cens'ps
,-----"-------., each c<-nsus No. lIve 1l1: hou:d-!Qid nn
Matenal of wall
house- of own or : clay of \ JSl t I hold WIth N:Jme of Head of rooms rented , _______ ..A.. ___ ---,
MateruIl1 ccnsus Household In hou~e ? i I house census (a) Own ' I
of rvof number house- (0), i Males I Females I' Totc:l
II (Column hold (b) Rentedl I
3) (R):' I
H.eln~lrks
__ 10 ____ 1_1_1 ____ 1 ____ 13______ 13 I J·f --,--B- 16 ,---'1'7 '----1-8~--
1 I -----,--- ----1 1 I I I i I --- ------,--l--~ 1 1 I --r-------- -----1-----
---- -----\-~~=_J ---- ---l-~C~~---~J _.~--l_----~1--:_ '-,_-_~-= Certified that the infolmation is COrrect to the best of my knowledge.
Signature of Enumerator ..... ..
Date .............................. ..
Total for page x
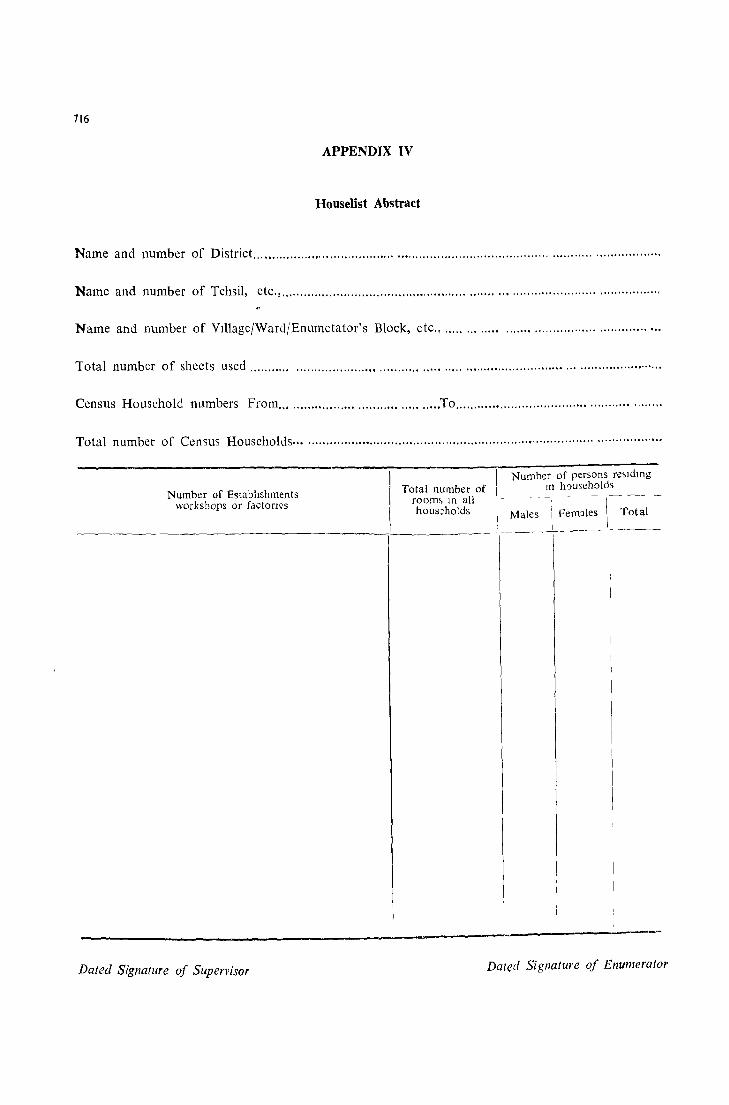
716
APPENDIX IV
Houselist Abstract
Name and number of District ............................................................................................................ ..
Name and number of Tehsil, etc., .................................................................................................... ,
Name and number of VlllagejWard/Enumetator's Block, etc., .................................................... .
Total number of sheets used .............................................. , ........................................................... .
Census Household numbers From ......................................... To ..................................................... ..
Total number of Census Households ................................................................................................... .
Number of persons re'ldlng Number of Establishments Total number of m h')uscholds
workshops or factories room, In all - - - - -. - - - - \----
_~~ __________________ c--_h_O_U_S_:h_O_ld_S __ ~Mal~~ales __ Total
Dated Signatllre of Supervisor Dated Signature of Enumerator
APPENDIX V
Instructions on Houselisting
1. Preparation of houselist is the first stage In Census Operations of 1961. In Madras State, it will be done in the month of October 1960. The object of houselisting is to gather particulars of houses, factones and workshops, the products made or serviced and the number of persons employed and the kInG of fuel or power used in the factory or workshop. The details of materials used in the construction of walls and roof, the number of persons livmg in the household as well as the rooms occupied by them will also be collected. Thus, a houselist WIll help us in having a complete record of all buildings including the uses to which they are put. It will also give us a preliminary idea of the population of Madras State as it exists at the time of housellsting, I.e., a few months in advance of our actual Census enumeration.
2. To complete the houselisting operation, it will be necessary that everyone connected with it must understand in clear terms three concepts which we would be using in census operations, viz., (1) building, (2) census house and (3) census household.
3. A building has been defined under the Madras House Numbering System. This definition will be adopted for our purpose. Under this system, every building with a separate main entrance is treated as an entity and given a number by which it can be distinguished from outside. This is the number given by the Municipalities, Panchayats and Village Officers and adopted for administration, election and taxation. An effort has been made to bring the house numbering up-to-date as on 30th September 1960. As such, a number will be found marked on the building throughout the State and will be adopted for houselisting and entered in column 2. It is important to us only to the extent of heJping us to locate Census houses and Censll3 households which are contal11ed in these buildings. The fact that there is any omission in the house numbering need not affect the operation of houselisting. All that we will do is to leave column 2 of the houselist blank and then proceed with the collection of other particulars in the houselist.
4. A Census house is a Universal concept adopted by all nations. It is a unit which is viable and which can be distinguished. It is used as a dwelling, a shop-cum-dwelling or a place of business, school or workshop. It can be inhabited or vacant. It can be a structure or part of a structure. As long as it is a unit for the purpose of common living or work, it is to be treated as a Census house and the aim of houselisting is to list out all Census houses which eXIst in the country.
5. On a closer scrutiny, it will be found that the principles governing the definition of a Census house are to a large extent simIlar to the principles adopted for the definition of a house under Madras House Numbering Scheme. But, for a Census house, there need not be a separate entrance. Thus a building which has only one separate main entrance can consist of a number of flats, each of which will be a Census house. A part of a bUlldmg which has no separate entrance may be used as a workshop or shop in which case each component WIll constitute a separate Census house. It is, therefore, to be borne in mind that Census house is a structure included in the building and functions as a sub-unit of the building. It can be used for the purpose of living or for work or for living-cum-work. In actual practice, in majority of cases in urban areas and in most cases in rural areas, the Census house will be
718 REPORT ON HOUSING AND ESTABLISHMENTS
identical with a building as defined in Madras House Numbering System. But any person engaged in houseIisting should understand that more than one Census house will be contained in a building as numbered actually on ground.
6. Census household refers to a group of persons who commonly live together and take their meals from a common mess unless the exigencies of work prevent any of them from doing so. A Census house can be occupied by one household or more. Institutions, catering houses, boarding houses are also households where unrelated persons live together. In OUr country, as the standard of living is low, it is likely that a good proportion of Census homes will be occupied by more than one household and as such, a clear distinction has been made between these two concepts-Census house and Census household-so that a proper assessment of our requirements and conditions of living can be made. A Census house refers to a structure while Census household refers to a group of persons.
7. After understanding these concepts clearly, it is your duty now to complete the houselist in the area in your charge. Your Supervisor will give you a rough plan of the block: where the houselisting is to be done by you. A key to the plan showing the dIstribution of residential and non-residential buildings will also be given to you along with the rough plan. It is desirable to study them carefully before proceeding to do the houselrsting which should begin on 1 st October, 1960.
8. Every house should be visited, whether it is residential or non-residential-found in your block in the order of the house numbers. In case a number of streets forms your block, it is desirable that you visit houses in serial order which will be indicated to you by your Supervisor, and not visit houses at random. The entries in the houselist should be in the serial order of the house numbers assigned in the block under the house numbering scheme.
9. Each houselist form supplied to the Enumerator contains twenty lines on a page. You should use a line for recording the details of a particular house. In case a house is occupied by more than one household you should record the particulars of each household in a separate line. It is sufti;;ient if the particulars of the house are recorded in columns two to ten only. Houselists should be prepared in duplicate, the first copy being compiled as and when you visit the house. When you have completed a street or block, you should copy out the entries from the original in a blank form taking care to see that the details about the area have been fill.:d in, giving no room for confusion in future identification. You should hand over the original copy to your Supervisor when you have completed your visit to the houses in the area allotted to you. The last date for submitting the houselist form to your Supervisor will be the 2nd November 1960.
10. The Supervisor will check the entries in the houselist form and will point out mistakes, if any, to be rectified by the 7th November 1960. The defects pointed out by the Supervisor should be rectified by revisiting the houses wherever necessary and the entries in the duplicate also be com:cted and both copies returned to the Supervisor. You should also prepare two copies of an accurate map of the block in your charge and mark all important topographical details such as roads, streets, rivers, hills, private forests, temples, tanks, parks and other land-marks situated in the area. In case you find any difficulty to prepare such a map, you may seek the assistance of the Supervisor for the purpose. J n the map you should also indicate the houses by numbers. You should also give on the map a key to the plan showing numbers of residential and non-residential buildings in the village or block. This map should be attached to the houselist form of the village, panchayat or municipality and then stitched with a cover or wrapper on which the following details should be recorded:~
APPENDIX V (contd.)
Name of District
Name of Taluk
Name of VIllage/Panchayat
No. of blocks for which househsts
have been prepared. }
(Code No.
(Code No.
(Code No.
11. The following instructions will guide you while filling in the houselists.
719
)
12. Column I-Serial nUlJlber.--ln this column, record the serial number of the entries. Only one digit of the lmc number has been printed. The number of the entries should rua continuously in a senal order for the block wh,re you are doing houselisting and where the line numbers exceed 9, make 0 into 10, 1 into 11 and so on.
13. Column 2-Building number.-In this column you enter the number painted on the door or wall of the building or at some prominent place near the entrance. It is likely that in the course of houselising you may come across a building for which no house number is given. In that case, you indicate by a 'X' that no house number exists.
14. Column 3-Building number with sub-number for each census hOllse.-As defind earlier, every bmlding with a separate main entrance is a census house. In the majority of cases, there will be only one census house for each building, especially in rural areas. In those cases, repeat the entry in column 2 in column 3 also. If a building has got more than one census house, as defined above, enter them serially after giving them sub-numbers, i. e., 5/1, 5/2, 5/3, etc. You need not paint the number on the door or the wall.
15. Note.-The details to be entered in columns 4 to 17 will relate to each census house and not to the entire building.
16. Column 4- The purpose for which the census house is used (e. g.,) dwelling, SIIOP, shop-cum-dwelling, business, factory, workshop, school or other institution, jail, hostel, etc.
17. As defined earlier, a house may accommodate a factory, workshop, shop, shop-culIlresidence, or a business. It may also be used as a place of religious worship or m:ly be a peml institution like a jailor it may be used as a hostel, hotel or school. It is your duty to see that you enter in column 4 the actual use to which a census house is put to. You should write 'Factory' if the establishment is registered under the Indian Factories Act and 'Workshop' for small unregistered workshop (establishment). In the case of factories or workshops. some kind of production, repair or servicing should be carried on. It may also be a place where articles or goods are manufactured and sold. Business houses WIll carryon transactions in money or other anicles, e.g., Bank, Chit, Auction Hall. Mundi, Pawnshop, etc. A shop IS
a place where articles arc sold for cash as well as on credit.
18. The places where medical men professionally examine patients other th':,n private clinics or chambers occupied by advocates or lawyers should be recorded as professional consultation rooms. If, in additIOn to the medic:.!l officer's consulting r00111, dispensing of medicines is also done, it should be classified as a dispensary. If the house is a pbce of religious worship, it may be entered as temple, church, mosque, etc. In the case of typewriting instItutes or commercial institutes where some professional teaching and training is imparted, write the nature of such institutIOn. If the house is used for any other purpose which has 110t been detailed in these instructions, write specifically the purpose for which it is used. If it is unoccup ied write' vacant '.
720 REPORT ON HOUSING AND ESTABLISHMENTS
19. Columns 5 to 8 should be filled in only in cases where the house IS used as an establIshment, workshop or factory (i.e.), where some kind of production, proce'ising, repair, or sen icing is undertaken or where goods are made or manufactured and sold. In respect of all other cases, write X in columns 5 to 8 of the housellst form. In fillin~ these columns, care should be taken to see that all actiVIties that are prescribed are entered in these columns whether they are part of the household or not.
20. Column 5-Nal1le of establishment or proprietor.-Wnte the name of the factory or large manufacturing concerns. In the case of small workshops and establishments which do not have a dlstmct trade name wnte the proprietor's name. For example, 111 the case of a bakery or confectionery or leather works write the name of the Propnetor of the establishment. When estabhshments like bakeries do bear a distinct trade name, like 'Grand Bakery', etc., add that also in the remarks column.
21. Column 6-Aame of product (s), repair or servicing undertaken -Write the actual work done in the establishment, factory or v.orkshop, e. g., paper-making, shoe-making, cycle repairing, petromax and gas light repairing, car servicing, watch and clock repairing, dolls and toys manufacturing, plastic bags manufacturing, horse-shoe and nails manufacturing, pnnting of cloth, dyeing of yarn, silk handloom weaving, lace garland making, etc. Let your description be as precise and exhaustive as possible.
22. Column 7-Average number of persons employed daily last week (including proprietor or household members, if aIlY).-Write the average number of persons working dally during the week preced1l1g the date of your visit. In calculating the number of persons working, take into account the following persom in addition to paid employees and labourers:-
(i) Apprentices-Paid or unpaid.
(ii) Owner or proprietor.
(iIi) Family members of the proprietor if working.
You need not write separately the number of persons englged for e..leh kind of product produced or articles repaired or serviced in the establishment, factory or workshop. It will be sufficient if the total number of persons working in the establi~hment, factory or workshop is entered. To arrive at the average number, total the number of persons working on all days of the week preceding the date of your visit and divide by seven or six if any holiday has intervened, and so on.
23. Column 8-Kind of fuel or p()wer, if machinery is lIsed.-In the case of establishments, factories or workshops, there may be m~chines installed for production, repair or servlcmg. For example, in the case of an Automobile Workshop, there may be several lathes used for sharpenmg metals which will be driven by electricity. In Cabinet Marts there may be big CIrcular saws used to cut logs, planks, sleepers, etc., which will be driven by electricity. So also in the case of rice mills, electnclty will be used to drive the rice hullers. In some cases the machines may be driven by kerosene or diesel oil. In the examples cited, electricity, steam, kerosene and dIesel oil supply the power for running the machinery installed for production, repair or servicing. You should WrIte the kind of fuel or power used-electricity, soft coke, kerosene, steam, diesel oil or water-power as the case may be.
APPENDIX V (contd.) 721
24. Columns 9 and 10-Description of a census house:-
Column 9-Material of \\'all.-The walls of the house may be constructed ordinarily with burnt bricks or unburnt bricks, or mud or stone or cement concrete or timber or a construction of mud and brIcks, etc. In certain houses like huts or cottages the walls may be made from materIals hke Kora grass, leaves (palmyra or coconut) reeds, bamboo, etc. You should write the material used in the constructIOn of 1he most of the walls of the house as grass, leaves, reeds, bamboo, stone, bricks (burnt or unburnt), cement concrete, etc. If different kinds of materials are used e.g., stone and cement concrete or mud and unburnt bricks, you should record the material used in the construction of the main room of the house.
25. Column 10-Material of roo{.-The material used 111 the roofing of the house should be written i.e., tiles, thatch, corrugated iron, zinc sheets or asbestos cement sheets, or concrete, etc. In the case of a multi-storeyed building, the intermediate floor or floors will be the roof of the lower floor.
26. Column 1 I - Sub-number of each census household with census house number.-As indicated earlier, a house may be occupied by a single household or by a number of households. You should clearly distmgUlsh the different households living in a census house; messes or boarding houses, are also households where people live together with no ties of relationship. If in those places more than one group of persons are found, each such group should be treated as a separate household. Each household should be distinguished by the addition of an alphabet within brackets (a, b, c, d, etc.) to the census house number entered in column 3. If house No.5 has three households, the household numbers will be 5 (a), 5 (b), 5 (c). If house No. 1011 has two households, the household numbers will be lOll/a, lOll/b. If house bearing No. 6(A has two households, the household numbers will be 6/ A/a, 6/ A/b. It is only by adding an alphabet to the census house number that each household can be identified. You should use only small letters of the alphabet since it will create confusion if capital letters are used, capital letters having been used already in the case of houses springing up between two houses for which numbers have already been assigned.
27. Column 12-Name of head of household.-Write the name of the head of the household in respect of each household written in column (11), who IS commonly acknowledged as such. The head of the household is a person on whom falls the chief responslbity for the maintenance of the household. The head of the household may be a member of either sex or be young and need not necessarily be the eldest male member of the family. In respect of institutIOns, hostels catering houses, boarding houses or lodging houses, etc., you should wnte the name of th; manaE;er or the person who is in administrative charge of such a place or a person who is regarded as 'Head' by the persons or group of persons hving in those places. If the census house is used as a ~itting place or cattle shed, etc., write the use to which it is put and add the name of the owner.
28. ColuII1Il 13-Number of rooms ill census lzousehold.-Enumer~tion of the rooms will be simple in case the house is occupied by one household. In case there are more than one census household in a house, the number of rooms occupied by each household should be written against the name of the head of the household. In cases where more than one household occupy a single room or share more than one room in such a way that it is not possible to say precisely the number of rooms occupied by each household, the number of rooms occupied by the household should be given together within brackets as common to all such households.
29. A room should usually have four walls with a doorway with a roof overhead and should be wide enough to enable a tall man to sleep in i.e., it should be at least
H-91
'722 REPORT ON liOUSING AND ESTABLISHMENTS
5 feet long. Unenclosed verandahs, kitchen, storeroom, garage, cattle-shed and latrine should not be treated as rooms. However, an enclosed space which is used for living, dining, storing and cooking should be regarded as a room.
30. Column 14-Does the household live ill own or rellted house.-Write '0' in case the household lives in own house and 'R' in case the household lives in a rented house.
Put 'x' in the case of public buildings like schools, hospitals, temples or places of worship, etc.
31. COlUI1l11S 15 to i7-Number of persons residing in census household on day of visit.Write the number of males residing in the household in column 15, the number of females in column 16 and the total number of persons (males and females) in column 17. Enquiries should be made in particular about the new born babies or very young children in each household, and the number included according to sex in the respective columns.
32.' Column 18-Remarks.-This column is intended for entering any useful and significant information about the building or the census house or the census household which has not been entered in any of the columns of the houselist form. The following are a few examples of such information which may be recorded in this column:-
(1) Households occupied by Scheduled Castes or Scheduled Tribes should be indicated by writing S.c. or S.T. as the case may be. This entry should be made with reference to the head of the household.
(2) If the census house is a shop, the name of the proprietor or owner should be indicated in the column.
(3) In cases of the census houses which are vacant or unoccupied (at the time of houselistillg) and which are likely to be occupied subsequently, i.e, before the census enumeration period 10th to 28th February 1961, a remark 'likely to be occupied shortly' should be entered in this column.
33. A sample houselist form duly filled 111 for a few typical cases is given as Annexure I of this circular for guidance.
34. Preparatioll of houselist abstract.-After completing the houselisting operations, you will have to prepare an abstract in the fOfm appended to this booklet for the block in Your charge.
35. It will be the responsibihty of the Supervisor to see that the Enumerator carries out all the instructions outlined in this booklet. He should. also test-check ten per cent of the houses. He should further satisfy himself that all the house lists have been prepared satisfactorily and that the maps and key lists are attached to each list and then hand them over to the Charge Officer by 15th November, 1960.
P. K. NAMBIAR,
Superintendent of Census Operations.

APPENDIX VI
Copy of G. O. Ms. No. 830 Public (Elections) Department dated 18th May 1960.
Census 1961-Appointment of Census Officers under Census Act, 1948-NotiRn tion published.
Read-the following paper:-
Letter from the Superintendent of Census Operations, Madras, No. 1190/59-2, dated '5th February 1960.
Order-No. 830, Public (Election II), dated 18th May 1960.
The following notification will be publi~hed in the Fort St. George Gazette.
Notification
Under sub-section (2) of section of 4 of the Census Act 1948 (Central Act XXXVII of 1948), the Governor of Madras hereby appoints the officers named below to be census officers within the local areas specified against each:-
Officers
1. The Superintendent of Census Operations, Madras and Deputy Supermtendent of Census OperatIOns, M'lclras.
2. Collectors of districts except Madras and all officers in charge of divIsions of dlstnct clsewhere than in Madras.
3. The Commissioner of the Madras Corporation
4. (I) Tahsildars (n) Deputy Tahsildars in charge of Taluks
(iiI) Incependcnt Deputy Tahsildar in charge of Sub-Taluks
5. Executive authorities or Special Officers m charge of Municipalities
6. Officers Commanding Army Stations or appomted by Officers Commanding Stations for the Census of strictly military areas
7. Executive Officers of Cantonments
8. Officers Commanding Units or bodies of troops in Camp
$). Officers Commanding Air Force Establishments
10. Officers Commanding Naval Establishments
11. Chairman, Madras Port Trust
Local Area
The whole of the State of Madras.
TheIr respective jurisdictions.
The CIty of Madras.
All areas within their jurisdictions other than municlpahties and the special charges constituted for Cantonments, Army, Naval and Air Force EstablIshments.
Their respective municipalities.
The limits of the strictly military areas as determined for each statIOn.
The limits of their Cantonments excluding the strictly military areas.
A II persons compnsed m such units or bodies.
The limits of their respective Establishments.
The limits of their respective Establishments.
The limits of Madras Port.
724 REPORT ON HOUSING AND ESTABLISHMENTS
2. The Officers named in paragraph I above are also hereby authorised to issue the declaration in writing referred to in sub-section (3) of section 4 in respect of all census officers
appointed by them.
3. In exercise of the powers conferred by sub-section 4 of the said Act, the Governor of Madras hereby delegates to the officers named in paragraph 1 above the power of appointing census officers within the local areas specified against their names.
4. Under sections 6 and 7 of the said Act, the Governor of Madras hereby appoints the Commissioner of the Madras Corporation to be the officer in the City of Madras on whose direction or order the officers and persons named in these sections shall perform the duties of census officers or give the assistance therein set forth.
5. Under section 8 of the said Act, census officers are hereby directed to ask all questions necessary for correctly filling up the prescribed census forms.
6. In exercise of the powers conferred by section 12 of the said Act, the Governor of Madras hereby authorises the Commissioner of the Corporation of Madras in respect of the City of Madras and the Collectors elsewhere to accord previous sanction for the institution of prosecutions under the Census Act.
(By order of the Governor)
S. VENKATESWARAN,
Chief Secretary.

List of agents for the sale of Government of India publications
(AS ON 17 FEBRUARY 1964)
AGARTALA-Laxmi Bpandar Books & Scientific Sales
AGRA-1. National Book House, Jeoni Mandi 2. Wadhawa & Co., 45, CIvil Lmes 3. Banwari Lal Jam, Pubhshers, Moti Katra 4. English Book Depot, Sadar Bazar, Agra Cantt.
AHMADNAGAR-V. T. Jorakar, Prop. Rama General Stores, Navi Path
AHMEDABAD-1. Balgovmd Kuber Dass & Co., Gandhi Road. 2. Chandras Kant Chlman Lal Vora, GandhI Road. 3 New Ordcr Book Co., Elhs Bridge 4. Mahajan Bros. Opp. Khadia Police Gate. 5. Satu Kitab Ghar, Near Rehef Talkies, Patthar Kuva, Relief Road
AJMER-1. Book-Land, 663, Madar Gate. 2. Rajputana Book House, Station Road 3. Law Book House, 271, Hathi Bhata 4- Vljay Bros" Kutchery Road. 5. Krishna Bros., Kutchery Road.
ALIGARH-Fnend's Book House; Muslim UniversIty Market
ALLAHABAD--I. Supenntendent, Printing & Stationery, U. P. 2. Klt:lbistan, 17-A, Kamala Nehru Road. 3. Law Book Co , Sardar Patel Marg , P. Box 4. 4. Ram Narain Lal Beni Modho, 2-A, Katra Road. 5. Universal Book Co., 20, M. G. Road. 6. The University Book Agency (of Lahore), Elgin Road 7. Wadhwa & Co., 23, M. G. Marg. 8. Bharat Law House, 15, Mahatma Gandhi Marg. 9. Ram Narain Lal Beni Prashad, 2-A, Katra Road.
AMBALA-1. English Book Depot, Ambala Cantt. 2. Scth Law House, 8719, Railway Road, Ambala Cantt.
AMRITSAR-1. The Law Book Agency, G. T. Road, Puthgarh. 2. S. Gupta, Agent, Govermment Publications, Near P.O., Majith Mandi 3. Amar Nath & Sons, Near P.O., Majlth Mandi
ANAND-1. Vijaya Stores, StatIOn Road 2. Charto Book Stall, Tulsi Sadan, Station Road
ASANSOL-D. N. Roy & R. K. Roy, Booksellers, Atwal Building
BANGALORE-: 1. The Bangalore Legal Practitioner Co-operative Society Ltd., Bar Association Building 2. S. S. Book Emporium, 118, Mound Joy Road .. The Bangalore Press, Lake View, Mysore Road, P.O., Box 507 4. The Standard Book Depot, Avenue Road 5. Vichara Sahltya Private Limited, Balepet 6. Makkala Pustaka Press, BalamandIra, Gandhinagar 7. MalUthl Book Depot, Avenue Road 8. InternatIOnal Book House (P) Limited, 4-E. Mahatma Gandhi Road 9. Navakarnataka PublIcatIOns (P) Limited, Majestic Circle
BAREILL Y -Agarwal Brothers. Bara Hazar
(Rest.)
(Reg.) (Rest.)
(Rest.)
(Reg.)
" (Rest.) (Reg.)
"
(Rest.)
" (Reg.)
"
(Rest.)
"
(Reg.) (Rest.)
(Reg.)
"
(Rest.)
(Reg.)
(Re~t.)
(Reg.) (Rest.)
(Reg.)
726
BARODA-1. Shl i Chandrakant Mohan Lal Shah, Raopura 2. Good Companion Booksellers, Publishers & Sub-Agent 3. Ncw Medical Book House, 540, Madan Zampa Road
BEAWAR-The Secretary, S. D. Collcge Co-operative Stores Limited
BELGHARIA-Granthlok, Antlquarian Booksellers & Pubhshers (24-Parganas), 5/1, Amlica Mukherjee Road
BHAGALPUR-Paper Stationery Stores, D. N. Singh Road
DHOPAL-1. Superintendent of State Government Press 2. Lyall Book Deput, Mohd. Din Building, Sultana Road 3. Dellte Books, Opp. Bhopal Talkies
BHUBANESWAR-ckamra Vldyabhaban, Eastern Tower, Room No.3
BJJAPUR-Shri D. V. Deshpande, Recognised Law Booksellers, PlOp. Vwod Book Depot., Near Shlralshettl Chowk
BTKANER-Bhandani Bros.
BILASPL1R-Shanna Book Stall, Sadar Bazar
BOMBAY-1. Superintendent, Printmg & StatIOnery, Queens Road 2. Charles Lambed & Co., 101, Mahatma Gandhi Road 3. Co-operator"s Book Depot, 5/32, Ahmed Sailore BuIlding, Dadar 4. Current Book Home, Maruti Lane, Raghunath Dadaji Street 5. Current Tcchmcal LIterature Company (P) Limited, IndIa House, 1st Floor 6. International Book House LimIted, 9, Ash Lane, M. G. Road 7. Lakkam Book Depot. GIrgaum 8. Elpers Agencies, 24, Bhangwadi. Kalbadevi 9. P P. H. Book Stall, 190-B, Khetwadi Main Road
10. New Book Company, 188-190, Dr. Dadabhai Naoroji Road II. Popular Book r,epot, Lammgton Road 12. Sunder D1s GDn Chand, 601, Girgam Road, Near Princess Street 13. D. B Taraporewala Sons & Company (P) Limited,
210, Dr. Dadabhai Naoroji Road 14. Th<lcker & Comp:my, Rampart Row 15. N. M. Tnpathi (P) LImIted, Pdncess Street 16, The Kathan Book Depot, King Edward Road 17. P. H. Rama Knshna & Sons, 147, Rajaram Bhuvan, Shivajl Park Road, No.5 18. C. Jamnadas & Co" Book-sellers, 146-C, Princess Street 19. Indo Nath & Co, AJ, Daulat Nagar Borivli 20. l\1mcrya Book Shop, Shop No. 1/80, N. Subhas Road 21. Acadamlc Book Company, AssociatIOn Building, Sir p. M. Road 22. Dommion PublIshers, 23, Bell BUIlding, SIr P. M. Road 23. Bombay NatIOnal History Society, 91, Walkeshwar Road 24. Dow8madeo & Company, 16, Nazina Buildmg, Ballard Estate 25. ASIan Trading Company, 310, the MirabaJI, P. B. 1505
CALCUTTA-1. Chatterjee & Company, 3/1, Racharam Chatterjee Lane 2. Dass Gupta & Company, Limited, 54/3, College Street 3. Hindu LIbrary, 69-A, Bolaram De Street 4. S. K. Lahlli & Company, (P) LImited, College Street 5. M. C. Sarkar & Som (P) Limited, 14, Bankim Chatterjee Street 6. W. Newman & Company, Limited, 3, Old Court House Street 7. O'\ford Book & StatIOnery Company, 17, Park Street 8. R. Chambray & Company, Limited, Kenf House, P. 33, Mission Road ExtenSIOn 9. S. C. Sdrkar & Sons (P) LimIted, J. C. College Square
10. Thacker Spmk & Company (1933) (P) Limited, 3, Esplanade East II. Firma K. L. Mukhopadhaya, 6/1 A, Banchha Ram Akrar Lane 12. K. K. Roy, P. Box No. 10210, Calcutta - 19 13. Sm. P. D. Upahdyay, 77, Muktaram Babu Street
(Rest.)
(Reg.)
(Rest.)
(Reg.)
(Rest.) (Reg.)
" (Rest.)
(Reg)
"
,.
" " " (Rest. )
"
J 4. Umversal Book Dist., 8/2, Hastings Street 15. Modern Book Depot, 9, Chownngee Centro 16. Soor & Company, 125, Canmng Street 17. S. Bhattacharjee, 49, Dharamtala Street 18. Mukherjee Library, 10, Sarba Khan Road 19. Current Literature Company, 208, Mahatma Gandl Road 20. The Book Depository, 4/1, Madan Street (1st Floor) 21. SCientific Book Agency, Netajl Subhas Road 22. Rohance Trading Company, 17/1, Banku Blhan Ghosc Lane, Dlstllct Howr.th 23. Indian Book Dlst. Company, 6512, Mahatma Gandhi Ro.td
CALICUT-Tounng Book Stall
CHANDIGARH-1. Supenntendent, Government Printing & Stationery, Punjab 2. Jain Law Agency, Flat No.8, Sector No. 22 3. Rama News Agency, Bookseller, Sector No. 22 4. Umversal Book Store, Booth, 25, Sectol 22D 5. English Book Shop, 34, Sector 22D 6. Mehta Bros., 15-Z, Sector 22D 7. Tandan Book Depot, Shopping Centre, Sector 16
8. Kahash Law Publishers, Sector 22-B
CHHINDWARA-The Verma Book Depot
COCHIN-Saraswat Corporation Limited, Palliarkav Road
CUTTACK-1. Press Officer, Onssa Sectt. 2. Cuttack Law Times 3. Prabhat K. Mahapatra, Mangalabagi P. B. 35 4. D. P. Sur & Sons, Mangalabag 5. Utkal Stores, Balu Bazar
DEHRADUN-1. Jugal Kishore & Company, Rajpnr Road 2. National News Agency, Paltan Bazar 3. Blshan Singh and Mahendra Pal Smgh, 318, Chukhuwala 4. Utam Pustak Bhandar, Paltan Bazar
DELHI-1. J. M. Jaina & Brothers, Mori Gate 2. Atma Ram & Sons, Kashmere Gate 3. Federal Law Book Depot, Kashmere Gate 4. Bahri Bros., 188, Lajpat Rai Market 5. Bawa Harkishan Dass Bedl (Vljaya General Agencies)
P. B. 2027, Ahata Kedara, Chamalian Road 6. Book-Well, 4, Sant Narankari Colony, P.B. 1565 7. Imperial PublIshing Co., 3, Falz Bazar, DaryaganJ 8. Metropoht:m Book Company, 1, Faiz Bazar 9. Publication Centre, Subzimandl
10. Youngman & Company, Nai Sarak 11. Indian Army Book Depot, 3, Daryaganj 12. All India EducatIOnal Supply Company, Shl1 Ram BUlldmg" Jawahar Nagar 13. Dhanwant Medical & Law Book House, 1522. Lajpat Rai Market 14. UniverSity Book House, 15, U. B. Bangalore Road, Jawahar N asar 15. Law Literature House, 2646, Bahmaran 16. Summer Brothers, P.O. BirJa Lmes 17. Universal Book & Stationery Company, 16, Netajl Subhash Malg 18. B. Nath & Bros., 3308, Charkhawalan tChowti Bazal) 19. Rajkamal Prakash an (P) limited, 8, Falz Bazar 20. Premier Book Company, Printers, Publlshers & Booksellers, Nal Salak 21. Umversal Book Traders, 80, Gokhale Market 22. Techmical & Commercial Book Company, 75, Gokhale Market 23. Saml Law Publlshmg Company, 1416, Chabiganj, Kashmere Gate
24. G. M. Ahup, B:>oks~llers & StatIOners, 30), N~hru B:E ar
(Rest.)
(Re~ ) (Rest.) (Reg.) (Reg.)
(Rest.)
(Re~.)
(Rest.)
(Reg.)
(Reg.)
(Rc;,t.)
(Reg)
(Rest.)
(Reg.)
(:~est. )
"
(Rlg) ( Rest.) (Re:;.)
(Rc,t.) (Reg.) (Rest.)
727

728
25. Sat Naram & Sons, 3141, Mohd , AlI Bazar, Man Gate (Reg.) 26. Kltab Mahal (Wholesale Dlv.) (P) Limited., 28, Falz Bazar
" 27. Hmdu Sahltya Sansar, Nai Sarak (Rest.) 28. Munshi Ram Manohar Lal, OrIental Booksellers & Publishers, P.B. 1165, Nal Sarak 29. K. L. Seth, SupplJers of Law, Commercial & Tech. Books, Shanti Nagar, Ganeshpura 30. Adarsh Pubhshmg Service, 5A! 10, Ansan Road
DHANBAD-1. Ismag Co-operatIVe Stores Limited, P.O_ Indian School of Mmes 2. New Sketch Press, Post Box 26
DHARWAR-1. The Agricultural College Consumers Co-operative SOClCty 2. Rameshraya Book Depot, Subhas Road 3_ Karnatakaya Sahitya Mandlfa of PublIshers & Booksellers
ERNAKULAM-1. Pal & Company, Cloth Bazar Road, 2. South IndIa Traders C/o Constitutional Journal
FEROZEPUR-English Book Depot, 78, Jhoke Road
GAUHATI-Mokshada Pustakalaya
GAYA-Sahitya Sadan, Gautam Budha Marg.
GHAZIABAD-Jayana Book Agency
GORAKHPUR-Vlswa Vidyalaya Prakashan, Nakhes Road
GUDUR-fhe General Manager, '(he N. D. C. Publishing & Printmg SocIety Lllmted
GUNTUR-Book Lovers Pnvate LImIted, Kaduguda, Chowrasta
GWALIOR-
1. Superintendent, Printing & Stationery, M. B. 2. Loyal Book Depot, Patankar B:lZar, Laskhar 3. M. C. Daftari, Prop., M. B. Jam & Bros, Booksellers, Sarafa, Laskhar
HUBLI-PervaJe's Book House, KOPPlkar Road
HYDERABAD-1. DIrector, Government Press 2. The Swara] Book Depot, Lakdlkapul 3. Book Lovers Pnvate LimIted 4. Labour Law PublIcations, 873, Sultan Bazar
IMPHAL-Tlkendra & Sons, Bookseller
INDORE-1. Wadhawa & Company, 56, M. G. Road 2. Swarup Brothers, KhaJun Bazar 3. Madhya Pradesh Book Centre. 41, AhJlya Pura 4. Modern Book House, Shiv Vilas Palace 5. Navyug Sahltya Sadan, Publishers & Booksellers, 10, Khajuo Bazar
JABALPUR-1. Modeln Book House, 286, lawaharganj 2. National Book House, 135, Jai Prakash Naram Marg
JAIPUR-1. Government PnntlOg and Stationery Department, Rajasthan 2. Bharat Law House, Booksellers & Publishers, Opp. Prem Prakash Cinema 3. Carg Book Company, Tripoha Bazar 4. Vam Mandlr, Sawai Mansmgh HIghway 5. Kalyan Mal & Sons, Tripolia Bazar 6. Popular Book Depot, Chaura Rasta 7. Krishna Book Depot, Chaura Rasta 8. Domimon Law Depot, Shah BuIlding, P. B. No. 23
JAMNAGAR-Swedesbl Vastu Bbandar
(Reg.)
(Rest.)
(Rest.) (Reg.)
(Rest.)
(Reg.)
(Rest.)
(Reg.)
(Reg.) (Res!.)
(Reg.)
(Res!.)
(Rest.)
(Reg.) (Rest.)
"
(Reg.) (R.)
(Reg)
" (Rest.) (Reg.)
(Re,t.)
(Reg.)
JAMSHEDPUR 1. Amar Kltab Ghar, Diagonal Road, P. B. 78 2. Gupta Slores, Dhatkrdlh 3. Sanyal Bros., Bookseller~ & Nc\\s Agents, Bistapur Market
JAWALAPUR-Sahyog Book Dcpct
JHUNJHUNU-1. Shashr Kumar Sarat Chand 2. Kapram Prakashan Prasaran, 1/90, Namdha Nlwas Azad Marg
JODHPUR-1. Dwarka Das Rathi, Wholesale Books and News Agents 2. Kltab-Ghar, SOjatl Gate 3. Choppra Brothers, Tnpolia Bazar
JULLUNDUR-1. Hazoolia Bro5., M<:i Hrran Gate 2. Jam Genc] al House, Bazar BansanwalJ 3. U nive; SHy Publishers, Rarlway Road
KANPUR-1. Advam & Co., P. Hox. 100, The Mall 2. Sahltya Nlketan, Shradllanand Park 3. The Ulliversal Book Stall, The Mall 4. Raj CorporatIOn, Raj House, P.B. 200, Chowk
KARUR-Shri V. Nagaraja Rao, 26, Srimvasapuram
KODARMA-The Bhagwati Press, P. O. Jhumntelaiya, Dt. Hazanbagh
KOLHAPUR-Maharashtra Glanth Bhandar, Mahadwar Road
KOTA-Kota Book Depot
KUMTA-S. Y. Kamat, Booksellers & StatIOners (N. Kanara)
LUCKNOW-1. Soochna Sahltya Depot (State Book Depot) 2. Balkrishna Book Co., Ltd , Hazaratganj 3. Bnt1sh Book DepoL, 84, Hazratganj 4. Ram Advani, Hazratganj, P. B. 154 5. Unl\ersal Publrshers (P) Ltd., Hazralganj 6. Eastern Book LO.> La:ba;;d1 ROJLi 7. CII II & l\!il,tary b.il'cdtlonal Stores, 106/B, Sadar Bazai 8. Aequ:lflum Supply Co .. 213, F.,lZabad Road 9. Law Book Mar t, Amll1-Ud-Daula Park
LUDHIANA-1. Lyall Book Dcpot, Chaura Bazar 2. Mohmdra Brothers, Kuteh-:n Ro.lu 3. Nanda StatiOnery Dhandar, Pmtak Bazar 4. The Pharmacy Nc\\s, Pmdi Street
MADRAS-1. Superintcndent, Government Press. Mount Road 2. Account Test fnStItL,te, P.O. i60, Egmorc 3. C. Subblah Ch'Ctty b Co., TnplIe:me 4. K. Knshllamunhy, Post Box, 384 5. Presidency Bock SupplIes, 8, p) crofts Road, Tnpltcane 6. P. Vardh2Ch'ld & Co., 8, Lwghi Chetty Street 7. PalaPl PraCbjra.l1, 3, Pycrofts Road, Triplicane 8. NCBH Pm ate Ltd., 199, Mount Road 9, V. Sad;mand, Tt1C Personal Bookshop, D, Congress BUllding, 111, Mount Road
MADURAI-1. Oriental Book House, 258, West Masl Street 2. Vivekananda Press, 48, West Masi Street
MANDYA SUGAR TOVvN-K. N. Narimhe Gowda & Sons
H-92
729
(Reg.)
" (Rest.)
"
" (R.)
(Reg.)
" "
(Rest.) (Reg.)
(Rest.)
(Reg.)
" (Rest.)
(Rest.)
(Reg.)
(Rest.)
" (Reg).
(Reg.)
" " " " (Rest.)
" "
(Reg.) (Rest.)
" "
(Reg.)
" " "
(Rest.)
(Reg.)
(Rest.)
730
MANGALORE-U. R. Shenoyc Sons, C<lr Stred, P. Bo,. 12:)
MANJESHWAR-l\1uk.:ncia KiishGil Naja!;:
MATHURA-Rath & Co., Tlloll1 Bu!ldll~g, n"ngall Glut
MEERUT-1. Prakash Educational Stores, SL:bhas BdLur 2. Hll1d Clutra Press, West Klltchery Road 3. Loyal Book Depot, Chhipi Tank 4. Bharat Educational Stores, ChlllPPI Tank 5. Universal Book Depot, Booksellers & Ne"s Ag,-,lls
MONGHYR-Anusandhan, Mmversa I'ress Builum;;
MUSSOORIE--1. Camblldge Book Depot, The Mdll 2. Hmd Traders
MUZAFFARANAGAR-1. Mittal & Co., 85-C, New Mandi 2. B. S. Jam & Co., 71, Abnpura
MUZAFFARPUR-1. SCIentific & Educational Supply Syndlcat.:: 2. Legal Corner, Tikmamo HGusc, Amgob Road 3. Tuhut Book Depot
MYSORE-1. H. Venkataramrah & SallS New Statue Cm:]e 2. Peoples Book House, Opp. J::Jgal1 Mohan P"LlCC 3. Geeta Book House, Boobdlcis & Publisbers. K[lshral1~Ul thlPUl am 4. News Paper House, Lans:lowne BUlld.nc; 5. Indian Mercantile Corporatlon, Toy Pal"cc Ram\ ilas
NADIAD-R. S. Desay, StatIOn Road
NAGPUR-1. Superintel,dwt, Governn,(nl Press & Boule I::"Fi)l
2. Western Book Depot, ReSiliency Road
3. The Assistant Secletary, !vllDel al Industly AS~")":l~" iOq~ ~..J1I1Cr;}~ _r~Jl_IS~
NANDED-1. Book Centre, College, La',',', GeneT,,1 Boals, S.a>,-l1 P Jad 2. Hindustan General Stol~S, Pa,x! .':: St;ltIODClY Mdcc,a.'l-', P. D No. 51 3. SanJoy Bouk Agency, 'vazllaba..i
NEW DELHI-1. Amnt Book Co., Cannausln Cucus 2. Bha\\ aUl & SO"S, S, F. C0l1:1~wghc Plcl..;e J. Central News Agel1cy, 23,'90, Connaughl ell Cll,
4. Empire Book Depot, 278, Allgal1] 5. English Book Stores, 7-L, COl1l~"ug1,t CltCllS P. 0. !: 2_0 6. Faqlf Ch"nd & Sons, 15-,\, K!::u l\1a,1,·.'t, l\"w U,'ll-,,-l 7. Jain Book A'b~ncy, C-9. Prenl tieL'S"', CO_In Pf;L~ Pk1~C 8. Ohford Book & Stationery Comp"ny, ~:c:nc1Ll H'y.!sc 9. Ram Knshna &. Sons (of Lahore) }II,"j, C011:',m;,ilt l'i,~:c
(Reg)
(Rest.)
(Reg.)
" (Rest.)
(Resl.)
(Reg.) (Rest.)
(Reg.)
(Rest.)
(Rc~t.)
(Reg.)
( Re;,t.)
(Rest.)
(Reg.)
"
10. SIkh PublIshing House, 7-C, Con:lau[,llt PI::ce (Reg.) 11. Suneja Bock Centr;;, 24/9-, Ccnn,'::;Llglll Cl,c}, 12. Umted Book Agency, 31, j\,Il.JnlClp..lI Malhet, COlli1,n.1_:J;t Cld':LJS
13. Jayana Book Depot, Chhapara\\al" Kuan, i,-arJ1 L ... g~l 14. Nava)'ug Tradels, Dcsh lland!lU GUl~~a RoaJ, De\ NilgM ] 5. Saraswati Book Depot, 15, Lady Ii ;rc m,; Road 16. The Secretary, Indl.1D Met. S0clety, LOJl Hoad 17. New Book Depot, Latest Books, P.;;noGlcals, SlY ;+ l';:OvcltICS, P. B. %, Connaught~Placc 18. Mehra BrothelS, 50-G, Kalka]l, :t\evv Dclhl-19 19. Luxml Book Stores, 42, Janpath (Rest.)
20. fIl 1-!dl :-~A0l.,: rT,)p~r:>, 82, Jnnp"j'1
21. f'eople rubJ,'hlllg House: (I') limited, Ram Jhansl Road 22. R. K. Pub! '"';' rs, 23, BcadcJD Pen, 1';: no] E,lgh 23. Shar;]1:l Lf'.~S, 17, ]\Ic,>, Niarkci, Motl Na;3,'i 2 ... L ./\apkl :GJk%1ll, 5 ~777, r;e".' l'\agar 25. S~,n0l;:l),:::: 'I\'1C<:, 66/\.-1, Rohtak Ror,d, P. B. 25:1 26. H. Chands"ll. P. I~. No 20].t 27. The SCCI'2L:y, FC.,l-::::ti;),; c[ t,Q~JCJation of Small Industry of India,
23-ll, 2, R0!"';L~!,;: ~c .. ~ : 211. SI,\pi] .ll;S n::;.)h_~iprs & Si: l'~r-crs, Pctl.1i11 Enclave :9~ ! Llk&htTII BCf)k r"::rot~ 57., I~._'~arpura
30. '::ant Ram Ibd s,,,!lcrs, 16, ',:c., l\'jllnIclpal 1\farket, Lody Colony
PANH',l-1. S['1gh:ds Eso': }h::Cl~", D, O. r 70, Nca:' (he Clll'fch
SdZJDl1 Go; ,'cv DhJ;"', ~3 .:[,,;;::.s, 5-7, Ru, J Idc Jamefi:l
f'ATTALA-1. ~llp~nLt~r.d.::pt, Dhup;:r.:h:, State PIC;S 2. Juln &. Cot:'~ any, 17, Sl aL r .... T3.sh1n Ea~lnr
PATNA.-1. ~upeYIr.tcnoc·1 ~ ~ Gcvcrnl11ent Prir. t'l~~ (131 11a!) 2~ J4 ~L P. Ag: rv',li (.~ C"r:l~:tn,) .. P~l~~r,"'l'::l-j{ tveli~ Raghunath Bhawan 3. Llr-:nil Tr~\d .. p:; C\.;~i;an), p2_(_1t ~-'.,_l-:-Ln,,,.:ll
4. Mot: 1 a1 Ban::\!·q D:o' s, [,cml,lr'.'~ ~
5. Dengal 12_'v I----I,--..u~e, ChJv.h~ltta,
PO:-;::>ICHE~RY-]\l/s. I~011c,;~y TIcol; House, 9, Rl'e Duplix
PCON:\-1. Dccca:1 L0('1·, S1_1 '1, 0ccc:ln GYlnkhana 2. Tn1p';:1 L' ~ Bo J[.: IJl'p:~, ::66, r~,l. C~~ Reed 3. Int:l nat'opal n20~, Sc:'\ lce, Dccc~n G\'mkhana 4. R,.l,a BOt,k "<::f)cy, Opr. r~:1tu's C1.l\V], Near Appa Ea1want Chowk, Poona-2 :". Vtl'.ly BO'.'k uCrt'~, 1339, S:'" , 3.'1 N<'l;
FV.:'UKOTTAI-3, I 1'. N. SV.l!.1matb:m S,\oam & Co., E8St Main Road
RAJ;(OT-Kolnl1 L11 Doss:tHnt Shah, Book~clJcrs and Sub-Agents
RANC;-U--1. C!m~n Book Drpct, Urpet Bazar 2. Pust.'k J\L:I1.~l, Upper B[lZ3l'
RE\VA-Supcflt1ten;~cnt, (io"ernment St:lte Empor!I)Jll V. P.
ROURKELA-Thc Rourk~la Re',lcw
SAHARANPUR-,CkmJr,l Bh:-rata Pllst::tk Bhand~r, Court Road
SEClJ;"DERA3AD-Hll1du<,tan Diary Pub,"hels, Market Street
sn CH \R-Shri Nisp:'to Sc;" N~Z1rp:\ttt
SI1\H,\·-1. Supcnntcnj·.:1t, Hlm:.lcnal Pra<1eoh Government 2. Mtncn a Dook Shop, Tl'e Mall 3. Th.:: Nc" E,10k Depot, T), The lVld11
SINNAR-Shn NN. J,ll-had', Agent. Times of Indb, Sinnar (Nasik)
SHlLLONG-1. The Officer-m-Ch,1rge, Assam Government B. D. 2. Chapla Boobtall, P. B. NC'. 1
SONEPAT-United Book Agency
SRI-:-TAGAR-Tbe Ka,;'" II' Bookshop, Resider.cy Road
SURAT--Shrt G,'la' <111 ., 'l'ii"l(~1n)a, Tower Road
731
(Rest.) (Reg.) (Rest.) (Reg.) (Rest.)
., ••
" " .. "
(Rest.) .. t,
(Reg.)
(Reg.)
" "
(Rest.)
(R)
(Reg.)
" (Reg.) (Rest.)
" (Reg.)
" (Rest.)
(Rest.)
" (Reg.)
(Rest.)
(Reg.)
.f
(Rest.)
(Rest.)
(Reg.)
OJ ..
732
TJRU CHIR APALLI-1. Kalpana Publishers, Woriur 2. S. Knshnaswaml & Co., 35, Subhash Chander Bose Road 3. PalaDlappa Bros.
TRIVANDRUM-1. InternatIOnal Book Depot, Mam Road 2. Reddear Pr,~s & Book Depot, P. B. f\o. 4
TUTICORIN-Shri K. Thiagarajao, 10·C, Frcrch Chap,tl ROJd
UDAIPUR-1. Jagdlsh & Co., Inside Surajapo1c 2. Book Centre, Maharana, Bhopal Consum'ors Co-openl'h~ SO~lety Ltd.
UJJAIl':-Manak Chand Book Depot, Sati Gate
VARANASI-1. Students Friends & Co., Lanka 2. Chowkhamba Sanskrit Senes Office, Gopal Mandlf Road, P. B. 8 3. Glob Book Centre 4. Kohinoor Stores, Universuy Road, Lanka 5. B. H. U. Book Depot
VELLORE-A. Venkatasubhan, Lav.' 'Booksellers
VIJAYAWADA-The Book & ReView Centre, Elum Road, G("ernorpet
VISAKHAPATNAM-1. Gupta Brothers, Vizla Building 2. Book Centre, 11197, Mam Road 3. The Secretary, Andhra Unrvelsity General CO'OpCI alIve Stores Ltd.
VIZIANAGARAM-Sarda & Co.
WARDHA"-SwaraJeya Bhandar, Bhorjl Market
FOR LOCAL SALE
1. Government of India Kitab Mahal, Janpath, Opp. 10(11] Co!f~e Honse, New Delhi 2. Government of India Book Depot, 8, Hastmgs Street, Calcutt:! 3. High Commissioner for India III London, India HOl.,se, London, W. C. 2
RAILWAY BOOKSTALL HOLDERS
1. S/S. A. H. Wheeler & Co., 15, Elgm Road, Allahabad 2. Gahlot Bros. K. E. M. Road, Blkaner 3. Hlgginbotharns & Co., Ltd., Mount Road, Madras 4. M. Gulab Singh & Sons Pnvate Ltd., Mathura Road, New Delhi
FOREIGN
1. SIS. Education Enterprise Pnvate Ltd , Kathumancill (Ncp:d) 2. SIS. Aktie Bologat, C. E. Fritzes Kung!, Hovobokhandd, Fred'g,.tlon-2, Box. 1656,
Stockbolm-16, (Sweden)
(Reg.) ., (Rest.)
(Reg.) (Rest.)
(Rest.)
"
(Rest.) tReg.)
(Rest.) (Reg) (Rest. \
(Reg.)
(Rest.)
(Reg.)
(Rest.)
(Rest.)
(Reg.)
3. Reise-und Verkehrsverlag Stuttgart, Post 730, Gutenbelgstf:! 2 , Stuttg3rt No. 11245, Stuttgart den (Germany West)
4. Shri Iswar Subramanyam 452, Reverslte Dnv. Apt. 6, Ne.v YOlk, 27 NWY 5. The Proprietor, Book Centre, Lakshml ManSIOl1S, 49, The Mall, Lah-re (r,\klstan)
ON. S. AND R. BASIS
1. The Head Clerk, Government, Book Depot, Ahmed.tb;;L! 2. The Asst. Director, Extension Centr~, K:.lpileswar Road, Bc1ganm 3. The Employment Officer, Employment Exchange, Dhar
4. Tile Asst. Director, Foot""ear Extension Centre, Polo Ground No.1, Jodhpur 5. The O. l/C., ExtensIOn Centre, Club Road, Muzaffarpur 6. The Director, Indian Bureau of Mmes. Government of India, Ministry of Mines & Fue], Nagpur 7. The Asst. Director, Industnal Extension Centle, Nadiad (Gujarat) 8. The Head Clerk, Photozincographlc Pless, 5, Finance Road, Poona Government Printing and
StatIOnery, R.:lJkot 9. Go\ernment PrInting and Stationary, RaJkot
10. The O. liC. ExtenSion Centre, Industrial Estate, Kokar, Ranchi 11. The Dm:ctor, S. I. S. I. Industrial ExtenslOn Centre, Udhana, Surat 12. The Registrar of Companies, Narayam Building 27, Erabourne Road, Calcutta-I 13. The Reglstnr of Companies, Kerala, 70, Feet Road, Ernakulam 14. The Registrar of Companies, H. No. 3-5-83, Hyderguda, Hyderabad 15. The Rtglstrar of Companies, Assam, Manipur and Tripura, Shillong 16. Registrar of Companie~, Sunlight Insurance Building, Ajmeri Gate Extension, New Delhi 17. Registrar of Compame~, Punjab and Himachal Pradesh, Link Road, Julundur CIty 18. Registrar of Compames, BIhar, Jamal Road, Patna-1 19. Registrar of Companies, Raj. & Ajmer, Shri Kamta Prasad House, 1st Floor, 'C' Scheme,
Ashok Marg. Jmpur 20· Tbe Registrar of Companies, Andhra Bank Building, 6, Linghi Chetty Street, P. B. 1530. Madras 21. The RegIstrar of Companies, Mahatma Gandhi Road, West Cott Buildi:1g P. B. 334, Kanpur 22. The Reg1strar of Companies, Everest 100, Marine Drive, Bombay 23. The Regl~trar of Companies, 162, Brigade Road. Bangalore 24. The Reglstwr of Companies, G""a:ior 25. Ass!. Director, ExtenSIOn Centre, Bhult Road, Dhanbad 26. RegIstrar of Companies, Orissa, Cuttack Chandi, Cuttack 27. The RegIstrar of Companies, GUjdrat StatIO', Samachar Building, Ahmedabad 28. PublicatIOn DivlSlon, Sale Depot, North Block, New Delhi 29. The Development CommiSSIOner, Small Scale Industries, New Delhi 30. The O. l/C., University Emplcyment Bureau, Lucknow 31. O. I/C., S.LS.I. Extension Centre, MaIda 32. O. liC., S.I S.l. ExtenSIOn Centre, Habra, Tabulana, 24 Parganas 33. O. I/C., S.l S.I. Model Carpentry Workshop, Piyah Napr, P. O. Burnipuf 34. O. IrC., S.LS.I. Chrometannmg Extension Centre, Tangra 33, North Topsia Road, Calcutta-46 35. O. I/C .• S I S.I. Extension Centre (Footwear), Calcutta 36. Asst. Director, ExtenSIOn Centre, Hyderabad 37. Asst. Director, Extension Centre, Krishna Dlst. (A.P.) 38. Employment Officer, Employment Exchange, Jhabua 39. Dy. Director In·charge, S.I.S.I. C/o. Chief Civil Admn. Goa, Panjim 40. The RegIstrar of Trade UnlODs, Kanpur 41. The Employment Officer, Employment Exchange, Gopal Bhavan, Morina 42. The O. I/C., State InformatIOn Centre, Hyderabad 43. The Registrar of Companies, Pondicherry 44. The Assistant Director of PubliCIty and Information, Vldhana Saubha (P.B. 271) Bangalore
733
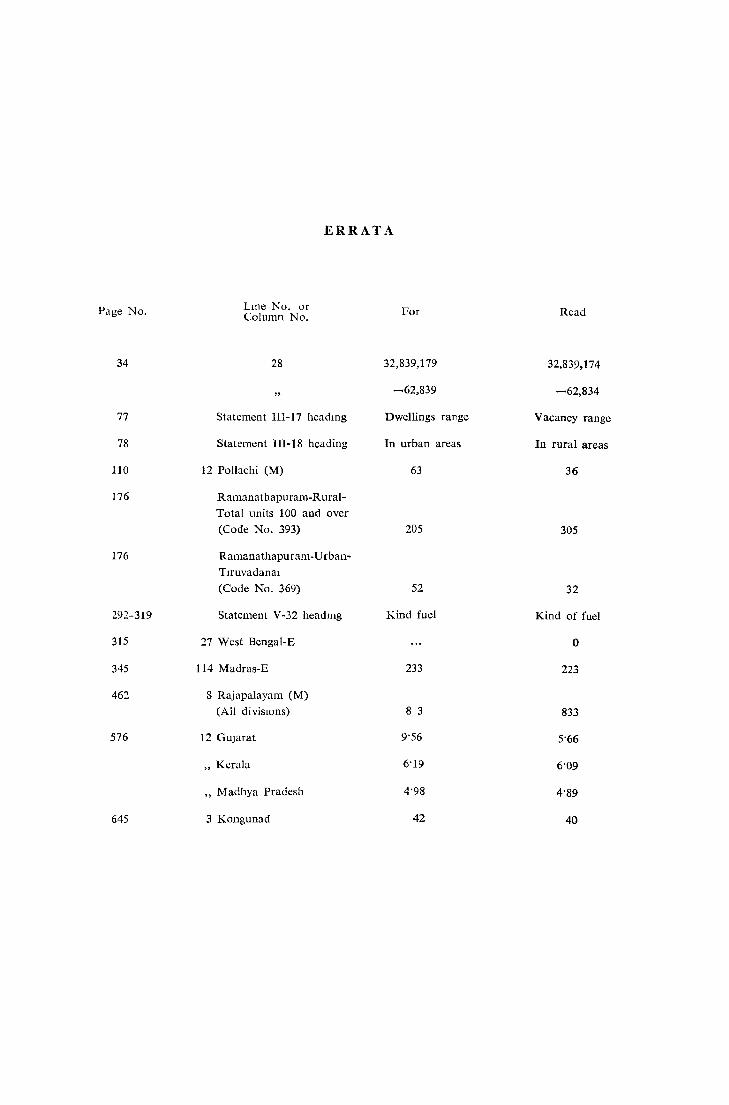
ERRATA
Page No, Lme No, or For Read Column No,
34 28 32,839,179 32,839.174
-62,839 -62,834
77 Statement III-17 headmg Dwellings range Vacancy range
78 Statement III-I8 heading In urban areas In rural areas
110 12 Pollachi (M) 63 36
176 Ramanathapuram-Rural-
Total units 100 and over
(Code No, 393) 205 305
176 Ramanathapuram-Urban-
Tuuvadanal
(Code No, 369) 52 32
292-319 Statement V-32 headmg Kind fuel Kind of fuel
315 27 West Bengal-E 0
345 114 Madras-E 233 223
462 S Rajapalayam (M)
(All divisIOns) 8 3 833
576 12 Guprat 9'56 5'66
" Kerala 6'19 6'09
" Madhya Pradesh 4'98 4'89
645 3 Kongunad 42 40