
Includes - Madras School of Economics
44
Includes Interviews with Dr. S Raghupathy Executive Director CII Godrej GBC Dr. U Sankar Member of Indian Delegation, RIO+20
-
Upload
khangminh22 -
Category
Documents
-
view
3 -
download
0
Transcript of Includes - Madras School of Economics
Includes Interviews with
Dr. S Raghupathy
Executive Director CII Godrej GBC
Dr. U Sankar
Member of Indian Delegation, RIO+20

2
Acknowledgements
Alpha, the Economics and Finance Club of
Madras School of Economics, is indebted to all
those who have helped us directly or indirectly in
bringing out this issue.
We thank our Director Dr. K R Shanmugam for
his constant support to this initiative.
We are obliged to our Administrative
Officer Mr. T.V Subramanian for fulfilling our
administrative requests with enthusiasm.
We extend our deep gratitude to the faculty
advisors, Dr. Sreejata Banerjee and Dr. Zareena
Begum, for their whole-hearted guidance and
selfless support.
We would also like to thank all our faculty
members for their tireless guidance and
intellectual input. We are extremely grateful to Dr.
K S Kavikumar for his prompt feedback
throughout the making of this issue.
Our sincere gratitude goes out to Dr. S.
Raghupathy and Dr. U. Sankar for sharing their
views with us. We also thank Drizzlin Media for
their article and the Economics Club of IIT-Delhi
for giving us permission to publish their cartoon.
We are also grateful to the students and alumni,
whose contribution in the making of this issue is
truly invaluable. We thank all our contributors for
their thought-provoking articles, which has made
this initiative really worthwhile.
Editorial Team
Nikhil Panicker
Shalini S
Chandrava Das
Madhurambal S
Nishtha Mishra
Rohit Parasar
Shubham Gupta
Ankush Whig
Shyamili Mohan
Arun B Chandran
Designing and Publishing Team
Jimut Bahan Chakrabarty
BNS Kumar
Coordinating Team
Pankaj Kumar
Bhupendu Sinha
Gunjeet Singh
Special Inputs
Shikha Dahiya
Disha Kumar
A Vishnu Bharadwaj
Send your feedbacks and queries
Editorial 4
Cover Story Heal the World 5
An Interview With Dr. S Raghupathy 7 Executive Director, CII Godrej GDC Dr. U Sankar 9 Honorary Professor, Madras School of Economics
Environment & Sustainability Sustainability and Stakeholder Engagement 11 Guest article from Drizzlin Media Environment and Sustainable Development 13 Article by MSE faculty Carbon Credit Trading and India 14 Shale Gas: An Auxiliary Energy Solution for India 38 The Journey That Is Meant To Be Taken Together 24
Development Economics Institutional Dynamics of Decentralized Planning in Purulia, West Bengal 19 Dharavi Redevelopment Plan 16 Power woes of India 21
Finance & Actuaries Unit Linked Insurance Products 26 A Guide to Gold Standard 34 Libor Unleashed 32
Contents
3
Broad Spectrum Autobiography of Indian Economy 30 FDI challenges and solution 36 Through the Kaleidoscope of Economics 23 Book Review 39 Movie Review 18
Obituary 40
News Around The Globe 41

Editorial
The third issue of Athena that you hold in your hands (or in most cases, your screens) is proudly dedicated to the ‘Centre of Excellence in Environmental Economics’ status achieved by Madras School of Economics with Environment and Sustainable Development as its theme. This issue shall act, as always, as a platform for experts as well as amateurs to express their opinions and validate their stands on a variety of pressing issues of sustainability that are currently plaguing the world at large and India in particular.
At a macro level, sustainability is not just an added external variable; it has become an inherent part of a “Green Econo-my”, where Green GDP, green investment, green employment etc. are the transformed macroeconomic aggregates. By 2030, India’s GDP is expected to rise to USD 4 trillion, with a one and a half billion population. The economic growth will drive up the demand in all sectors, especially pow-er (expected to increase more than five-fold) and also lead to an increase in greenhouse gas emissions.
Growth in the past decade has mainly been achieved through exploitation of natural resources, which is neither sustainable from an environmental nor economic perspective. But, as the 26th clause of the Zero Draft of the Rio+20 Conference highlights, a green economy emphasizing on sustainable development and poverty eradication should aim at protecting and enhancing the natural resource base, and not deplete it. As a country that always works only under pressure, the Environment Protection Act passed in 1986, right after the Bhopal Gas Tragedy, though very comprehensive, has not been able to address all environment related issues effectively, mainly owing to the institutional bottlenecks that plague implementation in all fields in general in the country.
But India does have tremendous potential to move towards becoming a green economy. Not only in terms of being a tropical country that can easily tap solar energy or exploit tidal energy from its vast coastline, but also in terms of the numerous initiatives that are increasingly being taken, by the government and otherwise, in this regard. India is the third country to have set up a National Green Tribunal that aims at speedy disposal of cases relating to environmental protection. The Convention on Biodiversity is to be held in India in October this year, with the ASEAN members as the participating countries. India also proposes to adopt the Green GDP measure by 2014.
Initiatives from the corporate side include a game quiz ‘Are you a Green Superhero?’ started by Accenture as a part of their annual Eco Challenge, with the objective of engaging employees and the general public in sustainable thinking and acting, and the “Water Less” way of producing denims by Le-vi’s, to name a few. Many others like Wipro, CII-Godrej and ITC have developed their offices as green buildings. To sup-plement these initiatives, the government has introduced vari-ous generation-based incentives in the form of tax-holidays, reduced customs duty, zero excise duty on
specific capital equipment and loans at cheap interest rates for setting up renewable energy enterprises.
As a result of these initiatives by the government and the corporate houses, India is now among the top five destinations in the world for solar energy development, as per Ernst & Young’s Renewable Energy Attractiveness Index. Hence, with such a strong commitment that can be witnessed on India’s part towards sustainability and environment protection, she could lead the developing countries in coming together to jointly adopt focused, pragmatic measures for ensuring sustainable development and poverty eradication, either through existing regional associations like ASEAN or SAARC or form new ones on a global scale.
This bulletin includes interviews of Mr. Raghupathy, Executive Director and Head, CII Godrej Green Business Centre and Dr. U Sankar, Honorary Professor, Madras School of Economics, on pressing environmental issues concerning their areas of expertise. Apart from a faculty article, the magazine also includes various student articles on themes ranging across environment, development and finance. A guest article by a social media consultancy firm, interestingly observes how brands build and shape their sustainability credentials. The book and movie reviews, and Athena’s very own capsules of facts make for interesting reads. We sincerely thank everybody for their contributions. We hope you enjoy reading this issue as much as we did while working for it.
-Editorial Team
4

Heal the World
“The sun, the moon and the stars would have disappeared long ago, had they happened to be within the reach of predatory human hands.”
Havelock Ellis
Climate disasters are on the rise. Around 70 percent of disasters are now climate related – up from around 50 percent two decades ago. These disasters come with a heavy human toll and a high price tag. During the last decade, 2.4 billion people were affected by climate related disasters, compared to 1.7 billion in the previous decade. The cost of responding to disasters has spiked tenfold between 1992 and 2008. Climate change is not a threat of the distant future. We were just foolish in believing so.
To face the fact but inevitably add insult to injury, climate change is just the tip of an iceberg in a sea of environmental and ecological issues. Our unscrupulous behaviour has led to the destruction of ecosystems and habitat, depletion of natural resources and the ozone layer, pollution, all sorts of nuclear issues ranging from fallouts and meltdowns to radioactive waste mismanagement, and bioaccumulation and toxins entering the food chain, to mention a few. Each of these has far reaching consequences that choke two of our greatest assets – nature, and the generations to come.
Though these predicaments envelope everything and everyone on this planet and beyond, no discipline has come up with an approach to curb the detrimental effects to nature and to replenish the environment, other than economics. Economic research, over the past few decades, has crafted an impressive body of knowledge called Environmental and Resource Economics, and more recently, directed the emergence of Ecological Economics. Either field is aided by the science of Evolutionary Economics, which provides the necessary theoretical and methodological inputs.
Environmental and Ecological Economics are both concerned with the economic analysis of the causes and the nature of environmental problems and their solutions. Although it is a common notion that Environmental and Resource Economics is occupied predominantly by applied policy issues, it in fact addresses a number of rather fundamental questions. These relate to the persistence of environmental externalities, the place of humans in the biosphere, the role of values– ethical and monetary, and the limits to regulating the behaviour of
households and firms. Ecological Economics addresses the interdependence and co-evolution between human economies and natural ecosystems. Both Ecological and Evolutionary Economics cover a range of fields of study - geography, ecology and hydrology to technology studies, management theory and evolutionary modelling.
It is said that nothing unites us more than the fear of impending doom. This piloted, in Stockholm in 1972, the world to witness the saviour of our environment for the first time – the United Nations Conference on the Human Environment, popularly known as the Earth Summit. It was the UN’s pioneer conference on international environmental issues, and marked a turning point in the development of international environmental politics. Here, numerous principles concerning the environment and development were discussed by the heads of states and oth-er delegates. It was an occasion of great pride for our nation, as the then Indian Prime Minister Indira Gandhi, who was the only speaker in the conference other than the Prime Minister of the hosting country, delivered a seminal speech that brought forward the connection between ecological manage-ment and poverty alleviation. Twenty years later, in 1992, a chapter was added into the history books written ever since – the United Nations Conference on Environment and Develop-ment or the Rio Conference held at Rio de Janeiro, which later led to the popular but controversial Kyoto Protocol. The Rio Conference was over twice as big in terms of the number of states and delegates that participated in comparison to the first Earth Summit. Climate Change was the main agenda of this conference. Till date, this has been characterized to be the glorious environmental knight in the shining armour. The subsequent couple of decades caught sight of the World Summit on Sustainable Development in Johannesburg in 2002 and United Nations Climate Change Conference in Copenhagen in 2009.
This year, forty years after the first Earth Summit and twenty years after the Rio Conference, the United Nations Conference on Sustainable Development, also known as Rio+20, was held at Rio de Janeiro, aimed at reconciling the economic and environmental goals of the global community. While the objectives of the conference were securing renewed political commitment for sustainable development, assessing the progress and implementation gaps in meeting previous commit-ments, and addressing new and emerging challenges, the offi-cial discussions had two focal themes – on how to build a green economy to attain sustainable development and lift people out of poverty, including support for developing countries, and on
5

how to improve international coordination for sustainable development by building an institutional framework.
The last decade has witnessed widespread adoption of environmental and sustainable policies and practices in trade. The bulk of mankind that used to reach cloud nine when the words “free trade” were whispered in their ears, now privy to the long term environmental and ecological aftermath, have found solace in the practice of “fair and safe trade”. Society is moving from a history of plundering resources and ignoring the environment to a future that fosters nothing but sustainable practices.
Modern economic policies envision taking us toward a futuristic and impeccable economic system where development and sustainability are brothers in arms. An ecosystem marketplace realigns global market forces to reward investments in ecosystem services to increase production of ecosystem goods. Regulation comes in the form of equator principles – a standard for addressing environmental and social issues when financing projects globally. Economic behaviour is streamlined through taxation policies such as Carbon tax and Eco tax, and incentives like emission trading. The state and progress of the ecosystem should be controlled by monitoring gauges such as the Environmental Sustainability Index, while sustainable growth indicators like the Genuine Progress Indicator and the Index of Sustainable Economic Welfare need to replace existing techniques of computing growth and development, such as the GDP.
At the World Summit for Sustainable Development (WSSD) 2002, India presented its position in a detailed study, “Empowering People for Sustainable Development”. The core objective was to set environmental standards in the country along with ways to battle poverty and improving green technology. Since 2002, the largest increase in percentage contribution to energy has been renewable sources. Thermal and nuclear sources have decreased by 0.5-1 percent since 2007. Green technologies are now being taken into consideration with 2-3 percent of all construction in India being green.
The Government of India is making strong efforts to realign its current and future energy demands with more sustainable energy sources. In the 2011-12 Union Budget the Finance Minister allocated US$ 56.6 million for research and development of new and renewable energy and US$ 89.41 million to the National Clean Energy Fund to expedite the goal to accomplish a greener, safer India. The government aims to increase the contributed capacity of alternate energy sources to the country’s energy mix over the next decade. The objective is to improve the overall installed capacity of clean energy
sources of energy by 15.9 percent by 2022.
With ever increasing population and thus consumption, our planet is under enormous strain. To reach a set goal of sustainability, we cannot expect social pressure of any kind to yield results in this commercialized world. Therefore, a tenacious mandate is essential to strong arm the businesses worldwide into embracing sustainable practices. Incentive for taking up a sustainable agenda is the only practical modus that will nudge today’s producers to stop pillaging the promise of tomorrow. But, it needs to be said, with the increase in cost of energy, sustainability is no longer just a social issue but a business issue. Consequently, it is important for all to understand the concept of sustainability. UNESCO has set the goal for the United Nations Decade of Education for Sustaina-ble Development (2005-2014) to compel governments to ob-serve all aspects of sustainability in development, and create awareness to move towards a sustainable future without causing damage to the environment.
To shelter our greatest physical asset, the environment, every member of the society – the citizens, governments and institutions need to push forward a unified agenda for this common cause. A competent environmental lobby should be established in every country that endeavours to get an adequate portion of the national budget for the promotion of sustainable economic behaviour and environmental research. Education needs to play a central role in creating awareness and facilitating the common man to engage in the environmental policy and decision making process. Let us not forget what Mahatma Gandhi said, “Earth provides enough to satisfy every man’s needs, but not every man’s greed.” We have an obligation to our younger ones as they do to theirs. Let us be the leaders, let us be the example.
6

Interview with Dr. S Raghupathy, Executive Director, CII-Godrej GBC
1. What were the motivations behind starting the green initi-ative for adoption of cleaner production techniques? How do the new techniques work in
an eco-friendly manner? What has been their impact on the Indian industrial set-up?
If India has to be a developed country by 2022 – India has to be a leader in green business and India must play a significant role in global green economy. In this regard, we are witness-ing two distinct trends in the country.
One, Indian industry has realized that ecological sustainability is important for the growth of the country as well as industry. Many of the industries have taken up initiatives to ensure that growth is not at the cost of environment.
Two, we have also realized that pursuing ecological sustaina-bility helps in - reducing energy consumption, reducing water consumption, reducing resource intensity, etc., ultimately making Indian industry more competitive.
Ecological sustainability is very important. This needs more attention as India marches towards the goal of becoming a developed nation. Ecological sustainability is also a good business opportunity and can build on competitiveness.
In light of this, CII initiated a voluntary programme titled- “Mission on Sustainable Growth" to facilitate ecologically sustainable business growth.
As a first step towards this direction, a CII - Code for Ecologi-cally Sustainable Business Growth was developed aiming to involve the top management of companies and seek voluntary commitments towards reducing intensity of the consumption of energy, water and other natural resources and promote ecologically sustainable growth in their companies.
The initiative launched by CII in 2008 has evoked great interest from the Indian Industry. More than 450 organisations in India have voluntarily committed to this initiative.
This clearly indicates an increasing trend of companies adopting measures towards reducing their ecological footprint in the years to come. Of late there has been a continuous demand from companies to formulate a system to evaluate the actual performance of companies pursuing ecologically sustainable growth.
A clear holistic mechanism is presently not available for evaluating the performance of companies on the ecological front. Against this background, CII, through an extensive
stakeholder consultation and interaction with experts have developed the ‘Green Company Rating System’ for evaluating the ‘greenness of companies’.
This rating system will act as a holistic framework to assess and evaluate the performance of the company's activities on the green front.
2. What is unique about the green ranking initiated by CII?
CII with the support of all the stakeholders has developed ‘Green Company Rating System’ (GreenCo) for evaluating the ‘greenness of companies’- the first- of- its- kind in the world.
Green Company Rating System’ intends to rate the companies on the environmental friendliness of their activities & products and will adopt a cradle- to cradle approach for evaluating the entire activities of the company, including the supply chain.
Green Company Rating System’ will act as a milestone for companies pursuing green to assess where they stand and help in defining the path forward. Green Company Rating System’ intends to rate the companies on the environmental friendliness of their activities & products
3. What has been the response of different industries to this green initiative?
The response of Indian industry has been very encouraging. The following clearly reflects the same.
2 companies awarded with GreenCo Rating
14 companies registered for GreenCo Rating
50 companies in the pipeline.
The following are the two GreenCo rated Companies in India
Bangalore International Airport Limited (BIAL) - First GreenCo (Silver) Rated Company
ITC Limited - Paperboards & Specialty Papers Division Bhadrachalam Unit -First Pulp and Paper GreenCo (Gold) Rated Company in the country
7
4. Does the initiative intend to develop firms as sustainable habitats?
Green Company Rating System advocates a performance based approach. It aims to provide leadership and guidance to businesses on how to implement green strategies.
These strategies are designed based on an iterative and consul-tative process that includes building partnerships with stakeholders and employing their cumulative knowledge and experience to address issues related to ecological sustainabil-ity.
Greenco Rating employs a holistic approach, wherein, it not only advises businesses on strategy and actions required but also provides mechanisms to quantify the impact of such actions and make course corrections if required.
Green Company Rating System focuses on ‘Individual manu-facturing & service related facilities, while Indian Green Building Council (IGBC) Green Building Rating Systems focus on sustainable habitats.
Green building rating brings together a host of sustainable practices and solutions to reduce the environmental impacts. Green building design provides an integrated approach consid-ering life cycle impacts of the resources used.
An important development in the growth of green building movement is the launch of the following Green Building Rating System:
IGBC Green Homes
IGBC Green Factory Buildings
IGBC Green SEZs
IGBC Green Townships
LEED 2011 for India
New Construction
Core & Shell
All the IGBC Green Building Rating Systems are based on the five elements of the nature (Panchabhutas) and are a perfect blend of ancient architectural practices and modern technological innovations.
A clear testimony of this success is the steady growth in the number of projects getting registered with IGBC. As on date, over 1,745 green buildings amounting to over 1.21 Billion sq.ft have been registered for designing and construction as per IGBC Rating System.
5. What is CII’s initiative on fostering carbon-friendly in-dustrial growth in India?
CII with the support of all the stakeholders facilitates in creat-ing solutions that help India and the rest of the world not only
reduce environmental impact of human activity but also regen-erate environment.
CII works with the Government to devise mitigation and adaption strategies to combat climate change
Advocates natural resource management, biodiversity conservation, environmental governance frameworks
Promote renewable energy, energy and water efficiency technologies
Lead the Green Building Movement in the country and develop Green public procurement guidelines
Formulate industry position for international climate change negotiations
Devise Programmatic approaches and international part-nerships towards intensity reduction of GHG emissions through voluntary schemes
Build capacity and consult on corporate climate change strategies and emissions inventory
Research on climate change mitigation, adaptation and economic & social impact analysis
Capacity building within Industry to develop Low Car-bon Growth Strategies
Creation of knowledge & information base on climate change
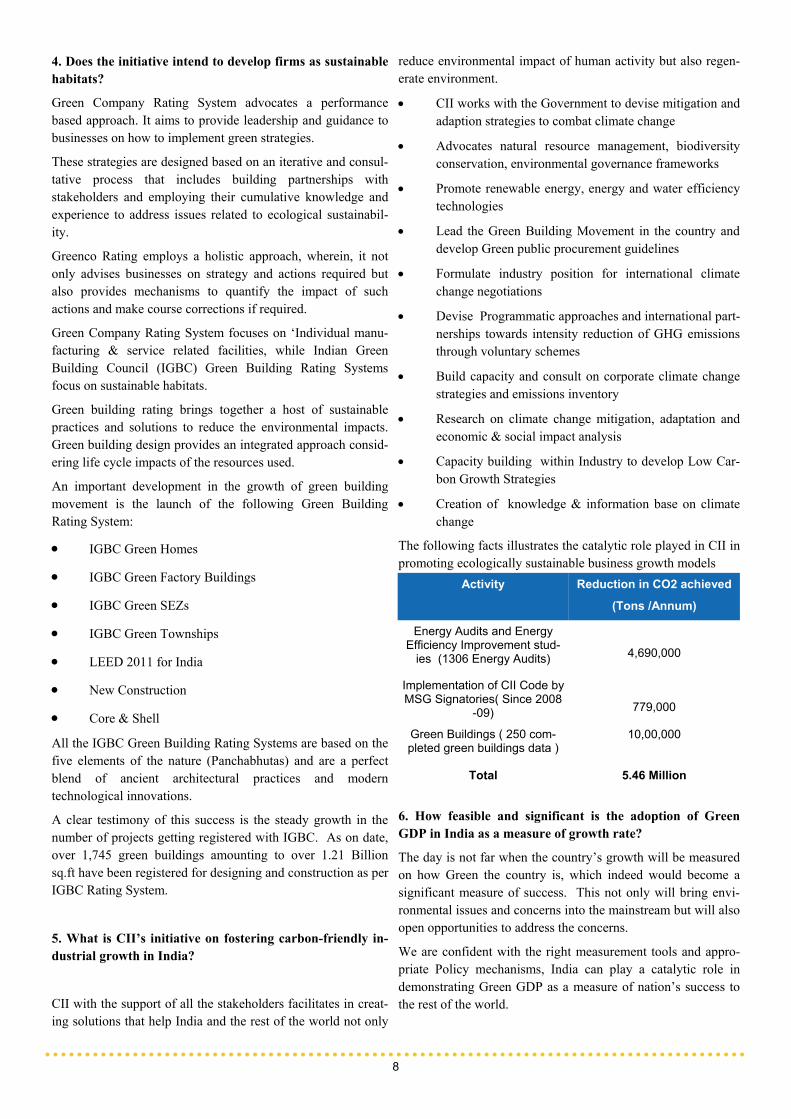
The following facts illustrates the catalytic role played in CII in promoting ecologically sustainable business growth models
6. How feasible and significant is the adoption of Green GDP in India as a measure of growth rate?
The day is not far when the country’s growth will be measured on how Green the country is, which indeed would become a significant measure of success. This not only will bring envi-ronmental issues and concerns into the mainstream but will also open opportunities to address the concerns.
We are confident with the right measurement tools and appro-priate Policy mechanisms, India can play a catalytic role in demonstrating Green GDP as a measure of nation’s success to the rest of the world.
8
Activity Reduction in CO2 achieved
(Tons /Annum)
Energy Audits and Energy Efficiency Improvement stud-
ies (1306 Energy Audits)
4,690,000
Implementation of CII Code by MSG Signatories( Since 2008
-09)
779,000
Green Buildings ( 250 com-pleted green buildings data )
10,00,000
Total 5.46 Million

Interview with Dr. U Sankar, Hon’ Professor, Madras School of Economics
Member of Indian Delegation to Rio+20
1. In the debate between devel-oped and developing countries on the adoption of absolute or per capita emissions for paying for pollution costs, as per In-
dia’s current stand on this issue, how far will the transfer of technology from developed to developing countries help the latter in reducing pollution levels in their countries?
Most environmentally-sound technologies come under the Intellectual Property Regime and they are patented. Access to these technologies on concessional terms from developed countries to developing countries will enable the latter to make a smooth transition to achieve sustainable development. Rio Declaration of 1992 recognizes the principle of “common but differentiated responsibilities” (CBDR) of states according to their respective capabilities in achieving international coopera-tion. The United Nations Framework Convention on Climate Change, the Johannesburg Plan of Implementation and the Rio plus 20 conference stress the need for the technology transfer. Transfer of energy efficient technologies such as ultra super critical thermal power plants, carbon capture and storage tech-nologies and energy efficient technologies at low interest rates from developed countries to developing countries will help the latter in greening their economies. Apart from the transfer of technologies on concessional terms, financial assistance for green projects, development-friendly world trading regime, and north-south and south-south cooperation on development of location-specific environmentally sound technologies are essential for reducing pollution levels in developing countries.
2. Major leaders of the developed and developing world (US’ Barack Obama, German Chancellor, Chinese Prem-ier and Russian Prime Ministers) were absent for the Earth Summit. This signals some insensitiveness for build-ing consensus for sustainable development. Do you think both the parts of world are underplaying their role in co-ordination for developing green and equitable world?
Developed countries’ lack of interest in the Rio+20 conference is due to (a) their preoccupation with the global recession since 2007 and means of recovering their economies; (b) their per-ception that the world economy has changed since 1992 due to the spectacular economic performance of China and signifi-cant growth performances of India, Brazil, South Africa and many other developing countries and hence, they argue, that the developed countries must also make binding commitments
to reach agreements on environmental cooperation; and (c) that the present classification of countries into developed and devel-oping countries is not relevant now.
3. How Rio +20 has given new approach to Agenda21? How does it impact Indian ambitions of high growth rate?
Many developing countries including India worked hard to re-tain the Rio Declaration and Agenda 21 as basic framework for international environmental cooperation. There was a consen-sus that each country could develop its own sustainable devel-opment path based on its national circumstances and policy priorities. Sustainable development requires balancing and inte-grating the three pillars- economic, social, and environmental- of sustainable development. The Rio +20 outcome would not constrain India’s growth ambition.
4. Has India lost the opportunity to demonstrate its leader-ship in Rio Earth Summit? What is your take on Indian stand for Rio Summit?
India worked closely with G77+ China group in articulating her policy concerns. India is satisfied that the Outcome Document retains basic Rio principles such as equity and CBDR and re-flects developing countries’ concern that green economy in the context of sustainable development and poverty eradication should ‘ not constitute a means of arbitrary or unjustifiable dis-crimination or a disguised restriction on international trade, avoid unilateral actions to deal with environmental challenges outside the jurisdiction of the importing country, and ensure that environmental measures addressing transboundary or glob-al environmental problems, as far as possible, are based on an international consensus’ [A/CONF.216/L.1, 19 June 2012]. Many developing countries including India are disappointed that no new financial support was available from developed countries for greening their economies. Regarding reducing unsustainable consumption and production patterns all coun-tries have to devise policies now.
5. What consequences does the collapse of the Doha round have for countries to arrive on an international consensus on issues of sustainable-development? What importance have summits like the Rio Earth Summit gained in this con-text?
9

The Doha Round was envisaged as a development round but eleven years of negotiations have not resulted in any consensus among WTO members. The main issues to be sorted out in-clude reduction of high agricultural subsidies in USA, Europe and other OECD countries; safeguards demanded by develop-ing countries on surge in imports of agricultural goods; amend-ments to TRIPS agreement to make technology transfer regime development friendly and meet the social needs, particularly in health care; and incorporation of country of origin, prior in-formed consent, and access and benefit sharing provisions of the Convention on Biodiversity in patent registration, when the inputs are biological resources and traditional knowledge. As WTO is a “single undertaking”, reaching consensus on all the Doha issues from all the members is a difficult task.
Rio + 20 document cited above urges ‘ the members of WTO to redouble their efforts to achieve an ambitious, balanced and development-oriented conclusion to the Doha Development Agenda, while respecting the principles of transparency, inclu-siveness and consensual decision-making, with a view to strengthening the multilateral trading system’. The prospects of reaching a balanced and development oriented agreement appear to be slim now. All countries must realize that a trans-parent, rule-based and development friendly global trading regime is a global public good.
6. How feasible and significant is the adoption of Green GDP in India as a measure of growth rate?
We need preparatory work to fill the empty boxes in a green accounting system. We need reliable measures of environmen-tal externalities in production and consumption, accounting of ecosystem services and means of capturing their values, and methods of balancing and integrating the three pillars of sus-tainable development. This type of information system will be helpful in designing taxes and subsidies in sectors such as agri-culture, forests, energy and transportation. A green GDP can be an indicator of sustainable growth rate.
7. Is co-operation among developing countries (through existing or new regional association) towards committing to ensure sustainable development feasible?
Regional cooperation among developing countries is desirable for (a) cross-boundary issues like sharing of river water and eco system services, (b) internalizing spillover effects in natu-ral resources management and pollution, and (c) development of location specific environmentally sound technologies for sustainable development. These co-operative arrangements may be undertaken bilaterally, plurilaterally, or under UN aus-pices. We must explore the scope of regional trade agreements to include environmental cooperation. At present, regional cooperation agreements could not deliver the expected out-
comes because of political reasons.
8. To what extent is exploitation of natural resources justi-fied for economic development that India is experiencing in recent years?
Exploitation of natural resources must be governed by the sus-tainability criterion. In case of unique natural resources or in cases where exploitation of natural resources will result in irre-versible losses, it is better to preserve the natural resources; the precautionary principle applies. Even in case of natural re-sources, where substitutes exist, conversion of natural resources for industrial or other uses must be subject to social cost benefit analysis , science-based environmental impact assessment and adequate provisions relating to resettlement, compensations and creation of livelihood opportunities for the affected people. We must avoid undue delays in completion of the projects by adopting transparency and deadlines for completion of different stages in projects.
9. The procedure of obtaining environmental clearances has been plagued with problems of lack of transparency leading to significant delays. How has this affected the growth of industries?
Many infrastructural projects e.g., roads, railways, mining pro-jects, and power projects are capital intensive and require long time periods for commercialization. Delays in completion of the projects result in cost overruns due to increases in costs of machinery and equipment over time, interest burden during construction, and sometime technological obsolescence. We need a transparent, socially just and environmentally sound but time bound environmental clearance system to achieve sustain-able growth.
10. The imbalances between tribal traditional way of living and that of industrial exploitation in these tribal areas that are rich in mineral resources are needed to be brought at par. How can India overcome these imbalances?
We need compensation, resettlement and creation of livelihood opportunities schemes which make the affected people better off. In addition to compensation and employment guarantee schemes we may explore the feasibility of assigning ownership rights (equity shares) to the displaced persons in the develop-ment projects.
10

Sustainability and Stakeholder Engagement
Megha Dada Chawdhry
As a Communications Consultancy delving in the area of Sus-tainability, it’s interesting to observe brands build and shape their sustainability credentials in today’s extremely volatile and connected environment.
A clear takeaway from most corporate communication man-dates today is the focus they have on demonstrating sustaina-bility initiatives. The increased significance in this area can also be gauged by the exponential growth in the number of niche agencies and think tanks that are helping brands better comprehend, create and communicate their social responsibil-ity practices to different stakeholder groups.
Participating in these conversations is a good thing as it acknowledges the role businesses play in developing social and economic infrastructure and in shaping consumption pat-terns globally, like they have been doing for decades. But at the same time we do need to ask ourselves two things, firstly why are they engaging? Secondly, what is the value addition that emerges from such a dialogue?
Are they truly leveraging the potential of pursuing their sus-tainability goals via stakeholder engagement?
Though stakeholder expectations have shaped corporate man-dates for centuries (with instances of social responsibility be-ing enforced dating back to 1700 BC!), what is changing are the implications of stakeholder sanctions today. They are far direr.
Global and social mediums like the Internet have lead to great-er disclosure with the increased degree of information sharing around corporate practices. At the same-time, they also are powerful mediums of exchange. Weary and disgruntled inves-tors, employees, governmental agencies and customers can easily damage corporate reputation and interests (BP, Nestle, KFC, Nike and Coke have their own interesting narratives to relate in this regard). Likewise, brand driven initiatives can also be celebrated creating a higher recall value and increasing loyalty. (IBM, Dell, Patagonia and Timberland are a few of the brands that have enjoyed wide reception in the past)
Businesses thus, realize the need for a more engaged and trans-parent dialogue with their stakeholders in turn silencing the critics of ‘Corporate Social Responsibility’.
But, it may be too early to bury the skepticism in totality. To clarify, we are not arguing against the case of adopting such practices but about the sustenance and effectiveness of various practices that organizations do adopt in the process.
A business outlook that speaks about incorporating sustainabil-ity is immensely welcome, but only if it translates into both real intent and real impact.
There are several instances of companies either resorting to green washing (claiming more than they do) or despite the intent, failing to decode sustainability in their own context. Our own homegrown examples include several seed funding initiatives that at times delve in areas and verticals not even remotely associated with their own business practices or com-munity initiatives!!! (Save the Tiger? Spark the Rise?) These instances are thus instances of force fits which attempt to live up-to expectations but are not really delivering value and in-stances of a myopic approach that considers sustainability as something to be adopted in addition to business functionality, not as an inherent part of it.
But Sustainability can have a strong business case backing it if the right questions are asked. Levis asked how it could reduce its water intake phenomenally and claims to have saved 172 million liters of water through it’s innovative ‘Waterless’ den-im line. It also rolled out a huge campaign encouraging con-sumers to wash their denim less.
Mercedes, Ford and other automobile brands asked what they could do to reduce the increasing traffic congestion around the globe and are now seeking to create more comprehensive sys-tems for mobility like car sharing programs.
The Nordic Fashion Institute asked what it could do to reduce the carbon footprint of its product offerings and ended up cre-ating a framework for engaging consumers on the sustainable consumption of fashion which include disclosing the environ-mental footprint of their end products to educating consumers about re-use, recycle and other means of environmentally sen-sitive disposal methods.
11
Everyone’s talking but are we asking the right questions?
HCL asked how it could enhance employee motivation and ended up revamping internal structures which it claims in-creased transparency and improved performance levels making the entire organization more sustainable in its outlook through a more empowered and conducive working environment. They have additionally rolled out certain environment centric em-ployee participation programs that help HCL achieve its envi-ronmental goals. (Sustainability goes beyond green right?! It’s about striving for a positive economic, social and environmen-tal impact)
These examples though few are relevant in showcasing the real potential businesses can have by strategically aligning and engaging with stakeholder communities. And how such inter-ventions demonstrate that responsibility lies in creating sys-tems of change which themselves are sustainable and go be-yond the mindset of ‘PRable’ charity.
References:
1. http://www.oup.com/uk/orc/bin/9780199209095/blowfield &
murray_ch02.pdf
2. http://www.nordicfashionassociation.com/28236/
3. http://levi.in/waterless/
4. http://www.youtube.com/watch?v=0stOKdMQReI
Megha Dada Chawdhry is from Drizzlin- a Branding Consul-tancy that strives to ‘humanize’ brands.
Disclaimer: Drizzlin does not have any commercial relationships with any of the brands mentioned above. The views expressed are independent opin-ions that stem from our experiences and observa-tion of this space as we actively engage in the area of Sustainability and Stakeholder Engagement.
12
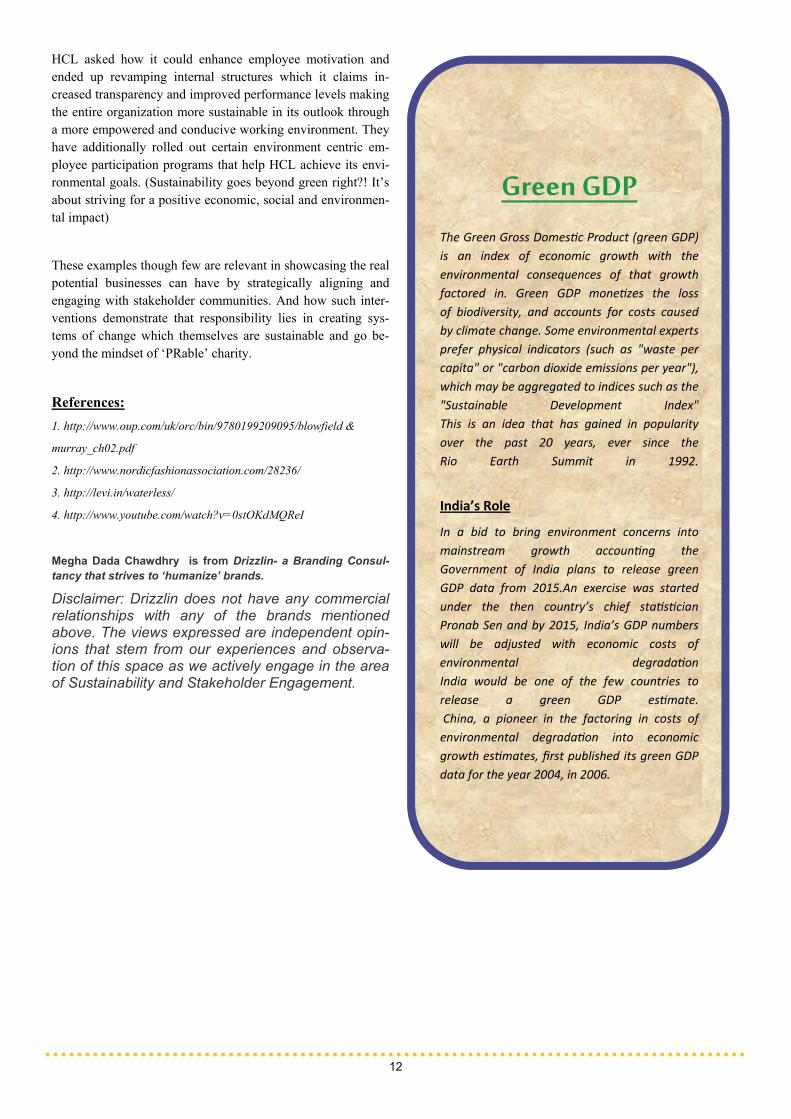
Green GDP The Green Gross Domes c Product (green GDP)
is an index of economic growth with the
environmental consequences of that growth
factored in. Green GDP mone zes the loss
of biodiversity, and accounts for costs caused
by climate change. Some environmental experts
prefer physical indicators (such as "waste per
capita" or "carbon dioxide emissions per year"),
which may be aggregated to indices such as the
"Sustainable Development Index"
This is an idea that has gained in popularity
over the past 20 years, ever since the
Rio Earth Summit in 1992.
India’s Role
In a bid to bring environment concerns into
mainstream growth accoun ng the
Government of India plans to release green
GDP data from 2015.An exercise was started
under the then country’s chief sta s cian
Pronab Sen and by 2015, India’s GDP numbers
will be adjusted with economic costs of
environmental degrada on
India would be one of the few countries to
release a green GDP es mate.
China, a pioneer in the factoring in costs of
environmental degrada on into economic
growth es mates, first published its green GDP
data for the year 2004, in 2006.
Environment And Sustainable Development
Dr. Sukanya Das, Assistant Prof. (MSE)
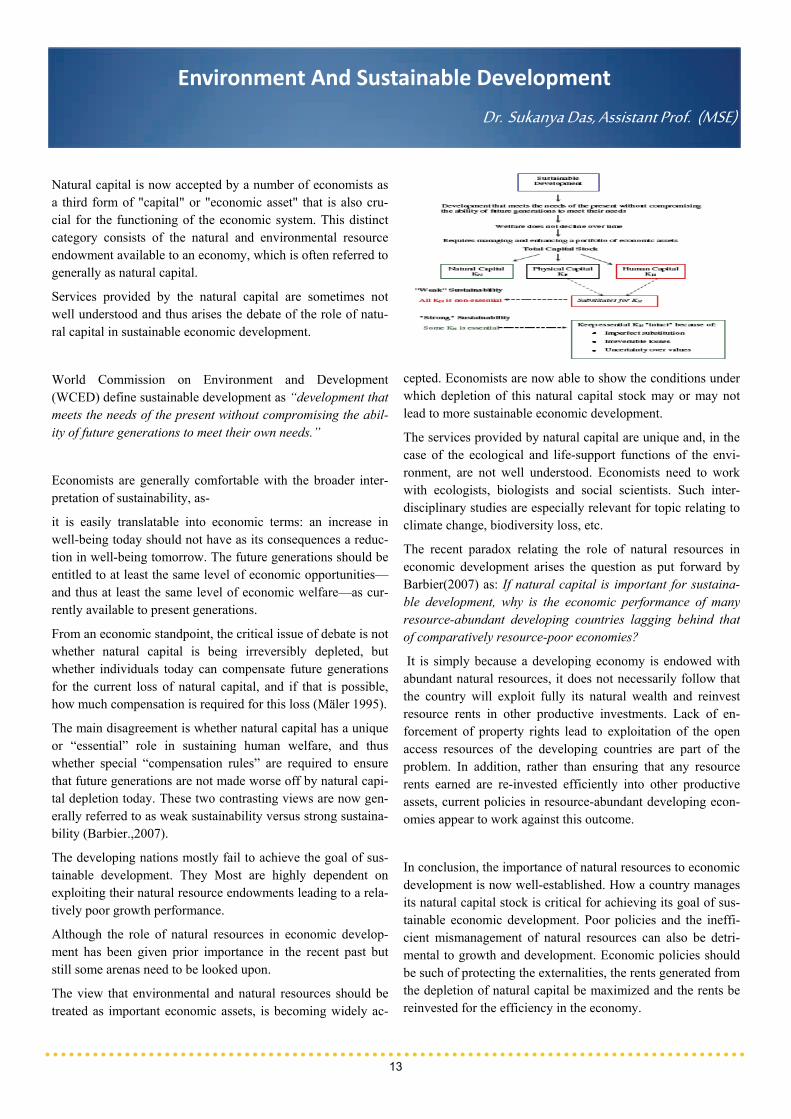
Natural capital is now accepted by a number of economists as a third form of "capital" or "economic asset" that is also cru-cial for the functioning of the economic system. This distinct category consists of the natural and environmental resource endowment available to an economy, which is often referred to generally as natural capital.
Services provided by the natural capital are sometimes not well understood and thus arises the debate of the role of natu-ral capital in sustainable economic development.
World Commission on Environment and Development (WCED) define sustainable development as “development that meets the needs of the present without compromising the abil-ity of future generations to meet their own needs.”
Economists are generally comfortable with the broader inter-pretation of sustainability, as-
it is easily translatable into economic terms: an increase in well-being today should not have as its consequences a reduc-tion in well-being tomorrow. The future generations should be entitled to at least the same level of economic opportunities—and thus at least the same level of economic welfare—as cur-rently available to present generations.
From an economic standpoint, the critical issue of debate is not whether natural capital is being irreversibly depleted, but whether individuals today can compensate future generations for the current loss of natural capital, and if that is possible, how much compensation is required for this loss (Mäler 1995).
The main disagreement is whether natural capital has a unique or “essential” role in sustaining human welfare, and thus whether special “compensation rules” are required to ensure that future generations are not made worse off by natural capi-tal depletion today. These two contrasting views are now gen-erally referred to as weak sustainability versus strong sustaina-bility (Barbier.,2007).
The developing nations mostly fail to achieve the goal of sus-tainable development. They Most are highly dependent on exploiting their natural resource endowments leading to a rela-tively poor growth performance.
Although the role of natural resources in economic develop-ment has been given prior importance in the recent past but still some arenas need to be looked upon.
The view that environmental and natural resources should be treated as important economic assets, is becoming widely ac-
cepted. Economists are now able to show the conditions under which depletion of this natural capital stock may or may not lead to more sustainable economic development.
The services provided by natural capital are unique and, in the case of the ecological and life-support functions of the envi-ronment, are not well understood. Economists need to work with ecologists, biologists and social scientists. Such inter-disciplinary studies are especially relevant for topic relating to climate change, biodiversity loss, etc.
The recent paradox relating the role of natural resources in economic development arises the question as put forward by Barbier(2007) as: If natural capital is important for sustaina-ble development, why is the economic performance of many resource-abundant developing countries lagging behind that of comparatively resource-poor economies?
It is simply because a developing economy is endowed with abundant natural resources, it does not necessarily follow that the country will exploit fully its natural wealth and reinvest resource rents in other productive investments. Lack of en-forcement of property rights lead to exploitation of the open access resources of the developing countries are part of the problem. In addition, rather than ensuring that any resource rents earned are re-invested efficiently into other productive assets, current policies in resource-abundant developing econ-omies appear to work against this outcome.
In conclusion, the importance of natural resources to economic development is now well-established. How a country manages its natural capital stock is critical for achieving its goal of sus-tainable economic development. Poor policies and the ineffi-cient mismanagement of natural resources can also be detri-mental to growth and development. Economic policies should be such of protecting the externalities, the rents generated from the depletion of natural capital be maximized and the rents be reinvested for the efficiency in the economy.
13

Carbon Credit Trading and India Rashmi Nayar
It is a well-known fact that on a global scale industrial activi-ties generate massive amounts of wastes, effluents and emis-sions. These Greenhouse gas emissions (of which C02 is a ma-jor component) have been a source of concern ever since their impact on the environment was recognized. With increasing industrial production in developed countries and industrial growth in developing countries, a rise in greenhouse gas emis-sions is inevitable.
In response to these concerns, a chain of intergovernmental conferences were organized focusing on climate change in the late 1980s and the initial years of 1990s. These efforts bore fruit when a protocol was adopted in Kyoto, Japan in Decem-ber 1997, called the Kyoto Protocol, currently ratified by 191 countries. Keeping in mind the different levels of industrial production in developing and developed countries, the Kyoto protocol introduced the system of carbon credit trade to reduce emissions.
A carbon credit or Certified Emis-sion Reduction (CER) units de-scribed as equivalent to the reduc-tion of one metric ton of CO2 (carbon dioxide) emission. Accord-ing to the standards set by United Framework Convention on Climate change (UNFCC), the industrialized countries whose carbon emission exceeds the quota allotted to them are expected to purchase carbon credits from the countries whose carbon emission is less. The system of carbon credit has thus lead to a formation of market which helps in reduction of carbon emission and thereby attaching a economic value to the cost of air pollution.
Developing countries have an advantage over developed ones in carbon credit trading. Industrialized countries which have approved the Kyoto Protocol have agreed to lessen their emis-sion levels to specified target levels. On the other hand the developing countries need not decrease the level of carbon emissions unless enough funding and technology is received from the developed countries. Under the Kyoto Protocol’s Clean Development Mechanism (CDM) a developed country can sponsor an emission reduction project in a developing country where the cost of these project activities is usually much lower. Newer technologies must be adopted by the com-panies in the developing nations which would help in reduc-
tion of gas emission and thereby save energy. Then carbon credits would be given to the developed countries for meeting its target of carbon emission reduction, while the countries which are developed would obtain the capital investment and clean technology. These would benefit the economy of the developing country.
Hence, by virtue of its status of a developing country, India has an advantage in the global carbon market. Currently, there are 873 registered CDM projects in India. This comprises 19.45% of the total number of CDM projects worldwide. India contributes around 10.92% to the world’s average annual CER credits. In India the expected average annual CER credits re-ceived from the projects which are registered is around 6.51 crores, which is estimated to be worth of Rs.1800 crores. Though this is substantial, it pales in comparison to China which has registered 2234 CDM projects amounting to about
50% of the total CDM projects worldwide.
Fraudulent practices in the carbon market are a major source of concern worldwide as well as India. Various scams have occurred. In addition, tax evasion is also attempted. Profit arising from sale of carbon credits is taxable in India. Section 28 of the Income Tax Act, related to taxation of profits and gains of a business or a profession, is appli-cable in the case of carbon credits trading.
However, a number of companies claim to be unaware of this.
Despite the environment-benefiting intentions of the carbon trading scheme, there exist elements with a single-minded pur-suit of profit. For instance, financial investors invest in Indian companies to obtain carbon credits, reasoning that the Europe-an countries will not be able to meet the emission reduction targets by the specified year. This will then raise the demand for carbon credits, leading to a price hike and enabling the investors to obtain a profit. On an ethical basis such trading can be condemned, but the very existence of carbon credits is based on the fact that financial incentives are necessary for sustainable growth.
14
Country No. of projects India 873
China 2234

The system of carbon credits therefore appears to have its flaws, but still remains an earnest effort to make an impact on the pressing environmental issue facing the world. Indian companies need to be educated on its benefits as a method of contributing to the environment without sacrificing profits in the short term, while encouraging investing in more environ-ment friendly methods for the long term.
References:
1. Kossoy, A. and Guigon, P. (2012), State and Trends of the Car-
bon Market 2012 Report, Carbon Finance Unit, The World Bank.
2. Huber, N. (2009, 19 Jul) Fraudsters target tax on carbon credits
Retrieved Aug 2012 from The Telegraph-
http://www.telegraph.co.uk/finance/5866178/Fraudsters-target-tax-
on-carbon-credits.html
15
3. Sorrell, S. and Sijm, J. (2003), Carbon Trading in the Policy Mix,
Oxford Review of Economic Policy, Vol. 19, No. 3
4. Carbon credits trading on Income Tax radar (August 22, 2011)
Retrieved Aug 2012 from The Hindu-
http://www.thehindu.com/business/markets/article2383770.ece
5. Polidano, C., Jotzo, F.,Heyhoe, E., Jakeman, G., Woffenden, K.
and Fisher, B.S. (2000), The Kyoto Protocol and Developing Coun-
tries: Impacts and. Implications for Mechanism Design, ABARE
research Report 2000.4
DID YOU KNOW?
From 1696 un l 1851, Britain had a tax based on number of windows in a house!
The name rupee is derived from the Sanskrit word ‘raupya’ meaning silver.
The name ‘Wall street’ was derived from an earthen wall on the northern boundary of the
Dutch se lement, perhaps to protect against English colonial encroachment or incursions by
na ve Americans.
The first hyperinfla on happened during the French Revolu on.

Moving Asia’s Largest Slum:
A Study on the Dharavi Redevelopment Project
Vandhana Sivakumar
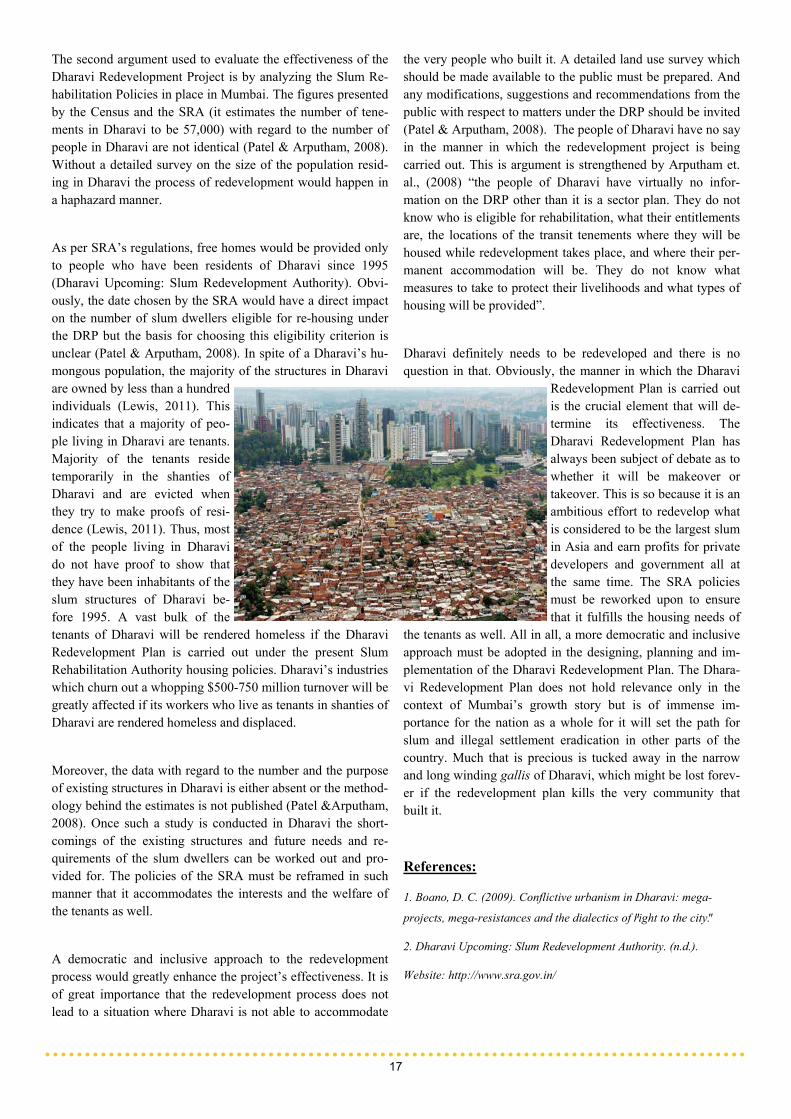
Historically, Dharavi was home to the traditional fishing com-munity of Kolis. The development and urbanization of the city of Mumbai led to the displacement of the Kolis. Soon the swamp lands became home to a growing set of settlements of hutments and became known as Dharavi. Today, Dharavi is home to an estimated population between 700,000 and 1 mil-lion people thus, earning the title of the Asia’s largest slum (Boano, 2009). Dharavi is not only a sprawling 600 acres of settlement of slum dwellers but is also home to around 5000 small-scale industries dealing in pottery, recycling and leather all generating an income of $500-750 million every year. In contrast to the swanky buildings of the neighboring commer-cial district; Bandra Kurla complex, Dharavi stands as an eye sore in dire need for better infrastructure and facilities. Much of the meager infrastructure that exists in Dharavi today has been built by the slum dwellers themselves without any offi-cial support or subsidy (Patel B. S., 2010). The ability of the people of Dharavi to build their lives, homes and work places without any help from the government has generated a very strong sense of community spirit which is very admirable and inspiring.
The Dharavi Redevelopment Project first introduced in 2004, is an attempt to do away with shanties and hutments and pro-vide proper housing and infrastructure to its slum dwellers. Though it failed to take off for the past eight years but the first phase of the Dharavi Redevelopment Project (DRP) met ap-proval in early January, 2012(Gadgil & Nandy, 2012 and Ku-mar, 2012). The quest to make Mumbai a world class city and the pressures on space and land in the city makes DRP very important but there remain several questions about its effec-tiveness. This essay attempts to analyse whether the present Dharavi Redevelopment Plan will effectively help in trans-forming this urban squalor without displacing and harming the very people who built it. It will do so by evaluating whether the involvement of private developers will be beneficial or change the very purpose of the Redevelopment Plan. The es-say will also attempt to study whether the policies of the State’s Slum Rehabilitation Authority (SRA) would pose as a hurdle or make the process of redevelopment smoother.
It is obvious that government’s plan to improve the infrastruc-ture and rebuild 600 acres of slums without harming the homes and livelihood of around 1 million people could very well be in association with private promoters. The proposed Dharavi Redevelopment Plan is expected to be a product of public-private partnership where Maharashtra Housing and Area De-velopment Authority (MHADA) will act as the nodal agency
and tenders for the project will be floated globally (Gadgil & Nandy, 2012).
The government is offering private promoters and builders higher Floor Space Index (FSI) as an incentive to ensure their participation in the Dharavi Redevelopment Plan. If a higher floor space index is permitted on a site, the potential profits from the venture would increase thus making the project more commercially viable (Patel & Arputham, An offer of partner-ship or a promise of a conflict in Dharavi, Mumbai? , 2007). MHADA and private developers are allowed to construct high-rise buildings, malls and office spaces in the remaining FSI once the free housing needs of the slum dwellers are met. This essentially means attempts will be made by private developers to maximize on the space that can be commercially exploited and minimize on the space that is to be allocated to the slum dwellers of Dharavi (Patel & Arputham, An offer of partner-ship or a promise of a conflict in Dharavi, Mumbai? , 2007). Moreover, Dharavi is already one of the most densely populat-ed places in the world, if the FSI is raised in order to make the project commercially viable it may lead to further crowding (Patel B. S., 2010). As pointed out by Arputham & Patel (2008) a detailed study on the implications of a surge in popu-lation due to an increase in FSI in Dharavi must be conducted. An environmental impact assessment must also be undertaken which is yet to be conducted (Patel & Arputham, 2008). On the basis of the findings strategies to deal with drainage sys-tem, traffic control, connectivity with the city etc. must be developed.
Dharavi’s strategic location in the heart of the city of Mumbai and its close proximity to Bandra-Kurla complex makes it one of the most lucrative areas to develop for private builders (Patel B. S., 2010). This strengthens the argument that the pri-vate builders may try to commercially exploit the land actually meant for slum rehabilitation. Ultimately, this would lead to the displacement of the slum dwellers of Dharavi which may give rise to slums and illegal settlements in other parts of the city of Mumbai. The system used by the government to check whether private developers are adhering to their commitments is another issue that needs to be addressed.(Patel & Arputham, 2008). The problem with the private developers being exces-sively involved in the redevelopment process is that the hunt for profits might replace the Dharavi Redevelopment Project’s primary intention of enhancing the living standards and well-being of the slum dwellers.
16
The second argument used to evaluate the effectiveness of the Dharavi Redevelopment Project is by analyzing the Slum Re-habilitation Policies in place in Mumbai. The figures presented by the Census and the SRA (it estimates the number of tene-ments in Dharavi to be 57,000) with regard to the number of people in Dharavi are not identical (Patel & Arputham, 2008). Without a detailed survey on the size of the population resid-ing in Dharavi the process of redevelopment would happen in a haphazard manner.
As per SRA’s regulations, free homes would be provided only to people who have been residents of Dharavi since 1995 (Dharavi Upcoming: Slum Redevelopment Authority). Obvi-ously, the date chosen by the SRA would have a direct impact on the number of slum dwellers eligible for re-housing under the DRP but the basis for choosing this eligibility criterion is unclear (Patel & Arputham, 2008). In spite of a Dharavi’s hu-mongous population, the majority of the structures in Dharavi are owned by less than a hundred individuals (Lewis, 2011). This indicates that a majority of peo-ple living in Dharavi are tenants. Majority of the tenants reside temporarily in the shanties of Dharavi and are evicted when they try to make proofs of resi-dence (Lewis, 2011). Thus, most of the people living in Dharavi do not have proof to show that they have been inhabitants of the slum structures of Dharavi be-fore 1995. A vast bulk of the tenants of Dharavi will be rendered homeless if the Dharavi Redevelopment Plan is carried out under the present Slum Rehabilitation Authority housing policies. Dharavi’s industries which churn out a whopping $500-750 million turnover will be greatly affected if its workers who live as tenants in shanties of Dharavi are rendered homeless and displaced.
Moreover, the data with regard to the number and the purpose of existing structures in Dharavi is either absent or the method-ology behind the estimates is not published (Patel &Arputham, 2008). Once such a study is conducted in Dharavi the short-comings of the existing structures and future needs and re-quirements of the slum dwellers can be worked out and pro-vided for. The policies of the SRA must be reframed in such manner that it accommodates the interests and the welfare of the tenants as well.
A democratic and inclusive approach to the redevelopment process would greatly enhance the project’s effectiveness. It is of great importance that the redevelopment process does not lead to a situation where Dharavi is not able to accommodate
the very people who built it. A detailed land use survey which should be made available to the public must be prepared. And any modifications, suggestions and recommendations from the public with respect to matters under the DRP should be invited (Patel & Arputham, 2008). The people of Dharavi have no say in the manner in which the redevelopment project is being carried out. This is argument is strengthened by Arputham et. al., (2008) “the people of Dharavi have virtually no infor-mation on the DRP other than it is a sector plan. They do not know who is eligible for rehabilitation, what their entitlements are, the locations of the transit tenements where they will be housed while redevelopment takes place, and where their per-manent accommodation will be. They do not know what measures to take to protect their livelihoods and what types of housing will be provided”.
Dharavi definitely needs to be redeveloped and there is no question in that. Obviously, the manner in which the Dharavi
Redevelopment Plan is carried out is the crucial element that will de-termine its effectiveness. The Dharavi Redevelopment Plan has always been subject of debate as to whether it will be makeover or takeover. This is so because it is an ambitious effort to redevelop what is considered to be the largest slum in Asia and earn profits for private developers and government all at the same time. The SRA policies must be reworked upon to ensure that it fulfills the housing needs of
the tenants as well. All in all, a more democratic and inclusive approach must be adopted in the designing, planning and im-plementation of the Dharavi Redevelopment Plan. The Dhara-vi Redevelopment Plan does not hold relevance only in the context of Mumbai’s growth story but is of immense im-portance for the nation as a whole for it will set the path for slum and illegal settlement eradication in other parts of the country. Much that is precious is tucked away in the narrow and long winding gallis of Dharavi, which might be lost forev-er if the redevelopment plan kills the very community that built it.
References:
1. Boano, D. C. (2009). Conflictive urbanism in Dharavi: mega-
projects, mega-resistances and the dialectics of "right to the city".
2. Dharavi Upcoming: Slum Redevelopment Authority. (n.d.).
Website: http://www.sra.gov.in/
17

3. Gadgil, M., & Nandy, M. (2012, January 04). LiveMint: Economy
and Politics: Chavan announces first phase of Dharavi redevelop-
ment project.
4. Kumar, K. (2012, August 9). India Today. Retrieved from India
Today Web site: http://indiatoday.intoday.in/story/dharavi-bachao-
andolan-threatens-to-hold-protest-for-larger-houses/1/212615.html
5. Lewis, C. (2011, December 17). With no proof, Dharavi tenants
have nowhere to go. The Times of India .
6. Patel, B. S. (2010). Dharavi: Makeover or Takeover? Economic
and Political Weekly, XLV NO 24 .http://www.epw.in/special-articles/dharavi-makeover-or-takeover.html
7. Patel, S., & Arputham, J. (2007). An offer of partnership or a promise of a conflict in Dharavi, Mumbai?. Environment & Urbani-zation (International Institute for Environment and Develop-ment.http://eau.sagepub.com/content/19/2/501)
8. Patel, S., d’Cruz, C., & Burra, S. (2002). Beyond evictions in a global city: people-managed resettlement in Mumbai. Environment ad Urbanization.
9. Patel , S., & Arputham, J. (2008). Plans for Dharavi: negotiating a reconciliation between a state driven market development and resi-dents' aspirations. Environment & Urbanization.
18
Movie Review
Movie Name : Margin Call
Director& Writer: J.C. Chandor
Cast: Kevin Spacey, Paul Bettany,Jeremy Irons, Zachary Quinto, Penn Badgley, Simon Baker, Mary McDonnell, Demi Moore, Stanley Tucci
Music: Nathan Larson
Cinematography: Frank DeMarco
2011 Release
Running time : 109 minutes
Genre : Thriller, Drama
Margin Call focuses on 24 hours in the life of a US investment bank just before the 2008 meltdown. It was nominated at the 84th Academy Awards for best original screen play and best international film
A reputed financial company decides to dismiss its head of its risk management division as a part of downsizing. He hands over the study he was working on, to his younger colleague, who completes the study that evening and discovers on the financial disaster his company is facing. The company has been buying and passing on worthless packages of mortgages, and it is on the brink of the biggest bank collapse of all time. The word on this shocking revelation passes up the hierarchy of the company. What follows is a long night for the senior management. They decide to come out of it safe, no matter whatever. This is clear when the CEO of the company, John Tuld (Jeremy Irons), whose name is similar to that of Richard Fuld, the infamous CEO of Lehman Brothers, explains, “There are three ways to make a living in this business: be first, be smarter, or cheat.” A handful of conscientious employees find themselves dragged along into the unethical bailout plan made by the management.
The film depicts the absolute and ruthless power of the corpo-ration over the lives of people that work there as well as the implications and ripples for everyone else. It also presents the financial meltdown as a result of human failure.

Ins tu onal Dynamics of Decentralized Planning in Purulia, West Bengal
Madhurambal S
In the last couple of decades, many countries have moved to-wards decentralizing their administrative systems. Decentrali-zation can best be understood as a political process in the sense of the devolution of resources, tasks and decision-making power to democratically elected lower-level authorities, which are largely or wholly independent of central government (World Bank, 2000). An important motivation for decentraliz-ing political, administrative and fiscal systems in developing countries is the belief that this will help to catalyze the devel-opment process and improve the living conditions of the peo-ple, particularly, the disadvantaged sections. In the Indian con-text, however, the issue is not whether or not decentralization leads to development, but how the Indian Constitution has mandated decentralized governance (Rao, 2012).
During my internship project with UNICEF India, in collabo-ration with Institute of Social Sciences, Kolkata, our team fo-cused on understanding the realities of the decentralized plan-ning process in Purulia (one of the most backward districts in West Bengal) that is significantly at odds with the theoretical framework for planning as mandated by the 73rd Amendment to the Indian Constitution. The team also studied the level of cooperation amongst various development actors and if this could be called ‘convergence’; and also the extent of commu-nity participation in planning. The team performed an institu-tional case study and information was collected through in-depth, semi-structured interviews from functionaries of the Panchayati Raj Institutions (PRIs) and through Focus Group Discussions from the villagers.
Theoretical Planning Framework
The 73rd Amendment empowered the PRIs as autonomous institutions that had to make plans for economic development and social justice. Based on Articles 243G and 243ZD of this Amendment, the West Bengal Panchayat Act 1973 and the Planning Commission guidelines for district planning, the fol-lowing model of decentralized planning was conceptualized.
West Bengal is a forerunner in decentralization and has made pioneering attempts to involve PRIs in the planning process from as early as 1985, much before the 73rd Amendment was enacted in 1992. The Gram UnnayanSamiti is an innovation of the West Bengal decentralized system, where developmental planning and implementation activities for the village are car-ried out by elected members of the Samiti. This is the body that is closest to the people and can directly incorporate their demands in the annual plans. . All tiers of PRIs have Standing Committees or Sub-Committees that make plans sectorally, for example, the Education Standing Committee comes up with the plan for education by incorporating demands from respec-tive PRI members and line departments, thereby acting as a forum for convergence of these two development actors. These sectoral plans from all committees are integrated at each level to form a holistic plan and forwarded to the next tier. Eventu-ally, the District Plan is formulated by the DPC, which incor-
19
DID YOU KNOW?
The first bubble ‐ ‘Tulip mania’ happened in the 17th century in the Netherlands. At its peak,
in February 1637, some single tulip bulbs sold for more than 10 mes the annual income of a
skilled cra sman!

porates demands of all levels and all departments.
Realities of the Planning Process
On-field observations of the decentralized planning process were in complete contrast to the theoretical model that had been conceptualized. PRIs did not function as autonomous institutions -they awaited state directives even to start off their planning activities for the year. Plans were not made holistical-ly but instead according to the various centrally and state spon-sored schemes like MGNREGS, NRHM and BRGF, and the 13th Finance Commission and 3rd State Finance Commission grants. This was mainly because majority of the funds allocat-ed by the centre and the state to the PRIs were scheme-based and thus tied, and very minimal untied funds were transferred. Obviously, the PRIs planned only for those activities for which they received funds and hence only schematic plans were be-ing made by all tiers of the PRIs in Purulia. Thus there exists a paradox between decentralization and schematic fund alloca-tion by the centre – as long as funds are centrally controlled and allocated purely on a scheme-wise basis to the PRIs, the latter cannot function independently and effectively and true decentralization cannot be achieved. PRIs act merely as imple-menting agencies of the centre’s policies - their actions do not reflect the needs and demands of the local villagers.
There are various socio-economic factors too that hamper the functioning of the Panchayat. Low literacy among elected members affected their ability to lead and fulfill their responsi-bilities effectively. The Pradhan receives a meager 1500 ru-pees a month as salary, which acts as a disincentive for com-mitted uptake of responsibilities. Moreover, this salary is paid through central and state funds and not through revenue raised from local sources, which compels the Pradhan to adhere to the former’s diktat. The Panchayat has no incentive to increase Own Source Revenue (OSR) in the form of taxes or otherwise, as majority of the people are poor and parties fear that intro-duction of taxes may make them unpopular.
The DPC and Standing Committees, which are supposed to act as forums for achieving horizontal convergence in planning activities of the PRIs and line departments, are dysfunctional as schematic planning only involves filling up pre-designed templates, thus leaving no scope for activity for these Commit-tees. The District Magistrate did help in achieving some coor-dination in activities related to implementation between vari-ous departments by calling for monthly meetings of all depart-ment officials but it is unfortunate that despite two decades since the creation of constitutionally mandated bodies for achieving convergence in planning and implementation, coor-dination (not even convergence) is still being carried out by the DM, just like he did in the 1960s!
Line departments make their plans independent of the PRIs, except for matters relating to infrastructure, which are included in the latter. Plans by the Education, Health and Women and Child Development Departments are made purely based on data from reports like DISE (District Information System of Education) and no need is felt by the department officials for ‘planning’ through collective decision-making with employees
at all levels or with the PRIs.
Through the course of field study, the team found disconnects between State guidelines and local level needs. Firstly, the Government of West Bengal has expressed policies that forbid PRIs from purchasing land for government use - land for gov-ernment buildings must either already be in the possession of the State or be donated by a private donor. Secondly, the State has currently imposed a hiring freeze for a number of sectors, leading to problems of acute staff shortage. Thirdly, delays in fund disbursement by the State have been a major hindrance to service delivery.
The lack of autonomy of the Panchayats and their subordina-tion to higher levels has presented itself as a barrier to commu-nity participation. Without the power to make decisions, it cannot be expected that true participation will be achieved automatically. Even the District Planning Officer noted from his observations that people’s needs are not represented in the PRI plans and attendance in the Gram Sansad meetings is fair-ly poor. The team’s observations also point to the social barri-ers at the village level that prevent participation. In particular, low literacy impacts local empowerment whilst poverty influ-ences villagers’ decisions to participate. Community dynamics has also neglected women’s participation. An example of one of our conversations during the Focus Group Discussion was as follows:
Interviewer: Do you attend the Gram Sansad meetings?
Villagers: Yes, yes, of course.
Interviewer: Who all attend the meeting?
Villagers: Everyone.
Interviewer: Who all in particular?
Villagers: Everybody attends the meetings!
Interviewer: Do women attend the meetings?
Villagers: No, no, no.
Thus we can infer that the real purpose of achieving economic development and social justice through participatory planning and convergence in actions of all development actors that the Constitution sought to achieve through decentralization has not been realized completely. Hence, a more pro-active role has to be played by the central and state governments to devolve greater power to local institutions for making decisions regard-ing their constitutionally mandated spheres of action. A greater proportion of untied funds based on performance should be devolved to the GP to help strengthen its role and relevance in the decentralized planning process.
References:
1. Armitage, Andrew, Social Welfare in Canada. Ideals, Realities,
and Future Path. Toronto, Mc. Clelland and Stewart Inc., 1988
20
India’s Power Woes and Answer to Garbage Kannan Kumar
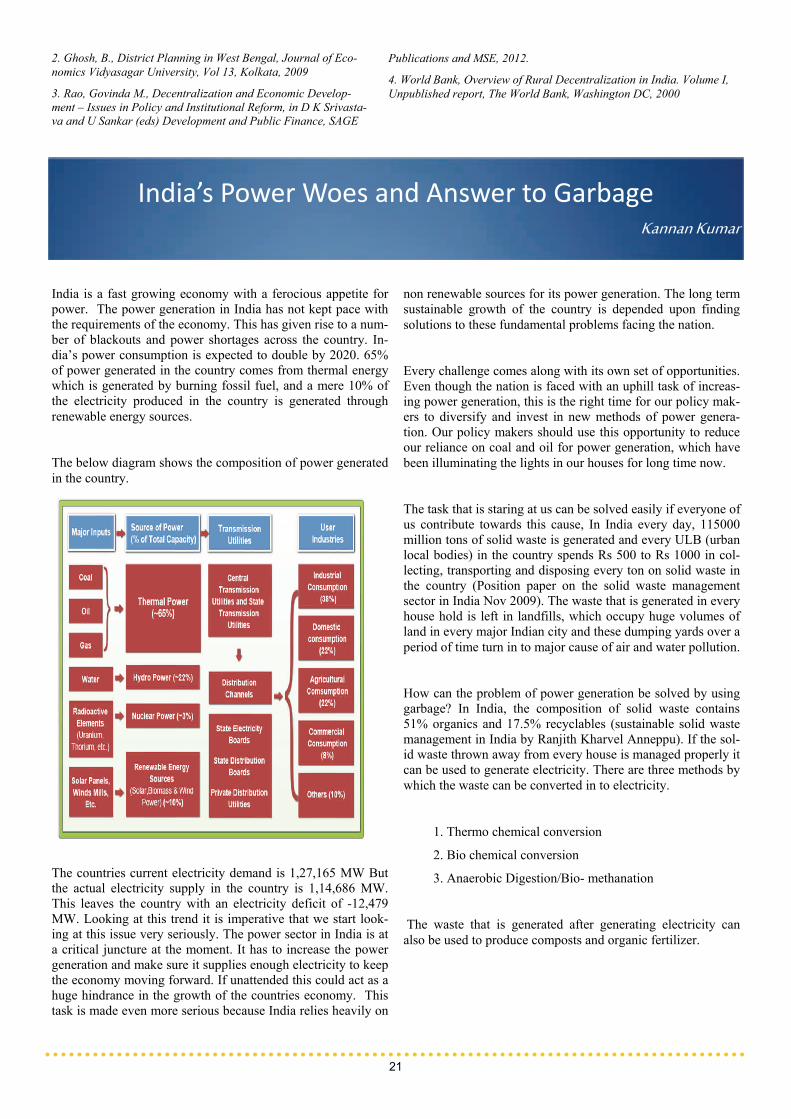
India is a fast growing economy with a ferocious appetite for power. The power generation in India has not kept pace with the requirements of the economy. This has given rise to a num-ber of blackouts and power shortages across the country. In-dia’s power consumption is expected to double by 2020. 65% of power generated in the country comes from thermal energy which is generated by burning fossil fuel, and a mere 10% of the electricity produced in the country is generated through renewable energy sources.
The below diagram shows the composition of power generated in the country.
The countries current electricity demand is 1,27,165 MW But the actual electricity supply in the country is 1,14,686 MW. This leaves the country with an electricity deficit of -12,479 MW. Looking at this trend it is imperative that we start look-ing at this issue very seriously. The power sector in India is at a critical juncture at the moment. It has to increase the power generation and make sure it supplies enough electricity to keep the economy moving forward. If unattended this could act as a huge hindrance in the growth of the countries economy. This task is made even more serious because India relies heavily on
non renewable sources for its power generation. The long term sustainable growth of the country is depended upon finding solutions to these fundamental problems facing the nation.
Every challenge comes along with its own set of opportunities. Even though the nation is faced with an uphill task of increas-ing power generation, this is the right time for our policy mak-ers to diversify and invest in new methods of power genera-tion. Our policy makers should use this opportunity to reduce our reliance on coal and oil for power generation, which have been illuminating the lights in our houses for long time now.
The task that is staring at us can be solved easily if everyone of us contribute towards this cause, In India every day, 115000 million tons of solid waste is generated and every ULB (urban local bodies) in the country spends Rs 500 to Rs 1000 in col-lecting, transporting and disposing every ton on solid waste in the country (Position paper on the solid waste management sector in India Nov 2009). The waste that is generated in every house hold is left in landfills, which occupy huge volumes of land in every major Indian city and these dumping yards over a period of time turn in to major cause of air and water pollution.
How can the problem of power generation be solved by using garbage? In India, the composition of solid waste contains 51% organics and 17.5% recyclables (sustainable solid waste management in India by Ranjith Kharvel Anneppu). If the sol-id waste thrown away from every house is managed properly it can be used to generate electricity. There are three methods by which the waste can be converted in to electricity.
1. Thermo chemical conversion
2. Bio chemical conversion
3. Anaerobic Digestion/Bio- methanation
The waste that is generated after generating electricity can also be used to produce composts and organic fertilizer.
21
2. Ghosh, B., District Planning in West Bengal, Journal of Eco-nomics Vidyasagar University, Vol 13, Kolkata, 2009
3. Rao, Govinda M., Decentralization and Economic Develop-ment – Issues in Policy and Institutional Reform, in D K Srivasta-va and U Sankar (eds) Development and Public Finance, SAGE
Publications and MSE, 2012.
4. World Bank, Overview of Rural Decentralization in India. Volume I, Unpublished report, The World Bank, Washington DC, 2000

In general, 100 tons of raw solid waste with 50% to 60% or-ganics can generate about 1-1.5 mega watt power . In India we roughly collect about 115000 million tons solid waste every day (Position paper on the solid waste management sector in India Nov 2009). I would like the reader to do this simple cal-culation and find out the electricity generation potential through organic waste in India.
The idea of generating electricity from waste is not new. It has already been tested and had shown tremendous promise for the future. But the initial momentum that was gained has been lost in between due to lack of continuous supply of segregated waste. The information about the bio-methanation power plants functioning in India is given below.
In the beginning of this article I said every problem comes with its own set of opportunities. It is easy to see the oppor-tunity now, but what should we do to utilize this opportunity. As an individual we should start segregating waste in different categories before putting it in the garbage bin. The ULB’s (urban local bodies) on its part should keep separate garbage bins for different kinds of waste and collect the waste from the households.
The organic waste that is collected, instead of being dumped outside the cities could be sold as raw material to the compa-nies that generate electricity from organic waste. The recycla-ble waste that is collected could be sold to recycling compa-nies for recycling. This will help the ULB’s to recover the ini-tial cost that it will have to incur in setting up separate dustbins for different kind of waste. As a citizen we will also be bene-fitted by less pollution caused by landfills. The whole country also will benefit by reducing its dependence on coal and oil based energy to a more secure and sustainable form of power generation. The time to act has come and it is up to the citizens and the government to decide which way the country should travel in the future.
References:
1. 2011 India energy handbook .
2. Sustainable solid waste management in India.
3. Biomass energy in India: Transition from traditional to modern.
4. Position paper on the solid waste management sector in India
5. http://www.powerscorecard.org/tech_detail.cfm?resource_id=10
6. http://www.cleantechinvestor.com/portal/bioenergy/5170-uk-
energy-from-waste.html
7. http://www.alternative-energy-news.info/waste-to-energy-gains-
steam/#disqus_thread
8. http://urbanindia.nic.in/publicinfo/swm/chap15.pdf
9. http://www.domain-b.com/industry/power/
10. http://stockshastra.moneyworks4me.com/indian-power-sector-
analysis-industry-overview-and-research-2011/
11. http://greencleanguide.com/2011/12/01/anticipated-power-supply
-position-of-india/
According to Australian Geothermal Energy Association 1%
of Australia’s untapped geothermal power potential could
provide enough energy to last for 26000 years.
Only 1% of China’s 560 million city residents breathe air that
is considered safe by the European Union. The severe air
pollution problem has lead to cancer which has become Chi-
na’s leading cause of death.
Every year 20 to 50 million metric tons of electronic waste
are generated worldwide. Only 11.4% of that is recovered for
“recycling”, and of that amount, very little actually ends up
getting recycled.
Recycling one ton of paper saves 17 trees, 2 barrels of oil,
4,100 kilowatts of energy, 3.2 cubic yards of landfill space
and 60 pounds of air pollution.
With the help of recycling the increasing steel capacity, ener-
gy equivalent to seven nuclear power plants can be saved.
Average temperatures will increase by as much as 12 degrees
Fahrenheit by the end of the 21st century if greenhouse gas
emissions continue to rise at the current pace.
22
Technology City Capacity
Biomethanation Lucknow 5.00 MW
Biomethanation Vijayawada 0.15 MW
Biomethanation Chennai 0.25 MW
Green Facts

Through the Kaleidoscope of Economics
Arjun Srinivas
This isn’t a scholarly article. Neither is it a discourse on a particular economic phenomenon. However, this is a collection of musings, observations of the real world through the spec-trum of economic analysis. In a society that is becoming in-creasingly pragmatic, the study of human economic behaviour is being given due cognizance. ‘Applied Econom-ics’ (Economic principles applied to various disciplines) is rapidly growing in prominence. Earlier restricted to conven-tional disciplines such as Finance, Economic theory is now being applied to fields of study as disparate as Sport, Political behaviour and disciplines such as Linguistics.
There are few cities in the world which are as religious about cricket as Chennai. It’s Cricket franchise Chennai Super kings has been phenomenally successful in the Indian Premier League IPL, which is one of the many fledgling cash rich Sports Leagues’ that have cropped up in Asia in the past dec-ade. China’s Football league is already attracting top European talent, while even countries like Thailand are cashing in on public adulation for football. Backed by regional Oligarchs and fuelled by local demand, these sporting enterprises are a ready recipe for success. Sports is a veritable goldmine for economic analysis. In a sport like cricket, which consists of a succession of discrete events, game theoretical modelling can be used to devastating effect. The English Cricket team, cur-rently ranked No:1 in the world seems to have realised this. Their team analyst, Nathan Leamon, a Cambridge trained Mathematician, used a simulator to explore flaws in the tech-nique of legendary batsman Sachin Tendulkar in the 2011 In-dian tour of England. The fact that extensive statistical data is available on modern sport and athletes, is a further advantage. Besides, Economics can be employed to suggest various tech-niques to effectively manage Sport Franchisees, Leagues and sponsors. Sports Economics, a corporation based in Califor-nia, US offers Economic consultancy to various Sporting Leagues such as NBA (National Basketball Association) and MLS( Major League Soccer). They offer their expertise in terms of Economic and Fiscal impact of stadium up gradation, optimal valuation of players and sponsorship rights, etc. There is immense scope for such enterprises to be established in the Developing world.
For any student who first approaches MSE, the first thing he encounters even before the campus, is the huge glass façade of the magnificent ‘Anna Centenary Library’. In the due course of time, we are made aware of the fact that the library was erected by the rival political party in its tenure. However, the incumbent political party intends to take the regressive meas-ure of shutting the library and using the building for a different purpose. The fate of the newly constructed Secretariat build-ing hangs in a similar balance. Why is it that political parties engage in such a vindictive brand of politics. Is it merely ‘Political Vendetta’ or is there a sophisticated ‘Strategy’ in-
volved. If we take a closer look at the situation at hand, we observe that it involves a sequential ‘Game’ wherein each po-litical party tries to underscore the legacy of its rivals by de-stroying/ reversing its biggest achievements. The strategies that can be adopted by each party is to either ‘Destroy’ or ‘Not Destroy’. The ideal situation (for the public) is if both parties choose not to destroy their rivals’ achievements, thus working towards progress. However, in a strategic situation, both par-ties will choose the strategy ‘Destroy.’ If the incumbent party commits to destroying its rival’s achievement, the rival will be forced to do likewise when it returns to power. However, the public, fearing the repercussions involved in this vindictive politics, will vote for stability, and the incumbent party will remain in power. This is a classical case of ‘Nash Equilibri-um’ wherein the ‘Strategic’ outcome is different from the ‘Socially Optimal’ outcome.
Coming to Chennai, entails encountering a new language, for most of us. Languages differ across the world in terms of tone, grammar and vocabulary. Why do different languages evolve different vocabulary? It is obvious that languages reflect the socio-cultural mores of the speakers. For instance, a palpable difference between Indian and European languages is the way our blood relatives are classified. While the English language is sparse, and uses all encompassing words such as cousin, uncle and aunt, Indian languages have a labyrinth of terms to identify specific relatives. Although this is representative of the differences in hierarchy and interaction between families in different cultures, the matter of interest to the economist is ‘the sub conscious optimization process which societies participate in, wherein they choose to include words in their vocabulary’. There is a trade-off involved between information and simplic-ity. People want their language to be comprehensive, but do not want it to be encumbered by unnecessary words. An ana-lytical study of this optimisation process might evolve answers to individual and collective behaviour in different societies. This relationship between ‘Evolutionary Linguistics and Evo-lutionary Economics’ has been rigorously examined by Ta-kashi Hashimoto in a research article.
These instances amply describe the utility of economics in analysing sundry disciplines. Although Economics involves abstraction from reality, its applications, fortunately are not lost on the real world!
23
DID YOU KNOW?
Soviet Union a ended the Bre on
Woods but was among the 4 na ons
that did not sign the agreement
reached at the conference.

The Journey That Is Meant To Be Taken Together
Arpita Ghosh
The concepts of economic progress of mankind and their rela-tionship with the Mother Nature are not two opposite poles; rather they are complementary to each other. But unfortunate-ly, the human race, in its continuous strive for economic growth, has quite detached itself from its surroundings on this Earth.
From the very dawn of civilization, man has always chosen lands near forests as their habitat because of the ample re-sources it provides, such as materials for food, cloth, medicine etc. Even in this 21st century, the scenario is not very differ-ent. The World Bank estimates that forests provide habitats to about two third of all species on earth and more than 1.6 bil-lion people depend on forests for their livelihood. The forest product industry is a source of economic growth and employ-ment, with global forest product traded internationally in the order of $270 billion. FAO data estimates that the world’s for-ests soil store more than 1 trillion tones of carbon, twice the amount found in the atmosphere.
The most dangerous problem facing us right now is global warming as an obvious effect of loss of forests. Over last 20 years, more than 300 million hectares of tropical forests have been cleared for mainly urban development. Deforestation, conversion to agricultural land, Shifting cultivation and unsus-tainable harvesting of timber, unsound land management prac-tices, and creation of human settlements are the most common reasons for the loss of forested area. According to the World Bank, deforestation accounts for up to 20% of the global green house gas emissions that contribute to global warming. Defor-estation of closed tropical rain forests could account for biodi-versity loss of as many of as 100 species a day. The United Nations has declared 2011 as the International year of Forests to raise awareness and strengthen the conservation, sustainable management and development of forests for social benefit.
India, being a developing country, has experienced a rapid progress for last few decades in terms of economic growth, per capita income, urbanization etc. But in terms of sustainable development and environmental situation our country has yet to traverse a long path. Development cannot be sustainable if a particular section of the society is neglected throughout. Indus-trialization and urbanization were aimed for a developed civili-zation, but the rapid destruction of forest resources has ham-pered the civilization process itself. Environmental degrada-tion has compromised many of the improvements that were otherwise made possible by greater economic prosperity. For example, in districts such as Kalahandi in Orissa, the collapse of forests has undermined people’s traditional livelihoods and forced a large proportion of the workforce into seasonal or permanent migration. Environment decline makes access to basic amenities of life more difficult for the poorer people. More than 250 million poor people live in the east and north-east states, central and Deccan states of India; most of these areas have the highest concentration of forests and tribal peo-ple.
Our country with a wide range of climate, geography & cul-ture, is unique among biodiversity- rich nations. Between the Himalaya in the north and the Deccan peninsula in the south, Indian Forests ranges from evergreen tropical rain forests, semi-evergreen, deciduous, subtropical and thorn forests. India has four global biodiversity hotspots - Eastern Himalayas, North East, Sunderbans and Western Ghats. Total Forest and Tree cover of the country is estimated as 23.84 percent of geo-graphical area of the country. With 17% of world's population, and 18% livestock population over 2.4% of world's total geo-graphical area, India's forests are facing severe biotic pressures as nearly 40% of domestic fuel wood needs of the people and 30% of fodder needs of the cattle population in the country are met from forests (source : Ministry of Environment and For-ests, India).
Source: Valuing the forests for sustainable development, Indian Institute of Forest Management.
The biennial survey of FSI, used images from India’s remote-sensing satellite system and estimated that in 2011, forest cov-ered 692,027 square kilometers of the country which is rough-ly 23% of India’s land area showing a decline of just 367 sq km from the state in 2009. This is a much smaller loss than in Brazil, for example, where more than 13000 sq km of forest was cleared over the same period. Though India has main-tained and increased her forest cover in the last 15 years, still its forest productivity is one of the lowest in the world. This results in a demand supply gap in various forest products and thus leading to forest degradation. Along with the exploding population pressure on Indian economy, the natural resources are depleting day by day in an increasing rate. The ever rising demand for forest products is not only being fulfilled partially through illegal removals from forests, but also through im-ports. Over many decades, imports of industrial wood volumes have grown threefold during the last 10 years, along with the rise in poaching. The continuous rise of deforestation has re-sulted in severe bio-diversity loss in India, several animal spe-cies have lost their natural habitat and many are extinct today. In 2009, as per the red data book of IUCN, total 440 animal species are threatened in the territory of India.
24
“God has cared for these trees, saved them…. But he cannot save them from fools.”- John Muir.
CLASS WISE CHANGE IN FOREST COVERS IN INDIA ‐2005‐2007 (km square)
CLASS ASSESS‐
MENT 2005 ASSESS‐
MENT 2007 CHANGE 2005‐2007
Very Dense Forest 83472 83510 38 Moderately Dense
Forest 319948 319012 ‐936
Open Forest 286751 288377 1626
Total Forest Cover 690171 690899 728
Some methods to meet the crisis:
Green Building technologies ensures sustainability in econom-ic growth, reduces the overall impact of the built environment on human health and the natural environment by:
Using energy, water, and other resources efficiently,
Protecting occupant health and improving employee produc-tivity,
Reducing waste, pollution and environmental degradation.
Mixed farming, in which a farmer conducts different types of agricultural practices together on a single farm in view of in-creasing his income through different sources, has been taken up to-
maintain soil fertility and biodiversity, minimize soil erosion, conserve water and provide suitable habitats for birds,
incorporate the stalks directly into the soil, when crop residues are not used as feed,
allow intensified farming with less dependence on natural re-sources.
Agro-forestry combines the production of crops and forest plants or animals simultaneously or sequentially on the same unit of land and applies management practices that are compat-ible with the cultural patterns of local population. For example, Papaya and banana are two of such plants that occupy less area and provide fruits of good commercial value in a comparative-ly short time.
Different agro-forestry combinations in India are:
Agri-silviculture: trees + crops
Boundary plantation: tree on boundary + crops
Effective and integrated population control and forest manage-ment strategies are essential to subvert the spiral of population pressure and forest degradation. Women’s sensitization and involvement in forest management and conservation can bring better results towards forest up-gradation as women are pri-marily responsible for collection and processing of fuel-wood in forest areas. Greater participation from local communities and NGOs can certainly help in faster regeneration of forest resources.
In spite of having the best known co-forest management pro-gram in the world, lack of real transfer of rights to use and trade in forest land and products, inherited laws from the colo-nial past and inefficient bureaucratic framework prevent mil-lions of forest dependent people from using their forest re-sources and becoming integrated into the booming economy. The Forestry sector recognizes its increasing role to provide sustained benefits to the people and strives to attain it by R&D & capacity building with forest management. National Forest
Commission has recommended allocation of minimum 2.5% of national budget to the forestry sector. In 2011, government of India took a decade long plan to create or improve 10 mil-lion hectares of forest, with US $ 10 billion, i.e. the National Mission for a Green India. Concern over inadequate role of elected Panchayati Raj Institutions (PRIs) vis a vis Joint Forest Management Committees (JFMCs) in forest management, control over Minor Forest Products, implementation of Forest Right Act and PESA has been voiced with little recognition in the present conflicting scenario. Forest Conservation Policies and constitution of Wildlife Crime Control Bureau and Nation-al Tiger Conservation Authority are other few efforts in the direction of forest and wildlife conservation.
As the concluding remarks, development in the true sense can only be enhanced when we achieve our consumption smooth-ening in the many period intertemporal frameworks, in terms of the resources available on this earth. Environmental sustain-ability is ensuring the needs of the current generation without compromising environmental carrying capacity for the future generation. Maintaining environmental sustainability needs not only to limit pollution but also to ensure eco-efficiency in meeting the needs of the present generation. The expedition towards the peak of success and excellence can only be achieved with the hand in hand progress of economic growth and environmental sustainability.
References:
1. India state of forest report‐ forest survey of India (FSI), GOI
2. Forest conserva on, afforesta on and reforesta on in India: Impli‐
ca ons for forest carbon stocks: N. H. Ravindranath, Rajiv Kumar
Chaturvedi and Indu K. Murthy.
3. Report to the People on Environment and Forests, MEF, GOI.
4. Towards an Economic Approach to Sustainable Forest Develop‐
ment: Archana S Mathur, and Arvinder S Sachdeva, Planning commis‐
sion working paper.
5. Valuing the forests for sustainable development: R.B.Lal, Indian
Ins tute of Forest Management.
6. Web of crea on, ecology resources: transforming faith and socie‐
ty.
7. www.moef.nic.in
8. www.fao.org
9. www.panda.org
10. www.nature.com
11. www.iucn.org
25

Unit Linked Insurance Products Trina R. Maitra
A Brief Introduction :
ULIPs combine the benefits of both insurance and invest-ments. A part of the Premium paid by the policyholder goes into the Insurance Fund which provides the life cover and the other part goes into the Investment Fund which in turn is in-vested in stocks or bonds. Each policyholder receives the In-vestment Fund Value at the time of maturity or the Sum As-sured at the time of death. Further, there is no pooling of the investments or allocation of the pooled surplus.
The advantages of such products from the policyholder per-spective are a few like : a). they are “transparent” which means that the investment, insurance and the expense (of the insurer also called the shareholder) elements are distinctly identified. b). flexibility is provided to the policyholder to choose the investment basket based on his degree of risk toler-ance. Such investment options include High Risk Funds like Equity Fund, Nifty Index Fund, Midcap Fund, Pure Fund, etc. or various Medium and Low Risk Funds like Bond Fund, Liquid Fund, Income Fund, etc or a combination of the above. From the insurer perspective the major advantage is that as they have less onerous guarantees as compared to Traditional Plans they prove to be less capital intensive.
On the other hand there are major disadvantages too. From the policyholder viewpoint , a). the point-of-sale illustration system is quite complex. b). the investment rewards and “risks” are transferred to the policyholder which is not favour-able. There are products with minimum guarantees but they prove to be quite costly for both the policyholder as well as the shareholder as an additional investment guarantee charge is levied. From the insurer viewpoint, it requires a sophisticated fund management and fund accounting system to ensure that correct assets are purchased and/or sold to match the invest-ments/ switches/ surrenders made by the policyholders.
However, though the idea of ULIP sounds attractive, there has been a major slowdown in the sales of these products as we can see from this graph.
The IRDA data on first year premium of life insurers reveals that the annual sale of Unit Linked Insurance Products(ULIPs) has slid to 27.86 lakhs as on March 2012 from 55.94 lakhs in the previous year. During the same period, traditional insur-ance plans such as term plans, endowment plans and money back plans clocked a sale of Rs 16.58 lakh policies, compared with 7.98 lakh policies in the previous financial year (Economic Times, June 8, 2012)
The major reasons for this poor performance are the numerous high charges levied and the decreasing compensation (commission) paid to the intermediaries as we can see from the following graph. This decrease in the compensation payments greatly discourage the intermediaries in performing optimally and gather new sales.
Here in this graph, the compensation is taken as a % of the Linked premium and we see that it has decreased considerably especially for the Private Insurers.
In order to improve this situation and to make these products more customer friendly, IRDA has imposed a few restrictions. As per IRDA rules, 2010, all ULIP annuity & pension prod-ucts should have a minimum guarantee of 4.5 per cent applica-ble on the maturity date. A few Insurance Companies have discontinued the Pension ULIP as this rate seems to be quite impractical given the volatile performance of the share market. The minimum Sum Assured or the Death Benefit as per IRDA
on a Single Premium policy for a policy term of less than 10 years is 125% of the Single Pre-mium while for a policy term of more than or equal to 10 years is 110% of the Single Premi-um. For a Regular Premium Policy the mini-mum Sum Assured is five times the annualized return.
26

The Unit Fund is what the policyholder sees – unit growth (investment fund value) and all the charges like Premium Allocation Charge (Initial Charge), Policy Administration Charge (Renewal Charge), Fund Management Charge, Mor-tality Charge, Surrender / Partial Withdrawl Charge, Switch-ing Charge( if a policyholder wants to switch from one fund option to another), Add on Insurance Benefit Charge, Invest-ment Guarantee Charge, etc is communicated to him. The intial and renewal charges are taken in order to recoup the Insurer’s initial and renewal expenses which include reim-bursements to the intermediaries (Commission), Sales Allow-ances, Product development costs, Administration costs, In-vestment Management costs, etc. The Unit Benefits include the value of the Investment Fund which are given to the poli-cyholder at the time of maturity and surrender of the policy. The maximum surrender charge that can be levied is Rs 6000 as per IRDA.
The Non Unit Fund is what goes on within the company and the policyholder does not see anything at this level. The Non Unit Benefits include any sum insured payable on death in excess of the value of the units or any guaranteed maturity
value in excess of the value of the units. The Profit or Loss of the Insurer in each year is the balance in the non-unit fund between all sources of income (charges, unallocated premium) and all sources of outgo(expenses, non unit benefits).
How to create Profit in ULIP business ?
Basically for an Insurance Company to run profits, the incidence of Charges should match with the incidence of Expenses. The discount rate i% shows the present value of the projected future cash flows of the Insurer. This is usually taken as 5%. The risk discount rate r% is the rate used to calculate the Distributed Profit after paying Taxes and taking into account the Solvency Margin to maintain the reserves. It is used when the Insurer de-cides to receive less of a return on their investment in exchange for less risk. This is usually taken as 14%. As per IRDA, the Sol-vency margin requirements are 175% of the 1.8% of Reserves and 0.2% of the Sum at Risk (Sum Assured – Fund Value). The Mortality Charge is usually calculated on the Sum at Risk. The profit margin indicates how meticulously the insurer converts sales into profits after deducting all the incurred expenses.
27
Also we see a very interesting fact that in the recent years Single Premium ULIP Products have gained much popularity vis-à-vis the Regular Premium ULIP Products which is clearly depicted in these graphs.
This may be due to the reason that people prefer a one time ULIP investment and pay all the charges at one go instead of in-curring regular charges at regular intervals.
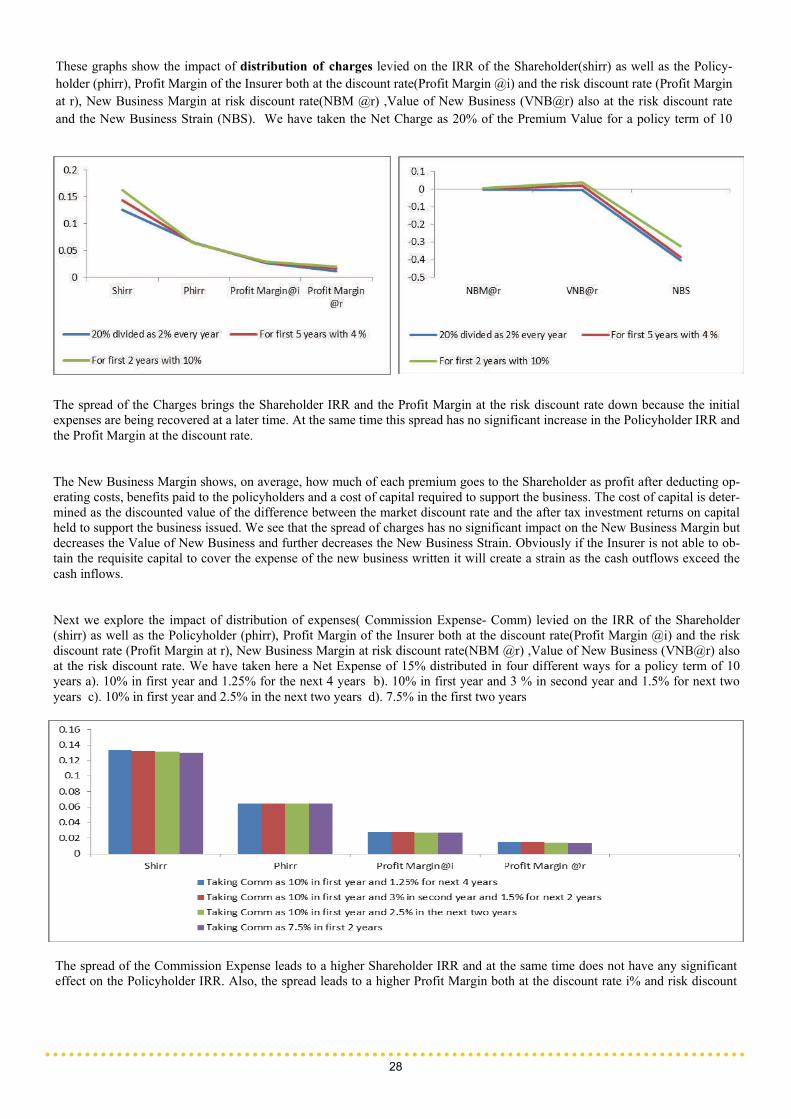
These graphs show the impact of distribution of charges levied on the IRR of the Shareholder(shirr) as well as the Policy-holder (phirr), Profit Margin of the Insurer both at the discount rate(Profit Margin @i) and the risk discount rate (Profit Margin at r), New Business Margin at risk discount rate(NBM @r) ,Value of New Business (VNB@r) also at the risk discount rate and the New Business Strain (NBS). We have taken the Net Charge as 20% of the Premium Value for a policy term of 10
28
The spread of the Charges brings the Shareholder IRR and the Profit Margin at the risk discount rate down because the initial expenses are being recovered at a later time. At the same time this spread has no significant increase in the Policyholder IRR and the Profit Margin at the discount rate.
The New Business Margin shows, on average, how much of each premium goes to the Shareholder as profit after deducting op-erating costs, benefits paid to the policyholders and a cost of capital required to support the business. The cost of capital is deter-mined as the discounted value of the difference between the market discount rate and the after tax investment returns on capital held to support the business issued. We see that the spread of charges has no significant impact on the New Business Margin but decreases the Value of New Business and further decreases the New Business Strain. Obviously if the Insurer is not able to ob-tain the requisite capital to cover the expense of the new business written it will create a strain as the cash outflows exceed the cash inflows.
Next we explore the impact of distribution of expenses( Commission Expense- Comm) levied on the IRR of the Shareholder(shirr) as well as the Policyholder (phirr), Profit Margin of the Insurer both at the discount rate(Profit Margin @i) and the risk discount rate (Profit Margin at r), New Business Margin at risk discount rate(NBM @r) ,Value of New Business (VNB@r) also at the risk discount rate. We have taken here a Net Expense of 15% distributed in four different ways for a policy term of 10 years a). 10% in first year and 1.25% for the next 4 years b). 10% in first year and 3 % in second year and 1.5% for next two years c). 10% in first year and 2.5% in the next two years d). 7.5% in the first two years
The spread of the Commission Expense leads to a higher Shareholder IRR and at the same time does not have any significant effect on the Policyholder IRR. Also, the spread leads to a higher Profit Margin both at the discount rate i% and risk discount
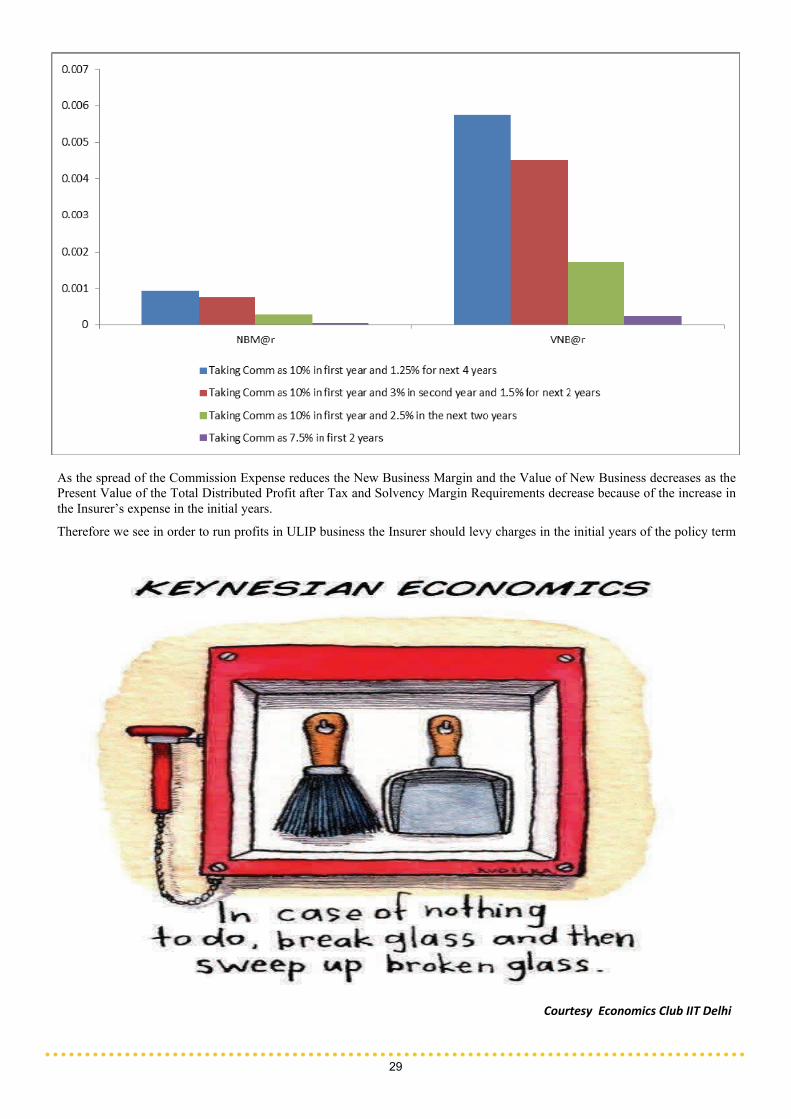
29
As the spread of the Commission Expense reduces the New Business Margin and the Value of New Business decreases as the Present Value of the Total Distributed Profit after Tax and Solvency Margin Requirements decrease because of the increase in the Insurer’s expense in the initial years.
Therefore we see in order to run profits in ULIP business the Insurer should levy charges in the initial years of the policy term
Courtesy Economics Club IIT Delhi

Autobiography of Indian Economy Himadri S Chakrabarty
License permit raj was my shackle
Until 1991 reforms came to my rescue
Industry and agriculture both I could tackle
And I became a part of the world purview
Adversity called for action,
As I was structurally dismantled
My growth rate nearing fraction
When fiscal reforms got me disentangled
My balance sheet finally smiled
Courtesy the dynamism shown through fiscal reforms,
Changes in quality of life, though mild
Yet had to adhere to SAP (Structural Adjustment Programme) and its norms.
The private sector soon became the cynosure
Though he was like my prodigal son
His progress gave me the required spur,
Long path to traverse but the take-off was done.
The public sector swapped responsibilities
With his brother, on whom reliance increased,
From regulatory to facilatatory abilities,
The internal deadlock was about to be ceased.
My cousins, education and health even needed reprieve
Along with road, railways and telecommunication
All wanted to be the sieve
For the resurgence of my mother, my nation.
My organs, agriculture and industry gained self-sufficiency
As grains & vegetables added to the green
Human labour improved on its efficiency
Development and diversification, a rare combination that I had hardly seen.
My growth rate was indeed on an upsurge,
And Mount 8% was close to being scaled
Promise and practice was about to merge
When disaster finally nailed.
The recessionary cancer broke out,
As I repented of my global relationships
Even then I tried to be steady and stout,
But, unemployment and financial patterns were the ones on whom I lost my grip.
My doctors applied a number of therapies,
To restore my stability and ability
Double digit growth targets weren’t enough to appease
My health condition, but promise of inclusive growth finally made me gritty.
My situation called for something new and historic
When inclusive growth made the tide turn
I promised to take my mother financially and physically to the peak,
But, I knew,” It was always easier said than done.”
My life has always been affected by doldrums,
Inflation and recession being the most fatal ones
The two mutually exclusive syndromes,
But it’s the pain of politics that actually burns.
30

Even the most reputed doctors haven’t discovered proper med-icines,
Yet the search and research continues,
Still so many living humans foraging the forests, having no other means,
And the extravagance of the rest continues to amuse.
I am not what I am
But I am what I can be
Residing in my body is some kind of virus, some kind of spam
Hurry up, lest a repeat of history you might just see..
31
Why shall my progress bow before political interventions?
I am no longer a slave
Yet I continue to be in alienation,
And a victim of policymakers, dogmatic and naïve.
Why shall my progress bow before political interventions?
I am no longer a slave
Yet I continue to be in alienation,
And a victim of policymakers, dogmatic and naïve.
Piece of the Past
IT WAS only after the outbreak of the World War II that con-trol of foreign exchange transactions was introduced in India on September 1939.Powers were vested to authorities by the British government under the financial provisions of the De-fence of India Rules, mainly to conserve the non-sterling area currencies and utilize them for essential purposes. In the clos-ing stages of the war, it became clear that control over foreign exchange transactions would have to continue in some form or other in the post-war period in the interests of making the most prudent use of the foreign exchange resources. It was, therefore, decided to place the control on a statutory basis and the Foreign Exchange Regulation Act (FERA) of 1947 was enacted. The Act, which came into force on March 25 1947,was valid initially for five years only.
In 1952,its life was extended till the end of 1957 and it was finally placed on a permanent basis in 1957.The Act empow-ered the Reserve Bank, and in certain cases the central govern-ment, to control and regulate dealings in foreign exchange, payments outside India, export and import of currency notes and bullion, transfers of securities between residents and non-residents, acquisition of foreign securities, etc. This Act was later replaced by a more comprehensive legislation; the new FERA,1973,came into force in January 1974.Subsequently as the Indian economy opened up and the external sector was more liberalized, FERA was replaced by Foreign Exchange Management Act in 1998,factoring in the liberalized foreign exchange market and the external sector.
General Anti Avoidance Rules (GAAR) GAAR Abbreviation
GAAR abbreviation stands for general-anti-avoidance rules and it has been introduced in India after the VODAFONE case ruling in favor of
this company by the Supreme Court. The new rules will come into effect from 01 April, 2012.
GAAR Implications in India
Indian Government gives more powers to income tax authorities as implementation of GAAR provides tremendous powers to deny tax
benefit to an entity if a transaction has been carried with the sole intention of tax avoidance. Due to powers in the hand of taxmen, now inno-
cents may be harassed by them.
FII & FDI money coming to India through Mauritius route will now become taxable. Increased litigations.
GAAR – Worst Scenario
The onus lies on the assesse to prove that there is no tax benefit and the transaction is not an avoidance transaction.
GAAR – Example
To make it easier to understand GAAR; we can say that suppose a person or a company is setting up business in Gulf Country and its clear
intention is to claim exemption from capital gains tax, in such a scenario Indian govt. has the right to deny the legitimate claim for exemption
provided under DTAA as it falls under tax avoidance and Indian govt. is trying to plug the loopholes. Courtesy: http://www.indian-share-tips.com
LIBOR Unleashed Shubham Gupta
Amidst the Euro crises, dwindling growth rates of the emerg-ing BRIC economies and with the largest economy, the US, still not out of the woods, the financial sector has taken a hit, shaking off investor confidence worldwide. Some big players of the international banking system like Barclays, Citigroup etc. have been held guilty by both U.S. and U.K. regulators for manipulating the LIBOR rate, that which serves as a primary benchmark for short-term interest rates worldwide. It is this rate which is used for increasing range of retail products such as mortgages, college loans and also works as a settlement rate of interest rate contracts on most of the world’s major futures and options exchange.
LIBOR:
Every working day international banks meet in order to figure out their daily financial obligations-how much they need to borrow and lend the surplus cash holdings as per in their balance sheets. The rate at which these day to day inter-bank transac-tions take place is termed as LIBOR-London Inter-Bank Offer Rate.
History:
In 1980s an increasing number of banks in London flourished in the financial sector with the emergence of whole array of new financial instruments like Forward Rate Agreements and soon the city became an epic centre of loan syndication in the world. This attracted huge investments in these derivatives from all around the world. Therefore to enter into the contract of buying and selling these financial products pricing them was rush of the hour. In order to stabilize the market British Bankers Association (BBA) along with The Bank of England developed a reference rate called as LIBOR which would serve as a benchmark for the pricing of the products.
Calculation:
Every day LIBOR is published for 10 currencies- GBP Pound Sterling, USD US Dollar, JPY Japanese Yen, CHF Swiss Franc, CAD Canadian Dollar, AUD Australian Dol-
lar, EUR Euro, DKK Danish Kroner, SEK Swedish Krona and NZD New Zealand Dollar with 15 maturities quoted for each of the currency thus totalling a whopping 150 rates each working day. These rates range from overnight to 12 months period. Under the light of Foreign Exchange and Money Mar-kets Committee-FX&MMC for each of the ten currencies 6-18 contributor banks (international banks) are chosen and then ranked depending on their total cash holdings, foreign ex-change swap activities over previous two quarters and their credit ratings. The contributor banks are asked to file their respective rate at which they would be willing to borrow funds by accepting inter-bank offers in a reasonable market size a
little before 11 am. The banks file in their submissions for funds in the currencies they require for different maturities.
Thomson Reuters, the calculating agent for LIBOR, appointed by BBA prepares the data in descending or-der. Then, by the trimming arithme-tic mean process it excludes the highest and the lowest 25% of the submissions and calculates the rate
by taking their average. This gives the LIBOR quotes in each currency with different maturities. Thus this activity is repeat-ed at 11 am on every working day so that all the derivatives, swaps, options and inter-bank transactions worth $350 trillion can be traded.
Significance:
As per the BBA, “LIBOR is the primary benchmark for short term interest rates globally and is used as the basis for settle-ment of interest rate contracts on many futures and option ex-changes”. The derivatives trading on various exchanges such as Chicago Mercantile Exchange (CME) and Chicago Board of Trade (CBOT), LIFFE, FTSE etc. are based on LIBOR. BBALIBOR is significant over SIBOR and HI-BOR in the sense that more than 20% of overall interna-tional bank lending; roughly 30% of all foreign exchange transactions are routed through London; home to head-quarters of around 500 international banks such as HSBC, Standard & Chartered, Barclays, Lloyds Banking Group etc. all these factors make BBALIBOR a unique snapshot of competitive cost funding .
32
LIBOR Scandal:
In 2007-08 the sub-prime crises in U.S. led toa global financial crisis stretching it to the extent of liquidity crunch followed by bankruptcy and bail-outs. Inter-bank money market had crashed, trading had halted. Deriving the real cost of lending from the borrowers had become diffi-cult. This pointed how much trouble was the banking sector was in. The submissions of LIBOR by Barclays had shot up as compared to that of its peers reflecting troubles with the bank which understated its creditworthiness and the financial health of the bank. In order to avoid the stigma of being an outlier among its contributor bankers, Barclays deliberately kept its LIBOR submissions so as to portray a healthy image. While on one side the suppressed (artificially created) LIBOR was prov-ing to be meaningless for the financial world, on the other side a handful of derivative trading members at Barclays were ma-nipulating the bank rates to boost their own desk profits. Four years later the U.S. Commodity Futures Trading Commis-sion (CFTC) and Britain’s Financial Services Authority fined Barclays bank by $450 million, one of the highest amounts ever imposed by the banking regulators in the history.
Impact of the Scam:
Estimating the dent a manipulation can cause to a financial industry worth $350 trillion is extremely important. According to the back of the envelope, say, if the LIBOR was suppressed by 1 basis point(1% is 100 basis point) only for a few months, payments on more than $300 trillion in mortgages, corporate bonds and derivatives tied to the benchmark might have fallen short by about $75 billion or so. If the problem lasted a few years, the shortfall could be close to $1 trillion. Thus the ma-nipulation of the LIBOR that was understated had twin effects. Where it became a gain in disguise for the borrowers of LI-BOR, such as financially stretched U.S. homeowners whose interest costs on floating-rate mortgages would have been less-er, this was countered by the lenders such as bond investors, corporate and municipality, hedge funds and others on the re-ceiving end of LIBOR which would translate into big heavy losses. Therefore to identify how much damage it caused is difficult to calculate.
Not a One–Man Game:
According to BBC, The British Bankers Association was
warned for a number of times in 2008 that the process of set-ting the LIBOR rates involved some wrong doings. But BBA denied any kind of distortion. Barclays has claimed that it was forced to understate its own borrowing cost to the BBA in 2008 because almost all other banks were doing the same. And if any troublesome borrowing problem the bank was facing it could have been nationalised then itself like Royal Bank of Scotland. Secondly, it has emerged that U.K. and U.S. regula-tors were aware of the wrong doings since May 2008 that other contributor banks along with Barclays were purportedly in-volved in under-reporting their cost of borrowings to BBA’s LIBOR Committee.
According to latest reports many other banks such as Citigroup Inc., Royal Bank of Scotland Group Plc., UBS AG, ICAP Plc., Lloyds Banking Group Plc. and Deutsche Bank AG have been brought into the radar by international investigation agencies to check into the probe.
Blaming the bank (or banks) for the unethical behaviour can-not be fair judgement. As per the reports by news agencies such as Times, BBC it has been stated that BBA denied any of the wrongdoings in spite of being warned several times in 2008 by a former rate-compiler. If Barclays had been deliber-ately lowering the LIBOR even before the global financial crises in 2007 it took five years for the US and UK regulators to expose the manipulation. Had the regulators and BBA dis-covered the problem then itself the story today would have been much different.
When big shots of any industry who have thrived for more than a century whether be it Barclays which has been banking since 1690 or Citigroup enjoying 200 years of service, are found guilty it takes no time to lose the goodwill which took years to build. This jiggles the investor sentiments and leads to economic woes. The series of scams that are surfacing the world after the global meltdown be it HSBC money laundering case, on-going LIBOR scam, or many others in other parts of the world brings in lots of irregularities which makes recovery of world economy even tougher.
References:
1. h p://topics.wsj.com/subject/L/libor‐rate
2. h p://www.washingtonpost.com/business
3. h p://www.bloomberg.com
4. h p://www.bbc.co.uk/news/business
5. h p://en.wikipedia.org/wiki/Libor#Currency
33
A Guide To The Gold Standard Ravi Saraogi
The crisis in the developed world has renewed interest in the gold standard. Many commentators, especially from the Aus-trian school of economics, have called for a return of the mon-etary system to the gold standard. The purpose of this write up is to show that it is technically possible to implement a gold standard today. Criticisms against the gold range from – the money supply will fall, there will be chaos if many agencies control money supply, there is not enough gold in the world to shift to a gold standard; these criticisms are baseless and be-tray an understanding of what money really is.
What is the Gold Standard?
Simply put, a gold standard means a monetary system based on the commodity gold. Does this mean you will have to carry gold bars in trucks to make payment for buying real estate? No. You can make payments in paper receipts which will be redeemable in gold. Who has the obligation to redeem the pa-per receipts for gold? Obviously, the entity who has issued the receipts; which brings us to a very contentious question – who has the right to issue such redeemable paper receipts?
In a gold standard, anybody who has gold can issue such re-ceipts. Suppose the government has gold reserves of 1 tonne. It can issue its own paper receipts, say the ‘dollar’ and define it as equal to 1 gram of gold. This will allow the government to issue 1 million dollars. Similarly, anyone can take out their own paper receipts. If you have 1 tonne of gold, you can take out your own receipts, and label it ‘rupiya’ and define it as 1 kg of gold. This will allow you to print 1000 rupiya. You can take this rupiya to the market and buy goods and services.
Will the market accept your rupiyas as payment? That will depend on your credibility in the market. Say you went to pur-chase a car and it costs 1 kg gold. You can use your one rupiya to buy the car. The car dealer can later knock at your door and ask you to redeem your one rupiya for 1 kg gold. If you do not redeem your rupiya, your credibility declines, and in the fu-ture, market participants may refuse to accept rupiyas.
Does this mean you will starve to death with nobody willing to sell you food? Of course not. Even if the credibility of your rupiya has gone for a toss, you can always turn in your gold to the government and receive dollar in exchange. Or you could turn over your gold to a bank whose currency is widely accept-ed by the public. Or, you could simply melt your gold into
smaller units and use it directly for exchange.
The point I am trying to make here is that in a free market gold standard, the market will decide the paper receipts or currency that will be used. Will there be multitude currencies and cha-os? No. History suggests that the market will eventually settle to a few different types of paper receipts. Maybe, only dollars will be used or maybe, currencies issued by certain trust wor-thy banks will be used.
Paper currency issued by different participants in the gold standard is simply receipts for a claim towards gold. As gold is the real money in a gold standard, we stumble on an important question. Who has the right to mine gold? Well, no points for guessing, but obviously the Austrian reply to this question will be – its a free market, everybody has the right to mine gold.
Suppose you want to buy a car, which costs 1 kg gold. You have two choices – either you can mine 1 kg gold and pay for your car, or you can choose to work somewhere and get 1 kg of gold as wages. Which option you choose depends on which activity will demand the least effort from your side – this is similar to saying which activity is preferable to you. Similarly, a mining company will mine gold till the time it is profitable for it to do so. It may seem that in a gold standard, private mining companies will earn super normal profits and will be-come masters of the universe. This is not true.
An example will clarify.
Assume a mining company can hire laborers for 1 kg gold per day to work on its gold mines, and each laborer can mine 5 kg of gold per day. Can such a situation arise in a free market? Of course not. Why would anyone accept 1 kg gold in payment for extracting 5 kg of gold? One can argue here that inde-pendently (without machinery of the mining company), the laborer will be unable to mine gold, and hence he may accept a lower payment that the value of gold he produces. Even then, what prohibits another company which can buy machinery and hire labourers to start mining operations? Eventually, as long as mining gold remains a profitable activity, the supply of gold will keep on increasing, adding to the existing supply of gold stock in the economy. Eventually, the “price” of gold (in terms of its purchasing power in buying goods and services) will fall to match the cost of extracting gold and we reach a sort of “steady state” supply of gold.
34
Can we shift to a Gold standard today?
Yes we can. Most of the criticisms against the gold standard have already been addressed above. We saw how in a free market gold standard, even though everybody has the right to issue currency, there is no chaos or dooms day. The market will choose as currency the paper receipts which have the highest credibility for redemption in gold. In fact, the term ‘dollar’ originated from coins which earned a reputation for their quality.
We also saw how the initial stock of gold or increase/decrease in supply of gold poses no difficulties in the technical opera-tion of the gold standard. Though we have implicitly addressed the criticism that there is not enough gold to shift to a gold standard, lets discuss this again through an example.
Assume an economy is running on gold standard. The gold reserve in this economy is 1000 kg and a dollar is defined as 10 kg of gold. Thus, there are 100 dollars in this economy. Now, the government abolishes the gold standard and monop-olizes the function of issuing currency in the economy. With the link between the dollar and gold reserves broken, the gov-ernment is now free to print dollars without any corresponding increase in gold reserves. Ten years later, the supply of dollars in the economy has increased to 1000 dollars.
If the government wants to re-introduce the gold standard, with the initial stock of gold reserves (1000 kg) and the inflat-
ed supply of 1000 dollars, the dollar will have to be redefined from being equal to 10 kg of gold to 1 kg of gold. We can shift back to the gold standard with the same initial gold re-serves but an inflated paper money supply. The question of insufficient gold reserves does not arise.
We now need to address a final point. Lets continue with the above example.
Before the government redefines the dollar as being equal to 1 kg of gold, the “price” of gold observed in the fiat economy will be lower than this rate, i.e., the dollar will be overvalued and gold undervalued. This is to be expected as under a fiat money system, the supply of dollars increase at a much faster rate than the supply of gold reserves. Gold has to be mined from the depths of the earth while money can be printed in bulk effortlessly. In our example, assume the price of gold in the fiat economy is half a dollar for 1 kg of gold. This creates a confusion that we need 2000 kgs of gold to convert the 1000 dollars into gold and shift to a gold standard. Since the gold reserves are only 1000 kgs, there must be “insufficient gold.” As we have seen, this betrays an understanding that money is not an independent entity, but a unit of account. The dollar simply has to be redefined to “equate” the available gold re-serves with the existing supply of paper money.
The above would summarize the main objections against the gold standard and their resolution as per the Austrian school of economics.
35
DID YOU KNOW?
The ‘Laundered Shirt Theory’ states that during an economic downturn, customers visit less
frequently and leave clothes longer at the dry cleaners. Data from the recent global financial
crisis proves it!
Ticker tape was the earliest digital electronic communica ons medium, transmi ng stock
price informa on over telegraph. Though Edward Calahan invented it in 1867, the more
prac cal version was created by Thomas Alva Edison.
The term ‘Geek 'was ini ally a ributed to those circus performers who were known for doing
crazy things like bi ng the heads off various small live animals or ea ng live insects and the
like!
Oldest War bonds s ll outstanding are the Bri sh Consols, some of which are the result of
the refinancing of debts incurred during the Napoleonic Wars. As the bond has a low coupon,
there is li le incen ve for the government to redeem it!
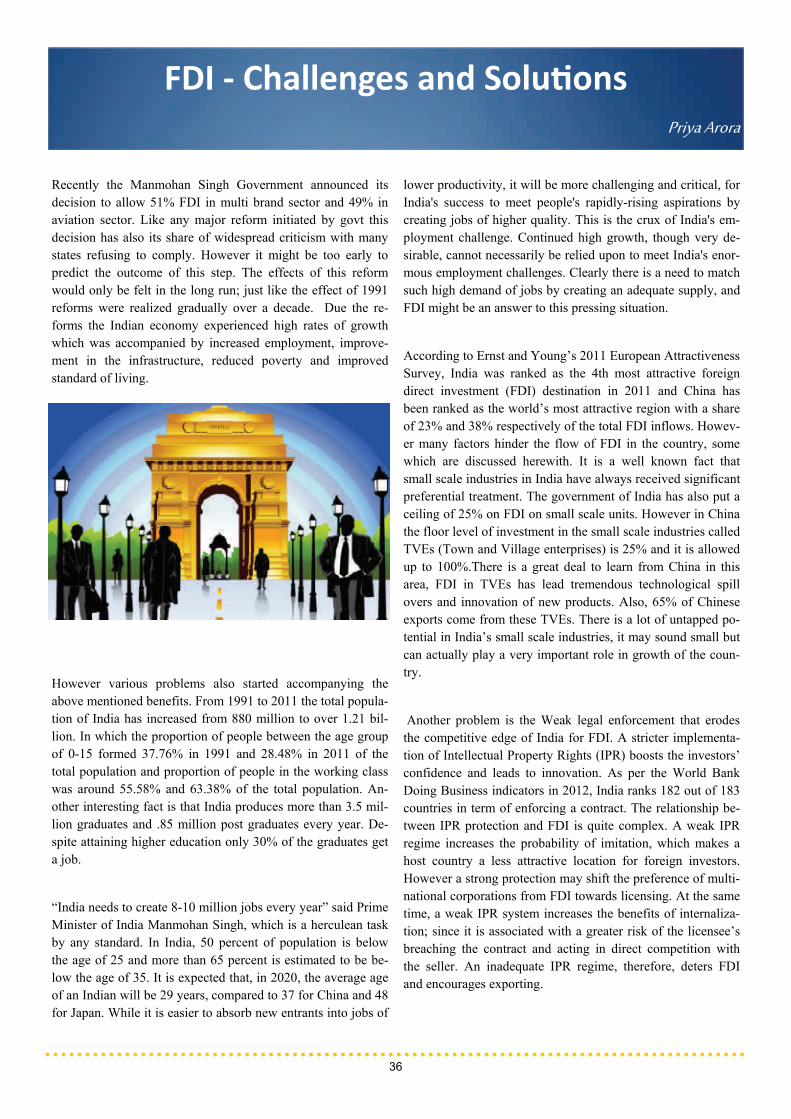
FDI ‐ Challenges and Solu ons Priya Arora
Recently the Manmohan Singh Government announced its decision to allow 51% FDI in multi brand sector and 49% in aviation sector. Like any major reform initiated by govt this decision has also its share of widespread criticism with many states refusing to comply. However it might be too early to predict the outcome of this step. The effects of this reform would only be felt in the long run; just like the effect of 1991 reforms were realized gradually over a decade. Due the re-forms the Indian economy experienced high rates of growth which was accompanied by increased employment, improve-ment in the infrastructure, reduced poverty and improved standard of living.
However various problems also started accompanying the above mentioned benefits. From 1991 to 2011 the total popula-tion of India has increased from 880 million to over 1.21 bil-lion. In which the proportion of people between the age group of 0-15 formed 37.76% in 1991 and 28.48% in 2011 of the total population and proportion of people in the working class was around 55.58% and 63.38% of the total population. An-other interesting fact is that India produces more than 3.5 mil-lion graduates and .85 million post graduates every year. De-spite attaining higher education only 30% of the graduates get a job.
“India needs to create 8-10 million jobs every year” said Prime Minister of India Manmohan Singh, which is a herculean task by any standard. In India, 50 percent of population is below the age of 25 and more than 65 percent is estimated to be be-low the age of 35. It is expected that, in 2020, the average age of an Indian will be 29 years, compared to 37 for China and 48 for Japan. While it is easier to absorb new entrants into jobs of
lower productivity, it will be more challenging and critical, for India's success to meet people's rapidly-rising aspirations by creating jobs of higher quality. This is the crux of India's em-ployment challenge. Continued high growth, though very de-sirable, cannot necessarily be relied upon to meet India's enor-mous employment challenges. Clearly there is a need to match such high demand of jobs by creating an adequate supply, and FDI might be an answer to this pressing situation.
According to Ernst and Young’s 2011 European Attractiveness Survey, India was ranked as the 4th most attractive foreign direct investment (FDI) destination in 2011 and China has been ranked as the world’s most attractive region with a share of 23% and 38% respectively of the total FDI inflows. Howev-er many factors hinder the flow of FDI in the country, some which are discussed herewith. It is a well known fact that small scale industries in India have always received significant preferential treatment. The government of India has also put a ceiling of 25% on FDI on small scale units. However in China the floor level of investment in the small scale industries called TVEs (Town and Village enterprises) is 25% and it is allowed up to 100%.There is a great deal to learn from China in this area, FDI in TVEs has lead tremendous technological spill overs and innovation of new products. Also, 65% of Chinese exports come from these TVEs. There is a lot of untapped po-tential in India’s small scale industries, it may sound small but can actually play a very important role in growth of the coun-try.
Another problem is the Weak legal enforcement that erodes the competitive edge of India for FDI. A stricter implementa-tion of Intellectual Property Rights (IPR) boosts the investors’ confidence and leads to innovation. As per the World Bank Doing Business indicators in 2012, India ranks 182 out of 183 countries in term of enforcing a contract. The relationship be-tween IPR protection and FDI is quite complex. A weak IPR regime increases the probability of imitation, which makes a host country a less attractive location for foreign investors. However a strong protection may shift the preference of multi-national corporations from FDI towards licensing. At the same time, a weak IPR system increases the benefits of internaliza-tion; since it is associated with a greater risk of the licensee’s breaching the contract and acting in direct competition with the seller. An inadequate IPR regime, therefore, deters FDI and encourages exporting.
36
Certainly there are specific short-term costs associated with intellectual property rights for the developing countries, like higher prices for the technology and protected products. Given this, the case for stronger intellectual property rights in these countries must rest on long term benefits like larger technology or foreign direct investment inflows and stronger stimuli to local innovation. Researches’ indicate that an adequate level of protection for IPR increase the level of FDI in the country. In-dia can learn from some of the developed country’s experience. Let’s take Europe’s example. Europe’s objective to protect its products is fulfilled by following certain measures like Agree-ment on Trade-Related Aspects of Intellectual Property Rights, The EU negotiates IPR provisions in its bilateral trade agree-ments and works closely at a technical level with its trading partners on IPR issues. The EU was also involved in the devel-opment of the Anti-Counterfeiting Trade Agreement. The state government, the central government and the society, should also make a coordinated effort to realize the benefits of an ef-fective IPR system.
Another problem faced by most of the developing countries is of implementing an appropriate tax structure. In today’s global environment there is immense Tax competition for FDI by var-ious countries. Investors from other countries compare tax bur-dens in different locations, as do policy makers, with compari-sons typically made across countries that are similar in terms of location and market size. According to KPMG report, high corporate taxes in India (30% for domestic company and 40% for foreign company excluding surcharge and education cess) can affect the flow of foreign direct investment significantly. However the corporate tax in other developing countries is much lower than that in India. Hong Kong's corporate tax at 16.5%, Singapore's 17% and Malaysia's 25%, these countries, with their lower corporate tax rates, can provide stiff competi-tion to India for attracting FDI. Studies examining cross-border flows suggest that on average, FDI decreases by 3.7% follow-ing a 1 percentage point increase in the tax rate on FDI. The focus of Indian government should be on setting up an efficient and fair tax system, so that it can raise the essential revenue and does not rely on borrowing.
According to a study of emerging economies that analysed which country had the most monetary and fiscal firepower. It studied 27 countries and used five indicators: inflation, excess credit (the growth in bank lending minus the growth in nomi-nal GDP), real interest rates, currency movements and current account balances. It showed that China, Indonesia and Saudi Arabia have the greatest capacity. India occupies the bottom of the scale (27th) along with Egypt. The study showed that In-dia does not have the fiscal power to be able to balance the economy and engage in massive fiscal programmes.
A healthy flow of FDI has the potential to solve some of the problems faced by the country like unemployment, inflation and can also help in integrating the Indian market with that of the global market. In order to achieve the target of high growth rate in the next financial year and to attract more FDI the gov-ernment should focus on addressing the problems which deter the inflow of FDI .Nearly two decades have passed since the 91 reforms were initiated and we cannot expect to continue reaping its benefits. A new bout of reform process is essential and the decision to allow FDI could give a much needed boost to the distressed workforce.
References:
1. Organisa on for Economic Co‐opera on and Development,
“Reforming cooperate income tax” h p://www.oecd.org/tax/
taxpolicyanalysis/41069272.pdf;
2. Bajpai Nirupam and Sachs D. Jeffrey, working paper “India’s dec‐
ade of development: looking back at the last 10 years and looking
forward to next 20”; h p://globalcenters.columbia.edu/southasia/
files/mumbai/content/
CGC_WP4_Indias_Decade_of_Development_II.pdf
3. Ernst and Young, “Growing opportuni es Russia FDI report 2011”;
h p://www.ey.com/Publica on/vwLUAssets/Growing‐opportuni es‐
Russia‐FDI‐Report‐EN/$File/Growing‐opportuni es‐Russia‐FDI‐Report
‐EN.pdf
4. News track India, “ India needs to generate 8‐10 million jobs every
year: PM” New Delhi, Thu, 29 Mar; h p://www.newstrackindia.com/
newsdetails/2012/3/29/275‐India‐needs‐to‐generate‐8‐10‐million‐
jobs‐every‐year:‐PM.html
5. European commission, Trade topics, “Intellectual property”; h p://
ec.europa.eu/trade/crea ng‐opportuni es/trade‐topics/intellectual‐
property/
6. The economist , ar cle “Which emerging economies have the
most monetary and fiscal firepower?” h p://www.economist.com/
node/21543468
37

Shale Gas: An Auxiliary Energy Solu on for India
Sumedha Minocha
Joining the global rush to tap the unconventional energy re-sources, the Government of India has announced a policy for auctioning shale gas blocks by December 20131. The recent estimate given to India by the US Geological Survey is 6.1 Trillion Cubic Feet (TCF)2 technical recoverable gas without regard to the associated cost. Even if this figure is ambitious and the actual amount of recoverable gas could be much lower given the commercial viability of extraction, the need of the hour is to address the sustainability of shale gas operations in India.
Shale gas or natural gas trapped in sedimentary rocks of shale formations below the earth's surface is the new focus area in the USA, Canada and China as an alternative to conventional oil and gas for meeting growing energy needs. Currently, natu-ral gas accounts for only 11%3 of the primary energy produc-tion and consumption in our country as compared to the world average of 24%4. With the projected demand and supply gap, it is important for India to enhance energy security for the country for which the government of India should induce poli-cies to promote exploration of shale gas. Raising the use of gas in the energy mix would help our country lower its depend-ence on conventional energy resources like coal and oil which have to be mainly imported. With the increasing fuel prices and carbon emissions, this seems to be a step in the right direc-tion. Even the USA success story suggests that with the right regulations, alternative gases like shale gas could significantly impact the energy scenario and thus, contribute to the econom-ic growth in a country. Not only has it seen nearly 50%5reduction in gas prices and self-sufficiency in meeting the domestic demand but it has also now become a net exporter of gas. This scenario is however, very ambitious for India given the highly subsidized and government controlled energy prices and also, the unavailability of that much amount of shale gas in the first place. Nevertheless, its role in decreasing the cur-rent pressure on existing energy resources is a good enough reason to promote the exploration of this alternative yet con-ventional resource.
It will not take long for India to fully exploit the potential of shale gas resources. In fact, during US President Obama's visit to India in November 20106, India signed a deal with U.S.A. for assisting it in its exploration. What India needs to focus on, now, is the optimization in the extraction and production of shale gas to ensure the success of shale gas operations in India. Therefore, the commercial viability as well as environmental hazards posed by the same need to be carefully assessed.
Till now, much hype has only been on the amount of shale gas trapped but there has been little emphasis on the feasibility of extraction. It was actually the rising energy demand and thus, the prices that pushed for advancement in extraction tech-niques for shale gas operations thereby, making it a profitable operation in U.S.A. However, India has to import this technol-ogy from U.S.A and use it in shale gas exploration and produc-tion, the opportunity cost of which is investment in other re-sources like coal. The freedom to market and price as well as adequate infrastructure is the key to encourage investment in shale blocks. Otherwise, it is rather more profitable to import than to invest in exploration, extraction and the production process.
It is also true that shale gas is a much cleaner burning fuel as compared to coal, India’s largest source of energy, though there are other damaging effects it can potentially cause to the environment. The method of hydraulic fracturing is mostly used in which water, sand and a small amount of additives is injected into the rock, opening up new fissures and fractures through which the gas or liquids can flow into the well bore and thus, can be extracted at minimum possible cost. Even though this is the least expensive method of extraction that has come up till now, its costs related to the impact on environ-ment should not be ignored. This process requires millions of gallons of water but only a fraction of it returns to the surface. Gas migration and groundwater contamination due to faulty well construction, blowouts, above-ground leaks and spill of waste water and chemicals used during drilling and fracturing are also some other concerns related to shale operations. The geological effects of the same, the impact of which is not easi-ly observable and cannot be easily calculated in the short run should also be looked into. Thus, proper management of water and prevention of such harmful effects is very important.
As per the available data, six basins located in Cambay, Assam-Arakan, Gondawana, KG onshore, Cauvery onshore and Indo Gangatic basins7, hold shale gas potential. Oil and Natural Gas Corporation Ltd (ONGC) is already pursuing shale gas explo-ration on the western coast of India8 to assess the availability and commerciality of shale gas. Given, the rising energy de-mand and for reducing the reliability on coal and oil imports, the shale gas exploration is a step in the right direction. The usage of natural gas in the fertilizer and pesticide industry can potentially substitute naphtha which is relatively more expen-sive. Even if it is rather a short- run solution like other non- renewable resources, it is a greener solution.
38
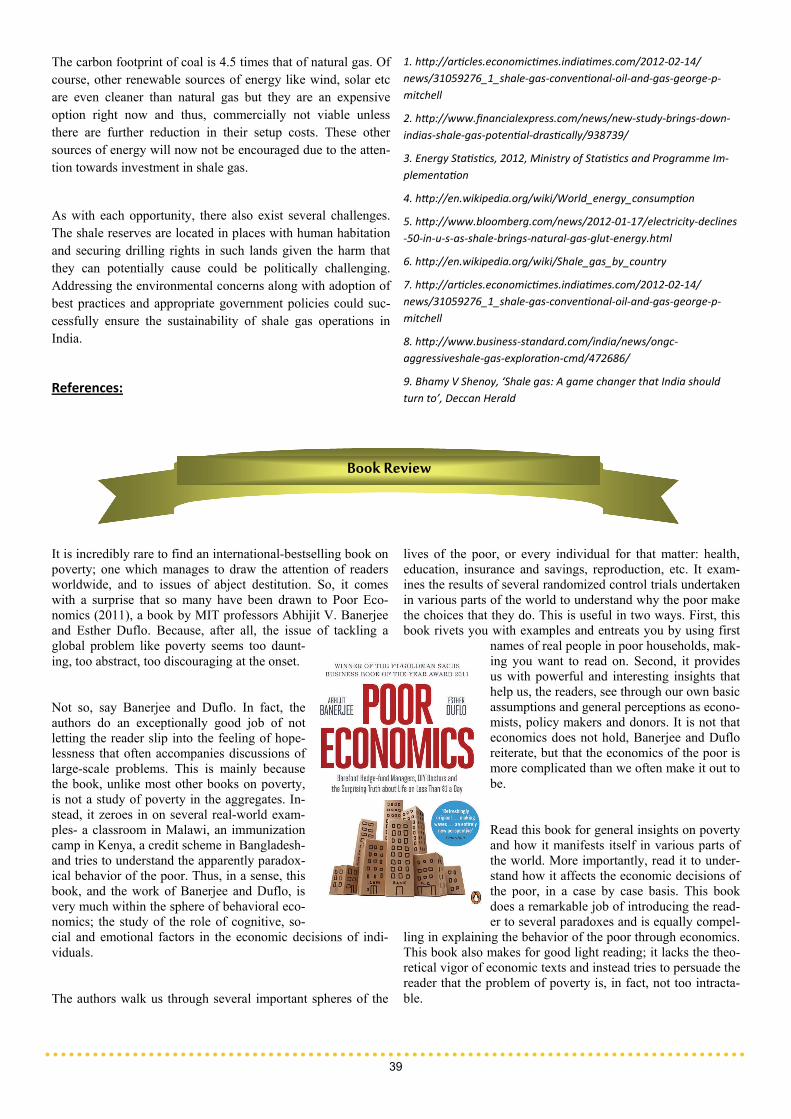
The carbon footprint of coal is 4.5 times that of natural gas. Of course, other renewable sources of energy like wind, solar etc are even cleaner than natural gas but they are an expensive option right now and thus, commercially not viable unless there are further reduction in their setup costs. These other sources of energy will now not be encouraged due to the atten-tion towards investment in shale gas.
As with each opportunity, there also exist several challenges. The shale reserves are located in places with human habitation and securing drilling rights in such lands given the harm that they can potentially cause could be politically challenging. Addressing the environmental concerns along with adoption of best practices and appropriate government policies could suc-cessfully ensure the sustainability of shale gas operations in India.
References:
1. h p://ar cles.economic mes.india mes.com/2012‐02‐14/
news/31059276_1_shale‐gas‐conven onal‐oil‐and‐gas‐george‐p‐
mitchell
2. h p://www.financialexpress.com/news/new‐study‐brings‐down‐
indias‐shale‐gas‐poten al‐dras cally/938739/
3. Energy Sta s cs, 2012, Ministry of Sta s cs and Programme Im‐
plementa on
4. h p://en.wikipedia.org/wiki/World_energy_consump on
5. h p://www.bloomberg.com/news/2012‐01‐17/electricity‐declines
‐50‐in‐u‐s‐as‐shale‐brings‐natural‐gas‐glut‐energy.html
6. h p://en.wikipedia.org/wiki/Shale_gas_by_country
7. h p://ar cles.economic mes.india mes.com/2012‐02‐14/
news/31059276_1_shale‐gas‐conven onal‐oil‐and‐gas‐george‐p‐
mitchell
8. h p://www.business‐standard.com/india/news/ongc‐
aggressiveshale‐gas‐explora on‐cmd/472686/
9. Bhamy V Shenoy, ‘Shale gas: A game changer that India should
turn to’, Deccan Herald
39
Book Review
It is incredibly rare to find an international-bestselling book on poverty; one which manages to draw the attention of readers worldwide, and to issues of abject destitution. So, it comes with a surprise that so many have been drawn to Poor Eco-nomics (2011), a book by MIT professors Abhijit V. Banerjee and Esther Duflo. Because, after all, the issue of tackling a global problem like poverty seems too daunt-ing, too abstract, too discouraging at the onset.
Not so, say Banerjee and Duflo. In fact, the authors do an exceptionally good job of not letting the reader slip into the feeling of hope-lessness that often accompanies discussions of large-scale problems. This is mainly because the book, unlike most other books on poverty, is not a study of poverty in the aggregates. In-stead, it zeroes in on several real-world exam-ples- a classroom in Malawi, an immunization camp in Kenya, a credit scheme in Bangladesh-and tries to understand the apparently paradox-ical behavior of the poor. Thus, in a sense, this book, and the work of Banerjee and Duflo, is very much within the sphere of behavioral eco-nomics; the study of the role of cognitive, so-cial and emotional factors in the economic decisions of indi-viduals.
The authors walk us through several important spheres of the
lives of the poor, or every individual for that matter: health, education, insurance and savings, reproduction, etc. It exam-ines the results of several randomized control trials undertaken in various parts of the world to understand why the poor make the choices that they do. This is useful in two ways. First, this book rivets you with examples and entreats you by using first
names of real people in poor households, mak-ing you want to read on. Second, it provides us with powerful and interesting insights that help us, the readers, see through our own basic assumptions and general perceptions as econo-mists, policy makers and donors. It is not that economics does not hold, Banerjee and Duflo reiterate, but that the economics of the poor is more complicated than we often make it out to be.
Read this book for general insights on poverty and how it manifests itself in various parts of the world. More importantly, read it to under-stand how it affects the economic decisions of the poor, in a case by case basis. This book does a remarkable job of introducing the read-er to several paradoxes and is equally compel-
ling in explaining the behavior of the poor through economics. This book also makes for good light reading; it lacks the theo-retical vigor of economic texts and instead tries to persuade the reader that the problem of poverty is, in fact, not too intracta-ble.

Having said that, the book does have its failings. While the real-life examples gathered from over fifteen years of fieldwork by the two empiricist economists make for interesting conversa-tion starters and discussion, it is not so easy to generalize these findings to talk generally about the “poor.” The authors seem to understand this, as they conclude their book with a chapter titled “In Place of a Sweeping Conclusion.” So, yes, Poor
Economics sheds light on issues of poverty at the granular level, and throws up several interesting questions about the behaviour of the poor, but the fact remains that a few scattered studies in Malawi or Nepal are not sufficient to draw heavy conclusions, even for policy sake.
40
“What we have ignored is what ci ‐zens can do and the importance of real
involvement.”
‐Elinor Ostrom
“Elinor Ostrom, the renowned American Political Economist aged 78 died of pancreatic cancer at Bloomington Indiana, U.S on June 12, 2012. She was born on August 7, 1933 in Los Angeles, California as a single child to Leah and Adrian Awan.Ostrom attended Beverly Hills High School and then went on to pursue her B.A (with honors), M.A and PhD from UCLA Department of Political Science.
Her main area of research was environmental protection. Her primary focus was on interaction of humans with ecosystem through which long term sustainable resource yields can be maintained. Her work tried to bring forth the different activi-ties taken up by the locals to preserve natural resources and thereby preserving the ecosystem from degradation. The multi-faceted nature of human – ecosystem interaction was high-lighted in her work. She was the co-founder of the “Workshop in Political theory and Policy Analysis” along with her hus-band. She is the author of books like “Governing the Com-mons: The evolution of Institutions for collective action”; “Rules, Games and Common pool resources”; “Understanding Institutional Diversity” and “Linking the formal and informal economy: Concepts and policies”.
Ostrom was the first woman recipient of the prestigious “Johan Skytte Prize” in Political Science in the year 1999. Her other achievements are “John J. Carty Award” in 2004; “James Madison Award” in 2005 and “William H. Riker” prize in Political Science in the year 2008 to name a few. Her greatest achievement was being the first woman to receive the es-teemed “Sveriges Riksbank Prize in Economics Sciences in Memory of Alfred Nobel” in 2009.
Elinor Ostrom is survived by her husband Vincent Ostrom, a political scientist.
Obituary

41
News Around the Globe
1. HSBC Money Laundering
July 17- HSBC, London headquartered bank has been found guilty of money-laundering activities
by the US Senates Permanent Sub-committee for financing illegal drug traffic in Mexico; it has
been accused of conducting over $ 19 billion in transactions involving persons in US business
prohibited countries.
2. LIBOR Scam
July 2012- Barclays Bank was fined a hefty $ 450 million fine by US and UK regulators after
being found guilty of manipulating LIBOR (London Interbank Operating Rate) ,a rate set by
British Bankers Association every working day at 11 am, which serves as a bench mark interest
rate for pricing of derivatives future and options.
3. Standard Chartered Case
August 2012-The bank Standard Chartered agreed to pay $340 million towards settlement with
New York regulators that accused it of hiding $250bn of transactions with Iran. The fine was
forcefully paid under the threat of cancellation of license in New York by the regulators.
4. Facebook IPO
May 2012-Menlo Park, California based social networking website Facebook with 995mn users
launched its IPO valuing the company worth more than $100bn. In the biggest ever IPO in the
internet industry shares were offered at $38 by fixed price method to trade on NASDAQ.
5. Coalgate
This year the GOI has been accused of making hodgepodge in allocating coal blocks to coal and
mining companies between 2004 and 2009. According to a report submitted by CAG, headed by
VinodRai, states that the misallocation has cost the exchequer a loss to the tune of 1.86 lakh crores
($ 198 billion).

42
News Around the Globe
6. India Grid Failure
July 2012-India went through a massive grid failure for over 15 hours that snapped the power
supply in over 19 states leaving 600 million people without power in North India. This was the
worst power cut any country ever had in the world.
7. Insider Trading
16 June -Indo -American business icon Rajat Gupta, a former McKinsey &Comanaging director
has been sentenced for 25 years of jail after being found accused of insider trading criminal
activity for passing on the news to Galleon Tech funds boss Raj Rajatnam.
8. Samsung v/s Apple
Iphone and Ipod maker Apple Inc. recently won a legal battle against South Korean electronics
firm Samsung after the latter was found guilty for infringing several of Apple's design and
software patents. Samsung has been fined $1.05 billion by the US court.
9. Verghese Kurien
September 2012- The man behind ‘The White Revolution in India’ -Verghese Kurien known as
The Milk Man of India passed away on 9th September 2012. The famous brand Amul a flagship of
Gujarat Co-operative Milk Marketing Foundation was founded by him.
10. Re Weakening
This year the Indian currency touched an all-time historic low figure of 55 against one US $
because of huge FIIs outflow. Various economists blame the weakening due to less impressive
growth rates of Indian economy and policy paralysis amidst Euro economics crises.

43
About the Authors
Himadri Shekhar Chakrabarty
First year student of Financial Economics at MSE. He can be reached at [email protected]
Sumedha Minocha
Final year student of M.Sc. General Economics at MSE. She can be reached at [email protected]
Rashmi Nayar
Student at Christ University. She can be reached at [email protected]
Arjun Srinivas
First year student of General Economics at MSE. He can be reached at [email protected]
Vandhana Sivakumar
First year student of Applied Quantitative Finance at MSE [email protected]
Priya Arora
Final year student of M.Sc. General Economics at MSE. She can be reached at [email protected]
Kannan K
Final year student of M.Sc. Financial Economics at MSE. He can be reached at [email protected]
Ravi Saraogi
Alumni of MSE. He can be reached at [email protected]
Madhurambal S
Final year student of M.Sc. General Economics at MSE. She can be reached at [email protected]
Shubham Gupta
Final year student of M.Sc. Financial Economics at MSE. He can be reached at [email protected]
Arpita Ghosh
First year student of General Economics at MSE. She can be reached at [email protected]
Trina R. Maitra
Final year student of M.Sc. Actuarial Economics-at MSE. She can be reached at [email protected]
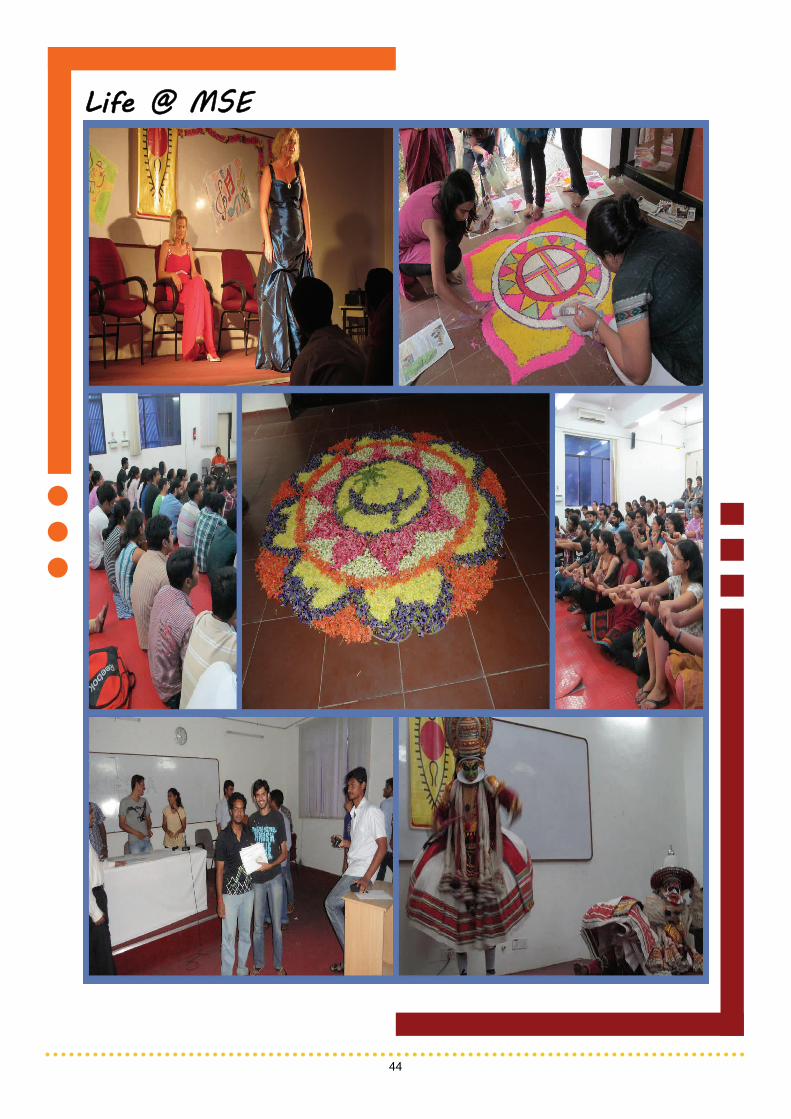
44
Life @ MSE