Intestinal Inflammation and Alterations in the Gut Microbiota in ...
Upload
independentCategory
view
1download
0
The Active Human Gut Microbiota Differs from the TotalMicrobiotaFrancesc Peris-Bondia1,2, Amparo Latorre1,2, Alejandro Artacho1, Andres Moya1,2, Giuseppe D’Auria1,2*
1 Joint Unit of Research in Genomics and Health, Centre for Public Health Research (CSISP) - Cavanilles Institute for Biodiversity and Evolutionary Biology (University of
Valencia), Valencia, Spain, 2 Centro de Investigacion en Red en Epidemiologıa y Salud Publica (CIBEResp), Barcelona, Spain
Abstract
The human gut microbiota is considered one of the most fascinating reservoirs of microbial diversity hosting between 400to 1000 bacterial species distributed among nine phyla with Firmicutes, Bacteroidetes and Actinobacteria representingaround 75 % of the diversity. One of the most intriguing issues relates to understanding which microbial groups are activeplayers in the maintenance of the microbiota homeostasis. Here, we describe the diversity of active microbial fractionscompared with the whole community from raw human fecal samples. We studied four healthy volunteers by 16S rDNA genepyrosequencing. The fractions were obtained by cell sorting based on bacterial RNA concentration. Bacterial families wereobserved to appear or disappear on applying a cell sorting method in which flow cytometry was used to evaluate the activecells by pyronin-Y staining of RNA. This method was able to detect active bacteria, indicating that the active players differedfrom that observed in raw fecal material. Generally, observations showed that in the active fractions, the number of readsrelated to Bacteroidetes decreased whereas several families from Clostridiales (Firmicutes) were more highly represented.Moreover, a huge number of families appeared as part of the active fraction when cell sorting was applied, indicating readsthat are simply statistically hidden by the total reads.
Citation: Peris-Bondia F, Latorre A, Artacho A, Moya A, D’Auria G (2011) The Active Human Gut Microbiota Differs from the Total Microbiota. PLoS ONE 6(7):e22448. doi:10.1371/journal.pone.0022448
Editor: Markus M. Heimesaat, Charite, Campus Benjamin Franklin, Germany
Received April 13, 2011; Accepted June 22, 2011; Published July 28, 2011
Copyright: � 2011 Peris-Bondia et al. This is an open-access article distributed under the terms of the Creative Commons Attribution License, which permitsunrestricted use, distribution, and reproduction in any medium, provided the original author and source are credited.
Funding: This work was funded by grant CP09/00049 Miguel Servet, Instituto de Salud Carlos III, Spain to GD; by projects SAF2009-13032-C02-01 from theSpanish Ministery for Science and Innovation (MCINN), BFU2008-04501-E from Spanish Ministery for Science and Innovation (MCINN) in the frame of ERA-NetPathoGenoMics and Prometeo/2009/092 from Conselleria D’Educacio Generalitat Valenciana, Spain, to AM. FPB is recipient of a fellowship from the University ofValencia. FCM-FACS experiments were carried out using facilities at the Servei Central de Suport a la Investigacio Experimental (SCSIE), University of Valencia. Thefunders had no role in study design, data collection and analysis, decision to publish, or preparation of the manuscript.
Competing Interests: The authors have declared that no competing interests exist.
* E-mail: [email protected]
Introduction
The human gastrointestinal tract (GIT) hosts one of the most
complex microbial communities, which has come under intensive
research in recent years by applying culture-dependent and -
independent methods [1–4]. The human gut microbiota (HGM) is
a complex community in which the extremely high diversity
undergoes a functional homogenization. Human gut transcrip-
tomic related studies, highlighted as main functional roles of the
gut microbiota are related to nutrient processing, energy
production and synthesis of cellular components [5].
HGM is notoriously dominated by Firmicutes and Bacteroidetes
phyla [2,6,7]. However, the functional relevance of a given taxa is
not necessarily associated to its numerical dominance and taxa
that represent a minority in terms of number may play important
functional roles, as well as being a reservoir of key genes
considering that several degradation enzymes are not coded by
human genome [8]. Recent studies have shown that microbiota
imbalances (dysbiosis) are associated with a wide variety of health
problems. Inflammatory bowel disease, obesity, atopic syndromes,
various forms of colitis, and even autism, have been linked to
disruptions in human-associated microbiota, or alterations in the
intimate cross-talk between microbiota and human cells [9–14].
Regarding obesity, Turnbaugh and collaborators observed an
abnormal bloom of a specific phylum that is normally present at
low concentrations in healthy individuals [15]. Also, inflammatory
bowel disease, ulcerative colitis, and pouchitis have been related to
changes in the gastrointestinal flora with an increase of anaerobe
Gram-negative bacteria as potentially ‘‘harmful’’ microbiota
colonizers versus the ‘‘protective’’ ones [16]. A general issue that
deserves further investigation is to ascertain which taxa in the
HGM are really metabolically active.
The study of natural microbial communities, particularly those
associated to humans, is a hard task with major culture-related
difficulties [17]. During the last 20 years, culture-independent
identification techniques have been a big step forward in the
analysis of the environmental microbial communities, as well as
that associated with higher organisms. At present, the HGM is
mainly studied by analyzing fecal samples, which are relatively
easy to retrieve and to work with. However, there are reports of
important findings showing that bacteria present in the intestinal
biofilms taken from biopsy samples differ in composition from
those observed in fecal ones [18–20].
Fecal samples are generally studied using direct approaches like
16S rDNA clone libraries or metagenomics [21–23]. However, the
conventional DNA-based approach is unable to differentiate
between viable, not viable and dead bacterial cells [24,25]. Studies
carried out on diverse types of natural samples have reported
important differences in microbial composition when an RNA-
based approach is applied [26–28]. Another feature complicating
PLoS ONE | www.plosone.org 1 July 2011 | Volume 6 | Issue 7 | e22448
a thorough description of the HGM relates to the current lack of
knowledge concerning underrepresented bacterial taxa (URB).
These taxa are numerically diluted by the overwhelming presence
of other taxa, which are overrepresented (ORB). This is the case,
for instance, of Firmicutes- and Bacteroidetes-related phylogroups
which represent about 75 % of the HGM. The remaining 25 %are still unknown or very poorly investigated [29,30]. These taxa
can belong to other phyla, or even to phylogroups very scarcely
represented within Firmicutes or Bacteroidetes. The rare biosphere is
actually a very discussed topic addressing questions about their
maintenance and contribution to the whole community [31].
Different analytical tools are needed to study URB. This is the case
of flow cytometry (FCM) and cell sorting techniques (CS).
Based on membrane integrity, FCM-CS has been applied to
quantify viable, injured and dead bacteria from fecal samples [32].
FCM-CS have also been applied, for example, to obtain the
genome scaffold of soil bacteria belonging to the TM7 phylum
[33], or to derive genomic information from uncultivated marine
organisms expressing a given gene [34]. Prior to the application of
genomic and/or metagenomic studies, FCM-CS has also been
successfully applied to count and/or enrich a given organism or
population from microbial communities [35–39]. Finally, in order
to study a selected fraction of a complex microbial community,
FCM-CS techniques can be a suitable choice for culture-
independent methodologies [40].
In the present work, we marked active microbial cells by means
of a technique based on the presence of RNA using pyronin-Y, a
fluorescent stain for total RNA. Thus, we have applied FCM-CS
to sort active microbial fraction from fecal samples of four healthy
volunteers. All fractions related to active and total bacteria have
been characterized by 16S rDNA gene amplification and next
generation sequencing (454 pyrosequencing), exploring the HGM
diversity. The taxonomical distributions of ORB and URB were
studied, with results indicating that in all samples active fraction
differed remarkably from that obtained from raw DNA fecal
samples. Several phylogroups appeared or disappeared on
applying cell sorting. One of the most striking results concerns
the high number of URB-related groups appearing only in the
active fractions. Finally, the results suggest that the active
population differs significantly from what is found by looking at
the total GIT microbial population which is, up-to-date, the most
common approach to gut microbiota descriptions.
Results and Discussion
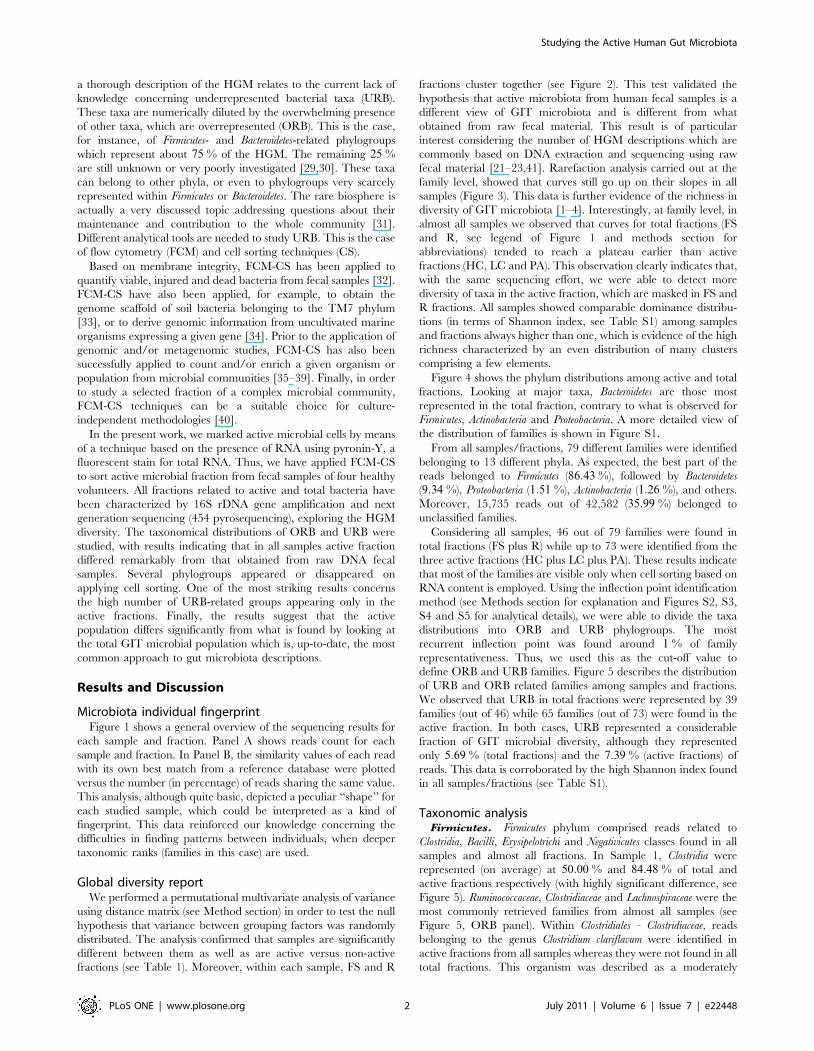
Microbiota individual fingerprintFigure 1 shows a general overview of the sequencing results for
each sample and fraction. Panel A shows reads count for each
sample and fraction. In Panel B, the similarity values of each read
with its own best match from a reference database were plotted
versus the number (in percentage) of reads sharing the same value.
This analysis, although quite basic, depicted a peculiar ‘‘shape’’ for
each studied sample, which could be interpreted as a kind of
fingerprint. This data reinforced our knowledge concerning the
difficulties in finding patterns between individuals, when deeper
taxonomic ranks (families in this case) are used.
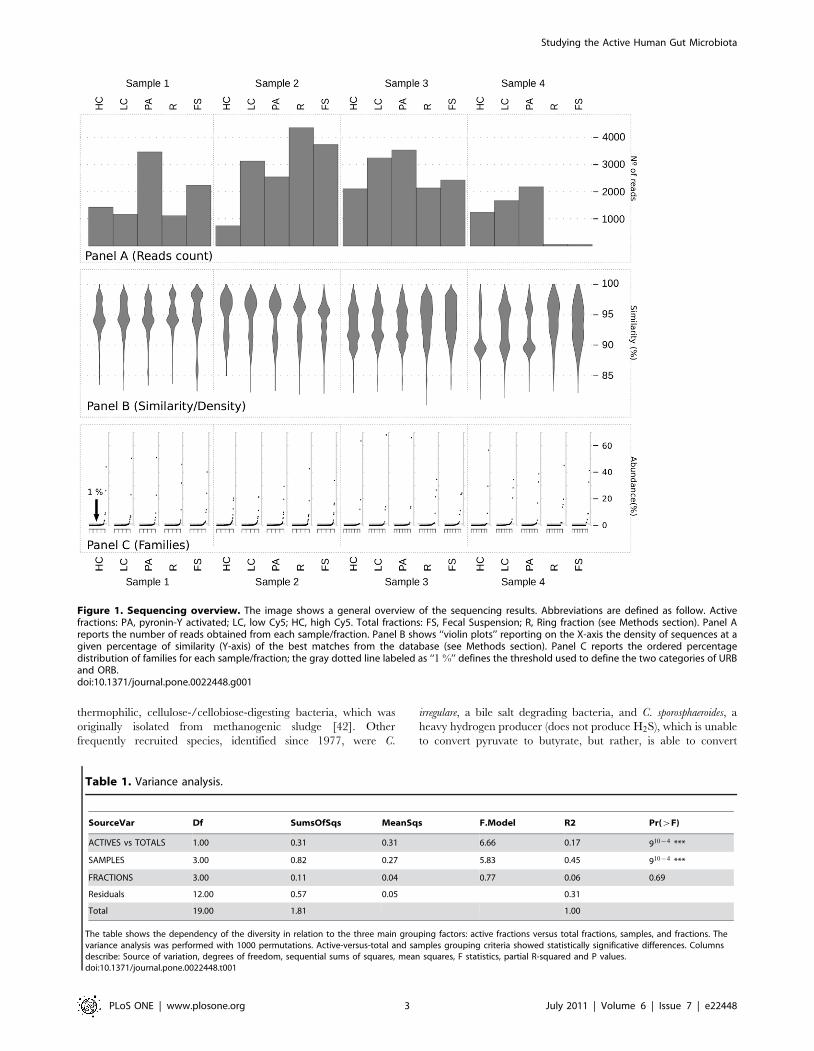
Global diversity reportWe performed a permutational multivariate analysis of variance
using distance matrix (see Method section) in order to test the null
hypothesis that variance between grouping factors was randomly
distributed. The analysis confirmed that samples are significantly
different between them as well as are active versus non-active
fractions (see Table 1). Moreover, within each sample, FS and R
fractions cluster together (see Figure 2). This test validated the
hypothesis that active microbiota from human fecal samples is a
different view of GIT microbiota and is different from what
obtained from raw fecal material. This result is of particular
interest considering the number of HGM descriptions which are
commonly based on DNA extraction and sequencing using raw
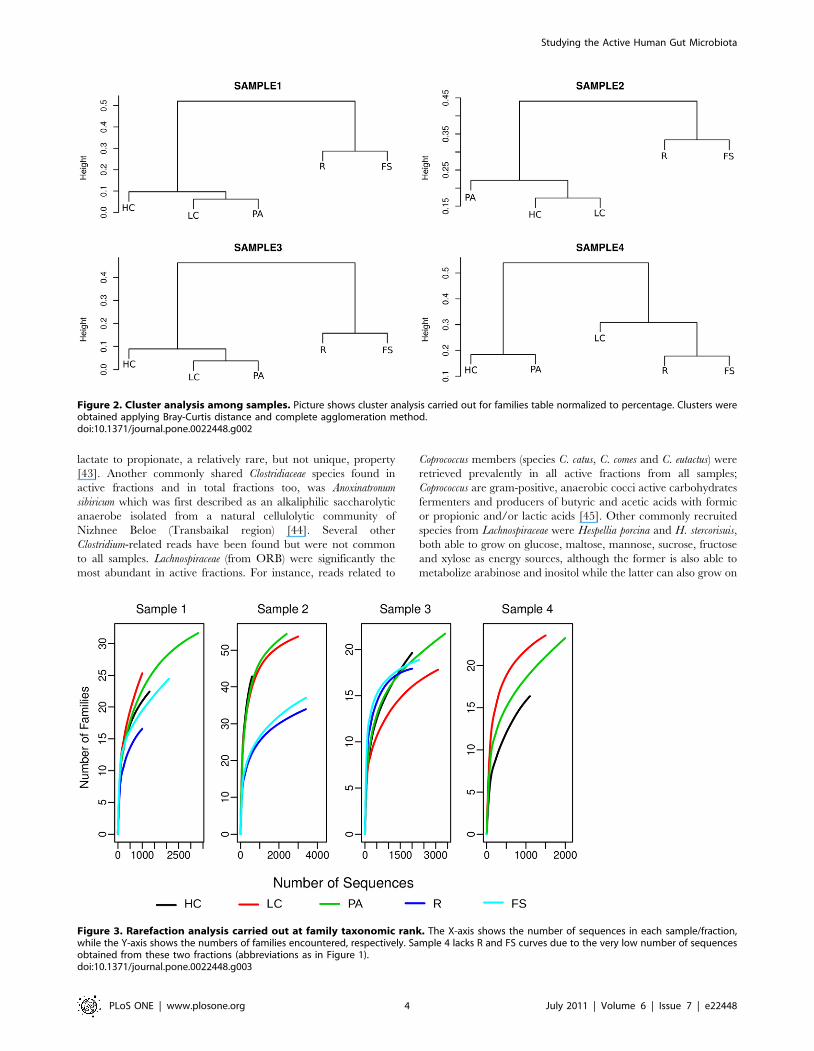
fecal material [21–23,41]. Rarefaction analysis carried out at the
family level, showed that curves still go up on their slopes in all
samples (Figure 3). This data is further evidence of the richness in
diversity of GIT microbiota [1–4]. Interestingly, at family level, in
almost all samples we observed that curves for total fractions (FS
and R, see legend of Figure 1 and methods section for
abbreviations) tended to reach a plateau earlier than active
fractions (HC, LC and PA). This observation clearly indicates that,
with the same sequencing effort, we were able to detect more
diversity of taxa in the active fraction, which are masked in FS and
R fractions. All samples showed comparable dominance distribu-
tions (in terms of Shannon index, see Table S1) among samples
and fractions always higher than one, which is evidence of the high
richness characterized by an even distribution of many clusters
comprising a few elements.
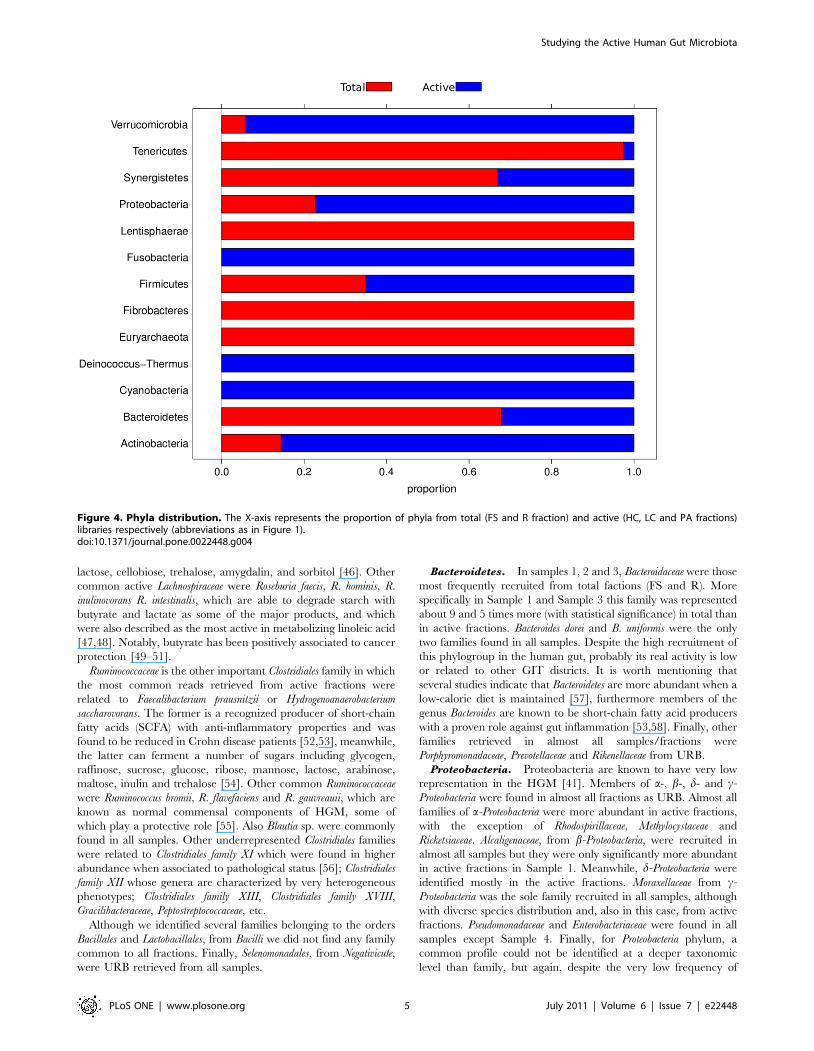
Figure 4 shows the phylum distributions among active and total
fractions. Looking at major taxa, Bacteroidetes are those most
represented in the total fraction, contrary to what is observed for
Firmicutes, Actinobacteria and Proteobacteria. A more detailed view of
the distribution of families is shown in Figure S1.
From all samples/fractions, 79 different families were identified
belonging to 13 different phyla. As expected, the best part of the
reads belonged to Firmicutes (86:43 %), followed by Bacteroidetes
(9:34 %), Proteobacteria (1:51 %), Actinobacteria (1:26 %), and others.
Moreover, 15,735 reads out of 42,582 (35:99 %) belonged to
unclassified families.
Considering all samples, 46 out of 79 families were found in
total fractions (FS plus R) while up to 73 were identified from the
three active fractions (HC plus LC plus PA). These results indicate
that most of the families are visible only when cell sorting based on
RNA content is employed. Using the inflection point identification
method (see Methods section for explanation and Figures S2, S3,
S4 and S5 for analytical details), we were able to divide the taxa
distributions into ORB and URB phylogroups. The most
recurrent inflection point was found around 1 % of family
representativeness. Thus, we used this as the cut-off value to
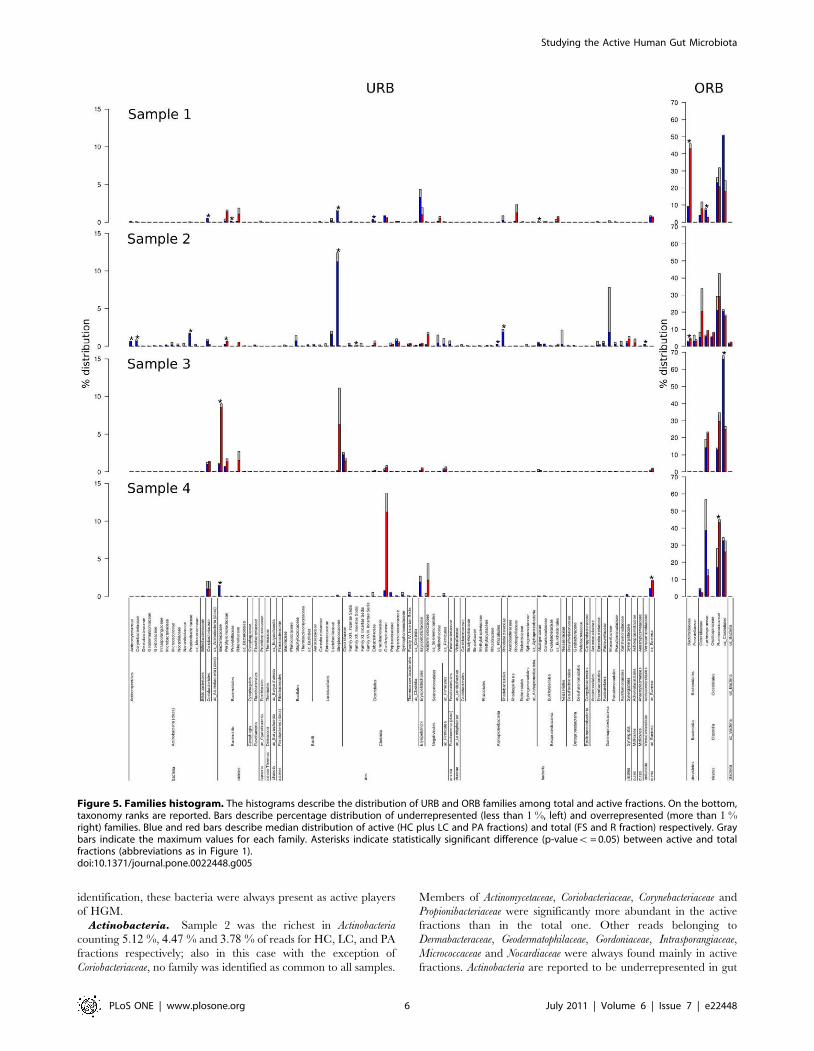
define ORB and URB families. Figure 5 describes the distribution
of URB and ORB related families among samples and fractions.
We observed that URB in total fractions were represented by 39
families (out of 46) while 65 families (out of 73) were found in the
active fraction. In both cases, URB represented a considerable
fraction of GIT microbial diversity, although they represented
only 5:69 % (total fractions) and the 7:39 % (active fractions) of
reads. This data is corroborated by the high Shannon index found
in all samples/fractions (see Table S1).
Taxonomic analysisFirmicutes. Firmicutes phylum comprised reads related to
Clostridia, Bacilli, Erysipelotrichi and Negativicutes classes found in all
samples and almost all fractions. In Sample 1, Clostridia were
represented (on average) at 50:00 % and 84:48 % of total and
active fractions respectively (with highly significant difference, see
Figure 5). Ruminococcaceae, Clostridiaceae and Lachnospiraceae were the
most commonly retrieved families from almost all samples (see
Figure 5, ORB panel). Within Clostridiales - Clostridiaceae, reads
belonging to the genus Clostridium clariflavum were identified in
active fractions from all samples whereas they were not found in all
total fractions. This organism was described as a moderately
Studying the Active Human Gut Microbiota
PLoS ONE | www.plosone.org 2 July 2011 | Volume 6 | Issue 7 | e22448
thermophilic, cellulose-/cellobiose-digesting bacteria, which was
originally isolated from methanogenic sludge [42]. Other
frequently recruited species, identified since 1977, were C.
irregulare, a bile salt degrading bacteria, and C. sporosphaeroides, a
heavy hydrogen producer (does not produce H2S), which is unable
to convert pyruvate to butyrate, but rather, is able to convert
Figure 1. Sequencing overview. The image shows a general overview of the sequencing results. Abbreviations are defined as follow. Activefractions: PA, pyronin-Y activated; LC, low Cy5; HC, high Cy5. Total fractions: FS, Fecal Suspension; R, Ring fraction (see Methods section). Panel Areports the number of reads obtained from each sample/fraction. Panel B shows ‘‘violin plots’’ reporting on the X-axis the density of sequences at agiven percentage of similarity (Y-axis) of the best matches from the database (see Methods section). Panel C reports the ordered percentagedistribution of families for each sample/fraction; the gray dotted line labeled as ‘‘1 %’’ defines the threshold used to define the two categories of URBand ORB.doi:10.1371/journal.pone.0022448.g001
Table 1. Variance analysis.
SourceVar Df SumsOfSqs MeanSqs F.Model R2 Pr(wF)
ACTIVES vs TOTALS 1.00 0.31 0.31 6.66 0.17 910{4 ***
SAMPLES 3.00 0.82 0.27 5.83 0.45 910{4 ***
FRACTIONS 3.00 0.11 0.04 0.77 0.06 0.69
Residuals 12.00 0.57 0.05 0.31
Total 19.00 1.81 1.00
The table shows the dependency of the diversity in relation to the three main grouping factors: active fractions versus total fractions, samples, and fractions. Thevariance analysis was performed with 1000 permutations. Active-versus-total and samples grouping criteria showed statistically significative differences. Columnsdescribe: Source of variation, degrees of freedom, sequential sums of squares, mean squares, F statistics, partial R-squared and P values.doi:10.1371/journal.pone.0022448.t001
Studying the Active Human Gut Microbiota
PLoS ONE | www.plosone.org 3 July 2011 | Volume 6 | Issue 7 | e22448
lactate to propionate, a relatively rare, but not unique, property
[43]. Another commonly shared Clostridiaceae species found in
active fractions and in total fractions too, was Anoxinatronum
sibiricum which was first described as an alkaliphilic saccharolytic
anaerobe isolated from a natural cellulolytic community of
Nizhnee Beloe (Transbaikal region) [44]. Several other
Clostridium-related reads have been found but were not common
to all samples. Lachnospiraceae (from ORB) were significantly the
most abundant in active fractions. For instance, reads related to
Coprococcus members (species C. catus, C. comes and C. eutactus) were
retrieved prevalently in all active fractions from all samples;
Coprococcus are gram-positive, anaerobic cocci active carbohydrates
fermenters and producers of butyric and acetic acids with formic
or propionic and/or lactic acids [45]. Other commonly recruited
species from Lachnospiraceae were Hespellia porcina and H. stercorisuis,
both able to grow on glucose, maltose, mannose, sucrose, fructose
and xylose as energy sources, although the former is also able to
metabolize arabinose and inositol while the latter can also grow on
Figure 2. Cluster analysis among samples. Picture shows cluster analysis carried out for families table normalized to percentage. Clusters wereobtained applying Bray-Curtis distance and complete agglomeration method.doi:10.1371/journal.pone.0022448.g002
Figure 3. Rarefaction analysis carried out at family taxonomic rank. The X-axis shows the number of sequences in each sample/fraction,while the Y-axis shows the numbers of families encountered, respectively. Sample 4 lacks R and FS curves due to the very low number of sequencesobtained from these two fractions (abbreviations as in Figure 1).doi:10.1371/journal.pone.0022448.g003
Studying the Active Human Gut Microbiota
PLoS ONE | www.plosone.org 4 July 2011 | Volume 6 | Issue 7 | e22448
lactose, cellobiose, trehalose, amygdalin, and sorbitol [46]. Other
common active Lachnospiraceae were Roseburia faecis, R. hominis, R.
inulinovorans R. intestinalis, which are able to degrade starch with
butyrate and lactate as some of the major products, and which
were also described as the most active in metabolizing linoleic acid
[47,48]. Notably, butyrate has been positively associated to cancer
protection [49–51].
Ruminococcaceae is the other important Clostridiales family in which
the most common reads retrieved from active fractions were
related to Faecalibacterium prausnitzii or Hydrogenoanaerobacterium
saccharovorans. The former is a recognized producer of short-chain
fatty acids (SCFA) with anti-inflammatory properties and was
found to be reduced in Crohn disease patients [52,53], meanwhile,
the latter can ferment a number of sugars including glycogen,
raffinose, sucrose, glucose, ribose, mannose, lactose, arabinose,
maltose, inulin and trehalose [54]. Other common Ruminococcaceae
were Ruminococcus bromii, R. flavefaciens and R. gauvreauii, which are
known as normal commensal components of HGM, some of
which play a protective role [55]. Also Blautia sp. were commonly
found in all samples. Other underrepresented Clostridiales families
were related to Clostridiales family XI which were found in higher
abundance when associated to pathological status [56]; Clostridiales
family XII whose genera are characterized by very heterogeneous
phenotypes; Clostridiales family XIII, Clostridiales family XVIII,
Gracilibacteraceae, Peptostreptococcaceae, etc.
Although we identified several families belonging to the orders
Bacillales and Lactobacillales, from Bacilli we did not find any family
common to all fractions. Finally, Selenomonadales, from Negativicute,
were URB retrieved from all samples.
Bacteroidetes. In samples 1, 2 and 3, Bacteroidaceae were those
most frequently recruited from total factions (FS and R). More
specifically in Sample 1 and Sample 3 this family was represented
about 9 and 5 times more (with statistical significance) in total than
in active fractions. Bacteroides dorei and B. uniformis were the only
two families found in all samples. Despite the high recruitment of
this phylogroup in the human gut, probably its real activity is low
or related to other GIT districts. It is worth mentioning that
several studies indicate that Bacteroidetes are more abundant when a
low-calorie diet is maintained [57], furthermore members of the
genus Bacteroides are known to be short-chain fatty acid producers
with a proven role against gut inflammation [53,58]. Finally, other
families retrieved in almost all samples/fractions were
Porphyromonadaceae, Prevotellaceae and Rikenellaceae from URB.
Proteobacteria. Proteobacteria are known to have very low
representation in the HGM [41]. Members of a-, b-, d- and c-
Proteobacteria were found in almost all fractions as URB. Almost all
families of a-Proteobacteria were more abundant in active fractions,
with the exception of Rhodospirillaceae, Methylocystaceae and
Ricketsiaceae. Alcaligenaceae, from b-Proteobacteria, were recruited in
almost all samples but they were only significantly more abundant
in active fractions in Sample 1. Meanwhile, d-Proteobacteria were
identified mostly in the active fractions. Moraxellaceae from c-
Proteobacteria was the sole family recruited in all samples, although
with diverse species distribution and, also in this case, from active
fractions. Pseudomonadaceae and Enterobacteriaceae were found in all
samples except Sample 4. Finally, for Proteobacteria phylum, a
common profile could not be identified at a deeper taxonomic
level than family, but again, despite the very low frequency of
Figure 4. Phyla distribution. The X-axis represents the proportion of phyla from total (FS and R fraction) and active (HC, LC and PA fractions)libraries respectively (abbreviations as in Figure 1).doi:10.1371/journal.pone.0022448.g004
Studying the Active Human Gut Microbiota
PLoS ONE | www.plosone.org 5 July 2011 | Volume 6 | Issue 7 | e22448
identification, these bacteria were always present as active players
of HGM.
Actinobacteria. Sample 2 was the richest in Actinobacteria
counting 5:12 %, 4:47 % and 3:78 % of reads for HC, LC, and PA
fractions respectively; also in this case with the exception of
Coriobacteriaceae, no family was identified as common to all samples.
Members of Actinomycetaceae, Coriobacteriaceae, Corynebacteriaceae and
Propionibacteriaceae were significantly more abundant in the active
fractions than in the total one. Other reads belonging to
Dermabacteraceae, Geodermatophilaceae, Gordoniaceae, Intrasporangiaceae,
Micrococcaceae and Nocardiaceae were always found mainly in active
fractions. Actinobacteria are reported to be underrepresented in gut
Figure 5. Families histogram. The histograms describe the distribution of URB and ORB families among total and active fractions. On the bottom,taxonomy ranks are reported. Bars describe percentage distribution of underrepresented (less than 1 %, left) and overrepresented (more than 1 %right) families. Blue and red bars describe median distribution of active (HC plus LC and PA fractions) and total (FS and R fraction) respectively. Graybars indicate the maximum values for each family. Asterisks indicate statistically significant difference (p-valuev = 0.05) between active and totalfractions (abbreviations as in Figure 1).doi:10.1371/journal.pone.0022448.g005
Studying the Active Human Gut Microbiota
PLoS ONE | www.plosone.org 6 July 2011 | Volume 6 | Issue 7 | e22448
phylogenetic descriptions, although there is evidence of their active
role as demonstrated by FISH-related studies [30,59]. For a
detailed view on distribution of families see Figure 5.
ConclusionsThe RNA-based cell sorting approach enables the HGM total
and active population to be clearly differentiated. The pyronin-Y-
based sorting methodology provides more detailed information of
the complex HGM community, highlighting the presence of active
underrepresented bacteria hidden by the over represented ones. At
family level the active fractions tend to cluster together
independently of the sample. Finally, altogether the data clearly
show that the functional microbiome should not be deduced
uniquely from DNA-based experiments using raw fecal samples.
Methods
Sample collection and microbial fractions preparationFecal samples were obtained from four healthy human
volunteers (three male and one female) between 25 and 35 years
old, resident in Valencia (Spain). All volunteers follow a
Mediterranean diet. The volunteers involved in this study
provided their written informed consent. The study was approved
by the Ethics and Research Committee of Centre for Public
Health Research (CSISP) of Valencia, Spain. None of the
volunteers had intestinal organic disorders or recent treatment
with antibiotics. Samples were collected in sterile 30 ml screw-cap
containers (25690 mm; PP SPOON; DELTALAB), containing
8 ml RNAlater (Ambion #AM7020) in order to preserve RNA.
The samples were delivered to the laboratory within 24 h and
stored at {800C. For each sample, around one gram of fecal
material was suspended by vortexing (2 min). Fecal suspension was
centrifuged (800 g) for 2 min to pellet big aggregates. Supernatant
was centrifuged at 7500 g for 7 min to collect microbial cells from
fecal suspension. Pellet was washed twice in PBS (Phosphate Buffer
Saline, Sigma-Aldrich #P4417-100TAB). A sub-sample of fecal
suspension (hereinafter ‘‘FS’’) was stored, considered as the total
microbiota control for each sample in order to describe the whole
fecal microbial community (standard metagenomic approach).
Two concentrations of Histodenz (Sigma-Aldrich #D2158), (35 %and 12 %), were dissolved in PBS and sterilized by 0.22 mm
filtration; 35 % and 12 % Histodenz solutions were stratified (2 ml
each) in 15 ml sterile centrifuge tubes. Two milliliters of fecal
suspension were finally deposited onto the 12 % Histodenz layer
and centrifuged for 7 min at 5000 g in a swing out rotor centrifuge
at 100C. This step is crucial for detached microbial cells collection.
Time, speed and temperature were optimized to avoid over-
centrifugation, which could produce aggregation of microbial cells
(data not shown). After centrifugation, two stratifications could
clearly be identified on top of the 12 % and 35 % layers and a
pellet at the bottom of the tube (see Figure S6). Upper PBS and
12 % layers were gently removed by pipetting. Cells floating on
the 35 % layers (called ‘‘Ring fraction’’, hereinafter ‘‘R’’ fraction),
containing microbial cells, were aspired and moved into a sterile
1.5 ml tube, washed twice and resuspended finally in 900 ml of
PBS. Microscopical observation of 12 % layer showed few
bacterial cells as well as some debris; pellet at the bottom of the
tube showed mainly fibers and microbial aggregates. Cells were
immediately fixed adding 100 ml of 37 % formaldehyde (final
concentration: 3:7 %) and incubated over-night at 40C. Fixed cells
were washed twice to remove residual formaldehyde.
Fluorescent in situ hybridization (FISH). A subsample of
100 ml of cells from R fraction, with an optical density (O.D. 600)
around 1, were permeabilized by lysozyme (Sigma-Aldrich
#L7651 approx 120 units/mg protein, 9 min at 370C) in order
to facilitate probe diffusion into Gram-positive bacteria.
Afterwards, tubes were chilled on ice and washed twice in PBS.
Microbial cells from the previous step were resuspended in 50 ml of
hybridization buffer (final concentration: NaCl 0.9 M, TrisHCl
0.02 M, SDS 0:01 %). One ml (0.5 mg/ml) of each Cy5-labeled
probe was added to the mixture (see Table S2 for probe details).
Hybridization was carried out for three hours at 560C. In order to
remove non-specifically hybridized probes, 1 ml of hybridization
buffer was added to the tubes and transferred to a 580C bath for
15 min. Hybridization mixture was then washed twice in PBS and
finally resuspended in 1 ml of PBS. The attempt to distinguish
between highly represented phylogroups and the rest of the
bacteria, supposedly not hybridized to fluorescent probes, did not
work as expected, resulting in an undifferentiated distribution of
reads between HC and LC samples (data not shown). A further
optimization is required.
RNA staining. One microliter of pyronin-Y (Sigma-Aldrich
#P9172, 10 mg/ml) was added to the sample from previous step
(1 ml of volume) for total RNA staining and incubated for 20 min
at 40C. Cells were then collected by centrifugation and washed
twice in PBS and finally resuspended in 50 ml of PBS. Cells were
stored at 40C before sorting (same day).
Cell Sorting (CS). Microbial cell sorting was carried out
using the MoFloTM XDP cell sorter. The cytometer emission
filter was the 580/30. The trigger was in FL2. The light sources
were the Argon 488 nm (blue) laser (200 mW power) and the
635 nm (red) diode laser (25 mW power). The lasers were aligned
using Flow-CheckTM (10mm) and Flow-SetTM (3mm) Beckman
Coulter Beads.
One microliter of each sample was diluted in 10 ml of 0.2 mm
filtered PBS. FL2 PMT (Photo Multiplier Tube) detected
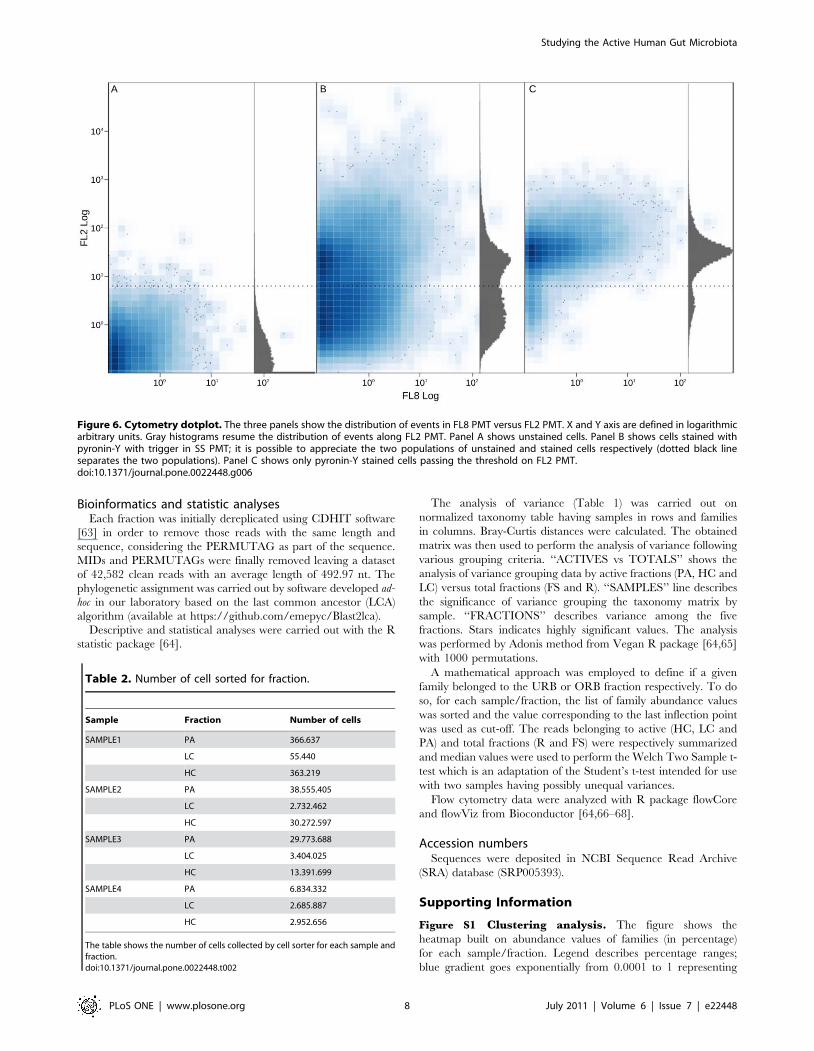
fluorescence emitted by excited pyronin-Y. Control experiments
to set the discriminator level were carried out with samples not
stained with pyronin-Y (see Figure 6). All particles not stained with
pyronin-Y (spore, inactive or dead cells and debris) were
discriminated and filtered out. Thus, we restricted the analysis to
cells with high RNA concentration only; this fraction was called
‘‘PA’’ (pyronin-Y activated, Figure S7, green frame). Number of
cells sorted from each fraction are reported in Table 2. Moreover
we attempted to separate cells by Cy5 fluorescent probe, obtaining
not-hybridized (‘‘LC’’, low Cy5, dark green frame) and Cy5-
hybridized (‘‘HC’’, high Cy5, red frame) cell fractions. All fractions
were sorted into sterile plastic tubes for further applications (see
Figure S7 for a general view of FCM-CS dotplots). A schema
clarifying the methodology is provided in Figure S8.
DNA extraction and rDNA amplificationDNA extraction from all fractions was carried out using the
CTAB method [60]. Total 16S rDNA was amplified from each
fraction using 27F and 530R universal primers [61]. Forward and
reverse primers were linked to multiplex identifier (MID) and
‘‘PERMUTAG’’ (WGNGNNGW), a combinatory tag to discrim-
inate between exactly equal sequences coming from a documented
pyrosequencing bias related to emulsion PCR [62], from which
are fully identical sequences. PERMUTAGs allow 256 possible
combinations, permitting discrimination of PCR products origi-
nated from different templates. The structure for each primer was
finally MID-PERMUTAG-TC(linker)-Primer (see Table S3 for
details). PCR products obtained from each fraction/sample were
purified by Nucleofast 96 PCR filter plates (Macherey Nagel
#74310050), pooled together in equimolar concentration and
sequenced by massive parallel 454 pyrosequencing (Roche) in 1/8
of plate (Titanium chemistry).
Studying the Active Human Gut Microbiota
PLoS ONE | www.plosone.org 7 July 2011 | Volume 6 | Issue 7 | e22448
Bioinformatics and statistic analysesEach fraction was initially dereplicated using CDHIT software
[63] in order to remove those reads with the same length and
sequence, considering the PERMUTAG as part of the sequence.
MIDs and PERMUTAGs were finally removed leaving a dataset
of 42,582 clean reads with an average length of 492.97 nt. The
phylogenetic assignment was carried out by software developed ad-
hoc in our laboratory based on the last common ancestor (LCA)
algorithm (available at https://github.com/emepyc/Blast2lca).
Descriptive and statistical analyses were carried out with the R
statistic package [64].
The analysis of variance (Table 1) was carried out on
normalized taxonomy table having samples in rows and families
in columns. Bray-Curtis distances were calculated. The obtained
matrix was then used to perform the analysis of variance following
various grouping criteria. ‘‘ACTIVES vs TOTALS’’ shows the
analysis of variance grouping data by active fractions (PA, HC and
LC) versus total fractions (FS and R). ‘‘SAMPLES’’ line describes
the significance of variance grouping the taxonomy matrix by
sample. ‘‘FRACTIONS’’ describes variance among the five
fractions. Stars indicates highly significant values. The analysis
was performed by Adonis method from Vegan R package [64,65]
with 1000 permutations.
A mathematical approach was employed to define if a given
family belonged to the URB or ORB fraction respectively. To do
so, for each sample/fraction, the list of family abundance values
was sorted and the value corresponding to the last inflection point
was used as cut-off. The reads belonging to active (HC, LC and
PA) and total fractions (R and FS) were respectively summarized
and median values were used to perform the Welch Two Sample t-
test which is an adaptation of the Student’s t-test intended for use
with two samples having possibly unequal variances.
Flow cytometry data were analyzed with R package flowCore
and flowViz from Bioconductor [64,66–68].
Accession numbersSequences were deposited in NCBI Sequence Read Archive
(SRA) database (SRP005393).
Supporting Information
Figure S1 Clustering analysis. The figure shows the
heatmap built on abundance values of families (in percentage)
for each sample/fraction. Legend describes percentage ranges;
blue gradient goes exponentially from 0.0001 to 1 representing
Figure 6. Cytometry dotplot. The three panels show the distribution of events in FL8 PMT versus FL2 PMT. X and Y axis are defined in logarithmicarbitrary units. Gray histograms resume the distribution of events along FL2 PMT. Panel A shows unstained cells. Panel B shows cells stained withpyronin-Y with trigger in SS PMT; it is possible to appreciate the two populations of unstained and stained cells respectively (dotted black lineseparates the two populations). Panel C shows only pyronin-Y stained cells passing the threshold on FL2 PMT.doi:10.1371/journal.pone.0022448.g006
Table 2. Number of cell sorted for fraction.
Sample Fraction Number of cells
SAMPLE1 PA 366.637
LC 55.440
HC 363.219
SAMPLE2 PA 38.555.405
LC 2.732.462
HC 30.272.597
SAMPLE3 PA 29.773.688
LC 3.404.025
HC 13.391.699
SAMPLE4 PA 6.834.332
LC 2.685.887
HC 2.952.656
The table shows the number of cells collected by cell sorter for each sample andfraction.doi:10.1371/journal.pone.0022448.t002
Studying the Active Human Gut Microbiota
PLoS ONE | www.plosone.org 8 July 2011 | Volume 6 | Issue 7 | e22448
URB distributions, brown gradient representing ORB. Dendro-
gram on top of the chart clusters the fractions. Abbreviations are
defined as follow. Active fractions: PA, pyronin-Y activated; LC,
low Cy5; HC, high Cy5. Total fractions: FS, Fecal Suspension; R,
Ring fraction (see Methods section).
(PDF)
Figure S2 Inflection points. Sample 1. Top panels show the
second derivative used to calculate inflection points for each
fraction. Bottom panels show ordered family distributions in
percentages. Red lines describe the smoothed curve calculated for
ordered family distribution data points. Dashed vertical lines mark
the identified inflection points for each fraction (continue…).
(PDF)
Figure S3 Inflection points. Sample 2. (Follow): Top panels
show the second derivative used to calculate inflection points for
each fraction. Bottom panels show ordered family distributions in
percentages. Red lines describe the smoothed curve calculated for
ordered family distribution data points. Dashed vertical lines mark
the identified inflection points for each fraction (continue…).
(PDF)
Figure S4 Inflection points. Sample 3. (Follow): Top panels
show the second derivative used to calculate inflection points for
each fraction. Bottom panels show ordered family distributions in
percentages. Red lines describe the smoothed curve calculated for
ordered family distribution data points. Dashed vertical lines mark
the identified inflection points for each fraction (continue…).
(PDF)
Figure S5 Inflection points. Sample 4. (Follow): Top panels
show the second derivative used to calculate inflection points for
each fraction. Bottom panels show ordered family distributions in
percentages. Red lines describe the smoothed curve calculated for
ordered family distribution data points. Dashed vertical lines mark
the identified inflection points for each fraction.
(PDF)
Figure S6 Microbial cell preparation from fecal sam-ples. Microscopy photograph on the left (panel a) shows DAPI
stained microbial cells obtained from R fraction recovered from
35 % Hystodenz layer (panel b). Photograph on the right (panel c)
shows DAPI stained microbial cells from pellet layer with several
fiber-like structures and microbe aggregates.
(PDF)
Figure S7 Cytometry dotplot. Fluorescence dotplot of
pyronine-Y-activated cells. The X-axis describes the intensity of
fluorescence emitted by each cell (arbitrary units), measured on the
FL8 photomultiplier. The Y-axis describes the intensity of the
fluorescence emitted by each cell passing over the FL2
discriminator (bacteria stained with pyronin-Y). The PA region
was used to collect all pyronin-Y activated cells; LC region
collected cells with low or null Cy5 fluorescence emission; HC
region collected mainly cells hybridized with group-specific probes
with high Cy5 fluorescence emission. Flow cytometry data were
analyzed with R package flowCore and flowViz by Bioconductor
[64,66–68].
(PDF)
Figure S8 Protocol schema. Arrows define the work flow.
Black arrows ideally represents all cells and particles contained in
the samples. Red arrows represents the fraction of the microbiota
hybridized to CY5 probes. Green arrows represents the fraction of
cells labeled with pyronin-Y. Double colored arrows indicate cells
stained simultaneously with pyronin-Y and CY5 fluorescent
probes. Gray arrows represents the unstained fraction (supposedly
inactive, spore, dead cells or simply debris). In bold are
represented the fractions obtained for downstream sequencing.
(PDF)
Table S1 Diversity indexes. Main diversity indexescalculated at family taxonomy rank for each sample/fraction.
(PDF)
Table S2 Probes used in this work [69–73].
(PDF)
Table S3 Multiplex Identifiers (MIDs) list and universal16S rRNA primers used in this work [61].
(PDF)
Acknowledgments
FCM-CS experiments were carried out using facilities at the Servei Central de
Suport a la Investigacio Experimental (SCSIE), University of Valencia. We want
to thank Dr. Juan Jose Abellan from Centre for Public Health Research
(CSISP) of Valencia, Spain, for stimulating discussions and suggestions
about statistical analysis.
Author Contributions
Conceived and designed the experiments: FPB AL AM GD. Performed the
experiments: FPB GD. Analyzed the data: FPB AA GD. Wrote the paper:
FPB AL AM GD.
References
1. Stark PL, Lee A (1982) The microbial ecology of the large bowel of breast-fed
and formula-fed infants during the first year of life. J Med Microbiol 15:
189–203.
2. Eckburg PB, Bik EM, Bernstein CN, Purdom E, Dethlefsen L, et al. (2005)
Diversity of the human intestinal microbial flora. Science 308: 1635–1638.
3. Gill SR, Pop M, Deboy RT, Eckburg PB, Turnbaugh PJ, et al. (2006)
Metagenomic analysis of the human distal gut microbiome. Science 312:
1355–1359.
4. Qin J, Li R, Raes J, Arumugam M, Burgdorf KS, et al. (2010) A human gut
microbial gene catalogue established by metagenomic sequencing. Nature 464:
59–65.
5. Gosalbes MJ, Durban A, Pignatelli M, Abellan JJ, Jimenez-Hernandez N, et al.
(2011) Metatran-scriptomic approach to analyze the functional human gut
microbiota. PLoS ONE 6: e17447+.
6. Dethlefsen L, McFall-Ngai M, Relman DA (2007) An ecological and
evolutionary perspective on human-microbe mutualism and disease. Nature
449: 811–818.
7. Hold GL, Pryde SE, Russell VJ, Furrie E, Flint HJ (2002) Assessment of
microbial diversity in human colonic samples by 16s rdna sequence analysis.
FEMS Microbiol Ecol 39: 33–39.
8. Sonnenburg JL, Xu J, Leip DD, Chen CH, Westover BP, et al. (2005) Glycan
foraging in vivo by an intestine-adapted bacterial symbiont. Science 307:
1955–1959.
9. Collins SM, Denou E, Verdu EF, Bercik P (2009) The putative role of the
intestinal microbiota in the irritable bowel syndrome. Dig Liver Dis 41:
850–853.
10. Sanz Y, Santacruz A, De Palma G (2008) Insights into the roles of gut microbes
in obesity. Interdiscip Perspect Infect Dis 829101 2008: 829101.
11. Campieri M, Gionchetti P (2001) Bacteria as the cause of ulcerative colitis. Gut
48: 132–135.
12. Guarner F, Malagelada JR (2003) Role of bacteria in experimental colitis. Best
Pract Res Clin Gastroenterol 17: 793–804.
13. Wasilewska J, Jarocka-Cyrta E, Kaczmarski M (2009) Gastrointestinal
abnormalities in children with autism. Pol Merkur Lekarski 27: 40–43.
14. Furrie E (2006) A molecular revolution in the study of intestinal microflora. Gut
55: 141–143.
15. Turnbaugh PJ, Hamady M, Yatsunenko T, Cantarel BL, Duncan A, et al.
(2009) A core gut microbiome in obese and lean twins. Nature 457: 480–484.
16. Tamboli CP, Neut C, Desreumaux P, Colombel JF (2004) Dysbiosis in
inflammatory bowel disease. Gut 53: 1–4.
Studying the Active Human Gut Microbiota
PLoS ONE | www.plosone.org 9 July 2011 | Volume 6 | Issue 7 | e22448
17. Keller M, Ramos JL (2008) Microbial goods from single cells and metagenomes.
Curr Opin Microbiol 11: 195–197.18. Zoetendal EG, Cheng B, Koike S, Mackie RI (2004) Molecular microbial
ecology of the gastrointestinal tract: from phylogeny to function. Curr Issues
Intest Microbiol 5: 31–47.19. Macfarlane S, Dillon JF (2007) Microbial biofilms in the human gastrointestinal
tract. J Appl Microbiol 102: 1187–1196.20. Durban A, Abellan JJ, Jimenez-Hernandez N, Ponce M, Ponce J, et al. (2011)
Assessing gut microbial diversity from feces and rectal mucosa. Microb Ecol 61:
123–133.21. Hattori M, Taylor TD (2009) The human intestinal microbiome: a new frontier
of human biology. DNA Res 16: 1–12.22. Hsiao WW, Fraser-Liggett CM (2009) Human microbiome project–paving the
way to a better understanding of ourselves and our microbes. Drug DiscovToday 14: 331–333.
23. Peterson J, Garges S, Giovanni M, McInnes P, Wang L, et al. (2009) The nih
human microbiome project. Genome Res 19: 2317–2323.24. Burtscher C, Wuertz S (2003) Evaluation of the use of pcr and reverse
transcriptase pcr for detection of pathogenic bacteria in biosolids from anaerobicdigestors and aerobic composters. Appl Environ Microbiol 69: 4618–4627.
25. Cordova-Kreylos AL, Cao Y, Green PG, Hwang HM, Kuivila KM, et al. (2006)
Diversity, composition, and geographical distribution of microbial communitiesin california salt marsh sediments. Appl Environ Microbiol 72: 3357–3366.
26. Josephson KL, Gerba CP, Pepper IL (1993) Polymerase chain reaction detectionof nonviable bacterial pathogens. Appl Environ Microbiol 59: 3513–3515.
27. Daffonchio D, Borin S, Brusa T, Brusetti L, van der Wielen PW, et al. (2006)Stratified prokaryote network in the oxic-anoxic transition of a deep-sea
halocline. Nature 440: 203–207.
28. Gentile G, Giuliano L, D, Auria G, et al. (2006) Study of bacterial communitiesin Antarctic coastal waters by a combination of 16s rrna and 16s rdna
sequencing. Environ Microbiol 8: 2150–2161.29. Suau A, Bonnet R, Sutren M, Godon JJ, Gibson GR, et al. (1999) Direct analysis
of genes encoding 16s rrna from complex communities reveals many novel
molecular species within the human gut. Appl Environ Microbiol 65:4799–4807.
30. Lay C, Rigottier-Gois L, Holmstrom K, Rajilic M, Vaughan EE, et al. (2005)Colonic microbiota signatures across five northern european countries. Appl
Environ Microbiol 71: 4153–4155.31. Lennon J, Jones S (2011) Microbial seed banks: the ecological and evolutionary
implications of dormancy. Nature Reviews Microbiology 9: 119–130.
32. Ben-Amor K, Heilig H, Smidt H, Vaughan EE, Abee T, et al. (2005) Geneticdiversity of viable, injured, and dead fecal bacteria assessed by fluorescence-
activated cell sorting and 16s rrna gene analysis. Appl Environ Microbiol 71:4679–4689.
33. Podar M, Abulencia CB, Walcher M, Hutchison D, Zengler K, et al. (2007)
Targeted access to the genomes of low-abundance organisms in complexmicrobial communities. Appl Environ Microbiol 73: 3205–3214.
34. Stepanauskas R, Sieracki ME (2007) Matching phylogeny and metabolism in theuncultured marine bacteria, one cell at a time. Proc Natl Acad Sci U S A 104:
9052–9057.35. Nebe-von Caron G, Stephens PJ, Hewitt CJ, Powell JR, Badley RA (2000)
Analysis of bacterial function by multi-colour fluorescence flow cytometry and
single cell sorting. J Microbiol Methods 42: 97–114.36. Zoetendal EG, Ben-Amor K, Harmsen HJ, Schut F, Akkermans AD, et al.
(2002) Quantification of uncultured ruminococcus obeum-like bacteria inhuman fecal samples by fluorescent in situ hybridization and flow cytometry
using 16s rrna-targeted probes. Appl Environ Microbiol 68: 4225–4232.
37. Collado MC, Calabuig M, Sanz Y (2007) Differences between the fecalmicrobiota of coeliac infants and healthy controls. Curr Issues Intest Microbiol
8: 9–14.38. McHugh IO, Tucker AL (2007) Flow cytometry for the rapid detection of
bacteria in cell culture production medium. Cytometry A 71: 1019–1026.
39. Heine F, Stahl F, Struber H, Wiacek C, Benndorf D, et al. (2009) Prediction offlocculation ability of brewing yeast inoculates by flow cytometry, proteome
analysis, and mrna profiling. Cytometry A 75: 140–147.40. Muller S, Nebe-von Caron G (2010) Functional single-cell analyses: flow
cytometry and cell sorting of microbial populations and communities. FEMSMicrobiol Rev 34: 554–587.
41. Wu GD, Lewis JD, Hoffmann C, Chen YY, Knight R, et al. (2010) Sampling
and pyrosequencing methods for characterizing bacterial communities in thehuman gut using 16s sequence tags. BMC Microbiol 10: 206.
42. Shiratori H, Sasaya K, Ohiwa H, Ikeno H, Ayame S, et al. (2009) Clostridiumclariflavum sp. nov. and clostridium caenicola sp. nov., moderately thermophilic,
cellulose-/cellobiose-digesting bacteria isolated from methanogenic sludge.
Int J Syst Evol Microbiol 59: 1764–1770.43. Mahony DE, Meier CE, Macdonald IA, Holdeman LV (1977) Bile salt
degradation by nonfermen-tative clostridia. Appl Environ Microbiol 34:419–423.
44. Garnova ES, Zhilina TN, Tourova TP, Lysenko AM (2003) Anoxynatronumsibiricum gen.nov., sp.nov. alkaliphilic saccharolytic anaerobe from cellulolytic
community of nizhnee beloe (transbaikal region). Extremophiles 7: 213–220.
45. Holdeman L, Moore W (1974) New genus, coprococcus, twelve new species, andemended descriptions of four previously described species of bacteria from
human feces. Int J Syst Bacteriol 24: 260–277.
46. Whitehead TR, Cotta MA, Collins MD, Lawson PA (2004) Hespellia stercorisuisgen. nov., sp. nov. and hespellia porcina sp. nov., isolated from swine manure
storage pits. Int J Syst Evol Microbiol 54: 241–245.
47. Devillard E, McIntosh FM, Duncan SH, Wallace RJ (2007) Metabolism oflinoleic acid by human gut bacteria: different routes for biosynthesis of
conjugated linoleic acid. J Bacteriol 189: 2566–2570.
48. Duncan SH, Hold GL, Barcenilla A, Stewart CS, Flint HJ (2002) Roseburiaintestinalis sp. nov., a novel saccharolytic, butyrate-producing bacterium from
human faeces. Int J Syst Evol Microbiol 52: 1615–1620.
49. Tan HT, Tan S, Lin Q, Lim TK, Hew CL, et al. (2008) Quantitative and
temporal proteome analysis of butyrate-treated colorectal cancer cells. Mol Cell
Proteomics 7: 1174–1185.
50. Comalada M, Bailon E, de Haro O, Lara-Villoslada F, Xaus J, et al. (2006) The
effects of short-chain fatty acids on colon epithelial proliferation and survivaldepend on the cellular phenotype. J Cancer Res Clin Oncol 132: 487–497.
51. Louis P, Duncan SH, McCrae SI, Millar J, Jackson MS, et al. (2004) Restricted
distribution of the butyrate kinase pathway among butyrate-producing bacteriafrom the human colon. J Bacteriol 186: 2099–2106.
52. Sokol H, Pigneur B, Watterlot L, Lakhdari O, Bermdez-Humarn LG, et al.
(2008) Faecalibacterium prausnitzii is an anti-inflammatory commensalbacterium identified by gut microbiota analysis of crohn disease patients. Proc
Natl Acad Sci U S A 105: 16731–16736.
53. Scheppach W, Weiler F (2004) The butyrate story: old wine in new bottles? Curr
Opin Clin Nutr Metab Care 7: 563–567.
54. Song L, Dong X (2009) Hydrogenoanaerobacterium saccharovorans gen. nov.,sp. nov., isolated from H2-producing UASB granules. Int J Syst Evol Microbiol
59: 295–299.
55. Kang S, Denman SE, Morrison M, Yu Z, Dore J, et al. (2010) Dysbiosis of fecalmicrobiota in Crohn’s disease patients as revealed by a custom phylogenetic
microarray. Inflamm Bowel Dis 16: 2034–2042.
56. Price LB, Liu CM, Melendez JH, Frankel YM, Engelthaler D, et al. (2009)
Community analysis of chronic wound bacteria using 16S rRNA gene-based
pyrosequencing: impact of diabetes and antibiotics on chronic woundmicrobiota. PLoS ONE 4: e6462.
57. Ley RE, Turnbaugh PJ, Klein S, Gordon JI (2006) Microbial ecology: humangut microbes associated with obesity. Nature 444: 1022–1023.
58. De Filippo C, Cavalieri D, Di Paola M, Ramazzotti M, Poullet JB, et al. (2010)
Impact of diet in shaping gut microbiota revealed by a comparative study inchildren from Europe and rural Africa. Proc Natl Acad Sci USA 107:
14691–14696.
59. Harmsen HJM, Raangs GC, He T, Degener JE, Welling GW (2002) Extensiveset of 16s rrna-based probes for detection of bacteria in human feces. Appl
Environ Microbiol 68: 2982–2990.
60. Ausubel F, Brent R, Kinston R, Moore D, Seidman J, et al. (1992) Current
protocol in molecular biology. pp 2.1.1–2.4.5.
61. Lane DDJ, Stackenbrandt E, Goodfellow M (1991) 16S/23S rRNA sequencing.John Wiley and Sons, nucleic acid techniques in bacterial systematics edition
115-175.
62. Niu B, Fu L, Sun S, Li W (2010) Artificial and natural duplicates inpyrosequencing reads of metagenomic data. BMC Bioinformatics 11: 187.
63. Li W, Godzik A (2006) Cd-hit: a fast program for clustering and comparing large
sets of protein or nucleotide sequences. Bioinformatics 22: 1658–1659.
64. R Development Core Team (2010) R: A Language and Environment for
Statistical Computing. R Foundation for Statistical Computing. Vienna, Austria,Available: http://www.R-project.org. ISBN 3-900051-07-0.
65. Oksanen J, Blanchet FG, Kindt R, Legendre P, O’Hara RB, et al. (2010) vegan:
Community Ecology Package. Available: http://CRAN.R-project.org/packa-ge = vegan. R package version 1.. pp 17–3.
66. Gentleman RC, Carey VJ, Bates DM, others (2004) Bioconductor: Open
software development for computational biology and bioinformatics. GenomeBiology 5: R80.
67. Ellis B, Haaland P, Hahne F, Meur NL, Gopalakrishnan N flowCore: flowCore:Basic structures for flow cytometry data. R package version 1.16.0.
68. Ellis B, Gentleman R, Hahne F, Meur NL, Sarkar D flowViz: Visualization for
flow cytometry. R package version 1.14.0.
69. Meier H, Amann R, Ludwig W, Schleifer KH (1999) Specific oligonucleotide
probes for in situ detection of a major group of gram-positive bacteria with low
dna g + c content. Syst Appl Microbiol 22: 186–196.
70. Franks AH, Harmsen HJ, Raangs GC, Jansen GJ, Schut F, et al. (1998)
Variations of bacterial populations in human feces measured by fluorescent insitu hybridization with group-specific 16s rrna-targeted oligonucleotide probes.
Appl Environ Microbiol 64: 3336–3345.
71. Rochet V, Rigottier-Gois L, Rabot S, Dor J (2004) Validation of fluorescent insitu hybridization combined with flow cytometry for assessing interindividual
variation in the composition of human fecal microflora during long-term storageof samples. J Microbiol Methods 59: 263–270.
72. O’Sullivan LA, Weightman AJ, Fry JC (2002) New degenerate cytophaga-
flexibacter-bacteroides- specific 16s ribosomal dna-targeted oligonucleotideprobes reveal high bacterial diversity in river taff epilithon. Appl Environ
Microbiol 68: 201–210.
73. Weller R, Glckner FO, Amann R (2000) 16s rrna-targeted oligonucleotideprobes for the in situ detection of members of the phylum cytophaga-
flavobacterium-bacteroides. Syst Appl Microbiol 23: 107–114.
Studying the Active Human Gut Microbiota
PLoS ONE | www.plosone.org 10 July 2011 | Volume 6 | Issue 7 | e22448
Copyright © 2022 FDOKUMEN