the acquisition of science process skills through - Open METU
272
THE ACQUISITION OF SCIENCE PROCESS SKILLS THROUGH GUIDED (TEACHER-DIRECTED) INQUIRY A THESIS SUBMITTED TO THE GRADUATE SCHOOL OF NATURAL AND APPLIED SCIENCES OF MIDDLE EAST TECHNICAL UNIVERSITY BY ELA AYŞE KÖKSAL IN PARTIAL FULFILMENT OF THE REQUIREMENTS FOR THE DEGREE OF DOCTOR OF PHILOSOPHY IN SECONDARY SCIENCE AND MATHEMATICS EDUCATION JUNE 2008
-
Upload
khangminh22 -
Category
Documents
-
view
2 -
download
0
Transcript of the acquisition of science process skills through - Open METU

THE ACQUISITION OF SCIENCE PROCESS SKILLS THROUGH GUIDED (TEACHER-DIRECTED) INQUIRY
A THESIS SUBMITTED TO THE GRADUATE SCHOOL OF NATURAL AND APPLIED SCIENCES
OF MIDDLE EAST TECHNICAL UNIVERSITY
BY
ELA AYŞE KÖKSAL
IN PARTIAL FULFILMENT OF THE REQUIREMENTS FOR
THE DEGREE OF DOCTOR OF PHILOSOPHY IN
SECONDARY SCIENCE AND MATHEMATICS EDUCATION
JUNE 2008

ii
Approval of the thesis:
THE ACQUISITION OF SCIENCE PROCESS SKILLS THROUGH GUIDED (TEACHER-DIRECTED) INQUIRY
submitted by ELA AYŞE KÖKSAL in partial fulfillment of the requirements for the degree of Doctor of Philosopy in Secondary Science and Mathematics Education Department, Midde East Technical University by, Prof. Dr. Canan Özgen __________ Dean, Graduate School of Natural and Applied Sciences Prof. Dr. Ömer Geban _________ Head of Department, Secondary Science and Mathematics Education Prof. Dr. Giray Berberoğlu _________ Supervisor, Secondary Science and Mathematics Education Dept., METU Examining Committee Members: Prof. Dr. Ömer Geban ________________ Secondary Science and Mathematics Education Dept., METU Prof. Dr. Giray Berberoğlu ________________ Secondary Science and Mathematics Education Dept., METU Assoc. Prof. Dr. Özlem Yıldırım ________________ Biology Dept., Ankara University Assoc. Prof. Dr. Ceren Tekkaya ________________ Elementary Education Dept., METU Ins. Dr. Ömer Faruk Özdemir ________________ Secondary Science and Mathematics Education Dept., METU
Date: ________________

iii
I hereby declare that all information in this document has been obtained and presented in accordance with academic rules and ethical conduct. I also declare that, as required by these rules and conduct, I have fully cited and referenced all material and results that are not original to this work.
Name, Last name: Ela Ayşe Köksal
Signature :
iv
ABSTRACT
THE ACQUISITION OF SCIENCE PROCESS SKILLS THROUGH GUIDED (TEACHER-DIRECTED) INQUIRY
Köksal, Ela Ayşe
PhD., Department of Secondary Science and Mathematics Education
Supervisor: Prof. Dr. Giray Berberoğlu
June 2008, 246 pages
The international and national assessment results indicated that Turkish students’ conceptual
understanding in science and basic inquiry skills are far behind the expected levels. The
reason of low achievement could be attributed to many sources such as family background
characteristics, students’ attitudes, and teaching methodologies. The low socioeconomic
environment in the school and crowded classrooms are important facts that should be
somehow considered by the educational researchers. The way a teacher teaches in a crowded
classroom is important to help students’ understanding of concepts and development of
inquiry skills.
The present study aimed to propose a methodology that helps teachers to enhance students’
understanding of concepts and develop inquiry skills in many schools with various socio-
economic-status environments and large classrooms. The method proposed could be called
as guided (teacher-directed) inquiry to develop concepts, skills, and affective characteristics
of the students such as attitudes.
This study was conducted with 168 sixth grade public elementary school students in Ankara
in 2006-07 academic year. Repeated measures design was used in the study. Intact groups
received either traditional or teacher-directed inquiry instructions. The students in both
groups were measured with the unit achievement and science process skills tests, and
attitudes toward science questionnaire before and after the instructions, and repeatedly after
no treatment by a retention or delayed test.

v
It was found that while the guided (teacher-directed) inquiry instruction made a difference on
student achievement in the first unit (Reproduction, Development and Growth in Living
Things), it could not make a difference on student achievement in the second unit (Force and
Motion). The instruction also made a difference on students’ science process skills test
performance and both the composite and individual attitude scores.
It is concluded that guided (teacher-directed) inquiry instruction generally helps students’
understanding of science concepts and results with achievement in science. It helps students’
development of scientific skills with authentic experiences. Guided (teacher-directed)
inquiry instruction also has an effect on students’ development of positive attitudes toward
science and technology course, specifically on self-concept, anxiety, interest, career,
enjoyment, and usefulness dimensions.
Keywords: Science Education, Guided Inquiry, Science Process Skills, Science
Achievement, Attitudes toward Science and Technology Course.

vi
ÖZ
ÖĞRETMEN REHBERLİĞİNDEKİ SORGULAYICI ARAŞTIRMA YÖNTEMİ İLE BİLİMSEL SÜREÇ BECERİLERİNİN KAZANDIRILMASI
Köksal, Ela Ayşe
Doktora, Ortaöğretim Fen ve Matematik Alanları Eğitimi Bölümü
Tez Yöneticisi: Prof. Dr. Giray Berberoğlu
Haziran 2008, 246 sayfa
Yapılan uluslararası ve ulusal değerlendirme sonuçları Türk öğrencilerinin fen bilimlerindeki
kavramsal anlama ve temel sorgulayıcı araştırma becerilerinin beklenen düzeylerden geride
olduğunu göstermiştir. Bu düşük başarının nedeni öğrencinin aile özelliklerine, tutumlarına
ve öğretim yöntemlerine bağlanabilir. Okuldaki düşük sosyoekonomik çevre ve kalabalık
sınıflar eğitim araştırmacılarının düşünmesi gereken önemli gerçeklerdir. Bir öğretmenin
kalabalık bir sınıfta nasıl öğretim yaptığı, öğrencilerin kavramları anlamalarına ve
sorgulayıcı araştırma becerilerini geliştirmelerine yardım etmede önem taşımaktadır.
Bu çalışma öğretmenlere farklı sosyoekonomik çevre ve büyük sınıflara sahip çoğu okulda
öğrenim gören öğrencilerin kavramları anlamalarını ve sorgulayıcı araştırma becerilerini
geliştirmelerine yardım eden bir yöntem önermeyi amaçlamıştır. Öğrencilerin kavramları,
becerileri ve tutumlar gibi duyuşsal özelliklerini geliştirmek için önerilen bu yöntem,
Öğretmen Rehberliğindeki Sorgulayıcı Araştırma Yöntemi olarak adlandırılabilir.
vii
Bu çalışma Ankara’da 2006-07 eğitim ve öğretim yılında devlete ait ilköğretim okullarına
giden 168 altıncı sınıf öğrencisiyle gerçekleştirilmiştir. Çalışmada Tekrarlı Ölçümler Deseni
kullanılmıştır. Çalışmaya katılan mevcut sınıflar ya geleneksel ya da öğretmen
rehberliğindeki sorgulayıcı araştırma yöntemine tabi tutulmuşlardır. Bu öğretim yöntemleri
uygulamadan önce ve sonra ve ardından uygulama yokken kalıcılık testi ya da gecikmiş test
olarak gruplardaki öğrencilere unite başarı ve bilimsel süreç becerileri testleri ile fen ve
teknoloji dersine yönelik tutumlar anketi uygulanmıştır.
Bu çalışmanın bulgular şunlardır: Öğretmen rehberliğindeki sorgulayıcı araştırma yöntemi
öğrencilerin ilk ünitedeki (Canlılarda Üreme Büyüme ve Gelişme) başarılarında bir farka
neden olurken, ikinci ünitedeki (Kuvvet ve Hareket) başarılarında bir farka neden
olamamıştır. Ayrıca bu yöntem öğrencilerin bilimsel süreç becerileri test performansları ile
tutum düzeylerinin genelinde ve alt boyutlarında bir farka neden olmuştur.
Bu çalışmadan çıkan sonuçlar şunlardır: Öğretmen rehberliğindeki sorgulayıcı araştırma
yöntemi genel olarak öğrencilerin fen kavramlarını anlamalarına yardım etmekte ve fen
başarısına neden olmaktadır. Bu yöntem yeni deneyimler aracılığıyla öğrencilerin bilimsel
becerileri geliştirmesine yardım eder. Öğretmen rehberliğindeki sorgulayıcı araştırma
yöntemi öğrencilerin fen ve teknoloji dersine yönelik olumlu tutumlar geliştirmelerinde,
özellikle akademik öz yeterlik, kaygı, ilgi, kariyer, zevk alma ve faydalılık boyutlarında
etkilidir.
Anahtar Kelimeler: Fen Eğitimi, Öğretmen Rehberliğindeki Sorgulayıcı Araştırma Yöntemi,
Bilimsel Süreç Becerileri, Fen Başarısı, Fen ve Teknoloji Dersine Yönelik Tutumlar

viii
T o T u r k i s h c h i l d r e n , A s e n a , A l p e r , a n d G ö k a y

ix
ACKNOWLEDGEMENTS
I primarily wish to express my special gratitude to Prof. Dr. Giray BERBEROĞLU for his
valuable suggestions, guidance, and criticism in the realization of this study.
I also wish to thank my jury members especially those in my Thesis Committee members,
Assoc. Prof. Dr. Özlem YILDIRIM and Prof. Dr. Ömer GEBAN, and Assoc. Prof. Dr. Ceren
TEKKAYA and Ins. Dr. Ömer Faruk ÖZDEMİR for their valuable remarks and advises.
Thanks are also due to my parents and friends for their endless support and patience
throughout my dissertation.
And thanks to the science teachers and their students participating to my study and the other
personnel from their schools without whose assistance and encouragement; this study could
not have been accomplished.
This study was supported by the Graduate School of Natural and Applied Sciences, Middle
East Technical University, Grant No: BAP-2006-07-02-00-01.

x
TABLE OF CONTENTS
ABSTRACT . . . . . . . . . . . . . . . . . . . . . . . . . . . . . . . . . . . . . . . . . . . . . . . . . . . . . . . . . . . . . . ii
ÖZ . . . . . . . . . . . . . . . . . . . . . . . . . . . . . . . . . . . . . . . . . . . . . . . . . . . . . . . . . . . . . . . . . . . . . . vi
ACKNOWLEDGEMENTS . . . . . . . . . . . . . . . . . . . . . . . . . . . . . . . . . . . . . . . . . . . . . . . . . . ix
TABLE OF CONTENTS . . . . . . . . . . . . . . . . . . . . . . . . . . . . . . . . . . . . . . . . . . . . . . . . . . . . .x
LIST OF TABLES . . . . . . . . . . . . . . . . . . . . . . . . . . . . . . . . . . . . . . . . . . . . . . . . . . . . . . . .xxii
LIST OF FIGURES. . . . . . . . . . . . . . . . . . . . . . . . . . . . . . . . . . . . . . . . . . . . . . . . . . . . . . . .xxv
CHAPTERS
1 INTRODUCTION . . . . . . . . . . . . . . . . . . . . . . . . . . . . . . . . . . . . . . . . . . . . . 1
1.1 Purpose of the Study . . . . . . . . . . . . . . . . . . . . . . . . . . . . . . . . . . . . . 6
1.1.1 Statement of the Hypotheses . . . . . . . . . . . . . . . . . . . . . . . . .7
1.2 Definition of Terms. . . . . . . . . . . . . . . . . . . . . . . . . . . . . . . . . . . . . . 7
2 LITERATURE REVIEW . . . . . . . . . . . . . . . . . . . . . . . . . . . . . . . . . . . . . . . 9
2.1 Inquiry . . . . . . . . . . . . . . . . . . . . . . . . . . . . . . . . . . . . . . . . . . . . . . . . 9
2.1.1 Inquiry Continuum . . . . . . . . . . . . . . . . . . . . . . . . . . . . . . ..12
2.1.2 The Research on Inquiry. . . . . . . . . . . . . . . . . . . . . . . . . . . 14
2.2 Guided (Teacher-Directed) Inquiry . . . . . . . . . . . . . . . . . . . . . . . . 18
2.2.1 The Research on Guided (Teacher-Directed) Inquiry . . . . 18
2.3 Inquiry Instruction Models . . . . . . . . . . . . . . . . . . . . . . . . . . . . . . . 20
2.3.1 Learning Cycle . . .. . . . . . . . . . . . . . . . . . . . . . . . . . . . . . . .20
2.3.1.1 The Research on Learning Cycle. . . . . . . . . . . . . .22
2.3.2 Guided Discovery . . . . . . . . . . . . . . . . . . . . . . . . . . . . . . . .25
2.3.2.1 The Research on Guided Discovery . . . . . . . . . . . 25
2.3.3 Using Scientists as an Inquiry Model . . . . . . . . . . . . . . . . .27
2.3.3.1 Research on Using Scientists as an Inquiry Model.27
2.4 Science Process Skills . . . . . . . . . . . . . . . . . . . . . . . . . . . . . . . . . . . 28
2.4.1 The Research on Effectiveness of Instruction on Science
Process Skills . . . . . . . . . . . . . . . . . . . . . . . . . . . . . . . . . . . . . . . . . .29
2.4.2 The Research on Science Process Skills of Teachers . . . . .31

xi
2.4.3 The Research on Content Analysis of Textbooks with
respect to Science Process Skills . . . . . . . . . . . . . . . . . . . . . . . . . . .32
2.4.4 The Research on Effectiveness of Curriculum with respect to
Science Process Skills . . . . . . . . . . . . . . . . . . . . . . . . . . . . . . . . . . .35
2.5 Attitudes toward Science . . . . . . . . . . . . . . . . . . . . . . . . . . . . . . . . 38
2.6 Science Achievement . . . . . . . . . . . . . . . . . . . . . . . . . . . . . . . . . . . 41
3 METHODOLOGY. . . . . . . . . . . . . . . . . . . . . . . . . . . . . . . . . . . . . . . . . . . . 43
3.1 Research Design . . . . . . . . . . . . . . . . . . . . . . . . . . . . . . . . . . . . . . . 43
3.2 Population and Sample . . . . . . . . . . . . . . . . . . . . . . . . . . . . . . . . . . 45
3.3 Instruments . . . . . . . . . . . . . . . . . . . . . . . . . . . . . . . . . . . . . . . . . . . 49
3.3.1 Demographic Form. . . . . . . . . . . . . . . . . . . . . . . . . . . . . . . 49
3.3.2 Science Process Skills Test. . . . . . . . . . . . . . . . . . . . . . . . . 50
3.3.3 Attitudes toward Science Lesson . . . . . . . . . . . . . . . . . . . . 53
3.3.4 Achievement Tests . . . . . . . . . . . . . . . . . . . . . . . . . . . . . . . 56
3.4 Procedures . . . . . . . . . . . . . . . . . . . . . . . . . . . . . . . . . . . . . . . . . . . . 59
3.4.1 Instrument Development. . . . . . . . . . . . . . . . . . . . . . . . . . . 60
3.4.1.1 Developing Science Process Skills Test, and
Attitudes toward Science and Technology Course
Questionnaire . . . . . . . . . . . . . . . . . . . . . . . . . . . . . . . . . . . 60
3.4.1.1.1 Constructing Science Process Skills
Test . . . . . . . . . . . . . .. . . . . . . . . . . . . . . . . . . . . . . 60
3.4.1.1.2 Constructing Attitudes toward
Science and Technology Course Questionnaire . . .61
3.4.1.1.3 The Pilot Testing of the Science
Process Skills Test and Attitudes toward Science and
Technology Course Questionnaire . . . . . . . . . . . . .61
3.4.1.1.3.1 The Pilot Testing of the
Science Process Skills Test . . . . . . . . . . . .62
3.4.1.1.3.2 The Pilot Testing of
Attitudes toward Science and Technology
Course Questionnaire Forms .. . . . . . . . . . 66
3.4.1.1.4 The Analysis of the Pilot Testing of
the Science Process Skills Test and Attitudes toward
Science and Technology Course Questionnaire
Forms . . . . . . . . . . . . . . . . . . . . . . . . . . . . . . . . . . .67

xii
3.4.1.1.5 The Results of the Pilot Testing of
the Science Process Skills Test and Attitudes toward
Science and Technology Course Questionnaire
Forms . . . . . . . . . . . . . . . . . . . . . . . . . . . . . . . . . . .69
3.4.1.2 Student Demographic Form, "Reproduction,
Development, and Growth in Living Things" and "Force and
Motion" Unit Achievement Tests. . . . . . . . . . . . . . . . . . . . 69
3.4.2 Instructional Design . . . . . . . . . . . . . . . . . . . . . . . . . . . . . . 71
3.5 Implementation of Instructional Design . . . . . . . . . . . . . . . . . . . . . 72
3.6 Analysis of Data . . . . . . . . . . . . . . . . . . . . . . . . . . . . . . . . . . . . . . . 74
4 RESULTS . . . . . . . . . . . . . . . . . . . . . . . . . . . . . . . . . . . . . . . . . . . . . . .. . . . 76
4.1 Descriptive Statistics. . . . . . . . . . . . . . . . . . . . . . . . . . . . . . . . . . . . 76
4.2 Inferential Statistics . . . . . . . . . . . . . . . . . . . . . . . . . . . . . . . . . . . . .82
4.2.1 The Results of the Analysis on the Differences between
Experimental and Control Group Students' SES Variables. . . . . . . 83
4.2.2 The Results of the Effect of Teacher-Guided Inquiry vs.
Traditional Instruction on Students' Achievement, Science Process,
and Attitudes toward Science and Technology Lesson. . . . . . . . . . 84
4.2.2.1 The Results of the Effect of Teacher-Guided Inquiry
vs. Traditional Instruction on Students’ Achievement. . . . 84
4.2.2.1.1 The Results of the Effect of
Teacher-Guided Inquiry vs. Traditional Instruction
on Students’ Achievement in Reproduction,
Development and Growth in Living Things Unit . 84
4.2.2.1.2 The Results of the Effect of
Teacher-Guided Inquiry vs. Traditional Instruction
on Students’ Achievement in Force and Motion Unit
. . . . . . . . . . . . . . . . . . . . . . . . . . . . . . . . . . . . . . . . 87
4.2.2.2 The Results of the Effect of Teacher-Guided Inquiry
vs. Traditional Instruction on Students’ Science Process
Skills. . . . . . . . . . . . . . . . . . . . . . . . . . . . . . . . . . . . . . . . . . 89
4.2.2.3 The Results of the Effect of Teacher-Guided Inquiry
vs. Traditional Instruction on Students’ Attitudes toward
Science and Technology Lesson. . . . . . . . . . . . . . . . . . . . . 92

xiii
4.2.2.3.1 The Results of the Effect of
Teacher-Guided Inquiry vs. Traditional Instruction
on Students’ Self-Concept Attitudes toward Science
and Technology Lesson. . . . . . . . . . . . . . . . . . . . . 93
4.2.2.3.2 The Results of the Effect of
Teacher-Guided Inquiry vs. Traditional Instruction
on Students’ Anxiety Attitudes toward Science and
Technology Lesson. . . . . . . . . . . . . . . . . . . . . . . . 96
4.2.2.3.3 The Results of the Effect of
Teacher-Guided Inquiry vs. Traditional Instruction
on Students’ Interest Attitudes toward Science and
Technology Lesson. . . . . . . . . . . . . . . . . . . . . . . . .98
4.2.2.3.4 The Results of the Effect of
Teacher-Guided Inquiry vs. Traditional Instruction
on Students’ Career Attitudes toward Science and
Technology Lesson. . . . . . . . . . . . . . . . . . . . . . . .100
4.2.2.3.5 The Results of the Effect of
Teacher-Guided Inquiry vs. Traditional Instruction
on Students’ Enjoyment Attitudes toward Science
and Technology Lesson. . . . . . . . . . . . . . . . . . . . 103
4.2.2.3.6 The Results of the Effect of
Teacher-Guided Inquiry vs. Traditional Instruction
on Students’ Usefulness Attitudes toward Science
and Technology Lesson. . . . . . . . . . . . . . . . . . . . 105
5 DISCUSSION .. . . . . . . . . . . . . . . . . . . . . . . . . . . . . . . . . . . . . . . . . . . . . . 109
5.1 Summary of the Experiment . . . . . . . . . . . . . . . . . . . . . . .109
5.2 Limitations . . . . . . . . . . . . . . . . . . . . . . . . . . . . . . . . . . . .110
5.2.1 Internal Validity. . . . . . . . . . . . . . . . . . . . . . . . . .110
5.2.2 External Validity . . . . . . . . . . . . . . . . . . . . . . . . . 114
5.2.2.1 Population Generalizability . . . . . . . . . . .114
5.2.2.2 Ecological Generalizability . . . . . . . . . . .115
5.3 Conclusions. . . . . . . . . . . . . . . . . . . . . . . . . . . . . . . . . . . .115
5.4 Discussions. . . . . . . . . . . . . . . . . . . . . . . . . . . . . . . . . . . .116
5.5 Implications . . . . . . . . . . . . . . . . . . . . . . . . . . . . . . . . . . .119
5.6 Recommendations for Future Research. . . . . . . . . . . . . . .120

xiv
REFERENCES . . . . . . . . . . . . . . . . . . . . . . . . . . . . . . . . . . . . . . . . . . . . . . . . . . . . . . . . . . .121
APPENDICES
A SCIENCE PROCESS SKILLS FOR GRADES 6-8 . . . . . . . . . . . . . . . . . .134
Table B.1 Science Process Skills for grades 6-8 . . . . . . . . . . . . . . . .134
B THE SCIENCE PROCESS SKILLS TEST FORMS AND ATTITUDES
TOWARD SCIENCE AND TECHNOLOGY COURSE QUESTIONNAIRE
DEVELOPED FROM THE PILOT STUDY . . . . . . . . . . . . . . . . . . . . . . . . . . . . . 135
B.1 The Science Process Skills Tests Developed From the Pilot Study . .
. . . . . . . . . . . . . . . . . . . . . . . . . . . . . . . . . . . . . . . . . . . . . . . . . . . . . . . . . . .135
B.1.1 The Science Process Skills Test Forms Developed From the
Pilot Study . . . . . . . . . . . . . . . . . . . . . . . . . . . . . . . . . . . . . . . . . . .135
B.1.1.1 First Science Process Skills Test Form. . . . . . . . .135
B.1.1.2 Second Science Process Skills Test Form . . . . . .138
B.1.1.3 Third Science Process Skills Test Form. . . . . . . .141
B.1.2 Science Process Skills Test Key. . . . . . . . . . . . . . . . . . . . 144
B.1.2.1 First Science Process Skills Test Key. . . . . . . . . .144
B.1.2.2 Second Science Process Skills Test Key. . . . . . . .148
B.1.2.3 Third Science Process Skills Test Key. . . . . . . . .151
B.1.3 Cognitive Processes of the Science Process Skills Test
Forms. . . . . . . . . . . . . . . . . . . . . . . . . . . . . . . . . . . . . . . . . . . . . . . 153
Table B.1 Cognitive processes of the science process
skills tests . . . . . . . . . . . . . . . . . . . . . . . . . . . . . . . . . . . . . 153
B.1.4 References for the Items of the Science Process Skills Test
Forms . . .. . . . . . . . . . . . . . . . . . . . . . . . . . . . . . . . . . . . . . . . . . . . 154
Table B.2 Reference of the first science process skills
test . . . . . . . . . . . . . . . . . . . . . . . . . . . . . . . . . . . . . . . . . . .154
Table B.3 Reference of the second science process
skills test. . . . . . . . . . . . . . . . . . . . . . . . . . . . . . . . . . . . . . 155
Table B.4 Reference of the third science process skills
test . . . . . . . . . . . . . . . . . . . . . . . . . . . . . . . . . . . . . . . . . . .156
B.1.5 Item difficulty (p) and corrected item-total correlation
coefficient (r) values of the items of the science process skills test
forms developed from the pilot study. . . . . . . . . . . . . . . . . . . . . . .157

xv
Table B.5 Item difficulty (p) and corrected item-total
correlation coefficient (r) values of the items of the science
process skills test forms developed from the pilot study . 157
B.2 The Attitudes toward Science Lesson Questionnaire Developed from
the Pilot Study. . . . . . . . . . . . . . . . . . . . . . . . . . . . . . . . . . . . . . . . . . . . . . .158
B.2.1 The Attitudes toward Science Lesson Questionnaire Form
(and Its’ Subtests) Developed from the Pilot Study. . . . . . . . . . . .158
B.2.2 Corrected item-total correlation coefficient (r) values of the
items of the attitudes toward science and technology course
questionnaire in the pilot study. . . . . . . . . . . . . . . . . . . . . . . . . . . .159
Table B.6 Corrected item-total correlation coefficient
(r) values of the items of the attitudes toward science and
technology course questionnaire in the pilot study. . . . . . 159
C DEMOGRAPHIC FORM . . . . . . . . . . . . . . . . . . . . . . . . . . . . . . . . . . . . . .160
D ATTITUDES TOWARD SCIENCE AND TECHNOLOGY LESSON
QUESTIONNAIRE FORM . . . . . . . . . . . . . . . . . . . . . . . . . . . . . . . . . . . . . . . . . . .162
E MISSING DATA IN ATTITUDES TOWARD SCIENCE AND
TECHNOLOGY COURSE QUESTIONNAIRE . . . . . . . . . . . . . . . . . . . . . . . . . . 163
E.1 Missing Data in First Attitudes toward Science and Technology
Course Questionnaire. . . . . . . . . . . . . . . . . . . . . . . . . . . . . . . . . . . . . . . . . 163
E.2 Missing Data in Second Attitudes toward Science and Technology
Course Questionnaire. . . . . . . . . . . . . . . . . . . . . . . . . . . . . . . . . . . . . . . . . 169
E.3 Missing Data in Third Attitudes toward Science and Technology
Course Questionnaire . . . . . . . . . . . . . . . . . . . . . . . . . . . . . . . . . . . . . . . . .175
E.4 Missing Data in Fourth Attitudes toward Science and Technology
Course Questionnaire. . . . . . . . . . . . . . . . . . . . . . . . . . . . . . . . . . . . . . . . . 180
F UNIT ACHIEVEMENT TESTS . . . . . . . . . . . . . . . . . . . . . . . . . . . . . . . . 184
F.1 Unit Achievement Test Forms . . . . . . . . . . . . . . . . . . . . . . . . . . . .184
F.1.1 Reproduction, Development, and Growth In Living Things
Achievement Test Form . . . . . . . . . . . . . . . . . . . . . . . . . . . . . . . . 184
F.1.2 Force and Motion Achievement Test Form . . . . . . . . . . . 187
F.2 Unit Achievement Tests Key . . . . . . . . . . . . . . . . . . . . . . . . . . . . .190
F.2.1 Reproduction, Development, and Growth in Living Things
Unit Achievement Test Key . . . . . . . . . . . . . . . . . . . . . . . . . . . . . 190
F.2.2 Force and Motion Unit Achievement Test Key . . . . . . . . 192

xvi
F.3 Unit Achievement Test Blueprints . . . . . . . . . . . . . . . . . . . . . . . . 196
Table F.1 Reproduction, development, and growth in living
things achievement test blueprint . . . . . . . . . . . . . . . . . . . . . . . . . 196
Table F.2 Force and motion achievement test blueprint . . . 197
F.4 Subject Matters of Units . . . . . . . . . . . . . . . . . . . . . . . . . . . . . . . . 198
Table F.3 Subject matters of reproduction, development, and
growth in living things unit . . . . . . . . . . . . . . . . . . . . . . . . . . . . . . 198
Table F.4 Subject matters of force and motion unit . . . . . . .198
F.5 Cognitive Processes. . . . . . . . . . . . . . . . . . . . . . . . . . . . . . . . . . . . 199
Table F.5 Cognitive processes . . . . . . . . . . . . . . . . . . . . . . . 199
F.6 References of Unit Achievement Tests . . . . . . . . . . . . . . . . . . . . .200
Table F.6 Reference of the reproduction, development, and
growth in living things unit achievement test . . . . . . . . . . . . . . . . 200
Table F.7 Reference of the force and motion unit achievement
test . . . . . . . . . . . . . . . . . . . . . . . . . . . . . . . . . . . . . . . . . . . . . . . . . 201
G RESULTS OF THE ANALYSIS OF STUDENTS’ SOCIO-ECONOMIC
STATUS VARIABLES . . . . . . . . . . . . . . . . . . . . . . . . . . . . . . . . . . . . . . . . . . . . . .200
G.1 Results of the Descriptive Analysis of Students’ Socio-Economic
Status Variables . . . . . . . . . . . . . . . . . . . . . . . . . . . . . . . . . . . . . . . . . . . . . 202
Table G.1 Mother education and group crosstabulation . . . .202
Table G.2 Father education and group crosstabulation . . . . 202
Table G.3 Number of sibling and group crosstabulation .. . .203
Table G.4 Income and group crosstabulation . . . . . . . . . . . .203
Table G.5 Dishwasher and group crosstabulation . . . . . . . . 203
Table G.6 Computer and group crosstabulation . . . . . . . . . .203
Table G.7 Study room and group crosstabulation. . . . . . . . . 203
Table G.8 Work and group crosstabulation.. . . . . . . . . . . . .204
Table G.9 Kindergarten and group crosstabulation. . . . . . . .204
Table G.10 Age of schooling and group crosstabulation. . . . .204
Table G.11 Number of books and group crosstabulation . . . .204
Table G.11 Newspaper/magazine and group crosstabulation .204
G.2 Results of the Factor Analysis of Students’ Socio-Economic Status
Variables . . . . . . . . . . . . . . . . . . . . . . . . . . . . . . . . . . . . . . . . . . . . . . . . . . .205
G.2.1 Results of the Factor Analysis of Students’ Socio-Economic
Status Variables with Listwise Deletion. . . . . . . . . . . . . . . . . . . . .205

xvii
Table G.13 Descriptive Statistics. . . . . . . . . . . . . . . .205
Table G.14 KMO and bartlett’s test result. . . . . . . . . 205
Table G.15 Communalities. . . . . . . . . . . . . . . . . . . . .205
Table G.16 Total variance explained. . . . . . . . . . . . . 206
Figure G.1 Scree plot . . . . . . . . . . . . . . . . . . . . . . . . .206
Table G.17 Component matrix . . . . . . . . . . . . . . . . . .206
Table G.18 Rotated component matrix . . . . . . . . . . .207
Table G.19 Component transformation matrix . . . . . 207
G.2.2 Results of the Factor Analysis of Students’ Socio-Economic
Status Variables with Pairwise Deletion. . . . . . . . . . . . . . . . . . . . .208
Table G.20 Descriptive Statistics. . . . . . . . . . . . . . . .208
Table G.21 KMO and bartlett’s test result. . . . . . . . . 208
Table G.22 Communalities. . . . . . . . . . . . . . . . . . . . .208
Table G.23 Total variance explained. . . . . . . . . . . . . 209
Figure G.2 Scree plot . . . . . . . . . . . . . . . . . . . . . . . . .209
Table G.24 Component matrix . . . . . . . . . . . . . . . . . .209
Table G.25 Rotated component matrix . . . . . . . . . . .210
Table G.26 Component transformation matrix. . . . . .210
H RESULTS OF THE ANALYSES ON ASSUMPTIONS . . . . . . . . . . . . . .211
H.1 Assumptions . . . . . . . . . . . . . . . . . . . . . . . . . . . . . . . . . . . . . . . . . 211
H.1.1 Assumptions Common to Independent t-Test and GLM
Repeated Measures ANOVA. . . . . . . . . . . . . . . . . . . . . . . . . . . . . 211
H.1.1.1 Independence of Observations. . . . . . . . . . . . . . . 211
H.1.1.2 Normality. . . . . . . . . . . . . . . . . . . . . . . . . . . . . . . 211
H.1.1.3 Homogeneity of Variance. . . . . . . . . . . . . . . . . . .211
H.1.2 Assumption Unique to GLM Repeated Measures ANOVA. .
. . . . . . . . . . . . . . . . . . . . . . . . . . . . . . . . . . . . . . . . . . . . . . . . . . . . 211
H.1.2.1 Sphericity (Circularity) . . . . . . . . . . . . . . . . . . . . 211
H.2 Results of Analyses on Assumptions. . . . . . . . . . . . . . . . . . . . . . . 212
H.2.1 Results of Analyses on Assumptions of Independent
Samples t-Test . . . . . . . . . . . . . . . . . . . . . . . . . . . . . . . . . . . . . . . 212
Table H.1 Result of tests of normality . . . . . . . . . . .212
Table H.2 Levene’s test for equality of variances. . .212

xviii
H.2.2 Results of Analyses on Assumptions of Repeated Measures
ANOVA for Reproduction, Development, and Growth in Living
Things Unit Achievement Tests . . . . . . . . . . . . . . . . . . . . . . . . . .213
Table H.3 Result of tests of normality . . . . . . . . . . .213
Table H.4 Result of levene's test of equality of error
variances . . . . . . . . . . . . . . . . . . . . . . . . . . .. . . . . . . . . . .213
Table H.5 Result of mauchly’s test of sphericity. . . 213
H.2.3 Results of Analyses on Assumptions of Repeated Measures
ANOVA for Force and Motion Unit Achievement Tests . . . . . . . 214
Table H.6 Result of tests of normality . . . . . . . . . . .214
Table H.7 Result of levene's test of equality of error
variances . . . . . . . . . . . . . . . . . . . . . . . . .. . . . . . . . . . . . 214
Table H.8 Result of mauchly’s test of sphericity. . . 214
H.2.4 Results of Analyses on Assumptions of Repeated Measures
ANOVA for Science Process Skills Tests. . . . . . . . . . . . . . . . . . . 215
Table H.9 Result of tests of normality . . . . . . . . . . .215
Table H.10 Result of levene's test of equality of error
variances . . . . . . . . . . . . . . . . . . . . . . . . .. . . . . . . . . . . . 215
Table H.11 Result of mauchly’s test of sphericity. . . 215
H.2.5 Results of Analyses on Assumptions of Repeated Measures
ANOVA for Self-Concept Subtests of Attitudes toward Science and
Technology Course Questionnaire. . . . . . .. . . . . . . . . . . . . . . . . . 216
Table H.12 Result of tests of normality . . . . . . . . . . .216
Table H.13 Result of levene's test of equality of error
variances . . . . . . . . . . . . . . . . . . . . . . . . .. . . . . . . . . . . . 216
Table H.14 Result of mauchly’s test of sphericity. . . 216
H.2.6 Results of Analyses on Assumptions of Repeated Measures
ANOVA for Anxiety Subtests of Attitudes toward Science and
Technology Course Questionnaire . . . . . . . . . . . . . . . . . . . . . . . . 217
Table H.15 Result of tests of normality . . . . . . . . . . .217
Table H.16 Result of levene's test of equality of error
variances . . . . . . . . . . . . . . . . . . . . . . . . .. . . . . . . . . . . . 217
Table H.17 Result of mauchly’s test of sphericity. . . 217

xix
H.2.7 Results of Analyses on Assumptions of Repeated Measures
ANOVA for Interest Subtests of Attitudes toward Science and
Technology Course Questionnaire. . . . . . . . . . . . . . . . . . . . . . . . .218
Table H.18 Result of tests of normality . . . . . . . . . . .218
Table H.19 Result of levene's test of equality of error
variances . . . . . . . . . . . . . . . . . . . . . . . . .. . . . . . . . . . . . 218
Table H.20 Result of mauchly’s test of sphericity. . . 218
H.2.8 Results of Analyses on Assumptions of Repeated Measures
ANOVA for Career Subtests of Attitudes toward Science and
Technology Course Questionnaire. . . . . . . . . . . . . . . . . . . . . . . . .219
Table H.21 Result of tests of normality . . . . . . . . . . .219
Table H.22 Result of levene's test of equality of error
variances . . . . . . . . . . . . . . . . . . . . . . . . .. . . . . . . . . . . . 219
Table H.23 Result of mauchly’s test of sphericity. . . 219
H.2.9 Results of Analyses on Assumptions of Repeated Measures
ANOVA for Enjoyment Subtests of Attitudes toward Science and
Technology Course Questionnaire. . . . . . . . . . . . . . . . . . . . . . . . .220
Table H.24 Result of tests of normality . . . . . . . . . . .220
Table H.25 Result of levene's test of equality of error
variances . . . . . . . . . . . . . . . . . . . . . . . . .. . . . . . . . . . . . 220
Table H.26 Result of mauchly’s test of sphericity. . . 220
H.2.10 Results of Analyses on Assumptions of Repeated Measures
ANOVA for Usefulness Subtests of Attitudes toward Science and
Technology Course Questionnaire. . . . . . . . . . . . . . . . . . . . . . . . .221
Table H.27 Result of tests of normality . . . . . . . . . . .221
Table H.28 Result of levene's test of equality of error
variances . . . . . . . . . . . . . . . . . . . . . . . . .. . . . . . . . . . . . 221
Table H.20 Result of mauchly’s test of sphericity. . . 221
I SYNTAXES . . . . . . . . . . . . . . . . . . . . . . . . . . . . . . . . . . . . . . . . . . . . . . . 220
I.1 Syntax for the Independent t-Test . . . . . . . . . . . . . . . . . . . . . . . . . 222
I.2 Syntax of the GLM Repeated Measures for Reproduction,
Development, and Growth in Living Things Unit Achievement Test. . . . 222
I.3 Syntax of the GLM Repeated Measures for Attitudes toward Science
and Technology Course Questionnaire . . . . . . . . . . . . . . . . . . . . . . . . . . . .223
J GUIDED (TEACHER-DIRECTED) INQUIRY INSTRUCTION . . . . . . 224

xx
J.1 Pilot “Piller ve Lambalar”Lesson . . . . . . . . . . . . . . . . . . . . . . . . . 224
J.1.1 Pilot “Piller ve Lambalar”Lesson Plan. . . . . . . . . . . . . . . 224
J.1.2 Pilot “Piller ve Lambalar”Lesson Worksheet. . . . . . . . . . 226
J.2 Guided (Teacher-Directed) Inquiry Instruction on Reproduction,
Development, and Growth in Living Things Unit . . . . . . . . . . . . . . . . . . . 227
J.2.1 “The Cell” Lesson . . . . . . . . . . . . . . . . . . . . . . . . . . . . . . 227
J.2.1.1 “The Cell” Lesson Plan . . . . . . . . . . . . . . . . . . . . 227
J.2.1.2 “The Cell” Lesson Worksheet . . . . . . . . . . . . . . . 230
J.2.1.3 Evaluation of “The Cell” Lesson . . . . . . . . . . . . .232
Table J.1 Inquiry in the cell tasks and coding
categories for the cell lesson plan . . . . . . . . . . . . 232
J.2.2 “Reproduction, Development, and Growth in Human
Beings” Lesson . . . . . . . . . . . . . . . . . . . . . . . . . . . . . . . .. . . . . . . .233
J.2.2.1 “Reproduction, Development, and Growth in Human
Beings” Lesson Activity 1. . . . . . . . . . . . . . . . . . . . . . . . .233
J.2.2.2 Evaluation of “Reproduction, Development, and
Growth in Human Beings” Lesson. . . . . . . . . . . . . . . . . . 234
Table J.2 Inquiry in the Human Development
tasks and coding categories for the Human
Development lesson plan . . . . . . . . . . . . . . . . . . .234
J.2.2.3 “Reproduction, Development, and Growth in Human
Beings” Lesson Activity 2 . . . . . . . . . . . . . . . . . . . . . . . . 235
J.2.3 “Reproduction, Development, and Growth in Animals”
Lesson Activity . . . . . . . . . . . . . . . . . . . . . . . . . . . . . . . . . . . . . . . 236
J.2.4 “Plant Reproduction, Development and Growth” Lesson . . .
. . . . . . . . . . . . . . . . . . . . . . . . . . . . . . . . . . . . . . . . . . . . . . . . . . . . 237
J.2.4.1 “Plant Reproduction, Development and Growth”
Lesson Worksheet 1 . . . . . . . . . . . . . . . . . . . . . . . . . . . . . 237
J.2.4.2 “Plant Reproduction, Development and Growth”
Lesson Worksheet 2 . . . . . . . . . . . . . . . . . . . . . . . . . . . . . 237
J.3 Guided (Teacher-Directed) Inquiry Instruction on Force and Motion
Unit . . . . . . . . . . . . . . . . . . . . . . . . . . . . . . . . . . . . . . . . . . . . . . . . . . . . . . .239
J.3.1 “Rocket Balloon” Lesson. . . . . . . . . . . . . . . . . . .. . . . . . . 239
J.3.1.1 “Rocket Balloon” Lesson Plan . . . . . . . . . . . . . . .239
J.3.1.2 “Rocket Balloon” Lesson Plan Worksheet . . . . . 240
xxi
J.3.2 “Toy Car” Lesson. . . . . . . . . . . . . . . . . . . . . . . . . . . . . . . 242
J.3.2.1 “Toy Car” Lesson Plan . . . . .. . . . . . . . . .. . . . . ..242
J.3.2.2 “Toy Car” Lesson Worksheet . . . . . . . .. . . . . . . .243
J.3.3 “Elastic Objects” Lesson. . . . . . . . . . . . . . . . . . . . . . . . . .244
J.3.3.1 “Elastic Objects” Lesson Plan . . . . . . . . . . . . . . .244
J.3.4 “Inclined Plane” Lesson. . . . . . . . . . . . . . . . . . . . . . . . . . .245
J.3.4.1 “Inclined Plane” Lesson Plan . . . . . . . . . . . . . . . .245
J.3.4.1 “Inclined Plane” Lesson Worksheet . . . . . . . . . . 246
CURRICULUM VITAE . . . . . . . . . . . . . . . . . . . . . . . . . . . . . . . . . . . . . . . . . . . . . . . . . . . 247

xxii
LIST OF TABLES
TABLES
Table 2.1 Inquiry continuum . . . . . . . . . . . . . . . . . . . . . . . . . . . . . . . . . . . . . . . . . . . . . . . . . 14
Table 2.2 Basic science process skills . . . . . . . . . . . . . . . . . . . . . . . . . . . . . . . . . . . . . . . . . . 28
Table 2.3 Integrated science process skills . . . . . . . . . . . . . . . . . . . . . . . . . . . . . . . . . . . . . . 29
Table 3.1 Research design of the study . . . . . . . . . . . . . . . . . . . . . . . . . . . . . . . . . . . . . . . . 44
Table 3.2 Number of the schools in population and sample . . . . . . . . . . . . . . . . . . . . . . . . . 46
Table 3.3 Number of classes, and students in the sample . . . . . . . . . . . . . . . . . . . . . . . . . . . 46
Table 3.4 Number of students in the sample who took all of the tests . . . . . . . . . . . . . . . . . 47
Table 3.5 Group and gender cross tabulation. . . . . . . . . . . . . . . . . . . . . . . . . . . . . . . . . . . . . 47
Table 3.6 Group and birth year cross tabulation . . . . . . . . . . . . . . . . . . . . . . . . . . . . . . . . . .48
Table 3.7 Group and mother occupation cross tabulation . . . . . . . . . . . . . . . . . . . . . . . . . . . 49
Table 3.8 Group and father occupation cross tabulation . . . . . . . . . . . . . . . . . . . . . . . . . . . . 49
Table 3.9 Item types, scale, and sample items from the science process skills test . . . . . . . .52
Table 3.10 Scoring system of the science process skills test . . . . . . . . . . . . . . . . . . . . . . . . .53
Table 3.11 Scale, description and sample test items from “the attitudes toward science and
technology course” instrument . . . . . . .. . . . . . . . . . . . . . . . . . . . . . . . . . . . . . . . . . . . . . . . . 55
Table 3.12 Scoring system of the attitudes toward science and technology course
questionnaire . . . . . . . . . . . . . . . . . . . . . . . . . . . . . . . . . . . . . . . . . . . . . . . . . . . . . . . . . . . . . 56
Table 3.13 Item types and sample items of the reproduction, development, and growth in
living things unit achievement test. . .. . . . . .. . . . . . . . . . . . .. . .. . . . . . . . . . . . . . . . . . . . . . 57
Table 3.14 Item types and sample items of the force and motion unit achievement test . . . .58
Table 3.15 Scoring system of the achievement tests . . . . . . . . . . . . . . . . . . . . . . . . . . . . . . . 59
Table 3.16 Number of the schools in population and sample for the pilot study of science
process skills tests, and attitudes toward science and technology course questionnaire forms .
. . . . . . . . . . . . . . . . . . . . . . . . . . . . . . . . . . . . . . . . . . . . . . . . . . . . . . . . . . . . . . . . . . . . . . . . .62
Table 3.17 School and grade cross tabulation for the pilot study of the science process skills
test forms and attitudes toward science & technology questionnaire forms . . . . . . . . . . . . . 62
Table 3.18 School and grade cross tabulation for the pilot study of the science process skills
test forms. . . . . . . . . . . . . . . . . . . . . . . . . . . . . . . . . . . . . . . . . . . . . . . . . . . . . . . . . . . . . . . . .63
xxiii
Table 3.19 School and grade cross tabulation for the pilot study of the first science process
skills test form. . . . . . . . . . . . . . . . . . . . . . . . . . . . . . . . . . . . . . . . . . . . . . . . . . . . . . . . . . . . .63
Table 3.20 School and grade cross tabulation for the pilot study of the second science
process skills test form. . . . . . . . . . . . . . . . . . . . . . . . . . . . . . . . . . . . . . . . . . . . . . . . . . . . . . 64
Table 3.21 School and grade cross tabulation for the pilot study of the third science process
skills test form. . . . . . . . . . . . . . . . . . . . . . . . . . . . . . . . . . . . . . . . . . . . . . . . . . . . . . . . . . . . .65
Table 3.22 School and grade cross tabulation for the pilot study of the fourth science process
skills test form. . . . . . . . . . . . . . . . . . . . . . . . . . . . . . . . . . . . . . . . . . . . . . . . . . . . . . . . . . . . .65
Table 3.23 School and grade cross tabulation for the pilot study of the fifth science process
skills test form. . . . . . . . . . . . . . . . . . . . . . . . . . . . . . . . . . . . . . . . . . . . . . . . . . . . . . . . . . . . .65
Table 3.24 Grade and test form cross tabulation for the pilot study of the attitudes toward
science and technology course questionnaire forms . . . . . . . . . . . . . . . . . . . . . . . . . . . . . . . 66
Table 4.1 Means and standard deviations of the students’ scores on the achievement tests. 77
Table 4.2 Means and standard deviations of students’ scores on the science process skills
tests. . . . . . . . . . . . . . . . . . . . . . . . . . . . . . . . . . . . . . . . . . . . . . . . . . . . . . . . . . . . . . . . . . . . . 78
Table 4.3 Means and standard deviations of students’ scores on the attitudes subtests. . . . . 81
Table 4.4 Result of independent t-test showing the differences between experimental and
control groups mean scores on wealth and impact of mother indices . . . . . . . . . . . . . . . . . . 83
Table 4.5 Result of glm repeated anova for the students’ scores on the reproduction,
development and growth in living things unit achievement tests . . . . . . . . . . . . . . . . . . . . . 85
Table 4.6 Result of tests of within-subjects contrasts for the students’ scores on the
reproduction, development and growth in living things achievement tests. . . . . . . . . . . . . . 86
Table 4.7 Result of glm repeated anova for the students’ scores on the force and motion unit
achievement tests . . . . . . . . . . . . . . . . . . . . . . . . . . . . . . . . . . . . . . . . . . . . . . . . . . . . . . . . . . 87
Table 4.8 Result of tests of within-subjects contrasts for the students’ scores on the force and
motion unit achievement tests . . . . . . . . . . . . . . . . . . . . . . . . . . . . . . . . . . . . . . . . . . . . . . . . 88
Table 4.9 Result of glm repeated anova for the students’ scores on the science process skills
tests . . . . . . . . . . . . . . . . . . . . . . . . . . . .. . . . . . . . . . . . . . . . . . . . . . . . . . . . . . . . . . . . . . . . . 90
Table 4.10 Result of tests of within-subjects contrasts for the students’ scores on the science
process skills tests . . . . . . . . . . . . . . . . . . . . . . . . . . . . . . . . . . . . . . . . . . . . . . . . . . . . . . . . . 91
Table 4.11 Result of glm repeated anova for the students’ scores on the attitudes toward
science and technology questionnaires . .. . . . . . . . . . . . . . . . . . . . . . . . . . . . . . . . . . . . . . . . 92
Table 4.12 Result of tests of within-subjects contrasts the students’ scores on the attitudes
toward science and technology questionnaires . . . . . . . . . . . . . . . . . . . . . . . . . . . . . . . . . . . 93

xxiv
Table 4.13 Result of glm repeated anova for the students’ scores on the self-concept subtests
. . . . . . . . . . . . . . . . . . . . . . . . . .. . . . . . . . . . . . . . . . . . . . . . . . . . . . . . . . . . . . . . . . . . . . . . . 94
Table 4.14 Result of tests of within-subjects contrasts the students’ scores on the self-
concept subtests . . . . . . . . . . . . . . . . . . . . . . . . . . . . . . . . . . . . . . . . . . . . . . . . . . . . . . . . . . . 95
Table 4.15 Result of glm repeated anova for the students’ scores on the anxiety subtests . . 96
Table 4.16 Result of tests of within-subjects contrasts for the students’ scores on the anxiety
subtests . . . . . . . . . . . . . . . . . . . . . . . . . . . . . . . . . . . . . . . . . . . . . . . . . . . . . . . . . . . . . . . . . .97
Table 4.17 Result of glm repeated anova for the students’ scores on the interest subtests . . 99
Table 4.18 Result of tests of within-subjects contrasts for the students’ scores on the interest
subtests . . . . . . . . . . . . . . . . . . . . . . . . . . . . . . . . . . . . . . . . . . . . . . . . . . . . . . . . . . . . . . . . . 99
Table 4.19 Result of glm repeated anova for the students’ scores on the career subtests . . 101
Table 4.20 Result of tests of within-subjects contrasts for the students’ scores on the career
subtests . . . . . . . . . . . . . . . . . . . . . . . . . . . . . . . . . . . . .. . . . . . . . . . . . . . . . . . . . . . . . . . . . 102
Table 4.21 Result of glm repeated for the students’ scores on the enjoyment subtests. . . . 103
Table 4.22 Result of tests of within-subjects contrasts for the students’ scores on the
enjoyment subtests . . . . . . . . . . . . . . . . . . . . . . . . . . . .. . . . . . . . . . . . . . . . . . . . . . . . . . . . 104
Table 4.23 Result of glm repeated anova for the students’ scores on the usefulness subtests . .
. . . . . . . . . . . . . . . . . . . . . . . . . . . . . . . . . . . . . . . . . . . . . . . . . . . . . . . . . . . . . . . . . . . . . . . 106
Table 4.24 Result of tests of within-subjects contrasts for the students’ scores on the
usefulness subtests . . . . . . . . . . . . . . . . . . . . . . . . . . . . . . . . . . . . . . . . . . . . . . . . . . . . . . . .107

xxv
LIST OF FIGURES
FIGURES
Figure 4.1 Profile plot for the students’ scores on the reproduction, development and growth
in living things unit achievement tests. . . . . . . . . . . . . . . . . . . . . . . . . . . . . . . . . . . . . . . . . . 86
Figure 4.2 Profile plot for the students’ scores on the force and motion unit achievement
tests. . . . . . . . . . . . . . . . . . . . . . . . . . . . . . . . . . . . . . . . . . . . . . . . . . . . . . . . . . . . . . . . . . . . . 89
Figure 4.3 Profile plot for the students’ scores on the science process skills tests . . . . . . . . 91
Figure 4.4 Profile plot for the students’ scores on the self-concept subtests. . . . . . . . . . . . . 95
Figure 4.5 Profile plot for the students’ scores on the anxiety subtests. . . . . . . . . . . . . . . . . 97
Figure 4.6 Profile plot for the students’ scores on the interest subtests. . . . . . . . . . . . . . . . 100
Figure 4.7 Profile plot for the students’ scores on the career subtests. . . . . . . . . . . . . . . . . 102
Figure 4.8 Profile plot for the students’ scores on the enjoyment subtests . . . . . . . . . . . . . 105
Figure 4.9 Profile plot for the students’ scores on the usefulness subtests. . . . . . . . . . . . . .107

1
CHAPTER 1
INTRODUCTION
The aims of science education are to develop students’ understanding of natural phenomena,
and the reasons underlying them; have students to be aware of the methodology that
involved in making sense of the natural phenomena; help students to appreciate that science
is a collective process of all human beings. Science education also aims to get attention of
students to the issues of science, technology, society, and environment and make them
interested in science and science related occupations for future. In other words, by affecting
students’ career choices, science education may initiate national development. Therefore
countries take some initiatives to support science education. For example, in Turkey, general
educational objectives are determined with Five-Year Development Plans, and specific
objectives are established with the science curricula developed by the Ministry of National
Education, and the universities (Keser, 2005). The relationship between importance given to
education and economic growth can be explained with the following example. A country,
which literacy score 1% higher than the international average, attains levels of labour
productivity and Gross Domestic Product (GDP) per capita that are 2.5% and 1.5% higher
than others (Coulombe, Tremblay, & Marchand, as cited in McGaw, 2006). On the other
hand, improved levels of education are also likely to lead to improved health and other social
outcomes (OECD, as cited in McGaw, 2006).
Besides the importance given to education, the value given to the quality of its outcomes is
also important for understanding educational productivity (McGaw, 2006). Although the
previous discussions often focused on international comparisons of levels of investment,
using the percentage of GDP spent on education as the indicator, currently the focus on
outcomes is supported by both national and international measurements of the knowledge
and skills of students (McGaw, 2006). There are national and international testing programs
that are used to give information about Turkish students’ performances on learning
outcomes. They are the Student Assessment Program (SAP, Öğrenci Başarılarının

2
Belirlenmesi Sınavı, in Turkish), Third International Mathematics and Science Study
(TIMSS), Programme for International Student Assessment (PISA), and Progress in
International Reading Literacy Study (PIRLS).
In general, those studies report low student achievement in science (Berberoğlu, 2008;
Kalender & Berberoğlu, 2008; Ceylan & Berberoğlu, 2007). The results of the international
studies were evaluated in terms of student achievement, teaching methods and techniques,
and teacher attitudes. Turkish students’ achievement is lower than that in European Union
countries; teachers’ use of classroom evaluation results (Turkish teachers’ preference to use
evaluation for summative reasons, i.e. to give grade, rather than formative, i.e. to feed-back),
their expectations from students (low rather than high), their motivation of students to use all
their capacities are different than those in European Union countries (Berberoğlu, 2008). On
TIMSS-R our 8th grade students were number 33rd among 38 countries, whereas on PIRLS
our 4th graders became number 28th among 35 countries (Türkiye İktisat Kongresi, 2004). On
the other hand, on PISA our 15-year-olds were 33rd out of 40 countries (EARGED, 2005).
The results of Turkish students’ performances in all these studies, especially in international
ones, showed the Ministry of National Education (MONE) to reform educational system, and
elementary school curricula were renewed for grades 1-5 in 2005-2006 academic year after a
pilot study a year ago (EARGED, 2005) especially for the courses of science, social science,
mathematics, and Turkish (Talim Terbiye Kurulu, as cited in Akşit, 2007). The reform has
also included elementary grades 6-8, which curricula were started to be renewed in 2006-
2007 academic year, and secondary school curriculum for the new 4-year high school (Talim
Terbiye Kurulu, as cited in Akşit, 2007). The following list shows some of the objectives
aimed by the curriculum reform (Talim Terbiye Kurulu, as cited in Akşit, 2007):
1. To lessen the amount of content and number of concepts,
2. To organize the units thematically,
3. To move from a teacher-centred didactic model to a student-centred constructivist model,
4. To integrate information and communication technologies into instruction,
5. To monitor student progress through formative assessment, and
6. To shift from traditional assessment of recall, and launch authentic assessment.
The MONE also determined both core and subject area specific teacher competencies in
order to guide teachers in new patterns of teaching. The core competencies are related to
students’ needs, interests and wants, the process of teaching and learning, observing
progress, and interaction with parents and community (ÖYEGM, as cited in Akşit, 2007).
3
Although our elementary science curriculum was revised according to the lessons gained
from the measurement studies, there are some factors that have an effect on Turkish
students’ achievement in science and should be considered first hand in order for the new
curriculum to be effective. In other words, some steps should be taken to improve these
conditions. These factors were determined by analysis of the national and international tests.
Here two studies will be outlined in order to present these factors.
The analysis of 2002 SAP data by Kalender & Berberoğlu (2008) showed that there were
positive relationships between students’ socio-economic status and teacher-centred activities
with science achievement, and student-centred activities did not contribute to explain
achievement measures positively. The researchers suggested that the quality of student-
centred activities should be examined in detail.
Ceylan & Berberoğlu (2007) investigated the factors related to Turkish students’ science
achievement in the TIMSS-R using Linear Structural Modelling, and found that there are
negative relation between our students’ perception of failure in science, student-centred
activities, and their attitudes toward science with their science achievement; and there are
positive relation between teacher-centred activities and science achievement. These studies
generally suggest that Turkish students’ performance in science is low due to teacher and
instructional methods. The reason might be the inability to apply student-centred activities
properly.
It should be noted that science teaching/learning effectiveness is likely a function of
compatibility between instructional outcomes, nature of the subject area, teaching strategy,
and the nature of students (Shymansky & Yore, as cited in Yore, 1984).
It is hard to cover all concepts in a science class when considering the limited time (Temiz &
Tan, 2003) and deepness of these concepts and principles (Berberoğlu, 2004). In fact,
science is a process to describe and explain nature (Lawson, Rissing, and Faeth, 1990). Since
it is a process of learning (Lawson et al., 1990), science lessons should include and improve
some science related skills, i.e. science process, critical thinking, and scientific judgment,
rather than content coverage (Badders, Fu, Bethel, Peck, Sumners, Valentino, & Mullane, as
cited in Dökme & Ozansoy, 2004).

4
The method that can be used to support both science understanding and science related skills
is Inquiry. The following quotations present Inquiry’s emphasis on both process and
knowledge dimensions of science learning:
Inquiry is a multifaceted activity that involves making observations; posing
questions; examining books and other sources of information to see what is already
known in light of experimental evidence; using tools to gather, analyze, and interpret
data; proposing answers, explanations, and predictions; and communicating results.
Inquiry requires identification of assumptions, use of critical and logical thinking,
and consideration of alternative explanations.” (National Research Council, as cited
in Llewllyn, 2005, p. 4-5)
“Inquiry abilities require students to mesh these processes with scientific knowledge
as they use scientific reasoning and critical thinking to develop their understanding
of science.” (National Research Council, 2000, p. 18)
Inquiry is a combination of inquiry teaching and learning, and scientific inquiry, in a way
that:
“Teaching science as a process of inquiry requires teachers to set up learning
environments in which students can engage in discovery. Finally, learning as a
process of inquiry involves students in using science process skills to investigate and
discover patterns in the world.” (Rakow, as cited in Davison, 2000, p.18)
National Science Education Standards explains scientific inquiry as
“the diverse ways in which scientists study the natural world and propose
explanations based on the evidence derived from their work, and the activities of
students in which they develop knowledge and understanding of scientific ideas, as
well as an understanding of how scientists study the natural world.” (National
Research Council, as cited in Chang & Mao, 1999)
As a summary, inquiry as a teaching method serves the aims of science education better due
to its inclusion of scientific inquiry as a process to reach a sound understanding of science
concepts.

5
When the research studies summarized above and inquiry approach used in the science
classrooms are thought together in terms of enhancing the quality of educational practices in
science classes, educators should reconsider the role of teachers within the inquiry method.
In the new curricula the inquiry approach is emphasized frequently in the objectives
considered in different content dimensions. For example, new Turkish science curriculum
was prepared according to student-centred approach, but as observed in the previous 1992
and 2000 curricula, which also took students in the centre of learning process, teacher-
centred activities have been dominant (Akdeniz, Yiğit & Kurt, as cited in Dede & Yaman,
2006), and teachers probably are going to continue this behaviour (Dede & Yaman, 2006).
Science teachers tend to use more teacher-centred activities when they perceive themselves
as the main factor in learning (Hansen, as cited in Dede & Yaman, 2006), or see themselves
as inadequate in teaching science (Çepni, Küçük, & Ayvacı, as cited in Dede & Yaman,
2006).
The preferences of teachers toward teaching and learning may reflect in their questioning
style. A study of the classification of elementary teachers’ questions with Bloom taxonomy
showed that the teachers tend to ask knowledge level questions in their classes (Baysen, as
cited in Afacan & Nuhoğlu, 2007). Students’ understanding should be evaluated in all
cognitive domains and the evaluation will be fairer when students are assessed in the
learning process (Afacan & Nuhoğlu, 2007).
The strategies used by Turkish science teachers also affect students’ achievement and
learning preferences. As the analyses of the performances of our students with respect to
their perceptions of science teaching strategies implemented in their science classes, teacher-
centred vs. student-centred, on both national (Kalender & Berberoğlu, 2008) and
international (Ceylan & Berberoğlu, 2007) studies, as explained previously, indicate there is
a positive relationship between teacher-centred activities and achievement. This finding is
also supported with another study by Dede & Yaman (2006) on science learning preferences
of 679 students attending grade 6-8 in Sivas showed that teacher-centred learning and
working with group was preferred more than individual learning. Students’ preference to
teacher-centred activities can be a consequence of their 5 year education with the same
classroom teacher, and they probably see this teacher as the only information source (Dede
& Yaman, 2006). Students, in transition from traditional to student-centred education, may

6
develop resistance to learn because they continue to be passive, can not take responsibility of
their own learning, and do not know how to learn (Akgün, as cited in Dede & Yaman, 2006)
The previous paragraphs highlight the importance of teacher factor in determining the
implementation of science curriculum and assessing its effectiveness in Turkey.
Another factor that should be considered as a limitation to the implementation of inquiry
instruction is related to classroom management. The crowded classrooms, and physical
conditions of schools and situations of students, i.e. being a rural village school and low
socio-economic status, are the actual inadequacies stated by elementary science teachers (in
implementing the new science and technology curriculum) (Demirci Güler & Laçin Şimşek,
2007).
When considering these situations, which are specific to Turkey, and the importance of
teacher on student learning and achievement, the method that can be suggested for Turkish
context is guided or teacher-directed inquiry. Guided (teacher-directed) inquiry will also
provide teachers (and students) a transition from teacher-centred approach to student-centred
approach.
In guided-inquiry (Germann, Haskins, & Auls, 1996), teacher guides students in developing
problem, purpose, hypothesis, variables, procedures, conclusion, and other science
processes. Teacher prepares student for a skill, students individually attempt the skill, and
these attempts are evaluated so that they can see positive and negative examples of the skill,
students and teacher construct a model response, and the model is applied to subsequent
skills. Although teacher knows the outcomes, students construct their own knowledge of
problem as the experiment goes on. Consequently, teacher helps students negotiate their way
through the processes until they have the declarative and procedural knowledge to process
inquiry (Germann, et al., 1996).
1.1 Purpose of the Study
The purpose of the present study is to integrate teacher-directed inquiry approach into
Turkish science classes and assess its impact on various student outcomes. Thus this study
aims at investigating how effective is the guided (teacher-directed) inquiry approach in

7
enhancing content knowledge achievement, attitudes toward science and technology course,
and science process skill development of students at the elementary education level.
1.1.1 Statement of the Hypotheses
The following null hypotheses are the hypotheses of the statistical analysis that are tested at
the .05 level of significance:
HO: There is no statistically significant difference between teacher-guided inquiry and
traditional instruction on the population means of the 6th grade students’ “Reproduction,
Growth and Development in Living Things” unit achievement test scores.
HO: There is no statistically significant difference between teacher-guided inquiry and
traditional instruction on the population means of the 6th grade students’ “Force and Motion”
unit achievement test scores.
HO: There is no statistically significant difference between teacher-guided inquiry and
traditional instruction on the population means of the 6th grade students’ attitudes toward
science and technology course questionnaire scores in total and specifically in academic self-
concept, anxiety, interest, career, enjoyment, and usefulness dimensions.
HO: There is no statistically significant difference between teacher-guided inquiry and
traditional instruction on the population means of the of 6th grade students’ science process
skills tests scores
1.2 Definition of Terms
Inquiry: Engaging students into inquiry in which they investigate a natural phenomenon by
using science process skills.
Guided (Teacher-Directed) Inquiry: Guided (teacher-directed) inquiry is engaging students
in scientific inquiry by teacher-directed question. Teacher also provides students the
materials that will be needed during the inquiry. The guided (teacher-directed) inquiry used
in this study is a combination of the instructional models of guided discovery, learning cycle,
and using scientists as an inquiry model.

8
Traditional Instruction: This type of instruction is widely used in science classrooms. It is
also used as control treatment in studies investigating the effect of a teaching method
(Myers, 2004). In traditional instruction, teachers follow “Teacher Guide Book for
Elementary Grade 6 Science and Technology” prepared by Turkish Ministry of National
Education. This book directs teachers on how to give the subject matter, how to deal with
misconceptions, which student outcomes are desirable, etc. It also gives teachers the
autonomy to select among the alternative activities so that the activities fit the students, and
class and laboratory conditions.
Unit Achievement Test: This test is designed to assess students’ knowledge about the topic
and administered before and after the instruction on the unit. Since there were two units, the
number of unit achievement tests was two: Reproduction, Growth and Development in
Living Things, and Force and Motion. The tests were developed from the items from
Secondary School Institutions Student Selection and Placement Test, TIMSS as well as the
literature on the subject by considering the Grade 6 Science and Technology Lesson
Program. The approximate number of test questions in each unit was 25.
Science Process Skills: The skills and abilities required in science and ranges from simple
observation to interpreting data.
Science Process Skills Test: The test aimed to assess students’ total progress in the science
process skills list outlined by the Board of Education of the Ministry of National Education.
There are 3 parallel forms of the science process skills test.
Attitudes toward Science and Technology Course: Students’ affective orientation toward
science and technology as a course matter.
Attitudes toward Science and Technology Course Questionnaire: The test aimed to assess
students’ attitudes toward science and technology course, and consisted of academic self-
concept, anxiety, interest, career, enjoyment, and usefulness subtests.

9
CHAPTER 2
LITERATURE REVIEW
The previous chapter gave the rationale for evaluating the impact of teacher-guided inquiry
on science process skills, unit achievement and attitudes toward science of students. This
chapter will give both the theoretical and empirical site of the related studies. The literature
review was based on the publications in science education as the search results of various
databases and indexes by using “inquiry”, guided (teacher-directed) inquiry”, “science
process skills”, “achievement”, and “attitudes toward science” as keywords. This chapter
consists of the following titles:
1. Inquiry
2. Guided (Teacher Directed) Inquiry
3. Inquiry Instruction Models
4. Science Process Skills
5. Attitudes toward Science
6. Science Achievement
2.1 Inquiry
The National Science Education Standards use inquiry in three different senses, scientific
inquiry, inquiry learning, and inquiry teaching.
Scientific inquiry is those what scientists investigate nature and explain their observations. It
is related to how science proceeds and can be considered independent from educational
processes.
Inquiry learning is the active processes in which students are engaged in order to develop
their understanding of science. There is a relation between scientific inquiry and inquiry
learning. Student learning in school environment should reflect the nature of scientific

10
inquiry in the scientific world. As how the meaning of constructivism changes from one
person to another, so does the meaning of inquiry. In the National Science Education
Standards (NSES) book, inquiry is used in different meanings. It is used in the same meaning
with constructivism. Learning requires an active process. That is to say inquiry is the core of
learning.
Inquiry teaching is the thing that develops inquiry learning. It is not used as simple as talking
about teacher’s daily activities (Anderson, 2005). There are five characteristics of inquiry
teaching; students are engaged by scientifically oriented questions, give priority to evidence,
formulate explanations from evidence to address the questions, evaluate their explanations in
light of alternate explanations particularly those reflecting scientific understanding, and
communicate and justify their proposed explanations (National Research Council, as cited
Beerer & Bodzin, 2004). The explanations of what each feature mean are given next.
1. Learner Engages in Scientifically Oriented Questions: Scientifically oriented questions
base on objects, organisms, and events in the natural world. These questions are investigated
empirically and guide to gathering and using data to develop explanations for scientific
phenomena. There are two kinds of questions: Existence, and causal and functional
questions. Existence questions search origins and consist of many “why” questions: Why do
objects fall toward Earth? Why do some rocks enclose crystals? Why do human beings have
chambered hearths? Many “why” questions can not be answered by science. On the other
hand, causal and functional questions, which investigate mechanisms and include most of the
“how” questions: How do sunlight assist plants to grow? How are crystals formed? (Bybee,
Carlson Powell, & Trowbridge, 2008)
Students tend to ask why questions. These questions can be transformed into how questions
and are investigated with scientific inquiry. This change limits and sharpens inquiry and
makes it more scientific (Bybee et al., 2008).
A question, which is robust and fruitful enough to drive an inquiry, creates a need to know in
students, stimulating additional questions of how and why a phenomenon occurs. The initial
question may be initiated by the students, teachers, instructional materials, internet, some
other source, or some combination of these. The teacher plays a crucial role in guiding the
identification of questions particularly those of students. Productive inquiries are developed
from questions that are meaningful and relevant to students, but they also must be

11
answerable by students’ observations and the scientific information they obtain from reliable
sources. The knowledge and procedures that students use in order to answer the questions
should be accessible and manageable besides being appropriate to the students’ cognitive
developmental level. Skilful teachers help students focus their questions so that they can
experience both interesting and productive investigations (Bybee et al., 2008).
2. Learner Gives Priority to Evidence in Responding to Questions: Science differs from other
knowledge through use of empirical evidence as the base for explanations about how the
natural world works. Scientists try to get accurate data from observations of phenomena.
They acquire evidence from observations and measurements taken in natural settings such as
oceans, or in artificial settings such as laboratories. They use their senses, the instruments
improving their senses, such as telescopes, or measuring what they can not sense, i.e.
magnetic fields. Scientists sometime control variables in order to get evidence, sometime can
not, or the control alters the phenomena. Therefore scientists collect data over a wide range
of naturally occurring conditions and long enough period of time in order that they can
deduce what the influence of different factors might be. The precision of the evidence
collected is confirmed by checking measurements, repeating the observations, or drawing
different data from the same phenomena (Bybee et al., 2008).
Conversely students use evidence in building explanations for scientific phenomena. They
observe plants, animals, and rocks and cautiously express their characteristics. Students
measure temperature, distance, and time and carefully record them. They observe chemical
reactions and moon phases, and graph their progress. They obtain evidence to stimulate their
inquiries from various resources, such as their teacher, instructional materials, and the
internet (Bybee et al., 2008).
3 Learner Formulates Explanations from Evidence: Scientific explanations are centred on
reason. They present causes for effects and ascertain relationships based on evidence and
logical argument. Scientific explanations should be coherent with experimental and
observational evidence about nature. They obey rules of evidence, and open to criticism, and
necessitate the use of many cognitive processes, which are associated with science such as
classification, analysis, inference, and prediction, along with general processes such as
critical thinking and logic (Bybee et al., 2008).

12
Explanations are means to learn about what is unknown by relating what is observed to what
is already known. Consequently, they go beyond present knowledge and propose new
understanding. New ideas have been developed on existing knowledge base in science,
whereas they stem from current understandings of students in science education. For
example, students may use observational and other evidence to propose an explanation for
the phases of the moon, why plants die under certain conditions but live in others, and
relationship between diet and health (Bybee et al., 2008).
4 Learner Connects Explanations to Scientific Knowledge: To evaluate and eliminate or
revise explanations in terms of the evidence, research question, reasoning connecting
evidence and explanation, and other rational explanations is one feature that discerns
scientific inquiry from other forms of inquiry and subsequent explanations. Alternative
explanations may be re-evaluated as students engage in dialogues, compare results, or check
their results with those proposed by teacher or instructional materials (Bybee et al., 2008).
5 Learner Communicates and Justifies Explanations: Scientists communicate their
explanations in such a way that their results can be replicated. This needs clear
representation of the question, procedures, evidence, and proposed explanation and a review
of alternative explanations. It provides a foundation for further review and the opportunity
for other scientists to use the explanation in work on new questions (Bybee et al., 2008).
Having students share their explanations offers them an occasion to ask questions, examine
evidence, recognize faulty reasoning, reveal statements that go beyond the evidence, and
advise alternative explanations for the same observations. Sharing explanations can lead to
query or strengthen the connections students made among the evidence, existing scientific
knowledge, and their proposed explanations. At the end, students can resolve contradictions
and solidify an empirically based argument (Bybee et al., 2008).
2.1.1 Inquiry Continuum
The characteristics of inquiry teaching may be implemented in a science class either in a
structured format, where teachers and/or materials direct students toward known outcomes,
or an open-ended format, which is student-centred (Beerer & Bodzin, 2004).

13
Inquiry science teaching engages students in thinking skills and processes, i.e. formulating
questions and hypotheses, predicting, interpreting data, synthesizing information, and
making conclusions (Chin & Kayalvizhi, 2002). While these skills are known as higher
order, the processes in which students are appointed are open-ended investigations. Open-
ended means students both ask their own problems and find a way to answer these questions
(Chin & Kayalvizhi, 2002). This investigation represents the holistic nature of scientific
inquiry (Woolnough, as cited in Chin & Kayalvizhi, 2002). Open-ended investigation also
develop scientific problem solving skills of students (Hodson; Woolnough; Woolnough &
Allsop, as cited in Chin & Kayalvizhi, 2002). Open-ended investigation according to Lock
(as cited in Chin & Kayalvizhi, 2002) is an experimental study which involves students
actively and directs them toward providing evidence that answers the question and according
to Duggan & Gott (as cited in Chin & Kayalvizhi, 2002) is a genuine problem solving
method and allows student autonomy in problem solution. Open-endedness lies in one end of
a continuum where close-endedness is found in the opposite end (Garrett; Lock, as cited in
Chin & Kayalvizhi, 2002). In close ended investigation, teacher has control on any step in
the investigation (Garrett; Lock, as cited in Chin & Kayalvizhi, 2002). The continuum of
inquiry ranging from close-ended to open-ended is given in the Table 2.1.
As the Table 2.1 suggests, there are variations among inquiry instruction. According to
Tafoya, Sunal, & Knecht (as cited in Staver & Bay, 1987), inquiry has four categories:
1. Confirmation: A concept, principle, etc. is presented before the activity. The student carry
outs an exercise, which confirms it. The student knows the results in advance and follows a
carefully designed procedure.
2. Structured inquiry: The student is presented with a problem, but does not know the results
before the activity. Procedures are summarized and materials are selected for the students.
The activity is structured so that the student can discover a relationship and generalize from
the data collected.
3. Guided inquiry: The student is given only a problem to be investigated. The student plans
the procedures and methods of data collection. The student finds out results and
generalizations.

14
4. Open inquiry: The student formulates the problem as well as the procedures for solving it.
The student collects and interprets data, and makes conclusions.
Table 2.1 Inquiry continuum
Feature
Direction from teacher or material Self-direction
Learner engages in scientifically oriented question
Learner engages in question presented by teacher, materials, or other sources
Learner sharpens or clarifies question presented by teacher, materials, or other sources
Learner chooses among questions, asks new questions
Learner asks a question
Learner gives priority to evidence in responding questions
Learner is provided data and told how to analyse
Learner is provided data and asked to analyse
Learner is guided to collect certain data
Learner decides what constitutes evidence and collects it
Learner formulates explanations from evidence
Learner is provided with evidence
Learner is provided possible ways to use evidence to formulate explanation
Learner is guided in the process of formulating explanations from evidence
Learner articulates explanations after summarizing evidence
Learner connects explanations to scientific knowledge
Learner is given all connections
Learner is given possible connections
Learner is directed toward areas and sources of scientific knowledge
Learner independently looks at other resources and forms the links to explanations
Learner communicates and justifies explanations
Learner is given steps and procedures for communication
Learner is provided broad guidelines to use to sharpen communication
Learner is coached in development of communication
Learner develops reasonable and logical argument to communicate explanations
Note: From Essential Features of Inquiry, National Research Council, as cited in Bybee et al., 2008, p. 63).
2.1.2 The Research on Inquiry
In this part, the studies on the effectiveness of inquiry on various academic outcomes are
summarized.
Montgomery (1969) investigated the effect of the Biological Science Curriculum Study
materials and inquiry teaching method on 9th and 10th grade students’ achievement in biology
and science process. He chose teachers based on who employed Biological Science
Curriculum Study (BSCS) materials with inquiry, BSCS materials with traditional method,
traditional materials with inquiry, and traditional materials with traditional method. He
15
randomly selected 12 students from each class and gave them the Nelson Biology Test and
the Processes of Science Test as pre-, post- and retention-tests. He analyzed data using pre-
test scores as covariate. He found that students of BSCS materials with inquiry class were
more successful; students of all BSCS classes had greater retention; students of traditional
materials with inquiry had greater retention on the Processes of Science Test than students of
traditional materials with traditional method. Tenth grade students were successful than ninth
graders.
Saunders & Shepardson compared two 6th grade classes, one receiving traditional and the
other receiving inquiry instruction for nine months and found that students in inquiry class
scored 2 standard deviations higher in both reasoning abilities and science achievement in
the post-test (as cited in Davison, 2000, p. 28-29).
Hall & McCurdy (1990) compared a Biological Sciences Curriculum Study (BSCS) type
inquiry laboratory with traditional instruction at two private liberal-arts colleges. While the
BSCS instruction included basic and integrated science process skills, concept development
through questioning, and student judgment; the traditional instruction comprised structured,
prescriptive, teacher-oriented activities. The researchers used quasi-experimental research
design in the study. They selected their sample from the students attending to the laboratory
sections of introductory general biology course. Hall & McCurdy (1990) used pre-and post
test to get data on three dependent variables (achievement, reasoning ability, and attitudes
toward biology). The achievement was measured by the Test on Biology Laboratory
Concepts, reasoning ability was measured by the Group Assessment of Logical Thinking
(GALT), and attitude was measured by the Biology Students Behaviour Inventory. Analysis
of covariance on students’ tests scores showed that the experimental group (n=60) were
significantly more successful than the control group (n=59) on achievement (F (1, 14) =
4.07, p <.05), but on the reasoning ability, and attitude. On the other hand, students’ gain
scores on the GALT showed that both groups made a 15% increase in the number of formal
thinkers. Hall & McCurdy (1990) concluded that a BSCS type laboratory achieved the
learner outcomes at higher education, and laboratory can be used to advance students’ formal
reasoning.
Chang & Mao (1998) investigated the effect of inquiry instruction on Taiwanese ninth grade
students’ achievement in earth science. They used a quasi-experimental non-equivalent
control group design. Their sample was consisted of 232 students, who were 15 years-old

16
and attending six classes. While the experimental group was delivered inquiry-based
instruction, the control group was given traditional-instruction. The students in both groups
were given an achievement test both as pre-and post-tests. The test had 27 items and was
constructed from Taiwan Indicators of Educational Progress in Science Skills and Taiwan
Entrance Examinations for Senior High School. The cognitive processes of the test items
according to Bloom’s Taxonomy were factual (knowledge), comprehension, and integrated
(application). The researchers by using students’ pre-test scores as covariate conducted an
analysis of covariance to assess the effect of treatment. After the analysis, they found that
experimental group students were more successful on the post-test (F=6.75, p<0.05),
especially on comprehension-level (F=3.94, p<0.05), and integrated-level (F=6.47, p<0.05)
test items.
The following four meta-analyses also show the effectiveness of inquiry-based science
programs on many outcomes:
1. Lott (as cited in Costenson & Lawson, 1986) made a metaanalysis of 39 studies published
between 1957 and 1980. The researcher found that inquiry compared to traditional
instruction led to significantly better performance on higher order thinking skills, but equal
performance on lower order thinking skills.
2. Shymansky (as cited in Costenson & Lawson, 1986) did a metaanalysis of 302 studies
comparing the effectiveness of inquiry curricula over traditional ones. He found that
students’ performance with inquiry curricula was higher than that with traditional, and
among the inquiry curricula, Biological Sciences Curriculum Study (BSCS) was more
successful, such that an average BSCS student outperformed 84% of traditional students on
attitude, 81% of traditional students on process skills, 77% of traditional students on analytic
skills, and 72% of traditional students on achievement.
3. Bredderman made a meta-analysis of 57 research reports published after 1965 and used
13,000 students from 900 elementary classes using Elementary Science System, Science – A
Process Approach and Science Curriculum Improvement Study. He found that with a
weighted mean effect size of .35, a 14 percentile improvement was measured for an average
student who participated in these programs (as cited in Davison, 2000, p. 29).

17
4. In a meta-analysis of the impact of the National Science Foundation-reform inquiry-
oriented science curricula on student performance; it was found that the science curricula
improved students' science achievement and process skills as well as their attitudes toward
science with larger effect sizes for biology (Shymansky, Kyle, & Alport, as cited in Chang &
Mao, 1999). Moreover, the re-synthesis of this study due to recent developments in the meta-
analysis indicated that the science programs of 1960’s and 70’s were effective in improving
student performance both in cognitive and affective domains (Shymansky, Hedges, &
Woodworth, as cited in Davison, 2000, p. 20-21).
The effectiveness of inquiry instruction was also studied by Turkish researchers. These
studies will be given in the following paragraphs.
Tatar (2006) in her PhD study investigated the effect of inquiry instruction in “Let’s Know
and Conserve our Blue Planet, Our Common Home with All Living Things” unit on 7th
grade students’ science process skills, achievement, and attitudes toward science. She used a
sample of 104 students attending two elementary schools in Çankaya, Ankara. In the study
Tatar applied quasi-experimental research design with pre- and post-test control group. She
administered the science process skills and achievement tests, and attitudes toward science
questionnaire to the students in order to get data. After analysis of data with repeated two
factors ANOVA, Tatar (2006) found that the inquiry instruction had more effect in
developing science process skills, academic achievement, and attitudes when compared to
the traditional instruction. According to this finding, she further suggested the need for both
in- and pre-service training of teachers, and revision of science curricula on inquiry.
Gençtürk & Türkmen (2007) studied the effect of inquiry instruction on achievement of
fourth grade students attending an elementary school in Afyonkarahisar. The researchers
used quasi-experimental research design with two classes, one was experimental and the
other was control group. Both groups were given an achievement test on “Living Things are
diverse” unit before and after a seven-week-instruction by the same teacher. The analysis of
pre-test data with ANOVA showed that the groups were similar and both female and male
students performed similarly in the achievement test. On the other hand, the analysis of post-
test scores showed that the groups performed differently in the achievement test, and both
gender groups performed similarly. The comparison of pre- and post-test scores with paired
t-test showed that both groups performed well after the instruction.

18
2.2 Guided (Teacher-Directed) Inquiry
In guided (teacher-directed) inquiry, teacher presents a problem to students. Students have to
solve this problem by presenting different hypotheses and then by testing them (Aho,
Huopio, & Huttunen, 1993).
There are some limitations to implement an effective science instruction intended to increase
science literacy (Beck, Czerniak, & Lumpe, as cited in Black, 2003), which is aimed by
inquiry (Black, as cited in Black, 2003). The reason is teachers’ lack of experience in
constructivist teaching and learning. The lack of experience with this kind of teaching make
teacher feels discomfort and unfamiliarity, thus increases the time for a teacher to spend on
the duties not related with teaching. Therefore there is a need to understand and be familiar
with guided inquiry during pre-service (Beck et al., as cited in Black, 2003).
2.2.1 The Research on Guided (Teacher-Directed) Inquiry
The first study is of Germann, who investigated the effect of the directed-inquiry approach
on science process skills and scientific problem solving. The sample was four sections of
grade 9 and 10 general biology students. The students were grouped into experimental and
control groups according to their academic abilities, average ability students were included
in the experimental group, whereas above-average ability students were incorporated in the
comparison group. It was found that directed-inquiry had no significant effect on the
learning of science process skills or on cognitive development over traditional instruction (as
cited in Myers, 2004).
In the second study, Aho, Huopio, & Huttunen (1993) examined the effect of teacher-guided
inquiry on knowledge, enjoyment, and evaluation of learning of students attending to grade 2
and 4. There were 17 second grade and 31 fourth grade students participating to the study.
The researchers organized two science lessons each based on a problem of water absorption
in plants and floating of leaves of water plants. The students’ own teacher implemented the
treatment. The teacher presented the first problem of water absorption on tulip plant and
instruments, and then she discussed with the class what and how to study, which instruments
to use, and what the result would be. The second experiment was given in the written form
by which the students were instructed to how to set up an experiment in order to study the
problem of floating of leaves of water plants. During both experiments, the teacher helped
19
students by asking why they were doing the experiment and what they would discover. After
the experiment she asked them what they learned. The students’ knowledge of water
absorption in plants and floating of leaves of water plants was assessed by two standard
school tests (in fact the first test measured students’ understanding of the concepts such as
what plants need to grow, why they need water, and how they get water; but the second test
assesses students’ knowledge of water lily and why the leaves of water plants float or sink,
and if the leaves of other plants will float or sink). Both tests administered two weeks prior
to the experiment as a pre-test and two weeks after the experiments as a post-test. The
second research question was studied according to the data from observations and videotapes
of the lesson, and the analyses of interactions among the students and among the students
and the teacher were done. The last research question was examined by asking the students
about their views on the experiments. The analyses of students’ performance on the pre-and
post-tests by t-test revealed that the understanding of plants’ water absorption did not
improve among the second graders but in the fourth grade (N=27 t-value 4.32, p=.000). On
the other hand, the students of each grade showed significant improvement in the second test
regarding floating of the leaves of water plants (for second grade N=15 t-value 4.07, p=.001,
and for fourth grade N=22 t-value 11.17, p=.000). Further analyses of students’ responses to
the first test items showed that students’ understanding increased after the experiments. For
example 29% of second grade students and 70% of fourth grade students gave the correct
answer to the item asking how plant obtains water in the pre-test. After the experiment, these
percentages raised to 46% for grade 2 students and to 78% for grade 4 students. On the other
hand, it was found that students use correct concepts only at grade 4 (or at grade 2 after the
experiment). For example the concept of “evaporation” was used by only 33% fourth graders
in the pre-test, and by only 15% second graders (and 82% fourth graders) in the post-test.
The analyses of classroom observations showed that at both grade, the students proposed
similar methodology on how to study the problems. However the students’ answers to the
inference questions, i.e. “Why the plant after being cut into two and put into water with
different colour has dyed these colours?” were showed second graders’ inability to describe
the phenomena. The analyses of students’ views on the lessons showed that 75% second
grade and 100% fourth grade students had positive attitudes towards the first experiment,
while all of them had positive attitudes toward the second experiment (although the fourth
graders found the second experiment simple). Aho et al. (1993) corroborated the previous
idea that inquiry tasks should be in line with students’ cognitive level, and concrete activities
support the formation of abstract concepts and suggested that when there are many concepts
to learn, students should be given the basic ones. The researchers stated that their result

20
confirmed the idea of students’ need to get help from teacher during inquiry, which may
result from students’ inexperience with inquiry. The researchers also found that the
discussions during the experiment helped students to test and change their own ideas. On the
other hand, Aho et al. concluded that since the students’ metacognition was low, they
evaluated their own learning in knowledge terms rather than in process terms. The
researchers also suggested teachers to use appropriate materials in science classes in order to
avoid teacher-oriented instruction.
2.3 Inquiry Instruction Models
Instructional models suggest a particularly useful way for teachers to improve their
utilization of inquiry (National Research Council, 2000). Inquiry teaching makes use of
various models, such as learning cycle, guided discovery (Carin, Bass, & Contant, 2005, p.
105), and using scientists as an inquiry model. Although both learning cycle and guided
discovery have many common elements, guided discovery is more open and more
unstructured when compared to learning cycle (Carin et al., 2005, p. 111).
2.3.1 Learning Cycle
Learning Cycle assists students in understanding of science concepts and developing science
process skills (Matyas, 2000). Generally learning cycle has 3 steps: exploration, term
introduction, and concept application. The 5E (and 4E, 7E, and 9E) is an extension of the
original three-phase learning cycle. For example the middle three phases of 5E Learning
Cycle are similar to three-phases learning cycle (Carin et al., 2005, p. 111). Apart from these,
engagement intends to give a focus about the subject and allows teacher to probe students’
prior knowledge, and evaluation reveals contemporary ideas about ongoing assessment of
student performance and learning (Carin et al., 2005, p. 111).
The explanations of the steps of the three-phase learning cycle are as follows (though they
are formerly named as exploration, invention, and discovery by Karplus & Their, as cited in
(Lawson, 1995, p. 136):
Exploration: In this step, students are given a new situation so that they start to ask questions
about it and try to solve the problem with their experiences. When students see that their
ideas are in conflict with the new situation or not adequate, they generate alternative ideas
and discuss the applicability of these ideas to the problem. Students also make an analysis of

21
the regularity pattern in the phenomena, and form hypotheses, for example heart rate
increases with temperature (Lawson, 1995, p. 136).
Term introduction: In this step, students are given the new concepts, which are used to refer
to the patterns realized in exploration, for example metabolism coldblooded or poikilotherm
by teacher, textbook, or other medium (Lawson, 1995, p. 136).
Concept application: In this step, students relate the new concept or pattern to additional
examples. For example, after teacher introduces the term cold-bloodedness, she/he asks
students to classify other invertebrates or vertebrates as coldblooded and warm-blooded
(Lawson, 1995, p. 137).
4E Learning Cycle: It is consisted of the phases of Explore, Explain, Expand, and Evaluate
(Yılmaz & Çavaş, as cited in Çavaş, 2004).
In exploration step, students interact with each other and material (Martin, Sexton &
Gerlowich, as cited in Çavaş, 2004).
In explanation step, students interact with teacher in order to find the concept which comes
out from the observations and data in exploration phase (Martin et al., as cited in Çavaş,
2004).
In expansion step, students are guided by teacher in applying the concept and expand their
ideas and science usage (Martin et al., as cited in Çavaş, 2004).
In evaluation step, students are assessed formally or informally throughout the cycle (Martin
et al., as cited in Çavaş, 2004).
5E Learning Cycle: It is consisted of the phases of Engage, Explore, Explain, Elaborate, and
Evaluate.
In engagement step, students’ interest is gained through a hands-on mini lab or
demonstration or a pre-test like KWL or concept map (Matyas, 2000).
In exploration step, students get concrete experiences on subject through laboratory activities
(by applying whole procedure or some steps of it such as collecting and analysing data)
(Matyas, 2000).
In explanation step, student questions are answered through using related sources for
example readings, web quests, lectures, discussions, and experts (Matyas, 2000).
In elaboration step, students utilize their subject knowledge and science process skills in
order to make use of the subject through a guided or open inquiry activity (Matyas, 2000).
In evaluation step, students are asked to apply their understanding to new situations through
use of some instruments such as the previous materials i.e., KWL, concept map, quiz, or new

22
materials i.e., reflection papers. Evaluation can be also made with use of students’
performances on the previous instruments such as laboratory reports, presentations and
posters, home works and web quests, reflection papers, self and peer evaluation forms on
group work (Matyas, 2000).
7E Learning Cycle: It is consisted of the phases of Engage, Elicit, Explore, Explain,
Elaborate, Evaluate, and Extend (Eisenkraft, as cited in Mecit, 2006).
In engagement step, students’ interest is taken through a scenario or an experimental activity.
This leads students to form questions. Students’ prior knowledge is also measured by this
way (Eisenkraft, as cited in Mecit, 2006).
In elicitation step, students’ prior knowledge is learned (Eisenkraft, as cited in Mecit, 2006).
In exploration step, students are given materials, questions, and directions so that they start
their discoveries as a group by using materials. Students also discuss with group members
and teacher (Eisenkraft, as cited in Mecit, 2006).
In explanation step, students after organizing data, determining pattern, comparing, and
stating problems with the guidance of teacher construct their own understandings and
communicate these concepts. The concepts can be introduced in the form of scientific
terminology by students and teacher (Eisenkraft, as cited in Mecit, 2006).
In elaboration step, students are asked to offer alternative solutions to the problem. They
may repeat the whole or some parts of the activity by transferring their understanding into
new areas, and form new questions and hypotheses, which means that they start to a new
discovery, or learning cycle (Eisenkraft, as cited in Mecit, 2006).
In extension step, by offering students new experiences to transfer their understanding into
new problem areas, students can relate what they have learned to daily life applications
(Eisenkraft, as cited in Mecit, 2006).
In evaluation step, students are assessed on what they learned. Assessment is done by teacher
or student (Eisenkraft, as cited in Mecit, 2006).
2.3.1.1 The Research on Learning Cycle
In this part, the studies on the effectiveness of learning cycle on various academic outcomes
are summarized.
Küçükyılmaz (2003) explored the effect of three-stage learning cycle on 5th grade students’
achievement in “Sound and Light” unit. She made use of pre test-post test control group

23
design in her study and took one of the classes in an elementary school as experimental and
the other as control group in the same school. The school was located in Eskişehir, Turkey.
The treatment took 6 weeks, during this time the experimental group received three-phase
learning cycle instruction whereas the control group received traditional instruction. She
measured the students’ achievement in the unit before and after the treatment, and after the
semester break as retention. She made the control and experimental group students equal by
eliminating the data from the students with diverse socio-economic status, and a high or low
score in the pre-achievement test and their previous science course grade point average. Thus
the original sample size of 69 (34 versus 35) decreased to 44 (22 in each group). She used
independent t-test for analyses and found that there was no significant difference between the
groups with respect to the mean achievement score after the treatment, but there was a
significant difference between the groups on the retention test, favouring the experimental
group students. The researcher concluded that learning cycle is effective on increasing the
level of remembrance of the students when compared to traditional instruction. She
concluded that in order to keep students’ retention of understanding, learning cycle should be
used; teachers and teacher candidates should be given some courses on learning cycle; when
applying learning cycle, class organization should be arranged in an order that permits
students to work independently and in group; and same kind of arrangements should be done
in school level so that students have rich experiences with interacting with materials.
Çavaş (2004) investigated the effect of 4E learning cycle on 6th grade elementary students’
attitudes toward science and understanding of flowing electricity subject within the
“Electricity Directing Our Life” unit. She made use of pre test-post test control group design
in her study and took one of the classes in an elementary school as experimental and the
other as control group in the same school. The school was located in İzmir, Turkey. There
were a total of 79 students in the sample. The researcher herself applied the treatment to each
group (4E learning cycle instruction to the experimental and traditional instruction to the
control group). She measured the students’ achievement in flowing electricity subject before
and after the treatment. She used the percentages of correct responses in each item of the
flowing electricity test, and both dependent and independent t-tests for analyses. The
researcher found that although there was a significant difference between the mean pre test
and post test scores in each group, when the percentages of correct responses given to each
test item was considered, there was more gain in the experimental group from pre test to post
test; there was a significant difference between the groups with respect to the mean post test
score favouring the experimental group; there was a significant difference between the

24
groups with respect to the difference between the post- and pre-test mean scores, in other
words the mean gain score, favouring the experimental group. On the other hand, when the
researcher analysed the data on attitudes toward science with independent t-test, she found
that although there was no significant difference between the mean pre- and post-attitudes
toward science score in the control group, there was a significant difference between the
mean pre- and post-attitudes toward science score in the experimental group; there was a
significant difference between the groups with respect to the mean post-attitudes toward
science test score favouring the experimental group. Moreover the researcher performed a
correlation analysis to find a relation between the achievement test and attitudes toward
science questionnaire scores and found that there was a significant correlation between both
tests, although the relationship was medium. The researcher concluded that 4E learning cycle
is effective in eliminating students’ misunderstandings in flowing electricity subject;
developing understanding and attitudes toward science due to its consideration of students’
prior knowledge and experiences; and providing a learning environment for students to make
discoveries on subject that result with increased interests and positive attitudes toward
science through active involvement of students. The researcher concluded that teachers after
getting acquaintance with constructivist teaching methods can prepare an effective learning
environment for their students and in-service training can help teachers in learning and
applying constructivist approaches.
Doğru Atay (2006) examined the effect of three-stage learning cycle on 8th grade students’
achievement in genetics concepts, and the main predictors of achievement with a pre test-
post test control group design. Her sample consisted of 213 students from eighth classes
attending two elementary schools in Ankara. The experimental group students received
learning cycle, whereas control group students received traditional instruction. She
administered a genetics achievement test to the students before and after the treatment. She
also used the Learning Approach Questionnaire to measure learning orientation, Test of
Logical Thinking for level of reasoning ability, Motivational Strategies for Learning
Questionnaire for determining self-efficacy, Locus of Control Scale for evaluating locus of
control, and Attitude towards Science Scale. She analysed the data with one-way ANOVA
and found that learning cycle instruction increased students’ achievement in genetics more
than traditional one. Moreover her analysis with stepwise multiple regression showed that
while in the learning cycle classes students’ meaningful learning orientation and attitudes
toward science are the main predictors of achievement; in the traditional classes students’
attitudes toward science and reasoning ability are the main predictors of achievement.

25
2.3.2 Guided Discovery
Students start guided discovery learning with interesting question and concrete materials, by
working as individual or as a group they explore materials, make observations, and discover
answers to their questions, when teacher works as a facilitator and guide (Carin et al., 2005,
p. 105). Discovery activities motivate students during their search and discovery (Sears &
Kessen, as cited in Carin et al., 2005, p. 105). Discovery activities also help students to find
their own meanings and systematize their own ideas (Wiggins & McTighe, as cited in Carin
et al., 2005, p. 105).
2.3.2.1 The Research on Guided Discovery
Aktamış, Ergin, & Akpınar (2002) explored the effect of discovery on 8th grade students’
achievement, understanding, and attitudes in “Magnetism Affecting Our Life” unit. The
researchers made use of pre test-post test control group design in their study. Their sample
was consisted of 60 students at two classes (30 in each class) attending an elementary school.
Both groups were given a magnetism achievement test, a set of essay questions to determine
their understanding of magnetism concepts, and attitudes toward magnetism questionnaire
both before and after the treatment. The researchers also interviewed with the experimental
and control group students after the treatment in order to understand how the students
constructed their understanding during the instruction. Both discovery and traditional
instruction were given by the same science teacher to the groups for four weeks. After the
analyses of student data on the measures with independent and dependent t-test, the
researchers found that that there was a significant difference between the groups on the post
achievement mean score, post essay mean score, and post attitudes toward magnetism mean
score favouring the experimental group. The researchers concluded that since the students in
the experimental group actively involved and learned how to learn, they constructed their
own knowledge easily. The interviews with the students showed that the students could
easily comprehend the subject and relate it with daily life. The researchers also concluded
that since various teaching materials were used and the students actively involved into the
lessons, discovery treatment improved students’ attitudes toward magnetism. Therefore, the
researchers suggested using teaching materials developed from simple and low-cost
materials rather than complex and expensive ones.

26
Ünal & Ergin (2006) studied the effect of discovery on 7th grade students’ achievement,
learning approach and attitudes for “Pressures of Liquids and Gases” unit. The sample of this
study was consisted of 59 students from two classes (30 in the experimental class and 29 in
the control class) of an elementary school in Buca, İzmir. The school was purposively
selected for best representing the other schools in the same region. Moreover the classes
were selected for having the students with similar GPA scores. Both groups were given an
achievement test and attitudes toward science questionnaire, and a science learning approach
scale before and after the treatment. Both the discovery and traditional treatments were given
by the same science teacher to the groups for five weeks. The discovery treatment was
consisted of three stages: study with concrete material, concept introduction, and generalize.
The teacher started each activity with discussion questions and assigned the students groups
of 3-4 for studying with the concrete materials. The teacher then handed out the concrete
materials and worksheets to the groups and asked the students to answer the questions on the
sheet while they work with the concrete material. After the groups finished their work with
the materials, the teacher asked them to explain their observations and the reasons of these
observation results. The teacher guided the students on reaching the concepts underlying the
phenomena. The teacher again asked the students to revise their answers to the worksheet
questions. Then the teacher started asking the evaluation questions of the sheet, which were
related to the daily life applications, transferring and generalizations. After the analyses of
student data on the measures with independent and dependent t-test, the researchers found
that that there was a significant difference between the groups on the mean post achievement
scores favouring the experimental group, there was no significant difference between the
groups on the mean post learning approach score, and post attitudes toward science scores,
and there was a significant relationship between students’ scores in achievement and
learning approach, between students’ scores in achievement and attitudes toward science,
and between students’ scores in attitudes toward science and learning approach, though these
relationships are medium. The researchers concluded that the worksheets provided an
opportunity for working with concrete materials and increased students’ motivation, and the
concepts introduction and generalization parts of the activity (worksheet) improved students’
understanding and made relating the subject with daily life easy. Regarding no attitude and
learning approach change for both groups, the researchers concluded that the instruction was
short to make a difference in attitudes and learning approach, and they suggested that their
research should be replicated for a longer instruction time.

27
2.3.3 Using Scientists as an Inquiry Model
Through working directly with students, a scientist can be a role model for students and
encourage them in science (Board of Agriculture, 1998, p. 25). Moreover scientists can
encourage teachers to learn science as a process and help them improve their science content
understanding (Board of Agriculture, 1998, p. 12; Morrison & Estes, 2007), whereas
teachers can help scientists understand learning processes and diversity of students (Board of
Agriculture, 1998, p. 12-13). Besides modelling science as inquiry, scientists can also serve
up a resource for science subject and help teacher in classroom demonstration (Board of
Agriculture, 1998, p. 13). Science teachers can integrate content with daily life and provide
students both an educational and vocational orientation (Kesercioğlu, Türkoğuz, & İşçier,
2005) toward science by using scientists in their classrooms. The use of scientists as models
improves elementary students’ scientific attitudes (Demirbaş & Yağbasan, as cited in
Demirbaş & Yağbasan, 2005), which are consisted of attitudes toward thinking and
knowledge, i.e. curiosity, open mindedness; attitudes toward evaluation of thinking and
knowledge, i.e. critical thinking, objectivity, and testing hypotheses; and accepting special
scientific beliefs, i.e. commitment to reality (Byrne & Johnstone, as cited in Demirbaş &
Yağbasan, 2005).
2.3.3.1 The Research on Using Scientists as an Inquiry Model
Marx, Honeycutt, Rahmati Clayton, & Moreno (2006) developed a set of inquiry lessons on
human anatomy called “The Elizabeth Towns Incident” with a partnership between a biology
teacher from the Houston Independent School District (HISD) and two graduate students
serving as content advisors from Baylor College of Medicine. This unit was a combination of
case-based teaching and laboratory, where the students could play a physican role. The unit
was implemented in Biology I classes of the HISD. The experiences gained during the
application of the unit showed that the collaboration increased students’ understanding of
human anatomy as assessed by the raise in the number of students passing the state mandated
Biology I test, helped to determine critical areas in collaboration, and assisted students’
change of their streotypes toward scientists, i.e., what scientists does, what to do to be a
scientist, etc.

28
2.4 Science Process Skills
Terminology of science process skills are those used by scientists in solving problems. The
name “skills” are given to the steps involved in scientific method after the development of
“Science-A Process Approach” or “SAPA” in the US. Scientists were studied to determine
what they do (McComas, 1989).
Science process skills are classified into two groups as basic and integrated. Basic skills
provide a foundation for learning the more complex integrated ones (Padilla, as cited in
Myers, Washburn, Dyer, 2004). The following tables (Table 2.2 and 2.3) outline both basic
and integrated skills.
Table 2.2 Basic science process skills
Basic Skills Observation: It is the process of gathering information by using sense organs and instruments that extend the senses, and the various instruments used in medical diagnosis (Minnesota Mathematics and Science Teaching Project, as cited in Carin et al, 2005, p. 38). Using Numbers: It is the process of using quantitative relationships (Chiappetta & Koballa, as cited in Myers, Washburn, Dyer, 2004). Measurement: It is the process of quantifying observations through measurement (Carin et al, 2005, p. 41). Classification: It is the process of organizing information, i.e., sorting objects according to their properties. There are two kinds of classification, binary and multistage. Binary classification is organization of objects into two groups on the base of common characteristics. On the other hand, multistage classification is organization of objects over and over again (Carin et al, 2005, p. 41-42). Using Space-Time Relationship: It is the process of describing changes in a parameter with time. The parameter can be location, direction, shape, size, volume, weight and mass (Ministry of Education Malaysia, 2003). Inference: It is the process of interpreting observations based on prior knowledge and experiences (Carin et al, 2005, p. 42). Prediction: It is the process of forecasting a possible outcome based on knowledge of patterns in data. The difference between inference and prediction is backward looking feature of inference (what happened), whereas forward looking feature of prediction (what will happen) (Carin et al, 2005, p. 44). Communication: It is the process of presenting and sharing the results of observation, investigation through oral, written, and visual materials (TTKB, 2005)
Note: The table shows all the skills found in the literature.

29
Table 2.3 Integrated science process skills
Integrated Skills Defining and Controlling Variables: It is the process of identifying the independent, dependent and control variables for investigation. A variable is a property of objects or events that can change and have various amounts, i.e., the time passed during a candle burn, amount of fertiliser given to a plant. Independent variable is the manipulated or changed variable, dependent variable is the responding variable as a result of change in independent variable, and control variable is the one kept constant or unchanged during investigation so that not confounded the results (Carin et al, 2005, p. 45). Planning Experiment: It is the process of suggesting an experiment in order to test the hypothesis (TTKB, 2005). Knowing and Using Laboratory Materials: It is the process of selecting and using materials safely and effectively (TTKB, 2005). Experimenting: It is the process of changing one variable at a time and observing the effect on another variable while holding all other variables constant (Carin et al, 2005, p. 44). Hypothesizing: It is the process of forming hypotheses, which are the statements of possible relationships between the independent and dependent variables that might be identified through investigation (Carin et al, 2005, p. 44). Collecting Information and Data: It is the process of gathering information from various sources via observation and experiment, and using books, maps or information and communication technologies (TTKB, 2005). Recording Data: It is the process of recording data in the form of writing, picture, table, and figure (TTKB, 2005). Interpreting Data: It is the process of seeing the relationships and trend among data (Arthur as cited in Temiz & Tan, 2003). Processing Data and Formulating Models: It is the process of presenting data in the forms of frequency distribution, histogram, table, physical models, etc. (TTKB, 2005). There are many ways to form a model even for the same event. For example, the melting of an ice cube can be shown with a graph, picture, three-dimensional object, video recording, table, or photograph (Turgut, Baker, Cunningham, & Piburn, 1997). Defining Operationally: It is the process of describing variables exactly with a measurement criterion (TTKB, 2005).
Note: The table shows all the skills found in the literature.
The following literature review is dealt with the studies on the effectiveness of instruction
and curriculum on science process skills; science process skills of students, and teachers, and
content analysis of textbooks with respect to these skills.
2.4.1 The Research on Effectiveness of Instruction on Science Process Skills
The first study is an investigation of science process skills development of university
students through computer-assisted instruction by Burchfield and Gifford (as cited in Myers,
2004). The sample was 92 students enrolled in General Biology I for Science Majors at a
small, rural community college in the south-eastern United States. The study found no
significant difference in the mean science process skill gain scores between students in the
traditional class and those in computer-assisted instruction class. It was also found no
significant effect of student academic aptitude, as measured by score on the Enhanced

30
American College Testing Assessment, and gender on science process skill development
(Burchfield & Gifford, as cited in Myers, 2004).
The following studies were done in Turkey at elementary school level when our current
science curriculum is in action.
Karahan (2006) studied the effect of looked into the effect of science process skills based
learning on achievement, attitude, science process, and logical and creative thinking of
fourth grade students in Ereğli, Zonguldak. She used quasi-experimental design with pre-
and post-test control group. There were a total of 76 students attending the same elementary
school in her study, 39 in the experimental, whereas 37 in the control groups. Karahan
(2006) used an achievement and attitude tests, a problem solving attitude inventory, the
Turkish version of Torrance’s Creative Thinking test and Tobin & Capie’s Test of Logical
Thinking and Science Process Skills tests, in her study. After the analysis of data with t-test,
Karahan (2006) found that the difference between both experimental and control groups
students’ post-test mean scores on logical and creative thinking skills tests were significantly
different than 0, on behalf of the experimental group, but the differences on problem-solving
attitude, science process skills, attitudes, and achievement. The researcher concluded that
because the new curriculum already based on science process skills, she could not observe
the change in most of the learning outcomes.
Başdaş (2007) investigated the effect of hands-on science learning in “Matter and Heat” unit
on sixth grade students’ science process skills, achievement, and motivation in his master’s
thesis. He used experimental research design with a treatment group and control group in one
elementary school, and one control group in another elementary school in Manisa Demirci.
The study was done when our current science curricula was in action. Therefore, while the
treatment group was receiving hands-on instruction, the control group was being instructed
with the new curriculum. There were 63 students in total (20 in experimental, 43 in control
groups). Başdaş (2007) used a science process skills test, an academic achievement test, and
a motivation scale towards science learning in his study. He found that experimental group
students got significantly higher scores in all measures than those in control. His interviews
with experimental group teacher also showed that treatment was effective and sufficient in
developing students’ scientific attitude and behaviour. Başdaş (2007) suggested that science
lesson should include hands-on activities which will develop science process skills, because
as asked in the international examinations such as PISA and TIMSS, the aim of science is to

31
develop those skills, and inclusion of science process skills in science curriculum will bring
our science education to the international standards. Başdaş (2007) stated that this also will
result with higher motivation and active involvement of students in science courses which
will turn out to be an increase in their career choices. Başdaş (2007) also suggested same
revisions in both pre- and in-service training.
2.4.2 The Research on Science Process Skills of Teachers
The first study was the investigation of the relation between science process skills and
attitudes toward science of pre-service elementary teachers. The sample was 46 pre-service
elementary teachers enrolled in a mathematics and science methods course before student
teaching. The study found that there is a moderately positive correlation (r = .39) between
the pre-service teachers’ competency levels of science process skill and attitudes toward
science (Downing, Filer, & Chamberlain, as cited in Myers, 2004).
In the second study Padilla, Okey, & Garrard studied how science teachers integrate process
skills to their sixth and eighth grade classrooms (as cited in Narode, Heiman, Lochead, &
Slomianko, 1987). These researchers used the following steps in their process skills based
instruction (it includes also what the previous research by both the first author (Padilla) and
Tobin and Capie utilized (as cited in Narode et al., 1987):
1. Teacher asks a researchable question, for example: “Are some body parts more sensitive
to touch than others?”
2. Students form hypotheses with the help of teacher, for example: “Fingertips are more
sensitive to touch than the palms”.
3. Students identify variables.
4. Students select independent and dependent variables and control others, for example:
operational definition for dependent variable is the ability to recognize the touch of a pencil,
and the tool and force used to touch fingertips and palms are controlled.
5. Students design the experiment and draw a proper table.
6. Students perform the experiment.
7. Students organize data onto a class chart and make generalizations in the form of
conclusion or new hypothesis.
The researchers found that this method was more effective after a two-week-introduction of
process skills (the total duration for the instruction took a semester). The study showed that
science process skills can be taught to middle school students and integrated into subject, and

32
continued instruction on science process skills in various content areas are more effective
than short term instruction in process skills alone (as cited in Narode et al., 1987).
In another study, Demir (2007) tried to find the relationship between pre-service classroom
teachers’ science process skills and some variables (gender, parent education level, income,
university entrance test score, average of the science and quantitative course scores, GPA,
attitudes toward science, self-efficacy, and cognitive development). He sampled 277 senior
students who were attending primary education department at Gazi University. In order to
collect data, he made use of the Test of Integrated Process Skills II, Science Teaching
Attitude Scale II, Science Teaching Self-efficacy Beliefs of Classroom Teachers, Test of
Logical Thinking, and a demographic form. He employed path analysis with AMOS 5.0. He
found that:
1. The model explains 36% of the variance observed in pre-service teachers’ science process
skills scores. Among the variables, cognitive development level has the most effect (.58),
followed by income (.10), and attitudes (.9) in explaining variance in the science process
skills scores.
3. The variables in the model (gender, mother education level, university entrance exam
score, average score of science and quantitative courses, GPA, and science self efficacy), do
not have a direct but an indirect effect on science process skills scores. From these variables
university entrance exam score has the highest indirect effect on science process skills
(.178).
He suggested that pre-service programs should consider and develop students’ cognitive
development levels, and in pre-service science courses should include activities by which
students have a chance to improve their attitudes toward science, which will result with
development of science process skills.
2.4.3 The Research on Content Analysis of Textbooks with respect to Science Process
Skills
Content analysis is a technique to study human behaviour indirectly through analysis of their
communications, i.e., textbooks, newspapers, articles, speeches, advertisements, films,
pictures, musical compositions (Fraenkel & Wallen, 2005, p. 483).
Content analysis is a powerful and efficient approach to curriculum evaluation (Tamir &
Lunetta, 1981). Although analysis of the content of curriculum materials does not give direct

33
data on student growth, it allows the researcher to find out the link between the actual
materials and the stated goals of the curriculum developers and others (Tamir & Lunetta,
1981).
Science process skills, along with critical thinking and scientific reasoning skills, take part
systematically in the textbooks of developed countries, and in both teacher, and student
books, this structure complete each other (Badders, Fu, Bethel, Peck, Sumners, Valentino, &
Mullane, as cited in Dökme, 2004b).
The first study by Tamir & Lunetta (1981) was a content analysis of laboratory handbooks of
selected high school curricula. Tamir & Lunetta (1981) content analysed the exercises of
some physics, chemistry, and biology laboratory handbooks with the Laboratory Structure
and Task Analysis Inventory (LAI). The LAI has two dimensions. Laboratory Organization,
and Laboratory Tasks. Laboratory organization part has 14 categories and consists of
Structure, Relation to Text, Cooperation Mode, and Simulations subparts. On the other hand,
laboratory tasks part has 24 categories and consists of Planning and Design, Performance,
Analysis, and Application subparts. The researchers coded every laboratory investigations in
the books with the LAI. When coding the Laboratory Organization categories, they checked
categories according to the classification of activities in each investigation. When coding the
Laboratory Task categories, the researchers checked the appropriate behavioural category
according to each statement of a laboratory investigation (if the statement called more than
one activity they put more checks). Tamir and Lunetta (1981) then counted the number of
the checks, and divided by the total number of investigations and represented this value in
percentages. After the analysis, the researchers found that investigations are highly
structured; while students are often asked to perform a variety of manipulative and
observational procedures and interpret the results of their investigations; they are rarely
asked to formulate a question and hypothesis, predict results, work according to their own
design, and both formulate new questions and apply an experimental technique after the
investigation. Tamir and Lunetta (1981) suggested that the LAI can be used to assess
laboratory curriculum; inquiry skills development of students; and selecting laboratory
activities and developing them by teachers. The researchers also mentioned that laboratory
experiences differentiate according to subject matter, for example inquiry skills in biology
are not same with those in chemistry, even in the same subject area variances occur.
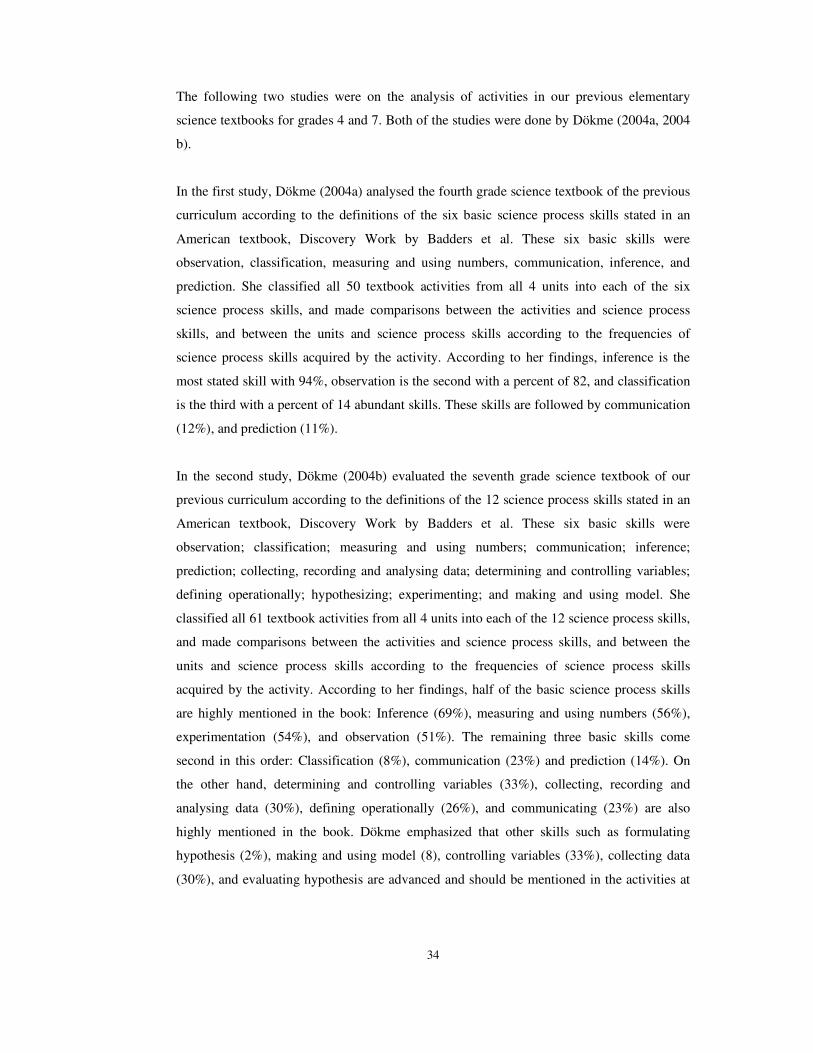
34
The following two studies were on the analysis of activities in our previous elementary
science textbooks for grades 4 and 7. Both of the studies were done by Dökme (2004a, 2004
b).
In the first study, Dökme (2004a) analysed the fourth grade science textbook of the previous
curriculum according to the definitions of the six basic science process skills stated in an
American textbook, Discovery Work by Badders et al. These six basic skills were
observation, classification, measuring and using numbers, communication, inference, and
prediction. She classified all 50 textbook activities from all 4 units into each of the six
science process skills, and made comparisons between the activities and science process
skills, and between the units and science process skills according to the frequencies of
science process skills acquired by the activity. According to her findings, inference is the
most stated skill with 94%, observation is the second with a percent of 82, and classification
is the third with a percent of 14 abundant skills. These skills are followed by communication
(12%), and prediction (11%).
In the second study, Dökme (2004b) evaluated the seventh grade science textbook of our
previous curriculum according to the definitions of the 12 science process skills stated in an
American textbook, Discovery Work by Badders et al. These six basic skills were
observation; classification; measuring and using numbers; communication; inference;
prediction; collecting, recording and analysing data; determining and controlling variables;
defining operationally; hypothesizing; experimenting; and making and using model. She
classified all 61 textbook activities from all 4 units into each of the 12 science process skills,
and made comparisons between the activities and science process skills, and between the
units and science process skills according to the frequencies of science process skills
acquired by the activity. According to her findings, half of the basic science process skills
are highly mentioned in the book: Inference (69%), measuring and using numbers (56%),
experimentation (54%), and observation (51%). The remaining three basic skills come
second in this order: Classification (8%), communication (23%) and prediction (14%). On
the other hand, determining and controlling variables (33%), collecting, recording and
analysing data (30%), defining operationally (26%), and communicating (23%) are also
highly mentioned in the book. Dökme emphasized that other skills such as formulating
hypothesis (2%), making and using model (8), controlling variables (33%), collecting data
(30%), and evaluating hypothesis are advanced and should be mentioned in the activities at

35
the end of the units. And the textbook sections called “Düşün ve Araştır” are regarded as
appropriate for her to include these skills.
Dökme (2004a; 2004b) in both of her studies suggested that:
1. Dökme suggested that communication, and prediction (and classification) skills should be
included more in the available activities or mentioned in the additional activities.
2. The activities should highlight the skills overtly, i.e., by emphasizing which skill to be
used through bold characters as “please observe the parts of the plant”.
3. In order to develop communication skills, students should prepare reports of their studies;
present their studies to their group members, class, teacher, or other listeners; and if needed
organize their studies in the format of graphic, table, and diagram; therefore the activities
should guide students to these actions with statements and these statement, as in the
mentioning the specific skills, should be obvious (and written bold).
3. The textbook activities should be revised for the purpose of improving science process
skills, and the review will support science teaching when integrated with teacher guide
books, student workbooks, and computer aided instruction.
2.4.4 The Research on Effectiveness of Curriculum with respect to Science Process
Skills
This part is dealt with the studies on the effectiveness of previous and current Turkish
science curricula with respect to science process skills. Three studies will be outlined here.
Although the third study explains clearly that the students were being instructed by both, the
second one does not say anything about when the students were tested, but the year of the
study implies that it deals with our previous science curriculum.
Aydoğdu (2006) investigated the factors affecting science process skills at seventh grade
level in Buca, İzmir. These factors were academic achievement, attitudes toward science,
parent’s relevance, instructional methods, teachers’ usage level of science process skills, and
demographic characteristics. Aydoğdu (2006) used a science process skills test for students
and science process skills test teachers, the attitudes toward science questionnaire and
perception toward parent attitude scale. He also made use of the course scores, which is the
mean of the students’ all science grades in the tests for the first semester and those in the
“Energy: The Meeting of Force and Motion” unit achievement test, and a teacher
observation form, by which he evaluated teacher use of science process skills as good,

36
mediocre, and poor. Aydoğdu administered these instruments to a sample of 176 students
and their teachers in 5 elementary schools. He found that there is a positive but medium
relationship between science process skills, academic achievement, attitudes towards science
and parent’s relevance; and there is a statistical difference between students’ acquisition of
science process skills and teachers’ usage level of science process skills, the education level
of parents, and having a computer.
Aydınlı (2007) studied Turkish 6-8 grade students’ basic and integrated science process
skills. She administered the Test of Integrated Process Skills test to the students attending an
elementary school in Ankara, and four elementary schools in Muş. Her sample consisted of a
total of 670 students. Aydınlı (2007) also analysed her data with one-way ANOVA and
found that there is a significant difference among students’ performance in both basic and
integrated skills subtest scores according to following variables:
1. Grade: Seventh graders are more successful than eighth and sixth graders respectively, and
differences between the grades are significant except grade 7 and 8.
2. Gender: Females are significantly more successful than males.
3. Family income: The students with high socio-economic status are more successful than
those with medium and low socio-economic status and the differences between the socio-
economic levels are significant.
4. Father job: For the basic skills subtest, the students whose fathers are white-collar are
more successful than those whose fathers are self-employed, blue-collar, or farmer, and the
differences in the student performances with respect to father occupation are significant
except white-collar and self-employed group.
On the other hand, for the integrated skills subtest, the students whose fathers are white-
collar are more successful than those whose fathers are self-employed, blue-collar, or farmer
and the differences in the student performances with respect to father occupation are
significant except blue-collar and self-employed group.
5. Mother job: For the basic skills subtest, the students whose mothers are self-employed are
more successful than those whose mothers are white-collar, farmer, blue-collar, or house-
wife, and the differences in the student performances with respect to mother occupation are
significant between housewife and white-collar, housewife and self-employed, and blue-
collar and self-employed groups.
On the other hand, for the integrated skills subtest, the students whose mothers are self-
employed are more successful than those whose mothers are white-collar, farmer, house-
wife, or blue-collar, and the differences in the student performances with respect to mother

37
occupation are significant between housewife and white-collar, housewife and self-
employed, blue-collar and white-collar, blue-collar and farmer, blue-collar and self-
employed groups.
6. Father Education: The students whose father are university graduate are more successful
than those whose father are graduated from high and elementary school, or not educated, and
the differences in the student performances with respect to father education level are
significant.
7. Mother Education: The students whose mothers are university graduate are more
successful than those whose mothers are graduated from high and elementary school, or not
educated, and the differences in the student performances with respect to mother education
level are significant except high school and university groups.
8. Family size: For the basic skills subtest, the students whose family consists of 2-3 persons
are more successful than those whose family consists of 4-7, 8-11, and more than 12 persons,
and the differences in the student performances with respect to family size are significant
except between 4-7 and more than 12, and 8-11 and more than 12 groups.
On the other hand, for the integrated skills subtest, the students whose family consisted of 2-
3 persons are more successful than those whose family consists of 4-7, more than 12, and 8-
11 persons, and the differences in the student performances with respect to family size are
significant except between 2-3 and 4-7, and 8-11 and more than 12. After analysis of data
with respect to number of correct responses in each grade level, Aydınlı (2007) also found
that seventh graders are proficient in both basic and integrated skill subtests because 67.8%
of them answered correctly 6-10 items of basic skill subtest, and 56.9% of them answered
correctly 7-12 items of integrated skills subtest. Eighth graders are proficient in basic skills
subtest but not in integrated skills subtest, because 52.7% of them answered correctly 6-10
items of basic skill subtest and 39.8% of them answered correctly 7-12 items of integrated
skills subtest. Sixth graders are not proficient in both subtests, because 35.2% of sixth
graders correctly answered 6-10 items of the basic skills subtest, and 21.3% of sixth graders
correctly answered 7-12 items of the integrated skills subtest. Aydınlı (2006) suggested that
teachers should do their best to achieve the requirements of new science curriculum and
motivate their students in importance of education, and further research is needed to study
the effect of instructional materials on student science process skill performance.
Our previous and current science curriculum with respect to science process skills were
compared by Başdağ (2006) in her MSc thesis. Başdağ (2006) investigated whether the
previous (2000 science curriculum) or current (2004 science curriculum) was more

38
successful on the students’ attainment of science process skills. She administered a science
process evaluation test to two groups of students, the ones being instructed by the 2000
curriculum and the others being instructed by the 2004 curriculum. The first group consisted
of the students in three elementary schools. On the other hand, the second included the
students in two elementary schools where the new curriculum was being piloted. Both
schools were located in Ankara. There were a total of 457 students. The researcher analysed
data with independent t-test, and found that the students of the 2004 science curriculum were
significantly performed well than those in the 2000 science curriculum on the whole and on
the items dealing with the following science process skills: observation, inference,
prediction, measuring, recording data, defining operationally, hypothesizing. However there
was a difference between the both curricula students on the mean scores of the following
science process skills; classification, number and space relation, experimenting, defining
variables, interpreting data, and model formation. Başdağ (2006) also found that among the
students who were being instructed with the 2000 curriculum, the female students performed
well on the items measuring classification skill when compared to males, and the students
from the higher socio-economic status had higher scores on the test in total and on the
following skills: Classification, prediction, measuring, hypothesizing, interpreting data. On
the other hand, among the students who were being instructed with the 2004 curriculum, the
female students performed well on the items measuring classification skill when compared to
males, and students from the higher socio-economic status had higher scores from the test on
the following skills: recording variables, and interpreting data. The researcher concluded that
the 2004 curriculum are more successful than the 2000 curriculum; gender has no effect in
development of science process skills, the 2004 science curricula is more effective in
developing scientific skills of the students’ regardless of their socio-economic status than the
2000 curriculum. Moreover she suggested that tests can be developed for elementary and
secondary students; since teachers are important in developing science process skills, they
should be given in-service courses; studies on science process skills are needed, and these
can be used in curriculum development; and studies can be done with the students of 2004
curriculum.
2.5 Attitudes toward Science
Attitude is a phenomenon, which is acquired by learning, directs individual’s behaviours and
causes subjectivity in decision making process (Ülgen, as cited in Durmaz & Özyıldırım,
2005). It includes the behaviours of showing positive attitude toward a course or subject,

39
being satisfied with answer, giving in positive part or value (Özçelik, as cited in Durmaz &
Özyıldırım, 2005).
Science is the all information that is formed from the process that helps students to
understand the world by studying the nature and natural events and directed to examine the
nature, and its product, the systematic knowledge (Çilenti, as cited in Durmaz & Özyıldırım,
2005). In order for today’s human being to feel and interpret technological developments
she/he should be given a basic science culture. And for this instruction to have an effect the
factors that influence student learning should be determined and those that give rise to
negative attitudes toward science and should be keep minimal (Durmaz & Özyıldırım, 2005).
A study by Yager & Yager (as cited in Hall & McCurdy, 1990) showed that students’
interest to science begin to decline at 4th grade to university. And another study by Lucas &
Dooley (as cited in Hall & McCurdy, 1990) found that negative attitudes toward science
among pre-service elementary teachers may be drawn back to their school experiences.
To study students’ attitudes toward science is important for the following reasons:
1. Attitudes affect some behaviour, i.e. to select courses, visit museum, and support scientific
inquiry (Kaballa & Crowley, as cited in Weinburgh, 2000).
2. Attitudes are related to achievement. Attitudes influence achievement (Schibeci & Riley,
as cited in Weinburgh, 2000). In other words, attitudes both influence personal and social
decision-making (Millar, as cited in Johnston 1997) and performance in science courses
(National Curriculum Council; Johnston; Harlen, as cited in Johnston, 1997) and taking of
science in the future grade levels (Sears; Havard, as cited in Johnston, 1997).
Both the educational practices and research studies showed that attitudes toward science
should be developed not only in students, but also teachers, teacher candidates (Johnston,
Ahtee, & Hayes; Watters & Ginns, as cited in Johnston, 1997), and parents (the Association
for Science Education; Johnston, as cited in Johnston, 1997). It can be said that attitudes are
developed through earlier contacts with family, teachers, and peers, which are influenced by
unconscious prejudices, interests, and thoughts (Johnston, 1997).
The first contributor to the literature on attitudes toward science was Klopfer who in 1971
classified some affective behaviour in science education as:
-the demonstration of positive attitudes towards science and scientists;

40
-the approval of scientific inquiry as a way of thought;
-the acceptance of scientific attitudes;
-the enjoyment of science learning experiences
-the growth of interest in science and related activities; and
-the growth of an interest in choosing a career in science and related jobs (as cited in
Osborne, Simon, and Collins, 2003).
The distinction between attitudes towards science and scientific attitudes was made by
Gardner (as cited in Osborne, Simon, and Collins, 2003). Scientific attitudes are a composite
of the wish to know and understand, a questioning approach to all statements, a search for
data and their meaning, a demand for verification, a respect for logic, a consideration of
premises and a consideration of results (Education Policies Commission, as cited in Osborne,
Simon, and Collins, 2003). Scientific attitudes characterize scientific thinking and relate to
cognitive domain Therefore scientific attitudes differ from attitudes towards science.
Attitudes toward science include the feelings, beliefs and values held about the enterprise of
science, school science, and the impact of science on society or scientists themselves
(Osborne, Simon, and Collins, 2003).
There are some factors that correlate with attitudes towards science. Some studies showed
that there is a positive correlation between attitudes toward science and achievement in it
(German; Hough & Piper, as cited in Durmaz & Özyıldırım, 2005), but some demonstrated
that in the elementary level, there is no relation with gender and attitude (Boylan; Dieck, as
cited in Durmaz & Özyıldırım, 2005). The studies on attitudes toward science will be
summarized in the following part.
Durmaz & Özyıldırım (2005) studied fourth and fifth grade students’ attitudes toward
science and its relation with school type (in terms of socio-economic status), gender, and
education level of both mother and father. They used a 16-item attitude questionnaire that
developed by themselves. There were 162 students in Edirne city participated to the study.
The researchers used both independent t-test (for comparing female and male students’
attitudes) and one way analysis of variance (for comparing students with different school
type, mother and father education level, and Scheffe Test in order to determine the group that
makes difference in the data analyses. They found that students’ attitudes toward science
differs with school type (p=.023, the higher socio-economic status the school has, the more
positive attitudes its students have) and father education level (p=.008 the higher education

41
level the father has, the more positive attitudes his student has), but not with gender (p=.365)
and mother education level (p=295). The researchers concluded that the school’s socio-
economic status influence students’ attitudes toward science. Therefore, both school’s and
parents’ support should be increased in order to develop students’ positive attitudes toward
science. The study showed that gender has not an effect on science attitude due to young age
of students. The reason is the characteristics of this stage (students share their interests and
cooperate with each other and they learn by doing and experiencing) (Aral et al., as cited in
Durmaz & Özyıldırım, 2005), and the curriculum that values this learning style (Durmaz &
Özyıldırım, 2005). Another thing that the study showed is the effect of father’s education
level on attitude. The reason is again related to socio-economic level, as it increases with the
education level, so does student’ attitudes.
Inquiry teaching and curriculum materials develop students' attitudes toward science (Gabel,
Rubba, & Franz, Kyle, Bonnstetter, & Gadsden, as cited in Chang & Mao, 1999). As stated
“In an inquiry classroom there is a time for doing ... a time for reflection ... a time for feeling
... and a time for assessment" (Welch, Klopfer, Aikenhead, & Robinson, 1981, p. 35),
inquiry teaching may help students to appreciate that they are doing and feeling real science.
And this directs them to more positive attitudes toward science.
2.6 Science Achievement
“Learning achievement is the grasp of subject matter, in which the student
constructs her/his own meaning as she/he places the learning in the broader context
of an accumulated base of knowledge for retrieval when the students needs that
learning for unanticipated problem solving arising in the context of schools, work,
or life” (Palincsar & Winn, as cited in Izard, 1991, p. 3).
Achievement consists of two dimensions, content achievement, and lifelong achievement
(Nitko & Brookhart, 2007, p. 507).
1. Content achievement is a continuum which includes the specific declarative and
procedural learning targets (Marzano, Pickering, & McTighe, as cited in Nitko & Brookhart,
2007, p. 510). Declarative knowledge can be considered as information and can be
categorised somewhat hierarchically according to its generality. The facts about people,
things, and events are in the bottom, whereas the concepts and generalizations are in the top

42
of this hierarchy. On the other hand, procedural knowledge can be considered as strategies or
skills. Similar to declarative knowledge, procedural knowledge can be classified
hierarchically according to its generality. Algorithms are in the bottom, whereas strategies
are in the top of this hierarchy. Algorithms are skills, and the procedures with steps that must
be executed in s set order. On the other hand, strategies apply to a variety of situations such
as the general strategy of analysing a novel problem, relating it to the familiar problems, and
identifying important differences (Marzano et al., 1993, p. 16-17).
2. Lifelong achievement is a category of achievement learning targets that cross curricula or
may be helpful out of school, such as complex thinking, information processing, effective
communication, cooperation/collaboration, and habit of mind (Marzano et al., 1993, p. 18-
19), which has in there categories: self-regulation, critical thinking, and creative thinking
(Ennis; Paul; Costa; Perkins; Flavell, Zimmerman; Amabile, as cited in Marzano et al., 1993,
p. 23-34).
Achievement is not measured directly. The measurement of achievement tries to identify
indications of the learning as it occurs or the outcomes at the end of a stage of learning. The
result of this measurement serves as the evidence to be considered when deciding whether or
not a change has occurred (Izard, 1991, p. 3).
Since inquiry curriculum has a positive effect on achievement, perception of science, and
some skills, i.e. science process skills, of students; students develop both science process
skills and interest in science in elementary school and these skills progress in secondary
school; and teachers who are trained in inquiry are more effective than traditional teachers
on achievement of their students (Shymansky, Hedges, & Woodworth, as cited in Davison,
2000, p. 31), it is worthwhile to explore the comparative efficiency between inquiry and
traditional teaching method in terms of the development of students’ science process skills in
typical elementary science classrooms.
43
CHAPTER 3
METHODOLOGY
3.1 Research Design
The purpose of this study was to find the effect of teacher directed inquiry on students’
science process skills. Therefore the design of the study was Experimental Design. Since the
random assignment of the subjects to the experimental and control groups was not possible
due to the rigid course schedule of the participating schools, “non-equivalent control group
quasi experimental design” (Campbell & Stanley, as cited in Chang & Mao, 1999) was used
to at least randomize classes and schools.
Table 3.1 indicates the design used in this research:
1. Both experimental and control group students took the Pre Achievement Test in
Reproduction, Development, and Growth in Living Things (PreRDGLT), Attitudes toward
Science & Technology Course Questionnaire (Att), and Science Process Skills Test First
Form (SPC 1) as a pre-test before the instruction on the Reproduction, Development, and
Growth in Living Things unit.
2. The experimental group students were taught using the Treatment in Reproduction,
Development, and Growth in Living Things (TreRDGLT), where the guided (teacher-
directed) inquiry instruction was implemented along with the elementary grade 6 science and
technology curriculum. On the other hand, the control group students were taught only the
elementary grade 6 science and technology curriculum.
3. After the instruction on the Reproduction, Development, and Growth in Living Things
unit, both experimental and control group students took the Post Achievement Test in
Reproduction, Development, and Growth in Living Things (PostRDGLT), Attitudes toward
Science & Technology Course Questionnaire (Att), and Science Process Skills Test Second
Form (SPC 2) as a post-test; and the Pre Achievement Test in Force and Motion (PreFM) as
a pre-test before the instruction on the Force and Motion unit.

44
4. The experimental group students were taught using the Treatment in Force and Motion
(TreFM), where the guided (teacher-directed) inquiry instruction was implemented along
with the elementary grade 6 science and technology curriculum. On the other hand, the
control group students were taught only the elementary grade 6 science and technology
curriculum.
5. After the instruction on the Force and Motion unit, both experimental and control group
students took the Post Achievement Test in Force and Motion (PostFM), Attitudes toward
Science & Technology Course Questionnaire (Att), and Science Process Skills Test Third
Form (SPC 3) as a post-test.
6. Both experimental and control group students were taught by the elementary grade 6
science and technology curriculum.
7. After the instruction on the Particulate Nature of Matter unit, both experimental and
control group students took the Delayed Achievement Test in Reproduction, Development,
and Growth in Living Things (DelRDGLT), Attitudes toward Science & Technology Course
Questionnaire (Att), and Science Process Skills Test Fourth Form (SPC 4), and Delayed
Achievement Test in Force and Motion (DelFM), as a retention test.
Table 3.1 Research design of the study
Groups Tests Types of
Treatment
Tests Types of Treatment
Tests Types of Treatment
Tests
Exp PreRDGLT Att SPS 1
TreRDGLT PostRDGLT Att SPS 2 PreFM
TreFM Att SPS 3 PostFM
No Tre DelRDGLT Att SPS 4 DelFM
Con PreRDGLT Att SPS 1
PostRDGLT Att SPS 2 PreFM
Att SPS 3 PostFM
DelRDGLT Att SPS 4 DelFM
Note: The abbreviations mean the following (according to time and alphabetic order): Exp: Experimental Group Con: Control Group PreRDGLT: Pre Achievement Test in Reproduction, Development, and Growth in Living Things PostRDGLT: Post Achievement Test in Reproduction, Development, and Growth in Living Things DelRDGLT: Delayed Achievement Test in Reproduction, Development, and Growth in Living Things PreFM: Pre Achievement Test in Force and Motion PostFM: Post Achievement Test in Force and Motion DelFM: Delayed Achievement Test in Force and Motion Att: Attitudes toward Science & Technology Course Questionnaire SPC 1: Science Process Skills Test First Form SPC 2: Science Process Skills Test Second Form SPC 3: Science Process Skills Test Third Form SPC 4: Science Process Skills Test Fourth Form Tre: Treatment No Tre: No Treatment TreRDGLT: Treatment in Reproduction, Development, and Growth in Living Things TreFM: Treatment in Force and Motion

45
3.2 Population and Sample
Since the guided (teacher-directed) inquiry units were developed for the elementary science
and technology students and curriculum, the population of the study was determined as the
6th grade students attending to the public elementary schools in Ankara city. This was the
target population.
The accessible population of the study was those students attending to the public elementary
schools in the Etimesgut and Çankaya districts of the Ankara city.
The sample of the study consisted of the students attending a public elementary school at
Etimesgut district, and six public elementary schools at Çankaya district. The reasons to
select these schools were their low socio-economic status, and the researcher’s access to
these schools both for transportation and permission. Therefore sampling method was both
purposive and convenient.
The students involved in the population were and hence the sample was approximately 11
years old. They were graduated from the 1st level of their elementary schooling which was
formerly known as “Primary School” or “İlkokul” in Turkish. Primary Schooling was
previously compulsory and was taking 5 years. In 1997-98 academic year (Gündem, 2007),
duration of the compulsory education became 8 years as a union of both 5 year primary and
3 year middle schooling. This means a student attending an elementary school has the same
classroom teacher for 5 years which corresponds to what is called “1st Level” or “1.
Kademe” in Turkish informally, and then has many subject teachers for 3 years which
corresponds to the middle school and hence called “2nd Level” or “2. Kademe” in Turkish
informally.
The students can be said to be in pre- or concrete operational stage (Gega; Simpson &
Anderson, as cited in Llyod & Contreras, 1985), which comes before formal operational
period characterized by abstract thinking, and controlling of variables, proportional,
hypothetico-deductive, and combinatorial reasoning (Staver, 1986).
When the district statistics (Çankaya MEM, 2007; Etimesgut MEM) were considered, the
number of the schools forming the population and sample were as follows:

46
Table 3.2 Number of the schools in population and sample
District Population Sample
Etimesgut 38 1 Çankaya 103 6 Total 141 7
As seen from the Table 3.2, the sample consisted of 7 schools and formed 5% of the schools,
of which 3% from the schools in Etimesgut, and 7% from the schools in Çankaya districts.
On the other hand, the number of students in the sample was as follows:
Table 3.3 Number of classes, and students in the sample
District Schools Number of Class in
the School Number of Class in the Sample
Number of Students in the Sample
Etimesgut 1 5 5 38 + 42 + 36 + 40 + 40 = 196 Çankaya 1 1 1 10 2 1 1 23 3 2 2 29 + 27 = 56 4 2 2 21 + 21 = 42 5 1 1 31 6 8 2 37 + 32 = 69 Total 7 20 14 427
As seen from the Table 3.3, the sample consisted of 14 classes corresponding to 70% of the
total class number. This value corresponded to 100% of the classes in the school located in
Etimesgut district, and 60% of the classes in the six schools located in Çankaya district. On
the other hand, the total number of students in the sample was 427.
As stated in the research design, there were two treatments, and the aim was to repeatedly
test each student with pre, post, and delayed tests. However some conditions, such as a
student’ absence from the school , resulted from their illness, or class, due to her/his
responsibility in the school, during the administration of tests limited the participation of this
student to at least one of the tests. Therefore the number of the students who took each one
of the tests was lower than 427. This number is given in the following table (Table 3.4).

47
Table 3.4 Number of students in the sample who took all of the tests
District Schools Number of Students in the Sample Number of Students in the Sample Who
Took All of the Tests Etimesgut 1 38 + 42 + 36 + 40 + 40 = 196 22 + 16 + 3 + 27 + 18 = 86 Çankaya 1 10 5 2 23 8 3 29 + 27 = 56 9+ 18 = 27 4 21 + 21 = 42 0 5 31 14 6 37 + 32 = 69 15 + 13 = 28 Total 7 427 168
As seen from the Table 3.4, the number of the students taking all the tests was 168, which is
39% of the sample participating to the study. It means that 61% of the students from the
original sample were missing. The missing value was in experimental group 64%, and in the
control group 65%. From the control group schools the missing values were as follows: the
first school 50%, the second school 65%, the third school 48%, the fifth school 100%, the
sixth school 65%, and the seventh school 59%.
The characteristics of the sample are given from Table 3.5 to Table 3.8.
As seen from the Table 3.5, the numbers of both female and male students were equal.
Furthermore, in the experimental group 48% of the students were female, 52% were male.
On the contrary, the females constituted 52%, males constituted 48% of the control group.
Table 3.5 Group and gender cross tabulation
Gender
Group Female Male Total
Experimental 41 45 86 Control 43 39 82 Total 84 84 168
The Table 3.6 shows that the majority of the students (116 out of 168, or 69%) were born in
1995. The students who were born in 1994 came second with 21% (35 out of 168). The
students who were born in 1993 were 2% (3 out of 168) and those who were born in 1996
were 1% (2 out of 168). There was no information about the year of birth for 7% (12 out of

48
168) of the students. Moreover, in the experimental group the students who were born in
1995 were 68% (59 out of 86), students who were born in 1994 came second with 20% (17
out of 86). There was no student born in 1993 and 1996. There was no information about
12% (10 out of 86) of the students in the experimental group. On the other hand, in the
control group, the students who were born in 1995 were 70% (57 out of 82), those born in
1994 were 22% (18 out of 82). The students who were born in 1993 were 4% (3 out of 82),
and those who were born in 1996 were 2% (2 out of 82). There was no information about the
year of birth for 2% (2 out of 82) of the students in the control group.
Table 3.6 Group and birth year cross tabulation
Year of Birth
Group 1993 1994 1995 1996 unknown Total
Experimental 0 17 59 0 10 86 Control 3 18 57 2 2 82 Total 3 35 116 2 12 168
As seen from the Table 3.7, the majority of the students’ mother (91%, 152 out of 168) was
house-wife, followed by white-collar (6%, 8 out of 168). The frequencies for blue-collar,
self-employed, and other job categories were equal (1%, 2 out of 168). There was no
information about the mother occupation for 1% (2 out of 168). In the experimental group
the majority of the students’ mother (97%, 83 out of 86) was house-wife, 1% (1 out of 86)
was in blue-collar, and 2% (2 out of 86) of the mothers were working in the other jobs. In the
control group the majority of the students’ mother (85%, 69 out of 82) was house-wife,
followed by white-collar (10%, 8 out of 82). 1% (1 out of 82) was blue-collar, 2% (2 out of
82) was self-employed. There was no information about the mother occupation for 2% (2 out
of 82).
On the other hand, the Table 3.8 demonstrates that the majority of the students’ father (35%,
59 out of 168) was self-employed, followed by blue-collar (34%, 57 out of 168), white-collar
(22%, 36 out of 168), and other (5%, 8 out of 168). The frequencies for unemployed and not
reported job categories were equal (2%, 4 out of 168). In the experimental group the majority
of the students’ father was blue-collar (47%, 40 out of 86), followed by self-employed (24%,
21 out of 68), white-collar (23%, 20 out of 86), and other (4%, 3 out of 68). The frequencies

49
for unemployed and not reported job categories were equal (1%, 1 out of 168). In the control
group the majority of the students’ father was self-employed (46%, 38 out of 82), followed
by blue-collar (21%, 17 out of 82) and white-collar (19%, 16 out of 82), and other (6%, 5 out
of 82). The frequencies for unemployed and not reported job categories were equal (4%, 3
out of 82).
Table 3.7 Group and mother occupation cross tabulation
Mother Occupation
Group Housewife Blue-collar White-collar Self-employed Other unknown Total
Experimental 83 1 0 0 2 0 86 Control 69 1 8 2 0 2 82 Total 152 2 8 2 2 2 168
Table 3.8 Group and father occupation cross tabulation
Father Occupation
Group Unemployed Blue-collar White-collar Self-employed Other unknown Total
Experimental 1 40 20 21 3 1 86 Control 3 17 16 38 5 3 82 Total 4 57 36 59 8 4 168
3.3 Instruments
There were five instruments used in the study; the first was student demographic form; the
second was science process skills test; the third instrument was attitudes toward science
questionnaire. The fourth and last instruments were “Reproduction, Development and
Growth in Living Things” and “Force and Motion” units achievement tests. The second and
third instruments were developed through a pilot testing.
3.3.1 Demographic Form
This first instrument was a kind of checklist asking students some of their demographic such
as age; socio-economic status such as parents’ education. This instrument was administered
to the students at the beginning of 2006-07 academic year before the treatment began. Each

50
student individually gave their responses to this form by checking each item’s alternatives.
When these alternatives did not apply to the students’ status, they could write down their
situation into the “others” part (See Appendix C for the demographic form).
3.3.2 Science Process Skills Test
There are some measurements to assess students’ science process skills. For example Padilla,
Okey, & Garrard studied how science teachers integrate process skills to their sixth and
eighth grade classrooms and used the Test of Integrated Process Skills (as cited in Narode et
al., 1987). The Test of Integrated Process Skills (TIPS) assesses students’ hypothesizing,
identifying variables, constructing operational definitions, designing experiments, and
interpreting data abilities (Padilla, Okey, & Garrard, as cited in Narode, et al., 1987). Padilla,
Okey, & Garrard stated that the Test of Integrated Process Skills (TIPS) are reliable and
valid instrument for measuring science reasoning abilities of middle and high school students
(as cited in Narode, et al., 1987). The sample items from TIPS are as following (Padilla,
Okey, & Garrard, as cited in Narode, et al., 1987):
a. Hypothesize
John cuts grass for seven different neighbours. Each week he makes the rounds with his lawn
mover. The grass is usually different in the lawns-in some it is tall not in others. He begins to
make hypotheses about the height of grass. Which of the following is a suitable hypothesis
he could test?
A) Lawn moving is more difficult when weather is warm.
B) The amount of fertilizer a lawn receives is important.
C) Lawns that receive more water have longer grass.
D) The more hills there are in a lawn the harder it is to cut.
b. Define Operationally
Students in a science class did an experiment; in it they pointed a flashlight at a screen. They
put the flashlight at different distances from the screen. They then measured the size of the
lighted spot.
Which of the following would be an appropriate measure of the size of the lighted spot?
A) The diameter of the flashlight.
B) The size of the batteries in the flashlight.
C) The size of the screen.
D) The radium of the spot on the screen.

51
On the other hand, the Processes of Science Test (POST), which was developed by the
Biological Science Curriculum Study, assesses students’ ability to use inquiry in biology
Montgomery (1969).
As these studies suggested, students’ science process skills can be measured by instruments,
and science process skills are consisted of many skills, such as hypothesize, and define
operationally.
The instrument, which was used to measure the science process skills of the sixth graders
students that participated to the study, was constructed by the researcher, due to abundance
of instruments employed to assess students’ science process skills, and being uncertain about
the appropriateness of them both for the sixth grade students, and our science curricula.
Although the information on how this instrument was developed is explained in the
following (Procedure) part, an overview is given here.
The Science Process Skills Test is consisted of three equal forms. Each form was
administered to the students as the first, second, and third science process skills test. A
combination of these three tests was administered as the fourth test during the study. The test
forms are all in Turkish. The first three science process skills tests have equal number of
items, each of which correspond to and intend to measure a science process skill outlined in
the 2005 Science and Technology Curriculum by the Board of Education for grades 6-8 in
Turkey except for the last 18th skill, which is communicating (presentation). On the other
hand, the last science process skills test has a total of 40 items since it consisted of the items
from the previous test forms (See Appendix A for the list of the science process skills for
grades 6-8, Appendix B for the science process skills test forms and their cognitive
processes). The science process skills are the cognitive processes of the science process
skills tests (and items). On the other hand, the subject matters of the tests (and items) are not
limited to a specific science subject area.
The items of the science process skills tests are in the multiple-choice with 3 to 5
alternatives, open-ended, matching, and hot-spot formats. The students gave their answers to
the multiple-choice items by selecting the alternative, which they thought the right answer,
and by writing the answer to the open-ended items right below the question. In other words
this test is a paper-and-pencil test. Table 3.9 shows the item characteristics of the test, along
with the dimensions.

52
Table 3.9 Item types, scale and sample items from the science process skills test
Type Scale Sample Items Multiple-choice with 3 alternatives
Inference
Gösterilen üç mıknatısın her biri altındaki maddenin içine batırılıyor. Hangi madde kahve olabilir?
Multiple-choice with 4 alternatives
Observation
Yandaki mum resmine bakınız. Hangi açıklama doğrudan göz ile yapılan bir gözlemdir? A) Mum, balmumundan yapılmıştır. B) Mum ağırdır. C) Mum yanıyor. D) Alev sıcaktır
Multiple-choice with 5 alternatives
Prediction
Gezegen Güneşten Ortalama Uzaklık (kilometre) Dünya 150 milyon Jübiter 778 milyon Mars 228 milyon Merkür 58 milyon Venüs 108 milyon
Tabloya göre, hangi gezegen en yüksek sıcaklığa sahip olur? Open-ended
Controlling Variables
Bir öğrenci eğik düzlemde sabit hızla çekilen bir cisme uygulanan kuvvet ile eğim açısı arasındaki ilişkiyi göstermek istiyor. Bunun için öğrenci yukarıdaki deney düzeneklerini kuruyor, ancak amacına ulaşamıyor. Bu amaca ulaşabilmek için düzeneklerde hangi değişiklikleri yapıp deneyi nasıl gerçekleştirmelidir, neden?
Matching
Classification
Yanda resmedilen kuşlar aynı bölgede yaşamaktadır. Kuşlardan birinin ana besin kaynağı uzun boru şekilli çiçeklerdeki nektardır. Diğer kuş kemiricilerle beslenir. Üçüncü kuş ise ağaçların kabuklarını, içerdeki böcekleri yakalamak için gagalar. Bu bilgiye dayanarak resimdeki kuşları ve besinlerini eşleştiriniz.
sinek kuşu atmaca ağaçkakan
Hot-spot
Knowing Laboratory Instruments, and Using Them
A. Büyüteç
B. Pil
Güvenlik amacıyla kullanılan laboratuar malzemeleri hangileridir?

53
The scoring of the science process skills tests is done by assigning 1 point to each correct
answer simply. In order to eliminate misinterpretations, the grading procedure is outlined in
Table 3.10.
Table 3.10 Scoring system of the science process skills test
Item type Marking Procedure Multiple-choice with 3-5 alternatives 1 point for correct response
0 point for incorrect or no response Open-ended 2 points for correct response
1 point for partially correct response 0 point for incorrect or no response
Matching 1 point for each correct matching 0 point for incorrect or no response
Hot-spot Each condition is regarded as separate item 1 point for each correct selection 0 point for incorrect or no response
After this item level scoring, the total test score can be calculated by counting the scores of
each items and dividing this value with the number of items in the test.
The Cronbach alpha reliability coefficients were found .744, .781, .739, and .870 after the
analyses of each science process skills test data with Reliability Analysis on SPSS.
3.3.3 Attitudes toward Science Lesson
In education, to assess affective characteristics of students besides their cognitive features is
wanted. One of the affective variables that are subject to measurement in education is
attitudes. Since attitudes are not observable directly, some actions which are thought to be
related to attitudes are measured by observation (Tezbaşaran & Kelecioğlu, 2004).
There are many attitude scales to assess students’ attitudes, such as Likert scales, two-point
scales, and semantics differentials (Kubiszyn & Borich, 2007, p. 452).
There are also some measurements to assess students’ attitude toward science. These can be
called as attitude toward science inventory. For example, Weinburgh (2000) made use of the
Attitude toward Science Inventory: Version A in order to examine grades 6 to 8 students’
attitudes toward science. The researcher employed The Attitude toward Science Inventory:

54
Version A (ATSI) because of its construct related validity evidence reported by Goglin &
Swartz, and Weinburgh as well as content related validity evidence of its mathematic version
stated by Sandman (as cited in Weinburgh, 2000). The other reason to select ATSI was its
multidimensionality, having six factors: perception of the science teacher, anxiety toward
science, value of science in society, self-concept in science, enjoyment of science, and
motivation in science (Weinburgh, 2000). The ATSI is four-point-Likert scale (strongly
agree, agree, disagree, and strongly agree), and has 48 items. Weinburgh (2000) reported that
the alpha reliability coefficients range from .56 to .84 according to the gender, ethnicity, and
grade level of the students who took ATSI and were acceptable (Nunnelly, as cited in
Weinburgh, 2000).
In other study, Dhindsa & Chung (2003) employed an attitude towards science instrument in
order to assess Bruneian 14-years-olders’ attitudes toward science. Although this test was
originally developed by Aiken to assess Iranian secondary students’ mathematics attitudes,
by changing the term, mathematics, with “science”, the researchers made use of it. The test
had six scales; enjoyment, anxiety, importance, interest, confidence, and motivation, and in
five-point Likert type. After some validity (consulting scholars whether the name change
would not be biased), and reliability (piloting the test twice and comparing Cronbach-alpha
values of each scale, and looking at test-retest reliability coefficient) studies, the researchers
developed it.
As these studies suggested, students’ attitudes toward science can be measured by
instruments, and attitudes toward science are consisted of many attitudes, such as anxiety,
enjoyment, and motivation; and it is possible to develop an attitudes toward science
instrument.
The instrument, which was used to measure the attitudes toward science and technology
course of the sixth graders students that participated to the study, was constructed by the
researcher, due to abundance of instruments employed to assess students’ attitudes toward
science, and being uncertain about the appropriateness of them both for the sixth grade
students, and our science courses. Although the information on how the instrument was
developed is explained in the following (Procedure) part, an overview is given here.
The Attitudes toward Science and Technology Course Questionnaire is in Turkish, and has 6
factors and a total of 30 items. The students gave their answers to the item statements by
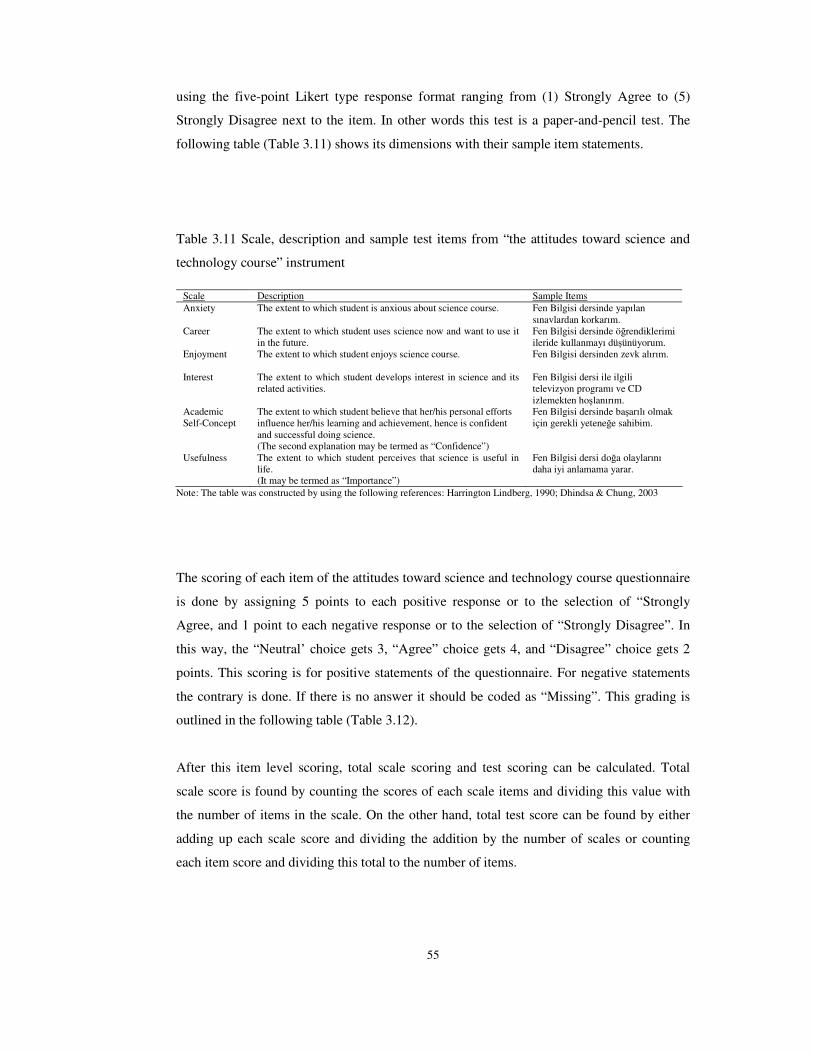
55
using the five-point Likert type response format ranging from (1) Strongly Agree to (5)
Strongly Disagree next to the item. In other words this test is a paper-and-pencil test. The
following table (Table 3.11) shows its dimensions with their sample item statements.
Table 3.11 Scale, description and sample test items from “the attitudes toward science and
technology course” instrument
Scale Description Sample Items Anxiety The extent to which student is anxious about science course. Fen Bilgisi dersinde yapılan
sınavlardan korkarım. Career The extent to which student uses science now and want to use it
in the future. Fen Bilgisi dersinde öğrendiklerimi ileride kullanmayı düşünüyorum.
Enjoyment
The extent to which student enjoys science course. Fen Bilgisi dersinden zevk alırım.
Interest
The extent to which student develops interest in science and its related activities.
Fen Bilgisi dersi ile ilgili televizyon programı ve CD izlemekten hoşlanırım.
Academic Self-Concept
The extent to which student believe that her/his personal efforts influence her/his learning and achievement, hence is confident and successful doing science. (The second explanation may be termed as “Confidence”)
Fen Bilgisi dersinde başarılı olmak için gerekli yeteneğe sahibim.
Usefulness
The extent to which student perceives that science is useful in life. (It may be termed as “Importance”)
Fen Bilgisi dersi doğa olaylarını daha iyi anlamama yarar.
Note: The table was constructed by using the following references: Harrington Lindberg, 1990; Dhindsa & Chung, 2003
The scoring of each item of the attitudes toward science and technology course questionnaire
is done by assigning 5 points to each positive response or to the selection of “Strongly
Agree, and 1 point to each negative response or to the selection of “Strongly Disagree”. In
this way, the “Neutral’ choice gets 3, “Agree” choice gets 4, and “Disagree” choice gets 2
points. This scoring is for positive statements of the questionnaire. For negative statements
the contrary is done. If there is no answer it should be coded as “Missing”. This grading is
outlined in the following table (Table 3.12).
After this item level scoring, total scale scoring and test scoring can be calculated. Total
scale score is found by counting the scores of each scale items and dividing this value with
the number of items in the scale. On the other hand, total test score can be found by either
adding up each scale score and dividing the addition by the number of scales or counting
each item score and dividing this total to the number of items.

56
Table 3.12 Scoring system of the attitudes toward science and technology course
questionnaire
Item type Marking Procedure Positive Statements Example: Fen Bilgisi dersinde öğrendiklerimi ailemle paylaşırım.
Strongly Agree: 5 points Agree: 4 points Neutral: 3 points Disagree: 2 points Strongly Disagree: 1 point
Negative Statements Example: Fen Bilgisi dersinde yapılan sınavlardan korkarım.
Strongly Agree: 1 point Agree: 2 points Neutral: 3 points Disagree: 4 points Strongly Disagree: 5 points
The Cronbach alpha reliability coefficients were found .894, .884, .893, and .905 after the
analyses of each attitudes toward science and technology course questionnaire test data with
Reliability Analysis on SPSS.
3.3.4 Achievement Tests
There were two achievement tests: Reproduction, Growth and Development in Living
Things, and Force and Motion. The researcher assumed that these tests measure students’
achievement for Reproduction, Growth and Development in Living Things, and Force and
Motion units.
Achievement test are the instruments chosen to assess students’ achievement. For example,
Montgomery (1969) employed the Nelson Biology Test for his study with ninth and tenth
grade students since is widely used and has the content of Biology courses.
As this study suggested, students’ achievement in science should be measured by any
instrument, which content is in line with the curriculum.
The instruments, which were used to measure the achievement in both “Reproduction,
Development, and Growth in Living Things”, and “Force and Motion” unit were constructed
by the researcher since there is no available test form. The researcher utilized the related
items from the national and international exams, such as Secondary School Institutions
Student Selection and Placement Tests, and TIMSS, and studies in science education
literature. The current science curriculum, and its objectives and subjects were taken as a

57
base to select the items from these resources. Although the information on how the
instrument was developed is explained in the following (Procedure) part, an overview is
given here (See Appendix F for the form and blueprints (subject matters and cognitive
processes) of “The Reproduction, Development, and Growth in Living Things Unit
Achievement Test” and “The Force and Motion Unit Achievement Test”).
The first “Reproduction, Development, and Growth in Living Things Unit Achievement
Test” is in Turkish and a total of 25 items: 23 of them are in multiple-choice format with 4
alternatives, one is in fill-in-the-blank format, and one is in open-ended format. The students
gave their answers to the multiple-choice items by selecting the alternative, which they
thought the right answer, by filling the blanks with the given words, and by writing the
answer to the open-ended items right below the question. In other words this test is a paper-
and-pencil test. Table 3.13 shows the item characteristics of the test.
Table 3.13 Item types and sample items of the Reproduction, Development, and Growth in
Living Things Unit Achievement Test
Type Sample Items Multiple-choice
Bir yaprağa konan kelebek, oraya yumurtalarını bıraktı. Aşağıda yumurtaların geçirdiği değişim görülmektedir. Sizce bu değişiklikler hangi sırada gerçekleşir?
A) 1, 2, 3, 4 B) 1, 3, 2, 4 C) 1, 4, 3, 2 D) 1, 4, 2, 3
Fill-in-the-blank
Molekül, atom ve bileşik kelimelerini kullanarak aşağıdaki cümleyi oluşturabiliriz: Şekerler, atomların oluşturduğu moleküllerden meydana gelen bileşiklerdir. Organ, doku ve hücre kelimelerini kullanarak aşağıdaki cümleyi tamamlayınız: Akciğerler, ……… oluşturduğu …………... meydana gelen ………..
Open-ended
Siz büyüdükçe vücudunuzda hangi değişiklikler meydana gelir? Gözlemlediklerinizi ve bildiklerinizi yazınız.
The second “Force and Motion Unit Achievement Test” is also in Turkish. It has a total of
23 items, 17 of which are in multiple-choice format with 4 alternatives, 4 of which are in
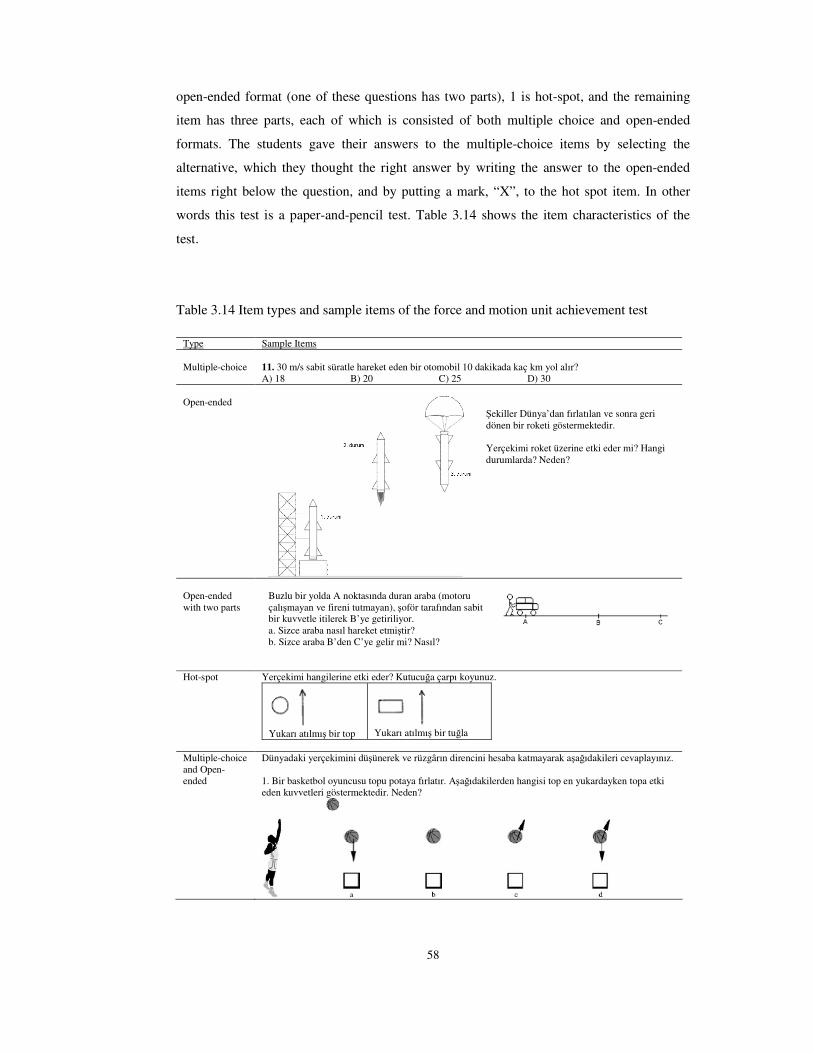
58
open-ended format (one of these questions has two parts), 1 is hot-spot, and the remaining
item has three parts, each of which is consisted of both multiple choice and open-ended
formats. The students gave their answers to the multiple-choice items by selecting the
alternative, which they thought the right answer by writing the answer to the open-ended
items right below the question, and by putting a mark, “X”, to the hot spot item. In other
words this test is a paper-and-pencil test. Table 3.14 shows the item characteristics of the
test.
Table 3.14 Item types and sample items of the force and motion unit achievement test
Type Sample Items Multiple-choice
11. 30 m/s sabit süratle hareket eden bir otomobil 10 dakikada kaç km yol alır? A) 18 B) 20 C) 25 D) 30
Open-ended
Şekiller Dünya’dan fırlatılan ve sonra geri dönen bir roketi göstermektedir. Yerçekimi roket üzerine etki eder mi? Hangi durumlarda? Neden?
Open-ended with two parts
Buzlu bir yolda A noktasında duran araba (motoru çalışmayan ve fireni tutmayan), şoför tarafından sabit bir kuvvetle itilerek B’ye getiriliyor. a. Sizce araba nasıl hareket etmiştir? b. Sizce araba B’den C’ye gelir mi? Nasıl?
Hot-spot Yerçekimi hangilerine etki eder? Kutucuğa çarpı koyunuz.
Yukarı atılmış bir top
Yukarı atılmış bir tuğla
Multiple-choice and Open-ended
Dünyadaki yerçekimini düşünerek ve rüzgârın direncini hesaba katmayarak aşağıdakileri cevaplayınız. 1. Bir basketbol oyuncusu topu potaya fırlatır. Aşağıdakilerden hangisi top en yukardayken topa etki eden kuvvetleri göstermektedir. Neden?

59
The scoring of the achievement tests is done by assigning 1 point to each correct answer
simply. In order to eliminate misinterpretations, the grading procedure is outlined in Table
3.15.
Table 3.15 Scoring system of the achievement tests
Item type Marking Procedure Multiple-choice 1 point for correct response
0 point for incorrect or no response Open-ended 2 points for correct response
1 point for partially correct response 0 point for incorrect or no response
Open-ended with two parts Each part is regarded as separate items 2 points for correct response 1 point for partially correct response 0 point for incorrect or no response
Fill-in-the-blank 1 point for all correct fillings 0 point for any incorrect filling or no response
Hot-spot Each condition is regarded as separate items 1 point for each correct selection 0 point for incorrect or no response
Multiple-choice and Open-ended 2 points when both multiple-choice and open-ended parts are answered correctly 1 point when either multiple-choice or open-ended part is answered correctly 0 point for all incorrect or no response
After this item level scoring, total test scoring can be calculated by counting the scores of
each item.
The Cronbach alpha reliability coefficients were found 770, .898, and .876 for the
Reproduction, Development, and Growth in Living Things Unit Achievement Test and .779,
.832, and .840 for the Force and Motion Unit Achievement Test after the analyses of each
test data with Reliability Analysis on SPSS.
3.4 Procedures
This part is consisted of two parts: Procedures on Instrument development and instructional
design.

60
3.4.1. Instrument Development
All of the instruments that were used in the study were developed by the researcher. There
were two steps in developing instruments:
1. Developing both the Science Process Skills Tests and Attitudes toward Science and
Technology Course Questionnaire, and
2. Developing Student Demographic Form, and two of the Unit Achievement tests, one of
which is on “Reproduction, Development, and Growth in Living Things”, and the other is on
“Force and Motion”.
The information on both the first step, where two pilot studies were conducted, and the
second step will be explained in the following titles.
3.4.1.1 Developing the Science Process Skills Tests, and Attitudes toward Science and
Technology Course Questionnaire
3.4.1.1.1 Constructing the Science Process Skills Pilot Tests
The science process skills pilot test items were gathered from various resources, such as
Secondary School Institutions Student Selection and Placement Test (years 1998-2001,
2004, 2005), Private Schools Test (years 2001, 2005), State Tests (Devlet Parasız Yatılı ve
Bursluluk Sınavları) (year 2001), TIMSS 1999, TIMSS-R, and Virginia State Science
Standards. The items were collected from these sources during the first semester of 2005-06
academic year (See Appendix B for the lists of reference for the items of “The Science
Process Skills Test”).
The reason to make use of Secondary School Institutions Student Selection and Placement
Test, and Private Schools Tests was their inclusion of items which consisted of both
knowledge and skills, and their aim to measure academic ability (Kutlu & Karakaya, 2004),
and their base on the elementary curricula (MEB, as cited in (Kutlu & Karakaya, 2004).
These tests, regardless of their subject matter, aim to assess students’ higher order thinking
skills i.e., whether to use, interpret, generalize, predict, discriminating among elements,
make relationships between elements, and evaluate information (EARGED, 1995). These
skills can be examined further as the cognitive processes of the achievement tests, which is
also a blue-print for the cognitive processes assessed through these tests by the Ministry of

61
National Education (See Appendix F). To know which cognitive process the test tries to
measure is important for the validity of the test (Kutlu & Karakaya, 2004). The studies on
the factor structure (cognitive processes) of the Secondary School Institutions Student
Selection and Placement Tests supported the aim of this test (Aslan, as cited in Kutlu &
Karakaya, 2004; Kutlu & Karakaya, as cited in Kutlu & Karakaya, 2004; Köksal, 2002).
The items from these sources were selected in terms of science process skills explained in
the MONE’s list of science process skills in the Elementary Science and Technology
Curriculum for Grades 6-8 (See Appendix A for the list of “The Science Process Skills”).
Since there were more than 200 test items found in the resources, theSE items were grouped
according to the process skill acquired. Thus, 5 equal forms of science process skills test
forms were prepared.
3.4.1.1.2 Constructing the Attitudes toward Science and Technology Course Pilot
Questionnaire Forms
The researcher prepared Attitudes toward Science and Technology Course Pilot
Questionnaire, the second pilot test, by the use of related literature on attitudes and science.
Since the number of items found from this literature review was more than 60, the items
were grouped by the researcher according to the factor measured. The names of the factors
were also found from the literature. The grouping was based on the opinions of a group of
scholar (mostly research assistants from the Secondary Science and Elementary Education
departments, and one biology teacher at a science and arts centre). The researcher asked the
opinions of the group individually by presenting them the items and factor sheet by which
they could classify the items to a specific factor. Finally, she prepared two equal forms of
Attitudes toward Science Lesson Questionnaire forms.
3.4.1.1.3 The Pilot Testing of the Science Process Skills Test and Attitudes toward
Science and Technology Course Pilot Questionnaire Forms
The pilot study in developing the science process skills tests and attitudes toward science and
technology questionnaire was conducted with the grade 6-8 students attending three
elementary schools, one of which was located in the Etimesgut district, whereas the latter
two were located in the Çankaya District, at the end of the first semester and at the beginning

62
of the second semester of 2005-06 academic year. The number of students in the sample was
as follows:
Table 3.16 Number of the schools in population and sample for the pilot study of science
process skills tests, and attitudes toward science and technology course questionnaire forms
District Population Sample
Etimesgut 38 1 Çankaya 103 2 Total 141 3
As seen from the Table 3.16, the sample, where both science process skills test forms, and
the attitudes toward science and technology questionnaire forms were piloted, consisted of 3
schools and formed 2% of the schools, 3% of which from the schools in Etimesgut, and 2%
from the schools in Çankaya districts. On the other hand, the distributions of students to the
grade levels were as follows:
Table 3.17 Grade levels of the students in the pilot study of the science process skills test
forms and attitudes toward science and technology questionnaire forms
Grades
6 7 8 Total
356 264 147 767
As seen from the Table 3.17, the sample, where both science process skills test forms, and
the attitudes toward science and technology questionnaire forms were piloted, consisted of
767 students, 47% of whom were attending sixth grade, 34% were attending seventh grade,
and 19% were attending eighth grade.
3.4.1.1.3.1 The Pilot Testing of Science Process Skills Test Forms
Each test form was administered to grades 6-8 students in the three elementary schools, one
of which was located in the Etimesgut district whereas the latter two were located in the
Çankaya District. This pilot study was done at the end of the first semester and at the

63
beginning of the second semester of 2005-06 academic year. On the other hand, the number
of students in the sample was as follows:
Table 3.18 School and grade cross tabulation for the pilot study of the science process skills
test forms
Grades School
6 7 8 Total
Etimesgut 1 167 52 32 251 Çankaya 1 74 42 36 152 Çankaya 2 39 70 29 138 Total 280 164 97 541
As seen from the Table 3.18, the sample, where the science process skills test forms were
piloted, consisted of 541 students, 46% of whom were attending the school located in
Etimesgut district, and the remaining 54% were attending to the two schools (as 28%, and
26%) located in Çankaya district. The grade levels of the students were as follows: 52% at
grade 6, 30% at grade 7, and 18% at grade 8. At the sixth grade level, students’ distributions
to the districts were 60% to Etimesgut, 40% to Çankaya (26% to the first school, and 14% to
the second school). At the seventh grade level, students’ distributions to the districts were
32% to Etimesgut, 68% to Çankaya (26% to the first school, and 42% to the second school).
At the eighth grade level, students’ distributions to the districts were 33% to Etimesgut, 67%
to Çankaya (37% to the first school, and 30% to the second school).
The following tables (from Table 3.19 to Table 3.23) show the sample along with the science
process skills test forms.
Table 3.19 School and grade cross tabulation for the pilot study of the first science process
skills test form
Grades School
6 7 8 Total
Etimesgut 1 35 0 0 35 Çankaya 1 0 0 36 36 Çankaya 2 0 34 9 43 Total 35 34 45 114

64
As seen from the Table 3.19, the sample, where the first science process skills test form was
piloted, consisted of 114 students, 31% of whom were attending the school located in
Etimesgut district, and the remaining 69% of whom were attending to the two schools (as
31%, and 38%) located in Çankaya district. The grade levels of the students were as follows:
31% at grade 6, 30% at grade 7, and 39% at grade 8. At the sixth grade level, all students
were from the school in Etimesgut. At the seventh grade level, all students were from the
second school in Çankaya. At the eighth grade level, all students were from Çankaya, 80%
from the first school, and 20% from the second school.
Table 3.20 School and grade cross tabulation for the pilot study of the second science
process skills test form
Grades School
6 7 8 Total
Etimesgut 1 37 18 0 55 Çankaya 1 38 0 0 38 Çankaya 2 0 6 15 21 Total 75 24 15 114
As seen from the Table 3.20, the sample, where the second science process skills test form
was piloted, consisted of 114 students, 48% of whom were attending the school located in
Etimesgut district, and the remaining 52% of whom were attending to the two schools (as
33%, and 19%) located in Çankaya district. The grade levels of the students were as follows:
66% at grade 6, 21% at grade 7, and 13% at grade 8. At the sixth grade level, 49% of the
students were from Etimesgut district, 51% were from the first school in Çankaya. At the
seventh grade level, 75% of the students were from Etimesgut district, 25% were from the
second school in Çankaya. At the eighth grade level, all students were from the second
school of Çankaya.
As seen from the Table 3.21, the sample, where the third science process skills test form was
piloted, consisted of 89 students, 66% of whom were attending the school located in
Etimesgut district, and the remaining 34% of whom were from the second school in
Çankaya. The students in Etimesgut formed the sixth grade sample with a percent of 66,
whereas those in the second school of Çankaya formed the seventh grade sample with a
percentage of 34. There were no students at grade 8.

65
Table 3.21 School and grade cross tabulation for the pilot study of the third science process
skills test form
Grades School
6 7 8 Total
Etimesgut 1 59 0 0 59 Çankaya 1 0 0 0 0 Çankaya 2 0 30 0 30 Total 59 30 0 89
Table 3.22 School and grade cross tabulation for the pilot study of the fourth science process
skills test form
Grades School
6 7 8 Total
Etimesgut 1 0 0 32 32 Çankaya 1 36 0 0 36 Çankaya 2 39 0 4 43 Total 75 0 36 111
As seen from the Table 3.22, the sample, where the fourth science process skills test form
was piloted, consisted of 111 students, 29% of whom were attending the school located in
Etimesgut district, and the remaining 71% of whom were attending to the two schools (as
32%, and 39%) located in Çankaya district. The grade levels of the students were as follows:
68% at grade 6, and 32% at grade 8. There were no students at grade 7. At the sixth grade
level, all students were from Çankaya, 48% of who were in the first, 52% of who were in the
second school. At the eighth grade level, 89% of the students were from Etimesgut, and 11%
of them were from Çankaya.
Table 3.23 School and grade cross tabulation for the pilot study of the fifth science process
skills test form
Grades School
6 7 8 Total
Etimesgut 1 36 34 0 70 Çankaya 1 0 42 0 42 Çankaya 2 0 0 1 1 Total 36 76 1 113

66
As seen from the Table 3.23, the sample, where the fifth science process skills test form was
piloted, consisted of 113 students, 62% of whom were attending the school located in
Etimesgut district, and the remaining 38% of whom were attending to the two schools (as
37%, and 1%) located in Çankaya district. The grade levels of the students were as follows:
32% at grade 6, 67% at grade 7, and 1% at grade 8. At the sixth grade level all students were
from Etimesgut. At the seventh grade level, 45% of the students were from Etimesgut, while
55% were from the second school in Çankaya. At the eighth grade level, all students were
from the second school in Çankaya.
3.4.1.1.3.2 The Pilot Testing of Attitudes toward Science and Technology Course Pilot
Questionnaire Forms
There were two forms of Attitudes toward Science Lesson Questionnaire for pilot. Each test
form was administered by the researcher to 226 grades 6-8 students in the three elementary
schools one of which was located in the Etimesgut district, whereas the latter two were
located in the Çankaya District. This pilot study was done at the end of the first semester and
at the beginning of the second semester of 2005-06 academic year.
The Table 3.24 shows the sample along with the attitudes toward science and technology
questionnaire forms.
Table 3.24 Grade and test form cross tabulation for the pilot study of the attitudes toward
science and technology course questionnaire forms
Grades 1st Form 2nd Form Total 6 21 55 76 7 44 56 100 8 50 0 50 Total 115 111 226
As seen from the Table 3.24, the sample, where the attitudes toward science and technology
course questionnaire forms were piloted, consisted of 226 students, 34% of whom were
going to grade six, 44% were attending to grade seven, and the remaining 22% were at grade
eight. On the other hand, the sample, where the first attitudes toward science and technology

67
course questionnaire form was piloted, consisted of 115 students, 18% of whom were at
grade six, 38% were going to grade seven, and the remaining 44% were attending to grade
eight. In addition, the sample where the second attitudes toward science and technology
course questionnaire form was piloted, consisted of 111 students, 50% of whom were
attending to grade six, and 50% were going to grade seven. There were no eighth grade
students.
3.4.1.1.4 The Analysis of the Pilot Testing of the Science Process Skills Test and
Attitudes toward Science and Technology Course Pilot Questionnaire Forms
The data from both the science process skills pilot tests and attitudes toward science and
technology course pilot questionnaires were analysed with the Statistical Package for Social
Sciences for WINDOWS (SPSS) program by both the Reliability Analysis, and Factor
Analysis, since reliability analysis gives information about each items in terms of the p (item
difficulty index) and r (corrected item-total correlation coefficient) values; and factor
analysis gives information about the factorial structure of test.
The p and r values stated above are important for test construction. When considering p,
which is the proportion of students who answered the item correctly, an item should not be
easy so that it is answered correctly or should not be hard so that it can not be answered
correctly by students. The ideal p should be between .20 and .80 (Kubiszyn & Borich, 2007,
p. 205, 207). On the other hand, r shows the extent to which an item separates students who
are successful on the overall test and those who are not. The ideal r should be positive, which
means that students who are successful on the overall test are also responded correctly to the
item (Kubiszyn & Borich, 2007, p. 205). When an achievement test is being developed both
p and r values are important. On the other hand, since there is no right answer in attitude
tests, only r should be looked at.
The reason to use factor analysis was the dimensionality of science process skills and
attitudes. Science process skills consist of various skills such as observation, prediction,
hypothesizing, etc. Attitudes toward science have also many features such as anxiety,
interest, enjoyment, etc.
For the pilot data, principal component analysis was selected as the extraction or factor
analysis method (Tinsley and Tinsley, as cited in Ashton, 2001). In this analysis, Kaiser’s

68
Criterion, which is extracting only the factors with an eigenvalue over one is met (Kaiser, as
cited in Ashton, 2001). Moreover “Varimax” was used as the rotation method. Factor
analysis gives KMO and Bartlett's Test, Total Variance Explained Table, Scree Plot, and
Rotated (Varimax Factor Rotation) Component Matrix.
KMO is a measure of whether the distribution of values is adequate for conducting factor
analysis (George & Malllery, 2003, p. 256). The classification used to interpret KMO values
is below (George & Malllery, 2003, p. 256):
KMO > .9 marvellous,
KMO > .8 meritorious,
KMO > .7 middling,
KMO > .6 mediocre,
KMO > .5 miserable,
KMO < .5 unacceptable.
On the other hand, Bartlett Test of Sphericity should be significant, < .05. According to
George & Malllery (2003, p. 256) this means that the test data do not produce an identity
matrix and approximately normal, and acceptable for factor analysis.
The total variance explained table shows how many factors with eigenvalues over 1 are there
and how much these factors are responsible for the variance in the total test scores.
Scree Plot is a representation of factors according to eigenvalues. This criterion asks to look
at this graph and determine the breaks in the slope of the line (Tinsley & Tinsley as cited in
Ashton, 2001).
Rotated Component Matrix shows the items loaded to the factors when the data were
reanalyzed with varimax rotation. This rotation hypothesizes that if there are underlying
factors they will be highly correlated (Tinsley & Tinsley as cited in Ashton, 2001).
For the science process skills pilot tests, item selection was done by the researcher and
supervisor according to both p and r; and scale selection was done according to factor
analysis results in terms of KMO and Bartlett's Test, Total Variance Explained Table, Scree
Plot, and Rotated (Varimax Factor Rotation) Component Matrix.

69
For the attitudes toward science and technology pilot questionnaires, item selection was done
by the researcher and supervisor according according to only r (item-total correlation
coefficient), and scale selection was done according to factor analysis results in terms of
KMO and Bartlett's Test, Total Variance Explained Table, Scree Plot, and Rotated (Varimax
Factor Rotation) Component Matrix.
3.4.1.1.5 The Results of the Pilot Testing of the Science Process Skills Test and
Attitudes toward Science and Technology Course Pilot Questionnaire Forms
The results of the science process skills pilot tests showed that many items worked well
(were in moderate difficulty and could differentiate between higher achievers and lower
achievers) and there were dimensions corresponding to each science process skills.
At the end the final forms were prepared by considering the p (or the mean) and r (item-total
correlation) values of the items (please see Appendix B); and factor structure.
3.4.1.2 Developing Student Demographic Form, “Reproduction, Development, and
Growth in Living Things” and “Force and Motion” Unit Achievement Tests
In the construction of “The Student Demographic Form”, the researcher made use of many
theses, and TIMSS-R student questionnaire (See Appendix C for the student demographic
form).
On the other hand, when developing the unit achievement tests (Reproduction, Development,
and Growth in Living Things, and Force and Motion), the researcher selected the related
items from many tests, such as Secondary School Institutions Student Selection and
Placement Tests (Ortaöğretim Kurumları Öğrenci Seçme ve Yerleştirme Sınavları), Private
Schools Tests (Özel Okullar Sınavları), State Tests (Devlet Parasız Yatılı ve Bursluluk
Sınavları), TIMSS 1999, TIMSS-R. The researcher also employed the related literature (See
Appendix F for the forms and references of the Reproduction, Development, and Growth in
Living Things and Force and Motion unit achievement tests).
The state tests, as stated earlier in the development of science process skills test, measure
higher order thinking skills and are consistent with the science curriculum, and therefore
these considered suitable for the achievement test by the researcher. On the other hand, the

70
TIMSS include the items from the life science, physical science, chemistry, and the nature of
science content category (TIMSS, 1999a; TIMSS, 1999b), or subject matter, which are
coherent with the objectives and subject matters of the 6th grade curriculum. For example,
TIMSS life science subject which contains the items on living-nonliving, sprouting of seeds,
stages of plant growth, stages of caterpillar, butterfly and frog, pollination, animal-plant,
changes in children’s’ bodies (TIMSS, 1999a) and chemistry subject, which contains the
item on compounds, molecules, and atoms (TIMSS, 1999b), measure students’
understanding on those subject areas, which are also found in our elementary school science
curriculum. Moreover the cognitive processes or performance objectives are on
understanding simple and complex information; theorizing, analyzing, and solving problems;
using tools; routine procedures, and science processes; and investigating the natural world
(TIMSS, 1999a; TIMSS, 1999b).
The researcher selected the items from these sources in terms of the objectives, and subject
matter given in our new science and technology curriculum for grade 6 and Reproduction,
Development, and Growth in Living Things, and Force and Motion units (See Appendix F
for the blue-prints of the Reproduction, Development, and Growth in Living Things and
Force and Motion unit achievement tests).
Both the science process skills tests and attitudes toward science and technology course
questionnaire data were analysed with the Statistical Package for Social Sciences for
WINDOWS (SPSS) program. Item selection was done by the researcher and supervisor
according according to both p (item difficulty index) and r (item-total correlation
coefficient). On the other hand, scale selection was done according to factor analysis results
in terms of KMO and Bartlett's Test, Scree Plot, and Rotated (Varimax Factor Rotation)
Component Matrix.
The results of the analyses (KMO and Bartlett's Test, Factor analysis, Scree Plot, item
discriminations and difficulty), which were summarized in the previous methodology part,
are given in the appendices.
At the end the final forms were prepared by considering the p (or the mean) and r (item-total
correlation) values of the items (please see Appendix B)

71
3.4.2 Instructional Design
When the researcher was preparing the guided (teacher-directed) inquiry instruction, she
considered the following points:
1. Inquiry when used with cooperative learning improves student achievement in science
classroom (Haukoos and Penick, as cited in Chang & Mao, 1999). Inquiry-oriented classes
tend to be more cooperative and should include a variety of cooperative activities (Johnson,
as cited in Chang & Mao, 1999).
2. Inquiry imposes an overload on the short term memory of students who simultaneously
have to attend to new subject, unfamiliar materials and problem-solving task (Case; Linn;
Pascual Leone, as cited in Rubin & Tamir, 1988). On the other hand, advance organizers
bridges students’ existing cognitive structure and the new content (Ausubel, as cited in
Rubin & Tamir, 1988). Therefore, as an invitation for students to inquiry (Scwab, as cited in
Rubin & Tamir, 1988), advance organizer tasks were found effective especially for average
and low achieving students (Rubin & Tamir, 1988). The following constitutes an example to
the advance organizer task (Rubin & Tamir, 1988):
The length of a kite’s tail
Students test the hypothesis that “the longer the tail in relation to the kite’s frame, the
higher the kite will rise.” They plan an adequate experiment and answer questions such as:
What is the problem?
What is the hypothesis?
What are the treatments?
How many replications are intended?
What is the dependent variable?
What is the independent variable?
Is it important that the size and shape of the kites used in different treatments be identical?
That weather conditions be identical?
That the kites are built of identical materials?
3. On the other hand, the environment of the school selected as experimental was taken into
account. This can be outlined as the physical class environment, laboratory facilities, science
and technology teachers’ choice to use laboratory for a classroom or instrumental source.

72
There was no available space for the students’ cooperative work in the classrooms. Although
the school laboratory offered a variety of instruments, they had limited in number.
4. The age level of the students, and their experience with inquiry were also important for the
design.
In order to meet the criteria outlined in the related literature especially those by Carin et al.
(2005), a pilot study on teacher-guided inquiry was performed with the experimental school
students when they were at grade 5. The pilot was on Electricity Unit and a worksheet was
used as both an advance organizer and report form. This material is given in the Appendix J.
The form was revised then for the actual treatment.
The teacher-guided inquiry materials were also evaluated by using performance tasks and
coding categories of Solano-Flores & Shavelson (1997), and Lee & Butler Songer (2003).
An example to this analysis can be seen in the Appendix J.
3.5 Implementation of Instructional Design
The treatment, guided (teacher-directed) inquiry instruction was implemented on the
experimental group students during their lessons on “Reproduction, Development, and
Growth in Living Things” and “Force and Motion” units. These units were the first two units
of the elementary grade 6 science and technology curriculum in Turkey. The experimental
group students were from the same school in Etimesgut District of Ankara. There were 5
classes at this grade level in the school. There were two teachers responsible for teaching
elementary grade 6 science and technology course; one of them was instructing two of the
classes (A, and B), the other one was instructing the last three classes (C, D, and E).
The researcher explained the teachers about the aim of the present research study and guided
(teacher-directed) inquiry treatment at the beginning of the academic year and before the
lessons. Moreover, the researcher instructed both teachers on how they would implement the
guided (teacher-guided) inquiry treatment by giving the related lesson plans and activity
sheets to them before the class. Sometimes the researcher only gave verbal instruction to the
teachers on what they would do in the class. The researcher also helped the teachers during
their implementation of the method by serving as a model to the teachers for the future
implementation of the treatment to the other class(es) and other guided (teacher-directed)

73
inquiry activities. Sometimes the researcher worked as co-teacher in the class and assisted to
the teacher and students. The teachers gave the guided (teacher-directed) inquiry instruction
to the students in the classroom or school laboratory according to the preferences of the
teachers to use either class or laboratory. The following paragraph gives an overview on how
guided (teacher-directed) inquiry treatment was implemented with a sample activity, which
was used in the experimental group in the Reproduction, Development, and Growth in
Living Things unit.
After revising the previous lesson on reproduction on flowering plants with the students, the
teacher inform the students that the present lesson is an inquiry activity based on what they
already know about this topic.
The teacher asks the research question “Is there a relationship between fruit size and number
of seed?” either verbally and by writing it to the white-board. The students give their
responses.
The teacher informs the students that they as a group will be using the activity sheets for
their inquires. The teacher hands out the activity sheets to the student groups and wants them
to follow the steps outlined in the paper. The teacher wants the students give answers to her
questions verbally and then write their responses to the related fields after the whole class
replied the question she asks. She further clarifies that one group member or all of the
members of the group can write the answer to the worksheet.
The teacher helps the students to form hypotheses on this relationship, and writes the
hypothesis statements on the board. She then determines the independent, dependent and
controlled variables with the students. The teacher asks over the students how they can study
to understand the relationship between the size of a fruit and the number of its seeds. After
listening the students’ answers, the teacher writes the summaries of the students’ proposed
methodology on the board. She then requests the names of the instruments to be used for the
study from the students. The teacher then asks the students which data they should collect
and record. Furthermore she asks how the students will control bias in the measurements
which may result from the instrument used, and the data collector and recorder. The teacher
writes the required information on these steps on the board too.

74
The teacher gives the materials the students will use during their inquiries. She gives enough
time to the students for data collection, recording, and analysis. She helps the student groups
during this process, for example on their determination of the variable to be measured,
writing of measurement units correctly, and recording and analysing data in the correct form.
After giving enough time to the students for their inquiries, the teacher asks the student
groups what they find, whether their hypotheses are failed to reject or rejected. The teacher
wants the groups to make conclusions by using their previous knowledge and the books,
especially their own textbooks. Furthermore she asks the students to explain the terminology
they used during this activity.
The teacher poses the students that what they would like to study further and the things they
should consider for their future studies. She then asks the students to relate what they learned
from this activity with the ones they learned from other subject areas.
3.6 Analysis of Data
General Linear Model Repeated Measures (repeated analysis of variance) design was used in
analyzing the experimental data to answer if guided (teacher-directed) inquiry affected
students’ acquisition of science process skills, achievement in unit tests, and attitudes toward
science and technology course subtests, and if guided (teacher-directed) inquiry interacts
with time. This analysis was performed after checking it for the assumptions such as equal
variances (Højsgaard & Jørgensen, 2001).
The independent variable is the method of instruction; the dependent variables are students’
science process skills, achievement, and attitudes toward science and technology course.
Students’ science process skills were measured by the science process skills test. Students’
achievement was measured by two unit achievement tests. Students’ attitudes were measured
by the attitudes toward science and technology course questionnaire.
Separate repeated analyses of variances (ANOVAs) were conducted to find any significant
difference between the experimental and control classes with respect to achievement and
science process skills. On the other hand, a repeated multivariate analysis of variance
(MANOVA) on the subtests of attitudes toward science and technology course was
performed in order to detect any significant differences between the experimental and

75
control groups. Then separate repeated analyses of variances (ANOVAs) were conducted to
find any significant difference between the experimental and control classes with respect to
academic self-concept, anxiety, interest, career, enjoyment, and usefulness dimensions. The
level of confidence was set at .05. The analyses were conducted by using the Statistical
Package for the Social Sciences (SPSS) Version 15.0 for Windows computer program.

76
CHAPTER 4
RESULTS
The results of the data analysis will be given in this part. First the descriptive statistics
regarding both experimental and control group students’ scores in achievement tests, science
process skills tests, and attitudes toward science and technology course questionnaire and its
subtests will be given in terms of means, and standard deviations. Then the inferential
statistics will be presented to determine the effect of instruction on these outcomes.
4.1 Descriptive Statistics
This part is devoted to give information about the descriptive statistics of the student
performances on the unit achievement tests, science process skills tests, and attitudes toward
science and technology course questionnaire.
Table 4.1 shows the means and standard deviations of students’ performances on
Reproduction, Development and Growth in Living Things (RDGLT) and Force and Motion
(FM) Unit Achievement Tests. As the table suggests, the mean of the students’ scores on the
Reproduction, Development, and Growth in Living Things Unit Achievement Tests were
medium when considering its total number of questions and correspondingly the maximum
score that can be taken from the test, which is 25. Both experimental and control group
students’ mean scores in the pre test were similar (10.72 versus 10.55). After the instruction
on the unit, the mean scores of both groups were increased in the post test (12.83 for the
experimental whereas 11.34 for the control group), especially that of the experimental group.
Then on the retention test, both groups’ mean scores on the Reproduction, Development, and
Growth in Living Things Unit Achievement Test were decreased (11.47 for the experimental
whereas 9.72 for the control group), especially that of the control group. On the other hand,
the mean of the students’ scores on the Force and Motion Unit Achievement Tests were low
when considering its total number of questions and correspondingly the maximum score that

77
can be taken from the test, which are 34. Both experimental and control group students’
mean scores in the pre test were similar (11.00 versus 11.22). After the instruction on the
unit, the mean scores of both groups were decreased in the post test (10.22 for the
experimental whereas 8.07 for the control group), especially that of the control group. Then
on the retention test, both groups’ mean scores on the Force and Motion Unit Achievement
Test were increased (13.23 for the experimental whereas 11.87 for the control group),
especially that of the experimental group.
Table 4.1 Means and standard deviations of the students’ scores on the achievement tests
Variable Group Mean Std. Deviation N RDGLT 1 1 10.72 3.886 86 2 10.55 3.349 82 Total 10.64 3.624 168 RDGLT 2 1 12.83 4.380 86 2 11.34 4.522 82 Total 12.10 4.498 168 RDGLT 3 1 11.47 4.972 86 2 9.72 4.717 82 Total 10.61 4.914 168 FM 1 1 11.00 5.062 86 2 11.22 4.792 82 Total 11.11 4.919 168 FM 2 1 10.22 5.639 86 2 8.07 4.648 82 Total 9.17 5.274 168 FM 3 1 13.23 5.873 86 2 11.87 5.447 82 Total 12.57 5.693 168
Note: The abbreviations mean the following (according to time and alphabetic order): RDGLT: Reproduction, Development and Growth in Living Things Unit Achievement Test RDGLT 1: Pre RDGLT RDGLT 2: Post RDGLT RDGLT 3: Delayed RDGLT FM: Force and Motion Unit Achievement Test FM 1: Pre FM FM 2: Post FM FM 3: Delayed FM Group 1: Experimental Group Group 2: Control Group
Table 4.2 shows the means and standard deviations of students’ performances on Science
and Process Skills Tests. As the table suggests, the mean of the students’ scores on the
Science Process Skills Tests were low when considering the percentage value of each item
and correspondingly the maximum score that can be taken from the test, which is 1 (the only
exception was the mean scores of the experimental group students on the second science
process skills test, which can be regarded as medium). Both experimental and control group

78
students’ mean scores in the pre test were similar (.319 versus .338). After the instruction on
the Reproduction, Development, and Growth in Living Things unit, the mean scores of both
groups were increased in the second test (.467 for the experimental whereas 1.352 for the
control group), especially that of the experimental group. After the instruction on the Force
and Motion unit, the mean scores of the experimental group students were decreased to .392,
whereas the mean scores of the control group students were increased to .355 in the third
test. Then on the retention test, both groups’ mean scores on the science process skills test
were decreased (.385 for the experimental whereas .354 for the control group).
Table 4.2 Means and standard deviations of the students’ scores on the science process skills
tests
Variable Group Mean Std. Deviation N SPS 1 1 .319 .157 86 2 .338 .155 82 Total .328 .156 168 SPS 2 1 .467 .157 86 2 .352 .145 82 Total .411 .162 168 SPS 3 1 .392 .154 86 2 .355 .124 82 Total .374 .141 168 SPS 4 1 .385 .147 86 2 .354 .130 82 Total .370 .139 168
Note: The abbreviations mean the following (according to time and alphabetic order): SPS: Science Process Skills Test SPS 1: The First SPS SPS 2: The Second SPS SPS 3: The Third SPS SPS 4: The Fourth SPS Group 1: Experimental Group Group 2: Control Group
Table 4.3 shows the means and standard deviations of students’ performances on the self-
concept, anxiety, interest, career, enjoyment, and usefulness attitudes toward science and
technology course subtests. Table 4.3 suggests the following:
1. The mean of the students’ scores on the Self-Concept subtest were high when considering
the number of response alternatives in the attitude scale and correspondingly the maximum
score that can be taken from the subtest, which is 5. Both experimental and control group
students’ mean scores in the first self-concept subtest were similar (4.13 versus 4.21). After

79
the instruction on the Reproduction, Development, and Growth in Living Things unit, the
mean self-concept subtest scores of both groups were increased in the second test (4.29 for
the experimental whereas 4.34 for the control group). After the instruction on the Force and
Motion unit, the mean self-concept subtest scores of the experimental group students were
increased to 4.57, and the mean scores of the control group students were increased to 4.39.
Then on the retention self-concept subtest, both groups’ mean scores on the self-concept
subtest were decreased (4.45 for the experimental whereas 4.38 for the control group).
2. The mean of the students’ scores on the anxiety subtest were medium when considering
the number of response alternatives in the attitude scale and correspondingly the maximum
score that can be taken from the subtest, which are 5. Both experimental and control group
students’ mean scores in the first anxiety subtest were similar (3.64 versus 3.78). After the
instruction on the Reproduction, Development, and Growth in Living Things unit, the mean
anxiety subtest scores of the experimental group students were increased when the mean
anxiety subtest scores of the control group students were decreased (3.65 for the
experimental whereas 3.47 for the control group). After the instruction on the Force and
Motion unit, the mean anxiety subtest scores of both groups decreased (3.37 versus 2.84).
Then on the retention anxiety subtest, both groups’ mean scores on the anxiety subtest were
decreased (3.59 for the experimental whereas 3.32 for the control group).
3. The mean of the students’ scores on the interest subtest were high when considering the
number of response alternatives in the attitude scale and correspondingly the maximum score
that can be taken from the subtest, which are 5. Both experimental and control group
students’ mean scores in the first anxiety subtest were similar (3.98 versus 4.20). After the
instruction on the Reproduction, Development, and Growth in Living Things unit, the mean
interest subtest scores of both group students were increased (4.09 for the experimental
whereas 4.27 for the control group). After the instruction on the Force and Motion unit,
while the mean interest subtest scores of the experimental group increased, those of the
control group decreased to 4.41, and 4.14 respectively. Then on the retention interest subtest,
both groups’ mean scores on the interest subtest were increased (4.42 for the experimental
whereas 4.20 for the control group).
4. The mean of the students’ scores on the career subtest were high when considering the
number of response alternatives in the attitude scale and correspondingly the maximum score
that can be taken from the subtest, which is 5. Both experimental and control group students’

80
mean scores in the first career subtest were similar (4.09 versus 4.24). After the instruction
on the Reproduction, Development, and Growth in Living Things unit, the mean career
subtest scores of both groups were increased in the second test (4.31 for the experimental
whereas 4.27 for the control group). After the instruction on the Force and Motion unit, the
mean career subtest scores of the experimental group students were increased to 4.42,
whereas the mean scores of the control group students were decreased to 4.16. Then on the
retention career subtest, while the mean scores of the experimental group decreased, the
mean scores of the control group increased (4.37 for the experimental whereas 4.28 for the
control group).
5. The mean of the students’ scores on the enjoyment subtest were high when considering
the number of response alternatives in the attitude scale and correspondingly the maximum
score that can be taken from the subtest, which are 5. Both experimental and control group
students’ mean scores in the first enjoyment subtest were similar (4.23 versus 4.34). After
the instruction on the Reproduction, Development, and Growth in Living Things unit, the
mean enjoyment subtest scores of the experimental group students were increased when the
mean enjoyment subtest scores of the control group students were decreased (4.38 for the
experimental whereas 4.30 for the control group). After the instruction on the Force and
Motion unit, the mean enjoyment subtest scores of the experimental group students were
increased when the mean enjoyment subtest scores of the control group students were
decreased (4.53 versus 4.17). Then on the retention enjoyment subtest, both groups’ mean
scores on the enjoyment subtest were increased (4.55 for the experimental whereas 4.43 for
the control group).
6. The mean of the students’ scores on the usefulness subtest were high when considering the
number of response alternatives in the attitude scale and correspondingly the maximum score
that can be taken from the subtest, which are 5. Both experimental and control group
students’ mean scores in the first usefulness subtest were similar (4.25 versus 4.46). After the
instruction on the Reproduction, Development, and Growth in Living Things unit, the mean
usefulness subtest scores of the experimental group students were increased but the mean
usefulness subtest scores of the control group students were remained same (4.48 for the
experimental whereas 4.46 for the control group). After the instruction on the Force and
Motion unit, while the mean usefulness subtest scores of the experimental group increased,
those of the control group decreased to 4.64, and 4.29 respectively. Then on the retention
usefulness subtest, while the mean scores of the experimental group students were decreased,

81
the mean usefulness subtest scores of the control group students were increased (4.53 for the
experimental whereas 4.35 for the control group).
Table 4.3 Means and standard deviations of the students’ scores on the attitudes subtests
Variable Group Mean Std. Deviation N Self-Concept 1 1 4.1308 .56974 86 2 4.2104 .58197 82 Total 4.1696 .57539 168 Self-Concept 2 1 4.2907 .62292 86 2 4.3415 .58599 82 Total 4.3155 .60390 168 Self-Concept 3 1 4.5698 .56315 86 2 4.3872 .61508 82 Total 4.4807 .59438 168 Self-Concept 4 1 4.4507 .62292 86 2 4.3841 .65522 82 Total 4.4643 .64179 168 Anxiety 1 1 3.6421 .90979 86 2 3.7764 .80209 82 Total 3.7077 .85899 168 Anxiety 2 1 3.6460 .95695 86 2 3.4743 1.01746 82 Total 3.5622 .98774 168 Anxiety 3 1 3.3708 1.18876 86 2 2.8388 1.06017 82 Total 3.1111 1.15182 168 Anxiety 4 1 3.5917 1.16876 86 2 3.3238 1.04293 82 Total 3.4610 1.11394 168 Interest 1 1 3.9826 .73743 86 2 4.2043 .79943 82 Total 4.0908 .77403 168 Interest 2 1 4.2791 .59337 86 2 4.1921 .64226 82 Total 4.2366 .61740 168 Interest 3 1 4.4128 .69321 86 2 4.1402 .87409 82 Total 4.2798 .79614 168 Interest 4 1 4.4186 .73007 86 2 4.2043 .66797 82 Total 4.3140 .70658 168
Career 1 1 4.0901 .67618 86 2 4.2378 .58122 82 Total 4.1622 .63407 168 Career 2 1 4.3140 .64190 86 2 4.2744 .60935 82 Total 4.2846 .62467 168 Career 3 1 4.4215 .63739 86 2 4.1646 .83723 82 Total 4.2961 .75057 168 Career 4 1 4.3663 .62860 86 2 4.2835 .69806 82 Total 4.3259 .66271 168

82
Table 4.3 (Cont’d)
Variable Group Mean Std. Deviation N Enjoyment 1 1 4.2267 .68560 86 2 4.3445 .63785 82 Total 4.2842 .66337 168 Enjoyment 2 1 4.3857 .67812 86 2 4.2988 .57794 82 Total 4.3423 .63077 168 Enjoyment 3 1 4.5320 .60609 86 2 4.1677 .83523 82 Total 4.3542 .74746 168 Enjoyment 4 1 4.5465 .65250 86 2 4.4329 .68273 82 Usefulness 1 1 4.2488 .55471 86 2 4.4561 .53173 82 Total 4.3500 .55186 168 Usefulness 2 1 4.4837 .51924 86 2 4.4610 .51801 82 Total 4.4726 .51721 168 Usefulness 3 1 4.6442 .53261 86 2 4.2878 .76018 82 Total 4.4702 .67572 168 Usefulness 4 1 4.5326 .71397 86 2 4.3537 .76871 82 Total 4.4452 .74438 168
Note: The abbreviations mean the following (according to time and alphabetic order): 1: The First Subtest 2: The Second Subtest 3: The Third Subtest 4: The Fourth Subtest Group 1: Experimental Group Group 2: Control Group
4.2 Inferential Statistics
This part is intended to give information on the results of inferential statistics. For the first
hand, the result of groups’ equivalency in socio-economic status (ses) variables will be
given. The following parts are devoted to the results of the testing null hypothesis via GLM
Repeated Measures analysis. In this part, first the results on achievement will take place.
Then the findings will be presented along with the tests for science process skills. This part
will end with the findings on the overall attitude test and then results will be given for each
sub test.

83
4.2.1 The Results of the Analysis on the Differences between Experimental and Control
Group Students’ Socio-Economic Status Variables
Socio-economic status is an important confounding variable that should be considered in
interpreting the results of experimental studies. In order to give evidence to the experimental
and control groups’ equivalency in terms of socio-economic status, students’ responses to
related socio-economic status items in the demographic form were analysed with exploratory
factor analysis. Two factors were found with this analyses, Wealth, and Impact of Mother.
After saving the regression factor scores of these two variables, the index values for wealth
and impact of mother variables were found. And these values were used in the analysis
comparing if there was difference among the groups when considering the means (The
results of these analyses can be found in the Appendix G).
Independent Samples t-test was done to compare experimental and control groups with
respect to the index values of the first two socio-economic status (ses) variables (The results
of the analyses on the assumptions can be found in the Appendix H). Table 4.5 shows the
results of independent t-test which was applied to find if there is a difference between the
experimental and control group students with respect to the mean socio-economic status
index.
Table 4.4 Result of independent t-test showing the differences between the experimental and
control groups mean scores on wealth and impact of mother indices
Group N Mean SD t df p
1 64 -,0202214 ,95172343 REGR factor score 1 for analysis 1 2 67 ,0193160 1,05086436
-.225 129 .822
1 64 -,1449165 ,95444092 REGR factor score 2 for analysis 1 2 67 ,1384277 1,02972311
-1.631 129 .105
Note: The data show the values for equal variances assumed
As the Table 4.4 suggests, independent t-test failed to reveal a statistically significant
difference between (1) the means of the experimental (X = -.02, s = .95) and control (X = -
.14, s = .95) groups on the wealth index, t (129) = -.225, p = .822, α = .05, and (2) the means
of the experimental (X = -.14, s = .95) and control (X = -.14, s = .95) groups on the impact of
84
mother index, t (129) = -1.63, p = .105, α = .05. These results mean that their corresponding
population distributions also do not differ.
4.2.2 The Results of the Effect of Teacher-Guided Inquiry vs. Traditional Instruction
on Students’ Achievement, Science Process, and Attitudes toward Science and
Technology Lesson
This part shows the results of the GLM Repeated Measures analyses that were used in testing
the null hypotheses regarding the effect of teacher-directed inquiry on some academic
outcomes (in order to save space, the analyses used in checking the assumptions of GLM
repeated measures analyses are given in Appendix H) .
In order to find the effect of instruction on students’ achievement, science process and
attitudes toward science and technology course, first the students who took all the tests
repeatedly were determined. The number of these students was 168. Missing data analysis
was done only for attitude questionnaire, because some students did not rated all the
questionnaire items. The analysis result showed that missing ratio (coded as 0) ranged from
.6 to 4.8 in percentage. The missings were replaced with the mode value in general, in one
case when there were two modes (bimodal distribution) the missing was replaced with the
one that close to 3 (see Appendix E for missings).
4.2.2.1 The Results of the Effect of Teacher-Guided Inquiry vs. Traditional Instruction
on Students’ Achievement
This part shows the GLM Repeated Measures ANOVA results for two hypotheses to be
tested: one for achievement in “Reproduction, Development and Growth in Living Things”
unit and the other is for “Force and Motion” unit.
4.2.2.1.1 The Results of the Effect of Teacher-Guided Inquiry vs. Traditional
Instruction on Students’ Achievement in Reproduction, Development and Growth in
Living Things Unit
H0: There is no statistically significant effect between teacher-guided inquiry and traditional
instruction on the population means of the 6th grade students’ “Reproduction, Growth, and
Development in Living Things” unit achievement test scores.
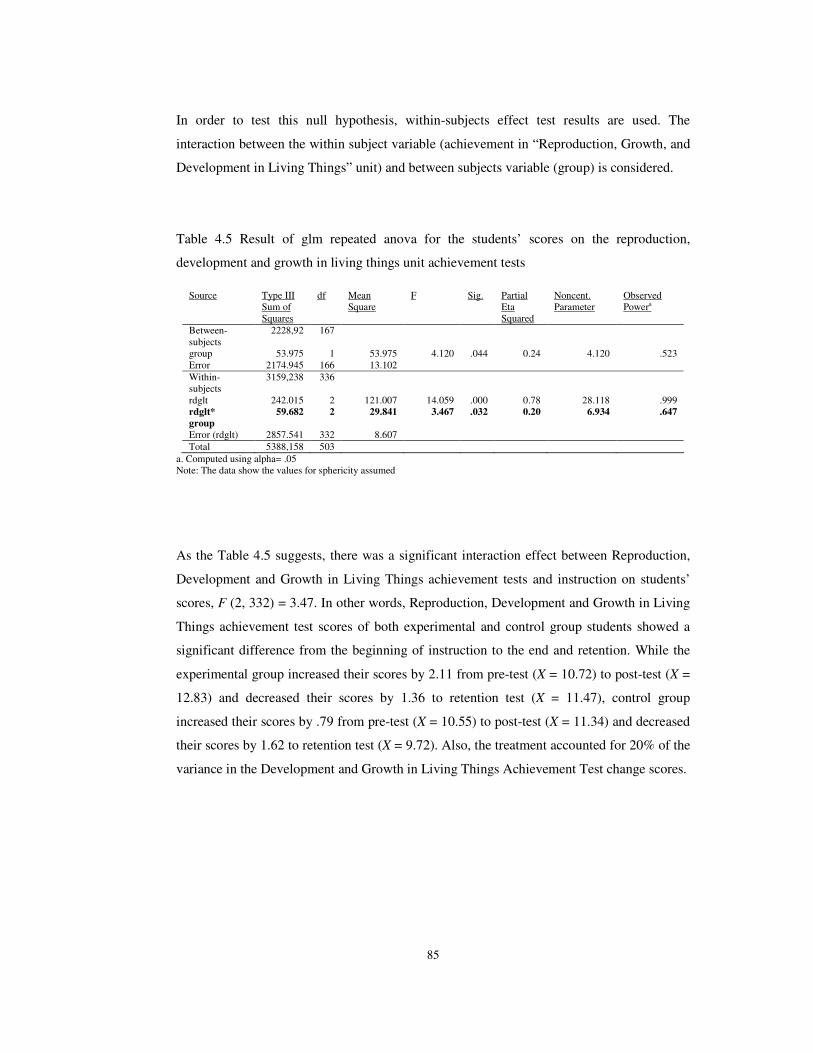
85
In order to test this null hypothesis, within-subjects effect test results are used. The
interaction between the within subject variable (achievement in “Reproduction, Growth, and
Development in Living Things” unit) and between subjects variable (group) is considered.
Table 4.5 Result of glm repeated anova for the students’ scores on the reproduction,
development and growth in living things unit achievement tests
Source Type III
Sum of Squares
df Mean Square
F Sig. Partial Eta Squared
Noncent. Parameter
Observed Powera
Between-subjects
2228,92 167
group 53.975 1 53.975 4.120 .044 0.24 4.120 .523 Error 2174.945 166 13.102 Within-subjects
3159,238 336
rdglt 242.015 2 121.007 14.059 .000 0.78 28.118 .999 rdglt* group
59.682 2 29.841 3.467 .032 0.20 6.934 .647
Error (rdglt) 2857.541 332 8.607 Total 5388,158 503
a. Computed using alpha= .05 Note: The data show the values for sphericity assumed
As the Table 4.5 suggests, there was a significant interaction effect between Reproduction,
Development and Growth in Living Things achievement tests and instruction on students’
scores, F (2, 332) = 3.47. In other words, Reproduction, Development and Growth in Living
Things achievement test scores of both experimental and control group students showed a
significant difference from the beginning of instruction to the end and retention. While the
experimental group increased their scores by 2.11 from pre-test (X = 10.72) to post-test (X =
12.83) and decreased their scores by 1.36 to retention test (X = 11.47), control group
increased their scores by .79 from pre-test (X = 10.55) to post-test (X = 11.34) and decreased
their scores by 1.62 to retention test (X = 9.72). Also, the treatment accounted for 20% of the
variance in the Development and Growth in Living Things Achievement Test change scores.

86
Table 4.6 Result of tests of within-subjects contrasts for the students’ scores on the
reproduction, development and growth in living things unit achievement tests
Source RDGLT
Type III Sum of Squares
df Mean Square
F Sig. Partial Eta Squared
Noncent. Parameter
Observed Powera
rdglt Level 1 vs. Level 2 Level 2 vs. Level 3
352.371 373.370
1 1
352.371 373.370
23.977 20.721
.000 .000
.126 .111
23.977 20.721
.998 .995
rdglt*group Level 1 vs. Level 2 Level 2 vs. Level 3
72.252 2.870
1 1
72.252 2.870
4.916 .159
.028 .690
.029 .001
4.916 .159
.597 .068
Error(rdglt) Level 1 vs. Level 2 Level 2 vs. Level 3
2439.534 2991.106
166 166
14.696 18.019
a. Computed using alpha = .05
The Table 4.6 revealed that students’ scores on the post-Reproduction, Development and
Growth in Living Things achievement test were significantly higher than the pre-test in the
experimental group (F (1, 166) = 4.92, r =.17). On the other hand students’ scores on the
delayed-Reproduction, Development and Growth in Living Things achievement test were
not significant than those on post-test in the experimental group (F (1, 166) = .16, r =.03).
321
Estimated Marginal Means
13
12
11
10
9
2
1
group
Estimated Marginal Means of MEASURE_1
Figure 4.1 Profile plot for the students’ scores on the reproduction, development and growth
in living things unit achievement tests

87
Looking at the interaction graph, this effect reflects that instruction (treatment) increased
post- Reproduction, Development and Growth in Living Things achievement test scores
significantly more in the experimental group than it did for the control group. All of the
groups’ scores decreased in the retention test.
4.2.2.1.2 The Results of the Effect of Teacher-Guided Inquiry vs. Traditional
Instruction on Students’ Achievement in Force and Motion Unit
H0: There is no statistically significant effect between teacher-guided inquiry and traditional
instruction on the population means of the 6th grade students’ “Force and Motion” unit
achievement test scores.
In order to test this null hypothesis, within-subjects effect test results are used. The
interaction between within subject variable (achievement in “Force and Motion” unit) and
between subjects variable (group) is considered.
Table 4.7 Result of glm repeated anova for the students’ scores on the force and motion unit
achievement tests
Source Type III
Sum of Squares
df Mean Square
F Sig. Partial Eta Squared
Noncent. Parameter
Observed Powera
Between-subjects
2228,92 167
group 50.636 1 50.636 3.066 .082 0.18 3.066 .413 Error 2741.584 166 16.516 Within-subjects
3159,238 336
fm 979.382 2 489.691 29.029 .000 .149 58.058 1.000 fm*group 122.152 2 61.076 3.621 .028 0.21 7.241 .667 Error (fm) 5600.534 332 16.869 Total 5388,158 499
a. Computed using alpha= .05 Note: The data show the values for sphericity assumed
There was a significant interaction effect between Force and Motion achievement tests and
instruction on students’ scores, F (2, 332) = 3.621. In other words, Force and Motion
achievement test scores of both experimental and control group students showed a
significant difference from the beginning of instruction to the end and retention. While the
experimental group decreased their scores by 0.78 from pre-test (X = 11.00) to post-test (X =
10.22) and increased their scores by 3.01 to retention test (X = 13.23), control group

88
increased their scores by 3.15 from pre-test (X = 11.22) to post-test (X = 8.07) and increased
their scores by 3.8 to retention test (X = 11.87). Also, the treatment accounted for 21% of the
variance in the Force and Motion Achievement Test change scores.
Table 4.8 Result of tests of within-subjects contrasts for the students’ scores on the force and
motion unit achievement tests
Source fm
Type III Sum of Squares
df Mean Square
F Sig. Partial Eta Squared
Noncent. Parameter
Observed Powera
fm Level 1 vs. Level 2 Level 2 vs. Level 3
646.805
1943.441
1 1
646.805
1943.441
18.006 55.561
.000 .000
.098 .251
18.006 55.561
.988
1.000 fm*group Level 1 vs. Level 2 Level 2 vs. Level 3
235.234
25.607
1 1
235.234
25.607
6.548 .732
.011 .393
.038 .004
6.548 .732
.720 .136
Error(fm) Level 1 vs. Level 2 Level 2 vs. Level 3
5963.046 5806.464
166 166
35.922 34.979
a. Computed using alpha = .05
The Table 4.8 revealed that students’ scores on the post-Force and Motion achievement test
were significantly higher than the pre-test in the experimental group (F (1, 166) = 6.548, r
=.19). On the other hand students’ scores on the delayed- Force and Motion achievement test
were not significant than those on post-test in the experimental group (F (1, 166) = .732, r
=.07).

89
321
Estimated Marginal Means
14
13
12
11
10
9
8
2
1
group
Estimated Marginal Means of MEASURE_1
Figure 4.2 Profile plot for the students’ scores on the force and motion unit achievement tests
Looking at the interaction graph, this effect reflects that instruction (treatment) decreased
post-Force and Motion achievement test scores significantly less in the experimental group
than it did for the control group. All of the groups’ scores increased in the retention test.
4.2.2.2 The Results of the Effect of Teacher-Guided Inquiry vs. Traditional Instruction
on Students’ Science Process Skills
H0: There is no statistically significant effect between teacher-guided inquiry and traditional
instruction on the population means of the 6th grade students’ “Science Process Skills Test”
scores.
In order to test this null hypothesis, within-subjects effect test results are used. The
interaction between within subject variable (achievement in the “Science and Process Skills”
test) and between subjects variable (group) is considered.

90
Table 4.9 Result of glm repeated anova for the students’ scores on the science process skills
tests
Source Type III
Sum of Squares
df Mean Square
F Sig. Partial Eta Squared
Noncent. Parameter
Observed Powera
Between-subjects
2.080 167
group .070 1 .070 5.822 .017 0.34 5.822 .670 Error 2.010 166 .012 Within-subjects
7,243 491,77
sps .557 2.927 .190 14.667 .000 .081 42.934 1.000 sps* group
.388 2.927 .133 10.229 .000 .058 29.941 .998
Error (sps) 6.298 485.916 .013 Total 9,323 658,77
a. Computed using alpha= .05 Note: Data show the values for Huynh-Feldt estimate of sphericity
There was a significant interaction effect between Science Process Skills tests and
instruction on students’ scores, F (2.93, 485.92) = 10.23. In other words, Science Process
Skills test scores of both experimental and control group students showed a significant
difference from the beginning of instruction to the end and retention. The experimental
group increased their scores by 0.148 from the first test (X = .319) to the second test (X =
.467), and decreased their scores by 0.075 to the third test (X = .392), and by 0.007 to the
fourth test (X = .385). On the other hand, the control group increased their scores by 0.014
from the first test (X = .338) to the second test (X = .352), and by 0.003 to the third test (X =
.355), and decreased by 0.001 to the fourth test (X = .354). Also, the treatment accounted for
5.8% of the variance in the Science Process Skills Test change scores.

91
Table 4.10 Result of tests of within-subjects contrasts for the students’ scores on the science
process skills tests
Source sps
Type III Sum of Squares
df Mean Square
F Sig. Partial Eta Squared
Noncent. Parameter
Observed Powera
sps Level 1 vs. Level 2 Level 2 vs. Level 3 Level 3 vs. Level 4
1.109 .222 .003
1 1 1
1.109 .222 .003
40.700 7.872 .110
.000 .006 .740
.197 .045 .001
40.700 7.872 .110
1.000 .797 .063
sps*group Level 1 vs. Level 2 Level 2 vs. Level 3 Level 3 vs. Level 4
.758 .260 .001
1 1 1
.758 .260 .001
27.835 9.220 .048
.000 .003 .828
.144 .053 .000
27.835 9.220 .048
.999 .855 .055
Error(sps) Level 1 vs. Level 2 Level 2 vs. Level 3 Level 3 vs. Level 4
4.522 4.688 3.944
166 166 166
.027 .028 .024
a. Computed using alpha = .05
The Table 4.10 revealed that students’ scores on the second Science Process Skills test were
significantly higher than the first test in the experimental group (F (1, 166) = 27.83, r =.38).
Additionally students’ scores on the third Science Process Skills test were significantly lower
than the second test in the experimental group (F (1, 166) = 9.22, r =.22). On the other hand
students’ scores on the fourth Science Process Skills test were not significant than those on
third test in the experimental group (F (1, 166) = .048, r =.02).
4321
Estimated Marginal Means
0,50
0,45
0,40
0,35
0,30
2
1
grup
Estimated Marginal Means of MEASURE_1
Figure 4.3 Profile plot for the students’ scores on the science process skills tests
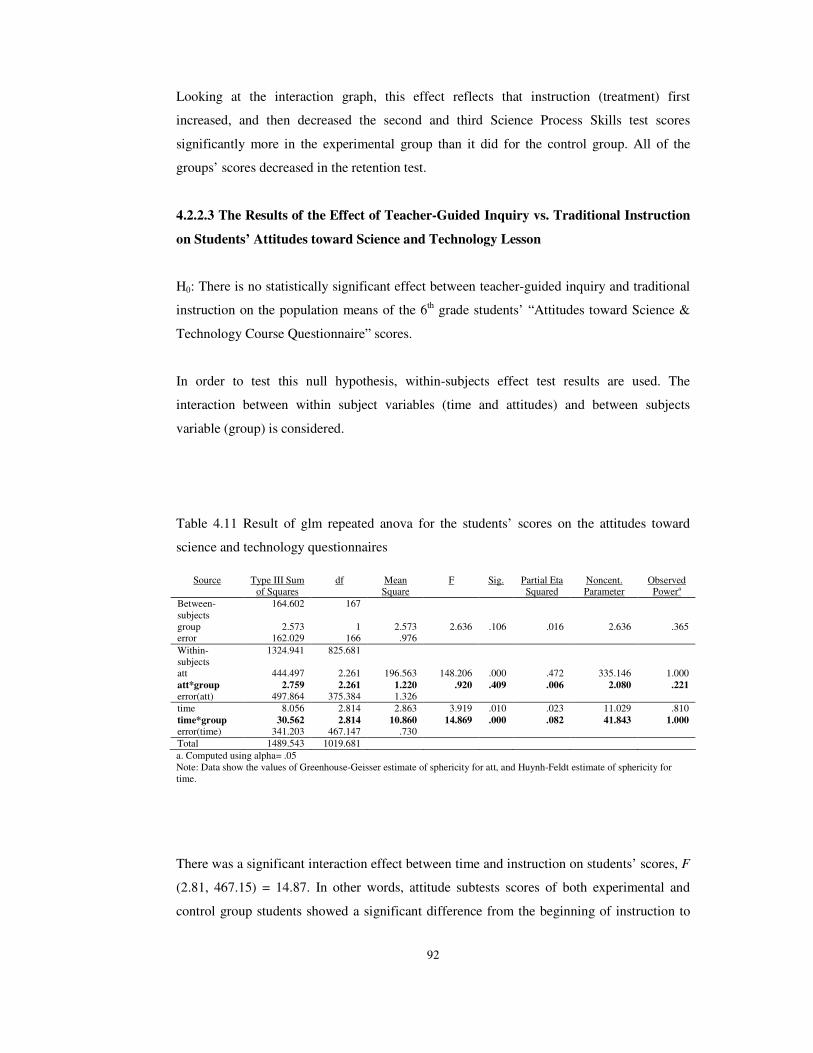
92
Looking at the interaction graph, this effect reflects that instruction (treatment) first
increased, and then decreased the second and third Science Process Skills test scores
significantly more in the experimental group than it did for the control group. All of the
groups’ scores decreased in the retention test.
4.2.2.3 The Results of the Effect of Teacher-Guided Inquiry vs. Traditional Instruction
on Students’ Attitudes toward Science and Technology Lesson
H0: There is no statistically significant effect between teacher-guided inquiry and traditional
instruction on the population means of the 6th grade students’ “Attitudes toward Science &
Technology Course Questionnaire” scores.
In order to test this null hypothesis, within-subjects effect test results are used. The
interaction between within subject variables (time and attitudes) and between subjects
variable (group) is considered.
Table 4.11 Result of glm repeated anova for the students’ scores on the attitudes toward
science and technology questionnaires
Source Type III Sum
of Squares df Mean
Square F Sig. Partial Eta
Squared Noncent. Parameter
Observed Powera
Between-subjects
164.602 167
group 2.573 1 2.573 2.636 .106 .016 2.636 .365 error 162.029 166 .976 Within-subjects
1324.941 825.681
att 444.497 2.261 196.563 148.206 .000 .472 335.146 1.000 att*group 2.759 2.261 1.220 .920 .409 .006 2.080 .221 error(att) 497.864 375.384 1.326 time 8.056 2.814 2.863 3.919 .010 .023 11.029 .810 time*group 30.562 2.814 10.860 14.869 .000 .082 41.843 1.000 error(time) 341.203 467.147 .730 Total 1489.543 1019.681 a. Computed using alpha= .05 Note: Data show the values of Greenhouse-Geisser estimate of sphericity for att, and Huynh-Feldt estimate of sphericity for time.
There was a significant interaction effect between time and instruction on students’ scores, F
(2.81, 467.15) = 14.87. In other words, attitude subtests scores of both experimental and
control group students showed a significant difference from the beginning of instruction to

93
the end and retention. The experimental group increased their scores by 0.18 from the first
test (X = 4.05) to the second test (X = 4.23), by 0.09 to the third test (X = 4.32), and by 0.01
to the fourth test (X = 4.16). On the other hand, the control group decreased their scores by
0.03 from the first test (X = 4.20) to the second test (X = 4.17), and by 0.18 to the third test
(X = 4.00), and increased by 0.17 to the fourth test (X = 4.38). Also, the treatment accounted
for 8.2% of the variance in the attitudes change scores.
Table 4.12 Result of tests of within-subjects contrasts the students’ scores on the attitudes
toward science and technology questionnaires
Source self
Type III Sum of Squares
df Mean Square
F Sig. Partial Eta Squared
Noncent. Parameter
Observed Powera
time Level 1 vs. Level 2 Level 2 vs. Level 3 Level 3 vs. Level 4
5.522 1.761 7.588
1 1 1
5.522 1.761 7.588
4.413 1.618 6.376
.037 .205 .013
.026 .010 .037
4.413 1.618 6.376
.551 .244 .709
time*group Level 1 vs. Level 2 Level 2 vs. Level 3 Level 3 vs. Level 4
11.169 18.123 6.324
1 1 1
11.169 18.123 6.324
8.925
16.650 5.314
.003 .000 .022
.051 .091 .031
8.925
16.650 5.314
.844 .982 .630
Error(time) Level 1 vs. Level 2 Level 2 vs. Level 3 Level 3 vs. Level 4
207.733 180.683 197.532
166 166 166
1.251 1.088 1.190
a. Computed using alpha = .05
The Table 4.12 revealed that the students’ scores on the second subtests were significantly
higher than the first subtests in the experimental group (F (1, 166) = 8.92, r =.22). Moreover,
the students’ scores on the third subtests were significantly higher than the second subtests in
the experimental group (F (1, 166) = 16.65, r =.30). On the other hand the students’ scores
on the fourth attitude subtests were significantly higher than those on the third attitude
subtests in the control group (F (1, 166) = 5.314, r =.18).
4.2.2.3.1 The Results of the Effect of Teacher-Guided Inquiry vs. Traditional
Instruction on Students’ Self-Concept Attitudes toward Science and Technology Lesson
H0: There is no statistically significant effect between teacher-guided inquiry and traditional
instruction on the population means of the 6th grade students’ “Self-Concept Attitudes
toward Science & Technology Course Questionnaire” scores.

94
In order to test this null hypothesis, within-subjects effect test results are used. The
interaction between within subject variables (self-concept scores) and between subjects
variable (group) is considered.
Table 4.13 Result of glm repeated anova for the students’ scores on the self-concept subtests
Source Type III
Sum of Squares
df Mean Square
F Sig. Partial Eta Squared
Noncent. Parameter
Observed Powera
Between-subjects 31,937 167 group .114 1 .114 .597 .441 .004 .597 .120 error 31.823 166 .192 Within-subjects 126,692 504 self 10.460 2.920 3.582 15.246 .000 .084 44.517 1.000 self*group 2.344 2.920 .803 3.417 .018 .020 9.977 .760 Error 113.888 484.723 .235 Total 158,629 671 a. Computed using alpha= .05 Note: Data show the values for Huynh-Feldt estimate of sphericity
There was a significant interaction effects between self-concept subtest scores and
instruction on students’ scores, F (2.920, 484.723) = 3.417. In other words, self-concept
subtests scores of both experimental and control group students showed a significant
difference from the beginning of instruction to the end and retention. The experimental
group increased their scores by 0.16 from the first test (X = 4.13) to the second test (X =
4.29), and by 0.27 to the third test (X = 4.57), and decreased their scores by 0.03 to the fourth
test (X = 4.54). On the other hand, the control group increased their scores by 0.13 from the
first test (X = 4.21) to the second test (X = 4.34), and by 0.05 to the third test (X = 4.39), and
decreased by 0.01 to the fourth test (X = 4.38). Also, the treatment accounted for 2% of the
variance in the Self-Concept change scores.

95
Table 4.14 Result of tests of within-subjects contrasts the students’ scores on the self-
concept subtests
Source self
Type III Sum of Squares
df Mean Square
F Sig. Partial Eta Squared
Noncent. Parameter
Observed Powera
self Level 1 vs. Level 2 Level 2 vs. Level 3 Level 3 vs. Level 4
3.554 4.428 .043
1 1 1
3.554 4.428 .043
7.878
12.687 .104
.006 .000 .747
.045 .071 .001
7.878
12.687 .104
.797 .943 .062
self*group Level 1 vs. Level 2 Level 2 vs. Level 3 Level 3 vs. Level 4
.035
2.285 .028
1 1 1
.035
2.285 .028
.077
6.548 .068
.782 .011 .794
.000 .038 .000
.077
6.548 .068
.059 .720 .058
Error(self) Level 1 vs. Level 2 Level 2 vs. Level 3 Level 3 vs. Level 4
74.892 57.943 68.989
166 166 166
.451 .349 .416
a. Computed using alpha = .05
The Table 4.14 revealed that students’ scores on the third Self-Concept Subtest were
significantly higher than the second test in the experimental group (F (1, 166) = 6.548, r
=.93). On the other hand students’ scores on the second Self-Concept Subtest were not
significant than those on first test in the experimental group (F (1, 166) = .077, r =.26), and
students’ scores on the fourth Self-Concept Subtest were not significant than those on third
test in the experimental group (F (1, 166) = .068, r =.25). However, these contrasts did yield
medium effect sizes.
4321
Estimated Marginal Means
4,6
4,5
4,4
4,3
4,2
4,1
2
1
grup
Estimated Marginal Means of MEASURE_1
at att = 1
Figure 4.4 Profile plot for the students’ scores on the self-concept subtests

96
Looking at the interaction graph, this effect reflects that instruction (treatment) increased the
third Self-Concept Subtest scores significantly more in the experimental group than it did for
the control group. All of the groups’ scores decreased in the retention test.
4.2.2.3.2 The Effect of Instruction on Students’ Anxiety Attitudes toward Science and
Technology Course
H0: There is no statistically significant effect between teacher-guided inquiry and traditional
instruction on the population means of the 6th grade students’ “Anxiety Attitudes toward
Science & Technology Course Questionnaire” scores.
In order to test this null hypothesis, within-subjects effect test results are used. The
interaction between within subject variables (anxiety scores) and between subjects variable
(group) is considered.
Table 4.15 Result of glm repeated anova for the students’ scores on the anxiety subtests
Source Type III Sum of Squares
df Mean Square
F Sig. Partial Eta Squared
Noncent. Parameter
Observed Powera
Between-subjects
104,063 167
group 1.840 1 1.840 2.987 .086 .018 2.987 .405 error 102.223 166 .616 Within-subjects 104,063 473,06 anx 33.301 2.816 11.826 19.118 .000 .103 53.832 1.000 anx*group 9.532 2.816 3.385 5.472 .001 .032 15.408 .927 Error (anx) 289.154 467.428 .619 Total 208,126 640,06
a. Computed using alpha= .05 Note: Data show the values for Huynh-Feldt estimate of sphericity
There was a significant interaction effect between anxiety and group on students’ scores, F
(2.816, 467.428) = 5.472. In other words, anxiety subtests scores of both experimental and
control group students showed a significant difference from the beginning of instruction to
the end and retention. The experimental group increased their scores by 0.01 from the first
test (X = 3.64) to the second test (X = 3.65), and decreased by 0.27 to the third test (X =
3.37), and increased their scores by 0.22 to the fourth test (X = 3.59). On the other hand, the
control group decreased their scores by 0.31 from the first test (X = 3.78) to the second test

97
(X = 3.47), and by 0.63 to the third test (X = 2.84); and decreased by 0.48 to the fourth test (X
= 3.32). Also, the treatment accounted for 3% of the variance in the Anxiety change scores.
Table 4.16 Result of tests of within-subjects contrasts for the students’ scores on the anxiety
subtests
Source anx
Type III Sum of Squares
df Mean Square
F Sig. Partial Eta Squared
Noncent. Parameter
Observed Powera
anx Level 1 vs. Level 2 Level 2 vs. Level 3 Level 3 vs. Level 4
3.735
34.814 20.924
1 1 1
3.735
34.814 20.924
3.735
30.869 22.554
.055 .000 .000
.022 .157 .120
3.735
30.869 22.554
.485
1.000 .997
anx*group Level 1 vs. Level 2 Level 2 vs. Level 3 Level 3 vs. Level 4
3.932 5.449 2.929
1 1 1
3.932 5.449 2.929
3.932 4.832 3.157
.049 .029 .077
.023 .028 .019
3.932 4.832 3.157
.505 .589 .423
Error(anx) Level 1 vs. Level 2 Level 2 vs. Level 3 Level 3 vs. Level 4
165.993 187.210 154.000
166 166 166
1.000 1.128 .928
a. Computed using alpha = .05
The Table 4.16 revealed that students’ scores on the second Anxiety Subtest were
significantly lower than the first test in both the experimental group, and control group (F (1,
166) = 3.932, r =.89). Moreover, students’ scores on the third Anxiety Subtest were
significantly lower than the second test in both the experimental group, and control group (F
(1, 166) = 4.832, r =.91). On the other hand students’ scores on the fourth Anxiety Subtest
were not significant than those on the third test in both the experimental group, and control
group (F (1, 166) = 3.157, r =.87). However, these contrasts yielded large effect size.

98
4321
Estimated Marginal Means
3,8
3,6
3,4
3,2
3,0
2,8
2
1
grup
Estimated Marginal Means of MEASURE_1
at att = 2
Figure 4.5 Profile plot for the students’ scores on the anxiety subtests
Looking at the interaction graph, this effect reflects that instruction significantly decreased
both experimental and control group students’ scores in the anxiety subtests, however this
decline was fewer in the experimental group when compared to the control group. Both
groups’ increased in the retention test.
4.2.2.3.3 The Effect of Instruction on Students’ Interest Attitudes toward Science and
Technology Course
H0: There is no statistically significant effect between teacher-guided inquiry and traditional
instruction on the population means of the 6th grade students’ “Interest Attitudes toward
Science & Technology Course Questionnaire” scores.
In order to test this null hypothesis, within-subjects effect test results are used. The
interaction between within subject variables (interest scores) and between subjects variable
(group) is considered.

99
Table 4.17 Result of glm repeated anova for the students’ scores on the interest subtests
Source Type III
Sum of Squares
df Mean Square
F Sig. Partial Eta Squared
Noncent. Parameter
Observed Powera
Between-subjects
46,188 167
group .325 1 .325 1.178 .279 .007 1.178 .190 error 45.863 166 .276 Within-subjects
172,796 171,274
int 4.614 2.637 1.750 4.726 .004 .028 12.462 .866 int*group 6.126 2.637 2.323 6.275 .001 .036 16.545 .948 Error (int) 162.056 437.691 .370 Total 218,984 338,274
a. Computed using alpha= .05 Note: Data show the values for Huynh-Feldt estimate of sphericity for interest
There was a significant interaction effect between interest and group on students’ interest
scores, F (2.637, 437.691) = 6.275. In other words, interest subtests scores of both
experimental and control group students showed a significant difference from the beginning
of instruction to the end and retention. The experimental group increased their scores by 0.30
from the first test (X = 3.98) to the second test (X = 4.28), by 0.13 to the third test (X = 4.41),
by 0.01 to the fourth test (X = 4.42). On the other hand, the control group decreased their
scores by 0.01 from the first test (X = 4.20) to the second test (X = 4.19), and by 0.05 to the
third test (X = 4.14), and increased by 0.0 to the fourth test (X = 4.20). Also, the treatment
accounted for 4% of the variance in the Interest change scores.
Table 4.18 Result of tests of within-subjects contrasts for the students’ scores on the interest
subtests
Source int
Type III Sum of Squares
df Mean Square
F Sig. Partial Eta Squared
Noncent. Parameter
Observed Powera
int Level 1 vs. Level 2 Level 2 vs. Level 3 Level 3 vs. Level 4
3.393 .282 .205
1 1 1
3.393 .282 .205
4.460 .643 .383
.036 .424 .537
.026 .004 .002
4.460 .643 .383
.556 .125 .094
int*group Level 1 vs. Level 2 Level 2 vs. Level 3 Level 3 vs. Level 4
4.000 1.445 .142
1 1 1
4.000 1.445 .142
5.258 3.301 .266
.023 .071 .607
.031 .019 .002
5.258 3.301 .266
.625 .439 .081
Error(int) Level 1 vs. Level 2 Level 2 vs. Level 3 Level 3 vs. Level 4
126.302
72.679 88.723
166 166 166
.761 .438 .534
a. Computed using alpha = .05

100
The Table 4.18 revealed that students’ scores on the second Interest Subtest were
significantly higher than the first test in the experimental group (F (1, 166) = 5.258, r = .84)
On the other hand students’ scores on the third (F (1, 166) = 3.301, r =.76), and fourth (F (1,
166) = .266, r =.21) Interest Subtests were not significant than those on previous ones in the
experimental group. However, these contrasts did yield very large and small effect sizes.
4321
Estimated Marginal Means
4,5
4,4
4,3
4,2
4,1
4,0
3,9
2
1
grup
Estimated Marginal Means of MEASURE_1
at att = 3
Figure 4.6 Profile plot for the students’ scores on the interest subtests
Looking at the interaction graph, this effect reflects that the instruction increased
significantly the second Interest subtest scores in the experimental group than it did for the
control group. Although this rise continued till the third and fourth implementations of the
Interest test, it was not significant. On the other hand, control group students’ scores declined
till the third test after that it raised.
4.2.2.3.4 The Effect of Instruction on Students’ Career Attitudes toward Science and
Technology Course
H0: There is no statistically significant effect between teacher-guided inquiry and traditional
instruction on the population means of the 6th grade students’ “Career Attitudes toward
Science & Technology Course Questionnaire” scores.

101
In order to test this null hypothesis, within-subjects effect test results are used. The
interaction between within subject variables (career scores) and between subjects variable
(group) is considered.
Table 4.19 Result of glm repeated anova for the students’ scores on the career subtests
Source Type III
Sum of Squares
df Mean Square
F Sig. Partial Eta Squared
Noncent. Parameter
Observed Powera
Between-subjects
38,619 167
group .141 1 .141 .607 .437 .004 .607 .121 Error 38.478 166 .232 Within-subjects 147,84 470,246 career 2.581 2.799 .922 3.022 .033 .018 8.459 .689 career* group
3.476 2.799 1.242 4.070 .009 .024 11.392 .824
Error (career)
141.783 464.648 .305
Total 186,459 637,246 a. Computed using alpha= .05 Note: Data show the values for Huynh-Feldt estimate of sphericity for career
There was a significant interaction effect between career and group on students’ scores, F
(2.799, 464.648) = 4.070. In other words, career subtests scores of both experimental and
control group students showed a significant difference from the beginning of instruction to
the end and retention. The experimental group increased their scores by 0.22 from the first
test (X = 4.09) to the second test (X = 4.31), and by 0.11 to the third test (X = 4.42), and
decreased their scores by 0.06 to the fourth test (X = 4.36). On the other hand, the control
group increased their scores by 0.03 from the first test (X = 4.24) to the second test (X =
4.27); and decreased by 0.11 to the third test (X = 4.16); and increased by 0.12 to the fourth
test (X = 4.28). Also, the treatment accounted for 2% of the variance in the Interest change
scores.

102
Table 4.20 Result of tests of within-subjects contrasts for the students’ scores on the career
subtests
Source career
Type III Sum of Squares
df Mean Square
F Sig. Partial Eta Squared
Noncent. Parameter
Observed Powera
career Level 1 vs. Level 2 Level 2 vs. Level 3 Level 3 vs. Level 4
2.847 .000 .170
1 1 1
2.847 .000 .170
4.954 .000 .442
.027 .985 .507
.029 .000 .003
4.954 .000 .442
.600 .050 .101
career*group Level 1 vs. Level 2 Level 2 vs. Level 3 Level 3 vs. Level 4
1.472 1.982 1.273
1 1 1
1.472 1.982 1.273
2.561 3.466 3.304
.111 .064 .071
.015 .020 .020
2.561 3.466 3.304
.356 .457 .439
Error(career) Level 1 vs. Level 2 Level 2 vs. Level 3 Level 3 vs. Level 4
95.394 94.955 63.953
166 166 166
.575 .572 .385
a. Computed using alpha = .05
The Table 4.20 revealed that students’ scores on the second (F (1, 166) = 2.561, r =.71),
third (F (1, 166) = 3.466, r =.77), and fourth (F (1, 166) = 3.304, r =.76) Career Subtests
were not significant in the experimental group. However, these contrasts did yield very large
effect sizes.
4321
Estimated Marginal Means 4,4
4,3
4,2
4,1
2
1
grup
Estimated Marginal Means of MEASURE_1
at att = 4
Figure 4.7 Profile plot for the students’ scores on the career subtests

103
Looking at the interaction graph, this effect reflects that instruction increased both group of
students’ Career scores in the second test, and then while it continued to increase scores in
the experimental group, decreased the scores of the control group students in the third test.
Finally by the fourth test, experimental group students’ scores decreased, while the control
group scores increased.
4.2.2.3..5 The Effect of Instruction on Students’ Enjoyment Attitudes toward Science
and Technology Course
H0: There is no statistically significant effect between teacher-guided inquiry and traditional
instruction on the population means of the 6th grade students’ “Enjoyment Attitudes toward
Science & Technology Course Questionnaire” scores.
In order to test this null hypothesis, within-subjects effect test results are used. The
interaction between within subject variables (enjoyment scores) and between subjects
variable (group) is considered.
Table 4.21 Result of glm repeated for the students’ scores on the enjoyment subtests
Source Type III
Sum of Squares
df Mean Square
F Sig. Partial Eta Squared
Noncent. Parameter
Observed Powera
Between-subjects
group .520 1 .520 2.397 .123 .014 2.397 .337 Error 35.991 166 .217 Within-subjects
enjoyment 3.801 3 1.267 4.025 .008 .024 12.075 .840 enjoyment* group
4.919 3 1.640 5.209 .002 .030 15.626 .926
Error (enjoyment)
156.761 498 .315
Total a. Computed using alpha= .05 Note: Data show the values for sphericity assumed
There was a significant interaction effect between enjoyment and group on students’ scores
F (3, 498) = 5.209. In other words, enjoyment subtests scores of both experimental and
control group students showed a significant difference from the beginning of instruction to

104
the end and retention. The experimental group increased their scores by 0.15 from the first
test (X = 4.23) to the second test (X = 4.38), by 0.15 to the third test (X = 4.53), and by 0.02
to the fourth test (X = 4.55). On the other hand, the control group decreased their scores by
0.04 from the first test (X = 4.34) to the second test (X = 4.30), and by 0.13 to the third test
(X = 4.17); and increased by 0.26 to the fourth test (X = 4.43). Also, the treatment accounted
for 3% of the variance in the Enjoyment change scores.
Table 4.22 Result of tests of within-subjects contrasts for the students’ scores on the
enjoyment subtests
Source enjoyment
Type III Sum of Squares
df Mean Square
F Sig. Partial Eta Squared
Noncent. Parameter
Observed Powera
enjoyment Level 1 vs. Level 2 Level 2 vs. Level 3 Level 3 vs. Level 4
.519 .012
3.286
1 1 1
.519 .012
3.286
.910 .019
5.209
.342 .890 .024
.005 .000 .030
.910 .019
5.209
.158 .052 .621
enjoyment *group Level 1 vs. Level 2 Level 2 vs. Level 3 Level 3 vs. Level 4
1.725 3.276 2.638
1 1 1
1.725 3.276 2.638
3.021 5.102 4.183
.084 .025 .042
.018 .030 .025
3.021 5.102 4.183
.408 .612 .529
Error(enjoyment) Level 1 vs. Level 2 Level 2 vs. Level 3 Level 3 vs. Level 4
94.772
106.575 104.713
166 166 166
.571 .642 .631
a. Computed using alpha = .05
The Table 4.22 revealed that students’ scores on the third (F (1, 166) = 5.102, r =.83), and
fourth (F (1, 166) = 4.183, r =.89) Enjoyment Subtests were significantly different in the
experimental and control group students. On the other hand students’ scores on the second
Enjoyment Subtest were not significant than those on first test (F (1, 166) = 3.021, r =.86).
However, this contrast yielded very large effect sizes.
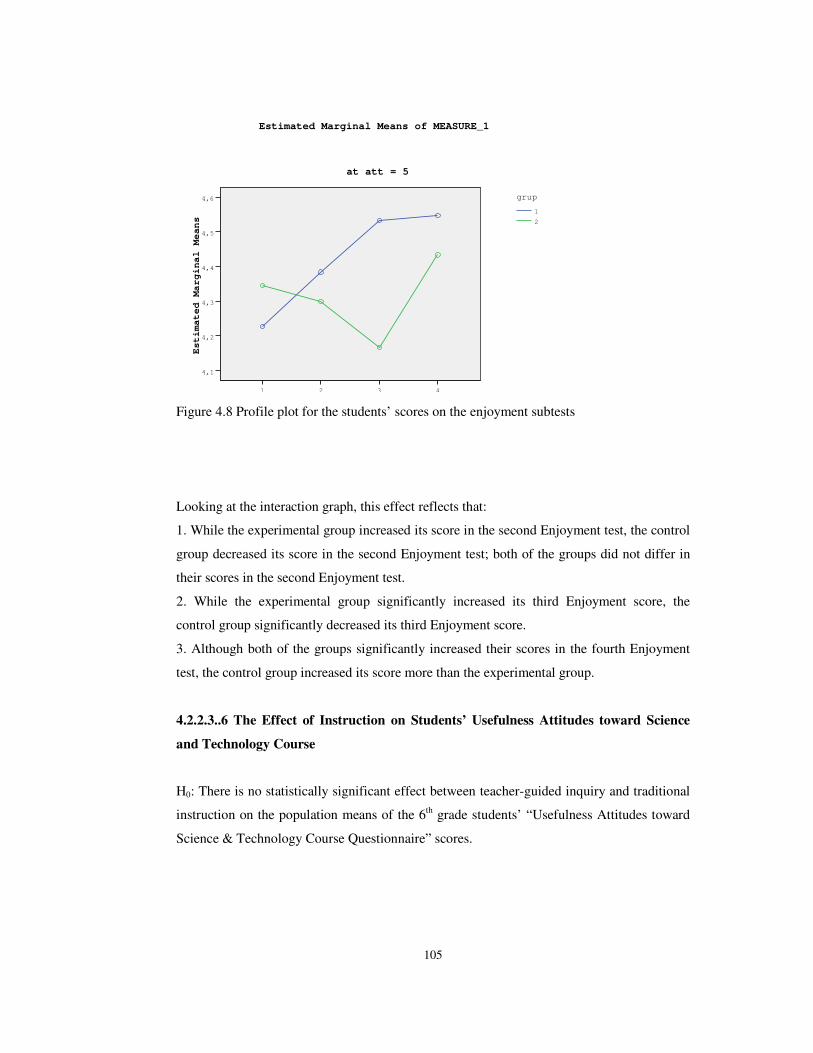
105
4321
Estimated Marginal Means
4,6
4,5
4,4
4,3
4,2
4,1
2
1
grup
Estimated Marginal Means of MEASURE_1
at att = 5
Figure 4.8 Profile plot for the students’ scores on the enjoyment subtests
Looking at the interaction graph, this effect reflects that:
1. While the experimental group increased its score in the second Enjoyment test, the control
group decreased its score in the second Enjoyment test; both of the groups did not differ in
their scores in the second Enjoyment test.
2. While the experimental group significantly increased its third Enjoyment score, the
control group significantly decreased its third Enjoyment score.
3. Although both of the groups significantly increased their scores in the fourth Enjoyment
test, the control group increased its score more than the experimental group.
4.2.2.3..6 The Effect of Instruction on Students’ Usefulness Attitudes toward Science
and Technology Course
H0: There is no statistically significant effect between teacher-guided inquiry and traditional
instruction on the population means of the 6th grade students’ “Usefulness Attitudes toward
Science & Technology Course Questionnaire” scores.

106
In order to test this null hypothesis, within-subjects effect test results are used. The
interaction between within subject variables (usefulness scores) and between subjects
variable (group) is considered.
Table 4.23 Result of glm repeated anova for the students’ scores on the usefulness subtests
Source Type III
Sum of Squares
df Mean Square
F Sig. Partial Eta Squared
Noncent. Parameter
Observed Powera
Between-subjects
32,44 167
group .323 1 .323 1.668 .198 .010 1.668 .250 Error 32.117 166 .193 Within-subjects
136,111 504
usefulness 1.549 3 .516 2.019 .110 .012 6.056 .519 usefulness* group
7.208 3 2.403 9.396 .000 .054 28.188 .997
Error (usefulness)
127.354 498 .256
Total 168,551 671 a. Computed using alpha= .05 Note: Data show the values for sphericity assumed
There was a significant interaction effects between usefulness and group, F (3, 498) = 9.396,
on students’ scores. In other words, usefulness subtest scores of both experimental and
control group students showed a significant difference from the beginning of instruction to
the end and retention. The experimental group increased their score by 0.59 from the first
test (X = 4.25) to the second test (X = 4.48), and by 0.16 to the third test (X = 4.64), and
decreased their score by 0.11 to the fourth test (X = 4.53). On the other hand, the control
group remained same from the first test (X = 4.46) to the second test (X = 4.46); then
decreased their score by 0.17 to the third test (X = 4.29); and increased by 0.06 to the fourth
test (X = 4.35). Also, the treatment accounted for 5% of the variance in the Usefulness
change scores.

107
Table 4.24 Result of tests of within-subjects contrasts for the students’ scores on the
usefulness subtests
Source usefulness
Type III Sum of Squares
df Mean Square
F Sig. Partial Eta Squared
Noncent. Parameter
Observed Powera
usefulness Level 1 vs. Level 2 Level 2 vs. Level 3 Level 3 vs. Level 4
2.413 .007 .088
1 1 1
2.413 .007 .088
6.090 .015 .156
.015 .903 .693
.035 .000 .001
6.090 .015 .156
.689 .052 .068
usefulness *group Level 1 vs. Level 2 Level 2 vs. Level 3 Level 3 vs. Level 4
2.221 4.672 1.322
1 1 1
2.221 4.672 1.322
5.605
10.286 2.350
.019 .002 .127
.033 .058 .014
5.605
10.286 2.350
.653 .890 .332
Error(usefulness ) Level 1 vs. Level 2 Level 2 vs. Level 3 Level 3 vs. Level 4
65.773 75.407 93.413
166 166 166
.396 .454 .563
a. Computed using alpha = .05
The Table 4.24 revealed that students’ scores on the second (F (1, 166) = 5.605, r =.92), and
third (F (1, 166) = 10.286, r =.95) Usefulness Subtests were significantly different in the
experimental and control group. On the other hand students’ scores on the fourth Usefulness
Subtest were not significant than those on third test (F (1, 166) = 2.350, r =.83). However,
this contrast yielded very large effect size.
4321
Estimated Marginal Means
4,7
4,6
4,5
4,4
4,3
4,2
2
1
grup
Estimated Marginal Means of MEASURE_1
at att = 6
Figure 4.9 Profile plot for the students’ scores on the usefulness subtests

108
Looking at the interaction graph, this effect reflects that:
1. Students’ usefulness scores significantly increased in the experimental group when
compared to the control group in the second test.
2. While the experimental group significantly increased its score, the control group
significantly decreased its score in the third usefulness test.
3. While the experimental group decreased its score, the control group increased its score in
the fourth usefulness test.

109
CHAPTER 5
DISCUSSION
The aim of the present study was to evaluate the effect of a teacher-guided inquiry
instruction on 6th grade students’ achievement, science process skills, and attitudes toward
science and technology course. To accomplish this aim the following steps were followed:
1) Two achievement tests, which were on “Reproduction, Development and Growth in
Living Things” (RDGLT) and “Force and Motion” (FM) units, were developed and
validated.
2) Three science process skills tests (SPS 1, SPS 2, and SPS 3) were developed and
validated.
3) An attitudes toward science and technology course questionnaire (ATT) was developed
and validated.
4) Teacher-guided activities on “Reproduction, Development and Growth in Living Things”
and “Force and Motion” units were developed and implemented in the experimental group.
5) RDGLT and FM achievement tests, SPS 1-3, and ATT were administered in order to
collect data.
6) Data were analysed by using GLM Repeated Measures ANOVA and MANOVA
statistical analyses.
5.1 Summary of the Experiment
424 grade 6 students participated to the study. The students were attending 7 elementary
schools, 1 in Etimesgut and 6 in Çankaya districts of Ankara city during the 2006-2007
academic year. From these schools, the one in Etimesgut was the experimental group,
whereas the others in Çankaya served as the control group of the study. There were 196
students in the experimental group, and 231 students in the control group.

110
The treatment was consisted of two instructions corresponding to the first two units of the
grade 6 elementary science and technology curriculum:
1. The instruction in Reproduction, Development, and Growth in Living Things unit, and
2. The instruction in Force and Motion unit.
Both experimental and control group students received the pre-tests (RDGLT, ATT, and
SPS) before the instruction in Reproduction, Development, and Growth in Living Things
unit. The experimental group was instructed with teacher-guided inquiry besides the new
science and technology curriculum, whereas the control group was instructed with the new
science and technology curriculum only. At the end of this unit, both experimental and
control group students were given the post-tests (RDGLT, ATT, and SPS) plus FM as a pre-
test.
The second instruction was on Force and Motion. Similar to the first treatment, the
experimental group experimental group was instructed with teacher-guided inquiry besides
the new science and technology curriculum, whereas the control group was instructed with
the new science and technology curriculum only. At the end of this unit, both experimental
and control group students were given the post-tests (FM, ATT, and SPS).
After the instruction in the third unit on Particulate Nature of Matter with new science and
technology curriculum, both groups were given delayed tests (RDGLT, FM, ATT, and SPS
4).
5.2 Limitations
5.2.1 Internal Validity
The degree to which the observed differences on the dependent variable are directly related
to the independent variable but the other variables is called internal validity. When a study
lacks internal validity, its’ results are explained by an alternative hypothesis or some
hypotheses. These alternative hypotheses are called threats to internal validity (Fraenkel &
Wallen, 2006, p. 169). The possible treats to the internal validity were tried to be minimized
by the researcher via some techniques as the followings (the names of the treats is in accord
with the classification of Fraenkel & Wallen, 2006, p. 170-185):

111
1. The research design of the study was a pre-test post-test quasi experimental research
design. Since the subjects were not assigned randomly to the both groups there might be
differences in terms of the characteristics between experimental and control group students.
As the information obtained from students’ demography variables such as age, gender, and
parents’ occupation showed, both groups have similar distribution. In addition to these, the
independent t-test result showed that the groups have no difference in socio-economic status.
Therefore subject characteristics can not be threat to the present study.
2. The research design of the study was also repeated measurements design, which requires
measuring the subjects several times. Due to their absence from the class, many students
were unable to take all the tests. The students could not attend the class because of illness,
business and relocation of family, requirement to work as an officer of the guard, and to
participate as a member to many club activities at the school. Thus, although the sample
consisted of 424 students, the analyses were made with only 168 of them, who participated
to all test administrations. In other words 61% of the students were lost from the study. The
comparison of the experimental and control groups with respect to this missing student
percentages showed that while 65% of the students from the experimental group were
missing from any one of the tests, 64% of the students from the control group were missing
from any one of the tests. These values show that both groups have nearly similar missing
ratio. This implies that the missings were random. Therefore mortality or loss of subjects can
not be threat to the present study.
3. Almost all the data were collected from the students when there were in their own classes.
The classes, where both the experimental and control group students were being instructed,
had similar physical structure consisting of a teacher table and many student desks; some
closets for books; some bulletin boards on the walls, on which student products could be
presented; a wide window from one wall to another, where a radiator took place right below;
and fluorescent lamps on the ceiling for lighting.
On the other hand, some tests were collected from the experimental group students while
they were in the laboratory. This was the case for just one class or two classes. The teachers
of the experimental group sometimes preferred to instruct their students in the laboratory,
and this made the researcher to give the tests when the students were already in the
laboratory. However the laboratory was not a new location for the students since they were
accustomed to being there for some of the science and technology lessons, and its’ physical
112
structure is similar to their classes. All materials of the laboratory were found in the inner
room and therefore not accessible by the students, and the only new material there was a TV.
For these reasons, location can not be threat to the present study.
4. There were several instruments used in this study to gather data. From these instruments
the attitudes toward science and technology course questionnaire was a Likert-scale
requiring students to select among choices. The multiple-choice questions of the
achievement tests, and science process skills tests had the same response type. And the
researcher could score these questions by using the answer key. On the other hand, for the
matching, open-ended, fill-in-the-blank, and hot-spot type questions of the achievement and
science process skills tests, the researcher did the scoring by using the evaluation criteria and
answer keys given in the related appendices. These scoring techniques provided the
standardization of the scoring process.
As stated earlier the data were collected mainly by the researcher. Besides collecting data,
the researcher tried to attend all science and technology course lessons of both experimental
and control group classes in order to get acquainted by the students. Very few data were
collected by the students’ own science and technology teacher due to the large number of
classes participated to the study and due to the researcher’s study schedule which did not
permit her to be more than one place at the same time.
When collecting data, the researcher did not behave differently to the students regarding
being in the experimental or control groups. The data were collected from the students when
they were in the science and technology course, and mainly when the science and technology
teacher of the class was present. On the other hand, for some of the times, the data were
collected when the students in the other lessons. The reason was the schedule of the science
and technology teachers, which required them to teach a specific lesson in order to be in line
with the time schedule outlined in the 6th grade science and technology curriculum as
suggested time line for the units. When this was the case, the teacher tried to get help from
this course teacher to be with her during data collection in order to standardize the data
collection procedure, and to minimize the disruptive student behaviours.
As the above procedures suggest, instrumentation can not be threat to the present study.

113
5. In this study, the students were tested before and after the instruction in order to assess the
effect of the instruction on some outcomes, and tested one more time in order to assess the
durability of these gains. Since both groups were following the elementary science and
technology curriculum (although in addition to this the experimental group included teacher-
guided activities), the time periods between the administrations of the tests were already
outlined by the curriculum. This means that for the first treatment there was at least one and
a half month time period, for the second treatment there was at least one month duration, and
finally for no treatment there was at least 2 months period. In other words, the time periods
between the tests were long enough to eliminate the students’ remembrance of the test items.
The use of the parallel forms for the science and technology test was also a technique to
overcome the testing threat.
6. The researcher tried to administer all the tests to each class where the students attend at
least in the same week in order to minimize the history threat. On the other hand, sometimes
the teachers of both groups could not come to the class due to illness, seminar attendance,
etc., but this happened randomly. As was the case for all teachers, when they came to the
class they made the necessary changes in order to catch up with the curriculum. In this case,
the researcher applied the post-tests after the unit was completely finished, or applied the
pre-tests before the unit was started or just started. Moreover, one of the teachers from the
control group was transferred to another school a new teacher started to teach the class, but
this occurred during the third unit when there was no treatment.
7. This study was conducted for one and a half semester, and the subjects of the study were
grade 6 students who were in the period of puberty. Because of the length and subjects’
characteristics, maturation could be thought to be in effect. But the inclusion of the control
group as a comparison, maturation threat was tried to be controlled.
8. The students, who participated to the study, were from diverse schools. The students in the
experimental group were attending the same school, whereas the students in the control
group were attending to 6 different schools. Therefore there was no interaction between the
groups to cause “attitude of subjects” threat or Hawthorne effect.
9. This study was conducted with the 6th grade students, who were attending to the public
elementary schools in Ankara city, Turkey. In Turkey all school children are instructed with
the same curriculum regardless of their academic ability, and there is no track. Therefore, the

114
students, who participated to this study, had similar educational background. Although
tracking is not a case for Turkish schools, some of the schools may have already constructed
a special class for their high achieving students. For none of the schools in the study, it is
known that there was such a grouping. On the other hand, the use of intact classes and
presence of a control group lessen regression threat.
10. This study aimed to investigate the effect of teacher-guided inquiry on some academic
outcomes, such as achievement; therefore required implementation of a treatment, in this
case two. The treatments were administered to the experimental group by two science and
technology teachers, and the researcher. There were 5 intact classes in the experimental
group. The first teacher was instructing two classes, whereas the second had three classes to
instruct. In order to minimize implementation threat, which would have resulted from the
characteristics of these teachers, the researcher instructed both teachers on teacher-guided
inquiry by first explaining the research aim, and guided (teacher directed) inquiry, and then
giving the lesson plans and activity sheets to them before the class. The researcher also
helped the teachers during their implementation of the method by serving as a model or co-
teacher. Sometimes the researcher just set and observed the class. On the other hand, the
teachers in the control group were 6, each with different background. The researcher also
tried to minimize implementation threat, which would have resulted from the characteristics
of these teachers, by observing their lessons. As stated earlier, although all these teachers
differed in their ability to teach, the requirement to use the same curriculum materials
minimized this effect, and also helped the researcher to be sure that implementation threat
was not a problem.
5.2.2 External Validity
The degree to which the results obtained from a study are generalizable to the population
where the sample was drawn, population generalizability; and other settings different from
the one the study was conducted, ecological generalizability, is called external validity
(Fraenkel & Wallen, 2006, p. 104, 106).
5.2.2.1 Population Generalizability
The target population of the study was all 6th grade students attending to the public
elementary schools in Ankara city. The accessible population was those in both Etimesgut
115
and Çankaya districts of Ankara. On the other hand, since the study aimed to propose a
teacher-guided inquiry instruction for our average classes, both purposive and convenient
samplings were used to select the sample as the 6th grade students with middle class socio-
economic status. Therefore the results of the study can be generalizable to the other 6th grade
students having similar characteristics.
5.2.2 Ecological Generalizability
The present study was conducted in 6th grade elementary science and technology classes of
city schools. The student population of the classes was ranging from 10 to 42, with an
average of 31. Moreover each science and technology class was being instructed by a science
and technology teacher with the same science and technology curriculum. The teachers made
use of Teacher Guide Book generally, whereas the students used both the textbook and
workbook. The teachers also used laboratory facilities of their school or made use of their
own materials. The teachers sometimes instructed their students in the school laboratory, or
sometimes borrowed some materials from the laboratory and brought to the classroom. The
results of this study can be generalizable to the other science and technology classes having
the similar settings.
5.3 Conclusions
1. The instruction made a difference on student achievement in Reproduction, Development
and Growth in Living Things unit test (F=3.467; p<.05).
2. The instruction could not make a difference on student achievement in Force and Motion
unit test (F=3.621; p<.05).
3. The instruction made a difference on student performance in science process skills test
(F=10.229; p<.05).
4. The instruction made a difference on students’ attitude scores in self-concept subtest
(F=3.417; p<.05).
5. The instruction made a difference on students’ attitude scores in anxiety subtest (F=5.472;
p<.05).
6. The instruction made a difference on students’ attitude scores in interest subtest (F=6.275;
p<.05).
7. The instruction made a difference on students’ attitude scores in career subtest (F=4.070;
p<.05).

116
8. The instruction made a difference on students’ attitude scores in enjoyment subtest
(F=5.209; p<.05).
9. The instruction made a difference on students’ attitude scores in usefulness subtest
(F=9.396; p<.05).
5.4 Discussions
The present study showed that guided (teacher-directed) inquiry instruction in general is
successful when developing students’ achievement in content knowledge and science
process skills (though there were differences between the experimental and control groups
with respect to their mean pre-, post- and retention- force and motion achievement test
scores, and among them the one between the pre- and post-test was significant, they are not
in the intended directions). These findings are similar to the results of the other studies on
inquiry. In the previous studies, which compared inquiry with traditional instruction, it was
found that the students in the inquiry group developed their science achievement and
reasoning abilities from the pre test to post test more than that the traditional group
(Saunders & Shepardson, as cited in Davison, 2000, p. 28-29). When pre-test scores were
controlled as a covariate, students in inquiry were still more successful on achievement
(Chang & Mao, 1998), especially on higher order thinking skills (Chang & Mao, 1998; Lott,
as cited in Costenson & Lawson, 1986). Moreover, inquiry had a positive effect on science
process skills (Tatar, 2006). Therefore it can be concluded that like inquiry, guided (teacher-
directed) inquiry helps students to understand science concepts and develop this
understanding, which will result with an increase in science achievement (Edelson, Gordin,
& Pea, 1999; Bredderman, as cited in Weinburgh, 2000; Shymansky, Hedges, &
Woodworth, as cited in Weinburgh, 2000). Through including students into authentic
experiences, guided (teacher-directed) inquiry also grows students’ scientific skills (Edelson
et al, 1999). Therefore guided (teacher-directed) inquiry instruction improves both
understanding and inquiry skills of students.
On the other hand, this study showed that guided (teacher-directed) inquiry instruction is
effective when developing students’ science process skills. These finding is contrary to the
previous finding that teacher-directed inquiry had no effect on science process skills and
cognitive development of the students at grade 9 and 10 (Germann, as cited in Myers, 2004).
This success can be attributable to the appropriateness of the guided (teacher-directed)
inquiry instruction to the cognitive level of the 6th grade students in this study. When the

117
instruction fits the cognitive level of the students, they can understand the inquiry task and
improve their science process skills. As Aho et al. (1993) found in their studies with grade 2
and 4 students, guided inquiry instruction although increased both grade students’
understanding of science concepts from pre test to post test, this increase was significant at
grade 4. In other words, students’ understanding of concepts is affected by their cognitive
level. Moreover both grade students proposed similar methodology to how to study the
problems. However students’ answers to the inference questions, i.e. “Why the plant, which
cut into two and each part has put into water with different colour, has dyed these colours?”
were showed second graders’ inability to describe the phenomena.
When the results of the presents study is evaluated in terms of the instructional models used
in the guided inquiry treatment applied, the use of learning cycle helped the students in the
experimental group to develop their understanding of science concepts and science process
skills as suggested by Matyas (2000). The improvement in the science understanding can be
attributable to the emergence of students’ prior knowledge about the phenomenon, which
might created a cognitive conflict for the student who holds that framework, and they could
generate alternative ideas and apply these ideas into the problem during engagement and
exploration steps (Lawson, 1995, p. 136). Moreover, since the naming and introducing the
concept took place after the students explored the patterns in the data (Lawson, 1995, p.
136), the students constructed their own understandings of the concept and made a link
between what they explored and what the term given to them meaned. After this stage, the
students were asked to relate the new concepts to new situations (Lawson, 1995, p. 137),
which provided both the transfer of learning and evaluating their own knowledge, thus better
refinement of students’ own understanding. The studies by Çavaş (2004) and Doğru Atay
(2006) showed that learning cycle is effective in developing students’ understanding of
various subjects (flowing electricity and genetics). Contrary to the results of Küçükyılmaz
(2003) regarding the effect of three-stage learning cycle on durability (retention) of some
science concepts, the guided (teacher-directed) inquiry instruction in the present study failed
to give evidence to the durability of the concepts. On the other hand, guided discovery
instruction required active involvement of students into learning process, and as a result the
students improved their understanding and transfered it to new situations (Aktamış et al,
2002). The use of worksheets during discovery activites provided a guide for the students in
their explorations with concrete materials to understand concepts better and make
generalizations (Aktamış et al., 2002).
118
This study also showed that guided (teacher-directed) inquiry instruction is successful when
developing students’ attitudes toward science and technology course. This finding is similar
to the results of the other studies on inquiry (Shymansky, Kyle, & Alport, as cited in Chang
& Mao, 1999; Tatar, 2006). When the results of the presents study is evaluated from the
instructional models point of view, similar to the studies of Çavaş (2004) and Doğru Atay
(2006) learning cycle has an effect on developing attitudes toward science. It can be said that
the significant improvement on the attitudes can be attributable to the ability of the activities
to consider students’ prior knowledge and experiences, and provide a positive environment
to them, get students’ interest and develop positive attitudes toward science and technology
course (Çavaş, 2004). On the other hand, although the previous studies with guided
discovery failed to show a difference from pre test to post treatment due to the short duration
of the treatment (Ünal & Ergin, 2006), this stuıdy could show the effect of guided discovery
instruction on students’ attitudes toward science and technology course. The length of the
present study could make a difference in finding a transformation in the attitudes.
One of the best things in this study was the use of subtests of attitudes toward science and
technology course. The previous studies took attitudes toward science as a whole measure.
The present “Attitudes toward Science and Technology Course Questionnaire” was
developed by the researcher and supervisor for this study specifically. The assessment of
students’ performances on these subtests could help the researcher to explain the effect of the
instruction on these attitudes separately. When the attitudes are considered individually, it
can be said that:
1. Though the guided (teacher-directed) inquiry had a positive effect on the experimental
group students’ self-concept scores, the one on force and motion unit was significant on
developing students’ self-concept. It should be kept in mind that instruction could not make
an effect on students’ achievement in force and motion.
2. Although the guided (teacher-directed) inquiry had a negative effect on the experimental
group students’ anxiety scores and caused a decrease on them, this decrease was not much as
did the traditional instruction on the control group students.
3. The guided (teacher-directed) inquiry positively affected students’ interest scores for two
units.
119
4. The guided (teacher-directed) inquiry had a positive effect on the experimental group
students’ career scores.
5. Though the guided (teacher-directed) inquiry increased students’ enjoyment scores, the
significant differences between the scores were found during the implementation of force
and motion unit and during the retention.
6. The guided (teacher-directed) inquiry positively affected students’ usefulness scores
during the units it was implemented.
As the above studies suggest, there is a relation between science process skills and
instruction, science achievement, and attitudes. The existence of this relationship was also
supported by Aydoğdu (2006) for Turkish context. Moreover Doğru Atay’s study (2006)
also showed the predictability of students’ achievement in science with their attitudes toward
science. The stepwise multiple regression analyses in her study showed that attitudes toward
science are the main predictor of achievement in genetics regardless of the treatment used. If
we take a science curriculum as the base instruction, we can evaluate the effectiveness of
that curriculum. In a study by Başdağ (2006), who compared our new curriculum with the
old one, found that 2004 science curriculum were significantly more successful than the
2000 science curriculum on total and the following science process skills: observation,
inference, prediction, measuring, recording data, defining operationally, and hypothesizing.
5.5 Implications
It is suggested that since students’ cognitive level is important for their understanding of
science concepts, therefore there should be concrete activities so that students understand
abstract concepts; students’ should get help from teacher during inquiry when they are
inexperienced in inquiry; and teachers should use appropriate materials in science classes in
order to avoid teacher-oriented instruction. The use of familiar materials and equipment from
the environment also provide an opportunity for science courses when considering the
scarcity of laboratory equipments. The employment of these materials works well and
motivates students to plan different ways to complete experiments (Aho et al., 1993).

120
Teachers attend both the processes of science and the reorganization of content based on the
curriculum. Therefore teacher training and in-service training should be given importance
(Aho et al., 1993).
It is expected that this research has a high “research utilisation”, the extent to be applicable
in the classes (Kempa, 2002), especially elementary science and technology classes in
Turkey.
5.6 Recommendations for Future Research
There are several suggestions for future studies in the same topic. Firstly this study should be
replicated by other researchers in other settings, for example in a village school; other grade
levels; other subjects within the same discipline for example Systems in Our Body unit of
biology, or Light and Sound unit of physics or in the other disciplines, for example chemistry
or earth science; and schools with low or high socio-economic status.

121
REFERENCES
Afacan, Ö., & Nuhoğlu, H. (2007, April). TIMSS-R projesi: Canlı bilimi ile ilgili soruların
fen öğretimi açısından değerlendirilmesi. Paper presented in VI. Ulusal Sınıf Öğretmenliği
Eğitimi Sempozyumu [The 6th National Classroom Education Symposium], Anadolu
University, Eskişehir. http://w3.gazi.edu.tr/web/okocabas/yayinlar/anadoluposter.doc, last
accessed date: 11 June, 2008.
Aho, L., Huopio, J., & Huttunen, S. (1993). Learning science by practical work in Finnish
primary schools using materials familiar from the environment: a pilot study. International
Journal of Science Education, 15(5), 497-507.
Akşit, N. (2007). Educational reform in Turkey. International Journal of Educational
Development, 27, 129-137.
Aktamış, H., Ergin, Ö., & Akpınar, E. (2002, September). Yapısalcı kurama örnek bir
uygulama. Paper presented in V. Ulusal Fen ve Matematik Eğitimi Kongresi [The 5th
National Science and Mathematics Education Congress], Middle East Technical University,
Ankara. http://www.fedu.metu.edu.tr/UFBMEK-5/b_kitabi/PDF/Fen/Bildiri/t58d.pdf, last
accessed date: 19 June, 2008.
Ashton, K. R. (2001). The public image of psychologists: Development and validation of an
attitudes toward psychologists scale (Doctoral Dissertation, Ohio State University, 2001).
(UMI No. 3059195)
Aydınlı, E. (2007). İlköğretim 6, 7 ve 8. sınıf öğrencilerinin bilimsel süreç becerilerine
ilişkin performanslarının değerlendirilmesi [Evaluation of science process skill study on the
6, 7 and 8. grade students]. Unpublished master’s thesis, Gazi University, Ankara.
http://www.acikarsiv.gazi.edu.tr/dosya/emek_aydinli__tez.pdf, last accessed date: 19 June,
2008.

122
Aydoğdu, B. (2006). İlköğretim fen ve teknoloji dersinde bilimsel süreç becerilerini
etkileyen değişkenlerin belirlenmesi [Identification of variables effecting science process
skills in primary science and technology course]. Unpublished master’s thesis, Dokuz Eylül
University, İzmir.
Başdağ, G. (2006). 2000 yılı fen bilgisi dersi ve 2004 yılı fen ve teknoloji dersi öğretim
programlarının bilimsel süreç becerileri yönünden karşılaştırılması [The comparison of the
2004 science and technology curriculum with the 2000 science curriculum in their effects on
developing the students’ scientific process skills]. Unpublished master’s thesis, Gazi
University, Ankara.
Başdaş, E. (2007). İlkögretim fen eğitiminde, basit malzemelerle yapılan fen aktivitelerinin
bilimsel süreç becerilerine, akademik başarıya ve motivasyona etkisi [The effect of hands-on
science learning method in the education of science in primary school on the science process
skills, academic achievement and motivation]. Unpublished master’s thesis Celal Bayar
University, Manisa.
Berberoğlu, G. (2004). Personal Communication. December 17, 2004
Berberoğlu, G. (2008). Uluslararası Durum Belirleme Çalışmaları Kapsamında Türkiye’nin
Dikkate Alması Gereken Sonuçlar.
http://siteresources.worldbank.org/INTTURKEY/Resources/361616-
1142415001082/Giray_Berberoglu_TR.pdf, last accessed date: 27 May, 2008.
Berry, A., Gunstone, R., & Loughran, J. (2007). Using laboratory work to teach about the
practice of science. http://www.ipn.uni-kiel.de/projekte/esera/book/007-ber.pdf, last
accessed date: 11 June, 2007.
Black, K. (2003). Science in the trenches: An exploration of four pre-service teacher’s first
attempts at teaching science in the classroom. Paper presented at the Annual Meeting of the
Association for the Education of Teachers of Science (St. Louis, MO, January 30-February,
2003). (ERIC Document Reproduction Service No. ED472953)
http://eric.ed.gov/ERICDocs/data/ericdocs2sql/content_storage_01/0000019b/80/1a/c1/8a.pd
f, last accessed date: 11 June, 2007.

123
Board of Agriculture (1998). Agriculture’s role in K-12 education: Proceedings from a
forum on the national science education standards. National Academy of Sciences –
National Research Council, Washington, DC. (ERIC Document Reproduction Service No.
ED425933)
http://eric.ed.gov/ERICDocs/data/ericdocs2sql/content_storage_01/0000019b/80/17/27/02.p
df, last accessed date: 11 June, 2007.
Bybee, R. W. (2007). Science teaching and international assessments. Science Teacher,
74(8), 41-48.
Bybee, R. W., Carlson Powell, J., & Trowbridge, L. W. (2008). Teaching Secondary School
Science: Strategies for Developing Scientific Literacy (9th ed.). Colombus, Ohio: Pearson
Education, Inc., Upper Saddle Pearson Prentice Hall.
Carin, .A. A., Bass, J. E., & Contant, T. L. (2005). Methods for teaching science as inquiry
(9th ed.). New Jersey: Pearson/Merrill Prentice Hall, Upper Saddle River.
Cavalcante, P. C., Newton, L. D., & Newton, D. P. (1993). Primary science teaching-facts
or procedures? Do different teaching approaches influence children's learning?
http://www.leeds.ac.uk/educol/documents/000000056.doc, last accessed date: 27 May, 2008.
Ceylan, E., & Berberoğlu, G. (2007). Öğrencilerin fen başarısını açıklayan etmenler: Bir
modelleme çalışması [Factors related with students’ science achievement: A modelling
study]. Eğitim ve Bilim, 32(144), 36-48.
Chang, C-Y., & Mao, S-L. (1998, April). The effects of an inquiry-based instructional
method on earth science students’ achievement. Paper presented at the annual meeting of the
National Association for Research in Science Teaching, San Diego, CA. (ERIC Document
Reproduction Service No. ED418858)
Chin, C., & Kayalvizhi, G. (2002). Posing problems for open investigations: What questions
do pupils ask? Research in Science & Technological Education, 20(2), 269-287.
Costenson, K., & Lawson A. E. Why isn't inquiry used in more classrooms? The American
Biology Teacher, 48(3), 150-158.

124
Çankaya MEM (2007).
http://cankaya.meb.gov.tr/index.asp?frame=&part=0&page=okullar/resmi.htm, last accessed
date: 7 January, 2007.
Çavaş, P. H. (2004). İlköğretim fen bilgisi dersinde yer alan yaşamımızı yönlendiren elektrik
ünitesinin öğrenme döngüsüne göre işlenmesi [Teaching the unit “electricity which directs
our life” in the scence lessons of primary school within the approach of learning cycle].
Unpublished master’s thesis, Ege University, İzmir.
Dede, Y., & Yaman, S. (2006). İlköğretim öğrencilerinin fen ve teknoloji ile matematik
dersini öğrenme tercihleri [Science and mathematics learning preferences primary school
students]. International Journal of Environmental and Science Education,1(2), 172-180.
http://www.ijese.com/Dede.pdf, last accessed date: 4 June, 2008.
Demir, M. (2007). Sınıf öğretmeni adaylarının bilimsel süreç becerileriyle ilgili yeterliklerini
etkileyen faktörlerin belirlenmesi [The factors affecting the pre-service primary teachers’
adequacies on science process skills]. Unpublished doctoral dissertation, Gazi University,
Ankara. http://www.acikarsiv.gazi.edu.tr/dosya/metin_demir_tez.pdf, last accessed date: 19
June, 2008.
Demirbaş, M., & Yağbasan, R. (2005, September). İlköğretim öğrencilerinin fen bilgisi
dersindeki bilimsel tutumlarının belirlenmesi ve geliştirilmesine yönelik öneriler. Paper
presented in XIV. Ulusal Eğitim Bilimleri Kongresi [The 14th National Educational Sciences
Congress], Pamukkale University, Denizli.
Demirci Güler, M. P., & Laçin Şimşek, C. (2007, April). 2005 Fen ve Teknoloji Öğretim
Programına Yönelik Öğretmen Görüşleri. Paper presented in VI. Ulusal Sınıf Öğretmenliği
Eğitimi Sempozyumu [The 6th National Classroom Education Symposium], Anadolu
University, Eskişehir.
Dhindsa, H. S., & Chung, G. (2003). Attitudes and achievement of Bruneian science
students. International Journal of Science Education, 25(8), 907-922.

125
Doğru Atay, P. (2006). Relative influence of cognitive and motivational variables on genetic
concepts in traditional and learning cycle classrooms. Unpublished doctoral dissertation,
Middle East Technical University, Ankara.
Dökme, İ. (2004a, September). Milli Eğitim Bakanlığı (MEB) ilköğretim 4. sınıf fen bilgisi
ders kitabının temel bilimsel süreç becerileri yönünden değerlendirilmesi. Paper presented in
VI. Ulusal Fen ve Matematik Eğitimi Kongresi [The 6th National Science and Mathematics
Education Congress], Marmara University, İstanbul.
Dökme, İ. (2004b, September). Milli Eğitim Bakanlığı (MEB) ilköğretim 7. sınıf fen bilgisi
ders kitabının bilimsel süreç becerileri yönünden değerlendirilmesi. Paper presented in XIII.
Ulusal Eğitim Bilimleri Kurultayı [The 13th National Educational Sciences Congress], İnönü
University, Malatya.
Dökme, İ., & Ozansoy, Ü. (2004, September). Fen öğretiminde bilimsel iletişim kurabilme
becerisi [Communicating in science education]. Paper presented in XIII. Ulusal Eğitim
Bilimleri Kurultayı [The 13th National Educational Sciences Congress], İnönü University,
Malatya.
Durmaz, H., & Özyıldırım, H. (2005). İlköğretim birinci kademe öğrencilerinin fen bilgisi
ders ve fen bilimlerine ilişkin tutumlarının incelenmesi [An investigation on the elementary
school students’ attitudes toward science course and science]. Çağdaş Eğitim, 30(323), 25-
31.
EARGED (1995). Eğitimi Araştırma ve Geliştirme Dairesinin Durum Tesbiti Faaliyetleri ve
Fen Bilgisi Durum Tesbiti Sonuçları.
EARGED (2003). PIRLS 2001 Uluslar Arası Okuma Becerilerinde Gelişim Projesi ulusal
rapor [PIRLS Progress in International Reading Literacy Study] T. C. Milli Eğitim
Bakanlığı, Eğitimi Araştırma ve Geliştirme Dairesi Başkanlığı [Republic of Turkey, Ministry
of National Education, Directorate of Educational Research and Development].
http://earged.meb.gov.tr/htmlsayfalar/birimlerimiz/olcmedeg/dokuman/PIRLSulusrap.rar,
last accessed date: 28 May, 2008.

126
EARGED (2005). OECD PISA-2003 araştırmasının Türkiye ile ilgili sonuçları PISA 2003
projesi ulusal nihai rapor [The results of OECD PISA-2003 study related to Turkey PISA
2003 project national Final Report]. T. C. Milli Eğitim Bakanlığı, Eğitimi Araştırma ve
Geliştirme Dairesi Başkanlığı [Republic of Turkey, Ministry of National Education,
Directorate of Educational Research and Development].
http://earged.meb.gov.tr/pisa/dokuman/2003/rapor/PISA_RAPOR_2003.pdf, last accessed
date: 28 May, 2008.
Edelson, D. C., Gordin, D. N., & Pea, R. D. (1999). Addressing the challenges of inquiry-
based learning though technology and curriculum design. The Journal of the Learning
Sciences, 8(2-3), 391-450.
Etimesgut MEM. (2007). http://etimesgut.meb.gov.tr/egitim_kurumlari.html, last accessed
date: 7 January, 2007.
Field, A. (2005). Discovering statistics using SPSS (2nd ed.). London: SAGE.
Field, A. (2008). A bluffer’s guide to ... sphericity. BPS-MSC Newsletter, 6(1), 13–24.
Retrieved June 10, 2008 from http://www.statisticshell.com/sphericity.pdf
Fraenkel, J. R., & Wallen, N. E. (2005). How to Design and Evaluate Research in Education
(6th ed.). Milan: McGraw-Hill.
Gençtürk, H. A., & Türkmen, L. (2007). İlköğretim 4. sınıf fen bilgisi dersinde sorgulama
yöntemi ve etkinliği üzerine bir çalışma [A study of effectiveness and application of inquiry
method in a 4th grade science course]. GÜ, Gazi Eğitim Fakültesi Dergisi, 27(1), 277-292.
http://www.gefad.gazi.edu.tr//window/dosyapdf/2007/1/2007-1-277-292-17-
haticeahugenctcrkvelctfullahtcrkmen.pdf, last accessed date: 10 June, 2008.
George, D., & Malllery, P. (2003). SPSS for windows step by step: A simple guide and
reference 11.0 update (4th ed.). Munich: Allyn & Bacon.
Germann, P. J., Haskins, S., & Auls, S. (1996). Analysis of nine high school biology
laboratory manuals: Promoting scientific inquiry. Journal of Research in Science Teaching,
33(5), 475-499.

127
Gündem. (2007). A’dan Z’ye 8 yıl. Kamuran Zeren Ankara. 24 Temmuz 1997.
http://webarsiv.hurriyet.com.tr/1997/07/24/2307.asp, last accessed date: 7 January, 2007.
Hale, R. (2008). Two sample tests.
http://espse.educ.psu.edu/edpsych/faculty/rhale/statistics/Chapters/Chapter10/Chap10.html,
last accessed date: 10 June, 2008
Hall, D. A., & McCurdy, D. W. (1990). A comparison of a Biological Sciences Curriculum
Study (BSCS) laboratory and a traditional laboratory on student achievement at two private
liberal arts colleges. Journal of Research in Science Teaching, 27(7), 625-636.
Hargreaves, J., & Hargreaves, T. (1983). Some models of school science in British
curriculum projects, and their implications for STS teaching at the secondary school level.
Social Studies of Science, 13(4), 569-604. http://links.jstor.org/sici?sici=0306-
3127%28198311%2913%3A4%3C569%3ASMOSSI%3E2.0.CO%3B2-B, last accessed
date: 5 March, 2005.
Harrington Lindberg, D. (1990). What goes ‘round comes ‘round doing science. Childhood
Education, 67(2), 79-81.
Harris, S. (1997, September). The Third International Mathematics and Science Study
(TIMSS) summary of national results. Paper presented at the British Educational Research
Association Annual Conference, University of York.
http://www.leeds.ac.uk/educol/documents/000000464.doc, last accessed date: 27 May, 2008.
Henson, K. T. (1986). Inquiry learning: A new look. Contemporary Education. 57(4), 181-
183.
Højsgaard, S., & Jørgensen, E. (2001). Repeated measurements.
http://www.cc.jyu.fi/~aphalo/YMP235/failsYMP235_8a.pdf, last accessed date: 5 March,
2005.
Izard, J. F. (1991). Assessment of learning in the classroom. Geelong, Victoria: Deakin
University Press.
128
Johnston, J. (1997). Measuring attitudes in science: What exactly are we measuring and
why? Paper presented at the annual conference of the British Educational Research
Association (BERA) Department of Primary Education, the Nottingham Trent University.
http://www.leeds.ac.uk/educol/documents/000000318.htm, last accessed date: 28 May, 2008.
Kalender, İ., & Berberoğlu, G. (2008). An assessment of factors related to science
achievement of Turkish students. International Journal of Science Education, 1–16.
Karahan, Z. (2006). Fen ve teknoloji dersinde bilimsel süreç becerilerine dayalı öğrenme
yaklaşımının öğrenme ürünlerine etkisi [Within the science and technology lesson, the effects
of scientific process skills based learning on learning products]. Unpublished master’s
thesis, Celal Bayar University, Manisa.
Keser, Ö. F. (2005). Recommendations towards developing educational standards to improve
science education in Turkey. The Turkish Online Journal of Educational Technology, 4(1),
46-53. http://www.tojet.net/volumes/v4i1.pdf, last accessed date: 27 May, 2008.
Kesercioğlu, T., Türkoğuz, S., & İşçier, E. (2005, September). Fen bilgisi eğitiminin
ilköğretimin 8. sınıflarının eğitsel ve mesleki yönlendirilmelerine olan etkisi. Paper presented
in XIV. Ulusal Eğitim Bilimleri Kongresi [The 14th National Educational Sciences
Congress], Pamukkale University, Denizli.
Köksal, E. A. (2002). The assessment of the biology items in the 1998-2001 secondary
school institutions student selection and placement tests. Unpublished master’s thesis,
Middle East Technical University, Ankara.
Kubiszyn, T., & Borich, G. (2007). Educational testing and measurement: Classroom
application and practice (8th ed.). Hoboken, New Jersey: John Wiley & Sons, Inc.
Kutlu, Ö., & Karakaya, İ. (2004, September). Orta öğretim kurumları öğrenci seçme ve
yerleştirme sınavının (OKÖSYS) faktör yapılarına ilişkin bir araştırma. Paper presented in
XIII. Ulusal Eğitim Bilimleri Kurultayı [The 13th National Educational Sciences Congress],
İnönü University, Malatya.

129
Küçükyılmaz, E. A. (2003). Fen bilgisi dersinde öğrenme halkası yaklaşımının öğrencilerin
akademik başarılarına ve hatırlama düzeylerine etkisi [The effect of learning cycle approach
on students’ academic achievement and recall level in science classes]. Unpublished
doctoral dissertation, Anadolu University, Eskişehir.
Lawson, A. E. (1995). Science teaching and the development of thinking. Belmont,
California: Wadsworth Publishing Company.
Lawson, A. E., Rissing, S. W., and Faeth, S. H. (1990). An inquiry approach to nonmajors
biology. Journal of College Science Teaching, 19(6), 340-346.
Lee, H-S. & Butler, Songer, N. (2003). Making authentic science accessible to students.
International Journal of Science Education 25(8), 923–948.
Llewllyn, D. (2005). Teaching high school science through inquiry: A case study approach.
Thousand Oaks, California: Corwin Press & National Science Teachers Press (A Joint
Publication).
Llyod, C. V., & Contreras, N. J. (1985, December). The role of experience in learning
science vocabulary. Paper presented at the annual meeting of the National Reading
Conference, San Diego, CA. (ERIC Document Reproduction Service No. ED281189)
Marx, J. G., Honeycutt, K. A., Rahmati Clayton, S., & Moreno, N. P. (2006). The Elizabeth
Towns incident: An inquiry-based approach to learning anatomy developed through high
school-university collaboration. The American Bıology Teacher, 68(3), 140-147.
Marzano, R. J., Pickering, D., & McTighe, J. (1993). Assessing student outcomes.
performance assessment using the dimensions of learning model. Alexandria, Virginia:
Association for Supervision and Curriculum Development.
Matyas, M. L. (2000). Teaching and learning by inquiry. The American Physiological
Society. http://www.the-aps.org/education/2005rts_Archive/doc/Inquiry%20Article.doc, last
accessed date: 26 May, 2008.

130
McGaw, B. (2006). Improving the effectiveness, efficiency and equity of education. In C.
Hughes (Ed.), Secondary education at the crossroads.
http://www.springerlink.com/content/v127588633568028/fulltext.pdf, last accessed date: 28
May, 2008.
MEB (2005). İktisadi İşbirliği ve Gelişme Teşkilatı (OECD) Türkiye temel eğitim politikası
incelemesi ön rapor [The Organisation for Economic Co-operation and Development
(OECD) Turkey primary education policy evaluation pre report]. T. C. Milli Eğitim
Bakanlığı [Republic of Turkey Ministry of National Education].
http://digm.meb.gov.tr/uaorgutler/OECD/OECD_onrapor_TRMart06.pdf, last accessed date:
28 May, 2008.
MEB (2008). T. C. Milli Eğitim Bakanlığı, Eğitimi Araştırma ve Geliştirme Dairesi
Başkanlığı [Republic of Turkey, Ministry of National Education, Directorate of Educational
Research and Development]. http://www.designtrain-
ldv.com/activitie1/presentationofministryofnationaleducation.ppt, last accessed date: 28
May, 2008.
Mecit, Ö. (2006). The effect of 7e learning cycle model on the improvement of fifth grade
students’ critical thinking skills. Unpublished doctoral dissertation, Middle East Technical
University, Ankara.
Ministry of Education Malaysia. (2003). Integrated curriculum for secondary schools.
curriculum specifications science form 3. Curriculum Development Centre.
http://myschoolnet.ppk.kpm.my/sp_hsp/sains/kbsm/hsp_sn_f3a.pdf, last accessed date: 18
June, 2008.
Monaghan, C. (1995). Science teaching methods in relationship to student knowledge and
attitude. (Unpublished master’s thesis, the Texas Woman’s University, 1995). (UMI No.
1375859)
Montgomery, J. I. (1969). A comparison of BSCS versus traditional teaching methods by
testing student achievement and retention of biology concepts. (ERIC Document
Reproduction Service No. ED033866)

131
Moore, J. M. (2001). The effects of inquiry-based summer enrichment activities on rising
eight graders’ knowledge of science processes, attitude toward science, and perceptions of
scientists. (Unpublished doctoral dissertation, University of Mississippi, Oxford, 2001).
(UMI No. 3011938)
Morrison, J. A., & Estes, J. C. (2007). Using scientists and real-world scenarios in
professional development for middle school science teachers. Journal of Science Teacher
Education, 18(2), 165–184.
Myers, B. E. (2004). Effects of investigative laboratory integration on student content
knowledge and science process skill achievement across learning styles. Dissertation
Abstracts International, 65(06), 2061A. (UMI No. 3128779)
Myers, B. E., Washburn, S. G., & Dyer, J. E. (2004). Assessing agriculture teachers’
capacity for teaching science integrated process skills. Journal of Southern Agricultural
Education Research 54(1), 74–85. http://pubs.aged.tamu.edu/jsaer/pdf/Vol54/54-01-074.pdf,
last accessed date: 19 June, 2008.
Narode, R., Heiman, M., Lochead, J., & Slomianko, J. (1987). Teaching thinking skills:
science. (ERIC Document Reproduction Service No. ED320755)
National Research Council (2000). Inquiry and national science education standards: A
guide for teaching and learning. Centre for Science, Mathematics, and Engineering
Education, National Research Council. Washington, D.C.: National Academy Press.
Nitko, A. J., & Brookhart, S. M. (2007). Educational assessment of students (5th ed.). Upper
Saddle River, New Jersey: Pearson/Merrill Prentice Hall.
Osborne, J., Simon, S., and Collins, S. (2003). Attitudes towards science: a review of the
literature and its implications. International Journal of Science Education, 25(9), 1049 –
1079. http://dx.doi.org/10.1080/0950069032000032199, last accessed date: 5 January, 2008.
Shepardson, D. P. (2002). Bugs, butterflies, and spiders: children's understandings about
insects. International Journal of Science Education, 24(6), 627-643.
http://dx.doi.org/10.1080/09500690110074765, last accessed date: 5 January, 2008.

132
Shan, G. B. (2008). Assignment expectations.
http://people.uleth.ca/~g.shan/Format%20of%20Lab%20Reports.htm, last accessed date: 5
May, 2008.
Solano-Flores, G., & Shavelson, R. J. (1997). Development of performance assessments in
science: conceptual, practical, and logistical issues. Educational Measurement: Issues and
Practice, Fall 1997, 16-25.
Staver, J. R. (1986, September). The constructivist epistemology of Jean Piaget: Its
philosophical roots and relevance to science teaching and learning. Paper presented at the
United States-Japan Seminar on Science Education, Honolulu, HI. (ERIC Document
Reproduction Service No. ED278563)
Staver, J. R., & Bay, M. (1986). Analysis of the project synthesis goal cluster orientation and
inquiry emphasis of elementary science textbooks. Journal of Research in Science Teaching,
24(7), 629 – 643.
Stevens, J. (2002). Applied multivariate statistics for the social sciences (4th ed.). London:
Lawrence Erlbaum Associates, Inc.
Tatar, N. (2006). İlköğretim fen eğitiminde araştırmaya dayalı öğrenme yaklaşımının
bilimsel süreç becerilerine, akademik başarıya ve tutuma etkisi [The effect of inquiry-based
learning approaches in the education of science in primary school on the science process
skills, academic achievement and attitude]. Unpublished doctoral dissertation, Gazi
University, Ankara.
Tezbaşaran, A., & Kelecioğlu, H. (2004, September). Madde-ölçek korelasyonlarına, alt-üst
grup ortalamalarına ve aşamalı tepki modeline göre geliştirilen sigaraya ilişkin tutum
ölçeğinin madde ve ölçek özelliklerinin incelenmesi. Paper presented in XIII. Ulusal Eğitim
Bilimleri Kurultayı [The 13th National Educational Sciences Congress], İnönü University,
Malatya.
TIMSS (1999a). TIMSS IEA’s Third International Mathematics and Science Study TIMSS
science items: Released set for population 1 (third and fourth grades).
http://timss.bc.edu/timss1995i/TIMSSPDF/ASitems.pdf, last accessed date: 28 May, 2008.

133
TIMSS (1999b). TIMSS 1999 science items released set for eighth grade.
http://timss.bc.edu/timss1999i/pdf/t99science_items.pdf, last accessed date: 28 May, 2008.
TTKB (2005). İlköğretim fen ve teknoloji dersi öğretim programı ve kılavuzu: 6-7-8. sınıflar
taslak basım. T.C. Milli Eğitim Bakanlığı Talim ve Terbiye Kurulu Başkanlığı. Ankara: Ders
Kitapları Müdürlüğü.
Turgut, M. F., Baker, D., Cunningham, R., & Piburn, M. (1997). İlköğretim fen öğretimi.
Öğretmen Eğitimi Dizisi. Ankara: YÖK/Dünya Bankası Milli Eğitimi Geliştirme Projesi
Hizmet Öncesi Öğretmen Eğitimi.
Turpin, T. J. (2000). A study of the effects of and ıntegrated, activity-based science
curriculum on student achievement, science process skills, and science attitudes.
(Unpublished doctoral dissertation, University of Louisiana at Monroe, 2000). (UMI No.
9993727)
Türkiye İktisat Kongresi (2004). Eğitim ve insangücü çalışma grubu raporları: Çalışma
grubu raporları-IV. http://ekutup.dpt.gov.tr/ekonomi/tik2004/cilt14.pdf, last accessed date:
28 May, 2008.
Ünal, G., & Ergin, Ö. (2006). Buluş yoluyla fen öğretiminin öğrencilerin akademik
başarılarına, öğrenme yaklaşımlarına ve tutumlarına etkisi. Türk Fen Eğitimi Dergisi
[Journal of Turkish Science Education], 3(1), 36–52.
http://www.tused.org/internet/tufed/arsiv/v3/i1/metin/tufedv3i1s3.pdf, last accessed date: 19
July, 2008.
Weinburgh, M. H. (2000). Gender, ethnicity, and grade level as predictors of middle school
students’ attitudes toward science. (ERIC Document Reproduction Service No. ED442662)
Wilder, M., & Shuttleworth, P. (2005). Cell inquiry: A 5E learning cycle lesson. Science
Activities, 41(4), 37-43.

134
APPENDIX A
SCIENCE PROCESS SKILLS FOR GRADES 6-8
Table A.1 Science process skills for grades 6-8
Beceriler Beceriye Yönelik Kazanım Gözlem Nesneleri (cisim, varlık) ve olayları duyu organlarını veya gözlem araç gereçlerini kullanarak
gözlemler. Bir cismin şekil, renk, büyüklük ve yüzey özellikleri gibi duyusal özelliklerini belirler. Gözlem için uygun ve gerekli araç,gereci seçip bunları beceriyle kullanır.
Karşılaştırma-Sınıflama
Nesneleri sınıflandırmada kullanılacak nitel ve nicel özellikleri belirler. Nesneler veya olaylar arasındaki belirgin benzerlikleri ve farklılıkları saptar. Gözlemlere dayanarak bir veya birden fazla özelliğe göre karşılaştırmalar yapar. Benzerlik ve farklılıklara göre grup ve alt-gruplara ayırma şeklinde sınıflamalar yapar.
Çıkarım Yapma Olmuş olayların sebepleri hakkında gözlemlere dayanarak açıklamalar yapar. Tahmin Gözlem, çıkarım veya deneylere dayanarak geleceğe yönelik olası sonuçlar hakkında fikir öne
sürer. Kestirme Olay ve nesnelere yönelik kütle, uzunluk, zaman, sıcaklık ve adet gibi nicelikler için uygun
birimleri de belirterek yaklaşık değerler hakkında fikirler öne sürer. Değişkenleri Belirleme
Verilen bir olay veya ilişkide en belirgin bir veya birkaç değişkeni belirler. Verilen bir olaydaki bağımlı değişkeni belirler. Verilen bir olaydaki bağımsız değişkeni belirler. Verilen bir olaydaki kontrol edilen değişkenleri belirler.
Hipotez Kurma Verilen bir olaydaki bağımsız değişkenin bağımlı değişken üzerindeki etkisini denenebilir bir önerme şeklinde ifade eder.
Deney Tasarlama Kurduğu hipotezi sınamaya yönelik bir deney önerir. Deney Malzemelerini, Araç ve Gereçlerini Tanıma ve Kullanma
Basit araştırmalarda gerekli malzeme, araç ve gereçleri seçerek emniyetli ve etkin bir şekilde kullanır.
Deney Düzeneği Kurma
Verilen malzemeleri kullanarak kurduğu hipotezi sınamaya yönelik tasarladığı deneyi gerçekleştireceği bir düzenek kurar.
Değişkenleri Kontrol Etme ve Değiştirme
Hipotezle ilgili olan değişkenlerin dışındaki değişkenleri sabit tutar. Bağımsız değişkeni değiştirerek bağımlı değişken üzerindeki etkisini belirler.
İşlevsel Tanımlama Değişkenlerin birden fazla anlama gelebileceği, sınırları tam çizilmemiş durumlarda araştırmanın amacına (hipotez) uygun değişkenleri kesin olarak ve ölçme kriteri ile birlikte tanımlar.
Ölçme Cetvel, termometre, tartı aleti ve zaman ölçer gibi ölçme araçlarını tanır. Büyüklükleri,uygun ölçme araçları kullanarak belirler. Büyüklükleri, birimleri ile ifade eder.
Bilgi ve Veri Toplama
Değişik kaynaklardan yararlanarak bilgi (çevrede, sınıfta gözlem ve deney yaparak, fotoğraf, kitap, harita veya bilgi ve iletişim teknolojilerini kullanarak) toplar. Kurduğu hipotezi sınamaya yönelik nitel veya nicel veriler toplar.
Verileri Kaydetme Gözlem ve ölçüm sonucunda elde edilen araştırmanın amacına uygun verileri yazılı ifade, resim, tablo ve çizim gibi çeşitli yöntemlerle kaydeder.
Veri İşleme ve Model Oluşturma
Deney ve gözlemlerden elde edilen verileri derleyip işleyerek gözlem sıklığı dağılımı, çubuk grafik, tablo ve fiziksel modeller gibi farklı formlarda gösterir. Grafik çizmeyle ilgili kuralları uygular.
Yorumlama ve Sonuç Çıkarma
İşlenen verileri ve oluşturulan modeli yorumlar. Elde edilen bulgulardan desen ve ilişkilere ulaşır.
Sunma Gözlem ve araştırmaları ve elde ettikleri sonuçları sözlü, yazılı ve/veya görsel malzeme kullanarak uygun şekillerde sunar ve paylaşır.
Note: From Tablo-2.2 6, 7 ve 8. Sınıf Düzeyleri İçin “Bilimsel Süreç Beceri” Kazanımları (TTKB, 2005).
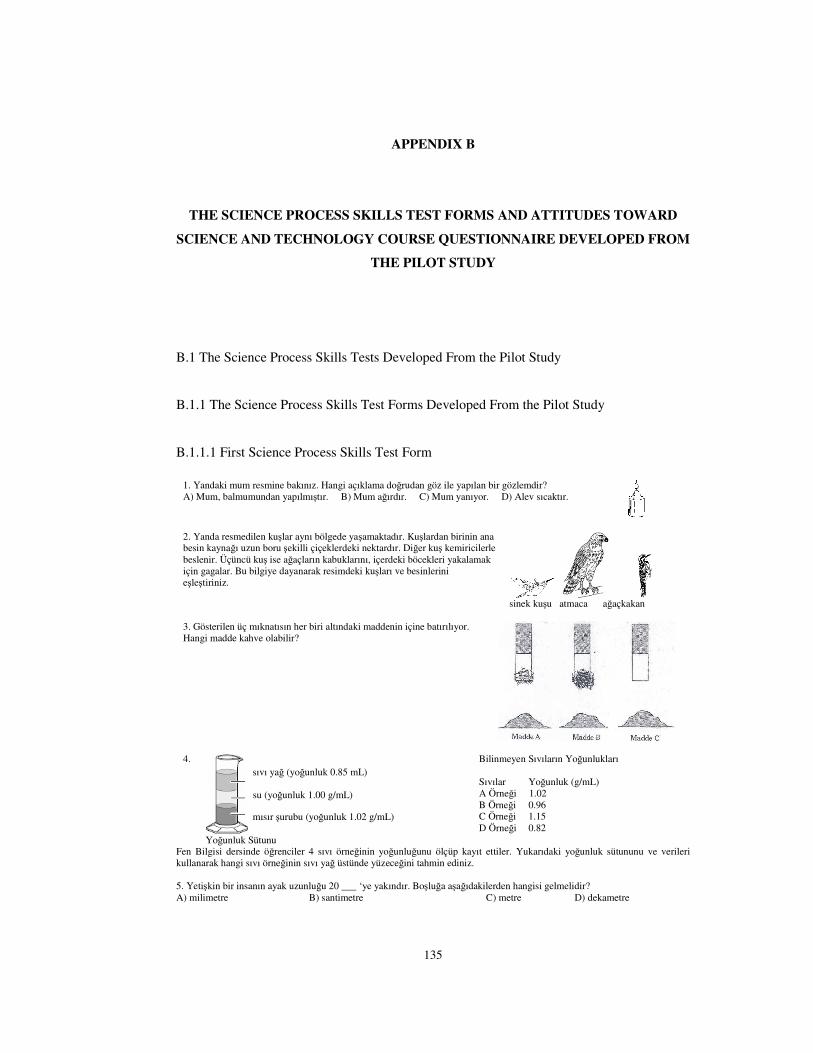
135
APPENDIX B
THE SCIENCE PROCESS SKILLS TEST FORMS AND ATTITUDES TOWARD
SCIENCE AND TECHNOLOGY COURSE QUESTIONNAIRE DEVELOPED FROM
THE PILOT STUDY
B.1 The Science Process Skills Tests Developed From the Pilot Study
B.1.1 The Science Process Skills Test Forms Developed From the Pilot Study
B.1.1.1 First Science Process Skills Test Form
1. Yandaki mum resmine bakınız. Hangi açıklama doğrudan göz ile yapılan bir gözlemdir? A) Mum, balmumundan yapılmıştır. B) Mum ağırdır. C) Mum yanıyor. D) Alev sıcaktır.
2. Yanda resmedilen kuşlar aynı bölgede yaşamaktadır. Kuşlardan birinin ana besin kaynağı uzun boru şekilli çiçeklerdeki nektardır. Diğer kuş kemiricilerle beslenir. Üçüncü kuş ise ağaçların kabuklarını, içerdeki böcekleri yakalamak için gagalar. Bu bilgiye dayanarak resimdeki kuşları ve besinlerini eşleştiriniz.
sinek kuşu atmaca ağaçkakan
3. Gösterilen üç mıknatısın her biri altındaki maddenin içine batırılıyor. Hangi madde kahve olabilir?
4.
Yoğunluk Sütunu
Bilinmeyen Sıvıların Yoğunlukları Sıvılar Yoğunluk (g/mL) A Örneği 1.02 B Örneği 0.96 C Örneği 1.15 D Örneği 0.82
Fen Bilgisi dersinde öğrenciler 4 sıvı örneğinin yoğunluğunu ölçüp kayıt ettiler. Yukarıdaki yoğunluk sütununu ve verileri kullanarak hangi sıvı örneğinin sıvı yağ üstünde yüzeceğini tahmin ediniz. 5. Yetişkin bir insanın ayak uzunluğu 20 ___ ‘ye yakındır. Boşluğa aşağıdakilerden hangisi gelmelidir? A) milimetre B) santimetre C) metre D) dekametre
sıvı yağ (yoğunluk 0.85 mL)
su (yoğunluk 1.00 g/mL)
mısır şurubu (yoğunluk 1.02 g/mL)

136
6. Can ve Emel sofra tuzunun bitki gelişmesine etkisini bir deneyle araştırmaktadır. Deneylerinde her gün aynı miktar tuzlu su ile bitkileri sularlar. Can ve Emel deneylerini geliştirmek için aşağıdaki yollardan hangisini izlemelidir? A) Suya eklenen tuz miktarını her gün artırarak. B) Bitkilerin yarısını saf su, yarısını tuzlu su ile sulayarak. C) Tuzun ne kadar hızlı bitkilere geçeceğini görmek için gıda boyası ekleyerek. D) Bitkileri sulamadan önce tuzlu suyu soğutarak.
7. Yandaki resimler Draceana bitkisiyle yapılan bir deney düzeneğini göstermektedir. Deneyin test ettiği hipotez aşağıdakilerden hangisidir? A) Sıcaklık artarsa bitki daha fazla büyür. B) Işık parlaksa bitki daha fazla büyür. C) Saksı genişse bitki daha fazla yaprak oluşturur. D) Bitkilerin hepsi yeşil yapraklara sahiptir.
Parlak ışıkta A bitkisi Loş ışıkta B bitkisi
8. Bilinen Laboratuar Malzemeleri
A. Büyüteç
B. Pil
C. Eldiven
D. Mıknatıs
E. Gözlük
F. Cetvel
G. Mikroskop
H. Damlalık
J. Termometre
K. Kronometre
L. Dereceli silindir
M. Terazi
N. Büret
Ö. Anemometre
P. Prizma
R. Steteskop
S. Erlen
T. İspirto ocağı ve sacayak
U. Teleskop
Z. Fotoğraf makinesi
a. Güvenlik amacıyla kullanılan laboratuar malzemeleri hangileridir? b. Beyaz ışığı renklerine ayırmakta kullanılan laboratuar malzemeleri hangileridir? 9. Ahmet Bey menekşe yetiştirmektedir. Bu menekşelerin altısı kırmızı, altısı beyaz çiçek açmaktadır. Bir arkadaşı ona sabah güneşi aldıklarında menekşelerin daha fazla çiçek açtıklarını söyler. Ahmet Bey sonra şu hipotezi kurar: ‘‘Menekşeler akşam güneşinden ziyade sabah güneşi aldığında daha fazla çiçek açar.’’ Ahmet Bey hipotezini sınamak için aşağıdakilerden hangisini yapmalıdır? A) Menekşelerin hepsini sabah güneşi alan bir yere koyar. Bir ay boyunca her bir menekşenin oluşturduğu çiçekleri sayar. B) Üç beyaz menekşeyi sabah güneşi alan bir yere, üç beyaz menekşeyi ise akşam güneşi alan bir yere koyar. Kırmızı menekşelere bir şey yapmaz. Dört hafta boyunca her bir beyaz menekşenin oluşturduğu çiçek sayısını hesaplar. C) Menekşelerin hepsini dört hafta boyunca sabah güneşi alan bir yere koyar. Bu zaman süresince oluşan çiçeklerin sayısını hesaplar. Sonra tüm bitkilerini dört hafta boyunca akşam güneşi alan bir yere koyar. Bu zaman süresince oluşan çiçeklerin sayısını hesaplar. D) Üç kırmızı ve üç beyaz menekşeyi sabah güneşi alan bir yere, üç kırmızı ve üç beyaz menekşeyi ise akşam güneşi alan bir yere koyar. Dört hafta boyunca her bir bitki tarafından oluşturulan çiçeklerin sayısını hesaplar.

137
10. Bir öğrenci eğik düzlemde sabit hızla çekilen bir cisme uygulanan kuvvet ile eğim açısı arasındaki ilişkiyi göstermek istiyor. Bunun için öğrenci yukarıdaki deney düzeneklerini kuruyor, ancak amacına ulaşamıyor. Bu amaca ulaşabilmek için düzeneklerde hangi değişiklikleri yapıp deneyi nasıl gerçekleştirmelidir, neden?
11. İki ayrı fabrika basketbol topu üretmektedir. Her iki fabrika da en yükseğe sıçrayan topu kendisinin ürettiğini avunmaktadır. Hangi fabrikanın ürettiği basketbol topunun en yükseğe sıçradığına karar vermede kullanılacak en bilimsel kanıt şağıdakilerden hangisidir? A) 12 Dev Adam’dan İbrahim Kutluay topları yukarıya fırlatırken her bir topun ne kadar yükseğe çıktığının ölçülmesi. B) Bir makine topları aynı kuvvetle yukarıya fırlatırken her bir topun ne kadar yükseğe çıktığının ölçülmesi. C) Fabrikaların kendi toplarının ne kadar yükseğe çıktığını belirlemek için yapmış olduğu deneyin sonuçlarının okunması. D) 12 Dev Adam’a topların ne kadar yükseğe çıktığının sorulması.
12. Fen Bilgisi dersinde Deniz, arkadaşlarının bir futbol topunu ne kadar uzağa atabildiklerini belirlemek için bir deney yapmıştır. Deniz, deneyinde elde ettiği ölçme sonuçlarını aşağıdaki tabloda göstermiştir. Hangi öğrenciye ait ölçüm olağan dışıdır? Neden?
Öğrencilerin Bir Futbol Topunu Atabildikleri Uzaklık Öğrenci Atılan Uzaklık 1 15 2 75 3 10 4 16 5 8
13. Yeni bulunan bir ilaç, kan pıhtılarını eritmektedir. Fakat ilaç çok fazla kullanıldığında, aşırı kanamaya neden olmaktadır. Alınması gereken en uygun ilaç miktarını belirlemek için aşağıdaki yöntemlerden hangisini kullanırsınız? A) İlacı farklı zamanlarda vererek, zamanlamanın kanamaya etkisini belirlemek. B) Deneklerin ilaçla birlikte çok çeşitli yiyecekler yemelerini sağlamak. C) İlacı farklı yaşlardaki insanlarda uygulamak. D) Herşeyi sabit tutarken sadece ilacın miktarını değiştirmek. 14. Tahılların kilo almaya etkisini bulmak için farelerle bir deney yapılmıştır. Deneyde mısır ile beslenen bir farenin 20 g, pirinç ile beslenen bir farenin 15 g, buğday ile beslenen bir farenin 18 g ve mısır-pirinç-buğday karışımı ile beslenen bir farenin de 22 g kilo aldığı görülmüştür. Başlangıçta mısır ile beslenen fare 95 g, pirinç ile beslenen fare 98 g, buğday ile beslenen fare 92 g, mısır-pirinç-buğday karışımı ile beslenen fare de 90 g idi. Bu verileri kullanarak bir tablo çiziniz. 15. Amonyak gazının sudaki çözünürlüğü sıcaklık arttıkça azalır. Bu bilgiye göre, amonyak gazının sıcaklık-çözünürlük grafiğini çiziniz.
16. Güneş sistemindeki bazı gezegenlerin yer çekimi ile sıçrama yüksekliği değerleri yandaki tabloda verilmiştir:
Gezegen Yer Çekimi Sıçrama Yüksekliği Merkür 0.38 250 Venüs 0.90 184 Dünya 1.00 100 Satürn 1.15 87 Jüpiter 2.40 43
Bu değerlere göre yer çekimi ile sıçrama yüksekliği arasında yandaki grafikte gösterilen bir ilişki vardır: Yer çekimi ile sıçrama yüksekliği ilişkisi hakkında ne söyleyebilirsiniz?
S
ıçra
ma
yüks
ekliğ
i (c
m)
Yer Çekimi

138
B.1.1.2 Second Science Process Skills Test Form
1. Bu fotoğraftan hangisi gözlemlenebilir? A) Ay küre şeklindedir. B) Ay ekseni etrafında döner. C) Ay katı bir kayadır. D) Ay’da çok az hava vardır.
A B C
D E F
2. Bitki tohumları anne bitkiden ayrılıp çoğalmayı sağlamak için farklı şekillerde olurlar. Bazı tohumlar anne bitkinin yakınında gezinen hayvanların kürküne yapışırken, bazıları rüzgârla uzaklara taşınır. Yandaki tohumlardan hangileri hayvanlarla, hangileri rüzgârla taşınır? Hayvanlarla Taşınan Tohumlar: Rüzgârla Taşınan Tohumlar:
3. Yazın bir deney yapmak isteyen öğrencilerin sınayacakları en iyi hipotez aşağıdakilerden hangisidir? A) Hangi etkenler yıl boyunca bitki büyümesini etkiler? C) Neden bitkiler yazın daha çok büyür? B) Farklı miktarlarda suyun bitki büyümesine etkisi nedir? D) Mıknatıslar nasıl çalışır? 4. Bir çiftçi yetiştirdiği çilek bitkisinin yeşil renkte meyveler oluşturduğunu gözlemler. Aşağıdakilerden hangisi çiftçinin çilekleriyle ilgili yapacağı bir tahmindir? A) Yeşil renkli çilekler kırmızı renkli çileklere dönüşeceklerdir. C) Yeşil çilekler yeni bir çilek türüdür. B) Çilek bitkisinin meşe ağacının altında gelişmektedir. D) Çilek bitkisine yeterince sulanmamaktadır.
5. Yandaki tabloya göre, hangi gezegen en yüksek sıcaklığa sahip olur?
Gezegen Güneşten Ortalama Uzaklık (kilometre)
Dünya 150 milyon Jübiter 778 milyon Mars 228 milyon
Merkür 58 milyon Venüs 108 milyon
6. Gül, fasulye tohumlarının çimlenmesiyle oluşan filizlerin uzunluğunu neyin etkilediğini bulmak ister. On benzer deney tüpünün her birine nemli bir kâğıt mendile sarılı fasulye tohumu yerleştirir. Deney tüplerinin beşini bir tüplüğe dizerek güneşli bir pencereye yerleştirir. Geri kalan beş deney tüpünü de başka bir tüplüğe dizerek karanlık bir buzdolabına yerleştirir. Bir hafta sonra her bir gruptaki fasulye filizlerinin uzunluğunu ölçer. Bu deneyde aşağıdaki değişkenlerden hangisi fasulye filizlerinin uzunluğunu etkiler? A) Sıcaklık ve nem. B) Nem ve deney tüpünün uzunluğu. C) Işık ve sıcaklık. D) Işık ve zaman 7. 50 metrelik bir yarışı koşmadan önce ve koştuktan sonra, nabzınız ve nefes alıp verme oranlarınız ölçülüyor. Nabız ve nefes alıp verme oranlarında hangi değişikliklerin olmasını beklersiniz?

139
8. Bilinen Laboratuar Malzemeleri
A. Büyüteç
B. Pil
C. Eldiven
D. Mıknatıs
E. Gözlük
F. Cetvel
G. Mikroskop
H. Damlalık
J. Termometre
K. Kronometre
L. Dereceli silindir
M. Terazi
N. Büret
Ö. Anemometre
P. Prizma
R. Steteskop
S. Erlen
T. İspirto ocağı ve sacayak
U. Teleskop
Z. Fotoğraf makinesi
a. Bir taşın kütlesini ölçmede kullanılan laboratuar malzemeleri hangileridir? (İlgili kutulardaki harfleri yazınız) b. 250 mL’lik suyu tam olarak ölçmekte kullanılan laboratuar malzemeleri hangileridir? 9. soruyu cevaplamak için aşağıdaki metni ve resmi kullanınız. Su farklı türdeki topraklardan ne kadar süratte geçer? Bir öğrenci bu soruya cevap bulmak için bir deney düzeneği hazırladı. Öğrencinin deneyinde kullandığı araç-gereçler aşağıda görülmektedir: Su kap kronometre kalem filtre kağıdı
A toprağı B toprağı C toprağı
Öğrencinin deney düzeneği kurmada izlediği basamaklar şunlardır: 1. Bir kalemin ucun kullanarak kâğıt bardağın tabanında bir delik aç. 2. Filtre kâğıdından daire şeklinde bir parça keserek, bu parçayla bardağın içindeki deliği kapat. 3. Bardağı A toprağı ile doldur. 4. Deliği parmağınla kapatırken, bardağa 20 mililitre su ekle. 5. İkinci bir bardağı birincisinin altına doğru tut. Parmağını gevşet. Suyun ne kadar sürede boşaldığını ölç. 6. İki bardağı da boşalt. B ve C toprakları için 2.-5. basamakları tekrarla. 9. Bu deneyde filtre kâğıdının kullanılma amacı nedir? A) Toprağı bardağın içinde tutarken suyun süzülmesine imkân vermek. D) Suyu bardakta tutmak. B) Toprağın içindeki hava boşluklarını temsil etmek. C) Öğrencilerin bardağın içini görmelerini sağlamak.

140
10. Bir öğrenci kullanılan gübre miktarının bitkilerin büyümesine olan etkisini incelemek istemektedir. Bu öğrenci aynı ortamda bulunan I. saksıya düzenli olarak bir miktar gübre koyarken aşağıdakilerden hangisini yaparsa araştırdığı soruya cevap verebilir? A) II. saksıya hiç gübre koymadan, her iki saksıyı aynı ölçüde sulayarak. B) II. saksıya I. saksı ile aynı miktarda gübre koyarak her iki saksıyı aynı ölçüde sulayarak. C) II. saksıya I. saksıdakinin yarısı kadar gübre koyarak her iki saksıyı aynı ölçüde sulayarak. D) II. saksıya I. saksının iki katı kadar su ve gübre koyarak.
11. K, M, N ve O türleri birbiriyle beslenmeyen türlerdir. Y türü, bu türlerle dört ayrı ortamda bir araya konduğunda, sayısındaki artış ve azalış tablodaki gibi gözleniyor. Buna göre hangi tür canlının Y türü canlı ile beslendiği söylenebilir?
12. Yandaki şekiller Abdullah’ın farklı büyüklükte tekerlekleri olan arabalarla yaptığı denemeleri göstermektedir. Denemelerinde arabalarını farklı yüksekliklerdeki rampalardan aşağıya bırakan Abdullah’ın arabalara eklediği tahta blokların kütlesi birbirlerine eşittir. Abdullah “Araba ne kadar ağırsa, rampanın aşağısındaki hızı o kadar fazladır” hipotezini test etmek istemektedir. Abdullah hangi üç denemeyi karşılaştırmalıdır? Neden?
13. Yanda görülen iribaş safhasındaki kurbağanın boyu ne kadardır?
14. Bir belediye şehirdeki hava kirliliğini karşı önlem almaya gerek olup olmadığını belirlemek için hava ölçümleri apmaktadır. Aşağıdakilerden hangisi hava kirliliğini ölçmek için en uygun zamandır? A) Günde bir defa, trafiğin yoğun olduğu iş gidişi veya çıkışında. B) Yılda bir defa trafiğin az olduğu bir günde. C) Havanın en az kirli olduğu geceleri. D) Günde birkaç defa, her türlü hava koşulunda.
15. Bir maddenin 1 cm3 ünün kütlesine yoğunluk denir. Buna göre tabloda gösterilen maddelerin hangisinin yoğunluğu en yüksektir?
Madde Maddenin kütlesi Maddenin hacmi T 11.0 gram 24 santimetreküp V 11.0 gram 12 santimetreküp Y 5.5 gram 4 santimetreküp Z 5.5 gram 11 santimetreküp
16. Yandaki grafik bir sabah bir sınıfta kaydedilen nemliliği göstermektedir. Grafikte gösterilen sabah, saat 6:00 ile 12:00 arasında nemlilik kaç kez tam olarak yüzde 20 idi?
Y türü canlı sayısı
Y türü canlılarla aynı ortamda bulunan canlılar
Artıyor K, M, N Azalıyor M, N,O Azalıyor O, K Artıyor N, M
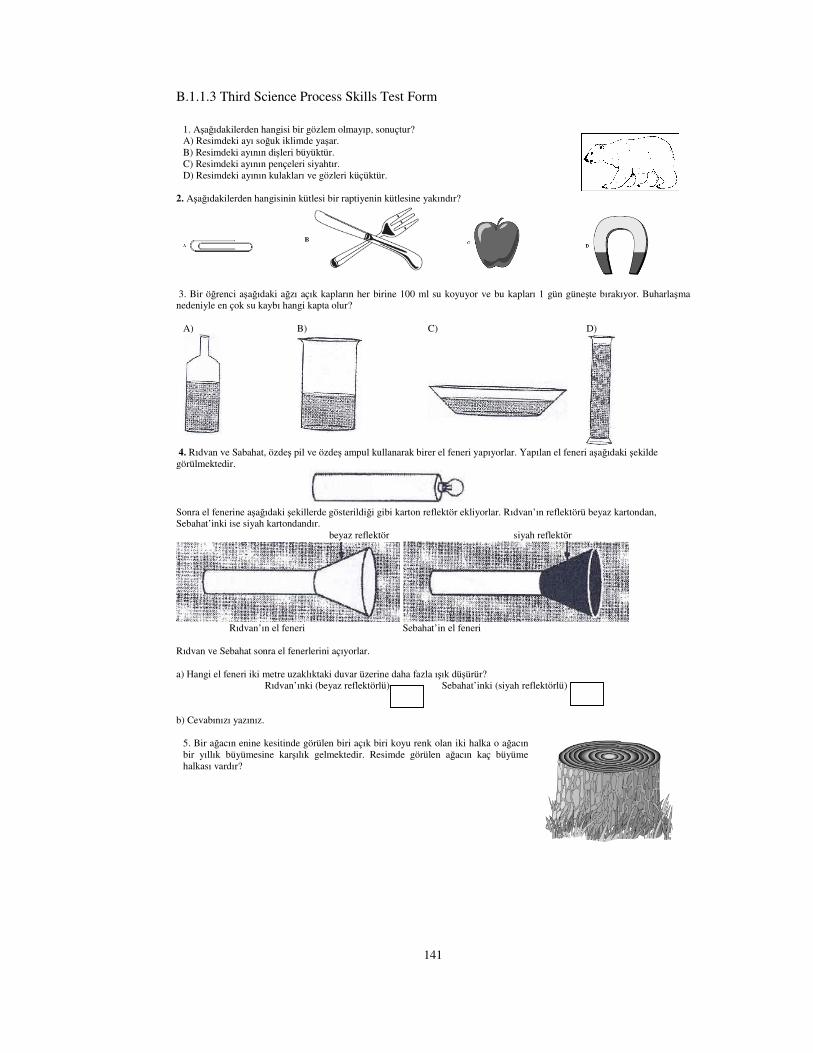
141
B.1.1.3 Third Science Process Skills Test Form
1. Aşağıdakilerden hangisi bir gözlem olmayıp, sonuçtur? A) Resimdeki ayı soğuk iklimde yaşar. B) Resimdeki ayının dişleri büyüktür. C) Resimdeki ayının pençeleri siyahtır. D) Resimdeki ayının kulakları ve gözleri küçüktür.
2. Aşağıdakilerden hangisinin kütlesi bir raptiyenin kütlesine yakındır?
3. Bir öğrenci aşağıdaki ağzı açık kapların her birine 100 ml su koyuyor ve bu kapları 1 gün güneşte bırakıyor. Buharlaşma
nedeniyle en çok su kaybı hangi kapta olur? A)
B)
C)
D)
4. Rıdvan ve Sabahat, özdeş pil ve özdeş ampul kullanarak birer el feneri yapıyorlar. Yapılan el feneri aşağıdaki şekilde görülmektedir.
Sonra el fenerine aşağıdaki şekillerde gösterildiği gibi karton reflektör ekliyorlar. Rıdvan’ın reflektörü beyaz kartondan, Sebahat’inki ise siyah kartondandır. beyaz reflektör siyah reflektör
Rıdvan’ın el feneri Sebahat’in el feneri
Rıdvan ve Sebahat sonra el fenerlerini açıyorlar. a) Hangi el feneri iki metre uzaklıktaki duvar üzerine daha fazla ışık düşürür? Rıdvan’ınki (beyaz reflektörlü) Sebahat’inki (siyah reflektörlü) b) Cevabınızı yazınız.
5. Bir ağacın enine kesitinde görülen biri açık biri koyu renk olan iki halka o ağacın bir yıllık büyümesine karşılık gelmektedir. Resimde görülen ağacın kaç büyüme halkası vardır?

142
6.- 9. sorular şu durumla ilgilidir: Beyaz sıçanlarla bir laboratuar araştırması yapılmaktadır. Araştırmayı yapan bilim insanı, anne sıçanların aldığı A Vitamini miktarının doğan yavru sayısını etkileyip etkilemediğini bilmek istemektedir. Bilim insanı, araştırmasında aynı tür sıçanları kullanır. Her sıçana aynı miktar besin verir ve günlük egzersiz uygular. Tüm kafeslerdeki sıcaklığı da aynı tutar. 6. Bilim insanı, araştırmasında aşağıdaki değişkenlerden hangisini kontrol etmektedir? A) A vitamini miktarı, besin miktarı ve egzersiz miktarı B) Besin miktarı, egzersiz miktarı ve sıcaklık C) Sıçan türü, A vitamini miktarı ve sıcaklık D) Egzersiz miktarı, sıçan türü ve A vitamini miktarı 7. Bilim insanının araştırmasında sınadığı hipotez aşağıdakilerden hangisidir? A) Kafesteki sıcaklık arttıkça, anne sıçanın doğurduğu yavru sayısı artar. B) Anne sıçan ne kadar çok A vitamini alırsa, o kadar çok yavruya sahip olur. C) Anne sıçanlar ne kadar fazla egzersiz yaparsa, o kadar çok yavruya sahip olur. D) Anne sıçanlar günlük ne kadar çok besin alırsa, o kadar çok yavruya sahip olur. 8. Bilim insanının araştırmasındaki bağımsız değişken aşağıdakilerden hangisidir? A) Her bir sıçana verilen besin miktarı. B) A vitamini miktarı C) Anne sıçanları sayısı D) Doğan yavru sayısı. 9. Bu çalışmadaki bağımlı değişken aşağıdakilerden hangisidir? A) Her bir sıçana verilen besin miktarı B) A vitamini miktarı C) Anne sıçanların sayısı D) Doğan yavru sayısı 10. Aşağıdakilerden hangisi tuzlu suyun tatlı sudan daha hızlı kaynadığını bulmak için en iyi yoldur?
A) tatlı su tuzlu su
ısı kaynağı
B) tatlı su tuzlu su
ısı kaynağı
C) tatlı su tuzlu su
ısı kaynağı
D) tatlı su tuzlu su
ısı kaynağı
11. Bilinen Laboratuar Malzemeleri
A. Büyüteç
B. Pil
C. Eldiven
D. Mıknatıs
E. Gözlük
F. Cetvel
G. Mikroskop
H. Damlalık
J. Termometre
K. Kronometre
L. Dereceli silindir
M. Terazi
N. Büret
Ö. Anemometre
P. Prizma
R. Steteskop
S. Erlen
T. İspirto ocağı ve sacayak
U. Teleskop
Z. Fotoğraf makinesi
Sıcaklık ölçmede kullanılan laboratuar malzemeleri hangileridir? (İlgili kutulardaki harfleri yazınız)

143
12. Öğrenci deneyinde bitkilerini eşit oranda su ile sulamakta ve aynı oranda güneş ışığı almalarını sağlamaktadır. Ayrıca bitkilere her hafta bir fincan dolusu sıvı gübre vermektedir. Öğrenci, her bir bitkiye verdiği gübreyi doğru olarak ölçmek için, gübrenin hacmini hangi birimle ifade etmelidir? A) Santimetreküp B) Mililitre C) Metre küp D) Kilolitre
13. A ağırlığını dengelemek için B ağırlığının ne kadar olması gereklidir? A) 20 kilogram B) 2000 miligram C) 0.2 kilogram D) 20 gram
14. Füsun Fen Bilgisi dersinde yaptığı deneyde iki elini birbirine sürtmek suretiyle elini ısıttı. Sonra elinin sıcaklığını ölçtü. Füsun bu deneyi dört defa tekrarladı. Yandaki tablo, Füsun’un yaptığı deneyin sonuçlarını göstermektedir. Tablodaki verilere göre denemelerin hangisi normal değildir? Neden?
Deneme Sıcaklık (0C) 1 41 2 40 3 31 4 42
15. Birkaç öğrenci, mahallelerinde bulunan kuş türlerini ve her bir türdeki kuş sayısını hesapladı. Öğrencilerin çalışmalarda topladıkları bu verileri gösterecekleri en uygun grafik şekli sizce nasıldır? 16. Aşağıdaki tabloda verilen bilgilerle aşağıdaki sonuçlardan hangisine ulaşılamaz? A) Gebelik süresi büyük vücutlu canlılarda daha uzundur. B) Çoğalma miktarı küçük vücutlu canlılarda daha fazladır. C) Üreme sıklığı çevre koşulları ile ilişkilidir. D) Bir doğumdaki yavru sayısı en büyük vücutlu canlıda en azdır.
Canlı türü Üreme sıklığı (yılda) Bir doğumdaki yavru sayısı (en fazla) Yaklaşık gebelik süresi (gün) Ev faresi 7-8 13 21 Tavşan 6-7 6 42 Köpek 2 10 60
Fil 2 yılda bir 1 660

144
B.1.2 Science Process Skills Test Key
B.1.2.1 First Science Process Skills Test Key
1. C 2. Coding Guide
Code Response Correct Response 20 Sinek Kuşu: Uzun boru şekilli çiçeklerdeki nektar
Atmaca: Kemiriciler Ağaçkakan: Ağaçların kabuklarının içindeki böcekler
Partial Response 10 Sinek Kuşu: Uzun boru şekilli çiçeklerdeki nektar 11 Atmaca: Kemiriciler 12 Ağaçkakan: Ağaçların kabuklarının içindeki böcekler Incorrect Response 70 Sinek Kuşu: Kemiriciler, Atmaca: Ağaçların kabuklarının içindeki böcekler, Ağaçkakan: Uzun boru
şekilli çiçeklerdeki nektar. Sinek Kuşu: Ağaçların kabuklarının içindeki böcekler, Atmaca: Uzun boru şekilli çiçeklerdeki nektar Ağaçkakan: Kemiriciler
No Response 99 BLANK
3. C 4. D 5. B 6. B 7. B 8. a. Coding Guide
Code Response Correct Response 20 C. Eldiven ve E. Gözlük Partial Response 10 C. Eldiven 11 E. Gözlük Incorrect Response 70 Other incorrect (including crossed out/erased, stray marks, illegible, or off task). No Response 99 BLANK
8. b.
Code Response Correct Response 10 P. Prizma Incorrect Response 70 Other incorrect (including crossed out/erased, stray marks, illegible, or off task). No Response 99 BLANK
9. D

145
B.1.2.1 (Cont.’d)
10. Coding Guide
Code Response Correct Response 10 Açılar farklı, kütleler ve yüzeyler aynı.
Düzeneklerdeki açıları sırası ile α, 2α ve 3α yaparak tüm düzeneklerdeki kütleleri eşitlerim (m veya 2m) ve sürtünen yüzeyleri aynı yaparım (tahta ya da mermer). F2 m olmalıdır. F2’nin eğim açısı 2α olmalıdır. F3 tahta olmalıdır. Çünkü burada 3. Düzenekte tahta kullanmalı. 2. Düzenekte kütleyi m’e düşürtmeli. 2. Düzenekte eğim açısını 2α’ya çıkartmalı. Çünkü, eğim açısının etkisini bulmak istiyor. Eğim açısı dışında tüm etkenler eşit olmalı.
Incorrect Response 10 Tahta: Tahta kısa olduğu için ve çok hafif olduğu için çekince düşer. 2m tahta: 2 m tahta uzun ama o
da hafif çekilince herhangi bir cisme takılınca düşer. Mermer: Mermer ağır ve dörtgen olduğu için herhangi bir cisme takılınca düşmez.
No Response 99 BLANK
11.B 12. Coding Guide
Code Response Correct Response 20 2. Öğrenci 75. Çünkü çok uzağa atıyor. Partial Response 10 2. Öğrenci 75 Incorrect Response 70 5 çünkü çok az atmıştır. No Response 99 BLANK
13. D

146
B.1.2.1 (Cont.’d)
14. Coding Guide
Code Response Correct Response 20
Tahıl Başlangıç g Aldıkları g Toplam g Mısır 95 g 20 g 115 g Pirinç 98 g 15 g 113 g Buğday 92 g 18 g 110 g Mısır Pirinç Buğday (Hepsi) 90 g 22 g 112 g
Partial Response 10
Veriler sadece bir tabloda kaydedilmiş, analiz edilmemiş:
Beslendiği Tahıl Eski kg Aldığı kg Mısır 95 20 Pirinç 98 15 Buğday 92 18 Mısır-buğday-Pirinç 90 22
Incorrect Response 70
Verilerden tablo çizilmeye çalışılmış:
20 g 90 g 15 g Pirinç 95 g Buğday 98 g Buğday 92 g pirinç
No Response 99 BLANK
15. Coding Guide
Code Response Correct Response 10
Incorrect Response 70
İlişki yazıyla ifade edilmiş:
Amonyak gazı arttıkça azalır
Sonra da bekledikten sonra çoğalır.
No Response 99 BLANK
çözünürlük
sıcaklık
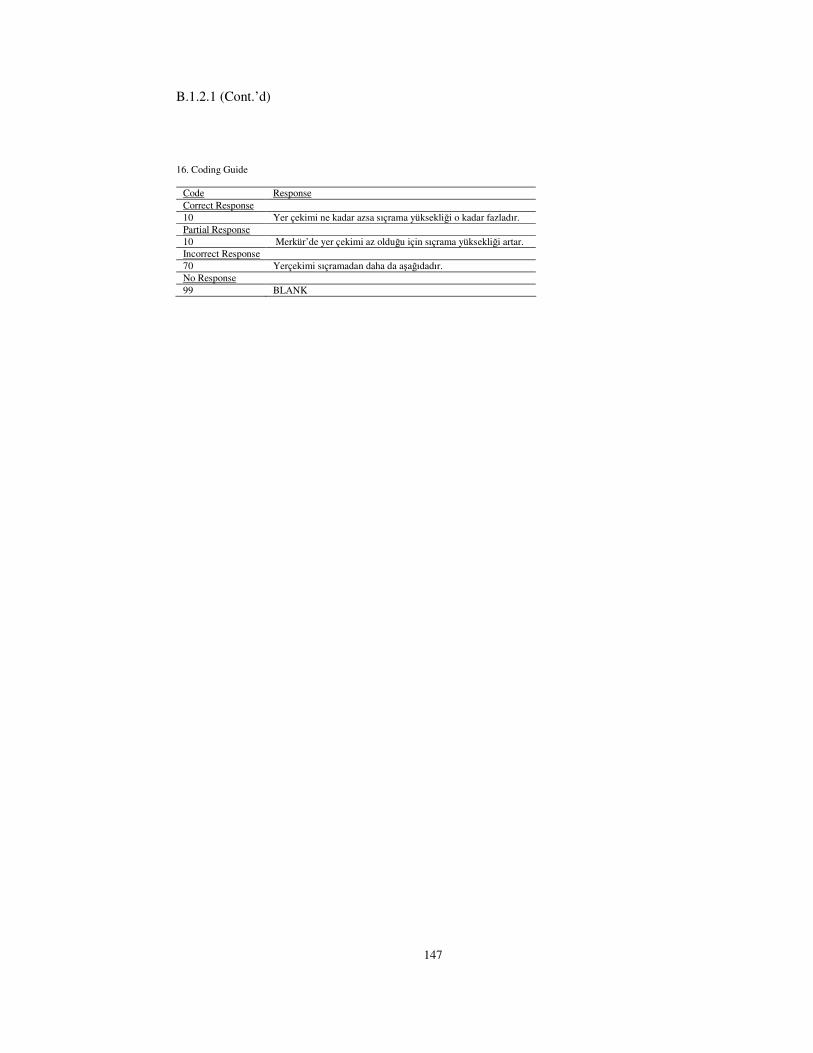
147
B.1.2.1 (Cont.’d)
16. Coding Guide
Code Response Correct Response 10 Yer çekimi ne kadar azsa sıçrama yüksekliği o kadar fazladır. Partial Response 10 Merkür’de yer çekimi az olduğu için sıçrama yüksekliği artar. Incorrect Response 70 Yerçekimi sıçramadan daha da aşağıdadır. No Response 99 BLANK

148
B.1.2.2 Second Science Process Skills Test Key
1. A 2. Coding Guide
Code Response Correct Response 20 Hayvanlarla Taşınan Tohumlar: A, C, F
Rüzgârla Taşınan Tohumlar: B, D, E Partial Response 10 Hayvanlarla Taşınan Tohumlar: A 11 Hayvanlarla Taşınan Tohumlar: C 12 Hayvanlarla Taşınan Tohumlar: F 13 Rüzgârla Taşınan Tohumlar: B 14 Rüzgârla Taşınan Tohumlar: D 15 Rüzgârla Taşınan Tohumlar: E Incorrect Response 70 Hayvanlarla Taşınan Tohumlar: B, D, E; Rüzgârla Taşınan Tohumlar: A, C, F No Response 99 BLANK
3. C 4. A 5. Coding Guide
Code Response Correct Response 10 Merkür Incorrect Response 70 Others No Response 99 BLANK
6. C 7. Coding Guide
Code Response Correct Response 20 Yarıştan önce nabız ve soluk alıp verme normalken, yarıştan sonra nabız ve soluk alıp verme
oranlarında artış olur. Partial Response 10 Yarışı koşmadan önce ve sonrasından bahsedilmez:
Nefes alıp verme hızlanır. 11 Sadece nabızdaki değişiklikten bahsedilir:
Nabzımız bir yerde otururken nabzımız rahat olur. Bir yeri koşarak gidersek nabzımız ve kalbimiz çok fazla artar.
12 Sadece soluk alıp vermedeki değişiklikten bahsedilir: 50 metreyi koşunca nefes alıp verme oranlarımız çoğalır. Nefes nefese kalırız.
Incorrect Response 70 Yavaş yavaş atmasını beklerim. No Response 99 BLANK

149
B.1.2.2 (Cont.’d)
8. a. Coding Guide
Code Response Correct Response 10 M Terazi Incorrect Response 70 Others No Response 99 BLANK
8.b Coding Guide
Code Response Correct Response 10 L. Dereceli Silindir Incorrect Response 70 Others No Response 99 BLANK
9. A 10. C 11. Coding Guide
Code Response Correct Response 10 O Incorrect Response 70 Others No Response 99 BLANK
12. Coding Guide
Code Response Correct Response 20 S, T, U. Boş olduğunda, 1 tahta olduğunda ve 2 tahta olduğunda ne olduğunu ve ne kadar hızı
olduğunu öğrenmek için. 21 S, T ve U’dan 2’si:
U ile S harfini karşılaştırmalıdır. Çünkü Abdullah araba ne kadar ağırsa, rampanın aşağısındaki hızı o kadar fazladır dediği için U harfi ile S harfini örnek verebiliriz.
Partial Response 10 S, T ve U Incorrect Response 70 Others No Response 99 BLANK

150
B.1.2.2 (Cont.’d)
13. Coding Guide
Code Response Correct Response 10 3.1 cm. 11 3 cm. 12 3.5 cm. Incorrect Response 70 Others No Response 99 BLANK
14. D 15. Coding Guide
Code Response Correct Response 10 Y Incorrect Response 70 Others No Response 99 BLANK
16. Coding Guide
Code Response Correct Response 10 7:00, 10:00 ve 11:30
3 kez 11 7:00 ve 10:00
2 kez Incorrect Response 70 Others No Response 99 BLANK

151
B.1.2.3 Third Science Process Skills Test Key
1. A 2. A 3. C 4. Coding Guide
Code Response Correct Response 20 Rıdvan’ınki. Beyaz reflektör ışığı daha çok yansıtır. Partial Response 10 Rıdvan’ınki. Incorrect Response 70 Others No Response 99 BLANK
5. Coding Guide
Code Response Correct Response 10 8
16 Incorrect Response 70 Others No Response 99 BLANK
6. B 7. B 8. B 9. D 10. A 11. Coding Guide
Code Response Correct Response 10 J Incorrect Response 70 Others No Response 99 BLANK
12. B 13. C

152
B.1.2.3 (Cont.’d)
14. Coding Guide
Code Response Correct Response 20 3. deneme. Çünkü; elimizi sürttükçe ısınır. Partial Response 10 3 Incorrect Response 70 Others No Response 99 BLANK
15. Coding Guide
Code Response Correct Response 10 Sütun grafiği.
Sütün grafiği çizilmiş. 11 Çizgi grafiği çizilmiş. Incorrect Response 70 Others No Response 99 BLANK
16. C

153
B.1.3 Cognitive Processes of the Science Process Skills Test Forms
Table B.1 Cognitive processes of the science process skills tests
First Second Third Fourth
1 Gözlem Gözlem Gözlem Gözlem 2 Karşılaştırma-Sınıflama Karşılaştırma-Sınıflama Karşılaştırma-Sınıflama Karşılaştırma-Sınıflama 3 Çıkarım Yapma Çıkarım Yapma Çıkarım Yapma Çıkarım Yapma 4 Tahmin Tahmin Tahmin Tahmin 5 Kestirme Kestirme Kestirme Kestirme 6 Değişkenleri Belirleme Değişkenleri Belirleme Değişkenleri Belirleme Değişkenleri Belirleme 7 Hipotez Kurma Hipotez Kurma Hipotez Kurma Hipotez Kurma 8 Deney Malzemelerini ve
Araç-Gereçlerini Tanıma ve Kullanma
Deney Malzemelerini ve Araç-Gereçlerini Tanıma ve Kullanma
Değişkenleri Belirleme Deney Malzemelerini ve Araç-Gereçlerini Tanıma ve Kullanma
9 Deney Düzeneği Kurma Deney Tasarlama Değişkenleri Belirleme Deney Düzeneği Kurma 10 Değişkenleri Kontrol Etme
ve Değiştirme Deney Düzeneği Kurma Değişkenleri Kontrol Etme
ve Değiştirme Değişkenleri Kontrol Etme ve Değiştirme
11 İşlevsel Tanımlama Değişkenleri Kontrol Etme ve Değiştirme
Deney Malzemelerini ve Araç-Gereçlerini Tanıma ve Kullanma
İşlevsel Tanımlama
12 Ölçme İşlevsel Tanımlama İşlevsel Tanımlama Ölçme 13 Bilgi ve Veri Toplama Ölçme Ölçme Bilgi ve Veri Toplama 14 Verileri Kaydetme Bilgi ve Veri Toplama Bilgi ve Veri Toplama Verileri Kaydetme 15 Veri İşleme ve Model
Oluşturma Veri İşleme ve Model Oluşturma
Veri İşleme ve Model Oluşturma
Veri İşleme ve Model Oluşturma
16 Yorumlama ve Sonuç Çıkarma
Yorumlama ve Sonuç Çıkarma
Yorumlama ve Sonuç Çıkarma
Yorumlama ve Sonuç Çıkarma
17 Gözlem 18 Karşılaştırma-Sınıflama 19 Çıkarım Yapma 20 Tahmin 21 Kestirme 22 Değişkenleri Belirleme 23 Hipotez Kurma 24 Deney Düzeneği Kurma 25 Değişkenleri Kontrol
Etme ve Değiştirme 26 İşlevsel Tanımlama 27 Ölçme 28 Bilgi ve Veri Toplama 29 Veri İşleme ve Model
Oluşturma 30 Yorumlama ve Sonuç
Çıkarma

154
B.1.4 References for the Items of the Science Process Skills Test Forms
Table B.2 Reference of the first science process skills test
Item No
Source
1 Illinois Standards Achievement Test Science Samples http://www.isbe.net/assessment/pdfs/2008/ISAT_Sample_Book_Gr_7_s.pdf
2 2003 VDOE Released Items Grade 8: Science http://www.iq.poquoson.org/2003vasol/8sci03v5.html
3
TIMSS 1999 Science Items Released Set for Eighth Grade DO2 http://timss.bc.edu/timss1999i/pdf/t99science_items.pdf
4
Vırgınıa Standards of Learnıng Assessments Spring 2001 Released Test Grade 8 Scıence http://www.kidsnewsroom.org/resources/sol/VA/G08S01.pdf
5 Grade 5: Science (2000 VDOE Released Items) http://www.iq.poquoson.org/5sci00v5.htm
6 Grade 8: Science - VDOE 2004 Released Items http://www.iq.poquoson.org/2004vasol/8sci/8sci04v5.html
7 McGraw-Hill Science © 2000, Texas Edition TAKS Practice Test Grade 5, Chapter 1 The Importance of Plants http://www.mhtexas.com/correlations/pdf/G5_C01_SciTAKS.pdf
8 Grade 5: Science - VDOE 2004 Released Items http://www.iq.poquoson.org/2004vasol/5sci/5sci04v5.html Grade 5: Science (2002 VDOE Released Items) http://www.iq.poquoson.org/5sci02v5.htm Illinois Standards Achievement Test Science Samples http://www.isbe.net/assessment/pdfs/2008/ISAT_Sample_Book_Gr_4_s.pdf
9 Utah State Office of Education Biology Standard 8 Objective 1 http://www.usoe.k12.ut.us/curr/Science/core/assess/bio/8-1.html
10 2001 Özel Okullar Sınavı http://egitek.meb.gov.tr/Sinavlar/Sorular/OzelOkullar2005/2001OzelOkullarSnv.pdf
11 Illinois Standards Achievement Test Science Samples http://www.isbe.net/assessment/pdfs/2008/ISAT_Sample_Book_Gr_7_s.pdf
12 Grade 5: Science (2003 VDOE Released Items) http://www.iq.poquoson.org/2003vasol/5sci03v5.html
13 Grade 8: Science (2002 VDOE Released Items) http://www.iq.poquoson.org/8sci02v5.htm
14 Comprehensive Science Review (2002 VDOE Released Items) http://www.iq.poquoson.org/compscirevhs02v5.htm
15 2001 Devlet Parasız Yatılı ve Bursluluk Sınavları 91011/9.sınıf http://egitek.meb.gov.tr/Sinavlar/Sorular/Dpy/Dpy2001/Dpy9_Test2001.pdf
16 Grade 5: Science - VDOE 2004 Released Items http://www.iq.poquoson.org/2004vasol/5sci/5sci04v5.html

155
Table B.3 Reference of the second science process skills test
Item No
Source
1 Grade 5: Science (2003 VDOE Released Items) http://www.iq.poquoson.org/2003vasol/5sci03v5.html
2 Grade 5: Science (2002 VDOE Released Items) http://www.iq.poquoson.org/5sci02v5.htm
3 Test of Integrated Process Skills (Dillashaw & Okey, as cited in Moore 2001, p. 77-92; Turpin, 2000, p. 99-104.)
4
Grade 5: Science (2002 VDOE Released Items) http://www.iq.poquoson.org/5sci02v5.htm
5 2003 VDOE Released Items Grade 8: Science http://www.iq.poquoson.org/2003vasol/8sci03v5.html
6 Test of Integrated Process Skills (Dillashaw & Okey, as cited in Moore 2001, p. 77-92; Turpin, 2000, p. 99-104.) 7 TIMSS 1999 Science Items Released Set for Eighth Grade XO3
http://timss.bc.edu/timss1999i/pdf/t99science_items.pdf 8 Grade 5: Science (2002 VDOE Released Items)
http://www.iq.poquoson.org/5sci02v5.htm Grade 5: Science (2000 VDOE Released Items) http://www.iq.poquoson.org/5sci00v5.htm Grade 5: Science (2002 VDOE Released Items) http://www.iq.poquoson.org/5sci02v5.htm
9 McGraw-Hill Science © 2000, Texas Edition TAKS Practice Test Grade 5, Chapter 9 Earth, Your Home http://www.mhtexas.com/correlations/pdf/G5_C09_SciTAKS.pdf
10 1999 Orta Öğretim Kurumları Öğrenci Seçme ve Yerleştirme Sınavı http://egitek.meb.gov.tr/Sinavlar/Sorular/Ook/Ook1999/Ook1999Test_Key.pdf
11 2001 Orta Öğretim Kurumları Öğrenci Seçme ve Yerleştirme Sınavı http://egitek.meb.gov.tr/Sinavlar/Sorular/Ook/Ook2001/Ook2001Test_Key.pdf
12 TIMSS Released Set for Population 2 (Seventh and Eighth Grades) I12 http://timss.bc.edu/timss1995i/TIMSSPDF/BSitems.pdf
13 Grade 5: Science (2002 VDOE Released Items) http://www.iq.poquoson.org/5sci02v5.htm
14 Grade 8: Science - VDOE 2004 Released Items http://www.iq.poquoson.org/2004vasol/8sci/8sci04v5.html
15 TIMSS 1999 Science Items Released Set for Eighth Grade BO3 http://timss.bc.edu/timss1999i/pdf/t99science_items.pdf
16 Test of Integrated Process Skills (Dillashaw & Okey, as cited in Moore 2001, p. 77-92; Turpin, 2000, p. 99-104.)

156
Table B.4 Reference of the third science process skills test
Item No
Source
1 Grade 5: Science (2000 VDOE Released Items) http://www.iq.poquoson.org/5sci00v5.htm
2 Grade 5: Science (2003 VDOE Released Items) http://www.iq.poquoson.org/2003vasol/5sci03v5.html
3
TIMSS 1999 Science Items Released Set for Eighth Grade JO4 http://timss.bc.edu/timss1999i/pdf/t99science_items.pdf
4
TIMSS 1999 Science Items Released Set for Eighth Grade N1O http://timss.bc.edu/timss1999i/pdf/t99science_items.pdf
5 Grade 5: Science (2000 VDOE Released Items) http://www.iq.poquoson.org/5sci00v5.htm
6 Test of Integrated Process Skills (Dillashaw & Okey, as cited in Moore 2001, p. 77-92; Turpin, 2000, p. 99-104.) 7 Test of Integrated Process Skills (Dillashaw & Okey, as cited in Moore 2001, p. 77-92; Turpin, 2000, p. 99-104.) 8 Test of Integrated Process Skills (Dillashaw & Okey, as cited in Moore 2001, p. 77-92; Turpin, 2000, p. 99-104.) 9 Test of Integrated Process Skills (Dillashaw & Okey, as cited in Moore 2001, p. 77-92; Turpin, 2000, p. 99-104.) 10 Grade 5: Science - VDOE 2004 Released Items
http://www.iq.poquoson.org/2004vasol/5sci/5sci04v5.html 11 Grade 5: Science (2000 VDOE Released Items)
http://www.iq.poquoson.org/5sci00v5.htm Grade 5: Science (2002 VDOE Released Items) http://www.iq.poquoson.org/5sci02v5.htm
12 Comprehensive Science Review (2002 VDOE Released Items) http://www.iq.poquoson.org/8sci02v5.htm
13 Test of Integrated Process Skills (Dillashaw & Okey, as cited in Moore 2001, p. 77-92; Turpin, 2000, p. 99-104.) 14 Grade 5: Science (2002 VDOE Released Items)
http://www.iq.poquoson.org/5sci01v5.htm 15 Comprehensive Science Review (2002 VDOE Released Items)
http://www.iq.poquoson.org/8sci02v5.htm 16 2000 Orta Öğretim Kurumları Öğrenci Seçme ve Yerleştirme Sınavı
http://egitek.meb.gov.tr/Sinavlar/Sorular/Ook/Ook2000/Ook2000Test_Key.pdf

157
B.1.5 Item difficulty (p) and corrected item-total correlation coefficient (r) values of the
items of the science process skills test forms developed from the pilot study
Table B.5 Item difficulty (p) and corrected item-total correlation coefficient (r) values of the
items of the science process skills test forms developed from the pilot study
First Second Third p r p r p r
1 .64 ,401 .53 ,245 .60 ,195 2 .35
.47
.48
,599 .484 .528
.14
.15
.07
.10
.13
.19
.541
.506
.263
.457
.494
.537
.85 ,216
3 .64 ,396 .47 ,383 .71 ,351 4 .43 ,382 .74 ,370 .26 ,364 5 .67 ,421 .59 ,512 .27 ,104 6 .35 ,324 .42 ,352 .26 -,122 7 .43 ,517 .49 ,437 .57 ,348 8 .43
.22 ,612 .500
.56
.25 ,312 .468
.25 ,216
9 .30 ,297 .29 ,446 .31 -,006 10 .21 ,543 .32 ,143 .25 ,710 11 .45 ,398 .13 ,504
.31
(not in the pilot) ,455
(not in the pilot) 12 .35 ,309 .26 ,379 .09 ,425 13 .35 ,370 .55 ,246 .46 ,540 14 .09 ,450 .40 ,263 .19 ,502 15 .23 ,472 .27 ,356 .22 ,271 16 .28
.19 (items combined)
,529 .706
(items combined)
.31 ,491
.48 ,319

158
B.2 The Attitudes toward Science Lesson Questionnaire Developed from the Pilot Study
B.2.1 The Attitudes toward Science Lesson Questionnaire Form (and Its’ Subtests)
Developed from the Pilot Study
Anxiety Fen Bilgisi dersinde başarılı olmak için gerekli yeteneğe sahibim. Fen Bilgisi dersini kolayca anlayabiliyorum. Fen Bilgisi dersi konularına yakın olduğumu düşünüyorum. Lise ve üniversitede Fen Bilgisi ile ilgili derslerde başarısız olacağımı düşünüyorum. Fen Bilgisi dersinde yapılan sınavlarda kendimi rahat hissederim. Fen Bilgisi dersinde yapılan sınavlardan korkarım. Interest/Curiosity Fen Bilgisi dersi ile ilgili televizyon programı ve CD izlemekten hoşlanırım. Fen Bilgisi dersinde öğrendiklerimi arkadaşlarımla paylaşırım. Fen Bilgisi dersinde öğrendiklerimi ailemle paylaşırım. Okulumda Fen Bilgisi topluluğu olsaydı üye olmak isterdim. Career Bilim, teknoloji ve çevre ilgili sorunları çözmek için bilim insanları ile çalışmak isterim. Fen Bilgisi ile ilgili sahip olabileceğim meslekleri öğrenmek isterim. Bana hediye olarak fen bilgisi dersi ile ilgili bir kitap ya da oyuncak verilmesinden hoşlanırım. Fen Bilgisi dersinde öğrendiklerimi ileride kullanmayı düşünüyorum. Enjoyment Fen Bilgisi dersinden zevk alırım. Fen Bilgisi dersine çalışmaktan hoşlanırım. Fen Bilgisi dersi sıkıcıdır. Fen Bilgisi dersinde rahatımdır. Fen Bilgisi dersine karşı ilgiliyimdir. Fen Bilgisi dersi eğlenceli değildir. Fen Bilgisi dersi beni huzursuz eder. Fen Bilgisi dersinden hoşlanmıyorum. Çalışma zamanımın önemli bir kısmını Fen Bilgisi dersine ayırmak isterim. Aldığım diğer dersler Fen Bilgisi dersinden daha ilgi çekicidir. Fen Bilgisi dersini sevmiyorum. Motivation Fen Bilgisi dersi ödevlerini, ne kadar zor olursa olsun yapmayı denerim. Fen Bilgisi dersinde iyi olmaya çalışırım. Fen Bilgisi dersinde sorulan soruların cevaplarını çeşitli kaynaklardan (kitap, internet gibi) araştırırım. Relation to Daily Life. Fen Bilgisi dersinde sorulan sorular gerçek hayatla ilgilidir. Fen Bilgisi dersi doğa olaylarını daha iyi anlamama yarar. Fen Bilgisi dersinde sorulan soruları cevaplamaktan hoşlanırım. Importance Fen Bilgisi dersinin gereksiz olduğunu düşünüyorum. Fen Bilgisi dersi düşünme yeteneğimi geliştirir.

159
B.2.2 Corrected item-total correlation coefficient (r) values of the items of the attitudes
toward science and technology course questionnaire in the pilot study
Table B.6 Corrected item-total correlation coefficient (r) values of the items of the attitudes
toward science and technology course questionnaire in the pilot study
İtems r 1 ,642 2 ,521 3 ,694 4 ,514 5 ,600 6 ,429 7 ,504 8 ,504 9 ,481 10 ,527 11 ,454 12 ,470 13 ,490 14 ,618 15 ,706 16 ,737 17 ,673 18 ,530 19 ,746 20 ,704 21 ,721 22 ,707 23 ,545 24 ,499 25 ,603 26 ,539 27 ,504 28 ,522 29 ,410 30 ,413 31 ,568 32 ,634 33 ,597

160
APPENDIX C
DEMOGRAPHIC FORM
1993
1994
1995
1996
Doğum tarihiniz nedir?
Anne ve babanızın mesleği nedir?
Ev
hanı
mı
İşsi
z
İşçi
Mem
ur
Ser
best
mes
lek
Diğ
er(y
azın
ız)
Annem
Babam
Anne ve babanızın eğitim düzeyi nedir?
Oku
r-ya
zar
deği
l
Oku
r-ya
zar
İlko
kul
Ort
aoku
l
İlköğr
etim
Oku
lu
Lis
e
Üni
vers
ite
Yük
sek
Lis
ans/
Dok
tora
Annem
Babam
Hiç yok 1 2 3 4 5 ve 5’ten fazla
Kaç kardeşiniz var?

161
Ailenizin aylık geliri yaklaşık ne kadar olabilir? (YTL olarak)
0–35
0
351-
500
501-
750
751-
1000
1001
-125
0
1251
-150
0
1501
-175
0
1751
’den
faz
la
Evinizde aşağıdakilerden hangisi bulunmaktadır? Var Kullandığımız bir bulaşık makinesi Bilgisayar Kendime ait bir çalışma odası
Aşağıdaki soruları cevaplayınız. Evet Hayır
Okul dışı zamanınızda para kazanmak için çalışıyorum.
Okul öncesi eğitim (ana okulu) aldım.
5 6 7 8 9 10 11
İlköğretim 1. sınıfa kaç yaşında başladınız?
0-10 11-25 26-100 101-200 200’den fazla kitap
Evinizde kaç tane kitap vardır?
Evet Hayır
Evinize gazete, dergi alınıyor mu?

162
APPENDIX D
ATTITUDES TOWARD SCIENCE AND TECHNOLOGY COURSE
QUESTIONNAIRE FORM
Self-Concept Fen Bilgisi dersinde başarılı olmak için gerekli yeteneğe sahibim. Fen Bilgisi dersini kolayca anlayabiliyorum. Fen Bilgisi dersi konularına yakın olduğumu düşünüyorum. Fen Bilgisi dersinde yapılan sınavlarda kendimi rahat hissederim. Anxiety Lise ve üniversitede Fen Bilgisi ile ilgili derslerde başarısız olacağımı düşünüyorum. Fen Bilgisi dersinde yapılan sınavlardan korkarım. Fen Bilgisi dersi sıkıcıdır. Fen Bilgisi dersi beni huzursuz eder. Fen Bilgisi dersinden hoşlanmıyorum. Fen Bilgisi dersi eğlenceli değildir. Aldığım diğer dersler Fen Bilgisi dersinden daha ilgi çekicidir. Fen Bilgisi dersini sevmiyorum. Fen Bilgisi dersinin gereksiz olduğunu düşünüyorum. Interest Fen Bilgisi dersi ile ilgili televizyon programı ve CD izlemekten hoşlanırım. Okulumda Fen Bilgisi topluluğu olsaydı üye olmak isterdim. Bilim, teknoloji ve çevre ilgili sorunları çözmek için bilim insanları ile çalışmak isterim. Bana hediye olarak fen bilgisi dersi ile ilgili bir kitap ya da oyuncak verilmesinden hoşlanırım. Career Fen Bilgisi dersinde öğrendiklerimi ailemle paylaşırım. Fen Bilgisi ile ilgili sahip olabileceğim meslekleri öğrenmek isterim. Fen Bilgisi dersinde öğrendiklerimi ileride kullanmayı düşünüyorum. Çalışma zamanımın önemli bir kısmını Fen Bilgisi dersine ayırmak isterim. Enjoyment Fen Bilgisi dersinden zevk alırım. Fen Bilgisi dersine çalışmaktan hoşlanırım. Fen Bilgisi dersinde rahatımdır. Fen Bilgisi dersine karşı ilgiliyimdir. Usefulness Fen Bilgisi dersinde iyi olmaya çalışırım. Fen Bilgisi dersinde sorulan sorular gerçek hayatla ilgilidir. Fen Bilgisi dersi doğa olaylarını daha iyi anlamama yarar. Fen Bilgisi dersinde sorulan soruları cevaplamaktan hoşlanırım. Fen Bilgisi dersi düşünme yeteneğimi geliştirir.

163
APPENDIX E
MISSING DATA IN ATTITUDES TOWARD SCIENCE AND TECHNOLOGY
COURSE QUESTIONNAIRE
E.1 Missing Data in the First Attitudes toward Science and Technology Course
Questionnaire
yetenek1
2 1,2 1,2 1,2
20 11,9 11,9 13,1
73 43,5 43,5 56,5
73 43,5 43,5 100,0
168 100,0 100,0
0
3
4
5
Total
ValidFrequency Percent Valid Percent
CumulativePercent
anlama1
2 1,2 1,2 1,2
4 2,4 2,4 3,6
17 10,1 10,1 13,7
70 41,7 41,7 55,4
75 44,6 44,6 100,0
168 100,0 100,0
0
2
3
4
5
Total
ValidFrequency Percent Valid Percent
CumulativePercent
basarisiz1
2 1,2 1,2 1,2
18 10,7 10,7 11,9
15 8,9 8,9 20,8
46 27,4 27,4 48,2
46 27,4 27,4 75,6
41 24,4 24,4 100,0
168 100,0 100,0
0
1
2
3
4
5
Total
ValidFrequency Percent Valid Percent
CumulativePercent
sinavdarahat1
4 2,4 2,4 2,4
6 3,6 3,6 6,0
10 6,0 6,0 11,9
29 17,3 17,3 29,2
58 34,5 34,5 63,7
61 36,3 36,3 100,0
168 100,0 100,0
0
1
2
3
4
5
Total
ValidFrequency Percent Valid Percent
CumulativePercent

164
E.1 (Cont.’d)
korkma1
4 2,4 2,4 2,4
17 10,1 10,1 12,5
12 7,1 7,1 19,6
25 14,9 14,9 34,5
53 31,5 31,5 66,1
57 33,9 33,9 100,0
168 100,0 100,0
0
1
2
3
4
5
Total
ValidFrequency Percent Valid Percent
CumulativePercent
tvcd1
3 1,8 1,8 1,8
11 6,5 6,5 8,3
14 8,3 8,3 16,7
21 12,5 12,5 29,2
48 28,6 28,6 57,7
71 42,3 42,3 100,0
168 100,0 100,0
0
1
2
3
4
5
Total
ValidFrequency Percent Valid Percent
CumulativePercent
aile1
3 1,8 1,8 1,8
4 2,4 2,4 4,2
8 4,8 4,8 8,9
25 14,9 14,9 23,8
58 34,5 34,5 58,3
70 41,7 41,7 100,0
168 100,0 100,0
0
1
2
3
4
5
Total
ValidFrequency Percent Valid Percent
CumulativePercent
uyelik1
4 2,4 2,4 2,4
6 3,6 3,6 6,0
4 2,4 2,4 8,3
47 28,0 28,0 36,3
46 27,4 27,4 63,7
61 36,3 36,3 100,0
168 100,0 100,0
0
1
2
3
4
5
Total
ValidFrequency Percent Valid Percent
CumulativePercent
blmnsncalisma1
4 2,4 2,4 2,4
6 3,6 3,6 6,0
2 1,2 1,2 7,1
25 14,9 14,9 22,0
39 23,2 23,2 45,2
92 54,8 54,8 100,0
168 100,0 100,0
0
1
2
3
4
5
Total
ValidFrequency Percent Valid Percent
CumulativePercent

165
E.1 (Cont.’d)
meslek1
3 1,8 1,8 1,8
1 ,6 ,6 2,4
5 3,0 3,0 5,4
18 10,7 10,7 16,1
48 28,6 28,6 44,6
93 55,4 55,4 100,0
168 100,0 100,0
0
1
2
3
4
5
Total
ValidFrequency Percent Valid Percent
CumulativePercent
kitapoyuncak1
3 1,8 1,8 1,8
7 4,2 4,2 6,0
10 6,0 6,0 11,9
15 8,9 8,9 20,8
52 31,0 31,0 51,8
81 48,2 48,2 100,0
168 100,0 100,0
0
1
2
3
4
5
Total
ValidFrequency Percent Valid Percent
CumulativePercent
ileridekullanma1
3 1,8 1,8 1,8
1 ,6 ,6 2,4
5 3,0 3,0 5,4
23 13,7 13,7 19,0
50 29,8 29,8 48,8
86 51,2 51,2 100,0
168 100,0 100,0
0
1
2
3
4
5
Total
ValidFrequency Percent Valid Percent
CumulativePercent
zevkalma1
3 1,8 1,8 1,8
2 1,2 1,2 3,0
5 3,0 3,0 6,0
11 6,5 6,5 12,5
59 35,1 35,1 47,6
88 52,4 52,4 100,0
168 100,0 100,0
0
1
2
3
4
5
Total
ValidFrequency Percent Valid Percent
CumulativePercent
hoslanma1
7 4,2 4,2 4,2
2 1,2 1,2 5,4
1 ,6 ,6 6,0
11 6,5 6,5 12,5
62 36,9 36,9 49,4
85 50,6 50,6 100,0
168 100,0 100,0
0
1
2
3
4
5
Total
ValidFrequency Percent Valid Percent
CumulativePercent

166
E.1 (Cont.’d)
sikici1
8 4,8 4,8 4,8
12 7,1 7,1 11,9
14 8,3 8,3 20,2
18 10,7 10,7 31,0
39 23,2 23,2 54,2
77 45,8 45,8 100,0
168 100,0 100,0
0
1
2
3
4
5
Total
ValidFrequency Percent Valid Percent
CumulativePercent
dersterahat1
3 1,8 1,8 1,8
3 1,8 1,8 3,6
6 3,6 3,6 7,1
20 11,9 11,9 19,0
57 33,9 33,9 53,0
79 47,0 47,0 100,0
168 100,0 100,0
0
1
2
3
4
5
Total
ValidFrequency Percent Valid Percent
CumulativePercent
ilgili1
1 ,6 ,6 ,6
9 5,4 5,4 6,0
6 3,6 3,6 9,5
18 10,7 10,7 20,2
65 38,7 38,7 58,9
69 41,1 41,1 100,0
168 100,0 100,0
0
1
2
3
4
5
Total
ValidFrequency Percent Valid Percent
CumulativePercent
huzursuz1
4 2,4 2,4 2,4
15 8,9 8,9 11,3
9 5,4 5,4 16,7
18 10,7 10,7 27,4
37 22,0 22,0 49,4
85 50,6 50,6 100,0
168 100,0 100,0
0
1
2
3
4
5
Total
ValidFrequency Percent Valid Percent
CumulativePercent
hoslanmamak1
5 3,0 3,0 3,0
33 19,6 19,6 22,6
13 7,7 7,7 30,4
14 8,3 8,3 38,7
29 17,3 17,3 56,0
74 44,0 44,0 100,0
168 100,0 100,0
0
1
2
3
4
5
Total
ValidFrequency Percent Valid Percent
CumulativePercent

167
E.1 (Cont.’d)
eglenceliolmama1
8 4,8 4,8 4,8
8 4,8 4,8 9,5
16 9,5 9,5 19,0
18 10,7 10,7 29,8
35 20,8 20,8 50,6
83 49,4 49,4 100,0
168 100,0 100,0
0
1
2
3
4
5
Total
ValidFrequency Percent Valid Percent
CumulativePercent
ayirma1
1 ,6 ,6 ,6
5 3,0 3,0 3,6
9 5,4 5,4 8,9
45 26,8 26,8 35,7
59 35,1 35,1 70,8
49 29,2 29,2 100,0
168 100,0 100,0
0
1
2
3
4
5
Total
ValidFrequency Percent Valid Percent
CumulativePercent
ilgicekici1
3 1,8 1,8 1,8
20 11,9 11,9 13,7
37 22,0 22,0 35,7
70 41,7 41,7 77,4
18 10,7 10,7 88,1
20 11,9 11,9 100,0
168 100,0 100,0
0
1
2
3
4
5
Total
ValidFrequency Percent Valid Percent
CumulativePercent
sevmeme1
8 4,8 4,8 4,8
40 23,8 23,8 28,6
29 17,3 17,3 45,8
9 5,4 5,4 51,2
23 13,7 13,7 64,9
59 35,1 35,1 100,0
168 100,0 100,0
0
1
2
3
4
5
Total
ValidFrequency Percent Valid Percent
CumulativePercent
iyiolma1
3 1,8 1,8 1,8
2 1,2 1,2 3,0
10 6,0 6,0 8,9
52 31,0 31,0 39,9
101 60,1 60,1 100,0
168 100,0 100,0
0
1
3
4
5
Total
ValidFrequency Percent Valid Percent
CumulativePercent

168
E.1 (Cont.’d)
gercekhayat1
2 1,2 1,2 1,2
1 ,6 ,6 1,8
1 ,6 ,6 2,4
34 20,2 20,2 22,6
57 33,9 33,9 56,5
73 43,5 43,5 100,0
168 100,0 100,0
0
1
2
3
4
5
Total
ValidFrequency Percent Valid Percent
CumulativePercent
iyianlama1
4 2,4 2,4 2,4
6 3,6 3,6 6,0
2 1,2 1,2 7,1
22 13,1 13,1 20,2
46 27,4 27,4 47,6
88 52,4 52,4 100,0
168 100,0 100,0
0
1
2
3
4
5
Total
ValidFrequency Percent Valid Percent
CumulativePercent
cevaphoslanma1
4 2,4 2,4 2,4
1 ,6 ,6 3,0
3 1,8 1,8 4,8
20 11,9 11,9 16,7
64 38,1 38,1 54,8
76 45,2 45,2 100,0
168 100,0 100,0
0
1
2
3
4
5
Total
ValidFrequency Percent Valid Percent
CumulativePercent
gereksiz1
4 2,4 2,4 2,4
17 10,1 10,1 12,5
11 6,5 6,5 19,0
8 4,8 4,8 23,8
24 14,3 14,3 38,1
104 61,9 61,9 100,0
168 100,0 100,0
0
1
2
3
4
5
Total
ValidFrequency Percent Valid Percent
CumulativePercent
dusunmegelistirme1
2 1,2 1,2 1,2
2 1,2 1,2 2,4
3 1,8 1,8 4,2
18 10,7 10,7 14,9
44 26,2 26,2 41,1
99 58,9 58,9 100,0
168 100,0 100,0
0
1
2
3
4
5
Total
ValidFrequency Percent Valid Percent
CumulativePercent

169
E.2 Missing Data in the Second Attitudes toward Science and Technology Course
Questionnaire
anlama2
2 1,2 1,2 1,2
2 1,2 1,2 2,4
12 7,1 7,1 9,5
63 37,5 37,5 47,0
89 53,0 53,0 100,0
168 100,0 100,0
0
2
3
4
5
Total
ValidFrequency Percent Valid Percent
CumulativePercent
yakinolma2
5 3,0 3,0 3,0
2 1,2 1,2 4,2
2 1,2 1,2 5,4
27 16,1 16,1 21,4
48 28,6 28,6 50,0
84 50,0 50,0 100,0
168 100,0 100,0
0
1
2
3
4
5
Total
ValidFrequency Percent Valid Percent
CumulativePercent
basarisiz2
3 1,8 1,8 1,8
29 17,3 17,3 19,0
19 11,3 11,3 30,4
34 20,2 20,2 50,6
30 17,9 17,9 68,5
53 31,5 31,5 100,0
168 100,0 100,0
0
1
2
3
4
5
Total
ValidFrequency Percent Valid Percent
CumulativePercent
sinavdarahat2
3 1,8 1,8 1,8
5 3,0 3,0 4,8
8 4,8 4,8 9,5
22 13,1 13,1 22,6
59 35,1 35,1 57,7
71 42,3 42,3 100,0
168 100,0 100,0
0
1
2
3
4
5
Total
ValidFrequency Percent Valid Percent
CumulativePercent
korkma2
4 2,4 2,4 2,4
29 17,3 17,3 19,6
24 14,3 14,3 33,9
17 10,1 10,1 44,0
29 17,3 17,3 61,3
65 38,7 38,7 100,0
168 100,0 100,0
0
1
2
3
4
5
Total
ValidFrequency Percent Valid Percent
CumulativePercent

170
E.2 (Cont.’d)
tvcd2
1 ,6 ,6 ,6
3 1,8 1,8 2,4
12 7,1 7,1 9,5
21 12,5 12,5 22,0
45 26,8 26,8 48,8
86 51,2 51,2 100,0
168 100,0 100,0
0
1
2
3
4
5
Total
ValidFrequency Percent Valid Percent
CumulativePercent
uyelik2
2 1,2 1,2 1,2
5 3,0 3,0 4,2
5 3,0 3,0 7,1
45 26,8 26,8 33,9
43 25,6 25,6 59,5
68 40,5 40,5 100,0
168 100,0 100,0
0
1
2
3
4
5
Total
ValidFrequency Percent Valid Percent
CumulativePercent
blmnsncalisma2
4 2,4 2,4 2,4
1 ,6 ,6 3,0
5 3,0 3,0 6,0
22 13,1 13,1 19,0
31 18,5 18,5 37,5
105 62,5 62,5 100,0
168 100,0 100,0
0
1
2
3
4
5
Total
ValidFrequency Percent Valid Percent
CumulativePercent
meslek2
2 1,2 1,2 1,2
2 1,2 1,2 2,4
7 4,2 4,2 6,5
10 6,0 6,0 12,5
40 23,8 23,8 36,3
107 63,7 63,7 100,0
168 100,0 100,0
0
1
2
3
4
5
Total
ValidFrequency Percent Valid Percent
CumulativePercent
kitapoyuncak2
2 1,2 1,2 1,2
2 1,2 1,2 2,4
8 4,8 4,8 7,1
18 10,7 10,7 17,9
48 28,6 28,6 46,4
90 53,6 53,6 100,0
168 100,0 100,0
0
1
2
3
4
5
Total
ValidFrequency Percent Valid Percent
CumulativePercent
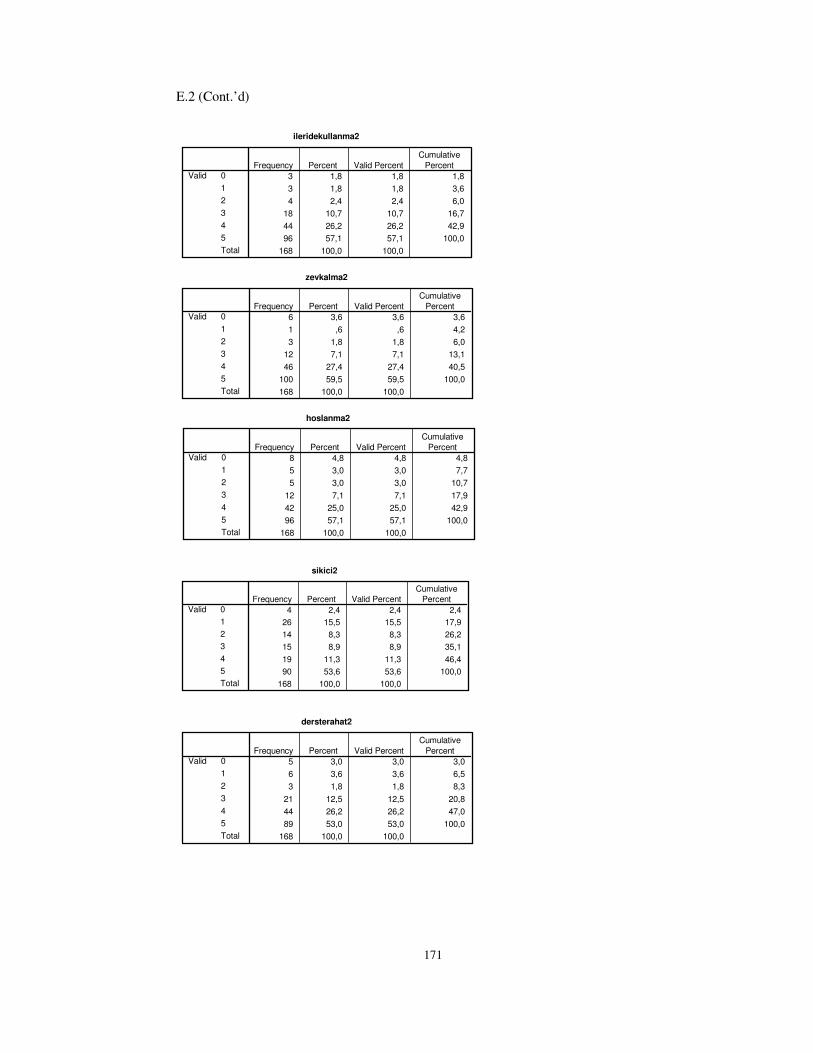
171
E.2 (Cont.’d)
ileridekullanma2
3 1,8 1,8 1,8
3 1,8 1,8 3,6
4 2,4 2,4 6,0
18 10,7 10,7 16,7
44 26,2 26,2 42,9
96 57,1 57,1 100,0
168 100,0 100,0
0
1
2
3
4
5
Total
ValidFrequency Percent Valid Percent
CumulativePercent
zevkalma2
6 3,6 3,6 3,6
1 ,6 ,6 4,2
3 1,8 1,8 6,0
12 7,1 7,1 13,1
46 27,4 27,4 40,5
100 59,5 59,5 100,0
168 100,0 100,0
0
1
2
3
4
5
Total
ValidFrequency Percent Valid Percent
CumulativePercent
hoslanma2
8 4,8 4,8 4,8
5 3,0 3,0 7,7
5 3,0 3,0 10,7
12 7,1 7,1 17,9
42 25,0 25,0 42,9
96 57,1 57,1 100,0
168 100,0 100,0
0
1
2
3
4
5
Total
ValidFrequency Percent Valid Percent
CumulativePercent
sikici2
4 2,4 2,4 2,4
26 15,5 15,5 17,9
14 8,3 8,3 26,2
15 8,9 8,9 35,1
19 11,3 11,3 46,4
90 53,6 53,6 100,0
168 100,0 100,0
0
1
2
3
4
5
Total
ValidFrequency Percent Valid Percent
CumulativePercent
dersterahat2
5 3,0 3,0 3,0
6 3,6 3,6 6,5
3 1,8 1,8 8,3
21 12,5 12,5 20,8
44 26,2 26,2 47,0
89 53,0 53,0 100,0
168 100,0 100,0
0
1
2
3
4
5
Total
ValidFrequency Percent Valid Percent
CumulativePercent
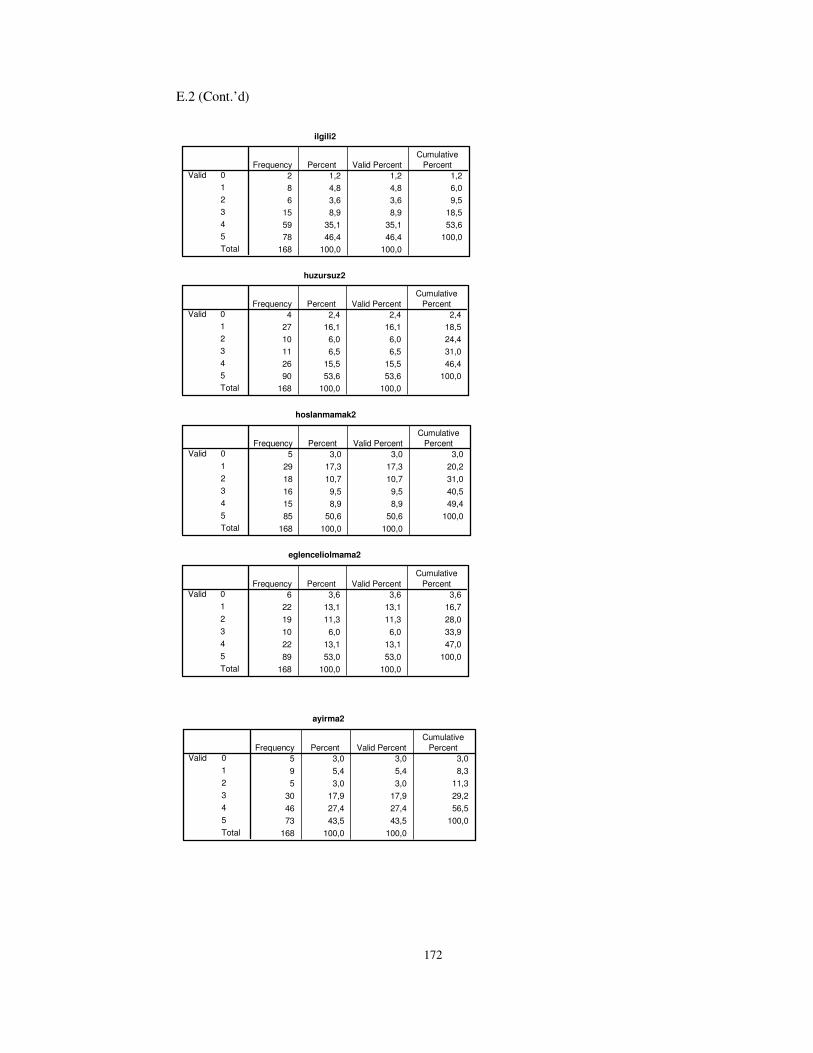
172
E.2 (Cont.’d)
ilgili2
2 1,2 1,2 1,2
8 4,8 4,8 6,0
6 3,6 3,6 9,5
15 8,9 8,9 18,5
59 35,1 35,1 53,6
78 46,4 46,4 100,0
168 100,0 100,0
0
1
2
3
4
5
Total
ValidFrequency Percent Valid Percent
CumulativePercent
huzursuz2
4 2,4 2,4 2,4
27 16,1 16,1 18,5
10 6,0 6,0 24,4
11 6,5 6,5 31,0
26 15,5 15,5 46,4
90 53,6 53,6 100,0
168 100,0 100,0
0
1
2
3
4
5
Total
ValidFrequency Percent Valid Percent
CumulativePercent
hoslanmamak2
5 3,0 3,0 3,0
29 17,3 17,3 20,2
18 10,7 10,7 31,0
16 9,5 9,5 40,5
15 8,9 8,9 49,4
85 50,6 50,6 100,0
168 100,0 100,0
0
1
2
3
4
5
Total
ValidFrequency Percent Valid Percent
CumulativePercent
eglenceliolmama2
6 3,6 3,6 3,6
22 13,1 13,1 16,7
19 11,3 11,3 28,0
10 6,0 6,0 33,9
22 13,1 13,1 47,0
89 53,0 53,0 100,0
168 100,0 100,0
0
1
2
3
4
5
Total
ValidFrequency Percent Valid Percent
CumulativePercent
ayirma2
5 3,0 3,0 3,0
9 5,4 5,4 8,3
5 3,0 3,0 11,3
30 17,9 17,9 29,2
46 27,4 27,4 56,5
73 43,5 43,5 100,0
168 100,0 100,0
0
1
2
3
4
5
Total
ValidFrequency Percent Valid Percent
CumulativePercent
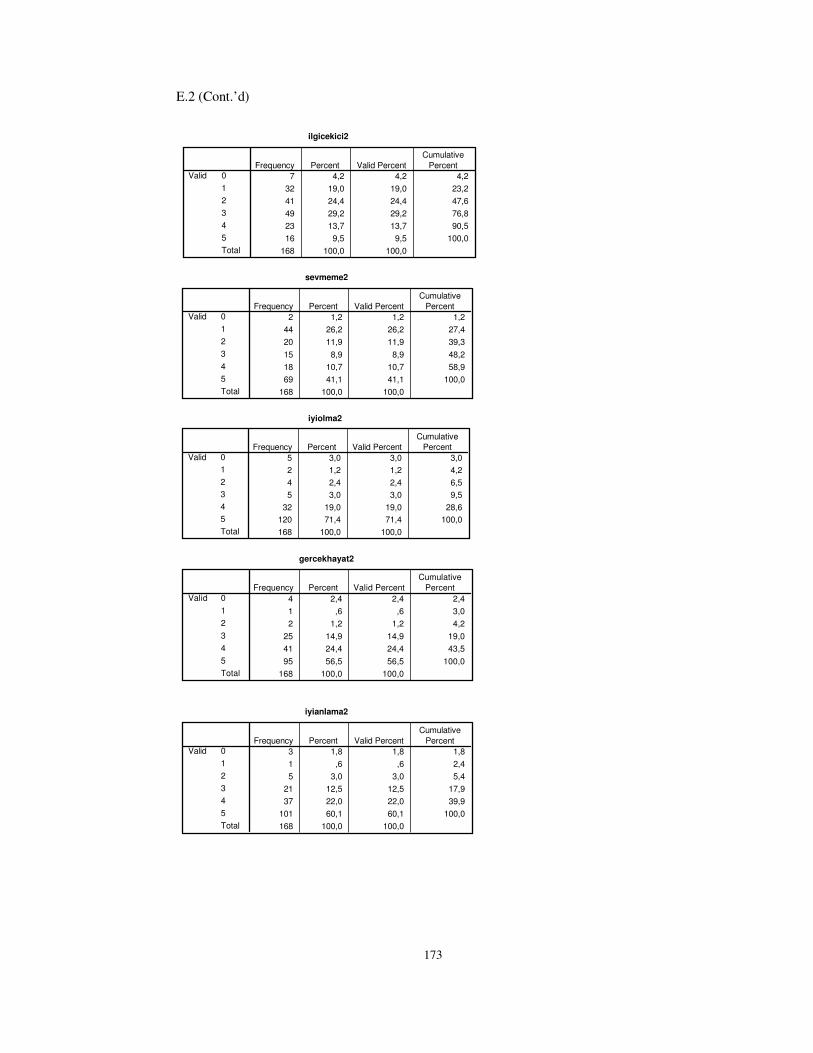
173
E.2 (Cont.’d)
ilgicekici2
7 4,2 4,2 4,2
32 19,0 19,0 23,2
41 24,4 24,4 47,6
49 29,2 29,2 76,8
23 13,7 13,7 90,5
16 9,5 9,5 100,0
168 100,0 100,0
0
1
2
3
4
5
Total
ValidFrequency Percent Valid Percent
CumulativePercent
sevmeme2
2 1,2 1,2 1,2
44 26,2 26,2 27,4
20 11,9 11,9 39,3
15 8,9 8,9 48,2
18 10,7 10,7 58,9
69 41,1 41,1 100,0
168 100,0 100,0
0
1
2
3
4
5
Total
ValidFrequency Percent Valid Percent
CumulativePercent
iyiolma2
5 3,0 3,0 3,0
2 1,2 1,2 4,2
4 2,4 2,4 6,5
5 3,0 3,0 9,5
32 19,0 19,0 28,6
120 71,4 71,4 100,0
168 100,0 100,0
0
1
2
3
4
5
Total
ValidFrequency Percent Valid Percent
CumulativePercent
gercekhayat2
4 2,4 2,4 2,4
1 ,6 ,6 3,0
2 1,2 1,2 4,2
25 14,9 14,9 19,0
41 24,4 24,4 43,5
95 56,5 56,5 100,0
168 100,0 100,0
0
1
2
3
4
5
Total
ValidFrequency Percent Valid Percent
CumulativePercent
iyianlama2
3 1,8 1,8 1,8
1 ,6 ,6 2,4
5 3,0 3,0 5,4
21 12,5 12,5 17,9
37 22,0 22,0 39,9
101 60,1 60,1 100,0
168 100,0 100,0
0
1
2
3
4
5
Total
ValidFrequency Percent Valid Percent
CumulativePercent
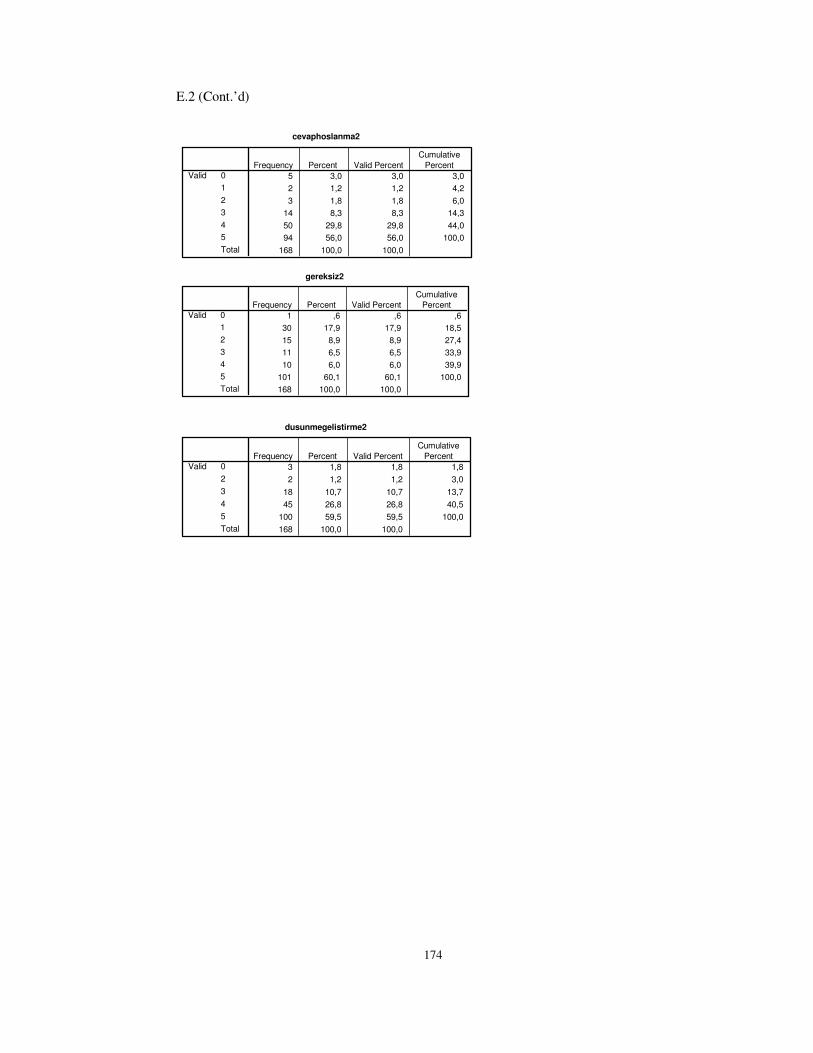
174
E.2 (Cont.’d)
cevaphoslanma2
5 3,0 3,0 3,0
2 1,2 1,2 4,2
3 1,8 1,8 6,0
14 8,3 8,3 14,3
50 29,8 29,8 44,0
94 56,0 56,0 100,0
168 100,0 100,0
0
1
2
3
4
5
Total
ValidFrequency Percent Valid Percent
CumulativePercent
gereksiz2
1 ,6 ,6 ,6
30 17,9 17,9 18,5
15 8,9 8,9 27,4
11 6,5 6,5 33,9
10 6,0 6,0 39,9
101 60,1 60,1 100,0
168 100,0 100,0
0
1
2
3
4
5
Total
ValidFrequency Percent Valid Percent
CumulativePercent
dusunmegelistirme2
3 1,8 1,8 1,8
2 1,2 1,2 3,0
18 10,7 10,7 13,7
45 26,8 26,8 40,5
100 59,5 59,5 100,0
168 100,0 100,0
0
2
3
4
5
Total
ValidFrequency Percent Valid Percent
CumulativePercent
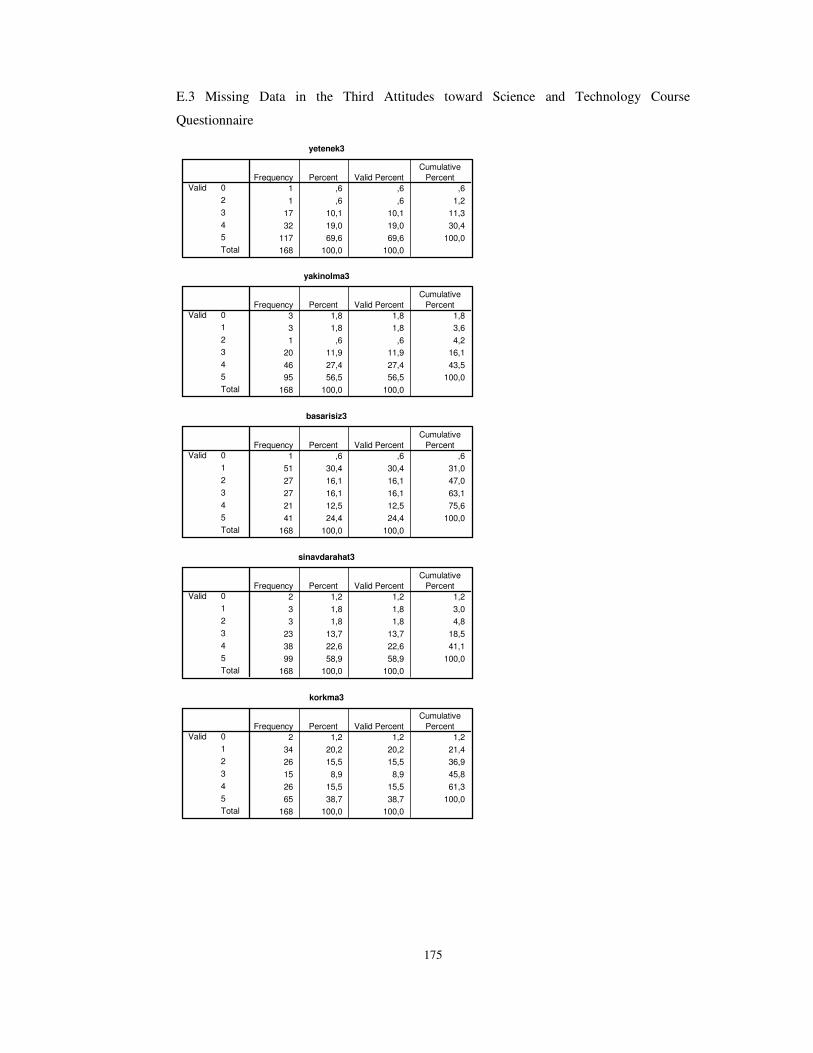
175
E.3 Missing Data in the Third Attitudes toward Science and Technology Course
Questionnaire
yetenek3
1 ,6 ,6 ,6
1 ,6 ,6 1,2
17 10,1 10,1 11,3
32 19,0 19,0 30,4
117 69,6 69,6 100,0
168 100,0 100,0
0
2
3
4
5
Total
ValidFrequency Percent Valid Percent
CumulativePercent
yakinolma3
3 1,8 1,8 1,8
3 1,8 1,8 3,6
1 ,6 ,6 4,2
20 11,9 11,9 16,1
46 27,4 27,4 43,5
95 56,5 56,5 100,0
168 100,0 100,0
0
1
2
3
4
5
Total
ValidFrequency Percent Valid Percent
CumulativePercent
basarisiz3
1 ,6 ,6 ,6
51 30,4 30,4 31,0
27 16,1 16,1 47,0
27 16,1 16,1 63,1
21 12,5 12,5 75,6
41 24,4 24,4 100,0
168 100,0 100,0
0
1
2
3
4
5
Total
ValidFrequency Percent Valid Percent
CumulativePercent
sinavdarahat3
2 1,2 1,2 1,2
3 1,8 1,8 3,0
3 1,8 1,8 4,8
23 13,7 13,7 18,5
38 22,6 22,6 41,1
99 58,9 58,9 100,0
168 100,0 100,0
0
1
2
3
4
5
Total
ValidFrequency Percent Valid Percent
CumulativePercent
korkma3
2 1,2 1,2 1,2
34 20,2 20,2 21,4
26 15,5 15,5 36,9
15 8,9 8,9 45,8
26 15,5 15,5 61,3
65 38,7 38,7 100,0
168 100,0 100,0
0
1
2
3
4
5
Total
ValidFrequency Percent Valid Percent
CumulativePercent

176
E.3 (Cont.’d)
tvcd3
1 ,6 ,6 ,6
5 3,0 3,0 3,6
11 6,5 6,5 10,1
23 13,7 13,7 23,8
24 14,3 14,3 38,1
104 61,9 61,9 100,0
168 100,0 100,0
0
1
2
3
4
5
Total
ValidFrequency Percent Valid Percent
CumulativePercent
blmnsncalisma3
4 2,4 2,4 2,4
7 4,2 4,2 6,5
7 4,2 4,2 10,7
20 11,9 11,9 22,6
25 14,9 14,9 37,5
105 62,5 62,5 100,0
168 100,0 100,0
0
1
2
3
4
5
Total
ValidFrequency Percent Valid Percent
CumulativePercent
meslek3
1 ,6 ,6 ,6
2 1,2 1,2 1,8
6 3,6 3,6 5,4
17 10,1 10,1 15,5
35 20,8 20,8 36,3
107 63,7 63,7 100,0
168 100,0 100,0
0
1
2
3
4
5
Total
ValidFrequency Percent Valid Percent
CumulativePercent
ileridekullanma3
1 ,6 ,6 ,6
2 1,2 1,2 1,8
5 3,0 3,0 4,8
17 10,1 10,1 14,9
36 21,4 21,4 36,3
107 63,7 63,7 100,0
168 100,0 100,0
0
1
2
3
4
5
Total
ValidFrequency Percent Valid Percent
CumulativePercent
zevkalma3
2 1,2 1,2 1,2
3 1,8 1,8 3,0
8 4,8 4,8 7,7
12 7,1 7,1 14,9
31 18,5 18,5 33,3
112 66,7 66,7 100,0
168 100,0 100,0
0
1
2
3
4
5
Total
ValidFrequency Percent Valid Percent
CumulativePercent

177
E.3 (Cont.’d)
sikici3
2 1,2 1,2 1,2
39 23,2 23,2 24,4
18 10,7 10,7 35,1
13 7,7 7,7 42,9
21 12,5 12,5 55,4
75 44,6 44,6 100,0
168 100,0 100,0
0
1
2
3
4
5
Total
ValidFrequency Percent Valid Percent
CumulativePercent
dersterahat3
2 1,2 1,2 1,2
8 4,8 4,8 6,0
3 1,8 1,8 7,7
21 12,5 12,5 20,2
28 16,7 16,7 36,9
106 63,1 63,1 100,0
168 100,0 100,0
0
1
2
3
4
5
Total
ValidFrequency Percent Valid Percent
CumulativePercent
ilgili3
2 1,2 1,2 1,2
8 4,8 4,8 6,0
7 4,2 4,2 10,1
20 11,9 11,9 22,0
40 23,8 23,8 45,8
91 54,2 54,2 100,0
168 100,0 100,0
0
1
2
3
4
5
Total
ValidFrequency Percent Valid Percent
CumulativePercent
huzursuz3
3 1,8 1,8 1,8
36 21,4 21,4 23,2
17 10,1 10,1 33,3
22 13,1 13,1 46,4
19 11,3 11,3 57,7
71 42,3 42,3 100,0
168 100,0 100,0
0
1
2
3
4
5
Total
ValidFrequency Percent Valid Percent
CumulativePercent
hoslanmamak3
1 ,6 ,6 ,6
52 31,0 31,0 31,5
24 14,3 14,3 45,8
13 7,7 7,7 53,6
20 11,9 11,9 65,5
58 34,5 34,5 100,0
168 100,0 100,0
0
1
2
3
4
5
Total
ValidFrequency Percent Valid Percent
CumulativePercent
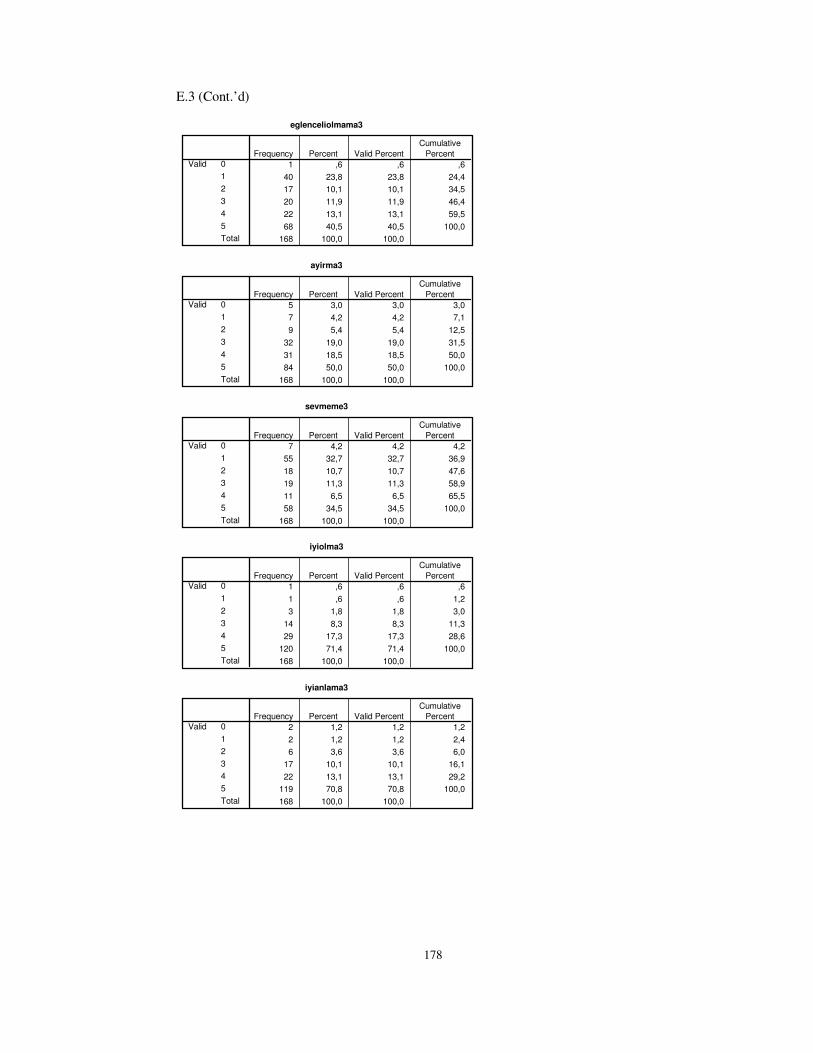
178
E.3 (Cont.’d)
eglenceliolmama3
1 ,6 ,6 ,6
40 23,8 23,8 24,4
17 10,1 10,1 34,5
20 11,9 11,9 46,4
22 13,1 13,1 59,5
68 40,5 40,5 100,0
168 100,0 100,0
0
1
2
3
4
5
Total
ValidFrequency Percent Valid Percent
CumulativePercent
ayirma3
5 3,0 3,0 3,0
7 4,2 4,2 7,1
9 5,4 5,4 12,5
32 19,0 19,0 31,5
31 18,5 18,5 50,0
84 50,0 50,0 100,0
168 100,0 100,0
0
1
2
3
4
5
Total
ValidFrequency Percent Valid Percent
CumulativePercent
sevmeme3
7 4,2 4,2 4,2
55 32,7 32,7 36,9
18 10,7 10,7 47,6
19 11,3 11,3 58,9
11 6,5 6,5 65,5
58 34,5 34,5 100,0
168 100,0 100,0
0
1
2
3
4
5
Total
ValidFrequency Percent Valid Percent
CumulativePercent
iyiolma3
1 ,6 ,6 ,6
1 ,6 ,6 1,2
3 1,8 1,8 3,0
14 8,3 8,3 11,3
29 17,3 17,3 28,6
120 71,4 71,4 100,0
168 100,0 100,0
0
1
2
3
4
5
Total
ValidFrequency Percent Valid Percent
CumulativePercent
iyianlama3
2 1,2 1,2 1,2
2 1,2 1,2 2,4
6 3,6 3,6 6,0
17 10,1 10,1 16,1
22 13,1 13,1 29,2
119 70,8 70,8 100,0
168 100,0 100,0
0
1
2
3
4
5
Total
ValidFrequency Percent Valid Percent
CumulativePercent
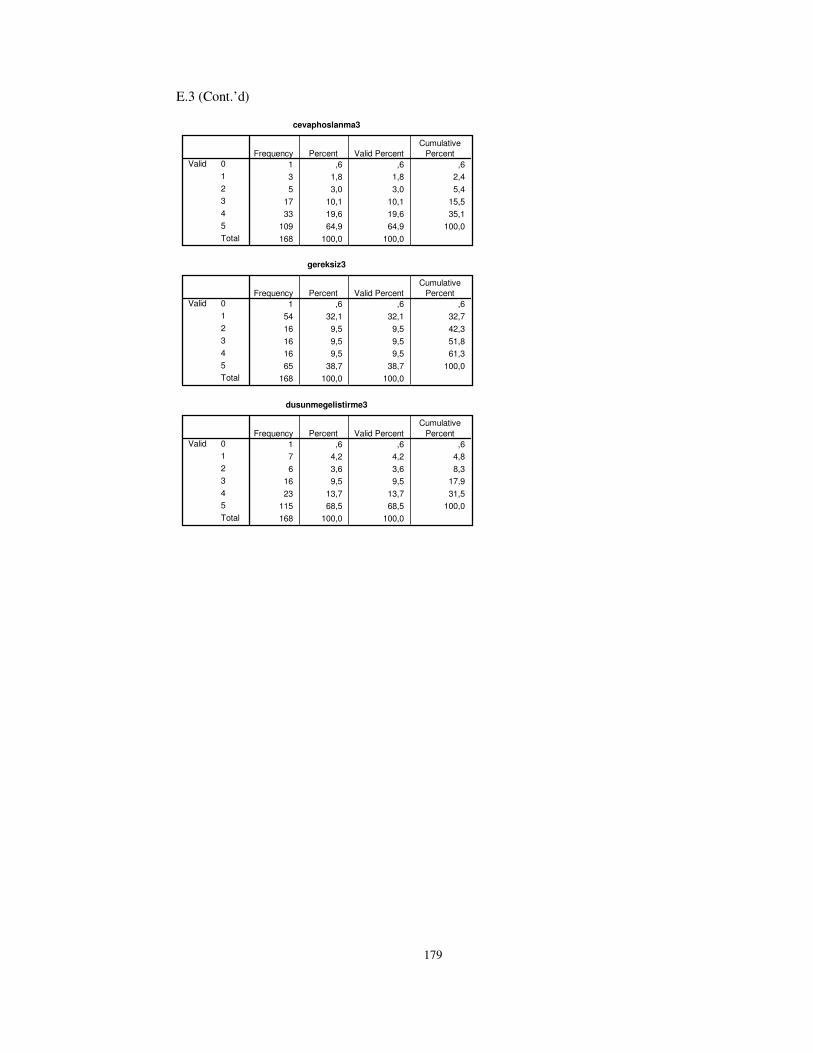
179
E.3 (Cont.’d)
cevaphoslanma3
1 ,6 ,6 ,6
3 1,8 1,8 2,4
5 3,0 3,0 5,4
17 10,1 10,1 15,5
33 19,6 19,6 35,1
109 64,9 64,9 100,0
168 100,0 100,0
0
1
2
3
4
5
Total
ValidFrequency Percent Valid Percent
CumulativePercent
gereksiz3
1 ,6 ,6 ,6
54 32,1 32,1 32,7
16 9,5 9,5 42,3
16 9,5 9,5 51,8
16 9,5 9,5 61,3
65 38,7 38,7 100,0
168 100,0 100,0
0
1
2
3
4
5
Total
ValidFrequency Percent Valid Percent
CumulativePercent
dusunmegelistirme3
1 ,6 ,6 ,6
7 4,2 4,2 4,8
6 3,6 3,6 8,3
16 9,5 9,5 17,9
23 13,7 13,7 31,5
115 68,5 68,5 100,0
168 100,0 100,0
0
1
2
3
4
5
Total
ValidFrequency Percent Valid Percent
CumulativePercent

180
E.4 Missing Data in the Fourth Attitudes toward Science and Technology Course
Questionnaire
anlama4
1 ,6 ,6 ,6
2 1,2 1,2 1,8
2 1,2 1,2 3,0
14 8,3 8,3 11,3
42 25,0 25,0 36,3
107 63,7 63,7 100,0
168 100,0 100,0
0
1
2
3
4
5
Total
ValidFrequency Percent Valid Percent
CumulativePercent
yakinolma4
1 ,6 ,6 ,6
1 ,6 ,6 1,2
3 1,8 1,8 3,0
20 11,9 11,9 14,9
35 20,8 20,8 35,7
108 64,3 64,3 100,0
168 100,0 100,0
0
1
2
3
4
5
Total
ValidFrequency Percent Valid Percent
CumulativePercent
sinavdarahat4
2 1,2 1,2 1,2
5 3,0 3,0 4,2
7 4,2 4,2 8,3
14 8,3 8,3 16,7
45 26,8 26,8 43,5
95 56,5 56,5 100,0
168 100,0 100,0
0
1
2
3
4
5
Total
ValidFrequency Percent Valid Percent
CumulativePercent
korkma4
2 1,2 1,2 1,2
30 17,9 17,9 19,0
16 9,5 9,5 28,6
16 9,5 9,5 38,1
26 15,5 15,5 53,6
78 46,4 46,4 100,0
168 100,0 100,0
0
1
2
3
4
5
Total
ValidFrequency Percent Valid Percent
CumulativePercent
uyelik4
2 1,2 1,2 1,2
6 3,6 3,6 4,8
5 3,0 3,0 7,7
27 16,1 16,1 23,8
36 21,4 21,4 45,2
92 54,8 54,8 100,0
168 100,0 100,0
0
1
2
3
4
5
Total
ValidFrequency Percent Valid Percent
CumulativePercent

181
E.4 (Cont.’d)
blmnsncalisma4
1 ,6 ,6 ,6
4 2,4 2,4 3,0
4 2,4 2,4 5,4
18 10,7 10,7 16,1
35 20,8 20,8 36,9
106 63,1 63,1 100,0
168 100,0 100,0
0
1
2
3
4
5
Total
ValidFrequency Percent Valid Percent
CumulativePercent
meslek4
Frequency Percent Valid Percent Cumulative
Percent Valid 0 2 1,2 1,2 1,2
1 5 3,0 3,0 4,2
2 4 2,4 2,4 6,6
3 17 10,1 10,2 16,8
4 33 19,6 19,8 36,5
5 107 63,1 63,5 100,0
Total 168 99,4 100,0
ileridekullanma4
1 ,6 ,6 ,6
1 ,6 ,6 1,2
5 3,0 3,0 4,2
18 10,7 10,7 14,9
34 20,2 20,2 35,1
109 64,9 64,9 100,0
168 100,0 100,0
0
1
2
3
4
5
Total
ValidFrequency Percent Valid Percent
CumulativePercent
sikici4
1 ,6 ,6 ,6
23 13,7 13,7 14,3
24 14,3 14,3 28,6
13 7,7 7,7 36,3
15 8,9 8,9 45,2
92 54,8 54,8 100,0
168 100,0 100,0
0
1
2
3
4
5
Total
ValidFrequency Percent Valid Percent
CumulativePercent
dersterahat4
1 ,6 ,6 ,6
4 2,4 2,4 3,0
8 4,8 4,8 7,7
11 6,5 6,5 14,3
39 23,2 23,2 37,5
105 62,5 62,5 100,0
168 100,0 100,0
0
1
2
3
4
5
Total
ValidFrequency Percent Valid Percent
CumulativePercent

182
E.4 (Cont.’d)
huzursuz4
2 1,2 1,2 1,2
29 17,3 17,3 18,5
20 11,9 11,9 30,4
10 6,0 6,0 36,3
19 11,3 11,3 47,6
88 52,4 52,4 100,0
168 100,0 100,0
0
1
2
3
4
5
Total
ValidFrequency Percent Valid Percent
CumulativePercent
hoslanmamak4
2 1,2 1,2 1,2
43 25,6 25,6 26,8
18 10,7 10,7 37,5
14 8,3 8,3 45,8
16 9,5 9,5 55,4
75 44,6 44,6 100,0
168 100,0 100,0
0
1
2
3
4
5
Total
ValidFrequency Percent Valid Percent
CumulativePercent
ilgicekici4
1 ,6 ,6 ,6
58 34,5 34,5 35,1
32 19,0 19,0 54,2
45 26,8 26,8 81,0
13 7,7 7,7 88,7
19 11,3 11,3 100,0
168 100,0 100,0
0
1
2
3
4
5
Total
ValidFrequency Percent Valid Percent
CumulativePercent
iyiolma4
1 ,6 ,6 ,6
1 ,6 ,6 1,2
4 2,4 2,4 3,6
13 7,7 7,7 11,3
31 18,5 18,5 29,8
118 70,2 70,2 100,0
168 100,0 100,0
0
1
2
3
4
5
Total
ValidFrequency Percent Valid Percent
CumulativePercent
iyianlama4
1 ,6 ,6 ,6
5 3,0 3,0 3,6
3 1,8 1,8 5,4
11 6,5 6,5 11,9
38 22,6 22,6 34,5
110 65,5 65,5 100,0
168 100,0 100,0
0
1
2
3
4
5
Total
ValidFrequency Percent Valid Percent
CumulativePercent

183
E.4 (Cont.’d)
cevaphoslanma4
1 ,6 ,6 ,6
4 2,4 2,4 3,0
8 4,8 4,8 7,7
16 9,5 9,5 17,3
28 16,7 16,7 33,9
111 66,1 66,1 100,0
168 100,0 100,0
0
1
2
3
4
5
Total
ValidFrequency Percent Valid Percent
CumulativePercent
gereksiz4
2 1,2 1,2 1,2
31 18,5 18,5 19,6
23 13,7 13,7 33,3
8 4,8 4,8 38,1
13 7,7 7,7 45,8
91 54,2 54,2 100,0
168 100,0 100,0
0
1
2
3
4
5
Total
ValidFrequency Percent Valid Percent
CumulativePercent

184
APPENDIX F
UNIT ACHIEVEMENT TESTS
F.1 Unit Achievement Test Forms
F.1.1 Reproduction, Development, and Growth In Living Things Achievement Test Form
1. Aşağıdaki seçeneklerden hangisi sadece canlıları içermektedir?
A) bulutlar, ateş, akarsular B) ateş, akarsular, ağaçlar C) akarsular, kuşlar, ağaçlar D) kuşlar, ağaçlar, solucanlar
2. Bir civciv, yumurtadan çıkmadan önce, onun içinde 21 gün gelişir. Sizce civciv yumurtadan çıkmadan önce besinini nereden
alır?
A) Civciv kendi besinini kendisi yapar. B) Civciv anne tavuk tarafından beslenir.
C) Civciv yumurtanın kabuğunu yer. D) Civciv yumurtanın içindeki besini kullanır.
3. Can, bir tabağın içine birkaç tane tohum koydu, üzerlerine pamuk yerleştirerek bastırdı, sonra pamuğu suyla ıslattı. Mert de
kendi tohumlarını aynı şekilde ekip, tabağını Can’ın tabağının yanına yerleştirdi ama pamuğu suyla ıslatmak yerine, tabağı
suyla doldurdu. İki gün sonra Can’ın ektiği tohumlar filizlenirken, Mert’in ektiği tohumlar filizlenmedi. Sizce bunun nedeni
aşağıdakilerden hangisidir?
A) Mert’in ektiği tohumların daha fazla havaya ihtiyacı vardı. C) Mert tabağı sıcak bir yere koymadı.
B) Mert’in ektiği tohumların daha fazla ışığa ihtiyacı vardı. D) Mert farklı bir tohum türü kullanmalıydı.
4. Bir yaprağa konan kelebek, oraya yumurtalarını bıraktı. Aşağıda yumurtaların geçirdiği değişim görülmektedir. Sizce bu
değişiklikler hangi sırada gerçekleşir?
A) 1, 2, 3, 4 B) 1, 3, 2, 4 C) 1, 4, 3, 2 D) 1, 4, 2, 3
5. Mikroskopta hayvan hücresini inceleyen bir öğrenci aşağıdaki kısımlardan hangisini göremez?
A) Hücre zarı B) Çekirdek C) Kloroplast D) Sitoplazma
6. Aşağıdakilerden hangileri bitki tohumlarının yayılmasında etkilidir?
I- Rüzgâr II- İnsan III- Hayvan
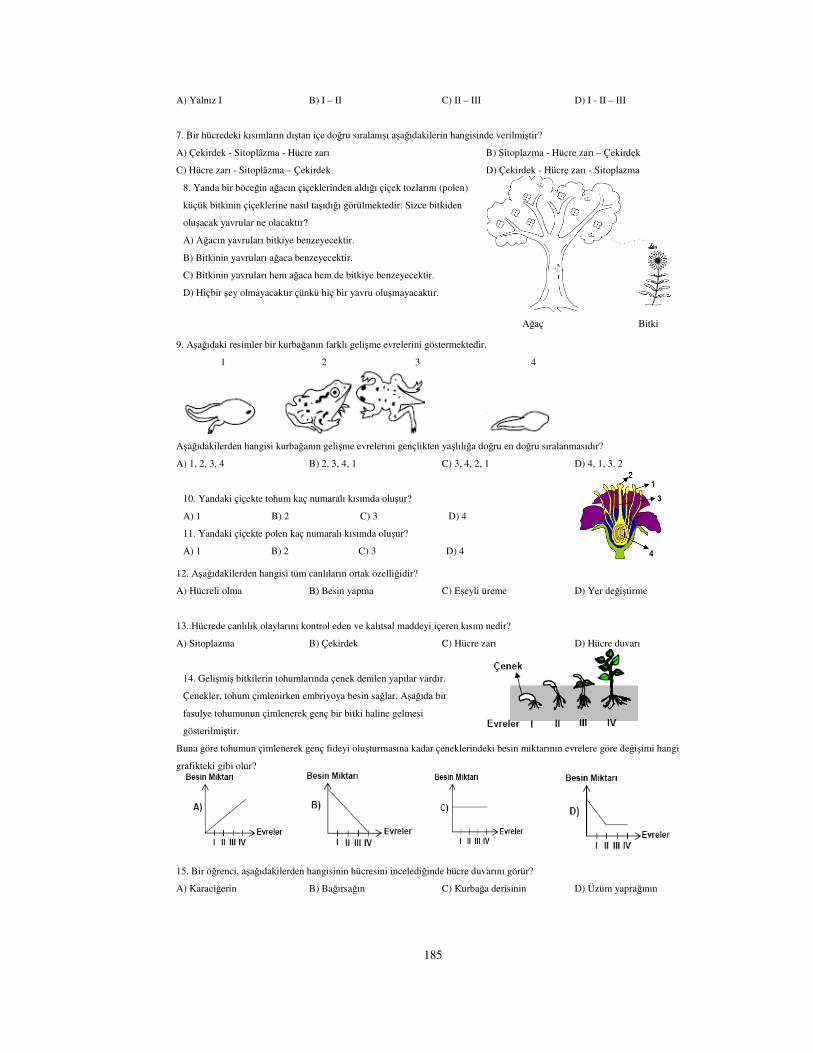
185
A) Yalnız I B) I – II C) II – III D) I - II – III
7. Bir hücredeki kısımların dıştan içe doğru sıralanışı aşağıdakilerin hangisinde verilmiştir?
A) Çekirdek - Sitoplâzma - Hücre zarı B) Sitoplazma - Hücre zarı – Çekirdek
C) Hücre zarı - Sitoplâzma – Çekirdek D) Çekirdek - Hücre zarı - Sitoplazma
8. Yanda bir böceğin ağacın çiçeklerinden aldığı çiçek tozlarını (polen)
küçük bitkinin çiçeklerine nasıl taşıdığı görülmektedir. Sizce bitkiden
oluşacak yavrular ne olacaktır?
A) Ağacın yavruları bitkiye benzeyecektir.
B) Bitkinin yavruları ağaca benzeyecektir.
C) Bitkinin yavruları hem ağaca hem de bitkiye benzeyecektir.
D) Hiçbir şey olmayacaktır çünkü hiç bir yavru oluşmayacaktır.
Ağaç Bitki
9. Aşağıdaki resimler bir kurbağanın farklı gelişme evrelerini göstermektedir.
1 2 3 4
Aşağıdakilerden hangisi kurbağanın gelişme evrelerini gençlikten yaşlılığa doğru en doğru sıralanmasıdır?
A) 1, 2, 3, 4 B) 2, 3, 4, 1 C) 3, 4, 2, 1 D) 4, 1, 3, 2
10. Yandaki çiçekte tohum kaç numaralı kısımda oluşur?
A) 1 B) 2 C) 3 D) 4
11. Yandaki çiçekte polen kaç numaralı kısımda oluşur?
A) 1 B) 2 C) 3 D) 4
12. Aşağıdakilerden hangisi tüm canlıların ortak özelliğidir?
A) Hücreli olma B) Besin yapma C) Eşeyli üreme D) Yer değiştirme
13..Hücrede canlılık olaylarını kontrol eden ve kalıtsal maddeyi içeren kısım nedir?
A) Sitoplazma B) Çekirdek C) Hücre zarı D) Hücre duvarı
14. Gelişmiş bitkilerin tohumlarında çenek denilen yapılar vardır.
Çenekler, tohum çimlenirken embriyoya besin sağlar. Aşağıda bir
fasulye tohumunun çimlenerek genç bir bitki haline gelmesi
gösterilmiştir.
Buna göre tohumun çimlenerek genç fideyi oluşturmasına kadar çeneklerindeki besin miktarının evrelere göre değişimi hangi
grafikteki gibi olur?
15. Bir öğrenci, aşağıdakilerden hangisinin hücresini incelediğinde hücre duvarını görür?
A) Karaciğerin B) Bağırsağın C) Kurbağa derisinin D) Üzüm yaprağının

186
16. Polenlerin, dişi organ üzerindeki yapışkan bölüme taşınmasına ne denir?
A) Tozlaşma B) Mayalanma C) Döllenme D) Başkalaşım
17. Mikroskopta hücreleri inceleyen bir öğrenci yandaki şekli görmüştür. Bu şekle bakıp hücreyle ilgili
hangi soruya cevap verebilir?
A) Kaç kısımdan oluşur? B) Hangi canlıya aittir?
C) Nasıl bölünür? D) Nasıl beslenir?
18. Aşağıdakilerden hangisi tohumun kısımlarından değildir?
A) Embriyo B) Yumurtalık C) Çenek D) Tohum kabuğu (kılıfı)
19. Aşağıdakilerden hangileri çimlenmeyi etkiler?
I- Isı II- Oksijen III- Nem
A) Yalnız I B) I-II C) II-III D) I-II-III
20. Aşağıdakilerden hangisi tohum oluşturmaz?
A) Eğrelti B) Gelincik C) Papatya D) Buğday
21. Aşağıdakilerden hangisi doğurarak çoğalır?
A) Kurbağa B) Alabalık C) Kertenkele D) Fare
22. Aşağıdakilerden hangisi kuluçkaya yatar?
A) Kanarya B) Kertenkele C) Kaplumbağa D) İstavrit
23. Tabloda bazı canlıların embriyolarının gelişim evreleri verilmiştir. Tabloyu
inceleyen bir öğrenci aşağıdaki sonuçlardan hangisine ulaşamaz?
A) I. evredeki tüm embriyolar benzerdir.
B) II. evrede balık embriyosu belirgin olarak farklıdır.
C) Her embriyo III. evrede kendi türünün belirgin özelliklerinin çoğuna sahiptir.
D) Her embriyo I. evreyi aynı sürede tamamlar.
24. Molekül, atom ve bileşik kelimelerini kullanarak aşağıdaki cümleyi oluşturabiliriz:
Şekerler, atomların oluşturduğu moleküllerden meydana gelen bileşiklerdir.
Organ, doku ve hücre kelimelerini kullanarak aşağıdaki cümleyi tamamlayınız:
Akciğerler, ……… oluşturduğu …………... meydana gelen ………..
25. Siz büyüdükçe vücudunuzda hangi değişiklikler meydana gelir? Gözlemlediklerinizi ve bildiklerinizi yazınız.

187
F.1.2 Force and Motion Achievement Test Form
1. Şekil I, II ve III’te verilen durumların hangilerinde cisimlere etkiyen kuvvet diğerlerinden farklıdır? A) Yalnız I B) Yalnız II C) I ve II D) I ve III
2. Ali ile Ayşe evlerinden aynı anda çıkarak şekildeki yollardan giderek okula 20 dakikada ulaşıyorlar. Buna göre Ayşe ile Ali’nin hareketi için aşağıdakilerden hangileri aynıdır?
I- Süratleri II- Yer değiştirmeleri III- Aldıkları yollar A) Yalnız I B) Yalnız II C) I ve II D) II ve III
3. Sürtünmesiz yatay bir düzlemdeki cisme F1 ve F2 kuvvetleri şekildeki gibi etkirse, cisim Z noktasına geliyor. Bu duruma göre aşağıdakilerden hangisi söylenemez? A) F1 kuvveti F2 den büyüktür. B) Bileşke kuvvet F1 yönündedir. C) F2 bileşke kuvvet ile zıt yöndedir. D) Bileşke kuvvet F2’ye eşittir.
4. Bir cismin birim zamanda aldığı yola sürat denir. Buna göre hangisindeki hareketlinin sürati en fazla olur? A) 40. km’den 60. km’ye 30 dakikada koşan sporcu. B) 10. m’den 15. m’ye 2 dakikada varan karınca. C) 100 km’yi 25 saatte alan helikopter. D) 40. km’den 140. km’ye 25 saatte varan traktör.
5. Şekildeki hayvanlar aynı anda koşuya başlayıp, aynı anda yollarını tamamlıyor. Buna göre hayvanların süratlerinin büyükten küçüğe göre sıralanışı hangisinde verilmiştir? A) Köpek, kedi, kertenkele B) Kertenkele, köpek, kedi C) Köpek, kertenkele, kedi D) Kedi, kertenkele, köpek
6. Tabloda K, L, M ve N araçlarının çeşitli sürelerde aldıkları yol verilmektedir. Tabloya göre, hangi aracın sürati en büyüktür? A) K B) L C) M D) N
Araçlar Geçen Zaman(saniye) Alınan Yol(metre) K 40 40 L 180 40 M 180 100 N 40 100
7. Bir öğrenci, AB yolunu 40 s de, BC yolunu ise 50 s de durmaksızın yürüyor. Buna göre, aşağıdakilerden hangisi kesinlikle doğrudur? A) AB yolunu sabit süratle yürümüştür. B) BC yolunu sabit süratle yürümüştür. C) AB yolunu daha süratle yürümüştür. D) BC yolunu daha süratle yürümüştür.
8. Şekilde halat çekme yarışı yapan Ayhan ve Fevzi’nin dengede kalabilmesi için hangisinin çekme yönüne kaç N’luk kuvvet eklenmelidir? A) Ayhan’a, 30 B) Fevzi’ye, 30 C) Ayhan’a, 60 D) Fevzi’ye, 60
9. A şehri ile B şehri arasındaki mesafeyi sabit süratle gidip gelen bir otomobilin alınan yol(x)-geçen zaman(t) grafiği hangisinde verilmiştir?
10. İvme, süratin birim zamandaki değişmesidir. Buna göre yandaki grafik aşağıdaki hareketlerden hangisi için doğru olabilir? A) Yüksekten düşen bir kutu B) Otoyolda sabit süratle giden bir araba C) Sabit süratle giderken ani fren yapan otobüs D) Duran bir top
11. 30 m/s sabit süratle hareket eden bir otomobil 10 dakikada kaç km yol alır? A) 18 B) 20 C) 25 D) 30

188
12. Yatay F1 ve F2 kuvvetleri, şekildeki gibi m cismine uygulandığında, cisim F1 yönünde hareket ediyor. Buna göre bileşke kuvvet aşağıdakilerden hangisi ile bulunur? A) F1 + F2 B) F1/F2 C) F2/F1 D) F1 - F2
13. Düşey doğrultuda aşağıya doğru atılan taş ile ilgili bilgilerden hangisi doğrudur? A) İlk sürati ile son sürati birbirine eşittir. B) Sürati aldığı yola bağlı olarak azalır. C) Birim zamanda aldığı yol sürekli artar. D) Yer değiştirme süresince sürati sabit kalır. 14. Başlangıç çizgisinden aynı anda koşmaya başlayan Metin ve Mustafa 100 metrelik doğrusal yol boyunca yarışarak bitiş çizgisine varmaktadırlar. Yapılan yarışla ilgili aşağıdakilerden hangisi kesinlikle yanlış olur? A) Bitiş çizgisine vardıklarında Metin ve Mustafa’nın yer değiştirmeleri eşit olur. B) Metin yarışı Mustafa’dan daha önce bitiriyorsa, Metin’in sürat ortalaması daha büyüktür. C) Süratleri eşitse, Metin yarışı daha önce bitirir. D) Mustafa’nın yarışı önce bitirmesi için Metin’den daha süratli koşması gerekir. 15. Süratin tam olarak bilinmesi için büyüklüğünün yanında başlangıç noktasının, doğrultusunun ve yönünün de belirtilmesi gerekir. Buna göre, sürat aşağıdaki olayların hangisinde tüm özellikleriyle verilmiştir? A) Araba, Bolu Ankara karayolunda 90 km/saat süratle gidiyor. B) Uçak, kuzeyden güneye gidiyor. C) Boğaz vapuru, Üsküdar’dan Beşiktaş’a 40 km/saat süratle gidiyor. D) Araba, saatte 50 km yol alıyor.
16. Dinamometre ile yukarıdaki ölçümleri yapan bir öğrenci, aşağıdaki sonuçlardan hangisine ulaşır? A) K ve L cisimleri eşit ağırlıktadır. B) Ağırlığı en küçük olan cisim K’dır. C) Ağırlığı en küçük olan cisim M’dir. D) L ve M cisimleri eşit ağırlıktadır.
17. Bir öğrenci ağırlığı önemsenmeyen eşit bölmeli, homojen çubuğa asılı K ve L boş kovalarını dinamometre ile O noktasından kaldırdığında çubuğun yatay konumda kaldığını görüyor. Öğrenci, bu deneyle aşağıdaki sonuçlardan hangisine ulaşamaz? A) O noktası sistemin denge noktasıdır. B) K kovası L kovasından ağırdır. C) Dinamometreden okunan değer K ve L kovalarının ağırlıkları toplamı kadardır. D) K ve L kovasının kütleleri birbirinden farklıdır.
18. Şekiller Dünya’dan fırlatılan ve sonra geri dönen bir roketi göstermektedir. Yerçekimi roket üzerine etki eder mi? Hangi durumlarda? Neden?
19. Yandaki grafik düz bir çizgi boyunca hareket eden bir karıncanın yaptığı hareketi göstermektedir. Eğer bu karınca aynı süratte gitmeye devam ederse 30 saniye sonunda ne kadar uzağa gitmiş olur?

189
20. Buzlu bir yolda A noktasında duran araba (motoru çalışmayan ve fireni tutmayan) şoför tarafından sabit bir kuvvetle itilerek B’ye getiriliyor. a. Sizce araba neden hareket etmiştir? b. Sizce araba B’den C’ye gelir mi? Nasıl?
21. Yerçekimi hangilerine etki eder? Kutucuğa çarpı koyunuz.
Yukarı atılmış bir top
Yukarı atılmış bir tuğla
Tramplende sıçrayan bir çocuk
Yerdeki bir top
Kayıktaki bir çocuk
Toprağa gömülü bir tuğla
Aşağı düşen bir top
Aşağı atlayan bir çocuk
Aşağı düşen tuğla
22. Bir cismin kütlesini baskül ve eşit kollu terazi ile dünyada ve ayda ölçersek aynı değeri mi buluruz? Neden? 23. Dünyadaki yerçekimini düşünerek ve rüzgârın direncini hesaba katmayarak aşağıdakileri cevaplayınız.
Bir basketbol oyuncusu topu potaya fırlatır. Aşağıdakilerden hangisi top en yukardayken topa etki eden kuvvetleri göstermektedir. Neden?
Raketini kötü bir şekilde tutan bir tenis oyuncusu topu yukarı doğru vurur. Aşağıdakilerden hangisi top en yukardayken topa etki eden kuvvetleri göstermektedir. Neden?
Bir beysbol oyuncusu sopasıyla topa yatay olarak vurur. Aşağıdakilerden hangisi hareketi sırasında topa etki eden kuvvetleri göstermektedir. Neden?

190
F.2. Unit Achievement Tests Key
F.2.1 Reproduction, Development, and Growth in Living Things Unit Achievement Test Key
1. D 2. D 3. A 4. B 5. C 6. D 7 C 8. D 9. D 10. D 11. A 12. A 13. B 14. B 15. D 16. A 17. A 18. B 19. D 20. A 21. D 22. A 23. D 24. Coding Guide
Code Response Correct Response 10 Hücre-Doku-Organ Incorrect Response 70 Hücre-Organ-Doku 71 Doku-Organ-Hücre 72 Doku-Hücre-Organ 73 Organ-Hücre-Doku 74 Organ-Doku-Hücre 79 Other incorrect (including crossed out/erased, stray marks, illegible, or off task). No Response 99 BLANK
Note: Developed from “JO3 Coding Guide”, TIMSS 1999 Science Items Released Set for Eighth Grade. Retrieved February 1, 2006 from http://timss.bc.edu/timss1999i/pdf/t99science_items.pdf, last

191
F.2.1 (Cont.’d)
25. Coding Guide
Code Response Correct Response 10 Refers to growth such as increases in height, weight, strength. Example: They get bigger.
Kollarımız, bacaklarımız, dişlerimiz, kafamız, ayaklarımız vb. gibi değişiklikler oluyor. En önemlisi büyüyoruz.
11 Refers to sexual maturation. Explanation may include secondary sexual features such as voice, hair. Koltuk altında kıllanma cinsel bölgede kıllanma .
12 Refers to appearance [Use code 10, 11 for those explicitly mentioned above.] Examples: Their nails grow. Their hair might darken. Büyüyünce sivilceler çıkar.
13 Refers to both growth and sexual maturation. Göğüs belirginleşme, boyumuzun uzaması, kilo almamız.
14 Refers to both appearance and sexual maturation. Sivilce, koltuk altı ve cinsel bölgelerde kıllanma vb.
15 Refers to growth, appearance and sexual maturation. Biz büyüdükçe boyumuz uzar, sivilcelerimiz çıkar, hormonlarımız çalışmaya başlar.
16 Refers to both growth and appearance Sesimiz değişir. Boyumuz uzar. Yüz şeklimiz değişebilir.
17 Other acceptable. Example: They lose teeth. Dişlerim, Vücudum ve Sesim değişir.
18 Refers to both growth and other Boyum uzar. Kollarım ve bacaklarım uzar. Eski dişler yerine yeni dişler gelir.
19 Refers to both growth, sexual maturation and other Boyum uzar, eller, ayaklar büyür. Kıllanmaya başlarız. Dişlerim çıkar.
20 Ilnesses associated with becoming old. Alerji, çiçek olduğunu gördüm.
21 Refers to both growth and emotional or intellectual changes. Boyumuz uzar, iyiyi kötüyü daha iyi ayırt ederiz daha çabuk gelişiriz.
22 Refers to both appearance and other Sivilce çıkal, dişlerimiz dökülür.
23 Refers to both sexual maturation and emotional or intellectual changes. Koltuk altında kıllanma, sivilcelerin çıkması, duygusallık meydana gelen değişikliklerdir.
24 Refers to both growth, emotional or intellectual changes and sexual maturation. Vücudumuzda bedensel ve ruhsal değişiklikler meydana gelir. Boyumuz uzar, kilomuz artar, sivilceler çıkar, derimiz yağlanır. Kızlar adet görür.
Incorrect Response 70 Refers to emotional or intellectual changes. Examples: The don't cry.
Their minds expand in intelligence. Büyürler. Herkes büyüdüğünü sanırlar.
71 Refers to social changes. Examples: They can decide more themselves. They wear fashion clothes. Büyüdüğümüzde 7 yaşına geldğimizde okula gider sonra daha da büyüdüğümüzde ergen oluruz.
72 Refers to changes associated with aging such as losing hair. Boyumuz artık sabit olur. Kilomuz da sabit olur.
76 Repeats information in the stem, such as referring to children becoming adults. Example: They get older. Olgunlaşırız. Biz büyüdükçe bedenimiz kilomuz uzunluğumuz değişir. Ergenlik çağına.
77 Refers to emotional or intellectual changes and repeats information in the stem, such as referring to children becoming adults. Konuşmamız davranışlarımız değişir. Birçok değişikliğe uğrarız
78 Refers to changes not associated with aging. Ben vücudumda karnım ağrıyor falan.
79 Other incorrect. Example: Bones. Vücudumuzun koltuk altında olur. Kemikleri, vücudu.
No Response 90 Crossed out/erased, illegible, or impossible to interpret.
Süt, yoğurt, Danone bunlardan bazıları. 99 BLANK
Note: Developed from “Y-2 Coding Guide”, TIMSS Released Set for Population 1 (Third and Fourth Grades). http://timss.bc.edu/timss1995i/TIMSSPDF/ASitems.pdf, last accessed date: 20 February, 2006.

192
F.2.2 Force and Motion Unit Achievement Test Key
1. A 2. B 3. D 4. A 5. A 6. D 7. C 8. B 9. B 10. A 11. A 12. D 13. D 14. C 15. C 16. C 17. B 18. Coding Guide
Code Response Correct Response 20 1., 2. ve 3. durumlarda. Çünkü ...
Eder. Yer çekimi her maddeye etki eder. 21 Etki eder. Uzay’a fırlatılırken güç yerçekimin yener. İnerken yer çekimi kuvveti etki eder. Partial Response 10 1, 2, 3.
Hepsinde. 11 Eder. Yerçekiminin kuvveti çoktur. Incorrect Response 70 Situation 1 (with explanation).
Yerçekimi roket üzerinde etki eder. 1. durumda çünkü roket hala hareket etmemiş olur. 71 Situation 2 (with explanation).
2. durum 72 Situation 3 (with explanation).
3. durum 73 Situation 1 and 2 (with explanation).
Etki eder. 1. 2. durumda. Çünkü 3. durumda paraşüt kullanıldığı için. 74 Situation 2 and 3 (with explanation).
Yerçekimi roket üzerine etki eder. Geliniş ve gidiniş durumundadır. Çünkü geliş ve gidişi aynıdır. 75 Situation 1 and 3 (with explanation).
Hayır. 1. durumda eder. 2. durumda etmez. 3. durumda eder. 76 Situation 2 (with explanation).
2. durum. Çünkü yukarı çıkarken yer çekimi etki eder. 77 Situation 3 (with explanation).
Etki eder. Çünkü roket aşağıya iniyor. 78 Situation 1 (with explanation).
Evet. Roket hareket halinde değilken. 79 In no situation.
Etmez. Çünkü onu göze alarak roketler yapılmıştır. No Response 90 Crossed out/erased, illegible, or impossible to interpret.
Evet. Kuvvetle. Mesela bir … attığımızda, yere düşer. Buna yerçekimi denir. 99 BLANK

193
F.2.2 (Cont.’d)
19. Coding Guide
Code Response Correct Response 20 6 cm uzağa gitmiş olur. 21 30 saniyede 60 cm gidiyor.
2 santimetre uzağa gitmiş olur. Partial Response 10 6’ya kadar gider. 11 Grafikte gösterilmiş Incorrect Response 70 Other responses
5 cm No Response 90 Crossed out/erased, illegible, or impossible to interpret.
Çapraz gider. 99 BLANK
20. a. Coding Guide
Code Response Correct Response 10 İtme kuvvetiyle b’ye getirilmiştir. 11 Buzlu yol olduğu için kayarak gider.
Arabanın el freni inik ve vites boştaysa gider. Incorrect Response 70 A’dan B’ye gelebilir. 71 Benzinlikten benzin alarak No Response 90 Crossed out/erased, illegible, or impossible to interpret. 99 BLANK
20. b. Coding Guide
Code Response Correct Response 10 Gelir. Yine itilerek. 11 Gelir. Kayarak.
El frenini indirip vitesi boşa alınca araba B’den C’ye gider. 12 Gelmez. Kuvveti yetmez. Incorrect Response 70 Gelir. 71 B’den C’ye gider. Benzinlikten benzin alarak 72 Gelmez. No Response 90 Crossed out/erased, illegible, or impossible to interpret.
C noktası daha 99 BLANK
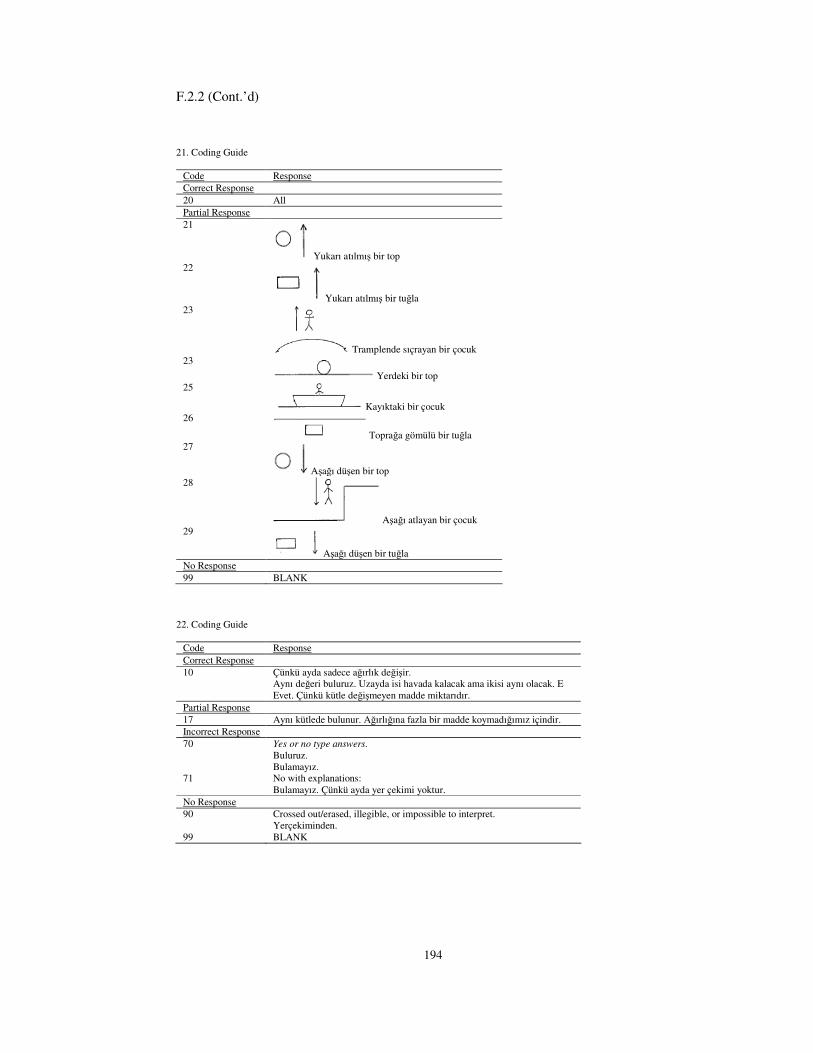
194
F.2.2 (Cont.’d)
21. Coding Guide
Code Response Correct Response 20 All Partial Response 21
Yukarı atılmış bir top 22
Yukarı atılmış bir tuğla 23
Tramplende sıçrayan bir çocuk 23
Yerdeki bir top 25
Kayıktaki bir çocuk 26
Toprağa gömülü bir tuğla 27
Aşağı düşen bir top 28
Aşağı atlayan bir çocuk 29
Aşağı düşen bir tuğla No Response 99 BLANK
22. Coding Guide
Code Response Correct Response 10 Çünkü ayda sadece ağırlık değişir.
Aynı değeri buluruz. Uzayda isi havada kalacak ama ikisi aynı olacak. E Evet. Çünkü kütle değişmeyen madde miktarıdır.
Partial Response 17 Aynı kütlede bulunur. Ağırlığına fazla bir madde koymadığımız içindir. Incorrect Response 70 Yes or no type answers.
Buluruz. Bulamayız.
71 No with explanations: Bulamayız. Çünkü ayda yer çekimi yoktur.
No Response 90 Crossed out/erased, illegible, or impossible to interpret.
Yerçekiminden. 99 BLANK

195
F.2.2 (Cont.’d)
23. 1. Coding Guide
Code Response Correct Response 10 A with explanation.
En yukardayken aşağı iner. Yer çekimi çeker. Partial Response 17 A. Incorrect Response 70 A with incorrect explanation
A. Çünkü hızlı giden bir top yer çekimidir. 71 Others
B. Hava onu kaldırıp attığı için. No Response 90 Crossed out/erased, illegible, or impossible to interpret.
Çünkü kuvvet uygulanıyor. 99 BLANK
23. 2. Coding Guide
Code Response Correct Response 10 A with explanation.
A. Top yukardayken aşağı iner. Yer çekimi çeker. Partial Response 17 A. Incorrect Response 70 A with incorrect explanation
A’dır. Çünkü tenis topuna vururken kuvvetle yukarıya gider. 71 Others
B düzdür o yüzden. No Response 90 Crossed out/erased, illegible, or impossible to interpret.
Çünkü topa daha hızlı vurmuştur. 99 BLANK
23. 3. Coding Guide
Code Response Correct Response 10 D with explanation.
D. Tekrar aşağıya düşer. Çünkü; yer çekimi vardır. Partial Response 17 D. Incorrect Response 70 D with incorrect explanation
D. Adam topa çok hızlı vuruyor. 71 Others
B. Çünkü çok hızlı gidiyor. No Response 90 Crossed out/erased, illegible, or impossible to interpret.
Sopanın gücü olduğu için. 99 BLANK

196
F.3 Unit Achievement Test Blueprints
Table F.1 Reproduction, development, and growth in living things achievement test blueprint
İtems Subject Matters Cognitive Processes 1 Canlılık Hücreyle Başlar
(Hücre) Knowledge (Knowledge of classifications)
2 Hayvanlarda Üreme, Büyüme ve Gelişme (Hayat Döngüsü)
Knowledge (Knowledge of facts)
3 Tohumdan Fidana (Çimlenme)
Comprehension (Prediction)
4 Hayvanlarda Üreme, Büyüme ve Gelişme (Başkalaşım)
Knowledge (Knowledge of sequences)
5 Canlılık Hücreyle Başlar (Organel)
Knowledge (Knowledge of classifications)
6 Çiçekli Bitkilerde Üreme (Tozlaşma)
Knowledge (Knowledge of facts)
7 Canlılık Hücreyle Başlar (Organel)
Knowledge (Knowledge of sequences)
8 Çiçekli Bitkilerde Üreme (Tozlaşma)
Comprehension (Prediction)
9 Hayvanlarda Üreme, Büyüme ve Gelişme (Hayat Döngüsü)
Knowledge (Knowledge of sequences)
10 Çiçekli Bitkilerde Üreme (Tohum)
Knowledge (Knowledge of classifications)
11 Çiçekli Bitkilerde Üreme (Tozlaşma)
Knowledge (Knowledge of classifications)
12 Canlılık Hücreyle Başlar (Hücre)
Knowledge (Knowledge of facts)
13 Canlılık Hücreyle Başlar (Organel)
Knowledge (Knowledge of facts)
14 Tohumdan Fidana (Çimlenme)
Comprehension (Translation of knowledge from one form into another)
15 Canlılık Hücreyle Başlar (Organel)
Comprehension (Giving Example)
16 Çiçekli Bitkilerde Üreme (Tozlaşma)
Knowledge (Knowledge of teminology)
17 Canlılık Hücreyle Başlar (Hücre)
Science Process (Recognition of a problem)
18 Çiçekli Bitkilerde Üreme (Tohum)
Knowledge (Knowledge of classifications)
19 Tohumdan Fidana (Çimlenme)
Knowledge (Knowledge of facts)
20 Çiçekli Bitkilerde Üreme (Tohum)
Knowledge (Knowledge of classifications)
21 Hayvanlarda Üreme, Büyüme ve Gelişme (Hayat Döngüsü)
Knowledge (Knowledge of classifications)
22 Hayvanlarda Üreme, Büyüme ve Gelişme (Hayat Döngüsü)
Knowledge (Knowledge of classifications)
23 Hayvanlarda Üreme, Büyüme ve Gelişme (Hayat Döngüsü)
Science Process (Conclusion according to evidences)
24 Canlılık Hücreyle Başlar (Organizma)
Knowledge (Knowledge of sequences)
25 İnsanlarda Üreme, Büyüme ve Gelişme Science Process (Description of observation)

197
Table F.2 Force and motion achievement test blueprint
İtems Subject Matters Cognitive Processes 1 Kuvveti Keşfedelim
(Kuvvet) Knowledge (Knowledge of classifications)
2 Yaşamımızdaki Sürat (Sürat)
Comprehension (Comment)
3 Kuvvetler İş Başında (Net, Bileşke Kuvvet)
Comprehension (Comment)
4 Yaşamımızdaki Sürat (Sürat)
Solving Problem (Show the answer in required form)
5 Yaşamımızdaki Sürat (Sürat)
Comprehension (Prediction)
6 Yaşamımızdaki Sürat (Sürat)
Comprehension (Prediction)
7 Yaşamımızdaki Sürat (Sürat)
Comprehension (Prediction)
8 Kuvvetler İş Başında (Dengelenmiş Kuvvet)
Solving Problem (Finding required principle for solution)
9 Yaşamımızdaki Sürat (Sürat)
Comprehension (Translation of knowledge from one form into another)
10 Yaşamımızdaki Sürat (Sürat)
Comprehension (Translation of knowledge from one form into another)
11 Yaşamımızdaki Sürat (Sürat)
Solving Problem (Show the answer in required form)
12 Kuvvetler İş Başında (Net (Bileşke) Kuvvet)
Comprehension (Identification of knowledge in a new context)
13 Yaşamımızdaki Sürat (Sürat)
Comprehension (Relation)
14 Yaşamımızdaki Sürat (Sürat)
Comprehension (Relation)
15 Yaşamımızdaki Sürat (Sürat)
Comprehension (Identification of knowledge in a new context)
16 Kuvveti Keşfedelim (Dinamometre)
Comprehension (Translation of knowledge from one form into another)
17 Kuvveti Keşfedelim (Dinamometre)
Comprehension (Prediction)
18 Ağırlık Bir Kuvvettir (Kütle Çekim Kuvveti)
Comprehension (Comment)
19 Yaşamımızdaki Sürat (Sürat)
Comprehension (Translation of knowledge from one form into another)
20. a Kuvvetler İş Başında (Dengelenmiş Kuvvet)
Comprehension (Explanation)
20. b Kuvvetler İş Başında (Dengelenmmemiş Kuvvet)
Comprehension (Prediction)
21 Ağırlık Bir Kuvvettir (Kütle Çekim Kuvveti)
Comprehension (Identification of criteria in a given information)
22 Ağırlık Bir Kuvvettir (Kütle Çekim Kuvveti)
Comprehension (Explanation)
23 Ağırlık Bir Kuvvettir (Kütle Çekim Kuvveti)
Comprehension (Explanation)

198
F.4 Subject Matters of Units
Table F.3 Subject matters of reproduction, development, and growth in living things unit
Subject Matters Subject
Hücre Organel
Canlılık Hücreyle Başlar
Organizma Yumurta Sperm Büyüme Olgunlaşma
İnsanlarda Üreme, Büyüme ve Gelişme
Gelişme Ergenlik Çocuk Değilim Artık Ergen Hayat Döngüsü Hayvanlarda Üreme, Büyüme ve Gelişme
Başkalaşım Tohum Meyve
Çiçekli Bitkilerde Üreme
Tozlaşma Çimlenme Tohumdan Fidana
Organik Tarım
Table F.4 Subject matters of force and motion unit
Subject Matters Subject
Sürat Yaşamımızdaki Sürat Hareket Enerjisi Kuvvet Kuvveti Keşfedelim Dinamometre Net (Bileşke) Kuvvet Dengelenmiş Kuvvet
Kuvvetler İş Başında
Dengelenmemiş Kuvvet Ağırlık Ağırlık Bir Kuvvettir Kütle Çekim Kuvveti

199
F.5 Cognitive Processes
Table F.5 Cognitive processes
Cognitive Processes Objective
Knowledge of facts Knowledge of terminology Knowledge of concepts Knowledge of classifications Knowledge of sequences Knowledge of techniques and procedures Knowledge of principles and laws
Knowledge
Knowledge of theories Identification of knowledge in a new context Explanation Summarization Giving example Identification of criteria in a given information Relation Comment Translation of knowledge from one form into another
Comprehension
Prediction Finding required principle for solution Bringing knowledge, law, and principle together Using formula and algorithms Using units correctly and making transition
Solving Problem
Show the answer in required form Observing Description of observation Comparison of results of observation Classification of results of observation Selection of appropriate measuring instrument Recognition of a problem Relation between elements of problem Formulation of a hypothesis to solve the problem Proposing procedure to verify (test) the hypothesis Design of experiment/think/formulate in figure Collection of data Processing/analyzing/interpreting data Discussing and evaluating hypotheses according to evidences Conclusion according to evidences Generalization (formulating models) and proposing new research questions
Science Process
Application of observation and research results to daily life or new situation Note: It is developed from “Taxonomy of Educational Objectives” by the MONE, EARGED, 1995, 43 using Bloom’s terminology.

200
F.6 References of Unit Achievement Tests
Table F.6 Reference of the reproduction, development, and growth in living things unit
achievement test
Item Source 1 TIMSS Released Set for Population 1 (3rd and 4th Grades):
http://timss.bc.edu/timss1995i/TIMSSPDF/ASitems.pdf 2 TIMSS Released Set for Population 1 (3rd and 4th Grades):
http://timss.bc.edu/timss1995i/TIMSSPDF/ASitems.pdf 3
TIMSS Released Set for Population 1 (3rd and 4th Grades): http://timss.bc.edu/timss1995i/TIMSSPDF/ASitems.pdf
4
TIMSS Released Set for Population 1 (3rd and 4th Grades): http://timss.bc.edu/timss1995i/TIMSSPDF/ASitems.pdf
5 2006 Devlet Parasız Yatılılık ve Bursluluk Sınavı: http://egitek.meb.gov.tr/Sinavlar/Sorular/Dpy/Dpy2006/DPY6SinifATesti_2006.pdf
6 2006 Devlet Parasız Yatılılık ve Bursluluk Sınavı: http://egitek.meb.gov.tr/Sinavlar/Sorular/Dpy/Dpy2006/DPY6SinifATesti_2006.pdf
7 2006 Devlet Parasız Yatılılık ve Bursluluk Sınavı: http://egitek.meb.gov.tr/Sinavlar/Sorular/Dpy/Dpy2006/DPY6SinifATesti_2006.pdf
8 TIMSS Released Set for Population 1 (3rd and 4th Grades): http://timss.bc.edu/timss1995i/TIMSSPDF/ASitems.pdf
9 TIMSS Released Set for Population 1 (3rd and 4th Grades): http://timss.bc.edu/timss1995i/TIMSSPDF/ASitems.pdf
10 2006 Devlet Parasız Yatılılık ve Bursluluk Sınavı: http://egitek.meb.gov.tr/Sinavlar/Sorular/Dpy/Dpy2006/DPY6SinifATesti_2006.pdf
11 2003 Devlet Parasız Yatılılık ve Bursluluk Sınavı: http://egitek.meb.gov.tr/Sinavlar/Sorular/Dpy/Dpy2003/DPY6Test_key2003.pdf
12 2004 Devlet Parasız Yatılılık ve Bursluluk Sınavı: http://egitek.meb.gov.tr/Sinavlar/Sorular/Dpy/Dpy2004/2006DPY_6SinifATesti_key.pdf
13 2003 Devlet Parasız Yatılılık ve Bursluluk Sınavı: http://egitek.meb.gov.tr/Sinavlar/Sorular/Dpy/Dpy2003/DPY4Test_key2003.pdf
14 2003 Orta Öğretim Kurumları Öğrenci Seçme ve Yerleştirme Sınavı: http://egitek.meb.gov.tr/Sinavlar/Sorular/Ook/Ook2003/Ook2003Test_Key.pdf
15 Devlet Parasız Yatılılık Ve Bursluluk Sınavı: http://egitek.meb.gov.tr/Sinavlar/Sorular/Dpy/Dpy2003/DPY4Test_key2003.pdf
16 Devlet Parasız Yatılılık Ve Bursluluk Sınavı: http://egitek.meb.gov.tr/Sinavlar/Sorular/Dpy/Dpy2003/DPY4Test_key2003.pdf
17 2003 Devlet Parasız Yatılılık ve Bursluluk Sınavı: http://egitek.meb.gov.tr/Sinavlar/Sorular/Dpy/Dpy2003/DPY6Test_key2003.pdf
18 2002 Devlet Parasız Yatılılık ve Bursluluk Sınavı: http://egitek.meb.gov.tr/Sinavlar/Sorular/Dpy/Dpy2002/DPY6Test_key2002.pdf
19 2001 Devlet Parasız Yatılılık ve Bursluluk Sınavı: http://egitek.meb.gov.tr/Sinavlar/Sorular/Dpy/Dpy2001/Dpy4_Test2001.pdf
20 2000 Devlet Parasız Yatılılık ve Bursluluk Sınavı: http://egitek.meb.gov.tr/Sinavlar/Sorular/Dpy/Dpy2000/DPY4Test_key2000.pdf
21 2000 Devlet Parasız Yatılılık ve Bursluluk Sınavı: http://egitek.meb.gov.tr/Sinavlar/Sorular/Dpy/Dpy2000/DPY4Test_key2000.pdf
22 1998 Devlet Parasız Yatılılık ve Bursluluk Sınavı: http://egitek.meb.gov.tr/Sinavlar/Sorular/Dpy/Dpy1998/DpyTest_4_1998.pdf
23 2003 Özel Okullar Sınavı: http://egitek.meb.gov.tr/Sinavlar/Sorular/OzelOkullar2005/2003OzelOkullarSnv.pdf 24 TIMSS 1999 Science Items Released Set for 8th Grade: http://timss.bc.edu/timss1999i/pdf/t99science_items.pdf 25 TIMSS Released Set for Population 1 (3rd and 4th Grades):
http://timss.bc.edu/timss1995i/TIMSSPDF/ASitems.pdf

201
Table F.7 Reference of the force and motion unit achievement test
Item No
Source
1 2006 Devlet Parasız Yatılılık ve Bursluluk Sınavı http://egitek.meb.gov.tr/Sinavlar/Sorular/Dpy/Dpy2006/DPY5SinifATesti_2006.pdf
2 2005 Devlet Parasız Yatılılık ve Bursluluk Sınavı http://egitek.meb.gov.tr/Sinavlar/Sorular/Dpy/Dpy2005/2007_DPY7_SINIF_A_TESTI.pdf
3 2004 Devlet Parasız Yatılılık ve Bursluluk Sınavı http://egitek.meb.gov.tr/Sinavlar/Sorular/Dpy/Dpy2004/2006DPY_7SinifATesti_key.pdf
4 2004 Devlet Parasız Yatılılık ve Bursluluk Sınavı http://egitek.meb.gov.tr/Sinavlar/Sorular/Dpy/Dpy2004/2006DPY_7SinifATesti_key.pdf
5 2003 Devlet Parasız Yatılılık ve Bursluluk Sınavı http://egitek.meb.gov.tr/Sinavlar/Sorular/Dpy/Dpy2003/DPY5Test_key2003.pdf
6 2002 Devlet Parasız Yatılılık ve Bursluluk Sınavı http://egitek.meb.gov.tr/Sinavlar/Sorular/Dpy/Dpy2002/DPY5Test_key2002.pdf
7 2002 Devlet Parasız Yatılılık ve Bursluluk Sınavı http://egitek.meb.gov.tr/Sinavlar/Sorular/Dpy/Dpy2002/DPY5Test_key2002.pdf
8 2002 Devlet Parasız Yatılılık ve Bursluluk Sınavı http://egitek.meb.gov.tr/Sinavlar/Sorular/Dpy/Dpy2002/DPY7Test_key2002.pdf
9 2001 Devlet Parasız Yatılılık ve Bursluluk Sınavı http://egitek.meb.gov.tr/Sinavlar/Sorular/Dpy/Dpy2001/Dpy6_Test2001.pdf
10 2002 Orta Öğretim Kurumları Öğrenci Seçme ve Yerleştirme Sınavı http://egitek.meb.gov.tr/Sinavlar/Sorular/Ook/Ook2002/Ook2002Test_Key.pdf
11 2001 Devlet Parasız Yatılılık ve Bursluluk Sınavı http://egitek.meb.gov.tr/Sinavlar/Sorular/Dpy/Dpy2001/Dpy6_Test2001.pdf
12 2000 Devlet Parasız Yatılılık ve Bursluluk Sınavı http://egitek.meb.gov.tr/Sinavlar/Sorular/Dpy/Dpy2000/DPY8Test_key2000.pdf
13 1998 Devlet Parasız Yatılılık ve Bursluluk Sınavı http://egitek.meb.gov.tr/Sinavlar/Sorular/Dpy/Dpy1998/DpyTest_6_1998.pdf
14 2005 Özel Okullar Sınavı http://egitek.meb.gov.tr/Sinavlar/Sorular/OzelOkullar2005/2005OzelOkullarSnv.pdf
15 2005 Özel Okullar Sınavı http://egitek.meb.gov.tr/Sinavlar/Sorular/OzelOkullar2005/2002OzelOkullarSnv.pdf
16 2005 Devlet Parasız Yatılılık ve Bursluluk Sınavı http://egitek.meb.gov.tr/Sinavlar/Sorular/Dpy/Dpy2005/2007_DPY7_SINIF_A_TESTI.pdf
17 2003 Orta Öğretim Kurumları Öğrenci Seçme ve Yerleştirme Sınavı http://egitek.meb.gov.tr/Sinavlar/Sorular/Ook/Ook2003/Ook2003Test_Key.pdf
18 TIMMS 1999 Science Items. Released Set for Eight Grade. JO5 http://timss.bc.edu/timss1999i/pdf/t99science_items.pdf
19 TIMSS IEA’s Third International Mathematics and Science Study TIMSS Science Items: Released Set for Population 2 (Seventh and Eighth Grades) P1 http://timss.bc.edu/timss1995i/TIMSSPDF/BSItems.pdf
20 Kurt, Ş. ve Akdeniz, A. R. [2004] Öğretmen Adaylarının Kuvvet Kavramı ile İlgili Yanılgılarını Gidermede Keşfedici Laboratuar Modelinin Etkisi. Hacettepe Üniversitesi Eğitim Fakültesi Dergisi, 27, 196-205.
21 Palmer, D. (2001) Students’ alternative conceptions and scientifically acceptable conceptions about gravity. International Journal of Science Education, 23 (7), 691- 706.
22 Developed by the researcher. 23 Jimoyiannis, A. ve Komis, V. (2003). Investigating Greek Students’ Ideas about Forces and Motion.
Research in Science Education 33, 375–392.

202
APPENDIX G
RESULTS OF THE ANALYSIS OF STUDENTS’ SOCIO-ECONOMIC
STATUS VARIABLES
G.1 Results of the Descriptive Analysis of Students’ Socio-Economic Status Variables
Table G.1 Mother education and group crosstabulation
group Total
Experimental Control
mother education illiterate 6 4 10 Literate 4 7 11 Primary school (5 years) 40 25 65 Secondary school (8 years) 18 16 34 Elementary education (8 year) 7 6 13 Secondary education (11 year) 9 15 24 University 0 5 5 Masters/doctorate 0 1 1 unknown 2 3 5 Total 86 82 168
Table G.2 Father education and group crosstabulation
group Total
Experimental Control
father education illiterate 0 1 1 Literate 1 5 6 Primary school (5 years) 25 28 43 Secondary school (8 years) 22 20 42 Elementary education (8 year) 3 3 6 Secondary education (11 year) 29 19 48 University 5 10 15 Masters/doctorate 0 2 2 unknown 1 4 5 Total 85 78 168
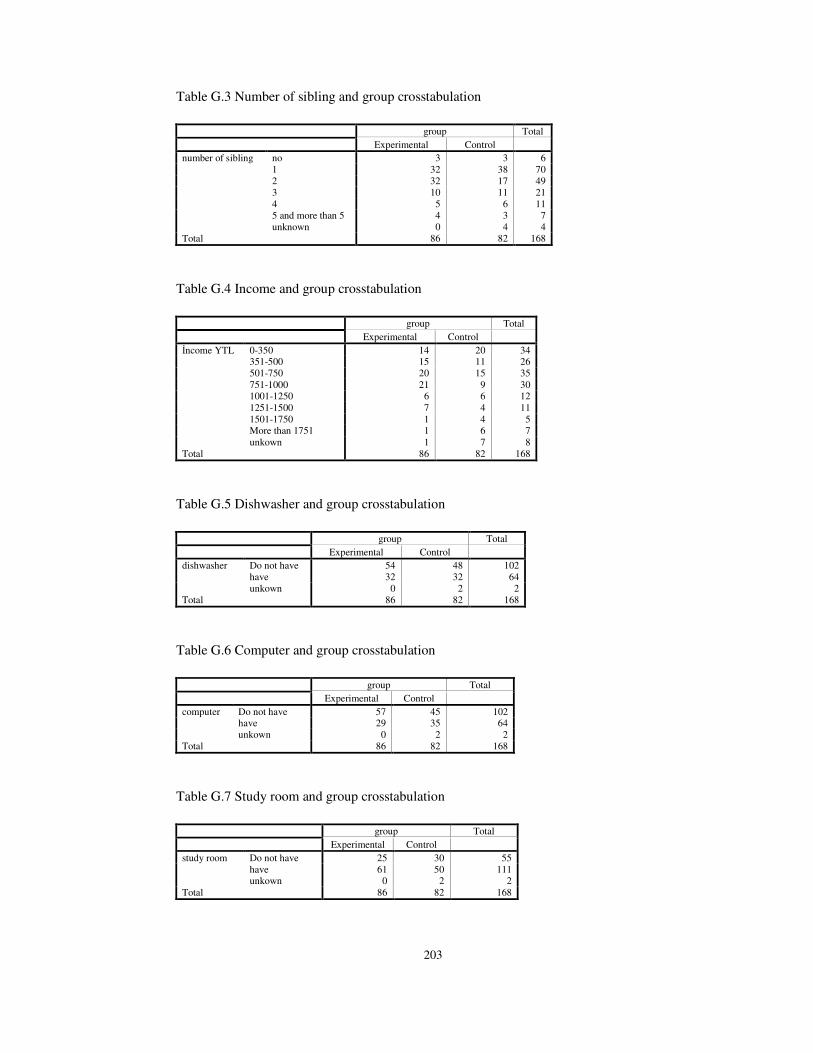
203
Table G.3 Number of sibling and group crosstabulation
group Total
Experimental Control
number of sibling no 3 3 6 1 32 38 70 2 32 17 49 3 10 11 21 4 5 6 11 5 and more than 5 4 3 7 unknown 0 4 4 Total 86 82 168
Table G.4 Income and group crosstabulation
group Total
Experimental Control
İncome YTL 0-350 14 20 34 351-500 15 11 26 501-750 20 15 35 751-1000 21 9 30 1001-1250 6 6 12 1251-1500 7 4 11 1501-1750 1 4 5 More than 1751 1 6 7 unkown 1 7 8 Total 86 82 168
Table G.5 Dishwasher and group crosstabulation
group Total
Experimental Control
dishwasher Do not have 54 48 102 have 32 32 64 unkown 0 2 2 Total 86 82 168
Table G.6 Computer and group crosstabulation
group Total
Experimental Control
computer Do not have 57 45 102 have 29 35 64 unkown 0 2 2 Total 86 82 168
Table G.7 Study room and group crosstabulation
group Total
Experimental Control
study room Do not have 25 30 55 have 61 50 111 unkown 0 2 2 Total 86 82 168

204
Table G.8 Work and group crosstabulation
group Total
Experimental Control
work yes 83 79 162 no 2 1 3 unkown 1 2 3 Total 85 82 168
Table G.9 Kindergarten and group crosstabulation
group Total
Experimental Control
kindergarten yes 63 52 115 no 21 26 47 unkown 2 4 6 Total 84 78 168
Table G.10 Age of schooling and group crosstabulation
group Total
Experimental Control
age of schooling 5 0 1 1 6 9 19 28 7 69 53 122 8 6 6 12 unkown 2 3 5 Total 86 82 168
Table G.11 Number of books and group crosstabulation
group Total
Experimental Control
number of books 0-10 11 14 25 11-25 30 22 52 26-100 24 25 49 101-200 13 10 23 More than 200 6 8 14 unkown 2 3 15 Total 86 82 168
Table G.12 Newspaper/magazine and group crosstabulation
group Total
Experimental Control
newspaper/magazine Yes 22 19 41 No 48 56 104 unkown 16 7 23 Total 86 82 168

205
G.2. Results of the Factor Analysis of Students’ Socio-Economic Status Variables
G.2.1 Results of the Factor Analysis of Students’ Socio-Economic Status Variables with
Listwise Deletion
Table G.13 Descriptive statistics
Descriptive Statistics
3,92 1,534 131
4,66 1,582 131
2,85 1,099 131
3,36 1,950 131
1,43 ,497 131
1,40 ,491 131
1,69 ,465 131
1,02 ,150 131
1,31 ,465 131
6,86 ,523 131
2,74 1,174 131
1,72 ,452 131
mothereducation
fathereducation
numberofsibling
income
dishwasher
computer
studyroom
work
kindergarten
ageofschooling
numberofbooks
newspapermagazine
Mean Std. Deviation Analysis N
Table G.14 KMO and bartlett’s test result
KMO and Bartlett's Test
,825
318,540
66
,000
Kaiser-Meyer-Olkin Measure of SamplingAdequacy.
Approx. Chi-Square
df
Sig.
Bartlett's Test ofSphericity
Table G.15 Communalities
Communalities
1,000 ,678
1,000 ,625
1,000 ,562
1,000 ,665
1,000 ,497
1,000 ,512
1,000 ,674
1,000 ,591
1,000 ,599
1,000 ,632
1,000 ,577
1,000 ,515
mothereducation
fathereducation
numberofsibling
income
dishwasher
computer
studyroom
work
kindergarten
ageofschooling
numberofbooks
newspapermagazine
Initial Extraction
Extraction Method: Principal Component Analysis.

206
Table G.16 Total variance explained
Total Variance Explained
3,573 29,779 29,779 3,573 29,779 29,779 2,610 21,754 21,754
1,490 12,415 42,194 1,490 12,415 42,194 1,858 15,484 37,238
1,058 8,819 51,013 1,058 8,819 51,013 1,357 11,312 48,550
1,005 8,377 59,390 1,005 8,377 59,390 1,301 10,840 59,390
,837 6,977 66,368
,801 6,677 73,044
,669 5,573 78,617
,659 5,494 84,111
,603 5,023 89,134
,552 4,598 93,732
,400 3,333 97,064
,352 2,936 100,000
Component1
2
3
4
5
6
7
8
9
10
11
12
Total % of Variance Cumulative % Total % of Variance Cumulative % Total % of Variance Cumulative %
Initial Eigenvalues Extraction Sums of Squared Loadings Rotation Sums of Squared Loadings
Extraction Method: Principal Component Analysis.
121110987654321
Eigenvalue
4
3
2
1
0
Scree Plot
Figure G.1 Scree plot
Table G.17 Component matrix
Component Matrixa
,804 ,110
,775 -,140
,729 -,371
,628 -,151 ,388
,583 ,262 ,322
,527 ,464 ,127
,511 ,128 -,490 -,285
,501 ,282 -,247 ,326
,300 -,647 ,397
-,527 ,378 -,406
,503 ,503 -,347
-,412 ,428 ,329 ,318
income
fathereducation
mothereducation
numberofbooks
newspapermagazine
computer
kindergarten
dishwasher
studyroom
work
ageofschooling
numberofsibling
1 2 3 4
Component
Extraction Method: Principal Component Analysis.
4 components extracted.a.

207
Table G.18 Rotated component matrix
Component
1 2 3 4
Numberofbooks ,742 ,115 -,101
newspapermagazine ,691 ,135 -,140
income ,674 ,379 ,258
fathereducation ,613 ,488
computer ,475 ,151 ,378 ,347
kindergarten ,709 ,305
mothereducation ,468 ,670
numberofsibling -,655 ,173 ,311
work -,762
dishwasher ,326 ,177 ,594
ageofschooling ,113 -,144 -,135 ,762
studyroom ,420 -,183 -,679
Extraction Method: Principal Component Analysis. Rotation Method: Varimax with Kaiser Normalization. a Rotation converged in 5 iterations.
Table G.19 Component transformation matrix
Component Transformation Matrix
,786 ,569 ,234 -,059
-,047 -,118 ,639 ,758
,559 -,521 -,515 ,388
,259 -,625 ,521 -,520
Component1
2
3
4
1 2 3 4
Extraction Method: Principal Component Analysis. Rotation Method: Varimax with Kaiser Normalization.
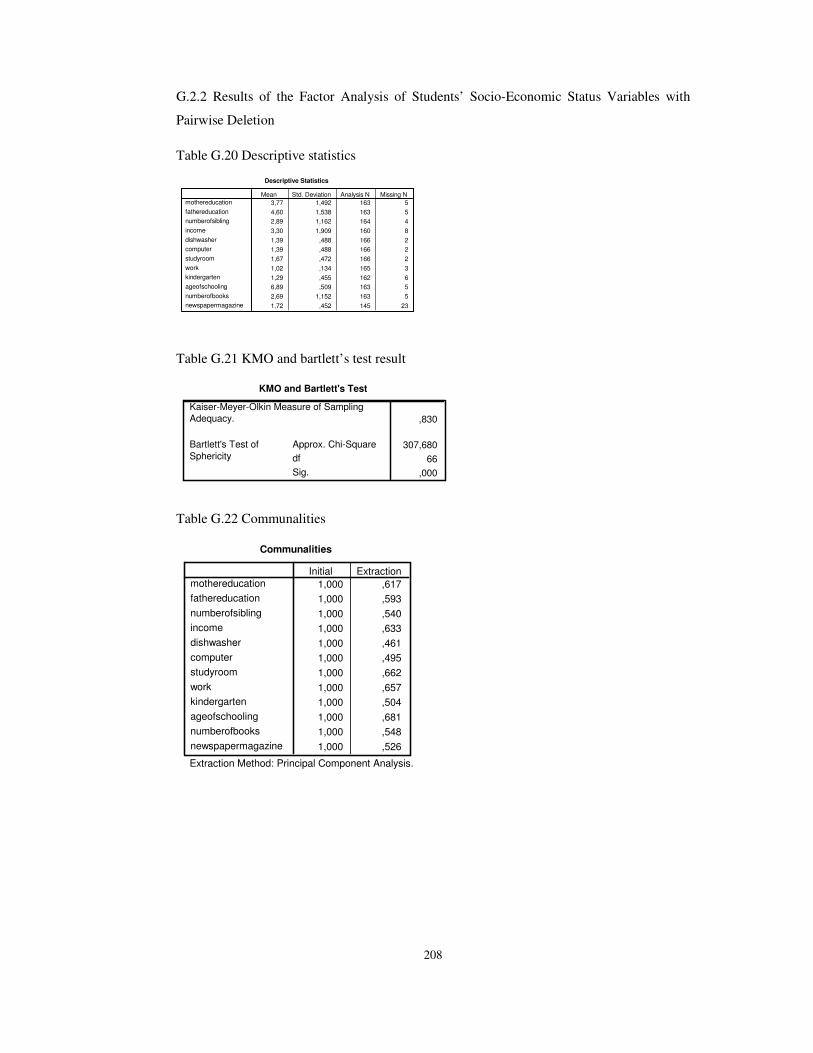
208
G.2.2 Results of the Factor Analysis of Students’ Socio-Economic Status Variables with
Pairwise Deletion
Table G.20 Descriptive statistics
Descriptive Statistics
3,77 1,492 163 5
4,60 1,538 163 5
2,89 1,162 164 4
3,30 1,909 160 8
1,39 ,488 166 2
1,39 ,488 166 2
1,67 ,472 166 2
1,02 ,134 165 3
1,29 ,455 162 6
6,89 ,509 163 5
2,69 1,152 163 5
1,72 ,452 145 23
mothereducation
fathereducation
numberofsibling
income
dishwasher
computer
studyroom
work
kindergarten
ageofschooling
numberofbooks
newspapermagazine
Mean Std. Deviation Analysis N Missing N
Table G.21 KMO and bartlett’s test result
KMO and Bartlett's Test
,830
307,680
66
,000
Kaiser-Meyer-Olkin Measure of SamplingAdequacy.
Approx. Chi-Square
df
Sig.
Bartlett's Test ofSphericity
Table G.22 Communalities
Communalities
1,000 ,617
1,000 ,593
1,000 ,540
1,000 ,633
1,000 ,461
1,000 ,495
1,000 ,662
1,000 ,657
1,000 ,504
1,000 ,681
1,000 ,548
1,000 ,526
mothereducation
fathereducation
numberofsibling
income
dishwasher
computer
studyroom
work
kindergarten
ageofschooling
numberofbooks
newspapermagazine
Initial Extraction
Extraction Method: Principal Component Analysis.

209
Table G.23 Total variance explained
Total Variance Explained
3,497 29,144 29,144 3,497 29,144 29,144 2,225 18,544 18,544
1,339 11,156 40,300 1,339 11,156 40,300 2,206 18,381 36,925
1,068 8,898 49,198 1,068 8,898 49,198 1,311 10,922 47,847
1,014 8,454 57,652 1,014 8,454 57,652 1,177 9,805 57,652
,848 7,066 64,718
,796 6,634 71,352
,783 6,525 77,877
,647 5,392 83,268
,630 5,254 88,522
,552 4,597 93,119
,428 3,565 96,684
,398 3,316 100,000
Component1
2
3
4
5
6
7
8
9
10
11
12
Total % of Variance Cumulative % Total % of Variance Cumulative % Total % of Variance Cumulative %
Initial Eigenvalues Extraction Sums of Squared Loadings Rotation Sums of Squared Loadings
Extraction Method: Principal Component Analysis.
121110987654321
Eigenvalue
4
3
2
1
0
Scree Plot
Figure G.2 Scree plot
Table G.24 Component matrix
Component Matrixa
,792
,766
,718 -,175 ,251
,609 -,145 ,357 ,168
,551 ,416 ,117
,543 ,462 -,113
,525 ,217 -,371
,522 ,130 -,455
,287 -,614 ,324 -,312
-,603 ,536
-,398 ,280 ,506 -,217
,492 ,345 ,561
income
fathereducation
mothereducation
numberofbooks
computer
newspapermagazine
dishwasher
kindergarten
studyroom
work
numberofsibling
ageofschooling
1 2 3 4
Component
Extraction Method: Principal Component Analysis.
4 components extracted.a.

210
Table G.25 Rotated component matrix
Component
1 2 3 4
newspapermagazine ,712 ,134
numberofbooks ,695 ,223
income ,534 ,532 ,251
numberofsibling -,685 ,216 ,153
mothereducation ,386 ,678
kindergarten ,639 ,304
fathereducation ,494 ,569 ,151
work -,798
dishwasher ,348 ,232 ,528
ageofschooling -,169 ,799
studyroom ,550 -,153 -,575
computer ,344 ,339 ,333 ,389
Extraction Method: Principal Component Analysis. Rotation Method: Varimax with Kaiser Normalization. a Rotation converged in 10 iterations.
Table G.24 Component transformation matrix
Component Transformation Matrix
,687 ,685 ,242 ,004
-,199 -,046 ,682 ,702
,699 -,682 -,057 ,209
-,014 ,252 -,688 ,681
Component1
2
3
4
1 2 3 4
Extraction Method: Principal Component Analysis. Rotation Method: Varimax with Kaiser Normalization.

211
APPENDIX H
RESULTS OF THE ANALYSES ON ASSUMPTIONS
H.1 Assumptions
H.1.1 Assumptions Common to Independent t-Test and GLM Repeated Measures ANOVA
H.1.1.1 Independence of Observations
Independence assumption means when the treatment is individually administered, observations are independent (Glass &
Hopkins, as cited in Stevens, 2002, p. 259). The researcher collected the data for this study by administering various
instruments to the students. She tried to ensure that the students answered the measurements independently by supervising the
test administration or instructing the teachers who would supervise the others.
H.1.1.2 Normality
Normality assumption means that the population from which the sample is drawn is normally distributed. There are many
techniques to assess the normality of the distribution of scores. Kolmogorov-Smirnow and Shapiro-Wilk tests are one of them.
When the result of these tests is not significant, it means that the dependent variables were normally distributed across all levels
of the independent variable (treatment groups).
H.1.1.3 Homogeneity of Variance
It means the population variances should be equal (Hale, 2008). Levene’s Test for Equality of Variances shows if variances for
the groups do not differ significantly from each other (George & Mallery, 2003, p. 140). When the result of this test is not
significant, it means that the variances of students’ scores on the dependent variable are equal in both experimental and control
groups.
H.1.2 Assumption Unique to GLM Repeated Measures ANOVA
H.1.2.1 Sphericity (Circularity)
Sphericity means the covariance matrix for the new (transformed) variables is a diagonal matrix, with equal variances on the
diagonal (Stevens, 2002, p. 501). Mauchly’s Test of Sphericity shows whether the differences between the variances for all
levels of within-subjects variable are similar. When the result of this test is not significant, it means that the differences between
the variances for all levels of within-subjects variable are similar.

212
H.2 Results of Analyses on Assumptions
H.2.1 Result of Analyses on Assumptions of Independent Samples t-Test
Table H.1 Result of tests of normality
Tests of Normality
,076 64 ,200* ,987 64 ,716
,057 67 ,200* ,979 67 ,314
,096 64 ,200* ,983 64 ,504
,092 67 ,200* ,968 67 ,078
group1
2
1
2
REGR factor score1 for analysis 1
REGR factor score2 for analysis 1
Statistic df Sig. Statistic df Sig.
Kolmogorov-Smirnova Shapiro-Wilk
This is a lower bound of the true significance.*.
Lilliefors Significance Correctiona.
Table H.2 Result of levene’s test for equality of variances
F Sig. REGR factor score 1 for analysis 1 .638 .426 REGR factor score 2 for analysis 1 .868 .353

213
H.2.2 Result of Analyses on Assumptions of Repeated Measures ANOVA for Reproduction,
Development, and Growth in Living Things Unit Achievement Tests
Table H.3 Result of tests of normality
Tests of Normality
,117 86 ,005 ,983 86 ,325
,129 82 ,002 ,967 82 ,035
,106 86 ,019 ,965 86 ,021
,140 82 ,000 ,970 82 ,048
,120 86 ,004 ,963 86 ,014
,147 82 ,000 ,943 82 ,001
group1
2
1
2
1
2
canli1
canli2
canli4
Statistic df Sig. Statistic df Sig.
Kolmogorov-Smirnova
Shapiro-Wilk
Lilliefors Significance Correctiona.
Table H.4 Result of levene's test of equality of error variances
F df1 df1 Sig. canli1 2.724 1 166 .101 canli2 .015 1 166 .903 canli4 1.292 1 166 .257
Tests the null hypothesis that the error variance of the dependent variable is equal across groups. a Design: Intercept+group Within Subjects Design: canli
Table H.5 Result of mauchly’s test of sphericity
Mauchly's Test of Sphericityb
Measure: MEASURE_1
,978 3,726 2 ,155 ,978 ,996 ,500Within Subjects Effectcanli
Mauchly's WApprox.
Chi-Square df Sig.Greenhouse-Geisser Huynh-Feldt Lower-bound
Epsilona
Tests the null hypothesis that the error covariance matrix of the orthonormalized transformed dependent variables isproportional to an identity matrix.
May be used to adjust the degrees of freedom for the averaged tests of significance. Corrected tests are displayed inthe Tests of Within-Subjects Effects table.
a.
Design: Intercept+group Within Subjects Design: canli
b.

214
H.2.3 Result of Analyses on Assumptions of Repeated Measures ANOVA for Force and
Motion Unit Achievement Tests
Table H.6 Result of Tests of Normality
Tests of Normality
,142 86 ,000 ,946 86 ,001
,161 82 ,000 ,948 82 ,002
,153 86 ,000 ,916 86 ,000
,184 82 ,000 ,921 82 ,000
,090 86 ,082 ,972 86 ,062
,103 82 ,033 ,973 82 ,082
group1
2
1
2
1
2
ontesttoplam
khsontoplam
khgecikmistoplam
Statistic df Sig. Statistic df Sig.
Kolmogorov-Smirnova
Shapiro-Wilk
Lilliefors Significance Correctiona.
Table H.7 Result of levene’s test of equality of error variances
Levene's Test of Equality of Error Variancesa
,753 1 166 ,387
3,520 1 166 ,062
,857 1 166 ,356
ontesttoplam
khsontoplam
khgecikmistoplam
F df1 df2 Sig.
Tests the null hypothesis that the error variance of the dependentvariable is equal across groups.
Design: Intercept+group Within Subjects Design: kuvvet
a.
Table H.8 Result of mauchly’s test of sphericity
Mauchly's Test of Sphericityb
Measure: MEASURE_1
,989 1,752 2 ,416 ,990 1,000 ,500Within Subjects Effectkuvvet
Mauchly's WApprox.
Chi-Square df Sig.Greenhouse-Geisser Huynh-Feldt Lower-bound
Epsilona
Tests the null hypothesis that the error covariance matrix of the orthonormalized transformed dependent variables isproportional to an identity matrix.
May be used to adjust the degrees of freedom for the averaged tests of significance. Corrected tests are displayed inthe Tests of Within-Subjects Effects table.
a.
Design: Intercept+group Within Subjects Design: kuvvet
b.

215
H.2.4 Result of Analyses on Assumptions of Repeated Measures ANOVA for Science
Process Skills Tests
Table H.9 Result of tests of normality
Tests of Normality
,078 86 ,200* ,973 86 ,067
,112 82 ,013 ,978 82 ,160
,094 86 ,060 ,976 86 ,117
,073 82 ,200* ,981 82 ,257
,091 86 ,074 ,983 86 ,337
,103 82 ,032 ,975 82 ,117
,058 86 ,200* ,985 86 ,404
,090 82 ,097 ,981 82 ,278
grup1
2
1
2
1
2
1
2
bsbir
bsiki
bsuc
bsdort
Statistic df Sig. Statistic df Sig.
Kolmogorov-Smirnova
Shapiro-Wilk
This is a lower bound of the true significance.*.
Lilliefors Significance Correctiona.
Table H.10 Result of levene’s test of equality of error variances
Levene's Test of Equality of Error Variancesa
,012 1 166 ,912
,187 1 166 ,666
3,871 1 166 ,051
1,974 1 166 ,162
bsbir
bsiki
bsuc
bsdort
F df1 df2 Sig.
Tests the null hypothesis that the error variance of thedependent variable is equal across groups.
Design: Intercept+grup Within Subjects Design: bsy
a.
Table H.11 The result of mauchly’s test of sphericity
Mauchly's Test of Sphericityb
Measure: MEASURE_1
,920 13,766 5 ,017 ,952 ,976 ,333Within Subjects Effectbsy
Mauchly's WApprox.
Chi-Square df Sig.Greenhouse-Geisser Huynh-Feldt Lower-bound
Epsilona
Tests the null hypothesis that the error covariance matrix of the orthonormalized transformed dependent variables isproportional to an identity matrix.
May be used to adjust the degrees of freedom for the averaged tests of significance. Corrected tests are displayed inthe Tests of Within-Subjects Effects table.
a.
Design: Intercept+grup Within Subjects Design: bsy
b.

216
H.2.5 Result of Analyses on Assumptions of Repeated Measures ANOVA for Self-Concept
Subtests of Attitudes toward Science and Technology Course Questionnaire
Table H.12 Result of tests of normality
Kolmogorov-Smirnova Shapiro-Wilk
Subtest
group statistic df Sig. statistic df Sig.
1 .129 86 .001 .948 86 .002 Self-Concept 1
2 .166 82 .000 .939 82 .001
1 .166 86 .000 .907 86 .000 Self-Concept 2
2 .135 82 .001 .906 82 .000
1 .242 86 .000 .773 86 .000 Self-Concept 3
2 .174 82 .000 .867 82 .000
1 .230 86 .000 .740 86 .000 Self-Concept 4
2 .204 82 .000 .853 82 .000
Table H.13 Result of levene's test of equality of error variances
Levene's Test of Equality of Error Variancesa
,319 1 166 ,573
,486 1 166 ,487
1,360 1 166 ,245
3,193 1 166 ,076
self1
self2
self3
self4
F df1 df2 Sig.
Tests the null hypothesis that the error variance of thedependent variable is equal across groups.
Design: Intercept+grup Within Subjects Design: self
a.
Table H.14 Result of mauchly’s test of sphericity
Mauchly's Test of Sphericityb
Measure: MEASURE_1
,922 13,333 5 ,020 ,949 ,973 ,333Within Subjects Effectself
Mauchly's WApprox.
Chi-Square df Sig.Greenhouse-Geisser Huynh-Feldt Lower-bound
Epsilona
Tests the null hypothesis that the error covariance matrix of the orthonormalized transformed dependent variables isproportional to an identity matrix.
May be used to adjust the degrees of freedom for the averaged tests of significance. Corrected tests are displayed inthe Tests of Within-Subjects Effects table.
a.
Design: Intercept+grup Within Subjects Design: self
b.

217
H.2.6 Result of Analyses on Assumptions of Repeated Measures ANOVA for Anxiety
Subtests of Attitudes toward Science and Technology Course Questionnaire
Table H.15 Result of tests of normality
Kolmogorov-Smirnova Shapiro-Wilk
Subtest
group statistic df Sig. statistic df Sig.
1 .115 86 .007 .928 86 .000 Anxiety 1
2 .135 82 .001 .921 82 .000
1 .094 86 .061 .949 86 .002 Anxiety 2
2 .158 82 .000 .919 82 .000
1 .170 86 .000 .889 86 .000 Anxiety 3
2 .084 82 .200* .970 82 .051
1 .170 86 .000 .888 86 .000 Anxiety 4
2 .108 82 .018 .940 82 .001
Table H.16 Result of levene's test of equality of error variances
Levene's Test of Equality of Error Variancesa
2,808 1 166 ,096
1,302 1 166 ,255
2,611 1 166 ,108
1,768 1 166 ,185
anx1
anx2
anx3
anx4
F df1 df2 Sig.
Tests the null hypothesis that the error variance of thedependent variable is equal across groups.
Design: Intercept+grup Within Subjects Design: anx
a.
Table H.17 Result of mauchly’s test of sphericity
Mauchly's Test of Sphericityb
Measure: MEASURE_1
,882 20,696 5 ,001 ,916 ,939 ,333Within Subjects Effectanx
Mauchly's WApprox.
Chi-Square df Sig.Greenhouse-Geisser Huynh-Feldt Lower-bound
Epsilona
Tests the null hypothesis that the error covariance matrix of the orthonormalized transformed dependent variables isproportional to an identity matrix.
May be used to adjust the degrees of freedom for the averaged tests of significance. Corrected tests are displayed inthe Tests of Within-Subjects Effects table.
a.
Design: Intercept+grup Within Subjects Design: anx
b.

218
H.2.7 Result of Analyses on Assumptions of Repeated Measures ANOVA for Interest
Subtests of Attitudes toward Science and Technology Course Questionnaire
Table H.18 Result of tests of normality
Kolmogorov-Smirnova Shapiro-Wilk
Subtest
group statistic df Sig. statistic df Sig.
1 .126 86 .002 .923 86 .000 Interest 1
2 .181 82 .000 .845 82 .000
1 .180 86 .000 .905 86 .000 Interest 2
2 .160 82 .000 .930 82 .000
1 .213 86 .000 .804 86 .000 Interest 3
2 .163 82 .000 .869 82 .000
1 .213 86 .000 .784 86 .000 Interest 4
2 .134 82 .001 .916 82 .000
Table H.19 Result of levene's test of equality of error variances
Levene's Test of Equality of Error Variancesa
,548 1 166 ,460
1,358 1 166 ,245
5,594 1 166 ,019
,030 1 166 ,863
int1
int2
int3
int4
F df1 df2 Sig.
Tests the null hypothesis that the error variance of thedependent variable is equal across groups.
Design: Intercept+grup Within Subjects Design: int
a.
Table H.20 Result of mauchly’s test of sphericity
Mauchly's Test of Sphericityb
Measure: MEASURE_1
,794 38,003 5 ,000 ,859 ,879 ,333Within Subjects Effectint
Mauchly's WApprox.
Chi-Square df Sig.Greenhouse-Geisser Huynh-Feldt Lower-bound
Epsilona
Tests the null hypothesis that the error covariance matrix of the orthonormalized transformed dependent variables isproportional to an identity matrix.
May be used to adjust the degrees of freedom for the averaged tests of significance. Corrected tests are displayed inthe Tests of Within-Subjects Effects table.
a.
Design: Intercept+grup Within Subjects Design: int
b.

219
H.2.8 Result of Analyses on Assumptions of Repeated Measures ANOVA for Career
Subtests of Attitudes toward Science and Technology Course Questionnaire
Table H.21 Results of the normality tests
Kolmogorov-Smirnova Shapiro-Wilk
Subtest
group statistic df Sig. statistic df Sig.
1 .112 86 .010 .921 86 .000 career 1
2 .143 82 .000 .911 82 .000
1 .193 86 .000 .865 86 .000 career 2
2 .136 82 .001 .918 82 .000
1 .197 86 .000 .843 86 .000 career 3
2 .159 82 .000 .978 82 .000
1 .171 86 .000 .877 86 .000 career 4
2 .158 82 .000 .884 82 .000
Table H.22 Result of levene's test of equality of error variances
Levene's Test of Equality of Error Variancesa
2,053 1 166 ,154
,133 1 166 ,716
6,648 1 166 ,011
,317 1 166 ,574
car1
car2
car3
car4
F df1 df2 Sig.
Tests the null hypothesis that the error variance of thedependent variable is equal across groups.
Design: Intercept+grup Within Subjects Design: career
a.
Table H.23 The result of mauchly’s test of sphericity
Mauchly's Test of Sphericityb
Measure: MEASURE_1
,863 24,181 5 ,000 ,911 ,933 ,333Within Subjects Effectcareer
Mauchly's WApprox.
Chi-Square df Sig.Greenhouse-Geisser Huynh-Feldt Lower-bound
Epsilona
Tests the null hypothesis that the error covariance matrix of the orthonormalized transformed dependent variables isproportional to an identity matrix.
May be used to adjust the degrees of freedom for the averaged tests of significance. Corrected tests are displayed inthe Tests of Within-Subjects Effects table.
a.
Design: Intercept+grup Within Subjects Design: career
b.

220
H.2.9 Result of Analyses on Assumptions of Repeated Measures ANOVA for Enjoyment
Subtests of Attitudes toward Science and Technology Course Questionnaire
Table H.24 Result of the normality tests
Kolmogorov-Smirnova Shapiro-Wilk
Subtest
group statistic df Sig. statistic df Sig.
1 .130 86 .001 .906 86 .000 Enjoyment 1
2 .157 82 .000 .876 82 .000
1 .182 86 .000 .822 86 .000 Enjoyment 2
2 .124 82 .003 .914 82 .000
1 .233 86 .000 .779 86 .000 Enjoyment 3
2 .172 82 .000 .878 82 .000
1 .250 86 .000 .732 86 .000 Enjoyment 4
2 .224 82 .000 .809 82 .000
Table H.25 Result of levene's test of equality of error variances
Levene's Test of Equality of Error Variancesa
,235 1 166 ,628
,846 1 166 ,359
12,818 1 166 ,000
,474 1 166 ,492
enj1
enj2
enj3
enj4
F df1 df2 Sig.
Tests the null hypothesis that the error variance of thedependent variable is equal across groups.
Design: Intercept+grup Within Subjects Design: enjoyment
a.
Table H.26 Result of mauchly’s test of sphericity
Mauchly's Test of Sphericityb
Measure: MEASURE_1
,973 4,496 5 ,480 ,982 1,000 ,333Within Subjects Effectenjoyment
Mauchly's WApprox.
Chi-Square df Sig.Greenhouse-Geisser Huynh-Feldt Lower-bound
Epsilona
Tests the null hypothesis that the error covariance matrix of the orthonormalized transformed dependent variables isproportional to an identity matrix.
May be used to adjust the degrees of freedom for the averaged tests of significance. Corrected tests are displayed inthe Tests of Within-Subjects Effects table.
a.
Design: Intercept+grup Within Subjects Design: enjoyment
b.
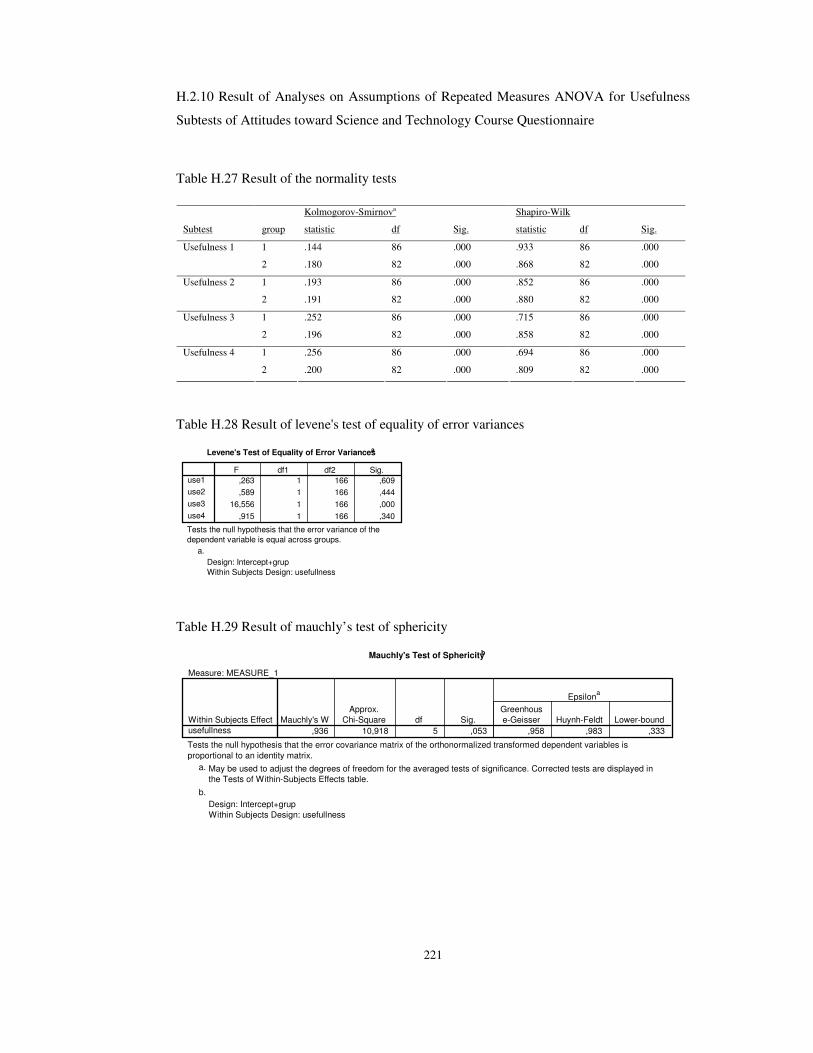
221
H.2.10 Result of Analyses on Assumptions of Repeated Measures ANOVA for Usefulness
Subtests of Attitudes toward Science and Technology Course Questionnaire
Table H.27 Result of the normality tests
Kolmogorov-Smirnova Shapiro-Wilk
Subtest
group statistic df Sig. statistic df Sig.
1 .144 86 .000 .933 86 .000 Usefulness 1
2 .180 82 .000 .868 82 .000
1 .193 86 .000 .852 86 .000 Usefulness 2
2 .191 82 .000 .880 82 .000
1 .252 86 .000 .715 86 .000 Usefulness 3
2 .196 82 .000 .858 82 .000
1 .256 86 .000 .694 86 .000 Usefulness 4
2 .200 82 .000 .809 82 .000
Table H.28 Result of levene's test of equality of error variances
Levene's Test of Equality of Error Variancesa
,263 1 166 ,609
,589 1 166 ,444
16,556 1 166 ,000
,915 1 166 ,340
use1
use2
use3
use4
F df1 df2 Sig.
Tests the null hypothesis that the error variance of thedependent variable is equal across groups.
Design: Intercept+grup Within Subjects Design: usefullness
a.
Table H.29 Result of mauchly’s test of sphericity
Mauchly's Test of Sphericityb
Measure: MEASURE_1
,936 10,918 5 ,053 ,958 ,983 ,333Within Subjects Effectusefullness
Mauchly's WApprox.
Chi-Square df Sig.Greenhouse-Geisser Huynh-Feldt Lower-bound
Epsilona
Tests the null hypothesis that the error covariance matrix of the orthonormalized transformed dependent variables isproportional to an identity matrix.
May be used to adjust the degrees of freedom for the averaged tests of significance. Corrected tests are displayed inthe Tests of Within-Subjects Effects table.
a.
Design: Intercept+grup Within Subjects Design: usefullness
b.

222
APPENDIX I
SYNTAXES
I.1 Syntax for Independent t-Test
T-TEST
GROUPS = group(1 2)
/MISSING = LISTWISE
/VARIABLES = wealth impactofmother
/CRITERIA = CI(.95) .
I.2 Syntax of the GLM Repeated Measures for Reproduction, Development, and Growth in
Living Things Unit Achievement Test
DATASET ACTIVATE DataSet1.
DATASET CLOSE DataSet2.
GLM
canli1 canli2 canli4 BY group
/WSFACTOR = canli 3 Repeated
/METHOD = SSTYPE(3)
/PLOT = PROFILE( canli*group )
/EMMEANS = TABLES(group*canli)
/EMMEANS = TABLES(canli)
/EMMEANS = TABLES(group)
/PRINT = DESCRIPTIVE ETASQ OPOWER HOMOGENEITY
/CRITERIA = ALPHA(.05)
/WSDESIGN = canli
/DESIGN = group .

223
I.3 Syntax of the GLM Repeated Measures for Attitudes toward Science and Technology
Course Questionnaire
GLM
self1 anx1 int1 car1 enj1 use1 self2 anx2 int2 car2 enj2 use2 self3 anx3
int3 car3 enj3 use3 self4 anx4 int4 car4 enj4 use4 BY grup
/WSFACTOR = time 4 Repeated att 6 Polynomial
/METHOD = SSTYPE(3)
/PLOT = PROFILE( time*grup*att )
/EMMEANS = TABLES(grup*att)
/EMMEANS = TABLES(grup*time)
/EMMEANS = TABLES(att)
/EMMEANS = TABLES(time)
/EMMEANS = TABLES(grup)
/PRINT = DESCRIPTIVE ETASQ OPOWER HOMOGENEITY
/CRITERIA = ALPHA(.05)
/WSDESIGN = time att
/DESIGN = grup .

224
APPENDIX J
GUIDED (TEACHER-DIRECTED) INQUIRY INSTRUCTION
J.1 Pilot “Piller ve Lambalar”Lesson
J.1.1 Pilot “Piller ve Lambalar”Lesson Plan
Amaçlar: Pil ve lambalarla basit incelemeler yapmak ve devre kavramını ve devre kurallarını kullanarak gözlemlerini
açıklamak.
Materyaller: 1.5 V Pil, Tel, Lamba, Büyüteç, Duy
Güvenlik İçin: Gözlük. Ayrıca öğrencilerinize ellerindeki materyalleri bir elektrik prizine sokmamalarını, gözlerini telin sivri uç
kısımlarına karşı korumalarını söyleyin.
1. Ders (Engagement)
Derse şu hikayeyle başlayın: Ormanda kamp yapan izcilerden üçü kaybolur. Gece olmuştur. Yanlarında el lambaları da yoktur.
Fakat içlerinden birinin pili, diğerinin lambası, sonuncunun da bakır teli vardır. İzciler pili, lambayı ve teli nasıl
birleştireceklerini de bilmemektedirler (Pil, lamba ve telden bahsederken, bu materyalleri (1.5 V pili, el lambasının lambasını ve
teli öğrenci gruplarınıza dağıtın.).
Sonra öğrencilerinize şunu sorun: “Önünüzde duran materyalleri kullanarak bir lamba yapıp izcilerin kamp alanlarına güvenle
ulaşmalarına yardım edebilir misiniz?
(Explore)
Öğrenci grupları verdiğiniz görevi yerine getirirken onlara soru sorarak ve grup arkadaşlarının yardımcı olmasını isteyerek
yardımcı olun.
2. Ders (Explore)
Ne Olduğunu Keşfet işleminden (1.-3. Etkinlikler) sonra sınıfın ya da laboratuarın lambasını söndürünüz ve gruplara pil ve tel
kullanarak yaktıkları lambayla ortamı aydınlatmalarını isteyin.
Sonra Gözlemlediğini Göster (4.-5. Etkinlik) işlemine geçin. Öğrencilerin lamba düzenekleriyle ilgili çizimleri, onların
bilgilerini materyal kullanarak elle lamba düzenekleri oluşturmalarından, ikonik hayal gücüne dönüştürür. Öğrenci gruplarının
çizdiği resimleri inceleyerek onlara yardımcı olun.
Bu aşamadan sonra 1. Tahmin Yaprağı’nı verin, bu etkinlik hakkında açıklama yapın.
Öğrenci grupları bu çalışma yaprağını tamamladıktan sonra, sınıfça cevapları değerlendirin.
3. Ders (Explain)
Genelleştir işlemi için öğrencilerinize şunu sorun:
“Farzedin ki izcilerden birinin bir cep telefonu var ve sizi arayarak lambayı nasıl yakacaklarını sordu. Ona ne dersiniz?
Cevabınızı yazınız.”
Öğrencilerden, bu soruya önce bireysel sonra grup halinde cevap vermelerini isteyin.
Lambanın yanması için gerekli kural şudur:
1. Lambanın ucunu bir pilin uç kısmına değdir.
2. Bir teli lambanın metal kısma değdir.

225
3. Elektriğin akması için teli diğer ucunu pilin diğer ucuna değdir.
Ayrıca devre kavramını da verin.Tahtaya “Devre” diye yazın ve devrenin lambalar, piller ve tellerden oluşan bir düzenek
olduğunu söyleyin. Eğer devre tamsa, bir pilin ucundan tel boyunca lambaya doğru ve ardından pilin diğer ucuna olan kesiksiz
bir yol olduğunu belirtin. Soru-cevap ve anlatım yoluyla öğrencilerinizin devreler hakkındaki bilgisini önceki devre
düzeneklerine uygulamasını sağlayın. Yani 1. Tahmin Yaprağı’ndaki elektiğin yönünü anlamada ve açıklamada kullanmalarını
sağlayın.
4. Ders (Elaborate)
Bilgini Yeni Durumlara Uygula işlemini yürütünüz. Ayrıca öğrencilerinizin yapacakları model bir evi aydınlatmalarını isteyin
ya da sınıf veya laboraturadaki lambaların nasıl bağlandığını düşünmelerini sağlayın.
5. Ders (Evaluate)
Öğrencilerin konuyla ilgili ve sorgulayıcı araştırma yöntemi bilgilerini ölçün. Yeni bir Tahmin Yaprağı verebilirsiniz.
İşlem Etkinlikler
Ne Olduğunu
Keşfet
1) Bir tel ve pil kullanarak bir lambayı yakmayı deneyin.
2) Lambayı yakma yolları bulun.
3) İki tel kullanarak, lambayı pile değdirmeden bir lambayı yakmayı deneyin.
Gözlemlediğini
Göster
4) 1. ve 2. etkinliklerdeki lamba-pil-tel düzeneklerini gösteren şekiller çizin.
5) 3. etkinlikteki lamba-pil-tel düzeneklerini gösteren şekiller çizin.
Tahmin Et ve
Sına
6) 1. Tahmin Yaprağı’nı tamamlayınız. İlk kutudan başlayarak, sırayla giderek öğrendiklerinizi bir sonraki
kutuda kullanınız. Bir tahminde bulununuz. Tahmininizi sınayınız. Denemenizden öğreniniz. Öğrendiğinizi
uygulayınız.
1. Tahmin Yaprağı
Lamba yanacak mı? Emin değilseniz deneyin ve görün.
Genelleştir 7) Yanması için lambanın nereye değmesi gereklidir? Pil nereye temas etmelidir? Bir lambanın yanması için
ne yapılması gerektiğiiyle ilgili genel bir kural yazınız. Genelleştirdiğiniz ifadeyi veya kuralı, 1. Tahmin
Yaprağı’nda kutular halinda gösterilen durumları açıklamakta kullanınız.
Bilgini Sonuç
Çıkarmada ve
Açıklamada
Kullan
8) Lambayı büyüteç yardımıyla inceleyin. Lamba içindeki sarılmış tele Filaman denir. Filaman elektrik
enerjisini ışık oluşturmakta kullanır. Lambanın tabanına doğru kaybolan iki teli gördünüz mü? Bu tellerin
lambanın tabanında birleştiğini biliyor musunuz?
7. Etkinlikle ilgili kuralınızı kullanarak yorumunuzu yapınız.
9) Bir duyu inceleyiniz. Duyun kısımları nelerdir? Duy, lambanın uç ve metal kısımlarna değecek şekilde
nasıl yapılmıştır?
Bilgini Yeni
Durumlara
Uygula
10) İki pil kullanarak bir lambayı yakın.
11) İki lambayı nasıl yakacağınızı bulun.
12) Şekil A’da görülen devreyi kurunuz. Kaç tel gereklidir? Lambalardan birini duyundan çıkarınız. Ne
oldu? Neden? Lambayı tekrar yerine takınız. Diğer lambayı duyundan çıkarınız. Ne oldu? Neden? Bir ya da
iki pil daha ekleyiniz. Ne oldu? Neden? “Seri Bağlı Devre” ismi, Şekil A’da gösterilen devreyi nasıl
tanımlar?
13) Şekil B’de görülen devreyi kurunuz. Kaç tel gereklidir? Lambalardan birini duyundan çıkarınız. Ne
oldu? Neden? Lambayı tekrar yerine takınız. Diğer lambayı duyundan çıkarınız. Ne oldu? Neden? Bir ya da
iki pil daha ekleyiniz. Ne oldu? Neden? “Paralel Bağlı Devre” ismi, Şekil B’de gösterilen devreyi nasıl
tanımlar?
Kaynak: Carin, A. A., Bass, J. E., & Contant, T. L. (2005). Methods for Taeching Science as Inquiry. 9 th Edition. Pearson
Education North Asia Ltd., p. 107-114.

226
J.1.2 Pilot “Piller ve Lambalar”Lesson Worksheet
İZCİ ARKADAŞLARA YARDIM EDELİM
Ormanda kamp yapan izcilerden üçü kaybolur. Gece olmuştur. Yanlarında el lambaları yoktur, fakat birincinin pili, ikincinin ampulü, üçüncünün de bakır teli vardır. İzciler el lamnbası yapmayı bilememektedir.
PİL, KABLO VE AMPUL
Sınıfa getirdiğiniz pil, ampul ve kablodan bir lamba yapıp izcilerin kamp alanına güvenle ulaşmalarına yardım edebilir misiniz?
Ne Olduğunu Keşfet
1. Bir kablo ve bir pil kullanarak bir ampulü yakmayı deneyin. 2. İki kablosu ve bir pil kullanarak bir ampulü yakmayı deneyin.
Gözlemle ve Genelleme Yap
1. Aşağıdaki boşluğa hazırladığınız düzenekleri gösteren şekiller çiziniz.
2. Aşağıdaki boşluğa bir ampulün yanması için ne yapılması gerektiğini yazınız. Ampul nereye değmelidir? Pil neye temas etmelidir?
ANAHTAR VE DUY
Ne Olduğunu Keşfet
İki bağlantı kablosu, bir pil, bir anahtar ve bir duy ile bir ampulü yakmayı deneyin.
Gözlemle ve Genelleme Yap
1. Aşağıdaki boşluğa hazırladığınız düzenekleri gösteren şekiller çiziniz. 2. Aşağıdaki boşluğa bir ampulün yanması için ne yapılması gerektiğini yazınız. Ampul nereye yerleştirilmelidir? Pil neye temas etmelidir. Anahtar ne yapılmalıdır?

227
J.1.2 (Cont.’d)
EL LAMBASININ IŞIĞI Küçük izciler ellerindeki materyallerden bir el lambası yapmışlardır. Ancak el lambasının ışığı etrafı tam aydınlatamamaktadır. Sizce izciler el lambalarının ışığını artırmak için ne yapmalıdır?
Tahmin Et
Aşağıdaki boşluğa hazırladığınız devredeki ampulün parlaklığını nasıl artırabileceğinizi yazınız.
Dene ve Sonuç Çıkar
1. Hazırladığınız devredeki ampulün parlaklığını artırmayla ilgili tahminlerinizi deneyin. Aşağıdaki boşluğa sonuçlarını yazınız.
2. Aşağıdaki boşluğa ampulün parlaklığını etkileyen değişkenleri yazınız. Bağımlı Değişken: Ampulün parlaklığı Bağımsız Değişken (Ampulün parlaklığını etkileyen değişken): Kontrollü Değişken (Sabit tutulan değişken):
DEVRE ELEMANLARI ve SEMBOLLERİ
Devre Elemanı Resmi Sembolü Pil Ampul Anahtar Kablo
Yanda bir elektrik devresinde yer alan elemanları ve sembollerini görüyorsunuz. Aşağıdaki boşluğa bu sembolleri kullanarak hazırladığınız devreleri çiziniz.
KAVRAMLARI AÇIKLAYALIM
Bugünkü derste yaptığınız etkinliklerden edindiğiniz bilgi ve deneyimlere de dayanarak, aşağıdaki kelimeleri birer cümle ile açıklayınız: Pil: Ampul: Anahtar: Kablo: Duy:
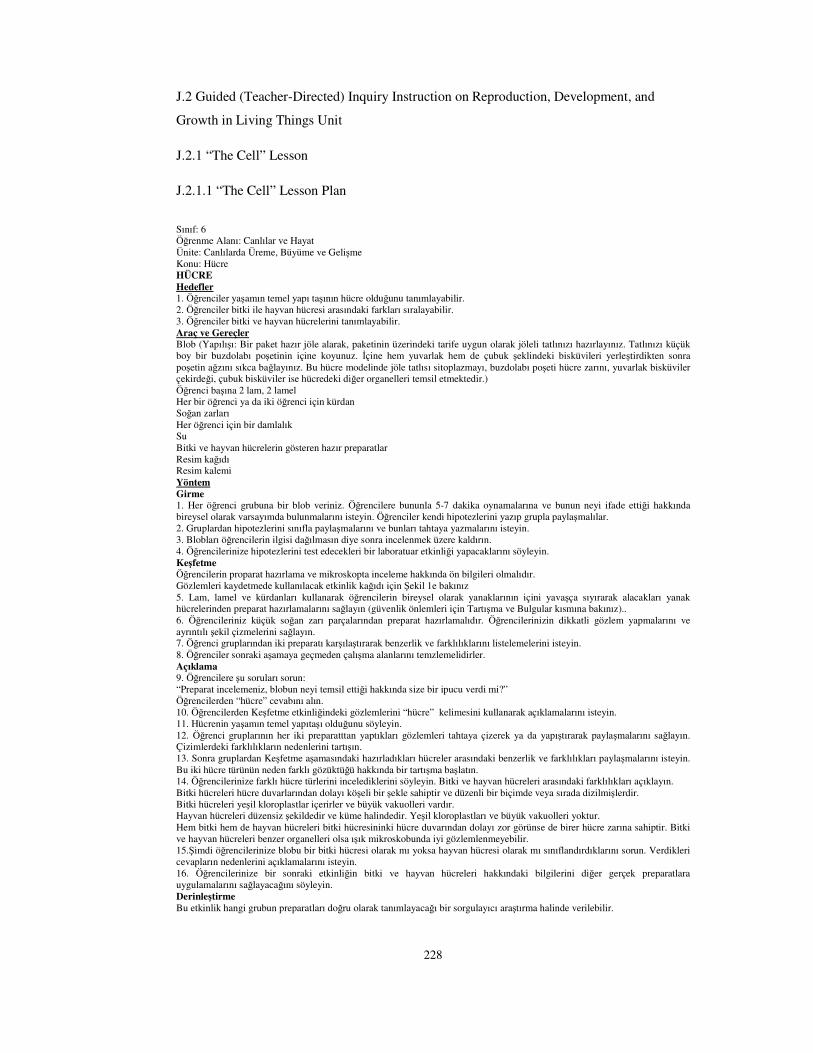
228
J.2 Guided (Teacher-Directed) Inquiry Instruction on Reproduction, Development, and
Growth in Living Things Unit
J.2.1 “The Cell” Lesson
J.2.1.1 “The Cell” Lesson Plan
Sınıf: 6 Öğrenme Alanı: Canlılar ve Hayat Ünite: Canlılarda Üreme, Büyüme ve Gelişme Konu: Hücre HÜCRE Hedefler 1. Öğrenciler yaşamın temel yapı taşının hücre olduğunu tanımlayabilir. 2. Öğrenciler bitki ile hayvan hücresi arasındaki farkları sıralayabilir. 3. Öğrenciler bitki ve hayvan hücrelerini tanımlayabilir. Araç ve Gereçler Blob (Yapılışı: Bir paket hazır jöle alarak, paketinin üzerindeki tarife uygun olarak jöleli tatlınızı hazırlayınız. Tatlınızı küçük boy bir buzdolabı poşetinin içine koyunuz. İçine hem yuvarlak hem de çubuk şeklindeki bisküvileri yerleştirdikten sonra poşetin ağzını sıkca bağlayınız. Bu hücre modelinde jöle tatlısı sitoplazmayı, buzdolabı poşeti hücre zarını, yuvarlak bisküviler çekirdeği, çubuk bisküviler ise hücredeki diğer organelleri temsil etmektedir.) Öğrenci başına 2 lam, 2 lamel Her bir öğrenci ya da iki öğrenci için kürdan Soğan zarları Her öğrenci için bir damlalık Su Bitki ve hayvan hücrelerin gösteren hazır preparatlar Resim kağıdı Resim kalemi Yöntem Girme 1. Her öğrenci grubuna bir blob veriniz. Öğrencilere bununla 5-7 dakika oynamalarına ve bunun neyi ifade ettiği hakkında bireysel olarak varsayımda bulunmalarını isteyin. Öğrenciler kendi hipotezlerini yazıp grupla paylaşmalılar. 2. Gruplardan hipotezlerini sınıfla paylaşmalarını ve bunları tahtaya yazmalarını isteyin. 3. Blobları öğrencilerin ilgisi dağılmasın diye sonra incelenmek üzere kaldırın. 4. Öğrencilerinize hipotezlerini test edecekleri bir laboratuar etkinliği yapacaklarını söyleyin. Keşfetme Öğrencilerin proparat hazırlama ve mikroskopta inceleme hakkında ön bilgileri olmalıdır. Gözlemleri kaydetmede kullanılacak etkinlik kağıdı için Şekil 1e bakınız 5. Lam, lamel ve kürdanları kullanarak öğrencilerin bireysel olarak yanaklarının içini yavaşça sıyırarak alacakları yanak hücrelerinden preparat hazırlamalarını sağlayın (güvenlik önlemleri için Tartışma ve Bulgular kısmına bakınız).. 6. Öğrencileriniz küçük soğan zarı parçalarından preparat hazırlamalıdır. Öğrencilerinizin dikkatli gözlem yapmalarını ve ayrıntılı şekil çizmelerini sağlayın. 7. Öğrenci gruplarından iki preparatı karşılaştırarak benzerlik ve farklılıklarını listelemelerini isteyin. 8. Öğrenciler sonraki aşamaya geçmeden çalışma alanlarını temzlemelidirler. Açıklama 9. Öğrencilere şu soruları sorun: “Preparat incelemeniz, blobun neyi temsil ettiği hakkında size bir ipucu verdi mi?” Öğrencilerden “hücre” cevabını alın. 10. Öğrencilerden Keşfetme etkinliğindeki gözlemlerini “hücre” kelimesini kullanarak açıklamalarını isteyin. 11. Hücrenin yaşamın temel yapıtaşı olduğunu söyleyin. 12. Öğrenci gruplarının her iki preparatttan yaptıkları gözlemleri tahtaya çizerek ya da yapıştırarak paylaşmalarını sağlayın. Çizimlerdeki farklılıkların nedenlerini tartışın. 13. Sonra gruplardan Keşfetme aşamasındaki hazırladıkları hücreler arasındaki benzerlik ve farklılıkları paylaşmalarını isteyin. Bu iki hücre türünün neden farklı gözüktüğü hakkında bir tartışma başlatın. 14. Öğrencilerinize farklı hücre türlerini incelediklerini söyleyin. Bitki ve hayvan hücreleri arasındaki farklılıkları açıklayın. Bitki hücreleri hücre duvarlarından dolayı köşeli bir şekle sahiptir ve düzenli bir biçimde veya sırada dizilmişlerdir. Bitki hücreleri yeşil kloroplastlar içerirler ve büyük vakuolleri vardır. Hayvan hücreleri düzensiz şekildedir ve küme halindedir. Yeşil kloroplastları ve büyük vakuolleri yoktur. Hem bitki hem de hayvan hücreleri bitki hücresininki hücre duvarından dolayı zor görünse de birer hücre zarına sahiptir. Bitki ve hayvan hücreleri benzer organelleri olsa ışık mikroskobunda iyi gözlemlenmeyebilir. 15.Şimdi öğrencilerinize blobu bir bitki hücresi olarak mı yoksa hayvan hücresi olarak mı sınıflandırdıklarını sorun. Verdikleri cevapların nedenlerini açıklamalarını isteyin. 16. Öğrencilerinize bir sonraki etkinliğin bitki ve hayvan hücreleri hakkındaki bilgilerini diğer gerçek preparatlara uygulamalarını sağlayacağını söyleyin. Derinleştirme Bu etkinlik hangi grubun preparatları doğru olarak tanımlayacağı bir sorgulayıcı araştırma halinde verilebilir.

229
17. Öğrencilerinizin bitki mi yoksa hayvan hücresi mi olduğu belirtilmemiş preparatları incelemelerini sağlayın. Preparat örnekleri öğrencilerinizin bildikleri canlılardan olmalıdır. Öğrenciler preparatları inceledikçe her bir preparatı bitki ya da hayvan olarak sınıflandırmalarını isteyin. 18. Tüm öğrenciler sekiz, on preparatı inceledikten sonra sınıflandırmalarını grup üyeleriyle tartışmalarını ve bir görüş birliğine ulaşmalarını isteyin. Sınıflandırma, Açıklama basamağında verilen bitki ve hayvan hücresi arasındaki farklara göre olmalıdır. 19. Sonra gruplardan sonuçlarını paylaşmalarını isteyin. Bu noktada sonuçları doğrular ve yarışmayı kimin kazandığını açıklar. Değerlendirme Bu değerlendirmeyi etkili olarak yapmak için öğrenciler kavram haritasının nasıl yapılacağını bilmelidir. 20. Öğrencilerinizden bireysel olarak hücre, bitki, hayvan, düzensiz şekil, kloroplast, çekirdek, hücre zarı ve hücre duvarı kelimelerini kullanarak bir kavram haritası oluşturmalarını isteyin (Şekil 2’ye bakınız). Tartışma ve Bulgular Yanak içi hücrelerini kullanırken dikkat edin. Güvenlik önlemleri olarak şunları göz önünde bulundurun: Öğrenciler tüm etkinlik boyunca sadece kendi hücreleriyle uğraşmalıdırlar. Temizlik sırasında lameller ayrı bir çöpe atılmalıdır. Lamlar ise iyice temizlenmelidir. Çalışma alanı ve mikroskoplar su ile seyreltilmiş çamaşır suyu ile temizlenmelidir. Tüm öğrenciler preparatları hazırlamadan önce ve hazırladıktan sonra ellerini iyice yıkamalıdır. Keşfetme ve Açıklama aşamalarında etkili öğrenmenin gerçekleşmesi için öğrencilerin mikroskobu hücreleri görebilecek kadar iyi ayarlamaları gerekmektedir. Dolayısıyla mikroskop kullanma hakkında önceden bilgi vermek gerekir. Bu etkinlikle öğrencilerin sorgulayıcı araştırma yeteneklerinin artırılması ve yapısalcı öğrenmenin gerçekleşmesi hedeflenmektedir. Blobların ne olduğu öğrencilerde merak uyandırmaktadır. Görsel/uzamsal zekâsı güçlü olan öğrenciler verilerini çizimler yoluyla kaydetmekten hoşlanır. Derinleştirme etkinliği bilinen cevaplar yerine doğru cevapları bulma konusunda öğrencileri güdüler. Kavram haritası öğrencilerinizin bitki ve hayvan hücreleri arasındaki ayrımı anlayıp anlamadıklarını değerlendirmenizi sağlar. Diğer Derslerle İlişkiler Resim-İş: Resim-İş öğretmeni ile işbirliği yaparak etkili bir resmin nasıl çizileceğini öğrencilerinize verebilirsiniz. Matematik: Matematik öğretmeni ile işbirliği yaparak oran ve orantı konusunu gözden geçirebilirsiniz. Öğrencileriniz böylece farklı hücre türlerinin büyüklüğünü fark edebilir. Teknoloji: Teknoloji öğretmeni ile işbirliği yaparak kavram haritasını Inspiration gibi bir program aracılığıyla çizebilirsiniz. Hatta video mikroskop yardımıyla mikroskopta incelediğini hücrelerin kısımlarını tüm sınıfa gösterebilirsiniz. Sonuç 5E Öğrenme Çemberi ile öğrencileriniz Girme aşamasındaki sorulara cevap vermesini sağlayabilirsiniz. Derinleştirme aşamasındaki etkinlik, bilgilerini doğru olarak uygulayabilmeleri için öğrencilerinizi güdüler.

230
J.2.1.2 “The Cell” Lesson Worksheet
Bitki ve Hayvan Hücreleri Arasında Benzerlik ve Farklılık Var Mıdır?
Yukarıdaki soruyu cevaplamak için şu etkinliği ve soruları yapın.
1. Tırnağınızdan daha küçük boyutta bir soğan zarı alın ve üzerine bir damla su damlatılmış lam üzerine koyun.
2. Soğan zarının üzerine lameli dikkatlice kapatın.
3. Hazırladığınız peparatı mikroskopta inceleyin. Mikroskobu açık alanları görecek şekilde ayarlayın. Mikroskobu koyu
alanları ayarlayacak şekilde ayarlayın. Preparatınızın bazı kısımları diğerlerine göre daha parlak gözüküyor mu?
4. Aşağıdaki ovalin içine preparatınızın neye benzediğini çizin.
a. Gördüğünüz şeylerin şeklini nasıl tanımlarsınız?
b. Blokların hepsi birbirine benziyor?
c. Hepsi aynı büyüklükte mi?
d. Hepsi aynı şekilde mi?
e. İçlerinde ne görüyorsun?
5. Lamın üstündeki soğan zarının üstüne Metilen mavisi boyasından kürdan yardımıyla biraz damlatın. Sonra bir damla su
ekleyin ve lamelle kapatın.
6. Praparatınızı mikroskopla dikkatlice biraz inceleyin. Şimdi içinde ne görüyorsunuz?
7. Temiz bir lama küçük bir damla su damlatın.
8. Temiz bir kürdan alın. Kör olan ucuyla yanağınızın içini nazikçe kazıyın.
9. Kürdanda toplanan maddeyi lamın üzerindeki su damlasına değdirin.
10. Küçük bir damla metilen mavisi ekleyin. Lamelle kapatın.
11. Mikroskopla bakıncaya kadar preparatınızda bir şey görmeyebilirsiniz.
12. Aşağıdaki ovalin içine preparatınızın neye benzediğini çizin.
a. Gördüğünüz şeylerin şeklini nasıl tanımlarsınız?
b. Blokların hepsi birbirine benziyor?
c. Hepsi aynı büyüklükte mi?

231
d. Hepsi aynı şekilde mi?
e. İçlerinde ne görüyorsun?
13. Bir Venn diyagramı çizerek gözlemlediğiniz iki farklı hücre türünün benzerlik ve farklılıklarını anlatınız.
Reference
Wilder , M. Ve Shuttleworth, P. (2005). Cell Inquiry: A 5E Learning Cycle Lesson. Science Activities, 41(4), 37-43.

232
J.2.1.3 Evaluation of “The Cell” Lesson
Table J.1 Inquiry in the cell tasks and coding categories for the cell lesson plan
Essential features of classroom inquiry*
Task organizations according to inquiry features (task component and response format of performance assessment, by Solones-Flores & Shavelson, 1997, fig.1)
Coding categories (scoring system component of performance assessment, by Solones-Flores & Shavelson, 1997, fig.1)
Learner engages in scientifically oriented questions.
1st Task: Observation* Blob neyi ifade etmektedir? 2nd Task: Observation* (Soğan zarı ve yanak epiteli hicrelerini mikroskopta inceledikten sonra) Aşağıdaki ovalin içine preparatınızın neye benzediğini çizin. a. Gördüğünüz şeylerin şeklini nasıl tanımlarsınız? b. Blokların hepsi birbirine benziyor? c. Hepsi aynı büyüklükte mi? d. Hepsi aynı şekilde mi? e. İçlerinde ne görüyorsun? 3rd Task: Classification* Bir Venn diyagramı çizerek gözlemlediğiniz iki farklı hücre türünün benzerlik ve farklılıklarını anlatınız. 4th Task: Classification* Mikroskoplardaki preparatları inceleyerek, her birini bitki ya da hayvan olarak sınıflandırın.
Not assessed: Question is provided for learner.
Learner gives priority to evidence in responding to questions.
Learner makes observations of blobs to explore it and uses microscopes to find out: a. the structure of the onion and cheek tissues b. differences between plant and animal cells c. whether undefined samples are either from a plant or an animal.
Not assessed: Students are instructed how to use microscopes and prepare slides. They are given activity sheets to record their observations.
Learner formulates explanations from evidence.
Learner explains what living things are made of, the content of cells, the differences and similarities between plant and animal cells, and classifies samples into these cell types.
Whether students give the names of the organelles not observed through the microscope, such as endoplasmic reticulum, ribosome, etc. Which criteria do students use when comparing plant and animal cells? (Explanation type) What kind of reasoning students provide from the evidence?
Learner connects explanations to scientific knowledge.
Learner’s explanation reflects the level of understanding about her/his knowledge of cells, cell parts, and cell types.
(Scientific knowledge use) How consistent and sophisticated are students’ explanations in conjunction with scientific knowledge?
Learner communicates and justifies explanations.
Learner compares her/his explanations with other students’ explanations and reference books.
(Prediction agreement) How well students predict that blobs represent cells. How many criteria do students use when comparing plant and animal cells? And whether these are correct or not. How many slides do students correctly classifies according to cell types.
Note: Developed from Table 1 of Lee & Butler Songer, 2003, and *Table 2 of Solano-Flores & Shavelson, 1997 REFERENCES
Solano-Flores, G., & Shavelson, R. J. (1997). Development of Performance Assessments in Science: Conceptual,
Practical, and Logistical Issues. Educational Measurement: Issues and Practice, Fall 1997, 16-25.
Lee, H-S. & Butler Songer, N. (2003). Making authentic science accessible to students. International Journal of
Science Education (25),8, 923–948

233
J.2.2 “Reproduction, Development, and Growth in Human Beings” Lesson
J.2.2.1 “Reproduction, Development, and Growth in Human Beings” Lesson Activity 1
Sınıf: 6
Öğrenme Alanı: Canlılar ve Hayat
Ünite: Canlılarda Üreme, Büyüme ve Gelişme
Konu: İnsanlarda Üreme, Büyüme ve Gelişme
İnsanlarda Üreme, Büyüme ve Gelişme
Öğrencilerden anne veya babaları ile bir görüşme yaparak onların hayat hikâyelerini doğdukları andan itibaren öğrenmeleri ve
bir rapor yazmaları istenecek. Öğrenciler ayrıca anne ve babalarının doğumlarından itibaren çekilmiş fotoğraflarını da bu rapora
ekleyeceklerdir.
Öğrenciler sınıfta arkadaşlarına hazırladıkları raporları sunacaklardır.
Öğrencilere sunudan sonra şu soru sorulacaktır:
Anne veya babanızın fotoğraflarını onların hayat hikâyelerini doğumlarından itibaren anlattığınız raporda ilgili yerlere eklerken
güçlük çektiniz mi? Size kim yardım etti? Fotoğrafları sıraya koyarken nelere dikkat ettiniz? gibi sorularla bu sınıflandırma-
sıralama işlemini nasıl yaptıkları öğrenilir.
Öğrencilere daha sonra anne veya babalarının fotoğraflarla gösterilen hayat evrelerini adlandırmaları istenir.
Öğrencilere anne veya babalarının nasıl anne ve baba oldukları, kendilerinin nasıl doğdukları, varsa kardeşlerinin nasıl
doğdukları, anne ve babalarının kendilerini ve kardeşlerini nasıl besleyip büyüttükleri sorulacak. Anne ve babalarının
vücudundaki hangi kısımların anne ve baba olmaktan sorumlu olduğu sorulur.
Öğrencilere ayrıca kendileriyle ilgili ailelerini ve çevrelerini de etkileyen hangi önemli olayları (örneğin emzik emme, parmak
emme, göbek bağının gömülmesi, diş çıkartma, süt dişlerinin çıkarılması, ana sınıfına başlama, okula başlama, kız/erkek
arkadaşı olma, ergenlik gibi) hatırladıkları sorulacak. Ayrıca bu olayların aile ve çevredeki yansımalarını (gelenek, görenek)
anlatmaları istenecek.

234
J.2.2.2 Evaluation of “Reproduction, Development, and Growth in Human Beings” Lesson
Table J.2 Inquiry in the Human Development tasks and coding categories for the Human
Development lesson plan
Essential features of classroom inquiry*
Task organizations according to inquiry features (task component and response format of performance assessment, by Solones-Flores & Shavelson, 1997, fig.1)
Coding categories (scoring system component of performance assessment, by Solones-Flores & Shavelson, 1997, fig.1)
Learner engages in scientifically oriented questions.
1st Task: Classification* Anne veya babanızın hayat hikâyelerini onların ilgili fotoğraflarını da ekleyerek yazınız. Anne veya babanızın fotoğraflarını onların hayat hikâyelerini doğumlarından itibaren anlattığınız raporda ilgili yerlere eklerken güçlük çektiniz mi? Size kim yardım etti? Fotoğrafları sıraya koyarken nelere dikkat ettiniz? 2nd Task: Observation* Anne veya babalarınızın fotoğraflarla gösterilen hayat evrelerini adlandırın. 3rd Task: Classification* Anne veya babalarınız nasıl anne ve baba oldular? Nasıl doğdunuz, varsa kardeşleriniz nasıl doğdu? Anne ve babalarınız sizi ve kardeşlerinizi nasıl besleyip büyüttü? 4th Task: Classification* Anne ve babalarınızın vücudundaki hangi kısımlar anne ve baba olmaktan sorumludur?
Not assessed: Questions are provided for learner.
Learner gives priority to evidence in responding to questions.
Learners write biographies of their parents. They make observations of photographs of their parents according to some attributes such as age, physical appearance, presence of other people, etc. Learners make use of their autobiographies when considering how human are born and nurtured. Learners relate reproductive organs with reproduction.
Students are expected to prepare a report telling the life story of their parents. They are also expected to visualize the life of their parents with appropriate photographs. Students are expected to share their understanding of reproduction in human by giving examples from their own experiences.
Learner formulates explanations from evidence.
Learner explains that human life has some steps and we give different names to people in each step, such as fetus, newborn, infant, child, adolescence, adult, and old. Learner understands that each stage has important characteristics. Learner also explains that some of our body parts are responsible for our reproduction.
Whether students included all stages of human life in their stories, named the stages correctly. Whether students relate reproductive organs with their functions in human reproduction.
Learner connects explanations to scientific knowledge.
Learner’s explanation reflects the level of understanding about her/his knowledge of human life stages, reproductive organs and reproduction.
(Scientific knowledge use) How consistent and sophisticated are students’ explanations in conjunction with scientific knowledge?
Learner communicates and justifies explanations.
Learner compares her/his explanations with other students’ explanations and reference books.
(Prediction agreement) How well students classified their parents’ photographs according to the characteristics of life stages. How many criteria do students use when classifying human life stages? How students relate reproductive organs with reproduction.
Note: Developed from Table 1 of Lee & Butler Songer, 2003, and *Table 2 of Solano-Flores & Shavelson, 1997 REFERENCES
Solano-Flores, G., & Shavelson, R. J. (1997). Development of Performance Assessments in Science: Conceptual, Practical, and Logistical Issues. Educational Measurement: Issues and Practice, Fall 1997, 16-25.
Lee, H-S. & Butler Songer, N. (2003). Making authentic science accessible to students. International Journal of Science Education (25),8, 923–948.

235
J.2.2.3 “Reproduction, Development, and Growth in Human Beings” Lesson Activity 2
Sınıf: 6
Öğrenme Alanı: Canlılar ve Hayat
Ünite: Canlılarda Üreme, Büyüme ve Gelişme
Konu: İnsanda Üreme, Büyüme ve Gelişme
İnsanda Üreme, Büyüme ve Gelişme
Araştırma Konuları
1. Anasınıfı kendi sınıfınız, 7. ve 8. sınıftakilerin boylarını ölçün /ellerini, ayaklarını çizin.
En uzun boy nedir? vs.
Uzunluk
120 121 122 123 124
Öğrenci sayısı
1 4 5 2 1
Öğrenci sayısı 2 1
120 121 boy uzunluğu
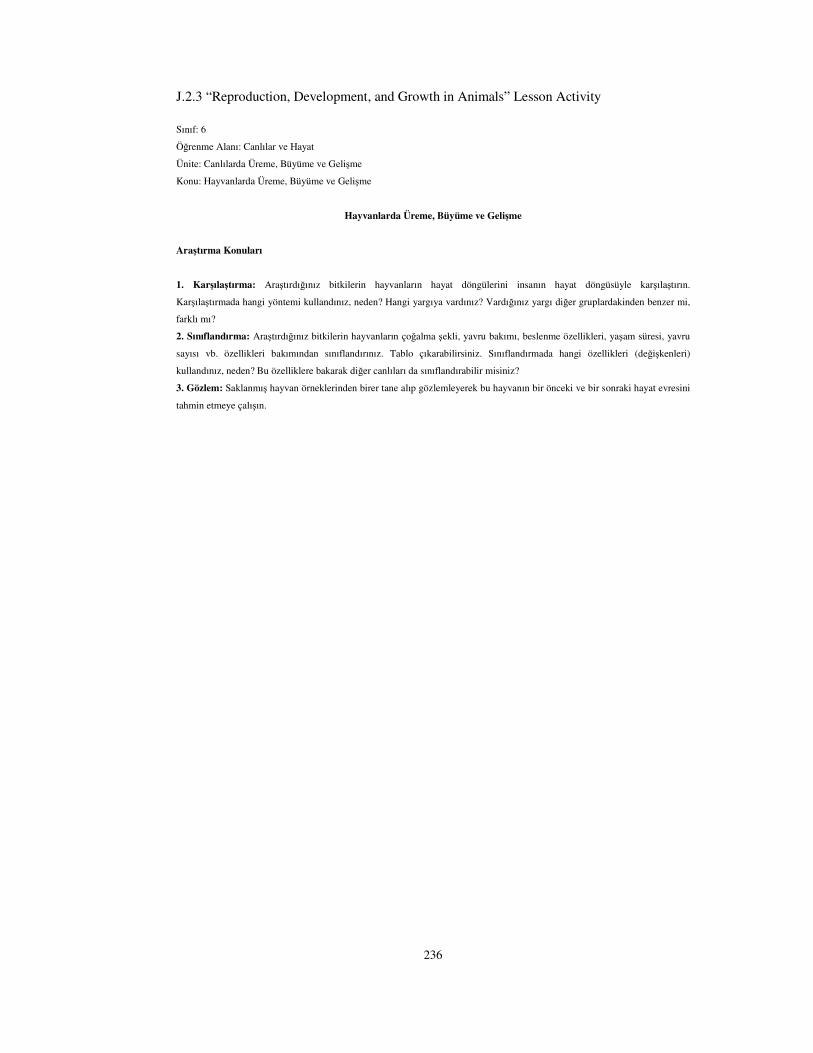
236
J.2.3 “Reproduction, Development, and Growth in Animals” Lesson Activity
Sınıf: 6
Öğrenme Alanı: Canlılar ve Hayat
Ünite: Canlılarda Üreme, Büyüme ve Gelişme
Konu: Hayvanlarda Üreme, Büyüme ve Gelişme
Hayvanlarda Üreme, Büyüme ve Gelişme
Araştırma Konuları
1. Karşılaştırma: Araştırdığınız bitkilerin hayvanların hayat döngülerini insanın hayat döngüsüyle karşılaştırın.
Karşılaştırmada hangi yöntemi kullandınız, neden? Hangi yargıya vardınız? Vardığınız yargı diğer gruplardakinden benzer mi,
farklı mı?
2. Sınıflandırma: Araştırdığınız bitkilerin hayvanların çoğalma şekli, yavru bakımı, beslenme özellikleri, yaşam süresi, yavru
sayısı vb. özellikleri bakımından sınıflandırınız. Tablo çıkarabilirsiniz. Sınıflandırmada hangi özellikleri (değişkenleri)
kullandınız, neden? Bu özelliklere bakarak diğer canlıları da sınıflandırabilir misiniz?
3. Gözlem: Saklanmış hayvan örneklerinden birer tane alıp gözlemleyerek bu hayvanın bir önceki ve bir sonraki hayat evresini
tahmin etmeye çalışın.

237
J.2.4 “Plant Reproduction, Development and Growth” Lesson
J.2.4.1 “Plant Reproduction, Development and Growth” Lesson Worksheet 1
Araştırma Sorumuz: Meyve Büyüklüğü ile Tohum Sayısı Arasında Bir İlişki Var Mıdır?
Kullanmam Gereken Materyaller: Meyve, cetvel
Varsayımımız/Hipotezimiz:
Değişkenler 1. Kontrol Edilen Değişken: Meyve türü
2. Bağımsız Değişken: Meyve Büyüklüğü
3. Bağımlı Değişken: Tohum Sayısı
İzlememiz Gereken Yöntem:
1. Meyvenin büyüklüğünü ölçeceğiz.
2. Meyveyi parçalayıp tohumlarını bulacağız.
3. Tohum sayılarını hesaplayacağız.
Toplamamız ve Kayıt Etmemiz Gereken Veriler: Meyvenin büyüklüğü (uzunluğu, çağı), tohum sayısı
Hatalara Nasıl Kontrol Edeceğiz? Aynı meyveyi hem arkadaşım hem de ben ölçeceğim. Tohumlarını da ikimiz sayacağız.
Bulgularımız:
(Verilerimizden Hazırladığım Tablo ve Grafik)
Yorumumuz:
Hipotezimiz Doğrulandı mı?
Kullandığımız ve Anladığımız Terimler:
Sonraki Araştırma Konumuz ve Dikkat Etmemiz Gerekenler:
Öğrendiklerimizin Diğer Konularla İlişkisi:

238
J.2.4.2 “Plant Reproduction, Development and Growth” Lesson Worksheet 2
OKUL BAHÇESİNDE
Bir Ağaç Evlat Edinin:
Öğrencilerden gösterilen ağaçlardan birini seçmeleri istenecek. Aynı ağacı seçen öğrenciler bir grup oluşturacak. Gruplar
aşağıdaki soruları cevaplayacak:
1. Bu ağacı neden seçtiniz?
2. Ağacınıza once uzaktan bakın. Hangi özellikleri dikkat çekiyor?
Sonra ağacınıza yaklaşın. Dikkatinizi çeken diğer özellikleri oldu mu? Neler?
3. (Daha sonra kolayca bulmak ve arkadaşlarınıza anlatmak için) Ağacınızın okul bahçesindeki yerini ve şeklini
tanımlar mısınız? (Ağaç bahçenin neresinde? Şekli, kısımları, boyu, rengi, yapısı, yaprakları, gövdesi,
meyvesi/tohumu, kokusu, vb. nasıl?
4. Bitkiye zarar vermeden gövdesini, yaprağını, meyve ve tohumunu elinize alıp inceleyin. Gördüklerinizi ve
hissettiklerinizi kaydedin.
5. Ağacınızın özelliklerini daha once hangi ağaçlarda görmüştünüz?”
6. Sizce ağaç kaç yaşında?
7. Bulunduğu yere nasıl geldi?
8. Sonbaharda olduğumuzu düşünürsek kış gelince ağaca ne olacak? İlkbaharda ve yazın ne olacak?
9. Sizce ağacın diğer canlılarla nasıl ilişkileri var?

239
J.3 Guided (Teacher-Directed) Inquiry Instruction on Force and Motion Unit
J.3.1 “Rocket Balloon” Lesson
J.3.1.1 “Rocket Balloon” Lesson Plan
KUVVET VE HAREKET ROKET BALON
1. Ders: Roket Balon
Gerekli Malzemeler:
1 balon
1 kamış/pipet
İp
Bant
Yapılışı:
İp’i kamıştan geçirin.
Balonu şişirip ucunu bağlayın.
Şişirdiğiniz balonu pipete bant yardımıyla yapıştırın.
Balonun bağlı ucunu serbest bırakın (balon ip boyunca gidecektir).
Sorular:
1. Ne gözlemlediniz?
2. Sizce bu olay nasıl oldu?
3. Bu olaydan sorumlu olan kuvvet nedir? Bu kuvvet temas gerektiren bir kuvvet mi yoksa temas gerektirmeyen bir kuvvet mi?
4. Bu deneyi evde az şişmiş ya da çok şişmiş bir balonla tekrarladığınız takdirde nasıl sonuçlanmasını beklersiniz?
2. Ders: Roket Balon
Roket Balon’u tekrar yapın.
Roket balonunuz ne kadar uzaklığa gitti? Bunu nasıl ölçersiniz?
En uzağa giden roket balonu yapmak için hangi değişkeni değiştirmeniz gerekir?
Bu değişkenin balonun ip üzerinde aldığı yola etkisini bulmak için bir deney yapınız. Deneyinizle ilgili ikinci sayfada verilen
örnekten faydalanarak bir rapor hazırlayınız.

240
J.3.1.2 “Rocket Balloon” Lesson Plan Worksheet
EN UZAĞA GİDEN ROKET BALON DENEYİ
Kullanmam Gereken Materyaller: Balonlar (en az 2), 1 kamış/pipet, İp, Bant, Cetvel/Mezura/Metre
Varsayımımız/Hipotezimiz: Balon ne kadar çok şişirilirse o kadar uzağa gider.
Değişkenler 1. Kontrol Edilen Değişken: Balon
2. Bağımsız Değişken: Balonun büyüklüğü
3. Bağımlı Değişken: Balonun ip üzerinde aldığı yol
İzlememiz Gereken Yöntem:
1. Balonu şişirip ağzını bağlarız.
2. Şişirdiğimiz balonun büyüklüğünü ölçeriz.
3. Balonu içinden ip geçirilmiş pipete bantlarız.
4. Balonun ipini çözeriz.
5. Balonun ip üzerinde aldığı yolu cetvelle ölçeriz.
6. Daha az ya da daha çok şişirilmiş balonla karşılaştırırız.
Toplamamız ve Kayıt Etmemiz Gereken Veriler: Balonun büyüklüğü (çevre uzunluğu), balonun ip üzerinde aldığı yol
Hatalara Nasıl Kontrol Edeceğiz? Aynı balonun çevresini hem arkadaşım hem de ben ölçeceğim. Balonun ip üzerinde aldığı
yolu ikimiz ölçeceğiz.
Bulgularımız:
(Verilerimizden Hazırladığım Tablo ve Grafik)
Yorumumuz (Hipotezimiz Doğrulandı mı?)
Kullandığımız ve Anladığımız Terimler:
Sonraki Araştırma Konumuz ve Dikkat Etmemiz Gerekenler:
Öğrendiklerimizin Diğer Konularla İlişkisi:
3. Ders: Roket Balon’la ilgili aşağıdaki sorulara cevap veriniz:
1. Roket Balon’a etki eden kuvvet ya da kuvvetler nelerdir? Bu kuvvetler temas gerektiren mi, yoksa temas gerektirmeyen
kuvvetler midir? (Roket balona etki eden kuvvet balonun içindeki sıkıştırılmış havadır. Bu temas gerektiren bir kuvvettir.
Balonun ağzı kapalı olduğunda tüm çeperine etki ederek onu iter.)
2. Roket balona etki eden kuvvetlerin yönü ve doğrultusu ne olur? Gösteriniz.
(Balon rokete etki eden kuvvet içteki basınçlı havadır. Balonun içindeki gaz balonu dışarı doğru bütün yönlerden iter ama çıkış
olmadığından bir yere gidemez. Balonun ağzını açtığımızda bu çıkıştan yüksek hızla çıkar. Buna etki (aksiyon, eylem) denir.
Bu etki balonu ters istikamette iter, buna da tepki (reaksiyon) denir.

241
(http://unmuseum.mus.pa.us/exjet.htm)
3. Roket balon hareket ederken etki ve tepki kuvvetleri birbirine eşit midir? Ne zaman eşit olur?
4. Roket balon ile gerçek roket birbirine nasıl benzer?
Roket sıkıştırılmış gazı bir seferde vermez, yakıtını yakarak sıkıştırılmış gazı oluşturur.
etki tepki

242
J.3.2 “Toy Car” Lesson
J.3.2.1 “Toy Car” Lesson Plan
KUVVET VE HAREKET OYUNCAK ARABA
1. Ders: Öğrencilere getirmiş oldukları oyuncak arabaları çıkarmaları istenir. Öğrencilere en süratli kimin arabası olduğu
sorulur. Bu arabalardan birkaçı sınıfta tahta önündeki boşlukta yarıştırılır. En süratli gidene karar verilir. Beton üzerinde en
süratli gidenin o araba olduğu, ama bununla birlikte asfalt, toprak gibi zeminlerin de olduğu ve en süratli giden arabanın
değişeceği söylenir.
Öğrencilere bu zeminlerden hangisinde arabalarının en süratli gideceği sorulur.
Öğrencilere bu derste yapılacak bir deneyle buna karar verecekleri bildirilir.
Oyuncak arabanın en süratli gittiği zemini bulmak için ne yapacakları sorulur.
(Bunun için şu soru sorulabilir: Oyuncak arabanın en süratli gittiği zemini bulmak için hangi değişkeni değiştirmeniz gerekir?)
Öğrencilere deney hakkında bilgi verilir.
Deneyinizle ilgili ikinci sayfada verilen örnekten faydalanarak bir rapor hazırlamaları söylenir.
Öğrenciler bahçeye çıkarılır.
Gerekli Malzemeler:
Oyuncak Araba, Mezura/metre, Tebeşir, Saat/kronometre
Yapılışı:
Tebeşir yardımıyla okulun bahçesinde farklı zeminler (toprak, asfalt ve beton) üzerinde her biri eşit uzunlukta olan yarış pistleri
(iki başlangıç noktası ve bir bitiş çizgisi olan) çizin
Oyuncak arabanızı ilk pistin ilk başlangıç noktası üzerine koyun ve elinizle ittirerek hareket etmesini sağlayın.
Oyuncak arabanız ikinci başlangıç noktasından geçerken saat tutun (oyuncak arabanız duran kadar).
Oyuncak arabanızın ikinci başlangıç noktasından bitiş çizgisine kadar olan pist boyunca durduğu yere kadar olan mesafeyi
mezura ya da metre ile ölçün.
Yukarıda yaptıklarınızı diğer zeminler için de deneyerek oyuncak arabanızın hangi zemin üzerinde daha süratli gittiğine karar
verin.
Sorular:
1. Ne gözlemlediniz? Oyuncak arabanız hangi zemin üzerinde daha süratli hareket etti?
2. Sizce bu durumdan sorumlu olan kuvvet ya da kuvvetler nelerdir? Bu kuvvetler temas gerektiren bir kuvvet mi yoksa temas
gerektirmeyen bir kuvvet mi?
3. Bu deneyde iki başlangıç noktası çizmemizin amacı ne olabilir?
4. Bu deneyi başka bir zaman halı, cam, buz, tahta gibi yüzeyler üzerinde tekrarladığınız takdirde nasıl sonuçlanmasını
beklersiniz? Neden?

243
J.3.2.2 “Toy Car” Lesson Worksheet
Oyuncak Arabam Hangi Zeminde En Süratli Gider?
Kullanmam Gereken Materyaller: Oyuncak Araba, Mezura/metre, Tebeşir, Saat/kronometre
Varsayımımız/Hipotezimiz: Oyuncak arabam en süratli asfalt zeminde gider.
Değişkenler 1. Kontrol Edilen Değişken: Oyuncak araba, arabaya uygulanan kuvvet
2. Bağımsız Değişken: Zemin
3. Bağımlı Değişken: Oyuncak arabanın sürati
İzlememiz Gereken Yöntem:
Tebeşir yardımıyla okulun bahçesinde farklı zeminler (toprak, asfalt ve beton) üzerinde her biri eşit uzunlukta olan yarış pistleri
(iki başlangıç noktası ve bir bitiş çizgisi olan) çizin
Oyuncak arabanızı ilk pistin ilk başlangıç noktası üzerine koyun ve elinizle ittirerek hareket etmesini sağlayın.
Oyuncak arabanız ikinci başlangıç noktasından geçerken saat tutun (oyuncak arabanız duran kadar).
Oyuncak arabanızın ikinci başlangıç noktasından bitiş çizgisine kadar olan pist boyunca durduğu yere kadar olan mesafeyi
mezura ya da metre ile ölçün.
Yukarıda yaptıklarınızı diğer zeminler için de deneyerek oyuncak arabanızın hangi zemin üzerinde daha süratli gittiğine karar
verin.
Toplamamız ve Kayıt Etmemiz Gereken Veriler: Zeminin niteliği, oyuncak arabanın sürati
Hatalara Nasıl Kontrol Edeceğiz? Oyuncak arabanın süratini hem arkadaşım hem de ben ölçeceğim. Oyuncak arabayı hem
arkadaşım hem de ben ittireceğiz.
Bulgularımız:
(Verilerimizden Hazırladığım Tablo ve Grafik)
Yorumumuz (Hipotezimiz Doğrulandı mı?)
Kullandığımız ve Anladığımız Terimler:
Sonraki Araştırma Konumuz ve Dikkat Etmemiz Gerekenler:
Öğrendiklerimizin Diğer Konularla İlişkisi:

244
J.3.3 “Elastic Objects” Lesson
J.3.3.1 “Elastic Objects” Lesson Plan
KUVVET VE HAREKET
ESNEK CİSİMLER
Öğrencilere nesnelere uygulanan kuvvet onları nasıl etkiler? diye sorulacak. Örneğin bir tükenmez kaleme kuvvet
uyguladığımızda ne olacağı sorulacak. Öğrencilerden cevap alındıktan sonra tükenmez kaleme elimizle kuvvet uygulanıp
kırılacak. Sonra bu durumda kuvvetin ölçülemeyeceği vurgulanacak.
Sonra tükenmez kalemin yayı çıkarılarak gösterilecek. Buna kuvvet uyguladığımda ne olacağı sorulacak. buna kuvvet
uygulanıp yay gerilecek. Sonra eski haline getirilecek.
Tükenmez kalemin yayı, sünger, lastik, oyun hamuru, silgi, kalem içi gibi cisimlere kuvvet uyguladıktan sonra bunların tekrar
eski hallerine döndüklerinden kuvveti ölçmekte kullanılabileceği buldurulacak.
Yukarıda sayılan cisimlerin Esnek Cisimler olarak tanımlandığı söylenecek.
Kuvvet ölçmekte kullanılan Dinamometre’nin yapısı açıklanacak. Dinamometre’deki yayın kuvvet etkisiyle gerildiği, kuvvet
etkisi ortadan kalktığında yayın tekrar eski haline geldiği için kuvvet ölçmekte kullanıldığı söylenecek.
Gerekli Malzemeler:
Tükenmez kalem, tükenmez kalemin yayı, dinamometre.

245
J.3.4 “Inclined Plane” Lesson
J.3.4.1 “Inclined Plane” Lesson Plan
KUVVET VE HAREKET
EĞİK DÜZLEM
Ders: EĞİK DÜZLEM
Sorular:
1. Yokuş çıkarken düz yola göre daha çok mu kuvvet harcarsınız? Neden? Peki, bisikletle ya da arabayla yokuş çıkarken ne
olur? Ne yapmak gerekir?
2. Eğer yokuş dikse harcadığınız kuvvet artar mı azalır mı? Neden? Peki, bisikletle ya da arabayla dik bir yokuşa çıkarken ne
olur? Ne yapmak gerekir?
3. Yokuş inerken harcadığınız kuvvet, düz yolda yürürken veya yokuş çıkarken harcadığınız kuvvetten daha mı azdır yoksa
daha mı fazladır? Neden? Peki, bisikletle ya da arabayla yokuş inerken ne olur? Ne yapmak gerekir?
4. Bu olaylarda etkili olan kuvvetler nelerdir?
Gerekli Malzemeler:
Makas
İp
Bir kütle
Dinamometre
Ders Kitapları
Yapılışı:
Makasla ipten bir parça kesin. Kestiğiniz ip’i kütleye bağlayarak, ucuna dinamometrenin çengelini takın.
Ders kitaplarınızı üst üste koyarak eğik düzlem oluşturun.
Ders kitaplarınızdan birini de bu kitaplarla sıra arasına yerleştirerek bir rampa oluşturun.
Kütleyi rampanın en altına yerleştirerek dinamometreyi yukarı doğru çekin ve harcadığınız kuvveti hesaplayın.
Aynı şeyleri daha yüksek bir eğik düzlem oluşturarak deneyin.
Deneyinizle ilgili ikinci sayfada verilen örnekten faydalanarak bir rapor hazırlayınız.

246
J.3.4.1 “Inclined Plane” Lesson Worksheet
İsimlerimiz: Sınıfımız:
Bir Kütleyi Yukarı Çekerken Eğik Düzlemin Yüksekliği ile Uygulanan Kuvvet Arasında Bir İlişki Var Mıdır?
Kullanmam Gereken Materyaller: Makas, İp, Bir kütle, Dinamometre, Ders Kitapları
Varsayımımız/Hipotezimiz: Bir kütleyi yukarı çekerken eğik düzlemin yüksekliği arttıkça uyguladığımız kuvvet da artar.
Değişkenler 1. Kontrol Edilen Değişken: Kütle miktarı, eğik düzlemin yüzeyi
2. Bağımsız Değişken: Eğik düzlemin yüksekliği
3. Bağımlı Değişken: Uygulanan kuvvet
İzlememiz Gereken Yöntem:
1. Farklı yüksekliklerde rampalar yapacağız.
2. Dinamometre yardımıyla kütleyi yukarı çerken uyguladığımız kuvveti ölçeceğiz
Toplamamız ve Kayıt Etmemiz Gereken Veriler: Eğik düzlemin yüksekliği (Kitap sayısı), kütleyi yukarı çekerken
harcadığımız kuvvetin şiddeti (Dinamometredeki aralıklar).
Hatalara Nasıl Kontrol Edeceğiz? Dinamometre ile hem ben hem arkadaşım kuvveti ölçeceğiz. Bulduğumuz değerler
birbirinden farklıysa aritmetik ortalamasını alacağız.
Bulgularımız (Verilerimizden Hazırladığım Tablo ve Grafik):
Eğik Düzlemin Yüksekliği Uygulanan Kuvvet Yüksekliği az(Hafif Eğimli) _____ Kitap
___ aralık
Yüksekliği fazla(Çok Eğimli) _____ Kitap
___ aralık
Yorumumuz (Hipotezimiz Doğrulandı mı? Eğik düzlemin yüksekliği ile kuvvet arasındaki ilişki neden kaynaklanmaktadır?)
Kullandığımız ve Anladığımız Terimler (Aşağıdaki şekilde açıklayınız):
Sonraki Araştırma Konumuz ve Dikkat Etmemiz Gerekenler: Örneğin; eğik düzlemin uzunluğu ile uygulanan kuvvet
arasındaki ilişki.
Öğrendiklerimizin Diğer Konularla İlişkisi: Örneğin, eski Mısır’da piramitler yapılırken taşları taşımada eğik düzlemden
yararlanılması.
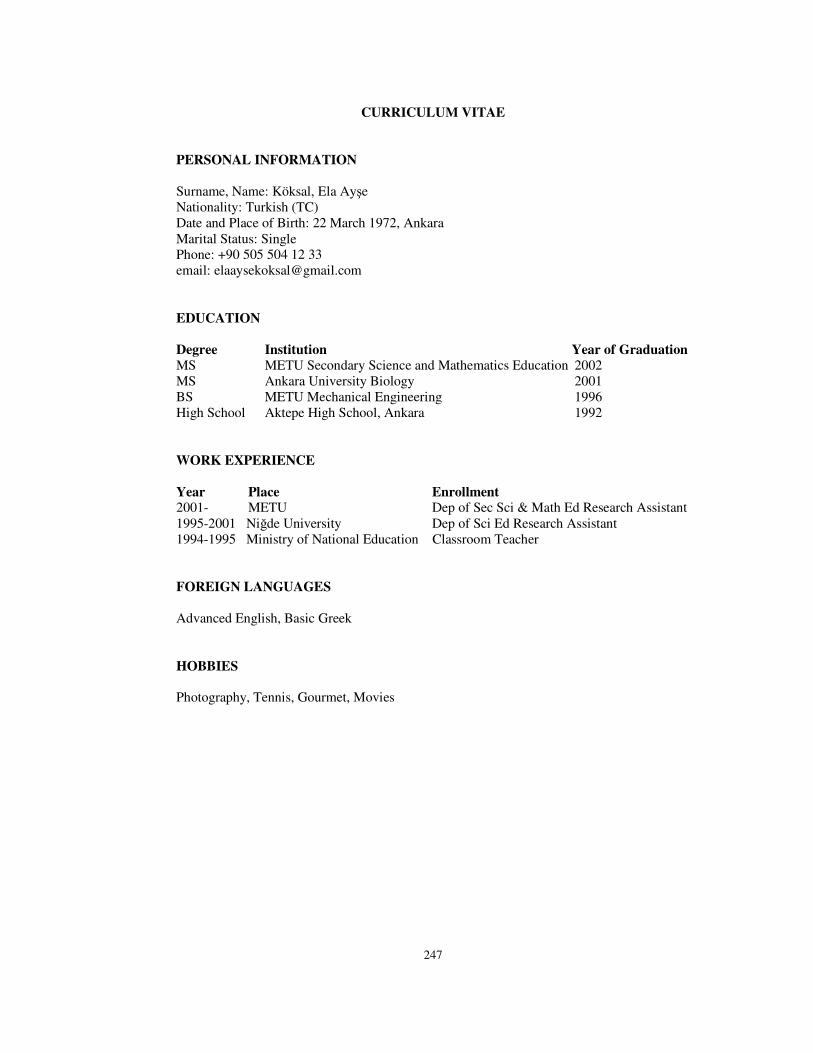
247
CURRICULUM VITAE
PERSONAL INFORMATION Surname, Name: Köksal, Ela Ayşe Nationality: Turkish (TC) Date and Place of Birth: 22 March 1972, Ankara Marital Status: Single Phone: +90 505 504 12 33 email: [email protected] EDUCATION Degree Institution Year of Graduation MS METU Secondary Science and Mathematics Education 2002 MS Ankara University Biology 2001 BS METU Mechanical Engineering 1996 High School Aktepe High School, Ankara 1992 WORK EXPERIENCE Year Place Enrollment 2001- METU Dep of Sec Sci & Math Ed Research Assistant 1995-2001 Niğde University Dep of Sci Ed Research Assistant 1994-1995 Ministry of National Education Classroom Teacher FOREIGN LANGUAGES Advanced English, Basic Greek HOBBIES Photography, Tennis, Gourmet, Movies