MOBILE GOVERNMENT IN TURKEY - Open METU
145
MOBILE GOVERNMENT IN TURKEY: INVESTIGATING CRITICAL SUCCESS FACTORS, DRIVERS AND BARRIERS A THESIS SUBMITTED TO THE GRADUATE SCHOOL OF INFORMATICS OF THE MIDDLE EAST TECHNICAL UNIVERSITY BY ANIL ÜSTÜN IN PARTIAL FULFILLMENT OF THE REQUIREMENTS FOR THE DEGREE OF MASTER OF SCIENCE IN THE DEPARTMENT OF INFORMATION SYSTEMS SEPTEMBER 2007
-
Upload
khangminh22 -
Category
Documents
-
view
2 -
download
0
Transcript of MOBILE GOVERNMENT IN TURKEY - Open METU

MOBILE GOVERNMENT IN TURKEY:INVESTIGATING CRITICAL SUCCESS FACTORS, DRIVERS AND BARRIERS
A THESIS SUBMITTED TOTHE GRADUATE SCHOOL OF INFORMATICS
OFTHE MIDDLE EAST TECHNICAL UNIVERSITY
BY
ANIL ÜSTÜN
IN PARTIAL FULFILLMENT OF THE REQUIREMENTS FOR THE DEGREE OFMASTER OF SCIENCE
INTHE DEPARTMENT OF INFORMATION SYSTEMS
SEPTEMBER 2007

Approval of the Graduate School of Informatics
_____________________________
Prof. Dr. Nazife Baykal
Director
I certify that this thesis satisfies all the requirements as a thesis for the degree of
Master of Science.
_____________________________
Assoc. Prof. Dr. Yasemin Yardımcı
Head of Department
This is to certify that we have read this thesis and that in our opinion it is fully
adequate, in scope and quality, as a thesis for the degree of Master of Science.
__________________
Prof. Dr. Ali Yazıcı Dr. Ali Arifoğlu
Co-Supervisor Supervisor
Examining Committee Members
Dr. Alptekin Temizel (METU, WBL) _____________________
Dr. Ali Arifoğlu (METU, IS) _____________________
Prof. Dr. Ali Yazıcı (TOBB-ETU, CENG) _____________________
Assoc. Prof. Dr. Yasemin Yardımcı (METU, IS) _____________________
Prof. Dr. İbrahim Akman (ATILIM, CENG) _____________________

iii
I hereby declare that all information in this document has been obtained and
presented in accordance with academic rules and ethical conduct. I also declare
that, as required by these rules and conduct, I have fully cited and referenced all
material and results that are not original to this work.
Name, Last name: Anıl Üstün
Signature : _________________

iv
ABSTRACT
MOBILE GOVERNMENT IN TURKEY:
INVESTIGATING THE CRITICAL SUCCESS FACTORS, DRIVERS AND
BARRIERS
Üstün, Anıl
M.S., Department of Information Systems
Supervisor: Dr. Ali Arifoğlu
Co-Supervisor: Prof. Dr. Ali Yazıcı
September 2007, 129 pages
The number of mobile phone users in Turkey has already exceeded the number of
households with the internet access. The presence of technologies which allowed more
bandwidth and access from almost everywhere such as UMTS, Wi-Fi, or Wi-Max is
putting a pressure on governments to enter into a new direction: m-government. As
mobile phone penetration increases, its presence in the public sector is increasingly
being viewed as inevitable.
v
In this thesis, a strategic action plan model for the developing countries to achieve
success in the development of m-government will be constructed. Meanwhile,
critical success factors for Turkey are to be identified by a comparison of selected
country cases. Moreoever, drivers and barriers for mobile government in Turkey and
the affects of the demographic factors are examined by using the One-Way ANOVA
and Pearson Chi-Square tests.
Keywords: Mobility, M-Government, Wireless Mobile Technologies, Critical Success Factors

vi
ÖZ
TÜRKİYE’DE MOBİL DEVLET:
KRİTİK BAŞARI FAKTÖRLERİ, YÖNLENDİRİCİLER VE ENGELLERİN
ARAŞTIRILMASI
Üstün, Anıl
Yüksek Lisans, Bilişim Sistemleri Bölümü
Tez Danışmanı: Dr. Ali Arifoğlu
Yardımcı Tez Danışmanı: Prof. Dr. Ali Yazıcı
Eylül 2007, 129 sayfa
Türkiye’de cep telefonu kullanıcılarının sayısı internet erişimine sahip hane sayısını
çoktan aşmıştır. UMTS, Wi-Fi, veya WiMax gibi hemen her yerden daha çok bant
genişliği ve erişim sağlayan teknolojilerin varlığı hükümetlere yeni bir düzene
geçmeleri için baskı yapmaktadır: m-devlet. Cep telefonu kullanımı arttıkça, m-
devletin varlığı kamu sektörü açısından gittikçe kaçınılmaz görünmektedir.

vii
Bu araştırmada, gelişmekte olan ülkelerin m-devlet gelişiminde başarı kazanmalarına
yönelik bir stratejik hareket plan modeli oluşturulacaktır. Aynı zamanda, seçilmiş ülke
vakaları karşılaştırılarak, Türkiye için kritik başarı faktörleri saptanacaktır. Ayrıca,
Tek-Yönlü ANOVA ve Pearson Ki-Kare testleri uygulanarak, Türkiye’de m-devlet
açısından yönlendiriciler, engeller, ve demografik faktörlerin etkileri incelenecektir.
Anahtar Sözcükler: Mobilite, M-Devlet, Kablosuz Mobil Teknolojiler, Kritik Başarı
Faktörleri

viii
ACKNOWLEDGEMENTS
I would like to thank my supervisor Dr. Ali Arifoğlu and co-supervisor Prof. Dr. Ali
Yazıcı for their help, guidance and insight throughout the research. I would also like to
thank Prof. Dr. İbrahim Akman for his valuable support and constructive criticism.
Throughout my studies, all my friends helped me in one way or another and provided
support with their invaluable friendship. Special thanks to Deniz Uzun, without her
patience, encouragement, support and valuable comments, I would not have completed
this thesis. She deserves more than a simple “thank you”.
Finally I wish to thank my mother, for her love, support, understanding, and faith in
me.

ix
TABLE OF CONTENTS
ABSTRACT................................................................................................................. iv
ÖZ................................................................................................................................. vi
ACKNOWLEDGEMENTS ....................................................................................... viii
TABLE OF CONTENTS............................................................................................. ix
LIST OF TABLES ..................................................................................................... xiii
LIST OF FIGURES.................................................................................................... xiv
LIST OF ABBREVIATIONS ..................................................................................... xv
CHAPTER
1. INTRODUCTION..................................................................................................... 1
1.1 Overview ............................................................................................................. 1
1.1.1 e-Government and m-Government ............................................................... 1
1.1.2 Investigating Mobility .................................................................................. 2
1.2 Problem Statement .............................................................................................. 4
1.3 Motivation ........................................................................................................... 5
1.4 Thesis Structure................................................................................................... 7
2. REVIEW OF LITERATURE.................................................................................... 9
2.1 The Conceptual Context for m-Government....................................................... 9
2.1.1 Understanding m-Government..................................................................... 9
2.1.2 The transition from e-government to m-government ................................. 10
2.1.3 M-Government and Its Differentiating Characteristics.............................. 11
2.1.4 The Impact of Mobile Government on the Internal Organization ............. 12
2.1.5 Soft Success Factors for M-Government .................................................. 15

x
2.2 m-Government Projects and Business Models.................................................. 17
2.2.1 Projects APNEE and APNEE-TU.............................................................. 17
2.2.2 USE-ME.GOV ........................................................................................... 17
2.2.3 Value Chains for Multi-Channel Services Model ...................................... 18
2.2.4 PPP Business Model................................................................................... 20
2.2.5 Mobile Government Response Model........................................................ 25
2.3 m-Government Technology, Architecture and Trends ..................................... 27
2.3.1 Wireless/Mobile Technology Trends ......................................................... 27
2.3.2 Characteristics of Mobile Technology ....................................................... 29
2.3.3 Main Types of Wireless Technology ......................................................... 31
2.3.4 Introduction to m-Government Infrastructure............................................ 34
2.3.5 Security for m-Government ....................................................................... 39
2.3.6 Spectrum Management Policies and Practices........................................... 42
2.4 m-Government Applications ............................................................................. 43
2.4.1 Applying Wireless/Mobile Technology to Government ............................ 43
2.4.2 Types of m-Government Applications....................................................... 44
2.4.3 Recent m-Government Applications in Turkey ......................................... 49
3. COUNTRY CASE STUDIES................................................................................. 52
3.1 Introduction ....................................................................................................... 52
3.2 Turkey ............................................................................................................... 53
3.2.1 e-Readiness................................................................................................. 53
3.2.2 The Telecommunications Market & Telephony ........................................ 54
3.2.3 Internet ....................................................................................................... 57
3.2.4 VoIP ........................................................................................................... 57
3.2.5 Summing Up / Conclusions........................................................................ 58
3.3 Japan.................................................................................................................. 58
3.3.1 e-Readiness................................................................................................. 58
3.3.2 The Telecommunications Market & Telephony ........................................ 58
3.3.3 Internet ....................................................................................................... 62

xi
3.3.4 VoIP ........................................................................................................... 63
3.3.5 Summing Up / Conclusions........................................................................ 63
3.4 Australia ............................................................................................................ 64
3.4.1 e-Readiness................................................................................................. 64
3.4.2 The Telecommunications Market & Telephony ........................................ 64
3.4.3 Internet ....................................................................................................... 68
3.4.4 VoIP ........................................................................................................... 69
3.4.5 Summing Up / Conclusions........................................................................ 69
3.5 South Korea....................................................................................................... 70
3.5.1 e-Readiness................................................................................................. 70
3.5.2 The Telecommunications Market & Telephony ........................................ 70
3.5.3 Internet ....................................................................................................... 72
3.5.4 VoIP ........................................................................................................... 73
3.5.5 Summing Up / Conclusions........................................................................ 73
3.6 Analysis of Country Results and Comparison .................................................. 74
3.7 Discussions and Justifications........................................................................... 78
3.8 Defining Critical Success Factors and Strategies for Turkey ........................... 80
3.9 Designing a Strategic Action Plan for Developing Country Governments ...... 83
3.9.1 Defining Components of the Strategical Mobile Government Model ....... 84
3.9.2 Conclusion.................................................................................................. 84
4.A CASE STUDY: DETERMINING M-DRIVERS AND M-BARRIERS ............. 87
4.1 Introduction ....................................................................................................... 87
4.2 Review and Definitions..................................................................................... 88
4.3 Hypotheses ........................................................................................................ 91
4.3.1 Personal attitudes towards Mobile Government Drivers ........................... 91
4.3.2 Personal attitudes towards Mobile Government Barriers .......................... 93
4.3.3 Research Design......................................................................................... 93
4.4 Results ............................................................................................................... 94
4.4.1 Descriptive Results..................................................................................... 94

xii
4.4.2 Test Results .............................................................................................. 102
4.5 Discussions...................................................................................................... 103
4.5.1 Gender ...................................................................................................... 103
4.5.2 Age .......................................................................................................... 104
4.5.3 Education.................................................................................................. 104
4.5.4 Occupation ............................................................................................... 105
4.5.5 Years of Experience ................................................................................. 105
4.6 Conclusions ..................................................................................................... 106
5.CONCLUSION & LIMITATIONS ....................................................................... 108
5.1 Summary ......................................................................................................... 108
5.2 Contribution .................................................................................................... 109
5.3 Limitations ...................................................................................................... 110
5.4. Future Work ................................................................................................... 111
REFERENCES.......................................................................................................... 112
APPENDICES........................................................................................................... 120
A. M-GOVERNMENT SURVEY QUESTIONNAIRE ITEMS.......................... 120
B. ONE-WAY ANOVA TEST RESULTS........................................................... 122
C. DEMOGRAPHIC FACTOR FIGURES .......................................................... 127
D. OTHER TABLES............................................................................................. 129

xiii
LIST OF TABLES
Table 1. Household technology ownership in Turkey (%) ................................................6
Table 2. Turkish mobile phone service provider market .................................................56
Table 3. Comparison of e-Readiness scores.....................................................................74
Table 4. Analysis - Comparison of Voice Communications............................................76
Table 5. Analysis - Comparison of Data Communications..............................................77
Table 6. Analysis - Comparison of Strategies and Consumer Demands .........................77
xiv
LIST OF FIGURES
Figure 1. Diffusion of mobile phone ownership in Turkey ...............................................6
Figure 2. The evolution of mobile government ...............................................................14
Figure 3. Cultural changes: Related enablers ..................................................................15
Figure 4. Structure of the information value chain in APNEE(-TU) ..............................19
Figure 5. A Mobility Response Model for Government .................................................26
Figure 6. Functionalities of the Systems .........................................................................27
Figure 7. World’s GSM Connections ..............................................................................29
Figure 8. Settlement of WiMAX Technology .................................................................34
Figure 9. Scope of e-Government ....................................................................................43
Figure 10. PHS and WLAN nomadic Internet access ......................................................62
Figure 11. ICT Market Indicators (Subscribers per 100 Inhabitants) ..............................75
Figure 12. Strategical Plan Model for Developing Countries..........................................84
Figure 13. Guiding framework.........................................................................................88
Figure 14. Demographic Factors......................................................................................95
Figure 15. Communication Devices-1 .............................................................................96
Figure 16. Mobile Communication Channel....................................................................97
Figure 17. Communication Devices-2 .............................................................................97
Figure 18. Communication Type .....................................................................................98
Figure 19. Infrastructure Types........................................................................................99
Figure 20. Preferred Mobile Government Services .......................................................100
Figure 21. Mobile Government Challenges ...................................................................101

xv
LIST OF ABBREVIATIONS
‘m’: Mobile
M-gov: Mobile Government
E-gov: Electronic Government
3G: Third Generation
ADSL: Asymmetric Digital Subscriber Line
CATV: Cable Television
CDMA: Code Division Multiple Access
EC: European Community
EU: European Union
G2B: Government-to-Business
G2C: Government-to-Citizen
G2G: Government-to-Government
GDP: Gross Domestic Product
GPRS: General Packet Radio Service
GSM: Global System for Mobile communications
HSDPA: High-Speed Downlink Packet Access
IEEE: Institute of Electrical and Electronics Engineers
ISP: Internet Service Provider
IT: Information Technology
iDEN: Integrated Digital Enhanced Network
LDAP: Lightweight Directory Access Protocol
MMS: Multimedia Messaging Service

xvi
MNP: Mobile Number Portability
MVNO: Mobile Virtual Network Operator
NGO: Non-Governmental Organization
DoCoMo: Do Communications Over the Mobile Network
OECD: Organization for Economic Cooperation and Development
OTC: Overseas Telecommunications Commission
PC: Personal Computer
PIN: Personal Identification Number
PSTN: Public Switched Telephone Network
RFID: Radio-Frequency Identification
SK: South Korea Corporation
SMS: Short Message Service
STAP: Short Term Action Plan
TA: Telecommunications Authority (Turkey)
TDMA: Time Division Multiple Access
UMTS: Universal Mobile Telecommunications System
UN: United Nations
VDSL: Very High Speed DSL
VoIP: Voice over IP
WAN: Wide Area Network
WAP: Wireless Application Protocol
W-CDMA: Wideband Code Division Multiple Access
WEP: Wireless Encryption Protocol
Wi-Fi: Wireless Fidelity
Wi-Max: Worldwide Interoperability for Microwave Access
WLAN: Wireless Local Area Network
VPN: Virtual Private Network
XML: Extensible Markup Language

1
CHAPTER 1
INTRODUCTION
This chapter explains the e-gov and m-gov concepts. First we look at mobility in
general. Afterwards the motivation behind that study and the problem is defined in the
context of mobile government in Turkey. Consequently, the thesis structure is included.
1.1 Overview
1.1.1 E-Government and M-Government
The OECD [1] defines e-gov as “the use of information and communication
technologies, and particularly the Internet, as a tool to achieve better government”. In
addition, Gang [2] defines e-gov as “Conventional government services made
available for citizens through electronic means such as internet connected computers
and other devices.”. Main objective of e-gov applications is to increase the
productivity in the public sector, so that services can be provided by various channels,
at a lower cost and time [3].
The rapid development of mobile technologies such as internet enabled mobile phones,
PDA, Wi-Fi and wireless networks has created a new direction and spurred the

2
development of m-commerce and m-business models, which are perhaps equally
relevant to government [2]. Such use of wireless technologies to deliver government
services is usually called mobile government or simply m-gov [4]. From a citizen
perspective, m-gov stands for a new kind of access to public services that have been
made available specifically for mobile devices or adapted from existing e-gov
applications [5].
Kushchu and Kuscu (as cited in [6]) defined m-gov as “Strategy and its
implementation involving the utilization of all kinds of wireless and mobile technology,
services, applications and devices for improving benefits for citizens, business and all
government units” [6]. This definition corrects our understanding of m-gov that m-gov
is not about a pure information provision via mobile phones from government to
citizens but a complex strategy for efficient utilization of all wireless/mobile devices
(mobile phones, handhelds, PDAs, wearable PCs, Blackberry pagers, etc.) with
maximal added value to all involved parties – government on one side and citizens and
business on the other [7].
Mobile government is a new research area with respect to electronic government.
There is no certainty whether it will replace e-Gov or if it is an alternative access
channel, however in the oncoming parts of the thesis we will witness that m-gov
cannot be seen as replacing e-gov and in many cases it will be complementary to e-gov
efforts [6].
While e-gov is interested in the handling of government operations, m-gov deals with
the mobility of the government itself. To better comprehend what lies behind m-gov we
should understand mobility concept in advance [7]. In the following section this
concept is analyzed.

3
1.1.2 Investigating Mobility
The adjective “mobile” goes back to the Latin word “mobilis”, meaning movable. In
this sense, mobile objects are capable of moving, being moved or not fixed in place or
condition [7].
There are functional characterizations of mobile technology use [9]. For instance, in
some cases mobility can be seperated as regional and global mobility [10], and in some
cases it can be classified in three modality of traveling, visiting and wandering [11]; on
the other side, there are three aspects of mobility: spatial, temporal, and contextual
[12]. Spatial mobility considers the mobility of people, objects, symbols, and space
itself. Temporal mobility means change from linear clock time to social time [8].
Contextual mobility means a shift from locally conditioned to flexibly coordinated
interaction [2].
The mentioned levels of mobility help to illustrate the relationship between mobility
and human interaction. The below stated levels mention mobility from the user point
of view [7].
• Device mobility: the continued access to services with a device while moving.
• User mobility: location and device independent service access.
• Service mobility: the capability to provide a certain service irrespective of
device and user.
There is an important difference between “Wireless” and “Mobile” concepts.
“Wireless” simply describes devices which can communicate wireslessly, on the other
side “Mobile” is something capable of moving or being moved. Therefore,
communication is available anytime and anywhere in the sense of mobility. For
instance, desktop PC can be wireless as mobile phone, however it does not have
4
mobility. Thus, a common misunderstanding in mobile technology has to be corrected:
wireless ≠ mobile [7].
1.2 Problem Statement
Turkey is well-developed in the ICT sector with modern networks in both fixed and
mobile technologies and it is a very large country with a mix of market segments.
However, it is the only country that doesn’t have 3G licences among European
member or candidate countries. On the Turkey’s 2007 agenda will be awarding of 3G
licenses, mobile number portability (numerical carriage) and entry of four operators.
Full liberalization and effective regulation of the market are expected to attract many
other foreign investments into the sector as operators, subcontractors or service
providers and equity suppliers.
Most European countries had made mistakes by requesting high license fees in tenders,
and implementing wrong strategies in the development of m-gov. On the other side,
Asian Pasific region countries were very successful as their governments implement
the correct strategies, for instance Japanese government gave the licenses for free and
kept good relationships with the operator and manufacturers. Moreover, South Korea
launched a training program for their citizens to increase their technology readiness.
Meanwhile, Australia decreased regulations to create an open environment for the
competition. Therefore, Turkey has to follow the correct footsteps and take good
lessons from successful m-gov country cases. Hence, comparing country cases is a
good way to derive good lessons from.
In the light of these explanations, there are three main goals of this thesis. Primarily, to
evaluate m-gov in Turkey and discuss the odds of Turkey’s success in m-gov.
Secondly, to develop a strategical plan model for the success of m-gov by identifying
critical success factors and other related components for m-gov, as we believe such a

5
model would prove useful for any developing government involved in the the initial
phase of planning, development and implementation of m-gov service delivery.
Moreover, when a country implements such strategical plan, there will be challenges to
be faced. Therefore, with respect to this, we investigate the drivers and barriers for
mobile government in Turkey and examine how they are affected.
1.3 Motivation
The starting point of this work can be described under three major trends [6]:
(1) mobile device penetration in Turkey;
(2) convergence of wired Internet and wireless telecommunication networks in
the world;
(3) the upcoming 3G services and higher data transfer rates in Turkey.
In Turkey, use and development of wireless services by a critical mass is achieved.
We are witnessing a great amount of demand on mobile and wireless internet
appliances, including internet-ready mobile phones and PDAs. As the number of
mobile and wireless internet appliances continues to grow, it is apparent that citizens
will demand e-gov services via the wireless medium besides wired medium. Wireless
access will include public and private partnerships to extend Internet access in rural
and remote areas.
Mobile technology use is not just a strategic choice at macro level, but the technology
is increasingly used by millions of Turkish citizens. As of early 2006, 44 million
mobile phones are estimated to be owned in Turkey. Ten years ago, this number was
only 0.8 million as you can see in Figure 1. Such a development gives developing
countries such as Turkey a leapfrog in adopting new technologies [12].
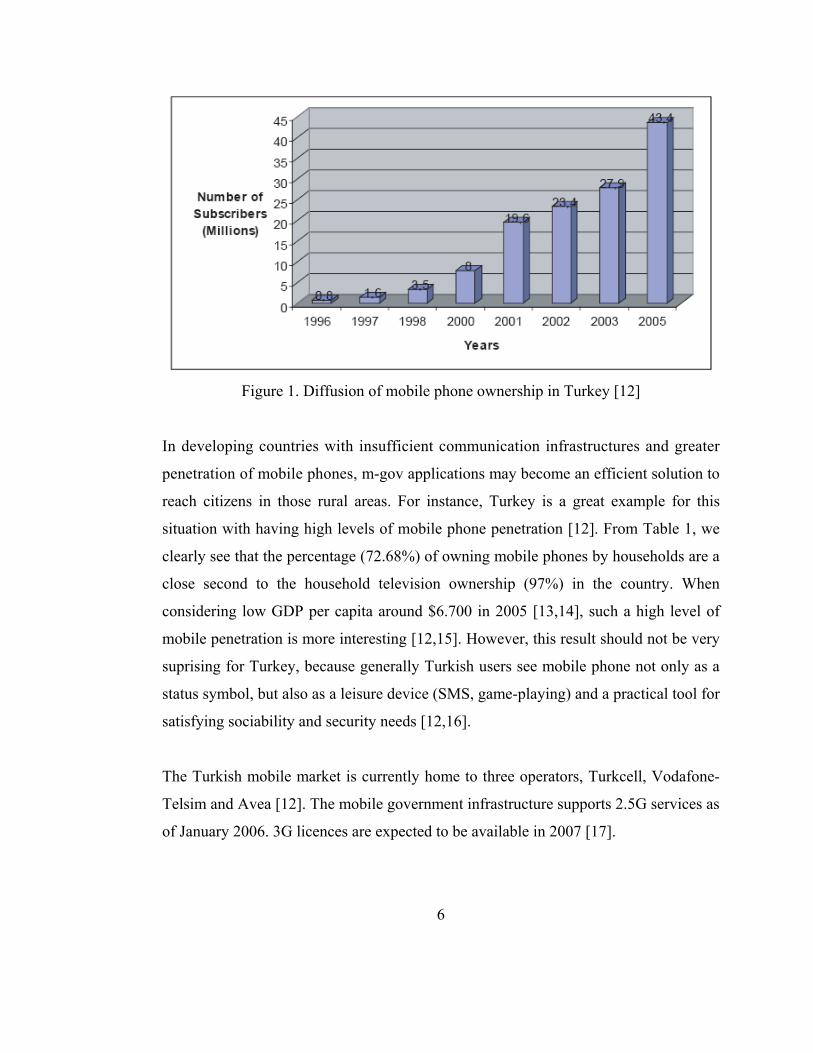
Figure 1. Diffusion of mobile phone ownership in Turkey [12]
In developing countries with insufficient communication infrastructures and greater
penetration of mobile phones, m-gov applications may become an efficient solution to
reach citizens in those rural areas. For instance, Turkey is a great example for this
situation with having high levels of mobile phone penetration [12]. From Table 1, we
clearly see that the percentage (72.68%) of owning mobile phones by households are a
close second to the household television ownership (97%) in the country. When
considering low GDP per capita around $6.700 in 2005 [13,14], such a high level of
mobile penetration is more interesting [12,15]. However, this result should not be very
suprising for Turkey, because generally Turkish users see mobile phone not only as a
status symbol, but also as a leisure device (SMS, game-playing) and a practical tool for
satisfying sociability and security needs [12,16].
The Turkish mobile market is currently home to three operators, Turkcell, Vodafone-
Telsim and Avea [12]. The mobile government infrastructure supports 2.5G services as
of January 2006. 3G licences are expected to be available in 2007 [17].
6

Table 1. Household technology ownership in Turkey (%) [8]
Turkey's telecoms regulator has delayed the country's planned 3G license tender after
Turkish general elections. In conclusion, in the sight of these developments in Turkey,
transformation from e-gov to m-gov become inevitable [6].
1.4 Thesis Structure
The thesis is organized as follows:
Chapter 2 is followed by a general literature overview of m-gov. Primarily, the
conceptual context for m-gov is described. Afterwards, different projects and business
modes are discussed. In addition to this, regarding technology, infrastructure and
achitecture is reviewed. Consequently, case studies about the different m-gov services
are given and different types of m-gov applications are explained.
In Chapter 3, comparison of four country cases is made, including the case of Turkey.
Odds for Turkey’s success in the context of m-gov is discussed. Critical success
factors are identified. With respect to this, a strategic plan model considering
developing countries is developed.
7

8
In Chapter 4, the most significant drivers/barriers, in the design of a successful
strategic action plan model for m-gov, are analyzed by a quantitative analysis, through
a total of 238 completed survey questionnaires. In addition to this, affects of
demographic factors on these drivers/barriers are analyzed and discussed by
implementing One-Way ANOVA test. Consequently, the findings are supported with
Pearson Chi-Square test.
Chapter 5 concludes by summarizing the literature survey, discussing findings, and
contributions and limitations of the work.

9
CHAPTER 2
REVIEW OF LITERATURE
2.1 The Conceptual Context for M-Government
2.1.1 Understanding M-Government
M-gov is a subset of e-gov. While in e-gov, use of information and communication
technologies (ICTs) is unlimited, in the case of m-gov, those ICTs are limited to
mobile and/or wireless technologies like cellular/mobile phones, and laptops and
PDAs connected to wireless local area networks (LANs). M-gov can help make public
information and government services available "anytime, anywhere" to citizens and
officials [18-20].
As discussed earlier, m-gov is not a replacement for e-gov, they complement each
other [6,18]. While mobile devices are very suitable for access from anywhere,
anytime, they are not suitable for complex and voluminous information transmission.
In time, more sophisticated mobile devices such as PDAs, Blakberrry pagers emerged,
however they do not have the same amount of features and services as PC-based
Internet applications.

10
Citizens may see m-gov as a tip of an iceberg, because they see only the the final
delivery channel to the citizen. Underneath is a complex and costly infrastructure that
is required in order to make that final delivery device work.
2.1.2 The transition from E-Government to M-Government
Today, in every country, societies are becoming connected to each other due to the fast
development of Internet and similar technologies. This coming decade seems to be the
era of e-gov. Citizens and customers who are aware of the improvement and efficiency
of these technologies are demanding more from their governments in terms of better
quality government and business services [6].
While e-gov is a very significant step for governments to close the digital divide,
wireless access, adoption of mobility, and providing improved services via mobile
technologies is now inevitable [6,21]. Wireless access and adoption of mobility will
not be only over GSM operators but also be via wide area government networks. For
instance, in some cases like in the developing countries, public and private institution
collaboration to extend Internet access in rural and remote areas should be realized to
ensure the adoption of mobility [8,22].
M-gov is particularly suited for the developing world where Internet access rates are
low but mobile phone penetration is growing rapidly, particularly in urban areas
[6,18]. Globally, the number of mobile phones has surpassed the number of
fixed/wired phones. This is also the case in many individual nations, including 49
middle-income and 36 low-income countries. Among these countries are Burkina
Faso, Chad, Honduras, Indonesia, Jordan, Mexico, Mongolia, Nigeria, Philippines,
Saudi Arabia, South Africa and Turkey. According to a recent study, the
population of global SMS users will grow to 1.36 billion in 2006.

11
2.1.3 M-Government and Its Differentiating Characteristics
It is very important to indicate that the specific use of mobile technologies and
applications differentiates m-gov from any other developments in the public sector
using new technologies, including e-gov. Based on a study of mobile technologies, and
their practical applications in governmental agencies, the following differentiating
factors are apparent [22]:
• Convenient accessibility and availability:
o Citizens can use the online governmental services not only “anytime”
but also “anywhere”.
o Mobile devices are always “switched on” compared to laptop computer.
o Applications are designed to provide instant information to the users,
for instance, sending out warnings about forthcoming bad weather
conditions or emergencies.
• Precision and personalisation:
o Mobile devices are designed for personal use by one individual, but a
computer might be shared among different users person.
o M-gov reaches end users through a more personal, familiar and friendly
device.
• Larger and wider user base:
o Mobile/wireless communication often far exceeds the wired Internet
user community, therefore m-gov reaches a larger number of people
through mobile devices.
o M-gov reaches not only experienced or active users of internet, but also
people who have no training or experience with computers and the
internet.

12
2.1.4 The Impact of Mobile Government on the Internal Organization
In this section, we summarize some of the potential impacts of mobile technologies on
organizational structure, civil workers, and business processes [22].
2.1.4.1 The Impact on Structure
One expected outcome of deploying m-gov is increase in productivity with the
increasing demands of the citizens for faster and better service. Mobile government
applications may reflect itself in the structure of the organization in the following
possible ways:
• Reduction in the number of people performing the job: With the advent of new
mobile applications bureaucracy decreases.
• Establishment of new virtual departments: Civil workers working in the local,
regional, and national government entities work online as they do not require
office space anymore to perform their tasks.
• Consolidation of divisions/departments and reduction in hierarchical levels:
With the initialization usage of new mobile applications, interrelated
divisions/departments will expect to integrate their databases or information
sharing processes and then move into a consolidation.
2.1.4.2 The Impact on Civil Workers
Depending on the demographic characters (age, background, etc.) of the users,
adaptation of using new wireless devices and learning process to enter information via
wireless/mobile networks may take longer than expected. This may cause delays in
project achievements. Furthermore, some adjustments in the civil workers’ job
descriptions can be required or hiring new people with different skills into the

13
organization can be necessary. To do some adjustments, extra training lessons may be
required for those who are not familiar with information technologies, and other
workers that have some deficiencies in their skills which are necessary for the adaption
of these new wireless/mobile technologies.
Although, these training sessions are successful, during the implementation phase,
some technical problems may arise. This may demorilize the officers and affect the
projects in a unfavorable way. Therefore, it is very crucial that civil workers involve in
part of the mobile solution during the planning and implementation phase. This policy
will encourage and convince workers that they can perform beter and save time by
using these applications.
Moreover, wireless/mobile technologies may reduce the amount of personal
communication between people. For instance, workers may acquire additional
information by using his/her mobile/wireless device, this enables workers to not need
to go the office and ask for additional information to their colleagues. Thus, besides
decreasing the working process of civil workers, m-gov applications make authorities
to track their own workers using the location-base characteristic of the mobile devices.
This may improve efficiency by making governments’ assignment task easier as
calling the person on duty located closest to the incident. On the other hand, this may
create a discipline environment, due to workers being monitored and tracked anytime
and anywhere.
2.1.4.3 The Impact on Business Processes
Within the same same government organization, information is scattered through its
different divisions/departments. Process time and costs can be reduced with the
support of m-gov by combining all organizational knowledge on a real-time basis. This
combining enables the civil workers who have different roles/tasks in the same
process to perform faster and more efficiently.
As discussed before, with the usage of mobile devices workers do not require any
office space, therefore civil workers could be viewed as virtual workers, and offices
could be visualized as virtual offices. This creates a more flexible environment for
those workers. The major impact of mobile government is likely to be on streamlining
business processes on a single, shared platform by gathering, updating, and processing
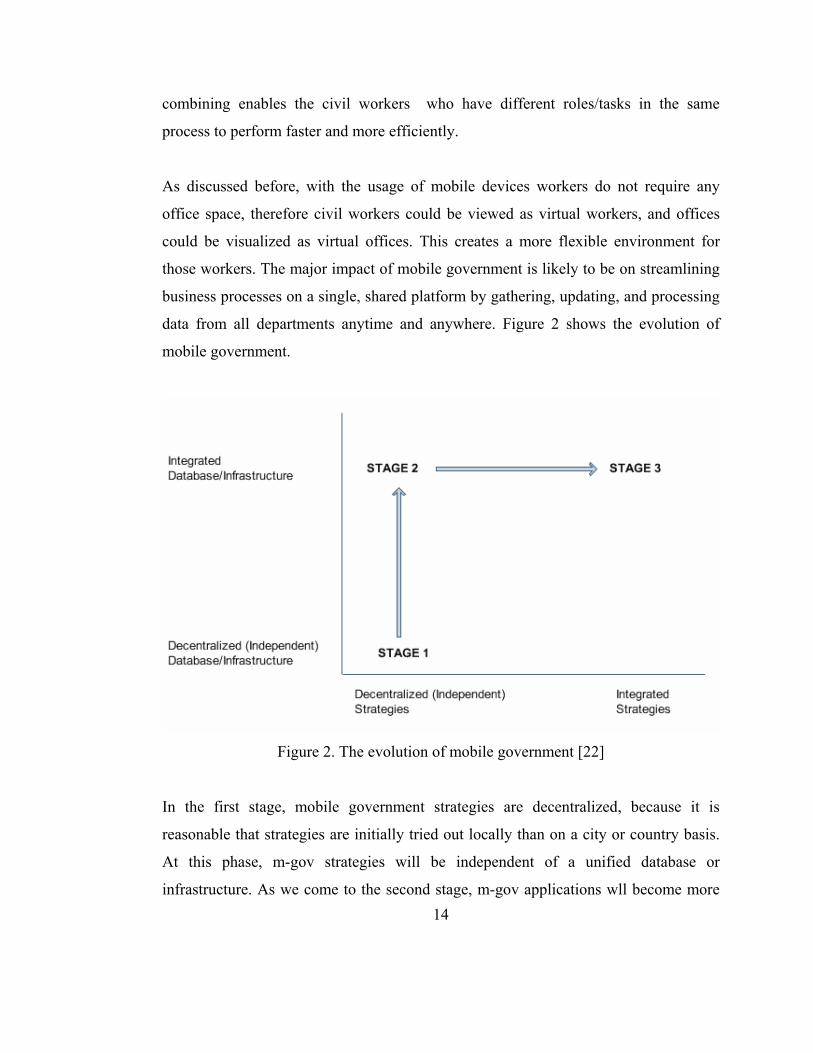
data from all departments anytime and anywhere. Figure 2 shows the evolution of
mobile government.
Figure 2. The evolution of mobile government [22]
In the first stage, mobile government strategies are decentralized, because it is
reasonable that strategies are initially tried out locally than on a city or country basis.
At this phase, m-gov strategies will be independent of a unified database or
infrastructure. As we come to the second stage, m-gov applications wll become more 14
common to the public, and more local authorities will adopt it. In the last stage, it is
appropriate to use integrated database and infrastructure that will allow the information
to be shared across all government entities [22].
2.1.5 Soft Success Factors for M-Government
Companies and institutions increasingly feel the need for strong organizational
frameworks and soft skills, that is, behavioral and managerial skills to be integrated
with technical competences [22,27]. “Soft” framework refers to organizational factors
and competences that enable successful e-gov and m-gov implementation. It supports
the implementation of m-gov actions and the management of related organizational
changes. For example, OECD [26] has highlighted the importance of leadership and
soft skills for successful e-gov.
2.1.5.1 A Soft Reference Framework for M-Government Success
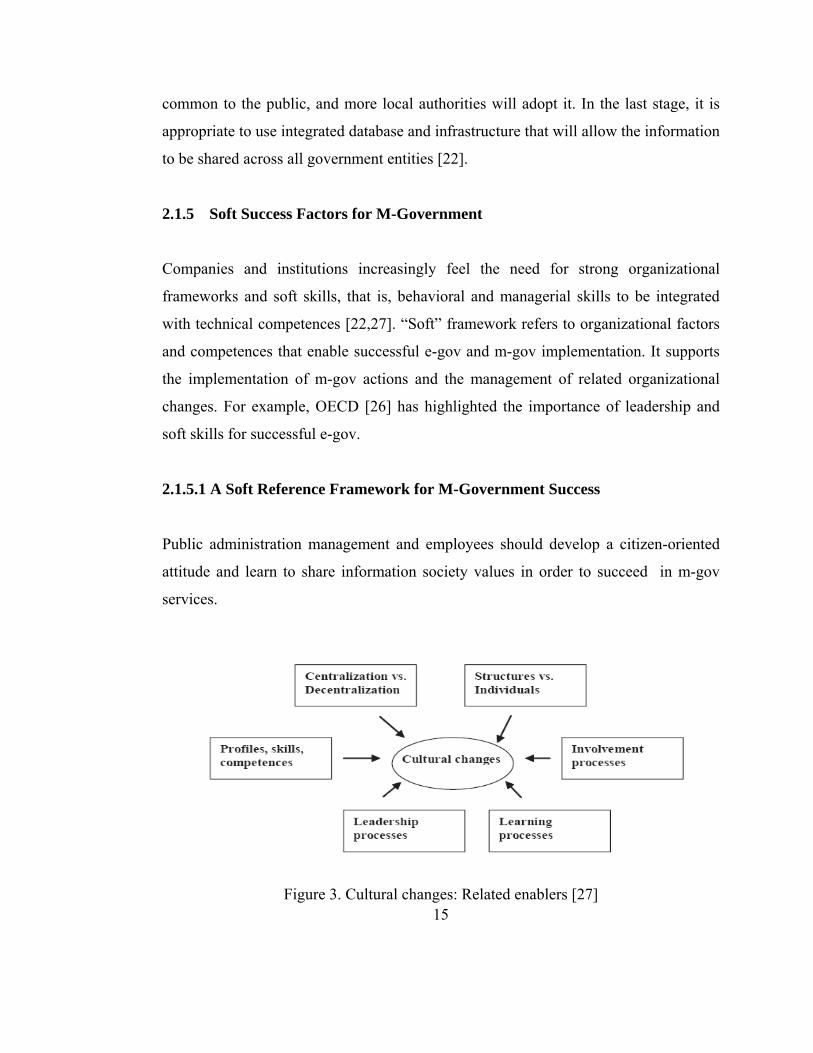
Public administration management and employees should develop a citizen-oriented
attitude and learn to share information society values in order to succeed in m-gov
services.
15Figure 3. Cultural changes: Related enablers [27]

16
According to this organization theory, a reference framework developed within the 12
countries considered, and validated by online questionnaires and field surveys which
incorporates a set of organizational, behavioral, and learning dimensions as well as
skills and attitudes.
In Figure 3, the mentioned reference framework dimensions are represented as [27]:
• Centralization vs. Decentralization: This dimension describes the relationship
between central government and local agencies.
• Structures vs. Individuals: This dimension classifies projects according to the
importance which is given to structures rather than to individuals.
• Involvement Processes: This dimensions focuses on the meaning of
“involvement” within e-gov and m-gov policies. When a new e-gov or m-gov
project needs to be promoted, involment is very crucial. This process can be
done both internally and externally. Internally, for instance, toward employees
and public servants, and externally, for example, toward customers (citizens
and companies) and stakeholders.
• Learning Processes: This dimension focuses on how public administrations
“learn” and on which role is attributed to formal training. Learning is a key
factor for cultural changes. Organizational models and size can have a
significant influence on informal (unaware/natural) or non-formal (non-
structured even if explicit) learning processes such as learning during their job,
through mentoring and coaching, team working, working by projects, job
rotation, business trips, and so on.
• Leadership Processes: This dimension focuses on leadership, which is the
capability to manage a complex process and become a recognized guide as
well, could be referred to structures or to individuals.

17
• Profiles, Skills, Competences: This dimension aims at identifying the skills and
competences, that is, knowledge and skills put into action. Actors with
different job profiles need to develop and manage m-gov projects.
2.2 M-Government Projects and Business Models
This section will evaluate the business and revenue models for running m-gov services
in a sustainable way. Moreover, it will analyze information strategies based on the
results of EC-funded projects and discuss some related issues like payments,
advertisement, sponsoring, funding and platform sharing [29].
2.2.1 Projects APNEE and APNEE-TU
The vision of APNEE (Air Pollution Network for Early warning and on-line
information Exchange in Europe) was to establish an information service which
informs citizens about the current air quality taking into account the current location of
the citizen, the preferences of the citizen, and the availability of different information
access channels (mobile: mobile phones, smart phones, PDAs, street panels; at home:
PC with Internet, voice server) [29,30]. Based on the successful implementation of an
online information service for the citizen, a major European field trial was launched
with project APNEE-TU (Take-UP measure). APNEE finally operates air pollution
information service in Norway, Germany, Spain, France, and Greece on different
channels according acceptance and business models [31].
2.2.2 USE-ME.GOV
Project USE-ME.GOV developed an open service platform for m-gov that can be
shared by networked authorities and institutions that is both cost-effective and
efficient. This open platform promotes usability, sharing, openness, interoperability,
18
and scalability, thus enabling service deployment and access [29,31]. Moreover, this
project developed attractive business models for the sustainable operation of such
services and also provide the sharing of services by several authorities as well as
public-private partnerships between authorities and commercial companies. Hence,
project USE-ME.GOV’s key objective was to support and encourage public
administrations to provide new e-gov services at any time and anywhere through the
use of mobile communications technologies allowing:
• To share common modules with other departments or other authorities (for
example subscription, alerting components).
• To secure development and operation by open source transparency.
• To attract further mobile operator independent of respective interfaces.
• To estimate efforts, outcome and benefits in advance.
Open service platform that can be shared by networked authorities and institutions in
terms of technical resources as well as commercial means will increase the quality of
public services and will help in closing the digital divide phenomena. The platform has
been finalized and validated in four European regions and will be operated on the basis
of different business models depending on the individual validation results [3,
29,31,32].
2.2.3 Value Chains for Multi-Channel Services Model
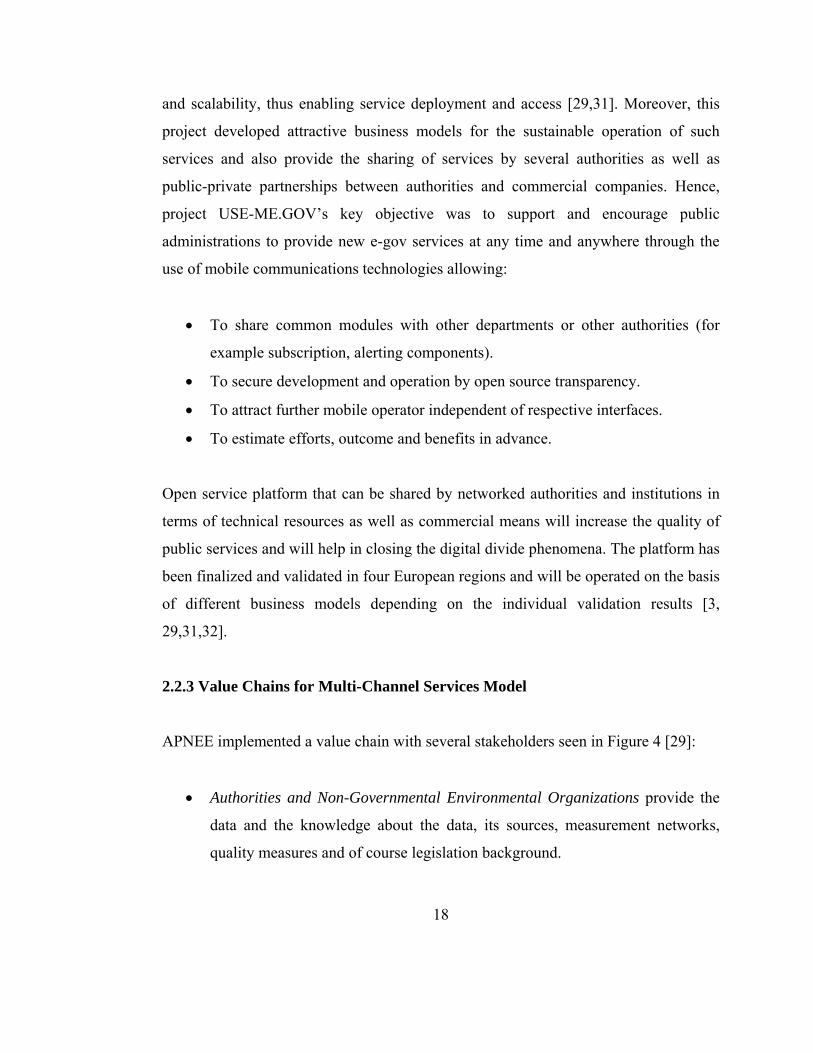
APNEE implemented a value chain with several stakeholders seen in Figure 4 [29]:
• Authorities and Non-Governmental Environmental Organizations provide the
data and the knowledge about the data, its sources, measurement networks,
quality measures and of course legislation background.

• Research Institutes and Universities supplement this information with
forecasting models and impact analysis.
• Private Portal Operators are bringing in the contacts and knowledge about
information markets and specific customer requirements. Therefore, they
supplement the data with background information (like health impacts) and
user-friendly visualization means.
• Telecommunication Operators are delivering the information and service to the
customers via multi-channel platforms. They might also enhance the service
with location based features.
Figure 4. Structure of the information value chain in APNEE-TU [29]
This value chain proved to be successful because:
• High-quality data is available.
• The impacts of air pollution elements are well researched.
• Internet and mobile end user devices are common and widespread; multi-
channel service provision will therefore better reach the citizen.
19

20
• Telecommunication providers host multi-channel systems and are eager for
content with demand.
• Authorities want and have to reach the public with modern communication
means.
• Authorities and NGOs foster the capitalization of their data and services to
create value.
This value chain allows authorities an easier implementation of multi-channel
information services for reaching the public [3, 29,30,31].
2.2.4 PPP Business Model
Public-private partnerships (PPP) combine partners from the public and the private
sector. They are differently structured, have a different policy and business aim, and
underlie different legislations. Let us examine the different partnership models
between them [29].
Firstly, governments deliver their data and service to a well-defined interface,
afterwards commercial organizations pick it up and revalue them for their business
purposes, respecting to the rules agreed upon concerning the end-user price. This
business model could increase the efficiency of the market of public sector
information, gives each commercial partner a fair access, and avoids competition by
public authorities operating such services themselves.
Secondly, the private sector carries the cost of initial implementations in order to prove
the effectiveness of the technology, and further costs are covered by the government, if
the service is successful [33]. This business model is established by the government of
Hong Kong for electronic services delivery named as electronic service delivery (ESD)
[34]. Here, the private sector operator was responsible for developing, financing,
21
operating, and maintaining the system, and the government started to pay transaction
fees to the operator after the transaction level has reached a pre-agreed volume. In this
case, the business risk to the government is low; while the private sector operator has
continuous incentive to promote the wider use of the e-gov services and to introduce
service enhancement.
Lastly, an another alternative option for a PPP is the one where commercial company
builds and operates the mobile service, and charges the customer/citizen for using the
service [35]. Revenues can be shared between authority and private partner, or retained
completely by the private company as reimbursement for efforts. This business model
is successfully implemented in the U.S. with a company named NIC (National
Information Consortium, Inc.) currently operating 18 U.S. state portals through the so-
called “self-funded model”.
2.2.4.1 Problems of Partnerships (PPP)
The problems of partnerships regarding PPP model are identified as [29]:
• Law concerning exchange of data and ownership/copyright of data: Issues on
how to deliver public data and services to external parties, how to process the
data to different countries, and how to resell the data.
• PPP contracts missing: PPPs are rare in most European countries because for
each binding agreement lawyers have to negotiate service level agreements
between the accuracy-oriented authorities and the reliability-oriented
commercial providers, so Nationwide and moreover European-wide standard
contracts would ease this negotiation process and spare time and costs.
• Documentation ownership: The ownerships of documentation must be clarified
on a public or research site before presented, otherwise this could result in a

22
fight between parties to detect who is the originator and such owner of which
piece of information.
• Niche product versus public policy: It is very important for governments to to
reach most citizens in order to inform and protect, however commercial
organizations concentrate on high revenues and they don’t want to invest in
niche services. To be successful, it is very important to balance the investment
on the private and the public site for a win-win-situation of both parties.
• Intermediator: External parties may intermediate the channel to the citizens. In
some cases, there is possibility of misuse of individual data of the citizen.
Therefore, private companies have to provide trustiness over customers in the
case of using sensitive data to overcome the suspicion. For instance, when
commercial companies are involved in service provision, USE-ME-GOV
validation interviews showed a clear expression of mistrust by citizens with
regard to data privacy. This can be solved by a flexible and clear contract
between public and private organizations to overcome misuse and incorrect
interpretations.
2.2.4.2 Advantages of Partnerships (PPP)
The advantages of partnerships regarding PPP model are identified as [29]:
• Provision of multi-channel services: Multi-channel services enables maximum
reach towards the citizen, anyhow, anywhere, and anytime. Public and private
organizations can provide financial resources for required investment more
easily when working together than working alone .
• New information markets: The PIRA study [30] estimated in the year 2000
that public sector information presents an economic value of between 28 billion
and 134 billion Euro per annum in Europe.

23
• Market driven approach of commercial partners: Market driven approach is
more creative in getting value out of data and services and are hence inventing
new service types and new demand.
• Bundling of information: Citizens are attracted to an information bundle which
is combined by several sources. For instance citizens may not only be curious
about their regions but other regions as well, and they also may desire to check
water, weather, sun, UV, and the like.
• Reselling of data: Not only one commercial partner is allowed to reach the
information from authorities, other parties have the same right to access the
data. Therefore, reselling of data is allowed and this will spread the availability
and use.
2.2.4.3 Advertising and Sponsoring
A survey of e-gov services showed in 2005 that only around 4% of government Web
sites world-wide relied on ads. They were presented as banners, pop-ups, and fly-by
advertisements [31].
It is experienced in project APNEE-TU [32] that the authorities involved agreed on
commercial advertising to be on the same interface where the environmental
information is presented, because someone had to pay for the servers and software that
will make e-gov work. However they restricted the type of advertising, for instance
they hinder commercials like cigarettes and offending material like gambling and the
like .
Sponsoring is defined as financial support of an information service by an external
non-public party, with the service in turn showing the sponsor’s name on the Web or
mobile interface, and/or mentioning them in other official publications [29]. Citizens
sometimes don’t welcome advertising, and in this case sponsoring could be a good

24
alternative for financial support. For instance, car drivers concern about deteriorated
streets and highways, therefore automobile clubs might sponsor a public infrastructure
complaint service as additional support service for their members.
2.2.4.4 Payment by Citizens
Citizens are unwilling to pay for governmental services since thay argue that the tax
payer is stressed enough with payments to the state, so governmental services should
be as free as possible [29]. Previously, we discussed about financial issues, so it is
reasonable for governments to support their specific personalized services with a clear
added-value by the citizens with an additional payment. This payment can be based on
subscriptions, pay-per-use, or transactions. For instance, micro-payment systems such
as FirstGate, PayPal or MobiPay can be used, and also authorities may collect charges
via the phone bill and transfers to the authority by the mobile operator.
Citizens in different regions may show different acceptance of technology, use and
pricing. In project APNEE it is shown that, North-European countries accept higher
prices for mobile services more than the citizens from southern Europe [33]. In
addition to this, age of customers may also show different acceptance levels of
technology especially with regard to mobile technology. Thus, authorities should
carefully examine their customer profiles, and act accordingly. Especially, this is a
very important issue for developing countries not to be confronted with the digital
divide phenomena.
2.2.4.5 Sharing of the Service or the Platform with Other Authorities
If several authorities including commercial orgranizations share the service and
operation of the mobile offer, costs and efforts can be naturally reduced. Of course,
including a commercial organization into this sharing model may create problems

25
regarding trust, privacy, and regulations. Besides, this problem may be valid for
authorities as well as a result of having different leadership and work-sharing models,
hierarchy, and structure. On the other hand, sharing model has clear advantages [29]:
• Sharing of costs and efforts, exchange of experiences and results.
• Provision of a larger dissemination field for services, possibility to offer cross
border services (also municipality borders), giving one anchor point for all
services—one-stop shop.
• Stronger negotiation position against mobile operators by bundling and
increasing
• Customer base.
• Implementation of chained and combined services (i.e., move from one city to
another; notifications of a move in one service instead of two notifications at
two city portals).
• Bundling of services according to citizen needs, not the authority structure.
2.2.5 Mobile Government Response Model
Governments implement mobile technologies either as a response to those
complementing e-gov efforts or as a response to take advantage of the benefits of
mobility.
The model highlights three interrelated issues: First, it identifies unique characteristics
of mobile government developments. Second, it highligths the various pressures
bureaucratic governments face in adopting mobile technologies. Finally, based on
examination of various mobile government applications; it specifies the response of
governments to address those pressures.
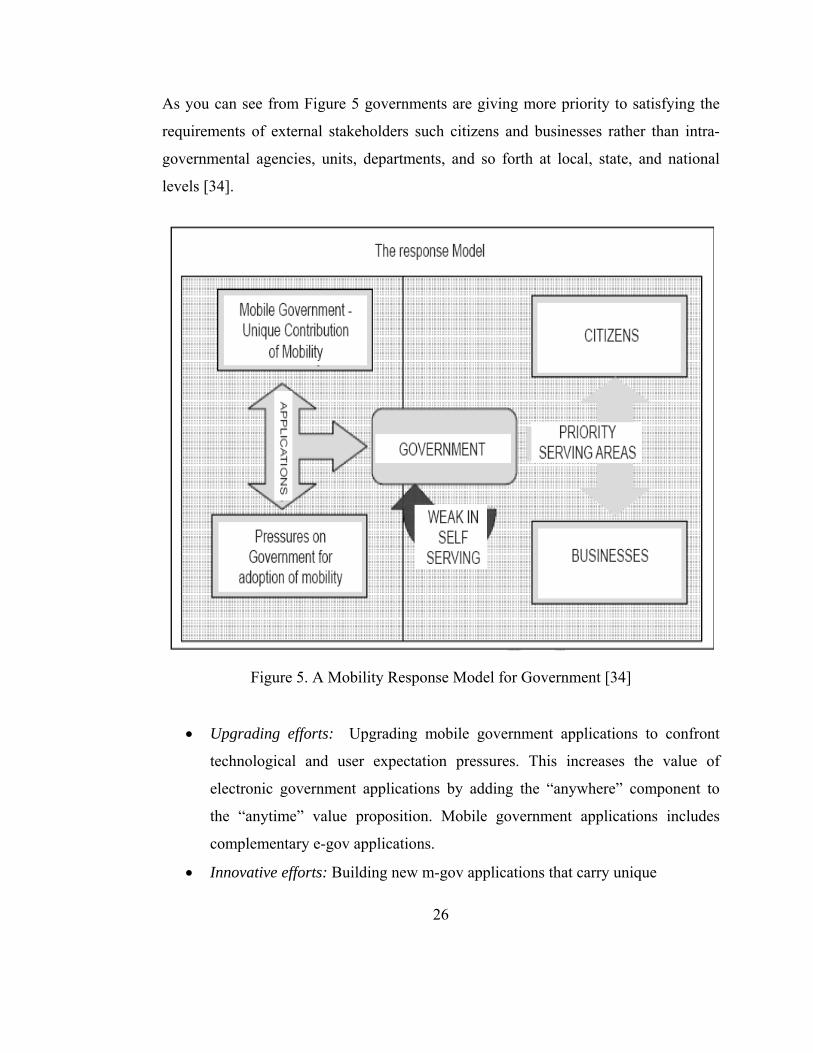
As you can see from Figure 5 governments are giving more priority to satisfying the
requirements of external stakeholders such citizens and businesses rather than intra-
governmental agencies, units, departments, and so forth at local, state, and national
levels [34].
Figure 5. A Mobility Response Model for Government [34]
• Upgrading efforts: Upgrading mobile government applications to confront
technological and user expectation pressures. This increases the value of
electronic government applications by adding the “anywhere” component to
the “anytime” value proposition. Mobile government applications includes
complementary e-gov applications.
• Innovative efforts: Building new m-gov applications that carry unique
26

characteristics of mobile Technologies. This creates a new value with the
implementation of unique mobile applications, and new kind of services that is
not dependent on e-gov applications.
2.3 M-Government Technology, Architecture and Trends
2.3.1 Wireless/Mobile Technology Trends
Complexity of the mobile phones is ranked by generations. First Generation (1G)
mobile phones began to increase in the 1980s with the introduction of "cellular"
phones based on cellular networks with multiple base stations located relatively close
to each other, and protocols for the automated "handover" between two cells when a
phone moved from one cell to the other. At this time analog transmission was in use in
all systems and data transmission was not available. In Figure 6 the functionalities of
the systems can be seen.
Figure 6. Functionalities of the Systems [35]
27

28
Systems such as GSM, IS-136 (TDMA), iDEN and IS-95 (CDMA) called Second
Generation (2G) mobile phone systems [35]. These systems were introduced in the
1990s. They were characterized by digital circuit switched transmission and the
introduction of advanced and fast phone to network signaling. Second generation of
wireless/mobile technology includes cellular phones, pagers, wireless-enabled laptop
computers, PDAs, wireless local area networks (WLANs), and GPSs, with the wireless
service providers’ technology enabling transmittal of voice and text/data (at 9.6 to 14.5
Kbps) working fairly well.
Turkey is currently using 2.5G mobile phone systems. This system is implemented a
packet switched domain in addition to the circuit switched domain. 2.5G phones does
not necessarily provide faster services, however it provides some of the benefits of 3G
and can use some of the existing 2G infrastructure in GSM and CDMA networks. It is
important to note that 3G technology is fully compatible with GSM, in other words, all
3G mobile phones support GSM [36]. GPRS is a 2.5G technology used by GSM
operators in Turkey. GSM has become the world's fastest growing communications
technology of all time and the leading global mobile standard, spanning 214 countries.
Today, GSM technology is in use by more than one in five of the world's population -
by the end of first quarter of 2007 there are over 2,8 billion cellular subscribers. In the
world, GSM subscribers have reached to 2.3 billion, representing approximately 80%
of the world's cellular market. In Figure 7 world’s GSM connections are represented.
With the arrival of Third Generation (3G) technology, wireless devices can be content
rich, enabling transmittal of content rich graphics, video, and other information at
speeds up to 2 Mbps. Currently, technology such as Bluetooth can provide short-range
wireless connectivity that can link several types of devices enabling seamless
interactions among various devices. 3G technology can further extend the similar
functionality and coverage [35]. 3G provide the ability to transfer simultaneously both

voice data and non-voice data such as downloading information, exchanging email,
and instant messaging.
Europe:Western Europe:Eastern
386,766,885 346,037,102USA/Canada
92,034,689 Asia Pacific
856,781,733
Middle East
131,242,851
Africa Americas 204,428,861
235,208,752
Figure 7. World’s GSM Connections [36]
2.3.2 Characteristics of Mobile Technology
In this section, we analyze the key characteristics of wireless/mobile devices
and technology and the characteristics of the environment within which the
applications are embedded.
2.3.2.1 Device Characteristics
Primarily, one of the key characteristics of the wireless environment is
“accessibility”. Citizens are able to reach and access government services at any
time and from any place. Not only citizens benefit from this property but also
employees and government agencies benefits from this in a way that they are able to
access each other at any time. Secondly, wireless devices are “distinctly personal”.
29

30
This is a very important property due to its usage can be reached instantaneously by
a government because the device can be associated with particular citizen/consumer
rather than a household or IP address. This creates more efficient channel for
organizations to provide services and reach consumers/citizens faster. Lastly,
wireless technology is “location aware” [35]. Government or organizations can track
citizens/consumers easily as long as the wireless device is on. This can be useful in
an emergency situation when the user of the device needs to be located or helped.
On the other side, this is also an invasion of privacy.
2.3.2.2 Usage Characteristics
It is very important to consider the current form and technology capacity of the
wireless/mobile devices [35]. Small size of the devices seem to be convenient for
the users, however limited size of user interfaces prevent to display information-rich
content in a useful way. Laptops have appropriate monitor to display such
information in an efficient way, however they are not as handy as small size devices.
Also, the bandwidth over the air for wireless transmission is another constraint for
the users today. These constraints limit customers’ capabilities for processing and
storing information and data, and also limit wireless technology to text-based and
less information intensive exchanges.
2.3.2.3 Environmental Characteristics
In the context of the characteristics of the wireless/mobile environment, three
significant issues need to be considered. These are security, privacy, and
application [35,36].
• Security: Security is one of the most important environmental
characteristics of wireless/mobile environment. When compared to

31
wired networks, wireless networks, such as Wi-Fi, are more vulnerable
to security risks. Security can exist at different levels: at the over-the-air
level, at the networks infrastructure level, at the software application
level, and at the device level. To prevent the security risks, governments
and organizations should implement the proper security measures and
employ sophisticated authentication and data encryption technology.
• Privacy: Tracking citizens/consumers easily as long as wireless/mobile
device is on can cause privacy concerns because some people may not
want to be tracked geographically. From the perspective of B2C market,
organizations are willing to use this property, as if a consumer were
tracked walking in a shopping mall, then personalized messages can be
transmitted to his/her wireless device regarding a product or service. So,
to prevent privacy concerns and emerging litigation problems,
technology should only be used during emergency situations.
• Application Platforms: So far, we discussed about device and
environmental characteristics of the wireless/mobile environment.
Multiplicity of application platforms is another characteristic of the
current environment. These platforms range from WAP and GSM, to
DoCoMo’s I-Mode, Windows CE, Palm OS, and Nokia’s open
middleware. For instance, WAP is an open platform, whereas I-Mode is
a proprietary platform. The challenge with the presence of platforms is
to understand what platforms will accept a larger user base.
2.3.3 Main Types of Wireless Technology
Two main types of wireless technology are available to municipatilies in implementing
a large-scale wireless network. These technologies are local area networks (LANs)
using Wi-Fi technology or metropolitan area networks (MANs) using Wi-Max

32
technology. Like every other technology these technologies have benefits and
weaknesses.
2.3.3.1 Wi-Fi Technology and Brief Description of IEEE Wireless
Communication Standards
Wi-Fi is a promising short-range high-speed wireless access method using the IEEE
802.11 standard for mobile communication. This standard operates on three different
levels. First standart to be released was 802.11b and this standart provides transfer
speeds up to 11 mbps and operates in the 2.4 GHz range. Several years later, 802.11a
which operated in the more expensive 5.0 GHz range was released and enabled
transfers speeds up to 54 mbps. Recently, 802.11g has been introduced and it operated
in 2.4 GHz range which was relatively cheap to 5.0 GHz range, however it still
provided transfer speeds up to 54 mbps.
Advantage of Wi-Fi technology is that it is relatively inexpensive to other
technologies. Main disadvantage of Wi-Fi is the limited signal range. After
approximately 30 meters signal starts to degrade. An effective operating area of Wi-Fi
is a little more than one city block (9,500 m2) [36]. If a municipatliy chooses Wi-Fi
technology for deployment, then that municipality will have to put one node on
approximately every corner in the covered area. Large portion nodes will need to be
hard wired to an Internet server. Another disadvantage of this technology is that, as
more and more users access the system Wi-Fi performance starts to decrease. In order
to solve this problem, several Wi-Fi nodes will need to tie directly into an Internet
server, giving the wireless network several access points needed to cope with the
anticipated volume.
Today, there are many Wi-Fi hotspots on trains and in coffee shops,bookstores, hotels,
airports, train stations, stadiums, and educational institutions all over the world. Users

33
can use mobile devices, appropriately-equipped laptops and PDAs to stay connected to
the Internet or a local area network (LAN) without Ethernet wiring with Wi-Fi
technology [36]. In addition to this, many governments around the world are
implementing Wi-Fi pilot applications and trials to show leadership in using this
technology.
2.3.3.2 Wi-Max Technology
Wi-MAX, the Worldwide Interoperability for Microwave Access, is a
telecommunications technology aimed at providing wireless data over long distances
in a variety of ways, from point-to-point links to full mobile cellular type access.
MANs uses Wi-MAX which is based on the IEEE 802.16 standard. Wi-Max has much
greater effective operation area than Wi-Fi with up to 30 miles under ideal conditions.
There are two main applications of Wi-MAX today: fixed WiMAX applications are
point-to-multipoint enabling broadband access to homes and businesses, whereas
mobile WiMAX offers the full mobility of cellular networks at true broadband speeds.
Both fixed and mobile applications of WiMAX are engineered to help deliver
ubiquitous, high-throughput broadband wireless services at a low cost.
As you can see from the Figure 8, Wi-Max operates in one of two ways. Firstly,
through line of site from one tower directly to another, up to 30 miles under ideal
conditions. A steady stream of data is beamed from these towers. Distance may change
depending on external conditions such as weather. Secondly, Wi-Max operates is
through non-line-of-sight when it is not rely on line of sight, similar to the way Wi-Fi
works [36-38]. From the Figure, there is a visual explanation of Wi-Max. Internet
Backbone, ISP Network, Wi-Max Transmitter, Backhauls, LANs are some
components of Wi-Max system.

Figure 8. Settlement of WiMAX Technology [36]
According to this operation, its effective distance is cut to about a 5 mile radius that
entire city can be covered with four to six towers strategically placed to provide
maximum coverage. Also, since the line of sight aspect of Wi-Max can carry such high
capacities, very few towers (possibly only one) will need to be hardwired into an
Internet server.
2.3.4 Introduction to M-Government Infrastructure
In this section, an open, integrated, and interoperable infrastructure model which
enables secure delivery of multichannel services of e-gov and m-gov is identified.
Infrastructure includes type of applications such as between governments , government
and businesses, and government and citizens as well as the type of applications
34
35
installed for the interactive and efficient communication between the participating
actors. Also, infrastructure components will also be explanied compherensively [37].
2.3.4.1 M-Government Infrastructure Design
Major investments have been made to legacy systems, however legacy systems are
standalone systems that do not corporate with other systems. Since there is a need for
intercommunication (G2G, G2B, and G2C), it is very important to build the
technological base for those systems that could be attached to and with some necessary
changes to become interoperable and integrated mobility.
The mentioned technological infrastructure is designed to comply with a general legal
and procedural framework as well as with a number of principles, rules, and
regulations and ready for services 24 hours a day and seven days a week.
Furthermore, the architectural design used all the necessary technologies (wired and
wireless), mechanisms and procedures that will best satisfy all the e-gov and m-gov
objectives and purposes. The particular infrastructure is composed of three main parts
[37]:
• User interface (front-end): It provides a single point of access to
informational, interactive and transactional public and business services.
• Integration middleware: The middleware layer represents the nervous system
of the platform. It enables service/user requests and helps to assemble/dispatch
data from across governments, and enables related transactions to be
conducted. It is based on XML messaging [39] and Web services.
• Back-end layer: It stores the actual internal and external services and related
requested information retrieved.
36
2.3.4.2 Principle Drivers of M-Government Open Service Infrastructure
Today, with the wireless technology availability of an e-gov infrastructure extends to
mobile and wireless channels [38]. The deployment of an m-gov open service platform
that could be shared by networked private and public authorities and institutions could
be a promising approach.
For a deep understanding of m-gov open service platform, critical requirements like
broadband, interoperability, scalability, transparency, personalization, privacy, and
security such should be analyzed and discussed [37].
• Broadband: Broadband is considered a new initiative that will have a unique
impact on the further development of the m-gov channels and infrastructure.
• Interoperability: To deploy mobile broadband services successfully
interoperability issue becomes very critical aspect. It is a multi-faceted issue
and is necessary at various levels: device-to-network; device-to-device;
network-to-network; and between content and/or applications. Without
appropriate interoperability between different infrastructure and terminal
solutions, the 3G reality could remain fragmented.
• Transparency and Scalability: Requirements such as design of software
applications and systems, the number of concurrent clients that access the
application, response times, transparency issues, transaction throughput, and so
forth are affected as new enterprise business requirements and constraints
changes. Actual design of the applications shifts due to these changes.
• Personalization: Such issues include, but are not limited to, the following:
what content to present to the user, how to show the content to the user, how to
ensure the user’s privacy, or how to create a global personalization scheme.
• Privacy and Security: Corporate and consumer mobile applications involves
personal and sensitive data. For these transactions, a trusted and secure
37
environment is needed. More specifically, the following areas are identified
with respect to mobile privacy and security research: trusted platforms for
mobile security and privacy, mobile network/transport security and privacy,
mobile application security and privacy, mobile privacy and identity
management, basic security and privacy technologies for mobile environments,
mobile application security framework, and user-centric mechanisms allowing
controlled release of personal information.
2.3.4.3 Multi-Tier Architecture Overview
This kind of archtitecture allows the distribution of components across multiple
servers and access of data that is stored in multiple databases. Every particular multi-
tier architecture has its own specific design and implementation according to user
requirements, therefore number of tiers may change accordingly. However, there are
some general principles that should be established for all multi-tire systems [37]:
• Scalable architecture and location transparency: It should be possible for each
application layer to be located (distributed) on a physical different piece of
hardware (server).
• Information exchange: Each layer should exchange information only with its
lower or upper one.
• Communication interface: Communication interface should exist to exchange
data between layers.
When compared to the traditional two-tier approach (client talks directly to a server
with no intervening server), multi-tier architecture performs substantially better than
the two-tier architecture and is much more scalable due to moving the business logic
from the client to the server where it is possible to perform tasks in parallel. Moreover,
this disparity provides much secure environment. To better undertand our multi-

38
channel infrastructure, an insight regarding the main parts of such a system design is
given in the following:
• Client Tier: It delivers a friendly user interface such as web browser by
receiving HTML, WML, XHTML, XML and so forth.
• Presentation Logic Tier: This is where HTML, WML, and so forth, are
rendered and delivered for the presentation in the client tier. It handles
requests/responses from/to multiple clients.
• Application Middle Tier: The middle tier receives requests from the client
application over the presentation tier, and retrieves data from the data
repository (database).
• Application Back-End: It consists various data repositories (database, files
system, LDAP), which exist separately from the client and the middle tiers.
Currently, in the market, the most suitable platforms for multi-tier application
development are Microsoft .NET and J2EE environments.
2.3.4.4 Multi-Channel Service Delivery
After examining m-gov’s infrastructure and architecture, it is suitable to analyze and
present concepts and arguments toward the provision of e-gov services via multi-
channel (WAP, MMS, SMS, Web, Satellite, etc.) mediums (PC, mobile phones, PDA,
tablet PC, Satellite handset, etc.) without loosing their integrity or quality of their
content [6,37].
A channel could be defined as “a means for users to contact public administrations
(inbound) or for public administrations to contact their users (outbound) with the aim
of acquiring or delivering public services. This includes the use of Web-based
technologies, telephony, paper media or face-to-face contacts; applications of these
39
technologies such as the Internet, e-mail, SMS, call centers or the counter; and devices
to access the applications such as a personal computer, mobile phone, kiosk or digital
TV” (IDA, 2004). Also, the term “channels” is often used as a concept that includes
“channel type”, “technology”, “platform”, “media”, “device”, and “touch point”.
Services can be delivered through a wide variety of channels, which have different
capabilities and limitations. Every user has his/her own perception of a service.
Accordingly, users will choose the channel that realizes the highest relative value for
them. If channels are integrated, the integration of channels means more accessible and
more flexible service delivery (which leads to better services) to the user. However,
inconsistencies such as different data formats or interfaces can occur when there is
separate development of different channels (multi-channel delivery) for a single
service.
To overcome the drawbacks of multiple-channel service delivery, the common data
that are used by the front-office applications should be stored centrally so that they can
be shared by the applications. In this way, users can access the services from the
locations and mediums (PC, mobile phones, PDA, tablet PC, Satellite handset, etc.)
they desire, as all the relevant information retrieval is taking place from the same
databases. Thus, with the integration of back-office processes, full-service integration
becomes possible (as different data formats or interfaces, or parallel workflow steps)
which raises the quality and number of services significantly.
2.3.5 Security for M-Government
In explaining the security issue, we mainly focus on WiFi, especially the IEEE
802.11b standard, and its application [36]. As discussed earlier, privacy and
confidentiality are very important for governments in the provision of services and in
implementing applications. Compared to wireline networks, wireless networks such as
40
Wi-Fi have seen more vulnerable to security risks, but by implementing appropriate
security measures and employing sophisticated authentication and data encryption
technology, security risks can be minimized.
2.3.5.1 Types of Attacks
Main security risks associated with Wi-Fi are as follows: [36,40,41].
• Spoofing attacks: Intruder can gain unauthorized access to the wireless network
by creating TCP/IP packets with somebody else's IP address.
• DoS Attacks (Denial of Service): It is an attempt to make a computer resource
unavailable to its intended users. Since many other types of wireless equipment
use the 2.4 GHz frequency band, an attacker operating in the same band can
“jam” the spectrum and thereby disrupt or block communications.
• War-driving attacks: It is the act of locating and possibly exploiting
connections to wireless local area networks while driving around a city or
elsewhere. An intruder can use applications such as NetStumbler which can
detect any unprotected IEEE 802.11b wireless network by scanning for
broadcasting access points.
• Man-in-the-Middle attacks: It is an attack in which an attacker is able to read,
insert and modify at will, messages between two parties without either party
knowing that the link between them has been compromised. Intruder can use
sniffer tools such as AirMagnet, Airsnort, Fluke Waverunner, Kismet,
NetStumbler, Sniffer Pro, Sniffer Wireless, WEPCrack, Yellow Jacket, and
YBT-250.
• Weather conditions: Wi-Fi equipment may be disabled due to bad weather
conditions.
41
You can see the brief descriptions of these tools from A-Table 6 in Appendix-D. Many
of these tools are legitimate network management tools, however, they also may be
used by hackers to intrude systems, capture legitimate information, collect transaction
information, inject false data, or even hijack the session.
2.3.5.2 Security Measures
To prevent these attack, some security measures can be taken [36]:
• WEP Protocol (Wired Equivalent Privacy): It is built into 802.11b
specification, and it provides a common way to encrypt data and authenticate
users by using 128-bit encryption technique with RC4 random number
generator and CRC-32 cyclic redundancy code that scrambles data before it
goes over the air and an authentication algorithm called shared key
authentication to authenticate the client.
• IEEE 802.1x: It provides authentication to devices attached to a LAN port,
establishing a point-to-point connection or preventing access from that port if
authentication fails. It provides much stronger security than WEP alone.
• VPN (Virtual private network): It is is an IP security (IPSec) protocol that was
developed to enable client systems to securely connect to servers over the
public Internet.
• Careful and proper management: Sometimes encryption can be broken by
hackers. If hackers can gain access to clients system, such as governmental
worker PC, as a result of this hackers may able to enter government networks.
Therefore the deployment of Wi-Fi should be backed up with employee
training, for instance password management education.
• Physical protection: It is necessary to necessary to protect Wi-Fi equipment
from the weather as well as from theft and vandalism.
42
As a result, it is recommended that VPN technology plus IEEE 802.1x authentication
should be implemented in addition to the WEP protocol built into IEEE 802.11b to
provide adequate security for the corporate Wi-Fi networks in government. In addition,
users should be educated on the importance of protecting their Wi-Fi equipment from
theft, damage, or misuse.
2.3.6 Spectrum Management Policies and Practices
There is a need for efficient frequency spectrum management policy in the deployment
of a wireless data access service [59]. For instance, taking consideration into Wi-Fi,
even though there are only three channels that an IEEE 802.11b access point can use,
governments must be very carefully plan and implement when they assign channels.
An effective spectrum management policy ensures that channels are assigned to the
network of access points in a manner that minimizes interference and maximizes the
performance and coverage for end users [36,42].
Besides Wi-Fi equipment, there are many devices, for example Bluetooth wireless
devices, cordless phones, microwave ovens, wireless cameras, wireless headphones,
and even certain fluorescent lighting than can interfere with each other due to utilizing
in the same IMS frequency band. The spectrum management policy must ensure that
all these devices optimally utilize and share the frequency band.
Moreover if a spectrum management policy is not adequately implemented, an
employee could easily set up his or her own access point without proper site planning
or approval from the network security and information management groups. If there
are no security measures for this access point, it may become entry point for intruders
into the government networks.

2.4 M-Government Applications
2.4.1 Applying Wireless/Mobile Technology to Government
With the improvement in e-gov and high-tech mobile devices, mobile government
applications seem to be inevitable in the coming decade. The potential for
wireless/mobile applications within government is vast [35]. Considering the high
mobility of targeted employee of government, deploying widespread
wireless/mobile environment will be very important step for governments to
improve their employee efficiency.
For instance, governments’ workforce involved in law enforcement and
compliance enforcement, transportation and logistics, and health and social
services can be a very good example for government departments that have high
mobility workers. This indicates that the potential for deploying wireless
technology for intra-governmental applications is significant.
Figure 9. Scope of E-Gov
43

44
2.4.2 Types of M-Government Applications
There already exists various m-gov applications and business models in the areas of
law enforcement, education, transport, health, and firefighting [20,43]. In the
following section, a number of m-gov applications from various countries are briefly
presented in order to familiarize the reader with what is actually involved in m-gov.
M-Gov can be applied to four main purposes in the public sector, as summarised
below:
2.4.2.1 M-Communication (G2C, C2G, G2G)
Government applications can be grouped into a few categories. The most common
category is called G2C. The next category is called G2B. The last category, called
G2G, is the category in which authorities are connected to each other [6,20,43].
Moreover, the services can be grouped along the rising complexity into three different
categories: Information, communication and transaction. The easist one to accomplish
is the information services. Communication services enable interaction with the
authorities, but it does not finalize processes for instance with an electronic signature.
This can be possible in transactional services that with an accepted e-Signature,
informational or communicational session can be closed. A number of m-gov services
via SMS from various countries are briefly presented below:
2.4.2.2 M-Education
• Giving Morale: In Knowsley (Great Britain), SMS messages are sent as a
motivation tool for secondary school students (tips about efficient test
preperation, wake-up phone calls for permanent late-goers). It is aimed to
increase average grades and morales of the students.

45
• Tracking Truancy: In Yishun City School (Singapore), East Riding (Great
Britain), and Ireland Schools, SMS messages are sent to the parents in case a
student is absent.
• Support for university education: Universities in London receive motivation
SMS messages regarding their interest in further education, mainly university
education.
• Test results: In Great Britain, France and South Africa, students can receive
their university test results (Bradford University) by SMS.
• Information channel for university students: In Leeds University and Univesity
of London, students are able to receive information academic life, preparation
for future occupation, extracurricular activities, interesting and discounted tips
and information. In National University of Ireland, students receive
information about jobs, scholarships, education, extracurricular activities and
SMS invitations to interesting events.
2.4.2.3 M-Safety
• Crisis information channel: In West Midlands (Great Britain), deaf or citizens
with hearing difficulties have a problem, can send a message to central police
mobile number /service for help. In Amsterdam (Holland), citizens are able to
receive caution message (e.g. Go home, close windows and doors) in case of
hazardous/toxic fire or other threat).
• Floods warning systems: In Malaysia, citizens receive warning messages by
automated measuring devices in the case of increased water supply. In Great
Britain, citizens receive information messages about emerging floods via SMS,
e-mail, fax, and digital TV in case of emergency. On the other hand, citizens in
Henan (China) can receive SMS messages to government about emerging bad
weather.

46
• Special notification cases: Citizens in USA and London can receive messages
about potential terrorist threats/attacks in the case of terrorist acts.
• Preventing bogus phone calls on emergency line: Citizens in Amsterdam
(Holland), can receive information messages missing phone in the case of theft.
• General fight against crime: Citizens in Manila (Philippines) and
Leicestershire (Great Britain) can send/receive messages to police department
about suspicious activities in their areas. In Ireland, citizens are able to send a
photo of wanted criminal act/thief by MMS. A couple of thieves caught in Italy
by sending a MMS photo.
• Search for missing children/citizens and criminals: In Germany, police can
send descriptive message about missing person to bus/taxi drivers. In Sussex
(England), citizens can register on special mobile number to receive SMS
messages with description of missing child from Sussex police department.
2.4.2.4. M-Democracy
Currently, there are no significant experiments with m-democracy in
developing/transitional countries. However, situation is different. For example, in UK
experiments with electronic voting are made, including voting via mobile phones. This
enables to discover more convenient ways to involve citizens in political decision-
making. Top questions are security and secrecy. M-voting system has to ensure that
the message sender is a registered voter, and that no-one abuses the system to vote
more than once or vote in place of another person. For instance, voters in Liverpool
and Sheffield in May 2002 local elections were given PIN numbers to use if they want
to vote by text message [6, 43]. Besides technical issues, there is the problem of the
voters' willingness to use mobile phones and SMS to vote. Latest studies in Scotland
and Wales have shown a general interest in electronic forms of voting, including m-
voting. However, another recent UK study ("Public Attitudes Toward the
Implementation of Electronic Voting") [6] finds, alongside this overall willingness to

47
vote electronically and an interest in m-voting, that many citizens appear unwilling to
use voting via text message as an electronic voting method.
According to this study, willingness changes according to voters’ age. While younger
respondents, and those that used text messaging, may find this as an easy option to
vote, but others may not. These findings may well have wider implications for all uses
of m-gov.
2.4.2.5 M-Administration
M-gov also provides opportunities to improve the internal operation of public
agencies. There are very few examples of such applications in developing/transitional
countries. M-administration applications can provide a seamless environment for
government employees to stay connected from any device. Up-to-date government-to-
employee (G2E) information and services can be provided at any time, whether the
data they need is on the Internet, on their network, or on a portable device under their
control.
2.4.2.6 M-Health
Health online or electronic health is a current priority for many governments. However
return of investment for such services is difficult to measure [20]. M-health or mobile
e-health applications do not only support healthcare in any particular healthcare
environment (hospitals, clinics, long term care facilities, homecare), but also can either
eliminate or greatly reduce the use of paper forms. Moreover, significant issues that
can affect the pattern of m-Health applications are as follows: usability, adoption,
interoperability, change management, risk mitigation, privacy and security, and return
on investment [6].
48
2.4.2.7 Other interesting M-Government services
Some interesting m-government services are presented below [43]:
• Library transactions: citizens are able to do library transactions (information
about their account, get notifications, extending borrowing periods) via mobile
phones in Singapore National Library.
• Efficient garbage collection: In Quezon, Philippines, citizens can report to
dustman service about increased need for cleaning services in given areas by
SMS.
• Higher rate of employment: Citizens of Austrialia received SMS messages
about potential offers, booking a meeting or updating data. This was a pilot
project involving 300 citizens and 96 percent of the citizens positively
responsed.
• Notification to debtor: In Fifi, Scotland, renters received notification messages
about their rent debt. This was a pilot application testing with 200 debtors and
50 percent responsed to this application. In New Zealand, citizens receive
notification messages regarding fines (parking, exceeding the speed limit) via
mobile phones.
• General advice to citizens: Contact centres in Scotland are ready to answer any
questions from fellow citizens. Citizens are able to send/receive SMS
messages.
• Political issues: Philippines government ask citizens to report bribes via SMS.
In vice versa, citizens may send complaint messages to directly to the office of
president.
• Tax declaration: In Norway, citizens are able to do pre-filled tax declaration
modification via SMS with specific code and the entire tax collection
procedure is cleared for him (relevant for app. 1,5 mil. citizens each year).

49
2.4.3 Recent M-Government Applications in Turkey
2.4.3.1 MOBESE and TBS
In this section, most recent developments in Turkey are briefly reviewed. In the
context of government, two major projects should be discussed. First one is MOBESE
(Mobile Electronic System Integration) and TBS (Traffic Information System). Both
systems are G2G law and traffic enforcement projects. These projects can be
considered as mobile intranet systems, and serve to the goal of increasing the
effectiveness and efficiency of law enforcement efforts and better communication
between mobile units and the central command equipped with a database [12]. With
the MOBESE project, İstanbul, which is one of the crowdest, the most active and the
biggest metropolitans of the world with a population of 12 million people, has been
kept under control in terms of order and security.
MOBESE is installed at the İstanbul Directorate of Security by the Governorship of
İstanbul Provincial Special Administration and successfully installed Command
Control Centre under its responsibility. Command Control Centre is the centre where
all information which may be necessary during the management of the city of İstanbul.
It is a control and management system where the security services are managed and
directed during the ordinary or extraordinary events. In this project which serves to the
security of İstanbul, huge screens are used to monitor the movements and works of the
security forces on the satellite maps of the city. The images that can be obtained from
768 dome cameras can be viewed simultaneously. With the mobile police station
practice, the events are promptly reported with the laptop computers, camera and
printers to be given to each police vehicle in the project. Reports are made more
reliable by taking photos of events like accidents etc. It is possible to manage the
operations in coordination with the centre in online connection via satellite and GSM
network. Information is evaluated faster with the 155 call centre established at the

50
centre. All district security directorates are connected to each other online and with
images making intervention to incidents possible.
2.4.3.2 MIP and UYAP
Moreover, we can add two other major m-gov projects at national government level.
Mobile Information Project (MIP), implemented by the Ministry of Education,
together with the Avea Mobile Phone Service Provider Company is a m-gov project
[12]. With the project, parents are able to view their childrens’ attendance records,
exam dates and grades, and the school curricula by connecting to the ministry database
via a mobile phone. On the other hand, this application also serves as a mobile intranet
that enables the Ministry personnel to access the current information about their
promotion and/or placement. Therefore, MIP is a two-sided project, with both C2G
and G2G application. Secondly, National Judicial Network Project (UYAP) can also
be considered as a major m-gov projects at national government level. In this project,
all the courts and other organizations in the judicial system in Turkey are aimed to be
integrated with an electronic network. Also, it targets to create a streamlined, more
efficient and transparent judicial system transfer by creating more efficient transfer of
judicial information among all the courts and other organizations in the system.
However, it is important to indicate that this project itself is not based on mobile
technologies, but in very soon, courts will be able to send official notification to the
mobile phones of attorneys and parties of a lawsuit as an SMS, including a digital
signature.
2.4.3.3 EMIS and Various Municipality Applications
Other important m-gov applications at local government level [6] are Earthquake
Monitoring and Information System (EMIS) implemented by the Kandilli Observatory
of Istanbul and municipality m-gov applications [12]. Primarly, Earthquake

51
Monitoring and Information System is earthquake detection network, with support
from the UK’s Export Credits Guarantee Department (ECGD). With this project,
ground vibrations are analysed as quickly as possible, thereby identifying the location,
time and magnitude of an earthquake. This information allows organisations, including
the emergency services, to set into action plans to help minimise the effects of an
earthquake. Secondly, the municipalities of Şişli, Kadıköy, Bahçeşehir, and Usküdar
(all in Istanbul) provide m-gov applications. This aplications enables citizens to
enquire and pay taxes via a mobile phone, municipalities are able to send municipal
information and reminders to the citizens’ mobile phones. Another interesting project
which is still in progress in Turkey is mobile e-Voting. In Bahçeşehir, there is a pilot
study for mobile e-Voting. Çorlu, (in Tekirdağ province), Yozgat and Eskişehir are
other municipalities that also transmit municipal information to the citizens.
We discussed WiMAX technology in previous sections. In this manner, Turkish
Ministry of Education, together with Intel Corporation, works on a pilot project to
implement Wi-Max technology to the Boğazlıyan Municipality in the Yozgat Province
of Turkey, by connecting five primary public schools to the Internet via wireless
network technology.
52
CHAPTER 3
COUNTRY CASE STUDIES
3.1 Introduction
Most European countries had made mistakes in making strategies in the transformation
to m-gov. Turkey has a better chance to success, because they are just at the start of the
m-Transformation. In this section we analyze some successful country cases across the
Asia Pacific region in the context of mobile government. This region shows a great
deal of variety from the point of view of government regulations and business
strategies. The chosen countries to be analyzed are:
• Turkey
• Japan
• Australia
• South Korea
Before a deep analysis, let us explain our reason of choosing from Asia Pacific region
countries. First of all, Japan is the third largest economy in the world by purchasing
power parity and a leader in the use and development of information and
communication technologies. It was one of the first countries to launch third-
generation mobile services in October 2001 and the first country to launch commercial

53
services based on the W-CDMA standard. Secondly, South Korea is home to mobile
handset manufacturers such as Samsung and LG. They have extremely technology
savvy population as a result of the government’s information technology training
program. Thirdly, Australia has a large landmass and highly dispersed rural
population, due to this, their strategies towards to offer telecommunications as widely
as possible and to upgrade its fixed network to a broadband fiber are very important.
Thus, examined country cases will guide us to determine the critical success factors, in
the design of creating a successful strategical plan for Turkey in the transformation to
m-gov. The countries are evaluated on four factors listed below:
• e-Readiness
• The Telecommunications Market & Telephony
• Internet
• VoIP
At the end of each country case, we summarized the main points. After the specific
country case analysis, we compared the country results and displayed them in tables.
3.2 Turkey
3.2.1 e-Readiness
In the UN e-Government Readiness Index for 2007 [44], Turkey is assigned a rank of
42 out of a total of 69 nations, a placement behind countries such as the Australia (9),
South Korea (16), and Japan (18). Back in 2005, Turkey was behind all the Member
States, however in 2007, new entered EU Member States such as, Romania (45) and
Bulgaria (48) are fall behind Turkey. On the other hand, Turkey’s ranking is
developing in annual e-Readiness Index of the World Economic Forum [45]. Last year
Turkey ranks 45th out of 69 county. Turkey ranks 48th out of 115 country in 2005,

54
where it was 56th out of 102 country in 2003. Also, in 2005 Turkey comes 9th among
EU members and EU candidate countries in terms of modern on-line public services
ranking which is done by INSEAD.
3.2.2 The Telecommunications Market & Telephony
e-gov strategies and policies are developed and coordinated centrally, Turkey’s
national approach to e-gov can be characterised as centralised [45]. E-gov actions were
defined in an action plan named the STAP for 2003-2004. 23 actions were contained in
the plan’s e-gov section, to be carried out in collaboration with public institutions and
NGOs. In the STAP, two main actions on e-gov are: preparation of a strategy for the
provision of public services through a portal and improvement of the services
themselves. As a result, Turkey’s national goal is to transform into an information
society and close the digital divide. By the year 2006, after STAP, Turkey launched e-
Transformation Turkey 2005 Action Plan. There, various activities on IT are proposed
and/or monitored for progress. As the most recent development, Turkey’s Information
Society Strategy (2006-2010) came into force in July 2006. The Strategy contains two
basic priority regarding e-gov: Citizen-oriented service transformation and the
modernisation of public administration. Some of these strategies can be summarized
as:
• Citizen-focused Service Transformation
• Modernization in Public Administration
• Development of broadband infrastructure and usage in Turkey
Telecommunications market was worth $17.7 billion in 2005 and carrier services
played the main role. The market grew 16% in 2005 compared to 2004 as the new
fixed line backbone companies and ADSL systems are established. Privatization of
Turk Telekom is one of the key components of the government to create a more

55
competitive market structure to help increase service quality while reducing costs. This
was completed as the majority of Turk Telekom’s shares were sold to the Saudi Oger
Telecoms Joint Venture Group. With the entrance of Vodafone through its purchase of
Telsim altered the Turkish industry’s landscape [46].
3.2.2.1 Telephony
Until 1980, fixed telephony penetration was barely 2.5%; afterwards, Turk Telekom
raised penetration rates through new investments. By the early 2000s Turkey’s fixed
network was the fourteenth largest in the world and the fifth largest in Europe by
subscriber volume. Turk Telekom’s monopoly over the fixed-line services ended at the
beginning of 2004. However PSTN investments slowed down as GSM networks were
launched.
3.2.2.2 Mobile Telephony
In early 2006, 44 million mobile phones are estimated to be owned in Turkey. Ten
years ago, this number was only 0.8 million. The mobile telephone services were
liberalized in 1994. It is still a growing market and the upcoming 3G licenses will offer
further business potential. There are three main competitors in the Turkish GSM
market. Turkcell is the first service provider and leading the market with 58% market
share, followed by Telsim (Vodafone) with 25% and Avea, the last entrant of the
market is competing for the second place [12,46].
Telsim, for example, was sold to Bitish company Vodafone for $4.55 billion in
December, 2005. Mobile operator Avea, is 49% owned by Telecom Italia Mobile and
Telsim, was bought by Vodafone in July 2006. A significant portion of Turkcell is
expected to be sold soon. The mobile government infrastructure supports 2.5G services

56
as of January 2006. There have not been any 3G licenses awarded yet and they 3G
license tender expected to be available in 2007 after general elections.
Table 2. Turkish mobile phone service provider market [12]
Name of the Service
Provider
Number of
Subscribers
(Million)
Market Share
(%)
Entry to the
Market
Turkcell 28 58 May 1994
Vodafone 11 25 February 1994
Avea 7 17 June 2004
3.2.2.3 Mobile Number Portability
National numbering resources are managed and carried out by the TA in compliance
with the rules and procedures defined in the Numbering Ordinance. Regarding number
portability, the rules and procedures are contained within the number portability
ordinance, but number portability is not available in (none)-geographic fixed numbers
or in mobile numbers. At the start of 2007, Turkey’s officials announced the
introduction of mobile number portability (MNP) for its 3 mobile operators, Vodafone,
Turkcell and Avea. MNP allows customers to change carriers and keep their number,
referred to as porting [46].
Turkcell, the leader mobile operator in Turkey, has called for the cancellation of MNP
in case of losing a large number of customers who port for better calls or family
reasons. However, Avea, Turkey’s third largest mobile operator has launched a legal
case in an attempt to make number portability mandatory for all telecoms providers in
the country. Avea is strictly in favor of number portability, as it allows subscribers to
transfer their own numbers while switching operators.
57
3.2.3 Internet
Turk Telekom marketed ADSL effectively in 2005. The already existing copper
telephone line infrastructure was capable of dealing with speeds up to fifty times faster
than dial-up. Moreover, ADSL is playing a strategic role as a locomotive for the
Turkish Government’s e-gov initiative, as government agencies have moved to ADSL-
based Internet technology and have invested in IT equipment. There are over fifty
private ISPs in Turkey, some of which include foreign ownership due to no foreign
ownership limits affecting ISPs [75].
From Figure 20, we see that broadband still has a very low penetration rate as
broadband subscriber lines are reach 2.3% in 2006, which would mean an almost 60%
growth from the previous year. Overall Internet user penetration is relatively small
compared the EU average of around 38%. The mobile telephony market, however, is
facing already three competitors, whereby Turkcell is dominating by far [45]. A
Turkish ISP, Turbonet, has marketed ADSL effectively in 2007 and continuing. Apart
from this, it has launched its first field trials of WiMAX in Istanbul. The provider,
which uses 3.5GHz WiMAX equipment, has received a test license allowing it to carry
out the tests [46].
3.2.4 VoIP
Long distance telephony service licenses allow national and international long distance
telephony services using any type of technology including VoIP. With this license, its
subscribers are allowed to make on-net calls without using E.1645 numbers. However,
it is not possible for those VoIP subscribers to receive calls from other networks, as the
relevant license does not allow the assignment of E.164 numbers. Twelve companies
have obtained licenses from Turk Telekom. However, these firms are allowed to use
VoIP only for international destinations, not for local and domestic calls. This means

58
firms are only permitted to do so within their company structure, despite their location
in Turkey [45].
3.2.5 Summing Up / Conclusions
Turkish mobile telephony market is growing fast. Young population and the limited
fixed line infrastructure are the important factors of this fast growth. As a part of the
EU convergence, E-Transformation Turkey in 2003 and e-gov projects are being
implemented. This will create a demand for ICT companies to create large e-gov and
m-gov projects with large amounts of public funding and fueling internet use and
content creation. The operators are still waiting for the 3G licenses, however there is
disagreement of mobile number portability issue between mobile operators. This issue
should be solved prior to 3G licences tender. Thus, Turkey is ready for the 3G services
as a result of high mobile penetration and presence of young population.
3.3 Japan
3.3.1 e-Readiness
In the UN eGovernment Readiness Index for 2007 [44], Japan is assigned a rank of 18
out of a total of 69 nations as seen in Figure 10, a placement behind countries such as
the Australia (9) and South Korea (16).
3.3.2 The Telecommunications Market & Telephony
In April 1985, Nippon Telegraph and Telephone (NTT), which had been a public
corporation since 1952, were privatized and the Japanese telecommunication market
was opened to new entrants [47]. This marked the start of competition in Japan’s
telecommunication market. This was a turning point for the Japanese

59
telecommunications industry, as up until that point, NTT held an unchallenged
monopoly. At the end of 2003, there were 77.3 million Internet users in Japan. Of
these, there are 14.95 million subscribers enjoying a broadband service based on DSL,
cable Internet, or wireless (e.g. FWA). The take-up of DSL (11.20 million subscribers)
is the most popular form of broadband.
E-Japan to U-Japan
Until 2000, there was no national policy on IT, in contrast to other countries in Europe
and Asia. In this context, in January 2001, the government put forward “e-Japan
Strategy”, with the main objective of making Japan the most advanced IT country in
the world within five years. This strategy was launched as a solution to the social and
economic challenges faced as a result of its aging population, falling birthrates, and
rapid urban development.
The “e-Japan Priority Policy Programme” [48] with a view to clarify specific action
plans. This programme, to be reviewed every year, sets out five policy areas for the
country to concentrate on:
(1) Infrastructure;
(2) Human resources;
(3) E-commerce;
(4) E-gov;
(5) Network security.
The programme clearly stated that, “the private sector is to play a leading role in the
area of IT”. In this case, the government took action in promoting an environment
conducive to innovation and investment, through mechanisms such as effective IT
policies, tax incentives and deregulation. With the success of first e-Japan strategy, it

60
was expanded to include the goal of providing always-on, high speed Internet access at
the lowest possible prices to households in Japan. This strategy changed the focus
from infrastructure to the use of ICTs. In this respect, the main aim is to create a
“vigorous, safe, impressive and convenient society”.
After achieving its e-Japan goals, the government has created a new vision for the
future, u-Japan, with the goal of working towards a ubiquitous network society to
make ICTs as seamless as possible and effectively integrate them into daily public life.
The country’s vision for a u-Japan aspires to connect fixed, mobile, and consumer
electronics into a single network.
3.3.2.1 Telephony
In Japan, there is an incease in use of mobile communications and a decline in
traditional fixed-line usage. In 2000, mobile subscribers exceeded fixed-line
subscribers for the first time, with the mobile operator reporting 66,784,000
subscribers and fixed-line subscribers at 61,957,000. Today, the number of mobile
subscribers has outnumbered the number of fixed-line subscribers (See Figure 10)
[47].
3.3.2.2 Mobile Telephony
Today, mobile communication is invetiable for Japanese people. Mobile
communication in Japan is operated by using digital mobile phone services and the
Personal Handy Phone System (PHS) (See Figure 9) [47]. PHS was launched in 1995
as a low cost, high speed cordless telephone. Japan allocated 3G licenses in June 2000.
NTT DoCoMo (Do Communications Over the Mobile Network) was the first operator
to launch 3G services in Japan in 2001, but did not anticipated at the first time. On the
other hand, KDDI, had success in its April 2002 launch. In the deployment of 3G

61
services in Japan, operators are free to choose which interface to adopt. The choice is
between Wideband CDMA (W-CDMA) and CDMA 2000 (CDMA2000 1x and
CDMA 2000 1x EV-DO). At the end of 2004, there were over 25 million 3G
subscribers in Japan . The figures mean that subscribers to 3G mobile phones in Japan
account for 30 % of all mobile phone subscribers, which indicates a steady transition
from 2G to 3G.
In the 2G world, Japan was one of the very few countries that have been successful
with the “mobile Internet”. In Europe, WAP suffered from low transmission speeds,
paucity of content and disenchanted users. On the other hand, Japan introduced a wide
array of mobile Internet services. In fact, Japan made mobile Internet services an
integral part of mobile phone ownership. This let phenomenal growth in usage and
subscribers. In 2003, over 89 per cent of mobile users enjoy some form of Internet
access in Japan. In terms of devices connected to the Internet, mobile phones now
outnumber personal computers. In February 1999, NTT DoCoMo launched its famous
Internet connection service for mobile phones, ‘i-mode’ [49]. The main services are e-
mail, information services and applications such as Internet banking and ticket
reservation. Other mobile operators also launched similar services at the same time as
NTT DoCoMo, however, by far, the most popular service remains NTT DoCoMo’s i-
mode.
There are several success factors contributing to the mobile networks for Internet
access in Japan Primarly, low PC and Internet penetration are the most important ones.
Also, analysts point to the large number of citizents that travel long-distance using
public transport as a stimulus for growth. In Japan, early adopters of mobile services
are usually young users, they also compose the largest proportion of data traffic.
The demand for browsing services has been responsible for transforming NTT
DoCoMo into the world’s largest ISP almost overnight. The introduction of colour

handset in 1999 and of java-enabled handsets 2001 (“i-appli” service), were also
driving forces. Though mobile Internet services are being used for a variety of reasons
in Japan, the primary use remains email.
3.3.3 Internet
High-speed Internet access services, such as wireless LAN were launched in 2002 in
Japan. In 2005, Japan had over 22 million broadband subscribers. Broadband in Japan
is available over ADSL, CATV, W-LAN and FTTH (Fiber to the Home). Most
Figure 10. PHS and WLAN nomadic Internet access [48]
62

63
broadband subscribers receive service through ADSL with CATV coming in second in
terms of penetration [48]. NTT communication leads the market with 1600 hotspots in
the Wireless LAN services. Another provider of wireless access is Freespot which
provides free access with a wider coverage. However, the non-profitability of wireless
LAN service has lead companies to combine wireless Internet with 3G or PHS to
provide high speed access and mobility to consumers. This system enables the use of
PHS (personal handy phone system) for always-on data connection and WLAN for
high-speed stationary access.
3.3.4 VoIP
In the provision of VoIP services, Japan is one of the leading countries. In its move
towards the tranformation of a ubiquitous network, Japan made serious investments on
IP applications. In December 2005, there were twenty eight service providers offering
VoIP service and thirteen operators providing category three VoIP service. The
adoption of VoIP services has been steadily rising in each year.
3.3.5 Summing Up / Conclusions
Japan has a clear vision towards a ubiquitous society. One of the most distinguishing
aspects of the Japanese mobile industry is that the very close relationship between
equipment manufacturers and operators. They work very closely and supply the market
with handsets and portable devices in a coordinated effort. The government apply
effective IT policies, tax incentives and deregulation to promote an environment open
to innovation and investment. With the support of the the right regulatory
environment, operators have invested hugely in infrastructure deployment and have
made strategic moves using mergers and acquisitions. By merging or acquiring other
operators, telecommunications companies are expanding their businesses into new
markets or increasing their market. This affects consumers in a positive way by

64
creating production and distribution efficiencies, and thereby reducing the price of
services.
3.4 Australia
3.4.1 e-Readiness
In the UN eGovernment Readiness Index for 2007 [44], Australia is assigned a rank of
9 out of a total of 69 nations as seen in Table 4. Australia haves the best e-Readiness
score among other choosen countries: South Korea (16), Japan (18), and Turkey (42).
3.4.2 The Telecommunications Market & Telephony
In the Asia Pacific region, Australia has the fourth largest telecommunications and IT
market. The current telecommunications sector is centralized, its monopoly structure is
controlled, and it is open to competitive market.
In the late 1980s, telecommunications services in Australia were provided by various
monopoly organizations. In 1988, the government restructured the regulatory
environment by making reforms, namely Telecommunications Act 1989 [51]. Reforms
were applied to monopolies of Telecom Australia, OTC, and AUSSAT to design to
foster an increased commercial focus and to provide greater operational freedom,
management independence and accountability.
In 1990, the Australian government announced further reforms. In the first phase, a
new approach of transition from monopoly to open competition in basic services was
adopted. The second phase was implemented in the Telecommunications Act of 1991
and related legislation. The most important components of the strategy were:

65
• Merging Telecom and OTC to become AOTC (later Telstra);
• Fixing the period for the facilities-based duopoly (ending in 1997);
• Licensing three public mobile operators (Telstra, Optus, and Vodafone);
• Creating an open competition in the resale of telecommunications capacity and
public access cordless telecommunications services;
• Giving AUSTEL a stronger mandate to promote competition and protect consumers’
interests.
To create more competitive environment and provide user choice, open competition
was introduced into the entire market in July 1997, with the Telecommunications Act
1997. Self-regulation within the industry was encouraged, particularly in technical
regulations and through codes of practice.
Currently, there is no restriction on entry into the telecommunications service market.
As a result, any number of carrier licenses that can be issued. Any corporation or
public body can apply for a license. However, to fulfill industry development plans,
and to comply with the telecommunications access regime, government expects
corporations to serve both in Australia’s regional and remote areas. A carrier,
especially the incumbent, is subject to criticism if it offers services in the urban areas
that cannot be offered in the rural areas. This creates an incentive to wait a longer time
before offering new services.
Liberalization affected the Australian telecommunications market significantly. One of
these effects has been the increase in operators. There were three carriers in 1997, and
in the beginning of 2001, there were sixty licensed carriers [51]. Liberalization has
also made each division in the sector to be looked independently, this made it difficult
to speak of a single telecommunication market. In terms of competition, mobile
telecommunications services is very competitive in most regions in Australia and the
competition is more intense where terrestrial coverage is available.

66
3.4.2.1 Telephony
The Australian telephony market is dominated by Telstra, also known as Telecom
Australia. Telstra is 51% government-owned and 49% market controlled, as a result,
the carrier has a lot of power in the telecommunications market. Other competitors in
the market are Optus, which is owned by Singapore Telecommunications; AAPT,
owned by Telecom New Zealand, Primus Telecom, Soul, Vodafone, and Powertel. In
2005, there were 11.46 million main lines in use and 18.42 million mobile telephony
subscribers [50,52].
3.4.2.2 Mobile Telephony
There are four mobile service operators: Telstra (the incumbent), Optus, Vodafone,
and Hutchison. As of 2004-2005, Telstra held 44% of the market, Optus held 35% of
the market, Vodafone had 16%, and Hutchison held the remaining 5%.154 Currently,
the mobile the telephony sector is a major contributor to the economy, offering more
contribution than many industries, such as newspaper and publishing industry [52].
In 2000-2001, the number of mobile service subscribers surpassed the number of fixed
services subscribers. Approximately 94% of the population in Australia is subscribed
to mobile telephony service and the terrestrial mobile phone networks now reach over
98% of the population and cover 20% of the Australian landmass. In 2004-2005, the
mobile penetration rate is reached to 81%. By the end of 2008, it is estimated that
Australia will surpass a 100% penetration rate. This growth in the number of
subscribers is due to the significant decrease in the price of mobile services.
When compared to other OECD countries, the Australian mobile telecommunication
market offers a high degree of competition, which is ranked fifth among twenty-seven

67
countries in the level of pricing competitiveness for business mobile services and third
for residential mobile services in 2002.
3.4.2.3 Convergence
In the Australian mobile market, convergence has been an important actor. In the past
few years, there have been significant advances in mobile phones that allow users to
have immediate access to news, sports information, stock prices, news and music radio
broadcasts, and television broadcasts. For intance, Telstra’s i-mode, which provides
customers with the ability to bid on E-bay, view local news from the Australian
Broadcasting Corporation, listen to music and new from radio station Triple-J, and
access international news from CNN [51]. Another service, Vodafone Live allows
customers to download, listen to, and watch over 500,000 music videos and also
provides the capability of viewing live performances from the handset. Moreover,
another interesting convergence example is that Telstra’s new service, SMSenabled, it
enables fixed-line telephones to send and receive SMS. Today, more than 80% of pay
phones can now be used to send SMS in Australia.
3.4.2.4 3G
In 2003, Hutchison launched “3“, The first commercial 3G network in Australia is
launched in 2003 by Hutchison. It uses the Wideband CDMA standard which enables
high speed delivery of multimedia services. The other competitors in Australia’s 3G
market include Optus, Vodafone, and Telstra. Optus and Vodafone have a 2.5G
network with 3G-like services. In July 2005, Vodafone ran a trial for its 3G network,
Telstra started selling its 3G handset in September 2005. Telstra operates jointly with
Hutchison. Australia illustrates very important innovations of 3G: the sharing of
networks and radio infrastructure by carriers. This sharing can significantly reduce

68
network costs and enable carriers to establish their services faster while providing
efficiencies for all those carriers sharing the network.
Currently, there are more than 300 content providers in the Australian mobile
telecommunications industry. With the partnership model between the operators and
the content providers, customers access to the latest entertainment services. For
instance, the content providers who work with Hutchison make various content
available for the its customers, such as news supplied by ABC, Reuters, Sky News,
and WeatherZone; sports provided by Fox Sports, Essendon, Cricket Australia, and
Sportal; comedy made available by the Comedy Channel; music supplied by Sony,
BMG, and Warner; and general entertainment information provided by HWW [51].
3.4.2.5 Mobile Television
With the advent of 3G services, telecommunications operators offer variety of
services, and mobile television technology is one them. In 2005, Nokia and the Bridge
Networks launched the first mobile TV trial in Australia. Moreover, Ericsson and
Milia TV offers interactive mobile television and the first mobile soap opera which is
sponsored by Vodafone. Ericsson and Milia TV’s service allows viewers to interact
with mobile television shows through voting or greeting (SMS or MMS-to-television)
simply by pressing a response key. This service also allows viewers to access other
services including shopping [51].
3.4.3 Internet
Currently, a majority of the users are accessing the Internet through large ISPs, who
provide non-dial-up access. At the end of June 2006, non-dial-up subscribers
represented 53% of all Internet subscribers in Australia [51,52].
69
The growth in the demand for Internet services has also led to an increase in the
demand for content in wireless data access and data transfer capabilities in mobile
telephony. This has resulted in convergence between Internet technology and mobile
telephony. For intance, Telstra has invested in a network called “Telstra Hotspots” that
allows certain customers to access localized Internet or broadband services at these
hotspots.
Internet service and broadband are an area of high competition in Australia, while
Telstra still controls a majority of the network. Currently, DSL is the predominant
access technology used for broadband Internet services. Almost 76% of the broadband
customers subscribe to this technology.
3.4.4 VoIP
In November 2005, Australian government announced the policy framework for the
development of new kind of VoIP services. During the last election, the Australian
Government committed to reviewing next generation services, including VoIP and, if
necessary, to create legislation to remove barriers to entry in the market. Also, to make
sure that consumers are aware of the choice VoIP offers and how VoIP is different
from tradition telephony, public information will be developed with the help of the
industry [51].
3.4.5 Summing Up / Conclusions
The mobile telecommunications market is where Australia has experienced success.
Penetration rates are high in part because of the concentration of population in urban
areas. Competition in the market is highly developed due to liberalization as well as a
relatively small amount of regulation. Mobile operators have embraced convergence of
services and technologies and offer a variety of value-added services. There is also an

70
issue regarding Telstra’s market control. They are in all major telecommunications
services. This situation hinders open competition and transparent market entry which
Australia is striving for.
3.5 South Korea
3.5.1 e-Readiness
In the UN eGovernment Readiness Index for 2007 [44], South Korea is assigned a
rank of 16 out of a total of 69 nations as seen in Table 4. It stands in second place after
Australia (9), and front of Japan (18) and Turkey (42).
3.5.2 The Telecommunications Market & Telephony
The Korean government considered information and communications technologies
(ICTs) as a way to overcome the financial crisis of 1997-98 and to build a more
advanced economy. So, the Korean government began an information technology (IT)
training program for its citizens [53].
Aim of this training program was to keep the unemployed occupied. Interestingly, the
program proved more beneficial than anticipated. This was a free program, initially
designed for 200,000 women but had to accommodate the three million women who
registered. Later it was gradually expanded to accommodate men. As a result, totally
ten million people were trained in IT. The results of this program made a majority of
the citizen technology savvy and more likely to use IT and contribute to the
information economy. Korean governments’ policy has contributed to the success of
communication technology deployment throughout the country. In the year 1999, the
mobile phone penetration passed the fixed-line penetration. The country has a greater
number of Internet and PC users than fixed telephone users.

71
In addition to these, there is very close relationship between the government,
equipment manufacturers, and the mobile communication operators, in the context of
agreement on standards, policies, and business models. Since, Koreans can not afford
to purchase the handsets outright, the government regulates the prices the subscribers
are charged and ensures all parties are sufficiently compensated (the mobile operator
for its services and the equipment manufacturer for its equipment).
3.5.2.1 Telephony
South Korea’s fixed-line penetration has been enhanced by the government’s provision
of the basic infrastructure to be used as a platform for the launch of various services.
However, fixed-line penetration has reached saturation with very few subscribers
joining the networks [54].
3.5.2.2 Mobile Telephony
Mobile communications began in South Korea in 1984. The service was provided by
the Korean Mobile Telecommunications Service (NTT). KMTS was a monopoly in the
provision of analogue cellular services for eleven years. SK group bought KMTS, as a
result, it currently operates services under the name of SK Telecom. Digital voice
service was launched in 1996 using CDMA (IS-95A) technology. With the
introduction of the digital voice service,the three new operators entered to this market,
Korea Telecom Freetel (KTF), LG Telecom, and Hansol (later merged with KTF), in
addition to the two existing operators [54].
South Korea remains a world leader in CDMA technology, introducing it first with
CDMA (IS-95A) and then continuing with CDMA 2000 and W-CDMA technologies.
Afterwards, in May 2006, HSDPA, which is an enhancement to the W-CDMA 3G

72
technology that increases downlink speed commerical service, was lauched and now
has 215,000 subscribers.
The country presently has a mobile penetration of approximately 80% [69]. Due to the
saturation of th mobile market, Korean mobile operators are now concentrating on the
development and provision of value-added services. Today, the mobile phone has
become a fundamental part of Koreans everyday life. Koreans use mobile phone not
only for voice communication but also for quick information searches, mobile
commerce, mobile banking, video services, gaming and music.
3.5.3 Internet
There are seventy nine Internet service providers in South Korea. Some of these
providers include KT (KORNET), Dacom (BORANET), and Hanaro Telecom
(HANANET) [53].
Broadband became available in South Korea in 1998. It has become a very popular
mode of Internet connection and there were 12.2 million subscriptions by the end of
2005. Korean operators offer some of the fastest and cheapest residential connections
in the world. ADSL connections of 2Mbps are available for less than US$ 25 per
month, while VDSL broadband connections of 20-40 Mbps are available for less than
US$ 50 [54].
The success South Korea has achieved in broadband is the result of cooperation
between the Korean government and the private sector investment. Private companies
supported the broadband backbone, and at the same time, the government encouraged
market entry by ligthening entry rules of registration and notification and by removing
foreign ownership restrictions.
73
3.5.3.1 Wi-Bro
Wi-Bro is a Korean variant of the international Wi-Max standard. This technology is
somewhat of a hybrid between the mobile phone and the wireless LAN (fixed
wireless). It enables mobility to be achieved at 120 km/h with continuous access. Wi-
Bro also has a same coverage area as the Wi-Max range which is about 1 km. The
WiBro licenses were won by the fixed-line operators, KT and Hanaro, and by the
mobile operator, SK Telecom [53].
3.5.3.3 Convergence
The broadband converged network (BcN) is an integrated network that allows secure
seamless access anywhere, at any time to quality multimedia services, including fixed
and mobile telecommunication services, broadcast services, and Internet services. It is
scheduled for completion in 2010. Adopting IPv6 technology is is another next
generation solution being looked at by South Korea due to shortage of IP addresses.
3.5.4 VoIP
There are many big private organizations that offer VoIP service for South Korea. For
intance, Skype, the Internet telephone giant, has begun providing VoIP services in
South Korea. Standard features of Skype services include instant messaging, SMS to
mobile phones, calls terminating on regular phones (SkypeOut), the option of a
personal phone number (SkypeIn), and conference calls [53].
3.5.5 Summing Up / Conclusions
South Korea’s success can be attributed to the commitment of the government and of
the private sector to the creation of necessary infrastructure for the provision of

74
converged services. This includes the creation and training of a technology savvy
public.
3.6 Analysis of Country Results and Comparison
South Korea, and Japan, all share the characteristic of being first-movers in
technology. While the remaining two, Australia and Turkey, have been reactionary in
their responses to change within the telecommunication industry.
Primarly, let us review the countries e-Readiness scores. e-Readiness can be defined as
“state of play” of a country’s information and communications technology (ICT)
infrastructure and the ability of its consumers, businesses and governments to use ICT
to their benefit. e-Readiness ranking allows governments to gauge the success of their
technology initiatives against those of other countries. It also provides companies that
wish to invest in online operations with an overview of the world’s most promising
investment locations [44]. Comparison of e-Readiness scores can be seen in Table 4
below. Turkey (42) has the lowest score among the group.
Table 3. Comparison of e-Readiness scores [44] Country Population
(million) 2006 e-Readiness Rank (of 69)
2007 e-Readiness Rank (of 69)
2006 e-Readiness Score (out of 10)
2007 e-Readiness Score (out of 10)
Australia 20
8 9 8.50 8.46
South Korea 48
18 16 7.90 8.08
Japan 128
21 18 7.77 8.01
Turkey
71 45 42 4.77 5.61
Using Figure 11 below, we examine a migration from fixed voice communication to
mobile voice communication.

56,86
45,8949,17
26,30
91,39
59,80
79,3973,97 70,4068,35
20,30
66,59
10,43
25,24
1,40
17,46
0,0010,0020,0030,0040,0050,0060,0070,0080,0090,00
100,00
Turkey Korea (Rep. of) Japan Australia
Telephone main lines Mobile subscribersInternet users Broadband subscriber lines
Figure 11. ICT Market Indicators (Subscribers per 100 Inhabitants), 2005
In all four countries, mobile communication has overtaken fixed communication in
terms of number of subscribers, as the number of mobile subscribers is greater than the
number of fixed subscribers. This may be result of low cost of mobile communication,
rise in the broadband subscriptions, and previous achievement of fixed-line saturation.
Countries do not share similar demographics, due to this, mobile penetrations show
differences among countries. For instance, Australia has a mobile penetration rate of
92% because of the concentration of the population within the urban areas. However,
Turkey's cellular market is not as fully penetrated as Asia Pasific region. Turkish
citizens often own more than one SIM card, thus distorting true penetration statistics.
Tables 5 and Table 6 provide a comparison of countries for voice communications and
data communications respectively. The use of data services as alternative means of
communication is widespread in many parts of the Asia Pacific region.
75

76
More than half of Turkey’s population is under the age of 24, therefore young
population of Turkey, increases the number of SMS messages. In South Korea, the
move to data services has been fueled by the country’s advancements in
communication technology. The availability of 3G network services and their upgrade
with HSDPA to provide a high speed connection makes data communication relatively
easy to deploy. Mobile gaming, music, video, mobile banking and commerce are but a
few of the services embraced by consumers. In South Korea, as in Turkey, SMS is not
the preferred means of communication. However, it is popular amongst the teenage
groups.
Table 4. Analysis - Comparison of Voice Communications Country Fixed-Line Mobile Turkey • Demand has been declining since
2002. • No 3G licenses. • 3G licences are on the Turkey’s
2007 agenda. Japan • Demand has been declining since
2000. • Digital mobile communication; • Using 3G and PHS across
various interfaces. Australia • Close to saturation;
• Universal service obligation; • Market is dominated by Telstra
which was 51.8% government owned until November 2006
• Close to saturation; • Expected to surpass 100% by
2008; • Major contributor to the
economy. South Korea • At a saturation point;
• • 2G and 3G available; • Home to global giants in handset
manufacturing; • Operators’ strategy relies on
content provision.
Internet subscribers are prefering broadband over dial-up. Among the four countries
examined, South Korea, and Japan are all in a good position to supply the
infrastructure necessary to support these services. Turkey still needs to work on its
infrastructure and regulations. Australia has plans to for a upgrade to its network
which will facilitate in the provision of broadband and its related services. In addition
to this, Australia is unique among the countries examined in that it is in a position
where the incumbent, Telstra, controls the infrastructure necessary for the provision of

77
services. This means other operators must have access to Telstra’s network in order to
provide competing service.
Table 5. Analysis - Comparison of Data Communications Country SMS Broadband VoIP Turkey • High usage, especially
young aged users prefer SMS messaging.
• Available over ADSL, however still very low compared to other countries.
• Twelve companies have obtained licenses from Turk Telekom.
• There is need for regulation.
Japan • Low usage; • Preference for other data
applications
• Available over ADSL, CATV, W-LAN and FTTH;
• FTTH experiencing a steady rise as the infrastructure of the future.
• Three types in existence according to quality of service;
• 13 operators who provide the best quality service.
Australia • A major source of growth within the telecommunications market;
• Initially linked to media such as TV programming.
• $3 billion network upgrade planned;
• Telstra controls the network;
• Dial-up customers exceeded broadband customers until 2006.
• Government feels that no regulation change need to accommodate VoIP;
• Legislation may be created to remove barriers from market entry.
South Korea • Common with teenagers;
• Inexpensive.
• Available over various technologies
• ADSL, VDSL, CATV, FTTH;
• Fast and inexpensive.
• Recognizes three types of VoIP services;
• Separate numbering plan.
Among these four countries, all have opened their market to VoIP in some manner,
although in Turkey, firms are only permitted to do VoIP within their company
structure, despite their location in Turkey. Japan categorizes and regulates services
based on their quality. South Korea, adopts a similar approach like Japan. Australia, on
the other hand, views VoIP not much differently than traditional telephony and has
chosen to focus on developing a regulatory framework based in consumer protection
and emergency.
Table 6. Analysis - Comparison of Strategies and Consumer Demands Country Government Strategy Operator Strategy Consumer Demand Turkey • Centralised approach;
• Goal of transforming • Operators such as
Turkcell aims to become • Willing to adopt new
technologies, due to

78
Table 6. (Cont.) • into an information
society and closing the digital divide;
• Full liberalization and effective regulation of the market are expected to attract foreign investments into the sector;
• As a part of the EU convergence, e- Transformation Turkey in 2003 and e-gov projects are being implemented.
• a regional player and established partnerships;
• GSM operators are waiting for the 3G licence tender.
• Vodafone and AVEA, aims to expand their market share, and to create a more competive market by reducing prices and launching new services.
• young and dynamic population.
• More than half of the population is under the age of 24.
Japan • The u-Japan program which is move towards the convergence of communication broadcasting and consumer electronics into a single network.
• Expand market power or move into new markets by merging with or acquiring another operator(s).
• Technology savvy; • Willing to adopt new
technologies.
Australia
• Slow regulatory reaction;
• Attempting to apply existing regulatory framework and only making changes as deemed necessary;
• Emphasis on industry self-regulation.
• Access to Telstra’s fixed network is key;
• Value-added services. •
• Willing to adopt new technologies if they are cost effective.
South Korea • Broadband Converged Network (BCN), executed in three phases, to be completed in 2010;
• First mover in the creation of infrastructure.
• Operators positioned to provide more than voice services as total solutions providers;
• Pilot project for IPTV allowed by KBC and MIC.
• Very technology savvy;
• Willing to adopt new technologies.
3.7 Discussions and Justifications
We already analyzed Turkey’s current position in terms of m-gov. In this section, we
will try to determine the critical success factors from our comparison of country cases,
and try to find answer to the question: What are the odds for Turkey’s success in m-
gov?

79
In the world, there are 41 different manufacturers that produce 355 different 3G model
mobile phones. On the other side, there are 19 different types of 3G mobile phones,
and at least 750 thousand 3G device users. According to GSM operators in Turkey,
this number is expected to be increase in time. Most importantly, 3G technology is full
compatible with GSM, in other words, all 3G mobile phones support GSM.
Currently, Turkey’s mobile penetration rate is officially at 70 per cent. However
Turkish citizens have the habit of switching SIM cards quite often and owning more
than one, thus distorting true penetration statistics. On that basis, it is possible to say
that the official penetration rate of 70 per cent, is actually lower. When Turkey's
cellular market compared to Japan, South Korea, Australia and other Western Europe
countries, penetration rates are low and not fully saturated.
Turkey is the only country that doesn’t have 3G licences among the European member
or candidate countries. Mobile operators in Turkey are aware of the upcoming 3G
market. However it seems that Turkcell is the only one of the three whose network is
anywhere near ready to launch 3G services. It is for sure that, 3G will bring
innovative services to subsribers, such as the provision of e-gov services by mobile
phones. With access to high speed Internet via mobile handsets, the subscriber base is
expected to be grow. This is possible because third generation technologies will be
offered at cheaper rates than GPRS. For customers in rural areas who cannot access
ADSL lines, mobile services means a gateway to knowledge. Turkey's traditional
digital divide could soon be closed.
Recently, Turkey’s one of most successful projects in 2006 has been ‘Turkcell-im’,
which brings together more than 100 services available online or via SMS. For
instance, in 1999, Japan’s NTT DoCoMo launched its famous Internet connection
service for mobile phones, ‘i-mode’. This was the most popular service among other
services in Japan, and attracted millions of new subscribers. This made mobile
Internet, the most popular Internet access technology in Japan. The factors that

80
contribute to the success of this service of mobile networks for Internet access in Japan
increases the chance that Turkey would be successful with a similar approach. Let us
examine these factors: low PC and Internet penetration, but high mobile penetration,
which is similar to Turkey. Another factor is that there is large number of long-
distance commuters using public transport. This pushes citizens to use mobile devices
in public transport due to long distances. In Turkey, major of the citizens in big cities
are using public transportation vehicles to reach their homes. In Istanbul and Ankara,
citizens use metro and public bus to reach their homes in long distances. Mobile
devices can be great alternative way to ensure pleasant time to citizens. Lastly, young
users compose the largest proportion of ‘i-mode’ in Japan. Similarly, Turkey has a
young and dynamic population that easily adapts to new technologies. More than half
of Turkey’s population is under the age of 24. These factors show us that mobile
phone may be very popular internet access technology as like Japan, and ‘Turkcell-im’
may play a major role in achieving this approach.
3.8 Defining Critical Success Factors and Strategies for Turkey
Japanese government implemented “e-Japan Strategy” in 2001. Main objective of this
strategy was making Japan the most advanced IT country in the world within five
years. Accordingly, the government foster the private sector through mechanisms such
as effective IT policies, tax incentives and deregulation. This created an innovative and
efficient environment for operators in Japan. Right regulatory environment, made
operators to invest hugely in infrastructure deployment and have made strategic moves
using mergers and acquisitions. With the support of the government, operators made
mobile Internet services an integral part of mobile phone ownership. This let
phenomenal growth in usage and subscribers. Now, in long term, they’re aiming to
create “ubiquitous network society”, achievement is also known as “Ubiquitous Net
Japan (u-Japan)”. This society will enable to connect to the network “anytime” (24
hours day or night), “anywhere” (at work, at home, in the city, in the country, or on the

81
move), with “anything” (home appliances, individual items, cars, food products), and
by “anyone” (adults or children, elderly or handicapped).
The South Korean government strategy was launching an information technology (IT)
training program for its citizens. Program success was more than anticipated. The
results of this program made a majority of the citizen technology savvy and more
likely to use IT and contribute to the information economy. Besides, government kept
intimate relationship with equipment manufacturers, and the mobile communication
operators. Combining this relationship with strategies standards, policies, and
business models was another success of South Korea government. Government also
promote the purchase of the mobile devices, by regulating the prices. Moreover,
connection speed for broadband is a priority for the Korean government which
believes it is important for the deployment of converged services. The government has
set out policies to facilitate the efficient use of existing infrastructure and the
innovation of new infrastructure.
The Australian government strategy was to create open competion. In July 1997, with
the Telecommunications Act 1997, self-regulation within the industry was encouraged.
As a result of liberalization and small amount of regulation, competition in the market
is highly developed. Australia followed similar policy that Japan and South Korea
applied regarding relationships with private industry.
Turkey launched e-Transformation Turkey 2005 Action Plan. Twenty three (23) e-gov
action items were contained in the plan’s e-gov section. The third item of this plan
explicitly states the importance of mobile technologies. The item reads, “The strategy,
which will support administrative, economic and technical steps, necessary to provide
the latest generation mobile technology services will be determined” [12]. This should
be a stimulative act for government to implement further strategies regarding m-gov.

82
Therefore, from now on, Turkish government should mention the e-gov concept along
with m-gov as they complement each other.
When evaluated together with data provided from country cases analysis earlier in this
chapter, and information derived from the literature survey, for the success of m-gov in
Turkey, government should implement actions described below:
• Firstly, the infrastructure should be improved to sufficient level for the highest
levels of data transmission possible.
• Mobile Government technologies such as, Wi-Fi, Wi-Max, and RFID
technologies should be deployed in Turkey for users to reach the information
‘anytime’ and ‘anywhere’ and minimize costs.
• Citizens technology readiness should be improved. This could be established
with the training programs such South Korea did for its citizens. Government
can adopt this model for the success.
• Organizations/governments should evaluate technology readiness of their
employees and accordingly, educate and train them. South Korea case can
contribute toward this end. Also IT partners could also help in training and
education.
• Organizations/governments should encourage employees’ use of
mobile/wireless devices, through incentives, both for work and personel use.
• Governments should implement the right strategies:
o Create open environment for the competition ;
o Create innovative atmospher for operators and organizations to do
R&D;
o Decrease regulations if possible;
o Keep intimate relationship with equipment manufacturers, and the
mobile communication operators;
o Build balance between citizens, operators and manufacturers;
83
o Foster the private sector through mechanisms such as effective IT
policies and tax incentives;
o Develop policies to make mobile Internet services an significant of
citizens’ lives.
o Educate and train their employees;
o Educate citizens.
• Specify barriers and act accordingly. For instance, make mobile
communication more secure and reliable;
• Integrate e-gov projects with mobile devices if possible, for instance integrate
e-gov Portal (e-Devlet Kapisi) with mobile devices;
• Improve research and development regarding mobile technology;
• Implement actions according to Prescriptive Matrix which is described earlier.
3.9 Designing a Strategical Plan Model for M-Government
Sandy and McMillan [61] developed a Success Factors Model to assist those in
planning and implementing m-gov services. This model included the factors that
ensure the benefits claimed for m-gov will be realized. We modified this model with
the support of comprehensive review of the literature, including government sites
worldwide.
In the previous section, we defined the critical success factors for Turkey in the light of
the four country case studies and based on our literature review. In addition to CSF
(Critical Success Factors), we added Drivers and Barriers component to our model. In
the literature, Kuscu, Kushchu and Yu [20] defined Drivers and Barriers in the
transition from e-gov to m-gov. Archer [62] described the Drivers and Barriers of
mobile e-health applications. Moreover, Pagani and Pasinetti [55] discussed Drivers
and Barriers in the development of t-government (Transformational Government)
services.
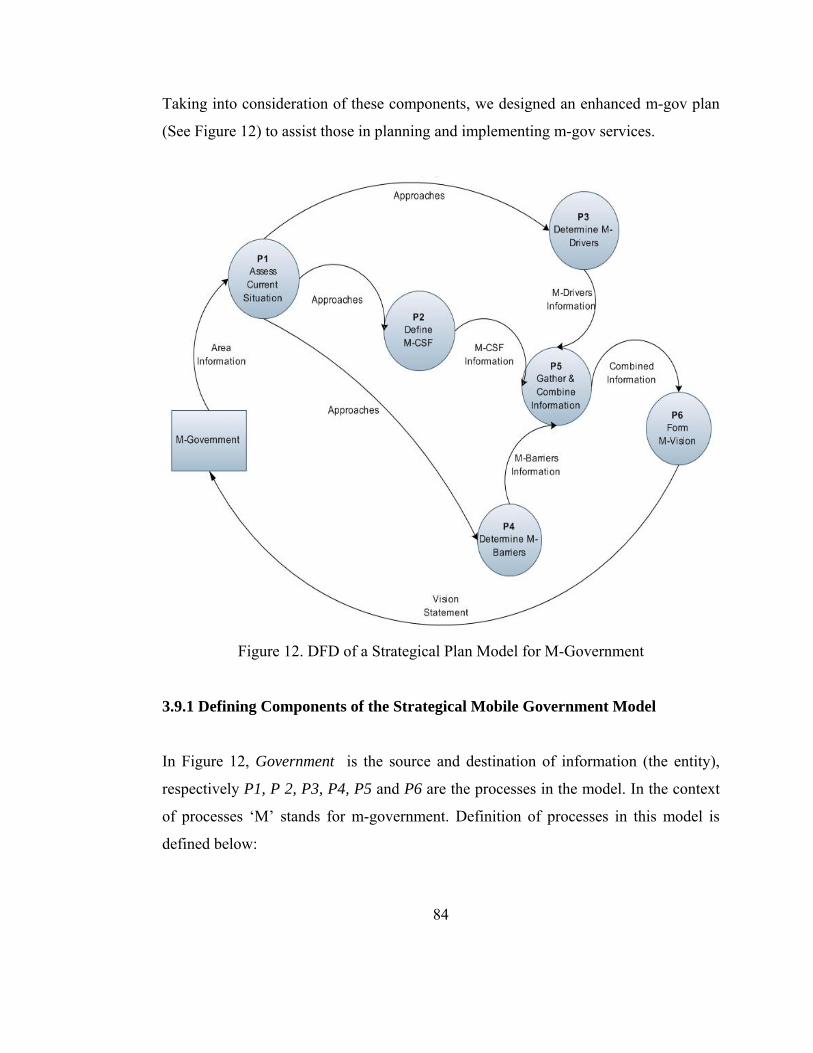
Taking into consideration of these components, we designed an enhanced m-gov plan
(See Figure 12) to assist those in planning and implementing m-gov services.
Figure 12. DFD of a Strategical Plan Model for M-Government
3.9.1 Defining Components of the Strategical Mobile Government Model
In Figure 12, Government is the source and destination of information (the entity),
respectively P1, P 2, P3, P4, P5 and P6 are the processes in the model. In the context
of processes ‘M’ stands for m-government. Definition of processes in this model is
defined below:
84

85
P1:Assess Current Situation: Understanding their current situation assessment is
vital for government to identify the approaches needed to drive success. In this
process, governments should consider areas presented below:
• Citizens/Mobile Subscribers: Citizens’ current and future needs, their adoption
of the wireless/mobile technology, their perceptions toward
governments/operators performance and services.
• Government workers: Their adoption of the wireless/mobile technology, their
perception of the government, measurement of wireless/mobile technology
over their effectiveness.
• Telecommunication industry trends: Recent developments and shifts in the
industry, forecasting future industry shifts.
• Countries: Comparison with other countries, their recent and anticipated
initiatives.
• Operator performance trends: Operators performance in the market, marketing
and R&D.
• Recent goals and initiatives: Government assessment of their recent initiatives,
implementations and projects.
P2:Define M-Critical Success Factors: Government approach toward Critical
Success Factors is significant to achieve the goals. These conditions include
strategies, regulations, policies, standarts, business models, and relationships with
private operators/organizations/citizens.
P3:Determine M-Drivers: Government approach toward M-Drivers is significant in
the development of m-gov infrastructure, mobile convergence, and emergence of new
services and applications.

86
P3:Determine M-Barriers: On the other side, government approach toward M-
Barriers is crucial in addressing series of challenges. Governments must overcome
those challenges to achieve its strategic direction. M-Drivers and M-Barriers will be
discussed in particular in the next chapter.
P5: Gather and Combine Information: All the information from P2, P3 and P4 is
Gathered and Combined to form M-Vision.
P6: Form M-Vision: The information gathered from P5 is combined with the
understanding of future trends to develop the vision statement. M-Vision is the
government’s preferred picture of the future in the context of m-government. Vision
phase includes the mission and goals statement. While the mission defines as “what the
government does, for whom, and the benefit”, the vision displays what the future will
look like if the government achieves its mission.
• Mission: the overall purpose of the government (i.e., what the government
does, for whom it does it, and the benefit)
• Goals: the long-term aims that define accomplishment of the mission.
3.9.2 Conclusion
So far, we have determined the Critical Success Factors in the model for Turkey. In the
next chapter, we’ll identify the most significant M-Drivers and M-Barriers in Turkey.

87
CHAPTER 4
A CASE STUDY: DETERMINING M-DRIVERS AND M-BARRIERS FOR
TURKEY
4.1 Introduction
Main purpose of this survey is to identify the most significant m-drivers and m-barriers
in order to provide some guiding lines in the design of a successful strategic action
plan model for mobile government in Turkey. Besides, we investigate the impact of
demographic factors on selected drivers and barriers.
To achieve our purpose, we conducted a quantitative analysis through a total of 238
completed survey questionnaires. The respondents were IT professionals from major
government and private sector organizations who were the attendees of the meeting on
issues in the use of IT in organizations, organized by the Informatics Associations of
Turkey (IAT). The sample was chosen intentionally for a reason. IT-oriented people
are more likely to be part of the “lead-user” segment of wireless device users, and it
was important to establish the relationships at their level rather than citizens level [35].
Before our analysis and discussions, let us review the literature regarding the
definitions of our driver and barrier factors.

Figure 13 details the guiding framework adopted in this study:
88
M-DRIVERS
Drivers and Barriers Influencing the
Design of a Mobile Government Mobile Communication
Mobile Infrastructure
Figure 13. Guiding framework
4.2 Review and Definitions
Reviews and definitions of dependent factors can be seen below (See A-Table 1 in
Appendix-A):
The dependent variables were categorized into two divisions as follows:
M-Drivers
• Mobile device penetration and increasing mobile/wireless
communication device usage
• Increasing mobile infrastructure
• Move towards 3G service applications
M-Barriers
• Mobile Government Challenges
Quantitative survey
238 IT-Oriented People
M-BARRIERS Demograhic Factors Affecting
the Drivers and Barriers
Mobile Challenges

89
Mobile device penetration and increasing mobile/wireless communication device
usage
The high mobile phone penetration rate will put serious pressure on mobile
government implementations. Today, mobile phones are not only used only for
voice communication purposes but also used to connect to the Internet for
transferring data, exchanging e-mails, and doing small scale business transactions
[6].
Increasing mobile infrastructure
Infrastructure can be both “physical” and “soft”. Technology, equipment (mobile
devices), and network (wired/wireless) required to implement m-gov are considered
as the physical infrastructure. On the other side, soft infrastructures refers to the
institutional arrangements, and software that make m-gov transactions possible.
Increasing mobile infrastructure will influence the new and existing e-gov efforts
and support in adopting mobile applications and services [55].
Move towards 3G Service Applications
The services include personalisation, location based services and context aware
applications. With reference to the potential field of application we consider nine main
areas of content :
• Local taxation: Information channel for local residents, payment of
house taxes, income taxes, etc.
• Personal Data: Request/renewal of documents, certificates, change of
place of residence.
• Postal Services: Postal notification service, etc.

90
• Education: Application forms, payment of school taxes, test results,
academic status, courses.
• Banking and Finance: Stock exchange, fund exchange, banking
services
• Security: Crisis information channel, emergency services
• Health: Reservation of hospital visits, monitoring vital parameters.
• Tourism: Information channel for tourists, hotel reservations
• Social Security: Pension information systems
Challenges for M-Government
At the implementation phase of mobile government, there will be a series of
challenges. As we discussed in previous chapters that mobile government applications
will be complementary to the e-gov activities. Therefore, some of the typical
challenges encountered by e-gov are naturally shared by the m-gov efforts. The
challenges and their definitions can be seen below [6]:
• Lack of technological infrastructure: Increasing mobile infrastructure
can be considered as a force in adopting mobile government activities,
however lack of an essential infrastructure refers to be a challenge for
mobile government.
• Low credit card penetration: In developing countries, the number of
persons with credit cards is too small when compared to the number of
potential users for m-gov transactions.
• Security and privacy gaps: Citizens have concerns about sending their
credit card information over the mobile and wireless devices. Also they
do not want their mobile phone numbers to be traced by the
government.
91
• Insufficient number of its users: Citizen participation depending on
socio-economic factors will play an important role in the success of
mobile government.
• Citizen adaptation process: Especially in the rural areas of developing
countries, citizens adaptation to the mobile and wireless aplications and
services is an another important factor to be successfull in mobile
government.
• Problems with laws and political process: There is no clear legal status
for mobile applications, no regulations and laws for online fillings,
online signings, and on online taxable transactions. In some countries,
slow bureaucratic process is also a challenge in implementation
processes.
• Compatibility of the mobile systems with the existing e-gov systems: It
may not be easy to integrate both systems in terms of functionalities
and data administration.
4.3 Hypotheses
We use a systematic and exploratory analysis approach to investigate the impact of
demographic factors on selected mobile government driver and barrier factors. The
demographic factors refer as independent variables and the selected drivers and
barriers refer as depependent variables. Each empirical factor were extracted based on
prior literature, and the corresponding hypotheses were made according to similar
researches on demographic factors.
4.3.1 Personal attitudes towards Mobile Government Drivers
The attitudes and behaviors of individuals are influenced by factors such as gender,
age, type of education, occupation and experience. Mobile/wireless devices and

92
technlogy take a significant place in our daily and business life. Their usage may
differ according to demographic factors [56]. There are many studies related to
communication device usage and acceptance of mobile technology. Literature
provides some studies including different respondent groups. For instance, Hung,
Yang, Hsiao and Yang [57] used students in their study on acceptance and use of
mobile services, while in an another study, Han [58] has examined physicians’
acceptance of mobile technology . In our case, we analyze IT-oriented people.
Moreover, impact of demographic factors on adoption decisions and willingness to
adopt technologies in general is very little known [58-60]. Also, recent literatures
[60] emphasize that consumers’ factors that influence adoption decisions and value
perceptions relating to m-Technology are not well researched. Following this line of
reasoning, the present study explores the impact of demographic factors in relation
to attitudes towards the m-gov. The present study therefore proposes the following
hypothesis.
H1. Demographic parameters have impact on the “mobile penetration and
communication device usage.”
To be successful in mobile government, one of the requirements is to have the
essential information technology infrastructure. The impact of demographic factors on
the effect of the type of infrastructure is an area which has not been studied yet and our
second hypothesis is therefore:
H2. Demographic parameters have impact on the “Types of mobile infrastructure”.
Another driving force of mobile government is the attitude towards 3G Service
applications. Based on prior literature, we consider nine main areas of the potential
field of applications. Besides, the literature provides some evidences for the
relationship between demographic factors and applications. Further, m-gov
applications and services are in a competition with alternative applications, services,

93
and channels. Consequently, the existence of alternative applications and services, put
consumers in a multiple-choice situation, and this needs to be considered [37]. So, we
propose the following hypothesis:
H3. Demographic parameters have impact on the “mobile government applications”.
4.3.2 Personal attitudes towards Mobile Government Barriers
Besides driving forces, there are also key barriers to mobile government deployment.
The impact of demographic factors on the mobile government challenges is an another
area which has not been studied yet, however there is a empirical evidence indicating
that perceived barriers are more significant determinants of adoption decisions than the
users’ perceptions of the benefits associated with the technology [60] and our last
hypothesis is therefore:
H4. Demographic parameters have impact on the “mobile government challenges”.
4.3.3 Research Design
In terms of the composition of the respondents, our sample is biased toward the more
educated and more IT-oriented people. The sample was chosen intentionally for a
reason. IT-oriented people are more likely to be part of the “lead-user” segment of
wireless device users, and it was important to establish the relationships at their level
rather than citizens level [3].
Each respondent was asked to evaluate the importance of each attribute through a five
point Likert scale. According to this, all items were measured on a 5-point scale
ranging from strongly agree (5) to strongly disagree (1), with (3) being neutral. The
items were developed based on related literature studies. The reliability of the
multiple-item scales is high as coefficient alpha value accepted as 0.95. The survey
94
instrument included information on whether the respondent owned wireless devices
such as cellular phones, laptops, PDAs, wired, and wireless access to the Internet.
Gender, age, education information, and work experience (years) along with career
information were also examined as they are excepted as independent variables [3].
In the survey instrument, we included items that measured (Please see A-Table 1 in
Appendix-A):
(1) current usage of mobile/wireless/wired Technologies;
(2) respondent perceptions of Turkey’s current infrastructure;
(3) their willingness toward potential m-gov applications;
(4) their attitudes toward challenges for m-gov.
In this study, SPSS software system was used for statistical analyses. It allowed us for
in-depth data access and preparation. First of all, we compare the mean of one or more
groups based on one independent variable (or factor) by using the One-Way ANOVA
as you can see in Table 2-3-4-5 in Appendix-B. In the discussion section, important
findings will be supported by the Pearson Chi-Square test. This test suggest that
whether two variables are independent or not. Suggestions are made according to the
significance of the Pearson Chi-Square test. If it is above our usual cut-off point of
0.05, then two variables are not related.
4.4 Results
4.4.1 Descriptive Results
4.4.1.1 Respondent Information
In all, 238 IT-oriented people, half of whom were IT employee from different
departments of governments, about 39 percent were IT managers and 9 percent were

IT-oriented academicians participated in the survey. Based on the DELAYs to the
demographic questions, approximately 71 percent of the respondents were male and 29
percent were female. About 16 percent were between the ages of 18 and 33, 70 percent
between 34 and 49, and 14 percent were higher than 50. In terms of education, 10
percent had postgraduate degrees, 32 percent had graduate degrees, 58 percent had
undergraduate degrees. Consequently, in terms of work experience, 15 percent of the
respondents had worked 1 to 10 years, 69 percent had worked 11 to 20 years, and 16
percent had worked more than 20 years. Respondent information may be followed
from Figure 13.
95
71%29%
16%70%
14%
58%32%
10%
52%9%
39%
15%69%
16%
0% 10% 20% 30% 40% 50% 60% 70% 80%
MaleFemale
Age<3434-49
Age>49
UndergraduaGraduate
Postgraduat
IT-PersonnelAcademician
IT-Manager
1-1011-20
20+
Figure 14. Demographic Factors

4.4.1.2 Mobile device penetration and increasing communication device usage
Communication device easiness
Most of the respondents (%58) say mobile phones are easy to use rather than other
communication devices.
58
30,3
6,3 5,4
0
10
20
30
40
50
60
Mobile Phone Laptop Desktop Handheld
Figure 15. Communication Devices-1
This result is very normal due to mobile phones having a unique and simple interface,
and less functionalities compared to computer.
Preferred mobile communication channel
Majority prefers e-mail rather than SMS in the terms of communication channel. This
result is due to SMS giving the possibility to receive and send text messages with
maximum volume of 160 digital alphabetic symbols. In spite of this poor attribute,
SMS still have some advantages; unlike an e-mail, SMS is much more likely to be read
by a person at any one time, since the majority of people have their mobile phones at
arms reach 24 hours a day.
96

37%
63%
SMS
Figure 16. Mobile Communication Channel
Preferred mobile/wireless communication device for connecting internet
Generality of participants (%51), prefer laptop computers for connecting internet.
Mobile phones and handheld computers seem not to be an altenative communication
device for connecting internet but seem to be a complementary device to laptop
computers.
2%
50%
24%
1%
11%9% 3%
Mobile Phone
Laptop
Mobile Phone &Laptop
Mobile Phone &PDA
Laptop & PDA
Mobile Phone,Laptop & PDA
None
Figure 17. Communication Devices-2
97

People are unwilling to use these devices to connect to internet because of their
limitations in display size, information processing capabilities and information
transmission capabilities [35]. According to the results of Turkey’s State Institute of
Statistics (TUIK) ICT Usage Survey on Households and Individuals carried out in
June 2005, availability of mobile phone devices in households is 73 percent, however
only 37 percent of households prefer mobile phone over narrowband (WAP, GPRS,
etc.) access to the Internet at home [8]. This implies, usage of WAP services are not
positively correlated with mobil penetration, due to high communication charges and
low communication speeds.
Communication type at home
Half of the respondents (%49) prefer wired connections at home. Wireless connection
(%20) seems to be a complementary connection (%28) to wired connection. According
to the results of ICT Usage Survey on Households and Individual [8], proportion of
people having internet connection at home is 28 percent, which is low when compared
with connection at place of work with 43 percent.
49%
20%
28%
3%
Wired
Wireless
Wired & Wireless
None
Figure 18. Communication Type
98

4.4.1.3 Mobile Government Infrastructure Types
This part of the survey tests which part of the Turkey’s mobile government
infrastructure is strong in the development of m-gov services. As seen in Figure 18, the
respondents scored significantly high on the technology infrastructure (mean = 4.25)
and high on the software (mean = 3.89). As we discussed in country cases, Turkey’s
GSM operators seem to have the essential technologic infrastructure to implement and
deploy mobile government applications, therefore this score (mean = 4.25) supports
this opinion.
4,253,84 3,55
2,69
3,89
0,00
1,00
2,00
3,00
4,00
5,00
Technology Equipment Network InstitutionalArrangement
Software
Figure 19. Infrastructure Types
Respondents as a group agree Turkey’s infrastructure (general mean: 3.64) generally is
ready for the mobile applications and 3G services, however interestingly they scored
low on the institutional arragements. According to these scores, respondents think that
Turkey have to improve its soft infrastructure which refer to its institutional
arrangements (mean = 2.69). This result is usual due to mistrust to goverment
institutions in collaborating with private institutions. With reference to the
developments of e-gov in Turkey, respondents think that m-gov developments will be
slow as e-gov developments.
99

4.4.1.4 Willingness to use M-Government services
Respondents were asked to indicate most preferred services to recognize in the future.
The most preferred mobile government services are Health (mean: 4.65), Personal
Data (mean: 4.37), Security (mean: 4.28) and Social Security (mean: 4,27) as seen in
Figure 19.
4,064,37
3,34
3,97
3,55
4,284,65
3,54
4,27
0,00
0,50
1,00
1,50
2,00
2,50
3,00
3,50
4,00
4,50
5,00
LocalTaxation
PersonalData
PostalServices
Education Banking &Finance
Security Health Tourism SocialSecurity
Figure 20. Preferred Mobile Government Services
A deeper analysis which considers also the age of respondents will be made in further
discussions. Preferred services by age of respondents may also be seen in A-Figure 4
in Appendix-C.
100

4.4.1.5 Challenges for M-Government
Respondents were asked to indicate the most important challenges that stand in the
front of mobile government development in Turkey. As seen in Figure 20,
respondents evaluated Problems with laws and political process (POLITICS) with the
highest score (mean: 4.10) and Security and privacy gaps (SECURITY) with the
second highest score (mean: 4.03). According to these scores, respondents do not trust
the Turkish politics and bureaucratic system. Also, they do not consider it safe giving
out a credit cart number on a wireless/mobile device due to wireless/mobile devives
having significant security risks as compared with using wired devices [35].
2,893,13
4,03
3,213,45
4,10
3,34
0,00
0,50
1,00
1,50
2,00
2,50
3,00
3,50
4,00
4,50
TECH CREDIT SECURITY USERS ADAPT POLITICS COMP
Figure 21. Mobile Government Challenges
Respondents do not consider Lack of technological infrastructure (TECH) as a threat
(mean: 2.89) in the development of mobile government. This result makes sense due to
the respondents attitude towards Technology infrastructure (upper section, mean:
4.29).
101

102
4.4.2 Test Results
Appendix-B presents the summary of the ANOVA test results alternately in A-Table 2,
A-Table 3, A-Table 4, and A-Table 5.
4.4.2.1 Personal attitudes towards Mobile Government Drivers
The examination of p-values in A-Table 3 indicated that there is no sufficient evidence
to accept H2ij (i=1,2,…,5) (j=1,2,…,5). This means that demographic factors do not
have any impact on Mobile Government Infrastructure Types. Besides, it can also be
observed from the A-Table 2 that, except for hypotheses H112 (p-value: 0,018) and
H132 (p-value: 0,023), all the remaining ones were not supported by the survey results.
In other words, Age has significant impact on the Communication Device Easiness and
Mobile/wireless communication device for connecting internet. Moreover, the first
column of A-Table 4 shows that, H311 (p-value: 0,039) and H351 (p-value: 0,033) were
found to be significant at 5 percent significance level in this category. This means that
gender has significant impact on Local Taxation and Banking & Finance. On the other
hand, the second column in A-Table 4 indicates that, H342 (p-value: 0,040), H372 (p-
value: 0,028) and H392 (p-value: 0,034) are found to be significant. This may also
interpreted as age having significant impact on the Education, Health and Social
Security.
4.4.2.2 Personal attitudes towards Mobile Government Barriers
The inspection of the A-Table 5 indicated that there is sufficient evidence to accept
H431 (p-value: 0,017) and H464 (p-value: 0,028) This concludes that gender factor has
significant impact on the Security and Privacy Gap, and occupation factor has
significant impact on Problems with Laws and Political Process.

103
4.5 Discussions
4.5.1 Gender
Present study results indicate that gender has significant impact on some of the driving
factors as seen on A-Table 2-3-4-5. From the tables, we see that gender has significant
impact on “communication device easiness” (A-Table 2: H111). However this
difference between genders was not found to be statistically significant in terms of
“communication device easiness” (χ2 = 1.74, df = 1, p-value = 0.184).
Our study also indicates that, gender has significant impact on the some of the
preferred mobile government services to be seen in future. Male respondents are more
likely to prefer “local taxation” (mean: 4.17) (A-Table 4: H311) and, “banking &
finance” (mean: 3.69) (A-Table 4: H351) services than female respondents (mean: 3.80
and mean: 3.17) as seen in Figure 11. Our explanation of this result may be that,
majority workers in these fields are men in Turkey. This finding was also supported by
the χ2 test results (χ2 = 20.862, df = 4, p-value = 0.041 / χ2 = 14.083, df = 4, p-value =
0.007) that there is significant relationship between gender and “local taxation” and,
“banking & finance” 3G service applications services.
Another implication is that gender also affects “security and privacy” (A-Table 5:
H431) challenge. Female respondents (mean: 4.27) are more fragile in this issue as well
than male respondents (mean: 3.93). However, this finding is not supported by the χ2
test results (χ2 = 7.59, df = 3, p-value = 0.055), that there is not significant relationship
between gender and “security and privacy” challenge.
For in-depth analysis graphics of gender, see A-Figure 1 and A-Figure 2 in Appendix-
C.

104
4.5.2 Age
The test results indicated that age has significant impact on specific factors as seen in
Anova Tables. Younger people find mobile phone easier than older people that in
general, the percentage of the younger group of IT professionals that finds mobile
phones easy to use (19%) is higher than the older ones (11%). Also younger group
mostly prefers mobile phones and PDAs to connect internet (%38) than older group
(%22). The χ2 test results (χ2 = 20.862, df = 4, p-value = 0.041 / = 14.083, df = 4, p-
value = 0.007) also showed that the “communication device easiness” and
“mobile/wireless communication device for connecting internet” variables changes
significantly with the age of respondents.
In the terms of 3G mobile application services, age has impact on “education” (A-
Table 4: H342) and “social security” (A-Table 4: H392) as seen in Anova Tables.
Younger aged group of respondents (mean: 4.28) are more willing to see “education”
services than older aged group (mean: 3.42) as seen in Figure 13. This finding was also
supported by the χ2 test results (χ2 = 20.830, df = 4, p-value = 0.008) that there is
significant relationship between age and “education”. Secondly, age has impact on
“social security” as seen in Figure 13, however, it is interesting to note that the
relationship between age and the reason for “social security” was not found to be
significant (χ2 = 11.643, df = 8, p-value = 0.168). For in-depth analysis graphics of
age, see A-Figure 2 and A-Figure 3 in Appendix-C.
4.5.3 Education
Surprisingly, we have investigated that education has no significant impact on none of
our dependent factors as seen in Anova Tables (See the tables in Appendix-B). We did
not find a strong relationship between these factors. For our finding explanation may
be that most of the respondents included in the survey have similar educational level.
105
4.5.4 Occupation
In the terms of their perceptions of driving forces, our test results indicated that
occupation has significant impact on type of infrastructures: “Institutional
Arrangements” (A-Table 3: H244). Mostly IT managers (mean: 2.42) perceive
“Institutional Arrangements” as weak property of Turkish mobile infrastructure rather
than other respondent groups (mean. 2.90). Cause of this outcome may be of managers
being more directly related with arrangement phases of projects in institutions. This
finding was also supported by the χ2 test results (χ2 = 15.244, df = 6, p-value = 0.048)
that there is significant relationship between occupation and the “Institutional
Arrangements”.
Another important finding is that, occupation has significant impact on one of the
mobile government challenges: “Problems with law and political process” (A-Table
5: H464). IT managers (mean: 4.28) perceive political process as more challenging
factor while other group of respondents (mean: 3.85) perceive it less challenging. Our
explanation of this result is similarly to prior outcome that IT managers being more
directly related with political processes in an organization. χ2 test results (χ2 = 30.365,
df = 6, p-value = 0.000) also support our finding.
4.5.5 Years of Experience
We observed that years of experience have affect on “Compatibility of the mobile
systems with the existing e-gov systems” (A-Table 5: H475) and “Social Security” (A-
Table 4: H395) as seen in Anova Tables, however according to χ2 test results (χ2 =
12.908, df = 8, p-value = 0.115 / χ2 = 14.290, df = 8, p-value = 0.058) there were no
significant association for mobile government driver and barrier factors in this
category.

106
4.6 Conclusions
Purpose of this survey was to examine most significant drivers and barriers of the
mobile government and impact of demographic factors on these driving and
challenging factors among IT-oriented respondents in Turkey.
The analysis revealed that, in terms of infrastructure, respondents as a group generally
recognize feel very positively about the mobile government infrastructure (general
mean = 3.64), however they evaluated“Institutional Arrangements” factor as weakest
infrastructure (mean: 2.69) and they recognize “Technology” (mean: 4.25) factor as
strongest infrastructure. Secondly, it emerges from this study that “Health” (mean:
4.65), “Personal Data” (mean:4.37), “Security” (mean: 4.28) and “Social Security”
(mean: 4.27) fields of m-gov are critical fields that should be primarily developed in
Turkey. Lastly, we observed that the most significant barriers to the adoption of m-gov
services will be the “Problems with laws and political process” (mean: 4.10) and
“Security and privacy gaps” (mean: 4.03).
On the other side, we observed that gender and age were the key factors for the
tendency towards selected mobile government drivers and barrier factors. Besides this,
occupation and experience were found to have an impact on some of the factors.
Interesting implication of this study was that education were not found to have an
impact on any driving and challenging factors [56].
A limitation of this study is the sample adopted in the survey of respondents refers
only to IT-oriented people, specific segments of population may be added to explore
mobile government in different prospects. For instance, questions may be modified
and GSM operators may be added as respondents to get results from different
perspectives. In the next future, this survey could be realised considering more

107
meetings in different places and may be different countries in order to compare the
impact of cultural attitude.
Mobile government driving factors such as “Technology Readiness Index” (TRI) and
“Attitudes toward Wireless Technology Adoption” were not included in this survey.
For for further research, these factors should be attached to present factors for more in-
depth analysis [35].
Finally, we propose to use larger samples which may lead to more accurate findings
for mobile government factor attitudes among IT-oriented people. Also demographic
factors such as income can be added to current factors. In addition to this, education
factor may be modified to type of university department to get different and better
results. Thus, adding sector factor such as government and private may contribute a lot
to this research for to acquire significant findings about disparity about private and
government sector and this will interest the reader in this direction [56].
108
CHAPTER 5
CONCLUSION & LIMITATIONS
Four research questions are tried to be answered in thesis as described below:
• What are the odds for Turkey’s success in m-gov?
• What are the critical success factors and other components to develop a
strategical plan model?
• What are the drivers/barriers for mobile government in Turkey?
• What are the affects of the demographic factors in the context of
drivers/barriers?
5.1 Summary
Mobile and wireless technology represents a great new transformation of the 21st
century. Governments find themselves at the center of this great transformation that
promises to deliver new technology solutions. As mobile phone penetration increases,
its application in the public sector is increasingly being viewed as inevitable. The
convergence of mobile and wireless technology has brought a whole new range of
alternative government service delivery options.

109
Another issue is also important to emphasise that m-gov affects on
organizations/governments. M-gov iniatives increase efficiency in public sector
operations and help to reduce the perceived gap between government and the public.
However, it is necessary to underline that m-gov is not a replacement for, but a
complement to, e-gov.
5.2 Contribution
Primarly, to comprehend m-gov and its concepts, we made an extensive literature
review. When the concepts regarding m-gov are better understood, we made a
comparison of four country cases, including Turkey’s case. Selection reason of these
specific Asia Pacific region countries was that countries had different characateristics
as they differ in demographic factors, government regulations and business strategies.
At the start, we analyzed countries personally based on some indicators. After
presenting indicator anaysis results, we specified each finding of that particular
country. Moreover, we accomplished a comparative country analysis, and we extracted
each comprative results into different tables to be explained compherensively. Taking
into consideration of the findings that gathered from the analysis and recent
developments in Turkey, we discussed the odds for Turkey’s success in the context m-
gov, with justifications. With the results gained from this explanation and in the light
of the literature, we identified critical success factors for Turkey. Afterwards, we
designed a strategic plan model considering developing countries, and with regards,
we clarified all the concepts alternately.
In the next section, we analyzed drivers and barriers concept, in a detailed way. This
concept was one of the components of the strategic action plan model we developed in
prior section. To analyze drivers and barriers of m-gov, we conduct a quantitative
analysis, through a total of 238 completed survey questionnaires, to IT professionals
from major government and private sector organizations. According to the literature

110
study, affects of the demographic factors was very little known, therefore we
investigate the impact of the demographic factors. To do the analysis, we implement
One-Way ANOVA to compare the mean of one or more group variables and we
support the findings with Pearson Chi-Square test.
Within our scope, the country comparison results showed that mobile technologies in
Turkey have the potential to bridge digital divide. Recent developments, market
peculiarities, and also having young population and high mobile penetration are some
of the characteristics of Turkey that justifies the possibility of its sucess in m-gov.
However, not only these characteristics are sufficient for the success, but also there are
lots of duties that Turkish government must accomplish, in order to gain success in the
development and deployment of m-gov services and application.
In brief, survey results revealed that, primarly, respondents as a group generally feel
very positively about the mobile government infrastructure (general mean of
infrastructure variables: 3.64), however they sense negatively about bureaucracy in
Turkey as they evaluated “Institutional Arrangements” factor as weakest
infrastructure (mean: 2.69). Secondly, respondents mostly prefer “Health” (mean:
4.65) services to recognize in the future as mobile service. Thirdly, very interestingly,
respondents perceive “Problems with laws and political process” (mean: 4,10) as
more challenging issue than “Security” (mean: 4,03) issue. Moreover, gender and age
were found to be the key factors for the tendency towards selected mobile government
drivers and barrier factors. Interesting implication of the survey was that education
demographic factor were not found to have an impact on any driving and challenging
factors.
5.3 Limitations
• Number of the country cases are limited to four countries;
111
• Country cases only cover, Asian Pacific region countries, except Turkey;
• In the survey of respondents refers only to IT-oriented people;
• The survey sample size is limited with number of 238 respondents. Sample size
needs to increased in order to get more accurate results;
• Demographic factors of the survey that affect drivers and barriers are limited.
5.4. Future Work
Recommendations for future research in this area are closely connected to the
limitations mentioned above.
• Thesis generally focuses m-gov from the government perspective, for more
depth analysis different perspectives can be added such as citizens’ and
operators’ perspective.
• In the context of country cases, European or other regions countries can be
examined as well.
• Specific segments of population may be added to survey to explore mobile
government in different prospects.
• Survey could be realised considering more meetings in different places and
may be in different countries in order to compare the impact of cultural attitude
• For further study, mobile government driving factors such as “Technology
Readiness Index” (TRI) and “Attitudes toward Wireless Technology Adoption”
issues can be included in the survey.
• Some adjustments can be done to demographic factors, for instance, income
can be added to current factors. Education factor may be modified to type of
university department to get different and better results. In addition to this,
sector type factor can be added, this may contribute a lot to this research for to
acquire significant findings about disparity about private and government
sector.

112
REFERENCES
[1] OECD e-Government Imperative (2003). Retrieved March 10, 2007, from http://webdomino.oecd.org/comnet/pum/egovproweb.nsf/viewhtml/index/$FILE/e_gov_project.htm
[2] Gang S. (2005) Transcending e-Government: A Case of Mobile Government in
Bejing. Retrieved April 22, 2007, from http://www.mgovworld.org/whitepapersandcasestudies/1trascending_egov.pdf
[3] Germanakos P., Samaras G., & Christodoulou E. (2005) Multi-channel Delivery of
Services The Road from eGovernment to mGovernment: Further Technological Challenges and Implications. Proceedings of the EGOV 2005 - International Conference on E-Government - Workshop Program (EGOV05), Copenhagen, August 22-26, 2005, Trauner Verlag, pp. 78-85.
[4] Europe’s Information Society, 2004, “Mobile services in eGovernment”, [online],
Retrived March 17, 2007, from http://europa.eu.int/information_society [5] Zálešák M. (2005) Overview and opportunities of mobile government Retrieved
March 17, 2007, from http://www.developmentgateway.org/download/218309/mGov.doc
[6] Kushchu, I., & Kuscu, H. (2003). From e-government to m-government: Facing
the inevitable. In the Proceeding of European Conference on E-Government (ECEG 2003), Trinity College, Dublin, July 3-4 (pp. 253-260). Reading, UK: Academic Conferences International

113
[7] Kristoffersen, S. & F. Ljungberg (2000). “Mobility: From stationary to mobile work.” Planet Internet. K.Braa, C. Sørensen and B. Dahlbom. Lund, Sweden, Studentliteratur (pp: 41-64).
[8] State Statistical Institute. (2005). Turkish Household Technology Ownership
Studies 2004 & 2005. Retrieved December 1, 2005, from http://www.die.gov.tr/TURKISH/SONIST/HHBilisim/hhbilisim.html
[9] Kristoffersen, S., J. Herstad, F. Ljungberg, F. Løbersli, J. R. Sandbakken and K.
Thoresen (1998) “Developing scenarios for Mobile CSCW,” In Proceedings of the First Workshop on Human Computer Interaction with Mobile Devices, (pp. 34-47).
[10] Kakihara, M. & C. Sørensen (2002a). “Mobility: An Extended Perspective.” 35th
Hawaii International Conference on System Sciences, Hawaii, USA. [11] Ghyasi, A. F. & Kushchu, I. (2004). m-Government: Cases of developing
countries. In D. Remenyi (Ed.), European Conference on E-Government (ECEG2004)
[12] Yildiz M. (2007) The State of Mobile Government in Turkey: Overview, Policy
Issues, and Future Prospects. In the Kushchu, I. (2007). In Mobile Government: An Emerging Direction in E Government (pp. 252-268). Hershey, PA: IGI
[13] UNDP. (2004). United Nations development programme report. Retrieved August
3, 2005, from http://hdr.undp.org/reports/global/2004/ [14] UNDP. (2005). United Nations development programme report. Retrieved January
3, 2006, from http://hdr.undp.org/reports/global/2005/pdf/HFR05 HDI.pdf [15] Suner, F. A. (2001). Bir Baglantı Koparma Aracı olarak Turkiye’de Cep Telefonu:
Kriz, Goc ve Aidiyet. Toplum ve Bilim, 90, 114-130. [16] Ozcan, Y. Z., & Kocak, A. (2003). Research note: A need or a status symbol.
European Journal of Communication, 18(2), 241-254.
114
[17] The Economist Intelligence Unit. (2005). Turkey country profile. Retrieved July 29, 2005, from http://www.eiu.com
[18] Lallana, E. C. (2004). eGovernment for development, mgovernment definition on
and models page. Retrieved January 13, 2005, from http://www.e-devexchange.org/eGov/mgovdefn.htm [5] National Electronic Commerce Coordinating Council (2005) M-Government The Convergence of Wireless Technologies and e-Government
[19] Roggenkamp, K. (2007). “It’s the Mobility, Stupid”: Designing Mobile
Government. In Mobile Government: An Emerging Direction in E Government (pp.60-85). Hershey, PA: IGI
[20] Kuscu, M.H., Kushchu, I, & Yu, B. (2007). Introducing Mobile Government. In
Mobile Government: An Emerging Direction in E Government (pp.1-11). Hershey, PA: IGI
[21] National Electronic Commerce Coordinating Council (2005) M-Government The
Convergence of Wireless Technologies and e-Government [22] Kushchu, I., Arat, S., & Borucki, C. (2007) The Impact of M-Government on
Organisations: A Mobility Response Model. In Mobile Government: An Emerging Direction in E Government (pp.134-154). Hershey, PA: IGI
[23] Yu, B., & Kushchu, I. (2004). The value of mobility for e-government. In
D.Remenyi (Ed.), European Conference on E-Government (ECEG 2004), Trinity College, Dublin, June 17-18 (pp. 887-899). Department of the Taoiseach, Dublin, Ireland; Reading, UK: Academic Conferences International.
[24] Cilingir, D., & Kushchu, I. (2004). E-government and m-government: Concurrent
leaps by Turkey. In D. Remenyi (Ed.), European Conference on E-Government (ECEG 2004), Trinity College, Dublin, June 17-18 (pp. 813-821). Department of the Taoiseach, Dublin, Ireland; Reading, UK: Academic Conferences International.

115
[25] Robillard, L. (2003). When e-government becomes simply government: Making the case for radical incrementalism in public sector governance. Speech. Crossing Boundaries Conference. Retrieved April 30, 2005, from http://www.tbs-sct.gc.ca/media/ps-dp/2003/0508_e.asp
[26] OECD. (2003b). The e government imperative. Retrieved April, 2005, from the
OECD Web site, http://www.oecd.com
[27] Capra, E., Francalanci, C. & Marinoni, C. (2007). Soft Success Factors for M-Government. In Mobile Government: An Emerging Direction in E Government (pp.106-133). Hershey, PA: IGI
[28] CEDEFOP. (2002). Non-formal learning (Press Release). Retrieved April 18, 2002, from the CEDEFOP Web site, http://www2.training village.gr/etv/nonformal/index.asp
[29] Peinel, G. Business Models for M-Government Services (2007). In Mobile
Government: An Emerging Direction in E Government (pp.86-105). Hershey, PA: IGI
[30] Peinel, G., & Rose, T. (2004). Dissemination of air quality information: Lessons
learnt in European field trials. In the Proceedings of the EnviroInfo 2004, Geneva, Switzerland, October 21-23. Retrieved from http://www.enviroinfo2004.org/cdrom/Datas/Fullpaper.htm
[31] Olmstead, P. M., Peinel, G., Tilsner, D., Abramowicz, W., Bassara, A., Filipowska
A., Wisniewski, M. & Zebrowski, P. (2007). Usability Driven Open Platform for Mobile Government (USE-ME.GOV). In Mobile Government: An Emerging Direction in E Government (pp.30-60). Hershey, PA: IGI
[32] Spencer, L. M., & Spencer, S. M. (1993). Competence at work. Model for superior
performance. New York, USA: John Wiley & Sons. [33] Leenes, R. E., & Svensson, J. (2002). Size Matters – Electronic service delivery by
municipalities? In R. Traunmüller, & K. Lenk (Eds.), Proceedings of the Electronic Government – First International Conference, EGOV 2002 (Lecture

116
Notes in Computer Science 2456), Aix-en-Provence, France, September 2-5 (pp.150-156). Springer.
[34] Kushchu, I., & Borucki, C. (2004). A mobility response model for government.
Retrieved January 15, 2005, from http://www.mgovlab.org/library/mgovlab/ mgovlab_ikcb.pdf
[35] Chang, A., & Kannan, P. (2002). Preparing for wireless and mobile technologies in
government. Arlington, VA: IBM Endowment for the Business of Government. [36] GSM Homepage (2007). Retrieved March 2007, from
http://www.gsmworld.com/index.shtml [37] Germanakos, P., Samaras, G., & Christodoulou, E. (2007) Multi-Channel Delivery
of E-Services in the Light of M-Government Challenge. In Mobile Government: An Emerging Direction in E Government (pp.292-317). Hershey, PA: IGI
[38] Coaker, B. & Deans, C. (2007) An Evaluation of U.S. City Government Wireless
Networks for Mobile Internet Access In Mobile Government: An Emerging Direction in E Government (pp.357-375). Hershey, PA: IGI
[39] Greunz, M., Schopp, B., & Haes, J. (2001). Integrating e-government
infrastructure through secure XML document containers. In the Proceeding of the 34th Hawaii International Conference on System Sciences, Hawaii, USA, January 3-6 (p. 10). IEEE.
[40] Deganutti, D., & Kolasa, M. (2003). Wireless vulnerability assessment. PWGSC
internal document. Retrieved April 2007, from http://www.pwgsc.gc.ca/acquisitions/text/ps/checklist-e.html
[41] Gort, J. (2002). Security analysis report. PWGSC internal document. Retrieved
April 2007, from http://www.pwgsc.gc.ca/acquisitions/text/ps/checklist-e.html

117
[42] Ranger, W. (2002). Wireless LAN spectrum management policy proposal. PWGSC internal document. Retrieved April 2007, from http://dsp-psd.pwgsc.gc.ca/Collection/Iu105-2004E.pdf
[43] Zálešák, M. (2003). M-government Case Studies. Retrieved January 2, 2005, from
http://www.europemedia.net/shownews.asp?ArticleID=14482 [44] Turkey now (2006): Information and Communication Technologies Retrieved
January 2, 2007, http://www.turkeynow.org/db%5cdocs%5c%5ctechnology06.doc [45] ITU - Regulatory Challenges of VoIP Telephony: Analysis for Selected South and
Eastern European Countries. Retrieved January 15, 2007, http://www.itu.int/net/home/index.aspx
[46] Economist - 2007 E-Readiness Scores Retrieved May 15, 2007, http://www-
03.ibm.com/industries/government/doc/content/bin/e-Readiness_2007.pdf [47] CIA World Factbook: Japan Retrieved January 19, 2007,
https://www.cia.gov/cia/publications/factbook/geos/ja.html. [48] ITU - Case Study: Broadband - UBIQUITOUS NETWORK SOCIETIES: THE
CASE OF JAPAN Retrieved January 30, 2007, http://www.itu.int/osg/spu/ni/ubiquitous/Papers/UNSJapanCaseStudy.pdf
[49] NTT Communications - Retrieved March 15, 2007,
http://www.ntt.com/release_e/news05/0008/0823.html. [50] ITU - Australia ICT Data Collection Case Study Retrieved April 15, 2007,
http://www.itu.int/ITU-D/ict/cs/australia/material/AUS_CS.pdf [51] ITU - Case Study: Broadband - The Case of Australia, pg 34-35. Retrieved May
21, 2007, http://www.itu.int/osg/spu/ni/voice/papers/FoV-Asia-Pacific-Johnson-Draft.pdf
118
[52] CIA World Factbook: Australia. Retrieved May 10, 2007 https://www.cia.gov/cia/publications/factbook/geos/as.html.
[53] ITU - Broadband Korea: Internet Case Study. May 15, 2007,
http://www.itu.int/ITU-D/ict/cs/korea/material/CS_KOR.pdf [54] CIA World Factbook: South Korea - Retrieved April 8, 2007
https://cia.gov/cia//publications/factbook/geos/ks.html. [55] Pagani, M. & Pasinetti, C. (2007). Technical and Functional Quality in the
Development of T Government Services. In Kushchu, I. In Mobile Government: An Emerging Direction in E Government (pp.375-404). Hershey, PA: IGI
[56] Mishra A, Akman I, & Yazici A. (2006). “Software piracy among IT professionals
in organizations.” International Journal of Information Management 26: 401–413 [57] Hung, Y. C., Yang, H., Hsiao, C. H., & Yang, Y. L. (2004). A study of behavioral
intention for mobile commerce using technology acceptance model. In the Proceedings of the 4th International Conference on Electronic Business, Beijing, China, December 5-9 (pp. 737-736)
[58] Han, S. (2005). Understanding user adoption of mobile technology: Focusing on
physicians in Finland. Doctoral Dissertation, Nr. 59. Turku: Turku Center for Computer Science, Åbo Akademi University.
[59] Venkatesh, V., Morris, M. G., Davis, G. B., & Davis, F. D. (2003). User acceptance of information technology: Toward a unified view. MIS Quarterly, 27(3).
[60] Sell A., Patokorpi E., Walden P., & Anckar B. (2007) Adoption of Mobile
Communication Technologies in the Municipal Open Care Service Sector. In the Kushchu, I.. In Mobile Government: An Emerging Direction in E Government (pp.134-154). Hershey, PA: IGI

119
[61] Sandy G.A. & McMillan S. (2005). A Succeess Factors Model For M-Government. Retrieved March 12, 2007, from http://www.mgovernment.org/resources/euromgov/2005/PDF/36_R348SG.pdf
[62] Sell A., Patokorpi E., Walden P., & Anckar B. (2007) Mobile e-Health: Making the
Case. In the Kushchu, I.. In Mobile Government: An Emerging Direction in E Government (pp.155-170). Hershey, PA: IGI

120
APPENDICES
APPENDIX – A: M-GOVERNMENT SURVEY QUESTIONNAIRE ITEMS
A-Table 1. Items Related to Mobile Government
DRIVERS
Mobile Penetration & Communication Device Usage
1. Communication device easiness
1. Mobile phones
2. Laptop
3. Desktop
4. Handheld (PDA/IPAQ)
2.
Preferred mobile communication
channel
5. SMS
6. e-mail
3. Preferred mobile/wireless
communication device for
connecting internet
7. Mobile phones
8. Laptop
9. Handheld (PDA/IPAQ)
10.None
4. Communication type at home 11.Wired
12.Wireless
13.None
Mobile Infrastructure
5.
Infrastructure/Physical 1. Technology
2. Equipment
3. Network
6.
Infrastructure/Soft 4. Institutional Arrangements
5. Software
Mobile Government Applications

121
A-Table 1 (cont.)
7. Potential fields of application
1. Local taxation
2. Personal data
3. Postal services
4. Education
5. Banking & Finance
6. Security
7. Health
8. Tourism
9. Social Security
BARRIERS
Mobile Government Challenges
8.
Infrastructure development 1. Lack of technological infrastructure (TECH).
2. Low credit card penetration (CREDIT).
3. Security and privacy gaps (SECURITY).
4. Insufficient number of its users (USERS).
5. Citizen adaptation process (ADAPT).
6. Problems with laws and political process
(POLITICS).
7. Compatibility of the mobile systems with the existing e-gov
systems (COMP).

122
APPENDIX – B: ONE-WAY ANOVA TEST RESULTS
A-Table 2. Summary of Test Results Part-1 (Anova Results)
Independent variables→
Dependent variables ↓ Gender Age Education Occupation
Year of
Experience
Communication device
easiness
Hyp: H111
χ2: 4.52
d.f.: 1
p-val: 0.035a
Hyp: H112
χ2: 4.06
d.f.: 2
p-val: 0.018a
Hyp: H113
χ2: 0.05
d.f.: 2
p-val: 0.951
Hyp: H114
χ2: 1.46
d.f.: 2
p-val: 0.233
Hyp: H115
χ2: 1.33
d.f.: 2
p-val: 0.266
Preferred mobile
communication channel
Hyp: H121
χ2: 0.03
d.f.: 1
p-val: 0.866
Hyp: H122
χ2: 1.39
d.f.: 2
p-val: 0.252
Hyp: H123
χ2: 0.75
d.f.: 2
p-val: 0.476
Hyp: H124
χ2: 1.04
d.f.: 2
p-val: 0.356
Hyp: H125
χ2: 1.08
d.f.: 2
p-val: 0.343
Mobile/wireless
communication device for
connecting internet
Hyp: H131
χ2: 2.95
d.f.: 1
p-val: 0.087
Hyp: H132
χ2: 3.85
d.f.: 2
p-val: 0.023a
Hyp: H133
χ2: 0.62
d.f.: 2
p-val: 0.538
Hyp: H134
χ2: 1.60
d.f.: 2
p-val: 0.203
Hyp: H135
χ2: 1.82
d.f.: 2
p-val: 0.191
Communication type at
home
Hyp: H141
χ2: 1.25
d.f.: 1
p-val: 0.265
Hyp: H142
χ2: 2.23
d.f.: 2
p-val: 0.109
Hyp: H143
χ2: 1.04
d.f.: 2
p-val: 0.356
Hyp: H144
χ2: 0.13
d.f.: 2
p-val: 0.876
Hyp: H145
χ2: 0.74
d.f.: 2
p-val: 0.479
a Indicates statistically significant at 5 per cent significance level.
A-Table 3. Summary of Test Results Part-2 (Anova Results)
Independent variables→
Dependent variables ↓ Gender Age Education Occupation
Year of
Experience

123
A-Table 3 (cont.)
Technology
Hyp: H211
χ2: 3.41
d.f.: 1
p-val: 0.066
Hyp: H212
χ2: 0.87
d.f.: 2
p-val: 0.420
Hyp: H213
χ2: 0.99
d.f.: 2
p-val: 0.374
Hyp: H214
χ2: 0.12
d.f.: 2
p-val: 0.885
Hyp: H215
χ2: 1.72
d.f.: 2
p-val: 0.181
Equipment
Hyp: H221
χ2: 0.13
d.f.: 1
p-val: 0.720
Hyp: H222
χ2: 0.68
d.f.: 2
p-val: 0.507
Hyp: H223
χ2: 2.21
d.f.: 2
p-val: 0.112
Hyp: H224
χ2: 1.59
d.f.: 2
p-val: 0.206
Hyp: H225
χ2: 2.24
d.f.: 2
p-val: 0.108
Network
Hyp: H231
χ2: 0.22
d.f.: 1
p-val: 0.638
Hyp: H232
χ2: 1.03
d.f.: 2
p-val: 0.358
Hyp: H233
χ2: 2.37
d.f.: 2
p-val: 0.096
Hyp: H234
χ2: 0.01
d.f.: 2
p-val: 0.988
Hyp: H235
χ2: 1.97
d.f.: 2
p-val: 0.142
Institutional
Arrangements
Hyp: H241
χ2: 1.76
d.f.: 1
p-val: 0.186
Hyp: H242
χ2: 2.66
d.f.: 2
p-val: 0.072
Hyp: H243
χ2: 1.15
d.f.: 2
p-val: 0.319
Hyp: H244
χ2: 3.42
d.f.: 2
p-val: 0.036a
Hyp: H245
χ2: 1.95
d.f.: 2
p-val: 0.145
Software
Hyp: H251
χ2: 0.16
d.f.: 1
p-val: 0.688
Hyp: H252
χ2: 1.07
d.f.: 2
p-val: 0.352
Hyp: H253
χ2: 1.52
d.f.: 2
p-val: 0.221
Hyp: H254
χ2: 2.86
d.f.: 2
p-val: 0.059
Hyp: H255
χ2: 0.50
d.f.: 2
p-val: 0.604
a Indicates statistically significant at 5 per cent significance level.
A-Table 4. Summary of Test Results Part-3 (Anova Results)
Independent variables→
Dependent variables ↓ Gender Age Education Occupation
Year of
Experience
124
A-Table 4 (cont.)
Local taxation
Hyp: H311
χ2: 4.32
d.f.: 1
p-val: 0.039a
Hyp: H312
χ2: 0.698
d.f.: 2
p-val: 0.499
Hyp: H313
χ2: 0.72
d.f.: 2
p-val: 0.488
Hyp: H314
χ2: 1.65
d.f.: 2
p-val: 0.196
Hyp: H315
χ2: 1.70
d.f.: 2
p-val: 0.187
Personal data
Hyp: H321
χ2: 0.46
d.f.: 1
p-val: 0.498
Hyp: H322
χ2: 0.15
d.f.: 2
p-val: 0.861
Hyp: H323
χ2: 1.60
d.f.: 2
p-val: 0.203
Hyp: H324
χ2: 1.37
d.f.: 2
p-val: 0.256
Hyp: H325
χ2: 1.40
d.f.: 2
p-val: 0.249
Postal services
Hyp: H331
χ2: 2.93
d.f.: 1
p-val: 0.089
Hyp: H332
χ2: 1.09
d.f.: 2
p-val: 0.340
Hyp: H333
χ2: 2.25
d.f.: 2
p-val: 0.110
Hyp: H334
χ2: 1.48
d.f.: 2
p-val: 0.231
Hyp: H335
χ2: 0.85
d.f.: 2
p-val: 0.431
Education
Hyp: H341
χ2: 0.01
d.f.: 1
p-val: 0.981
Hyp: H342
χ2: 3.28
d.f.: 2
p-val: 0.040a
Hyp: H343
χ2: 1.18
d.f.: 2
p-val: 0.311
Hyp: H344
χ2: 0.35
d.f.: 2
p-val: 0.709
Hyp: H345
χ2: 1.79
d.f.: 2
p-val: 0.170
Banking & Finance
Hyp: H351
χ2: 4.63
d.f.: 1
p-val: 0.033a
Hyp: H352
χ2: 0.39
d.f.: 2
p-val: 0.678
Hyp: H353
χ2: 0.63
d.f.: 2
p-val: 0.535
Hyp: H354
χ2: 0.51
d.f.: 2
p-val: 0.605
Hyp: H355
χ2: 0.18
d.f.: 2
p-val: 0.837
Security
Hyp: H361
χ2: 2.86
d.f.: 1
p-val: 0.103
Hyp: H362
χ2: 2.26
d.f.: 2
p-val: 0.108
Hyp: H363
χ2: 1.60
d.f.: 2
p-val: 0.205
Hyp: H364
χ2: 2.24
d.f.: 2
p-val: 0.110
Hyp: H365
χ2: 0.29
d.f.: 2
p-val: 0.749

125
Health Hyp: H371
χ2: 0.07
d.f.: 1
p-val: 0.788
Hyp: H372
χ2: 3.63
d.f.: 2
p-val: 0.028a
Hyp: H373
χ2: 0.39
d.f.: 2
p-val: 0.678
Hyp: H374
χ2: 1.26
d.f.: 2
p-val: 0.288
Hyp: H375
χ2: 2.56
d.f.: 2
p-val: 0.080
Tourism
Hyp: H381
χ2: 0.24
d.f.: 1
p-val: 0.624
Hyp: H382
χ2: 0.120
d.f.: 2
p-val: 0.887
Hyp: H383
χ2: 1.14
d.f.: 2
p-val: 0.326
Hyp: H384
χ2: 1.99
d.f.: 2
p-val: 0.143
Hyp: H385
χ2: 0.21
d.f.: 2
p-val: 0.813
Social Security
Hyp: H391
χ2: 0.64
d.f.: 1
p-val: 0.424
Hyp: H392
χ2: 3.46
d.f.: 2
p-val: 0.034a
Hyp: H393
χ2: 0.51
d.f.: 2
p-val: 0.601
Hyp: H394
χ2: 2.15
d.f.: 2
p-val: 0.120
Hyp: H395
χ2: 1.99
d.f.: 2
p-val: 0.190
a Indicates statistically significant at 5 per cent significance level.
A-Table 5. Summary of Test Results Part-4 (Anova Results)
Independent variables→
Dependent variables ↓ Gender Age Education Occupation
Year of
Experience
Lack of technological
infrastructure
Hyp: H411
χ2: 3.41
d.f.: 1
p-val: 0.066
Hyp: H412
χ2: 1.83
d.f.: 2
p-val: 0.162
Hyp: H413
χ2: 0.67
d.f.: 2
p-val: 0.515
Hyp: H414
χ2: 1.27
d.f.: 2
p-val: 0.283
Hyp: H415
χ2: 1.50
d.f.: 2
p-val: 0.226
Low credit card
penetration
Hyp: H421
χ2: 0.56
d.f.: 1
p-val: 0.456
Hyp: H422
χ2: 0.68
d.f.: 2
p-val: 0.508
Hyp: H423
χ2: 1.80
d.f.: 2
p-val: 0.168
Hyp: H424
χ2: 0.98
d.f.: 2
p-val: 0.376
Hyp: H425
χ2: 0.07
d.f.: 2
p-val: 0.937
126
A-Table 5 (cont.)
Security and privacy
gaps
Hyp: H431
χ2: 5.78
d.f.: 1
p-val: 0.017a
Hyp: H432
χ2: 2.22
d.f.: 2
p-val: 0.108
Hyp: H433
χ2: 1.07
d.f.: 2
p-val: 0.346
Hyp: H434
χ2: 0.54
d.f.: 2
p-val: 0.585
Hyp: H435
χ2: 0.99
d.f.: 2
p-val: 0.374
Insufficient number of
its users
Hyp: H441
χ2: 1.52
d.f.: 1
p-val: 0.219
Hyp: H442
χ2: 0.503
d.f.: 2
p-val: 0.605
Hyp: H443
χ2: 1.72
d.f.: 2
p-val: 0.181
Hyp: H444
χ2: 0.08
d.f.: 2
p-val: 0.920
Hyp: H445
χ2: 1.18
d.f.: 2
p-val: 0.310
Citizen adaptation
process
Hyp: H451
χ2: 0.11
d.f.: 1
p-val: 0.739
Hyp: H452
χ2: 0.801
d.f.: 2
p-val: 0.450
Hyp: H453
χ2: 1.06
d.f.: 2
p-val: 0.349
Hyp: H454
χ2: 0.56
d.f.: 2
p-val: 0.572
Hyp: H455
χ2: 0.19
d.f.: 2
p-val: 0.821
Problems with laws and
political process
Hyp: H461
χ2: 0.60
d.f.: 1
p-val: 0.440
Hyp: H462
χ2: 1.12
d.f.: 2
p-val: 0.329
Hyp: H463
χ2: 1.95
d.f.: 2
p-val: 0.145
Hyp: H464
χ2: 3.63
d.f.: 2
p-val: 0.028a
Hyp: H465
χ2: 0.85
d.f.: 2
p-val: 0.427
Compatibility of the
mobile systems with the
existing e-gov systems
Hyp: H471
χ2: 3.45
d.f.: 1
p-val: 0.064
Hyp: H472
χ2: 2.03
d.f.: 2
p-val: 0.133
Hyp: H473
χ2: 2.58
d.f.: 2
p-val: 0.078
Hyp: H474
χ2: 2.65
d.f.: 2
p-val: 0.073
Hyp: H475
χ2: 0.24
d.f.: 2
p-val: 0.798
a Indicates statistically significant at 5 per cent significance level.
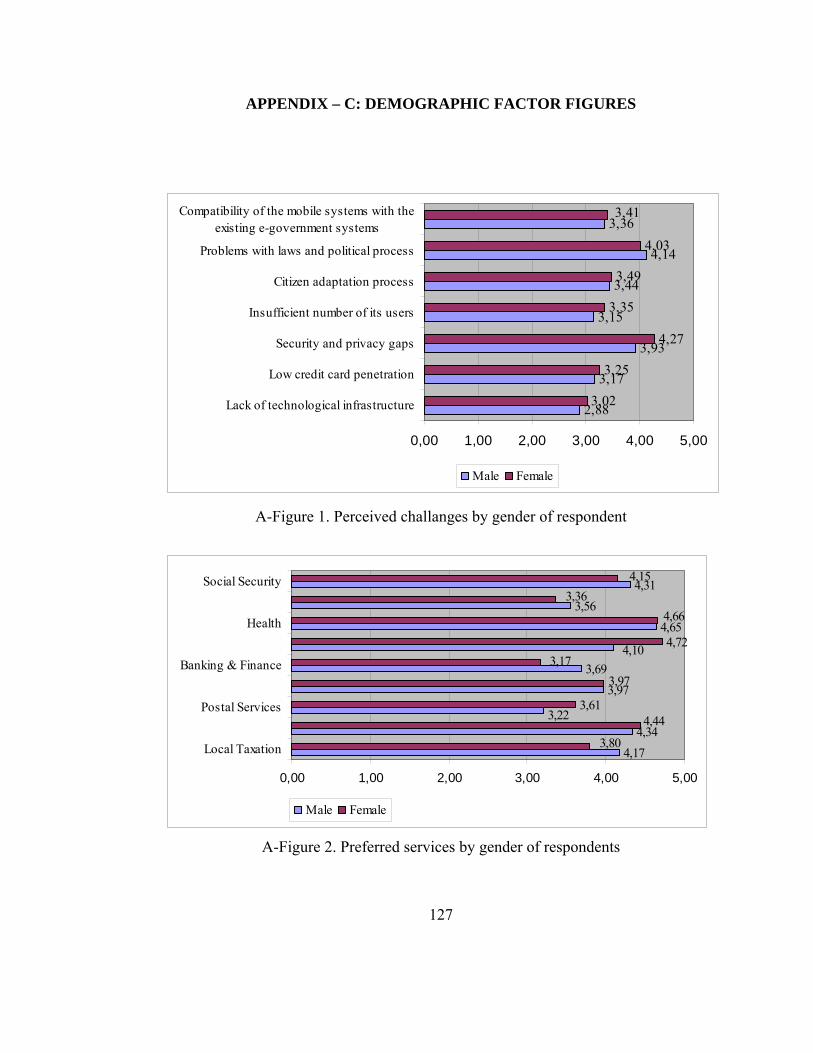
APPENDIX – C: DEMOGRAPHIC FACTOR FIGURES
2,88
3,17
3,93
3,15
3,44
4,14
3,36
3,02
3,25
4,27
3,35
3,49
4,03
3,41
0,00 1,00 2,00 3,00 4,00 5,00
Lack of technological infrastructure
Low credit card penetration
Security and privacy gaps
Insufficient number of its users
Citizen adaptation process
Problems with laws and political process
Compatibility of the mobile systems with theexisting e-government systems
Male Female
A-Figure 1. Perceived challanges by gender of respondent
4,17
4,34
3,97
3,69
4,65
3,56
4,31
3,61
4,724,10
3,22
4,15
3,36
4,66
3,17
3,97
4,44
3,80
0,00 1,00 2,00 3,00 4,00 5,00
Local Taxation
Postal Services
Banking & Finance
Health
Social Security
Male Female
A-Figure 2. Preferred services by gender of respondents
127

2,82
3,13
4,04
3,38
3,59
4,05
3,32
2,98
3,31
4,20
3,18
4,15
3,39
2,48
2,93
4,10
3,19
3,86
3,31
3,403,59
0,00 1,00 2,00 3,00 4,00 5,00
Lack of technological infrastructure
Low credit card penetration
Security and privacy gaps
Insufficient number of its users
Citizen adaptation process
Problems with laws and political process
Compatibility of the mobile systems withthe existing e-government systems
Age<34 34-49 Age>49
A-Figure 3. Perceived challanges by age of respondents
4,02
4,29
4,13
3,73
4,07
4,42
4,07
3,68
4,37
3,20
3,26
4,35
4,56
3,96
3,36
3,34
4,26
4,81
4,24
3,56
3,39
4,23
3,71
4,74
4,93
3,56
3,85
0,00 1,00 2,00 3,00 4,00 5,00 6,00
Local Taxation
Personal Data
Postal Services
Education
Banking & Finance
Security
Health
Tourism
Social Security
Age<34 34-49 Age>49
A-Figure 4. Preferred services by age of respondents
128

APPENDIX – D: OTHER TABLES
A-Table 6. A sampling of Wi-Fi network management and cracking tools [25]
129