The Absorption and Scattering Characteristics of Interior ...
135
-
Upload
khangminh22 -
Category
Documents
-
view
3 -
download
0
Transcript of The Absorption and Scattering Characteristics of Interior ...

TheAbsorptionandScatteringCharacteristics
ofInteriorLivingWalls
MahsaAkbarnejad
AThesis
Inthe
BuildingScienceGraduateProgram
PresentedinPartialFulfillmentoftheRequirementsfortheDegreeofMasterofAppliedScienceinBuildingEngineering/BuildingScience
Atthe
BritishColumbiaInstituteofTechnology
Burnaby,BritishColumbia,Canada
BritishColumbiaInstituteoftechnology
Date(January,2017)

3
TableofContents
1.ABSTRACT..........................................................................................................................5
2.INTRODUCTION................................................................................................................6
3.LITERATUREREVIEW.....................................................................................................93.1. Acousticalcharacteristicsandparametersofvegetation....................................103.2. Acousticalcharacteristicsandparametersofsubstratesandporousmaterials.............................................................................................................................................183.3. Materialabsorptionandscattering;effectonroomacoustics...........................223.4. Experimentalmethods.....................................................................................................323.4.1. Absorption..................................................................................................................................323.4.2. Scattering....................................................................................................................................323.4.3. Reverberationtime.................................................................................................................33
3.5. Roomcriteria......................................................................................................................35
4.METHODOLOGY.............................................................................................................364.1. ScopeandHypotheses......................................................................................................364.2. Materials...............................................................................................................................374.2.1. Substrate..........................................................................................................................394.2.2. PlantsDescription........................................................................................................414.2.3. PlantProperties............................................................................................................434.3. Measurementprocedureofplantproperties..........................................................444.3.1. Absorption..................................................................................................................................46Intoaccesstheconsistencyofthemeasurements.........................................................................484.3.2. Scattering....................................................................................................................................504.3.3. ScatteringMeasurements.....................................................................................................51ThescatteringcoefficientofSubstrate(30%pumice,70%pottingsoil).............................51
5.Result................................................................................................................................565.1. Plantproperties(Physicalpropertiesoftheplantsstudied).............................565.2. AbsorptionandScattering..............................................................................................605.2.1. AbsorptionofEmptyRoom:................................................................................................605.2.2. Absorptionoflivingwallsystems:...................................................................................615.2.3. Absorptionevaluationofamultipleofpanels............................................................75
5.3. 1/3ScaleMeasurements;AbsorptionandScattering...........................................78Absorptioncoefficientofdifferentspecies........................................................................................795.3.1. Thescatteringcoefficientofplantspecieschangeswithdifferentpercentagecoverageofvegetation................................................................................................................................86
6.Discussion........................................................................................................................916.1. Absorptionoflivingwallpanelmeasurement........................................................916.1.1. Effectofmoisturecontentandvegetationonthecarries’absorption.............92
6.2. Absorptionandscatteringof1/3scalemodel;thespeciestypeeffectonabsorptionandscatteringcoefficientatdifferentcoveragedensity.............................936.2.1. Scattering....................................................................................................................................986.2.2. Therelationshipbetweentheabsorption&scatteringcoefficientandthepropertiesofsixavailablespecies.......................................................................................................101
6.3. Solvingfortheacousticalcoefficient.......................................................................1036.3.1. Attemptedmethodone.......................................................................................................1046.3.2. Resolvingequation................................................................................................................106

4
6.3.3. ScatteringcoefficientforapplicationinOdeon........................................................1086.4. Roomsensitivityanalysis............................................................................................1106.4.1. Roomdefinition......................................................................................................................1106.4.2. Modeltheroomeffectoflivingwalls............................................................................112
7.CONCLUSIONSANDOUTCOMES..............................................................................117
8.FUTUREWORK.............................................................................................................119
GLOSSARYANDABBREVIATIONS...................................................................................120
AKNOWLEDGEMENTS........................................................................................................122
BIBLIOGRAPHY.....................................................................................................................123
APPENDICES..........................................................................................................................126Appendix1:Theconsideredacousticalstandardsandcriteriainthisresearch....126Appendix2:Irrigationsystem..................................................................................................127Appendix3:1/3scaledturningtableparameters............................................................127Appendix4:Equipmentandfacilities....................................................................................128Appendix5:ThemeasurementconditionofCarrierA&B............................................129Appendix6:.....................................................................................................................................131
5
1. ABSTRACT
Installationofinteriorlivingwallsisincreasingrapidlyduetotheirbeauty,biophilic
designandtheirpotentialcontributiontoindoorenvironmentalquality.However,
thereislittleunderstandingofthespecificeffecttheyhaveontheacousticsofa
room.
Toadvancethestateofpractice,thisinterdisciplinarystudyexplorestheacoustical
characteristicsofinteriorlivingwallstodeterminehowtheycanbeusedto
positivelybenefitroomacousticbyreducingexcessnoiseandreverberation.
Specifically,theobjectiveoftheresearchistomeasuretheacousticalcharacteristics
oftheinteriorlivingwallinordertodeterminetheirabsorptioncoefficient,
scatteringcoefficient,andtheparametersthatmostsignificantlyimpactthese
coefficients.
First,aseriesofmeasurementsarecarriedoutinareverberationchamberto
examinerandom-incidenceabsorptionbyconsideringparameterssuchascarrier
type,moisturecontent,vegetationtype,andsubstrate.Inaddition,bothabsorption
andscatteringcoefficientsareexaminedbyconsideringvariousvegetationtypes
andcoverage.Thefindingsfromempiricalmeasurementsfacilitateasensitivity
analysis,withtheuseofthecommercialsoftwareOdeon,oftheabsorptionand
scatteringcoefficients.
Next,theempiricalabsorptionandscatteringcoefficientsareusedonamodel,
developedinthecommercialsoftwareOdeon,toseetheeffectofinteriorliving
wallsonroomacoustics.Theaimofthisstudyistoevaluatetheapplicationof
interiorlivingwallsasasustainableandacousticallybeneficialmaterialfor
buildingsofanykind.
Keywords:acousticalcharacteristicsofinteriorlivingwalls,soundabsorption
coefficient,soundscatteringcoefficient,Odeonsoftware,roomacoustics,livingwall

6
2. INTRODUCTION
Noise…isoneofthechiefdrawbackstotheenjoymentofmodernurbanliving.
- Dr.VernO.Knudsen,1967
This quote highlightsthe profound effect ofnoise on the quality of urban life.
Therefore,itisimperativetocomeupwithpracticalacousticalmeasurestoreduce
unwanted noise in living, studying and working environments.This research will
determine if the newtechnologyof living walls can reduce noise andwhetherthe
improvement of room acoustics can be truly considereda benefit of the modern
technology.
Tomeettheacousticalcriteriaforroomsawiderangeofbuildingmaterialsare
availableforuseinsideoftherooms.Usinginteriorgreenwalls,whichaddress
multipleissuesinthesustainabilitydiscussion,maybeanefficientoptionforthe
designteam.Theacousticcharacteristicsmustfirstbequantifiedintermsof
absorptionandscatteringproperties.
Inordertodeterminetheacousticalimpactofusinglivingwallsinaroomandto
makeitpossibletopredicttheireffectinroomdesign(layoutoftheroom),the
absorptionandscatteringcharacteristicofsystemsshouldbeempiricallyevaluated
andtheimpactofthemosteffectivecomponentsoftheinteriorlivingwallsystems
mustbeunderstoodanddefined.
Additionaltothepotentialacousticimpactoflivingwalls,introducingaplanttothe
livingspacebreakstheroughness,thecoldness,anddisciplinaryaestheticnatureof
urbanarchitecture(Figure1).Plantsalsoactasnaturalair-conditioners,removing
carbondioxideandotherpollutantssuchastoxicvolatileorganiccompoundsfrom
theairandreleasingoxygen,andcontributingtoacomfortablerelativehumidityof
45-65percentandtemperatureof20o-22oC[23].

7
Figure1.Interiorlivingwallinstallation[9]
Theinteriorlivingwallsystemiscomposedofthreemajorcomponents:carrier
panel,substrateandplants(leaf,stemandroot).Eachplaysaspecificrolein
absorbingandscatteringsound.Therefore,itisnecessarytocharacterizetheeffect
ofeachcomponentseparatelyaswellasthecombinedeffects.
Thecarriersaremadeinmanyformsfromavarietyofmaterialssuchasstainless
steel,plastic,andpolypropylenefabrics.Thesubstratecanvaryintermsof
percentageoforganicmatter,aggregatetypeandrangeofmoisturecontent.Plants
candifferintermsofphysiology,structureandthedensityofwallcoverage.Interior
livingwallsaresupportedwithanautomatic,closedcircuitirrigationsystem,some
withanin-linefertilizerandsomewithawaterreservoir.Interiorlivingwallsneed
about5to10μmole/m2/soflight,whichcanbeprovidednaturallywithstandard
sizewindowsintheroom.Naturaldaylightisthebestchoicetoprovideinterior
livingwallsystemswithnecessarylightforplantgrowthandleaves.Insituations
wherethatisnotpossible,alightingsystemcanbeinstalled.
Specificobjectivesofthisresearchareprimarilytomeasuretheacoustical
characteristicsoftheinteriorlivingwallinordertodeterminetheirnormaland
diffuseabsorptioncoefficient,scatteringcoefficient,andtheparameter,whichmost

8
significantlyimpactthesecoefficients.Asecondaryobjectiveistousethemeasured
absorptionandscatteringcoefficientdatatomodeltheeffectsoftheinteriorliving
wallsusingthecommercialsoftwareOdeonandinvestigatethemodelssensitivity
tothemeasureddata.

9
3. LITERATUREREVIEW
Noise,alsoknownasinvisiblepollutionbyacousticalexperts,hasagreatimpacton
happiness,andthephysicalandmentalhealthofhumanbeings.TheWorldHealth
Organization(WHO)identifiedlow-frequencysoundasaparticularenvironmental
noiseproblem,itsannoyancerisingwithincreasingsoundlevel[1].
Figure2.Interiorlivingwallinstallationincommercialbuildings[10]
Theinfluenceofcontactwithnatureonthehealthandpsychologicalwell-beingof
humansisrepresentedinnumerousliteratures.Anexaminationoftheeffectof
beingclosetogreeneryillustratedarelieffromstress,whichcanhelptoimprove
differentaspectsofwell-being[1].However,limitedresearchoninteriorgreeneryis
available.
Theliteraturesupportingthisthesisfocusesonthreemaintopics:acoustical
characteristicsandparametersofvegetation,acousticalcharacteristicsand
parametersofsubstrates,effectofmaterialabsorptionandscatteringinroom
acoustics.

10
3.1.Acousticalcharacteristicsandparametersofvegetation
Previousstudieshaveshownthatleavesofplantsattenuatesoundbyreflecting,
refractingandabsorbingacousticenergyinsmallamounts.Martensevaluated
soundpropagationthroughamodeledforestinananechoicchamber,andfound
thatplantsactasalow-passfilter[19].Healsostudiedacousticreflection
characteristicsofdeciduousplantleaves,andshowedtheimportanceofleaf
dimensionandleafmassforsoundreflection[18].AnotherinvestigationbyMartens
examinedreverberationpatternandsoundenergyabsorptionoffourtypesofplant
leavesinasoundfieldusingaLaser-Doppler-Vibrometersystemoverawide
frequencyrange(0-100Hz)[20].Inanotherinvestigation,hemeasuredsound
reflectionoffaplantleafasafunctionofleafmassusingpulsedandpuretones.The
resultofthisstudyshowedtheimportanceofthedimensionsofaplantleaf,
especiallyathighsoundfrequencies,andthemassoftheleaftissueonthereflection
ofsoundwaves[21].
Attenborough’smeasurementsofleafvibrationinducedbysoundshowedthat
absorptionbyleavesisimportantathighfrequenciesabove1kHz,whereasbelow1
kHzthereislittlesoundabsorptionbyleaves[3].Thiskindofstudywasdonewith
theaimofunderstandingthemechanismsofreflection,diffractionandabsorptionof
soundwavesaroundplantleaves.
InthestudybyAzkorra,twodifferentstandardizedlaboratorytestswereconducted
onthecontributionofverticalgreenerysystemstonoisereduction[21].Findings
indicatedaweightedsoundreductionindex(Rw)of15dBandaweightedsound
absorptioncoefficient(a)of0.40attributedtothemodular-basedsystems.
ComparingAzkorra’sresultswiththoseofpreviousstudies,itcanbeconcludedthat
theintroductionofthegreenwallsintothereverberationroomresultsina
reductioninthereverberationtimefrom4.2to5.9,highlightingandquantifyingthe
soundabsorptioncapacityofthisconstructionsystem[21].
Theleavesofplantsabsorbthevibrationofsoundwaves[23].Acompletestudyon

11
theacousticandmechanicalcharacteristicsofplantleavesstillneedstobespecified
foruseininteriorgreenwalls.
VanderHeideninvestigatedthecomplexityoftheplantandsoilinterfaceand
possibleeffectsofvegetationontheacousticalpropertiesofsoilsurfacessuchas
porosityandsoilstructure.Hisresearchindicatedgreatinfluenceofvegetationon
theporosity,inorganicandorganicmattercontent,watercontentandsoil
temperature[26].Theresultsalsoindicatedacorrelationbetweenthepenetration
ofrootsintothesoil,andtheporosityofsoil.
InanexperimentbyAylor,soundattenuationinvegetatedareaswithdifferent
configurationsofplantsandgroundconditionswasexamined.Heconsideredthe
effectofarea,width,thicknessandsurface-areadensityoftheleaves,aswellasstem
diameteranddensityandgroundimpedance.Hedescribedtherelationship
betweenabsorptivecapacityoftheplantmaterialandsoundattenuation[4].Aylor’s
resultsindicatedthatfoliagereducessoundtransmission,especiallyathigh
frequenciesmainlybystems,andmoreefficientlywithincreasingleafdensity,leaf
widthandleafthickness,asshowninFigure3.
Figure3.Excessattenuationvs.plantdensity(Plant/m2)andleafareadensity(m-1)atdifferentfrequencies[4]
Wongexaminedthesoundabsorptioncoefficientofverticalgreenerysystemsinthe
reverberationchambertoshowtheattenuationthroughoutthefrequencyspectrum

12
forvaryingLeafAreaIndex(LAI)(Figure4).Figure5illustratedtheaveragesound
absorptioncoefficientrelativetocoverage.However,hisstudydidn’tdefinethe
effectofscatteringcoefficient.Diffractionisaconcernbecauseitsignificantlyaffects
thesoundpressurelevel(SPL)atlowfrequencies[29].Additionally,Wongcarried
outinsertionlossexperimentson8systemsoflivingwallsinHortPark.The
frequency-dependentaverageSPLreadingsandinsertionlossduetothedifferent
plantcharacteristicsineachzoneareshowninFigure6andFigure7.
Figure4.Verticalgreenerysystemwithempty,43%,71%and100%greenerycoveragedensitiesinreverberationchamber(fromlefttoright)[29].
TheresultsofthestudybyPriceshowedthestrongerattenuationininsertionlossat
lowtomiddlefrequenciesthatisduetotheabsorbingeffectofthesubstrate.
Furthermorethesoundabsorptioncoefficientincreasedwithincreasingfrequency
andgreatergreenerycoverage.Itwasshownthatverticalgreenerysystemsare
effectiveinreducingsoundlevelsaswellasabsorbingsoundenergyandfoundthat
scatteringbyleavescancontributetonoiseattenuationespeciallyabove1kHz[17].

13
Figure5.Averagesoundabsorptioncoefficientrelativetocoverage[17].
Figure6.AverageSPLreadingsatthebackoftheentireeightverticalgreenerysystemsduringtheacousticsexperimentsinHortPark[17]

14
Figure7.Averageinsertionlossfortheentireeightverticalgreenerysystems(VGS)duringtheacousticalexperimentsinHortPark[17]
Yangexaminedrandomincidenceabsorptioncoefficientforsoilwithoutvegetation,
soilwithvegetation,above-groundcomponentsofplantsandgreenwallwithout
vegetation.Healsomeasuredrandomincidencescatteringcoefficientsofabove-
groundcomponentsofplantssuchasleafandstemsinareverberationchamber
[11].Theabsorptionandscatteringcoefficientsofdifferentinstallationsof
vegetationweredeterminedinthereverberationchamberinordertoillustratethe
influenceoffactorssuchassoildepth,soilwatercontent,plantsize,levelof
vegetationcoverageandthelike.
Withincreased soil moisture content,astrong decrease in absorption coefficient
wasreported,sincetheapplicationofwatertosoilresultsinadeclineinporespace.

15
Figure8.Absorptioncoefficientof200mmtopsoilwithdifferentsoilmoisturecontent[11]
Aninvestigationoftheeffectofthecombinedsoilsubstrateandlow-growing
vegetationonabsorptioncoefficientshowedbetterabsorptionatlowandmid
frequencies(ratherthanhighfrequenciesabove2000Hz)withincreasing
vegetationdensity.Thislikelyhappensduetoviscousfrictionlossesandtheinertia
effectofvegetationonsoundabsorptionatlowandmidfrequencies[11].
Figure9.Absorptioncoefficientoftopsoilwithdifferentlevelofvegetationcoverage[11]
Lookingseparatelyattheabsorptionandscatteringcoefficientoftheaboveground
components,fordifferenttypesofvegetationsuchasBuxusandIvywithvarious
levelsofvegetationcoverage,showedthatgenerallytheabsorptioncoefficient
increaseswithincreasingvegetationdensityandleafsize.

16
Figure10.Absorptioncoefficientofvegetationwithdifferentlevelofvegetationcoverage/density.(a)Buxus,(c)Ivy[11]
InFigure11itcanbeseenthat,justlikeabsorptioncoefficient,thescattering
coefficientincreaseswithincreasinglevelsofvegetationandleafsizeforbothtypes
ofplants.
Figure11.Scatteringcoefficientofvegetationwithdifferentlevelsofvegetationcoverage/density.(a)Buxus,(c)Ivy[11]
Frominvestigationsonagreenwallwithoutvegetation,itwasreportedthatagreen
wallwithhighlyporoussubstratemaintainedahighabsorptioncoefficienteven
withhighmoisturecontentFigure12[11].

17
Figure12.Absorptioncoefficientofthegreenwallwithdifferentlevelsofsubstratemoisturecontent[11]
ThereisalsoastudybyHoroshenkovbasedonimpedancetubemeasurements,
whichevaluatedtheinfluenceofleavesontheacousticabsorptionofsoil,plants,
andtheircombination.Theresultshowedthatthepresenceofplantswitha
particulartypeofleafcouldresultinaconsiderableimprovementintheabsorption
coefficientofagreenwallatcertainwatersaturationlevelsincomparisonwiththe
wallwithoutvegetation[25].
InthestudybyAlessandrothenormalincidencesoundabsorptioncoefficientoften
specimensofFernandthreespecimensofBabyTearsweremeasuredinthe
presenceandinabsenceofasubstrate[47].Thesoundabsorptioncoefficientwere
measuredinthefrequencyrangeof50-1600Hzusingaverticallymounted
impedancetubewithadiameterof100mm.Themeasurementswerecarriedoutin
accordancewithUNE-ENISO354-2standards.Thesoilsubstrateusedforthe
measurementsweremadeof70%coconutfibersand30%expandedperlite.The
morphologicalparametersoftheplants,suchasareaofasingleleaf,numberof
leavesinaplant,heightofaplant,predominantangleofleavesorientation,were
alsomeasured.Themeasurementsresultsconfirmedthatplantsareabletoabsorba
considerableamountofacousticenergy,particularlyinpresenceofthesoil
substrate.Thesoilsubstrateisabletoabsorbupto80%ofacousticincidentenergy,
atfrequenciesabove1000Hz[47].

18
3.2.Acousticalcharacteristicsandparametersofsubstratesandporousmaterials
Anumberofstudieshavebeendoneonthesubstratepropertiesthathaveaneffect
onacousticalresponse.AstudybyTittmann[24]illustratedtheinfluenceof
saturationonthespeedandattenuationofcompressionalandshearswavesin
porousmaterials.
Attenborough’smodeltookintoconsiderationthephysicalpropertiesofmaterials
toformulateatheoryforsoundpropagationinporousmaterials.Knowinganumber
ofphysicalparameterssuchasflowresistivity,porosity,layerthicknessand
structureshapefactors,theacousticalpropertiesofrigidporousmaterialscanbe
predictedusingAttenborough’stheory[3].
ApreviousstudybyOelze,O’Brien,andDarmodydeterminedtheacoustical
attenuationcoefficientandthespeedofsoundpropagationtobeafunctionofsoil
type(sixsoiltypeswereclassified)anddifferentmoisturecontents.Theresults
illustratedthat,generally,theattenuationcoefficientsincreasewithcompactionand
watercontent[33].
DelanyandBazleydeterminedtheacousticalpropertiesofanumberoffibrous
absorbentmaterialsusingtransmission-lineanalysis.Theiraimwastoprovidethe
expectedvalueoftheflow-resistanceformaterials[8].
Aylor’sstudyonsoilattenuationcharacteristicsshowed(Figure13)bettersound
attenuationatlowfrequenciesforthesofterandmoreporousthesoilsurface[4].

19
Figure13.ExcessAttenuationforafinesandyloam(o)andforthesoilafterdisking(Ʌ)vs.frequency[4]
TheresultfromtherecentstudybyVanderHeidenindicatedthatathinsoillayer
providesasignificantabsorptioncoefficient,butincreasingthesoildepthmorethan
90mmdidnotresultinalargechange,Figure14[26].Therefore,itcanbe
understoodthatsoileffectsonabsorptioncoefficientdependmoreon
characteristicssuchasporosityandflowresistanceratherthandepth.
Figure14.Absorptioncoefficientoftopsoilwithdifferentsoildepth[26]
Examiningtheacousticalcharacteristicsofgreenroof,itwasconfirmedbyConnelly
thatthereisarelationshipbetweentheplantcommunityandsoundabsorptionas
wellasbetweensoildepthandabsorption[44].Connellymeasuredtheabsorption
coefficientofvegetatedroofsonarooftopexperimentalset-upforthreeplant
communitieswitharangeofdepthsofsubstrates.Thethreedifferentplant
communitieswereselectedbasedontheiraerialbiomass(foliageabovesubstrate)

20
androotsystemasstructuraldifferencesinexaminingtheabsorptionpotentialof
greenroofs.Theresults,showninFigure15,illustratetheincreaseinabsorption
coefficientofthesubstrate(withoutvegetation)withdepthandfrequency.
Figure15showstheabsorptioncoefficientofthesubstrateontherooftop.
Absorptioncoefficientincreaseswithfrequencyupto1250Hzthenitstaysconstant
athigherfrequenciesupto4000Hz.Italsocanbeinferredthattheabsorption
coefficientincreaseswithdepth[44].
Figure15.Measured third-octave diffuse-field absorption coefficients of reference roof and substrates of 50- to 200-mm depth in rooftop test plots.[44]
Figure16.Measuredthird-octave-banddiffuse-fieldabsorptioncoefficientsofrooftoptestplotsplantedwithsedums(P1).[44]

21
Figure17.Measuredthird-octave-banddiffuse-fieldcoefficientsofsubstrateandsedums(P1)inrooftoptestplots.[44]
Figure18.Measured third-octave-band diffuse-field absorption coefficients of 3 plant communities (substratedepths125e200mm)after2seasonsofestablishment[44].
Figure16 and 17 from the same study [44] showedthat with vegetation
(established P1 communityofplanted sedum albumandmoss) the absorption
coefficient trend of increase with soil depth wasthesame asthe substrate only.
Generally speaking plots with community P1 wereless absorptive than the

22
substrateplots.Whilethechangesinabsorptionwithfrequencyissimilarforboth
(Figure17).
Figure18showsthataftertwoyearsofestablishment3differentplantcommunities
have similar absorption trends. However, the range of absorptivity between three
communitiesoverlappedatsomefrequencies.
ThestudybyConnellyshowedthat:theabsorptivityofvegetatedroof(livingroof)is
a function ofsubstrate depth, establishment of plant community and moisture
contentofsubstrate[34].
Furtherresearchontherelationshipofplantrootstructuretoporosityand
substratemass,asthevegetationestablishesovertime,isrequiredinorderto
measureandfullyunderstandtheimpactofplantestablishmentontheeffective
absorptionofthevegetatedroofandwallmateriallayer,substrateandestablished
plantcommunities.
Therehasbeenlittleworkcompletedonsimilareffectsassociatedwithsoildepth,
moistureandplanttypeinlivingwalls.However,wecantakesomeguidancefrom
researchongreenroofs.
3.3.Materialabsorptionandscattering;effectonroomacousticsAllsurfacesoftheroomabsorbandreflectsoundenergy.Absorptionremoves
soundenergyfromaroom.Therefore,manyfactorssuchasceilingheight,room
volume,surfacetypesofallmaterialsandanyequipmentinaroomhaveadirect
impactontheroom’stotalsoundlevelandsoundabsorption.Materialshavesound
absorptionandscatteringpropertiesthatcanbequantifiedwithfrequency-
dependentsoundabsorptionandscatteringcoefficients.

23
Acousticalabsorptionresultsfromfrictionandresonancephenomena.Absorption
throughfrictionispossiblewhenusingporousandfibrousmaterials,workingbest
inthemidandhighfrequencies.Iftheabove-mentionedmaterialtypesareof
adequatethicknessorbackedbyair,theycanbeefficientinlowfrequenciesaswell.
Resonantabsorbersareefficientatlowfrequencies[31].
NeubauerandKostekreviewedandcomparedseveraldifferentreverberation
modelsandtheirderivations,beyondSabine(Equation1),includeErying(Equation
2),Millington-Sette(Equation3),Fitzroy(Equation4)andFitzroy-Kuttruff
(Equation5)[22].InFigure19,itcanbeobservedthatthevaluescalculatedusing
TohyamaandEyring’smodeldifferconsiderablywiththeresultfromtheother
formulae.ItcanbeseenthatTohyama,Fitzroy,ArautendstooverpredicttheRT.It
alsoshowedthatthenewformulamentionedinthepapermatcheswellwiththe
measuredreverberationtime(RT).
Sabine’sformula
T60=0.161V/A Equation1
Eyring’sformula
T60=(0.161V)/(-Sln(1-α)) Equation2
S - total surface area (m²) . α - average absorption coefficient.
Millington-Sette’s
formula
T60=(0.161V)/(Σ(-Si.ln(1-αi)) Equation3
Si - surface area of the material αi - its actual absorption coefficient.
Fitzroy’sformula
T60=0.16V/S2[(-x/In(1-αx))+(-y/In(1-αy))+(-z/In(1-αz))]
Equation4
x, y, z - total areas of two opposite parallel walls in m2,

24
αx, αy, αz - average absorption coefficients of a pair of opposite walls, S - total surface area of the room in [m
2],
V - total volume of the room [m3].
Fitzroy-Kuttruff’sformula
T60=(0.32V/S2)(h(1+w)/α*L.w/α*cf) Equation5
V, S - volume in [m
3] and total surface area of the room in [m
2],
h, w, l - room dimensions: height, width and length in [m], α*Lw, α
*cf- average effective absorption exponent of walls, ceiling
and floor.
Figure19.Comparisonofmeasuredandpredictedreverberationtimevaluesforaroomwithavolumerangeof50-200
MeasurementsbyDucourneau&Planeaushowedthatthechangeinaverage
acousticalabsorptiondependsontherelativedistancebetweenthesoundsource
andtheabsorbentpanels[14].
Thecurrentlyusedformulastocalculatethereverberationradiushavebeenderived
bytheclassictheoriesofSabineorEyring.However,thesetheoriesareonlyvalidin
perfectlydiffusedsoundfields;thus,onlywhentheenergydensityisconstant
throughoutaroom.Nevertheless,thegenerallyusedformulasforthereverberation
radiushavebeenusedinanycircumstance,regardlessoftheuniformityofthe
-0,5
0
0,5
1
1,5
2
2,5
3
3,5
0 200 400 600 800 1000 1200 1400 1600 1800 2000
Room volume in m3
Reverberation Time [s]
Difference between measured RT and Sabine's
approxim. T60 [s] Sabine's approxim. [s]
Measured Value (RT) [s]
Difference: Measured RT minusSabine's approxim. [s]
Fig. 7. Differences between "approximated" and measured reverberation time
Comparison of Measured and Calculated RT
0.0
0.5
1.0
1.5
2.0
2.5
3.0
3.5
0 50 100 150 200
Room volume in m³
Reverberation Time in s
Measured RT Eyring New Formula
Eyring-Kuttruff Fitzroy Mi l l i n g to n -Se tte
Tohyam a Ara u An n e x D o f p rEN 1 2 3 5 4 -6
Fig. 8. Comparison of measured and predicted reverberation time values for a room with a
volume range of from 50 to 200 m³

25
distributionofabsorption.Arau-PuchadesandBerardihaswritten
theexpressionofthereverberationtimeas:
T=(0.16V/Ax)Sx/S.(0.16V/Ay)Sy/S.(0.16V/Az)Sz/SEquation6
TheArau-Puchades’sformulashowsthatFitzroy’stheorywasnotcompletely
correct,asitwasonlyvalidwhenthereverberationtimesineachdirection(Tx,Ty,
Tz)areequal,orapproximatelyequal.Atendencyforco-incidenceoftheFitzroy’s
formulawiththeSabine’sandEyring’sformulasmayoccurdependingonthe
closenessoftheaverageabsorptioncoefficientsineverydirection.However,
wheneverthereverberationtimesarewelldifferentiatedamongthedirections,then
theFitzroy’sformuladivergessignificantlyfromtheoreticalresultsasrecently
showninsomeroundrobintests(Mehta,Mulholland,1976;Istafa,Bradley,2000;
Ducourneau,Planeau,2003).ThenewformulaEquation6coversdiffuseandnon-
diffusesoundfields,andappearsasageneralformulationofthetheoryof
reverberation[46].
AccordingtothedatafromCavanaugh,itcanbeconcludedthatwell–placed,correct
amountsofabsorptivematerialsintheroomcancontrolthereverberation
characteristicsoftheroom[31].ThestudybyBistafaandBradlyvalidatesthis
findingthroughchangingthelocationandamountofabsorptivematerialsina
classroom[5].Theyalsodeterminedthatspreadingtheabsorptivematerialsaround
theroomsurfacesismoreeffectiveincontrollingreverberationratherthanputting
theminonearea.Thisworkwasfollowedupwithfurtherstudythatnotedand
rankedabsorptionsurfacedesignvariationsandtheirimpactonproducingadiffuse
soundfield[5].Thesefindingsareveryrelevanttothepotentialeffectsoftheliving
wallinthat,livingwallsaretypicallyinstalledonalimitedwallareainaroom
Acousticalscatteringresultsfromtheroughnessofthematerial,knownasdiffusing
anddiffractionduetoedgeandalimitedsurfacesize.Scatteringdoesnotremove
thesoundenergyfromaroombutreducesspecularreflection.Scatteringfrom

26
diffusionisnotwellunderstood.Scatteringfromdiffractionisalsonotfully
understoodbutisknowntobedependentonincidencepathlengthsandangleof
incidence.VorlanderandMommertzintroducedthescatteringcoefficientand
defineditas:thetotalreflectedenergyminusSpecularreflectedenergy[27].
VorlanderandMommert’sresearchonscatteringhasprovidedthemethodologyby
whichtodefineandmeasurethescatteringcoefficientforvariousmaterials.They
comparedthescatteringcoefficientofrandomincidencefromthemeasurementof
impulseresponsesfromafree-fieldmethodandareverberationchambermethod
forvariousorientationsonasamplesurface.Theresearchidentifiedthe
reverberationchambermethodtobemoreconsistentformeasuringthescattering
ofreflectivesurfaces[27].
Sauro&Michael’sresearchconfirmedthatalltheenergyfromanincidentsound
waveisreflectedasspecularlyreflectedandscatteredenergy.Inaddition,the
amountofscatteredandspecularenergydependsonthewavelengthsofthe
incidentenergy[40].
ThestudybyChristensenandRindelinvestigatedthescatteringofreflectedsound,
sd(bydiffraction,duetosurfacedimensions,angleofincidence,incidentand
reflectedpath-lengths),andsurfacescattering,ss(roughnessofsurfacematerial)
[6].Adecreasedsensitivityofroomstothescatteringcoefficientofmaterialsisdue
toincreasedsoundfielddiffusivity.
Mostnumericalmodelslookatabsorptionintermsofspecularreflectiononlyand
ignorescattering.
Odeonsoftwarewasdevelopedforsimulatingtheinterioracousticsofbuildings,
usingimage-sourcemethodcombinedwithraytracing.Givenasetofgeometryand
surfacepropertiesandabsorptionandscatteringcoefficients,theacousticscanbe
predicted,illustratedandanalyzed.InOdeonsurfacediffractionanddiffused
diffractionarecombinedtoestimatethereflection-basedscattering.Thescattering
coefficientisdefinedastheamountofscatteredsoundenergyindifferentdirections
overthetotalreflectedsoundenergy,Figure20.


28
materialsandaloweraverageabsorptioncoefficient.Inroomswithnon-mirrored
reflectivesurfaces,theareaofabsorptionisthedeterminingfactorinitssensitivity
toscatteringcoefficients.Sensitivityincreasesastheaverageabsorptioncoefficient
isdecreased.
HuberandBednar[35]studiedtheeffectofthescatteringcoefficientonthe
reverberationtimethroughsimulationresultsfromcomputermodels(CATT-
Acousticv8.0f).First,theyfoundthatCATTwasingoodagreementwiththe
reverberationtimecalculationsaccordingtoSabineandEyring’salgorithmswith
respecttoabsorptioncoefficientonly.Theresultsoftheirstudyillustratedthatthe
lowscatteringcoefficientsproducehighreverberationtimesinthesimulation.
Reverberationtimeisincreasedwhentheabsorptioncoefficientisnotuniform.
Fromtheirresults,italsocanbeunderstoodthattheinfluenceofthescattering
coefficientonthereverberationtimeincreaseswithlargerdifferencesbetweenthe
absorptioncoefficientofthedifferentsurfacesoftheroomanddecreaseswith
increasingtheaverageabsorptioncoefficientoftheroom.Thisstudyillustratedand
summarizedthesignificantinfluenceofthescatteringcoefficientonthe
reverberationtime.
Navarro,etal[38]evaluatedthepredictedvaluesforreverberationtime,absorption
andscatteringcoefficients,fromageometricalacousticmodelandthediffusion
equationmodel.Theywereabletoestablisharangeinwhichthepredictedvalues,
forabsorptionandscattering,fromthementionedmodelsareingoodagreement.
Comparingtheresults,itwasdeterminedthatthevaluesfromthediffusionequation
modelareclosertothevaluesoftheRay-tracingsoftwareforhomogeneousrooms
withascatteringrangegreaterthan0.6andanabsorptionoflessthan0.45.
Therefore,itcanbeusedtopredictreverberationtimeinthatrange.Thesimulation
resultsalsoshowedagreaterimpactofscatteringonreverberationtimeforsmaller
valuesofabsorption.

29
Farinacompletedaseriesofexperimentalmeasurementsofthescattering
coefficientbasedonthewavefieldsynthesismethod[37].Thecomparisonofthe
resultsfromherworkwasingoodagreementwiththenumericalsimulations.Her
workdescribedtheextensionofanumericalsimulation,whichbecomespossibleby
developmenttothepyramid-tracingalgorithm.Hertechniquemakesitpossibleto
derivethevaluesofthescatteringcoefficient.Thescatteringcoefficientwas
introducedasanewconceptinISO17497-1,standard(2013)[12].Whichisan
internationalstandardformeasurementoftherandom-incidencescattering
coefficientinareverberationroomandwillbereviewedinsection3.4.
Tomeasurenormal-incidencecoefficients,absorptionandscattering,Tetsuya,
HyojinandKashiwanohadevelopedanalternativetoFarina’smethod.However,itis
notsufficientlydevelopedyetforthisresearch.Also,theydevelopedanumerical
simulationtodeterminetheabsorptioncoefficientandscatteringbuthaveonly
appliedittosimplesurfacesratherthanthecomplexsurfacessuchasplants[36].
Shtrepi,etalresearchinvestigatedtheeffectofscatteringonsixacoustical
parametersoftheroom,reverberationtime(T30),clarity(C80),strength(G),Early
DecayTime(EDT),definition(D50)andLateralenergyFraction(LF)usingCatt-
acousticsoftware.Sixdifferentscatteringvaluess=10,30,50,60,70,&90%was
appliedtoroomsurfaces(ceiling,sideandrearwalls)toconsiderscattering
variationinthemeasurement.Fromtheresultsitcanbeillustratedthatthedistance
betweensourceandreceivergreatlyaffecttheacousticalparameters.Fromthe
findingsitcanbeunderstoodthatbyincreasingthescatteringcoefficientvalueT30,
C80,GandD50valuesaredecreasing.ItwasalsofoundthatLFandEDTarenot
affectedbyscattering[39].
ApreliminaryevaluationwasdonelastyearatBCITinclassroom317(NE1
building)asshowninFigure18,withdifferentconfigurationsofnewlyplanted
livingwallsinstalled.Areductioninlowfrequencyreverberationwasobserved

30
accordingtothestudyresultsFigure22.Absorptionandscatteringcoefficientwere
notknownandmodellingwasnotvalidated[30].
SoundLevelMeter Microphone Speaker
Amplifier
LivingWallPosion1–WallinCorner
LivingWallPosion2–WallsParallel
LivingWallPosion3–WallsOpposing
Ourresearchisfocusedonquanfyingthesoundabsorbingabiliesofliving
wallsbymeasuringthereduconinreverberaon me.
BenefitsofLivingWalls
Studieshaveshownthatlivingwallsininteriorapplica
onscanoersignificantbenefitstotheoccupants,in
cluding:
Improvedairquality
Reduconsinover300VOCs(1)
Reducedbloodpressure
Reducedlevelsofstressandanxiety(2)
Increasedproducvity(3)
Reducedabsenteeism(4)
Visualaesthecs
ClassroomAcouscs
Pooracouscalenvironmentsnegavelyimpactlearningbyreducingspeech
intelligibility.(5)
Reverb me–ameasureofhowlongittakesforsoundstodecay–isimpacted
bythesoundabsorponoftheroom.
Whatifalivingwallcouldbeusedinclassroomstoabsorbsoundandfoster
learning,andatthesamemeintroduceallofitshealthbenefits?
ContactInformaon
JesseListoen [email protected] 6047910842
AshkonMohammadi [email protected] 6049164701
SoundTesngResults
MaureenConnelly,DirectorofBCITCenterforArchitecturalEcology|RonKrpan,BCITInstructor
LivingWallassembly
ByAshkonMohammadiandJesseListoen
Conclusions
0.00
0.50
1.00
1.50
2.00
125 250 500 1000 2000 4000
RT(s)
Frequency(Hz)
AverageClassroomReverberationTime
WithoutLivingWall
WithLivingWall
EmptyRoom
Speakerin2dierentcorners
Microphoneat5dierentlocaons
5microphonereadingsateachlocaon
50readingsaveragedtofindRT
LivingWallPresent
Wallsin3dierentposions
Speakerin2dierentcorners
Microphoneat5dierentlocaons
5Microphonereadingsateachlocaon
150readingsaveragedtofindRT.
TestStandard
ThetesngmethodwasbasedonASTMC42307a(6)
Thetesngwascarriedoutthroughfieldtesng,whichinvolvedphysicallytak
ingmeasurementsintheroom,bothwithandwithoutthelivingwall.Amicro
phonewasusedtorecordrandomnoisegeneratedbyaspeakerandamplifi
er.Thespeakerwasturnedontheno whileamicrophonemeasuredhow
longittookthesoundtodecayby60dB.
TestMethod
0.00
0.50
1.00
1.50
2.00
125 250 500 1000 2000 4000
RT(s)
Frequency(Hz)
WallsOpposingReverbTime
0.00
0.50
1.00
1.50
2.00
125 250 500 1000 2000 4000
RT(s)
Frequency(Hz)
WallsParallelReverbTime
WithoutLivingWall
WithLivingWall
WithoutLivingWall
0.00
0.50
1.00
1.50
2.00
125 250 500 1000 2000 4000
RT(s)
Frequency(Hz)
WallsinCornerReverbTime
WithoutLivingWall
WithLivingWall
WithLivingWall
Introducon—Whyalivingwall?
Posion1WallsinCorner Posion2WallsParallel Posion3WallsOpposing
(1)Knowles,L.,MacLean,P. ,Rosato,M.,Stanley,C.,Volpe,S.,&Yousif,D.(2002).LivingWall:FeasibilityStudyofSLCUniversityofWaterloo.UniversityofWaterloo.
(2)Heerwagen,J.(1990).Thepsychologicalaspectsofwindowsandwindowdesign.Proceedingsof21stannualconferenceoftheEnvironmentalDesignResearchAssociaon,269280.
(3)Marchanct,B.(1982).Alookattheindustrydimensionsandprospects.AmericanNurseryman156,3049.
(4)Conklin,E.(1978).Interiorlandscapingandarboriculture.JournalofArboriculture4,7379.
(5)Zannin,P.H.T,Marcon,C.R.(2007).Objecveandsubjecveevaluaonsoftheacousccomfortinclassrooms.AppliedErgonomics38,675680.
(6)ASTMInternaonal.(2007).ASTMStandardC42307a"StandardTestMethodforSoundAbsorponandSoundAbsorponCoe cientsbytheReverberaonRoomMethod.WestConshohocken,PA.
(7)BuildingBullen93(2003).UnitedKingdom.
Acknowledgments
References
Temperature: 22C
RelaveHumidity: 36%
DewPoint: 7C
AverageReverberaonTime(s)
Frequency(Hz) 125 250 500 1000 2000 4000
WithoutLivingWall 1.07 1.95 0.96 0.45 0.47 0.48
WithLivingWall 1.06 1.25 0.75 0.43 0.34 0.34
PercentReducon 1% 36% 22% 4% 27% 29%
Thelivingwallreducedreverberaon meacrossallfrequencies,comparedtotheroomwithoutaliving
wall.
19%reduconinRTatlowrangefrequencies(125250Hz)
13%reduconinRTatmidrangefrequencies(5001000Hz)
28%reduconinRTathighrangefrequencies(20004000Hz)
BB93recommendsatmaximummidfrequencyreverbmeinclassroomsof0.6to0.8seconds(7).Without
thelivingwall,theroomhadareverbmeof0.64s.Withtheintroduconofalivingwall,theRTdropped
to0.51s,represenngareduconof20%.
Basedonourresearch,itmaybesuitabletointroducealivingwallintoclassroomstoimprovetheacousc
environmentthroughareduconreverberaon me,inaddiontointroducingitsaforemenonedenviron
mentalbenefits.Furthertesngneedstobedoneondierentlivingwallstructuresandclassroomsizesto
getabroadersenseofthesoundabsorbingabiliesoflivingwalls.
AverageReverberaonTime(s)
Frequency(Hz) 125 250 500 1000 2000 4000
WithoutWall 1.07 1.95 0.96 0.45 0.47 0.48
WithWall 1.27 1.09 0.86 0.44 0.33 0.30
%Reducon +19% 44% 10% 2% 30% 38%
Room317Info
FloorArea:58m2
WallHeight:2.7m
RoomVolume:160m3
AverageReverberaonTime(s)
Frequency(Hz) 125 250 500 1000 2000 4000
WithoutWall 1.07 1.95 0.96 0.45 0.47 0.48
WithWall 0.96 1.50 0.73 0.39 0.33 0.33
%Reducon 10% 23% 24% 13% 30% 31%
AverageReverberaonTime(s)
Frequency(Hz) 125 250 500 1000 2000 4000
WithoutWall 1.07 1.95 0.96 0.45 0.47 0.48
WithWall 0.94 1.15 0.67 0.46 0.35 0.39
%Reducon 12% 41% 30% +2% 26% 19%
Temperature: 22C
RelaveHumidity: 39%
DewPoint: 7C
Temperature: 22C
RelaveHumidity: 37%
DewPoint: 7C
Materials&SurfaceAreaTotalSurfaceArea:203m2
AcouscCeilingTile:46m2
CarpetFlooring:58m2
Drywall:56m2
LighngFixtures:12m2
LivingWall:3.6m2
WallVegetaon LivingWall
Figure21.PuttingILWindifferentconfigurationintheclassroom[30]

31
Walls in corner
Walls parallel
Walls opposing
Figure22.Reverberationtimeoftheroomwithdifferentconfigurationoflivingwalls[30]
SoundLevelMeter Microphone Speaker
Amplifier
LivingWallPosion1–WallinCorner
LivingWallPosion2–WallsParallel
LivingWallPosion3–WallsOpposing
Ourresearchisfocusedonquanfyingthesoundabsorbingabiliesofliving
wallsbymeasuringthereduconinreverberaon me.
BenefitsofLivingWalls
Studieshaveshownthatlivingwallsininteriorapplica
onscanoersignificantbenefitstotheoccupants,in
cluding:
Improvedairquality
Reduconsinover300VOCs(1)
Reducedbloodpressure
Reducedlevelsofstressandanxiety(2)
Increasedproducvity(3)
Reducedabsenteeism(4)
Visualaesthecs
ClassroomAcouscs
Pooracouscalenvironmentsnegavelyimpactlearningbyreducingspeech
intelligibility.(5)
Reverb me–ameasureofhowlongittakesforsoundstodecay–isimpacted
bythesoundabsorponoftheroom.
Whatifalivingwallcouldbeusedinclassroomstoabsorbsoundandfoster
learning,andatthesamemeintroduceallofitshealthbenefits?
ContactInformaon
JesseListoen [email protected] 6047910842
AshkonMohammadi [email protected] 6049164701
SoundTesngResults
MaureenConnelly,DirectorofBCITCenterforArchitecturalEcology|RonKrpan,BCITInstructor
LivingWallassembly
ByAshkonMohammadiandJesseListoen
Conclusions
0.00
0.50
1.00
1.50
2.00
125 250 500 1000 2000 4000
RT(s)
Frequency(Hz)
AverageClassroomReverberationTime
WithoutLivingWall
WithLivingWall
EmptyRoom
Speakerin2dierentcorners
Microphoneat5dierentlocaons
5microphonereadingsateachlocaon
50readingsaveragedtofindRT
LivingWallPresent
Wallsin3dierentposions
Speakerin2dierentcorners
Microphoneat5dierentlocaons
5Microphonereadingsateachlocaon
150readingsaveragedtofindRT.
TestStandard
ThetesngmethodwasbasedonASTMC42307a(6)
Thetesngwascarriedoutthroughfieldtesng,whichinvolvedphysicallytak
ingmeasurementsintheroom,bothwithandwithoutthelivingwall.Amicro
phonewasusedtorecordrandomnoisegeneratedbyaspeakerandamplifi
er.Thespeakerwasturnedontheno whileamicrophonemeasuredhow
longittookthesoundtodecayby60dB.
TestMethod
0.00
0.50
1.00
1.50
2.00
125 250 500 1000 2000 4000
RT(s)
Frequency(Hz)
WallsOpposingReverbTime
0.00
0.50
1.00
1.50
2.00
125 250 500 1000 2000 4000
RT(s)
Frequency(Hz)
WallsParallelReverbTime
WithoutLivingWall
WithLivingWall
WithoutLivingWall
0.00
0.50
1.00
1.50
2.00
125 250 500 1000 2000 4000
RT(s)
Frequency(Hz)
WallsinCornerReverbTime
WithoutLivingWall
WithLivingWall
WithLivingWall
Introducon—Whyalivingwall?
Posion1WallsinCorner Posion2WallsParallel Posion3WallsOpposing
(1)Knowles,L.,MacLean,P. ,Rosato,M.,Stanley,C.,Volpe,S.,&Yousif,D.(2002).LivingWall:FeasibilityStudyofSLCUniversityofWaterloo.UniversityofWaterloo.
(2)Heerwagen,J.(1990).Thepsychologicalaspectsofwindowsandwindowdesign.Proceedingsof21stannualconferenceoftheEnvironmentalDesignResearchAssociaon,269280.
(3)Marchanct,B.(1982).Alookattheindustrydimensionsandprospects.AmericanNurseryman156,3049.
(4)Conklin,E.(1978).Interiorlandscapingandarboriculture.JournalofArboriculture4,7379.
(5)Zannin,P.H.T,Marcon,C.R.(2007).Objecveandsubjecveevaluaonsoftheacousccomfortinclassrooms.AppliedErgonomics38,675680.
(6)ASTMInternaonal.(2007).ASTMStandardC42307a"StandardTestMethodforSoundAbsorponandSoundAbsorponCoe cientsbytheReverberaonRoomMethod.WestConshohocken,PA.
(7)BuildingBullen93(2003).UnitedKingdom.
Acknowledgments
References
Temperature: 22C
RelaveHumidity: 36%
DewPoint: 7C
AverageReverberaonTime(s)
Frequency(Hz) 125 250 500 1000 2000 4000
WithoutLivingWall 1.07 1.95 0.96 0.45 0.47 0.48
WithLivingWall 1.06 1.25 0.75 0.43 0.34 0.34
PercentReducon 1% 36% 22% 4% 27% 29%
Thelivingwallreducedreverberaon meacrossallfrequencies,comparedtotheroomwithoutaliving
wall.
19%reduconinRTatlowrangefrequencies(125250Hz)
13%reduconinRTatmidrangefrequencies(5001000Hz)
28%reduconinRTathighrangefrequencies(20004000Hz)
BB93recommendsatmaximummidfrequencyreverbmeinclassroomsof0.6to0.8seconds(7).Without
thelivingwall,theroomhadareverbmeof0.64s.Withtheintroduconofalivingwall,theRTdropped
to0.51s,represenngareduconof20%.
Basedonourresearch,itmaybesuitabletointroducealivingwallintoclassroomstoimprovetheacousc
environmentthroughareduconreverberaon me,inaddiontointroducingitsaforemenonedenviron
mentalbenefits.Furthertesngneedstobedoneondierentlivingwallstructuresandclassroomsizesto
getabroadersenseofthesoundabsorbingabiliesoflivingwalls.
AverageReverberaonTime(s)
Frequency(Hz) 125 250 500 1000 2000 4000
WithoutWall 1.07 1.95 0.96 0.45 0.47 0.48
WithWall 1.27 1.09 0.86 0.44 0.33 0.30
%Reducon +19% 44% 10% 2% 30% 38%
Room317Info
FloorArea:58m2
WallHeight:2.7m
RoomVolume:160m3
AverageReverberaonTime(s)
Frequency(Hz) 125 250 500 1000 2000 4000
WithoutWall 1.07 1.95 0.96 0.45 0.47 0.48
WithWall 0.96 1.50 0.73 0.39 0.33 0.33
%Reducon 10% 23% 24% 13% 30% 31%
AverageReverberaonTime(s)
Frequency(Hz) 125 250 500 1000 2000 4000
WithoutWall 1.07 1.95 0.96 0.45 0.47 0.48
WithWall 0.94 1.15 0.67 0.46 0.35 0.39
%Reducon 12% 41% 30% +2% 26% 19%
Temperature: 22C
RelaveHumidity: 39%
DewPoint: 7C
Temperature: 22C
RelaveHumidity: 37%
DewPoint: 7C
Materials&SurfaceAreaTotalSurfaceArea:203m2
AcouscCeilingTile:46m2
CarpetFlooring:58m2
Drywall:56m2
LighngFixtures:12m2
LivingWall:3.6m2
WallVegetaon LivingWall

32
3.4.Experimentalmethods
3.4.1. Absorption
Anumberofmethodsusedinpreviousstudiesrelevanttothisresearchcanbe
mentioned:random-incidenceabsorptioncoefficientaccordingtoISO354[13]and
random-incidencescatteringcoefficientbasedonISO17497-1[12].VanderHeijden
measuredfreefieldsoundpressurelevelandfoundabsorptionbasedonimpedance
tubemethods[26].MartensusedLaser-Doppler-Vibrometersystemformeasuring
thevibrationvelocityofsmallareasontheplantsoverawidefrequencyrange(0-
100Hz)[20].Wongdeterminedanabsorptioncoefficientthroughinsertionloss
experimentsinareverberationchamber[29].
3.4.2.ScatteringRonaldandMichaelprovidesuggestionstomodifyrequirementsandmethod
recommendationsbyISO-17497-1standardinordertogathermoreaccuratedata.
Theirmeasurementsonhundredsoffullsizedmaterialsamplesillustratedthatthe
shapeandsizeofthesamplesareimportantincollectingthedata.Itis
recommendedthatthestructuraldepthofthesampleformeasurementsshouldbe
lessthan1/16ofthetotalsamplediameter.Andthediameterofthesampleshould
belongerthan3.5meter(137.8inches)atfullscaleinordertogetthemore
accuratemeasurementsatlowfrequencies.Thechamberdoorshouldbeclosedfor
15minutesbeforestartingthemeasurementstoletairmovementinthechamber
stabilize.Duringthemeasurementforeachset,thetemperaturecannotchange
morethantwodegreesCelsius,alsotherelativehumidityofthechambermustbe
constantandabove50%.Theselectedstimulusshouldhavelesssensitivityto
temperature,humidityandairmovementsuchaspinknoise.Thetestsampleson
theturntableshouldbeconstantlyrotatedmorethan3completeturns.Becauseof
therequirementsofthesimulationprogramsthefrequencyrangeshouldbe
extendedfrom100Hzto10kHz[40].

33
Choi,etalusedascalemodeltoinvestigateissuesandambiguitiesofrandom-
incidencescatteringcoefficientmeasurementbasedonISO1749-1[41].They
consideredthreeparameters:theairgapbelowtheturntable,thediameterofthe
turntableandtestsampleabsorption.Theresultsfromtheirworkshowedthat
diameteroftheturntablehasaneffectonthescatteringcoefficientvaluesofthe
baseplateatthehighfrequencybandsbetween1kHzand5kHz.Increasingtheair
gapundertheturntableto50mmleadsinahigherscatteringcoefficientofthebase
plate.Also,changingtheabsorptionofthetestsampledidnotchangethescattering
coefficientsignificantly.
3.4.3. Reverberationtime
TheliteraturebyJambrosic,etalreviewsthreedifferentmethodsofreverberation
timeempiricalmeasurementinthefield[32].Themethodsare:theinterrupted
noisemethod,theintegratedimpulseresponsemethodandtheburstmethod.
BalloonswereusedintheburstmethodevaluationandanOmni-directionalsound
sourcewasusedforthetwootherexperiments.Thedifferentmethodswereusedto
measuretworooms.Thefirstroomisa230m3rectangularroom,containinga
numberofacousticmaterials,andthesecondroomisan800m3L-shapehallway
withhardandreflectivesurfaces.Thereverberationtimemeasurementsforthefirst
roomweremoreconsistentcomparedwiththesecondroom.Figure23and24
illustrateabetteragreementatfrequenciesabove125Hzintherectangularroom
andabove1000HzintheL-shapedroom.Fromthisresult,itcanbeconcludedthat
allthementionedmethodsformeasuringreverberationtimeareusableinthe
experimentaslongasthereispowerfulexcitationtoprovidesufficientdynamic
range.Limitedmeasurementshavebeencarriedoutonverticalgreenerysystems,
suchas,thestudybyWong[29].Thesefindingswillsupportthemethodof
evaluationoflivingwalls.

34
Figure23.Room1atposition1[32]
Figure24.Room2atposition1[32]
Toinvestigatetheacousticalbenefitsofinteriorlivingwallssystematically,more
detailsaboutthesoilsurface,thefoliage,diffusionandabsorptioncharacteristics
areneeded.

35
3.5.RoomcriteriaTherearecommonlyadoptedcriteriaforbackgroundnoiselevel,speech
intelligibilityindexandreverberationtimeindifferentinteriorspaces.ASHRAEhas
manycriteriaforallusesandoccupancies.
ASHRAE,LEED(LeadershipinEngineeringandEnvironmentalDesign)andANSI
S12.60areguidelinesforappropriateacousticsinschoolareas.Thesestandards
takeintoconsiderationthebackgroundnoise,speechintelligibility,and
reverberationtime(whichhasaneffectontheothercriteria).Backgroundnoise
level(BNL)canbeidentifiedbynoisecriteria(NC)curves.AccordingtoLEED(LEED
forschool-2009IEQc9)theminimumacousticalperformancerecommendedbythe
criteriaintheclassroomisNC30-40forspacesbiggerthan20,000SF,ASHRAE1
recommendsNC-30.Reverberationtimeshouldbelessthan1.5secondsandNRC
(NoiseReductionCoefficient)rateof0.7inordertomeettheLEEDrequirementorit
shouldhaveT60between0.6to0.7onthebasisoftheANSIstandardS12.60-2012
(Part1).
Appropriate,strategically-placedmaterialsandroomgeometryeffectreverberation
time,andaquietHVACsystemcandecreasethebackgroundnoiselevel.According
tothestudybyKang,appropriateabsorptivecharacteristicsoftheroomsurfaces
canimprovespeechintelligibilityintheroom.Ininternalspaceswithacoustic
defectssuchasechoesandlongreverberation,selectingsuitablescattering
propertiesofboundariesisalsoimportanttoimprovespeechintelligibility[15].For
highspeechintelligibility,SIImustbehigherthan0.75,whileforhighspeech
privacy,itmustbelessthan0.2.Theconsideredacousticalstandardsandcriteriain
thisresearcharelistedinappendixA.
1ASHRAEHandbook,Chapter47,Controlbackgroundnoiselevelsincorelearningspace

36
4. METHODOLOGY
4.1. ScopeandHypothesesThescopeofthisinterdisciplinaryresearchisfocusedontheabsorptionand
scatteringcharacteristicsoflivingwalls.Theempiricaldatacollectionincludesfull
scaleabsorptionmeasurementsoftheconstituentparts-carrier,substrateand
plantsforthreeavailablelivingwallsystems,fullscaleabsorptionmeasureoffully
establishedlivingwallsystems.Plantswereevaluatedovertimetoestablishthe1/3
scaledspecies,1/3-scaleabsorptionandscatteringmeasurementofsixdifferent
plantspecies.
Fromthefindingsoftheliteraturereview,itisexpectedthatthesubstrateisthe
mostsignificantcomponentoflivingwallsintermsofabsorption,andplantsarethe
mostsignificantintermsofscattering.Additionally,thesoundscatteringofliving
wallssignificantlyimpactsthereverberationtimeandcannotbeneglectedin
modelling.Theplantcoveragedensityisalsoimportantintermsofabsorptionand
scattering,whilethecarriertypewillnotbesignificant.Theinteriorlivingwalland
itslocation,asasoundabsorptiveandsoundscatteringmaterial,giventhetypical
sizeofinteriorlivingwallswillhaveaneffectonreverberationtimeinrooms.
Parametersofsubstratemixture,moisturecontent,andoverallplantcoverage
investigated.Thenthesoundabsorptionandscatteringcoefficientsfromthe
reverberantchamberwillbeusedtoinvestigatethesensitivityofroommodellingto
themeasureddata.

37
4.2. MaterialsThepurposeofhavingthreesignificantlydifferentlivingwallsystemsistoseethe
effectsoforganicattributeslikesubstrateandplantsontheabsorptionand
scatteringofabroadrepresentationalrangeofmarket-establishedlivingwall
systems.Ofthethreesystems,twosystemshavesoil-basedsubstrates,whilethe
thirdsystemhasafibrouswool-basedsubstrate.
Figure25.interiorlivingwallsystemdimension.(CarrierTypeA)
Depth= 15.6 cm
Figure26.interiorlivingwallsystem.(CarrierTypeB)
ByNature - Showroom: Studio 490 - 1000 Parker Street - Vancouver, BC, V6A 2H2.
www.bynaturedesign.ca - 1-800-436-2919
The Modulogreen Living Wall
Origin: France
Launch: 2003
Track record: More 500,000 square feet installed all over the world
Canada: A dozen living wall installations in Canada since 2013
A living ecosystem on your wall - how cool is that? Designed with simplicity in mind, and based on living
wall technology popular in Europe, our ModuloGreen Living Wall system ensures your vertical garden
will thrive.
1 - Specifications
The ModuloGreen is a soil-based living wall system, making water use and the maintenance needs
extremely low, thus limiting the long-term cost associated with the system. The horizontal orientation of
the planting areas makes it very easy to plant, and the ample space available for the roots to develop
allows for a diversity of plants to flourish. The smart design also makes it easy to change the plants
according to the season or to customer preferences.
100% recyclable ABS plastic was chosen for its resistance to warping, compatibility with roots and for its
thermal properties. Each module is designed to overlap with another, making the entire living wall
seamless and completely waterproof. 60.00
60.00
10.00
15.00

38
Depth: 15.6 cm
Figure27.interiorlivingwallsystem.(CarrierTypeC)
System1-CarrierAFigure25:Thisisasoil-basedlivingwallsystemwithrelatively
lowwaterconsumption(about220Lperyear/perm2).Thecarrieris100%-
recyclableABSplastic.Theself-regulating,low-outputdripirrigationnetwork
providesfortheplants’waterneeds.Wateroverflowisdraineddirectlythroughthe
bottomedgeofthemodule.Thedesignofthecarriersmakesiteasytoplantandthe
systemprovidesplentyofspaceforrootdevelopment,theformofthecarrierholds
thesubstrateandrootssecurelyinside.
System2-CarrierBFigure26:Thissystemisasoil-basedlivingwallsystemwith
relativelylowwaterconsumption(about220Lperyear/perm2)andusesaself-
regulating,low-outputsoakhosewhichprovidestheplants’water(Thepanelsare
plantedhorizontally,andthesoilisexposed).Thecarrierismadeofstainless-steel,
andcanbeusedforbothinteriorandexteriorpurposes.Theformofthecarrier
presentsthesubstrateastheverticalexposedfacecannotholdthesubstrateuntil
aftertheestablishmentoftheplantroots(30-60daysafterplantinginahorizontal
orientation).
System3-CarrierC
Figure27:Isahybridhydroponiclivingwallsystem.Constantirrigationisrequired
toprovidesufficientmoisturecontentandnutrientsforsuccessfulgrowthofplants
60.00
51.00
10.00
8.50


40
Table1.Weightofthecarriers,carrierswith2differentsubstratemixtureandplantedcarriers
Systems
No. CTA(weight)
CTB(weight) CTC(weight)
1 EmptyCarrier 6.04kg 10.92kg 2.65kg2 Carrierwithsubstrate
(80%soil-20%pumice)25.88kg 32.70kg -
3 Carrierwithsubstrate(70%soil-30%pumice)
26.80kg 34.11kg -
4 Carrierwithpottingsoilonly
- - 3.35kg
5 Carrierwithsubstrateinfieldcapacity(70%soil-30%pumice)
27.30kg 35.00kg 3.79kg
6 Plantedcarrier,(70%soil-30%pumice)(Mixvegetation)*
Mix1=30.20Mix2=32.35Mix3=34.70
Mix1=38.62KgMix2=39.44Mix3=41.90
7 Plantedcarrier,(70%soil-30%pumice)
- 1.Ivy=36.72Kg2.Spider=35.14Kg3.Pilea=45.54Kg4.Creep.fig=42.36Kg5.Fern=40.74Kg6.Gold.Poth.=43.86Kg
-
NoteCTA:CarrierTypeA , CTB:CarrierTypeB , CTC:CarrierTypeCMix1,2,3=tomeasureconsistencyinmeasurementsIconductedthreeexperimentswiththreeofeachcarriershavingtheexactsamemixtureofplantsspecies*Allthreesystemswereplantedwith40plants.
Eachpanel(CarrierA,CarrierBandCarrierC)wasplantedusing40pots,witha
mixtureofsixavailablespecies.Inordertoverifytheconsistencyreliabilityofthe
resultsforeachcarriertypethreesetsofexperimentswereconductedforeachof
thethreetestsamples.Intotal9setsofexperimentswereconductedtomakesure
theresultsareconsistentandrepeatable.Theresultsarediscussedinsection5.2.2
(Figure53-55)andshowpromisingconsistency.

41
4.2.2. PlantsDescriptionSixavailableplantswerestudied,namelyEnglishIvy(Hederahelix),Fern
(Filicophyta),GoldenPothos(Epipremnumaureum),Pilea(Pileamicrophylla),Spider
Plant(Chlorophytumcomosum‘Variegatum’)andCreepingFig(Ficuspumila).The
selectedspeciesdifferintheirproperties(leafthickness(mm),leaflength(mm),leaf
area(mm2),leafmasslive(mg),leafmassdry(mg),stemdiameter(mm),plant
height(mm)),andwillfacilitatetheexaminationofdifferentplantproperties’
impactonsoundabsorptionandscattering.Figure29illustrateseachspecies,figure
30illustratesthevarianceinplantstructureandfigure31illustratesthevariancein
plantleafs.Followareshortplantdescriptions;
ShortplantsdescriptionIvy
Ivieshavedark-green and waxy leaves, alternately arranged along the stems,Ivy
growswellinsandy,clayandnutrient-poorsoils.Itgrowsto235mminheight,with
stemsupto1.6mmindiameter,inheightinlivingwallsystems[28].
Fern
Fernsaregreenflowerlessplantswithdividedleavesthattendtogrowindamp,
shadyareas.Itgrowsto514mmheight,withstemsupto1.47mmindiameterin
livingwallsystems[28].
GoldenPothos
GoldenPothosisapopularhouseplantintemperateregions.Theplantgrowsto318
mmheight,withstemsupto4mmindiameter,climbingbymeansofaerialroots
whichadheretosurfaces.Thisplantproducestrailingstemsandrequireslittlecare.
[28].

42
Pilea
Pileahavepeculiarlypuffyleaveswithdepressedveins.Theyrequiredlowlight
levels.MostPilea(Glauca)grownomorethan299mmtall,withstemsdiameterup
to1.1mm.[28]
SpiderPlant
TheSpiderPlantisoneofthemostcommonhouseplants.Itiseasilygrownandis
especiallypopularfortheeaseandspeedwithwhichitformsnewplants.Spider
Plantsgrowquicklyto475mmheightinlivingwallsystems.[28]
CreepingFig
CreepingFigisawoodyevergreenvineandpopularhouseplantincoolerareas.It
growsto262mmheight,withstemsdiameterupto1.4mm.[28]
a) English Ivy
b) Fern
c) Golden Pothos
d) Pilea
e) Spider Plants
f) Creeping Fig
Figure29.Imagesofthevariousspeciesusedforplantingthelivingwallpanels.

43
Figure30.Sixspeciesunderinvestigation(inpot)
Figure31.Shapeoftheleafofeachspecies
4.2.3. PlantPropertiesTheplantspeciesarecharacterizedintermsof
§ Leafthickness(mm)
§ Leaflength(cm)
§ Leafarea(mm2)
§ Leafmass(live)mg
§ Leafmass(dry)mg
§ Stemdiameter(mm)
§ Plantheight(mm)
§ Leafareaindex(LAI),whenplanted
§ Totalcoverage,whenplanted

44
4.3. MeasurementprocedureofplantpropertiesPlantpropertiesweredeterminedfromanaverageofthreepotsofeachspeciestype
selectedrandomlyfromtheplantsreservedfortheresearchproject.Thethickness
oftheleaveswasdeterminedusingadigitalcaliper.Leafareawasmeasuredfrom
randomlyselectedleavesfromeachspecies.Theleavesweretracedandimportedto
AutoCADandtheareawasdeterminedwithapolyline.Leafmasswasmeasuredby
dryandliveweight.Forlivemassallselectedleafswereweightedusingascalewith
theaccuracyof0.00g(a100…ofagram)andaveraged.Todeterminedrymass,
theleaveswereblottedtoremoveexistingfreesurfacemoisture,driedinanoven
overnight(around105oF)andthenweighted.Stemdiameter(mm)wasmeasured
usingadigitalcaliper.Plantheight(mm)wasmeasuredwitharulerfromthebase
substratetotheheightofthetallestleafineachpot.LeafAreaIndex,definedasthe
areaofleavesoversurfacearea.
Scaledmeasurementsofplants
Inordertoconsidertheuseofplantsforsoundscatteringmeasurementofthe1/3
scalemodelinfrastructure,theplantcharacteristicsweremeasuredrepeatedlyover
time,astheplantschangedwithgrowth.Theresultsofallmeasurementswere
comparedtotheresultofthefully-grownspeciescharacteristics.Fromthis
investigation,itwasdeterminedthatitwasonlypossibletoscaletheplantspecies
intermsoftheliveleafmass.Inthismanner,a1/3-scaledplantwasdeterminedfor
scaledacousticmeasurements.

45
Figure32illustratestheprocessoftheestablishmentoftheplantsinthelivingwallsystems.
Figure32.PreparationphaseattheCenterforArchitecturalEcology(BCIT).Thelivingwallpanelsweredeveloped
asjointexperimentset-upwithIvanCheung(UBC,Theimpactoflivingwallsonindoorairquality).

46
4.3.1. AbsorptionAbsorptioncoefficientweremeasuredandcalculatedbasedonISO354[13]and
ASTMC423-08ainareverberationchamberof88m3atBCITFigure33.The
chamberwidth,length,heightratiois1:1.29:1.56asperASTME90-98.Theroom
wasdesignedtocreateadiffusesoundfieldwithauniformdistributionofacoustic
energyandrandomdirectionofsoundincidenceoverashorttimeperiod.According
tostudybyConnellythelow-frequencycutoffofthechamberis177Hz[7].Spatial
variationofSPLisshowntobewithin1.5dBatallfrequenciesabove177Hz.The
changeofimpedanceattheboundaryoftheconcreteroomsurfacesbetweenairand
concreteissolargethatalmostalloftheacousticenergythatisincidentonthe
roomsurfacesisreflectedbackintotheroom.Duetothediffusedsoundfieldand
theuseofabroadbandsoundsource,theresultingsoundfieldcontainsacoustic
energyacrossthewholeaudiblerange.Theabsorptionoftheroomanditscontent
soundfieldiscalculatedbasedontheassumptionsthattheincidentsoundfieldis
diffusebeforeandduringdecayandthatnoadditionalenergyenterstheroom
duringdecay[2].Inthisstudysetupthelow-frequencycutoffwasdeterminedtobe
315Hz.
Soundabsorptionareafunctionoffrequencyandmeasurementswillbemade
acrossaseriesoffrequencybands,inone-third-octavebandsfrom177Hzto4000
Hz.Asstatisticalmodeltheresultofeachtestisfromaveraging50measurements
(n=50).
Photocredit:commons.bcit.ca
Figure33.ReverberationChamberatBCIT

47
Figure34.Microphone(X)andsource(S)positionplan
Tofindtheabsorptioncoefficient,RTwasdeterminedwithimpulseresponse
measurementusingWinMLSsoftware.Thesetestmethodsdeterminethesound
absorptioninareverberationroombymeasuringdecayrate.Thesoundabsorption
wasmeasuredbeforeandafterplacingthetestspecimeninthechamber.According
toBibbysstudychangesintemperatureandrelativehumidityduringtheRT
measurementscanhaveasignificantimpactonthetestresults[42].Therefore,all
attemptsweremadeforthemeasurementstobecompletedundersimilarclimatic
conditions,andvarianceintemperatureandRHisaccommodatedduringpost-
measurementanalysis.Soundabsorptionwasalsomeasuredinaprocessof
obtainingthescatteringcoefficientat1/3scaleandisdiscussedinthefollowing
section.Asillustratedinfigure34,absorptionofeachsamplewasaveragedover50
measurements;(eachsetofmeasurementweretakenatfivedifferentpoints,every
pointhasthreespotswithdifferentheight,andthewholemeasurementateach
pointwasdonetwice).SeeAppendix4forequipmentlistandspecifications.
5.34
5.58
3.56
S
0.50
0.90
1,2,3,4,56,7,8,9,10
11,12,13,14,1516,17,18,19,20
21,22,23,24,2526,27,28,29,30
31,32,33,34,3536,37,38,39,40
2.23
3.42
4.46
1.00
2.00
3.00
4.00
0.90
1.78
2.66
3.56
41,42,43,44,4546,47,48,49,50
0.50
S
0.50
0.90
1,2,3,4,56,7,8,9,10
11,12,13,14,1516,17,18,19,20
21,22,23,24,2526,27,28,29,30
31,32,33,34,3536,37,38,39,40
2.23
3.42
4.46
0.90
1.78
2.66
3.56
41,42,43,44,4546,47,48,49,50
0.50

48
Acousticalabsorptionofeachcomponentoftheinteriorlivingwallwascalculated
fromtheSabineformula(seeEquation1).
A=A2–A1Equation7
A=Absorptionofthespecimen,m2
A1=Absorptionoftheemptyreverberationroom,m2
A2=Absorptionoftheroomafter
α=(A2–A1)/S+α1Equation8.
Inordertoaccessthelivingwallandinvestigatethecontributionofeachcomponent
(carrier,substrate,plant)aseriesoftestswereexecuted.Thefirstseriesevaluateda
singleemptypanelofeachsystem.Thesecondseriesevaluatethesinglepanelof
eachsystemfilledwithsubstrate.Theabsorptionoftwodifferentsubstratemixesin
theCarrierAandCarrierBwereevaluated.Alsotwolevelsofmoisturecontentwere
evaluatedfortheCarrierAandcarrierCfilledwithsubstrate.Thethirdseriesof
testsevaluatedeachsystemwithamixofallsixspecies.AlsoCarrierBwasplanted
witheachofthesixspeciesindividuallytoassesstheabsorptionofeachplant
species(Section5.2.2Figure57).Inthisseriesthepanelswereevaluated
individuallyandingroupsof3CarrierApanels,4CarrierBpanelsand8CarrierB
panelsinordertoconsidertheeffectofpanelsmultiplierinsoundabsorption
(Appendix5).InthattheareadoesnotmeetASTM423standardforsamplesize.
ThedataispresentedascomparativeinDSabine.
Intoaccesstheconsistencyofthemeasurements
Eachpanel(CarrierA,CarrierBandCarrierC)wasplantedusing40pots,witha
mixtureofthesixavailablespecies.Inordertoverifytheconsistencyandreliability

49
oftheresultsforeachcarrierthreetestsampleswereestablished.Foreachcarrier
typethreesetsofmeasurementwereconducted(Mix1,Mix2,Mix3).Intotal9setsof
measurementwereconductedtoensurethattheresultsareconsistentand
repeatable.TheresultsarediscussedinSection5.2.2(Figures53-55)andshow
promisingconsistency.ThisseriesofevaluationsaresummarizedinTable2.
Table2. Tableoftestinthereverberationchamber-fullscaleabsorptiontest
Test
No.
Description ASTMC423-08 Species
1 Empty reverberation chamber - 2 Turning table (1/3 scale) -
Carrier panel 3 Carrier Type A (CTA) - 4 Carrier Type B (CTB) - 5 Carrier Type C (CTC) -
Carrier panel with substrate 6 CTA with Substrate (S1: mixing rate of pumice / pot soil =
20%/80%) -
7 CTA with Substrate (S2: mixing rate of pumice / pot soil = 30%/70%)
-
8 CTB with Substrate (S1) - 9 CTB with Substrate (S2) - 10 CTC with Substrate (PS) 11 CTA with Substrate (S2),field Capacity 12 CTC with Substrate (PS), Fieled Capacity
Fully established panels 13 CTA, S2 (Sample 1) Mix1 14 CTA, S2 (Sample 2) Mix2 15 CTA, S2 (Sample 3) Mix3 16 All three CTA Mix 17 CTC, S2 (Sample 1) Mix1 18 CTC, S2 (Sample 2) Mix2 19 CTC, S2 (Sample 3) Mix3 20 CTB, S2 (Sample 1) Mix1 21 CTB, S2 (Sample 2) Mix2 22 CTB, S2 (Sample 3) Mix3 23 CTB, S2 P1= English Ivy 24 CTB, S2 P2= Fern 25 CTB, S2 P3= Golden Pothos 26 CTB, S2 P4= Pilea 27 CTB, S2 P5= Spider Plants 28 CTB, S2 P6= Ficus pumila 29 4 CTB Mix 30 8 CTB Mix
Note 1 - 10 times in 5 microphone location

50
4.3.2. Scattering
Measurementsforrandom-incidencescatteringcoefficientwerecarriedout
accordingtoISO17497-1[12]inthereverberationroom.TheBCITreverberation
chamberis88m3therefore,scatteringmeasurementsareconductedat1/3scale.
The1/3scaledturningtablethatwasbuiltaccordingtostandardasshownin
Appendix3[45]
Aperiodicpseudo-randomnoisesignals(MLS)isusedtogaintheimpulseresponse.
RTsinone-thirdoctavebandswereaveragedover50source-receiverpositions
(Figure34and36).Thedurationofthemeasurementforeachsource-receiver
positionwasequaltoonecompleterotationoftheturntable(60secondsforone
completerotationoftheturntable).Theimpulseresponsewasevaluatedbasedon
ISO354(usingthecalculatedvaluesforT1,T2,T3,T4).Reverberationtimeofthe
emptyroom(T1)andthereverberationtimewiththesampleintheroom(T2)was
measuredonanon-rotatingturntable.Additionally,thereverberationtimewhen
theturntableisrotating(T3)andwhiletheroundtableisrotatingwiththetest
sample(T4)wasmeasured.
Thescatteringcoefficient,s,wascalculatedasfollows:
αS=55.3V/S(1/c2T2–1/c1T1)Equation9.
αspec=55.3V/S(1/c4T4–1/c3T3)Equation10.
Where:
αs=random-incidenceabsorptioncoefficient
αspec=random-incidencespecularabsorptioncoefficient
V=volumeofthereverberationroom(m3)
c=speedofsound(m/s)
T20=reverberationtime

51
4.3.3.ScatteringMeasurementsInordertoinvestigatetheimpactofthetypeofspeciesandthedensityofvegetation
inthesoundabsorptionandsoundscattering,theseriesoftestswereexecutedand
listedintable3.
Toensuretheaccuracyofanysamplethescatteringcoefficientofthebaseplatewas
firstmeasured,toconfirmthatitislowerthanthespecifiedmaximumfrequency-
dependentscatteringcoefficientfrom160to4000HzaccordingtoISO17497-1
[12].Figure35showsthatthescatteringcoefficientofthebaseplateiswellbelow
theISOcriteria.Figure36illustratesthelocationofthebaseplate,microphone
positionsandsoundsourceforthescaledmeasurements.
Investigationdeterminedthatthesubstrateeffectinscatteringisnegligible
thereforeitcouldactasabaseplate.
ThescatteringcoefficientofSubstrate(30%pumice,70%pottingsoil)Inordertocalculatescatteringfromplantsfoliagewhileplantedinsubstrate,itwas
necessarytoverifythatthesubstrateconformswiththestandardcriteriaforabase
plate(turningtable).Illustratedinfigure35.AccordingtoISO17497-1[12],the
scatteringcoefficientforabaseplateusedinmeasurementshouldnotexceedthe
maximumplottedinFigure35.Asthefigureillustratestheturningtable,covered
with100mmofsubstrate,meetsthestandardcriterion;asthebaseplateforallour
scatteringexperiments.

52
Figure35.ScatteringCoefficientofbaseplateandsubstrate(30%pumice,70%soil)
Figure36.Microphone,turningtableandsourcepositionplans
Whenscatteringcoefficientsaredeterminedthroughscaledmeasurement,all
aspectsoftheexperimentalset-upmustbescaled,thisincludesthematerialunder
testandthesoundwavelengths.Themeasurementsweremadefrom160Hzto
3150Hz.160Hzisthelowfrequencylimitofthereverberationchamber,these
0.0
0.1
0.2
0.3
0.4
0.5
0.6
0.7
0.8
0.9
1.0
130 1300
ScatteringCoefficient
Frequency(Hz)
sbase(1/3scaled) sSubstrate30%-70% ISOmaximum
16020025031540050063080010001250160020002500231504000
3.56
4.46
S
0.50
0.50
R0.63
12
3
S2
0.50
0.50
1.79
2.25

53
measurementsrepresentthefullscalefrequencyrangeof583Hzto10000Hz.
Theplantscannotbescaled,howevertheplantspeciesevaluatedatspecifictime
periodsgrowingwithrespecttoscalingthesematerials.Afterfullgrowththe1/3
scaleplantwasdeterminedandthemeasureddatawasusedforanalysis.
Toexaminetheeffectofvegetationcoverageonsoundabsorptionandsound
scatteringcoefficient,coveragewasgraduallydecreasedbyremovingplantswhile
keepingthedistributionofplantsevenacrossthesubstratesurface.Sound
absorptioncoefficientsandscatteringcoefficientsweremeasuredforthreelevelsof
vegetationcoverageontopoftheturningtable:112plantsplantedin4-inchpots
(100%ofmaximumcoverage);56plants(50%coverage);and28plants(25%
coverage)(Figure37).Thesectionofthesamplearrangementontheturningtable
(baseplate)isshowninfigure38.
Table3. Table of test in the reverberation chamber- 1/3 scaled
Test No.
Description ISO 17497-1 Species
31 Empty Table - 32 S2 with - 33 S2 -100% cov P1= English Ivy 34 S2 -100% cov P2= Fern 35 S2 -100% cov P3= Golden Pothos 36 S2 -100% cov P4= Pilea 37 S2 -100% cov P5= Spider Plants 38 S2 -100% cov P6= Ficus pumila 39 S2 - 50% cov P1= English Ivy 40 S2 - 50% cov P2= Fern 41 S2 - 50% cov P3= Golden Pothos 42 S2 - 50% cov P4= Pilea 43 S2 - 50% cov P5= Spider Plants 44 S2 - 50% cov P6= Ficus pumila 45 S2 - 25% cov P1= English Ivy 46 S2 - 25% cov P2= Fern 47 S2 - 25% cov P3= Golden Pothos 48 S2 - 25% cov P4= Pilea 49 S2 - 25% cov P5= Spider Plants 50 S2 - 25% cov P6= Ficus pumila
Note - In 50 microphone location - S2: Substrate with mixing rate of pumice / pot soil = 30%/70%
Data of table 1 & 2 collected at each above test.


55
MeasurementAccuracyThemeasurementofeachsampleusedtodeterminethescatteringandabsorption
coefficientsisfromtheaverageofthemeasurementstakenfromseveral
microphonepositions.Inordertochangethemicrophoneposition,openingofthe
door,toenterthechambercreateschangesintemperatureandhumidity.
Measurementishighlysensitivetotemperatureandrelativehumidityfactors,
especiallyathighfrequencies[44].Givenuncertaintyinthemeasurementswhich
comesfromthelimitedcontroloverthetemperatureandhumidityinthe
reverberationchamber,theaccuracyofthemeasurementswasincreasedbywaiting
forapproximately30minafterclosingthedoortoallowthetestspecimenstoadjust
tothetemperatureandhumidityinthereverberationchamber.

56
5. Result
5.1. Plantproperties(Physicalpropertiesoftheplantsstudied)TheTables4,5and6illustratetheplantpropertiesofeachspeciesbasedonplant
growthduring6months.Plantpropertieswereevaluated4timesover6monthsas
describedinmethodssection,thetime-determinedplantpropertiesarelistedin
Table4.
Bycomparingthemeasurementsoftheplantpropertiesmeasurements(leaf
thickness,leaflengthandetc.)over6months(T1,T2,T3)withfullygrownplant
propertymeasurements(T4)itwasdeterminedthatthespecieswereat1/3-scaleof
thefullygrownspeciesattimeT2.Comparingtheplantpropertiesforfull-scale(at
T4)and1/3-scale(atT2)setsofmeasurementsinTable4,indicatesthatthemass
oftheplantsscaledequallywithtimeforall6speciesandthattherewasno
correlationbetweenthepropertiesotherthantheirliveanddrymass.TheLeafArea
Index(LAI)hasbeenmeasuredonlyfor1/3-scalespecies(T2),asallmeasurements
atturningtablewasdoneat1/3-scale.
ThesoundabsorptionmeasurementsforthelivingwallsandtheLAIcalculations
(Table6)werecarriedoutonlyforthefullscalespecies(atT4).

57
Table4.Thecharacteristicsofplantleafspecimen
No. Plants characterization
Plant Species
Leaf
thickne
ss
(mm)
Leaf
length
(cm)
*Leaf
area
Index
(LAI)
Leaf area
Average
(mm2)
Leaf
mass
(live)
mg
Leaf
mass
(dry)
mg
Stem
diameter
(mm)
Plant
height
(mm)
10 English Ivy -T1 0.34 3 0.0009 0.01 1.19 124
11 English Ivy -T2 (1/3
scale)
0.379 3 154.54 0.001 0.09 0.02 1.36 177.96
12 English Ivy -T3 0.391 43 - 0.0012 0.03 1.52 184
13 English Ivy –T4 0.4 5 - 0.0013 0.22 0.04 1.6 235
14 Fern -T1 0.3 4 - 0.005 0.007 1 109
15 Fern -T2 (1/3 scale) 0.338 5.5 505.48 0.007 0.08 0.01 1.073 199.92
16 Fern -T3 0.666 1 - 0.001 0.02 1.321 228
17 Fern -T4 0.68 1.5 - 0.002 0.21 0.03 1.47 514
18 Golden Pothos -T1 0.52 6 - 0.0019 0.042 2.221 176
19 Golden Pothos -T2
(1/3 scale)
0.582 7.7 48.29 0.003 0.52 0.06 2.942 240
20 Golden Pothos -T3 0.63 9.2 - 0.0038 0.09 3.6 291
21 Golden Pothos -T4 0.65 1 - 0.004 1.26 0.15 4 318
22 Pilea -T1 0.45 1 - 0.00017 0.013 1 120
23 Pilea -T2 (1/3 Scale) 0.492 1.7 814.57 0.0002 0.04 0.02 1.02 135.9
24 Pilea -T3 0.527 2.2 - 0.00022 0.034 1.612 237
25 Pilea -T4 0.53 2.5 - 0.00023 0.11 0.04 1.1 292
26 Spider Plants -T1 0.44 1.1 - 0.003 0.02 - 166
27 Spider Plants -T2
(1/3 Scale)
0.495 18.8 141.66 0.0034 0.79 0.06 - 216.45
28 Spider Plants -T3 0.741 3.9 - 0.004 0.15 - 383
29 Spider Plants -T4 0.9 5 - 0.0048 2.44 0.19 - 475
30 Creeping Fig -T1 0.31 1 - 0.00036 0.081 1.197 98
31 Creeping Fig -T2
(1/3 Scale)
0.319 2 643.93 0.00040 0.04 0.01 1.215 135
32 Creeping Fig -T3 0.331 2.7 - 0.00052 0.016 1.35 195
33 Creeping Fig -T4 0.34 3 - 0.00056 0.07 0.02 1.4 262
Note - T1, … Tn (max; n=4) to be determine base on plant growth during
6 months period
*Leaf Area Index of each species at the turning table


59
Table6.TheCharacteristicssurfaceareaofplants
No. Sample Leaf area Index (LAI) of planted
carriers
1 CTA (CarrierTypeA), mix plants 224
2 CTB (CarrierTypeB), mix plants 561
3 CTC (CarrierTypeC), mix plants 652
4 CTB, S2 with P1(EnglishIvy) 574
5 CTB, S2 with P2(Fern) 1744
6 CTB, S2 with P3(GoldenPothos) 583
7 CTB, S2 with P4(Pilea) 678
8 CTB, S2 with P5(SpiderPlants) 1699
9 CTB, S2 with P6(Ficuspumila) 894
Note S2:Substratewithmixingrateofpumice/potingsoil=30%/70%

60
5.2. AbsorptionandScattering
5.2.1. AbsorptionofEmptyRoom:
Thechamberishighlyreverberantandabsorptionofthechamberincreases
insignificantlywithincreasingfrequency. Figure39showsabsorptiontotalinSabine
oftheemptyreverberationchamber.Thesoundabsorptionofthereverberation
chamber(Figure39)islessthan0.08Sabineforfrequenciesbetween177and4000
Hz.
Figure39.Absorption(Sabine)ofemptyreverberationchamber
0
0.5
1
177 1770
Absorption(Sabine)
One-ThirdOctaveBandsFrequency(Hz)
2002503154005006308001000125016002000250031504000

61
5.2.2. Absorptionoflivingwallsystems:
TheabsorptionforallfullscalemeasurementsareinSabineunits.Thefirstsetof
resultsisforasinglepanelofeachcarriertype(Figure40),thesecondsetisofthe
singlepanelofeachcarriertypewithtwodifferentmixturesofsubstrates(Figure
43),andthirdsetisofthefullyestablishedvegetatedlivingwallsystemsofeach
carriertype(e.g.Figure48).Itshouldbementionedthatwiththehighabsorptive
sampleintheroomtheroomisnolongerdiffusearound315Hzwhichgenerated
artificialresults.
EmptylivingwallCarrierpanelFigure41comparestheabsorptionofthreeemptypanelsconstructedwithvarious
materialsandgeometry:CarrierA,CarrierBandCarrierC.Theoveralltrendisthe
sameforall;theabsorptionrisesslightlyfromlowtohighfrequency.Theempty
CarrierChasahigherabsorptivitythanCarrierAandCarrierBatfrequenciesbelow
1600Hz.TheabsorptionofCarrierAandCarrierBfollowsthesametrend,whilethe
CarrierBsystemismoreabsorptiveatfrequenciesabove500Hzanditsabsorption
increaseswithfrequency.
(a)
(b)
(c)
Figure40.Themeasurementconditionofrandom-incidentAbsorptionofthreedifferentemptylivingwallpanels;(a)CarrierA,((b)CarrierB(c)CarrierC

62
Figure41.Comparisonofabsorption(DSabine)ofemptycarriers
0
1
2
3
4
177 1770
Absorption(DDSabines)
One-thirdOctaveBandsFrequency(Hz)
EmptyModuloGreenCarrier EmptyPlantConnectionCarrier EmptyEverGreenCarrier
2002503154005006308001000125016002000250031504000
EmptyCarrierA EmptyCarrierB EmptyCarrierC
1

LivingwallscarrierpanelwithsubstrateThepresenceofsubstratessignificantlyaffectstheabsorptivecapacityofthe
carrier.Figure42illustratesabsorptionofthelivingwallcarriersfilledwith
substrate.Theoveralltrendshowsincreasingabsorptionwithfrequency.Atmid
frequencythesystemhassimilarabsorption.Atfrequenciesabove1770Hz,the
carrierBisthemostabsorptive.ThetrendofthegraphsofCarrierAandCarrierB
aresimilartoeachotherstartingat800Hz.Whilefollowingthesametrend,the
absorptioncoefficientofCarrierAisabout0.2morethanCarrierCatallfrequencies
from800Hzto4000Hz.RecallthatCarrierCisahydroponicsystem.Thissystem
hasanominalamountofpottingsoilinit,whichisonlythesoilthatcomeswiththe
plantsfromthe2-inchpots.(RefertoSection4.4fordetailedspecificationsofeach
carriersystem.)
Figure42.Comparisonofabsorption(DSabine)ofcarriersfilledwithsubstrate
0
1
2
3
4
177 1770
Absorption(DDSabines)
One-thirdOctaveBandsFrequency(Hz)
MGCarrier&Sub30%,70% PCCarrier&substrate30%70% EG&PottingSoil
20025031540050063080010001250160020002500 31504000
CarrierA&Sub30%/70% CarrierB&Sub30%/70% CarrierC&pottingsoil
1

Carrierswithadifferentmixtureofsubstrate
Therandom-incidenceabsorptionoftwomixturesofsubstrateswasmeasured:(a)
20%pumiceand80%pottingsoil,(b)30%pumiceand70%pottingsoil(Figure
43).Figure44&Figure45illustrateoverallincreaseinabsorptionduetothe
substratemixturesinCarrierAandB.TheCarrierCwasnotevaluatedwith
differentmixturesofsubstrate.AspreviouslyexplainedinSection4.4,itisnot
possibletoaddsubstratetoCarrierC.Inallcases,theabsorptionoftheempty
carrierisshownasthebaseline.
Itshouldbenotedthatthevolumeofthecarrierpanelsarenotsame.The
percentageofmoistureinthesubstratemixtureswasthesamebutwasnot
quantified. However,thedifferenceinthemixtureofthesubstratedoesnotmakea
noteworthydifferenceintermsofabsorptionofCarrierA.InCarrierBtheaddition
ofsubstrateincreasedabsorptionbyapproximately0.5Sabins.Theabsorptionof
themixturewithahigherpercentageofsoil(80%)isonlyslightlymorethanthe
absorptionofthesecondmixture(70%soil)formostfrequencies(Figure45).
(a)
(b)
Figure43.Themeasurementconditionofrandom-incidentAbsorptionoftwodifferentmixturesofsubstrate;
(a)20%pumice,80%pottingsoil,(b)30%pumice,70%pottingsoil)

65
Figure44.Comparisonofabsorption(DSabine)ofcarrierAfilledwithsubstrate
Figure45.Comparisonofabsorption(DSabine)ofcarrierBfilledwithsubstrate
0
1
2
3
4
177 1770
Absorption(DDSabines)
One-thirdOctaveBandsFrequency(Hz)
MGCarrier&Sub20%,80% MGCarrier&Sub30%,70% EmptyMGCarrier
20025031540050063080010001250160020002500 31504000
CarrierA&Sub20%/80% CarrierA&Sub30%/70% EmptyCarrierA
1
0
1
2
3
4
177 1770
Absorption(DDSabines)
One-thirdOctaveBandsFrequency(Hz)
Carrier&Substrate20%80% Carrier&substrate30%70% EmptyPCCarrier
2002503154005006308001000125016002000250031504000
CarrierB&Sub20%/80% CarrierB&Sub30%/70% EmptyCarrierB
1

66
Theeffectofmoistureinthesubstrate
Theeffectoftheamountofwaterinthesubstratewasinvestigatedonasinglepanel
whichrequiressubstraterepresentedbyCarrierAandCarrierC,whichhasroomfor
onlyasmallamountofpottingsoil(Figure46and47).Drysubstratemixture
30%/70%forlivingwallwastakendirectlyfromthebaginwhichthemixturewas
stored.Thereisanominalamountofmoisture(unquantified)inthis“dry”substrate
comparedtothelivingwallcarrierwithsubstratein“fieldcapacity”.Fieldcapacityis
establishedbysaturatingthesubstrateandallowingthesubstratetodrainfor24
hours.
Figure46showstheabsorption(Sabine)forCarrierAfilledwithdrysubstrateand
withsubstrateatfieldcapacity.Thetrendslookverysimilarbefore630Hz.The
absorptivityincreaseswithfrequenciesforbothcases.After630Hz,thedrier
substratemixabsorbssignificantly(about0.5Sabine)moresoundthanthe
substrateinfieldcapacity:Thisdifferenceis0.3Sabineat1000Hzandincreasesto
about0.6around2000Hzandincreasesto1Sabineat400Hz.
Figure47illustratesthattheemptyCarrierChascomparable;andevenhigher
absorptionthanthecarrierwithsubstrate.after800Hzthetrendsaresimilar
(increasingwithfrequency).AndthedrierCarrierCisabout0.2Sabinemore
absorptivethancarrierCinfieldcapacity.

67
Figure46.Comparisonofabsorption(DSabine)ofCarrierAfilledwithsubstrate(30%/70%mix);dryandinfield
capacity
Figure47.Comparisonofabsorption(DSabine)ofcarrierCfilledwithsubstrate(30%/70%mix);dryandinfieldcapacity
0
1
2
3
4
177 1770
Absorption(DDSabines)
One-thirdOctaveBandsFrequency(Hz)
MGCarrier&Sub30%,70% MGCarrier&Sub30%70%infieldcapacity
MGEmptyCarrier
2002503154005006308001000125016002000250031504000
DryCarrierA&Sub30%/70% CarrierA&Sub30%/70% infieledcapacity
EmptyCarrierA
1
0
1
2
3
4
177 1770
Absorption(DDSabines)
One-thirdOctaveBandsFrequency(Hz)
EG&PottingSoil EGinFieldCapacity EG-EmptyCarrierEG&DryPottingSoil
2002503154005006308001000125016002000250031504000
DryCarrierC&PottingSoil CarrierCinfieledcapacity EmptyCarrier
1

68
VegetatedlivingwallpanelsThegraphsinthissectionshowabsorptionpatternsofthethreelivingwallsystems
plantedwithamixtureofsixspeciesIvy,CreepingFig,SpiderPlant,Pilea,Fernand
GoldenPothos.Figure48illustratesthesinglepanelvegetatedlivingwallsinthe
reverberationchamber.Amixtureofthethreeplantspecimensisgrownineachof
thecarriersystemsA,BandC.
Figure49illustratesthedifferencebetweentheabsorptionoftheCarrierAfilled
withsubstrateandplantedCarrierA.Plantsaddedtothesubstratedonotincrease
theabsorptionofthelivingwallsystemabovesubstrateonlypanels.Moreover,
absorptiondecreaseswithvegetationabove1000Hz,butitisstillhigherthanthe
emptypanelusedasareference.Above1000Hztheplantsdiminishtheabsorption
ofthepanelprovidedbythesubstrate.Thediminishingabsorptionincreaseswith
frequency. Figure50illustratesresultsimilartoFigure49,theabsorptionofthe
carrierBwithandwithoutthevegetationisveryclosebelow1600Hzfrequency.
Above1600Hzpanelthecarrierfilledwithsubstrateismoreabsorptivethanthe
vegetatedpanel,above2500Hztheabsorptionofthevegetatedpanelisevenless
thantheemptycarrierpanelitself. Below1600Hztheneteffectofplantson
absorptionofCarrierCisnotclear. Figure51indicatesthattheabsorptivityabove
1000HzofCarrierCdoesnotchangebyaddedpottingsoilandvegetation.The
vegetatedCarrierCisasabsorptiveastheemptypanel,especiallyathigh
frequencieswherealltrendsarethesame.

69
(a)
(b)
(c)
Figure48.Themeasurementconditionofrandom-incidentAbsorptionoftheplantedlivingthreedifferentlivingwallsystems;(a)CarrierA,(b)CarrierB,(c)CarrierC.(40planteachpanel)
Figure49.Comparisonofabsorption(DSabine)ofCarrierAnempty,withsubstrateandvegetated.
0
1
2
3
4
177 1770
Absorption(DDSabines)
One-thirdOctaveBandsFrequency(Hz)
MGCarrier&Sub30%,70% MGMixVegitated(Avegare)
EmptyMGCarrier
2002503154005006308001000125016002000250031504000
CarrierA&Sub30%/70%
EmptyCarrierA
CarrierA,MixVegetated
1

70
Figure50.Comparisonofabsorption(DSabine)ofCarrierBempty,withsubstrateandvegetated.
Figure51.Comparisonofabsorption(DSabine)ofCarrierCempty,withsubstrateandvegetated.
0
1
2
3
4
177 1770
Absorption(DDSabines)
One-thirdOctaveBandsFrequency(Hz)
Carrier&substrate30%70% EmptyPCCarrier 1PannelMix-Vegetated(Average)
2002503154005006308001000125016002000250031504000
CarrierB&Sub30%/70% EmptyCarrierB CarrierB,Mixvegetated
1
0
1
2
3
4
177 1770
Absorption(DDSabines)
One-thirdOctaveBandsFrequency(Hz)
EG&PottingSoil EGMixVegetated(Average) EG-EmptyCarrier
2002503154005006308001000125016002000250031504000
CarrierC&PottingSoil CarrierC,MixVegetated EmptyCarrierC
1

71
Figure52comparestheabsorptivityofeachlivingwallsystem.Theaverageof
measurementoftheresultsfrom3plantedsinglelivingwallpanelswiththemixof
specieswasusedforeachsystem(CarrierA,B&C).Above1000Hz theabsorption
ofallthreesystemsareminimaldifferentintrend.Below1000HzsystemAhas
about0.5SabinehigherabsorptionthansystemsBandC.
CheckingfortheconsistencyoftheresultsAsdiscussedinsection4.5.1.1measurementareconductedtoverifytheconsistency
oftheresults.Threeofeachcarriersystemsareplantedwiththesamemixof
speciestoexaminetheconsistencyandrepeatabilityofresults. Figure53presents
thatallthreemixedvegetatedCarrierAsamples(in30%,70%carrier)havethe
sameabsorptionatlowerandmidfrequency.Thisshowsconsistencyof
measurementsfortheCarrierAthatwasplantedwiththesamemixtureofspecies.
Similarly,Figure54showsthattheCarrierBtrendsareveryclosetoeachotherbut
onepanel(Mix1)islessabsorptiveafter1600Hz(0.6Sabinelessthantheother
two.). AccordingtoFigure55,resultsshowminorabsorptiondifferencesbetween
thecarrierCpanels.Thehighfrequencydifferenceinabsorptionofthethree
samplesofthesamesystemisnominallythesameasthedifferenceoftheaverage
measurementofthethreesystem.

72
Figure52.Comparisonofabsorption(DSabine)ofthreevegetated(mixspecies)livingwallpanels
Figure53.Comparisonofabsorption(DSabine)ofCarrieranemptyandplantedpanels(Mix1,2&3).ThetestspecimensthatwerestudiedforcheckingtheconsistencyofthemeasurementsincarrierA(Section
4.5.1.1).
0
1
2
3
4
177 1770
Absorption(DDSabinses)
One-thirdOctaveBandsFrequency(Hz)
ModuloGreenMix(Vegetated) PlantConnectionMix(vegetated)
EverGreenMix(Vegetated)
2002503154005006308001000125016002000250031504000
CarrierA,MixVegetated
CarrierC,MixVegetated
CarrierB,MixVegetated
1
0
1
2
3
4
177 1770
Absorption(DDSabines)
One-thirdOctaveBandsFrequency(Hz)
Mix1(vegetated) Mix2(vegetated) Mix3(vegetated) EmptyMGCarrier
2002503154005006308001000125016002000250031504000
1

73
Figure54.Comparisonofabsorption(DSabine)ofCarrierBemptyandplantedpanels(Mix1,2&3).ThetestspecimensthatwerestudiedforcheckingtheconsistencyofthemeasurementsincarrierA(Section
4.5.1.1).
Figure55.Comparisonofabsorption(DSabine)ofCarrierCemptyandplantedpanels(Mix1,2&3).ThetestspecimensthatwerestudiedforcheckingtheconsistencyofthemeasurementsincarrierA(Section
4.5.1.1).
0
1
2
3
4
177 1770
Absorption(DDSabines)
One-thirdOctaveBandsFrequency(Hz)
PCMix1 PCMix2 PCMix3 EmptyPCCarrier
2002503154005006308001000125016002000250031504000
EmptyCarrierBMix1(Vegetated) Mix2(Vegetated) Mix3(Vegetated)
1
0
1
2
3
4
177 1770
Absorption(DDSabines)
One-thirdOctaveBandsFrequency(Hz)
EverGreen(EG)-Mix1 EG-Mix2 EG-Mix3 EmptyEGCarrier
2002503154005006308001000125016002000250031504000
Mix1(Vegetated) Mix2(Vegetated) Mix3(Vegetated) EmptyCarrierC
1

74
InvestigationofCarrierBwith6individualspecies(evaluationofsinglePanel)
SufficientnumberofCarriertypeBpanelsweresixfortheinvestigationoftheeffect
oftheindividualspeciesonabsorption.
Figure56showsthatthetypeofplantsaffectsabsorptivity.Thetrendsarealmost
thesame.GoldenPothoshasthehighestabsorptivityoverall.Thenextmost
absorptiveisPileawithaslightlylowerabsorptioncoefficientthanGoldenPothos
throughthefrequencyband.CreepingFig,SpiderPlant,mixplantedpanelandFern
aresimilarintermsofabsorptionatmidfrequencies(630-1000Hz).After1000Hz,
thedifferenceintheabsorptivityofCreepingFig,SpiderPlant,mixvegetatedismore
significantandincreaseswithfrequency.ThetrendforFerndoesnotincreasewith
frequencybetween6300and2500Hz.Themixplantedpanelisapanelusinga
combinationofsixspecies(SpiderPlant,Ivy,Pilea,CreepingFig,GoldenPothosand
Fern)intheFigure56,anditsabsorptivityissomewherebetweentheother6
species.
Figure56.Comparisonofabsorption(DSabine)ofvegetatedCarrierBpanel
0
1
2
3
4
177 1770
Absorption(DDSabine)
One-thirdOctaveBandsFrequency(Hz)
Spider IVY Pilea
CFig GoldenPothos Fern
EmptyPCCarrier PCMixVegetated(averaged)
2002503154005006308001000125016002000250031504000
CarrierB,MixVegetatedCarrierB,Empty
1

75
5.2.3. AbsorptionevaluationofamultipleofpanelsCarrierBwasagainusedforthisseriesofmeasurementtakentoinvestigatethe
effectofmultiplepanelsasitwasnotexpectedtobelinear.
Figure58showstherandom-incidentabsorption(Sabine)resultsfor1vegetated
CarrierApaneland3vegetatedCarrierApanels.Theabsorptionisconsistently
greateratallfrequencies.Atlowfrequenciesbelow500Hz,theabsorptionincreases
bymorethantwo,withtheadditionoftwomorepanels.Ontheotherhand,at
frequenciesabove500Hz,3carriersprovideaboutonefoldmoreabsorptionthana
singlecarrier.
The4-panelsampleisacombinationof3mixedplantedpanelsand1homogenous
panel.8panelsareacombinationof3mixedpanelsand5homogeneousplanted
panelsexcludingtheFernspecies(Figure57).
IllustratedinFigure59,increasingthenumberofCarrierBpanelssignificantly
increasestheabsorptionatlowfrequencies(below630Hz)andtheabsorption
resultalmostdoubledwithadoublingofthepanels.Theincreasednumberofpanels
hasagreatereffectatlowfrequencies.Above800Hz,thereatwo-foldincreasein
absorptionfrom1panelto4panels(about1Sabine)andfrom4panelsto8panels
andadditionaltwo-foldincrease.After800Hzthereisanapproximateone-fold
increasewitheachdoubledthenumberofpanels.

76
Figure57.Themeasurementconditionofthelivingwallmadeof8vegetatedCarrierBpanels
Figure58.Comparisonofabsorption(DSabine)ofmultiple,CarrierA
0
1
2
3
4
5
6
177 1770
Absorption(DDSabines)
One-thirdOctaveBandsFrequency(Hz)
1MGpannel 3MGPannels MGEmptyCarrier
20025031540050063080010001250160020002500 31504000
1CarrierApanel 3CarrierApanels CarrierA,Empty
1

77
Figure59.Comparisonofabsorption(DSabine)ofmultiple,CarrierB
0
1
2
3
4
5
6
177 1770
Absorption(DDSabines)
One-thirdOctaveBandsFrequency(Hz)
PCEmptyCarrier 1PannelMix-Vegetated(Average)
4pannelsMix-Vegetated 8PannelsMix-Vegetated
20025031540050063080010001250160020002500 31504000
CarrierB,Empty 1CarrierB,MixVegetated
4CarrierB,MixVegetated 8CarrierB,MixVegetated
1

78
5.3. 1/3ScaleMeasurements;AbsorptionandScatteringThisseriesoftestillustratetheeffectofpercentagecoverageonsoundabsorption
andsoundscattering.Recallthatmeasurementmethodataone-thirdscalewas
developed,duetothecapacityandsizeofthereverberationchamber.Additionally,
(seesection4.5.3)the1/3-scaleoftheplantsisreviewedinsection5.1.
(a)(BasePlate)TurningTable
(b)Turningtablecoveredwithsubstrate
Figure60.Themeasurementconditionof(a)Baseplateand(b)substrate100mmtopsoil

79
Figure61.Scatteringcoefficientofbaseplateandsubstrate(30%pumice,70%pottingsoil)
AbsorptioncoefficientofdifferentspeciesThissectiondiscussestheinvestigationoftheabsorptioncoefficientofdifferent
speciesasafunctionofpercentcoverage.Theevaluationmethodistobediscussed
insection6.3.2.
Figure62illustratestheGoldenPothoswithdifferentpercentagecoverage,25,50
and100%ontheturningtable.Thesamplewith100%coveragehasthehighest
absorptionthroughallfrequencies.SAAis0.31,0.31and0.37for25%coverage,
50%coverageand100%coveragerespectively.Theabsorptioncoefficientcurvefor
GoldenPothosatmidfrequenciesbetween1000and2500Hz;0.4for25%and50%
and0.45for100%coveragerespectively(Figure63).2
2GoldenPothos;NRC(25%)=0.30,NRC(50%)=0.31,NRC(100%)=0.37
0.0
0.1
0.2
0.3
0.4
0.5
0.6
0.7
0.8
0.9
1.0
130 1300
ScatteringCoefficient
Frequency(Hz)
sbase(1/3scaled) sSubstrate30%-70% ISOmaximum
16020025031540050063080010001250160020002500231504000

80
(a)
(b)
(c)
Figure62.Themeasurementconditionof100mmsubstratewithGoldenPothos.(a)25%vegetationcoverage),(b)50%vegetationcoverage,(c)100%vegetationcoverage
Figure63.AbsorptioncoefficientofGoldenPothos,differentvegetationcoverage(25%,50%&100%)
Figure64illustratesIvywithdifferentcoverage25,50,100%ontheturningtable.As
showninFigure65,atmidfrequenciestheabsorptioncoefficientofIvywith100%
coverageisabout0.07higherthantheabsorptionoftheIvywith50%coverageand
25%(SAA=0.34,0.27and0.25respectively).Thedifferencebetweenthe50%and
25%coverage,isaround0.02.3
3Ivy;NRC(25%)=0.25,NRC(50%)=0.27,NRC(100%)=0.34
0
0.2
0.4
0.6
0.8
1
150 1500
Absorptioncoefficient
One-thirdOctaveBandsFrequency(Hz)
αs(GoldenPothos100%cov) αs(GoldenPothos50%cov) αs(GoldenPothos25%cov)
160200250315400500630800100012501600200025003150 4000

81
(a)
(b)
(c)
Figure64.Themeasurementconditionof100mmsubstratewithIvy.(a)25%vegetationcoverage,(b)50%vegetationcoverage,(c)100%vegetationcoverage
Figure65.AbsorptioncoefficientofIvy,differentvegetationcoverage(25%,50%&100%)
Figure66showstheset-upfortheabsorptioncoefficientmeasurementswithPilea.
Bycomparingthe3setsofmeasurementsinFigure67,thedifferenceinabsorption
coefficientofPileaatlowfrequenciesismoresignificantthanthedifferenceat
frequenciesabove630Hz.Thehighfrequencyabsorptioncoefficientabout800Hz
forPileaisalmostthesameforallthemeasuredcoveragepercentages. The
absorptioncoefficientsfordifferentcoveragesarewithinthesamerangeatmid
0
0.2
0.4
0.6
0.8
1
160 1600
Absorptioncoefficient
One-thirdOctaveBandsFrequency(Hz)
α(Ivy100%cov) α(Ivy50%cov) αs(Ivy25%cov)
160 200 2503154005006308001000125016002000250031504000

82
frequencieswiththeSAAvaluesbeing0.34,0.34and0.4for25%,50%and100%
coveragerespectively.4
(a)
(b)
(c)
Figure66.Themeasurementconditionof100substratewithPilea.(a)25%vegetationcoverage,(b)50%vegetationcoverage,(c)100%vegetationcoverage
Figure67.AbsorptioncoefficientofPilea,differentvegetationcoverage(25%,50%&100%)
Figure68showstheset-upfortheabsorptioncoefficientmeasurementswith
CreepingFig.Results(Figure69)displayaslightdifferenceinabsorptivityof
CreepingFigwithincreaseinplantcoverage.Asshownathigherfrequencies(above
1600Hz),theabsorptivityofCreepingFigismoredependentonthedensityofthe
4Pilea;NRC(25%)=0.32,NRC(50%)=0.34,NRC(100%)=0.4
0
0.2
0.4
0.6
0.8
1
160 1600
Absorptioncoefficient
One-thirdOctaveBandsFrequency(Hz)
αs(Pilea100%cov) αs(Pilea50%cov) αs(Pilea25%cov)
160 200250315400500630800100012501600200025003150 4000

83
coverage.Theabsorptiongraduallyincreaseswithincreasingcoverage.TheSAAof
theCreepingFigis0.30for25%,0.32for50%and0.34for100%plantcoverageat
4000Hz.5
(a)
(b)
(c)
Figure68.Themeasurementconditionof100mmsubstratewithCreepingFig.(a)25%vegetationcoverage,(b)50%vegetationcoverage,(c)100%vegetationcoverage
Figure69.AbsorptioncoefficientofCreepingFig,differentvegetationcoverage(25%,50%&100%)
Themeasurementset-upforabsorptioncoefficientmeasurementsofSpiderPlant
areillustratedinFigure70.AsillustratedinFigure71absorptionsforthethreesets
ofcoveragearefluctuatingbetween0.4and0.6atfrequenciesbetween630and
5CreepingFig;NRC(25%)=0.3,NRC(50%)=0.32,NRC(100%)=0.34
0
0.2
0.4
0.6
0.8
1
177 1770
Absorptioncoefficient
One-thirdOctaveBandsFrequency(Hz)
αs(CreepingFig100%cov) αs(CreepingFig50%cov) αs(CreepingFig25%)
160200250315400 5006308001000125016002000250031504000
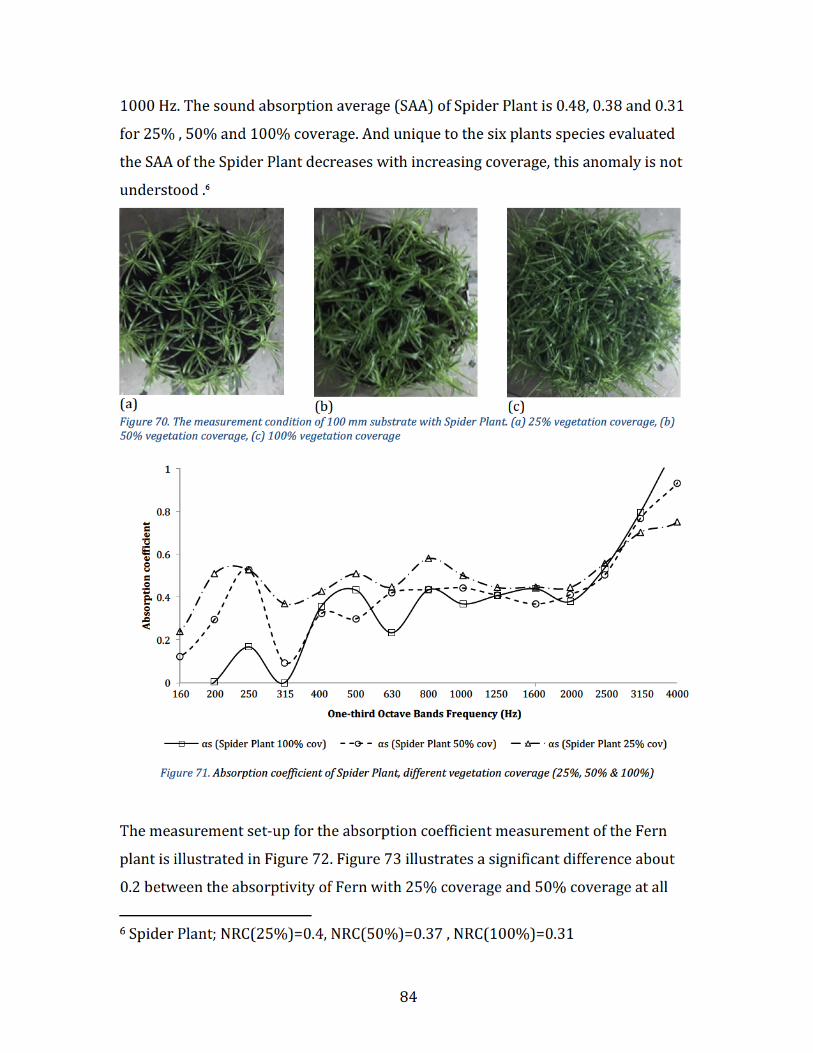
84
1000Hz.Thesoundabsorptionaverage(SAA)ofSpiderPlantis0.48,0.38and0.31
for25%,50%and100%coverage.Anduniquetothesixplantsspeciesevaluated
theSAAoftheSpiderPlantdecreaseswithincreasingcoverage,thisanomalyisnot
understood.6
(a)
(b)
(c)
Figure70.Themeasurementconditionof100mmsubstratewithSpiderPlant.(a)25%vegetationcoverage,(b)50%vegetationcoverage,(c)100%vegetationcoverage
Figure71.AbsorptioncoefficientofSpiderPlant,differentvegetationcoverage(25%,50%&100%)
Themeasurementset-upfortheabsorptioncoefficientmeasurementoftheFern
plantisillustratedinFigure72.Figure73illustratesasignificantdifferenceabout
0.2betweentheabsorptivityofFernwith25%coverageand50%coverageatall
6SpiderPlant;NRC(25%)=0.4,NRC(50%)=0.37,NRC(100%)=0.31
0
0.2
0.4
0.6
0.8
1
160 1600
Absorptioncoefficient
One-thirdOctaveBandsFrequency(Hz)
αs(SpiderPlant100%cov) αs(SpiderPlant50%cov) αs(SpiderPlant25%cov)
160200250 315400 5006308001000125016002000250031504000

85
frequencies,relativetothedifferencebetween50%coverageand100%coverage.
Thesoundabsorptionaverageincreaseswithdensityoftheplants.Itis0.11,0.31
and0.33for25%,50%and100%respectively.7
(a)
(b)
(c)
Figure72.Themeasurementconditionof100mmsubstratewithFern.(a)25%vegetationcoverage,(b)50%vegetationcoverage,(c)100%vegetationcoverage
Figure73.AbsorptioncoefficientofFern,differentvegetationcoverage(25%,50%&100%)
7Fern;NRC(25%)=0.1,NRC(50%)=0.3,NRC(100%)=0.33
0
0.2
0.4
0.6
0.8
1
160 1600
Absorptioncoefficient
One-thirdOctaveBandsFrequency(Hz)
αs(Fern100%cov) αs(Fern50%cov) αs(Fern25%cov)
160200250 315 400500630800 1000125016002000250031504000

86
5.3.1. Thescatteringcoefficientofplantspecieschangeswithdifferentpercentagecoverageofvegetation
Thisseriesofthetestsinthissectioninvestigatesscatteringpatternofthesix
availablespeciesandinvestigatestheimpactofthepercentagecoverageof
vegetationonsoundscattering.Theevaluationmethodisdiscussedinsection4.5.3.
InFigure74scatteringcoefficientofGoldenPothoswiththreedifferentlevelsof
vegetationcoverageisshown.Itcanbeseenthat,ingeneral,scatteringcoefficient
increaseswithfrequencyandpercentageofcoverage.GoldenPothos’saverage
scatteringcoefficientatmidfrequencies(200-2500Hz)with25%,50%and100%
coverageis0.05,0.13and0.14respectively.ScatteringcoefficientofGoldenPothos
with50%coverageisaround0.14higherthan25%,whilethereisnotmuch
differencebetweenthescatteringcoefficientat50%and100%coverage,whichis
about0.04.
AsshowninFigure75,averagescatteringcoefficientofIvy(200-2500Hz)is0.005
at25%,anditis0.01with50%coverageand0.05with100%coverage.The
scatteringcoefficientofIvyincreaseswithincreasingfrequencyandvegetation
coverage.25%and50%coverageofIvy,isalmostsameintermsofscattering
sound,100%coveragescattersmoreatfrequenciesabove800Hz.
Figure76showsthescatteringcoefficientofPileawithdifferentvegetation
coverage.Itcanbeseenthatscatteringcoefficientisalmostthesameatfrequencies
below500Hz.At100%coveragescatteringincreasesabove2000Hz.Andthe
averagesoundscatteringforPileais0.015,0.04and0.014for25%,50%and100%
coveragerespectively.
InthecaseofCreepingFig,itcanbeseenthattheoveralltrendisupwardandthe
scatteringcoefficientgraduallyincreaseswithfrequencyabove800Hz,especiallyat

87
100%coverage(Figure77).Theaveragescatteringcoefficientis0.10,0.11and0.19
at25%,50%and100%coveragerespectivelybetween200and2500Hz.
Figure78suggeststhatthescatteringcoefficientofFernwithdifferentcoverage
percentagesfluctuatesaround0.05atfrequenciesbelow630Hz.Abovethat,it
graduallyincreasesandtheaveragesoundscatteringofFernis0.05,0.06and0.17
for25%,50%and100%coveragerespectively.
Figure79showsavariationofthescatteringcoefficientcurvesofSpiderPlantover
differentfrequencies.Thedifferencesbetweenthescatteringcoefficientofthe
differentpercentcoveragesismorepronouncedthantheotherplantspecies.Inthe
lowerfrequencies,aswellastheaveragesoundscatteringofSpiderPlantis0.07,
0.05,and0.1for25%,50%and100%coveragerespectively.
Clearlyabove630Hzscatteringisincreasingwithcoverageanditisinterestingto
seeincreaseconsistencyata100%coverage.
Figure74.ScatteringcoefficientofGoldenPothos,differentvegetationcoverage(25%,50%&100%)
0
0.2
0.4
0.6
0.8
1
120 1200
ScatteringCoefficient
One-thirdOctaveBandsFrequency(Hz)
s(GoldenPothos,100%cov) s(Goldenpothos50%cov) s(Goldenpothos25%cov)
1602002503154005006308001000125016002000250031504000

88
Figure75.ScatteringcoefficientofIvy,differentvegetationcoverage(25%,50%&100%)
Figure76.ScatteringcoefficientofPilea,differentvegetationcoverage(25%,50%&100%)
0.0
0.2
0.4
0.6
0.8
1.0
120 1200
Scatteringcoefficient
One-thirdOctaveBandsFrequency(Hz)
s(Ivy100%cov) s(Ivy50%cov) s(Ivy25%cov)
16020025031540050063080010001250160020002500 31504000
0.0
0.2
0.4
0.6
0.8
1.0
120 1200
ScatteringCoefficient
One-thirdOctaveBandsFrequency(Hz)
s(Pilea,100%cov) s(Pilea,50%cov) s(Pilea,25%cov)
1602002503154005006308001000125016002000250031504000

89
Figure77.ScatteringcoefficientofCreepingFig,differentvegetationcoverage(25%,50%&100%)
Figure78.ScatteringcoefficientofFern,differentvegetationcoverage(25%,50%&100%)
0.0
0.2
0.4
0.6
0.8
1.0
120 1200
ScatteringCoefficient
One-thirdOctaveBandsFrequency(Hz)
s(CreepingFig,100%cov) s(CreepingFig,50%cov) s(CreepingFig,25%cov)
160200250315400500630 8001000125016002000250031504000
0.0
0.2
0.4
0.6
0.8
1.0
120 1200
ScatteringCoefficient
One-thirdOctaveBandsFrequency(Hz)
s(Fern,100%cov) s(Fern,50%cov) s(Fern,25%cov)
1602002503154005006308001000125016002000250031504000

90
Figure79.ScatteringcoefficientofSpiderPlant,differentvegetationcoverage(25%,50%&100%)
0
0.2
0.4
0.6
0.8
1
120 1200
ScatteringCoefficient
One-thirdOctaveBandsFrequency(Hz)
s(SpiderP,100%cov) s(SpiderP,50%cov) s(SpiderP,25%cov)
1602002503154005006308001000125016002000250031504000

91
6. DiscussionTheabsorptionofthelivingwallpanelinSabinewasdeterminedfirstfortheempty
carrierwhichareconstructedwithsignificantlydifferentmodules.Secondlyforthe
carrierswithsubstrate,thesubstrateevaluatedincludeda30/70mixtureofpumice
andpottingsoilanda20/80mixtureofthesame.Additionally,theeffectofthe
watercontentofthe30/70mixturewasevaluated.Finally,theabsorptionofthe
fullyvegetatedpanelwasevaluated.
Thematerialsandconstructionofthecarriersdonotdominatetheabsorption
performanceofthesystemoncethesubstrateisinstalled.Althoughthe2Dpanelsize
ofthecarrierAistwicetheareaofcarrierB.Thesubstratemassofthetwonon-
hydroponicsystemsarewithin10%ofeachother.Andthetwosystemperformed
similarlyinthemidfrequencyandwithin1Sabineinlowfrequencyand0.5Sabine
inhighfrequencies.Theresultsalsoshowtheincreaseinorganicmatterofthe
20/80ofpumiceandpottingsoilrelativetothe30/70didnotaffectabsorption.
6.1. AbsorptionoflivingwallpanelmeasurementTheabsorptionofthelivingwallpanelinSabinewasdeterminedfirstfortheempty
carrierwhichareconstructedwithsignificantlydifferentmodules.Secondlyforthe
carrierswithsubstrate,thesubstrateevaluatedincludeda30/70mixtureofpumice
andpottingsoilanda20/80mixtureofthesame.Additionally,theeffectofthe
watercontentofthe30/70mixturewasevaluated.Finally,theabsorptionofthe
fullyvegetatedpanelwasevaluated.
Thematerialsandconstructionofthecarriersdonotdominatetheabsorption
performanceofthesystemoncethesubstrateisinstalled.Althoughthe2Dpanelsize
ofthecarrierAistwicetheareaofcarrierB.Thesubstratemassofthetwonon-
hydroponicsystemsarewithin10%ofeachother.Andthetwosystemperformed
similarlyinthemidfrequencyandwithin1Sabineinlowfrequencyand0.5Sabine

92
inhighfrequencies.Theresultsalsoshowtheincreaseinorganicmatterofthe
20/80ofpumiceandpottingsoilrelativetothe30/70didnotaffectabsorption.
6.1.1. Effectofmoisturecontentandvegetationonthecarries’absorption AccordingtoFigure41,theabsorption(Sabine)oftheemptyCarrierA,madefrom
ABSplastic,islowest,CarrierB,madefromstainlesssteel,ismoreabsorptiveand
CarrierC,madeofinsulationmaterial,itexhibitssignificantlyhigherabsorption.8
Resultsindicatedthatusingamixof70%pottingsoiland30%pumicethe
differenceinabsorption(Sabine)betweenthepanelswithdrysubstrateandthe
panelswithsubstrateinfieldcapacityintheexperimentisconsiderableintwo
substratebasedsystems.Inthehydroponicsystem,whichrequiresirrigationonthe
hour,absorptiondecreasesrelativetoitswetness,aligningwiththeadditionalofthe
plantstothecarriersandsubstrateagainaffectsabsorption.
Above400Hz,thesubstrateatfieldcapacityislessabsorptivethanthedry
substrate.Theresultofthisstudyiscomparablewiththeresultoftheprevious
experiment[11].
Yang’sinvestigationsoftheabsorptioncoefficientforavegetationsubstrateitwas
reportedthathighlyporoussubstratesmaintainahighabsorptionevenwithhigh
moisturecontent[11].
Theadditionoftheplantstothecarriersandsubstrateagainaffectsabsorption.At
midandhighfrequencies,theresultsuggeststhattheplantedpanel,carrierAandB
islessabsorptivethanthepanelthatisfilledwithsubstrateonly,measuredatfield
capacity.Also,thedifferencebetweenplantedpanelsandsubstrate-onlypanels
absorptionincreaseswithfrequency,especiallyafter1600HzforCarrierAand
8Carrier A: recyclable ABS plastic; Carrier B: stainless-steel; Carrier C: isolative rock wool material used as a substrate.

93
CarrierB.TheabsorptionofCarrierCisthesamefortheemptypanelandthe
plantedpanel.Thevegetationimprovesthelowfrequencyabsorptionofcarrier
howeveritinverselyinfluencesthemidandhighfrequencyabsorption.
Theeffectofplanttypeontheabsorptionofasinglepanelwasevaluatedoncarrier
C.Thesixplantspeciesandamixofspeciesaffectabsorptionsimilarlyinthelow
andmidfrequencies.Athigherfrequenciesabove1000Hzthevariancein
absorptionincreaseswithfrequency.
6.2. Absorptionandscatteringof1/3scalemodel;thespeciestypeeffectonabsorptionandscatteringcoefficientatdifferentcoveragedensity
Themeasurementresultsoftheabsorptionandscatteringcoefficientofthefoliage
componentsofsixlivingwallspecies,withvariouslevelsofvegetationcoverage,
showedthatgenerally,theabsorptionandscatteringcoefficientsincreasewith
increasingvegetationdensity.
PriorinvestigationsbyNavarroetal[38]showedagreatereffectofscatteringon
thereverberationtimeformaterialswithlowerabsorptioncoefficients.
TheresultsofstudybyHurberandBednarsuggestedthatthelowscattering
coefficientsproducehighreverberationtimesinthesimulation.Reverberationtime
isincreasedwhentheabsorptioncoefficientisnotuniform[35].
Followingisacomparisonoftheeffectofplantspeciesandpercentagecoverageof
theplantsontheabsorptionandscatteringpropertiesofvegetation.

94
Table7illustratestheabsorptioncoefficientof6differentplantspeciesforeach
vegetationcoverage.Table7showsthattheabsorptioncoefficienttrendsof
differentspeciesaremoresimilarasthecoveragedensityincrease.
Table7.Absorptioncoefficientofallspecieswith100%,50%&25%vegetationcoverage(Frequenciesbetween(1000-4000Hz)
0
0.25
0.5
0.75
1
1000
AbsorptionCoefficient
One-thirdOctaveBandsFrequency(Hz)
6Species(100%cov)
α(Ivy100%cov) α(GoldenPothos100%cov)
αs(Pilea100%cov)
αs(CreepingFig100%cov)
αs(Fern100%cov)
αs(SpiderPlant100%cov)
α(Substrate70%/30%)
1000125016002000250031504000
0
0.25
0.5
0.75
1
1000
AbsorptionCoefficient
One-thirdOctaveBandsFrequency(Hz)
6Species(50%cov)
α(Ivy50%cov)
αs(GoldenPothos50%cov)
αs(Pilea50%cov)
αs(CreepingFig50%cov)
αs(Fern50%cov)
αs(SpiderPlant50%cov)
10001250160020002500 3150
0
0.25
0.5
0.75
1
1000
AbsorptionCoefficient
One-thirdOctaveBandsFrequency(Hz)
6Species(25%cov)
αs(Ivy25%cov)
αs(GoldenPothos25%cov)
αs(Pilea25%cov)
αs(CreepingFig25%)
αs(Fern25%cov)
αs(SpiderPlant50%cov)
αsSubstrate70%/30%
1000125016002000250031504000

95
Withtheleastvegetationcoverage(25%),thedifferencebetweenspeciesonsound
absorptionismorepronounced. At50%coverageitisclearthatatfrequencies
above1000Hz,thetrendsaremoresimilar.At1600Hzfrequencyallspecieswith
50%coveragehaveaboutthesameabsorption.Atfrequencieshigherthan1600and
with50%vegetationcoverage,SpiderPlantisthemostabsorptiveandPilea,
CreepingFig,Fern,GoldenPothosandIvyarethenextabsorptiveonesrespectively.
At100%coverage,thetypeofspeciesissignificantonlyathighfrequencies.
Between1000Hzand2000Hz,thetypeoftheplantdoesnotmakeanydifferencein
termsofabsorption.Theresultsalsoindicatethattheplantpropertiesaremore
significanthigherfrequenciesthevarianceinabsorptionincreaseswithincreasing
frequencybutisdimensionascoverageincrease.(Table7)
Table8belowshowstheabsorptioncoefficientresultbetween200Hzand2500Hz.
ASoundAbsorptionAverage(SAA)valueisasinglenumberratingthatindicatesthe
levelofsoundabsorptionprovidedbytheproductbeingtested[28].
TheSAAvalueistheaverageofthesoundabsorptioncoefficientsattwelve1/3-
octavefrequenciesrangingfrom200to2500Hertz.TheresultsshowninTable8
indicatethatat100%coverage,differentspeciesbehavedifferentlyintermsof
absorptivityatdifferentfrequencies.

96
Table8.Absorptionvaluefor6plantspeciesplantedontheturningtableatthreedifferentcoveragepercentages
Species 200 250 315 400 500 630 8001000
1250
1600
2000
2500 SAA
NRC
GoldenPothos25%cov 0.24 0.26 0.17 0.22 0.29 0.33 0.41 0.34 0.37 0.37 0.36 0.39 0.31
0.3
GoldenPothos50%cov 0.19 0.22 0.11 0.29 0.25 0.35 0.46 0.35 0.36 0.37 0.37 0.44 0.31
0.31
GoldenPothos100%cov 0.33 0.27 0.22 0.39 0.35 0.35 0.46 0.37 0.39 0.41 0.41 0.47 0.37
0.36
Ivy25%cov 0.08 0.13 0.19 0.17 0.21 0.18 0.31 0.33 0.30 0.33 0.33 0.41 0.250.25
Ivy50%cov 0.09 0.16 0.26 0.16 0.25 0.20 0.32 0.29 0.31 0.36 0.37 0.45 0.270.27
Ivy100%cov 0.18 0.29 0.37 0.27 0.31 0.28 0.37 0.35 0.38 0.41 0.43 0.45 0.340.34
Pilea25%cov 0.28 0.36 0.26 0.11 0.21 0.45 0.42 0.38 0.39 0.41 0.33 0.45 0.34
0.32
Pilea50%cov 0.14 0.18 0.48 0.24 0.23 0.38 0.40 0.40 0.40 0.40 0.40 0.47 0.340.34
Pilea100%cov 0.20 0.26 0.52 0.41 0.46 0.36 0.44 0.41 0.39 0.40 0.44 0.49 0.400.40
CreepingFig25% 0.15 0.13 0.18 0.23 0.33 0.29 0.38 0.34 0.37 0.39 0.40 0.43 0.30
0.30
CreepingFig50%cov 0.19 0.29 0.12 0.32 0.29 0.24 0.48 0.40 0.38 0.37 0.34 0.42 0.32
0.32
CreepingFig100%cov 0.26 0.14 0.10 0.33 0.33 0.33 0.48 0.40 0.35 0.38 0.44 0.49 0.34
0.33
SpiderPlant25%cov 0.51 0.53 0.37 0.43 0.51 0.45 0.58 0.50 0.44 0.45 0.44 0.56 0.48
0.40
SpiderPlant50%cov 0.29 0.53 0.09 0.32 0.30 0.42 0.43 0.44 0.41 0.37 0.41 0.50 0.38
0.37
SpiderPlant100%cov 0.00 0.17 0.00 0.36 0.43 0.23 0.43 0.37 0.41 0.44 0.38 0.53 0.31
0.31
Fern25%cov 0.08 0.06 0.09 0.09 0.11 0.12 0.12 0.11 0.12 0.14 0.14 0.17 0.11
0.1
Fern50%cov 0.30 0.22 0.00 0.19 0.42 0.33 0.42 0.33 0.33 0.36 0.33 0.43 0.31
0.3
Fern100%cov 0.25 0.21 0.00 0.18 0.35 0.48 0.44 0.39 0.35 0.40 0.42 0.50 0.33
0.33

97
Averagingtheabsorptionfromthesixplantspeciesatdifferentlevelofcoverageitis
illustratedthat,ingeneral,theabsorptioncoefficientincreaseswithincreasingthe
plantspeciesdensityofcoverage(Figure80).
Figure80.Averageabsorptioncoefficientof6differentspecieswith3differentvegetationcoverage,Emptyroom
andturningtableintheroom
0
0.5
1
1.5
80 800
AbsorptionCoefficient
One-thirdOctaveBandsFrequency(Hz)
α(Substrate70%/30%) α(AveragePlantSpecies100%cov)
α(AveragePlantSpecies50%cov) α(AveragePlantSpecies25%cov)
α(Turningtableintheroom) α(EmptyRoom)
1602002504005006308001000125016002000250031504000

98
6.2.1. ScatteringTheimpactofplantcoverageonsoundscatteringwasinvestigatedforeach
vegetationspecies.Asexpectedtheoveralltrendissimilartoabsorption,scattering
increaseswithfrequency.However,thevarianceinscatteringbetweentheplant
speciesincreasewithincreasingcoverage.Table10comparesthescattering
coefficientof6differentplantspeciesatthesamevegetationcoveragefor
frequenciesbetween1000Hzand4000Hz.
Table9illustratestheNRC(Scattering)ofsixspeciesunderstudyat25%,50%and
100%coveragerespectively.
AccordingtoTable10itisclearthatat100%coverage,SpiderPlant,CreepingFig,
FernandGoldenPothosscattermoresoundenergyatmidfrequencies(between
1000and2500Hz)withtheaveragesoundscatteringof0.24,0.19,0.187and0.14
respectivelyincomparisonwithIvyandPileawith0.5and0.4soundscattering
averagerespectively.
Table10showsthatthescatteringcoefficientresultsfor6specieswithadensityof
50%coveragefollowsasimilartrendto100%coverage.Soundscatteringaverage
forSpiderPlant,GoldenPothos,CreepingFig,Fern,PileaandIvyis0.15,0.13,0.11,
0,06,0.04and0.01respectivelyatfrequenciesbetween1000Hzand2500Hz.With
evenlessvegetationcoverage(25%),thedifferencebetweenspeciessound
scatteringismorepronounced.

99
Table9.NRC(Scattering)ofdifferentspeciesat25%,50%and100%coverage
NRC(Scattering)
Golden
Pothos
Ivy
Pilea
Creeping
Fig
Fern
Spider
Plant
25%cov 0.07 0.002 0.008 0.18 0.09 0.19
50%cov 0.17 0.02 0.13 0.07 0.18
100%cov 0.16 0.05 0.05 0.26 0.2 0.26
Table10.Scatteringcoefficientof6differentspecies,100%,50%&25%vegetationcoverage
0
0.2
0.4
0.6
0.8
1
820
ScatteringCoefficient
One-thirdOctaveBandsFrequency(Hz)
6PlantSpecies(100%cov)
s(Ivy100%cov)
s(GoldenPothos,100%cov)
s(Pilea,100%cov)
s(CreepingFig,100%cov)
s(Fern,100%cov)
s(SpiderP,100%cov)
sSubstrate30%-70%
10001250160020002500315040000
0.2
0.4
0.6
0.8
1
820
ScatteringCoefficient
One-thirdOctaveBandsFrequency(Hz)
6PlantSpecies(50%cov)
s(Ivy50%cov)
s(Goldenpothos50%cov)
s(Pilea,50%cov)
s(CreepingFig,50%cov)
s(Fern,50%cov)
s(SpiderP,50%cov)
1000125016002000250031504000
0
0.2
0.4
0.6
0.8
1
820
ScatteringCoefficient
One-thirdOctaveBandsFrequency(Hz)
6PlantSpecies(25%cov)
s(Ivy25%cov)
s(Goldenpothos25%cov)
s(Pilea,25%cov)
s(CreepingFig,25%cov)
s(Fern,25%cov)
s(SpiderP,25%cov)
1000125016002000250031504000

100
Figure81illustratesthatscatteringcoefficient(averagedbetweenallspecies)
increaseswithvegetationcoverageabove500Hz.Itcanbeconcludedthatthe
vegetationdensity,evaluatedascoveragepercentageisimportantinincreasingthe
scatteringcoefficient.
Figure81.Averagescatteringcoefficientof6differentspecieswith3differentvegetationcoverage,andturningtableintheroom
0
0.2
0.4
0.6
0.8
1
120 1200
ScatteringCoefficient
One-thirdOctaveBandsFrequency(Hz
s(AveragePlantSpecies100%cov) s(AveragePlantSpecies50%cov)
s(AveragePlantSpecies25%cov) sbase
------ssubstrateonturningtable

101
6.2.2. Therelationshipbetweentheabsorption&scatteringcoefficientandthepropertiesofsixavailablespecies
Absorptionandscatteringandplantpropertiesmeasurementswerecompletedon
plantspeciesat1/3-scale.Fromthemeasurements,itwasinvestigatedhow
significantlyplantcharacteristics(section5.3)canaffectabsorptionandscattering
coefficients.
Therelationshipbetweentheacousticalcharacteristicsofabsorptionand
scattering)andthepropertiesofthesixplantspecieswasexaminedusingsimple
scatteringplotstoidentifypossiblecorrelations.
Therelationshipsbetweentheabsorptioncoefficientsandscatteringcoefficientsto
propertiesoftheplantsarepresentedinAppendix6. Theplantscharacteristics
Height,leafthickness,stemdiameter,leaflength,drymass,wetmassandleafarea
areindependentvariables.Additionally,compoundedvariableswereexamined
including;LeafNumber*LeafArea,LeafNumber*LeafArea*LeafThickness,Leaf
Number*LeafArea*StemDiameter,LeafNumber*LeafArea*StemDiameter*
Height,LeafNumber*LeafArea*WetMass,LeafNumber*LeafArea*DryMass.
RecallthatLeafNumber*LeafAreaisthetotalleafareawhichisnotequaltoLAI.
Ingeneral,thecorrelationsuggeststhat,LAI*Mass(dryandwet)predictsscattering
coefficientsatmid-frequencies(200-2500Hz)andabsorptioncoefficientathigh
frequencies(2500-5000).
Thereisaweakindicationthattotalleafareaandmassintherangeof200and2500
Hzhaveanimpactontheabsorptioncoefficientofthevegetation(Appendix6-Table
A).Athighfrequency,thecorrelateoftotalleafareaandabsorptionisslightly
stronger(Appendix6-TableB).Atthespecificfrequencyof1333Hz(Appendix6-
TableC),thereisclearerindicationofrelationbetweenabsorptioncoefficientand

102
totalleafareaandwiththecompoundvariablesofLN*LAMassandalsoLN*LA*
Leafthickness.Thoseappearstronglyrelatedtoscatteringat1333Hzthough
(Appendix6-TableE).
Withrespecttothecorrelationofplantproperties,totalleafarea*massmayrelate
totheaveragescatteringcoefficient(Appendix6-TableD-F). Thereisaweak
indication,whichasksforfurtherinvestigation.
Inordertohaveresultsfrommultipleregressionsmodelling,moresamplesare
required.Thisisafurtherexplorationofthestudyby Attenborough[3],thatfound
theabsorptionbyleavestobeimportantathighfrequenciesabove1kHz,whereas
below1kHzthereislittlesoundabsorptionbyleaves.

103
6.3. Solvingfortheacousticalcoefficient
Livingwallpanelsareusuallyusedinacombinationofgeometricarrangementsand
becausethereisadiversityofapplicationofLivingWallSystems,itisdesirableto
haveanabsorptioncoefficientforpredictivemodelling.Thereforeconvertingthe
measuredSabinetoanabsorptioncoefficientvalueisrequired.
ResultindicatesthatforbothCarrierAandCarrierBtheabsorption(Sabine)does
notincreaselinearlywiththenumberofpanels(Figure59).Thepanelsareina3-
dimensionalshapewithcomplexsurfaces.Theunusualshapeofthepanelsandthe
factthattheeffectiveareachangeswithanassemblyofmultiplepanelsmustbe
takenintoaccount. Twomethodswereattemptedtoderivetheabsorption
coefficientofthelivingwallsystems.Thefirstmethodcalculatestheabsorption
coefficientbydividingtheareaofthetestspecimenintothemeasuredSabine
(Equation7).
Thesecondmethodinvolveddevelopingfrequencydependentlinearregression
equationstoresolvethecoefficient.
Itwasconsideredthattheacousticaleffectivearea,maybedifferentfromthe
architecturalareaofthelivingwallunitandthattheacousticaleffectiveareacould
bedetermined.

104
6.3.1. Attemptedmethodone
Theratioofabsorption(Sabine)overareashouldbethesameregardlessofthe
numberofpanels.However,usingarchitecturalarea(definedas2Darea)ofthe
panelsintheratioresultedinamismatchbetween3and1CarrierAasshownin
Figure82.Toaddressthisproblem,aneffectiveacousticalareawasderived.
Thefirstapproachsimplysummedthetotalexposedsurfaceareasofthepanelsina
livingwallgeometricconfiguration.
Figure82.measuredabsorptioncoefficientof1CarrierA
0
0.5
1
1.5
2
177 1770
AbsorptionCoefficientofMG
One-thirdOctaveBandsFrequency(Hz)
1MGpannel 3MGPannelsαfrom1CarrierA αfrom3CarrierA

105
SimplegeometricalapproachTheeffectiveacousticalarea(Equation10)formultiplepanels(1,2,3,…,n)each
livingwallsystemis:
EffectiveArea=n1(ab)+n2(bc)+n3(ca)Equation11
Wheren=numberofexposedsurfacesofageometricandconfiguration
Anda,b,c=thedimensionofthepanel
Usingthissimplegeometricapproachtodidnotresultinaconsistentabsorption
coefficient.
Complexgeometricapproach
Thesecondapproachusedcomplexgeometrytodescribethecarrierandleafarea
indextodescribetheexposesurfacesoftheplantsanddrivetheacousticaleffective
area.Thisareaiscalculatedbymeasuringthesidesandthemainareaofthepanel.
ThesubstrateandleafareasarebothestimatedusingtheLeafAreaIndex(LAI)of
40potsforeverypanel.Butevenwiththiscalculation,theacousticaleffectivearea
didnotresultinaconsistentabsorptioncoefficient(Sabineoverarearatio)for3
and1CarrierApanels.
Neithergeometricalapproachprovidesvalidmethodtoderivetheabsorption
coefficientoverthefrequencyspectrum(125Hzto4000Hz).Furtheraccordingto
a
b
c
Figure83.Samplebox

106
Figure58and59(section5.2.3),theratiobetweentheabsorptionofdifferent
numberofcarriersvarieswithfrequency.Thissuggeststhattheeffectiveacoustical
areaisfrequency-dependent.
6.3.2. Resolvingequation
Thegoalhereistoderivetotalabsorptionforaspecificnumberofpanels.Figure84
illustratestheplottedaverageSabineabsorption(rangefrom200to25001/3
octavedata)fromallthreetypesoflivingwallsystem.Usingalinearapproximation,
Equation12,canbederivedforcalculatingfortheaverageSABINEpanel.The
numberofpanelsusedintotaltherewere15measurementofasinglepanel,6
measurementsofthreepanels,3measurementsoffourpanelsand3measurement
ofeightpanels.RepeatingthesameprocedureforNRCrange(one-octaveband250
and2000HzleadstofindingEquations14-19.
Figure84.relationshipbetweentheaverageSabineandquantityofpanels
*TheR2=0.95792indicatesthatthelinearregressionmodelhasahighleveloffit
withthemeasureddata.Althoughthereisalimitedstatisticalpowerduetothe
numberofsamples.
y=0.4369x+0.6748R²=0.95792
0
0.5
1
1.5
2
2.5
3
3.5
4
4.5
0 1 2 3 4 5 6 7 8 9
AverageSAAofallsystems
NumberofPanels
Series1 Linear(Series1)measuredabsorption bestfit

107
Sabine(200-2500Hz)=0.4369N+0.6748Equation12
Sabine(200-2500Hz)=0.4577N+0.7167Equation13.
N=Numberofpanels
However,theabsorptionofthepanelsarefrequency-dependent.Therefore,using
thesamemethodsmentionedabove(Figure86),thefollowingequationswere
derivedforeachfrequency.
Theseequationsarebasedonpanelsizebetween0.36and0.72whereNisnumber
ofpanel.
Sabine125=(0.1054N+0.1435)Equation14.
Sabine250=(0.6485N+0.7537)Equation15.
Sabine500=(0.4346N+0.744)Equation16.
Sabine1000=(0.2665N+0.79063)Equation17.
Sabine2000=(0.4358N+0.8144)Equation18.
Sabine4000=(0.6896N+0.8515)Equation19.
Equation14to19wereusedfortheroomsensitivityanalysis(section6.4)

108
6.3.3. ScatteringcoefficientforapplicationinOdeonSurfacescatteringfunctionsusedinOdeonarederivedfromRindaltheory. InOdeon
thescatteringcoefficientforthemiddlefrequencyof707Hz,isrequiredasaninput
forthematerialslist,Odeonexpandsthiscoefficientintovaluesforeachoctave-
band[43].
Inordertofindthe707Hzscatteringcoefficientvalueforeachspeciesthe
scatteringcoefficientresultsfromlabmeasurementforeachspecieswasplottedina
graphalongwiththevaluesgeneratedbyRindalalgorithm(figure87).
Odeonresultsvs.labmeasurementsScatteringcoefficientof6differentspeciesismeasuredatdifferentfrequenciesas
showninFigure85.
Figure85.ScatteringcoefficientofsixspeciesresultsfromLabmeasurements
Figure86belowillustratestheaveragescatteringcoefficientofthesamespecies
excludingtheCreepingFig.Theaveragescatteringcoefficientis0.11forthemiddle
frequencyof707Hz(averageof500-1000Hz).AsOdeon,thecoefficientis
0.0
0.2
0.4
0.6
0.8
1.0
120 1200
ScatteringCoefficient
Frequency(Hz)s(Ivy100%cov) s(GoldenPothos,100%cov)
s(Pilea,100%cov) s(CreepingFig,100%cov)
s(Fern,100%cov) s(SpiderP,100%cov)
2002505001000 2000

109
expandedintoscatteringcoefficientsvaluesforeachoctaveband–byinterpolation
orextrapolation.Thegraphlabeled0.11inFigure87bshowstheresult.
Figure86.ScatteringresultsfromLabmeasurements&Odeonsuggestedscatteringcoefficients(FrequencyfunctionsforPlantsat707Hz)[43])
Comparingtheaveragescatteringcoefficientfromthelabmeasurementswith
Odeonsoftware’sexpandedscatteringcoefficients,itwasdeterminedthatgraphs
alignwellinthemidandhighfrequencies.Althoughthelabresultssuggestssome
morescatteringinthelowandhighfrequenciesthantheOdeonmodel.
0
0.2
0.4
0.6
0.8
1
125 1250
ScatteringCoefficient
Frequency(Hz)
0.11 Labresult
707 1000
Odeon

110
6.4. RoomsensitivityanalysisOdeonwasusedtoestimatethereverberationtimeofa56m2roomsizespace,with
andwithoutthelivingwalls.Theeffectofdifferentconfigurationsoflivingwall
systemsintheroomweremodeled.Inaddition,thesensitivityofusingthe
empiricallymeasuredscatteringcoefficientvaluetothelivingwallsurfaceswas
analyzed.
6.4.1. RoomdefinitionThecasestudycouldbeatypicalofficeorsmallclassroomsizespace.Theroom
dimensionsweresetat7.5m*7.5mandheight3.5withthebasedrywallcondition
developedwasonallwallsurfacesandconcreteforthefloorandceilingsurfaces.
Thepointsourcewaslocatedinthemiddleoftheroomat1-meterheight.One
sourceintheroomandfive-receiverlocationswererandomlylocated.
First,thebaseconditionwasmodeled.Second,theroomwasmodeledwithonewall
coveredwithlivingwallsystems(211-m2panels).Third,theroomwasmodeled
with2wallscoveredwithlivingwallsystemsparallelandperpendiculartocheck
theeffectofdifferentconfigurationsoflivingwalls.Finally,thecasestudywasalso
modeledwithall4wallscoveredwiththelivingwallsystem.Themodelswere
repeatedwithandwithoutconsideringscatteringcoefficient.TheOdeonmodel
defaultforscatteringwasnotused.Thescenariosmodeledincludedscattering
coefficientof0forallsurfaces,scatteringcoefficientof0forwall,floor,andceiling
surfaces,andscatteringcoefficientvaluederivedfromlabdataforlivingwalls
surfaces.
ForthefirstseriesofOdeonmodels,theassignedabsorptionwasderivedfrom
equations13to18.TheassignedscatteringcoefficientwastakenfromSection5.3.3.
Forthesecondseries,bothabsorptionandscatteringcoefficientofthelivingwall
surfacesweretakenfrom1/3-scalemeasurementsonaturningtable(Section5.3).

111
(a) Oneside
(b)Parallel
(c)Perpendicular
(d)Allsides
Figure87.Livingwallsdifferentconfigurationsinroom.

112
6.4.2. Modeltheroomeffectoflivingwalls
ThevegetatedlivingwallsystemsintheroomweremodeledinOdeonusingabsorptionvaluesandscatteringcoefficientfoundfromlabmeasurements(5.3.3)
Figures88,89and90illustratethatthedifferencebetweentheresultof
reverberationtimelivingwallswithandwithoutthescatteringcoefficient,ismore
dramaticfortheroomwith1livingwall,21panelwith2livingwalls,42panelsor4
livingwalls,84panels.
AsseeninFigure88,Odeonresultshowsthesignificantdifferenceinreverberation
timebetweenthemodelthatincludesthescatteringcoefficientofthelivingwall
areaandthemodelwithscatteringcoefficientsetto0forallsurfaces.Reverberation
timevaluesincreasebyabout0.25throughallfrequencieswhenscatteringis
considered.Thisemphasizestheimportanceofconsideringthescatteringcoefficient
whenusingOdeonsoftwaremodellingfortheacousticalevaluationofthespace.
Figure90illustratesthatwhenallthefourwallsoftheroomarecoveredwithliving
walls,applyingthescatteringcoefficienttothelivingwallssurfacesdoesnotmakea
significantdifferenceintermsofreverberationtimeintheroom.

113
Figure88.Reverberationtimeoftheroomwithlivingwallononeside;sc=0vs.scvalue
Figure89.Reverberationtimeoftheroomwithlivingwallsontwosides;sc=0vs.scvalue
0
0.5
1
1.5
2
2.5
125 1125 2125 3125 4125 5125 6125 7125
ReverbrationTime(T20)
One-thirdOctaveBandsFrequency(Hz)
EmptyRoom 1MGLWinroom(NoS) 1MGLWinroom(S)
010002000300040005000600070008000
1LWinroom(S) 1LWinroom(NoS)
0
0.5
1
1.5
2
2.5
125 1125 2125 3125 4125 5125 6125 7125
ReverberationTime(T20)
One-thirdOctaveBandsFrequency(Hz)
EmptyRoom 2perpendicularMGLWsinroom(Nos)
2perpendicularMGLWsinroom(s) 2parallelMGLWsinroom(Nos)
2parallelMGLWsinroom(s)
010002000300040005000600070008000
2PerpendicularLWsinroom(NoS)
2ParallelLWsinroom(NoS)
2PerpendicularLWsinroom(S)
2ParallelLWsinroom(S)


115
wallsreducesreverberationtimebyabout0.3atlowfrequenciesand0.2at
frequenciesafter4000Hz. Thegraphshowsthat,ingeneral,increasingthenumber
oflivingwallsdecreasethereverberationtimeoftheroomandkeepingthewalls
perpendicularismoreefficientthanhavingtheminparallel.Thesemodelisinclude
theabsorptionvaluesderivedfromequation12-19andtolabmeasuredscattering
coefficient.
Figure91.Reverberationtimeoftheroomwithdifferentconfigurations(Emptyroomisbaseline)
Figure92showsreverberationtimeofplantspecieswithtwodifferentabsorption
coefficients.TheOdeonmodelisimplementedforspeciesonturningtableandthe
onesonlivingwallpanels.
Thegraphslabeled“S”showstheresultofreverberationtimewithscattering
coefficientappliedtothelivingwalls.Reverberationtimeincreasesbyapplying
scatteringcoefficientinbothcases.
0
0.5
1
1.5
2
2.5
0 1000 2000 3000 4000 5000 6000 7000 8000
ReverberationTime(T20)
One-thiredOctaveBandsFrequency(Hz)-Series1
EmptyRoom 1MGLWinroom(S)
2perpendicularMGLWsinroom(s) 2parallelMGLWsinroom(s)
4MGLWsinroom(s)
1LWinroom(S)
2ParallelLWsinroom(S)
Emptyroom
2PerpendicularLWsinroom(S)
4LWsinroom(S)

116
Figure92.Reverberationoftheroomwithdifferentabsorptioncoefficientvaluesforlivingwalls.
0
0.5
1
1.5
2
2.5
0 1000 2000 3000 4000 5000 6000 7000 8000 9000
ReverberationTime(T20)
One-thirdOctaveBandsFrequency(Hz)
1EGLWinroom(NoS) 1EGLWinroom(S)
1MGLWinroom(S) 1MGLWinroom(NoS)
1LW(S)series2 1LW(NoS)serries2
1LW(NoS)serries1 1LW(S)serries1

117
7. CONCLUSIONSANDOUTCOMESInthisinterdisciplinaryresearchthebasisofthedataanalysiswastofindoptimal
carrierpropertiesforefficientsoundabsorptionininteriorlivingwalls.
Experimentaldataforsoundabsorptionpropertiesofmaterialsisanessentialtool
fornoisecontrolspecialists.Inthisresearch,acousticalcharacterizationsofinterior
livingwallsaremeasured.Theevaluationgoalistoquantifytheimpactofthe
interiorlivingwallsonindooracousticalquality.Aseriesofmeasurementswere
carriedoutinareverberationchambertoexaminerandom-incidenceabsorption
coefficientsoffulllivingwallsystem,alsorandom-incidenceabsorptionand
scatteringcoefficientofavarietyofvegetation,consideringvariousfactorssuchas
vegetationtypesandvegetationcoverage.Thefinalstepwasmodellingthecase
studybyusingthedatafromthelabmeasurementstoinvestigatethemodel
sensitivitytothedata.
Twomethodswereestablishedforobtainingdataontheacousticalcharacteristicof
livingwallsinreverberationchamber.Firstoneistheabsorptionmeasurementof
livingwallsystematfullscaleandsecondoneisthe1/3scaleabsorptionand
scatteringmeasurementsoflivingwallplantspecies.
Whencomparingabsorption(Sabine)ofempty,vegetatedandcarriersfilledwith
substratetooneanother,itisclearthattheabsorptionofalllivingwallpanelshave
thesametrendwithvariationinabsorptionduetodifferentmaterialsandgeometry
ofthepanel.Addingsubstrateandplanttocarrierschangestheirrelative
performanceandforthesubstratebasesystemnegatesthedifferencesofpanel
construction.Theresearchconfirmedthatdriersubstratemixabsorbssignificantly
moresoundthanthesubstrateinfieldcapacity.Atmidandhighfrequencies,the
resultshowedthattheplantedpanelislessabsorptivethanthepanelthatisfilled
withsubstrate.Thevegetationimprovesthelowfrequencyabsorptionhoweverit
inverselyinfluencesthemidandhighfrequencyabsorption.

118
Theimpactofthethreedifferentlevelsofplantcoverageinsoundabsorptionand
soundscatteringwasinvestigatedforeachplantspecies.Fromtheresultsitcanbe
concludedthattheabsorptioncoefficientandscatteringcoefficientincreaseswith
increasingtheplantspeciesdensityofcoverage.Withlessvegetationcoverage,the
differencebetweenspeciessoundscatteringismorepronounced.Whilethe
absorptioncoefficienttrendsofdifferentspeciesaremoresimilarasthecoverage
densitydecreases
Inthisstudytherelationshipbetweentheabsorptioncoefficientandscattering
coefficientandthepropertiesoftheplantswaspresented.
Thereisanindicationthatatmidfrequenciestotalleafareaandmasshavean
impactontheabsorptioncoefficientofthevegetation.Itcanbeconcludedthat
LAI*Mass(dryandwet)predictsscatteringcoefficientsatmid-frequencies(200-
2500Hz)andabsorptioncoefficientathighfrequencies(2500-5000).
TwoseriesofOdeonmodelswithconsideringdifferentmethodofassigning
absorptionandscatteringvaluesforlivingwallsurfaceswasusedtoestimatethe
reverberationtimeofaroom,withandwithoutthelivingwalls.Theresultusing
datafromthemeasurementoffullyestablish,ratherthanplantspeciesdataismost
plausible.Resultsshowthatvegetationdecreasesthereverberationtimeand
increasingthenumberoflivingwallsdecreasethereverberationtimeofthe
modeledroom.Resultsalsoillustratetheimportanceofconsideringthescattering
coefficientwhenusingOdeonsoftwaremodellingandscatteringcoefficientdatais
moreessentialforsmallerlivingwallinstallations.Alsodifferentconfigurationsof
livingwallsystemsweremodeled.
Somedifferenceswithpreviousstudieswerefoundintermsofthesoundabsorption
coefficient,mostlikelyduetothedifferencesinthetestedconstructive.However,
despitethesedifferences,thepotentialofthegreenwallsoundabsorptiontoolfor
buildingscanbeconfirmed.Itcouldbeconcludedthatgreenwallscanbeusedasa
soundabsorptivematerialsinsidethebuildings.Wealsoconcludedthattheeffectof

119
thetypeoftheplantonabsorptionandscatteringofthelivingwallsisnotnoticeable
inpractice.
Thepracticalconsiderationfordesignersofsoil-basedlivingwallsystemsisthatthe
primarydeterminingfactorsinabsorptionandscatteringistheamountofsoiland
plantcoverageforagivenlivingwallsystem’ssurfacearea.Thisistrueevenwhen
emptycarriershavedifferentabsorptionandscatteringcharacteristic.Itshouldalso
benotedthattypeoftheplantspecieshaslimitedimpactonabsorptionand
scatteringofthelivingwallsystem.
Themaincontributionofthisresearchistocharacterizeandintroduceinterior
livingwallsasasustainableandacousticallybeneficialmaterialtothedesignerteam
andtoprovidethedesignerswithpracticalmeanstoevaluateaninstallationofthe
livingwallsystems.Absorptionandscatteringcoefficientsarenowavailablefor
roomprediction.
8. FUTUREWORKThisinterdisciplinaryresearchgoalistolookatthepotentialoftheinteriorliving
wallandenablemoresophisticatedandmatureuseofit.Theresultsofthese
evaluationsprovideuswithenoughinformationtoexplaintheacousticalbenefitsof
usinginteriorlivingwalls.Eventually,withanunderstandingofallthementioned
factorsandparameters,theefficiencyoflivingwallscanbeoptimizedtoimprove
theacousticalenvironmentofaroom.
Todeterminetheexactinfluenceofthescatteringcoefficientonthereverberation
time,furtherstatisticalanalysisisnecessary.Todeterminethevalidityofthe
measureddataacrossexaminationofroompredictionmodellingandfield
measurementsarerequired.

120
GLOSSARYANDABBREVIATIONSAbsorption coefficient:A value that shows how efficient a material absorbs
incidentsound.
Diffuse sound field: Sound field in which the incident sound intensity on a plane
surfaceisequallydistributedoverallsolidanglescoveringahemisphere[17].
Hydroponic:Thetechnologyofgrowingplantswithoutsoil.
Interruptednoisemethod:Methodofobtainingdecaycurvesbydirectrecording
of the decay of the sound pressure level after exciting a room withbroadband or
band-limitednoise[18].
Integrated impulse response method:Method of obtaining decay curves by
reverse-timeintegrationofthesquaredimpulseresponse[18].
Impulseresponse:Temporalevolutionofthesoundpressureobservedatapoint
inaroomasaresultoftheemissionofaDiracimpulseatanotherpointintheroom
[18].
MoistureContent(MC):Theamountofwaterinamateriallikesoil[42].
NoiseReduction(NR): Noise level measured at source position minus noise level
measuredatreceiverposition.
NRCorNRCC:NationalResearchCouncilofCanada.
RealTimeAnalyzer(RTA):Instrumentformeasuringanacousticproperty.

121
ReverberationTime(RT):Thetimeittakesforsoundlevelstoattenuateby60dB
withinaspace,importantacousticallyforcalculationofroomsoundabsorption[41].
SAA:The SAA value is the average of the sound absorption coefficients at twelve
1/3-octavefrequenciesrangingfrom200to2500hertz.[62]
soundabsorptionaverage,SAA—asinglenumberrating,theaverage,roundedoffto
thenearest0.01,ofthesoundabsorptioncoefficientsofamaterialforthetwelve
one-thirdoctavebandsfrom200through2500Hz,inclusive,measuredaccordingto
thistestmethod.
SoundAttenuation:Decreaseinsoundlevel.
Soundpressurelevel(SPL):istheratiooftheabsolute,SoundPressureanda
referencelevelwhichisthethresholdofhearing.SPLispresentedinalogarithmic
valueofdecibels(dB)[41].
Specularreflection: reflection that obeys Snells law, i.e. the angle of reflection is
equaltotheangleofincidence[17].
Speech Transmission Index (STI): A value to evaluate the speech transmission
quality. Measuring some physical characteristics of a transmission channel, for
instance a room, telephone line, etc. can determine the effect of transmission
channelcharacteristicsonspeechintelligibility.
Speechintelligibility:Ameasuretopredicthowclearlyspeechcanbeunderstood
inaroom.(Vorland,Michael,Eckard)
Scattering:Thedifferencebetweenthetotalreflectedenergyandthespecular
reflectedenergy

122
AKNOWLEDGEMENTSSpecialthankstoDr.MaureenConnellyandtomyfellowgraduatestudentRosaLin
andIvanCheungandtothecommitteemembers,Dr.KarenBartlettandMichel
LabrieMAIBCandeveryonewhohashelpedmealongthewaytomakethisthesis
projectpossible.

123
BIBLIOGRAPHY[1] Gidlof-Gunnarsson, A., & Ohrstrom, E. (2007). Noise and well-being in urban residential
environments: The potential role of perceived availability to nearby green areas. Landscape
and Urban Planning, 83, 115-126.
[2] ASTM C423-09a: Standard Test Method for Sound Absorption and Sound Absorption
Coefficients by the Reverberation Room Method. (2009). Retrieved from www.astm.org.
[3] Attenborough, K. (1988). Review of ground effects on outdoor sound propagation from
continuous broadband sources. Appl. Acoust, 24, 289–319.
[4] Aylor, D. (1972). Noise reduction by vegetation and ground. The Journal of the Acoustical
Society of America, 51, 107-205.
[5] Bistafa, SR., & Bradley, JS. (2000). Predicting reverberation times in a simulated classroom.
J Acoust Soc Am, 108(4), 1721-31.
[6] Christensen, C.L, Rindel, J.H. (2005). A new scattering method that combines roughness
and diffraction effects. Form Acusticum.
[7] Connelly, M. (2012). Laboratory-based experimental investigation of the acoustical
characteristics of vegetated roofs. Acoustic and Noise Research Group, University of British
Columbia, BC, Canada, V6T 1Z3; Center for Architectural Ecology, British Columbia Institute
of Technology, Burnaby, BC, Canada.
[8] Delany, M. E., & Bazley, E. N. (1970). Acoustical properties of fibrous absorbent materials.
Applied Acoustics, 3, 105-116.
[9] Pead, M. (Photographer). (10, May 2016). Green Walls For High Profile Office Locations
[digital image]. Retrieved from https://wallflower.com.br/produtos/paredes-verdes/
[10] Architectes Associés (Photographer). (4, Jan 2010). BACCHUS, Brasserie Restaurant [digital
image]. Retrieved from http://www.modulogreen.pt/en/gallery/bacchus-brasserie-restaurant
[11] Yang, H., Kang, J., & Cheal, C. (2013). Random-Incidence Absorption and Scatering
Coefficients of Vegetation. Acta Acoustica United with Acustica, 99, 379-388.
[12] ISO 17497-1: Acoustics: Measurement of random-incidence-scattering coefficient in a
reverberation room. (2004).
[13] ISO 354: Acoustics: Measurement of sound absorption in a reverberation room. (2003).
[14] Ducourneau, J., & Planeau, V. (2003). The average absorption coefficient for anclosed
spaces with non-uniformly distribute absorption. Applied Acoustics, 64, 845-862.
[15] Kang, J. (2002). Numerical modelling of the speech intelligibility in dining spaces. Appl.
Acoust. 63, 1315–1333.
[16] Wang, L., & Rathsam, J. (2008). The influence of absorption factors on the sensitivity of a
virtual rooms sound field to scattering coefficients. Applied Acoustics, 69, 1249-1257.

124
[17] Price, M. (1988). Sound attenuation through trees: Measurements and models. J. Acoust.
Soc. Am, 84, 1836–1844.
[18] Martens, M., Severens, P., Van Wissen, H., & Van Der Heijden, L. (1985). Acoustic reflection
characteristics of deciduous plant leaves (Vol. 25). Environ. Exp. Bot.
[19] Martens, M. (1980). Foliage as a low-pass filter. Experiments with model-forests in an
anechoic chamber. J. acoust. Soc. Am, 67, 66-72.
[20] Martens, M. (1981). Absorption of acoustic energy by plant leaves. The Journal of Acoustical
Society of America, 69, 303-306.
[21] Azkorra, Z. Pérez, G. Coma, J. Cabeza, L.F. Bures, S. Álvaro, J.E. Erkoreka, A. Urrestarazu,
M. (2015). Evaluation of green walls as a passive acoustic insulation system
for buildings. Applied Acoustics, 89, 46-56.
[22] Neubauer, R., & Kostek, B. (2001). Prediction of the reverberation time in rectangular rooms
with non-uniformly distributed sound absorption. Archives of Acoustics, 26(3), 183-202.
[23] Robinette, G. (1973). Plants, people and environmental quality. US department of the
Interior, American Society of Landscape Architects foundation.
[24] Tittmann, B., Clark, V., Richardson, J., & Spencer, T.W. (1980). Possible mechanism for
seismic attenuation in rocks containing small amount of volatiles. J. Geophys. Res, 85, 5199-
5208.
[25] Horoshenkov, V., Khan, A., & Benkeria, H. (2006). Acoustical properties of green walls with
and without vegetation. J. Acoust. Soc. Am, 120, 1910-1921.
[26] Van der Heijden, L.A. (1983). Influence of vegetation on acoustic properties of soils.
Oecologia, 56, 226-233.
[27] Vorlander, M. (2000). Definition and measurement of random-incidence scattering coefficient.
Applied Acoustics, 60, 187-199.
[28] Melbourne. In Wikipedia. Retrieved November 20, 2016, from
https://en.wikipedia.org/wiki/Melbourne
[29] Wong, N. H. (2010). Acoustics evaluation of vertical greenery systems for building walls.
Building and environment, 45(2), 411- 420.
[30] Listoen, J., Mohammadi, A. (2015). Living wall in class room. Poster presented at BCIT,
Vancouver, BC. Canada.
[31] Cavanaugh, W.J., Wilkes, J.A. (1998) Architectural acoustics principles and practice. John
Wiley & Sons, Inc.
[32] Jambrošić, K., Horvat, M., & Domitrović, H. (2007). Methods of Measuring the Reverberation
Time. 3rd Congress of the Alps Adria Acoustics Association.
[33] Oelze, M.L., O’Brien, W.D., & Darmody, R. Measurement of Attenuation and Speed of Sound
in Soils (b)

125
[34] Connelly, M. (2011). Acoustical Characteristics of Vegetated Roofs Contributions to the
Ecological Performance of Buildings and the Urban Soundscape. University of British
Colombia, Vancouver, Canada.
[35] Huber, F., & Bednar, T. (2008). The influence of the scattering coefficient on the
reverberation time. Sfa, Acoustics08 Paris.
[36] Sakuma, T., Lee, H., & Kashiwanoha. (2013). Recent topics in acoustic scattering coefficient
determination for wall surfaces. International Symposium on room Acoustics.
[37] Farina, A. (2000). A new method for measuring the scattering coefficient and the diffusion
coefficient of panels. Acta Acustica united with Acustica.
[38] Navarro, J. M., Escolano, J., Cobos, M., & Lopez, J. (2013). Influence of the scattering and
absorption coefficients on homogeneous room simulations that use a diffusion equation
model (L). Acoustical Society of America , 1218-1221.
[39] Shtrepi, L., Pelzer, S., Rychtarikova, M., & Astofi, A. (2011). Influence of scattering coefficient
on the prediction of room acoustics parameters ina virtual concert hall. 6th International
Conference Material-Acoustic-Place.
[40] Sauro, R., & Michael, V. (2009). A suggested method to be used to measure scattering
coefficients of full scale samples.
[41] Choi, Y.J., Jeong, D., & Kim, J. (2006). Some issues in measurement of the random-
incidence scattering coefficients in a reverberation room. Acoustics (Turning Table Section).
20-22.
[42] Bibby, C., & Hodgson, M. (2010). Characterization and Improvement of Scattering and
Absorption by Architectural Surfaces Without the Use of Specialized Facilities. Canadian
Acoustics / Acoustique Canadienne. Vol. 38 No. 3, 166
[43] Odeon Room Acoustics [Computer Software]. (2016). Retrieved from
http://www.odeon.dk/pdf/ODEONManual12.pdf
[44] Connelly, M. & Hodgson, M. (2015). Experimental investigation of the sound-absorption
characteristics of vegetated roofs. Building and Environment, 92. 335-346.
[45] Bolbolan, D. (2014). Development of a Scaled Method for Testing Scattering Coefficients in
BCIT Reverberation Room. An applied research project.
[46] Arau-puchades, H. Berardi, U. (2015). A Revised Sound Energy Theory Based on a New
Formula for the Reverberation Radius in Rooms with Non-Diffuse Sound Field. ARCHIVES OF
ACOUSTICS, 40, 33-40.
[47] D'Alessandro, F. Asdrubali, F. Mencarelli, N. (2015).Experimental evaluation and modelling of
the sound absorption properties of plants for indoor acoustic applications. Building and
Environment, 94, 913-923.
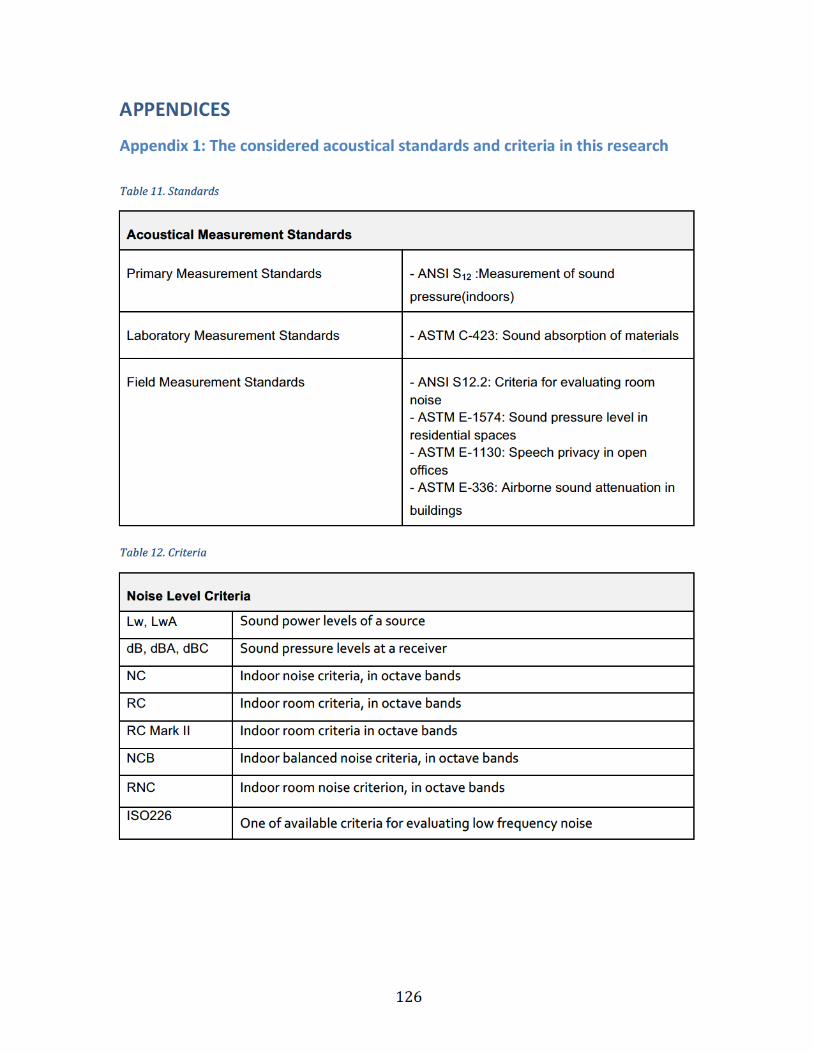
126
APPENDICES
Appendix1:Theconsideredacousticalstandardsandcriteriainthisresearch
Table11.Standards
Acoustical Measurement Standards
Primary Measurement Standards
- ANSI S12 :Measurement of sound
pressure(indoors)
Laboratory Measurement Standards
- ASTM C-423: Sound absorption of materials
Field Measurement Standards
- ANSI S12.2: Criteria for evaluating room
noise
- ASTM E-1574: Sound pressure level in
residential spaces
- ASTM E-1130: Speech privacy in open
offices
- ASTM E-336: Airborne sound attenuation in
buildings
Table12.Criteria
Noise Level Criteria
Lw, LwA Sound power levels of a source
dB, dBA, dBC Sound pressure levels at a receiver
NC Indoor noise criteria, in octave bands
RC Indoor room criteria, in octave bands
RC Mark II Indoor room criteria in octave bands
NCB Indoor balanced noise criteria, in octave bands
RNC Indoor room noise criterion, in octave bands
ISO226 One of available criteria for evaluating low frequency noise

127
Appendix2:IrrigationsystemTable13.Systemswaterflow(Irrigationsystem)
Wall(everythinginkg) Water(kg)in5min WaterFlow(Lit/Day) Litofwaterin1min
Modulogreen-All 2.604 3.1248 0.5208
Modulogreen-Topleft 0.942 1.1304 0.1884
Modulogreen-Bottomright 0.894 1.0728 0.1788
Plantconnection-Toprow 2.844 3.4128 0.5688
Plantconnection-Middlerow 3.047 3.6564 0.6094
Plantconnection-Bottomrow 2.195 2.634 0.439
Evergreen-All 2.748
Appendix3:1/3scaledturningtableparametersTable14.Parametersanddimensionsofturningtable[45]
Parameters & Dimension of Turntable
ISO 17497-1 Standard
1/3 scale model
Actual Represents Diameter of Turntable 3.0 m 1.2 m 3.75 m Area of Turntable 7.065 m2 1.23 m2 3.7 m2 Thickness of Turntable - 1.5 cm 4.5 cm Air gap below the table As small as possible 9 cm 27 cm Volume of chamber Min 197 m3 88.78 m3 2397.06 m3 Frequency Range 40-5000 Hz 53-2333 Hz 160-5000 Hz
Figure93.Sectionofturningtable

128
Appendix4:EquipmentandfacilitiesTheacousticchamberusedforabsorptionandscatteringevaluation.Theequipment
requiredincludes:
• Omni-directionalspeaker(mustbeimplementedtoachieveanexcited,uniform,
measuredspace.),
• RTA(realtimeanalyzer),
• Testsignalnoisegenerator,
• Powersupplyandpower,
• Pressuremicrophone,
• Computertoanalyzethedata,
• Scatteringtable
• Odeonsoftwaretobeusedforanalyses.

129
Appendix5:ThemeasurementconditionofCarrierA&B
(a)1Panel (b)3Panels
Figure94.Themeasurementconditionof(a)1Modulogreenpaneland(b)3ModulogreenPanels
3.56
4.46
S
0.50
0.50
1.06
0.79
3.56
4.46
S
0.50
0.50
2.14
0.79
0.73
1.06
1.03
1.221.14
12
3

130
1Panel 8Panels
Figure95.ThemeasurementconditionofMultipleplantconnectionpanels
3.56
4.46
S
0.50
0.50
0.60
0.51
1.06
2.11
1.11
3.56
4.46
S
0.50
0.50
1 2 3
4
7
5
8
6
1.90
1.901.06
1.25
1.37

131
Appendix6:TableA.SAASoundAbsorptionCoefficient(Averageof200to2500Hz)&PlantProperties
PlantProperties
LN:LeafNumberofplantsundermeasurementsonscatteringtable.LA:LeafArea(mm2).SD:StemDiameter
y=-0.0002x+0.3916R²=0.10685
0
0.5
130 180 230
SAA
(mm)
Height&SAA
0
0.5
1.2 1.7 2.2 2.7 3.2
(mm)
StemD&SAA
y=-0.0351x+0.357R²=0.12886
0
0.5
0.00 0.20 0.40 0.60 0.80
(mg)
Wetmass&SAA
0
0.5
0.00 0.02 0.04 0.06
SAA
(mg)
Drymass&SAA
y=0.0001x+0.332R²=0.1709
0
0.5
0 100 200
LN
LeafNo&SAA
y=-0.2758x+0.3658R²=0.32397
0
0.5
0 0.1 0.2
(m)
Leaflenght&SAA
y=0.1344x+0.2894R²=0.20258
0
0.5
0.3 0.4 0.5 0.6
SAA
(mm)
ThichnessofLeaf&SAA
y=4E-05x+0.332R²=0.1709
0
0.5
0 500
LAI
LAI&SAA
y=-0.0884x+0.3657R²=0.20991
0
0.5
0 0.2
(mm)2
Leafarea&SAA
y=-0.0055x+0.3951R²=0.48606
0
0.5
5 10 15
SAA
(mm)2
LeafNo*Leafarea&SAA
y=-0.008x+0.3807R²=0.29188
0
0.5
1.8 3.8 5.8 7.8
(mm)3
LN*LA*LeafThicnes&SAA
0
0.5
0 20 40 60
(mm)3
LN*LA*Stem&SAA
y=-3E-06x+0.3665R²=0.23656
0
0.5
0 5000 10000
SAA
(mm)4
LN*LA*Stem*Height&SAA
y=-0.0043x+0.3625R²=0.40152
0
0.5
0 5 10
(mm)2mg
LN*LA*Wetmass&SAA
y=-0.0527x+0.3676R²=0.40364
0
0.5
0 0.5 1
(mm)2mg
LN*LA*Drymass&SAA

132
TableB.SoundAbsorptionCoefficient,HighFrequencies,(Averageof2500to5000)&PlantProperties
PlantProperties
HF:SoundAbsorptionCoefficientAverageofHighfrequencies(2500-5000)
y=-0.0027x+2.253R²=0.19035
1
1.5
2
2.5
130 180 230
HF
(mm)
Height&HF
1
1.5
2
2.5
0 1 2 3 4
(mm)
StemD&HF
R²=0.16269
1
1.5
2
2.5
0 0.2 0.4 0.6 0.8
(mg)
Wetmass&HF
y=-2.8664x+1.8359R²=0.076
1
1.5
2
2.5
0 0.02 0.04 0.06 0.08
HF
(mg)
Drymass&HF
y=0.0009x+1.6435R²=0.10188
1
1.5
2
2.5
0 100 200 300
LN
leafNo&HF
y=-2.6049x+1.9186R²=0.38749
1
1.5
2
2.5
0 0.05 0.1 0.15 0.2
(m)
Leaflenght&HF
y=-0.2203x+1.8446R²=0.0073
1
1.5
2
2.5
0.3 0.4 0.5 0.6
HF
(mm)
Leafthickness&HF
y=0.0003x+1.6435R²=0.10188
1
1.5
2
2.5
0 200 400 600 800
LAI
LAI&HF
y=-0.8948x+1.93R²=0.28819
1
1.5
2
2.5
0 0.1 0.2 0.3 0.4
(mm)2
LeafArea&HF
y=-0.0377x+2.0927R²=0.33591
1
1.5
2
2.5
4 9 14
HF
(mm)2
LN*LA&HF
1
1.5
2
2.5
1 3 5 7
(mm)2
LN*LA*LeafThickness&HF
y=-0.0064x+1.9391R²=0.346
0
1
2
0 20 40 60
(mm)2
LN*LA*stemd&HF
y=-3E-05x+1.9328R²=0.3532
1
1.5
2
2.5
0 5000 10000 15000
HF
(mm)4
LN*LA*Stem*Height&HF
y=-0.0415x+1.8898R²=0.49971
1
1.5
2
2.5
0 13
(mm)2mg
LN*LA*Wetmass&HF
y=-0.5468x+1.9546R²=0.58348
1
1.5
2
2.5
0 0.2 0.4 0.6 0.8 1
(mm)2mg
LN*LA*Drymass&HF

133
TableC.SoundAbsorptionCoefficient(At1333Hz)&PlantProperties
PlantProperties
y=0.0017x+0.5625R²=0.27136
0
1
130 180 230
At1333Hz
(mm)
Height&1333Hz
0
1
0.5 1.5 2.5 3.5
(mm)
Stemdia&1333Hz
y=0.3307x+0.7931R²=0.55213
0
1
0 0.2 0.4 0.6 0.8
mg
Wetmass&1333Hz
y=3.1268x+0.7844R²=0.32634
0
1
0 0.02 0.04 0.06
At1333Hz
(mg)
Drymass&1333Hz
y=-0.0005x+0.939R²=0.11776
0
1
0 100 200
LN
leafN&1333Hz
y=1.8097x+0.7615R²=0.67496
0
1
0.01 0.06 0.11 0.16
(mm)
Leaflenght&1333Hz
y=0.1573x+0.811R²=0.01342
0
1
0.3 0.4 0.5 0.6
At1333Hz
(mm)
Leafthickness&1333Hz
y=-0.0002x+0.939R²=0.11776
0
1
0 200 400 600 800 1000
LAI
LAI&1333Hz
y=0.6026x+0.7574R²=0.47162
0
1
0 0.1 0.2 0.3
(mm2)
LeafArea&1333Hz
y=0.0313x+0.6214R²=0.72153
0
1
5 10 15
At1333Hz
(mm2)
LN*LA&1333Hz
y=0.0579x+0.6602R²=0.69134
0
1
1.8 3.8 5.8 7.8
(mm)3
LN*LA*LeafThickness&1333Hz
y=0.0027x+0.7835R²=0.32518
0
1
5 25 45
(mm)3
LN*LA*stemd&1333Hz
y=1E-05x+0.7858R²=0.33759
0
1
500 5500 10500
At1333Hz
(mm)4
LN*LA*Stem*Height& 1333Hz
y=0.0264x+0.7899R²=0.72821
0
1
0 5 10
(mm)2mg
LN*LA*Wetmass&1333Hz
y=0.3085x+0.7633R²=0.67024
0
1
0 0.2 0.4 0.6 0.8 1
(mm)2mg
LN*LA*Drymass&1333Hz

134
TableD.SoundScatteringCoefficient(Averageof200to2500Hz)&PlantProperties
PlantProperties
y=0.0008x-0.0045R²=0.17574
0.0
0.3
130 170 210 250
Avgs.c
(mm)
Height&Avgs.c
0.0
0.3
0 1 2 3 4
(mm)
Stemdia&Avgs.c
y=0.155x+0.0985R²=0.38327
0.0
0.3
0.0 0.2 0.4 0.6 0.8
(mg)
Wetmass&Avgs.c
y=1.3552x+0.0978R²=0.19366
0.0
0.3
0.00 0.05
Avgs.c
(mg)
Drymass&Avgs.c
0.0
0.3
0 100 200 300
LN
LeafNo&Avgs.c
y=0.8723x+0.0821R²=0.49545
0.0
0.3
0 0.05 0.1 0.15 0.2
(m)
Leaflenght&Avgs.c
0.0
0.3
0.00 0.50 1.00
Avgs.c
(mm)
Leafthichness&Avgs.c
0.0
0.3
0 200 400 600 800 1000
LAI
LAI&Avgs.c
y=0.296x+0.079R²=0.35954
0.0
0.3
0 0.1 0.2 0.3 0.4
(mm2)
Leafare&Avgs.c
y=0.0164x+0.0024R²=0.63319
0.0
0.3
4 9 14
Avgs.c
(mm)2
LeafNo.*Leafarea*Avgs.c
y=0.0282x+0.0307R²=0.52235
0.0
0.3
1.5 3.5 5.5 7.5 9.5
(mm)3
LN*LA*Leafthickness&Avgs.c
y=0.0016x+0.0878R²=0.25538
0.0
0.3
0 20 40 60
(mm)3
LN*LA*Stemdia&Avgs.c
y=8E-06x+0.0898R²=0.25114
0.0
0.3
0 5000 10000
Avgs.c
(mm)4
LN*LA*Stem*Height&Avgs.c
y=0.013x+0.0949R²=0.55784
0.0
0.3
0 5 10
(mm)2mg
LN*LA*Wetmass&Avgs.c
y=0.1534x+0.0813R²=0.5232
0.0
0.3
0 0.5 1
(mm)2mg
LN*LA*Drymass&Averages.c

135
TableE.SoundScatteringCoefficient,HighFrequencies,(Averageof2500to5000)&PlantProperties
PlantProperties
y=-0.0023x+0.9058R²=0.16364
0.0
1.0
130 180 230
s.cHF
(mm)
Height&Avgs.cHF
0.0
1.0
0 1 2 3 4
(mm)
Stemdia&Avgs.cHF
0.0
1.0
0.0 0.2 0.4 0.6 0.8
(mg)
Wetmass&Avgs.cHF
0.0
1.0
0 0.05 0.1
s.cHF
(mg)
Drymass&Avgs.cHF
0.0
1.0
0 100 200 300
LN
LeafNo&Avgs.cHF
y=-0.9487x+0.5411R²=0.06176
0.0
1.0
0 0.05 0.1 0.15 0.2
(m)
Leaflenght&Avgs.cHF
0.0
1.0
0.3 0.5
s.cHF
(mg)
Leafthichness&Avgs.cHF
y=0.0002x+0.4031R²=0.06404
0.0
1.0
0 200 400 600 800
LAI
LAI&Avgs.cHF
y=-0.6176x+0.6043R²=0.16493
0.0
1.0
0 0.1 0.2 0.3 0.4
(mm)2
Leafare&Avgs.c
0.0
1.0
0 5 10 15 20
s.cHF
(mm)2
LeafNo.*Leafarea*Avgs.c
0.0
1.0
0 2 4 6 8
(mm)3
LN*LA*Leafthickness&Avgs.cHF
y=-0.0049x+0.5895R²=0.15723
0.0
1.0
0 20 40 60
(mm)3
LN*LA*Stemdia&Avgs.c
0.0
1.0
0 5000 10000
s.cHF
(mm)4
LN*LA*stem*Height&Avgs.cHF
y=-0.016x+0.5336R²=0.08929
0.0
1.0
0 5 10 15
(mm)2mg
LN*LA*Wetmass&Avgs.c
y=-0.2765x+0.5833R²=0.17915
0.0
1.0
0 0.5 1
(mm)2mg
LN*LA*Drymass&Avgs.c