
Chromophore concentrations, absorption and scattering properties of human skin in-vivo
28
Chromophore concentrations, absorption and scattering properties of human skin in-vivo Sheng-Hao Tseng 1,* , Paulo Bargo 2 , Anthony Durkin 3 , and Nikiforos Kollias 2 1 Department of Electro-Optical Engineering, National Cheng-Kung University, Tainan 701, Taiwan R.O.C. 2 Johnson&Johnson, CPPW, Methods and Models Development, Skillman, NJ 08558 3 Beckman Laser Institute, University of California, Irvine, Irvine, CA 92617 Abstract Absorption and reduced scattering coefficients of in-vivo human skin provide critical information on non-invasive skin diagnoses for aesthetic and clinical purposes. To date, very few in-vivo skin optical properties have been reported. Previously, we reported absorption and scattering properties of in- vivo skin in the wavelength range from 650 to 1000nm using the diffusing probe in the “modified two-layer geometry”. In this study, we determine the spectra of skin optical properties continuously in the range from 500 to 1000nm. It was found that the concentration of chromophores, such as oxy- hemoglobin, deoxy-hemoglobin, and melanin, calculated based on the absorption spectra of eighteen subjects at wavelengths above and below 600nm were distinct because of the inherent difference in the interrogation region. The scattering power, which is related to the average scatterer’s size, demonstrates a clear contrast between skin phototypes, skin sites, and wavelengths. We also applied venous occlusion on forearms and found that the concentrations of oxy- and deoxy-hemoglobin as assessed at wavelengths above and below 600nm were different. Our results suggest that diffuse reflectance techniques with the visible and near infrared light sources can be employed to investigate the hemodynamics and optical properties of upper dermis and lower dermis. 1. Introduction The absorption coefficient μ a , the scattering coefficient μ s ′, and chromophore concentrations of skin are fundamental properties of tissue that can provide essential information for many aesthetic, therapeutic, and diagnostic applications such as monitoring of skin blood oxygenation, melanin concentration, detection of cancer with fluorescence, laser surgery, and photodynamic therapy.[1–4] Many researchers have quantified the optical properties of skin tissue and most of them used ex-vivo skin samples and integrating sphere techniques. For example, Troy and Thennadil determined the optical properties of 22 human skin samples ex- vivo in the wavelength range from 1000 to 2200nm using double integrating sphere measurements.[5] Simpson et al. measured samples of dermis of five subjects (four Caucasians and one Negroid) ex-vivo and obtained the optical properties in the wavelength range from 625 to 1000nm using integrating sphere measurements.[6] Bashkatov et al. have characterized optical properties of 21 skin samples ex-vivo in the wavelength range from 400 to 2000nm using an integrating sphere approach.[7] Salomatina et al. have determined and compared the © 2009 Optical Society of America *Tel: +886-6-2757575*63925, [email protected]. OCIS codes: (170.5280) Photon migration; (170.6510) Spectroscopy, tissue diagnostics; (290.1990) Diffusion. NIH Public Access Author Manuscript Opt Express. Author manuscript; available in PMC 2009 September 30. Published in final edited form as: Opt Express. 2009 August 17; 17(17): 14599–14617. NIH-PA Author Manuscript NIH-PA Author Manuscript NIH-PA Author Manuscript
Transcript of Chromophore concentrations, absorption and scattering properties of human skin in-vivo

Chromophore concentrations, absorption and scatteringproperties of human skin in-vivo
Sheng-Hao Tseng1,*, Paulo Bargo2, Anthony Durkin3, and Nikiforos Kollias21Department of Electro-Optical Engineering, National Cheng-Kung University, Tainan 701, TaiwanR.O.C.2Johnson&Johnson, CPPW, Methods and Models Development, Skillman, NJ 085583Beckman Laser Institute, University of California, Irvine, Irvine, CA 92617
AbstractAbsorption and reduced scattering coefficients of in-vivo human skin provide critical information onnon-invasive skin diagnoses for aesthetic and clinical purposes. To date, very few in-vivo skin opticalproperties have been reported. Previously, we reported absorption and scattering properties of in-vivo skin in the wavelength range from 650 to 1000nm using the diffusing probe in the “modifiedtwo-layer geometry”. In this study, we determine the spectra of skin optical properties continuouslyin the range from 500 to 1000nm. It was found that the concentration of chromophores, such as oxy-hemoglobin, deoxy-hemoglobin, and melanin, calculated based on the absorption spectra of eighteensubjects at wavelengths above and below 600nm were distinct because of the inherent difference inthe interrogation region. The scattering power, which is related to the average scatterer’s size,demonstrates a clear contrast between skin phototypes, skin sites, and wavelengths. We also appliedvenous occlusion on forearms and found that the concentrations of oxy- and deoxy-hemoglobin asassessed at wavelengths above and below 600nm were different. Our results suggest that diffusereflectance techniques with the visible and near infrared light sources can be employed to investigatethe hemodynamics and optical properties of upper dermis and lower dermis.
1. IntroductionThe absorption coefficient µa, the scattering coefficient µs′, and chromophore concentrationsof skin are fundamental properties of tissue that can provide essential information for manyaesthetic, therapeutic, and diagnostic applications such as monitoring of skin bloodoxygenation, melanin concentration, detection of cancer with fluorescence, laser surgery, andphotodynamic therapy.[1–4] Many researchers have quantified the optical properties of skintissue and most of them used ex-vivo skin samples and integrating sphere techniques. Forexample, Troy and Thennadil determined the optical properties of 22 human skin samples ex-vivo in the wavelength range from 1000 to 2200nm using double integrating spheremeasurements.[5] Simpson et al. measured samples of dermis of five subjects (four Caucasiansand one Negroid) ex-vivo and obtained the optical properties in the wavelength range from 625to 1000nm using integrating sphere measurements.[6] Bashkatov et al. have characterizedoptical properties of 21 skin samples ex-vivo in the wavelength range from 400 to 2000nmusing an integrating sphere approach.[7] Salomatina et al. have determined and compared the
© 2009 Optical Society of America*Tel: +886-6-2757575*63925, [email protected] codes: (170.5280) Photon migration; (170.6510) Spectroscopy, tissue diagnostics; (290.1990) Diffusion.
NIH Public AccessAuthor ManuscriptOpt Express. Author manuscript; available in PMC 2009 September 30.
Published in final edited form as:Opt Express. 2009 August 17; 17(17): 14599–14617.
NIH
-PA Author Manuscript
NIH
-PA Author Manuscript
NIH
-PA Author Manuscript

ex-vivo optical properties of human skin samples with those of non-melanoma skin cancers inthe spectral range from 370 to 1600nm.[8]
Although the integrating sphere based techniques can be used to investigate ex-vivo opticalproperties of epidermis, dermis, and subcutaneous tissue, the need to take biopsies fromsubjects limits their applicability in the clinic. Furthermore, once tissue has been excised, it isno longer part of the living organism; oxy- and dexoy-hemoglobin concentrations begin todiverge from physiologic quantities and if not carefully handled, the hydration of the tissuebegins to change.
Photon diffusion theory derived from the radiative transport equation is usually employed asan forward model to determine optical properties of in-vivo samples at source-detectorseparation longer than five mean-free-paths, where mean-free-path is defined as 1/(µa+µs′). Ithas been proven to be a not adequate model for source-detector separations longer than fivemean-free-paths, because boundary conditions and the assumption of multiple scattering in aturbid medium cannot be satisfied.[9,10] However, in order to limit interrogation to superficialtissue volumes, such as skin, source-detector separations shorter than five mean-free-paths aremore favorable. To the best of our knowledge, in-vivo techniques which employ alternativeforward models to determine optical properties of skin do exist, but have some importantlimitations. For example, Zhang et al. determined optical properties of in-vivo skin using visiblereflectance spectroscopy with a multi-layer skin model and a genetic optimization algorithm.[11] A multi-layer skin model and a number of fitting parameters, such as layer thickness,chromophores, and scattering properties for each layer, and their corresponding ranges mustbe chosen carefully in advance to avoid non-uniqueness in the solution space. Zonios andDimou proposed a model to extract optical properties from diffuse reflectance spectra collectedfrom human skin in-vivo.[12] Their technique requires that all of the chromophorescontributing to the measured signals are known in advance and the reduced scatteringcoefficient has a linear relation to the wavelength in order to separate absorption and reducedscattering coefficients from measured reflectance. For the case where all constituentchromophores cannot be determined, the absorption spectra cannot be recovered. In addition,for the case where the reduced scattering coefficient does not have a linear dependence onwavelength, the empirical mathematical model will not recover tissue optical propertiesproperly.
Previously, we used the diffusing probe that has a “modified two layer geometry” inconjunction with the Steady-State Frequency Domain Photon Migration (SSFDPM) techniqueto quantify the in-vivo skin optical properties of 15 subjects (five Caucasians, five Asians, andfive African-Americans) in the wavelength range from 650 to 1000nm.[13] The facilitatingtechnologic innovation of this probe is the presence of a highly diffusing Spectralon layer atthe input side that enables a diffusion model for small source-detector distances (less than threemean-free-paths), and, thus, the absorption and reduced scattering coefficients of thesuperficial volumes of samples can be separated and quantified.
In this study, the probe design has been adjusted into multiple source-detector pairs so that itcan employ a white light source to obtain continuous spectra of absorption and reducedscattering coefficients. The advantages of this multi source-detector separation probe includerelative low instrument cost and self-calibration for instrument response (by using thereflectance of one source detection pair as the reference and normalizing the reflectance ofother source detector separation pairs to the reference). The normalized reflectance versussource-detector separation is then fit to a diffusion model by a least square minimizationalgorithm to determine the absorption and reduced scattering spectra. The recovered absorptionspectra are fit linearly with known chromophore absorption spectra to extract chromophore
Tseng et al. Page 2
Opt Express. Author manuscript; available in PMC 2009 September 30.
NIH
-PA Author Manuscript
NIH
-PA Author Manuscript
NIH
-PA Author Manuscript

concentrations, and the reduced scattering spectra are fit to a scattering power law to obtainthe scattering power.[14]
The goal of this paper was to use this new diffusing probe to determine the skin opticalproperties of 18 subjects of different skin phototypes and also extract the chromophoreconcentrations and the scattering power of skin. It is found that performing the “two-regionchromophore fitting” to the absorption spectrum would result in the best fit with minimalresiduals. By two-region chromophore fitting, we mean that the skin absorption spectrum isfit to a set of known chromophore absorption spectra at wavelengths between 500 nm and 600nm and again fit separately between 600 nm and 1000 nm. The rationale for performing thetwo-region fitting is that the skin has very different optical properties in the visible and theNIR wavelength regions, and thus the sampling volumes at these two regions are quite different.Monte Carlo simulation results were generated to support this assumption. Likewise, the bestfittings for reduced scattering coefficients of skin were obtained when the reduced scatteringspectra were fit in the region below and above 600nm separately. This suggests that the averagescatterer sizes of skin determined in the visible and the NIR regions are much different. Resultsfrom the measurements carried out here also indicate that the scattering power is not onlydependent to anatomical location but also on skin phototype. Finally, experimental resultsobtained from measuring 10 subjects with forearm venous occlusion were provided. Werecovered significantly different hemoglobin concentration at the region below and above600nm. Our results agree with those reported by other researchers and support that our proposedprobe and fitting method are capable of studying in-vivo superficial tissue at different depthssimultaneously.
2. Materials and methods2.1 Instrumentation
The diffusing probe used in this study is similar in design to the one we presented in our previouspaper that was designed for SSFDPM instruments.[13] The geometry of this probe is illustratedin Fig. 1. The fibers employed in this probe are 480µm diameter low OH multimode fibers(core diameter=440µm) with numerical aperture of 0.22. The diameter of the Spectralon(Labshpere, NH, USA) disc is 6.5mm. The detection fiber penetrates the 1mm thick Spectralonlayer so that it is flush with the lower surface of the Spectralon. There are four source fibersplaced on the upper surface of the Spectralon and their distances from the detection fiber are1.44mm, 1.92mm, 2.4mm, and 2.88mm, respectively. There are two 480µm spacer fibersplaced in between the detection fiber and the first source fiber. The presence of the detectionfiber in the Spectralon disturbs the photon propagation in the Spectralon that cannot be properlydescribed by the diffusion theory. This phenomenon is severe when the source is close to thedetector. Experimentally, we found that the reflectance measured with the source-detector pairof 0.48mm and 0.96mm separation cannot match with the theoretically calculated one.Therefore, in order to make the diffusion model work with our current probe, the shortestsource-detector separation was chosen as 1.44mm. The probe was fabricated by RoMack FiberOptics, VA, USA.
The detection fiber was connected to a spectrometer equipped with a back-thinned CCD(Model# BTC613, B&W TEK, DE, USA). An 1*4 optical switch (Piezosystem jena, MA,USA) was employed to switch between one fiber that is connected to a broadband TungstenHalogen light source (Model# HL2000, Ocean Optics, FL, USA) and four source fibers of thediffusing probe. Because of the limitation imposed by the weak light source intensity below600nm, the wavelength range in this study spanned from 500nm to 1000nm for subjects withskin type I–IV and spanned from 600nm to 1000nm for subjects with skin type V–VI. Theoptical switch and the spectrometer were connected to a computer and were coordinated andcontrolled by Labview (National Instruments, TX, USA). At each measurement, four
Tseng et al. Page 3
Opt Express. Author manuscript; available in PMC 2009 September 30.
NIH
-PA Author Manuscript
NIH
-PA Author Manuscript
NIH
-PA Author Manuscript

reflectance spectra associated with four source-detector pairs were sequentially acquired andstored into one file. The average time required to take one complete measurement is about10~20 seconds depending on skin pigmentation.
By using the reflectance from the 1.44mm source-detector pair as the reference, the reflectancefrom other source-detector pairs was normalized with respect to the reference reflectance. Thus,a normalized reflectance versus source-detector separation curve was generated. A modifiedtwo-layer diffusion model which has been described elsewhere was employed as a forwardmodel to generate normalized reflectance versus source-detector separation curves to solvethis inverse problem.[9][15] For completeness, we will provide a brief model derivation in thenext subsection. The curve obtained from the experiment was then fit to the forward model tosolve this inverse problem. The “lsqcurvefit” function in MATLAB (MathWorks, MA, USA)was used to perform the least-squares fittings to recover absorption and reduced scatteringcoefficients. With a personal computer equipped with an Intel Q6600 processor, absorptionand reduced scattering spectra from a single sample can be determined within 10 seconds.
2.2 Modified two-layer modelThe modified two-layer model was adopted from the two-layer photon diffusion modelproposed by Kienle et al.[9][15] The derivation of the equation for calculating the reflectanceat the detector in a modified two-layer geometry is briefly described here. In a two-layer turbidmedium system, the diffusion equation can be written as:
(1)
, where D=1/3(µa+µs’) and Φ are the diffusion constant and the fluence rate, respectively. S isthe source term, c is the speed of light in the medium, and i=1,2 is the number of the layer. Thelight source from the source fiber can be approximated as S1=δ(x,y,z−z0) and S2=0, wherez0=1/(µa+µs’). By applying proper boundary conditions, where we employ the extrapolatedboundary condition and assume the fluence and the flux are continuous at the boundary, thefluence rate of the diffusion equation system can be solved in the Fourier domain. In themodified two-layer geometry, one needs the fluence rate at the boundary of the first layer andthe second layer to calculate the detected reflectance. The fluence rate at the boundary has thefollowing form in the Fourier domain:
(2)
, Where , ω isthe source modulation frequency, l is the thickness of the first layer, and s2 = s1
2 + s22. By
performing inverse Fourier transform to the solution numerically, we can obtain the fluencerate at the boundary. The spatially resolved reflectance can be calculated as the integral of theradiance L2 at the boundary, where L2 = φ2 + 3D2(∂Φ2/∂z)cos θ, over the backward hemisphere:
(3)
Here , and Rfres (θ) is the Fresnel reflection coefficient for a photon with an incidentangle θ elative to the normal to the boundary.
Tseng et al. Page 4
Opt Express. Author manuscript; available in PMC 2009 September 30.
NIH
-PA Author Manuscript
NIH
-PA Author Manuscript
NIH
-PA Author Manuscript

2.3 In-vivo skin measurementsIn this study, six subjects in skin type I–II, six subjects in skin type III–IV, and six subjects inskin type V–VI were recruited. The protocol was approved by the Institutional Review Boardand the written informed consent was obtained from all subjects prior to the measurements.Measurement sites included the dorsal aspect of forearm and the upper inner arm. Threemeasurements were taken at each anatomic site on each subject, and the probe was physicallyremoved and replaced on each site for each measurement. Because the dorsal forearm is usuallya sun-unprotected site while the upper inner arm is relatively a sun-exposed site, we havechosen these locations for the first in-vivo experiments. The mean and the standard deviationof the age of the subjects in each skin photo-type category are shown in Fig. 2. There is nostatistically significant difference in age between each group; therefore, the influence ofintrinsic ageing on the optical properties is minimal.
2.4 Interrogation depth of diffusing probeThe diffusing probe was designed to investigate superficial volume of tissues. In order tointerpret our results, the interrogation depth of this probe geometry needs to be carefullycharacterized in advance. The details of interrogation depth depend on wavelength dependentoptical properties of the sample as well as source-detector separations. Monte Carlo simulationswere used to obtain a detailed understanding of the interrogation region and depth of thisdiffusing probe. Since skin absorption and reduced scattering coefficients at 500nm are muchhigher than those at 900nm, the skin optical properties at 500nm and 900nm (data will bepresented later in this paper) were used as input parameters in the Monte Carlo simulations.Moreover, the source-detector separations were set to 1.5mm and 3mm in the simulations toencompass the range of source-detector separations of our probe. Therefore, four sets (two s-d distances, two sets of optical properties) of Monte Carlo simulation results will be shown.
The Monte Carlo code used here is an extension of the general multi-layer, three dimensional,weighted photon Monte Carlo code developed by Wang et al.[16] In order to visualize thedistribution of detected photon packets in the superficial diffusing probe geometry, twodimensional fluence distribution maps were generated using Monte Carlo simulations. Whena photon packet encounters a collision, a fraction of energy of the photon packet, which isproportional to the weight of the photon packet and the absorption of the medium, is depositedto a local voxel in a three dimensional Cartesian coordinate system. Local fluence (J/mm2) iscalculated by dividing the deposited energy by the local absorption coefficient. A threedimensional photon fluence distribution map is obtained by accumulating the fluencedistribution of all photon packets arriving at the detector. The three dimensional map isconverted to a two dimensional x–z map by binning along the y axis. The maps are normalizedby the number of photon packets launched, the volume of a voxel, and the maximal fluence inthe map.
In the simulations, we used modified two-layer geometry in which the detection fiberpenetrated the top high scattering layer and in contact with the semi-infinite sample layer. Theoptical properties were set as µa=1e−5/mm and µs′=50/mm for the high scattering top layer,and the source-detector separation was 1.5mm. The indices of refraction of the high scatteringlayer and the sample were 1.35 and 1.33, respectively. The index of refraction of the sourcefiber and the detection fiber was not considered in the simulations. The numerical aperture ofthe fibers was 0.22. Five million of photon packets were launched in each simulation. Tosimulate the effect of wavelength dependent optical properties on the size of the interrogationregion, we used two sets of optical properties for the sample: µa=0.05/mm, µs′=1.5/mm tosimulate light complexion skin at 900nm, and µa=0.1/mm, µs′=3/mm to simulate lightcomplexion skin at 500nm. The distribution maps generated based on these parameters areshown in Fig. 3 and they are presented here as the logarithm base 10 of the original maps for
Tseng et al. Page 5
Opt Express. Author manuscript; available in PMC 2009 September 30.
NIH
-PA Author Manuscript
NIH
-PA Author Manuscript
NIH
-PA Author Manuscript

greater ease of visualization. The fluence map illustrated in Fig. 3(a) represents photondistribution in light complexion skin at 500nm and Fig. 3(b) represents photon distribution inlight complexion skin at 900nm. Comparing Fig. 3(a) and 3(b) qualitatively, it can be seen the“−4” contour line in Fig. 3(b) is wider and deeper than that in Fig. 3(a). This means the diffusingprobe has deeper interrogation depths at 900nm compared to the interrogation depths at 500nm.
To compare the interrogation depth and region quantitatively, threshold maps were generated,as illustrated in Fig. 4, based on the fluence maps. The threshold maps shown in Fig. 4 illustrateonly the sample layer and do not include the high scattering layer. The white area in thethreshold maps denotes the voxels that have top 50 % greatest fluence values, and black areadenotes otherwise. The interrogation depth of a 1.5 mm source-detector separation diffusingprobe defined by the threshold map shown in Fig. 4(a) is about 1000µm at 500 nm while thatdefined by Fig. 4(b) is about 1750µm at 900 nm. The increase in interrogation depth is about75% as the light source wavelength is changed from 900nm to 500nm. Similarly, the thresholdmaps were generated for a diffusing probe with source-detector separation of 3mm and theyare illustrated in Fig. 4(c) and 4(d). The interrogation regions are larger in Fig. 4(c) and 4(d)than in 4(a) and 4(b). The interrogation depths defined by Fig. 4(c) and 4(d) are 1250µm and1850µm, respectively, which represents 48% increase in interrogation depth as the wavelengthis changed from 900nm to 500nm.
In addition to the interrogation depth defined above, since the Monte Carlo simulations cantally the travel histories of all detected photons, the average interrogation depth of simulation
can also be defined as following: Let , where Wi is the final weight of a detectedphoton packet and n is the number of photon packets launched. The average interrogation depth
of a simulation is determined as , where is the averagepenetration depth of a detected photon packet, dj is the depth at which a collision happens inthe sample, and m is the total collision number in the sample of the detected photon packet.Based on this definition, the average interrogation depth for the light complexion skin at 500nmis 646µm while that for the light complexion skin at 900nm is 947µm for the diffusing probewith 1.5mm source-detector separation. The average interrogation depth is 1100µm and1601µm at wavelengths of 500nm and 900nm, respectively, for the diffusing probe with 3mmsource-detector separation. Therefore the average interrogation depth of the diffusing probehas a 45%–47% increase as the light source wavelength is varied from 900nm to 500nm. Hence,the interrogation depth and interrogation region are significantly modulated by the lightwavelength, whichever definition of interrogation depth is used. The interrogation region ofthe probe includes epidermis and upper dermis at wavelength of 500nm. As the wavelengthincreases to 900nm, the interrogation region includes epidermis, dermis, and a portion ofsubcutaneous lipid layer. The optical properties determined would be the average propertiesof the volume under investigation. This information will be used in the next few sections tohelp interpret the in-vivo data obtained and support the analyses applied to the data.
3. Results and discussions3.1 Optical properties of in-vivo skin of various skin phototypes
The absorption and reduced scattering coefficients of in-vivo dorsal forearm of eighteensubjects are demonstrated in Fig. 5. The data shown in Fig. 5 are in good agreement with thoseobtained from ex-vivo measurements and the in-vivo data reported earlier.[6] In Fig. 5(a), theabsorption coefficients of the dorsal forearm of skin type I–II and III–IV increase steeply bya factor of two as the wavelength decreases from 600nm to 500nm. Hemoglobin and melaninboth contribute to the increase in the absorption in this region. From ex-vivo measurement ofextinction coefficients of hemoglobin, the abrupt increase at 600nm is one of the signatures of
Tseng et al. Page 6
Opt Express. Author manuscript; available in PMC 2009 September 30.
NIH
-PA Author Manuscript
NIH
-PA Author Manuscript
NIH
-PA Author Manuscript

hemoglobin.[17] The optical properties of the dorsal forearm of skin type V–VI in the regionfrom 500 to 600nm are not shown here since the skin was too absorbing and the measuredreflectance were too noisy to recover accurate optical properties.
In the 600–800nm region, the absorption coefficients decrease monotonically as thewavelength increases, and both hemoglobin and melanin contribute to this trend. Overall, theabsorption spectra of dorsal forearms of skin type V–VI have greater slope in this wavelengthregion compared to the skin type I–II and III–IV. This should be caused by the difference inmelanin concentration in various skin types, assuming other chromophore concentrations aresimilar. At wavelengths longer than 900nm, the absorption coefficients of three skin typegroups have almost the same magnitude and the prominent absorption peak induced by waterabsorption at 980nm can clearly be observed.
The reduced scattering coefficients of the dorsal forearm of eighteen subjects are illustrated inFig. 5(b). The average reduced scattering coefficients of the three groups are very similar. Theaverage reduced scattering coefficients of the skin type V–VI group are is 1–10% higher thanthose of the skin type I–II and III–IV groups. This phenomenon may due to the fact that thedensity of scatterers in skin, such as melanin, is higher in the skin type V–VI group than skintype I–II and III–IV groups. In addition, the scattering spectra are not smooth over the wholewavelength region. Specifically, the scattering spectra have a very minor peak at 580nm whichcoincide with the absorption peak of oxy-hemoglobin. This phenomenon is very likely causedby the cross talk between µa and µs′ in the diffusion theory. Nevertheless, in the data reportedby Bashkatov et al. and Salomatina et al., the coupling between absorption and reducedscattering coefficients is also evident.[7] They employed the inverse adding doublingtechnique, which should have smaller µa and µs′ cross talk than the diffusion theory, to recoverthe optical properties of human tissues. These observations reflect the fact that the structureswhich are commonly associated with absorbing chromophores could also play a role in lightscattering.
The absorption and reduced scattering coefficients of unexposed upper inner arm of eighteensubjects are illustrated in Fig. 6(a) and 6(b), respectively. The absorption coefficients of upperinner arm are generally lower than those of dorsal forearm within each skin type group in thewavelength range from 500 to 900nm. This can be attributed to higher melanin concentrationat the dorsal forearm than upper inner arm, since, as mentioned before, the dorsal forearm isusually a sun-exposed site while the upper inner arm is usually a sun-protected site. Bysubtracting the mean absorption spectrum of the upper inner arm from that of the dorsal forearmof twelve subjects of skin type I–IV, the differential spectrum is shown in Fig. 7(a). Thedifferences increase as the wavelength decreases from 900nm to 500nm, and this trendresembles those of ex-vivo and in-vivo melanin reported by Jacques et al. and Kollias et al.[18][19] However, because our probe has larger sampling volumes at longer wavelengths,melanin volume density is not constant over the wavelength region. Moreover, the differentialspectrum shown in Fig. 7(a) may contain contributions from other chromophores such ashemoglobin. In addition, the lower subcutaneous fat absorption at 930nm of dorsal forearmcompared to upper inner arm is illustrated.
The differential spectrum obtained by subtracting the mean reduced scattering coefficient ofupper inner arm from that of dorsal forearm of twelve subjects of skin type I–IV is plotted inFig. 7(b). Unlike the differential absorption spectrum shown in Fig. 7(a), the differentialreduced scattering spectrum first increases gradually as the wavelength decreases from 800nmto 580nm and then decreases precipitously for wavelengths shorter than 580nm. The meanreduced scattering coefficients for the dorsal forearm and the upper inner arm are very similarin the range from 800 to 1000nm. The bending of the curve at 580nm represents that the meanscatterer sizes at the two anatomical locations are different. Specifically, the mean scatterer
Tseng et al. Page 7
Opt Express. Author manuscript; available in PMC 2009 September 30.
NIH
-PA Author Manuscript
NIH
-PA Author Manuscript
NIH
-PA Author Manuscript

size at the dorsal forearm is larger than that at the upper inner arm. Mourant et al. havedemonstrated the similar trend using 0.05 and 0.1-µm-radius polystyrene spheres (Fig. 5).[20] From the Monte Carlo study, we understand that the diffusing probe has a much moresuperficial interrogation volume at short wavelengths than at long wavelengths. Therefore, wemight conjecture that the size of the scatterers located at superficial skin, such as melanin dust,of the dorsal forearm is larger than that of the upper inner arm. We will discuss and performanalyses on the reduced scattering coefficients at wavelength regions covering 500–600nmand 600–1000nm in the following section.
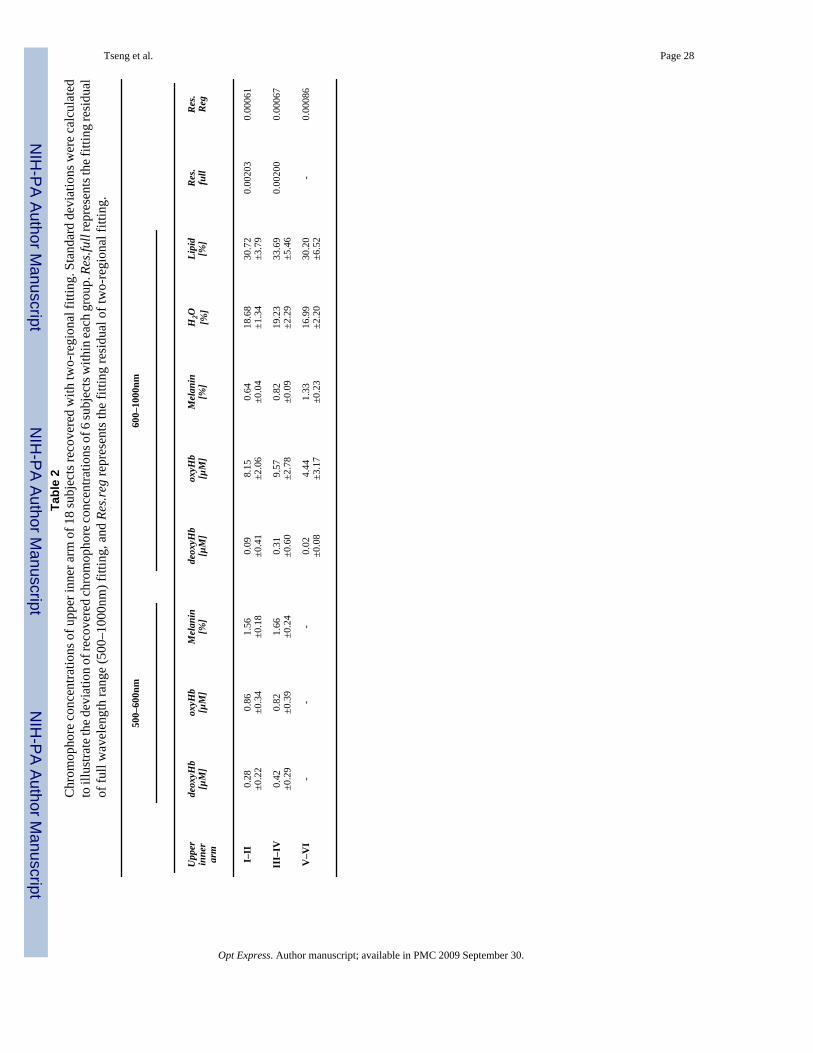
3.2 Calculating skin chromophore concentrations using two-region fittingFrom our Monte Carlo simulation results, it can be inferred that the spectrum at 500–600nmderives from shallower skin layers than does the spectrum for the 600–1000nm region. Becauseof this reason, we have investigated the effect of fitting the chromophore extinction coefficientsto the absorption coefficients in two wavelength regions independently versus fitting the entirewavelength region alone. Two fitting examples are demonstrated in Fig. 8. First, the skinabsorption spectra ranging from 500nm to 1000nm were linearly fit with positive constraint toa set of chromophore spectra consisting of the extinction coefficients of oxy-hemoglobin,deoxy-hemoglobin, melanin, water and lipid. The fitting results of two absorption spectra areshown in Fig. 8(a) and 8(c). Linear fits with positive constraint were then performed to thesame skin absorption spectra in 500–600nm and 600nm–1000nm regions independently. Inthe 500–600nm regional fitting, the water and lipid in the chromophore spectra set wereexcluded since their absorption coefficients are at least four orders of magnitude weaker thanthose of hemoglobin and melanin. The two-region fit results are shown in Fig. 8(b) and 8(d).Overall, it can be seen that the two-region fit performs better than the full range fit. Thechromophore fit results of eighteen subjects are listed in Table 1 and Table 2 for dorsal forearmand upper inner arm, respectively.
The mean of the residual of full range fit and two-region fit is displayed in Table 1 and Table2. The mean residual is defined as follows. Let ri be the fit residual at wavelength λi; the average
residual equals , where n is the number of wavelengths. The mean residual for thetwo-region fit is about one third of that for the full range fit in all cases.
The oxy-hemoglobin concentrations obtained in the 600–1000nm range are an order ofmagnitude higher than those obtained in the 500–600nm range. This suggests that the bloodconcentration in skin increases as depth increases, and this finding agrees with the general skinmodel that assumes vessel diameter increases from the upper plexus in the papillary dermis tothe lower plexus at the dermal-subcutaneous interface. Braverman indicated that the vesseldiameter at the lower plexus is generally about two to three times larger than that at the upperplexus in the dermis.[21]
The average oxygen saturation of hemoglobin StO2 can be calculated from table 1 and table2. The average StO2 is in the range of 97–99% at the wavelength region 600–1000nm. This isa reasonable range for the blood vessels at the lower plexus in the dermis, since they areconnected to the arteries coming from the subcutaneous fat layer and the muscle layer. Incontrast, the average StO2 is in the range of 66–75% for dorsal forearm or upper inner arm ofskin type I–II and III–IV at the wavelength region 500–600nm. Our finding indicates that theblood flow and hemoglobin dynamics at the upper and lower plexuses are quite different.Nishidate et al. employed noninvasive optical method to investigate skin property and reportedthat the StO2 of skin of arm at rest was about 60% using wavelength from 400–700nm.[1]Since the 500–600nm wavelength range we used in our study for determining the upper plexusStO2 is located at the center of the 400–700nm range that Nishidate et al. used in their study,their result is an excellent support to our finding.
Tseng et al. Page 8
Opt Express. Author manuscript; available in PMC 2009 September 30.
NIH
-PA Author Manuscript
NIH
-PA Author Manuscript
NIH
-PA Author Manuscript

On the other hand, melanin concentrations recovered at 500–600nm are significantly higherthan those recovered at 600–1000nm at both measurement sites of skin type I–II and III–IV.Since the melanin is localized in the epidermis, as the interrogation region becomes larger at600–1000nm, the derived melanin concentrations are diluted and thus smaller compared tothose derived at 500–600nm. Jacques et al. reported that the volume fraction of melanin in theepidermis is 1 to 3% for light-skinned Caucasians, 11 to 16% for Mediterranean types, and 18–43% for darkly pigmented Africans.[22] In table 1 and 2, the trend of the melanin percentageversus the skin phototype number correspond reasonably well with those reported by Jacqueset al. Note that the melanin fraction determined at 500–600nm region is about 40–50% higherthan those determined at 600–1000nm region. This result is consistent with the wavelengthdependent reduction in interrogation volume as indicated by our Monte Carlo simulation results(45% increase in interrogation depth as the wavelength increases from 500nm to 900nm).
In this study, we also determined the concentration of water and lipid using their absorptionfeatures at 980nm and 930nm, respectively. By fitting NIR absorption spectra to chromophorespectra, Taroni et al. obtained the water volume percentage of forearms to be in the range from13–32%.[23] The source-detector separation employed in their study was 2cm; thus, the watervolume percentage determined by them represented the average value of the bulk tissue. Thewater volume fractions presented in this study are in the range from 16–22% as demonstratedin Table 1 and Table 2. Since we employed the wavelength region near 980nm to recover thewater concentration, the interrogation depth is relatively deep and thus our results reasonablyagree with those reported by Taroni et al. However, our results are not consistent with the skinwater content (~65%) determined by skin desiccation.[24] We speculate that this discrepancymay come from two sources. First, the whole interrogation region of our probe most likelycovers the epidermis, the dermis, and part of the subcutaneous layer of skin at the wavelengthof 980nm. Hence, we have recovered the skin lipid concentration in the range from 16 to 30%as shown in Table 1. Since the subcutaneous layer has very low water content (~18% asindicated by Reinoso et al.), the skin water concentration determined by our method is lowerthan that reported by Reinoso et al. using desiccation method where they employed skinsamples that were separated from the subcutaneous tissue.[24] Furthermore, it can be seen fromTable 1 and 2 that the skin water concentration decreases as the skin melanin concentrationincreases. This means that the water concentration recovered by our algorithm could be affectedby the melanin content of skin. Because water has only one prominent absorption feature at980nm in the wavelength range of concern in this study, the accuracy of the skin waterconcentration determined using our algorithm strongly relies on the correctness of thechromophore absorption spectra near 980nm. The melanin absorption spectrum employed inour algorithm was adopted from the power law equation proposed by Jacques, which was anapproximated equation derived from the data reported by various researchers at severalwavelengths.[18] The uncertainty of this power law equation is high at wavelengths longerthan 800nm since there is only one data point in this range. The uncertainty of the melaninabsorption spectrum near 980nm could be another source for underestimating the waterconcentration of skin. The problem of underestimating skin water concentration caused by thetwo factors mentioned above could be alleviated by extending the upper bound of theexperiment wavelength range to above 1000nm. Since there are more water absorption featuresand the melanin absorption is weaker in the wavelength range above 1000nm, the waterconcentration can be reliably recovered with minimum influence from melanin absorption.Moreover, the absorption coefficient of skin rapidly increases with the wavelength in thewavelength range above 1000nm due to strong water absorption in this range. Therefore, theinterrogation depth of our probe decreases as the wavelength increases in this range, whichwill in turn diminish the contribution of the subcutaneous tissue to the measurement results.Extending the measurement wavelength range is one of the subjects of our continued researchin an effort to develop a probe that can more accurately and reliably be used to deduce skinchromophore concentrations.
Tseng et al. Page 9
Opt Express. Author manuscript; available in PMC 2009 September 30.
NIH
-PA Author Manuscript
NIH
-PA Author Manuscript
NIH
-PA Author Manuscript

3.3 Two-region scattering power law least-square fitWe have illustrated in the previous section that the chromophore fitting quality can be improvedby performing a two-region fit. In this section we will perform a two-region scattering powerlaw fit to the reduced scattering spectra of skin.
Mourant et al. used a power law a * λ−b to fit the reduced scattering spectra of samples, andfound that the scattering power −b was correlated to the scatterers’ average size in tissuephantoms: the smaller the value of −b, the smaller the average size of scatterers.[20] In fittingthe skin reduced scattering spectra to a scattering power law, we found that a single scatteringpower law did not produce good fit results over the wavelength range of 500–1000nm. A two-region scattering power law fit to the skin reduced scattering spectrum was performed in whichthe reduced scattering spectrum at 500–700nm was fit with one scattering power law and thatat 700–1000nm was fit with a separate scattering power law. An example is shown in Fig. 9,which demonstrates the two-region fit of the reduced scattering spectra of the dorsal forearmand upper inner arm of a subject. It can be seen in Fig. 9 that either spectrum cannot be wellfit by a single scattering power law. We performed two-region fitting to the reduced scatteringspectra of dorsal forearm and upper inner arm of eighteen subjects and summarized thecalculated scattering power in the Fig. 10.
One of the first noteworthy features that are apparent in Fig. 10 is that the scattering power at500–600nm is smaller than that at 600–1000nm for dorsal forearm and upper inner arm of skintype I–II and III–IV. Bashkatov et al. used two scattering power law to fit the skin reducedscattering spectra from 400nm to 2000nm, and concluded the scattering at wavelengths shorterthan 600nm was attributed to the small Rayleigh scatterers, such as melanin dust and structuralcell components, (size<<300nm) while the scattering at wavelengths longer than 600nm camefrom large Mie scatterers, such as collagen and elastin bundles, (size~1–8µm).[7] Theyreported scattering power of skin was −1.1 for the spectral range of 500–1200nm. In our data,we find that the reduced scattering of skin type I–II and III–IV at the wavelength range of 600–1000nm has scattering power of −1.15~−1.0 which is similar to the values obtained byBashkatov et al. At wavelengths shorter than 600nm, we obtain scattering power in the rangefrom −1.35~−1.6. The scattering power of this range corresponds to the medium size Rayleigh-Gans scatterers, such as cells and melanocytes, (size~300–600nm).[7,25] In the 400–600nmrange, Bashkatov et al. reported scattering power of –4, which was induced by Rayleighscattering (size<100nm). The difference between our results and Bashkatov’s results in thewavelength shorter than 600nm may be caused by different fitting wavelength ranges and/orthe inherent differences between in-vivo and ex-vivo samples, such as tissue hydration thataffects the matrix surrounding the scattering bodies which in turn affects the scattering process.
As shown in Fig. 10, in the wavelength from 600–1000nm, the mean scattering power of dorsalforearm is lower than that of upper inner arm for all skin types. Considering the averageinterrogation depth is about 1000µm in this wavelength range, the dermis dominates the wholeinterrogation volume. Assuming the main difference between the two sites is the degree of sunexposure, the difference of the scattering power of the two sites is resulted mainly from thesun exposure altered dermis scattering property and partly from the sun exposure alteredepidermis scattering property. Several researchers reported skin collagen structure could beaffected by chronic UV exposure. Kollias et al. found that the fluorescence from the collagencross-links in dermis decrease with chronic UVB exposure.[26] Miyamae concluded that thechanges in the dermis property with photoaging are tied to the collapse of dermal collagen andthe degeneration of elastic fibers.[27] Since the dermis dominates the interrogation volume ofthis probe, we speculate that the collagen and elastin bundles at the chronically sun-exposedsite, such as dorsal forearm, may have smaller size than those at the sun-protected site, suchas upper inner arm, which causes the mean scattering power of dorsal forearm is smaller thanthat of upper inner arm. In addition, sun exposure induces skin melanin production; therefore,
Tseng et al. Page 10
Opt Express. Author manuscript; available in PMC 2009 September 30.
NIH
-PA Author Manuscript
NIH
-PA Author Manuscript
NIH
-PA Author Manuscript

the interrogation depth will be shallower in the relatively high melanin, high absorption dorsalforearm compared to the low melanin, low absorption upper inner arm. This will also makethe scattering power move to smaller values at higher absorption site, since the size of thedominant scatterers in the epidermis, melanosome and cell structure, is much smaller than thatof the dominant scatterers in the dermis, collagen and elastin bundles. Note that in thiswavelength range, the scattering power decreases as the skin type number increases. Again,this phenomenon comes from the gradually more significant influence of the small sizescatterers at epidermis on the overall scattering power as the skin type number and skinabsorption increases.
In contrast, the mean scattering power of upper inner arm is smaller than that of dorsal forearmfor skin type I–II and III–IV at 500–600nm. Melanin, which has index refraction of about 1.7[28], is generated and stored in the melanosome in the epidermis. Because the diffusing probehas average interrogation depths less than 500µm at wavelengths shorter than 600nm andmelanin particles are very strong scatterers, the diffusing probe is sensitive to scatteringintroduced by melanin particles stored in the melanosome. Since solar radiation stimulatesmelanin generation, a sun-exposed site would have more melanin dust clustered in themelanosome compared to a sun-protected site. Therefore, the equivalent scatterer size in theepidermis of sun-exposed dorsal forearms may be larger than that of sun-protected upper innerarms which causes this trend shown in our data for skin type I–II and III–IV. Furthermore, itis seen that the mean scattering power in this wavelength region increases as skin type increases(I–II to III–IV) for both measurement sites in this study. Brenner and Hearing reported that themajor elliptical axis of melanosome in Black skin is longer than that in White skin (roughly800nm versus 400nm).[29] Their result is a strong support to our finding which demonstratesthat, in the 500–600nm wavelength region, the mean scatterer size increases as skin typenumber increases (I–II to III–IV) for both anatomic sites. This also implies that at 500–600nmregion our probe is sensitive to the epidermal scattering structure.
3.4 Determining hemoglobin concentrations of forearm skin with occlusion using two-regionfitting
To demonstrate that the two-region chromophore fitting method can be used to monitor thevariation of in-vivo skin chromophore concentrations at different depths, venous occlusion wasinduced on the forearm of 10 subjects who were enrolled in the previous study and had skintype I–IV. A pneumatic cuff was placed on the upper arm of the subjects and three baselinemeasurements were taken with the diffusing probe on the volar forearm of each subject. Thepneumatic cuff was then inflated to a pressure of 50mm-Hg to induce venous occlusion. Afterthe pressure was applied on the upper arm for 30 seconds, the volar forearm of each subjectwas measured once with the diffusing probe. The pressure was kept constant at 50mmHg overthe course of measurement.
The average oxy-hemoglobin and deoxy-hemoglobin concentrations before and after venousocclusion recovered at the 500–600nm and 600–1000nm regions of 10 subjects are plotted inFig. 11. It can be seen in Fig. 11(a), the deoxy-hemoglobin concentration of upper dermis afterocclusion is statistically higher (p-value=4.9e-6) than that before occlusion, while the oxy-hemoglobin concentration of the upper dermis before and after occlusion have no statisticallysignificant difference (p-value=0.056). This indicates that the accumulation of deoxy-hemoglobin in the vessels locating at the upper dermis when venous occlusion occurs. On theother hand, as shown in Fig. 11(b), the oxy-hemoglobin concentration at deeper dermis hashigher value after occlusion than before occlusion (p-value=1.9e-4), while the deoxy-hemoglobin has no statistically significant difference before and after occlusion (p-value=0.098). The rise of oxy-hemoglobin concentration in the deeper dermis provoked by venousocclusion can be attributed to the inflow of the arterial blood.
Tseng et al. Page 11
Opt Express. Author manuscript; available in PMC 2009 September 30.
NIH
-PA Author Manuscript
NIH
-PA Author Manuscript
NIH
-PA Author Manuscript

It is noted that in Fig. 11(b) that the concentration of deoxy-hemoglobin is zero beforeocclusion. In addition, the uncertainty of the deoxy-hemoglobin concentration after occlusionis very high compared to the mean value. A reasonable explanation to this result is that theconcentration of deoxy-hemoglobin is very low compared to those of oxy-hemoglobin andmelanin, and our method for extracting chromophore concentrations is not sensitive enoughto accurately pick up the small amount of deoxy-hemoglobin concentration in the wavelengthrange from 600 to 1000nm. In this wavelength range, the absorption of deoxy-hemoglobindecreases with wavelength, and this trend is similar to the property of melanin absorption. Inaddition, deoxy-hemoglobin has absorption peaks at 760nm, which coincides with theabsorption peak of lipid. These factors combined make the uncertainty of the skin deoxy-hemoglobin concentration determined in the wavelength range from 600 to 1000nm with ourmethod very high. In contrast, because lipid has an additional dominant absorption peak at930nm, the concentration of lipid can be properly recovered.
Stamatas and Kollias employed diffuse reflectance spectroscopy to study the dependence ofhemoglobin concentration of forearm skin on the pressure applied on the upper arm.[30] Theprobe used for light delivery and collection consisted of multiple, tightly packed, randomlyarranged optical fibers with 50µm core diameter. The wavelength range used to recoverhemoglobin concentration was from 500nm to 580nm. The pressure applied to induce venousocclusion was in the range from 20 to 60mmHg. They found that the deoxy-hemoglobinconcentration increased with the pressure and the oxy-hemoglobin concentration wasindependent from the applied pressure. From the probe geometry and the wavelength rangeused to extract hemoglobin concentration, it is reasonable to estimate the interrogation regionin their study was limited in the upper dermis. The results shown in Fig. 11(a) agree withStamatas and Kollias’s results.
Wolf et al. used intensity-modulated laser at 830 and 758nm to determine the hemoglobin flowin calf muscle when the venous occlusion was induced on the leg with a pressure of 60mmHg.[31] The source-detector separation they used was 3cm. The data they obtained alsodemonstrated that the oxy-hemoglobin concentration increased with time at a rate about 4 timeshigher than that of deoxy-hemoglobin concentration. As shown in Fig. 11(b), we obtainedstatistically higher oxy-hemoglobin concentration after venous occlusion while the averagedeoxy-hemoglobin concentration was higher after venous occlusion but was statisticallyinsignificant from that of the baseline measurement. Although our probe is not measuring thehemoglobin concentration of muscle, it is clear that the trend of dramatic increase in oxy-hemoglobin concentration in deeper dermis after occlusion coincides with the trend of oxy-hemoglobin concentration in muscle reported by Wolf et al.
We did not find that scattering power, melanin concentration, lipid concentration and waterconcentration of each individual had statistically significant change after applying venousocclusion for the 10 subjects we measured (P<0.05). The observation of different trends ofhemoglobin concentration variation recovered at 500–600nm and 600– 1000nm regionsinduced by the venous occlusion validates our proposed probe combined with the two-regionfitting method are applicable to monitor physiological dynamics of in-vivo superficial tissueat two different depths at the same time.
4. ConclusionIn this paper, we reported the optical properties of in-vivo skin of skin phototypes I–VI in thewavelength from 500nm to 1000nm. We conducted Monte Carlo simulations and generatedphoton fluence distribution maps to characterize the interrogation region of the diffusing probein typical skin. The results of these simulations indicate that the interrogation depth at 500nmis at least 46% shallower than that at 900nm for skin. We can extrapolate this to mean that the
Tseng et al. Page 12
Opt Express. Author manuscript; available in PMC 2009 September 30.
NIH
-PA Author Manuscript
NIH
-PA Author Manuscript
NIH
-PA Author Manuscript

skin optical properties obtained with this probe at wavelengths shorter than 600nm are morerelevant to the upper dermis and the epidermis while those obtained at wavelengths longer than600nm are more relevant to the lower dermis. We used the results of these simulations to assistwith the analysis of absorption and reduced scattering spectra of in-vivo skin. We performedtwo-region chromophore fit to the absorption spectra of skin and found that the hemoglobinoxygen saturation was about 60–70% in the upper dermis and about 97–99% in the lowerdermis. In addition, the concentration of oxy-hemoglobin in the lower dermis is one order ofmagnitude higher than that in the upper dermis. Thus the effect of the wavelengths on theinterrogation region cannot be overlooked.
We also used scattering power law to fit the reduced scattering spectra of dorsal forearm andupper inner arm skin. Our analyses of the scattering power of skin reveal that dorsal forearmskin may have smaller mean scatterer size than upper inner arm skin in the lower dermis. Thiscould be caused by the difference in collagen and elastin bundle size and/or melanin contentthat are introduced by skin photoaging. On the other hand, the dorsal forearm skin may havelarger mean scatterer size than upper inner arm skin in the upper dermis and epidermis, for allskin types. This is possibly the result of different melanin cluster size in the melanosome atdifferent sites.
Finally, we demonstrated that our diffusing probe combined with the two-region fitting methodwas capable of monitoring the variation in hemoglobin concentration of in-vivo skin at differentdepths simultaneously. We obtained that the deoxy-hemoglobin concentration at upper dermisand oxy-hemoglobin concentration at deeper dermis increased when venous occlusion of50mmHg was applied on the forearm. Our results agree with those reported by other researchersand thus further support and validate our proposed method. In the future, we will employ thisprobe to study skin photoaging and in-vivo skin melanin synthesis. We will be able to studythe modulation of mean scatterer size as well as chromophore concentrations in the epidermisand dermis introduced by UV radiation.
AcknowledgementsWe thank Rashda Ali’s help in recruiting and measuring subjects. Dr. Tseng would like to acknowledge the supportprovided by the National Science Council of Taiwan under Grant No. NSC-98-2218-E-006-013. Dr. Durkin issupported by the National Institutes of Health/NCRR under grant P41-RR01192 (Laser Microbeam and MedicalProgram: LAMMP).
References and links1. Nishidate I, Aizu Y, Mishina H. Estimation of melanin and hemoglobin in skin tissue using multiple
regression analysis aided by Monte Carlo simulation. J. Biomed. Opt 2004;9:700–710. [PubMed:15250756]
2. Chang SK, Arifler D, Drezek R, Follen M, Richards-Kortum R. Analytical model to describefluorescence spectra of normal and preneoplastic epithelial tissue: comparison with Monte Carlosimulations and clinical measurements. J. Biomed. Opt 2004;9:511–522. [PubMed: 15189089]
3. Kelly KM, Choi B, McFarlane S, Motosue A, Jung BJ, Khan MH, Ramirez-San-Juan JC, Nelson JS.Description and analysis of treatments for port-wine stain birthmarks. Arch. Facial Plast. Surg2005;7:287–294. [PubMed: 16172335]
4. Tromberg BJ, Svaasand LO, Fehr MK, Madsen SJ, Wyss P, Sansone B, Tadir Y. A mathematicalmodel for light dosimetry in photodynamic destruction of human endometrium. Phys. Med. Biol1996;41:223–237. [PubMed: 8746106]
5. Troy TL, Thennadil SN. Optical properties of human skin in the near infrared wavelength range of1000 to 2200 nm. J. Biomed. Opt 2001;6:167–176. [PubMed: 11375726]
Tseng et al. Page 13
Opt Express. Author manuscript; available in PMC 2009 September 30.
NIH
-PA Author Manuscript
NIH
-PA Author Manuscript
NIH
-PA Author Manuscript

6. Simpson CR, Kohl M, Essenpreis M, Cope M. Near-infrared optical properties of ex vivo human skinand subcutaneous tissues measured using the Monte Carlo inversion technique. Phys. Med. Biol1998;43:2465–2478. [PubMed: 9755939]
7. Bashkatov AN, Genina EA, Kochubey VI, Tuchin VV. Optical properties of human skin, subcutaneousand mucous tissues in the wavelength range from 400 to 2000 nm. J. Phys. D 2005;38:2543–2555.
8. Salomatina E, Jiang B, Novak J, Yaroslavsky AN. Optical properties of normal and cancerous humanskin in the visible and near-infrared spectral range. J. Biomed. Opt 2006;11064026
9. Tseng SH, Hayakawa C, Tromberg BJ, Spanier J, Durkin AJ. Quantitative spectroscopy of superficialturbid media. Opt. Lett 2005;30:3165–3167. [PubMed: 16350274]
10. Yoo KM, Liu F, Alfano RR. When Does the Diffusion-Approximation Fail to Describe PhotonTransport in Random-Media. Phys. Rev. Lett 1990;64:2647–2650. [PubMed: 10041774]
11. Zhang R, Verkruysse W, Choi B, Viator JA, Jung R, Svaasand LO, Aguilar G, Nelson JS.Determination of human skin optical properties from spectrophotometric measurements based onoptimization by genetic algorithms. J. Biomed. Opt 2005;10024030
12. Zonios G, Dimou A. Modeling diffuse reflectance from semi-infinite turbid media: application to thestudy of skin optical properties. Opt. Express 2006;14:8661–8674. [PubMed: 19529247]
13. Tseng SH, Grant A, Durkin AJ. In vivo determination of skin near-infrared optical properties usingdiffuse optical spectroscopy. J. Biomed. Opt 2008;13014016
14. Cerussi A, Shah N, Hsiang D, Durkin A, Butler J, Tromberg BJ. In vivo absorption, scattering, andphysiologic properties of 58 malignant breast tumors determined by broadband diffuse opticalspectroscopy. J. Biomed. Opt 2006;11044005
15. Kienle A, Patterson MS, Dognitz N, Bays R, Wagnieres G, van den Bergh H. Noninvasivedetermination of the optical properties of two-layered turbid media. Appl. Opt 1998;37:779–791.[PubMed: 18268653]
16. Wang LH, Jacques SL, Zheng LQ. Mcml - Monte-Carlo Modeling of Light Transport in MultilayeredTissues. Comput. Methods Programs Biomed 1995;47:131–146. [PubMed: 7587160]
17. Prahl, S. Hemoglobin absorption coefficient. 1999.http://omlc.ogi.edu/spectra/hemoglobin/index.html
18. Jacques, SL. Melanosome absorption coefficient. 1998.http://omlc.ogi.edu/spectra/melanin/mua.html
19. Kollias N, Baqer A. Spectroscopic characteristics of human melanin in vivo. J. Invest. Dermatol1985;85:38–42. [PubMed: 4008975]
20. Mourant JR, Fuselier T, Boyer J, Johnson TM, Bigio IJ. Predictions and measurements of scatteringand absorption over broad wavelength ranges in tissue phantoms. Appl. Opt 1997;36:949–957.[PubMed: 18250760]
21. Braverman IM. Ultrastructure and organization of the cutaneous microvasculature in normal andpathologic states. J. Invest. Dermatol 1989;93:2S–9S. [PubMed: 2666519]
22. Jacques S, Glickman R, Schwartz J. Internal absorption coefficient and threshold for pulsed laserdisruption of melanosomes isolated from retinal pigment epithelium. SPIE Proc 1996;2681:468–477.
23. Taroni P, Pifferi A, Torricelli A, Comelli D, Cubeddu R. In vivo absorption and scatteringspectroscopy of biological tissues. Photochem. Photobiol. Sci 2003;2:124–129. [PubMed: 12664972]
24. Reinoso RF, Telfer BA, Rowland M. Tissue water content in rats measured by desiccation. J.Pharmacol. Toxicol. Methods 1997;38:87–92. [PubMed: 9403779]
25. Graaff R, Dassel ACM, Koelink MH, de Mul FFM, Aarnoudse JG, Zijlstra WG. Optical propertiesof human dermis in vitro and in vivo. Appl. Opt 1993;32:435.
26. Kollias N, Gillies R, Moran M, Kochevar IE, Anderson RR. Endogenous skin fluorescence includesbands that may serve as quantitative markers of aging and photoaging. J. Invest. Dermatol1998;111:776–780. [PubMed: 9804337]
27. Miyamae Y, Yamakawa Y, Kawabata M, Ozaki Y. A noninvasive method for assessing interior skindamage caused by chronological aging and photoaging based on near-infrared diffuse reflectionspectroscopy. Appl. Spectrosc 2008;62:677–681. [PubMed: 18559156]
Tseng et al. Page 14
Opt Express. Author manuscript; available in PMC 2009 September 30.
NIH
-PA Author Manuscript
NIH
-PA Author Manuscript
NIH
-PA Author Manuscript

28. Rajadhyaksha M, Grossman M, Esterowitz D, Webb RH, Anderson RR. In vivo confocal scanninglaser microscopy of human skin: melanin provides strong contrast. J. Invest. Dermatol 1995;104:946–952. [PubMed: 7769264]
29. Brenner M, Hearing VJ. The Protective Role of Melanin Against UV Damage in Human Skin.Photochem. Photobiol 2008;84:539–549. [PubMed: 18435612]
30. Stamatas GN, Kollias N. Blood stasis contributions to the perception of skin pigmentation. J. Biomed.Opt 2004;9:315–322. [PubMed: 15065897]
31. Wolf U, Wolf M, Choi JH, Levi M, Choudhury D, Hull S, Coussirat D, Paunescu LA, Safonova LP,Michalos A, Mantulin WW, Gratton E. Localized irregularities in hemoglobin flow and oxygenationin calf muscle in patients with peripheral vascular disease detected with near-infraredspectrophotometry. J. Vasc. Surg 2003;37:1017–1026. [PubMed: 12756348]
Tseng et al. Page 15
Opt Express. Author manuscript; available in PMC 2009 September 30.
NIH
-PA Author Manuscript
NIH
-PA Author Manuscript
NIH
-PA Author Manuscript

Fig. 1.Configuration of the diffusing probe.
Tseng et al. Page 16
Opt Express. Author manuscript; available in PMC 2009 September 30.
NIH
-PA Author Manuscript
NIH
-PA Author Manuscript
NIH
-PA Author Manuscript

Fig. 2.Average and standard deviation of age of 6 subjects in each skin photo-type category.
Tseng et al. Page 17
Opt Express. Author manuscript; available in PMC 2009 September 30.
NIH
-PA Author Manuscript
NIH
-PA Author Manuscript
NIH
-PA Author Manuscript

Fig. 3.Normalized photon fluence distribution maps of the diffusing probe with (a) a light source of500nm wavelength and (b) a light source of 900nm wavelength. Whiter region represent higherfluence rate area. Note that the contour line “−4” in (b) encloses larger region than that in (a).Please refer to text for the parameters used.
Tseng et al. Page 18
Opt Express. Author manuscript; available in PMC 2009 September 30.
NIH
-PA Author Manuscript
NIH
-PA Author Manuscript
NIH
-PA Author Manuscript

Fig. 4.50% threshold maps for the diffusing probe of 1.5mm source-detector separation with (a)500nm light source and (b) 900nm light source, and for the diffusing probe of 3mm source-detector separation with (c) 500nm light source and (d) 900nm light source. White region inthe tissue sample represents the area that has top 50% fluence rate. Please refer to text for theparameters used.
Tseng et al. Page 19
Opt Express. Author manuscript; available in PMC 2009 September 30.
NIH
-PA Author Manuscript
NIH
-PA Author Manuscript
NIH
-PA Author Manuscript

Fig. 5.(a) absorption coefficient and (b) reduced scattering coefficient of in-vivo dorsal forearm of18 subjects. Each skin phototype group has 6 subjects. Solid squares, open circles, and openstars represent optical properties of skin type I–II, III–VI, and V–VI, respectively.
Tseng et al. Page 20
Opt Express. Author manuscript; available in PMC 2009 September 30.
NIH
-PA Author Manuscript
NIH
-PA Author Manuscript
NIH
-PA Author Manuscript

Fig. 6.(a) absorption coefficient and (b) reduced scattering coefficient of in-vivo upper inner arm of18 subjects. Each skin phototype group has 6 subjects. Solid squares, open circles, and openstars represent optical properties of skin type I–II, III–VI, and V–VI, respectively.
Tseng et al. Page 21
Opt Express. Author manuscript; available in PMC 2009 September 30.
NIH
-PA Author Manuscript
NIH
-PA Author Manuscript
NIH
-PA Author Manuscript

Fig. 7.The difference between the (a) mean absorption coefficient, and (b) mean reduced scatteringcoefficient of dorsal forearm and upper inner arm of twelve subjects of skin type I–IV. (Themean coefficient of upper inner arm is subtracted from that of dorsal forearm)
Tseng et al. Page 22
Opt Express. Author manuscript; available in PMC 2009 September 30.
NIH
-PA Author Manuscript
NIH
-PA Author Manuscript
NIH
-PA Author Manuscript

Fig. 8.Two typical chromophore fitting examples with full range fitting method and two-region fittingmethod. (a) and (b) demonstrate the fitting results of two fitting methods with the same rawdata. (c) and (d) demonstrate another example. Solid squares represent raw data and open circlesrepresent fit spectra.
Tseng et al. Page 23
Opt Express. Author manuscript; available in PMC 2009 September 30.
NIH
-PA Author Manuscript
NIH
-PA Author Manuscript
NIH
-PA Author Manuscript
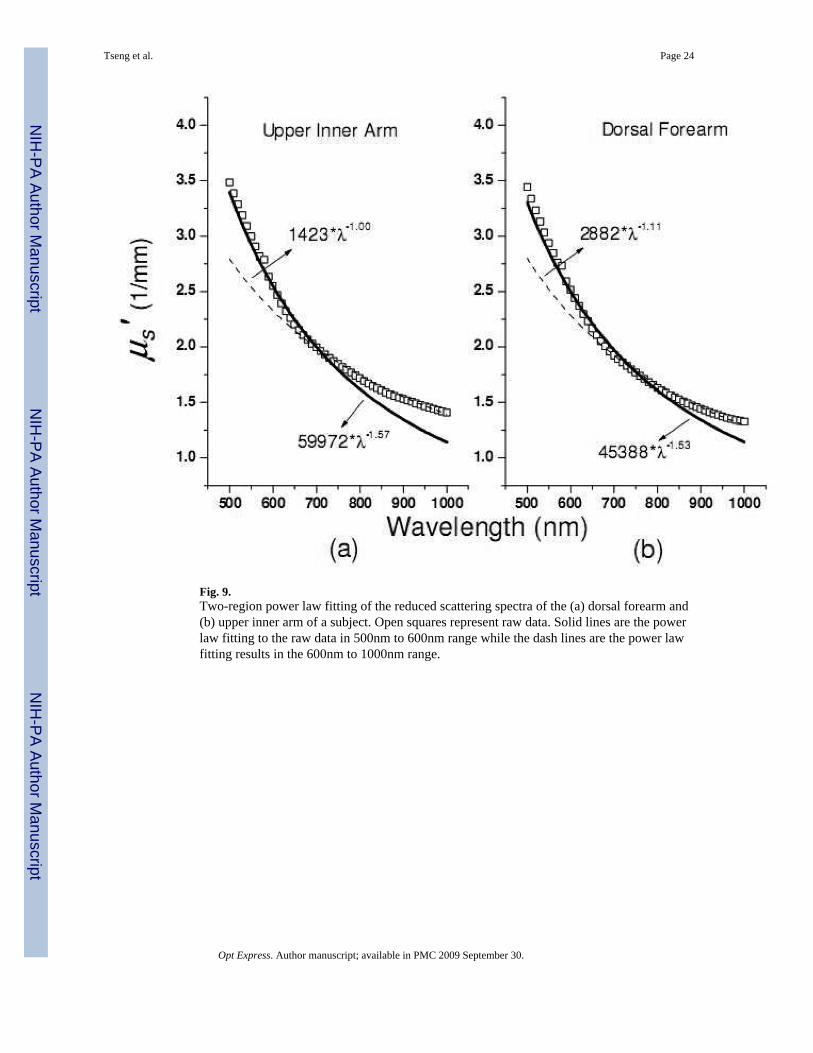
Fig. 9.Two-region power law fitting of the reduced scattering spectra of the (a) dorsal forearm and(b) upper inner arm of a subject. Open squares represent raw data. Solid lines are the powerlaw fitting to the raw data in 500nm to 600nm range while the dash lines are the power lawfitting results in the 600nm to 1000nm range.
Tseng et al. Page 24
Opt Express. Author manuscript; available in PMC 2009 September 30.
NIH
-PA Author Manuscript
NIH
-PA Author Manuscript
NIH
-PA Author Manuscript

Fig. 10.Scattering power calculated from two-region fitting to the reduced scattering spectra of dorsalforearm and upper inner arm of 18 subjects. Each skin phototype group has 6 subjects.
Tseng et al. Page 25
Opt Express. Author manuscript; available in PMC 2009 September 30.
NIH
-PA Author Manuscript
NIH
-PA Author Manuscript
NIH
-PA Author Manuscript
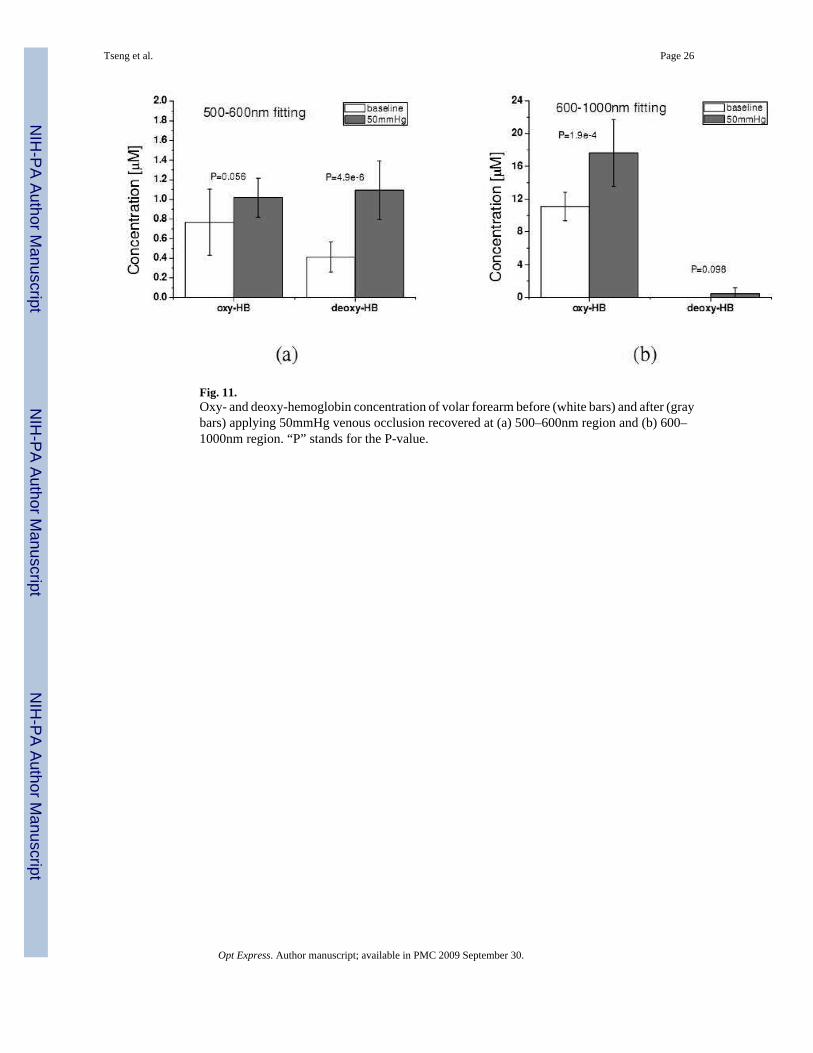
Fig. 11.Oxy- and deoxy-hemoglobin concentration of volar forearm before (white bars) and after (graybars) applying 50mmHg venous occlusion recovered at (a) 500–600nm region and (b) 600–1000nm region. “P” stands for the P-value.
Tseng et al. Page 26
Opt Express. Author manuscript; available in PMC 2009 September 30.
NIH
-PA Author Manuscript
NIH
-PA Author Manuscript
NIH
-PA Author Manuscript

NIH
-PA Author Manuscript
NIH
-PA Author Manuscript
NIH
-PA Author Manuscript
Tseng et al. Page 27Ta
ble
1C
hrom
opho
re c
once
ntra
tions
of d
orsa
l for
earm
of 1
8 su
bjec
ts re
cove
red
with
two-
regi
onal
fitti
ng. S
tand
ard
devi
atio
ns w
ere
calc
ulat
edto
illu
stra
te th
e dev
iatio
n of
reco
vere
d ch
rom
opho
re co
ncen
tratio
ns o
f 6 su
bjec
ts w
ithin
each
gro
up. R
es.fu
ll re
pres
ents
the f
ittin
g re
sidu
alof
full
wav
elen
gth
rang
e (5
00–1
000n
m) f
ittin
g, a
nd R
es.re
g re
pres
ents
the
fittin
g re
sidu
al o
f tw
o-re
gion
al fi
tting
.
500–
600n
m60
0–10
00nm
Dor
sal
fore
arm
deox
yHb
[µM
]ox
yHb
[µM
]M
elan
in[%
]de
oxyH
b[µ
M]
oxyH
b[µ
M]
Mel
anin
[%]
H2O [%
]Li
pid
[%]
Res.
full
Res.
Reg
I–II
0.26
±0.1
90.
81±0
.42
1.65
±0.1
80.
12±0
.51
7.74
±3.1
50.
87±0
.18
21.4
2±2
.59
27.7
4±5
.01
0.00
165
0.00
066
III–
IV0.
31±0
.28
0.84
±0.3
01.
98±0
.09
0.08
±0.2
69.
47±3
.41
1.15
±0.0
922
.46
±2.4
626
.12
±6.0
40.
0014
90.
0006
9
V–V
I-
--
0.02
±0.1
02.
72±2
.40
1.65
±0.2
318
.66
±3.1
716
.56
±8.2
3-
0.00
104
Opt Express. Author manuscript; available in PMC 2009 September 30.
NIH
-PA Author Manuscript
NIH
-PA Author Manuscript
NIH
-PA Author Manuscript
Tseng et al. Page 28Ta
ble
2C
hrom
opho
re c
once
ntra
tions
of u
pper
inne
r arm
of 1
8 su
bjec
ts re
cove
red
with
two-
regi
onal
fitti
ng. S
tand
ard
devi
atio
ns w
ere
calc
ulat
edto
illu
stra
te th
e dev
iatio
n of
reco
vere
d ch
rom
opho
re co
ncen
tratio
ns o
f 6 su
bjec
ts w
ithin
each
gro
up. R
es.fu
ll re
pres
ents
the f
ittin
g re
sidu
alof
full
wav
elen
gth
rang
e (5
00–1
000n
m) f
ittin
g, a
nd R
es.re
g re
pres
ents
the
fittin
g re
sidu
al o
f tw
o-re
gion
al fi
tting
.
500–
600n
m60
0–10
00nm
Upp
erin
ner
arm
deox
yHb
[µM
]ox
yHb
[µM
]M
elan
in[%
]de
oxyH
b[µ
M]
oxyH
b[µ
M]
Mel
anin
[%]
H2O [%
]Li
pid
[%]
Res.
full
Res.
Reg
I–II
0.28
±0.2
20.
86±0
.34
1.56
±0.1
80.
09±0
.41
8.15
±2.0
60.
64±0
.04
18.6
8±1
.34
30.7
2±3
.79
0.00
203
0.00
061
III–
IV0.
42±0
.29
0.82
±0.3
91.
66±0
.24
0.31
±0.6
09.
57±2
.78
0.82
±0.0
919
.23
±2.2
933
.69
±5.4
60.
0020
00.
0006
7
V–V
I-
--
0.02
±0.0
84.
44±3
.17
1.33
±0.2
316
.99
±2.2
030
.20
±6.5
2-
0.00
086
Opt Express. Author manuscript; available in PMC 2009 September 30.