
Light absorption and scattering by particles and CDOM at the New England shelfbreak front
22
Light absorption and scattering by particles and CDOM at the New England shelfbreak front Robert D. Vaillancourt and John Marra Lamont-Doherty Earth Observatory of Columbia University, 61 Route 9W, Palisades, New York 10970, USA ([email protected]) Laura Prieto Lamont-Doherty Earth Observatory of Columbia University, 61 Route 9W, Palisades, New York 10970, USA Now at Instituto de Ciencias Marinas de Andalucia, Poligono Rio San Pedro s/n, 11510 Puerto Real (Cadiz), Spain Robert W. Houghton Lamont-Doherty Earth Observatory of Columbia University, 61 Route 9W, Palisades, New York 10970, USA Burke Hales College of Oceanic and Atmospheric Sciences, Oregon State University, Corvallis, Oregon 97331, USA Dave Hebert Graduate School of Oceanography, University of Rhode Island, South Ferry Road, Narragansett, Rhode Island 02882, USA [1] A fine-scale survey of physical, chemical, and optical properties was done across the shelfbreak front in the Middle Atlantic Bight region south of Martha’s Vineyard, Cape Cod (70.5°W) during late summer 2002. The front displayed physical and biological structure typical for this region and season: a density- compensating front with strong horizontal T and S and optical gradients, and a chlorophyll maximum layer that deepened in the seaward direction across the front, became detached beneath the shelfbreak jet, reappeared on a deeper and greater density surface on the seaward side of the shelfbreak front, and then shoaled again in the seaward direction. At times the shoreward leading edge of the chlorophyll maximum layer seaward of the front was situated beneath the chlorophyll maximum layer shoreward of the front. Hydrography on the shoreward side of the front was dominated by a bolus of cold pool water of shelf origin with minimum salinity and temperature of 33 and 10°C, respectively. The cold pool was also a pool of high CDOM absorption whose distribution coincided with the temperature and salinity across the front. The persistence of sharp horizontal T, S, and CDOM gradients indicated that advective processes exceed diffusive mixing processes at the front. CDOM in the euphotic zone showed a strong inverse relationship to temperature and, below the euphotic zone, a strong inverse relationship to salinity, indicating a terrestrial CDOM source within the cold pool and a photodegradation sink at the surface. Cross-frontal exchange of shelf CDOM and upper slope waters is inferred from the T-S properties of the CDOM pool and previously reported measurements of the mixing and circulation at this site. The chlorophyll specific absorption coefficients of discrete samples collected within the chlorophyll maximum layers, along with LPS surveys of dissolved and particulate absorption and scattering, indicate that the variability of optics at the shelfbreak front is influenced mostly by particle optics. Due to the presence of the cold pool with its high CDOM signature, the waters masses across the shelfbreak front can be considered as case 1 for particles but case 2 for dissolved materials. Components: 13,876 words, 10 figures, 1 table. Keywords: CDOM; Mid-Atlantic Bight; New England shelfbreak front; optics; shelfbreak front; upwelling. G 3 G 3 Geochemistry Geophysics Geosystems Published by AGU and the Geochemical Society AN ELECTRONIC JOURNAL OF THE EARTH SCIENCES Geochemistry Geophysics Geosystems Article Volume 6, Number 11 4 November 2005 Q11003, doi:10.1029/2005GC000999 ISSN: 1525-2027 Copyright 2005 by the American Geophysical Union 1 of 22
Transcript of Light absorption and scattering by particles and CDOM at the New England shelfbreak front
Light absorption and scattering by particles and CDOM atthe New England shelfbreak front
Robert D. Vaillancourt and John MarraLamont-Doherty Earth Observatory of Columbia University, 61 Route 9W, Palisades, New York 10970, USA([email protected])
Laura PrietoLamont-Doherty Earth Observatory of Columbia University, 61 Route 9W, Palisades, New York 10970, USA
Now at Instituto de Ciencias Marinas de Andalucia, Poligono Rio San Pedro s/n, 11510 Puerto Real (Cadiz), Spain
Robert W. HoughtonLamont-Doherty Earth Observatory of Columbia University, 61 Route 9W, Palisades, New York 10970, USA
Burke HalesCollege of Oceanic and Atmospheric Sciences, Oregon State University, Corvallis, Oregon 97331, USA
Dave HebertGraduate School of Oceanography, University of Rhode Island, South Ferry Road, Narragansett, Rhode Island 02882,USA
[1] A fine-scale survey of physical, chemical, and optical properties was done across the shelfbreak front inthe Middle Atlantic Bight region south of Martha’s Vineyard, Cape Cod (70.5!W) during late summer2002. The front displayed physical and biological structure typical for this region and season: a density-compensating front with strong horizontal T and S and optical gradients, and a chlorophyll maximum layerthat deepened in the seaward direction across the front, became detached beneath the shelfbreak jet,reappeared on a deeper and greater density surface on the seaward side of the shelfbreak front, and thenshoaled again in the seaward direction. At times the shoreward leading edge of the chlorophyll maximumlayer seaward of the front was situated beneath the chlorophyll maximum layer shoreward of the front.Hydrography on the shoreward side of the front was dominated by a bolus of cold pool water of shelforigin with minimum salinity and temperature of 33 and 10!C, respectively. The cold pool was also a poolof high CDOM absorption whose distribution coincided with the temperature and salinity across the front.The persistence of sharp horizontal T, S, and CDOM gradients indicated that advective processes exceeddiffusive mixing processes at the front. CDOM in the euphotic zone showed a strong inverse relationshipto temperature and, below the euphotic zone, a strong inverse relationship to salinity, indicating a terrestrialCDOM source within the cold pool and a photodegradation sink at the surface. Cross-frontal exchange ofshelf CDOM and upper slope waters is inferred from the T-S properties of the CDOM pool and previouslyreported measurements of the mixing and circulation at this site. The chlorophyll specific absorptioncoefficients of discrete samples collected within the chlorophyll maximum layers, along with LPS surveysof dissolved and particulate absorption and scattering, indicate that the variability of optics at theshelfbreak front is influenced mostly by particle optics. Due to the presence of the cold pool with its highCDOM signature, the waters masses across the shelfbreak front can be considered as case 1 for particlesbut case 2 for dissolved materials.
Components: 13,876 words, 10 figures, 1 table.
Keywords: CDOM; Mid-Atlantic Bight; New England shelfbreak front; optics; shelfbreak front; upwelling.
G3G3GeochemistryGeophysics
GeosystemsPublished by AGU and the Geochemical Society
AN ELECTRONIC JOURNAL OF THE EARTH SCIENCES
GeochemistryGeophysics
Geosystems
Article
Volume 6, Number 11
4 November 2005
Q11003, doi:10.1029/2005GC000999
ISSN: 1525-2027
Copyright 2005 by the American Geophysical Union 1 of 22
Index Terms: 4219 Oceanography: General: Continental shelf and slope processes (3002); 4264 Oceanography: General:Ocean optics (0649); 4279 Oceanography: General: Upwelling and convergences (4964).
Received 12 April 2005; Revised 5 August 2005; Accepted 16 September 2005; Published 4 November 2005.
Vaillancourt, R. D., J. Marra, L. Prieto, R. W. Houghton, B. Hales, and D. Hebert (2005), Light absorption and scattering byparticles and CDOM at the New England shelfbreak front, Geochem. Geophys. Geosyst., 6, Q11003,doi:10.1029/2005GC000999.
1. Introduction
[2] The Mid-Atlantic Bight (MAB) shelfbreakfront is a retrograde front separating the colder,fresher waters of the northeast US continental shelffrom the warmer, saltier waters overlying thecontinental slope. The front extends from CapeHatteras northward to the Great South Channel onthe southwest flank of Georges Bank. The NewEngland shelfbreak front constitutes a subregion ofthis larger feature, and is located directly south ofNantucket and Martha’s Vineyard [O’Reilly andZetlin, 1998]. The position of the front has beenidentified at various times by the location of the34.5 isohaline and the 10!C isothermal [Wright,1976; Mooers et al., 1979; Beardsley and Flagg,1976], with surface features typically overlying the200 m isobath and its foot anchored near the 80–100 m isobath. In the wintertime extending intoearly spring, horizontal temperature and salinitygradients are strong and isopycnals are vertical,reaching to the surface. Satellite imagery for theouter continental shelf of the northeast US showstrong horizontal gradients in temperature andchlorophyll [Ullman and Cornillon, 1999; Ryanet al., 1999a, 1999b]. The position of thesegradients are often variable owing to meandersinduced by frontal instabilities and interaction withwarm core rings shed from the Gulf Stream andpropagated northward [Churchill and Cornillon,1991]. Beginning in the spring and extending toearly fall, increased insolation erases the frontaltemperature expression at the surface and causes itto deepen to 20–30 meters. The frontal chlorophyllalso becomes subsurface and strongly coherentwith the seasonal pycnocline and with the deepen-ing nitracline [Houghton and Marra, 1983]. Thesummertime stratification is most pronounced overthe deeper outer continental shelf resulting in apersistent ‘‘cold pool’’ of deep remnant winterwater overlying the continental shelf from NewEngland to the southern end of the MAB [Bigelow,1933; Houghton et al., 1982]. The origin of thecold pool water is likely some admixture of cold
water advected southwestward from the Gulf ofMaine and Scotian Shelf and locally formed MABshelf water.
[3] The cold pool hugs the outer continental shelfand its seaward edge constitutes the boundarybetween cold, fresh shelf water and warm, saltyslope water. There is a typical summertime struc-ture of this boundary region that is characterized byparcels of cold pool water that appear to beseparating from the cold pool proper and dispers-ing in the seaward direction, and an interleaving ofshelf and slope water types to form salinity inver-sions in the vertical that are a persistent feature atthe front [Houghton and Marra, 1983; Lentz,2003]. The boundary of cold pool and slope watersis characterized by strong horizontal temperatureand salinity gradients that are maintained alongsloping isopycnals. There is cross-shelf upwellingalong the sloping isopycnals that has been mea-sured with purposeful tracers [Houghton andVisbeck, 1998; Houghton et al., 2005] and inferredfrom the distribution of passive tracers [Barth etal., 1998]. Along with this upwelling at the front isthe observation of a baroclinic westward flowingjet often associated with the frontal density gradi-ent [Linder and Garwarkiewicz, 1998; Barth et al.,1998; Fratantoni et al., 2001; Fratantoni andPickart, 2003].
[4] A local maximum in phytoplankton biomass isoften observed at the front and is attributed to theupwelling of deep, nutrient-rich water into the welllit, but nutrient-deplete surface water [Malone etal., 1983; Houghton and Marra, 1983; Marra etal., 1990]. The typical summertime chlorophyllstructure across the front is characterized by asubsurface chlorophyll layer atop the seasonalpycnocline arranged in a downward ‘‘stepped’’fashion seaward across the front, often with a localchlorophyll minimum at or near the shelf-slopewater boundary [Houghton and Marra, 1983;Barth et al., 1998]. Therefore the shelfbreak frontis also an optical front with relatively clear surfacewater on the seaward side and more turbid con-
GeochemistryGeophysicsGeosystems G3G3 vaillancourt et al.: new england shelfbreak front 10.1029/2005GC000999
2 of 22
ditions on the shoreward side. Increased nutrientinput and high water clarity at the seaward edge ofthe front provides an optimal environment forphytoplankton growth and the accumulation ofchlorophyll biomass [Marra et al., 1990]. Surfacechlorophyll enhancement along the shelfbreakfront, detected throughout the entire MAB regionby satellite ocean color sensors during late spring,was related to entrainment of shelf water seawardalong rising isopycnals by perturbation by frontalmeanders [Ryan et al., 1999a] and Gulf Streamwarm core rings [Ryan et al., 1999b].
[5] Here we report fine-scale hydrographic andoptical measurements across the front south ofNew England during the summer 2002 as part ofthe New England Shelf Productivity EXperiment(NESPEX). Previous observations in this regionhave revealed strong cross-shelf gradients inoptical properties as the influence of river dis-charge, with its increased load of particles anddissolved substances, decreases exponentially withdistance from shore [Nelson and Guarda, 1995;DeGrandpre et al., 1996; Vodacek et al., 1997;Boss et al., 2001b]. Optical variations occur at theshelfbreak front over multiple timescales owingto the passage of internal waves, solitons, storms,and tides, and seasonal variations of vertical strat-ification, phytoplankton growth and freshwater
discharge [Boss et al., 2001a, 2001b; Gardner etal., 2001; Sosik et al., 2001; Chang and Dickey,2001; Vodacek et al., 1997; Nelson and Guarda,1995]. Our data are evaluated to determine howphysical processes of local mixing and upwellinginfluence the optical environment, and thus pro-ductivity, at the front.
2. Methods
2.1. Description of Study Site, CTD,and LPS Surveys
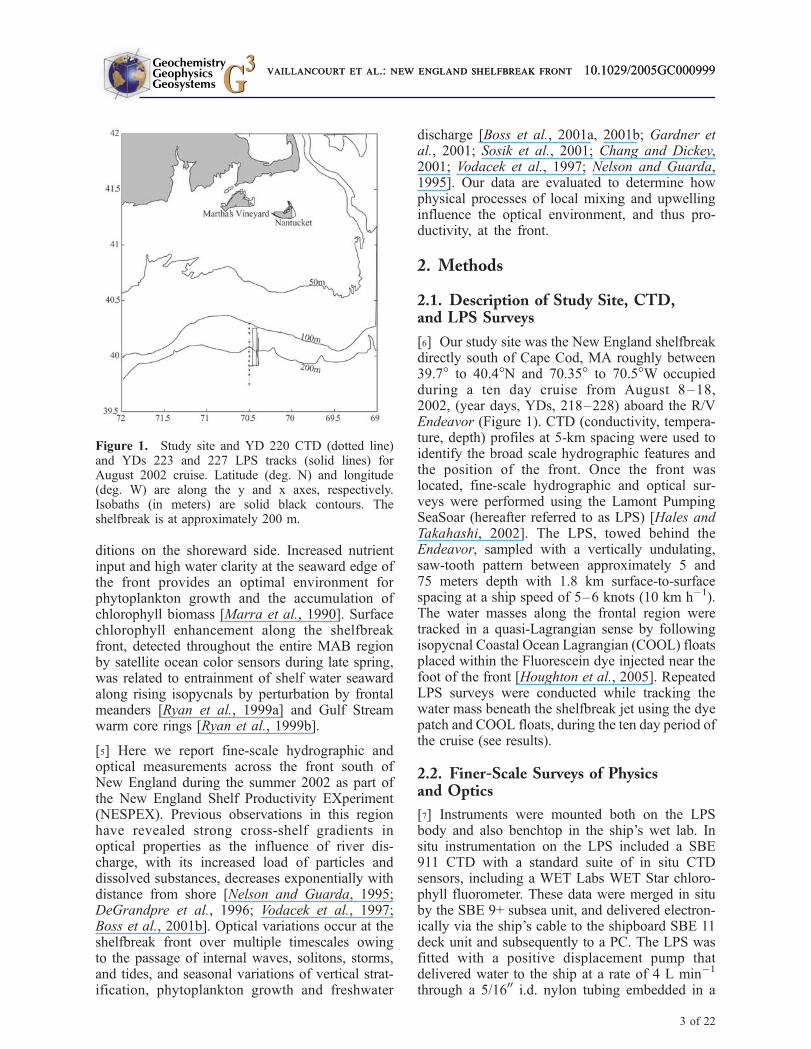
[6] Our study site was the New England shelfbreakdirectly south of Cape Cod, MA roughly between39.7! to 40.4!N and 70.35! to 70.5!W occupiedduring a ten day cruise from August 8–18,2002, (year days, YDs, 218–228) aboard the R/VEndeavor (Figure 1). CTD (conductivity, tempera-ture, depth) profiles at 5-km spacing were used toidentify the broad scale hydrographic features andthe position of the front. Once the front waslocated, fine-scale hydrographic and optical sur-veys were performed using the Lamont PumpingSeaSoar (hereafter referred to as LPS) [Hales andTakahashi, 2002]. The LPS, towed behind theEndeavor, sampled with a vertically undulating,saw-tooth pattern between approximately 5 and75 meters depth with 1.8 km surface-to-surfacespacing at a ship speed of 5–6 knots (10 km h!1).The water masses along the frontal region weretracked in a quasi-Lagrangian sense by followingisopycnal Coastal Ocean Lagrangian (COOL) floatsplaced within the Fluorescein dye injected near thefoot of the front [Houghton et al., 2005]. RepeatedLPS surveys were conducted while tracking thewater mass beneath the shelfbreak jet using the dyepatch and COOL floats, during the ten day period ofthe cruise (see results).
2.2. Finer-Scale Surveys of Physicsand Optics
[7] Instruments were mounted both on the LPSbody and also benchtop in the ship’s wet lab. Insitu instrumentation on the LPS included a SBE911 CTD with a standard suite of in situ CTDsensors, including a WET Labs WET Star chloro-phyll fluorometer. These data were merged in situby the SBE 9+ subsea unit, and delivered electron-ically via the ship’s cable to the shipboard SBE 11deck unit and subsequently to a PC. The LPS wasfitted with a positive displacement pump thatdelivered water to the ship at a rate of 4 L min!1
through a 5/1600 i.d. nylon tubing embedded in a
Figure 1. Study site and YD 220 CTD (dotted line)and YDs 223 and 227 LPS tracks (solid lines) forAugust 2002 cruise. Latitude (deg. N) and longitude(deg. W) are along the y and x axes, respectively.Isobaths (in meters) are solid black contours. Theshelfbreak is at approximately 200 m.
GeochemistryGeophysicsGeosystems G3G3 vaillancourt et al.: new england shelfbreak front 10.1029/2005GC000999vaillancourt et al.: new england shelfbreak front 10.1029/2005GC000999
3 of 22
Kevlar-reinforced cable, about 750 m long. Thetransit time of water through the tubing was deter-mined precisely by comparing sharp salinity sig-nals detected by a CTD unit mounted on the LPSand a second unit installed at the water dischargeaboard the ship. It took "5 minutes for the pumpedwater to reach shipboard laboratories where sam-ples were analyzed by bench-top instrumentationplumbed in series to the flow-stream tubing.Smearing of water pumped through the 750 mtubing was estimated to be about 2 m by compar-ing the shape of the salinity signals recorded by thepair of CTD units.
[8] A portion of the flowing seawater stream wasdiverted from the flowstream and plumbed throughtwo WET Labs’ AC-9 long tube (i.e., 25 cm pathlength) absorption meters arranged in series andmounted horizontally on the benchtop atop foampads. The first AC-9 received raw unfiltered sea-water. The second AC-9 received seawater withparticles removed by placing a 0.2 mm Gelmancartridge filter prior to the entry ports. In thismanner, the first AC-9 measured the absorptionand attenuation of the particles and colored dis-solved organic matter (CDOM, or ‘‘g’’ for ‘‘gelbst-off’’), or apg and cpg, respectively. The second AC-9measured the optical coefficients of CDOM only, orag and cg, respectively (pure water absorption wassubtracted using clean-water calibrations). Down-stream of the second AC-9, a positive displacementpump (model ‘‘QD’’, Fluid Metering, Inc., Syosset,NY) was plumbed to assure a constant flow rate of1.5 L min!1 regardless of flow resistance caused bythe gradual clogging of the Gelman filter mountedupstream. A pressure gauge mounted upstreamalerted us to when the Gelman filter needed to bereplaced. A typical backpressure on the Gelmanfilter for one five-hour period increased from 5 to18 P.S.I. while the flow rate decreased from 1.52 to1.48 L min!1. The filter was replaced when noiseand drift in the CDOM absorption was evident. Aflow lag correction for the ‘‘total’’ AC-9 was madeby optimizing the match between chlorophyllfluorescence measured at the LPS and the totalabsorption at 676 nm measured by the ‘‘total’’AC9. A second flow lag correction was deter-mined for the second ‘‘dissolved’’ AC-9 as thevoid volume of the tubing (with Gelman filter)connecting the two AC-9s, divided by the flowrate.
[9] AC-9 measurements were made only duringLPS deployments, from sunrise to sunset. At theend of each day, Milli-Q water (18 M-Ohm resis-tance) was passed through each AC-9 until both
channels’ readings were near baseline, and then theMilli-Q water was left remaining in the instrumentsand tubing overnight until the LPS surveys beganagain the following morning. At three points dur-ing the cruise the AC-9s were disassembled,cleaned with soapy water, Milli-Q water and thenmethanol, dried and reassembled. A clean-watercalibration was performed at the beginning of thecruise and the instruments’ device files wereadjusted to correct for the baseline offset. Twosubsequent clean-water calibrations were per-formed during the cruise on YDs 225 and 227,and these clean water offsets were applied duringpostcollection processing after appropriate adjust-ments were made for differences in water temper-ature between calibration times, and betweencalibration water and sample water. Correctionsfor instrument drift were made by linear interpola-tion between the days that clean-water calibrationswere performed. Maximum instrument drift for theabsorption channels of the ‘‘dissolved’’ AC-9 var-ied between !0.002 and !0.003 m!1 d!1, and forattenuation channels, between !0.0001 and!0.0008 m!1 d!1, depending on the wavelength.Likewise, the maximum instrument drift for theabsorption channels of the ‘‘total’’ AC-9 variedbetween !0.0001 and +0.0005 m!1 d!1, and forattenuation channels, between !0.0008 and!0.001 m!1 d!1. Underway corrections for tem-perature and salinity effects were made usingcontinuous salinity and temperature data collectedsimultaneously with AC-9 data with a benchtopthermosalinograph mounted upstream of the instru-ments, according to the WET Labs’ [2002] AC-9User’s Guide, using the temperature- and salinity-dependent coefficients of Pegau et al. [1997].
[10] A scattering correction must also be applied tothe absorption channel data to account for thephotons scattered outside the collection angle ofthe AC-9s’ optics. We corrected for scattering bysubtracting the a715 value from the absorptionvalues at all other wavelength. This type of cor-rection assumes that (1) absorption at this wave-length is negligible and due mostly to scatteringerror and (2) the shape and magnitude of thevolume scattering function do not vary with wave-length [Zaneveld et al., 1994]. When an inter-comparison was performed on the two metersarranged serially with unfiltered seawater passingthrough during an LPS transect, the two AC-9sshowed excellent agreement at each wavelength,i.e., slope values near one (0.992, 0.97), interceptsnear zero (0.0082, 0.0048), and high r2 values(0.97, 0.97). The good agreement allowed us to
GeochemistryGeophysicsGeosystems G3G3 vaillancourt et al.: new england shelfbreak front 10.1029/2005GC000999
4 of 22
calculate by difference, the particulate absorptioncoefficients (ap = apg ! ag). Particle scatteringcoefficients were assumed equal to total scattering(bpg # bp # cpg ! apg) under the assumption thatoptical scattering by colloidal particles smaller thanthe nominal porosity of the Gelman filter (0.2 mm)is negligible. The single scattering albedo wascalculated as wo = bp/cpg. Lastly, heating of theAC-9s’ electronics was kept within the prescribedtemperature calibration range by cooling the in-strument using ice packs during operation.
2.3. Radiative Transfer Modeling
[11] Optical depth, x (dimensionless), was calcu-lated as ln [E(0!)/E(z)] where E(0!), was PARirradiance (photosynthetically available radiation,l = 400–700 nm, hereafter referred to as PAR) justbeneath the air/water interface, and E(z) was PARat the sampling depth. Since the LPS reached onlywithin 5 to 10 m of the surface, any light sensormounted on this platform would not measure thesharp attenuation of red wavelengths in the near-surface, and thus would be inappropriate for mea-suring depth-integrated diffuse attenuation of PAR(Kd,PAR [Mueller, 2000]), and hence optical depth.Instead, we modeled light depths using the radiativetransfer numerical model Hydrolight (version 4.1;Sequoia Scientific). Input into the model consistedof the inherent optical properties (IOPs) of the watercolumn, the sun and sky radiance incident on the seasurface, and the appropriate boundary conditions ofbottom depth and sea surface state. The IOPs con-sisted of the total absorption and attenuation valuesmeasured by the AC-9 instrument (with Pope andFry’s [1997] pure water values added), and anassumed constant (with depth and location) particlescattering phase function approximated by theaverage particle phase function of Petzold [1972].This phase function assumes a constant particlebackscattering ratio (bb,p/bp) of 1.8%, and iswithin the bounds reported for ocean waterswhere only chlorophyll and its degradation andexcretion products dominate optical properties.(Boss et al. [2004]: bb,p/bp at 440 nm # 0.6–0.9% for Chl a # 4–9 mg L!1; Green and Sosik[2004]: bb,p/bp at 410–555 nm # 0.7–1.6% forChl a # 0.5–1.8 mg L!1; Chang et al. [2002]:bb442/b440 # 0.4 – 1%; Twardowski et al.[2001]: bb,p/bp at 532 nm # 0.5–1.8% for Chla # 0.3–3.5 mg L!1.) Although our choice ofbackscattering ratio is on the high end of thesevalues, model sensitivity analysis showed that theresulting modeled Kd,PAR was relatively insensi-tive to the magnitude of bb ratio. A nearly ten-
fold increase in bb ratio from 0.3 to 1.8%,representing the approximate span of reportedvalues, resulted in a change in modeled depth-integrated Kd,PAR of between !3% near thesurface, to +10% at 75 meters. Additional modelinput parameters included the PAR incident onand below the sea surface and were taken fromthe semiempirical RADTRAN model [Gregg andCarder, 1990], where the sky and the air/watersurface boundary conditions were specified bythe time (local noon for YD 223), the location ofthe study site (40!N, 70.5!W) and the meteorolog-ical conditions on that day. The IOPs were assumednot to vary throughout the day, and were alsospecified as constant from the top-most samplingdepth reached by the LPS ("5–10 m) to the surface.This assumption is valid on the basis of CTD castswhich measured low and constant chlorophyllfluorescence in the upper 10 to 15 meters. Calmconditions (wind speed "5 knots) during the cruisealso indicated that scattering by turbulence-injectedair bubbles in the near-surface water was probablynot significant. We specified no internal sources ofillumination and no inelastic scattering, and thewater column depth was specified as infinite.
2.4. Bulk Sample Analysis of Absorption,POC, and Chlorophyll
[12] Spectral light absorption by particulates, in-cluding that due to pigmented phytoplankton andnonpigmented heterotrophs and detrital matter, wasmeasured following the procedure outlined byMitchell et al. [2000]. Two liters of seawater werecollected from an unfiltered branch of the LPS flowstream. A chlorophyll fluorometer placed at theterminus of the flow stream allowed us to samplefrom the chlorophyll layer, as well as above orbelow it. From this volume, 1.2 L was filteredthrough a 25 mm Whatmann GF/F filter, and thefilter stored in liquid nitrogen until later analysis inthe laboratory. The optical density of the filteredparticle sample, ODp(l), was measured from 400to 750 nm at 1-nm intervals on a Perkin-ElmerLambda-3b spectrophotometer, following appro-priate baseline correction using an unused GF/Ffilter wetted with seawater. A different blank GF/Ffilter was measured for each set of six samplefilters and their spectra were subtracted fromODp(l). Uncorrected ODs at l = 674 nm fellbetween 0.05 and 0.26, and in the blue wave-lengths were <0.4. Any samples that fell outsidethis range were discarded according to the perfor-mance criteria established by Mitchell et al. [2000].The sample filter was then extracted in hot meth-
GeochemistryGeophysicsGeosystems G3G3 vaillancourt et al.: new england shelfbreak front 10.1029/2005GC000999
5 of 22
anol [Kishino et al., 1985] to remove methanol-soluble plant pigments and the OD of the remaining‘‘detrital’’ fraction, ODd(l), was scanned across thesame wavelength range. To correct for scatteringartifacts, the optical density of the sample averagedover the null wavelengths 740 to 750 nm (ODnull)was subtracted from ODp(l) and ODd(l). The finalcorrection was to account for the path lengthamplification due to multiple scattering in thefilter and particle layer, which enhances ODp(l)and ODd(l) compared to the true value of theparticles measured in a suspension, ODsusp(l),the so-called ‘‘b correction’’ [Kiefer and Soohoo,1982]. The quadratic equation used, ODsusp(l) =0.309[ODp(l)] + 0.5473[ODp(l)]2, was deter-minedwith amixture of 12 different cultured speciesof marine phytoplankton using the same make andmodel spectrophotometer as ours (C. Trees, per-sonal communication). The form of the quadraticformulae and the values of the coefficients weused were very similar to those published byothers [Mitchell et al., 2000, Table 2]. Absorptioncoefficients (units of m!1) of the particulate anddetrital fractions were then calculated as [Mitchellet al., 2000]
ap l$ % & 2:303' ODsusp l$ %V=A
; $1%
where A is the clearance area of the filter (unitsof m2), V is the volume filtered (units of m3), thefactor 2.303 transforms natural logarithm to base-10 logarithm. The subscript p in the above equationis replaced by d for calculation of the detritalabsorption coefficient. The phytoplankton pigmentabsorption aph(l) was calculated as the difference,ap(l) ! ad(l).
[13] Chlorophyll a and phaeophytin a concentra-tions were measured in 90% acetone extractsaccording to the method outlined in the JointGlobal Ocean Flux Study (JGOFS) [1996] meth-ods manual using a Turner Designs’ TD700 fluo-rometer with chlorophyll filters. Fluorescencebefore and after acidification with 10% HClallowed determination of phaeopigments. TheTD700 was calibrated using pure chlorophyll aisolated from spinach (Sigma chemical Co.) whoseconcentration was determined spectrophotometri-cally. The WET Star chlorophyll fluorometer vol-tages (VChl) were calibrated to the extractedchlorophyll a + phaeophytin concentration. Thederived equation was Chl a + phaeo [mg L!1] =3.258 * VChl + 0.1738 (r2 = 0.88, N = 24). Blankreadings with pure water read "0.14 v which
resulted in a detection limit for fluorescence-derived chlorophyll of "0.6 mg L!1. No middayquenching of chlorophyll fluorescence was appar-ent in the day-long LPS surveys. Samples forparticulate organic carbon (POC) analysis werefiltered onto precombusted (400!C, 24 h) GF/Ffilters and stored at !20!C. POC concentrationswere determined using a CE Instruments Flash EA1112 gas chromatograph after the method ofVerardo et al. [1990]. High speed nitrate + nitriteanalyses were done on seawater pumped from theLPS to the ship’s laboratory according to themethods described by Hales et al. [2005].
3. Results
3.1. Broad Hydrographic Structure ofShelfbreak Front
[14] Initial CTD sections (Figure 2) revealed strongthermal stratification in the upper surface watersbetween roughly 20–60 m depth with temperaturedeclining from 22!C at the surface to 10!C at30–35 m depth. The sharpest thermocline wasobserved above the cold pool, at 20–40 m depth,and particularly over a portion of the cold pool thatappeared detached and displaced seaward and up-ward ("40.1–40.2!N), pushing a sharp thermalgradient to within "25 m of the surface. Seawardof the detached cold pool the thermocline broad-ened and deepened. Salinity ranged from "32.9 to35.7, with the lowest values found within the coreof the cold pool, and the highest within the deeperslope water.
[15] The interleaving of shelf and slope watersseen in our cross-front sections, most obviousbetween 39.8! and 40.05!N, above "75 meters(Figures 2a and 2b), was typical of the shelf-break front [Houghton and Marra, 1983; Linderand Garwarkiewicz, 1998], and resulted in fre-quent reversals in the sign of the vertical andhorizontal gradients of water properties. At thesurface the freshest water was at the seaward edgeof the section at "39.7!N. This parcel must haveoriginated from the inner shelf. At 30–100 m depththere were two parcels of cold pool water separatedfrom their source over the shelf and mixed tovarying degrees with warmer, saltier slope water.Above these cold pool parcels was a lens of saltierwater, the ubiquitous Smax [Gordon and Aikman,1981; Lentz, 2003]. The apparent patchiness of theseintrusive features was probably the result of thehighly convoluted structure of the frontal boundaryinvolving 3-D turbulent flow at various spatial
GeochemistryGeophysicsGeosystems G3G3 vaillancourt et al.: new england shelfbreak front 10.1029/2005GC000999
6 of 22
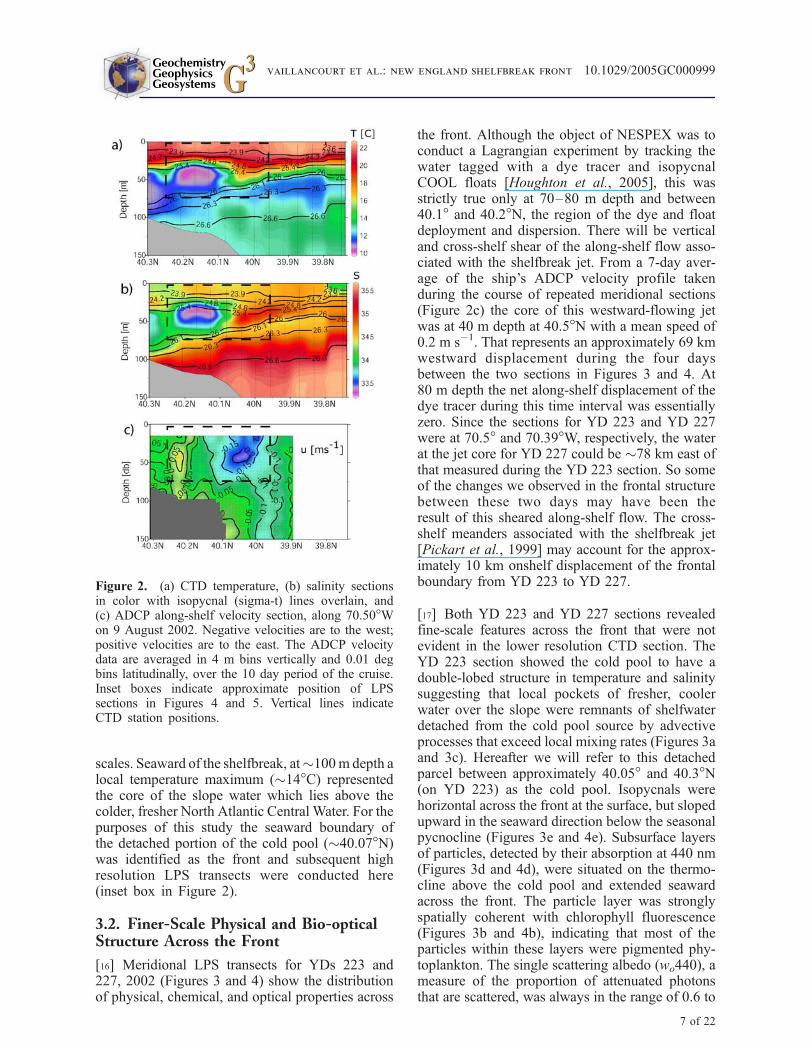
scales. Seaward of the shelfbreak, at"100m depth alocal temperature maximum ("14!C) representedthe core of the slope water which lies above thecolder, fresher North Atlantic Central Water. For thepurposes of this study the seaward boundary ofthe detached portion of the cold pool ("40.07!N)was identified as the front and subsequent highresolution LPS transects were conducted here(inset box in Figure 2).
3.2. Finer-Scale Physical and Bio-opticalStructure Across the Front
[16] Meridional LPS transects for YDs 223 and227, 2002 (Figures 3 and 4) show the distributionof physical, chemical, and optical properties across
the front. Although the object of NESPEX was toconduct a Lagrangian experiment by tracking thewater tagged with a dye tracer and isopycnalCOOL floats [Houghton et al., 2005], this wasstrictly true only at 70–80 m depth and between40.1! and 40.2!N, the region of the dye and floatdeployment and dispersion. There will be verticaland cross-shelf shear of the along-shelf flow asso-ciated with the shelfbreak jet. From a 7-day aver-age of the ship’s ADCP velocity profile takenduring the course of repeated meridional sections(Figure 2c) the core of this westward-flowing jetwas at 40 m depth at 40.5!N with a mean speed of0.2 m s!1. That represents an approximately 69 kmwestward displacement during the four daysbetween the two sections in Figures 3 and 4. At80 m depth the net along-shelf displacement of thedye tracer during this time interval was essentiallyzero. Since the sections for YD 223 and YD 227were at 70.5! and 70.39!W, respectively, the waterat the jet core for YD 227 could be "78 km east ofthat measured during the YD 223 section. So someof the changes we observed in the frontal structurebetween these two days may have been theresult of this sheared along-shelf flow. The cross-shelf meanders associated with the shelfbreak jet[Pickart et al., 1999] may account for the approx-imately 10 km onshelf displacement of the frontalboundary from YD 223 to YD 227.
[17] Both YD 223 and YD 227 sections revealedfine-scale features across the front that were notevident in the lower resolution CTD section. TheYD 223 section showed the cold pool to have adouble-lobed structure in temperature and salinitysuggesting that local pockets of fresher, coolerwater over the slope were remnants of shelfwaterdetached from the cold pool source by advectiveprocesses that exceed local mixing rates (Figures 3aand 3c). Hereafter we will refer to this detachedparcel between approximately 40.05! and 40.3!N(on YD 223) as the cold pool. Isopycnals werehorizontal across the front at the surface, but slopedupward in the seaward direction below the seasonalpycnocline (Figures 3e and 4e). Subsurface layersof particles, detected by their absorption at 440 nm(Figures 3d and 4d), were situated on the thermo-cline above the cold pool and extended seawardacross the front. The particle layer was stronglyspatially coherent with chlorophyll fluorescence(Figures 3b and 4b), indicating that most of theparticles within these layers were pigmented phy-toplankton. The single scattering albedo (wo440), ameasure of the proportion of attenuated photonsthat are scattered, was always in the range of 0.6 to
Figure 2. (a) CTD temperature, (b) salinity sectionsin color with isopycnal (sigma-t) lines overlain, and(c) ADCP along-shelf velocity section, along 70.50!Won 9 August 2002. Negative velocities are to the west;positive velocities are to the east. The ADCP velocitydata are averaged in 4 m bins vertically and 0.01 degbins latitudinally, over the 10 day period of the cruise.Inset boxes indicate approximate position of LPSsections in Figures 4 and 5. Vertical lines indicateCTD station positions.
GeochemistryGeophysicsGeosystems G3G3 vaillancourt et al.: new england shelfbreak front 10.1029/2005GC000999
7 of 22
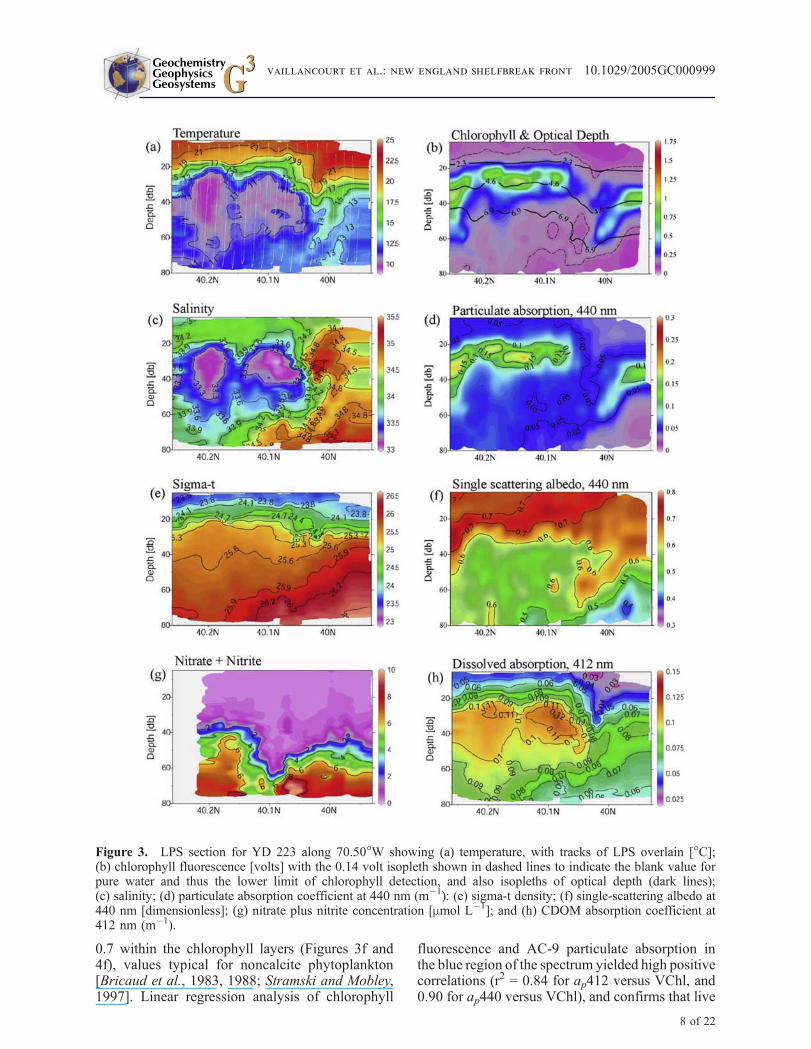
0.7 within the chlorophyll layers (Figures 3f and4f), values typical for noncalcite phytoplankton[Bricaud et al., 1983, 1988; Stramski and Mobley,1997]. Linear regression analysis of chlorophyll
fluorescence and AC-9 particulate absorption inthe blue region of the spectrum yielded high positivecorrelations (r2 = 0.84 for ap412 versus VChl, and0.90 for ap440 versus VChl), and confirms that live
Figure 3. LPS section for YD 223 along 70.50!W showing (a) temperature, with tracks of LPS overlain [!C];(b) chlorophyll fluorescence [volts] with the 0.14 volt isopleth shown in dashed lines to indicate the blank value forpure water and thus the lower limit of chlorophyll detection, and also isopleths of optical depth (dark lines);(c) salinity; (d) particulate absorption coefficient at 440 nm (m!1): (e) sigma-t density; (f) single-scattering albedo at440 nm [dimensionless]; (g) nitrate plus nitrite concentration [mmol L!1]; and (h) CDOM absorption coefficient at412 nm (m!1).
GeochemistryGeophysicsGeosystems G3G3 vaillancourt et al.: new england shelfbreak front 10.1029/2005GC000999
8 of 22
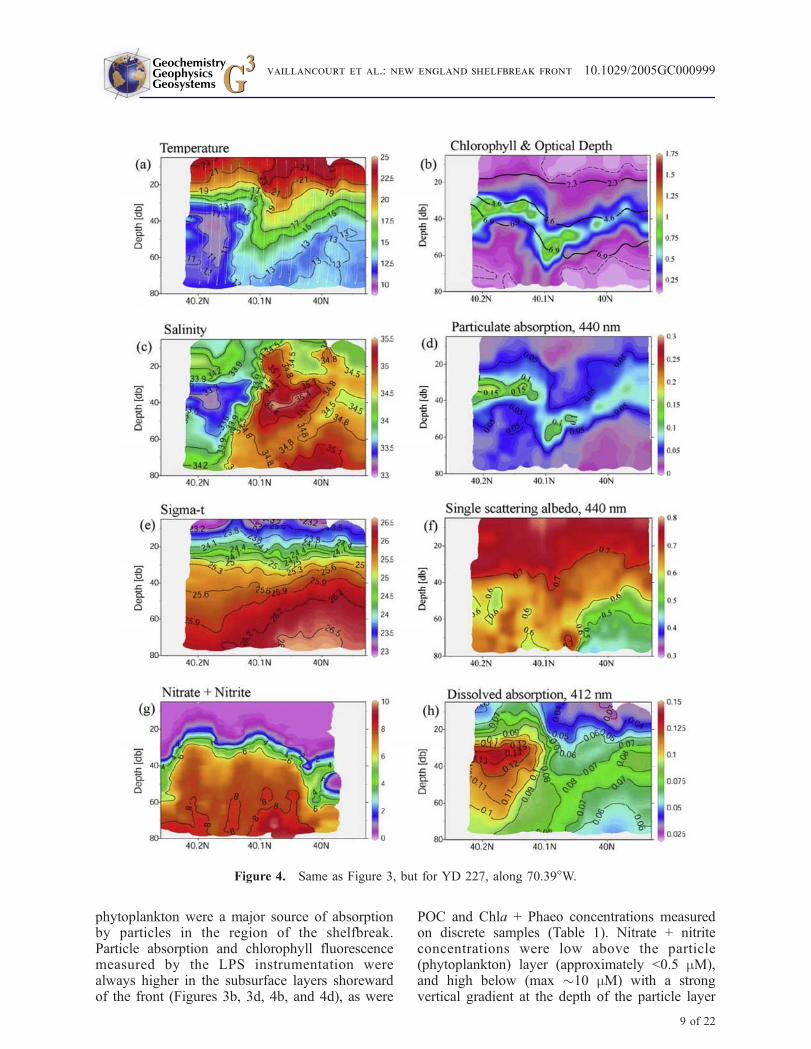
phytoplankton were a major source of absorptionby particles in the region of the shelfbreak.Particle absorption and chlorophyll fluorescencemeasured by the LPS instrumentation werealways higher in the subsurface layers shorewardof the front (Figures 3b, 3d, 4b, and 4d), as were
POC and Chla + Phaeo concentrations measuredon discrete samples (Table 1). Nitrate + nitriteconcentrations were low above the particle(phytoplankton) layer (approximately <0.5 mM),and high below (max "10 mM) with a strongvertical gradient at the depth of the particle layer
Figure 4. Same as Figure 3, but for YD 227, along 70.39!W.
GeochemistryGeophysicsGeosystems G3G3 vaillancourt et al.: new england shelfbreak front 10.1029/2005GC000999
9 of 22
(Figures 3g and 4g), suggesting increased phyto-plankton uptake here.
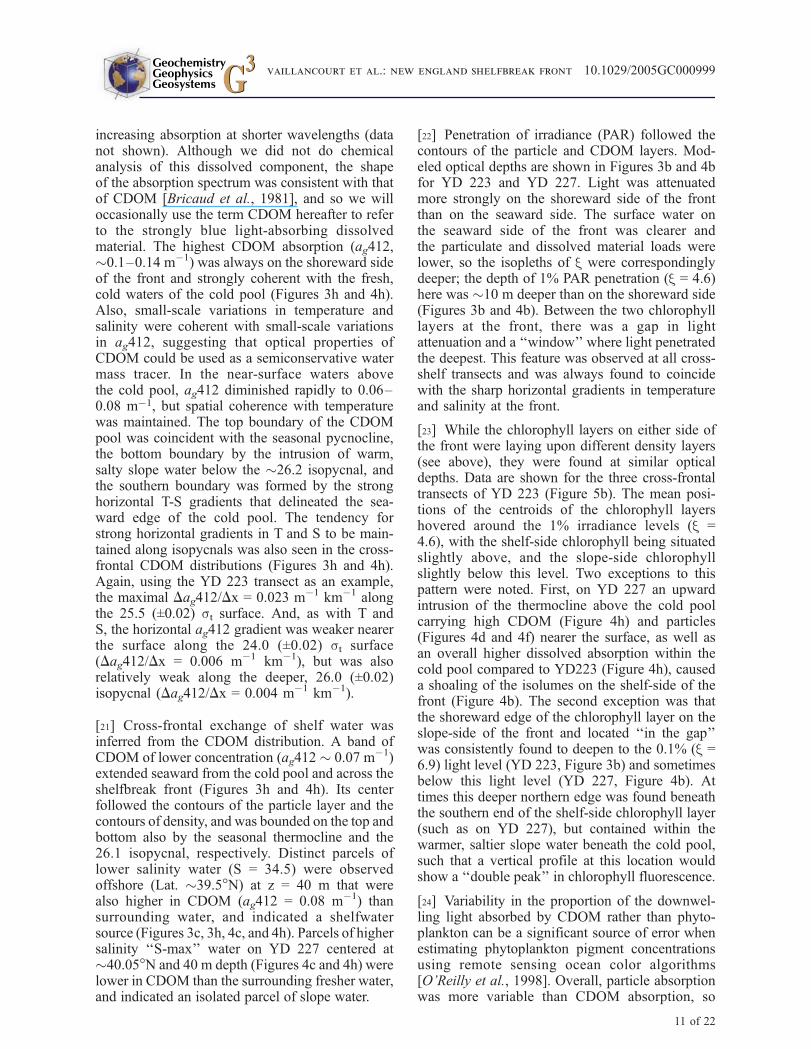
[18] On all LPS sections there was a pronounceddeepening of the surface isotherms and to a lesserextent the isopycnals (but not salinity) on theseaward edge of the cold pool. The particle layermaintained coherence with the summer thermo-cline and the upper boundary of the cold pool ata depth of 20 to 25 m. On the seaward edge of thecold pool the thermocline and particle layer quicklydeepened within a horizontal distance of "0.5 kmto "60 m depth, then gradually shoaled again inthe seaward direction within a horizontal distanceof "9 to 15 km to form the slope-side chlorophylllayer at "40 m depth. The particle layer on theslope-side of the front was at slightly denser water(st = 25.9) than on the shelf-side (st = 25.3)(Figure 5a). The slope-side particle layer was alsolocated on the same density surface on which dyeinjection experiments showed upwelling to beactive during this period, albeit deeper in the watercolumn near the foot of the shelfbreak front[Houghton et al., 2005].
[19] In the vicinity of the shelfbreak front, sharphorizontal T and S gradients were observed thatwere density-compensating (Figures 3 and 4). Themaximum DT/Dx and DS/Dx along the 25.5 iso-pycnal (approximately the middepth of the coldpool) = 3.6 !C km!1, and 1.0 km!1, respectively.Along the 26.0 isopycnal, the density surfacedefining the deep boundary of the cold pool andthe approximate position of the shelfbreak front,the maximum horizontal temperature and salinitygradients were similar (DT/Dx = 2.5 !C km!1 andDS/Dx = 0.7 km!1, respectively). Horizontal T andS gradients were weaker nearer the surface along
the 24.0 density surface (DT/Dx = 0.9 !C km!1,DS/Dx = 0.4 km!1).
[20] Below the seasonal pycnocline there was apool of dissolved material that absorbed lightstrongly at 412 nm (ag412, Figures 3h and 4h).This dissolved material showed exponentially
Table 1. Phytoplankton Biomass and Optical Properties for Discrete Samples Collected DuringLPS Deployments Between YD 223 and 228, 2002a
Parameter Shoreward Side Seaward Side ANOVA
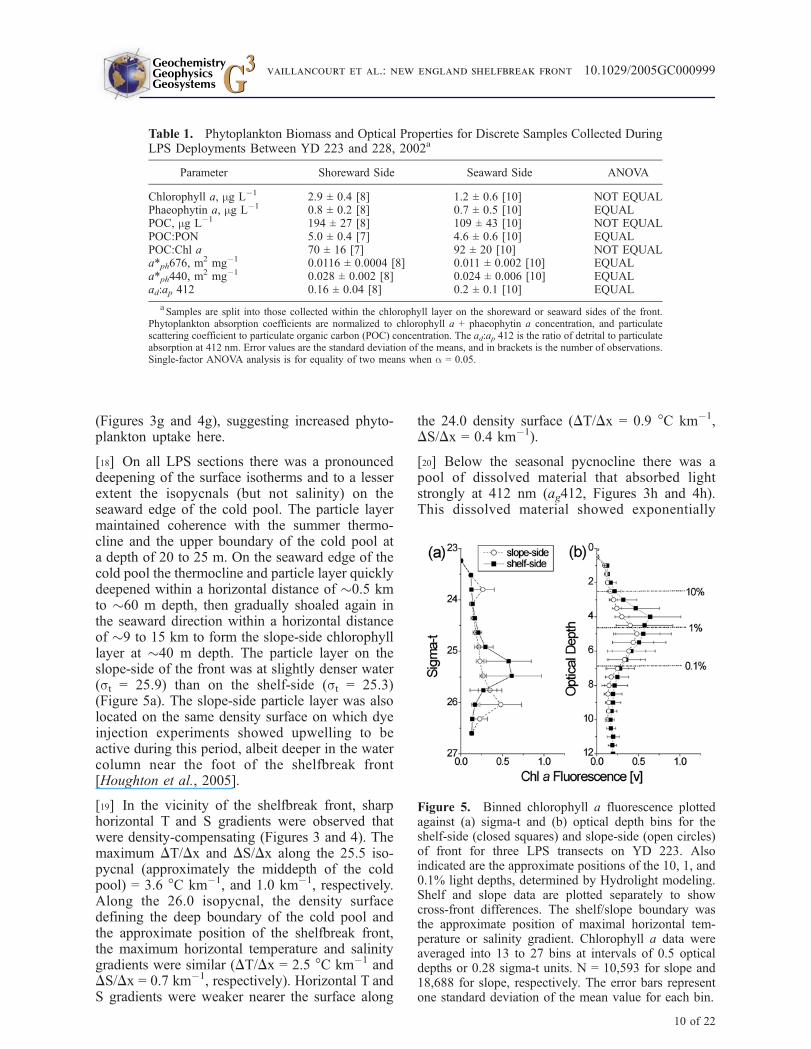
Chlorophyll a, mg L!1 2.9 ± 0.4 [8] 1.2 ± 0.6 [10] NOT EQUALPhaeophytin a, mg L!1 0.8 ± 0.2 [8] 0.7 ± 0.5 [10] EQUALPOC, mg L!1 194 ± 27 [8] 109 ± 43 [10] NOT EQUALPOC:PON 5.0 ± 0.4 [7] 4.6 ± 0.6 [10] EQUALPOC:Chl a 70 ± 16 [7] 92 ± 20 [10] NOT EQUALa*ph676, m
2 mg!1 0.0116 ± 0.0004 [8] 0.011 ± 0.002 [10] EQUALa*ph440, m
2 mg!1 0.028 ± 0.002 [8] 0.024 ± 0.006 [10] EQUALad:ap 412 0.16 ± 0.04 [8] 0.2 ± 0.1 [10] EQUAL
aSamples are split into those collected within the chlorophyll layer on the shoreward or seaward sides of the front.
Phytoplankton absorption coefficients are normalized to chlorophyll a + phaeophytin a concentration, and particulatescattering coefficient to particulate organic carbon (POC) concentration. The ad:ap 412 is the ratio of detrital to particulateabsorption at 412 nm. Error values are the standard deviation of the means, and in brackets is the number of observations.Single-factor ANOVA analysis is for equality of two means when a = 0.05.
Figure 5. Binned chlorophyll a fluorescence plottedagainst (a) sigma-t and (b) optical depth bins for theshelf-side (closed squares) and slope-side (open circles)of front for three LPS transects on YD 223. Alsoindicated are the approximate positions of the 10, 1, and0.1% light depths, determined by Hydrolight modeling.Shelf and slope data are plotted separately to showcross-front differences. The shelf/slope boundary wasthe approximate position of maximal horizontal tem-perature or salinity gradient. Chlorophyll a data wereaveraged into 13 to 27 bins at intervals of 0.5 opticaldepths or 0.28 sigma-t units. N = 10,593 for slope and18,688 for slope, respectively. The error bars representone standard deviation of the mean value for each bin.
GeochemistryGeophysicsGeosystems G3G3 vaillancourt et al.: new england shelfbreak front 10.1029/2005GC000999
10 of 22
increasing absorption at shorter wavelengths (datanot shown). Although we did not do chemicalanalysis of this dissolved component, the shapeof the absorption spectrum was consistent with thatof CDOM [Bricaud et al., 1981], and so we willoccasionally use the term CDOM hereafter to referto the strongly blue light-absorbing dissolvedmaterial. The highest CDOM absorption (ag412,"0.1–0.14 m!1) was always on the shoreward sideof the front and strongly coherent with the fresh,cold waters of the cold pool (Figures 3h and 4h).Also, small-scale variations in temperature andsalinity were coherent with small-scale variationsin ag412, suggesting that optical properties ofCDOM could be used as a semiconservative watermass tracer. In the near-surface waters abovethe cold pool, ag412 diminished rapidly to 0.06–0.08 m!1, but spatial coherence with temperaturewas maintained. The top boundary of the CDOMpool was coincident with the seasonal pycnocline,the bottom boundary by the intrusion of warm,salty slope water below the "26.2 isopycnal, andthe southern boundary was formed by the stronghorizontal T-S gradients that delineated the sea-ward edge of the cold pool. The tendency forstrong horizontal gradients in T and S to be main-tained along isopycnals was also seen in the cross-frontal CDOM distributions (Figures 3h and 4h).Again, using the YD 223 transect as an example,the maximal Dag412/Dx = 0.023 m!1 km!1 alongthe 25.5 (±0.02) st surface. And, as with T andS, the horizontal ag412 gradient was weaker nearerthe surface along the 24.0 (±0.02) st surface(Dag412/Dx = 0.006 m!1 km!1), but was alsorelatively weak along the deeper, 26.0 (±0.02)isopycnal (Dag412/Dx = 0.004 m!1 km!1).
[21] Cross-frontal exchange of shelf water wasinferred from the CDOM distribution. A band ofCDOM of lower concentration (ag412 " 0.07 m!1)extended seaward from the cold pool and across theshelfbreak front (Figures 3h and 4h). Its centerfollowed the contours of the particle layer and thecontours of density, and was bounded on the top andbottom also by the seasonal thermocline and the26.1 isopycnal, respectively. Distinct parcels oflower salinity water (S = 34.5) were observedoffshore (Lat. "39.5!N) at z = 40 m that werealso higher in CDOM (ag412 = 0.08 m!1) thansurrounding water, and indicated a shelfwatersource (Figures 3c, 3h, 4c, and 4h). Parcels of highersalinity ‘‘S-max’’ water on YD 227 centered at"40.05!N and 40 m depth (Figures 4c and 4h) werelower in CDOM than the surrounding fresher water,and indicated an isolated parcel of slope water.
[22] Penetration of irradiance (PAR) followed thecontours of the particle and CDOM layers. Mod-eled optical depths are shown in Figures 3b and 4bfor YD 223 and YD 227. Light was attenuatedmore strongly on the shoreward side of the frontthan on the seaward side. The surface water onthe seaward side of the front was clearer andthe particulate and dissolved material loads werelower, so the isopleths of x were correspondinglydeeper; the depth of 1% PAR penetration (x = 4.6)here was "10 m deeper than on the shoreward side(Figures 3b and 4b). Between the two chlorophylllayers at the front, there was a gap in lightattenuation and a ‘‘window’’ where light penetratedthe deepest. This feature was observed at all cross-shelf transects and was always found to coincidewith the sharp horizontal gradients in temperatureand salinity at the front.
[23] While the chlorophyll layers on either side ofthe front were laying upon different density layers(see above), they were found at similar opticaldepths. Data are shown for the three cross-frontaltransects of YD 223 (Figure 5b). The mean posi-tions of the centroids of the chlorophyll layershovered around the 1% irradiance levels (x =4.6), with the shelf-side chlorophyll being situatedslightly above, and the slope-side chlorophyllslightly below this level. Two exceptions to thispattern were noted. First, on YD 227 an upwardintrusion of the thermocline above the cold poolcarrying high CDOM (Figure 4h) and particles(Figures 4d and 4f) nearer the surface, as well asan overall higher dissolved absorption within thecold pool compared to YD223 (Figure 4h), causeda shoaling of the isolumes on the shelf-side of thefront (Figure 4b). The second exception was thatthe shoreward edge of the chlorophyll layer on theslope-side of the front and located ‘‘in the gap’’was consistently found to deepen to the 0.1% (x =6.9) light level (YD 223, Figure 3b) and sometimesbelow this light level (YD 227, Figure 4b). Attimes this deeper northern edge was found beneaththe southern end of the shelf-side chlorophyll layer(such as on YD 227), but contained within thewarmer, saltier slope water beneath the cold pool,such that a vertical profile at this location wouldshow a ‘‘double peak’’ in chlorophyll fluorescence.
[24] Variability in the proportion of the downwel-ling light absorbed by CDOM rather than phyto-plankton can be a significant source of error whenestimating phytoplankton pigment concentrationsusing remote sensing ocean color algorithms[O’Reilly et al., 1998]. Overall, particle absorptionwas more variable than CDOM absorption, so
GeochemistryGeophysicsGeosystems G3G3 vaillancourt et al.: new england shelfbreak front 10.1029/2005GC000999
11 of 22
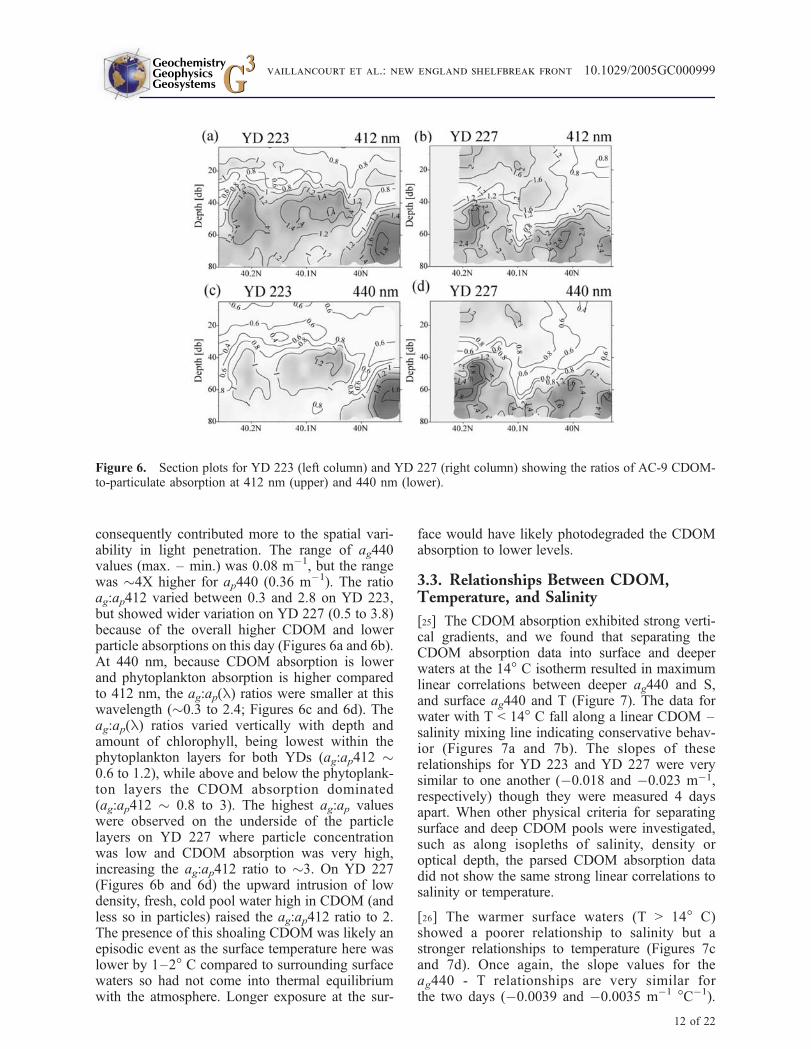
consequently contributed more to the spatial vari-ability in light penetration. The range of ag440values (max. – min.) was 0.08 m!1, but the rangewas "4X higher for ap440 (0.36 m!1). The ratioag:ap412 varied between 0.3 and 2.8 on YD 223,but showed wider variation on YD 227 (0.5 to 3.8)because of the overall higher CDOM and lowerparticle absorptions on this day (Figures 6a and 6b).At 440 nm, because CDOM absorption is lowerand phytoplankton absorption is higher comparedto 412 nm, the ag:ap(l) ratios were smaller at thiswavelength ("0.3 to 2.4; Figures 6c and 6d). Theag:ap(l) ratios varied vertically with depth andamount of chlorophyll, being lowest within thephytoplankton layers for both YDs (ag:ap412 "0.6 to 1.2), while above and below the phytoplank-ton layers the CDOM absorption dominated(ag:ap412 " 0.8 to 3). The highest ag:ap valueswere observed on the underside of the particlelayers on YD 227 where particle concentrationwas low and CDOM absorption was very high,increasing the ag:ap412 ratio to "3. On YD 227(Figures 6b and 6d) the upward intrusion of lowdensity, fresh, cold pool water high in CDOM (andless so in particles) raised the ag:ap412 ratio to 2.The presence of this shoaling CDOM was likely anepisodic event as the surface temperature here waslower by 1–2! C compared to surrounding surfacewaters so had not come into thermal equilibriumwith the atmosphere. Longer exposure at the sur-
face would have likely photodegraded the CDOMabsorption to lower levels.
3.3. Relationships Between CDOM,Temperature, and Salinity
[25] The CDOM absorption exhibited strong verti-cal gradients, and we found that separating theCDOM absorption data into surface and deeperwaters at the 14! C isotherm resulted in maximumlinear correlations between deeper ag440 and S,and surface ag440 and T (Figure 7). The data forwater with T < 14! C fall along a linear CDOM –salinity mixing line indicating conservative behav-ior (Figures 7a and 7b). The slopes of theserelationships for YD 223 and YD 227 were verysimilar to one another (!0.018 and !0.023 m!1,respectively) though they were measured 4 daysapart. When other physical criteria for separatingsurface and deep CDOM pools were investigated,such as along isopleths of salinity, density oroptical depth, the parsed CDOM absorption datadid not show the same strong linear correlations tosalinity or temperature.
[26] The warmer surface waters (T > 14! C)showed a poorer relationship to salinity but astronger relationships to temperature (Figures 7cand 7d). Once again, the slope values for theag440 - T relationships are very similar forthe two days (!0.0039 and !0.0035 m!1 !C!1).
Figure 6. Section plots for YD 223 (left column) and YD 227 (right column) showing the ratios of AC-9 CDOM-to-particulate absorption at 412 nm (upper) and 440 nm (lower).
GeochemistryGeophysicsGeosystems G3G3 vaillancourt et al.: new england shelfbreak front 10.1029/2005GC000999
12 of 22
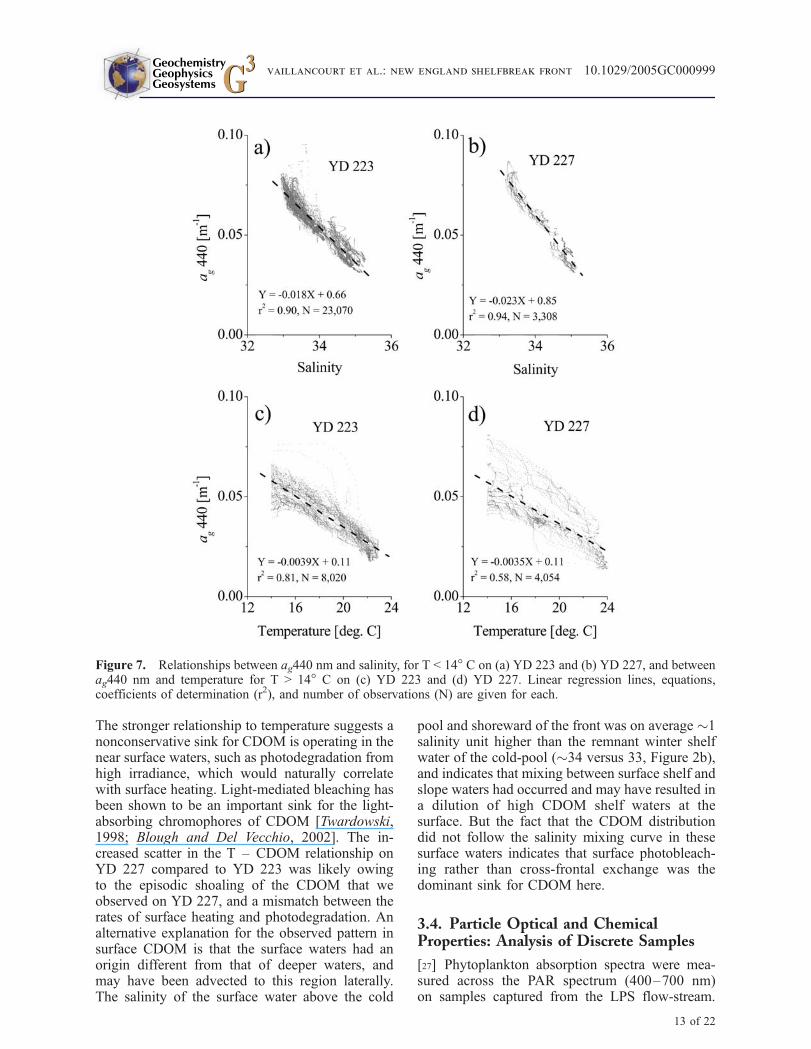
The stronger relationship to temperature suggests anonconservative sink for CDOM is operating in thenear surface waters, such as photodegradation fromhigh irradiance, which would naturally correlatewith surface heating. Light-mediated bleaching hasbeen shown to be an important sink for the light-absorbing chromophores of CDOM [Twardowski,1998; Blough and Del Vecchio, 2002]. The in-creased scatter in the T – CDOM relationship onYD 227 compared to YD 223 was likely owingto the episodic shoaling of the CDOM that weobserved on YD 227, and a mismatch between therates of surface heating and photodegradation. Analternative explanation for the observed pattern insurface CDOM is that the surface waters had anorigin different from that of deeper waters, andmay have been advected to this region laterally.The salinity of the surface water above the cold
pool and shoreward of the front was on average "1salinity unit higher than the remnant winter shelfwater of the cold-pool ("34 versus 33, Figure 2b),and indicates that mixing between surface shelf andslope waters had occurred and may have resulted ina dilution of high CDOM shelf waters at thesurface. But the fact that the CDOM distributiondid not follow the salinity mixing curve in thesesurface waters indicates that surface photobleach-ing rather than cross-frontal exchange was thedominant sink for CDOM here.
3.4. Particle Optical and ChemicalProperties: Analysis of Discrete Samples
[27] Phytoplankton absorption spectra were mea-sured across the PAR spectrum (400–700 nm)on samples captured from the LPS flow-stream.
Figure 7. Relationships between ag440 nm and salinity, for T < 14! C on (a) YD 223 and (b) YD 227, and betweenag440 nm and temperature for T > 14! C on (c) YD 223 and (d) YD 227. Linear regression lines, equations,coefficients of determination (r2), and number of observations (N) are given for each.
GeochemistryGeophysicsGeosystems G3G3 vaillancourt et al.: new england shelfbreak front 10.1029/2005GC000999
13 of 22
Absorption spectra are useful as a ‘‘first-order’’taxonomic indicator by revealing the mean pigmentcomposition and relative pigment concentrations ofthe phytoplankton assemblage by virtue of the invivo absorptive properties of their various pig-ments. Most samples were captured at depthswithin the subsurface chlorophyll layers, while afew were captured above or below the layers. The
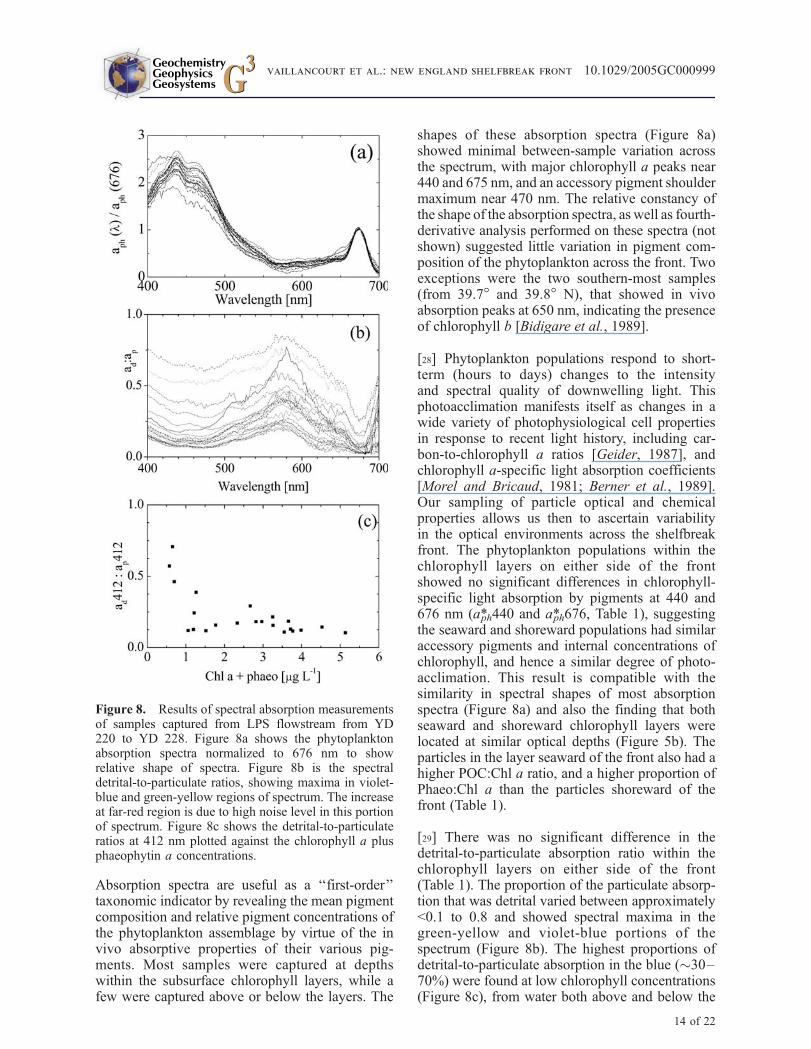
shapes of these absorption spectra (Figure 8a)showed minimal between-sample variation acrossthe spectrum, with major chlorophyll a peaks near440 and 675 nm, and an accessory pigment shouldermaximum near 470 nm. The relative constancy ofthe shape of the absorption spectra, as well as fourth-derivative analysis performed on these spectra (notshown) suggested little variation in pigment com-position of the phytoplankton across the front. Twoexceptions were the two southern-most samples(from 39.7! and 39.8! N), that showed in vivoabsorption peaks at 650 nm, indicating the presenceof chlorophyll b [Bidigare et al., 1989].
[28] Phytoplankton populations respond to short-term (hours to days) changes to the intensityand spectral quality of downwelling light. Thisphotoacclimation manifests itself as changes in awide variety of photophysiological cell propertiesin response to recent light history, including car-bon-to-chlorophyll a ratios [Geider, 1987], andchlorophyll a-specific light absorption coefficients[Morel and Bricaud, 1981; Berner et al., 1989].Our sampling of particle optical and chemicalproperties allows us then to ascertain variabilityin the optical environments across the shelfbreakfront. The phytoplankton populations within thechlorophyll layers on either side of the frontshowed no significant differences in chlorophyll-specific light absorption by pigments at 440 and676 nm (a*ph440 and a*ph676, Table 1), suggestingthe seaward and shoreward populations had similaraccessory pigments and internal concentrations ofchlorophyll, and hence a similar degree of photo-acclimation. This result is compatible with thesimilarity in spectral shapes of most absorptionspectra (Figure 8a) and also the finding that bothseaward and shoreward chlorophyll layers werelocated at similar optical depths (Figure 5b). Theparticles in the layer seaward of the front also had ahigher POC:Chl a ratio, and a higher proportion ofPhaeo:Chl a than the particles shoreward of thefront (Table 1).
[29] There was no significant difference in thedetrital-to-particulate absorption ratio within thechlorophyll layers on either side of the front(Table 1). The proportion of the particulate absorp-tion that was detrital varied between approximately<0.1 to 0.8 and showed spectral maxima in thegreen-yellow and violet-blue portions of thespectrum (Figure 8b). The highest proportions ofdetrital-to-particulate absorption in the blue ("30–70%) were found at low chlorophyll concentrations(Figure 8c), from water both above and below the
Figure 8. Results of spectral absorption measurementsof samples captured from LPS flowstream from YD220 to YD 228. Figure 8a shows the phytoplanktonabsorption spectra normalized to 676 nm to showrelative shape of spectra. Figure 8b is the spectraldetrital-to-particulate ratios, showing maxima in violet-blue and green-yellow regions of spectrum. The increaseat far-red region is due to high noise level in this portionof spectrum. Figure 8c shows the detrital-to-particulateratios at 412 nm plotted against the chlorophyll a plusphaeophytin a concentrations.
GeochemistryGeophysicsGeosystems G3G3 vaillancourt et al.: new england shelfbreak front 10.1029/2005GC000999
14 of 22
phytoplankton layers. Within the phytoplanktonlayers, blue-light absorption by detritus was typi-cally 10–20% of the particulate absorption (andincreased to 20–30% in the green-yellow part ofthe spectrum). Since the AC-9 measurement pro-tocol could not distinguish between the detrital andphytoplankton absorption, we do not know ingreater detail the distribution of the detrital-to-phytoplankton absorption ratio with respect tohydrography and velocity structures at the front.
4. Discussion
4.1. Optical-Physical Relationships at theShelfbreak Front
[30] Understanding the optical properties at theshelfbreak front requires consideration of its hydro-graphic structure and circulation. Since temperatureand salinity gradients are density compensating thedensity structure at the front is much less distinctthan the corresponding temperature and salinitystructure. But geostrophic adjustment to the slopingdensity field below 40 m depth generates thewestward flowing shelfbreak jet which is centeredvery close to the seaward edge of the cold pool.Because of this jet there are velocity shears atthe front and the potential for shear instability.From ship ADCP current velocity measurements(Figure 2c) the speed of the jet at its core, centeredat approximately 40–45 m depth is"0.2 m s!1, butdecreases dramatically below "60–70 m depth,resulting in significant vertical velocity shears.
[31] A persistent feature at the shelfbreak is thecross-shelf interleaving of shelf and slope water[Houghton and Marra, 1983] as is evident in theCTD sections (Figure 2). Although many of thesefeatures, when seen in a cross-shelf section, appeardetached from their source, they are often the resultof an eddy circulation that is readily detected insatellite SST images [Houghton et al., 1986]. Thepersistence of these distinct ‘‘detached’’ parcels ofwater indicates that advective processes exceeddiffusive mixing processes at these short time andspace scales. The exchange of shelf and slopewater at the front can be characterized as a stirringprocess which is consistent with the observation ofthe dye tracer dispersion over the slope region insmall ‘‘filaments’’ [Houghton et al., 2005].
[32] It is still not clear what maintains the sharpwater property and optical gradients on isopycnalsurfaces at the shelfbreak front (Figures 3 and 4).The cross shelf diffusivity measured directly by thespreading of the dye patch [Houghton et al., 2005]
was approximately 1 m2 s!1, a value nearly anorder of magnitude smaller than previous estimatesderived from cross-front heat flux [Horne, 1978;Houghton and Marra, 1983; Houghton et al.,1994]. With such a small lateral diffusivity anadvective-diffusive balance at the front can beachieved with a convergent flow "10!3 m s!1.Thus the convergent flow required to balancediffusive spreading at the outer edge of the coldpool is small. A convergent flow of this magnitudein the core of the shelfbreak jet, which is located atthis frontal boundary, has been detected (C. Flagg,personal communication, 2005).
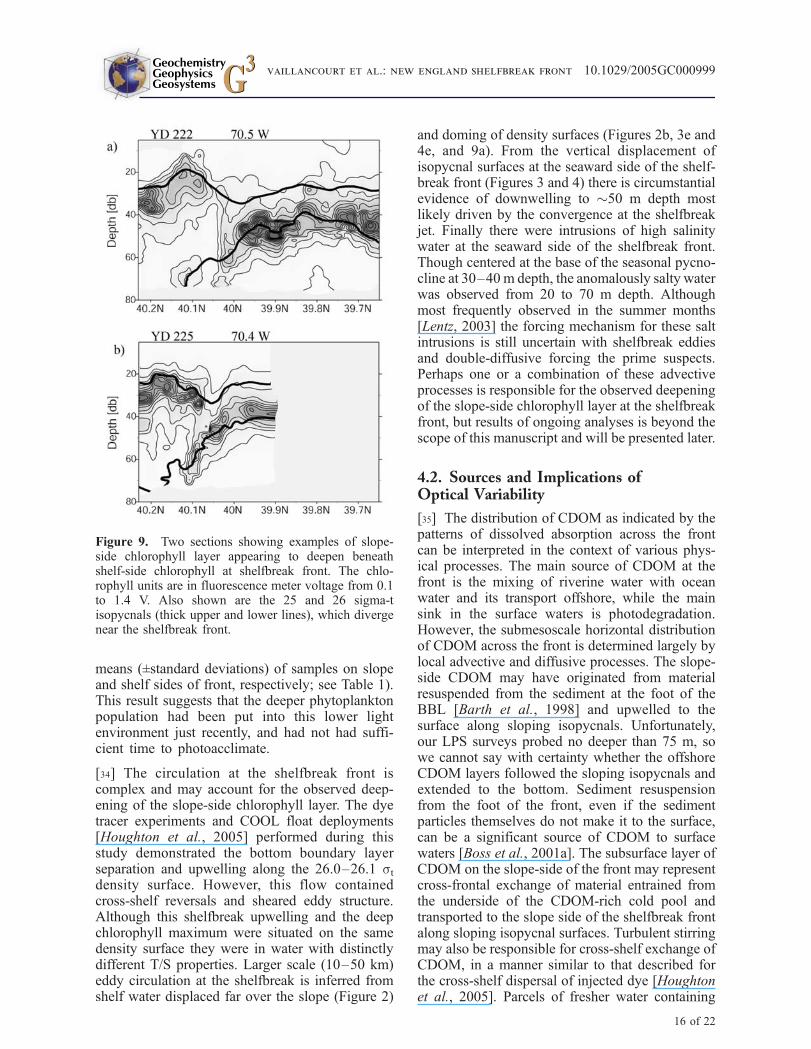
[33] A recurring feature at the shelfbreak frontreported by us and others [Houghton and Marra,1983; Barth et al., 1998] is the pronounced deep-ening of the shoreward edge of the slope-sidechlorophyll layer. Not reported before, however,is the observation of the two chlorophyll maximaon either side of the front sometimes overlappingand forming ‘‘double layers’’ when viewed verti-cally. The ‘‘double layers’’ of chlorophyll wereseen in the LPS sections when the shoreward edgeof the slope-side chlorophyll layer, situated on thedeepening "26 st surface, was positioned beneaththe shelf-side chlorophyll layer on the "25.5 stsurface (e.g., Figure 4b). More pronounced exam-ples of this were observed during the LPS transectson YD 222 and YD 225 (Figure 9). Additionally,the shallower chlorophyll layers on either side ofthe front were typically located between the 1 and10% surface PAR levels, but the deeper edge of theslope-side chlorophyll layer was consistently foundin a different light environment, between roughlythe 0.1 and 1% surface PAR levels (Figures 3band 4b). This raises the question of whether theobserved chlorophyll pattern is the result of insitu phytoplankton growth or physical conver-gence. Basterretxea et al. [2002] reported similarfindings in an anticyclonic wind-shear eddylocated southeast of Gran Canaria Island in thesubtropical Northeast Atlantic. Although no‘‘double-layering’’ was observed, they reportedthat the deep-chlorophyll maximum in the conver-gence and downwelling zone remained spatiallycoherent with density isopleths, but deepenedto below the depth of 1% surface PAR, ascompared to waters outside this feature. Ourresults show the a*ph675 of a single samplecollected within the deeper chlorophyll layer onYD 223 (latitude = 40.026! N, z = 62 m, x = 6.2,a*ph675 = 0.0125 m2 mg!1) was not significantlydifferent than the mean for all samples (a*ph675 =0.011 (±0.002) and 0.0116 (±0.0004) m2 mg!1 for
GeochemistryGeophysicsGeosystems G3G3 vaillancourt et al.: new england shelfbreak front 10.1029/2005GC000999
15 of 22
means (±standard deviations) of samples on slopeand shelf sides of front, respectively; see Table 1).This result suggests that the deeper phytoplanktonpopulation had been put into this lower lightenvironment just recently, and had not had suffi-cient time to photoacclimate.
[34] The circulation at the shelfbreak front iscomplex and may account for the observed deep-ening of the slope-side chlorophyll layer. The dyetracer experiments and COOL float deployments[Houghton et al., 2005] performed during thisstudy demonstrated the bottom boundary layerseparation and upwelling along the 26.0–26.1 stdensity surface. However, this flow containedcross-shelf reversals and sheared eddy structure.Although this shelfbreak upwelling and the deepchlorophyll maximum were situated on the samedensity surface they were in water with distinctlydifferent T/S properties. Larger scale (10–50 km)eddy circulation at the shelfbreak is inferred fromshelf water displaced far over the slope (Figure 2)
and doming of density surfaces (Figures 2b, 3e and4e, and 9a). From the vertical displacement ofisopycnal surfaces at the seaward side of the shelf-break front (Figures 3 and 4) there is circumstantialevidence of downwelling to "50 m depth mostlikely driven by the convergence at the shelfbreakjet. Finally there were intrusions of high salinitywater at the seaward side of the shelfbreak front.Though centered at the base of the seasonal pycno-cline at 30–40 m depth, the anomalously salty waterwas observed from 20 to 70 m depth. Althoughmost frequently observed in the summer months[Lentz, 2003] the forcing mechanism for these saltintrusions is still uncertain with shelfbreak eddiesand double-diffusive forcing the prime suspects.Perhaps one or a combination of these advectiveprocesses is responsible for the observed deepeningof the slope-side chlorophyll layer at the shelfbreakfront, but results of ongoing analyses is beyond thescope of this manuscript and will be presented later.
4.2. Sources and Implications ofOptical Variability
[35] The distribution of CDOM as indicated by thepatterns of dissolved absorption across the frontcan be interpreted in the context of various phys-ical processes. The main source of CDOM at thefront is the mixing of riverine water with oceanwater and its transport offshore, while the mainsink in the surface waters is photodegradation.However, the submesoscale horizontal distributionof CDOM across the front is determined largely bylocal advective and diffusive processes. The slope-side CDOM may have originated from materialresuspended from the sediment at the foot of theBBL [Barth et al., 1998] and upwelled to thesurface along sloping isopycnals. Unfortunately,our LPS surveys probed no deeper than 75 m, sowe cannot say with certainty whether the offshoreCDOM layers followed the sloping isopycnals andextended to the bottom. Sediment resuspensionfrom the foot of the front, even if the sedimentparticles themselves do not make it to the surface,can be a significant source of CDOM to surfacewaters [Boss et al., 2001a]. The subsurface layer ofCDOM on the slope-side of the front may representcross-frontal exchange of material entrained fromthe underside of the CDOM-rich cold pool andtransported to the slope side of the shelfbreak frontalong sloping isopycnal surfaces. Turbulent stirringmay also be responsible for cross-shelf exchange ofCDOM, in a manner similar to that described forthe cross-shelf dispersal of injected dye [Houghtonet al., 2005]. Parcels of fresher water containing
Figure 9. Two sections showing examples of slope-side chlorophyll layer appearing to deepen beneathshelf-side chlorophyll at shelfbreak front. The chlo-rophyll units are in fluorescence meter voltage from 0.1to 1.4 V. Also shown are the 25 and 26 sigma-tisopycnals (thick upper and lower lines), which divergenear the shelfbreak front.
GeochemistryGeophysicsGeosystems G3G3 vaillancourt et al.: new england shelfbreak front 10.1029/2005GC000999
16 of 22
relatively high CDOM concentrations observed onthe slope side of the front at "39.5!N and 40 mdepth (Figures 3 and 4) suggest cross-frontal ex-change via upwelling or stirring mechanism hadoccurred. The fresher parcel of surface shelf waterfound far offshore at "39.7!N (Figure 2b), likelytransported by turbulent stirring, had lost itsCDOM signature from exposure to high surfaceirradiances, but still represents potential cross-shelfexchange of nonchromophoric DOC. Further char-acterizing the different CDOM pools using theshape of the absorption spectra [Twardowski,1998], unfortunately was not possible given thelow spectral resolution of the measurements andthe AC-9 instrument drift at longer wavelengths.
[36] Boss et al. [2001b] performed CTD transectsduring August, 1996 as part of the Coastal Mixingand Optics (CMO) experiments [Dickey andWilliams, 2001]. We compare our observations inorder to put our results in a larger temporal andspatial context. Boss et al. [2001b] observed sim-ilar cross-frontal physical structure with thermalstratification at the surface and a subsurface coldpool, albeit at coarser horizontal resolution com-pared to ours (18.7 versus 1.8 km). As in our study,near the shelfbreak in August 1996 the highestag440 values ("0.1 m!1) were associated with coldpool water, and particle absorption at 440 nm(ap440) was highest at the subsurface chlorophyllmaximum (0.1 m!1). During August 1996, how-ever, the surface waters in the vicinity of theshelfbreak ("40!–40.3!N, 70.5!W) were fresherand colder than during August 2002 (S # 31.5versus 34.5, and T # 17.5! C versus 21.5!C foryears 1996 versus 2002), and the average surfaceag440 was greater ("0.08 m!1 in 1996 versus0.03–0.045 m!1 in 2002). This probably reflectsthe combined effect of a more coastal nature of thesurface waters, as indicated by the lower S, andless photodegradation of the CDOM during summer1996. For deeper waters the center of the cold poolwas colder (7.5 versus 9.7!C), but only slightlyfresher (S " 32.5 versus 33), with the same CDOMabsorption as in August 2002 (ag440 in cold pool"0.07 m!1 for both studies). Lastly, the CDOM-salinity relationship was similar to ours when watersof the same salinity were compared. For the salinityinterval 33 to 35.5 (the approximate DS observed inAugust 2002) the below-surface summer (prior tostorm event) ag440 values of Boss et al. [2001b]varied from approximately 0.075 m!1 at S # 33, toapproximately 0.035 m!1 at S # 35.5 (read ‘‘byeye’’ from their Figure 3a). This result is similarto the salinity !ag440 relationships we observed
(Figures 7a and 7b), although the linear regressionequation for Boss et al. [2001b] August data(prestorm, excluding data ‘‘close to surface’’) wasapproximately twice as steep as ours (Boss’sequation: ag440 = !0.032S + 1.155; this study’sequation for YD 223 (Figure 7a): ag440 =!0.018S + 0.66). Their ag440 data for spring orduring August following the passage of a hurricane,showed a linear relationship to salinity that wascloser to ours (Boss’s spring and summer, poststormequation: ag440 = !0.0157S + 0.58).
[37] Perhaps the most comprehensive CDOM dataset for theMiddle Atlantic Bight was that ofVodaceket al. [1997]. They reported the salinity – CDOMrelationship for waters below the thermocline duringAugust, and forDS = 30–34. The linear relationship(after conversion of ag355 to ag440 nm using slopevalue of !0.014 and their equation (3)) showedslope and intercept values several times largerthan ours: ag440 = !0.072S + 2.5. Althoughthese CDOM – salinity relationships for the NewEngland shelfbreak region seem quite disparate,they are relatively consistent when compared toCDOM - salinity relationships reported for theSouth Atlantic Bight. For example, Nelson andGuarda [1995] reported a CDOM – salinityrelationship with slope and intercept values nearlyan order of magnitude higher than those reported byus and Boss et al. [2001b]. Their equation is (esti-mated ‘‘by eye’’ from their Figure 8, and convertingag350 to ag440 using slope value of !0.014 andVodacek et al. [1997, equation (3)]: ag440 =!0.168S + 6.0. The discrepancy in the CDOM –salinity relationship likely is due to the differences inmagnitude and quality of the riverine input betweentheMiddle Atlantic Bight (St. Lawrence, Penobscot,Kennebec, Merrimack, Connecticut and HudsonRivers) and South Atlantic Bight (all of the above,plus watersheds of the Delaware and ChesapeakeBays). These comparisons demonstrate the rela-tively conservative nature of the CDOM – salinityrelationship within the Middle Atlantic Bight.
4.3. Relative Impact of Dissolved andParticulate Matter on Light Penetrationand Light Scattering
[38] We found that particle and CDOM absorptionwas highly variable vertically and horizontally, sohad a large effect on the variability in water clarityacross the shelfbreak front. To the degree that lightintensity controls the rate of photosynthesis in theupper few optical depths, then variability of lightabsorbing components in the upper 20 to 30 meters
GeochemistryGeophysicsGeosystems G3G3 vaillancourt et al.: new england shelfbreak front 10.1029/2005GC000999
17 of 22
of the water column, immediately above the chlo-rophyll layers, will directly control variability inphytoplankton productivity. Cross frontal differ-ences in absolute and relative particle and CDOMcontribution to total absorption are evident in ourdata. Shoreward of the front in the surface waters("10 m depth) particle and CDOM absorptions are"2' higher than in the surface waters seaward ofthe front. Surface optics are dominated sometimesby particles (Figure 6, YD 223) but at other times(Figure 6, YD 227), episodic shoaling (or verticalmixing) of deeper water to the upper surface layer,perhaps forced by the enhanced vertical shear inthe vicinity of the shelfbreak jet (Figure 2), mayintroduce large changes in the ag:ap(l) ratio. Thisshoaling (or vertical mixing) of deep waterincreases the contribution of CDOM at times to2X that of particles to the total absorption. Incontrast to the shelf waters, seaward of the shelf-break front the surface slopewater shows consis-tently low CDOM and particle absorption, andCDOM contributes less proportionally to the totalabsorption. Sosik et al. [2001] working at a mid-shelf site 50 km to the north of the NESPEX site,during late summer 1996, reported that surfacewater ag:ap440 ratio was "0.7, and at the depthof the subsurface chlorophyll layer this ratio in-creased to "1. Sosik et al. [2001] using correlationanalysis of ag(l), ap(l) and Kd(l) also concludedthat overall, particulates, rather than CDOM, dom-inated the absorption contribution to Kd(l) in theblue wavelengths. Boss et al. [2001b] reported verysimilar ag:ap440 ratios both for surface waters andwithin the subsurface chlorophyll maxima, and alsostated that particle absorption was more variablethan CDOM absorption, both spatially and tempo-rally. Chang et al [2002] working in the sameregion reported ag:ap440 ratios "1 for a midshelfstation (24 m depth), and "0.5 for a nearshorestation (15 m depth), both during the summer of2000. These results are not too different from ourresults further offshore at the shelfbreak, but ourfiner spatial scale sampling indicates that for shortperiods at least CDOM can become more opticallyimportant than particles in the near surface waters.
[39] The nature of the particles at the shelfbreakfront can also be discerned using the AC-9 scat-tering data. The single-scattering albedo, wo(l), isthe probability that a photon of a given wavelengthwill be scattered rather than absorbed [Mobley,1994], and thus is dependent upon the physiochem-ical properties of the particle assemblage includingits size, shape, and real and imaginary refractiveindex. Particle assemblages composed mostly of
noncalcite phytoplankton cells with real refractiveindices close to that of the surrounding water, andwhich contain chlorophyll a that absorbs lightstrongly in the blue, have been shown in laboratorystudies to have wo440 values between approxi-mately 0.6 and 0.8 [Bricaud et al., 1983, 1988;Stramski and Mobley, 1997]. If CDOM or detritalmaterials are present in substantial quantities, thentheir strong absorptive properties at shorter wave-lengths will reduce wo440. This effect is seen asreduced wo440 values in the center of the cold poolwhere CDOM absorption was maximal, and belowthe chlorophyll layers where detrital absorption isalso higher (Figures 3f and 4f), and is also consis-tent with the distribution of ag:ap440 ratios weobserved (Figure 6). Within the chlorophyll layershowever, on both YDs, the wo440 remains fairlyconstant at 0.6 to 0.7, right in the range expected fora particle assemblage composed of non-calcitephytoplankton cells. If we subtract for CDOMabsorption by calculating a single scattering albedofor particles only (wp440), then wp440 typicallyexceeded wo440 by only 10 to 20% within thechlorophyll layers (wp440 " 0.75). The wo440(and wp440) values in surface waters were consis-tently higher ("0.8) owing to the reduced CDOMabsorption at the surface from photobleaching onYDs 223 and 227, and also by the increased particlelight scattering from the upward intrusion of deeper,particle-rich water shoreward of the shelfbreak fronton YD 227 (Figures 3f and 4f). Babin et al. [2003]found similarly high values of wp440 in a survey ofsurface water optics in the North Atlantic ocean,although their wo440 values (reported as wp440 butthey did not subtract CDOM absorption) were evenhigher, between 0.8 and 0.9. Sosik et al. [2001]reported bp:ap440 ratios near 20 for summertimesurface waters of the New England continentalshelf, possibly from high abundances of heterotro-phic bacteria that scatter blue light much moreefficiently than they absorb it, and thus possesswo440 values near one [Stramski and Mobley,1997]. This was not the case for the summertimesurface waters at the shelfbreak front, wherebp:ap440 ratios in the upper 20 meters were "4.This difference may indicate a large gradient existsin light scattering properties of surface particleassemblages between midshelf to the shelfbreak.
4.4. Relationship of Optical Properties toChlorophyll: Case 1 Versus Case 2Water Types
[40] Morel and Prieur [1977] partitioned seawatertypes on the basis of optical criteria into case 1 and
GeochemistryGeophysicsGeosystems G3G3 vaillancourt et al.: new england shelfbreak front 10.1029/2005GC000999
18 of 22
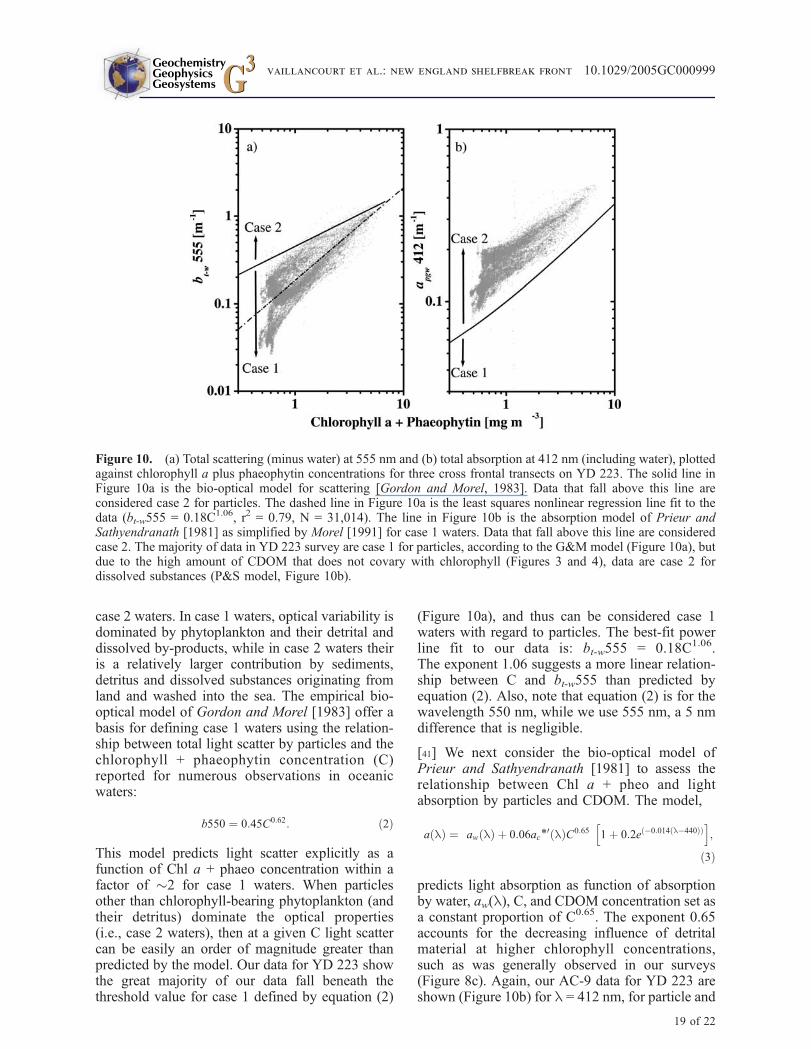
case 2 waters. In case 1 waters, optical variability isdominated by phytoplankton and their detrital anddissolved by-products, while in case 2 waters theiris a relatively larger contribution by sediments,detritus and dissolved substances originating fromland and washed into the sea. The empirical bio-optical model of Gordon and Morel [1983] offer abasis for defining case 1 waters using the relation-ship between total light scatter by particles and thechlorophyll + phaeophytin concentration (C)reported for numerous observations in oceanicwaters:
b550 & 0:45C0:62: $2%
This model predicts light scatter explicitly as afunction of Chl a + phaeo concentration within afactor of "2 for case 1 waters. When particlesother than chlorophyll-bearing phytoplankton (andtheir detritus) dominate the optical properties(i.e., case 2 waters), then at a given C light scattercan be easily an order of magnitude greater thanpredicted by the model. Our data for YD 223 showthe great majority of our data fall beneath thethreshold value for case 1 defined by equation (2)
(Figure 10a), and thus can be considered case 1waters with regard to particles. The best-fit powerline fit to our data is: bt-w555 = 0.18C1.06.The exponent 1.06 suggests a more linear relation-ship between C and bt-w555 than predicted byequation (2). Also, note that equation (2) is for thewavelength 550 nm, while we use 555 nm, a 5 nmdifference that is negligible.
[41] We next consider the bio-optical model ofPrieur and Sathyendranath [1981] to assess therelationship between Chl a + pheo and lightabsorption by particles and CDOM. The model,
a l$ % & aw l$ % ( 0:06ac*0 l$ %C0:65
! "
1( 0:2e !0:014 l!440$ %$ %h i
;
$3%
predicts light absorption as function of absorptionby water, aw(l), C, and CDOM concentration set asa constant proportion of C0.65. The exponent 0.65accounts for the decreasing influence of detritalmaterial at higher chlorophyll concentrations,such as was generally observed in our surveys(Figure 8c). Again, our AC-9 data for YD 223 areshown (Figure 10b) for l = 412 nm, for particle and
Figure 10. (a) Total scattering (minus water) at 555 nm and (b) total absorption at 412 nm (including water), plottedagainst chlorophyll a plus phaeophytin concentrations for three cross frontal transects on YD 223. The solid line inFigure 10a is the bio-optical model for scattering [Gordon and Morel, 1983]. Data that fall above this line areconsidered case 2 for particles. The dashed line in Figure 10a is the least squares nonlinear regression line fit to thedata (bt-w555 = 0.18C1.06, r2 = 0.79, N = 31,014). The line in Figure 10b is the absorption model of Prieur andSathyendranath [1981] as simplified by Morel [1991] for case 1 waters. Data that fall above this line are consideredcase 2. The majority of data in YD 223 survey are case 1 for particles, according to the G&M model (Figure 10a), butdue to the high amount of CDOM that does not covary with chlorophyll (Figures 3 and 4), data are case 2 fordissolved substances (P&S model, Figure 10b).
GeochemistryGeophysicsGeosystems G3G3 vaillancourt et al.: new england shelfbreak front 10.1029/2005GC000999
19 of 22
CDOM absorption, and with the pure seawaterabsorption added at l = 410 nm (aw410 =0.017 m!1) from Mobley [1994, Table 3.7]. Thedimensionless chlorophyll-specific absorption coef-ficient ac*
0 of 0.828 for 410 nm is used here for l =412 nm. Our data show that while there is in generalan increase in apgw412 with increasing C, theobserved apgw412 is, on average, "2' higher thanthat predicted by equation (3) at a given value of C(Figure 10b). Thus our data for YD 223 do notconform to the Prieur and Sathyendranath [1981]model for case 1 waters, and fall into the case 2category. That the same data conformed to theparticle scattering model for case 1 (equation (2)),suggests that the CDOM component of the totalabsorption was responsible for our data’s noncon-formity to the P&S model. This is apparent alsowhen one considers the general lack of spatialcoherence between ag440 and phytoplankton bio-mass seen on the shoreward side of the front in theLPS sections (Figure 3). While the upper boundaryof the CDOM pool was coincident with thephytoplankton layer, the bulk of the CDOM wasbeneath it, and thus probably not derived directlyfrom local production and grazing. A second reasonis that the strong coherence observed betweensalinity and ag440 in the subsurface water argues forthe CDOM being a tracer of winter remnant waterand derived from an admixture of shelf water andCDOM input via river and land runoff. Theseresults, considered within the limitations andcaveats of the models for case 1 waters, suggestthat the water masses across the shelfbreak front arecase 1 for particles, but case 2 for dissolvedsubstances.
Acknowledgments
[42] We thank the crew and technicians of the R/V Endeavor.Cheng Ho of LDEO helped with LPS data acquisition, datamerging and analysis, and graphics preparation. We also thankR. Schlitzer for the use of his analysis and graphing programOcean Data View (http://www.awi-bremerhaven.de/GEO/ODV/), and one anonymous reviewer and H. Sosik for theirhelpful comments. Support was provided by the NationalScience Foundation, grant OCE0002390 to LDEO/CU,OCE-0002754 to GSU/URI, OCE-002755 to COAS/OSU,and by a Spanish MECD post-doctoral fellowship to L.P.Lamont Doherty Earth Observatory contribution 6831.
References
Babin, M., A. Morel, V. Fournier-Sicre, F. Fell, and D. Stramski(2003), Light scattering properties of marine particles incoastal and open ocean waters as related to the particle massconcentration, Limnol. Oceanogr., 48, 843–859.
Barth, J. A., D. Bogucki, S. D. Pierce, and P. M. Kosro (1998),Secondary circulation associated with a shelfbreak front,Geophys. Res. Lett., 25, 2761–2764.
Basterretxea, G., E. D. Barton, P. Tett, P. Sangra, E. Navarro-Perez, and J. Arı́stegui (2002), Eddy and deep chlorophyllmaximum response to wind-shear in the lee of Gran Canaria,Deep Sea Res., Part I, 49, 1087–1101.
Beardsley, R. C., and C. N. Flagg (1976), The water structure,mean currents, and shelf-water/slope-water front on theNew England continental shelf, Mem. Soc. Sci. Liege, 10,209–225.
Berner, T., Z. Dubinsky, K. Wyman, and P. G. Falkowski(1989), Photoadaptation and the ‘‘package’’ effect inDunaliella tertiolecta (Chlorophyceae), J. Phycol., 25, 70–78.
Bidigare, R. R., J. H. Morrow, and D. A. Kiefer (1989),Derivative analysis of spectral absorption by photosyntheticpigments in the western Sargasso Sea, J. Mar. Res., 47,323–341.
Bigelow, H. B. (1933), Studies of waters on the continentalshelf, Cape Cod to Chesapeake Bay, Pap. Phys. Oceanogr.Meteorol., 2, 135 pp.
Blough, N. V., and R. Del Vecchio (2002), ChromophoricDOM in the coastal environment, in Biogeochemistry ofMarine Dissolved Organic Matter, edited by D. A. Hanselland C. A. Carlson, pp. 509–546, Elsevier, New York.
Boss, E., W. S. Pegau, W. D. Gardner, J. R. V. Zaneveld, A. H.Barnard, M. S. Twardowski, G. C. Chang, and T. D. Dickey(2001a), Spectral particulate attenuation and particle sizedistribution in the bottom boundary layer of a continentalshelf, J. Geophys. Res., 106, 9509–9516.
Boss, E., W. S. Pegau, J. R. V. Zaneveld, and A. H. Barnard(2001b), Spatial and temporal variability of absorption bydissolved material at a continental shelf, J. Geophys. Res.,106, 9499–9507.
Boss, E., W. S. Pegau, M. Lee, M. Twardowski, E. Shybanov,G. Korotaev, and F. Baratange (2004), Particulate back-scattering ratio at LEO 15 and its use to study particlecomposition and distribution, J. Geophys. Res., 109,C01014, doi:10.1029/2002JC001514.
Bricaud, A., A. Morel, and L. Prieur (1981), Absorption bydissolved organic matter of the sea (yellow substance) in theUV and visible domains, Limnol. Oceanogr., 26, 43–53.
Bricaud, A., A. Morel, and L. Prieur (1983), Optical efficiencyfactors of some phytoplankters, Limnol. Oceanogr., 28,816–832.
Bricaud, A., A. L. Bedhomme, and A. Morel (1988), Opticalproperties of diverse phytoplankton species: Experimentalresults and theoretical considerations, J. Plankton Res., 10,851–873.
Chang, G. C., and T. D. Dickey (2001), Optical and physicalvariability on timescales from minutes to the seasonal cycleon the New England shelf: July 1996 to June 1997, J. Geo-phys. Res., 106, 9435–9453.
Chang, G. C., T. D. Dickey, O. M. Schofield, A. D.Weidemann, E. Boss, W. S. Pegau, M. A. Moline, andS. M. Glenn (2002), Nearshore physical processes andbio-optical properties in the New York Bight, J. Geophys.Res., 107(C9), 3133, doi:10.1029/2001JC001018.
Churchill, J. H., and P. C. Cornillon (1991), Water dischargedfrom the Gulf Stream north of Cape Hatteras, J. Geophys.Res., 96, 22,227–22,243.
DeGrandpre, M. D., A. Vodacek, R. K. Nelson, E. J. Bruce,and N. V. Blough (1996), Seasonal seawater optical proper-ties of the U.S. Middle Atlantic Bight, J. Geophys. Res., 101,22,727–22,736.
GeochemistryGeophysicsGeosystems G3G3 vaillancourt et al.: new england shelfbreak front 10.1029/2005GC000999
20 of 22
Dickey, T. D., and A. J. Williams (2001), Interdisciplinaryocean studies on the New England shelf, J. Geophys. Res.,106, 9427–9434.
Fratantoni, P. S., and R. S. Pickart (2003), Variability of theshelf break jet in the Middle Atlantic Bight: Internally orexternally forced?, J. Geophys. Res., 108(C5), 3166,doi:10.1029/2002JC001326.
Fratantoni, P., R. Pickart, D. Torres, and A. Scotti (2001),Mean structure and dynamics of the shelfbreak jet in theMiddle Atlantic Bight during fall and winter, J. Phys.Oceanogr., 31, 2135–2156.
Gardner, W. D., et al. (2001), Optics, particles, stratification,and storms on the New England continental shelf, J. Geo-phys. Res., 106, 9473–9497.
Geider, R. J. (1987), Light and temperature dependence of thecarbon: Chlorophyll a ratio in microalgae and cyanobacteria:Implications for physiology and growth of phytoplankton,New Phytol., 160, 1–34.
Gordon, A. L., and F. Aikman III (1981), Salinity maximum inthe pycnocline of the Middle Atlantic Bight, Limnol. Ocea-nogr., 26, 123–130.
Gordon, H. R., and A. Morel (1983), Remote Assessment ofOcean Colour for Interpretation of Satellite Visible Imagery:A Review, 81 pp., Springer, New York.
Green, R. E., and H. M. Sosik (2004), Analysis of apparentoptical properties and ocean color models using measure-ments of seawater constituents in New England continentalshelf surface waters, J. Geophys. Res., 109, C03026,doi:10.1029/2003JC001977.
Gregg, W. W., and K. L. Carder (1990), A simple spectralsolar irradiance model for cloudless maritime atmospheres,Limnol. Oceanogr., 35, 1657–1675.
Hales, B., and T. Takahashi (2002), The Pumping SeaSoar: Ahigh-resolution seawater sampling platform, J. Atmos.Ocean. Technol., 19, 1096–1104.
Hales, B., J. N. Moum, P. Covert, and A. Perlin (2005),Irreversible nitrate fluxes due to turbulent mixing in acoastal upwelling system, J. Geophys. Res., 110, C10S11,doi:10.1029/2004JC002685.
Horne, E. P. W. (1978), Interleaving at the subsurface front inthe slope water off Nova Scotia, J. Geophys. Res., 83, 3659–3671.
Houghton, R. W., and J. Marra (1983), Physical/biologicalstructure and exchange across the thermohaline shelf/slopefront in the New York Bight, J. Geophys. Res., 88, 4467–4481.
Houghton, R. W., and M. Visbeck (1998), Upwelling and con-vergence in the Middle Atlantic Bight shelfbreak front, Geo-phys. Res. Lett., 25, 2765–2768.
Houghton, R. W., R. Schlitz, R. C. Beardsley, B. Butman, andJ. L. Chamberlin (1982), The Middle Atlantic Bight ColdPool: Evolution of the temperature structure during summer1979, J. Phys. Oceanogr., 12, 1019–1029.
Houghton, R. W., D. B. Olson, and P. J. Celon (1986),Observation of an anticyclonic eddy near the continentalshelf break south of New England, J. Phys. Oceanogr., 16,16–71.
Houghton, R. W., C. N. Flagg, and L. J. Pietrafesa (1994),Shelf-slope water frontal structure, motion and eddy heatflux in the southern Middle Atlantic Bight, Deep Sea Res.,Part II, 41, 273–306.
Houghton, R. W., D. Hebert, and M. Prater (2005), Circulationand mixing at the New England shelfbreak front: Results ofpurposeful tracer experiments, Progr. Oceanogr., in press.
Joint Global Ocean Flux Study (JGOFS) (1996), Protocolsfor the Joint Global Ocean Flux Study (JGOFS) core mea-
surements, Rep. 19, 170 pp., Intergov. Oceanogr. Comm.,Bergen, Norway.
Kiefer, D. A., and J. B. Soohoo (1982), Spectral absorptionby marine particles of coastal waters of Baja, California,Limnol. Oceanogr., 27, 492–499.
Kishino, M., N. Takahashi, N. Okami, and S. Ichimura (1985),Estimation of the spectral absorption coefficients of phyto-plankton in the sea, Bull. Mar. Sci., 37, 634–642.
Lentz, S. J. (2003), A climatology of salty intrusionsover the continental shelf from Georges Bank to CapeHatteras, J. Geophys. Res., 108(C10), 3326, doi:10.1029/2003JC001859.
Linder, C. A., and G. Garwarkiewicz (1998), A climatology ofthe shelfbreak front in the Middle Atlantic Bight, J. Geo-phys. Res., 103, 18,405–18,423.
Malone, T. C., T. S. Hopkins, P. G. Falkowski, and T. E.Whitledge (1983), Production and transport of phytoplank-ton biomass over the continental shelf of the New YorkBight, Cont. Shelf Res., 1, 305–337.
Marra, J., R. W. Houghton, and C. Garside (1990), Phyto-plankton growth at the shelf-break front in the Middle Atlan-tic Bight, J. Mar. Res., 48, 851–868.
Mitchell, B. G., et al. (2000), Determination of spectral absorp-tion coefficients of particles, dissolved material and phyto-plankton for discrete water samples, in Ocean OpticsProtocols for Satellite Ocean Color Sensor Validation,Revision 2, edited by G. S. Fargion and J. L. Mueller, NASATech. Memo., NASA-TM 2000-209966, 125–153.
Mobley, C. D. (1994), Light and Water, 592 pp., Elsevier, NewYork.
Mooers, C. N. K., R. W. Garving, and W. W. Martin (1979),Summertime synoptic variability of the Middle Atlantic shelfwater/slope front, J. Geophys. Res., 84, 4837–4859.
Morel, A. (1991), Light and marine photosynthesis: a spectralmodel with geochemical and climatological implications,Progr. Oceanogr., 26, 263–306.
Morel, A., and A. Bricaud (1981), Theoretical results concern-ing light absorption in a discrete medium and applications tothe specific absorption of phytoplankton, Deep Sea Res.,Part A, 28, 1375–1393.
Morel, A., and L. Prieur (1977), Analysis of variations inocean color, Limnol. Oceanogr., 22, 709–722.
Mueller, J. L. (2000), In-water radiometric profile measure-ments and data analysis protocols, Ocean Optics Protocolsfor Satellite Ocean Color Sensor Validation, Revision 2,edited by G. S. Fargion and J. L. Mueller, NASA Tech.Memo., NASA-TM 2000-209966, 87–97.
Nelson, J. R., and S. Guarda (1995), Particulate and dissolvedspectral absorption on the continental shelf of the southeast-ern United States, J. Geophys. Res., 100, 8715–8732.
O’Reilly, J. E., and C. Zetlin (1998), Seasonal, horizontal, andvertical distribution of phytoplankton chlorophyll a in thenortheast U.S. continental shelf ecosystem, in NOAA Tech.Rep., NMFS 139, 119 pp., U.S. Dept. of Commer., Washing-ton, D. C.
O’Reilly, J. E., S. Maritorena, B. G. Mitchell, D. A. Siegel,K. L. Carder, S. A. Garver, M. Kahru, and C. McClain(1998), Ocean color chlorophyll algorithms for SeaWiFS,J. Geophys. Res., 103, 24,937–24,953.
Pegau, W. S., D. Gray, and J. R. V. Zaneveld (1997), Absorp-tion and attenuation of visible and near-infrared light inwater: Dependence on temperature and salinity, Appl. Opt.,36, 6035–6046.
Petzold, T. J. (1972), Volume scattering functions for selectedocean waters, SIO Ref. 72-78, 79 pp., Scripps Inst. of Ocea-nogr., La Jolla, Calif.
GeochemistryGeophysicsGeosystems G3G3 vaillancourt et al.: new england shelfbreak front 10.1029/2005GC000999
21 of 22
Pickart, R. S., D. J. Torres, T. K. McKee, M. J. Caruso, andJ. E. Przystup (1999), Diagnosing a meander of the shelfbreak current in the Middle Atlantic Bight, J. Geophys.Res., 104, 3121–3132.
Pope, R. M., and E. S. Fry (1997), Absorption spectrum (380–700 nm) of pure water, II, Integrating cavity measurements,Appl. Opt., 36, 8710–8723.
Prieur, L., and S. Sathyendranath (1981), An optical classifica-tion of coastal and oceanic waters based on the specificspectral absorption curves of phytoplankton pigments,dissolved organic matter, and other particulate materials,Limnol. Oceanogr., 23, 35–47.
Ryan, J. P., J. A. Yoder, J. A. Barth, and P. C. Cornillon(1999a), Chlorophyll enhancement and mixing associatedwith meanders of the shelf break front in the Mid-AtlanticBight, J. Geophys. Res., 104, 23,479–23,493.
Ryan, J. P., J. A. Yoder, and P. C. Cornillon (1999b), Enhancedchlorophyll at the shelfbreak of the Mid-Atlantic Bightand Georges Bank during the spring transition, Limnol.Oceanogr., 44, 1–11.
Sosik, H. M., R. E. Green, W. S. Pegau, and C. S. Roesler(2001), Temporal and vertical variability in optical propertiesof New England shelf waters during late summer and spring,J. Geophys. Res., 106, 9455–9472.
Stramski, D., and C. D. Mobley (1997), Effects ofmicrobial particles on ocean optics: A database of single-particle optical properties, Limnol. Oceanogr., 42, 538–549.
Twardowski, M. S. (1998), The finescale distribution, originand photobleaching of the spectral absorption of dissolvedorganic matter in coastal waters, Ph.D. thesis, Univ. of R.I.,Kingston.
Twardowski, M. S., E. Boss, J. B. MacDonald, W. S. Pegau,A. H. Barnard, and J. R. V. Zanaveld (2001), A model forestimating bulk refractive index from the optical backscatter-ing ratio and the implications for understanding particle com-position in case I and case II waters, J. Geophys. Res., 106,14,129–14,142.
Ullman, D. S., and P. C. Cornillon (1999), Satellite-derived seasurface temperature fronts on the continental shelf off thenortheast U.S. coast, J. Geophys. Res., 104, 23,459–23,478.
Verardo, D. J., P. N. Froelich, and A. McIntyre (1990), Deter-mination of organic carbon and nitrogen in marine sedimentsusing the Carlo Erba NA 1500 Analyser, Deep Sea Res., PartA, 37, 157–165.
Vodacek, A., N. V. Blough, M. D. DeGrandpre, E. T. Peltzer,and R. K. Nelson (1997), Seasonal variation of CDOM andDOC in the Middle Atlantic Bight: Terrestrial inputs andphotooxidation, Limnol. Oceanogr., 42, 674–686.
WET Labs (2002), AC-9 User’s Guide, Philomath, Oreg.Wright, W. R. (1976), The limits of shelf water south of CapeCod, J. Mar. Res., 34, 1–14.
Zaneveld, J. R., J. C. Kitchen, and C. C. Moore (1994), Scat-tering error correction of reflecting tube absorption meters, inOcean Optics XII, Proc. SPIE Int. Soc. Photo Opt. Instrum.Eng., 2258, 44–55.
GeochemistryGeophysicsGeosystems G3G3 vaillancourt et al.: new england shelfbreak front 10.1029/2005GC000999
22 of 22