The 2000 Workshop on the Utilization of Research Reactors
419
JP0250084 JAERI-Conf 2001-017 PROCEEDINGS OF THE 2000 WORKSHOP ON THE UTILIZATION OF RESEARCH REACTORS Department of Research Reactor Jp* AI Enr- Rs ai sit u Jaa Atmi Energy Reeac Istiut
-
Upload
khangminh22 -
Category
Documents
-
view
5 -
download
0
Transcript of The 2000 Workshop on the Utilization of Research Reactors

JP0250084
JAERI-Conf 2001-017
PROCEEDINGS OF THE 2000 WORKSHOPON THE UTILIZATION OF RESEARCH REACTORS
Department of Research Reactor
Jp* AI Enr- Rs ai sit u
Jaa Atmi Energy Reeac Istiut

)J®ThbleD# Hd tg+ tW '$~fiE~t~gE1:AW$M (F3 19-1195 j;!SYAgF
- (T319-1195 ;½W#I4tI H T Pt~i) ;I ; A
This report is issued irregularlyInquiries about availability of the reports should be addressed to Research
Information division, Department of Intellectual Resources, Japan Atomic EnergyResearch Institute, Tokai-mura, Naka-gun, Jbaraki-ken 319-1195, Japan.
© Japan Atomic Energy Research Institute, 2001

JAERI-Conf 2001-017
The 2000 Workshopon the Utilization of Research Reactors
November 20-24,2000 Taejon, Korea
1. Opening (November 20)
Welcome address by Mr. CHANG, KAERi
Opening address by
Mr. LEE, MOST, KOREA& Mr. SHIGEYAMA, STA, JAPAN
Participants for Workshop on U.R.R.

JAERI-Conf 2001-017
Opening session ( November 20, at Seminar room, KAERI )
I , I
2. Neutron Scattering ( November 20 at NSL, KAERI )

JAERI-Conf 2001-017
Small Angle Neutron Scattering Experiments (November 20-24 at HANARO Reactor Hall)
3. Neutron Activation Analysis (November 20-23, KAERI)
~~~~~~~~~~~~~/ J

JAERI-Conf 2001-017
4. Utilization Technology (BNCT) (November 20-23, KAERI)
I'
C. § g g S g g 0 2 ~~~~~~~~~~~~~~~~/

JAERI-Conf 2001- 017
5. Round Table Discussion (November 24, 2000 at SPAPIA HOTEL)
g | E E g W W W g g W | | 2 g g g g ~~~~~~~~~~>
g~~~~~~~~~2 - Eg.Xigg|g0
* 0 g t X g Ailk S

JAERI -Conf 2001 -017
Site Tour: RI Building & Reactor Building (November 22, KAERI)
Site Tour : HANARO Reactor Hall (November 22, KAERI)
Technical Tour Yonggwang Nuclear Power Plant(November 23, 2000)

JAERI-Conf 2001-017
Proceedings of the 2000 Workshop on the Utilization of Research Reactors
November 20 - 24
Taejon, Korea
(Contract Research)
Department of Research Reactor
Tokai Research Establishment
Japan Atomic Energy Research Institute
Tokai-mura, Naka-gun, Ibaraki-ken
(Received November 6, 2001)
The 2000 Workshop on the Utilization of Research Reactors, which is the ninth Workshop on the
theme of research reactor utilization, was held in Taejon, Korea from November 20 to 24. This
Workshop was executed based on the agreement in the First Coordinator's Meeting of Forum for
Nuclear Cooperation in Asia (FNCA) held in Tokyo, March 2000.
The Workshop consists of three groups under the themes of the following fields; 1) Neutron
Scattering, 2) Neutron Activation Analysis, and 3) Research Reactor Utilization (BNCT). The total
number of participants for the Workshop was about 60 people from 8 countries; Australia, China,
Indonesia, Korea, Malaysia, The Philippines, Thailand, Vietnam, and Japan.
This report consists of 13papers for Neutron Scattering, 12 papers for Neutron Activation
Analysis, and 12 papers for Research Reactor Utilization (BNCT) and 2 summary reports.
Keywords: Utilization, Research Reactor, Neutron Scattering, Neutron Activation Analysis,
Research Reactor Utilization, BNCT, and FNCA.
This Workshop was sponsored by the Ministry of Education, Culture, Sports, Science and
Technology (MEXT), and the Japan Atomic Energy Research Institute (JAERI) had been assigned
by MEXT as the responsible organization for holding the Workshop. This report includes the results
carried out under the contract between JAERI and MEXT under the auspices of the special account
law for electric power development promotion.

JAERI-Conf 2001-017
2000 lfa fFX0EifJJM 17 -7 V 7° '5i~FUA
2000 w 11 A 20 H-E24 n
5! V 3 > 1X
(I ARg tE FM I~~f
(2001 I 11 ,G 6 El3W)
fS4IJff-<y>9' 'y2T71 2000 I 3 1(i-Lt~ 1 FNCA D-5 i
>-47-a~O~t~g<48X><gg?~i~t5(aOM;F 1C ll)g 20 2 4 E T 24
11 J 20 HE b 5 H W3 .rV TIUI J 3:P1Tt~t-L,
JH40 (BNCT) 6:)3c?(.1 79 e>7&Xl OuQ> °.t
-X--} L, -U>i;z H 1*> 6D biE;UE87 8b t6 O 6 0 Xt6X -bIV L
* ~k<t 1:3 : 12 l 12 Q
VibiePfr: T319-1195 XXVAYM fiiO~tl)tW 2-4
ii

JAERI-Conf 2001-017
CONTENTS
1. Workshop
Neutron Scattering
1.1 The Acquisition and Reduction of Small Angle Neutron Scattering DataKNOTT Robert .*. 1
1.2 Neutron Scattering Science at the Australian Nuclear Science and TechnologyOrganisation(ANSTO)
KNOTT Robert . I .......................................................................... ..... 13
1.3 The Investigation of Artificial Articular Cartilage- PVA -hydrogel with SANSYANG Tong Hua, WANG Hong Li, ZHAO Xin, CHEN Dong Feng . 31GU Zheng Qiu, XL40 Jiu Mei, ZHANG Xiang Hong, LINMin Yue
1.4 Current Status of Neutron Scattering in IndonesiaIKRAMAbarrul *...................................................................................................34
1.5 Measurements of PS-PEP Sample in SerpongIKRAMAbarrul, SUDIRMAN and A. INSANI . 42
1.6 Revitalization of Neutron Diffractometers in SerpongIKRAMAbarrul, M. R. MUSLIH, A. PURWANTO, T. H. PRIYANTO . -------------------------- 47and E. SANTOSO
1.7 Progress Report on Neutron Scattering at KAERILEE Chang Hee ........................................... 55
1.8 Enhancement of Small Angle Neutron Scattering Facility and Related Activities inMalaysia
MOHAMED Abdul, A. J. B. A. HAMID and SHUKRI B. Mohd . I * 61
1.9 Current Status of Neutron Scattering in ThailandSANGARIYAVANICH Archara, PONGKASEM Somchai -...... ----------------------------- 70PA TCHAR Suriya, AMPORNRA T Pantip
1.10 Progress Report on the Preparation of Co Substitution for Cu in BSCCO(2223) SuperconductorSANGARIYAVANICH Archara, . - 76AMPORNRATPantip
1.11 High Temperature Superconductors of Pb and Sb Doped Bi-Sr-Ca-Cu-O SystemTRAN Thi Thu Phuong, TRAN Kim Cuong . 81
NGUYEN Thi Cam Phuong
1.12 Residual Stress Analysis by Neutron ScatteringMINAKAWA Nobuaki, MORIAIAtushi, OHTOMOAkitoshi .86
1.13 Synchrotron SAXS Facility at the PAL and Its Applications inMaterials Science
BOLZE Jorg, KIM Jehan, LEE Byeongdu, SHIN Joo Tae, .92LEE Jinwon, HUANG Jung- Yun, RAH Seungyu, YOUNShik Hwa, LEE Ki-Bong, and REE Moonhor
ili

JAERI-Conf 2001-017
Neutron Activation Analysis
1.14 Introduction of the Neutron Activation Analysis Facilities in High Flux Engineering Test ReactorFENG Mingquan ................................................................... ..................... 131
1.15 Current Status and Progress of Research and Development of NAA at GA. SiwabessyReactor
SUTISNA, YVUSUF Saeful, RUKIHA TI .1 * 137WARDANI Sri, HAMZAHAmir, M Th Rina
1.16 Application and Facility of Neutron Activation Analysis in HANARO Research ReactorCHUNG Yong Sam . * -........................ 148
1.17 The Use of Neutron Activation Analysis in Environmental Pollution StudiesMOHD YUSOF Alias, GILL S. K., SALLEHS., 160AKYIL S., HA MZA H S., RAHMAN S. A., WOOD A. K. H.
1.18 Utilization of NAA in ThailandSRINYA WACH Chastbongkoch . . - . 193
1.19 Neutron Activation Analysis at the Dalat Nuclear Research ReactorNGUYEN Van Minh -. - -- 203
1.20 NAA Supporting System of JAERISASAJIMA F., SA WAH4 TA H., ONIZA WA K, ICHIMURA S.,. * 211OHTOMO A., HORIGUCHI Y., ITO V., TAKA YANAGI M.
1.21 Air Pollution Study by NAA in KoreaMOON Jong Hwa .- * - 223
1.22 Probabilistic Risk Analysis of Airborne Toxic Metals in Korean Industrial CompiexLEE fin-Hong, JANG Mi-Suk . ** ** 242
1.23 Application of NAA in the Field of Environmental GeologyLEE Kil Yong and YOON Yeol Yoon . --- - -- 248
1.24 Application of NAA in High Purity MaterialsYOON Yeol Yoon and LEE Kil-Yong .258
1.25 The Study of Trace Element Distribution in Biological Samples with NAA for Human HealthCHO Seung Yeon, KANG Sang Hun, CHUNG Yong Sam *------------ -274
Research Reactor Utilization
1.26 Current Status of Operation and Utilization with Several Research Reactors in ChinaXU Hanming . * 293
1.27 Present Status of Research and Test Reactors in JAERISA TO Mitsugu, KOBA YASHI Shinsho . 302TAKA YANAGI Masaji
1.28 Overview of HANAROJUN Byung Jin, KIM Hark Rho .306
iv

JAERI-Conf 2001-017
1.29 Utilization of Beam Ports of MINT Research ReactorBOKHARI Adnan, KASSIMMohammad Suhaimi .313
1.30 Current Status of Operation and Utilization of the Dalat Research ReactorNGUYEN Nhi Dien .318
1.31 BNCT Project in ThailandSAKDA Charoen . - 327
1.32 Development of BNCT Facility at the Indonesian Research ReactorHASTOWO Hudi ....................... ................ 335
1.33 Development of PGNAA Facility in HANAROCHOI H. D., B YUNS. H., ............................................... 344SUN G. M., KIM M. S., JUNB. J.
1.34 JRR-4 Medical Irradiation FacilityTORI) Y., YAMAMOTO K., HORI N., .352KUMADA H., HORIGUCHI Y.
1.35 Development of Computational Dosimetry System and Measurement of Dose Distributionin Water Head Phantom for BNCT in JAERI
KUMADA H., YAMAMOTO K., 357TORII Y., MATSUMURA A., YAMAMOTO T.,NAKAGAWA Y., HORIGUCHI Y.
1.36 Carboranyl Tetrahydroisoquinolines. Synthesis and the X- ray Structural Study of 1-(O-Carboran- 1- ylmethyl )-1,2,3,4-Tetrahydroisoquinolines
LEE Jong Dae, LEE Chai Ho, LEE Seung Hoon .363LIM Sang Moo, CHO Sungil, KANG Sang Ook
1.37 Neutronic Design Approach to a Small Medical Reactor for BNCTCHO Nam Zin .368
2. Summary Reports
2.1 Workshop .......................................................................................... 371
2.2 Sub W or sho ............................................................... ................ ---------------------- 3762.2 Sub-Workshop37
AppendixSchedule ...................................................-------......................................... 390
List of Participants ............................................................................................... 393
V

This is a blank-page.

JAERI-Conf 2001-017
I .Workshop
Abstract & Papers
Neutron Scattering

This is a blank page.

JP0250085JAERI-Conf 2001-017
1. A TheAcquislion and Reducfion ofSmall Angle Neuhon Scatteing Daba
Robert KnottAustralian Nuclear Science and Technology OrganisationPrivate Mail BagMenai NSW 2234Australiarobert.knott ~ansto.pov.au
ABSTRACT
The Small Angle Neutron Scattering (SANS) technique is used to investigateproblems in a wide range of fields including chemistry, materials science andbiology. Therefore, there is considerable variation in the physical and chemicalform of samples, with liquids, hard and soft solids, and gaseous particulates allunder investigation. In order to obtain accurate SANS data from these samples,it is very important to design the experiment and configure the instrument
appropriately.
Given that the SANS technique will provide structural information on bulkmaterial, the first step is to ensure that the sample has maximum scatteringcontrast and the correct geometry, and that the sample environment(temperature, pressure etc) is applied with minimum impact on the samplescattered pattern.
The next important step is to configure the SANS instrument. A typicalinstrument has a variable wavelength and wavelength resolution, and adjustablepre- and post-sample flight paths. The proper configuration for a given sampledepends upon many factors, including the sample size and density, the size ofthe scattering object (which determines the desired q range) in the sample, theneutron scattering and absorption cross-sections of the sample, and desiredaccuracy of the data. A number of algorithms have been developed to assist withthe calculation of the instrument geometry.
A complete SANS experiment requires not only the measurement of thescattered pattern from the sample but also the measurement of the empty celland blocked beam, plus correction for instrumental effects such as detectoruniformity. In addition, data from a standard sample must be collected to place

JAERI-Conf 2001-017
the sample scattered pattern on an absolute scale. This will often assist with the
interpretation of the scattered pattern.
Generally the 2D scattered pattern must be reduced to a 1 D (intensity versus q)profile to facilitate fitting of various models and functional forms. A number of
algorithms are available for this reduction including radial integration for isotropicscattered patterns, and segment integration for anisotropic scattered patterns.
The final step is the storage and transmission of all the data for further analysis.It is often very convenient to adopt a standard format for data storage particularlywhen transferring data from one institute to another- There are a number of
international standard formats presently under discussion.
SAMPLE PREPARATION
Initial planning The first step in a SANS experiment is to define the structuralfeature of interest and then to decide if the feature is accessible with the SANStechnique given the length scale of -10A to -5000A applies. Is there sufficientsample available and what is the neutron scattering contrast within the sample?Can the scattering contrast be readily changed, and finally what environment isrequired either to maintain a sample in a given state, or to explore a scatteringdependence on an external parameter (temperature, pressure, shear etc)?
Neutron scattering contrast The neutron scattering length density, p, iscalculated from the chemical composition of the sample, viz:
bi
p = _= N A Pmass0 Yb.
where NA = Avagardo's number (6x1 023), Mw = molecular weight, bD = boundcoherent scattering length of atom i.
The scattering length density is a fundamental parameter that can be calculatedfor all sample components if the chemical composition and mass density areknown. From the p of each component the contrast factor for the sample may becalculated and it is this parameter that will indicate the likely success of the SANSexperiment. It may also suggest whether the deuteration of the sample, thesolvent, or the supporting matrix will provide a higher contrast and thereforeimproved SANS data.
Sample cells. Samples for SANS experiments come in very different physicaland chemical forms and include soft and hard solids, liquids and gel, and evenfine gaseous particulates. A range of sample environments is usually availablewith liquid sample thickness varying from 1 to 5mm and diameter 10 to 25mm(Figure 1). Sample cells usually have quartz (suprasil or equivalent) windows butthin aluminium may also be used. However, if a new material is to be used for acell window it is advisable to check for any scattering in the small angle region.
Sample size. The area of the sample must be greater than the area of theneutron beam. The area of the neutron beam is calculated to give the highest
-2-

JAERI-Conf 2001-017
neutron intensity for the lowest qmin required by the experiment (Section: SANSInstrument Configuration). The sample thickness must be selected formaximum scattered intensity and the scattering processes within the samplemust be considered (Figure 2). As a general rule a sample with large hydrogencontent should not be more than 1mm thick, and a low hydrogen content samplemay be up to 5mm thick.
Sample environment. There is an extensive range of sample environmentspossible. Temperature, pressure, shear and magnetic field are the mostcommonly varied parameters.
* Furnaces, heating/cooling blocks, and cryostats are used forhigh, medium, and low temperatures respectively.
* High pressures require a pressure cell and a vacuum is usuallyreadily available for low pressure.
* A Couette cell (Figure 3) is best used for liquids and gels, and aplate shear cell for shearing soft solids (eg polymers in the melt)
* A magnetic field may be applied with either a standardelectromagnet or a superconductor magnet for high (severaltesla) magnetic fields.
To make the best use of available beam time it is advisable to use an automaticsample changer wherever possible.
SANS INSTRUMENT CONFIGURATION
A typical instrument has a variable wavelength and wavelength resolution, andadjustable pre- and post-sample flight paths[l] (Figure 4). The properconfiguration for a given sample depends upon many factors, including thesample size and density, the size of the structural feature (which determines thedesired q range) in the sample, the neutron scattering and absorption cross-sections of the sample, and desired accuracy of the data. A number ofalgorithms have been developed to assist with the calculation of the instrumentgeometry.
The appropriate q range can be chosen for a given sample by considering thefollowing relations-
qmin-27lrmax
qmax'- 2)Trmin
where rmax and rmn are the longest and shortest scale lengths in the sample,respectively. Note that 1, 2 or 3 instrument configurations may be required tocover the entire q range of interest. The beam apertures and distances whichdetermine the instrument resolution (and hence the minimum q) as well as theintensity on the sample are indicated in Figure 4. Collimation is achieved byadjusting the incident flight path using the neutron guide sections that can be
- 3--

JAERI-Conf 2001-017
moved into the beam in order to bring the effective neutron source closer to thesample.
The values of qmj for a given configuration can be computed from
qmin(2r2nrA) 9amin
where '3 ~in is the nominal value of the scattering angle at which the measured
incident beam intensity would go to zero. Thus
S9in- (B/2+A312)/L2
where A3 is the FWHM of the detector spatial resolution function and B is thepenumbra beam size at the detector given by
B=(LIL1 )(A,+A?)+A2
Therefore,
qmin ==(TA){(A,+AZ/L I+(A2+A3)/L2J
Here Al, A2 and A3 are the source aperture, sample aperture and detectorresolution respectively, and L, and L2 are the source-to-sample and sample-to-detector distances.
Note that the direct neutron beam image on the detector must be smaller thanthe beamstop size.
in general, long flight paths rather than long wavelengths should be used first toreduce qmi- Neutron intensity values can be calculated for differentconfigurations from one known value assuming that the intensity (n/sec) on thesample, 1, scales as (A1A21L1)2 for a given wavelength X. These intensity valuescan be extrapolated to longer wavelengths assuming that I_-(1/?4) at longwavelengths when the wavelength spread AXJ. is fixed. Flux can be increasedby adding guides (shortening LI) at the expense of qmi and/or by relaxing thewavelength resolution (AX/X) at the expense of Aq. When higher resolution isdesired then the wavelength should be increased only when the detector is at thefurthest distance from the sample and all guides have been moved out of the pre-sample flight path.
When Al, A2, L, and L2 have been selected, the beamstop size and positiondetermined, and the sample environment selected, the instrument is ready for theexperiment.
SANS Instrument Calibration. An important issue that should be consideredwhen planning an experiment is the absolute calibration of the instrument. Whilstcalibration is usually the responsibility of the instrument scientist it is importantthat the guest scientist is familiar with the concept and whether the process mayintroduce significant errors into the final reduced data. A SANS instrumentrequires calibration in q and in scattered intensity, I.
- 4 -

JAERI-Conf 2001-017
Silver behenate [CH3(CH 2)20COOAg] (AgBE) is a useful standard for q calibrationsince it is one of the very few materials featuring Bragg reflections in the angularrange accessible to SANS instruments 24]. AgBE has the following favourablephysical and chemical properties:
* reasonable scattering cross-section
* relatively easy to prepare quality powders
o stable over reasonable time scales
o provides a sharp diffraction peak at 1.08nm>'.
AgBE has been assessed as an international standard for the calibration of bothX-ray and neutron scattering instruments. It is, therefore, possible to comparethe results with those obtained at other institutes around the world12 41.
One of the major achievements of the FNCA Sub-workshops on NeutronScattering is the inter-laboratory comparison of the q-calibration of all SANSinstruments in the region.
The absolute calibration of intensity presents somewhat of a challenge. Thereare a number of possibilities and each has their limitations14 -7]. The followinghave been used for absolute intensity calibration:
o Irradiated aluminium
* Water - incoherent scatterer - inelastic effects must beconsidered
Polymer mixtures
Porous silica - pore size to match q range
* Direct neutron flux (calibrated attenuator)
The standard sample should be selected to match the q range used during theexperiment and it should have a large differential cross-section (typical 20-100cm ') to minimise counting time. As given in more detail in the next section,data from the standard sample is collected under identical conditions and used tonormalise the unknown sample data.
SANS DATA ACQUISITION PROTOCOL
A complete SANS experiment requires not only the measurement of thescattered pattern from the sample but also the measurement of the empty celland blocked beam, plus correction for instrumental effects such as detectoruniformity. In addition, data from a standard sample must be collected to placethe sample scattered intensity on an absolute scale. This will often assist withthe interpretation of the scattered data.
-5-

JAERI-Conf 2001-017
According to counting statistics, the noise level of an experiment decreases withthe square root of the measurement time. In any experiment, a judicious choicemust be made between number of samples, environmental conditions, countingstatistics and the available beam time for the measurement. The counting timesneeded for different experiments vary widely depending upon how strongly thesamples scatter and what kind of information is sought. Total detector counts permeasurement may vary from 2x10⁴ to 1X10⁷ neutrons. The lower limitcorresponds to measurements where the intensity is concentrated in the centreof the detector, and where the fit parameters have several percent error. Theupper limit corresponds to data fitted over the entire detector to high accuracy.Radially integrated data consists of approximately 100 data points. To achieve a1% noise level, a total of 1x1 06 detector counts is needed if the intensity is evenly
distributed radially.
At the beginning of an experiment, an estimate is made of the time for eachexperiment. It is recommended to sub-divide long accumulation times intoshorter time periods and monitor the neutron beam flux and the scatteredintensity for major shifts in instrument parameters and/or sample characteristics.
Background runs such as from the empty cell, blocked beam, solvent or controlsamples should normally have accumulation times of the same length as that ofthe sample.
Data Correction. A complete SANS dataset consists of scattered patterns fromthe sample, 'Sarnpie. empty cell, 'empty, and background, lbackground, viz:
/sample = COTsample+ce(r-Z(q) + ( (q)) + IockedbeaKdQ ),sampe dO 'empty)
lempty = COTcet-ll + IbhockedbeamdQ empty
lbackground { blocked-beam
where
Co 4 A .d AQ g t
Here X = incident neutron flux; A = sample area; d = sample thickness; AQ = solidangle of each detector pixel; e detector efficiency; t = counting time.
The sample scattered pattern is corrected for backgrounds according to thefollowing relationship:
I = (I -I ) _bc T..mple+cell l (Icll -Icorrect sample background T backgroundT.cell'
Finally, the corrected data is multiplied by the detector sensitivity matrix toaccount for the pixel to pixel variation in detector efficiency.
-6-

JAERI-Conf 2001-017
The resultant intensity data is now related to the sample cross-section viz:
I(q).crret = i1A d .Tsample 4 ell(d-qj ) AQ 6 tkdQ2 sample
It remains to obtain the differential cross-section for the sample.
Absolute scale. The background corrected scattered intensity may placed on anabsolute scale using one of two standard methods[4-7T; direct beam flux method orstandard sample calibration. The direct beam flux method requires measuring thedirect flux on the detector and knowing the absolute values of neutron flux andthe transmission of a standard attenuator.
Idirect A A Tattenuator AQn f
Therefore,
(d1-q)) = __ (_(_rrect )( 1 )( Tattenuator
sample direc d Tsample + cell
The second method uses a scattered pattern collected under identical conditionsto normalise the scattered pattern from the sample.
I(q =)sn dard b= A qAdstandardTstan dard+cell (d ) AQE tJstandard
Therefore,
C d~(q -r _ (q).orrect dstan dard NfTstan dard +cell dZ(q=O)'
d Q ) sample (q = 0)s.tan dard A d ATsample +cell " f stan dard
SANS DATA REDUCTION
Generally the 2D scattered pattern must be reduced to a 1 D (intensity versus q)profile to facilitate fitting of various models and functional forms. A number ofalgorithms are available for this reduction including radial integration for isotropicscattered patterns, and segment integration for anisotropic scattering patterns,
For radial integration, the (x, y) coordinates for zero q are usually defined indetector pixel units during positioning the beamstop and also during sampletransmission measurements. These coordinates are then used to determine theAq distance of each detector pixel from zero q to facilitate radial integration(Figure 5). Note that the radial integration function should not have a q resolutiongreater than the original data.
For segment integration, the coordinates for zero q plus the angular limits forsegment integration are required (Figure 6). Depending on the asymmetry of thepattern and the nature of the structural feature causing the asymmetry, a radial
- 7 -

JAERI-Conf 2001-017
integration algorithm-within the angular limits will provide 1 D data with acceptableq smearing.
The 1D SANS data is now corrected for all background and instrument effects,placed on an absolute scale and is now ready for detailed data analysis.
DATA STORAGE
The final step is the storage and transmission of all the data for further analysis.It is often very convenient to adopt a standard format for data storage particularlywhen transferring data from one institute to another.
At present there is no internationally accepted standard although there are anumber under discussions. The data files must contain all the information aboutthe experiment (instrument parameters, sample details etc) and must be able tobe analysed either by specific software provided by the host institute, or by one ofthe ever increasingly available general data analysis packages (IDL, IGOR etc).The following are data storage formats under discussion
* ASCI - readable text
* CIF
* NEXUS
* HDF - internally self contained
To a large extent it remains with the host institute to offer to the guest scientistdata storage options that are convenient and useable.
SUMMARY
SANS experiments should be well planned and well executed. Since dataanalysis is complex and in many cases model dependent, it is important that thereduced data used as input to the data analysis process is accurate with well-defined errors.
ACKNOWLEDGEMENTS
SANS experiments benefit from the knowledge and experience of the instrumentscientists. The many contributions of scientists at National Institute of Standardsand Technology (USA), Brookhaven National Laboratory (USA), Riso NationalLaboratory (Denmark), Japan Atomic Energy Research Institute (Japan) andIndonesia National Nuclear Energy Agency (BATAN) (Indonesia) are gratefullyacknowledged.
-8-

JAERI-Conf 2001-017
REFERENCES
1. The 30m Small-Angle Neutron Scattering Instruments at the National Instituteof Standards and Technology. C.J. Glinka, J.G. Barker, B. Hammouda, S.Krueger, J.J. Moyer and W.J. Orts. Journal of Applied Crystallography 31,430-445 (1998).
2. X-ray powder Diffraction Analysis of Silver Behenate: A possible Low-AngleDiffraction Standard. T.C. Huang, H. Toraya, T.N. Blanton and Y. Wu_ Journalof Applied Crystallography 26, 180 - 184 (1993).
3. JCPDS - International Centre for Diffraction Data round robin study of silverbehenate. A possible low-angle X-ray diffraction calibration standard. T.N.Blanton, T.C. Huang, H. Toraya, C.R. Hubbard, S.B. Robie, D. Louer, H.EGdbel, G. Will, R. Gilles and T. Raftery. Powder Diffraction 10, 91 - 95 (1995).
4. Silver behenate powder as a possible low-angle calibration standard for small-angle neutron scattering. R. Gilles U. Keiderling and A. Wiedenmann. Journalof Applied Crystallography 31, 957 - 959 (1998).
5. Assessment of Detector Calibration Materials for SANS Experiments. A.R.Rennie. Journal of Applied Crystallography 38, 35 (1995).
6. The Forward Scattering of Cold Neutrons by Mixtures of Light and HeavyWater. R.P. May, K. Ibel and J. Haas. Journal of Applied Crystallography 15,15 -19 (1982).
7. Intercalibration of Small-Angle X-ray and Neutron Scattering Data. T.P.Russell, J.S. Lin, S. Spooner and G.D. Wignall. Journal of AppliedCrystallography 21, 629 - 638 (1988).
8. Data Handling for Small-Angle Scattering. J.D. Barnes, M. Capel, J. SkovPedersen and D. Svergun. ACA Workshop, July 1998.
-9-

JAERI-Conf 2001-017
Standard Spectrometer Cell
Standard Spectrometer Cell
Width 10mmPath-length up to 5mm
Diameter 18mmPath-length 1mm
Custom CellQuartz window
(Spa>yXX Spacer+Orng
Quartz window
Diameter 20mm Extemal clamp/holderPath-length up to 5mm
Figure 1. A selection of standard cells used in small angle neutron scattering experiments.
Transmitted
Coherent T- x( d
IncoherentT
Absorption
incident beam, ; Multiple coherentr
Figure 2. Scattering process within a sample that must be considered when planning a small
angle neutron scattering experiment.
- 10-

JAERI-Conf 2001-017
Top View'
~Co~t Cell
Figure 3. Schematic of a Couette cell for small angle neutron scattering applications
AttenuatorNeutron guide
Sample aperture, A2
Source aperture, A
Velocity selector
Figureg4. Schematic of a typical small angle neutron scattering instrument.

JAERI-Conf 2001-017
I I I | l il E .,I _____
Figure 5.
Radial integration of a 2D SANS scattered pattern results in a 1 D function (intensity versus q)~
Figure 6.
Segment integration of a 20 SANS scattered pattern results in one or more 10 functions
(intensity versus q). (a) Major axis; (b) Minor axis.
- 12 -

l111 101110110 DIIIl 100lll lll ll llll hIll 101111 IIIl JP0250086
JAERI-Conf 2001-017
1.2 Neutron Scattering Science at theAustralian Nuclear Science and TechnologyOrganisation (ANSTO)
Robert KnottAustralian Nuclear Science and Technology Organisation
Private Mail BagMenai NSW 2234
Australia.
robert.knott(cbansto.gov.au
ABSTRACT
Neutron scattering science at the Australian Nuclear Science and Technology Organisation(ANSTO) is being applied to a number of fields in the scientific and industrial research
communities. The 10MW research reactor HIFAR at the ANSTO research laboratories has a
suite of neutron scattering instruments including a medium and a high resolution powder
diffractometer; a small angle neutron scattering facility; a single crystal diffractometer; apolarised neutron spectrometer, and a triple axis spectrometer. A reflectometer suitable for
solids and liquids is under development. These instruments are being used to investigate
problems in chemistry, materials science, physics, engineering and biology.
The HIFAR research reactor is now forty years old and approaching the end of its useful lifecertainly as a source for leading-edge neutron scattering science. Therefore by 2005, HIFARwill be replaced with a modern multi-purpose research reactor. The contract for the design and
construction of the replacement research reactor has recently been signed. The experimentaland analysis equipment associated with a modern research reactor will permit the establishmentof a national centre for world class neutron science research focussed on the structure and
functioning of materials, industrial irradiations and analyses in support of Australianmanufacturing, minerals, petrochemical, pharmaceuticals and information science industries.
A brief overview will be presented of all the instruments available on the HIFAR reactor withemphasis on the small angle neutron scattering facility. A description of the replacementresearch reactor and the planned neutron scattering instruments will also be presented.
THE HIFAR RESEARCH REACTOR
The High Flux Australian Reactor (HIFAR) is a DIDO-class 1OMW(th) research reactor ofmodest performance (maximum thermal neutron flux lX 1x1 4cm- 2sec-') and provides the only
neutron source in the country suitable for neutron scattering. HIFAR is operated by theAustralian Nuclear Science and Technology Organisation (ANSTO) (http://www.ansto.gov.au), a
- 13 -

JAERI-Conf 2001-017
government research organisation with the mission to 'ensure that its research, technologytransfer, commercial and training activities in nuclear science and associated technologies willadvance Australia's innovation, international competitiveness and environmental and healthmanagement'.
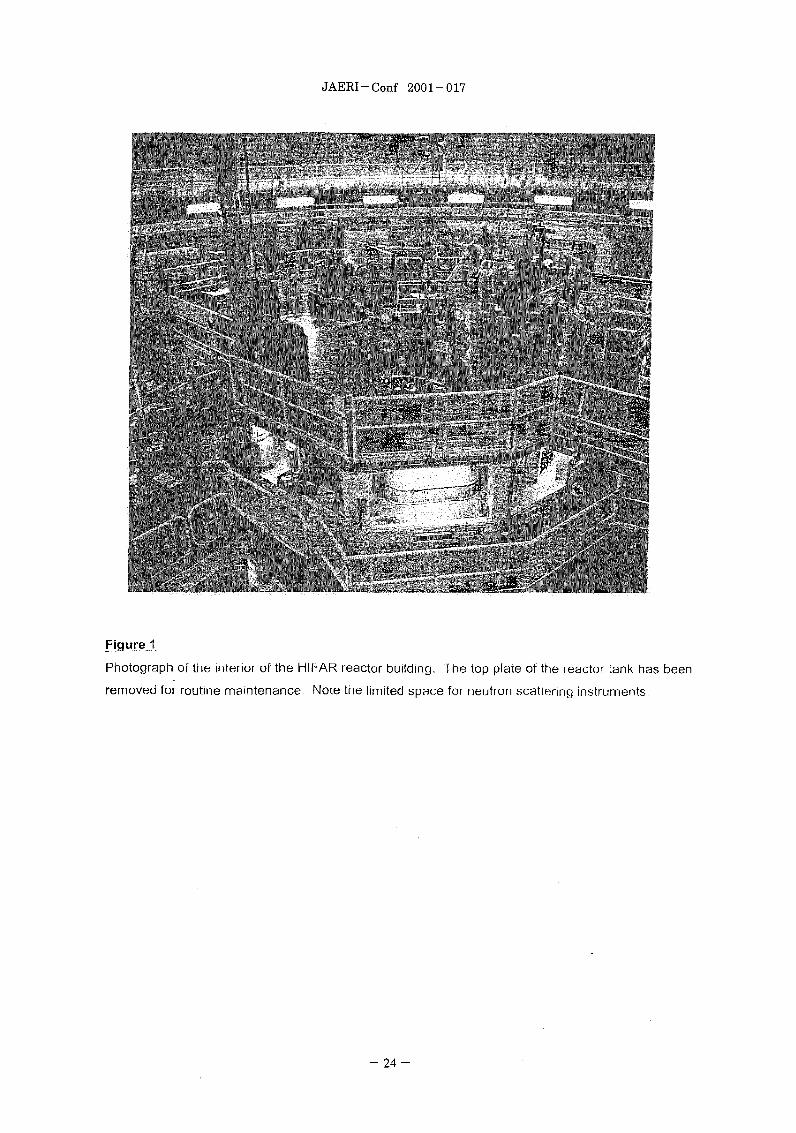
HIFAR was designed and built in the 1950's primarily as a materials testing reactor and as suchhas limited facilities for neutron beam studies. Apart from the neutron beam quality discussedbelow, the reactor building is small (20 metre diameter) and does not provide the space requiredfor modern neutron scattering instruments. In addition, there is no cold source installed. Figure1 is a photograph of the interior of the HIFAR reactor building. The limitations of HIFAR as aneutron source have been recognised and in September 1997 the Australian government madethe decision to replace HIFAR with a multi-purpose pool-type research reactor.
Despite the inherent limitations in HIFAR, the neutron scattering instrument presently inoperation are being used to investigate a number of important problems.
NEUTRON SCATTERING INSTRUMENTS ON HIFAR
The present supported instruments located on the HIFAR reactor include a single crystaldiffractometer (2tanA), a polarised beam facility (Longpol), two powder diffractometers (HRPD,MRPD) and a small angle neutron scattering (SANS) instrument. A reflectometer is underconstruction. Except for 2tanA instruments are located on radial beam tubes. The beam tubeshave a diameter up to 25cm, and terminate either in the D20 moderator or the graphite reflectorregions of the reactor core. This has an impact on beam quality and has influenced instrumentdesign. Table 1 is a summary of instrument characteristics and Figure 2 illustrates theirdisposition on the experimental floor.
Single Crystal Diffractometer
The High Resolution Single Crystal Diffractometer (2tanA) is a four circle single crystaldiffractometer located at one end of a 'tangential' beamline that passes under the reactor bore.The 1,235A monochromatic neutron beam is selected at a take off angle of 580 by a coppersingle crystal. The 10mm diameter neutron beam has a flux of 6 x 10⁵ n.cm 2.s- at the sampleposition with good signal to background characteristics. The maximum 20 is ~-1 180 and over thisrange the reflection widths are typically 0.44 (fwhm) (20) at 50 (20) increasing to -0.75° at 105g.
The diffractometer has undergone upgrade (since 1996) in nearly every aspect of theinstrument. These upgrades now allow the use of heavy environment stages (such as the newcryorefrigerator) on the sample stage.
The following three detector configurations are now available; a BF3 single detector suitable forroutine single crystal studies; a 3He single detector with Soller collimator suitable for preferred-orientation/pole-figure studies; a 3He multidetector (90 mm x 90 mm) particularly suited to diffusescattering and other studies which need to sample large volumes of reciprocal space.
In single crystal mode Bragg reflection peaks typically have full widths at half maximum of order0.4' (2q) at 5' scattering angle, 0.20 at 50', and 0.75° at 105° with a maximum scattering angleof 118'. In pole figure mode powder peaks have a FWHM resolution of approx. 0.7' (2q).
-14-

JAERI-Conf 2001-017
The main applications include general single crystal structure determinations (chemical andmagnetic) particularly where accurate information is sought on hydrogen bonding, thermalparameters, etc; preferred-orientation/pole-figure studies; and diffuse scattering studies
Long Wavelength Polarised Neutron Spectrometer
The long-wavelength polarisation analysis spectrometer (Longpol) (Figure 3) is a 2-axisinstrument that uses a neutron beam of wavelength 3.6A and is equipped with 8 3He neutrondetectorst'1. It incorporates neutron polarisation techniques and timed control of the polarisationdirection of the incident neutron beam to produce time-of-flight (TOF) spectra. The instrument istherefore able to simultaneously detect changes in momentum, polarisation and energy of theneutrons after interaction with the sample. Polarisation analysis can be used to separatemagnetic scattering from nuclear scattering, providing unambiguous data for determination ofatomic and magnetic short-range order. It is also used to isolate the nuclear-spin-incoherentscattering that is caused by elements such as hydrogen. The energy analysis enablesmeasurement of (low energy) inelastic scattering events such as magnons and phonons, andcrystal field transitions. The instrument can also be used to measure trapped magnetic flux insuperconductors and magnetic domain size in magnetic ribbons by analysing the polarisation ofthe undeflected portion of the neutron beam after transmission through the sample.
Recent improvements to the instrument include complete replacement of the neutron polariser,the neutron spin flipper, and the TOF data acquisition system, and partial replacement of theneutron spin analysers. The upgrade has so far produced a 10 fold increase in the quality of thepolarisation analysis system and has also produced an increase in flux and in resolution. Thespectrometer now has a neutron flux at the sample position of about 2 x 10⁴ n.cMr2 .s<A. It uses
supermirror devices to polarise the neutron beam (polarising efficiency about 96%) and also forpolarisation analysis in 3 of the 8 detectors (analysing efficiency about 94%). A Pentium PC isused to control the experiments, including neutron spin flipping, data binning, sample anddetector positioning and sample temperature. The computer can also perform on line cross-correlation of data with the flipper control sequence to produce the TOF spectrum in real time.The energy resolution is currently <1meV, allowing some measurements of quasi-elasticscattering and further improvements are expected in the near future.
Present applications include the determination of atomic and magnetic distributions in magneticmaterials; determination of hydrogen concentration in bulk materials; measurement ofparamagnetic correlations in itinerant electron systems; magnon measurements; measurementof critical fields and flux pinning energies in type-l1 superconductors and flux creep insuperconductors1 2 ]; magnetic domain size in metallic ribbons; and determination of low energycrystal field transitions and diffusion processes.
Powder Diffractometers
The two powder diffractometers (Figure 4) were designed specifically to accommodate theconflicting requirements of neutron intensity and resolution1 31. The neutron flux at the sampleposition on the Medium Resolution Powder Diffractometer (MRPD) is typically five times that ofthe High Resolution Powder Diffractometer (HRPD) and the resolution is about half. Thisenables rapid phase transition type patterns to be collected on the MRPD and high resolutionstructure patterns on the HRPD. The HRPD has a selection of two Soller collimators before themonochromator (0.16 and 0.25°), a take-off angle of 120° and uses a germaniummonochromator. Routine wavelengths are 1.371, 1.493 and 1.8834A. The beam has
- 15 -

JAERI-Conf 2001-017
dimensions 20mm wide by 50mm high and the neutron flux at 1.8834A is approximately 8 x104 cm 2sec '. Patterns are collected from 5 - 156° (20) in a bank of 24 detectors (50 apart), witheach detector having its own high efficiency collimator (0.170). The minimum peak width is 0.250and the width is less than 0.40 over most of the pattern. Data collected on this instrument isprimarily for structure determination and quantitative phase analysis by multiphase Rietveldrefinement of known components.
The collimation of the primary neutron beam on the MRPD can be either 0.25 or 0.5°. Themonochromator consists of an array of 8 germanium single crystals with total height 80mm andwidth of 50mm, with vertical focussing to increase the neutron flux at the sample position to-106cm 2 sec&1 Currently, 32 -3He neutron detectors are mounted at 40 spacings at a distance of0i7m on the 20 drive. Each detector is mounted down-beam from a Soller collimator that has anacceptance angle of 0.350. The instrument is designed for neutron powder diffractometry,magnetic structure determination, phase transition and residual stress measurements. In-situkinetic studies of structure transformations, hydration mechanisms etc down to time resolution of-15 minutes are also possible.
Small Angle Neutron Scattering Instrument
The Small Angle Neutron Scattering (SANS) instrument (Figure 5) has a 5m collimation lengthand sample-to-detector distance range of 1.5 - 5m. The monochromator and first section of thecollimator are located within the reactor containment building, and the second section of thecollimator, the sample position and the detector system are located in an external laboratory.The monochromator is a double multilayer system f45 3 in a dog-leg configuration. The multilayermonochromators are single d-spacing, planar geometry used in reflection mode. The large 64 x64cm2 active area PSD has been designed in collaboration with BNL and the ILL, andconstructed at ANST0 161. The detector is mounted in a vacuum tank that can be rotated +5 to -300 in 26 to expand the accessible q range. The sample position provides a range ofenvironments including a computer controlled sample changer that can operate in vacuo, or inthe laboratory atmosphere. Since the instrument is located on a thermal neutron source, the fluxis modest particularly at longer wavelengths. Nevertheless, considerable useful work is beingundertaken on samples with high contrast and large physical dimensions.
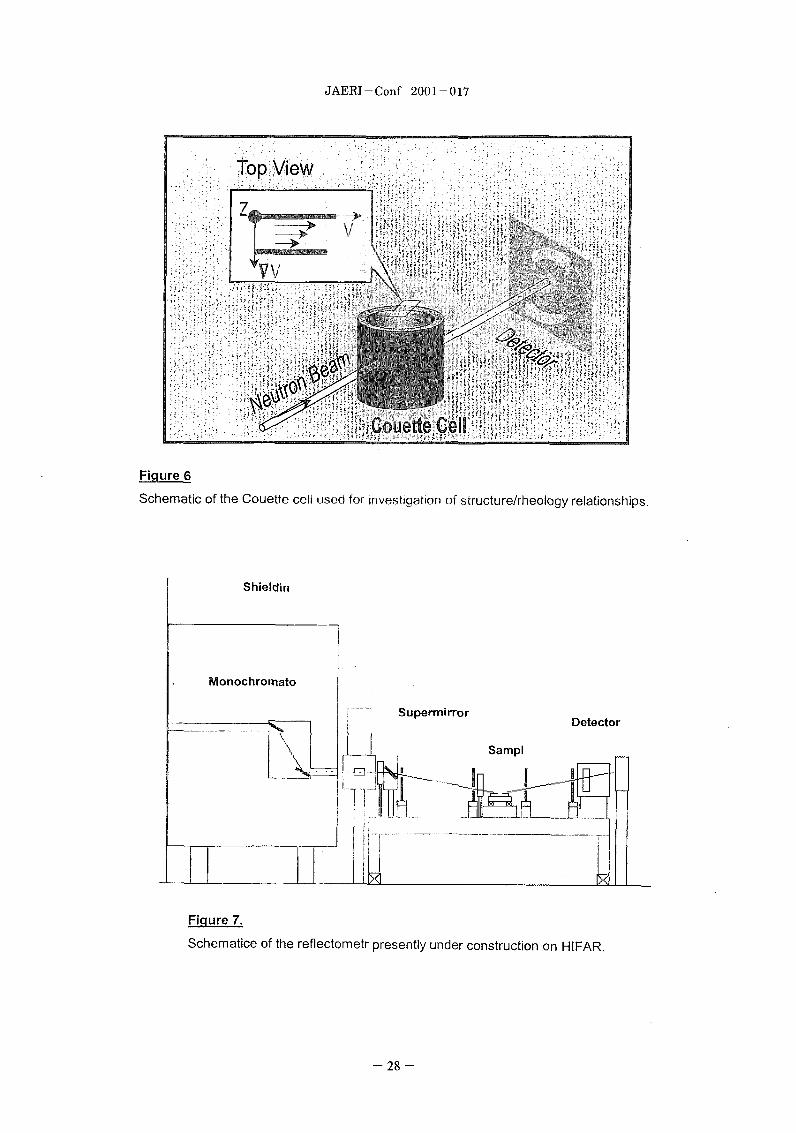
A number of sample environments, including a range of temperature controlled cells for liquids,polymers and gels, is presently available. The most recent addition is a temperature controlledCouette cell for investigating the structural changes induced by an applied shear field (Figure 6).
Reflectometer
A reflectometer has been designed and is presently being constructed. The instrument will besuitable for both solid and liquid surface reflectivity measurements, and polarised neutronfacilities will be added in a later development phase. The neutron wavelength will be either1 .75A (Cu) or 4.OA (pyrolytic graphite) produced by the dog-leg monochromator. The resultant qrange (liquids) will be 0.005 - 0.17A-: and the q resolution (Aqlq) will be 6%. Accessiblereflectivities will be -10-5. Figure 7 is a schematic of the reflectometer. When complete, theinstrument will facilitate a number of useful experiments in surface structure (monolayersurfactants, for example) and enable capability development.
- 16-

JAERI-Conf 2001-017
NEUTRON SCATTERING SCIENCE
International scientific assessments rate the neutrons produced by research reactors as aunique and broadly applicable scientific tool for leading edge, basic and applied investigationsacross a wide range of scientific and technological disciplines in physics, chemistry, biology andmedicine. Because neutrons probe in a non-destructive way, they are particularly suited forinvestigating the microstructure and properties of existing solid and liquid materials and ofemerging advanced materials in the aerospace, automotive, biotechnology, petrochemical andtelecommunications fields. As each new class of materials (eg, high-temperaturesuperconductors, carbon-cage "fuilerene" molecules) has been developed, neutrons have beenthe primary tool for studying the properties and understanding the behaviour.
Whilst opportunities exist to pursue scientific ideas of a fundamental nature, in general, theneutron scattering science at ANSTO is problem driven. Consistent with ANSTO's mission tocontribute to the vitality and competitiveness of Australian industrial research and development,the neutron scattering effort has a focus on science that support this mission. Recent studies ofpractical significance include the following:
* To estimate the .pore structure of rocks intact. Porosity in rock controls the flow of oil to thewell head. An ideal bore should have a porosity that allows the oil to flow but does not allow thedrill lubricant to penetrate. If possible, therefore, the location of the oil well should take this intoaccount hence porosity needs to be determined. A problem is that conventional methodsusually underestimate porosity and require the rock sample to be crushed. SANS is a means toovercome these limitations and at the same time measure the smaller pores that have the majorinfluence on oil flow. SANS measurements are being coordinated with conventional methods.
* To estimate the pore structure of metals and contaminated metals during the refining
process. Metal extraction from an ore in a blast furnace obviously requires the addition of afiring agent. Separation of the residual firing agent from the molten metal is the key to theefficiency of the blast furnace. This separation is a wetting problem. Pore size determination ofthe residual is needed to determine if pore size and distribution is a factor. Pore sizedetermination on the nano-scale must be combined with techniques that determine theinterfacial structure on the atomic scale.
a To investigate template/framework interactions during the synthesis of oxides with orderedmesoporosity, controlled wall thickness and domain sizes exceeding 100nm (particularly titania)by surfactant templating. SANS contrast variation will be used for in-situ studies of the evolutionof the ordered oxide framework, surfactant self-assembly processes, and surfactant/metal oxideprecursor interactions in "isolation".
a Production of mesoporous titanate gel microspheres from sheared sols. To investigate theeffect of shearing precursor sols on the microstructure and porosity of spray-dried gelmicrospheres. Simultaneous SANS/rheology studies on sheared silica sols have indicated thatthe application of shear during the sol-gel transition profoundly alters the properties of theresulting gels. This work is being extended to titanate-based sols, and the effect of suchshearing on the properties of titanate gel microspheres (e.g. porosity) is being determined.
a Crystal growth in contaminated environments. The goal of the study is to measure crystalgrowth in aqueous solutions contaminated with organic impurities and propose methods toremove the contaminants. Metal refining requires the treatment of complex contaminated ores.
- 17-

JAERI-Conf 2001-017
Metals are extracted from the appropriate crystals that must be isolated and grown in thiscontaminated, organic environment. How these organics affect crystal growth is a majorconcern to industry.
e Nanocomposites. To prepare and characterise nano-structure organo-clay minerals andorgano-colloid composites. The potential of using clay as the filler in a polymericorganic/inorganic composite is well understood and appreciated. The properties, however, of acomposite are most influenced when the largest possible clay surface area is presented to thepolymer matrix. Ideally, the clay should be fully dispersed into its constituents and bonded to thematrix using an appropriate organic intermediary or the polymeric material itself. Unfortunately,clay platelets tend to form large aggregates in the presence of organics, so normally will not
disperse. The problem is to prevent this aggregation. The solution will not only allow themanufacture of nanomaterials, but will impact significantly such divers areas as pollutionprevention and remediation, enhanced oil recovery and the treatment of petroleum liquids andthe manufacture of cosmetics and pharmaceuticals.
a Deposition in petroleum liquids. The aims of the study are to monitor and measureasphaltenes and waxes in petroleum fluids and propose possible growth arrestors to preventtheir formation. Deposition is a major economic problem in oil extraction, transport and refiningparticularly in Australian oil fields. Deposition can occur any time when the ambient conditionsare changed eg changes in temperature and chemical composition of the petroleum fluid itself.There is an urgent need for growth arrestors to prevent the formation of asphaltenes and waxes.It is necessary to understand the physical and chemical nature of asphaltenes before any growtharrestors can be used effectively.
. Inorganic materials with ordered mesoporosity. The synthesis and structure of inorganicmaterials with ordered mesoporosity and surface areas exceeding 1000m2/g, using self-assembled surfactant systems as supramolecular templates, is an important, emerging field inMaterials Science. Such materials have applications in areas as diverse as ion exchangers,selective sorption of cations and anions, filtration, catalysis, biomolecuie separations, formationof semiconductor nanostructures, etc. They could also form the fundamental building blocks forthe development of a range of "Smart Materials" with surfaces functionalised for a range ofspecific environmental responses. Although there have been numerous reports of thepreparation and characterisation of tempiated silica systems (eg MCM-41), there have been onlylimited reports of templated mesoporosity in alternative metal oxide systems such as titania, tinoxide, zirconia, niobium oxide, tantalum oxide, alumina, etc. In addition, many of the reportedproducts are not pure metal oxides, and contain residues due to incomplete removal of thetemplating species during sample washing and/or pyrolysis. They also contain significantquantities of disordered and/or amorphous material.
THE AUSTRALIAN NEUTRON SCATTERING COMMUNITY
The neutron scattering community in Australia is distributed throughout universities, governmentresearch organisations and industry. Within this context, neutron scattering is identified as anational facility and this influences the funding for its continued use and expansion. The neutronscattering group at ANSTO undertakes scientific research as well as the development ofinstruments and techniques for neutron scattering and provides assistance to guest scientistswith instrument operation and data analysis.
- 18 -

JAERI-Conf 2001-017
In order to become more globally competitive, Australian industry is investing in research and
development. As a consequence there is an increasing number of industry based scientists
becoming involved in neutron scattering science. This is particularly relevant in the mining and
mineral processing, environment, polymer and food industries.
The attachment of guest scientists to ANSTO from Australian universities is facilitated by the
Australian Institute for Nuclear Science and Engineering (AINSE) (http://www.ainse.gov.au).
AINSE is a consortium of 36 Australian and New Zealand universities in partnership with
ANSTO, and was established to provide a mechanism for access to all the special facilities at
ANSTO by universities and other tertiary institutions.
REPLACEMENT RESEARCH REACTOR
The Australian Government has decided that HIFAR will be replaced to ensure that Australia
retains the capabilities to produce its own medical and industrial radioisotopes, to conductnuclear based research and to maintain the first hand ability to remain abreast of international
and regional nuclear developments and regulation. The decision to replace the HIFAR research
reactor by the year 2005 will opened up new opportunities for Australia's capabilities in nuclear
medicine, neutron scattering science, environmental science, education and industrial support.
The modern neutron source will facilitate research and development relating to, for example,
polymers, ceramics and other new materials, life sciences and biotechnology, understandingcomplex industrial processes, advanced therapeutic treatment strategies withradiopharmaceuticals, and advanced environmental management processes.
Therefore, Australia's requirement is for a multipurpose neutron source with adequate facilities
for radioisotope and materials irradiation plus the ability to efficiently illuminate a range of
neutron beam tubes and sources. A pool-type reactor with its open architecture, adaptabledesign, and inherent safety and reliability features meets all the design criteria. The contract forthe design and construction of a state-of-the-art, multipurpose research reactor was recentlysigned between ANSTO and the Argentinian company INVAP S.E. and its Australian alliancepartners, John Holland Construction and Engineering Pty Ltd and Evans Deakin IndustriesLimited. The contract is basically for the reactor facility and associated infrastructure, and alarge guide hall. In addition, a reference set of eight neutron scattering instruments, scheduled
for installation by the time the reactor comes on line in 2005, has been selected by a BeamFacilities Consultative Grdup. This group represented a cross-section of Australian scientificinterests, including industry, academia, CSIRO and other research laboratories- in order toensure that the neutron scattering instruments will be the most appropriate for the Australianscientific and industrial research community, the consultative group identified present and futureresearch priorities. - As a consequence of extensive deliberations a suite of instruments wasformulated. Table 2 lists the range of instruments considered most likely to facilitate the priorityresearch science areas, and Figure 8 is a schematic of the suite of neutron scatteringinstruments located on the replacement research reactor. The neutron scattering facilities willbe built up from the existing expertise and equipment base. Design and construction of theneutron scattering instruments will be carried out by the Neutron Scattering Group at ANSTO.
Figure 9 is a photograph of an architect's model of the proposed design for the replacementresearch reactor. Table 3 illustrates the difference between HIFAR and the replacementresearch reactor.
- 19-

JAERI-Conf 2001-017
The total project will including reactor island, all associated infrastructure and buildings. It will
incorporate modern instrumentation and enhanced experimental access, high intensity neutronbeams, and a cold neutron source. Since cold neutron sources provide the basis for many of
the current advances in neutron science and technology, the replacement reactor with the mostadvanced cold neutron source will enable Australia's basic and applied research scientists toenter new areas of endeavour. An example is the field of nanotechnology, which requiresmultidisciplinary application of knowledge in physics, chemistry, mathematics, biology andelectronics and where science and engineering converge at the level of individual atoms. Thedevelopments in nanotechnology will require access to intense sources of neutrons to probe the
most minute structures of materials.
SUMMARY
Neutron scattering science is an important, integral component of the scientific and industrialresearch community in Australia. The present neutron source, HIFAR, and the suite of neutronscattering instruments facilitate research programs of a very high standard. The replacementresearch reactor due to be commissioned in 2005 will build on the strengths developed onHIFAR as well as offer new opportunities particularly in cold neutron scattering science. Thecombination of four decades of experience and a modern research reactor will assure ANSTO'splace as a national and regional centre for neutron scattering science.
ACKNOWLEDGEM ENTS
The neutron scattering team at ANSTO is Sandra Leigh Cram, Margaret Elcombe, Tunay Ersez,Yang Fei, Gerard Gadd, Brett Hunter, Michael James, Shane Kennedy, Robert Knott, VenassaPeterson, Ross Piltz, Robert Robinson (Leader), Andrew Studer, Robin Walsh and HowardHanley (Scientific Advisor). Their contributions are gratefully acknowledged.
REFERENCES
1. L. Cussen, et al., Nuclear Instr. & Methods A314, 155 (1992).2. P.A. Miles, et al., J. Mag- Mag. Materials 140-144, 1317 (1995).3. S.J. Kennedy, in 'Advances in X-ray Analysis" (Plenum Press NY) 38, 35 (1995).4. A.M. Saxena and BP. Schoenborn, Materials Sci. Forum 27/28, 313 (1988).5. B.P. Schoenborn, SPIE 1738, 192 (1992).6. R.B. Knott, et al., Nuclear Instr. & Methods 389, 62 (1997).7. E.H. Kisi, et al., J. Alloys Comp. (1994)8. S.J. Kennedy, et al., J. Phy: Condensed Matter (1994).9. R.W. Cheary, J. Solid State Chem. 98, 323 (1992) J. Bartlett, Prog. Polymer Colloid Sci. (1999)
- 20 -

Table 1:
Characteristics of neutron scattering instruments located on HIFAR
Instrument Monochromator Detectors Neutron Maximum Resolution Beam size
Wavelength Neutron Flux (mm)
(A) (cm 2sec')
2tanA High Resolution Single Cu single crystal 1 (BF3) 1.235 6 x 10⁵ 0.40 at 50 (20) 10 diameter
Crystal Diffractometer 0.20 at 500 (20)
(2D (162 elements) 3H 0.75° at 1050 (20)
2tanB Medium Resolution pyrolytic graphite 1 (BFa) 1.239 l 0.4° at 5a (20) 10 diameter
Single Crystal 20 at 900 (20)0
Diffractometer
LONGPOL || Long Wavelength pyrolytic graphite CD8 ( He) 3.6 3 x 10 1 < E • 10meV | 30(H)x20(V) o
Polarised Neutron 0.3 <q •3.oA
||Spectrometer 1l l1 t(
| MRPD 12 Medium Resolution (Ge multiple single 32 (He) 1.06 -5.0 3.8 x Io 5 0.4° -0 8° (20) 20(H)x50(V)
M Powder Diffractometer Ge crystals
(focussing) |
| HRPD ll High Resolution Powder Ge single crystal 24 He) 1.2 - 2.96 |025Qf - 1 4° (20) 20(H)x50(V)
HRD || Diffractometer 24 2 8 x io 0 )
SANS 1 Small Angle Neutron multilayer 2D (128 elements) 2.0 - 8.0 ] -104 0.08 • q < 0.1 A" 40(H)x50(V) 1Scattering Instrument ('He)

JAERI-Conf 2001-017
Table 2.
List of neutron scattering instruments proposed for the replacement research reactor.
InstrumentJ
I Small Angle Neutron Scattering (SANS) Instrument (40 metre)
2 Horizontal Neutron Reflectometer
3 High Intensity Powder Diffractometer
4 J High Resolution Powder Diffractometer
l Polarisation Analysis Spectrometer
6 |f Residual Stress Diffractometer
7 Quasi Laue Diffractometer
8 f 3-Axis Spectrometer
9 High Resolution Backscattering Spectrometer
10 |I Amorphous Materials Diffractometer
11 f 4-Circle Diffractometer
12 J Radiography Station
13 Small Angle Neutron Scattering Instrument (6 metre)
14 Neutron Spin Echo Spectrometer
15 I[ Vertical Neutron Reflectometer
16 11 4-Circle Diffractometer
17,18 [ Thermal and Cold Neutron Instrument Development Stations
-22 -

JAERI-Conf 2001-017
Table 3.Comparison of relevant features for the HIFAR reactor and the replacement research reactor.
Feature HIFAR reactor Replacement research
reactor
Reactor power heat output (MW) jf 10-15 if 14-20
Neutron Flux (x 1014 n cm- 2 S-1) Jf 1 | At least 3
[Number of fuel elements f 25
Fuel enrichment (% uranium-235) f 60f 20% ]Fuel load (kg uranium-235) _ f ._I
Achitecture II Tank 1s Pool
Core Loose array of fuel C compact array of fuel
elements 1f elements
Spent fuel elements a year 3i 5_ ]I[Coolant Df 020 1f H20
Reflector f D20 t 320°
Experimental positions* If _ If 17 (max)
Neutron guide hall ! No f Yes
Beamline geometry Radi Tangential
Cold source j[ No | Yes
Hot source [ No Yes
Notes:* for neutron scattering instruments# dependent upon design
-23 -
JAERI-Conf 2001-017
Figure I
Photograph of the interior of the HIFAR reactor building. The top plate of the reactor tank has been
removed for routine maintenance. Note the limited space for neutron scattering instruments.
24 -

JAERI-Conf 2001-017
< t !>AUSANIS
HIRPD aHRPD LONGPOL
ProposedM/llRPD \ S -> / Reflectom eaer
TAS
Figure 2.
Disposition of the neutron scattering instruments on HIFAR.
-25 -

JAERI-Conf 2001-017
Reodor. face
Mi. &A 2j.:Pyro~ikigf[¢hi?. MnDn Dch roffial Dr
itxz Orn~~of.pile. Sh ifeinq
4IDD
Figure 3.
Schematic of the Long Wavelength Polarised Neutron Spectrometer (LONGPOL) on HIFAR.
HiC kfsowfei PyarR Df'rOw¢r (HRPD)
SU0ERfLS I
SrlllrR ~ ~ ~ KTO MtC
roeU iSoS esubno PONMXR DartsOW (MRPD)
Figure 4.
Schematic of the two powder diffraction instruments (MRPD and HRPD) on HIFAR.
-26 -

JAERI-Conf 2001-017
z
00 Uj~~~~~
Figure 5.
Schematic of the small angle neutron scattering (SANS) instrument on HIFAR.
- 27 -
JAERI-Conf 2001-017
; :: Top View n ;-:
Figure 6
Schematic of the Couette cell used for investigation of structure/rheology relationships.
Shieldin
Monochromato
Supermirror Detector
Sampl
Figure 7.
Schematice of the reflectometr presently under construction on HIFAR.
- 28 -

JAERI-Conf 2001-017
>
tt~~~~~~~~~~~~~~~~~~1t~~~~~~~~~
-c
C.)
CVU
E~ ~ ;1, E W
0)
::T:c rltV 0 D r,4a2 ! j F A O
°0: $ f ] t D X g - b - °~~~~~~~~~~~~~CI t B F g P a: ~~~~~~~~~~~~~ t~~~d ,lt r~~~~~~~r~~~ju- r g 2 S~~~~~C.
F /-d; ' \ 04 /60 0 g 7 7 \ a en i t; O~~~~~~~~~~~~~~~~~~~~~~~~~~~(A
v X v
a~~~~~~~~~~~
t .03 , g , M g \ f ll s-° at~~
_0_C i' 0ff:02002 g | gf):1 | , r;:0:?D 'StU O~~~~~~~~~~~~~~~~~~~~~~~~~~~~~~~C~
: ~~~~~~~~~~~~~~~~~~~~~~~~~~~~~~~~~~~~~~~~~~~~~~., g) ,||;
Jig / g B d _~~~~~~~~~~
- 29 -

JAERI-Conf 2001-017
Cl)
a)
Co
0
_0
0
a,C.,
co
30 -~~~~~~~~~
u 3 a ~~~~~~~~~~~~~~~~0
g S E E X~~~~~~~~~~~~~~~~~~~~~a
ER # R <%~~~~~~~~~~~~~~~~~~~~~~a
f l 11|_1~~~~~~~~~
| l ) ~~~~~~~~~~~~~~~~~oi f l _g f _s~~~~~~~
i i | | l 11 o~~~~~~~
-30-1
JP0250087JAERI-Conf 2001-017
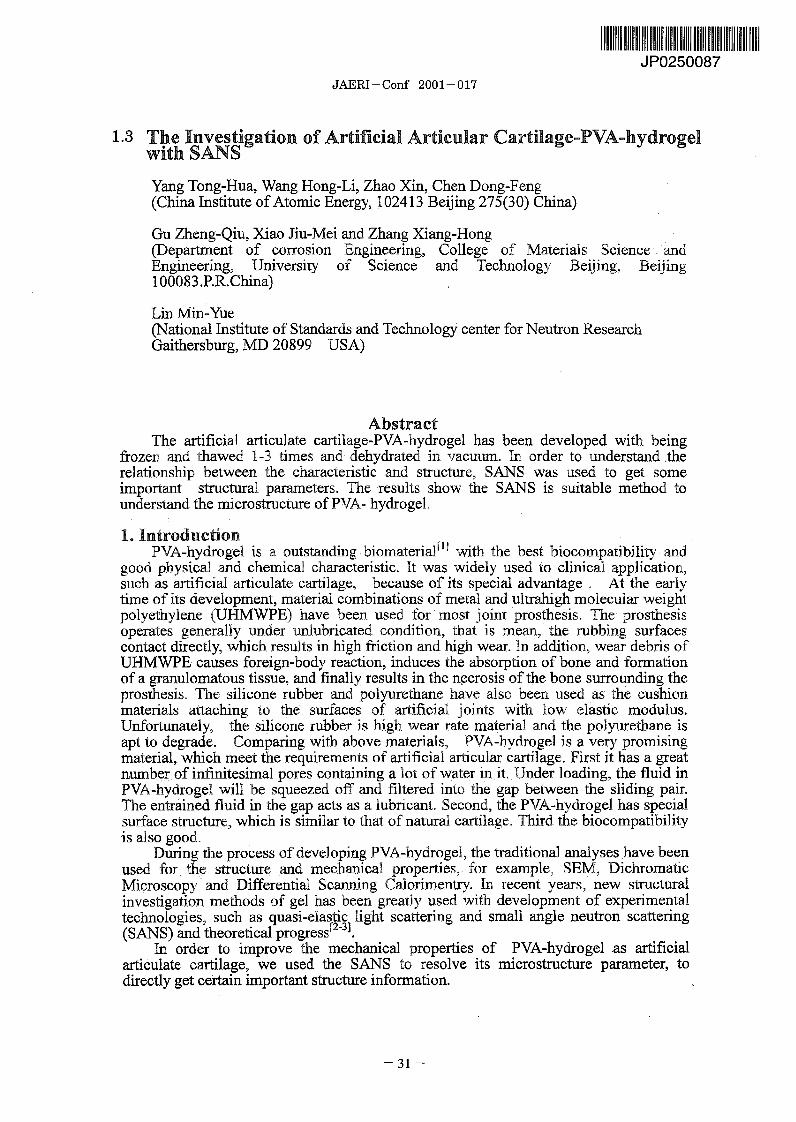
1.3 The Investigation of Artificial Articular Cartilage-PVA-hydrogelwith SANS
Yang Tong-Hua, Wang Hong-Li, Zhao Xin, Chen Dong-Feng(China Institute of Atomic Energy, 102413 Beijing 275(30) China)
Gu Zheng-Qiu, Xiao Jiu-Mei and Zhang Xiang-Hong(Department of corrosion Engineering, College of Materials Science andEngineering, University of Science and Technology Beijing, Beijing100083 .P.R.China)
Lin Min-Yue(National Institute of Standards and Technology center for Neutron ResearchGaithersburg, MD 20899 USA)
AbstractThe artificial articulate cartilage-PVA-hydrogel has been developed with being
frozen and thawed 1-3 times and dehydrated in vacuum. In order to understand therelationship between the characteristic and structure, SANS was used to get someimportant structural parameters. The results show the SANS is suitable method tounderstand the microstructure of PVA- hydrogel.
1. IntroductionPVA-hydrogel is a outstanding biomateria1lt' with the best biocompatibility and
good physical and chemical characteristic. It was widely used to clinical application,such as artificial articulate cartilage, because of its special advantage . At the earlytime of its development, material combinations of metal and ultrahigh molecular weightpolyethylene (UHMWPE) have been used for most joint prosthesis. The prosthesisoperates generally under unlubricated condition, that is mean, the rubbing surfacescontact directly, which results in high friction and high wear. In addition, wear debris ofUHMWPE causes foreign-body reaction, induces the absorption of bone and formationof a granulomatous tissue, and finally results in the necrosis of the bone surrounding theprosthesis. The silicone rubber and polyurethane have also been used as the cushionmaterials attaching to the surfaces of artificial joints with low elastic modulus.Unfortunately, the silicone rubber is high wear rate material and the polyurethane isapt to degrade. Comparing with above materials, PVA-hydrogel is a very promisingmaterial, which meet the requirements of artificial articular cartilage. First it has a greatnumber of infinitesimal pores containing a lot of water in it. Under loading, the fluid inPVA-hydrogel will be squeezed off and filtered into the gap between the sliding pair.The entrained fluid in the gap acts as a lubricant. Second, the PVA-hydrogel has specialsurface structure, which is similar to that of natural cartilage. Third the biocompatibilityis also good.
During the process of developing PVA-hydrogel, the traditional analyses have beenused for the structure and mechanical properties, for example, SEM, DichromaticMicroscopy and Differential Scanning Calorimentry. In recent years, new structuralinvestigation methods of gel has been greatly used with development of experimentaltechnologies, such as quasi-elastic light scattering and small angle neutron scattering(SANS) and theoretical progresst2 31.
In order to improve the mechanical properties of PVA-hydrogel as artificialarticulate cartilage, we used the SANS to resolve its microstructure parameter, todirectly get certain important structure information.
- 31 -

JAERI-Conf 2001-017
II Sample preparation and TestCommercially available PVA with a degree of polymerization (DP) of 1800 (1799
PVA) was provided by the Beijing (second) chemical factory, China. The degree ofsaponification is 99.9 mol %.
The 1799 PVA was dissolved in 90'C water in autoclave for about 6h. The PVAsolution was poured into the die, frozen at about -200C for 6-12h, then thawed at roomtemperature for 1-2h. The above freezing-thawing process was repeated for 1-3 times.Finally the frozen specimens were dehydrated in vacuum for about 1 Oh.
The PVA-hydrogel was observed by means of dichromatic microscopy and SEM.The specimens were dried in an alcohol environment for 2h, then dehydrated in vacuumfor 24h to get rid of all of the water. Differential scanning calorimentry (DSC) wascarried out on DSC 7-differential scanning calorimentry analyzer made bv Perkin-ElmerCorporation in USA. Aluminum pans with a scanning rate of I00C min were used forthe samples. The specimen was in an environment of flowing argon (Ar).
The ensile tests were conducted on a LLDYD-2000R material testing machine(rate of extention=~10mm/min). In addition, the indention test were also performed onthe above testing machine and a plain-end cylindrical indented was used to evaluate theelastic compression modulus of the'specimens soaked in 0.9% NaCI solutions at 37'C
III Experiment and ResultsThe neutron-scattering experiment was carried out on the small-angle neutron
scattering facility-NG7 at the National Institute of Standards and Technology(NIST),Maryland, USA. The PVA sample was swollen in the heavy water and poured intoquartz cells and keep it several hours, in order to get swelling balance before the SANSmeasurements. A flux of cold neutrons was monochromatized with a velocity selectorof wavelength Xt-6A. The scattered intensity was corrected for air scattering, incoherentscattering, fast neutron, and then re-scale to the absolute intensity.
2504-250 > | a-PVAd o | 24-s | a-PVAd o -
2.0200 1
E \ E 1.6l oo 8
50 -~~~~~~~~~~~~~~~~~~~~~~~~ ~~~~ 1.2
l.0
O ~~~~~~~~~~~~~~~~~~~~~~~~~0.8 ,l, ,,, ,
.001 0.02 0.03 0.04 005 2 -20. -1 -16 -1 4
q/AN' Log1 qt(A )J
Figure 1. l(q) - q curve Figure 2. LogioI(q) - Logloq curve
Figure I shows the scattering intensity profiles of SANS experiment forPVA-hydrogel. The scattering intensity decreases monotonously with q and shows noscattering peaks.
Figure 2 shows double logarithmic plot of the scattering intensity I(q) versus thescattering vector q for the PVA-hydrogel sample. The value of D should be obtainedfrom the slope at the high-q region. We obtained the value of D from the slope of thecurve. The fractal dimension D is one of the most important parameters to describe the
- 32 -

JAERI-Conf 2001-017
gel structure. D, which is 2.8±0.1, is strongly depend on the structure characteristic ofamorphous zone.
4.5 a .
5.0
4.00
:1: * 0.0 -
3.0 - 3.S a-PVAd |
2.5, 0.04 -,.
2.0 0.02
0.0000 0o65 0.0010 0.0015 0.0020 0.002 o.0000 o.oos 0.0o l 0.0015 0.0020 0.0025
Figure 3. lnI(q)-q 2 curve Figure 4. I(q)-'q 2 curve :
Figure 3. shows the plot of logarithmic I(q) versus q2 for PVA-hydrogel sample.From the slope we can obtain the Rr[4l, which is interpreted as the radius of gyration ofpolymer dense or poor domains. In this measurement, the slope is not totally straight,and it demonstrate that there is a tendency size- distribution in this. system. Themaximum RG malx is around 273.6A.
Figure 4. shows that plot [I(q)-I vs q2j, we can make the asymptotic line for theplot. And get the 4, which is the correlation length(or blob size[5
]).
From the simple treatment of our SANS data we can get certain importantparameters of microstructure of gel. So we think that Small-angle neutron scattering is apowerful tool for the investigation of Small-scalestructure of polymer gels.[63
References[1] Gu Zheng-Qiu,Xiao Jiu-Mei and Zhang Xiafig-Hong Bio-Medical Material andEngineering 8 (1998) 75-81[2] Mitsuhiro . shibayamaHidenobu Kurokawa and Shunji Nomura et;POLYMER,1992,Volume 33,Number 14[3] Wen-li Wu, Mitsuhiro shibayarnaSaroj Roy et. Macromolecules 1990,23,2245-2251[4]Mitsuhiro shibayama and Toyoichi Tanaka J.Chem.Phys. 97(9) November 1992.[5] Mistsuhiro shibayama ," Small-angle Neutron Scattering on Polymer Gels"[6] Simon Mallamn,Ferenc, Anne-Marie Hecht, Adrian R, Rennie and Erick Geissler,Macromolecules 1991.24. 543-548
-33 -

JP0250088JAERI-Conf 2001-017
1.4 CURRENT STATUS OF NEUTRON SCATTERINGIN INDONESIA
Abarrul IkramnNeuitron Scattering Laboratory
R & D Centre for Materials Science & TechnologyNational Nuclear Energy Agency
Serpong - Indonesia
ABSTRACT
Neutron Scattering activities in Indonesia during the last one year period arereported in this paper. The National Neutron Scattering Seminar in Serpong as an effort togather people interested in Neutron Scattering is also described. The neutron beamfacilities in Serpong include one diffractomneter for residual stress measurement (DNI-M),one diffiractometer for single crystal structural determination and texture measurement(FCD/TD), one high resolution powder diffractometer (HRPD), one neutron radiographyfacility (NRFT), one triple axis spectrometer (TAS), one small angle neutron scatteringspectrometer (SANS) and one high resolution small angle neutron scattering spectrometer(HRSANS). This paper discuss -three out of these seven neutron beam instruments whichare related to this workshop. HRSANS is working but not at its best condition. The othertwo i.e. HRPD and SANS are running well especially HRPD which is heavily used. Thelatest situation of the reactor and its operation mode is also described briefly in connectionwith the activities of the neutron scattering instruments.
1. INTRODUCTION
In the last three workshops we have presented the neutron scattering facilities inSerpong together with their problems, guesses of the causes as well as the possibility ofovercoming them especially the ones related to the workshop which include three mainneutron instruments.
In 1992, BATAN commissioned some instruments utilizing neutrons produced bythe Multi-Purpose Reactor (RSG) GA Siwabessy in Serpong. These instruments areneutron powder diffractometer, four circle/texture diffractometer, triple axisspectrometer, neutron radiography facility, small angle neutron scattering (SANS)spectrometer, high resolution SANS spectrometer and high resolution powderdiffractometer (HRPD).
The first four instruments were installed in the reactor experimental hadl (XHR)while the last three are located in the neutron guide hall (NGH). Those two halls areconnected by a tunnel in which two neutron guides are used to take neutrons from thereactor to the instruments in the neutron guide hall. Lay out of the neutron instruments inthe reactor hall (XHR) and in the neutron guide hall (NGH) is presented in figure 1.
-34 -

JAERI-Conf 2001-017
After five years in operation, some and different problems have come out fromeach instrument which raised some questions of how to solve them. Many efforts havebeen done by BATAN with the help from other established neutron scattering centres inthe world especially from JAERI. In this paper we present again briefly the current statusof three instruments closely related to this workshop together with efforts that have beendone in the past one year to find alternative solutions of some problems, and we expectsome positive responses from this workshop in utilizing the spectrometers.
2. THE RESEARCH REACTOR
The research reactor, called RSG-GAS (Multipurpose Reactor - GA Siwabessy) inhonor to Prof. GA Siwabessy for his contribution in promoting and developing atomicenergy in Indonesia, is a light water open pool reactor with a maximum thermal power of30 MW. It is considered to be the first high-power research reactor in the world, designedand constructed for the use of low enriched (19.75%) uranium MTR-type fuel. It producesan average thermal neutron flux of 2.5 x 10¹⁴ n cm 2 secA at the central irradiation positionin its core. An L-shaped beryllium block reflector surrounds one half of the core. Sixbeam tubes - two tangentials and four radials - are available for neutron experiments.When they are not in use these beam tubes are flooded with water and closed by theinsertion of concrete plugs. One of the beam tube has a larger diameter (0 = 27 cm) thanthe others (0 = 24 cm), to accommodate two thermal neutron guides supplying neutronbeam for the spectrometers in the extemal neutron guide hall (NGH). In addition, thereactor provides facilities for nuclear engineering expenriments, neutron activation analysisand radioisotopes production. The arrangement of the beam tubes and other facilities inthe reactor core is shown in figure 2.
The RSG-GAS. has achieved its criticality in 1987 and reached its full power level of30 MW thermal in 1992. However continuous regular operation was started not earlierthan 1995. The delay was due to a long shutdown period owing to the installations of thein-pile engineering loops radioisotope production equipment, neutron scatteringinstruments, and also due to other technical problems.
i 1996, the reactor has been operated quite regularly for three cycles per month andnine days per cycle. In order to improve the radioisotope production, in 1997 the reactoroperation has been made weekly with 5 operation days with reactor power of 25MWthermal. This was not so convenience for the neutron scattering activities. After someconsultations and discussions, the reactor operation mode has been compromised andchanged to 12 days operation and followed by 9 days off. Thlls schedule has been settledand started in July 1998 and lasted until July 1999. in return the reactor will only be inoperation at 15MW thermal to maintain the length of the operation with the available fuelelements. Due to some more problem in the financial sector, in the past one year thereactor has been in operation for 12 days followed by 16 days off which means we haveneutron beams for 12 days monthly which is about 100 days yearly.
So far the neutron beams have been used for most of the scheduled operation days.This continuous and regular monthly scheduled operation days give advantages inplanning the experiments in advance and improve the reliability of the neutroninstruments.
- 35 -

JAERI-Conf 2001-017
3. NEUTRON SCATTERING INSTRUMENTS
3.1. SANS SPECTROMETER
This instrument is installed at the end of the 58 m long neutron guide (NG-l),situated in the neutron guide hall (NGH), to benefit from low background environment.The incident beam is monochromatised by a slot-type mechanical velocity selector havinga minimum rotational speed of 700 rpm and a maximum rotational speed of 7000 rpm,The selector's tilting angle can be varied from -3.9° to +3.9'. By varying these rotationalspeed and tilting angle, neutron wavelengths of 2-5 A and a Q range of (0.001<Q< 0.6) A`can be obtained.
The collimator is placed in an 18 m long tube, comprises of four sections of movableguide tube, and one section of a fixed collimator (non-reflecting) tube. Collimation ismade by adjustable apertures (pinholes) at discrete distances of 1-5 m, 4 m, 8 m, 13 m and18 m from the sample position The detector, which can be moved continuously from 15m to 18 m in anotherl8 m tube, is a 128 x 128 He-3 two dimensional position sensitivedetector (2D-PSD) made by RISO, with three beam stoppers of 40, 80 and 140 mm indiameter. The whole system excluding the sample position is evacuated to 10- torr.Variation of collimation length and sample to detector distance are fully computercontrolled. An automatic sample changer with six sample holders is provided.
i the last two years, many efforts have been carried out to bring this spectrometer inaction, including the SANS subworkshops held together with the workshops. Some of itscomponents have been replaced, but there are still many others need carefull attention andrepaired, such as the velocity selector, control motor for the guide tube and beam stopperto mention a few. Last year we reported in Mito, Japan the problem coming from aspurious peak. We have tried to adopt the'solution taken in JAERI by covering some partof the guide tube entrance after the velocity selector. It seemed at that time that it waseffective, especially for experiments where the detector are placed at a distance which isless than 5 meters from sample position. Some checkings after that proved that actuallythe method is not working, especially for longer sample to detector distance experiments.
We also have checked some combinations of the pinhole and it seems that the neutronleakage is coming from the second guide tube in the collimation path. Right now we arerunning the experiment by placing neutron absorber in front of the sample to absorbneutron coming from other source. Eventhough this doesn't solve the problem completely,but for the time being, it works for some number of experimental settings.
3.2. HRSANS SPECTROMETER
This neutron spectrometer, which is similar to the Bonse-Hart type diffractometerfor small angle X-ray scattering, extends the Q range covered by SANS spectrometer tolower Q. This increases the sensitivity of inhoomogenity on length up to some microns. T7heinstrument has a PG(004) monochromator mounted on the neutron guide (NG-2), 63 maway from the reactor core.
Two nearly perfect Si(31 1) single crystals are used as monochromator (AVX =
0.15 %) and analyzer (AO = 0.0001°) and installed on goniometers. These goniometers
- 36 -

JAERI-Conf 2001-017
which provide rotation, translation and tilting movements are mounted on an opticalbench moving on air cushions and controlled by a computer or handy tenninal (Hf).Three detectors are installed for alignment, monitoring and diffracted beammeasurements.
The sample with a maximum size of 30x30 mm2 is placed between the two Si(31 1)crystals whereas the whole system is installed in a thermostatic room to obtain constantsample temperature within 0.5° C.
This spectrometer has already been in operation since 1992, but we couldn't haveutilized it very much. This is due to the problem in performing the calibration everytimewe want to start this machine. Even in the middle of running it, we have to startcalibration again if there is an electric failure. So, actually we have calibrated thisspectrometer so many times or in another word everytime. A solution that we have forseenis by changing the software so we can keep the calibration state even when we turn of theelectronics. It would be a great help if this meeting can provide us with suggestions forsolving this problem.
3.3. HRPD (HIGH RESOLUTION POWDER DIFFRACTOMETER)
The -RPD, which is the most heavily used instrument for the time being, isinstalled at the neutron guide (NG2) in the Neutron Guide Hall (NGH) about 71 I m awayfrom the reactor core. The monochromator drum has three beam exits corresponding tothree different take off angles, 2 6 M = 41.5', 89° and 130°. At present the instrument is setfor 26M =890.
In the last three years we found so many strange things coming to the diffractionpatterns of this diffractometer. The worst problem is that we cannot get the same thingagain. This means that it is not reproducible. In order to solve this problem, we replacedsome of the 32 detectors with the help of JAERI two years ago. We have reported theresults last year in Mito. It did help in some part of the pattern, but the rest still remainsunpredictable- At that time we received suggestions to replace the third collimator andcheck and evaluate the electronics after the detectors. In June this year we had theopportunity to replace the third collimators with the help of 3AERJ. At that time wereplaced our original 10 minutes collimator with the 6 minutes ones from JAERI. Figure 3presents the diffraction patterns of TiO2 standard sample taken after the replacement ofthe third collimators with the 6 minute ones, while figure 4 shows the diffraction patterntaken earlier before the replacemnent. Eventhough we can see some improvement,especially the elimination of some extra intensities around 130' of 2theta angle, but thereis another sharp and strong extra peak below 400 of 2theta angle. We still couldn't find outthe origin of this extra peak and some other smaller peaks. On the other hand, as it ispredicted before, the intensity of the whole pattern is becoming a bit less for the 6 minutescollimators. The confusing problems are that this diffraction pattern is not constantly beproduced everytime.
-37 -

JAERI-Conf 2001-017
4. NATIONAL SEMINAR ON NEUTRON SCATTERING
Last June, we held the third National Seminar on Neutron Scattering in Serpong.The first seminar was launched in 1998 to gather people who has interest in neutronscattering in general. We had 20 papers presented orally and in the form of posters. Therewere about 100 partipants all together discussing many aspects of neutron scattering inIndonesia. Last year this seminar presented 23 papers all together and attended by about150 participants. At that time the idea of replacing the control system by microcontrollerswas raised and gathered strong support from the audience. The seminar this year, whichwas held on June 28, was presenting 34 papers. Many of the papers related more to theinstrumentation since last year we agreed to solve our instrumentation first beforelaunching some neutron scattering experinents. We expected that by handling ourinstrumentation by ourself will lead to a better state in the operation and maintaining ofthe instruments. In the second week of August 2000 we held a training course discussingmicrocontroller as alternative solution for the problem in the instrumentation of ourspectrometers. Out of that course, we are pursuing the possibility of replacing somecomponents to the ones that can be produced and repaired by our ownselves in the future.Right now we are planning to implement this on the four circle diffractometer/texturediffractometer (FCD/TD).
5. SUMMARY
The conditions of the three neutron scattering instruments, i.e. SANSspectrometer, -RSAINS spectrometer and HRPD have been reported. Problems andshortcomings that attached with each instrument have also been presented together withsome efforts in dealing with them. The help from JAERI and the previous workshops andsub-workshops is acknowledged and received with gratefulness.
Right now HRPD is the most heavily used instrument since it is stil capable to runsome structural analysis. Some rooms for improvements are still available especially inthe area of increasing its electronics capabilities.
The next instrument in line is the SANS spectrometer which is ready for some realexperiments. Some of its components need replacement and/or repair due to their ages.Eventhough the spurious peak is still an obstacle in the instrument, some data taken frompolymer samples are quite acceptable.
The HRSANS spectrometer is still has the calibration problem but it can handle thetasks good enough, especially when the calibration is already in place. Suggestions andsolutions from this workshop will be appreciate.
6. ACKNOWLEDGEMENT
The author would like to thank STA Japan for the financial support so he couldfattend the workshop to pre.scnf this paper. He is also very grateful to JAFRI, KAERI and
MOST for the support. Thank is also due to Mr. Yatno for his help in preparing thispaper.
- 38 -

JAERI-Conf 2001-017
7. REFERENCES
1. A. Ikramn, IAEA TCM on Neutron Beam Research, Lisbon, Sept. 70-12 19972. A. Ikram, National Syrmtposium on X- Ray and Neutron Scattering, Serpong,
May 13, 19983. A. Ikram, Workshop on the Utilization of Research Reactor, Mito, Nov 29 - Dec 2,
19994. A. ]kram, National Symposium on X-Ray and Neutron Scattening, Serpong, June 28,
2000
-39 -

JAERI-Conf 2001-017
-s
XHR~ ~~ ~~~~~~~~~~~~~~GNOMT-IT
t~~~~~~~~~~~~~~~~~~~~~~~m.
Figure 1. The Layout of the neutron scattering instruments in the reactorexperimental hail (XHR) and in the neutron guide hall (NGH)
_ N~~~~~~J~ ^Fuel Assemubly= - NRS4 EBeryllitm Reflction Element9 TR = Irradiation Position (reflector)___________________________CIP Central Irraiation Position
, _ - 2 NRS1 NRS = Nonnail Rabbit System- - ~~~~p = IrdainPosition (core)
Si. 6= Beain TubeS4 FRS = Fast Rabbit Systean
NRF = Neutron Radiovraphy Facility (out ofcore)
S3{, . PRTF = Power Rautp Tust Facility
' S2
NGH Neutron Guide Hall FCD/TD Four Circle DiffractometeriNGI Neutron Guide #1 Texture DiffractometerNG2 Neutron Guide #2 HRPD High Resolution PowderNDT-1 Neutron Radiography Facility DiflractometerSANS Small Angie Neutron Spectrometer TAS Triple Axis DiffractometerHRSANS High Resolution Small Angie Neutron
Scattering Spectrometer
Figure 2. The arrangement of the beam tubes and other facilities in the reactor core
- 40 -

JAERI-Conf 2001-017
3000 -- - - - - - -- - - - - - -- - - - - - I -- -- -- -- -- - ... ... ..... . ................_ ..._._.._ ...__._______.
25C0...................... ....... ............................. .......................................... _
~00-
200 , ,,,J A ,, _ ,, ,
0 - L ilLL ,\L s0 20 40 00 so 1 120 140 1G
2
Figure 3. Diffraction Pattern of TiO 2 using 6 minute Collimators
25DO ---------------------------............. --- - ---- ---- ----- ---- ---- ---- ----- ---- ---- ----.. ... ... ------- ,
lo . - -- -- - -- -- ... . ..... - ........ . . . . . . . -- --- ...................... ......-------- i
------ ------ ------ -----.-.-.-- --- .-....... ----------------.... .... .
O x I r m 1Z w I 120 140 *6
212
Figure 4. Difflraction Pattern of Ti02 using 10 minute Colilimiators
-41-

JP0250089JAERI-Conf 2001-017
1.5 MEASUREMENTS OF, PS-PEP SAMPLE IN SERPONG
A. Ikram, Sudirman and A. InsaniNeutron Scattering Laboratory
R & D Center for Materials Science & TechnologyNational Nuclear Energy Agency
Serpong - Indonesia
ABBSTRACT
SANS spectrometer in Serpong is described briefly. Results from the measurementsof PS-PEP standard samples, through and edge views, taken by the instrument arepresented and compared with the ones taken by SANS-J in JAERI. The outcome is not verysatisfactory but the features are there. Suggestions from the workshop are very invited toimprove the results not only from the instrumentation but also from the software.
1. INTRODUCTION
In the last three years SANS technique has been explore in the workshops followed bysub-workshop in Serpong (February 1999) and Tokai (November 1999). Polymer sampleshave been chosen for the study starting from SPU (segmented polyurethane), polystyrene,PMMA (polymethylmethacrylate), sodium dodecyl sulphate (SDS). The study wasintended to find out the capability of the technique as well as the instrument. Last year inMito, it was decided to run some standard samples with different SANS machines in theregion to compare the performances of the instruments in each country. In this paper wereported the results of measuring PS-PEP standard samples, through and edge views, inSerpong.
2. THE SMALL ANGLE NEUTRON SCATTERING SPECTROMETER
This instrument is installed at the end of the 58 m long neutron guide (NG-1), situatedin the neutron guide hall (NGH), to benefit from low background environment. Theincident beam is monochromatised by a slot-type mechanical velocity selector having aminimum rotational speed of 700 rpm and a maximum rotational speed of 7000 rpm. Theselector's tilting angle can be varied from -3.9° to +3.9°. By varying these rotational speedand tilting angle, neutron wavelengths of 2-5 A and a Q range of (0.001<Q< 0.6) A-' can beobtained.
-42-

JAERI-Conf 2001-017
The collimator is placed in an 18 m long tube, comprises of four sections of movableguide tube, and one section of a fixed collimator (non-reflecting) tube. Collimation is madeby adjustable apertures (pin-holes) at discrete distances of 1.5 m, 4 m, 8 m, 13 m and 18 mfrom the sample position. The detector, which can be moved continuously from 1.5 m to18 m in another 18 m tube, is a. 128 x 128 He-3 two dimensional position sensitive detector(2D-PSD) made by RISO, with three beam stoppers of 40, 80 and 140 mm in diameter. Thewhole system, excluding the sample position is evacuated to i0 3 torr. Variation ofcollimation length and sample to detector distance are fully computer controlled. Anautomatic sample changer with six sample holders is provided. Figure I shows theschematic block diagram of the instrument.
In the last four years, many efforts have been carried out to bring this spectrometer inaction. Some of its components have been replaced but there are still many others needcareful attention and repaired such as the velocity selector, control motor for the guide tubeand beam stopper to mention a few.
3. EXPERIMENTAL SETTINGS
The experiment is carried out by placing the detector at 12 m position away fromthe sample position. The beam stopper of 80 mm in diameter was applied. In order to keepthe simmetry, we replace the the last three guide tubes with non reflecting tubes to bring theneutron source away fiom the sample. The combination of pin-hole setting was chosen sothe neutron beam is optimized. The first pin-hole was open, the following five pin-holeswere set at 30 mm, 20 mm, 14 mm, 10 mm and 10 mm in diameter respectively. Thevelocity selector was set at 7000 rpm correspnding to producing neutron with. lambda at
*0.408 nm. The samples, through and edge views, were placed in the air atmosphere at thesample changer. It took 3 days to run the whole experiment including measuring the patternfrom water, cell, empty, background and 6 hours for each sample. Eventhough we havetaken the data for several time while the reactor at 15 MW thermal power, but the resultsthat we are reporting here in this paper are the best ones and were taken at the time whenthe reactor was operated at 10 MW thermal power.
4. RESULTS
Figure two presents the results of the measurements. The top picture shows thepattern taken from the through view sample. We can see the first peak at 0.07 nrn 1 and aveiy shallow hump at about 0.125 nm i, while the third is a bit distracted and slash in twohumps with the centre at about 0.19 nrnl. The lower figure is presenting the pattern fromthe edge view sample. It is obvious that there are two peaks with a small hump in themiddle. The first peak is at 0.07 nm', while the hump is centered at 0. 16 nm i, and the lastpeak at 2.2 nnm<. Figure 3 shows the results taken by SANS-J, JAERI in the last sub-workshop in Tokai last year. The quality of the results is uncomparable, but we still hopethat the instrument in Serpong can be improved.
-43 -

JAERI-Conf 2001-017
5. -SUMMARY
We have presented the SANS spectrometer in Serpong. We also present results from themeasurements of PS-PEP standard sample using that spectrometer. It is obvious that thedata were not very satisfactory, eventhough we have taken the best available data frommany trial and error experiments. We are still hopeful to improve the data quality taken bythis instrument, especially with the help and suggestions coming from this workshop.
in order to do that, we are planning to run again some standard samples in JAERI, withthe kind permission of JAERI experts, so we can calibrate the results taken by ourinstrument. Ms. A. Insani has spent four weeks in JAERI lately and she is very motivated torun some more calibration procedures in Serpong once the reactor is in operation.
6. ACKNOWLEDGEMENT
The authors would like to express their gratitude to JAERI for all the support that hasbeen provided by JAER1 to bring the BATAN SANS instrument into its best condition.We'd also like to thank Mr. SM Prasetyo and Mr. IP. Utomo who have been very helpfull inoperating the instrument and Mr. Yatno and Ms. AD Puspitasari for preparing this paper.
7. REFERENCES
I Marsongkohadi et.al, IAEA Regional Expert Workshop on Neutron Scattering andApplications, Serpong, June 16 - 20, 1997.
2. A. 1kram, IAEA TCM on Neutron Beam Research, Lisbon, Sept. 10-12 19973. A. Ikram et.al, National Symposium on X- Ray and Neutron Scattering, Serpong, 2000.
Non-rflecting Tube
Mechanical Velocity Selector Neutron Guide Tube Sinplc Detecor Track BMonitrDtctr Collint Tue zDnStpper
Figure 1. BATAN-SANS Instrument
-44 -

JAERI-Conf 2001-017
PS-PEP (TV)10000
> 100C
1
0 0.05 0.1 0.15 0.2 0.25 0.3
Q (nm-1)
PE-PEP (EV)10000
- 10(
- 10X
0 0.05 0.1 0.15 0.2 0.25 0.3
Q (nm-1)
Figure 2. SANS data from PS-PEP Sample, through view (top)and edge view (bottom), taken by BATAN Instrument
-45-

JAERI-Conf 2001-017
._ * F I I I
0.087 [nr1
.6 10
,, 169 [nm I
0.256 [nm 'I10 -
0.0 0.1 0.2 *0.3 0.4
q [nm ]104
103 0.076 [nm '
10
.6
lo' \qt 0.227 [nm ?
10~
0.0 0.1 0.2 0.3 0.4
q (nm '
Figure 3. SANS data from PS-PEP Sample, through view (top)and edge view (bottom), taken by SANS-J, JAERI
-46 -

JP0250090JAERI-Conf 2001-017
1.6 REVITALIZATION OF NEUTRON DIFFRACTOMETERSIN SERPONG
A. Ikram, M. R. Muslih, A. Purwanto, T. H. Priyanto and E. SantosoNeutron Scattering Laboratory
Research & Development Centre of Materials Science & TechnologyNational Nuclear Energy Agency
Serpong - Indonesia
ABSTRACT
The neutron beam facilities in Serpong include one diffractometer for residual stressmeasurement and one diffiactometer for single crystal structural determination and texturemeasurement. Current status of these instruments are presented together with thedevelopment carried out in the past year to overcome some of their problems. Theirperformances are also described briefly. The capabilities of the diffractometer for residualstress measurements are also discussed as well as the possibility of running the FCD/TDusing a promising modified control system which implement microcontrollers.
1. INTRODUCTION
The RSG-GAS, a very high neutron flux research reactor commissioned in Serpong, hasachieved its criticality in 1987 and reached its full power level of 30 MW thermal in 1992.However continuous regular operation was started not earlier than 1995. The delay was dueto a long shutdown period owing to the installations of the in-pile engineering loops,radioisotope production equipment, neutron scattering instruments, and also due to othertechnical problems.
Since 1996, the reactor has been operated quite regularly for three cycles per montl andnine days per cycle. In order to improve the radioisotope production, in 1997 the reactoroperation has been made weekly with 5 operation days with reactor power at 25MWthermal. This was not so convenience for the neutron scattering activities. After someconsultations and discussions file reactor operation mode has been compromised andchanged to 12 days operation and followed by 9 days off. This schedule has been settledand started in July 1998 and lasted until July 1999 In return the reactor will only be inoperation at 15MW thermal to maintain the length of the operation with the available fuelelements. Due to some more problem in the financial sector, in the past one year the reactorhas been in operation for 12 days followed by 16 days off which means we have neutronbeams for 12 days monthly which is about 100 days yearly.
So far the neutron beams have been used for most of the scheduled operation days. Thiscontinuous and regular monthly scheduled operation days give advantages in planning theexperiments in advance and improve the reliability of the neutron instruments.
During 1992, various neutron scattering instruments have been installed in the NSL-Serpong . Those instruments are:
-47 -

JAERI-Conf 2001-017
1) Powder Diffractometer (PD), DN- 12) High-Resolution Powder Diffractometer (HRPD), DN-23) Four-Circle diffractometer for single crystal structural studies and texture analysis
(FCD/TD), DN-34) Neutron Radiography Facility (NRF) with real time experiment capability, RN-15) Triple Axis Spectrometer (TAS), SN-I6) Small Angle Neutron Scattering (SANS) spectrometer, SN-27) High-Resoiution Small Angie Neutron Scattering (FIRSANS) spectrometer, SN-3
About five years ago, the powder diffiactometer was modified to accommodate residualstress measurements (DN-IM) and has been used for some measurements. The powderdifi-ractometer, the triple axis spectrometer and the neutron radiography facility are installedat the beam port S6 (tangential), S4 (radial), and S2 (tangential), respectively in theexperimental hall of the reactor (XIR).
Two neutron guides are installed starting from S5 radial beam port, penetrating thereactor confinement building wall and going through a 35 m tunnel into the externalneutron guide hall (NGH). The first neutron guide (NGI) is dedicated to the small angleneutron scattering spectrometer, which is installed at the end of the guide. The secondneutron guide (NG2) has three beam ports labelled as NG2-1, NG2-2 and NG2-3 at whichthe four-circle diffractometer, the high-resolution small angle neutron scatteringspectrometer and the high-resolution powder diffractometer are installed respectively. Inorder to shield the radiation coming from the neutron guide, they are confined inside acasemate Saving concrete walls along their whole length, except those parts, which areinside the tunnel.
In this short paper we presents the last development implemented to the diffractometers,especially related to the residual measurements which will be discussed further in theforthcoming workshops.
2. Neutron Diffractometer (DN-1M)
The powder diffractometer was the first instrument installed and situated in the reactorexperimental hall (X-R). It was a standard two axis type diffractometer with a PG (004)focussing monochromator to enhance the neutron flux at the sample position Mylar filmscoated with gadolinium are used for collimators with angular divergences of 20' and 40'. Incollaboration with the Japan Atomic Energy Research Institute (JAERRT), five years ago thediffractometer was modified for residual stress measurements.
Modifications were made by installing a divergent flight tube of 1750 mm long on thediffractometer ann in front of a 256 mm long one-dimensional position sensitive detector(ID-PSD). The distance between the sample and the tip of the flight tube can be variedcontinuously in the range of 0-190 mm, to allow handling big samples. For samplemounting and positioning the instrument is equipped with goniometer having threeorthogonal translation as well as a turn table to rotate samples around the incident beam.Al sample movements and data collection are controlled by a NEC PC-9821 computer.The size of both incident aid scattered beams are defined iv anertures having variousdamneters ranging from 2 to 5 mnm. The volume sampled by the diffractometer is thendefined by the intersection of the incident and scattered beams in the scattering plane.
-48 -

JAERI-Conf 2001-017
Three years ago we replaced the PG (004) monochromator with a bent Si (311) singlecrystal to obtain higher intensity of monochromatic neutron beam. At that time we reportedin the Workshop that there was a double peak coming from the monochromator detected bythe 1-D PSD. We have tried many things to overcome this problem. Last year, again withthe help from JAERI we replaced the monochromator system with horizontally bent andvertically focussed Ge (311) single crystals. After so many consultations with JAERI'sexperts we decided to remove the I-D PSD early this year and replaced it again With theoriginal detector (He3). We also made some modification to the diffractometer such asremoving the flight tube, etc ; and went through a calibration procedure starting from thefirst collimator, monochromator, second and third collimators and so on. Table I shows thelatest technical specification of the diffractometer Figure I shows a diffracton patterntaken from a standard sample of Alumina after the latest modifications of thediffractometer.
Last June we had an opportunity to run a Ring-Plug sample supplied by JAERL Theplug is develope according to the standard procedure produced by VAMAS. Themeasurements were also performed according to VAMAS instructions. Figure 2 shows thediffraction pattern of the ring plug taken by the neutron diffractometer. Figure 3 presentsthe strain calculated from peak (220) for hoop, radial and axial configurations. TIe resultsshow irregular pattern which roughly representing the strain in the sample. There was a bitof confusion when we perform the experiments since we couldn't find the line on the ringplug indicating where the experiments should be carried out. But, by looking at the results,we are confident that the instrument is capable of handling many other sample containingresidual stress. Further development of the instrument will include some modifications sowe could measure the stress directly and at the same time measuring the strain through acertain the diffraction peak.
Table 1. Technical Specification of the neutron diffractometerfor residual stress measurements
1. Monochroinator Ge (31 1.), horizontally bent and vertically focussed2. Collimators #1 = 40' (before monochroniator)
#2 = 40' (between monochromator and sample)#3 = 20' (between sample and main detector)
3. Incoming beam size :30(w)*500i) mm2
4. Take-off angie :0705. 2-theta range : -100 +1006. Incident slit to sample : max. 190 mm7. Sample to diffraction slit : max. 310 mm8. Beam axis height :91 mm9. Sample table translator : X = -70 - 70 mm
Y = -70 - 7,0 mmZ =0 50mm
10. Main Detector .- fe3
11. Counting System : Canberra12. Control System : IBM-PC13. Software . modified from RESA (JAERI).
-49 -

JAERI-Conf 2001-017
3. Four-Circle Diffractometer/Texture Diffractometer (DN-2)
The four-circle diffractometer is installed at the NG2-1 beam port sited in the XHR.This dual purpose instrument was designed for single crystal structural studies and texturemeasurements, and was constructed robustly to allow heavy attachments. The allowableload on the sample table is 300 kg.
A Cu (220) or PG (004) monochromator with a fixed take off angle of 460 is mountedinside the neutron guide casemate to obtain monochromatic beam having a wavelength of0.997 A or 1.311 A for Cu (220) or PG (004) monochromator, respectively. The maximumbeam size at the sample position is 40 x 40 mm2 and the detector is BF3 end windowcounter with 100 mm0 and 236 mm effective length.
This instrument is operated automatically by an IBM PC 2/70 computer Ancillaryequipment available are full and half circle Eulenian goniomeiers, a fiber specimen holderand a cryostat. Since October 1998 the computer is out of order, so we were thinking of bypassing the computer. In the last two years we have tried to find an alternative way inoperating the diffractometer. Last August we started to implement a system usingmicrocontrollers. Figure 4 shows block diagrams of the original and modified configurationof the control system. 'Using the new configuration we expect to overcome the problemsoccurred in the instrument. We hope by the end of the year 2001 we already can run someexperiments using this diffractometer. From this workshop, we'd like to ask somesuggestion in installing the software to control the instrument.
4. SUMMARY
We have presented the modification in our diffractometers, i.e. the neutrondifiractometer for residual stress measurements (DN-IM) and the four circlediff-ractometer/texture diffractometer (FCD/TD). The calibration of DN-IM using Aluminastandard sample showed that the instrument is in good shape, especially to contribute to thenext sub-workshop ; and furthermore this is supported and confirmed by the results comingfrom a ning plug sample provide-by JAERI.
The difficulties faced by FDC/TD in the last two years have pushed us in Serpongto find an alternative way in controling the instrument. Application of microcontroller cameout as a better choice not only because the components could be obtained easily locally inIndonesia but also we can apply this to other instruments once it works with FCD/TD,
5. ACKNOWLEDGEMENT
We'd like to thank STA, Japan for the financial support so Dr. Ikram could attendthe workshop to present this paper. We are also very grateful to JAERI, KAERI and MOSTfor the support. We'd like to thank Mr. Yatno for the help in preparing this paper.
-50 -

JAERI-Conf 2001-017
6. REFERENCES
1. Marsongkohadi et.al., IAEA Regional Expert Workshop on Neutron Scattering andApplications, Serpong, June 16 - 20, 1997.
2. NSL - Serpong, Infornation Brochure, August 19973. A. Ikram, IAEA TCM on Neutron Beam Research, Lisbon, Sept. 10-12 19974. A. Ikram, National Symposium on X- Ray and Neutron Scattering, Serpong, 19985. A. 1krarn, Workshop on the Utilization of Research Reactor, Mito, 19996. A. Skram, National Symposium on X-Ray and Neutron Scattering, Serpong, 20007. G. A. Webster, Neutron Diffraction Measurements of Residual Stress in a Shrink-fit
Ring and Plug, VAMAS Report No. 38, January 2000
- 51 -

JAERI-Conf 2001-017
eO72r0011400
8 0 0 -- - - - - - - - -- - - - - - - - - -- -- - -- -- - -- -- - -- -- - .. ........... ..... ...... .. ..... ... ...~~~
6S 0 0 -- - - - - -- - - - - -- - - - - - -- -- -- -- .. ... .............. .. :..... .......................1200- - . . I . .......... ..... .800
200 -- - - - - - - - - - - - -....... ... ... ......... ... .... .. ...600O'-' B
0 2 ThetaI. 20 30 40 50 60 70 80 90 100 110
2 Theta (Degree)
Fig. 1. Neutron Diffraction Pattern of Sample Standard A1203
300CeO08rO16
1500 ..... . . . .; .... .... . .................. ......... ................. ....................
2 000 --------- --------- --- -- --- -- -- --- -- --- -- -- .......................... K................
250
5000 ................. .............. . ......... . . . . . ................................2000
C 150_0-
40 50 60 70 80 90 100 110
2 Theta [Degree]
Fig. 2. Neutron Diffraction Pattern of Ring Plug A6063
-52 -

JAERI-Conf 2001-017
(a) e(Hoop)
0.002
e
-20 -1 1 20 31
i _- ~~~0.001'1
position
(I') ~~~~e(radial)
e -53 -_
-0.002 _
position
(C) e(Axial)
l ~~~~~0.002j
........... ... ........ .............................e A d 0 0
-20 -10 d 10 20 .3
position
Fig. 3. Strain Distribution of A6063 (220 peak) Ibr (a) Hoop (b) Radial and (c )Axial
-53 -

JAERI-Conf 2001-017
<l >
P.
ENCODER .... ..............
MONITOTOR ([-9)
COUECTO R STEPPER
r--n <5 , _ ~~~~> DISPLAY
DETECOR .______ COUNTER SYSTEM - -------------------------------------
(CANBERRA)
OR::" IGINAL
--------- - --- ----- 1
/711 ~ .. > MASTER
PIC
P C
PIC-3MONITOR MD4ECTOR B f C
ma}> L z > l TIMER l MAINt.
DETECTORCOIJNTE SSTM - --- - - -- -- - - --- --
(CANBERRA) S=EPERMOTOR
| MODIFIED 1--...
Fig. 4. Block Diagram of Control System of FC:D/TD Instrument(a) Original and (b) Modified Version
-54 -

l 1111111111 lll 1111 11111 1111 l~llll l ll 1111 liiil 1111JP0250091
JAERI-Conf 2001-017
1.7 Progress Report on neutron scattering at KAERI
Chang-Hee Lee
Korea Atomic Energy Research Institute, Taejon 305-6000, Korea
ABSTRACT
The neutron beam facilities in HANARO are presented and the specification of the research reactor is
described. Present status, performance and on-going development with utilization fields of each instrument such
as the high resolution powder diffractometer, the four-circle diffractometer, the neutron radiography facility, and
the commissioning status of the small angle neutron spectrometer are described. We also present some of
technical developments for spectrometer components, and starting-phase users' program and promoting
activities.
1. The Research Reactor, HANARO
The specifications of the reactor, HANARO, are summarized in table 1. The HANARO is an
open-tank-in-pool type reactor cooled by light water, and moderated by heavy water. Its
compact core inside the inner shdll is surrounded by a spacious reflector, which
accommodates a variety of experimental holes. At its maximum thermal power of 30MW, the
maximum thermal neutron flux is expected to be 5 x 10¹⁴ neutrons/cm2/sec at the central
thimble. In the reflector there are seven horizontal beam tubes and a total of 25 vertical holes.
These holes with different sizes are widely used for radioisotope production and neutron
activation analyses, and a large vertical hole for the future installation of a cold neutron
source is provided.
Table 1. The reactor characteristicsType Open-tank-in-pool
Maximum thermal power 30MW thermalPeak thermal neutron flux 5 x 10¹⁴ neutrons/cm2/secCoolant / Moderator, ReflectorCore Coolin Light water, Heavy water
CoreCooling -Upward flow forced convection combined withbypass flow
Fuel LEU 19.75w/o 235U, U3Si in Al matrixHorizontal beam ports / Vertical holesMaximum thermal neutron flux(<0.625 eV) 7 / 36
Operation 4.5x10¹⁴ nv @ core, 2.IxWOl nv @ reflector
28 day x 9 cycles/year
- 55 -

JAERI-Conf 2001-017
A cold neutron beam port (CN) is equipped with a vertical channel of 160mm diameter with
its beam tube nose of 60mm(W) x 50mm(H) for the installation of a liquid hydrogen cold
source in the future. The in-pile channel of the CN beam port is designed so that three or four
neutron guides of about 20mm width x 150mm height each could be installed reaching up to
about 150cm to the cold source. Cold neutron source installation project were decided to be
postponed by 2003 after evaluation and re-planning overall aspects including neutron guides
and a cold neutron laboratory, a set of spectrometers and users community.
HANARO has been operated for about 150 days a year as before and more than 95% of beam
time from the operation days has been serviced to meet the demand from internal and external
users. As the SANS commissioning is going well, small modification in the vertical hole,
which was supposed to be for CNS installation, is expected in the next year. Because the hole
is filled with light water and the estimation for several candidate materials for the insert
replacing the light water region showed promising result, we will undertake more detailed
flux calculation based on the models and put the insert plugging structure in the vertical hole.
As a result, it is expected about two times higher flux gain for the SANS.
As for the TR port, the BNCT installation has been done continuously and a large platform
structure attached to the port was constructed. In the STI port, neutron beam extraction for
PGNAA by adopting 90 degree take-off from PG crystals in vertical direction is under way.
2. Neutron Beam Facilities
2.1 The High Resolution Powder Diffractometer (HRPD)
This instrument has been used most heavily without any serious problems since its
commissioning and competition rate for beam time request becomes 1.5 to 2.0 these days andexpected to be higher than 2.5 in the next year. The high temperature sample furnace has been
used very much higher than expected but more works on sample cans and fine temperature
control is needed to reduce beam time loss Iand easy handing. Overall upgrade of the
instrument control program will be done next year for fixing and addition of different
measuring modes, integration of computer control of several sample environments, and re-
designing of communication between instruments and experiment database management by
TCP/IP protocol.
Various chemical structures and magnetic structural studies has been undertaken mostly
collaborating with external users from universities by using low and high temperature sample
environments. In this year we have tried to do several feasibility works using the HRPD on
the accurate determination of hydrogen content in materials by incoherent diffraction, neutron
-56-

JAERI-Conf 2001-017
diffraction of very small sample quantity in high pressure sapphire anvil cell and structure
studies on the fullerene and its derivatives. Industrial application by using quantitative phase
analysis and by combining texture measurements produced good result and is becoming
attractive to industrial researchers.
Another progress is the development of residual stress instrument. Full set of measurements
on VAMAS samples and a welded stainless steel plate of 20mm thickness could be done
satisfactorily. This instrument is still an optional one to the HRPD and so beam time
allocation for the residual stress measurement is to be limited to some extent depending on the
users' demand.
2.2. The Four Circle Diffractometer
FCD is a conventional two-axis diffractometer with an Eulerian cradle and has been be used
for the structural study of single crystals and for the texture measurements for industrial
applications. Ge(331) monochromators with a fixed take-off angle of -45 degree were
mounted and the wavelengths of the neutron beam for the three monochromators are 0.99A.
The effective beam size at the sample position is 20mm in diameter. A detector unit with a
single He-3 counter is connected to the 29-table by a cantilever type arm with a counter
weight.
The early commissioning had been done by August 1999, and it has been routinely used for
single crystal diffraction experiments as well as texture measurements. As for single crystals,
KDP-DKDP system has been being undertaken and a few university users used it for their
structural works as trial base. But texture measurement and analysis has been increased a lot
by internal and external researchers related with industries.
Two sample environments fitted with the Euler cradle such as a CCR-type low temperature
cryostat and a high temperature furnace are under development. In the end of this year the
furnace will be tested first. As for neutron detection, we have a plan to install a 2-D PSD
developed by us and/or the image plate for fast and wide measurement in near future
depending on the characteristics of requested experiments.
2.3. The Small Angle Neutron Scattering Spectrometer
Until the cold neutron source is available, this SANS instrument would be operated at the CN
beam port in the reactor hall. Neutrons filtered by liquid nitrogen cooled beryllium are
monochromatized using a high speed Dornier velocity selector to obtain neutrons with a
wavelength range of mostly 4A to 8A. To avoid gamma radiation from the beam port in a
forward direction, a liquid nitrogen cooled Bi filter, an angular divergence of the transmitted
beam, can be used in combination or independently depending on the situation. The total
length of the SANS is about 8.5m due to the limitation of the reactor hall space. The scattered
- 57 -

JAERI-Conf 2001-017
neutrons is measured by using an large area 2-D position-sensitive detector of 128 x128 pixels
with a resolution of 5mm x 5mm.
For the design goal of Qmin-0.O05A- and a neutron intensity of I,> 104 n/cm 2/sec at the
sample position, the instrumental parameters of the single-aperture collimation are optimized
at a wavelength spread of Ak/k= 0.1. The detector can be moved continuously from 1.5m
to 5m inside the detector chamber of 1.7m diameter to change the available Q-range of the
instrument; The whole system including the sample chamber would be evacuated down to
about 10-3 torr. The Q iaxwill be extended to 0.81 A-' by rotating the detector up to 300 around
the sample stage. Its design characteristics are summarized in Table 2. The collimator with the
pinhole type apertures, which are changeable with different sizes, is 4.2m long.
Table .. The design characteristics of SANSSource CN beam port without cold neutron sourceGamma/Fast neutron filter Liquid Nitrogen cooled Bi/Be filter
Neutron V-benderMonochromator Neutron velocity selector with variable speed
Wavelength range 0.45nm to 0.7nmWavelength resolution (FWHM) 10 %
Minimum beam divergence 0.003 radSample size 5 to 20 mm in diameter
Sample to Detector distance 1.5 to 4.25mQrange 0.06 to 8 nm 'Detector active area 65cm x 65cm with 128 x 128 pixels
Calculated neutron current(n/sec) at the sample0min (nmn ) = 0.06 2 x 10'
0.1 3x10⁴
1.0 3x10⁵
The performance test on major components and the neutron beam characteristics of the port
had been done mostly last year and an overall testing of the integrated system by SANS
experiments using a one-dimensional, position sensitive detector done early this year, too. The
base structure to rotate scattering angle position of the 2-D PSD, a safety interlock, integration
of control and data acquisition system and completion of sample chamber, etc. will be done
for next six months. The 2-D SAS measurement had been made since August and is now
under full commissioning by first quarter of next year. Two polymer research groups will be
joining with us on the test and performance evaluation during the commissioning phase.
2.4 The Neutron Radiography Facility
The neutron radiography facility was installed at the NR beam port late in 1996, as the first
neutron facility at HANARO. NRF has been used for the nondestructive testing of
components from general mechanics, aerospace, ordnance industries, etc., using both the
direct and the indirect methods. The training of university students related to nuclear
engineering or non-destructive test is also one of the important utilization of the above
- 58 -

JAERI-Conf 2001-017
instrument.
As the industrial applications are increasing slowly, we started quality assurance work
specifically on neutron radiography test complying with KOLAS and ISO standards and a
process of accreditation to the KOLAS is under way. The usage of image plate and real time
analysis technique by image processing are also being developed and applied. In addition to
this traditional radiography technique, neutron-induced auto-radiography using solid state
nuclear track detectors has also been used internally and externally, such as for boron content
and distribution in steel or fission fragments. Feasibility studies on neutron tomography and
dynamic two-phase flow started, too.
2.5 Development of Spectrometer components and Plan for next phase Spectrometers
Development of a l-D & 2-D position-sensitive detector with delay-line readout could be
mentioned. As a continued work for last three years, now 1-dimensional position-sensitive
neutron and X-ray detectors could be fabricated easily. Several wide vertical aperture 1-D
neutron PSD of 200mm H x 100mm V, 120mm x 80mm, and 100mm x 200mm, which are
receiving neutrons of relaxed vertical collimation from diffractometers were fabricated and
applied for residual stress instrument and fast changing measurement. The results showed
quite good and complied with the expectation. We are now discussing PSDs for synchrotron
SAXS with Pohang Accelerator Laboratory.
Our design of the polarized neutron spectrometer at the STi beam port would have both a
triple axis and polarized neutron beam capability in its final shape. This instrument will
consist of a conventional monochromator drum which can be rotated from 10-Oto 60+hin 26,a filter, polarizing crystals or a PG(002), analyzers, and spin flippers. CoFe or Heusler crystals
or a polarizing mirror will produce polarized neutrons. All the tables of the sample, analyzer,
and detector move on the dance floor. We have completed the preparation works such as
installation of the monochromator drum and dance floor but major parts of the work for
instrument development will be done during next 3 years. This instrument will be used for
general test station for spectrometer component test and techniques development, too.
In the second phase from 2000 to 2006, a neutron reflectometer and a triple axis spectrometer,
which are strongly requested by external users from universities and industries, are to be
realized to extend the activity to surface and interface structure and dynamics studies. A
medium resolution powder diffractometer, a dedicated instrument for residual stress
measurement, or a double crystal diffractometer complementary to the present SANS is under
intense discussion.
3. Users program and activities
In the past before 1996, users of neutron scattering research were scattered around and not
- 59 -

JAERI-Conf 2001-017
organized. KAERI scientists had been developing instruments and doing research for
themselves without any serious connection with external researchers, and the number of
universities researchers who could be interested in neutron scattering were very few. But since
the time of reactor criticality in 1995, there had been many discussions among the researchers
in the institutes and the universities. As a result, the first neutron scattering workshop could
be held during June 12-13, 1997, before the commissioning of the HRPD. More than 120
participants attended and many of them became the early users of the HRPD. The 2nd
workshop was held during June 11-12, 1998, before the commissioning of FCD, and about
100 participants attended. Some of the early users presented their results in this workshop.
With the increasing number of users, the first winter school focused on graduate school
students was organized in February 1999. As a result of many discussions and efforts by the
institute and outside users, a peer group of 15 members from universities, institutes and
industry was formed in October 1999. It is to accommodate the users' demand and to make a
body toward users' group or an association in the future if possible. Based on these activities
and the record of experiments on operational instruments, the Ministry of science and
technology decided to support the users outside the institute in December 1999 and 18 grants
were awarded mostly to the university groups. If this trial program worked successful, we
could expect a strong, long-term program, which would boost up the neutron scattering
research in Korea.
The 3 neutron scattering workshop (February 16-17) and 2 nd winter school (February 18-19,
2000) were organized jointly by the KAERI, the Korea Advanced Institute of Science and
Technology (KAIST) and the Garcia Center at the State University of New York at Stony
Brook. The subjects were small angle neutron scattering and reflectometry from soft matter. A
one-day tutorials on SANS and reflectometry in the winter school for about 100 graduate
students was given by the well-known experts in the field.
This year's workshop by users group will be held mid December and a joint workshop with
Synchrotron scattering groups is under discussion. More and more researchers are now
visiting the HANARO site and Pohang Synchrotron is also available for them. We, therefore,
could hope to make strong scattering research community within a short time. By now most
of the experiments have been limited to powder diffraction and single crystal diffraction
related fields. Small angle scattering works could be included next year depending on the
availability of the instrument and then the users' community would be expanded more rapidly.
- 60 -

JP0250092JAERI-Conf 2001-017
1.8 Enhancement of Small Angle Neutron Scattering
Facility and Related Activities in Malaysia
Abdul Aziz Bin Mohamed, Abd Jalil Bin Abd Hamid and ShukriBin Mohd
Malaysian Institute for Nuclear Technology Research(MINT), Complex of PUSPATI, Bangi, 43000, Kajang,
Malaysia
Abstract
Materials research, together with traditional scientificinterest in understanding matter at the atomic scale,requires detail knowledge of the arrangement and thedynamics of the atoms or molecules. To enhance Malaysianresearch and development in this area, MINT has continuallymaintained the existing small angle neutron scatteringfacility. The scope was focussed on the data acquisitionsystem.
The upgraded Malaysian Small Angle Neutron Scattering(MySANS) data acquisition program that is running onpersonnel computer (PC) platform has been developed byutilising the Super Video Graphic Array (SVGA) graphicaluser interface (GUI) environment. It is operating in a realmode under MSDOS operating system. The technique used toexpand the 640KB conventional memory (base memory forMSDOS) is called flat real mode where linear 32-bit memoryaccessing method could be employed.
In addition data analysis and a future work planning arealso described.
1. Introduction
This report highlights activities that have been carriedout in year of 2000. Two main areas are presented, namely,facility upgrading- and data acquisition modification. Inaddition, the work plans from 2001-2004 are presented.
2. Facility Upgrading
Since the system has already reached its five years old,the repairing and enhancement have become a major agenda infurther extend the system lifetime. Two areas are targeted,namely, mechanical and data acquisition systems. The latterarea was given more attention.
-61 -

JAERI-Conf 2001-017
2.1 Mechanical System
Both primary collimator and flight tube had repaired andupgraded. Some minor modifications were made on neutronbeam filter cryostat. The system is installed with a newbeam shutter at the collimator front and a new shieldingcover for the cryostat and the monochromator.
2.2 Data Acquisition
MySANS is using the RISO Small Angle Neutron Scatteringdetector - a multi-wire instrument. It uses the Time toDigital Converter (TDC) to process neutron events bydetermining the rise time difference for pulses arriving ateither side of three multi-wire plane. The results form anaddress to a location in one of the two histogram memories.
The TDC histogramming memories consist of 3 boards, 2 14-bit 500 MHz counter boards and a Z180 micro-processer board.For the microprocessor board, it makes use of two DMAdevices as well as one of the timer circuits. One of theinternal DMA is used to transfer data to the host computerusing built-in routine. In all other communications withthe host computer programmed input/output transfer is used.
Input/outputs from the TDC to host computer is establishedvia IEEE-488 (GPIB) interface bus connector.
TDC communication program uses DMA to read N bytes formhistogram 0 or 1 to the host computer. The TDCcommunication program is activated by an interrupt from thehost computer. The program uses a queue structure toprevent cross interruption between sources.
To transfer data from the DMA counting system, the hostcomputer is also installed a GPIB card. The card is set touse DMA mode for moving data from TDC to the host computerdevice memory. DMA is a method of allowing datatransferring from one location to another in a computerwithout intervention from the central processing (CPU). Alimitation of this mode is that the DMA write must beperformed onto conventional PC memory since extended memorythat is mapped to upper memory blocks is mapped only forCPU accesses due to the 80386 memory mapping is on chip,not on the motherboard.
In SANS data acquisition, most of the time required in toread data from buffers and then display on the screen inform of 2D or 3D graph presentation. The acquired data arealso needed fairly amount of space to store in a storagemedia. To address the first problem, the new program hasutilised the flat real mode technique which allows programto treat one or more segments as large (32 bits) segments.With this technique the entire memory available on the
- 62 -

JAERI-Conf 2001-017
motherboard (maximum 4 GBytes) can be access withoutspecial memory managers in a fast and efficient way. Theprevious software was using pixel by pixel drawing datafrom the memory. In the current program, the 2D and 3D PSDdata images are displaying by using a double bufferapproach. The video card is programmed to get video datadirectly from the double buffer rather than from it regularaddress (AOOO:OOOh). Since the host computer using SVGAvideo card the approach chosen works very well. It shouldbe noted that there are many different chipsets used bygraphics cards, which would make it very convenient toprogram them all. The VESA specification of the SVGAgraphic cards provides many different pixels resolution andcolour. This procedure makes programming the graphic cardmore manageable since under VESA the graphic memories arehandled by the bank switching method. Table 1 showsmemories required for various graphic resolution under 256colour. The MySANS is currently configured to 800x600resolution under the new program. In term of time requiredto acquire data from counting and display the 2D and 3Dimages on the computer screen, the new program needs only 2seconds compare to the previous method which was 10 seconds.The images displayed are considered real-time displayed asin actual time required for PSD to collect all data and putin the DMA is around 2 seconds.
Table 1: Graphic resolution under VESA specification
No. Resolution Colour Memories allocated(Kbytes)
______ _ I ~ _______ __
1 640x400 256 250
2 640x480 256 300
3 8OOx600 256 469
4 1024x768 256 768
5 j_1280x1024 256 1,280 (1.28 Mbytes)
For storing 2D and 3D data, the binary (single precision)format is used. The experimental set-up parameters are onthe first portion of the file data block followed by theimage data.
"Window"d style input dialogue and output display has beendeveloped; the displaying of scattered neutron data in twoor three-dimensional isometric view - utilised VESA.Graphical User Interface (GUI) fast and user friendly. Cprogramming Language and Assembler Tools are chosen for theupgrading the system software development.
3. Data Analysis
Modelling of scattering intensities which was started inearly March 1999 is on going work. The hard sphere
- 63 -

JAERI.-Conf 2001-017
particles model is currently under investigation andapplication is now on degradation in alloy. Multiplescattering method of analysis is under planning and furtherliteratures survey will be followed.
4. Conclusion
The on-going activities related to SANS in Malaysia 2000has been presented. Main works on the system improvementhad been completed. System is ready to be used forexperiment for studying related materials.
-64 -

JAERI-Conf 2001-017
MINT's Personnel Involved in SANS for 2000
Researcher Assistant Researcher
Abdul Aziz Mohamed Razali Kassim
Azali Muhammad Abd Jalil Hamid
Mohd Ali Sufi Mohd Arif Hamzah
Shukri Mohd Ramzah Mohamed
Ishak Mansur Mohd Syarif
Summary on 2000 activities
No Item Period Remarks
1 Primary & Secondary Jun -Oct Successfullytubes, Cryostat completedmaintenance andupgrading.
2 Detection Oct - Dec Waiting forverification, budget andcalibration and componentrepairment repair
3 MathCad Programming Jan Purchasedsoftware - version2000
4 Request expert from Nov (1-2 Postponed toIAEA (Dr. Robert weeks) 2001 (date toKnott from ANSTO) be determined
soon)
-65 -

JAERI-Conf 2001-017
Year 2001 Tentative Programme
No Item Remarks
1 Discussion and formation small Waiting forlaboratory on SANS sample (i.e. commitment andpolymer and metallic materials) budget from thepreparation with MINT polymer and higher authoritymetallurgy groups; target and relatedmaterial: carbon glassy for groups supportcatalyst and bio-material forartificial bones.
2 Modelling of metallic alloys using Required deptha multiple scattering method. literature
survey on thesubject matters
3 National workshop and training June/Julycourse (with expert assistancefrom IAEA)
4 2 IAEA fellowship application August/Septemberforms have been submitted; (1-2 months)Australia Dr. Robert Knott, ANSTOand Mr. B. Seong, KAERI.
Work Plan for 2002-2004
Year Focussed area(s) Remarks
2002 SANS application in a request for morefailure analysis grants from various
available sources;
. support frommaterials studygroup
2003 SANS application in support from localcomposite materials industries
2004 SANS application in support from SIRIMadvanced materials advanced material
centre.
-66 -

JAERI-Conf 2001-017
Figure Th us and password scheme employed in
MySANS.
.~~~~~~~~~~~~~~ -
Figure 2: General GUI layout for MySANS.
- 67 -

JAERI-Conf 2001-017
Figure 3- Graphic Presentation for PSD electronic alignment.
rsh S~ p RMEI
I . ~~~~t _ _ _ _ _ _ _ _ _ _ _
} 1, W-A
R{lf, M 1 tA,10/tC R
| -W11 - }~~68
I ~ s I t -I
t Wa i 9
__________________ | __________a_ IFiur 4: Adrs anIeoyMpigi yAScmue
I | f intrfaing
s~~~-6 -

JAERI-Conf 2001-017
0 lz~~~~~~~~~~~~~~~-
z~ ~ --
0 E 0z m~~~~~
ww- 0~~~~
Z a~~~~~~~~~~~~~~~~a
u~~~~~~~~~~~~~~~~~~u
4-
4-H
-69-

JP0250093JAERI-Conf 2001-017
1.9 Current Status of Neutron Scattering in Thailand
Archara Sangariyavanich*, Somchai Pongkasem, Suriya Patchar and Pantip Ampornrat
Office of Atomic Energy for PeaceVibhavadi Rangsit Road, Chatuchak, Bangkok 10900, THAILAND*e-mail: archara(boaep.go.th ; archaras~yahoo.com
Abstract
The first double-axis neutron spectrometer in Thailand was installed at the ThaiResearch Reactor (TRR-1) in 1968. It was about a decade that this diffractometer hadsupported a number of the magnetic materials researches. During 1975-1977, the reactor wasmodified into a TRIGA MARK III type with nominal power of 2 MW. Meanwhile thediffractometer was dismantled, since then neutron scattering activities had ceased for manyyears. As the Office of Atomic Energy for Peace recognized the important role of neutronscattering techniques in materials research, therefore in 1992, a spectrometer upgradeprogram has been setup in order to improve the performance of the obsolete diffractometer.At present, installation and alignment of the diffractometer have been completed. This reportgives brief description about the past activities as well as current status of the upgradeddiffractometer.
Additionally, the Office of Atomic Energy is in process of establishing a new NuclearResearch Center. Its main facility is a multipurpose 10 MW TRIGA reactor. The reactor willbe equipped with a High Resolution Powder Diffractometer. The HRPD is anticipated to beready for operation soon after the commission of the reactor. Feature of the HRPD includingits potential utilization are also presented in this report.
1. Introduction
The Thai Research Reactor TRRI achieved its first criticality on October 27, 1962. Itwas a multipurpose 1 MW pool type using plate type HEU fuel. In 1968, the first double-axis neutron spectrometer in Thailand was installed at one of its beam tubes. It was about adecade that this diffractometer had served a number of magnetic materials researches. In1977, the reactor core was changed into TRIGA MARK III type with nominal power of 2MW at steady state and pulsing capacity up to 2000 MW. It was designated as TRR-l/MI.At present the reactor is normally operated at 1.2 MW for 3 days a week, about 12 hours aday to meet 40 MW-hours per week as required by radioisotope production.
During the modification of TRR1, the diffractometer was dismantled. Since thenneutron scattering activities had ceased for many years. As the Office of Atomic Energy forPeace recognized the important role of neutron scattering technique in broad areas of researchparticularly in materials science, therefore in 1992, a spectrometer upgrade program has beenestablished. The purpose was to improve the performance of the obsolete existingdiffractometer. Implementation of the program included modification of the oldmonochromator shielding, construction of a new in-pile collimator and a specimen table aswell as purchasing a new detection system. At present time, installation of the diffractometeris completed and performance test is being carried on.
-70 -

JAERI-Conf 2001-017
2. Description of the Upgraded Neutron Powder Diffractometer
The upgraded diffractometer was aimed to have medium resolution. Optimization ofresolution and intensity was conducted through selection of 600 takeoff angle in combinationwith 30', 30' and 20' for the first, the second and the third collimations, respectively. In orderto minimize the background heavy concrete blocks more than 50 cm. thick were addedaround the old monochromator shielding. The new detector shielding has been designed toaccommodate four He-3 detectors setting at 60 apart. This detector bank was surrounded by acurved fixed-shielding made of 5% borated paraffin. At this moment, because of highbackground intensity, only a single He-3 detector is in use to provide more room foradditional shielding. Automated data acquisition is accomplished by incorporating the motorcontroller and the counter with a personal computer through the GPIB communicationcontroller system. Detail of the upgraded diffractometer is indicated in Table I and its layoutis illustrated in Fig. 1.
Table I Characteristics of the upgraded neutron diffractometer
Beam size 20 mm.x 100 mm.First collimation 30'Second collimation 30'Third collimation 20'Monochromator:
Take-off 59°Wavelength: Cu(l I1) 2.0557 A
PG(004) 1.6524 ANeutron detectors 4 x He-3 (4 atm.)Neutron source to monochromator 400 cm.Monochromator to specimen 1 80 cm.Specimen to detector 70 cm.Thermal neutron flux at specimen position 2 x 10⁴ n.cm 2.sec-1
g o ~~~~~~~~~~~lend
Soller collimator
Sk. ~W(201
Fig. I Layout of the upgraded neutron powder diffractometer
-71-

JAERI-Conf 2001-017
3. Diffractometer Performance
Performance test has been carried out by running a standard silicon powder (NISTStandard Reference Material 640b)and a high purity corundum powder samples (99.999%A1203, Aldrich Chemical Company) on the diffractometer. The silicon sample was containedin small vanadium tubes, 10 mm. in diameter and 50 mm. high. In an attempt to gain higherpeak intensity, the sample size of corundum was increased to 13 mm. in diameter and 60 mmhigh. Data were collected from 80 to 1050 with 20 step size. The counting time was 5 minutesper step. A 75mm.x75 mm.xl mm. pyrolytic graphite monochromator was employed toprovide thermal neutron flux greater than 2 x 10⁴ n.cm 2.sece 1 at the sample position.
The recorded data were refined by Rietveld method. The Voigt profile function wasassigned to fit the diffraction peak shapes. Since examination of the diffraction. patterns fromsilicon and corundum samples revealed severe contamination from 2X , 2/3k and 1/2', thus inthe refinement both samples were treated as four-phase compounds. It was found that dataobtained beyond 1000 were ambiguous, therefore they were not taken into account in theanalysis. The wavelength using in the refinement was 1.6537 A
4. Results of Analysis from Silicon and Corundum Diffraction Pattern
HI dC..Phi ._1 GM- P.tW. 1^^ - J. "1PIn
Fig.2 Rietveld refinement of silicon powder Fig.3 Rietveld refinement of corundumnsample showing contamination from showing contamination from higherhigher order beams. order beams.
Table 2 Results of Rietveld Analysis of silicon and corundum samples, data from OAEP ND
Parameters _____ Silicon Corundum, 2X 2/3X lt2, X a 2/3, 1/2X
Scale factor 0._32(1) 0.96(g) 0.035(3) 0.003(l) 0.165(3) 0.4 1(1 I) 0.0 19(3) .0001(0LScale fdctor 1 2.94 0,11 .009 1 2.48 0.1I1 -006ratio ________
Cell a=5,4300(4) a=4.759(2)dimension(A) refinement o 2.997(3) __rfm o rn
Ra %1/62 2.34 0.91 6.85 7.28 3.45 2.93 3.42 4.73Scal factor 0. .96(S) .035(3)13.07 7.60
R_ ~~~~~~16.91 9.52R, 15.28 7.14GOF(A) 1.22 1.78U .4986 0.8712V -.2034 -0.9201W .2957 0.5069
-72 -

JAERI-Conf 2001-017
Fig.2 indicates the results of Rietveld refinement from silicon powder diffractionpattern. The resulting reliability factors shown in Table 2 imply that the observed data do notfit well the calculated values. Nevertheless, its observed cell dimension which isa=5.4300(4) A agrees closely with the expecting 5.4309A.
The peak widths of silicon derived from theRietveld analysis were plotted in comparison with
_________ the calculated values as indicated in Fig.4. It is__ obvious that the observed and calculated peak
resolutions are consistent for scattering anglesbelow (20) 65°. At higher angles, the observedpeaks widths are comparable small.
IH Results of Rietveld refinement fromcorundum diffraction data are shown in Fig.3 and
Fig.4Comparpson ofwtheobserved and Table2. Although more than three hundred peaks
produced from 2X , 2/3X and V/2k. are observed,there is a good agreement between the observed
and calculated profiles. The reliability factors obtained from the analysis are included inTable2.
5. Future development of ND and its applications
From the scale factor ratio of the contaminants X:2X:2/3X:Y/2L. indicated in Table2,interference from the half lamda was less than 1% and could be neglected. Contribution from2k was more than 250% but could be reduced by using small unit cell sample. It seemed thatcontribution from 2/32k which was about 10% had significant effect on the analytical resultsparticularly on the reliability factors.
Besides the interference from the higher order beams, other significant problems aredue to low neutron intensity and high background. It is noted that the peak to backgroundratio were about 9 at peak(1 I 1) of silicon and 7 at peak (113) of corundum.
To improve the neutron intensity at specimen position, the existing monochromatormay be replaced with a vertical focusing or a bent focusing crystals. The data acquisition ratecould be enhanced by adding more detectors. Meanwhile, better shielding for detectors isneeded. Alternatively, the diffractometer could be modified to serve residual stressmeasurement, which requires smaller data range. However, at the present time the facilitycould be employed for investigation of small unit cell samples and training universitystudents in the field of neutron scattering.
6. High Resolution Powder Diffractometer at the Ongkharak Nuclear Research Center
The Office of Atomic Energy for Peace is presently in process of constructing a 10MW TRIGA nuclear research reactor at the Ongkharak Nuclear Research Center (ONRC)site which is about 60 km. from Bangkok. The reactor is a multipurpose, pool type, cooledand moderated by light water using low enriched uranium fuel. Reflectors are heavy waterand beryllium. The expecting maximum thermal neutron flux is 2x10¹⁴ n.cm-2.sec& . Sixhorizontal beam tubes are available for beam experiment, four of them are allocated forexperiments in neutron scattering, neutron radiography, prompt gamma neutron activation
- 73 -

JAERI-Conf 2001-017
analysis and BNCT. The rest are reserved for the future neutron guide tube and unforeseenexperiment. Configuration of the reactor core is illustrated in Fig. 5 [1]. Provision of a HighResolution Powder Diffractometer has also been included as part of the ONRC projectcontract. Installation of the HRPD shall be completed before the commission of the reactor.
___________ I~B~. hi
oI® 'V _ _ r.
0~~
_L___Lrl-- 0-- D
Fig.5 Configurdtion of the reactor core at Fig.6 Layout of the HRPD at ONRCONRC
Layout of the HRPD at ONRC is shown in Fig.6. The design basis of the proposedHRPD involves the matching of a bent focusing monochromator, small sample and positionsensitive detector[2. No collimators are required in this system. The monochromator is adoubly focusing bent silicon perfect crystal, which is at 950 takeoff, could be adjusted toprovide four wavelengths, that is 2.41 A, 1.84 A, 1.54 A and 1.22 A, from diffraction planes(311), (331), (511) and (533) respectively. To achieve high peak resolution, the samplediameter needs to be less than 3 mm. The detector bank is consisted of 7 He-3 positionsensitive detectors assembled together with 200 horizontal and 6.270 vertical spanning at 160cm. distance. The detector electronics provide position resolution better than 3 mm. Anoscillation collimator is positioned between the sample and the detector bank to reducebackground from the environment. The monochromator shielding is designed to providetakeoff angles at 950, 60 0 and 300.
arW R."--.l d Coleman 1.,0, 00 calve MURP "RPO Performance of the proposedfacility has been investigated by measuringthe diffraction pattern of a standard alumina(A120 3) sample with the High ResolutionNeutron Powder Diffiractometer at the
:1 _j j { A IMissouri University Research Reactor,which is a similar type diffractometer. Ittook several hours to collect more than
_ I,,,, " 2000 counts at peak (113) of alumina withthe peak to background ratio of 10. The
Fig.7 Rietveld refinement of alumina sample result of Rietveld refinement, which isshowing good agreement between the illustrated in Fig.7 shows good agreementobserved and calculated profiles. between the observed and calculated
profiles. The unit cell parameters obtainedfrom the analysis were a= 4.7589(4) A, c=12.9941(7) A with the reliability factors R.p=6.89%, R,(p 6.36%, RB=1.56% and Goodness of Fit =1.17%.
-74 -

JAERI-Conf 2001-017
The High Resolution Powder Diffractometer at the ONRC site would be dedicated forbroad range research areas. Potential applications would be in the area of advanced materialsresearch e.g. high temperature superconducting materials, PZT, magnetic materials, structuraltransitions and training.
7. Neutron Scattering Research Program
At present, our Nuclear Material Science Group has a national joint research projecton gemstone enhancement with the Department of Physics of Kasetsart University and theDepartment of Mineral Resources. We are taking parts in gemstone characterization andcoloration by irradiation. Two collaborative projects with Mahidol university in theinvestigation on the atomic positions in RE-doped PZT and the study of the morphology ofelastomer under strain are being planned.
Besides the above projects, an international research program on the investigation ofhigh temperature superconductors is being proceeded in collaboration with BATAN,Indonesia and Vietnam.
Acknowledgement
We would like to extend our sincere gratitude to the late R.L. Davis (ANSTO) for hiseffort to design the in-pile collimator for our ND and for his kind supervision on our neutronspectrometer upgrade program. We are in debt to N. Minakawa (JAERI) for his strongencouragement and support, without him substantial improvement in the performance of ourexisting neutron diffractometer would never be achieved. We are grateful to the IAEA andJAERI for their continuous support and funding. Special thanks are given to the OAEPPhysics Division, Mechanical Workshop and the Reactor Operation Division staffs for theirkind contribution in the spectrometer installation.
References
1. A. Sangariyavanich, Proceedings of the 1997 Workshop on the Utilization of ResearchReactors, November 6-13, 1997, Bandung, Indonesia.
2. W.B. Yelon, B. Berliner and M. Popovici, Physica, B241-243, 237-239 (1998).
-75 -

JP0250094JAERI-Conf 2001-017
1.10 Progress Report on the Preparation of Co Substitution for Cu inBSCCO(2223) Superconductor
Archara Sangariyavanich and Pantip AmpornratNuclear Material Sciences Group, Physics DivisionOffice of Atomic Energy for Peace16 Vibhavadi-Rangsit Road, Chatuchak, Bangkok 10900, THAILANDTel: (66-2) 562-0119; Fax: (66-2) 562-0118e-mail: ag , archaraswyahoo.com
ABSTRACT
The samples of Bi2Sr2Ca2(Cu(IX)CoJ3 0, when x = 0.0, 0.01, 0.02, 0.04,0.06, and 0.08 were prepared by solid state reaction. Samples were sintered
between 828-853 OC and then quenched in liquid nitrogen. Physical properties
of the specimens were examined by standard four-probe technique to determinethe critical temperatures. Phase identifications were performed by using X-ray
diffraction technique. It was found that at a certain sintering temperature,increasing the amount of cobalt impurities suppressed the criticaltemperatures. This result agrees with that has been reported by Youwen Xu(').
Introduction
As agreed in 1999 Workshop on the Utilization of Research Reactor, the JointResearch Project on high temperature superconductor would be continued on the investigationof Co substitution for Cu in BSCCO (2223). A. Santoro 2
) has proposed a models for oxygenordering in BaYCu 30, and BaYCu3 , MOx In his model, substitution of copper by impuritymetal atoms involved the rearrange of oxygen atoms in the basal plane, which was associatedwith a change in stoichiometry.
In this experiment, effect of cobalt substitution on the superconductivity properties ofBi2Sr,Ca2 (Cu( .,Co§)3O was studied.
Experimental
Samples of Bi2SrCa2 (Cu(lX)Cox)30y when x = 0.0, 0.01, 0.02, 0.04, 0.06, and 0.08were synthesized by solid state reaction. The nominal compositions of high-purity gradechemicals (99-99.99%) were mixed together in an agate mortar and ground for 8-10 hours.The mixture was calcined at 720 'C for 24 hours, then ground again for 4 hours and pressed toform pellets with 1.3 mm in diameter and 2 mm thick. The pellets were sintered at 8280C -853 0C for 65 hours in normal atmosphere. The synthesized conditions are shown in Tablel.At the end of the sintering process, each specimen was subsequently quenched in liquidnitrogen.
- 76 -

JAERI-Conf 2001-017
Superconducting transition temperature of the sintered samples was investigated byusing standard four-probe technique and the electrical resistivity as a function of temperaturewas determined. X-ray diffraction technique was employed for phase identification.
Table I Synthesized conditions of Bi2Sr2 Ca,(Cu( xCox)3OY.
Sample Co-doped Cu: Co Calcine Pressure Sinter(x) Temp (0C) (ton) Temp (0 C)
#6A11 0.0 3: 0 720 1 828 + 2#6A/2 0.0 1 840 ± 2#7A11 0.01 1 837 ± 2#7AJ2 0.01 2.97 : 0.03 718 1 837 ± 2#7A!3 0.01 1 844 ± 2#8A11 0.02 1 841 ± 2#8AJ2 0.02 2.94: 0.06 718 1 838 ± I#8A13 0.02 3 842 ± 1#9A1 . 0.04 1 853 ± 3#9A/2 0.04 2.88 :0.12 717 1 848 2#9A/3 0.04 3 850 3#IOAI1 0.06 1 850 2#IOA/2 0.06 2.82: 0.18 720 1 841 ± I#IOA!3 0.06 3 843 i
#1 IAI 0.08 1 843 I#1IA/2 0.08 2.76 0.24 720 1 841 I#1 IA13 0.08 3 846 I
Result and Discussion
The result in Table 2 shows that the appropriate calcining temperature is 720'C for 24hours, while sintering temperature is around 840'C for 65 hours.
The electrical resistivity property was examined by four-probe technique. The resultsare indicated in Table 2. It is found that the superconducting transition temperatures diminishwith the increasing amount of cobalt and could not be observed at x >0.02. Figure I showssharp superconducting transitions of the undoped samples while Co-doped samples havelarger transition widths.
X-ray powder diffraction was used for phase identification. The pattern showed thatthe 2212, 2223 and 2234 phases were formed in samples. Table 3 shows phase identificationby XRD. The highest amount is 2212 phase, 2223 phase and 2234 phase, respectively. Theseresults do not relate to the superconductivity behavior that obtained by resistivitymeasurement. Therefore, the high resolution neutron diffraction measurement should be donein order to investigate these effects.
- 77 -

JAERI-Conf 2001-017
Table 2 Superconducting transition temperatures of the samples.
Sample Co-doped (x) Electrical T, (K) Ton set (k)
Property
#6A/1 0.0 Superconductor 109 114
#6A/2 0.0 Superconductor 98 114
#7A/ I 0.01 Conductor -
#7A/2 0.01 Superconductor 8 7 109
#7A/3 0.01 Conductor -
#8AJI 0.02 Conductor
#8A/2 0.02 Conductor -
#8A/3 0.02 Superconductor 99 121
#9A/ 1 0.04 NS -
#9A/2 0.04 Conductor =
#9A/3 0.04 NS -
I1OA/I 0.06 N S -
I OA/2 0.06 Conductor -
I OA/3 0.06 NS -
1 A/1 0.08 Conductor -
#II A/2 0.08 NS -
#1 A/3 0.08 NS -
*NS - Non Superconductor
(IS * A ?I . A /S
,0 ~ ~ ~ ~ ~ ~ ~ ~ ~~ 0 _ _ a,--
TA12) OA0
M25303 K)T.0.53U, K
Figure 1 Resistivity curve of samples #6A11, #6A/2, #7A/2 and OMA/
78 -

JAERI-Conf 2001-017
Table 3 Phase identification obtained by X-ray diffraction.
Sample Co-doped Resistivity result Phase identification
(x) 2212 2223 2234
#6A/1 0 Superconductor 1 2
#6A/2 0 Superconductor 1 -
#7A/1 0.01 Conductor 1 2
#7A/2 0.01 Superconductor 1 2
#7A/3 0.01 Conductor 1 2
#8A/1 0.02 Conductor 1 2
#8A/2 0.02 Conductor I -
#8A/3 0.02 Superconductor 1 2
#9A/1 0.04 NS 1 2
#9A/2 0.04 Conductor 1 2
#9A/3 0.04 NS 2 I
#IOAI 0.06 NS 1 2 3
#10A/2 0.06 Conductor 1 2
# I OA/3 0.06 NS 1 2
#1 1A1 0.08 Conductor 1 2 3
#11A/2 0.08 NS 1 2 3
# 1A/3 0.08 NS 1 2
Note 1 major phase
2 minor (1) phase
3 minor (2) phase
Conclusion and Future Plan
From the experimental, 840'C is the best condition in synthesizing the studiedsamples. The Co-doped BSCCO (2223) samples showed the superconductivity behavior whenx = 0, 0.01 and 0.02. Increasing the amount of Co-doped resulted in decreasing thesuperconductivity property of samples. These effects were clearly shown by the electricalresistivity measurement. X-ray diffraction pattern, nevertheless, could not indicate phasedifferent of a superconductor sample from the other.
The future plan for high Tc superconductor research is to synthesize the bulk samplesfor high resolution neutron diffraction measurement. Preparation of Sb-doped Pb-BSCCO
-79 -

JAERI-Conf 2001-017
specimens which was a Joint research project agreed in 1998 Workshop will be carried on.(3While investigation of Co-doped BSCCO (2223) will still be an ongoing project.
References
1. Y.Xu. et al. Ibid. pp. 221-224.2. A.Santoro. Material Research Society Symposium Proceedings,V 169, Material Research
Society, Pittsburgh, Pensylvania (1990) pp. 185-188.3. P. Ampornrat and A. Sangariyavanich. Proceedings of the 1998 Workshop on the
Utilization of Research Reactors, (1999).
-80 -

l ulllh IGIllh Bl IIGI Huhl 1GBl IIll lID!l 1111 IhGl hIlhJP0250095
JAERI-Conf 2001-017
1.11 HIGL< TEMPER {TUE SrPERONDCTORJS OF Pb A1NDSb DOPED EiBiSr-Ca-Cu-O SYSTEM
Tran Thi Thlu Phutong, Tran Kim Cuong, Nguyen Thi Cam PhuiongNu c/lecar Physics Departmrent
Dalat Nuclear Research Instillute01, Nguyen Tu Lac, Dalat, Vietnam
Tel. 84 63 829-436, Fax. 84 63 821107Email: luonghoan(fpt.vn
ABSTRACT. From 1996, Dalat Nuclear Research Institute has been participated in the RegionalProgram with taking of studying " The mechanism of Ph and Sb doping role on superconductivity of2223 phase of BSCCO system". To achieve this aim, following reports about just Sb or Pb doped Bi-Sr-Ca-Cu-O system (BSCCO system), we investigate a mixing doping Pb+Sb. In fact, we investigatedBi2.,.,PbSbySr 2Ca2Cu3O. samples with x ranged from 0.1 to 0.8 and y from 0.1 to 0.4. After processingthose samples were measured the resitivity depending on temperature with the four probe techniqueand studied the phase properties carefully by using X ray diffractometor SIEMENS D5000.Distinguishing with the BSSCCO and BPSCCO samples, there was a new phase in the XRD pattems ofthe BPSSCCO ones, called 4441, and TC", attained approximately 140K. Unfortunately, we are unableto deten-nine neutron scattering data from these samples.
Key words. High temperature superconductor (HTS); Bi-Sr-Ca-Cu-O system (BSCCO); Pb doped Bi-Sr-Ca-Cu-O system (BPSCCO); Sb doped Bi-Sr-Ca-Cu-0 system (BSSCCO); X Ray diffraction(XRVD); XR pattern; resitivity dependent temperatute (R-T) characteristic, critical temperature or zeroresistance temperature (Tc0), onset transformation temperature (T:c"), new phase.
I.Introduction
The doped Pb or Sb BSCCO high temperature superconductive system have a T,0 of morethan lOOK [1], [17]. The phase with the highest temperature for this system isBi 2Sr2Ca2Cu3O01 (2223) with T, = 110K. There were also a few reports [9-16] on the partialsubstitution of Bi by Sb and Pb simultaneously. Different techniques such as the conventionalsolid state diffusion reaction [9, 10, 15, 163, melt quenching [II], coprecipitation [12], planarflow casting [13], and the matrix reaction method [14] were adopted for synthesis.Irrespective of the different proportions of Pb and Sb the resultant material was a multi-phase system. However, the values of T."n and T,, were observed to vary to a large extent(between 50K and 132K) [181. Though addition of Sb along with Pb in Bi systems seems toincrease the formation of the high temperature phase or the formation of a 'new phase', there
-81 -

JAERI-Conf 2001-017
are many questions that remain unanswered. The role of Sb in high superconductivity, theeffect of the presence of the 'ne.w phlase' on the superconducting behavior of the Bi-Pb systemand the nature of the 'new phase' -- superconducting or not, still remain unclear and futherinvestigations were thou-ght to be necessary. With the hope obtaining answers to thesequestions, even if only partial ones, systernatic investigations of a system 2223 as the startingcomposition with addition of Sb and Pb, synthesized via the solid state diffusion. reactiolnwere calied out. The resulting material was characterized via XRD and temperaturedependent resistance studies for vanous duration of sinterinlg. The effect of heatingtemperature has been studied. The detailed analysis of these investigations is presented inthis report.
2.Experimental procedure
The samples were prepared by the conventional solid state reaction of Bi2 03, PbO, Sb203,CaCO3, CuO, SrCO3 of high purity, in air. The investigating composition was Bi2. XyPb1SbSr2CalCu3O2 with x ranged from 0.1 to 0.8 and y from 0.1 to 0.4. There were two stepsin the material processing. In the first step, the mixture were calcined at 820'C - 8250C for24h in open funace and repeat this step. In the final phase, this mixture were sintered at 840-850°C for 1 00 - 135 h and repeat. The resultant material were cooled in furnace.
Resistance was measured as a function of temperature using the standard four probetechnique. Electronical contacts were made by using an air drying silver paste. Temperaturewas monitored by using a Cooper-Constantan thermocouple. X-ray diffraction analysis wasperformed by using a SIEMENS D5000 diffractometer with Cu K radiation.
3.Results and discussion
3.lResistance El Temperature (R-T) characteristics
In general, the R-T characteristics were observed to depend strongly on the sintering period,with the best superconducting characteristics observed for lOOh of sintering.
Samples with Sb = 0. i and 0.2 and Pb = 0.4 and 0.5 had TC°" vary from 90-105K and (T0)m,approximately 90K. The others were semiconductor.
Samples with Sb = 0.3, only Bi1 6Pb0 1Sb0 Sr2Ca2Cu3C,; had TC° = 140K and T 130K(it canbe seen in figure 1 and 2). In contrast, if Sb = 0.4, irrespective of the different proportions ofPb, semiconducting behavior was exhibited (it can be seen in table 1).
3.2 X ray diffraction (XRD) investigation
- 82 -

JAERI-Conf 2001-017
From R-T characteristic studies it was thus quite clear that after an optimum heating time thesuperconducting characteristics of the resulting material reverted back from a broad single
Table X: Typical Samples
Composition Sintering Sinteriag T5J (K) 1 T 0 ° Behavior in R-T 1
of Samples Temperature time (h) (K) characteristics phases inl(0C) XRD
_ _ ___ _ _ _ __ _ _ _ ! __ _ _ ___G p______Sb =0.1 820-845 24 - 96 901 05 SuprconductiLg 2212Pb=0.4& 0.5 1 I _ __ 23Sb =l02 820-845 24 - 96 90105 190 Superconducting 2212Pb=0.4& 0.5 l 2223 __ __
Sb=0.3 825-850 100 140 130 Superconducting 4441Pb=O. I CuO
Sb=0.4 825-850 100-130 Semiconducting
transition to 2-step transitions with distinct decreased in both TCr0 and T, 0 values. Our XRDinvestigations also supported these observations as can seen in the following part of thissection. It also revealed the development and transition of different phases during the processof heating.
In XRD of the system (Sb=0.3 and Pb=0.1) under consideration it has been observed thatirrespective of the sintering or calcine there existed always a cluster of sharp and intensepeaks around 2 =30° and a few others that were never obtained earlier in undoped Sb or PbBSCCO system. The most surprising and interesting observation was the presence of thesepeaks in XRD pattern of a pellet just calcined at 8200 C for 24h.
The position and intensities of all these peaks match with those reported by Tingzhu et al [16]and Agnihotry et al [18]. These authors have attributed these peaks to a 'new phase'belonging to the monoclinic system and identified as Bi3Sb0 gPb0:2Sr4.1Ca3 9C'uO 5 representedas 4441.
Our XRD studies also made it evident that there was an optimum sintering time of 100h andcalcining time of 25h, when the best superconducting behavior was exhibited. However,exceeding this time may lead to deterioration of the superconducting characteristics.
The most interesting figure to note was the optimum TGO = 130K, which was comparable tothat of only Sb or Pb doped Bi-systems, and TC00 =140K which was much higher. The unusualhigh value of T." can be correlated with the presence of the 'new phase' that has appeareddue to doping Sb.
4. Conclusion
Our combined R-T and XRD studies proved that the partial substitution of Bi by Pb+Sb andan appropriate thermal treatment leaded to a material with an unusual high value of TC,' =
- 83 -

JAERI-Conf 2001-017
140K never achievable in Pb or Sb substituted Bi systems. The important role of Sb seems tobe in forming the so-called 'new phase' (4441) from calcination step to the final sinteringstep. and accelerating the formation of the high temperature phase.
Acknowledgements
The authors are thankful to Director of the lnstitute ,Dr. Nguyen Nhi Dien, and Vice Directorof the Vietnamese Atomic Energy Agency, Dr. Vuong Huu Tan for his keen interest andencouragement. The authors would like to acknowledge the Science and Technology Agencyof Japan (STA) and Ministry of Science and Technology (MOST) of Korea who supportedfor organization of the Workshop.
References
1.Maeda H. et al, 1988 Japan J!.Appl. Phys. 27 L2092.Sunshine S.A. et al 1988 Phys. Rev. B38 8933.Green S.M et al. 1988 phys. Rev. B 38 50614.Takano M et al 1988 Japan J Appl. Phys.- 27 L1045.Chandra S. et al (communicated to Phys. Status Solidi)6.Ramesh R. et al 1988 Appl. Phys. Lett. 53 17597.Liu H.B et al 1988 physica C 156 8048.Chandrahood M.R. et al 1989 appl Phys. Lett. 55 14729.Hongbao L et al 1988 Solid State Commun. 69 86710.Dou S. X. et al 1989 Physica C 158 971 l.Komatsu T. et al 1989 Japan. J.Appl. Phys. 28 L 115912.Spencer N.D. et al 1989 Japan. J. Appl. Phys. 28 L156413.Luo J.S. et al 1989. Appl. Phys. Lett.55 144814.Sastri P.V. et al 1989 Solid State Commun.71 93515.Pissas H. et al 1989 Physica C 159 64316.Tingzhu C. et al 1990 Supercond. Sci. Technol. 3 8717.Nguyen Thi Kieu Oanh et al 1995, Master Thesis, The Pb doped BSCCO system18.Agnihotry S.A. et al 1991 Supercond. Sci. Technol. 4 7-12
-84-

JAERI-Conf 2001-017
T_ r , * ~~~~~~~_,C t~
.n, I,- i L~
CD 4s+7 S-z- <
0-~~~~~~~~~~~~~~~~~~~~
rn ~ ~ ~ ~ ~ .. IS)
<
(r
f tR
rn
Sn Co
O'-= - Wt~Jn,
,, #s+F g-rir-47
A -~~~~~~~~~~~~~~~~~~~~~~~~~~~~~~~7
85 -~~~~~~~~~~~~~(
tq7 7 Esr~~~~~~~~~~~~~~t = ! @3~~~~~~~w,* ;;, I era r, _ _ - t7-h 17
~~~ t ~~~~~~~rU) .~~~~~~~~
1'$47-7 z9 <
_ LvI
Y [.
- 85 -

JP0250096JAERI-Conf 2001-017
1.12 Residual Stress Analysis by Neutron Scattering
'Nobuaki.Minakawa, 2Atushi. Moriai, 2 Akitoshi.Ohtomo
'Research Group for Neutron Scattering,
Advanced Science Research Center, JAERT2Research Reactor Utilization Division,
Department of Research Reactor, JAERI
Tokai -Mura, Naka-Gun, Ibaraki, Japan 319-1195
Abstract
The structure material of the sample can understand a neutron diffraction measurement, and it
can know the structure. The property of material can be known from as a result. A strain
measurement is a kind of measurement of physics, and change of a spacing of lattice planes is
a strain. It is also highly precise spacing of lattice planes measurement technique. A strain is
convertible into a stress with a Hooke's law. Getting to know the strain distribution in material
can guess the strength of material, fatigue condition, a life, etc.
1. Introduction
By the measurement of internal residual stress for the material, it is possible to do the
lifetime of the structure material, the development of new materials, the safe securing of
the structures and so on. It has only a neutron diffraction method that can measure the
internal residual stress.
We made a sample for the residual stress measurement by the neutron diffraction
method, which is planned from 2002 in this "WS on the utilization of research reactors"
and began the manufacturing of the standard sample. We do like to report for the
standard shrink-fit sample was manufactured which used an aluminum material A6063
as for sample of the residual stress by the thermal expansion. As for this sample, to
measure with the neutron diffractometer in every country, we will introduce the way of
measurement.
2. Design
As for the sample to measure with the practice of WS and that the neutron scattering
equipment in every country, the sample measurement evaluation can do easily is
desirable. Therefore, we manufactured shrink-fit sample, which is easily of the
computation of the occurrence stress and it is possible to measure by installing in the
sample table directly.
For the inner stress be able to measured even if the incident monochromatic neutron
- 86 -

JAERI-Conf 2001-017
beam flux was weak, it was necessary to choose material with small neutron absorption
coefficient( u) and we chose an aluminum material. The neutron absorption coefficient
of aluminum about the neutron wavelength of 0.2 nm is 0.012. As for the aluminum
material, the age hardening chose done A6063 and A7075 of heat-treatment-type alloy
in the precipitation process in the Mg-Si layer. This time, we manufactured a sample
using A6063. The characteristic of mechanical properties and the chemical composition
of A6063 are shown in table 1.
The shrink fit sample is considered neutron attenuates and a manufacturing size is
The chemical composition (mass%)
Si Fe Cu Mn Mg Zn Cr Ti
0.2 < C 0.45 < < c
0 6 0.35 0.10 0.10 O 0.10 0.10 0.10
0.6 J0.9The mechanical properties
quality Thetensile strength (MPa) 0.2% proof stress elongation(%)
T6 Ž206 Ž 177 2 8
Table-1 Chemical composition and mechanical properties of A6063
composed of outside diameter 50mm 0, 50 mm height, ring with caliber 25mm b
and plug. In order to make shrink fit samples the plug is cooled in the liquid nitrogen
and the shrunk plug is inserted into the ring immediately. The internal pressure, which
occurs by the thermal expansion, was found by the formula (1) and the manufacturing
size was found by the formula (2).
s = Ee= Ea(t- to) (1)
where: a = stress of the direction of the circumference, E = elastic constant, E
strain by the thermal expansion, a = expansion coefficient, t = plug cooling
temperature, to = normal temperature (200C)
The 209C coefficient of linear expansion a of aluminum is 23.6 X 10⁻⁶ and the
elastic constant is 7OGpa. Depending on the occurring thermal stress is 281 MPa. Plug
temperature rise until inserts in the ring center, which was cooled at the liquid-nitrogen
(77.348K). To decide on the operation time and insertion temperature, which plug into
the ring, with measured a characteristic of the temperature rises, when leaving in the
- 87 -

JAERI-Conf 2001-017
-120 --140 _ _77+ 1P toon to Rg, le_ in t e at rse.i
Left in tOat.. phore-140-
-1500
-100
-19- 0
-2000 5 IC 15 20 25 30 35 40 45 50 05 60
Time (so.)
Fig. 1: Characteristic of the temperature rises Fig.2: Manufactured Ring and Plug
room temperature and make a plug touch to ring taking out ftom liquid-nitrogen. It
found expansion length by the formula (2). Figure 1 shows a characteristic of the
temperature rises.
I (dl
IR dti
where: 1R = plug diameter about 209C of room temperature, dl = change length with
plug diameter at the cooling temperature tVC, dt = change quantity with temperature
As a result, the operation time is about 30 seconds, the plug surface temperature is
about -1 50C then it should manufacture a plug diameter 0.1 mm more longer than ring
caliber. Even if ring and plug makes by a precise automatic milling machine, but
manufacturing precision is becomes 5/1000 mm. Therefore, it made a ring caliber
25.000mm f +Ommn, -0.005mm tolerance and plug diameter is 25. 100mm 4 +Omm,
-0.005mm, and tolerance. Manufactured Ring and plug is shown in Figure 2.
The stress, which occurred by the thermal expansion, dispersed and estimated a
remaining condition as follows.
The stress equivalent condition will be achieved at the contacting boundary of the ring
and plug: the ring was pressurized whereas the plug is compressed. The samples are not
constrained to the axial direction. In polar coordinates system the axis symmetric stress
condition of the elastic body is described by
( R van) H
E (3)
(a fH V7R)
- 88 -

JAERI-Conf 2001-017
where ER radius strain component, e.= circumferential strain component, AR=
radius stress component, or, = circumferential stress component, v = Poisson's ratio
and E = Young's modulus. After shrink fit the plug was compressed by the pressure
-P(P>O), then its stress state to the radius direction as well as to the circumferential
direction is given by (Rr -H =-P The pressure P is denoted by
P E= (bc) (4)b2
C
where 6 = a-b, a= diameter of plug, b= outer diameter of ring, c= inner diameter of ring.
A circumferential stress components for the internally pressurized cylinder is obtained:
UH 4r2 [b 2 C 2 (5)4 Tr 2- ( 2 _ C 2 ) S
Substituting P the next equation is easily found
4cr°H 42 (6)
The measurement method and be expected distribution of stress for hoop direction is
shown in Figure 3.
HOOP DIRECTION
DIFFRACTED BEAM INSIDENTSEAM I
BEM*IT t h do (GMPa)… _… -----------
gAQ|ESCANNING FORiOP DIRECTIO~ RING PLUG RING
f~~~~d~ ~ I 25m M 0-i/ 0 0 / 2s~~mme
Fig.3: The measurement method and expected of stress for hoop direction
3. Measurement and result by the Neutron Diffraction
It is only a neutron diffraction method, which can measure the state of stress disperse
in the sample that occurred at the 281MPa by the thermal expansion.
The inner stress measurement used the neutron diffractometer for residual stress
analysis (RESA) that is installed T2-1port in the thermal guide hall at JRR-3M in
JAERI. An equipment and strain measurement condition is shown next.
-89 -

JAERI-Conf 2001-017
Monochromator crystal: Si(3 11) Bending and focusing method Crystal mosaicnes
0.230 Scattering angle of monochromator crystal : 80.00° Wavelength : 2.01nm
Collimation: a 1 = 0.35° a 2 = 0.3° a 3 = 0.33
Strain was measured 33 points in amount of +-23 mm from the sample center. In the
arrow, which was written in the upper part of the sample, according to the direction of
the scattering vector, it measured the 3 directions of radial, hoop, and axial, and
diffraction plane chose the (220) where the gauge volume is small, but this material had
strong texture then could not measurement of axial direction. Therefore, it analyzed a
stress in radial and hoop. A texture is shown in Figure 4.
Intensity (n/1 5sec)
M 550-600
i ED i iii~~~~~~- - -i 80 M 5DO-550* 450-5007 0 400-450
e S5 . id _ $ _ EE = E SE 3 a i ffl; =60 0 3350-4003 0600-350
50 0200-300
-. 4 0200-250t r r< ,>]_ _ . | [ ] 1t;| add 1 ._ ~~~0150-200
30 X 0100-150050-100
0 10 20 30 40 50 60 70 30 90 1 110120130140 1501601701
Fni (nrlg "
Fig.4: Texture of A6063 (220)
The strain free lattice spacing do was measured by the plug sample.
The stress analysis from the measured strain used formula (7). An analysis of the
stress for hoop directions are shown in Figure 5.
R, ~-v K [ORH +12 ( R +H)] (7)
4. Result
The VAMAS TWA 20* was manufacturing the design of the sample for the neutron
diffraction, which used stress generation by the thermal expansion already as the Round
Robin sample but as for the process of the manufacturing design wasn't published.
Therefore, it became manufacturing design from nothing.
The maximum stress for the hoop direction in the boundary part neighborhood of
plug and ring is about 200MPa from the measurement result. The analysis result
becomes a value with the low of 8OMPa than an estimated value. As this cause, the
following item is thought of the manufactured plug size was smaller than 25.100 mm
- 90 -

JAERI-Conf 2001-017
as well as it stores up that there was texture which is strong in the plug to have used for
the spacing of lattice planes do measurement of the stresses Condition.
It is possible to say that the following item is important in the standard sample
manufacturing this time.
O the computation of the thermal expansion occurrence stress, because the plug
outward form size, the ring caliber size influence precision mainly, improve
manufacturing and size measurement precision.
(Z The aluminum material is very small neutron absorption coefficient but although the
grain orientation is So big.It is necessary to measure texture every each index in the manufacturing of the standard
sample and to fix the plug and ring direction of the cut out from the material.
*: Versailles Project on Advanced Materials and Standards, Technical Working Area 20,
it was worked on measurement of residual stress by the neutron diffraction method.
5. Conclusion
An internal residual stress measurement of material can measure only a neutron
diffraction. This is an indispensable measurement technique and contributes to the
industrial prosperity of each country, in order that to make and develop the excellent
manufactured goods.
a_-oa _____ __X,____
300
1 00
0 P I TIT -
LUJ
g -100 _ _ _ _
-200 __ _ _ __ _ ___ _ _ _ _ _
-300 .....
-30 -20 -10 0 10 20 30
POSITION (mm) FROM CENTER
Fig.5: An analysis of stress for hoop and radial directions
-91 -

JP0250097JAERI-Conf 2001-017
1.13 Synchrotron Small-Angle X-ray Scattering Facilityat the Pohang Accelerator Laboratory and
Its Applications in Materials Science
Jorg Bolze," 2 Jehan Kim, 1 Byeongdu Lee, Tae Joo Shin,2 Jinwon Lee,2
Jung-Yun Huang1, Seungyu Rahl, Hwa Shik Youn SKi-Bong Leel and Moonhor Ree, 1 2*
1 Pohang Accelerator Laboratory;2Dept. of Chemistry, Center for Integrated MolecularSystems, BK21 Functional Polymer Thin Film Group,
and Polymer Research Institute,Pohang University of Science and Technology,
San 31, Hyoja-dong, Pohang 790-784, Republic of Korea
presented at the 2000 WS on the Utilization ofResearch Reactors, 20-24 November 2000, KoreaAtomic Energy Research Institute (KAERI),Daejon, Korea
* To whom all correspondence should be addressed:(Tel) +82-54-279-2120; (Fax) +82-54-279-3399;(E-Mail) [email protected]
- 92-

JAERI-Conf 2001-017
Abstract: The small-angle X-ray scattering (SAXS) beamline BL4C1 at the 2.5 GeV
storage ring of the Pohang Accelerator Laboratory (PAL) has been in its first year of
operation since August 2000. During this first stage it could meet the basic requirements
of the rapidly growing domestic SAXS user community, which has been carrying out
measurements mainly on various polymer systems. The X-ray source is a bending
magnet which produces white radiation with a critical energy of 5.5 keV. A synthetic
double multilayer monochromator selects quasi-monochromatic radiation with a
bandwidth of ca. 1.5 %. This relatively low degree of monochromatization is sufficient
for most SAXS measurements and allows a considerably higher flux at the sample as
compared to monochromators using single crystals. Higher harmonics from the
monochromator are rejected by reflection from a flat mirror, and a slit system is
installed for collimation. A charge-coupled device (CCD) system, two one-dimensional
photodiode arrays (PDA) and imaging plates (IP) are available as detectors. The overall
performance of the beamline optics and of the detector systems has been checked using
various standard samples. While the CCD and PDA detectors are well-suited for
diffraction measurements, they give unsatisfactory data from weakly scattering samples,
due to their high intrinsic noise. By using the IP system smooth scattering curves could
be obtained in a wide dynamic range. In the second stage, starting from August 2001,
the beamline will be upgraded with additional slits, focusing optics and gas-filled
proportional detectors. In addition, the second SAXS beamline BL4C2 based on a
bending magnet X-ray source and a double crystal monochromator is under construction
and this construction will be completed by August of 2002. And, the third SAXS
beamline based on an undulator X-ray source and a double crystal monochromator is
also planned to construct by 2005. In Korea the SAXS beamlines become very
important advanced tools for structural investigations on various commodity and
advanced materials. Together with these SAXS facilities, the wide-angle and small-
angle neutron scattering (WANS and SANS) beamlines at the Hanaro Center of Korea
Atomic Energy Research Institute open a wide view of features to the fundamental and
applied researches of materials in Korea.
Keywords: X-ray, small-angle scattering, synchrotron, Pohang AcceleratorLaboratory, beamline, detector, polymer, latex.
-93 -

JAERI-Conf 2001-017
1. Introduction
Small-angle X-ray scattering from an irradiated specimen arises from electron
density fluctuations on a mesoscopic length scale in the range of ca. 10 to 500 A. This
method has become a very important too] for structural studies on a wide variety of
materials, such as polymers, fibers, metals and alloys, liquid crystals, and colloidal
systems.1-5 Examples for colloids which have been investigated are biomolecules,6
synthetic nanoparticles, aggregates of amphiphilic molecules, gels etc. Information
about the overall shape and size of the scattering object, its density, orientation, packing
with other objects etc. may be obtained. Typical applications in polymer science 7 8 are
studies on the nanodomain formation in block copolymer systems as a function of
temperature and composition, on the crystallization mechanisms and kinetics of
homopolymers and copolymers, on the structure of polymer latexes, on the
conformation of polymers in solution etc. Due to the high photon flux which is available
at synchrotron sources, the data collection times can be greatly reduced which also
allows for time-resolved studies on phase transitions, crystallization kinetics,
assembly/disassembly processes, denaturation/renaturation etc. Other merits of
synchrotron radiation are the naturally low beam divergence and the available
wavelength continuum.
Beamline BLAC1 at the Pohang Accelerator Laboratory (PAL)9 is the first dedicated
synchrotron small-angle X-ray scattering station in Korea. The first phase of
construction was started in January 1999 and completed in August 2000. Domestic
SAXS user and SAXS working groups were founded in 1994 and 1995, respectively,
and have been growing rapidly. To date, simple optical components have been installed
-94-

JAERI-Conf 2001-017
at the beamline, which can meet the basic requirements of the domestic SAXS
community. This paper summarizes the current status of the beamline instrumentation
and reports about some measurements on standard samples, which were conducted to
test the performance of the beamline optics and of the various detector systems. Brief
outlooks on to further upgrading plans and on upcoming new SAXS beamlines are also
given.
2. X-Ray Source
The Pohang Accelerator Laboratory (PAL) is a 2.5 GeV synchrotron radiation
facility in Pohang, Korea. It is operated at a ring current of typically 150 - 200 mA. The
radiation source for the SAXS beamline is a bending magnet with a magnetic field of
1.32 T. The size of the source (root mean square deviation 6 of the electron beam with
respect to the orbit) is 6, = 0.059 mm vertically and 6h = 0.160 mm horizontally, and the
divergence of the emitted white beam is 0.1 mrad vertically and 3.0 mrad horizontally.
At a stored electron energy of 2.5 GeV the critical energy of radiation is 5.5 keV and a
usable photon flux up to 15 keV is delivered. The calculated angular photon flux density
(which is given in units of the number of photons per unit time (s), per unit solid angle
(mrad), and per 0.1 % relative bandwidth) amounts to 2.15 x 10¹³ photons / sec / mrad2
/ 0.1% b.w. at a stored electron energy of 2.5 GeV, a ring current of 200 mA and an
energy of radiation of 7.7 keV. The ultra-high vacuum in the storage ring is separated
from the high vacuum beamline by a beryllium window. The access of the X-ray beam
to the-experimental station is controlled by a photon shutter.
- 95 -

JAERI-Conf 2001-017
e Z.5 GeV, 200 ma SC
Bending 7-$X _E_' h
SI DMM S2 S3 M S4 S BS
I I I I I t
0.0 14.0 15.0 10.5 21.5 22.0 22.5 22.6 [f1]-24.2
Figure 1. Schematic diagram of the SAXS beamline BLMC1 at the Pohang
Accelerator Laboratory: S1-S4: slits; DMM: double mulitlayer monochromator;
M: flat mirror; S: sample; IC: ionization chamber; BS: beamstop; SC: scintillation
counter; D: detector.
3. Beamline Optics
3.1. Monochromator
The monochromator is located at a distance of 15 m from the source of
radiation. It consists of a set of two synthetic multilayers (Osmic Inc.) which are
deposited on silicon substrates with a size of 20 x 50 x 5 mm. Each multilayer consist of
200 W/B4 C layers, with a d-spacing of 25 ± 1 A and a root-mean-square roughness
smaller than 1 A. The first order Bragg reflection of these multilayers is used to obtain a
quasi-monochromatic beam. The reflectivity at the Bragg angle amounts to ca. 70 % at
- 96-

JAERI-Conf 2001-017
8 keV and the band width of the reflected beam, which is mainly determined by the
number of layers, is ca. 1.5 %. In addition to the fundamental, the second harmonic is
also present in the same reflected beam. As will be described further below, it is
removed downstream using the reflection from a flat mirror. The two multilayers are
mounted on a holder in a parallel geometry and offset the incoming beam ca. 3 mm
upwards without changing its direction. This optical system yields X-rays with energies
E varying from 7.5 to 9.5 keV. The beamline is usually operated at E = 7.709 keV,
which corresponds to a wavelength e of 1.607 A. Energy calibration is done using the
K-absorption edge of a cobalt foil. At that energy the Bragg angle of the multilayer is
1.842° and the vertical beam size which is intercepted by the monochromator is 1.6 mm.
The resolution of the double multilayer monochromator in terms of As / e, where As
represents the full width at half maximum of the reflected wavelength distribution, is ca.
1.5 %. This degree of monochromatization is rather poor compared to that of single
crystal monochromators, for which AE / e is of the order of 10- , The advantage of a
wide-bandpass monochromator as being used here, however, is a considerable gain of
photon flux by about a factor of 100.
In the following we discuss how the monochromator characteristics will affect
scattering and diffraction data. A wavelength spread in the radiation incident on a
specimen leads to a distribution of scattering vectors q (q = 46 x sin(6/2) / e, where e
denotes the scattering angle) which are being probed simultaneously at one angle in the
detector plane. The scattering curve I(q), which is measured from a sample when using
a polychromatic beam with a wavelength distribution W(6), is related to the scattering
pattern I(q), which would be measured in case of an ideally monochromatic beam (AM /
e = 0), by the following smearing integral:2
- 97 -

JAERI-Conf 2001-017
I(q) =fW(QC) *I(q) d;'
(1)
where e' e / e and eo denotes the mean wavelength. From this equation it can be
seen, that there is no smearing effect at q = 0 nm- , and that the width of distribution in q,
over which I(q) is being averaged, increases with q. In order to estimate the smearing
effect due to the finite energy resolution of the monochromator used at BLAC1, a
computer program was written, which applies the smearing integral given in equation
(1) on various calculated model scattering patterns.
First we discuss the scattering from an assembly of non-interacting, homogeneous
spheres with a mean sphere diameter of 100 nm. A Gaussian particle size distribution
with a rather small standard deviation of 3 % was assumed. This kind of model system
may represent a dilute polymer dispersion (latex). The scheme for calculating the
scattering intensity of such a system was reported elsewhere's Figure 2 displays the
scattering patterns which were calculated as a function of AE / e, where W(8') was
assumed to be a Gaussian. The model curve calculated for the case of an ideally
monochromatic beam exhibits deep minima in the oscillations because symmetric
particles with a narrow particle size distribution are being considered. In case of AE / e
= 1.5 %, no significant smearing of the oscillations occurs, whereas in case of AE / e =
10 % (a typical resolution for neutron scattering) considerable smearing is evident. Thus,
such a sample can be measured using the double multilayer monochromator at BIAC1,
without any drawback in resolution. On the other hand, if the data were measured with a
- 98-

JAERI-Conf 2001-017
resolution of AE / e = 10 %, a desmearing of the scattering curve would be necessary.
Otherwise, the determination of the particle size polydispersity would lead to an
erroneous result.
0~
100
0%, o 1.5 %x 10 %
1 -2 10
AL 1-4. 0.
10-60 0.2 0.4 0.6
q [nm-1 ]
Figure 2. Model calculation demonstrating how SAXS data are affected by a finite
wavelength resolution of the monochromator. Shown is the form factor P(q) of a
homogenous sphere with a radius of 50 nm. The standard deviation of the Gaussian
particle size distribution was set to 1.5 nm or 3 %. Parameter is the width of the
wavelength distribution in the incident X-ray beam which is assumed to be Gaussian.
The smearing effect due to a bandwidth AL / e of 1.5 % (as provided by the double
multilayer monochromator) is still negligible, whereas 10 % bandwidth would result in
a considerable smearing of the extrema.
-99 -

JAERI-Conf 2001-017
8 a=0.0516 nm-1
0.0561
0.0630
6 0.0714
0.0915
2
00 2 4 6 8 10 12
q [nm-1]
Figure 3. Model calculation demonstrating how the width of a diffraction peak
is affected by a finite wavelength resolution of the monochromator. The
wavelength distribution in the incident beam was assumed to be Gaussian with AE
/ e = 1 5 % and the intrinsic line width (standard deviation) of the Gaussian peak
was set to 6 = 0.0500 nm-'. In order to elucidate how the peaks are affected as a
function of their angular position, this calculation was done assuming various
Bragg spacings. As can be seen, the broadening increases with increasing
scattering vector. The figures given in the plot indicate the calculated standard
deviation of the broadened Bragg peaks.
Next we consider the diffraction from a sample containing some ordered domains.
The Bragg peak originating from this sample is assumed to be Gaussian with an
intrinsic line width (standard deviation) of 6 = 0.0500 nm1'. This corresponds to a
-100-

JAERI-Conf 2001-017
correlation length of 54 nm in real space. In Figure 3 it is shown, how the width of the
Bragg peak is affected by a finite energy resolution of 1.5 %. In order to elucidate how
the smearing effect depends on the diffraction angle, various d-spacings were assumed.
It can be seen, that significant peak broadening is induced, and that the effect increases
considerably with increasing scattering vector. As an example, the peak width is
broadened by 3.2 % at q = 2 nm-1 (SAXS regime), but at q = 10 nm-' (WAXD regime)
by as much as 62 %. Before any quantitative interpretation of such data is done, a
desmearing of the raw data is required. Desmearing procedures are discussed in
References 2 and 3.
In summary, the bandwidth which is provided by the double multilayer
monochromator is sufficient and suitable for most of the SAXS measurements which
are typically performed at BL4C1 and no data correction procedures are required. In
case of highly ordered samples, however, it is necessary to desmear the raw data,
especially when intermediate or wide angles are being considered.
3.2. Mirror
In order to reject the higher harmonics from the beam which is reflected by the
multilayer monochromator, a flat, gold-coated mirror (Beamline Technology Corp.,
USA) is installed 22 m from the source. The dimensions of the mirror are 200 x 30 x 30
mm and the surface roughness is smaller than 1.5 A. To prevent radiation damage on the
mirror surface, it is kept in a box under a helium atmosphere. The tilt angle of the mirror
is adjusted so that the beam is reflected under 8 mrad with respect to the mirror surface.
At that angle the reflectivity for X-rays with E = 7.7 keV is about 75 %, whereas it is
less than 2 % for the second harmonic. Thus, the total reflecting mirror acts as a low-
- 101 -

JAERI-Conf 2001-017
pass filter which effectively reduces the intensity of the second harmonic to a negligible
level. The performance of the mirror is demonstrated in Figure 4. It compares the
diffraction patterns from lead stearate which were measured by a charge-coupled device
(CCD) detector before and after the installation of the mirror. Without the mirror, an
intense diffraction ring was observed in the small-angle region, and in addition a weak
ring at half angle. Upon installation of the mirror, only the intense diffraction ring
remained. It is thus obvious that the weak ring must be attributed to the diffraction of
the second harmonic, which could be effectively suppressed using the mirror.
102 -

JAERI-Conf 2001-017
Figure 4. Diffraction pattern from lead stearate before (a) and after (b) a flat
mirror had been installed. The weak diffraction ring in (a) corresponds to the
diffraction of the second harmonic. It could be rejected upon reflecting the
incident beam at the mirror surface.
3.3. Slit Collimation System
A very tight collimation of the X-ray beam and the minimization of any
parasitic scattering is essential in small-angle scattering, so that measurements can be
done in the immediate vicinity of the direct beam. Several slits are installed along the
beam path for that purpose. A primary slit is located 14 m from the source point, in
front of the monochromator. It is usually set to 0.5 mm vertically and 1.0 mm
horizontally, thus slicing off a rectangular portion from the central cone of the emitted
beam. The actual beam size is determined by two more slits behind the monochromator
(one of those slits is scheduled to be installed in August 2001), whereas a guard slit just
- 103 -

JAERI-Conf 2001-017
in front of the sample has the function to cut down any parasitic scattering without
touching the main beam. This setting still needs to be optimized, because the parasitic
scattering originating from the mirror cannot be completely removed with this
configuration. Two viewing ports are installed along the beam path in order to monitor
the shape and position of the X-ray beam.
4. SAXS Camera
The SAXS camera is enclosed in a safety hutch and all components are remotely
controlled. A motorized sample stage is located 22.5 m from the source and allows
users to install various sample cells in a flexible way. The photon flux at the sample
position was estimated from the current measured with an ionization chamber to ca. 2 x
1010 photons/mm2 /s at a ring current of 200 mA. Attenuators with various thickness
may be inserted into the beam in order to control the photon flux on the sample. An
evacuated beam path with adjustable length (10, 90, 130, and 170 cm) is mounted on a
double optical rail between the sample and the detector stage. It is sealed on both ends
with thin Kapton foils and the vacuum level (typically 5 x 10⁻³ Torr) is continuously
monitored. The beamstop, which is made of tantalium, is located inside the vacuum
path, close to the Kapton window at the end. A motor-controlled detector stage is
installed right behind the vacuum path. The intensity of the primary beam may be
monitored by ionization chambers before and/or behind the sample, and also by a
scintillation counter which measures the back-scattering from the beamstop under an
angle of ca. 450.
-104 -

JAERI-Conf 2001-017
5. Detector Systems
At present two one-dimensional photodiode array detectors (PDA), an area-CCD
detector, as well as phosphor imaging plates (IP) are available. In the following we will
first discuss the properties, merits and demerits of each detector. Afterwards, we present
SAXS measurements from some standard samples and compare the performance of the
various detection systems.
5.1. Photodiode Array Detector System (PDA)
This is an unintensified solid state detector which is based on an X-ray
sensitive, linear silicon photodiode array (Princeton Instruments, USA, Model X/PDA).
X-rays directly hit the sensing area after passing through the entrance window, which is
made of beryllium. It is a multichannel line-scan camera which consists of two arrays
placed one above the other. The total length of the combined arrays is two inches, which
is divided in 2048 channels. The light sensing area per pixel is 25 x 25 Am7. For storing
the accumulated charge, however, a much larger area of 25 x 2500 Am 2 is used. This has
the advantage that a high charge may be collected before the saturation level of a pixel
is reached. Other merits of this type of integrating detector are its high gain (as
compared to indirectly illuminated array detectors) and its high count rate capability,
which is important when synchrotron radiation is used to measure intense diffraction
peaks. According to the manufacturer, the spatial resolution is better than 1.5 pixels,
geometric distortion less than one pixel and the uniformity of response is 5 to 10 %.
After a preset exposure time, the array is scanned and the charge in each diode is read
-105 -
JAERI-Conf 2001-017
out by the preamplifier board in the detector head. An analog signal is created and sent
to the detector controller, where it is further shaped and amplified. It is then digitized by
an analog-to-digital converter (ADC) with a resolution of 16 bit. The digitized signals
are integer numbers measured in analog-to-digital units (ADU). They are sent via Direct
Memory Access to the interface board of a personal computer, where data are displayed,
further processed and stored.
A main disadvantage of this detector type is its inherently high dark current noise,
which varies from pixel to pixel. Main sources of this background are thermally induced,
statistical noise (accumulated charge in the array) as well as electronic noise originating
from the readout electronics and from the digitizer. As thermally induced dark charge
decreases exponentially with temperature, the array is cooled to typically -30'C. The
thermoelectric cooler and the array are confined within a static vacuum chamber in
order to prevent water condensation and to ensure optimal insulation. The detector is
prone to radiation damage which is manifested in a locally increased dark current. Even
though damaged areas may be recovered upon annealing the array, this process is not
fully reversible. The dark current increases linearly with the integration time, but in
damaged pixels it increases much faster than in undamaged areas. The detector dark
signal has to be determined carefully each time before a sample is to be measured. It has
to be measured using the same integration time as for the sample and with the photon
shutter being closed. The dark signal amounts to ca. 800 ADU when measured for 10 s.
The detector is controlled using software provided by Princeton Instruments (Winspec
3.1) which automates data acquisition, display, and basic processing. Further data
processing, as scaling, background subtraction and model fitting is done using other
software developed by ourselves.
-106 -

JAERI-Conf 2001-017
70000 16 bit (or 65536 ADU)_____-_-_----- -------- --------~~~
60000… detectornoise
50000
* 40000.a)/4-
30000
CL- 20000 o Experimental DataLinear Regression
10000K ,, ,
O . ...................0 5 10 15 20 25 30 35
Exposure Time [s]
Figure 5. Measured diffraction peak intensity from an ordered block copolymer
sample. Shown is the response of the PDA detector as a function of the exposure
time. The full-well-capacity per pixel (i.e. the integrated signal which saturates a
detector pixel) is 16 bit. Good linearity in the detector response was found until
the pixel well capacity is reached. From the intensities which are displayed here,
the dark noise was subtracted to yield solely the intensity scattered from the
sample. Evidently, the dynamic range which is available for the sample, is
diminished due to the dark noise. This is becoming most severe when the
scattering intensity from the sample under consideration is low.
The linearity of the detector was checked by measuring the intensity of a Bragg peak
from a block copolymer sample with ordered nanodomains as a function of the exposure
time. The measured intensity shows good linearity with a relative error of less than
-107 -

JAERI-Conf 2001-017
0.5 %. It increases until the saturation level of the detector is reached (16 bit, or 65536
ADU). The dynamic range of the detector is greatly diminished due to the high dark
signal, which has to be subtracted from the measured raw data. Thus, as shown in
Figure 5, at long exposure times the maximum signal from the sample scattering does
not reach the 16 bit level. It is reduced by the dark signal. In particular in case of weakly
scattering samples, where long exposure times of several minutes are required for good
counting statistics, the dark current may strongly dominate the measured raw data. In
such a case the maximum exposure time is mainly determined by the accumulated dark
current rather than by the scattering intensity of the sample. The PDA detector is not
well-suited to study weakly scattering samples. Data then tend to become noisy after
subtraction of the dark signal, because the dark signal itself shows a random fluctuation
of ca. 0.5 % when measured repeatedly.
5.2. Charge-Coupled Device (CCD) Area Detector
The. unintensified CCD area detection system (Princeton Instruments, USA)
is based on a scientific grade CCD image sensor (EEV 1152x1242 CCD, 1.4 Megapixel;
EEV, U.K.), where charges are stored in an array of photosensitive capacitors. The
entrance window of the detector is made of beryllium and has a diameter of 115 mm.
Incident X-rays are converted by an 0.5 mm GdOs phosphor screen into visible
scintillation photons which are guided to the CCD image sensor by a demagnifying
fiber-optic taper with a reduction ratio of 4.6:1. The pixel size is 104 x 104 [Lm at the
entrance window and 22.5 x 22.5 Itm2 at the CCD image sensor. The sensor has a size
of 25.9 x 27.5 mm2 and is divided into 1152 x 1242 pixels. The diameter of the taper at
the CCD is 25 mm. In order to reduce its dark current, the CCD is cooled to -50'C by a
- 108 -
JAERI-Conf 2001-017
Peltier device in combination with a circulating coolant. Water condensation inside the
detector is prevented by evacuation. The output from the CCD is amplified, digitized by
a 12- or 16-bit A/D converter, and transferred to the image memory of a Pentium
computer via a high speed serial interface. Normal readout speed of the CCD at lowest
noise is 200 KHz with a dynamic range of 16 bits per pixel. There also exists an option
for a high speed readout at 1 MHz with a dynamic range of 12 bits per pixel. Other
possibilities to achieve a faster readout are binning of pixels, partial readout, or a frame
transfer mode. To prevent a smearing of the image during readout, an electromagnetic
fast shutter, which is triggered by the detector controller, was installed close to the
sample. The detector is controlled using software provided by Princeton Instruments
(Winview32). It automates data acquisition, display, and basic processing. Further data
processing, as e.g. spherical averaging, scaling, background subtraction and model
fitting is done using other software developed by ourselves.
As in case of the PDA detector, a precise measurement and subtraction of the dark
charge signal is essential, in particular when low intensity patterns are to be measured.
Compared to the PDA detector, the dark signal from the CCD is low and shows little
fluctuation over the array. Fluctuations are further reduced upon spherical averaging.
When measured repeatedly, a stability of the dark signal within ca. 0.2 % was found.
The dark signal amounts to ca. 90 ADU within 1 s, most of which are offset counts from
the A/D converter. Compared to the PDA detector, the CCD detector has only a very
small increase of dark current with integration time, which makes it better suitable for
measurements of samples with a low scattering intensity. According to the manufacturer
the response nonuniformity is less than ± 3 % over the entire CCD area. The good
linearity of the detector within the dynamic range was reconfirmed using the same
- 109-

JAERI-Conf 2001-017
method as for the PDA-detector (cf. Figure 5). The detector was checked for spatial
distortion effects which could arise e.g. due to a shear distortion of the fiber optics taper.
For that purpose the detector was illuminated through a grid patterned mask made of
brass which consists of an array of holes 5 mm apart from each other with a hole
diameter of 0.25 mm. The image obtained in that way (cf. Figure 6) is to be compared
with the real geometry of the grid. We found a fairly good reproduction of the grid; the
maximum deviation of a grid point from a straight line was found to be ca. 1 % of the
taper diameter at the CCD sensor side. Sophisticated software exists to correct acquired
images for such spatial distortion effects."
Figure 6. Image of a grid patterned mask measured with the CCD detector.
- 110 -

JAERI-Conf 2001-017
5.3. Phosphor Imaging Plate System
White image plates (Fuji BAS 2000) with a dimension of 400 x 200 mm2 and a
pixel size of 100 x 100 tm2 are available. After exposure, the photo-stimulated
phosphor screen is read out off-line with a MAC Science IPR-420 reader system and
subsequently erased. The advantages of this integrating area detector are its high
dynamic range (16 bit), a good detection quantum efficiency, and a very low readout or
dark noise. On the other hand it is not well-suited for real time or time-resolved
measurements.
6. Experimental Results
We now compare the performance of the various detector systems by discussing
experimental data acquired from a polymer latex and from chicken tendon collagen. A
latex, which is prepared by emulsion polymerization, consists of an aqueous dispersion
of polymer particles with a particle size in the range of ca. 50 - 500 nm.12 Here we
discuss the scattering profiles obtained from highly uniform, spherical
poly(methyimethacrylate) (PMMA) latex particles with a diameter of ca. 90 nm. The
latex was dried at room temperature and subsequently ground to yield a fine powder.
Even in the dried state, the spherical particles keep their identity due to the high glass
transition temperature of PMMA.'3 We found that such a dried polymer latex is highly
suitable to test critically the performance of detectors, because its scattering curve
shows a number of peculiar characteristics: i) a very high scattering intensity, due to the

JAERI-Conf 2001-017
high electron density contrast between the particles and the surrounding air, ii) a large
number of oscillations due to the narrow particle size distribution and due to the
symmetry of the particles, and iii) a steep, continuous decay of the intensity over several
orders of magnitude within a small angular range. Thus, for the measurement of such a
sample, a suitable detector is required to have a high count-rate capability, a good
resolution, and a high dynamic range.
Figure 7. Scattering pattern of a PMMA latex powder acquired by the CCD
detector with an exposure time of 2.5 s. The image is displayed on a logarithmic
intensity scale in order to visualize the scattering features in the low intensity
region more clearly.
- 112-

JAERI-Conf 2001-017
Figure 7 displays an image of the scattering pattern which was measured from the
dried PMMA latex using the CCD detector system with an exposure time of 2.5 s. The
intensity is displayed on a logarithmic scale for a better visualization of the data over
the whole intensity range. Several rings of high and low intensity can be seen, due to the
oscillations in the form factor of those uniform, spherical particles (cf. Figure 2).
Furthermore it was found, that the scattering intensity of this sample is so high, that the
contribution of any parasitic scattering to the measured intensity is negligible at all
angles. As the sample under consideration is an isotropic powder, we will from now on
discuss spherically averaged scattering profiles.
Figure 8 displays the SAXS patterns measured with the PDA, CCD and image plate
detection systems, respectively. In all cases, the sample-to-detector distance was ca. 110
cm. Following a procedure given by Fujisawa et al.,14 the dynamic ranges of the
detectors were checked by variation of the height (in case of the one-dimensional PDA
detector) or diameter (in case of the CCD area detector and IP) of the beamstop, so as to
mask increasing parts of the highest intensity region at small angles. In Figure 8 the first
data points in the various measurements at different beamstop heights are marked by
arrows and numbered consecutively. As can be seen from those data, the scattering
intensity decays over nearly five orders of magnitude in the angular range under
consideration and displays several maxima and minima at smallest angles.
In case of the PDA detector the decays of the curves measured with various
beamstop heights are clearly different. By using attenuators of various thickness it was
found, that the shape and decay of the scattering pattern does not depend on the incident
photon flux, even though the scattering intensity of this sample is very high. This shows
that the detector has a high count rate capability and that the differences in the curves
-113 -

JAERI-Conf 2001-017
are due to the insufficient dynamic range of the detector. Using the PDA detector, it is
not possible to measure simultaneously the regions of highest and lowest intensities
correctly. The curves only superimpose when the beamstop is in positions numbered 3
and 4 in Figure 8). Thus, if such a sample is to be measured with the PDA detector, it is
necessary to perform two measurements with the beamstop placed in positions 1 and 3,
respectively. It is concluded that the practical dynamic range of this detector is limited
to ca. 500: 1.
In case of the CCD and IP detectors, the respective differences in the scattering
curves acquired at various beamstop sizes are only marginal. This means that the
dynamic range of those detectors is sufficient to simultaneously acquire data over an
intensity range of at least 104 1. Additional measurements using attenuators have
shown, that both detectors are working correctly even at a very high count rates.
In Figure 9 the scattering data from the latex powder, which were acquired with the
three different detectors, are shown together in a single plot. The displayed data for the
PDA detector were combined from three measurements at different beamstop heights,
whereas the data which -are shown for the CCD and IP detectors are the single
measurements at smallest beamstop size, respectively. As can be seen, all three curves
superimpose very well at smallest angles where the oscillations appear, but also the
decay of the intensity over more than four orders of magnitude is identical. In
conclusion, when carefully applied, all available detectors can yield reliable SAXS data
over a wide dynamic range and may reveal fine scattering features, provided that the
scattering intensity from the sample is high.
- 114 -

JAERI-Conf 2001-017
05 1 | PDA Detector
10
o 0.5 1.0 1.5
10 10 4 CCD Detector]
nd 103. 1h n Iv3 10 ¶12 2+
01
100 0.5 1.0 1.5
14 |Image Plate|10 11
10 f. .2~~~
1010
0 0.5 1.0 1.5
q [nM']
Figure 8. SAXS patterns from a dried PMMA latex measured with PDA and CCD
detectors as well as with an image plate (IP). In order to check the dynamic range of the
various detection systems the height (in case of the 1-D PDA detector) or diameter (in
case of CCD area detector and IP) of the beamstop was varied and increasing parts of
the highest intensity region were thus masked at smallest angles. The arrows indicate
the first data point for the respective measurements.
- 115 -

JAERI-Conf 2001-017
10000 1000
7 1000 100
(Dow 100 -L 0.3 0.4 0.5
10,
PDA
1IP
0.5 1.0 1.5
q [nm-1]
Figure 9. Comparison of the SAXS patterns from a dried PMMA latex
measured with the PDA and CCD detectors, as well as with an image plate (IP).
The PDA data were combined from three measurements at three different
beamstop heights (cf. Figure 8), whereas the CCD and IP data were collected in a
single measurement using the smallest beamstop size. The inset shows a
magnification of the curves in a small angular region. For sake of clarity, only
every third measured data points are displayed for the CCD and IP detectors.
Next we discuss the performance of the detectors when samples with a lower
scattering intensity are to be investigated. For that purpose the aqueous PMMA latex
was measured at a concentration of 17 vol.%. In that case the scattering intensity is
considerably lower than for the dried latex, because of the much lower electron density
difference between PMMA and water, as compared to that between PMMA and air. To
- 116-

JAERI-Conf 2001-017
yield the scattering intensity from the latex particles only, it is necessary to measure
separately the scattering from water and from the empty sample cell, and to subtract
those contributions from the gross scattering curve measured from the aqueous
dispersion, taking properly into account the respective transmission factors.1 0 Figure 10
displays the thus obtained scattering curves which were acquired using the CCD
detector and the imaging plate with an exposure time of 600 s, respectively. Like in
the case of the latex powder sample, the data coincide well in the angular region of
highest intensity where the oscillations occur. At higher angles (q 0.5 nm 1),
however, the CCD data become very noisy and at scattering vectors higher than 1 nm-1
the data are no more meaningful. On the other hand, the data acquired with the image
plate are comparatively smooth and show a reasonable decay in the whole angular range.
The main reason for the strong noise in the CCD signal is the instability of its dark
current. At high angles, the scattering intensity is considerably lower than the dark
current, so that small fluctuations in the dark image can create a high noise level in the
scattering curve, even if the data are radially averaged. In case of the one-dimensional
PDA detector this problem is even more severe, because the dark current is relatively
much higher, especially when it is acquired over the period of a few minutes or longer.
In addition, data smoothing by radial averaging is not applicable, of course. For the
image plate system, dark and readout noise are negligible compared to the scattering
intensity. The efficiency of the image plate is ca. 3.5 times higher as compared to the
CCD. This is evident in Figure 10, where the measured scattering curves are displayed
in the actual intensity ratio. This example has shown, that among the currently available
detector systems, the image plate is the detector of choice when weakly scattering
samples are to be investigated.
-117-

JAERI-Conf 2001-017
1000 -UIP
l O00t ~~~~~~CCD
100
104..;
0.1
0 0.5 1.0 1.5
q [nm-1]
Figure 10. Comparison of the radially averaged SAXS profiles from a PMMA
latex dispersion (ca. 17 Vol.%) measured with the CCD detector and an image
plate (IP), respectively. In both cases the data collection time was 600 s, the
sample-to-detector distance was set to 110 cm and the beamsize at the sample
position was ca. 0.40 x 0.20 mm 2. Note that the counting efficiency of the IP is
approximately three times higher as compared to the CCD detector. The strong
fluctuations of the CCD data at higher angles are mainly due to high contributions
of dark and readout noise of the detector, which have to be subtracted.
It was possible to fit the experimental data from the PMMA latex using a model that
assumes a system of homogeneous spheres with a mean diameter of 93.1 nm, and a
standard deviation of the particle size distribution of 5.6 %. The shape of the assumed
particle size distribution function was slightly asymmetric.'l Figure 11 shows that the
data measured with the imaging plate are well fitted by such a model. In particular the
- 118 -

JAERI-Conf 2001-017
oscillations and the overall decay are well matched. The scattering curve that we
measured at BL4CT also coincides very well with SAXS data which were acquired by
others15 from the same sample at the ESRF (European Synchrotron Radiation Facility,
Grenoble, France).
10 experimental datefit
~~~~~~~
10
1 0~~~~~~~~~~~~~~~~~~
0 0.5 1.O
q [nm-1j
Figure 11. Radially averaged SAXS data acquired from a PMMA latex (18 vol.%)
using an image plate detector. The exposure time was 600 s and the sample-to-detector
distance was set to 110 cm. The experimental data were fitted with the scattering from a
system of noninteracting, homogeneous spheres having an average diameter of 93.1 nm
and a standard deviation of the (asymmetric) particle size distribution of 5.6 %.
-119-

JAERI-Conf 2001-017
Figure 12. Diffraction pattern from a dry chicken tendon collagen acquired by
the CCD detector with an exposure time of 100 s. The image is displayed on a
logarithmic intensity scale in order to visualize the weaker diffraction peaks more
clearly.
-120-

JAERI-Conf 2001-017
6000 . . . . X
1.0
ECr
4000 CE 0 5
2000 8 5 10
COD
0L
0 0.2 0.4 0.6 0.8 1.0 1.2 1.4
q [nm-1]
Figure 13. SAXS data measured from dried chicken tendon collagen using a
CCD detector and a PDA detector at a sample-to-detector distance of 110 cm. The
intensities were scaled with suitable factors to superimpose both curves,
background scattering was not subtracted. The inset shows the position qm of the
Bragg peak maxima as a function of the order m of the peak. The slope of the
linear fit curve is inversely proportional to the d-spacing.
Figure 12 displays a small angle diffraction image which was acquired from a dry
chicken tendon using the CCD detector with an exposure time of 100 s and a sample-to-
detector distance of 110 cm. A large number of meridional reflections, which arise due
to the periodic arrangement of collagen units along the fiber axis, could be detected. The
repeat distance, which was obtained by using a PMMA-latex of known particle size as a
cross-calibrant, was determined to 643 A. We observed a slow degradation of the
- 121 -

JAERI-Conf 2001-017
collagen sample, so its repeat distance should be rechecked from time to time, if it is to
be used as a SAXS calibrant. Figure 13 shows a one-dimensional slice of those
diffraction data together with the diffraction pattern measured by the PDA detector. As
can be seen, the patterns from both detector systems coincide well. In addition, the
measured interpeak distances are highly periodic (cf. inset in Figure 13, which shows
that both detectors are free from a significant spatial distortion. Together with other
cross-calibrated samples (e.g. lead stearate, ordered block copolymer) the chicken
tendon collagen is routinely used for angle calibration and for the exact determination of
the center coordinates of the incident beam. Note that the measured higher order peaks
in Figure 13 are considerably broadened, mainly due to the beam polychromaticity (cf.
discussion of this point in connection with Figure 3). The first order Bragg peak of
collagen could not be resolved at a camera length of 110 cm. Upon increasing the
distance between sample and detector to 170 cm, the resolution of the SAXS camera
can be increased to ca. 800 A.
As an example for time-resolved SAXS measurements, Figure 14 displays
experimental data acquired during the isothermal crystallization of a poly(ethylene
terephthalate) (PET) sample.' 6 Using a dual-chamber temperature jump unit, the sample
was first molten at 280'C in the upper chamber, and then rapidly transferred into
another chamber (which is aligned in the X-ray beam), where the isothermal
crystallization was carried out at 2250C. Successive SAXS profiles were collected by
the PDA detector with an acquisition time of 10 s per scan. During the induction period
only diffuse scattering curves without maxima were observed. Above 90 s, a distinct
scattering maximum appears. It progressively moves to higher scattering angles with
time and simultaneously the integral scattering intensity (invariant Q) increases. The
-122 -

JAERI -- Conf 2001-017
angle position of the broad diffraction peak is related to the average separation (long
period L) of crystalline regions within a lamellar stack. Using a correlation function
approach,17 the change of morphological parameters (such as lamellar and amorphous
layer thickness) could be extracted from the experimental data as a function of time.
40001
0 ~ ~ 0 0
600
200 . , 300
150 .
__ 12h 200
100 i _
50 -100
0
50 100 200 500
t IsI
Figure 14. (a) Time-resolved SAXS patterns as collected during the isothermal
crystallization of PET at 2250C. (b) Morphological parameters which were obtained
from the data analysis: Long period L, lamellar thickness is, and amorphous layer
thickness 12. Q denotes the scattering invariant.
- 123-

JAERI-Conf 2001-017
Upon decreasing the sample-to-detector distance to ca. 10 cm, wide-angle
diffraction (WAXD) measurements can be performed. As already discussed in
connection with Figure 3, a desmearing of the experimental data due to the wavelength
spread in the incident beam is required when well-ordered samples are to be
investigated. Corrections for the polarization factor and for smearing and distortion of
the data due to the oblique incidence of the scattered beam on the flat detectors (because
the solid angle subtended by one pixel on the detector changes with the scattering angle)
are also required.2" 8 Furthermore- the l/r2 dependence of the scattered intensity, as well
as the angle-dependence of the absorption factor (inside the sample and between
sample and detector) have to be considered. Note that all those points are of no concern
for SAXS, due to the validity small angle approximation in that regime. A typical
application of WAXD which was performed at BL4C 1 is the time-resolved study of the
thermal imidization of a precursor polymer to yield the corresponding polyimide. Some
of the time-resolved WAXD measurements are shown in Figure 15. In this
measurement the film sample was heated with 2.0 K/min to 380'C in the upper chamber
under nitrogen atmosphere, dwelled at that temperature for 30 min, and cooled down to
room temperature. WAXD profiles were collected by the PDA detector with an
acquisition time of 10 s per scan. During early stage of heating up to around 120'C only
poorly developed structural features were observed. Above 1240 C distinct diffraction
peaks appear, indicative of the structural evolution induced by the thermal imidization.
For the newly developed. each diffraction peak, its angle position changed and the
intensity became strong as temperature elevated. The angle position corresponds to the
Bragg d-spacing. Further, the coherence length L, was estimated. As representative
- 124 -

JAERI-Conf 2001-017
examples the d-spacings and LCs determined for the Peak 1 and Peak 3 are plotted in
Figure 15 as a function of temperature.
(a)
19.73°Peak 3
R.T.80°CJ
120 IC16000C
2 t = < ~~~~~~1200oc IC1Xi~~~~~~~~4 I240CC
N - ~ ~ ~ ~ ~ -- A 3~~~80 00
0)t-+<.>S>. 5 < ~~320 IC I
3810 0350 °C
DPW A~~IK 30 :C
~~ /< 1~~~~90 CC
^ N. 170 IC
150 00Ay 7¾wC
-/ 1 t\<>\-Q 230 0C 3I0
> >g/ < 210 2 Cn 'SL,,/ X \ ~~~190 C
Vt ,_,// Z, , 11. T.
KA t^,eak2 15°7.17~~ ________170_I
I I I ~~~~I SO I
5 10 1520253040T; J< Z z ^ ~~~130 TC
-125- > s^ t 124 T
7.17°
s 10 15 20 25 30
-2 0 (degree)
- 125 -

JAERI-Conf 2001-017
(b)17.0- 150 A-
PEAK I16.5E A KaI
[V .Cooling
16.0
4.5 PEAK 3. + ~--DHeating
-- a-Cooling
0 100 200 300 400
110 - T (°C )PEAK 1
| &-Heatin100 I O ooi
90O
80
70
PEA1K 360 Heating
_Cooling
50 _r0 100 200 300 400
T (0 C )
Figure 15. (a) WAXD patterns measured during thermal imidization of
PMDAODA-34 precursor polymer and subsequent cooling. (b) Morphological
parameters which were obtained from the data analysis: d-Spacing and coherence
length L.
-126-

JAERI-Conf 2001-017
7. Conclusions
The beamline BL4C1 (SAXS-1 Beamline) of PAL is the first dedicated synchrotron
small-angle X-ray scattering station in Korea, which meets the basic requirements of the
rapidly growing domestic SAXS user community. The X-ray source is a bending
magnet which produces white radiation with a critical energy of 5.5 keV. A synthetic
double multilayer monochromator is adopted, which selects quasi-monochromatic
radiation with a bandwidth of ca. 1.5 % that is sufficient for most SAXS measurements
and allows a considerably higher flux at the sample as compared to monochromators
using single crystals. Higher harmonics from the monochromator are rejected by
reflection from a flat mirror, and a slit system is installed for collimation. A CCD
system,- two one-dimensional photodiode arrays (PDA) and imaging plates (IP) are
available as detectors, depending on the SAXS users' needs. The CCD and PDA
detectors are suitable for diffraction measurements but give unsatisfactory data from
weakly scattering samples due to their high intrinsic noise. By using the IP system
smooth scattering curves could be obtained in a wide dynamic range.
In order to increase the photon flux at the sample position, a toroidal mirror will be
installed at the beamline, using a 2: 1 focusing geometry. Another slit will be added to
further reduce the parasitic scattering at smallest angles. To increase the angle
resolution, the maximum camera-to-sample distance will be extended to 3 m. Another
area detectors, Gabriel-type gas-filled proportional counters (1-D and 2-D) will be
available for measuring samples with low scattering intensities. It is also planned to
facilitate simultaneous SAXS/WAXD measurements. Absolute scattering intensities
- 127-

JAERI-Conf 2001-017
will be obtainable through cross-calibrated standard samples. These upgrading works
will be completed by August of 2002.
The second SAXS beamline BL4C2 (SAXS-2 beamline) is under construction. The
major part of the beamline construction was done now. This is another bending magnet
based beamline but the optics is based on a double crystal monochromator, two toroidal
focusing mirrors and three sets of slits. The energy resolution of the monochromatized
X-ray source will be <0.01 %. Its end station (i.e., experimental hutch) is under design,
which will be filled by specially designed optic tables with a SAXS/WAXD camera
system and a 4-circle diffractometer. A CCD area detector and gas-filled wire area
detectors (1-D and 2-D) will be available by the end of 2002.
A third SAXS beamline (SAXS-3 beamline) is also planned to construct on one of
undulator insertion devices in 2005. The beam flux at the experimental station would be
at least two orders higher than those of the SAXS-1 and SAXS-2 beamlines. Further, the
beamline will have much higher energy resolution and be equipped with the state of art
1-D and 2-D detectors which can allow rapid time-resolution and give the highest
spatial resolution.
The SAXS beamlines become very important advanced tools for structural
investigations on various commodity and advanced materials in Korea. Together with
the SAXS facilities at PAL, the wide-angle and small-angle neutron scattering
beamlines at the Hanaro Center of Korea Atomic Energy Research Institute open a wide
view of features to the fundamental and applied researches of functional and high
performance materials.
-128 -

JAERI-Conf 2001-017
Acknowledgments
This work was supported in part by the Ministry of Science & Technology and POSCO,
by the Center for Integrated Molecular Systems (Korea Science & Engineering
Foundation), and by the Ministry of Education (BK21 Functional Polymer Thin Films).
References
(1) A. Guinier and G. Fournet, Small Angle Scattering of X-rays, Chapman & Hall,
London 1955.
(2) 0. Glatter and 0. Kratky, Eds., Small Angle X-ray scattering, Academic Press,
London 1982.
(3) L. A. Feigin and D. I. Svergun Structure analysis by small-angle X-ray and
neutron scattering, Plenum Press, New York, 1987.
(4) H. Brumberger, Ed., Modern Aspects of Small-Angle Scattering, Kluwer Academic
Press, Dordrecht 1995.
(5) R.J. Roe, Methods of X-ray and Neutron Scattering in Polymer Science, Oxford
Univ. Press, Oxford 2000.
(6) S. Doniach, Chem. Rev., 101, 1763 (2001).
(7) P. Cebe, B. S. Hsiao (ed.), and D.J. Lohse, Eds., Scattering from Polymers:
Characterization by X-rays, Neutrons and Light, ACS Symposium Series 739,
Oxford Univ. Press 1999, and further references given therein.
(8) B. Chu and B. S. Hsiao, Chem. Rev., 101, 1727 (2001).
(9) T.-Y. Lee, J. Choi, Y. Chung, J.Y. Huang, J.M. Lee, S.H. Nam, H.S. Youn, Nuclear
Instruments and Methods in Physics Research A, 467-468, 47 (2001).
-129 -

JAERI-Conf 2001-017
(10) N. Dingenouts, J. Bolze, D. Potschke, and M. Ballauff, Adv. Polym. Sci., 144, 1
(1999), and further references given therein.
(11) ANP. Hammersley, S.O. Svensson, A. Thompson, H. Graafsma, A. Kvick, and J.
Moy, Rev. Sci Instr., 66, 2729 (1995).
(12) R.G. Gilbert, Emulsion Polymerization, Academic Press, London, 1995.
(13) N. Dingenouts and M. Ballauff, Langmuir, 15, 3283 (1999)
(14) T. Fujisawa, Y. Inoko, and N. Yagi, J. Synchr. Rad., 6, 1106 (1999).
(15) N. Dingenouts, Rontgenkleinwinkelstreuung als Methodik der Strukturanalyse
teilgeordneter Systeme, Shaker Verlag, Aachen 1999.
(16) S.W. Lee, B. Lee, and M. Ree, Macromol. Phys. Chem., 201, 453 (2000).
(17) G.R. Strobl and M. Schneider, J. Polym. Sci., 18, 1343 (1980).
(18) P. Norby, J. Appl. Cryst., 30, 21(1997)..
-130-

JAERI-Conf 2001-017
1. Workshop
Abstract & Papers
Neutron Activation Analysis

This is a blank page.

JP0250098JAERI-Conf 2001-017
1.14 Introduction of the Neutron Activation Analysis
Facilities in High Flux Engineering Test Reactor
Feng Mingquan
(Nuclear Power Institute of China, Chengdu, 610005, P.R. China)
Abstract
Neutron activation is used for minimum element analysis widely in agriculture,biological medicine, geology and metallurgy. Based on High Flux Engineering TestReactor, the "rabbit" facilities and neutron activation analysis system for theminimum impurity analysis of silicon doping and production of short-life isotopeswere developed by Nuclear Power Institute of China (NPIC). They include "rabbit"irradiation rig and supporter in reactor vessel; sample entry and distributor; active gaspurifier; sample stripped and storage, pneumatic transportation and y spectrumanalysis system. Each inner dimension of three irradiation boxes is 15mm in diameterand 30mm in length; the speed of pneumatic transportation is at •l5nmmisec. Thermalneutron (E<0.625ev) flux of the "rabbit" channel is at (0.6- 4)x O 14n/cm 2 sec.
The "rabbit" facilities are applied to analysis of minimum elements (such as AgSe Cr Sn Sb Fe Zn Co) for silicon doping. Production of short-life isotopes and otherapplication are developing.
Keywords: HFETR Rabbit facilities Activation analysis
1 Introduction
Neutron activation is a high sensitive and non-destructive analysis
method. It is widely used for minimum element analysis in agriculture,
biological medicine, geology, metallurgy, and archaeology as well as
environment control Because of high thermal neutron flux in High Flux
Engineering Test Reactor (HFETR), irradiation time of specimen can be
shortened in seconds for neutron activation analysis. The sensitivity of
analysis can be improved too. The neutron activation analysis systems
(rabbit facilities) in HFETR have been established in order to develop the
- 131 -

JAERI-Conf 2001-017
utilization of HFETR. The main purpose is for the analysis of minimum
impurity element in silicon neutron irradiation processing and the
production of short-life isotope indicators with high specific activity.
2 Design of the Rabbit Facilities
Taking some particularities in HFETR as following pressured tank
type reactor, no any horizontal irradiation channel and neutron energy
spectrum harder into account, it must be complied with the design
principles as follow:
a. more than 8m vertical irradiation rig to be used;
b. irradiation rig must be bear pressure more than 1.65Mpa;
C. y heating of specimen low;
d. accurate irradiation time and location;
e. high fly speed of specimen;
f. leakage of activated gases as low as possible;
g. radioactive ray disturbance of V spectrometry measurement small;
h. operation of the whole system easily;
i. Safety and reliability of rabbit facilities.
3 Outline of the Rabbit Facilities
3.1 Technological process
The facilities consist of sample entry; active gases purifier, irradiation
rig, sample distributor, sample stripped, storage, y spectrum analysis, and
pneumatic transportation as well as control protection system. The flow
-132 -

JAERI-Conf 2001-017
diagram of the facilities shows in Fig. 1. When rabbit (sample box) run
I ,rradl IoR rig
,IHLFETR
Fig 1. Flo dIigrtM of the rabbit faui1ties
into point A of arch transportation tube, it slows down to irradiation rig
controlled by buffer gas. The rabbit from the rig enters purifier for clean,
then pass distributor or to be stripped and measured either to be stored.
For protecting vibration of the rig from water flowing in the core, 32
anti-shake rings are fixed at a space of 200mm in axial and a supporter is
installed at the middle of the rig in reactor vessel. The rig is 8750mmn in
length and 63mm in diameter. Its cross section shows in Fig.2. The two
safety valves are mounted respectively rabbit tube and gas tube at the top
of HFETR, and controlled by the threshold signal from minimum
humidity analysis instrument for avoid coolant water into rabbit system
- 133 -

JAERI-Conf 2001-017
Fig.2. CriOqsecioi o the ig
and out of the core. In order to detect rabbit pass through point A and
control irradiation time, a photoelectric device is mounted at point A of
arch rabbit tube.
3.2 System parameters
a. irradiation channel: Be reflector R- 11 channel;
b. thermal neutron flux: (0.6-1.4)x 1014n/cm 2.s;
c. size of sample box: +1 5x3Omm;
3 boxes can be irradiated simultaneously
d. speed of transportation: •15m/s;
e. pressure of pneumatic transportation: -0.2Mpa;
f. flow of coolant gas: -8.5m3/h;
-134 -

JAERI-Conf 2001-017
3.3 Characteristics of the Facilities
a. high thermal neutron flux;
b. The all process (including sample enter, irradiation, exit and stripped)
automati cally.
c. the run line and location of sample box visible with photoelectric;
d. accurate irradiation time;
e. better gas quality purified by oil-water separator;
f. sample box exit the rig, then safety valves closed within 1 second
after alarm.
4 Applications of the Facility
The rabbit facilities are applied to analysis of minimum elements for
improving quality of single crystal silicon neutron irradiation processing.
The typical analysis results are shown in table 1. Production of short-life
Table 1. the results of neutron activation analysis for silicon doping
Company Company Company Company Company|___ A-1 A-2 B-3 B-4*'Co <l.2xlO-9 •1.0Ox 9 <1.4x1O-9 •lI.3xIBY 9 •5.0x1 08
Ag •3.9x 10⁻⁸ _ 3.4xlO10 <4.6x O-80 4.4x 10⁸ <2.8x1o-8
Se <3.6x 10⁷ <3.7x 10 7 <4.7x10⁻⁷ 55.2x1 0-7
Cr Kl.Ox10-8 . 1.2xlO- 3 1.4xlO-8 <1.6xlO-1 •1.Ox1-8Sn 1.2x1 LOX10-7 I l8.7x 10-7 <9.1x 1 0 /7Sb_ I.Ox 10-9 1.4x 10⁻⁹ LOXO 9 1.2x 10⁻⁹ _•S2.0x 108
Fe |<3.2xlo-7 <3.8x 10- 96.9x 10⁻⁷ <6.5x 10⁻⁷ <2.5x 10⁻⁷
ZHn JI•"lx1 O 8 < 3.2x10⁸ IO'xI 10 • <L.2x O8'_Note: * analyzed by mass spectrometry,
isotopic indicators and other application are developing. The table 2
shows the calculation results for production of some short-life isotopic
indicators.
- 135 -

JAERI-Conf 2001-017
Table 2. calculation results for production of short-life isotopic indicators
isotopic half-life reaction abundance irradiation Specificindicators cross sect. % time activity
10 24cm Bg/g24Na 15.02h 0.53 100 lh 3.15x10 0
32p 14.28d 0.18 100 Id 8.14x10⁹
__K 12.36h 1.46 6.7 = h 4.IOxlO46Sc 83.8d 29.00 i 100 Id 1.61xlO1j'Cr 27.7d 15.90 4.35 Id 1.03x10'064Cu 12.7h 4.40 69.2 lh 7.73x10¹⁰
76As 1.1Od 4.30 00 lh 4.48x10°82Br 1.50d 2.70 49.6 lh 9.96x 10986Rb 18.65d 0.41 17 Id 9.03x1 O8
89Sr 50.53d 0.01 82.56 Id 1.92x 10⁷
90y 2.67d 1.28 100 Id 9.92x 10H IOmAg 250.4d 4.50 48.18 Id 1.66x10 9
" 5Cd _ 2.23d 0.30 26.7_ __ Id 5.92x l09___ 2.72d 6 6.25 57.25 ld 2.00xlO1
_4_La 1.68d 9.00 99.91 lh 3.32x 101
'97 Pt 18h 0.79 25.30 Llh l.16x 109Note: in the case of thermal flUx at 5x 10 ln/cm2.s
5 Conclusion
The rabbit facilities in HFETR have been completed some tests and
neutron activation analysis. It fulfils the requirements of design,
manufacture and installation as well as the demands of the reactor for
safety operation. There is a good prospect for neutron activation analysis
and other application.
-136-

JP0250099JAERI-Conf 2001-017
1.15 CURRENT STATUS AND PROGRESS OF RESEARCH AND
DEVELOPMENT OF NAA AT GA. SIWABESSY REACTOR*)
By
Sutisnal, Saeful Yusuf', Rukihatil, Sri Wardani2 , Amir Hamzah , Th. Rina M2
'Research and Development Center for Materials Science and Technology2 Center for Development of Research Reactor Technology
ABSTRACT
Progress of R & D on Neutron Activation Analysis (NAA) at G.A. Siwabessy research reactor brieflypresented in this paper. We describe a current status and research progress that cover of application of NAAtechnique, a software development and an improvement of laboratory capability. Future program andcollaboration plans are also presented. Application of Instrumentation Neutron Activation Analysis (INAA)technique has been used on environmental study to solve a pollution problem, especially for a trace elementsdetermination on water and soil samples. Trace elements determinations have been carried out in Ciliwung riverwater sample using a combination of INAA and pre-concentration method. River water sample was taken from afive sampling site of Ciliwung River, from Kedung Badak at Bogor area to Marina Beach at Jakarta area. Wehave been determine some toxic elements such as As, Ag, Mn, Fe, V, Hg, Co and Zn which have quantitiesdepended on sampling site. The analytical results show some elements have quantity higher compare togovernment regulation value. Soil analysis has been carried out in Puspiptek area using non-destructive method.In this study we applied an enrichment factor to estimate a pollution level of the soil. Meanwhile the softwaredevelopments have been done to support the environmental study. Examination of this software was done usingstandard reference materials of NIES CRM 3, NIST SRM 1646a, NIST SRM 1573a and NIST 1648 and wecompare our result to a certified value of NIES and NIST. Quantitative analysis results show that elements of Cr,Co, Sb, As, Cd, Mn, Sc, Se, V and Na have el good enough precision and accuracy of about 5 - I0%. Meanwhilefor other elements, such as Hg and Zn, they have a precision and accuracy of about 11 - 15 %. A capability ofthe NAA laboratory is going to improve by applying a quality system based on ISO/DIS 17025. At present time,we are going ahead with our laboratory accreditation program to obtain international recognition for ourlaboratories. We also introduce a k0 and PGAA method to develop INAA technique. Some research work havebeen prepared with Environmental Management Center (EMC) and Osaka University in order to determine traceelements contained on suspended particulate matter at Jakarta Metropolitan area.
Key words: INAA, Environmental pollution, Pollutant, Trace elements analysis, Enrichment factor
INTRODUCTION
The GA. Siwabessy research reactor located at Serpong, Indonesia, is one of three-
research reactor operated in Indonesia. The reactor irradiation facilities includes in a core
irradiation position, four hydraulics transfer system and one pneumatic transfer system. The
reactor also has a neutron beam facility for research and development in materials science.
) Presented in The 2000 Workshop on the Utilization on Research Reactor, Taejon, November 20-24, 2000,Korea
-137 -

JAERI-Conf 2001-017
The main utilization of GA Siwabessy reactor is in the R & D of science and nuclear
technology, such as: radioisotope production for medical purpose, application of neutron
beam for materials science and technology research, fuel elements testing, nuclear
instruments examination and, neutron activation analysis.
The activities of neutron activation analysis in GA. Siwabessy reactor have been doing
since 1990. The NAA was intensive applied in field of wide range for instance an
environmental study, geological, biological and industrial materials. In the last five years, we
focused in analysis of trace elements in environmental samples such as: airborne particulate
matter, water, soil and sediment. We believe that the analysis results will be a great help for
the environmental monitoring management.
In this paper we present a briefly a progress of R & D in the NAA and the future
program.
RESEARCH PROGRESS
Environmental Study
Utilization of INAA technique in the environmental is intensive used to solve a
pollution problem, especially in a contaminated air, water and soil. The research has a priority
on evaluation and determination of elements that have potentially a toxic effect to human.
Water is an object that very important to be study because it is potentially
contaminated by pollutant released from industrials activities, such as textile industry, dry
battery factory and automotive assembly. Quantity of toxic elements contained in the water
polluted is very small and some times very difficulty to determine by non-nuclear method.
Combination of pre-concentration method and INAA technique could improve a sensitivity
determination, We use this method for trace elements determination on water sample.
We have been determine a Ag, As, Co, Mn, Fe, Hg, V, and Zn on the Ciliwung river
water sample taken from five sampling point, i.e., Kedung Badak (KBK), Pancoran Mas
(PMS), Tanjung Barat (TBR), Kampung Melayu (KMB) and Pantai Marina (MAR). Figure 1
shows an elemental distribution for all sampling point [1].
According to the Indonesian Government Regulation No. 20/1990 about Category A
Water Quality, the concentrations of Fe, Mg and Mn were significant higher than its value
permitted. A quantity of As in all sampling point is in the range of permitted value, except for
-138 -

JAERI-Conf 2001-017
N .Java Sea __ =_._
4W 5 1 , Lr Iii g )'At a- -= _=__
'A U - _______
Figure 1: The distribution of elements detected at five sampling point, L~e:lKedung Badak, (2) Kampung Melayu Besar, (3) Tanjung Barat, (4) Pancoran Masand (5) Pantai Marina [I].
- 139 -

JAERI-Conf 2001-017
the first sampling at Kedung Badak sampling point. Its value is three times comparing to
others value. In case of Mn, it has a quantity relatively high for all sampling point, especially
at Pantai Marina sampling point. From this analysis results we conclude that the Ciliwung
River was polluted with some toxic elements that probably coming from human activities as
well as the industrial activity alongside the river.
Soil analysis has been doing since 1966, which involve an Environmental
Management Center (EMC) and Center for Development of Radioactive Waste Management
(CDRWM). Determinations of elements in surface soil iave been done using INAA
technique, which involve a non-destruction method. Soil samples were collected from nine
sampling point at PUSPIPTEK area. In this study, we use CRM IAEA Soil 7 as comparator to
control the analytical results. The enrichment factor was used to estimate the enrichment level
of element. This factor is calculated for each element in the samples, and we use the Al
reference element as proposed by Vinogradov [2]. The enrichment factor close to unity would
indicate that a particular element is identical to its appearance in the crustal origin. While as
the enrichment factor of ten or greater is indicative that the source of the element is
Table 1, Some analytical result of elements concentration in certifiedreference material of IAEA CRM Soil 7 [I J.
Our result [l.gIg] IAEA [pg/gJNo. Elements _
Mean Range value Mean Range value
I. Al 4.3 3.9 -4.7 4.7 4.4 -5.1
2. Ce 52.4 50.1 - 54.7 61,0 50.0 - 63.0
3. Co 7.6 7.4 - 7.8 8.9 8.4 -10.1
4. Cr 52.9 50.8 - 55.0 60.0 49.0 - 74.0
5. Cd 1.1 0.6- 1.6 1.3 1.1 -2.7
6. Eu 0.9 0.6- 1.1 1.0 0.9- 1.3
7 Fe* 2.6 2,4 - 2.9 2.6 2.5 - 2.6
8. Hf 5,5 5.0 - 6.4 5.1 4,8 -5.5
9. La 27.0 36.8 - 30.0 28.0 27 - 29
10. Mn 654 612- 694 631 604.0 -650.0
11. Sb 1.8 1.6 -2.7 1.7 1.4 -1.8
12. Sc 7.9 5.8 - 9.7 8.3 6.9 - 9.0
13. V 60.6 53.5 - 67.7 66 59.0 - 73.0
14. U 3.0 1.7 - 3.9 2.6 2.2 -3.3
15. Zn 94.6 83.9- 105.6 104 101.0- 113.0
*Unit in %
-140-
JAERI-Conf 2001-017
anthropogenic in nature. That is, its source is not from the natural environment [2-4].
The analysis results of CRM IAEA Soil 7 show in Table 1. Meanwhile the elemental
concentration and the enrichment factor of elements detected presented in Table 2. A total of
16 elements were analyzed in the soil samples. Six of them, i.e., Al, Fe, Mn, Na, K and Ti,
have a concentration range of 0. 1% - 16.2% and the others were in order of mg/kg. The result
shows that the enrichment factor of all elements is less than 10. It indicated that it is not any
anthropogenic contribution [5].
NAA software development
We develop ourselves a new software for gamma rays analysis to support R & D in
INAA. The research had been successfully establishing software for neutron activation
analysis. Examination of program obtained has been done using some materials that its
properties and its characteristic are known. The materials were used are Standard Reference
Materials (SRM) as well as Certified Reference Materials (CRM). The software performance
is demonstrated with of capability to identify a nuclide. Identification capability of new
software was compared to the Gamma Trac software, and we define a quantity of nuclide
identification in %
The comparison result show that the new software is better than Gamma Trac software
for identification of long half life radionuclide, i.e., 93.3% for new software and 66.6% for
Gamma Trac. Meanwhile in case of short half-life radionuclde, new software . is worse
(65.3%) than the Gamma Trac (80.9%) [6]. Analytical result shows that a precision and
accuracy are good enough, however some software module should be improve. Quantitative
analysis result shows that the elements of Cr, Co, Sb, As, V, Cd, Mn, Sc, Se and Na have a
deviation of 5%° 13%. Meanwhile the Hg and Zn have a deviation of 11% -15% as shown
in the Table 3 [71.
Improvement laboratory capability
In a free market era, a competition of testing and calibration laboratory for services
and analysis is going to hard. The laboratory must provide a result data that have a high
confidence level. According to those reason, we study and develop a method and procedure of
materials testing and characterization that compliant to national and international quality
standard. Standardized procedure has been carried out for analysis of rear earth element in
-141 -

JAERI-Conf 2001-017
C-i .=f toFW < _Xm CO o 0 e'u 0'. 00 o, 56 00 w - . o 0o
.C .E X _ xO O. 0° _ , 0 ° N0 O _ OO
3 ~ ~~~ - r'o .. _ ob o.. '. 6o > o. 0 o -
CO WL _ _ 0 6 0 - 0 - ! °l 0 °- --
~~~~~~~~~~~~~~~~~~~~~~~~~~~(11 c2 , __ _ _
Cd
C.) 'O r'~~~~~~~ ~ ~ ~ (~~40C -o C
WN _ E~mI~a~f, t-1C<> *:of~lv,[voFO~v~l > ° °4-W°
ms v 1b1 ;-Itlsls mmo ''1e s ko M ,x ' j i n i 1 ° j ! > ! vo ! v { ~~~~~~~ ~~~~l Oi QW 0 l m
~00.) t-t o~c - -'' 0'.C! 0' :R
.~ ~ 0 qt 50 00 - 00- - -oeoo od ~ f
< :> j m G T\0 0'. ,, | |-
> rGCD|t ; l l l
CO~~~~~~~~~~~~~~~~~~~~~C
U.)
9 N ! WII!- I\" CD-14 - .C. \_ C-) 0'C
,.C,., WI) 0 04 0 - 0 - C
.2 -i - - - , -,
4) __~~~~~~L _ 0 '2c: C~lV _ 7 _- 16 1
CO I~~~~~~~~~~~~~~~~~~CC, ~ ~ ~ ~ ~ C 0 0 0'
CO 0 0~~~~~~~~~~~~~~~~~~~I 0CDC- 09 -
LO m0~~~~~~~~~~~~~~~~~~~~~~~~~~~~~~~~a CD -*C~.
- 0)~~~~~~~l 0 0'. C- ,I j-0 0 6 0 - 0 ---- 0 0~~~~~~~~~~~~~~~~~~~~~~~~~~~~~~~~~~~~~~~~~~~~~~~~~~~~~~~~~~~~0r 0
CO~~~~~fl - -~~~~~~c r-: , -
4) ~~~~~j. . . . o~~~~~~~~~~~~ 0 ~~r r C ,- .D 0 v ~ ~~~~~ ~ ~~~~~~~~~~~~~~ Cl CD o6 A- 6 0 x
Co -- C7, 0' 0'.
1) c __ - - - CN
'.0 c-I w0 - el .-: a- 0. 0 -
u ,6 6o, 6 d 16 o -0'It c5-0 0 0
-142-

Table 3: Quantitative result of elemental analysis in SRM 1646a, SRM 1648, SRM 1573a and CRM No. 3 samples compare to GammaTrac and NTST certified. Concentration unit is in Vg/g (6,71.
SRM 1646a SRM 1648 SRM 1573a CRM No. 3Ele- Gamm Ohmma OUT Gamma Our Gamma Ourment NIST Trac softvare NIST Trac software NIST Trac software NIES Trac software
(dev.) (dev.) (dev.) (dev.) (dev.) (dev.) (dev.) (dev.)
0.148±+ 0.133 75.7± 7 82.2 82.35 1.52± 1.675 0.026 0.029 0.293Cd 0.007 (10.1%) (10.4%) (9.8%) 0.64 (10.2%) (11.5%) (12.5%)
234.5± 250 257.48 860 936.54 946.5 246± 265.93 270.3 69± 76.25 26.45Mn 2.8 (6.95%) (9,8%) (8.9%) (10.06%) 8 (8.1%) (9. 8%) 5 (10.5%) (10.8%)
1 989 1.97MO 1.8 - - ----
(10.5%) (9.5%)
0.193± 0.207 0.210 27± 24.5 24.9 0.054±Se .2% (7 .30/) (11./) X (9.3%/) (7 .8%/) 0.03
1.99_40.9± 37.7 37.30 403± 368.5 367.5 1.99i
1.9 (7.8%) (9.8%) 12 (8.56%) (8.9%) 0.06
6.23± 5.52 5.80 115± 103.5 0.122± 0.123 00.21 (11.35%) (6.9%) 10 (10%) 0.004 (9.87%) o
0.273 0.271 49.32 49.14 0.063± 0.069 0.068 _Sb 0.3 (9%) (9.6%) 45 (9.6%) (9.2%) 0.006 (9.5%) (7.9%)
4.9 4.75 1 8.47 19.08 0.057± 0.63 0.87± 0.80 0.963Co 5 (2%) (5%) 18 (2.6%/6) (6%) 0.02 (10.5%) 0.05 (8.1%) (10.7%)
214.5 205Ba 210 (2.1%) (2.4%) 737
Hg 0.04 - - - ~~~~~~~~~~0.034± 0.03 75 0.0383 Hg 0.04 - - - - 0.004 (10.3%) (12.5%)
.Zn 48.9± 52.5 53.3 0.476± 0.566 0.572 309± 340.2 344.54 20.5± 22.06 22.6531.6 (7.4) (9%) 0.014 (9%) (10.9%) 0.7 (10.19%) (11.59%) 1.0 (9.8%) (10.5%)
44.84± 140± 151.5 152.8 0.835±0.76 3 (8.2%) (9.1 °%) 0.010 _ _ _

JAERI-Conf 2001-017
geological materials. We applied a quality system of ISO Guide 17025 to prepare this
procedure [8]. Validation and evaluation of data resulted have been done using a statistical
approach using control chart. In this activity, evaluation of elements in certified reference
materials of CRM SY-3 and CRM Soil-7 has been carried out. Quantitative determination of
elements were done by an instrumental neutron activation analysis using a comparative
method to laboratory standard which involve a utilization of coaxial and planar type HPGe
detector. Standard procedure obtained was applied to evaluate a rear earth element
concentration in monazite minerals. The experimental result show some rear earth elements
such as Ce, Dy, Eu, Hf, Lu, La, Nd, Sm and Yb can be evaluated quantitatively by planar type
detector. Meanwhile Al, Co, Cr, Cd, Fe, Mn, Sc, V and Zn are given a best result if it
evaluated by coaxial type detector. From six monazite minerals evaluated using method
recommended, we obtained that a concentration of some rear earth elements have value of La
[4.4 - 11.9] %, Ce [7.1 - 10.1] %, Sm [0.7 - 11] %, Gd [0.4 - 1.8] %, Nd [3.5 - 5.6] %, Yb
[0.3 - 0.4] % and Lu [0.08 - 4.8] %. We have a conclusion that the implementation of quality
system on materials shows a consistency of analytical result [9].
In the present time, the complete quality system document is intensive going to
prepare consist of a quality manual, a standard operational procedure and a work instruction.
Preparation for development of the PGAA facility
In the development of analytical method, the PGAA is not only a complement of
Instrumental Neutron Activation Analysis (INAA), but also becomes a potential method in
the field of materials characterization. The PGAA has characteristic of non-destructive
multielements analysis which can not be analyzed by INAA. It able to analyze a H (biological
and polymer), C, N and S (important in industrial material such as Iron and Stainless Steel), B
and Be (reactor material) and Si (high purity material) element which are difficult to
determine by INAA technique.
Indonesia National Nuclear Energy Agency (Batan) has commitment to develop and
applied a nuclear science and technology for peace and to improve a quality life. According to
this program, in 1992 Batan constructed a neutron guide hall provided with some instruments
for a research and development of materials science. One of the beam port at TPN2 is free and
could be used to setup PGAA facility. The location of the beam port is about 30 meter from
-144 -

JAERI-Conf 2001-017
the reactor core and to be made low y-rays. This condition can support the PGAA installation
because they will give a lower background and can improve an analytical sensitivity.
We have been determined a thermal neutron flux distribution at the end of beam port
as a preliminary study. We calculated the. neutron flux in this beam port is about 2.6 x 10⁷
n.cm-2. detf' at reactor power operation of 15 MW.
The beam portReactor Building proposed for
PGAA facility
\ @ ~SNI \\NGH
<~~~~~~N P DN3 BPHv_\ N1-M \\ c h 1
BPR \\
Figure 2: Schematic diagram of neutron spectrometry facility at National Nuclear EnergyAgency of Indonesia.
Future program
A. Air particulate matter study
Research cooperation was carrying out with Environmental Management Center
(EMC) in an air pollution study for Jakarta Metropolitan Area. In this study we choice two
sampling point, i.e. the Jakarta City and Serpong, as urban and rural area respectively. and
we use INAA and ICP-MS methods to determine some elements interested. The result show a
total suspended particulate matter (TSP) volume taken from Jakarta was 6 - ] 0 times higher
than Serpong area. We have been determine an elements of Ag, As, Al, Ba, Cd, Co, Cr, Cs,
Cu, Fe, In, K, Mg, Mn, Na, Ni, PbjRb, V and Zn [10]. We shall continue this research
cooperation and will be expanded with Osaka University, Japan. In this research we shall used
a new type of air sampler unit developed by Department of Environmental, Osaka University.
Trace elements analysis should carry out in Suspended Particulate Matter taken from 20
- 145 -

JAERI-Conf 2001-017
sampling site at Jakarta Metropolitan region. The instrumental neutron activation analysis
should be used intensively to support this research.
B. Implementation of a Quality System
In the 2003, Indonesia will access to global market that has a strong competition in the
product and services marketing. Accordance with this challenge, we have to improve our
laboratory capability by implementation of suitable quality system, software upgrading and
hardware. Quality system in neutron activation laboratory has applied in aim. to get an
accreditation status according to ISO Guide 17025.
Meanwhile to support our quality system program, we are going to involve in IAEA
RCA on QA for Nuclear Analytical Technique in the near future.
C. The k 0 standardization
Elemental quantitative determination based on comparative method almost depends on
the standard reference materials, and also time consumed, especially for multi-elements
determination. Meanwhile an application of numerical calculation was supported by
utilization high-speed computer grows increasingly in all discipline, including neutron
activation analysis application based on workstation computer. According to those methods,
we planed to improve the NAA technique by implementation of k, method in own facility.
The NAA group committed to prepare a time schedule of 5 years covered some activities: (i)
to study a flux characteristic of irradiation position, especially in a RI to R4 position of the
GA. Siwabessy reactor at Serpong. (ii) Standardization and implementation of k0 and provide
a NAA program, (iii) to test of NAA program obtained using some standard reference
materials with applied Quality Assurance and Quality Control program. (iv) Application of kIc
in material analysis. Some contact person and scientist are needed to guide a Batan staff.
Perhaps in 5 years future the k, methods could be install and could handle an elemental
analysis problem in the field of industry and environmental.
D. Establishment of the PGAA facility
According to recommendation from Dr. Chushiro YONEZAWA (JAERI experts), we
shall continue the PGAA program. We plan to construct a simple PGAA facility using Ge
detector gamma spectrometer, neutron and gamma-ray shielding materials, and start the
- 146 -

JAERI-Conf 2001-017
PGAA research. Technical skill will be improved using this simple facility and the facility
should be improved gradually.
ACKNOWLEDGEMENT
I would like to express special thank to Dr. Hudi Hastowo and Dr. Wuryanto for their
support, and would like to acknowledge other members of NAA group members for useful
discussion.
REFERENCES
1. Sutisna, Istanto, N.M. Ekasari, "Heavy Metal Content Analysis of The Ciliwung RiverUsing Neutron Activation Technique", Technical Report, Research and DevelopmentCenter for Materials Science and Technology, Serpong 1999.
2. A.P. Vinogradov, "The Geochemistry of Rare and Dispersed Chemical Elements inSoils", 2iid Ed. (English Translation), Consultants Bur., New York, 1959.
3. Alice. Sirinuntavid, Paphot Provantosai, "Application of Instrumental Neutron ActivationAnalysis for Elemental Determination of Airborne Particulate Matter in Thailand",Regional Workshop on the Utilization of Research Reactors, Jakarta, November 24 - 28,1996.
4. M. Rashid, A. Khalik, A. Rabmalan, "Elemental Analysis of Inhalable Particulates in AnIndustrialized Ares of Pasir Gudang", Regional Workshop on the Utilization of ResearchReactors, Jakarta, November 24 - 28, 1996
5. Dhandang Purwadi, R. Muhammad Subekti, Amir Hamzah, Kristedjo, "SoftwareDevelopment for Gamma Spectrum Analysis Which is Resulted by Neutron Activation", inPrint, Jakarta 2000.
6. Adel Fish, Rukihati, Sutisna, Sudiati, Edison Sihombing, "Determination of ElementalConcentration in Soil of Puspiptek Area by Instrumental Neutron Activation Analysis",Prosiding of The 2M National Seminar on Spectroscopy, 1996.
7. Sri Wardani, "Laporan dan Kertas Kerja Riset Unggulan Terpadu", Kantor MenteriNegara Riset dan Teknologi & Lembaga Ilmu Pengetahuan Indonesia, Jakarta 2000
8. ISO Guide 170259. Sutisna, Rukihati, Saeful Yusuf, Adel Fish, saryati, "Application and Development of
Quality System for Material Testing", Technical Report, Research and DevelopmentCenter for Materials Science and Technology, Serpong 1999.
10. Rukihati, Sutisna, Ruska P.P., Arlinah, Hari Wahyudi, Liliansari, "Air PollutionMonitoring Using Instrumental Neutron Activation Analysis and Nuclear RelatedAnalytical Technique", Presented on Asia Symposium on Research Reactor V, Taejon,Korea, May 29-31, 1996
-147-

JP02501 00JAERI-Conf 2001-017
1.16 Application and Facility of Neutron Activation Analysisin HANARO Research Reactor
Yong Sam Chung
Korea Atomic Energy Research Institute
P.O.Box 105 Yusong, 305-600, Taejon, Korea
Summary
The facilities for neutron activation analysis in the HANARO research reactor are
described and the main applications of NAA in Korea are reviewed. The sample
irradiation tube, automatic and manual pneumatic transfer system, were installed at three
irradiation holes at the end of 1995. One irradiation hole is lined with a cadmium tube
for epithermal NAA. The performance of the NAA facility was examined to identify the
characteristics of tube transfer system, irradiation sites and custom made polyethylene
irradiation capsule. The available thermal neutron flux with each irradiation site are in
the range of 3 x 10 -1 x 10s n/cm2 * and cadmium ratios are 15-250.
For an automatic sample changer for gamma-ray counting, a domestic product was
designed and manufactured. An integrated computer program(Labview) for the
calculation of content was developed.
Neutron activation analysis has been applied in the trace component analysis of
nuclear, geological, biological, environmental and high purity materials and various
polymers for research and development. Improvement of analytical procedures andestablishment of an analytical quality control and assurance system were studied.
Applied research and development for the environment, industry and human health by
NAA and its standandization was carried out. For the application of the Korea
Laboratory Accreditation Scheme(KOLAS), evaluation of measurement uncertainty andproficiency testing of reference materials was performed. Also to verify the reliability
and validity of analytical results, intercomparison studies between laboratories were
carried out. In this paper, analytical services, national cooperation and the results of the
researches are summarized.
-148 -

JAERI-Conf 2001-017
I. Facilities for Neutron Activation Analysis
There are three irradiation holes(NAA 1-3) for Neutron Activation Analysis(NAA)
in the HANARO research reactor as shown in Figure 1. The pneumatic transfer
system(PTS) had been mainly used to sample irradiation of NAA and has been operated
since the end of 1996. A Neutron beam facility is planned for prompt gamma neutron
activation analysis from 2001. One of the irradiation holes(NAA 2) is a Cd lined tube
for epitherrmal NAA. PTS consists of two nodes PTS #1 is handled manually as a a
simple shuttle system, and PTS #2 Is controlled by a preset computer program; start
from a sample loader via an automnatic sample loader, deverter, two reactor core,
radiation detector, delay stacker, two counters with and without window, finish to
discharged receiver. The control program is written in Microsoft's Visual Basic for
Windows which is an extension of Qulck Basic and employs many of the structured
features of C and other high level languages.
At the initial stage of HANARO, the samples are transferred by fresh air. Air
pressures of 0.6 bar and 1 bar are used to transfer the irradiation capsuie(sample of less
than 30 g). A 42 cc irradiation capsule is available for manual PTS. Up to one
hundred 27 cc irradiation capsules can be loaded for automatic PTS at a time. The
layout of PTS is presented in Figure 2. The operation of the program starts from the
main menu of the Windows screen display.
3T
', , O,
* Fig. 1. Cumfiguratiou of NNA Irradiation Holes in HANARO.
-149-

JAERI-Conf 2001-017
Dbiverlerl I
S , 1 , ~ ~ ~~~~~~~~~~~~~~~~~~~~~~~~~~~ .... ...............
EL V 13 , . .__ _.
Pool l l [ HVAC I [>[: 5 --t ; ................~............ ....... .. e, ..t1.
E.v 9.3m U el N2 TankN2 Tank
NM I z yMaccat soten, INM 2: Automatic sYstem. Cd
2 NM 3 Atornatic syste, I .
Storage Irradiation &Rx Hall 1; ' | Room PTS Room
Fig. 2. Layout of Irradiation Facility(PTS) for Neutron Activation Analysis in HANARO.
The available neutron flux with each irradiation site and the general characteristics
of pneumatic transfer system are in the range of 3 x 10¹³ ~ 1 x i4 n,'crn2 s antd
presented in Table I with cadmium ratios and temperature of irradiation tubes.
We examined the characterization of the three irradiation sites and two kinds of
polyethylene irradiation capsules. Firstly, the temperature of three irradiation sites were
measured with irradiating time. In the case of PTS#1, the internal temperature of the
PE capsule was rose from 50 to 70 TC with increase of thermal power.
Table 1. Measured Thermal, Epithermal and Fast Neutron Flux of NAA Irradiation Holes and
Cadimium Ratios at 22MW 1 hermal Power.
Irradiation Neutron flux, n/cm'sec. Cadimium Temperature
Hole -I hermal, Ot Epithermal, 0, Fast, OZf Ratio(Au) IC
NAA 1 1.75±0.02 x 10"s 3.62±2.13 x 10 x b0tt 205 40 - 70
NAA 2 5.78+0.56 x 10'] 3.40±0.41 x 10l° 3.85±0.31 x 10' 35 > 80(Cd lined)
NAA 3 7.60±0.06 x 10' 4.35 ±1.85 x 10" ]6.80±0.70 x 10ll 13 > 70
-150 -

JAERI-Conf 2001-017
Table 2. Analytical Results of Trace Elements in Polyethylene Rabbit and Various Polyethylene
Samples by INAA and ICP. Concentration in ppb.
Element Rabbit HN1 -HN2 TR1 TR2 1R3 LCI L G2Ca(ppm) - 150 160 270 <3.7 <23 230 300Mg(ppm) 140 110 110 3.6 150 0.28 23 26Al(ppm) 74 76 52 8.7 57 0.20 13 23Cl(ppm) 38 100 79 19 53 0.19 140 140Ti(ppm) 6.1 4.1 5.2 1.4 4.1 0.17 9A4 13Cu <280 <240 <130 680 54 <'170 <240/ 20 <4 <3 <2 440 1.5 <2 <2
Mn 170 <6 <6 6.78 <19 4.4 8.8 10Na(ppm) 1.3 0.26 0.43 <0.02 0.20 1.0 0.65 0.92Fe(ppm) 2.3 1.5 <0.75 <0.84 <0.46 <0.55 0.52 0.81Mo 280 - - . - <1100 <1600 <260 <260
As 0.51 <0.71 0.66 <.1.3 1.2 <1.2 <0.35 <0.43Br 90 <2.4 3.0 5.0 4.6 5.4 8.00 51Sb 3.1 <1.1 2.9 2.3 <1.8 <2.4 4.4 55La 10 <0.16 <0.14 <0.18 I.l 9.9 1.3 0.72Au 0.44 0.028 <0.015 <0.015 0.059 0.067 <0.009 <0.01.9Cd 30 <24 '<28 <12 <32 <51 <6.7 <15Cr 310 21 20 37 <7.5 18000 5.2 12Ga 2.9 <38 <42 <26 <25 <6.2 <1.3 <1.5Hf 0.66 <0.72 <0.69 <0.71 <0.64 2.5 <0.4 <0.75Hg 1.7 <2.9 '2.8 <2.1 <2.2 <3.0 <1.1 <1.6Co 4.3 9.2 0.6 3.8 5.5 6.3 2.8 3.4Zn 60 <74 110 <70 160 74 <30 55Cs 1.3 <3.1 7.1 <2.5 <1.2 <1A4 <0.71 <2.6Eu - <2.0 1.7 1.1 <1.1 <1.3 <0.86 <0.34
Ba 0.18 0.11 340 <860 <270 <310 <190 <210Sc - <0.06 0.23 0.20 <0.044 <0.061 0.076 0.057K 250 <2600 <5500 <1060 <3300 <530 <820 <240Zr - <660 800 <760 <210 <260 <280 <300
Ce 50 95- <5.9 17 <4.5 <9.5 <2.8 <2.8Sm 0.07 0.23 <0.11 <0.13 0.10 0.27 0.13 0.060Rb - <24 <47 57 <21 100 <17 <20Th 1.4 < 1.2 < 1I. <0.84 <0.59 <0,90 <0.31 <0.48W 1.1 <4.3 <4.0 <3.4 <2.9 <5.0 <0.85 <1.4
Two kinds of irradiation capsulesirabbit) were manufactured using a high density
polyethylene material produced by the domestic industry. Also five kinds of inner
sample capsules and two kinds of outer capsules made of pure high density polyethylene
were manufactured. Some stability and physical properties such as heat-resistance,
radiabon-resistance and mechanical characteristics were checked to estimate a suitable
irradiation condition. TIhe physical properties of the polyethylene capsule are as follows
melting index(20.7), density(0.95). melting point(l31.61C). The analytical results of
trace elements in the polyethylene rabbit and various polyethylene materials by INAA
- 151 -

JAERI-Conf 2001-017
and ICP are presented in Table 2.
Recently, the connection part of 13 diverters using the coupling method were
converted and an examination of stability and transfer functions was carried out to
improve the NAA facility in HANARO as shown in Figure 2. The PTS #1 receiver
and controller for the return of a sample rabbit irradiated for a long period of time was
manufactured and installed in the sample storage room. The PTS #2 receiver, which
was semi-automatically operated for short irradiation(1-2 min.) was manufactured and
set up in a shielded box in the hood. Software programs for the operation of PTS #2
were developed and upgraded. The air pressure system was changed to nitrogen gas to
decrease the level of background radiation.
For an automatic sample changer for gamma-ray counting, a domestic product was
designed and manufactured. An integrated computer program(Labview) for the
calculation of content was developed.
II. Application of Neutron Activation Analysis in Korea
The Application of NAA in KAERI started after the operation of TRIGA-I1(250
KW) in 1962. Since 1972, neutron activation analysis using TRIGA-III(2 MW) has
made remarkable progress both in its methodology and applications in industry,
agriculture, geology, environmental pollution, biology, archaeology, forensic science and
many other fields in Korea. Now we are using an advanced research reactor(HANARO,
30 MW). There are two NAA groups the Korea Atomic Energy Research Institute
(KAERI) and the Korea Institute of Geology, Mining and Materials(KIGAM) as well as
many users at universities and other organizations. In the future, the applied field of
NAA will be extended and users will increase. Table 3 are summarises the utilization of
NAA in HANARO[l, 2]. Examples of applications of NAA from 1970 to 1995 in Korea
are as follows
O Nuclear Materials Trace impurities in nuclear fuel and materials such as uranium
oxide, graphite, reactor coolant and alloy metals were determined using radiochemical
NAA mainly. For the analysis of boron, a prompt gamma counting technique was also
studied in the 1980s. To improve analytical accuracy, spectral and isotope interference
occuring from uranium fission products were studied and an interference calibrationprogram was developed and an anticoincidence counting method was studied.
*Enoironrnental Science: For a long-term study of environmental pollution monitoring,
trace and toxic elements in enviromental samples such as air dust, coal and fly-ash,
soil, sediment, plants and, sea and river water, rain- and snow fall samples were
analyzed. Recently, KAERI has been participating in international cooperative research
which organized by the IAEA(sub-project on air pollution, UNDP/RCA/IAEA Project).
The migration of trace elements was studied using a radioactivable tracer method.
*Biological and Medical Science : Analysis of a number of animal and plant tissues,
-152 -

JAERI-Conf 2001-017
serum and blood, fishery, etc. are carried out. Analysis of trace elements in cancer
tissues was performed together with the Korea Cancer Center Hospital.
eIndustrial Science: Analysis of the-composition of high purity materials, noble metals,
rare earth elements and inorganic compounds are darnied out. Analytical quality service
for QA/QC in industries are supported. Trace element analysis of high purity metals
and a study on improvement of accuracy were performed; an analytical method of high
purity silicon semiconductor was developed by INAA and analytical methods of high
purity Mo, Ni, Ta were also developed by RNAA.
Table 3. Utilization of Neutron Activation Analysis Facility.
1) Number of Samples
Items ~ Year1996 1997 1998 1999
INT 800 | 1,200 1,381 2,500Research &Development EXT 80 200 813 1,900
.Total 880 1,400 2 I94 4,400
IN 130 166 381 750
Analytical Services FXT 50 209 354 800
.total 180 375 735 1,550
2) Contents of Analysis
\Year
Items Objects Users
Fnvironmental Samples: Airborne Particulates. Biological Samples: Rice, Algae, Foodstuff, Hair KAFRI
Rocks, Soils, Sediments etc.)
Research & * PTS Examination etC.* Measurement of Neutron Flux, Cadimiurn Ratios Industries (L Corp.,
Development Data Intercomparison of Reference Materials Samsung, Fnlec, etc.)International CRP Universities (Seoul,
* Plastic Samples Yonsei, Kyungsan,* Proficiency Test of Reference Materials Cnungnarn, etc.)
Impurities in IodineFlyash, Air Dust, Air Filter, Resin, Human Hair KRInSS KIGAM KORI,Ground Water, Waste Water, Sludge, SedimernrtsBentonite, Granite, Silicate, Rock, Soil, Sand etc.)Dry Bid Sar v ' Industries (L[, Corp.,
Analytical - Dry Bid Sam-ple SmugEet II Reactor Coolent, Fuel Materials, Irradiation lest Samsung Elect., KIA
Servie .Fi Motors,Sarnrirn Corp.,Flux Monitors, Fission Track Analysis mpung nu ry,* HP SiC Plate & Tube Sampung Industry,* Impurities in RI Medicines etc.)
Tooth Sample Irradiation Universities (Seoul,* Impurities in Iodine, Molybdenum, Nickel Yonsei, etc.)
-153-

JAERI-Conf 2001-017
e Geological Science : To improve analytical sensitivity, nuclear and spectral
interference related to spectrum analysis and irradiation methods were studied. The
composition of trace elements in soils, rocks, minerals, etc. were determined using
thermal and epithermal neutron activation analysis. Analysis of rare earth elements in
cosmic materials such as meteorites were carried out as the Apollo project. The
isotopes from the reactions of fast neutrons were studied and the interference was also
corrected, and 40 elements in geological samples were determined.
e Life Science : For clinical, nutritional and contamination research, the concentration
level of essential, toxic elements and heavy metal in biological samples such as
foodstuff, rice, human milk, human hair, tabacco and smoke, Korean Ginseng, etc. were
analyzed by INAA and RNAA. Iodine analysis of the colostrum and mature milk of
Korean lactating mothers related to diseases and metabolism of infants was performed.
eArchaeoiogy, Forensic Science: The origin and classification of Korean antiques was
investigated using chemornetrics and multivariate analysis of multi-elements composition
in the pottery and coinages in the laboratories of universities, institutes and museums.
To study individual identification for criminal investigation, several kinds of human hair
samples were analyzed by INAA.
e Certification of Reference Materials: Cross-checking and identification of standards
has been performed and obtained good scores in international and domestic
intercomparison and certification of reference materials. Our laboratory has participated
in the IAFA's data intercomnparison study(AQCS).
III. Applications of Neutron Activation Analysis in HANARO
In the last years, basic and applied research for an analytical quality control system
and trace component analysis of nuclear, geological, biological, environmental and high
purity materials and various polymers has been carried out using a neutron activation
analysis facility in HANARO, major contents are summarized.!3-231
1) Improvement of analytical procedures and establishment of an analytical quality
control system.With the analysis of six kinds of biological and environmental standard reference
materials(NIST SRM Peach Leaves, Citrus Leaves, Total Diet, Bovine Liver, Oyster
Tissue, Wheat Flour), the analytical error was identified(15 elements were within 10% of
the relative error, and 20 elerents were within 15% of the relative standard deviation).
A radiochemical separation procedure(RNAA) for U and Th to improve analytical
sensitivity(> 0.5 ng) was developed by using the co-precipitation and ion exchange resin
methods, and the ENAA method for I and Sr determination(sensitivity: >0.1 ppm) was
also examined.
In connection with fundmental qualification for the application for the Korea
Laboratory Accreditation Scheme(KOLAS), education and training for practical
- 154 -

JAERI-Conf 2001-017
application, evaluation of measurement uncertainty and proficiency test reference
materials were performed.
To verify the reliability and validity of the analytical results, intercomparison studies
between laboratories for twelve kinds of samples such as dust, soil, coal fly ash,
sediment, algae, etc., were carried out. All results obtained were excellent and a typical
result of urban dust was plotted, in Figure 3.
3
2-3
W Ba C. Fe Ri Br Na ZL Cs Th Ce Ci iK Co A As -it Mn Su V Eu Sc Se La Ag Sm Cu Ti Cd
Elerment
Fig. 3. Evaluation of z-score for the elements measured in urban dust.
2) Applied research and development in the fields of the environment, industry and
human health.
A study on the development of analytical methods and the standardization of a
procedure for the analysis of airborne particulate matter were carried out using standard
reference materials(NIST SRM 1648, NIES CRM-8) and laboratory intercomparison
work. Air pollution monitoring was performed using a Gent stacked filter unit low
volume sampler and polycarbonate membrane filter(coarse particle : 2.5 10 gm, fine
particle: <2.,5 fm. To compare air quality, airborne particulates with two particle
sizes were collected from urban, rural and industrial areas from May 1997 to 2000. The
concentrations of impurities in the blank filters were estimated and used for correction.
The concentrations of 25 heavy metals, trace elements and the mass of airborne
particulate matter(PM2s/PMio) and elemental black carbon were measured. From the
measured data, a presumption of the source origin and a correlation pattern between PM
and the elements was statistically treated with the calculation of enrichment factor and
correlation coefficient. The results of air monitoring are plotted in Figure 4 and 5.
Concerning applied research on human health and the environment using NAA of
biological samples, five kinds of biological standard reference materials were analyzed
and the measurement error of the analytical results was evaluated.
- 155-

JAERI-Conf 2001-017
Industrial area160.0
140.0 0 - CoarseE120.0 ----- Fine ll
800
0.0
____ ____________ ___ Sam paing date
Suburban area _ =160.0 - _ _
100 --- ----------------------- -ose
BO -E -2 . - - - . - - - - - - - - - - - - - - - - - - -- -- -Fin -6 10.0 -r- --- - - -- --- --- -- ------ -- - -
120 .0 fFin'0000_ N G a ras ~
_____ Sampling date
Fig. 4 Mass concentration of fine and coarse fraction with sampling date.('98,11 - 99.10)
I OE+04 [a 41W OE+00
106E02 DFiiL1hi
nrSc L, C Ce As HgSe SmV Sb S Ba OrMr OuTh Zr C; K Ne CaAl Pe
Element
Fig. 5. Average elemental concentration of airborne particulate matter collected in urban
and industrial areas('98. 11 - '99. 10).
The amounts of trace elements in the air dust samples collected from inside a foundry
working place were analyzed and the distribution of trace elements in the hair and blood
of corresponding workers were measured to investigate a correlation. In addition,
identification of the elemental distribution in healthy supplementary foodstuffs,
comparison of the component elements of six kinds of herb medicines in Korea and
-156 -

JAERI-Conf 2001-017
China, the distribution of trace elements in the Korean total diet(Table 4) and
representative foods were studied.
Table 4. Analytical Result of Korean Total Diet by .NAA.
Concentration of elernentElement Nuclide Range Mean Value Standard
Deviation
< ppm >
Al Al-28 16.1 -18.3 17.6 1.28Br Br-80/Br-82 9.59 -10.6 9.95 0.58Ca Ca-49/Ca-47 1358 1496 1418 70.9Cl Cr38 10870 -11780 11353 458Fe Fe-59 23.7 - 26 25.2 1.32l l -128 1.50 -1.77 1.64 0.19K K-42 5394 -5706 5579 134
MR MR-27 807 -896 850 44.4Mn Mn-56 8.46 - 8.78 8.65 0.16Na Na-24 10080-10470 10298 162Rb Rb-86 5.43 -5.49 5.46 0.03Sr Sr-87m/Sr-85 5.3-5.80 .5.55 0.36Zn Zn-65 31.5733.74 32.48 1.13
< ppb >
As As-76 493- 603 526 51.8Co Co-GO 29.6-31.6 30.8 1,06Cr Cr-51 348-420 393 39.4Cs Cs-134 10.6-i1 .6 11.1 0.71Sc Sc-46 3.2 -- 3.6 .43 0.21Se Se-75 223- 328 276 74.5Sm Sm-153 46.1 -47.5 46.8 0.99Th Pa-233 2.38 -2.82 2.6 0.3U Np-239 31.5-38.6 35 5.0
In connection' with the analysis of trace elements in plastics(raw material and
fabricated products) using NAA, identification of the results by NAA and comparison
with those by the XR:F and ICP methods, the optimum analytical conditions for NAA
were determined, a new freezing-crushing technique for the preparation of a polymer
sample was developed, analysis of inorganic components and additive agents in plastic
materals(PE, PP) was carried out for the manufacture of irradiation rabbits and sample
capsules, and the elution charateristics of toxic elements in plastic materials was also
evaluated.
-157 -

JAERI-Conf 2001-017
IV. Future Plan
We will carry out analysis of airborne particulate matter as well as other
environmental and biological samples for air and marine environmental pollution studies.
This workscope is also involved as a part of our long term nuclear research and
development project related to intensive study on the application of NAA. Particularly,
we are interested in the applications as well as the supporting system for analytical
quality control of NAA involving the PGAA facility. Continously, to improve the
analytical accuracy and detection limit, we are making plans for the development of
various irradiation facilities and equipment, and research of analytical techniques using
ko-standardization method. However, to make the above project a success application
of international standards is essential, i.e., standardization and harmonization of
analytical techniques in sampling and sample preparation, analytical procedures and data
evaluation. Collaboration with RCA member states, IAEA *and other nations will be
promoted.
V. References
[11 Yong Sam Chung, Annual Report of Korea Atomic Energy Research Institute,KAERT/RR-1745/96
[2] Yong Sam Chung, Technical Report of Korea Atomic Energy Research Institute,KAEIR/TH-898/97].
[31 Yong Sam Chung, Technical Report of Korea Atomic Energy Research Institute,KAERI/TR-2031/99].
[4] Y.S. Chung, Y.J, Chung, E.S. Jung and SY. Cho ;'Comparison and Determination ofEnvironmental Standard Samples by Instrumental Neutron Activation Analysis', J.JRadioanal. Nuci. Chem., 217, 1, (1997) 71-76.
[51 Y.S. Chung, Y.J. Chung, K. H. Cho and J.H. Lee ;'Detennination of Trace andToxic Elements in Korean Rice CRM by INAA, ICP and AAS', J. Radioanal. Nucl.Chem., 215, 1 (1997) 129-134.
[61 S.Y. Cho, O.D, Awh and Y.S. Chung; 'Trace Element Exposure in Human byInstrumental Neutron Activation Analysis of Hair', J. Radioanal. Nucl. Chem., 217,1.(1997) 107-109.
[71 Y.S. Chung, Y.J. Chung, E.S. Jeong and S.Y. Cho; 'Study on Air PollutionMonitoring in Korea using Instrumental Neutron Activation Analysis', J. RudioanaLNocL Chern., 217, 1 (1997) 83-89.
[81 S. Y. Cho, S. G. Jang and Y S. Chung; 'Human Hair Identification byInstrumental Neutron Activation Analysis', J. Rcdiounal. NucL. Chem. Letters, 229,1-2 (1998) 143-147.
[9} J. H. Lee, J. S. Kim. K. H. Cho, J. C. Woo, M. S. Han and Y. S. Chung'Determination of Trace Elements in High Purity Copper by INAA, GFAAS andICP-AES', J. RadioanaL. NucL. Chern., 234, 1-2 (1998) 77-83.
[101 S. J. Moon, J. Y. Kim, Y. J. Chung, Y. S. Chung, 'The Iodine Contents in CommonKorean Foods', Korean J. Nutrition, 31, 2, (1998) 206-212.
[111 S. J. Moon, J. Y. Kim, Y. J. Chung, Y. S. Chung, 'The Determination of Iodine in
-158-

JAERI-Conf 2001-017
Human Milk and Cow Milk by Iodide Specific Ion Electrode and NeutronActivation Analysis', Korean J. Nutrition, 31, 2, (1998) 213-219.
[121 Y.S.Chung, J.H.Moon, Y.J.Chung, Y.J.Park, K.Y.Lee, Y.Y.Yoon, S.H.Lee, K.T.Kim,'Intercomparison and Determination of Sediment by Instrumental Neutron ActivationAnalysis', Journal of the Korean Socirty of Groundwater Environment, 5,2 (1998) 116.
[131 Y. S. Chung, J. H. Moon, Y. J. Chung, S. Y. Cho, S. H. Kang, 'Study on AirPollution Monitoring in Korea using low Volume Air Sampler by InstrumentalNeutron Activation Analvsis', /. RodioonoL Nuc. Chem., 240, 1 (1999) 79.
[141 Y. S. Chung, J. H. Moon, Y. J. Chung, K. Y. Lee, Y. Y. Yoon, 'Determination ofToxic and Trace Elements in Algae by Instrumenltal Neutron Activation Analysis',J. Radioanai. Nuc. (Chem., 240, 1(]999) 95.
[15] K. Y. Lee, S, K. Shim, Y. Y. Yoon, Y. S. Chung, G. H. Lee, 'An accurate andSensitive Analysis of Trace and Ultra Trace Metallic Impurities in Plastics byNeutron Activation Analysis', J. Radioural. Nucl. Chem., 241, 1 (1999) 129.
[161 Y. S. Chung, J. Hi. Moon, Y. J. Chung, Y. J. Park, 'Determination of Uranium inGroundwater by Instrumental Neutron Activation Analysis', journal of the KoreanSocirty of Groundwater Environment, 5, 4 (1999) 210.
[17] K. Y. Lee and Y. S. Chung, 'Analysis of Inorganic Elements in Polymer Materialsby NAA', Polymer Science and Technology, 10, 3 (1999) 395.
[18] Y. S. Chung, J. H. Moon, K. W. Park, K. Y. Lee, Y. Y. Yoon, 'DataIntercomparison and Determination of Toxic and Trace Elements in Algae byInstrumental Neutron Activation Analysis', Analytical Science &, Technology, 12,4 (1999) 346.
p191 Y.H.Seo, B.K.Lee, YS.Chung, Y.J.Chung, J.H.Moorn, K.Y.Lee, S.K.Shim, W.Hong,H.W.Choi and K.H.Kim, Interlaboratory Comparison for the Sampling and Chemical
Species Measurement of PM1 , Journal of Korean Society for AtmosphericEnvironment, 15, 4 (1999) '485.
[20] Y.S.Chung, J.H.Moon, Y.JCiong, K.WPark, K.Y.Lee, Y.Y.Yoon, S.K.Shim, K.H.Cho,M.S.Han and J.H.Lee, Multielement Analysis in Airborne Particulate Matter(PMoj)by INAA, 1CP and AAS, Journal of Korean Society fbr AtmospherEc noiroomen,
15, 4 (1999) 495.[21] Y.S.Chung, J.K-Moon, S.H..Kim, K.W.Park and S.H.Kang, Intercomparison and
Determination of Trace Elements in Urban Dust by Neutron Activation Analysis,Analyticul Science c Technology, 13, 2 (2000k 179.
[221 Y.S.Chung, J.H.Moon, S,H.Kim, K.WPark, SHiKang and S.Y.Cho, Study onAirborne Particulate Matter(PM.:PMmo) Monitoring in Urban and Rural Area byusing gent SFU sampler and INAA, Journal of Korean Society for AtmosphericEnvironment, 16, 5 (2000).
[23] Y.S.Chung, J.H.Moon, SH.Kim, K.W.Park, S.H.Kang and SY.Cho, Evaluation ofDaily Intake of ' U and 232Th in a Korean Mixed Diet Sample Using RNAA,Journal of the Korean Nuclear Society, 32, 5 (2000) 477.
-159-

lI~i~ 111111l Blll IIIIII 11111 llli lll iii! IlIll liii liiJP02501 01
JAERI-Conf 2001-017
1.17 The Use of Neutron Activation Analysis inEnvironmental Pollution Studies
A. M. Yusof', S. K. Gill', S. Salleh', S. Akyil2 ,S. Hamzah3 ,S. A. Rahman 3 and A. K. H. Wood3
'Department of Chemistry, Universiti Teknologi Malaysia,81310 UTMSkudai, Johor, Malaysia.
institute of Nuclear Sciences, Ege University, 35100 Bornova, Izmir, TurkeyMalaysia Institute of Nuclear Technology Research, PUSPATI Complex,
43000 Bangi, Selangor, Malaysia
Abstract
Environmental samples and localized species from a marine environment, water samples for publicdrinking, sediment core samples from a polluted marine environment, soil samples from tin-tailing dumpsites, air particulate matter and leachates from landfills were analyzed for their trace, toxic elementalcontents, chemical species and natural radioactivity in an attempt to assess the safety levels of thesepollutants in these matrices by means of instrumental neutron activation analysis (INAA) and other relatednuclear techniques. Complementary techniques such as the graphite furnace atomic absorptionspectrometry (GFAAS), 1CP-MS, ion chromatography and pre-concentration steps particularly in thespeciation studies were also incorporated in these studies for specific elemental determinations prior toirradiation in a neutron flux of about 5.lxlO njn2.s' from a TRIGA Mk.II reactor. Pre-concentration ofthe chemical species of As and Se was done using a mixture of ammonium pyrrolidinethiocarbamate-chloroform (APDTC-CHC13) while activated carbon derived from agricultural wastes was used in theiodine speciation. Some of the specific chemical species have to be separated prior to the final quantitativedetermination to reduce interference and enhance the sensitivity of the INAA technique. These includearsenic, selenium and iodine species present in various matrices. *The more toxic inorganic arsenic,selenium, iodine and a host of other trace elements were detected in these samples by quantifying theirrespective 7-rays emitted from the radioisotopes. The amounts of As(Hll) present vary from about 1.8 ng/gto 15.5 ng/g in localized marine species, 0.1 ngig to more than 5.0 ng/g in treated public drinking waterwhile the more toxic inorganic Se(IV) is present in the range of 1.5 ,ug/L to about 4.5 gg/L. Thedistribution patterns of pollutants were presented on maps and deductions were made from these patterns toaddress pollution issues.
Results obtained from the analysis of sediment core samples taken from a fairly polluted marineenvironment were analyzed for the REE contents to determine the concentrations of La, Ce, Smn, Eu, Tb,Dy and Yb using instrumental neutron activation analysis. Core samples were divided into strata ofbetween 2 to 3 cm intervals and prepared in the powdered form before irradiating them in a neutron flux ofabout 5.OxI012 n.crnr 2.si in a TRIGA Mk.II reactor. Down-core concentration profiles of La, Ce, Sm, Eu,Th, Dy and Yb in 3 core sediments from three sites are obtained. The shale- normalized REE pattern fromeach site was examined and later used to explain the history of sedimentation by natural processes such asshoreline erosion and weathering products deposited on the seabed and furnishing some baseline dataand/or pollution trend occurring within the study area. The shale-normalized REE patterns also showedthat LREE in the sediment samples exhibit enrichment relative to HREE particularly, La and Sm showingenrichment compared to the ratios in shale. REE concentrations of 124 lig/g at the surface of sedimentcollected at two of the three sites were found to decrease to 58 and 95 ig/g, respectively. This was ofparticular interest when it is used to explain the anomalies occurring in the marine sediment as a result ofgeochemical processes over a long period of time. The air pollution trend in the Asia Pacific region wasalso studied for source emission identification with samples collected using the Gent Stack Sampler andmodeling was done using the Chemical Mass Balance-7 and Statgraphic software. About 100 filters wereanalyzed and close to about 60% of the mass within the particulate matter group has been identified. Alldeterminations were validated using suitable SRMs.
-160 -

JAERI-Conf 2001-017
Introduction
Most of the major sources of pollution are anthropogenic in origin and they particularly affect
not only the estuarine and coastal areas but other areas. With most of the pollutants likely to
originate from industrial discharges, metals and metal species have resulted in a sharp increase in
environmental contamination. The aquatic and marine environment, particularly sediments,
localized and freshwater species, even the waters from these areas, have traditionally been
surveyed for environmental assessments. Marine life found on the sea beds and freshwater
species have been subjected to either direct or indirect contamination and the pollutants will
eventually find their way into the human food chain through the consumption of marine derived
foodstuffs such as popular localized species and seaweed. Freshwater species are commonly
found in disused tin-mining pools which provide natural habitats for aqua-culture activities where
most of the freshwater fishes are bred. With many fishing villages found along the coastal areas
and some of them are near an industrial zone, this study area was thought to be ideal in terns of
anthropogenic activities-pollution-human surrounding relation.
Much attention has been given to the long-lived 1291 radionuclide with a half-life of 1.6 x 10 7 y
since it behaves similarly to its stable isotope of 1271 in the biogeochemical cycle. Its introduction
into the atmosphere is mainly through the spontaneous fission of uranium and by cosmic ray
interactions with xenon. Iodine concentrations in soil are much higher than in the parent rock
materials due to the transfer of iodine, evaporated from the ocean [11, into soil through wet and
dry deposition and decomposition of iodine-containing vegetation. From the natural leaching
process, dissolved iodine finds its way into the underground water system. In drinking well
waters, the concentrations of iodine range from 0.5 to 35 ng.mI' and this is extremely low
compared to seawater.[2,3] Since iodine is an essential element for human especially in thyroid
gland functions, the iodine intake by human beings from drinking water is important from the
health view point.
Landfills, either sanitary or conventional is still. the preferred method for municipal solid
waste disposal though incineration and composting has gained grounds as the suitable alternative
to landfill depending on limitations of available space for landfill sites. Most landfills accept
wastes of all kinds including hazardous wastes generated as a result of the extensive use of heavy
and toxic metals in modem society. The changed flow path of these toxic contaminants in their
soluble forms may be harmful for the balance of biological systems at different levels, micro-
organisms, human beings and the whole eco-systems, since the toxicity of these contaminants is
determined by their concentrations and chemical forms. Some would find their way into water
system and will enter the human food paths through direct or indirect ingestion. These
contaminants in their enriched forms will be dispersed in the water system and eventually pollute
the ground water often used as water intake sources. Chemical components in leachates from
- 161 -

JAERI-Conf 2001-017
hazardous wastes landfills in Japan were studied to determine their components and their effects
on human beings.[4]
The use of rare earth elements (REE) as an indicator in the understanding of the accretionary
processes of the earth's crust has been investigated during the last two decades, nevertheless
continuing work has been done in view of the potential of REE to elucidate the geo-chemical
processes involved in depositional processes on the ocean floor. Sedimentation history and the
knowledge of the abundance and distribution of the major sources of pollution, especially toxic
and heavy metals which are anthropogenic and also natural in origin has shown to be very helpful
in explaining the geo-chemical and environmental investigations. A fairly polluted marine
environment in the waters in the Straits of Johore, Malaysia, a shallow channel in the continental
shelf connecting the South China Sea to the east with the Straits of Malacca to the west situated
at the southern tip of the Malaysian peninsular in Johore has been investigated to look into the
possibility of using rare earth elements (REE) as an anthropogenic indicator. Determination of
the natural processes controlling REE distributions will assist in the recognition of man-made
inputs to the marine system[5], in this case industrial effluents discharge into the marine system.
The chemistry of the REE, especially their similar chemical properties and low solubility that
allow only limited elemental fractionation during weathering and diagenesis, make these elements
useful as geochemical indicators in sediments and in sedimentary Tocks.[6] Of particular interest
are the abundance and distribution patterns of rare earth elements in marine minerals and
sediments in order to identify the source of these elements, the mechanism of their incorporation
and the depositional environment. REE can also be a powerful tool to define the remobilization
mechanism during diagenesis and weathering of sediments. Moreover REE are used as indicators
of the behavior in the environment of transuranic elements on the account of the similarity in their
physico-chemical properties.[7]
Shale-normalized REE patterns have been conveniently used to explain some oceanic
processes governing the mechanism by which the sedimentation occurred over a period of time
and the environment in which these processes took place. Murray et al.[8] have shown that
specific depositional environments of chert and shale could be deduced from their REE chemistry,
and differences in the REE relative fractionations and total abundance in marine cherts and shales
reflect the depositional location of the sediments. Sholkovitz[9] observed that shale-normalized
REE patterns of shelf and slope sediments are enriched in light REE (LREE) relative to heavy
REE (HREE). Significant LREE enrichment in marine sediments has also been investigated for
use in making assumptions in the interpretation of many processes associated with the
fractionation of REE in oceanic waters and sediments.[9]
A comprehensive study on the geochemistry of sediments in these straits was reported by
other workers[10] and the report in this study concerns the rare earth elements patterns in the
sediment cores of three sites located in the vicinity of an industrial area. Total rare earth element
-162-

JAERI-Conf 2001-017
(REE) concentrations were used to develop correlations between the Ce/Ce* anomalies and the
distribution patterns of some of the light rare earth elements (LREE) and the heavy rare earth
elements (HREE). Several interpretations of the results are obtained such as vertical profiles of
REE (La, Ce, Sm, Eu, Th, Dy and Yb) using concentrations data at all the sites, correlation study
using certain standard elements such as Sm and elemental distribution based on total REE
concentrations according to area to trace the history of sedimentation by natural processes such as
shoreline erosion and weathering products on the seabed.
Technical Study
Samples and Standards
Aquatic samples used in this study were obtained from specific water bodies such as disused
tin-mining pools as in the case of the determination of selenium species in these samples. Since
the concentration of selenium species in natural waters is governed by the rate of seepage from
seleniferous environments, water bodies in disused tin-mining pools could be a good source of
selenium input as a result of the landuse activity related to dredging. The aquatic species found in
these water bodies range from algae undergrowth found along the perimeter of the pools to a
common, hardy freshwater fish, the Tilapia nilotica. This particular fish from the tilapia family is
found in abundant in disused tin-mining pools and because of its rapid breeding nature, they are
also bred in man-made ponds and is a major contribution to the local aqua-culture industry.
TBOLND
u sOMPI site
Figure 1. Locations of disused tin-mining pools
163-

JAERI-Conf 2001-017
)/>_ By_ ~~~SOUTHFigure2. Tr n pa2w CHItd A
Water saples fr m diue 4minn polMeecllce rmSEveAifrn oain
E7S we 5- 27E
/Xg ~~1i 17M 1 'l =1.26
< 12 1g4 l1 R
813 2 3016 5 25
sl5919~~~~~~7 208 24
MALACCA <,#2 J
w USAer keasnert pi If0 Land ill sl es
Figure 2. Treatment plants for raw and treated for water sampling
Water samples frorn disused mining pools were collected frorn seven different locations
throughout the Malaysian peninsula, as shown in Fig. 1, with one location chosen as a control.
Samples from water treatment plants were collected from 27 sampling sites chosen in the state of
Johore, as depicted in Fig. 2, in an effort to evaluate the treatment process at the plants. The
nature of activities in the vicinity of the reservoirs or rivers feeding the treatment plants has a
profound effect on the arsenic and radium concentrations in the water samples depending on the
locality of the raw water intake points. Preparation of samples for analyses was done within 72 h
to avoid any changes in the metal species. Synthetic drinking water used as a reference sample
was prepared by spiking with 100 ptg.dmn-3 of As(IH) and As(V) each according to a prescribed
method.(Lo et al). [11 1
All fish samples were collected from a fresh catch and selected to ensure only fish of similar
sizes were used in the study. Samples were also taken from a man-made pond to be used as a
control. The fish samples were cut and separated into three parts, namely the head, flesh and
bones using pre-cleaned stainless steel blades. The wet weights were recorded before freeze-
drying them using an Edward Mudalyo freeze-dryer and later ground to <200 mesh size with a
Herzog HSM-100 grinder. Samples were sealed in pre-treated polyethylene containers for further
analysis. For quality assurance controls, a CRM Lobster Hepatopancreas marine reference
material (TORT-1) supplied by the National Research Council of Canada (NRCC) and standard
selenic acid (H2SeO3) were used.
The well and river water samples used in this study were collected from 26 sites (10 from
wells and 16 from rivers) in the State of Perak, Malaysia. Well water samples were collected
using pre-washed plastic buckets while river water samples were taken from water intake points
-164-

JAERI-Conf 2001-017
designated by the state water authority. Only surface waters were used in this study since no
depth profile analysis was planned.
Johor1 City of Johor Bahru .... River
ZJIndustirial Area MLYI* Sampling Station MALAYSIA
Sand & d 3Jd TebAnoxia Sediments Rive R 2
30' l m aimWeRiver~~~~~~~~~~~~~~~~~~:le
20' *
ION30' 40' 50 1040E
Fig. 3. Sampling locations of core sediment samples (courtesy of Wood et al [10])
Sediment cores were collected at the 3 locations as shown in Fig. 3 in July 1993. Three core
sediments were identified as J-17 (Nl°25' E103'58'), J-19 (N10 26' E104°0 ') and J-21 (N1°28'
E104'3'). The core sediment samples collected at a sea depth of between 5 to 10 m from the
Johore Straits between Malaysia and Singapore using a box corer of 20 x 30 cm cross-sectional
area were taken to a depth of 60 cm. with the central core cut into strata between 2- and -3 cm
intervals. The procedures adopted in the coring activities followed those of the University of
Washington and was carried out by a team of workers from the Malaysian Institute for Nuclear
Technology Research (MINT), Universiti Pertanian Malaysia (UPM) and School of
Oceanography, University of Washington.[101 Analytical accuracy was obtained by using
standard reference materials JAEA Soil-7 or prepared standards consisting of a combination of
solutions evaporated onto filter papers. This area is one of the most important Malaysian
continental shelf areas where increasing economic development along the coast may threaten
preservation of valuable biological resources in adjacent sea waters. An industrial settlement is
situated on the south-eastern part of the tip of the peninsula. (Fig. 3)
As for leachates, water samples were collected from waterways found in the vicinity of thq
landfill areas. (Fig. 2) Sampling was done about one hour after a heavy down pour because the
leachates would have a better chance of seeping into the nearby waterways. Synthetic leachate
-165-

JAERI-Conf 2001-017
used as a reference sample was prepared and spiked with 100 Jtg.L-' each of As(III) and Se(IV)
according to a prescribed procedure.l 1] Mixed standards were prepared in the laboratory using
AS20 3 for As(III), Na2HAsO4.7H2 0 for As(V), SeO2 for Se(IV) and Na2SeO4 for Se(VI) species.
Nearshore Seawater (CASS-2) purchased from the United States National Institute of Standards
and Technology (NIST) was used as SRM and treated similarly as the water samples prior to the
final analysis using neutron activation technique.
Samples Treatment and Preparations
In the speciation studies of inorganic selenium in aquatic species, all reagents used were of
analytical grade (Analar), purified prior to use and prepared by diluting Analar acids (15.8 M
HN03, 11.8 M HCI and 18.1 M H2SO4), base (7.1 M NH 4OH) or salt (NH4COOCH3) with quartz-
distilled water (Q-H2 0) to the appropriate concentrations. The chelating resin Chelex-100, in the
sodium form used in the total inorganic selenium separation step, was obtained from Sigma
Chemicals. Aqueous stock solutions of Se(TV) were prepared by dissolving H2SeO 3 in Q-H2 0
and made up to the mark. Ammonium pyrrolidinecarbodithioate (APCDT) used in the extraction
step was obtained from Fluka. Sample solutions for the extraction step with APCDT-CHCI3
and preconcentration with Chelex-100 were prepared by dissolving I g of the dried material with
10 mL of HN0 3 (70%) in a Teflon™ pressure decomposition vessel of a CEM Model MDS-81D
microwave digester and the details are described elsewhere.[l2] All CRMs and standards used in
this study were similarly treated for consistency. Since inorganic selenium species exist in the
Se(JV) and Se(VI) forms, the extraction was done on the Se(IV). The Se(VI) determination was
achieved by first reducing the Se(VI) to Se(IV) with 25% sodium thiosulphate (Na2 S203) solution.
The difference in the two selenium concentrations constitutes the Se(VI) in the samples
investigated. The details of the extraction procedure for the Se(IV) species is described
elsewhere.[131 The ion-exchange procedure using the chelating resin Chelex-100 was carried out
to preconcentrate the elements prior to the total inorganic species determination. The procedure
followed that of Kingston et al [141 with some modifications. The final solution obtained after
the phase separation was used in the irradiation step to determine the inorganic Se content in the
samples.
The charcoals used in the adsorption of iodine species from river and well water samples were
derived from used palm oil kernel and were prepared according to the method described by
Hussain and Ui.[151 The most suitable activated charcoal was chosen based on their physical
characteristics related to pore size and type and the best iodine number obtained. The substrate
used in this work is designated as PK-ZC-H-450 (palm kernel-zinc chloride activated-acid
treated-at 450'C). All reagents were of analytical grade (Analar) and supplied by Sigma
Chemicals. Standard iodine solutions were prepared indirectly by dissolving it together with the
-166-

JAERI-Conf 2001-017
iodide salt solution. About 20 g of KI was dissolved in between 30-40 mL of DDW in a 1 L
flask and later 12.7 g of 12 added followed by shaking until all the iodine was dissolved. A
standard iodate solution was prepared by the dissolution of 0.12 g of Analar KI03 supplied by
Sigma Chemicals in DDW in a I L flask. The dilution made up to the mark gives a standard
stock solution of 100 ptg.mL-'. Required standard of varying concentrations were prepared
accordingly by using certain dilution factors. A schematic representation of the separation
procedure is shown in Fig.4. After filtration the filter was freeze-dried using an Edward Mudalyo
freeze-dryer and stored for further analysis.
500 mL water sample c
Stir, fiacolllrrytetrrfltr n freeze-dried Irradiate for chodate
_ |~~~~~~~ dsorbable iodine I
Filtrate (discard)ltrat
A iB
+ 5OOgtg PMC1 + 200 mg hydrazine chloride+I mL charcoal slurry + 500 fig PdC12
- 1 ~~~~~~~~~~~~~+ I rrL charcoal slurry
Stir, filter a shem o iodine sei In r a w wSediment core samples col|ected were oven-dried for atleaStir2 filter, freeze dried u
+ 200 mg hydrazine chloridec d 00 wig PdCw2 oriadiate for total* I mnL charcoal slurry inorganic I
gn Stir, filter, feeze-ddredr Irdimatel 0
Filtrate (discard)
Fig. 4. Separation scheme of iodine species in river and well water samples:
Sediments core samples collected were oven-dried for at least 2 weeks at 60° C or until a
constant dry weight was observed followed by grinding using a grinder mill (Herzog) to get the
homogenous powdered form of approximately < 200 mesh size (±75 pm) prior to further analyses
as in the case of rare earth elements determination and distribution patterns studies. Further
treatment, as in the case of speciation of Se(IV) in marine sediments, was required whereby the
sample solutions for the extraction step with DBDTC-Pp were prepared by dissolving I g of the
dried material with a mixture of 6.0 mL of HN03 (70%), 4.0 mL of HC104 (60%) and 2.0 .mL of
- 167-

JAERI-Conf 2001-017
HF (48%) in a Teflon™ pressure decomposition vessel of a CEM Model MDS-81D microwave
digester. The resultant solutions were allowed to cool to ambient temperature before filtering
them through a Whatman 0.45ptrm membrane filter followed by the addition of 1.5 mL of 30%
H202 and finally made up to 250 mL with DDW for subsequent analyses. All SRMs and
standards used in this study were similarly treated for consistency. The extraction procedure for
the Se(IV) species requires the preparation of a fresh batch of DBDTC solution and the sample
solution was first adjusted to pH 2.0 with 2.0 M HCI. About 2.0 mL of 2% DBDTC, 4.0 mL of
12% EDTA and 6.0 mL of 5% phenolphtalein were added to 250 mL of sample solution in a
conical flask. The samples were stirred with a magnetic stirrer for about 1 min. and the
precipitate formed was separated by filtration through a 0.45 prm membrane and freeze-dried using
an Edward Mudalyo freeze-dryer prior to the irradiation step.
The determination of inorganic As and Se in leachates was done according to the method
similarly described for sediment samples. Details for the extraction procedures for inorganic As
species were described by Yusof el al.[12,16,17] Inorganic Se(IV) species were extracted by a
modified method involving co-precipitation with sodium dibenzylcarbodithioate-phenolphthalein
(NaDBDTC-Pp) on the aqueous solution. A 1 00 mL aliquot of sample solution was acidified to
pH 2 with concentrated HN03 in a conical flask. About 4 mL of 5% Na-DBDTC solution was
added to the aliquot followed by 8 mL of 12% EDTA and 10 mL of phenolphthalein and the
mixture was stirred with a magnetic stirrer for 10 min. and then left standing for 60 min. for the
precipitate to settle. The precipitate obtained was filtered through a 0.45 gm Whatman membrane
filter, washed with 2 mL of 0.01 M HN0 3 making sure that no precipitate was left in the flask and
later freeze-dried prior to the irradiation step. The total inorganic selenium contents were
determined similarly but the Se(VI) species from a fresh batch of 100 mL aliquot adjusted to pH 2
was first reduced to the Se(IV) state by adding 10 mL of 6M HCI and heated to about 70'C in a
water-bath for 10 min. The difference in the total Se(IV) and the actual Se(IV) content
determined earlier gives the Se(VI) concentration.
Irradiation and Counting
Irradiation of all samples were carried out in a TRIGA Mk.II reactor at the Malaysian Institute
of Nuclear Technology and Research (MINT). Liquid samples solution of I mL from the final
solutions were pipetted into vials of i.d. 10mm x 20mm, heat-sealed to prevent any leakages
which might lead to reactor contamination and packed into larger vials before irradiating them in
a neutron flux of 5.lxlo'2 n.cm-2.s '. Between 0.15 and 0.25 g of the dried sediment samples were
weighed into flip-top polyethylene vials (Olympia) and placed into larger vials before irradiating
them. An irradiation period usually of 6h. followed by 2 weeks of cooling is normally required
for the determination of Se species while it required only about 3 days of cooling after an
-168-
JAERI-Conf 2001-017
irradiation period of 6h. before the concentration of the As species is determined.[12,16]
Irradiation of up to 6 h followed by varying cooling times were performed on the sedi'ment
samples to measure longer-lived isotopes of La, Ce, Sm, Eu, Th and Yb. The short-lived isotope
of Dy was counted for 5 min. immediately after an irradiation time of I min. followed by a
cooling time of 20 min. Signals from the 559 keV y-rays from 76As and 264.7 keV and 136.0 keV
from 75Se were used in the quantitative determination of the inorganic As and Se species
respectively. Counting was done over a period of 3600 s to ensure good statistics. The gamma
spectrometry equipment used in the counting procedure consists of a large coaxial hyperpLre
germanium detector (HPGe) Model GC-1520, with a resolution of 1.9 keV at 1332 keV 60Co
connected to a pre-amplifier, amplifier and an ADC ND592 (Nuclear Data) analyzer connected to
a ND6000 (Nuclear Data) multichannel analyser.
Output and Benefits of Study
Inorganic Se in Aquatic Species
Selective separation and extraction of the Se(IV) species from aqueous media by APDC and
subsequent adsorption on Ci 8-bonded silica gel prior to determination by GFAAS[18] enabled
concentrations of Se(IV) as low as 50 ng/L to be detected. Preconcentration of Se(IV) with the
formation of a complex with 3-phenyl-5-mercapto-1,3,4-thiadiazole-2(3H)-thione potassium salt
(Bismuthiol-1I) have been successfully used by Sakai et al [19] where the complex was later
adsorbed onto activated carbon and irradiated in a thermal neutron beam using the short-lived
77,Se with a half-life of 17.5 s to calculate the amount of Se(lV) present in water samples.
However, the success of the preconcentration and extraction step by APCDT-CHCI3 followed by
neutron activation analysis on aqueous samples for inorganic arsenic determination[13] prompted
the application of this technique to the quantitative analysis of Se(IV) and Se(VI) in biological
samples.
The Lobster Hepatopancreas TORT-1 SRM used in this study has a certified Se
concentration of 6.88±0.47 4.g/g and the value obtained in this study using the Chelex-100
chelating resin separation is 6.22±0.49 4g/g. This is equivalent to about 90.33% recovery and
considered quite substantial, thus enabling this procedure to be used throughout the study. The
microwave digestion with programmed heating was chosen instead of the normal heating to
prevent massive loss of the volatile materials during the digestion step. The reproducibility of this
technique in arsenic speciation was reported by Yusof et al.[13] Table 1 shows the
concentrations of total inorganic Se in different parts of the Tilapia nilotica species using the
Chelex-100 separation procedure. Comparatively, different parts of the fish seem to indicate
-169 -

JAERI-Conf 2001-017
O ~ ~ ~~~ r- 1, t- N1D , S t 1,0 -t V) Cq r4
o o c kn t C 6o oo
V 00 rn Ol tn- 0 N O O O
to 4-1 +1 + +4-
t~~ ~ 6 o n -o t o o oo t- a) o o
_ i r ~CN CN en C4 cn CN en C
ga)
Cl) ~ ~ l)
4-4 ::e l l+ +l+l+ +l +l +1 +1 +l+
Co S C m o o o I o Ln _
,D~~~~~~~~~~~~~~r C S:
O E > +l +} +l X + + X +[ +t C +l 4C' qC) kn "os t- 00 ONr rx
o 0C.)t
o ~ ~ ~ ~ ~ ~ ~ ~ ~ ~~~W W) kr 'I %O t fiO
-6i td +1 -H+ +1 -H +1+ -H +1 +1 -H
. 0% ol 00 00 00 CS r o - r- -r- o 0
ca~~~~~~~~% 0 0-Mt0t; 8 to +l +l -i 1- i -aH i l-+-i
.o~~~~~C C) . ON O- %0 t- ul 0 r- so r bZ .& rl> - oo N - 0_ CI- tn I tn m c
O C14m N M eN N N9 N Sc S
-C E- Ob > 1 oo ~ o 'toCh O l ' >T m N
S = E = X 9 X~~ +1 +l;+ +1+ T M+ +!~~~~~~~~~~I ON 00 rn14 10 N 1 t 0E 00t >S 00
> ~~~~~~~~~~oo
0
U)0 1
-170 -

JAERI-Conf 2001-017
special preference in the accumulation of the inorganic Se species. In general, the bones have
relatively higher concentrations of inorganic Se than the flesh with the head showing the least
affinity for this element. This trend is prevalent in all the samples taken from all the locations.
Other parts of the fish might show different preference but since only the bone, head and flesh
parts are normally used in the preparation of food, other parts are not relevant and therefore
discarded.
The Se(IV) and Se(VI) concentrations determined in the bone, flesh and head of the Tilapia
nilotica species are presented in Tables 2, 3 and 4 respectively. The values given are expressed in
jig/g dry weight. The normal weight used in the preparation of food is about five times more than
the dry weight. Figures obtained for the Se(IV) concentrations in various parts of the Tilapia
nilotica species show that the reduced form of the Se species is very much lower than the Se(VI)
species. The bones of the Tilapia nilotica species have a greater tendency to concentrate the
inorganic Se as compared to the head and flesh parts. This was also reflected in the figures
obtained for the total inorganic Se contents using the Chelex-100 preconcentration step as shown
in Table 1. The overall results indicate that most of the Se occur as the Se(VI) species and this is
reflected in the low Se(IV)/Se(VI) ratio in the three parts of the Tilapia nilotica species
investigated. The low Se(IV)/Se(VI) ratio also suggests that high oxidizing environment prevails
in these water bodies thus favouring the formation of the Se(VI) than the Se(IV) counterpart. The
inorganic Se uptake by the Tilapia nilotica species depends on the chemical forms of the element
and its quantity, microbiological activities in the water and the age of the fish.
The extraction procedure used in waters from disused tin-mining pools and water treatment
plants to separate the inorganic arsenic species from natural waters was found to .be effective, as
depicted by the percentage recoveries in Table 5. The percentage recovery for standard As(III)
species was 100.6% and is comparable to 100.4% obtained in another study by Yusof et.al.[13]
and 102.2% by Subramanian et.ai. [20] This method enabled the elimination of interfering alkali
metals especially 23Na, alkaline-earth metals and the halogens especially 8'Br, both of which
produce high-intensity y-peaks from the 24Na and 82Br resulted from the high neutron capture
cross-sections during the irradiation step. With the elimination of bromine, possible overlapping
of the 556 keV peak from S12Br on the 559 keV peak from 76As is overcome. The presence of
other metal ions such as Pb2+, Cu2+, Sn 2' and Sn 4 t which could affect the degree of extraction of
As(III) with the dithiocarbamate due to competitions by these ions was eliminated by using
EDTA as the masking agent. The As(III) is readily extractable from the aqueous solution
compared to the As(V) species, hence it was therefore more effective to reduce the As(V) to its
lower oxidation state of As(III) using a suitable reducing agent such as Na2S203 followed by
extraction of the total As(III). The difference in the As(III) concentrations from the two water
sample aliquots constitutes the As(V) present.
-171 -

JAERI-Conf 2001-017
,o C 00 C) Dt eno~ : C~s o c 0 °N ON 00N °° 0 W) es
Q cJ~~~~j
W U
oE m L +1 +H + 1+I +°l ++ +1 I +° +1 +1
O~~~~l skm= tm s__n kn . . .eo
0 + -H--- + -H -- --+1+1
*o
6~~~~~~~~~~~~~~~~C No ce m es oo CY O O >co C00r cs b
0~~~
=~~~~~I o o o7 o) o C, o o
X,~~~~~~~~~~~~~~~c cn4
i~~~~~~~~~~7 + 5vr 1;m+, +1 m +1 +, +1 T, -H
i.~~~~~~~~.
O 0 0 'O O0 ° ° N +°l
=~~~~~~~~C1 C- 1?0 r sn ,I, -o It -
000nnn000000000
0 o
0)
- 172 -

JAERI-Conf 2001-017
Table 5. Percentage recoveries of APCDT-CHCI 3 extraction of As(III) and As(V)with and without EDTA
sample As(III) added As(V) added % recovery % recovery(p~g.L-) (pig.L-') of As(ITI) of As(V)
seawatera 100 100 71.5±1.7 75.5±1.9
well-water'1 100 100 79.8±1.8 87.9±2.0
seawaterb 100 100 100.7±2.5 96.5±2.2
well-waterb 100 100 101.3±2.7 98.7±2.3
a - without EDTA; at room temperatureb - with EDTA; at room temperature
Table 6. Concentrations of As(III) and As(V) species in water samplesfrom mining pools
Site pH Temp. As(III) As(V) As(III)
(OC) (pg.L-') (pg.L-i)
1 7.54 30.5 44.2± 5.90 221.0± 5.90 0.202 7.30 29.0 157.3±20.2 557.0± 77.1 0.283 7.54 30.3 731.0±50.3 1017± 41.5 0.724 7.33 30.5 255.8±31.0 235.5± 23.3 1.095 6.80 31.7 689.3±66.0 595.0± 45.2 1.166 7.50 30.3 238.1±34.3 2320± 59.0 0.107 7.65 29.0 170.7±19.5 1115±120 0.15
ND - not detectable
The overall concentrations of the inorganic arsenic species in water samples taken from
mining pools as shown in Table 6, range between a minimum of 265.2 pg.L-1 to a maximum of
2558.1 pgL-1 that is between 0.265 ptg.L-' to about 2.26 4g.L-1 and the average total inorganic
arsenic for most surface waters is about 1.0 pjg.L-'. [21J In this study only three sites (5,6, and 7)
as shown in Fig. 1, recorded total arsenic concentrations exceeding 1.0 1Lg.L" and this reflected
the nature of the soil in these particular areas as compared to the others. In terms of inorganic
arsenic contents related to water quality, and under normal circumstances of an aquatic
environment, the As(V) concentrations would far exceed the As(III) concentrations. However
several factors, such as the external introduction of arsenic species from the surrounding areas
where the sites are located, competing processes which can modify the concentrations of the
- 173 -

JAERI-Conf 2001-017
arsenic species in natural waters, such as lack of oxygen since most of the pools have depths of
more than 30 m, leading to a low oxidizing environment and would shift the As(III)/As(V) ratio
from less than 1.0 for a normal condition to more than 1.0 as illustrated by sites 4 and 5. The shift
from a more dominant As(V) to one which is more dominant in As(IJI) can be found in certain
reduced environments especially for water samples taken from deep wells or from surface waters
of tropical gyres where the high internal cycling of phosphorous-based compounds inputs result
in the rapid uptake of As(V) by phytoplanktons in the warm waters and excreting it as the As(III)
reduced species.[22] Sites 4 and 5 could be comparable to a rather confined water body with
little or no flow, thus depriving the aquatic environment with reduced oxygen required to sustain
life. In terms of water quality the dissolved oxygen in waters taken from these sites is relatively
low thus providing an environment not suitable for the formation of the more stable higher
oxidation state of As(V). It can be inferred that water samples with As(III)/As(V) ratios of less
than unity originate from a normal surface water environment suitable for aquatic life.
The charcoal prepared and used in the speciation of iodine from well and river waters had the
highest iodine capacity of 838.2 (mg I g-' carbon) compared to other substrates prepared under
different conditions.[23] Prior to using the PK-ZC-H-450 activated charcoal as the adsorbant,
recovery experiments were performed for iodine, iodate and iodide species by spiking the
prepared standards in DDW and subjecting them through the same chemical separation using the
adsorbant as filters, Each iodine species fraction after removal of the charcoal through filtration
was irradiated to determine the percentage retained by the charcoal for various species. More
than 52.1% iodine was retained in the prepared charcoal, while the percentage is lower for iodate
(45.9%) and iodide (41.6%) species. The percentage of iodine species retained by the prepared
charcoal appeared to be relatively lower compared to the commercially available substrates used
by Woittiez et al.[23] However, Mukherjee et al.[24] reported that charcoal derived from
agricultural wastes and impregnated with ZnC12 as the activating agent during the carbonation
process resulted in a degradation of the cellulose material, causing the structural framework to
expand and resulting in improved pore size. This could be the reason for the relatively lower
retantion for most iodine species in the substrates used in this work.
The PdC12 used in the iodate and total inorganic iodine separation was maintained at 500 Fg to
achieve quantitative recovery as mentioned by Woittiez et al.[231 The chemical treatment used in
the sequential separation of the iodine species follows that of Woittiez et al,[23] except in the
quantitative analysis where instead of iodine tracers, prepared standards were irradiated together
with the separated iodine species. The amount of hydrazine added was also not critical as it did
not give any significant change in the concentration of iodate or iodide determined in the water
samples.[23] All separation procedures were performed at the natural pH of between 6.3 - 7.5 of
the river. and well water samples. Quality assurance control tests were performed by standard
addition as no standard reference materials were available for comparison. The concentrations of
-174 -

JAERI-Conf 2001-017
various iodine species obtained from the neutron activation analysis of the filter were tabulated in
Table 7 for river water samples and in Table 8 for well water samples.
Table 7. Concentrations of charcoal-adsorbable iodine, iodide, iodate and total inorganic iodinefor river water samples
Sample Temp. pH Charcoal- Iodide Iodate Total Ratiolocation (0C) adsorbable ([tgfL) (pg/L) inorganic (sum species/
iodine (ggL) iodine (.g/L) total)
RI 24.0 7.4 0.197±0.02 0,067±0.01 0.121±0.01 0.313±0.02 1.23R2 25.0 7.0 0.121±0.01 0,038±0,01 0.115±0.01 0.325±0.01 0.84R3 25.0 7.0 0.159±0.01 0.067±0.01 0.121±0,01 0.293±0.01 1.18R4 24.0 7.2 0.144±0.01 0,120±0.01 0.101±0.02 0.258±0,02 1.41R5 25.0 7.0 0.180+0.01 0.014±0.02 0.100±0,02 0.249±0.01 1.18R6 26.0 7.0 0.188±0.02 0.083±0.01 0.091±0.01 0.288±0.01 1.26R7 24.0 7.2 0.190±0.01 0.055±0,01 0.129±0.01 0.345±0.01 1.08R8 26.0 7.4 0.135±0.01 0.135±0,01 0.137±0.01 0.352±0,01 1.16R9 23.4 6.4 0.182±0.01 0.047±0.01 0.090±0.01 0.242±0.01 1.32RIO 23.3 7.8 0.110±0.02 0.063±0.01 0.098±0.01 0.263±0.01 1.03R11 24.0 7.2 0.153±0,01 0.078±0.02 0.112±0.01 0.299±0.02 1.15R12 27.0 6.3 0.146±0.02 0.077±0.01 0.108±0.01 0.227±0.01 1.46R13 29.0 6.3 0.199±0.01 0.069±0.01 0.122±0.01 0.238±0.01 1.64R14 22.4 6.4 0.173±0,01 0.132±0.02 0.123±0,02 0.300±0.01 1.43R15 24.1 6.5 0.160±0.01 0.125±0.01 0.110_0,01 0.303±0.01 1.30R16 23.2 6.8 0.154±0,01 0.041±0.02 0.100±0.01 0.3100,01 0.95
R = river
The study serves as an indication of the presence of iodine and its species in different drinking
water sources and it also attempts to relate the different geochemical surroundings from where
these waters were drawn. Well waters seem slightly more acidic than river waters due to the
reduced aeration taking place in well waters. More bacterial actions, either aerobic or anaerobic,
would have taken place in stagnant waters as in the case of well waters, thus giving rise to acidic
by-products associated with organic material breakdown.[25)
Charcoal-adsorbable iodine, mainly 12 in solution, is the quantity of iodine remaining on the
activated charcoal filter after filtration from the river and well water samples without changing
their natural pH values. It was observed in Tables 7 and 8 generally, that the amounts of
charcoal-adsorbable iodine in river water samples were higher compared to well waters. Hoede el
a1426] have reported on the simultaneous decrement of iodate species with an increase of iodide
species in reducing environments of marine sediment during a study conducted in Indonesian
waters. The same trend is also observed in this work in well water samples with relatively higher
reducing conditions compared to river waters. The reduced iodine species of iodide were much
higher than those determined in river waters. Much of the acidic by-products produced by
-175 -

JAERI-Conf 2001-017
bacterial actions at the bottom of the well must have provided the reducing environment that can
convert the higher oxidation state iodine species into the reduced forms of iodide. The slightly
higher temperature of the well water is expected since the water samples were drawn from the
sub-surface epilimnion strata. Natural convection of the water has brought up some of the bottom
water rich in reduced iodine species to the top. The same is not true in river waters since constant
aeration has provided the iodine species with oxygen-rich water thus maintaining them in the
oxidized forms of iodate and charcoal-adsorbable iodine.
Table 8. Concentrations of charcoal-adsorbable iodine, iodide, iodate and total inorganic iodinefor well water samples
Sample Temp. pH Charcoal- Iodide Iodate Total Ratiolocation (0C) adsorbable (Pg/L) (pg/0) inorganic (sum species/
iodine (pg/L) iodine (pg/L) total)
WI 29.0 5.9 0.077±0.01 0.312±0.01 0.108±0.01 0.214±0.01 2.32W2 28.0 5.3 0.022±0.01 0.297±0.01 0.063±0.01 0.101±0.02 3.78W3 28.0 5.4 0.079±0.01 0.298±0.01 0.097±0.01 0.153±0.01 3.10W4 29.0 5.0 0.032±0.01 0.301±0.01 0.073±0.02 0.158±0.02 2.57W5 34.0 4.5 0.058±0.01 0.313±0.01 0.112±0.01 0.198±0.01 2.44W6 27.0 5.2 0.021±0.02 0.288±0.01 O080±0,01 0.220+0.01 1.77W7 26.0 5.5 0.035±0.01 0.277±0.01 0.091±0.01 0.122±0.02 3.30W8 26.0 5.4 0.063±0.01 0.270±0.01 0.110±0.01 0.180+0.01 2.46W9 26.2 5.8 0.078±0.01 0.286±0.02 0.092±0.02 0.192±0.02 2.38W10 25.9 5.5 0.020+0.01 0.312±0.01 0.090±0.01 0.215±0.01 1.96
WMwell
0.4
&0.3 iodine
=: 0.2~~~~~~~~~~~~-~ |charcoal adsorbable iodineco 0.2
U 0.1 -- X- total inorganic iodine
u 0
0 5 10 15
location codes
Fig. 5. The distribution of iodine species in river water samples according to locations
-176 -

JAERI-Conf 2001-017
0.35 -
, 0.3 ___
s 0.25 - -4iodine
0.2 - - >¢- charcoal adsorbable iodine
0.15 A iodate
to 0°5 --- total inorganic iodine
o 0.05
0 2 4 6 8 10
location codes
Fig. 6. The distribution of iodine species in well water samples according to locations
Figures 5 and 6 show the distribution of the various iodine species in river and well water
samples according to the sampling locations. The analysis of iodine species in water samples
taken from the same locations showed that the concentration patterns were almost identical.
There were no abnonnalities in terms of relative concentrations of the iodine species. This serves
to illustrate that any incremental in the concentrations of the reduced iodine species is consistent
with the simultaneous decrease of their oxidized forms.
The efficiency of the procedure described in the speciation of Se(IV) in marine sediments was
tested by comparing the certified selenium contents in both the SRMs of BCSS and MESS-2 with
those obtained in this work. Table 9 shows the percentage recoveries of total selenium in both the
SRMs. It was found that a percentage of 95.4 and 93.1 for BCSS and MESS-2 respectively
provided good quality assurance controls and these figures were used throughout this work for
consistency. The relatively good recoveries for Se(TV) using phenolphtalein as a coprecipitant
was also reported by Saleh et.al[271 where more than 90% of the spiked Se(IV) was recovered.
Linder et.al [28] adopted the coprecipitation technique using only DBDTC to extract twelve
heavy metals in pharmaceutical products with recoveries of more than 90%.
Table 9. Percentage recoveries of selenium in standard reference materials
SRM certified values determined values % recovered
(4g.g') (4Lg go)
BCSS 0.43±0.06 0.41±0.07 95.4MESS-2 0.72±0.09 0.08±0.08 93.1
-177-

JAERI-Conf 2001-017
The use of microwave digestion with programmed heating was chosen instead of the normal
heating to prevent massive loss of the volatile materials during the digestion step. The
reproducibility of this technique was reported by Yusof et.al[13] in the speciation of arsenic in
seawater and some localized marine species.
Some of the concentrations for Se(IV), expressed in jig.g-' or ppb, determined at different
sediment strata for the four locations are given in Table 10. There is no distinct pattern observed
for all the four sites in terms of Se(IV) distribution implying that the concentrations of Se(IV) in
the sediment were subjected to constant changes in the inorganic selenium input. Except for
samples taken at location JI9, the rest showed varying amounts of inorganic selenium inputs
possibly originating either from the industrial settlement between SJ2 and J17 or pollutants
trapped within the bay area where J21 is located. There is a possibility that location 119 is located
in the path of a fairly constant sea current originating from the bay area as well as moving along
the straits. The distribution of Se(IV) is quite constant at J19 with time since the lower strata
represents the accumulation trend of pollutants in the past. Fig. 7 shows the distribution pattern of
Se(IV) concentrations for the four sites for comparison.
Table 10. Concentrations of Se(IV) in sediment strata at different locations
Locations SJ2 J17 J19 J21Strata (cm) (pg.g1') (Ptg.g-') (Ptg.g 1,) (±gg-lg)
0 - 02 50.17±0.08 20.79±0.03 13.36±0.07 ND02 - 04 19.93±0.09 40.24±0.07 16.93±0.02 ND04 - 06 24.95±0.05 16.62±0.03 16,24±0.05 ND06 - 08 30.56±0.08 12.93±0.05 37.29±0.09 ND08 - 10 35.83±0.09 20.13±0.06 18.48±0.05 ND10 - 12 47.79±0.08 33.10±0.08 17.50±0.05 ND12 - 14 19.55±0.06 25.78±0.06 16.20±0.09 12.57±0.0514 -16 17.28±0.04 17.55±0.04 11.48±0.07 10.23±0.0316-18 - - 17.17±0.05 3.93±0.0518-20 - - 12.62±0.09 ND20-23 - - 12.25±0.06 11.64±0.0723 - 26 - - 15.47±0,08 30,03±0.0626 - 29 - - 17.86±0.02 9.07±0.0729 - 32 - - 11.48±0.09 13.55±0.0832 -35 - - 17.17±0.05 15.93±0.0535 - 38 - - 20.15±0.07 -
38 - 41 - - 30.93±0.06 -
Note: ND - not detectable
-178 -

JAERI-Conf 2001-017
60
--4-SJ2 --i-J17'to 50 0 +S~~~~~~~~~~~~~~~~19 x 2
40
0 30
0
20
o 10U
LP Li L.2 L3 4 5L lb 2L7 is L9 LIO Lu L12 LII L14 115 L16
Location strata, cm
Fig. 7. Distribution pattern of Se(IV) concentrations at different depths
The accumulation of Se(IV) at SJ2 recorded relatively higher concentrations of Se(IV),
between 17.28±0.04 ~gg.g-1 to 50.17±0.08 gg.g-1 . There is no clear trend in the accumulation
pattern except that this location is within the industrial belt along the coast and it is quite natural
that it acts as a receiving basin for most pollutants. It was reported by Cobo et.a429] that in fresh
water the usual range of inorganic selenium is between 0.02 - 1.0 ng.mL-' and in sea water 0.004
ng. mL at the surface and 0.06 ng.mL-' in the deep ocean, mostly in the selenite form.
Groundwater in contact with different geological environments may reach much higher
concentrations of inorganic selenium, sometimes as high as 6000 ng.mL-'.[30] Since the
sediments obtained varies in nature, from high in organic materials to mostly clay, it was
anticipated that the determination of Se(IV) and/or Se(VI) was somewhat suppressed by the
interference of dissolved organic carbon (DOC) as reported by Workman and Soltanpour[31]
when they found out that recoveries of Se(IV) and Se(VI) in some extracts were poor. All these
factors could have contributed to the non-uniformity of Se(IV) species in different sediment strata
resulting in uneven accumulation and distribution of the inorganic selenium species as indicated
in this study.
The analytical results for some of the REE elements for sediment core samples taken at sites
1-17, J-19 and J-21 (as shown in Fig.3) are presented in Tables 11, 12 and 13 respectively and are
expressed in 4g.g-1. A better representation of the variation in down-core concentrations and
distribution of the REEs can be seen from the profiles as shown in Fig. 8 for the three sites .- 1 7,
J-19 and J-21. The extent of change in the concentrations of the REEs with depth is better
demonstrated by these profiles and can be used to distinguish enrichments due to anthropogenid
input from those due to natural processes, especially if the age of the sediment layers can be
- 179 -

JAERI-Conf 2001-017
estimated by using accumulation rates, surface layer mixing depths and rates obtained from
radionuclide activity profiles.
Table 1 1. Concentrations (Rig/g) of REE in core sediment collected at site J-17
Depth La Ce Sm Eu Tb Dy Yb(cm)
0-2 i3.53±8.18 70.61±i.29 9.95±0.36 0.66±0.08 0.74±0.22 3.86±0.66 3.12±0.202-4 66.36±540 62.94±0.94 10.31±0.26 0.63±0.05 0.77±0.13 3.40±0.50 2.96±0.184-6 65.97±5.41 74.35±1.00 10.05+0.25 0.75±0.05 0.80±0.16 4.09±0.56 3.05±0.186-8 47.88±4.12 68.61±0.96 6.49±0.21 0.68±0.05 0.81±0.16 3.81±0.47 2.64+0.178-10 57.20±7.22 72.99±1.31 7.61±0.26 0.71±0.08 0.61±0.25 3.11±0.48 2.01+0.1610-12 59.15±4.94 68.81±1.00 8.33±0.23 0.79±0.05 0.61±0.15 3.31±0.42 3.62±0.2312-14 54.97±4.75 76.51±1.08 8.32±0.22 0.77±0.06 1.24±0.19 3.06±0.57 3.25±0.2014-16 22.30±10.67 55.94+2.58 6.28±0.60 0.65+0.15 N.D. N.D. N.D.16-1818-2020-2323-2626-29 46.51±4.18 66.57+0.89 7.79±0.21 0.82±0.05 1.20±0.18 4.08±0.50 2.37±0.1429-32 29.18+9.55 68.28±2.70 7.78±0.53 0.67±0.14 N.D. N.D. 2.53±0.5232-3535-38 40.23±4.43 77.00±1.16 7.42±0.22 0.51±0.06 0.57±0.18 3.33±0.47 1.59±0.0938-41 49.44±3.79 72.24±0.09 6.73±0.19 0.82±0.05 0.76±0.13 3.96±0.52 2.22±0.13
ND - not determined
Tabie 12. Concentrations (,ug/g) of REE in core sediment collected at site J- 1 9
Depth La Ce Sm Eu Tb Dy Yb(cm)
0-2 50.08±0.52 59.10+1.01 8.15±1.13 0.48±0.04 0.70±0.11 2.94+0.47 2.30±0.112-4 57.85±0.55 51.81±0.97 10.27±1.16 0.60±0.04 0.66±0.11 3.75±0.A7 2.20±0.124-6 63.54±0.56 59.88±1.01 11.97±1.25 0.62±0.04 0.47±0.09 3.77±0.44 2.54±0.136-8 ND 58.44±1.96 11.28±2.17 0.73±0.08 0.75±0.21 3.22±0.88 ND
8-10 56.84±0.54 62.69±1.00 12.79±1.19 0.73±0.04 0.66±0.10 3.02+0.49 2.11+0.1210-12 53.77±0.50 67.21±1.04 9.18±1.10 0.65±0.05 0.69±0.12 4.00±0.50 1.92±0.1012-14 49.33±0.48 55.70+0.94 8.69±1.05 0.59±0.04 0.43±0.11 3.49±0.45 1.92+0.1014-16 51.66±0.47 63.57±1.01 10.16±1.05 0.62±0.05 0.51±0.12 3.72±0.39 2.14±0.1016-18 44.84±0.45 56.52±0.98 6.81±0.78 0.65±0.04 0.42±0.07 3.22+0.46 1.97+0.1218-20 42.52±0.43 61.50_1.00 11,06±0.97 0.74±0.05 0.70±0.10 3.06±0.46 1.85+0.1020-23 46.43±0.44 60.55±1.00 9.81±0.95 0.59±0.04 0.67±0.15 4.11±0,45 1.99±0.1023-26 44.96±0.44 62.21±1,00 7.01±0.86 0.71±0.05 0.86±0.18 3.39±0.42 1.88±0.0926-29 50.26±0.46 64.60±1.00 7.99±0.81 0.69±0.05 0.55±0.09 3.80±0.40 2.03+0.1029-32 37.79±0.40 52.86±0.92 8.69±0.85 0.52±0.04 0.52±0.07 3.37±0.56 1.73±.0.0932-35 28.57±0.32 57.05+0.85 9.87±0.89 0.70+0.05 0.74±0.12 3.77±0.52 1.35±0.0735-3S 27.88±0.31 61.50+0.93 9.09±0.87 0.85±0.05 0.95±0.13 3.85±0.50 1.39±0.0738-41 26.38±0.29 59.90±0.94 8.38±0.92 0.77±0.05 0.63±0.10 4.20±0.36 1.43±0.0741-44 24.58±0.28 59.17±0.92 7.82±1.44 0.79±0.05 0.73±0.11 3.77±0.46 1.40±0.0744-47 25.06±0.28 57.52±0.92 6.43±0.62 0.70±0.05 0.56±0.12 2.99±0.40 1.55±0.08
ND - not determined
- 180 -

JAERI-Conf 2001-017
Table 13. Concentrations (jtg/g) of REE in core sediment collected at site J-21
Depth La Ce Sm Eu Tb Dy Yb(cm)
0-2 38.42±1.49 69.97±0.98 7.23±0.11 0.78±0.06 0.55±0.12 4.24±0.49 2.83±0262-4 32.67±6.13 67.68±4.14 7.66±046 N.D . N.D. N.D 2.42±1i14
4-6 35.66±1.39 62.18±0.91 6.67±0.09 0.70±0.05 0.78+0.13 4.46±0.48 2.20±0.226-8 37.92+1.52 62.17±0.94 6.51±0.09 0.68±0.06 0.63±0.15 5.22±0.49 2.31±0.248-10 34.17±1.61 61.71+0.99 6.18±0.09 0.69±0.06 0.52+0.14 4.79±0,46 2 88±0.29
10-12 29.59±1.25 66.62±0.92 5.88±0i08 0.79±O.05 0.62±0.11 4.82+0.38 2.47±0.2112-14 28.44±1.31 59,06±0.9! 4.95±0.08 0.74±0.06 0.57±0.15 5.07±0i41 2.06±0.2214-16 25.18+1.07 64.52±0.93 4.32±0.07 0.63±0.05 0.56±0.13 4.53±0i45 1,79+0.2016-18 17.73±0.95 61.93±0.94 3.69±0.07 0.74±0.06 0.69±0.17 3.91±0.41 1.96±0.2018-20 17.59+0.90 63.38±0.93 3,58i0.06 0.77±0.06 0.59±0.13 5.40±0.44 1.26±0.1520-23 11,84±0.70 38.68±0.80 2.56±0.05 0.48±0.04 0.80±0.13 2.95±0.35 0.87±0.1323-26 8.40±0.63 33.38±0.79 1.99+0.05 0.36±O.04 0.32±0,09 2.66±0.29 0.74+0.1226-29 7.89+0.57 27.45±0.72 1.70±0.05 0.41i0.04 0.32±0.08 2.26±0.31 0.54±0.1129-32 6.54±0.71 24.52±0.77 1.53+0.05 0.33±0.05 0.34±0.16 2.40±0.26 0.68+±0.1432-35 8.18±0.81 26.16±0.79 1.74±0.05 0.27±0.06 N.D. 1.68±0.33 0.98±0.2035-38 7.37±0.53 27.98+0.71 1.52±0.05 0.31±0.06 0.17±0.09 2.04±0.31 1.05±0.1538-41 10.03±0.80 41.76+0.82 1.92±0.05 0.35±0.06 0.40±0.09 2.59±0.37 0.86+0.19
ND - not determined
La Ce Sm Eu Tb Yb La Ce Sm Eu Tb Dy Yb La Ce Sm Eu Tb Dy Yb
15i S i.5i 5 45 i 39
1.5 30 16 m 0.47 _ _ *U
I 0.5i + f f 0 e 15 220
21 <9 7?1 l 1Xn21 <~>5 1.5 1- 5 11 I's_ , ,¢ 1 15 0 1 2 12
1.5 2
21 A
13~ ~ ~ 0 0~~~~~~~~
La CeSm EUTObDYYb La Ce Sm Eu TbDYYb La Ce SmEu TbDy gb
J-17 J-19 J-21
Fig. 8 Distribution patterns of shale-normalized REE placed in stratigraphic order for coresamples taken at three sites (J-17, J-l9 and J-21)
In general the concentrations of other REEs determnined at sites J- 17 and J- 19 have not
extremely changed with depth though the concentrations of La, Sm and Yb at these two sites
- 181 -

JAERI-Conf 2001-017
seemed to decrease with increasing depth (Tables 11 and 12). On the other hand all REEs at site J-
21 exhibit decreasing concentrations from surface to the bottom of the sediment (Table 13).
Incidentally, concentrations of REE except Eu and Dy at site J- 17 were higher than sites J- 19 and
J-21. It is evident that the REEs are more enriched in the surface of sediments compared to the
lower strata. This enrichment reflects the preferential scavenging of REEs from the seawater
rendering the continual accumulation of these REES at the upper part of the sediment core. De
Baar et al 3 have reported that REE concentrations were found to increase with the depth of
sea water column taken from the Pacific and Atlantic Ocean basins. Increasing of REE
concentrations in the surface of core sediments are supported by these results since the higher
concentrations of REEs in the deeper sea water column enables scavenging of REEs to occur at
the top sediment layer as compared to sediments taken at a depth of between 5 to 10 m as
described in this work. It was found that except La and Sm, REE concentrations in core
sediments were lower than those in average shale given by De Baar et al[32] and Sholkovitz.[33]
Table 14. The total REE values, CeICe* anomalies, La/Sm and Yb/Sm ratios at all depths of 3core sediment samples
Depth J-21 I-19 J-17
(cm) SREE CeICeF LaISm Yb/Sm 1REE Ce/Ce* LaISm Yb/Sm SREE Ce/Cel LaSm Yb/Sr
1 124 0.89 5.32 0.39 124 0.60 6.14 0.28 162 0.50 7.39 0.313 110 0.97 4,26 0.32 127 0.44 5.63 0.21 147 0.48 6.44 0.295 113 0.86 5.35 0.33 143 0.53 5.31 0.21 159 0.58 6.56 0.307 115 0.82 5.82 0.35 74 131 0.75 7.38 0.419 111 0.89 5.53 047 139 0.52 4.44 0.17 144 0.67 7.52 0.2611 111 1.09 5.04 0.42 137 0.63 5.86 0.21 145 0.60 7.10 0.4313 101 1.04 5.75 0.42 120 0.56 5.67 0.22 148 0.71 6,60 0.3915 102 1.28 5.83 0.42 132 0.60 5.08 0.21 85 1.12 3.5517 91 1.68 4.80 0.53 114 0.64 6.59 0.2919 93 1.74 4.91 0.35 121 0.66 3,84 0.1721 58 1.56 4.63 0.34 124 0.62 4.73 0.2024 47 1.85 4.21 0.37 121 0.70 6.42 0.2727 41 1.66 4.63 0.32 130 0.65 6.29 0.25 129 0.72 5.97 0.3030 36 1.75 4.27 0.45 105 0.66 4.35 0.20 108 1.06 3.75 0.3333 39 1.53 4.69 0.56 102 0,84 2.90 0.1436 40 1.83 4.85 0.69 106 0.94 3.07 0.15 131 0.94 5.42 0.2139 58 2.04 5.22 0.45 102 0.98 3,15 0.17 136 0.76 7.34 0.3342 98 1.04 3.14 0.1845 95 1.05 3.90 0.23
The total rare earth element concentrations, TREE values, as given in Table 14, indicate that
the mechanism of REE incorporation could be lithologically dependent4 . The YREE in sediments
is correlated with the depth of the sediment strata. EREEs decrease with increasing distance from
the surface to deeper layers for each sediment core. REE concentrations of 124 glg/g at the
- 182 -

JAERI-Conf 2001-017
surface *in samples taken at sites J-21 and J-19 sediments decreased to 58 and 95 grg/g,
respectively. However, EREE concentrations in sediment taken at site J- 17 showed little
variation. This results reflect'the dominant role of REE at the surface layers and the significant
role of seawater in the contribution of REE to the sediment. It was also observed that at intervals
where Ce/Ce* anomalies increase the corresponding TREEs are found to decrease, Murray et
al[8] reported that REE vary in marine sediments in a consistent fashion that can be directly
related to depositional environment as in the case of the study area.
A comparison on the distribution of REEs in core sediments investigated in this study to those
obtained from average shale and mean crustal materials and SRM Soil 7 was made and are given
in Table 15. Almost all of the average concentrations of REEs determined in this work fall within
the range reported by other workers[34-361 except for Eu which recorded a lower average
concentration of about 0.66±0.14 jig/g but having a good agreement with values found in SRM
Soil 7. This is attributed to the similar conditions existing between this area and those reported by
other workers.[34-36] The Ce/La ratios calculated from the average concentrations in the core
sediment samples gave a value of 1.55 which in this case is almost comparable to those found in
the average shale and crustal materials, indicating the low probability of Ce enrichment due to its
possible reduction to the lower valence state. It also suggests that there were little external inputs,
especially from the effluents of a large oil refining complex situated to the south of Singapore
island due to strong local undercurrents which prevent transport of the effluent around the island
and into the Johore Straits.(Fig. 3) These observations were also reported by Wood et al.[IO]
Table .15. Comparison of the concentrations (glg/g) of REE in core sediments with those inaverage shale and mean crustal materials
Straits of Johore Average shales Mean crustal materials SRM SoiI-7
Element Range Average B, M&M or T&W M&M B SRM
La 6.54 - 73.50 38.52±2.60 24 - 92 30 32 28Ce 24.52 - 77.00 59.89±1.11 50 - 96 60 68 61Sm 1.52- 12.79 7.14±0.48 6,2 6.0 7.9 5.1Eu 0.27 - 0.85 0.64±0.06 1.0 --1.2 1.2 2.1 1.0Tb 0,17 - 0.86 0M66±0,14 ND ND ND 0.6Dy 1.68- 5.22 3.61±0.46 ND ND ND 3.9Yb 0.54- 3.62 2.06±0.18 2.4 0.5 3.3 2.4
B=Bowen (I979)r34j; M&M=Mason and Moore (1982)[35]; T&W=Turekian and Wedepohl (1961)[36J
REEs behaviors were also investigated with correlation between concentrations of Sm and
these elements. Figs. 9, 10 and I 1 show the concentrations of REEs plotted against those of Sm
for sediments of varying depths. Sm was chosen because it is roughly in the middle of the series;
- 183 -
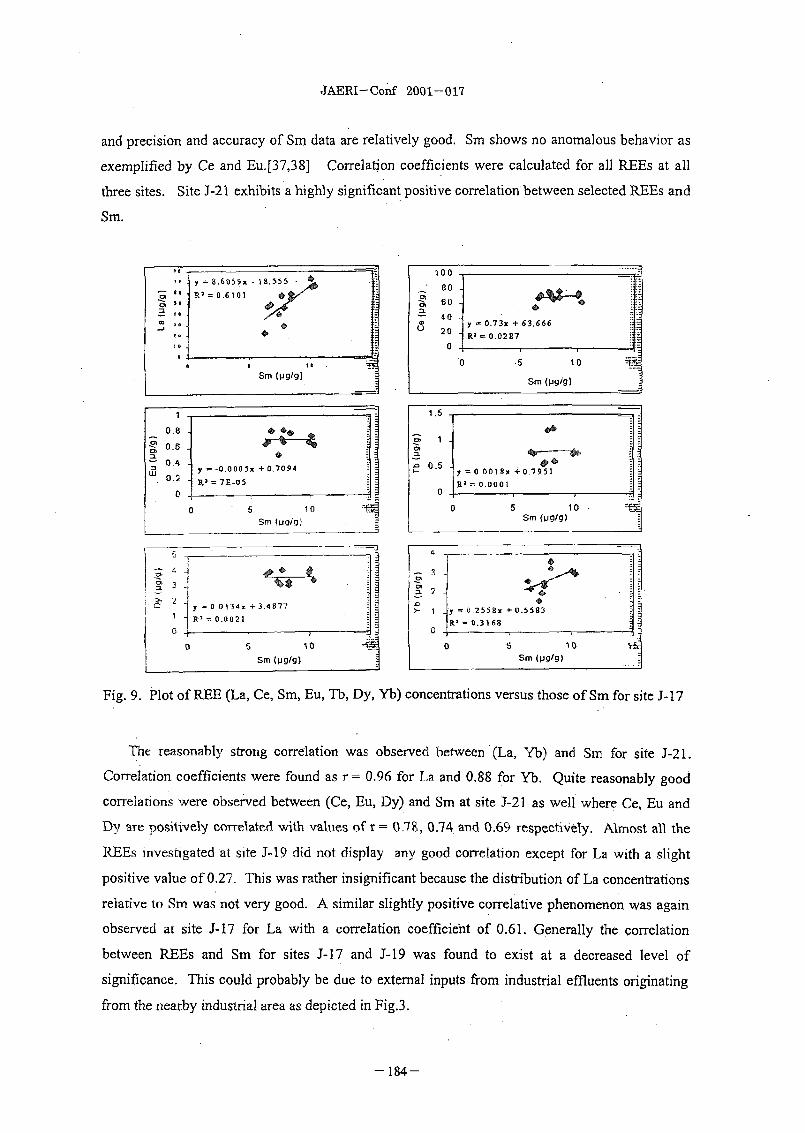
JAERI-Conf 2001-017
and precision and accuracy of Sm data are relatively good. Sm shows no anomalous behavior as
exemplified by Ce and Eu.[37,38] Correlation coefficients were calculated for all REEs at all
three sites. Site J-21 exhibits a highly significant positive correlation between selected REEs and
Sm.
100A, yS - 6 059x - 18.555 - 8d
C.. 4 2~~~~~~~~~~~~~~~~ ]y0.30c e v n y - 0.73x + 63.6662 0 RI e 0.0287 :.
. , -.O-5 10 5 10Sm (pglg) -
1.2.1 -,, 3g50 .6 o
0 -0.0005x + 0.7094 n 0.5 y00018x+0.7951
0. RI= 7E-o5 R= O.OOOi
_______________________00 5 10 0 5 10
t}2y =0 0134ke + 3.4877 .58 0.5533
Fig. 9. * -' ,. 5_ iSm (pgig) Sm (Wgig)
Fg9.Plot of REE (La, Ce, Sm, Eu, Th, Dy, Yb) concentrations versus those of Sm for site 3- 17
The reasonably strong correlation was observed between (La, Yb) and Sm for site J-2 1.
Correlation coefficients were found as r= 0.96 for La and 0.88 for Yb. Quite reasonably good
correlations were observed between (Ce, Eu, Dy) and Sm at site J-21 as well where Ce, Eu and
Dy are positively correlated with values ofT T= 0.78., 0.74 and 0.69 respectively. Almost all the
REEs investigated at site J-19 did not display any good correlation except for La with a slight
positive value of 0.27. This was rather insignificant because the distribution of La concentrations
*relative to Sm. was not very good. *A similar slightly positive correlative phenomenon was again
observed at site J-17 for La with a correlation coefficient of 0.61. Generally the correlation
between REEs and Sm for sites J- 17 and J- 19 was found to exist at a decreased level of
significance. This could probably be due to external inputs from industrial effluents originating
from the nearby industrial area as depicted in Fig.3.
- 184-

JAERI-Conf 2001-017
.80 .=3.7 0 6 7x +9.6.496 _ 80 =0
_ 60 R .' 0.2693 0
°'40 . , ._ 40
g 20 e eO° .- O ~~~~~~~~~2 y =0.2 65 6x + 5 7.t 14 -_j 40-
RI' = 0146 -
0 5 5(J5100
0 5 Sm (pg/9} 10 15 Sm (pg/g) I
.,
U 0.4 = 0023Y +0.6485 1 0 2 0 0 45x +0.6012
R'=0 00 18 R - 0.0032
0 5 l0 3 0 S 10Sm (pg/g)
5 3
- 3
2 y 0 0836w + 1 1078C) y =0.0047x + 3.5054 -> g=003w+117 -1 R' = o~noo4 0 RI-0 1771
0 5 10 1 0 5 10Sm (pg/gM Sm (Pg/g)
Fig.lO. Plot of REE (La, Ct, Sm, Eu, Tb, Dy, Yb) concentrations versus those of Sm for site 3-19
50 80
401 60 ras
3 30
20 0 8
1 7. + 2 2.64kh'
10 3 53469x 0 886W- 2C vt.818
I l ~~~~~~~R=O 0Y58 -1 0.7 1 R'07880 0~~~~~ 5
0.
Sm (pgtg) Sm (pg/g)
02 4 036 .4j- .35
_ _ _ _ _ _ _ _ _ _ _ _ _ _~~~~ I _
0 ~ ~ ~~~~ 0.0806
X +02 04-:0.5.+ T0 oe X -|) f 08 2
1~~~~~~~R t,7 3 63 RI -35
Sm pglg,) SmO (pg/g)
4
a~~~~~~~~~~~~~~~~~~~~
2~~~~~~~~~~
0 O S . t 0 5Sm (pg/g) Sm (pg/9)
Fig.1 1. Plot of REE (La, Ce, Sm, EuIb, Dy, Yb) concentrations versus those of Sm for-site J-21
-185 -

JAERI-Conf 2001-017
The 8 landfill sites chosen, as shown in Fig. 2 were scattered over an area of about 18950
Ia2. All the 8 sites chosen are situated near rivers or streams which have water intake points
somewhere along the length of the waterways. Hence this study is not only looking at the extent
of pollution at water intake points by some trace elements leachates but also quantifying the
dominant metal species present in the soluble toxic form using techniques with high efficiency
and accuracy.
A SRM of Nearshore Seawater used in this study gave a total recovery of >95%, as shown in
Table 16 suggesting good reproducibility in the techniques used. The same method for Se(IV)
extraction and determination by co-precipitation with sodium dibenzyldithiocarbamate-
phenolphthalein (NaDBDTC-Pp) on acidified aqueous solutions prepared from BCSS-2
Nearshore Seawater and MESS-2 Marine Sediment reference materials was employed in another
study with good recoveries for total selenium.[l 7]
Table 16. Percentage recoveries of spiked As(III) and Se(IV) in aqueous solutions and in SRM
Sample Species Concentration in solutions % recoveryor SRM (jig.mL-')
Before After
Spiked water As(III) 1.0000 0.9584 95.84±1.50Spiked water Se(MV) 1.0000 0.9463 94.63±1.30CASS-2 (certified) As(,,,,,) 0.97±0.02 0.93±0.04 96.10±2.75
Table 17. Concentrations of As(Tf) and As(V) in leachates
Location As(III) jtg/L As(V) J.g/L Total As jlgfL pH As(Ifl)/As(V)
1 0.70±0.04 0.83±0.04 1.53±0.04 6.2 0.842 0.69±0.06 0.96±0.02 1.65±0.04 6.8 0.723 0.88±0.06 0.81±0.07 1.69±0.08 7.0 1.094 1.17±0.07 1.19±0.06 2.36±0.04 6.0 0.985 0.80±0.03 0.98±0.04 1.78±0.04 6.0 0.826 1.24±0.04 1.05±0.05 2.29±0.05 6.8 1.187 0.82±0.04 0.84±0.09 1.66±0.06 7.7 0.988 0.56±0.03 0.66±0.06 1.22±0.09 6.6 0.85
-186 -

JAERI-Conf 2001-017
Concentrations from 8 locations of As(III), As(V) and the total inorganic arsenic species
expressed in .tg.L-' or ppb in leachate samples are given in Table 17 while those of Se(IV), Se(VI)
and total inorganic selenium are given in Table I S. Water may be purposely or inadvertently used
as carriers for soluble toxic inorganic arsenic and selenium depending on the source, especially
from landfills located near rivers or streams and which will be loaded with these species after a
heavy down pour. The determination and quantification of these species in water samples taken
from water intake points need to be done to ensure that the treatment of raw water for public
consumption is efficient in the reduction of the level of toxic inorganic species especially arsenic
and selenium species. The pH of leachate samples range from 6.2 to 7.7 which is about the pH of
normal freshwater. The fluctuations in pH in the leachates did not have any significant impact on
the inorganic arsenic or selenium species concentrations.
Table 18. Concentrations of Se(IV) and Se(VI) in leachates
Location Se(IV) pg/L Se(VI) jig/L Total Se itg/L pH Se(IV)/Se(VI)
1 0.71+0.04 0.89±0.04 1.60±0.04 6.2 0.802 0.99±0.06 0(.76±0.02 1.75±0.08 6.8 1.303 1.36±0.14 2.33±0.61 3.69±0.08 7.0 0.584 1.10±0.07 1.34±0.06 2.44±0.08 6.0 0.825 1.03±0.04 0.92±0.08 1.95±0.12 6.0 1.126 1.36±0.14 1,29±0.61 2.65±0.15 6.8 1.057 0.92±0.10 2.05±0.23 2.97±0.34 7.7 0.458 0.63±0.03 0.98±0.13 1.60±0.17 6.6 0.64
All the samples have As(1II) concentrations of more than 0.5 .vg/L. Though the concentration
of total arsenic in most natural water systems are in the range of 10-9 - 104s g/L,[39] the
maximum admissible concentration for inorganic arsenic in public drinking water as
recommended by the World Health Organization (WHO) is 50 ,tg/L.[40] All water samples taken
near the landfill sites have values of total inorganic arsenic of less than 50 jig/L. The highest
concentration recorded was 2.36±0,04 1±g/L. While the total inorganic arsenic species might be
less than the maximum acceptable limit imposed by WHO, EEC and the US[40] guidelines, the
chemical environment could be different, one which is favouring the formation of the more toxic
As(III) species at several sites. The balance between the corresponding existence of As(III) and
As(V) species in water samples could be viewed from the As(III)/As(V) ratio. A ratio value of
more than unity indicates predominantly higher concentration of the more toxic As(III) species.
This could be the significant factor in determining the water quality of rivers used as intake
- 187 -

JAERI-Conf 2001-017
points. For example there are two sites with As(III)/As(V) ratio of more than unity and perhaps
water taken from rivers situated near these sites require special attention during the treatment
process in order to reduce the more toxic As(III) species to reasonable levels before distribution to
the public. Under normal conditions, the As(III) species is a thermodynamically unstable
oxidation state and the expected As(llI)/As(V) would be less than unity. However because of the
continuous discharge of arsenic compounds from the solid wastes dumped in these landfills, and
also because of the anaerobic conditions in the waste pile, more of the As(III) would be preferably
formed thus pushing the As(IIII)/As(V) to more than unity. Several competing biogeochemical
processes taking place in the waste pile under anaerobic conditions could modify the
concentrations of the dissolved ions in leachates giving rise to the concentration of the more toxic
As(III) species.
The corresponding inorganic selenium species in water samples mixed with leachates taken
from the same locations are given in Table 18. The same justification for the variation in Se(IV)
and Se(VI) concentrations could be used to explain the distribution of these species in water
samples taken from nearby streams and rivers at landfill sites. While some locations exhibited
fairly low Se(IV)/Se(VI) ratios (locations 3, 7 and 8) three locations (2, 5 and 6) as shown in Fig.
2, have Se(lV)/Se(VI) of more than unity. Again these variations in Se(IV) and Se(VI)
concentrations could be brought about by the intense contact of groundwater, especially after a
heavy downpour or possibly resident groundwater, with the solid waste high in selenium contents
reacting in different geological environments. Eleazer et al[41] reported an average pH of about
7.5 for the decomposition of organic refuse leaving the by-products in the form of soluble ions,
perhaps metal ions which can easily be washed down into the leachates and consequently into the
groundwater. It was also reported that coated paper, old newsprint, old corrugated containers and
office paper represent 4.2, 6.6, 12.2 and 3.3% of municipal waste respectively and with the high
content in chemicals especially in the treatment of the pulp and coatings, the anaerobic
degradation will contribute to the accummulation of inorganic Se(IV), Se(VI) and other species in
the leachates and with the right amount and flow of groundwater, these species will be washed
down the waterways into streams and rivers. Very low levels of inorganic selenium species, in
the range of 0.02 - 1.0 ng.mL- are normally present in freshwater but the increased concentration
of the lower oxidation state of the Se(IV) species described a different picture in terms of water
quality where these landfills are closely situated. It will have a significant impact on the quality
of the raw water used for public consumption and also on the cost of operation at water treatment
plants. Though the maximum admissible limit for total selenium in drinking water is about
10 ptg.L-'[40] the total inorganic selenium however is much lower.
Basically out of the 8 locations where this study was carried out, most of them showed high
As(IH)/As(V) and Se(IV)/Se(VI) ratios indicating rather abnormal conditions for natural
-188 -

JAERI-Conf 2001-017
groundwaters to exist. Naturally these abnormalities have been traced to sources with
anthrapogenic inputs originating from landfills.
Future Studies
Much of the future studies using research reactors as far as this group is concerned would be
focussed on environmental related areas including monitoring work, assessment of environmental
safety and risk and to a certain extent inter-laboratory exercise. Some work on air pollution
studies and its trend within the Asia Pacific region is under way using TNAA as the main
technique of analysis of elements in the finest air particulate matter (PM 2.5) and also in the
coarser particles complemented with ICP-MS and ion chromatography. The air pollutants will be
collected using a Gent Stack Sampler and softwares such as Chemical Mass Balance - 7 and
Statgraphic will be used for source emission identification.
Further work in the marine environment will be pursued diverting from the usual sediment
analysis to the more general marine materials to be collected within the Straits of Malacca.
Elemental analysis will be performed using normalization procedure to address anthropogenic
contaminants. This study will also attempt to investigate the multiple oxidation state of various
elements such as U, As, Sb, Fe, Mn and Cr within the sediment column profile. Perhaps an
extended application of INAA is the determination of anthropogenic elements in coral rings. The
elemental contents in each ring would correspond to the historical profile of pollution trend within
the study area, And this leads to the question of bio-indicator studies using marine species as the
possible subject to map the pollution trend along the coastal areas. Substantial amount of sample
collection has to be planned to provide enough input for modeling studies to be conducted such as
using the MINTEQA 2 software for water quality studies.
Conclusions
The simplicity of the preconcentration step using a complexing agent such as APCDT as in
the case of the inorganic selenium species determination in aquatic species followed by INAA
have eliminated the problem associated with interfering metallic ions and with sufficient cooling
time after the irradiation (usually two weeks) most of the 264.7 and 136.0 keV photopeaks would
be visible for peak area estimation. This was also true in the speciation studies of inorganic Se in
marine sediments. Some of the intriguing problems in the sample preparations, namely the
dissolution of the sediments with little or minumum loss of the volatiles, have been partly
overcome by using programmed microwave digestion. The problem would not be as demanding
- 189 -

JAERI-Conf 2001-017
if the determination of Se(IV) was done on seawater though some precautionary steps have to be
taken to address the interfering alkali, alkaline earth and halogens.
The efficiency of the separation process in the speciaiton of inorganic As in the water quality
studies of waters from disused tin-mining pools and in drinking water was evaluated using spiked
standards for As(III) and As(V) and the method proved to be useful in low levels arsenic species
determination. Water quality for water samples taken from different aquatic environment was
also examined by assessing the concentrations of dissolved species which was also used as an
indicator of the redox status of the water bodies.
Instrumental neutron activation analysis (INAA) is used because of its sensitivity for multi-
elemental non-destructive analysis to address the quantitative aspect of the trace elements
contents in samples used in various studies. By using charcoal derived from agricultural waste
material, a study on the speciation of iodine was possible and the use of INAA further
complemented the quantitative analysis.
References
1. J. E. LOVELOCK, R. J. MAGGS, R. J. WADE, (1973) Nature, 241, 194.
2. V. W. TRUESDALE, (1978) Mar.Chem., 6, 1.
3. V. W. TlRUESDALE, C. P. SPENCER, (1974) Mar.Chem., 2,33.
4. A. YASUHARA, (1995) Toxicol.Environ.Chem., 51, 113-120.
5. R. W. MURRAY, T. B. M. BUCHHOLTZ, D. C. GERLACH, G. PRICE RUSS III, D. L.
JONES, (1991) Geochim.Cosmochim.Acta, 55, 1875-1895.
6. G. Th. KLAVER , T. C. E. VAN WEERING, (1993) Marine Geology, 111, 345-359.
7. V. C. CRESPI, N. GENOVA, L. TOSITTI, 0. TUBERINI, G. BETTOLl , M. ODDONE,
S. MELONI, A. BERZERO, (1993) J. Radioanal. Nucl. Chem., Articles, 168, No.1, 107-
114.
8. R. W. MURRAY, T. B. M. BUCHIIHOLTZ, D. L. JONES, D. C. GERLACH, G. PRICE
RUSS 1I, (1990) Geology, 18, 268-271.
9. E. R. SHOLKOVITZ, (1990) Chem.Geol., 88, 333-347.
10. A. K. H. WOOD, Z. AHMAD, N. A. M. SHAZILI, R. YAAKOB, R. CARPENTER,
(1997) Continental Shelf Research. 17, No.10, 1207-1228.
11. J. M. LO, J. C. YUJ, F. I. HUTCHINSON, and C. M. WAI, (1982). Anal.Chem., 54, 2536-
2541.
12. A. M. YUSOF, M. MvISNI, A. K. H. WOOD, (1997) J. Radioanal.Nucl. Chem. 216, No.1
59-63.
-190-

JAERI-Conf 2001-017
13. A. M. YUSOF, Z. B. IKHSAN, A. K. H. WOOD, (1994) J.Radioanal.Nucl.Chem., 179,
No.2, 277.
14. H. M. KINGSTON, I. L. BARNES, T. J. BRADY, T. C. RAINS, M. A. CHAMPS, (1978)
Anal.Chem., 50, 2064.
15. A. HUSSAIN, S. Y. UI, (1993) Proc.Malaysian Sci.Tech.Congress, Vol. 1, 188.
16. A. M. YUSOF, N. A. RAHMAN and A. K. H. WOOD, (1994). Biological Trace Element
Research, 43, 2.
17. A. M. YUJSOF, Z. HANAFIAH and A. K. H. WOOD, (1998). The Sci.of the Tot.Environ.
214, 247-252.
18. R. E. STURGEON, S. N. WILLIE, S. S. BERMAN, (1985) Anal. Chem., 57, 6.
19. Y. SAKAI. K. TOMURA, K. OHSHITA., (1994) J. Radioanal.Nucl.Chem., 187, 441.
20. K. S. SUBRAMANIAM, J. C. MERANGER, R. F. McCURDY, (1984) Atomic
Spectroscopy, 5(4), 192-194.
21. K. H. WEDEPOHL, S. W. STEARNS., (1994) Env.Science and Technology, 28(3), 534-
537.
22. M. 0. ANDREAE, (1986) Organometallic compounds in the environment: Principles and
reactions. In: P. J. Craig (Ed.). Organoarsenic Compounds in the Environment. John Wiley
and Sons, New York.
23. J. R. W. WOITTIEZ, H. A. van der SLOOT, G. D. WALS, B. J. T.
NIEUWENDIJK, J. ZONDERHUIS, (1991) Marine Chemistry, 34, 247.
24. S. MUKHERJEE, S. BHATLACHAY, (1974) J.Phys.Chem., 2, 1725.
25. S. E. MANAHAN, Fundamentals of Environmental Chemistry, (1993) Lewis
Publishers, Michigan, U.S.A. pp394.
26. D. HOEDE, J. WIJKSTRA, van der SLOOT, (1987) Netherlands Energy Research
Foundation Rep.ECN-203, 231.
27. A. I. SALEH, J. R. W. WOITTIEZ, G. D. WALS, H. A. DAS, (1990)
J.Radioanal.Nucl.Chem., 140(2), 357.
28. H. R. LINDER, H. D. SELTNER, B. SCHREIBER, (1978) Analytical Chemistry, 50(7),
896.
29. M. G. COBO, M. A. PALACIOS, C. CAMARA, F. REIS, P. H. QUEVAUVILLER, (1994)
Anal.Chim.Acta 286, 371.
30. J. GLOVER, 0. LEVANDER, J. PARIZEK, V. VOUK, (1979) Handbook on the
Toxicology of Metals, Elsevier, Amsterdam, p555.
31. S. M. WORKMAN, P. N. SOLTANPOUR, (1980) Soil Sci.Soc.Am.J., 44, 1331.
32. H. J. W. De BAAR, M. P. BACON, P. G. BREWER, (1985) Geochim.Cosmochim.Acta,
49, 1943-1959.
- 191 -

JAERI-Conf 2001-017
33. E. R. SHOLKOVITZ, (1988) Am.J.Sci., 288, 236-281.
34. H. J. M. BOWEN, (1979) "Environmental Chemistry of Elements", Academic Press,
London, pp 333.
35. B. MASON, C. B. MOORE, (1982) "Principles of Geochemistry", 4h. edn. J. Wiley and
Sons, New York, pp 344.
36. K. K. TUREKIAN, K. H. WEDEPOHL, (1961) Bulletin of the Geological Society of
America, 72, 925-965.
37. A. MATSUDA, Y. MATSUI, (1966) Geochim.Cosmochim.Acta. 30, 239-250.
38. K. TOYODA, Y. NAKAMURA, A. MASUDA, (1990) Geochim. Cosmochim.Acta, 54
1093-1103.
39. W. M. MOK, N. K. SHAH,. AND C. M. WAI, (1986). Anal.Chem., 58: 110-113.
40. I. M. SAYRE, (1988). J.Amn.Water Works Assoc., 80(2): 53-59.
41. W. E. ELEAZER, W. S. ODLE, Y. S. WANG, M. A. BARLAZ, (1997)
Environ.Sci.Technol. 31, 911-917.
-192-

JP02501 02JAERI-Conf 2001-017
1.18 Utilization of NAA in Thailand
Chastbongkoch Srinyawach
Office of Atomic Energy for Peace
Bangkok 10900, Thailand
ABSTRACT
Although it is more than sixty years old Neutron
Activation Analysis (NAA) is still widely used and continues to develop
all over the world. Up to now, no other new analytical methods have
been able to replace it for some applications. In Thailand ,NAA is
avery popular nuclear technique for analysis of Trace elements in
various samples and various fields by using the Thai Research
Reactor-1/modification-1( TRR-1/M-1 ) as following: 1. Geological
field, 2.Environmental field 13.Biological field, 4.industrial field and 5.
Training and Technology Transfer
- 193 -

JAERI-Conf 2001-017
Introduction
The Office of Atomic Energy for Peace (OAEP) was established
after the worldwar 1i under the program of "Atoms for Peace"
proposed by the United States of America (USA) to the United Nation
(UN): the program aimed to promote the peaceful use of atomic
energy for the benefit of humankind and to discourage nations from
obtaining or building destructive weapons.
On October ,27,1962 , The operation of the Thai Research
Reactor to the criticallity was successful. The Thai Research Reactor-
I /modification-l(TRR-1/M-1) is a light water reactor (TRIGA MARK
IIl)which has a power of 2 MW steady state and could be increased to
2,000 MW in pulsing state. The maximum nuetron flux at 1 MW is
approximately 1O' n/cm2/sec.. The TRR-1/M-1 utilization has been
achieved in many area :e. isotope production , research in the field of
chemistry, reactor characteristic studies and physics experiments,
personnel training in reactor operation, industry and economy serving.
All of these are Neutron Activation Technique.
Irradiation facilities
The TRR-1/M-1 has 7 facilities depending on the purpose of the
activities as following:
1. In- core pneumatic transfer system
2. Out-core pneumatic transfer system
3. Rotary specimen rack system
4. Accessory tubes facility
-194-

JAERI-Conf 2001-017
5. Cadmium accessory tubes facility
6. Thermal column facility
7. Wet tubes facility
1Ur core PneumaticTransf s
This facility is used for producing the very short-lived
radioisotopes . The specimen will be conveyed to and from reactor
core, The major components as following:
- specimen capsule (rabbit)
- blower and filter assembly
- valve assembly
- terminus assembly
- receive-sender assembly
- control assembly
- specimen transfer box ( optimal)
The system is controlled from the receiving area and may be
operated either manually or automatically with an electric timing
device in corporate into the system so that the specimen capsule is
ejected automatically from the core from predetermined time span, A
solinoid-operated valve controls the air flow . The system operates on
a pressure differential drawing the specimen capsule into and out of
the core by vacuum. Tnus, the system is always under a negative
pressure , so that any leakage is always into the tubing system. All
the air from the pneumatic is passed through a filter before it is
discharged or recycled back through the system. The thermal neutron013 11M2
flux are 0.9-2.9x10 n/cm /sec.and the epithermal flux are 3.1x10 -
- 195 -

JAERI-Conf 2001-017
1.3x10¹² n/cm2 /sec. The very small amount of sample and very short-
lived radionuclides approved for this facility.
2.Out-core Pneumatic Transfer system
This facility cannot be used now because of the coorosive
damage inside of the tubes.
3.Rotarv Specimen Rack system (RSR)
There are 41 holes irradiation by this facility . The intermediate
and long-lived radionuclides can be produced. The thermal neutron
flux is approximately 3.1-3.5x10 2/sec, and the epithermal flux
is 6.9-8.8x10¹⁰ n/cm2/sec.
4.Accessory tube facility
There are 2 tubes ( Al,A4) in this facility and similar to the RSR
for producing the intermediate and long -lived radionuclides and for
the elements which have a thermal neutron cross-section better than
epithermal neutron cross- section. The thermal flux are approximately
2.4x I10, 3.5x10 n/cm /sec. and epithermal flux are 5.4x10⁸ /C 2
77.9x10 n/cm /sec..
5.Cadmium accessory tubes falty
This facility has 2 cadmium covered tubes ( CA2, CA3 ) and
suitable for the irradiation of the resonance neutron active elements
which produce the intermediate or long-lived radionuclides . there are
only epithermal and fast neutron which have a epithermal flux in CA29 C 2/ 9 CM2/
2.2X10 n/cm /sec. and in CA3 1.2X10 n/cm /sec.
-196-

JAERI-Conf 2001-017
6.Thermal column facility
The core was moved to the center of the pool. This facility was
temporarily neglected.
7.Wet tubes failit
This facility has 5 big tubes (Pl-5)diameter are about 4 inches
and 8 small tubes (Wi-8) diameter are about 2 inches. The big ones
were established for topaz irradiation which have the approximately
thermal flux 2.0-3.9x10 n/C 2/sec.. Small tubes were established
for biological samples irradiation which have a long time loading . The
thermal and epithermal flux are 0.45-0.55x10 n/cm /sec and 0.45-
0.55x1 012 n/cm2/sec.respectively.
Previous and Current status of NAA in Thailand
The utilization of NAA for studying on determination of multi elements
in various samples have been carried out for many years at OAEP.
Up to now such analytical technique has still been performed an
important role on many researches and application works of OAEP.
The following is a summary of these applications.
-197 -

JAERI-Conf 2001-017
4-o-X 'C.o
E7 Co irS
a)
> Z
a~F- S , C z
0-~~~~~~~~0
~~ ^s SC)<w(1)
_ 4a' a)
- 19 -)
C/)~o~Cl) o~~~U)c:E
w L-0• I W
Cl) a'~~~~~~~~~~wC)U - T
_~~~~~~~~~~~~~~<~C co
< C 2 < '
I ~~~~~~~~~~ -0~~~~~~~- Co o C -~~~~~~~~~~~~~~~~~C CD
4-4
o a'U) 4-C
o C u
LL Cc A
(9 C
Lii
-198-

JAERI-Conf 2001-017
aD
4- .) * ° )
~~~) a~;- > E --U) - ) w 0
o n o D -0 o o
ai) a ca, _0 E<
w CU ~ ~ C ) CL) 0 ci
z
z ~~CU
4--~ODa
t~I V C-
C) C/)
K ~ ~~_
C/)
199 -

Biological Vegetable BrAs,Hg, RNAA
Blood, Mn,CuZn,Fe,Mo, RNAA
Body fluids Cu RNAA
Gallstone P,Ca,Mg,Na,Zn, INAA,RNAA
Ag,Se
Urine, P RNAA
Rice, N RNAA
Fish, U,Br, Co,Zn,Hg INAA,RNAA
Teak, Au RNAA
Human hair Hg RNAA

JAERI-Conf 2001-017
X _ X
a)~
LL E n
0 °UXo 3 No
2 a_- CZ 0CU 0)0
E: U) 0) L
mU 0
o W eU =
_0 w m 0 U) u CU
V0 >1
4- cm~~ 4-
_0 'E~~0
H-

JAERI-Conf 2001-017
Future Utilization Plan of NAA in Thailand
Some activities as mention above are still continued
Especially ,for the environmental field, rainwater and the
food stuff are the interesting materials for the future
projects.
- 202 -

JP02501 03JAERI-Conf 2001-017
1.19 NEUTRON ACTIVATION ANALYSISAT THE DALAT NUCLEAR RESEARCH RACTOR
NGUYEN VAN MINHNuclear Research Institute, Dalat, Vietnam
INTRODUCTION
Neutron Activation Analysis (NAA) 'is one of the most sensitive, rapid,accurate methods for determination of major, minor and trace elements indifferent materials. This method is playing an important role of nuclear and non-- nuclear analytical methods, which are being carried out at Dalat NuclearResearch Institute (DNRI). A Review is made of current status of the activitiesand the results in studying and developing NAA at DNRI and applying thismethod to different sectors of science and technology in Vietnam.
I. The irradiation facilities and their characteristics for NAA
The Dalat Nuclear Research Reactor, former TRIGA Mark II reactor, wasbuilt in 1963 with thermal power of 250 kW. It was reconstructed and upgradedin 1984 with the power of 500 kW.
The Dalat Nuclear Research Reactor has two dry channels (7-1, 13-2), athermal column and one wet channel (1-4). Inside of the reactor there are aneutron trap and a rotary specimen rack in the graphite reflector consisting of 40irradiation positions.
Since 1984 the reactor has been operated mainly in continuous runs of 100hours one every 4 weeks for radioisotope production, neutron activation analysisand other related studies. In the neutron activation analysis we have carried outthe following methods: Instrumental Neutron Activation Analysis (INAA),Radiochemical Neutron Activation Analysis (RNAA), Ko - standardizationmethod (Ko-NAA) and Prompt Gamma Neutron Activation Analysis (PGNAA).
- 203 -

JAERI-Conf 2001-017
The characteristics and the parameters of neutron spectrum for activationAnalysis of Dalat nuclear research reactor are shown in Table 1.
Table 1: Irradiation facilities and their characteristic parameters of Dalat reactor
Irradiation positions *'hermal Average Noteneutron flux Rcd
.___ __ __ __ __ _ (n. c 2 ) V alue
Neutron trap 2.21 x 10³ 2.93 Wet channel with berylliummoderator, diameter: 64 mm,length: 600 mm for RI and NAA
Rotary Specimen 4.27 x 10¹² 3.0 40 irradiation holes, diameterRack 40 mm, length: 30 mnm for NAA
and RI-Channel 1 - 4 1.28 x I013 Wet channel, diameter: 32
mm; length: 600 mrnm for NAAand RI
Channel 7 -1 4.5 x 10'" 2.1 Dry channel with pneumatic____ ____ ____ ____ .____ _ _ _transfer system for NAA
Channel 13 - 2 4.6 x 10 2 2.2 Dry channel with pneumatictransfer system for NAA
Thermal column 5.5 x 10⁹ 1.94 Dry channel with pneumatictransfer system for NAA
Horizontal 2.3 x 10⁶ For PGNAA(tangential) beamtube No-3
II. Development of methodology for NAA at NIRISince neutron will activate almost all the elements present in the sample
by different nuclear reactions. The activation techniques are developed at DNRIin more than fifteen last years such as INAA, RNAA. Besides, the othertechniques have also been established and studied such as Ko - standardizationmethod and the prompt gamma neutron activation analysis (PGNAA).
- 204 -

JAERI-Conf 2001-017
11.1. Instrumental Neutron Activation Analysis (INAA) [1]Advantages of INAA technique are non-destructive, reduction of the time
and well suited for on line analysis.For determination of elements which have short live radionuclides, in the
few past years we developed capacity for analyzing of samples includingestablishment of facilities for rapid INAA by using the pneumatic transfer
systems of the channels 13-2, 7-1 and thermal column. The samples areirradiated in these channels for from 3 seconds to 30 mIn and after appropriate
cooling time the samples are directly measured on the HPGe detector.
For determination of elements which have long live radionuclides, theirradiation process of the samples is carried out in the rotary specimen rack or atneutron trap.
The irradiation time depends on characteristics of the nuclide of elementsand the sample to be analyzed.
11.2. Radiochemical Neutron Activation Analysis (RNAA)The need for chemical separation in activation analysis arises from the
peculiar characteristics of gamma ray spectrum. There are counts from zero tofull energy peak of a gamma ray instead of the peak alone. This gives rise acontinuous base line and other peaks in this energy range and lead tointerference with the detection and measurement of other peaks of low energy.Thus radiochermical separation have remained an integral part of activationanalysis even after the introduction of high-resolution detector.
Techniques of separation in NAA
The choice of the techniques for a chemical separation depends on anumber of factors such as the elements to be separated, time available for theseparation and the extent of decontamination required. The techniques ofseparation in RNAA. at DNRI have been developed such as precipitationchromatography, extraction, ion exchange, etc. for the individual or groups ofelements in different samples. The inorganic or organic compounds such as
MnO2 , SnO2 , ZrPO4 , SBW, AG xl-8, Dowex 50, HAP... have been studied fortheir possible use in radiocheMnical separation.
The pre-concentration chemical separation in NAA for determination ofthe trace elements can be carried out before or after irradiation of the samples.
- 205 -

JAERI-Conf 2001-017
The RNAA techniques for determination of trace elements in different
materials at DNRI are summarized in Table 2
Table 2: Summary of radio-chemical separation techniques in RNAA at DNRI
Matrix (elements analyzed) Sample opening Separation techniques
Rock sample (REE) Fusing with Na2O2 Anion ex.chromat (NO03 )in methanol - nitric
mediumRock sample (Ga, Cu, Co, HF-HN0 3 treatment Anion ex.chromat. (Cl),
Cd, Fe, Mn) elution with different
gradient concent. of HCl
Rock sample (Ag) Fusing with Na2 O2 Filter through the PbCI
filter in 4N HN03
Rock sample (W, Mo, Sn, HF-HN0 3 treatment MnO 2 sorp. in 1M HC104
Th)
Environmental sample HF-HNO3 treatment HAP sodium removal;
(about 20 elements) anion ex. elution (CL)
Water sample (Hg, Cd, Sb, Scavenging on active
Cu, Mn ...) carbon of chelat complex
of dithiz. with ion ofelements
Water sample (As) Co-precipitate with
Fe(OH)3
Biological samples (about H 2 S0 4 - H 20 2 Anion ex.chromat. (Cl)
30 elements) Cation ex.chromat. using
citrat, EDTA, KSCN
Rock sample (Au) Hf-HNO3 treatment Concentration on. anion
ex.chromat. (Cl-) in 4N
HN03Soil sample (about 30 HF-HN0 3 treatment Anion ex. (Cl-); cation, in
elements) ex. chromat; extractionwith TBP, DDC CCl4
- 206 -

JAERI-Conf 2001-017
III. Typical results and application of NAA at DNRIIII.1. Application of NAA in geochemistry
Application of NAA in geological and geochemical study has played avery important role in our country. In combination with Vietnamese geologists,every year thousands samples of rocks and minerals have been determined. TheDNRIs directions for the application of NAA to geochemistry at present arefollowing:
L) The investigation of the distribution of rare earth elements (REE) insome minerals such as monazite and zircon in beach sand to get the informationabout the relation between monazite and zircon and their origin [2].
+) Determination of noble metals such as Au, Ag, Pt [6, 7].+) Determination of Uranium, Thorium and the related elements.+) Determination of trace elements and heavy metals[8].+) Determination of major and minor elements.Etc.
Table 3. Results of analysis for geological samples from 1986 to Oct. 2000 [3]
Year Number of samples1986 1001987 2001988 4901989 24001990 26001991 27001992 33001993 9501994 8341995 9271996 8211997 976
1998 7731999 11202000 897
-207 -

JAERI-Conf 2001-017
III.2. Application of NAA in environmental research [4, 5]Results obtained of the application of NAA to environmental research at
DNRI recently are focused on:1. The concentration of toxic elements and radio nuclides in
environmental objects in different areas of Vietnam.2. Supporting the sustainable development of agriculture and improving
the quality of human life;3. Investigation of environmental pollution by heavy metals and other
toxic elements corming from industrial manufacturing and development. Thesamples of soil, water, plant, aerosol have been collected indifferent areas ofVietnam for determination of toxic elements and radio nuclides.
Some results of aerosol and water samples at environmental monitoringstations and lakes in Dalat, Nha trang and HCM City are given in Tables 4, 5and 6.
Table 4. Element composition of aerosol collected in Dalat and Ho Chi MinhCity, determination by NAA and related method
Element Concentration range Element Concentration range(n gg 3 ) (ng/m3)
Al 1200- 7200 320 - 880Ba 12- 40 Mn 24- 64Br 10- 18 Na 450- 1150Ca 1600- 5600 Nd 0.6- 2.2Cd -0.004 - 0.030 Sb 800- 4400Ce 1.6- 4.2 Sc 4- 44Cl 1000- 1200 Se 0.3 - 0.8Co 0.5- 1.5 Sm 0.02- 0.06Cu 0.8 - 6.8 Ta 0.04- 0.10Fe 160- 40000 Tb 0.02- 0.06Hf 0.08 - 0.35 Ti 160 - 400Hoa 0.004- 0.04 U 0.06- 0.20
I 0.3 -0.4 V 8 -42K 600 - 2200 Yb 0.024- 0.092
- 208 -

JAERI-Conf 2001-017
Table 5. Composition of heavy metals in fresh water of Dalat, determination by
RNAA and related method (1tg/l)
Sample. Pb Cd Cu Zn As Ha
Suoi-vang Lake 6.33 0.94 7.16 12.8 2.64 1.22
Tuyen -lam Lake 10.6 1.41 5.75 22.1 3.95 0.98
Chien -thang Lake 10.8 0.86 7.50 12.8 5.60 1.66
Ta -in stream 15.3 1.65 9.95 12.5 6.90 1.22
VN. Standard (1995) 50 10 100 1000 50 2
Inter. Standard (1963) 50 10 1000 5000 50 -
Table 6. Composition of heavy metals in seawater of Nha trang, determination
by RNAA and related method (.tg/l)
Element Drying season Raining season
As 3.9 2.5
Co 5.3 7.1
Cu 3.1 3.1
Fe 13415 13651
IvMn 258 288
Pb 0.9 0.4
II.3. Application of NAA in biologyWe use NAA method to analyze the heavy - toxic metals; radio nuclides
and trace elements in biological materials for investigation of their distribution
in plants, foods, foodstuffs... such as U, Th, Cs, Sr, Hg and Hg(methyl) in human
urine and hair of women living in different areas of Vietnam [5]. The maindirections of application of this method in present and future at DNRI are:
- Determination and assessment of the nutritional roles of microelements
in agriculture plants growing in different kinds of soil.- Determination and assessment of the concentration and distribution of
elements in food used for feeding domestic animals and livestock.- Quality control for heavy and toxic metals in foodstuffs including
products for export.
- 209 -

JAERI-Conf 2001-017
IV. ConclusionsAfter more than 15 years of NAA activities by using Dalat reactor, it has
seen that this method has a very important role to- study and apply for
determination elemental compounds in geo - bio - environmental samples.
Every year we have analyzed thousands samples for different sectors of science
and technology in Vietnam.
For the further achievements in the development and application of NAA,
DNRI wishes to strengthen the co-corporation with other Institutions in theregion as following problems:
- To introduce and implement the new NAA techniques and procedures in
the practice (RNAA, INAA, PGNAA).
- To exchange the experience in the applications of NAA in differentfields of science such as geochemistry, environmental, biology, purity materialsetc. by scientific visits, training courses and workshops.
References[1]. N.T.Anh: Report on investigation and development of nuclear analytical
techniques in 1997 at Nuclear Physics Department, NRI.
[2]. N. V. Suc, N.M. Sinh: Determination of REE in Vietnamese monazite
samples by RNAA. J. Radioanal.Nucl.Chem. Letters 164 (5) 321-325 (1992).[3]. N. Q. Hien, N, V. Minh, C. M. Khoa, L. Hai: Brief review of research anddevelopment activities in radiochemistry, NAA and radiation chemistry at NRI;
J. of Chemistry, T.35, No-3b, 59-63, 1997.
[4]. L.T. Mua, N.N. Tuan, N.M. Sinh: Determination of nutrient and toxicelements in seafood by RNAA method. J~of Chemistry, T.33, No-4, 66-69, 1995.
[53. N.V. Hung, N.V. Suc, N.V. Minh: Determriination of the iodine in human
urine by neutron activation. Jour. of Chemistry, T.33, No-4, 74-76,1995.[6]. N.V. Minh, N.V. Suc: Determination of Au, Ag and Pt in geological samples
by NAA technique. Journal of Chemistry, T.33, No-3,39-40,1995-[7]. N.V. Minh, N.V. Suc: The fast determination of Ag in geological samples by
NAA. J. of Chemistry, T.34, No-1,39-40,1996.[8]. N.V. Minh: Study of optimal conditions for simultaneous determination of
Zn and Cd in geological samples by RNAA. J. of Chemistry, T.33, No-1, 1996.
-210 -

JP02501 04JAERI-Conf 2001-017
1.20 NAA Supporting system of JAERI
F. SASAJIMA, H. SAWAHATA*', K. ONIZAWA* 2, S. ICHIMURA
A. OHTOMO, Y. HORIGUCHI, Y. ITO*', M. TAKAYANAGI
Department of Research Reactor
Japan Atomic Energy Research Institute (JAERI)
2-4 Shirane, Shirakata, Tokai-mura, Ibaraki-ken 319-1195, JAPAN
* The University of Tokyo, Research Center for Nuclear Science and Technology
*2 Radiation Application Development Association
ABSTRACT
Neutron Activation Analysis (NAA) has been performing as a major part of irradiation utilization at
research reactor in JAERI. To carry out NAA in the reactor, researchers have been required to be
versed in advanced technique also being enough experienced at same time, therefore, we started to
develop a support system that will enable to carry out NAA easily even by a beginner. NAA
supporting system is the system in which even the user who has not much experience in the NAA can
conveniently and accurately carry out the multi-element analysis of the sample. We carried out
verification test of this system using irradiation device, measuring device, automatic sample changer
and analyzer equipped in the JRR-3M PN-3 facility, and analysis software KAYZERO/SOLCOI based
on the k, method. With these equipments, calibration of the germanium detector, measurement of the
parameter of the irradiation field and analysis of three kinds of environmental standard sample were
carried out. The ko method adopted in this system is primarily utilized in Europe recently, and it is the
analysis method, which can conveniently and accurately carried out the multi element analysis of the
sample without requiring individual comparison standard sample. By this system, total 28 elements
were determined quantitatively, and 16 elements with the value guaranteed as analytical data of the
NIST (National Institute of Standards and Technology) environment standard sample were analyzed
in the accuracy within 15%(max.).
Keyword: Neutron Activation Analysis, JRR-3M, PN-3, INAA, ko, Support, System
-211-

JAERI-Conf 2001-017
INTRODUCTION
For joint use of JRR-3M, INAA support system is applied to the PN-3 facility. This system was
automates the operating procedure of irradiation, measurements, analysis, etc. as much as possible,
and it would enable to use INAA conveniently even by beginners. As an analysis method, the ko
method which does not require individual standard reference material is applied in order to obtain the
fixed quantity of the elements easily.
INAA SUPPORTING SYSTEM
1. Irradiation facility
JRR-3M is a light water moderated and cooled swimming pool type reactor, operating with
maximum thermal power of 20MW. The reactor is operated on 5weeks/lcycle, with about 26
continuous days at full power operation followed by 9 days for maintenance and refueling. There are a
lot of experimental facilities in JRR-3M, as shown in Figure 1, involving 9 vertical holes installed, for
irradiation usage in the core and heavy water tank region and 9 horizontal tubes for neutron beam
experiments. The PN-3 facility for the irradiation of INAA is installed in the D20 tank region.
1.1 Irradiation holeThe PN-3 facility provides well-thermalized neutrons with (Dth=2xl 0 3(n/cm 2s), cDf=IlxIO 9(n/cm 2s),
RCd#300. Homogeneity of the thermal flux in the facility is less than 1%. An irradiation' rabbit for the
PN-3 facility, which is made of polyethyilene, has the dimension of 17mm diam. and 30mm long. The
specifications of the irradiation hole are shown in Table 1.
1.2 Irradiation device
The irradiation device is composed of PN-3 irradiation tube, automatic rabbit loader, remover,
solenoid valve and control equipment using sequencer, etc. The device has 3 operating modes; the
automatic, semiautomatic and manual modes. The automatic operation can control a series of
processes from irradiation to measurement at preset sample conditions. This mode suites to the
process for a group of samples at the same conditions. The semiautomatic operation is used when
conditions to be.carried out for each sample are different individually. The manual mode is used only
to operate by some skilled operators, particularly for the recovery when minor troubles occur in the
device. The PN-3 facility allows the irradiation times of 3s up to 1200s. For short-lived nuclides, the
sample in the rabbit must be off from the core within about 7s, followed by quickly measuring with
the sample encapsulated. If necessary, it is also possible to repeatedly irradiate the same sample. On
processing, necessary information can be collected, e.g. irradiation start date/time, irradiation finish
-212-

JAERI-Conf 2001-017
time, exposure time, measurement start date/time, output of neutron detector, etc. PN-3 irradiation
device is shown in Photo 1.
2. Measuring system
2.1 Gamma-ray spectroscopy system
The system has 2 Gamma-ray spectrometers; one for short-lived nuclide and the other for normal
measurements. The former spectrometer for short-lived is for immediate measurement after irradiation.
For the later case, samples are measured by replacing from the rabbit into polyethylene bag,
subsequently setting them on the shelf. Especially, it has been composed of the Gamma-ray
spectrometer using DSP(digital signal processor) that is latest measurement equipment in proportion
to the measurement of high count rate such as short-lived nuclide. The block diagram of the Gamma-
ray spectroscopy system is shown in Figure 2.
2.2 Automatic sample changer
The automatic sample changer is composed of leads shield (1Ocm), 5 axis arm robot, controllers,
sequencers, gravimeters for liquid nitrogen, etc. Up to 100 samples can be set into the changer. The
changer has random sample accessibility and allows placing the sample at a measurement position.
The sample-to-detector distance (Omm-300mm) is variable at 10mm intervals. Photograph of the
automatic sample changer is shown in Photo 2.
2.3 Gamma-ray spectrum analysis software
Software GENIE-2000( 4) for the spectrum analysis is a commercially available package running on
personal computers under Microsoft Windows NT/95. Multi-user environment by ETHENET is
available, enabling the data analysis and monitor through the network.
3. Data analysis system
The data analysis system is calculated for quantitative analysis by ko method or relative method,
after the analysis sample is measured Irradiation and measurement data necessary for the data
analysis can be automatically received from INAA support system. As an analysis method of INAA, it
is carried out based on the convenient and accurately procedure of the k, method. In this system, it is
analyzed using evaluated marketing software SAMPO-90 5 ), KAYZERO/SOLCOI. Flowchart of
INAA support system is shown in Figure 3.
3.1 Peak analysis
The peak analysis needs SAMPO-90 spectral format and analytical result used in the
KAYZERO/SOLCOI. Therefore it is used after conversion of the gamma-ray spectrum into the type
of data, which can be read in KAYZERO/SOLCOI. And, conversion software in proportion to several
-213 -

JAERI-Conf 2001-017
kinds binary file is prepared in order to convert the gamma-ray spectrum type.
3.2 Calibration of the Ge detector by SOLCOI
The SOLCOI determines effective solid angles and coincidence correction factors. Since accuracy
of a detector is indispensable for ko method, a detector must be accurately calibrated beforehand for
general users.
3.3 Calculation of the reactor parameter
The reactor parameter is a coefficient for correcting neutron spectrum of reactor, and it is shown in
the thermal-to-epithermal neutron flux ratio (f) and the slope of l/E distribution (cc). These parameters
(f, a) must be also measured beforehand for general users.
3.4 Analysis
KAYZERO software, which performs qualitative/quantitative analysis based on the k0 method in
this system, provides a list of concentrations and/or detection limits of all measurable elements.
However, there are some difficulties in transporting analysis results automatically to KAYZERO from
INAA support system, which runs under DOS. As a solution of this problem, original software, which
will perform analysis automatically by k, method, will be prepared.
3.5 Analytical database
Analytical databases are that it accumulates data such as analysis condition, result of analysis,
gamma-ray spectrum got by this system. And does the data base construction which faces every
analysis sample. It will be improved bl order to conjugate as a reference for deciding beginners or
analysis conditions of the inexperience sample, etc.
EVALUATION
As verifying performance of the analyzing system, its accuracy and confidence were confirmed
analysis on SRM-1633b (Coal Fly Ash) 1577b (Bovine Liver) 'SRM-1515 (Apple Leaves)
environmental standard reference by NIST. The samples were irradiated for 30 sec and 20 min at the
bottom position of JRR-3M PN-3 facility, and then their radioactivity were measured by calibrated
system. Fig. 4 - 6 show the results of each sample analyzed with the ko method. In the present study,
28 elements in the 3 samples could be quantitatively analyzed by the system, especially we found out
that almost of the elements could be done within approximately 10 % accuracy except for few
elements of outermost 15 %.
- 214 -

JAERI-Conf 2001-017
FURTHER DEVELOPMENT
It is understood that the improvement of INAA support system based on the k0 method is
convenient instruments for the NAA users. An attempt to apply the support system to the PN-3
facility in JRR-3M of JAERI has been made at present, and its application for JRR-4 will be done in
future. Further development and improvement of this system will be preceded in order to utilize NAA
more conveniently and accurately.
REFERENCES
(1) KAYZERO/SOLCOI User's Manual, DSM Research (1996)
(2) F. DE. CORTE and A. SIMONITS,'VADE MECUM FOR ko-USERS (1994)
(3) F. DE CORTE, "The ko Standardization Method", Rijksuniversiteit Gent (1987)
(4) Genie-2000 Spectroscopy System/Operations, Canberra Industries, (1997)
(5) SAMPO 90 User's Manual, Canberra Industries, (1991)
-215-

JAERI-Conf 2001-017
Table 1 Specification of PN-3 facility
Potitin \Bottom Middle
42)th~~1 .9x1 013 1 x1 12
o)f 6.0x10⁹ 108
Rcd 300 700 -
Irradiationtime ~ max. 20 min.time .
Irradiation 20 mmtube size I _ 20_mm
Irradiation rabbit
rn :g[: e(unit: mm)
--------- -- - e@- -- + -
Material Polyethylene
-216 -

JAERI-Conf 2001-017
Standard fuel element
@I1 Control rod with follower fuel0 Vertical irradiation holeE lfHorizontal experimental hole
9C PN-3
2G
3G tube
- ~~~~~~~~PN- 2 8T
2G R
SG
Fig. 1 JHRR-3M Reactor core and utilization facilities
-217-

JAERI-Conf 2001-017
@ t' <- * z 1S~l L E in =v
O E _ _ _ _ _ _¢!.g~
L U <1
~~~~ C w ~~~~~~~~~C
Q~~~~~~~~~~C~~C
A2 A0s 7' -
0E
~~~~~U _ _ I _ _ _ _ _ I _
L=< - n ~~~o z~~~~~~
~ O
CD~~~~~~~~~~~~~~~~~~~C
0
~ij
- 218 -
a- a. ~ ~ ~ ~ ~ ~ ~
-218

JAERI-Conf 2001-017
Data input forsample,irradiation
Irradiation
PN-3 irradiation
y-ray measurement /Other y-ray Analysis software > Automatic
spectrum data Genie-2000 sample changer
Available forNetwork,Windows
Converinoyras ectrum. dataspectrum plot
0-__0
y-ray peak analysis
Data of sample,irradiation and Data store inmeasurement directory
+ KAYERO Analysis by 5 omethd fo, 0
!Report NAA
Fig. 3 Flowchart of INAA supporting system
-219-

JAERI-Conf 2001-017
40
20
0 ~~~. . .... ._ ._ _._._ . ._ _. _.
.O. . . .. . . . . ....-.. ........ .... .....
-20 _ _ _ _ _ _ _ _
-40
D.IT: V00S0Ln2/17 TRew.,o JRR.3M PN-3 .
-60 Irdai :J"... 20.i. M..-u m-t: PN-3 S33t.. B .- nO.9088, -2561.361FC-1400.9021
-SO
,N. Mg; Al K C. (n3 Ti V Cr Min F~ A. Sr , r()2(3(3( )f()! Th
0:Nonertifird Vahes
Fig.4 Comparison of Analytical results (NIST SRM-1633b)
30
20
10
10 .: : : .: .. .. . . . . . .. . . . . . .
'1 'M , ' ' Ril;JRR-3,Wi Nii' ' '- ' -. . . . . s
Irradiation s 30c, 20nin
Mer-urtment: PN-3 SystemB
-20 _-0.09098, f 2561361, F-1400.902
-30
Na Mg .Cl K Ni Cu WB)
/ QeNoncerified Values
Fig.5 Comparison of Analytical results (NIST SRM-1577b)
so- Dase: 200Wo02fl7
,-0-09088, 1- 2561-361, Fe-1400,902 11020
30~~~~~~~~~~~~ . .
.................-l ............................
-30 _ _ _ _ _ _ _
-40 _
-50
Na Mg Al Cl K Ca Mn Br a M QO Noncertified Values
Fig.6 Comparison of Analytical results (NIST SRM-1515)
- 220 -

JAERI-Conf 2001-017
Specification
*Easy operation
O Operation byauto/semi-auto/manual mode
* Monitoring of operation conditionand process data
Repeatedly irradiation
0 Interlock by dose rate0 Quick measurement for
short-live nuclide0 Etc.
Photo 1 PN-3 irradiation device
221

JAERI-Conf 2001-017
Spscifications
*Measurement method : Random Access
OSample number :100 sample (max.)
OThickness of Shield: Ph 100mm (low B.G.)Cu 5mm
OShielding door: Manual / Automatic door
IMeasurable distance :0 - 300 mm
Manual : 200 mm x 200 mm x 3 mm
Auto: 100 mm x 100 mm x 3 mm
ORobot:. 5 degrees of freedom
Repeatability +/- 0.05 mm
*Others
- Balances for liquid N2 level
- Adjustable of Ge Det. height
- Controls: Sequencer
- Communication . RS-232C
Photo 2 Automatic sample changer
- 222 -

JP02501 05JAERI-Conf 2001-017
1.21 Air Pollution Study by NAA in Korea
Moon Jong Hwa
Korea Atomic Energy Research Institute,
P.O.Box 105 Yusong, laejon, 305-600, Korea.
E-mail: jhmoonl @kaeri.re.kr
Abstract
The aim of this research is to enhance use of a nuclear analytical technique(instrurnental neutron
activation analysis) in the field of air pollution studies through a feasibility study of the usefulness of a
routine monitoring tool in assessing and comparing air pollution levels in the region, in order to identify
critical air pollution sources. For the collection of airborne particulate matter(APM) for the fine (<2.5
pm EAD) and coarse particle (2.5-10 pm FAD) fractions the Gent stacked filter unit low volume sampler
and two types of Nuclepore polycarbonate filters were employed. Samples were collected on selected
sampling dates(working and non-working days) at two regions(suburban residential site and industrial
complex of Taejon city in the Republic of Korea). Trace elements in the samples collected were
analyzed by INAA. Variations of the concentrations of particulate matter, elements and elemental carbon
were measured monthly and enrichment factors with the sampling sites were calculated. The analytical
data were treated statistically to estimate the relationship between two variables, the concentrations of
elements and iwo particulate matters. The results were used to describe the emission sources and their
correlations.
1. Introduction
Due to recognition and regulation for environmental pollution, which is caused by rapid
industrialization and urbanization, vehicle increment, etc., public concerns about clean,
comfortable surroundings have increased. For this reason, intensive efforts to control pollution
sources and to examine contamination levels through the analysis of various environmental
samples are being followed up. Therefore, measurement of elemental concentrations in
environmental samples including air, soil and water, is very important in solving pollution
problems. In particular, airborne particulate matter(APM) consists of various elements both
- 223 -

JAERI-Conf 2001-017
artificial as well as of natural origin. When the level of total suspended particulate
matter(TSP) and/or the content of specific elements in PM10 (<10 urm) are high, the short and
long term effects on human health are insidious and important. However, sampling of PM 1o is
the first step in estimating the effects of air pollution and mass concentrations of PM1o are
generally less than 0.1 mg/m3. So the method of analyzing the elements should be sensitive and
precise, and also be able to identity multi-elements simultaneously because of the diversity of
elements in the samples. Instrumental neutron activation analysis(INAA) using thermal neutrons in
a nuclear reactor as an irradiation source, and high resolution semiconductor detectors as measuring
equipment, is the most suitable method for satisfying the above mentioned requirements. INAA for
airborne particulate matter can analyze up to ppm. ppb level of concentrations for 30. 40 trace
elements simultaneously.[1-7] The results can be used to conduct epidemiological studies, to
investigate source identification and apportionment, to study long-range transport phenomena, and to
establish a more cost-effective plan to control air pollution. Air pollution sources can also be
identified by employing a statistical method of analytical data such as the Enrichment Factor,
Receptor Modeling and Chemical Mass Balance Methods.[8-10] If the concentrations of several
elements in air samples that are specifically related to emission sources are measured, the above
statistical techniques can be used to identify the fingerprinting of air pollution from the results. For
these emission source studies, collection of comprehensive analytical data is required continuously.
The selection of a sampling site, sampling methods and air sampler depend on the purpose of
research and the elements to be analyzed.
In this study, INAA was applied for the determination of trace elements in airborne
particulate samples, to identify emission sources, to assess and compare air pollution levels for
two regions in Taejon city of Korea. That is, airborne samples collected at two sites were
analyzed using this method and monthly variations, distribution of the concentration of elements and
the enrichment factor were evaluated to verify the emission sources and to estimate their correlation.
II. Experimental
2.1. Sampling and sample preparation
For the collection of airborne particulates for the fine (<2.5 [xm EAD) and coarse particle
(2.5-10 [xm EAD) fractions, the Gent SFU sampler(low volume air sampler with fine and coarse
fraction) with polycarbonate filters(p 47 mm, 0.4 and 8 ulm pore size, Nuclepore) according to
the recommended method[11] was used. Samples were collected on selected sampling
dates(working and non-working days) at two regions, a suburban residential area and industrial
-224 -

JAERI-Conf 2001-017
complex in the middle of Korea. The sampler was placed about 4m above the ground.
Atmospheric conditions such as temperature, humidity, wind direction, wind velocity and
change in weather conditions were recorded regularly during the collection of samples. The
flow rate was adjusted to 18 l/min at the beginning of sampling and collected for 24 hours twice
a week from November 1998 to October 1999. The total volume of air sampled through the
filter was calculated from the reading of the volume meter and compared with the obtained
value from the average of the initial and final flow rate. The collected samples were pre-stored
for 24 hours in a controlled atmosphere(20'C, 50% relative humidity) and prepared in
polyethylene vials after weighing in the same conditions. Electrostatic charges are controlled
by 210Po radioactive source. For both fine and coarse filters, each filter was cut into three parts,
half for the analysis of medium-long half-life nuclides, a quarter for the short half-life nuclides
and the rest for storage.
Before elemental analysis of the sample collected, the reflectance of fine particle filters was
measured using Smoke Stain Reflectometer(Model 43D) according to recommended procedure
for calculation of concentration of the elemental carbon. [12]
2.2. INAA analysis of sample
Collected samples were irradiated with thermal neutrons using the Pneumatic Transfer
System(PTS, (dt = 1.75 x 10i3 n/cm 2. s, R, - 250) at the HANARO research reactor at the
Korea Atomic Energy Research Institute. Samples were irradiated at the same position to
minimize geometric errors. For neutron flux monitoring, activation wires (Reactor Exp. Inc.,
R/X activation wire, 99.99% purity) such as Au-Al, Co, Fe and Mn were used. Analytical
conditions were optimized after considering the preliminary results.
The measurements were carried out using a high purity Ge detector of 25% relative
efficiency and 1.9 keV resolution(FWHM) at 1332 keV of 60Co and peak to Compton ratio is
45:1, coupled to a personal computer and 8K-multichannel analyzer (EG&G ORTEC, 919A
MCB). Energy and efficiency calibration were done using multi-nuclide reference sources
(NEN Products Inc., NES-602, 1" diameter disc type) certified by NIST. GammaVision
software (EG&G ORTEC) for energy and efficiency calibrations, the acquisition of gamma
spectra and peak analysis were used.
2.3. Data Treatment
Under the same analytical conditions, such as irradiation cooling and counting time, the
elemental concentrations in both samples and blank filters were measured. Concentration of
the elements was calculated using the new Windows PC-code, Labview software of KAERI
- 225 -

JAERI-Conf 2001-017
with the nuclear data library[13, 14] which was developed at this laboratory for rapid and simple
data treatment with the gamma. ray spectrum obtained at preset analytical conditions. The
detection limits for the elements were calculated by Currie's quantitative definition[15] with
10% allowable uncertainty. The detection limits of trace components.were in the range of 10 -
0.01 ppm which were 0.5 - 0.01 times the measured concentrations. The assessment of
measurement uncertainty were evaluated as a combined uncertainty including most of the
sources of standard uncertainty to be considered in INAA.[16] The analytical data were
treated statistically using Microsoft Excel(version 7.0).
The concentrations of elemental carbon, EC, were determined for fine particle (PM2.5) by W.
Maenhaut and D. Cohen's suggestion [12] using the reflection method on Nuclepore filter as
follows
EC(ptg/cm2) = [100/2F £] Ln [RW/R]
where, F is a correction factor of order 1, £ is the mass attenuation coefficient in m2/g, Ro is the
unloaded filter reflectance and R is the loaded filter reflectance for a given wavelength.
IlL Results and Discussion
3.1 Analytical quality control
After the optimum analytical conditions such as neutron flux, irradiation facilities,
irradiation time, cooling time, counting time, etc were pre-estimated according to previous
procedures[17-19], the standard reference material(NIST, the National Institute of Standards
and Technology, U.S.A., SRM 1648, urban particulate matter) was used for analytical quality
control . The concentrations of 37 elements in the certified reference material were determined.
The concentrations of 12 elements were statistically compared with the certified values.r20]
The relative errors of Al, Cd, Cr. K, Na, V agreed within 5% and those of As, Fe, Zn agreed
within 10%. The concentration of 19 elements were compared with the recommended values.
The relative errors of Ba, Br, Cl, Co, Cs, Mn, Rb, Th, Ti, W agreed within 5%. The relative
standard deviations were within 15% except Au, As, Cl, Cu, Dy, Hg, In, Ta, Ti and W. In
addition the results of the combined uncertainty at a 95% confidence interval and the detection
limit for each element under analytical conditions were evaluated. The filter blank values of
major impurities are used for the correction of individual concentrations. [19] The
concentrations of interfering elements such as Al, Cl, Mn, Br, Na were low relative to other
filter types.t 21]
- 226 -

JAERI-Conf 2001-017
3.2 Mass concentrations of APM
The mass concentrations of APM were measured during the sampling period and the
variations in particle size, sampling date and sampling site is presented in Figure 1. The mass
concentration of the coarse fraction(DC) was in the range of 15.2 - 50.9 pg/rn3 and that of the fine
fraction(DF) was in the range of 9.3 - 33.1 [tg/m3 in the industrial area. On the other hand, the mass
concentration of the coarse fraction(KC) was in the range of 3.1 - 24.6 [tg/m3 and that of fine
fraction(KF) was in the range of 10.3 - 36.3 tg/rn3 in the suburban area. The average of the mass
concentrations yearly and monthly were also compared in accordance with sampling site and
particle size and are presented in Figure 2. The concentration of coarse samples collected from
March to May are relatively higher than other sampling periods. This is probably caused by the
phenomena of "yellow sand storm" from continental Asia. The annual average mass concentrations
of total suspended particulate rnatter(PM1 o) in the suburban and industrial areas are 36.2 g/rm3 and
41.9 pg/m3, respectively. The mass concentration of the coarse fraction is higher than that of the fine
fraction in the industrial area, whereas the result of the suburban area is the opposite.
3.3 Elemental concentrations in APM
The distribution and variation of the annual average concentrations of elements were obtained
from the average of measured values weekly and the results together with its ratio are
summarized in Figures 3 and 4. The concentrations of 25 elements, Al, As, Ba, Br, Ca, Ce, Cl,
Co, Cr, Cu, Fe, Hg, I, In, K, La, Mn, Na, Sb, Sc, Se, Sm, Ti, V and Zn were analyzed. In
comparison with particle size, most of the elemental concentration of the coarse fraction in the
industrial area were higher than those of suburban area except Fe, but in the case of the fine
fraction, the trend is reversed. In comparing sampling sites, most of the elemental
concentrations of the coarse fraction in the industrial area were higher than those of the fine
fraction except iodine, but in the case of suburban area, the concentrations of elements such as
As, Br, Co, Cu, Hg, I, In, K, Sb, Se, V and Zn in the fine fraction were high.
Figure 5 showed the ratio of elemental concentrations for working day to non-working day.
There are some differences with sampling site and particle size. In the industrial area, the
concentration of elements like Ba, Ca, Ce, Cl, Co, Cr, Fe, Hg, In, Mn, Se, Sm, Ti, V, Zn in the
coarse fraction of the working day were higher than the non-working day, whereas in the case of
the fine fraction, elements like Ce, Fe, 1, Mn, Ti, V, Zn showed the same results. In the
suburban area, the concentration of elements like Ba, Br, Ca, Ce, Cl, Co, Cu, Fe, Hg, ;, La, Mn,
Na, Sc, Se, Zn in the coarse fraction and elements of Ce, Cr, Hg, La, Sm, Zn in the fine fraction
of the working day were higher than the non-working day. The patterns of elemental
distribution in the two areas were different from each other.
- 227 -

JAERI-Conf 2001-017
3.4 Elemental carbon in APM
The monthly average concentrations of elemental black carbon (BC) were, determined for
the fine fraction according to suggested methods and are plotted in Figure 6. The average
concentrations of elemental black carbon at the industrial and suburban areas were in the range of
1.86 - 5.84 tgm3 and 1.90 - 7.24 1tg/m3, respectively. The amounts of elemental black carbon
during the fall and winter seasons were relatively higher than those of other seasons. In
general fine particles originate mainly from combustion processes and also the elemental black
carbon fraction consists of soot aggregates originating from smoke, coal and wood burning,
vehicle exhaust, industry, etc. The yearly concentration of elemental black carbon in the fine
fraction at the industrial and suburban areas were about 22.7 % and 17.1 %, respectively. The
value of winter was higher than in other seasons. Figure 7 shows the ratio of elemental black
carbon for working day and non-working day at the industrial and suburban areas.
3.5 Enrichment factor
In order to find out the major emission sources, enrichment factors(EF) were calculated from
measured elemental concentrations using Mason's crustal abundances [22] for the sampling
period. An enrichment factor is given by the double ratio of the element of interest in the
sample to a reference element in the sample divided by the ratio of the same element found in a
reference material(e.g. rock, soil, etc) ; EF =(X/C:)ApM / (Xi/Cj)pF. Sc is taken as the
reference element because it is supposed to be a unique element in soil. In general, most of the
crustal elements (Al, Si, Ca, K. Fe., Mn. Ti, etc.) have EF values close to unity, higher EF values
of elements indicates that they are not of crustal origin. Therefore, it can be classified to two
group from the EF value of measured element; the anthropogenic origin and the crustal origin.
The average EF values calculated for particle size and sampling site are presented in Figure 8
and Figure 9. These values were in the range 100 - 104 and the industrial area showed generally
higher values than those of the suburban area. High EF values of As to Se are observed at both
areas, and they are assumed to be anthropogenic elements. Also the EF values of the fine
fraction are higher than those of the coarse fractions in anthropogenic elements with respect to
the elements of crustal origin generally. The ratio of the elemental concentration for working
day to non-working day is presented Figure 10. The difference in EF values with sampling site
and particle size can be clearly seen. This trends suggest that this result is available to investigate
air pollution sources and levels for the evaluation of environmental conditions.
- 228 -

JAERI-Conf 2001-017
3.6 Correlation Patterns
The correlation coefficient measures the extent of association in the linear relationship
between two variables. A Linear regression equation is obtained to describe the functio ial
nature of the relationship between elements of crustal and anthropogenic origin involving
industry and motor vehicles. We focus on typical elements like Al, Sc, Fe, K, La, Br, As, Cr,
Sb, Zn as possible emission sources from two areas. In Table 1, the correlation coefficients are
given for each pair of elements and APM for the sampling period. From the result of the
correlation analysis, the group of variables can be distinguished as a weak(<0.4), moderate and
strong(>0.8) linear relationship according to particle sizes. However, these relationship is a
manifold pattern according to sampling dates, areas and particle sizes. In addition to
investigating the correlation of these elements, the correlation patterns of elements associated
with soil and other pollution sources are plotted.
The correlation between elemental black carbon and fine particles of APM at the two areas
are plotted in Figure 11. The correlation coefficients of the industrial and suburban area were
0.67 and 0.70, respectively. Therefore the linear relationships are strong for all of the
industrial and suburban area. The above relationship allows prediction of a correlation
between concentrations of the other elements and the measured elements as well as the long
term pattern of the specific elemental concentration in the environment.
IV. Conclusion
To enhance the use of nuclear analytical techniques(NAT). for air pollution studies and to
study the feasibility of the use of INAA as a routine monitoring tool to find out environmental
pollution sources, the concentrations of 25 trace elements in airborne particulate matter
collected for two sampling dates and particle sizes at two different locations using a low volume
air sampler were measured. The statistical results of analytical data obtained by INAA were
used to investigate the emission sources of air pollution and relevant environmental information.
Consequently, neutron activation analysis using a research reactor proved to be a useful tool for
environmental pollution monitoring.
Acknowledgement This research project has been carried out under the Nuclear R&D Program by
Ministry of Science and Techniology, Republic of Korea, and a part of the international cooperative
research program(RCA/IAEA sub-project) on air pollution.
- 229 -

JAERI-Conf 2001-017
V. References
[1] R. Dams, J. A. Robbins, K. A. Rahn and J. W. Winchester, Anal Czhem., 42, (1970) 861.
[2] W. H. Zoller and G. E. Gordon, INAA of Atomospheric Pollutants Utilizing Ge(Li)y -ray Detector', AnaL
Chem., 42, (1970) 257.[3] E. S. .Gladney, W. H. Zoller, A. G. Jones and G. E. Gordon, 'Composition and Size Distribution for Atmospheric
Particulate Matter in Boston Area', Environ. Sci. Technol., 8, (1974) 551.
[4]A. Alian and B. Sansoni, 'A Review on Activation Analysis of Airborne Particulate Matter', J. RadioanaL and
Noel Chemn., Articles,, 89, (1985) 191.[5] A. Alian and B. Sansoni, 'Activation Analysis of Airborne Particulate Matter', Central Department for Chemical
Analysis, Report Jul-Spez-475, ISSN 0343-7639, Kernforschungsaril -age Julich GmbH, D-5170 Julich,
Federal Republic of Germany, 99 (1988).
[6] W. D. Ebntann and D. E. Vance, 'Advances in Neutron Activation Analysis" CRL Critical Reviews in AnaL
Chern., 20, (1989) 405.[7] J. Tolgyessy and E. H. Klehr, Nuclear Environmental Chemical Analysis, Ellis Harwood Series in Analytical
Chemistry, John Wiley and Sons (1987).
[8] P. K. Hopke, 'Receptor-Modelling in Environmental Chemistry, Chemical Analysis., 76 (1985).
[9] K. H. Wedepohl, Origin and Distribution of the Elements, Pergamon Press, London, 999 (1968).
[10] LAA, Sampling and Analytical Methodologies for Instrumental Neutron Activation Analysis of Airborne
Particulate Matter', Training Course Series No.4, 1AEA-TCS-4, Vienna, 1992.
[11] IAEA Report 'Regional RCM on Applied Research on Air Pollution using Nuclear-related Analytical
Techniques in the Asia and Pacific Region', 1995.
[12] Meeting Report of Mid-Term Review Meeting Joint UNDP/RCA/IAEA sub-Project on Air Pollution and its
trends, Sigapore 18-22 October 1999.
[141 G. Erdimann Neutron Activation Tables', Vol.6, New York (1976).
[151 IAEA; Handbook on Nuclear Activation Analysis Data', IAEATec. Rep. No. 273 (1987).
[16] L. A. Currie ;Anal.Chem., 40 (1968) 586.
[17] Quantifying Uncertainty in Analytical measurement, EURACHEM/CrIAC, 1999.
[181 Y. S. Chung, Y. J. Chuong, E. S. Jeong and S. Y. Cho; Determination of Trace Elements in Airborne Particulates
by INAA' .J Kor. Nucl, Soc., 27, 2 (1995) 234.
[191 Y. S. Chung, Y. J. Chung, E. S. Jung and S. Y. Cho ;"Comparison and Determination of Environmental StandardSamples by Instrumental Neutron Activation Analysis, J. RadioanaLNucl. Chem., 217, 1 (1997) 71-76.
[20] Y. S. Chung, Y. J. Chung, F. S. Jeong and S. Y. Cho; Study on Air Pollution Monitoring in Korea usingInstrumental Neutron Activation Analysis', .1. Radloanal Nuel. Chen., 217, 1 (1997) 83-89.
[21] LA-A, Survey of Reference Materials "Biological and Environmental Reference Materials for Trace elements,
Nuclides and Microcontanuinants" AFA-TECDOC-854 vol.1, Vienna (1995); IAEA, Survey of Reference
Materials "Biological and Environmental Reference Materials for Trace elements, Nuclides and
Microcontaminants" IAFA-TECDOC-880 vol.2, Vienna (1996).[22] 7eev B. Alfassi, Activation Analysis, vol. 2, CRC Press, 1990.
[23] B. Mason; Principles of Geochemistry, 3rd ed. 1966.
- 230 -

JAERI-Conf 2001-017
Table 1. Correlation Coefficients between of Elements and PM (a) DC, (b) DF, (c) KC, (d)KF
Sc Al Fe k L. As Cr Sb Zn PMio Sc Al Fe k La As Cr Sb Zn PMao
Sc 1.00 S. 1.00
Al 0.93 1.00 (A) Al 0.87 1.00 (B)
Fe 0.92 0.90 1.00 Fe 0.77 0.59 1.00
k 0.92 0.77 0.07 1.00 k 0.64 038 0.38 1.00
L. 0,9S 0.69 0.90 0.96 1.00 TA 0.76 0.27 0.29 0.63 1.00
As 0.75 0.51 0.65 0.71 0.74 1.00 As 0.51 049 0.52 0.5S 0.34 1.00
Cr OA6 0.03 0.73 OA7 OA9 0.29 1.00 Cr 0.13 0.28 0.36 0.01 0.14 0.17 1.00
Sb O.5Z 0.57 0.62 0.65 0.59 0.37 OAS 1.00 Sb 0.25 0.29 0.34 0.39 0.58 OAZ 0.38 1.00
Z. 0.61 0.24 0.83 0.67 0.67 OA2 0.85 0.6s 1.00 Znj 0.46 0.44 0.76 OAI 0.17 OAS. 0.77 0.37 1.00
FM,, 0.78 0.68 0.84 0.89 0.85 0.60 0.65 0.73 0.73 1.00 PK5. 0.40 0.35 038 0.70 0.20 0.76 0.0S 0.39 0.40 1.00
5e Ai Fe k L. As Cr St Z7n PMoN, S Al Fe h TA as Cr SO P PM,,
Or 1.00 Sr 1.OO
AI 0.96 .00 (C) Al 0.94 1.00 ID)
Fe 0.97 0,60 1.09 Fe 0,93 3.80 1.00
k 0.91 0.97 0.01 1.00 k 0.48 0.40 0.92 1.00
1" 0.97 013 0.96 0.21 1.0 L. 0,96 O. 0.89 0.57 1.00
As 0.60 0.24 0.61 0.44 0.57 1.00 As .037 OA 0.65 0.35 0.65 1.00
Cr -011 -0.04 .0.06 -0.06 .0.11 -0.14 1.00 Cr 0.92 0020 010 0.19 .014 .0.18 1.00
Sb 0936 0.21 OAR 0-.0 0.09 0.24 0.14 1.00 Sb -0o36 0.16 0.25 0.20 0.24 0.24 -0.22 1.00
Zn 0.05 0.36 0.66 0.72 0.62 OAS 0.12 0.80 1.00 Zn .0.33 0.25 O.9 0.68 0.O0 0.19 -0.23 0.59 1.00
PM,, 0U.0 0.00 0.89 0.86 0.39 0.07 .010 0.51 0.71 1.00 PMK 032 0.34 OA3 0.74 OA7 0.63 -0.27 OA6 0.83 1.00
-231-

JAERI-Conf 2001-017
160.0 Industial area140.0 -oa-e --------------------------------------------------- Coarse
v 12.0.0 ------------------ -- 5-------- ----------- ---------------------------- -|-- - F n! ' 120.0 -------- Fine
160.0 - -- -0O 40.0
160.0 *Sampling date
160.0 Siuburrban area_140.0 ---------------- ----------------------- --------------------------------------------- Coarse
------ - - Fine1 20.0 --- ----------------------------------------------------------------------------- --- ------ Fn
60. li 11 0 0.
0.0-40, --- 00-
. N. ... ... ° N Q 7
\ > a \ \ e 8 > t c~~a 8
Sampling date
Fig. I Mass concentration of fine and coarse fraction with sampling date.('98.11 - '99.10)
- 232 -

JAERI-Conf 2001-017
60
4 -40 ------ ------------ . . --- -- - -- - -- -
>30 ! SHE, / S > ~~~~~~~~~~~~~K CXE
3-20 AfiM!__.a
10 ...XaL L
0
. :d e. dO (C 8. 0
0 - 0 0 0 ax 0 0 0 0 0
Sam pling period
(IL glm3)
DC 15.2-50.9 28.71 10.79 26.86DF 7.2-33.1 13.24 6.77 12.17
DC+DF 41.95 39.03
KC 3.1-23.9 16.10 7.37 13.90KF 10.3-36.3 20.12 8.40 18.61
_ KG+KF _ 36.22 32.51
Fig. 2 Monthly variation of mass concentration of APM at industrial and suburban areas.
- 233 -

JAERI-Conf 2001-017
1.OE+04
1.OE+O3 0.15 ED0 0.03- -. 06
DF
1S .E+02 0
2C1.OE+O [I6KFm~~~~~~~~d..~~~~~~~~m
Hg 2.42 i 3 t 2.tn Sc La Go I Ce As Hg Se Sm V Sb Sr Be Cr M Cu Ti Zn CI K Na Go A Fe
Elem ent
~~~~~~~~~~~~~~~~~~~(ng/m 3)
Elemeants DC DF KG KFIn 0.15 0.07 0.03 0.06SC 018 0.02 0.10 0.03La 0.71 0.12 0.38 0.15Co 0.80 0.33 0 16 0.18
i 1.14 1.29 0.80 1.68Ce 1.71 0.68 0.94 0~50Zn 76.190 5.53 1.29 2.924Hg 2.42 2.32 1.77 2.71Se 2.87 1.01 0.81 1.~33Sm 2.93 0.83 293 03.57V 5.98 2.96 1.73 2.29
Sb 7.02 5.15 2. 67 6.70Br 173.22 9.95 6.26 11762Ba 22.46 7.60 11.21 5.33Or 23.11 6.15 9.53 4.61Mn 29.94 11.13 9.66 8.27CU 43.43 12.24 1073 1 3.02Ti 73.84 I16.918 45.89 171.6P2Zn 76.511 53.53 21 27 40.47GI 329.25 7 2.82 1 56,63 58. 76K 497.51 212.98 254.71 317.58
Na 598.96 1 62. 94 31 9. 79 1 67.47Ca 723. 50 149.55 406.14 73. 72Al 934.21 134.26 606.95 1 71.47Fe 1 021.67 1 67.45 405.77 1 55.98
Fig. 3 Average concentration of measured elements at industrial and suburban areas.
-234 -

JAERI-Conf 2001-017
3.0 -Industrial area
.0
2. I .°0.5 l I 0
So Sm Al Fe La Ca Ci Ti Cr Na Cu Ba Se Mn Ce Co K In V Zn Sb Br As Hg I
Elem ent
0.~~~~~~~~~~~~~~~~~~~~~~~~~~~~~~~~~~~~~~~~~~~~~~~~~~ 2.3.0 Suburb annareaa
Ca m A SoCl Ti Fe La Ba Cr Na Ce Mn Co Cu 1K V Hg Se In Br Zn IAs S. . :. _ ~Elem ent
Fig.4 Ratio of elemental concentration between PM2 5 and PM10
- 235 -

JAERI-Conf 2001-017
N. 1.
| CIJ Sb As Br Na T Al Sc K La Mn Ce Cl V Ca Ba Ti Fe Hg Co In 2n Cr Sm Se
2.5
2.0 *DF
N. t5mnuul l0.0
In Co La Sm Sb Hg Cr Al r K Sc LM Ge Ce S As Na Cu I Ti Fe Zn V Mn Ce
____ - - - - - - Elem ent
2.5
2 .0 ----- ---- ---- --- -- ---------------- - -- ~ ~ ~ ~ ~ ~
0.6
0.0
In Sm La As l Sb V Or Ti Mn C Ce BeNa La Sc Fe K CI Hg SI Co Zn Ba Cu Br
Elem ent
2.5 ____..
2.0 EK--------
4 15
0,
: .1.0
In CSCu Tis s br Al NOr Sb I Co S K V Ba Fe Se MnOCl Zn L Hgo r CSmuCe
Elem ent
Fig. 5 Ratio of elem ental concentration for working to non-working day.
- 236 -

JAERI-Conf 2001-017
8.0
6.0 -. --- DF
E 4.0 ---------------------------------------------------------- - - -E
O3 2,0u
0~0- Z~J . i .. . t .. .. : .. X ) 0_ - 0S s 0 10 0 0 0 0 0O
c6~~~~ a) C) 0) cm a)0) ;
Sampling Period
Fig. 6. Monthly variatuion of black carbon concentration. (PM 2 5 )
2.5 - - -- - -KF 1
1.2
0-, > o ct O O ' ° ° ~~~~co o 8
co- 0 0 0 0 0 0 o 0 0 0ao a 0) 0) 0) 0) On 0) 0) 0) 0
Sample period
Fig. 7 Ratio of black carbon concentration(PM 2 ,) for working to non-workingday.
- 237 -

JAERI-Conf 2001-017
1.OE+05
1.OE+04 -- - E DO -----
1.O E +02 - -- - - - - - - - - - - - - - - - - - - - - -
1.OE+O1 -li
Al Ti K Ca Fe Na La Ce Mn Oo V Sa Or Sm Gu As Zn ir I Cl Br Hg Sb Se
Elem ent
Element DC DF KC KF
Al 1.40 1.83 1.65 1.53Ti 2.04 4,27 2.31 2.90K 2.33 9.10 2.18 8.88
Ca 2.42 4.56 2.48 1.47Fe 2.48 3.71 1 80 2.26
Na 2.57 6.37 2.50 4.29
La 2.86 4.30 2.83 3.57Ce 3.45 12.60 3.48 6.04
Mr 3.83 12.97 2.25 6.31Co 3 87 14.41 1.40 5.24V 5.38 24.29 2.84 12.30
Ba 6.42 19.80 5.84 9.08Cr 28.05 68.12 21.09 33.40
Sm 59.23 61.01 108.20 68.32Cu 95.86 246.33 43.17 171>60As 128.06 970 97 158.43 1174.13Zn 132.70 846,64 67.22 418.88In 1 79.87 738.59 73.87 403,071 277,64 2866,23 355.92 2432.79
C1 307.49 620.16 266.56 327. 52Br 641.78 4408.51 553.77 3368.11Hg 3680 13 32153. 56 4900.64 24583.41Sb 4263.90 28500.21 2956.83 24266.05Se 6973.51 22387.28 3578.02 19341.62
Fig. 8. Enrichm ent factor of measured elem ents.
- 238 -

JAERI-Conf 2001-017
Industrial area12
o41
0Sm Al Fe La Ca Cl To Cr Na Cu Ba Se Mn Ce Co K In V Zn Sb Br As Hg I
Elem ent . _.... -
Suburban area
10-- -- - - -0-
......8-. .-- --- -
2
Ca Sm Al Cl Ti Fe La Ba Cr Na Ce Mn Co Cu K V Hg Se In Br Zn I As Sb
Elem ent
Fig 9. Ratio of enrichment factor between PM2 5 and PM,0(
- 239 -

JAERI-Conf 2001-017
2.5 -- - - - - ------ - - - - - ---
0,0Cu As Na Sb Oi Sr I LA Ce Al K Mn Sr Ce Be Fe Hg Ti Sm Cr Co V Zn In Se
Elem ant
2. -- - -_ _ _
r ------------ --- - ----- -------------- --- ---- - --- --- - --- -------- - -- ----- __ __ ___ _-- _0.
21 0 -- - -- - - ----- --- --I In La Cu Sb fg K Sc Or No Ti Al As Cr Se CG Br Sm V Be Fe Mn Zr Ce CaElem ant
2.5 ---- -- - - - - -------- ---2,0 EKG
-. p ------- -------- F -- - -------- -- ---- --- - ---- - --------- ---- -- --- ---- ----- - - -- -- -- - -- - -
o ~ ~ ~ ~ ~ - - -- - - -- ---- - -
0.0I In Sm Al Vl V Ti As Na Ca Ca Sc Cr Mn Fs Se Hg Cu La Zn Sb Co K Br Ba
Elem ent
256
240 -

JAERI-Conf 2001-017
10
y = 0.0908x + 0.5024
FeR2 0. 6984
C. 4 - - -- --------------- ---------
E
0 10 20 30 40 50 6 70 g 90
PM2.5(ug/m 3)
(a) Correlation between Elemental Carbon and PM2.5 at suburban area.
y-.4289x1+0.4118R2 = 0.6701
LU .
t 1 0 20 30 40) 50
(b) Correlation between Elemental Carbon and PM2.5 at industrial area.
Figure I1. Correlaltion between Elemental Black (Carbon and PM2.5
-241 -

JP02501 06JAERI-Conf 2001-017
1.22 Probabilistic Risk Analysis of Airborne Toxic Metals
in Korean Industrial Complex
Jin-Hong Lee Mi-Suk JangDepartment of Environmental Engineering, Chungnam National University,
Daeduck Science Town, Taejon 305-764, Korea
Abstract
The research centered on the concentration profiles and probabilistic risk analysis
of toxic metals for ambient air in Taejon industrial complex, one of the most polluted
industrial complexes in Korea. Airborne concentrations of toxic metals for the analysis
were obtained from about two-year sampling and analysis in the complex. The long-term arithmetic means of human carcinogens such as arsenic, hexavalent chromium and
nickel subsulfide were 5.53, 2.16 and 3.46 ng/m3 while the means of probable human
carcinogens such as beryllium, cadmium and lead were 0.08, 2.35, 293.29 nglm3 ,
respectively. And the long-term arithmetic mean concentration of non-carcinogenic
toxic metal, manganese was 55.91 ng/m3 . The point risk estimate for the inhalation of
carcinogenic metals was 6.2 10'5, about 90% of which was due to the inhalation ofhuman carcinogens, arsenic and hexavalent chromium. From a probabilistic risk
analysis, the 50th - 95th percentile cancer risks for men and women were estimated to
be 2.8 10-5 -9.6 10-l and 2.5 10-'-8.5 10', respectively. About 70% of the 50thpercentile risk for both men and women came from human carcinogens such as arsenic
and hexavalent chromium. A comparison of the probabilistic risk estimates with point
risk estimate showed that the probabilistic analysis can provide a more completeassessment of risk and more useful information to risk manager and the public.
However, uncertainty remains and improved Korean probabilistic density functions
(PDF) are needed for factors such as inhalation rate, exposure frequency, cancer potencyfactors and reference doses.
Key words: probabilistic risk analysis, airborne toxic metals, industrial complex
I . IntroductionIn spite of low concentrations of toxic metals in urban air, the magnitude of health
risk associated with may be not smaller than that with other hazardous air pollutants.
- 242 -

JAERI-Conf 2001-017
Especially, it has been expected that the risk from industrial complexes might be much
higher by toxic metals including carcinogenic ones. However, unfortunately there has
been few of domestic studies on the concentration profiles and risk analysis of airborne
toxic metals in such areas. Thus, few of long-term concentration profiles for toxic
metals in ambient air has been made. Therefore, this study focuses on about two-year
analysis by using ICP-MS for the concentrations of twenty-two metals including six
airborne carcinogenic metals in Taejon industrial complex, which is one of the most
polluted industrial complexes in Korea. ICP-MS has much more excellent detection
limits and reproducibility for almost every metal than any other analytical technique. In
addition, the study centers on a probabilistic risk analysis of the inhalation of airborne
toxic metals based on the concentration profiles. For carcinogenic metals, the risk is
assessed quantitatively by using dose-response model selected as the best for each metal.
If a substance is identified as a potential human carcinogen, its carcinogenicity may be
related to the chemical form of a substance and the route of exposure. This type of
information with regard to carcinogenic uncertainty is incorporated into hazard
quantification. The carcinogenic group of toxic metal is also emphasized with regard to
the hazard quantification.
II. Material and MethodsThe suspended particulate matters were collected on quartz micro-fiber filter
(Whatman QMA, 8 " 10") by a high volume air sampler (Sierra Andersen: SAUB-1OHmodel). The sampling was carried out in Taejon industrial complex two or four times
per month during weekdays from April, 1997 to December, 1998. Sampled air per filter
was computed by using flow recorder from the start to the end of sampling. Whenever
motor brush of sampler was changed, flow rate was adjusted by orifice calibrator
(GMW-25). Twenty-two metal elements were analyzed by ICP-MS (FISONS PQ3 STE
model) and 1CP-AES (SHIMADZU ICPS 1000-I model) after the pre-treatment ofmixed acid extraction using microwave digestion system('. Risks were calculated by the
following equations, adapted from EPA guidance(2):
C IR * 'EF -.ENDRisk=(C~E E) CPF
RiskBW-AT
HI = C IR -EF -ED) RDBW -AT
Where Risk = upper bound lifetime cancer risk (unitless)
- 243 -

JAERI-Conf 2001-017
HI = non-carcinogenic hazard index (unitless)
C = pollutant concentration in ambient air (mg/m3)
IR= daily inhalation rate (m3/day)
EF exposure frequency (days/year)
ED exposure duration (years)
BW = body weight of an exposed individual (kg)
AT = averaging time (lifetime for carcinogen, exposure duration for non-
carcinogen) (days)
CPF = inhaled cancer potency factor (mg/kg/day)-
RfD = inhaled reference dose (mg/kg/day)
Table 1. Fixed assumptions and PDFs used as inputs to estimate risk
'Parameter Distributio typ Distribution Source
(ng/m3) ~~~~~~GM 109
Beryllium (ng/m') LN GM - 1.07 65 SamplesGSD __1.97__ _ _ _ _ _ _
Cadmium (ng/md) LN GM= 1.68 70 Samples______________ ~~~ ~ ~~GSD 2.61_ _ _ _ _ _ _ _
Hexavalent GM= i.53chromium ; (ng/mi) LN GSD = 2.29 68 Samples'Nikel subsufide"' GM 2.75
(ng/mike ) s LN GSD 2.09 69 Samples
Manganese (ng/rnm) LN GM = 45.63 70 Samples.__ _ _ _ _ _ _ _ _ _ _ _ _ _ _ _ _ _ _ _ _ _ _ _ _G SD _= 1.93
Men inhalation rate LN GM = 15.07 (3)(m/day)_ GSD= 1.11
Women inhalation LN GM= 11.15 (3)W ten/dA GSD 1.14
Min = 180Exposure reency TR Best = 345 (4)
(days/yr) Max = 365
Men body weight LN GM = 64.96 (5)(kg) GSD = 1.13 Vv
Women body weight LN GM = 54.28 (5)(kg) -GSD =1 1.3
Cancer potency factor Point value Adjusted IRIS (6)(mglcg/kday)-' ______v alue Values_
Reference dose Point value Adjusted IRIS (6)(mg/kg/day) Valueb)
LN Lognormal; TR: Triangular, GM: Geometric Mean; GSD: Geometric Standard Deviation.
a) Each chemical form of a metal was assumed to be ten percent of total amount.
b) Adjusted IRIS value for reference Korean of a 60-kg body weight over a 70-year life span
- 244 -

JAERI-Conf 2001-017
Exposure assumptions and concentrations used for probabilistic risk analysis are
shown in Table 1. Probabilistic calculations were done by running Crystal Ball
(Decisioneerng, version 4.0) Monte Carlo simulator. The simulation software sampled
all distribution variables 10,000 times using Latin hypercube strategy. The point risk
estimate was computed by same software for reference Korean of a 60-kg body weight
with 20 m3 /day of daily inhalation rate. Results of probabilistic calculations are shown
in Table 2.
Table 2. Monte Carlo carcinogenic risk estimates in Taejon industrial complex
Risk estimatePercentile
Men Women5 percentile 9.8 x 1046 8.6 x 10.6
10 percentile 1.2 x 10⁵ 1.1 10-5
25 percentile 1.8 x 10' 1.6 x 10⁻⁵
50 percentile 2.8 x 1IV 2.5 X 10⁻⁵
75 percentile 4.6 x 1C54.0 x 10-5
90 percentile 7.2 x iV 6.4 x 10-s
95 percentile 9.6 x 10' 8.5 x lo-5
Average -3.8 x 1i-5 3.4 x 10⁻⁵
-II. Results and Discussion
The arithmetic mean concentration of ambient particulate matters was 99.4 gg/m'
during the sampling period in the study area. The minimum is 36.4 ,g/m while the
maximum is 200.1 ugIm', respectively. The seasonal concentration of airborne
particulate matters was minimum in every summer, which might be due to mainly
washout effect by high rainfall intensity. About two-year arithmetic means of human
carcinogens such as arsenic, hexavalent chromium and nickel subsulfide were 5.53, 2.16
and 3.46 ngfmr while the means of probable human carcinogens such as beryllium,
cadmium and lead were 0.08, 2.35, 293.29 ngm 3 , respectively. And the long-term
arithmetic mean concentration of non-carcinogenic toxic metal, manganese was 55.91
ng/m3 . The concentrations of soil related metals, that is, Al, Ca, Fe, K, Mg, Na and Si
- 245 -

JAERI-Conf 2001-017
were to be much higher. Among those metals the maximum concentration of 1,730
ng/m3 was for Al while the minimum concentration of 435ng/m3 was for Mg,
respectively. By analyzing main emission sources in Taejon industrial complex, it was
judged that arsenic was emitted from agricultural chemical manufacturing, copper
related and/or alloy steel industry, chromium from chemical and metal coating industry,
and finally lead from diesel engine exhaust, coal combustion, and storage battery
manufacturing, respectively.
The point risk estimate for the inhalation of carcinogenic metals was 6.2 1 0-,
about 90% of which was due to the inhalation of human carcinogens arsenic and
hexavalent chromium. From a probabilistic risk analysis, the 50th-95th percentile
cancer risks for men and women were estimated to be 2.8 1 05. 9.6 1 0-5 and 2.5
105'-8.5 10-5, respectively. About 70% of the 50th percentile risk for both men andwomen came from human carcinogens such as arsenic and hexavalent chromium. A
comparison of the probabilistic risk estimates with point risk estimate showed that the
probabilistic analysis can provide a more complete assessment of risk and more useful
information to risk manager and the publicS.( However, uncertainty remains and
improved Korean probabilistic density finctions(PDF) are needed for factors such as
inhalation rate, exposure frequency, cancer potency factors and reference doses.
Since December of 1999, a study on the concentration profiles of trace metals for
ambient air over Taejon metropolitan city is going on by using INAA, which is funded
by ANARO Steering Committee. The committee and ANARO User
Association has been operated actively since autumn of 1999. Recently, air pollution
studies in Korea have concentrated on the following topics:
1) Ozone related problems, especially for World Cup 2002 in Korea;
2) Non-criteria. hazardous air pollutants including VOCs;
3) PM-2.5,
4) The analysis and data interpretation of a large number of samples by INAA;
5) Receptor modeling including CMB modeling, and so on.
INAA has very low detection limits and needs very small amount of airborne
particulate sample for the analysis. However, it is difficult to analyze metals such as
lead, nickel, cadmium and silica, which are very important metals for either risk
assessment or receptor modeling. Thus, it is necessary to use other analytical tool like
ICP-MS as a complement.
- 246 -
JAERI-Conf 2001-017
References
1. Greenberg AE, Clesceri LS, Eaton AD. Standard Method(18th edition). American
Public Health Association 1992:3.6
2. U. S. EPA. Risk Assessment Guidance for Superfimnd. U. S. EPA 1989
3. U. S. EPA. Exposure Factors Handbook(Draft). U. S. EPA 1996
4. Smith RL, Use of Monte Caric simulation for human exposure assessment at a
superfund site. RiskAnalysis 1994:14(4):433-439
5.. KRISS. Investigation of Standard Korean Body, KRISS, 1992
6. U. S. EPA. IRIS (Integrated Risk Information System). U. S. EPA 1999
7. Finley B, Paustenbach, D. The benefits of probabilistic exposure assessment: three
cases studies involving contaminated air, water, and soil. Risk Analysis
1994:14(l):53-73
- 247 -

JAERI-Conf 2001-017
1.23 Application of NAA in the Field of Environmental Geology
KiU Yong Lee, Yoon Yeol Yoon
Environmental Geology Division, Korea Institute of Geoscience & Mineral
Resources(KJGAM), 30 Gajung-dong, Yuseong-gu, Daejeon 305-350,
Korea(E-mail: kylee@kigam. re.kr)
ABSTRACT
NAA is a very useful technique for the nondestructive analysis of trace elements in environmental and geological
materials. Sampling and preparation procedures were established to analysis of various major and trace elements in
environmental and geologic materials. About 40 elements in pine needle, rice and a few crops and the soils have been
analyzed at different sites. The pine needle, rice and other crops were investigated whether they can be feasible or not
as bio-monitors. NAA procedure was optimized for sample types and elements analyzed. ICP and XRF also applied
to analysis of some samples and the results were compared with NAA. The elemental distributions and relationship
between plants and soils were also investigated. NAA appeared to be a very fruitful method to analysis environmental
and geologic materials. It was found that pine needles and rice could be able to use as indicator plants for pollution
monitoring in Korea.
INTRODUCTION
The aim of present work is to investigate applicability of NAA in the field of environmental geology. Their are so
many samples such as soil, air, water(groundwater) to be analyzed in the environmental geology field. It is very
difficult to study of environmental pollution, because the sampling, pretreatment and analytical procedures are very
tedious and complicate works. For a meaningful evaluation of degree of environmental pollution in a site it is
necessary to analysis enormous and various samples such as air, water, and soil and to know various climate
parameters. It has been well known NAA has peculiar advantages, nondestructive and multielemental and sensitive
analysis. Several studies reported considering the biomonitor using plants such as spruce, moss, lichen, and so on. In
the present work, pine needle, rice and some common crops grown in Korea were analyzed by NAA and compared
other analytical methods. Pine needle was chosen as a possible biomonitor of pollution because it is largely present in
anywhere of our country, and it is evergreen tree and the needle possess a high surface homogeneity. Rice., soybean
and red pepper were also chosen as possible biomonitors, because they have similar motive with pine needle.
Optimum conditions for the analysis of the plants and soils by NAA such as sampling, preparing, irradiation and
cooling procedures have been studied. Feasibility as bio-monitors of these plants has also been discussed.
- 248 -

JAERI-Conf 2001-017
Sampling and Preparation
Pine Needle
The sampling sites were urban, suburban and rural regions and sampling time were spring, summer, fall and winter.
Needle samples were taken from twenty pine trees in a site. Sampling was done on Korean pine (Pinus denaiflora) at
a height of 1.5 to 2 m above ground, taking only a year old needle which is more yellowish than old needle and has
two scales on it. Needle samples were put in a clean P' bag and the bag was stored an ice chest. After the transferring
the needle samples in laboratory, the samples were stored in refrigerator and the temperature was controlled to 4 0.
Each needle sample was split into two parts. Only a part was cleaned successively with 1% HCI and deionized water.
Both cleaned and uncleaned needle samples were then dried in a freeze dryer at -50X+C for 2 weeks. Dried needle
samples were pulverized with a ball mill to make fine powder (-150 mesh) and mixed in a mixer mill to improve
homogeneity.
Soil and Crops
Soil samples were taken from 5-15cm deep field ground around the root of each crop. The soil sample was sieved
with 2mm sieve and store in a clean PE(polyethylene) zipper bag. In our laboratory, the soil samples were dried at
60 for 72 h in an electric oven and then they were pulverized under 150 z particle and homogenized. All crops
were freeze dried and pulverized, homogenized. In case of root samples(rice, soybean), they were washed with
distilled water to remove soil on their surface before drying.
NAA
Pine Needle and crops
500mg of the each sample powder was placed in PP(polypropylene) vial and the vial was sealed. An SRM(NIST-
1575, pine needle) was also prepared. The sample and SRM were irradiated for 2min and 30 minutes for short and
long lived nuclide at a PTS(pneumatic transfer system) in a research reactor (HANARO). Thermal and epithermal
neutron flux densities were 1.8 x 10¹³ and 1.2 x 10¹⁰, respectively. Activity measurements of the irradiated needle
samples and SRMs were carried out with three different decay intervals. For the short lived nuclide the 2min
irradiated samples were counted two times, after 5 and 30min decay. And for medium and long lived nuclide, 30min
irradiated samples were counted 3 times, after 2, 7, and 20days decay.
Soil
1i0mg of the each soil sample was placed in PP(polypropylene) vial and the vial was sealed. An SRM(NIST-coal)
was also prepared. Irradiation and counting of soil samples were carried out with the same method of crop samples.
Fig. i and 2 show the preparation procedure of pine needle sample and NAA procedure, respectively.
- 249 -

JAERI-Conf 2001-017
PINE NEEDLE
Cleaned Part Uncleaned Part
NAA, XRF Anainis ICP-AFSIMS
Fig. 1. Flow chart for preparing of pine needle.
______SAMPLE _POWDER _ *SOILSAMPLE 100 MGSAMPLE POWDER BIOSAMPLE: 500 MG
PP Vial 0 apsulating OSealing
A~~~~~~HANARO Neutron Irradiation with Monitors OShort lived Nuclides 2 min
Omedium & long lived nuclides 30 mm
HPGe-MCA 0 .______ i-__yC__ut _Sh OSport lived Nuclides 5, 30 min coolingActivity Counting Omedium & long lived nuclides: 2, 7, 20 day
SCM / SRM 0 Content Calculation @30 elements in most samples
Fig. 2. NAA Procedure of soil and plant samples.
Results and Discussion
Collected sample must be representative of the site, and contamination of analytes must be suppressed contamination
of analytes must be suppressed during sampling and analysis. Table 1 shows the NAA results of pine needle samples
taken from three different regions at four seasons. Almost all of the elements examined, except for a few elements
related to lithosphere such as as Ca, Co, Fe, Rb, and Sc, have different content values with region and needle body or
surface. Some elements such as As, Br, Cr, W, and Zn show significantly higher contents in urban and sub-urban
regions than in rural region. Fig. 3 shows the content ratio on needle surface and body in urban region with seasons
based on fall. The content ratio with seasons is very different on needle surface and body.
- 250-

JAERI-Conf 2001-017
Table 1. NAA results of pine needle samples(ppm)
Region Element Fall Winter Spring SummerUncleaned cleaned uncleaned cleaned uncleaned cleaned uncleaned cleaned
Urban As 0.29 0.15 0.39 0.19 1.3 0.62 0.54 0.19Au 0.0058 0.0035 0.011 0.0025 0.012 0.0066 0.010 0.0054Br 4.7 3.6 3.8 2.2 5.2 4 6.6 5.1Ca 5100 3700 4700 3300 5300 4700 4000 3400Ce 0.72 0.18 0.74 0.32 0.93 0.66 0.62 0.38Co 0.35 0.31 0.32 0.29 0.36 0.31 0.29 0.3Cr 4.1 4 3.6 3.4 3.9 2.3 3.6 3.4Eu 0.01 0.01 0.01 0.01 0.11 0.01 0.01 0.01Fe 110 95 120 89 240 180 170 140K 7600 720(0 6600 5200 5000 4600 4700 4800La 0.48 0.18 0.58 0.18 0.59 0.38 0.51 0.2Na 53 24 86 29 130 .79 110 110Rb 17 13 9.6 7.8 6.1 4.8 7.4 7.2Sb 0.1 0.09 0.1 0.09 0.16 0.1 0.23 0.16Sc 0.03 0.02 0.03 0.02 0.08 0.04 0.06 0.05Sm 0.04 0.02 0.05 0.04 0.1 0.05 0.05 0.02Th 0.05 0.05 0.06 0.02 0.17 0.07 0.1 0.06W 0.26 0.15 0.31 0.14 0.21 0.23 0.18 0.06Zn 74 62 60 57 80 75 36 30
Sub-urban As 0.2 0.12 0.51 0.09 0.69 0.2 0.24 0.12Au 0.0074 0.0049 0.0056 0.0016 0.0053 0.0048 0.0039 0.0015Br 5.1 5 5.9 3.7 3.5 3.2 3.9 3.4Ca 4900 3800 4400 3400 3200 2800 4500 3700Ce 0.65 0.41 0.74 0.38 0.69 0.63 0.69 0.35Co 0.49 0.36 0.52 0.32 0.36 0.31 0.41 0.38Cr 1.8 1.9 1.9 1.7 1.9 1.6 2.7 2.5Eu (.01 0.01 0.02 ().1 (0.01 0.01 0.02 0.01Fe 170 130 160 120 160 130 160 110K 6600 6400 6800 4300 6200 5100 3400 2700La 0.79 0.36 0.52 022 0.7 0.6 0.38 0.22Na 180 140 49 39 80 51 1]10 110Rb 12 11 15 12 10 10 7.1 3.8Sb 0.09 0.06 0.06 0.06 0.11 O.0M 0.18 0.1Sc 0.03 0.02 0.03 (.02 0,04 0.02 (1.03 0.03Sm 0.01 0.005 0.08 0.04 0.06 0.02 0.05 (.02Th 0.09 0.08 0.06 0.02 0.09 0.05 0.14 0.07W 0.82 0.07 0.49 0.15 0.07 0.04 0.13 0.06Z11 78 54 75 59 68 62 74 69
Rural As 0.08 0.05 0.08 0.04 0.32 0.19 0.28 0.09Au 0.0030 0.0013 0.0040 0.0010 0.0050 0.0020 0.0021 0.0018Br 2.7 2.3 3.3 2.5 3.8 3.7 3.4 2.6Ca 3500 2800 3700 2700 3800 2800 2900 2600Ce 0.56 0.5 0.59 (.48 0.55 0.53 0.63 0.23Co 0.57 0.48 0.61 0.58 0.65 0.54 0.35 0.33Cr 3.3 3.3 2.6 2.6 3 2.7 2.8 2.5Eu 0.01 0.01 0.01 0.01 0.01 0.01 0.01 0.01Fe 130 98 (10 77 130 94 160 100K 5700 5600 5800 5200 5200 5100 4800 4500La 0.26 (0.17 0.36 0.12 0.26 0.17 0.21 0.15Na 86 30 50 38 74 62 120 50Rb 13 11 8.9 8.3 8.4 6.7 6.9 5.4Sb 0.04 0.04 0.04 0.04 0.1 0.07 0.1 0(05Sc 0.05 0.03 0.05 0.03 0.04 0.04 0.05 (.(02Sm 0.04 0.02 0.02 0.02 0.04 0.03 0.02 0.01Th 0.05 0.04 0.()5 0.04 0.07 0.05 0.07 0.04W 0.29 0.09 0.15 0.04 0.1 0.03 0.13 0.03Zn 33 21 35 27 35 23 26 24
-251-

JAERI-Conf 2001-017
Sub-urban Needle Surface Sub-urban Needle Body2500 - 250 e
,w, ~ ~ ~ ~ ~ 0W
2000 - ~~~~~~0 S-i g 0 sping2000 -V |8,, 1 200 - | v s
61500 -e0 °
1000- V
t$ 609o 88¢eXov so e , v go0~~~
-500 0 . . ------
Lt 0 fi 63 0 W Z' 3 lZRXZEi 28OOO3L3zS"9 Element Element
Content ratio besed on rural pine needle
4 Vo A A
7 ~~~~AAA A A
0 AC 2 VV I °a @V
01 .. ,- . _, . _ ,,
Element
Fig. 3 The mean content ratio on needle body and surface in urban and sub-urban based on rurals'.(circle needle
body, triangle surface, closed form: urban, opened form: sub-urban)
As we can see in table and figures, the concentration of elements on pine needle body and surface are very different
with growing regions and sampling seasons.
The concentration ratios of major elements, rare earth elements and trace elements in the part of rice based on soil
were presented in Fig. 4, 5 and 6, respectively. Fig. 7 and 8 also show the concentration of several elements in
soybean and other crops. In Fig. 4 and 6, we can see that the trends of concentration ratios for major and trace
elements are very similar in three regions. However, in Fig. 5, the concentration ratios of rear earth elements have
different characteristics with regions and rice parts.
In case of soybean in Fig. 7, almost all elements except for Ca, K and Zn have sinilar trends for the concentration
ratios. The trends are also similar in other crops of Fig. 8.
- 252 -

JAERI-Conf 2001-017
Rotvs Il Stri vs WdI3 2
00 0b 1 aI-
Na Ro Aa K KtM i 4 a
BaEl i t Bef~tel
Packly vsSoil
Nf--
2- -, P~253 -

JAERI-Conf 2001-017
12 oao ~~~~~~~~~~~~~~~Stern vs Sn6Pbo vs So IlRmsSi12 V + F> \ O03D t
025~~~~~~~~
1.0 \ 0 0 b 0
0 08~~~~~~~~~~~~~2
O 0.6 0 ep QOo ° .
026 - OrD o* o c Xt;
0.00010 0~~~~~~~~
0~~~~~~~~~~~~~~~~~~~~ 0
0~~~~~~~
0.0 ~ ~ ~ 01- _ _ __ _ _
>2q E7FS,:-P Lb E 9- :1 g36i:tge~E
BBnint
Pacd \0 Sdl
1: FkN4-a0.08 0 N,* 4 ° -b
-V - pwP-c
.. ,,,, .. ._- .. .. .. .. .
Fig. 5. Concentration ratio of rare earth elements in the part of rice based on soil from three regions.
-254 -

JAERI-Conf 2001-017
Ro vs Sdl stem vs Sol3 _ 6 l
M ~ ~~~~ Rx- o Iso2 g -°c-o-FH-c 41 -\ $-j(0~~~~~~~~
~~v0 }2 40~~~~~
13en3t 3 srOnt
Pait \,S SdlI0.35 - _ -
3P020 .0 l t
00i
0-~ ~~~~~~~~
Fig. 6. Concentration ratio of trace elements in the part of rice based on soil from three regions.
- 255 -

JAERI-Conf 2001-017
Soybean3
--3-| Bean. 0.- Stem
2 --.- _ Root
0
Sm Bt Ca N. La Co T'h CrS' R'b Fe Zn C'o E'u
Element
Fig. 7. Concentration ratio of trace elements in the part of soybean based on soil from three regions.
Crops
: O Pepper ~~~~~~~~Leaf5 --. V Rapper Berry
: A~~~~~~-7 ~Sweet P Leafirk~~~~~~~~-~ S eeam .La
0 .,/2,a -'- M-ngbaan
z 3 10, \ /:\
0~~~~~~~~~~~~~~~~~~~0
Sm Br Ca No K La Co Th Cr Sc Rb Fe Zn Co Eu
Element
Fig. 8. Concentration ratio of trace elements in the part of crops based on soil from three regions.
Conclusion
In the present work we investigated sampling, preparing and analysis procedures of soil and several plants for NAA.
Elemental concentrations in pine needle were compared with seasons and sites. Cleaning effect of surface on pine
- 256 -

JAERI-Conf 2001-017
needle were also investigated. Concentration ratios based on soil in each part of crops also investigated. Sampling and
preparing procedures of the samples could be optimized for NAAN Therefore in conclusion this work confirms the
validity of pine needle and rice as environmental biomonitor for pollution caused by various elements. And NAA
could be applied to analysis the environmental geologic samples.
- 257 -

l1111 111111 Ill 11111 111 llll lll hIDl 11111 11111 liii liiJP02501 08
JAERI-Conf 2001-017
1.24 Application of NAA in High Purity Materials
Yoon-Yeol Yoon, KiR-Yong Lee
Korea Institute of Geoscience and Mineral Resources(KJGAM), 30 Kajung-dong, Yusung-gu,
Daejon Korea 305-350
The analysis of trace impurities in high purity materials is important. Some
impurities could change the property of the device. But these materials are
extremely difficult to dissolve and could be contaminated by chemical pretreatment.
Therefore, limiting the application of analytical methods that rely on the sample
being in solution. NAA has been found to be extremely useful in the
determination of trace impurities in high purity materials. Because this method
possesses several important advantages such as freedom from blank, multi-
elements determination and chemical contamination free. Using these
characteristics, some high purity materials were analyzed by the radiochemical
neutron activation analysis(RNAA). The impurities in some refractory metals
such as Mo, W, Ta, Nb and Ti, Ni, were separated using ion exchange and solvent
extraction method. The chemical yield was acquired by tracer analysis method
and the analytical accuracy was confirmed by analyzing certified reference
materials. And also., impurities distribution characters were investigated by
analyzing semiconductor silicon wafers using instrumental neutron activation
analysis(INAA).
Introduction
High purity refractory metals are attracting attention as they have useful properties such as
corrosion resistance, good thermal conductivity, high melting point and superior gettering
characteristics. In order to increase the usefulness as a base material for electronics, and for
chemical and nuclear reactor equipment, impurities in high purity materials should be
minimized. Neutron activation analysis is well known to be a excellent method for the
analysis of trace impurities in high purity metals. On irradiation with reactor neutrons, high
matrix activity makes difficult for the analysis of impurities in the sample. So, radiochemical
separation procedure has to be applied.
In the analysis of refractory metal, separations on a strong anion exchange resin .from a
mixture of hydrofluoric acid and hydrochloric acid have become classical techniques. The
behavior of elements in these systems has been studied in detail by several authors. The high
distribution coefficient of tantalum and niobium in concentrated hydrofluoric acid enable their
quantitative separation from a large number of elements which are of interest as relevant
-258 -

JAERI-Conf 2001-017
impurities. And also, the impurities in tungsten and molybdenum are separated using anion
and cation exchange resin. High purity nickel sample is separated using solvent extraction
with 2-benzylpyridine(BPy). And impurities distribution characters are investigated by
analyzing semiconductor silicon wafers using instrumental neutron activation analysis(INAA).
Experimental
Reagents and Instruments; The reagents used for the radiochemical separation methods were
OR grade reagents and ion exchanges were 200-400 mesh size anion(Dowex 1X8, cloride
form) and cation(Dowex 50X8, hydrogen form). The ion exchange resins were classified by
sedimentation and then conditioned by successive washing with the eluents. The prepared
resins were poured into column tube to make a column length of 8 cm. Ion exchange column
was pre-equilibriated by passing sufficient volume of eluent through the resin column at a flow
rate of 2 mi/min.
For the detection of -rays emitted from radio-tracers, high purity germanium detector was
used. The detector efficiency was 30% and energy resolution was 1.9 keV at 1332 keV.
Measured y-ray spectrum was amplified and stored at 4k channel multichannel analyzer. The
peak identification and activity determination of each nuclides were done by the "Gamma
Vision" EG&G Ortec software.
Tracer Experiments ; High purity Nb and Ta materials were dissolved with 10 ml mixture of
concentrated hydrofluoric and nitric acid(9:1 volume ratio). The appropriate activities of each
tracer were then added. The solution sample was dried by heating and redissolved in 5 ml of
2M hydrofluoric acid. The solution was passed through the anion exchange resin column and
separated each tracers successively with appropriate eluents. This separation procedure was
shown in Fig. 1. And also, analytical procedure of the trace impurities in high purity
molybdenum and tungsten were shown in Fig. 2 and 3. The most important trace impurities,
U and Th, were quantitatively separated with hydrochloric and hydrofluoric acid eluents.
Another important chemical and electrical material, titanium was also analyzed by ion exchange
method. This procedure was shown in Fig. 4. In this method, hydrobromic acid eluent
was effectively separated trace impurities from the matrix.
Solvent extraction method applied for the analysis of high purity nickel samples was shown
in Fig. 5. Nickel sample was dissolved in 0.1M hydrochloric acid and impurities were
effectively separated from the matrix by IM KSCN/1M BPy solvent.
Semiconductor silicon wafer was divided into three parts; central sample was taken from a
site less than 1 cm from the center, middle one from a site 5-6 cm from the center and outer part
from a site less than 1 cm from the edge. All the samples were treated by washing, etching
- 259 -

JAERI-Conf 2001-017
and rinsing procedures, sequentially. The distribution of impurities was investigated by
analyzing above three kinds of samples.
Results and Discussion
As niobium and tantalum have similar chemical properties, the separation scheme in the
present work has been developed based on tantalum separation, the main impurity, from
niobium. For the separation of impurities of niobium and tantalum, four kinds of eluents
were used. At first 2M hydrofluoric acid was eluated and 32M hydrofluoric acid was eluated.
After then, the mixture of O.5M hydrofluoric acid and 3M hydrochloric acid, the mixture of IM
ammonium fluoride and 4M ammonium chloride were passed through the anion exchange
column successively. The recovery yield of each nuclide was shown in table 1. In this table,
most impurities were quantitatively separated. Using this separation scheme, two kinds of
99.9% high purity tantalum samples were analyzed and the results were shown in table 2.
Molybdenum and tungsten produce high activity by neutron activation. So, radiochemical
separation method was applied. The important alpha emitting trace impurities, uranium and
thorium, and some other elements were quantitatively separated from matrix element using
anion and cation exchange resin and the separation yields were represented in table 3 and 4.
Due to low specific weight, high corrosion resistance and melting point properties of titanium,
it was widely used in various fields. Their property was affected by the presence of some trace
impurities. When titanium was exposed to reactor neutron, it produce long-lived scandium
radionuclides by (n,p) reaction. The scandium was effectively separated from trace impurity
using cation exchange resin and 6.5M hydrobromic acid. The separation yield was shown in
table 5. Using this procedure, two kinds of 99.99% high purity titanium was analyzed and the
results were shown in table 6. Nickel is another important metal used in catalyst, magnet and
electronic equipment. For the analysis of high purity nickel radiochemical neutron activation
analysis using solvent extraction was applied. The separation of cobalt and other 27 elements
was studied using tracers. The major interfering nuclide, cobalt, was extracted into organic
phase in the form of BPy3Co(SCN)2 and other trace impurities are quantitatively separated into
aqueous phase. The distribution coefficient of each element in two kinds of organic phase are
represented in table 7 and analytical results of four kinds of high purity nickel samples are
shown in table 8.
The distribution of impurities in semiconductor silicon wafer was investigated using INAA.
Surface contaminated elements were studied by washing samples with deionized water, aceton,
trichloroethylene and etching with the mixture of concentrated nitric and hydrofluoric acid.
The analytical results of above experiment are shown in table 9.
By the radiochemical neutron activation analysis(RNAA), it has been found that RNAA is
- 260 -

JAERI-Conf 2001-017
the most powerful tool for the element analysis in various high purity metal samples. Trace
impurities in high purity metal samples could be analyzed by RNAA and considerable
improvement in the detection limit achieved.
Reference
1. J. Hoste, F. DeCorte, W. Maenhaut, "Application of Nuclear Activation Analysis: High Purity
Materials", Treatise on Analytical Chemistry, I.M. Kolthoff, P. elving, V. Krivan ed., 2nd ed.
Part I, Vol. 14, Wiley Intersciencs, New York, 1986, p.645.
2. R. Caletka, R. Hausbeck, V. Krivan, J. Radioanal. Nucl. Chem., 120 (1988) 319.
3. R. Caletka, V. Krivan,, Talanta, 30 (1983) 465.
4. M. Ebihara, J. Radioanal. Nucl. Chem., 11 (1987) 385.
5. S. Zuha, A. Rusheed, J. Radioanal. Nucl. Chem., 133 (1989) 241.
6. K.S. Park, N.B. Kim, H.J. Woo, K.Y. Lee, Y.Y. Yoon, S.K. Chun, J. Radioanal. Nucl. Chem.,
168 (1993) 497.
7. K.S. Park, N.B. Kim, H.J. Woo, K.Y. Lee, Y.Y. Yoon, W. Hong, J. fadioanal. Nucl. Chem.,
179 (1994) 81.
8. K.S. Park, N.B. Kim, Y.S. Kim, K.Y Lee, H.W. Choi, Y.Y. Yoon, J. Radioanal. Nucl. Chem.,
123 (1988) 585.
9. N.B. Kim, K.S. Park, H.J. Woo, K.Y. Lee, Y.Y. Yoon, D.K. Kim, J. Radioanal. Nucl. Chem.,
160 (1992) 539.
10. K.S. Park, N.B. Kim, K.Y. Lee, Y.Y. Yoon, S.K. Chun, J.H. Lee, J. Radioanal. Nucl. Chem.,
192 (1995) 155.
11. Y.Y. Yoon, K.Y. Lee, G.H. Lee, J. Radioanal. Nucl. Chem., 210 (1996) 55.
12. K.S. Park, N.B. Kim, H.J. Woo, D.K. Kim, J.K. Kim, H.W. Choi, J. Radioanal. Nucl. Chem.,
151 (1991) 373.
-261 -

JAERI-Conf 2001-017
Irradiated Nb, Ta (100 mg)
<- dissolved in HF/HNO3
evaporated until crystals appeared
redissolved in 3 ml 2 M HF
2M HF 32M HF O.5M HF/ 1M NH4F/3M IHCI 4Mt NH4CI
Co Cr, Fe K Hfe Mo, W As, Eu Hf. Nb Ta
M~n, Na, Sec Zn Mo, Sc, W. Zr
Fig. 1. lFlow chart for the separation of imnpurities in niobiumn andtantalum
- 262 -

JAERI-Conf 2001-017
Irradiated W(100 mg)
<- dissolved in 5 ml HF/HNO3
heat near to dryness
redissolved in 10 ml 0.05M HCI/1M HF
0.05M HCll IM HCI! 9M HCI/IM IF 1M[ 1HF IMt H:F
As, K, Na, Cr, Th, U, W
Fig. 2. Flow chart for the separation of impurities in tungsten.
- 263 -

JAERI-Conf 2001-017
Irradiated Mo(200 mg)
- dissolved in 5 ml HCI/HNO3
<- heat to dryness
redissolve in 30 ml H20/1 ml H202
1st por on 2nd portion Co, Cr, Cs, Fe, La,
(K, Na) Rb, Sm, Zn, Zr
heat near to dryness
<-redissolve in 15 ml H120/1 ml 11202
<-- Add 15 ml conc. HN0 3
7M HNO 3FM HOi
(0.3% % 202) {
discard Th, U
Fig. 3. Flow chart for the separation of impurities in molybdenum.
- 264 -

JAERI-Conf 2001-017
Irradiated Ti
<- dissolved in 10 MB HF/HNO3
evaporated near to dryness
<-redissolved in 3 Mg 6.5M HBr
6.5M HBr 4M HC
V~~~~
As, Ce, Co, Cr, Cs, Sc
Fe, Hf, La, Mo, Na,
Sb, Se, Sr, Ta, Tb,
Th, U, W, Yb, Zr
Fig. 4. Flow chart for the separation of impurities in titanium.
- 265 -

JAERI-Conf 2001-017
Ni metal
- dissolved in HNO3
- add tracers
- evaporated to dryness
X < redissolved in O.1M HCI
Separatory funnel
aqueous phase | organic phase
alkali, REE, Ba, Cr, Co, Fe,
Hf, Rb, Ru, Sb, Sc, MO, Zn
Sr, Th, U, Zr
Fig. 5. Flow chart of radioactive tracer work for the separation of impurities
from Co in case of using 1M-KSCN and iM BPy.
- 266 -

JAERI-Conf 2001-017
Table 1. Separation yields of impurities from tracer work(%)nuclide 2M HF 32M HF 0.5M HF/ IM NH4F/
3M HCI 4M NH4 C1Co-60 99.9Cr-51 98.1Fe-59 98.2K-42 99.7Mn-54 99.6Na-24 99.4Zn-65 100.4Mo-99 - 96.8W-187 - 98.1Hf-181 - 99.9As-76 - - 99.3Eu-152 - - 98.8Hf-181 - - 100.0Mo-99 - - 97.6Nb-94 - - 100.0Sc-46 - - 99.3W-187 - - 99.4Zr-95 - - 99.9Ta-182 - - - 99.7
- 267 -

JAERI-Conf 2001-017
Table 2. Analytical results of impurities in tantalum. (ppm)element sample 1 sample 2
As 0.0041±0.0010 0.011±0.003
Co <0.003 0.027±0.001
Cr 1.9±0.3 14±1
Eu <0.1 0.0040±0.0003
Fe <3 16±1
Hf 0.38±0.03 0.0030±0.0005
K 1.9±0.3 16±1
Mn 0.080±0.003 0.65±0.02
Mo 110±8 1.4±0.2
Na 2.2±0.1 3.6±0.1
Sc <0.002 <0.002
W 0.55±0.04 0.22±0.02
Zn <0.2 <0.2
Zr <2 <2
* sample 1 Johnson & Matthey Co.(BN-625291, 99.95%)sample 2: Shoa Cabot Supermetals Co.(DCUH-8-1481LDX, 99.9%)
Table 3. Recovery yield of tungsten tracer worktlement added(ug) found(ug) yield(%)
Na 22.2 21.7±1.2 97.3±5.3
K 96.1 94.2±2.9 98.0±3.0
As 10.2 10.0±0.2 98.0±2.0
U 15.5 14.8±0.9 95.5±5.8
Th 33.3 33.0±0.6 99.1±1.8
Cr 141.7 137.9±6.6 97.3±4.7
- 268 -

JAERI-Conf 2001-017
Table 4. Recovery yield of Mo tracer work.element added(ug) found(ug) yield(%)
U 21.1 20.7±1.0 98.1±4.7Th 42.9 36.0±3.6 84.1±8.4Co 3.8 3.77±)0.03 99.2±0.8Cr 120.4 117.4+6.5 97.8±5.4Cs 27.0 26.6±0.8 98.5+3.0Fe 203.8 191.7±11.4 94.1±5.6K 123.7 122.9±1.2 99.4±1.0La 1.15 1.16±0.03 100.9±2.6Na 22.8 21.8±1.3 95.6±5.7Rb 83.6 80.1±4.5 95.8±5.4Sm 15.4 15.9±0.7 103.0±4.5Zn 45.6 44.8±1.9 98.2±4.2Zr 251.3 251.9±2.5 100.2±1.0
Table 5. Separation characteristics of elements by Ti tracer work.(Recovery Yield, %)
Cation ColumnElement
Resin 6.5M-HBrlOO MB) 4M-HCI(100 MB)Sc - - 100Ba - 100Ce - 99 1Co - 100
Hf - 100Nd - 1(0 -Pa - 98 2Sb - 100Se - 98 2Ta - 100Th - 100Yb - 99 1Zr - 100
- 269 -

JAERI-Conf 2001-017
Table 6. Analytical results of high purity titanium metals by NAA.
(unit: ppm)Johnson & Matthey Supetter Target(Japan) Maximum
ElementINAA RNAA INAA RNAA Limit
As <0.04 0.026 <0.08 <0.04Co <0.18 0.037 <0.06 <0.03Cr 3.6 4.8 1.8 2.0 2Cs <0.27 0.017 <0.13 <0.04Fe 150 150 <56 <30 2Hf <0.49 0.39 <0.08 <0.02Mo <16 <2.9 <2.8 1.2Na 120 118 <0.2 <0.03 0.1Sb <0.2 0.15 <0.13 <0.06Se <1.3 <0.69 <0.58 <0.22Ta <0.18 0.16 <0.08 <0.02W <0.1 0.27 <0.25 <0.01Zr <5 3.6 <6.8 <3.4Ce <0.9 <0.6 <0.36 <0.28Tb <0.16 <0.06 <0.09 <0.03Yb <0.19 <0.09 <0.09 0.04Th <0.16 <0.08 <0.07 <0.03 0.001
- 270 -

JAERI-Conf 2001-017
Table 7. Distribution coefficient of some elements in 0.1M HCI!1M BPy
element D(benzene) D(benzene/acetone)As 0.01 0.01Ba 0.02 0.03Ce 0.( 2.64Co 43 90Cr 0.09 0.(1Eu 0.01 0.01Fe 14.3 140Hf <0.01 4.6K <0.01 <0.01La <0.01 <0.01Lu <0.01 <0.01Mo 39 0.23Na <0.01 <0.01Nd 0.02 0.03Np(U) 0.02 0.02Pa(Th) 0.13 0.05Rb ().02 0.02Ru 0.18 10.6Sb 0.06 0.03Sc 0.01 0.05
Se 0.02 0.03Sr 0.02 0.04Ta 0.01 0.04Tb 0.01 0.03W 0.03 0.03Yb 0.02 0.02Zn 55.6 120Zr 0.00 0.02
-271-

JAERI-Conf 2001-017
Table 8. Analytical result of high purity nickel(e/g)
element 1 2 3 4 5As 0.17±0.05 0.028±0.003 0.09±0.01 0.37±0.05 (0.4)Ba <25 <25 <25 <35Ce 0.4±0.1 0.049±0.004 0.08±0.01 0.15±0.04Cr 6±1 <0.4 0.75±0.08 3.2±0.6 (3)Eu 0.6±0.1 0.57±0.03 1.1±0.8 1.50+0.06Ht <0.04 <0.06 <0.05 <0.04K 0.25+.09 0.5+0. I <0.3 32±1La 0.021±0).006 0.016+0.004 0.012+0.002 0.030±0.005Lu <0.005 <0.04 <0.006 <0.006Na 0.7±0.1 1.3±0.1 0.32=0.05 3.4±0.5Nd <2 <3 <2 <3U <0.1 <0.2 <0.2 <0.2Th 1.5±0.2 1.30±0.03 1.4+0.3 3.9±0.2Rb <1 <2 <1 <3Ru <0.2 <0.3 <0.2 <0.2Sb 3.3±0.5 0.6±0.2 0.6+0.1 0.4±0.1 (<0.5)Sc 0.015±0.003 0.016±0.004 0.076±0.009 0.04±0.01Se <0.1 0.11±0).01 0.4±0.1 0.21±0.03 0.2Sr <30 <30 <25 <25Ta <0.1 <0.1 <0. I <0.1Tb 0.58±0.06 4±2 3.5±+0.8 2.6±0.4W 0.40±00.3 <0.06 <0.04 <0.06Yb 0.22±0.01 0.053±0.003 0.28±0O.04 0.028±0.003Zr 21±8 <30 9±1_ <30
* 1. Japan High Purity Chemical Institute Inc.2. Johnson & Matthey Co., nickel oxide3. Johnson & Matthey Co., nickel foil4. NIST SRM-673 nickel oxide5. NIST value0 * recommended value
- 272 -

JAERI-Conf 2001-017
Table 9. Analytical results for semiconductor wafers.
(unit: ppt)
element central region middle region outer region
washing etching washing etching washing etchingp-type wafer
Au 0.40 0.12 0.48 0.11 0.44 0.11Br 150 41 1400 33 960 31As 71 8.9 120 11 68 12W 150 14 370 14 480 14Co 87 65 51 48 86 57Cr 760 160 830 160 1200 120Eu 120 52 70 50 140 37La 970 180 150 110 170 110Sc 27 2.5 8.3 2.3 6.2 2.7Zn 1500 270 2000 260 1800 280U 350 160 270 160 290 200Th 75 9.7 88 12 120 9.9Hf 43 8.9 36 11 89 8.0Sb 190 63 96 58 70 53Fe(ppb) 59 12 130 13 280 16
n-type waferSb(ppm) 180 170 160
- 273 -

JAERI-Conf 2001-017
1.25 The Study of Trace Element Distribution in
Biological Samples with NAA for Human Health
Seung Yeon Cho, Sang Hun Kang, and Yong Sam Chung
Dep& of Environmental Engineering, Yonsei University
"Korea Atomic Energy Research Institute
A one day representative mixed diet of an adult Korean was collected from the data
based on the food intake of 108 healthy subjects between the ages 20 and 50. Sampling
for the Korean total diet was carried out by the way of using a market basket study
based on the Korean standard food consumption scheme reported by the Korean
Nutrition Society. Average consumption frequency of different food items for a one day
representative mixed diet of an adult Korean and the amount of each item to prepare a
one day Korean representative total diet are surveyed. The analytical methods involve
both instrumental and radiochemical neutron activation techniques developed for the
determination of the elements Cs, I, Sr, Th and U in various kinds of food samples.
Concentrations of trace elements including 5 important elements for radiological
protection, U, Th, Cs, Sr and I in the Korean total diet and the 4 most frequently
consumed Korean foodstuffs have been analyzed by neutron activation analysis.
Detection limits for U, Th, Sr and I were improved to ppb levels by radiochemical
separation after neutron irradiation. Five biological NIST reference materials were also
analyzed for quality control of the analysis. Seventeen trace elements in the Korean
total diet and four Korean representative foodstuffs were also analyzed quantitatively by
instrumental neutron activation analysis.
The elemental distributions in supplemental healthy food and Korean and Chinese
origin oriental medicine were also identified. The amount of trace elements ingested
with the hair analysis of oriental medicine takers were estimated. The amounts of trace
elements inhaled with the analysis of foundry air, blood and hair of foundry workers
were also estimated. The basic estimation method in view of health and environment
with the neutron activation analysis of biological samples such as foods and hair was
established with the result.
Nationwide usage system of the NAA facility in Hanaro in many different and
important areas of biological area can be initiated with the results. The output of the
project can support public health, environment, and medical research area. The results
- 274 -

JAERI-Conf 2001-017
can be applied for the process of rnicronutrients enhanced health food production and forthe health safety and health status enhancement with the additional necessary dataexpansion and the development of various evaluation technique.
Introduction
The advances in trace element analytical techniques have led to the
re-examination of much of the published data for trace elements in foods
and body fluids (13). Determination of trace mineral intake is important
not only for assessing nutritional status but also for estimating the
metabolic parameters of uptake and deposition of radionuclides such as
137Cs, "'I, 'Sr, 'Th and 'U in the human body. To control the
radiation hazard, it is important to have reliable data on food types in
which these radionuclides tend to accumulate, once they are released in
the environment. A proper control can be exercised on the distribution of
various food types in case of a nuclear emergency with established
reliable data. It is aiso important to have accurate knowledge of the
biokinetic behaviour of the above radionuclides in humans for realistic
assessment of radiation dose4.
Studies on intakes for different age groups are scarce in the literature.
This paper describes the daily intake of 22 elements for Korean adults.
Quantitative data were collected by performing instrumental and
radiochemical neutron activation analysis(INAA & RNAA) following
collecting of a Korean representative total diet.
Experimental
Sample Collection
Sampling for the Korean total diet was carried out by using a market
basket study based on the Korean standard food consumption scheme
reported by the Korean Nutrition Society(5) Average consumption
frequency of different food items for a one day representative total diet of
- 275 -

JAERI-Conf 2001-017
an adult Korean which obtained from a food intake by study group for a
week was used and the amount of each ready-to-eat food item was
mixed to prepare a one day Korean total diet.
Sample Preparation
Immediately after the completion of the initial blending of the prepared
one day Korean representative total diet in a blender with titanium
blades, an analytical sub-sample representing about 20% of the total diet
was withdrawn using a large plastic spoon and placed in a container for
freeze-drying. Samples were initially frozen at -801C for 3 hours and
freeze-dried for 30 hours at the same temperature. The four most
popular Korean representative foodstuffs were also collected and
freeze-dried. Their weight loss after freeze-drying is listed in Table 1.
Samples of meat and fish cannot be dried fully because of their large oil
content. Solvent (chloroform:methanol, 2:1 V/V) was added to the
samples containing a large amounts of oil component with the ratio of 1:3
and shaken well. Oils in upper level were discarded and the remaining
solution was stored for a day and freeze-dried. Freeze-dried samples
were ground well to get sample homogeneous for the analysis. Samples
were stored in polyethylene vials at 2 - 4 C- for short term storage and
in a Teflonim vial at below -151C for long term storage to avoid
absorption or evaporation which may cause a change of elemental
concentrations.
Table 1. Weight loss after freeze-drying of the Korean total diet and
Korean representative foodstuffs
Habitat Wet Diet Freeze-drying
Total Diet Korea 1120.0 g 130.2 g
Boiled Rice Kanghwa 268.1 9 76.8 g
Kimch'i Chungju 315.0 g 27.4 g
Mackerel East Sea 309.2 9 142.2 g
Beef & Pork Wonju 338. g 138.3 g
-276 -

JAERI-Conf 2001-017
Neutron Activation Analysis
Samples were irradiated with thermal neutrons from the HANARO
research reactor (20 MW) at the Korea Atomic Energy Research Institute.
The Pneumatic Transfer System (PTS) was used for sample irradiation.
Samples were irradiated at the same geometrical position to minimize the
geometry error. For neutron flux monitoring, activation wire (Reactor
Exp. Inc., R/A activation wire, 99.99% purity) such as Au, Cu. and Mn
were used to monitor the thermal neutron flux (Ot = 1.7X10¹³ Cm-2 S-1).
Samples were allowed to decay for an appropriate time to ensure
satisfactory detection limits. Radiochemical separation processes were
needed to quantify the ultra-trace elemental concentrations of Th, U, Cs
and I in Korean total diet.
Radioactivity Measurement
Garnma-ray spectra and activity for the irradiated samples were
obtained with the following equipment. The crystal of the high purity
germanium serni-conductor detector (EG&G ORTEC, GMX-25190P) was
surrounded with a 10 cm thick lead shielding box (75x90x90 cm) with its
inner wall lined with 0.1 cm Cd and Cu plate to reduce the influence of
the external radiation. Gamma-ray interactions with surrounding material
were also considered. The detector is a coaxial type with 25% relative
efficiency and 1.9 keV resolution (FVVHM) at 1332 keV (60Co) and a peak
to Compton ratio of 45:1. The detector was connected to a personal
computer and a 8K-multichannel analyzer (EG&G ORTEC, 919A MCB,
Maestro-II) to complete the Y-ray spectrometer for activity measurement
and data analysis. Energy and efficiency calibrations were done with the
radioactive multinuclide reference source (NEN Products Inc., NES-602, 1"
diameter disc type) certified by NIST. The dead time of detector was
maintained under 5% as much as possible. Decay and pile up correction
were done automatically.
- 277 -

JAERI-Conf 2001-017
Data Treatment
Concentrations of elements were calculated with a new graphical
programme, POWER NAA, coded with LabView version 5.0 for rapid and
simple data treatment after obtaining the 7' -ray spectrum under the
preset analytical condition. The program is run with the counting
condition, automatic identification of nuclides and their r -ray energies,
decay time correction for short half-life nuclides in order to calculate
activities, elemental concentrations, counting errors and detection limits.
Elemental concentration was calculated from peak area which is measured
by Y-ray activity along with the related nuclear data(67).
Results and Discussion
Five biological reference materials such as NIST SRM 1548(total diet),
NIST SRM 1567a(wheat flour), NIST SRM 1547(peach leaves), NIST
SRM 1566a(oyster tissue) and NIST SRM 1577b(bovine liver) were
analyzed mainly by instrumental neutron activation analysis for quality
control (Table 2-6). The elemental concentrations, relative standard
deviations, and relative errors to certified values were calculated. After
the repetitive analysis( !5 times), the relative standard deviations were
within 10% except for Fe(12.4%) in SRM 1548, Rb(11.7%) and V(23.9%)
in 1567a, Ce(14.4%) and La(15.7%) in 1547 and V(12.9%), Rb(15.8%) and
Sc(10.8%') in 1566a The relative errors to certified values are within 5%
except for K(7.2%) and Zn(10.9%) in 1548, Mn(10.2%) and Rb(7.9%) in
1567a, CM(1.2%), Fe(9.3%) and Rb(5.8%) in 1547, Cd(5.4%), Cl(7.6%),
Co(5.7%) Cr(6.6%), Cu(7.2%), K(10.2%) and Zn(23.1%) in 1566a and
Cu(8.7%), K(7.1%), Rb(8.6%) and Zn(9.4%) in 1577b. Analytical results
of elemental distribution in Korean total diet and four Korean
representative foodstuffs are listed in Table 7-11.
- 278 -

JAERI-Conf 2001-017
Table 2. Analytical Result of Total Diet, NIST SRM 1548 by NAA
(unit: ppm)
Certified This Work Relative
Element Value(SD.%) Range Mean(S.D.%) Error(%)
Ca 1740 (4) 1676-1765 1735 (0.08) 0.31
CL 8700 (5) 8210-8883 8460 (5 63) 2.76
Fe 32.6 (11) 30.4-36.4 34.2 (12.4) 4.83
K 6060 (5) 5049-5958 5621 (1.28) 7.24
Mg 556 (5) 521-568 551 (5.98) 0.95
Mn 5.2 (8) 5.00-5.39 5.25 (0.4) 0.94
Na 6250 (4) 6352-6605 6460 (2) 3.36
Se 0.245 (2) 0.24-0.27 0.26 (4.9) 4.79
Zn 30.8 (4) 32.5-36.3 34.2 (7.89) 10.9
Al [331 32.6-37.7 34.4 (10.4)
Cs [0.0143 0.0141 -0.0149 0.014 (5.5)
Rb [4.8] 4.78-5.01 4.92 (3.32)
Sn [3.61 3.10-3.49 3.29 (8.31)
[ ] reference value
- 279 -

JAERI-Conf 2001-017
Table 3. Analytical Result of Wheat Flour, NIST SRM 1567a by NAA
(unit: ppm)
Certified This Work RelativeElement Value(S.D.%) Range Mean(S.D.%) Error(%)
Al 5.7 (22) 5.25-5.99 5.72 (8.09) 0.3
Ca 191 (2) 178-200 188 (5.04) 1.47
Cu 2.1 (10) 2.01-2.27 2.14 (8.40) 1.86
Fe 14.1 (4) 12.9-15.1 14.3 (0.69) 1.7
K 1330 (2) 1239-1303 1271 (3.56) 4.46
Mg 400 (2) 401-414 405 (2.15) 1.3
Mn 9.4 (5) 8.42-8.48 8.45 (0.18) 10.2
Na 6.1 (13) 6.13-6.36 6.25 (1.35) 2.42
Rb 0.68 (4) 0.66-0.78 0.73 (11.7) 7.92
Se 1.1 (18) 1.10-1.19 1.15 (3.26) 4.39
Zn 11.6 (3) 12.0-12.2 12.2 (1.11) 4.71
Cl [565] 528-547 535 (0.08)
Co [0.006] 0.0058-0.0062 0.006 (4.69)
V [0.0111 0.0138-0.018 0.0154 (23.9)
-280 -

JAERI-Conf 2001-017
Table 4. Analytical Result of Peach Leaves, NIST SRM 1547 by NAA
(unit: ppm)
Certified This Work Relative
Element Value(S.D.96) Range Mean(S.D.%) Error(%)
Al 249 (3) 242-253 249 (2.61) 0.05
Ba 124 (3) 124-129 126 (2.63) 1.8
Ca 15600 (1) 14720-15210 14950 (0.95) 4.17
Cl 360 (5) 306-322 312 (1.02) 13.2
Fe 218 (6) 234-242 238 (2.35) 9.25
K 24300 (1) 23090-23190 23137 (0.12) 4.79
Mg 4320 (2) 4150-4450 4307 (2.79) 0.31
Mn 98 (3) 93.7-96.7 95.1 (2.23) 2.95
Na 24 (8) 22A-23.4 22.8 (2.98) 5.15
Rb 19.7 (0) 18.9-22.1 20.9 (8.89) 5.84
Sr 53 (8) 47.3-54.2 51.7 (9.38) 2.44
V 0.37 (8) 0.34-0.38 0.37 (6.06) 0.97
Zn 17.9 (2) 16.8-18.7 17.7 (2.64) 1.21
Br [11] 10.5-12.0 11.4 (2.37)
Ce L[O] 9.19-11.7 10.8 (14.4)
Co [O.071 0.071-0.076 0.074 (3.92)
Cr [1 1.16-1.20 1.18 (1.14)
La 9 9,44-12.0 11.1 (15.7)
Nd [71 6.84-7.69 7.22 (5.29)
SC [0.041 0.045-0.054 0.050 (6.85)
Sm Ill] 1.14-1.22 1.19 (3.87)
Tb [0.11 0.10-0.11 0.11 (3.98)
Th [0.051 0.049-0.0548 0.051 (0.42)
-281 -

JAERI-Conf 2001-017
Table 5. Analytical Result of Oyster Tissue, NIST SRM 1566a by NAA
(unit: ppm)
Certified This Work Relative
Element Value(S.D.%) Range Mean(S.D.%) Error(%)
Ag 1.68 (9) 1.55-1.78 1.66 (4.51) 1.07
Al 202.5 (6) 193-213 204 (2.42) 0.84
As 14 (9) 13.7-15.2 14.4 (3.63) 3.05
Ca 1960 (10) 1857-1983 1936 (4.6) 1.22
Cd 4.15 (9) 4.36-4.39 4.37 (0.58) 5.4
Cl 8290 (9) 7501-7932 7656 (3.66) 7.64
Co 0.57 (19) 0.60-0.61 0.60 (1.8) 5.7
Cr 1.43 (32) 1.47-157 1.52 (4.92) 6.6
Cu 66.3 (6) 60.7-62.4 61.5 (1.93) 7.2
Fe 539 (6) 529-570 552 (3.5) 2.39
K 7900 (6) 6720-7726 8.45 (0.18) 10.2
Mg 1180 (14) 1139-1204 1165 (0.85) 1.24
Mn 12.3 (12) 11.8-12.3 12.0 (2.77) 2.28
Na 4170 (3) 4047-4271 4185 (3.19) 0.35
Se 2.21 (11) 2.20-2.48 2.30 (8.12) 4.01
V 4.68 (3) 4.13-4.97 4.57 (12.9) 2.26
Zn 830 (7) 1004-1034 1022 (2.08) 23.1
Au [0.01] 0.013-0.017 0.015 (6.27)
La [0.31 0.29-0.30 0.30 (0.91)
Rb [3] 2.76-3.46 3.11 (15.8)
Sc [0.061 0.059-0.069 0.066 (10.8)
Sm [0.06] 0.058-0.061 0.059 (1.32)
-282 -

JAERI-Conf 2001-017
Table 6. Analytical Result of Bovine Liver, NIST SRM 1577b by NAA
(unit: ppm)
Certified This Work Relative
Value(S.D,%) Range Mean(S.D.%) Error(%)
Ca 116 (3) 113 113 2.5
C1 2780 (2) 2633-2685 2657 (0.85) 4.42
Cu 160 (5) 173-175 174 (0.73) 8.73
Fe 184 (8) i79-197 188 (2.97) 2.21
K 9940 (0) 9 -60-9572 9238 (3.92) 7.07
Mg 601 (5) 594-658 620 (1.5) 3.12
Mn 10,5 (16) 9,82-10.4 10.1 (2.89) 3.41
Na 2420 (2) 2299-2391 2345 (1.42) 3.11
Rb 13.7 (8) 13.8-16.4 14.9 (9.13) 8.59
S 7850 (1) 8013-8235 8124 (1.93) 3.49
Se 0.73 (8) 0.66-0.76 0.72 (2.33) 1.5
Zn 127 (13) 130-146 139 (7.84) 9.37
Co [0.25] 0,26-0.27 0.26 (0.81)
V [0.1231 0.108-0.115 0.110 (6.81)
- 283 -

JAERI-Conf 2001-017
Table 7. Analytical Result of Korean Total Diet by NAA
StandardElement Range Mean Value DeStaond
<ppm>
Al 16.1-18.3 17.6 1.28
Br 9.59 -- 10.6 9.95 0.58
Ca 1358-1496 1418 70.9
Cl 10870-11780 11353 458
Fe 23.7-26.0 25.2 1.32
I 1.59-2.01 1.81 0.30
K 5394-5706 5579 134
Mg 807-896 850 44.4
Mn 8.46-8.78 8.65 0.16
Na 10080- 10470 10298 162
Rb 5.43-5.49 5.46 0.03
Sr 5.3-5.80 5.55 0.36
Zn 31.6-33.7 32.5 1.13
ppb
As 493 -603 526 51.8
Co 29.6-31.6 30.8 1.06
Cr 348-420 393 39.4
Cs 10.6-11.6 11.1 0.71
Sc 3.2-3.6 3.43 0.21
Se 223 -328 276 74.5
Sm 46.1-47.5 46.8 0.99
Th 2.38-2.82 2.6 0.3
U 31.5-38.6 35 5.0
- 284 -

JAERI-Conf 2001-017
Table 8. Analytical Result of Korean Boiled Rice by NAA
StandardElement Range Mean Value De.td
<ppm>
Al 0.87 -1.19 1.03 0.23
Ca 83.3 -87.2 85.2 2.77
CT 298-331 316 16.6
Fe 2,22-2.34 2.28 0.085
K 757-786 775 12.3
mg 65.9-68.9 67.1 1.61
Mn 3.23-3.36 3.27 0.07
Na 109-112 110 1.25
Zn 16-17.3 16.6 0.69
< ppb
level >
As 103-142 130 18,1
Au 0.17-0.23 0.2 0.04
Br 645-742 679 43.9
Go 4.64-5.5 5.01 0.44
I 77-120 100 30
Mo 268-384 326 82.0
Rb 452-510 486 24.2
Sc 1.8-2.46 2.17 0.34
Sr 77-91 840 10
Th 0.1-012 0.11 0.02
U 2.7-4.2 3.5 1.0
- 285 -

JAERI-Conf 2001-017
Table 9. Analytical Result of Korean Kimch'i by NAA
StandardElement Range Mean Value
Deviation
<ppm>
Br 182-210 197 11.6
Ca 4022-4480 4284 236
Cl 115900-120500 118433 2335
Cr 1.10-1.44 1.30 0.16
Fe 49.2-54.8 51.4 2.97
K 27320-30770 29535 1604
Mn 26.6-30.6 29.1 2.22
Na 97790- 104500 99843 3167
Rb 22.8-28.0 26.1 2.47
Sr 22.3-25.2 23.8 2.06
Zn 425-46.5 44.7 1.70
<ppb>
Co 346-392 365 23.1
Cs 69.5-71.8 70.9 12.4
Sc 30-33.8 31.6 1.75
Th 4.1-5.75 4.9 1.2
- 286 -

JAERI-Conf 2001-017
Table 10. Analytical Result of Mackerel by NAA
StandardElement Range Mean Value Deviaton
<ppm>
Al 12.6-15.8 13.8 1.77
As 6.28-6.92 6.50 0.37
Br 16.3-- 18.5 17.3 1.01
Ca 3448 -3973 3675 2706
Cl 22980-24170 23747 665
Cr 0.88-1.37 1.14 0.21
Fe 45.3-49.4 47.6 1.75
K 11250-11790 11510 223
Mg 649-694 675 23.4
Na 2183 -2289 2230 53.3
Rb 1.06-1.39 1.17 0.15
Se 2.91-3.10 2.99 0.10
Sr 6.4 -7.54 7.0 0.8
Zn 35.7-39.8 37.3 1.89
<ppb>
Au 1.2-1.7 1.45 0.35
co 587-638 614 27.1
Cs 53.6-66.2 61.1 5.47
Sc 3.2-3.8 3.5 0.42
Th 0.85-1.07 0.96 0.15
- 287 -

JAERI-Conf 2001-017
Table 11. Analytical Result of Korean Mixed Pork and Beef by NAA
StandardElement Range Mean Value StandardDeviation
<ppm>
Al 17.6-21.4 19.5 2.68
Br 13.3-13.9 13.5 0.24
Cd 1.55-1.58 1.56 0.02
Cl 26020-26840 26343 437
Fe 39.8-46 43.4 2.81
K 11500-11930 11625 205
Mg 603-674 635 36.1
Na 2110-2205 2162 41.1
Rb 18.6-21.6 20.8 1.45
Zn 119-131 124 5.83
<ppb>
As 72.5-107 85 15.7
Co 13.6-17.3 15.4 1.74
Cr 337-683 515 143
Cs 34.6-46.2 40.2 5.62
Hg 33.8-36.9 35.4 2.19
1 150-250 200 70
Se 449-606 527 79.1
Sm 7.2-7.3 7.25 0.07
Sr 640 -870 760 150
Th 0.44 -0.53 048 0.05
Analytical results can be classified into four groups such as essential
minor elements(group 1 C Ca, K, Mg, Na), essential trace elements(group
2: Fe, Mn, Se, Zn), toxic trace eiements(group 3 Al, As, Cd, Cr, Hg)
and trace elements which are important for radiological protection(group 4
: Cs, I, Sr, Th, U). Elemental distribution of group 1 was in a range
from a few hundred to several ten thousand ppm. The concentration of
Ca in Kimch'i was the highest among Korean staple foodstuffs.
Elemental distribution in group 2 was below several tens ppm. Elemental
-288-

JAERI-Conf 2001-017
distribution of group 3 was below a few ppm except for Al. Arsenic
concentration in mackerel was ten times higher than that of the Korean
total diet. These results suggest that a specific enriched element in food
because of environment can be accumulated in the body system by an
individual's eating habit. Elemental distribution in group 4 of the
Korean total diet was in the order of U< Cs < Th < I< Sr. High U
concentration in the Korean total diet was probably from groundwater
used to prepare the Korean total diet. To identify the amount of U
contribution from water many different Korean total diet samples must be
prepared for analysis with various sources of water such as tap, surface,
bottled and ground water. Iodine concentration in the wet Korean total
diet can be 235pg/day which is greater than WHO's adult recommended
value, 150 , g/day. This shows Korean's eating habit of large
consumption of seaweeds and fishes.
The NAA results obtained from the various samples such as total
diet oriental medicine. indoor air and human hairs are summarized in
Table 12. We can say that trace elements introduced to human body
through inhalation and ingestion reflect elemental distribution in human
hair.
- 289 -

JAERI-Conf 2001-017
Table 12. Elemental Concentrations in Different Biological Materials and
Air to See Elemental Deposition in Hair
Ingestion [ppm] Inhalation [ng/m'] Hair [pmnJElement Total Tonc Ambient Foundry Common Foundry Tonic
Diet _ Air Air Person Worker Taker
Al 17.6 307 2305 - 25.9 14.6 20.7
As 0.526 0.159 9.09 163 0.234 0.107 0.232
Br 9.95 8.29 8.02 133 1.21 1.76 29.7
Ca 1 1 407 D-9 1097
C1 11353 759 577 142 598 597
Cr 0.393 1.09 5.73 M _
______ 40.2 -14.6 '
I 1.64 - 4.13 0.724 1.50 1.63
K 5579 5570 346 _ 16.7 - -
Mg 850 _ _ 114 175
Mn 8.65 13.9 1.19 1.20
Sb } - 0031 5.59 40 0.328 0.08 - ISc 0.003 0.048 0.054 74 - 0.06 _
Sr 5.55 S 6680 4.94 _
Th 0.0026 0.1.33 0.086 121 - _ _
U 0.035 _ 0.694 _
Zn 32.5 52.3 91.3 26800 410 241 205
Conclusions
Concentrations of trace elements including 5 important elements for
radiological protection such as U, Th, Cs, Sr and I in the Korean total
diet and four Korean representative foodstuffs have been analyzed by
neutron activation analysis and their results were listed in Table 2-6.
RNAA was used for Th, U, Sr and I determination because of their low
concentration(-ppb) in food and detection limits for U, Th, Sr and I were
improved by radiochemical separation after neutron irradiation.
- 290 -

JAERI-Conf 2001-017
References
1. Report of a Joint WHO/IAEA Collaborative Study, Geneva, World Health
Organization, 1989.
2. Trace elements in human nutrition and health, Geneva, World Health Organization,
1996
3. G. V. lyengar, Radiat. Phys. Chem., 51 (1998) 545.4. ICRP, Report of the Task Group on Reference Man, ICRP publication 23, Pergamon
Press, Oxford, 19755. Recommenoed Dietary Allowances for Koreans, 6th Revision, the Korean Nutrition
Society, 1966. G. Erdtmann, Nuftton Activation Tables, Voi. 6, New York, 1976
7. Handbook on Nclear Activation Analysis Data, IAEA Tech. fRept. No. 273, 1987
-291-

This is a blank page.

JAERI-Conf 2001-017
I .Workshop
Abstract & Papers
Research Reactor Utilization(BNCT)

This is a blank page.

JP02501 10JAERI-Conf 2001-017
1.26 Current Status of Operation and Utilization
with Several Research Reactors in China
Xu Hanming
China Institute of Atomic Energy
102413 Beijing 275(33) ,PRC
xuhming~iris.ciae.ac.cn
A general overview of operation and utilization in this year with
several research reactors in China are given. The involved reactors are
HWRR, SPR, HFETR and MJTR. As a result of great efforts on the
upgrading of safety system and renewal of old equipment, a good
availability of reactor operation has been achieved compared to that
in previous years. The research and production work have been
accomplished on schedule.
Utilization on these four reactors including PWR fuel element
and material testing, radioisotope production, silicon doping,
neutron activation analysis, etc. Some work on neutron scattering
are also briefed.
1. Introduction
Facing sustained requirements from unclear technology and nuclear power
development, the aged reactors in China are still asked to continue their service
on a safe operation basis before the new research reactor CARR is constructed.
The basic strategy to accomplish the above purpose is to renew essential
equipment and to strengthen aging management. Efforts on this aspect look
effective as the practical situation in the recent years has shown. In this paper,
status of operation and utilization is described for four research reactors, named
HWRR, SPR, HFETR and MJTR.
2. General Situation of the Reactor Operation
As mentioned above, all the four research reactors were designed and
- 293 -

JAERI-Conf 2001-017
constructed in the old years when the safety requirements and regulations were
not completely and well established. In addition, aging problems further worsen
safety and availability of these reactors. Based on these facts, under the
organizing and audit of National Nuclear Safety Administration (NNSA), a
retroactive safety review was performed for each of those reactors. As a result of
this activity, a series of equipment renewal and upgrading items were established
in order to make the safety level of those old reactors close to or approaching
modern requirements. After implementation of the equipment renewal and
upgrading, which took more or less than one year for each reactor, the safety
level and availability have been significantly improved. For example, the
operation duration, which is affected both by the tasks of the reactor utilization
and by the reliability of the components and systems, is increased in 2000 by 10
to 20 percent compared to that of past years. The number of unexpected reactor
scram has also been significantly decreased.
Table 1 gives basic parameters for the four reactors and also a list of
equipment renewal. A brief description of the general situation in 2000 for each
reactor is followed after the Table.
Table 1 Basic Data and Safety Upgrading for Four Reactors
Reactor Basic Data Increase System Renewal Other Improve
HWRR D2O coolant Emergence recirculation Emergence operationPool type Earthquake safety rod procedure15MW Two set diesel unitsfrom 1958 Safetyectior _ _
SPR H:-O coolant UPS system Motors of secondary Change protectionPool type Period protection pumps logic3.5MW Pool level protection Venting fansfrom 1964
HFETR H2O coolant Residual heat removalTank type Emergence electricity125MW Secondary emergencefrom 1979 cooling
MJTR H20 coolant Partially improvementPool type5MWfrom 1991
- 294 -

JAERI-Conf 2001-017
Heavy water Research Reactor (HWRR)
In this year, the reactor operates one cycle each month regularly including
power operation, maintenance and experiment preparation during shut down
duration. The accumulated operation duration in 2000 is about 20% longer than
ever. Due to reactivity requirement by the testing and irradiating material, the
average burn-up of the discharged spent fuel has to be decreased from 8000 to
6500 MWed/t. There are three unexpected reactor scram in this year all due to
instability or prompt loss of offsite power. Two principles are followed for aging
management of HWRR. The first is to implement an elaborated maintenance
plan. Actually during shut down duration three main pumps and two of the main
heat exchangers have been routinely maintained and cleaned, resin of the
ion-exchanger for the primary coolant purification system has been replaced,
and under-water in-core inspection has been carried out regularly. The second is
to apply a strategy based on reduced power operation. Quantitative study on the
corrosion and erosion of essential components shows that aging progress is not
linearly dependent on the reactor operation duration T. For a fixed value of PT.
the larger the power P (and the coolant flow rate), the more severe the erosion.
Therefore, instead of design power of 15 MW, the reactor is now usually
operated at a power not higher than 7.5MW unless the operation is engineered
for some kinds of special purposes. By these methods, it is believed that HWRR
can be safely operated till the new reactor CARR is constructed.
Swimming Pool Reactor (SPR)
Similarly, SPR has also been improved in safety and availability after
the equipment renewal and upgrading were accomplished. In this year, there are
three times of unexpected reactor scram, two due to loss of off site power in
very short time and the another is due to operator's error, The maintenance plan
has been strictly implemented, including clean-up of two heat exchangers,
protective repair of the main pump axle sealing, and inspection and adjustment
of other equipment. SPR will also be long term shut down after CARR go to
operation. However, the difficulties for its continuing operation during this
period not only stem from aging problem, but also from insufficient fuel element
- 295 -

JAERI-Conf 2001-017
storage inventory. The fuel element inventory in storage is not enough to support
the reactor operation up to the year of 2007. A fuel element fabrication project
of 10% enriched U-Mg alloy has been commenced recently to guarantee the fuel
supply for SPR operation in the coming years.
High Flux Engineering Testing Reactor (HFETR) and Ming Jiang Research
Reactor (MJTR)
HFETR has been designed with capability of operation at partial loading.
So, based on the task the reactor has been recently operated at a power of 50 to
60 MW instead of its rated power 125MW. MJTR is operating at power of 5
MW. This couple of reactors applies same type of tubular fuel assembly
composed of six tubes with different diameters. An unified fuel management
strategy is applied for this reactor couple. Fresh fuel assemblies are loaded into
HFETR, stay there up to an average relative burn-up of about 38%, then after
discharging and cooling, the spent fuel from HFETR were reloaded into MJTR
for continued burning. The ultimate relative burn-up will reach a value of more
than 45%. HFETR mainly used for power reactor fuel and material testing and
for other utilization requiring high neutron flux, while MJTR mainly used for
isotope production and silicon doping. By this way the fuel can be used more
economically.
3 Radioisotope Production, Silicon Doping and Other Application
Research reactor are still important facility irreplaceable for production of
radioisotope, silicon doping and other irradiation products.
Table 2 shows the capability and also the practical annual yield around
recent years. The real production amount in recent years keeps almost constant.
Reactor produced radioisotopes are supplied for more than three thousands of
domestic hospitals, therefore continuing operation of research reactors has
significant importance even only from this point.
- 296 -

JAERI-Conf 2001-017
Table 2 Isotope Production in China
Isotope Installed capability, Ci Actual production yield, Ci remarks'Co 3,000,000 1,500,000192Ir 1,500,000 L ,200,000 -
31 ______ 3000 2,500 ___ ___
125I 200 60,9MO 14000 3,000 NPIC, gel- tpe
3,000 CIAE, fission-type_ 3mln 400 5 F_ _ 5 _ or well logging
8 _ 400 _ 8089Sr 10 10
'5 3 SM 1000 300 _
131Ba 300 100186 Re 50 nonscheduled90_ nonscheduled For 90Y applicator14 _ -nonscheduled For labeling compounds
Production of doped silicon in 2000 is maintained on an amount of less than
100 tons.
Fig.1 shows artificial gem produced by SPR.
4 Fuel Test for Nuclear Power
China follows an energy source policy of developing nuclear power to
proper extent. There is a research and develop plan in field of PWR fuel
performance study in accordance with that policy. The research reactors play an
important role in this regard.
(a) HFETR has a fuel testing loop in its core with a loop power of
500kW and pressure of 15.5MPa. Twelve fuel rods with different dimension and
various core pellets manufacture technology have been loaded in it. The target of
the testing is to reach an average (maximum) burn -up of 51 (60) GW d/tu. Up
to now, an average (maximum) burn-up of 36 (40) GW d/tu has already been
reached.
- 297 -

JAERI-Conf 2001-017
(b) HWRR is being used for the transient performance study for PWR fuel
assembly. The study is divided into two phases. In the first phase which will be
ended in next year, the power ramp of the fuel rod will be realized by means of
movement of silver absorber. The re-fabrication technology for the spent fuel
assembly has already been practiced during this phase. In the second phase,
which is scheduled one year later, the power transient will be achieved by means
of filling gas absorber He-3 into the loop.
Fig.2 gives a simplified diagram of transient performance study facility,
which is scheduled to be loaded into HWRR by the end of this year. The
movement of the silver absorber will result in a ramp of linear power density of
the testing rod from 20OW/cm to 450W/cm within the environment of HWRR
core in about two minutes. Up to now, the preparation of the whole test section
has been completed, the in-core physics parameters has been experimentally
determined, and the safety report for transient testing has been prepared. The
project is now being reviewed and waiting for approval.
(c) HWRR is also used for in-core testing of the instrumented fuel elements.
In order to master the on-line measurement technique for the central line
temperature of the U0 2 pellet and the interior gas pressure from the fission
product, special kind of instrumented fuel element has been developed. Pellet of
this fuel is made of 10% enriched U0 2 with a linear power density of 220 to 240
W/cm when it is located in the HWRR core. This testing capsule is also
scheduled in the coming December to load into HWRR.
5 Neutron Scattering
Due to the equipment problems of cold neutron source on HWRR, main
attention is now focused on establishment of new experiment facility on CARR.
In spite of the equipment difficulties on HWWRR, efforts is still given on some
topics with SANS as follows.
(a) SANS study of artificial articular cartilage has been started in
cooperation with University of Science and Technology Beijing. Since the
equipment of SANS in HWRR is not in good condition, preliminary experiment
- 298 -

JAERI-Conf 2001-017
has been performed in NIST, United States. The first step in this study, which
has been completed in this year, is the determination of optimized measurement
means.
(b) As part of the cooperative research project between Asian countries
on SANS, CIAE has tested and applied the neutron camera supplied by JAFRI,
and found the camera is very effective in sample positioning for SANS
experiment.
6 BNCT
Research and develop with BNCT has been highly concerned in China.
However, no definite decision of the technique line for BNCT has been made
yet. Several possibilities have been considered while each of them has problems
which should be further studied. The most probable approach among them is to
install a tentative BNCT beam tube on a MNSR modification, or to use one of
the tubes of CA-RR for this purpose.
7 Conclusion
Recognizing the fact that the role of research reactors is irreplaceable by
other kind of facilities in fulfilling their fixed scientific and engineering
functions and that aging problem is impairing safety operation and utilization of
research reactors, China has made efforts both in design and construction of a
new research reactor CARR and in upgrading and renewal of equipment and
systems in old reactors. Operation and utilization of old reactors has been
improved due to these efforts in recent years.
BNCT is highly concerned not only by nuclear engineer but also by
medical doctors and hospitals in China. International experience and cooperation
will be well utilized. Progress in this field will be further reported in the coming
workshop.
- 299 -

JAERI-Conf 2001-017
- 300 -

JAERI-Conf 2001-017
Head flange
Control unit
Step motor
Hollow screw
Thermal isolator
p-Pressurized tube
Absorber
Fig.2 Diagram of In-pile Transient Test Facility
-301-

JP02501 11JAERI-Conf 2001-017
1.27 PRESENT STATUS OF RESEARCH AND TEST REACTORS IN JAERI
Mitsugu Sato,
Shinsho Kobayashi
And
Masaji Takayanagi
Department of Research Reactor
Tokai Research Establishment, JAERI
Tokai-mura, Naka-gun, Ibaraki-ken 319-1195 JAPAN
ABSTRACT
Several research and test reactors have been constructed in Japan Atomic Energy
Research Institute (JAERI) and extensively utilized for various studies. At present,
four reactors, the upgraded Japan Research Reactor No.3 (JRR-3), the Japan
Research Reactor No.4 (JRR-4), the Japan Materials Testing Reactor (JMTR) and
the Nuclear Safety Research Reactor (NSRR) are in operation, and a new High
Temperature Engineering Test Reactor (HTTR) is under commissioning test. This
paper introduces the research and test reactors in JAERI and describes the present
operational status of them.
1 INTRODUCTION
Since 1956, many research and development works in the field of the nuclear
energy have been carried out in JAERL. Four multi-purpose research reactors
(JRR-1, JRR-2, JRR-3 and JRR-4), one material testing reactor (JMTR), one pulse
reactor (NSRR) and one power demonstration reactor (JPDR) were successively
-302-

JAERI-Conf 2001-017
constructed in Tokai and Oarai Research Establishment. A high temperature
gas-cooled reactor (HTTR) is under commissioning test in Oarai Research
Establishment.(see OHP-1)
JRR-1 is the first nuclear reactor in Japan, JRR-2 is the first multi-purpose and
high-performance research reactor in Japan and lPDR is the first nuclear power
reactor in Japan. They were already shut down with the completion of their
operating mission and JRR-2 has been utilized for the development of
decommissioning technology of research reactors.(see OHP-2)
Upgraded JRR-3 (JRR-3M) has been operated and utilized for about 12 years.
The operation of JMTR using tie low enriched silicide fuel was started in 1992.
JRR-4 changed fuels from high-enriched fuels to low enriched ones and resumed the
operation successively in 1998.(see OHP-3)
2.OVERVIEWS
2.1 JRR-3M
The old JRR-3 was domestically designed and constructed as the first Japan
made reactor in 1962 and used in various research fields for about twenty-one
years.(see OHP-4)
In order to satisfy the requirements of the date for neutron utilization, JRR-3
was modified to the upgraded research reactor as the JRR-3M. JRR-3M is a light
water moderated and cooled swimming pool type reactor with the maximum
thermal output of 20MW J-RR-3M got the first criticality in March 1990.
At first, JRR-3M used fuel elemwnt of material testing reactor (MTR) type with
low enriched (19.75wt%) UAlx-Al dispersion type fuel material. But, in 1999, the
fuel material was changed from UAIx-Al to USSi2-Al in order to reduce the number
of discharged fuel elements by increasing an amount of uranium loading.
The isometric view of JRR-3M reactor pool is shown in OHP.-4. Five irradiation
holes in core region and 4 holes in beryllium reflector region are furnished, and
eight irradiation facilities are installed in the heavy water reflector tank. They are
being utilized for fuel and material irradiation tests, RI production, neutron
transmutation doping for silicon semiconductors, activation analysis and so on.
Nine beam tubes, including the tube (9C) of the cold neutron source (CNS)
facility, are installed tangentially for neutron beam experiments.(see OHP-5) The
beam tubes 8T and 9C are followed by two and three neutron guide tubes,
respectively, which lead thermal (8T) and cold (9C) neutron beams to experimental
instruments in the beam hall. There are about thirty beam experimental facilities
such as many kinds of neutron scattering experimental facilities, neutron
radiography facility and neutron-induced prompt gamma-ray analysis facility.
-303 -

JAERI-Conf 2001-017
JRR-3M has been operated about 70 cycles of four weeks continuous operation
for about 12 years. Some troubles happened in this operation but many of them
are troubles of initial stage on the operation. There is no serious trouble. Due to
the high performance of JRR-3M, the number of beam experimental users are
remarkably increasing through the past operation years.
2.2 JRR-4
JRR-4 is a light water moderated and cooled swimming pool type reactor. It
was originally constructed for the purpose of shielding experiments of nuclear ship
and has been operated and utilized since 1965. JRR-4 is operated daily with the
thermal output of 3.5MW. The main utilization fields of JRR-4 are activation
analysis, RI production, neutron transmutation doping for silicon semiconductors
and educational training of reactor engineers (including trainees from abroad).
The reactor core components of JRR-4 are shown in OHP-6.
Although JRR-4 started its operation with high-enriched fuel elements, in 1998,
JRR-4 modified to use low enriched silicide fuels in order to follow the worldwide
reduced enrichment program and upgrade the utilization facilities. Now, the
reactor is renowned for the research reactor that is utilizing the boron neutron
capture therapy (BNCT) facilities.
2.4 NSRR
NSRR is a modified TRIGA-ACPR (Annular Core Pulse Reactor) which was
constructed for investigating the reactor fuel behavior under reactivity initiated
accident (RIA) conditions. The cross section of NSRR reactor core is shown in
OHP-7. NSRR can be operated in steady power mode of less than 300KW and in
pulse power mode of maximum peak power of 23,000MW.
NSRR is mainly used for the pulse irradiation to determine the threshold energy
for fuel failure and to investigate its mechanism and failure consequences under
RIA conditions.
It is expected to establish the experimental data base for the evaluation of fuel
integrity during RIA,especially on the high burnup fuel and plutonium mixed oxidefuel.
2.5 JMTR
JMTR is a light water moderated and cooled tank type reactor with maximum
thermal output of 50MW, and has been operated and. utilized since 1971. The
reactor core components of JMTR are shown in OHP-8.
The reactor core is installed in a reactor pressure vessel consists of twenty-two
standard fuel elements, five control rods followed by fuel elements and beryllium
-304 -

JAERI-Conf 2001-017
reflectors. Fuel elements are of ETR type and the fuel materials were changed
from high enriched (93wt%) U-Al alloy type fuel to low enriched (19.75wt%)
U3Si2-Al dispersion type fuel in 1994 through medium enriched (45wt%) UAlx-A1
dispersion type fuel which became utilized in 1986.
At present, JMTR is continuously operated for twenty-five days with LEU fuel
elements.
A lot of irradiation facilities are installed as follows; many capsule irradiation
holes, two hydraulic rabbit irradiation facilities and one shroud irradiation facility
(OSF-1). Many kinds of reactor fuels and materials for testing are irradiated
under various conditions such as high temperature, high pressure and so on.
Irradiation tests of blanket materials for fusion reactor are being carried out.
2.6 HTTR
HTTR is a graphite moderated and helium gas cooled test reactor with thermal
output of 30MW and outlet coolant temperature of 950C using the LEU pin-in-block
type fuel. Its construction work started in 1991. HTTR attained the first
criticality in 1997, and now is carrying out the commissioning test. OHP-9 shows
the reactor core components and fuel element of HTTR.
After the completion of the test, research and development works for
establishing and upgrading the basic technology of high temperature gas-cooled
reactors (HTGRs) will be carried out and innovative basic researches will be
conducted under high temperature condition by utilizing HTTR.
3.CONCLUSION
At present, five research and test reactors are in operation or under
commissioning test in JAERL. They are contributing to the basic researches as well
as engineering researches & developments (R&Ds) in both nuclear and non-nuclear
energy fields. After the completion of JRR-3M, the research fields have been
widely expanding, therefore, advanced technologies which can comply with the
demands from users are requested.
JAERI is making efforts not only to continue the stable operation but also to
conduct R&Ds in order to improve and develop the utilization technology.(see
OHP- 10)
- 305 -

JP02501 12JAERI-Conf 2001-017
1.28 Overview of HANARO
Byung-Jin Jun and Hark-Rho Kim
HANARO Center, Korea Atomic Energy Research Institute
P.O.Box 105, Yusong, Daejon, KOREA
ABSTRACT
A general overview of the HANARO is given. Design features of the HANARO are
described. Also, main utilization areas of fuel and material tests, radioisotope
production, neutron beam application, neutron activation analysis, etc., are briefly
summarized.
1. INTRODUCTION
Two TRIGA reactors of 250kW and 2MW were operating at the time of HANARO
project. TRIGA Mk-lf of 250kW opened the nuclear era in Korea and was used for
manpower development. It reached an initial criticality in 1962. TRIGA Mk-Il of
2MW which had an initial criticality in 1972, played an important role in enhancing
nuclear research in Korea.
HANARO which would replace two prior TRIGA reactors, was designed for
multipurpose applications to satisfy national requirements and to promote national
development. Demonstration of our capability for safe and peaceful use of nuclear
energy and technology was also very important for this project. Therefore, HANARO
can be said to represent the crystallization of our efforts and technology around 1990.
HANARO project started at 1985 and got a construction permit on 1987. In 1993,
installation of reactor structure started. HANARO reached the first criticality in
February 1995. Most part of the project except fuel and component supply was achieved
inside Korea.
2. DESIGN FEATURES
HANARO is an open tank in pool type reactor. It is cooled and moderated by light
water. Heavy water reflector surrounds the core.
Fuel is 19.75w/o enriched U3Si dispersed in Al matrix. There are two kinds of fuel
-306-

JAERI-Conf 2001-017
assembly, hexagonal 36-element assembly in triangular array and circular 18-element
assembly in two concentric annular rings. Hexagonal assembly has two kinds of fuel
element, standard and reduced, with different radius of fuel meat, whereas circular
assembly has only standard elements. U density and loading amount in the fuel element
are 3.15gU/cc and 69.8(standard)/52.4gU(reduced), respectively. The fuel element has 8
fins to enhance the capability of heat removal and structural strength. The core consists
of 23 hexagonal sites to load 36-element assemblies or irradiation capsules and 8
circular sites to load 18-element assemblies. 4 control absorber rods (CARs) and 4
shutoff rods (SORs) made of Hf have annulus shape and positioned at circular sites. In
addition, there are 8 circular sites adjacent to the core called outer. core; 4 are fuel sites
and 4 are irradiation sites.
HANARO has a compact core and wide reflector region to have many experimental
holes with different neutron spectrum. Three central flux traps located at the central
region of the core have high fast neutron flux over 2x10'4 n/cm2 -sec. They can be
utilized for material and fuel test. Four holes in outer core region can give high
epithermal neutron flux. These sites are utilized for fuel or material test and
radioisotope production. In the heavy water reflector region, 25 holes having high
quality thermal neutron flux are prepared for radioisotope production, neutron activation
analysis, fuel test loop, neutron transmutation doping, cold neutron source. In addition
to the above vertical holes, there are 7 horizontal beam tubes for research in neutron
scattering, neutron radiography, medical application, and neutron guide tubes.
The core is cooled by upward forced convection for inherent safety against cooling
pump failure or channel blockage accident. The reactor structure has a double
containment of cooling water to protect against hypothetical accidents such as LOCA or
pool failure. Control rods are driven from the core top and has long lifetime. Digital
control is adopted for the stable neutron tlux and compact operation room.
Figure 1 shows the plan view of the HANARO.
3. UTILIZATION FIELDS
3.1 Material and Fuel Test
Material and fuel tests have been performed using instrumented or non-instrumented
capsules. Instrumented capsule for material test has a characteristic of 5 stages
independent temperature control and maximum temperature control up to 5000C. It has
- 307 -

JAERI-Conf 2001-017
12 thermocouples and 5 micro-heaters. It is utilized for structural materials of nuclear
power reactors such as reactor pressure vessel, reactor core materials, CANDU pressure
tube, etc.
Non-instrumented capsule for fuel test with a total length of 960mm and an outside
diameter of 56mm is utilized for burnup test of newly developed fuels such as DUPIC,
advance PWR and metallic fuels.
Atomized research reactor fuel is developed in KAERI as part of RERTR program.
It is stable to high burnup and has high thermal conductivity. The irradiation test for this
fuel has been performed at HANARO. The test consists of mini-assembly test, mini-
plate test in cooperation with ANL, high power full length bundle test and U-Mo full
length bundle test.
3.2 Radioisotope Production
There are 4 concrete and 17 lead cells for radioisotope production. Many RIs are
produced for medical and industrial use to suffice domestic demand. Those are Tc-99m,
1-131, Dy-165, Au-198, Cr-51, P-32, Ir-1 92, Co-60, etc.
In addition to routine RI production, new application such as Ho-166 has been
developed. Research projects to realize fission moly, 1-125 production, high activity
cobalt, etc. are steadily in progress. Production of 1-125, P-33, Sr-89, Sm-153 as non-
sealed sources and Re-186, Re-188, Yb-169, Se-75, Gd-153, Eu-152, Sb-125, No-63
and Tm-170 as sealed sources are planned in the future.
3.3 Neutron Beam Application
A High Resolution Powder Diffractometer (HRPD) and a Four Circle
Diffractometer (FCD) are in full service. HRPD is applied in the area of crystal
structure and phase transition studies, magnetic structure studies, hydrogen and hydride
studies, etc. FCD is utilized for single crystal analysis, measurement and analysis of
texture, etc. A Small Angle Neutron Spectrometer (SANS) is ready for commissioning.
It will be utilized for analysis of defects in metallic and ceramic materials, structural
studies of biological macromolecules, etc. A Neutron Radiography Facility (NRF) has
been occasionally used for the demand from industry and its upgrade for the dynamic
image is underway. Current application areas are nuclear industry, aerospace industry,
metallurgy, etc. Table 1 summarizes design characteristics of neutron beam facilities.
Facilities for Boron Neutron Capture Therapy (BNCT) and Prompt Gamma Neutron
- 308 -

JAERI-Conf 2001-017
Activation Analysis (PGNAA) are under construction, and will be available for user in
the next year. Characteristics of BNCT facility and PGNAA system are as follows.
* BNCT facility
- Thermal neutron flux 2 higher than 2x10⁹ n/cm2 -sec
- Thermal-to-tast neutron flux ratio 2 100
- Gamma dose • (.5Gy/hr- Irradiation time n 2 hours
- Irradiation without interruption of reactor shutdown
- Temporal surgical operation at site
* PGNAA system
- Sensitivity of boron concentration measurement < I ppm
- Measurement time 5 10 min.
A polarized neutron spectrometer is being installed. Installation of a reflectometer
and a triple axis spectrometer is planned for the next step. Then all beam ports in the
reactor hall will be occupied, and we will judge the proper time to install cold neutron
source and neutron guide tubes for the quantum jump in neutron beam experiments.
3.4 Neutron Activation Analysis
There are three holes for neutron activation analysis in the reflector region. Neutron
flux and cadmium ratio is given in Table 2.
Application areas of NAA are wide as follows:
- trace analysis of impurities in nuclear materials
- trace element analysis of heavy metals and toxic materials in environmental
samples
- analysis of micro-elements in geological mineral samples
- analysis of composition in cosmic materials
- analysis of heavy metal and specific element related with agriculture and life
science
- analysis of forensic, medicines, archaeology and material science
The record of neutron activation analysis has shown a very sharp increase every
- 309 -

JAERI-Conf 2001-017
year especially in its application to the environmental research.
3.5 Neutron Transmutation Doping
A feasibility study for the NTD utilizing two large holes in the reflector region is
underway. The holes are capable of irradiating up to 6- and 8-inch crystals, but the
facility will be designed to irradiate 5- and 6-inch crystals considering the current
market demand. Annual capacity of the NTD service is estimated about 50 tons.
4. CONCLUSION
HANARO is successfully operating since its first criticality in February 1995 and
widely utilized or to be utilized in the areas of material/fuel irradiation test, radioisotope
production, neutron beam research, medical research, neutron activation analysis,
neutron transmutation doping.
Users are increasing rapidly as experimental facilities are steadily added, modified,
and upgraded. New technologies, especially in non-nuclear R&D area, are continuously
being developed using HANARO.
it is believed that HANARO will play a key role in basic and applied sciences in both
nuclear and non-nuclear areas in Korea.
-310-

JAERI-Conf 2001-017
Table 1. Design Characteristics of HRPD, FCD, SANS and NRF in HANARO
Beam Facility Design Characteristics20m 440, 650, 900 '120Wavelength 0.980-2.510AMin. step size 0.010Qmax(A-1) 11.105Beam collimation al = 6', 10', 20', open (50')
(X2 = 30', opena3 = 10'
Neutron flux at sample table (S)1 ) 2.6x10⁶ (n/cm2 /s)Resolution (Ad/d) 2.00x10 3 (tan OB/ tan OM =110)
HRPD Detectors 32 He-3 Multi-detectorsLinear-PSD (600mm,
200mm)Sample Environment CCR:1OK-RT
Electromagnet : 1Tesla, 1OK-RTFurnace: up to 1300K
1) Ge(331) (vertically focused), al=a 3=10', a2=30' and p=20'
The transmissions of the Soller collimators and the filter are not included.Take-off angle -450Monochromators Ge(331) in transmission
Ge(113) in reflectionWavelength 0.99 A for Ge(331)
1.30 A for Ge(113)FCD Beam collimation at = 20, 30, open
a2 = 55, (x.3 = 17Eff. beam dimension 25mm dia. at the Sample Tablel)Neutron flux at sample 6.61xi05 u/cm2 /sScanning mode coupled or independent
1) Measured at 20MW with Au-foil activation analysisBeam Port CNGamma/Fast neutron flux filter Liquid nitrogen cooled Bi/Be filter
Super-mirror V-BenderMonochromator Mechanical velocity selector(Dornier)Wavelength range 0.4nm to 0.8nm variable
AX/X (FWHM) = 10% Detector 2D-PSD(He-3), 65x65 cm2 with 0.5x0.5
SANS cm resolutionSample size 0.5 to 2.0cm diameterQ-range 0.06 to 8 nm-;Calculated flux at sample Qmin(nmn') Isn/sec)
0.06 2x100.1 3x10⁴
1.03x1 5
_-
Exposure Room 1st 2ndCollimation ratio 206 >2904)th (n/cm2/s) 1.13x10⁷ 5.07x10⁶
Beam uniformity (a) - 7%NRF Cadmium ratio -45
Neutron-y ratio 3 .9x106 (n/mrem/cm2)Eff. beam size (cm) 250x350 350x450ASTM Designation NC-H-C = 75-8-7
-311-

JAERI-Conf 2001-017
Table 2. Characteristics of NAA holes in HANARO
Neutron Flux (n/cm2-s) CadmiumIrradiation~aiRatio
Hole Thermal Epithermal Fast (Au)
NAA1 2. lx1013 3.6x10'0 3.3x10¹⁰ 205
NAA2 R .8x10'1 3.4x10 0 3.8x10 9 35Cd lined)
NAA3 7.6x10l 3 4.4xlO"1 6.8x10'1 13
ST1r1
JR ,54 2@
CNCANLNAAIP7
F Igr NA5-312 -VST2
IP ORBP16
C~ANAL 0 T
2 I~~~~~R R P15 IPI7
// LH -CC) )/ P5 OBTIP4 C,
NR' ~ ( (IH~N
Figure 1. Plan View of HANARO
-312 -
JP02501 13JAERI-Conf 2001-017
1.29 Utilization of Beam Ports of MINT Research Reactor
Adnan Bokhari, Mohammad Suhaimi Kassim
Malaysian Institute for Nuclear Technology Research (MINT)Bangi, 43000 Kajang, Malaysia
Abstract
The first application of MINT TRIGA Reactor (commissioned in1982) has been with the standard irradiation locations in the coreand reflector in support of projects involving neutron activationanalysis and production of radioisotopes. As neutron beamsexperimental facilities, four beam tubes and one thermal columnare available, fabrication of beam instruments was initiated in1984. A neutron radiography facility, which is being used byexperimenters in the areas of non-destructive testing, has beeninstalled in 1985. The construction of the small angle neutronscattering (SANS) on the radial piercing beam port was completedin 1995. Some of the devices already in operation butconsiderable effort is still needed, before the research programsplanned for these instruments can be initiated in their full extendThe paper also describes briefly about the prospect of installing aIBNCT facility at the reactor.
1. Introduction
The original role of MINT TRIGA Reactor, commissioned in 1982, wasmanpower training facility in preparation for the introduction of nuclear powerprogram in Malaysia. That nuclear power program never realized over the years,and the mission was later changed towards supporting activities relating to thenon-power application of isotopes and radiation technologies.
The reactor, with a maximum steady state power of 1 MWth, consists of acircular core containing a circular grid plate and a graphite assembly surroundingthe core. To facilitate neutron beam experiments, the reactor is equipped withfour beam ports installed at mid-core height and a thermal column. The locationof the beam ports and the thermal column is shown in figure 1. The differentdesigns of the ports give rise to differences in the neutron beams obtainable. Theflux available at the entrance to the beam ports are approximately ranges from 1 x10¹² nlcm2/s to 2 x 10¹² n/cm2/s. Presently, only two beam ports are utilized forthe neutron beam experiments, namely neutron radiography and small angleneutron scattering.
-313 -

JAERI-Conf 2001-017
5 RallPA~J~e. /- * .8 -7-2. Neutron Radiography
Neutron raiorph h be t u of many rsc reacrsads Teerrdgp ati in Malaysia started
construc g 1 Te oction copetdf the fisburerm pofr198 and wa the firsta atteptma
Neutronraigahhs beamtpia utilization on the eeac reactor.Bsds for tesiligcluain hpupseverf thiads. fclTywstfaiarzthe neutron radiography gciiy Mlyi troup on 98sev teral i aspec of cntutn emnn neutron radiography suhafolmaoeinandit expsure
Fromrthe idastarvilable appermanent facii was construceda beamr podrtak3ngTheachoice of bhea porilty, as texlocaioentof neutron radiography facility wasbaeuponsthuced unavilailt cofrthe pircing betam port whichs hasl higer noeutround flu
intnsityuwhich waslte intened forcostrqucrtion of a98 sall wangl netron fiscattering.t
Fiurpoe 2sows theisfchematic diagroamiarz of e netrnraigrpyrupo
-vaapcon14-doayshaolt" mm
geomtry
From he dta aailalen peranentfclt a osrc tba ot3 h
upon~~Fi. The locailablit of the pecn beam portsn thec theral coluern. urnfu
inenity, themich wasimtne for constructing of pemnn neutro radglenuraph facilitering.
deignr sows the fachematy, dangxprimena neuro raiorphfcliy a
costute uig onrteblcssotatth lokscul-b3ov1ao4dt

JAERI-Conf 2001-017
Fig.2. Cut-away isometric view of NuR2
The characteristics of Nur2 are listed below:
Collimator type - Step divergentLength - 200 cmInlet aperture - 5.4 cmLID ratio - 37Thermal neutron flux - I x I 1 nlcm2/sGamma dose rate - 36.7 R/hr
The quality of the radiograph produced now is comparable to that of other similarfacilities elsewhere. NuR2 has been used for number of purposes such asexamination historical artifacts on archeological objects, during the early years ofcompletion. The limited number of opportunities to apply the technique toindustrial applications in the country did not warrant expansion of the facility. Itsfurther promotion has been has not been encouraging. A part of small spacehandler to accommodate big samples, this is also due to the immobile nature thereactor based neutron radiography facility. It may also be due to industryimmaturity to fully utilize neutron radiography for final product inspection.
3. Neutron Scattering
The use of neutron beams for research reactors to study the physical properties ofmaterials has been a primary area of reactors since the early development. Inview of this, a neutron scattering community at MINT, with the assistant of anexpert from IAEA in late 1985, began planning for the construction of a smallangle neutron scattering (SANS) facility at the radial piercing beam port of thereactor for carrying out neutron scattering experiment in the country.
- 315 -

JAERI-Conf 2001-017
The design, construction and installation of SANS instrument were completed in1995. The isometric view of the SANS instrument set-up is shown in fig.3 Theinstrument consists principally of a monochromator system, a collimator, asample handler and a detector system.
Rc'ra'l4)
i:filter andl manoch~notlor ShieldiiHP
A , Off S~~tnPic chamber? Secondary fli~ght 1ube
Fig. 3. An isometric view of the SANS instrument
The coarse collimator, which is placed inside the beam port of the reactor, ismade of an aluminum tube of diameter 110 mm and length 1.5 mm. Themonochromator which is composed of three layers of highly oriented pyroliticgraphite crystals is mounted on a remote-controlled goniometer and a turntable.The main collimator consists of three stainless steel tube (two length 1.0 m andone of 2.0 m) containing cadmium diaphragms mounted on separate stands on arail, which allows variation of collimation length by removal of one or moreelements. Presently, sample is placed in air at the exit of the main collimator. Thesecondary flight path, which is covered by layer of paraffin wax, consists of twosections of 1.0 m lengths and one of 2 m to enable length adjustment. Theneutron detection system is made of 3He filled position sensitive detector.
3. The Prospect of BNCT Facility at MINT Reactor
At present, there is in no major group in Malaysia working on BNCT approach intreatment of cancer patients. Today's standard treatments, conventionalradiotherapy techniques using Co-60 source is the main approach by doctors inproviding treatment to many kind of cancers. Although the TRIGA reactor isequipped with a thermal column, which is suitable for modification for BNCTfacility, there are several factors that need to be established before a BNCTfacility for medical treatment can be considered. The most important factor is theestablishment of infrastructure such as formation of collaboration betweendoctors and scientists to develop specialists in BNCT technology. This includesthe training of professionals including in BNCT related fields such dosimetercalculation, radiation shielding and so on.
-316-

JAERI-Conf 2001-017
Basically, the health service in Malaysia is geared toward providing basic healthcare to the population. Presently, there is no cancer registry established in thecountry to determine the number of cancer patients especially those that requireBNCT treatment. The lack of information regarding the cancer patients mayprobably contribute to the lack of interest among the scientists and academiciansto initiate BNCT studies in the country,
To begin the BCNT study, a student at Radiophamacytical School in one of thelocal university is currently reported to be working for early investigation ofBNCT technology such as in basic information in dosimetry calculation. Inaddition, a substantial funding is being requested for such studies in the nextEighth Malaysian Plan which begins next year to enable such activity to becarried out at the MINT reactor.
Conclusion
MINT TRIGA Reactor has been in operation for more than 18 years, mostly forthe purpose of neutron activation analysis, production of radioisotopes andneutron beams experiments. At present there is no major activity being carriedout toward the establishment of BNCT facility at the reactor.
References
A. G. Ramli (1994), Paper presented at Workshop on Research ReactorUtilization, ANSTO, Australia, 27 April - 13 May
M. A. M. Sufi, et al: J. Appl. Crst. (1997), 307884-888
- 317 -
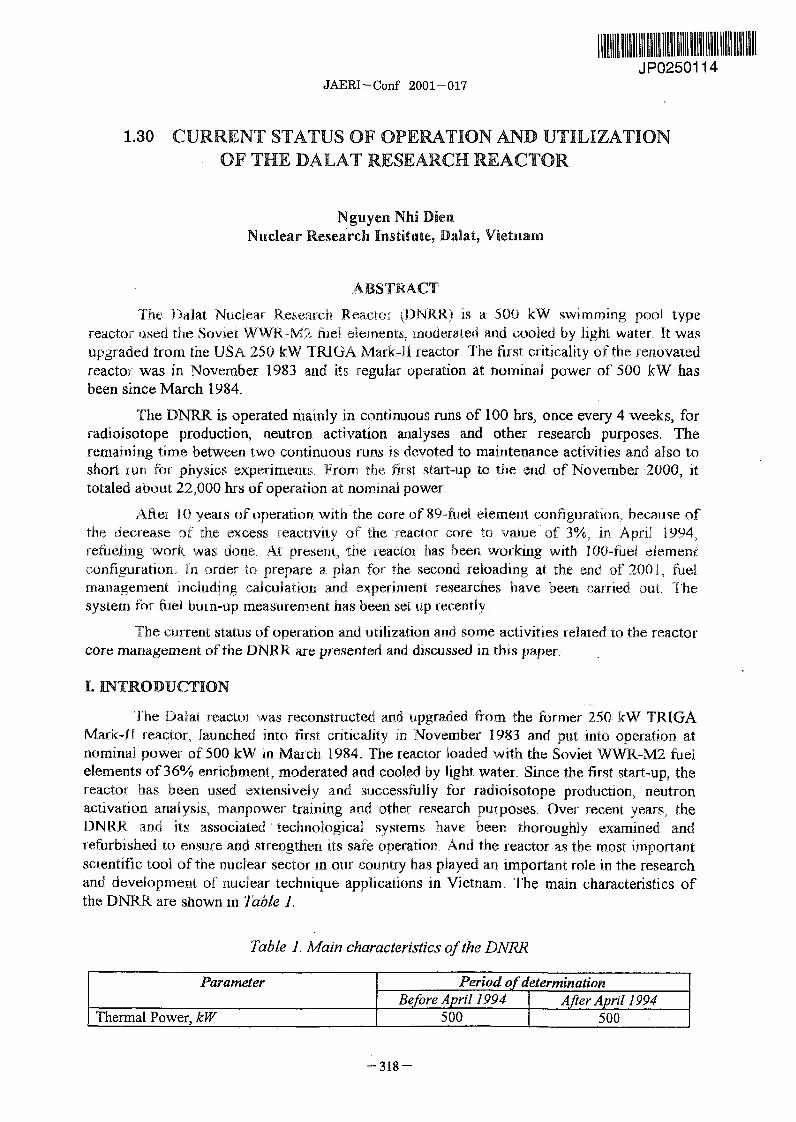
JP02501 14JAERI-Conf 2001-017
1.30 CURRENT STATUS OF OPERATION AND UTILIZATIONOF THE DALAT RESEARCH REACTOR
Nguyen Nhi DienNuclear Research Institute, Dalat, Vietnam
ABSTRACT
The. Dalat Nuclear Research Reactor (DNRR) Is a 500 kW swimming pool typereactor used the Soviet WWR-M2 fuel elemrents, moderated and cooled by light water. It wasupgraded from the USA 250 kW TRIGA Mark-if reactor. The first criticality of the renovatedreactor was in, November 1983 and its regular operation at nominal power of 500 kW hasbeen since March 1984.
The DNRR is operated mainly in continuous runs of 100 hrs, once every 4 weeks, forradioisotope production, neutron activation analyses and other research purposes. Theremaining time between two continuous runs is devoted to maintenance activities and also toshort run for physics experiments. From the first start-up to the end of November 2000, ittotaled about 22,000 hrs of operation at nominal power.
After 10 years of operation with the core of 89-fuel element configuration, because ofthe decrease of the excess reactivity of the reactor core to value of 3%, in April 1994,refueling work was done. At present the reactor has been working with 100-fuel elementconfiguration. In order to prepare a plan for the second reloading at the end of 2001, fuelmanagement including calculation and experiment researches have been carried out. Thesystem for fuel burn-up measurement has been set up recently.
The current status of operation and utilization and some activities related to the reactorcore management of the DNRR are presented and discussed in this paper.
I. INTRODUCTION
The Dalat reactor was reconstructed and upgraded from the former 250 kW TRIGAMark-Il reactor, launched into first criticality in November 1983 and put into operation atnominal power of 500 kW in March 1984. The reactor loaded with the Soviet WWR-M2 fuelelements of 36% enrichment moderated and cooled by light water. Since the first start-up, thereactor has been used extensively and successfully for radioisotope production, neutronactivation analysis, manpower training and other research purposes. Over recent years, theDNRR and its associated technological systems have been thoroughly examined andrefurbished to ensure and strengthen its safe operation. And the reactor as the most importantscientific tool of the nuclear sector in our country has played an important role in the researchand development of nuclear technique applications in Vietnam. The main characteristics ofthe DNRR are shown in Table 1.
Table 1. Main characteristics of the DNRR
Parameter Period of determinationBefore April 1994 After April 1994
Thermal Power, kW 500 500
-318-

JAERI-Conf 2001-017
Core configuration, Number offlel elements 89 100Fuel enrichment, % U-235 36 36Reactivity reserve, /3 eff 9.17 (1984), 5.8 6.5 (4/1994), 4.8
(1990), 3.8 (3/1994) (12/1996), 3.2 (11/2000)Control rod worth, 3
eff
* Safetyandshimrods(B4Q 2.7 - 3.5 2.7 - 3.1* Automatic regulating rod (,St. steet) 0.47 - 0.49 0.504* Four shim rods (total) 10.67 - 12,47 11.26* Two safety rods (total) 5 0 5 36
Xenon poisoning effect, Pff I .62 ± 0.15 1.65 ± 0.06Thermal neutron flux, n.cm-2.s-1
e Neuiron trap 2.13 x 10'3 2.21 x 10¹³
* Wet channel 1-4 1.02 x ]3 1.2$ x lolle Dty channel 7-1 3.8 x 10¹² | .5 x 10')
* Dy channel 13-2 4.0 x 1}2 4.6 x 10¹²
• Rotaryspecimen rack 3.27X 10¹² 4-0 x IG"• Thermal column 5.5 x 10' 5.8 x 10⁹
Horizontal beam tube No.3 2.3 x 10 2.3 x 10• Horizontal beam tube NO.4 1.8 x 10' 1.8 x 10⁷
11. REACTOR DESCRIPTION AND ITS OPERATION
-2000 mm
/ ' Rotating tOp lid
Fig. I. Verticalsectionview of the Dala r c r
-319 -.. . ...
v VX i\\\ ~~~~~~~~~~~~~~~..................................:.:, : .. :-: \
~~~~~~~~~~~~~~~~~. . ... ...... ~ li. .. .. .\\
tz -":"C~~~~k\\M " 1 M 680 \\\\mm
.~~~~~~~~~~~~~~~~~~~~~......... .......
Fig I. Vertical secf~~~~~ion view of the Dalat.... resea.............
.. ... . .. . .. ... . .

JAERI-Conf 2001-017
Thennal Column
CD :Neutron trap 0 Safety and shim rods
0od :Fuel elemeIRegulating rodAd uel element
0 :Beryllium block Irradiation channel
Fig. 21 Cross-section view of the Diala reactor core
The Dalat reactor consists of a cylindrical aluminum tank 6.26 m high and 1.98 m indiameter of the original TRIGA Mark Li reactor, The reactor core, positioned inside thegraphite reflector, is suspended from above by an inner cylindrical extracting well in order toincrease the cooling efficiency for copping with higher thermal power of the reactor. Thevertical section of the reactor is shown in Figure I and the cross-section view of the reactorcore in shown in Figure 2.
In the framework of the reconstruction and renovation project of the 1982-1984period, the reactor core, the control and instrumentation system, he primary and secondarycooling systems, as well as other associated systems were newly designed and installed. Somestructures of the reactor such as the reactor aluminum tank, the graphite reflector, the thermalcolumn, four horizontal beam tubes and the radiation concrete shielding have been remained.
The DNRR is operated mainly in continuous runs of 100 hrs, once every 4 weeks, forradioisotope production, neutron activation analyses and other research purposes. Theremaining time between two consecutive runs is devoted to maintenance activities and also tophysics experiments. From the first start-up of the reactor in March 1984 to the end ofNovember 2000, it totaled about 22,000 hrs of operation at nominal power of 500 kW, givinga yearly average of 1300 hrs. Throughout the entire period, the reactor has proved to be safe
- 320-

JAERI-Conf 2001-017
and reliable, as it has never suffered from any incident which significantly affected theenvironment, and annual operation schedules have been rigorously respected (Table 2).
Table 2. Operation data of the Dalat Reactor
Year Operation Released Ac-cumlulated Number of scramtime Energy released energy _ _
(hrs) (MWd) (MWd) Electric network Other Totudfalure reasons
_____ 1 1120 18.6 18.6 11 17 281985__ 1771 31.7 50.3 5 8 1 3
1 986 1387 26.9 ?7.2 6 4 1019871 993 17.9 95.1 6 4 101988 1286 25.2 _ 1_ 20.3 14 4 18
1 989 1343 1 26.3 146.6 9 2 111990 1505 30.4 __ 7_7 13 5 18
K!fr41 1654 33.9 _ 210.9 8 2 10(1992 1 1486 30.4 2413 8 2 101993 966 17.7 259 1 2 31994 1302 26.8 285.8 I I 1 12995 1351 27.9 3.13.7 9 2 11
1996 1370 28.1 341.8 7 3 101997 1206 24.7 366.5 9 1 10t99% 9 1203 24.9 39L.4 2 4 61999 1215 25.1 416.5 9 4 13Nov. 1013 20.8 437.3 8 0 82000 _ _ . _. . . ___
STATISTICS OF OPERATION TIME OF THE DALAT REACTOR
17711t ; 1800 4 1771 1654
f 6 138 134S 1505 1486 3 17
1400 ~~~1 286 1302 ~ 371206 1204 1215
993 961013
600
400 -~1984 1985 1986 1987 1988 1989 1990 1991 1992 1993 1994 1995 1996 1997 1998 1999 200
| ~~~~~~~~Year
Fig. 3. Statistics of reactor operation time from 1984 to November 2000
-321-

JAERI-Conf 2001-017
HI. FUEL MANAGEMENT
The fuel elements of the DNRR are of Soviet-designed standard type WWR-M2,enriched to 36% in U-235. Each element composes of 3 concentric layers: 2 circular innertubes and one hexagonal outer tube. The fuel layer with a thickness of 0.7 mm is wrappedbetween two aluminum alloy cladding layers of 0.9 mm thickness (Fig. 4).
3235
A_.~~~8~
600
Fig. 4. Fuel element type WWR-M2 of the Dalat research reactor
Up to 1994, after 10 years of operation with 89 fuel elements, the reactivity reservehas lowered at a level, which required fuel reloading In April 1994, refueling work wasimplemented. Based on theoretical calculations, a reloading scheme was adopted, whichconsisted of adding 11 new fuel elements in the core periphery at previous beryllium elementlocations. Control measurements were made after reloading operations have confirmed thetheoretical calculation validity. This fuel reloading ensured the reactor to be exploitedefficiently for about 7 years before the next refueling, which scheduled for the second half of2001. At present time, the reactor has been working with 1 00-fuel element configuration.
- 322 -

JAERI-Conf 2001-017
To prepare a future plan for the second reloading, fuel management activities bycalculation and experiment measurements have been done. The code HEXA-BURNUP hasbeen developed to solve the problem of in-core fuel management optimization basing on theperturbation theory and binary shuffle technique- The code can search an optimal fuel loadingpattern with the lowest power peaking factor for any available set of fuel elements. Todetermine the number of fuel elements to be discharged at the end of cycle, which satisfieswith operational constraints, several different reloading schemes with the different number ofdischarged fiel elements are investigated. Some experiments have been done for checkingcalculation results and evaluating the safety of the reactor.
Table 3 presents the experimental and calculation values of the maximum fuel surfacetemperature at some positions in the core at different reactor power levels. Determination ofthe fuel surface temperature is carried out by replacing the fuel elements at measuringpositions with a thermocouple instrumented fuel element, which consists of 9 thermocouplesplaced on the surface of this element in the axial direction.
Table 3. Iaximnufime surface temperature distribution
Reactor Inlet water Iaxiim fiel surface Deviation betweenpower temperature temperature calculaion and(kW) (C) _ C) expnement
________- Experiment Caculation - ___
Position 5-6 1250 19.2 ±0.1 61.2 ±0.4 66.5 5.3 8. l400 19.7±0.1 80.8 ± 0.2 85.1 4.3 7 5.3500 20.7±0.4 92.3 ±0.6 96.3 4.0 : 4 3
Position 3-4 . . __
250 19.7 ±0.1 48.0 ± 0.2 51.4 X 3.4 ?. 7.1400 {20.3 ± 0. 60. ±8 0.4 63.6 2.8 4.6500 21.4 ±0.3 67.4 ±0.3 71.4 4.0 5.9
_____ __ Position 1-1250 21.1 ±0.1 46.3±0.90.9 49.0 2.7 5.8400 21.6 ± 0.1 56.6±0 60.5 3.9 6.9500 22.7 ± 0.2 363 +0 67.4 3.6 5.6
Table 4. Relative distribution offuel burn-up Table 5. Reactivity distribution offuel elements
Pos. Relative Burn-up P. R i =Experiment Calculation Experiment Calcula=on
5-6 1.28±0.14 1.42 4-5 0.38±0.03 0.473-4 L11 ± 0.13 1.03 7-3 0.20 ± 0.03 0.244-1 0.72 ± 0.10 0.71 7-2 0.28±0.03 0.265-3 0.88±0.11 0.78 7-9 0.18±0.03 0.237-3 0.93 ± 0.12 1.00 7-4 0.50 ±0.21 0.534-6 1.03 ± 0.15 1.15 1-1 0.41 ± 0.21 0.36
4-4 1.10 ± 0.16 1 0. 97 5-6 0.76±0.21 0.75
2-3 0.95±0.14 093-4 0.30 ± 0.21 0.38
We have also developed a method for measuring the radial distribution of fuelburning-up. The method allows to determine the relative burn-up distribution of fuel elements
- 323 -

JAERI-Conf 2001-017
by counting the neutron density of the reactor at subcritical states directly through detectors ofthe control and instrumentation system. The experimental and calculation results arepresented in Table 4. Table S shows the fuel reactivity worth distribution. The reactivityworth of a fuel element is measured from the difference in critical positions of control rodsbefore and after the fuel element is withdrawn from the core. It can be seen that thecalculation and experimental results are in a good agreement except at some positions aroundthe control rods.
Detector HPGe
Shielimg
L - MCA i
Reactor platform Collimator
-, _.J-andling controlt Wa ter le vel in reactor tank _ ....... .. ............. ... ............................ ...... ...... ..... ...... ..... .. .......... .....T Water level in reactor tank
Stainless steel tube
3,2m
Fig. 5. Set-upforfuelburn-up distributionmeasurement
/ If
/ t 2 Collimator 20cm long Fuel element
Supporting plate 2Plate gear
r.......... ....................... ....................... J/lt....... L . ................ i Supporting plate 1
Reactor tank supportHinge Bevel gear
-324-

JAERI-Conf 2001-017
Recently, the burn-up distribution has been studied using the gamma scanningmethod. The measurement system is shown in Figure 5.
Gamma spectra, treated by a multichannel analyzer can be used to evaluate thecomponent of fission and activation products in fuel elements. It means based on theanalyzing the gamma spectra, we can define the burn-up of each fuel element. It is clear thatthe activity of long-lived fission product - Cs 37 has concern with fuel burn-up. But because ofthe difficulty with the efficient standardization of the measurement system, the relativemethod is usually used. By relative method, ratios of Cs'3 4/CsI37, Eu154/Cs 37, CsI34/Sb' 2 5 canbe used for evaluating the fel burn-up. In our case, we are interested in using ' 3 4 / sl3 7
ratio because radioactivity of Cs 137 can measured after several days of fuel cooling and Cs'3 4
can be measured after one month of fuel cooling with our existing 70cm3 HIPGe system.Preliminary results of measurement are shown in Figure 6. And Figures 7 and 8 show thecurves of variation of Cs' 34 and Cs137 activity by fuel burn-up using Pf{DOSE program.
0 10 20 30 40 50 60
Fig. 6. Distribution of Cs3 4 and Cs'3 7 infrel element No. 6-S
1.2
350E+2g50 0E2+3 4 5
Fig. 7. Variation of Cs 134 activity by fuel burn-up using PHDOSE
- 325 -

JAERI-Conf 2001-017
2.OOE+23
1.80E+23
1.60E+23
1.40E+23
1.20E+23
8.OOE+2-8 .00E *22 _
2.00E+2,2=
QOGOE +000 10 20 30 40 50
Fig. 8. Variation of Cs 537 activity by fuel burn-up using PHDOSE
IV. REACTOR UThILIZATION FOR SERVICE OF SOCIETY
For the past years, Dalat Nuclear Research Institute has pushed forward applicationsof nuclear techniques for answering country's needs, Practically, many products and serviceshave been introduced in our society.
Radioisotopes and radiopharmaceuticals are routinely delivered to more than twentyhospitals in the country, allowing them to diagnose and treat thousands of patients.Continuous efforts have been produced to assist local hospitals in setting up nuclear medicinedepartments in such aspects as laboratory design, instrument procurement, training, radiationprotection. For other nuclear technique users, the assistance is delivered in any needed aspect.
In the nuclear analytical field, requests of many branches of the national economy forvarious types of samples have been answered. Nuclear techniques have an advantage inserving geology and oil field study. Environmental studies are carried out efficiently withnuclear and associated methods.
V. CONCLUSION
The Dalat reactor has been safely operated for more than 16 years. To achieve that,maintaining and upgrading the reactor technological facilities have been done with a highquality. Besides, reactor researches have also provided the important bases for safetyevaluation and in-core fuel management to ensure its safe operation and effective exploitation,
Taking this opportunity, -we would like to express our thanks to Japanese Governmentfor co-ordination and financial support for this collaboration program
REFERENCES
[1] Nguyen Nhi Dien, The Dalat Research Reactor - Operation Status and Fuel Management.The ITC on the Technical and Administrative Preparations Required for Shipment ofResearch Reactor Spent Fuels to Its Country of Origin, Illinois, USA, 3 - 14 May, 1999.
[2] Do Quang Binh et al, Experience in operation and fuel management at the Dalat NuclearResearch Reactor. The 2-nd International Topic Meeting on Research Reactor FuelManagement, Bruges, Belgium, March 29-31, 1998.
-326-

JP02501 15JAERI-Conf 2001-017
1.31 BNCT Project in Thailand
Sakda Charoen
Office of Atomic Energy for Peace
Vibhavadi Rangsit Road, Chatuchak, Bangkok, THAILAND
Tel. (662) 562 - 0127 Fax. (662) 562 - 0127
e - mail: sakdaqoaep.go.th
ABSTRACT
Boron Neutron Capture Therapy (BNCT) is considered as an intra
cellular internal radiation therapy for brain tumor treatment. The grate potential
advantage of BNCT is its cell level selective destruction of tumor tissue
without significant damage to healthy brain tissue.
BNCT Project in Thailand was established in 1996. The working group
was set up to study and plan for this project. The BNCT facility was planned
to install in a new research reactor of Ongkarak Nuclear Research Center. The
project is in the process of detail design and will be ready for operation in the
near future. Feature and activities of BNCT Project are presented.
- 327 -

JAERI-Conf 2001-017
Introduction
BNCT is used in nuclear medicine for brain tumor treatment. Alpha
particles and recoiling lithium -7 nuclei from reaction between boron - 10 and
thermal neutrons have a high linear energy transfer and an associated high
relative biological effectiveness. The great potential advantage of BNCT is its
cell level selective destruction of tumor tissue without significant damage of
healthy brain tissue. It is well known that for successful brain tumor treatments,
it is essential to secure a sufficient radiation dose. This depends on an adequate
accumulation of boron in the tumor cells and a satisfactory neutron fluence at
the target area.
To develop and promote utilization of research reactor in Thailand,
BNCT project was decided to include in Ongkarak Nuclear Research Center
(ONRC) project. BNCT facility was planned to install in a new research
reactor.
ONRC Research Reactor
The reactor system shall be a multipurpose, pool type reactor, cooled
and moderated by light water, reflected by beryllium and heavy water (D 20),
that will use low - enriched uranium (LEU) fuel. This uranium erbium
zirconium hydride fueled TRIGA reactor shall have a steady state thermal
power rating of 10 MW, and shall be capable of generating a neutron flux
suitable for the following functions:
* Beam experiments : Neutron Diffraction (HRPD), Neutron Radiography
(NR), and Prompt Gamma Neutron Activation Analysis (PGNAA.)
* Radioisotope production for medical, industrial and agricultural uses.
- 328-

JAERI-Conf 2001-017
l Neutron transmutation doping (silicon.)
* Applied research and technology development in the nuclear field.
° General training to master the fundamental principles of the reactor
and its operation.
* Training in reactor physics (neutron physics, thermal hydraulics,
reactor experiments, etc.)
* The capability for later modification to perform medical therapy for
patients using the boron neutron capture (BNCT) technique, and/or
small angle neutron scattering. (SANS.)
Flux. The 10 MW core shall be capable of generating the neutron fluxes
shown in table, in support of the various functions.
REACTOR FLUX
Location Flux
H2 0 flooded irradiation facility > 1.0 x 101 (F < 0.42 eV)
Fast neutron irradiation facility 2 1.0 x l O (E > 2 MeV)
Epithermal irradiation positions 2 1.0 x IO" (0.82 MeV > E > 0.42 eV)
Beam tubes (thermal) > 0.5 x 10¹² (E < 0.42 eV)
Neutron transmutation doping (NTD) > 1.6 x 10 (E <0.42 eV)
The reactor system is located within the Reactor Island Building's
reactor hall. The system consists of a nuclear research reactor, immersed in
water - filled, stainless steel lined pools, that are supported and contained by a
steel - reinforced concrete biological shield. The reactor system includes those
portions of the primary coolant and D 20 piping within the shield, and to the
- 329 -

JAERI-Conf 2001-017
portions of the primary coolant and D 20 piping within the shield, and to the
first weld outside the shield. The shield, which is approximately 1000-mm high,
uses high-density concrete for portions of the lower half (approximately 5000-
mm height), in the area surrounding the reactor pool. The shield and the pool
water provide sufficient radiation shielding from the various sources within the
pools to allow personnel to work safely at any location in the reactor hall.
Bridges over the reactor pool allow personnel safe access to all reactor
components.
Beam Ports
Beam Port 1. This is a tangential beam port that is designed for
neutron diffraction with a high - resolution powder diffractometer.
Beam Port 2. This is a tangential beam port that is designed for
neutron radiography.
Beam Port 3. This is a tangential beam port that is designed for
prompt gamma neutron activation analysis.
Beam Port 4. This radial beam port is reserved for boron neutron
capture therapy (BNCT.)
Beam Port 5. This tangential beam port is reserved for small
angle neutron scattering.
Beam Port 6. This radial beam port is reserved for future use.
Beam Port Plugs. The heavy port plugs will be designed such that
radiation levels outside the beam ports will be comparable to that of the. reactor
shield structure. These plugs will be stored in receptacles in the biological
shield when not in use. The receptacles will be located within a practical
distance from the floor, and on the side of the shield near the east wing.
-330-

JAERI-Conf 2001-017
Beam Port Shutters. The lead shutters will be designed to provide
adequate temporary shielding during installation of beam tube experiments. The
reactor is assumed to be shutdown during such periods.
BNCT Neutron Beam Facility
BNCT Beam Port. The portion of the BNCT beam port within the
reactor pool is an enclosed box, which is normally water- filled to minimize
liner and concrete activation. When water filled, a small flow rate will be
provided from the water cleanup system to assure proper water quality is
maintained within the enclosure. This portion of the BNCT port has the
plumbing required to permit draining, flushing, and gas filling.
The box is welded to the reactor structure on the two sides of the
shroud not in contact with the D20 tank. The arrangement has a single
aluminum barrier, and no water, between the core and the box. The design of
the box, and the reactor structure's installation, will minimize the water gap
between the box and liner to maximize the number of useful neutrons available
for BNCT use.
Where attached to the shroud, the box inside height, 854-mmn, is
concurrent with the core height to maximize the available neutrons ; the box
enlarges to 1000-mm square where it fits against the pool liner. To avoid the
possibility. of overloading the shroud when either air or water - filled, the
BNCT port top plate has "wings" that transfer loads around the square shroud,
and through the 3/4 cylindrical shroud, to the D 20 tank's top plate.
-331 -

JAERI-Conf 2001-017
Two layers of removable aluminum blocks are provided at the periphery
of the core adjacent to the BNCT port.
Progress activities of BNCT project
Nov. 1996 Set up working group for BNCT project
Sep. 1997 A staff of BNCT working group scientific visit on BNCT Facility
at KURAI, Japan
Jan. 1998 Invite expert Dr. T. Kobayashi from KURAI, Japan for Conceptual
Design of BNCT Facility and lecture on "Boron Neutron Capture
Therapy"
Sep. 1999 Invite IA3A Expert Professor McMla Hiisinaki from V IT
Chemical lechmology, Finland for Conceptual Design of BNCT
Facility
Dec. 19,99 Lecture on "The Finnish BNCT Programnme Before and After the
Treatment of the First Glioma Patient" by Prof Pekka Hiismaki
Mar. 2000 Lecture on "Boron Neutron Capture Therapy" by Prof. Yoshimobu
Nakagawa, Japan.
Mar. 2000 Seminar on "Clinical Practice in BNCT to the Brain" by Prof.
Yoshimobu Nakagawa, Japan
Present BNCT neutron beam facility is in the process of detail design.
Future Plan
Since our BNCT project is in the process of detail design. The BNCT
neutron beam facility will be designed and provided by the contractor. The
design of BNCT supporting facility eg. irradiation room, treatment room,
- 332 -

JAERI-Conf 2001-017
preparation room, etc. will be also done for the next phase. The collaboration
among the participating countries on the BNCT facility design will be needed.
Our further activities will continue with the design of BNCT neutron
beam facility and other supporting facilities.
Propose for collaboration
Workshop on BNCT Facility Design
Since many participating countries are interested in BNCT
technology and almost of them do not have this facility. To prepare and
modify the existing reactor facility for BNCT, it need to plan for the design of
BNCT facility. The facility for BNCT should comprise of neutron beam facility,
irradiation room, treatment room, preparation room, etc. which have to be
carefully designed.
To hold workshops on BNCT facility design at the country which
the BNCT facility existed would be very useful for the participating countries
who are interested in this field.
Sub-workshop on Demonstration of Clinical Treatment by BNCT
BNCT Technology is not widely utilized in many countries. To
demonstrate of clinical treatment by BNCT for nuclear physicists, nuclear
medicine doctors, etc. would be beneficial for them to gain more experience in
this Technology.
This sub - workshop would be also helpful for the participating
countries in preparing a working staff, instruments and equipments for
implemention of the project.
- 333 -

JAERI-Conf 2001-017
Conclusion
To expand the utilization of a new 10 MW research reactor of ONRC
project, OAEP has planned to install BNCT facility in the project. The ONRC
project are during the detailed design phase, the BNCT neutron beam facility
will be provided by the contractor. OAEP has to design the BNCT supporting
facilities eg. irradiation room, treatment room, preparation room, etc. which
need some advice and assistance forn the experienced countries. The
collaboration among participating countries wvill be beneficial for implementation
of our BNCT project.
-334-

JP02501 16JAERI-Conf 2001-017
1.32 Development of BNCT Facility
at the Indonesian Research Reactor'
Hudi Hastowo
Center for Development of Research Reactor Technology,National Nuclear Energy Agency of the Republic of Indonesia (P2TRR-BATAN),
Kawasan PUSPIPTEK Serpong, Tangerang, 15310, INDONESIAPhone: +62-21-7560908, Facsimile. +62-21-7560573.
E-mail: prsgc.id
Abstract
Batan has an intention to develop BNCT facility at one of the research reactoravailable in Indonesia. Study on utilization of the BNCT fcility has a good response fromhospital nearby research reactor facility.
In order to realize development of the BNCT facility, a feasibility study to definewhich reactor in Indonesia will be used for that purpose has been done. The result indicatesthat the TRIGA Kartii reactor in Yogyakarta will be the most suitable for that purpose incomparison with the other reactors. Further action plans for that program has been defined asmuch as reasonable with availability of fund can be provided-
With a support of JAIF Japan, a JAERI's expert an BNCT has visited Indonesia toexplain basic requirement for the BNCT and he has also intensively discussed withIndonesian reactor engineers as well as medical doctor to explain the latest status of theBNCT facility available in JAPAN. Under bilateral JAERI-Batan cooperation program,scientist exchanges from both institutions has been focused and also will be utilized tosupport development of the BNCT facility in Batan's reactor.
Up to know Batan is expetg the IAEA Technical Cooperation Program on BNCTfor the fiscal year 2001. Under this program, another aspects of BNCT technology i.e.radiation dose and radiobiology, as well as radio-pharmaceutical aspects will be developed.Visit of foreign experts to Indonesia and also joint research work between Batan facility andforeign research institute will be done.
This report will describe status report on development of the BNCT facility in theIndonesian research reactor, mainly from reactor engineering aspects, and also furthercooperation with an international institution being sought.
Key-words: bnct, research reactor, Indonesia.
1. Introduction
As a result of a good promotion on application of the nuclear technology for medicalpurposes as well as availability of the BATAN's reactors to supply radioisotopes to hospitals,nuclear medicine has progressively growth in Indonesia. Ups to now, 19 hospitals in
l Presented to the Workshop on Utilization of Research Reactors, Taejon, Korea, 20 - 24 November2000.
- 335 -

JAERI-Conf 2001-017
Indonesia have been facilitated with nuclear medicine. Further support of BATAN to thathospitals in the form of providing nuclear-medical equipment such as thyroid up-take andrenograph unit have a good response by medical doctor at those hospitals. Numbers ofpatients treated by nuclear techniques in those hospitals have increased significantly.
Progress on development of the BNCT treatment to cure cancers have been achievedby developed countries such as Japan, USA, European Countries, etc has attracted BATAN toconsider possibility to develop BNCT facility in Indonesia. Whenever this idea wascommunicated to the oncologist, they give a good response. This idea is inline with evidentgiven by oncologist regarding incidence for cancerous tumors and other brain tumors inIndonesia. Data from Sardjito hospital in Yogyakarta stated 30 brain tumor patients in 1998have been treated using combination of surgery and photon irradiation, and the results wereunsatisfied.
Feasibility study to develop BNCT at the Indonesian Research Reactor has done lastyear. With support of the Japan Atomic Industrial Forum (JAIF) one JAERI experts onBNCT facility has been assigned to support this feasibility study. With support of the JapanAtomic Energy Research Institute (JAERI) author has a chance to visit BNCT facility inJapan and also to gather latest information on BNCT facility, especially on the preparation ofthe reactor and beam design to facilitate BNCT treatment.
Further steps on development of the BNCT facility have been defined in accordancewith Batan's 5-year development program. Since limited funds available for the near future,up to 4-5 years from now on, the activities on the BNCT program will be stressed to theengineering design. The main goal with be achieved is within 4-5 years from now-on, BasicEngineering Design of the BNCT facility will be finalized.
2. Feasibility study of the BNCT facility in Indonesia
Three research reactors are available in Indonesia, those reactors are: TRIGA typereactor Bandung, Kartini (TIEGA) reactor Yogyakarta, and Multipurpose Research Reactor(MTR-type) RSG-GAS located in Serpong Nuclear Research Center [1]. Further detaildescription and also its status are described below.
a. TRIGA reactor in Bandung
TRIGA reactor Bandung has been operated since 1964. On the early period of itsoperation the reactor has a nominal power of 250 kWM Last 1971; the reactor was thenupgraded to 1000 kW with replacement of the reactor core and its fuel elements;instrumentation and other related process system equipment Finally, after replacement ofreactor liner and reflector, on last June 2000 the reactor has been successfully operated at2000 kW. The TRIGA Bandung reactor has utilized for radioisotope production purposes,neutron beam experiment and also training for reactor operator; as well as doing some reactorphysics experimental activities. This reactor has 4 beam tubes, 3 radial and 1 tangential tube,thermal column and thennalizing column
Several types of radioisotopes have been produced using this reactor. Radioisotopefor medical purposes, such as: 13"I and -9Mo/99Cc. Other radioisotope has been producedeither for hydrology (82Br) or R & D on agriculture; 3 2p.
This reactor has a laboratory for NAA and equipped with a nuclear counting systemas well as personnel to perform neutron flux measurement and neutron dosimetry. A bighospital with nuclear medicine facility is available around 5 km from the reactor site. Thishospital is also used as a teaching hospital by faculty of medicine, Padjadjaran University.
- 336 -

JAERI-Conf 2001-017
Up to 1990, medical radioisotope as well as radioisotope for other purposes inIndonesia were fulfilled by this reactor, Whenever the new reactor RSG-GAS, 30 MW andthe radioisotope laboratory in Serpong at that time become in operation, radioisotope requiredfor medical as well as for industry and other purposes were then flilfilied by this new reactor.Since then the TRIGA reactor in Bandung is mainly used to perform R & D on newradioisotope and also this reactor is used as a back-up when the RSG-GAS reactor in the shutdown period.
b. Kartini reactor in Yogyakarta
Kartmi research reactor is a 100 kW TRIGA operated since 1979 in Yogyakarta. Thisreactor is equipped with in-core as well as in reflector irradiation facilities. The irradiationfacilities are equipped also with rabbit system and also gamma spectrometry system as wellas delayed neutron-counfing system So that this reactor can be used to perform NAA(Neutron Activation Analysis) and also U-Th analysis (using delay neutron countingtechnique) from the mining. This reactor has 4 beam tubes, these tubes are equipped with aneutron-radiography facility, and sub-critical assembly, The thermal column andthermalizing column are available in the reactor, see Figures 1 & 2.
The Kartini reactor is operated by Center for Research and Development ofAdvanced Technology of Batan, which is very closed in relationship with Gadjah MadaUniversity. Based on this situation, the Kartni reactor is used as a training facility forstudent from the Gadjah Mada University.
Several hospitals, either government or private own hospitals are located near by thisreactor facility in the distance less then 10-km. One of those hospitals is a teaching hospitalof Faculty Medicine, Gadjah Mada University. This reactor is located just five minutes by carfrom Yogyakarta airport, and this area also very well connected to the other city in Indonesiawith transportation facility.
c. Multipurpose Research Reactor RSG-GAS
The RSG-GAS reactor is located in Serpong Research Center; it has nominal power30 MW. The RSG-GAS reactor is a plate type/MTR type reactor using LEU fuel in form ofU30 8-AI and U3Si2-Al. This reactor is equipped with irradiation facility as well as equipmentfor neutron beam experimental purposes, see Figure 3.
This reactor was officially inaugurated on August 1987 and reactor utilization forradioisotope production was started on December 1990. Up to know this reactor produced theentire radioisotope used in Indonesia, either for medical purposes as well as for industrialpurposes. Some of the radioisotopes produced from this reactor are also exported to foreigncountry. The reactor equipped with 6 beam tubes, one of this up to know is still unused. Theother beam tubes used for radioisotope production (75I), and neutron beam experimentspurposes, i.e. neutron radiography, powder diffractometer, triple axis spectrometer, neutronguide tube, otc.
This reactor is also has a facility for fuel element irradiation under high pressure andtemperature condition as occurred in the NPP. This reactor has equipped with a powerramping facility, a facility to stimulate power ramping on the BWR or PWR fuel elementunder irradiation condition
This reactor is located in Serpong, a suburb of Jakarta for about 35-km in SouthWestdirection. Several big hospitals either private or government own are available in Jakarta,however due to traffic condition in near by Jakarta, at least one and half hour is required to gofrom the nearest hospital in Jakarta to the reactor acility in Serpong vice versa.
-337-

JAERI-Conf 2001-017
Survey to the Indonesian research reactor for the BNCT treatment facility have donewith the following requested criteria used as considerations:
a. Neutron flux requirement:Neutron flux might be used at the front of beam tube or other facility should be around108 - 109 &n/c 2.s for thermal or epithermal [2,3J. It was considered also possibilities tomodify such of beam-tubes arrangement if it would be needed to reach that requirement.It was considered also volume of the beam and available space in front of beam tube toallow activities for BNCT treatment.
b. Reactor utilization program:Since the BNCT treatment requires preparation in the reactor area/ room, neutron as wellas gamma beam shutter is absolutely needed, other wise reactor should be started-up andshut-down to perform this treatment or single purpose only.
c. Supporting facility:The most important supporting facility is neutron flux measuring laboratory and boronconcentration measurement facility. All of the reactor facilities have a laboratory toperform neutron flux as well as neutron spectrum measurement. The available equipmentto measure boron concentration in the tissue as well as in the blood is ICP-MS, and thisequipment is available in Serpong facility.
d. Potential users of the BNCT/hospital:Positive response of the medical staff in the hospital, their expertise as well as facilityavailable on that hospital is considered as a supporting items to decide utilization of thereactor for BNCT.
e. Transportation for patient especially from hospital to the facility w.A good transportation facility is required for patients before and after treatment. It isassumed that only one facility will be made available in Indonesia, so that a goodtransportation mode from other city to this facility is available.
With a support of JAIF, a BNCT expert of JAERI has visited Indonesia and spentaround one week at the RSG-GAS reactor in Serpong beginning of last year. He hasperformed intensive discussion with the Indonesian reactor engineered and he explains basicrequirement for the BNCT facility. He has visited also TRIGA reactor in Yogyakarta andperforned technical discussion with reactor engineers and medical doctor/oncologist of theSardjito hospital and Faculty of Medicine, Gadjah Mada University. With support fromJAERI, Japan, author has spent 2 weeks in JAERI facility to gather further detail informationregarding BNCT technology, and he has also visited several institutions operated thesefacilities. During his visit to Japan, discussions with specialist expert on neutron beam designas well reactor engineers have been done in order to finalize decision on which reactor theBNCT facility will be installed.
Result on this survey indicated that the RSG-GAS reactor is not suitable to performBNCT treatment due to some reasons:
a. Neutron beam as well as volume of the neutron beam available in the front of beam tubeis only 107 and it is not suffcient j4j. Beam-tube modification is very difficult and alsonot possible since utilization program of the reactor.
b. Neutron and gamma beam shutter is required because of utilization program of thisreactor will be disturbed by BNCT treatment. However, construction of the beam shutterin this room/hall is not possible since available space on this area as well as bearingcapacity of that floor is limited.
c. Transportation of the patient being treated from hospital to the reactor facility is ratherdifficult since arrangement of the reactor building, and also traffic from Jakarta to thereactor site vice versa are not comfortable.
-338 -

JAERI-Conf 2001-017
Since the RSG-GAS reactor is not suitable for the BNCT facility, other two TRIGAreactors are considered to be used for that purposes. Further activity on preparation of thebeam design for BNCT will be concentrated to the TRIGA reactor. Using TRIGA reactor,BNCT facility should be installed in front of the thermal column.
Availability of the supporting facility as well as a good response of oncologist andother medical staff of the Sardjito hospital and Gadjah Mada University to the BNCTprogram is indicating that utilization of TRIGA reactor in Yogyakarta will be feasible. Fromthe transportation point of view, Yogyakarta is more accessible and also less traffic densethan Bandung. Furthermore, results of the FiR-1 TRJGA Mark II reactor 250 kW forepithermal BNCT treatment facility gave an indication that TRIGA Kartni reactor inYogyakarta more preferable than TRIGA Bandung reactor.
4. Further step on BNCT activities in Indonesia
The BNCT facility in Indonesia is planned in operation within next 5 years from nowon. Based on the literature survey referring to the other facilities now are available (2,3,5,6]or being available in the near future (73, epithermal neutron beam is more preferable ratherthan thermal neutron beam. To follow on the tendency, BNCT facility for the IndonesianTRIGA reactor is planned to use epithermal neutron beam.
Since the BNCT program has started several activities now were identified and alsoinitiated. The main activities can be described as follows:
a. Up-rating Kartii reactor.Power up-rating from 100 kW to 250 kW is underway. In general this activity would nothave a technical problem because previously the reactor was designed at that power level.However to fiulfill licensing requirements, Safety Analysis Report of this reactor as wellas Environment Impact Analysis Report should be issued and approved by the relevantinstitution.
b. Beam designThe thermal column of TRIGA reactor will be modified to produce epithermal neutronbeam required for the BNCT facility. Material in the thermal column will be changed inorder to get epithennal neutron beam As the first step, the reactor physics calculationusing-montecarlo code MCNP is initiated. To get a better result and also to speed up thecalculation process, shifter material or moderator and also photon -shield have used inthe Finnish reactor (8J will be considered. Calculation model as described by Matsumoto[9,1O0 will be applied on this work. Completion of this work will be followed with thenext step to perform engineering design to prepare basic and detail design. Preparation ofthe reactor physics calculation as well as engineering activities of the neutron beamdesign is planned for two years, This activity will be followed by construction, testingand commissioning of the equipment including also phantom measurement.
c. Neutron dosimetry and treatment planningAt the reactor facility, neutron flux and spectrum measurements have done using foil andwire activation detectors. Laboratory with nuclear counting system is available, includedalso sample changer to perform multiple sample analysis. Neutron flux measurementusing SPND is also used in the experimental facility. Since manpower to perform theseactivities is also available, the most important activity to be done in the field of neutrondosimetry is improvement on accuracy and to speed-up the measurement result. Theother aspect of dosimetry for BNCT as described by Watkin [11] will be considered andprepared.Dose treatment planning can be done through calculation process and it will be checkedor verified using measurement.
- 339-

JAERI-Conf 2001-017
d. B concentration measurementB concentration in tissue and blood can be measured using PGAA and ICP-MS/AES. Upto know PGAA system is still being prepared, it is expected that within 5 years from now,the equipment is ready and well-trained personnel are available to determine Bconcentration in tissue as used in other facility [121,The ICP-MS is available and also well-trained personnel are ready to perform lightelement identfication and measurement
e. Radiobiology and pre-clinical experimentRadiobiology and pre-clinical experiment for animal will be continued, as previouslydone using TRIGA reactor in Bandung. This experiment should be done in cooperationwith medical doctor or oncologist to get better result.
f. Man power improvementSince the BNCT facility is considered as a priority of the Batan's program, activity forpreparation of this facility will be done not only by staff of the Kartini reactor but alsodone by personnel from other centers such as from Serpong facility.Sending them to the foreign facility as well as receiving expert from other countrythrough bilateral arrangement and IAEA technical assistance does enhancement of themanpower capability.Through JAERI-BATAN arrangement one Batan's staff has received training on neutrondose measurement for 1BNCT treatment beginning of this year, and another Batan's staffwill be trained on the field of neutron beam design at the beginning of 2001. UnderIAEA TC program for 2001, is planned to accept experts on the fields of radiobiology,dose calculation/measurement, and radio-pharmaceutical aspect.
4. Conclusions
Development of the BNCT facility at the Indonesian research reactor is just beingstarted. The Kartni reactor in Yogyakarta is the most suitable for BNCT facility incomparison with others. Since several circumstances of the current economical situation, thenext 5-year planning has a target to finalized engineering design of this facility. Severaltechnical activities have been initiated and further support from foreign countries is sought toimprove manpower required for realizing the program.
Reference
[1] Hastowo, H, Utlization of Research Reactor and its R & D Program in Indonesia, paperpresented to the Project Fonmulation Meeting on the Reactor Utilization, Taejon, Korea,March 1998
[2]. Tori, Y., et al., BNCT Irradiation Facility at JRR-4, paper presented to the ASRR-6,Mito, Japan, 29- 31 March, 1999
[3]. Yokoo, K., et al., The Installation of a New Medical Irradiation Facility at JRR-4, paperpresented to the Workshop on the Utilization of Research Reactor, Yogyakarta, Indonesia,8-11 February 1999.
[4]. Ikoam, A., personal communication, 1999[5]. Constantine, G., "The physics and technology of NCT, an overview', Advance in
Neutron Capture Therapy, Volume I, Medicine and Physics, Edited by B. Larsson et al.,pp. 301 - 310, Elsevier Science, 1997.
[6]. "Boron Neutron Capture Therapy - BNCT", Annual Report 1998, Operation of the HighFlux Reactor, Joint Research Centre, European Commission, EUR 18714 - EN.
[7]. Savolainen, S., et al., "The Finnish boron neutron capture therapy program, an overviewon scientific projects", Advance in Neutron Capture Therapy, Volume 1, Medicine andPhysics, Edited by B. Larsson et al., pp. 342 -347, Elsevier Science, 1997.
-340-

JAERI-Conf 2001-017
[8]. Auterinen, I., and Hiismfnd, P., Epithermal BNCT Neutron Beam Design for a TRIGA IIReactor, Advances in Neutron Capture Therapy, Edited by A.H Soloway at al., pp. 81 -84, Plenum Press, New York, 1993
[9]. Matsumoto, T, et al., Design Studies of an Epithermal Neutron Beam for NeutronCapture Therapy at the Musashi Reactor, Journal of Nuclear Science and Technology,Vol. 32, No. 2, pp. 87 - 94, Feb. 1995.
[10]. Matsumoto, T, Design of Neutron Beams for Boron Neutron Capture Therapy forTRIGA Reactor, Journal of Nuclear Science and Technology, Vol. 33, No. 2, pp. 171 -178, Feb. 1996.
[l 1]. Watkin, P., et aL, "Dosimetry for BNCT in theory and practice@, Advance in NeutronCapture Therapy, Volume L, Medicine and Physics, Edited by B. Larsson et al., pp. 141 -146, Elsevier Science, 1997.
[12]. Yonezawa, C., et al., "Application of Neutron-induced Prompt Gamma-Ray Analysisfor Determination for B-10 in BNCT", Cancer Neutro Therapy, Edited by Mishima, pp.221 - 225, Plenum Press, New York, 1996.
-341-

JAERI-Conf 2001-017
W~~~e' ______ '~%V
Be. . , *..__ .......= - ~. b -.I. _
Eo hrk g -'. .t, l _ L L~~~~~~~~~~~~4. .
figusre L. V~ertical crass-secdon of the TIRIGA Kartini reactor
- ~~~~~~~~~~~~~~~~~-1
4.. 4* s 0m
,, ; .. t o _ri- . F '5 S:
- ~ ~ ~ -. 9 .*,.e PF 4.: .g
Figure 2. Horizontal cross-section of the TRIGA Kartini reactor
- 342-

JAERI-Conf 2001-017
'tl
343 -#'," EM
W n_ - L tx1 \ 1'm *
:s j X & 0 1 i v1 XX~~~~~~~~~
t # F g,@ g :} g 7
1~~~~~ ~ ~~~~~ 1 e
-1 t_ X R-343-Iii //'

l ulllh IGIIIl lUl IIGI 11111 lUGl 1111111 BIGl 111111ll JP02501 17
JAERI-Conf 2001-017
1.33 Development of PGNAA Facility in HANARO
H. D. Choi, S. H. Byun. G. M. Sun,
M. S. Kimt, and B. J. Jun'
Department of Nuclear Engineering, Seoul National University, Seoul 151-742, Korea
' HANARO Center, Korea Atormic Energy Research Institute, Taejon 305-600, Korea
A prompt gamma neutron activation analysis(PGNAA) system is being set up in HAkNARO, a multipurpose
research reactor 'L the Korea Atomic Energy Research Instirute. The beam is polychinomatic thermal neutrons
diffracted vertically by a set of pyrolytic graphite crystals at the Bragg angle of 45° frerm a horizontal beam line.
Prior to assembling, measurements of the neutron spectrum and gold wire activation confirmed that a sufficient
neutron flux can be obtained. A tapered collimator is positioned between graphite crystals and the Teflon sample
holder, being composed of alternating layers of borated plastic, lead and polyethylene. The detection system
consists of a 43% n-type HPGe detector, signal electronics and a fast ADC. At present, graphite crystals and
collimator with the surrounding shield on the beam line are set up and measurements of beam characteristics are
progressing. Thermal neutron flux of 6. 1x10⁷ n/cm2s and the Cd-ratio of 364 are achieved at sample position
while the reactor is operating at 24MW in November 2000. The first application of the system will be analyzing
'0B in biological samples.
1. Introduction
Determnning '0B concentration in treating area is necessarily required in BNCT before implementing the
irradiation in order to decide the neutron irradiation time and to evaluate the therapeutic effect[I]. For measuring
"B, PGNAA method and ICP(inductively coupled plasma) atomic emission spectroscopy are widely used,
among which PGNAA method has the merit of matrix-independent result in short turn-around time[2].
In PGNAA method, concentration of component nuclide in the sample is analyzed by detecting prompt
gamma-rays which are emitted promptly within the order of l0- " sec after a neutron is absorbed by the nuclide.
This method is particularly suitable for analyzing the elements of B, Cd, Sm, Gd etc. which have large neutron
corresponding author: (email) choihdggsnu.ac.kr
- 344 -

JAERI-Conf 2001-017
capture cross sections, and also for the elements like H, C, N, S etc. which do not lead to radioactive isotopes by
neutron absorption[3].
The performance of a PGNAA facility depends on obtaining a high flux thermal or cold neutron beam with
fast neutron and gamma backgrounds removed to a sufficient degree. The pioneering facilities mostly adopted
direct neutron beam from the ports, while the recent trend is developing facility by using cold neutrons as the
construction of cold neutron beam lines is widespread over the research reactor sites[4,5,6]. In HANARO,
developing PGNAA facility was initiated by the requirement of 0B analysis along with the plan of BNCT
facility[7]. The present facility adopts the method of Bragg diffraction by using pyrolytic graphite(PG) crystal
for extracting thermal neutrons from a direct beam line[8,9]. The facility, however, has the unique feature of
utilizing diffracted polychromatic neutrons without filtration[l0,1 1].
In the design stage, thermal neutron flux was predicted to be above 107 n'cnm2 s for the case of Bragg angle
450 by calculating the theoretical reflectivity of mosaic PG crystal and by simulating the beam divergence
effect with Monte Carlo method. The prediction was afterwards confirmed by a prototype experimental
setup[10]. At present, measuring the characteristics of neutron beam is finished for varying conditions of
extraction methods such as the thickness of crystal and the focusing geometry. Since all other components of the
facility are ready to assemble, the installation is planned to finish by the end of 2000.
2. System features
21. Thermal neutron extraction
The schematic diagram of PGNAA facility in HANARO is shown in Fig. 1. The PGNAA device is installed
at the wall end of the STI horizontal neutron beam port, and shares the neutron beam with the polarized neutron
spectrometer(PNS). The cross section of STI port exit is 70wxl20h mm', whose central part of 70wx6Oh w1m 2 will
be used for PNS, while the area of top-and-bottom edges is assigned to PGNAA facility. The thermal neutrons in
the horizontal beam line are diffracted upwards as shown in the figure. For the diffracting crystal, pyrolytic
graphite(PG) is chosen for its high reflectivity. The mosaic spread of PG is 0.80. It is chosen to give the
maximum flux at the sample position, predicted through a detailed optimizing calculation of two conflicting
effects from reflectivity and beam divergence[ 11]. PG crystals are located at the both top and bottom edge
regions at the exit of STl port. One piece of crystal is 2 num thick and 25 mm wide by 50 num long. A double
- 345 -

JAERI-Conf 2001-017
layer of 3 pieces occupies the beam cross section of 70vx30h mm2 . The two side-pieces are inclined with respect
to the central piece and hence they are shaped in concave form in order to achieve focusing the diffracted
neutrons at sample position. Before mounting, the inclination of the side-pieces are fine-tuned by using a parallel
light beam. The reflected light image was observed at the sample distance on an optical table. By varying the
tilting angle of side-pieces, tilting position was fixed when both images from the side pieces coincide with that
from the center piece.
The PG crystal mount is located 4 m from the nose of STI beam tube. It is attached to a two-axis
goniometer of manual driven type. After installing a BF3 detector wrapped with Cd-sheet having a pin-hole at the
detection position, the angle of goniometer is adjusted by maximizing the neutron count rate at sample position.
Between PG crystals and sample, beam collimator is installed to limit the beam cross section at sample
location which is 1.5 m from crystal. The collimator has layered structure of alternating rings made of borated
plastic, lead, and polyethylene, respectively, to reduce thermal neutron, gamma ray and fast neutron. The
diameter of alternating ring is gradually decreased to reduce to a circle of 20 mm diameter at sample position.
2.2. Shielding, sample holder and detection system
The PGNAA device needs shielding around the collimator, the beam shutter, the stopper, and also around
the diffracted beam line and the HPGe detector. Since the PG mount and collimator are near the exit of beam
port, the background level is inaccessibly high. To shield the high level background, heavy concrete blocks
containing B4 C powder are installed around the STI beam line. For shielding of diffracted beam line and
detector, neutron is shielded at first and gamma-ray at next. The material for thermal neutron shielding contains
boron or lithium of which absorption cross section is high. The boron shields neutron effectively but produces
more secondary gamma-ray. Therefore, borated plastic in which B4C is mixed by 66 % weight fraction is used in
shielding for the beam shutter, the beam stopper and the regions where the production of secondary gamma-ray
does not influence the detector. The LiF tiles(lOOxlOOxlO mm 3) are used for locations near sample and detector
entrance where the production of secondary gamma-ray has to be suppressed. The 95% enriched 'Li is used only
for the detector window while natural lithium is used in other places. The 6LiF tile is produced from the sintering
process after converting the commercial 6Li2CO3 powder to 6LiF by use of hydrofluoric acid. The shield for
gamma-ray is lead of thickness 10 cm minimum.
The gamma-ray detection system is shown in Fig. 2. The gamma-ray detector is n-type HPGe with relative
efficiency of 43%. A charge sensitive preamplifier with resistive feedback is to be used. To increase the
-346-

JAERI-Conf 2001-017
maximum tolerable count rate of the spectroscopy system, an amplifier with gated integrator and a fast ADC
with a constant conversion time of 1.5 psec have been chosen.
3. System performance
Since the details of the neutron spectrum obtained by diffraction are unknown, a measurement by time-of-
flight(TOF) spectrometer has been carried out, the result of which is shown in Fig. 3. Due to the difficulty of
installing TOF spectrometer at STI line, the measurement was performed at the neighboring CN beam line. The
neutron spectrum is obtained for 90' diffraction by PG crystal. The relative proportion of neutron flux for each
diffraction order is determined from the measured area of Bragg peak with proper correction for the effects of
chopper transmission and detection efficiency etc. Table 1 shows the comparison of the measured result with that
obtained by theoretical calculation using integrated reflectivity. For the case of Bragg angle of 450 ,both results
confirm that there is little contribution from the I" order diffraction but those from the 2 "d, 3r and 4"' order are
the majority.
The beam profile at the sample position is measured by use of a pin-hole BE3 detector. The result is shown
in Fig, 4. It is evident in the figure that a flat distribution is achieved in a region of 20 mm diameter. For clear cut
of beam cross section, a final slit will be located at the exit side of beam shutter.
To determine the neutron flux and Cd-ratio, gold-wire of 0.1 mm diameter and 0.5 mm thick Cd sheet are
used. For the rotary shutter of STI beam port set at full open position, the results of measuring diffracted neutron
flux at the sample position are listed in Table 2 for several PG crystal configurations. When the PG crystals are
used in single layer and flat geometry, the flux and Cd-ratio are 2.2xlQ7 rnlcm 2 s and 292, respectively. For the
double layered PG, the crystal thickness is doubled and the gain in flux reached to 1.6 which is slightly larger
than the theoretical gain 1.4. By considering the non-proportional increase in Cd-ratio, considerable amount of
background fast neutron leaking into the sample region exists in parallel with those scattered from the crystals.
The flux gain by tilting the side crystal pieces to produce focusing effect is 1.7 which is equal to the calculated
gain by Monte Carlo method. The increase of Cd-ratio by only a factor of 1.2 requires further study. The
achieved neutron flux 6.1xl07 n/cm2 s and the Cd-ratio 364 are of sufficient quantity and quality required for
analyzing ppm level 10B in the course of BNCT[I], and prove a unique neutron beam environment which is not
seen in the existing PGNAA facilities utilizing thermal neutron.
- 347 -

JAERI-Conf 2001-017
The test performance of gamma spectroscopy system is summarized in Table 3. The relative efficiency of the
purchased HPGe detector is 43% and the resolution for 1332 keV gamma-ray was measured to be consistent
with the vendor's value 1.9 keV.
4. Condusion
The characteristics of neutron beam for use in HANARO PGNAA facility are measured and described.
The optimized beam flux at the sample position is 6.1 x 10⁷ n/cin2s and the Cd-ratio is 364, at 24 MW of reactor
power. Hence it is verified that the 900 diffracted beam by PG crystals has suitable qualifications for applying
to PGNAA. By this year's end, assembling all components is carried out with a view of application to lOB
analysis in biological samples.
References
1 . T. Kobayashi and K. Kanda, Nucl. Instr. and Meth. 204 (1983) 525.
2. T.U. Probst, Fresenius J. Anal. Chem. 364 (1999) 391.
3. R.M. Lindstrorn, Proceedings of the International Workshop on Cold Neutron Utilization, Taejon, Korea
(1998) 205.
4. C. Yonezawa, A.K.H. Wood, M. Hoshi, Y. Ito and E. Tachikawa, Nucl. Instr. and Meth. A329 (1993) 207.
5. R.M. Lindstrom, R. Zeisler, D.H. Vincent, R.R. Greenberg, C.A. Stone, E.A. Mackey, D.L, Anderson and
DD. Clark, J. Radioanal. Nucl. Chem. 167 (1993) 121.
6. K. Onii, C. Rios-Martinez and B.W. Wehring, J. Radioanal. Nucl. Chem. 193 (1995) 145.
7. H.D. Choi, S.H. Byun and B.J. Jun, Proceedings of 6th Meeting of the International Group on Research
Reactors, Korea (1998) 449.
S. D.F.R. Mildner, R. Berliner, O.A. Pringle and J.S. King, J. Appl. Cryst. 14 (1981) 370.
9. KI.J Riley and O.K. Harling, Nucl. Intstr. and Meth. B143 (1998) 414.
10. H.D. Choi, S.H. Byun, B.J. Jun and M.S. Kim, Proceedings of 10th International Symposium on Capture
Gamma-Ray Spectroscopy and Related Topics, USA (2000) 731.
11. S.H. Byun and H.D. Choi, J. Radioanal. Nucl. Chem., 244 (2000) 413.
- 348 -

JAERI-Conf 2001-017
Table 1. Comparison of the measured and calculated relative fractions of the diffracted neutronflux from each diffraction order for a double layer of PG crystals.
Way 1 1 ~~~~~~~D(n )/~D, __ 4id() 'th"Diffraction Wavelength Energy ___
Order (n) [A] {meVl CalcilationT Measurement Calculation_~~47 ± . 7 J K -___ _ ._ _ _ _ _
1 4.74 ± 0.07 3.6 ± 0.1 5.9 5.0 ± 0.1 0.0014_______ ______ I _~ ---__ _
_2 2.37 ± 0.03 14.6 ± 0.4 22.2 25.4 ± 0.2 0.0052
3 1.58 ± 0.02 32.8 ± 0.9 30.9 37.9 ± 0.2 0.0072
1.19 ± 0.02 58.3 ± . 4 3 l22.9 +0.2 0.0057
5 0.95 ± 0.01 91.1 + 2 12.4 8.2 0.1 0.0029
6 0.79±0.01 13 .2371 43 0_ 0.5+0. 1 0.0010
* ,D(n) neutron flux from n-th order diffraction, sumn of all f,(n)'s.** Cth: total thermal neutron flux of incident beam.
Table 2. Thermal neutron beam characteristics measured at the sample position.
Crystal Number of Neutron flux .shape crystal layer I Flux gai Cd-rafo
1 2.2x 10⁷ 29Flat
2 3.5x10⁷ 1.6 315
Tilted 6. x107 1.7 364
Table 3. Result of performance test of the y-ray spectrometer for1332 keV y-rays.
MeasuredWarranted
Factory This study
Resolution 1.90 keV 1.83 keV 1.90 keV(FWHM)_______ __
Relative % 43.1 % 43.1 %efficiency3
- 349 -

JAERI-Conf 2001-017
Beam: :: stopper Beam hole
: .... ........ ... IR
:. :... 00... ........ ..Led,.............. I. Lead
Neutron shield - plan view -absorber ..... H..Ge / 1/ . .
....... , , '....-.....LN 2|Sample dewarholder...'..
Beamshutter m Yoke shield
.............. ~ ~~~~~~~~~(Steel)*Collmator - ;j I; Neutron shield~
z OX STI tube . ; + DoPNS drum
*. ...... ,,.,,-, - ..Q Pyro. yti c gr aphite
Reactorwall
Floor
0 0.5 im
Fig. 1. A schematic layout of the PGNAA system on the STI beam port of HANARO. Additionalshielding around the sample and the beam path is not shown here.
supply Oscilloscope
HPGe->ByACr
l ~~~~~~~~~~~~~~~~~Ethernet
| Pulser || & || PC lI~~~~~~~~scaler
Fig. 2. Block diagram of the detection system for PGNAA.
-350-

JAERI-Conf 2001-017
o 10000-
aC n=3 PG 0.8 degree (double layer)
C:0
6000
n=4
4000 -
2000 fn=5 ..n=6 X n=1
0- 0 100 200 300 400 500
Channel number
Fig. 3. The TOF neutron spectrum of the diffracted polychromatic beam at the Bragg angle of 45°obtained by using a double layer of PG crystals having 0.80 mosaic spread.
~' 2.5x1 04 _
CDo
0 2.0x10⁴O -0
4-0 1.Ox104 X
0O 5.0x10³
0.0 - I I
-30 -20 -10 0 10 20 30Y-position [mm]
in 2.5x1 04-
Cz 2.Ox1 O -0
C1 .0X1 04 _ 00) 15.x10C3
5 .OxlO0
0 .0-
-30 -20 -10 0 10 20 30X-position [mm]
Fig. 4. Neutron profile at the sample position, measured by a BF3 pin-hole detector.
-351-

I 1111111111 BI 11 Bll IlIllll lull 1111 11111 11111lii1111JP02501 18
JAERI-Conf 2001-017
1.34 JRR-4 Medical Irradiation Facility
Y Torii, K Yamamoto, N. Hori, H. Kumada, Y Horiguchi
Japan Atomic Energy Research Institute
Tokai-mura Naka-gun Ibaraki 319-119 JAPAN
1. ABSTRACT
JAERI started Boron Neutron Capture Therapy (BNCT) at JRR-2 in 1990. JRR-2 was
performed 33 BNCT until 1996 when JRR-2 operation was terminated for decommissioning the
reactor. JRR-4 was constructed to research the reactor shielding of the first Japanese nuclear ship
"Mutsu" in 1965. JRR-4 was modified for reducing fuel enrichment and constructing a new medical
irradiation facility at 1997 when after the terminating operation of JRR-2. The medical irradiation
facility is especially using for BNCT of brain cancer. JRR-4 medical irradiation facility was
designed for both using of thermal neutron beam and epi-thrmal neutron. Thermal neutron is using
for conventional Japanese BNCT as inter operative irradiation therapy. Epi-thermal neutron beam
will be using advanced BNCT for deep cancer and without craniotomy operation for irradiation at
the facility. The first medical irradiation for BNCT of JRR-4 was carried out on October 25, 1999.
Since then, seven times of irradiation was performed by the end of June 2000. In BNCT irradiation,
boron concentration and thermal flux measurements were performed by JAERt. Boron concentration
of patient brood was measured using prompt gamma ray analysis technique. Thermal neutron flux
was measured by gold wire activation method using beta - gamma coincidence counting system.
There data were furnished to medical doctor for determination the irradiation time of BNCT.
2. OUTLINE OF JRR-4
JRR-4 was constructed for the purpose of shielding design study for nuclear ship. It was
a swimming pool type research reactor using light water for its moderator and coolant. Its maximum
thermal power is 3.5MW and first criticality on January 28, 1965. The operation of JRR-4 using
HEU fuel terminated at the beginning of 1996. A new medical irradiation facility was constructed
and the operation of the reactor resumed with LEU fuel in July 1998. The new facility at JRR-4 was
designed to be capable of providing both thermal and epithermal neutron beams. Bard eyes view of
JRR-4 is shown Fig. 1
3. IRRADIATION FACILITY
The cross section of JRR-4 medical irradiation facility is shown in Fig. 1. The heavy water
tank is structurally composed aluminum and heavy water layer. The material of ammonium was
selected for fast neutron absorber. The heavy water layers are separated and optimum heavy water
- 352 -

JAERI-Conf 2001-017
thickness can be chosen for both thermal and epithermal beams according to the need of each
treatment. The tank is installed together with a cadmium filter, which is set for beam condition
changing thermal mode to epi-thermal mode.
P Prompt Gamma Ray Analysis:DeviceX~~~~~~~~~~~~~~~~~~~~~~~~~~~~. .hI.F.6 ....
XJY 7vNeutron Beam Facility
Irradiation R.oom
Fig.1 Bard eyes view of JRR-4
The beam experimental elements consist of Bismuth filter for reducing gamma-ray dose,
Lead and graphite for neutron reflectors, LiF and B4C for decreasing activation of structural
materials, LiF collimator at beam port, and Borated polyethylene and lead blocks set for shielding
around the beam port. The irradiation room have sufficient space for setting angle of patients
which is possible to adjust within 90 degree to left side, and 60 degree to right side. The medical
treatment room and patient-monitoring area were also prepared adjacent to the irradiation room.
Patient monitoring area was installed video monitor, neutron and gamma rays area monitor in the
irradiation room.
- 353 -

JAERI-Conf 2001-017
Reactor
\ I ~~~~~Beam Experimental Elemnent //
\ / D2~0 Tank RO X / / / //
Fig. 2 Cross Section otXJRR-4 Medical Irradiation Facility
4. Boron Concentration Measurement
The boron concentration of patient blood was measured using prompt gamma ray analysis
(PGA) device. JRR-4 has no horizontal experiment tube, which can use for PGA. Therefore, thermal
neutron is transferred in the neutron guide tube using the neutron mirror (tile super mirror) to the top
of reactor pool, and the prompt gamma-ray analysis is carried out. Neutron guide tube with the super
mirror consists 8m length was adopted in order to obtain sufficient thermal neutron flux at
measurement position which is necessary for the analysis of the boron concentration. As a super
mirror of the neutron guide tube, flat surface glass that alternately coated 124 layers of nickel and
titanium was used, it has the performance of two times further than the nickel mono layer.
Crystalline Bismuth was installed in the neutron beam aperture in order to shield the gamma ray,
which comes from reactor core. The boron concentration measurement at JRR-4 is performed by
taking the ratio of the peak areas of B-10 and hydrogen. The method of using the ratio is not affected
to difference of sample value and neutron flux density; A Ge detector measures the prompt gamma
ray that the sample radiates. By this spectral data, boron peak area and hydrogen peak area are
calculated to obtain the peak area ratio (B/H ratio). The boron peak becomes trapezoid-shaped by the
Doppler shift because radiation of prompt gamma-ray from the Li-7 particle with high speed motion.
Fitting function was defined in order to accurately integrate trapezoid-shaped peak area, and
nonlinear fitting program to this function as known Error Function was developed. This program
similarly carries out the fitting of hydrogen peak area to the Gaussian curve, and the area would be
- 354 -

JAERI-Conf 2001-017
calculated. We made a calibration curve using standard boron acid solution and blood with
BSH(mercaptoundecahydrododecaborate). Patients boron concentration of blood was measured
using B/H ratio to concentration calibration curve. The required measurement time is only 5min for
obtain sufficient accuracy from 1 cm3 blood sample.
5. Thermal Neutron Flux Measurement
Thermal neutron flux is measured using Au foil activation method with coincidence
counting device. Absolute activity measurement is usually carried out finding efficiency of the
detector. But the determination of the efficiency is very difficult because usually the shape of sample
and standard radiation source are different and the standard radiation source has error to definition of
the accuracy. The use of coincidence courting method often affords the most practical technique for
measuring the absolute activity of a given radioisotope source. Beta - gamma coincidence counting
as shown as follows. The system has auto sample changer therefore it is available for much samples
measurement.
|Pre-amp |source Pr-m |
Liner Amplifier Amlifier
Timing S.C. A. TiigSC.A.
Coincidence UniMt 0
Timer Counter TmrCunter Timer Counter
Fig. 3 Beta Gamma Coincidence counting system
- 355 -
JAERI-Conf 2001-017
6. Conclusions
The first medical irradiation for BNCT of JRR-4 was carried out on October 25, 1999. In
that case, the patient was treated by the Tsukuba University group used mixed thermal and
epithermal neutron generated the above TNB I. And as for reactor power, 2MW was selected in
order to get necessary time for dose determination. The status of irradiation of first patient is shown
Fig. 3. Since then, total seven times of BNCT irradiation were performed at JRR-4 by Dr.
Matsumura as Tsukuba Univ. and Dr. Nakagawa as national Kagawa children's hospital by the end of
June 2000. In the BNCTs, we carried out boron concentration and neutron flux. The doctors used
these data for determination of irradiation time.
Reference1) K. Yokoo, T. Yamada et al., Advances in Neutron Capture Therapy. Vol. I, Medical and Physics,
ed. by B. Lasson et al., 1997, 326-2302) T.Kishi, Y.Torii et al., Abstract of Eighth International Symposium on Neutron Capture Therapy
for Cancer. La Jolla, California, USA, September 13 -18 abstract, 1998, p83
3) Y.Torii, T.Kishi et al., JAERI-Conf 99-006,1999, 228-2314) K. Yokoo, Y. Torii et al., Measurement of Thermal Neutron Flux for BNCT in JRR-2, JAERI-M
94-058, 19945) Glenn F. Knoll, Radiation Detection and Measurement Second edition, 1989
- 356 -

l1100101 00ll lul iii UlOl 100l HII0 11100101010 JP02501 19
JAERI-Conf 2001-017
1.35 Development of Computational Dosimetry System and Measuremnent ofDose Distribution in Water Head Phantom for BNCT in JAERI
H. KUMADA', K. Yamamoto', Y. Torii1 , A. Matsumura 2
T. Yamamnoto 2, Y. Nakagawa 3t Y. Horiguchi'
1: Japan Atomic Energy Research Institute,Ibaraki 319-1195, Japan
2: Institute of Clinical Medicine, University of Tsukuba,Ibaraki 305-8575,Japan
3: National Kagawa Children's Hospital,Kagawa 765-8501, Japan
AbstractA new medical irradiation facility has been installed in JRR-4 in 1998. By using this
facility, it is possible to initiate the research and development of BNCT with
epithermal neutron beam more suitable for deep brain tumor. A new treatmentplanning software: Computational Dosimetry System (JCDS), which can calculate the
dose distribution in a patient head accurately by MCNP Monte-tarlo code, is in
progress its development for carrying out BNCT in JRR-4. Also, Free beam and
phantom experiments at neutron beam facility in JRR-4 are being performed in order
to measure neutron and gamma distribution concurrently, because the experimental
data can be applied to verification of JCDS.
In this report, the current status of the development of JCDLS and results of the
experiments will be described.
Keywords: BNCT, JRR-4, BNCT, Epithermal Neutron Beam, Treatment Planning, JCDS,
Computational Dosimetry, Phantom experiment
Introduction
It is necessary to adequate estimate irradiation dose in patient head in order to
carry out BNCT. In 10BNCT that carried out currently in Japan, thermal neutron flux
distribution and gamma dose in patient head are measured by using Au wires and
TLDs respectively. Also Boron concentration is determined by using PGA. By these
data acquired, irradiation dose in the head can be estimated and irradiation time are
decided. It is important to comprehend the thermal neutron flux distribution in the
head due to attribute to the dosimetry. Therefore thermal neutron flux and gamma
dose distribution are measured by experiments of water head phantom so that dose
distribution in the head are grasped accurately. These measurement data not only can
be used to the dosimetry for the actual BNCT is executed at JRR-4, but also is able to
be applied for verification of JCDS.
- 357 -

JAERI-Conf 2001-017
By using medical irradiation facility that was installed at JRR-4, it is possible to
carry out BNCT with epithermal neutron beam as well as thermal neutron BNCT.
However, at the epithermal neutron BNCT, dosimetry measurement at inner brain was
impossible, therefore it is necessary to precise calculate dosimetry for preparation of
treatment planning before BNCT operation. Currently new treatment planning
software; Computational Dosimetry System (JCDS), which can calculate the dose
distribution in the patient head by Monte Carlo Code and support to prepare treatment
planning beforehand, is being developed in JAERI in order to carry out the epithermal
neutron BNCT.
Water Head Phantom Experiments
Grasping of thermal neutron flux distribution and gamma dose distribution in
patient head are very important for the dosimetry at BNCT irradiation. Thermal
neutron and gamma dose have a great influence on irradiation dose in the head
because Nitrogen dose, Boron dose and gamma dose mainly attribute to irradiation
dose. Nitrogen dose and Boron dose are depend on thermal neutron fluence
proportionally, and gamma dose is calculated from integration of gamma-ray fluence
which is generated from secondary source of Hydrogen to neutron capture reaction.
Therefore, water head phantom experiments are carried out for measurement of
thermal neutron flux and gamma dose distributions in order to comprehend dose
distribution in the head precisely.
Cyli idrical Water Phanitom(Dionieter 18 6cm, Leugth; 24cui.Tlicknegs 3ului )
i on s 4~~~~~~~~00o
Fig.I Configuration of Au wires for measurement two-dimensional
distribution of thermal neutron flux in water phantom
- 358 -

JAERI-Conf 2001-017
A cylindrical water phantom of 18.6cm diameter and 24cm depth was put from the
beam port with the gap for 1cm. Au wires and/or TLDs are inserted within the
phantom for measurement thermal neutron flux and gamma dose distributions
respectively. By disposing Au wires as radial in the phantom, it is possible to measure
the flux distributions as two-dimensional in order to accurate estimate the irradiation
dose in patient head at BNCT. (Fig.1) The phantom within Au wires or TLDs are
irradiated at respective beam modes at neutron beam facility.
Fig.2 is shown the thermal neutron flux distribution with Thermal Neutron Beam
mode 1 (TNBI mode) and Epithermal Neutron Beam mode (ENB mode) with 15cm
collimator. At TNBI mode, maximum thermal neutron flux is approximately 6.0X 10⁹
cm-2 sec-i in the vicinity of about 5mm depth from the phantom surface, and
maximum thermal neutron flux at ENB mode is about 4.OX 109 cm-2-sect it is
possible to recognize that the depth of peak region is about 2cm from phantom surface
and is deeper than TNB1 one.
-80 -60 -40 -20 0 20 40 80 80
Rfdutn
Neutron lBeam
Fig.2 Thermal neutron flux distribution in water phantom that compared
TNB1 mode with ENB mode at O 150mm collimator.
- 359 -

JAERI-Conf 2001-017
Development of Computational Dosimetry System in JAERIComputational Dosimetry System (JCDS) that is necessary to carry out the
epithermal neutron BNCT is be developing in JAERI. JCDS can estimate of dose
distribution in the patient head by Monte Carlo code. By using JCDS at BNCT
operation, adequate irradiation conditions such as beam mode, patient irradiation
position and irradiation time can be decided and treatment planning is able to be
prepared beforehand.
JCDS is comprised of three components such as Preprocessing, Dose calculation
processing, and Post-processing. Preprocessing could create detailed numerical
models for dose calculation by MCNP. The tissue components such as soft tissue, bone
and air can be automatically selected from the CT data set, On the other hand, the
tumor volume and the region of interest (ROI) can be specified by MRI images, because
MRI allows differentiating among normal tissue and for example tumor- Therefore, by
using CT and MRI data set together, it is possible to make a 3-D patient head image
easily and correctly. This 3-D model is editable to simulate the surgical processes, such
as skin flap opening and bone removal. By these procedures, a calculation condition is
specified, and a numerical model for the calculation is generated (Fig.3).
Fig.Z 3D patient head model determined calculation conditions for the
dosimetry by MCNP.
-360-

JAERI-Conf 2001-017
Utilizing the numerical models from preprocessing, the neutron and gamma ray
distributions are calculated by MCNP Monte Carlo code. By Post-processing, Fig.4 is
shown the dose distributions so obtained can be displayed on the 3-D head image or CT
and MRI images as a contour, and total dose to normal tissue, tumor and target volume
and any ROI are displayed. Finally, Post-processing can provide adequate information
for preparation of treatment planning. By using JCDS, irradiation conditions such as
beam mode, irradiation time, and beam angle with a patient are decided, and a
treatment planning for BNCT operation can be prepared.
Fig.4 Dose distribution drawn on MRI medical images as a contour
System Characteristics
This system will be designed to work with the UNIX and Windows operating System.
For the purpose of efficient utilization, the system will operate on a network. Virtual
CT or MR1 images are available simultaneously in order to create a numerical model
precisely for MCNP calculation. It is possible to use JCDS for BNCT with craniotomy
currently done by Japanese medial group because the 3-D head image could be edited
to simulate surgical procedures. By applying JCDS to the thermal neutron BNCT, the
more precise posterior evaluation of BNCT can be performed. JCDS could transfer the
information that is necessary to the patient setting to the Patient Setting System that
can support more accurate setting to the actual irradiation position.
- 361-

JAERI-Conf 2001-017
ConclusionNew treatment planning software; JCDS is in progress its development in JAERI in
order to carry out BNCT with the epithermal neutron beam. At present, JCDS is being
verified for precise dosimetry and calculation more. Several data acquired from water
phantom experiments and actual BNCT carried out currently are applied for
verification the system.
Reference1) Y. Torii T. Kishi et al., JAERI-Gonf 99-006, 1999 p228-231
2) JAERI-Gonf 2000-01( Proceedings of Neutron Irradiation Technical Meeting on
BNCT, March 13, 2000? p25-36
3) K. Yokoo, Y. Torii, F. Samaria, K. Koibuchi et al- JAElR-M 94-058 Measurement of
Thermal Neutron Flux for BNCT in JRR-2, 1994,
4) H. Kumada, Y. Nakagawa, A. Matsumura et al., 1998 Abstract of Eighth
International Symposium on Neutron Capture Therapy for Canner. La Jolla,
California. USA, September 13-18 abstract, 1998, p58
5) K. Yamamoto, H. Kumada. Y. Torii, et al., Program & Abstracts Ninth International
Symposium on Neutron Capture Therapy for Cancer. 2000, p243-244
6) H. Kumada, K. Yamamoto, Y. Torii, A. Matsumura, et al., Program & Abstracts
Ninth International Symposium on Neutron Capture Therapy for Cancer. 2000.
p281-282
7) N. Hori, T. Yamamoto, A. Matsumura, et ah, Program & Abstracts Ninth
International Symposium on Neutron Capture Therapy for Cancer. 2000, p2 6 3-2 64
-362 -

IIG IBIIll DIIll Il IIll 1DBl IIlIl GIOl DIDl lIDl IIl lJP02501 20
JAERI-Conf 2001-017
1.36 Carboranyl Tetrahydroisoquinolines. Synthesis and the X-ray Stmrctural Study of 1-
(o-Carboran-1-ylmethyl)-1,2,3,4-Tetrahydroisoquinolines
Jong Dae Leet Chai-Ho Lee,* Seung-Hoon Lee,' Sang-Moo Lim,@ Sungil Cho,# and
Sang Ook Kangt
tDepartment of Chemistry, Korea University, 208 Seochang, Chochiwon, Chung-nam 339-
700, Korea. tDepartment of Chemistry, Wonkwang University, Iksan, Jeonbuk 570-749,
Korea. 6 National Cancer Center, fsan, Goyang, Kyungi-do,_Korea. vKorea Cancer Center
Hospital, Gongnung, Seoul, Korea. #Department of Chemical Engineering, Junnong-dong 90,
Seoul City University, Seoul 130-743, Korea.
Synthesis of the first fully characterized boronated tetrahydroisoquinolines is reported.
Thus, tetrahydroisoquinolines containing 1-(o-carboran-1-ylmethyl)-1,2,3,4-
tetrahydroisoquinolines have been synthesized from the corresponding arylethylamines to
provide carboranes attached to functional group capable of being covalently incorporated into
structures of potential use in boron neutron capture therapy (BNCT). The carboranyl
finctionalities were attached at the 1-position of the tetrahydroisoquinoline molecule.
Experimental details and analytical data leading to the identification of the reported
compounds are provided. Additionally, the X-ray diffraction structure of 9b is reported.
-363 -

JAERI-Conf 2001-017
Introduction
1,2,3,4-Tetrahydroisoquinolines present in mammalian brain plays a major role in therapy of
variety of neurological disorders.' In particular, I-aryimethyl-1,2,3,4-tetrahydroisoquinolines
1 has been reported to be a potent doparnine antagonists as neuroleptic agents.2 As part of a
program of synthesis and evaluation of tetrahydroisoquinolines in the treatment of cancer, 3
we have proposed that compounds containing o-carborane cages linked to 1-
tetrahydroisoquinolines would form a useful method of delivering borons in brain tumors.
Therefore, the aim of this work was to synthesize and determine the characteristics of l-(o-
carboran-l-ylmethyl)-1,2,3,4-tetrahydroisoquinolines containing o-carboranes as a new
boron-rich class of tetrahydroisoquinoline analogues, which may allow the advantage of
BNCT.4
R R
NH-
RA3~~~~~B 0 0H10 -oAr
2a, R = Hb, R=Me
In this paper, we discribe the synthesis of 1-(o-carboran-1-ylmethyl)-1,2,3,4-
tetrahydroisoquinolines 7 and 9 which benzyl groups of I are replaced by the boron clusters,
for new BNCT agents and dopamine antagonists. And key spectral properties for 7 and 9 are
presented along with the data obtained from the single crystal X-ray structural determination
of 9b.
-364 -

JAERI-Conf 2001-017
Result and Discussions
Synthesis of 1-(o-carboran-1-ylmethyl)-1,2,3,4-tetrahydroisoquinolines (7). The
general synthetic strategy for the preparation of the starting materials used to prepare the
reported o-carboranylacetaldehydes (5) relied on the methods developed by Rudolph. The
synthesis of 5 was accomplished in three steps (Scheme 1).
Scheme I
2 + BAc>OEt _HR RcOH .CHOBrOEt ~" ~ E onc HC
B10H10 B 10H10
3 4aR=H 6a, R= Hb, R =Me b, R =Me
The synthesis was initiated by the monoalkylation of o-carborane derivatives (2). When o-
carborane was reacted with an equimolar quantity of n-butyllithium in a mixture of ether and
benzene (1:2 ratio), followed by reaction with 3, diethyl acetal (4) was formed in high yield.
The resultant diethyl acetal (4) was reacted with acetic acid in the presence of concentrated
HCI The o-carboranylacetaldehyde (5) was formed in excellent yield.
With this carboranylacetaldehyde (5) now available, the Pictet-Spengler reacton (dipolar
cyclocondensation) with the arylethylamine (6) was investigated (reaction 1). Dipolar
cyclocondensation of aryiethylamine with aldehyde proceeds under mild conditions; this
methods of hetero-cyclic ring formation was investigated as a route to the target compounds.
Thus, this condensation was finally achieved in 50-60% yield by refluxing the mixture of 5
and 6 in a formic acid solution.
- 365 -

JAERI-Conf 2001-017
All products in the synthesis were examined by 'H NMWR and IR spectroscopy. The
introduction of the o-carborane cage into a molecule can be identified by particular features
of their spectra. In the IR the B-H stretch at ca. 2600 cm'l is relatively strong. In the 'H NMR
spectrum, however, the hydrogens attached to the boron in the carborane cage appear as a
broad unresolved band in the region 1.3-3.2 ppnt
R1 1
NHE + 5 N;O2HH (1)R2 N2 reflux R RR 3
6a, R = OMe, R2=Hv1 2 ~~~~~~~~~~~~~~B10H10b, R 1 = OMe, R2 - OMe
7a, RI = OMe, R2= H, R3 Hb, R' = OMe, R2= H, R3= Mea, RI = OMe, R2 = OMe, R 3 = H
d, R1 =OM, R 2=OMe, R =Me
To provide a o-carborane with tetrahydroisoquinoline directly attached to C-1, a strategy
based on an a-sulfamidoalkylation reaction was employed (Scheme 2). Following the
standard method for the synthesis of tetrahydroisoquinolilne from sulfamides (6) and acetal
(4) at elevated temperatures in the presence of a formic acid solution, the
tetrahydroisoquinoline (9) was formed from sulfamide (6) and o-carboranylacetal (4) in 80-
90% yield. A formic acid solution of an sulfamide 6 and acetal 4 was heated at refluxed to
give the corresponding 9 in 80-90% yield,
- 366 -

JAERI-Conf 2001-017
Scheme 2
6 + (H2N)2 S02 Hi D Iref u NHS02NH2 HC02H R2 S02NH2
1 2 R38a, R' =OMe, R = H
b, R1 = OMe, R2 OMe \HIO
Ba, R=OMe, R2=HR 3 =H
b, R' OMe, R2 =H, R3 =Me
c, Ri = OMe, R2 = OMe, R = Hd, RI =OMe, R2 =OMe, R3 = Me
Conclusions
Compounds 7 and 9 are the first fully characterized boronated tetrahydroisoquinolines to be
reported and contains one o-carborane cage covalently linked to the tetrahydroisoquinoline
periphery. These boronated tetrahydroisoquinolines may be uselbl as a tumor-selective
sensitizer for boron neutron capture using thermal neutrons to activate 10B through the 10 B(n,
a) 7Li reaction. Studies evaluating the in vitro and in vivo localizing ability of 7 and 9 are
currently being carried out and will be reported in an appropriate venue in the near future.
References
1. Yates, F. S. in Comprehensive Heterocyclic Chemistry, Boulton, A. J.; McKillop, A.
Eds. Pergamon Press: Oxford, 1984; pp. 511-524.
2. Shamma, M. The Isoquinoline Alkaloids, Chemistiy, and Pharmacology, Academic
Press, New York, 1972.
3. Stork, G.; Guthikonda, R. N. J. Am. Chem. Soc. 1972, 94, 5109.
4. Soloway, A. H.; Tjarks, W.; Barnum, B. A.; Rong, F.-G.; Barth, R. F.; Codogni, I. M.;
Wilson, J. G. Chem. Rev. 1998, 98, 1515.
- 367 -

liii! III Jl11ll l~ll llll 11111 lllll 11111 11111 11111 UIIJIJP02501 21
JAERI-Conf 2001-017
1.37 Neutronic Design Approach to a Small
Medical Reactor for BNCT
Nam Zin Cho
Korea Advanced Institute of Science and Technology
Department of Nuclear Engineering
373-1 Kusong-dong, Yusong-gu, laejon, Korea 305-701
Email : nzchoamail.kais .ac.kr
AbstractTo provide high quality neutron beams for BNCT using a small reactor, two types of reactor cores are
designed: a square core with rod-type fuel in hexagonal cells and a rectangular slab core with plate-type
fuel.
1. Introduction
BNCT is a binary radiation therapy modality that brings together two components that when kept
separate have only minor effects On cells. The first component is a stable isotope of boron, UB13 that can be
concentrated in tumor cells. The second is a beam of low-energy neutrons. IUB in or adjacent to the tumor
cells disintegrates after capturing a neutron. This interaction produce high energy, high linear energy
transfer, short-range radiation of 4He nuclei(i.e. a particles) and recoiling 7Li ions that would be confined
to the tumor and destroy its cells.
currently available epithermal neutron beams are produced directly from the reactor core but they are
not sufficiently intense to meet the anticipated demand for BNCT treatments. There is another method of
generating an epithermal neutron beam, namely a 235U fission plate set in the thermal column of low-
power reactor. To get a high-intensity, high-quality epithermal neutron beam for BNCT, fission converter-
based epithermal neutron beam has been designed for the IM1T Research Reactor, the Brookhaven
Medical Research Reactor (BMRR) and the Musashi Reactor.
This paper describes two types of medical reactors, square core reactor and plate type fuel based
reactor respectively. One (type 1) is a square core with four assemblies and inner D2 0 tank. The 23 5U
loading of the core is consist of 1056 fuel rods using U3Si-AI cylindrical type fuel. The other, type 2, is a
based on plate type U3Si2 -AI fuel, has four epithermal neutron beam collimators. Both types have a
maximum operating power of 300kW.
2. Design Goals
Thermal neutrons are attenuated exponentially in tissue with half-value layers of 1.5 to 2.5cm and
- 368 -

JAERI-Conf 2001-017
could effectively irradiate tumors <3-cm depth. Thermal neutrons are appropriate for use in irradiating
skin tumors or tumors in small animals such as rats and mice. Epithermal neutrons have a lower
probability of interacting with and damaging the skin as they enter. This probability then gradually
decreases with greater depths. These would be used to treat tumors from 2- to 8-cm depth.
Neutron beams used for BNCT are designed to meet the best dosimetric conditions for patients. The
design goals in this study are a thermal neutron flux >3.0x10⁹ n/cm2 sec, the dose from fast neutrons
<3.0xlO' 3 Gycm2 /n, the dose from gamma rays <2.0x10 1 3 Gy'cm 2/n, and an epithermal flux >1.Oxl0W
n/cm2.sec for type 1 and >1.0x101 In/cm 2 see for type 2. Forward directed beams (ratio of neutron
current-to-flux, J/q, close to 1) offer better dosimetry in the target than do isotropic beams.
3. Designs and ResultsThe design results of the two types of nuclear reactors, a square reactor with two epithermal neutron
beams and two thermal neutron beams, and a plate fuel based reactor with four epithermal neutron beams,
are as follows. The square reactor(type 1) provides an epithermal neutron beam of >3.2x10⁹ nri/cnm2 sec
intensity with low contamination by fast neutrons(<1.6x10l 3 Gy.cM2 /n ;) and gamma rays(<1 .0x104 3
Gy cm2i/nep) and a thermal neutron beam of 8.9xl09 ntb/cm2_sec intensity with low contamination by fast
neutrons (<I.lxl0-j3 Gy-cm2/nth) and gamma rays(<1.2xI0-j JGycmr/nth,). Both neutron beams are highly
forward-directed with low contamination by fast neutrons and gamma rays.
On the other hand, type 2 reactor provides an East-West regional epithermal neutron beam of 1.7x10¹⁰
npIIm 2 sec intensity with low contamination by fast neutrons(<2.2x1W0- 3 Gy-cm2 /nu,) and gamma
rays(<l.4xI-1&3 Gy cm2!nepj) and a North-South regional epithermal neutron beam of 1.3xl01cn,,km2 -sec
intensity with low contamination by fast neutrons (<3.0x1O- 3 Gy cm 2/nth) and gamma rays(<2.0xI0 "
GyC.m2/nth).
The heat generated in the core can be removed by natural convection through a pool of light water. The
proposed design in this study could be constructed for a dedicated clinical BNCT facility that would
operate very safely.
4. Conclusions
The two types of reactor cores designed produce high quality neutron beams for use for BNCT. Type 1
reactor provides very good epithermal neutron beams and also provides relatively good thermal neutron
beams. Type 2 reactor designed to provide epithermal beams produce epithermal flux in excess of 1x10¹⁰
II/cm 2 , surpassing the neutronic design goals. The neutron beams of both reactors are forward-directed
with low contamination by fast neutrons and gamma rays. The low operating power of 300kW allows the
proposed reactors to be installed in a medical facility dedicated to BNCT.
-369 -

This is a blank page.

JAERI-Conf 2001-017
2. Summary Reports

This is a blank page.

JAERI-Conf 2001-017
2.1 SUMMARY REPORT FROM THE WORKSHOP
ON THE RESEARCH REACTORS
NOVEMBER 20 - NOVEMBER 24,2000
TAEJON, KOREA
This document presents a summary on the implementation of the ninth Workshop on the Utilization of
Research Reactors held in Taejon from November 20 to November 24. 2000. It was attended by
scientists and specialists from Australia, China, Indonesia, Japan, Korea, Malaysia, Thailand and
Vietnam.
Dr. Chang In Soon - president of KAERI, welcomed participants, and opening remarks by the
Ministry of Science and Technology of Korea and Science and Technology Agency of Japan followed.
Three general lectures were composed of topics closely related with research reactor - UMo fuel
development, BNCT for malignant brain tumor, and new technology for the medical application of RI.
The workshop discussed three different fields of activities, namely, neutron scattering, neutron
activation analysis, and research reactors and utilization technology (BNCT). A summary of the
discussions, progress reports and future programs of each group are presented below.
I. NEUTRON SCATTERING
A sub-workshop on the utilization of SANS instruments and the evaluation of data was held from
November 20 to 23 in KAERI, Daejon (Korea). Topics ranged from the study of the structure of polymer
materials to the porosity of giassy-carbon materials. Participants gained valuable experience in the
design of SANS experiments, sample preparation, data reduction and analysis.
Progress Report on Collaborative Activities for 1999/2000
Two approved projects that cover a number of research topics are currently in progress: (1)
Small-angle Neutron Scattering (SANS), and (2) Structural Analysis of Functional Materials. Reports on
these projects were presented and discussed.
1. Small-Angle Neutron Scattering
Regional collaborative activities in SANS are identified under four headings.
1.1 SANS Instrument Calibration
The scattering intensity from a polystyrene-hl/polystyrene-d (PSH/PSD) binary polymer mixture
prepared by Prof. Matsushita (Nagoya University) was calibrated on the SANS-J instrument at JAERI
and data collected on the SANS instrument at KAERI. The results obtained were of excellent quality
-371-

JAERI-Conf 2001-017
and, therefore, the sample is suitable for use as one of the primary absolute cross-section standards for
instruments in the region. In addition, an inter-laboratory comparison for instrument q calibration using
silver behenate was successfully completed for the SANS instruments at KAERI, JAERI, BATAN and
ANSTO.
MILESTONE
* Under the FNCA programme, all SANS instruments in the region have been calibrated in q.
* A series of standards for the absolute cross-section- This will be achieved by a thorough evaluation
of all available standards including water, LUPOLEN and porous silica.
1.2 SANS and Soft Condensed Matter
There are three topics under investigation: strain induced crystallisation of natural rubber; miscibility
of polymer blends; and microstructure of polymer gels. SANS data have been collected on these three
systems and data analysis is in progress. Detail of the investigations is contained in the Summary Report
of the Sub-workshop on Neutron Scattering.
MILESTONE
6 Detailed analysis and interpretation of the SANS data with assistance from specialist research
collaborators in the participant's institute. For example, SANS results from polymer blends must be
interpreted with the assistance of a specialist polymer chemist.
* Sharing the results of all studies between participating countries.
1.3 SANS and Condensed Matter
Because of the potential industrial importance, glassy-carbon systems prepared from the combustion
of palm-oil tree waste materials are under investigation. The effect of polymer binder on the
microstructure of the system is important to their end-use in industrial application such as a catalyst.
MILESTONE
Porosity will be the first structural feature studied using the SANS technique.
* The results of a systematic structural study of a wide range of glassy-carbon polymer samples will
be compared with results from other techniques.
o As a collaborative project SANS beam time will be sought at regional facilities.
• The data analysis will be carried out and results shared between participating countries.
1.4 SANS Data Reduction and Analysis
It is crucial to the success of SANS experiments to accurately correct the scattering data for
instrumental and background effects. To date, this correction has been accomplished using a number of
strategies adopted by individual institutes and it is recognised that there are distinct advantages in
- 372 -

JAERI-Conf 2001-017
sharing these strategies.
The analysis of the corrected data has been undertaken with a variety of computer programs including
IGOR, JAERI and ILL software packages. Each package has advantages.
MILESTONE
• Standardization of data reduction procedures will be in accordance with those established at JAERI.
o The IGOR0 software package will be adopted for the analysis of corrected scattering data wherever
possible, and programs for a variety of analyses shared amongst institutes in the region.
* Standard data storage format in the short term requires a detailed description of all instrument and
data parameters. In the future an international standardized data format may be adopted.
2. Structural Analysis of Functional Materials
The following projects were discussed and the agreements is that all will be continued.
2.1 High Tc Superconductor
There are two topics on the high Tc superconductor project, both based on the BSCCO (2223) system.
The first topic was the preparation of Pb and Sb doped BSCCO system by Vietnam researchers. Samples
of Bi2x -PbSbST2Ca2CUIO,, where x - 0.1 - 0.8 and y = 0.1 - 0.4 were synthesized. After processing,
the temperature dependent resistivity of these samples was measured using the four-probe technique and
the phase identification carefully studied using X-ray diffraction. In contrast to the BPSCCO samples,
the BSSCCO sample displayed a new phase, called 4441, in the X-ray diffraction pattern and the Te
attained approximately 140K.
The second topic is the mechanism study of Co-doped BSCCO (2223). As agreed in 1999 Workshop
on the Utilization of Research Reactor, the Joint Research Project on high temperature superconductor
would be continued on the investigation of Co substitution for Cu in BSCCO (2223). The samples of
Bi2Sr2Ca2(Cu(lX,)Cox)3Oy where x = 0.0, 0.01, 0.02, 0.04, 0.06, and 0.08 were prepared by solid state
reaction. Samples were sintered between 828-853C and then quenched in liquid nitrogen. Physical
properties of the specimens were examined by standard four-probe technique to determine the critical
temperatures. Phase identifications were performed using the X-ray diffraction technique. It was found
that at a certain sintering temperature, increasing the amount of cobalt impurities suppressed the critical
temperatures.
MILESTONE
* Bulk specimens of Sb and Co doped Pb-BSCCO (2223) synthesized under the proper conditions by
Thailand and Vietnam researchers.
o Neutron diffraction results obtained by Indonesian researchers.
- 373 -

JAERI-Conf 2001-017
2.2 Permanent Magnet
The neutron diffraction pattern of commercially available permanent magnets of the Nd-Fe-B system
will provide information on its phase separated structure that will be valuable for development of its
utilization.
2.3 Superionic Conductors
In view of the application of Cu- and Ag-based superionic conductors as devices (e.g. capacitors and
batteries) study of (i) detailed structure investigation (especially for the non-stoichiometric
compounds) using HRPD, and (ii) investigation of the influence of stoichiometry on dielectric and
electrical properties, could improve the quality of the bulk materials.
3. Presentations
1. Introduction of SANS Measurement (Dr. Robert KNOTI)
2. Introduction of SANS Facility in HANARO (Mr. SEONG Baek-Seok)
3. Introduction of Data analysis (Prof. HASEGAWA Hirokazu)
4. Explanation of HANARO SANS facility for data analysis (Dr. HAN Young-Soo)
5. Neutron Scattering in Australia (Di. Robert KNO1TI
6. 'Me Study of Artificial Articular Cartilage - PVA-Hydrogel by SANS (Mr. Tonghua YANG)
7. Current Status of Neutron Scattering in Indonesia (Dr. Abarrul JKRAM)
8. Current Status of Neutron Scattering in JAERI (Dr. HAMAGUCHI Yoshikazu)
9. Current Status of Neutron Scattering in KAERI (Mr. LEE Chaug-Hee)
10. Current Status of Neutron Scattering in Malaysia (Dr. Abdul Aziz Bin MOHAMED)
11. Optimisation of Data Acquisition System For Mysans (Malaysian Small Angle Neutron Scattering) -
Graphical User Interface (GUI) Personnel Computer Based (Dr. Abdul Aziz Bin MOHAMED)
12. Present Status of Neutron Scattering in Thailand (Mrs. Archara SANGARIYAVANICH)
13. High temperature superconductors of Pb and Sb doped Bi-Sr-Ca-Cu-O system (Ms. Phuong Thi Thu
TRAN)
14. Introduction of the Research on Polymer Blends (Prof. HASEGAWA Hirokazu)
15. Residual Stress Analysis by Neutron Scattering (Mr. MINAKAWA Nobtiaki)
16. SAX Facility at PAL and Its Applications in Materials Science (Prof. REE Moon-Hor)
4. New Collaborative Project Planned for 2001 and Beyond
The SANS collaborative research project is in the third year of an approved four year program. The
project is achieving the stated goals of regional capability development and application to the study of
polymers and related materials. In 2001 the focus will be on data analysis and interpretation, and linking
with industrial partners.
-374-

JAERI-Conf 2001-017
The future activities in neutron scattering were discussed. In order to highlight the socio-economic
benefits of neutron beam applications it was decided to include neutron reflectometry and residual
stress/texture diffractometry as strong candidates for future plans. At the 2001 workshop submissions on
the two techniques will be made and further discussion will be held. In the meantime participating
countries will evaluate the potential application of these techniques in their respective end user
commurnities.
4.1. Residual Stress/Texture Dilfractometry
This project is potentially useful for a collaborative research program particularly for participating
countries with a heavy-industry base. The residual stress technique is important in solving many
problems including the aging of power generation and petrochemical plants, and the failure welded
components. In 2001, participating countries will prepare project plans and discuss the possibility of
commencing the research project in 2002.
4.2. Reflectometry
Reflectometry is a rapidly emerging technique with wide applications in many fields of scientific and
industrial research. For example reflectometry provides detailed structural information on thin films on
surfaces such as detergents, polymers, semiconductors and biomaterials. In 2001, participating countries
will prepare project plans and discuss with each other the possibility of commencing the research project
in 2002.
5. We plan to publish our activity in Neutron News and to distribute our newsletter in 2001.
6. Recommendation
The neutron scattering group strongly recommends that a sub-workshop for the utilization of SANS
instruments and cooperative research using SANS instrument will be held jointly with the 2001
Workshop on the Utilization of Research Reactor. The title of 'NEUTRON SCATTERING' would like
to be modified to 'NEUTRON BEAM APPLICATIONS'.
- 375 -

JAERI-Conf 2001-017
2.2 SUMMARY REPORT OF SUB-WORKSHOP
ON THE UTILIZATION OF SANS INSTRUMENT AND EVALUATION OF DATA
November 20-23, 2000
KAER1, TAEJON, KOREA
The Sub-Workshop was held over 4 days from Nov. 20 to 23, 2000, in KAERI-TAEJON (Korea). The
participants were a total of 17 from Australia, China, Indonesia. Malaysia, Thailand, Vietnam, Japan and
Korea.
Experiments and data analysis on the standard polymer samples and samples from several countries of
table I were performed using the HANARO SANS instrument. In addition, two lectures on the
analytical technique of SANS data and the talks on the introduction of SANS instrument and
characterization of prepared samples were presented.
EXPERIMENTS
All the samples measured in this workshop are listed in the table 1 below.
Table 1. The SANS samples provided by participants
Number Countr Name e_ amp CommentsI Deuterated PS in THF
2 Australia Dr. Robert Knot, TF solvent
3 China Mr. Tonghua Yang PVA-hydrogel 2OkGy &
4 Indonesia Dr. Abarrul Ikram Porous silica5 PSD/PSH __
Dr. Hamaguchi Edge view6 Yoshikazu PS-PEP & Through
Japan & view7 Prof -asegawa Poly ball SS175 _
8 ~~~~~Hirokazu 8 HioaeDPB/HPI ______
9 PS/PI
10 1 Malaysia Dr. Abdul Aziz Bin Carbon-glassy 4 samples10_Malaysia Mohamed _ ____ ____ ____ ___ _ 4__ ____ ___
Mrs. Archara Natural11 Thailand SANGARTYAVANI Rubber
The number of samples prepared by participating countries exceeded the time available on the SANS
instrument and careful selection, therefore, was required. The following samples were selected:
* Before the sub-workshop, data were collected on the two samples- Silver Behenate from Dr. Robert
Knott and Poly ball ss175 in JAERI. The purpose of the experiments was to calibrate the SANS
instrument in q and to check the smearing effect.
* Samples of natural rubber were prepared in Thailand. The strength of natural rubber is important in
- 376 -

JAERI-Conf 2001-017
engineering applications. It is known that the strength of rubber increases under strain and this
effect can be explained by strain induced polymer crystallization. The purpose of the SANS
experiments was to observe this effect. In the experiment, various SANS patterns were collected
under normal and applied strain conditions.
* Samples of glassy-carbon were prepared in Malaysia. These samples originated from palm-oil fruit
bunch waste products. The proposal is to process the waste products and develop value-added
industrial materials for carbon-based conducting applications. SANS experiments were carried out
to determine the porosity of the samples.
* A series of PVA-hydrogels were prepared in China. The development of dressings for damaged
human tissue is important. In order to understand the relationship between clinical effectiveness and
polymer structure, a series of gamma initiated PVA-hydrogels were prepared for study.
f The miscibility of polymers of different composition is important to the polymer industry
particularly for manufacturing of consumer products with defined properties, as well as for the
re-cycling of polymer materials. A deuterated polystyrene sample (MW approximately 100,000)
was prepared in Australia to investigate the conformation of an important polymer in a good
solvent (tetrahydrofuran).
* A sample of poly balls was prepared by Prof. Hideki Matsuoka, Kyoto University to observe the
resolution of the SANS instrument. Regular spherical particles provide a characteristic SANS
pattern.
* A sample of DPB/HPI (polybutadiene-d/ polyisoprene-h) polymer blend was prepared by Prof.
Hasegawa to investigate the microstructure of a miscible polymer blend.
X The following SANS instrument calibration samples were investigated
• a PSH/PSD (polystyrene-h/polystyrene-d) binary polymer mixture supplied by Prof.
Matsushita (Nagoya Univ.) for absolute intensity calibration.
• a PS-PEP (polystyrene-poly (ethylene-alt-propylene)) block copolymer supplied by Prof.
Hasegawa (Kyoto Univ.) for q calibration.
• porous silica (supplied by Indonesia) for q calibration
* silver behenate (prepared by Australia) for q calibration.
The SANS instrument was configured with a neutron wavelength of 0.644 mn and a q-range 0.05
nnmi to 0.8 nm-'. Under the guidance of KAERI scientists, participants observed the preparation of
some samples operation of the SANS instrument and collection of raw data. Total experiment time was
about 96 hours.
DATA ANALYSIS
* The data collected on the silver behenate, PS-PI, and Porous silica sample were corrected for
instrumental effects and independently analyzed for the q position of the diffraction peak as well as
the uniformity of the scattering pattern.
* The PSH/PSD standard sample was corrected for instrument and background effects and the radius
- 377 -

JAERI-Conf 2001-017
of gyration and scattered intensity at zero q were determined.
* The Poly Ball ss175 was corrected for smearing effect of instrument and background effects.
• Data from the PS-PEP standard sample were corrected and analysed to demonstrate the two orthogonal
views of scattering from a lamella structure.
Data from the various samples provided by participants were corrected and analysed to explore the
microstructural features of the sample.
RESULTS
* The results for the inter-laboratory comparison for q calibration using silver behenate, PS-Pt, and
Porous silica indicate excellent agreement. The expected diffraction peak of silver behenate at 1.I
nm'l was closely observed on the three instruments. The diffraction peak of PS- PI sample at 0.272
nm-'was clearly observed on the KAERI SANS and SANS-J The results to calibration in q
were a good agreement with JAERI, ANSTO, and BATAN.
* The results from the PSH/PSD standard sample were excellent quality and therefore provide a
useful intensity standard for SANS instruments in the region. The measured radius of gyration was
5.27 nm and a good agreement with the result from JAERI.
e The results from the edge-view and through view of the PS-PEP standard sample clearly displayed
the lamelia structure.
The results from various samples provided by participants displayed a number of interesting
features.
o 4 giassy-carbon samples with various aging time were measured and the peak shift was observed
with varying aging time. This result showed that the porosity of glassy-carbon increased with
increasing aging time.
SANS SOFTWARE
The reduction of two-dimensional raw data to one-dimensional data was performed using KAERI
and ILL software.
Through the discussion among the participants it was decided by the group to standardize on the
macro package on IGOR® software for data analysis wherever possible. The programs for standard
data analysis (Guinier Fits etc) will be shared amongst participants.
PROPOSAL FOR FUTURE ACTIVITIES
All participants discussed the next year program and future activities. Strong agreement was made
to have a workshop on the analysis of SANS data taken this sub-workshop and new data from now to
next year. Based on the proposal made with last meeting and strong recommendation for the
socioeconomic contribution of each activity in this program at the Thailand meeting at November,
2000, two fields are recommended as a candidate for future program. One of them is residual stress
measurement combined with texture analysis and the other is reflectometry. As a result of continued
discussion, it was decided to have specialists' talks on these two fields in next year meeting.
- 378 -

JAERI-Conf 2001-017
CONCLUSION
At the sub-workshop on the utilization of SANS instrument for polymer studies,
participants gained valuable experience in the design of SANS experiments, sample
preparation, data analysis and planning for future activities.
- 379 -

JAERI-Conf 2001-017
II.NEUTRON ACTIVATION ANALYSIS
1. Summary of the Workshop
A session of neutron activation analysis (NAA) of the 2000 workshop on Utilization of Research Reactors
held in Daejon on 20-24 November 2000 was attended by 14 participants from 7 countries (China, Indonesia,
Japan, Korea, Malaysia, Thailand and Vietnam). The NAA session started with country reports presented by
individual participating countries, followed by invited lectures. After these presentations, the future activity
of the NAA group was discussed. In the following, presentation and discussion taken place in the NAA
session are summarized in this order.
2. Country Reports
At the workshop held in Yogyakarta, 1999, a long-standing project concerning NAA was finalized and
future activities were discussed. In the previous report, several plans were proposed after the intense
discussion. Following this, a theme of "supporting system for the neutron activation analysis" was chosen for
the 2000 workshop Unfortunately, this theme was not well announced and, therefore, was not well
understood by most participating countries before attending the workshop. In place of this theme, the current
situation of reactor facilities related with NAA and/or research activities of NAA were presented by several
countries. Followings are brief summaries of presentations of individual countries;
a- China ("Introduction of the Neutron Activation Analysis Facilities in High Flux Engineering Test Reactor"
by M. Feng).
Several facilities such as pneumatic transfer (rabbit) system and NAA system in a high flux test reactor at
the Nuclear Power Institute of China (NPIC) were introduced.
b. Indonesia ("Current status of Research and Development-of Neutron Activation Analysis Group at GA
Siwabessy Reactor" by Stitisna).
Progress of R & D on NAA at Siwabessy research reactor was presented. Ko method is being developed
for further utilization of NAA.
c-l. Japan ("Current Activity and Problem of Neutron Activation Analysis in Japan" by M. Ebihara).
The present situation concerning NAA in Japan is summarized and a possible problem about NAA in
future is pointed out.
c-2. Japan ("NAA Supporting System of JAERI" by F. Sasajima)
A supporting system developed at JAERT is introduced. This system includes Ko method, data analysis,
automatic sample changer and gamma ray acquisition. Some data for SRM samples obtained by using this
system were shown.
d. Korea ("Application and Facility of Neutron Activation Analysis in HANARO Research Reactor" by Y.-S.
Chung)
The facilities for NAA in HANARO research reactor are described and the main application of NAA in
Korea are reviewed. Automatic sample changer and integrated computer software for data calculation
were acknowledged to be highly effective for efficient use of NAA.
e. Malaysia ("The Use of Neutron Activation Analysis in Environmental Pollution Studies" by A. M. Yusof)
- 380-

JAERI-Conf 2001-017
Analytical data for various environmental samples were presented and the usefulness of NAA for
multi-elemental analysis of these samples was emphasized.
f. Thailand ("Utilization of NAA in Thailand" by C. Srinyawach)
It was shown that how extensively and effectively the Thai Research Reactor-1 (modification-1)
(TRR-1/M-1) was used in a variety of research fields.
g. Vietnam ("Neutron Activation Analysis using the Dalat Nuclear Research Reactor' by M. V. Nguyen)
Facilities related NAA at Dalat nuclear research institute was presented. Ko method has been tried using
homemade software. PGA has also been initiated.
3. Invited Talks
A session of invited talks consists of 6 presentations. In each presentation, a specific research subject was
clearly outlined and a contribution of NAA to its subject was emphasized. From these presentations, the
usefulness, the effectiveness and the advantage of NAA in a variety of fields of applications were impressed.
Titles, speakers and brief summaries of invited talks are following;
a. "Air Pollution Study by NAA in Korea" by J. -H. Moon.
The recent air pollution in Taejon and the surrounding areas including industrial complex was examined
by using INAA. Data and their interpretation were presented.
b. "Probabilistic Analysis of Airborne Toxic Metals in Korean Industrial Complex" by I -H. Lee.
Concentration profiles and probabilistic risk analyses of toxic metals for ambient air in Taejon industrial
complex were presented.
c. "How Important can Neutron Activation Analysis be in Coming Century? - In a Case of Planetary Science"
by M. Ebihara.
It was demonstrated that NAA would be of great importance in planetary science in the 21st century when
a large variety of extraterrestrial materials were returned to the earth by space missions.
d. "Application of NAA in Environmental Geology" by K. -Y. Lee.
A large number of environmental and geological materials were analyzed by different analytical methods
including NAA. From these analyses, it was concluded that NAA is the most effective method for
analyzing these samples. Promising candidates as indicator plants for pollution monitoring were proposed.
e. "Application of NAA in High Purity Materials" by Y. -Y. Yoon.
Several examples of analyses of high purity materials for trace impurities were presented, demonstrating
that radiochemnical neutron activation analysis can be the best choice for these analysis.
f. "The Study of Trace Element Distribution in Biological Samples with NAA for Human Health" by S. -Y.
Cho.
It was shown that NAA of biological samples were essential for estimating the uptake rate of trace
elements into human bodies. Such estimation was emphasized to be very important for public health.
4. Discussion for Future Activities
As this is the first year after the completion of the previous project and past activities with that project
were evaluated at the last meeting in Yogyakarta, we have not tried to review them. Instead, we have rather
extensively discussed the future activities which we could have in the next couple of years. It must be
- 381 -

JAERI-Conf 2001-017
needless to admit that we have initiated our discussion after the recognition of the last report of this workshop,
in which evaluation of past activities (1992-1998) and proposal for future activities were printed.
After the discussion, we have come to the following conclusions;
(i) This workshop is very important and efficient for promoting NAA in participating countries.
(ii) In order to promote NAA in each country, a supporting system is highly desirable. It was
acknowledged that Ko method could be one of the best choices.
(iii) As admitted in the previous report, we need to prepare environmental samples and geological samples
for the inter-laboratory comparison of NAA data.
The followings are some additional explanations for these conclusions.
It is now well recognized that not oniy in participating countries of this workshop but also in worldwide
that mono-standard method like Ko method is very useful for end-users of NAA. The largest reason to
prevent Ko method from being widely distributed is its high price for software package. There are several
other problems with commercial Ko softwares: the software is written on old operation system (OS) (DOS)
and the software cannot be run on computers with modern CPUs. Considering these situations, it is highly
desirable that non-commercial software of Ko method which can be run on modern computers with
"MS-windows" as OS is developed.
It can be agreed that NAA has been almost established as an analytical tool This doesn't mean that an
effort for refining the NAA procedure is no more necessary. NAA, especially INAA seems to be one of
instrumen al analytical methods, but it is not so instrumental as other real instrumental analytical methods
like ICP-MS and XRF. Considering that NAA is admitted to be the best reliable method for elemental
analysis and that NAA values are usually used for evaluating analytical data obtained by other methods, we
definitely need to make effort to keep the analytical capability by NAA at the best level. Inter-laboratory
comparison of analytical data by NAA has been carried repeatedly in the past and needs to be continued in
future, considering that such an activity is very essential to keep the analytical level reasonably high. For
inter-laboratory comparison, well-prepared common samples are needed.
Neutron activation analysis is particularly efficient for the analysis of solid samples such as geological
samples and dust particles. These samples can be subjected to INAA without any further processing. In
ICP-MS, a competitive analytical method to NAA, such solid samples need to be completely decomposed
and dissolved into solution. During these procedures, contamination of impurities and/or loss of samples are
more or less probable and tend to yield less reliable data. In this sense, NAA can be the best method for air
pollution monitoring by measuring dust particulates. To monitor the pollution level in nation-wide of each
country, a large number of samples need to be analyzed. INAA coupled with Ko method must be capable of
matching such a requirement.
5. Proposals for Future Activities
Based on the discussion stated above, we would propose the following subjects for future activities.
(i) Non-commercial Ko software will be developed. This software should be user-friendly, written on
"MS-windows" as OS, run on computers with latest CPUs and able to be distributed to any user with no
cost. Considering the current progress in participating countries, Japan and Vietnam are required to
participate in this development. We estimate one and a half year for the completion of this project under
-382-

JAERI-Conf 2001-017
the best condition. Korea can join this project, especially in upgrading the data calculation algorithm.
(ii) Meanwhile, three kinds of reference materials as common samples will be prepared and/ or distributed.
These common samples as follows;
a. Averaged Asian food diet sample. Each. participating country is required to send its food diet sample to
Malaysia by January 31, 2001. Malaysia is responsible to make well-mixed samples, which is
designated here as an averaged Asian food diet sample, and send a portion of it to every participating
countries. It is also required for Malaysia that the homogeneity of mixed sample is good enough for
INAA work (an error due to heterogeneity must be less than 1%).
b. GeoLogical referencesan"e- Korea is responsible to distribute Korean geological reference samples
(eight samples in total). prepared by Korean Institute of Geology, Mining and Materials (KIGAM) by
the end of February. Basic description of each sample (type of rock, sampling site, grain size, etc.)
should be noticed at tile same time.
c. Pollution samples (air particulates. Preparation of common samples of this category is not intended.
Instead, air particulate samples will be collected in each participating country. In order to make the later
discussion more meaningful, several conditions for collecting the samples should be unified. Korea is
responsible for distributing pre-fixed conditions to each participating country by the end of this year
2000. It must be considered that a specified dust sampler is not available in any country.
(iii) These samples will be analyzed by using conventional NAA which is used in individual
institutes/laboratories. Ko method may be applied in Japan and Vietnam. Results will be discussed in the next
workshop. If any country likes to have some particular samples analyzed by other countries for confirmation
of data, such a request is highly welcome and asked to announce to other countries. Communication by using
e-mail helps fast and effective exchange of data and idea.
(iv) Once a Ko software is newly developed, it is required to distribute to all participating countries. The
software will be immediately evaluated by analyzing the common samples which are already distributed and
analyzed in individual countries. If any bug or bug-like defect is found, it should be noted to developers. With
several catching-ball communications, the software will be completed in a reasonable time.
(v) By using the final version of Ko software, air particulate samples as well as the common samples are to be
analyzed. Data from all participating countries for the common samples will be compared with each other for
evaluating the usefulness of the newly developed Ko software. Data for airborne particulate samples also are
compared for discussing the degree of air pollution in participating Asian countries.
-383 -

JAERI-Conf 2001-017
III. RESEARCH REACTOR UTILIZATION (BNCp
Sixteen scientists from seven countries of China, Indonesia, Japan, Korea, Malaysia, Thailand and
Vietnam made presentations in this section. The participating countries reported the current status of
their research reactor as well as the recent achievements in the design, construction, research, and
clinical trials of BNCT.
1. Country Progress Report
1 China upgraded the safety system and renewed the old equipment in research reactors. As a
result, good availability of the reactor operation has been achieved. Research and utilization of
four reactors, which are HWRR, SPR, HFFER and MJTR, are on schedule. Research and
development in BNCT has been greatly concerned, however, no definite decision on BNCT
technique line has been made.
* Japan presented the present status of research and test reactors in JAERI. Also reported is JRR-4
BNCT Facility, In JRR-4, ever since the first medical irradiation for BNCT was carried out Oct.
25, 1999, seven times of treatments were performed by the end of June 2000. By using prompt
gamma ray analysis, boron concentration in the patient's blood was measured by gold wire
activation method using beta-gamma coincidence counting system. This data was furnished to
medical doctor for irradiation time determination.
* Ever since Korea built HANARO, which is a multipurpose research reactor and whose design
feature is rather unique, the experimental facilities such as HRPD, FCD are in service and
SANS is ready for commissioning, Neutron Radiography is occasionally used by the demand of
industry. BNCT and PGNAA are under construction, and will be available to user next year
Other spectrometers like PNS etc. are planned for the next step and proper installation time of
CNS and neutron guide tube are in consideration. Material irradiation test for the newly
developed research reactor fuel and structural material for nuclear power reactors, RI production,
and neutron activation analysis has increased. A feasibility study for the NTD is underway.
* Malaysia reported that the construction of the small angle neutron scattering (SANS) on the
radial piercing beam port-was completed in 1995 and some devices are already in operation but
considerable effort is still required before the research program for this instrument is made in
their full extent.
U Vietnam presented the status of operation utilization and some activities related to the core
management of the Dalat Nuclear Research Reactor (DNRR). It will reach about 22,000 hours
of operation at nominal power by the end of November this year.
* Thailand reported that they established the working group for BNCT project in 1996. Detail
design is now underway and the BNCT facility will be provided to expand the utilization of a
new 10 MW research reactor of ONRC project.
* Indonesia reported that Batan has an intention to develop BNCT facility at one of the research
reactors. Study indicates that the TRIGA Kartini reactor in Yogyakarta will be the most suitable
-384-

JAERI-Conf 2001-017
one. Depending on the availability of fund, further action plans for this program will be defined.
They expect scientist exchange program to be utilized to support development of the BNCT
facility under the bilateral JAERI-BATAN cooperation program. They also expect the IAEA
Technical Cooperation on BNCT in 2001.
E Korea introduced the recent progress in developing the BNCT facility in HANARO. They
installed radiation filter made of single crystals of silicon and bismuth. It effectively attenuates
fast neutrons and gamma, but it allows effective penetration of thermal neutrons. Water shutter
for continuous operation of reactor is installed. The thermal neutron flux of 2.6 x 10⁹ n/cm2 -s is
estimated at the irradiation position.
li Korea also reported that a prompt gamma neutron activation analysis (PGNAA) system is being
set up in HANARO. Polychromatic thermal neutron beam diffracted vertically by a set of
pyrolytic graphite crystals at a Bragg angle of 45 deg. from a horizontal beam line. Thermal
neutron flux of 6.1x10⁷ n/cm2s and the Cd-ratio of 364 are achieved at sample position.
1 Japan introduced JRR-4 BNCT Facility. JRR-4 medical irradiation facility was designed to use
thermal, epithermal or mixed neutron beam. The first medical irradiation foi BNCT of JRR-4
was carried out on Oct. 25, 1999. In BNCT irradiation, boron concentration was measured by
prompt gamma neutron activation analysis and thermal flux distribution in the irradiation
position was measured by gold wire activation method using beta-gamma coincidence counting
system.
* Dr. Nakagawa who is the leader in BNCT worldwide introduced BNCT in Japan from the
viewpoint of clinical application. This kind of clinical information seems to be very important to
Neurosurgeon.
* A Korean professor introduced newly developing boron compounds. These boronated
tetrahydorisoquinolines may be useful as a tumor-selective sensitizer for BNCT. Studies
evaluating the in vitro and in vivo localizing ability are currently being carried out and will be
reported in near future.
* A Korean medical doctor pointed in his presentation that the I-BPA-Fructose is a promising
tumor imaging radiopharmaceutical for BNCT research.
* Japan introduced a new treatment planning software, Computational Dosimetry System (JCDS)
and experiments being done to verify the JCDS in JRR-4.
1 A Korean professor introduced image data formats for dose planning and DICOM (Digital
Image Communication in Medicine), which is standard protocol for medical images and related
information.
* A Korean professor introduced the small medical reactor for BNCT in terms of neutronic design
approach.
2. Discussions:
The information presented by every country in the BNCT session seems to be very useful to
those who are planning to have BNCT facility. Especially, presentations by Dr. Nakagawa who is
-385 -

JAERI-Conf 2001-017
the pioneer in this field, Mr. Torri and Mr. Kumada conveyed very useful information. When the
future plan was made last year, it was agreed to have discussion on BNCT this year, Neutron
Radiography next year and Reactor Core Management in 2002. Although BNCT is not scheduled
for future workshops, since BNCT is very useful and interesting, and some countries are planning
to have BNCT facilities, continued information exchange through communication link or network
would be very beneficial to the member states. Consideration in this matter will be commissioned
to future program under the FNCA framework.
8 Korea pointed that the workshop on BNCT is not necessary to continue next year or in near
future because any significant progress among member states except Japan would not be
expected within short time period. If the initiation of BNCT facility in China, Indonesia or
Thailand is made, or if some clinical trial is made in Korea, then another workshop can be
applied.
*1 Malaysia suggested the continuation of our workshop as agreed last year, and one or two
lectures about BNCT development could be inserted into the workshop.
E Japan suggested inclusion of the progress and new ideas on BNCT into our country report in
order to continue the information exchange on BNCT.
* Vietnam also agreed to put the report for BNCT in the country report even though BNCT is not
in consideration now.
*1 Indonesia expressed that the way to support the society using research reactor is the production
of radioisotopes for medical & industrial purpose, and they intended to have BNCT facility
and had good response from medical doctors. Also expressed that they would like to put the
topic of radioisotope as an item for the next workshop.
X Japan realized that many Asian countries are interested in BNCT. Therefore, they expressed
their hope to develop collaboration with other countries in this subject.
*S Thailand decided to have BNCT facility in their reactor. Since BNCT is a new technology and
it involves many fields, they would like to have collaboration with the countries that have
experience. They would like to have workshop on the design of BNCT facility as well.
11 Dr. Nakagawa made comment that BNCT is not familiar to people and medical doctors, and
therefore it is necessary to keep them informed of the correct status of BNCT. Also comment
made was that if we have more clinical data and result in future, it would be important for the
medical doctors to know them. Mr. Torri said that he was willing to collaborate in the
measurement technology with any country anytime and anywhere
I China was pleased to deliver three remarks. The first one is that the most realistic option in
China is to install BNCT in CARR that is under design and second possibility is to construct a
small reactor for BNCT. In near future, they will have decision and hope to report the BNCT
progress in their country report. The second remark is that production of RI in China is
supposed to be not so efficient due to various reasons. The third is that China has experience
in NAA field and they are happy to communicate with other country, if they have chance.
El Japan is willing to provide communication network to deliver important information about
-386-

JAERI-Conf 2001-017
BNCT. They can open and even allow the tour to KUR or JRR4 facilities while an actual
BNCT is underway under the FNCA framework or other cooperation programs. Also they told
that they could even receive patients up to about five in a year from FNCA member states.
Financial support for the treatment and some part of the hospital fee just after the BNCT in
Japan would be possible.
E Korea mentioned that it would be good for Thailand to utilize STA program, or IAEA
fellowship or expert mission to consult the design, instead of workshops.
1 Thailand told that they had difficulty in setting up the requirements for BNCT and which type
of BNCT facility they had to have due to lack of medical doctors with enough knowledge in
BNCT.
* Indonesia expressed that good communication network is indispensable. And medical doctors
in Indonesia are very interested in that information.
* China is much interested in the application of their Miniature Neutron Source Reactor to the
BNCT, which seems to be more attractive to medical doctors.
Xl Korea pointed out that there was a misunderstanding in the design of neutron beam for BNCT,
and what matters is whole brain irradiation vs. local (or focal) irradiation not the use of
thermal vs. epithermal neutron.
X Japan indicated that the focal irradiation is seemed better than whole brain irradiation, but the
use of neutrons with higher penetration power is the better.
Since all project leaders participating in this workshop except Australia were in this section,
pre-discussion was made for the future activity on the Utilization of Research Reactors. Japan
explained about the recommendations from the review committee of Japan. The criticism can be
summarized that the themes has been rather oriented to the interest of researcher, the number of
topics has seemed rather many, but it has been not so clear that how the results have been
contributed to the end user or public. Close link with the activities of other international
organization such as IAEA was also emphasized-
* Japan proposed RI using PZC for the Tc generator and NAA for its application to
environmental research and mine exploration, as future activity.
* Korea, as the lead country of an IAEA/RCA project on research reactor, explained the
scheduled activities in this region by the IAEA/RCA and the Japanese extra-budgetary
program of IAEA, considering the close link with other international activities. It was found
that the workshop on the research reactor core management in 2002 would be overlapping.
Korea also expressed that they prefer to discuss radioisotope rather than neutron radiography
in 2001, and proposed to include the discussion on the neutron radiography at the IAEA/RCA
workshop on neutron scattering in 2001 rather than in the workshop under the FNCA
framework.
* Japan explained that new proposal for FNCA workshop such as Establishment and Transfer of
Tc-99m Generator Technology and Utilization of NAA would not be accepted in 2001
-387-

JAERI-Conf 2001-017
because the budget of 2001 is already fixed. It may be considered for the topic of 2002
workshop.
= It was understood that the topic of the next year program would be Neutron Scattering,
Neutron Activation Analysis and Neutron Radiography.
* The contact point for Neutron Scattering and NAA already have been established. If we will
have workshop for Neutron Radiography next year, then we need to assign contact points for
NR.
3. Results
* Communication network especially in BNCT is necessary. Contact person of each country is to
be assigned. List server is also necessary.
* The BNCT of Japan are open to member states. Japan is willing to help member states for the
facility development or for learning on the patient treatment.
* The progress of BNCT in each country will be included in the status report of each country.
IV. ROUND TABLE DICUSSION
All participants attended the round table meeting lead by project leaders of member states.
Leaders of three sections summarized their activity during the workshop focusing on the future activities,
and discussion followed.
Dr. Machi - the coordinator of FNCA, presented summary of the first FNCA meeting held in Bangkok
in November 2000. He told that FNCA was recognized as an efficient mechanism of cooperation in
nuclear technology for the social and economic development. The recommendation from the FNCA
meeting to this workshop was almost the same with that from the project review committee of Japan as
Mr. Kaieda explained at the BNCT section and his iterated explanation after Dr. Machi's presentation.
Linkage with end user was emphasized for all future activities. Several impressive examples
demonstrating the advantage of nuclear technology for various applications were presented. Dr. Machi
also explained about the proposal of Japan on RI and NAA as the future activities.
The project leader of Korea proposed an activity on RI in 2001 instead of neutron radiography for the
better linkage with the backup supply of RI of which topic will be discussed at an expert meeting of
IAEA/RCA in Bangkok on sharing of resources in May 2001. He also requested the project leaders,
since most of them are Project Coordinators of IAEA/RCA as well, to support the inclusion of neutron
radiography at the IAEA/RCA workshop on neutron scattering in Korea in 2001. Discussion to avoid
overlapping in the neutron scattering by this workshop and by the IAEA/RCA followed.
A few participants pointed out the possible problem or difficulty to provide budget for our activities
within limited time if the topics or contents of activities in near future are changed. It was understood
that it depends on the time span, plan and financial issue of the project.
- 388 -

JAERI-Conf 2001-017
Dr. Machi emphasized the importance of close communication among experts in each. specific field.
For this purpose, he suggested assignment of contact point of each country in each field and a leader
among them.
The project leader of China announced that China would host this workshop in 2001.
The conclusions of the round table meeting are as following
U The topics of 2001 will be,
1) Neutron Activation Analysis focusing on the environmental research and mine exploration.
2) Radioisotope for the realization of Tc generator technology using PZC.
3) Neutron Scattering focusing to its application to end-user.
* The venue of 2001 workshop will be in China.
* The recent development, on BNCT will be included in the country reports, and a communication
network will be provided.
New projects such as establishment and transfer for Tc-99m generator production technology and
application of NAA for environment monitoring and mineral resources exploration were agreed and a
recommendation of the new projects will be submitted to the coming coordinator meeting.
-389-

JAERI-Conf 2001-017
AppendixSchedule of the 2000 Workshop on the Utilization of Research Reactors
November 20 - November 24, 2000Taejon, korea
Time Nov 20,2000 C] ap n Tim Nov. 21, 2000 ChairpersonTime -~~ Monua hipesn rr TuesdayChrpso
[Room: Seminar room 2F09 00 -09 30 Main Building KAERqI
Registration _
Welconing RemarkDr. CHANG In Soon RYoom. Meeting room of RI
09:30- 1010 Opening Remark Dr, KIM S Y, BuildingiMr. SHIGEYAMAMasaru 0900- 1100 SANS ExpenmentsOpening Remark (Contnue)M_. LEE Moon Ki __________
10:10-10:30 Coffee Break
10:30 -1100 General Lecture
1:00-11:30 GeneraDr. NAKAGAWA 11:00-12:00 DemonstratonofData Antysis
113 1:0General Lecture Mr. KAIEDA K11:30-12:00 Dr. PyARKKvunabae Mr, JUN B J_
12:00 - 12:20 Video Presentation
12:20-12:30 Group Photo 12:00 -13:00 Lunch
12:30- 13:30 Lunch CountryReporl:Australia[Room- Meeting room of Rt- Coumry Rerorf .Korea
1330- 13:40 Building) 3O 44 Country epoDt:MnduriesA13-30- Confirmation of Chai on Dr. KAWAGUCHI 1300- 14:40 Country Repel: Indonesia UM. SANGARNAVA
13-40 -14:40 Country Report Australia W LEE C. H Country Repor: Japao1340nt140 CoutryrReptKorea
14:40- 15:20 Coffee Break140- 15:00 n ~ offee 3 e__1.D152iot- re aks14:40 i5:00 Coffee 3z-eek ~~~~~~Country Report: Malaysia
15:00 - 16 30 CDounry Repo rKAM AJ 15:20- 16:20 Country Report: ThilanyCountry Report: Korea__- I'ARPYAA N. Dr.yeor:iets KNOT R.B._ _ _ ~~~~~~~~~~~~~~~Couniry Reprt: Viethanr, __ YNGT
16.30 - 17.00 Demonstration Experment 16:20- 17:30 Reports on the Cooperativep Research Project .___
Time Nov ?222000 [ rT Time Nov. 23 2000 ChairpersonTime ~~~Wednesday L hipro ieThursday ______
[Room: Meeting oon, of RI |Room: Meeting room of R
09:00 1200 Su1iding] 09:00- 1200 Building]~, Caii 9f SANS Eveas _ I Discussion(Continued)
12:00- 13:00 Lunch 12:00-13:00 Lunch
13-00. 13:00 -14:00 Repor onSub WrhoCountry Report Japan W sEoK Spr BCounlry Report Japan t h. T T 14:00-14:30 Coffee Break
_ _ _Q __ _ ___ 14 30-15:30 Discussion of the Report1500-15:30 Coffee Break ._._ and Future Plan |
15 30 -16 30 Country Reporl Koea 3 v.M L H _. _ 7_
16:30 - 17:30 | Discusson of the Fulure Fw~rr WS amh | umr
[Room: Conference room ofHotel Spapia3
09-0° -10-00 Summary o WS Activity & Mr. KAJEDA K.|______ |Reports Mr. JUN B. J.
10:00- 12:00 Future Platn12:00-13:00 Lunch
[Room: Conference room of
13:00- 14:00 Hotel Spapia] . Mr. KAIEDAK.Finalrzation of WS Reporl Mr. JUN B. J.
114:00- 15:001 Closing Session
- 390 -

JAERI-Conf 2001-017
AppendixSchedule of the 2000 Workshop on the Utilization of Research Reactors
November 20 - November 24, 2000Taejon, korea
Group: Neutron Activation Analysis
TnmE Nov. 20, 2000 C s Nov 21, 2000 ChairprsonMonday Tuesday
(Room: Seminar room 2F09:00-9:30 Main Buildinq KAERI]
Registration [Room: Seminar room ofNETECI Mr. FENG M.
Dr. CHANG inmark: Dr, KIM S Y 09:00 -10:00 Country Report: Thiland Mr. LEE J. H.
09:30 - 10:10 Opening Remark Country Report: Vietham09.3 -10 Mr. SHIGEYAMAMasaru
Opening RemarkMr. LEE Moon Ki _
10:10-10:30 Coffee Bre 10:00-10:30 Coffee Break_G6ne-ra-T~e-cture
10:30 -11:00 Dr. KUK II Hvun Country Report: Japan Mr. SUTISNA
11:00-11:30 GeneralLecture 10:30-12:00 CountryReport Korea Mr.YOONY.Y..1c0 -. ue Mr. KA AK 0 Country Report: Korea
113 -1.0 renraA Le~t~ur~e Mr. KAIEDA K.1_30 -12.00 Dr. PARK un bae_ Mr. JUN B. J. -
12:00 - 12:20 Video Presentation12:00 -13:00 Lunch
12:20 - 12 30 Group Photo
12:30 -13:30 Lunch ___
[Room: Seminar room of13:30- 1340 NETEC-O Country Report: Japan Prof. ALAS M. Y
Gonfihnmaton of chairperson 13:00 -15:00 Country Report: Korea Mr. CHO5 Y.13:40 - 13:50 Overview _ _ t NGUYEN t v. Country Report: Korea
Country Report: China !k*AEEfY.Y13:50 - 1520 Country Report: tndonesia__-____
Country _ _ 15:00 15:30 Coffee Break-1520 40 Coffee Break15.20 -1.:40 rQffee orea~c 15 30 - 6:0 Country Report: Korea or. CHUNG Y.S
15:40- 1640 Country Report Korea M-SR oI NTIN C Mk SASAJIMAF.0 - 640-Country Report: Malaysia Mr MOON J. F 16:00 - 16:30 Disrcssion in Technal Matter
Tine ] Nov. 22 2000 Chaiperson T Nov 23, 2000 Chairperson___________ Wednesday j Thursday
[Room: Meeting room ot 0900 [Departure it Hotel SpapiaJ
HAsARO Reactor IuifdmgJ tTceclTu0900- 1030 4AnAtO -INRe ando BNCTm Technicall Tour.Visitv to .ANARO and Young- KvnngFacilfty ~~~~~~~~~~Nuclear Povwer Plant
10:30-11:00 Coffee Break110-12:00 Demonstration of Facility _
12:00 - 13:00 Lunch1300 -14:00 General Discussion Pro*. EBIHPRAM
Dr. CHWG Y S,14:00 -15:00 Disoission oftoe FutrePromam
15:00 -15:30 ___ Coffee Break
15:30- 16:30 OOoisscos of the Fuaure Progm p A _ ,
16-30-17:00 Reviewof Final Report D. CHUG Y. S.
Nov.24. 2000 ChaIrpersonTi mFrdyire n
IRoo:conference room ofI| | ~~Hotel SPapiaj
09:00 -10:00 Summary t WS Activity & Mr. KAIEDAK|I Reports Mr. JUN B. J.
10:00 -12:00 Future Plan12:00 - 13:00 Lunch _
13:00-14:00 [Room: conference room ofHotel Spaplal Mr. KAIEDAK.Finalization of WS Report Mr. JUN. B. J
14:00-15:00 Closing Session
-391-

JAERI-Conf 2001-017
Appendix Schedule of the 2000 Workshop on the Utilization of Research Reactors
November 20 - Novemrber 24, 2000Taejon, korea
~~ 1 ~~ Nov. 20, 200 Nov. 21, 2000 ] arpro
T-WrleMonday Chiprsn Tm Tuesday Chairperson_
[Room: Seminar room 2F09:00 -930 Main Buildinq KAERI]
Registration[Room: Seminar roomn of
Welcoming Remark Dr. KIM S. Y N ETEC) Dr. XU H.Dr. CHANG in Soon 09:00 -10.30 Country Repoort! Thiland Mr. KUMaDAH.
09:30- 10:10 Opening Remark Country Report: indonesiaMi. SWGENPPA~Masaru Counlry Repov KoreaOpening RemarkMr. LEE Moon Ki _
10:10-10:30| Coffee Break
10 30 lectre 10:30 -11:00 Coffee Break
11:00-e11a30 Lcu Mrr KAADK 11:0012:00 CountryReport: Korea Mr. KAIEDAK.
____ Dr NA~~~~~~~~~~~~~~~~~~~~~~~~~~~~~~~~~~~~_ A(`_A___ ____12_011:30-12:00 General Lecture Mr. KAIEDA K. Country Report: Japan Mr. LIM S. M.Dr. PARK K gae Mr. JUN B. J.
12:00-12:20 Video Presentation_ _ _ _ _ _-- 12:00 - 13:00 Lunch
12:20-12 30 Group Photo
12:30 -13.30 Lunch -____[Room: Semina romo[Room: Semi mar room 0? ~~~~Country Report: Japan I.1. BOK(HARI AB.
t13:30-13:40 ECo tot}of Cttpa5on Of G PACAROEN s 13:00-14:30 Country Report Korea POt o1 H D.
Country Report: China i. LEE B. C1340 -15 10 Country Report: Japan ] 14:30 -15:00 Coffee Break
_ _ _ ountryBpod:15:10 - 15:30 Coffee Break Country Report: Korea
_ __- 17500 Country Report: Japan Ir. NGUYEN N.D.
15:30-16-30 Counry Report Malaysia Dr IHASTOMH CountryReport: Korea W KANG S. U.Country Report: Vietnam WA. TOBRt Y Country Report: Korea
!me ~~Nov. 22, 2000 larperson Time Nov~ 23, 2000 Chairrsn?Tim. S W 22 da VnWednesday Thursday I_______
[Room Meeting room of 09 00 [Departure at Hotel Spapia7
0900 - 1 I3f 1AHR Reco S1tig Technical TourVisi tANARO Randr BukNg)
Facility Young- Kwang10:30 - I 1:G0 Catfee Break Nuclear Power Plant
10:30 -11:0w Coff ee Break
1:00-12:00 Discussion
1200 - 13 00 Lunch
13:00 -14:30 Discussion ____14:30 - 15:00 Coffee Break15:00 -16:00 Discussion of the Future
16:00 - 17:00 Review of Finai Repor _ ._ _ _
Nov. 24, 2000_______ Fniday! -
[Room: Conference room of -
09:00- :0 Suroena ySof WSActivity & Mr. KAIEDA K.
_______ 1Reports Mr. JUN B. J.10:00 -12:00 Future Plan12:00- 13:00 Lunch13:00- 14:00 [Room: Conference room of
Hotel Spapia] Mr. KAIEDA K.
Finalization of WS Report Mr. JUN B. J.14:00-15:00 Closing Session _ __
- 392 -

JAERI-Conf 2001-017
AppendixLIST OF PARTICIPANTS
2000 WORKSHOP ON THE UTILIZATION OF RESEARCH REACTORSNovember 20 - 24, 2000
Taejon, Korea
Telephone & Facsimile No.No Country Field Name Organization and Position E-mail address acileN
- - ~~~~~~~~~~~~~~~~~~~~~~Private Mail Bag, Menai NSWPrincipal Research_ Scientist 2234, Australia
1 Australia NS Dr. KNOTT Robert Barry Physics Division, c + 6 -2-39717- 3218Atsit lan Nuclear Science and Technology F. + 61- 2- 9717- 9262Organization (ANSTO) robeut.knotkbansto.govUau
i RXO.Box 291-109 Chengdu SichuanSenior Engineer, Reactor Operation and 610005 China
2 China NAA Mr, FENG Mingquan Application Sub-institute Nuclear Power T + 86- 28- 55582199- 44474Institute of China(NPIC) F: + 86- 28- 5582223
fengmgnp ic.ac.cnChief Engineer, PO.Box 275(33), Be/ing China
3 China BNCT Dr, XU Hanmin Reactor Engeneering Deparbtent, T + 86- 10- 6935- 7582China BNCT Dr XU Hanming China Institute of Atomic Energy (CIAE) F: + 86- 10- 6935- 8140
___ I ______________ CNNC Xuhanmingins.ciae.ac.cn
I ~~~~~~~~~Nuclear Physics Division PO .Box 275(33), Be/jing China4 China NS Mr. YANG Tong Hua China Institute of Atomic Energy (CIAT) F + 86- 10- 6935- 7564
China CNNC M orThyangoiF6 s. ciae. ac. cn
Leader of Natural Materials Group Kawasan Puspiptek SerpongDepartment of Industrial Materials Tangrang i5314 Indonesia
5 Indonesia NM M r. SUTISNA R & D Center for Materials Science & T + 62- 21- 756- 0562 Ext. 21 11Technology, F; + 62- 21- 756- 0926
__________ __ -- BATANh tisn iMnknetdKawasan Puspiptek Serpong
Head of Neutron Scattering Laboratory Tangrang 15314 Indonesia6 Indonesia NS Dr. iKRAM Aganru! R & D Center for Materials Science & T&F: - 62- 21- 756- 0926
Technology, BATAN nsibetianolcentrin.net~id
Kawasan Puspiptek Building
Director, No.31Serpong Tangrang 153107 Indonesia BNCT Mr. HASTOWO Hudi Center for Development of Research Indonesia
T: . 62- 21- 156- 0908Reactor Technology, P2TRR- BATAN F + 62-21-756-0573--------- __ __ LPLrsg~cbn.neLii
Reactor Manager, Division of Technical Bangi 43000 Kajiang SelangorService Malaysia
_ Malaysia NCT Mr. BOKHARI Adnan Institute for Nuclear Technology T. 60-3- 892- 82988MalasiarcMN T F .+60- 3- 892- 53037
Research (MIN ~atiokhawi~mmtgovmySenior Research Officer, NDT-Radiation Bangi 43000 Kaiiang Selangor
9 Malaysia NS Mr. MOHAMED Abdul Aziz Technology, Industrial Technology Division Malaysia9 Malaysia NS Bin Malaysian Institute for Nuclear Technology T + 60- 3- 892- 50510
Research (MINT) F: * 60- 3- 892- 50907____ _________ Azi mohdrnminLgov.my
Profsso, Uivesit Tenolgi alasia 81310 UTM Skudai Johor Malaysia10 Malaysia NAA Prof. MOHD YUSOF Alias ProIfssor, Unvieroie Tealologi Malaysia T + 607- 550450/ 3079
Management, Faculty of Civil Engineering Fiias: k5miai6s.utm.my
Vibhavadi Rangsit Rd.. ChatuchakSenior Nuclear Physicist, BANGKOK 10900 ThailandThaiand MS .SANGARIYAVANICH,
11 Thailand NS ArcrM Physics Division, T .+66-2-5620119A rchara Office of Atomic Energy tor Peace (OAEP) F: + 66- 2- 5620118
_ . . ~~~~~~~~~~~~~~~~~~~~archara~yoaepqgo.y1TVibhavadi Rangsit Rd., Chatuchak
Ms. SRI hNAWACH Project Leader, Chemical Research section BANGKOK 10900 Thailand12 Thailand NMA T,.66- 2-5620121
Chastbongkoch Chemistry Division F. 10066- 2-T5613031
Chastbontyoaep.go.thVibhavadi Rangsit Rd, Chatuchak
Head Isoope rodctio Secion BANGKOK 10900 Thailand13 Thailand BNCI Mr. CHAROEN Sakda Head.Isotope Production Section T* 66-2- 5620121/5795230-4
Isotope-Production Division F: 66- 2-5613013/5620127____ ___ ___ ____ ____ ___ ____ ___ ___ ____ ____ ___ ____ ___ sakda oaep qo th
- 393 -

JAERI-Conf 2001-017
AppendixLIST OF PARTICIPANTS
2000 WORKSHOP ON THE UTILIZATION OF RESEARCH REACTORSNovember20 - 24, 2000
Taejon, Korea
No County Field Name Organization and Position Telephone & Facsimile No.E-mail addkess
Scientific Researcher, 01 Nguyen Tu Luc Street DelatCenter for Analytical Techniques and Vietnam
14 Vetnam NAA Mr. NGUYEN Minh Van Environmental Research T. + 84- 63- 832630Nuclear Research Institute (NRI) F + 84- 63- 821107
_______ _______ _ _ Jluoanghoan6 t. vn*01 Nguyen Tu Luc Street Delat
15 ~~~~~~~~iemam ~ ~ ~ DietoVietnam15 Vietnaml BNCT Dr. NGUYEN Nhi Dien NuDcear Research insttute (NRI) T. + 84- 63- 828620
NuclearResear nstitut (NR)F: + 84- 63- 821107_______ ________ _______________ __________ _ -nndien(hcm.vnn.vn
01 Nguyen Tu Luc Street DelatEngineer, ~~~~~Vietnam
16 Vietnam NS Ms. TRAN Phuong Thi Thu ngineer, Nuclear Physics Division F + 84- 63- 822191huNcerResearch Institute (NRI) F: + 84- 63- 821107
_ _____ _ _ __________________ ________________________________ n ngevnn hcm . vnn. vnTechnicai Otticial, International Affairs and 2-2-1 Kasumigaseki Chiyoda-kuSategard Dvio n Aomc Tokyo 100- 8966 Japan
17 Japar M Mr. SHIGEYAhiA Masarul S.afeuards Dision Atomic Ergy T . 81- 3- 3581- 259717 Jap~an M Mr HGYM aau Bureau, Science and Technology Agency F: . 81- 3-. 3581- 5198
j ________ _____ _____________ (STA) mshigeyao-sta.go.1-7-6, Torano-mon Minato-ku Tokyo
18 Japan M Dr. MACHI Sueo Senior Managing Direc or 105- 0001 Japan18 Japan M Dr. MACHI Sueo Japan Industrial Forum.,lnc- T 831 -3- 3508- 7932:____ ______ ___ _________ __________ ___F: + 81- 3- 3508- 9021
2-53 Shirakata Shirane Tokai-mura
Projector Leader Naka-gun Ibaraki-Ken 319- 110619 Japan BNCT Mr. KA EDA Keisuke Special Senior Staff Jap- an
Nuclear Material Control Center F + 81- 29- 282- 8004
_ . ~~~~~~~~~~~~~~~~~~~~~~~~~~katedajncc.arijp24 Shirakata Shirane Tokial-mura
Deputy General Manager, Naka-gum Ibaraki-ken 319- 119520 Japan M Mr. SATO Kenji Research Reactor Admninistration Division. Japan
Deptof Rseach Ractr, JFRI T:+8-1- 29- 282- 6895Dept o Reserch Rec orJAFRI F: . 81 -29- 282- 5258
_ __. ~~~~~~~~~~~~~~~kjsato@3nems~jaen~g~o jp
4-20-16403 Honcho Tanashi TokyoSenior Scientific Advisor 188- 0011 Japan
21 Japan NS Dr. HAMAGUCHI Yoshikazut o f arch r T: +81- 424- 66-9361Deptof~esearchReacor, JAFI F~ . 81 -424- 66- 9361
____________________ _________ _ ________________ _ayot& hhJ94u o2-4 Shirakata Shirane Tokai-mura
Sub-leader, Naka-gun Ibaraki-ken 319- 119522 Japan NS Mr. MINAKAWA Nobuak ~Research Group for Neutron Scattering Japan22 Japan NS Mr. MINAKAWA Nobutaki at Ulralow Terperat Se T + 81- 29- 282- 5997
Advanced Science Research Center, JAERI F: + 81- 29- 282- 5939___-_______ minakawa~kotai3.tokaijaeri.go.jp_
Associate Professor, Yoshida-honmachi Sakyo-ku KyotoDepw~et of olyme Chemstry, 606- 8501 Japan
23 Japan NS Prof. HASEGAWA Hirokazu Grde ate Scho PolymEnrCneemins, T. .81- 75- 753- 5614GradutoUierschoift nieeig F: + 81- 75- 753- 4864Kyoto tlIiv_ sI nhasegawatailoyvpolym. kyoo-u acip
2-4 Shirakata Ibaraki-ken 319- 1195Deputy General Manager, Research Japan
24 Japan M Mr. OHTOMO Akitoshi Reactor Utilization Div., Dept of Research T + 81- 29- 282- 6765Reaclor JAERI F. +81- 29- 282- 6763
ohtomo@,if3fep2.tokaijaeri.go.jp2-4 Shirakata Shirane Tokai-mura
Research Reactor Utilization Div., Dept of Naka-gun ibaraki 319- 1195 Japan25 Japan NM Mr. SASAJIMA Fumio Research Reactor, JAERI TF: + 81- 29- 282- 656
-__394___-sasajima~jrr3fep2.tokai.aeri.
-394 -

JAERI-Conf 2001-017
AppendixLIST OF PARTICIPANTS
2000 WORKSHOP ON THE UTILIZATION OF RESEARCH REACTORSNovember 20 - 24, 2000
Taejon, Korea
No Country ield Name Organization and Position Telephone B Facsimile No_ ~ ~ ~ ~ ~~ ________ _________________ _ E-mail address
24 Shirakata Shirane Tokai-muraNaka-gun ibaraki-ken 319- 1195
Japan BNCT Mr. SATO Mitsugu ~Deputy General Manager, JRR-3 Operation Japan26 Japan BNCT Mr. SATO Mitsugu Div., Dept of Research Reactor, JAFRI T + 8t- 29- 282- 5095
F: + 81- 29- 282- 5933________________ _____ ____ __ satotjr r3fep2.toka rjae gn.gjp_
1-1 Minami-Ohsawa Hachioji TokyoAssociate Professor, Department of 192- 0397 Japan
27 Japan NA Prof. EBIHARA Mitsuru Chemistry, Graduate School of Science 1- + 81- 426- 77- 2553Tokyo Metropolitan University F: + 81- 426- 77- 2525
_______ ______ _________________ ________ ___________________ ebiharamitsuntuc.melto-u.ac.ijp2-4 Shirakata Shirane Tokai-mura
Deputy General Manager, Naka-gun Ibaraki-ken 319-119528 Japan BNCT Mr. TORII Yoshiya Research Reactor Utilization Div., Dept of JTpa5
F + 81- 29- 282- 5592Research Reactor, JAERI F: + 81- 29- 282- 6763
2-4 Shiratata Shirane Tokai-mura29 Japan KUMADA ~~~~~~~Researcher, Research Reactor Utilization Nalia-un lbaiaki-ken 319-1195
29 Jap n BNCT Mr. KUIVIADA Hiroaki Div., Dept of Research Reactor, JAERI T + 81- 29- 282- 5593
F: + 81- 29- 282- 6763_ _____ - _ _ __ __ _ kumadajr3ffep2.tokai.jaerLgu.jp
2603 Zentsuji-cho Zentsuji-shiVice President, National Kagawa Ghiltken's Kagawa 765-8501 Japan30 Japan BNCT Dr. NAKAGAWA Yoshinobu F', +81-8377- 62-53845
Hospital ~~~~F>-+ 81- l77- 62- 5384________ __________________ _ . nakagawahkagawasyo.hosp.go-jp
2-4 Shirakata Shirane Tokah-muraNaka-gun Ibaraki-hen 319-1195
31 Japan M Mr. SHIRAI Eiji Executive Director, Radiation Application Japanand Development Association (RADA) T: + 81- 29- 282- 6300F: + 81- 29- 282- 1182
______ ~~~~~~~~~~~~~~~~~~Sh rT~r3fep2.tokA*.aeoi. W. 2-4 Shirakata Shirane Tokai-muraNaka-gun Ibaraki-ken 319-1195
Director, Radiation Application and Japan32 Japan M Mr. !SSHIK( Masahiko Development Associabon(RADA) T + 81- 29- 282- 6300
F +81-29-282- 1182_ ______________________ issikiK jrr3fep2.tokai.jaeri.go.jp
P.O.Box 105 Yusung Taejon 305-600President, Korea Atomic Energy Research Korea
33 Korea M Mr. CHANG In Soon lsioeK ~ T. +82- 42- 888-2121Institute(KAERI) ~F' + 82- 42- 861- 9611
____ __-ischar aeri.re.krPO.BOX 105 Yusung Taejon
Principal Researcher, HANARO Center 305-600 Korea34 Korea M Mr. KIM Seong Yun Korea Atomic Energy Research T1 82- 42- 868- 2126
institute(KAERI) F. + 82- 42- 861- 8292_I _sykimpkeri. kr
Government Complex-KwachonDirec or, Nuclear Policy & R&D Divsioni Kwachon Korea 427- 760
35 Korea M Mr. LEE Moon Ki DietrNcesPlc & itiD T + 82- 2- 503- 7646- 835 Korea N Mr. LEE Moon Ki ~~~Ministry of Science and Technology F: + 82- 2- 507- 0558
_mi~lee most. o.r_RO.BOX 105 Yusung Taejon
Vice President, HIANARO Center. Korea 305-600 Korea36 Korea M Mr. KUK II Hyun Atomic Energy, Research Insfitute(KAERI) 1 + 82- 42- 868- 2334
F: + 82- 42- 868- 8501_____________________________________________________itkuk2kaefi~re.kr
-395 -

JAERI-Conf 2001-017
AppendixLIST OF PARTICIPANTS
2000 WORKSHOP ON THE UTILIZATION OF RESEARCH REACTORSNovember 20 - 24, 2000
Taejon, Korea
-~~~~ -Telephone & Facsimile No.No Country Field Name Organization and Position E-mail address
_ __ ___ __ __ P.O.BOX 105 Yusung TaejonI ~ ~ ~ ~ ~~~~~~~eea aaer ITaKraAtomic 305-600 Korea
37 Korea M Mr. PARK Kyung Fae Generay Managrc I Te KcERea T: + 82- 42- 868- 8120Energy Research Institute (KAERI) F'. +82- 42- 868- 8448___ ______ ____ _____ kbpark~dnanvum.haenre.kr
P.O.BOX 105 Yusung TaejonGeneral Manager, HANARO Management 305-600 Korea
38 Korea BNCT Mr. JUN Byung Jin Team, HANARO Center, Korea Atomic T. + 82- 42- 868- 8493Energy Research Institute (KAERI) F: + 8i- 42- 861- 0209
_________ .,__________________ ____ _________________ [email protected] Maeji-i Hungup-myun Wonju-si
Professor, Dept of Environmental Science, Kangwon-do 222- 701 Korea39 Korea NM Mr. CHO Seung Yeon Yonsei University T + 82- 33- 760- 2437
F + 82- 33- 766- 2551_________ ________ ________ ________ ________ ________ sychot~drapon.yonesei~ac.kr
Seoul National University 151- 742Proessr, eptof uclarngieerng, K orea
40 Korea BNCT Mr. CHOI Hee Dong Sesuo NaDtonal University T + 82- 2- 880- 7205Seoul Nationl UniversityF: -82- 2- 889- 2688
____________ _ ____ ____________ ___________________ choihdgtsnu.ac.kr150 Puckjindoug Yusungku Taejon
Projector Manager, NAA Project, HANARO Korea 305-35341 Korea NA-A Mr. CHUNGi Yong Sam Center, Korea Atomic Energy Research T + 82- 42- 868- 8412
Insbttute (KAFRI) F. + 82- 42- 868- 8610_ _- L [email protected]
P.O. Box 105 Yusung TaejonResearcher, NM Project, HANARO 305-600 Korea
42 Korea NM Mr. MOON Jong Hwa Utilization Team, Korea Atomic Energy T. + 82- 42- 868- 8534Research Institute (KAERI) F. + 82- 42- 868- 8448
Jhmoon 1kaen.re.kr
30 Gajung-Dong Yusung TaejonProject Manager, Environmental Geology 305-350
43 Korea NAA Mr. LEE Kil Yong Division, Korea Institute of Geology, Mining T: + 82- 42- 868- 3652and Materials (KIGAM) F: + 82- 42- 861- 9727
_____ __________ ____ _________ [email protected] Gajung-Dong Yusung Taejon
Senior Researcher, Environmental Geology 305-35044 Korea NAA Mr. YOON Yoon Yeol Division, Korea Institute of Geology, Mining T: + 82- 42- 868- 3654
and Materals (K)GAM) F. + 82- 42- 861- 9727yyyoonpkigam.re.kr
220 kung-Dong Daeduck Science
Assoc, Prot, Dept ot Environmental Eng. Town Taejon 305-76445 Korea NAA Mr. LEE Jin Hong Chung.rDn National University F + 82- 42- 823- 754
1 Seocheon-ri Giheung-eup Yogin
Professor, School of Electronics and Gyeonggido46 Korea BNCT Mr. PARK Seung Hun Information, Kyung Hee Univesiy T + 82- 31- 205- 2950682
_Parkshftkhu.ac.kr
PO0,13x 105 Yusung Taejon 305-600Senior Researcher, HANARO Management Korea
47 Korea BNCT Mr. LEE Byung Chul Team, HANARO Center, Korea Atomic T: + 82- 42- 868- 8489Energy Research Institute (KAERI) F: + 82- 42- 868- 8341
I__ I__I_ [email protected] Madu 1-dong Ilsan-ku KoyangGyeonggido 411-351
48 Korea BNCT Mr. LEE Seung Hun M.D, National Cancer Center Hospital T. + 82- 31- 920- 1660F: + 82- 31- 920- [email protected]@chllian.net
-396 -

JAERI-Conf 2001-017
AppendixLIST OF PARTICIPANTS
2000 WORKSHOP ON THE UTILIZATION OF RESEARCH REACTORSNovember 20 - 2* 2000
Taejon, Korea
1 ~~~~~~~~~~~Telephone & Facsimile No.No Country Field Name Organization and Position E-mail adFress
1 . _ 215-4809 Kongreung-rlongNowon-ku Seoul
49 Korea BNCT Mr. LIM Sang Mu MOD, Korea Cancer Center Hospital T. + 82- 2- 970- 1213F. + 82- 2- 978- 2005Smfim328@kc hsun.kcch.re.kr373-1 Kusong-dong Yusong-guTaejon 305-701 Korea
Professor, Dept of Nuclear Engineering T: + 82- 42- 869- 381950 Korea BNCT Prof. CHO Nam Zin Korea advanced Institute of Science and F: + 82- 42- 869- 3810/ 8860
Technology (KAIST) nzcho@mad kast.ac. krnzcho@sorak. kaist ac. kr
__ _______ ________________________ ___ __ htpJI/nurapt. kaisL. ac. kr
208 Seochang, Chochiwon,51 CT ro.KN Sag ok Professor, Dept of Chemistry Chung-nam 339-700, Korea51 Korea BNCT Prof. KANG Sang Ook Korea University T: + 82- 41- 360; 1334
F1 82- 41- 860- 1334
_ _ _ ~~~~~~~~~~~~~~~~~~~~~~sangok~tiger.horea.ac.krKorea _o~;a~nr~ersi N on Beam ~P. O. Box 105 yusung Taejon 305- 600
_Project Manager, Neutron Beam Korea52 Korea NS Mr. LEE Chang Hee Application, HANARO Center, Korea T + 82- 42- 868- 8443
Atomic Energy Research institute (KAERI) F: + 82- 42- 868- 8448
Professor, Dept of Chemisty San 31 Hyoja-dong Pohang 790- 784,53 Korea NS Prof. REE Moon Hor Pohang University of Science and F + 82- 54- 279- 3390
Senior Researcher, Neutron Beam P. OBox 105 Yusung Taejon 305- 600Application, ~~~Korea
54 Korea NS Mr. SEONG Baek Seok Krea Atomic Energy Research Instute T + 82- 42- 868- 8442(KoraAtomIc nryRsac)ntt F* +832-42- 868- 8448
_ _ _ _ ; ~~~~~~~~~~~~~~~~~~bsseong~kaefire.kr_ P. O.Box 105 Yusung Taejon 305- 600
Senior Researcher, Neutron Beam Korea55 Korea NS Mr. HAN Young Soo Application, HANARO Center, Korea T. - 82- 42- 868- 8441
Atomic Energy Research Institute (KAERI) F. + 82- 42- 868- 8448
P. O.Box 105 Yusung Taejon 305- 600Senior Researcher, Neutron Beam Korea
56 Korea NS Mr. CHOI Young Nam Application, HANARO Center, Korea T + 82- 42- 868- 8439Atomic Energy Research Ins tute (KAERI) F: + 82- 42- 868- 8448
dragonpkaen.re.kr
P0 _Box 105 Yusung Taejon 305-600Senior Researcher, Neutron Beam Korea
57 Korea NS Mr. LEE Jeong Soo Application, HANARO Center, Korea T + 82- 42- 868- 8435Atomic Energy Research Institute (KAERI) F .+ 82- 42- 868- 8448I_______________________________ Jsiee3 Dkaeni.re.kr
P. O.Box 105 Yusung Taejon 305- 600Senior Researcher, Neutron Beam Korea
58 Korea NS Mr. SHIM Hae Seop Application, HANARO Center, Korea T: + 82- 42- 868- 8437Atomic Energy Research institute (KAERI) F: + 82- 42- 868- 8448
i _________ _____I hsshim tDkaeri.rekrP.O.Box 105 Yusung TaeJon 305- 600
Post Doctor, Neutron Beam Application, Korea59 Korea NS Dr. KIM Shin Ae HANARO Center, Korea Atomic Energy T. + 82- 42- 868- 8438
Research Institute (KAERI) F: + 82- 42- 868- 8448I _________ I___________________________ ___ _____________________ _ ex-sakim ~ kaeti.re.kr
P.O.Box 105 Yusung Taejon 305- 600Post Doctor, Neutron Beam Application, Korea
60 Korea NS Mr. NAM Ki Young HANARO Center, Korea Atomic Energy T: + 82- 42- 868- 8439Research Institute (KAERI) PF + 82- 42- 868- 8448
___________ __________________________ _ Iex-nam k kaet.re.kr
Field: NS -NeutronScattering, NAA - Neutron Activation Analysis, BNCT - Research Reactor Utiliztion(BNCT), M-Management.
- 397 -