Tercera clase Est
21
MARCA fi hi Fi Hi Hp 2 11.11% 2 11.11% Toshiba 3 16.67% 5 27.78% Dell 4 22.22% 9 50.00% Compaq 8 44.44% 17 94.44% Acer 1 5.56% 18 100.00% total 18 100.00% MARCA Nro de Lapto % HP 2 11.11% TOSHIBA 3 16.67% DELL 4 22.22% COMPAQ 8 44.44% HACER 1 5.56% TOTAL 18 100.00% Fuente: Almacen tienda Herdtech Solution S.A 19 20 23 Edad fi hi 20 18 3 25.00% 18 19 1 8.33% 20 20 4 33.33% las laptops que quedan en stok de la tienda Hardtech solucion S.A
Transcript of Tercera clase Est

MARCA fi hi Fi HiHp 2 11.11% 2 11.11%
Toshiba 3 16.67% 5 27.78%Dell 4 22.22% 9 50.00%
Compaq 8 44.44% 17 94.44%Acer 1 5.56% 18 100.00%total 18 100.00%
MARCA Nro de Lapto%HP 2 11.11%TOSHIBA 3 16.67%DELL 4 22.22%COMPAQ 8 44.44%HACER 1 5.56%TOTAL 18 100.00%Fuente: Almacen tienda Herdtech Solution S.A
192023 Edad fi hi20 18 3 25.00%18 19 1 8.33%20 20 4 33.33%
Tabla Nro 1: Distribucion de frecuencia de las laptops que quedan en stok de la tienda
Hardtech solucion S.A

25 23 2 16.67%18 25 2 16.67%18 Total 12 100.00%202523
59 45 46 76 6683 71 53 63 8361 49 56 69 7055 64 59 57 5154 45 60 66 4258 65 47 66 5254 48 53 73 4656 62 55 64 6778 89 56 68 6064 66 63 45 6541 75 73 61 53
Pesos Alumnos41 47 948 54 1155 61 1762 68 1569 75 776 82 383 89 3
65
41 48 55 62 69 76 83 024681012141618
41 - 4748 - 5455 - 6162 - 6869 - 7576 - 8283 - 89

Practica
Ejercicio 1
4.8 5.2 7.6 5.73.7 7.3 6.7 7.75.4 9.3 10 7.3
1- Valor Maximo = 10 Valor Minim 3.7 2- R = Vmx-Vmn= 6.3 3- K= 5.90699681 6 4- A = R/K 1.05 1.1
Ganancias tiendas3.7 4.7 24.8 5.8 45.9 6.9 47 8 98.1 9.1 79.2 10.2 4
30
41 48 55 62 69 76 83 024681012141618
41 - 4748 - 5455 - 6162 - 6869 - 7576 - 8283 - 89
3,7 - 4,7
4,8 - 5,8
5,9 - 6,9
7 - 8 8,1 - 9,1
9,2 - 10,2
012345678910
3,7 - 4,74,8 - 5,85,9 - 6,97 - 88,1 - 9,19,2 - 10,2

Ejercicio 2
96 171 202 178157 185 90 116141 149 206 18595 163 206 185108 119 150 154
1- Valor maximo = 213 Valor minimo = 822- Rango = 1313- K = 1 +3,322*log(50)6.643978354 74- A = R/K 18.71428571 19
Costo Departamento82 100 4101 119 7120 138 8139 157 12158 176 8177 195 6196 214 5
50
3,7 - 4,7
4,8 - 5,8
5,9 - 6,9
7 - 8 8,1 - 9,1
9,2 - 10,2
012345678910
3,7 - 4,74,8 - 5,85,9 - 6,97 - 88,1 - 9,19,2 - 10,2
82 - 100
101 - 119
120 - 138
139 - 157
158 - 176
177 - 195
196 - 214
0
2
4
6
8
10
12
14
82 - 100101 - 119120 - 138139 - 157158 - 176177 - 195196 - 214

Ejercicio 3
Marca Marca fiAiwa Aiwa 2Yamaha Yamaha 3Panasonic Panasonic 2Panasonic Sony 4Sony Sharp 1Sharp 12SonyYamahaAiwaYamahaSonySony
Ejercicio 4
82 - 100
101 - 119
120 - 138
139 - 157
158 - 176
177 - 195
196 - 214
0
2
4
6
8
10
12
14
82 - 100101 - 119120 - 138139 - 157158 - 176177 - 195196 - 214
17%
25%
17%
33%
8%
Chart TitleAiwa Yamaha Panasonic Sony Sharp
si LL if

Fi hi160 – 170 12 12 0.15170 – 180 48 60 0.6180 – 190 10 70 0.125190 – 200 6 76 0.075200 – 210 4 80 0.05
80 1
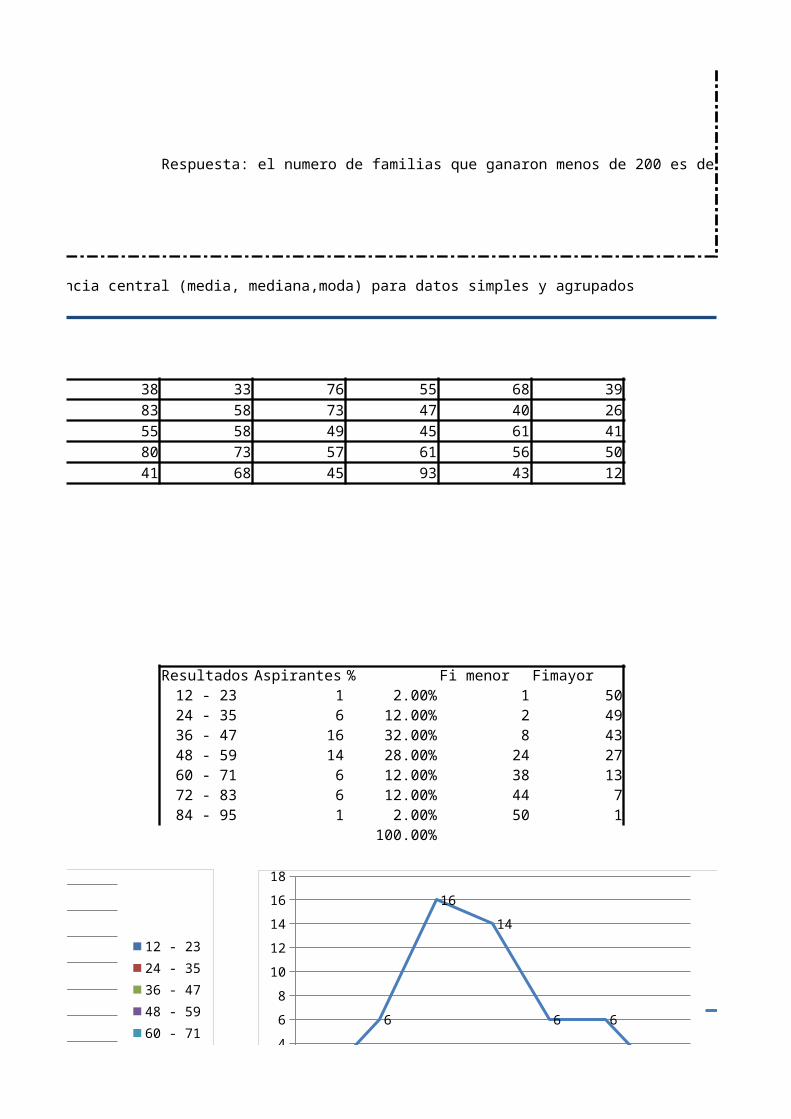
Tarea : Medidas descriptivas: Medidas de tendencia central (media, mediana,moda) para datos simples y agrupados
Ejercicio 5
77 44 49 3329 41 45 3234 47 66 5354 50 51 6638 45 51 44
1- Valor Maximo 932- Valor minimo 123- Rango 814- K 6.6439783545- A A= R/k 12.19149065
Resultados Aspirantes12 23 124 35 636 47 1648 59 1460 71 672 83 684 95 1
50
12 - 23 24 - 35 36 - 47 48 - 59 60 - 71 72 - 83 84 - 95024681012141618
12 - 2324 - 3536 - 4748 - 5960 - 7172 - 8384 - 95
si LL if

12 - 23 24 - 35 36 - 47 48 - 59 60 - 71 72 - 83 84 - 95024681012141618
12 - 2324 - 3536 - 4748 - 5960 - 7172 - 8384 - 95
12 - 23 24 - 35 36 - 47 48 - 59 60 - 71 72 - 83 84 - 950
10
20
30
40
50
60
1 28
24
3844
50
Column K

11%17%
22%
44%
6%
Chart TitleHp Toshiba Dell Compaq Acer
Hp Toshiba Dell Compaq Acer
11.11%16.67%
22.22%
44.44%
5.56%
Chart TitleColumn D
1 2 3 4 5
3
1
4
2 2
Chart TitleColumn E

53 1- Valor maximo= 8959 Valor minimo= 4147 2- Rango= Vmx-Vmn= 4882 3- K = 7.02 7 K=1+3.322*lg(n)60 4- A= 6.86 7 A=R/K56
73635456
5.90699681
Pesos Alumnos % Fi menor Fi mayor Hi41 - 47 9 13.85% 9 6548 - 54 11 16.92% 20 5655 - 61 17 26.15% 37 4562 - 68 15 23.08% 52 2869 - 75 7 10.77% 59 1376 - 82 3 4.62% 62 683 - 89 3 4.62% 65 3
65 100.00%
1 2 3 4 5
3
1
4
2 2
Chart TitleColumn E
41 48 55 62 69 76 83 024681012141618
41 - 4748 - 5455 - 6162 - 6869 - 7576 - 8283 - 89
41 - 47
48 - 54
55 - 61
62 - 68
69 - 75
76 - 82
83 - 89
0
10
20
30
40
50
60
70
Column J

6.2 6.6 7.5 8 9 7.78.2 9.2 8.3 7.3 8.2 6.58.2 9.7 8.4 4.7 7.4 8.3
Ganancias tiendas % Fi menor Fi mayor3,7 - 4,7 2 6.67% 2 304,8 - 5,8 4 13.33% 6 285,9 - 6,9 4 13.33% 10 24 7 - 8 9 30.00% 19 208,1 - 9,1 7 23.33% 26 119,2 - 10,2 4 13.33% 30 4
30 100.00%
El 30 % de las tiendas obtuvieron ganancias entre 7 y 8 %El 6,67% de las tiendas obtuivieron ganancias entre 3,7 y 4,7
41 48 55 62 69 76 83 024681012141618
41 - 4748 - 5455 - 6162 - 6869 - 7576 - 8283 - 89
41 - 47
48 - 54
55 - 61
62 - 68
69 - 75
76 - 82
83 - 89
0
10
20
30
40
50
60
70
Column J
3,7 - 4,7
4,8 - 5,8
5,9 - 6,9
7 - 8 8,1 - 9,1
9,2 - 10,2
012345678910
3,7 - 4,74,8 - 5,85,9 - 6,97 - 88,1 - 9,19,2 - 10,2

147 102 153 197 127 82172 111 148 213 130 165123 128 144 168 109 167130 143 187 166 139 149114 135 191 137 129 158
12 Departamentos pagaron en energia entre 139 y 1574 Departamentos pagaron en energia entre 82 y 100
Ganancias Departamento % Fi menor Fi mayor82 - 100 4 8.00% 4 50101 - 119 7 14.00% 11 46120 - 138 8 16.00% 19 39139 - 157 12 24.00% 31 31158 - 176 8 16.00% 39 19177 - 195 6 12.00% 45 11196 - 214 5 10.00% 50 5
100.00%
3,7 - 4,7
4,8 - 5,8
5,9 - 6,9
7 - 8 8,1 - 9,1
9,2 - 10,2
012345678910
3,7 - 4,74,8 - 5,85,9 - 6,97 - 88,1 - 9,19,2 - 10,2
82 - 100
101 - 119
120 - 138
139 - 157
158 - 176
177 - 195
196 - 214
0
10
20
30
40
50
60
411
19
31
3945
50
Column K
82 - 100
101 - 119
120 - 138
139 - 157
158 - 176
177 - 195
196 - 214
0
2
4
6
8
10
12
14
82 - 100101 - 119120 - 138139 - 157158 - 176177 - 195196 - 214

hi Fi Hi16.67% 2 16.67%25.00% 5 41.67%16.67% 7 58.33%33.33% 11 91.67%8.33% 12 100.00%
100.00%
La marca que tiene mayor porcentaje es Sony
82 - 100
101 - 119
120 - 138
139 - 157
158 - 176
177 - 195
196 - 214
0
10
20
30
40
50
60
411
19
31
3945
50
Column K
82 - 100
101 - 119
120 - 138
139 - 157
158 - 176
177 - 195
196 - 214
0
2
4
6
8
10
12
14
82 - 100101 - 119120 - 138139 - 157158 - 176177 - 195196 - 214
17%
25%
17%
33%
8%
Chart TitleAiwa Yamaha Panasonic Sony Sharp
Respuesta: el numero de familias que ganaron menos de 200 es de 76
Tarea : Medidas descriptivas: Medidas de tendencia central (media, mediana,moda) para datos simples y agrupados
38 33 76 55 68 3983 58 73 47 40 2655 58 49 45 61 4180 73 57 61 56 5041 68 45 93 43 12
Resultados Aspirantes % Fi menor Fimayor12 - 23 1 2.00% 1 5024 - 35 6 12.00% 2 4936 - 47 16 32.00% 8 4348 - 59 14 28.00% 24 2760 - 71 6 12.00% 38 1372 - 83 6 12.00% 44 784 - 95 1 2.00% 50 1
100.00%
12 - 23 24 - 35 36 - 47 48 - 59 60 - 71 72 - 83 84 - 95024681012141618
12 - 2324 - 3536 - 4748 - 5960 - 7172 - 8384 - 95
12 - 23
24 - 35
36 - 47
48 - 59
60 - 71
72 - 83
84 - 95
024681012141618
1
6
1614
6 6
1
Column I

Interpreatacion
12 - 23 24 - 35 36 - 47 48 - 59 60 - 71 72 - 83 84 - 95024681012141618
12 - 2324 - 3536 - 4748 - 5960 - 7172 - 8384 - 95
12 - 23
24 - 35
36 - 47
48 - 59
60 - 71
72 - 83
84 - 95
024681012141618
1
6
1614
6 6
1
Column I
12 - 23 24 - 35 36 - 47 48 - 59 60 - 71 72 - 83 84 - 950
10
20
30
40
50
60
1 28
24
3844
50
Column K

1 2 3 4 5
3
1
4
2 2
Chart TitleColumn E

K=1+3.322*lg(n)
1 2 3 4 5
3
1
4
2 2
Chart TitleColumn E

El 30 % de las tiendas obtuvieron ganancias entre 7 y 8 %El 6,67% de las tiendas obtuivieron ganancias entre 3,7 y 4,7

82 - 100
101 - 119
120 - 138
139 - 157
158 - 176
177 - 195
196 - 214
0
10
20
30
40
50
60
411
19
31
3945
50
Column K

La marca que tiene mayor porcentaje es Sony
82 - 100
101 - 119
120 - 138
139 - 157
158 - 176
177 - 195
196 - 214
0
10
20
30
40
50
60
411
19
31
3945
50
Column K

Respuesta: el numero de familias que ganaron menos de 200 es de 76
12 - 23
24 - 35
36 - 47
48 - 59
60 - 71
72 - 83
84 - 95
024681012141618
1
6
1614
6 6
1
Column I

12 - 23
24 - 35
36 - 47
48 - 59
60 - 71
72 - 83
84 - 95
024681012141618
1
6
1614
6 6
1
Column I