Temporal variation of rhizodeposit-C assimilating microbial communities in a natural wetland
11
1 23 Biology and Fertility of Soils Cooperating Journal of International Society of Soil Science ISSN 0178-2762 Volume 49 Number 3 Biol Fertil Soils (2013) 49:333-341 DOI 10.1007/s00374-012-0729-7 Temporal variation of rhizodeposit-C assimilating microbial communities in a natural wetland Wajira K. Balasooriya, Dries Huygens, Karolien Denef, Dries Roobroeck, Niko E. C. Verhoest & Pascal Boeckx
Transcript of Temporal variation of rhizodeposit-C assimilating microbial communities in a natural wetland
1 23
Biology and Fertility of SoilsCooperating Journal of InternationalSociety of Soil Science ISSN 0178-2762Volume 49Number 3 Biol Fertil Soils (2013) 49:333-341DOI 10.1007/s00374-012-0729-7
Temporal variation of rhizodeposit-Cassimilating microbial communities in anatural wetland
Wajira K. Balasooriya, Dries Huygens,Karolien Denef, Dries Roobroeck, NikoE. C. Verhoest & Pascal Boeckx

1 23
Your article is protected by copyright and
all rights are held exclusively by Springer-
Verlag. This e-offprint is for personal use only
and shall not be self-archived in electronic
repositories. If you wish to self-archive your
work, please use the accepted author’s
version for posting to your own website or
your institution’s repository. You may further
deposit the accepted author’s version on a
funder’s repository at a funder’s request,
provided it is not made publicly available until
12 months after publication.
ORIGINAL PAPER
Temporal variation of rhizodeposit-C assimilating microbialcommunities in a natural wetland
Wajira K. Balasooriya & Dries Huygens & Karolien Denef &Dries Roobroeck & Niko E. C. Verhoest & Pascal Boeckx
Received: 8 May 2012 /Revised: 26 July 2012 /Accepted: 31 July 2012 /Published online: 12 August 2012# Springer-Verlag 2012
Abstract The objective of this study was to apply phos-pholipid fatty acid (PLFA)-based stable isotope probing toassess the temporal variation of active microorganisms as-sociated with rhizosphere-C flow in a natural wetland. Weapplied 13CO2 pulse labeling at three different timesthroughout the vegetation period: spring (April), early sum-mer (June), and early autumn (October). Soil redox poten-tials (Eh) at 10 cm depth ranged from moderately reduced(October) to oxidized conditions (June). Based on combinedPLFA relative abundance and 13C enrichment results, wesuggest that gram-negative bacteria play a main role inrhizodeposit-C uptake in these wetland ecosystems, espe-cially when reduced soil conditions prevail in October.Arbuscular and saprotrophic fungi also take up a significantproportion of the belowground allocated C, though mostlyin the summer period. Gram-positive bacteria showed only a
minor reliance on rhizodeposit-C throughout the year. It isconcluded that rhizodeposit-C-assimilating microbial com-munities are heterogeneous and temporal variable entitieswith groups that are capable of adapting differently to sea-sonally varying environmental conditions.
Keywords Natural wetland . Phospholipid fatty acidanalysis . Stable isotope probing . 13CO2 pulse labeling .
Rhizodeposit-C assimilation . Temperate climate
Introduction
Awetland soil is characterized by year-round seasonal fluc-tuations of the groundwater table and redox conditions,leading to a varying electron donor and acceptor availabilityfor microbial growth and functioning (Reddy and DeLaune2008). Moreover, plant controls over microbial communitiesvary as a function of time, adding an extra degree of com-plexity to microbial dynamics in wetland ecosystems(Neubauer et al. 2005). Little information exists on externaldrivers of microbial community composition in wetlandecosystems (Gutknecht et al. 2006; Jin and Kelley 2007).Moreover, previous studies mostly focused on spatial rathertemporal variations of microbial communities and are oftenperformed under laboratory or greenhouse conditions. Phos-pholipid fatty acid (PLFA) profiling of microbial communi-ty structure has indicated that hydrologic regimes and plantcontrols exert a strong influence over microbial communi-ties in wetland soils (Bossio and Scow 1995; Mentzer et al.2006). However, PLFA fingerprinting is only a measure forviable microbial abundance and does not necessarily pro-vide information on the composition of functionally activemicrobial communities. By using stable isotope probing(SIP), it is possible to trace in situ plant-fixed 13C in soilmicrobial communities (Kreuzer-Martin 2007), representing
Electronic supplementary material The online version of this article(doi:10.1007/s00374-012-0729-7) contains supplementary material,which is available to authorized users.
W. K. Balasooriya :D. Huygens (*) :D. Roobroeck : P. BoeckxIsotope Bioscience Laboratory—ISOFYS, Ghent University,Coupure Links 653,Ghent, Belgiume-mail: [email protected]
D. HuygensFaculty of Agricultural Sciences, Universidad Austral de Chile,Casilla 567,Valdivia, Chile
K. DenefNatural Resource Ecology Laboratory, Colorado State University,Fort Collins, CO, USA
N. E. C. VerhoestLaboratory of Hydrology and Water Management,Ghent University,Coupure Links 653,Ghent, Belgium
Biol Fertil Soils (2013) 49:333–341DOI 10.1007/s00374-012-0729-7
Author's personal copy

an exciting tool to identify spatio-temporal variations inmetabolically active microbial communities. Plants transfera large proportion of newly fixed C to the rhizosphere (up to40 % of the total net C assimilated by plants) (Lynch andWhipps 1990), where heterotrophic microbial communitiescompete for this universal electron donor (Butler et al. 2003;Denef et al. 2009). Rhizodeposition is known to vary greatlyamong plant species, plant development stage, environmen-tal conditions, and soil fertility (Van der Krift et al. 2001;Kuzyakov 2002). Increasing evidence suggests that rootexudates initiate and modulate the dialog between rootsand soil microbes, implicating major ecosystem processesincluding carbon storage and nutrient cycling (Badri andVivanco 2009; Cesco et al. 2012). The continuous flow ofrhizodeposit compounds thus affects, together with specificphysicochemical and biological conditions in the rhizo-sphere, microbial activity and community structure in therhizosphere soil (Sørensen 1997; Brimecombe et al. 2001;Paterson et al. 2007; Drigo et al. 2010).
The objective of this study was to determine the seasonalvariation in the structure of microbial communities active inshort-term rhizodeposit-C assimilation in a natural wetlandusing phospholipid fatty acid-based stable isotope probing(PLFA–SIP). We applied in situ 13CO2 pulse labeling at threedifferent times throughout the vegetation period—spring(April), early summer (June), and early autumn (October)—and measured 13C incorporation in microbial PLFAs 24 hlater. Significant seasonal variation in the rhizodeposit-C as-similating microbial groups was observed. Fungi had a gen-erally higher contribution to rhizodeposit-C assimilation whenoxidized soil condition occurred, while gram-negative bacte-rial PLFAwere more involved in rhizodeposit-C uptake whenflooding occurred in October. These findings have majorimplications for ecosystem dynamics as groups of soil micro-biota play a dissimilar functional role in carbon and nutrientcycling in wetland ecosystems.
Materials and methods
Study site
The study has been conducted in a wet depression located inthe northern part of the wetland nature reserve Bourgoyen-Ossemeersen (3°41′ E, 51°4′ N), Gent (Belgium). The studysite consists of a 150-m eco-hydrological study transectwhich has a flat topography (5.0–5.5 m above sea level).The vegetation of the study site consists of Caricetumgracilis (Schamin’ee et al. 1995) grassland association, aCarex acuta L.-dominated vegetation type with Ranunculusflammula L. and Galium palustre L. (Peters et al. 2009).Vegetation data of living aboveground biomass [gm−2] andleaf area index [m2m−2], being the quotient of the total
one-sided leaf area and the ground area, were measuredduring the entire year 2006 (Supplementary Table 1 ofthe “Electronic supplementary material”).
Study site, field instrumentation, and monitoring of siteconditions
At three different sampling points, one soil core (3-cmdiameter, 80-cm depth) was taken in August 2004 for soilprofile description using a soil auger. The different soilhorizons were described morphologically in terms of colorand texture. Afterwards, samples of the different soil hori-zons were collected for laboratory analyses of soil pH, soiltexture using sedimentation analyses (Gee and Bauder1986), and organic C content using the chromic acid wetoxidation method (Walkley and Black 1934).
Soil water content reflectometers (CS616, Campbell Sci-entific Ltd.), temperature probes (107 Temperature Probe,Campbell Scientific Ltd.), and platinum electrodes with areference electrode (Ag/AgCl) are permanently installed inthe three different sites at different depths for measuring thevolumetric water content (VWC) [cm3cm−3], soil tempera-ture [°C], and redox potential (Eh) [mV], respectively. Re-dox profiles were categorized as oxidized (> +400 mV),weakly reduced (+400 to +200 mV), moderately reduced(+200 to −100 mV), or strongly reduced (< −100 mV) basedon minimum and maximum values (Mansfeldt 2003). Piez-ometers were installed and equipped with divers (TD Diver,Van Essen Instruments) for groundwater depth measure-ments relative to the soil surface. Hourly data recordedduring a sampling period of 3 years (from 21 December2004 until 21 December 2007) were used in this study.
In situ 13CO2 pulse labeling procedure
Three 13CO2 pulse labeling events were conducted on April11, June 12, and October 4 of the year 2007 at threelocations along the study transect (three replicate sites).The 2007 site mowing event occurred shortly afterperforming the 13CO2 pulse labeling event in October. Thetime points were selected based on the temporal hydrolog-ical pattern and plant growth in order to represent spring,summer, and autumn, respectively. For each of the threereplicate sites, 500 ml of 13C-labeled (99 at.%) CO2 wassupplied to photosynthesizing plants (C. gracilis grasslandassociation) inside a Plexiglas chamber (30×30×30 cm)over a period of six daylight hours as described byBalasooriya et al. (2008). Chambers were placed on top ofstainless steel collars firmly inserted in the soil to a depth ofabout 10 cm. Carbon dioxide concentrations were moni-tored (EGM–4, PP systems) within the chambers duringthe 6-h pulse labeling to follow the uptake of 13CO2 byphotosynthesizing plants. Chambers were removed 24 h
334 Biol Fertil Soils (2013) 49:333–341
Author's personal copy
after the first 13CO2 injection to maximize 13CO2 uptake andallow sufficient time for 13C assimilation by microbial com-munities. Within each replicate site, three soil samples (0–10and 10–20 cm in depth) and three shoot samples were takenimmediately following the removal of the chambers. Allsamples from a replicate site were composited before anal-yses. Prior to labeling, three samples of soil and shootsamples were taken within 2-m distance to each of thechambers and composited for analysis (no replicate analysisfor control samples).
Sample preparation and δ13C analysis
Soil samples were wet-sieved (250 μm), centrifuged (3,500×g for 10 min) and freeze-dried in order to obtain a homoge-neous dry soil sample free of coarse roots and soil faunasuitable for PLFA analysis (Balasooriya et al. 2008). Thisaspect is of importance because plants contain large concen-trations of the fungal biomarker PLFA “linoleic acid”(18:2ω6,9c) (Zelles 1997). Shoot samples and separated rootswere oven-dried (24 h at 60 °C) and then ground using anultra-centrifugal mill (ZM200, Retsch, Germany). A subsam-ple of ground shoot and root samples (1.5 mg) and soilsamples (20 mg) were analyzed for %C, %N, and δ13C (‰)using an elemental analyzer (EA) (ANCA–SL, Europa PDZ,UK) coupled to an isotope ratio mass spectrometer (IRMS)(20–20, Sercon, UK). The measured 13C/12C ratios areexpressed as δ13C values (‰) vs. the international ViennaPee Dee Belemnite (VPDB) standard. The net 13C enrichment(Δδ13C, expressed as‰) of shoot, root, and soil samples wascalculated by subtracting the pre-labeling natural abundanceδ13C values from the post-labeling δ13C values.
PLFA extraction, quantification, and compound-specificδ13C analysis
The extraction, quantification, and compound-specific δ13Canalysis of PLFAs was performed as described by Balasoor-iya et al. (2008) and Denef et al. (2007). In brief, total lipidswere extracted from 6 g of soil using phosphate buffer/chloroform/methanol and separated on silica gel columns(CHROMABOND SiOH 500 mg, Macherey–Nagel, Ger-many). Neutral and glycolipids were eluted with chloroformand acetone, respectively. Phospholipids were eluted withmethanol and collected by drying under N2. Phospholipidswere subsequently transesterified by mild methanolysis(0.2 M methanolic KOH) to form volatilizable fatty acidmethyl esters (FAMEs). FAMEs were analyzed by capillarygas chromatography combustion–isotope ratio mass spec-trometry (GC–c–IRMS) (GC–C/Delta PLUS XP, ThermoScientific, Germany) via a GC/C III interface. The gaschromatograph (splitless mode and He carrier gas) wasequipped with a Chrompack CPSIL88 column (100 m×
0.25 mm i.d. × 0.2 mm, Varian, USA). The oven tempera-ture was programmed at 75 °C for 2 min., followed by aramp-up at 5 °Cmin−1 to 180 °C with a 20-min hold, and afinal ramp at 2 °Cmin−1 to 225 °C with a 20-min hold.Individual fatty acids were identified based on relative re-tention times compared to two internal standards (12:0 and19:0) which were added to the FAME extract prior to gaschromatography and cross-referenced with several stand-ards: a mixture of 37 FAMEs (37 component FAME mix,no. 47885, Supelco, USA) and a mixture of 24 bacterialFAMEs (FAME mix, no. 47080, Supelco, USA).
On average, 25 FAME peaks were detected and quantified,but only 17 PLFA components were investigated in this studyas they are recognized as biomarkers for microbial communi-ties (Zelles 1997; McKinley et al. 2005; Olsson and Johnson2005; Potthoff et al. 2006). The δ13C value of the individualPLFAs was calculated by correcting the δ13C values ofFAMEs obtained from GC–c–IRMS for the addition of themethyl group during transesterification:
d13CPLFA ¼ NPLFA þ 1½ �d13CFAME � d13CMEOH
NPLFA
where NPLFA is the number of C atoms of the PLFA compo-nent, δ13CFAME is the δ
13C value of the FAME, and δ13CMeOH
is the δ13C value of methanol (−36.7±0.4 % vs. VPDB viaEA–IRMS, n020).
PLFA parameter calculations
The abundance of individual PLFAs was calculated in ab-solute C amounts (PLFA–Ci, nmolg−1 soil) based on thePLFA-C concentrations in the liquid extracts. We used totalconcentrations of PLFAs as a measure for viable biomass.The proportion of an individual PLFA-C (PLFA-Ci ) relativeto the total PLFA-C of microbial group specific biomarkerswas calculated and expressed as molar carbon percentage(MC, %) using the following formula:
MC %ð Þ ¼ PLFA� CiPPLFA� Ci½ �
Net labeling (Δδ13C, ‰) was used as a measure forrhizosphere-C assimilation in PLFAs:
Δd13C ¼ d13Cli � d13Cui
where δ13Cli represents the δ13C (‰) of the PLFA from the
13C-labeled soil and δ13Cui represents the δ13C (‰) of thePLFA from the unlabeled soil.
13C excess in PLFAs was calculated relative to the 13Cexcess in the entire PLFA microbial community (denomi-nated relative 13C concentration, 13CCr):
Biol Fertil Soils (2013) 49:333–341 335
Author's personal copy
13CCr %ð Þ ¼ Δd13Ci �MCiPΔd13Ci �MCi½ �
Statistical analyses
Univariate statistical analyses for soil, plant, and PLFA param-eters were performed using SPSS (SPSS 16, SPSS Inc., 2007,Chicago, IL, USA) by ANOVA and a Tukey post-hoc test.Principal component analysis (PCA), available in R packagevegan (Dixon 2003), followed by a permutation test, was usedto assess the effect of time and soil depth on 13CCr. Multivar-iate statistical analyses were conducted using the R languageand environment (R Development Core Team 2009).
Results and discussion
Site characterization
Organic C content in the surface layer was on average 8.0 and3.2 % for the 0–10 and 10–20 cm soil layer, respectively(Table 1). Soil pH equaled 6.8 in both soil layers. The soiltexture of the study site is somewhat courser in the 0–10 cm(sandy clay loam, USA classification) than in the 10–20 cmsoil layer (clay; Table 1). Both plant biomass and leaf arearemained stable during the period January–April. Startingfrom April until July, a rapid increase was observed in bio-mass (from 25.0 until 746.3 gm−2) and leaf area (from 0.28m2
m−2 until 8.27 m2m−2), reaching its maximum in August(Supplementary Table 1 of the “Electronic supplementarymaterial”). Maximum increase in biomass (470.3 gm−2) andleaf area (4.9 m2m−2) was observed from May to June. FromSeptember onwards, biomass (−306.8 gm−2) and leaf area(−2.57 m2m−2) decreased due to plant senescence. Vegetationcover significantly decreased in October due to a single yearlymown event that was performed in mid-October.
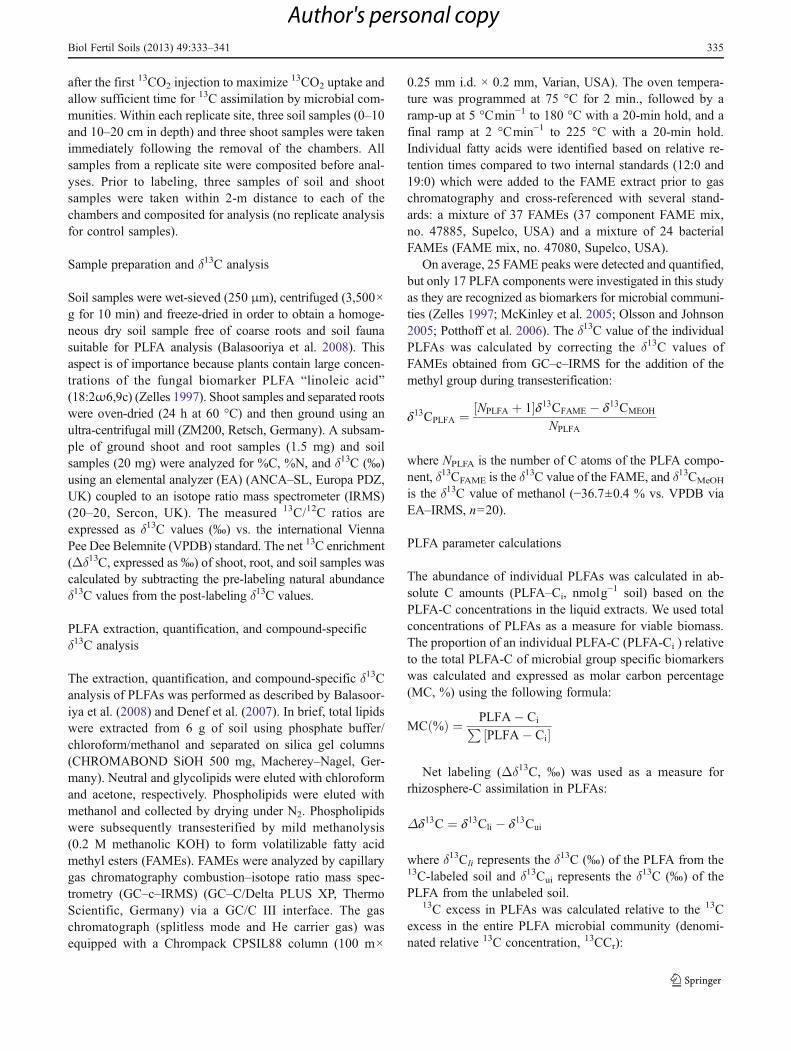
Temporal averages in groundwater level ranged between 6.1and 14.6 cm above the surface during autumn and winter,respectively, and between 7.0 and 26.6 cm below the surfaceduring spring and summer (Fig. 1a). The groundwater depthduring the three pulse labeling events for April, June, andOctober 2007 was 11.9 and 20.3 cm below the surface and8.2 cm above the surface, respectively. At 10-cm depth, VWC
equaled 0.62, 0.60, and 0.73 cm3cm−3 during the pulse labelingevents in April, June, and October, respectively (Fig. 1b). At20-cm depth, an approximately constant VWCwas maintainedthroughout the year (0.77–0.84 cm3cm−3). Soil redox potential(Eh) in the wetland displayed a seasonal pattern with generallyhigher Eh values during spring–summer and lower Eh valuesduring autumn–winter (Fig. 1c). At 10-cm soil depth, Eh variedbetween strongly reduced and oxidized conditions in spring,moderately reduced and oxidized conditions in summer, andmoderately reduced to weakly reduced conditions in autumn.At 20-cm depth, year-round Eh values fluctuated between thestrongly reduced and moderately reduced range. The Eh at10 cm during the three pulse labeling events for April, June,and October 2007 was 327 mV (weakly reduced), 452 mV(oxidized), and 11 mV (moderately reduced), respectively.
PLFA–SIP profiles
Stable isotope probing allows direct observations of sub-strate assimilation in minimally disturbed communities andthus represents an exciting tool for linking microbial identityand function (Qiu et al. 2008). Both PLFA and nucleic acidSIP techniques have been developed to target active micro-bial populations (Kreuzer-Martin 2007). PLFA offers thepossibility to separate large functional groups within theentire soil microbial community (Joergensen and Wichern2008). However, the interpretation of PLFA–SIP data iscomplex as the biomarkers are not specific to a singleorganism and some of the PLFAs are even not fully specificfor a single microbial group (Joergensen and Wichern
Table 1 Physico-chemical soil properties of the study site located atthe wetland nature reserve Bourgoyen-Ossemeersen (3°41′ E, 51°4′ N),Gent (Belgium)
Soil layer (cm) Organic C pH Sand Loam Clay(%) (−) (%) (%) (%)
0–10 8.0 6.8 55.5 19.6 25.0
10–20 3.2 6.8 19.1 25.3 55.6
Fig. 1 a The groundwater depth (GWD), b volumetric water content(VWC) at 10 cm (red), 20 cm (blue), and 30 cm (black), and c redoxpotential at 10 cm (red), 20 cm (blue), and 30 cm (black). Vertical dottedlines indicate time of pulse labeling events in April, June, and October
336 Biol Fertil Soils (2013) 49:333–341
Author's personal copy
2008). In addition, the microbial classification is only basedon previously cultivated organisms for which a PFLA profileis available (Joergensen and Wichern 2008). Therefore, com-plementary techniques targeting gene expression, such asnucleic acid SIP, are generally thought to be the most infor-mative for taxonomic purposes, particularly among closelyrelated organisms (Radajewski et al. 2000). Nevertheless,nucleic acid SIP has the inherent disadvantage of relying ona much less sensitive approach (separation by ultracentrifuga-tion) for detecting isotopic enrichment when compared toPFLA analysis using IRMS (Neufeld et al. 2007).
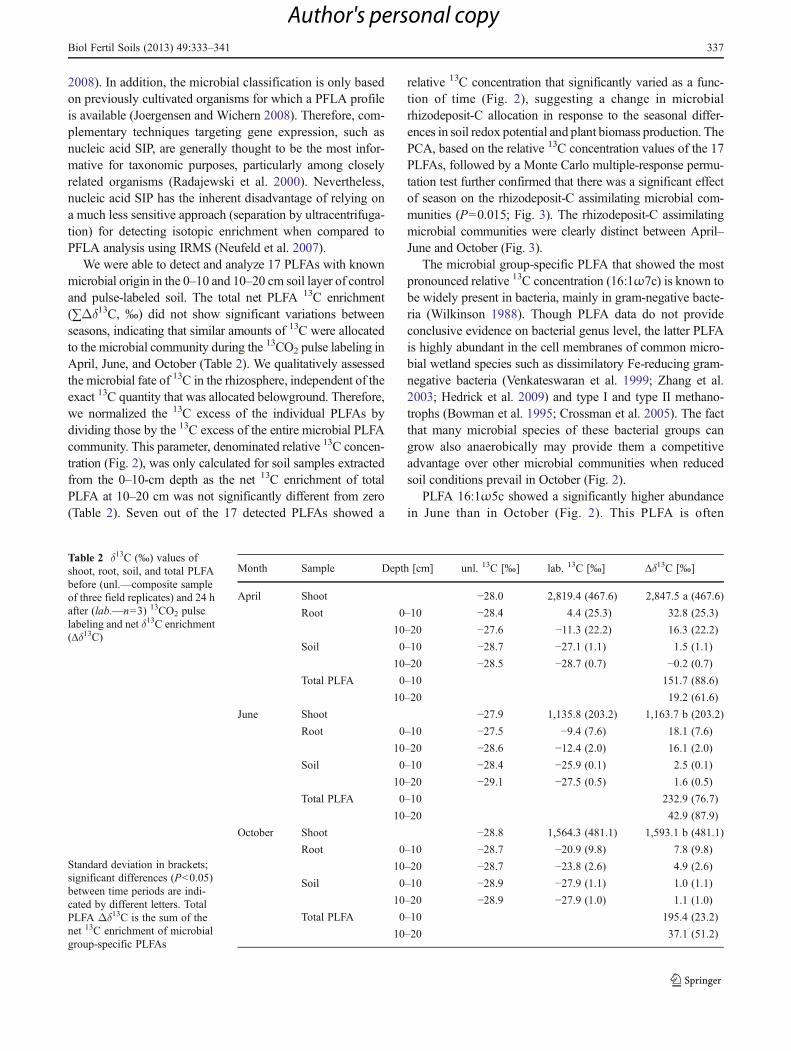
We were able to detect and analyze 17 PLFAs with knownmicrobial origin in the 0–10 and 10–20 cm soil layer of controland pulse-labeled soil. The total net PLFA 13C enrichment(∑Δδ13C, ‰) did not show significant variations betweenseasons, indicating that similar amounts of 13C were allocatedto the microbial community during the 13CO2 pulse labeling inApril, June, and October (Table 2). We qualitatively assessedthe microbial fate of 13C in the rhizosphere, independent of theexact 13C quantity that was allocated belowground. Therefore,we normalized the 13C excess of the individual PLFAs bydividing those by the 13C excess of the entire microbial PLFAcommunity. This parameter, denominated relative 13C concen-tration (Fig. 2), was only calculated for soil samples extractedfrom the 0–10-cm depth as the net 13C enrichment of totalPLFA at 10–20 cm was not significantly different from zero(Table 2). Seven out of the 17 detected PLFAs showed a
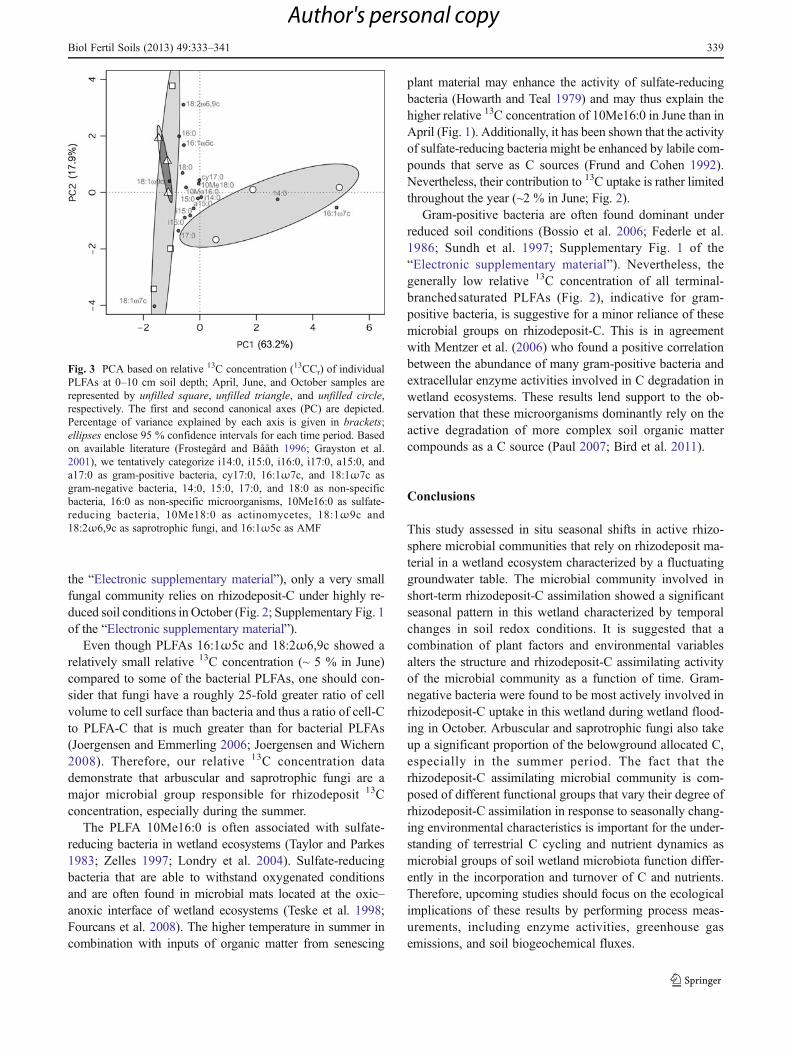
relative 13C concentration that significantly varied as a func-tion of time (Fig. 2), suggesting a change in microbialrhizodeposit-C allocation in response to the seasonal differ-ences in soil redox potential and plant biomass production. ThePCA, based on the relative 13C concentration values of the 17PLFAs, followed by a Monte Carlo multiple-response permu-tation test further confirmed that there was a significant effectof season on the rhizodeposit-C assimilating microbial com-munities (P00.015; Fig. 3). The rhizodeposit-C assimilatingmicrobial communities were clearly distinct between April–June and October (Fig. 3).
The microbial group-specific PLFA that showed the mostpronounced relative 13C concentration (16:1ω7c) is known tobe widely present in bacteria, mainly in gram-negative bacte-ria (Wilkinson 1988). Though PLFA data do not provideconclusive evidence on bacterial genus level, the latter PLFAis highly abundant in the cell membranes of common micro-bial wetland species such as dissimilatory Fe-reducing gram-negative bacteria (Venkateswaran et al. 1999; Zhang et al.2003; Hedrick et al. 2009) and type I and type II methano-trophs (Bowman et al. 1995; Crossman et al. 2005). The factthat many microbial species of these bacterial groups cangrow also anaerobically may provide them a competitiveadvantage over other microbial communities when reducedsoil conditions prevail in October (Fig. 2).
PLFA 16:1ω5c showed a significantly higher abundancein June than in October (Fig. 2). This PLFA is often
Table 2 δ13C (‰) values ofshoot, root, soil, and total PLFAbefore (unl.—composite sampleof three field replicates) and 24 hafter (lab.—n03) 13CO2 pulselabeling and net δ13C enrichment(Δδ13C)
Standard deviation in brackets;significant differences (P<0.05)between time periods are indi-cated by different letters. TotalPLFA Δδ13C is the sum of thenet 13C enrichment of microbialgroup-specific PLFAs
Month Sample Depth [cm] unl. 13C [‰] lab. 13C [‰] Δδ13C [‰]
April Shoot −28.0 2,819.4 (467.6) 2,847.5 a (467.6)
Root 0–10 −28.4 4.4 (25.3) 32.8 (25.3)
10–20 −27.6 −11.3 (22.2) 16.3 (22.2)
Soil 0–10 −28.7 −27.1 (1.1) 1.5 (1.1)
10–20 −28.5 −28.7 (0.7) −0.2 (0.7)
Total PLFA 0–10 151.7 (88.6)
10–20 19.2 (61.6)
June Shoot −27.9 1,135.8 (203.2) 1,163.7 b (203.2)
Root 0–10 −27.5 −9.4 (7.6) 18.1 (7.6)
10–20 −28.6 −12.4 (2.0) 16.1 (2.0)
Soil 0–10 −28.4 −25.9 (0.1) 2.5 (0.1)
10–20 −29.1 −27.5 (0.5) 1.6 (0.5)
Total PLFA 0–10 232.9 (76.7)
10–20 42.9 (87.9)
October Shoot −28.8 1,564.3 (481.1) 1,593.1 b (481.1)
Root 0–10 −28.7 −20.9 (9.8) 7.8 (9.8)
10–20 −28.7 −23.8 (2.6) 4.9 (2.6)
Soil 0–10 −28.9 −27.9 (1.1) 1.0 (1.1)
10–20 −28.9 −27.9 (1.0) 1.1 (1.0)
Total PLFA 0–10 195.4 (23.2)
10–20 37.1 (51.2)
Biol Fertil Soils (2013) 49:333–341 337
Author's personal copy
considered a biomarker for arbuscular mycorrhizal fungi(AMF) (Olsson 1999) but has also been found in the cellmembrane of gram-negative bacteria (Zelles 1999; Steer andHarris 2000). The dominant plant species in this ecosystem (R.flammula, Carex spp., and G. palustre) are typically associat-ed with AMF (Miller et al. 1999; Beck-Nielsen and Madsen2001; Klironomos 2003). In this study, 16:1ω5c showed thehighest relative 13C concentration in June when plant growthpeaks and soil redox potential was highest. Increased plantbiomass production concurs with an augmented plant C in-vestment in mycorrhizal fungi such as AMF (Gamper et al.2005). High AMF abundance in wetland soils during activeplant growth stages was also observed by Bohrer et al. (2004)and Welsh et al. (2010). Additionally, Miller et al. (1999)indicated that environmental characteristics, including in-creased soil moisture content, exert a negative influence onthe extent of mycorrhizal colonization of Carex spp. Theseobservations, in combination with the distinct seasonal patternof 16:1ω5c compared to other monounsaturated PLFAs char-acteristic for gram-negative bacteria (Fig. 2), suggest a dom-inant AMF origin of PLFA 16:1ω5c. This confirms theintimate physiological and physical linkage of plant and my-corrhizal fungi in wetland C dynamics (12).
The relative 13C concentration of 18:2ω6,9c, a PLFA thatis indicative for saprotrophic fungi (Zelles 1999), was signif-icantly higher in June than in October (Fig. 2). In addition,PLFA 18:1ω9c, also present in the cell membranes of sapro-trophic fungi (Waldrop and Firestone 2004), showed a higherrelative 13C concentration in April and June than in October(Fig. 2). Rhizodeposition is therefore mostly a C-source forsaprotrophic fungal communities in this wetland during sum-mer. Broeckling et al. (2008) indicated that root exudates are amajor regulator for the fungal community in aerobic soils.Rhizodeposit-C causes a positive effect on soil fungal popu-lation density, either through growth-inducing chemical sig-nals or the provision of an appropriate C substrate (Broecklinget al. 2008). Despite the fact that fungi are effective in colo-nizing nutrient-poor and recalcitrant substrates due to theirwide-ranging enzymatic capabilities (Dighton 2003; Paul2007), our data suggest that saprotrophic fungi also rely onthe more available rhizodeposit-C in wetland ecosystems. OurApril and June results are in agreement with Lu et al. (2007),who documented significant involvement of saprotrophic fun-gi in root-derived C metabolism during the early stages of riceplant growth under aerobic conditions. Albeit the high net 13Cenrichment of 18:2ω6,9c in October (Supplementary Fig. 2 of
Fig. 2 Relative 13C concentration for the PLFA biomarkers in April(white bars), June (light gray bars), and October (dark gray bars);error bars represent one standard error (n03); significant differences(least significant differences post-hoc test; dot, P<0.1; asterisk, P<0.05) over time for a certain PLFA are indicated by different letters.Based on available literature (Frostegård and Bååth 1996; Grayston et
al. 2001), we tentatively categorize i14:0, i15:0, i16:0, i17:0, a15:0,and a17:0 as gram-positive bacteria, cy17:0, 16:1ω7c, and 18:1ω7c asgram-negative bacteria, 14:0, 15:0, 17:0, and 18:0 as non-specificbacteria, 16:0 as non-specific microorganisms, 10Me16:0 as sulfate-reducing bacteria, 10Me18:0 as actinomycetes, 18:1ω9c and18:2ω6,9c as saprotrophic fungi, and 16:1ω5c as AMF
338 Biol Fertil Soils (2013) 49:333–341
Author's personal copy
the “Electronic supplementary material”), only a very smallfungal community relies on rhizodeposit-C under highly re-duced soil conditions in October (Fig. 2; Supplementary Fig. 1of the “Electronic supplementary material”).
Even though PLFAs 16:1ω5c and 18:2ω6,9c showed arelatively small relative 13C concentration (~ 5 % in June)compared to some of the bacterial PLFAs, one should con-sider that fungi have a roughly 25-fold greater ratio of cellvolume to cell surface than bacteria and thus a ratio of cell-Cto PLFA-C that is much greater than for bacterial PLFAs(Joergensen and Emmerling 2006; Joergensen and Wichern2008). Therefore, our relative 13C concentration datademonstrate that arbuscular and saprotrophic fungi are amajor microbial group responsible for rhizodeposit 13Cconcentration, especially during the summer.
The PLFA 10Me16:0 is often associated with sulfate-reducing bacteria in wetland ecosystems (Taylor and Parkes1983; Zelles 1997; Londry et al. 2004). Sulfate-reducingbacteria that are able to withstand oxygenated conditionsand are often found in microbial mats located at the oxic–anoxic interface of wetland ecosystems (Teske et al. 1998;Fourcans et al. 2008). The higher temperature in summer incombination with inputs of organic matter from senescing
plant material may enhance the activity of sulfate-reducingbacteria (Howarth and Teal 1979) and may thus explain thehigher relative 13C concentration of 10Me16:0 in June than inApril (Fig. 1). Additionally, it has been shown that the activityof sulfate-reducing bacteria might be enhanced by labile com-pounds that serve as C sources (Frund and Cohen 1992).Nevertheless, their contribution to 13C uptake is rather limitedthroughout the year (~2 % in June; Fig. 2).
Gram-positive bacteria are often found dominant underreduced soil conditions (Bossio et al. 2006; Federle et al.1986; Sundh et al. 1997; Supplementary Fig. 1 of the“Electronic supplementary material”). Nevertheless, thegenerally low relative 13C concentration of all terminal-branchedsaturated PLFAs (Fig. 2), indicative for gram-positive bacteria, is suggestive for a minor reliance of thesemicrobial groups on rhizodeposit-C. This is in agreementwith Mentzer et al. (2006) who found a positive correlationbetween the abundance of many gram-positive bacteria andextracellular enzyme activities involved in C degradation inwetland ecosystems. These results lend support to the ob-servation that these microorganisms dominantly rely on theactive degradation of more complex soil organic mattercompounds as a C source (Paul 2007; Bird et al. 2011).
Conclusions
This study assessed in situ seasonal shifts in active rhizo-sphere microbial communities that rely on rhizodeposit ma-terial in a wetland ecosystem characterized by a fluctuatinggroundwater table. The microbial community involved inshort-term rhizodeposit-C assimilation showed a significantseasonal pattern in this wetland characterized by temporalchanges in soil redox conditions. It is suggested that acombination of plant factors and environmental variablesalters the structure and rhizodeposit-C assimilating activityof the microbial community as a function of time. Gram-negative bacteria were found to be most actively involved inrhizodeposit-C uptake in this wetland during wetland flood-ing in October. Arbuscular and saprotrophic fungi also takeup a significant proportion of the belowground allocated C,especially in the summer period. The fact that therhizodeposit-C assimilating microbial community is com-posed of different functional groups that vary their degree ofrhizodeposit-C assimilation in response to seasonally chang-ing environmental characteristics is important for the under-standing of terrestrial C cycling and nutrient dynamics asmicrobial groups of soil wetland microbiota function differ-ently in the incorporation and turnover of C and nutrients.Therefore, upcoming studies should focus on the ecologicalimplications of these results by performing process meas-urements, including enzyme activities, greenhouse gasemissions, and soil biogeochemical fluxes.
Fig. 3 PCA based on relative 13C concentration (13CCr) of individualPLFAs at 0–10 cm soil depth; April, June, and October samples arerepresented by unfilled square, unfilled triangle, and unfilled circle,respectively. The first and second canonical axes (PC) are depicted.Percentage of variance explained by each axis is given in brackets;ellipses enclose 95 % confidence intervals for each time period. Basedon available literature (Frostegård and Bååth 1996; Grayston et al.2001), we tentatively categorize i14:0, i15:0, i16:0, i17:0, a15:0, anda17:0 as gram-positive bacteria, cy17:0, 16:1ω7c, and 18:1ω7c asgram-negative bacteria, 14:0, 15:0, 17:0, and 18:0 as non-specificbacteria, 16:0 as non-specific microorganisms, 10Me16:0 as sulfate-reducing bacteria, 10Me18:0 as actinomycetes, 18:1ω9c and18:2ω6,9c as saprotrophic fungi, and 16:1ω5c as AMF
Biol Fertil Soils (2013) 49:333–341 339
Author's personal copy

Acknowledgments This study was funded by the special researchfund (BOF) of the Ghent University. Dries Huygens is a postdoctoralfellow of the Fund for Scientific Research—Flanders (FWO).
References
Badri DV, Vivanco JM (2009) Regulation and function of rootexudates. Plant Cell Environ 32:666–681. doi:10.1111/j.1365-3040.2009.01926.x
Balasooriya WK, Denef K, Peters J, Verhoest NEC, Boeckx P (2008)Vegetation composition and soil microbial community structuralchanges along a wetland hydrological gradient. Hydrol Earth SystSci 12:277–291
Beck-Nielsen D, Madsen TV (2001) Occurrence of vesicular–arbus-cular mycorrhiza in aquatic macrophytes from lakes and streams.Aquat Bot 71:141–148
Bird JA, Herman DJ, Firestone MK (2011) Rhizosphere priming of soilorganic matter by bacterial groups in a grassland soil. Soil BiolBiochem 43:718–725. doi:10.1016/j.soilbio.2010.08.010
Bohrer KE, Friese CF, Amon JP (2004) Seasonal dynamics of arbus-cular mycorrhizal fungi in differing wetland habitats. Mycorrhiza14:329–337. doi:10.1007/s00572-004-0292-7
Bossio DA, Fleck JA, Scow KM, Fujii R (2006) Alteration of soilmicrobial communities and water quality in restored wetlands. SoilBiol Biochem 38:1223–1233. doi:10.1016/j.soilbio.2005.09.027
Bossio DA, Scow KM (1995) Impact of carbon and flooding on themetabolic diversity of microbial communities in soils. Appl En-viron Microbiol 61:4043–4050
Bowman JP, Sly LI, Stackebrandt E (1995) The phylogenetic positionof the family Methylococcaceae. Int J Syst Bacteriol 45:182–185
Brimecombe MJ, De Leij F, Lynch JM (2001) Nematode communitystructure as a sensitive indicator of microbial perturbations in-duced by a genetically modified Pseudomonas fluorescens strain.Biol Fertil Soils 34:270–275
Broeckling CD, Broz AK, Bergelson J, Manter DK, Vivanco JM(2008) Root exudates regulate soil fungal community composi-tion and diversity. Appl Environ Microbiol 74:738–744.doi:10.1128/aem.02188-07
Butler JL, Williams MA, Bottomley PJ, Myrold DD (2003) Microbialcommunity dynamics associated with rhizosphere carbon flow. ApplEnviron Microbiol 69:6793–6800. doi:10.1128/aem.69.11.6793-6800.2003
Cesco S, Mimmo T, Tonon G, Tomasi N, Pinton R, Terzano R,Neumann G, Weisskopf L, Renella G, Landi L, Nannipieri P(2012) Plant-borne flavonoids released into the rhizosphere: im-pact on soil bio-activities related to plant nutrition. A review. BiolFertil Soils 48:123–149. doi:10.1007/s00374-011-0653-2
Crossman ZM, Ineson P, Evershed RP (2005) The use of 13C labellingof bacterial lipids in the characterisation of ambient methane-oxidising bacteria in soils. Org Geochem 36:769–778.doi:10.1016/j.orggeochem.2004.12.005
Denef K, Bubenheim H, Lenhart K, Vermeulen J, Van Cleemput O,Boeckx P, Muller C (2007) Community shifts and carbon trans-location within metabolically-active rhizosphere microorganismsin grasslands under elevated CO2. Biogeosciences 4:769–779.doi:10.5194/bgd-4-1437-2007
Denef K, Roobroeck D, Manimel Wadu MCW, Lootens P, Boeckx P(2009) Microbial community composition and rhizodeposit-carbonassimilation in differently managed temperate grassland soils. SoilBiol Biochem 41:144–153. doi:10.1016/j.soilbio.2008.10.008
Dighton J (2003) Fungi in ecosystem processes. Marcel Dekker, NewYork
Dixon P (2003) VEGAN, a package of R functions for communityecology. J Veg Sci 14:927–930
Drigo B, Pijl AS, Duyts H, Kielak A, Gamper HA, Houtekamer MJ,Boschker HTS, Bodelier PLE, Whiteley AS, van Veen JA,Kowalchuk GA (2010) Shifting carbon flow from roots intoassociated microbial communities in response to elevated atmo-spheric CO2. Proc Natl Acad Sci USA 107:10938–10942.doi:10.1073/pnas.0912421107
Federle TW, Dobbins DC, Thorntonmanning JR, Jones DD (1986)Microbial biomass, activity, and community structure in subsur-face soils. Ground Water 24:365–374
Fourcans A, Ranchou-Peyruse A, Caumette P, Duran R (2008) Molec-ular analysis of the spatio-temporal distribution of sulfate-reducing bacteria (SRB) in Camargue (France) hypersaline mi-crobial mat. Microb Ecol 56:90–100. doi:10.1007/s00248-007-9327-x
Frostegård A, Bååth E (1996) The use of phospholipid fatty acidanalysis to estimate bacterial and fungal biomass in soil. BiolFertil Soils 22:59–65. doi:10.1007/BF00384433
Frund C, Cohen Y (1992) Diurnal cycles of sulfate reduction underoxic conditions in cyanobacterial mats. Appl Environ Microbiol58:70–77
Gamper H, Hartwig UA, Leuchtmann A (2005) Mycorrhizas improvenitrogen nutrition of Trifolium repens after 8 yr of selection underelevated atmospheric CO2 partial pressure. New Phytol 167:531–542. doi:10.1111/j.1469-8137.2005.01440.x
Gee GW, Bauder JW (1986) Particle-size analysis. In: Klute A (ed)Methods of soil analysis, part 1. Physical and mineralogicalmethods, 2nd edn. American Society of Agronomy, Soil ScienceSociety of America, Madison, pp 383–411
Grayston SJ, Griffith GS, Mawdsley JL, Campbell CD, Bardgett RD(2001) Accounting for variability in soil microbial communitiesof temperate upland grassland ecosystems. Soil Biol Biochem33:533–551. doi:10.1016/S0038-0717(00)00194-2
Gutknecht JLM, Goodman RM, Balser TC (2006) Linking soil processand microbial ecology in freshwater wetland ecosystems. PlantSoil 289:17–34. doi:10.1007/s11104-006-9105-4
Hedrick DB, Peacock AD, Lovley DR, Woodard TL, Nevin KP, LongPE, White DC (2009) Polar lipid fatty acids, LPS-hydroxy fattyacids, and respiratory quinones of three Geobacter strains, andvariation with electron acceptor. J Ind Microbiol Biotechnol36:205–209. doi:10.1007/s10295-008-0486-7
Howarth RW, Teal JM (1979) Sulfate reduction in a New England saltmarsh. Limnol Oceanogr 24:999–1013
Jin G, Kelley TR (2007) Characterization of microbial communities ina pilot-scale constructed wetland using PLFA and PCR–DGGEanalyses. J Environ Sci Health Part A-Toxic/Hazard Subst Envi-ron Eng 42:1639–1647. doi:10.1080/10934520701518125
Joergensen RG, Emmerling C (2006) Methods for evaluating humanimpact on soil microorganisms based on their activity, biomass,and diversity in agricultural soils. J Plant Nutr Soil Sci 169:295–309. doi:10.1002/jpln.200521941
Joergensen RG, Wichern F (2008) Quantitative assessment of thefungal contribution to microbial tissue in soil. Soil Biol Biochem40:2977–2991
Klironomos JN (2003) Variation in plant response to native and exoticarbuscular mycorrhizal fungi. Ecology 84:2292–2301
Kreuzer-Martin HW (2007) Stable isotope probing: linking functionalactivity to specific members of microbial communities. Soil SciSoc Am J 71:611–619. doi:10.2136/sssaj2006.0093
Kuzyakov Y (2002) Review: factors affecting rhizopshere primingeffects. J Plant Nutr Soil Sci 165:382–396
Londry KL, Jahnke LL, Marais DJD (2004) Stable carbon isotoperatios of lipid biomarkers of sulfate-reducing bacteria. Appl En-viron Microbiol 70:745–751. doi:10.1128/aem.70.2.745-751.2004
Lu YH, Abraham WR, Conrad R (2007) Spatial variation of activemicrobiota in the rice rhizosphere revealed by in situ stable
340 Biol Fertil Soils (2013) 49:333–341
Author's personal copy
isotope probing of phospholipid fatty acids. Environ Microbiol9:474–481. doi:10.1111/j.1462-2920.2006.01164.x
Lynch JM, Whipps JM (1990) Substrate flow in the rhizosphere. PlantSoil 129:1–10
Mansfeldt T (2003) In situ long-term redox potential measurements ina dyked marsh soil. J Plant Nutr Soil Sci 166:210–219
McKinley VL, Peacock AD, White DC (2005) Microbial communityPLFA and PHB responses to ecosystem restoration in tallgrassprairie soils. Soil Biol Biochem 37:1946–1958. doi:10.1016/j.soilbio.2005.02.033
Mentzer JL, Goodman RM, Balser TC (2006) Microbial response overtime to hydrologic and fertilization treatments in a simulated wetprairie. Plant Soil 284:85–100. doi:10.1007/s11104-006-0032-1
Miller RM, Smith CJ, Jastrow JD, Bever JD (1999) Mycorrhizal statusof the genus Carex (Cyperaceae). Am J Bot 86:547–553
Neubauer SC, Givler K, Valentine SK, Megonigal JP (2005) Seasonalpatterns and plant-mediated controls of subsurface wetland bio-geochemistry. Ecology 86:3334–3344
Neufeld JD, Vohra J, Dumont MG, Lueders T, Manefield M, FriedrichMW, Murrell JC (2007) DNA stable-isotope probing. NatureProtoc 2:860–866. doi:10.1038/nprot.2007.109
Olsson PA (1999) Signature fatty acids provide tools for determinationof the distribution and interactions of mycorrhizal fungi in soil.FEMS Microb Ecol 29:303–310
Olsson PA, Johnson NC (2005) Tracking carbon from the atmosphereto the rhizosphere. Ecol Lett 8:1264–1270. doi:10.1111/j.1461-0248.2005.00831.x
Paterson E, Gebbing T, Abel C, Sim A, Telfer G (2007) Rhizodeposi-tion shapes rhizosphere microbial community structure in organicsoil. New Phytol 173:600–610
Paul EA (2007) Soil microbiology, ecology and biochemistry, 3rd edn.Academic, Amsterdam
Peters J, Samson R, Boeckx P, Balasooriya WK, Verhoest NEC (2009)Hydrological and vegetation analysis of an alluvial floodplain inBelgium. Belg J Bot 142:19–38
Potthoff M, Steenwerth KL, Jackson LE, Drenovsky RE, Scow KM,Joergensen RG (2006) Soil microbial community composition asaffected by restoration practices in California grassland. Soil BiolBiochem 38:1851–1860. doi:10.1016/j.soilbio.2005.12.009
Qiu QF, Noll M, Abraham WR, Lu YH, Conrad R (2008) Applyingstable isotope probing of phospholipid fatty acids and rRNA in aChinese rice field to study activity and composition of the meth-anotrophic bacterial communities in situ. ISME J 2:602–614.doi:10.1038/ismej.2008.34
R Development Core Team (2009) R: a language and environment forstatistical computing. R Foundation for Statistical Computing, Vienna
Radajewski S, Ineson P, Parekh NR, Murrell JC (2000) Stable-isotopeprobing as a tool in microbial ecology. Nature 403:646–649
Reddy K, DeLaune RD (2008) Biogeochemistry of wetlands: scienceand applications. CRC, Boca Raton
Schamin’ee JHJ, Stortelder AHF, Westhoff V (1995) De vegetatie vanNederland: Deel 2: Plantengemeenschappen van wateren, moer-assen en natte heiden. Opulus, Uppsala
Sørensen J (1997) The rhizosphere as a habitat for soil microorgan-isms. In: van Elsas JD, Trevors JT, Wellington AMK (eds) Mod-ern soil microbiology. Marcel Dekker, New York, pp 21–45
Steer J, Harris JA (2000) Shifts in the microbial community in rhizo-sphere and non-rhizoshere soils during the growth of Agrostisstolobifera. Soil Biol Biochem 32:869–878
Sundh I, Nilsson M, Borga P (1997) Variation in microbial communitystructure in two boreal peatlands as determined by analysis ofphospholipid fatty acid profiles. Appl Environ Microbiol63:1476–1482
Taylor J, Parkes RJ (1983) The cellular fatty acids of the sulphate-reducing bacteria, Desulfobacter sp., Desulfobulbus sp. andDesulfovibrio desulfuricans. J Gen Microbiol 129:3303–3309
Teske A, Ramsing NB, Habicht K, Fukui M, Kuver J, Jorgensen BB,Cohen Y (1998) Sulfate-reducing bacteria and their activities incyanobacterial mats of Solar Lake (Sinai, Egypt). Appl EnvironMicrobiol 64:2943–2951
Van der Krift TAJ, Kuikman PJ, Moller F, Berendse F (2001) Plantspecies and nutritional-mediated control over rhizodeposition androot decomposition. Plant Soil 228:191–200
Venkateswaran K, Moser DP, Dollhopf ME, Lies DP, Saffarini DA,MacGregor BJ, Ringelberg DB, White DC, Nishijima M, Sano H,Burghardt J, Stackebrandt E, Nealson KH (1999) Polyphasictaxonomy of the genus Shewanella and description of Shewanellaoneidensis sp. nov. Int J Syst Bacteriol 49:705–724
Waldrop MP, Firestone MK (2004) Microbial community utilization ofrecalcitrant and simple carbon compounds: impact of oak-woodlandplant communities. Oecologia 138:275–284. doi:10.1007/s00442-003-1419-9
Walkley A, Black IA (1934) An examination of Degtjareff method fordetermining soil organic matter, and a proposed modification ofthe chromic acid titration method. Soil Sci 37:29–38
Welsh AK, Burke DJ, Hamerlynck EP, Hahn D (2010) Seasonalanalyses of arbuscular mycorrhizae, nitrogen-fixing bacteria andgrowth performance of the salt marsh grass Spartina patens. PlantSoil 330:251–266. doi:10.1007/s11104-009-0197-5
Wilkinson SG (1988) Gram-negative bacteria. In: Ratledge C, WilkinsonSG (eds) Microbial lipids. Academic, London, pp 299–488
Zelles L (1997) Phospholipid fatty acid profiles in selected members ofsoil microbial communities. Chemosphere 35:275–294
Zelles L (1999) Fatty acid patterns of phospholipids and lipopolysac-charides in the characterisation of microbial communities in soil:a review. Biol Fertil Soils 29:111–129
Zhang CLL, Li YL, Ye Q, Fong J, Peacock AD, Blunt E, Fang JS,Lovley DR, White DC (2003) Carbon isotope signatures of fattyacids in Geobacter metallireducens and Shewanella algae. ChemGeol 195:17–28. doi:10.1016/s0009-2541(02)00386-8
Biol Fertil Soils (2013) 49:333–341 341
Author's personal copy