Temporal dynamics of prokaryotic communities in the
16
Temporal dynamics of prokaryotic communities in the marine sponge Sarcotragus spinosulus CRISTIANE C. P. HARDOIM and RODRIGO COSTA Microbial Ecology and Evolution Research Group, Centre of Marine Sciences (CCMar), University of Algarve (UAlg), Gambelas, 8005-139 Faro, Portugal Abstract In spite of their putative relevance to host functioning, in-depth knowledge of sponge microbiome stability over time is scarce. This study tackles the temporal maintenance of bacterial and archaeal assemblages in the model host Sarcotragus spinosulus along three successive years. Prokaryotic communities were profiled by polymerase chain reaction-denaturing gradient gel electrophoresis (PCR-DGGE) and 454-pyrosequencing of S. spinosulus-derived 16S rRNA gene amplicons. Prevailing bacterial phyla were Actinobacteria, Acidobacteria, Proteobacteria, Poribacteria, PAUC34f, Chloroflexi and Bacteroidetes, with Bacteroidetes, Chloroflexi and Poribacteria showing different abun- dances over the years. At the approximate species level (operational taxonomic units, OTUs, defined at 97% sequence similarity), no major changes in bacterial richness and composition were found through time. Nearly 50% of all detected bacterial symbionts (96 in 205 OTUs) were recovered from all sampling years, whereas a taxonomically equivalent community of less dominant bacteria characterized the transient sponge microbiota. Despite the evidence for temporal symbiont maintenance, an intriguing cumulative degree of variation between individuals was unravelled, with all the sur- veyed sponge specimens sharing only 27 bacterial OTUs. Archaeal communities were dominated by one single symbiont of the candidate genus Nitrosopumilus (Thau- marchaeota), known for its ability to aerobically oxidize ammonia to nitrite. Only few bacterial ammonia oxidizers consistently occurred in S. spinosulus across the years as documented by PCR-DGGE fingerprinting. In conclusion, prokaryotic symbionts of S. spinosulus display a state of dynamic stability shaped by the interplay between the maintenance of dominant players and turnover of less prevalent community members, in time and across host individuals, with no apparent consequences to holobiont functioning. Keywords: Ammonia oxidizers, host–microbe interactions, microbial diversity, next-generation sequencing, symbiosis Received 10 February 2014; revision received 30 April 2014; accepted 5 May 2014 Introduction Marine sponges harbour complex and diverse prokary- otic assemblages. Based on 16S rRNA gene analyses, 28 bacterial phyla have thus far been identified in close association with these animals (Taylor et al. 2007; Hentschel et al. 2012; Schmitt et al. 2012), of which Proteobacteria (especially Alpha and Gamma classes), Actinobacteria, Cyanobacteria, Bacteroidetes, Acidobacteria, Poribacteria and Chloroflexi are among the most dominant. Sequences from the two main archaeal phyla— Thaumarchaeota and Euryarchaeota—have also been recovered from marine sponges (Taylor et al. 2007; Simis- ter et al. 2012; Webster & Taylor 2012). A comprehensive phylogenetic analysis carried out with more than 7500 sponge-derived 16S rRNA gene sequences revealed 173 monophyletic ‘sponge-specific’ bacterial clusters as well as five monophyletic ‘sponge-specific’ archaeal clusters (Simister et al. 2012) according to the definition of Correspondence: Rodrigo Costa, Fax: (+351) 289 800 069; E-mails: [email protected]; [email protected] © 2014 John Wiley & Sons Ltd Molecular Ecology (2014) doi: 10.1111/mec.12789
-
Upload
independent -
Category
Documents
-
view
0 -
download
0
Transcript of Temporal dynamics of prokaryotic communities in the
Temporal dynamics of prokaryotic communities in themarine sponge Sarcotragus spinosulus
CRISTIANE C. P. HARDOIM and RODRIGO COSTA
Microbial Ecology and Evolution Research Group, Centre of Marine Sciences (CCMar), University of Algarve (UAlg),
Gambelas, 8005-139 Faro, Portugal
Abstract
In spite of their putative relevance to host functioning, in-depth knowledge of sponge
microbiome stability over time is scarce. This study tackles the temporal maintenance
of bacterial and archaeal assemblages in the model host Sarcotragus spinosulus along
three successive years. Prokaryotic communities were profiled by polymerase chain
reaction-denaturing gradient gel electrophoresis (PCR-DGGE) and 454-pyrosequencing
of S. spinosulus-derived 16S rRNA gene amplicons. Prevailing bacterial phyla were
Actinobacteria, Acidobacteria, Proteobacteria, Poribacteria, PAUC34f, Chloroflexi and
Bacteroidetes, with Bacteroidetes, Chloroflexi and Poribacteria showing different abun-
dances over the years. At the approximate species level (operational taxonomic units,
OTUs, defined at 97% sequence similarity), no major changes in bacterial richness and
composition were found through time. Nearly 50% of all detected bacterial symbionts
(96 in 205 OTUs) were recovered from all sampling years, whereas a taxonomically
equivalent community of less dominant bacteria characterized the transient sponge
microbiota. Despite the evidence for temporal symbiont maintenance, an intriguing
cumulative degree of variation between individuals was unravelled, with all the sur-
veyed sponge specimens sharing only 27 bacterial OTUs. Archaeal communities were
dominated by one single symbiont of the candidate genus Nitrosopumilus (Thau-marchaeota), known for its ability to aerobically oxidize ammonia to nitrite. Only few
bacterial ammonia oxidizers consistently occurred in S. spinosulus across the years as
documented by PCR-DGGE fingerprinting. In conclusion, prokaryotic symbionts of
S. spinosulus display a state of dynamic stability shaped by the interplay between the
maintenance of dominant players and turnover of less prevalent community members,
in time and across host individuals, with no apparent consequences to holobiont
functioning.
Keywords: Ammonia oxidizers, host–microbe interactions, microbial diversity, next-generation
sequencing, symbiosis
Received 10 February 2014; revision received 30 April 2014; accepted 5 May 2014
Introduction
Marine sponges harbour complex and diverse prokary-
otic assemblages. Based on 16S rRNA gene analyses, 28
bacterial phyla have thus far been identified in close
association with these animals (Taylor et al. 2007;
Hentschel et al. 2012; Schmitt et al. 2012), of which
Proteobacteria (especially Alpha and Gamma classes),
Actinobacteria, Cyanobacteria, Bacteroidetes, Acidobacteria,
Poribacteria and Chloroflexi are among the most dominant.
Sequences from the two main archaeal phyla—
Thaumarchaeota and Euryarchaeota—have also been
recovered from marine sponges (Taylor et al. 2007; Simis-
ter et al. 2012; Webster & Taylor 2012). A comprehensive
phylogenetic analysis carried out with more than 7500
sponge-derived 16S rRNA gene sequences revealed 173
monophyletic ‘sponge-specific’ bacterial clusters as well
as five monophyletic ‘sponge-specific’ archaeal clusters
(Simister et al. 2012) according to the definition ofCorrespondence: Rodrigo Costa, Fax: (+351) 289 800 069;
E-mails: [email protected]; [email protected]
© 2014 John Wiley & Sons Ltd
Molecular Ecology (2014) doi: 10.1111/mec.12789

Hentschel et al. (2002). Recently, the application of high-
throughput sequencing technology has shown that many
of the so-called ‘sponge-specific’ microbial lineages occur
in rare numbers in the open environment, being notice-
ably enriched within the sponge body (Taylor et al. 2013).
Sponge prokaryotic symbionts probably mediate the
cycling of several chemical elements (Taylor et al. 2007).
In particular, the first nitrification step within the nitro-
gen cycle, that is, the conversion of ammonia to nitrite
performed by ammonia-oxidizing archaea and bacteria
(AOA and AOB, respectively), is of supposed relevance
for marine sponges because it could aid the host in the
process of metabolic waste removal (Taylor et al. 2007;
Steger et al. 2008). The subunit A of the ammonia mono-
oxygenase gene (amoA gene) has been extensively
applied as a genetic marker to detect prokaryotic ammo-
nia oxidizers in several ecosystems (Rotthauwe et al.
1997; Francis et al. 2005), including the marine sponge
holobiome where AOA seem to prevail over AOB (Bayer
et al. 2008; Hoffmann et al. 2009; Cardoso et al. 2013).
However, little is known about the spatial and temporal
dynamics of these functional cohorts in the sponge host.
In the last 10 years or so, we experienced a sharp
increase in knowledge concerning the diversity and func-
tion of sponge symbiont communities (Taylor et al. 2007;
Hentschel et al. 2012; Webster & Taylor 2012). However,
our perspective of their temporal dynamics remains
limited as the majority of sponge microbiology surveys
undertaken so far relied on single sampling events.
Regardless of their diversity, unveiling the spatiotempo-
ral stability of the marine sponge microbiome is central
not only to our understanding of host–symbiont co-evo-
lutionary relationships, but also to the management of
marine resources of potential biotechnological use and
relevance to global biogeochemistry. Overall, studies that
have thus far addressed the marine sponge microbiome
along a time series proposed that the bacterial commu-
nity in these hosts was temporally stable, from 6-month
to 3-year periods (Taylor et al. 2004; Thiel et al. 2007;
Erwin et al. 2012; White et al. 2012). With one exception
(White et al. 2012) these surveys used more traditional
molecular tools to characterize the communities, such as
rRNA gene clone libraries or polymerase chain reaction-
denaturing gradient gel electrophoresis (PCR-DGGE)/
terminal restriction fragment length polymorphism (T-
RFLP) fingerprinting. With ever-evolving resolving
power, next-generation sequencing technologies are
needed to overcome depth biases of previous protocols
and will soon certainly enable novel insights into sponge
microbiome dynamics across time.
In this study, the hypothesis of temporal stability of
prokaryotic communities in the temperate sponge Sar-
cotragus spinosulus Schmidt, 1862 (Demospongiae, Irci-
niidae) is tested over a 3-year period. Sarcotragus
spinosulus is a high-microbial-abundance sponge hosting
distinct bacterial communities in comparison with those
in the environmental surroundings or inhabiting other
sponge hosts (Hardoim et al. 2012). Bacteria isolated
from this model species have shown bioactivities in vi-
tro that highlight their potential use in biotechnological
applications (Esteves et al. 2013). Here, the 16S rRNA
gene was used as a phylogenetic marker in PCR-DGGE
and 454-pyrosequencing profiling of the Bacteria and
Archaea domains, and the amoA gene was used as a tar-
get to PCR-DGGE fingerprint prokaryotic ammonia oxi-
dizers associated with S. spinosulus over time.
Material and methods
Sponge sampling
Four specimens of Sarcotragus spinosulus (Schmidt, 1862;
Demospongiae, Irciniidae) were randomly collected by
scuba-diving at depths around 15 m at Gal�e Alta,
Armac�~ao de Pera (37° 040 09.6″N and 8° 190 52.1″W) off
the coast of the Algarve, South Portugal, in June 2010,
September 2011 and October 2012. Samples were placed
in plastic bags (type Ziploc�) underwater, transported
to the laboratory inside cooling boxes and processed
upon arrival. Sampling procedure was followed as
given previously (Hardoim et al. 2012).
Sponge identification
Traditional sponge classification was performed as
explained elsewhere (Hardoim et al. 2012). Sponge
molecular phylogeny was applied to aid in the identifi-
cation of the specimens. To this end, total community
DNA was extracted from the sponge samples and used
for PCR amplification of the subunit I of the cyto-
chrome oxidase gene (CO1) with the primer pair
dgLCO1490 and dgHCO2189 (Meyer et al. 2005;
Table 1). PCR conditions, amplicon sequencing and
phylogenetic inference were carried out following the
procedures of Hardoim et al. (2012).
Total community DNA extraction
Metagenomic DNA from 0.25 g of the internal sponge
body was extracted using the UltraClean� Soil DNA
isolation kit (Mo Bio, Carlsbad, CA, USA) according to
the manufacturer’s protocol.
Preparation of amplicons for PCR-DGGEfingerprinting
Bacterial 16S rRNA gene. A nested PCR-DGGE approach
was selected to fingerprint bacterial communities in
© 2014 John Wiley & Sons Ltd
2 C. C. P . HARDOIM and R. COSTA
S. spinosulus using the primer pairs F27-R1492
(first PCR, Table 1) and F984-GC-1378R (second
PCR, Table 1) as described previously (Hardoim et al.
2012).
Archaeal 16S rRNA gene. A nested PCR-DGGE approach
was also applied to profile archaeal symbionts inhabit-
ing S. spinosulus. The first PCR reaction mixture was
prepared with the Archaea-specific primer pair
ARC344f-mod–Arch958R-mod (Table 1) as described by
Pires et al. (2012), using 3.75 mM MgCl2, 0.1 mg mL�1
of bovine serum albumin, 2% (vol/vol) dimethyl
sulphoxide and 0.625 U of BioTaqTM DNA polymerase
(Bioline, London, UK). The reaction mixture was pre-
pared as explained by Pires et al. (2012) with the primer
pair 524F-10–Arch958R-mod (GC) (Table 1) using 2 lLof the previous amplicons as templates, 3.75 mM MgCl2and 0.625U of BioTaqTM DNA polymerase. Thermal
cycling in both PCRs was as described by Pires et al.
(2012).
Bacterial amoA gene. A semi-nested PCR-DGGE was
chosen to address ammonia-oxidizing bacteria associ-
ated with S. spinosulus. For the first PCR, the reaction
mixture (25 lL) contained 1.0 lL of template DNA
(~10 ng), 19 reaction buffer, 0.2 mM dNTPs, 3.75 mM
MgCl2, 4% (vol/vol) acetamide, 0.2 lM of primer pair
amoA1F–amoA2R-GG (Nicolaisen & Ramsing 2002) and
0.625 U of BioTaqTM DNA polymerase. After initial
denaturation at 92 °C for 1 min, 35 cycles of 30 s at
92 °C, 30 s at 57 °C and 60 s at 72 °C were performed.
A final extension of 5 min at 72 °C was used to finish
the reaction. The obtained amplicons [3.0–4.5 lL] were
used as templates in a second PCR-DGGE with the
primer pair amoA1F-GC–amoA2R-GG (Nicolaisen &
Ramsing 2002; Table 1) in 15 thermal cycles using the
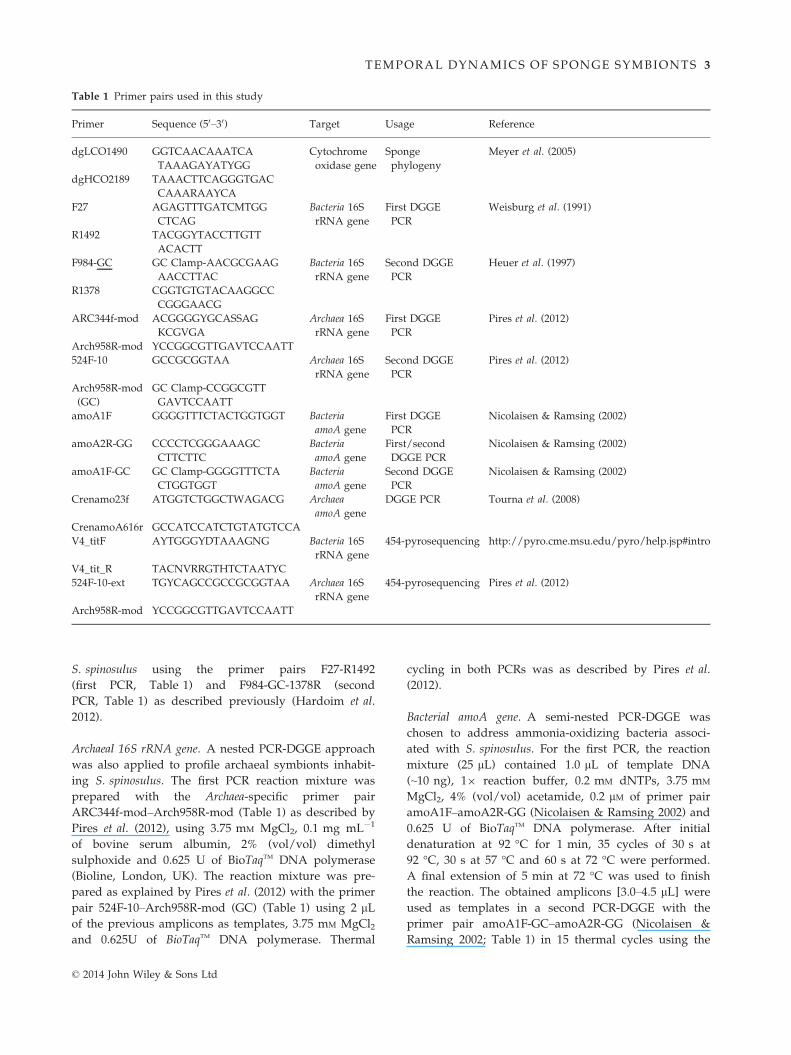
Table 1 Primer pairs used in this study
Primer Sequence (50–30) Target Usage Reference
dgLCO1490 GGTCAACAAATCA
TAAAGAYATYGG
Cytochrome
oxidase gene
Sponge
phylogeny
Meyer et al. (2005)
dgHCO2189 TAAACTTCAGGGTGAC
CAAARAAYCA
F27 AGAGTTTGATCMTGG
CTCAG
Bacteria 16S
rRNA gene
First DGGE
PCR
Weisburg et al. (1991)
R1492 TACGGYTACCTTGTT
ACACTT
F984-GC GC Clamp-AACGCGAAG
AACCTTAC
Bacteria 16S
rRNA gene
Second DGGE
PCR
Heuer et al. (1997)
R1378 CGGTGTGTACAAGGCC
CGGGAACG
ARC344f-mod ACGGGGYGCASSAG
KCGVGA
Archaea 16S
rRNA gene
First DGGE
PCR
Pires et al. (2012)
Arch958R-mod YCCGGCGTTGAVTCCAATT
524F-10 GCCGCGGTAA Archaea 16S
rRNA gene
Second DGGE
PCR
Pires et al. (2012)
Arch958R-mod
(GC)
GC Clamp-CCGGCGTT
GAVTCCAATT
amoA1F GGGGTTTCTACTGGTGGT Bacteria
amoA gene
First DGGE
PCR
Nicolaisen & Ramsing (2002)
amoA2R-GG CCCCTCGGGAAAGC
CTTCTTC
Bacteria
amoA gene
First/second
DGGE PCR
Nicolaisen & Ramsing (2002)
amoA1F-GC GC Clamp-GGGGTTTCTA
CTGGTGGT
Bacteria
amoA gene
Second DGGE
PCR
Nicolaisen & Ramsing (2002)
Crenamo23f ATGGTCTGGCTWAGACG Archaea
amoA gene
DGGE PCR Tourna et al. (2008)
CrenamoA616r GCCATCCATCTGTATGTCCA
V4_titF AYTGGGYDTAAAGNG Bacteria 16S
rRNA gene
454-pyrosequencing http://pyro.cme.msu.edu/pyro/help.jsp#intro
V4_tit_R TACNVRRGTHTCTAATYC
524F-10-ext TGYCAGCCGCCGCGGTAA Archaea 16S
rRNA gene
454-pyrosequencing Pires et al. (2012)
Arch958R-mod YCCGGCGTTGAVTCCAATT
© 2014 John Wiley & Sons Ltd
TEMPORAL DYNAMICS OF SPONGE SYMBIONTS 3
same reaction mixture and cycling conditions described
for the first PCR.
Archaeal amoA gene. One single step was used to
amplify archaeal amoA gene fragments for PCR-DGGE
profiling. The reaction mixture was prepared as for the
first PCR used in the amplification of the bacterial amoA
gene, except for the primer pair Crenamo23f–Crena-
moA616r (Tourna et al. 2008; Table 1) and template
DNA quantity (~30 ng). After initial denaturation at
95 °C for 5 min, 35 cycles of 30 s at 92 °C, 30 s at 55 °Cand 60 s at 72 °C were performed, followed by a final
extension of 10 min at 72 °C.
PCR-DGGE profiling and analysis
Polymerase chain reaction–denaturing gradient gel elec-
trophoresis was carried out in a PhorU-2 gradient sys-
tem (Ingeny International, Goes, the Netherlands). The
16S rRNA and amoA gene amplicons were applied in
even concentrations onto polyacrylamide gels
containing a 40–75% gradient of denaturants (100%
denaturants defined as 7M urea and 40% formamide)
and 6% of acrylamide, except for the bacterial amoA
gene, where 8% acrylamide was used. Marker constitu-
ents, electrophoresis conditions and staining procedures
were described previously (Hardoim et al. 2012). The
PCR-DGGE profiles were processed with the software
GelCompar II 5.1 (Applied Maths, Kortrijk, Belgium) as
explained by Hardoim et al. (2009). This analysis
delivered a table species vs. samples encompassing the
relative abundance of all bands in each profile, which
was further used as input for ordination analyses of
PCR-DGGE fingerprints with CANOCO for Windows 4.5
(Microcomputer Power, Ithaca, NY, USA) as described
by Costa et al. (2006), using Hellinger-transformed
abundance data.
Preparation of samples for pyrosequencing
A bar-coded pyrosequencing method was applied for in-
depth analysis of bacterial and archaeal community com-
position and diversity. A thorough description of (i) py-
rosequencing sample preparation, (ii) data processing
and (iii) analysis is provided in Appendix S1 (Supporting
information). Briefly, the V4 hypervariable region of bac-
terial 16S rRNA genes was PCR-amplified using the
Ribosomal Database Project primer set (Table 1), which
generates amplicons of around 248 bp in length. For
Archaea, the V4–V5 hypervariable region of the 16S rRNA
gene was targeted and two independent PCR amplifica-
tions (25 lL) were performed for each sample. Ampli-
cons from the first archaeal PCR (Table 1) were used as
templates (2 lL) in the pyrosequencing reaction, which
was carried out with 25 cycles using the primers 524F-10-
ext–Arch958R-mod (Table 1) and conditions as described
by Pires et al. (2012). Bacterial and archaeal amplicons
were delivered for pyrosequencing on a 454 Genome
Sequencer GS FLX Titanium platform (Roche Diagnostics
Ltd, West Sussex, UK) at Biocant (Biotechnology Innova-
tion Center, Portugal).
Pyrosequencing data processing and analysis
454-pyrosequencing raw data were subjected to quality
filtering and removal of homopolymers and chimeras
with AmpliconNoise (Quince et al. 2011). Analyses of fil-
tered sequences were carried out as explained in detail in
Appendix S1 (Supporting information), using the QUANTI-
TATIVE INSIGHTS INTO MICROBIAL ECOLOGY (QIIME) software
package (Caporaso et al. 2010). In summary, taxonomic
assignments of bacterial and archaeal sequences
were inferred with the greengenes 13_05 database
release (http://greengenes.secondgenome.com/downlo-
ads/database/13_5) within the QIIME environment. Opera-
tional taxonomic units (OTUs) were defined at ≥97% 16S
rRNA gene sequence similarity. A final OTU vs. samples
table was generated for both prokaryotic domains after
the removal of unclassified OTUs, chloroplasts and sin-
gletons and was used for downstream analyses. These
comprised (i) phylum- and class-level composition in
individual and pooled samples, (ii) determination of
specific and common symbionts across years by OTU
networking and Venn diagrams, (iii) estimates of sym-
biont richness (Chao1) and diversity (Shannon’s index)
and (iv) multivariate analysis of OTU data. The latter
was achieved by (a) unconstrained UPGMA clustering
and principal coordinate analysis (PCoA) of OTU
profiles using the Unifrac metric within QIIME and (b)
constrained Redundancy Analysis (RDA) of OTU profiles
and environmental variables (i.e. sampling years) with the
software package CANOCO 4.5 using Hellinger-transformed
OTU abundance data. Analyses were performed using
full-size and size-normalized, quality-filtered sample
libraries, hereafter called, for each prokaryotic domain,
‘full’ and ‘normalized’ data sets, respectively.
Tests of significance
Homogeneity of variance tests were used to check the
normal distribution of the richness and diversity mea-
surements from PCR-DGGE fingerprints and 454-py-
rosequencing. Analysis of variance (ANOVA) tested
whether or not the mean values obtained for all sample
groups were equal. A pairwise t-test—which analyses
the significance between groups, in our case distinct
sampling years—was then carried out. Homogeneity
of variance and ANOVA were also used to compare the
© 2014 John Wiley & Sons Ltd
4 C. C. P . HARDOIM and R. COSTA
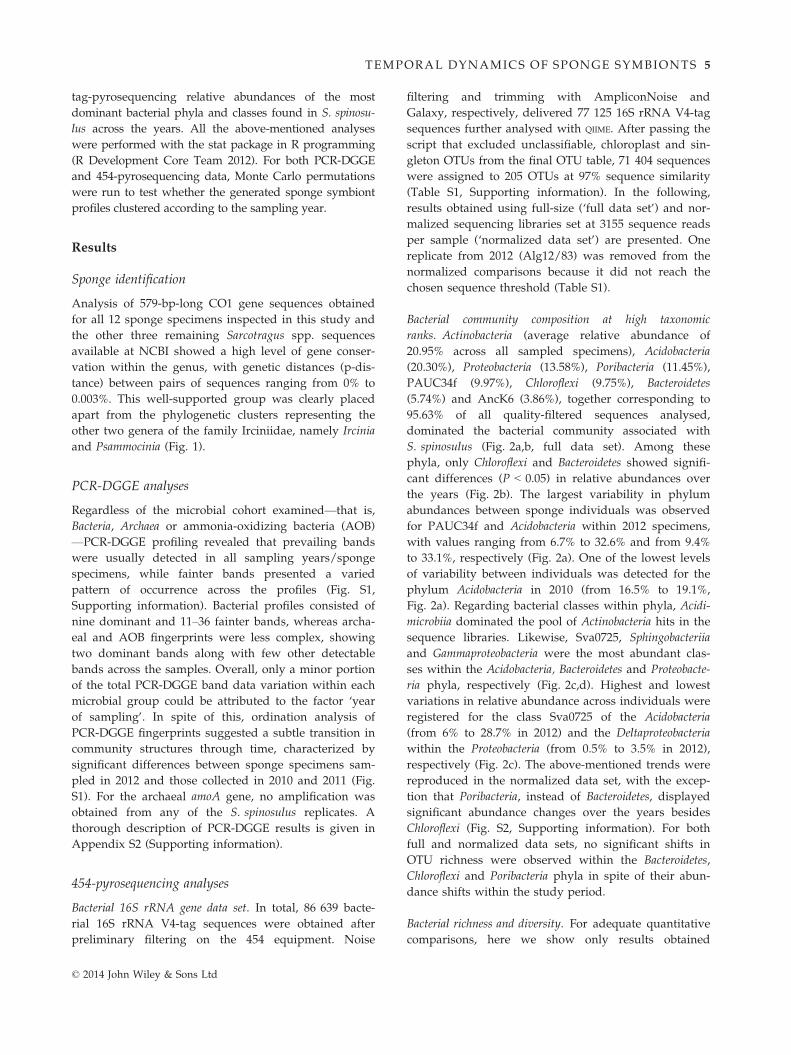
tag-pyrosequencing relative abundances of the most
dominant bacterial phyla and classes found in S. spinosu-
lus across the years. All the above-mentioned analyses
were performed with the stat package in R programming
(R Development Core Team 2012). For both PCR-DGGE
and 454-pyrosequencing data, Monte Carlo permutations
were run to test whether the generated sponge symbiont
profiles clustered according to the sampling year.
Results
Sponge identification
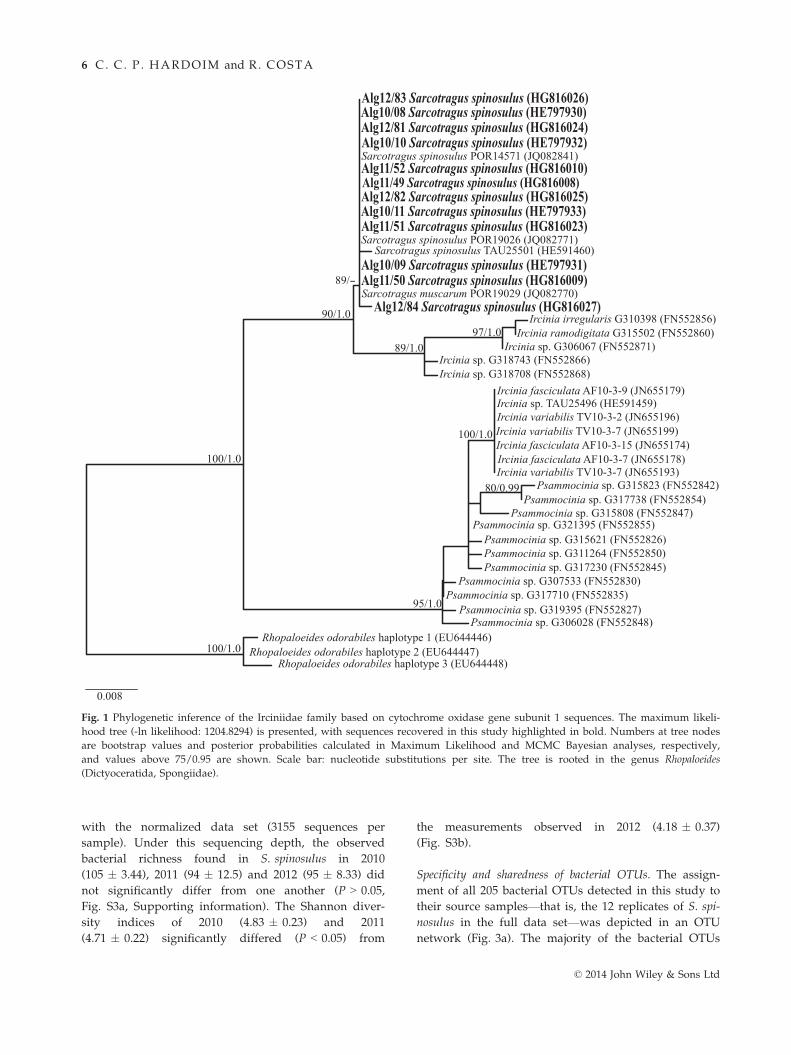
Analysis of 579-bp-long CO1 gene sequences obtained
for all 12 sponge specimens inspected in this study and
the other three remaining Sarcotragus spp. sequences
available at NCBI showed a high level of gene conser-
vation within the genus, with genetic distances (p-dis-
tance) between pairs of sequences ranging from 0% to
0.003%. This well-supported group was clearly placed
apart from the phylogenetic clusters representing the
other two genera of the family Irciniidae, namely Ircinia
and Psammocinia (Fig. 1).
PCR-DGGE analyses
Regardless of the microbial cohort examined—that is,
Bacteria, Archaea or ammonia-oxidizing bacteria (AOB)
—PCR-DGGE profiling revealed that prevailing bands
were usually detected in all sampling years/sponge
specimens, while fainter bands presented a varied
pattern of occurrence across the profiles (Fig. S1,
Supporting information). Bacterial profiles consisted of
nine dominant and 11–36 fainter bands, whereas archa-
eal and AOB fingerprints were less complex, showing
two dominant bands along with few other detectable
bands across the samples. Overall, only a minor portion
of the total PCR-DGGE band data variation within each
microbial group could be attributed to the factor ‘year
of sampling’. In spite of this, ordination analysis of
PCR-DGGE fingerprints suggested a subtle transition in
community structures through time, characterized by
significant differences between sponge specimens sam-
pled in 2012 and those collected in 2010 and 2011 (Fig.
S1). For the archaeal amoA gene, no amplification was
obtained from any of the S. spinosulus replicates. A
thorough description of PCR-DGGE results is given in
Appendix S2 (Supporting information).
454-pyrosequencing analyses
Bacterial 16S rRNA gene data set. In total, 86 639 bacte-
rial 16S rRNA V4-tag sequences were obtained after
preliminary filtering on the 454 equipment. Noise
filtering and trimming with AmpliconNoise and
Galaxy, respectively, delivered 77 125 16S rRNA V4-tag
sequences further analysed with QIIME. After passing the
script that excluded unclassifiable, chloroplast and sin-
gleton OTUs from the final OTU table, 71 404 sequences
were assigned to 205 OTUs at 97% sequence similarity
(Table S1, Supporting information). In the following,
results obtained using full-size (‘full data set’) and nor-
malized sequencing libraries set at 3155 sequence reads
per sample (‘normalized data set’) are presented. One
replicate from 2012 (Alg12/83) was removed from the
normalized comparisons because it did not reach the
chosen sequence threshold (Table S1).
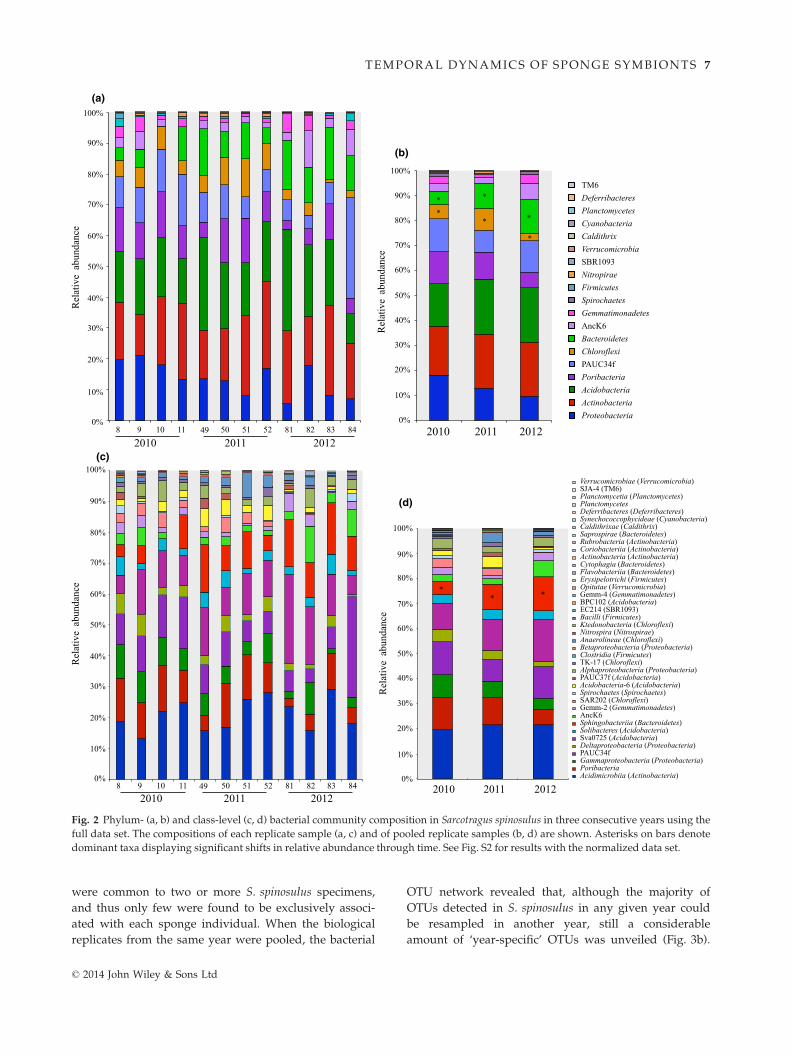
Bacterial community composition at high taxonomic
ranks. Actinobacteria (average relative abundance of
20.95% across all sampled specimens), Acidobacteria
(20.30%), Proteobacteria (13.58%), Poribacteria (11.45%),
PAUC34f (9.97%), Chloroflexi (9.75%), Bacteroidetes
(5.74%) and AncK6 (3.86%), together corresponding to
95.63% of all quality-filtered sequences analysed,
dominated the bacterial community associated with
S. spinosulus (Fig. 2a,b, full data set). Among these
phyla, only Chloroflexi and Bacteroidetes showed signifi-
cant differences (P < 0.05) in relative abundances over
the years (Fig. 2b). The largest variability in phylum
abundances between sponge individuals was observed
for PAUC34f and Acidobacteria within 2012 specimens,
with values ranging from 6.7% to 32.6% and from 9.4%
to 33.1%, respectively (Fig. 2a). One of the lowest levels
of variability between individuals was detected for the
phylum Acidobacteria in 2010 (from 16.5% to 19.1%,
Fig. 2a). Regarding bacterial classes within phyla, Acidi-
microbiia dominated the pool of Actinobacteria hits in the
sequence libraries. Likewise, Sva0725, Sphingobacteriia
and Gammaproteobacteria were the most abundant clas-
ses within the Acidobacteria, Bacteroidetes and Proteobacte-
ria phyla, respectively (Fig. 2c,d). Highest and lowest
variations in relative abundance across individuals were
registered for the class Sva0725 of the Acidobacteria
(from 6% to 28.7% in 2012) and the Deltaproteobacteria
within the Proteobacteria (from 0.5% to 3.5% in 2012),
respectively (Fig. 2c). The above-mentioned trends were
reproduced in the normalized data set, with the excep-
tion that Poribacteria, instead of Bacteroidetes, displayed
significant abundance changes over the years besides
Chloroflexi (Fig. S2, Supporting information). For both
full and normalized data sets, no significant shifts in
OTU richness were observed within the Bacteroidetes,
Chloroflexi and Poribacteria phyla in spite of their abun-
dance shifts within the study period.
Bacterial richness and diversity. For adequate quantitative
comparisons, here we show only results obtained
© 2014 John Wiley & Sons Ltd
TEMPORAL DYNAMICS OF SPONGE SYMBIONTS 5
with the normalized data set (3155 sequences per
sample). Under this sequencing depth, the observed
bacterial richness found in S. spinosulus in 2010
(105 � 3.44), 2011 (94 � 12.5) and 2012 (95 � 8.33) did
not significantly differ from one another (P > 0.05,
Fig. S3a, Supporting information). The Shannon diver-
sity indices of 2010 (4.83 � 0.23) and 2011
(4.71 � 0.22) significantly differed (P < 0.05) from
the measurements observed in 2012 (4.18 � 0.37)
(Fig. S3b).
Specificity and sharedness of bacterial OTUs. The assign-
ment of all 205 bacterial OTUs detected in this study to
their source samples—that is, the 12 replicates of S. spi-
nosulus in the full data set—was depicted in an OTU
network (Fig. 3a). The majority of the bacterial OTUs
Fig. 1 Phylogenetic inference of the Irciniidae family based on cytochrome oxidase gene subunit 1 sequences. The maximum likeli-
hood tree (-ln likelihood: 1204.8294) is presented, with sequences recovered in this study highlighted in bold. Numbers at tree nodes
are bootstrap values and posterior probabilities calculated in Maximum Likelihood and MCMC Bayesian analyses, respectively,
and values above 75/0.95 are shown. Scale bar: nucleotide substitutions per site. The tree is rooted in the genus Rhopaloeides
(Dictyoceratida, Spongiidae).
© 2014 John Wiley & Sons Ltd
6 C. C. P . HARDOIM and R. COSTA
were common to two or more S. spinosulus specimens,
and thus only few were found to be exclusively associ-
ated with each sponge individual. When the biological
replicates from the same year were pooled, the bacterial
OTU network revealed that, although the majority of
OTUs detected in S. spinosulus in any given year could
be resampled in another year, still a considerable
amount of ‘year-specific’ OTUs was unveiled (Fig. 3b).
(a)
(b)
(d)
(c)
Fig. 2 Phylum- (a, b) and class-level (c, d) bacterial community composition in Sarcotragus spinosulus in three consecutive years using the
full data set. The compositions of each replicate sample (a, c) and of pooled replicate samples (b, d) are shown. Asterisks on bars denote
dominant taxa displaying significant shifts in relative abundance through time. See Fig. S2 for results with the normalized data set.
© 2014 John Wiley & Sons Ltd
TEMPORAL DYNAMICS OF SPONGE SYMBIONTS 7
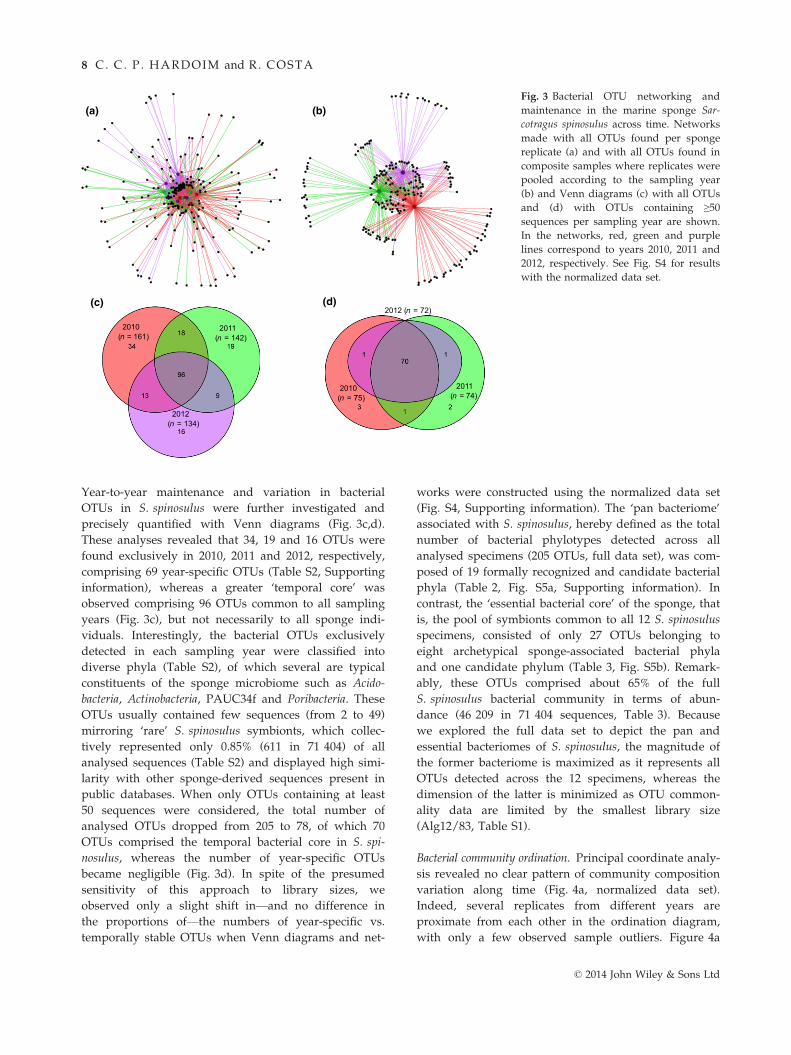
Year-to-year maintenance and variation in bacterial
OTUs in S. spinosulus were further investigated and
precisely quantified with Venn diagrams (Fig. 3c,d).
These analyses revealed that 34, 19 and 16 OTUs were
found exclusively in 2010, 2011 and 2012, respectively,
comprising 69 year-specific OTUs (Table S2, Supporting
information), whereas a greater ‘temporal core’ was
observed comprising 96 OTUs common to all sampling
years (Fig. 3c), but not necessarily to all sponge indi-
viduals. Interestingly, the bacterial OTUs exclusively
detected in each sampling year were classified into
diverse phyla (Table S2), of which several are typical
constituents of the sponge microbiome such as Acido-
bacteria, Actinobacteria, PAUC34f and Poribacteria. These
OTUs usually contained few sequences (from 2 to 49)
mirroring ‘rare’ S. spinosulus symbionts, which collec-
tively represented only 0.85% (611 in 71 404) of all
analysed sequences (Table S2) and displayed high simi-
larity with other sponge-derived sequences present in
public databases. When only OTUs containing at least
50 sequences were considered, the total number of
analysed OTUs dropped from 205 to 78, of which 70
OTUs comprised the temporal bacterial core in S. spi-
nosulus, whereas the number of year-specific OTUs
became negligible (Fig. 3d). In spite of the presumed
sensitivity of this approach to library sizes, we
observed only a slight shift in—and no difference in
the proportions of—the numbers of year-specific vs.
temporally stable OTUs when Venn diagrams and net-
works were constructed using the normalized data set
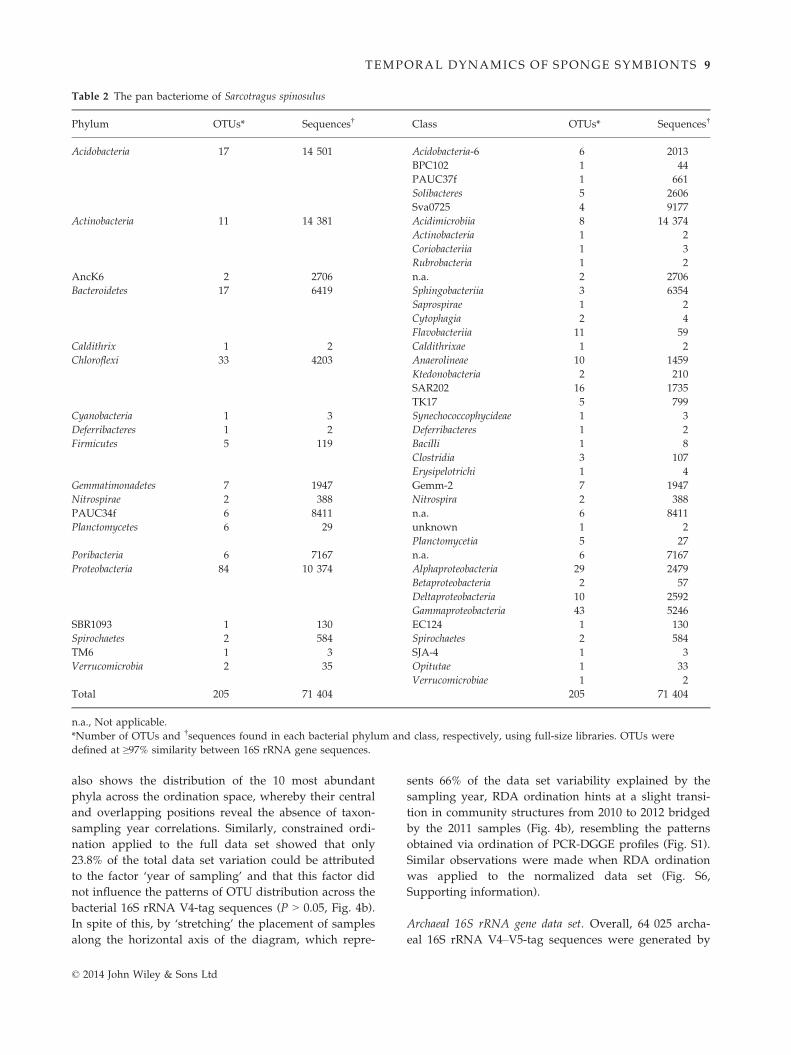
(Fig. S4, Supporting information). The ‘pan bacteriome’
associated with S. spinosulus, hereby defined as the total
number of bacterial phylotypes detected across all
analysed specimens (205 OTUs, full data set), was com-
posed of 19 formally recognized and candidate bacterial
phyla (Table 2, Fig. S5a, Supporting information). In
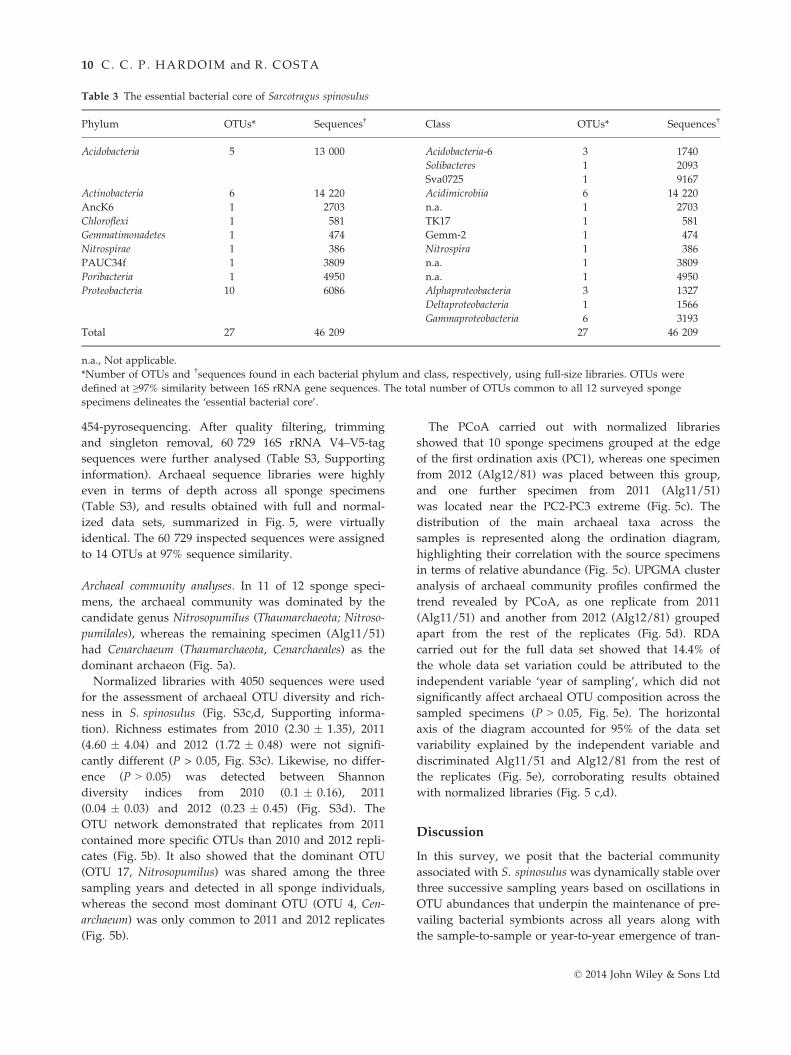
contrast, the ‘essential bacterial core’ of the sponge, that
is, the pool of symbionts common to all 12 S. spinosulus
specimens, consisted of only 27 OTUs belonging to
eight archetypical sponge-associated bacterial phyla
and one candidate phylum (Table 3, Fig. S5b). Remark-
ably, these OTUs comprised about 65% of the full
S. spinosulus bacterial community in terms of abun-
dance (46 209 in 71 404 sequences, Table 3). Because
we explored the full data set to depict the pan and
essential bacteriomes of S. spinosulus, the magnitude of
the former bacteriome is maximized as it represents all
OTUs detected across the 12 specimens, whereas the
dimension of the latter is minimized as OTU common-
ality data are limited by the smallest library size
(Alg12/83, Table S1).
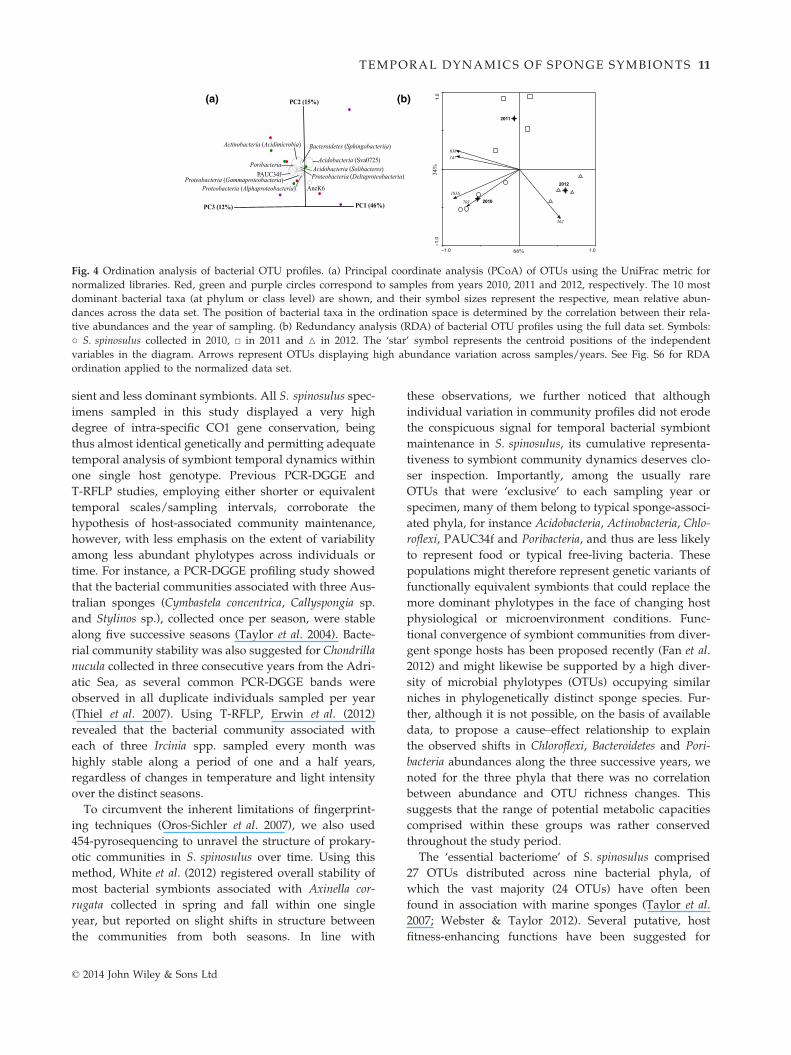
Bacterial community ordination. Principal coordinate analy-
sis revealed no clear pattern of community composition
variation along time (Fig. 4a, normalized data set).
Indeed, several replicates from different years are
proximate from each other in the ordination diagram,
with only a few observed sample outliers. Figure 4a
(a) (b)
(d)(c)
Fig. 3 Bacterial OTU networking and
maintenance in the marine sponge Sar-
cotragus spinosulus across time. Networks
made with all OTUs found per sponge
replicate (a) and with all OTUs found in
composite samples where replicates were
pooled according to the sampling year
(b) and Venn diagrams (c) with all OTUs
and (d) with OTUs containing ≥50sequences per sampling year are shown.
In the networks, red, green and purple
lines correspond to years 2010, 2011 and
2012, respectively. See Fig. S4 for results
with the normalized data set.
© 2014 John Wiley & Sons Ltd
8 C. C. P . HARDOIM and R. COSTA
also shows the distribution of the 10 most abundant
phyla across the ordination space, whereby their central
and overlapping positions reveal the absence of taxon-
sampling year correlations. Similarly, constrained ordi-
nation applied to the full data set showed that only
23.8% of the total data set variation could be attributed
to the factor ‘year of sampling’ and that this factor did
not influence the patterns of OTU distribution across the
bacterial 16S rRNA V4-tag sequences (P > 0.05, Fig. 4b).
In spite of this, by ‘stretching’ the placement of samples
along the horizontal axis of the diagram, which repre-
sents 66% of the data set variability explained by the
sampling year, RDA ordination hints at a slight transi-
tion in community structures from 2010 to 2012 bridged
by the 2011 samples (Fig. 4b), resembling the patterns
obtained via ordination of PCR-DGGE profiles (Fig. S1).
Similar observations were made when RDA ordination
was applied to the normalized data set (Fig. S6,
Supporting information).
Archaeal 16S rRNA gene data set. Overall, 64 025 archa-
eal 16S rRNA V4–V5-tag sequences were generated by
Table 2 The pan bacteriome of Sarcotragus spinosulus
Phylum OTUs* Sequences† Class OTUs* Sequences†
Acidobacteria 17 14 501 Acidobacteria-6 6 2013
BPC102 1 44
PAUC37f 1 661
Solibacteres 5 2606
Sva0725 4 9177
Actinobacteria 11 14 381 Acidimicrobiia 8 14 374
Actinobacteria 1 2
Coriobacteriia 1 3
Rubrobacteria 1 2
AncK6 2 2706 n.a. 2 2706
Bacteroidetes 17 6419 Sphingobacteriia 3 6354
Saprospirae 1 2
Cytophagia 2 4
Flavobacteriia 11 59
Caldithrix 1 2 Caldithrixae 1 2
Chloroflexi 33 4203 Anaerolineae 10 1459
Ktedonobacteria 2 210
SAR202 16 1735
TK17 5 799
Cyanobacteria 1 3 Synechococcophycideae 1 3
Deferribacteres 1 2 Deferribacteres 1 2
Firmicutes 5 119 Bacilli 1 8
Clostridia 3 107
Erysipelotrichi 1 4
Gemmatimonadetes 7 1947 Gemm-2 7 1947
Nitrospirae 2 388 Nitrospira 2 388
PAUC34f 6 8411 n.a. 6 8411
Planctomycetes 6 29 unknown 1 2
Planctomycetia 5 27
Poribacteria 6 7167 n.a. 6 7167
Proteobacteria 84 10 374 Alphaproteobacteria 29 2479
Betaproteobacteria 2 57
Deltaproteobacteria 10 2592
Gammaproteobacteria 43 5246
SBR1093 1 130 EC124 1 130
Spirochaetes 2 584 Spirochaetes 2 584
TM6 1 3 SJA-4 1 3
Verrucomicrobia 2 35 Opitutae 1 33
Verrucomicrobiae 1 2
Total 205 71 404 205 71 404
n.a., Not applicable.
*Number of OTUs and †sequences found in each bacterial phylum and class, respectively, using full-size libraries. OTUs were
defined at ≥97% similarity between 16S rRNA gene sequences.
© 2014 John Wiley & Sons Ltd
TEMPORAL DYNAMICS OF SPONGE SYMBIONTS 9
454-pyrosequencing. After quality filtering, trimming
and singleton removal, 60 729 16S rRNA V4–V5-tag
sequences were further analysed (Table S3, Supporting
information). Archaeal sequence libraries were highly
even in terms of depth across all sponge specimens
(Table S3), and results obtained with full and normal-
ized data sets, summarized in Fig. 5, were virtually
identical. The 60 729 inspected sequences were assigned
to 14 OTUs at 97% sequence similarity.
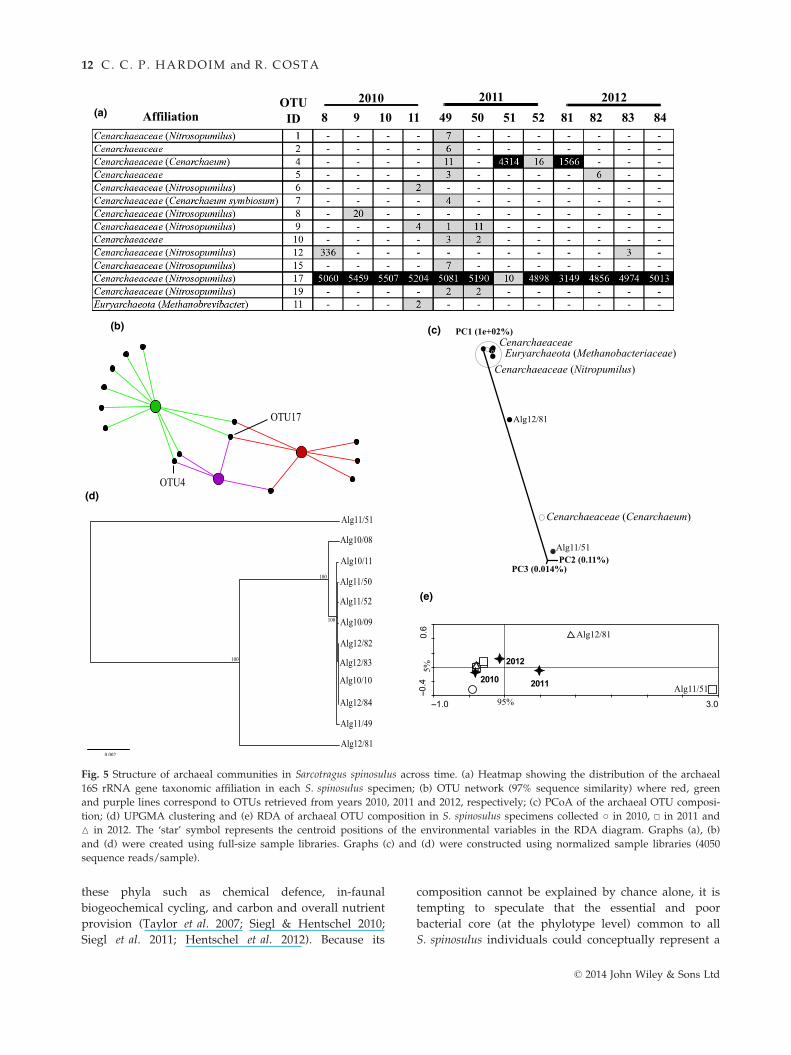
Archaeal community analyses. In 11 of 12 sponge speci-
mens, the archaeal community was dominated by the
candidate genus Nitrosopumilus (Thaumarchaeota; Nitroso-
pumilales), whereas the remaining specimen (Alg11/51)
had Cenarchaeum (Thaumarchaeota, Cenarchaeales) as the
dominant archaeon (Fig. 5a).
Normalized libraries with 4050 sequences were used
for the assessment of archaeal OTU diversity and rich-
ness in S. spinosulus (Fig. S3c,d, Supporting informa-
tion). Richness estimates from 2010 (2.30 � 1.35), 2011
(4.60 � 4.04) and 2012 (1.72 � 0.48) were not signifi-
cantly different (P > 0.05, Fig. S3c). Likewise, no differ-
ence (P > 0.05) was detected between Shannon
diversity indices from 2010 (0.1 � 0.16), 2011
(0.04 � 0.03) and 2012 (0.23 � 0.45) (Fig. S3d). The
OTU network demonstrated that replicates from 2011
contained more specific OTUs than 2010 and 2012 repli-
cates (Fig. 5b). It also showed that the dominant OTU
(OTU 17, Nitrosopumilus) was shared among the three
sampling years and detected in all sponge individuals,
whereas the second most dominant OTU (OTU 4, Cen-
archaeum) was only common to 2011 and 2012 replicates
(Fig. 5b).
The PCoA carried out with normalized libraries
showed that 10 sponge specimens grouped at the edge
of the first ordination axis (PC1), whereas one specimen
from 2012 (Alg12/81) was placed between this group,
and one further specimen from 2011 (Alg11/51)
was located near the PC2-PC3 extreme (Fig. 5c). The
distribution of the main archaeal taxa across the
samples is represented along the ordination diagram,
highlighting their correlation with the source specimens
in terms of relative abundance (Fig. 5c). UPGMA cluster
analysis of archaeal community profiles confirmed the
trend revealed by PCoA, as one replicate from 2011
(Alg11/51) and another from 2012 (Alg12/81) grouped
apart from the rest of the replicates (Fig. 5d). RDA
carried out for the full data set showed that 14.4% of
the whole data set variation could be attributed to the
independent variable ‘year of sampling’, which did not
significantly affect archaeal OTU composition across the
sampled specimens (P > 0.05, Fig. 5e). The horizontal
axis of the diagram accounted for 95% of the data set
variability explained by the independent variable and
discriminated Alg11/51 and Alg12/81 from the rest of
the replicates (Fig. 5e), corroborating results obtained
with normalized libraries (Fig. 5 c,d).
Discussion
In this survey, we posit that the bacterial community
associated with S. spinosulus was dynamically stable over
three successive sampling years based on oscillations in
OTU abundances that underpin the maintenance of pre-
vailing bacterial symbionts across all years along with
the sample-to-sample or year-to-year emergence of tran-
Table 3 The essential bacterial core of Sarcotragus spinosulus
Phylum OTUs* Sequences† Class OTUs* Sequences†
Acidobacteria 5 13 000 Acidobacteria-6 3 1740
Solibacteres 1 2093
Sva0725 1 9167
Actinobacteria 6 14 220 Acidimicrobiia 6 14 220
AncK6 1 2703 n.a. 1 2703
Chloroflexi 1 581 TK17 1 581
Gemmatimonadetes 1 474 Gemm-2 1 474
Nitrospirae 1 386 Nitrospira 1 386
PAUC34f 1 3809 n.a. 1 3809
Poribacteria 1 4950 n.a. 1 4950
Proteobacteria 10 6086 Alphaproteobacteria 3 1327
Deltaproteobacteria 1 1566
Gammaproteobacteria 6 3193
Total 27 46 209 27 46 209
n.a., Not applicable.
*Number of OTUs and †sequences found in each bacterial phylum and class, respectively, using full-size libraries. OTUs were
defined at ≥97% similarity between 16S rRNA gene sequences. The total number of OTUs common to all 12 surveyed sponge
specimens delineates the ‘essential bacterial core’.
© 2014 John Wiley & Sons Ltd
10 C. C. P . HARDOIM and R. COSTA
sient and less dominant symbionts. All S. spinosulus spec-
imens sampled in this study displayed a very high
degree of intra-specific CO1 gene conservation, being
thus almost identical genetically and permitting adequate
temporal analysis of symbiont temporal dynamics within
one single host genotype. Previous PCR-DGGE and
T-RFLP studies, employing either shorter or equivalent
temporal scales/sampling intervals, corroborate the
hypothesis of host-associated community maintenance,
however, with less emphasis on the extent of variability
among less abundant phylotypes across individuals or
time. For instance, a PCR-DGGE profiling study showed
that the bacterial communities associated with three Aus-
tralian sponges (Cymbastela concentrica, Callyspongia sp.
and Stylinos sp.), collected once per season, were stable
along five successive seasons (Taylor et al. 2004). Bacte-
rial community stability was also suggested for Chondrilla
nucula collected in three consecutive years from the Adri-
atic Sea, as several common PCR-DGGE bands were
observed in all duplicate individuals sampled per year
(Thiel et al. 2007). Using T-RFLP, Erwin et al. (2012)
revealed that the bacterial community associated with
each of three Ircinia spp. sampled every month was
highly stable along a period of one and a half years,
regardless of changes in temperature and light intensity
over the distinct seasons.
To circumvent the inherent limitations of fingerprint-
ing techniques (Oros-Sichler et al. 2007), we also used
454-pyrosequencing to unravel the structure of prokary-
otic communities in S. spinosulus over time. Using this
method, White et al. (2012) registered overall stability of
most bacterial symbionts associated with Axinella cor-
rugata collected in spring and fall within one single
year, but reported on slight shifts in structure between
the communities from both seasons. In line with
these observations, we further noticed that although
individual variation in community profiles did not erode
the conspicuous signal for temporal bacterial symbiont
maintenance in S. spinosulus, its cumulative representa-
tiveness to symbiont community dynamics deserves clo-
ser inspection. Importantly, among the usually rare
OTUs that were ‘exclusive’ to each sampling year or
specimen, many of them belong to typical sponge-associ-
ated phyla, for instance Acidobacteria, Actinobacteria, Chlo-
roflexi, PAUC34f and Poribacteria, and thus are less likely
to represent food or typical free-living bacteria. These
populations might therefore represent genetic variants of
functionally equivalent symbionts that could replace the
more dominant phylotypes in the face of changing host
physiological or microenvironment conditions. Func-
tional convergence of symbiont communities from diver-
gent sponge hosts has been proposed recently (Fan et al.
2012) and might likewise be supported by a high diver-
sity of microbial phylotypes (OTUs) occupying similar
niches in phylogenetically distinct sponge species. Fur-
ther, although it is not possible, on the basis of available
data, to propose a cause–effect relationship to explain
the observed shifts in Chloroflexi, Bacteroidetes and Pori-
bacteria abundances along the three successive years, we
noted for the three phyla that there was no correlation
between abundance and OTU richness changes. This
suggests that the range of potential metabolic capacities
comprised within these groups was rather conserved
throughout the study period.
The ‘essential bacteriome’ of S. spinosulus comprised
27 OTUs distributed across nine bacterial phyla, of
which the vast majority (24 OTUs) have often been
found in association with marine sponges (Taylor et al.
2007; Webster & Taylor 2012). Several putative, host
fitness-enhancing functions have been suggested for
(a) (b)
Fig. 4 Ordination analysis of bacterial OTU profiles. (a) Principal coordinate analysis (PCoA) of OTUs using the UniFrac metric for
normalized libraries. Red, green and purple circles correspond to samples from years 2010, 2011 and 2012, respectively. The 10 most
dominant bacterial taxa (at phylum or class level) are shown, and their symbol sizes represent the respective, mean relative abun-
dances across the data set. The position of bacterial taxa in the ordination space is determined by the correlation between their rela-
tive abundances and the year of sampling. (b) Redundancy analysis (RDA) of bacterial OTU profiles using the full data set. Symbols:
○ S. spinosulus collected in 2010, □ in 2011 and M in 2012. The ‘star’ symbol represents the centroid positions of the independent
variables in the diagram. Arrows represent OTUs displaying high abundance variation across samples/years. See Fig. S6 for RDA
ordination applied to the normalized data set.
© 2014 John Wiley & Sons Ltd
TEMPORAL DYNAMICS OF SPONGE SYMBIONTS 11
these phyla such as chemical defence, in-faunal
biogeochemical cycling, and carbon and overall nutrient
provision (Taylor et al. 2007; Siegl & Hentschel 2010;
Siegl et al. 2011; Hentschel et al. 2012). Because its
composition cannot be explained by chance alone, it is
tempting to speculate that the essential and poor
bacterial core (at the phylotype level) common to all
S. spinosulus individuals could conceptually represent a
(a)
(b) (c)
(d)
(e)
Fig. 5 Structure of archaeal communities in Sarcotragus spinosulus across time. (a) Heatmap showing the distribution of the archaeal
16S rRNA gene taxonomic affiliation in each S. spinosulus specimen; (b) OTU network (97% sequence similarity) where red, green
and purple lines correspond to OTUs retrieved from years 2010, 2011 and 2012, respectively; (c) PCoA of the archaeal OTU composi-
tion; (d) UPGMA clustering and (e) RDA of archaeal OTU composition in S. spinosulus specimens collected ○ in 2010, □ in 2011 and
M in 2012. The ‘star’ symbol represents the centroid positions of the environmental variables in the RDA diagram. Graphs (a), (b)
and (d) were created using full-size sample libraries. Graphs (c) and (d) were constructed using normalized sample libraries (4050
sequence reads/sample).
© 2014 John Wiley & Sons Ltd
12 C. C. P . HARDOIM and R. COSTA
minimum repertoire of symbionts (nevertheless charac-
terized by high phylum-level richness) needed for full
holobiont functioning. The sharp reduction in phylotype
richness, but simultaneous maintenance of the archety-
pical sponge-associated phyla and classes in the
essential core corroborates the perception of higher bac-
terial taxonomic ranks as ecologically relevant units to
microecosystem functioning (Philippot et al. 2010). The
absence of the Bacteroidetes from this core suggests a
more sporadic pattern of occurrence of these symbionts
in S. spinosulus, supporting the notion of Bacteroidetes as
copiotrophic r-strategists (Fierer et al. 2007) and
opportunistic dwellers (Thomas et al. 2011) in open and
host-related microhabitats.
In summary, temporally transient bacterial symbionts
that do correspond to typical sponge-associated lineages
were unravelled. Collectively, they compete in richness
with the persistent microbiota, but are much less abun-
dant. Conversely, very few symbionts were common to
all analysed specimens, but found to rule the full
microbiome makeup—and probably its functioning—in
this host as they encompassed about 65% of all bacterial
sequences recovered with our effort. Sequence depth
largely influences observations of sponge microbiome
diversity (Moitinho-Silva et al. 2014). Hence, the slope
of the curves describing the pan and essential bacterial
core in S. spinosulus, as portrayed here, is to be chal-
lenged by analyses employing increased sequencing
power and other sponge hosts. Although it is likely that
the ‘rare’ or less frequent OTUs, as delineated in this
study, might lose their year- or specimen-dependent
‘specificity’ statuses when deeper analyses are under-
taken, gradients in relative abundances among commu-
nity members are expected to be preserved. Further, we
noticed considerable oscillations in the relative abun-
dance of several OTUs across sponge individuals or
time, this being the main factor underpinning differenti-
ation in community profiles among sponge specimens
(Appendix S3, Supporting information). Thus, the mi-
crobiome of S. spinosulus appears to be in dynamic sta-
bility as supported by the community turnover concept
in which the maintenance of the most dominant species
would be under constant assault by the emergence/
establishment of transient/rare species, which might
replace the dominant ones when conditions favour
(Gonz�alez et al. 2011). Such dynamics has been
observed in other environments, for instance the human
body (Costello et al. 2009; Caporaso et al. 2011), oceans
(Gilbert et al. 2009), lakes (Shade et al. 2007) and soils
(Costello & Schmidt 2006; Griffiths et al. 2011). In the
light of the current evidence for a tight control of the
host species in shaping its own microbiome (Erwin
et al. 2012; Hardoim et al. 2012; Pita et al. 2013), it
remains to be understood which ‘conditions’ would
likely trigger such replacements and drive symbiont
turnover, if any, within the sponge host. Finally, it is
felt that exacerbating specimen replication in diversity
surveys, as performed here through the inspection of
symbiont sharedness across 12 genetically equivalent
individuals, holds promise in enlightening our under-
standing of microbial community dynamics in marine
sponges and essentially any other host.
There is a current lack of knowledge of the temporal
persistence of archaeal symbionts in marine sponges.
With one exception (Lee et al. 2011), previous assays
have documented low archaeal diversity (usually ≤fourDGGE bands or OTUs) in these animals (Webster et al.
2001, 2004; Meyer & Kuever 2008). Here, the community
of archaeal symbionts in S. spinosulus was highly stable
and poorly diversified throughout the study period. It
was largely dominated by Nitrosopumilus in the three
consecutive years, except for one single sponge speci-
men that was dominated by Cenarchaeum sp. Candidatus
Nitrosopumilus maritimus is capable to grow chemoli-
thoautotrophically by aerobically oxidizing ammonia to
nitrite (K€onneke et al. 2005). Cenarchaeum symbiosum has
been observed in different sponge species from various
locations and even found to persist in one species kept
in aquarium during a 6-month period (Preston et al.
1996; Schleper et al. 1998; Margot et al. 2002). Genomic
analysis of C. symbiosum revealed homologues of genes
related to chemolithotrophic ammonia oxidation,
including ammonia monooxygenase-encoding genes
(Hallam et al. 2006). This indicates functional redun-
dancy between the Cenarchaeum and Nitrosopumilus spe-
cies found in association with S. spinosulus in our study.
Thus, alterations in their shared prevalence in a given
host individual, regardless of whether these changes
were caused by a deterministic factor or stochastic event
(s), do not seem to compromise the presumed roles
archaeal sponge symbionts play in ammonia oxidation.
The bacterial ammonia oxidizers (AOB) associated
with S. spinosulus comprised up to 14 amoA PCR-DGGE
bands. Previous studies are in congruence with our sur-
vey. PCR-DGGE profiling of the Caribbean Halisarca
caerulea and the deep cold-water species Higginsia thielei
and Nodastrella nodastrella (North Atlantic), generated
from a single sampling, showed few bands associated
with these hosts (Cardoso et al. 2013). Moreover, only
two AOB OTUs were retrieved from the endosome of
Astrosclera willeyana (Yang & Li 2012), and the AOB
associated with Geodia barretti was usually on the detec-
tion limit for PCR amplification (Hoffmann et al. 2009).
In S. spinosulus, the AOB community was stable
through time, presenting only small variation among
replicates and similar measurements of richness and
diversity. Although no archaeal amoA gene amplicon
could be obtained from S. spinosulus with the PCR-
© 2014 John Wiley & Sons Ltd
TEMPORAL DYNAMICS OF SPONGE SYMBIONTS 13
DGGE system employed in this study, 454-pyrose-
quencing profiling of 16S rRNA genes hints at archaeal
ammonia oxidation potential in this host given the
documented dominance of Nitrosopumilus within these
communities. Altogether, these results represent the
first evidence for AOA and AOB stability in marine
sponges over time.
Conclusions
We reveal a predominantly stable microbiota in S. spi-
nosulus across time through the simultaneous analysis
of bacterial, archaeal and AOB community structures. A
subtle signal for bacterial community shifts within the
study period was nevertheless captured, characterized
by oscillations in OTU abundances driving lower
within-year and higher between-year variability among
replicate sponge specimens. This pattern became more
apparent when constrained ordination was applied to
the data, highlighting the usefulness in employing such
methods in microbial community profiling (Erb-Down-
ward et al. 2012). Studies covering larger time scales
(e.g. decades) are now needed to better verify the
strength of the sponge microbiome stability usually
reported in short-term surveys.
Acknowledgements
We acknowledge Joana R. Xavier and Francisco R. Pires for
their assistance in the identification of sponge specimens. We
thank Priya T. Suryakumar for the processing of DGGE images
with the GelCompar II software. This research was financed by
the Portuguese Foundation for Science and Technology (FCT)
through the research project PTDC/MAR/101431/2008,
granted to RC. It was further partially supported by the Euro-
pean Regional Development Fund (ERDF) through the Opera-
tional Competitiveness Programme (COMPETE) and by
national funds through FCT (Foundation for Science and Tech-
nology), under the project ‘PEst-C/MAR/LA0015/2011. CCPH
was the recipient of a PhD fellowship granted by FCT (Grant
No. SFRH/BD/60873/2009).
References
Bayer K, Schmitt S, Hentschel U (2008) Physiology, phylogeny
and in situ evidence for bacterial and archaeal nitrifiers in
the marine sponge Aplysina aerophoba. Environmental Microbi-
ology, 10, 2942–2955.
Caporaso JG, Kuczynski J, Stombaugh J et al. (2010) QIIME
allows analysis of high-throughput community sequencing
data. Nature Methods, 7, 335–336.Caporaso JG, Lauber CL, Costello EK et al. (2011) Moving
pictures of the human microbiome. Genome Biology, 12, R50.
Cardoso J, van Bleijswijk JDL, Witte H, van Duyl FC (2013)
Diversity and abundance of ammonia-oxidizing Archaea and
Bacteria in tropical and cold-water coral reef sponges. Aquatic
Microbial Ecology, 68, 215–230.
Costa R, Salles JF, Berg G, Smalla K (2006) Cultivation-inde-
pendent analysis of Pseudomonas species in soil and in the
rhizosphere of field-grown Verticillium dahliae host plants.
Environmental Microbiology, 8, 2136–2149.Costello EK, Schmidt SK (2006) Microbial diversity in alpine
tundra wet meadow soil: novel Chloroflexi from a cold,
water-saturated environment. Environmental Microbiology, 8,
1471–1486.Costello EK, Lauber CL, Hamady M et al. (2009) Bacterial Com-
munity variation in human body habitats across space and
time. Science, 326, 1694–1697.
Erb-Downward JR, Akha AAS, Wang J et al. (2012) Use of
direct gradient analysis to uncover biological hypotheses in
16S survey data and beyond. Scientific Reports, 2, 774.
Erwin PM, Pita L, L�opez-Legentil S, Turon X (2012) Stability of
sponge-associated bacteria over large seasonal shifts in tem-
perature and irradiance. Applied and Environmental Microbiol-
ogy, 78, 7358–7368.Esteves AIS, Hardoim CCP, Xavier JR, Gonc�alves JMS, Costa R
(2013) Molecular richness and biotechnological potential of
bacteria cultured from Irciniidae sponges in the north-east
Atlantic. FEMS Microbiology Ecology, 85, 519–536.Fan L, Reynolds D, Liu M et al. (2012) Functional equivalence
and evolutionary convergence in complex communities of
microbial sponge symbionts. Proceedings of the National Acad-
emy of Sciences, USA, 109, E1878–E1887.Fierer N, Bradford MA, Jackson RB (2007) Toward an ecologi-
cal classification of soil bacteria. Ecology, 88, 1354–1364.
Francis CA, Roberts KJ, Beman JM, Santoro AE, Oakley BB
(2005) Ubiquity and diversity of ammonia-oxidizing archaea
in water columns and sediments of the ocean. Proceedings of
the National Academy of Sciences, USA, 102, 14683–14688.
Gilbert JA, Field D, Swift P et al. (2009) The seasonal structure
of microbial communities in the Western English Channel.
Environmental Microbiology, 11, 3132–3139.Gonz�alez A, Clemente JC, Shade A et al. (2011) Our micro-
bial selves: what ecology can teach us. EMBO Reports, 12,
775–784.
Griffiths RI, Thomson BC, James P et al. (2011) The bacterial
biogeography of British soils. Environmental Microbiology, 13,
1642–1654.Hallam SJ, Konstantinidis KT, Putnam N et al. (2006) Genomic
analysis of the uncultivated marine crenarchaeote Cenarchae-
um symbiosum. Proceedings of the National Academy of Sciences,
USA, 103, 18296–18301.Hardoim CCP, Costa R, Ara�ujo FV et al. (2009) Diversity of
Bacteria in the marine sponge Aplysina fulva in Brazilian
Coastal Waters. Applied and Environmental Microbiology, 75,
3331–3343.Hardoim CCP, Esteves AIS, Pires FR et al. (2012) Phylogeneti-
cally and spatially close marine sponges harbour divergent
bacterial communities. PLoS One, 7, e53029.
Hentschel U, Hopke J, Horn M et al. (2002) Molecular evidence
for a uniform microbial community in sponges from different
oceans. Applied and Environmental Microbiology, 68, 4431–4440.Hentschel U, Piel J, Degnan SM, Taylor MW (2012) Genomic
insights into the marine sponge microbiome. Nature Reviews
Microbiology, 10, 641–654.
Heuer H, Krsek M, Baker P, Smalla K, Wellington EMH (1997)
Analysis of Actinomycete communities by specific amplifica-
tion of genes encoding 16S rRNA and gel-electrophoretic
© 2014 John Wiley & Sons Ltd
14 C. C. P . HARDOIM and R. COSTA
separation in denaturing gradients. Applied Environmental
Microbiology, 63, 3233–3241.Hoffmann F, Radax R, Woebken D et al. (2009) Complex nitro-
gen cycling in the sponge Geodia barretti. Environmental
Microbiology, 11, 2228–2243.
K€onneke M, Bernhard AE, de la Torre JR et al. (2005) Isolation
of an autotrophic ammonia-oxidizing marine archaeon. Nat-
ure, 437, 543–546.Lee OO, Wang Y, Yang JK et al. (2011) Pyrosequencing reveals
highly diverse and species-specific microbial communities in
sponges from the Red Sea. ISME Journal, 5, 650–664.
Margot H, Acebal C, Toril E, Amils R, Puentes JLF (2002) Con-
sistent association of crenarchaeal Archaea with sponges of
the genus Axinella. Marine Biology, 140, 739–745.Meyer B, Kuever J (2008) Phylogenetic diversity and spatial
distribution of the microbial community associated with the
Caribbean deep-water sponge Polymastia cf. corticata by 16S
rRNA, aprA, and amoA gene analysis. Microbial Ecology, 56,
306–321.
Meyer CP, Geller JB, Paulay G (2005) Fine scale endemism on
coral reefs: archipelagic differentiation in turbinid gastro-
pods. Evolution, 59, 113–125.Moitinho-Silva L, Bayer K, Cannistraci CV et al. (2014) Specific-
ity and transcriptional activity of microbiota associated with
low and high microbial abundance sponges from the Red
Sea. Molecular Ecology, 23, 1348–1363.Nicolaisen MH, Ramsing NB (2002) Denaturing gradient gel
electrophoresis (DGGE) approaches to study the diversity of
ammonia-oxidizing bacteria. Journal of Microbiological Meth-
ods, 50, 189–203.
Oros-Sichler M, Costa R, Heuer H, Smalla K (2007) Molecular
fingerprinting techniques of microbial communities. In: Mod-
ern Soil Microbiology II (eds van Elsas JD, Trevors JT, Jansson
JK), pp. 357–388. CRC Press, Boca Raton, Florida, USA.
Philippot L, Andersson SGE, Battin TJ et al. (2010) The ecologi-
cal coherence of high bacterial taxonomic ranks. Nature
Reviews Microbiology, 8, 523–529.Pires ACC, Cleary DFR, Almeida A et al. (2012) Denaturing
gradient gel electrophoresis and barcoded pyrosequencing
reveal unprecedented archaeal diversity in mangrove sedi-
ment and rhizosphere samples. Applied and Environmental
Microbiology, 78, 5520–5528.
Pita L, Turon X, L�opez-Legentil S, Erwin PM (2013) Host rules:
spatial stability of bacterial communities associated with
marine sponges (Ircinia spp.) in the Western Mediterranean
Sea. FEMS Microbiology Ecology, 86, 268–276.
Preston CM, Wu KY, Molinski TF, DeLong EF (1996) A psy-
chrophilic crenarchaeon inhabits a marine sponge: Cenarchae-
um symbiosum gen nov, sp, nov. Proceedings of the National
Academy of Sciences, USA, 93, 6241–6246.
Quince C, Lanzen A, Davenport RJ, Turnbaugh PJ (2011)
Removing noise from pyrosequenced amplicons. BMC Bioin-
formatics, 12, 38.
R Development Core Team (2012) R: A Language and Environ-
ment for Statistical Computing. R Foundation for Statistical
Computing, Vienna, Austria. Available at: http://www.
R-project.org.
Rotthauwe JH, Witzel KP, Liesack W (1997) The ammonia
monooxygenase structural gene amoA as a functional mar-
ker: molecular fine-scale analysis of natural ammonia-oxidiz-
ing populations. Applied and Environmental Microbiology, 63,
4704–4712.Schleper C, DeLong EF, Preston CM et al. (1998) Genomic
analysis reveals chromosomal variation in natural popula-
tions of the uncultured psychrophilic archaeon Cenarchaeum
symbiosum. Journal of Bacteriology, 180, 5003–5009.Schmitt S, Tsai P, Bell J et al. (2012) Assessing the complex
sponge microbiota: core, variable and species-specific bacte-
rial communities in marine sponges. ISME Journal, 6, 564–
576.
Shade A, Kent AD, Jones SE et al. (2007) Interannual dynamics
and phenology of bacterial communities in a eutrophic lake.
Limnology and Oceanography, 52, 487–494.
Siegl A, Hentschel U (2010) PKS and NRPS gene clusters from
microbial symbiont cells of marine sponges by whole gen-
ome amplification. Environmental Microbiology Reports, 2, 507–513.
Siegl A, Kamke J, Hochmuth T et al. (2011) Single-cell genom-
ics reveals the lifestyle of Poribacteria, a candidate phylum
symbiotically associated with marine sponges. ISME Journal,
5, 61–70.
Simister RL, Deines P, Botte ES, Webster NS, Taylor MW
(2012) Sponge-specific clusters revisited: a comprehensive
phylogeny of sponge-associated microorganisms. Environ-
mental Microbiology, 14, 517–524.
Steger D, Ettinger-Epstein P, Whalan S et al. (2008) Diversity
and mode of transmission of ammonia-oxidizing archaea in
marine sponges. Environmental Microbiology, 10, 1087–1094.
Taylor MW, Schupp PJ, Dahllof I, Kjelleberg S, Steinberg PD
(2004) Host specificity in marine sponge-associated bacteria,
and potential implications for marine microbial diversity.
Environmental Microbiology, 6, 121–130.
Taylor MW, Radax R, Steger D, Wagner M (2007) Sponge-asso-
ciated microorganisms: evolution, ecology, and biotechnolog-
ical potential. Microbiology and Molecular Biology Reviews, 71,
295–347.
Taylor MW, Tsai P, Simister RL et al. (2013) ‘Sponge-specific’
bacteria are widespread (but rare) in diverse marine environ-
ments. ISME Journal, 7, 438–443.Thiel V, Leininger S, Schmaljohann R, Bruemmer F, Imhoff JF
(2007) Sponge-specific bacterial associations of the Mediterra-
nean sponge Chondrilla nucula (Demospongiae, Tetractino-
morpha). Microbial Ecology, 54, 101–111.Thomas F, Hehemann J-H, Rebuffet E, Czjzek M, Michel G
(2011) Environmental and gut Bacteroidetes: the food connec-
tion. Frontiers in Microbiology, 2, 93.
Tourna M, Freitag TE, Nicol GW, Prosser JI (2008) Growth,
activity and temperature responses of ammonia-oxidizing ar-
chaea and bacteria in soil microcosms. Environmental Microbi-
ology, 10, 1357–1364.
Webster NS, Taylor MW (2012) Marine sponges and their
microbial symbionts: love and other relationships. Environ-
mental Microbiology, 14, 335–346.Webster NS, Watts JEM, Hill RT (2001) Detection and phyloge-
netic analysis of novel crenarchaeote and euryarchaeote 16S
ribosomal RNA gene sequences from a Great Barrier Reef
sponge. Marine Biotechnology, 3, 600–608.Webster NS, Negri AP, Munro M, Battershill CN (2004)
Diverse microbial communities inhabit Antarctic sponges.
Environmental Microbiology, 6, 288–300.
© 2014 John Wiley & Sons Ltd
TEMPORAL DYNAMICS OF SPONGE SYMBIONTS 15
Weisburg WG, Barns SM, Pelletier DA, Lane DJ (1991) 16S
ribosomal DNA amplification for phylogenetic study. Journal
of Bacteriology, 173, 697–703.
White JR, Patel J, Ottesen A et al. (2012) Pyrosequencing of bac-
terial symbionts within Axinella corrugata sponges: diversity
and seasonal variability. PLoS One, 7, e38204.
Yang ZY, Li ZY (2012) Spatial distribution of prokaryotic sym-
bionts and ammoxidation, denitrifier bacteria in marine
sponge Astrosclera willeyana. Scientific Reports, 2, 528.
C.C.P.H. and R.C. conceived and designed the study.
C.C.P.H. performed the laboratory experiments and
analysed the data. R.C. contributed reagents, materials
and analysis tools. C.C.P.H. and R.C. wrote the article.
Data accessibility
Sponge CO1 sequences were deposited under the NCBI
accession nos HE797930-HE797933, HG816008-
HG816010 and HG816023-HG816027. Raw pyrosequenc-
ing sequences were deposited in the NCBI Sequence
Read Archive (SRA) with the study accession no.
SRP033344. Scripts used in the analysis of 454-pyrose-
quencing data have been submitted as supporting infor-
mation (Appendix S1). Quality-filtered OTU tables and
taxonomic assignment of bacterial and archaeal OTUs
are provided as supporting information (Appendices
S3–S6). Alignment of CO1 sequences used in sponge
phylogeny is accessible as supporting information
(Appendix S7).
Supporting information
Additional supporting information may be found in the online
version of this article.
Appendix S1 Detailed 454-pyrosequencing methodology.
Appendix S2 Detailed description of PCR-DGGE results.
Appendix S3 Bacterial OTU table constructed from the full
quality-filtered data set.
Appendix S4 Taxonomic assignment of bacterial OTUs.
Appendix S5 Archaeal OTU table constructed from the full
quality-filtered data set.
Appendix S6 Taxonomic assignment of archaeal OTUs.
Appendix S7 Alignment of CO1 sequences used in sponge
phylogenetic inference.
Fig. S1 PCR-DGGE fingerprinting of bacterial 16S rRNA (a), ar-
chaeal 16S rRNA (b) and bacterial amoA (c) gene fragments
amplified from the marine sponge Sarcotragus spinosulus in
three consecutive years.
Fig. S2 Phylum- (a, b) and class-level (c, d) bacterial commu-
nity composition in Sarcotragus spinosulus in three consecutive
years using the normalized data set (3155 sequence reads per
sample).
Fig. S3 Observed and estimated (Chao1 index) richness and
diversity indices of bacterial (a,b) and archaeal (c,d) 454-py-
rosequencing OTUs (97% cut-off) detected in the marine
sponge Sarcotragus spinosulus along three consecutive years.
Fig. S4 Bacterial OTU networking and maintenance in the mar-
ine sponge Sarcotragus spinosulus across time using normalized
library sizes (3155 sequence reads per sample).
Fig. S5 The pan (left) and essential core (right) bacteriome of
Sarcotragus spinosulus.
Fig. S6 Redundancy analysis (RDA) of bacterial OTU profiles
using the normalized data set.
Table S1 Bacterial 16S rRNA gene pyrosequencing data set.
Table S2 Taxonomic classification and absolute abundance of
bacterial OTUs found exclusively in each sampling year.
Table S3 Archaeal 16S rRNA gene pyrosequencing data set.
© 2014 John Wiley & Sons Ltd
16 C. C. P . HARDOIM and R. COSTA