Temporal and spatial variation in the growth rates of Baltic herring ( Clupea harengus membras L.)...
9
T. Hakala M. Viitasalo H. Rita E. Aro J. Flinkman I. Vuorinen Temporal and spatial variation in the growth rates of Baltic herring (Clupea harengus membras L.) larvae during summer Received: 11 February 2002 / Accepted: 12 August 2002 / Published online: 26 September 2002 Ó Springer-Verlag 2002 Abstract It has been suggested that larval survival de- termines the year-class strength in most marine fish species. During their growth and development, the ability of the larvae to catch prey and avoid predation will increase. However, the factors affecting short-term changes in the growth of Baltic Sea herring have been little studied in the field. We collected Baltic herring (Clupea harengus membras L.) larvae from five different towing areas in the Archipelago Sea (SW Finland) during May and June 1989, right after the main spawning season. Twenty thousand two hundred and ten larvae were analysed and the area-specific growth rate (i.e. increase in standard length) was estimated by tracing the larval cohorts from the length–frequency data. This represents the first Baltic herring study with daily sampling during a long study period. The growth rate was related to environmental factors, such as temperature, number of zooplankters, and wind speed and direction. Large variation in larval growth rate occurred between areas: lowest and highest growth rates were 0.18 and 0.52 mm day –1 . Temperature was an important variable controlling larval-fish growth rate. An increase of one 1°C in average water temperature corresponded to an increase in growth rate of 0.043 mm day –1 . This may have been caused either by a direct temperature effect (changes in metabolic rate) or by the indirect effect of changes in food availability. We also found the densest herring populations in the areas with highest average water temperature. However, temperature and larval growth rate both increased towards the inner archipelago. Introduction In all fish species, growth rate defines the duration of the larval stage and therefore the length of time the larvae are susceptible to mortality factors, such as low tem- perature, low food availability, and predation (reviewed by Hempel 1963; Dragesund and Nakken 1971; Buckley et al. 1987; Busch et al. 1996). The ability of larvae to catch prey and avoid predation will increase during their growth and development (e.g. Blaxter 1986). Hjort (1914) presented the ‘‘critical period’’ concept, which holds that the year-class strength of fish is largely determined by survival during the early larval stage. According to Blaxter and Hempel (1963), the transition period from yolk-sac stage to external feeding is an es- pecially critical period. The failure to initiate external feeding can lead to a ‘‘point of no return’’ when the starved larva becomes too weak to feed even if enough food is available. Finally, Cushing (1975) concluded that the success or failure of the year-class is a result of the temporal ‘‘match or mismatch’’ between the abundance of the larvae and that of their prey. Year-class strength of herring (Clupea harengus harengus) has been observed to fluctuate strongly from Marine Biology (2003) 142: 25–33 DOI 10.1007/s00227-002-0933-3 Communicated by L. Hagerman, Helsingør T. Hakala (&) Department of Ecology and Systematics, Division of Hydrobiology, P.O. Box 17, University of Helsinki, 00014 Helsinki, Finland E-mail: tomi.hakala@erweko.fi Tel.: +358-40-5538422 M. Viitasalo J. Flinkman Finnish Institute of Marine Research, P.O. Box 33, 00931 Helsinki, Finland H. Rita Department of Ecology and Systematics, Division of Population Biology, P.O. Box 17, University of Helsinki, 00014 Helsinki, Finland E. Aro Finnish Game and Fisheries Institute, Fisheries Division, P.O. Box 6, 00721 Helsinki, Finland I. Vuorinen Archipelago Research Institute, University of Turku, 20014 Turku, Finland T. Hakala Keijuniityntie 5 C 14, 02130 Espoo, Finland
Transcript of Temporal and spatial variation in the growth rates of Baltic herring ( Clupea harengus membras L.)...
T. Hakala Æ M. Viitasalo Æ H. Rita Æ E. AroJ. Flinkman Æ I. Vuorinen
Temporal and spatial variation in the growth rates of Baltic herring(Clupea harengus membras L.) larvae during summer
Received: 11 February 2002 /Accepted: 12 August 2002 / Published online: 26 September 2002� Springer-Verlag 2002
Abstract It has been suggested that larval survival de-termines the year-class strength in most marine fishspecies. During their growth and development, theability of the larvae to catch prey and avoid predationwill increase. However, the factors affecting short-termchanges in the growth of Baltic Sea herring have beenlittle studied in the field. We collected Baltic herring(Clupea harengus membras L.) larvae from five differenttowing areas in the Archipelago Sea (SW Finland)during May and June 1989, right after the mainspawning season. Twenty thousand two hundred andten larvae were analysed and the area-specific growthrate (i.e. increase in standard length) was estimated bytracing the larval cohorts from the length–frequencydata. This represents the first Baltic herring study withdaily sampling during a long study period. The growthrate was related to environmental factors, such as
temperature, number of zooplankters, and wind speedand direction. Large variation in larval growth rateoccurred between areas: lowest and highest growth rateswere 0.18 and 0.52 mmÆday–1. Temperature was animportant variable controlling larval-fish growth rate.An increase of one 1�C in average water temperaturecorresponded to an increase in growth rate of0.043 mmÆday–1. This may have been caused either by adirect temperature effect (changes in metabolic rate) orby the indirect effect of changes in food availability. Wealso found the densest herring populations in the areaswith highest average water temperature. However,temperature and larval growth rate both increasedtowards the inner archipelago.
Introduction
In all fish species, growth rate defines the duration of thelarval stage and therefore the length of time the larvaeare susceptible to mortality factors, such as low tem-perature, low food availability, and predation (reviewedby Hempel 1963; Dragesund and Nakken 1971; Buckleyet al. 1987; Busch et al. 1996). The ability of larvae tocatch prey and avoid predation will increase during theirgrowth and development (e.g. Blaxter 1986). Hjort(1914) presented the ‘‘critical period’’ concept, whichholds that the year-class strength of fish is largelydetermined by survival during the early larval stage.According to Blaxter and Hempel (1963), the transitionperiod from yolk-sac stage to external feeding is an es-pecially critical period. The failure to initiate externalfeeding can lead to a ‘‘point of no return’’ when thestarved larva becomes too weak to feed even if enoughfood is available. Finally, Cushing (1975) concluded thatthe success or failure of the year-class is a result of thetemporal ‘‘match or mismatch’’ between the abundanceof the larvae and that of their prey.
Year-class strength of herring (Clupea harengusharengus) has been observed to fluctuate strongly from
Marine Biology (2003) 142: 25–33DOI 10.1007/s00227-002-0933-3
Communicated by L. Hagerman, Helsingør
T. Hakala (&)Department of Ecology and Systematics,Division of Hydrobiology, P.O. Box 17,University of Helsinki, 00014 Helsinki, Finland
E-mail: [email protected].: +358-40-5538422
M. Viitasalo Æ J. FlinkmanFinnish Institute of Marine Research,P.O. Box 33, 00931 Helsinki, Finland
H. RitaDepartment of Ecology and Systematics,Division of Population Biology, P.O. Box 17,University of Helsinki, 00014 Helsinki, Finland
E. AroFinnish Game and Fisheries Institute,Fisheries Division, P.O. Box 6, 00721 Helsinki, Finland
I. VuorinenArchipelago Research Institute,University of Turku, 20014 Turku, Finland
T. HakalaKeijuniityntie 5 C 14, 02130 Espoo, Finland
Verwendete Distiller 5.0.x Joboptions
Dieser Report wurde automatisch mit Hilfe der Adobe Acrobat Distiller Erweiterung "Distiller Secrets v1.0.5" der IMPRESSED GmbH erstellt. Sie koennen diese Startup-Datei für die Distiller Versionen 4.0.5 und 5.0.x kostenlos unter http://www.impressed.de herunterladen. ALLGEMEIN ---------------------------------------- Dateioptionen: Kompatibilität: PDF 1.2 Für schnelle Web-Anzeige optimieren: Ja Piktogramme einbetten: Ja Seiten automatisch drehen: Nein Seiten von: 1 Seiten bis: Alle Seiten Bund: Links Auflösung: [ 600 600 ] dpi Papierformat: [ 595.276 785.197 ] Punkt KOMPRIMIERUNG ---------------------------------------- Farbbilder: Downsampling: Ja Berechnungsmethode: Bikubische Neuberechnung Downsample-Auflösung: 150 dpi Downsampling für Bilder über: 225 dpi Komprimieren: Ja Automatische Bestimmung der Komprimierungsart: Ja JPEG-Qualität: Mittel Bitanzahl pro Pixel: Wie Original Bit Graustufenbilder: Downsampling: Ja Berechnungsmethode: Bikubische Neuberechnung Downsample-Auflösung: 150 dpi Downsampling für Bilder über: 225 dpi Komprimieren: Ja Automatische Bestimmung der Komprimierungsart: Ja JPEG-Qualität: Mittel Bitanzahl pro Pixel: Wie Original Bit Schwarzweiß-Bilder: Downsampling: Ja Berechnungsmethode: Bikubische Neuberechnung Downsample-Auflösung: 600 dpi Downsampling für Bilder über: 900 dpi Komprimieren: Ja Komprimierungsart: CCITT CCITT-Gruppe: 4 Graustufen glätten: Nein Text und Vektorgrafiken komprimieren: Ja SCHRIFTEN ---------------------------------------- Alle Schriften einbetten: Ja Untergruppen aller eingebetteten Schriften: Nein Wenn Einbetten fehlschlägt: Warnen und weiter Einbetten: Immer einbetten: [ ] Nie einbetten: [ ] FARBE(N) ---------------------------------------- Farbmanagement: Farbumrechnungsmethode: Alles für Farbverwaltung kennzeichnen (keine Konvertierung) Methode: Standard Arbeitsbereiche: Graustufen ICC-Profil: Dot Gain 10% RGB ICC-Profil: sRGB IEC61966-2.1 CMYK ICC-Profil: R705-Noco-gl-01-220499-ICC Geräteabhängige Daten: Einstellungen für Überdrucken beibehalten: Ja Unterfarbreduktion und Schwarzaufbau beibehalten: Ja Transferfunktionen: Anwenden Rastereinstellungen beibehalten: Ja ERWEITERT ---------------------------------------- Optionen: Prolog/Epilog verwenden: Nein PostScript-Datei darf Einstellungen überschreiben: Ja Level 2 copypage-Semantik beibehalten: Ja Portable Job Ticket in PDF-Datei speichern: Nein Illustrator-Überdruckmodus: Ja Farbverläufe zu weichen Nuancen konvertieren: Nein ASCII-Format: Nein Document Structuring Conventions (DSC): DSC-Kommentare verarbeiten: Nein ANDERE ---------------------------------------- Distiller-Kern Version: 5000 ZIP-Komprimierung verwenden: Ja Optimierungen deaktivieren: Nein Bildspeicher: 524288 Byte Farbbilder glätten: Nein Graustufenbilder glätten: Nein Bilder (< 257 Farben) in indizierten Farbraum konvertieren: Ja sRGB ICC-Profil: sRGB IEC61966-2.1 ENDE DES REPORTS ---------------------------------------- IMPRESSED GmbH Bahrenfelder Chaussee 49 22761 Hamburg, Germany Tel. +49 40 897189-0 Fax +49 40 897189-71 Email: [email protected] Web: www.impressed.de
Adobe Acrobat Distiller 5.0.x Joboption Datei
<< /ColorSettingsFile () /AntiAliasMonoImages false /CannotEmbedFontPolicy /Warning /ParseDSCComments false /DoThumbnails true /CompressPages true /CalRGBProfile (sRGB IEC61966-2.1) /MaxSubsetPct 100 /EncodeColorImages true /GrayImageFilter /DCTEncode /Optimize true /ParseDSCCommentsForDocInfo false /EmitDSCWarnings false /CalGrayProfile (Dot Gain 10%) /NeverEmbed [ ] /GrayImageDownsampleThreshold 1.5 /UsePrologue false /GrayImageDict << /QFactor 0.9 /Blend 1 /HSamples [ 2 1 1 2 ] /VSamples [ 2 1 1 2 ] >> /AutoFilterColorImages true /sRGBProfile (sRGB IEC61966-2.1) /ColorImageDepth -1 /PreserveOverprintSettings true /AutoRotatePages /None /UCRandBGInfo /Preserve /EmbedAllFonts true /CompatibilityLevel 1.2 /StartPage 1 /AntiAliasColorImages false /CreateJobTicket false /ConvertImagesToIndexed true /ColorImageDownsampleType /Bicubic /ColorImageDownsampleThreshold 1.5 /MonoImageDownsampleType /Bicubic /DetectBlends false /GrayImageDownsampleType /Bicubic /PreserveEPSInfo false /GrayACSImageDict << /VSamples [ 2 1 1 2 ] /QFactor 0.76 /Blend 1 /HSamples [ 2 1 1 2 ] /ColorTransform 1 >> /ColorACSImageDict << /VSamples [ 2 1 1 2 ] /QFactor 0.76 /Blend 1 /HSamples [ 2 1 1 2 ] /ColorTransform 1 >> /PreserveCopyPage true /EncodeMonoImages true /ColorConversionStrategy /UseDeviceIndependentColor /PreserveOPIComments false /AntiAliasGrayImages false /GrayImageDepth -1 /ColorImageResolution 150 /EndPage -1 /AutoPositionEPSFiles false /MonoImageDepth -1 /TransferFunctionInfo /Apply /EncodeGrayImages true /DownsampleGrayImages true /DownsampleMonoImages true /DownsampleColorImages true /MonoImageDownsampleThreshold 1.5 /MonoImageDict << /K -1 >> /Binding /Left /CalCMYKProfile (R705-Noco-gl-01-220499-ICC) /MonoImageResolution 600 /AutoFilterGrayImages true /AlwaysEmbed [ ] /ImageMemory 524288 /SubsetFonts false /DefaultRenderingIntent /Default /OPM 1 /MonoImageFilter /CCITTFaxEncode /GrayImageResolution 150 /ColorImageFilter /DCTEncode /PreserveHalftoneInfo true /ColorImageDict << /QFactor 0.9 /Blend 1 /HSamples [ 2 1 1 2 ] /VSamples [ 2 1 1 2 ] >> /ASCII85EncodePages false /LockDistillerParams false >> setdistillerparams << /PageSize [ 595.276 841.890 ] /HWResolution [ 600 600 ] >> setpagedevice
year to year (Anthony and Fogarty 1985; Houde 1987).Growth and survival rates have also been shown to varywithin a year-class as well (McGurk 1987; Fey 2001). Asfor Baltic herring (Clupea harengus membras L.), largevariations have been observed in juvenile and adultgrowth rates. Studies of the 1980s’ ‘‘growth anomaly’’ ofBaltic herring (Anonymous 1994; Flinkman et al. 1998)suggest that changes in predation and food conditionscaused a 50% decrease in weight-at-age (WAA) duringless than 10 years (Raid and Lankov 1995; Flinkmanet al. 1998; Cardinale and Arrhenius 2000). The con-nection between larval growth rate and WAA of olderherring is, however, unclear.
There are some studies of feeding and diet composi-tion of 0-group Baltic herring (Rudstam et al. 1992;Arrhenius and Hansson 1993; Arrhenius 1996). Arrhe-nius and Hansson (1993) suggested that larvae and ju-venile herring from the first year accounted for 45% offood consumption of the herring stock, and that achange in food selection will affect the growth rate.It has also been suggested that the growth rate of youngBaltic herring is food-limited (Kiørboe et al. 1988;Arrhenius and Hansson 1999). However, the level offood limitation in fish larvae could be regulated byvariables other than prey density alone (Leggett andDeBlois 1994). The most important of these factors aretemperature, which influences metabolic rates (Houde1989), light conditions (Fox et al. 1999) and small-scaleturbulence of the water, which influence rates of en-counter with prey (e.g. MacKenzie et al. 1994). In thecoastal area these factors are typically different in shal-low and deep water. Shallow coastal waters are poten-tially important nursery areas for Baltic herring larvae(Urho and Hilden 1990). There is often more zoo-plankton available (Frank 1988) and temperature isusually higher. Temperature may have a direct effect ongrowth rate by regulating the growth and intensity ofdigestive processes, or an indirect effect on the avail-ability of the food.
We have studied the growth rate of Baltic herringlarvae by daily sampling in May and June 1989, rightafter the spring spawning season (Sjoblom 1961; Ojaveerand Simm 1975). The study area represented a transitionregion between the ‘‘inner’’ and ‘‘middle’’ archipelagoes(Jaatinen 1960); it is characterised by strong physical,chemical and biological gradients. The growth rate ofherring larvae was compared to variations in potentiallyimportant environmental factors, such as temperature,zooplankton abundance and wind speed and direction,as well as density of larval herrings. The aim was to findout which factors determine the growth rate and survivalof the Baltic herring larvae during one season.
Materials and methods
Sampling
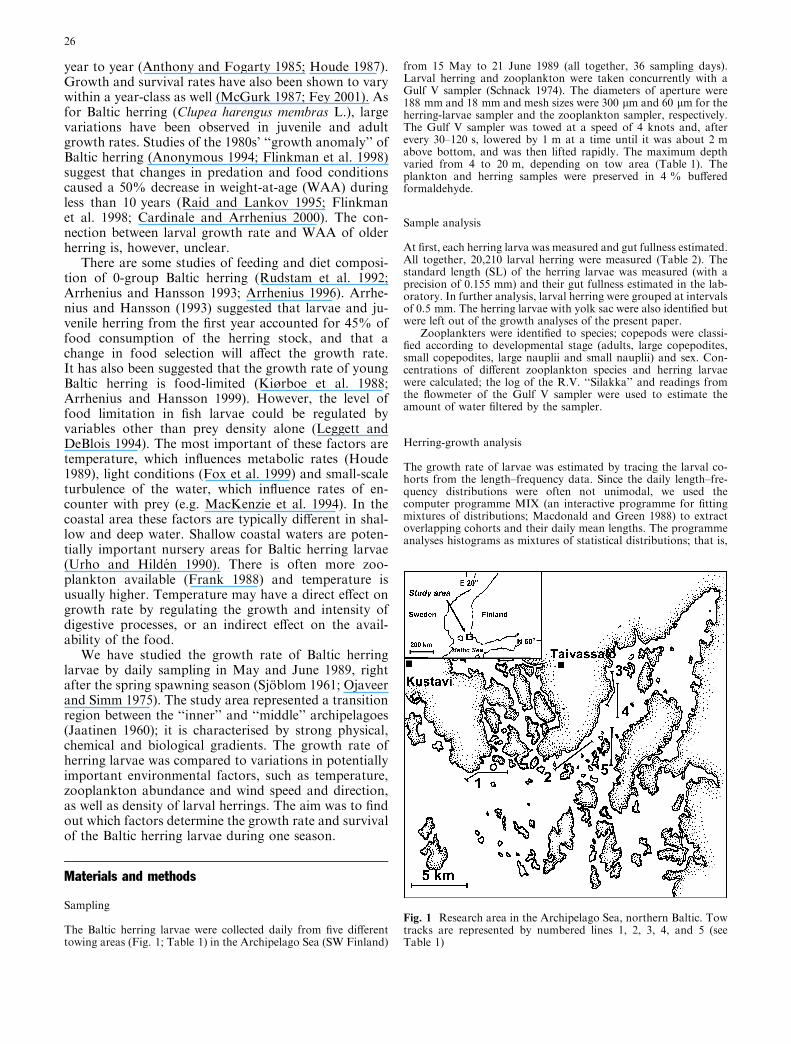
The Baltic herring larvae were collected daily from five differenttowing areas (Fig. 1; Table 1) in the Archipelago Sea (SW Finland)
from 15 May to 21 June 1989 (all together, 36 sampling days).Larval herring and zooplankton were taken concurrently with aGulf V sampler (Schnack 1974). The diameters of aperture were188 mm and 18 mm and mesh sizes were 300 lm and 60 lm for theherring-larvae sampler and the zooplankton sampler, respectively.The Gulf V sampler was towed at a speed of 4 knots and, afterevery 30–120 s, lowered by 1 m at a time until it was about 2 mabove bottom, and was then lifted rapidly. The maximum depthvaried from 4 to 20 m, depending on tow area (Table 1). Theplankton and herring samples were preserved in 4 % bufferedformaldehyde.
Sample analysis
At first, each herring larva was measured and gut fullness estimated.All together, 20,210 larval herring were measured (Table 2). Thestandard length (SL) of the herring larvae was measured (with aprecision of 0.155 mm) and their gut fullness estimated in the lab-oratory. In further analysis, larval herring were grouped at intervalsof 0.5 mm. The herring larvae with yolk sac were also identified butwere left out of the growth analyses of the present paper.
Zooplankters were identified to species; copepods were classi-fied according to developmental stage (adults, large copepodites,small copepodites, large nauplii and small nauplii) and sex. Con-centrations of different zooplankton species and herring larvaewere calculated; the log of the R.V. ‘‘Silakka’’ and readings fromthe flowmeter of the Gulf V sampler were used to estimate theamount of water filtered by the sampler.
Herring-growth analysis
The growth rate of larvae was estimated by tracing the larval co-horts from the length–frequency data. Since the daily length–fre-quency distributions were often not unimodal, we used thecomputer programme MIX (an interactive programme for fittingmixtures of distributions; Macdonald and Green 1988) to extractoverlapping cohorts and their daily mean lengths. The programmeanalyses histograms as mixtures of statistical distributions; that is,
Fig. 1 Research area in the Archipelago Sea, northern Baltic. Towtracks are represented by numbered lines 1, 2, 3, 4, and 5 (seeTable 1)
26
by finding a set of overlapping component distributions that givesthe best fit to the histogram. We calculated the average length in-crease for each cohort separately. A cohort was here identified if itwas possible to follow the growth linearly during at least 6 con-secutive days. Average growth rate was then defined as the averagelarval length increase divided by the number of days in each period.
Larval herring growth (increase in SL) was assumed to be linear(Peltonen 1990; Fey 2001) and linear models were fitted to the best-fitted mean lengths given by the MIX programme. Analysis ofvariance (ANOVA) and covariance (ANCOVA) were used to studydifferences in temperature and growth rate among and withinsampling areas. Simple and multiple regressions were used to ex-amine the effects of temperature and other environmental variableson the growth rate.
Below we use the term ‘‘short-term’’ to describe growth ratescalculated over periods of a few weeks; that is, to separate thegrowth rate studied from the variation in interseasonal and inter-annual growth rates .
Background data
Water temperature (�C) was measured daily from surface to bot-tom (in most cases at 1-m intervals) and this average was used infurther analysis. The observations of air temperature, as well aswind speed and wind direction, are from the data base of theFinnish Meteorological Institute. There is no meteorological sta-tion near the sampling areas, so we used an average from the twoclosest meteorological stations, Turku airport and Uto Island. Theairport is situated on the mainland and Uto on the outer edge ofarchipelago, about 40 and 80 km from the study area, respectively.Wind-direction measurements were made daily at 1200 hours.
Water temperature and other environmental variables (airtemperature, wind speed, wind direction and number of zoo-plankters in different size categories) were compared, by a t-test,among and within the towing areas (analysis of variance) and be-tween the beginning (15 May–3 June) and the end (4 June–21 June)of the study period. Also, interactions among different environ-mental factors were studied with multiple linear-regression models.
Results
Abiotic environment
Water temperature increased steadily in every towingarea during the study period (Fig. 2A). There was asignificant difference in water temperature betweentowing areas (ANOVA, F4,170=30.0, P<0.001). Fur-ther, the change in water temperature from the begin-ning to the end of the study period was different betweenareas. The study areas formed two groups with respectto average water temperature (Tukey HSD, P<0.001):lower mean temperature in areas 1 and 2, higher in areas3, 4 and 5 (Fig. 2A). The areas 1 and 2 were also deeper(maximum depth 20 m) than the areas 3, 4 and 5(maximum depths 4 to 10 m; Table 1).
Wind velocity was quite stable: no increasing or de-creasing trend was observed during the study period.Average wind speed was 4.7±1.2 mÆs–1 (mean ± SD).Highest wind velocities were 6.8 and 9.5 mÆs–1 at Turkuairport and Uto station, respectively. Prevailing winddirection was from the south-west at both stations(25%). Easterly winds were rare (19%) and westerlywinds were predominant (54%).
Zooplankton
The number of zooplankters varied strongly betweentowing areas and during the sampling period (two-wayANOVA, F4,75=29.3, P<0.001 and F1,75=27.4,
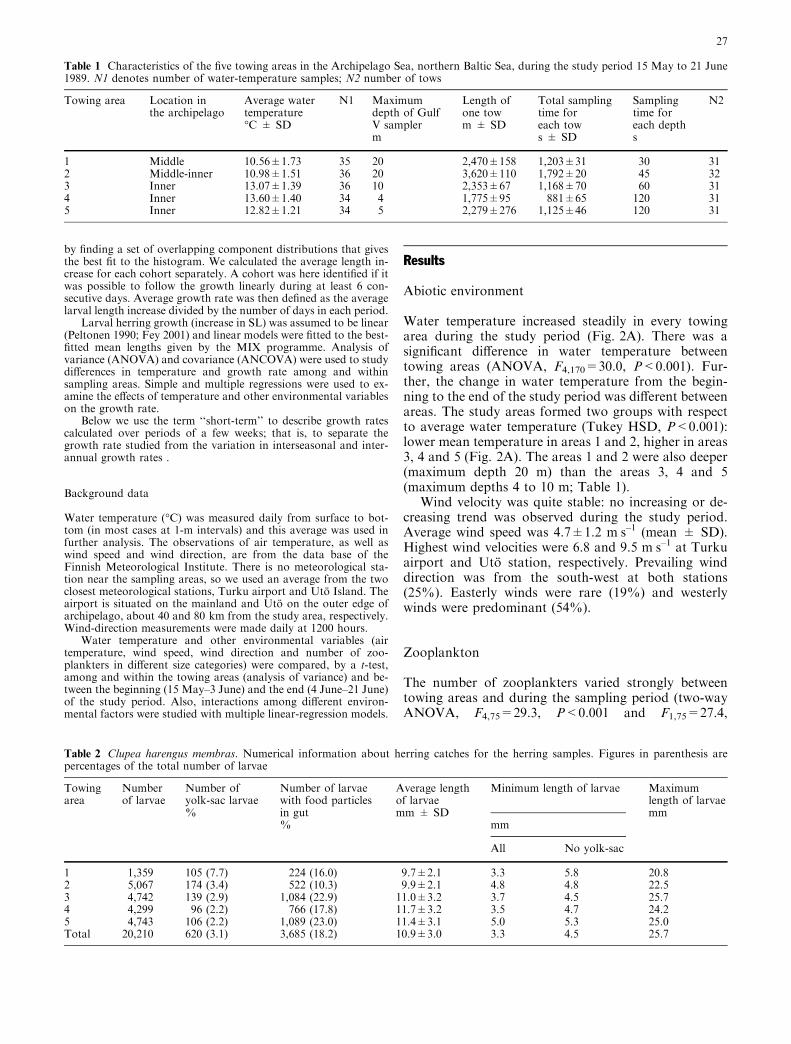
Table 2 Clupea harengus membras. Numerical information about herring catches for the herring samples. Figures in parenthesis arepercentages of the total number of larvae
Towingarea
Numberof larvae
Number ofyolk-sac larvae%
Number of larvaewith food particlesin gut
Average lengthof larvaemm ± SD
Minimum length of larvae Maximumlength of larvaemm
% mm
All No yolk-sac
1 1,359 105 (7.7) 224 (16.0) 9.7±2.1 3.3 5.8 20.82 5,067 174 (3.4) 522 (10.3) 9.9±2.1 4.8 4.8 22.53 4,742 139 (2.9) 1,084 (22.9) 11.0±3.2 3.7 4.5 25.74 4,299 96 (2.2) 766 (17.8) 11.7±3.2 3.5 4.7 24.25 4,743 106 (2.2) 1,089 (23.0) 11.4±3.1 5.0 5.3 25.0Total 20,210 620 (3.1) 3,685 (18.2) 10.9±3.0 3.3 4.5 25.7
Table 1 Characteristics of the five towing areas in the Archipelago Sea, northern Baltic Sea, during the study period 15 May to 21 June1989. N1 denotes number of water-temperature samples; N2 number of tows
Towing area Location inthe archipelago
Average watertemperature�C ± SD
N1 Maximumdepth of GulfV sampler
Length ofone towm ± SD
Total samplingtime foreach tow
Samplingtime foreach depth
N2
m s ± SD s
1 Middle 10.56±1.73 35 20 2,470±158 1,203±31 30 312 Middle-inner 10.98±1.51 36 20 3,620±110 1,792±20 45 323 Inner 13.07±1.39 36 10 2,353±67 1,168±70 60 314 Inner 13.60±1.40 34 4 1,775±95 881±65 120 315 Inner 12.82±1.21 34 5 2,279±276 1,125±46 120 31
27
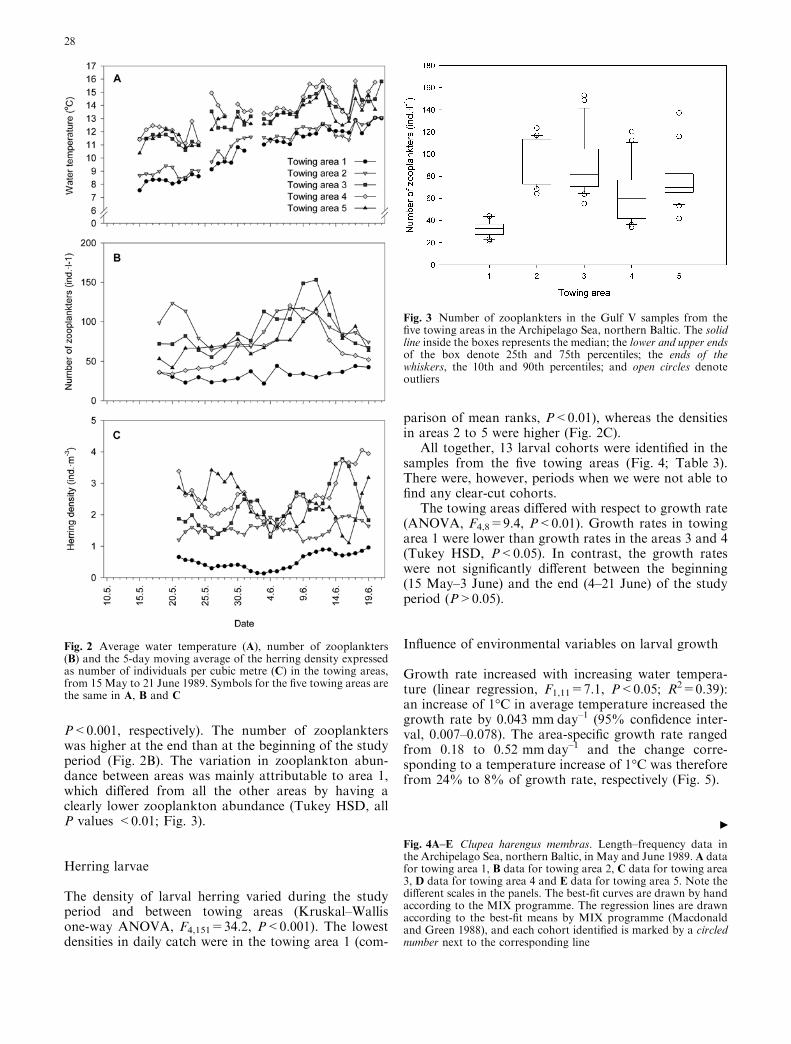
P<0.001, respectively). The number of zooplankterswas higher at the end than at the beginning of the studyperiod (Fig. 2B). The variation in zooplankton abun-dance between areas was mainly attributable to area 1,which differed from all the other areas by having aclearly lower zooplankton abundance (Tukey HSD, allP values <0.01; Fig. 3).
Herring larvae
The density of larval herring varied during the studyperiod and between towing areas (Kruskal–Wallisone-way ANOVA, F4,151=34.2, P<0.001). The lowestdensities in daily catch were in the towing area 1 (com-
parison of mean ranks, P<0.01), whereas the densitiesin areas 2 to 5 were higher (Fig. 2C).
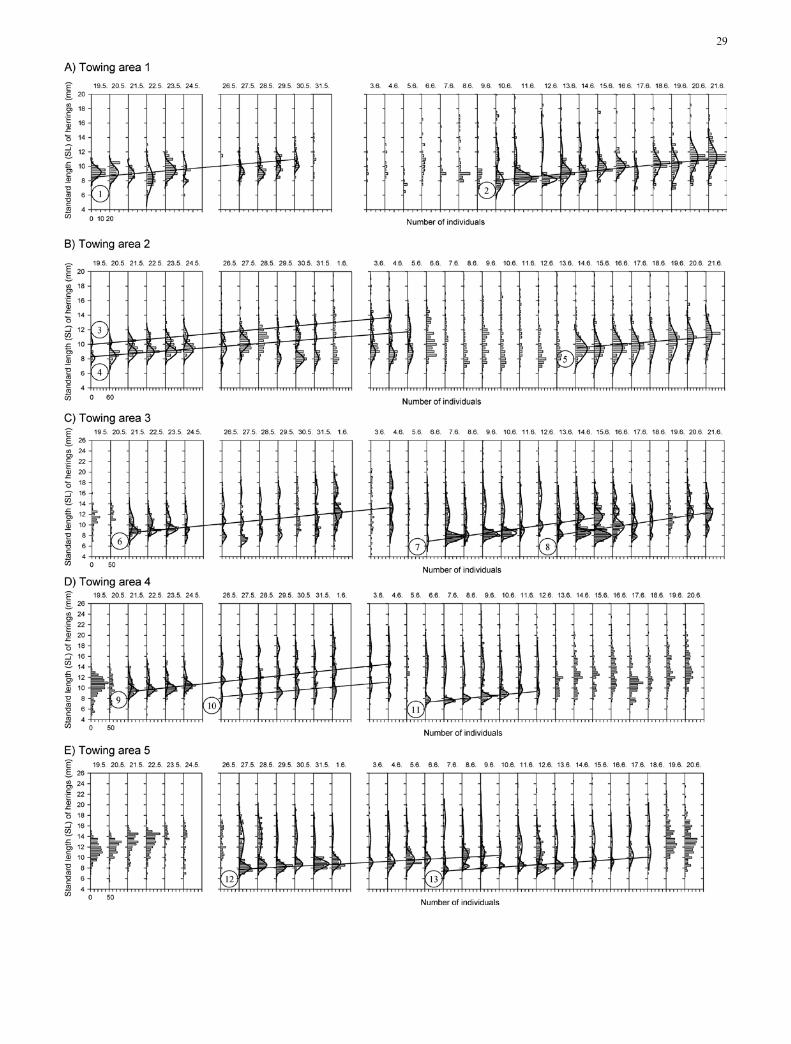
All together, 13 larval cohorts were identified in thesamples from the five towing areas (Fig. 4; Table 3).There were, however, periods when we were not able tofind any clear-cut cohorts.
The towing areas differed with respect to growth rate(ANOVA, F4,8=9.4, P<0.01). Growth rates in towingarea 1 were lower than growth rates in the areas 3 and 4(Tukey HSD, P<0.05). In contrast, the growth rateswere not significantly different between the beginning(15 May–3 June) and the end (4–21 June) of the studyperiod (P>0.05).
Influence of environmental variables on larval growth
Growth rate increased with increasing water tempera-ture (linear regression, F1,11=7.1, P<0.05; R2=0.39):an increase of 1�C in average temperature increased thegrowth rate by 0.043 mmÆday–1 (95% confidence inter-val, 0.007–0.078). The area-specific growth rate rangedfrom 0.18 to 0.52 mmÆday–1 and the change corre-sponding to a temperature increase of 1�C was thereforefrom 24% to 8% of growth rate, respectively (Fig. 5).
Fig. 2 Average water temperature (A), number of zooplankters(B) and the 5-day moving average of the herring density expressedas number of individuals per cubic metre (C) in the towing areas,from 15 May to 21 June 1989. Symbols for the five towing areas arethe same in A, B and C
Fig. 3 Number of zooplankters in the Gulf V samples from thefive towing areas in the Archipelago Sea, northern Baltic. The solidline inside the boxes represents the median; the lower and upper endsof the box denote 25th and 75th percentiles; the ends of thewhiskers, the 10th and 90th percentiles; and open circles denoteoutliers
Fig. 4A–E Clupea harengus membras. Length–frequency data inthe Archipelago Sea, northern Baltic, in May and June 1989. A datafor towing area 1, B data for towing area 2, C data for towing area3, D data for towing area 4 and E data for towing area 5. Note thedifferent scales in the panels. The best-fit curves are drawn by handaccording to the MIX programme. The regression lines are drawnaccording to the best-fit means by MIX programme (Macdonaldand Green 1988), and each cohort identified is marked by a circlednumber next to the corresponding line
c
28
29

When towing area was included in the model (anal-ysis of covariance), the regression coefficient (slope) ofwater temperature was only 0.026 (F5,7=9.7, P<0.2).This was almost 50% less than when towing area wasnot included. This means that the differences in growthrates between the towing areas are partly due to differ-ences in their temperature. Towing-area-specific slopesvaried from –0.010 (area 2) to 0.089 (area 3). The vari-ation between the slopes was almost significant(F4,3=8.82, P<0.06). To summarise, the analysis ofcovariance suggests that environmental differences be-tween areas were responsible for changes in growthrates.
When larval-herring density was added to the re-gression on growth rate, the regression coefficient ofwater temperature decreased to 0.0036, i.e. more than90%, and was no longer statistically significant(P=0.90). Larval-herring density was significant whenused alone (t-test, P<0.01), but not in the bivariatemodel (P=0.14). Inclusion of zooplankton as a thirdexplanatory variable resulted in a minor change in thecoefficient of water temperature and did not affect itssignificance.
Discussion and conclusions
High-frequency sampling is needed for analysing larvalcohorts and determining larval-herring growth rate fromfield data (Fey 2001). To our knowledge, there has beenno other study of the Baltic Sea with as long a contin-uous daily larval sampling as ours. Our data showedthat this high sampling frequency is needed to followcohorts, since even very distinct larval cohorts maydisappear if samples are taken one or more weeks apart(see Peltonen 1990; Arrhenius and Hansson 1999). Thismay be caused by active horizontal migration, or bylarvae being advected with water masses (Munk et al.1986; Kiørboe et al. 1988; Urho and Hilden 1990).
Consequently, Munk et al. (1986), sampling herring inthe North Sea, found clear polymodality in only a smallproportion of samples. According to Munk et al. (1986),McGurk (1987), Peltonen (1990) and Fey (2001), sepa-rate larval-herring cohorts are an expression of discretespawning periods. In the present study we were able tocatch larval herring from five areas almost continuouslyduring the whole study period. We were able to distin-guish larval-herring cohorts from daily data. However,in some cases, we were not able to identify cohortsbecause of small sample size or almost equal lengthdistribution.
We also demonstrated statistically significant short-term changes in larval Baltic herring growth rates.Lowest and highest growth rates were 0.18 mmÆday–1
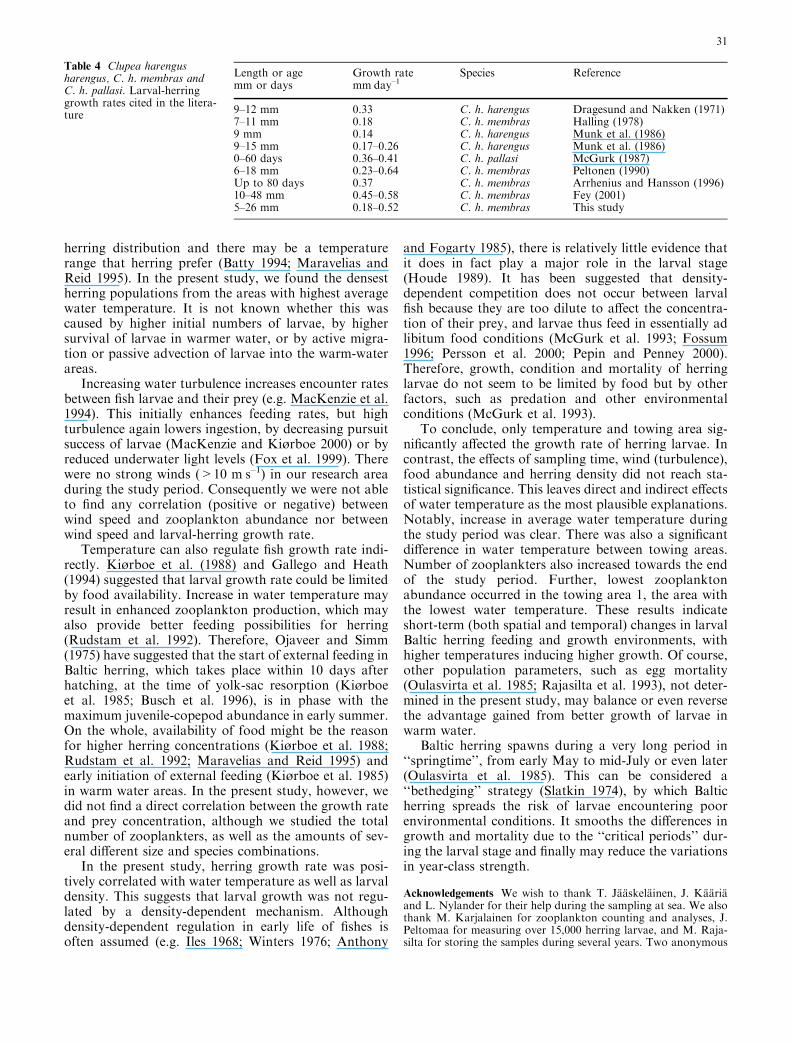
and 0.52 mmÆday–1 from tow areas 5 and 3, respectively.In general, the growth rates were similar to those cited inthe literature (Table 4, and references therein). The lar-val herrings showed a linear average growth, i.e. linearincrease in SL, which has also been demonstrated byPeltonen (1990), Arrhenius and Hansson (1996) and Fey(2001). From our data we could estimate that, if bothcohorts, with growth rates of 0.18 mmÆday–1 and0.52 mmÆday–1, started from, for example, 10.0 mm SL,they would during 2 weeks attain lengths of 10.5 and15.3 mm, respectively.
Our results suggest that temperature is an importantenvironmental variable controlling larval-fish growthrate. A 1�C increase in temperature can increase thegrowth rate by 0.043 mmÆday–1. Increase in growth ratecan be achieved through a higher metabolic rate inwarmer temperatures within optimum thermal bound-aries (Wootton 1990; Larsson and Berglund 1998, Stei-narsson and Bjornsson 1999). On the other hand, theincrease in growth in higher temperature must be sup-ported by increased food ingestion as well (Houde 1989).Conversely, fish growth can also be limited by temper-ature, even if food is unlimited (Kitchell et al. 1977).Water temperature may also have a direct effect on
Table 3 Clupea harengus membras. Growth rate data (in mm day–1)for the 13 cohorts identified from the five towing areas. Growth rateis a coefficient from the linear-regression analysis between the aver-age length in a cohort and a sampling day (see Fig. 4). All regressionswere statistically significant (P<0.01)
Towingarea
Cohortnumber
Growthrate
R2 df Period
1 1 0.23 0.80 9 19.5.89–30.5.892 0.27 0.87 11 10.6.89–21.6.89
2 3 0.24 0.96 12 19.5.89–4.6.894 0.21 0.94 13 19.5.89–5.6.895 0.21 0.94 7 14.6.89–21.6.89
3 6 0.34 0.95 10 21.5.89–4.6.897 0.52 0.93 9 6.6.89–15.6.898 0.52 0.98 7 13.6.89–21.6.89
4 9 0.40 0.95 12 21.5.89–4.6.8910 0.33 0.77 8 26.5.89–4.6.8911 0.43 0.91 6 6.6.89–11.6.89
5 12 0.18 0.88 13 27.5.89–10.6.8913 0.23 0.75 11 7.6.89–18.6.89
Fig. 5 Clupea harengus membras. Larval-herring growth rate inrelation to water temperature from the 13 identified cohorts (1–13)
30
herring distribution and there may be a temperaturerange that herring prefer (Batty 1994; Maravelias andReid 1995). In the present study, we found the densestherring populations from the areas with highest averagewater temperature. It is not known whether this wascaused by higher initial numbers of larvae, by highersurvival of larvae in warmer water, or by active migra-tion or passive advection of larvae into the warm-waterareas.
Increasing water turbulence increases encounter ratesbetween fish larvae and their prey (e.g. MacKenzie et al.1994). This initially enhances feeding rates, but highturbulence again lowers ingestion, by decreasing pursuitsuccess of larvae (MacKenzie and Kiørboe 2000) or byreduced underwater light levels (Fox et al. 1999). Therewere no strong winds (>10 mÆs–1) in our research areaduring the study period. Consequently we were not ableto find any correlation (positive or negative) betweenwind speed and zooplankton abundance nor betweenwind speed and larval-herring growth rate.
Temperature can also regulate fish growth rate indi-rectly. Kiørboe et al. (1988) and Gallego and Heath(1994) suggested that larval growth rate could be limitedby food availability. Increase in water temperature mayresult in enhanced zooplankton production, which mayalso provide better feeding possibilities for herring(Rudstam et al. 1992). Therefore, Ojaveer and Simm(1975) have suggested that the start of external feeding inBaltic herring, which takes place within 10 days afterhatching, at the time of yolk-sac resorption (Kiørboeet al. 1985; Busch et al. 1996), is in phase with themaximum juvenile-copepod abundance in early summer.On the whole, availability of food might be the reasonfor higher herring concentrations (Kiørboe et al. 1988;Rudstam et al. 1992; Maravelias and Reid 1995) andearly initiation of external feeding (Kiørboe et al. 1985)in warm water areas. In the present study, however, wedid not find a direct correlation between the growth rateand prey concentration, although we studied the totalnumber of zooplankters, as well as the amounts of sev-eral different size and species combinations.
In the present study, herring growth rate was posi-tively correlated with water temperature as well as larvaldensity. This suggests that larval growth was not regu-lated by a density-dependent mechanism. Althoughdensity-dependent regulation in early life of fishes isoften assumed (e.g. Iles 1968; Winters 1976; Anthony
and Fogarty 1985), there is relatively little evidence thatit does in fact play a major role in the larval stage(Houde 1989). It has been suggested that density-dependent competition does not occur between larvalfish because they are too dilute to affect the concentra-tion of their prey, and larvae thus feed in essentially adlibitum food conditions (McGurk et al. 1993; Fossum1996; Persson et al. 2000; Pepin and Penney 2000).Therefore, growth, condition and mortality of herringlarvae do not seem to be limited by food but by otherfactors, such as predation and other environmentalconditions (McGurk et al. 1993).
To conclude, only temperature and towing area sig-nificantly affected the growth rate of herring larvae. Incontrast, the effects of sampling time, wind (turbulence),food abundance and herring density did not reach sta-tistical significance. This leaves direct and indirect effectsof water temperature as the most plausible explanations.Notably, increase in average water temperature duringthe study period was clear. There was also a significantdifference in water temperature between towing areas.Number of zooplankters also increased towards the endof the study period. Further, lowest zooplanktonabundance occurred in the towing area 1, the area withthe lowest water temperature. These results indicateshort-term (both spatial and temporal) changes in larvalBaltic herring feeding and growth environments, withhigher temperatures inducing higher growth. Of course,other population parameters, such as egg mortality(Oulasvirta et al. 1985; Rajasilta et al. 1993), not deter-mined in the present study, may balance or even reversethe advantage gained from better growth of larvae inwarm water.
Baltic herring spawns during a very long period in‘‘springtime’’, from early May to mid-July or even later(Oulasvirta et al. 1985). This can be considered a‘‘bethedging’’ strategy (Slatkin 1974), by which Balticherring spreads the risk of larvae encountering poorenvironmental conditions. It smooths the differences ingrowth and mortality due to the ‘‘critical periods’’ dur-ing the larval stage and finally may reduce the variationsin year-class strength.
Acknowledgements We wish to thank T. Jaaskelainen, J. Kaariaand L. Nylander for their help during the sampling at sea. We alsothank M. Karjalainen for zooplankton counting and analyses, J.Peltomaa for measuring over 15,000 herring larvae, and M. Raja-silta for storing the samples during several years. Two anonymous
Table 4 Clupea harengusharengus, C. h. membras andC. h. pallasi. Larval-herringgrowth rates cited in the litera-ture
Length or age Growth rate Species Referencemm or days mmÆday–1
9–12 mm 0.33 C. h. harengus Dragesund and Nakken (1971)7–11 mm 0.18 C. h. membras Halling (1978)9 mm 0.14 C. h. harengus Munk et al. (1986)9–15 mm 0.17–0.26 C. h. harengus Munk et al. (1986)0–60 days 0.36–0.41 C. h. pallasi McGurk (1987)6–18 mm 0.23–0.64 C. h. membras Peltonen (1990)Up to 80 days 0.37 C. h. membras Arrhenius and Hansson (1996)10–48 mm 0.45–0.58 C. h. membras Fey (2001)5–26 mm 0.18–0.52 C. h. membras This study
31
referees are acknowledged for helpful comments. This study wasfinanced by the Walter and Andree de Nottbeck Foundation andthe Academy of Finland. The sampling complied with the currentlaws of Finland.
References
Anonymous (1994) Growth changes of herring in the Baltic. Nor-dic Council of Ministers, Copenhagen, TemaNord 532:1–122
Anthony VC, Fogarty MJ (1985) Environmental effects onrecruitment, growth, and vulnerability of Atlantic herring(Clupea harengus) in the Gulf of Maine region. Can J FishAquat Sci 42:158–173
Arrhenius F (1996) Diet composition and food selectivity of0-group herring (Clupea harengus L.) and sprat (Sprattussprattus (L.)) in the northern Baltic Sea. ICES J Mar Sci53:701–712
Arrhenius F, Hansson S (1993) Food consumption of larval, youngand adult herring and sprat in the Baltic Sea. Mar Ecol Prog Ser96:125–137
Arrhenius F, Hansson S (1996) Growth and seasonal changes inenergy content of young Baltic Sea herring (Clupea harengusL.). ICES J Mar Sci 53:792–801
Arrhenius F, Hansson S (1999) Growth of Baltic Sea young-of-the-year herring Clupea harengus is resource limited. Mar Ecol ProgSer 191:295–299
Batty RS (1994) The effect of temperature on the vertical distri-bution of larval herring (Clupea harengus L.). J Exp Mar BiolEcol 177:269–276
Blaxter JHS (1986) Development of sense organs and behaviour ofteleost larvae with special reference to feeding and predatoravoidance. Trans Am Fish Soc 115:98–114
Blaxter JHS, Hempel G (1963) The influence of egg size on herringlarvae (Clupea harengus L.). J Cons Perm Int Explor Mer28:211–240
Buckley LJ, Halavik TA, Smigielski AS, Laurence GC (1987)Growth and survival of the larvae of three species of temperatemarine fishes reared at discrete prey densities. Am Fish SocSymp 2:82–92
Busch A, Jonsson N, Lorenz T, Suchau A, Holst A (1996) Mor-tality in successive cohorts of young Baltic herring larvae.Meeresbiol Beitr 4:17–31
Cardinale M, Arrhenius F (2000) Decreasing weight-at-age ofAtlantic herring (Clupea harengus) from the Baltic Sea between1986 and 1996: a statistical analysis. ICES J Mar Sci 57:882–893
Cushing DH (1975) Marine ecology and fisheries. CambridgeUniversity Press, Cambridge
Dragesund O, Nakken O (1971) Mortality of herring during theearly stage in 1967. Rapp P-V Reun Cons Perm Int Explor Mer160:142–146
Fey DP (2001) Differences in temperature conditions and somaticgrowth rate of larval and early juvenile spring-spawned herringfrom the Vistula Lagoon, Baltic Sea, manifested in the otolithto fish size relationship. J Fish Biol 58:1257–1273
Flinkman J, Aro E, Vuorinen I, Viitasalo M (1998) Changes innorthern Baltic zooplankton and herring nutrition from 1980sto 1990s: top-down and bottom-up processes at work. Mar EcolProg Ser 165:127–136
Fossum P (1996) A study of first-feeding herring (Clupea harengusL.) larvae during the period 1985–1993. ICES JMar Sci 53:51–59
Fox CJ, Harrop R, Wimpenny A (1999) Feeding ecology of herring(Clupea harengus) larvae in the turbid Blackwater Estuary. MarBiol 134:353–365
Frank KT (1988) Independent distributions of fish larvae and theirprey: natural paradox or sampling artifact? Can J Fish AquatSci 45:48–59
Gallego A, Heath MR (1994) The development of schooling beha-viour in Atlantic herringClupea harengus. J Fish Biol 45:569–588
Halling F (1978) Autumn spawning herring larvae and theabundance of copepods off the Aland islands in September–
November 1977. ICES C M 1978/J:20 Baltic Fish Committee(mimeograph)
Hempel G (1963) The causes of changes in recruitment. Rapp P-VReun Cons Perm Int Explor Mer 154:17–22
Hjort J (1914) Fluctuations in the great fisheries of Northern Eu-rope viewed on light of biological research. Rapp P-V ReunCons Perm Int Explor Mer 20:1–228
Houde ED (1987) Fish early life dynamics and recruitment vari-ability. Am Fish Soc Symp 2:17–29
Houde ED (1989) Comparative growth, mortality, and energeticsof marine fish larvae: temperature and implied latitudinal ef-fects. Fish Bull US 87:471–495
Iles TD (1968) Growth studies on North Sea herring. II. 0-groupgrowth of East Anglian herring. J Cons Perm Int Explor Mer32:98–116
Jaatinen S (1960) Atlas of the archipelago of south-western Finland(in Swedish). Map 15. Helsinki, Finland
Kiørboe T, Munk P, Støettrup JG (1985) First feeding by larvalherring Clupea harengus L. Dana 5:95–107
Kiørboe T, Munk P, Richardson K, Christensen V, Paulsen H(1988) Plankton dynamics and larval herring growth,drift and survival in a frontal area. Mar Ecol Prog Ser44:205–219
Kitchell JF, Stewart DJ, Weininger D (1977) Applications of abioenergetics model to yellow perch (Perca flavescens) andwalleye (Stizostedion vitreum vitreum). J Fish Res Bd Can34:1922–1935
Larsson D, Berglund I (1998) Growth and food consumption of0+ Arctic charr fed pelleted or natural food at six differenttemperatures. J Fish Biol 52:230–242
Leggett WC, DeBlois E (1994) Recruitment in marine fishes: is itregulated by starvation and predation in the egg and larvalstages? Neth J Sea Res 32:119–134
Macdonald PDM, Green PEJ (1988) User’s guide to programMIX: an interactive program for fitting mixtures of distribu-tions. Guenther, Hamilton, Ontario, Canada
MacKenzie BR, Kiørboe T (2000) Larval fish feeding and turbu-lence: a case for the downside. Limnol Oceanogr 45:1–10
MacKenzie BR, Miller TJ, Cyr S, Leggett WC (1994) Evidence fora dome-shaped relationship between turbulence and larval fishingestion rates. Limnol Oceanogr 39:1790–1799
Maravelias CD, Reid DG (1995) Relationship between herring(Clupea harengus, L.) distribution and sea surface salinityand temperature in the northern North Sea. Sci Mar 59:427–438
McGurk MD (1987) Age and growth of Pacific herring larvaebased on length–frequency analysis and otolith ring number.Environ Biol Fish 20:33–47
McGurk MD, Paul AJ, Coyle KO, Ziemann DA, Haldorson LJ(1993) Relationships between prey concentration and growth,condition, and mortality of Pacific herring, Clupea pallasi, lar-vae in an Alaskan subarctic embayment. Can J Fish Aquat Sci50:163–180
Munk P, Christensen V, Paulsen H (1986) Studies of a larval her-ring (Clupea harengus L.) patch in the Buchan area. II. Growthmortality and drift of larvae. Dana 6:11–24
Ojaveer E, Simm M (1975) Effect of zooplankton abundance andtemperature on time and place of reproduction of Baltic herringgroups. Merentutkimuslait Julk/Havsforskningsinst Skr239:139–145
Oulasvirta P, Rissanen J, Parmanne R (1985) Spawning of Balticherring (Clupea harengus L.) in the western part of the Gulf ofFinland. Finn Fish Res 5:41–54
Peltonen H (1990) Growth and mortality of Baltic herring (Clupeaharengus L.) larvae in the Archipelago Sea estimated fromlength–frequency data. Finn Fish Res 11:35–44
Pepin P, Penney R (2000) Feeding by a larval fish community:impact on zooplankton. Mar Ecol Prog Ser 204:199–212
Persson L, Bystrom P, Wahlstrom E, Nijlunsing A, Rosema S(2000) Resource limitation during early ontogeny: constraintsinduced by growth capacity in larval and juvenile fish. Oeco-logia 122:459–469
32

Raid T, Lankov A (1995) Recent changes in the growth and feedingof Baltic herring and sprat in the northeastern Baltic Sea. ProcEst Acad Sci Ecol 5:38–55
Rajasilta M, Eklund J, Hanninen J, Kurkilahti M, Kaaria J,Rannikko P, Soikkeli M (1993) Spawning of herring (Clupeaharengus membras L.) in the Archipelago Sea. ICES J Mar Sci50:233–246
Rudstam LG, Hansson S, Johansson S, Larsson U (1992) Dy-namics of planktivory in a coastal area of the northern BalticSea. Mar Ecol Prog Ser 80:159–173
Schnack D (1974) On the biology of herring larvae in Schlei Fjord,western Baltic. Rapp P-V Reun Cons Perm Int Explor Mer166:114–123
Sjoblom V (1961) Wanderungen des Stromlings (Clupea harengusL.) in einigen Scharen- und Hochseegebieten der Nordlichen
Ostsee. Merentutkimuslait Julk/Havsforskningsinst Skr199:166–182
Slatkin M (1974) Hedging one’s evolutionary bets. Nature 250:704–705
Steinarsson A, Bjornsson A (1999) The effects of temperature andsize on growth and mortality of cod larvae. J Fish Biol 55:100–109
Urho L, Hilden M (1990) Distribution patterns of Baltic herringlarvae, Clupea harengus L., in the coastal waters off Helsinki,Finland. J Plankton Res 12:41–54
Winters GH (1976) Recruitment mechanism of southern Gulf of St.Lawrence Atlantic herring (Clupea harengus harengus). J FishRes Bd Can 33:1751–1763
Wootton RJ (1990) Ecology of teleost fishes. Chapman & Hall,London
33