Temperature-dependent development, cold tolerance, and potential distribution of Gratiana boliviana...
8
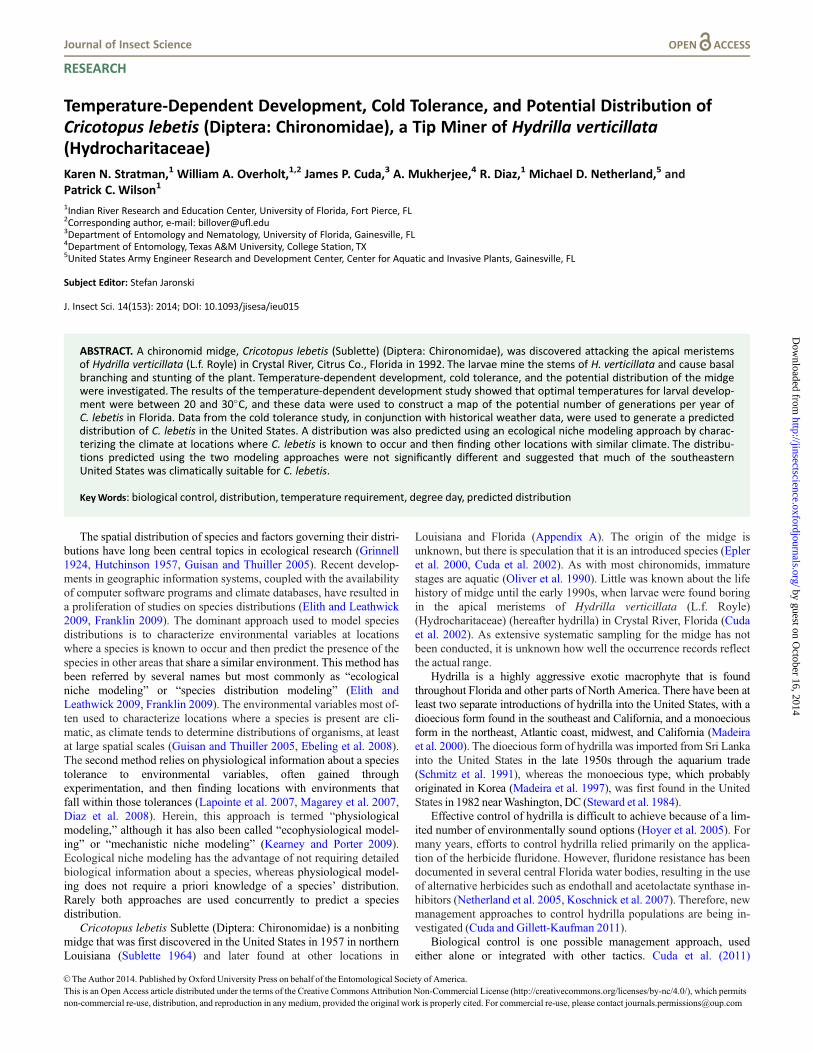
Temperature-Dependent Development, Cold Tolerance, and Potential Distribution of Cricotopus lebetis (Diptera: Chironomidae), a Tip Miner of Hydrilla verticillata (Hydrocharitaceae) Karen N. Stratman, 1 William A. Overholt, 1,2 James P. Cuda, 3 A. Mukherjee, 4 R. Diaz, 1 Michael D. Netherland, 5 and Patrick C. Wilson 1 1 Indian River Research and Education Center, University of Florida, Fort Pierce, FL 2 Corresponding author, e-mail: billover@ufl.edu 3 Department of Entomology and Nematology, University of Florida, Gainesville, FL 4 Department of Entomology,Texas A&M University, College Station, TX 5 United States Army Engineer Research and Development Center, Center for Aquatic and Invasive Plants, Gainesville, FL Subject Editor: Stefan Jaronski J. Insect Sci. 14(153): 2014; DOI: 10.1093/jisesa/ieu015 ABSTRACT. A chironomid midge, Cricotopus lebetis (Sublette) (Diptera: Chironomidae), was discovered attacking the apical meristems of Hydrilla verticillata (L.f. Royle) in Crystal River, Citrus Co., Florida in 1992.The larvae mine the stems of H. verticillata and cause basal branching and stunting of the plant. Temperature-dependent development, cold tolerance, and the potential distribution of the midge were investigated. The results of the temperature-dependent development study showed that optimal temperatures for larval develop- ment were between 20 and 30 C, and these data were used to construct a map of the potential number of generations per year of C. lebetis in Florida. Data from the cold tolerance study, in conjunction with historical weather data, were used to generate a predicted distribution of C. lebetis in the United States. A distribution was also predicted using an ecological niche modeling approach by charac- terizing the climate at locations where C. lebetis is known to occur and then finding other locations with similar climate. The distribu- tions predicted using the two modeling approaches were not significantly different and suggested that much of the southeastern United States was climatically suitable for C. lebetis. Key Words: biological control, distribution, temperature requirement, degree day, predicted distribution The spatial distribution of species and factors governing their distri- butions have long been central topics in ecological research (Grinnell 1924, Hutchinson 1957, Guisan and Thuiller 2005). Recent develop- ments in geographic information systems, coupled with the availability of computer software programs and climate databases, have resulted in a proliferation of studies on species distributions (Elith and Leathwick 2009, Franklin 2009). The dominant approach used to model species distributions is to characterize environmental variables at locations where a species is known to occur and then predict the presence of the species in other areas that share a similar environment. This method has been referred by several names but most commonly as “ecological niche modeling” or “species distribution modeling” (Elith and Leathwick 2009, Franklin 2009). The environmental variables most of- ten used to characterize locations where a species is present are cli- matic, as climate tends to determine distributions of organisms, at least at large spatial scales (Guisan and Thuiller 2005, Ebeling et al. 2008). The second method relies on physiological information about a species tolerance to environmental variables, often gained through experimentation, and then finding locations with environments that fall within those tolerances (Lapointe et al. 2007, Magarey et al. 2007, Diaz et al. 2008). Herein, this approach is termed “physiological modeling,” although it has also been called “ecophysiological model- ing” or “mechanistic niche modeling” (Kearney and Porter 2009). Ecological niche modeling has the advantage of not requiring detailed biological information about a species, whereas physiological model- ing does not require a priori knowledge of a species’ distribution. Rarely both approaches are used concurrently to predict a species distribution. Cricotopus lebetis Sublette (Diptera: Chironomidae) is a nonbiting midge that was first discovered in the United States in 1957 in northern Louisiana (Sublette 1964) and later found at other locations in Louisiana and Florida (Appendix A). The origin of the midge is unknown, but there is speculation that it is an introduced species (Epler et al. 2000, Cuda et al. 2002). As with most chironomids, immature stages are aquatic (Oliver et al. 1990). Little was known about the life history of midge until the early 1990s, when larvae were found boring in the apical meristems of Hydrilla verticillata (L.f. Royle) (Hydrocharitaceae) (hereafter hydrilla) in Crystal River, Florida (Cuda et al. 2002). As extensive systematic sampling for the midge has not been conducted, it is unknown how well the occurrence records reflect the actual range. Hydrilla is a highly aggressive exotic macrophyte that is found throughout Florida and other parts of North America. There have been at least two separate introductions of hydrilla into the United States, with a dioecious form found in the southeast and California, and a monoecious form in the northeast, Atlantic coast, midwest, and California (Madeira et al. 2000). The dioecious form of hydrilla was imported from Sri Lanka into the United States in the late 1950s through the aquarium trade (Schmitz et al. 1991), whereas the monoecious type, which probably originated in Korea (Madeira et al. 1997), was first found in the United States in 1982 near Washington, DC (Steward et al. 1984). Effective control of hydrilla is difficult to achieve because of a lim- ited number of environmentally sound options (Hoyer et al. 2005). For many years, efforts to control hydrilla relied primarily on the applica- tion of the herbicide fluridone. However, fluridone resistance has been documented in several central Florida water bodies, resulting in the use of alternative herbicides such as endothall and acetolactate synthase in- hibitors (Netherland et al. 2005, Koschnick et al. 2007). Therefore, new management approaches to control hydrilla populations are being in- vestigated (Cuda and Gillett-Kaufman 2011). Biological control is one possible management approach, used either alone or integrated with other tactics. Cuda et al. (2011) V C The Author 2014. Published by Oxford University Press on behalf of the Entomological Society of America. This is an Open Access article distributed under the terms of the Creative Commons Attribution Non-Commercial License (http://creativecommons.org/licenses/by-nc/4.0/), which permits non-commercial re-use, distribution, and reproduction in any medium, provided the original work is properly cited. For commercial re-use, please contact [email protected] Journal of Insect Science RESEARCH by guest on October 16, 2014 http://jinsectscience.oxfordjournals.org/ Downloaded from
-
Upload
independent -
Category
Documents
-
view
0 -
download
0
Transcript of Temperature-dependent development, cold tolerance, and potential distribution of Gratiana boliviana...
Temperature-Dependent Development Cold Tolerance and Potential Distribution ofCricotopus lebetis (Diptera Chironomidae) a Tip Miner of Hydrilla verticillata(Hydrocharitaceae)
Karen N Stratman1 William A Overholt12 James P Cuda3 A Mukherjee4 R Diaz1 Michael D Netherland5 andPatrick C Wilson1
1Indian River Research and Education Center University of Florida Fort Pierce FL2Corresponding author e-mail billoverufledu3Department of Entomology and Nematology University of Florida Gainesville FL4Department of Entomology Texas AampM University College Station TX5United States Army Engineer Research and Development Center Center for Aquatic and Invasive Plants Gainesville FL
Subject Editor Stefan Jaronski
J Insect Sci 14(153) 2014 DOI 101093jisesaieu015
ABSTRACT A chironomid midge Cricotopus lebetis (Sublette) (Diptera Chironomidae) was discovered attacking the apical meristemsof Hydrilla verticillata (Lf Royle) in Crystal River Citrus Co Florida in 1992 The larvae mine the stems of H verticillata and cause basalbranching and stunting of the plant Temperature-dependent development cold tolerance and the potential distribution of the midgewere investigated The results of the temperature-dependent development study showed that optimal temperatures for larval develop-ment were between 20 and 30C and these data were used to construct a map of the potential number of generations per year ofC lebetis in Florida Data from the cold tolerance study in conjunction with historical weather data were used to generate a predicteddistribution of C lebetis in the United States A distribution was also predicted using an ecological niche modeling approach by charac-terizing the climate at locations where C lebetis is known to occur and then finding other locations with similar climate The distribu-tions predicted using the two modeling approaches were not significantly different and suggested that much of the southeasternUnited States was climatically suitable for C lebetis
KeyWords biological control distribution temperature requirement degree day predicted distribution
The spatial distribution of species and factors governing their distri-butions have long been central topics in ecological research (Grinnell1924 Hutchinson 1957 Guisan and Thuiller 2005) Recent develop-ments in geographic information systems coupled with the availabilityof computer software programs and climate databases have resulted ina proliferation of studies on species distributions (Elith and Leathwick2009 Franklin 2009) The dominant approach used to model speciesdistributions is to characterize environmental variables at locationswhere a species is known to occur and then predict the presence of thespecies in other areas that share a similar environment This method hasbeen referred by several names but most commonly as ldquoecologicalniche modelingrdquo or ldquospecies distribution modelingrdquo (Elith andLeathwick 2009 Franklin 2009) The environmental variables most of-ten used to characterize locations where a species is present are cli-matic as climate tends to determine distributions of organisms at leastat large spatial scales (Guisan and Thuiller 2005 Ebeling et al 2008)The second method relies on physiological information about a speciestolerance to environmental variables often gained throughexperimentation and then finding locations with environments thatfall within those tolerances (Lapointe et al 2007 Magarey et al 2007Diaz et al 2008) Herein this approach is termed ldquophysiologicalmodelingrdquo although it has also been called ldquoecophysiological model-ingrdquo or ldquomechanistic niche modelingrdquo (Kearney and Porter 2009)Ecological niche modeling has the advantage of not requiring detailedbiological information about a species whereas physiological model-ing does not require a priori knowledge of a speciesrsquo distributionRarely both approaches are used concurrently to predict a speciesdistribution
Cricotopus lebetis Sublette (Diptera Chironomidae) is a nonbitingmidge that was first discovered in the United States in 1957 in northernLouisiana (Sublette 1964) and later found at other locations in
Louisiana and Florida (Appendix A) The origin of the midge isunknown but there is speculation that it is an introduced species (Epleret al 2000 Cuda et al 2002) As with most chironomids immaturestages are aquatic (Oliver et al 1990) Little was known about the lifehistory of midge until the early 1990s when larvae were found boringin the apical meristems of Hydrilla verticillata (Lf Royle)(Hydrocharitaceae) (hereafter hydrilla) in Crystal River Florida (Cudaet al 2002) As extensive systematic sampling for the midge has notbeen conducted it is unknown how well the occurrence records reflectthe actual range
Hydrilla is a highly aggressive exotic macrophyte that is foundthroughout Florida and other parts of North America There have been atleast two separate introductions of hydrilla into the United States with adioecious form found in the southeast and California and a monoeciousform in the northeast Atlantic coast midwest and California (Madeiraet al 2000) The dioecious form of hydrilla was imported from Sri Lankainto the United States in the late 1950s through the aquarium trade(Schmitz et al 1991) whereas the monoecious type which probablyoriginated in Korea (Madeira et al 1997) was first found in the UnitedStates in 1982 nearWashington DC (Steward et al 1984)
Effective control of hydrilla is difficult to achieve because of a lim-ited number of environmentally sound options (Hoyer et al 2005) Formany years efforts to control hydrilla relied primarily on the applica-tion of the herbicide fluridone However fluridone resistance has beendocumented in several central Florida water bodies resulting in the useof alternative herbicides such as endothall and acetolactate synthase in-hibitors (Netherland et al 2005 Koschnick et al 2007) Therefore newmanagement approaches to control hydrilla populations are being in-vestigated (Cuda and Gillett-Kaufman 2011)
Biological control is one possible management approach usedeither alone or integrated with other tactics Cuda et al (2011)
VC The Author 2014 Published by Oxford University Press on behalf of the Entomological Society of America
This is an Open Access article distributed under the terms of the Creative Commons Attribution Non-Commercial License (httpcreativecommonsorglicensesby-nc40) which permitsnon-commercial re-use distribution and reproduction in any medium provided the original work is properly cited For commercial re-use please contact journalspermissionsoupcom
Journal of Insect Science
RESEARCH
by guest on October 16 2014
httpjinsectscienceoxfordjournalsorgD
ownloaded from
demonstrated that in the laboratory C lebetis was able to suppress thegrowth of hydrilla bygt90 and thus the midge may have value for bi-ological control This could be accomplished by augmentation of exist-ing populations in areas where the midge already occurs or introducingthe midge into areas where it does not occur Temperature will influencethe midgersquos population growth and to a large extent determine limitsto the midgersquos spatial distribution but there is no information on theeffect of temperature of the life history ofC lebetis
The purpose of this study was to determine the influence of tempera-ture on survival and developmental rate of C lebetis and to use this in-formation to predict areas conducive to its establishment andpopulation growth In addition the midgersquos potential distribution waspredicted using an ecological niche model by extrapolation of theclimate at locations where it is known to occur to other locationswhere its presence has not been studied The predicted distributions ofC lebetis derived from physiological data and from the ecologicalniche model were compared to examine the degree of overlap betweenthe two models
Materials and MethodsSource and Culturing of H verticillata and C lebetis Hydrilla was
collected from Lake Tohopekaliga Osceola Co Florida (282 N814 W) and C lebetis was collected from Lake Rowell BradfordCo Florida (299 N 821 W) Both cultures were maintained at theUniversity of Floridarsquos Biological Control Research and ContainmentLaboratory Fort Pierce FL Hydrilla was propagated from stems(10ndash30 cm) collected at the field site and planted in 100 by 90 cm(diameter by height) pots containing a layer of potting soil (5 cm)covered by a layer of sand (2 cm) The pots were placed in a largeplastic livestock watering tank (378 liters) filled to a depth of 50 cmwith well water and covered with 60 shade cloth to suppress algalgrowth Growing tips were harvested as needed
C lebetis was reared by placing hydrilla tips in well water in a plas-tic container (34 by 28 by 15 cm length by weight by height) heldinside a cubic cage (50 cm each side) constructed from polyvinyl chlor-ide tubing covered with fine nylon mesh cloth C lebetis egg masseswere added to the containers and larvae colonized the hydrilla tipsEmerging adults were collected using an aspirator and transferred to a250ml separatory funnel with 15ml of well water Females ovipos-ited on the water surface and egg masses were collected by opening thestopcock of the separatory funnel (see Cuda et al 2002 for furtherdetails on rearing)Survival and Developmental Time Temperature-dependent devel-
opment of C lebetis was investigated during a single study in environ-mental chambers maintained at a constant photoperiod (1410 [LD] h)and 10 constant temperatures (10 15 20 22 25 27 30 32 35 3661C) Healthy undamaged plant tips 4ndash6 cm in length were placedindividually in 35-ml test tubes filled with well water as described byCuda et al (2002) Each test tube was placed in a rack that held 40tubes Two newly hatched larvae were transferred to each plant tipusing a pipette Once the larvae were introduced into the tubes a capwith ventilation holes was placed on each tube One hydrilla tip wastypically used but on a few occasions destroyed tips were replaced toallow midge larvae to complete development to adulthood The propor-tion of individuals surviving at different temperatures was comparedwith a chi-square test followed by Tukeyrsquos procedure for separation ofproportions (Elliott and Reisch 2006) Developmental rate at differenttemperatures was analyzed using linear regression The linear portion(15ndash35C) of the developmental rate curve [R(T)frac14 athorn bT)] wasmodeled using least squares regression where Tfrac14 temperatureafrac14 intercept and bfrac14 slope The lower temperature threshold for devel-opment was estimated as the intersection of the regression line and thex-axis (R(T)frac14 0) Degree-days were calculated as the inverse slope ofthe fitted regression line (Campbell et al 1974)
The relationship between developmental rate and temperaturewas also examined with the nonlinear Briere-1 model which allows
estimation of upper and lower developmental thresholds (Briere et al1999) The model is defined as R(T)frac14 aT(T T0) (TL T)12 whereRfrac14 developmental rate Tfrac14 temperature T0frac14 base temperaturethreshold TLfrac14 lethal temperature and afrac14 empirical constant T0 andTL were initially set to 6 and 36C respectively and the equation wasthen solved iteratively using PROCNONLIN (SAS Institute 2008)
Estimation of Generations per Year Daily minimum and maximumtemperatures from Florida were obtained from 91 weather stationsthrough the Applied Climate Information System (Climate Informationfor Management and Operational Decisions Southeast RegionalClimate Center httpacissercccom) Daily minimum and maximumtemperatures were averaged from the last 5 to 10 yr (1 January 2002 to1 January 2012) depending the availability of data which provided 365values for maximum and minimum temperatures for each station
The DegDay program version 101 which is an Excel (MicrosoftRedmond WA) application developed by University of California-Davis (httpbiometucdavisedu) was used to calculate accumulateddegree-days for C lebetis This application uses the upper and lowertemperature thresholds for an organism and daily average of minimumand maximum temperatures to calculate accumulated degree-days(Baskerville and Emin 1969) The lower and upper temperature thresh-olds were estimated from the Briere-1 nonlinear model as 95 and360C respectively The linear regression model was used to calculatethe degree-days (K) required for one generation of C lebetis[R(T)frac14 abT] as Kfrac14 1b (Campbell et al 1974) The prediction of thenumber of generations per year was calculated by dividing the cumula-tive degree-days per station by K
Weather station name latitude longitude and number of C lebetisgenerations per year were imported into ArcGIS 90 (ESRI IncRedlands CA) The imported file was converted to a shape file usingthe ADD X-Y DATA function followed by the selection of the StatePlane Projection A shapefile of the border of Florida was obtainedfrom the AWhere Continental database (AWHERE Inc Denver CO)and used to delineate the range of predictions
The geostatistical analysis function in ArcGIS (ESRI Inc) was usedto generate a predicted distribution of C lebetis generations acrossFlorida Values at unsampled locations were estimated by interpolationof values at sample locations The inverse-distance-weighted (IDW)deterministic method was used where predictions are made by mathe-matical formulas that generate weighted averages of nearby known val-ues The IDW model gives more influence to points that are closer thanto ones that are farther away The parameters used in the IDW analysiswere as follows
bull The number of stations used for interpolation was set to a maximumof 15 and minimum of 10
bull The power optimization option was selected generating a powervalue of pfrac14 2 This weights weather station values proportional tothe inverse distance raised to the power p
bull The search neighborhood shape was circular because there were nodirectional influences on the weighting of number of generationsper station Ellipse parameters were set to angle 0 major and minorsemiaxis 1020596
Cold Tolerance A cold tolerance study was conducted using second-to fourth-stage larvae Although there is no information on overwinter-ing of C lebetis larvae were used for the cold tolerance study becausethis is the typical overwintering life stage of chironomids (Pinder 1986Tokeshi 1995) Four second- to fourth-stage larvae were placed inside a35-ml vial containing two hydrilla tips and well water Insects wereacclimated from 20C to the final temperature at intervals of 5C every2 h Larvae were exposed to three constant temperatures (5 75 and10C) for 05 1 2 4 8 16 and 32 d In total five vials of four insectswere assayed at each time interval at the constant temperatures of 5 and75C After each exposure time insects were placed at room tempera-ture and survival was assessed by observing for movement once the
2 JOURNAL OF INSECT SCIENCE VOLUME 14
by guest on October 16 2014
httpjinsectscienceoxfordjournalsorgD
ownloaded from
water reached room temperature The effect of exposure times on midgesurvival was analyzed using logistic regression (PROC LOGISTICSAS Institute 2008) The LT90 (lethal times of 90 of tested individu-als) at 5 and 75C were used to predict isothermal lines delineatingregions in the southeastern United States favorable for C lebetis estab-lishment based on historical weather data A model was created in theNorth Carolina State University Animal Plant Health InspectionService Plant Pest Forecasting System (NAPPFAST) an internet-based system that allows users to mine weather databases and link thisinformation with templates for biological modeling (Borchert andMagarey 2007 Magarey et al 2007) Using NAPPFAST the numberof days at or below 5 and 75C were recorded at weather stationsacross the southeastern United States A probability map was generatedusing the last 10 yr of weather data to examine the frequency of occur-rence of reaching the LT90 in at least 5 out of 10 yr The map wasimported into ArcGIS 90 and converted to an ESRI band interleavedby line (bil) raster layer The area within the continental USA south ofthe projected LT90 line was extracted from the layer using the ldquoextractrdquotool in the Spatial Analyst Tools The raster was then reclassified tomake all raster cell values equal to one to provide a continuous gridlayer of the predicted areaEcological Niche Modeling Geographic coordinates of locations
where C lebetis was collected were obtained from voucher specimensliterature and known field collection sites including our own data anddata provided by Dana Denson (Reedy Creek Improvement District)Doug Strom (Water and Air Associates Inc) and Robert Rutter(Florida Department of Environmental Protection see Appendix A forlist of records) The Maximum Entropy Species Distribution Model(MaxEnt version 333e) was used to analyze climate at locationswhere C lebetiswas known to occur and find locations with similar cli-mate to predict the potential distribution of C lebetis (Phillips et al2006) MaxEnt estimates the probability of a species presence by con-trasting the probability density of environmental variables acrossknown occurrences of the species to that of randomly selected pseudo-absences from the target landscape or model background Followingthe method used in Webber et al (2011) Koppen-Geiger climate zonepolygons (Koppen 1936 available from CliMond 10rsquo historical climatedata Kriticos et al 2011) containing one or more records of C lebetiswas used as a background (see Appendix B) The default setting ofMaxEnt was used (Mukherjee et al 2011) Six temperature-related bio-climatic variables (Table 1) with a spatial resolution of 10 arc-secondwere used to predict C lebetis distribution (Kriticos et al 2011) Onlytemperature variables were included in the model because the midge isaquatic in its immature life stages and therefore precipitation-relatedvariables were assumed to have minimal direct effect Air temperaturewas used rather than water temperature because no large-scale spatiallayer of water temperature was available and water surface temperaturetends to be well correlated with air temperature (McCombie 1959)The prediction was limited to the southeastern United States to avoidextrapolation beyond known occurrences The continuous probabilityprediction generated by MaxEnt was converted to binary (presence or
absence) prediction using the lowest presence threshold defined as theminimum nonzero predictive value received by any known occurrence(Pearson et al 2007)
Comparison of Distributions Predicted from Cold Tolerance Dataand from Ecological Niche Modeling Following Mukherjee et al
(2012) overlap in bioclimatic space predicted by the MaxEnt ecologi-cal niche model and the NAPPFAST cold tolerance model were exam-ined by principal component analysis (PCA) of a covariance matrix ofthe six bioclimatic variables A Monte-Carlo test with 99 repeats(afrac14 005) was used to determine the statistical difference between thecentroids of the climatic polygons predicted by MaxEnt and the
Table 1 Bioclimatic variables and their loadings on three PCA axes used to examine the similarity between the distributions predicted bythe MaxEnt ecological niche model and the NAPPFAST physiological model
Climate variables Variable descriptions Axis 1 (81) Axis 2 (16) Axis 3 (2)
Bio1 Annual mean temperature 0955 0283 0078Bio4 Temperature seasonality (SD 100) 0936 0322 0142Bio6 Min temperature of coldest month 0991 0066 0105Bio7 Temperature annual range 0907 0373 0195Bio10 Mean temperature of warmest quarter 0510 0858 0064Bio11 Mean temperature of coldest quarter 0994 0003 0106
Valuesgt 0 indicate a positive contribution whereas those lt0 indicate a negative contribution to the axis Values in parenthesis denote the percent of varia-bility described by each axis cumulatively explaining 99 of variability
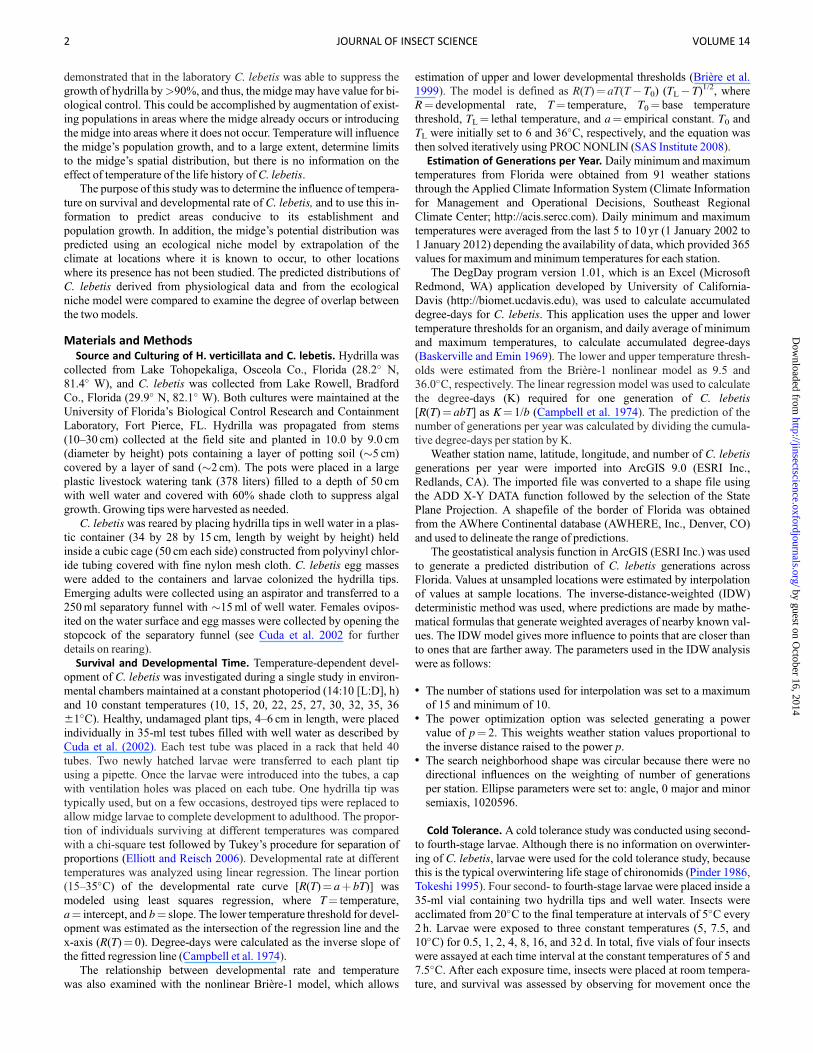
Fig 1 Percent survival of C lebetis larvae at constant temperaturesDifferent letters above bars represent statistically different means(analysis of variance and Student-Newman-Keuls (SNK) testPlt 001) Error bars6 SEM
Fig 2 Developmental rate of C lebetis larvae at constanttemperatures between 15 and 35C
2014 STRATMAN ET AL OPTIMAL TEMPERATURE CONDITIONS FOR C LEBETIS 3
by guest on October 16 2014
httpjinsectscienceoxfordjournalsorgD
ownloaded from
NAPPFAST models (Mukherjee et al 2012) Convex hulls were con-structed to delimit the climate space predicted under each approachClimatic variation within a climate space was illustrated with a 15 SDinertia ellipse around the centroid of climate space Correlation circleswere constructed to indicate the contribution of each climatic variableto the PCA axes To examine spatial coincidence between MaxEnt andNAPPFAST predictions centroids of grid cells predicted by eachmodel were extracted Spatial intersection between model predictionswas examined by calculating the percentage of centroid overlap and thepercentages of unique centroids for each model
ResultsSurvival and Developmental Time Larval C lebetis survival varied
with temperature (v2frac14 956 Plt 00001 Fig 1) Larvae could notcomplete development at low and high temperature extremes (10Cand 36C respectively) Only a single individual was able to completedevelopment at 35C Survival to adulthood was highest at tempera-tures between 20 and 30C and survival rate peaked at 75ndash80(Fig 1) Survival rate was approximately halved at the low and hightemperature thresholds of 5 and 32C respectively The developmentrate increased with increasing temperature until reaching 32C(F16frac14 155 Plt 0008 Fig 2) Degree-day requirements (K) were cal-culated to be 495
The Briere-1 model fit the data well with a pseudo R2frac14 076(Institute for Digital Research and Education University of Californiaat Los Angeles [IDRE] 2012) The estimated lower and upper develop-mental thresholds were 95 and 360C respectively (Fig 3) These val-ues were very similar to those found in the laboratory tests (Fig 1) Themodel showed that the rate of development increased with temperatureuntil the curve reached an optimum of about 300C and then decreasedrapidly as the temperature approached the upper developmental thresh-old (Fig 3)
Based on degree-day requirements C lebetis is predicted tocomplete several generations per year in Florida ranging from 68 to117 with the most generations estimated for the southern portion ofthe state and the fewest in the panhandle (Fig 4) Florida countieslocated south of Palm Beach County had the highest number of esti-mated generations ranging from 102 to 117 Counties in the middleportion of the state are predicted to support 82ndash102 generationsper year
Cold Tolerance After 4 d at 5C larvae survival rapidly decreased(max-rescaled R2frac14 076 Fig 5A) Only 50 and 10 of larvae wereable to survive for 8 and 16 d respectively No insects were able to sur-vive after 32-d exposure to 5C (Fig 5A) After 16 d at 75C the
Fig 4 Predicted number of generations per year of C lebetis in Florida
Fig 3 Briere-1 nonlinear model of the relationship of temperatureand developmental rate of C lebetis The estimated upper and lowerthresholds are 360 and 95C respectively
4 JOURNAL OF INSECT SCIENCE VOLUME 14
by guest on October 16 2014
httpjinsectscienceoxfordjournalsorgD
ownloaded from
survival of larvae remained close to 100 (max-scaled R2frac14 088Fig 5B) The isothermal lines showed that at both 5 and 75C 90mortality of C lebetis was predicted to occur along a line running fromsoutheastern South Carolina extending through the middle of GeorgiaAlabama andMississippi northern Louisiana and through the mid-sec-tion of Texas (Fig 6) Similar to the NAPPFAST model MaxEnt pre-dicted the distribution of C lebetis in the much of southeastern UnitedStates (Fig 6)
Comparison of Distributions Predicted From Cold Tolerance Dataand From Ecological Niche Modeling PCA resulted in three signifi-
cant axes explaining 99 of variability (Table 1) Graphical representa-tion of climate space across first two components showed no significantdifference in climate space predicted by the MaxEnt and NAPPFASTmodels (Fig 7) As evident by the extensive overlap of predicted cli-mate spaces no difference between the climate spaces was found by thebetween-class analysis of variance using 99 Monte-Carlo randomiza-tions (between-class inertia percentagefrac14 009 Pfrac14 012) Of all thegrid centroids 814 were predicted by both MaxEnt and NAPPFASTmodels (Fig 6) The MaxEnt model predicted 169 unique centroidsand the NAPPFASTmodel 17
DiscussionTemperature is a critical factor that influences insect distributions
(Andrewartha and Birch 1954 Munroe 1984) Understanding the ther-mal requirements for C lebetis is an important step for predicting themidgersquos distribution Water temperatures during the winter monthsthroughout Florida range from 8 to 15C (Beaver et al 1981) and thesetemperatures are mostly above the lower developmental threshold of95C The predicted number of generations per year of C lebetisincreased as latitude decreased suggesting that the midge may reachhigher densities in south Florida than further north However insummer months maximum water temperatures in Florida lakes rangeas high as 30ndash35C (Beaver et al 1981) which approaches the esti-mated upper developmental threshold of 36C and includes the tem-perature at which the midgersquos development rate began to slow (32C)Water temperatures in hydrilla mats near the water surface tend to behigher than water temperatures at a 1-m depth in hydrilla stands or atthe surface in open water (Bowes et al 1979 Cuda et al 2008)Temperatures reaching 45C in vegetation mats have been reported(Wheeler and Center 2001) which is well above the upper lethalthreshold of C lebetis Wheeler and Center (2001) partially attributedthe poor performance of the introduced biological control agent ofhydrilla Hydrellia pakistanae Deonier (Diptera Ephydridae) to hightemperatures in hydrilla mats Likewise C lebetis is likely to sufferhigh mortality during summer months particularly in south Floridaresulting in possible local extirpation Although there is no informationavailable on the dispersal ability of C lebetis in general chironomidsare considered to be weak flyers (Delettre and Morvan 2000) Thushigh temperatures could play a critical role in determining the perform-ance and persistence ofC lebetis in Florida and other areas where watertemperatures approach or exceed the upper lethal threshold
The physiological model based on cold tolerance of midge larvaepredicted survival of the midge in much of the southeastern UnitedStates The area south of the LT90 isothermal line includes all ofFlorida about one-half of Georgia Alabama and Mississippi most ofLouisiana and the southern half of Texas A reasonable prediction for
Fig 5 Survival of C lebetis larvae at different exposure times at (A)5C and (B) 75C Single dots are observed values and lines areexpected value of the logistic regression Maximum survival occurredat 75C with an exposure time of 16 d
Fig 6 Predicted distributions of C lebetis based on the NAPPFAST model using the area south of the LT90 isothermal line for survival oflarvae at 5C and the predicted distribution based on the MaxEnt ecological niche model using six climate variables (see text) Values inparentheses following the legends for the NAPPFAST and MaxEnt predictions indicate percent of unique grid cells predicted by each method
2014 STRATMAN ET AL OPTIMAL TEMPERATURE CONDITIONS FOR C LEBETIS 5
by guest on October 16 2014
httpjinsectscienceoxfordjournalsorgD
ownloaded from
areas that would support positive population growth of C lebetiswouldbe below the LT90 at 5
C Lapointe et al (2007) used a combination ofLT50 and LT95 values along with field observations to predict areassuitable for the establishment of the introduced root weevil Diaprepesabbreviatus (L) (Coleoptera Curculionidae) in Texas Arizona andCalifornia and Diaz et al (2008) speculated that the introduced biologi-cal control agent Gratiana boliviana Spaeth (ColeopteraChrysomelidae) would establish south of LT50 or LT90 isothermallines Our prediction for C lebetis is based on the assumption that tem-perature alone influences the midgersquos distribution which may be rea-sonable on a coarse (country wide) spatial scale On a finer scale themidge can only occur in aquatic environments and host plants must bepresent Host plant availability is probably not highly limiting becauseat least one of the midgersquos host plants hydrilla is found in water bodiesthroughout the southern United States (Madeira et al 2000) and C leb-etis has been shown to complete development in several other commonaquatic plants (Stratman et al 2013)
The MaxEnt ecological niche model based on six temperature vari-ables also predicted that suitable locations for the establishment ofC lebetis are present throughout the southeastern United States but theprediction extended further north than that of the NAPPFAST modelThe difference in the outputs from the two modeling approaches maybe due to the origin of the insects used in the cold tolerance study Themidge colony was initiated with individuals collected from LakeRowell in Bradford Co Florida (2992 N 8216W) which is consid-erably south of the most northern known occurrence of C lebetis inFarmersville Louisiana (3275 N 924 W Sublette 1964)Intraspecific variation in cold tolerance among insects is a commonoccurrence (Turnock and Fields 2005) and thus it would not besurprising if our colony had a lower tolerance for cold than populationsoccurring further north
Very few studies have incorporated both niche and physiologicalmodels to predict potential distribution of a species Ebeling et al
(2008) predicted the distribution of the invasive ornamental plantBuddleja davidii F (Lamiales Scrophulariaceae) by combining phys-iological data on frost tolerance with an ecological niche model Elithet al (2010) incorporated information fromMaxEnt and a physiologicalmodel to predict the distribution of the invasive cane toad [Bufo mari-nus (L) (Anura Bufonidae)] in Australia In both cases the authorsconcluded that incorporating information from physiological modelscan improve the reliability of distributional predictions Although theMaxEnt model in this study yielded a slightly larger geographic predic-tion than the physiological model there was no statistical difference inthe distributions predicted by the two modeling methods The spatialcoincidence of these two approaches increases confidence in the predic-tion However the MaxEnt model should be interpreted with caution asthe presence data were limited to 3 records from Louisiana and 25 fromFlorida Because the native range of this insect is unknown it couldpossibly be narrowed down by identifying areas with climate similar tothat found in the southeastern United States
Temperature-dependent development and cold tolerance studiesprovide basic information that can be used to develop or improve rear-ing methods and to predict field colonization and establishmentTemperature studies revealed that optimal temperature conditions forC lebetis are from 20 to 30C with lower survival occurring at 15 and32C This could explain why this insect is widely established inFlorida and also occurs in Louisiana Ongoing studies on populationdynamics and field impact will reveal the potential value ofC lebetis asan augmentative biological control agent
AcknowledgmentsWe thank the Florida Fish and Wildlife Conservation Commission
and the United States Department of Agriculture Hydrilla IntegratedPest Management Risk Avoidance and Mitigation grant for providingfunding for this research
Fig 7 Model prediction of climate suitability for C lebetis using known sampling locations and climate records Inertia ellipses (15 SD) weredrawn around the centroids of climatic envelops predicted by the physiological and MaxEnt models The enclosed correlation circle describes theimportance of individual bioclimatic variables along the two PCA axes See Table 1 for descriptions of climatic variables and contribution ofindividual variables to PCA axes Note that some physiological prediction symbols (yellow squares) are hidden beneath the MaxEnt symbols
6 JOURNAL OF INSECT SCIENCE VOLUME 14
by guest on October 16 2014
httpjinsectscienceoxfordjournalsorgD
ownloaded from
References CitedAndrewartha H G and L C Birch 1954 The distribution and abundance
of animals University of Chicago Press Chicago ILBaskerville G L and P Emin 1969 Rapid estimation of heat ac-
cumulation from maximum and minimum temperatures Ecology 50514ndash517
Beaver J R T L Crisman and J S Bays 1981 Thermal regimes ofFlorida Lakes Hydrobiologia 83 267ndash273
Borchert D and R Magarey 2007 User manual for NAPPFAST(httpwwwnappfastorgusermanualnappfast-manualpdf) (accessed 14September 2012)
Bowes G A S Holaday and W T Haller 1979 Seasonal variation in thebiomass tuber density and photosynthetic metabolism of hydrilla in threeFlorida lakes J Aquatic Plant Manag 17 61ndash65
Briere J F P Pracos A Y Le Roux and J S Pierre 1999 A novel modelof temperature-dependent development for arthropods Environ Entomol28 22ndash29
Campbell A B D Frazier N Gilbert A P Gutierrez and M Mackauer1974 Temperature requirements of some aphids and their parasites J ApplEcol 11 431ndash438
Cuda J P B R Coon Y M Dao and T D Center 2002 Biology and lab-oratory rearing of Cricotopus lebetis (Diptera Chironomidae) a naturalenemy of the aquatic weed hydrilla (Hydrocharitaceae) Ann Entomol SocAm 95 587ndash596
Cuda J P B R Coon Y M Dao and T D Center 2011 Effect of an her-bivorous stem-mining midge on the growth of hydrilla J Aquatic PlantManag 49 83ndash89
Cuda J P and J L Gillett-Kaufman 2011 New hydrilla project RAMPUP Aquatics 33 9
Cuda J P R Charudattan M J Grodowitz R M Newman J FShearer M L Tamayo and B Villegas 2008 Recent advances in biologi-cal control of submersed aquatic weeds J Aquatic Plant Manag 46 15ndash32
Delettre Y R and N Morvan 2000 Dispersal of adult aquaticChironomidae (Diptera) in agricultural landscapes Freshwater Biol 44399ndash411
Diaz R W A Overholt A Samayoa F Sosa D Cordeau and J Medal2008 Temperature-dependent development cold tolerance and potential dis-tribution of Gratiana boliviana (Coleoptera Chrysomelidae) a biologicalcontrol agent of tropical soda apple Solanum viarum (Solanaceae)Biocontrol Sci Technol 18 193ndash207
Ebeling S K E Welk H Auge and H Bruelheide 2008 Predicting thespread of an invasive plant combining experiments and ecological nichemodel Ecography 31 709ndash719
Elith J and J R Leathwick 2009 Species distribution models ecologicalexplanation and prediction across space and time Annu Rev Evol Syst 40677ndash697
Elith J M Kearney and S Phillips 2010 The art of modelling range-shift-ing species Methods Ecol Evol 1 330ndash342
Elliot A C and J S Reisch 2006 Implementing a multiple comparison testfor proportions in a 2xc crosstabulation in SASVR (httpwww2sascomproceedingssugi31204-31pdf) (accessed 14 September 2012)
Epler J H J P Cuda and T D Center 2000 Redescription of Cricotopuslebetis (Diptera Chironomidae) a potential biocontrol agent of the aquaticweed hydrilla (Hydrocharitaceae) Florida Entomol 83 171ndash180
Franklin J 2009 Mapping species distributions spatial inference and predic-tion Cambridge University Press Cambridge United Kingdom
Grinnell J 1924Geography and evolution Ecology 5 225ndash229Guisan A and W Thuiller 2005 Predicting species distribution offering
more than simple habitat models Ecol Lett 8 993ndash1009Hoyer M V M D Netherland M S Allen and D E Canfield Jr 2005
Hydrilla management in Florida a summary and discussion of issuesidentified by professionals with future management recommendations Finaldocument 14 June 2005 (httpplantsifasufleduosceolahydrilla_mngmt_flhydrilla_management_floridahtml) (accessed 14 September 2012)
Hutchinson G E 1957 Population studiesmdashanimal ecology and demogra-phymdashconcluding remarks Cold Spring Harb Symp 22 415ndash427
(IDRE) Institute for Digital Research and Education 2012 SAS librarynon-linear regression in SAS (httpstatisticsatsuclaedustatsaslibrarySASNLin_oshtm) (accessed 14 September 2012)
Kearney M and W Porter 2009 Mechanistic niche modelling combiningphysiological and spatial data to predict species ranges Ecol Lett 12334ndash350
Koppen W 1936 Das geographische system der klimate pp 1ndash44 InW Koppen and R Geiger (eds) Handbuch der klimatologie Verlag vonGebruder Borntraeger Berlin Germany
Koschnick T J M D Netherland and W T Haller 2007 Effect of threeALS-inhibitors on five emergent native plant species in Florida J AquaticPlant Manag 45 47ndash51
Kriticos D J B L Webber A Leriche N Ota I Macadam J Bathols JK Scott 2011 CliMond global high-resolution historical and future scenarioclimate surfaces for bioclimatic modeling Methods Ecol Evol 3 53ndash64
Lapointe S L D M Borchert and D G Hall 2007 Effect of low tempera-tures on mortality and oviposition in conjunction with climate mapping topredict spread of the root weevil Diaprepes abbreviatus and introduced natu-ral enemies Environ Entomol 36 73ndash82
Madeira P T C C Jacono and T K Van 2000Monitoring hydrilla usingtwo RAPD procedures and the nonindigenous aquatic species databaseJ Aquatic Plant Manag 38 33ndash40
Madeira P T T K Van K K Steward and R J Schnell 1997 Randomamplified polymorphic DNA analysis of the phenetic relationships amongworld-wide accessions ofHydrilla verticillata Aquatic Bot 59 217-ndash236
Magarey R D G A Fowler D M Borchert T B Sutton M Colunga-Garcia and J A Simpson 2007 NAPPFAST An internet system forweather-based mapping of plant pathogens Plant Dis 91 336ndash345
McCombie A M 1959 Some relations between air temperatures and the sur-face water temperature of lakes Limnol Oceanogr 4 525ndash258
Mukherjee A D Williams G Wheeler J Cuda S Pal and W Overholt2012 Brazilian peppertree (Schinus terebinthifolius) in Florida and SouthAmerica evidence of a possible niche shift driven by hybridization BiolInvasions 14 1415ndash1430
Mukherjee A M C Christman W A Overholt and J P Cuda 2011Prioritizing areas in the native range of hygrophila for surveys to collect bio-logical control agents Biol Control 56 254ndash262
Munroe E 1984 Biogeography and evolutionary history wide-scale andlong-term patterns of insects pp 279ndash304 In C B Huffaker and R LRabb (eds) Ecological entomology Wiley and Sons New York NY
Netherland M D K D Getsinger and D R Stubbs 2005 Aquatic plantmanagement invasive species and chemical control Outlooks Pest Manag16 100ndash104
Oliver D R M E Dillon and P S Cranston 1990 A catalog of neacrticChironomidae Research Branch Agriculture Canada Ottawa Canada
Pearson R G C J Raxworthy M Nakamura and A T Peterson 2007Predicting species distributions from small numbers of occurrence records atest case using cryptic geckos in Madagascar J Biogeogr 34 102ndash117
Phillips S J R P Anderson and R E Schapire 2006 Maximum entropymodeling of species geographic distributions Ecol Model 190 231ndash259
Pinder L C V 1986 Biology of freshwater Chironomidae Annu RevEntomol 31 1ndash23
SAS Institute 2008 SASSTAt userrsquos guide SAS Institute Cary NCSchmitz D C B V Nelson L E Nall and J D Schardt 1991 Exotic
aquatic plants in Florida a historical perspective and review of the presentaquatic plant regulation program pp 306ndash326 In T C Center R FDoren R L Hofstetter R L Myers and L D Whiteaker (eds)Proceedings of a symposium on exotic pest plants Technical report NPSNREVERNRTR-9106 U S Department of Interior National Park ServiceDenver CO
Steward K K T K Van C Carter and A H Pieterse 1984 Hydrilla in-vades Washington D C and the Potomac Am J Bot 71 162ndash163
Stratman K N W A Overholt J P Cuda M D Netherland and PCWilson 2013 Host range and searching behavior of Cricitopus lebetis(Diptera Chironomidae) a tip miner of Hydrilla verticillata(Hydrocharitiaceae) Bio Sci Technol 23 317ndash334
Sublette J E 1964 Chironomidae (Diptera) of Louisiana I Systematics andimmature stages of some lentic chironomids of west-central LouisianaTulane Stud Zool 11 109ndash150
Tokeshi M 1995 Life cycles and population dynamics pp 225ndash268 InP Armitage P S Cranston and L C V Pinder (eds) Chironomidae bi-ology and ecology of non-biting midges Chapman and Hall London UnitedKingdom
Turnock W J and P G Fields 2005Winter climates and cold hardiness interrestrial insects Eur J Entomol 102 561ndash576
Webber B L C J Yates D C Le Maitre J K Scott D J Kriticos NOta A McNeill J J Le Roux and G F Midgley 2011Modelling horsesfor novel climate courses insights from projecting potential distributions ofnative and alien Australian acacias with correlative and mechanistic modelsDivers Distrib 17 978ndash1000
Wheeler G S and T D Center 2001 Impact of the biological control agentHydrellia pakistanae (Diptera Ephydridae) on the submersed aquatic weedHydrilla verticillata (Hydrocharitaceae) Biol Control 21 168ndash181
Received 5 December 2012 accepted 23 June 2013
2014 STRATMAN ET AL OPTIMAL TEMPERATURE CONDITIONS FOR C LEBETIS 7
by guest on October 16 2014
httpjinsectscienceoxfordjournalsorgD
ownloaded from
Appendix B MaxEnt model background used to predict potential distribution of C lebetis Model background is based on theKoppenndashGeiger climate zone polygons containing one or more records of C lebetis
Appendix A North American occurrence records of C lebetisa
Location Latitude Longitude Source
Baton Rouge LA 304619 N 911431 W Epler et al (2000)Natchitoches LA 317610 N 930861 W Sublette (1964)Farmersville LA 327528 N 924046 W Sublette (1964)Lake Tohopekaliga FL 282414 N 814064 W KNS (unpublished data)Lake Istokpoga FL 273944 N 812445 W KNS (unpublished data)Bulldozer Canal FL 279976 N 807939 W KNS (unpublished data)Lake Rowell FL 299185 N 821603 W KNS (unpublished data)Crystal River 288917 N 826033 W Cuda et al (2002)Lake Brantley FL 286935 N 814210 W D Denson (personal communication)Village Lake FL 283702 N 815325 W D Denson (personal communication)EPCOT Lake FL 283678 N 814956 W D Denson (personal communication)West Feeder Canal FL 263012 N 810728 W D Strom (personal communication)West Feeder Canal FL 262907 N 809720 W D Strom (personal communication)North Feeder Canal FL 263390 N 809796 W D Strom (personal communicationNorth Feeder Canal FL 262913 N 809703 W D Strom (personal communication)L4 Canal FL 263299 N 808826 W D Strom (personal communication)28 Interceptor Canal FL 262586 N 809532 W D Strom (personal communication)L28 Borrow Canal FL 263299 N 808807 W D Strom (personal communication)L28 Borrow Canal FL 260278 N 808303 W D Strom (personal communication)Harney Pond Canal FL 270911 N 810702 W D Strom (personal communication)Harney Pond Canal FL 270164 N 810702 W D Strom (personal communication)Indian Prairie Canal FL 271526 N 810685 W D Strom (personal communication)Indian Prairie Canal FL 270977 N 810104 W D Strom (personal communication)South Lake Istopkoga FL 273039 N 811299 W R Rutter (personal communication)Caloosahatchee River FL 267868 N 812655 W R Rutter (personal communication)Arbuckle Creek FL 275025 N 813354 W R Rutter (personal communication)North Prong Alligator Creek FL 268952 N 819702 W R Rutter (personal communication)Southwest FL 270200 N 813026 W R Rutter (personal communication)aGeopositions of records provided by Dana Denson Doug Strom and Robert Rutter are estimated from label descriptions and personal communications
8 JOURNAL OF INSECT SCIENCE VOLUME 14
by guest on October 16 2014
httpjinsectscienceoxfordjournalsorgD
ownloaded from
demonstrated that in the laboratory C lebetis was able to suppress thegrowth of hydrilla bygt90 and thus the midge may have value for bi-ological control This could be accomplished by augmentation of exist-ing populations in areas where the midge already occurs or introducingthe midge into areas where it does not occur Temperature will influencethe midgersquos population growth and to a large extent determine limitsto the midgersquos spatial distribution but there is no information on theeffect of temperature of the life history ofC lebetis
The purpose of this study was to determine the influence of tempera-ture on survival and developmental rate of C lebetis and to use this in-formation to predict areas conducive to its establishment andpopulation growth In addition the midgersquos potential distribution waspredicted using an ecological niche model by extrapolation of theclimate at locations where it is known to occur to other locationswhere its presence has not been studied The predicted distributions ofC lebetis derived from physiological data and from the ecologicalniche model were compared to examine the degree of overlap betweenthe two models
Materials and MethodsSource and Culturing of H verticillata and C lebetis Hydrilla was
collected from Lake Tohopekaliga Osceola Co Florida (282 N814 W) and C lebetis was collected from Lake Rowell BradfordCo Florida (299 N 821 W) Both cultures were maintained at theUniversity of Floridarsquos Biological Control Research and ContainmentLaboratory Fort Pierce FL Hydrilla was propagated from stems(10ndash30 cm) collected at the field site and planted in 100 by 90 cm(diameter by height) pots containing a layer of potting soil (5 cm)covered by a layer of sand (2 cm) The pots were placed in a largeplastic livestock watering tank (378 liters) filled to a depth of 50 cmwith well water and covered with 60 shade cloth to suppress algalgrowth Growing tips were harvested as needed
C lebetis was reared by placing hydrilla tips in well water in a plas-tic container (34 by 28 by 15 cm length by weight by height) heldinside a cubic cage (50 cm each side) constructed from polyvinyl chlor-ide tubing covered with fine nylon mesh cloth C lebetis egg masseswere added to the containers and larvae colonized the hydrilla tipsEmerging adults were collected using an aspirator and transferred to a250ml separatory funnel with 15ml of well water Females ovipos-ited on the water surface and egg masses were collected by opening thestopcock of the separatory funnel (see Cuda et al 2002 for furtherdetails on rearing)Survival and Developmental Time Temperature-dependent devel-
opment of C lebetis was investigated during a single study in environ-mental chambers maintained at a constant photoperiod (1410 [LD] h)and 10 constant temperatures (10 15 20 22 25 27 30 32 35 3661C) Healthy undamaged plant tips 4ndash6 cm in length were placedindividually in 35-ml test tubes filled with well water as described byCuda et al (2002) Each test tube was placed in a rack that held 40tubes Two newly hatched larvae were transferred to each plant tipusing a pipette Once the larvae were introduced into the tubes a capwith ventilation holes was placed on each tube One hydrilla tip wastypically used but on a few occasions destroyed tips were replaced toallow midge larvae to complete development to adulthood The propor-tion of individuals surviving at different temperatures was comparedwith a chi-square test followed by Tukeyrsquos procedure for separation ofproportions (Elliott and Reisch 2006) Developmental rate at differenttemperatures was analyzed using linear regression The linear portion(15ndash35C) of the developmental rate curve [R(T)frac14 athorn bT)] wasmodeled using least squares regression where Tfrac14 temperatureafrac14 intercept and bfrac14 slope The lower temperature threshold for devel-opment was estimated as the intersection of the regression line and thex-axis (R(T)frac14 0) Degree-days were calculated as the inverse slope ofthe fitted regression line (Campbell et al 1974)
The relationship between developmental rate and temperaturewas also examined with the nonlinear Briere-1 model which allows
estimation of upper and lower developmental thresholds (Briere et al1999) The model is defined as R(T)frac14 aT(T T0) (TL T)12 whereRfrac14 developmental rate Tfrac14 temperature T0frac14 base temperaturethreshold TLfrac14 lethal temperature and afrac14 empirical constant T0 andTL were initially set to 6 and 36C respectively and the equation wasthen solved iteratively using PROCNONLIN (SAS Institute 2008)
Estimation of Generations per Year Daily minimum and maximumtemperatures from Florida were obtained from 91 weather stationsthrough the Applied Climate Information System (Climate Informationfor Management and Operational Decisions Southeast RegionalClimate Center httpacissercccom) Daily minimum and maximumtemperatures were averaged from the last 5 to 10 yr (1 January 2002 to1 January 2012) depending the availability of data which provided 365values for maximum and minimum temperatures for each station
The DegDay program version 101 which is an Excel (MicrosoftRedmond WA) application developed by University of California-Davis (httpbiometucdavisedu) was used to calculate accumulateddegree-days for C lebetis This application uses the upper and lowertemperature thresholds for an organism and daily average of minimumand maximum temperatures to calculate accumulated degree-days(Baskerville and Emin 1969) The lower and upper temperature thresh-olds were estimated from the Briere-1 nonlinear model as 95 and360C respectively The linear regression model was used to calculatethe degree-days (K) required for one generation of C lebetis[R(T)frac14 abT] as Kfrac14 1b (Campbell et al 1974) The prediction of thenumber of generations per year was calculated by dividing the cumula-tive degree-days per station by K
Weather station name latitude longitude and number of C lebetisgenerations per year were imported into ArcGIS 90 (ESRI IncRedlands CA) The imported file was converted to a shape file usingthe ADD X-Y DATA function followed by the selection of the StatePlane Projection A shapefile of the border of Florida was obtainedfrom the AWhere Continental database (AWHERE Inc Denver CO)and used to delineate the range of predictions
The geostatistical analysis function in ArcGIS (ESRI Inc) was usedto generate a predicted distribution of C lebetis generations acrossFlorida Values at unsampled locations were estimated by interpolationof values at sample locations The inverse-distance-weighted (IDW)deterministic method was used where predictions are made by mathe-matical formulas that generate weighted averages of nearby known val-ues The IDW model gives more influence to points that are closer thanto ones that are farther away The parameters used in the IDW analysiswere as follows
bull The number of stations used for interpolation was set to a maximumof 15 and minimum of 10
bull The power optimization option was selected generating a powervalue of pfrac14 2 This weights weather station values proportional tothe inverse distance raised to the power p
bull The search neighborhood shape was circular because there were nodirectional influences on the weighting of number of generationsper station Ellipse parameters were set to angle 0 major and minorsemiaxis 1020596
Cold Tolerance A cold tolerance study was conducted using second-to fourth-stage larvae Although there is no information on overwinter-ing of C lebetis larvae were used for the cold tolerance study becausethis is the typical overwintering life stage of chironomids (Pinder 1986Tokeshi 1995) Four second- to fourth-stage larvae were placed inside a35-ml vial containing two hydrilla tips and well water Insects wereacclimated from 20C to the final temperature at intervals of 5C every2 h Larvae were exposed to three constant temperatures (5 75 and10C) for 05 1 2 4 8 16 and 32 d In total five vials of four insectswere assayed at each time interval at the constant temperatures of 5 and75C After each exposure time insects were placed at room tempera-ture and survival was assessed by observing for movement once the
2 JOURNAL OF INSECT SCIENCE VOLUME 14
by guest on October 16 2014
httpjinsectscienceoxfordjournalsorgD
ownloaded from
water reached room temperature The effect of exposure times on midgesurvival was analyzed using logistic regression (PROC LOGISTICSAS Institute 2008) The LT90 (lethal times of 90 of tested individu-als) at 5 and 75C were used to predict isothermal lines delineatingregions in the southeastern United States favorable for C lebetis estab-lishment based on historical weather data A model was created in theNorth Carolina State University Animal Plant Health InspectionService Plant Pest Forecasting System (NAPPFAST) an internet-based system that allows users to mine weather databases and link thisinformation with templates for biological modeling (Borchert andMagarey 2007 Magarey et al 2007) Using NAPPFAST the numberof days at or below 5 and 75C were recorded at weather stationsacross the southeastern United States A probability map was generatedusing the last 10 yr of weather data to examine the frequency of occur-rence of reaching the LT90 in at least 5 out of 10 yr The map wasimported into ArcGIS 90 and converted to an ESRI band interleavedby line (bil) raster layer The area within the continental USA south ofthe projected LT90 line was extracted from the layer using the ldquoextractrdquotool in the Spatial Analyst Tools The raster was then reclassified tomake all raster cell values equal to one to provide a continuous gridlayer of the predicted areaEcological Niche Modeling Geographic coordinates of locations
where C lebetis was collected were obtained from voucher specimensliterature and known field collection sites including our own data anddata provided by Dana Denson (Reedy Creek Improvement District)Doug Strom (Water and Air Associates Inc) and Robert Rutter(Florida Department of Environmental Protection see Appendix A forlist of records) The Maximum Entropy Species Distribution Model(MaxEnt version 333e) was used to analyze climate at locationswhere C lebetiswas known to occur and find locations with similar cli-mate to predict the potential distribution of C lebetis (Phillips et al2006) MaxEnt estimates the probability of a species presence by con-trasting the probability density of environmental variables acrossknown occurrences of the species to that of randomly selected pseudo-absences from the target landscape or model background Followingthe method used in Webber et al (2011) Koppen-Geiger climate zonepolygons (Koppen 1936 available from CliMond 10rsquo historical climatedata Kriticos et al 2011) containing one or more records of C lebetiswas used as a background (see Appendix B) The default setting ofMaxEnt was used (Mukherjee et al 2011) Six temperature-related bio-climatic variables (Table 1) with a spatial resolution of 10 arc-secondwere used to predict C lebetis distribution (Kriticos et al 2011) Onlytemperature variables were included in the model because the midge isaquatic in its immature life stages and therefore precipitation-relatedvariables were assumed to have minimal direct effect Air temperaturewas used rather than water temperature because no large-scale spatiallayer of water temperature was available and water surface temperaturetends to be well correlated with air temperature (McCombie 1959)The prediction was limited to the southeastern United States to avoidextrapolation beyond known occurrences The continuous probabilityprediction generated by MaxEnt was converted to binary (presence or
absence) prediction using the lowest presence threshold defined as theminimum nonzero predictive value received by any known occurrence(Pearson et al 2007)
Comparison of Distributions Predicted from Cold Tolerance Dataand from Ecological Niche Modeling Following Mukherjee et al
(2012) overlap in bioclimatic space predicted by the MaxEnt ecologi-cal niche model and the NAPPFAST cold tolerance model were exam-ined by principal component analysis (PCA) of a covariance matrix ofthe six bioclimatic variables A Monte-Carlo test with 99 repeats(afrac14 005) was used to determine the statistical difference between thecentroids of the climatic polygons predicted by MaxEnt and the
Table 1 Bioclimatic variables and their loadings on three PCA axes used to examine the similarity between the distributions predicted bythe MaxEnt ecological niche model and the NAPPFAST physiological model
Climate variables Variable descriptions Axis 1 (81) Axis 2 (16) Axis 3 (2)
Bio1 Annual mean temperature 0955 0283 0078Bio4 Temperature seasonality (SD 100) 0936 0322 0142Bio6 Min temperature of coldest month 0991 0066 0105Bio7 Temperature annual range 0907 0373 0195Bio10 Mean temperature of warmest quarter 0510 0858 0064Bio11 Mean temperature of coldest quarter 0994 0003 0106
Valuesgt 0 indicate a positive contribution whereas those lt0 indicate a negative contribution to the axis Values in parenthesis denote the percent of varia-bility described by each axis cumulatively explaining 99 of variability
Fig 1 Percent survival of C lebetis larvae at constant temperaturesDifferent letters above bars represent statistically different means(analysis of variance and Student-Newman-Keuls (SNK) testPlt 001) Error bars6 SEM
Fig 2 Developmental rate of C lebetis larvae at constanttemperatures between 15 and 35C
2014 STRATMAN ET AL OPTIMAL TEMPERATURE CONDITIONS FOR C LEBETIS 3
by guest on October 16 2014
httpjinsectscienceoxfordjournalsorgD
ownloaded from
NAPPFAST models (Mukherjee et al 2012) Convex hulls were con-structed to delimit the climate space predicted under each approachClimatic variation within a climate space was illustrated with a 15 SDinertia ellipse around the centroid of climate space Correlation circleswere constructed to indicate the contribution of each climatic variableto the PCA axes To examine spatial coincidence between MaxEnt andNAPPFAST predictions centroids of grid cells predicted by eachmodel were extracted Spatial intersection between model predictionswas examined by calculating the percentage of centroid overlap and thepercentages of unique centroids for each model
ResultsSurvival and Developmental Time Larval C lebetis survival varied
with temperature (v2frac14 956 Plt 00001 Fig 1) Larvae could notcomplete development at low and high temperature extremes (10Cand 36C respectively) Only a single individual was able to completedevelopment at 35C Survival to adulthood was highest at tempera-tures between 20 and 30C and survival rate peaked at 75ndash80(Fig 1) Survival rate was approximately halved at the low and hightemperature thresholds of 5 and 32C respectively The developmentrate increased with increasing temperature until reaching 32C(F16frac14 155 Plt 0008 Fig 2) Degree-day requirements (K) were cal-culated to be 495
The Briere-1 model fit the data well with a pseudo R2frac14 076(Institute for Digital Research and Education University of Californiaat Los Angeles [IDRE] 2012) The estimated lower and upper develop-mental thresholds were 95 and 360C respectively (Fig 3) These val-ues were very similar to those found in the laboratory tests (Fig 1) Themodel showed that the rate of development increased with temperatureuntil the curve reached an optimum of about 300C and then decreasedrapidly as the temperature approached the upper developmental thresh-old (Fig 3)
Based on degree-day requirements C lebetis is predicted tocomplete several generations per year in Florida ranging from 68 to117 with the most generations estimated for the southern portion ofthe state and the fewest in the panhandle (Fig 4) Florida countieslocated south of Palm Beach County had the highest number of esti-mated generations ranging from 102 to 117 Counties in the middleportion of the state are predicted to support 82ndash102 generationsper year
Cold Tolerance After 4 d at 5C larvae survival rapidly decreased(max-rescaled R2frac14 076 Fig 5A) Only 50 and 10 of larvae wereable to survive for 8 and 16 d respectively No insects were able to sur-vive after 32-d exposure to 5C (Fig 5A) After 16 d at 75C the
Fig 4 Predicted number of generations per year of C lebetis in Florida
Fig 3 Briere-1 nonlinear model of the relationship of temperatureand developmental rate of C lebetis The estimated upper and lowerthresholds are 360 and 95C respectively
4 JOURNAL OF INSECT SCIENCE VOLUME 14
by guest on October 16 2014
httpjinsectscienceoxfordjournalsorgD
ownloaded from
survival of larvae remained close to 100 (max-scaled R2frac14 088Fig 5B) The isothermal lines showed that at both 5 and 75C 90mortality of C lebetis was predicted to occur along a line running fromsoutheastern South Carolina extending through the middle of GeorgiaAlabama andMississippi northern Louisiana and through the mid-sec-tion of Texas (Fig 6) Similar to the NAPPFAST model MaxEnt pre-dicted the distribution of C lebetis in the much of southeastern UnitedStates (Fig 6)
Comparison of Distributions Predicted From Cold Tolerance Dataand From Ecological Niche Modeling PCA resulted in three signifi-
cant axes explaining 99 of variability (Table 1) Graphical representa-tion of climate space across first two components showed no significantdifference in climate space predicted by the MaxEnt and NAPPFASTmodels (Fig 7) As evident by the extensive overlap of predicted cli-mate spaces no difference between the climate spaces was found by thebetween-class analysis of variance using 99 Monte-Carlo randomiza-tions (between-class inertia percentagefrac14 009 Pfrac14 012) Of all thegrid centroids 814 were predicted by both MaxEnt and NAPPFASTmodels (Fig 6) The MaxEnt model predicted 169 unique centroidsand the NAPPFASTmodel 17
DiscussionTemperature is a critical factor that influences insect distributions
(Andrewartha and Birch 1954 Munroe 1984) Understanding the ther-mal requirements for C lebetis is an important step for predicting themidgersquos distribution Water temperatures during the winter monthsthroughout Florida range from 8 to 15C (Beaver et al 1981) and thesetemperatures are mostly above the lower developmental threshold of95C The predicted number of generations per year of C lebetisincreased as latitude decreased suggesting that the midge may reachhigher densities in south Florida than further north However insummer months maximum water temperatures in Florida lakes rangeas high as 30ndash35C (Beaver et al 1981) which approaches the esti-mated upper developmental threshold of 36C and includes the tem-perature at which the midgersquos development rate began to slow (32C)Water temperatures in hydrilla mats near the water surface tend to behigher than water temperatures at a 1-m depth in hydrilla stands or atthe surface in open water (Bowes et al 1979 Cuda et al 2008)Temperatures reaching 45C in vegetation mats have been reported(Wheeler and Center 2001) which is well above the upper lethalthreshold of C lebetis Wheeler and Center (2001) partially attributedthe poor performance of the introduced biological control agent ofhydrilla Hydrellia pakistanae Deonier (Diptera Ephydridae) to hightemperatures in hydrilla mats Likewise C lebetis is likely to sufferhigh mortality during summer months particularly in south Floridaresulting in possible local extirpation Although there is no informationavailable on the dispersal ability of C lebetis in general chironomidsare considered to be weak flyers (Delettre and Morvan 2000) Thushigh temperatures could play a critical role in determining the perform-ance and persistence ofC lebetis in Florida and other areas where watertemperatures approach or exceed the upper lethal threshold
The physiological model based on cold tolerance of midge larvaepredicted survival of the midge in much of the southeastern UnitedStates The area south of the LT90 isothermal line includes all ofFlorida about one-half of Georgia Alabama and Mississippi most ofLouisiana and the southern half of Texas A reasonable prediction for
Fig 5 Survival of C lebetis larvae at different exposure times at (A)5C and (B) 75C Single dots are observed values and lines areexpected value of the logistic regression Maximum survival occurredat 75C with an exposure time of 16 d
Fig 6 Predicted distributions of C lebetis based on the NAPPFAST model using the area south of the LT90 isothermal line for survival oflarvae at 5C and the predicted distribution based on the MaxEnt ecological niche model using six climate variables (see text) Values inparentheses following the legends for the NAPPFAST and MaxEnt predictions indicate percent of unique grid cells predicted by each method
2014 STRATMAN ET AL OPTIMAL TEMPERATURE CONDITIONS FOR C LEBETIS 5
by guest on October 16 2014
httpjinsectscienceoxfordjournalsorgD
ownloaded from
areas that would support positive population growth of C lebetiswouldbe below the LT90 at 5
C Lapointe et al (2007) used a combination ofLT50 and LT95 values along with field observations to predict areassuitable for the establishment of the introduced root weevil Diaprepesabbreviatus (L) (Coleoptera Curculionidae) in Texas Arizona andCalifornia and Diaz et al (2008) speculated that the introduced biologi-cal control agent Gratiana boliviana Spaeth (ColeopteraChrysomelidae) would establish south of LT50 or LT90 isothermallines Our prediction for C lebetis is based on the assumption that tem-perature alone influences the midgersquos distribution which may be rea-sonable on a coarse (country wide) spatial scale On a finer scale themidge can only occur in aquatic environments and host plants must bepresent Host plant availability is probably not highly limiting becauseat least one of the midgersquos host plants hydrilla is found in water bodiesthroughout the southern United States (Madeira et al 2000) and C leb-etis has been shown to complete development in several other commonaquatic plants (Stratman et al 2013)
The MaxEnt ecological niche model based on six temperature vari-ables also predicted that suitable locations for the establishment ofC lebetis are present throughout the southeastern United States but theprediction extended further north than that of the NAPPFAST modelThe difference in the outputs from the two modeling approaches maybe due to the origin of the insects used in the cold tolerance study Themidge colony was initiated with individuals collected from LakeRowell in Bradford Co Florida (2992 N 8216W) which is consid-erably south of the most northern known occurrence of C lebetis inFarmersville Louisiana (3275 N 924 W Sublette 1964)Intraspecific variation in cold tolerance among insects is a commonoccurrence (Turnock and Fields 2005) and thus it would not besurprising if our colony had a lower tolerance for cold than populationsoccurring further north
Very few studies have incorporated both niche and physiologicalmodels to predict potential distribution of a species Ebeling et al
(2008) predicted the distribution of the invasive ornamental plantBuddleja davidii F (Lamiales Scrophulariaceae) by combining phys-iological data on frost tolerance with an ecological niche model Elithet al (2010) incorporated information fromMaxEnt and a physiologicalmodel to predict the distribution of the invasive cane toad [Bufo mari-nus (L) (Anura Bufonidae)] in Australia In both cases the authorsconcluded that incorporating information from physiological modelscan improve the reliability of distributional predictions Although theMaxEnt model in this study yielded a slightly larger geographic predic-tion than the physiological model there was no statistical difference inthe distributions predicted by the two modeling methods The spatialcoincidence of these two approaches increases confidence in the predic-tion However the MaxEnt model should be interpreted with caution asthe presence data were limited to 3 records from Louisiana and 25 fromFlorida Because the native range of this insect is unknown it couldpossibly be narrowed down by identifying areas with climate similar tothat found in the southeastern United States
Temperature-dependent development and cold tolerance studiesprovide basic information that can be used to develop or improve rear-ing methods and to predict field colonization and establishmentTemperature studies revealed that optimal temperature conditions forC lebetis are from 20 to 30C with lower survival occurring at 15 and32C This could explain why this insect is widely established inFlorida and also occurs in Louisiana Ongoing studies on populationdynamics and field impact will reveal the potential value ofC lebetis asan augmentative biological control agent
AcknowledgmentsWe thank the Florida Fish and Wildlife Conservation Commission
and the United States Department of Agriculture Hydrilla IntegratedPest Management Risk Avoidance and Mitigation grant for providingfunding for this research
Fig 7 Model prediction of climate suitability for C lebetis using known sampling locations and climate records Inertia ellipses (15 SD) weredrawn around the centroids of climatic envelops predicted by the physiological and MaxEnt models The enclosed correlation circle describes theimportance of individual bioclimatic variables along the two PCA axes See Table 1 for descriptions of climatic variables and contribution ofindividual variables to PCA axes Note that some physiological prediction symbols (yellow squares) are hidden beneath the MaxEnt symbols
6 JOURNAL OF INSECT SCIENCE VOLUME 14
by guest on October 16 2014
httpjinsectscienceoxfordjournalsorgD
ownloaded from
References CitedAndrewartha H G and L C Birch 1954 The distribution and abundance
of animals University of Chicago Press Chicago ILBaskerville G L and P Emin 1969 Rapid estimation of heat ac-
cumulation from maximum and minimum temperatures Ecology 50514ndash517
Beaver J R T L Crisman and J S Bays 1981 Thermal regimes ofFlorida Lakes Hydrobiologia 83 267ndash273
Borchert D and R Magarey 2007 User manual for NAPPFAST(httpwwwnappfastorgusermanualnappfast-manualpdf) (accessed 14September 2012)
Bowes G A S Holaday and W T Haller 1979 Seasonal variation in thebiomass tuber density and photosynthetic metabolism of hydrilla in threeFlorida lakes J Aquatic Plant Manag 17 61ndash65
Briere J F P Pracos A Y Le Roux and J S Pierre 1999 A novel modelof temperature-dependent development for arthropods Environ Entomol28 22ndash29
Campbell A B D Frazier N Gilbert A P Gutierrez and M Mackauer1974 Temperature requirements of some aphids and their parasites J ApplEcol 11 431ndash438
Cuda J P B R Coon Y M Dao and T D Center 2002 Biology and lab-oratory rearing of Cricotopus lebetis (Diptera Chironomidae) a naturalenemy of the aquatic weed hydrilla (Hydrocharitaceae) Ann Entomol SocAm 95 587ndash596
Cuda J P B R Coon Y M Dao and T D Center 2011 Effect of an her-bivorous stem-mining midge on the growth of hydrilla J Aquatic PlantManag 49 83ndash89
Cuda J P and J L Gillett-Kaufman 2011 New hydrilla project RAMPUP Aquatics 33 9
Cuda J P R Charudattan M J Grodowitz R M Newman J FShearer M L Tamayo and B Villegas 2008 Recent advances in biologi-cal control of submersed aquatic weeds J Aquatic Plant Manag 46 15ndash32
Delettre Y R and N Morvan 2000 Dispersal of adult aquaticChironomidae (Diptera) in agricultural landscapes Freshwater Biol 44399ndash411
Diaz R W A Overholt A Samayoa F Sosa D Cordeau and J Medal2008 Temperature-dependent development cold tolerance and potential dis-tribution of Gratiana boliviana (Coleoptera Chrysomelidae) a biologicalcontrol agent of tropical soda apple Solanum viarum (Solanaceae)Biocontrol Sci Technol 18 193ndash207
Ebeling S K E Welk H Auge and H Bruelheide 2008 Predicting thespread of an invasive plant combining experiments and ecological nichemodel Ecography 31 709ndash719
Elith J and J R Leathwick 2009 Species distribution models ecologicalexplanation and prediction across space and time Annu Rev Evol Syst 40677ndash697
Elith J M Kearney and S Phillips 2010 The art of modelling range-shift-ing species Methods Ecol Evol 1 330ndash342
Elliot A C and J S Reisch 2006 Implementing a multiple comparison testfor proportions in a 2xc crosstabulation in SASVR (httpwww2sascomproceedingssugi31204-31pdf) (accessed 14 September 2012)
Epler J H J P Cuda and T D Center 2000 Redescription of Cricotopuslebetis (Diptera Chironomidae) a potential biocontrol agent of the aquaticweed hydrilla (Hydrocharitaceae) Florida Entomol 83 171ndash180
Franklin J 2009 Mapping species distributions spatial inference and predic-tion Cambridge University Press Cambridge United Kingdom
Grinnell J 1924Geography and evolution Ecology 5 225ndash229Guisan A and W Thuiller 2005 Predicting species distribution offering
more than simple habitat models Ecol Lett 8 993ndash1009Hoyer M V M D Netherland M S Allen and D E Canfield Jr 2005
Hydrilla management in Florida a summary and discussion of issuesidentified by professionals with future management recommendations Finaldocument 14 June 2005 (httpplantsifasufleduosceolahydrilla_mngmt_flhydrilla_management_floridahtml) (accessed 14 September 2012)
Hutchinson G E 1957 Population studiesmdashanimal ecology and demogra-phymdashconcluding remarks Cold Spring Harb Symp 22 415ndash427
(IDRE) Institute for Digital Research and Education 2012 SAS librarynon-linear regression in SAS (httpstatisticsatsuclaedustatsaslibrarySASNLin_oshtm) (accessed 14 September 2012)
Kearney M and W Porter 2009 Mechanistic niche modelling combiningphysiological and spatial data to predict species ranges Ecol Lett 12334ndash350
Koppen W 1936 Das geographische system der klimate pp 1ndash44 InW Koppen and R Geiger (eds) Handbuch der klimatologie Verlag vonGebruder Borntraeger Berlin Germany
Koschnick T J M D Netherland and W T Haller 2007 Effect of threeALS-inhibitors on five emergent native plant species in Florida J AquaticPlant Manag 45 47ndash51
Kriticos D J B L Webber A Leriche N Ota I Macadam J Bathols JK Scott 2011 CliMond global high-resolution historical and future scenarioclimate surfaces for bioclimatic modeling Methods Ecol Evol 3 53ndash64
Lapointe S L D M Borchert and D G Hall 2007 Effect of low tempera-tures on mortality and oviposition in conjunction with climate mapping topredict spread of the root weevil Diaprepes abbreviatus and introduced natu-ral enemies Environ Entomol 36 73ndash82
Madeira P T C C Jacono and T K Van 2000Monitoring hydrilla usingtwo RAPD procedures and the nonindigenous aquatic species databaseJ Aquatic Plant Manag 38 33ndash40
Madeira P T T K Van K K Steward and R J Schnell 1997 Randomamplified polymorphic DNA analysis of the phenetic relationships amongworld-wide accessions ofHydrilla verticillata Aquatic Bot 59 217-ndash236
Magarey R D G A Fowler D M Borchert T B Sutton M Colunga-Garcia and J A Simpson 2007 NAPPFAST An internet system forweather-based mapping of plant pathogens Plant Dis 91 336ndash345
McCombie A M 1959 Some relations between air temperatures and the sur-face water temperature of lakes Limnol Oceanogr 4 525ndash258
Mukherjee A D Williams G Wheeler J Cuda S Pal and W Overholt2012 Brazilian peppertree (Schinus terebinthifolius) in Florida and SouthAmerica evidence of a possible niche shift driven by hybridization BiolInvasions 14 1415ndash1430
Mukherjee A M C Christman W A Overholt and J P Cuda 2011Prioritizing areas in the native range of hygrophila for surveys to collect bio-logical control agents Biol Control 56 254ndash262
Munroe E 1984 Biogeography and evolutionary history wide-scale andlong-term patterns of insects pp 279ndash304 In C B Huffaker and R LRabb (eds) Ecological entomology Wiley and Sons New York NY
Netherland M D K D Getsinger and D R Stubbs 2005 Aquatic plantmanagement invasive species and chemical control Outlooks Pest Manag16 100ndash104
Oliver D R M E Dillon and P S Cranston 1990 A catalog of neacrticChironomidae Research Branch Agriculture Canada Ottawa Canada
Pearson R G C J Raxworthy M Nakamura and A T Peterson 2007Predicting species distributions from small numbers of occurrence records atest case using cryptic geckos in Madagascar J Biogeogr 34 102ndash117
Phillips S J R P Anderson and R E Schapire 2006 Maximum entropymodeling of species geographic distributions Ecol Model 190 231ndash259
Pinder L C V 1986 Biology of freshwater Chironomidae Annu RevEntomol 31 1ndash23
SAS Institute 2008 SASSTAt userrsquos guide SAS Institute Cary NCSchmitz D C B V Nelson L E Nall and J D Schardt 1991 Exotic
aquatic plants in Florida a historical perspective and review of the presentaquatic plant regulation program pp 306ndash326 In T C Center R FDoren R L Hofstetter R L Myers and L D Whiteaker (eds)Proceedings of a symposium on exotic pest plants Technical report NPSNREVERNRTR-9106 U S Department of Interior National Park ServiceDenver CO
Steward K K T K Van C Carter and A H Pieterse 1984 Hydrilla in-vades Washington D C and the Potomac Am J Bot 71 162ndash163
Stratman K N W A Overholt J P Cuda M D Netherland and PCWilson 2013 Host range and searching behavior of Cricitopus lebetis(Diptera Chironomidae) a tip miner of Hydrilla verticillata(Hydrocharitiaceae) Bio Sci Technol 23 317ndash334
Sublette J E 1964 Chironomidae (Diptera) of Louisiana I Systematics andimmature stages of some lentic chironomids of west-central LouisianaTulane Stud Zool 11 109ndash150
Tokeshi M 1995 Life cycles and population dynamics pp 225ndash268 InP Armitage P S Cranston and L C V Pinder (eds) Chironomidae bi-ology and ecology of non-biting midges Chapman and Hall London UnitedKingdom
Turnock W J and P G Fields 2005Winter climates and cold hardiness interrestrial insects Eur J Entomol 102 561ndash576
Webber B L C J Yates D C Le Maitre J K Scott D J Kriticos NOta A McNeill J J Le Roux and G F Midgley 2011Modelling horsesfor novel climate courses insights from projecting potential distributions ofnative and alien Australian acacias with correlative and mechanistic modelsDivers Distrib 17 978ndash1000
Wheeler G S and T D Center 2001 Impact of the biological control agentHydrellia pakistanae (Diptera Ephydridae) on the submersed aquatic weedHydrilla verticillata (Hydrocharitaceae) Biol Control 21 168ndash181
Received 5 December 2012 accepted 23 June 2013
2014 STRATMAN ET AL OPTIMAL TEMPERATURE CONDITIONS FOR C LEBETIS 7
by guest on October 16 2014
httpjinsectscienceoxfordjournalsorgD
ownloaded from
Appendix B MaxEnt model background used to predict potential distribution of C lebetis Model background is based on theKoppenndashGeiger climate zone polygons containing one or more records of C lebetis
Appendix A North American occurrence records of C lebetisa
Location Latitude Longitude Source
Baton Rouge LA 304619 N 911431 W Epler et al (2000)Natchitoches LA 317610 N 930861 W Sublette (1964)Farmersville LA 327528 N 924046 W Sublette (1964)Lake Tohopekaliga FL 282414 N 814064 W KNS (unpublished data)Lake Istokpoga FL 273944 N 812445 W KNS (unpublished data)Bulldozer Canal FL 279976 N 807939 W KNS (unpublished data)Lake Rowell FL 299185 N 821603 W KNS (unpublished data)Crystal River 288917 N 826033 W Cuda et al (2002)Lake Brantley FL 286935 N 814210 W D Denson (personal communication)Village Lake FL 283702 N 815325 W D Denson (personal communication)EPCOT Lake FL 283678 N 814956 W D Denson (personal communication)West Feeder Canal FL 263012 N 810728 W D Strom (personal communication)West Feeder Canal FL 262907 N 809720 W D Strom (personal communication)North Feeder Canal FL 263390 N 809796 W D Strom (personal communicationNorth Feeder Canal FL 262913 N 809703 W D Strom (personal communication)L4 Canal FL 263299 N 808826 W D Strom (personal communication)28 Interceptor Canal FL 262586 N 809532 W D Strom (personal communication)L28 Borrow Canal FL 263299 N 808807 W D Strom (personal communication)L28 Borrow Canal FL 260278 N 808303 W D Strom (personal communication)Harney Pond Canal FL 270911 N 810702 W D Strom (personal communication)Harney Pond Canal FL 270164 N 810702 W D Strom (personal communication)Indian Prairie Canal FL 271526 N 810685 W D Strom (personal communication)Indian Prairie Canal FL 270977 N 810104 W D Strom (personal communication)South Lake Istopkoga FL 273039 N 811299 W R Rutter (personal communication)Caloosahatchee River FL 267868 N 812655 W R Rutter (personal communication)Arbuckle Creek FL 275025 N 813354 W R Rutter (personal communication)North Prong Alligator Creek FL 268952 N 819702 W R Rutter (personal communication)Southwest FL 270200 N 813026 W R Rutter (personal communication)aGeopositions of records provided by Dana Denson Doug Strom and Robert Rutter are estimated from label descriptions and personal communications
8 JOURNAL OF INSECT SCIENCE VOLUME 14
by guest on October 16 2014
httpjinsectscienceoxfordjournalsorgD
ownloaded from
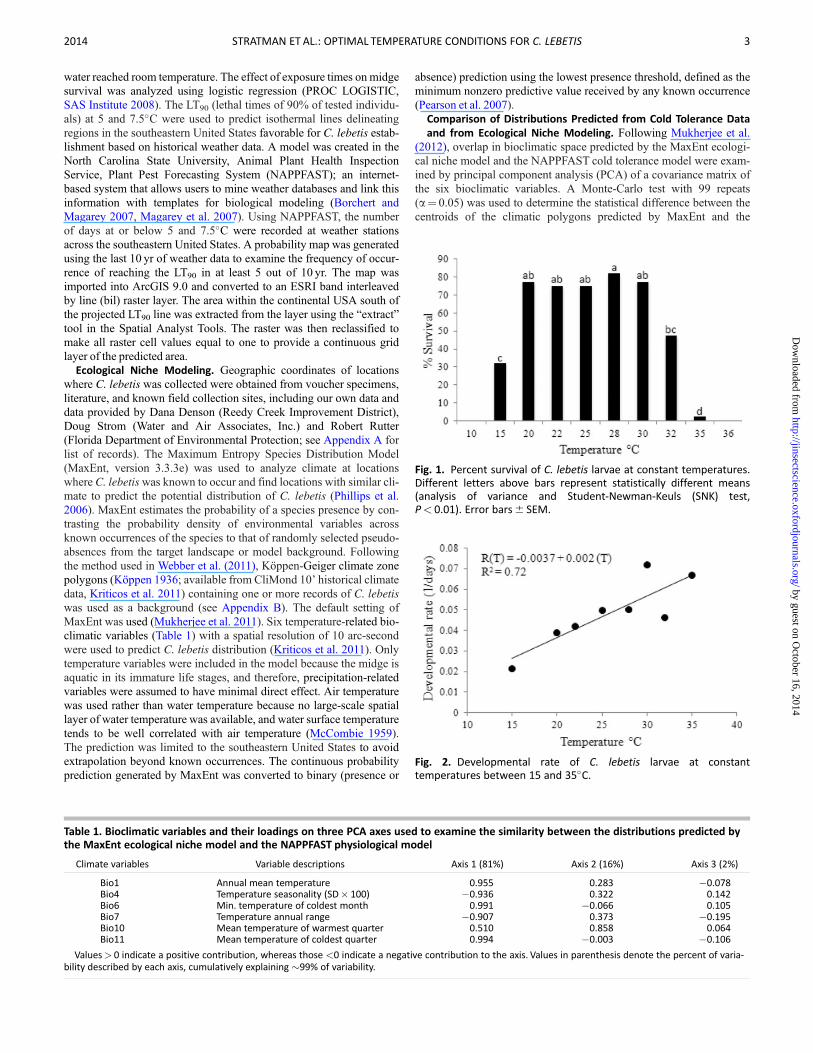
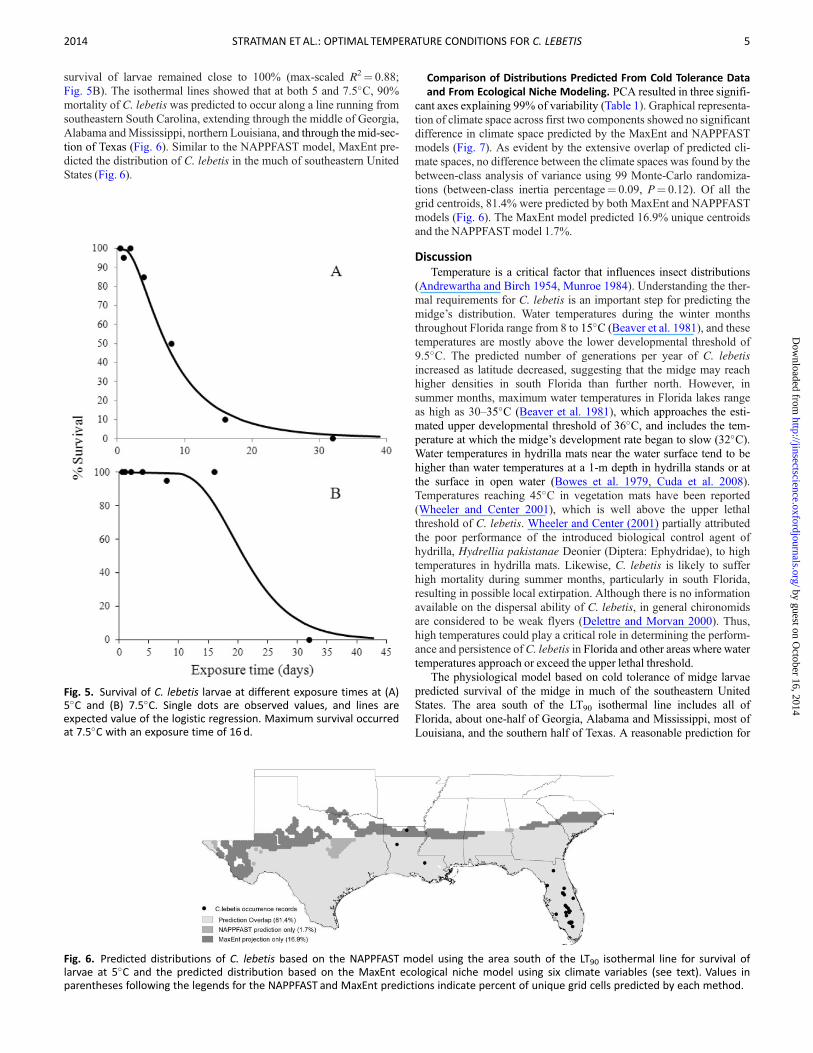
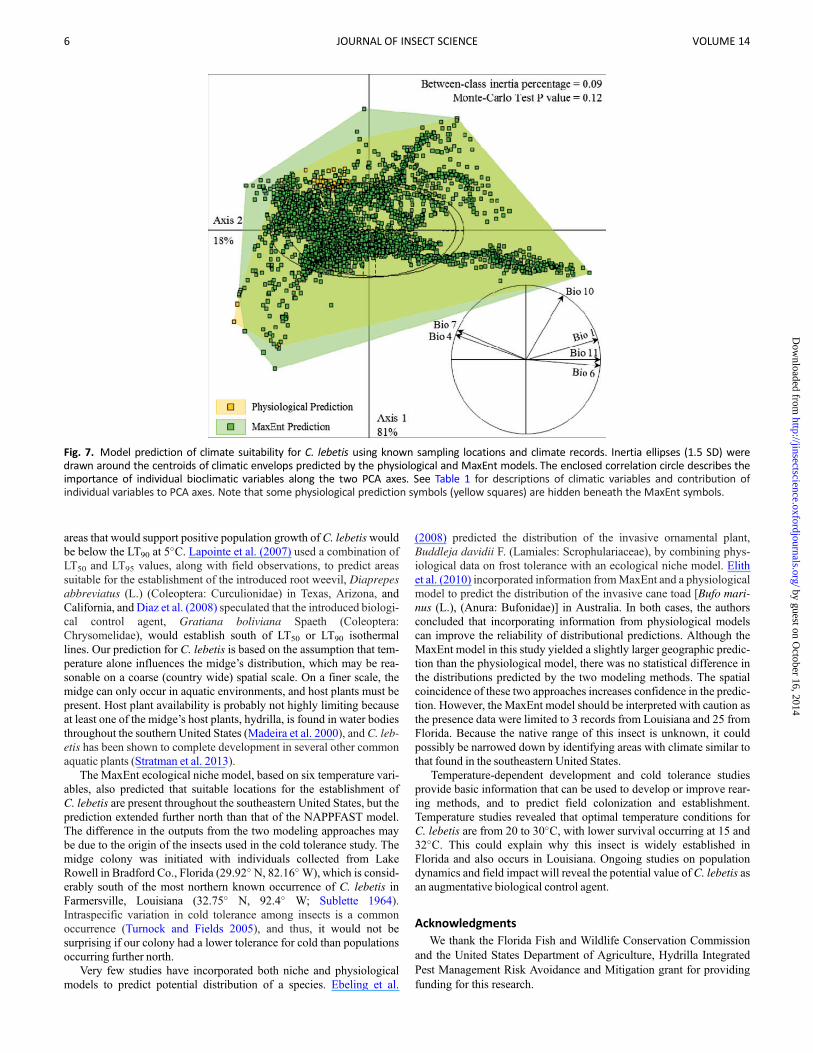
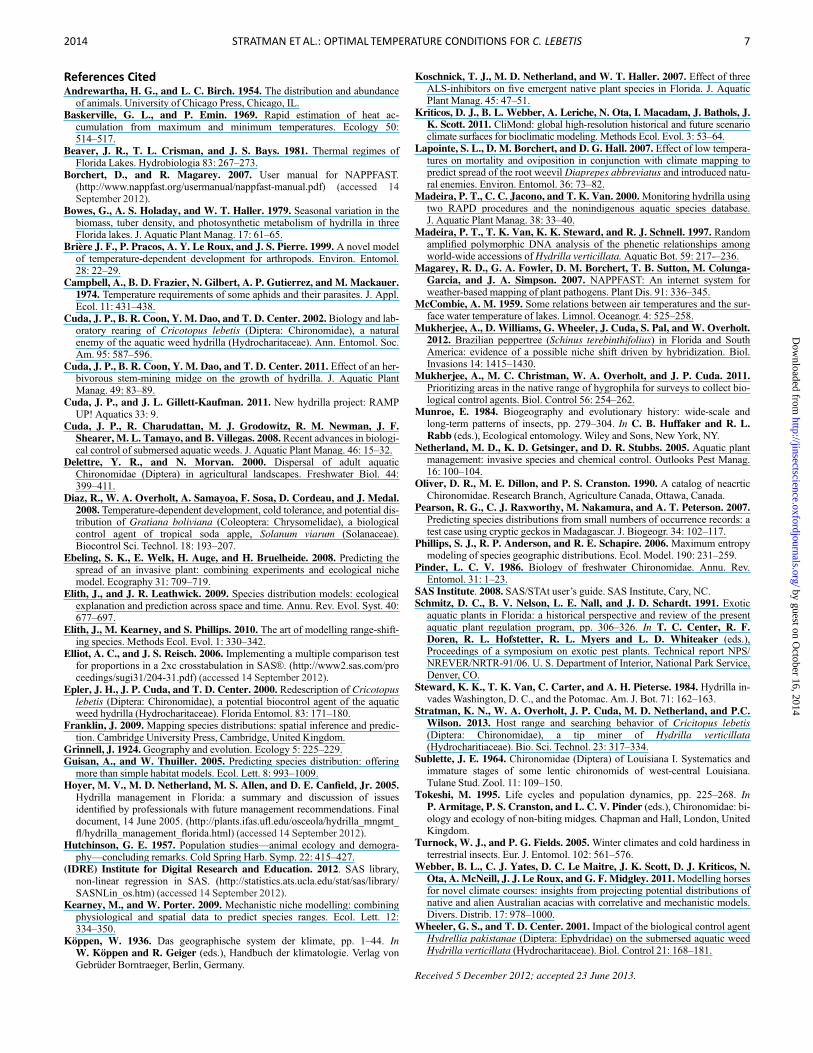
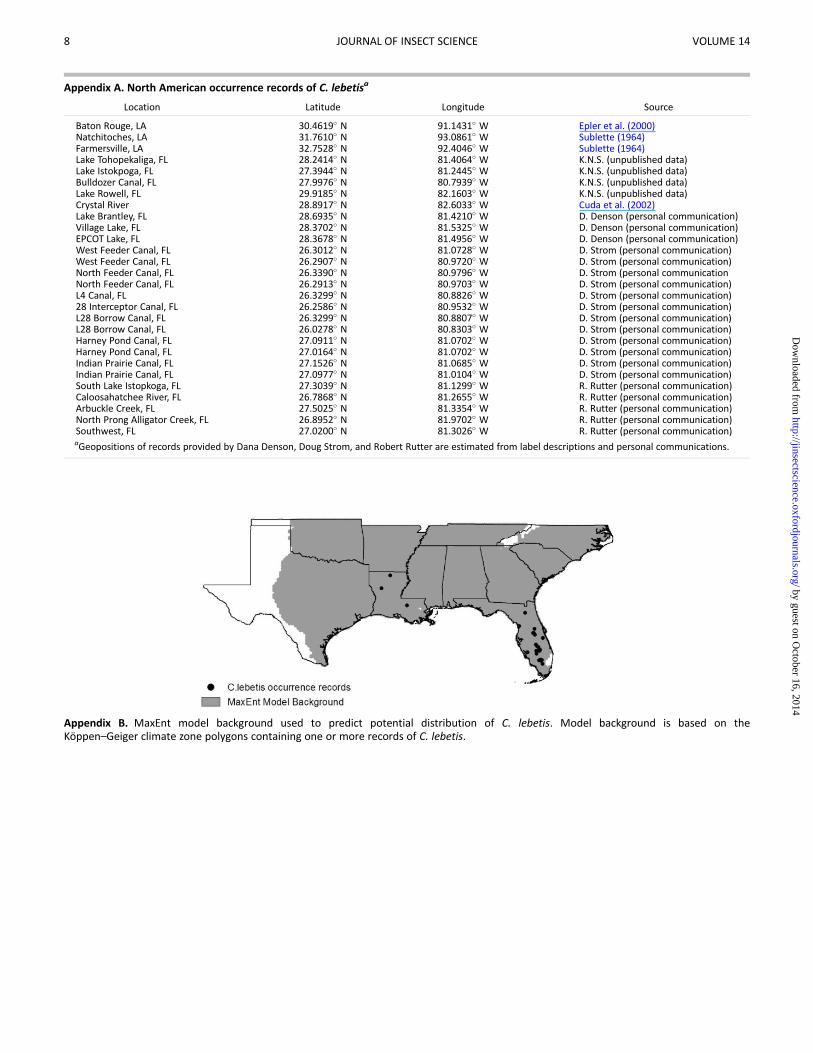