Integrating Human and Ecosystem Health Through Ecosystem Services Frameworks
Upload
un-lincolnCategory
view
1download
0
NASA/TMm2000-209891, Vol. 71
Technical Report Series on theBoreal Ecosystem-Atmosphere Study (BOREAS)
Forrest G. Hall and Jaime Nickeson, Editors
Volume 71
BOREAS RSS-17 Stem, Soil,
and Air Temperature Data
R. Zimmerman, K.C. McDonald, and J.B. Way
National Aeronautics and
Space Administration
Goddard Space Flight CenterGreenbelt, Maryland 20771
August 2000
The NASA STI Program Office ... in Profile
Since its founding, NASA has been dedicated tothe advancement of aeronautics and spacescience. The NASA Scientific and Technical
Information (STI) Program Office plays a key
part in helping NASA maintain this importantrole.
The NASA STI Program Office is operated by
Langley Research Center, the lead center forNASA's scientific and technical information. The
NASA STI Program Office provides access tothe NASA STI Database, the largest collection of
aeronautical and space science STI in the world.The Program Office is also NASA's institutionalmechanism for disseminating the results of its
research and development activities. These
results are published by NASA in the NASA STI
Report Series, which includes the followingreport types:
• TECHNICAL PUBLICATION. Reports of
completed research or a major significantphase of research that present the results ofNASA programs and include extensive data or
theoretical analysis. Includes compilations ofsignificant scientific and technical data andinformation deemed to be of continuing
reference value. NASA's counterpart of
peer-reviewed formal professional papers but
has less stringent limitations on manuscriptlength and extent of graphic presentations.
• TECHNICAL MEMORANDUM. Scientific
and technical findings that are preliminary or
of specialized interest, e.g., quick releasereports, working papers, and bibliographiesthat contain minimal annotation. Does not
contain extensive analysis.
• CONTRACTOR REPORT. Scientific and
technical findings by NASA-sponsored
contractors and grantees.
• CONFERENCE PUBLICATION. Collected
papers from scientific and technicalconferences, symposia, seminars, or other
meetings sponsored or cosponsored by NASA.
• SPECIAL PUBLICATION. Scientific, techni-
cal, or historical information from NASA
programs, projects, and mission, often con-cerned with subjects having substantial publicinterest.
TECHNICAL TRANSLATION.
English-language translations of foreign scien-tific and technical material pertinent to NASA'smission.
Specialized services that complement the STI
Program Office's diverse offerings include creat-ing custom thesauri, building customized data-bases, organizing and publishing research results...
even providing videos.
For more information about the NASA STI Pro-
gram Office, see the following:
• Access the NASA STI Program Home Page at
http://www.sti.nasa.gov/STI-homepage.html
• E-mail your question via the Internet to
• Fax your question to the NASA Access HelpDesk at (301) 621-0134
• Telephone the NASA Access Help Desk at
(301) 621-0390
• Write to:
NASA Access Help Desk
NASA Center for AeroSpace Information7121 Standard Drive
Hanover, MD 21076-1320
NASA/TMm2000-209891, Vol. 71
Technical Report Series on theBoreal Ecosystem-Atmosphere Study (BOREAS)
Forrest G. Hall and Jaime Nickeson, Editors
Volume 71
BOREAS RSS-17 Stem, Soil,
and Air Temperature Data
Reiner Zimmerman, Bayreuth Institute for Terrestrial Ecosystem Research (BITOEK),
University of Bayreuth, Bayreuth, Germany
Kyle C. McDonald, Jet Propulsion Laboratory, Pasadena, California
JoBea Way, Jet Propulsion Laboratory, Pasadena, California
National Aeronautics and
Space Administration
Goddard Space Flight CenterGreenbelt, Maryland 20771
August 2000
NASA Center for AeroSpace Information7121 Standard Drive
Hanover, MD 21076-1320Price Code: AI7
Available from:
National Technical Information Service
5285 Port Royal Road
Springfield, VA 22161Price Code: A10
BOREAS RSS-17 Stem, Soil, and Air Temperature Data
Kyle McDonald, Reiner Zimmermann, JoBea Way
Summary
The BOREAS RSS-17 team collected several data sets in support of its research in monitoring and.analyzing environmental and phenological states using radar data. This data set consists of tree boleand soil temperature measurements from various BOREAS flux tower sites. Temperatures weremeasured with thermistors implanted in the hydroconductive tissue of the trunks of several trees ateach site and at various depths in the soil. Data were stored on a data logger at intervals of either 1 or 2hours. The majority of the data were acquired between early 1994 and early 1995. The primaryproduct of this data set is the diurnal stem temperature measurements acquired for selected trees at fiveBOREAS tower sites. The data are provided in tabular ASCII format.
Table of Contents
1) Data Set Overview2) Investigator(s)3) Theory of Measurements4) Equipment5) Data Acquisition Methods6) Observations7) Data Description8) Data Organization9) Data Manipulations10) Errors11) Notes12) Application of the Data Set13) Future Modifications and Plans14) Software15) Data Access16) Output Products and Availability17) References18) Glossary of Terms19) List of Acronyms20) Document Information
1. Data Set Overview
1.1 Data Set Identification
BOREAS RSS- 17 Stem, Soil, and Air Temperature Data
1.2 Data Set Introduction
This documentation file describes tree bole and soil temperature data acquired during the BORealEcosystem-Atmosphere Study (BOREAS) field experiment at five of the BOREAS tower sites. Thetree bole data were collected in separate but representative trees at each of the tower sites. Data werecollected from the Southern Study Area (SSA) at the Old Black Spruce (OBS), Old Jack Pine (OJP),Old Aspen (OA), and Young Jack Pine (YJP) sites. Data were also collected at the Northern StudyArea (NSA) OBS site. The majority of the data were acquired between early 1994 and early 1995.
All of the temperature data were collected with 3-mm x 3-mm x l-ram thermistors. Data werepostprocessed to derive temperature values (in Celsius) from the raw data taken (in kOhms) by
Page 1
resistance measurements from nonlinear response-type thermistors. Thermistors were implanted in thehydroconductive tissues of selected tree trunks and at various depths in the soil. Measurements wererecorded automatically on a data logger at 1- or 2-hour intervals.
1.3 Objective/PurposeThese measurements were taken to assist with the interpretation of radar backscatter measurements
obtained with the Earth Resource Satellite-1 0ERS-1) Synthetic Aperture Radar (SAP,). Data were usedto assess the freeze/thaw state of the soil and vegetation to aid interpretation of the radar images.
1.4 Summary of Parameters and VariablesThe primary measured parameter is diurnal vegetation temperature, Some soil and air temperatures
were collected at a subset of sites.
1.5 Discussion
Temperature measurements were used to quantify freeze/thaw transitions in the soil and vegetation.Landscape freeze/thaw transitions are readily observable with imaging radar. Thus, radar may beapplied to assess growing season length in boreal landscapes.
1.6 Related Data SetsBOREAS RSS-17 Dielectric Constant Profile Measurements
BOREAS RSS-17 Xylem Flux Density Measurements at the SSA-OBS SiteBOREAS RSS- 17 1994 ERS-1 Level-3 Backscatter Change Images
2. Investigator(s)
2.1 Investigator(s) Name and TitlePrincipal InvestigatorDr. JoBea Way Scientist
Co-InvestigatorsDr. Kyle McDonald ScientistDr. Reiner Zimmermann Scientist
2.2 Title of InvestigationMonitoring Environmental and Phenologic State and Duration of State with SAP, as Input to
Improved CO2 Flux Models
2.3 Contact Information
Contact 1:
Dr. JoBea WayJet Propulsion LaboratoryMail Stop 300-233California Institute of Technology4800 Oak Grove Drive
Pasadena, CA 91109USA
(818) 354-8225(818) 354-9476 (fax)[email protected].
Page 2
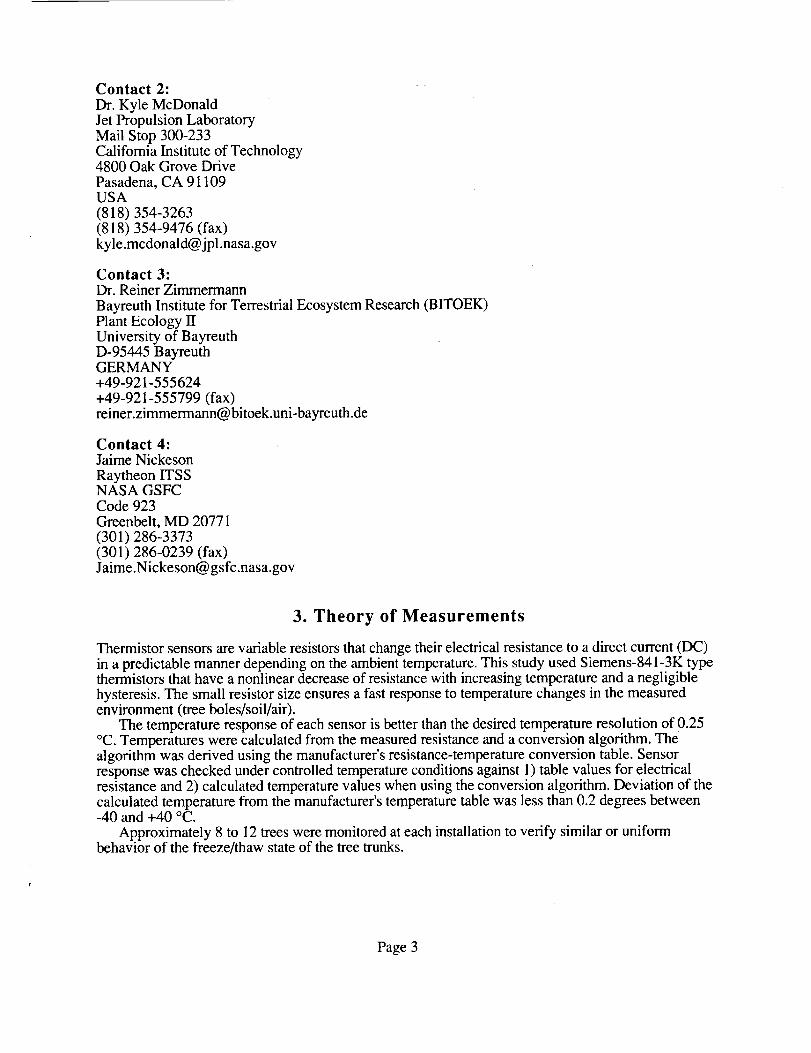
Contact 2:Dr.KyleMcDonaldJetPropulsionLaboratoryMail Stop300-233CaliforniaInstituteof Technology4800OakGroveDrivePasadena,CA 91109USA(818)354-3263(818)354-9476(fax)[email protected]
Contact 3:Dr. Reiner Zimmermann
Bayreuth Institute for Terrestrial Ecosystem Research (BITOEK)Plant Ecology IIUniversity of BayreuthD-95445 BayreuthGERMANY+49-921-555624
+49-921-555799 (fax)[email protected]
Contact 4:Jaime Nickeson
Raytheon ITSSNASA GSFCCode 923
Greenbelt, MD 20771(301) 286-3373(301) 286-0239 (fax)[email protected]
3. Theory of Measurements
Thermistor sensors are variable resistors that change their electrical resistance to a direct current (DC)in a predictable manner depending on the ambient temperature. This study used Siemens-841-3K typethermistors that have a nonlinear decrease of resistance with increasing temperature and a negligiblehysteresis. The small resistor size ensures a fast response to temperature changes in the measuredenvironment (tree boles/soil/air).
The temperature response of each sensor is better than the desired temperature resolution of 0.25°C. Temperatures were calculated from the measured resistance and a conversion algorithm. Thealgorithm was derived using the manufacturer's resistance-temperature conversion table. Sensorresponse was checked under controlled temperature conditions against 1) table values for electricalresistance and 2) calculated temperature values when using the conversion algorithm. Deviation of thecalculated temperature from the manufacturer's temperature table was less than 0.2 degrees between-40 and +40 °C.
Approximately 8 to 12 trees were monitored at each installation to verify similar or uniformbehavior of the freeze/thaw state of the tree trunks.
Page 3
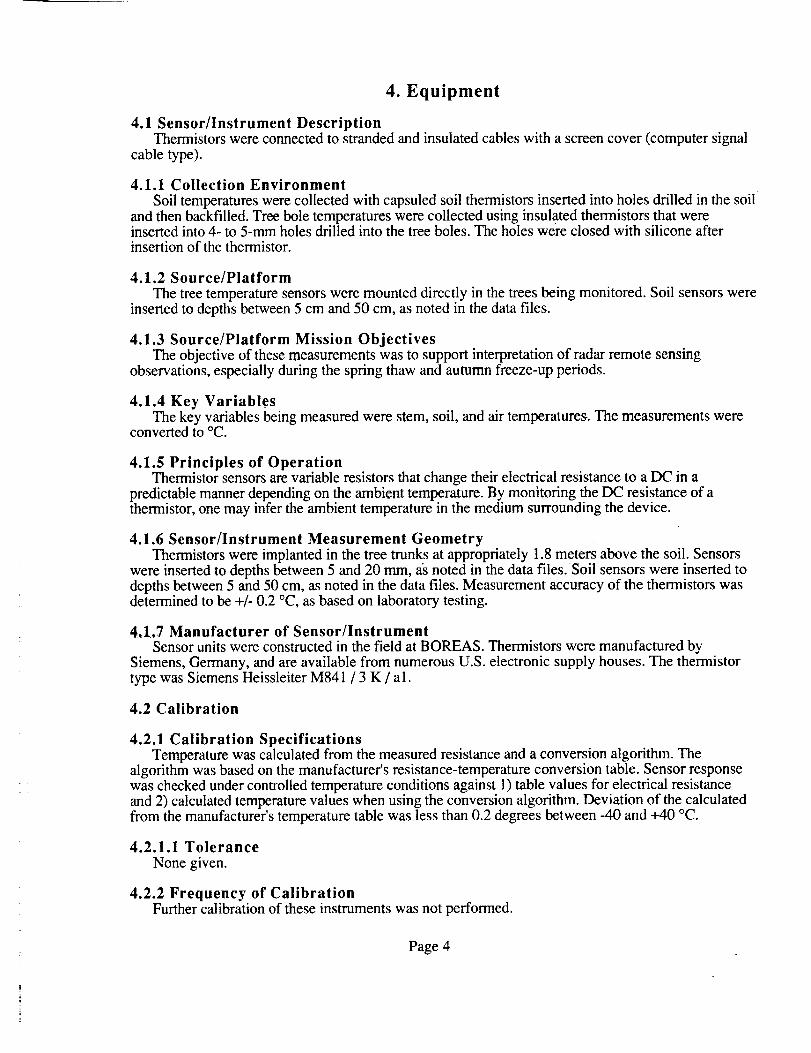
4. Equipment
4.1 Sensor/Instrument DescriptionThermistors were connected to stranded and insulated cables with a screen cover (computer signal
cable type).
4.1.1 Collection Environment
Soil temperatures were collected with capsuled soil thermistors inserted into holes drilled in the soiland then backfilled. Tree bole temperatures were collected using insulated thermistors that wereinserted into 4- to 5-mm holes drilled into the tree boles. The holes were closed with silicone afterinsertion of the thermistor.
4.1.2 Source/Platform
The tree temperature sensors were mounted directly in the trees being monitored. Soil sensors wereinserted to depths between 5 cm and 50 cm, as noted in the data files.
4.1.3 Source/Platform Mission ObjectivesThe objective of these measurements was to support interpretation of radar remote sensing
observations, especially during the spring thaw and autumn freeze-up periods.
4.1.4 Key VariablesThe key variables being measured were stem, soil, and air temperatures. The measurements were
converted to °C.
4.1.5 Principles of OperationThermistor sensors are variable resistors that change their electrical resistance to a DC in a
predictable manner depending on the ambient temperature. By monitoring the DC resistance of athermistor, one may infer the ambient temperature in the medium surrounding the device.
4.1.6 Sensor/Instrument Measurement GeometryThermistors were implanted in the tree trunks at appropriately 1.8 meters above the soil. Sensors
were inserted to depths between 5 and 20 mm, as noted in the data files. Soil sensors were inserted todepths between 5 and50 cm, as noted in the data files. Measurement accuracy of the thermistors wasdetermined to be +/- 0.2 °C, as based on laboratory testing.
4.1.7 Manufacturer of Sensor/Instrument
Sensor units were constructed in the field at BOREAS. Thermistors were manufactured bySiemens, Germany, and are available from numerous U.S. electronic supply houses. The thermistortype was Siemens Heissleiter M841 / 3 K / al.
4.2 Calibration
4.2.1 Calibration SpecificationsTemperature was calculated from the measured resistance and a conversion algorithm. The
algorithm was based on the manufacturer's resistance-temperature conversion table. Sensor responsewas checked under controlled temperature conditions against l) table values for electrical resistanceand 2) calculated temperature values when using the conversion algorithm. Deviation of the calculatedfrom the manufacturer's temperature table was less than 0.2 degrees between -40 and +40 °C.
4.2.1.1 Tolerance
None given.
4.2.2 Frequency of CalibrationFurther calibration of these instruments was not performed.
Page 4
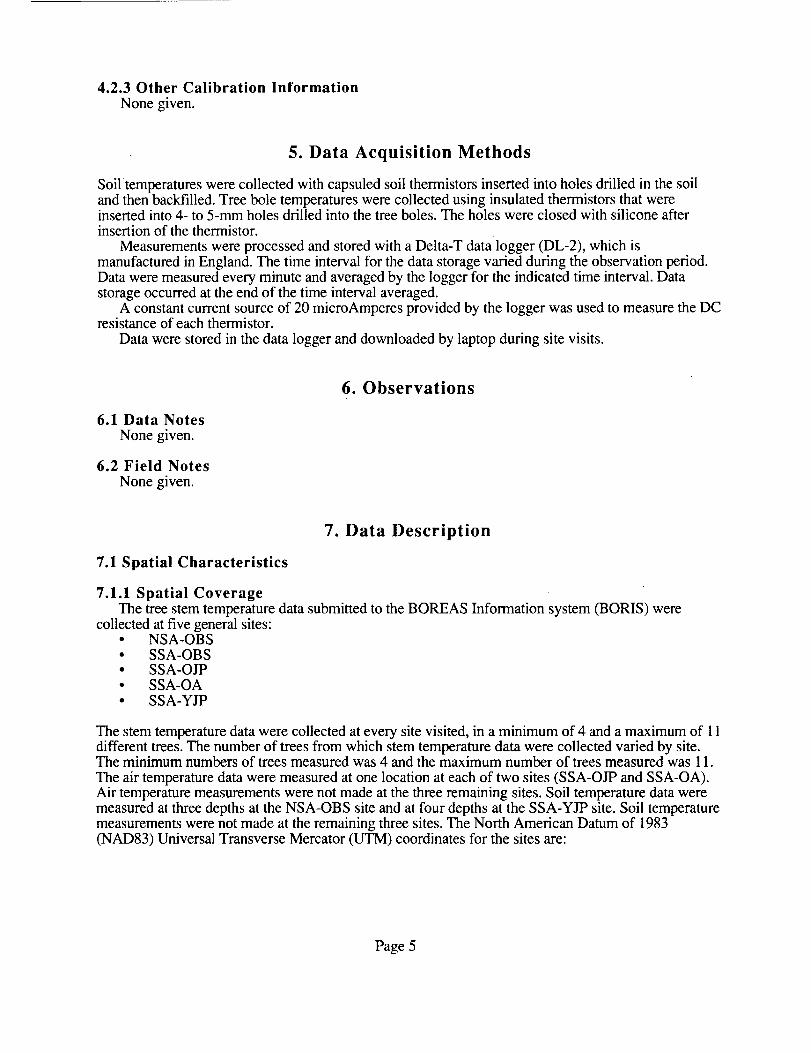
4.2.3 Other Calibration Information
None given.
5. Data Acquisition Methods
Soil temperatures were collected with capsuled soil thermistors inserted into holes drilled in the soiland then backfilled. Tree bole temperatures were collected using insulated thermistors that wereinserted into 4- to 5-mm holes drilled into the tree boles. The holes were closed with silicone afterinsertion of the thermistor.
Measurements were processed and stored with a Delta-T data logger (DL-2), which ismanufactured in England. The time interval for the data storage varied during the observation period.Data were measured every minute and averaged by the logger for the indicated time interval. Datastorage occurred at the end of the time interval averaged.
A constant current source of 20 microAmperes provided by the logger was used to measure the DCresistance of each thermistor.
Data were stored in the data logger and downloaded by laptop during site visits.
6.1 Data Notes
None given.
6.2 Field Notes
None given.
6. Observations
7. Data Description
7.1 Spatial Characteristics
7.1.1 Spatial CoverageThe tree stem temperature data submitted to the BOREAS Information system (BORIS) were
collected at five general sites:• NSA-OBS• SSA-OBS• SSA-OJP• SSA-OA• SSA-YJP
The stem temperature data were collected at every site visited, in a minimum of 4 and a maximum of 11different trees. The number of trees from which stem temperature data were collected varied by site.The minimum numbers of trees measured was 4 and the maximum number of trees measured was 11.
The air temperature data were measured at one location at each of two sites (SSA-OJP and SSA-OA).Air temperature measurements were not made at the three remaining sites. Soil temperature data weremeasured at three depths at the NSA-OBS site and at four depths at the SSA-YJP site. Soil temperaturemeasurements were not made at the remaining three sites. The North American Datum of 1983(NAD83) Universal Transverse Mercator (UTM) coordinates for the sites are:
Page 5
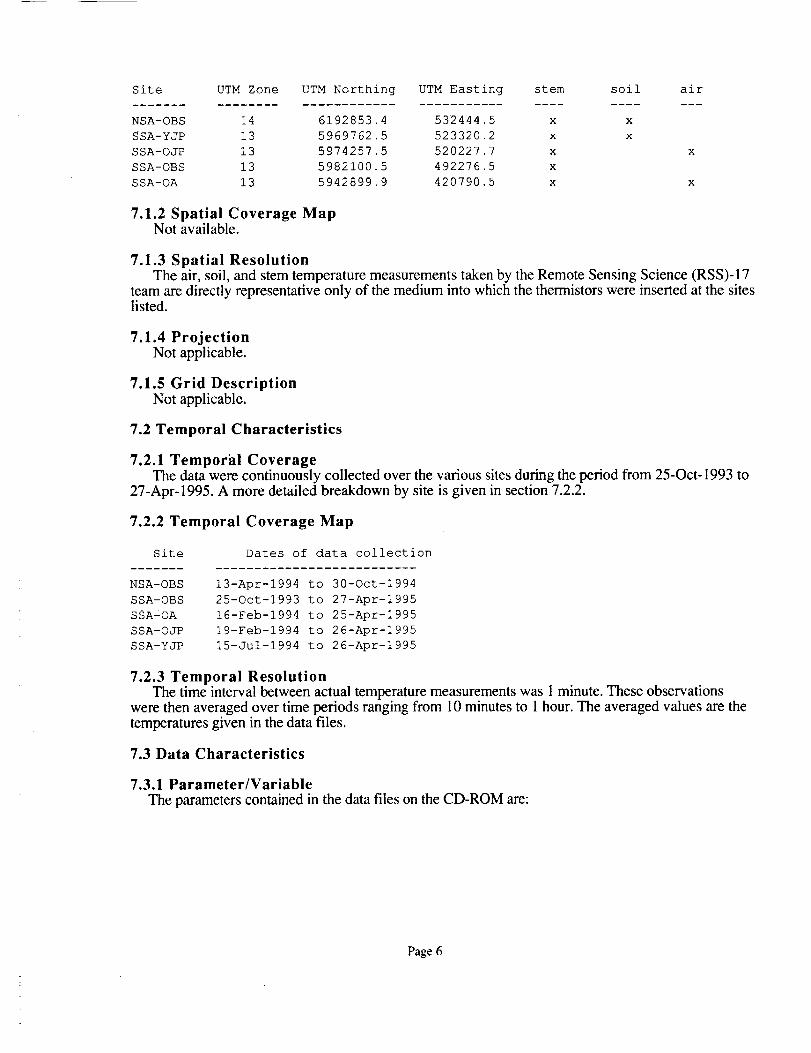
Site UTM Zone UTM Northing UTM Easting stem soil air
NSA-OBS 14 6192853.4 532444.5 x x
SSA-YJP 13 5969762,5 523320.2 x x
SSA-OJP 13 5974257.5 520227.7 x x
SSA-OBS 13 5982100.5 492276.5 x
SSA-OA 13 5942899.9 420790.5 x x
7.1.2 Spatial Coverage MapNot available.
7.1.3 Spatial ResolutionThe air, soil, and stem temperature measurements taken by the Remote Sensing Science (RSS)-17
team are directly representative only of the medium into which the thermistors were inserted at the siteslisted.
7.1.4 ProjectionNot applicable.
7.1.5 Grid DescriptionNot applicable.
7.2 Temporal Characteristics
7.2.1 TemporM CoverageThe data were continuously collected over the various sites during the period from 25-Oct-1993 to
27-Apr-1995. A more detailed breakdown by site is given in section 7.2.2.
7.2.2 Temporal Coverage Map
Site Dates of data collection
NSA-OBS 13-Apr-1994 to 30-0ct-1994
SSA-OBS 25-0ct-1993 to 27-Apr-1995
SSA-OA 16-Feb-1994 to 25-Apt-1995
SSA-OJP 19-Feb-1994 to 26-Apr-1995
SSA-YJP 15-Jui-1994 to 26-Apr-1995
7.2.3 Temporal ResolutionThe time interval between actual temperature measurements was 1 minute. These observations
were then averaged over time periods ranging from 10 minutes to 1 hour. The averaged values are thetemperatures given in the data files.
7.3 Data Characteristics
7.3.1 Parameter/Variable
The parameters contained in the data files on the CD-ROM are:
Page 6
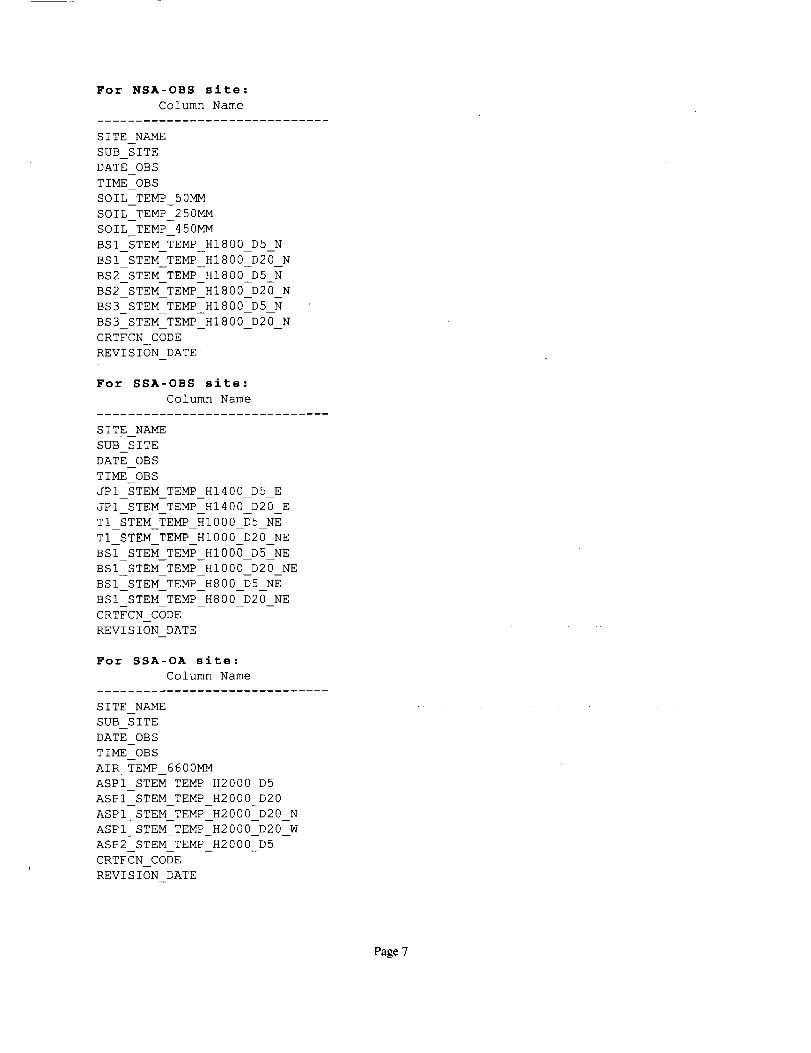
For NSA-OBS site:
Column Name
SITE NAME
SUB SITE
DATE OBS
TIME OBS
SOIL TEMP 50MM
SOIL TEMP 250MM
SOIL TEMP 450MM
BSI STEM TEMP HI800 D5 N
BSI STEM TEMP HI800 D20 N
BS2 STEM TEMP HI800 D5 N
BS2 STEM TEMP HI800 D20 N
BS3 STEM TEMP HI800 D5 N
BS3 STEM TEMP HI800 D20 N
CRTFCN CODE
REVISION DATE
For SSA-OBS site:
Column Name
SITE NAME
SUB SITE
DATE OBS
TIME OBS
JPI STEM TEMP HI400 D5 E
JPI STEM TEMP HI400 D20 E
TI _TEM YEMP _I000 _5 N_TI STEM TEMPHI000 D20 NEBs¥ STE_ TEM_HlOOg DS-_EBSI STEM TEMP HI000 D20 NE
BSI STEM TEMP H800 D5 NE
BSI STEM TEMP H800 D20 NE
CRTFCN CODE
REVISION DATE
For SSA-OA site:
Column Name
SITE NAME
SUB SITE
DATE OBS
TIME OBS
AIR TEMP 6600MM
ASP1 STEM TEMP H2000 D5
ASP1 STEM TEMP H2000 D20
ASP1 STEM TEMP H2000 D20 N
ASP1 STEM TEMP H2000 D20 W
ASP2 STEM TEMP H2000 D5
CRTFCN CODE
REVISION DATE
Page 7
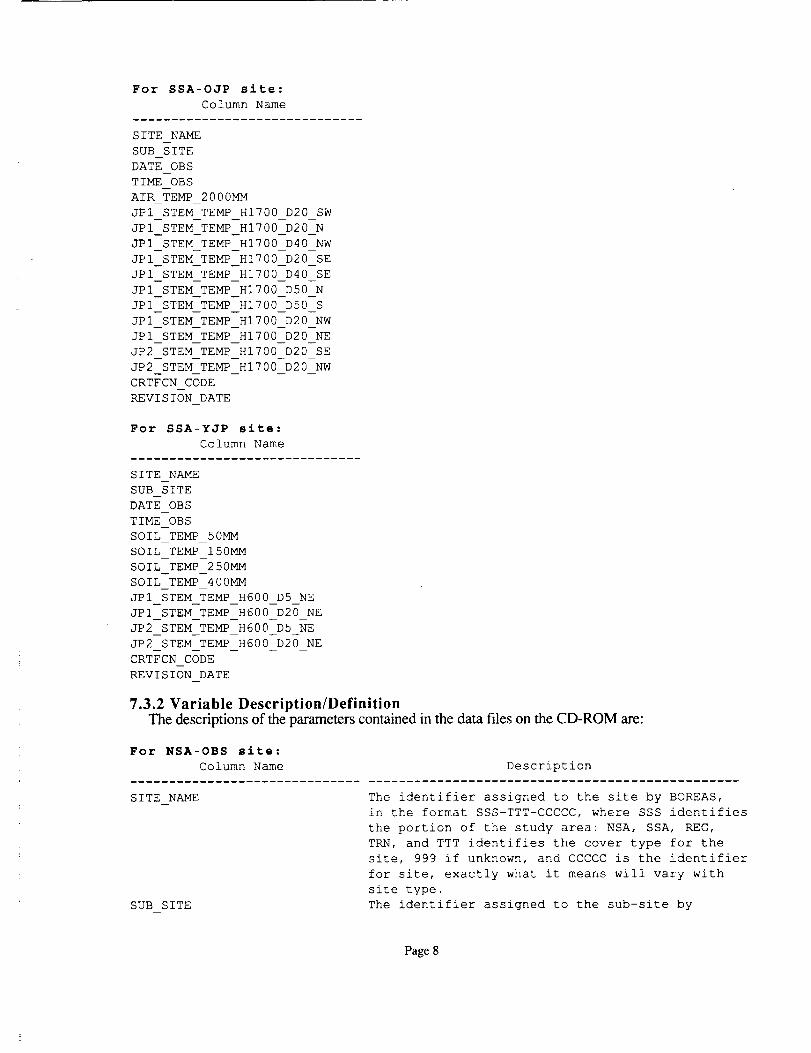
For SSA-OJP site:
Column Name
SITE NAME
SUB SITE
DATE OBS
TIME OBS
AIR TEMP 2000MM
JPI STEM TEMP HI700 D20 SW
JPI STEM TEMP HI700 D20 N
JPI STEM TEMP HI700 D40 NW
JPI STEM TEMP HI700 D20 SE
JPI STEM TEMP HI700 D40 SE
JPI STEM TEMP HI700 D50 N
JPI STEM TEMP HI700 D50 S
JPI STEM TEMP HI700 D20 NW
JPI STEM TEMP HI700 D20 NE
JP2 STEM TEMP HI700 D20 SE
JP2 STEM TEMP HIT00 D20 NW
CRTFCN CODE
REVISION DATE
For SSA-YJP site:
Column Name
SITE NAME
SUB SITE
DATE OBS
TIME OBS
SOIL TEMP 50MM
SOIL TEMP 150594
SOIL TEMP 250MM
SOIL TEMP 400MM
JPI STEM TEMP H600 D5 NE
JPI STEM TEMP H600 D20 NE
JP2 STEM TEMP H600 D5 NE
JP2 STEM TEMP H600 D20 NE
CRTFCN CODE
REVISION DATE
7.3.2 Variable Description/DefinitionThe descriptions of the parameters contained in the data files on the CD-ROM are:
For NSA-OBS site:
Column Name Description
SITE NAME
SUB SITE
The identifier assigned to the site by BOREAS,
in the format SSS-TTT-CCCCC, where SSS identifies
the portion of the study area: NSA, SSA, REG,
TRN, and TTT identifies the cover type for the
site, 999 if unknown, and CCCCC is the identifier
for site, exactly what it means will vary with
site type.
The identifier assigned to the sub-site by
Page 8
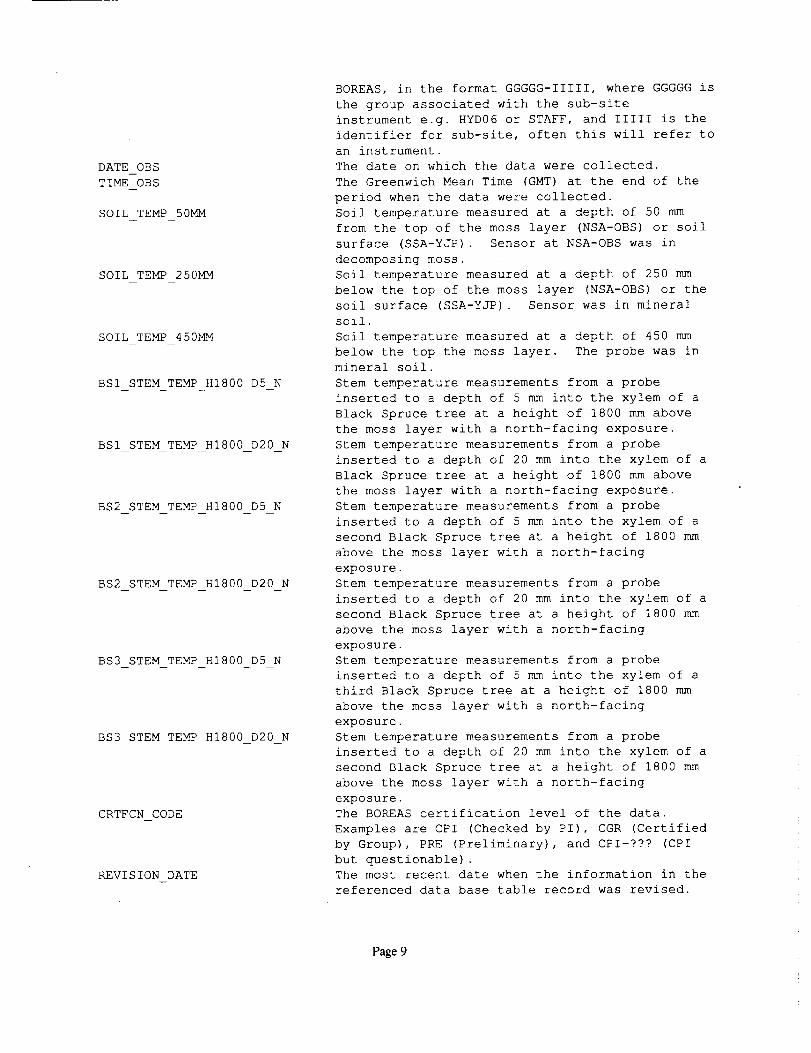
DATE OBS
TIME OBS
SOIL TEMP 50MM
SOIL TEMP 250MM
SOIL TEMP 450MM
BSI STEM TEMP HI800 D5 N
BSI STEM TEMP HI800 D20 N
BS2 STEM TEMP HI800 D5 N
BS2 STEM TEMP HI800 D20 N
BS3 STEM TEMP HI800 D5 N
BS3 STEM TEMP HI800 D20 N
CRTFCN CODE
REVISION DATE
BOREAS, in the format GGGGG-IIIII, where GGGGG is
the group associated with the sub-site
instrument e.g. HYD06 or STAFF, and IIIII is the
identifier for sub-site, often this will refer to
an instrument.
The date on which the data were collected.
The Greenwich Mean Time (GMT) at the end of the
period when the data were collected.
Soil temperature measured at a depth of 50 mm
from the top of the moss layer (NSA-OBS) or soil
surface (SSA-YJP). Sensor at NSA-OBS was in
decomposing moss.
Soil temperature measured at a depth of 250 mm
below the top of the moss layer (NSA-OBS) or the
soil surface (SSA-YJP) . Sensor was in mineral
soil.
Soil temperature measured at a depth of 450 mm
below the top the moss layer. The probe was in
mineral soil.
Stem temperature measurements from a probe
inserted to a depth of 5 mm into the xylem of a
Black Spruce tree at a height of 1800 mm above
the moss layer with a north-facing exposure.
Stem temperature measurements from a probe
inserted to a depth of 20 mm into the xylem of a
Black Spruce tree at a height of 1800 mm above
the moss layer with a north-facing exposure.
Stem temperature measurements from a probe
inserted to a depth of 5 mm into the xylem of a
second Black Spruce tree at a height of 1800 mm
above the moss layer with a north-facing
exposure.
Stem temperature measurements from a probe
inserted to a depth of 20 mm into the xylem of a
second Black Spruce tree at a height of 1800 mm
above the moss layer with a north-facing
exposure.
Stem temperature measurements from a probe
inserted to a depth of 5 mm into the xylem of a
third Black Spruce tree at a height of 1800 mm
above the moss layer with a north-facing
exposure.
Stem temperature measurements from a probe
inserted to a depth of 20 mm into the xylem of a
second Black Spruce tree at a height of 1800 mm
above the moss layer with a north-facing
exposure.
The BOREAS certification level of the data.
Examples are CPI (Checked by PI), CGR (Certified
by Group), PRE (Preliminary), and CPI-??? (CPI
but questionable).
The most recent date when the information in the
referenced data base table record was revised.
Page 9
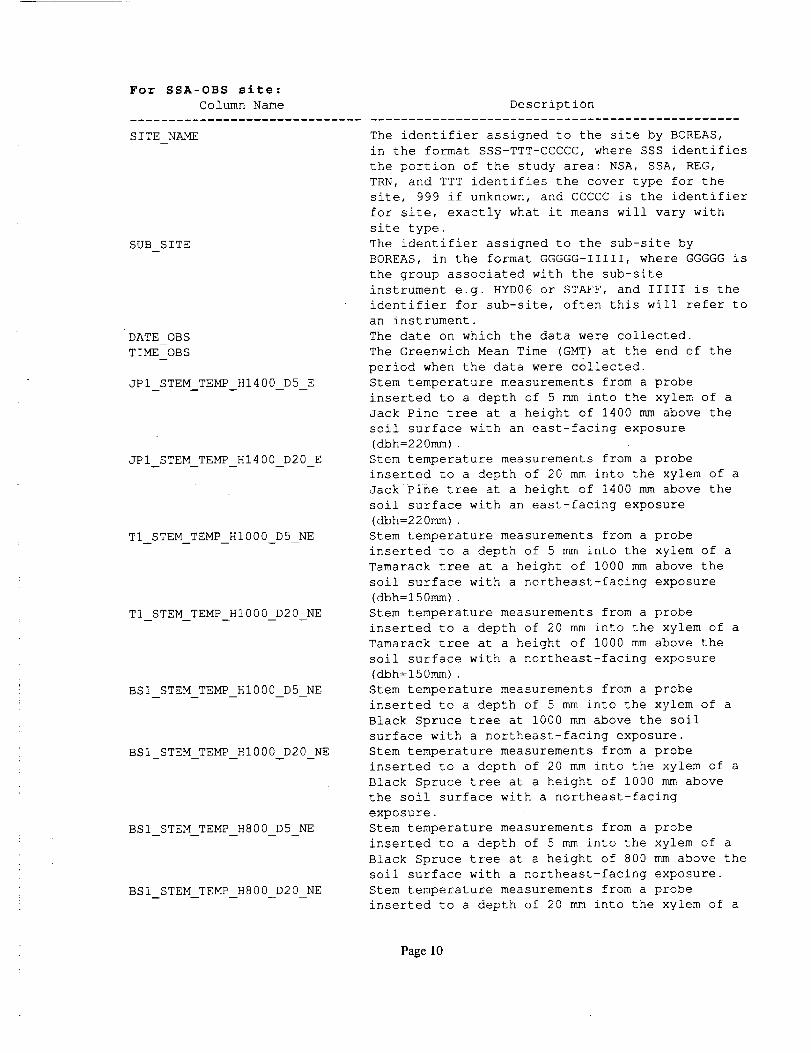
For SSA-OBS site:
Column Name
SITE NAME
SUB SITE
DATE OBS
TIME OBS
JPI STEM TEMP HI400 D5 E
JPI STEM TEMP HI400 D20 E
T1 STEM TEMP HI000 D5 NE
T1 STEM TEMP HI000 D20 NE
BSI STEM TEMP HI000 D5 NE
BSI STEM TEMP HI000 D20 NE
BSl STEM TEMP H800 D5 NE
BSI STEM TEMP H800 D20 NE
Description
The identifier assigned to the site by BOREAS,
in the format SSS-TTT-CCCCC, where SSS identifies
the portion of the study area: NSA, SSA, REG,
TRN, and TTT identifies the cover type for the
site, 999 if unknown, and CCCCC is the identifier
for site, exactly what it means will vary with
site type.
The identifier assigned to the sub-site by
BOREAS, in the format GGGGG-IIIII, where GGGGG is
the group associated with the sub-site
instrument e.g. HYD06 or STAFF, and IIIII is the
identifier for sub-site, often this will refer to
an instrument.
The date on which the data were collected.
The Greenwich Mean Time (GMT) at the end of the
period when the data were collected.
Stem temperature measurements from a probe
inserted to a depth of 5 mm into the xylem of a
Jack Pine tree at a height of 1400 mm above the
soil surface with an east-facing exposure
(dbh=220mm).
Stem temperature measurements from a probe
inserted to a depth of 20 mm into the xylem of a
Jack Pine tree at a height of 1400 mm above the
soil surface with an east-facing exposure
(dbh=220mm) .
Stem temperature measurements from a probe
inserted to a depth of 5 mm into the xylem of a
Tamarack tree at a height of I000 mm above the
soil surface with a northeast-facing exposure
(dbh:150mm).
Stem temperature measurements from a probe
inserted to a depth of 20 mm into the xylem of a
Tamarack tree at a height of I000 mm above the
soil surface with a northeast-facing exposure
(dbh=150mm) .
Stem temperature measurements from a probe
inserted to a depth of 5 mm into the xylem of a
Black Spruce tree at I000 mm above the soil
surface with a northeast-facing exposure.
Stem temperature measurements from a probe
inserted to a depth of 20 mm into the xylem of a
Black Spruce tree at a height of i000 mm above
the soil surface with a northeast-facing
exposure.
Stem temperature measurements from a probe
inserted to a depth of 5 mm into the xylem of a
Black Spruce tree at a height of 800 mm above the
soil surface with a northeast-facing exposure.
Stem temperature measurements from a probe
inserted to a depth of 20 mm into the xylem of a
Page 10
CRTFCN CODE
REVISION DATE
For SSA-OA site:
Column Name
SITE NAME
SUB SITE
DATE OBS
TIME OBS
AIR TEMP 6600MM
ASP1 STEM TEMP H2000 D5
ASP1 STEM TEMP H2000 D20
ASP1 STEM TEMP H2000 D20 N
ASP1 STEM TEMP H2000 D20 W
ASP2 STEM TEMP H2000 D5
CRTFCN CODE
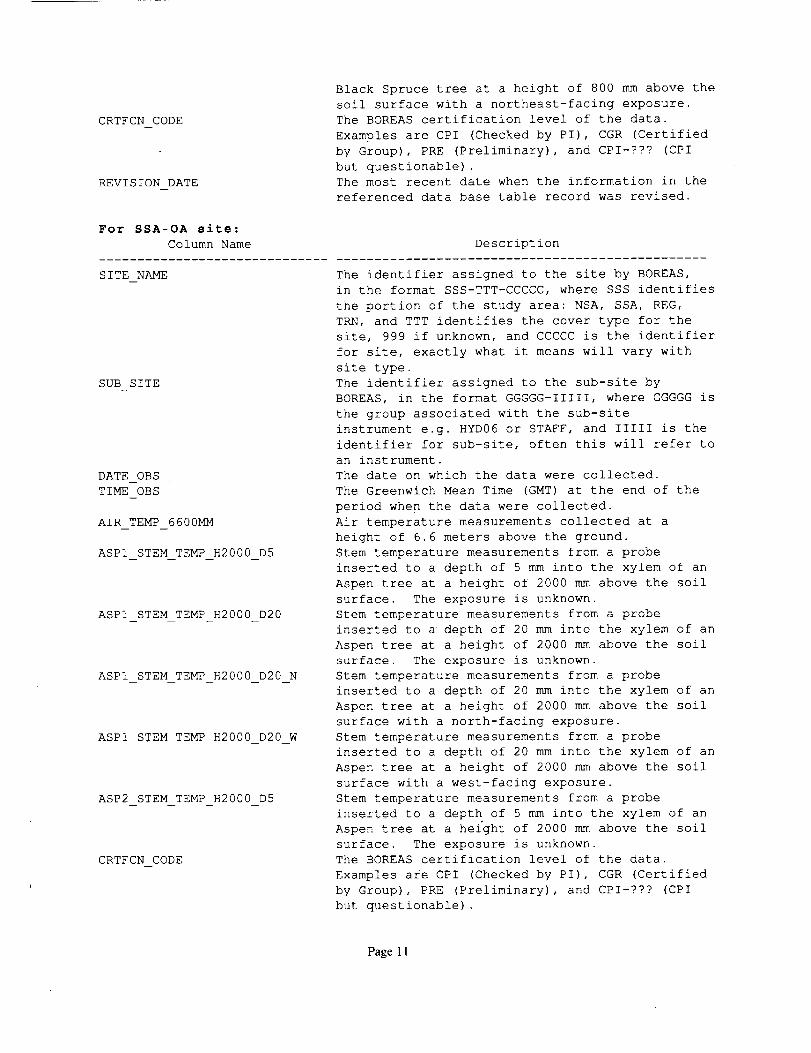
Black Spruce tree at a height of 800 mm above the
soil surface with a northeast-facing exposure.
The BOREAS certification level of the data.
Examples are CPI (Checked by PI), CGR (Certified
by Group), PRE (Preliminary), and CPI-??? (CPI
but questionable).
The most recent date when the information in the
referenced data base table record was revised.
Description
The identifier assigned to the site by BOREAS,
in the format SSS-TTT-CCCCC, where SSS identifies
the portion of the study area: NSA, SSA, REG,
TRN, and TTT identifies the cover type for the
site, 999 if unknown, and CCCCC is the identifier
for site, exactly what it means will vary with
site type.
The identifier assigned to the sub-site by
BOREAS, in the format GGGGG-IIIII, where GGGGG is
the group associated with the sub-site
instrument e.g. HYD06 or STAFF, and IIIII is the
identifier for sub-site, often this will refer to
an instrument.
The date on which the data were collected.
The Greenwich Mean Time (GMT) at the end of the
period when the data were collected.
Air temperature measurements collected at a
height of 6.6 meters above the ground.
Stem temperature measurements from a probe
inserted to a depth of 5 mm into the xylem of an
Aspen tree at a height of 2000 mm above the soil
surface. The exposure is unknown.
Stem temperature measurements from a probe
inserted to a depth of 20 mm into the xylem of an
Aspen tree at a height of 2000 mm above the soil
surface. The exposure is unknown.
Stem temperature measurements from a probe
inserted to a depth of 20 mm into the xylem of an
Aspen tree at a height of 2000 mm above the soil
surface with a north-facing exposure.
Stem temperature measurements from a probe
inserted to a depth of 20 mm into the xylem of an
Aspen tree at a height of 2000 mm above the soil
surface with a west-facing exposure.
Stem temperature measurements from a probe
inserted to a depth of 5 mm into the xylem of an
Aspen tree at a height of 2000 mm above the soil
surface. The exposure is unknown.
The BOREAS certification level of the data.
Examples are CPI (Checked by PI), CGR (Certified
by Group), PRE (Preliminary), and CPI-??? (CPI
but questionable).
Page 11
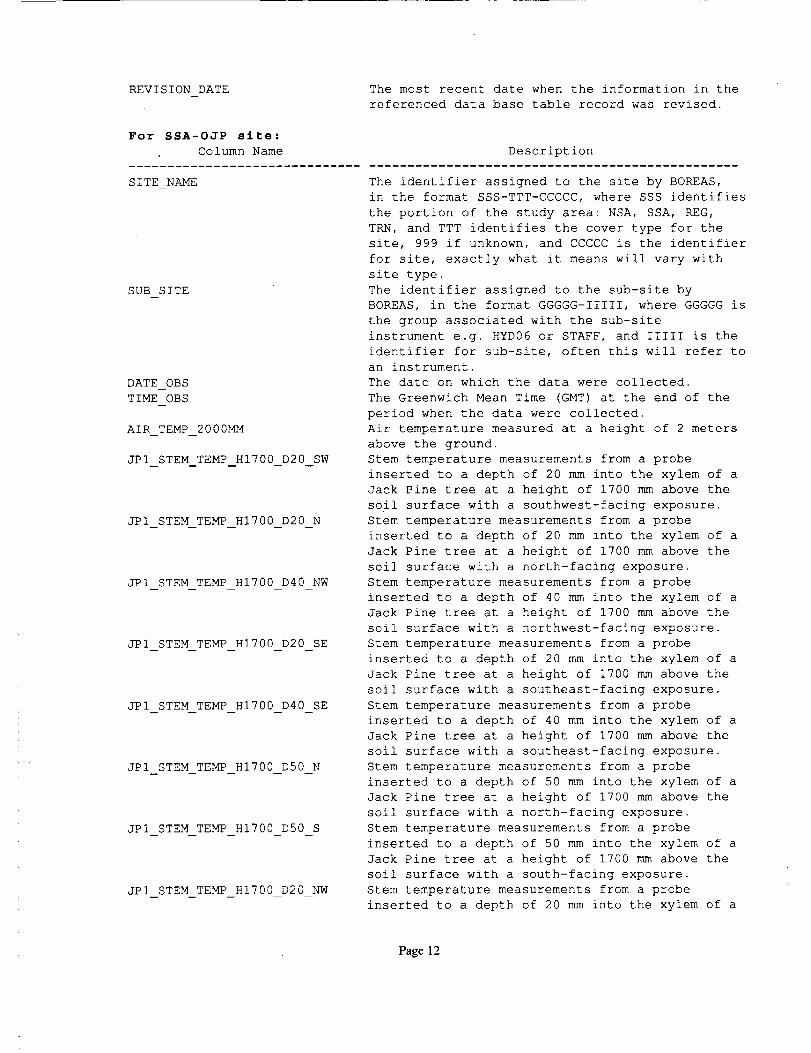
REVISION DATE The most recent date when the information in the
referenced data base table record was revised.
For SSA-OJP site:
Column Name
SITE NAME
SUB SITE
DATE OBS
TIME OBS
AIR TEMP 2000MM
JPI STEM TEMP HI700 D20 SW
JPI STEM TEMP HI700 D20 N
JPI STEM TEMP HI700 D40 NW
JPI STEM TEMP HI700 D20 SE
JPI STEM TEMP HI700 D40 SE
JPI STEM TEMP HI700 D50 N
JPI STEM TEMP HI700 D50 S
JPI STEM TEMP HI700 D20 NW
Description
The identifier assigned to the site by BOREAS,
in the format SSS-TTT-CCCCC, where SSS identifies
the portion of the study area: NSA, SSA, REG,
TRN, and TTT identifies the cover type for the
site, 999 if unknown, and CCCCC is the identifier
for site, exactly what it means will vary with
site type.
The identifier assigned to the sub-site by
BOREAS, in the format GGGGG-IIIII, where GGGGG is
the group associated with the sub-site
instrument e.g. HYD06 or STAFF, and IIIII is the
identifier for sub-site, often this will refer to
an instrument.
The date on which the data were collected.
The Greenwich Mean Time (GMT) at the end of the
period when the data were collected.
Air temperature measured at a height of 2 meters
above the ground.
Stem temperature measurements from a probe
inserted to a depth of 20 mm into the xylem of a
Jack Pine tree at a height of 1700 mm above the
soil surface with a southwest-facing exposure.
Stem temperature measurements from a probe
inserted to a depth of 20 mm into the xylem of a
Jack Pine tree at a height of 1700 mm above the
soil surface with a north-facing exposure.
Stem temperature measurements from a probe
inserted to a depth of 40 nun into the xylem of a
Jack Pine tree at a height of 1700 mm above the
soil surface with a northwest-facing exposure.
Stem temperature measurements from a probe
inserted to a depth of 20 mm into the xylem of a
Jack Pine tree at a height of 1700 mm above the
soil surface with a southeast-facing exposure.
Stem temperature measurements from a probe
inserted to a depth of 40 mm into the xylem of a
Jack Pine tree at a height of 1700 mm above the
soil surface with a southeast-facing exposure.
Stem temperature measurements from a probe
inserted to a depth of 50 mm into the xylem of a
Jack Pine tree at a height of 1700 mm above the
soil surface with a north-facing exposure.
Stem temperature measurements from a probe
inserted to a depth of 50 mm into the xylem of a
Jack Pine tree at a height of 1700 mm above the
soil surface with a south-facing exposure.
Stem temperature measurements from a probe
inserted to a depth of 20 mm into the xylem of a
Page 12
JP I_STEM_TEMP_HI 700 _ D20 __NE
JP2 STEM TEMP HI700 D20 SE
JP2 STEM TEMP HI700 D20 NW
CRTFCN CODE
REVISION DATE
For SSA-YJP site:
Column Name
SITE NAME
SUB SITE
DATE OBS
TIME OBS
SOIL TEMP 50MM
SOIL TEMP 150MM
SOIL TEMP 250MM
SOIL TEMP 400MM
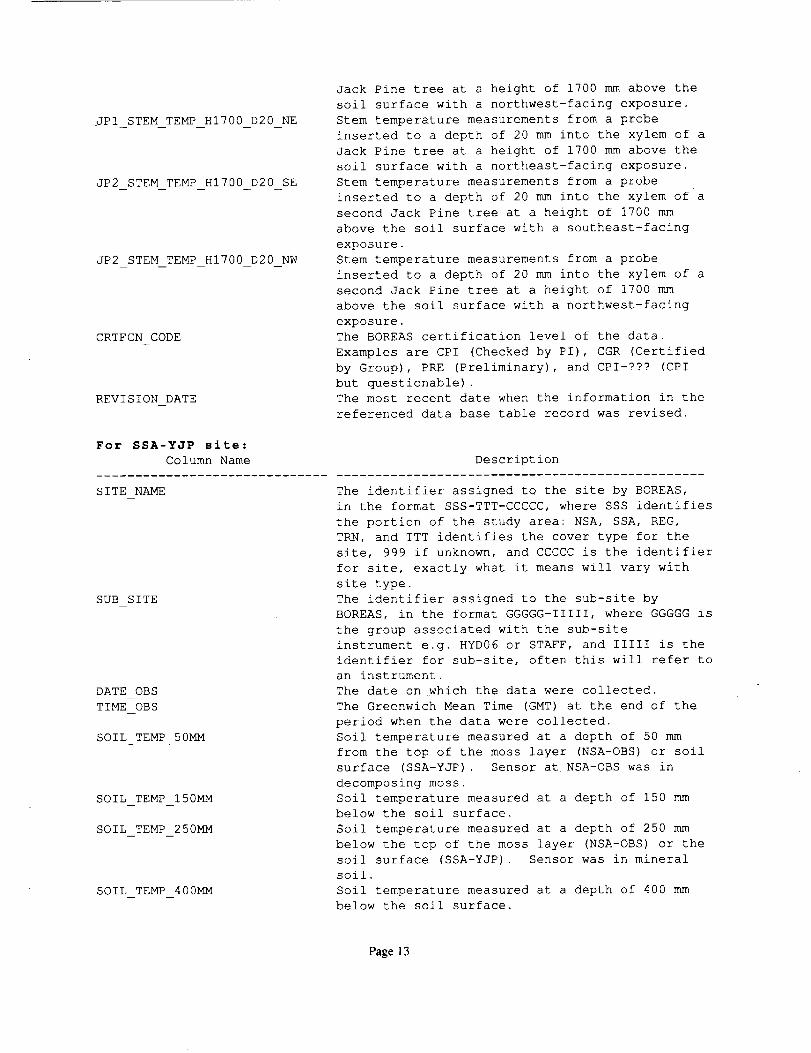
Jack Pine tree at a height of 1700 mm above the
soil surface with a northwest-facing exposure.
Stem temperature measurements from a probe
inserted to a depth of 20 mm into the xylem of a
Jack Pine tree at a height of 1700 mm above the
soil surface with a northeast-facing exposure.
Stem temperature measurements from a probe
inserted to a depth of 20 mm into the xylem of a
second Jack Pine tree at a height of 1700 mm
above the soil surface with a southeast-facing
exposure.
Stem temperature measurements from a probe
inserted to a depth of 20 mm into the xylem of a
second Jack Pine tree at a height of 1700 mm
above the soil surface with a northwest-facing
exposure.
The BOREAS certification level of the data.
Examples are CPI (Checked by PI), CGR (Certified
by Group), PRE (Preliminary), and CPI-??? (CPI
but questionable).
The most recent date when the information in the
referenced data base table record was revised.
Description
The identifier assigned to the site by BOREAS,
in the format SSS-TTT-CCCCC, where SSS identifies
the portion of the study area: NSA, SSA, REG,
TRN, and TTT identifies the cover type for the
site, 999 if unknown, and CCCCC is the identifier
for site, exactly what it means will vary with
site type.
The identifier assigned to the sub-site by
BOREAS, in the format GGGGG-IIIII, where GGGGG is
the group associated with the sub-site
instrument e.g. HYD06 or STAFF, and IIIII is the
identifier for sub-site, often this will refer to
an instrument.
The date on which the data were collected.
The Greenwich Mean Time (GMT) at the end of the
period when the data were collected.
Soil temperature measured at a depth of 50 mm
from the top of the moss layer (NSA-OBS) or soil
surface (SSA-YJP) . Sensor at NSA-OBS was in
decomposing moss.
Soil temperature measured at a depth of 150 mm
below the soil surface.
Soil temperature measured at a depth of 250 mm
below the top of the moss layer (NSA-OBS) or the
soil surface (SSA-YJP) . Sensor was in mineral
soil.
Soil temperature measured at a depth of 400 mm
below the soil surface.
Page 13
JPI STEM TEMP H600 D5 NE
JPI STEM TEMP H600 DI0 NE
JP2 STEM TEMP H600 D5 NE
JP2 STEM TEMP H600 DI0 NE
CRTFCN CODE
REVISION DATE
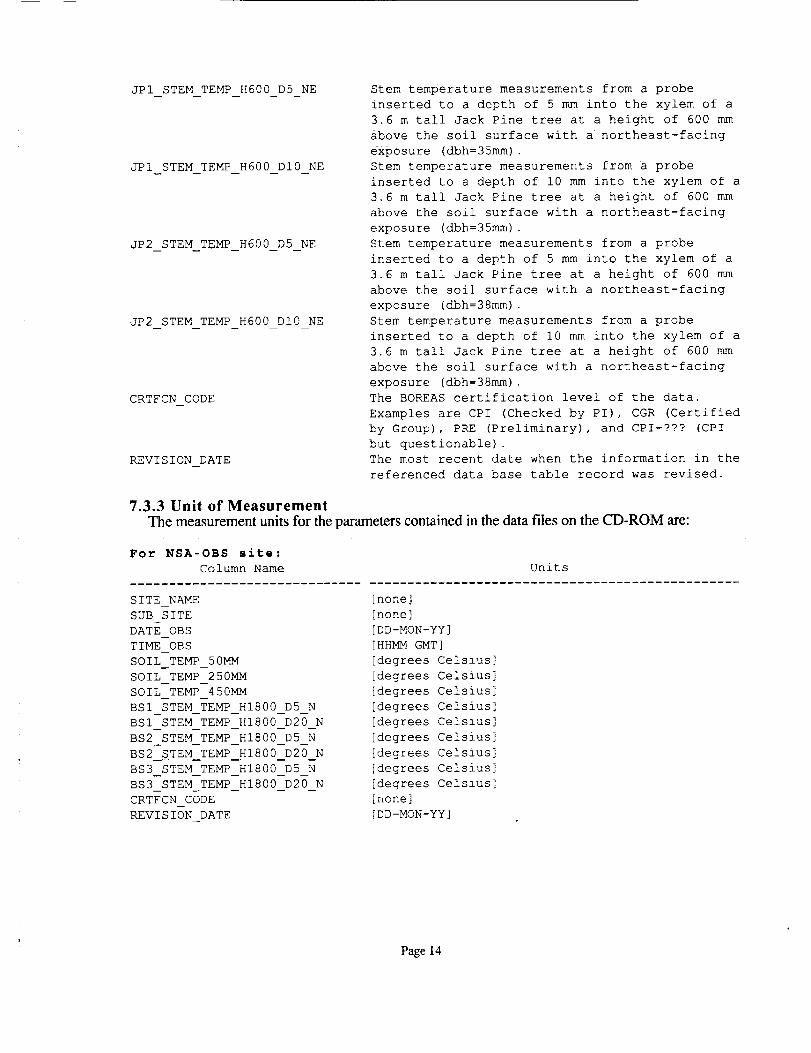
Stem temperature measurements from a probe
inserted to a depth of 5 mm into the xylem of a
3.6 m tall Jack Pine tree at a height of 600 mm
above the soil surface with a northeast-facing
exposure (dbh=35mm).
Stem temperature measurements from a probe
inserted to a depth of i0 mm into the xylem of a
3.6 m tall Jack Pine tree at a height of 600 mm
above the soil surface with a northeast-facing
exposure (dbh=35mm).
Stem temperature measurements from a probe
inserted to a depth of 5 mm into the xylem of a
3.6 m tall Jack Pine tree at a height of 600 mm
above the soil surface with a northeast-facing
exposure (dbh=38mm).
Stem temperature measurements from a probe
inserted to a depth of I0 mm into the xylem of a
3.6 m tall Jack Pine tree at a height of 600 mm
above the soil surface with a northeast-facing
exposure (dbh=38mm).
The BOREAS certification level of the data.
Examples are CPI (Checked by PI), CGR (Certified
by Group), PRE (Preliminary), and CPI-??? (CPI
but questionable).
The most recent date when the information in the
referenced data base table record was revised.
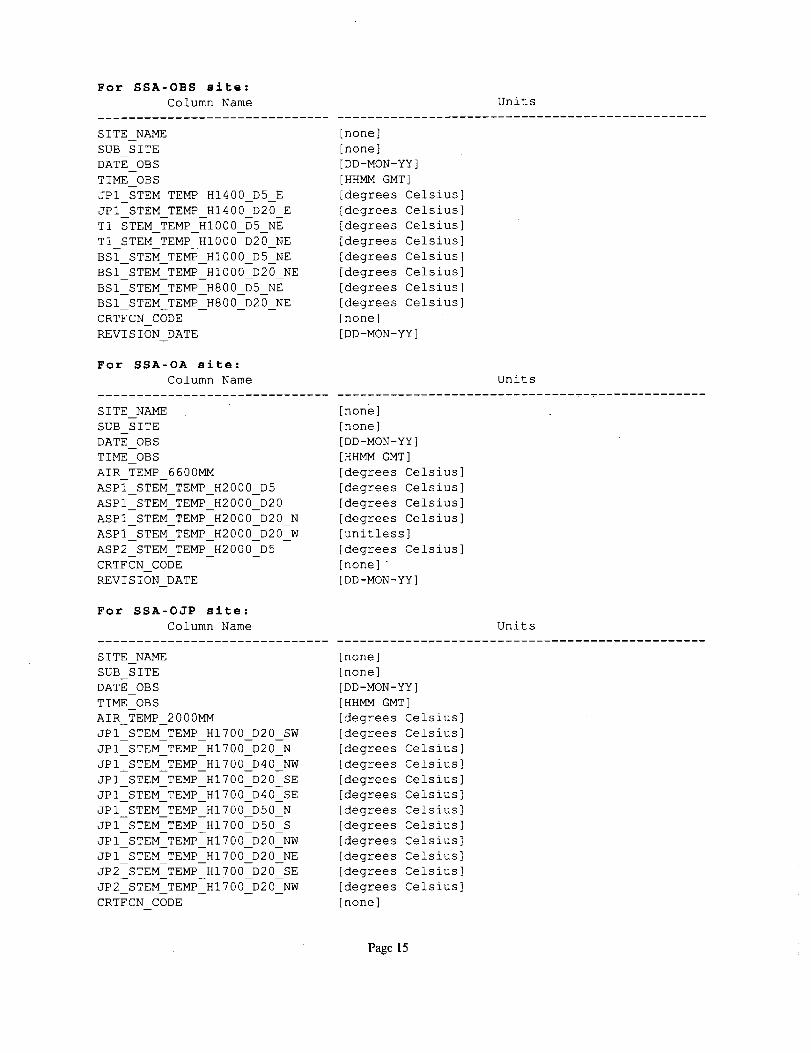
7.3.3 Unit of MeasurementThe measurement units for the parameters contained in the data files on the CD-ROM are:
For NSA-OBS site:
Column Name Units
SITE NAME [none]
SUB SITE [none]
DATE OBS [DD-MON-YY]
TIME OBS [HHMM GMT]
SOIL TEMP 50MM [degrees Celsius]
SOIL TEMP 250MM [degrees Celsius]
SOIL TEMP 450MM [degrees Celsius]
BSI STEM TEMP HI800 D5 N [degrees Celsius]
BSl STEM TEMP HI800 D20 N [degrees Celsius]
BS2 STEM TEMP HI800 D5 N [degrees Celsius]
BS2_STEM_TEMP_HI800_D20_N [degrees Celsius]
BS3 STEM TEMP HI800 D5 N [degrees Celsius]
BS3 STEM TEMP HI800 D20 N [degrees Celsius]
CRTFCN CODE [none]
REVISION DATE [DD-MON-YY]
Page 14
For SSA-OBS site:
Column Name
SITE NAME
SUB SITE
DATE OBS
TIME OBS
JPI STEM TEMP HI400 D5 E
JPl STEM TE_ m400 D20 ETI _TEM YEMP _I000 _5 N_T1 STEM TEMP HI000 D20 NE
BSI STEM TEMP HI000 D5 NE
BSI STEM TEMP HI000 D20 NE
BSI STEM TEMP H800 D5 NE
BSI STEM TEMP H800 D20 NE
CRTFCN CODE
REVISION DATE
For SSA-OA site:
Column Name
SITE NAME
SUB SITE
DATE OBS
TIME OBS
AIR TEMP 6600MM
ASP1 STEM TEMP H2000 D5
ASP1 STEM TEMP H2000 D20
ASP1 STEM TEMP H2000 D20 N
ASP1 STEM TEMP H2000 D20 W
ASP2 STEM TEMP H2000 D5
CRTFCN CODE
REVISION DATE
For SSA-OJP site:
Column Name
SITE NAME
SUB SITE
DATE OBS
TIME OBS
AIR TEMP 2000MM
JPI STEM TEMP HI700 D20 SW
JPI STEM TEMP HI700 D20 N
JPI STEM TEMP HI700 D40 NW
JPI STEM TEMP HI700 D20 SE
JPI STEM TEMP HI700 D40 SE
JPI STEM TEMP HI700 D50 N
JPI STEM TEMP HI700 DS0 S
JPI STEM TEMP HI700 D20 NW
JPI STEM TEMP HI700 D20 NE
JP2 STEM TEMP HI700 D20 SE
JP2 STEM TEMP HI700 D20 NW
CRTFCN CODE
Units
[none]
[none]
[DD-MON-YY]
[HHMM GMT]
[degrees Celsius]
[degrees Celsius]
[degrees Celsius]
[degrees Celsius]
[degrees Celsius]
[degrees Celsius]
[degrees Celsius]
[degrees Celsius]
[none]
[DD-MON-YY]
Units
[none]
[none]
[DD-MON-YY]
[HHMM GMT]
[degrees Celsius]
[degrees Celsius]
[degrees Celsius]
[degrees Celsius]
[unitless]
[degrees Celsius]
[none]
[DD-MON-YY]
Units
[none]
[none]
[DD-MON-YY]
[HHMM GMT]
[degrees Celsius]
[degrees Celsius]
[degrees Celsius]
[degrees Celsius]
[degrees Celsius]
[degrees Celsius]
[degrees Celsius]
[degrees Celsius]
[degrees Celsius]
[degrees Celsius]
[degrees Celsius]
[degrees Celsius]
[none]
Page 15
REVISION DATE [DD-MON-YY]
For SSA-YJP site:
Column Name Units
SITE NAME [none]
SUB SITE [none]
DATE OBS [DD-MON-YY]
TIME OBS [HHMM GMT]
SOIL TEMP 50MM [degrees Celsius]
SOIL TEMP 150MM [degrees Celsius]
SOIL TEMP 250MM [degrees Celsius]
SOIL TEMP 400MM [degrees Celsius]
JPI STEM TEMP H600 D5 NE [degrees Celsius]
JPI STEM TEMP H600 DI0 NE [degrees Celsius]
JP2 STEM TEMP H600 D5 NE [degrees Celsius]
JP2 STEM TEMP H600 DI0 NE [degrees Celsius]
CRTFCN CODE [none]
REVISION DATE [DD-MON-YY]
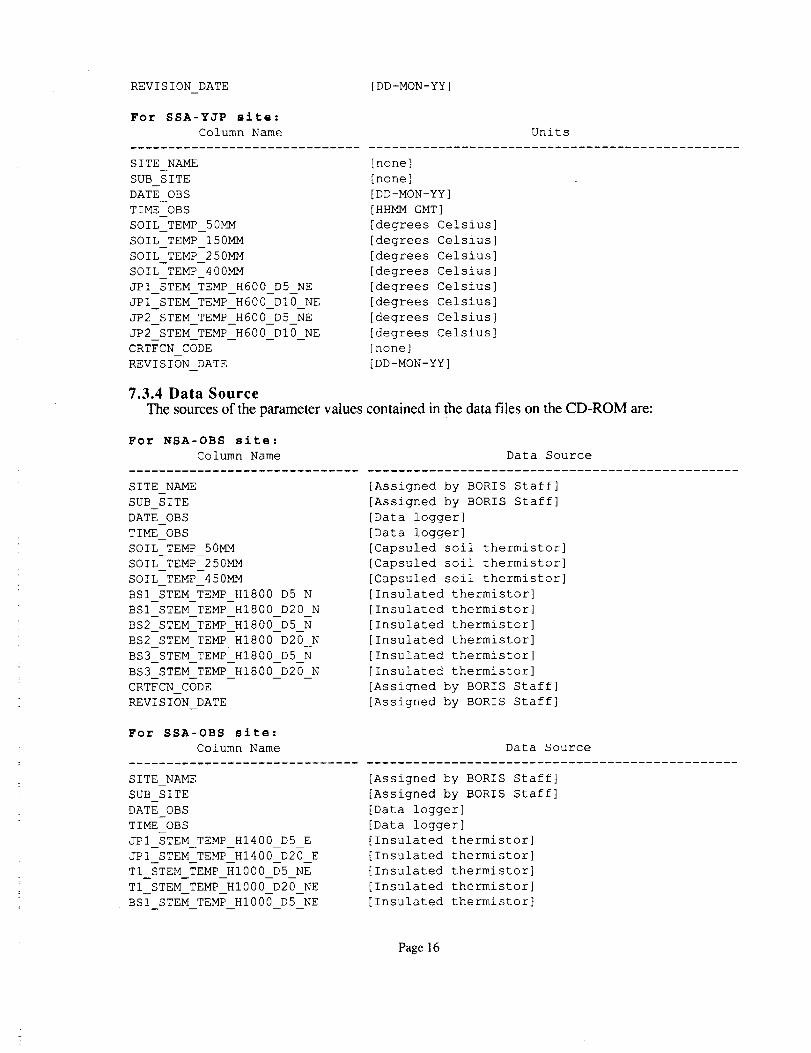
7.3.4 Data SourceThe sources of the parameter values contained in the data files on the CD-ROM are:
For NSA-OBS site:
Column Name Data Source
SITE NAME
SUB SITE
DATE OBS
TIME OBS
SOIL TEMP 50MM
SOIL TEMP 250MM
SOIL TEMP 450MM
BSI STEM TEMP HI800 D5 N
BSI STEM TEMP HI800 D20 N
BS2 STEM TEMP HI800 D5 N
BS2 STEM TEMP HI800 D20 N
BS3 STEM TEMP HI800 D5 N
BS3 STEM TEMP HI800 D20 N
CRTFCN CODE
REVISION DATE
[Assigned by BORIS Staff]
[Assigned by BORIS Staff]
[Data logger]
[Data logger]
[Capsuled soil thermistor]
[Capsuled soil thermistor]
[Capsuled soil thermistor]
[Insulated thermistor]
[Insulated thermistor]
[Insulated thermistor]
[Insulated thermistor]
[Insulated thermistor]
[Insulated thermistor]
[Assigned by BORIS Staff]
[Assigned by BORIS Staff]
For SSA-OBS site:
Column Name
SITE NAME
SUB SITE
DATE OBS
TIME OBS
JPI STEM TEMP HI400 D5 E
JP1 STEM TEm_ H1400 D20 ETI _TEM YEMP_I000 _5 N_T1 STEM TEMP HI000 D20 NE
BSI STEM TEMP HI000 D5 NE
Data Source
[Assigned by BORIS Staff]
[Assigned by BORIS Staff]
[Data logger]
[Data logger]
[Insulated thermistor]
[Insulated thermistor]
[Insulated thermistor]
[Insulated thermistor]
[Insulated thermistor]
Page 16
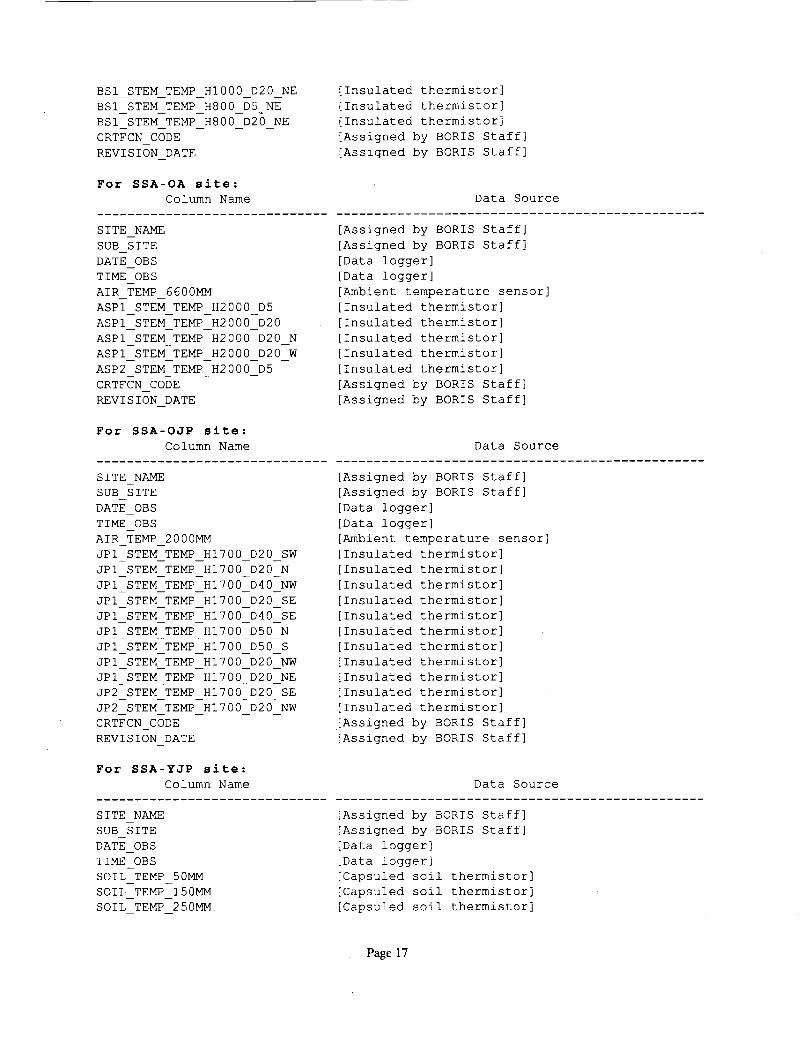
BSI STEM TEMP HI000 D20 NE
BSl STEM TEMP H800 D5 NE
BSI STEM TEMP H800 D20 NE
CRTFCN CODE
REVISION DATE
For SSA-OA site:
Column Name
SITE NAME
SUB SITE
DATE OBS
TIME OBS
AIR TEMP 6600594
ASP1 STEM TEMP H2000 D5
ASP1 STEM TEMP H2000 D20
ASP1 STEM TEMP H2000 D20 N
ASP1 STEM TEMP H2000 D20 W
ASP2 STEM TEMP H2000 D5
CRTFCN CODE
REVISION DATE
For SSA-OJP site:
Column Name
SITE NAME
SUB SITE
DATE OBS
TIME OBS
AIR TEMP 2000MM
JPI STEM TEMP HI700 D20 SW
JPI STEM TEMP HI700 D20 N
JPI STEM TEMP HI700 D40 NW
JPI STEM TEMP HI700 D20 SE
JPI STEM TEMP HI700 D40 SE
JPI STEM TEMP HI700 D50 N
JPI STEM TEMP HI700 D50 S
JPI STEM TEMP HI700 D20 NW
JPI STEM TEMP HI700 D20 NE
JP2 STEM TEMP HI700 D20 SE
JP2 STEM TEMP HI700 D20 NW
CRTFCN CODE
REVISION DATE
For SSA-YJP site:
Column Name
SITE NAME
SUB SITE
DATE OBS
TIME OBS
SOIL TEMP 50MM
SOIL TEMP 150MM
SOIL TEMP 250594
[Insulated thermistor]
[Insulated thermistor]
[Insulated thermistor]
[Assigned by BORIS Staff]
[Assigned by BORIS Staff]
Data Source
[Assigned by BORIS Staff]
[Assigned by BORIS Staff]
[Data logger]
[Data logger]
[Ambient temperature sensor]
[Insulated thermistor]
[Insulated thermistor]
[Insulated thermistor]
[Insulated thermistor]
[Insulated thermistor]
[Assigned by BORIS Staff]
[Assigned by BORIS Staff]
Data Source
[Assigned by BORIS Staff]
[Assigned by BORIS Staff]
[Data logger]
[Data logger]
[Ambient temperature sensor]
[Insulated thermistor]
[Insulated thermistor]
[Insulated thermistor]
[Insulated thermistor]
[Insulated thermistor]
[Insulated thermistor]
[Insulated thermistor]
[Insulated thermistor]
[Insulated thermistor]
[Insulated thermistor]
[Insulated thermistor]
[Assigned by BORIS Staff]
[Assigned by BORIS Staff]
Data Source
[Assigned by BORIS Staff]
[Assigned by BORIS Staff]
[Data logger]
[Data logger]
[Capsuled soil thermistor]
[Capsuled soil thermistor]
[Capsuled soil thermistor]
Page 17
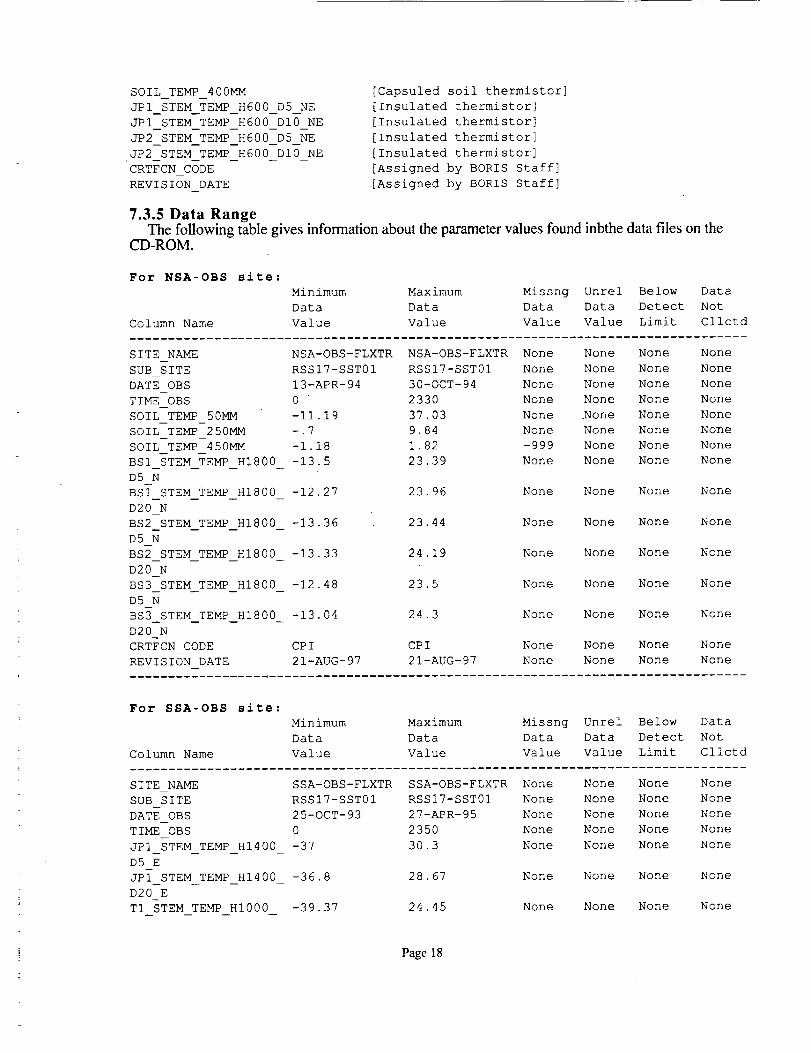
SOIL TEMP 400MM
JPI STEM TEMP H600 D5 NE
JPI STEM TEMP H600 DI0 NE
JP2 STEM TEMP H600 D5 NE
JP2 STEM TEMP H600 DI0 NE
CRTFCN CODE
REVISION DATE
[Capsuled soil thermistor]
[Insulated thermistor]
[Insulated thermistor]
[Insulated thermistor]
[Insulated thermistor]
[Assigned by BORIS Staff]
[Assigned by BORIS Staff]
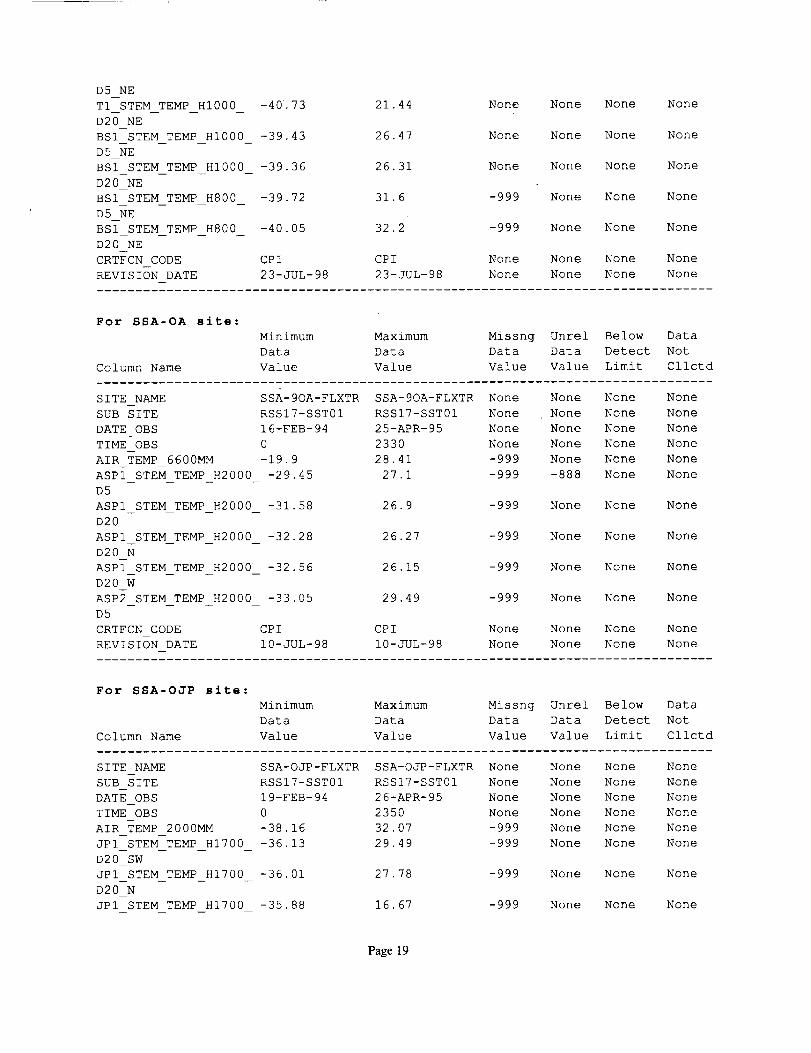
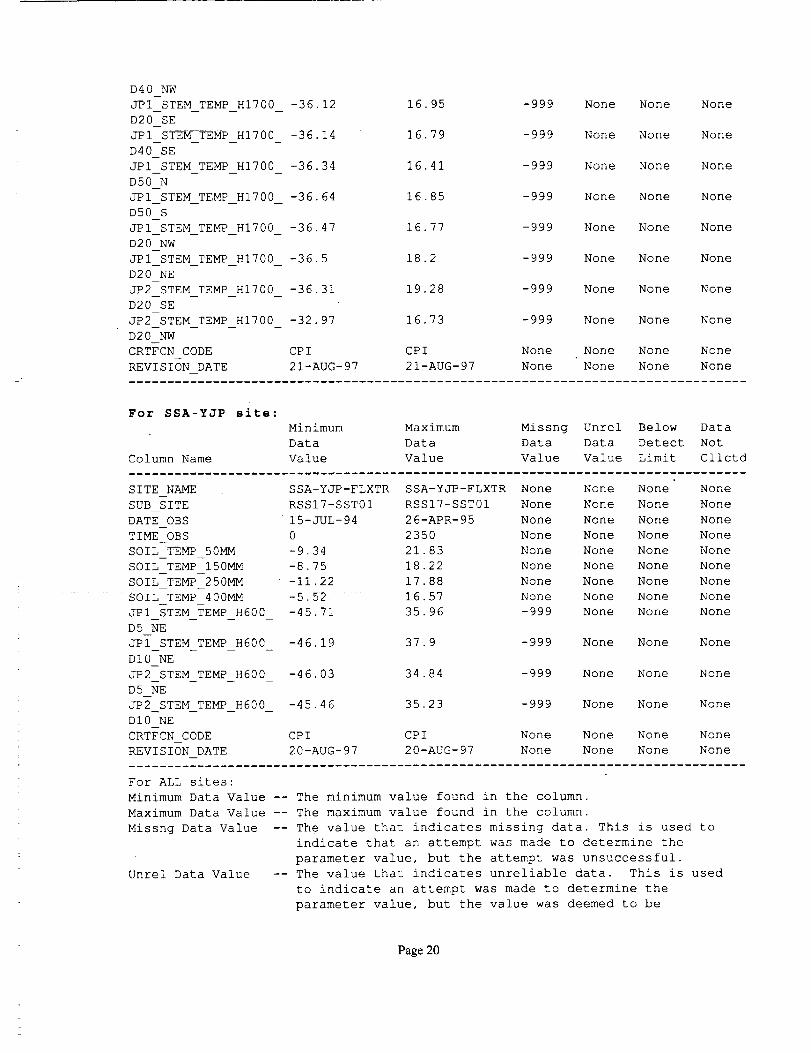
7.3.5 Data RangeThe following table gives information about the parameter values found inbthe data files on the
CD-ROM.
For NSA-OBS site:
Column Name
Minimum Maximum Missng Unrel Below Data
Data Data Data Data Detect Not
Value Value Value Value Limit Cllctd
SITE NAME NSA-OBS-FLXTR NSA-OBS-FLXTR None None None None
SUB SITE RSSI7-SST01 RSSI7-SST01 None None None None
DATE OBS 13-APR-94 30-OCT-94 None None None None
TIME OBS 0 2330 None None None None
SOIL TEMP 50MM -11.19 37.03 None .None None None
SOIL TEMP 250MM -.7 9.84 None None None None
SOIL TEMP 450MM -1.18 1.82 -999 None None None
BSI STEM TEME HI800 -13.5 23.39 None None None None
D5 N
BSI STEM TEMP HI800 -12.27 23.96 None None None None
D20 N
BS2 STEM TEMP HI800 -13.36 23.44 None None None None
D5 N
BS2 STEM TEMP HI800 -13.33 24.19 None None None None
D20 N
BS3 STEM TEMP HI800 -12.48 23.5 None None None None
D5 N
BS3 STEM TEMP HI800 -13.04 24.3 None None None None
D20 N
CRTFCN CODE CPI CPI None None None None
REVISION DATE 21-AUG-97 21-AUG-97 None None None None
!
For SSA-OBS site:
Minimum Maximum Missng Unrel Below Data
Data Data Data Data Detect Not
Column Name Value Value Value Value Limit Cllctd
SITE NAME SSA-OBS-FLXTR SSA-OBS-FLXTR None None None None
SUB SITE RSSI7-SST01 RSSI7-SST01 None None None None
DATE OBS 25-OCT-93 27-APR-95 None None None None
TIME OBS 0 2350 None None None None
JPI STEM TEMP HI400 -37 30.3 None None None None
D5 E
JPI STEM TEMP HI400 -36.8 28.67 None None None None
D20 E
T1 STEM TEMP HI000 -39.37 24.45 None None None None
Page 18
D5 NE
T1 STEM TEMP HI000 -40.73
D _u NE -- -- --
BSI STEM TEMP HI000 -39.43
D5 NE
BSI STEM TEMP HI000 -39.36
D20 NE
BSI STEM TEMP H800 -39.72
D5 NE
BST STEM TEMP H800 -40.05
D20 NE
CRTFCN CODE CPI
REVISION DATE 23-JUL-98
21.44 None None None None
26.47 None None None None
26.31 None None None None
31.6 -999 None None None
32.2 -999 None None None
CPI None None None None
23-JUL-98 None None None None
For SSA-OA site:
Column Name
Minimum Maximum Missng
Data Data Data
Value Value Value
Unrel
Data
Value
Below
Detect
Limit
Data
Not
Cllctd
SITE NAME SSA-9OA-FLXTR SSA-90A-FLXTR None
SUB SITE RSSI7-SST01 RSSI7-SST01 None
DATE OBS 16-FEB-94 25-APR-95 None
TIME OBS 0 2330 None
AIR TEMP 6600MM -19.9 28.41 -999
ASPT STEm TEMP H2000 -29.45 27.1 -999
D5
ASP1 STEM TEMP H2000 -31.58 26.9 -999
D20
ASP1 STEM TEMP H2000 -32.28 26.27 -999
D20 N
ASP1 STEM TEMP H2000 -32.56
D20 W
ASP2 STEM TEMP H2000 -33.05
D5
CRTFCN CODE CPI
REVISION DATE 10-JUL-98
26.15 -999
29.49 -999
CPI None
10-JUL-98 None
None
None
None
None
None
-888
None
None
None
None
None
None
None
None
None
None
None
None
None
None
None
None
None
None
None
None
None
None
None
None
None
None
None
None
None
None
For SSA-OJP site:
Column Name
Minimum
Data
Value
Maximum
Data
Value
Missng Unrel Below Data
Data Data Detect Not
Value Value Limit Cllctd
SITE NAME SSA-OJP-FLXTR SSA-OJP-FLXTR None
SUB SITE RSSI7-SST01 RSSi7-SST01 None
DATE OBS 19-FEB-94 26-APR-95 None
TIME OBS 0 2350 None
AIR TEMP 2000MM -38.16 32.07 -999
JPI STEM TEMP HI700 -36.13 29.49 -999
D20 SW
JPI STEM TEMP HI700 -36.01 27.78 -999
m20 N
JPI STEM TEMP HIT00 -35.88 16.67 -999
None
None
None
None
None
None
None
None
None
None
None
None
None
None
None
None
None
None
None
None
None
None
None
None
Page 19
D40 NW
JPI STEM TEMP HIT00 -36.12 16.95 -999 None None None
D20 SE
JPi STEM TEMP HI700 -36.14 16.79 -999 None None None
D40 SE
JPI STEM TEMP HI700 -36.34 16.41 -999 None None None
D50 N
JPI STEM TEMP HI700 -36.64 16.85 -999 None None None
D50 S
JPI STEM TEMP HI700 -36.47 16.77 -999 None None None
D20 NW
JPI STEM TEMP HI700 -36.5 18.2 -999 None None None
D20 NE
JP2 STEM TEMP HI700 -36.31 19.28 -999 None None None
D20 SE
JP2 STEM TEMP HIT00 -32.97 16.73 -999 None None None
D20 NW
CRTFCN CODE CPI CPI None None None None
REVISION DATE 21-AUG-97 21-AUG-97 None None None None
For SSA-YJP site:
Column Name
Minimum Maximum Missng Unrel Below Data
Data Data Data Data Detect Not
Value Value Value Value Limit Cllctd
SITE NAME SSA-YJP-FLXTR SSA-YJP-FLXTR None None None None
SUB SITE RSSI7-SST01 RSSI7-SST01 None None None None
DATE OBS 15-JUL-94 26-APR-95 None None None None
TIME OBS 0 2350 None None None None
SOIL TEMP 50MM -9.34 21.83 None None None None
SOIL TEMP 150MM -8.75 18.22 None None None None
SOIL TEMP 250MM -11.22 17.88 None None None None
SOIL TEMP 400MM -5.52 16.57 None None None None
JPI STEM TEMP H600 -45.71 35.96 -999 None None None
D5 NE
JPT STEM TEMP H600 -46.19 37.9 -999 None None None
DI0 NE
JP2 STEM TEMP H600 -46.03 34.84 -999 None None None
D5 NE
JP2 STEM TEMP H600 -45.46 35.23 -999 None None None
DI0 NE
CRTFCN CODE CPI CPI None None None None
REVISION DATE 20-AUG-97 20-AUG-97 None None None None
For ALL sites:
Minimum Data Value -- The minimum value found in the column.
Maximum Data Value -- The maximum value found in the column.
Missng Data Value -- The value that indicates missing data. This is used to
indicate that an attempt was made to determine the
parameter value, but the attempt was unsuccessful.
Unrel Data Value -- The value that indicates unreliable data. This is used
to indicate an attempt was made to determine the
parameter value, but the value was deemed to be
Page 20
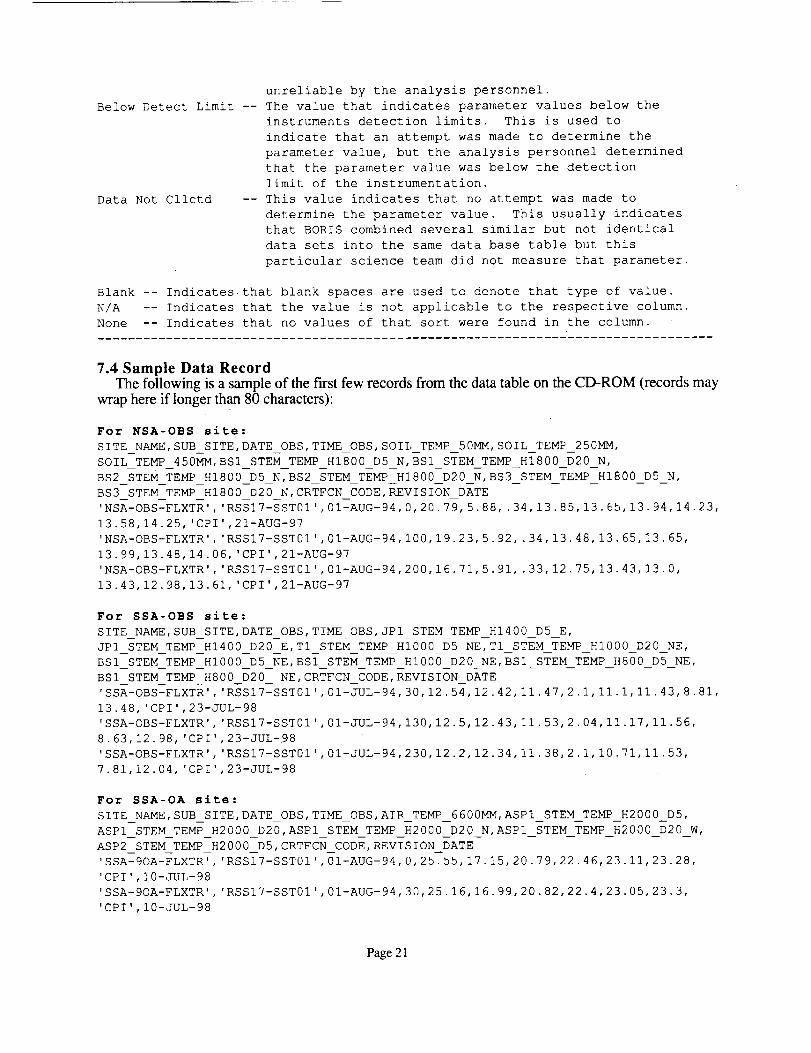
unreliable by the analysis personnel.
Below Detect Limit -- The value that indicates parameter values below the
instruments detection limits. This is used to
indicate that an attempt was made to determine the
parameter value, but the analysis personnel determined
that the parameter value was below the detection
limit of the instrumentation.
Data Not Cllctd -- This value indicates that no attempt was made to
determine the parameter value. This usually indicates
that BORIS combined several similar but not identical
data sets into the same data base table but this
particular science team did not measure that parameter.
Blank -- Indicates.that blank spaces are used to denote that type of value.
N/A -- Indicates that the value is not applicable to the respective column.
None -- Indicates that no values of that sort were found in the column.
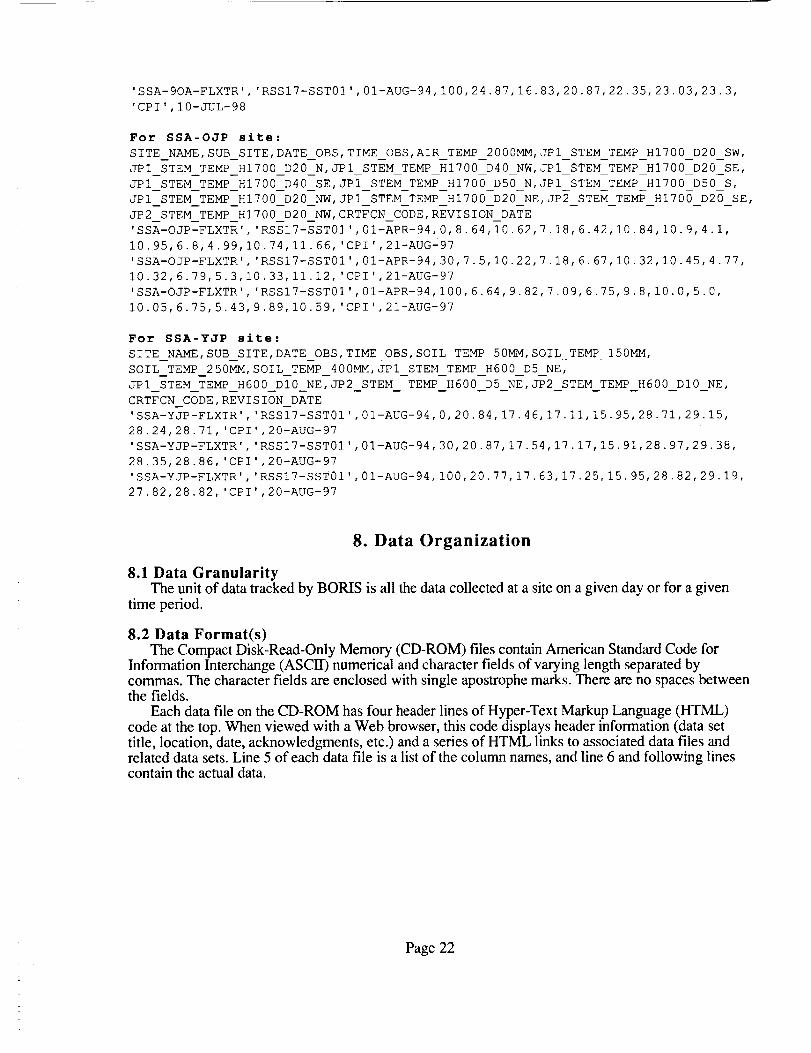
7.4 Sample Data RecordThe following is a sample of the first few records from the data table on the CD-ROM (records may
wrap here if longer than 80 characters):
For NSA-OBS site:
SITE NAME, SUB SITE,DATE OBS, TIME OBS,SOIL TEMP 50MM, SOIL TEMP 250MM,
S 01 L--TEMP_450_]M, B S I__S TE<TEMP__H 1800 D 5 N, BS I__STEM__TEMP__HT800__D20__N,
BS2__STEM__TEMP_HI800 D5 N,BS2__STEM_TEMP__HI800__D20__N, BS3__STEM__TEMP__HI800 D5 N,
BS3 STEM TEMP HI800 D20 N,CRTFCN CODE, REVISION DATE
'NSA-OBS-FLXTR', 'RSSI7-SST01',01-AUG-94,0,20.79,5.88, .34,13.85,13.65,13.94, 14.23,
13.58,14.25, 'CPI',21-AUG-97
'NSA-OBS-FLXTR', 'RSSI7-SST01',01-AUG-94,100,19.23,5.92, .34,13.48,13.65,13.65,
13.99,13.48,14.06, 'CPI ', 21-AUG-97
'NSA-OBS-FLXTR', 'RSSIT-SST01',01-AUG-94,200,16.71,5.91, .33,12.75, 13.43,13.0,
13.43,12.98,13.61, 'CPI ', 21-AUG-97
For SSA-OBS site:
SITE NAME,SUB SITE,DATE OBS, TIME OBS,JPI STEM TEM_ HI400 D5 E,
JPI_STEM_TEM?_HI400_D20--E,TI STEM .......TEM_ HI000 D5 NETTI STEM TEMP HI000 D20 NE,
BSI STEM TEMP HI000 D5 NE,BSI STEM TEMP HI000 D20 NE,BSI STEM TEMP H800 D5 NE,
BSl STEM TEMP H800 D20 NE,CRTFCN CODE,REVISION DATE
'SSA-OBS_FLXTR ' 'RSSI7-SST01' 01-JUL-94 30 12 54 12.42,11 47 2 I,II 1 II 43 8.81, t r , • , • t • • ; • , r
13.48,'CPI',23-JUL-98
'SSA-OBS-FLXTR', 'RSSI7-SST01',01-JUL-94,130,12 .....5,12.43,11 53,2 04,11 17,11 56,
8.63,12.98, 'CPI',23-JUL-98
'SSA-OBS-FLXTR','RSSI7-SST01',01-JUL-94,230,12.2,12.34,11.38,2.1,10.71,11.53,
7.81,12.04, 'CPI',23-JUL-98
For SSA-OA site:
S ITE_NAM_, SUB_S ITE, DATE_OBS, TIME_OBS, AIR TEMP_6600594, ASP I_STEM_TEMP_H2000_D5,
ASPI_STEM_TEMP_H2000_D20,ASPI_STEM_TEMP ........H2000 D20 N,ASPI STEM TEMP H2000 D20 W,
ASP2 STEM TEMP H2000 D5,CRTFCN CODE,REVISION DATE
'SSA--9OA-FLXTR', 'RSSI7-SST01',01-AUG-94,0,25.55, 17.15,20.79,22.46,23.11,23.28,
'CPI ' , 10-JUL-98
'SSA-9OA-FLXTR', 'RSSlT-SST01',01-AUG-94,30,25.16,16.99,20.82,22.4,23.05,23.3,
'CPI ' , 10-JUL-98
Page 21
'SSA-9OA-FLXTR', 'RSSI7-SST01',01-AUG-94,100,24.87,16.83,20.87,22.35,23.03,23.3,
'CPI',I0-JUL-98
For SSA-OJP site:
SITE_NAME, SUB_SITE, DATE_OBS, TIME_OBS, AIR TEMP_2000MM, JPI_STEM_TEMP_HI700_D20_SW,
JPI STEM TEMP HI700 D20 m, aml STEM TEMP HI700 D40 NW, JPI STEM TEMP HI700 m20 sm,
JPI=STEM--TEMP--HI700--D40--SE,JPI STEM TEMP HI700 m50 N, JPI--STEM--TEMP--HI700--D50--S,
JPl_STE<TEM<H1700_D20_m,JPI_STEM_TEMP_H1700_D20_NE,J _ST _TE HI70 _D20_SE,JP 2_S TEM_TEMP_H 1700_D 20_NW, CRTF CN_CODE, REVI S I ON DATE
'SSA-OJP-FLXTR', 'RSSI7-SST01',01-APR-94,0,8.64,T0.62,7.18,6.42,10.84,10.9,4.1,
10.95, 6.8,4.99, 10.74, 11.66, 'CPI',21-AUGS97
'SSA-OJP-FLXTR', 'RSSI7-SST01',01-APR-94,30,7.5,10.22,7.18,6.67,10.32,10.45,4.77,
10.32,6.79,5.3,10.33,11.12, 'CPI ', 21-AUG-97
'SSA-OJP-FLXTR', 'RSSI7-SST01',01-APR-94,100,6.64,9.82,7.09,6.75,9.8,10.0,5.0,
10.05,6.75,5.43,9.89,10.59, 'CPI ', 21-AUG-97
For SSA-YJP site:
SITE_NAME, SUB_S ITE, DATE_OBS, T IME_OBS, SOIL_TEMP_50594, SOIL_TEMP_150594,
SOIL_TEMP_250MM, SOIL_TEMP_400MM, JPI_STEM__TEMP_H600 D5 NE,
JPI STEM TEMP H600 DI0 NE,JP2 STEM TEMP H600 D5 NE,JP2 STEM TEMP H600 DI0 NE,
CRTFCN_CODE, REVIS ION_DATE
'SSA-YJP-FLXTR', 'RSSI7-SST01',01-AUG-94,0,20.84, 17.46,17.11,15.95,28.71,29.15,
28.24,28.71, 'CPI',20-AUG-97
'SSA-YJP-FLXTR', 'RSSI7-SST01',01-AUG-94,30,20.87,17.54,17.17,15.91,28.97,29.38,
28.35,28.86, 'CPI',20-AUG-97
'SSA-YJP-FLXTR', 'RSSI7-SST01',01-AUG-94, I00,20.77,17.63,17.25,15.95,28.82,29.19,
27.82,28.82, 'CPI',20-AUG-97
8. Data Organization
8.1 Data GranularityThe unit of data tracked by BORIS is all the data collected at a site on a given day or for a given
time period.
8.2 Data Format(s)The Compact Disk-Read-Only Memory (CD-ROM) files contain American Standard Code for
Information Interchange (ASCII) numerical and character fields of varying length separated bycommas. The character fields are enclosed with single apostrophe marks. There are no spaces betweenthe fields.
Each data file on the CD-ROM has four header lines of Hyper-Text Markup Language (HTML)code at the top. When viewed with a Web browser, this code displays header information (data settitle, location, date, acknowledgments, etc.) and a series of HTML links to associated data files andrelated data sets. Line 5 of each data file is a list of the column names, and line 6 and following linescontain the actual data.
Page 22
9. Data Manipulations
9.1 Formulae
None given.
9.1.1 Derivation Techniques and AlgorithmsNone given.
9.2 Data Processing Sequence
9.2.1 Processing StepsThermistor resistance was measured in kOhms and converted to °C using the manufacturer's data
conversion table.
9.2.2 Processing ChangesNone given.
9.3 Calculations
9.3.1 Special Corrections/AdjustmentsNone given.
9.3.2 Calculated VariablesThermistor resistance was measured in kOhms and converted to °C using the manufacturer's data
conversion table.
9.4 Graphs and PlotsNone.
10. Errors
10.1 Sources of Error
Thermistors may read higher temperatures than their environment when exposed to direct radiationor if output leads get shorted by moisture in cables with faulty insulation. The latter is a problem afterrain if the shorting resistance is very high, and its effect is hard to separate/detect from true readings ofsensor resistance.
10.2 Quality Assessment
10.2.1 Data Validation by Source
None given.
10.2.2 Confidence Level/Accuracy JudgmentMeasurement accuracy of the thermistors was determined to be ÷/- 0.2 °C, as based on laboratory
testing.
10.2.3 Measurement Error for Parameters
None given.
10.2.4 Additional Quality AssessmentsNone given.
Page 23
10.2.5 Data Verification by Data CenterBOREAS staff performed initial quality checks while loading the data into BORIS. This was, by
no means, an exhaustive effort. Individual users are cautioned that unreliable data may still be present.
11. Notes
ll.1 Limitations of the Data
None given.
11.2 Known Problems with the Data
None given.
11.3 Usage GuidanceNone given.
11.4 Other Relevant Information
• NSA-OBS: One soil temperature sensor was also inserted to a depth of 700 mm below thesurface but it was shorted during the season in 1994 by cable damage and thus not used in thisdata file.
• SSA-OA: One stem temperature probe was also inserted at l0 mm into JP1, but the sensorreadings were found to be erratic beginning in September 1994. Data collected after this datewere removed.
• SSA-OBS: Four soil temperature sensors were also inserted to a depth of 50, 250, 450, and700 mm below the surface, but they were shorted by sensor and cable damage during 1994and thus the data were not included in this file.
12. Application of the Data Set
Radar may be applied to assess growing season length in boreal landscapes.
13. Future Modifications and Plans
No future modifications are planned.
14. Software
14.1 Software DescriptionData conversion was performed in Sigmaplot 4.0 for DOS 0andel Scientific, acquired by SPSS,
Inc., http://www.spss.com/[Internet Link]).
14.2 Software Access
The software mentioned above may be acquired from SPSS, Inc., or a software reseller.
Page 24
15. Data Access
The RSS-17 stem, soil, and air temperature data are available from the Earth Observing System Data
and Information System (EOSDIS) Oak Ridge National Laboratory (ORNL) Distributed ActiveArchive Center (DAAC).
15.1 Contact InformationFor BOREAS data and documentation please contact:
ORNL DAAC User Services
Oak Ridge National LaboratoryP.O. Box 2008 MS-6407
Oak Ridge, TN 37831-6407Phone: (423) 241-3952Fax: (423) 574-4665E-mail: [email protected] or [email protected]
15.2 Data Center IdentificationEarth Observing System Data and Information System (EOSDIS) Oak Ridge National Laboratory
(ORNL) Distributed Active Archive Center (DAAC) for Biogeochemical Dynamicshttp://www-eosdis.ornl.gov/[Internet Link].
15.3 Procedures for Obtaining DataUsers may obtain data directly through the ORNL DAAC online search and order system
[http://www-eosdis.ornl.gov/] and the anonymous FTP site [ftp://www-eosdis.ornl.gov/data/] or bycontacting User Services by electronic mail, telephone, fax, letter, or personal visit using the contactinformation in Section 15.1.
15.4 Data Center Status/Plans
The ORNL DAAC is the primary source for BOREAS field measurement, image, GIS, andhardcopy data products. The BOREAS CD-ROM and data referenced or listed in inventories on theCD-ROM are available from the ORNL DAAC.
16. Output Products and Availability
16.1 Tape ProductsNone.
16.2 Film ProductsNone.
16.3 Other ProductsThese data are available on the BOREAS CD-ROM series.
Page 25
17. References
17.1 Platform/Sensor/Instrument/Data Processing DocumentationNone given.
17.2 Journal Articles and Study ReportsNewcomer, J., D. Landis, S. Conrad, S. Curd, K. Huemmrich, D. Knapp, A. Morrell, J. Nickeson,A. Papagno, D. Rinker, R. Strub, T. Twine, F. Hall, and P. Sellers, eds. 2000. Collected Data of TheBoreal Ecosystem-Atmosphere Study. NASA. CD-ROM.
Sellers, P. and F. Hall. 1994. Boreal Ecosystem-Atmosphere Study: Experiment Plan. Version1994-3.0, NASA BOREAS Report (EXPLAN 94).
Sellers, P. and F. Hall. 1996. Boreal Ecosystem-Atmosphere Study: Experiment Plan. Version1996-2.0, NASA BOREAS Report (EXPLAN 96).
Sellers, P., F. Hall, and K.F. Huemmrich. 1996. Boreal Ecosystem-Atmosphere Study: 1994Operations. NASA BOREAS Report (OPS DOC 94).
Sellers, P., F. Hall, and K.F. Huemmrich. 1997. Boreal Ecosystem-Atmosphere Study: 1996Operations. NASA BOREAS Report (OPS DOC 96).
Sellers, P., F. Hall, H. Margolis, B. Kelly, D. Baldocchi, G. den Hartog, J. Cihlar, M.G. Ryan, B.Goodison, P. Crill, K.J. Ranson, D. Lettenmaier, and D.E. Wickland. 1995. The borealecosystem-atmosphere study (BOREAS): an overview and early results from the 1994 field, year.Bulletin of the American Meteorological Society. 76(9): 1549-1577.
Sellers, P.J., F.G. Hall, R.D. Kelly, A. Black, D. Baldocchi, J. Berry, M. Ryan, K.J. Ranson, P.M.Crill, D.P. Lettenmaier, H. Margolis, J. Cihlar, J. Newcomer, D. Fitzjarrald, P.G. Jarvis, S.T.Gower, D. Halliwell, D. Williams, B. Goodison, D.E. Wickland, and F.E. Guertin. 1997. BOREASin 1997: Experiment Overview, Scientific Results and Future Directions. Journal of GeophysicalResearch 102(D24): 28,731-28,770.
17.3 Archive/DBMS Usage DocumentationNone.
None.
ASCII
BOREAS
BORIS
CD-ROM
DAAC
DC
EOS
EOSDIS
ERS-I
GIS
18. Glossary of Terms
19. List of Acronyms
- American Standard Code for Information Interchange
- BOReal Ecosystem-Atmosphere Study
- BOREAS Information System
- Compact Disk-Read-Only Memory
- Distributed Active Archive Center
- Direct Current
- Earth Observing System
- EOS Data and Information System
- Earth Resources Satellite-i
- Geographic Information System
Page 26
= =
GSFC
HTML
NASA
NSA
OA
OBS
OJP
ORNL
PANP
RSS
SAR
SSA
URL
UTM
YJP
- Goddard Space Flight Center
- HyperText Markup Language
- National Aeronautics and Space
- Northern Study Area
- Old Aspen
- Old Black Spruce
- Old Jack Pine
- Oak Ridge National Laboratory
- Prince Albert National Park
- Remote Sensing Science
- Synthetic Aperture Radar
- Southern Study Area
- Uniform Resource Locator
- Universal Transverse Mercator
- Young Jack Pine
Administration
20. Document Information
20.1 Document Revision Date(s)Written: 15-Jul- 1997
Last Updated: 26-Jul- 1999
20.2 Document Review Date(s)BORIS Review: 10-Jun- 1998Science Review:
20.3 Document IDNone.
20.4 Citation
When using these data, please include the following acknowledgment as well as citations ofrelevant papers in Section 17.2:
Please acknowledge the efforts of the following investigators when using this data set: R.Zimmermann, K.C. McDonald, J.B. Way.
ff using data from the BOREAS CD-ROM series, also reference the data as:Way, J.B., K. McDonald, and R. Zimmermann, "Monitoring Environmental and Phenologic State
and Duration of State with SAR as Input to Improved CO2 Flux Models." In Collected Data of The
Boreal Ecosystem-Atmosphere Study. Eds. J. Newcomer, D. Landis, S. Conrad, S. Curd, K.Huemmrich, D. Knapp, A. Morrell, J. Nickeson, A. Papagno, D. Rinker, R. Strub, T. Twine, F.Hall, and P. Sellers. CD-ROM. NASA, 2000.
Also, cite the BOREAS CD-ROM set as:Newcomer, J., D. Landis, S. Conrad, S. Curd, K. Huemmrich, D. Knapp, A. Morrell, J.
Nickeson, A. Papagno, D. Rinker, R. Strub, T. Twine, F. Hall, and P. Sellers, eds. Collected Data ofThe Boreal Ecosystem-Atmosphere Study. NASA. CD-ROM. NASA, 2000.
20.5 Document Curator
20.6 Document URL
Page 27
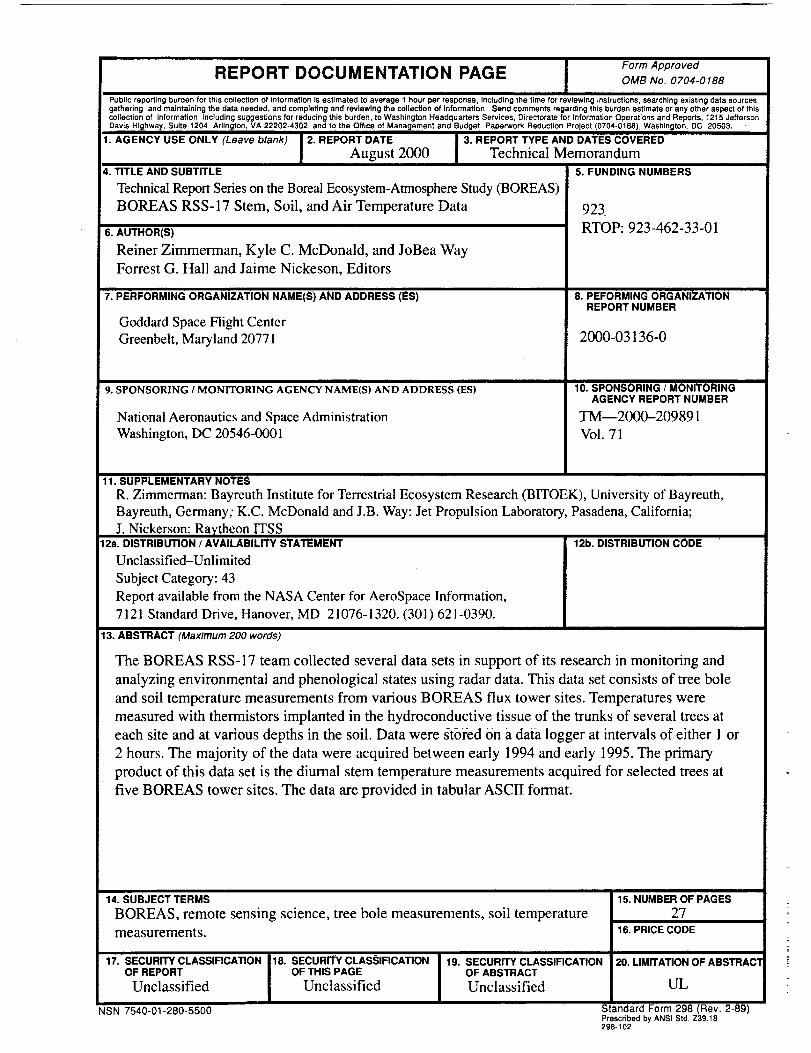
Form Approved
REPORT DOCUMENTATION PAGE OMBNo.0704-0188
Public reporting burden for this collection of information is estimated to average 1 hour per response, Including the time for reviewing instructions, searching existing data sources,
gathering and maintaining the data needed, and completing end reviewing the collection of information. Send comments regarding this burden estimate or any other aspect of this
collection of information, including suggestions for reducing this burden, to Washington Headquarters Services. Directorate for Information Operations and Reports. 1215 Jefferson
Davis Highway,.==,, Suite 1204, Arlington, VA 22202-4302,_,= and_ to_= the Office of Management and Budge_, Paperwork Reduction Project (0704-0188), Washington, DC 20503.
1. AGENCY USE ONLY (Leave blank) 2. REPORT DATE 3. REPORT TYPE AND DATES COVERED
August 2000 Technical Memorandum4. TITLE AND SUBTITLE
Technical Report Series on the Boreal Ecosystem-Atmosphere Study (BOREAS)
BOREAS RSS-17 Stem, Soil, and Air Temperature Data
6. AUTHOR(S)
Reiner Zimmerman, Kyle C. McDonald, and JoBea Way
Forrest G. Hall and Jaime Nickeson, Editors
7. PERFORMING ORGANIZATION NAMEtS) AND ADDRESS iES) ......
Goddard Space Flight Center
Greenbelt, Maryland 20771
9. SPONSORING/ MONITORINGAGENCYNAME(S)AND ADDRESS (ES)
National Aeronautics and Space Administration
Washington, DC 20546-0001
5. FUNDING NUMBERS
923
RTOP: 923-462-33-01
8. PEFORMING ORGANIZATIONREPORT NUMBER
2000-03136-0
10. SPONSORING/MONITORING
AGENCY REPORT NUMBER
TM--2000-209891
Vol. 71
11. SUPPLEMENTARY NOTES
R. Zimmerman: Bayreuth Institute for Terrestrial Ecosystem Research (BITOEK), University of Bayreuth,
Bayreuth, Germany; K.C. McDonald and J.B. Way: Jet Propulsion Laboratory, Pasadena, California;
J. Nickerson: Raytheon ITSS12a. DISTRIBUTION / AVAILABILITY STATEMENT 12b. DISTRIBUTION CODE
Unclassified-Unlimited
Subject Category: 43
Report available from the NASA Center for AeroSpace Information,
7121 Standard Drive, Hanover, MD 21076-1320. (301) 621-0390.
13. ABSTRACT (Maximum 200 words)
The BOREAS RSS-I 7 team collected several data sets in support of its research in monitoring and
analyzing environmental and phenological states using radar data. This data set consists of tree bole
and soil temperature measurements from various BOREAS flux tower sites. Temperatures were
measured with thermistors implanted in the hydroconductive tissue of the trunks of several trees at
each site and at various depths in the soil. Data were stored on a data logger at intervals of either 1 or
2 hours. The majority of the data were acquired between early 1994 and early 1995. The primary
product of this data set is the diurnal stem temperature measurements acquired for selected trees at
five BOREAS tower sites. The data are provided in tabular ASCII format.
14. SUBJECT TERMS
BOREAS, remote sensing science, tree bole measurements, soil temperature
measurements.
17. SECURITY CLASSIFICATIONOF REPORT
Unclassified
NSN 7540-01-280-5500
i18. SECURITY CLAS,SIFiCATIONOF THIS PAGE
Unclassified
19. SECURITY'CLASSIFICATION
OF ABSTRACT
Unclassified.,....,.,.
15. NUMBER OF PAGES
2716. PRICE CODE
20. LIMITATION OF ABSTRACT
UL
Standard Form 298 (Rev. 2-89)Prescribed by ANSI Std Z39.18
298-102
Copyright © 2022 FDOKUMEN