Short-term effects of reduced white-tailed deer density on insect communities in a strongly...
18
1 23 Biodiversity and Conservation ISSN 0960-3115 Biodivers Conserv DOI 10.1007/s10531-012-0400-5 Short-term effects of reduced white-tailed deer density on insect communities in a strongly overbrowsed boreal forest ecosystem Pierre-Marc Brousseau, Christian Hébert, Conrad Cloutier & Steeve D. Côté
Transcript of Short-term effects of reduced white-tailed deer density on insect communities in a strongly...

1 23
Biodiversity and Conservation ISSN 0960-3115 Biodivers ConservDOI 10.1007/s10531-012-0400-5
Short-term effects of reduced white-taileddeer density on insect communities ina strongly overbrowsed boreal forestecosystem
Pierre-Marc Brousseau, ChristianHébert, Conrad Cloutier & SteeveD. Côté

1 23
Your article is protected by copyright and all
rights are held exclusively by Her Majesty the
Queen in Right of Canada. This e-offprint is
for personal use only and shall not be self-
archived in electronic repositories. If you
wish to self-archive your work, please use the
accepted author’s version for posting to your
own website or your institution’s repository.
You may further deposit the accepted author’s
version on a funder’s repository at a funder’s
request, provided it is not made publicly
available until 12 months after publication.

ORI GIN AL PA PER
Short-term effects of reduced white-tailed deer densityon insect communities in a strongly overbrowsed borealforest ecosystem
Pierre-Marc Brousseau • Christian Hebert • Conrad Cloutier •
Steeve D. Cote
Received: 22 March 2012 / Accepted: 12 November 2012� Her Majesty the Queen in Right of Canada 2012
Abstract Browsing by overabundant deer modifies plant communities and alters forest
regeneration, which can indirectly impact associated insect fauna. We tested the hypothesis
that the response of insect communities to changes in deer abundance should depend on the
strength of their association with plants, which we considered as a key functional trait.
Seven years after a deer density control experiment was established in partly harvested
forests on Anticosti Island (Quebec, Canada), we evaluated the effects of reducing white-
tailed deer (Odocoileus virginianus) density from [20 down to 15, 7.5 and 0 deer km-2,
on four insect taxa representing different levels of dependence on plants. As predicted by
our hypothesis, the sensitivity of insect taxa to deer density decreased along a gradient
representing their degree of association with plants. Carabidae remained unaffected, while
Apoidea and Syrphidae communities differed between uncontrolled and reduced deer
densities, but not as clearly as for Lepidoptera. As expected, insect communities responded
faster in harvested than in forested areas because vegetation changes more rapidly in open
habitats. For most insect taxa, dominant species were the most strongly affected by deer
density reduction, but it was clearly stronger for predator taxa (Syrphidae and Carabidae).
A fast recovery of rare species was observed for macro Lepidoptera. Reducing deer density
down to 15 deer km-2 is sufficient to restore insect diversity on Anticosti Island, but it is
unlikely to be efficient in all situations, particularly when competing tree regeneration is
firmly established.
Keywords Functional traits � Restoration � Perturbation � Dominance � Rare species
P.-M. Brousseau � C. Hebert (&) � C. Cloutier � S. D. CoteDepartement de biologie, Chaire de Recherche Industrielle CRSNG-Produitsforestiers Anticosti, Universite Laval, Quebec, Quebec G1V 0A6, Canadae-mail: [email protected]
C. HebertNatural Resources Canada, Canadian Forest Service, Laurentian Forestry Centre,1055 du P.E.P.S., Stn. Sainte-Foy, 10380, Quebec, Quebec G1V 4C7, Canada
S. D. CoteCentre d’etudes nordiques, Universite Laval, Quebec, Quebec G1V 0A6, Canada
123
Biodivers ConservDOI 10.1007/s10531-012-0400-5
Author's personal copy

Introduction
Since the beginning of the 20th century, populations of cervids have been increasing in
many parts of the world, mainly because of reductions in predators and in hunting pressure,
as well as increasing forage availability (reviewed in Cote et al. 2004). The overabundance
of cervids has important ecological consequences because selective overbrowsing can be
detrimental to forest regeneration (Watson 1983; Cote et al. 2004) and can modify plant
communities (Rooney and Waller 2003; Cote et al. 2004). Also, the direct effect of high
cervid density on vegetation is known to indirectly impact populations of invertebrates
(Stewart 2001), birds (McShea and Rappole 2000), small mammals (McShea 2000) and
even large omnivores such as black bear (Ursus americanus) (Cote 2005).
Large herbivores can indirectly affect invertebrates by removing their host plants or by
reducing plant biomass or quality, as well as by simplifying vegetation structure, soil
microclimate and litter quantity and quality (reviewed in Stewart 2001; Suominen and
Danell 2006). Studies on different herbivorous insect taxa have generally shown that they
were negatively affected by high ungulate density (Gibson et al. 1992; Baines et al. 1994;
Kruess and Tscharntke 2002; Martin et al. 2010), while studies on predators yielded
variable responses. For instance, web-spiders, which highly depend on vegetation archi-
tecture (Greenstone 1984), were shown to be negatively affected by high ungulate density
(Miyashita et al. 2004; Takada et al. 2008) while ground beetles (Carabidae) were more
abundant at high grazing intensity (Suominen et al. 2003; Melis et al. 2006; 2007).
However, few empirical studies considered multiple guilds showing different functional
relationships with plants in assessing the impact of ungulate density on arthropods (see
Allombert et al. 2005). Furthermore, some groups such as pollinators have rarely been
studied, except while observing their activity on flowers (Vazquez and Simberloff
2003, 2004).
Based on these results, we hypothesized that arthropods respond to ecosystem changes
resulting from overbrowsing as a function of the strength of their association with plants.
We consider dependence on plants for feeding and reproduction as a key functional trait
linking arthropods to terrestrial communities, which could help in predicting the impact of
mammal browsing (or other similar perturbations) on arthropod fauna in different eco-
logical situations. For example, it has been shown that vegetation changed more rapidly in
harvested than in forested areas following deer density reduction (Tremblay et al. 2006).
Thus, considering the close link between arthropods and vegetation, a similar effect of
forest harvesting can be expected on insect fauna. Moreover, based on the ecological niche
theory, if deer density reduction modifies plant communities or microclimate sufficiently, a
shift in interspecific competition among a guild could occur (Chase and Leibold 2003).
As dominant species are those that benefited from the environmental conditions generated
by overabundant deer, a shift in interspecific competition is more likely to affect these
species, resulting in abundance reduction of dominant species and augmentation of less
abundant ones.
In this study, we evaluate the short-term effects on insect communities of reducing the
density of overabundant white-tailed deer (Odocoileus virginianus) in strongly over-
browsed balsam fir forests on Anticosti Island, Quebec, Canada in spatially close for-
ested and harvested areas. We aim to determine the highest deer density compatible with
the objective of restoring insect communities in unbrowsed stands. We predicted that: (1)
sensitivity to deer density would be stronger for herbivores and decrease along a guild
gradient representing the degree of association with plants (from Lepidoptera, which are
mostly herbivores, to Carabidae, which are not directly dependent on plants), (2) short-
Biodivers Conserv
123
Author's personal copy

term responses would be stronger in harvested areas than in forested areas, and (3) the
abundance of the dominant species would decrease, while the abundance of less abun-
dant species would increase.
Materials and methods
Study area
Study sites were located on Anticosti Island (7,943 km2) in the Gulf of St. Lawrence (498300N638000W), Quebec, Canada. The north coast of the island is 35 km from the mainland
compared with 72 km for the south coast. White-tailed deer were introduced on Anticosti
Island between 1896 and 1900. Without predators, the deer population increased rapidly and
its density is now estimated at[20 deer km-2 across the island (Potvin and Breton 2005).
The forest of Anticosti Island is in the boreal zone and is mostly composed of balsam fir (Abiesbalsamea), white spruce (Picea glauca) and black spruce (Picea mariana). The dynamics of
Anticosti forest ecosystems are strongly disturbed by deer overabundance. Old-growth for-
ests originating prior to the time when deer became overabundant are mostly dominated by
balsam fir while recent forests are almost entirely dominated by white spruce because of
browsing selectivity on balsam fir and deciduous trees (Potvin et al. 2003). The proportion of
balsam fir dominated stands across the landscape has decreased from approximately 40 to
20 % over the last century and many plant species that were once abundant are now rare, such
as fireweed (Chamaerion angustifolium), raspberry (Rubus idaeus) and yellow clintonia
(Clintonia borealis) (Potvin et al. 2003).
Experimental design
A permanent deer exclosure system, where deer density was controlled, was established in
2001 (Tremblay et al. 2006). The experiment formed a factorial design, where deer density
was controlled at 0, 7.5 and 15 deer km-2 in fenced exclosures in three replicated blocks
(A, B and C) located in different parts of the island. Each block also included an additional
experimental unit with the local uncontrolled deer density ([20 deer km-2).
To control deer density in experimental units, all deer were removed from a 10 ha
exclosure (0 deer km-2), whereas three deer ([11 months old) were stocked in exclosures
of 40 ha (7.5 deer km-2) and 20 ha (15 deer km-2), for the other controlled densities.
Deer used in the controlled densities were captured in early spring, released within ex-
closures and euthanized in late fall. Deer were equipped with VHF radio transmitters with
mortality and activity sensors (Lotek Wireless, Newmarket, ON) to ensure constant
monitoring of deer density during the summer treatment period.
In each experimental unit (four densities x three blocks), *70 % of the forest was
harvested just before the onset of the experiment in 2001, leaving *30 % of the mature
balsam fir forest. The deer density was controlled in each experimental unit between 2002
and 2007. In the unharvested residual forested areas of the experimental units, most of the
vegetation biomass was represented by mature trees almost unaffected by the reduction of
deer density as they only browse on lower branches of fir during winter, thus the main
changes were in herbaceous plants density, such as dwarf cornel (Cornus canadensis)
(Tremblay et al. 2006). However, in harvested areas, pioneering species such as fireweed
and Rubus spp. rapidly established. In some parts of block B, a high level of white spruce
regeneration was observed, probably resulting from partial fir mortality caused by an
Biodivers Conserv
123
Author's personal copy

outbreak of the hemlock looper (Lambdina fiscellaria) in the early 1970’s (Jobin and
Desaulniers 1981; Potvin et al. 2003). Uncontrolled deer density in each block was esti-
mated each year between 2002 and 2007 using line transect surveys of summer fecal pellet
clusters using a distance sampling protocol (Buckland et al. 2001) and computed with
DISTANCE 5.0 software (Thomas et al. 2010). For details about the estimation protocol,
see Tremblay et al. (2006). Through the years, uncontrolled deer densities were estimated
at 26 deer km-2 for block B and 57 deer km-2 for blocks A and C.
Vegetation data
Vegetation was inventoried during summer 2007 in 20 plots of 10 9 10 m randomly
distributed in both the harvested and forested areas of each experimental unit. The per-
centage cover of shrubs was visually evaluated by several observers in each 10 9 10 m
plot, while that of other vascular plant species was estimated in each of two randomly
selected quadrats of 1 9 1 m inside the larger plot; for trees, only seedlings were con-
sidered (2 quadrats 9 20 plots 9 2 cover types = 80 quadrats per experimental unit). The
technique was similar to that used by Tremblay et al. (2006). The mean percentage cover
of each species across all quadrats of each experimental unit was used for the analyses.
Insect sampling
Four taxonomic groups belonging to different ecological guilds along a gradient of asso-
ciation with plants were sampled. Nocturnal macro Lepidoptera (i.e. Bombycoidea,
Drepanoidea, Geometroidea, Noctuoidea) represent mostly herbivorous insects such as
caterpillars; Apoidea (excluding former Sphecoidea) (Hymenoptera) represent the most
important insect pollinator specialists and are also seasonal nesting insects; Syrphidae
(Diptera) are pollinators (polliniphage) when adults, while presenting diverse feeding
behaviours at the larval stage such as predators, saprophages, herbivores or inquilines with
ants or bees (Foote 1991). The absence of nesting behaviour also makes Syrphidae less
affected by landscape structure (such as forest fragmentation) than Apoidea (Jauker et al.
2009). Finally, Carabidae were selected because they represent a broad diversity of mostly
epigeal predators, often considered as useful bioindicators (Rainio and Niemela 2003).
These four taxa represent a gradient relative to their degree of association with plants:
macro Lepidoptera (close relationship with plants and numerous cases of mono- and
oligophagy) [ Apoidea [ Syrphidae [ Carabidae (no direct relationship).
Luminoc� traps (BIOCOM, Quebec City, QC) (Jobin and Coulombe 1992) equipped
with a 1.8 W blue light tube were used as pitfall traps to sample Carabidae (Hebert et al.
2000). In each experimental unit, two pitfall traps at least 100 m apart from each other
were installed at random locations in both harvested and forested areas. Traps were placed
at least 100 m away from exclosure fences and whenever possible (i.e. when the forest
patch was large enough), at least 50 m from the forest edge. Trapping periods were
separated into two phases so that Carabidae and Lepidoptera were not caught concurrently.
First, traps were operated as pitfall during 9-11 day periods using 40 % ethyl alcohol as a
preservative. In the second phase, the Luminoc� traps were raised and placed on a post
3 m above the ground to sample macro Lepidoptera for 3 day periods with Vapona� strips
instead of ethyl alcohol. Traps set 3 m high were operated when three consecutive non-
rainy days were forecasted by Environment Canada. Five trapping periods were carried out
between mid-June and mid-August 2007.
Biodivers Conserv
123
Author's personal copy

Flying adult Apoidea and Syrphidae were sampled using one Malaise trap (Gressitt and
Gressitt 1962) in each experimental unit, installed in the harvested area, 50 m away from
the forest edge and at least 100 m away from the exclosure fence. These traps were
operated between 15 June and 19 August 2007. A solution of 40 % ethyl alcohol was used
as a preservative and samples were collected at intervals of *14 days.
All specimens were identified at the species level whenever possible except for a few
genera: i.e. Andrena (Apoidea: Andrenidae), Cheilosia and Microdon (Syrphidae), Eupi-thecia (Lepidoptera: Geometridae) and most female Heringia, Platycheirus and Sph-aerophoria (Syrphidae). Furthermore, specimens of the subgenus Lasioglossum (Dialictus)
(Apoidea: Halictidae) were identified as morphospecies. Specimen identifications were
cross-checked at the Canadian National Collection (CNC) of insects, arachnids and
nematodes in Ottawa, Canada and at the Insectarium Rene-Martineau (IRM) of the
Canadian Forest Service in Quebec City, Canada.
Statistical analyses
For each major taxon (macro Lepidoptera, Apoidea, Syrphidae and Carabidae), we used
mixed model ANOVAs (PROC mixed) (SAS 9.1, SAS Institute 2003) to examine variation
in species richness (R), the Shannon-Wiener index and the overall abundance of each
major taxon in relation to deer density. Deer density was considered a fixed effect and
blocks a random effect. For macro Lepidoptera and Carabidae, a split-plot model with
cover (forested or harvested) included as a subplot was used. To meet the assumptions of
ANOVA (i.e. normality, homogeneity of variances), abundance and species richness data
were square-root transformed. Furthermore, for the abundance of each major taxon, the
relative contribution of blocks to the total variance among experimental units was calcu-
lated as follows:
r2B= r2
B þ r2e
� �
where r2B is the estimated variance of the block effect and r2
e is the estimated variance of
residuals (Fleiss et al. 2003). Raw species richness was preferred to rarefaction because our
sampling effort was the same in all experimental units. This is in agreement with Collins and
Simberloff (2009) who suggest using standardized sampling protocols rather than rarefaction
when possible. Rossi (2011) also argued that the use of rarefaction to compare sites sampled
with the same effort, but where abundance differs can lead to misinterpretation.
To investigate how dominant and rare species responded to deer density reductions, we
classified all species of each major taxon into four groups based on their ordered total
abundance in uncontrolled deer densities. For Carabidae and macro Lepidoptera, this was
done for both harvested and forested areas. A dominant species was defined as a species
representing at least 25 % of the total abundance of the taxon; common species were those
that composed the first 75 % of the total abundance, but were not dominant; uncommon
species were present in the interval between 75 and 95 %; and rare species were the
remaining 5 %. A mixed ANOVA was used to compare the abundance of each group
between deer densities using the model previously described.
Variations in community composition were examined using redundancy analysis (RDA)
based on Hellinger transformed species data (Legendre and Gallagher 2001) performed
with the software R (function rda of the library vegan, version 1.15-4) (Oksanen et al.
2009). They were conducted for each major taxon and also separately for harvested and
forested areas for macro Lepidoptera and Carabidae considering only the vegetation from
Biodivers Conserv
123
Author's personal copy

these specific areas. All RDAs included the twelve experimental units (four deer densities x
three blocks), all insect species identified in the taxon and a number of explanatory
variables selected using the two-steps forward selection procedure described by Blanchet
et al. (2008), using the function forward.sel of library packfor in R (Dray et al. 2007), with
a = 0.1. Explanatory variables included deer density, % cover of each common plant
species (i.e. representing C5 % of total cover in at least one experimental unit) and the
Shannon-Wiener index (based on the percentage ground cover of each species) estimated
for all vascular plants. Non-normal variables (based on the Shapiro test) were square-root
or fourth-root transformed; if they could not be normalized, they were removed from the
analysis. Multicollinearity among explanatory variables was assessed by calculating tol-
erance value (Quinn and Keough 2002); if tolerance was \0.2 for one or more variables,
the one with the lower score was removed from the pool and the forward selection was run
again until a result [0.2 was obtained for all variables. The list of retained explanatory
variables for each RDA is available in Table 1. RDA results were interpreted using dis-
tance triplots (scaling 1) where the eigenvectors are scaled to unit length, as described in
Legendre and Legendre (1998), p. 586.
Results
Diversity and abundance
A total of 260 specimens of macro Lepidoptera were collected in the harvested areas and
1,343 in the forested areas. They belong to five families (Arctiidae, Drepanidae, Geo-
metridae, Lymantriidae and Noctuidae) and to 105 species (56 in the harvested areas and
90 in the forested areas). Only four species representing 0.03 % of the total abundance
were associated with lichens, forest litter or ant nests, with all others being herbivores.
Apoidea totalled 1,308 specimens representing 35 species that belong to five families
(Andrenidae, Apidae, Colletidae, Halictidae and Megachilidae). The Syrphidae were
represented by 7,481 specimens belonging to 109 species, of which 63, representing 88 %
of the total abundance, were predators of herbivorous insects (mainly on aphids) at the
larval stage. Larval stages of other syrphid species were saprophagous on litter or wood
(5.4 % of total abundance), epigeal predators (3.3 %), aquatic saprophages (2.3 %),
inquiline with ants or bumblebees (0.2 %) or herbivores (0.1 %). Finally, 1,878 Carabidae
belonging to 30 species were caught; 875 in the harvested areas and 1,003 in the forested
areas. Twenty-one carabid species, representing 58 % of total abundance, were epigeal
predators. One species (Synuchus impunctatus) representing 37 % of total abundance was
both predator and granivorous. Pure granivorous species represented only 5 % of total
abundance.
Although significant ANOVAs were obtained for most taxa, the block effect was high,
explaining from 18.2 % to 95.8 % of variance in the abundance of the four major insect
taxa (Table 2). The block effect was not significant for Syrphidae while the strongest effect
was observed for Carabidae in forested areas. For both macro Lepidoptera and Carabidae, a
significant block effect was found in both harvested and forested areas (Table 2).
Mixed ANOVAs did not reveal any significant effect of deer density on total abundance
of any major taxa (Table 3;Fig. 1a). However, the effect of deer density was significant on
the number of species of macro Lepidoptera (Table 3; Fig. 1b), for which more species
were captured at 7.5 and 15 deer km-2 than in uncontrolled densities. At 0 deer km-2, the
number of species was lower than at mid densities, but not significantly so. No effect of
Biodivers Conserv
123
Author's personal copy

Tab
le1
Veg
etat
ion
expla
nat
ory
var
iable
sse
lect
edusi
ng
the
two-s
teps
forw
ard
sele
ctio
npro
cedure
and
use
din
redundan
cyan
alyse
s(R
DA
)on
inse
ctco
mm
unit
ies
on
An
tico
sti
Isla
nd
(Qu
ebec
,C
anad
a),
wit
hth
eir
mea
n%
cover
and
range
for
‘H’a
rves
ted
and
‘F’o
rest
edar
eas
Expla
nat
ory
var
iable
sP
erce
nta
ge
cover
Mac
roL
epid
op
tera
(H)
Mac
roL
epid
op
tera
(F)
Ap
oid
eaS
yrp
hid
aeC
arab
idae
(H)
Car
abid
ae(F
)H
arv
este
dar
eas
Fo
rest
edar
eas
Mea
n±
SD
Ran
ge
Mea
n±
SD
Ran
ge
Ab
ies
ba
lsa
mea
(L.)
Mil
l.2
.4±
0.5
\0
.1,
6.2
3.1
±0
.50
.2,
5.4
XX
Co
pti
sg
roen
land
ica
(Oed
er)
Fer
n.
3.7
±0
.61
.2,
7.1
4.0
±0
.41
.5,
5.7
XX
XX
Co
rnu
sca
na
den
sis
L.
15
.7±
1.8
4.4
,2
8.0
14
.5±
1.2
6.4
,1
8.9
X
Dry
op
teri
sd
isju
nct
a(L
edeb
.)M
ort
on
2.4
±0
.70
.2,
8.7
1.9
±0
.40
.5,
6.5
X
Oxa
lis
mo
nta
na
Raf
.2
.5±
0.7
0,
7.7
XX
Pic
eag
lau
ca(M
oen
ch)
Vo
ss1
7.5
±3
.73
.0,
36
.71
4.1
±2
.40
.8,
30
.6X
XX
Pic
eam
ari
an
a(M
ill.
)B
.S.P
.2
.0±
0.8
0,
9.0
6.5
±1
.90
,2
2.7
XX
Ru
bu
sid
aeu
sL
.4
.1±
1.7
0,
18
.1X
Ru
bu
sp
ub
esce
nsR
af.
8.3
±1
.71
.7,
22
.84
.0±
0.6
0.1
,7
.0X
Sh
ann
on
index
of
all
vas
cula
rp
lants
2.7
±0
.12
.2,
3.0
2.9
±0
.12
.4,
3.3
X
Bet
ula
pa
pyr
ifer
aM
arsh
.2
.3±
0.6
\0
.1,
8.0
Cir
siu
ma
rven
se(L
.)S
cop
.2
.8±
0.5
0.5
,5
.7
Dic
entr
aca
na
den
sis
(L.)
Ber
nh
.1
.8±
0.3
0.7
,5
.2
Ch
am
aer
ion
an
gus
tifo
liu
m(L
.)7
.4±
2.3
0,
19
.2
Fra
ga
ria
virg
inia
na
Duch
esne
2.2
±0
.50
.5,
5.9
Ga
ult
heri
ah
isp
idu
la(L
.)M
uhl.
1.9
±0
.60
,6
.2
Lin
nae
ab
ore
alis
L.
3.2
±0
.70
.1,
6.8
Ma
ian
them
um
can
ad
ense
Des
f.4
.5±
0.7
0.7
,9
.64
.9±
0.3
3.4
,6
.5
Pla
nt
spec
ies
un
sele
cted
,b
ut
pre
sen
tin
the
ori
gin
ald
ata
po
ol
are
pre
sen
ted
inth
elo
wer
par
to
fth
eta
ble
Biodivers Conserv
123
Author's personal copy
deer density was observed on the diversity of any taxon based on Shannon-Wiener index
(Fig. 1c). The abundance of the dominant species of Syrphidae (Melanostoma mellinum)
and Carabidae (S. impunctatus) in both harvested and forested areas, decreased at reduced
deer densities (Fig. 2a). No dominant species was identified in forested areas for macro
Lepidoptera, while the dominant species in harvested areas, the noctuid Leucania multi-linea, did not vary significantly with deer density (Fig. 2a). The dominant species of
Apoidea, Bombus borealis, did not vary significantly with deer density but, nevertheless,
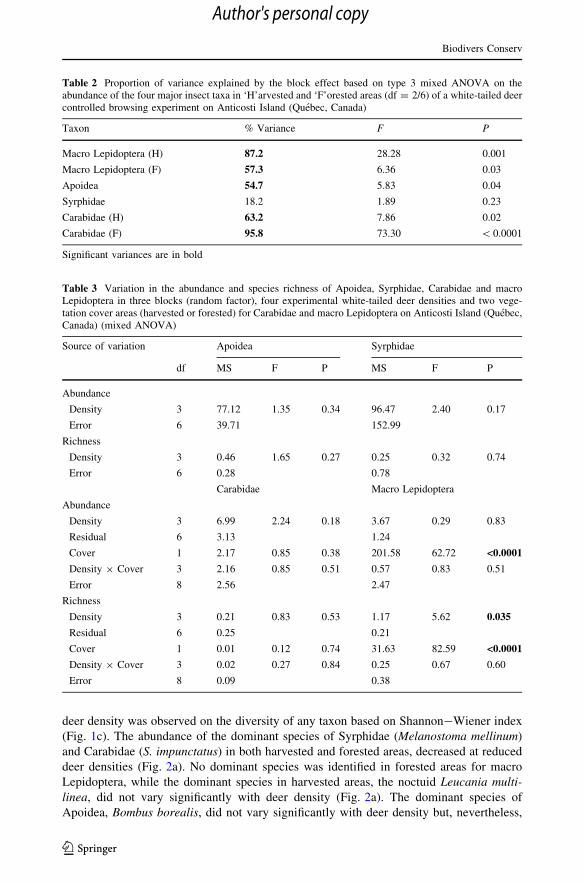
Table 2 Proportion of variance explained by the block effect based on type 3 mixed ANOVA on theabundance of the four major insect taxa in ‘H’arvested and ‘F’orested areas (df = 2/6) of a white-tailed deercontrolled browsing experiment on Anticosti Island (Quebec, Canada)
Taxon % Variance F P
Macro Lepidoptera (H) 87.2 28.28 0.001
Macro Lepidoptera (F) 57.3 6.36 0.03
Apoidea 54.7 5.83 0.04
Syrphidae 18.2 1.89 0.23
Carabidae (H) 63.2 7.86 0.02
Carabidae (F) 95.8 73.30 \ 0.0001
Significant variances are in bold
Table 3 Variation in the abundance and species richness of Apoidea, Syrphidae, Carabidae and macroLepidoptera in three blocks (random factor), four experimental white-tailed deer densities and two vege-tation cover areas (harvested or forested) for Carabidae and macro Lepidoptera on Anticosti Island (Quebec,Canada) (mixed ANOVA)
Source of variation Apoidea Syrphidae
df MS F P MS F P
Abundance
Density 3 77.12 1.35 0.34 96.47 2.40 0.17
Error 6 39.71 152.99
Richness
Density 3 0.46 1.65 0.27 0.25 0.32 0.74
Error 6 0.28 0.78
Carabidae Macro Lepidoptera
Abundance
Density 3 6.99 2.24 0.18 3.67 0.29 0.83
Residual 6 3.13 1.24
Cover 1 2.17 0.85 0.38 201.58 62.72 <0.0001
Density 9 Cover 3 2.16 0.85 0.51 0.57 0.83 0.51
Error 8 2.56 2.47
Richness
Density 3 0.21 0.83 0.53 1.17 5.62 0.035
Residual 6 0.25 0.21
Cover 1 0.01 0.12 0.74 31.63 82.59 <0.0001
Density 9 Cover 3 0.02 0.27 0.84 0.25 0.67 0.60
Error 8 0.09 0.38
Biodivers Conserv
123
Author's personal copy

its abundance decreased in all reduced deer density sites by 25-79 % while Bombusfrigidus became the dominant species in these sites. Total abundance of common and
uncommon species did not vary for any taxa as a function of deer density (Fig. 2b, c). The
abundance of rare species of macro Lepidoptera was significantly higher at reduced deer
densities than in uncontrolled densities in both harvested and forested areas (Fig. 2d). An a
posteriori test revealed that the number of rare species was also significantly higher in
0
200
400
600
800
1000
1200
Mea
n a
bu
nd
ance
0 deer7.5 deer km-2
15 deer km-2
Uncontrolled
0
10
20
30
40
50
60
70
80
Mea
n s
pec
ies
rich
nes
s
abaa
b
aba
a
b
0
0.5
1
1.5
2
2.5
3
3.5
4
Lepidoptera
(Harvested)
Lepidoptera
(Forested) Apoidea
Syrphidae
Carabidae
(Harvested)Carabidae
(Forested)
(A) Abundance
(B) Species richness
(C) Shannon-Wiener Index
Mea
n S
han
no
n-W
ien
erIn
dex
Fig. 1 a Mean abundance, b mean species richness and c mean Shannon-Wiener Index (with standarderror) of macro Lepidoptera, Apoidea, Syrphidae and Carabidae in harvested and forested areas along anexperimental white-tailed deer density gradient (0, 7.5 and 15 deer km-2 and uncontrolled) replicated inthree blocks on Anticosti Island (Quebec, Canada). Within each group and for each area, different lettersindicate significant differences between deer densities based on mixed ANOVAs at a = 0.05
Biodivers Conserv
123
Author's personal copy

reduced deer density sites than in uncontrolled deer densities, suggesting that the change in
the overall number of species was related to the change in the number of rare species.
Community assemblages
Community analyses carried out with RDAs showed markedly different responses by the
four studied insect taxa. For macro Lepidoptera, in harvested areas, the three uncontrolled
deer density sites had negative values on axis 1 along with the 15 deer km-2 density of
block B, while other experimental units had positive values (Fig. 3a). The second axis
mostly separated block A from blocks B and C. In forested areas, community patterns were
not as clear as in harvested areas (Fig. 3b). However, sites of block A, except for the
0 deer km-2 site, had negative values on the second axis along with uncontrolled density
of block B, which was far from other densities in this block.
For Apoidea (Fig. 4a), experimental units of block A had negative values on axis 1
while those of blocks B and C were on the positive side, confirming the aforementioned
substantial block effect on insect abundance (Table 2). Uncontrolled deer densities of
blocks A and C were clearly separated from reduced deer densities of the same blocks, but
this was not observed in block B.
Uncontrolled deer densities of the three blocks clearly shared a similar syrphid com-
munity, which was also shared with the 15 deer km-2 density of block B (Fig. 4b). The
0
200
400
600
800
1000
1200
1400
Lepidoptera
(Harvested)Apoidea
Syrphidae
Carabidae
(Harvested)
Carabidae
(Forested)
Ab
un
dan
ce
0
50
100
150
200
250
300
3500 deer
7.5 deer km-2
15 deer km-2
Uncontrolled
0
50
100
150
200
250
300
350
Lepidoptera
(Forested)Apoidea
Syrphidae
Carabidae
(Harvested)
Carabidae
(Forested)
Ab
un
dan
ce
0
50
100
150
200
250
Lepidoptera
(Harvested)
Lepidoptera
(Forested)Apoidea
Syrphidae
Carabidae
(Harvested)
Carabidae
(Forested)
a
abab
b
a a a b a a b b
aa a
b
aa
a
b
Lepidoptera
(Harvested)
Lepidoptera
(Forested)Apoidea
Syrphidae
Carabidae
(Harvested)
Carabidae
(Forested)
(A) Dominant species (B) Common species
(C) Uncommon species (D) Rare species
Fig. 2 Total abundance of a dominant, b common, c uncommon and d rare species based on their relativeabundance in uncontrolled deer density sites for macro Lepidoptera, Apoidea, Syrphidae and Carabidaealong an experimental white-tailed deer density gradient (0, 7.5 and 15 deer km-2 and uncontrolled) inharvested and forested areas on Anticosti Island (Quebec, Canada). Dominant species was not identified formacro Lepidoptera in forested areas, as well as uncommon species for Lepidoptera in harvested areas.Within each group and for each area, different letters indicate significant differences between deer densitiesbased on mixed ANOVAs at a = 0.05
Biodivers Conserv
123
Author's personal copy

dominant species (M. mellinum) was strongly associated with this group of experimental
units. Experimental units with reduced deer densities of block A were far from those of
blocks B and C.
Finally, for Carabidae, no significant RDA could be obtained either for the harvested or
the forested areas.
Discussion
Our results showed that the sensitivity of different insect taxa and feeding guilds to deer
density decreased along a gradient representing their degree of association with plants.
Epigeal Carabidae, which do not have any direct relationship with plants, did not vary with
+
+++++++
+
+
+
++++
+
+
++
++
++
+
+
+
+
+
+
+
++
++
+
++
+
+
+
+
+
++ +
++++
+
+++
+
+
+
++ ++
+++
+
+
+ +
+
+
+
+
+
+
+
+ +
+ ++
+
+
++
+
++++
+++
+
+
++
++
++
++++
++
++
+
+
++
++
+
+
++
+
++++
+
+++
+++
+
+
+
+++
+
++
+
+
+
-0.4 -0.2 0.0 0.2 0.4 0.6
-0.4
-0.2
0.0
0.2
0.4
RDA1 (λ = 0.18)
RD
A2
(λ =
0.1
1)
-0.5 0.0 0.5
-0.8
-0.6
-0.4
-0.2
0.0
0.2
0.4
RDA1 (λ = 0.18)
RD
A2
(λ =
0.1
5)
(A) Lepidoptera: Harvested
A. balsamea
R. idaeus
R. pubescens
P. mariana
P. glauca
O. montana
(B) Lepidoptera: Forested
0 deer km-2
7.5 deer km-2
15 deer km-2
Uncontrolled
Block ABlock BBlock C
Fig. 3 Distance triplots (scaling1) of redundancy analyses (RDA)on species data of macroLepidoptera in a harvested areas(species richness R = 56) andb forested areas (R = 90) at allexperimental sites (4 deerdensities 9 3 blocks) of a white-tailed deer controlled browsingexperiment on Anticosti Island(Quebec, Canada). Species arerepresented by a cross symbol(?). Arrows represent percentcover of each plant speciesretained as explanatory variableswith the two-steps forwardselection procedure
Biodivers Conserv
123
Author's personal copy

deer density. Communities of Apoidea and Syrphidae differed in uncontrolled and reduced
deer density sites but were not separated as clearly as for the macro Lepidoptera, which is
the group most intimately linked to vegetation. Moreover, macro Lepidoptera was the only
taxon with significantly higher abundance of rare species and higher species richness
overall at reduced than at uncontrolled deer densities.
Insect communities
Because our study sites were located far from the shore, and Anticosti Island itself is
located at least 35 km from the continent, we assume that the species pool here was
composed of resident species that were present on the island at the start of the experiment
-0.4 -0.2 0.0 0.2 0.4 0.6
-0.4
-0.2
0.0
0.2
0.4
RDA1 (λ = 0.21)
RD
A2
(λ =
0.1
2)
(B) Syrphidae
+
++
+
++
+
+
++
+
++
++
+
+
+
+
++
++
+
+
++ + +
+++
+
+++
+
+
+
+
+
++++
+
+ +++
++
++
+
+
++
+
+
+++
+
+
+
+++
++
+
+
+
+
+
+
+
+
++++
+
+
++
++++
+ +
+++
++
+ +
++
+ +
+++ ++
+ +
+
(A) Apoidea
-0.6 -0.4 -0.2 0.0 0.2 0.4 0.6
-0.6
-0.4
-0.2
0.0
0.2
0.4
0.6
RDA1 (λ = 0.23)
RD
A2
(λ =
0.0
8)
A. balsamea
C. groenlandica
D. disjuncta
C. groenlandica
0 deer km-2
7.5 deer km-2
15 deer km-2
Uncontrolled
Block ABlock BBlock C
M. mellinum
Fig. 4 Distance triplots (scaling1) of redundancy analyses (RDA)on species data of a Apoidea(R = 35) and b Syrphidae(R = 109) at all experimentalsites (4 deer densities 9 3blocks) of a white-tailed deercontrolled browsing experimenton Anticosti Island (Quebec,Canada). Species are representedby a cross symbol (?). Arrowsrepresent percent cover of eachplant species retained asexplanatory variables with thetwo-steps forward selectionprocedure
Biodivers Conserv
123
Author's personal copy
in 2001. This implies, on one hand, that the most common species must be those that were
adapted to conditions generated by deer overabundance and were already abundant locally
and thus were available to colonize the new habitats. On the other hand, rare species are
more likely to be those inhabiting restricted areas on the island, such that their colonizing
potential depends on the distance between the source populations and the new habitats
(Littlewood et al. 2009). Dominant species of each group decreased in abundance with
decreasing deer density, but it was significant only for Syrphidae and Carabidae, i.e. the
two taxa that are least strongly associated with the plants among the four studied. In
addition to their degree of association with plants, trophic level could also be important;
Syrphidae and Carabidae are mostly predators, at least in their larval stages. Indeed,
predators may be slower to colonize new habitats than herbivorous species (Brown and
Southwood 1983) as they depend on the recovery of herbivorous insect prey.
Deer density reduction seems to have generated less favourable conditions for dominant
species and, as no significant modification in total abundance of any major group studied
was observed, we can speculate that less abundant species benefited from these new
conditions. Community changes were fast, particularly for macro Lepidoptera in which we
observed a rapid return of rare species, suggesting a higher colonization capacity than
expected for this taxon. The increasing abundance of rare species and higher species
richness of macro Lepidoptera in reduced deer density sites are in agreement with eco-
logical niche theory. Thus, deer density reduction could increase the number of niches per
unit area, which is reflected in the higher number of rare Lepidoptera species. Among
predator taxa, rare species may recover over a longer time frame, which remains to be
determined.
Our experiment was designed to study the impact of deer browsing on regeneration. In
Norway, winter browsing by deer on Vaccinium spp. has been associated with increases in
Carabidae abundance. However, winter browsing was not considered in our study. During
winter on Anticosti Island, deer feed mainly on the lower branches of mature balsam fir
and have only a small impact on the total foliage biomass of trees (Lefort 2002). In fact,
winter browsing has virtually no impact on the forest structure and thus it is unlikely to
have an impact on insects. The main impact of deer browsing on forest structure is caused
by summer feeding when they browse on most fir seedlings, which results in the quasi
absence of balsam fir saplings in Anticosti forests and a conversion from balsam fir to
white spruce forests.
Several studies have already shown the positive impact of high Cervid density on
Carabidae abundance (Melis et al. 2006; 2007) and diversity (Suominen et al. 2003), while
we only observed a positive impact on the abundance of the dominant species S. im-punctatus. In both Melis et al. (2007; 2006) studies, the dominant species Pterostichusoblogopunctatus represented respectively 45 % and 33 % of the total abundance of Car-
abidae. When we look closely at the data, this species seems to be the main cause of the
variation in the abundance of the whole family. These results are thus similar to ours and
are in agreement with our hypothesis on the dominant species. Suominen et al. (2003)
observed no dominant species, which might result from the smaller scale of their study,
with exclosure dimensions \ 50 9 50 m, compared with 0.5 9 1 km in Melis and[10 ha
in ours.
Forested vs. harvested areas
For macro Lepidoptera, results of the RDAs agree with our hypothesis that changes occur
faster in an ecosystem fully exposed to sunlight by forest harvesting, which allows rapid
Biodivers Conserv
123
Author's personal copy

establishment and growth of colonizing plants. However, the abundance of rare species
was higher at reduced deer densities than in uncontrolled densities in both harvested and
forested areas. This suggests that moth communities can rapidly benefit from new vege-
tation growth in both open and forested areas. In temperate deciduous forests, it has been
shown that rare Lepidoptera species were mostly associated with understory vegetation
(Hirao et al. 2009), which could explain why rare species were also affected in forested
areas. Alternatively, it could also suggest that Lepidoptera in our relatively small residual
forest patches benefit from the fast regeneration of the surrounding harvested areas.
Conservation
Our results support the suggestion of Hebert and Jobin (2001) that regeneration of balsam
fir forests and of pioneering plant species such as raspberry are important for restoring
insect communities on Anticosti Island. These plants, once very abundant on the island, are
now endangered by deer overabundance and only a marked decrease in deer density could
make it possible to restore them (Tremblay et al. 2006; 2007). Insect communities in the
15 deer km-2 of block B differed from those in other sites with the same deer densities and
were more similar to uncontrolled density sites. We speculate that the high level of
regeneration of white spruce in this site may have reduced sunlight penetration and
adversely affected herbaceous plant regeneration. In any event, this indicates that deer
reduction to 15 deer km-2 could be sufficient to restore insect diversity, but is unlikely to
be effective in all situations. Unfortunately, unlike plants, no historical data are available
for insects of Anticosti Island before deer overbrowsing became noticeable in the mid 20th
century (Potvin et al. 2003) and thus it is difficult to determine how reducing deer density
can actually help to restore original natural insect communities.
Conclusion
Our results show that even in highly perturbed environments, restoration of plant com-
munities can rapidly benefit insects and particularly rare herbivorous species with high
dispersal ability. More specifically, our results are consistent with our hypothesis that the
impact of deer density on insect communities strongly depends on their degree of asso-
ciation with plants. This hypothesis was tested here in the context of a recent density
reduction experiment involving Anticosti’s overabundant deer population. More support
for the hypothesis could become available from future studies of ungulate overbrowsing
impact on insect diversity and abundance, where a range of insect guilds and functional
traits are studied. Considering finer and more diverse traits than trophic relationships (e.g.
related to insect behaviour or reproductive strategy), could also lead to a deeper under-
standing of the impact of mammal browsing on arthropod communities.
Acknowledgments Our research was financed by the Natural Sciences and Engineering Research Councilof Canada (NSERC), Produits forestiers Anticosti Inc. (PFA), Natural Resources Canada (NRCan) andUniversite Laval. We would like to thank M. Poulin, S. Pellerin and M. Bachand for vegetation data; N.Giasson for help in field work and Y. Paiement for help in laboratory work. We also thank Y. Dubuc fortechnical assistance and G. Pelletier for his taxonomic expertise, both from NRCan and S. de Bellefeuillefrom the NSERC-Produits forestiers Anticosti Industrial Research Chair for logistical assistance. We aregrateful to Y. Bousquet from the Eastern Cereal and Oilseed Research Center in Ottawa for confirmingidentification of Carabidae and G. Daigle of the Departement de Mathematiques et de Statistiques atUniversite Laval and E. Azeria from NRCan for statistical advice. We also thank I. Lamarre and P. Cheersfrom NRCan for editing the manuscript.
Biodivers Conserv
123
Author's personal copy

References
Allombert S, Stockton S, Martin J-L (2005) A natural experiment on the impact of overabundant deer onforest invertebrates. Conserv Biol 19(6):1917–1929
Baines D, Sage RB, Baines MM (1994) The implications of red deer grazing to ground vegetation andinvertebrate communities of Scottish native pinewoods. J Appl Ecol 31(4):776–783
Blanchet FG, Legendre P, Borcard D (2008) Forward selection of explanatory variables. Ecology 89(9):2623–2632
Brown VK, Southwood TRE (1983) Trophic diversity, niche breadth and generation times of exopterygoteinsects in a secondary succession. Oecologia 56(2–3):220–225
Buckland ST, Anderson DR, Burnham KP, Laake JL, Borchers DL, Thomas L (2001) Introduction to distancesampling: estimating abundance of biological populations. Oxford University Press, New York
Chase JM, Leibold MA (2003) Ecological niches: Linking classical and contemporary approaches. TheUniversity of Chicago Press, Chicago, IL
Collins MD, Simberloff D (2009) Rarefaction and nonrandom spatial dispersion patterns. Environ Ecol Stat16(1):89–103. doi:10.1007/s10651-007-0051-y
Cote SD (2005) Extirpation of a large black bear population by introduced white-tailed deer. Conserv Biol19(5):1668–1671. doi:10.1111/j.1523-1739.2005.00252.x
Cote SD, Rooney TP, Tremblay J-P, Dussault C, Waller DM (2004) Ecological impacts of deer over-abundance. Annu Rev Ecol Evol Syst 35:113–147. doi:10.1146/annurev.ecolsys.35.021103.105725
Dray S, Legendre P, Blanchet FG (2007) packfor: forward selection with permutation. R package version0.0-7. Available: http://r-forge.r-project.org/R/?group_id=195. Accessed 15 March 2010
Fleiss JL, Levin B, Paik MC (2003) Statistical methods for rates and proportions, 3rd edn. John Wiley &Sons Inc., New York
Foote BA (1991) Syrphidae. In: Stehr FW (ed) Immature insects, vol 2, Kendall/Hunt Publishing CompanyDubuque, IA, pp 792–795
Gibson CWD, Brown VK, Losito L, McGavin GC (1992) The response of invertebrate assemblies tograzing. Ecography 15(2):166–176
Greenstone MH (1984) Determinants of web spider species-diversity: vegetation structural diversity vs. preyavailability. Oecologia 62(3):299–304
Gressitt JL, Gressitt MK (1962) An improved Malaise trap. Pac Insects 4(1):87–90Hebert C, Jobin L (2001) Impact du cerf de Virginie sur la biodiversite des forets de l’ıle d’Anticosti: Les
insectes comme indicateurs. Nat Can 125(3):96–107Hebert C, Jobin LJ, Frechette M, Pelletier G, Coulombe C, Germain C, Auger M (2000) An efficient pit-
light trap to study beetle diversity. J Ins Conserv 4:191–202Hirao T, Murakami M, Kashizaki A (2009) Importance of the understory stratum to entomofaunal diversity
in a temperate deciduous forest. Ecol Res 24:263–272Jauker F, Diekotter T, Schwarzbach F, Wolters V (2009) Pollinator dispersal in an agricultural matrix:
opposing responses of wild bees and hoverflies to landscape structure and distance from main habitat.Landsc Ecol 24(4):547–555. doi:10.1007/s10980-009-9331-2
Jobin L, Coulombe C (1992) The Luminoc insect trap. Forestry Canada, Inf. Leaf. LFC-26, QuebecJobin L, Desaulniers R (1981) Results of aerial spraying in 1972 and 1973 to control the eastern hemlock
looper (Lambdina fiscellaria fiscellaria (Guen.)) on Anticosti Island. Can. For. Serv., Laurentian For.Centre, Inf. Rep. LAU-X-49E, Quebec
Kruess A, Tscharntke T (2002) Grazing intensity and the diversity of grasshoppers, butterflies, and trap-nesting bees and wasps. Conserv Biol 16(6):1570–1580
Lefort S (2002) Habitat hivernal du cerf de Virginie (Odocoileus virginianus) a l’ıle d’Anticosti. UniversiteLaval, Quebec
Legendre P, Gallagher ED (2001) Ecologically meaningful transformations for ordination of species data.Oecologia 129:271–280
Legendre P, Legendre L (1998) Numerical Ecology, 2nd edn. Elsevier, AmsterdamLittlewood NA, Pakeman RJ, Woodin SJ (2009) Isolation of habitat patches limits colonisation by moorland
Hemiptera. J Ins Conserv 13(1):29–36. doi:10.1007/s10841-007-9114-5Martin J-L, Stockton SA, Allombert S, Gaston AJ (2010) Top-down and bottom-up consequence of
unchecked ungulate browsing on plant and animal diversity in temperate forests: lesson from a deerintroduction. Biol Invasions 12:353–371
McShea WJ (2000) The influence of acorn crops on annual variation in rodent and bird populations. Ecology81(1):228–238
McShea WJ, Rappole JH (2000) Managing the abundance and diversity of breeding bird populationsthrough manipulation of deer populations. Conserv Biol 14(4):1161–1170
Biodivers Conserv
123
Author's personal copy

Melis C, Buset A, Aarrestad PA, Hanssen O, Meisingset EL, Andersen R, Moksnes A, Røskaft E (2006)Impact of red deer Cervus elaphus grazing on bilberry Vaccinium myrtillus and composition of groundbeetle (Coleoptera, Carabidae) assemblage. Biodivers Conserv 15(6):2049–2059. doi:10.1007/s10531-005-2005-8
Melis C, Sundby M, Andersen R, Moksnes A, Pedersen B, Røskaft E (2007) The role of moose Alces alcesL. in boreal forest the effect on ground beetles (Coleoptera, Carabidae) abundance and diversity.Biodivers Conserv 16(5):1321–1335. doi:10.1007/s10531-005-6230-y
Miyashita T, Takada M, Shimazaki A (2004) Indirect effects of herbivory by deer reduce abundance andspecies richness of web spiders. Ecoscience 11(1):74–79
Oksanen J, Kindt R, Legendre P, O’Hara B, Simpson GL, Solymos P, Steven MHH, Wagner H (2009) Thevegan library: Community ecology package. Available: http://cran.r-project.org/web/packages/vegan/index.html. Accessed 21 Dec 2010
Potvin F, Breton L (2005) Testing 2 aerial survey techniques on deer in fenced enclosures - visual double-counts and thermal infrared sensing. Wildl Soc Bull 33(1):317–325
Potvin F, Beaupre P, Laprise G (2003) The eradication of balsam fir stands by white-tailed deer on AnticostiIsland, Quebec: a 150-year process. Ecoscience 10(4):487–495
Quinn GP, Keough MJ (2002) Experimental design and data analysis for biologists. Cambridge UniversityPress, Cambridge
Rainio J, Niemela J (2003) Ground beetles (Coleoptera : Carabidae) as bioindicators. Biodivers Conserv12(3):487–506
Rooney TP, Waller DM (2003) Direct and indirect effects of white-tailed deer in forest ecosystems. For EcolManag 181(1–2):165–176. doi:10.1016/s0378-1127(03)00130-0
Rossi J-P (2011) rich: an R package to analyse species richness. Diversity 3(1):112–120Stewart AJA (2001) The impact of deer on lowland woodland invertebrates: a review of the evidence and
priorities for future research. Forestry 74(3):259–270Suominen O, Danell K (2006) Impacts of large herbivores on other fauna. In: Danell K, Bergstrom R,
Duncan P, Pastor J (eds) Large Herbivore Ecology. Cambridge University Press, Cambridge, Eco-system Dynamics and Conservation, pp 383–412
Suominen O, Niemela J, Martikainen P, Niemela P, Kojola I (2003) Impact of reindeer grazing on ground-dwelling Carabidae and Curculionidae assemblages in Lapland. Ecography 26(4):503–513
Takada M, Baba YG, Yanagi Y, Terada S, Miyashita T (2008) Contrasting responses of web-buildingspiders to deer browsing among habitats and feeding guilds. Environ Entomol 37(4):938–946
Thomas L, Buckland ST, Rexstad EA, Laake JL, Strindberg S, Hedley SL, Bishop JRB, Marques TA,Burnham KP (2010) Distance software: design and analysis of distance sampling surveys for esti-mating population size. J Appl Ecol 47:5–14
Tremblay J-P, Huot J, Potvin F (2006) Divergent nonlinear responses of the boreal forest field layer along anexperimental gradient of deer densities. Oecologia 150(1):78–88. doi:10.1007/s00442-006-0504-2
Tremblay J-P, Huot J, Potvin F (2007) Density-related effects of deer browsing on the regenerationdynamics of boreal forests. J Appl Ecol 44(3):552–562
Vazquez DP, Simberloff D (2003) Changes in interaction biodiversity induced by an introduced ungulate.Ecol Lett 6(12):1077–1083. doi:10.1046/j.1461-0248.2003.00534.x
Vazquez DP, Simberloff D (2004) Indirect effects of an introduced ungulate on pollination and plantreproduction. Ecol Monogr 74(2):281–308
Watson A (1983) Eighteenth century deer numbers and pine regeneration near Braemar. Scotland. BiolConserv 25(4):289–305
Biodivers Conserv
123
Author's personal copy