GPCR Heteromers and their Allosteric Receptor-Receptor Interactions
Upload
khangminh22Category
view
2download
0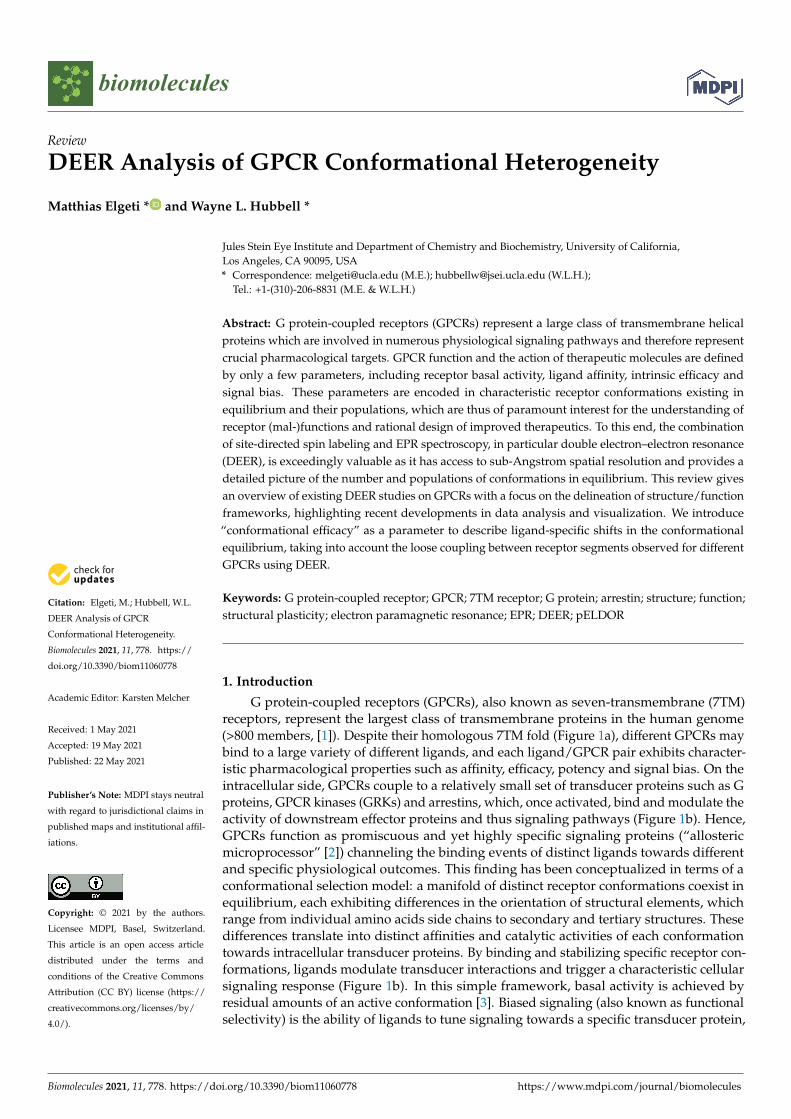
biomolecules
Review
DEER Analysis of GPCR Conformational Heterogeneity
Matthias Elgeti * and Wayne L. Hubbell *
�����������������
Citation: Elgeti, M.; Hubbell, W.L.
DEER Analysis of GPCR
Conformational Heterogeneity.
Biomolecules 2021, 11, 778. https://
doi.org/10.3390/biom11060778
Academic Editor: Karsten Melcher
Received: 1 May 2021
Accepted: 19 May 2021
Published: 22 May 2021
Publisher’s Note: MDPI stays neutral
with regard to jurisdictional claims in
published maps and institutional affil-
iations.
Copyright: © 2021 by the authors.
Licensee MDPI, Basel, Switzerland.
This article is an open access article
distributed under the terms and
conditions of the Creative Commons
Attribution (CC BY) license (https://
creativecommons.org/licenses/by/
4.0/).
Jules Stein Eye Institute and Department of Chemistry and Biochemistry, University of California,Los Angeles, CA 90095, USA* Correspondence: [email protected] (M.E.); [email protected] (W.L.H.);
Tel.: +1-(310)-206-8831 (M.E. & W.L.H.)
Abstract: G protein-coupled receptors (GPCRs) represent a large class of transmembrane helicalproteins which are involved in numerous physiological signaling pathways and therefore representcrucial pharmacological targets. GPCR function and the action of therapeutic molecules are definedby only a few parameters, including receptor basal activity, ligand affinity, intrinsic efficacy andsignal bias. These parameters are encoded in characteristic receptor conformations existing inequilibrium and their populations, which are thus of paramount interest for the understanding ofreceptor (mal-)functions and rational design of improved therapeutics. To this end, the combinationof site-directed spin labeling and EPR spectroscopy, in particular double electron–electron resonance(DEER), is exceedingly valuable as it has access to sub-Angstrom spatial resolution and provides adetailed picture of the number and populations of conformations in equilibrium. This review givesan overview of existing DEER studies on GPCRs with a focus on the delineation of structure/functionframeworks, highlighting recent developments in data analysis and visualization. We introduce“conformational efficacy” as a parameter to describe ligand-specific shifts in the conformationalequilibrium, taking into account the loose coupling between receptor segments observed for differentGPCRs using DEER.
Keywords: G protein-coupled receptor; GPCR; 7TM receptor; G protein; arrestin; structure; function;structural plasticity; electron paramagnetic resonance; EPR; DEER; pELDOR
1. Introduction
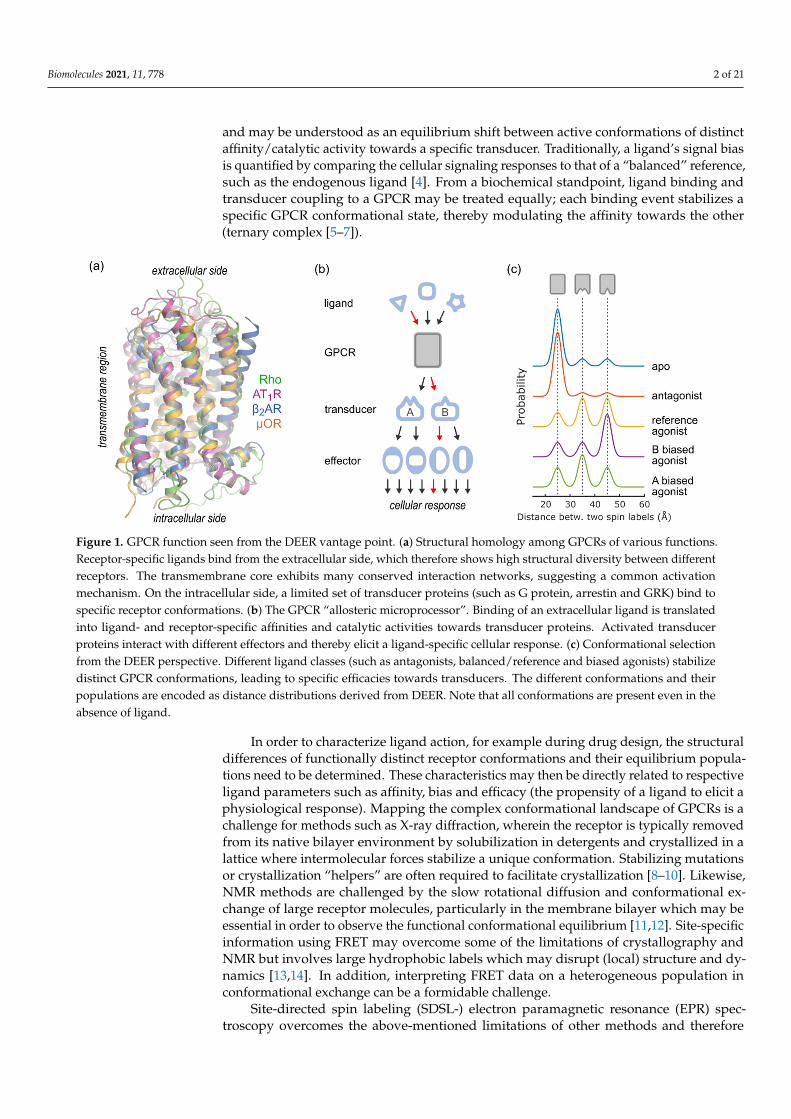
G protein-coupled receptors (GPCRs), also known as seven-transmembrane (7TM)receptors, represent the largest class of transmembrane proteins in the human genome(>800 members, [1]). Despite their homologous 7TM fold (Figure 1a), different GPCRs maybind to a large variety of different ligands, and each ligand/GPCR pair exhibits character-istic pharmacological properties such as affinity, efficacy, potency and signal bias. On theintracellular side, GPCRs couple to a relatively small set of transducer proteins such as Gproteins, GPCR kinases (GRKs) and arrestins, which, once activated, bind and modulate theactivity of downstream effector proteins and thus signaling pathways (Figure 1b). Hence,GPCRs function as promiscuous and yet highly specific signaling proteins (“allostericmicroprocessor” [2]) channeling the binding events of distinct ligands towards differentand specific physiological outcomes. This finding has been conceptualized in terms of aconformational selection model: a manifold of distinct receptor conformations coexist inequilibrium, each exhibiting differences in the orientation of structural elements, whichrange from individual amino acids side chains to secondary and tertiary structures. Thesedifferences translate into distinct affinities and catalytic activities of each conformationtowards intracellular transducer proteins. By binding and stabilizing specific receptor con-formations, ligands modulate transducer interactions and trigger a characteristic cellularsignaling response (Figure 1b). In this simple framework, basal activity is achieved byresidual amounts of an active conformation [3]. Biased signaling (also known as functionalselectivity) is the ability of ligands to tune signaling towards a specific transducer protein,
Biomolecules 2021, 11, 778. https://doi.org/10.3390/biom11060778 https://www.mdpi.com/journal/biomolecules
Biomolecules 2021, 11, 778 2 of 21
and may be understood as an equilibrium shift between active conformations of distinctaffinity/catalytic activity towards a specific transducer. Traditionally, a ligand’s signal biasis quantified by comparing the cellular signaling responses to that of a “balanced” reference,such as the endogenous ligand [4]. From a biochemical standpoint, ligand binding andtransducer coupling to a GPCR may be treated equally; each binding event stabilizes aspecific GPCR conformational state, thereby modulating the affinity towards the other(ternary complex [5–7]).
Biomolecules 2021, 11, x 2 of 22
protein, and may be understood as an equilibrium shift between active conformations of distinct affinity/catalytic activity towards a specific transducer. Traditionally, a ligand’s signal bias is quantified by comparing the cellular signaling responses to that of a “bal-anced” reference, such as the endogenous ligand [4]. From a biochemical standpoint, lig-and binding and transducer coupling to a GPCR may be treated equally; each binding event stabilizes a specific GPCR conformational state, thereby modulating the affinity to-wards the other (ternary complex [5–7]).
Figure 1. GPCR function seen from the DEER vantage point. (a) Structural homology among GPCRs of various functions. Receptor-specific ligands bind from the extracellular side, which therefore shows high structural diversity between differ-ent receptors. The transmembrane core exhibits many conserved interaction networks, suggesting a common activation mechanism. On the intracellular side, a limited set of transducer proteins (such as G protein, arrestin and GRK) bind to specific receptor conformations. (b) The GPCR “allosteric microprocessor”. Binding of an extracellular ligand is translated into ligand- and receptor-specific affinities and catalytic activities towards transducer proteins. Activated transducer pro-teins interact with different effectors and thereby elicit a ligand-specific cellular response. (c) Conformational selection from the DEER perspective. Different ligand classes (such as antagonists, balanced/reference and biased agonists) stabilize distinct GPCR conformations, leading to specific efficacies towards transducers. The different conformations and their populations are encoded as distance distributions derived from DEER. Note that all conformations are present even in the absence of ligand.
In order to characterize ligand action, for example during drug design, the structural differences of functionally distinct receptor conformations and their equilibrium popula-tions need to be determined. These characteristics may then be directly related to respec-tive ligand parameters such as affinity, bias and efficacy (the propensity of a ligand to elicit a physiological response). Mapping the complex conformational landscape of GPCRs is a challenge for methods such as X-ray diffraction, wherein the receptor is typi-cally removed from its native bilayer environment by solubilization in detergents and crystallized in a lattice where intermolecular forces stabilize a unique conformation. Sta-bilizing mutations or crystallization “helpers” are often required to facilitate crystalliza-tion [8–10]. Likewise, NMR methods are challenged by the slow rotational diffusion and conformational exchange of large receptor molecules, particularly in the membrane bi-layer which may be essential in order to observe the functional conformational equilib-rium [11,12]. Site-specific information using FRET may overcome some of the limitations of crystallography and NMR but involves large hydrophobic labels which may disrupt (local) structure and dynamics [13,14]. In addition, interpreting FRET data on a heteroge-neous population in conformational exchange can be a formidable challenge.
Figure 1. GPCR function seen from the DEER vantage point. (a) Structural homology among GPCRs of various functions.Receptor-specific ligands bind from the extracellular side, which therefore shows high structural diversity between differentreceptors. The transmembrane core exhibits many conserved interaction networks, suggesting a common activationmechanism. On the intracellular side, a limited set of transducer proteins (such as G protein, arrestin and GRK) bind tospecific receptor conformations. (b) The GPCR “allosteric microprocessor”. Binding of an extracellular ligand is translatedinto ligand- and receptor-specific affinities and catalytic activities towards transducer proteins. Activated transducerproteins interact with different effectors and thereby elicit a ligand-specific cellular response. (c) Conformational selectionfrom the DEER perspective. Different ligand classes (such as antagonists, balanced/reference and biased agonists) stabilizedistinct GPCR conformations, leading to specific efficacies towards transducers. The different conformations and theirpopulations are encoded as distance distributions derived from DEER. Note that all conformations are present even in theabsence of ligand.
In order to characterize ligand action, for example during drug design, the structuraldifferences of functionally distinct receptor conformations and their equilibrium popula-tions need to be determined. These characteristics may then be directly related to respectiveligand parameters such as affinity, bias and efficacy (the propensity of a ligand to elicit aphysiological response). Mapping the complex conformational landscape of GPCRs is achallenge for methods such as X-ray diffraction, wherein the receptor is typically removedfrom its native bilayer environment by solubilization in detergents and crystallized in alattice where intermolecular forces stabilize a unique conformation. Stabilizing mutationsor crystallization “helpers” are often required to facilitate crystallization [8–10]. Likewise,NMR methods are challenged by the slow rotational diffusion and conformational ex-change of large receptor molecules, particularly in the membrane bilayer which may beessential in order to observe the functional conformational equilibrium [11,12]. Site-specificinformation using FRET may overcome some of the limitations of crystallography andNMR but involves large hydrophobic labels which may disrupt (local) structure and dy-namics [13,14]. In addition, interpreting FRET data on a heterogeneous population inconformational exchange can be a formidable challenge.
Site-directed spin labeling (SDSL-) electron paramagnetic resonance (EPR) spec-troscopy overcomes the above-mentioned limitations of other methods and therefore
Biomolecules 2021, 11, 778 3 of 21
provides an important complementary vantage point. SDSL-EPR is applicable to mem-brane proteins of any size, in detergent or lipid bilayers and can easily map ordered anddisordered domains using minimally perturbing labels and small amounts of protein (pico-moles). Although SDSL, like all site-specific labeling methods, provides a sparse samplingof the overall structure, this is often sufficient to characterize conformations given a startingmodel provided by crystallography or electron microscopy (EM).
EPR utilizes energetic transitions of unpaired electrons in an external magnetic field,which manifests in characteristic microwave absorption or emission lines. Apart fromthe analysis of paramagnetic metal ion centers, the use of EPR for the characterizationof proteins depends on the introduction of stable radicals using SDSL. Generally, for thispurpose, amino acid side chains are derivatized using a variety of different spin labelingreagents. The resulting continuous-wave (CW) EPR line shapes may be theoretically under-stood [15] and interpreted in terms of spin label motion in the range of 1 ps to 100 ns, whichis ideally suited to monitor side chain and backbone dynamics [16–18]. The CW method ofSaturation Transfer EPR covers the range of 100 ns to msec, well suited to monitor confor-mational movements [19,20]. Real-time resolution of milliseconds to seconds and beyondis possible with time-resolved CW [21]. The pulsed EPR methods of saturation recoveryand electron–electron double resonance (ELDOR) provide complementary information inthe µs time domain, which represents a challenging time domain for NMR [22].
SDSL-EPR applications also include a toolbox of structural methods which may beemployed to characterize accessibility to paramagnetic solutes [23], in order to measureshort distances in the range of 10–25 Å [24] and more [25]. The focus of this review lies ondouble electron–electron resonance (DEER, also known as pulsed electron–electron doubleresonance, pELDOR), which resolves distances between a pair of spin labels in the range of15 to ~80 Å with sub-Angstrom resolution [26,27]. Protein structure and conformationalheterogeneity is uniquely represented by analytical distance distributions, as opposed toaverage distances, providing a detailed picture of conformations and their populationsunder the chosen experimental conditions (Figure 1c). Therefore, the DEER method hasproven particularly useful for the study of large, conformationally heterogeneous proteinssuch as GPCRs and their complexes with transducer proteins.
In the following sections we will review the conformational changes of individualGPCR segments (such as helices and loops) as reported by DEER. Table 1 summarizesall reported studies on GPCRs utilizing DEER at the time of this writing. Thereafter, wewill describe an approach to globally analyze DEER data obtained for multiple label pairs(Section 2.2) and its visualization via trilateration (Section 2.3). Technical details of spinlabels and the spin labeling methodology will be discussed in Section 3.
Biomolecules 2021, 11, 778 4 of 21
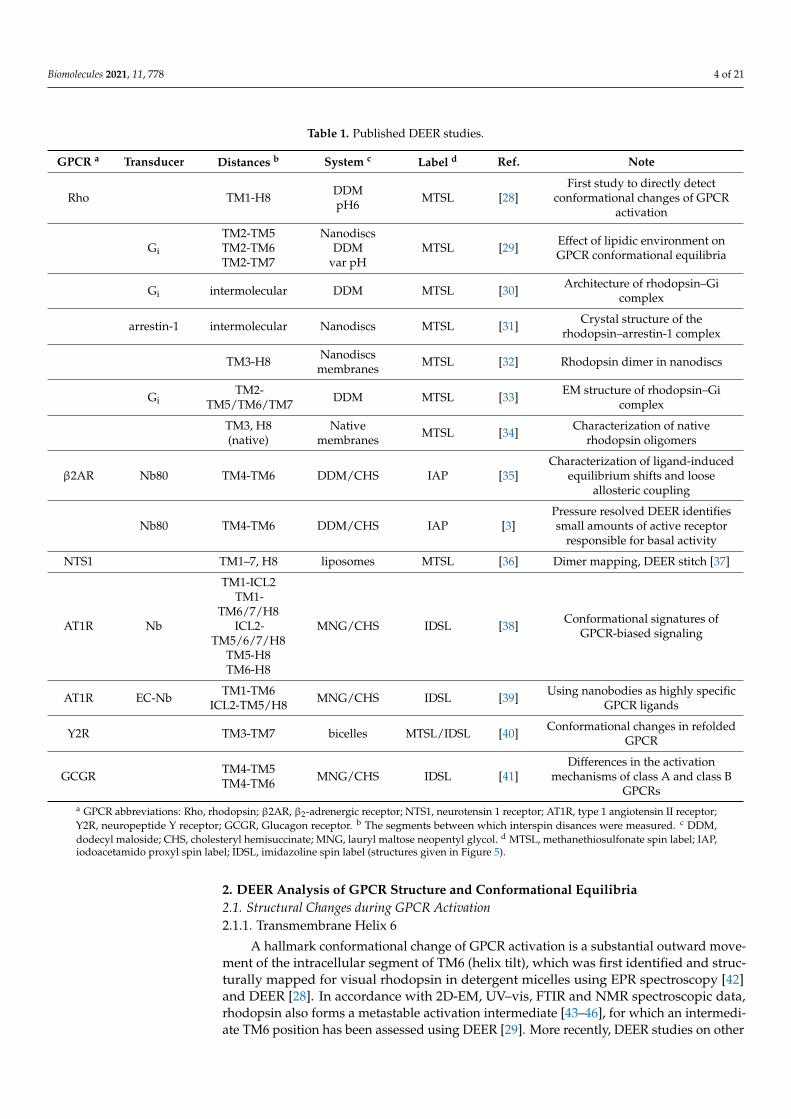
Table 1. Published DEER studies.
GPCR a Transducer Distances b System c Label d Ref. Note
Rho TM1-H8 DDMpH6 MTSL [28]
First study to directly detectconformational changes of GPCR
activation
Gi
TM2-TM5TM2-TM6TM2-TM7
NanodiscsDDM
var pHMTSL [29] Effect of lipidic environment on
GPCR conformational equilibria
Gi intermolecular DDM MTSL [30] Architecture of rhodopsin–Gicomplex
arrestin-1 intermolecular Nanodiscs MTSL [31] Crystal structure of therhodopsin–arrestin-1 complex
TM3-H8 Nanodiscsmembranes MTSL [32] Rhodopsin dimer in nanodiscs
GiTM2-
TM5/TM6/TM7 DDM MTSL [33] EM structure of rhodopsin–Gicomplex
TM3, H8(native)
Nativemembranes MTSL [34] Characterization of native
rhodopsin oligomers
β2AR Nb80 TM4-TM6 DDM/CHS IAP [35]Characterization of ligand-induced
equilibrium shifts and looseallosteric coupling
Nb80 TM4-TM6 DDM/CHS IAP [3]Pressure resolved DEER identifiessmall amounts of active receptor
responsible for basal activity
NTS1 TM1–7, H8 liposomes MTSL [36] Dimer mapping, DEER stitch [37]
AT1R Nb
TM1-ICL2TM1-
TM6/7/H8ICL2-
TM5/6/7/H8TM5-H8TM6-H8
MNG/CHS IDSL [38] Conformational signatures ofGPCR-biased signaling
AT1R EC-Nb TM1-TM6ICL2-TM5/H8 MNG/CHS IDSL [39] Using nanobodies as highly specific
GPCR ligands
Y2R TM3-TM7 bicelles MTSL/IDSL [40] Conformational changes in refoldedGPCR
GCGR TM4-TM5TM4-TM6 MNG/CHS IDSL [41]
Differences in the activationmechanisms of class A and class B
GPCRsa GPCR abbreviations: Rho, rhodopsin; β2AR, β2-adrenergic receptor; NTS1, neurotensin 1 receptor; AT1R, type 1 angiotensin II receptor;Y2R, neuropeptide Y receptor; GCGR, Glucagon receptor. b The segments between which interspin disances were measured. c DDM,dodecyl maloside; CHS, cholesteryl hemisuccinate; MNG, lauryl maltose neopentyl glycol. d MTSL, methanethiosulfonate spin label; IAP,iodoacetamido proxyl spin label; IDSL, imidazoline spin label (structures given in Figure 5).
2. DEER Analysis of GPCR Structure and Conformational Equilibria2.1. Structural Changes during GPCR Activation2.1.1. Transmembrane Helix 6
A hallmark conformational change of GPCR activation is a substantial outward move-ment of the intracellular segment of TM6 (helix tilt), which was first identified and struc-turally mapped for visual rhodopsin in detergent micelles using EPR spectroscopy [42]and DEER [28]. In accordance with 2D-EM, UV–vis, FTIR and NMR spectroscopic data,rhodopsin also forms a metastable activation intermediate [43–46], for which an intermedi-ate TM6 position has been assessed using DEER [29]. More recently, DEER studies on other
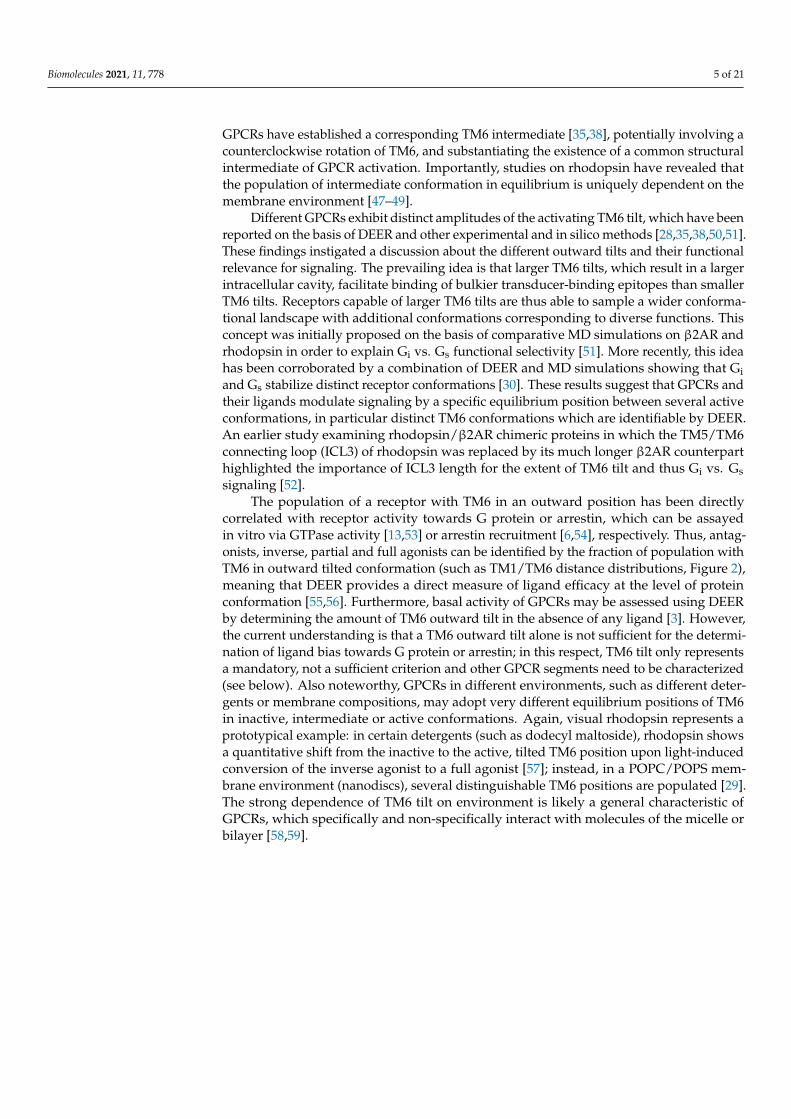
Biomolecules 2021, 11, 778 5 of 21
GPCRs have established a corresponding TM6 intermediate [35,38], potentially involving acounterclockwise rotation of TM6, and substantiating the existence of a common structuralintermediate of GPCR activation. Importantly, studies on rhodopsin have revealed thatthe population of intermediate conformation in equilibrium is uniquely dependent on themembrane environment [47–49].
Different GPCRs exhibit distinct amplitudes of the activating TM6 tilt, which have beenreported on the basis of DEER and other experimental and in silico methods [28,35,38,50,51].These findings instigated a discussion about the different outward tilts and their functionalrelevance for signaling. The prevailing idea is that larger TM6 tilts, which result in a largerintracellular cavity, facilitate binding of bulkier transducer-binding epitopes than smallerTM6 tilts. Receptors capable of larger TM6 tilts are thus able to sample a wider conforma-tional landscape with additional conformations corresponding to diverse functions. Thisconcept was initially proposed on the basis of comparative MD simulations on β2AR andrhodopsin in order to explain Gi vs. Gs functional selectivity [51]. More recently, this ideahas been corroborated by a combination of DEER and MD simulations showing that Giand Gs stabilize distinct receptor conformations [30]. These results suggest that GPCRs andtheir ligands modulate signaling by a specific equilibrium position between several activeconformations, in particular distinct TM6 conformations which are identifiable by DEER.An earlier study examining rhodopsin/β2AR chimeric proteins in which the TM5/TM6connecting loop (ICL3) of rhodopsin was replaced by its much longer β2AR counterparthighlighted the importance of ICL3 length for the extent of TM6 tilt and thus Gi vs. Gssignaling [52].
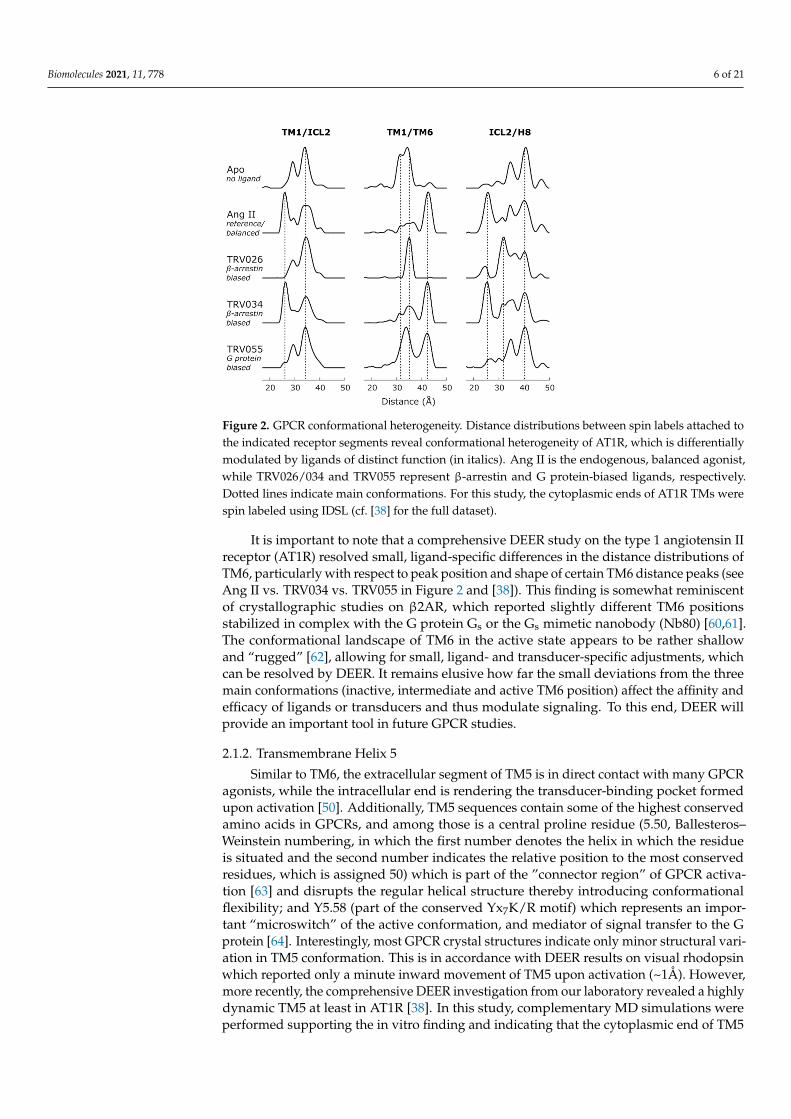
The population of a receptor with TM6 in an outward position has been directlycorrelated with receptor activity towards G protein or arrestin, which can be assayedin vitro via GTPase activity [13,53] or arrestin recruitment [6,54], respectively. Thus, antag-onists, inverse, partial and full agonists can be identified by the fraction of population withTM6 in outward tilted conformation (such as TM1/TM6 distance distributions, Figure 2),meaning that DEER provides a direct measure of ligand efficacy at the level of proteinconformation [55,56]. Furthermore, basal activity of GPCRs may be assessed using DEERby determining the amount of TM6 outward tilt in the absence of any ligand [3]. However,the current understanding is that a TM6 outward tilt alone is not sufficient for the determi-nation of ligand bias towards G protein or arrestin; in this respect, TM6 tilt only representsa mandatory, not a sufficient criterion and other GPCR segments need to be characterized(see below). Also noteworthy, GPCRs in different environments, such as different deter-gents or membrane compositions, may adopt very different equilibrium positions of TM6in inactive, intermediate or active conformations. Again, visual rhodopsin represents aprototypical example: in certain detergents (such as dodecyl maltoside), rhodopsin showsa quantitative shift from the inactive to the active, tilted TM6 position upon light-inducedconversion of the inverse agonist to a full agonist [57]; instead, in a POPC/POPS mem-brane environment (nanodiscs), several distinguishable TM6 positions are populated [29].The strong dependence of TM6 tilt on environment is likely a general characteristic ofGPCRs, which specifically and non-specifically interact with molecules of the micelle orbilayer [58,59].
Biomolecules 2021, 11, 778 6 of 21Biomolecules 2021, 11, x 6 of 22
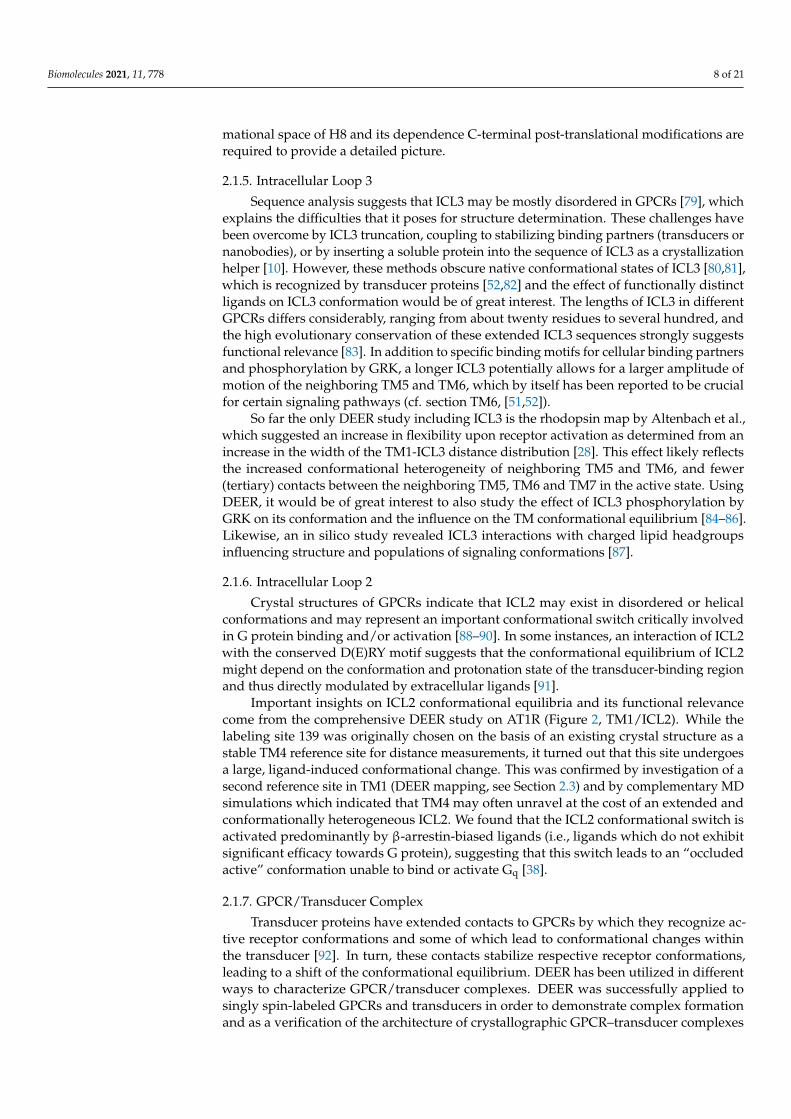
Figure 2. GPCR conformational heterogeneity. Distance distributions between spin labels attached to the indicated receptor segments reveal conformational heterogeneity of AT1R, which is differ-entially modulated by ligands of distinct function (in italics). Ang II is the endogenous, balanced agonist, while TRV026/034 and TRV055 represent β-arrestin and G protein-biased ligands, respec-tively. Dotted lines indicate main conformations. For this study, the cytoplasmic ends of AT1R TMs were spin labeled using IDSL (cf. [38] for the full dataset).
2.1.2. Transmembrane Helix 5 Similar to TM6, the extracellular segment of TM5 is in direct contact with many GPCR
agonists, while the intracellular end is rendering the transducer-binding pocket formed upon activation [50]. Additionally, TM5 sequences contain some of the highest conserved amino acids in GPCRs, and among those is a central proline residue (5.50, Ballesteros–Weinstein numbering, in which the first number denotes the helix in which the residue is situated and the second number indicates the relative position to the most conserved res-idues, which is assigned 50) which is part of the ”connector region” of GPCR activation [63] and disrupts the regular helical structure thereby introducing conformational flexi-bility; and Y5.58 (part of the conserved Yx7K/R motif) which represents an important “mi-croswitch” of the active conformation, and mediator of signal transfer to the G protein [64]. Interestingly, most GPCR crystal structures indicate only minor structural variation in TM5 conformation. This is in accordance with DEER results on visual rhodopsin which reported only a minute inward movement of TM5 upon activation (~1Å). However, more recently, the comprehensive DEER investigation from our laboratory revealed a highly dynamic TM5 at least in AT1R [38]. In this study, complementary MD simulations were performed supporting the in vitro finding and indicating that the cytoplasmic end of TM5 frequently unravels while exploring a wide range of positions and conformations. Two possible explanations for these differences are conceivable: on the one hand, differences in the micellar or lipidic environment of the two studies may lead to specific effects on TM5 conformational space. Specific TM5/lipid interactions which are altered during re-ceptor activation have been reported for rhodopsin on the basis of FTIR results [64–66]. On the other hand, TM5 conformational dynamics may be receptor specific and of func-tional relevance, e.g., for coupling to specific ligands or transducer proteins. Clearly, a combination of both cases is conceivable as well.
One TM5 arrangement which has been described for many GPCRs on the basis of crystal structures and verified in solution by DEER is the “helix pairing”, in which the cytoplasmic ends of TM5 and TM6 are stabilizing each other almost parallel due to con-served hydrogen bonds. This conformation is of particular importance as it represents a
Figure 2. GPCR conformational heterogeneity. Distance distributions between spin labels attached tothe indicated receptor segments reveal conformational heterogeneity of AT1R, which is differentiallymodulated by ligands of distinct function (in italics). Ang II is the endogenous, balanced agonist,while TRV026/034 and TRV055 represent β-arrestin and G protein-biased ligands, respectively.Dotted lines indicate main conformations. For this study, the cytoplasmic ends of AT1R TMs werespin labeled using IDSL (cf. [38] for the full dataset).
It is important to note that a comprehensive DEER study on the type 1 angiotensin IIreceptor (AT1R) resolved small, ligand-specific differences in the distance distributions ofTM6, particularly with respect to peak position and shape of certain TM6 distance peaks (seeAng II vs. TRV034 vs. TRV055 in Figure 2 and [38]). This finding is somewhat reminiscentof crystallographic studies on β2AR, which reported slightly different TM6 positionsstabilized in complex with the G protein Gs or the Gs mimetic nanobody (Nb80) [60,61].The conformational landscape of TM6 in the active state appears to be rather shallowand “rugged” [62], allowing for small, ligand- and transducer-specific adjustments, whichcan be resolved by DEER. It remains elusive how far the small deviations from the threemain conformations (inactive, intermediate and active TM6 position) affect the affinity andefficacy of ligands or transducers and thus modulate signaling. To this end, DEER willprovide an important tool in future GPCR studies.
2.1.2. Transmembrane Helix 5
Similar to TM6, the extracellular segment of TM5 is in direct contact with many GPCRagonists, while the intracellular end is rendering the transducer-binding pocket formedupon activation [50]. Additionally, TM5 sequences contain some of the highest conservedamino acids in GPCRs, and among those is a central proline residue (5.50, Ballesteros–Weinstein numbering, in which the first number denotes the helix in which the residueis situated and the second number indicates the relative position to the most conservedresidues, which is assigned 50) which is part of the ”connector region” of GPCR activa-tion [63] and disrupts the regular helical structure thereby introducing conformationalflexibility; and Y5.58 (part of the conserved Yx7K/R motif) which represents an impor-tant “microswitch” of the active conformation, and mediator of signal transfer to the Gprotein [64]. Interestingly, most GPCR crystal structures indicate only minor structural vari-ation in TM5 conformation. This is in accordance with DEER results on visual rhodopsinwhich reported only a minute inward movement of TM5 upon activation (~1Å). However,more recently, the comprehensive DEER investigation from our laboratory revealed a highlydynamic TM5 at least in AT1R [38]. In this study, complementary MD simulations wereperformed supporting the in vitro finding and indicating that the cytoplasmic end of TM5
Biomolecules 2021, 11, 778 7 of 21
frequently unravels while exploring a wide range of positions and conformations. Twopossible explanations for these differences are conceivable: on the one hand, differences inthe micellar or lipidic environment of the two studies may lead to specific effects on TM5conformational space. Specific TM5/lipid interactions which are altered during receptoractivation have been reported for rhodopsin on the basis of FTIR results [64–66]. On theother hand, TM5 conformational dynamics may be receptor specific and of functional rele-vance, e.g., for coupling to specific ligands or transducer proteins. Clearly, a combinationof both cases is conceivable as well.
One TM5 arrangement which has been described for many GPCRs on the basis ofcrystal structures and verified in solution by DEER is the “helix pairing”, in which thecytoplasmic ends of TM5 and TM6 are stabilizing each other almost parallel due to con-served hydrogen bonds. This conformation is of particular importance as it represents a Gαi/o subtype-specific conformation and therefore may be relevant for G protein selectiv-ity [30,51].
2.1.3. Transmembrane Helix 7
EM and X-ray structures of many GPCRs have reported a small inward movement(~2 Å) as activating conformational change of TM7. The activating change of TM7 involvesa pattern of changing hydrogen bonds between the highly conserved residues of the NPxxYand D/ERY motifs (Y7.53 and R3.50, respectively [67]), corroborating the notion that thisconformational change is conserved among GPCRs.
In agreement, DEER studies monitoring TM7 reported an inward movement in thepresence of agonists [28,29,38]; however, the observed population shift between inac-tive/active TM7 conformations were much less pronounced than for TM6. Even for deter-gent solubilized rhodopsin which otherwise converts quantitatively a small but significantpopulation of non-active TM7 conformation remained upon light-activation [28,29]. Thesefindings are in accordance with the notion of TM7 change succeeding TM6 tilt. For AT1R, athird conformation of TM7 has also been described, which is mostly populated in the pres-ence of a specific β-arrestin-biased ligand (TRV026). The observed DEER distance changesare in accordance with a subtle, counterclockwise rotation of TM7, similar to the TM6 inter-mediate. These findings highlight the importance of TM7 for biased signaling, a notionwhich is compatible with 19F-NMR studies and more recent MD simulations [4,68–70]).
2.1.4. Helix 8
For most GPCRs (class A), the C-terminal end of TM7 connects via a short, struc-tured turn to an amphipathic helix (helix 8, H8). H8 position parallel to the membranesurface is further stabilized in its inactive conformation by an aromatic π–π stacking inter-action between two conserved aromatic side chains (Y7.53/F7.60, [67,71]). Importantly, H8forms direct contacts to transducer proteins suggesting its involvement in signal transduc-tion [31,60,72–74]. H8 is also common segment for post-translational modification such asprenylation of cysteine residues. These function as membrane anchors and thereby modu-late conformation and dynamics of helix 8 and the attached C-terminus, which exhibitsphosphorylation sites for GRK interaction [75,76].
DEER studies on H8 are so far limited to only two reports, rhodopsin and AT1R, whichdescribe the main aspects of H8 conformational heterogeneity [28,38]. In both studies,receptor activation triggered only a minor movement of helix 8, likely orchestrated by theconformational change of the adjacent TM7, the only known connection of helix 8 to thetransmembrane bundle. Furthermore, the conformational heterogeneity increased signifi-cantly with receptor activation (Figure 2). An intermediate conformation was identifiedwhich includes features of rhodopsin’s Meta I conformation such as a potential TM6 rota-tion [77,78], and a small changes in TM5 and TM7. Additionally, DEER data suggests anout-of-plane movement of H8 for the intermediate conformation which is likely facilitatedby the absence H8 prenylation in AT1R. This finding suggests a particular importance ofH8 for characteristic receptor functionality. However, further investigation of the confor-
Biomolecules 2021, 11, 778 8 of 21
mational space of H8 and its dependence C-terminal post-translational modifications arerequired to provide a detailed picture.
2.1.5. Intracellular Loop 3
Sequence analysis suggests that ICL3 may be mostly disordered in GPCRs [79], whichexplains the difficulties that it poses for structure determination. These challenges havebeen overcome by ICL3 truncation, coupling to stabilizing binding partners (transducers ornanobodies), or by inserting a soluble protein into the sequence of ICL3 as a crystallizationhelper [10]. However, these methods obscure native conformational states of ICL3 [80,81],which is recognized by transducer proteins [52,82] and the effect of functionally distinctligands on ICL3 conformation would be of great interest. The lengths of ICL3 in differentGPCRs differs considerably, ranging from about twenty residues to several hundred, andthe high evolutionary conservation of these extended ICL3 sequences strongly suggestsfunctional relevance [83]. In addition to specific binding motifs for cellular binding partnersand phosphorylation by GRK, a longer ICL3 potentially allows for a larger amplitude ofmotion of the neighboring TM5 and TM6, which by itself has been reported to be crucialfor certain signaling pathways (cf. section TM6, [51,52]).
So far the only DEER study including ICL3 is the rhodopsin map by Altenbach et al.,which suggested an increase in flexibility upon receptor activation as determined from anincrease in the width of the TM1-ICL3 distance distribution [28]. This effect likely reflectsthe increased conformational heterogeneity of neighboring TM5 and TM6, and fewer(tertiary) contacts between the neighboring TM5, TM6 and TM7 in the active state. UsingDEER, it would be of great interest to also study the effect of ICL3 phosphorylation byGRK on its conformation and the influence on the TM conformational equilibrium [84–86].Likewise, an in silico study revealed ICL3 interactions with charged lipid headgroupsinfluencing structure and populations of signaling conformations [87].
2.1.6. Intracellular Loop 2
Crystal structures of GPCRs indicate that ICL2 may exist in disordered or helicalconformations and may represent an important conformational switch critically involvedin G protein binding and/or activation [88–90]. In some instances, an interaction of ICL2with the conserved D(E)RY motif suggests that the conformational equilibrium of ICL2might depend on the conformation and protonation state of the transducer-binding regionand thus directly modulated by extracellular ligands [91].
Important insights on ICL2 conformational equilibria and its functional relevancecome from the comprehensive DEER study on AT1R (Figure 2, TM1/ICL2). While thelabeling site 139 was originally chosen on the basis of an existing crystal structure as astable TM4 reference site for distance measurements, it turned out that this site undergoesa large, ligand-induced conformational change. This was confirmed by investigation of asecond reference site in TM1 (DEER mapping, see Section 2.3) and by complementary MDsimulations which indicated that TM4 may often unravel at the cost of an extended andconformationally heterogeneous ICL2. We found that the ICL2 conformational switch isactivated predominantly by β-arrestin-biased ligands (i.e., ligands which do not exhibitsignificant efficacy towards G protein), suggesting that this switch leads to an “occludedactive” conformation unable to bind or activate Gq [38].
2.1.7. GPCR/Transducer Complex
Transducer proteins have extended contacts to GPCRs by which they recognize ac-tive receptor conformations and some of which lead to conformational changes withinthe transducer [92]. In turn, these contacts stabilize respective receptor conformations,leading to a shift of the conformational equilibrium. DEER has been utilized in differentways to characterize GPCR/transducer complexes. DEER was successfully applied tosingly spin-labeled GPCRs and transducers in order to demonstrate complex formationand as a verification of the architecture of crystallographic GPCR–transducer complexes
Biomolecules 2021, 11, 778 9 of 21
(Table 1). Both the rhodopsin/arrestin-1 and rhodopsin in complex with heterotrimericG protein (Gαiβγ) have been analyzed by DEER and good agreement with respectivecrystal structures has been assessed. The DEER distance distributions indicate residualstructural heterogeneity, especially for the rhodopsin–arrestin-1 complex. This findingsuggests that either the receptor or the transducer exist in more than one conformation,a hint at different architectures of this complex with potentially distinct function [31,93].DEER, due to its superior applicability to large, structural heterogeneous proteins andprotein complexes, represents a predestined experimental method to track down thosealternative “flavors” [94].
DEER distance distributions have also been reported for doubly spin-labeled receptorin complex with (unlabeled) transducers or mimetics thereof. For rhodopsin in a lipidicenvironment, it was shown that binding of the cognate G protein Gi lead to a substantialshift towards the active conformation in both TM6 and TM7, leading to depopulation ofunbound rhodopsin [29]. However, while TM6 shift was quantitative at chosen receptor andG protein concentrations, for TM7, a small but substantial fraction of inactive conformationremained. This finding corroborates that TM6 and TM7 conformation are not strictlycoupled to one another. Further, binding of G protein to TM7/H8 of the receptor, asindicated by crystal structures, is not mandatory for G protein binding but might play anadditional, downstream role, e.g., for activation of the G protein α-subunit (nucleotideexchange) or G protein release. In contrast, binding of a Gq mimetic nanobody to AT1Rstabilized all transmembrane helices including TM7 in the active conformation [38]. Thisfinding may indicate potential differences in Gi versus Gq binding or, more likely, thespecific nature of the nanobody which was matured to exhibit highest affinity and stabilizea structurally homogeneous receptor population for crystallization [39].
2.1.8. GPCR Dimers
Homo- and hetero-oligomerization of GPCRs has been shown to occur for severalGPCRs [95], and its functional relevance for signaling and signal bias is currently underscrutiny [14,96]. In principle, dimerization can also be assessed using DEER, using theintensity of the DEER signal modulation as measure of the number of coupled spins pernano-object [97]. However, GPCR oligomerization shows strong concentration dependencyand cell-surface expression levels of most GPCRs are below the concentrations commonlyused in DEER. These challenges may be overcome by complementing DEER with othertechniques, such as fluorescence spectroscopy or simulations [36]: While DEER providessuperior resolution and an ensemble picture, application of (single-molecule) FRET issuitable at very low concentrations provided by native GPCR expression levels [14]. Instead,simulations may evaluate different dimer assemblies and their agreement with site-directedlabeling (DEER or FRET) results, and allow extrapolation towards all-atom structures ofthe oligomer [98]. Conversely, in the case of rhodopsin, receptor molecules are tightlypacked in the disc membrane of rod outer segment (25,000 molecules/µm2) complicatingDEER analysis by imposing a strong background signal [34]. Here, nanodiscs and otherlipidic environments such as polystyrene-co-maleic acid lipid particles (SMALP) mayprovide a possible solution for the characterization of GPCR oligomers by DEER [32,99].These platforms compartmentalize receptor molecules into independent lipidic nano-particles, thereby providing tight control of GPCR to lipid ratios even at the micromolarconcentrations typically used for DEER.
2.2. Non-Negative Matrix Factorization
Intriguingly, even under conditions of saturating ligand concentration, the multimodaldistance distributions obtained from DEER indicate the coexistence of several conforma-tional states. As demonstrated in several DEER studies and exemplified in Figure 2, thepopulations of conformational states appear shifted in the presence of distinct ligands.This suggests that the underlying conformational states share a common equilibrium. Theresults also reveal uneven population shifts for different spin label pairs in response to
Biomolecules 2021, 11, 778 10 of 21
changes in ligand condition. This may indicate that specific label positions disturb the localprotein structure, leading to an altered conformational equilibrium, which can be ruled out,e.g., by evaluating ligand binding of each spin-labeled receptor [38]. Instead, the unevenpopulation shifts reflect an increase in conformational heterogeneity, with individual recep-tor segments only loosely coupled in the active state. The concept of “loose allostery”, con-sistent with the considerable increase in conformational entropy occurring with rhodopsinactivation [46,48], is gaining traction in GPCR research [63,100]. From the DEER perspec-tive, multimodal distance distributions and uneven conformational responses complicatethe assignment of specific distance peaks to global conformational states.
A possible solution is to investigate all spin label pairs under a variety of differentconditions, such as different ligand conditions, and correlate the observed distance peakswith respect to their populations. Common ways to combine different observables includeprincipal component analysis (PCA), singular value decomposition (SVD) or independentcomponent analysis (ICA), all of which summarize a given dataset in a reduced numberof components C and their loadings P. Due to the non-negative nature of DEER distancedata, non-negative matrix factorization (NNMF) can be utilized in order to identify confor-mations and equilibrium positions [38,101]. NNMF factorizes a given (non-negative) datamatrix M (each column Mi containing the area normalized distance distributions from allspin label pairs recorded under identical conditions) into two smaller (non-negative) matri-ces C and P so that ‖M− C× P‖2 is minimized. NNMF requires selection of a number ofn columns and rows for the resulting matrices C and P, respectively, so that their productM′ = C× P becomes a reasonable approximation of the original data matrix M. For DEER,n reflects the number of conformations observed in the dataset M and may be identified bycomparing M′ calculated for a variable number n. The most parsimonious model (smallestn) is identified by model selection methods using information criteria such as the Akaikeinformation criterion corrected (AICc) or the Bayesian information criterion (BIC) [102].Notably, it is important to not blindly accept the results from model selection tools but torather use them as guidance for the selection of an appropriate model.
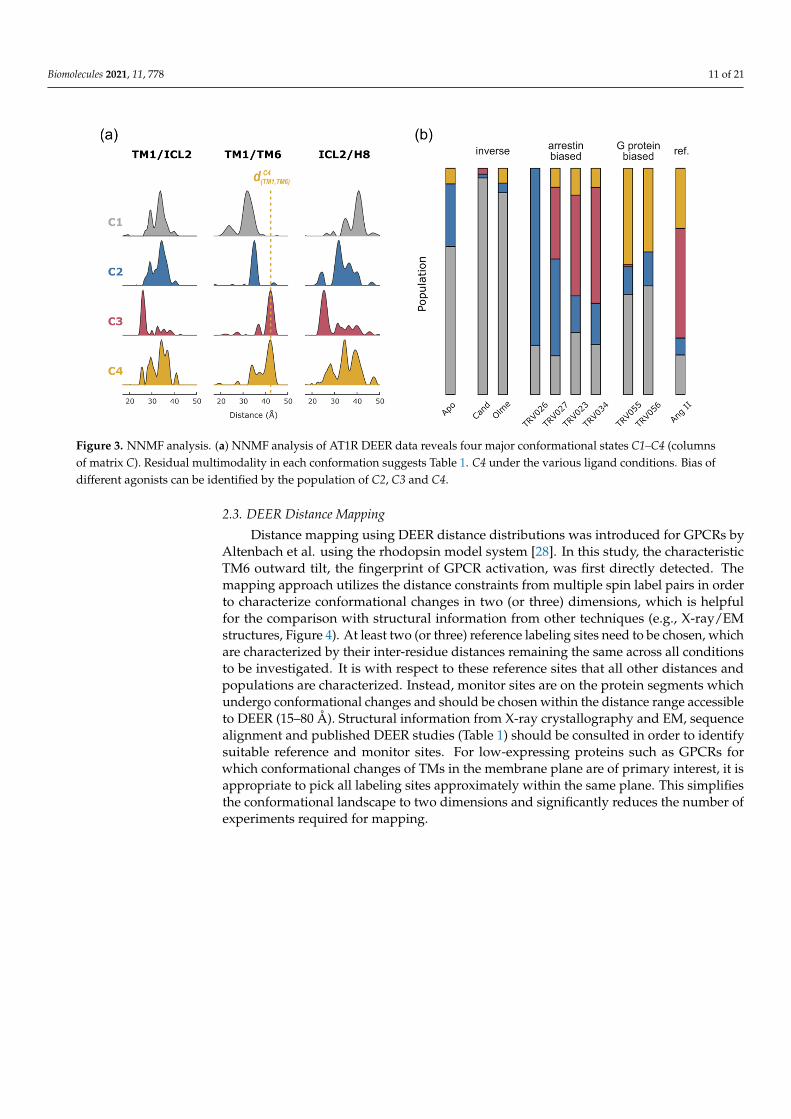
In the case of AT1R, we collected DEER data on ten spin pairs covering the cytoplasmicreceptor surface under ten different ligand conditions. NNMF yielded four conformationsC (Figure 3a), and the associated matrix P provided a detailed picture how these conforma-tions are differentially populated under each ligand condition (Figure 3b). Compared toG protein-biased agonists and the endogenous reference agonist Ang II, arrestin-biasedligands did not stabilize large amounts of conformation C4 but stabilized C2 and C3 instead.Accordingly, the population of C4 showed high correlation with the ligand’s ability totrigger G protein activation [38]. These findings provide structural underpinnings of biasedsignaling in AT1R and possibly in GPCRs in general.
Interestingly, the distance distributions of the resulting conformations C1–C4 stillshow considerable multimodality, at least in some spin pairs (e.g., for those involving ICL2,Figure 3a). This demonstrates that the identified four conformations represent main energywells in the conformational landscape and that conformational substates exist reflectinglocal plasticity. Since DEER experiments are performed on an ensemble under equilibriumconditions, strict (energetic and structural) coupling between individual receptor segmentsremains to be elucidated by other means such as kinetic experiments.
Biomolecules 2021, 11, 778 11 of 21
Biomolecules 2021, 11, x 10 of 22
allostery”, consistent with the considerable increase in conformational entropy occurring with rhodopsin activation [46,48], is gaining traction in GPCR research [63,100]. From the DEER perspective, multimodal distance distributions and uneven conformational re-sponses complicate the assignment of specific distance peaks to global conformational states.
A possible solution is to investigate all spin label pairs under a variety of different conditions, such as different ligand conditions, and correlate the observed distance peaks with respect to their populations. Common ways to combine different observables include principal component analysis (PCA), singular value decomposition (SVD) or independent component analysis (ICA), all of which summarize a given dataset in a reduced number of components C and their loadings P. Due to the non-negative nature of DEER distance data, non-negative matrix factorization (NNMF) can be utilized in order to identify con-formations and equilibrium positions [38,101]. NNMF factorizes a given (non-negative) data matrix M (each column Mi containing the area normalized distance distributions from all spin label pairs recorded under identical conditions) into two smaller (non-nega-tive) matrices C and P so that ‖𝑀 𝐶 𝑃‖ is minimized. NNMF requires selection of a number of n columns and rows for the resulting matrices C and P, respectively, so that their product 𝑀 𝐶 𝑃 becomes a reasonable approximation of the original data ma-trix M. For DEER, n reflects the number of conformations observed in the dataset M and may be identified by comparing M’ calculated for a variable number n. The most parsi-monious model (smallest n) is identified by model selection methods using information criteria such as the Akaike information criterion corrected (AICc) or the Bayesian infor-mation criterion (BIC) [102]. Notably, it is important to not blindly accept the results from model selection tools but to rather use them as guidance for the selection of an appropriate model.
In the case of AT1R, we collected DEER data on ten spin pairs covering the cytoplas-mic receptor surface under ten different ligand conditions. NNMF yielded four confor-mations C (Figure 3a), and the associated matrix P provided a detailed picture how these conformations are differentially populated under each ligand condition (Figure 3b). Com-pared to G protein-biased agonists and the endogenous reference agonist Ang II, arrestin-biased ligands did not stabilize large amounts of conformation C4 but stabilized C2 and C3 instead. Accordingly, the population of C4 showed high correlation with the ligand’s ability to trigger G protein activation [38]. These findings provide structural underpin-nings of biased signaling in AT1R and possibly in GPCRs in general.
Figure 3. NNMF analysis. (a) NNMF analysis of AT1R DEER data reveals four major conformational states C1–C4 (columnsof matrix C). Residual multimodality in each conformation suggests Table 1. C4 under the various ligand conditions. Bias ofdifferent agonists can be identified by the population of C2, C3 and C4.
2.3. DEER Distance Mapping
Distance mapping using DEER distance distributions was introduced for GPCRs byAltenbach et al. using the rhodopsin model system [28]. In this study, the characteristicTM6 outward tilt, the fingerprint of GPCR activation, was first directly detected. Themapping approach utilizes the distance constraints from multiple spin label pairs in orderto characterize conformational changes in two (or three) dimensions, which is helpfulfor the comparison with structural information from other techniques (e.g., X-ray/EMstructures, Figure 4). At least two (or three) reference labeling sites need to be chosen, whichare characterized by their inter-residue distances remaining the same across all conditionsto be investigated. It is with respect to these reference sites that all other distances andpopulations are characterized. Instead, monitor sites are on the protein segments whichundergo conformational changes and should be chosen within the distance range accessibleto DEER (15–80 Å). Structural information from X-ray crystallography and EM, sequencealignment and published DEER studies (Table 1) should be consulted in order to identifysuitable reference and monitor sites. For low-expressing proteins such as GPCRs forwhich conformational changes of TMs in the membrane plane are of primary interest, it isappropriate to pick all labeling sites approximately within the same plane. This simplifiesthe conformational landscape to two dimensions and significantly reduces the number ofexperiments required for mapping.
Biomolecules 2021, 11, 778 12 of 21
Biomolecules 2021, 11, x 11 of 22
Figure 3. NNMF analysis. (a) NNMF analysis of AT1R DEER data reveals four major conformational states C1–C4 (col-umns of matrix C). Residual multimodality in each conformation suggests Table 1. C4 under the various ligand conditions. Bias of different agonists can be identified by the population of C2, C3 and C4.
Interestingly, the distance distributions of the resulting conformations C1–C4 still show considerable multimodality, at least in some spin pairs (e.g., for those involving ICL2, Figure 3a). This demonstrates that the identified four conformations represent main energy wells in the conformational landscape and that conformational substates exist re-flecting local plasticity. Since DEER experiments are performed on an ensemble under equilibrium conditions, strict (energetic and structural) coupling between individual re-ceptor segments remains to be elucidated by other means such as kinetic experiments.
2.3. DEER Distance Mapping Distance mapping using DEER distance distributions was introduced for GPCRs by
Altenbach et al. using the rhodopsin model system [28]. In this study, the characteristic TM6 outward tilt, the fingerprint of GPCR activation, was first directly detected. The map-ping approach utilizes the distance constraints from multiple spin label pairs in order to characterize conformational changes in two (or three) dimensions, which is helpful for the comparison with structural information from other techniques (e.g., X-ray/EM structures, Figure 4). At least two (or three) reference labeling sites need to be chosen, which are characterized by their inter-residue distances remaining the same across all conditions to be investigated. It is with respect to these reference sites that all other distances and pop-ulations are characterized. Instead, monitor sites are on the protein segments which un-dergo conformational changes and should be chosen within the distance range accessible to DEER (15–80 Å). Structural information from X-ray crystallography and EM, sequence alignment and published DEER studies (Table 1) should be consulted in order to identify suitable reference and monitor sites. For low-expressing proteins such as GPCRs for which conformational changes of TMs in the membrane plane are of primary interest, it is ap-propriate to pick all labeling sites approximately within the same plane. This simplifies the conformational landscape to two dimensions and significantly reduces the number of experiments required for mapping.
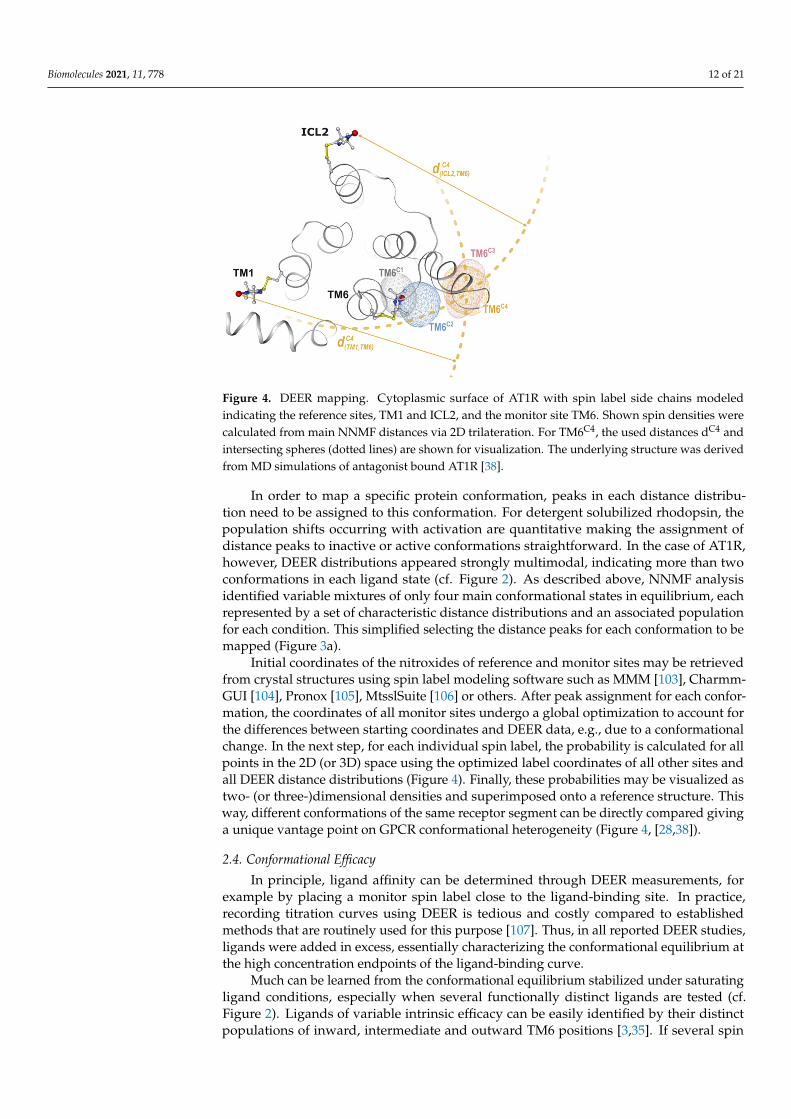
Figure 4. DEER mapping. Cytoplasmic surface of AT1R with spin label side chains modeled indi-cating the reference sites, TM1 and ICL2, and the monitor site TM6. Shown spin densities were calculated from main NNMF distances via 2D trilateration. For TM6C4, the used distances dC4 and intersecting spheres (dotted lines) are shown for visualization. The underlying structure was de-rived from MD simulations of antagonist bound AT1R [38].
Figure 4. DEER mapping. Cytoplasmic surface of AT1R with spin label side chains modeledindicating the reference sites, TM1 and ICL2, and the monitor site TM6. Shown spin densities werecalculated from main NNMF distances via 2D trilateration. For TM6C4, the used distances dC4 andintersecting spheres (dotted lines) are shown for visualization. The underlying structure was derivedfrom MD simulations of antagonist bound AT1R [38].
In order to map a specific protein conformation, peaks in each distance distribu-tion need to be assigned to this conformation. For detergent solubilized rhodopsin, thepopulation shifts occurring with activation are quantitative making the assignment ofdistance peaks to inactive or active conformations straightforward. In the case of AT1R,however, DEER distributions appeared strongly multimodal, indicating more than twoconformations in each ligand state (cf. Figure 2). As described above, NNMF analysisidentified variable mixtures of only four main conformational states in equilibrium, eachrepresented by a set of characteristic distance distributions and an associated populationfor each condition. This simplified selecting the distance peaks for each conformation to bemapped (Figure 3a).
Initial coordinates of the nitroxides of reference and monitor sites may be retrievedfrom crystal structures using spin label modeling software such as MMM [103], Charmm-GUI [104], Pronox [105], MtsslSuite [106] or others. After peak assignment for each confor-mation, the coordinates of all monitor sites undergo a global optimization to account forthe differences between starting coordinates and DEER data, e.g., due to a conformationalchange. In the next step, for each individual spin label, the probability is calculated for allpoints in the 2D (or 3D) space using the optimized label coordinates of all other sites andall DEER distance distributions (Figure 4). Finally, these probabilities may be visualized astwo- (or three-)dimensional densities and superimposed onto a reference structure. Thisway, different conformations of the same receptor segment can be directly compared givinga unique vantage point on GPCR conformational heterogeneity (Figure 4, [28,38]).
2.4. Conformational Efficacy
In principle, ligand affinity can be determined through DEER measurements, forexample by placing a monitor spin label close to the ligand-binding site. In practice,recording titration curves using DEER is tedious and costly compared to establishedmethods that are routinely used for this purpose [107]. Thus, in all reported DEER studies,ligands were added in excess, essentially characterizing the conformational equilibrium atthe high concentration endpoints of the ligand-binding curve.
Much can be learned from the conformational equilibrium stabilized under saturatingligand conditions, especially when several functionally distinct ligands are tested (cf.Figure 2). Ligands of variable intrinsic efficacy can be easily identified by their distinctpopulations of inward, intermediate and outward TM6 positions [3,35]. If several spin
Biomolecules 2021, 11, 778 13 of 21
pairs are investigated under identical conditions and, if necessary, a global analysis suchas NNMF is performed, transducer-specific active conformations can be identified andstructurally mapped. This has been demonstrated for AT1R and its interaction with Gq, inwhich case the population of a specific conformational state (NNMF component C4) in thepresence of different ligands was highly correlated with the ligands’ efficacy towards Gqsignaling [6,38]. This “conformational efficacy”, namely the ligand’s propensity to stabilizea specific conformation (of a certain function), appears to be one of the critical ligandparameters and is directly accessible by DEER. In light of the uneven population shiftsobserved for distinct receptor segments, (global) conformational efficacy can be broken upeven further into segment-specific efficacies.
Taken together, the extension of the traditional GPCR conformational selection modelto include loose coupling of individual receptor segments, the role of individual conforma-tional changes and their inter-segmental coupling are major challenges of GPCR research.DEER will be at the forefront of these studies, facilitating the development of highly effica-cious and specific therapeutics with fewer adverse effects, as well as providing a deeperunderstanding of membrane protein function in general.
3. Site-Directed Spin Labeling (SDSL) and Reagents to Modify Cysteines
Introducing paramagnetic spin centers to a protein for EPR studies can be achievedin many different ways [108]. Most common is the site-specific introduction of a cysteineresidue at a solvent-exposed site, followed by derivatization of the reactive sulfhydryl by athiol-specific spin labeling reagent. Selective labeling of introduced cysteines does requirereplacement of any solvent-exposed and reactive native cysteines with a suitable substitute(such as serine). Such solvent-exposed native cysteines are generally not functionallyimportant, but GPCR sequences do contain conserved buried or partially buried cysteinesand functionally important cystines, the latter of which could in principle be involved insulfhydryl-disulfide exchange equilibria [109].
Even after removal of solvent-exposed cysteines, more solvent inaccessible residues, ifpresent, can react to a limited extent, and such background labeling and its consequencemust be evaluated in each individual case. Thus, replacing solvent accessible, non-criticalcysteines with suitable non-reactive amino acids (the pseudo-wild type), and optimizinglabeling conditions to minimize background labeling may require considerable experi-mental groundwork. These steps should be guided by CW-EPR and by determination oflabeling efficiency to guarantee site-specific labeling and optimize yield. Ideally, sites forthe labels should be chosen to lie at non-interacting solvent-exposed surfaces of the proteinto insure the absence of structural perturbation. Such sites are typically selected based on astructural model of the protein derived from either crystallographic studies or molecularmodeling. In the case of the commonly used R1 nitroxide side chain (Figure 5a), a propernon-interacting surface site is readily confirmed by the signature CW-EPR line shape thatarises from the well-characterized anisotropic internal motion of R1 [17,18]. If the siteselected from the model does not have the anticipated line shape, the model apparentlydoes not represent the actual structure under the experimental conditions, and nearbysites can be tested. It is desirable that the sites selected for spin labeling be such that theconformation of the side chain (rotameric state) be insensitive to the conformational stateof the protein. This latter condition provides insurance that distance changes measured byDEER reflect true spatial rearrangement of the protein with minimal contributions fromrotameric changes of the labels. Again, if R1 is employed, this condition can be confirmeddirectly by the CW line shapes, which should not change with protein conformation. Otherspin labels (discussed below) may be immobilized relative to the protein due to internalside chain interactions and the CW line shapes contain little information on dynamics orlocal interactions of the side chain. However, for such labels the strong internal interactionsof the side chain that lead to the immobilization suggest that single rotamers are selectedwith little probability of rotameric changes due to changes in conformation of the protein.For strongly immobilized spin labels it is particularly important that solvent-exposed sites
Biomolecules 2021, 11, 778 14 of 21
be selected because, unlike R1, such side chains cannot accommodate steric clashes byrotameric adjustments; rather, the protein is forced to repack. R1 has the ability to adapt tolocal structure with little energetic cost and is much less perturbing if buried or partiallyburied sites must be employed.
Biomolecules 2021, 11, x 14 of 22
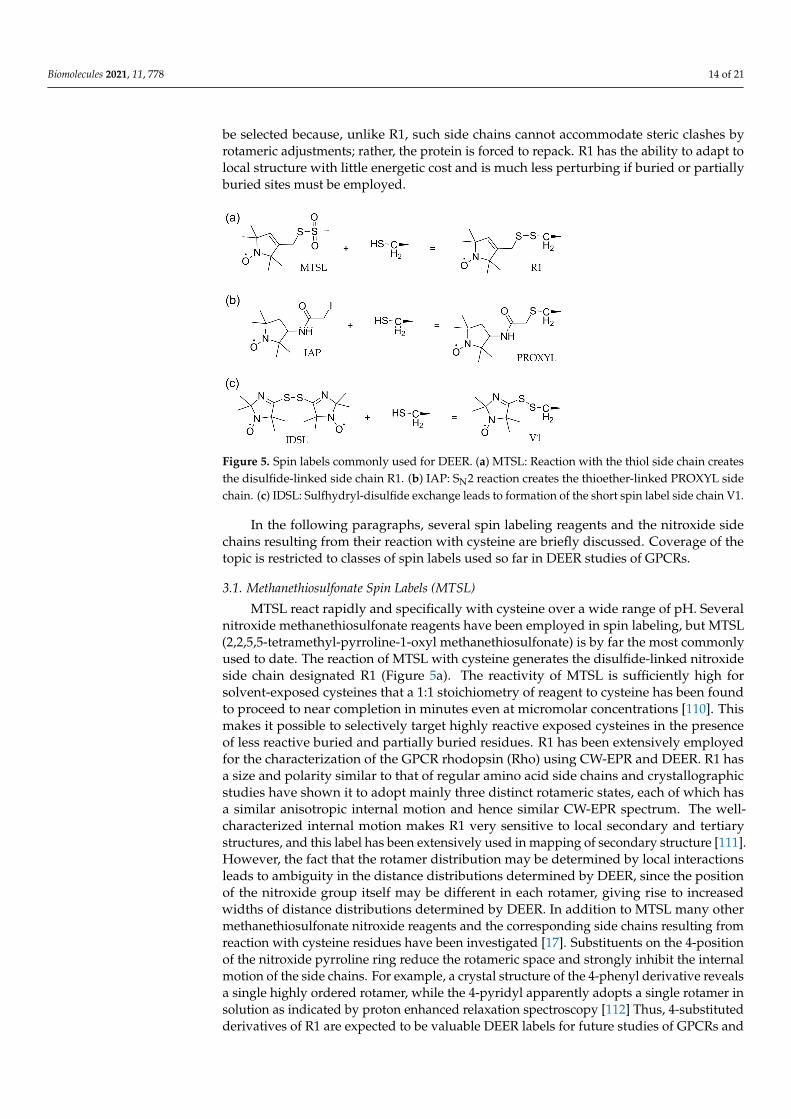
Figure 5. Spin labels commonly used for DEER. (a) MTSL: Reaction with the thiol side chain cre-ates the disulfide-linked side chain R1. (b) IAP: SN2 reaction creates the thioether-linked PROXYL side chain. (c) IDSL: Sulfhydryl-disulfide exchange leads to formation of the short spin label side chain V1.
3.1. Methanethiosulfonate Spin Labels (MTSL) MTSL react rapidly and specifically with cysteine over a wide range of pH. Several
nitroxide methanethiosulfonate reagents have been employed in spin labeling, but MTSL (2,2,5,5-tetramethyl-pyrroline-1-oxyl methanethiosulfonate) is by far the most commonly used to date. The reaction of MTSL with cysteine generates the disulfide-linked nitroxide side chain designated R1 (Figure 5a). The reactivity of MTSL is sufficiently high for sol-vent-exposed cysteines that a 1:1 stoichiometry of reagent to cysteine has been found to proceed to near completion in minutes even at micromolar concentrations [110]. This makes it possible to selectively target highly reactive exposed cysteines in the presence of less reactive buried and partially buried residues. R1 has been extensively employed for the characterization of the GPCR rhodopsin (Rho) using CW-EPR and DEER. R1 has a size and polarity similar to that of regular amino acid side chains and crystallographic studies have shown it to adopt mainly three distinct rotameric states, each of which has a similar anisotropic internal motion and hence similar CW-EPR spectrum. The well-characterized internal motion makes R1 very sensitive to local secondary and tertiary structures, and this label has been extensively used in mapping of secondary structure [111]. However, the fact that the rotamer distribution may be determined by local interactions leads to ambiguity in the distance distributions determined by DEER, since the position of the ni-troxide group itself may be different in each rotamer, giving rise to increased widths of distance distributions determined by DEER. In addition to MTSL many other methanethi-osulfonate nitroxide reagents and the corresponding side chains resulting from reaction with cysteine residues have been investigated [17]. Substituents on the 4-position of the nitroxide pyrroline ring reduce the rotameric space and strongly inhibit the internal mo-tion of the side chains. For example, a crystal structure of the 4-phenyl derivative reveals a single highly ordered rotamer, while the 4-pyridyl apparently adopts a single rotamer in solution as indicated by proton enhanced relaxation spectroscopy [112] Thus, 4-substi-tuted derivatives of R1 are expected to be valuable DEER labels for future studies of GPCRs and other proteins. The most highly restricted and localized spin label is the cross-linked side chain designated RX generated by the corresponding bis-methanethiosul-fonate. However, use of this reagent for both spins requires the introduction of four cys-teine residues [113].
3.2. Activated Alkyl Halides
Figure 5. Spin labels commonly used for DEER. (a) MTSL: Reaction with the thiol side chain createsthe disulfide-linked side chain R1. (b) IAP: SN2 reaction creates the thioether-linked PROXYL sidechain. (c) IDSL: Sulfhydryl-disulfide exchange leads to formation of the short spin label side chain V1.
In the following paragraphs, several spin labeling reagents and the nitroxide sidechains resulting from their reaction with cysteine are briefly discussed. Coverage of thetopic is restricted to classes of spin labels used so far in DEER studies of GPCRs.
3.1. Methanethiosulfonate Spin Labels (MTSL)
MTSL react rapidly and specifically with cysteine over a wide range of pH. Severalnitroxide methanethiosulfonate reagents have been employed in spin labeling, but MTSL(2,2,5,5-tetramethyl-pyrroline-1-oxyl methanethiosulfonate) is by far the most commonlyused to date. The reaction of MTSL with cysteine generates the disulfide-linked nitroxideside chain designated R1 (Figure 5a). The reactivity of MTSL is sufficiently high forsolvent-exposed cysteines that a 1:1 stoichiometry of reagent to cysteine has been foundto proceed to near completion in minutes even at micromolar concentrations [110]. Thismakes it possible to selectively target highly reactive exposed cysteines in the presenceof less reactive buried and partially buried residues. R1 has been extensively employedfor the characterization of the GPCR rhodopsin (Rho) using CW-EPR and DEER. R1 hasa size and polarity similar to that of regular amino acid side chains and crystallographicstudies have shown it to adopt mainly three distinct rotameric states, each of which hasa similar anisotropic internal motion and hence similar CW-EPR spectrum. The well-characterized internal motion makes R1 very sensitive to local secondary and tertiarystructures, and this label has been extensively used in mapping of secondary structure [111].However, the fact that the rotamer distribution may be determined by local interactionsleads to ambiguity in the distance distributions determined by DEER, since the positionof the nitroxide group itself may be different in each rotamer, giving rise to increasedwidths of distance distributions determined by DEER. In addition to MTSL many othermethanethiosulfonate nitroxide reagents and the corresponding side chains resulting fromreaction with cysteine residues have been investigated [17]. Substituents on the 4-positionof the nitroxide pyrroline ring reduce the rotameric space and strongly inhibit the internalmotion of the side chains. For example, a crystal structure of the 4-phenyl derivative revealsa single highly ordered rotamer, while the 4-pyridyl apparently adopts a single rotamer insolution as indicated by proton enhanced relaxation spectroscopy [112] Thus, 4-substitutedderivatives of R1 are expected to be valuable DEER labels for future studies of GPCRs and
Biomolecules 2021, 11, 778 15 of 21
other proteins. The most highly restricted and localized spin label is the cross-linked sidechain designated RX generated by the corresponding bis-methanethiosulfonate. However,use of this reagent for both spins requires the introduction of four cysteine residues [113].
3.2. Activated Alkyl Halides
Activated alkyl halides are generally less reactive towards cysteine and less specificthan methanethiosulfonates. The reaction mechanism (SN2) involves a back-side attack bythe nucleophile (S-) with inversion of configuration at the carbon bonded to the halide. Thestereochemical requirement apparently limits the rate of reaction for cysteines in a confinedenvironment. For example, the iodoacetamide IAP (Figure 5b, (3-(2-Iodoacetamido)-2,2,5,5-tetramethyl-1-pyrrolidinyloxy) fails to react with the two partially exposed native cysteinesin rhodopsin, both of which rapidly react with MTSL (WLH, unpublished results). How-ever, it is also less selective than MTSL and can undergo nucleophilic reaction with theprimary amine of lysine. This reaction becomes important at basic pH where the amountof unprotonated lysine becomes significant (ca. pH > 8.5). The saturated proxyl ringof IAP has an asymmetric center and the label is synthesized as a mixture of isomers.Finally, the PROXYL ring of IAP allows relatively unrestricted motions about the terminalbonds adjacent to the ring [17]. These latter two features can potentially lead to broadinterspin distances determined and reduced resolution in DEER [3,35]. The sole advantageof IAP as a spin label is that the reaction with cysteine generates a thioether linkage stableto reducing agents such as TCEP and DTT, unlike the disulfide linkage of R1 which israpidly cleaved by these reagents. This can be an advantage for proteins that require areducing environment.
Another activated alkyl halide that has been used for myosin labeling is the iodoketonedesignated IKSL [114]. The unsaturated ring of IKSL eliminates some of the problemsmentioned for IAP related to the PROXYL ring, and the side chain generated by the reactionwith cysteine is highly immobilized, suggesting a more localized nitroxide. While IKSLmay have significant advantages over IAP, it is still subject to low reactivity and specificityof alkyl halides in general.
3.3. Disulfides
Sufficiently reactive disulfides can also act as spin labeling reagents for cysteine viaa sulfhydryl-disulfide exchange reaction. The sole example of this class that has beenemployed as a spin labeling reagent is the bis(2,2,5,5-tetramethyl-3-imidazoline-1-oxyl-4-il)-disulfide spin label (IDSL, also known as RSSR, Figure 5c). The reaction product withcysteine is the disulfide-linked spin label side chain designated V1 [109,115]. Extensiveanalysis using CW-EPR, X-ray crystallography and quantum chemical calculations revealedan intra-side chain S-N stabilizing interaction, which strongly reduces both the rotamericspace and the side chain flexibility [115,116], making IDSL an attractive label for DEER.The imidazoline function renders the sulfur adjacent to the ring electrophilic, susceptibleto nucleophilic attack by hydroxide ion [109] resulting in cleavage of the spin label underbasic conditions (ca. pH > 7.5). The details of the mechanism may be complex, but theproduct is the free imidazoline thiolate anion. The cleavage reaction, if present, is evident inthe CW line shape. For DEER, the slow hydrolytic reaction is of little consequence becausethe sample is rapidly frozen after labeling.
The activated disulfide of V1 is also susceptible to attack by an S− nucleophile froma nearby cysteine in the protein, again releasing the free imidazoline thiolate. In thissulfhydryl-disulfide exchange reaction, V1 acts as an oxidizing reagent. In our recentcomprehensive investigation of the angiotensin receptor (AT1R), this reaction may havetaken place, resulting in the oxidation of two nearby native cysteines to cystine, allowingthe selective labeling of the exposed engineered cysteine. Both MTSL and IAP consistentlyand stably derivatized the native cysteines as well as the engineered cysteine giving riseto complex distance distributions in DEER. Similar behavior was recently observed inpreliminary DEER data on the Y2 receptor [40].
Biomolecules 2021, 11, 778 16 of 21
4. Conclusions and Outlook
This review aimed to summarize the conformational changes occurring with activationof GPCRs; we limited our explanation to the vantage point of DEER, which is unique as itprovides an accurate lengths scale and can resolve multiple conformations in equilibrium,which is the case for GPCRs. The reader is referred to excellent reviews focusing on otheraspects of GPCR research [2,4,63,92,117].
In recent years, SDSL-EPR spectroscopy, and in particular DEER, has being recognizedas an important technique for uncovering the structural underpinnings of GPCR function.Indeed, SDSL does not yield all-atom structural information. However, in combinationwith other methods, e.g., computational tools, new GPCR conformations may be identifiedpotentially exhibiting functional relevance and therefore presenting important drug tar-gets [30,118]. Moreover, the site-directed labeling approach provides superior resolutioncompared to other, global spectroscopic methods such as NMR or FTIR spectroscopy,where frequency assignment often represents a major challenge. Finally, DEER providesthe important length scale to the description of conformational landscapes. This alsofacilitates direct comparison with structural information derived from X-ray crystallogra-phy, electron microscopy or MD simulations, all of which may provide complementaryall-atom resolution.
DEER requires rapid freezing in order to extend the labels phase memory time T2*into the microsecond time regime and to trap the protein conformational equilibrium. Ex-perimental evidence indicates that the conformational equilibrium at ambient temperatureis effectively trapped by flash freezing [119–121], which is further corroborated by otherdistance measurement techniques (such as smFRET [13,122] and relaxation enhancementEPR [123]). To avoid low temperatures, progress is being made in label developmentto achieve phase memory times (T2*) long enough for DEER at physiologically relevanttemperatures [124,125].
A further important factor to consider when interpreting DEER data in a physiologicalcontext is the in vitro environment, since detergent or membrane environments exerta strong and specific influence on the stability and conformational equilibria of GPCRconformations. However, this topic is out of the focus of this review and the reader isreferred to specialized publications [126,127].
The vast conformational heterogeneity of GPCR indicated by broad DEER distancedistributions poses challenges for structure determination. The modulation of confor-mational equilibria by ligands of diverse function also indicates the vast potential forpharmacological research in order to find selective and efficacious therapeutics. To resolvethe conformational equilibrium using DEER, progress is being made in terms of dataanalysis including model-based fitting tools which provide the statistical rigor to a fullyreproducible DEER analysis [128,129].
DEER may be used to investigate GPCR homo- and hetero-dimerization, importantregulators of GPCR function and potentially involved in signal bias [14]. This will befacilitated by the commercial availability of large volume Q-band cavity resonators andother instrumentation, which allow for sample concentrations in the physiological regime.Progress towards more dilute samples and the development of reduction-resistant spinlabels will also boost in-cell DEER investigations [130]. Another promising avenue is the ap-plication of hydrostatic pressure, which, in combination with DEER, shows great potentialfor exploring the conformational landscape of GPCRs by stabilizing rare conformations andelucidating the thermodynamics of ligand binding and conformational change [3,131,132].
Funding: This research was funded by R01GM137081 (to M.E.), R01EY005216 and the Jules SteinProfessorship (to W.L.H.).
Conflicts of Interest: The authors declare no conflict of interest.
Biomolecules 2021, 11, 778 17 of 21
References1. Fredriksson, R.; Lagerström, M.C.; Lundin, L.-G.; Schiöth, H.B. The G-Protein-Coupled Receptors in the Human Genome Form
Five Main Families. Phylogenetic Analysis, Paralogon Groups, and Fingerprints. Mol. Pharmacol. 2003, 63, 1256–1272. [CrossRef][PubMed]
2. Smith, J.S.; Lefkowitz, R.J.; Rajagopal, S. Biased Signalling: From Simple Switches to Allosteric Microprocessors. Nat. Rev. DrugDiscov. 2018, 17, 243–260. [CrossRef] [PubMed]
3. Lerch, M.T.; Matt, R.A.; Masureel, M.; Elgeti, M.; Kumar, K.K.; Hilger, D.; Foys, B.; Kobilka, B.K.; Hubbell, W.L. Viewing RareConformations of the B2 Adrenergic Receptor with Pressure-Resolved DEER Spectroscopy. Proc. Natl. Acad. Sci. USA 2020,202013904. [CrossRef]
4. Wingler, L.M.; Lefkowitz, R.J. Conformational Basis of G Protein-Coupled Receptor Signaling Versatility. Trends Cell Biol. 2020, 30,736–747. [CrossRef] [PubMed]
5. De Lean, A.; Stadel, J.M.; Lefkowitz, R.J. A Ternary Complex Model Explains the Agonist-Specific Binding Properties of theAdenylate Cyclase-Coupled Beta-Adrenergic Receptor. J. Biol. Chem. 1980, 255, 7108–7117. [CrossRef]
6. Strachan, R.T.; Sun, J.; Rominger, D.H.; Violin, J.D.; Ahn, S.; Rojas Bie Thomsen, A.; Zhu, X.; Kleist, A.; Costa, T.; Lefkowitz, R.J.Divergent Transducer-Specific Molecular Efficacies Generate Biased Agonism at a G Protein-Coupled Receptor (GPCR). J. Biol.Chem. 2014, 289, 14211–14224. [CrossRef]
7. Furness, S.G.B.; Liang, Y.-L.; Nowell, C.J.; Halls, M.L.; Wookey, P.J.; Dal Maso, E.; Inoue, A.; Christopoulos, A.; Wootten, D.; Sexton,P.M. Ligand-Dependent Modulation of G Protein Conformation Alters Drug Efficacy. Cell 2016, 167, 739–749.e11. [CrossRef]
8. Rosenbaum, D.M.; Cherezov, V.; Hanson, M.A.; Rasmussen, S.G.F.; Thian, F.S.; Kobilka, T.S.; Choi, H.-J.; Yao, X.-J.; Weis, W.I.;Stevens, R.C.; et al. GPCR Engineering Yields High-Resolution Structural Insights into Beta2-Adrenergic Receptor Function.Science 2007, 318, 1266–1273. [CrossRef]
9. Zhao, Q.; Wu, B. Ice Breaking in GPCR Structural Biology. Acta Pharmacol. Sin. 2012, 33, 324–334. [CrossRef]10. Chun, E.; Thompson, A.A.; Liu, W.; Roth, C.B.; Griffith, M.T.; Katritch, V.; Kunken, J.; Xu, F.; Cherezov, V.; Hanson, M.A.; et al.
Fusion Partner Toolchest for the Stabilization and Crystallization of G Protein-Coupled Receptors. Struct. Lond. Engl. 1993 2012,20, 967–976. [CrossRef]
11. Kaptein, R.; Wagner, G. NMR Studies of Membrane Proteins. J. Biomol. NMR 2015, 61, 181–184. [CrossRef] [PubMed]12. Lange, O.F.; Lakomek, N.-A.; Farès, C.; Schröder, G.F.; Walter, K.F.A.; Becker, S.; Meiler, J.; Grubmüller, H.; Griesinger, C.; De
Groot, B.L. Recognition Dynamics Up to Microseconds Revealed from an RDC-Derived Ubiquitin Ensemble in Solution. Science2008, 320, 1471–1475. [CrossRef] [PubMed]
13. Gregorio, G.G.; Masureel, M.; Hilger, D.; Terry, D.S.; Juette, M.; Zhao, H.; Zhou, Z.; Perez-Aguilar, J.M.; Hauge, M.; Mathiasen, S.;et al. Single-Molecule Analysis of Ligand Efficacy in B2AR-G-Protein Activation. Nature 2017, 547, 68–73. [CrossRef] [PubMed]
14. Möller, J.; Isbilir, A.; Sungkaworn, T.; Osberg, B.; Karathanasis, C.; Sunkara, V.; Grushevskyi, E.O.; Bock, A.; Annibale, P.;Heilemann, M.; et al. Single-Molecule Analysis Reveals Agonist-Specific Dimer Formation of µ-Opioid Receptors. Nat. Chem.Biol. 2020, 16, 946–954. [CrossRef]
15. Budil, D.E.; Sanghyuk, L.; Saxena, S.; Freed, J.H. Nonlinear-Least-Squares Analysis of Slow-Motion EPR Spectra in One and TwoDimensions Using a Modified Levenberg-Marquardt Algorithm. J. Magn. Reson. Ser. A 1996, 120, 155–189. [CrossRef]
16. Mchaourab, H.S.; Lietzow, M.A.; Hideg, K.; Hubbell, W.L. Motion of Spin-Labeled Side Chains in T4 Lysozyme. Correlation withProtein Structure and Dynamics. Biochemistry 1996, 35, 7692–7704. [CrossRef]
17. Columbus, L.; Kálai, T.; Jekö, J.; Hideg, K.; Hubbell, W.L. Molecular Motion of Spin Labeled Side Chains in α-Helices: Analysis byVariation of Side Chain Structure. Biochemistry 2001, 40, 3828–3846. [CrossRef]
18. Columbus, L.; Hubbell, W.L. A New Spin on Protein Dynamics. Trends Biochem. Sci. 2002, 27, 288–295. [CrossRef]19. Hyde, J.S.; Dalton, L. Very Slowly Tumbling Spin Labels: Adiabatic Rapid Passage. Chem. Phys. Lett. 1972, 16, 568–572. [CrossRef]20. Hemminga, M.A.; de Jager, P.A. Saturation Transfer Spectroscopy of Spin Labels. In Spin Labeling: Theory and Applications; Berliner,
L.J., Reuben, J., Eds.; Biological Magnetic Resonance; Springer US: Boston, MA, USA, 1989; pp. 131–178. ISBN 978-1-4613-0743-3.21. Steinhoff, H.J.; Mollaaghababa, R.; Altenbach, C.; Hideg, K.; Krebs, M.; Khorana, H.G.; Hubbell, W.L. Time-Resolved Detection of
Structural Changes during the Photocycle of Spin-Labeled Bacteriorhodopsin. Science 1994, 266, 105–107. [CrossRef]22. Hubbell, W.L.; López, C.J.; Altenbach, C.; Yang, Z. Technological Advances in Site-Directed Spin Labeling of Proteins. Curr. Opin.
Struct. Biol. 2013, 23, 725–733. [CrossRef] [PubMed]23. Altenbach, C.; Marti, T.; Khorana, H.G.; Hubbell, W.L. Transmembrane Protein Structure: Spin Labeling of Bacteriorhodopsin
Mutants. Science 1990, 248, 1088–1092. [CrossRef] [PubMed]24. Altenbach, C.; Oh, K.J.; Trabanino, R.J.; Hideg, K.; Hubbell, W.L. Estimation of Inter-Residue Distances in Spin Labeled Proteins
at Physiological Temperatures: Experimental Strategies and Practical Limitations. Biochemistry 2001, 40, 15471–15482. [CrossRef][PubMed]
25. Altenbach, C.; López, C.J.; Hideg, K.; Hubbell, W.L. Exploring Structure, Dynamics, and Topology of Nitroxide Spin-LabeledProteins Using Continuous-Wave Electron Paramagnetic Resonance Spectroscopy. Methods Enzymol. 2015, 564, 59–100. [CrossRef]
26. Pannier, M.; Veit, S.; Godt, A.; Jeschke, G.; Spiess, H.W. Dead-Time Free Measurement of Dipole–Dipole Interactions betweenElectron Spins. J. Magn. Reson. 2000, 142, 331–340. [CrossRef]
27. Jeschke, G. DEER Distance Measurements on Proteins. Annu. Rev. Phys. Chem. 2012, 63, 419–446. [CrossRef]
Biomolecules 2021, 11, 778 18 of 21
28. Altenbach, C.; Kusnetzow, A.K.; Ernst, O.P.; Hofmann, K.P.; Hubbell, W.L. High-Resolution Distance Mapping in RhodopsinReveals the Pattern of Helix Movement Due to Activation. Proc. Natl. Acad. Sci. USA 2008, 105, 7439–7444. [CrossRef]
29. Eps, N.V.; Caro, L.N.; Morizumi, T.; Kusnetzow, A.K.; Szczepek, M.; Hofmann, K.P.; Bayburt, T.H.; Sligar, S.G.; Ernst, O.P.;Hubbell, W.L. Conformational Equilibria of Light-Activated Rhodopsin in Nanodiscs. Proc. Natl. Acad. Sci. USA 2017, 114,E3268–E3275. [CrossRef]
30. Eps, N.V.; Altenbach, C.; Caro, L.N.; Latorraca, N.R.; Hollingsworth, S.A.; Dror, R.O.; Ernst, O.P.; Hubbell, W.L. Gi- andGs-Coupled GPCRs Show Different Modes of G-Protein Binding. Proc. Natl. Acad. Sci. USA 2018, 115, 2383–2388. [CrossRef]
31. Kang, Y.; Zhou, X.E.; Gao, X.; He, Y.; Liu, W.; Ishchenko, A.; Barty, A.; White, T.A.; Yefanov, O.; Han, G.W.; et al. Crystal Structureof Rhodopsin Bound to Arrestin by Femtosecond X-Ray Laser. Nature 2015, 523, 561–567. [CrossRef]
32. Zhao, D.Y.; Pöge, M.; Morizumi, T.; Gulati, S.; Eps, N.V.; Zhang, J.; Miszta, P.; Filipek, S.; Mahamid, J.; Plitzko, J.M.; et al. Cryo-EMStructure of the Native Rhodopsin Dimer in Nanodiscs. J. Biol. Chem. 2019, 294, 14215–14230. [CrossRef]
33. Kang, Y.; Kuybeda, O.; de Waal, P.W.; Mukherjee, S.; Van Eps, N.; Dutka, P.; Zhou, X.E.; Bartesaghi, A.; Erramilli, S.; Morizumi, T.;et al. Cryo-EM Structure of Human Rhodopsin Bound to an Inhibitory G Protein. Nature 2018, 558, 553–558. [CrossRef] [PubMed]
34. Yasuda, S.; Hara, H.; Tokunaga, F.; Arata, T. Spatial Arrangement of Rhodopsin in Retinal Rod Outer Segment MembranesStudied by Spin-Labeling and Pulsed Electron Double Resonance. Biochem. Biophys. Res. Commun. 2012, 425, 134–137. [CrossRef][PubMed]
35. Manglik, A.; Kim, T.H.; Masureel, M.; Altenbach, C.; Yang, Z.; Hilger, D.; Lerch, M.T.; Kobilka, T.S.; Thian, F.S.; Hubbell, W.L.;et al. Structural Insights into the Dynamic Process of B2-Adrenergic Receptor Signaling. Cell 2015, 161, 1101–1111. [CrossRef][PubMed]
36. Dijkman, P.M.; Castell, O.K.; Goddard, A.D.; Munoz-Garcia, J.C.; de Graaf, C.; Wallace, M.I.; Watts, A. Dynamic Tuneable GProtein-Coupled Receptor Monomer-Dimer Populations. Nat. Commun. 2018, 9, 1710. [CrossRef] [PubMed]
37. Lovett, J.E.; Lovett, B.W.; Harmer, J. DEER-Stitch: Combining Three- and Four-Pulse DEER Measurements for High Sensitivity,Deadtime Free Data. J. Magn. Reson. San Diego Calif 1997 2012, 223, 98–106. [CrossRef]
38. Wingler, L.M.; Elgeti, M.; Hilger, D.; Latorraca, N.R.; Lerch, M.T.; Staus, D.P.; Dror, R.O.; Kobilka, B.K.; Hubbell, W.L.; Lefkowitz,R.J. Angiotensin Analogs with Divergent Bias Stabilize Distinct Receptor Conformations. Cell 2019, 176, 468–478.e11. [CrossRef]
39. McMahon, C.; Staus, D.P.; Wingler, L.M.; Wang, J.; Skiba, M.A.; Elgeti, M.; Hubbell, W.L.; Rockman, H.A.; Kruse, A.C.; Lefkowitz,R.J. Synthetic Nanobodies as Angiotensin Receptor Blockers. Proc. Natl. Acad. Sci. USA 2020, 117, 20284–20291. [CrossRef]
40. Laugwitz, J.M.; Haeri, H.H.; Kaiser, A.; Krug, U.; Hinderberger, D.; Beck-Sickinger, A.G.; Schmidt, P. Probing the Y2 Receptor onTransmembrane, Intra- and Extra-Cellular Sites for EPR Measurements. Molecules 2020, 25, 4143. [CrossRef]
41. Hilger, D.; Kumar, K.K.; Hu, H.; Pedersen, M.F.; O’Brien, E.S.; Giehm, L.; Jennings, C.; Eskici, G.; Inoue, A.; Lerch, M.; et al.Structural Insights into Differences in G Protein Activation by Family A and Family B GPCRs. Science 2020, 369. [CrossRef]
42. Farrens, D.L.; Altenbach, C.; Yang, K.; Hubbell, W.L.; Khorana, H.G. Requirement of Rigid-Body Motion of TransmembraneHelices for Light Activation of Rhodopsin. Science 1996, 274, 768–770. [CrossRef]
43. Ruprecht, J.J.; Mielke, T.; Vogel, R.; Villa, C.; Schertler, G.F.X. Electron Crystallography Reveals the Structure of Metarhodopsin I.EMBO J. 2004, 23, 3609–3620. [CrossRef] [PubMed]
44. Siebert, F. Application of FTIR Spectroscopy to the Investigation of Dark Structures and Photoreactions of Visual Pigments. Isr. J.Chem. 1995, 35, 309–323. [CrossRef]
45. Smith, S.O. Structure and Activation of the Visual Pigment Rhodopsin. Annu. Rev. Biophys. 2010, 39, 309–328. [CrossRef][PubMed]
46. Mahalingam, M.; Martínez-Mayorga, K.; Brown, M.F.; Vogel, R. Two Protonation Switches Control Rhodopsin Activation inMembranes. Proc. Natl. Acad. Sci. USA 2008, 105, 17795–17800. [CrossRef] [PubMed]
47. Matthews, R.G.; Hubbard, R.; Brown, P.K.; Wald, G. Tautomeric Forms of Metarhodopsin. J. Gen. Physiol. 1963, 47, 215–240.[CrossRef]
48. Arnis, S.; Hofmann, K.P. Two Different Forms of Metarhodopsin II: Schiff Base Deprotonation Precedes Proton Uptake andSignaling State. Proc. Natl. Acad. Sci. USA 1993, 90, 7849–7853. [CrossRef] [PubMed]
49. Hofmann, K.-P. Photoproducts of Rhodopsin in the Disc Membrane. Photobiochem. Photobiophys. 1986, 13, 309–327.50. Dror, R.O.; Arlow, D.H.; Maragakis, P.; Mildorf, T.J.; Pan, A.C.; Xu, H.; Borhani, D.W.; Shaw, D.E. Activation Mechanism of the
B2-Adrenergic Receptor. Proc. Natl. Acad. Sci. USA 2011, 108, 18684–18689. [CrossRef]51. Rose, A.S.; Elgeti, M.; Zachariae, U.; Grubmüller, H.; Hofmann, K.P.; Scheerer, P.; Hildebrand, P.W. Position of Transmembrane
Helix 6 Determines Receptor G Protein Coupling Specificity. J. Am. Chem. Soc. 2014, 136, 11244–11247. [CrossRef]52. Kim, J.-M.; Hwa, J.; Garriga, P.; Reeves, P.J.; RajBhandary, U.L.; Khorana, H.G. Light-Driven Activation of Beta 2-Adrenergic
Receptor Signaling by a Chimeric Rhodopsin Containing the Beta 2-Adrenergic Receptor Cytoplasmic Loops. Biochemistry 2005,44, 2284–2292. [CrossRef]
53. Godchaux, W.; Zimmerman, W.F. Membrane-Dependent Guanine Nucleotide Binding and GTPase Activities of Soluble Proteinfrom Bovine Rod Cell Outer Segments. J. Biol. Chem. 1979, 254, 7874–7884. [CrossRef]
54. Gurevich, V.V.; Benovic, J.L. [29] Arrestin: Mutagenesis, expression, purification, and functional characterization. In Methods inEnzymology; Vertebrate Phototransduction and the Visual Cycle, Part A; Academic Press: Cambridge, MA, USA, 2000; Volume315, pp. 422–437.
55. Clarke, W.P.; Bond, R.A. The Elusive Nature of Intrinsic Efficacy. Trends Pharmacol. Sci. 1998, 19, 270–276. [CrossRef]
Biomolecules 2021, 11, 778 19 of 21
56. Livingston, K.E.; Mahoney, J.P.; Manglik, A.; Sunahara, R.K.; Traynor, J.R. Measuring Ligand Efficacy at the Mu-Opioid ReceptorUsing a Conformational Biosensor. eLife 2018, 7, e32499. [CrossRef] [PubMed]
57. Knierim, B.; Hofmann, K.P.; Ernst, O.P.; Hubbell, W.L. Sequence of Late Molecular Events in the Activation of Rhodopsin. Proc.Natl. Acad. Sci. USA 2007, 104, 20290–20295. [CrossRef] [PubMed]
58. Dawaliby, R.; Trubbia, C.; Delporte, C.; Masureel, M.; Van Antwerpen, P.; Kobilka, B.K.; Govaerts, C. Allosteric Regulation of GProtein-Coupled Receptor Activity by Phospholipids. Nat. Chem. Biol. 2016, 12, 35–39. [CrossRef]
59. Strohman, M.J.; Maeda, S.; Hilger, D.; Masureel, M.; Du, Y.; Kobilka, B.K. Local Membrane Charge Regulates β 2 AdrenergicReceptor Coupling to G I3. Nat. Commun. 2019, 10. [CrossRef] [PubMed]
60. Rasmussen, S.G.F.; DeVree, B.T.; Zou, Y.; Kruse, A.C.; Chung, K.Y.; Kobilka, T.S.; Thian, F.S.; Chae, P.S.; Pardon, E.; Calinski, D.;et al. Crystal Structure of the B2 Adrenergic Receptor-Gs Protein Complex. Nature 2011, 477, 549–555. [CrossRef]
61. Rasmussen, S.G.F.; Choi, H.-J.; Fung, J.J.; Pardon, E.; Casarosa, P.; Chae, P.S.; DeVree, B.T.; Rosenbaum, D.M.; Thian, F.S.; Kobilka,T.S.; et al. Structure of a Nanobody-Stabilized Active State of the β 2 Adrenoceptor. Nature 2011, 469, 175–180. [CrossRef]
62. Frauenfelder, H.; Sligar, S.G.; Wolynes, P.G. The Energy Landscapes and Motions of Proteins. Science 1991, 254, 1598–1603.[CrossRef]
63. Weis, W.I.; Kobilka, B.K. The Molecular Basis of G Protein–Coupled Receptor Activation. Annu. Rev. Biochem. 2018, 87, 897–919.[CrossRef] [PubMed]
64. Elgeti, M.; Kazmin, R.; Heck, M.; Morizumi, T.; Ritter, E.; Scheerer, P.; Ernst, O.P.; Siebert, F.; Hofmann, K.P.; Bartl, F.J. ConservedTyr223(5.58) Plays Different Roles in the Activation and G-Protein Interaction of Rhodopsin. J. Am. Chem. Soc. 2011, 133,7159–7165. [CrossRef] [PubMed]
65. Beck, M.; Siebert, F.; Sakmar, T.P. Evidence for the Specific Interaction of a Lipid Molecule with Rhodopsin Which Is Altered inthe Transition to the Active State Metarhodopsin II. FEBS Lett. 1998, 436, 304–308. [CrossRef]
66. Beck, M.; Sakmar, T.P.; Siebert, F. Spectroscopic Evidence for Interaction between Transmembrane Helices 3 and 5 in Rhodopsin.Biochemistry 1998, 37, 7630–7639. [CrossRef]
67. Fritze, O.; Filipek, S.; Kuksa, V.; Palczewski, K.; Hofmann, K.P.; Ernst, O.P. Role of the Conserved NPxxY(x)5,6F Motif in theRhodopsin Ground State and during Activation. Proc. Natl. Acad. Sci. USA 2003, 100, 2290–2295. [CrossRef]
68. Liu, J.J.; Horst, R.; Katritch, V.; Stevens, R.C.; Wüthrich, K. Biased Signaling Pathways in B2-Adrenergic Receptor Characterizedby 19F-NMR. Science 2012, 335, 1106–1110. [CrossRef]
69. Kim, T.H.; Chung, K.Y.; Manglik, A.; Hansen, A.L.; Dror, R.O.; Mildorf, T.J.; Shaw, D.E.; Kobilka, B.K.; Prosser, R.S. The Role ofLigands on the Equilibria between Functional States of a g Protein-Coupled Receptor. J. Am. Chem. Soc. 2013, 135, 9465–9474.[CrossRef]
70. Suomivuori, C.-M.; Latorraca, N.R.; Wingler, L.M.; Eismann, S.; King, M.C.; Kleinhenz, A.L.W.; Skiba, M.A.; Staus, D.P.; Kruse,A.C.; Lefkowitz, R.J.; et al. Molecular Mechanism of Biased Signaling in a Prototypical G Protein–Coupled Receptor. Science 2020,367, 881–887. [CrossRef]
71. Prioleau, C.; Visiers, I.; Ebersole, B.J.; Weinstein, H.; Sealfon, S.C. Conserved Helix 7 Tyrosine Acts as a Multistate ConformationalSwitch in the 5HT2C Receptor. Identification of a Novel “Locked-on” Phenotype and Double Revertant Mutations. J. Biol. Chem.2002, 277, 36577–36584. [CrossRef]
72. Scheerer, P.; Park, J.H.; Hildebrand, P.W.; Kim, Y.J.; Krauss, N.; Choe, H.-W.W.; Hofmann, K.P.; Ernst, O.P. Crystal Structure ofOpsin in Its G-Protein-Interacting Conformation. Nature 2008, 455, 497–502. [CrossRef]
73. Szczepek, M.; Beyrière, F.; Hofmann, K.P.; Elgeti, M.; Kazmin, R.; Rose, A.; Bartl, F.J.; von Stetten, D.; Heck, M.; Sommer, M.E.;et al. Crystal Structure of a Common GPCR-Binding Interface for G Protein and Arrestin. Nat. Commun. 2014, 5, 4801. [CrossRef][PubMed]
74. Tsai, C.-J.; Marino, J.; Adaixo, R.; Pamula, F.; Muehle, J.; Maeda, S.; Flock, T.; Taylor, N.M.; Mohammed, I.; Matile, H.; et al.Cryo-EM Structure of the Rhodopsin-Gαi-Bγ Complex Reveals Binding of the Rhodopsin C-Terminal Tail to the Gβ Subunit.eLife 2019, 8, e46041. [CrossRef]
75. Alexiev, U. Dynamics of Helix 8 in GPCR Function. In Encyclopedia of Biophysics; Roberts, G.C.K., Ed.; Springer: Berlin/Heidelberg,Germany, 2013; pp. 549–552. ISBN 978-3-642-16712-6.
76. Sensoy, O.; Weinstein, H. A Mechanistic Role of Helix 8 in GPCRs: Computational Modeling of the Dopamine D2 ReceptorInteraction with the GIPC1–PDZ-Domain. Biochim. Biophys. Acta BBA Biomembr. 2015, 1848, 976–983. [CrossRef] [PubMed]
77. Eilers, M.; Goncalves, J.A.; Ahuja, S.; Kirkup, C.; Hirshfeld, A.; Simmerling, C.; Reeves, P.J.; Sheves, M.; Smith, S.O. StructuralTransitions of Transmembrane Helix 6 in the Formation of Metarhodopsin I. J. Phys. Chem. B 2012, 116, 10477–10489. [CrossRef][PubMed]
78. Kusnetzow, A.K.; Altenbach, C.; Hubbell, W.L. Conformational States and Dynamics of Rhodopsin in Micelles and Bilayers.Biochemistry 2006, 45, 5538–5550. [CrossRef] [PubMed]
79. Jaakola, V.-P.; Prilusky, J.; Sussman, J.L.; Goldman, A. G Protein-Coupled Receptors Show Unusual Patterns of Intrinsic Unfolding.Protein Eng. Des. Sel. PEDS 2005, 18, 103–110. [CrossRef] [PubMed]
80. Eddy, M.T.; Didenko, T.; Stevens, R.C.; Wüthrich, K. B2-Adrenergic Receptor Conformational Response to Fusion Protein in theThird Intracellular Loop. Struct. Lond. Engl. 1993 2016, 24, 2190–2197. [CrossRef]
81. Ozcan, O.; Uyar, A.; Doruker, P.; Akten, E.D. Effect of Intracellular Loop 3 on Intrinsic Dynamics of Human B2-AdrenergicReceptor. BMC Struct. Biol. 2013, 13, 29. [CrossRef]
Biomolecules 2021, 11, 778 20 of 21
82. Seo, M.J.; Heo, J.; Kim, K.; Chung, K.Y.; Yu, W. Coevolution Underlies GPCR-G Protein Selectivity and Functionality. Sci. Rep.2021, 11, 7858. [CrossRef]
83. Katritch, V.; Cherezov, V.; Stevens, R.C. Diversity and Modularity of G Protein-Coupled Receptor Structures. Trends Pharmacol.Sci. 2012, 33, 17–27. [CrossRef]
84. Kaya, A.I.; Perry, N.A.; Gurevich, V.V.; Iverson, T.M. Phosphorylation Barcode-Dependent Signal Bias of the Dopamine D1Receptor. Proc. Natl. Acad. Sci. USA 2020, 117, 14139–14149. [CrossRef]
85. Yang, Z.; Yang, F.; Zhang, D.; Liu, Z.; Lin, A.; Liu, C.; Xiao, P.; Yu, X.; Sun, J.-P. Phosphorylation of G Protein-Coupled Receptors:From the Barcode Hypothesis to the Flute Model. Mol. Pharmacol. 2017, 92, 201–210. [CrossRef] [PubMed]
86. Latorraca, N.R.; Masureel, M.; Hollingsworth, S.A.; Heydenreich, F.M.; Suomivuori, C.-M.; Brinton, C.; Townshend, R.J.L.;Bouvier, M.; Kobilka, B.K.; Dror, R.O. How GPCR Phosphorylation Patterns Orchestrate Arrestin-Mediated Signaling. Cell 2020.[CrossRef] [PubMed]
87. Salas-Estrada, L.A.; Leioatts, N.; Romo, T.D.; Grossfield, A. Lipids Alter Rhodopsin Function via Ligand-like and Solvent-likeInteractions. Biophys. J. 2018, 114, 355–367. [CrossRef]
88. Du, Y.; Duc, N.M.; Rasmussen, S.G.F.; Hilger, D.; Kubiak, X.; Wang, L.; Bohon, J.; Kim, H.R.; Wegrecki, M.; Asuru, A.; et al.Assembly of a GPCR-G Protein Complex. Cell 2019, 177, 1232–1242.e11. [CrossRef] [PubMed]
89. Mahoney, J.P.; Sunahara, R.K. Mechanistic Insights into GPCR-G Protein Interactions. Curr. Opin. Struct. Biol. 2016, 41, 247–254.[CrossRef]
90. Franke, R.R.; Konig, B.; Sakmar, T.P.; Khorana, H.G.; Hofmann, K.P.; König, B. Rhodopsin Mutants That Bind but Fail to ActivateTransducin. Science 1990, 250, 123–125. [CrossRef]
91. Worth, C.L.; Kleinau, G.; Krause, G. Comparative Sequence and Structural Analyses of G-Protein-Coupled Receptor CrystalStructures and Implications for Molecular Models. PLoS ONE 2009, 4, e7011. [CrossRef]
92. Hilger, D.; Masureel, M.; Kobilka, B.K. Structure and Dynamics of GPCR Signaling Complexes. Nat. Struct. Mol. Biol. 2018, 25,4–12. [CrossRef]
93. Elgeti, M.; Kazmin, R.; Rose, A.S.; Szczepek, M.; Hildebrand, P.W.; Bartl, F.J.; Scheerer, P.; Hofmann, K.P. The Arrestin-1 FingerLoop Interacts with Two Distinct Conformations of Active Rhodopsin. J. Biol. Chem. 2018, 293, 4403–4410. [CrossRef] [PubMed]
94. Seyedabadi, M.; Gharghabi, M.; Gurevich, E.V.; Gurevich, V.V. Receptor-Arrestin Interactions: The GPCR Perspective. Biomolecules2021, 11, 218. [CrossRef] [PubMed]
95. Ferré, S.; Casadó, V.; Devi, L.A.; Filizola, M.; Jockers, R.; Lohse, M.J.; Milligan, G.; Pin, J.-P.; Guitart, X. G Protein–CoupledReceptor Oligomerization Revisited: Functional and Pharmacological Perspectives. Pharmacol. Rev. 2014, 66, 413–434. [CrossRef][PubMed]
96. Grushevskyi, E.O.; Kukaj, T.; Schmauder, R.; Bock, A.; Zabel, U.; Schwabe, T.; Benndorf, K.; Lohse, M.J. Stepwise Activation of aClass C GPCR Begins with Millisecond Dimer Rearrangement. Proc. Natl. Acad. Sci. USA 2019, 116, 10150–10155. [CrossRef]
97. Hilger, D.; Jung, H.; Padan, E.; Wegener, C.; Vogel, K.-P.; Steinhoff, H.-J.; Jeschke, G. Assessing Oligomerization of MembraneProteins by Four-Pulse DEER: PH-Dependent Dimerization of NhaA Na+/H+ Antiporter of E. coli. Biophys. J. 2005, 89, 1328–1338.[CrossRef] [PubMed]
98. Filizola, M.; Weinstein, H. The Study of G-Protein Coupled Receptor Oligomerization with Computational Modeling andBioinformatics. FEBS J. 2005, 272, 2926–2938. [CrossRef] [PubMed]
99. Wheatley, M.; Charlton, J.; Jamshad, M.; Routledge, S.J.; Bailey, S.; La-Borde, P.J.; Azam, M.T.; Logan, R.T.; Bill, R.M.; Dafforn, T.R.;et al. GPCR–Styrene Maleic Acid Lipid Particles (GPCR–SMALPs): Their Nature and Potential. Biochem. Soc. Trans. 2016, 44,619–623. [CrossRef] [PubMed]
100. Ribeiro, J.M.L.; Filizola, M. Allostery in G Protein-Coupled Receptors Investigated by Molecular Dynamics Simulations. Curr.Opin. Struct. Biol. 2019, 55, 121–128. [CrossRef]
101. Paatero, P.; Tapper, U. Positive Matrix Factorization: A Non-Negative Factor Model with Optimal Utilization of Error Estimatesof Data Values. Environmetrics 1994, 5, 111–126. [CrossRef]
102. Burnham, K.P.; Anderson, D.R.; Burnham, K.P. Model Selection and Multimodel Inference: A Practical Information-Theoretic Approach,2nd ed.; Springer: New York, NY, USA, 2002; ISBN 978-0-387-95364-9.
103. Jeschke, G. MMM: A Toolbox for Integrative Structure Modeling. Protein Sci. 2018, 27, 76–85. [CrossRef]104. Jo, S.; Cheng, X.; Islam, S.M.; Huang, L.; Rui, H.; Zhu, A.; Lee, H.S.; Qi, Y.; Han, W.; Vanommeslaeghe, K.; et al. Chapter Eight—
CHARMM-GUI PDB Manipulator for Advanced Modeling and Simulations of Proteins Containing Nonstandard Residues. InAdvances in Protein Chemistry and Structural Biology; Karabencheva-Christova, T., Ed.; Biomolecular Modelling and Simulations;Academic Press: Cambridge, MA, USA, 2014; Volume 96, pp. 235–265.
105. Hatmal, M.M.; Li, Y.; Hegde, B.G.; Hegde, P.B.; Jao, C.C.; Langen, R.; Haworth, I.S. Computer Modeling of Nitroxide Spin Labelson Proteins. Biopolymers 2012, 97, 35–44. [CrossRef]
106. Hagelueken, G.; Abdullin, D.; Schiemann, O. MtsslSuite: Probing Biomolecular Conformation by Spin-Labeling Studies. MethodsEnzymol. 2015, 563, 595–622. [CrossRef]
107. Yakimchuk, K. Receptor-Ligand Binding Assays. Mater. Methods 2011, 1, 199. [CrossRef]108. Hubbell, W.L.; Altenbach, C. Site-Directed Spin Labeling of Membrane Proteins. In Membrane Protein Structure: Experimental
Approaches; White, S.H., Ed.; Methods in Physiology Series; Springer: New York, NY, USA, 1994; pp. 224–248. ISBN 978-1-4614-7515-6.
Biomolecules 2021, 11, 778 21 of 21
109. Khramtsov, V.V.; Yelinova, V.I.; Weiner, L.M.; Berezina, T.A.; Martin, V.V.; Volodarsky, L.B. Quantitative Determination of SHGroups in Low- and High-Molecular-Weight Compounds by an Electron Spin Resonance Method. Anal. Biochem. 1989, 182,58–63. [CrossRef]
110. Van Eps, N.; Oldham, W.M.; Hamm, H.E.; Hubbell, W.L. Structural and Dynamical Changes in an Alpha-Subunit of a Het-erotrimeric G Protein along the Activation Pathway. Proc. Natl. Acad. Sci. USA 2006, 103, 16194–16199. [CrossRef] [PubMed]
111. Hubbell, W.L.; Altenbach, C.; Hubbell, C.M.; Khorana, H.G. Rhodopsin Structure, Dynamics, and Activation: A Perspective fromCrystallography, Site-Directed Spin Labeling, Sulfhydryl Reactivity, and Disulfide Cross-Linking. Adv. Protein Chem. 2003, 63,243–290. [CrossRef] [PubMed]
112. Fawzi, N.L.; Fleissner, M.R.; Anthis, N.J.; Kálai, T.; Hideg, K.; Hubbell, W.L.; Clore, G.M. A Rigid Disulfide-Linked Nitroxide SideChain Simplifies the Quantitative Analysis of PRE Data. J. Biomol. NMR 2011, 51, 105–114. [CrossRef] [PubMed]
113. Fleissner, M.R.; Bridges, M.D.; Brooks, E.K.; Cascio, D.; Kálai, T.; Hideg, K.; Hubbell, W.L. Structure and Dynamics of aConformationally Constrained Nitroxide Side Chain and Applications in EPR Spectroscopy. Proc. Natl. Acad. Sci. USA 2011, 108,16241–16246. [CrossRef] [PubMed]
114. Raucher, D.; Sar, C.P.; Hideg, K.; Fajer, P.G. Myosin Catalytic Domain Flexibility in MgADP. Biochemistry 1994, 33, 14317–14323.[CrossRef]
115. Toledo Warshaviak, D.; Khramtsov, V.V.; Cascio, D.; Altenbach, C.; Hubbell, W.L. Structure and Dynamics of an ImidazolineNitroxide Side Chain with Strongly Hindered Internal Motion in Proteins. J. Magn. Reson. San Diego Calif 1997 2013, 232, 53–61.[CrossRef]
116. Balo, A.R.; Feyrer, H.; Ernst, O.P. Toward Precise Interpretation of DEER-Based Distance Distributions: Insights from StructuralCharacterization of V1 Spin-Labeled Side Chains. Biochemistry 2016, 55, 5256–5263. [CrossRef]
117. Latorraca, N.R.; Venkatakrishnan, A.J.; Dror, R.O. GPCR Dynamics: Structures in Motion. Chem. Rev. 2017, 117, 139–155.[CrossRef] [PubMed]
118. del Alamo, D.; Tessmer, M.H.; Stein, R.A.; Feix, J.B.; Mchaourab, H.S.; Meiler, J. Rapid Simulation of Unprocessed DEER DecayData for Protein Fold Prediction. Biophys. J. 2020, 118, 366–375. [CrossRef] [PubMed]
119. Kurzbach, D.; Platzer, G.; Schwarz, T.C.; Henen, M.A.; Konrat, R.; Hinderberger, D. Cooperative Unfolding of CompactConformations of the Intrinsically Disordered Protein Osteopontin. Biochemistry 2013, 52, 5167–5175. [CrossRef] [PubMed]
120. López, C.J.; Oga, S.; Hubbell, W.L. Mapping Molecular Flexibility of Proteins with Site-Directed Spin Labeling: A Case Study ofMyoglobin. Biochemistry 2012, 51, 6568–6583. [CrossRef] [PubMed]
121. Weickert, S.; Cattani, J.; Drescher, M. Intrinsically disordered proteins (IDPs) studied by EPR and in-cell EPR. In ElectronParamagnetic Resonance; Royal Society of Chemistry: London, UK, 2018; pp. 1–37.
122. Maeda, R.; Hiroshima, M.; Yamashita, T.; Wada, A.; Nishimura, S.; Sako, Y.; Shichida, Y.; Imamoto, Y. Single-Molecule Observationof the Ligand-Induced Population Shift of Rhodopsin, A G-Protein-Coupled Receptor. Biophys. J. 2014, 106, 915–924. [CrossRef][PubMed]
123. Yang, Z.; Jiménez-Osés, G.; López, C.J.; Bridges, M.D.; Houk, K.N.; Hubbell, W.L. Long-Range Distance Measurements in Proteinsat Physiological Temperatures Using Saturation Recovery EPR Spectroscopy. J. Am. Chem. Soc. 2014, 136, 15356–15365. [CrossRef]
124. Meyer, V.; Swanson, M.A.; Clouston, L.J.; Boratynski, P.J.; Stein, R.A.; Mchaourab, H.S.; Rajca, A.; Eaton, S.S.; Eaton, G.R.Room-Temperature Distance Measurements of Immobilized Spin-Labeled Protein by DEER/PELDOR. Biophys. J. 2015, 108,1213–1219. [CrossRef]
125. Yang, Z.; Bridges, M.D.; López, C.J.; Rogozhnikova, O.Y.; Trukhin, D.V.; Brooks, E.K.; Tormyshev, V.; Halpern, H.J.; Hubbell,W.L. A Triarylmethyl Spin Label for Long-Range Distance Measurement at Physiological Temperatures Using T1 RelaxationEnhancement. J. Magn. Reson. 2016, 269, 50–54. [CrossRef]
126. Lavington, S.; Watts, A. Lipid Nanoparticle Technologies for the Study of G Protein-Coupled Receptors in Lipid Environments.Biophys. Rev. 2020, 12, 1287–1302. [CrossRef]
127. Chung, K.Y.; Kim, T.H.; Manglik, A.; Alvares, R.; Kobilka, B.K.; Prosser, R.S. Role of Detergents in Conformational Exchange of aG Protein-Coupled Receptor. J. Biol. Chem. 2012, 287, 36305–36311. [CrossRef]
128. Stein, R.A.; Beth, A.H.; Hustedt, E.J. A Straightforward Approach to the Analysis of Double Electron–Electron Resonance Data.In Methods in Enzymology; Elsevier: Amsterdam, The Netherlands, 2015; Volume 563, pp. 531–567. ISBN 978-0-12-802834-6.
129. Fábregas Ibáñez, L.; Jeschke, G.; Stoll, S. DeerLab: A Comprehensive Software Package for Analyzing Dipolar Electron Paramag-netic Resonance Spectroscopy Data. Magn. Reson. 2020, 1, 209–224. [CrossRef]
130. Karthikeyan, G.; Bonucci, A.; Casano, G.; Gerbaud, G.; Abel, S.; Thomé, V.; Kodjabachian, L.; Magalon, A.; Guigliarelli, B.; Belle,V.; et al. A Bioresistant Nitroxide Spin Label for In-Cell EPR Spectroscopy: In Vitro and In Oocytes Protein Structural DynamicsStudies. Angew. Chem. Int. Ed. 2018, 57, 1366–1370. [CrossRef] [PubMed]
131. Lerch, M.T.; López, C.J.; Yang, Z.; Kreitman, M.J.; Horwitz, J.; Hubbell, W.L. Structure-Relaxation Mechanism for the Response ofT4 Lysozyme Cavity Mutants to Hydrostatic Pressure. Proc. Natl. Acad. Sci. USA 2015, 112, E2437–E2446. [CrossRef] [PubMed]
132. Lerch, M.T.; Yang, Z.; Altenbach, C.; Hubbell, W.L. High-Pressure EPR and Site-Directed Spin Labeling for Mapping MolecularFlexibility in Proteins. Methods Enzymol. 2015, 564, 29–57. [CrossRef] [PubMed]
Copyright © 2022 FDOKUMEN